“Belt and Road” investment opportunities offered by Stock ...
21
February 2019 RESEARCH REPORT “BELT AND ROAD” INVESTMENT OPPORTUNITIES OFFERED BY STOCK CONNECT COMPANIES
-
Upload
khangminh22 -
Category
Documents
-
view
3 -
download
0
Transcript of “Belt and Road” investment opportunities offered by Stock ...

February 2019 RESEARCH REPORT “BELT AND ROAD” INVESTMENT OPPORTUNITIES OFFERED BY STOCK CONNECT COMPANIES

Chief China Economist’s Office Hong Kong Exchanges and Clearing Limited
14 February 2019
CONTENTS Page
Summary ........................................................................................................................................ 1
1. The Belt and Road Initiative ..................................................................................................... 2
1.1 Initiation and significance ................................................................................................ 2
1.2 Multilateral cooperation priorities and initiatives .............................................................. 3
2. The CESC’s B&R Survey ......................................................................................................... 4
3. B&R participation by listed companies ..................................................................................... 5
3.1 Overall B&R participation ................................................................................................ 5
3.2 The growth in B&R businesses ....................................................................................... 7
3.3 B&R participation by type and industry of listed companies............................................. 8
3.4 B&R businesses by geographical region and country...................................................... 9
3.5 Key trends from survey results ...................................................................................... 13
4. The CES B&R Index and other B&R indices .......................................................................... 13
5. Conclusion ............................................................................................................................. 16
Appendix 1. List of Belt and Road countries in the CESC 2018 B&R Survey ............................. 17
Appendix 2. Methodology of the CES B&R Index ...................................................................... 18
“Belt and Road” investment opportunities offered by Stock Connect companies 14 February 2019
1
SUMMARY
The Belt and Road Initiative (BRI) was initiated by the Chinese President Xi Jinping in 2013, with the visions and action plan released in 2015. The BRI is expected to help promote the economic prosperity of the countries along the Belt and Road (B&R) (referred to as the B&R countries) and regional economic cooperation, strengthen exchanges and mutual learning between different civilisations, and promote world peace and development. More than 100 countries are involved in the BRI, with over 60 B&R countries, through various forms of cooperation. Over the five years after the announcement of the BRI, significant progress has been achieved in respect of economic and trade cooperation, investments and services.
The BRI has opened up abundant business opportunities and possibly high potential return on investments along the B&R countries to worldwide enterprises across all industry sectors. For providing insights on investment opportunities to capital market participants, the China Exchanges Services Company Ltd (CESC) conducted its B&R Survey to reveal the trend of B&R business participation by listed companies in the Mainland and Hong Kong. The Survey revealed that (1) there has been continuous increase in B&R participation and growth in B&R businesses of the listed companies; (2) participation has been increasingly active particularly in engineering contracts and insurance businesses; (3) Mainland companies have assumed dominance in non-financial businesses and have a growing share in financial businesses; (4) participation by companies in B&R businesses have become more diverse across industry sectors; and (5) the geographical distribution of B&R businesses have also become increasingly diverse.
A number of B&R indices have been developed to track these B&R opportunities. In particular, the CES Belt and Road Index is the first and only Mainland-Hong Kong cross-border benchmark for B&R investment, with index constituents being listed stocks tradable through the Mainland-Hong Kong Mutual Market Access pilot programme, i.e. the Stock Connect schemes. Investment tools such as exchange traded funds could be developed based on the index to facilitate investors to reap the B&R investment opportunities across the border.
“Belt and Road” investment opportunities offered by Stock Connect companies 14 February 2019
2
1. THE BELT AND ROAD INITIATIVE
1.1 Initiation and significance
The Belt and Road Initiative (BRI) was firstly raised by the Chinese President Xi Jinping in 2013 during his visit to Asian countries. The initiative consists of the the Silk Road Economic Belt (SREB) and the 21st-Century Maritime Silk Road (MSR). The SREB runs through Central Asia, West Asia, the Middle East to Europe, with extension to South Asia and Southeast Asia. The MSR runs through Southeast Asia, Oceania and North Africa. In a subsequent event in 2013, Chinese Premier Li Keqiang emphasized the need to build the MSR oriented toward the Association of South East Asian Nations (ASEAN)1. In March 2015, the Chinese Government issued the foundation document on the visions and actions on the BRI (the BRI Action Plan)2, stating that accelerating the building of Belt and Road (B&R) can help promote the economic prosperity of the countries along B&R and regional economic cooperation, strengthen exchanges and mutual learning between different civilisations, and promote world peace and development. According to the B&R Action Plan, the BRI is aimed at promoting orderly and free flow of economic factors, highly efficient allocation of resources and deep integration of markets; encouraging the countries along B&R to achieve economic policy coordination and carry out broader and more in-depth regional cooperation of higher standards; and jointly creating an open, inclusive and balanced regional economic cooperation architecture that benefits all (see Section 1.2).
The BRI is said to involve over 100 countries ― over 60 along B&R3 and many others participating through joining the Asian Infrastructure Investment Bank (AIIB)4, developing transport infrastructure in collaboration with China, or through other forms of cooperation5. A series of infrastructure projects, such as highways and railways, in countries along B&R (B&R countries) have been initiated and underway. China has been actively participating in these projects, both in financing and in the construction work. At the Belt and Road Forum for International Cooperation in May 2017, the Chinese President reaffirmed China’s commitment to globalisation and free trade by promising a US$124 billion investment into countries along B&R.
Many of the B&R countries lack the financial capacity to develop the infrastructure themselves either by public or private means. Backed by China in the B&R projects, these countries will benefit from the resultant enhanced infrastructure establishments, foreign investment and the trade and economic activities so stimulated. China itself has committed to further opening up its market with greater international cooperation.
The identified B&R countries had a combined share of about 65% of the world’s population, 40% of the world’s gross domestic products (GDP), three quarters of global energy resources
1 ASEAN consists of the ten nations of Brunei, Cambodia, Indonesia, Laos, Malaysia, Myanmar, the Philippines, Singapore, Thailand
and Vietnam. 2 Vision and Actions on Jointly Building Silk Road Economic Belt and 21st-Century Maritime Silk Road《推動共建絲綢之路經濟帶和
21 世紀海上絲綢之路的願景與行動》, jointly issued by the National Development and Reform Commission, the Ministry of Foreign Affairs, and the Ministry of Commerce of the People’s Republic of China (PRC), with State Council authorisation, March 2015.
3 The report, Industrial cooperation between countries along the Belt and Road (《「一帶一路」沿線國家產業合作報告》), released by the China International Trade Institute in August 2015 identified 65 countries along B&R that will be participating in the initiative.
4 AIIB is a multilateral development bank headquartered in Beijing, which is promoted by China to be established to support the BRI, with a mission to improve social and economic outcomes in Asia and beyond. As of 8 October 2018, AIIB had 44 Regional Members, 24 Non-Regional Members and 19 Prospective Members from around the world (source: AIIB website, viewed on 12 December 2018).
5 The report, The Belt and Road Initiative: 65 Countries and Beyond, Fung Business Intelligence Centre, May 2016, identified 48 such countries.

“Belt and Road” investment opportunities offered by Stock Connect companies 14 February 2019
3
and one-quarter of global trade in goods and services6. The BRI is expected to create abundant job and trade opportunities for people and enterprises in the region.
1.2 Multilateral cooperation priorities and initiatives
According to the BRI Action Plan, the BRI upholds the principles of peaceful co-existence7; it is open for cooperation, harmonious and inclusive, follows market operation and seeks mutual benefit of all parties involved. Five key areas are highlighted to be of cooperative or “connectivity” priorities, briefed below:
• Policy coordination ― promote inter-governmental cooperation, building a multi-level inter-governmental macro policy exchange and communication mechanism, reaching new cooperation consensus;
• Facilities connectivity ― form an infrastructure network connecting all sub-regions in Asia, and between Asia, Europe and Africa step-by-step;
• Unimpeded trade ― with investment and trade cooperation, improve investment and trade facilitation, and removing investment and trade barriers for the creation of a sound business environment within the region and in all related countries;
• Financial integration ― deepen financial cooperation, make more efforts in building a currency stability system, investment and financing system and credit information system in Asia;
• People-to-people bond ― carry forward the spirit of friendly cooperation of the Silk Road by promoting extensive cultural and academic exchanges, personnel exchanges and cooperation, media cooperation, youth and women exchanges and volunteer services.
The BRI has received strong positive responses from the B&R countries since its announcement. Over the 5 years after the announcement of the BRI, China has signed 118 cooperation agreements with 103 countries, regions and international organisations on developing the B&R and signed or upgraded five free trade agreements with 13 B&R countries by August 2018. The initiative’s scope has been thereby extended from the Eurasian continent to Africa, Latin America and the Caribbean, and the South Pacific region.8
Apart from infrastructure projects, BRI business opportunities involve also trade and investment, and financial and professional services ― in terms of finance, some institutions estimated that BRI projects will require up to US$5-6 trillion of financing during the next 15 years9. B&R countries reported to have partnered with China in respect of infrastructure projects include, among others, Sri Lanka, Malaysia, the Philippines, Pakistan, Belgium, Ethiopia, Kenya, Cambodia, Mozambique10. Total trade between China and B&R countries over the past 5 years has exceeded US$5 trillion, with an annual average growth rate of 1.1%, and 82 overseas economic and trade cooperation zones have been established in these countries, with an accumulated investment of US$28.9 billion11. Countries and regions like the UK, Singapore and Hong Kong are also actively grasping the opportunities in offering financial
6 Sources: “China says it’s building the New Silk Road. Here are five things to know ahead of a key summit”, Time, 12 May 2017;
website of the Singapore Government (https://www.iesingapore.gov.sg). 7 There are five principles of peaceful co-existence: mutual respect for each other’s sovereignty and territorial integrity, mutual non-
aggression, mutual non-interference in each other’s internal affairs, equality and mutual benefit, and peaceful co-existence. 8 Sources: “China sees trade, investment growth with B&R countries”, Xinhua, 27 August 2018; “Belt and Road Initiative in 5 years”,
Xinhua, 27 August 2018, viewed on the website of the State Council Information Office of the PRC (SCIO). 9 HSBC gave an estimate of US$6 trillion while PricewaterhouseCoopers gave an estimate of US$5 trillion (source: “BRI helps
companies build global bridges of connectivity”, China Daily, 14 November 2018). 10 Source: Various media reports. 11 Source: “B&R countries eye production capacity cooperation with China”, Xinhua, 22 October 2018, viewed on the SCIO website.
“Belt and Road” investment opportunities offered by Stock Connect companies 14 February 2019
4
and professional services including banking and insurance, legal, engineering, city planning, etc. for the BRI.
Driven by the BRI, Chinese enterprises were reported to have increased their businesses and investments in the B&R countries, achieving a win-win outcome with their B&R business partners. BRI benefits enterprises in the industries of construction, port operations, cargo/shipping and logistics, energy, trading and financial services12. For example, for the trade and cargo industries, the shipping time has been significantly reduced as a result of railway and ocean cargo routes and port facilities established under BRI13. In 2018 up to October, new investments by Chinese enterprises of US$11.9 billion were recorded in 55 B&R countries, a year-on-year increase of 6.4%14. Chinese enterprises signed new construction contracts along B&R worth US$57.11 billion in 2018 up to July15. Chinese banking institutions are also taking important roles in B&R financing. For example, Bank of China Singapore branch was reported to have raised an accumulated sum of US$16 billion for financing BRI projects16.
The BRI, therefore, has opened up abundant business opportunities and possibly high potential return on investments along the B&R countries to enterprises in the Mainland, Hong Kong and across the world.
2. THE CESC’S B&R SURVEY
In view of the significance of the BRI in the global business and investment world, China Exchanges Services Company Ltd (CESC), a joint venture of Hong Kong Exchanges and Clearing Limited (HKEX), the Shanghai Stock Exchange (SSE) and the Shenzhen Stock Exchange (SZSE), initiated the B&R Survey to collect data and information from listed companies about their scope and extent of business participation in the BRI. The survey is conducted on a regular basis, with an attempt to keep track of the changes in the capital market landscape along with the development of the BRI. The survey results are expected to provide insights to capital market participants in the following ways:
(1) Revealing the current characteristics and development trends in B&R economic activities;
(2) Revealing the different business models of listed companies in their product and service markets in capturing BRI opportunities; and therefore
(3) Revealing the investment opportunities in the capital market offered by Mainland- and Hong Kong-listed companies participating in BRI.
Target respondents of the survey cover listed companies on the SSE, the SZSE and the HKEX with their stocks being eligible securities for trading under the Mainland-Hong Kong Mutual Market Access pilot programme ― the Stock Connect schemes17. The first survey was conducted in 2017 (the 2017 Survey) to collect data for the financial years of 2014 to 2016 while the latest survey was conducted in 2018 (the 2018 Survey) to collect data for the financial year of 2017. The 2017 Survey and the 2018 Survey covered 1,931 and 1,939 listed
12 As reported by various media reports. 13 These include, among many others, the China-Singapore rail-sea transit route, the Zhengzhou-Liege (Belgium) cargo train route,
Lanzhou-Islamabad (Pakistan) rail and road cargo service, the China-Europe Land-Sea Express Route and the Sino-Euro Cargo Railway program.
14 Source:〈前 10個月我國企業對「一帶一路」沿綫國家新增投資 119 億美元〉, the SCIO website, 15 November 2018. 15 Source: “Belt and Road Initiative in 5 years”, Xinhua, 27 August 2018, viewed on the SCIO website. 16 Source: “China, Singapore explore more potentials for BRI cooperation”, Xinhua, 12 November 2018, viewed on the SCIO website. 17 Consisting of the Shanghai-Hong Kong Stock Connect (Shanghai Connect) and the Shenzhen-Hong Kong Stock Connect
(Shenzhen Connect).
“Belt and Road” investment opportunities offered by Stock Connect companies 14 February 2019
5
companies respectively in the target population, achieving respective response rates of 67% (1,286 valid responses) and 66% (1,274 valid responses).
The measures of BRI participation of listed companies are identified with reference to the five key areas of connectivity among B&R countries (see Section 1.2 above). Three of the five key areas are considered to be quantifiable ― “facilities connectivity”, “unimpeded trade” and “financial integration”. The following six B&R business participation indicators are identified:
(1) Goods/services sales amount ― Amount of trade exports, selling goods and/or providing services domestically, etc. in order to generate revenue from the B&R countries;
(2) Goods/services purchases amount ― Amount of trade imports, buying goods and/or receiving services domestically, etc. for production or resale purpose from the B&R countries;
(3) Newly signed engineering contract value ― For infrastructure design and/or construction, civil engineering, and equipment manufacturing, etc. offered to the B&R countries;
(4) New investment amount ― Capital expenditure and/or equity investment in the B&R countries;
(5) Financing/loan amount (for financial institutions only) ― Amount of direct financing, bond issuance and/or lending business in the B&R countries;
(6) Insured amount (for financial institutions only) ― Insured amount in the insurance services and underwriting of customers’ insurance applications in the B&R countries.
Provided with the reference list of B&R countries18, the survey respondents were asked to report the amounts of the respective six indicators listed above which are applicable to them, together with any other information on B&R-related businesses. As there is no definite geographical boundary of the B&R, the list of B&R countries in the survey series may expand over the years19.
Section 3 below gives the trends of B&R participation of the responded companies in the key areas of infrastructure, trade and investment, and financial services as revealed by the survey results.
3. B&R PARTICIPATION BY LISTED COMPANIES20
3.1 Overall B&R participation
Current and future plans for B&R participation
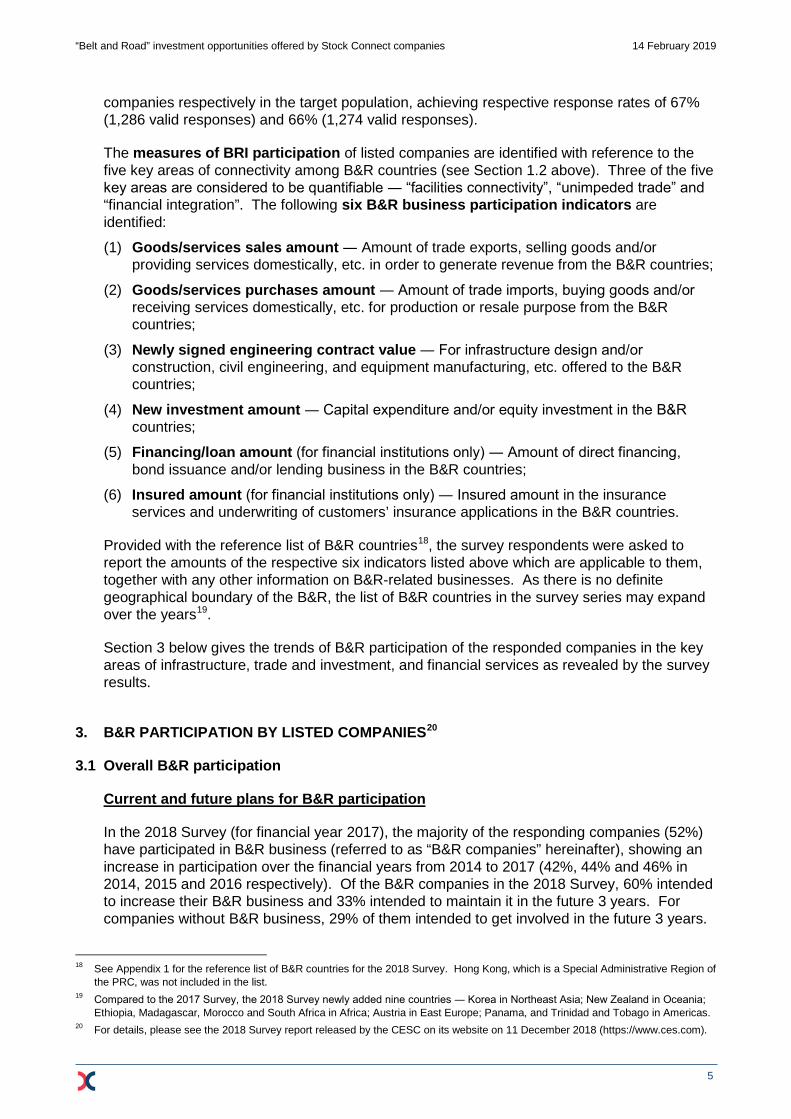
In the 2018 Survey (for financial year 2017), the majority of the responding companies (52%) have participated in B&R business (referred to as “B&R companies” hereinafter), showing an increase in participation over the financial years from 2014 to 2017 (42%, 44% and 46% in 2014, 2015 and 2016 respectively). Of the B&R companies in the 2018 Survey, 60% intended to increase their B&R business and 33% intended to maintain it in the future 3 years. For companies without B&R business, 29% of them intended to get involved in the future 3 years.
18 See Appendix 1 for the reference list of B&R countries for the 2018 Survey. Hong Kong, which is a Special Administrative Region of
the PRC, was not included in the list. 19 Compared to the 2017 Survey, the 2018 Survey newly added nine countries ― Korea in Northeast Asia; New Zealand in Oceania;
Ethiopia, Madagascar, Morocco and South Africa in Africa; Austria in East Europe; Panama, and Trinidad and Tobago in Americas. 20 For details, please see the 2018 Survey report released by the CESC on its website on 11 December 2018 (https://www.ces.com).
“Belt and Road” investment opportunities offered by Stock Connect companies 14 February 2019
6
Overall, 94% of the responding companies intended to increase or maintain their B&R business participation. (See Figure 1.)
Figure 1. Current status and future plans of responding companies on B&R participation (a) Companies with B&R participation (b) Future 3-year plan on B&R participation (2017 & 2018 Survey) (2018 Survey)
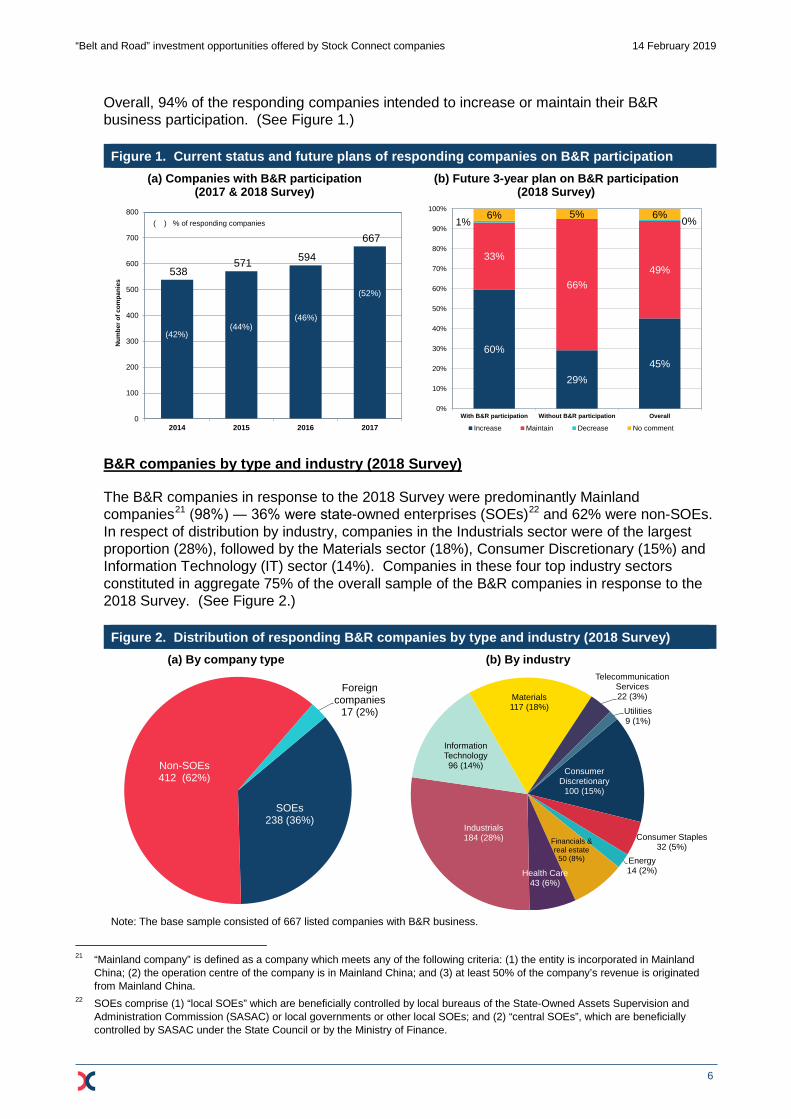
B&R companies by type and industry (2018 Survey)
The B&R companies in response to the 2018 Survey were predominantly Mainland companies21 (98%) ― 36% were state-owned enterprises (SOEs)22 and 62% were non-SOEs. In respect of distribution by industry, companies in the Industrials sector were of the largest proportion (28%), followed by the Materials sector (18%), Consumer Discretionary (15%) and Information Technology (IT) sector (14%). Companies in these four top industry sectors constituted in aggregate 75% of the overall sample of the B&R companies in response to the 2018 Survey. (See Figure 2.)
Figure 2. Distribution of responding B&R companies by type and industry (2018 Survey) (a) By company type (b) By industry
Note: The base sample consisted of 667 listed companies with B&R business.
21 “Mainland company” is defined as a company which meets any of the following criteria: (1) the entity is incorporated in Mainland
China; (2) the operation centre of the company is in Mainland China; and (3) at least 50% of the company’s revenue is originated from Mainland China.
22 SOEs comprise (1) “local SOEs” which are beneficially controlled by local bureaus of the State-Owned Assets Supervision and Administration Commission (SASAC) or local governments or other local SOEs; and (2) “central SOEs”, which are beneficially controlled by SASAC under the State Council or by the Ministry of Finance.
538 571 594
667
2014 2015 2016 20170
100
200
300
400
500
600
700
800
Num
ber o
f com
pani
es
(42%)(44%)
(46%)
(52%)
( ) % of responding companies
60%
29%45%
33%
66%49%
1% 0%6% 5% 6%
With B&R participation Without B&R participation Overall0%
10%
20%
30%
40%
50%
60%
70%
80%
90%
100%
Increase Maintain Decrease No comment
SOEs238 (36%)
Non-SOEs412 (62%)
Foreign companies
17 (2%)
Consumer Discretionary
100 (15%)
Consumer Staples32 (5%)
Energy14 (2%)
Financials & real estate
50 (8%)
Health Care43 (6%)
Industrials184 (28%)
Information Technology96 (14%)
Materials117 (18%)
Telecommunication Services22 (3%)
Utilities9 (1%)
“Belt and Road” investment opportunities offered by Stock Connect companies 14 February 2019
7
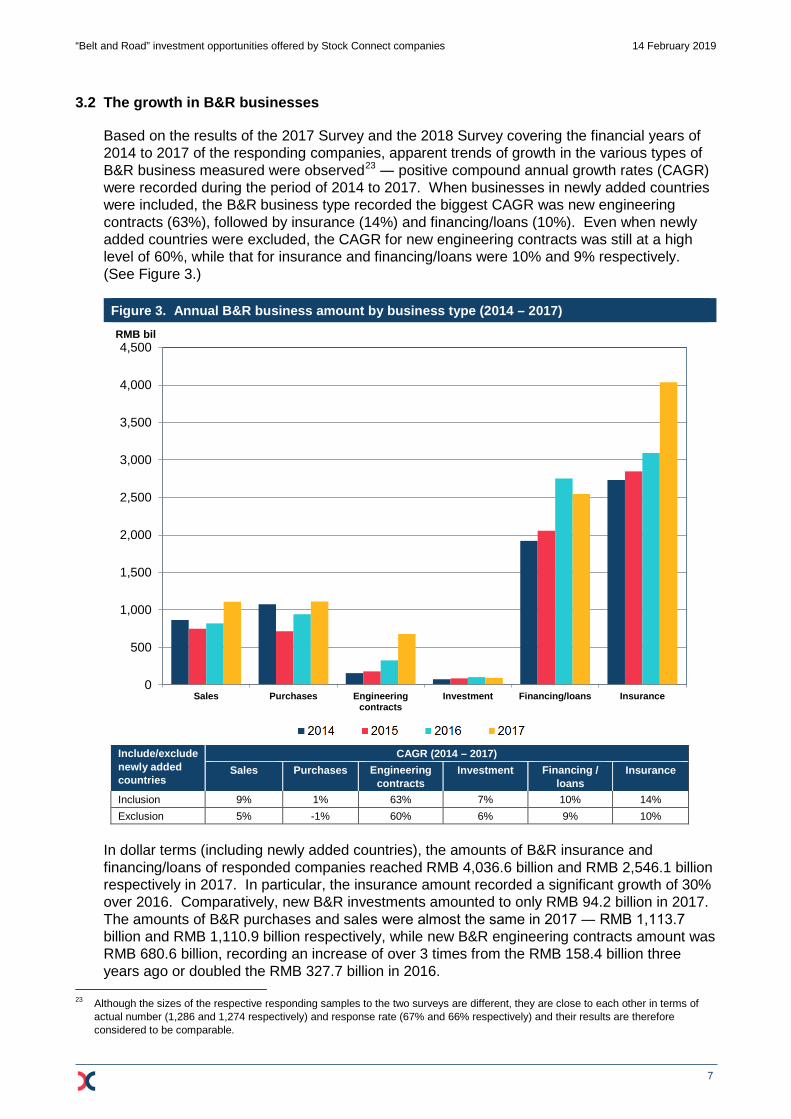
3.2 The growth in B&R businesses
Based on the results of the 2017 Survey and the 2018 Survey covering the financial years of 2014 to 2017 of the responding companies, apparent trends of growth in the various types of B&R business measured were observed23 ― positive compound annual growth rates (CAGR) were recorded during the period of 2014 to 2017. When businesses in newly added countries were included, the B&R business type recorded the biggest CAGR was new engineering contracts (63%), followed by insurance (14%) and financing/loans (10%). Even when newly added countries were excluded, the CAGR for new engineering contracts was still at a high level of 60%, while that for insurance and financing/loans were 10% and 9% respectively. (See Figure 3.)
Figure 3. Annual B&R business amount by business type (2014 – 2017)
Include/exclude newly added countries
CAGR (2014 – 2017) Sales Purchases Engineering
contracts Investment Financing /
loans Insurance
Inclusion 9% 1% 63% 7% 10% 14% Exclusion 5% -1% 60% 6% 9% 10%
In dollar terms (including newly added countries), the amounts of B&R insurance and financing/loans of responded companies reached RMB 4,036.6 billion and RMB 2,546.1 billion respectively in 2017. In particular, the insurance amount recorded a significant growth of 30% over 2016. Comparatively, new B&R investments amounted to only RMB 94.2 billion in 2017. The amounts of B&R purchases and sales were almost the same in 2017 ― RMB 1,113.7 billion and RMB 1,110.9 billion respectively, while new B&R engineering contracts amount was RMB 680.6 billion, recording an increase of over 3 times from the RMB 158.4 billion three years ago or doubled the RMB 327.7 billion in 2016.
23 Although the sizes of the respective responding samples to the two surveys are different, they are close to each other in terms of
actual number (1,286 and 1,274 respectively) and response rate (67% and 66% respectively) and their results are therefore considered to be comparable.
Sales Purchases Engineeringcontracts
Investment Financing/loans Insurance0
500
1,000
1,500
2,000
2,500
3,000
3,500
4,000
4,500RMB bil

“Belt and Road” investment opportunities offered by Stock Connect companies 14 February 2019
8
3.3 B&R participation by type and industry of listed companies
By company type
Figure 4. Share of B&R business amount by company type (2014 – 2017)
Note: Percentages may not add up to 100% due to rounding.
Mainland companies (SOEs and non-SOEs) had the dominant share in non-financial B&R businesses among responding companies ― in 2017, they shared 83%, 93% and 100% in sales, purchases and new engineering contracts respectively, and 76% in respect of new investments (see Figure 4). For the business types of sales, purchases and new engineering contracts, SOEs played a much more significant role than non-SOEs (65%, 82% and 97% respectively in 2017). On the other hand, non-SOEs had a rapidly growing share in new investments over the years, from 6% in 2014 to 39% in 2017.
Financial business types had been dominated by foreign companies, but Mainland companies were slowly catching up. The share of foreign companies in financing/loans and insurance were respectively 67% and 79% in 2017, down from respectively 98% and 88% in 2014. (See Figure 4.)
By industry sector
Companies in the Energy sector, which constituted only 2% in number of the responding B&R companies in the 2018 Survey, played a dominant role in B&R purchases and sales ― constituting the majority share of 68% and 33% respectively in 2017, albeit showing a decline from 85% and 52% respectively in 2014. Companies in the Industrials sector showed increasing shares in all four non-financial B&R business types ― from 76% in 2014 to 99% in 2017 for new engineering contracts, from 13% in 2014 to 25% in 2017 for sales, from 6% in 2014 to 11% in 2017 for purchases and from 8% in 2014 to 17% in 2017 for new investments. Notably, companies in the Finance sector had relatively high shares in new investments (23% in 2017) and sales (12% in 2017). (See Figure 5.) Note that only companies in the Finance sector, by nature of their business, provide B&R financing/loans and insurance services.
68%60% 58%
65%
90%83% 85% 82%
91% 95%
84%
97%
83%74%
46%36%
2%
16%25%
33%
10%14% 14%
20%
11%
16% 19%
17%
4%7% 7% 10%
9% 5%
16%
3%
6%18%
42%
39%
1%
0%
2%2% 2%
1%
21% 24% 23%17%
6% 10% 8% 7% 11% 8% 12%
24%
98%
84%74%
67%
88%84% 84%
79%
2014
2015
2016
2017
2014
2015
2016
2017
2014
2015
2016
2017
2014
2015
2016
2017
2014
2015
2016
2017
2014
2015
2016
2017
0%
10%
20%
30%
40%
50%
60%
70%
80%
90%
100%
SOEs Non-SOEs Foreign companies
Sales Purchases Engineering Contracts Investment Financing
/loansInsurance

“Belt and Road” investment opportunities offered by Stock Connect companies 14 February 2019
9
Figure 5. Share of B&R business amount by industry sector (2014 – 2017)
Note: Percentages may not add up to 100% due to rounding.
3.4 B&R businesses by geographical region and country
Figure 6 shows the distribution of B&R businesses of responding companies24 by geographical region in 2016 and 2017 in terms of value, with the percentage shares shown. In the 2018 Survey (for collecting data on the financial year of 2017), nine countries in five geographical regions were newly added25 such that Africa, Oceania and America were newly added regions compared to the 2017 Survey (for collecting data on the financial years of 2014 to 2016).
The responding B&R companies had their B&R businesses relatively concentrated in Southeast Asia ― in 2017, the percentage shares were 59% for sales, 42% for purchases, 50% for new engineering contracts, 55% for new investments, 45% for financing/loans, and especially high for insurance (78%). The Middle East region constituted a significant share in purchases (31% in 2017) and financing/loans (36% in 2017), while South Asia constituted a relatively high share in new engineering contracts (18% in 2017, same as the Middle East) and in sales (11% in 2017, compared to 9% for the Middle East).
24 A total of 512 and 657 companies provided answers to the questions on country breakdown in the 2017 Survey and 2018 Survey
respectively. These responding companies’ B&R businesses measured by the survey amounted, in aggregate, to RMB 6,700 billion and RMB 8,409 billion in the financial years of 2016 and 2017 respectively, representing a coverage of 83% and 88% of the total B&R business in value terms in the respective years of the overall sample of responding B&R companies to the survey in the two years.
25 See Appendix 1 for the list of B&R countries in the 2018 Survey and footnote 19 above for the changes.
7% 8% 9% 9%1% 2% 2% 2% 5% 7% 6% 5%
6% 7% 7% 6%
4% 6% 5% 5% 4%3% 2% 5%
52%40% 37%
33%
85% 76% 78%68%
16%7% 3%
42%32%
12%15%
13%
16%15%
12%
1%
2% 2%
2%
0%
0%0%
0%
33%
22%
25%
23%
13%17%
19%25%
6%9% 9%
11%
76%
84% 94% 99%
8%
15%
20%17%
5% 2%9%
3%9%
5% 6% 7% 6%2% 2% 2%
6%5% 5% 4%
3%
30%9%
4%5%
14%
2% 3% 3% 2% 3% 3%
2014
2015
2016
2017
2014
2015
2016
2017
2014
2015
2016
2017
2014
2015
2016
2017
0%
10%
20%
30%
40%
50%
60%
70%
80%
90%
100%
Consumer Discretionary Consumer Staples Energy FinancialsHealth Care Industrials Information Technology MaterialsReal estate Telecommunication Services Utilities
Sales Purchases Engineering Contracts
Investment

“Belt and Road” investment opportunities offered by Stock Connect companies 14 February 2019
10
Figure 6. Share of B&R business amount by region (2016 – 2017)
Notes: The base samples consisted of 512 and 657 companies in the 2017 Survey and 2018 Survey respectively, which
provided the geographical breakdown of their B&R businesses. Percentages may not add up to 100% due to rounding.
Southeast Asia, the dominating region in B&R businesses, recorded in 2017 the strongest annual growth in new engineering contracts (153% in value terms) and also considerable annual growth in purchases (64%), investment (58%) and sales (32%). On the contrary, the B&R businesses in the Middle East suffered an annual decline of 17% in purchases and 11% in sales, but managed to have a 51% annual growth in new engineering contracts in 2017. The growth in B&R businesses in Northeast Asia in 2017 (which constituted an overall 5% in 2017, compared to 0% in 2016) was mainly attributed to the newly added country, Korea.
Although the top three regions constituted about 80% or more in each business type in 2017, the concentration had declined compared to 2016 and that B&R businesses of responding companies had achieved a wider distribution among different geographical regions in 2017 (see Figure 7).
65% 59%
32%
42%
43%
50%
48% 55%
12%
11%
1%
2%
27%
18%
15%
9%
47%
31%
25%
18%
8% 6%
4%
6%
11%
11%
7%
5%
4%
9%
8%3%
5%
696
1,003
816
1,013
293
636
64 88
2016 2017 2016 2017 2016 2017 2016 20170
200
400
600
800
1,000
1,200RMB bil
Sales Purchases Engineering Contracts
Investment
54% 45%
92% 78%
11%7%
3%
2%
32%
36%
3%6% 5%
3%
3%3%
1,800 1,715
3,031
3,954
2016 2017 2016 20170
500
1,000
1,500
2,000
2,500
3,000
3,500
4,000RMB bil
Financing/loans
Insurance
Total amount
Southeast Asia South Asia Middle East Northeast AsiaEast Europe Central Asia Africa/Oceania/America

“Belt and Road” investment opportunities offered by Stock Connect companies 14 February 2019
11
Figure 7. Percentage share of top three regions for each B&R business type (2016 & 2017)
Financial
year Sales Purchases Engineering
contracts Investment Financing/
loans Insurance
2016 SE Asia (65%) Middle East (15%) South Asia (12%)
Middle East (47%) SE Asia (32%)
East Europe (11%)
SE Asia (48%) South Asia (27%) Middle East (25%)
SE Asia (48%) Middle East (24%) South Asia (15%)
SE Asia (54%) Middle East (32%) South Asia (11%)
SE Asia (92%) South Asia (3%)
Central Asia (3%)
2017 SE Asia (59%) South Asia (11%) Middle East (9%)
SE Asia (42%) Middle East (31%) East Europe (11%)
SE Asia (50%) South Asia (18%) Middle East (18%)
SE Asia (55%) Middle East (13%)
East Europe (12%)
SE Asia (45%) Middle East (36%) South Asia (7%)
SE Asia (78%) NE Asia (6%)
East Europe (5%)
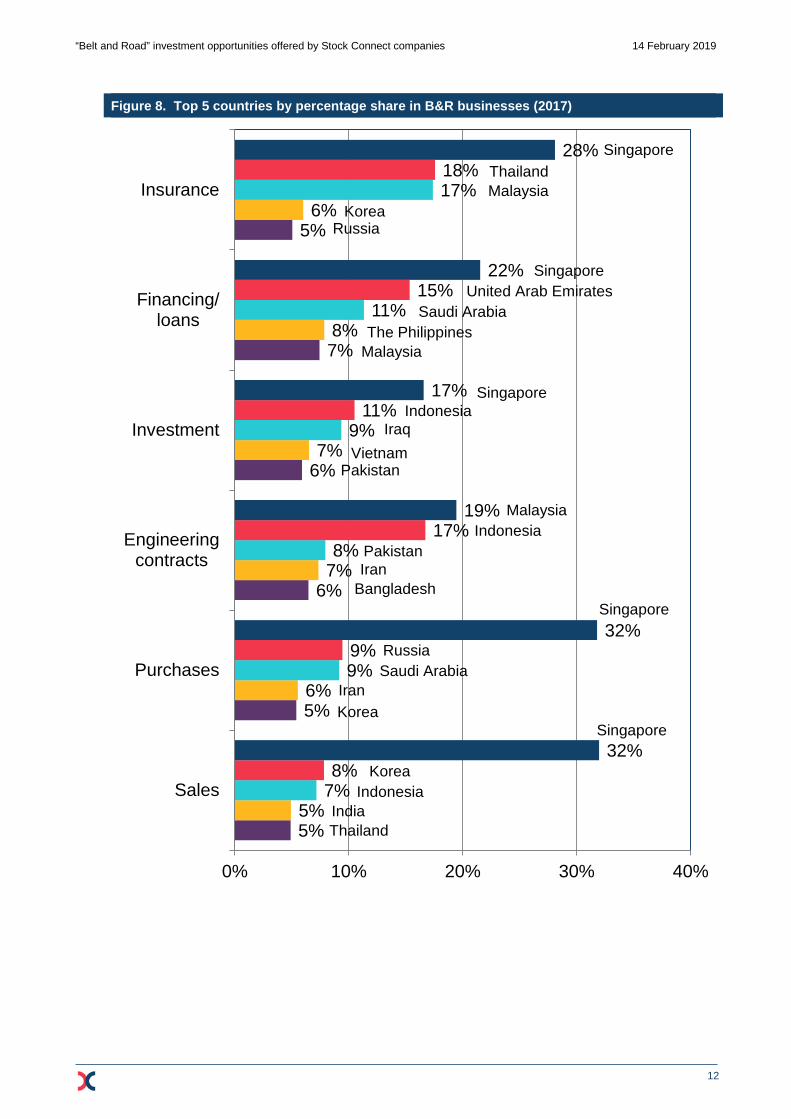
Figure 8 shows the top five countries by percentage share in each B&R business type of the responding B&R companies for the financial year of 2017. In particular, Singapore ranked top in five of the six identified B&R business types. Malaysia assumed the top rank in new engineering contracts.
92% 89%95%
87%
97% 98%
79%84% 86%
80%
89% 89%
Sales Purchases Engineeringcontracts
Investment Financing/loans Insurance0%
10%
20%
30%
40%
50%
60%
70%
80%
90%
100%
2016 2017
“Belt and Road” investment opportunities offered by Stock Connect companies 14 February 2019
12
Figure 8. Top 5 countries by percentage share in B&R businesses (2017)
5%
5%
6%
6%
7%
5%
5%
6%
7%
7%
8%
6%
7%
9%
8%
9%
11%
17%
8%
9%
17%
11%
15%
18%
32%
32%
19%
17%
22%
28%
Sales
Purchases
Engineeringcontracts
Investment
Financing/loans
Insurance
0% 10% 20% 30% 40%
Singapore
KoreaIndonesia
IndiaThailand
Singapore
RussiaSaudi Arabia
IranKorea
MalaysiaIndonesia
PakistanIran
Bangladesh
SingaporeIndonesia
IraqVietnam
Pakistan
United Arab EmiratesSaudi Arabia
The PhilippinesMalaysia
Singapore
MalaysiaKorea
Russia
SingaporeThailand

“Belt and Road” investment opportunities offered by Stock Connect companies 14 February 2019
13
3.5 Key trends from survey results
In summary, the survey results revealed the following key trends of B&R participation by listed companies surveyed:
(1) Continuous increase in B&R participation and growth in B&R businesses
There were a growing number of companies with B&R participation over the financial years of 2014 to 2017, with the proportion increased from being the minority in prior years to being the majority in 2017. Significant growth in business amounts was also recorded over the years in various business types measured by the survey.
(2) Increasing active participation in B&R engineering contracts and insurance businesses
Among the business types measured, new engineering contracts and insurance business showed particularly high growth in 2017 (over 100% and 30% respectively compared to that in 2016). This reflects the continuous significance of infrastructure developments in the B&R countries.
(3) The significance of participation from Mainland companies
Mainland companies have dominated the businesses of B&R sales, purchases, new engineering contracts and new investments. The Mainland companies (mainly the SOEs) are also gaining increasing and relatively more significant market shares in the financial business (financing/loans and insurance), in which foreign companies have had the majority share. Notably, non-SOEs had an increased share in new investments.
(4) More diverse participation by industry sector in B&R businesses
The dominance of the Energy sector in B&R sales, purchases and new investments has declined, giving way to increasing participation from other industry sectors. Nevertheless, companies in the Industrials sector continued to have business dominance in B&R new engineering contracts.
(5) More diverse geographical distribution of B&R businesses
The B&R business concentration in the top three regions had declined over the years. The top three countries with the biggest market share varied across different B&R business types. Among the countries outside Greater China that were assessed by the survey, Singapore ranked top in five of the six B&R business types measured in 2017.
4. THE CES B&R INDEX AND OTHER B&R INDICES
In June 2017, HKEX appointed CESC to explore a B&R index in response to the market’s interest in a barometer for the BRI. The CES Belt and Road Index (中華一帶一路指數) (CES B&R Index) was therefore developed.
The CES B&R Index is the first cross-border B&R Index in the offshore market, with the objective to reflect the price performance of companies which demonstrate substantial participation in the BRI.

“Belt and Road” investment opportunities offered by Stock Connect companies 14 February 2019
14
The constituents of the CES B&R Index are selected from the stocks eligible for Northbound Trading or Southbound Trading of Stock Connect (excluding those which are labelled as “ST” or “ST*” on the SSE or the SZSE26) based on their degrees of B&R participation in respect of the six business areas as measured in the B&R Survey27. That is, the CES B&R Index consists of constituent companies listed in the Mainland exchanges and HKEX. The composition of the index would reflect the progress of the BRI in the various economic sectors participated in by listed companies tradable through Stock Connect. The index benchmarks the performance of B&R businesses-related stocks.
Apart from the CES B&R Index, there are three major Mainland onshore B&R indices comprising A shares of companies engaged in industries related to the BRI theme. These are:
(1) The CSI One Belt & One Road Index (中證一帶一路主題指數) (referred to as the “CSI B&R Index” hereinafter28) launched by the China Securities Index Co., Ltd (CSI) on 16 February 2015;
(2) The SSE One Belt & One Road Index (上證一帶一路主題指數) (referred to as the “SSE B&R Index” hereinafter29) launched by the CSI for the SSE on 24 June 2015; and
(3) The CNI Silk Road Economic Belt Index (國證新絲路主題指數) (referred to as the “CNI B&R Index” hereinafter30) launched by the Shenzhen Securities Information Company Limited (SSIC) on 8 January 2015.
In addition, there is at least a global B&R-related index, the MSCI Global China Infrastructure Exposure Index (referred to as the MSCI B&R Index), which tracks listed companies within developed, emerging and frontier markets with high revenue exposure to China infrastructure development from within a specified set of industries related to B&R. China has the highest country weighting in the index (43.5%), followed by Singapore (10.2%), Malaysia (7.2%), Russia (6.6%) and Thailand (6.1%), as of end-November 2018.31
Figure 9 shows the industry composition of the five B&R indices. The CES B&R Index gives a relatively wide distribution across industry sectors compared to the CSI, SSE and MSCI B&R indices. The CNI B&R Index gives a comparably wide industry distribution as the CES B&R Index but its constituents are selected based on place of incorporation of the companies rather than their substantive B&R business relations.
26 Stocks with “ST” or “ST*” label are stocks under “special treatment”, which are a kind of risk alert label for the attention of investors. 27 See Appendix 2 on the methodology of the CESC B&R Index. 28 The official English short name of the index is CSI OBOR Index. It consists of the most representative A shares listed on the SSE
or the SZSE from five B&R-related industries: Infrastructure Construction, Traffic & Transportation, Equipment Manufacturing, Electric Power & Communication, and Resource Development. (Source: CSI website, viewed on 10 December 2018.)
29 The official English short name of the index is SSE OBOR Index. It consists of the most representative A shares listed on the SSE from the same five B&R-related industries as the CSI OBOR Index. (Source: CSI website, viewed on 10 December 2018.)
30 The official English short name of the index is New Silk Road Index. It consists of companies with A shares listed on the SSE or the SZSE which are incorporated in the five provinces of Shaanxi, Gansu, Ningxia, Qinghai and Xinjiang (these are economic regions along the B&R). (Source: SSIC website, viewed on 10 December 2018.)
31 Source: The index factsheet (November 2018) on the MSCI website, viewed on 10 December 2018.

“Belt and Road” investment opportunities offered by Stock Connect companies 14 February 2019
15
Figure 9. Industry composition of B&R indices (Nov 2018) (a) CES B&R Index (b) CSI B&R Index
(c) SSE B&R Index (d) CNI B&R Index
(e) MSCI B&R Index
Note: Percentages may not add up to 100% due to rounding.
Source: CESC for CES B&R Index; index factsheets from the respective index companies’ websites.
Consumer Discretionary
(17.4%)Consumer Staples
(3.3%)
Energy (4.9%)
Financials(11.0%)
Health Care (1.1%)
Industrials(35.4%)
Information Technology
(6.0%)
Materials(17.8%)
Real Estate (0.9%)
Telecommunication Services (0.9%)
Utilities (1.4%)
Consumer Discretionary
(2.8%)
Energy(10.4%)
Industrials(71.4%)
Materials (6.5%)
Telecommunication Services (7.9%)
Utilities (1.0%)
Consumer Discretionary
(4.7%)
Energy(13.4%)
Industrials(69.1%)
Materials (7.1%)
Telecommunication Services (4.7%)
Utilities (0.9%)
Consumer Discretionary
(4.9%)Consumer Staples
(6.1%)
Energy(11.8%)
Financials(10.2%)
Health Care (4.9%)
Industrials(34.5%)
Information Technology (2.4%)
Materials(23.1%)
Telecommunication Services (0.3%)
Utilities (1.8%)
Energy(11.2%)
Financials(10.5%)
Industrials(31.2%)
Materials(31.7%)
Utilities(15.3%)

“Belt and Road” investment opportunities offered by Stock Connect companies 14 February 2019
16
Figure 10 shows the relative performance of the four B&R indices comprising constituent companies listed on the Hong Kong and/or the Mainland markets for the period July 2015 to October 201832.
Figure 10. Daily closings of the B&R indices (30 Jun 2015 – 31 Oct 2018) (Rebased on 30 June 2015)
Note: The rebased date of 30 June 2015 is the base date of the CES B&R Index. The base point for all index series in the
chart is set to 2000 points on the base date.
Source: Wind.
With the availability of B&R indices of specialised scopes of coverage, investors would be able to benchmark their investment in B&R-related stocks by making reference to the suitable index. Furthermore, thematic investment tools such as exchange traded funds (ETFs) based on these B&R indices could be developed to facilitate participation by retail and institutional investors. In particular, the CES B&R Index is the only Mainland-Hong Kong cross-border B&R index with the underlying stocks tradable by both Mainland and Hong Kong investors through the Stock Connect scheme. Investment tools based on this index help provide B&R investment opportunities across the border.
5. CONCLUSION
The BRI is considered a significant driver of multilateral economic cooperation and development, providing abundant business opportunities and possibly high potential return on investments along the B&R countries to worldwide enterprises across all industry sectors. The CESC’s B&R Survey provides insights on investment opportunities to capital market participants by revealing the trend of B&R business participation by listed companies in the Mainland and Hong Kong. These opportunities are being tracked by related B&R indices. In particular, the CES B&R Index is the first and only Mainland-Hong Kong cross-border benchmark for B&R investment. Investment tools such as ETFs could be developed based on the index to facilitate investors to reap the B&R investment opportunities across the border.
32 The MSCI B&R Index is excluded as the index data series is only dated back to August 2017.
500
700
900
1,100
1,300
1,500
1,700
1,900
2,100
30/0
6/20
1531
/07/
2015
31/0
8/20
1530
/09/
2015
31/1
0/20
1530
/11/
2015
31/1
2/20
1531
/01/
2016
29/0
2/20
1631
/03/
2016
30/0
4/20
1631
/05/
2016
30/0
6/20
1631
/07/
2016
31/0
8/20
1630
/09/
2016
31/1
0/20
1630
/11/
2016
31/1
2/20
1631
/01/
2017
28/0
2/20
1731
/03/
2017
30/0
4/20
1731
/05/
2017
30/0
6/20
1731
/07/
2017
31/0
8/20
1730
/09/
2017
31/1
0/20
1730
/11/
2017
31/1
2/20
1731
/01/
2018
28/0
2/20
1831
/03/
2018
30/0
4/20
1831
/05/
2018
30/0
6/20
1831
/07/
2018
31/0
8/20
1830
/09/
2018
31/1
0/20
18
CES B&R Index CSI B&R Index SSE B&R Index CNI B&R Index
“Belt and Road” investment opportunities offered by Stock Connect companies 14 February 2019
17
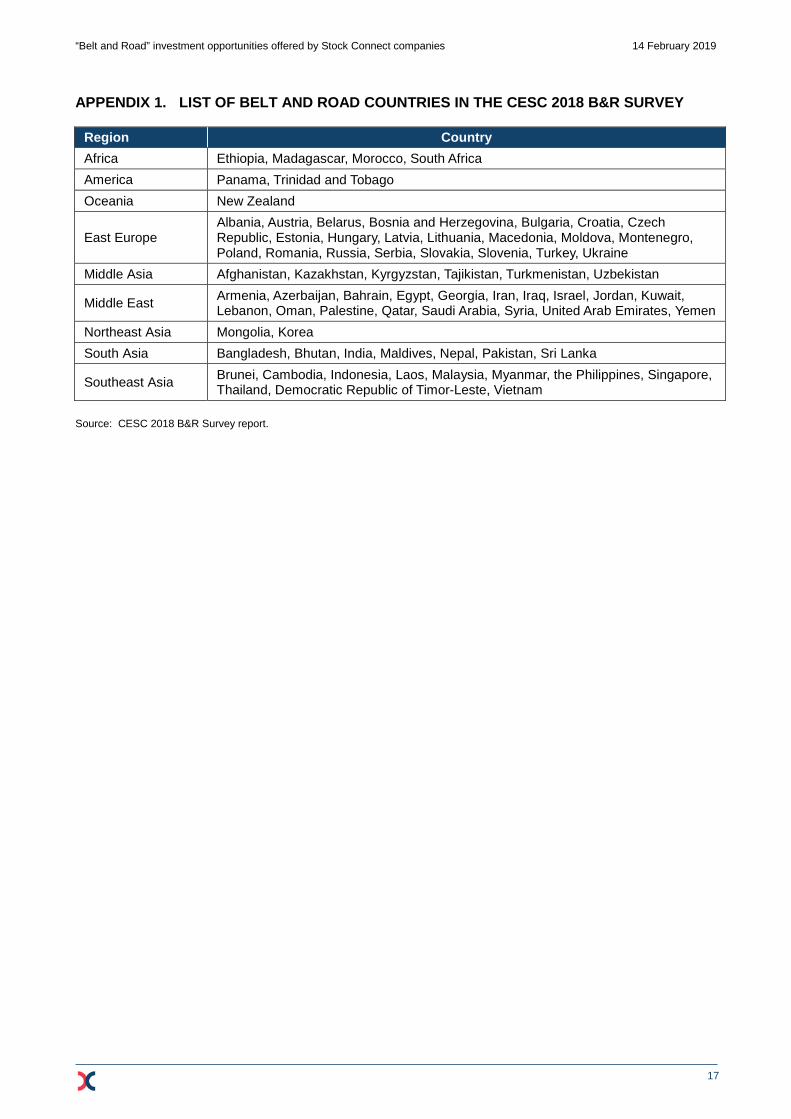
APPENDIX 1. LIST OF BELT AND ROAD COUNTRIES IN THE CESC 2018 B&R SURVEY
Region Country Africa Ethiopia, Madagascar, Morocco, South Africa America Panama, Trinidad and Tobago Oceania New Zealand
East Europe Albania, Austria, Belarus, Bosnia and Herzegovina, Bulgaria, Croatia, Czech Republic, Estonia, Hungary, Latvia, Lithuania, Macedonia, Moldova, Montenegro, Poland, Romania, Russia, Serbia, Slovakia, Slovenia, Turkey, Ukraine
Middle Asia Afghanistan, Kazakhstan, Kyrgyzstan, Tajikistan, Turkmenistan, Uzbekistan
Middle East Armenia, Azerbaijan, Bahrain, Egypt, Georgia, Iran, Iraq, Israel, Jordan, Kuwait, Lebanon, Oman, Palestine, Qatar, Saudi Arabia, Syria, United Arab Emirates, Yemen
Northeast Asia Mongolia, Korea South Asia Bangladesh, Bhutan, India, Maldives, Nepal, Pakistan, Sri Lanka
Southeast Asia Brunei, Cambodia, Indonesia, Laos, Malaysia, Myanmar, the Philippines, Singapore, Thailand, Democratic Republic of Timor-Leste, Vietnam
Source: CESC 2018 B&R Survey report.
“Belt and Road” investment opportunities offered by Stock Connect companies 14 February 2019
18
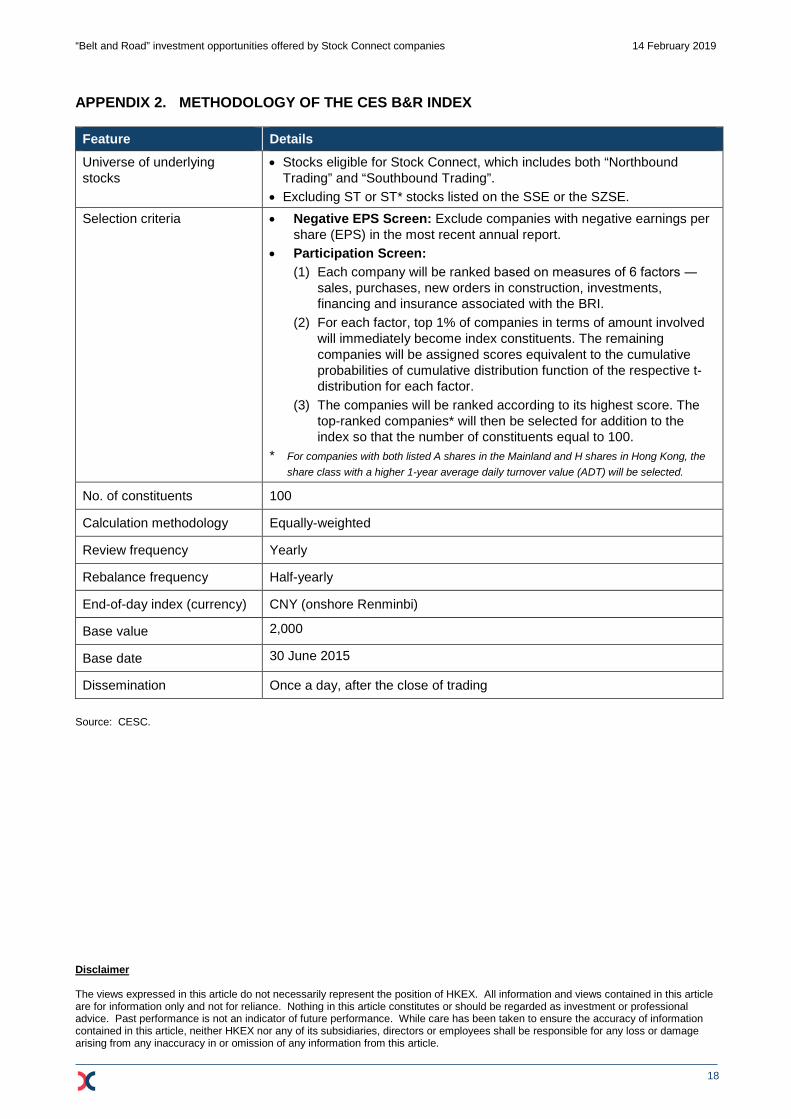
APPENDIX 2. METHODOLOGY OF THE CES B&R INDEX
Feature Details
Universe of underlying stocks
• Stocks eligible for Stock Connect, which includes both “Northbound Trading” and “Southbound Trading”.
• Excluding ST or ST* stocks listed on the SSE or the SZSE. Selection criteria • Negative EPS Screen: Exclude companies with negative earnings per
share (EPS) in the most recent annual report. • Participation Screen:
(1) Each company will be ranked based on measures of 6 factors ― sales, purchases, new orders in construction, investments, financing and insurance associated with the BRI.
(2) For each factor, top 1% of companies in terms of amount involved will immediately become index constituents. The remaining companies will be assigned scores equivalent to the cumulative probabilities of cumulative distribution function of the respective t-distribution for each factor.
(3) The companies will be ranked according to its highest score. The top-ranked companies* will then be selected for addition to the index so that the number of constituents equal to 100.
* For companies with both listed A shares in the Mainland and H shares in Hong Kong, the share class with a higher 1-year average daily turnover value (ADT) will be selected.
No. of constituents 100
Calculation methodology Equally-weighted
Review frequency Yearly
Rebalance frequency Half-yearly
End-of-day index (currency) CNY (onshore Renminbi)
Base value 2,000
Base date 30 June 2015
Dissemination Once a day, after the close of trading
Source: CESC. Disclaimer The views expressed in this article do not necessarily represent the position of HKEX. All information and views contained in this article are for information only and not for reliance. Nothing in this article constitutes or should be regarded as investment or professional advice. Past performance is not an indicator of future performance. While care has been taken to ensure the accuracy of information contained in this article, neither HKEX nor any of its subsidiaries, directors or employees shall be responsible for any loss or damage arising from any inaccuracy in or omission of any information from this article.