BELLEVILLE TOWNSHIP SCHOOL DISTRICT ... - NJ.gov
167
BELLEVILLE TOWNSHIP SCHOOL DISTRICT COMPREHENSIVE ANNUAL FINANCIAL REPORT FOR THE FISCAL YEAR ENDED JUNE 30, 2017 Belleville, New Jersey
-
Upload
khangminh22 -
Category
Documents
-
view
0 -
download
0
Transcript of BELLEVILLE TOWNSHIP SCHOOL DISTRICT ... - NJ.gov

BELLEVILLE TOWNSHIP SCHOOL DISTRICT
COMPREHENSIVE ANNUAL FINANCIAL REPORT
FOR THE FISCAL YEAR ENDED JUNE 30, 2017
Belleville, New Jersey

COMPREHENSIVE ANNUAL
FINANCIAL REPORT
of the
Belleville Township School District
Belleville, New Jersey
For The Fiscal Year Ended June 30,2017
Prepared by
Business Office

BELLEVILLE TOWNSHIP SCHOOL DISTRICT TABLE OF CONTENTS
INTRODUCTORY SECTION
Letter of Transmittal Organizational Chart Roster of Officials Consultants and Advisors
Independent Auditor's Report
FINANCIAL SECTION
REQUIRED SUPPLEMENTARY INFORMATION- PART I
Management's Discussion and Analysis
Basic Financial Statements
A. District-wide Financial Statements
A-1 A-2
Statement of Net Position Statement of Activities
B. Fnnd Financial Statements
Governmental Funds B-1 Balance Sheet B-2 Statement of Revenues, Expenditures, and Changes in Fund Balances B-3 Reconciliation of the Statement of Revenues, Expenditures and
Changes in Fund Balances of Governmental Funds to the Statement of Activities
Proprietary Funds B-4 Statement of Net Position B-5 Combining Statement of Revenues, Expenses, and Changes in Net Position B-6 Statement of Cash Flows
Fiduciary Funds B-7 Statement of Fiduciary Net Position B-8 Statement of Changes in Fiduciary Net Position
Notes to the Financial Statements
i-v vi
vii viii
1-3
4-14
15 16-17
18-19 20
21
22 23 24
25 26
27-61

BELLEVILLE TOWNSHIP SCHOOL DISTRICT TABLE OF CONTENTS
REQUIRED SUPPLEMENTARY INFORMATION- PART II
C. Budgetary Comparison Schedules
C-1 C-2
Budgetary Comparison Schedule- General Fund Budgetary Comparison Schedule- Special Revenue Fund
NOTES TO THE REQUIRED SUPPLEMENTARY INFORMATION -PART II
C-3 Budgetary Comparison Schedule- Note to Required Supplementary Information
REQUIRED SUPPLEMENTARY INFORMATION- PART III
L. Schedules Related to Accounting and Reporting for Pensions (GASB 68)
L-1
L-2
L-3
L-4
Required Supplementary Information - Schedule of the District's Proportionate Share of the Net Pension Liability- Public Employees Retirement System
Required Supplementary Information - Schedule of District Contributions -Public Employees Retirement System
Required Supplementary Information - Schedule of the District's Proportionate Share of the Net Pension Liability- Teachers Pension and Annuity Fund
Notes to Required Supplementary Information
OTHER SUPPLEMENTARY INFORMATION
D. School Level Schedules- Not Applicable
E. Special Revenue Fund
E-1
E-2
Combining Schedule of Revenues and Expenditures Special Revenue Fund- Budgetary Basis
Schedule of Preschool Aid Expenditures -Budgetary Basis- Not Applicable
F. Capital Projects Fund
F-1 F-2
F-2a-2d
Summary Schedule of Project Expenditures - Budgetary Basis Summary Schedule of Revenues, Expenditures and Changes in Fund BalanceBudgetary Basis
Schedule of Project Revenues, Expenditures, Project Balance and Project StatusBudgetary Basis
62-69 70
71
72
73
74 75
76-77
78
79
80
81-84

BELLEVILLE TOWNSHIP SCHOOL DISTRICT TABLE OF CONTENTS
Page
K. SINGLE AUDIT SECTION
K-1 Report on Internal Control Over Financial Reporting and on Compliance and Other Matters Based on an Audit of Financial Statements Performed in Accordance with Government Auditing Standards -Independent Auditor's Report 115-116
K-2 Report on Compliance for Each Major Federal and State Program; Report on Internal Control Over Compliance; and Report on the Schedule of Expenditures of Federal Awards Required by the U.S. Uniform Guidance and Schedule of Expenditures of State Financial Assistance as Required by New Jersey OMB Circular 15-08-Independent Auditor's Report 117-119
K-3 Schedule of Expenditure of Federal Awards 120
K-4 Schedule of Expenditures of State Financial Assistance 121-122
K-5 Notes to the Schedules of Expenditures of Federal Awards and State Financial Assistance 123-124
K-6 Schedule of Findings and Questioned Costs- Part I -Summary of Auditor's Results 125-126
K-7 Schedule of Findings and Questioned Costs- Part 2- Schedule of Financial Statement Findings 127
K-7 Schedule of Findings and Questioned Costs- Part 3- Schedule of Federal and State Award Findings and Questioned Costs 128-132
K-8 Summary Schedule of Prior Year Findings 133-136

INTRODUCTORY SECTION

BELLEVILLE PUBLIC SCHOOLS Office of the Superintendent
Richard D. Tomko, Ph.D., M.J. Superintendent of Schools
November 29, 2017
Honorable President and Members of the Board of Education Belleville School District Essex County, New Jersey
Dear Board Members:
1 02 Passaic A venue
Belleville, New Jersey 07109 www. bellevilleschools.org
Phone: 973 450-3500 Fax: 973 450-3504 E-mail: [email protected]. us
The comprehensive annual financial report of the Belleville School District for the fiscal year ended June 30, 2017 is hereby submitted. Responsibility for both the accuracy of the data and completeness and fairness of the presentation, including all disclosures, rests with the management of the Board of Education. To the best of our knowledge and belief, the data presented in this report is accurate in all material respects and is reported in a manner designed to present fairly the financial position and results of operations of the various funds and account groups of the District. All disclosures necessary to enable the reader to gain an understanding of the District's financial activities have been included.
The comprehensive annual financial report is presented in four sections: introductory, financial , statistical and single audit. The introductory section includes this transmittal letter, the District's organizational chart and a list of principal officials. The financial section includes management discussion and analysis (MD&A), the basic financial statements and schedules, as well as the auditor's report thereon. The MD&A of the District's financial activities is added to this section under GASB 34 to introduce the basic financial statements. The statistical section includes selected financial and demographic information, generally presented on a multi-year basis. The District is required to undergo an annual single audit in conformity with the provisions of the Single Audit Act and the Uniform Administrative requirements, cost principles, and audit requirements for federal awards (Uniform Guidance) and the N.J. Treasury Circular OMB 15-08, "Single Audit Policy for Recipients of Federal Grants, State Grants and State Aid Payments." Information related to this single audit, including the auditor's report on the internal control structure and compliance with applicable laws and regulations and findings and recommendations, are included in the single audit section of this report.
1) REPORTING ENTITY AND ITS SERVICES: Belleville School District is an independent reporting entity within the criteria adopted by the GASB as established by GASB Statement No. 14. All funds of the District are included in this report. The Belleville Board of Education and all its schools constitute the District's reporting entity.
The District provides a full range of educational services appropriate to grade levels Pre K through 12. These include regular, vocational as well as special education for handicapped youngsters. The District completed the 2016-2017 fiscal year with an enrollment of 4,465 students, which is 2.8% less than previous year's enrollment. The district's student enrollment over the last two years is 4,593 students in 2015-2016 and 4,666 students in 2014-2015 .

2. ECONOMIC CONDITION AND OUTLOOK: The Township has little undeveloped land and, accordingly, any new industry will have to be a replacement to existing establishments.
3. MAJOR INITIATIVES: Curricula changes have been made to meet the New Jersey Student Learning Standards in all major content areas. The five-year curricula cycle has been followed to ensure continuity in programming and proper funding distribution to meet the needs of anticipated curricula changes and implementation of such. Curricula initiatives have been supported by continuous and ongoing professional development to support the integration of new curricula into classrooms, as needed. The district has purchased K-8 Science series (Dimensions); 6-12 English Language Arts (My perspectives); updated the Algebra I text series (Glenco); updated biology text series (Miller-Levine); and supported K-6 Social Studies curricula through supplemental series (Studies Weekly) that will all be implemented in the 2017-18 school year. To support 21" Century learning initiatives, the district has purchased technology devices (laptop carts, chrome books, interactive TVs) to prepare and support the 2017-18 one-to-one initiative beginning with the sixth and ninth grades. The district has also purchased a data collection program (OnCourse Analytics) that will compile information from our teacher lesson plans, teacher observations, student information system, discipline records, standardized test scores, and district benchmark assessments to present clear and unambiguous data streams to staff and administration to steer instruction and curricula. The purchase of a district-wide benchmark assessment tool ( OnCourse Assessment) will allow for staff to monitor and adjust both individual and whole-class learning as per the date outputs. To support such, the district has secured funding for two full-time teacher coaches that will assist teachers, K -12, with data interpretation, ongoing individualized professional development, best practice modeling, and resource management strategies for the 2017-18 school year. To compliment any such academic elementary initiatives, all elementary schools have instituted a twenty-five minute "period" during their school day to meet the remedial needs of individual students (R.I.S.E. program). To meet the social-emotional needs of our high school students, Belleville High School will initiate a student "dropin" center that will serve students that are struggling with social-emotional situations to allow the time needed for our high school guidance counselors to focus on student academic progress and growth. The high school guidance department will be, again, utilizing programs (Naviance) to compile academic records for students in an effort to expedite the college application process. Such will complement our SAT preparation classes that will, again, be offered beyond the traditional school day. Additional data collection programs will be initiated to track our upcoming graduation community service requirement (x2VOL). Credit recovery initiatives will continue at the high school level to allow students to progress towards graduation in addition to their school attendance (BUCS Program, Online Educere, Summer School-MS & HS). To enhance instruction, the district will be entering into formal partnerships with both Essex County Community College and Seton Hall University to allow students to accumulate college credits while in Belleville High School. Academic advancement beyond course offerings will be possible through Educere as well. Option II credit opportunities will continue to expand and work with community organizations to allow for student learning beyond curricula offerings. The district will also begin a Student Learning Experience (SLE) program to introduce students into the workforce.
4. INTERNAL ACCOUNTING CONTROLS: Management of the District is responsible for establishing and maintaining an internal control structure designed to ensure that the assets of the District are protected from loss, theft or misuse and to ensure that adequate accounting data are compiled to allow for the preparation of financial statements in conformity with generally accepted accounting principles (GAAP). The internal control structure is designed to provide reasonable, but not absolute, assurance that these objectives are met. The concept of reasonable assurance recognizes that: (I) the cost of a control should not exceed the benefits likely to be derived; and (2) the valuation of costs and benefits requires estimates and judgments by management. The district was assigned a state monitor by the Department of Education based on a prior year general fund deficit. The Board of Education worked with the state monitor to ensure that the administration maintained appropriate internal controls. The process resulted in a positive fiscal year ending with a budgetary basis surplus balance at June 30, 2017.
ii

As a recipient of federal and state financial assistance, the District also is responsible for ensuring that an adequate internal control structure is in place to ensure compliance with applicable laws and regulations related to those programs. This internal control structure is also subject to periodic evaluation by the District management. As part of the District's single audit described earlier, tests are made to determine the adequacy of the internal control structure, including that portion related to federal and state financial assistance programs, as well as to detennine that the District has complied with applicable laws and regulations.
5. BUDGETARY CONTROL: In addition to internal accounting controls, the District is obligated to maintain budgetary controls. The objective of these budgetary controls is to ensure compliance with legal provisions embodied in the annual appropriated budget approved by the Board. Annual appropriated budgets are adopted for the general fund, and the special revenue fund. Project-length budgets are approved for the capital improvements accounted for in the capital projects fund. The final budget amount as amended for the fiscal year is reflected in the financial section.
An encumbrance accounting system is used to record outstanding purchase commitments on a line item basis. Open encumbrances at year-end are either canceled or are included as reappropriations of fund balance in the subsequent year. Those amounts to be reappropriated are reported as reservations of fund balance as of June 30, 2017.
The district submitted a Corrective Action Plan to the Executive County Superintendent dated December 19, 2016 regarding findings from the 2015-16 audit. The plan included areas of administrative practices and procedures; school purchasing practices; student activities; athletic advisory council; application for State School Aid; student transportation; facilities and capital assets; and status of prior year audit findings and recommendations. The superintendent, state monitor, business administrator, board of education and administration addressed these issues which were identified in the correction plan. The plan was defined by Action required by the Board, Method of Implementation, position responsible for implementation, and target date for implementation.
6. ACCOUNTING SYSTEM AND REPORTS: The District's accounting records reflect generally accepted accounting principles, as promulgated by the Governmental Accounting Standards Board (GASB). The accounting system of the District is organized on the basis of funds. These funds are explained in "Notes to the Financial Statements", Note 1. The district filed appropriate monthly financial reports for the 2016-17 school year which were available to the public. District staffing was monitored closely to reflect the educational needs at all schools. Monthly student enrollment and staffing were compared for adequacy. The district reorganized the registration and residency process to validate home addresses and insure that incoming students would attend the proper school. The Board approved administrative changes and budgetary transfers to insure the fiscal year would not end in a deficit. The State Monitor attended public meetings and with the Superintendent reported the financial condition and board action to the Essex County Executive Superintendent of school.
iii

7. FINANCIAL INFORMATION AT FISCAL YEAR-END: As demonstrated by the various statements and schedules included in the financial section of this report, the District did meet its responsibility for sound financial management. The following schedule presents a summary of the general fund revenues from local and state sources, and federal revenue grant funds for the fiscal year ended June 30,2017:
Revenues Amount %of Total
Local $39,006,313 52.9% State Sources 34,520,252 46.8% Federal Sources 263 041 0.3%
Total $73.789.606 100.0%
The following schedule presents a summary of the general fund expenditures based on instruction, support service, capital expenditure and lease payments (debt service) to fund building projects, technology upgrades, and transportation. The schedule represents expenditures for the fiscal year ending June 30, 2017:
Expenditures
Current Expenditures: Instruction Support Services
Capital Outlay Debt Service
Total Expenditures
Amount
$44,035,395 26,765,374
241,589 1 899 129
$12,941,487
%of Total
60.4% 36.7%
0.3% 2.6%
100.0%
8. DEBT ADMINISTRATION: The District had no outstanding bonded debt issues (serial bonds) since September 1996. The district does have outstanding capital leases totaling $4,125,259 at June 30, 2017.
9. CASH MANAGEMENT: The investment policy of the District is guided in large part by state statute as detailed in the "Notes to the Financial Statements". The District has adopted a cash management plan, which requires it to deposit public funds in public depositories protected from loss under the provisions of the Governmental Unit Deposit Protection Act ("GUDPA"). GUDPA was enacted in 1970 to protect Governmental Units from a loss of funds on deposit with a failed banking institution in New Jersey. The law requires governmental units to deposit public funds only in public depositories located in New Jersey, where the funds are secured in accordance with the Act.
IV

10. RISK MANAGEMENT: The Board carries various forms of insurance, including but not limited to general liability, automobile liability and comprehensive/collision, hazard and theft insurance on property and contents, and fidelity bonds
11. OTHER INFORMATION: Independent Audit - State statutes require an annual audit by independent certified public accountants or registered municipal accountants. The accounting firm of Lerch, Vinci & Higgins, LLP was selected by the Board of Education. In addition to meeting the requirements set forth in state statutes, the audit also was designed to meet the requirements of the Single Audit Act and the related Uniform Administrative requirements, cost principles, and audit requirements for federal awards (Uniform Guidance) and N.J. Treasury Circular Letter OMB 15-08. The auditor's report on the basic financial statements and combining and individual fund statements and schedules is included in the financial section of this report. The auditor's reports related specifically to the single audit are included in the single audit section of this report.
Superintendent of Schools
v

< f-1·
POLICY 1110 Organizational Chart
Cbld )!DJ:>Cl'I'OAI
;md p.....,.<tldllp
Officer
SO. per SAC
MAtnr
lttuDr.
l'rillfS
~
Prial4 Prlnes PrlDJI7 Prtala
. ~
' ............ ~ ~
Custodians (Di~ctSUJ)C'rvtJiOD by buildi!ll pnDCip:d)
Prloi9/UO
seen
MS l'rilldp.ll
AP »
Sec
D<U ""' AP
~
liS Priadpal
Deal\
~
iite~~
Dhutor ELA/IIInK•U.
O'"""'r)Uth/Id ~a
Dlt M>tb/Sd/Eio<l
'H2
. ~
DiffCJOf Spod>ltd.
SapCITisor
CST
So<
,..,..
I Tea<h= I (DiroctSupemS!OO by ba!ldlog pnnap>O
Olr.Stwl<at Prn.ounel
s.rv.
cUid.:u.cc C41U>nlors -,
Stc
~
Olrol PbllailiJ:, R.a.ud
f\'11.
Coord. IT
Asst.Coo<d. rr
T«hc
a.ctstnrf a.JcfS3f~IJ
Ol!k-ct
School Sec Satel)'
ornc.n-

BELLEVILLE TOWNSHIP SCHOOL DISTRICT
ROSTER OF OFFICIALS
Members of the Board of Education
Christine Lamparello, President
Ralph Vellon, Vice President
Nelson Barrera
Patricia Dolan
Thomas Graziano
Thomas Grolimond
Liza Lopez
Richard D. Tomko, Ph.D., Superintendent
JUNE 30,2017
Other Officials
Term Expires December 31
2019
2018
2019
2018
2020
2020
2020
Wayne Demikoff, Interim Board Secretary/Business Administrator (7 /1116-5/31117)
Matthew Paladino, Acting Board Secretary, Business Administrator (6/1117-6/30/17)
Debra Besold, Treasurer of School Monies
Schwartz Simon Edelstein Celso, Esqs., Board Attorney
Thomas Egan, State Monitor
VJI

BELLEVILLE TOWNSHIP SCHOOL DISTRICT
CONSULTANTS & ADVISORS
JUNE 30,2017
ARCHITECT
DiCara- Rubino Architects 30 Galesi Drive
Wayne, New Jersey 07470
ATTORNEY
Schwartz Simon Edelstein Celso 100 South Jefferson Road
Whippany, New Jersey 07981
AUDIT FIRM
Lerch, Vinci & Higgins LLP 17-17 Route 208
Fair Lawn, NJ 07410
OFFICIAL DEPOSITORY
Valley National Bank 237 Washington Avenue
Belleville, New Jersey 07407
viii

FINANCIAL SECTION

LERCH, VINCI & HIGGINS,LLP CERTIFIED PUBLIC ACCOUNTANTS REGISTERED MUNICIPAL ACCOUNTANTS
DIETER P. LERCI~. CPA, RMA, PSA
GARY J. VINCI. CPA, RMA. PSA
GARY W. HIGGINS, CI'A. RMA. PSA
ffif'f'REY C. BLISS, CPA, RMA, PSA
PAULl. LEI{CH,CI'A , RMA. PSA
DONNA L. JAPIIET, CPA, PSA
JULIUS B. CONSONI. CPA, PSA
ANDREW D. PARENTE, CPA, RMA, PSA
Honorable President and Members of the Board of Education
Belleville Township School District Belleville, New Jersey
INDEPENDENT AUDITOR'S REPORT
Report on the Financial Statements
ELIZABETH A. SHICK.Cl'A , RMA. PSA
ROBERT W. IIAAG. CPA, I'SA
DEBORAH K. LERCH. CPA. PSA
RALPH M. PICONE, CPA. RMA, PSA
DEBRA GOLLE, CPA
CINDY JANACEK, CPA, RMA
MARK SACO, CPA
SIIERYL M. NlCOLOSJ. CPA. PSA
We have audited the accompanying financial statements of the governmental activities, the business-type activities, each major fund, and the aggregate remaining fund information of the Belleville Township School District as of and for the fiscal year ended June 30, 2017 and the related notes to the financial statements, which collectively comprise the Board of Education's basic financial statements as listed in the table of contents.
Management's Responsibility for the Financial Statements
Management is responsible for the preparation and fair presentation of these financial statements in accordance with accounting principles generally accepted in the United States of America; this includes the design, implementation, and maintenance of internal control relevant to the preparation and fair presentation of financial statements that are free from material misstatement, whether due to fraud or error.
Auditor's Responsibility
Our responsibility is to express opinions on these financial statements based on our audit. We conducted our audit in accordance with auditing standards generally accepted in the United States of America, the standards applicable to financial audits contained in the Government Auditing Standards, issued by the Comptroller General of the United States and audit requirements as prescribed by the Office of School Finance, Department of Education, State of New Jersey. Those standards require that we plan and perform the audit to obtain reasonable assurance about whether the financial statements are free from material misstatement.
An audit involves performing procedures to obtain audit evidence about the amounts and disclosures in the financial statements. The procedures selected depend on the auditor's judgment, including the assessment of the risks of material misstatement of the financial statements, whether due to fraud or error. Jn making those risk assessments, the auditor considers internal control relevant to the entity's preparation and fair presentation of the financial statements in order to design audit procedures that are appropriate in the circumstances, but not for the purpose of expressing an opinion on the effectiveness of the entity's internal control. Accordingly, we express no such opinion. An audit also includes evaluating the appropriateness of accounting policies used and the reasonableness of
significant accounting estimates made by management, as well as evaluating the overall presentation of the financial statements.
We believe that the audit evidence we have obtained is sufficient and appropriate to provide a basis for our audit opinions.
17-17 ROUTE 208 • FAIR LAWN, NJ074 10 • TELEPHONE (20 1) 791-7100 • FACSIMILE (201) 791 -3035
WWW.LVHCPA.COM
I

Opinions
In our opinion, the financial statements referred to above present fairly, in all material respects, the respective financial position of the govermnental activities, the business-type activities, each major fund, and the aggregate remaining fund information of the Belleville Township School District as of June 30, 2017, and the respective changes in financial position and, where applicable, cash flows thereof for the fiscal year then ended in accordance with accounting principles generally accepted in the United States of America.
Other M atte1-s
Required Supplementary Information
Accounting principles generally accepted in the United States of America require that the management's discussion and analysis, budgetary comparison information and pension information be presented to supplement the basic financial statements. Such information, although not a part of the basic financial statements, is required by the Governmental Accounting Standards Board who considers it to be an essential part of financial reporting for placing the basic financial statements in an appropriate operational, economic, or historical context. We have applied certain limited procedures to the required supplementary information in accordance with auditing standards generally accepted in the United States of America, which consisted of inquiries of management about the methods of preparing the information and comparing the information for consistency with management's responses to our inquiries, the basic financial statements, and other knowledge we obtained during our audit of the basic financial statements. We do not express an opinion or provide any assurance on the information because the limited procedures do not provide us with sufficient evidence to express an opinion or provide any assurance.
Other Information
Our audit was conducted for the purpose of forming opinions on the financial statements that collectively comprise the Belleville Township School District's basic financial statements. The introductory section, combining fund financial statements, financial schedules, statistical section, schedule of expenditures of federal awards as required by Title 2 U.S. Code of Federal Regulations Part 200, Uniform Administrative Requirements, Cost Principles, and Audit Requirements for Federal Awards (Uniform Guidance) and schedule of expenditures of state financial assistance as required by New Jersey OMB Circular 15-08, Single Audit Policy for Recipients of Federal Grants, State Grants and State Aid, are presented for purposes of additional analysis and are not a required part of the basic financial statements of the Belleville Township School District.
The combining fund financial statements, schedule of expenditures of federal awards and schedule of expenditures of state financial assistance are the responsibility of management and were derived from and relate directly to the underlying accounting and other records used to prepare the basic financial statements. Such information has been subjected to the auditing procedures applied in the audit of the basic financial statements and certain additional procedures, including comparing and reconciling such information directly to the underlying accounting and other records used to prepare the basic financial statements or to the basic financial statements themselves, and other additional procedures in accordance with auditing standards generally accepted in the United States of America. In our opinion, the combining fund financial statements, schedules of expenditures of federal awards and state financial assistance are fairly stated in all material respects in relation to the basic financial statements as a whole.
The introductory section, financial schedules and statistical section have not been subjected to the auditing procedures applied in the audit of the basic financial statements and, accordingly, we do not express an opinion or provide any assurance on them.
2

Other Reporting Required by Government Auditing Standards
In accordance with Government Auditing Standards, we have also issued our report dated November 29, 2017 on our consideration of the Belleville Township School District's internal control over financial reporting and on our tests of its compliance with certain provisions of laws, regulations, contracts, and grant agreements and other matters. The purpose of that report is to describe the scope of our testing of internal control over financial reporting and compliance and the results of that testing, and not to provide an opinion on the effectiveness of the Belleville Township School District's internal control over financial reporting or on compliance. That report is an integral part of an audit perf01med in accordance with Government Auditing Standards in considering the Belleville Township School District's internal control over financial reporting and compliance.
Fair Lawn, New Jersey November 29, 2017
3
Ls.ll< ~ . {),:Oc i ~ H'W/IQ$ , L C. P LERCH, VINCI & HIGGINS, LLP Certified Public Accountants Public School Accountants
~~--------------~ Public School Accountant PSA Number CS00932

REQUIRED SUPPLEMENTARY INFORMATION- PART I
MANAGEMENT'S DISCUSSION AND ANALYSIS

BELLEVILLE TOWNSHIP SCHOOL DISTRICT
Management's Discussion and Analysis Fiscal Year Ended June 30, 2017
This section of Belleville Township School District's annual financial report presents our discussion and analysis of the District's financial performance during the fiscal year that ended on June 30, 2016. We encourage readers to consider the information presented here in conjunction with the transmittal letter at the front of this report and the District's financial statements and notes to the financial statements, which immediately follow this section.
FINANCIAL HIGHLIGHTS
Key financial highlights for the 2016-2017 fiscal year include the following:
• The liabilities and deferred inflows of resources of the Belleville Township School District exceeded its assets and deferred outflows of resources at the close of the fiscal year resulting in a deficit of$13,642,021. (Net Position)
• The District's total net position increased by $902,262 or 6%.
• Overall District revenues were $92,890,864. General revenues accounted for $61,352,868 or 66% of all revenues. Program specific revenues in the form of charges for services and grants and contributions accounted for $31,537,996 or 34% of total revenues.
• The school district had $89,814,281 in expenses for governmental activities; only $29,458,655 of these expenses were offset by program specific charges, grants or contributions. General revenues (predominantly property taxes and unrestricted state and federal aid) of $61 ,352,332 were adequate to provide for these programs.
• As of the close of the current fiscal year, the District's governmental funds reported a combined ending fund balance of$1,382,250. Of this amount, $2,141,257 is restricted for capital projects, $193,656 is restricted for required maintenance projects, $893,042 is assigned to year end encumbrances and the remaining amount is the unassigned fund deficit of$1,845,705.
• The General Fund fund balance at June 30, 2017 was $627,142, an increase of $848,119 compared to the ending fund deficit at June 30,2016 of$220,977.
• The General Fund budgetary fund balance at June 30, 2017 was $3,512,757, which represents an increase of $859,457 compared to the ending budgetary fund balance at June 30, 2016 of $2,653,300.
• The District's governmental activities capital assets, net increased by $125,164 during the current fiscal year.
• The District's governmental activities long-term liabilities increased by $309,876 during the current fiscal year.
4

BELLEVILLE TOWNSHIP SCHOOL DISTRICT
Management's Discussion and Analysis Fiscal Year Ended June 30,2017
OVERVIEW OF THE FINANCIAL STATEMENTS
The financial section of the annual report consists of four parts - Independent Auditors' Report, required supplementary information which includes the management's discussion and analysis (this section), the basic financial statements, and supplemental information. The basic financial statements include two kinds of statements that present different views of the District:
• The first two statements are district wide financial statements that provide both short-term and long-term information about the District's overall financial status.
• The remaining statements are fund financial statements that focus on individual parts of the District, reporting the District's operations in more detail than the district-wide statements.
• The governmental funds statements tell how basic services were financed in the short term as well as what remains for future spending.
• Proprietary funds statements offer short-term and long-term financial information about the activities the district operated like businesses.
• Fiduciary funds statements provide information about the financial relationships in which the District acts solely as a trustee or agent for the benefit of others to whom the resources belong.
The basic financial statements also include notes that explain some of the information in the statements and provide more detailed data. The following shows how the various parts of this Annual Report are arranged and related to one another.
Management Discussion
And Analysis
District-wide Financial
Statements
'-s_u_m_m_ar_Y __ __JI4
Basic Financial
Statements
Fund Financial
Statements
5
Notes To the
Financial Statements
~~ Detail

BELLEVILLE TOWNSHIP SCHOOL DISTRICT
Management's Discussion and Analysis Fiscal Year Ended June 30, 2017
The table below summarizes the major features of the District's financial statements, including the portion of the District's activities they cover and the types of information they contain. The remainder of this overview section of management's discussion and analysis highlights the structure and contents of each of the statements.
M. F .RJOr eatures o t e 1stnct-f h o· 1 e an Fun w·d d d . I Fmancta Statements
District-Wide Fund Financial Statements
Statements Governmental Funds Proprietary Funds Fiduciary Funds
Scope ~ntire district( except he activities of the district that Activities the district nstances in which the
1duciary funds) re not proprietary or fiduciary, perates similar to istrict administers resources
uch as instruction, building rivate businesses: Pn behalf of someone else,
~aintenance, transportation, and Enterprise Funds uch as unemployment com-
dministration. IPensation, student activities
nd payroll activities
Required financial ~tatement of Net Position ~alancc Sheet tatemcnt of Net position ~tatement of
Statements ~tatement of Activities ~tatement of Revenue, !Statement of Revenue, !Fiduciary Net Position.
Expenditures and Changes in ~xpenses, and Changes in ~tatement of Change
:und Balances und Net Position, n Fiduciary Net
Statement of Cash Flows Position
!Accounting Basis and !Accrual accounting and Modified accrual accounting Accrual accounting and !Accrual accounting
Measurement focus !economic resources focus nd current financial focus conomic resources focus nd economic resources
ocus
rrype of asset, liability and ~II assets, deferred outflows, penerally assets expected to be All assets, deferred out- II assets and liabilities,
deferred inflows/outflows labilities, and deferred !used up and liabilities that come flows, liabilities and oth short-term and long-
information · nflows, both financial ~ue during the year or soon there eferred inflows, both erm; funds do not currently
nd capital, short-term and fter; no capital assets or long-term financial and capital, and ·ontain capital assets,
ong-term iabilities included hort-term and long-term !though thev can
Type of inflow/outflow All revenues and expenses evenues for which cash is received All revenues and expenses 1\11 additions and
Information uring year, regardless of uring or soon after the end of the during the year, regardless edications during the
when cash is received or ear; expenditures when goods or of when ca<;h is received ear, regardless of when
aid ervices have been received and the br paid. ash is received or paid.
elated liability is due and oavable.
District-Wide Statements
The district-wide statements report information about the District as a whole using accounting methods similar to those used by private-sector companies. The statement of net position includes all of the District's assets, deferred outflows of resources, liabilities and deferred inflows of resources. All of the current year's revenues and expenses are accounted for in the statement of activities regardless of when cash is received or paid.
The two district-wide statements report the District's net position and how it has changed. Net positionthe difference between the District's assets/deferred outflows and liabilities/deferred inflows- is one way to measure the District's financial health or position.
• Over time, increases or decreases in the District's net position is an indicator of whether its financial condition is improving or deteriorating, respectively.
• To assess the overall health of the District you need to consider additional non-fmancial factors such as changes in the District's property tax base and the condition of school buildings and other facilities.
6

BELLEVILLE TOWNSHIP SCHOOL DISTRICT
Management's Discussion and Analysis Fiscal Year Ended June 30,2017
In the district-wide financial statements the District's activities are shown in two categories:
• Governmental activities- Most of the District's basic services are included here, such as regular and special education, transportation, administration, and plant operation and maintenance. Property taxes and Federal and State aid finance most of these activities.
• Business type activities- These are activities for operations that are financed and operated in a manner similar to private business enterprises. The District's food services (cafeteria) program is included under this category.
Fund Financial Statements
The fund financial statements provide more detailed information about the District's funds- focusing on its most significant or "major" funds - not the District as a whole. Funds are accounting devices the District uses to keep track of specific sources of funding and spending on particular programs:
• Some funds are required by State law and bond covenants.
• The District establishes other funds to control and manage money for particular purposes or to show that it is properly using certain revenues (federal and state grants).
The District has three kinds of funds:
• Governmental funds - Most of the District's basic services are included in governmental funds, which generally focus on (I) how cash and other financial resources that can readily be converted to cash flow in and out and (2) the balances left at year-end that are available for spending. Consequently, the governmental funds statements provide a detailed short-term view that helps to determine whether there are more or fewer financial resources that can be spent in the near future to fmance the District's programs. Because this information does not encompass the additional long-term focus of the district-wide statements, we provide additional information at the bottom of the governmental funds statements that explains the relationship (or differences) between them.
• Proprietary funds - Services for which the District charges a fee are generally reported in proprietary funds. Proprietary funds are reported in the same way as the district-wide statements.
• Enterprise Funds - This fund is established to account for operations that are financed and operated in a manner similar to private business enterprises. The stated intent is that costs of providing goods or services to the students on a continuing basis are financed or recovered primarily through user charges. The District currently has one enterprise fund for its food service (cafeteria) program.
• Internal Service Funds- This fund is established to account for activities that provide services primarily for the District's other programs and activities. The District currently uses an internal service fund to account for its worker's compensation self-insurance program. Because these services benefit governmental rather than business-type functions, they have been included in governmental activities in the district-wide financial statements.
• Fiduciary funds - The District is the trustee, or fiduciary, for assets and other resources that belong to others. The District is responsible for ensuring that the assets and other resources reported in these funds are used only for their intended purposes and by those to whom they belong. All of the District's fiduciary activities are reported in a separate statement of fiduciary net position and a statement of changes in fiduciary net position. We exclude these activities from the district-wide financial statements because the District cannot use these resources to finance its operations.
7

BELLEVILLE TOWNSHIP SCHOOL DISTRICT
Management's Discussion and Analysis Fiscal Year Ended June 30, 2017
Notes to the Financial Statements
The notes provide additional information that is essential to a full understanding of the data provided in the government-wide and fund financial statements. The notes to the financial statements can be found following the financial statements.
Other Information
In addition to the financial statements and accompanying notes, this report also presents certain required supplementary information concerning the District's budget process. The District adopts an annual expenditure budget for the general, special revenue and debt service funds. A budgetary comparison statement has been provided for the general and special revenue funds as required supplementary information. Information regarding the District's employee retirement systems and pension plans has also been provided as required supplementary information. The required supplementary information can be found following the notes to the financial statements.
Combining statements and schedules are presented immediately following the major budgetary comparisons and pension information.
FINANCIAL ANALYSIS OF THE DISTRICT AS A WHOLE
Net Position. The District's combined net position deficit was $13,642,021 on June 30, 2017 and $14,544,283 on June 30, 2016 as follows:
Net Position As of June 30, 2016 and 2015
Governmental Business~ Type Activities Activities Total
2017 2016 2017 2016 2017 Assets Current and Other Assets $ 3,109,906 $ 5,197,203 $ 309,618 $ 272,766 $ 3,419,524 $ Capital Assets 10,551,040 10,425,876 101,892 144,244 10,652,932
Total Assets 13,660,946 15,623,079 411,510 417,010 14,072,456
Deferred Outflows of Resources 6,404,540 3,504,456 6,404,540
Liabilities Long~Tenn Liabilities 30,192,673 29,882,797 30,192,673 Other Liabilities 1,763,851 3,799,991 186,145 92,434 1,949,996
Total Liabilities 31,956,524 33,682,788 186,145 92,434 32,142,669
Deferred Inflows of Resources 1,969,331 301,822 7,017 11,784 1,976,348
Net Position Net Investment in Capital Assets 7,066,551 6,536,372 101,892 144,244 7,168,443 Restricted 1,694,143 676,149 1,694,143 Unrestricted (22,621,063) (22,069,596) 116,456 168,548 (22,504,607)
2016
5,469,969 10,570,120
16,040,089
3,504,456
29,882,797 3,892,425
33,775,222
313,606
6,680,616 676,149
(21,901,048)
Total Net Position $ (13,860,369) $ (14,857,075) $ 218,348 $ 312,792 $ (13,642,021) $ (14,544,283)
By far the largest portion of the District's net position reflects its investment in capital assets (e.g., land and improvements, buildings and improvements, vehicles, furniture and equipment), less any related debt used to acquire those assets that are still outstanding. The District uses these capital assets to provide services to its students; consequently, these assets are not available for future spending. Although the District's investment in its capital assets is reported net of related debt, it should be noted that the resources needed to repay this debt must be provided from other sources, since the capital assets themselves cannot be used to liquidate these liabilities. Restricted net position represents amonnts reserved for specific purposes by outside parties or statutory requirements. Unrestricted net position represents amounts available to the government that are neither restricted nor invested in capital assets.
8

BELLEVILLE TOWNSHIP SCHOOL DISTRICT
Management's Discussion and Analysis Fiscal Year Ended June 30, 2017
The District's deficit in total net position of$13,642,021 at June 30,2017 represents a $902,262 or a 6% increase in net position from the prior year deficit of $14,544,283. The following presents the changes in net position for the fiscal years ended June 30, 20 17 and 2016.
Revenues Program Revenues
Charges for Services and Sales Operating Grants and Contributions Capital Grants and Contributions
General Revenues Property Taxes State and Federal Aid- Unrestricted Miscellaneous Income
Total Revenues
Expenses Instruction Regular
Special Education Other Instruction School Sponsored Activities and Athletics
Support Services Student and Instruction Related Services General Administrative Services School Administrative Services Central Administrative Services Plant Operations and Maintenance Pupil Transportation
Interest on Long-Term Debt Food Services
Total Expenses
Change in Net Position
Net Position, Beginning of Year
Net Position, End of Year
Changes in Net Position
For the Fiscal Years Ended June 30,2017 and 2016
Governmental
Activities Business-Type
Activities
$ 181,435 $ 29,122,236
154,984
38,667,832 22,523,414
161,086
90,810,987
37,115,854
15,165,972 4,457,171 1,125,987
10,249,971 2,305,809 7,664,156 1,813,496 6,853,846 2,946,159
115,860
89,814,281
996,706
(14,857,075)
230,509 $ 23,332,011
87,646
37,665,506
22,214,027 286,923
83,816,622
33,204,564
14,015,994 3,711,081
942,304
9,317,872 2,737,192 6,331,181 1,687,127 6,350,149 3,048,329
108,879
81,454,672
650,743 $ 1,428,598
536
2,079,877
2,174,321
2,174,321
2,361,950 (94,444)
(17 ,219,025) _ ___:3:.c12,_, 7"'9"2
666,206 $ 832,178 $ 1,355,359 30,550,834
477
2,022,042
2,115,354
2,115,354
(93,312)
406,104
154,984
38,667,832
22,523,414 161,622
92,890,864
37,115,854
15,165,972 4,457,171 1,125,987
10,249,971 2,305,809 7,664,156 1,813,496 6,853,846 2,946,159
115,860 2,174,321
91,988,602
902,262
(14,544,283)
896,715 24,687,370
87,646
37,665,506 22,214,027
287,400
85,838,664
33,204,564
14,015,994 3,711,081
942,304
9,317,872 2,737,192 6,331,181 1,687,127 6,350,149 3,048,329
108,879 2,115,354
83,570,026
2,268,638
(16,812,921)
$ (13,860,369) $ (14,857,075) $ 218,348 $ 312,792 $ (13,642,021) $ (14,544,283)
9
BELLEVILLE TOWNSHIP SCHOOL DISTRICT
Management' s Discussion and Analysis Fiscal Year Ended June 30, 2017
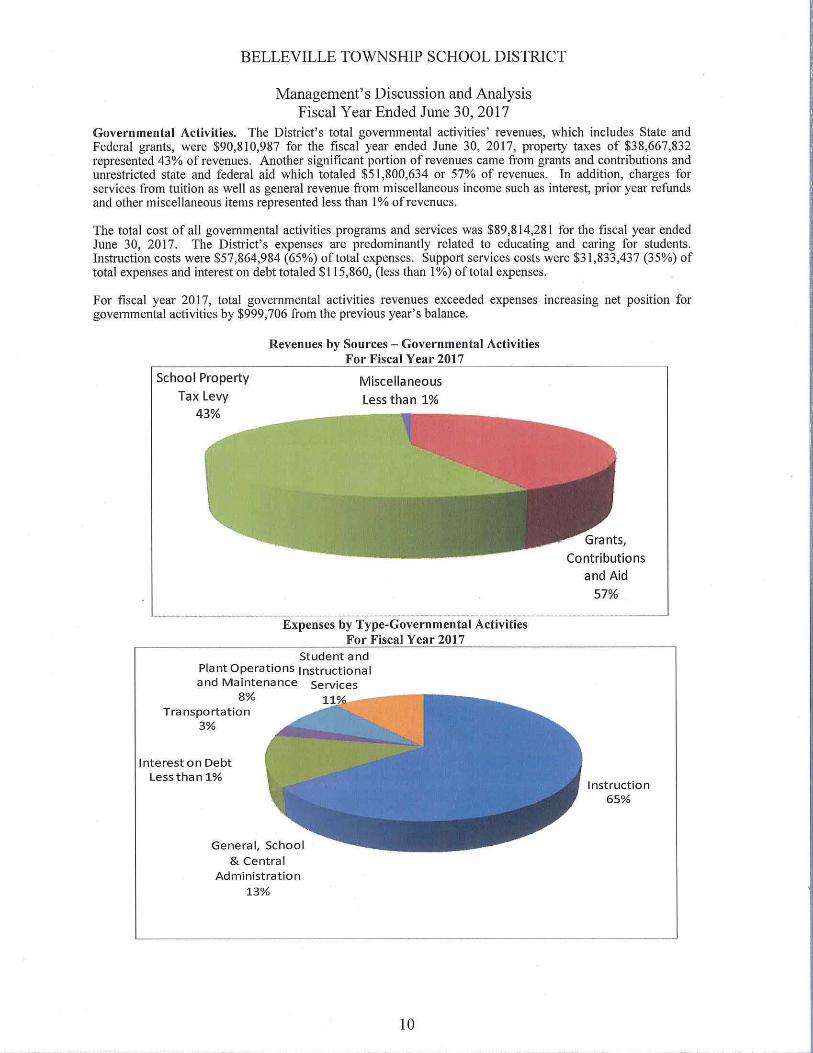
Governmental Activities. The District's total governmental activities ' revenues, which includes State and Federal grants, were $90,810,987 for the fiscal year ended June 30, 2017, property taxes of $38,667,832 represented 43% of revenues. Another significant portion of revenues came from grants and contributions and unrestricted state and federal aid which totaled $51,800,634 or 57% of revenues. In addition, charges for services from tuition as well as general revenue from miscellaneous income such as interest, prior year refunds and other miscellaneous items represented less than 1% of revenues.
The total cost of all governmental activities programs and services was $89,814,281 for the fiscal year ended June 30, 2017. The District's expenses are predominantly related to educating and caring for students. Instruction costs were $57,864,984 (65%) of total expenses. Support services costs were $31,833,437 (35%) of total expenses and interest on debt totaled $115,860, (less than 1%) oftotal expenses.
For fiscal year 2017, total governmental activities revenues exceeded expenses increasing net position for govemmental activities by $999,706 from the previous year's balance.
Revenues by Sources- Governmental Activities For Fiscal Year 2017
School Property
Tax Levy Miscellaneous
Less than 1%
Expenses by Type-Governmental Activities For Fiscal Year 2017
Student and Plant Operations Instructional and Maintenance Services
8% Transportation
3%
Interest on Debt Lessthanl%
General, School & Central
Administration 1 3%
10
Grants,
Contributions and Aid
57%
Instruction 65%

BELLEVILLE TOWNSHIP SCHOOL DISTRICT
Management's Discussion and Analysis Fiscal Year Ended June 30, 2017
Net Cost of Governmental Activities. The District's total cost of services was $89,814,281. After applying program revenues, derived from operating and capital grants and contributions of $29,277,220 and charges for services of $181,435, the net cost of services of the District was $60,355,626 for the fiscal year ended June 30, 2017.
Total and Net Cost of Governmental Activities
Total Cost of Net Cost Services of Services
2017 2016 2017 2016
Instruction: Regular $ 37,115,854 $ 33,204,564 $ 23,081,242 $ 21,981,826
Special Education 15,165,972 14,015,994 7,840,206 7,255,988
Other Instruction 4,457,171 3,711,081 2,763,770 2,503,894
School Sponsored Activities and Athletics 1,125,987 942,304 1,125,987 942,304
Support Services: Student & Instruction Related Services 10,249,971 9,317,872 6,937,844 7,058,045
General Administrative Services 2,305,809 2,737,192 2,188,361 2,648,415
School Administrative Services 7,664,156 6,331,181 5,358,202 4,808,739
Central Administrative Services 1,813,496 1,687,127 1,759,133 1,660,758
Plant Operations and Maintenance 6,853,846 6,350,149 6,525,704 6,069,473
Pupil Transportation 2,946,159 3,048,329 2,659,317 2,766,185
Interest on Long Term Debt 115,860 108,879 115,860 108,879
Total $ 89,814,281 $ 81,454,672 $ 60,355,626 $ 57,804,506
Business-Type Activities- The District's total business-type activities revenues were $2,079,877 for the fiscal year ended June 30, 2017. Charges for services of $650,743 accounted for 31% of total revenues and operating grants and contributions of $1,428,598 accounted for 69% of total revenues.
Total cost of all business-type activities programs and services was $2,174,321 for the fiscal year ended June 30,2017.
For fiscal year 2017, total business-type activities expense exceeded revenues, decreasing net position by $94,444 or 30% compared to the previous year.
11

BELLEVILLE TOWNSHIP SCHOOL DISTRICT
Management's Discussion and Analysis Fiscal Year Ended June 30, 2017
FINANCIAL ANALYSIS OF THE DISTRICT'S FUNDS
The financial performance of the District as a whole is reflected in its governmental funds as well. As the District completed the year, its governmental funds reported a combined fund balance of $1,382,250 at June 30,2017, a decrease of$47,269 from last year's fund balance of$1,429,519.
Revenues for the District's governmental funds were $76,386,057, while total expenditures were $76,433,326 for the fiscal year ended June 30,2017.
GENERAL FUND
The General Fund includes the primary operations of the District in providing educational services to students from Pre-K through 12 including pupil transportation, extra-curricular activities and plant operation and maintenance costs.
The following schedule presents a summary of General Fund Revenues.
Fiscal Fiscal Amount of Year Ended Year Ended Increase Percent
June 30, 2017 June 30, 2016 {Decrease) Change Local Sources:
Property Tax Levy $ 38,667,832 $ 37,665,506 $ 1,002,326 3% Tuition 181,435 230,509 (49,074) 329% Miscellaneous 157,046 284,269 (127,223) -45%
State Sources 34,520,252 33,307,496 1,212,756 4% Federal Sources 263,041 164,183 98,858 60%
Total General Fund Revenues $ 73,789,606 $ 71,651,963 $ 2,137,643 3%
For fiscal year 2017, total General Fund revenues increased $2,137,643 or 3% from the previous year. Property taxes increased $1,002,326 or 3% to support increases in operating costs. As indicated, State aid increased 4% mainly attributable to on behalf pension contributions made by the State for the District's teaching professionals.
The following schedule presents a summary of General Fund expenditures.
Fiscal Fiscal Amount of Year Ended Year Ended Increase Percent
June 30,2017 June 30, 2016 {!!ecrease) Change
Instruction $ 44,035,395 $ 4!,873,454 $ 2,161,941 5% Support Services 26,765,374 26,513,818 251,556 1% Debt Service 1,899,129 2,023,993 (124,864) -6% Capital Outlay 241,589 30,961 210,628 680%
Total Expenditures $ 72,941,487 $ 70,442,226 $ 2,499,261 4%
12

BELLEVILLE TOWNSHIP SCHOOL DISTRICT
Management's Discussion and Analysis Fiscal Year Ended June 30, 2017
GENERAL FUND (Continued)
For fiscal year 2017, total General Fund expenditures increased $2,499,261 or 4% over the previous year. Increases in instruction costs and capital outlay were offset by decreases in general administrative support services and student transportation costs in the current year.
In fiscal year 2017 General Fund revenues exceeded expenditures by $848,119. Therefore, the total fund deficit of $220,977 was eliminated to a fund balance of $627,142 at June 30, 2017. After deducting restricted and assigned fund balances, the unassigned fund deficit decreased from $1,863,401 at June 30, 2016 to $1,845,705 atJune 30,2017.
General Fund Budgetary Highlights
The District's budget is prepared according to New Jersey Department of Education guidelines, and is based on accounting for certain transactions. on the budgetary basis of accounting for revenues, expenditures and encumbrances. The most significant difference between the budgetary basis of accounting and generally accepted accounting principles is the legally mandated revenue recognition of certain delayed or deferred state aid payments. The most significant budgetary fund is the General Fund.
Over the course of the year, the District revised the annual operating budget several times. Revisions in the budget were made through the reappropriation of prior year encumbrances and budget transfers to prevent over expenditures in specific line item accounts.
For fiscal year 2017 General Fund budgetary revenues exceeded budgetary expenditures increasing budgetary fund balance $859,457 from the previous year. After deducting fund balances restricted and assigned, the unassigned budgetary fund balance increased $29,034, from a fund balance of$1,010,876 at June 30,2016 to a fund balance of$1,039,910 at June 30,2017. In addition, the District increased its restricted capital reserve fund balance by a total of $710,000 at June 30, 2017, and established a maintenance reserve in the amount of$193,656 at June 30, 2017.
CAPITAL ASSET
At the end of fiscal year 2017, the District had $10,551,040 invested in land, buildings, furniture, equipment and vehicles for goverrnnental activities and $10 I ,892 for business type activities. The following is a comparison of the June 30,2017 and 2016 balances:
Land $ Construction in Progress Land Improvements Buildings and Improvements Furniture, Equipment and Vehicles
Capital Assets
(Net of Accumulated Depreciation) at June 30, 2017 and 2016
Governmental Activities
225,057 $ 225,057 46,211 769,836 10,938 11,621
9,266,426 8,415,370 1,002,408 1,003,992 $
Business-Type
Activities
101,892 $ 144,244
$ 225,057 $ 46,211 10,938
9,266,426 1,104,300
225,057 769,836
11,621 8,415,370 1,148,236
Total Capital Assets, Net $ 10,551,040 $ 10,425,876 $ 101,892 $ 144,244 $ 10,652,932 $ 10,570,120
Additional information on the District's capital assets is presented in Note 3 of this report.
13

BELLEVILLE TOWNSHIP SCHOOL DISTRICT
Management's Discussion and Analysis Fiscal Year Ended June 30, 2017
LONG TERM LIABILITIES
At June 30, 20 17 the District had $30,192,673 of total outstanding long-term liabilities for governmental activities. Of this amount, $4,125,259 is for capital leases, $1,549,016 is for compensated absences, $3,329,940 is for the state aid advance loan payable and $21,188,458 is for the District's net pension liability. The following is a comparison of the June 30,2017 and 2016 balances:
Outstanding Long-Term Liabilities as of June 30, 2017 and 2016
Governmental Activities 2017 2016
Capital Leases $ 4,125,259 $ 5,540,000 Compensated Absences 1,549,016 1,824,366 State Aid Advance Loan Payable 3,329,940 3,746,183 Net Pension Liability 21,188,458 18,772,248
Total $ 30,192,673 $ 29,882,797
Additional information of the District's long-term liabilities is presented in Note 3 of this report.
FACTORS BEARING ON THE DISTRICT'S FUTURE
While many factors influence the District's future, the availability of funding for increased enrollment, staffing needs, facility improvements, the District's financial condition and the economy will have the most impact on educational and fiscal decisions in the future.
Many factors were considered by the District's administration during the process of developing the fiscal year 2016-2017 budget. The primary factors were the District's projected student population, anticipated state and federal aid as well as increasing salary and related benefit costs.
These indicators were considered when adopting the budget for fiscal year 2017-2018. Budgeted expenditures in the General Fund increased approximately 2% to $66,617,195 for fiscal year 2017-2018.
CONTACTING THE DISTRICT'S FINANCIAL MANAGEMENT
This fmancial report is designed to provide our citizens, taxpayers, customers, and investors and creditors with a general overview of the District's finances and to demonstrate the District's accountability for the money it receives. If you have questions about this report or need additional information contact the Business Office, Belleville Township School District, 102 Passaic Ave., Belleville, NJ 07109.
14

FINANCIAL STATEMENTS

DISTRICT-WIDE FINANCIAL STATEMENTS

BELLEVILLE TOWNSHIP SCHOOL DISTRICT STATEMENT OF NET POSITION
AS OF JUNE 30,2017
Governmental Activities
ASSETS
Cash and Cash Equivalents $ 1,725,105
Receivables, Net 584,503
Internal Balances 15,958
Inventory Restricted Assets
Cash and Cash Equivalents with Fiscal Agent 784,340
Capital Assets, Not Being Depreciated 271,268 Capital Assets, Being Depreciated, Net 10,279,772
Total Assets 13,660,946
DEFERRED OUTFLOWS OF RESOURCES
Deferred Amounts on Net Pension Liability 6,404,540
Total Deferred Outflows of Resources 6,404,540
Total Assets and Deferred Outflows of Resources 20,065,486
LIABILITIES
Accounts Payable and Other Current Liabilities 1,569,597
Payable to Other Governments 92,815
Accrued Interest Payable 36,195
Unearned Revenue 65,244
Noncurrent Liabilities Due Within One Year 2,283,173
Due Beyond One Year 27,909,500
Total Liabilities 31,956,524
DEFERRED INFLOWS OF RESOURCES
Deferred Amounts on Net Pension Liability 1,969,331
Deferred Commodities Revenue
Total Deferred Inflows of Resources 1,969,331
Total Liabilities and Deferred Inflows
of Resources 33,925,855
NET POSITION
Net Investment in Capital Assets 7,066,551
Restricted for: Capital Projects 1,500,487
Plant Maintenance 193,656
Unrestricted (22,621,063)
$ (13,860,369)
The accompanying Notes to Financial Statements are an integral part of this statement. 15
EXHIBIT A-I
Business-type Activities Total
$ 185,243 $ 1,910,348 120,887 705,390 (15,958)
19,446 19,446
784,340 271,268
101,892 10,381,664
411,510 14,072,456
6,404,540
6,404,540
411,510 20,476,996
176,670 1,746,267 92,815 36,195
9,475 74,719
2,283,173 27,909,500
186,145 32,142,669
1,969,331 7,017 7,017
7,017 1,976,348
193,162 34,119,017
101,892 7,168,443
1,500,487 193,656
I 16 456 (22,504,607)
$ 218,348 $ (13,642,021)

EXHIBIT A-2
BELLEVILLE TOWNSHIP SCHOOL DISTRICT STATEMENT OF ACTIVITIES
FOR THE FISCAL YEAR ENDED JUNE 30, 2017 Net (Expense) Revenue and
Program Revenues Changes in Net Position Operating Capital
Charges for Grants and Grants and Governmental Business-Type
Functions/Programs ExQenses Services Contributions Contributions Activities Activities Total
Governmental Activities: Instruction:
Regular $ 37,ll5,854 $ 86,985 $ 13,816,352 $ 131,275 (23,081,242) $ (23,081,242)
Special Education 15,165,972 94,450 7,231,316 (7,840,206) (7,840,206)
Other Instruction 4,457,171 1,679,592 13,809 (2, 763, 770) (2, 763, 770)
School Sponsored Activities and Athletics 1,125,987 (1,125,987) (1,125,987)
Support Services: Student & Instruction Related Services 10,249,971 3,302,227 9,900 (6,937,844) (6,937,844)
General Administrative Services 2,305,809 117,448 (2,188,361) (2,188,361)
School Administrative Services 7,664,156 2,305,954 (5,358,202) (5,358,202)
Central Administrative Services 1,813,496 54,363 (1,759,133) (1,759,133)
Plant Operations and Maintenance 6,853,846 328,142 (6,525,704) (6,525,704)
Pupil Transportation 2,946,159 286,842 (2,659,317) (2,659,317)
:;:: Interest on Long Term Debt ll5,860 (115,860) (ll5,860)
Total Governmental Activities 89,814,281 181,435 29,122,236 154,984 __ (60,355,626) (60,355,626)
Business-Type Activities: Food Senrice 2,174,321 650,743 1,428,598 $ (94,980) (94,980)
Total Business-Type Activities 2,174,321 650,743 1,428,598 (94,980) (94,980)
Total Primary Government $ 91,988,602 $ 832,178 $ 30,550,834 $ 154,984 (60,355,626) (94,980) (60,450,606)
Continued
The accompanying Notes to Financial Statements are an integral part of this statement.

_,
BELLEVILLE TOWNSHIP SCHOOL DISTRICT STATEMENT OF ACTIVITIES
FOR THE FISCAL YEAR ENDED JUNE 30, 2017
General Revenues: Property Taxes: Levied for General Purposes
Unrestricted State & Federal Aid Miscellaneous Income
Total General Revenues
Change in Net Position
Net Position, Beginning of Year,
Net Position, End of Year
The accompanying Notes to Financial Statements are an integral part of this statement.
Net {Expense) Revenue and Changes in Net Position
Governmental Activities
$ 38,667,832 22,523,414
1612086
61,352,332
996,706
(14,857,075)
$ (13,860,369)
Business-Type Activities
$ 536
536
(94,444)
312,792
$ 218,348
$
$
EXHIBIT A-2
Total
38,667,832 22,523,414
161,622
61,352,868
902,262
(14,544,283)
(13,642,021)

FUND FINANCIAL STATEMENTS

BELLEVILLE TOWNSHIP SCHOOL DISTRICT GOVERNMENTAL FUNDS
BALANCE SHEET AS OF JUNE 30, 2017
Special General Revenue
Fund Fund
ASSETS Cash and Cash Equivalents $ 1,461,174 $ 20,521 Receivables From Other Governments 178,006 354,013
Due from Other Funds 97,674
Restricted Assets
Cash and Cash Equivalents with Fiscal Agent
Total Assets $ 1,736,854 $ 374,534
UABILITIES AND FUND BALANCES Liabilities: Accounts Payable $ 1,078,425 $ 234,223
Accrued Salaries and Wages 13,539
Due to Other Funds Payable to State Government 7,924 68,281
Payable to Federal Government 16,610 Unearned Revenue 9,824 55,420
Total Liabilities 1,109,712 374,534
Fund Balances Restricted
Capital Reserve 1,386,149 Maintenance Reserve 193,656 Capital Projects
Assigned Year End Encumbrances 893,042
Unassigned (1,845,705)
Total Fund Balances 627,142
Total Liabilities and Fund Balances $ 1,736,854 $ 374,534
The Notes to the Financial Statements are an Integral Part of this Statement 18
EXHIBIT B-1
Capital Total Projects Governmental
Fund Funds
$ I ,481,695 532,019
97,674
$ 784,340 784,340
$ 784,340 $ 2,895,728
$ 1,312,648 13,539
29,232 29,232 76,205 16,610 65,244
29,232 1,513,478
1,386,149 193,656
755,108 755,108
893,042 (1,845,705)
755,108 1,382,250
$ 784,340 $ 2,895,728

BELLEVILLE TOWNSHIP SCHOOL DISTRICT GOVERNMENTAL FUNDS
BALANCE SHEET AS OF JUNE 30,2017
Total Fund Balances- Governmental Funds (Exhibit B-1)
Amounts reported for governmental activities in the statement of
net position (A-1) are different because:
Capital assets used in governmental activities are not financial resources and therefore are not reported in the funds. The cost of the assets is $25,300,171 and the accumulated depreciation is $14,749,131.
Certain amounts resulting from the measurement of the net pension liability are reported as either deferred inflows of resources or deferred outflows of resources in the statement of the net position and amortized over future years.
Deferred Outflows of Resources Deferred Inflows of Resources
The District has financed capital assets through the issuance of serial bonds, long-term lease obligations, and notes. The interest accrual at year end is:
Long-term liabilities are not due and payable in the current period and therefore are not reported as liabilities in the funds
Capital Leases State Aid Advance Loan Payable Compensated Absences
Net Pension Liability
Net Position of Governmental Activities (Exhibit A-1)
The Notes to the Financial Statements are an Integral Part of this Statement 19
$ 6,404,540 (1,969,331)
4,125,259 3,329,940 1,549,016
21,188,458
$
$
EXHIBIT B-1
1,382,250
10,551,040
4,435,209
(36,195)
(30, 192,673)
(13,860,369)

BELLEVILLE TOWNSHIP SCHOOL DISTRICT GOVERNMENTAL FUNDS
STATEMENT OF REVENUES, EXPENDITURES, AND CHANGES IN FUND BALANCES FOR THE FISCAL YEAR ENDED JUNE 30, 2017
General Fund
REVENUES Local sources:
Property Tax Levy $ 38,667,832
Tuition 181,435 Miscellaneous 157,046
Total - Local Sources 39,006,313
State Sources 34,520,252 Federal Sources 263,041
Total Revenues 73,789,606
EXPENDITURES
Instruction Regular 27,593,371
Special Education 12,033,592
Other Instruction 3,365,514
School Sponsored Activities and Athletics 1,042,918
Support Services Student and Instruction Related Services 8,227,875
General Administrative Services 2,171,704
School Administrative Services 6,030,603
Central Administrative Services 1,702,511
Plant Operations and Maintenance 5,866,137
Pupil Transportation 2,766,544
Debt Service Principal 1,830,984
Interest 68,145
Capital Outlay 241,589
Total Expenditures 72,941,487
Excess (Deficiency) of Revenues
Over/(Under) Expenditures 848,119
Fund Balance (Deficit), Beginning of Year (220,977)
Fund Balance, End of Year $ 627,142
The accompanying Notes to Financial Statements are an integral part of this statement. 20
Special Revenue
Fund
$ 27,923
27,923
81,471 2,484,063
2,593,457
1,153,129 1,119,868
62,462
103,014
154,984
2,593,457
$
Capital Projects
Fund
$ 2,994
2,994
2,994
43,827 854,555
898,382
(895,388)
1,650,496
$ 755,108
EXHIBIT B-2
Total Governmental
Funds
$ 38,667,832 181,435 187,963
39,037,230
34,601,723 2,747,104
76,386,057
28,746,500 13,153,460 3,427,976 1,042,918
8,330,889 2,171,704
6,030,603 1,702,511 5,866,137 2,766,544
1,830,984 111,972
1,251,128
76,433,326
(47,269)
1,429,519
$ 1,382,250

BELLEVILLE TOWNSHIP SCHOOL DISTRICT RECONCILIATION OF THE STATEMENT OF REVENUES, EXPENDITURES,
AND CHANGES IN FUND BALANCES OF GOVERNMENTAL FUNDS TO THE STATEMENT OF ACTIVITIES
FOR THE FISCAL YEAR ENDED .JUNE 30,2017
Total Net Change in Fund Balances - Governmental Funds (Exhibit B-2)
Amounts reported for governmental activities in the statement of activities {A~2) are different because:
Capital outlays are reported in governmental funds as expenditures. However, in the statement of activities, the cost of those assets is allocated over their estimated useful lives as depreciation expense. This is the amount by which capital outlay exceeded depreciation expense in the period.
Capital Outlays Depreciation Expense
The net effect of various miscellaneous transactions involving capital assets (i.e., sales, disposals
donations) is to increase net position. These transactions are not reported in the governmental
fund financial statements.
Loss on Disposal of Capital Assets
Repayment of debt is an expenditure in the governmental funds, but the repayment reduces Jong-tenu liabilities in the statement of net position and is not reported in the statement of activities.
Capital Lease Principal
State Aid Advance Loan Payable
In the statement of activities, interest on long-term debt in the statement of activities is accrued, regardless of when due. In the governmental funds, interest is reported when paid. The accrued
interest is a decrease to the reconciliation. (-)
In the statement of activities, certain operating expenses, e.g., compensated absences (vacations) and
and pension expense are measured by the amounts earned or incurred during the year. In the governmental funds,
however, expenditures for these items are reported in the amount of financial resources used (paid).
$
When the earned or incurred amount exceeds the paid amount, the difference is a reduction in the reconciliation ( -);
when the paid amount exceeds the earned or incurred amount the difference is an addition to the reconciliation(+).
Net Decrease in Compensated Absences Net Increase in Pension Expense
Change in Net Position of Governmental Activities (Exhibit A-2)
The accompanying Notes to Financial Statements are an integral part of this statement. 21
1,251,128 (1,099,629)
1,414,741 416,243
275,350 (1,183,635)
EXHIBIT B-3
$ (47,269)
151,499
(26,335)
I ,830,984
(3,888)
(908,285)
$ 996,706

BELLEVILLE TOWNSHIP SCHOOL DISTRICT PROPRIETARY FUND
STATEMENT OF NET POSITION
ASSETS
Cash and Cash Equivalents Intergovernmental Receivable Other Accounts Receivable Inventories
Total Current Assets
Capital Assets Equipment Accumulated Depreciation
Total Capital Assets, Net
Total Assets
LIABILITIES
Current Liabilities Accounts Payable Due To Other Funds Claims and Judgements Payable Accrued Liability for Insurance Claims Unearned Revenue
Total Current Liabilities
DEFERRED INFLOWS OF RESOURCES
Deferred Commodities Revenue
Total Liabilities and Deferred Inflows of Resources
NET POSITION Investment in Capital Assets Unrestricted
Total Net Position
AS OF JUNE 30, 2017
The accompanying Notes to Financial Statements are an integral part of this statement. 22
$
$
Business-Type Activities
Enterprise Fund
Food Service
185,243 105,255
15,632 19,446
325,576
767,751 (665,859)
101,892
427,468
176,670 15,958
9,475
202,103
7,017
209,120
101,892 116,456
EXIDBITB-4
Internal Service Fund
Worker's Compensation Self-Insurance
Fund
$ 243,410
243,410
243,410
192,969 50,441
243,410
243,410
218,348 "'$~~~:_

BELLEVILLE TOWNSHIP SCHOOL DISTRICT
PROPRIETARY FUND
COMBINING STATEMENT OF REVENUES, EXPENSES AND
CHANGES IN NET POSITION
FOR THE FISCAL YEAR ENDED .JUNE 30, 2017
OPERATING REVENUES
Local Sources Daily Sales - Reimbursable Programs Daily Sales- Non-Reimbursable Programs Special Events
Total Operating Revenues
OPERATING EXPENSES
Salaries
Employee Benefits Cost of Sales -Reimbursable Programs Cost of Sales -Non-Reimbursable Programs Repairs & Maintenance Supplies and Materials Other Purchased Services Management Fee Miscellaneous Expense Worker1s Compensation Claims Depreciation
Total Operating Expenses
Operating Loss
Nonoperating Revenues State Sources
State School Lunch Program Federal Sources
School Breakfast Program National School Lunch Program Food Distribution Program
Interest Earnings
Total Nonoperating Revenues
Changes in Net Position
Total Net Position, Beginning of Year
Total Net Position, End of Year
The accompanying Notes to Financial Statements are an integral part of this statement. 23
$
$
Business-Type Activities
Enterprise Fund
Food Service
355,712
291,504 3,527
650,743
707,718
246,720
765,614
136,701
15,813
81,015
44,702
85,523
13,925
76,590
2,174,321
(1,523,578)
23,475
99,885
1,155,546
149,692 536
1,429,134
(94,444)
312,792
218,348
EXffiBITB-5
Internal Service Fund
Worker's Compensation Self-Insurance
Fund
1,046
1,046
(1,046)
1,046
1,046
$

BELLEVILLE TOWNSHIP SCHOOL DISTRICT PROPRIETARY FUNDS
STATEMENT OF CASH FLOWS FOR THE FISCAL YEAR ENDED JUNE 30, 2017
Cash Flows from Operating Activities
Cash Received from Customers Cash Received From District Contribution Cash Payments for Employees Salaries and Benefits Cash Payments to Suppliers for Goods and Services
Net Cash (Used for) Operating Activities
Cash Flows from Noncapital Financing Activities Cash Received from (Paid to) Other Funds Cash Received from State and Federal Subsidy Reimbursements
Net Cash Provided by Noncapital Financing Activities
Cash Flows from Capital and Related Financing Activities Purchase of Capital Assets
Net Cash (Used for) Capital and Related Financing Activities
Cash Flows from Investing Activities Interest Earnings Received
Net Cash Provided by Investing Activities
Net Increase (Decrease) in Cash and Cash Equivalents
Cash and Cash Equivalents (Overdraft), Beginning of Year
Cash and Cash Equivalents, End of Year
Reconciliation of Operating Loss to Net Cash Provided by (Used for) Operating Activities
Operating Loss
Adjustments to Reconcile Operating Loss to Net Cash (Used for) Operating Activities Depreciation Non-Cash Federal Assistance-Food Distribution Program Change in Assets, Liabilities and Deferred Inflows of Resources
(lncrease)/Decrease in Accounts Receivable (Increase )/Decrease in Inventory Increasc/(Decrease) in Accounts Payable lncrease/(Decrease) in Claims and Judgements Payable Increase/(Decrease) in Accrued Liability for Insurance Claims Increase/(Dccrease) in Unearned Revenue Increase/(Decrease) in Deferred Commodities Revenue
Total Adjustments
Net Cash (Used For) Operating Activities
Non-Cash Invest, Capital and Financing Activities: Value Received- Food Distribution Program
The accompanying Notes to Financial Statements are an integral part of this statement. 24
$
$
$
$
$
Business-Type
Activities
Enterprise Fund
Food
Service
644,332
(954,438) (790,830)
(1,100,936)
(2,534) 1,406,441
1,403,907
(34,238)
(34,238)
536
536
269,269
(84,026)
185,243
EXIITBIT B-6
Internal
Service
Fund Worker's
Compensation Self-Insurance
Fund
$
(115,561)
(115,561)
1,046
1,046
(114,515)
357,925
$ 243,410
(1,523,578) $ (1,046)
76,590
149,692
14,405
8,985
176,670
(60,162) (54,353)
1,067 (4,767)
422,642 (114,515)
(I, I 00,936) $ (115,561)
144,925

BELLEVILLE TOWNSHIP SCHOOL DISTRICT FIDUCIARY FUNDS
STATEMENT OF FIDUCIARY NET POSITION AS OF JUNE 30,2017
Unemployment Compensation
Trust
ASSETS Cash and Cash Equivalents $ Due from Other Funds
Total Assets $
LIABILITIES Due to Student Groups Intergovernmental Payable - State $ Payroll Deductions and Withholdings Due to Other Funds
Total Liabilities $
NET POSITION
Held in Trust for Unemployment Claims and Other Purposes $
The accompanying Notes to Financial Statements are an integral part of this statement. 25
19,049 19,024
38,073
16,975
16,975
21,098
EXHIBIT B-7
Agency Fund
$ 597,463
$ 597,463
$ 175,002
350,953 71,508
$ 597,463

BELLEVILLE TOWNSHIP SCHOOL DISTRICT FIDUCIARY FUNDS
STATEMENT OF CHANGES IN FIDUCIARY NET POSITION FOR THE FISCAL YEAR ENDED JUNE 30, 2017
EXHIBIT B-8
Unemployment Compensation
TrnstFnnd
ADDITIONS Contributions
District $ Employee
Investment Earnings
Interest
Total Additions
DEDUCTIONS
Unemployment Claims and Contributions
Total Deductions
Change in Net Position
Net Position, Beginning of Year
Net Position, End of Year $
The accompanying Notes to Financial Statements are an integral part of this statement. 26
15,000 62,256
65
77,321
130,239
130,239
(52,918)
74,016
21,098
NOTES TO THE FINANCIAL STATEMENTS

BELLEVILLE TOWNSIDP SCHOOL DISTRICT NOTES TO THE FINANCIAL STATEMENTS FOR THE FISCAL YEAR ENDED JUNE 30, 2017
NOTE 1 SUMMARY OF SIGNIFICANT ACCOUNTING POLICIES
A. Reporting Entity
The Belleville Township School District (the "Board" or the "District") is an instrumentality of the State of New Jersey, established to function as an education institution. The Board consists of seven elected officials and is responsible for the fiscal control of the District. A superintendent is appointed by the Board and is responsible for the administrative control of the District. Under existing statutes, the Board's duties and powers include, but are not limited to, the development and adoption of a school program; the establishment, organization and operation of schools; and the acquisition, maintenance and disposition of school property.
The Board also has broad financial responsibilities, including the approval of the annual budget and the establishment of a system of accounting and budgetary controls.
The reporting entity is composed of the primary government, component units, and other organizations that are included to ensure that the financial statements of the District are not misleading. The primary government consists of all funds, departments, boards and agencies that are not legally separate from the District. For the Belleville Township School District this includes general operations, food service, and student related activities of the District.
Component units are legally separate organizations for which the District is financially accountable. The District is financially accountable for an organization if the District appoints a voting majority of the organization's governing board and (I) the District is able to significantly influence the programs or services performed or provided by the organization; or (2) the District is legally entitled to or can otherwise access the organization's resources; the District is legally obligated or has otherwise assumed the responsibility to finance the deficits of, or provide financial support to, the organization; or the District is obligated for the debt of the organization. Component units may also include organizations that are fiscally dependent on the District in that the District approves the budget, the issuance of debt or the levying of taxes. Based on the foregoing criteria, the District has no component units. Furthermore, the District is not includable in any other reporting entity as a component unit.
The accompanying financial statements present the District and its component units, entities for which the District is considered to be financially accountable. Each discretely presented component unit is reported in a separate column in the District-wide financial statements to emphasize that it is legally separate from the District.
B. New Accounting Standards
During fiscal year 2017, the District adopted the following GASB statements:
• GASB No. 73, Accounting and Financial Reporting for Pensions and Related Assets that Are Not Within the Scope of GASB Statement 68, and Amendments to Certain Provisions of GASB Statements 67 and 68. The objective of this Statement is to improve the usefulness of information about pensions included in the general purpose external fmancial reports of state and local governments for making decisions and assessing accountability.
• GASB No. 77, Tax Abatement Disclosures. The requirements of this Statement will improve financial reporting by providing disclosure of information about the nature and magnitude of tax abatements that will make these transactions more transparent to financial statement users. As a result, users will be better equipped to understand ( 1) how tax abatements affect a government's future ability to raise resources and meet its financial obligations and (2) the impact those abatements have on a government's financial position and economic condition.
• GASB No. 80, Blending Requirements for Certain Component Units- An Amendment of GASB Statement No. 14. The objective of this Statement is to improve financial reporting by clarifYing the financial statement presentation requirements for certain component units. This Statement amends the blending requirements established in paragraph 53 of Statement No. 14. The Financial Reporting Entity, as amended.
27

BELLEVILLE TOWNSHIP SCHOOL DISTRICT NOTES TO THE FINANCIAL STATEMENTS FOR THE FISCAL YEAR ENDED JUNE 30, 2017
NOTE 1 SUMMARY OF SIGNIFICANT ACCOUNTING POLICIES (Continued)
B. New Accounting Standards (Continued)
• GASB No. 82, Pension Issues -An Amendment ofGASB Statements No.67, No.68, and No.73. The objective of this Statement is to address certain issues that have been raised with respect to Statements No. 67, Financial Reporting for Pension Plans, No. 68, Accounting and Financial Reporting for Pension, and No. 73, Accounting and Financial Reporting for Pensions and Related Assets That are Not Within the Scope of GASB Statement 68, and Amendments to Certain Provisions ofGASB Statements 67 and 68. Specifically, this Statement addresses issues regarding (1) the presentation of payroll-related measures in required supplementary information, (2) the selection of assumptions and the treatment of deviations from the guidance in an Actuarial Standard of Practice for financial reporting purposes, and (3) the classification of payments made by employers to satisfY employee (plan member) contribution requirements.
Other accounting standards that the District is currently reviewing for applicability and potential impact on the financial statements include:
• GASB No. 75, Accounting and Financial Reporting for Postemployment Benefits Other Than Pensions, will be effective beginning with the fiscal year ending June 30,2018. The primary objective of this Statement is to improve accounting and financial reporting by state and local governments for postemployment benefits other than pensions (other postemployment benefits or OPEB). It also improves information provided by state and local governmental employers about financial support for OPEB that is provided by other entities.
• GASB No. 84, Fiduciary Activities, will be effective with the fiscal year ending June 30, 2020. The objective of this Statement is to improve guidance regarding the identification of fiduciary activities for accounting and financial reporting purposes and how those activities should be reported. This Statement established criteria for identifYing fiduciary activities of all state and local governments.
• GASB No. 85, Omnibus 2017, will be effective with the fiscal year ending June 30, 2018. The objective of this Statement is to address practice issues that have been identified during implementation and application of certain GASB Statements. This Statement addresses a variety of topics including issues related to blending component units, goodwill, fair value measurement and application, and post-employment benefits (pensions and other postemployment benefits (OPEB)).
• GASB No. 86, Certain Debt Extinguishment Issues, will be effective with the fiscal year ending June 30, 2018. The primary objective of this Statement is to improve consistency in accounting and financial reporting for in-substance defeasance of debt by providing guidance for transactions in which cash and other monetary assets acquired with only existing resources - resources other than the proceeds of refunding debt are placed in an irrevocable trust for the sole purpose of extinguishing debt. This Statement also improves accounting and financial reporting for prepaid insurance on debt that is extinguished and notes to financial statements for debt that is defeased in substance.
• GASB No. 87, Leases, will be effective with the fiscal year ending June 30, 2021. The objective of this Statement is to better meet the information needs of financial statement users by improving accouuting and finaucial reporting for leases by governments. This Statement increases the usefulness of governments' financial statements by requiring recognition of certain lease assets and liabilities for leases that previously were classified as operating leases and recognized as inflows of resources or outflows of resources based on the payment provisions of the contract.
C. Basis of Presentation - Financial Statements
The financial statements include both district-wide fmancial statements (based on the District as a whole) and fund financial statements (based on specific District activities or objectives). Both the district-wide and fund financial statements categorize activities as either governmental activities or business-type activities. While separate district-wide and fund financial statements are presented, they are interrelated. In the district-wide financial statements, the governmental activities colunm incorporates data from governmental funds and internal service funds, while business-type activities incorporate data from the District's enterprise funds. Fiduciary funds are excluded from the district-wide financial statements.
28

BELLEVILLE TOWNSHIP SCHOOL DISTRICT NOTES TO THE FINANCIAL STATEMENTS FOR THE FISCAL YEAR ENDED JUNE 30, 2017
NOTE 1 SUMMARY OF SIGNIFICANT ACCOUNTING POLICIES (Continued)
C. Basis of Presentation- Financial Statements (Continued)
District-Wide Financial Statements
The district-wide financial statements (i.e., the statement of net position and the statement of activities) report information on all of the nonfiduciary activities of the Board of Education. All fiduciary activities are reported only in the fund financial statements. For the most part, the effect of interfund activity has been removed from these statements. Governmental activities, which normally are supported by property taxes and intergovernmental revenues, are reported separately from business-type activities, which rely to a significant extent on fees and charges for support. In the statement of net position, both the governmental and business-type activities columns (a) are presented on a consolidated basis by column, and (b) reflect on a full accrual economic resource basis, which incorporates long-term assets and receivables as well as long-term debt and obligations.
The statement of activities demonstrates the degree to which the direct expenses of a given function or segment are offset by program revenues. Direct expenses are those that are clearly identifiable with a specific function or segment. Program revenues include I) charges to customers or other governmental entities, including other school districts, who purchase, use, or directly benefit from goods or services provided by a given function or segment and 2) grants and contributions that are restricted to meeting the operational or capital requirements of a particular function or segment. Property taxes, unrestricted state aid, federal and state grants for school-based budgeting and other items not properly included among program revenues are reported instead as general revenues.
As a general rule the effect of interfund activity has been eliminated from the district-wide financial statements. Exceptions to this general rule are charges between the Board's proprietary and fiduciary funds since elimination of these charges would distort the direct costs and program revenues reported for the various functions concerned.
Fund Financial Statements
Separate fund financial statements are provided for governmental, proprietary, and fiduciary activities, even though the latter are excluded from the district-wide financial statements. The emphasis of fund financial statements is on major individual governmental and enterprise funds, each reported as separate columns in the fund financial statements. All remaining governmental and enterprise funds are aggregated and reported as nomn~or funds. The District considers all of its governmental and enterprise funds to be major funds.
The District reports the following major governmental funds:
The general fond is the School District's primary operating fund. It accounts for all financial resources of the District, except those to be accounted for in another fund.
The special revenue fond accounts for the proceeds of specific revenue sources legally restricted to expenditures for specified purposes. This fund accounts for federal, state and local fmancial programs, with the exception of grants for major capital projects and the child nutrition programs.
The capital projects fond accounts for the proceeds from the sale of bonds, lease purchases and other revenues used for the acquisition or construction of capital facilities and other capital assets, other than those financed by the proprietary funds.
29

BELLEVILLE TOWNSHIP SCHOOL DISTRICT NOTES TO THE FINANCIAL STATEMENTS FOR THE FISCAL YEAR ENDED JUNE 30, 2017
NOTE 1 SUMMARY OF SIGNIFICANT ACCOUNTING POLICIES (Continued)
C. Basis of Presentation- Financial Statements (Continued)
Fund Financial Statements (Continued)
The District reports the following major proprietary fund which is organized to be self-supporting through user charges:
The food service fund accounts for the activities of the school cafeteria, which provides food service to students as well as a Ia carte and catering services for teachers and special events.
Additionally, the government reports the following fund types:
The internal service fond accounts for the activities of the Districts self-insured worker's compensation program coverages provided to other departments or agencies of the District on a cost reimbursement basis.
The fiduciary trust fond is used to account for resources legally held in trust for the state unemployment insurance claims, payroll related activities and student related activities which are supported and controlled by student organizations and clubs. All resources of the fund, including any earnings on invested resources, may be used to support the intended purpose. There is no requirement that any portion of these resources be preserved as capital.
Activity between funds that are representative of lending/borrowing arrangements outstanding at the end of the fiscal year are referred to as either "due to/from other funds" (i.e., the current portion of interfund loans) or "advances to/from other funds" (i.e., the non-current portion of interfund loans). All other outstanding balances between funds are reported as "due to/from other funds". Any residual balances outstanding between the governmental activities and business-type activities are reported in the district-wide financial statements as "internal balances".
Reclassifications
Certain amounts presented in the prior year data may have been reclassified in order to be consistent with the current year's presentation.
D. Measurement Focus and Basis of Accounting
The accounting and fmancial reporting treatment is determined by the applicable measurement focus and basis of accounting. Measurement focus indicates the type of resources being measured such as current financial resources or economic resources. The basis of accounting indicates the timing of transactions or events for recognition in the financial statements.
The district-wide financial statements are reported using the economic resources measurement focus and the accrual basis of accounting, as are the proprietary fund and fiduciary fund financial statements with the exception of the agency fund which does not have a measurement focus. All assets, all liabilities and all deferred outflows/inflows of resources associated with these operations (with the exception of the fiduciary funds) are included on the Statement of Net Position. Revenues are recorded when earned and expenses are recorded at the time liabilities are incurred, regardless of the timing of related cash flows. Property taxes are recognized as revenues in the year for which they are levied. Grants and similar items are recognized as revenue as soon as all eligibility requirements imposed by the provider have been met.
30

BELLEVll..LE TOWNSHIP SCHOOL DISTRICT NOTES TO THE FINANCIAL STATEMENTS FOR THE FISCAL YEAR ENDED JUNE 30, 2017
NOTE 1 SUMMARY OF SIGNIFICANT ACCOUNTING POLICIES (Continued)
D. Measurement Focus and Basis of Accounting (Continued)
Governmental fund financial statements are reported using the current financial resources measurement focus and the modified accrual basis of accounting. Revenues are recognized when susceptible to accrual (i.e. when they are both measurable and available). Revenues are considered to be available when they are collectible within the current period or soon enough thereafter to pay liabilities of the current period. For this purpose, the Board considers revenues to be available if they are collected within 60 days after year-end. Expenditures are recorded when a liability is incurred, as under accrual basis of accounting, with the exception of debt service expenditures as well as expenditures related to compensated absences and claims and judgments which are recorded only when payment is due. General capital asset acquisitions are reported as expenditures in governmental funds. Issuance of long-term debt and acquisitions under capital leases are reported as other fmancing sources.
Property taxes, tuition, unrestricted state aid, and interest associated with the current fiscal period are all considered to be susceptible to accrual and so have been recognized as revenues of the current fiscal period. Entitlements (formula-type grants and aid) are recorded as revenues when all eligibility requirements are met, including any time requirements, and the amount is received during the period or within the availability period for this revenue source. Expenditure-driven grants and similar awards (reimbursement-type grants and awards) are recognized as revenue when the qualifYing expenditures have been incurred and all other eligibility requirements imposed by the grantor or provider have been met, and the amount is received during the period or within the availability period for this revenue source. All other revenue items are considered to be measurable and available only when cash is received by the District.
When both restricted and unrestricted resources are available for use, it is the Board's policy to use restricted resources first, then unrestricted resources as they are needed.
E. Assets, Liabilities, Deferred Outflows/Inflows of Resources, and Net Position/Fund Balance
1. Cash, Cash Equivalents and Investments
Cash and cash equivalents are considered to be cash on hand, demand deposits, and short-term investments with original maturities of three months or less from the date of acquisition.
Investments are reported at fair value and are limited by N.J.S.A. 18A:20-37.
2. Receivables
All receivables are reported at their gross value, and where appropriate, are reduced by the estimated portion that is expected to be uncollectible.
3. Inventories
The cost of inventories of the governmental fund types are recorded as expenditures at the time individual inventory items are purchased.
Food Service Fund inventories, exclusive of the federal commodities, are valued at cost, using the first-in first-out (FIFO) method and consist of food and expendable supplies. The cost of such inventories is recorded as expenses when consumed rather than when purchased. The United States Department of Agriculture (USDA) commodity portion of the Food Service Fund inventory consists of food donated by the USDA. It is valued at estimated market prices by the USDA. The amount of unused commodities at year-end is reported as deferred inflows of resources.
31

BELLEVILLE TOWNSIITP SCHOOL DISTRICT NOTES TO THE FINANCIAL STATEMENTS FOR THE FISCAL YEAR ENDED JUNE 30,2017
NOTE 1 SUMMARY OF SIGNIFICANT ACCOUNTING POLICIES (Continued)
E. Assets, Liabilities, Deferred Outflows/Inflows of Resources, and Net Position/Fund Balance (Continued)
4. Restricted Assets
Certain assets are classified as restricted on the balance sheet because they are maintained in separate bank accounts and their use is limited by capital lease agreements for capital projects.
5. Capital Assets
Capital assets, which include property, plant and equipment, are reported in the applicable governmental or business-type activities columns in the district-wide financial statements. Capital assets are defined by the Board as assets with an initial, individual cost of$2,000 and an estimated useful life in excess of two years. The District was able to estimate the historical cost for the initial reporting of these capital assets through back trending. As the District constructs or acquires additional capital assets each period, they are capitalized and reported at historical cost. Donated capital assets are recorded at acquisition value at the date of donation. The costs of normal maintenance and repairs that do not add to the value of the asset or materially extend its useful life are not capitalized.
Major outlays for capital assets and improvements are capitalized as projects are constructed. Interest incurred during the construction phase of capital assets of business-type activities is included as part of the capitalized value of the assets constructed.
Land and construction in progress are not depreciated. The other property, plant, and equipment of the District IS
depreciated using the straight line method over the following estimated useful lives:
Land Improvements Buildings Building Improvements Heavy Equipment Office Equipment and Furniture Computer Equipment
6. Deferred Ouiflowsllnjlows of Resources
20 45
10-25 10 5 5
In addition to assets, the statement of financial position will sometimes report a separate section for deferred outflows of resources. This separate financial statement element, deferred outflows of resources, represents a consumption of net position that applies to future periods and so will not be recognized as an outflow of resources (expense/expenditure) until then. The Board has one item which arises only under the accrual basis of accounting that qualifies for reporting in this category. The item that qualifies for reporting in this category is the deferred amounts on net pension liability. Deferred amounts on net pension liability are reported in the district-wide statement of net position and result from: (I) differences between expected and actual experience; (2) changes in assumptions; (3) net difference between projected and actual investment earnings on pension plan investments; ( 4) changes in proportion and differences between employer contributions and proportionate share of contributions; and (5) contributions made subsequent to the measurement date. These amounts are deferred and amortized over future years.
32

BELLEVILLE TOWNSIDP SCHOOL DISTRICT NOTES TO THE FINANCIAL STATEMENTS FOR THE FISCAL YEAR ENDED JUNE 30, 2017
NOTE 1 SUMMARY OF SIGNIFICANT ACCOUNTING POLICIES (Continued)
E. Assets, Liabilities, Deferred Outflows/Inflows of Resources, and Net Position/Fund Balance (Continued)
6. Deferred Outflows/Inflows of Resources (Continued)
In addition to liabilities, the statement of financial position will sometimes report a separate section for deferred inflows of resources. This separate financial statement element, deferred inflows of resources, represents an acquisition of net position that applies to future periods and so will not be recognized as an inflow of resources (revenue) until that time. The Board has two types which arise only under the accrual basis of accounting that quality for reporting in this category. One item that qualifies for reporting in this category are the deferred amounts on net pension liability. Deferred amounts on net pension liability are reported in the district-wide statement of net position and result from: (I) differences between expected and actual experience; (2) changes in assumptions; (3) net difference between projected and actual investment earnings on pension plan investments; and (4) changes in proportion and differences between employer contributions and proportionate share of contributions. These amounts are deferred and amortized over future years. The other item is the deferred commodities revenue. reported in both the district-wide and the proprietary funds statements of net position. The deferred commodities revenue represents the estimated market value of the donated and unused Federal commodities inventory at year end. This amount is deferred and recognized as an inflow of resources in the period the commodities are consumed.
7. Compensated Absences
It is the District's policy to permit employees to accumulate (with certain restrictions) earned but unused sick leave benefits. A long-term liability of accumulated sick leave and salary related payments has been recorded in the governmental activities in the district-wide financial statements, representing the Board's commitment to fund such costs from future operations. Proprietary Funds accrue accumulated sick leave and salary related payments in the period that they are earued. A liability is reported in the governmental funds only to the amount actually due at year end as a result of employee resignations and retirements.
8. Pensions
In the district-wide financial statements, for purposes of measuring the net pension liability, deferred outflows of resources and deferred inflows of resources related to pensions, and pension expense, information about the fiduciary net position of the retirement systems sponsored and administered by the State of New Jersey and additions to/deductions from these retirement systems' fiduciary net position have been determined on the same basis as they are reported by the retirement systems. For this purpose, benefit payments (including refunds of employee contributions) are recognized when due and payable in accordance with the benefit terms. Investments are reported at fair value.
In the governmental fund financial statements, net pension liabilities represent amounts normally expected to be liquidated with expendable available fmancial resources for required pension contributions that are due and payable at year end. Pension expenditures are recognized based on contractual pension contributions that are required to be made to the pension plan during the fiscal year.
9. Long-Term Obligations
In the district-wide financial statements, and proprietary fund types in the fund financial statements, long-term debt and other long-term obligations are reported as liabilities in the applicable governmental activities, business-type activities, or proprietary fund type statement of net position.
In the fund financial statements, government fund types report the face amount of debt issued as other financing sources.
33

BELLEVILLE TOWNSHIP SCHOOL DISTRICT NOTES TO THE FINANCIAL STATEMENTS FOR THE FISCAL YEAR ENDED JUNE 30, 2017
NOTE 1 SUMMARY OF SIGNIFICANT ACCOUNTING POLICIES (Continued)
E. Assets, Liabilities, Deferred Outflows/Inflows of Resources, and Net Position/Fund Balance (Continued)
I 0. Net Position/Fund Balance
District-Wide Statements
In the district-wide statements, there are three classes of net position:
• Net Investment in Capital Assets- consists of net capital assets (cost less accumulated depreciation) reduced by outstanding balances of related debt obligations from the acquisition, construction or improvement of those assets. Deferred outflows of resources and deferred inflows of resources attributable to the acquisition, construction or improvement of those assets or related debt also should be included.
• Restricted Net Position -reports net position when constraints placed on the residual amount of noncapital assets are either externally imposed by creditors (such as through debt covenants), grantors, contributors, or laws or regulations of other governments, or imposed by law through constitutional provisions or enabling legislation.
• Unrestricted Net Position - any portion of net position not already classified as either net investment in capital assets or net position -restricted is classified as net position- unrestricted.
Governmental Fund Statements
Fund balance categories are designed to make the nature and extent of the constraints placed on the District's fund balance more transparent. These categories are comprised of a hierarchy based primarily on the extent to which the District is bound to observe constraints imposed upon the use of the resources reported in governmental funds.
Restricted Fund Balance- Amounts constrained to specific purposes by their providers (such as grantors, bondholders, and higher levels of government), through constitutional provisions, or by enabling legislation.
Capital Reserve- This restriction was created by the District in accordance with NJAC 6A:23A-14.1 to fund future capital expenditures (See Note 2D.)
Maintenance Reserve - This restriction was created by the Board in accordance with NJAC 6A:23A-14.2 to accumulate funds for the required maintenance of school facilities in accordance with the EFCA (NJSA 18A:7G-9) for a thorough and efficient education (See Note 2E).
Capital Projects - Represents fund balance restricted specifically for capital acquisitions and improvements in the Capital Projects Fund.
Assigned Fund Balance - Amounts a government intends to use for a specific purpose; intent can be expressed by the governing body or by an official or body to which the governing body delegates the authority.
Year-End Encumbrances - Represent outstanding purchase orders for goods or services approved by management for specific purposes from available resources of the current year for which the goods and materials have not yet been received or the services have not yet been rendered at June 30.
Unassigned Fund Balance- Represents fund balance that has not been restricted or assigned to specific purposes within the governmental funds.
34

BELLEVILLE TOWNSHIP SCHOOL DISTRICT NOTES TO THE FINANCIAL STATEMENTS FOR THE FISCAL YEAR ENDED JUNE 30, 2017
NOTE 1 SUMMARY OF SIGNIFICANT ACCOUNTING POLICIES (Continued)
F. Revenues and Expenditures/Expenses
I. Program Revenues
Amounts reported as program revenues in the district-wide statement of activities include 1) charges to customers or applicants for goods or services, provided, 2) operating grants and contributions, and 3) capital grants and contributions. Internally dedicated resources are repmted as general revenues rather than as program revenues. Likewise, general revenues include all property taxes, unrestricted state and federal aid, investment earnings and miscellaneous revenues.
2. Property Taxes
Property taxes are levied pursuant to law and are collected by the municipality and are transferred to the District as requested. Property tax revenues are recognized in the year they are levied and become available. Propetty taxes collected in advance of the year-end for which they are levied and transfen·ed to the District are reported as deferred inflows of resources. The tax bills are mailed annually in June by the municipal tax collector and are levied and due in four quarterly installments on August 1, November 1, February I and May 1 of the fiscal year. When unpaid, taxes or any other municipal lien, or part thereof, on real propetty, remains in arrears on April 1 '' in the year following the calendar year levy when the same became in arrears, the tax collector of the municipality shall, subject to the provisions of New Jersey Statute, enforce the lien by placing the property on a tax sale. The municipality may institute annual "in rem" tax foreclosure proceedings to enforce the tax collection or acquisition of title to the property.
3. Tuition Revenues and Expenditures
Tuition Revenues - Tuition charges were established by the Board of Education based on estimated costs. The charges are subject to adjustment when the final costs are determined and certified by the State Department of Education.
Tuition Expenditures- Tuition charges for the fiscal years 2015-2016 and 2016-2017 were based on rates established by the receiving district. These rates are subject to change when the actual costs have been certified by the State Department of Education.
4. Proprietary Funds, Operating and Nonoperating Revenues and Expenses
Proprietary funds distinguish operating revenues and expenses from nonoperating items. Operating revenues and expenses generally result from providing services and producing and delivering goods in connection with a proprietary fund's principal ongoing operations. The principal operating revenues of the food service enterprise fund and of the District's internal service fund are charges to customers for sales and services. Operating expenses for enterprise funds and internal service funds include the cost of sales and services, administrative expenses, and depreciation on capital assets. All revenues and expenses not meeting this definition are reported as nonoperating revenues and expenses. Federal and State subsidies for the food service operation are considered nonoperating revenues.
35

BELLEVILLE TOWNSHIP SCHOOL DISTRICT NOTES TO THE FINANCIAL STATEMENTS FOR THE FISCAL YEAR ENDED JUNE 30, 2017
NOTE 1 SUMMARY OF SIGNIFICANT ACCOUNTING POLICIES (Continued)
NOTE 2 STEWARDSHIP, COMPLIANCE AND ACCOUNTABILITY
A. Budgetary Information
In accordance with the requirements of the New Jersey Department of Education ("the Department"), the District annually prepares its operating budget for the forthcoming year. The budget, except for the general fund and special revenue fund, which is more fully explained below and in the notes to the required supplementary information, is prepared in accordance with accounting principles generally accepted in the United States of America and serves as a formal plan for expenditures and the proposed means for financing them. Capital lease transactions are accounted for on the GAAP basis.
The annual budget is adopted in the spring of the preceding year for the general and special revenue funds. The District is not required to adopt an annual budget for the capital projects fund. The budget is submitted to the county superintendent for review and approval prior to adoption. Prior to the 2012/2013 budget year, the annual budget was required to be voted upon at the annual school election held on the third Tuesday in April. On January 17, 2012, Chapter 202 of the Laws ofP.L. 2011 was approved which established procedures for moving the date of a school district's annual school election from April to the general election in November. Under the new law, districts that have their school board members elected in November no longer have to submit their budgets that meet levy cap requirements for voter approval beginning with the 2012/2013 budget year. Only a school board decision to exceed the tax levy cap would require voter approval for the additional amount on the November ballot. The Board adopted a resolution to move its annual election to the date of the general elections in accordance with the law; therefore voter approval of the annual budget is not required.
Budget adoptions and amendments are recorded in the District's board minutes. The budget is amended by the Board of Trustees as needed throughout the year. The budget for revenues, other resources, other uses, and fund balances is prepared by fund source and amount. The budget for expenditures is prepared by fund, program, function, object and amount. The legal level of budgetary control is established at the line item account within each fund. Line item accounts are defined as the lowest (most specific) level of detail as established pursuant to the minimum chart of accounts referenced in N.J.A.C. 6:20-2A.2(m)l. The Board approved several budget transfers during 2016/2017. Also, during 2016/2017 the Board increased the original budget by $2,014,902. The increase was funded by additional appropriation of restricted fund balance, grant awards and the reappropriation of prior year general fund encumbrances. During the fiscal year the State Monitor authorized and approved an appropriation of$190,000 of capital reserve fund balance in the general fund.
Formal budgetary integration into the accounting system is employed as a management control device during the year. For governmental funds there are no substantial differences between the budgetary basis of accounting and accounting principles generally accepted in the United States of America, with the exception of the legally mandated revenue recognition of certain state aid payments for budgetary purposes only and the treatment of encumbrances in the special revenue fund as described in the Notes to Required Supplementary Information (RSI). Encumbrance accounting is also employed as an extension of formal budgetary integration in the governmental fund types. Unencumbered appropriations lapse at fiscal year end.
Encumbrance accounting is employed in the governmental funds. Under encumbrance accounting, purchase orders, contracts and other commitments for the expenditure of resources are recorded to reserve a portion of the applicable appropriation. Open encumbrances in governmental funds other than the special revenue fund are reported as committed and/or assigned fund balances at fiscal year end as they do not constitute expenditures or liabilities but rather commitments related to unperformed contracts for goods and services which are reappropriated and honored during the subsequent fiscal year.
36

BELLEVILLE TOWNSHIP SCHOOL DISTRICT NOTES TO THE FINANCIAL STATEMENTS FOR THE FISCAL YEAR ENDED JUNE 30,2017
NOTE 2 STEWARDSHIP, COMPLIANCE AND ACCOUNTABILITY (Continued)
B. Excess Expenditures Over Appropriations
The following is a summary of expenditures in excess of available appropriations. The overexpended appropriations resulted in unfavorable variances.
Final Budget
General Fund General Administration
Legal Services $ 742,387 Unallocated Benefits
Health Benefits 7,607,736
The above variances were offset with other available resources.
C. Deficit Fund Equity
Actual
$ 765,500
7,677,901
Unfavorable Variance
$(23,113)
(70,165)
The District has an unassigned fund deficit of $1,845,705 in the General Fund as of June 30, 2017 as reported in the fund financial statements (modified accrual basis). NJSA 18A:22-44.2 provides that in the event a state school aid payment is not made until the following school budget year, districts must record these delayed state aid payments as revenue, for budget purposes only, in the current school budget year. The statute provides legal authority for school districts to recognize this revenue in the current budget year. GASB Statement No. 33, "Accounting and Financial Reporting for Nonexchange Transactions", requires that intergoverrunental transactions (revenue, expenditure, asset, liability) should be recognized in symmetry (i.e., if one goverrunent recognizes an asset, the other government recognizes a liability). Since the State of New Jersey is recording certain 2016/2017 budgeted state aid payments in the subsequent fiscal year, the school district cannot recognize such payments on the GAAP (fund) financial statements until the year the State records the payable. Due to the timing difference of recording these delayed state aid payments, the General Fund deficit does not alone indicate that the District is facing financial difficulties; however, unless the State of New Jersey budgets the delayed payments in future years, the District may also report fund deficits in the future.
Pursuant to NJSA 18A:22-44.2, any negative unreserved, undesignated (i.e., unassigned) general fund balance that is reported as a direct result of a delay in the payment of state aid until the following fiscal year, is not considered as a violation of New Jersey Statute or regulation and is not considered an item in need of corrective action. The District deficit in the GAAP (fund) fmancial statements of$1,845,705 in the General Fund is less than the delayed state aid payments at June 30, 2017.
D. Capital Reserve
A capital reserve account was established by the District. The accumulation of funds will be used for capital outlay expenditures in subsequent fiscal years. The capital reserve is maintained in the general fund and its activity is included in the general fund annual budget.
Funds placed in the capital reserve are restricted to capital projects in the district's approved Long Range Facilities Plan (LRFP). Upon submission of the LRFP to the Department, a district may increase the balance in the capital reserve by appropriating funds in the annual general fund budget certified for taxes or by transfer by board resolution at year end of any unanticipated revenue or unexpended line-item appropriation amounts or both. A district may also appropriate additional amounts when the express approval of the voters has been obtained either by a separate proposal at budget time or by a special question at one of the four special elections authorized pursuant to N.J.S.A. 19:60-2. Pursuant to N.J.A.C. 6:23A-14.l(g), the balance in the reserve cannot at any time exceed the local support costs of uncompleted capital projects in its approved LRFP.
37

BELLEVILLE TOWNSHIP SCHOOL DISTRICT NOTES TO THE FINANCIAL STATEMENTS FOR THE FISCAL YEAR ENDED JUNE 30,2017
NOTE 2 STEWARDSHIP, COMPLIANCE AND ACCOUNTABILITY (Continued)
D. Capital Reserve (Continued)
The activity of the capital reserve for the fiscal year ended June 30, 2017 is as follows:
Balance, July I, 2016 $ 676,149
Increased by Approved by State Monitor 900,000
1,576,149
Withdrawals Approved by State Monitor 190,000
Balance, June 30, 2017 $ 1,386,149
The withdrawals from the capital reserve were for use in a facilities project, consistent with the district's Long Range Facilities Plan.
E. Maintenance Reserve
A maintenance reserve account was established by the District. The accumulation of funds will be used for required maintenance of school facilities expenditures in subsequent fiscal years. The maintenance reserve is maintained in the General Fund and its activity is included in the General Fund annual budget.
Funds placed in the maintenance reserve are restricted to required maintenance activities for a school facility as reported in the comprehensive maintenance plan. A District may appropriate funds into the maintenance reserve in the annual General Fund budget certified for taxes or by transfer by board resolution at year end of any unanticipated revenue or unexpended line item appropriation amounts or both. Pursuant to N.J.A.C. 6A:23A-14.2(g), the balance in the reserve cannot at any time exceed four percent of the replacement cost of the school district's school facilities for the current year.
The activity of the maintenance reserve for the fiscal year ended June 30, 2017 is as follows:
Balance, July I, 2016 $
Increased by Approved by State Monitor 193,656
Balance, June 30, 2017 $ 193,656
The June 30, 2017 comprehensive maintenance plan indicated a maximum maintenance reserve amount of$2,823,220.
38

BELLEVILLE TOWNSHIP SCHOOL DISTRICT NOTES TO THE FINANCIAL STATEMENTS FOR THE FISCAL YEAR ENDED JUNE 30, 2017
NOTE 3 DETAILED NOTES ON ALL FUNDS
A. Cash Deposits and Investments
Cash Deposits
The Board's deposits are insured through either the Federal Deposit Insurance Corporation (FDIC), National Credit Union Share Insurance Fund (NCUSIF), Securities Investor Protection Corporation (SIPC) or New Jersey's Goverurnental Unit Deposit Protection Act (GUDPA). The Board is required to deposit their funds in a depository which is protecting such funds pursuant to GUDPA. The New Jersey Goverrunental Unit Deposit Protection Act requires all banks doing business in the State of New Jersey to pledge collateral equal to at least 5% of the average amount of its public deposits and 100% of the average amount of its public funds in excess of the lesser of 75% of its capital funds or $200 million for all deposits not covered by the FDIC.
Bank balances are insured up to $250,000 in the aggregate by the FDIC for each bank. NCUSIF insures credit union accounts up to $250,000 in the aggregate for each financial institution. SIPC replaces cash claims up to a maximum of $250,000 for each failed brokerage firm. At June 30, 2017, the book value of the Board's deposits were $3,311,200 and bank and brokerage firm balances of the Board's deposits amounted to $4,029,256. The Board's deposits which are displayed on the various fund balance sheets as "cash and cash equivalents" or "cash and cash equivalent with Fiscal Agent" are categorized as:
Depository Account
Insured $ 4,029,256
Custodial Credit Risk- Deposits- Custodial credit risk is the risk that in the event of a bank failure, the government's deposits may not be returned to it. The Board does not have a policy for custodial credit risk. As of June 30, 2017 none of the Board's bank balance was exposed to custodial credit risk.
Investments
The Board is permitted to invest public funds in accordance with the types of securities authorized by N.J.S.A. 18A:20-37. Examples of the allowable investments are bonds or other obligations of the United States or obligations guaranteed by the United States of America, Goverurnent Money Market Mutual Funds, bonds or other obligations of the school district or bonds or other obligations of the local unit or units within which the school district is located, Local Government investment pools, and agreements or the repurchase of fully collateralized securities, if transacted in accordance with the above statute.
As of June 30, 2017, the Board had no outstanding investments.
Interest Rate Risk - The Board does not have a formal investment policy that limits investment maturities as a means of managing its exposure to fair value losses arising from increasing interest rates.
Credit Risk - State law limits investments as noted above (N.J.S.A. 18A:20-37). The District does not have an investment policy that would further limit its investment choices.
Concentration of Credit Risk - The Board places no limit in the amount the District may invest in any one issuer.
39

BELLEVILLE TOWNSHIP SCHOOL DISTRICT NOTES TO THE FINANCIAL STATEMENTS FOR THE FISCAL YEAR ENDED JUNE 30,2017
NOTE 3 DETAILED NOTES ON ALL FUNDS (Continued)
B. Receivables
Receivables as of June 30, 2017 for the district's individual major funds including the applicable allowances for uncollectible accounts, are as follows:
Special Food General Revenue Service Total
Receivables: Intergovernmental Local $ 5,719 $ 5,719 State $ 178,006 1,008 $ 1,904 180,918 Federal 347,286 I 03,351 450,637
Accounts 15,632 15,632
Gross Receivables 178,006 354,013 120,887 652,906 Less: Allowance for Uncollectibles
Net Total Receivables $ 178,006 $ 354,013 $ 120,887 $ 652,906
C. Unearned Revenue
Governmental funds report unearned revenue in connection with resources that have been received, but not yet earned. At the end of the current fiscal year, the various components of unearned revenue reported in the governmental funds were as follows:
General Fund Prepaid Tuition Charges
Special Revenue Fund Unencumbered Grant Draw Downs Grant Draw Down Reserve for Encumbrances
Total Unearned Revenue for Governmental Funds
$
$
40
9,824
33,336 22,084
65,244

BELLEVILLE TOWNSHIP SCHOOL DISTRICT NOTES TO THE FINANCIAL STATEMENTS FOR THE FISCAL YEAR ENDED JUNE 30, 2017
NOTE 3 DETAILED NOTES ON ALL FUNDS (Continued)
D. Capital Assets
Capital asset activity for the fiscal year ended June 30, 2017 was as follows:
Balance, Balance,
July I, 2016 Increases Decreases June 30, 2017
Governmental Activities:
Capital Assets, Not Being Depreciated:
Land $ 225,057 $ 225,057 Construction in Progress 769,836 $ 866,781 $ (I ,590,406) 46,211
Total Capital Assets, Not Being Depreciated 994,893 866,781 (1,590,406) 271,268
Capital Assets, Being Depreciated:
Land Improvements 13,670 13,670
Building and Building Improvements 19,651,307 1,590,406 21,241,713 Machinery and Equipment 3,543,786 384,347 (154,613) 3,773,520
Total Capital Assets Being Depreciated 23,208,763 1,974,753 (154,613) 25,028,903
Less Accumulated Depreciation for:
Land Improvements (2,049) (683) (2,732)
Buildings and Improvements (II ,235,937) (739,350) (11,975,287)
Machinery and Equipment (2,539,794) (359,596) 128,278 (2,771,112)
Total Accumulated Depreciation (13,777,780) (1,099,629) 128,278 (14,749,131)
Total Capital Assets, Being Depreciated, Net 9,430,983 875,124 (26,335) 10,279,772
Governmental Activities Capital Assets, Net $ 10,425,876 $ 1,741,905 $ (1,616,741) $ 10,551,040
Balance, Balance, July I, 2016 Increases Decreases June 30, 2017
Business-Type Activities: Capital Assets, Being Depreciated:
Equipment $ 733,513 $ 34,238 $ 767,751
Total Capital Assets Being Depreciated 733,513 34,238 767,751
Less Accumulated Depreciation for: Equipment (589,269) (76,590) (665,859)
Total Accumulated Depreciation (589,269) (76,590) (665,859)
Total Capital Assets, Being Depreciated, Net 144,244 (42,352) 101,892
Business-Type Activities Capital Assets, Net $ 144,244 $ (42,352) $ $ 101,892
41

BELLEVILLE TOWNSHIP SCHOOL DISTRICT NOTES TO THE FINANCIAL STATEMENTS FOR THE FISCAL YEAR ENDED JUNE 30, 2017
NOTE 3 DETAILED NOTES ON ALL FUNDS (Continued)
D. Capital Assets (Continued)
Depreciation expense was charged to functions/programs of the District as follows:
Governmental Activities: Instruction
Regular Special Education
Total Instruction
Support Services Student and Instruction Related Services General Administrative Services School Administrative Services Plant Operations and Maintenance Pupil Transportation
Total Support Services
Total Depreciation Expense- Governmental Activities
Business-Type Activities: Food Service Fund
Total Depreciation Expense- Business-Type Activities
Construction and Other Significant Commitments
The District has the following active construction projects as of June 30, 2017:
Project
Entry Portico Restoration at School No.7
Roof Replacement Project at School No.4
42
$ 377,386 7,359
384,745
9,456 6,274
79,195 557,721
62,238 714,884
$ 1,099,629
$ 76,590
$ 76,590
Remaining Commitment
$ I 07,750
$ 183,800

BELLEVILLE TOWNSIITP SCHOOL DISTRICT NOTES TO THE FINANCIAL STATEMENTS FOR THE FISCAL YEAR ENDED JUNE 30, 2017
NOTE 3 DETAILED NOTES ON ALL FUNDS (Continued)
E. Interfund Receivables, Payables, and Transfers
The composition ofinterfund balances as ofJune 30,2017, is as follows:
Due To/From Otber Fnnds
Receivable Fund
General Fund General Fund General Fund Unemployment Compensation Trust Fund
Total
Payable Fund
Capital Projects Fund Food Service Fund Payroll Agency Fund Payroll Agency Fund
$
Amount
29,232 15,958 52,484 19,024
116,698
The above balances are the result of revenues or receipts deposited in one fund which are due to another fund or expenditures paid by one fund on behalf of another fund.
The District expects all interfund balances to be liquidated within one year.
F. Leases
Operating Leases
The District leases copiers under noncancelable operating leases. Lease payments for the fiscal year ended June 30, 2017 were $55,936. The future minimum lease payments for these operating leases are as follows:
Fiscal Year Ending
June 30, Amount
2018 $ 67,124 2019 67,124 2020 67,124 2021 67,124 2022 II, 187
Total $ 279,683
43

BELLEVILLE TOWNSillP SCHOOL DISTRICT NOTES TO THE FINANCIAL STATEMENTS FOR THE FISCAL YEAR ENDED JUNE 30, 2017
NOTE 3 DETAILED NOTES ON ALL FUNDS (Continued)
F. Leases (Continued)
Capital Leases
The District is leasing school buses, a roof renovation project, trucks, mower, teclmology and network upgrades and boiler replacements totaling $7,920,214 under capital leases. The leases are for terms of 5 years.
The capital assets acquired through capital leases are as follows:
Construction in Progress Building hnprovements Machinery and Equipment
Governmental Activities
$ 46,211 6,780,360
452,873
$ 7,279,444
The unexpended proceeds from capital leases in the amount of $640,770 at June 30, 2017 are held with the Fiscal Agent.
The future minimum lease obligations and the net present value of these minimum lease payments as of June 30, 2017 were as follows:
Fiscal Year Ending June 30,
2018 2019 2020 2021 2022
2013
Total minimum lease payments Less: amount representing interest
Present value of minimum lease payments
44
Governmental Activities
$ 1,809,015 1,220,797
522,529 522,529 261,265
4,336,135 (210,876)
$ 4,125,259

BELLEVILLE TOWNSIITP SCHOOL DISTRICT NOTES TO THE FINANCIAL STATEMENTS FOR THE FISCAL YEAR ENDED JUNE 30, 2017
NOTE 3 DETAILED NOTES ON ALL FUNDS (Continued)
G. Long-Term Debt
State Aid Advance Loan Payable
In March 2015, the Board entered into a loan agreement with the State of New Jersey in the amount of$4,162,426 pursuant to N.J.S.A. 18A:7A-56 in the form of an advancement of state aid to provide funds to eliminate the unassigned budgetary fund deficit in the General Fund. The State aid advance loan is being repaid by the school district through automatic reductions in the State aid provided to the school district in each year. The term of the loan repayment is ten (10) years which began in the 2015/2016 school year at a minimum amount of $416,243 per year, but may be for a shorter term as determined by the State Treasurer. At any time during the term of the repayment the State Treasurer, in consultation with the Commissioner of Education, may determine to impose interest on the unpaid balance. The State Treasurer has not imposed interest during the 2016/2017 school year.
The Board's schedule of principal and interest for long-term debt issued and outstanding is as follows:
Governmental Activities: Year Ended
June 30,
2018 $ 2019 2020 2021 2022
2023-2025
Totals $
Statutorv Borrowing Power
State Aid Advance Loan Principal Interest
416,243 416,243 416,243 416,243 416,243
1,248,725
3,329,940 $
$ 416,243 416,243 416,243 416,243 416,243
1,248,725
$ 3,329,940
The Board's remaining borrowing power under N.J.S. 18A:24-19, as amended, at June 30, 2017 was as follows:
4% of Equalized Valuation Basis (Municipal) Less: Net Debt
Remaining Borrowing Power
45
$ 109,971,672
$ 109,971,672

BELLEVILLE TOWNSHIP SCHOOL DISTRICT NOTES TO THE FINANCIAL STATEMENTS FOR THE FISCAL YEAR ENDED JUNE 30,2017
NOTE 3 DETAILED NOTES ON ALL FUNDS (Continued)
H. Other Long-Term Liabilities
Changes in Long-Term Liabilities
Long-term liability activity for the fiscal year ended June 30, 2017, was as follows: Due
Balance, Balance, Within July 1, 2016 Additions Reductions June 30,2017 One Year
Governmental Activities:
Capital Leases $ 5,540,000 $ 1,414,741 $ 4,125,259 $ 1,712,030 Compensated Absences 1,824,366 $ 64,033 339,383 1,549,016 154,900 State Aid Advance Loan Payable 3,746,183 416,243 3,329,940 416,243 Net Pension Liability 18,772,248 3,051,772 635,562 21,188,458
Governmental Activity Long-term Liabilities $ 29,882,797 $ 3,115,805 $ 2,805,929 $ 30,192,673 $ 2,283,173
Internal service funds predominantly serve the governmental funds. Accordingly, long-term liabilities for them are included as part of the above totals for governmental activities. Also, for the governmental activities, the liabilities for capital leases, compensated absences, state aid advance loan and net pension liability are generally liquidated by the general fund .
• J. Short-Term Debt
The Board's short-term activity for the fiscal year ended June 30, 2017 was as follows:
Loans Payable
The Board issues loans to temporarily finance the delayed state aid payment received subsequent to the fiscal year end. The Board's short-term debt activity for the fiscal year ended June 30, 2017 was as follows:
General Fund
Delayed State Aid
Rate %
3.25%
Maturity Date
Balance, July I. 2016
7/8/2016 $ 2,449,473
$ 2,449,473 ;:;.$~~~~
NOTE 4 OTHER INFORMATION
A. Risk Management
Redeemed
$ 2,449,473
Balance, June 30, 2017
$ 2,449,473 ;:;_$~~~~
The District is exposed to various risks of loss related to property, general liability, automobile coverage, theft of, damage to and destruction of assets; errors and omissions; injuries to employees; student accident; termination of employees and natural disasters. The Board has obtained commercial insurance coverage to guard against these events to minimize the exposure to the District should they occur. A complete schedule of insurance coverage can be found in the statistical section of this Comprehensive Annual Financial Report.
Prior to July I, 2014, the District established a worker's compensation plan for its employees. Transactions related to the plan are accounted for in the Internal Services Fund. The District funds the entire cost of the plan. Claims are paid directly by the plan up to a maximum of $450,000 for any one accident or occurrence. Any claims in excess of this amount are covered by insurance policies to the statutory limit.
46

BELLEVILLE TOWNSHIP SCHOOL DISTRICT NOTES TO THE FINANCIAL STATEMENTS FOR THE FISCAL YEAR ENDED JUNE 30, 2017
NOTE 4 OTHER INFORMATION (Continued)
A. Risk Management (Continued)
Estimates of claims payable and of claims incurred, but not reported (IBNR) at June 30,2017, are reported as claims and judgments payable and accrued liability for insurance claims, respectively. These estimates were determined based on claim information supplied by the claims administrator and actuary. The unpaid claims liability of $243,410 reported at Juue 30, 2017 is based on the requirements of the Governmental Accounting Standards Board Statement No. I 0, which requires that a liability for claims be reported if information prior to the issuance of the financial statements indicates that it is probable that a liability has been incurred at the date of the financial statements and the amount of the Joss can be reasonably estimated.
Changes in the balances of claims liabilities for the worlanen's compensation plan for the fiscal years ended June 30, 2017 and 2018 are as follows:
Governmental Activities:
Unpaid Claims, Begim1ing of Year
Incurred Claims (Including IBNR)
Claim Payments
Unpaid Claims, End of Year
Fiscal Year Ended
June 30,2017 June 30,2016
$
$
357,925
1,046 (115,561)
243,410
$
$
416,893
58,995 (117,963)
357,925
The District is a member of the New Jersey School Insurance Group (NJSIG or Group). The Group is a risk sharing public entity pool, established for the purpose of insuring against worker's compensation claims.
The relationship between the Board and the Group is governed by a contract and by-laws that have been adopted by resolution of each unit's governing body. The Board is contractually obligated to make all allilual and supplementary contributions to the Group, to report claims on a timely basis, cooperate with the management of the Group, its claims administrator and attorneys in claims investigation and settlement, and to follow risk management procedures as outlined by the Group. Members have a contractual obligation to fund any deficit of the Group attributable to a membership year during which they were a member.
NJSIG provides its members with risk management services, including the defense of and settlement of claims and to establish reasonable and necessary loss reduction and prevention procedures to be followed by the members. Complete financial statements of the respective insurance funds are on file with the School's Business Administrator.
There has been no significant reduction in insurance coverage from the previous year nor have there been any settlements in excess of insurance coverage's in any of the prior three years.
The District has elected to fund its New Jersev Unemolovment Compensation Insurance under the "Benefit Reimbursement Meiliod". Under this ulan the District is required to reimburse the New Jersev Unemolovment Trust Fund for benefits oaid to its former emolovees and charged to its account wiili the State. The District is billed quarterlv for amounts due to the State. The following is a summarv of District contributions. emolovee contributions, reimbursements to the State for benefits paid and the ending balance of the District's fiduciary trust fund for the cmTent and previous two years:
Fiscal Year Ended District Employee Amount Ending
June 30, Contributions Contributions Reimbursed Balance
2017 $ 15,000 $ 62,256 $ 130,239 $ 21,098 2016 105,000 60,133 175,631 74,016 2015 422,729 55,956 480,001 84,405
47

BELLEVILLE TOWNSHIP SCHOOL DISTRICT NOTES TO THE FINANCIAL STATEMENTS FOR THE FISCAL YEAR ENDED JUNE 30, 2017
NOTE 4 OTHER INFORMATION (Continued)
B. Contingent Liabilities
The District is a party defendant in some lawsuits, none of a kind unusual for a school district of its size and scope of operation. In the opinion of the Board's Attorney the potential claims against the District not covered by insurance policies would not materially affect the financial condition of the District, except for the following pending litigation.
Pending Litigation - Former Employee vs. Belleville Board of Education: This is an employment litigation in the United States District Court for the District of New Jersey that, although partly covered by insurance, contains significant uncovered claims. The former employee's complaint alleges, among other things, age and gender discrimination, political retaliation and an improper transfer. According to the expert report served by the plaintiff's attorneys, claim damages of $1.7 million much of which would be uninsured. Discovery is nearing an end at the date of audit but no trial date has yet been set. In the opinion of the Board Attorney it is estimated the potential liability to the District in this case could exceed $500,000. The District has encumbered $475,000 in the general fund at June 30, 2017 for any potential liability that may arise from an unfavorable outcome to the District.
Federal and State Awards - The Board participates in a number of federal and state programs that are fully or partially funded by grants received from other governmental units. Expenditures financed by grants are subject to audit by the appropriate grantor government. If expenditures are disallowed due to noncompliance with grant program regulations, the Board may be required to reimburse the grantor government. As of June 30, 2017, significant amounts of grant expenditures have not been audited by the various grantor agencies but the Board believes that disallowed expenditures, if any, based on subsequent audits will not have a material effect on any of the individual governmental funds or the overall financial position of the District.
C. Federal Arbitrage Regulations
The District is subject to Section 148 of the Internal Revenue Code as it pertains to the arbitrage rebate on all tax-exempt obligations, both long and short-term debt. Under the 1986 Tax Reform Act, the Internal Revenue Service (IRS) required that all excess earnings from investment proceeds be rebated to the IRS. Arbitrage, for purposes of these regulations, is defined as the difference between the yield on the investment and the yield on the obligations issued. If there are excess earnings, this amount may be required to be rebated to the IRS. At June 30, 2017, the District has not estimated its arbitrage earnings due to the IRS, if any.
D. Employee Retirement Systems and Pension Plans
The State of New Jersey sponsors and administers the following contributory defined benefit public employee retirement systems (retirement systems) covering substantially all eligible Board employees:
Public Employees' Retirement System (PERS)- Established in January 1955, under the provisions ofN.J.S.A. 43: 15A to provide coverage, including post-retirement health care, to substantially all full time employees of the State or any county, municipality, school district, or public agency provided the employee is not a member of another State-administered retirement system. Membership is mandatory for such employees and vesting occurs after I 0 years of service for pension benefits and 25 years for post-retirement health care coverage. PERS is a cost sharing multi-employer defined benefit pension plan.
Teachers' Pension and Annuity Fund (TPAF)- Established in January 1955, under the provisions ofN.J.S.A. 18A:66 to provide coverage including post-retirement health care to substantially all full time certified teachers or professional staff of the public school systems in the State. Membership is mandatory for such employees and vesting occurs after 10 years of service for pension benefits and 25 years for post-retirement health care coverage. TPAF is a cost sharing plan with special funding situations.
The State of New Jersey sponsors and administers the following defined contribution public employee retirement program covering certain state and local government employees which include those Board employees who are eligible for pension coverage.
48

BELLEVILLE TOWNSIITP SCHOOL DISTRICT NOTES TO THE FINANCIAL STATEMENTS FOR THE FISCAL YEAR ENDED JUNE 30, 2017
NOTE 4 OTHER INFORMATION (Continued)
Defined Contribution Retirement Program (DCRP) - established under the provisions of Chapter 92, P .L. 2007 and Chapter 103, P.L. 2008 to provide coverage to elected, certain appointed officials, and certain Board employees not eligible for enrollment in PERS or TPAF. Effective July I, 2007 membership is mandatory for such individuals with vesting occurring after one (I) year of membership. DCRP is a defined contribution pension plan.
Other Pension Funds
The State established and administers a Supplemental Annuity Collective Trust Fund (SACT) which is available to active members of the State-administered retirement systems to purchase armuities to supplement the guaranteed benefits provided by their retirement system. The state or local government employers do not appropriate funds to SACT.
The cost of living increase for PERS and TPAF, are funded directly by each of the respective systems but are currently suspended as a result of reform legislation.
According to state law, all obligations of each retirement system will be assumed by the State of New Jersey should any retirement system be terminated.
The State of New Jersey, Department of the Treasury, Division of Pensions and Benefits, issues publicly available financial reports that include the financial statements and required supplementary information of each of the above systems. The financial reports may be accessed via the New Jersey, Division of Pensions and Benefits, website at www.state.nj.us/treaswy/pensions.
Basis of Accounting
The financial statements of the retirement systems are prepared on the accrual basis of accounting. Employer contributions are recognized when payable to the retirement systems. Benefits or refunds are recognized when due and payable in accordance with the terms of the retirement systems.
Investment Valuation
Investments are reported at fair value. Securities traded on a national or international exchange are valued at the last reported sales price at current exchange rates. Mortgages are valued on the basis of future principal and interest payments, and are discounted at prevailing interest rates for similar instruments. The fair value of real estate investments is based on independent appraisals. Investments that do not have an established market are reported at estimated fair values.
The State of New Jersey, Department of the Treasury, Division of Investment, issues publicly available financial reports that include the fmancial statements of the State of New Jersey Cash Management Fund. The financial reports may be obtained in writing to the State of New Jersey, Department of the Treasury, Division of Investment, P.O. Box 290, Trenton, New Jersey 08625-0290 or at www.state.nj/treasmy/doinvest.
Funding Status and Funding Progress
As of July I, 2015, the most recent actuarial valuation date, the aggregate funded ratio for the State administered TPAF and local PERS retirement systems, is 28 percent with an unfunded actuarial accrued liability of$108.6 billion. The aggregate funded ratio and unfunded accrued liability for the State-funded TPAF system is 22.33 percent and $79.0 billion, and the aggregate funded ratio and unfunded accrued liability for local PERSis 40.14 percent and $29.6 billion, respectively.
The funded status and funding progress of the retirement systems is based on actuarial valuations which involve estimates of the value of reported amounts and assmnptions about the probability of events far into the future. These amounts are subject to continual revision as actual results are compared to past expectations and new estimates are made about the probability of future events.
49

BELLEVILLE TOWNSHIP SCHOOL DISTRICT NOTES TO THE FINANCIAL STATEMENTS FOR THE FISCAL YEAR ENDED JUNE 30, 2017
NOTE 4 OTHER INFORMATION (Continued)
D. Employee Retirement Systems and Pension Plans (Continued)
Actuarial calculations reflect a long-term perspective and are based on the benefits provided under the terms of the retirement systems in effect at the time of each valuation and also consider the pattern of the sharing of costs between the employer and members at that point in time. The projection of benefits for financing reporting purposes does not explicitly incorporate the potential effects of legal or contractual funding limitations on the pattern of cost sharing between the employer and members in the future.
Actuarial Methods and Assumptions
In the July I, 2015 actuarial valuation, the projected unit credit was used as the actuarial cost method, and the five year average of market value was used as the asset valuation method for the retirement systems. The actuarial assumptions included (a) an investment rate of return for the retirement systems of 7.65 percent and (b) projected salary increases applied through the year 2026 of 1.65-5.15 percent based on age for the PERS and varying percentages based on experience for TPAF.
Employer and Employee Pension Contributions
The contribution policy is set by laws of the State of New Jersey and contributions are required by active members and participating employers. Plan member and employer contributions may be amended by State of New Jersey legislation with the amount of contributions by the State of New Jersey contingent upon the Annual Appropriations Act. As defined, the retirement systems require employee contributions based on 7.06% for PERS, 7.06% for TPAF and 5.50% for DCRP of the employee's annual compensation.
Annual Pension Costs (APC)
Per the requirements of GASB Statement No. 27 Accounting for Pensions by State and Local Government Employees, for the fiscal year ended June 30, 2017 for TPAF, which is a cost sharing plan with special funding situations, the annual pension cost differs from the annual required contribution. For PERS, which is a cost sharing multi-employer defined benefit pension plan, the annual pension cost equals contributions made. TPAF employer contributions are made annually by the State of New Jersey to the pension system on behalf of the Board. PERS employer contributions are made annually by the Board to the pension system in accordance with Chapter 114, P.L. 1997. In the DCRP, which is a defined contribution plan, member contributions are matched by a 3% employer contribution.
During the fiscal years ended June 30, 2017, 2016 and 2015 the Board was required to contribute for PERS and DCRP and the State of New Jersey was required to contribute for TP AF, respectively for normal cost pension and accrued liability contributions (including non-contributory group life insurance (NCGI)) the following amounts:
Fiscal Year Ended On-behalf
June 30, PERS TPAF DCRP
2017 $ 635,562 $ 3,212,266 $ 23,655 2016 718,955 2,388,926 27,407 2015 661,443 1,598,937 19,793
50

BELLEVILLE TOWNSHIP SCHOOL DISTRICT NOTES TO THE FINANCIAL STATEMENTS FOR THE FISCAL YEAR ENDED JUNE 30, 2017
NOTE 4 OTHER INFORMATION (Continued)
D. Employee Retirement Systems and Pension Plans (Continued)
Annual Pension Costs (APC) (Continued)
In addition for fiscal year 2016/2017 the District contributed $1,648 for PERS and the State contributed $5,962 for TPAF for Long Term Disability Insurance Premium (LTD!).
The PERS contributions are recognized in the governmental fund financial statements (modified accrual basis) as an expenditure. The on-behalf TPAF contributions are recognized in the governmental fund financial statements (modified accrual basis) as both a revenue and expenditure in accordance with GASB No. 24. The DCRP contributions are recognized in the governmental fund financial statements (modified accrual basis) as an expenditure, as well as, the district-wide financial statements (accrual basis) as an expense.
Also, in accordance with N.J.S.A. 18A:66-66 the State of New Jersey reimbursed the Board $2,208,564 during the fiscal year ended June 30, 2017 for the employer's share of social security contributions for TPAF members as calculated on their base salaries. This amount has been recognized in the district-wide financial statements (accrual basis) and the governmental fund fmancial statements (modified accrual basis) as a revenue and expense/expenditure in accordance with GASB No. 24.
Pension Liabilities, Pension Expense, and Deferred Outflows of Resources and Deferred Inflows of Resources Related to Pensions
Public Employees Retirement System (PERS)
At June 30, 2017, the District reported in the statement of net position (accrual basis) a liability of $21,188,458 for its proportionate share of the PERS net pension liability. The net pension liability was measured as of June 30,2016 and the total pension liability used to calculate the net pension liability was determined by an actuarial valuation as of that date. The District's proportionate share of the net pension liability was based on a projection of the District's long-term share of contributions to the pension plan relative to the projected contributions of all participating governmental entities, actuarially determined. At June 30, 2016, the District's proportionate share was 0.07154 percent, which was a decrease of 0.01209 percent from its proportionate share measured as of June 30, 2015 of0.08363 percent.
For the fiscal year ended June 30, 2017, the District recognized in the district-wide statement of activities (accrual basis) pension expense of $1,819,197 for PERS. At June 30, 2017, the District reported deferred outflows of resources and deferred inflows of resources related to PERS pension from the following sources:
Difference Between Expected and Actual Experience
Changes of Assumptions Net Difference Between Projected and Actual
Earnings on Pension Plan Investments Changes in Proportion and Differences Between
District Contributions and Proportionate Share of Contributions
Total
$
$
Deferred Outflows
of Resources
394,041 4,389,117
807,935
813,447
6,404,540
51
2016
Deferred Inflows
of Resources
$ 1,969,331
$ 1,969,331

BELLEVILLE TOWNSillP SCHOOL DISTRICT NOTES TO THE FINANCIAL STATEMENTS FOR THE FISCAL YEAR ENDED JUNE 30, 2017
NOTE 4 OTHER INFORMATION (Continued)
D. Employee Retirement Systems and Pension Plans (Continued)
Pension Liabilities, Pension Expense, and Deferred Outflows of Resources and Deferred Inflows of Resources Related to Pensions (Continued)
Public Employees Retirement System (PERS) (Continued)
At June 30, 2017, the amounts reported as deferred outflows of resources and deferred inflows of resources related to PERS pension will be recognized in pension expense as follows:
Fiscal Year
Ending June 30, Total
2018 $ 1,059,443
2019 1,059,443
2020 1,283,252
2021 923,668 2022 109,403
$ 4,435,209
Actuarial Assumptions
The District's total pension liability for the June 30,2016 measurement date was determined by an actuarial valuation as of July 1, 2015, which was rolled forward to June 30,2016. This actuarial valuation used the following actuarial assumptions, applied to all periods in the measurement:
Inflation Rate
Salary Increases:
Through 2026
Thereafter
Investment Rate of Return
Mortality Rate Table
3.08%
1.65-4.15% Based on Age
2.65-5.15% Based on Age
7.65%
RP-2000
Assumptions for mortality improvements are based on Society of Actuaries Scale AA.
The actuarial assumptions used in the July I, 2015 valuation were based on the results of an actuarial experience study for the period July 1, 2011 to June 30, 2014.
52

BELLEVILLE TOWNSHIP SCHOOL DISTRICT NOTES TO THE FINANCIAL STATEMENTS FOR THE FISCAL YEAR ENDED JUNE 30, 2017
NOTE 4 OTHER INFORMATION (Continued)
D. Employee Retirement Systems and Pension Plans (Continued)
Pension Liabilities, Pension Expense, and Deferred Outflows of Resources and Deferred Inflows of Resources Related to Pensions (Continued)
Public Employees Retirement System (PERS) (Continued)
Long-Term Expected Rate of Return
The long-term expected rate of return on pension plan investments was determined using a building-block method in which best-estimate ranges of expected future real rate of return (expected returns, net of pension plans investment expense and inflation) are developed for each major asset class. These ranges are combined to produce the long-term expected rate of return by weighting the expected future real rates of return by the target asset allocation percentage and by adding expected inflation. Best estimates of aritbrnetic real rates of return for each major asset class included in the pension plans' target asset allocation as of June 30, 2016 are summarized in the following table:
Asset Class
Cash U.S. Treasuries
Investment Grade Credit Mortgages
High Yield Bonds Inflation-Indexed Bonds
Broad US Equities Developed Foreign Equities
Emerging Market Equities Private Equity
Hedge Funds/ Absolute Return
Real Estate (Property) Commodities Global Debt ex US
REIT
Discount Rate
Target Allocation
5.00%
!.50% 8.00%
2.00% 2.00% !.50%
26.00% 13.25%
6.50% 9.00%
12.50% 2.00%
0.50% 5.00% 5.25%
Long-Term
Expected Real Rate of Return
0.87%
!.74% !.79%
!.67% 4.56% 3.44%
8.53% 6.83%
9.95% 12.40%
4.68% 6.91%
5.45% -0.25%
5.63%
The discount rate used to measure the total pension liabilities of the PERS plan was as follows:
Year Measurement Date Discount Rate
2017 June 30,2016 3.98%
53

BELLEVILLE TOWNSillP SCHOOL DISTRICT NOTES TO THE FINANCIAL STATEMENTS FOR THE FISCAL YEAR ENDED JUNE 30,2017
NOTE 4 OTHER INFORMATION (Continued)
D. Employee Retirement Systems and Pension Plans (Continued)
Pension Liabilities, Pension Expense, and Deferred Outflows of Resources and Deferred Inflows of Resources Related to Pensions (Continued)
Public Employees Retirement System (PERS) (Continued)
Discount Rate (Continued)
The following table represents the crossover period, if applicable, for the PERS defined benefit plan:
Period of Projected Benefit Payments for which the Following Rates were Applied:
Long-Term Expected Rate of Return
Municipal Bond Rate *
Through June 30, 2034
From July I, 2034 and Thereafter
*The municipal bond return rate used is 2.85% as of the measurement date of June 30, 2016. The source is the Bond Buyer Go 20-Bond Municipal Bond Index, which includes tax-exempt general obligation municipal bonds with an average rating of ANAa or higher.
Sensitivity of Net Pension Liability
The following presents the District's proportionate share of the PERS net pension liability calculated using the discount rate of 3 .98%, as well as what the District's proportionate share of the PERS net pension liability would be if it were calculated using a discount rate that is ]-percentage-point lower (2.98 percent) or ]-percentage-point higher (4.98 percent) than the current rate:
1% Current 1% Decrease Discount Rate Increase (2.98%) (3.98%) (4.98%)
District's Proportionate Share of the PERS Net Pension Liability $ 25,963,982 $ 21,188,458 $ 17,245,849
The sensitivity analysis was based on the proportionate share of the District's net pension liability at June 30, 2016. A sensitivity analysis specific to the District's net pension liability was not provided by the pension system.
Pension Plan Fiduciary Net Position
Detailed information about the PERS pension plan's fiduciary net position is available in the separately issued financial report from the State of New Jersey, Department of the Treasury, Division of Pension and Benefits. The financial report may be accessed via the New Jersey, Division of Pensions and Benefits, website at www.state.nj.us/treasury/pensions.
54

BELLEVILLE TOWNSHIP SCHOOL DISTRICT NOTES TO THE FINANCIAL STATEMENTS FOR THE FISCAL YEAR ENDED JUNE 30, 2017
NOTE 4 OTHER INFORMATION (Continued)
D. Employee Retirement Systems and Pension Plans (Continued)
Pension Liabilities, Pension Expense, and Deferred Outflows of Resources and Deferred Inflows of Resources Related to Pensions (Continued)
Teachers Pension and Annuity Fund (TP AF)
In accordance with GASB Statement No. 68, Accounting and Financial Reporting for Pensions, the District is not required to recognize a net pension liability for TPAF. The State of New Jersey is the only entity that has a legal obligation to make employer contributions to TPAF on behalf' of the District .. Accordingly, the District's proportionate share percentage determined under Statement No. 68 is zero percent and the State's proportionate share is 100% of the net pension liability attributable to the District for TPAF. Therefore, in addition, the District does not recognize any portion of the TPAF collective deferred outflows of resources and deferred inflows of resources.
For the fiscal year ended June 30, 2017, the District recognized in the district-wide statement of activities (accrual basis) pension expense of $17,636,150 for TPAF. This amount has been included in the district-wide statement of activities (accrual basis) as a revenue and expense in accordance with GASB No. 24.
At June 30,2017 the State's proportionate share of the net pension liability attributable to the District is $234,722,770. The nonemployer allocation percentages are based on the ratio of the State's contributions made as an employer and nonemployer towards the actuarially determined contribution amount adjusted by locations who participated in the State early retirement incentives to total contributions to TPAF during the year ended June 30,2016. At June 30,2016, the state's share of the net pension liability attributable to the District was 0.29838 percent, which was an increase of 0.00263 percent from its proportionate share measured as of June 30, 2015 of0.29575 percent.
Actuarial Assumptions
The total pension liability for the June 30, 2016 measurement date was determined by an actuarial valuation as of July 1, 2015, which was rolled forward to June 30,2016. This actuarial valuation used the following actuarial assumptions, applied to all periods in the measurement.
Inflation Rate
Salary Increases: 2012-2021
Thereafter
Investment Rate of Return
2.50%
Varies based on experience
Varies based on experience
7.65%
Assumptions for mortality rates were based on the experience of TP AF members reflecting mortality improvement on a generational bases based on a 60-year average of Social Security data from 1953 to 2013.
The actuarial assumptions used in the July 1, 2015 valuation were based on the results of an actuarial experience study for the period July l, 2012 to June 30, 2015.
55

BELLEVILLE TOWNSIDP SCHOOL DISTRICT NOTES TO THE FINANCIAL STATEMENTS FOR THE FISCAL YEAR ENDED JUNE 30, 2017
NOTE 4 OTHER INFORMATION (Continued)
D. Employee Retirement Systems and Pension Plans (Continued)
Pension Liabilities, Pension Expense, and Deferred Outflows of Resources and Deferred Inflows of Resources Related to Pensions (Continued)
Teachers Pension and Annuity Fund (TP AF) (Continued)
Long-Term Expected Rate of Return
The long-term expected rate of return on pension plan investments was determined using a building-block method in which best-estimate ranges of expected future real rate of return (expected returns, net of pension plans investment expense and inflation) are developed for each major asset class. These ranges are combined to produce the long-term expected rate of return by weighting the expected future real rates of return by the target asset allocation percentage and by adding expected inflation. Best estimates of arithmetic real rates of return for each major asset class included in the pension plans' target asset allocation as of June 30, 2016 are summarized in the following table:
Long-Term Target Expected Real
Asset Class Allocation Rate of Return
US Cash 5.00% 0.39% US Government Bonds 1.50% 1.28%
US Credit Bonds 13.00% 2.76% US Mortgages 2.00% 2.38% US Inflation-Indexed Bonds 1.50% 1.41% US High Yield Bonds 2.00% 4.70% US Equity Market 26.00% 5.14% Foreign-Developed Equity 13.25% 5.91% Emerging Markets Equity 6.50% 8.16%
Private Real Estate Property 5.25% 3.64% Timber 1.00% 3.86% Farmland 1.00% 4.39% Private Equity 9.00% 8.97% Commodities 0.50% 2.87% Hedge Funds - MultiStrategy 5.00% 3.70% Hedge Funds - Equity Hedge 3.75% 4.72% Hedge Funds - Distressed 3.75% 3.49%
56

BELLEVILLE TOWNSillP SCHOOL DISTRICT NOTES TO THE FINANCIAL STATEMENTS FOR THE FISCAL YEAR ENDED JUNE 30, 2017
NOTE 4 OTHER INFORMATION (Continued)
D. Employee Retirement Systems and Pension Plans (Continued)
Pension Liabilities, Pension Expense, and Deferred Outflows of Resources and Deferred Inflows of Resources Related to Pensions (Continued)
Teachers Pension and Annuity Fund (TPAF) (Continued)
Discount Rate
The discount rate used to measure the total pension liabilities of the TPAF plan was as follows:
Year Measurement Date Discount Rate
2017 June 30, 2016 3.22%
The following table represents the crossover period, if applicable, for the TP AF defined benefit plan:
Period of Projected Benefit Payments for which the Following Rates were Applied: Long-Term Expected Rate of Return
Municipal Bond Rate *
Through June 30, 2029
From July l, 2029 and Thereafter
* The municipal bond return rate used is 2.85% as of the measurement date of June 30, 2016. The source is the Bond Buyer Go 20-Bond Municipal Bond Index, which includes tax-exempt general obligation municipal bonds with an average rating of AA/Aa or higher.
Sensitivity of Net Pension Liability
The following presents the State's proportionate share of the TPAF net pension liability attributable to the District calculated using the discount rate of 3.22%, as well as what the State's proportionate share of the TPAF net pension liability attributable to the District that would be if it were calculated using a discount rate that is !-percentage-point lower (2.22 percent) or !-percentage-point higher ( 4.22 percent) than the current rate:
1% Current 1% Decrease Discount Rate Increase (2.22%) (3.22%) {4.22%}
State's Proportionate Share of the TP AF Net Pension Liability Attributable to the District $ 280,311,442 $ 234,722,770 $ 197,493,736
The sensitivity analysis was based on the State's proportionate share of the net pension liability attributable to the District at June 30,2016. A sensitivity analysis specific to the State's proportionate share of the net pension liability attributable to the District at June 30, 2016 was not provided by the pension system.
57

BELLEVILLE TOWNSHIP SCHOOL DISTRICT NOTES TO THE FINANCIAL STATEMENTS FOR THE FISCAL YEAR ENDED JUNE 30, 2017
NOTE 4 OTHER INFORMATION (Continued)
D. Employee Retirement Systems and Pension Plans (Continued)
Pension Liabilities, Pension Expense, and Deferred Outflows of Resources and Deferred Inflows of Resources Related to Pensions (Continued)
Teachers Pension and Annuity Fund (TP AF) (Continued)
Pension Plan Fiduciary Net Position
Detailed information about the TPAF pension plan's fiduciary net position is available in the separately issued financial report from the State of New Jersey, Department of the Treasury, Division of Pension and Benefits. The financial report may be accessed via the New Jersey, Division of Pensions and Benefits, website at www.state.nj.us/treasmy/pensions.
E. Post-Retirement Medical Benefits
The State of New Jersey sponsors and administers the post-retirement health benefit program plans for school districts. The Plans are classified as either single employer plans or cost sharing multiple employer defined benefit plans depending on the plan the eligible employee is covered under.
As a result of implementing Governmental Accounting Standards Board (GASB) Statement No. 43, Financial Reporting for Post-employment Benefit Plans Other than Pension Plans (OPEB), effective for Fiscal Year 2007, the State Health Benefits Program (SHBP), and the Prescription Drug Program (PDP), and Post-Retirement Medical (PRM) of the PERS and TP AF are combined and reported as Pension and Other employee Benefit Trust Funds in the State's Comprehensive Annual Financial Report (CAFR). Specifically, SHBP-State, and the PRM of the PERS are combined and reported as a Health Benefits Program Fund - State classified as a single employer plan. The SHBP-Local, PDP-Local, and the PRM of the TPAF-Local are combined and reported as Health Benefits Program Fund -Local Government classified as a cost-sharing multiple-employer plan in the State's CAFR. The post-retirement benefit programs had a total of 584 state and local participating employers and contributing entities for Fiscal Year 2016.
The State of New Jersey sponsors and administers the following health benefit programs covering certain state and local government employees, including those Board employees and retirees eligible for coverage.
Health Benefits Program Fund (HBPF) - Local Education (including Prescription Drug Program Fund) - The State of New Jersey provides paid coverage to members of the Teachers' Pension and Annuity Fund who retire from a board of education or county college with 25 years of service or on a disability retirement. Under the provisions ofP.L. 1992, c.l26, the State also provides paid coverage to members of the Public Employees' Retirement System and Alternate Benefits Program who retire from a board of education or county college with 25 years of service or on a disability retirement if the member's employer does not provide this coverage. Certain local participating employers also provide post-retirement medical coverage to their employees. Retirees who are not eligible for state paid health coverage at retirement can continue in the program if their employer participates in this program or if they are participating in the health benefits plan of their former employer and are enrolled in Medicare parts A and B by paying the cost of the insurance for themselves and their covered dependents. Also, education employees are eligible for the PDP coverage after 60 days of employment.
The State of New Jersey, Department of the Treasury, Division of Pensions and Benefits, issues publicly available financial reports that include the financial statements and required supplementary information of the above Fund. The financial reports may be accessed via the State of New Jersey, Department of the Treasury, Division of Pensions and Benefits, website at www.state.nj.us/treasury/pensions.
58

BELLEVILLE TOWNSHIP SCHOOL DISTRICT NOTES TO THE FINANCIAL STATEMENTS FOR THE FISCAL YEAR ENDED JUNE 30,2017
NOTE 4 OTHER INFORMATION (Continued)
E. Post-Retirement Medical Benefits (Continued)
Basis of Accounting
The financial statements of the health benefit programs are prepared on the accrual basis of accounting. Employer contributions are recognized when payable to the health benefit programs. Benefits or refunds are recognized when due and payable in accordance with the terms of the health benefit programs.
Significant Legislation
P.L. 2011, c.78, effective October 2011, sets new employee contribution requirements towards the cost of employerprovided health benefit coverage. Employees are required to contribute a certain percentage of the cost of coverage. The rate of contribution is determined based on the employee's annual salary and the selected level of coverage. The increased employee contributions will be phased in over a 4-year period for those employed prior to this new legislation's effective date with a minimum contribution required to be at least 1.5% of salary.
Investment Valuation
Investments are reported at fair value. Investments that do not have an established market are reported at estimated fair values.
Funded Status and Funding Progress
As of July 1, 2015, the most recent actuarial valuation date, the State had a $84.3 billion unfunded actuarial accrued liability for other post-employment benefits (OPEB) which is made up to $25.9 billion for state active and retired members and $41.6 billion for education employees and retirees that become the obligation of the State of New Jersey upon retirement.
The funded status and funding progress of the OPEB includes actuarial valuations which involve estimates of the value of reported amounts and assumptions about the probability of events far into the future. These amounts are subject to continual revision as actual results are compared to past expectations and new estimates are made about the probability of future events.
Actuarial calculations reflect a long-term perspective and are based on the benefits provided under the terms of the OPEB in effect at the time of each valuation and also consider the pattern of the sharing of costs between the employer and members at the point in time. The projection of benefits for financial reporting purposes does not explicitly incorporate the potential effects of legal or contractual funding limitations on the pattern of cost sharing between the employer and members in the future.
Actuarial Methods and Assumptions
In the July 1, 2015, OPEB actuarial valuation, the projected unit credit was used as the actuarial cost method, and the market value was used as asset valuation method for the OPEB. The actuarial assumptions included an assumed investment rate of return of 4.50 percent.
59

BELLEVILLE TOWNSIITP SCHOOL DISTRICT NOTES TO THE FINANCIAL STATEMENTS FOR THE FISCAL YEAR ENDED JUNE 30, 2017
NOTE 4 OTHER INFORMATION (Continued)
E. Post-Retirement Medical Benefits (Continued
Post-Retirement Medical Benefits Contributions
P.L. 1987, c. 384 and P.L. 1990, c.6 required the Teachers' Pension and Annuity Fund (TPAF) and Public Employees' Retirement System (PERS), respectively to fund post-retirement medical benefits for those State employees and education employees who retire after accumulating 25 years of credited service or on a disability retirement. As of June 30, 2016, there were 110,512, retirees receiving post-retirement medical benefits and the State contributed $1.37 billion on their behalf. The cost of these benefits is funded through contributions by the State and in accordance with P .L. 1994, c.62. Funding of post-retirement medical benefits changed from a pre-funding basis to a pay-as-you-go basis beginning in Fiscal Year 1994.
The State is also responsible for the cost attributable to P.L. 1992, c.l26, which provides employer paid health benefits to members of PERS and the Alternate Benefit Program (ABP) who retired from a board of education or county college with 25 years of service. The State paid $231.2 million toward Chapter 126 benefits for 20,045 eligible retired members in Fiscal Year 2016.
The School Employees Health Benefits Program (SEHBP) Act is found in New Jersey Statutes Annotated, Title 52, Article 17.25 et.seq. Rules governing the operation and administration of the program are found in Title 17, Chapter 9 of the New Jersey Administrative Code. The State of New Jersey Division of Pensions and Benefits issues a publicly available financial report that includes financial statements and required supplementary information for SEHBP. That report may be obtained from the Treasury website at: http://www.nj.gov/treasury/pensions/pdf/financial/2015divisioncombined.pdf.
The State sets the contribution rate based on a pay as you go basis and not on the annual required contribution of the employers (ARC), an amount actuarially determined in accordance with the parameters of GASB Statement 45. The ARC represents a level of funding that, if paid on an ongoing basis, is projected to cover normal cost each year and amortize any unfunded actuarial liabilities (or funding excess) of the plan over a period not to exceed thirty years. The State's contributions to the State Health Benefits Program Fund for TP AF retirees' post-retirement benefits on behalf of the School District for the fiscal years ended June 30, 2017, 2016 and 2015 were $2,676,549, $2,844,551 and $2,538,314, respectively, which equaled the required contributions for each year. The State's contributions to the State Health Benefits Program Fund for PERS retirees' post-retirement benefits on behalf of the School District was not determined or made available by the State of New Jersey.
F. Tax Abatements
As defined by the Governmental Accounting Standards Board (GASB), a tax abatement is an agreement between a government and an individual or entity in which the government promises to forgo tax revenues and the individual or entity promises to subsequently take a specific action that contributes to economic development or otherwise benefits the government or its citizens. School districts are not authorized by New Jersey statute to enter into tax abatement agreements. However, the municipality in which the school district is situated may have entered into tax abatement agreements, and that potential school tax revenue must be disclosed in these financial statements. If the municipality entered into tax abatement agreements, those agreements will not directly affect the school district's local tax revenue because N.J.S.A. 54:4-75 and N.J.S.A. 54:4-76 require that amounts so forgiven must effectively be recouped from other taxpayers and remitted to the school district.
For Belleville Township School District, the District's share of abated taxes resulting from the municipality having entered into a tax abatement agreement is indeterminate.
60

BELLEVILLE TOWNSHIP SCHOOL DISTRICT NOTES TO THE FINANCIAL STATEMENTS FOR THE FISCAL YEAR ENDED JUNE 30, 2017
NOTE 4 OTHER INFORMATION (Continued)
G. Subsequent Event
On November 7, 2017, the voters of the Belleville Township School District approved a $48,536,610 referendum authorizing the District to issue bonds and/or notes to fmance various capital improvements and upgrades to all District schools, consisting of safety and security improvements, enhancement of exterior structures, improvements and upgrade to infrastructure and building systems and other improvements to create long-term efficiencies throughout the District. The referendum project includes $24,148,600 of project costs eligible for State ofNew Jersey debt service aid. As of the date of audit, the Board has not sold Bonds or Notes in conjunction with these projects.
61

REQUIRED SUPPLEMENTARY INFORMATION- PART II
BUDGETARY COMPARISON SCHEDULES

EXHIBITC-1 BELLEVILLE TOWNSHIP SCHOOL DISTRICT
GENERAL FUND BUDGETARY COMPARISON SCHEDULE
FOR THE FISCAL YEAR ENDED JUNE 30,2017 Variance
Original Budget Final Final To Budget Adjustments Budget Actual Actual
REVENUES Local Sources
Property Tax Levy $ 38,667,832 $ 38,667,832 $ 38,667,832 Tuition From Individuals 245,700 245,700 86,985 $ (158,715) Tuition From Other LEAs Within the State 94,450 94,450 Unrestricted Miscellaneous Revenues 27,000 27,000 157,046 130,046
Total Local Revenues 38,940,532 38 940,532 39,006,313 65,781
State Sources Special Education Aid 2,880,246 2,880,246 2,880,246 Equalization Aid 21,896,193 21,896,193 21,896,193 Security Aid 332,971 332,971 332,971 Transportation Aid 221,550 221,550 221,550 Under Adequacy Aid 500,000 500,000 500,000 PARCC Readiness Aid 47,430 47,430 47,430 Per Pupil Growth Aid 47,430 47,430 47,430 Professional Learning Community Aid 45,960 45,960 45,960 Extraordinary Special Education Costs Aid 531,771 531,771 389,131 (142,640) Nonpublic School Transportation Costs 67,338 67,338 On-BehalfTPAF Contributions (Non-Budgeted)
Pension Benefit Contribution 3,099,948 3,099,948
Pension- NCGI Premium 112,318 112,318 Post Retirement Medical Benefit Contribution 2,676,549 2,676,549 Long Term Disability Insurance 5,962 5,962 Reimbursed Social Security Contribution 2,208,564 2,208,564
Total State Revenues 26,503,551 26,503,551 34,531,590 8,028,039
Federal Sources
FEMA 14,891 14,891
Special Education Medicaid Initiative Reimbursement 87,144 87,144 242,935 155,791 SEM!-ARRA 5,215 5,215
87 144 87,144 263,041 175,897
Total Revenues 65,531,227 65,531,227 73,800,944 8,269,717
CURRENT EXPENDITURES Regular Programs - Instruction
Salaries of Teachers Kindergarten 1,152,084 $ (17,726) 1,134,358 1,126,386 7,972
Grades 1-5 5,930,183 (295,451) 5,634,732 5,610,004 24,728
Grades 6-8 3,273,939 155,123 3,429,062 3,415,240 13,822
Grades 9-12 7,335,955 60,325 7,396,280 7,393,869 2,411
Regular Programs - Home Instruction Salaries of Teachers 125,000 98,955 223,955 223,955
Purchased Professional-Educational Services 100,000 (37,400) 62,600 54,510 8,090
Regular Programs - Undistributed Instruction Other Salaries for Instruction 44,151 6,829 50,980 50,611 369
Purchased Technical Services 5,000 5,000 5,000
Other Purchased Services 2,080 321 2,401 2,401
General Supplies 338,640 83,583 422,223 394,784 27,439
Textbooks 335,570 215,761 551,331 551,331
Other Objects 20 5,934 5,954 5,954
Total Regular Programs 18,642,622 276,254 18,918,876 18,834 045 84,831
62

EXHIBIT C~I BELLEVILLE TOWNSHIP SCHOOL DISTRICT
GENERAL FUND BUDGETARY COMPARISON SCHEDULE
FOR THE FISCAL YEAR ENDED JUNE 30,2017 Variance
Original Budget Final Final To Budget Adjustments Budget Actual Actual
CURRENT EXPENDITURES (Continued) Special Education Learning I Language Disabilities Salaries of Teachers $ 562,609 $ 62,693 $ 625,302 $ 625,302 Other Salaries for Instruction 312,047 134,122 446,169 446,169 General Supplies 4,000 (2,574) 1,426 1,426
Total Learning I Language Disabilities 878,656 194,241 1,072,897 1,072,897
Behavioral Disabilities
Salaries of Teachers 138,647 3,103 141,750 140,185 $ 1,565 Other Salaries for Instruction 77,866 22,764 100,630 100,630 General Supplies 2,000 (625) 1,375 1,375
Total Behavioral Disabilities 218,513 25,242 243,755 242,190 1,565
Multiple Disabilities Salaries of Teachers 181,041 39,484 220,525 220,525
Other Salaries for Instruction 154,131 (11,238) 142,893 142,893 General Supplies 1,500 (l ,500)
Total Multiple Disabilities 336,672 26,746 363,418 363,418
Resource Room I Resource Center Salaries of Teachers 2,390,741 (25,594) 2,365,147 2,365,147 Other Salaries for Instruction 479,903 (19,916) 459,987 459,987 General Supplies 17,500 (11,796) 5,704 5,704
Total Resource Room I Resource Center 2,888,144 (57,306) 2,830,838 2,830,838
Autism Salaries of Teachers 196,219 98,866 295,085 294,860 225
Other Salaries for Instruction 155,863 129,268 285,131 284,564 567 General Supplies 3,000 12,517 15,517 12,259 3,258
Total Autism 355,082 240,651 595,733 591,683 4,050
Preschool Disabilities~ Part M Time
General Supplies 1,800 4,871 6,671 4,907 1,764
Total Preschool Disabilities~ Part~ Time 1,800 4,871 6,671 4,907 1,764
Preschool Disabilities ~ Full ~ Time Salaries of Teachers 171,053 145,486 316,539 316,057 482
Other Salaries for Instruction 381,599 (73,095) 308,504 307,854 650
General Supplies 500 760 1,260 445 815
Total Preschool Disabilities~ Full~ Time 553,152 73,151 626,303 624,356 1,947
Home Instruction Salaries of Teachers 60,000 31,963 91,963 91,963
Total Home Instruction 60,000 31,963 91,963 91,963
Total Special Education 5,292,019 539,559 5,831,578 5,822,252 9,326
63

EXHIBIT C~l BELLEVILLE TOWNSHIP SCHOOL DISTRICT
GENERAL FUND BUDGETARY COMPARISON SCHEDULE
FOR THE FISCAL YEAR ENDED JUNE 30,2017 Variance
Original Budget :Final Final To Budget Adjustments Budget Actual Actual
CURRENT EXPENDITURES (Continued)
Basic Skills/Remedial Salaries of Teachers $ 1,212,580 $ 209,085 $ 1,42!,665 $ 1,420,161 $ 1,504 General Supplies 1,000 (244) 756 756
Total Basic Skills/Remedial 1,213,580 208,841 1,422,421 1,420,161 2,260
Bilingual Education Salaries of Teachers 897,426 (18,119) 879,307 877,371 1,936 General Supplies 6,869 6,869 6,869
Total Bilingual Education 904,295 (18,119) 886,176 877,371 8,805
School Sponsored Co-Curricular Activities Salaries 134,782 30,448 165,230 165,065 165
Purchased Services 4,993 4,993 4,993
Other Objects 385 359 744 744
Total School Sponsored Co-Curricular Activities 135,167 35,800 170,967 170,802 165
School Sponsored Athletics- Instruction Salaries 397,579 65,163 462,742 460,258 2,484
Purchased Services 113,745 (48,284) 65,461 65,321 140
Supplies and Materials 48,873 14,307 63,180 61,813 1,367
Other Objects 48,893 (1 ,956) 46,937 41,775 5,162
Total School Sponsored Athletics- Instruction 609,090 29,230 638,320 629,167 9,153
Total- Instruction 26,796,773 1,071,565 27,868,338 27,753,798 114,540
Undistributed Expenditures Instruction (Tuition)
Tuition- Other LEA's Within State- Reg. 1,733 1,733 1,177 556
Tuition- Other LEA's Within State- Special 420,807 87,247 508,054 483,165 24,889
Tuition to County Vocational School District-Reg. 156,760 11,112 167,872 167,872
Tuition to County Vocational School/Dist-Spec. 32,501 26,676 59,177 59,177
Tuition to County Special Services - School Districts & Regional Day Schools 16,550 319,639 336,189 336,189
Tuition to Private Schools- Disabled Within State 3,733,197 (980,049) 2,753,148 2,739,749 13,399
Tuition- State Facilities 4,500 4,500 4,500
Tuition - Other 32,000 29,409 61,409 54,083 7,326
Total Undistributed Expenditures- Instruction 4,396,315 (504,233) 3,892,082 3,845,912 46,170
Attendance and Social Work Services Salaries 56,942 (56,942)
Total Attendance and Social Work Services 56,942 (56,942)
64

EXHIBIT C~l BELLEVILLE TOWNSHIP SCHOOL DISTRICT
GENERAL FUND BUDGETARY COMPARISON SCHEDULE
FOR THE FISCAL YEAR ENDED JUNE 30,2017 Variance
Original Budget Final Final To Budget Adjustments Budget Actual Actual
CURRENT EXPENDITURES (Continued) Health Services
Salaries $ 840,874 $ 62,712 $ 903,586 $ 903,077 $ 509
Purchased Professional and Technical Services 46,915 12,792 59,707 58,055 1,652
Other Purchased Services 5,892 (3,042) 2,850 2,850 Supplies and Materials 18,960 (7,702) 11,258 9,812 1,446
Total Health Services 912,641 64,760 977,401 973,794 3,607
Speech, OT, PT and Related Services Salaries 663,075 23,621 686,696 686,438 258
Purchased Professional - Educational Services 678,707 (100,000) 578,707 574,265 4,442 Supplies and Materials 80 80 80
Total Speech, OT, PT and Related Services I ,341,862 (76,379) 1,265,483 1,260,703 4,780
Other Support Services-Students-Extra Services
Salaries 192,000 (93,228) 98,772 98,099 673 Purchased Professional-Educational Services 794,097 (59,256) 734,841 703,187 31,654
Total Other Support Services-Extra 986,097 (152,484) 833,613 801,286 32,327
Guidance Salaries of Other Professional Staff 900,103 (42,029) 858,074 856,718 1,356
Salaries of Secretarial and Clerical Assistants 144,748 8,301 153,049 152,885 164
Purchased Professional-Educational Services 35,520 (2,260) 33,260 33,260 Supplies and Materials 12,461 (5,785) 6,676 5,868 808
Total Guidance 1,092,832 (41,773) 1,051,059 1,048,731 2,328
Child Study Team Salaries of Other Professional Staff 1,409,464 77,174 I ,486,638 1,477,776 8,862
Salaries of Secretarial and Clerical Assistants 162,527 (274) 162,253 162,253
Other Purchased Professional and Technical Services 20,192 (334) 19,858 31 19,827
Residential Costs 593 (593)
Other Purchased Services 1,171 1,171 \,171
Miscellaneous Purchased Services 12,725 12,725 12,205 520
Supplies and Materials 20,687 16,508 37,195 37,195
Other Objects 29,177 (26,242) 2,935 2,935
Total Child Study Team I ,655,365 67,410 1,722,775 1,693,566 29,209
Improvement of Instruction Services Salaries of Other Professional Staff 5,600 36,000 41,600 30,264 11,336
Total Improvement of Instruction Services 5,600 36,000 41,600 30,264 11,336
65

EXHIBIT C~I BELLEVILLE TOWNSHIP SCHOOL DISTRICT
GENERAL FUND BUDGETARY COMPARISON SCHEDULE
FOR THE FISCAL YEAR ENDED JUNE 30, 2017 Variance
Original Budget Final Final To Budget Adjustments Budget Actual Actual
CURRENT EXPENDITURES (Continued) Educational Media Services/School Library Salaries $ 293,338 $ (18,698) $ 274,640 $ 273,959 $ 681 Supplies and Materials 37,500 (3,349) 34,151 32,642 1,509
Total Educational Media Services/School Library 330,838 (22,047) 308,791 306,601 2,190
Instructional Staff Training Services Purchased Professional " Educational Services 23,500 (23,500) Other Purchased Services 12,000 (12,000)
Total Instructional Staff Training Services 35,500 (35,500)
Support Services General Administration Salaries 462,072 (23,536) 438,536 438,536 Salaries of Fiscal Monitors 146,520 (18,024) 128,496 128,496 Repayment ofPrincipal-NJ DOE Loan 416,243 416,243 416,243 Legal Services 380,000 362,387 742,387 765,500 (23,113) Audit Fees 110,000 4,176 114,176 68,189 45,987 Architectural/Engineering Services 110,000 (6,500) 103,500 57,059 46,441 Other Purchased Professional Services 60,030 (16,995) 43,035 43,035 Communications/Telephone 90,900 (35,000) 55,900 37,330 18,570 BOE Other Purchased Services 3,800 (!53) 3,647 3,647 Miscellaneous Purchased Services 287,590 (10,561) 277,029 276,589 440 General Supplies 4,806 (747) 4,059 4,042 17 BOE In-House Training/Meeting Supplies 700 (650) 50 50
Judgments Against the School District 164,515 371,100 535,615 40,993 494,622 Miscellaneous Expenditures 8,598 14,441 23,039 23,039 BOE Membership Dues and Fees 29,953 544 30,497 30,497
Total Support Services General Administration 2,275,727 640,482 2,916,209 2,333,245 582,964
Support Services School Administration Salaries of Principals/Asst. Principals/Prog. Dir. 2,222,003 (254,550) 1,967,453 1,928,585 38,868
Salaries of Other Professional Staff 692,477 751,637 1,444,114 1,411,760 32,354
Salaries of Secretarial and Clerical Assistants 883,065 (125,486) 757,579 754,704 2,875
Other Purchased Services 40,197 50,978 91,175 90,395 780
Supplies and Materials 39,000 (4) 38,996 29,049 9,947 Other Objects 2,819 (2,819)
Total Support Services School Administration 3,879,561 419,756 4,299,317 4,214,493 84,824
Central Services Salaries 523,349 (75,558) 447,791 447,752 39
Purchased Technical Services 32,760 (13,608) 19,152 19,152
Miscellaneous Purchased Services 36,500 (1,263) 35,237 29,413 5,824
Supplies and Materials 7,500 3,888 11,388 11,388
Interest on Lease Purchase Agreements 118,005 (49,860) 68,145 68,145 MisceHaneous Expenditures 5,150 35,009 40,159 39,774 385
Total Central Services 723,264 (101 ,392) 621,872 615,624 6,248
66

EXHIBITC-1 BELLEVILLE TOWNSHIP SCHOOL DISTRICT
GENERAL FUND BUDGETARY COMPARISON SCHEDULE
FOR THE FISCAL YEAR ENDED JUNE 30,2017 Variance
Original Budget Final Final To Budget Adjustments Budget Actual Actual
CURRENT EXPENDITURES (Continued)
Administration Information Technology
Salaries $ 256,919 $ (48,469) $ 208,450 $ 208,399 $ 51 Purchased Technical Services 400,000 202,152 602,152 601,738 414 Other Purchased Services 75,000 (32,117) 42,883 36,058 6,825 Supplies and Materials 65,000 (13,801) 51,199 48,604 2,595
Total Administration Information Technology 796,919 107,765 904,684 894,799 9,885
Required Maintenance for School Facilities
Salaries 406,550 78,775 485,325 485,325 Cleaning, Repair & Maintenance Services 149,319 (16,793) 132,526 127,811 4,715 General Supplies 140,000 47,593 187,593 154,649 32,944
Total Required Maintenance for School Facilities 695,869 109,575 805,444 767,785 37,659
Custodial Services Salaries 2,003,896 7,466 2,011,362 2,011,362 Purchased Professional and Technical Services 4,220 621 4,841 4,841 Cleaning, Repair and Maintenance Services 144,039 20,620 164,659 131,189 33,470
Other Purchased Property Services 65,400 (2,950) 62,450 62,070 380 Insurance 314,838 (18,559) 296,279 296,279 Misce!laneous Purchased Services 563 (313) 250 250 General Supplies 62,344 23,022 85,366 60,915 24,451
Energy (Natural Gas) 230,000 4,548 234,548 201,109 33,439
Energy (Electricity) 600,000 (106,000) 494,000 490,334 3,666 Other Objects 3,169 (175) 2,994 2,614 380
Total Custodial Services 3,428,469 (71,720) 3,356,749 3,260,963 95,786
Care and Upkeep of Grounds
Salaries 92,774 1,012 93,786 93,786 Cleaning, Repair and Maintenance Services 6,672 6,672 5,792 880 General Supplies 3,166 3,166 3,166
Total Care and Upkeep of Grounds 92,774 10,850 103,624 102,744 880
Security Salaries 352,280 97,560 449,840 448,107 1,733 Purchased Professional and Technical Services 90,000 12,000 102,000 102,000 General Supplies 1,341 2,766 4,107 3,999 108
Total Security 443,621 112,326 555,947 554,106 1,841
Student Transportation Services Salaries ofNon-Instruetional Aides 346,000 18,572 364,572 337,205 27,367
Salaries for Pupil Transportation (Between Home and School) - Regular 195,445 (49,458) 145,987 144,256 1,731
Salaries for Pupil Transportation (Between Home and School) - Special 275,000 (7,461) 267,539 267,539
Salaries for Pupil Transportation (Other Than Between Home & School) 103,318 42,538 145,856 134,573 11,283
Management Fee- ESC & CTSA Trans. Prog. 60,040 4,963 65,003 42,948 22,055
Cleaning, Repair and Maintenance Services 46,455 18,776 65,231 64,075 1,156
Contracted Services- Aid in Lieu Payments- Non-Public 367,082 (30,402) 336,680 322,791 13,889
Contracted Services (Other Than Between Home and School)- Vendors 50,000 50,000 42,705 7,295
Contracted Services (Spec Ed)- Joint Agreements 17,000 (6, 116) 10,884 10,884
Contracted Services (Spec Ed)- ESC's & CTSA's 1,202,571 1,202,571 988,268 214,303
Miscellaneous Purchased Services- Transportation 8,000 (8,000)
Transportation Supplies 115,000 60,058 175,058 61,443 113,615
Miscellaneous Expenditures 11,500 (4,026) 7,474 6,574 900
Total Student Transportation Services 2,797,411 39,444 2,836,855 2,423,261 413,594
67

EXHIBIT C-1
BELLEVILLE TOWNSHIP SCHOOL DISTRICT GENERAL FUND
BUDGETARY COMPARISON SCHEDULE FOR THE FISCAL YEAR ENDED JUNE 30,2017
Variance Original Budget Final Final To Budget Adjustments Budget Actual Actual
CURRENT EXPENDITURES (Continued) Unallocated Benefits Social Security Contributions $ 770,472 $ 113,891 $ 884,363 $ 878,652 $ 5,711 Other Retirement Contributions - PERS 719,000 (81,790) 637,210 637,210
Other Retirement Contributions - Regular 34,681 (4,942) 29,739 29,031 708 Unemployment Compensation 105,000 (78,567) 26,433 15,000 11,433 Workmen's Compensation 466,621 (53,362) 413,259 400,819 12,440 Health Benefits 8,673,028 (1,065,292) 7,607,736 7,677,901 (70, 165) Tuition Reimbursement 50,000 (I 0,879) 39,121 39,121 Other Employee Benefits 247,753 (195,253) 52,500 52,500 Unused Sick Payment to Terminated/Retired Staff 83,445 411,809 495,254 339,383 155,871
Total Unallocated Benefits 11,150,000 (964,385) 10,185,615 10,069,617 115,998
On BehalfTPAF Contributions (Non Budgeted) Pension Benefit Contribution 3,099,948 (3,099,948)
Pension *NCGI Premium 112,318 (112,318)
Post Retirement Medical Benefit Contribution 2,676,549 (2,676,549)
Long Term Disability Insurance 5,962 (5,962)
Reimbursed Social Security Contribution 2,208,564 (2,208,564)
Total On-Behalf Contributions 8,103,341 (8,103,341)
Total Undistributed Expenditures 37,097,607 (418,487) 36,679,120 43,300,835 (6,621,715)
Total Expenditures- Current Expenditures 63,894,380 653,078 64,547,458 71,054,633 (6,507, 175)
CAPITAL OUTLAY Equipment
Instructional Equipment 2,341 2,341 2,341
Grades 1-5 7,095 7,095 7,095 Grades 9-12
Undistributed Expenditures School Buses - Special 278,150 278,150 219,927 58,223
Total Equipment 287,586 287,586 229,363 58,223
Facilities Acquisition and Construction Services Architectural I Engineering Services 24,000 24,000 12,226 11,774 Construction Services 166,000 166,000 166,000
Lease Purchase Agreements - Principal 1,562,668 (130,736) 1,431,932 1,414,741 17,191
Assessment for Debt Service on SDA Funding 22,935 22,935 22,935
Total Facilities Acquisition and Construction Services 1,585,603 59,264 1,644,867 1,449,902 194,965
Total Capital Outlay I ,585,603 346,850 I ,932,453 1,679,265 253,188
SUMMER SCHOOL· INSTRUCTION Salaries of Teachers 16,134 16,134 16,134
Total Summer School* Instruction 16,134 16,134 16,134
Transfer of Funds to Charter Schools 51,244 140,211 191,455 191,455
Total Expenditures 65,531,227 I, 156,273 66,687,500 72,941,487 (6,253,987)
Excess (Deficiency) of Revenues Over (Under) Expenditures (1,156,273) (1,156,273) 859,457 2,015,730
68

BELLEVILLE TOWNSHIP SCHOOL DISTRICT GENERAL FUND
BUDGETARY COMPARISON SCHEDULE FOR THE FISCAL YEAR ENDED JUNE 30,2017
Excess (Deficiency) of Revenues and Other Financing Sources Over (Under) Expenditures and Other Financing (Uses) $
Fund Balances, Beginning of Year
Fund Balances, End of Year
Recapitulation Rest•·ictcd Capital Reserve Maintenance Reserve Assigned Year End Encumbrances
Unassigned
Fund Balance Per State Budgetary Basis of Accounting
Reconciliation to Governmental Funds Statements (GAAP)
Less State Aid Revenue Not Recognized on GAAP Basis
Fund Balance Per Governmental Funds (GAAP)
$
Original Budget
2,653,300
2,653,300
69
Budget Adjustments
$ {1,156,273)
$ {1,156,273)
$
$
Final Budget
{1,156,273)
2,653,300
1,497,027
$
$
$
$
Actual
859,457
2,653,300
3,512,757
\,386,149 193,656
893,042 1,039,910
3,512,757
{2,885,615)
627,142
EXHIBIT C-1
$
$
Variance Final To Actual
2,015,730
2,015,730

EXIDBITC-2
BELLEVILLE TOWNSHIP SCHOOL DISTRICT SPECIAL REVENUE FUND
BUDGETARY COMPARISON SCHEDULE
FOR THE FISCAL YEAR ENDED JUNE 30,2017
Original Budget Final Variance Budget Adjustments Budget Actual Final to Actual
REVENUES Intergovernmental
State $ 153,317 $ (4,573) $ 148,744 $ 81,471 $ (67,273)
Federal 1,908,139 804,777 2,712,916 2,498,735 (214,181) Local Sources
Miscellaneous 58,425 58,425 35,335 (23,090)
Total Revenues 2,061,456 858,629 2,920,085 2,615,541 (304,544)
EXPENDITURES
Instruction
Salaries 995,903 (324,709) 671,194 639,707 31,487 Other Salaries for Instruction
Purchased Professional I Technical Services 114,122 89,854 203,976 165,134 38,842
Other Purchased Services 881,684 305,976 1,187,660 1,166,841 20,819
General Supplies 34,272 433,066 467,338 334,754 132,584 Textbooks 6,926 1,490 8 416 8,107 309
Total Instruction 2,032,907 505,677 2,538,584 2,314,543 224,041
Support Services - Instruction Salaries 54,154 54,154 54,154 Purchased Professional I Technical Services 11,026 22,136 33,162 24,070 9,092 Other Purchased Services 2,796 2,796 2,796 Contracted Services - Transportation 14,954 22,682 37,636 37,636
Supplies and Materials 2,569 28,579 31,148 I9,0IO 12,138 Other Objects 2,620 2,620 1,700 920
Total Support Services 28,549 132,967 161,516 98,934 62,582
Unallocated Benefits:
Personnel Services - Employee Benefits 130,300 130,300 47,080 83,220
Capital Outlay Facilities Acquisition and Construction Services Instructional Equipment 79,785 79,785 145,084 (65,299) Non-Instructional Equipment 9,900 9 900 9,900
Total Capital Outlay 89 685 89,685 154,984 (65,299)
Total Expenditures 2,061,456 858,629 2,920,085 2,615,541 304,544
Excess (Deficiency) of Revenues and Other Financing Sources Overi(Under) Expenditures
Fund Balance, Beginning of Year
Fund Balance, End of Year $ $ $ $
70

NOTES TO THE REQUIRED SUPPLEMENTARY INFORMATION- PART II

BELLEVILLE TOWNSHIP SCHOOL DISTRICT REQUIRED SUPPLEMENTARY INFORMATION
BUDGETARY COMPARISON SCHEDULES NOTES TO THE REQUIRED SUPPLEMENTARY INFORMATION
FOR THE FISCAL YEAR ENDED JUNE 30,2017
EXHIBITC-3
Formal budgetary integration into the accounting system is employed as a management control device during the year. For governmental funds there are no substantial differences between the budgetary basis of accounting and accounting principles generally accepted in the United States of America, with the exception of the legally mandated revenue recognition of certain state aid payments for budgetary purposes only and the treatment of encumbrances in the special revenue fund as described below. Encumbrance accounting is also employed as an extension of formal budgetary integration of the governmental fund types. Unencumbered appropriations lapse at fiscal year end.
The accounting records of the Special Revenue Fund are maintained on the grant accounting budgetary basis. The grant accounting budgetary basis differs from GAAP in that the grant accounting budgetary basis recognizes encumbrances as expenditures and also recognizes the related revenues, whereas the GAAP basis does not. Sufficient supplemental records are maintained to allow for the presentation of GAAP basis financial reports.
The following presents a reconciliation of the General and Special Revenue Funds from the budgetary basis of accounting as presented in the Budgetary Comparison Schedule - General Fund and Special Revenue Fund to the GAAP basis of accounting as presented in the Statement of Revenues, Expenditures and Changes in Fund Balance- Governmental Funds.
Sources/inflows of resources Actual amounts (budgetary basis) "revenue"
from the budgetary comparison schedule Difference - Budget to GAAP:
State Aid payments recognized for budgetary purposes, not
recognized for GAAP statements.(20 16-20 17) State Aid payments recognized for GAAP statements, not
recognized for budgetary purposes (2015-2016) Grant accounting budgetary basis differs from GAAP in that
encumbrances are recognized as expenditures, and the related revenue is reqognized.
Encumbrances, June 30, 2017 Encumbrances, June 30,2016, net of cancellations
Total revenues as reported on the Statement of Revenues, Expenditures
and Changes in Fund Balances - Governmental Funds.
Uses/outflows of resources Actual amounts (budgetary basis) 11total expenditures11 from the
budgetary comparison schedule
Differences -Budget to GAAP Encumbrances for supplies and equipment ordered but
not received are reported in the year the order is placed for budgetary purposes, but in the year the supplies are received for financial reporting purposes.
Encumbrances , June 30, 2017
Encumbrances , June 30, 2016, net of cancellations
Total expenditures as reported on the Statement of Revenues, Expenditures, and Changes in Fund Balances - Governmental Funds
71
Special General Revenue
Fund Fund
$ 73,800,944 $ 2,615,541
(2,885,615)
2,874,277
(22,084)
$ 73,789,606 $ 2,593,457
$ 72,941,487 $ 2,615,541
(22,084)
$ 72,941,487 $ 2,593,457

REQUIRED SUPPLEMENTARY INFORMATION- PART III
PENSION INFORMATION

District's Proportion of the Net Position Liability (Asset)
District's Proportionate Share of the Net Pension Liability (Asset)
District's Covered~Employee Payroll
District's Proportionate Share of the Net Pension Liability (Asset) as a Percentage of its Covered-Employee Payroll
Plan Fiduciary Net Position as a Percentage of the Total Pension Liability
BELLEVILLE TOWNSHIP SCHOOL DISTRICT REQUIRED SUPPLEMENTARY INFORMATION
SCHEDULE OF THE DISTRICT'S PROPORTIONATE SHARE OF THE NET PENSION LIABILITY
Public Employees Retirement System
Last Four Fiscal Years*
2017 2016 2015 2014
.07154% .08363% .08023% .07642%
$ 21,188,458 $ 18,772,248 $ 15,022,124 $ 14,606,291
$ 5,027,264 $ 4,680,094 $ 5,498,805 $ 5,051,790
421.47% 401.11% 273.19% 289.13%
40.14% 47.93% 52.08% 48.72%
The amounts presented for each fiscal year were determined as of the previous fiscal year-end.
EXHIBIT L-1
This schedule is presented to illustrate the requirement to show information for 10 years in accordance with GASB Statement No. 68. However, until a fulllO-year trend is compiled, the District will only present information for those years for which information is available.
72

2017
Contractually Required Contribution $ 635,562 $
Contributions in Relation to the Contractually Required Contribution 635,562
Contribution Deficiency (Excess) $ $
District's Covered~ Employee Payroll $ 5,027,264 $
Contributions as a Percentage of Covered~Employee Payroii 12.64%
BELLEVILLE TOWNSHIP SCHOOL DISTRICT REQUIRED SUPPLEMENTARY INFORMATION
SCHEDULE OF DISTRICT CONTRIBUTIONS
Public Employees Retirement System
Last Four Fiscal Years
2016 2015 2014
718,955 $ 661,443 $ 573,845
718,955 661,443 573,845
$ $
4,680,094 $5,498,805 $5,051,790
15.36% 12.03% 11.36%
EXHIBIT L-2
This schedule is presented to illustrate the requirement to show information for 10 years in accordance with GASB Statement No. 68. However, until a full 10-year trend is compiled, the District will only present information for those years for which information is available.
73

District's Proportion of the Net Position Liability (Asset)
District's Proportionate Share of the Net Pension Liability (Asset)
State's Proportionate Share of the Net Pension Liability (Asset) Associated with the District
Total
District's Covered-Employee Payroll
District's Proportionate Share of the Net Pension Liability (Asset) as a Percentage of its Covered-Employee Payroll
Plan Fiduciary Net Position as a Percentage of the Total Pension Liability
$
BELLEVILLE TOWNSHIP SCHOOL DISTRICT REQUIRED SUPPLEMENTARY INFORMATION
SCHEDULE OF THE DISTRICT'S PROPORTIONATE SHARE OF THE NET PENSION LIABILITY
Teachers Pension and Annuity Fund
Last Four Fiscal Years*
2017 2016 2015 2014
0% 0% 0% 0%
so $0 $0 so
234,722)70 186,927,127 154,793,607 150,597,225
234,722,770 $ 186,927.127 $ 154,793,607 $ 150,597,225
28,765,071 28,475,277 29,722,849 28,462,899
0% 0% 0% 0%
22.33% 28.71% 33.64% 33.76%
The amounts presented for each fiscal year were determined as of the previous fiscal year-end.
EXHIBIT L-3
This schedule is presented to illustrate the requirement to show information for 10 years in accordance with GASB Statement No. 68. However, until a full 10-year trend is compiled, the District will only present information for those
years for which information is available.
74

BELLEVILLE TOWNSHIP SCHOOL DISTRICT REQUIRED SUPPLEMENTARY INFORMATION
EXHIBITL-4
SCHEDULE OF DISTRICT'S PROPORTIONATE SHARE OF NET PENSION LIABILITY AND SCHEDULE OF DISTRICT CONTRIBUTIONS
NOTES TO REQUIRED SUPPLEMENTARY INFORMATION
Change of Benefit Terms:
Change of Assnmptions:
FOR THE FISCAL YEAR ENDED JUNE 30, 2017
None.
Assumptions used in calculating the net pension liability and statutorily required employer contribution are presented in Note 40.
75

SCHOOL LEVELS SCHEDULES
GENERAL FUND
NOT APPLICABLE

SPECIAL REVENUE FUND

EXHIBIT E-1
BELLEVILLE TOWNSHIP SCHOOL DISTRJCT SPECIAL REVENUE FUND
COMBTh'ING SCHEDULE OF REVENUES AND EXPENDITURES BUDGETARY BASIS
FOR THE FISCAL YEAR ENDED JUNE 30, 2017
IDEA Regular
Local Title III Car! D. Preschool Program (Exhibit) Total
Grants Title I TitleD A Title III Immigrant Perkins Handicani!ed PartB E-1a) 2017
REVENUES Intergovemmental
State s 81,471 $ 81,471
Federal $ 1,096,500 $ 151,579 $ 67,360 $ 8,659 $ 46,839 $ 20,550 $ 1,107,248 2,498,735
Other Sources $ 3\335 35,335
Total Revenues $ 35,335 $ 1,096,500 $ 151,579 L....21360 $ 8,659 $ 46,839 s 20,550 $ 1.107,248 $ 81,471 $ 2,615,541
EXPENDITURES Instruction
Salaries $ 559,512 $ 14,645 $ 45,000 $ 20,550 639,707
Purchased Professional I Technical Services 42,063 73,442 $ 49,629 165,134
Other Purchased Services $ 5,718 12,551 49,254 $ 1,099,318 1,166,841
General Supplies 27,917 247,342 14,238 6.803 s 8,659 s 26,195 3,600 334,754
Textbooks 8,107 8,107
Total Instruction 33,635 861,468 151.579 . 51,803 8,659 26,195 20,550 1,099,318 61,336 2,314,543
Support Services Salaries 54,154 54,154 Personnel Services- Employee Benefits 45,332 1,748 47,080
Purchased Professional I Technical Services 3,000 7,930 13,140 24,070
Supplies and Materials 7,167 4,848 6,995 19,010
Other Objects ___ 1,700 1,700
Total Support Services ___ 1,700 106,653 1.748 7,848 ------ --- ___ __!_,2_~_Q ___ )Q,J}_~ ------ __ !:1-§,014
Capital Outlay Instructional Equipment 128,379 13,809 2,896 145,084
Non-Instructional Equipment 9,900 9,900
Total Capital Outlay 128,379 13,809 __ 1_2,796 154,984
Total Expenditures $ 35,335 $ 1,096,500 $ 151,579 $ 67,360 $ 8,659 $ 46,839 $ 20,550 $ 1,107,248 $ 81,471 s 2,615,541
76 (Continued)

EXHffiiT E-Ia
BELLEVILLE TOWNSHIP SCHOOL DISTRICT SPECIAL REVENUE FUND
COMBINING SCHEDULE OF REVENUES AND EXPENDITURES BUDGETARY BASIS
FOR THE FISCAL YEAR ENDED JUNE 30, 2017
Chapter 192 Services Chapter 193 Services Total Nonpublic Nonpublic Nonpublic Nonpublic Compensatory Home Corrective Supplemental Exhibit Security TechnoloitY Nursing Textbook Education m Instruction Sneech Instruction E-b
REVENUES Intergovernmental State s 6,995 $ 3,600 $ 13,140 $ 8,107 $ 33,851 $ 1,553 $ 1,008 s 7,671 $ 5,546 $ 81,471 Federal
Other Sources ----
Total Revenues s 6,995 $ 3,600 $ 13 140 $ 8,107 $ 33,851 $ 1,553 $ 1,008 $ 7,671 $ 5,546 s 81,471
EXPENDITURES lnstmction Salaries Purchased Professional I Technical Services $ 33,851 $ 1,553 $ 1,008 $ 7,671 $ 5,546 $ 49,629 Other Purchased Services General Supplies $ 3,600 3,600 Textbooks $ 8,107 8,107
Total instruction 3,600 8,107 33,851 1,553 1,008 7,671 5,546 61.,_336
Support Services
Salaries Personnel Services - Employee Benefits Purchased Professional I Technical Services $ 13,140 13,140 Supplies and Materials $ 6,995 6,995 Other Objects $
6,995 13,140 20.135
Capital Outlay Instmctionai Equipment
Non - Instructional Equipment
Total Capital Outlay
Total Expenditures $ 6,995 $ 3,600 s 13,140 $ 8,107 $ 3M 51 $ 1,55} $ 1,Q08 s 7,671 s 5,546 $ 81,471
77

BELLEVILLE TOWNSHIP SCHOOL DISTRICT SPECIAL REVENUE FUND
SCHEDULE OF PRESCHOOL AID EXPENDITURES BUDGETARY BASIS
FOR THE FISCAL YEAR ENDED JUNE 30, 2017
NOT APPLICABLE
78
EXHIBITE-2

CAPITAL PROJECTS FUND

BELLEVILLE TOWNSHIP SCHOOL DISTRICT CAPITAL PROJECTS FUND
SUMMARY SCHEDULE OF PROJECT EXPENDITURES FROM INCEPTION AND FOR THE FISCAL YEAR ENDED JUNE 30, 2017
Modified Expenditures to Date Issue/ Project Title Aporonriation Prior Years Current Year
Partial Roof Replacement at School Number 7 and Belleville High School and Related Masonry and Electrical Upgrades $ 1,025,477 $ 877,156 $ 33,983
Acquisition and Installation of Security System and Network Upgrades 1,950,033 1,949,916
IP Integration Services and Network Cabling
and Refreshing 3,324,031 3,246,492
Boiler Replacement at School Number 8 and the Middle School 2,403,520 769,836 864,399
$ 8,703,061 $ 6 843,400 $ 898,382
Reconciliation to GAAP Basis
Project Balance, June 30,2017
Less: Capital Leases Authorized by Not Issued
Fund Balance, June 30,2017 ~ GAAP Basis
Reconciliation to Fund Balance
Restricted for Capital Projects Year End Encumbrances Available for Capital Projects
Total Fund Balance- Restricted for Capital Projects
79
EXHIBIT F-1
Unexpended Project Balance
June 30. 2017
$ 114,338
117
77,539
769,285
$ 961,279
$ 961,279
(206,171)
$ 755,108
$ 100,250 654,858
$ 755,108

BELLEVILLE TOWNSHIP SCHOOL DISTRICT CAPITAL PROJECTS FUND
EXHIBITF-2
SUMMARY SCHEDULE OF REVENUES, EXPENDITURES AND CHANGES IN FUND BALANCE BUDGETARY BASIS
FOR THE FISCAL YEAR ENDED JUNE 30, 2017
Revenues and Other Financing Sources Interest on Investments
Total Revenues and Other Financing Sources
Expenditures and Other Financing Uses Purchased Professional/Technical Services Rentals Construction Services Other Objects - Interest
Total Expenditores and Other Financing Uses
Excess (Deficiency) of Revenues and Other Financing Sources over (under) Expenditores and Other Financing Uses
Fund Balance- Beginning
Fund Balance- Ending
Reconciliation to GAAP
Fund Balance, End of Year- Budgetary Basis
Fund Balance, June 30, 2017- GAAP
80
$
$
$
2,994
2,994
45,474 41,525
767,556 43,827
898,382
(895,388)
1,650,496
755,108
755,108
755,108

BELLEVILLE TOWNSHIP SCHOOL DISTRICT CAPITAL PROJECTS FUND
EXHIBIT F-2a
SCHEDULE OF PROJECT REVENUES, EXPENDITURES, PROJECT BALANCE AND PROJECT STATUS BUDGETARY BASIS
PARTIAL ROOF REPLACEMENT AND RELATED MASONRY REPAIRS AT SCHOOL NUMBER 7 AND PARTIAL ROOF REPLACEMENT AT BELLEVILLE HIGH SCHOOL AND ELECTRIC SERVICE UPGRADE
FROM INCEPTION AND FOR THE FISCAL YEAR ENDED JUNE 30, 2017
Revenues and Other Financing Sources Capital Lease Proceeds Interest Earnings
Total Revenues and Other Financing Sources
Expenditures and Other Financing Uses Purchased Professional/Technical Services Construction Services Other Objects
Total Expenditures and Other Financing Uses
Excess (Deficiency) of Revenues and Other Financing Sources over (under) Expenditures and Other Financing Uses
$
$
Prior Periods Current Year
81
1,025,000 $ 303 174 =-$ -----"-'=
1,025,174
875,656 1,500
877,156
148,018 $
303
29,233 4,750
33,983
(33,680) $
1,025,000 477
1,025,477
29,233 880,406
1,500
911,139
Revised Authorized
Cost
$ 1,025,000 477
1,025,477
36,733 987,244
1,500
1,025,477
114,338 ;;;,S ___ _

BELLEVILLE TOWNSHIP SCHOOL DISTRICT
CAPITAL PROJECTS FUND
EXHIBIT F-2b
SCHEDULE OF PROJECT REVENUES, EXPENDITURES, PROJECT BALANCE AND PROJECT STATUS BUDGETARY BASIS
ACQUISITION AND INSTALLATION OF SECURITY SYSTEM AND NETWORK UPGRADES
FROM INCEPTION AND FOR THE FISCAL YEAR ENDED .JUNE 30, 2017
Revenues and Other Financing Sources
Capital Lease Proceeds Interest Earnings
Total Revenues and Other Financing Sources
Expenditures and Other Financing Uses
Construction Services Other Objects
Total Expenditures and Other Financing Uses
Excess (Deficiency) of Revenues and Other Financing Sources over (under) Expenditures and Other Financing Uses
$
$
Prior Periods
82
1,950,000 33
1,950,033
1,948,916 1,000
1,949,916
Current Year
$
$
Totals
1,950,000 33
1,950,033
1,948,916 1,000
1,949,916
Revised Authorized
$
Cost
1,950,000
33
1,950,033
1,948,533 1,500
1,950,033

BELLEVILLE TOWNSHIP SCHOOL DISTRICT
CAPITAL PROJECTS FUND
EXHIBIT F-2c
SCHEDULE OF PROJECT REVENUES, EXPENDITURES, PROJECT BALANCE AND PROJECT STATUS BUDGETARY BASIS
IP INTEGRATION SERVICES AND NETWORK CABLING/ REFRESHING
FROM INCEPTION AND FOR THE FISCAL YEAR ENDED JUNE 30, 2017
Revised Authorized
Prior Periods Current Year Totals Cost
Revenues and Other Financing Sources
Capital Lease Proceeds Interest Earnings
Total Revenues and Other Financing Sources
Expenditures and Other Financing Uses Equipment Construction Services
Total Expenditures and Other Financing Uses
Excess (Deficiency) of Revenues and Other Financing Sources over (under) Expenditures and Other Financing Uses
$
$
83
3,323,512 358
3,323,870
307,499 2,938,993
3,246,492
$
77,378 $
$ 161
161
161 $
3,323,512 519
3,324,031
307,499 2,938,993
3,246,492
$ 3,323,512 519
3,324,031
356,909 2,967,122
3,324,031
77,539 ~$ ~~.,;;,.~

BELLEVILLE TOWNSHIP SCHOOL DISTRICT CAPITAL PROJECTS FUND
EXHIBIT F-2d
SCHEDULE OF PROJECT REVENUES, EXPENDITURES, PROJECT BALANCE AND PROJECT STATUS BUDGETARY BASIS
BOILER REPLACEMENT AT SCHOOL NUMBER EIGHT AND THE MIDDLE SCHOOL FROM INCEPTION AND FOR THE FISCAL YEAR ENDED JUNE 30, 2017
Prior Periods Current Year Totals
Revenues and Other Financing Sources
Capital Lease Proceeds 2,193,829.00 $ $ 2,193,829 Interest Earnings 990 2,530 3,520
Total Revenues and Other Financing Sources 2,194,819 2,530 2,197,349
Expenditures and Other Financing Uses Purchased Professional/Technical Services 118,796 16,241 135,037 Rentals 278,160 41,525 319,685 Construction Services 372,880 762,806 1,135,686 Other Objects - Interest 43,827 43,827
Total Expenditures and Other Financing Uses 769,836 864,399 1,634,235
Excess (Deficiency) of Revenues and Other Financing Sources over (under) Expenditures and Other Financing Uses $ 1,424,983 $ (861,869) $ 563,114
84
Revised Authorized
Cost
$ 2,400,000 3,520
2,403,520
396,956 278,150
1,214,323 514,091
2,403,520
$

PROPRIETARY FUNDS

BELLEVILLE TOWNSHIP SCHOOL DISTRICT COMBINING STATEMENT OF NET POSITION FOR THE FISCAL YEAR ENDED JUNE 30, 2017
NOT APPLICABLE
COMBINING STATEMENT OF REVENUES, EXPENSES AND CHANGES IN NET POSITION
FOR THE FISCAL YEAR ENDED JUNE 30, 2017
NOT APPLICABLE
COMBINING STATEMENT OF CASH FLOWS FOR THE FISCAL YEAR ENDED JUNE 30, 2017
NOT APPLICABLE
85
EXHIBIT G-1
EXHIBIT G-2
EXHIBIT G-3

FIDUCIARY FUNDS
AGENCY FUNDS
I

BELLEVILLE TOWNSHIP SCHOOL DISTRICT FIDUCIARY FUNDS
COMBINING STATEMENT OF AGENCY ASSETS AND LIABILITIES AS OF JUNE 30,2017
Agency Student Activity Payroll
ASSETS
Cash $ 175,002 $ 422,461
Total Assets $ 175,002 $ 422,461
LIABILITIES
Due to Student Groups $ 175,002 Payroll Deductions and Withholdings $ 350,953 Due to Other Funds 71,508
Total Liabilities $ 175,002 $ 422,461
86
EXHIBIT H-1
Total
$ 597,463
$ 597,463
$ 175,002 350,953
71,508
$ 597,463

Elementary Schools: Summer Program
Middle School :
Senior High School:
Total All Schools
BELLEVILLE TOWNSHIP SCHOOL DISTRICT FIDUCIARY FUNDS
STATEMENT OF CHANGES IN FIDUCIARY NET POSITION
FOR THE FISCAL YEAR ENDED JUNE 30, 2017
FINANCIAL STATEMENTS ARE PRESENTED ON EXHIBIT B-8
AGENCY FUNDS STUDENT ACTIVITY AGENCY FUND
SCHEDULE OF RECEIPTS AND DISBURSEMENTS FOR THE FISCAL YEAR ENDED JUNE 30, 2017
Balance,
July 1, Cash Cash 2016 Receipts Disbursements
$ 4,785 $ 6,548 6,034
29,561 54,377 64,031
175,777 178,886 204,867
$ 210,123 $ 239,811 $ 274,932
87
EXHIBITH-2
EXHIBITH-3
Balance,
June 30, 2017
$ 5,299
19,907
149,796
$ 175,002

BELLEVILLE TOWNSHIP SCHOOL DISTRICT AGENCY FUNDS
PAYROLL AGENCY FUND >
STATEMENT OF CHANGES IN ASSETS AND LIABILITIES FOR THE FISCAL YEAR ENDED JUNE 30, 2017
Balance, Jnly 1, 2016 Increases Decreases
ASSETS
Cash and Cash Equivalents $ 194,728 $ 44,061,877 $ 43,834,144
Total Assets $ 194,728 $ 44,061,877 $ 43,834,144
LIABILITIES
Payroll Deductions and Withholdings $ 6,251 $ 18,567,312 $ 18,222,610 Accrued Salaries and Wages 25,429,771 25,429,771 Due to Other Funds 188,477 64,794 181,763
Total Liabilities $ 194,728 $ 44,061,877 $ 43,834,144
88
EXHIBITH-4
Balance, June 30,
2017
$ 422,461
$ 422,461
$ 350,953
71,508
$ 422,461

LONG-TERM DEBT

BELLEVILLE TOWNSHIP SCHOOL DISTRICT SCHEDULE OF SERIAL BONDS
FOR THE FISCAL YEAR ENDED JUNE 30, 2017
NOT APPLICABLE
89
EXHIBIT 1-1

BELLEVILLE TOWNSHIP SCHOOL DISTRICT SCHEDULE OF OBLIGATIONS UNDER CAPITAL LEASES AND LEASE-PURCHASE AGREEMENTS
FOR THE FISCAL YEAR ENDED JUNE 30,2017
Original Interest Balance,
Issue Rate July 1, 2016 Issued
CAPITAL LEASES
5 School Buses $ 452,873 2.63% $ 232,698 $
Roof Projects 1,025,000 3.92% 212,730
Trucks, MOwers and Technology 460,000 1.68% 93,769
Acquisition and Installation of Security System and Network Upgrades 1,950,000 1.12% 800,642
IP Integration Services and Network Cabling and Refreshing 3,323,512 2.189% 2,006,332
Boiler Replacement at School No. 8 and the Middle School 2,193,829 2.82% 2,193,829 $
$ 5,540,000 $ $
90
EXHIBIT I-2
Balance,
Retired June 30, 2017
55,804 $ 176,894
212,730
93,769
398,089 402,553
654,349 1,351,983
2,193,829
1,414,741 $ 4,125,259

BELLEVILLE TOWNSHIP SCHOOL DISTRICT DEBT SERVICE FUND
BUDGETARY COMPARISON SCHEDULE FOR THE FISCAL YEARS ENDED JUNE 30,2017
NOT APPLICABLE
91
EXHIBIT I-3

STATISTICAL SECTION
This part of the Belleville Township School District's comprehensive annual financial report presents detailed information as a context for understanding what the information in the financial statements, note disclosures, and required supplementary information says about the government's overall financial health.
Contents
Financial Trends
These schedules contain trend information to help the reader understand how the government's financial performance and well-being have changed
Exhibits
over time. J-1 to J-5
Revenue Capacity
These schedules contain information to help the reader assess the government's most significant local revenue source, the property tax.
Debt Capacity
These schedules present information to help the reader assess the affordability of the government's current levels of outstanding debt and the government's ability to issue additional debt in the future.
Demographic and Economic Information
These schedules offer demographic and economic indicators to help the reader understand the environment within which the government's financial activities take place.
Operating Information
These schedules contain service and infrastructure data to help the reader understand how the information in the government's financial report
J-6 to J-9
J-10 to J-13
J-14 and J-15
relates to the services the government provides and the activities it performs. J-16 to J-20
Sources: Unless otherwise noted, the information in these schedules is derived from the comprehensive annual financial reports for the relevant year.

EXHIBIT J-1 BELLEVILLE TOWNSHIP SCHOOL DISTRICT
NET POSITION BY COMPONENT LAST TEN FISCAL YEARS
(Unaudited) (accnwf basis of accounting)
Fiscal Year Ended JWJe 30, 2008 2009 2010 2011 2012 2013 2014 (l) 2015 2016 2017
Governmental activities Net Investment in Capital Assets $ 5,920,405 s 5,980,916 $ 6,103,240 $ 5,960,277 $ 5,476,606 $ 5,505,798 $ 5,513,725 $ 5,984,419 s 6,536,372 $ 7,066,551 Restricted 80,038 447,023 90,310 90,310 90,310 676,149 1,694,143 Unrestricted {2,280,400} (4,065,793) {4,374,982} {3,404,453} {2,179,1122 {2,667,763} (24,352,115} (23,203,444) {22,069,596} {22,621,063}
Total governmental activities net position $_ 3,720,043 $ 2,3gJ4_~ $ 1,818,568 _jl __ 2,646.134 $ 3,387 804 $ 2,838,035 $ UM~-~.}291 $ (17,219,025) $ J!4,857,075) ' (13,860,369)
Business"type activities Net Investment in Capital Assets $ 115,498 $ 98,679 s 134,953 $ 158,249 $ 139,998 $ 107,347 $ 79,214 $ 203,689 $ 144,244 $ 101,892 Restricted 100,937 156,596 234,957 310,712 413,791
~ Unrestricted 261,874 170,029 202,415 168,548 116.456 N Total business-type activities net position $ 216,435 $ 255,275 $ 369,910 $ 468,%1 $ 553.789 $ 369,221 $ 249,243 $ 406,1_~--- $ 312,792 s 218,348
District-wide Net Investment in Capital Assets $ 6,035,903 $ 6,079,595 $ 6,238,193 $ 6,ll8,526 $ 5,616,604 $ 5,613,145 s 5,592,939 $ 6,188,108 $ 6,680,616 $ 7,168,443 Restricted 180,975 603,619 325.267 401,022 504,101 676,149 1,694,143 Unrestricted f2,280,400) {4,065,7932 {4,374,982! (3,404,453} [2,179,112) (2,405,889} f24,182,086} {23,001,029} {21,901,048) {22,504,6072
Total district net position $ 3,936,478 $ 2,617,421 $ 2,188,478 $ 3,115,095 $ 3,941,593 $ 3,207,25§_ $ (18,589,147) $ (16,8I.?,nJ1 s (14,544,283) $ (13,642,021)
Note I- Net Position at June 30,1014 is restated to reflect the implementation ofGASB No. 68, "Accounting and Financial Reporting for Pensions".

EXHffiiT J-2 BELLEVU..LE TOWNSHIP SCHOOL DISTRICT
CHANGES IN NET POSITION LAST TEN F1SCAL YEARS
(Unaudited) (accrual basis of accaunting)
Fiscal Year Ended June 30,
__1QQ§, 2009 2010 2011 2012 2013 2014 2015 2016 2017
Expenses Governmental Activities
Instruction Regular $ 26,331,126 $ 25,614,309 $ 28,820,781 $ 26,803,278 $ 26,803,278 $ 28,096,259 $ 29,359,361 $ 31,848,519 $ 33,204,564 $ 37,115,854
Special Education 5,628,654 5,694,473 5,774,871 6,475,254 6,475,254 11,247,415 14,259,892 14,795,513 14,015,994 15,165,972
Other Education 2,268,857 3,424,402 3,199,050 3,428,171 3,428,171 3,490,781 2,696,274 2,992,762 3,711,081 4,457,171
School Sponsored Activities and Athletics 1,037,391 1,058,623 1,074,939 752,773 752,773 858,266 901,700 939,711 942,304 1,125,987
Community Services 854
Support Services: Tuition 3,258,755 3,335,392 3,337,206 2,808,929 4,056,220
Student & Instruction Related Services 7,775,806 8,254,068 8,646,165 8,703,081 8,046,007 8,466,757 8,242,412 9,153,952 9,317,872 10,249,971
General Administrative Services 2,142,171 2,221,811 2,302,139 2,264,597 2,385,665 2,300,841 1,739,238 2,142,876 2,737,192 2,305,809
School Administrative Services 4,154,928 4,329,659 4,361,647 3,911,559 4,301,275 4,612,201 5,404,032 4,435,456 6,331,181 7,664,156
Central Administrative Services 1,314,961 1,652,492 1,687,127 1,813,496
Plant Operations and Maintenance 5,508,039 5,352,901 5,401,538 5,473,863 5,526,539 6,035,508 7,725,157 5,635,419 6,350,149 6,853,846
Pupil Transportation 2,372,323 2,545,750 2,584,583 2,443,239 2,650,853 2,798,546 3,364,058 3,527,897 3,048,329 2,946,159
Special Schools 84,465 107,962 Chaner Schools 882 19,910 13,881 76,130
Unallocated Depreciation 463,278 462,081 408,581 411,836 394,881 640,723
Interest on Long T enn Debt 79 305 88 069 108 879 115,860 Total Governmental Activities Expenses 61,026,675 62,401,431 65,931,410 63,490.461 64,897,900 68,547,297 75,086,390 77,212,666 8].454,672 89,814,281
Business-Type Activities: Food service 1,647,043 1,745,759 1,814,275 1 850 369 2 053,616 2,069,270 2,128,248 2,114,192 2 ll5,354 2,174,321
Total Business-Type Activities Expense 1,647,043 1,745,759 1 814 275 1 850,369 2,053 616 2,069,270 2,128,248 2,ll4,192 2,ll5,354 2,174,321 Total District Expenses $ 62,673,718 $ 64,147,190 $ 67,745,685 $ 65,340,830 $ 66,951,516 $ ?Q.~I6,567 $ ?7,214,§38 $ 79,326,858 $ 83,570,026 $ 91,988,602
Program Revenues Governmental Activities:
Charges for Services 35,448 151,999 230,509 181,435
Operating Grants and Contributions 9,847,957 4,352,348 5,619,617 6,068,699 5,492,802 8,800,769 11,453,747 19,446,982 23,332,011 29,122,236
Capital Grants and Contributions 5 657 8 697 87 646 154 984
Total Governmental Activities Program Revenues 9,847,957 4,352,348 5,619,617 6,068,699 5,492,802 8,800,769 11,494,852 19,607,678 23,650,166 29,458,655
93

EXHffiiT J-2 BELLEVILLE TOWNSHIP SCHOOL DISTRICT
CHANGES IN NET POSITION LAST TEN FISCAL YEARS
(Unaudited) (accrual basis of accouming)
Fiscal Year Ended June 30, 2008 __1QQ2_ 2010 2011 2012 2013 2014 2015 2016 2017
Business-Type Activities: Charges for Services
Food Service s 725,809 s 734,506 $ 700,377 $ 657,873 $ 655,259 s 613,357 $ 706,289 s 673,996 $ 666,206 s 650,743
Operating Grants and Contributions 657,307 805,502 976,316 1 022 207 1206,613 1,271,126 1 301 807 1,337,727 1,355,359 1 428 598 Total Business Type Activities Program Revenues 1,383,116 1 540,008 1,676,693 1 680 080 1 861,872 1,884,483 2 008 096 2,011 723 2 021,565 2079341 Total District Program Revenues $ 11,231,07:!_ $ 5,892,356 $ 7,296,31Q_ $ _7318,779 $ 7,354,674 $ 10,685,252 -~ _1}_,502,91!_ $ 21,619,401 $ 25,1)_7_1_,_?}1 $ - :)_1,537,9%
Net (Expense)/Revenue Governmental Activities $ (51,178,718) $ (58,049,083) s (60,311,793) $ (57,421,762) $ (59,405,098) $ (59,746,528) $ (63,591,538) $ (57,604,988) $ (57,804,506) $ (60,355,626)
Business-Type Activities {263,927} (205,751} (137,582} {170,2892 (191,744} {184,787} (120,1522 (102,469} (93,789} !94,980} Total District-Wide Net Expense s (51,442,645) $ (58,254,834) s (60,449,375) _J (,5?,_?2~,9_?_1)_ $ (59,596,842) $ (59,931,315) $ (63,711,690) $ (57,707,457) s (57,898,295) $ (60,450,606)
General Revenues and Other Changes in Net Position Governmental Activities:
Property Taxes Levied for General Purposes $ 31,691,984 31,691,984 31,691,984 32,959,663 $ 32,959,663 $ 32,959,663 s 34,177,243 $ 36,249,715 $ 37,665,506 $ 38,667,832
Unrestricted Grants and Contributions 19,013,428 25,102,296 28,047,188 25,587,305 27,269,440 26,074,345 22,253,116 22,982,748 22,214,027 22,523,414
Restricted Grants and Contributions 13,245 439,295 69,485
Tuition Received 117,413 93,616 94,998 61,355 26,699 Investment Earnings 20,915 14,473 16,266 8,586 4,900 Miscellaneous Income 211,544 104,955 156,407 175,589 171,780 93,266 91,045 113,690 286,923 161,086 Capital Assets Retired Net of Accumulated Depreciation (71,845) (56,000) (9,329) State Aid Receivable Cancelled Transfers (275,0002 £244,293} (251,872} £269,014} £276,383} (105,000}
Total Governmental Activities so 780 284 56,691,186 59,768,216 58,906,779 60,146,770 59,1%,759 56,521,404 59,241,153 60,166,456 61,352,332
Business-Type Activities: Investment Earnings 186 298 345 326 189 219 174 176 477 536 Transfers 275,000 244,293 251,872 269 014 276,383 105,000
Total Business-Type Activities 275,186 244,591 252,217 269,340 276,572 219 174 !05,176 477 536 Total District-Wide $ 51,055,470 $ 56,935,777 $ 60,020,433 $ 59,176,119 $ 60,423,342 $ 59,196,978 $ 56,521,578 $ 59,346,329 $ 60,166,933 $ 61,352,868
Change in Net Position Governmental Activities $ (398,434) $ (1,357,897) $ (543,577) $ 1,485,017 $ 741,672 $ (549,769) $ (7,070,134) $ 1,636,165 $ 2,361,950 $ 996,706
Business-Type Activities 11259 38 840 114 635 99,051 84 828 {184,568} (] 19,978) 2,707 (93,312} (94,444) Total District $ (387,175) $ (1,319,057) $ (428,942) $ 1_,~~:1-_,Q()~ $ 826,500 $ (734,337) _$ Q,]90,11?) $ 1,638,872 $ 2,268,638 $ 902,262
94

~
BELLEVILLE TOWNSHIP SCHOOL DISTRICT FUND BALANCES- GOVERNMENTAL FUNDS
LAST TEN FISCAL YEARS (Unaudited)
(modified accrual basis of accounting)
Fiscal Year Ended June 30,
2008 2009 2010 2011 2012
General Fund
Reserved $ 478,332 $ 1,288,262 $ 562,265
Unreserved 189,432 (1,775,829) (1,719,713)
Restricted Committed Assigned ' 1,066,348 $ 1,783,404
Unassigned (1,753,025) {1,262,908)
Total General Fund ' 667,764 ' (487,567) $ (1,157,448) $ (686,677) ' 520,496
All Other Governmental Funds Reserved $ 463,508
Unreserved, Reported in: Special Revenue Fund (68,268)
Capital Projects Fund Restricted for:
Capital Projects Fund
Total all other governmental funds $ 395,240 $ $ $ $
Beginning with Fiscal Year 2011, the District implemented GASB Statement No. 54, "Fund Balance Reporting and Governmental Type Definitions." The Statement provides more clearly defined fund balance categories to make the nature and extent of the constraints placed on a government's fund balance more transparent This Statement established fund balance classifications that comprise a hierarchy based primarily on the extent to which a government is bound )o observe constraints imposed upon the use of resources reported in governmental funds. Reclassification of prior year fund balance amounts
to comply with Statement No. 54 is not required
2013
$ 4ll,044 (1,640,025)
$ 0.228,981)
898,000
$ 898,000
EXHIBIT J-3
2014 2015 2016 2017
$ 676,149 $ 1,579,805
$ 584,066 $ 551,059 %6,275 893,042 (6,920,154) (1,981,773) (1,863,401) (1,845,705)
$ (6,336,088) $ (1,430,714) $ (220,977) ' 627,142
148,543 1,308,242 1,650,496 755,108
$ 148,543 $ 1,308,242 $ 1,650,496 $ 755,108

EXHIBIT J-4 BELLEVILLE TOWNSHIP SCHOOL DISTRICT
CHANGES IN FUND BALANCES- GOVERNMENTAL FUNDS, LAST TEN FISCAL YEARS
(Unaudited) (modified accrual basis of accounting)
For Fiscal Year Ended June 30,
2008 2009 2010 2011 2012 2013 2014 2015 2016 2017
Revenues Tax Levy $ 31,691,984 $ 31,691,984 $ 31,691,984 $ 32,959,663 $ 32,959,563 $ 32,959,663 $ 34,177,243 $ 36,249,715 $ 37,665,506 $ 38,667,832
Tuition 117,413 93,616 94,998 61,355 26,899 21,168 151,649 230,509 181,435
Transportation Fees 14,280 350
Interest Earnings Miscellaneous 231,254 ll9,132 171,238 183,586 176,528 93,266 116,401 144,339 286,276 187,963
State Sources 26,812,714 27,134,103 26,263,729 27,766,521 29,273,069 32,400,542 31,221,147 33,369,666 33,425,734 34,601,723
Federal Sources 2,004,072 2,287,492 7,394,317 4,312,478 3,460,554 2,474,572 2,466,017 2,304,352 3,182,483 2,747,104
Private Sources 44,599 33,048 2?,004 16,300 28,618 69,485
Total revenue 60,902,036 61,359,375 65,638,270 65,299,903 65,925,231 67,997,528 68,016,256 72,220,071 74,790,508 76,386,057
Expenditures Instruction
Regular Instruction 19,297,777 19,560,995 21,509,273 20,320,443 19,258,186 20,455,246 28,237,321 27,736,394 27,776,518 28,746,500
Special Education Instruction 3,973,777 4,242,045 4,144,156 4,441,093 4,513,484 9,665,269 13,886,060 13,859,517 12,883,573 13,153,460
Other Instruction 1,594,166 2,538,582 2,282,075 2,337,533 2,375,586 2,463,787 2,589,920 2,593,607 3,125,208 3,427,976
School Sponsored Activities and Athletics 786,142 833,596 815,271 650,230 570,048 663,163 871,950 922,027 909,795 1,042,918
Community Service Programs 854 Support Services:
Instruction- Tuition 3,258,755 3,335,392 3,337,206 2,808,929 4,056,220
Student & Inst. Related Services 6,062,149 6,543,789 6,788,699 6,905,529 6,197,196 6,405,219 7,963,690 8,183,981 8,081,925 8,330,889
General Administrative 1,702,703 2,085,684 2,665,188 2,171,704
School Administrative Services 2,940,062 3,227,418 3,150,046 2,793,659 3,000,652 3,305,995 5,194,945 3,973,916 5,471,386 6,030,603
Central Administrative Services 1,280,768 1,523,341 1,624,441 1,702,511
Other Administrative Services 1,657,267 1,803,518 1,831,341 1,844,179 1,918,343 2,229,402
Operations and Maintenance 4,518,468 4,522,597 4,427,767 4,406,715 4,376,102 4,762,829 7,500,158 5,368,915 5,981,135 5,866,137
Pupil Transportation 1,995,413 2,204,730 2,210,292 2,064,803 2,262,663 2,514,617 3,291,038 3,477,562 2,917,804 2,766,544
Unallocated Benefits 13,930,329 12,792,767 14,286,043 14,837,925 15,320,377 16,6l1,562
Special Schools 84,465
Transfer to Charter Schools 882 107,962 19,910 13,881 76,130
Debt Service Principal 375,339 734,819 1,490,947 1,916,388 1,830,984
Interest 54,313 82,028 107,605 111,972
Capital Outlay 545,333 801,263 713,785 522,994 97,287 1,334,449 2,751,170 2,238,017 1,971,380 1,251,128
Total Governmental Fund Expenditures 60,644,985 62,514,654 65,515,864 63,947,913 64,023,128 70,786,877 76,058,855 73,535,936 75,432,346 76,433,326
Excess (Deficiency) of revenues over (under) expenditures 257,051 (1,155,279) 122,406 1,351,990 1,902.103 (2,789,349) (8,042,599) (1,315,865) (641,838) (47,269)
96

EXHIBIT J-4 BELLEVILLE TOWNSHIP SCHOOL DISTRICT
CHANGES IN FUND BALANCES- GOVERNMENTAL FUNDS, LAST TEN FISCAL YEARS
(Unaudited) (modified accrnol basis of accounting)
For Fiscal Year Ended June 30, ----2008 2009 2010 2011 2012 2013 2014 2015 2016 ---,-017
Other Financing sources (uses) Capital Leases (Non-Budgeted) $ 1,937,873 $ 2,186,035 $ 3,323,512 s 2,193,829 $
Transfers in $ 148,551 $ 33,015 356,713 Transfers out (586,720) (428,306) (1,149,001) $ (881,220) s (694,930) (105,000) State Aid Cancelled State Aid Advance Loan Proceeds 4,162,426
Total other financing sources (uses) (438,169~ (395,291) (792,288) ~881,220) (694,930} 1,937,873 2,186,035 7,380,938 2,193,829
Net change in fund balances s (181,118) $ (1,550,570) s (669,882) s 470,770 $ 1,207,173 $ (851,476) $ (5,856,564) $ 6,065,073 $ 1,551,991 $ (47,269)
Debt service as a percentage of noncapital expenditures 0.00% 0.00% 0.00% 0.00% 0.00% 0.54% 1.08% 2.21% 2.76% 2.58%
* Noncapital expenditures are total expenditures less capital outlay.
97

EXHIBIT J-5
BELLEVILLE TOWNSHIP SCHOOL DISTRICT GENERAL FUND OTHER LOCAL REVENUE BY SOURCE
LAST TEN FISCAL YEARS (Unaudited)
Fiscal Year Interest Voided Ended Transportation on Gate Miscellaneous Outstanding Other
June 30, Tuition Fees Investments Receipts Fees Refunds Checks Misc. Total
2008 $ 117,413 $ 13,989 $ 20,529 $ 154,616 $ 306,547
2009 93,616 10,403 14,177 65,367 183,563
"' 2010 94,998 18,030 16,112 111,520 240,660 00
2011 61,355 19,095 8,427 111,181 200,058
2012 26,699 28,647 4,848 113,750 173,944
2013 9,683 62,760 72,443
2014 21,168 14,280 7,892 $ 11,087 37,228 $ 34,723 126,378
2015 151,649 350 10,047 79,568 23,670 265,284
2016 230,509 850 12,454 $ 9,423 8,342 126,738 84,144 42,318 514,778
2017 181,435 19,086 $ 8,538 6,301 35,860 87,261 338,481

Fiscal Year
Ended June 30, Vacant Land
2008 $ 62,586,000 2009 63,067,000 2010 59,270,400 2011 81,072,280 2012 46,700,780 2013 44,590,880 2014 42,638,180 2015 43,391,480 2016 51,164,380 2017 41,897,880
Source: County Abstract ofRatables
a Tax rates are per $100
Residential
s 2,545,600,800 2,567,684,702 2,504,842,452 2,078,775,000 2,045,375,500 1,994,921,600 1,989,920,400 1,989,053,050 1,990,272,550 1,993,404,400
Qfann
BELLEVILLE TOWNSHIP SCHOOL DISTRICT ASSESSED VALUE AND ACfUAL VALUE OF TAXABLE PROPERTY
LAST TEN YEARS (Unaudited)
Commercial Industrial Apartment
$ 339,804,000 $ !67,937,700 s 281,739,200 334,527,700 167,707,000 261,608,800 324,554,350 146,289,900 245,014,600 309,523,000 159,276,850 235,705,600 299,717,800 136,380,450 213,775,750 294,635,600 133,782,550 213,202,050 301,318,400 13!,609,250 213,90!,650 300,728,800 129,236,250 219,413,050 301,983,200 123,162,150 212,165,950 296,131,350 128,147,550 209,359,250
99
EXHIBIT J-6
Estimated Actual Total Direct
Total Assessed Net Valuation (County Equalized) School Tax
Value Public Utilities Taxable Value Rate'
$ 3,397,667,700 $ 4,200,950 $ 3,401,868,650 $ 3,643,093,779 $ 0.932
3,394,595,202 4,200,950 3,398,796,152 3,718,167,748 0.933 3,279,971,702 4,056,500 3,284,028,202 3,567,135,218 1.004
2,864,352,730 8,314,100 2,872,666,830 3,503,942,829 1.160
2,741,950,280 6,458,076 2,748,408,356 2,982,890,760 1.199 2,681,132,680 6,186,500 2,687,319,180 2,918,535,288 1.272 2,679,387,880 5,589,772 2,684,977,652 2,850,879,126 1.350
2,681,822,630 5,591,772 2,687,414,402 2,799,204,926 1.402
2,678,748,230 5,912,200 2,684,960,430 2,781,981,547 1.440 2,668,940,430 6,505,628 2,675,446,058 2,719,414,127 1.486

Calendar Year
2008 2009 2010 2011 2012 2013 2014 2015 2016 2017
EXHIBIT J-7 BELLEVILLE TOWNSHIP SCHOOL DISTRICT
DIRECT AND OVERLAPPING PROPERTY TAX RATES LAST TEN YEARS
(Unaudited) (rate per $100 of assessed value)
Total Direct School Tax
Rate
Belleville Local School
District
$ 0.932 0.933 !.004 1.160 1.199 !.272 !.350 1.402 1.440 1.486
Overlapping Rates
Municipality of Belleville County of Essex
$ 1.103 $ 0.416 1.104 0.427 1.262 0.441 !.504 0.538 !.598 0.491 1.678 0.530 !.708 0.547 !.765 0.537 !.850 0.544 1.867 0.524
Total Direct and Overlapping Tax
Rate
$ 2.451 2.464 2.707 3.202 3.288 3.480 3.605 3.704 3.834 3.877
Source: Municipal Tax Collector
100

EXHIBIT ,J-8
BELLEVILLE TOWNSHIP SCHOOL DISTRICT PRINCIPAL PROPERTY TAXPAYERS,
LAST YEAR AND NINE YEARS AGO
(Unaudited)
2017 2008 Taxable o/oofTotal Taxable %ofTotal Assessed District Net Assessed District Net
Taxpayer Value Assessed Value Value Assessed Value
Branch Brook Garden $ 36,722,900 1.37% $ 42,007,500 1.24%
Clara Maass Health Systems 23,521,600 0.88% 16,312,800 0.48%
432 Owners, Inc 17,250,000 0.64% Route 21 Assoc of Belleville LLC 14,435,000 0.54% 22,115,000 0.65%
Belleville Industrial Center C/0 Heron 12,505,600 0.47% 17,539,100 0.52%
Oster Belleville Properties LLC I 1,405,000 0.42% 11,405,000 0.34%
Belleville Center LLC 10,804,200 0.40% 12,052,300 0.35%
SROA Belleville Property LLC 9,797,700 0.36%
SH726 LLC 7,900,000 0.29% Venture, Draisin~Levco Blville Assoc 7,661,500 0.29%
Belleville Industrial Properties Bldg 12 0.00% I 1,695,300 0.34%
Arbor Hills 0.00% 33,000,000 0.97%
Rouche Diagnostics 0.00% 29,856,100 0.88%
K-Mart 0.00% 10,745,100 0.32%
$ 91,759,000 3.42% $ 206,728,200 6.08%
Source: Municipal Tax Assessor
N/ A ~Not Available
101

Fiscal Year
Ended June 30,
2008 2009 2010 2011 2012 2013 2014 2015 2016 2017
BELLEVILLE TOWNSHIP SCHOOL DISTRICT PROPERTY TAX LEVIES AND COLLECTIONS
LAST TEN FISCAL YEARS (Unaudited)
Collected within the Fiscal Year of the Levy Collections in
Taxes Levied for Percentage Subsequent the Fiscal Year Amount of Levy Years
$ 31,691,984 $ 31,691,984 100.00% 31,691,984 31,691,984 100.00% 31,691,984 31,691,984 100.00% 32,959,663 32,959,663 100.00% 32,959,663 32,959,663 100.00% 32,959,663 32,959,663 100.00% 34,177,243 34,177,243 100.00% 36,249,715 36,249,715 100.00% 37,665,506 37,665,506 100.00% 38,667,832 38,667,832 100.00%
102
EXHIBIT J-9

BELLEVILLE TOWNSHIP SCHOOL DISTRICT RATIOS OF OUTSTANDING DEBT BY TYPE
LAST TEN FISCAL YEARS (Unaudited)
Governmental Activities
Lease Purchase
EXHIBIT J-10
Fiscal Year
Ended June 30, Capital Leases Agreements Total District Population Per Capita
2008 2009 2010 2011 2012 2013 2014 2015 2016 2017
$
Source: District records
40,277 12,195 3,113
1,937,873 2,815,293 4,731,651 5,540,000 4,125,259
$ 198,458 114,665
$ 40,277 12,195 3,113
1,937,873 3,013,751 4,846,316 5,540,000 4,125,259
103
33,820 33,755 33,842 35,924 36,062 36,048 36,155 36,291 36,354 36,203
$ 1.19 0.36 0.09
53.76 83.36
133.54 152.39 113.95

Fiscal Year
Ended June30,
2005 2006 2007 2008 2009 2010 2011 2012 2013 2014
BELLEVILLE TOWNSHIP SCHOOL DISTRICT RATIOS OF NET GENERAL BONDED DEBT OUTSTANDING
LAST TEN FISCAL YEARS (Unaudited)
General Bonded Debt Outstanding
General Obligation Bonds Deductions
$
Net General Bonded Debt Outstanding
Percentage of Actual Taxable
Value" of Property
Source: District records
104
EXHIBIT J-11
Per Capita

EXHIBIT J-12 BELLEVILLE TOWNSHIP SCHOOL DISTRICT
DIRECT AND OVERLAPPING GOVERNMENTAL ACTIVITIES DEBT AS OF DECEMBER 31, 2016
(Unaudited)
Total Debt
Municipal Debt: (1) Belleville Township School District $ Township of Belleville 26,851,866
26,851,866
Overlapping Debt Apportioned to the Municipality: Essex County:
County of Essex (A) 14,231,252
Passaic Valley Sewerage Authority (B) 5,437,249
Total Overlapping Debt 19,668,501
Total Direct and Overlapping Debt $ 46,520,367
Source: (I) Township's 2016 Annual Debt Statement
(A) The debt for this entity was apportioned to the municipality by dividing the municipality's 2016 equalized value by the total2016 equalized value for Essex County. (B) The debt was computed based upon municipal flow to the Authority.
105
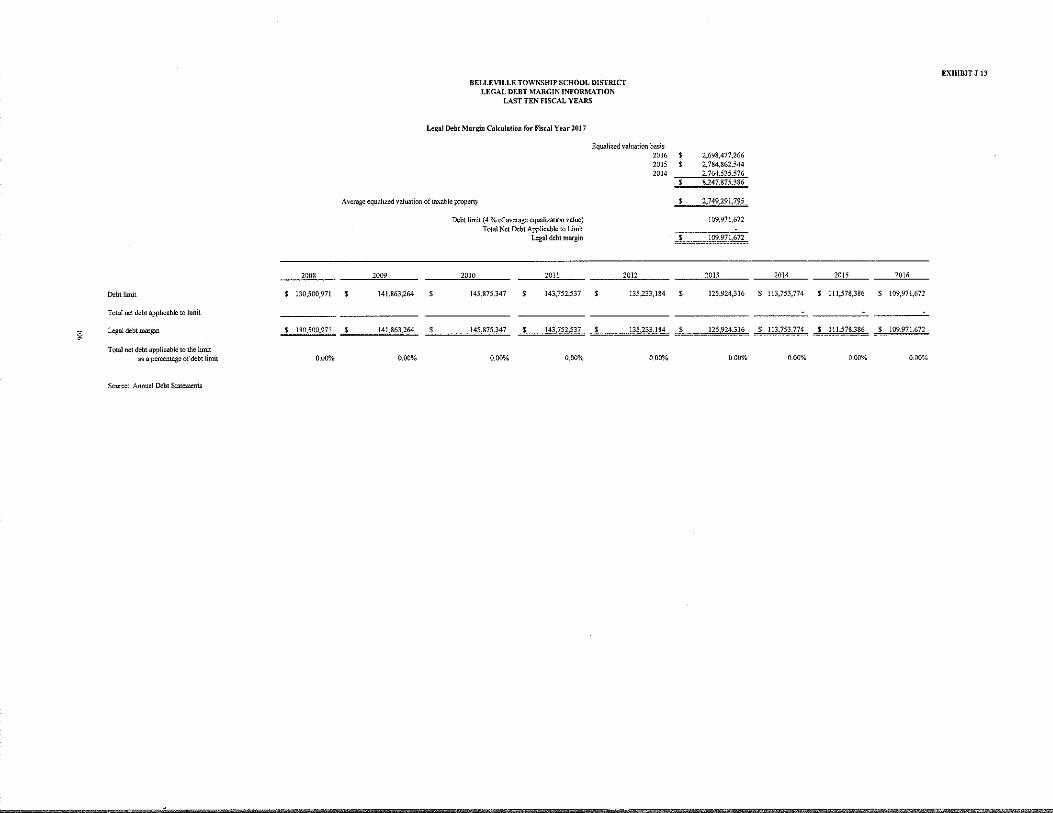
g
O.:btlimit
Total net debt applicable to limit
Legal debt margin
Total net debt applicable to the limit as a percentage of debt limit
Source: Annual O.:bt Statements
2008
130,500,971
$ 130,500.971
0.00"/,
BELLEVILLE TOWNSHIP SCHOOL DISTRICT LEGAL DEBT MARGIN INFORMATION
LAST TEN FISCAL YEARS
Legal Debt Margin Calculation for Fiscal Year 2017
Equalized valuation basis 2016 $ 2,698,477,266 2015 $ 2.784,862,544 2014 2.764.535.576
$ 8.247,875.386
A veragc equalized valuation of ta-..:able property 2.749.291.795
2009
141,863,264
141.863.264
0.00%
Debt limit (4% of average cqualiz.ation value) Total Net O.:btApplicable to Limit
Legal debt margin
2010 2011
145,875,347 s 143,752.537
145,875,347 143,752,537
0.00% 0.00%
109,971,672
109.971,672
2012 2013
135,233,184 s 125,924,316
135.233.184 125,924.316
0.00% 0.00%
EXHIBIT J~t3
2014 2015 2016
113,753,774 lll,578,386 s 109,971,672
113.753.774 111.578386 109.971.672
0.00% 0.00% 0.00%

Year
2008 2009 2010 2011 2012 2013 2014 2015 2016 2017
BELLEVILLE TOWNSHIP SCHOOL DISTRICT DEMOGRAPHIC AND ECONOMIC STATISTICS
LAST TEN FISCAL YEARS (Unaudited)
Per Capita Population Personal Income
33,820 $ 49,158 33,755 51,568 33,842 53,136 35,924 51,288 36,062 52,324 36,048 55,014 36,155 55,404 36,291 5,569 36,354 58,319 36,203 60,030
Source: New Jersey State Department of Education
(E) - Estimate
107
EXHIBIT J-14
Unemployment Rate
6.30% 10.70% 11.10% 10.70% 10.80% 9.50% 7.90% 6.30% 5.40% (E) 5.40% (E)

Employer
BELLEVILLE TOWNSHIP SCHOOL DISTRICT PRINCIPAL EMPLOYERS,
CURRENT YEAR AND NINE YEARS AGO (Unaudited)
2017
Employees
Percentage of Total
Municipal Employment
INFORMATION IS NOT AVAILABLE
108
Employees
EXHIBIT J-15
2008
Percentage of Total
Municipal Employment

EXHIBIT J-16 BELLEVILLE TOWNSHIP SCHOOL DISTRICT
FULL-TIME EQUIVALENT DISTRICT EMPLOYEES BY FUNCTION/PROGRAM LAST TEN FISCAL YEARS
(Unaudited)
2008 2009 2010 2011 2012 2013 2014 2015 2016 2017
Function/Prol!ram
Instruction Regular 257.0 243.0 241.0 230.0 242.0 327.0 249.0 270.0 293.0 238.0 Special Education 91.0 90.0 88.0 83.0 84.0 45.0 144.0 138.0 45.0 70.0 Other Special Education 41.0 40.0 36.0 36.0 40.0 28.0 29.0 29.0 44.0 104.0 Other Instruction 1.0 1.0 1.0 1.0 1.0 1.0 1.0
Support Services: Student and Instruction Related Services 68.0 77.0 68.0 74.0 57.0 56.0 69.0 67.0 33.0 51.0 General Administrative Services 5.0 5.0 5.0 7.0 6.0 5.0 5.0 5.0 5.0 11.0 School Administrative Services 34.0 34.0 34.0 29.0 32.0 27.0 39.0 42.0 21.0 17.0 Central Services 7.0 7.0 6.0 6.0 6.0 8.0 6.0 7.0 7.0 10.0 Administrative Information Technology 5.0 5.0 5.0 3.0 2.0 1.0 1.0 1.0 4.0 3.0 Plant Operations and Maintenance 40.0 40.0 40.0 38.0 42.0 59.0 50.0 47.0 36.0 39.0 Pupil Transportation 18.0 20.0 18.0 2.0 2.0 15.0 36.0 35.0 15.0 14.0 Other Support Services 1.0 18.0 23.0 23.0 16.0 15.0
Total 568.0 562.0 542.0 509.0 513.0 589.0 652.0 665.0 520.0 572.0
Source: District Personnel Records
N!A- Infonnation is not available.
109

Operating Cost Per Percentage Fiscal Year Enrollment • ExEenditures b PuEil" Change
2008 4,435 $ 60,099,652 $ 13,551 4.41% 2009 4,531 61,713,391 13,620 0.51% 2010 4,552 61,813,462 13,579 -0.30% 2011 4,626 63,424,919 13,711 0.97% 2012 4,705 64,023,128 13,607 -0.75% 2013 4,638 69,077,090 14,894 9.45% 2014 4,650 72,518,553 15,595 4.71% 2015 4,761 69,724,944 14,645 -6.09"/o 2016 4,642 71,436,973 15,389 -1.32% 2017 4,587 73,239,242 15,967 9.02%
Sources: District records
Note: a Enrollment based on annual October district count b Operating expenditures equal total expenditures less debt service and capital outlay.
Cost per pupil represents operating expenditures divided by enrollment.
NIA • lnform•ti<m not a,,.j]able
BELLEVILLE TOWNSHIP SCHOOL DISTRICT OPERATING STATISTICS
Teaching
LAST TEN FISCAL YEARS (Unaudited)
Teacher/Pupil Ratio
Sbff Elementary Middle School High School
338 23.6 15.4 15.7 346 17.0 12.0 11.3 364 17.0 11.0 10.7 312 17.3 13.6 12.1 337 !5.4 12.6 12.3 328 12.3 11.9 11.9 342 12.3 16.3 13.7 342 12.6 16.9 13.4 338 14.0 13.8 12.3 342 14.2 14.0 12.7
Average Daily Enrollment (ADE)
4,410.8 4,459.3 4,491.9 4,554.7 4,648.9
NIA 4,430.8 4,666.1 4,593.4 4,464.6
EXHffilT J-17
Average Daily %Change in Student Attendance Average Daily Attendance
(ADA) Enrollment Percentage
4,220.1 -0.93% 95.68% 4,181.7 l.IO% 93.77% 4,209.1 0.73% 93.70"h 4,265.8 1.40% 93.66% 4,387.2 2.07% 94.37%
NIA NIA NIA 4,428.5 NIA 99.95% 4,461.4 5.31% 95.61% 3,977.8 -1.56% 86.60% 4,047.9 -2.80% 90.67%

EXHIBIT J-18
BELLEVILLE TOWNSHIP SCHOOL DISTRICT SCHOOL BUILDING INFORMATION
LAST TEN FISCAL YEARS (Unaudited)
2008 2009 2010 2011 2012 2013 2014 2015 2016 2017
District Building
Elementarv School Three
Square Feet 43,852 43,852 43,852 43,852 43,852 43,852 43,852 42,852 42,852 42,852
Capacity Students 299 299 299 299 299 299 299 299 299 299
Enrollment 340 379 379 379 379 388 342 341 338 306
School Four Square Feet 64,647 64,647 64,647 64,647 64,647 64,647 64,647 64,647 64,647 64,647
Capacity Students 434 434 434 434 434 434 434 434 434 434
Enrollment 369 364 382 382 382 410 368 374 360 349
School Five Square Feet 44,434 44,434 44,434 44,434 44,434 44,434 44,434 44,434 44,434 44,434
Capacity Students 333 333 333 333 333 333 333 333 333 333
Enrollment 386 401 393 393 393 413 339 347 308 328
School Seven Square Feet 52,030 52,030 52,030 52,030 52,030 52,030 52,030 52,030 52,030 52,030
Capacity Students 387 387 387 387 387 387 387 387 387 387
Enrollment 379 342 383 383 383 378 364 370 396 388
School Eight Square Feet 41,283 41,283 41,283 41,283 41,283 41,283 41,283 41,283 41,283 41,283
Capacity Students 430 430 430 430 430 430 430 430 430 430
Enrollment 490 524 533 533 533 542 465 447 430 430
School Nine Square Feet 16,167 16,167 16,167 16,167 16,167 16,167 16,167 16,167 16,167 16,167
Capacity Students 158 158 158 158 158 158 158 158 158 158
Enrollment 147 152 141 141 141 156 119 114 116 127
School Ten Square Feet 24,401 24,401 24,401 24,401 24,401 24,401 24,401 24,401 24,401 24,401
Capacity Students 169 169 169 169 169 169 169 169 169 169
Enrollment 148 167 184 184 184 214 166 163 148 166
111

EXHIBIT J-18 BELLEVILLE TOWNSHIP SCHOOL DISTRICT
SCHOOL BUILDING INFORMATION LAST TEN FISCAL YEARS
(Unaudited)
2008 2009 2010 2011 2012 2013 2014 2015 2016 2017
District Building:
Middle School Square Feet 148,552 148,552 148,552 148,552 148,552 148,552 148,552 148,552 148,552 148,552
Capacity Students 639 639 639 639 639 639 639 639 639 639 Enrollment 687 683 708 708 708 667 1,046 1,046 1,024 974
High School Square Feet 208,454 208,454 208,454 208,454 208,454 208,454 208,454 208,454 208,454 208,454
Capacity Students 1,474 1,474 1,474 1,474 1,474 1,474 1,474 1,474 1,474 1,474
Enrollment 1,495 1,453 1,454 1,454 1,454 1,443 1,510 1,460 1,404 1,388
Other School One
Square Feet 33,512 33,5!2 33,512 33,512 33,512 Garage Middle School Square Feet 465 465 465 465 465 465 465 465 465 465
FieldHouse Square Feet 1,080 1,080 1,080 1,080 1,080 1,080 1,080 1,080 1,080 1,080
Field House Square Feet 1,080 1,080 1,080 1,080 1,080 1,080 1,080 1,080 1,080 1,080
Plant Building Square Feet 3,000 3,000 3,000 3,000 3,000 3,000 3,000 3,000 3,000 3,000
Nwnber of Schools at June 30,2017 Elementary 7 Middle School High School Other d
12
Source: District Records
112

EXHIBIT J-19
BELLEVILLE TOWNSHIP SCHOOL DISTRICT GENERAL FUND
SCHEDULE OF REQUIRED MAINTENANCE FOR SCHOOL FACILITIES LAST TEN YEARS
(Unaudited)
UNDISTRIBUTED EXPENDITURES- REQUIRED MAINTENANCE FOR SCHOOL FACILITIES 11-000-261-XXX
2008 2009 2010 2011 2012 2013 2014 2015 2016 2017
School Facilities
School Three $ 74,464 $ 36,702 $ 29,035 $ 81,151 $ 94,660 $ 90,411 $ 115,324 $ 76,151 $ 65,827 $ 71,216
School Four 44,233 20,821 43,851 29,228 104,830 74,583 95,135 62,820 54,303 58,749
School Five 37,439 38,130 78,430 105,709 53,009 51,547 65,751 43,417 37,531 40,603 :;:; School Seven 96,599 42,395 62,067 111,017 47,811 95,438 121,736 80,385 69,487 75,175
School Eight 80,842 75,102 83,178 153,380 80,265 102,985 131,363 86,742 74,982 81,120
School Nine 24,377 39,546 10,097 13,336 101,867 63,923 81,537 53,841 46,541 50,351
School Ten 87,402 70,626 19,191 99,919 48,564 42,567 54,297 35,854 30,993 33,530
Middle School 290,513 124,669 81,592 111,740 137,154 146,166 186,443 123,113 106,422 115,134 High School 361,625 492,188 359,380 227,664 378,733 307, II 1 391,736 258,672 223,602 241,907
Grand Total $1,097,494 $ 940,179 $ 766,821 $ 933,144 $ 1,046,893 $ 974,731 $ 1,243,322 $ 820,995 $ 709,688 $ 767,785
Source: District Records
~ ................................................................................................................................................................ .o .................... :m .......... .,

BELLEVILLE TOWNSHIP SCHOOL DISTRICT INSURANCE SCHEDULE
JUNE 30,2017 (Unaudited)
School Package Policy- N.J. Schools Insurance Group Property:
Blanket Building and Contents Boiler and Machinery Real and Personal Property Extra Expense Valuable Papers and Records Demolition and Increased Costs of Construction Fire Department Service Charge/ Arson Reward Pollutant Cleanup and Removal Special Flood Hazard Area Flood Zones All Flood Zones Accounts Receivable Earthquake Terrorism
General Liability Bodily Injury from Products and Completed Operations Product & Completed Operations Personal & Advertising Injury Premises Medical Payments Sexual Molestation I Abuse Employee Benefits Liability
Electronic Data Processing: Hardware/Software
Crime: Blanket Dishonest Forgery or Alteration Money and Securities Money Order/Counterfeit Computer Fraud
Automobile: Comprehensive Automobile Liability Uninsured/Underinsured Motorists Personal Injury Protection Garage keepers Liability
Inland Marine:
$
Coverage
156,103,442 I 00,000,000
450,000 50,000,000 10,000,000 25,000,000
10,000 250,000
25,000,000 75,000,000
250,000 50,000,000
1,000,000
II ,000,000 11,000,000 11,000,000
10,000 11,000,000 11,000,000
3,500,000
500,000 100,000 100,000 100,000 500,000
l\,000,000 1,000,000
250,000 Included
Blanket Hardware/Software N/A
Source: School District's records
114
EXHIBIT J-20
Deductible
$ 5,000 5,000 5,000 5,000
500,000 10,000
N/A
1,000
1,000 1,000 1,000 1,000 1,000
1,000

SINGLE AUDIT

LERCH, VINCI & HIGGINS,LLP
[)JETER P. LERCH, CPA, RMA, PSA
GARY J. VINCI, CPA , RMA , PSA
GARY W. HJGGINS , CPA, RMA, PSA
JEFFREY C. BUSS, CPA, RMA, PSA
PAULJ. LERCH. CPA, RMA, PSA
DONNA L. JAPHET, CPA, I'SA
JULIUS B. CONSONI ,CPA, PSA
ANDREW D. PARENTE. CPA, RMA, PSA
CERTIFIED PUBLIC ACCOUNTANTS REGISTERED MUNICIPAL ACCOUNTANTS EXHIBITK-1
ELIZABETH A. SHICK, CPA. RMA. PSA
ROBERT W. IIAAG. CPA. PSI\
DEBORAH K. LERCH, CPA, PSA
RALPH M. PICONE. CPA, RMA, l'SA
DEBRA GOLLE. CPA
CINOY JANACEK. CPA, RMA
MARK SACO, CPA
SHERYLM . NICOLOSI. CPA . PSA
REPORT ON INTERNAL CONTROL OVER FINANCIAL REPORTING AND ON COMPLIANCE AND OTHER MATTERS
BASED ON AN AUDIT OF FINANCIAL STATEMENTS PERFORMED IN ACCORDANCE WITH GOVERNMENT AUDITING STANDARDS
INDEPENDENT AUDITOR'S REPORT
Honorable President and Members of the Board ofEducation
Belleville Township School District Belleville, New Jersey
We have audited, in accordance with the auditing standards generally accepted in the United States of America; the standards applicable to financial audits contained in Government Auditing Standards issued by the Comptroller General of the United States and audit requirements prescribed by the Office of School Finance, Department of Education, State of New Jersey, the financial statements of the govenunental activities, the business-type activities, each major fund, and the aggregate remaining fund information of the Belleville Township School District as of and for the fi scal year ended June 30, 2017 and the related notes to the financial statements, which collectively comprise the Belleville Township School District's basic financial statements and have issued our report thereon dated November 29, 2017.
Internal Control Over Financial Reporting
In planning and performing our audit of the financial statements, we considered the Belleville Township School District's internal control over financial reporting (internal control) to determine the audit procedures that are appropriate in the circumstances for the purpose of expressing our opinions on the financial statements but not for the purpose of expressing an opinion on the effectiveness of the Belleville Township School District's internal control. Accordingly, we do not express an opinion on the effectiveness of the Belleville Township School District 's internal control.
A deficiency in internal control exists when the design or operation of a control does not allow management or employees, in the normal course of performing their assigned functions, to prevent, or detect and correct, misstatements on a timely basis. A material weakness is a deficiency, or a combination of deficiencies, in internal control, such that there is a reasonable possibility that a material misstatement of the entity's financial statements will not be prevented, or detected and corrected on a timely basis. A significant deficiency is a deficiency, or a combination of deficiencies, in intemal control that is less severe than a material weakness, yet important enough to merit attention by those charged with governance.
17-17 ROUTE 208 •FAIR LAWN, NJ 074 10 • TELEPHONE (201 ) 791 -7100 • FACSTMfLE (201) 79 1-3035
WWW.LVHCPA.COM
11 5

EXHIBITK-1
Our consideration of internal control was for the limited purpose described in the first paragraph of this section and was not designed to identify all deficiencies in internal control that might be material weaknesses or significant deficiencies and therefore, material wealmesses or significant deficiencies may exist that were not identified. Given these limitations, during our audit we did not identify any deficiencies in internal control that we consider to be material weaknesses. We did identify a cettain deficiency in intemal control, described in the accompanying schedule of findings and questioned costs as item 2017-001 that we consider to be a significant deficiency.
Compliance and Other Matters
As part of obtaining reasonable assurance about whether the Belleville Township School District's financial statements are free from material misstatement, we performed tests of its compliance with certain provisions of laws, regulations, contracts, and grant agreements, noncompliance with which could have a direct and material effect on the determination of financial statement amounts. However, providing an opinion on compliance with those provisions was not an objective of our audit, and accordingly, we do not express such an opinion. The results of our tests disclosed an instance of noncompliance or other matter that is required to be reported under Government Auditing Standards and audit requirements as prescribed by the Office of School Finance, Department of Education, State of New Jersey and which is described in the accompanying schedule offindings and questioned costs as item 2017-001.
We also noted certain matters that are not required to be repmted under Government Auditing Standards that we reported to management of the Belleville Township School District in a separate report entitled, "Auditor's Management Rep01t on Administrative Findings- Financial, Compliance and Perfotmance" dated November 29, 2017.
Bellevillle Township School District's Response to Finding
The Belleville Township School District's response to the finding identified in our audit is described in the accompanying schedule of findings illld questioned costs. The Belleville Township School District's response was not subjected to the auditing procedures applied in the audit of the financial statements and accordingly, we express no opinion on the response.
Purpose of this Report
The purpose of this report is solely to describe the scope of our testing of intemal control and compliance and the results of that testing, and not to provide an opinion on the effectiveness of the Belleville Township School District's internal control or on compliance. This report is an integral part of an audit performed in accordance with Government Auditing Standards in considering the Belleville Township School District's internal control and compliance. Accordingly, this communication is not suitable for any other purpose.
Fair Lawn, New Jersey November 29, 2017
116
Lef2(~ , Vi.oe\ ~ H·~<Q~. <.L.P LERCH, VINCI & HIGGINS, LLP Certified Public Accountants Public School Accountants
} ffrey C. Bliss / Public School Accountant
PSA Number CS00932

LERCH, VINCI & HIGGINS,LLP
DIETER P. LERCH, CPA, RMA, PSA
GARY J. VINCI. CPA, RMA, PSA
GARY W. HIGGINS. CPA. RMA . PSA
JErrREY C. BLISS. CPA, RMA, PSA
PAULl. LERCI·I. CPA, RMA , PSA
DONNA L. JAPHET. CPA, PSA
JlJJ.llJS 13. CONSONI, CPA. PSA
ANDREW D. PARENTE, CPA, RMA, PSA
CERTIFIED PUBLIC ACCOUNTANTS REGISTERED MUNICIPAL ACCOUNTANTS
EXIDBITK-2
ELIZABETH A. SHICK. CPA. RMA. PSA
ROBERT W. HAAG, CPA, PSA
Dfli30RAH K. LERCH, CPA. PSA
RALPI I M. PICONE. CPA, RMA, PSA
DEBRA GOLLE, CPA
CINDY JANACEK. CPA. RMA
MARK Si\CO. CPA
SHERYL M. NICOLOSI. CPA , PSA
REPORT ON COMPLIANCE FOR EACH MAJOR FEDERAL AND STATE PROGRAM; REPORT ON INTERNAL CONTROL OVER COMPLIANCE; AND REPORT ON SCHEDULE
OF EXPENDITURES OF FEDERAL AWARDS REQUIRED BY THE U.S. UNIFORM GUIDANCE AND SCHEDULE OF EXPENDITURES OF STATE FINANCIAL ASSISTANCE AS REQUIRED BY NEW
JERSEY OMB CIRCULAR 15-08
Honorable President and Members of the Board ofEducation
Belleville Township School District Belleville, New Jersey
INDEPENDENT AUDITOR'S REPORT
Report on Compliance for Each Major Federal and State Program
We have audited the Belleville Township School District 's compliance with the types of compliance requirements described in the U.S. Office of Management and Budget (OMB) Compliance Supplement and the New Jersey OMB Circular 15-08 State Aid/ Grant Compliance Supplement that could have a direct and material effect on each of Belleville Township School District' s major federal and state programs for the fiscal year ended June 30, 2017. The Belleville Township School District's major federal and state programs are identified in the summary of auditor 's results section of the accompanying schedule of findings and questioned costs.
Management's Responsibility
Management is responsible for compliance with the requirements of federal and state statutes, regulations, and the terms and conditions of its federal awards and state financial assistance applicable to its federal and state programs.
Auditor's Responsibility
Our responsibility is to express an opinion on compliance for each of the Belleville Township School District 's major federal and state programs based on our audit of the types of compliance requirements referred to above. We conducted our audit of compliance in accordance with auditing standards generally accepted in the United States of America; the standards applicable to financial audits contained in Government Auditing Standards, issued by the Comptroller General of the United States; audit requirements as prescribed by the Office of School Finance, Department of Education, State of New Jersey; Title 2 U.S. Code of Federal Regulations Part 200, Uniform Administrative Requirements. Cost Principles. and Audit Requirements for Federal Awards (Uniform Guidance) and New Jersey OMB Circular 15-08, Single Audit Policy for Recipients of Federal Grants. State Grants and State Aid. Those standards, U.S. Uniform Guidance and New Jersey Circular require that we plan and perform the audit to obtain reasonable assurance about whether noncompliance with the types of compliance requirements referred to above that could have a direct and material effect on a major federal or state program occurred. An audit includes examining, on a test basis, evidence about the Belleville Township School District's compliance with those requirements and performing such other procedures as we considered necessary in the circumstances.
17- 17 ROUTE 208 • FATR LAWN, NJ 074 10• TELEPHONE (201) 79 1-7 100 • FACSTMlLE (201 ) 791-3035
WWW.LVHCPA .COM
11 7

EXHIBITK-2
We believe that our audit provides a reasonable basis for our opinion on compliance for each major federal and state program. However, our audit does not provide a legal determination of the Belleville Township School District's compliance.
Opinion on Each Major Federal and State Program
In our opinion, the Belleville Township School District complied, in all material respects, with the types of compliance requirements refetTed to above that could have a direct and material effect on each of its major federal and state programs for the fiscal year ended June 30, 2017.
Other Matters
The results of our auditing procedures diselosed an instance of noncompliance, which is required to be reported in accordance with the U.S. Uniform Guidance and New Jersey OMB Circular 15-08 and which is described in the accompanying schedule of findings and questioned costs as items 2017-002 and 2017-005. Our opinion on each major federal and state program is not modified with respect to these matters.
The Belleville Township School District's response to the noncompliance findings identified in our audit is described in the accompanying schedule of findings and questioned costs. The Belleville Township School District's response was not subjected to the auditing procedures applied in the audit of compliance and, accordingly, we express no opinion on the response.
Report on Internal Control Over Compliance
Management of the Belleville Township School District is responsible for establishing and maintaining effective internal control over compliance with the types of compliance requirements referred to above. In planning and performing our audit of compliance, we considered the Belleville Township School District's internal control over compliance with the types of requirements that could have a direct and material effect on each major federal and state program to determine the auditing procedures that are appropriate in the circumstances for the purpose of expressing an opinion on compliance for each major federal and state program and to test and report on internal control over compliance in accordance with the U.S. Uniform Guidance and New Jersey OMB Circular 15-08, but not for the purpose of expressing an opinion on the effectiveness of internal control over compliance. Accordingly, we do not express an opinion on the effectiveness of the Belleville Township School District's internal control over compliance.
A deficiency in internal control over compliance exists when the design or operation of a control over compliance does not allow management or employees, in the normal course of performing their assigned functions, to prevent, or detect and correct, noncompliance with a type of compliance requirement of a federal or state program on a timely basis. A material weakness in internal control over compliance is a deficiency, or combination of deficiencies, in internal control over compliance, such that there is a reasonable possibility that material noncompliance with a type of compliance requirement of a federal or state program will not be prevented, or detected and corrected, on a timely basis. A significant deficiency in internal control over compliance is a deficiency, or a combination of deficiencies, in internal control over compliance with a type of compliance requirement of a federal or state program that is less severe than a material weakness in internal control over compliance, yet important enough to merit attention by those charged with governance.
Our consideration of internal control over compliance was for the limited purpose described in the first paragraph of this section and was not designed to identify all deficiencies in internal control over compliance that might be material weaknesses or significant deficiencies and, therefore, material weaknesses or significant deficiencies may exist that were not identified. We did not identity any deficiencies in internal control over compliance that we consider to be material weaknesses. However, we identified a certain deficiency in internal control over compliance, as described in the accompanying schedule of findings and questioned costs as item 2017-004 that we consider to be a significant deficiency.
118

EXHIBITK-2
The Belleville Township School District's response to the internal control over compliance finding identified in our audit is described in the accompanying schedule of findings and questioned costs. The Belleville Township School District's response was not subjected to the auditing procedures applied in the audit of compliance and, accordingly, we express no opinion on the response.
The purpose of this report on internal control over compliance is solely to describe the scope of our testing of internal control over compliance and the results of that testing based on the requirements of U.S. Uniform Guidance and New Jersey OMB Circular 15-08. Accordingly, this report is not suitable for any other purpose.
Report on Schedules of Expenditures of Federal Awards Required by the U.S. Uniform Guidance and Schedule of Expenditures of State Financial Assistance Required by New Jersey OMB Circular 15-08
We have audited the financial statements of the governmental activities, the business-type activities, each major fund, and the aggregate remaining fund information of the Belleville Township School District as of and for the fiscal year ended June 30, 2017 and the related notes to the financial statements, which collectively comprise the Board of Education's basic financial statements. We issued our report thereon dated November 29, 2017, which contained unmodified opinions on those financial statements. Our audit was conducted for the purpose of forming opinions on the financial statements that collectively comprise the basic financial statements. The accompanying schedule of expenditures of federal awards as required by the U.S. Uniform Guidance and schedule of expenditures of state financial assistance as required by New Jersey OMB Circular 15-08 are presented for purposes of additional analysis and are not a required part of the basic financial statements. Such information is the responsibility of management and was derived from and relates directly to the underlying accounting and other records used to prepare the basic financial statements. The information has been subjected to the auditing procedures applied in the audit of the financial statements and certain additional procedures, including comparing and reconciling such information directly to the underlying accounting and other records used to prepare the basic financial statements or to the basic financial statements themselves, and other additional procedures in accordance with auditing standards generally accepted in the United States of America. In our opinion, the schedule of expenditures of federal awards and schedule of expenditures of state financial assistance are fairly stated in all material respects in relation to the basic financial statements as a whole.
Fair Lawn, New J,ersey November 29,2017
119
L uzc L . V: ~ c ; ~ H'.0/':) s... (.c.. .P LERCH, VINCI & HIGGINS, LLP Certified Public Accountants Public ccountants
~L J ef ey r-. n-t+li"'"ss...--
blic School Accountant PSA Number CS00932

~ [ I ~ I I I I 1 1~ H I~ ~ 11 ! 11 ~ . ~ I, I ~ ~ -.-u ---=----c:--1--;--1 ---:----1 --------T---1 r 1---il--i-----1 ----7711-----::C:§I ~:T---:1 .:-:i---11 ---;, 1~'1 ' -----,---------1--:::-:::;~PI ;
'I 8]
' ' , .I ~j
I ~1 I ·1 I I 5151 ~ ~ lr 1·1 , 1~1 • § 1~1 ~ ~1 ~1 ~1
~ r1 ~ I I I I ~ I~ ~ ~ I~ ~ 11 ~ li ~ ~ I, I ~ ~
I I I ~~~~~~~~I
1 UHI ~I ~I
• 0
I I I I I I I I I I ~1 I
: l ,
'I " ]
s l I I I
51~1 II ~1~1 ~§1 ~1 ~1 ; 1~1 P l~j • lr 1~1 ~§1 ~1 ~~ ~~1~1 ~~ 'I, ~~ lgl g 1~1
I I I ~~I H§r11 ll H II I I I ~~II ~;~§ II ll Rll I I I II ~~~~ §1§1 ~~~1 I I I ~Iii H 1~1 -1=1 ~ 1~1
,, [ ' , ~ l ~ ~
~ '1~1 ~ § 1~1
~~ g 1~1
~~ I I ;_:! [$ .1.1
'~ §1~1 , ~. Iii " m ~ I
I if :1
PI ~I PI ~I ILl ILl I ~1 :1
~j 21 !I I - -
~ ~

State Granton/Program Title
State Department of Education
Current Expense·
Equalization Nd
Equaliwtion Nd
Under Adequacy Nd
Under Adequacy Nd
Special Education Aid
Special Education Nd
Security Nd
Security Nd
P ARCC Readiness Nd
PARCC ReadinessNd
Per Pupil Gro\\'lh Aid
Per Pupil Gro\\-ih Nd
Professional Learing Community Nd
Total State Nd Public Cluster
Transponation Aid
Transponalion Aid
Non-Public School Transportation Non-Public School Transponation
Total Transportation Nd Cluster
E:o,:traordinary Special Ed Costs Nd
Extraordinary Special Ed Costs Nd
On BehalfPa}ments
TP Af Social Security
TP Af Social Security
TP Af Social Security
TPAF Pension
Pension- NCGI Premium
Pension Benefit Contribution
Long Term Disability Insurance Post Retirement Medical Benefit Contribution
Total General Fund
Special Revenue:
New Jersey Nonpublic Nd:
Auxiliary Services:
Compensatory Education
Compensalory Education
English as a Second Language
English as a Second Language
Transportation
Transportation Home Instruction
Total Auxiliary Services (Chapter 192) Cluster
Grant or State
Project Number
17-495-034-5120-078
16-495-034-5120-078
17 -495-034·5120-096
16-495-034-5120-096
17-495-034-5120-089
16-495-034-5120-089
17-495-034-5120-084
16-495-034-5120-084
17-495-034-5120-098
1 6-495-034-5120-098
17-495-034-5120-097
16-495-034-5120-097
17-495.034-5120-ID I
17-495-034-5120-014
16-495-034-5120-014
17-495-034-5120-014 16-495-034-5120-014
17-100.034-5120-044
16-1 00-034-51 20-044
17-495-034-5094-003
16-495-034-5094-003
15-495-034-5094-003
17-495-034-5094-004
17-495-034-5094.002
17-495-034-5094-004 17-495-034-5094..00 I
17-100-034-5120-067
16-100-034-5120-067
17-100-034-5120-067
16-100-034-5120-067
17-100-034-5120-068
16-1 00-034-5120-068 17·1 00-034-5120-067
BELLEVILLE TOWNSHIP SCHOOL DISTRICT
SCHEDULE OF EXPENDITURES OF STATE FINANCIAL ASSISTANCE
FOR THE FISCAL YEAR EJ'IiDED JUNE 30,2017
Grant
Period
711(16-6130117
7/lfl5-6/30/16
7/1/16-6130117
7/1115-6130116
7{1/16-6!30/17
711115-6!30/16
711116-6130/17
7!1/15-6/30/16
711116-6/30/17
7/1/15-6/30/16
7/lfl6-6130!17
7/1115-6/30/16
711!16-6/30/17
Award
Amount
21,802,381
21,802,381
500,000
500,000
2,880,246
2,840,089
322,971
285,421
47.430
47,430
47,430
47,430
45,960
Balance,
July l-2016
(2,075,977)
(47,609)
(270,427)
(27,177)
(4,516)
(4,516)
(2,430,222)
(19,251)
Cash
~
19,791,466
2,075,977
451,939
47,609
2,603,388
270,427
300,965
27,177
42,871
4.516
42,871
4,516
41.542
25,705,264
200,254
19,251
Budgetary
Expenditures
21,896,193
500,000
2.880.246
332,971
47,430
47,430
45,%0
25,750,230
221,550
67,338
Refund ,, Prior Years'
Balanees
Balance, Jnne 30, 2017
(Accounts Deferred Due to
Receivable) Revenue Grantor
(2,104,727)
(48,061)
(276,858)
(32,006)
(4,559)
(4,559)
--c:-=''"·'=18) ---~ (2,475.188) ---~-
(21,2%)
(67,338)
7/lfl6-6/30/17
7/1/15-6/30/16
7!1/16-6/30/17 7/l/15-6/30/16
221,550
202,174
67_338 64,206 --==j'64~,2~0~6) 64 206
- (83 457) 283,711 ===]2~88~8~8~8 (88,634) ===~=
7/1/16-6!30117
7/1115-6/30116
7/1/16-6/30117
7/l/15-6/30/16
7/1114-6/30/15
7/1/16-6/30/17
7/l/16-6/30117
7/1116-6/30117 7/1!16-6/30117
7/lll6-6/30/l7
711115-6/30/16
7!1/16-6!30/17
7/1/15-6/30/!6
7/1/16-6/30/17
7/1115-6/30/16 7/1116-6/30!17
389.131
424.804
2,208,564
2,097,428
2,130,405
112,318
3,099,948
5,962 2,676,549
48,373
65,144
8,222
15,530
37,636
21,250 1,008
(424,804)
(104,770)
7,924
(3,035,329)
21,351
12,729
2,125
36,205
424,804
2,097,896
104,770
112,318
3,099,948
5,962 2,676,549
34,511,222
48,373
8,222
37,636
94,231
389,131
2,208,564
112,318
3,099,948
5,962 2,676,549
34,531,590
33,851
1.553
21.351
12.729
2,125
(389,131)
(110,668)
s 7.924
(3,063,621} 7,924
14,522
6,669
37,636
____ cLo~o"-8 (1,008) ____ c
36.412 ---""'-'"'"-5 (1,008) ____ c 58,827
See Accompanying Notes to Schedules of Expenditures of Federal Awards and State Financial Assistance 121
F.XHIBITK-4
GAAP
Memo
Cnmulative
Total
Receivable Expenditures
21,896,193
500,000
2,880,246
332,971
47.430
47,430
45.960
25,750,230
221,550
(67,338) 67.338
==J(6~7~.3~3~8) 288,888
(110,668)
(178,006)
389,131
2,208,564
112,318
3,099,948
5,962 2,676,549
34,531,590
33,851
1,553
__ _.\!(1~00"'"8) 1,008
__ _c(l~.OO""J8) 36,412
(Continued)

State Grantor/Program Title
Handicapped Services: Examination and Classification
Examination and Classification
Corrective Speech Corrective Speech Supplemental Instruction Supplemental Instruction
Total Handicapped Services (Chapter 193) Cluster
Textbook Aid Nursing Services Nonpublic Technology Noupublic Technology Nonpublic Security Nonpublic Security
Total Special Revenue Fund
State Department of Agriculture
Enterprise Fund:
State School Lunch Program State School Lunch Program
Total Food Service Fund
Grant or State I'Toject Number
17-1 00-034-5120-066
16-100-034-5120-066
17-100-034-5120-066
16-100-034-5120-066
17-100-034-5120-066 16-1 00-034-5120-066
17-1 00-034-5120-064
17-100-034-5120-070
17-100-034-5120-373
16-1 00-034-5120-373 17-100-034-5120-084
16-100-034-5120-084
17-1 01)..01 0-3350-023 !6-1 00-010-3350-023
Total State Financial Assistance Subject to Single Audit Detennination
State Financial Assistante
Not Subject to Major I'Togram Determination
General Fund On-BehalfTPAF Pension System Contributions-NCO!
On-BehalfTPAF Pension System Contributions- Pension Benefit
On-BehalfTPAF Long Term
Disability Insurance On-BehalfTPAF Post-Retirement Medical Contribution
17495-034-5094-004
17495-034-5094-002
17-495-034-5094-004
17-495-034-5094-00 I
Total State Financial Assistance Subject to Major Program Determination
BELLEVILLE TOWNSHIP SCHOOL DISTRICT
SCHEDULE OF EXPENDITURES OF STATE FINANCIAL ASSISTANCE FOR THE FtSCAL YEAR ENDED JUNE 30,2017
Grant Period
7/1/16-6/30/17 s 7/1/15-6/30/16
7!1/16-6/30117
7 !1!15-6/30!16
711/16-6/30117 711115-6/30/16
711116-6/30!17
4/lfl6-6/30/17
711!16-6/30117
711/15-6/30/16 711116-6/30/17
711115-6/30/16
7/l/16-6/30!1 7 7/1115-6/30f16
7/1f16-6/30/17
7/1116-6/30/17
711116-6/30/17
7/1116-6/30/17
Award Amount
3,610
23,188
8,835
10,033
9,416 21,535
8,416 13,140
3,796
3,822 7,300
3,675
23,475 23,625
112,318
3,099,94&
5,%2
2,676,549
Balance, Cash Budgetary July l 2016 Re~"eived E~~nditures
3,610
14,134
8.835 7,671
3,214
9,416 5,546 13,103 -
30,451 2l.Ml 13,217
8,416 8,107
13,140 13,140
3,796 3,600
451 7,300 6,995
"' --
67,563 148,744 81.471
21,571 23,475
---"'''""'""4} 4,534
---''~'-~''"4) 26,105 23,475
(2.972.300} 34,686,071 34,636,536
(112,318) {ll2,318)
(3,099,948) (3,099,948)
(5,962) (5,962)
(2,676,549) (2 676,549)
12 972 300> $ 28 791 294 $ 28 741 759
See Accompanying Notes to Schedules of Expenditures of Federal Awards and Stare Financial Assistance
See Accompanying Notes to Schedules of Expenditures of Federal Awards and State Financial Assistance 122
Refund of Ba1ance, June 30, 2017
Prior Years' (Accounts Deferred Due to
.b!m:!lli ~ ~ Grantor
$ 3,610
14,134
1,164
3,214
3,870 13.103
30,451 8,644
309
196
451 305
456
67,563 __ _.ll(J~.OQ-".08} ----'- ""·"'"'
(1,904)
(1,904)
67,563 (3,066,533) 76 205
$ 67 563 $ 0.066.533) I 76 205
I
$
I
"""" GAAP
Receivable
\l.UU6)
(1,904)
(1,904)
{180,918)
{1809!8)
Cumulative Tota1
Exoenditures
7,671
5,546
13,217
8,107 13,140
3,600
6,995
81,471
23.475
23,475
34 636536
(112,318)
(3,099,948)
(5,962)
(2,676,549)
28 741 759

BELLEVILLE TOWNSIDP SCHOOL DISTRICT NOTES TO THE SCHEDULES OF EXPENDITURES OF FEDERAL AWARDS AND STATE FINANCIAL ASSISTANCE FOR THE FISCAL YEAR ENDED JUNE 30, 2017
NOTE 1 GENERAL
EXHIBITK-5
The accompanying schedules present the activity of all federal and state financial assistance programs of the Belleville Township School District. The Board of Education is defined in Note !(A) to the Board's financial statements. All federal financial assistance received directly from federal agencies, as well as federal awards and state financial assistance passed through other government agencies is included on the schedule of expenditures of federal awards and state financial assistance.
NOTE 2 BASIS OF ACCOUNTING
The accompanying schedules are prepared and presented using the budgetary basis of accounting with the exception of programs recorded in the food service fund, which are presented using the accrual basis of accounting. These basis of accounting are described in Notes I (C) to the Board's fmancial statements. The information in these schedules is presented in accordance with the requirements of Title 2 U.S. Code of Federal Regulations Part 200, Uniform Administrative Requirements, Cost Principles, and Audit Requirements for Federal Awards (U.S. Uniform Guidance) and New Jersey OMB Circular 15-08, "Single Audit Policy for Recipients of Federal Grants, State Grants, and State Aid". Therefore, some amounts presented in these schedules may differ from the amounts presented in, or used in the preparation of, the financial statements.
NOTE 3 RELATIONSHIP TO FINANCIAL STATEMENTS
The fmancial statements present the general fund and special revenue fund on a GAAP basis. Budgetary comparison statements or schedules (RSJ) are presented for the general fund and special revenue fund to demonstrate fmance-related legal compliance in which certain revenue is permitted by law or grant agreement to be recognized in the audit year, whereas for GAAP reporting, revenue is not recognized until the subsequent year or when expenditures have been made.
The general fund is presented in the accompanying schedules on a modified accrual basis with the exception of the revenue recognition of the delayed state aid payments in the current budget year, which is mandated pursuant to N.J.S.A. 18A:22-44.2. For GAAP purposes, those payments are not recognized until the subsequent year due to the state deferral and recording of certain state aid payments in the subsequent year. The special revenue fund is presented in the accompanying schedules on the grant accounting budgetary basis which recognizes encumbrances as expenditures and also recognizes the related revenues, which may include the delayed state aid payments, whereas the GAAP basis does not. The special revenue fund also recognizes the delayed state aid payments in the current budget year, consistent with N.J.S.A. 18A:22-44.2.
The net adjustment to reconcile from the budgetary basis to the GAAP basis is a decrease of $11,338 for the general fund and a decrease of $22,084 for the special revenue fund. See the Notes to Required Supplementary Information for a reconciliation of the budgetary basis to the modified accrual basis of accounting for the general and special revenue funds. Awards and fmancial assistance revenues are reported in the Board's financial statements on a GAAP basis as presented as follows:
General Fund Special Revenue Fund Food Service Fund
Total Financial Assistance
$
$
Federal
263,041 $ 2,484,063 1,405,123
4,152,227 $
123
State Total
34,520,252 $ 34,783,293 81,471 2,565,534 23,475 1,428,598
34,625,198 $ 38,777,425

BELLEVILLE TOWNSHIP SCHOOL DISTRICT NOTES TO THE SCHEDULES OF EXPENDITURES OF FEDERAL A WARDS AND STATE FINANCIAL ASSISTANCE FOR THE FISCAL YEAR ENDED JUNE 30, 2017
NOTE 4 RELATIONSHIP TO FEDERAL AND STATE FINANCIAL REPORTS
EXHIBITK-5
Amounts reported in the accompanying schedules may not necessarily agree with the amounts reported in the related federal and state financial reports due to timing differences between the District's fiscal year and grant program years.
NOTE 5 STATE LOANS OUTSTANDING
The District's state loan outstanding at June 30, 2017, which is not required to be reported on the schedule of state financial assistance, is as follows:
Loan Program State Account Number
State Aid Advance Loan 100-034-5120-489 $ 3,329,940
NOTE6 OTHERINFORMATION
Revenues and expenditures reported under the Food Distribution Program as non-cash assistance represent current year value received and current year distributions, respectively. TP AF Social Security contributions in the amount of $2,208,564 represents the amount reimbursed by the State for the employer's share of social security contributions for TPAF members for the fiscal year ended June 30, 2017. The amount reported as TPAF Pension System Contributions in the amount of $3,212,266, TPAF Post-Retirement Medical Benefits Contributions in the amount of $2,676,549 and TPAF Long-Term Disability Insurance in the amount of $5,962 represents the amount paid by the State on behalf of the District for the fiscal year ended June 30, 2017.
NOTE 7 ON-BEHALF PROGRAMS NOT SUBJECT TO STATE SINGLE AUDIT
On-behalf State Programs for TPAF Pension, Post-Retirement Medical Benefits and Long-Term Disability Insurance Contributions are not subject to a State single audit and, therefore, are excluded from major program determination. The Schedule of State Financial Assistance provides a reconciliation of State financial assistance reported in the District's financial statements and the amount subject to State single audit and major program determination.
NOTE 8 DE MINIMIS INDIRECT COST RATE
The District has elected not to use the 10 percent de minimis indirect cost rate allowed under the Uniform Guidance.
124

EXHIBITK-6 BELLEVILLE TOWNSHIP SCHOOL DISTRICT
SCHEDULE OF FINDINGS AND QUESTIONED COSTS FOR THE FISCAL YEAR ENDED JUNE 30,2017
Part I- Summary of Auditor's Results
Financial Statement Section
Type of auditors' report issued on financial statements
Internal control over financial reporting:
I) Material weakness(es) identified?
2) Significant deficiencies identified that are not considered to be material weaknesses?
Noncompliance material to basic financial statements noted?
Federal Awards Section
Internal Control over major programs: (1) Material weakness(es) identified?
(2) Significant deficiencies identified that are not considered to be material weaknesses?
Type of auditor's report issued on compliance for major programs
Any audit findings disclosed that are required to be reported in accordance with Title 2 Part 200 of U.S. Uniform Guidance?
Identification of major federal programs:
CFDA Number(s)
84.010 SOIOAI60030
84.027/84.173 H027Al60100/Hl73Al60114
93.778
Dollar threshold used to distinguish between Type A and Type B programs:
Auditee qualified as low-risk auditee?
1705NJSMAP
125
Unmodified
____ yes X no
--'X.:..__ yes none reported
--'-X'--_yes no
___ yes X no
___ yes ~none reported
Unmodified
_ _,_X"-_ yes no
Name of Federal Program or Cluster
Title I, Part A
IDEA Part B Basic I Preschool
Medical Assistance Program
$ 750,000
___ yes X no

EXHIBIT K-6
BELLEVILLE TOWNSHIP SCHOOL DISTRICT SCHEDULE OF FINDINGS AND QUESTIONED COSTS (CONT'D)
FOR THE FISCAL YEAR ENDED JUNE 30,2017
Part 1- Summary of Auditor's Results
State Awards Section
Internal Control over major programs:
(1) Material weakness(es) identified?
(2) Significant deficiencies identified that are not considered to be material weakness(es)?
yes _ _..:..:X'--_ no
X yes ____ none reported
Type of auditor1s report issue~ on compliance for major programs
Any audit findings disclosed that are required to be reported in accordance with N.J. Circular Letter 15-08?
Identification of major state programs:
GMIS Numbcr(s)
17-495-034-5120-078
17-495-034-5120-096
17-495-034-5120-084
17-495-034-5120-089
17-495-034-5120-101
17-495-034-5120-098
17-495-034-5120-097
17-495-034-5094-003
Dollar threshold used to distinguish between Type A and Type B programs:
Auditee qualified as low-risk auditee?
126
Unmodified
X yes ____ no
Name of State Program
Equalization Aid
Under Adequacy Aid
Security Aid
Special Education Aid
Professional Learning Community Aid
PARCC Readiness Aid
Per Pupil Growth Aid
TPAF Social Security
$ 862,253
yes _ _..:.:X'--- no

BELLEVILLE TOWNSHIP SCHOOL DISTRICT SCHEDULE OF FINDINGS AND QUESTIONED COSTS
FOR THE FISCAL YEAR ENDED JUNE 30, 2017
Part 2- Schedule of Financial Statement Findings
EXHIDITK-7
This section identifies the reportable conditions, material weaknesses, and instances of noncompliance related to the basic financial statements that are required to be reported in accordance with paragraphs 5.18 through 5.20 of Government Auditing Standards.
Finding 2017-001
Our review of the June 2017 Board Secretary's and Treasurer's reports revealed they were not in agreement when approved by the Board.
Criteria or specific requirement
State Department of Education's GAAP Technical System Manual, Generally Accepted Accounting Principles
Condition
The Board Secretary's Report cash account balances were not in agreement with the Treasurer's report cash balances at June 30, 2017.
Context
A difference of$612,251 was noted between the Board Secretary's and Treasurer's Reports at year end.
The cash balances in the District's accounting records were misstated at year end.
Unknown
Recommendation
Internal control procedures be revised to ensure the Board Secretary's and Treasurer's monthly reports are in agreement prior to submission and approval by the Board.
View of Responsible Officials and Planned Corrective Action
Management has reviewed this finding and indicated it will revise its procedures to ensure corrective action is taken.
127

BELLEVILLE TOWNSHIP SCHOOL DISTRICT SCHEDULE OF FINDINGS AND QUESTIONED COSTS (CONT'D)
FOR THE FISCAL YEAR ENDED JUNE 30, 2017
Part 3- Schedule of Federal and State Award Findings and Questioned Costs
EXHIBITK-7
This section identifies the significant deficiencies, material weaknesses, and instances of noncompliance, including questioned costs, related to the audit of major federal and state programs, as required by U.S. Uniform Guidance and New Jersey OMB's Circular 15-08, as amended.
CURRENT YEAR FEDERAL AWARDS
Finding 2017-002
Our audit of the NCLB Title I grant program revealed expenditures for equipment were not charged to the proper budget line account.
Federal Program Information:
Title I 84.010
Criteria or Specific Requirement
Federal Grant Compliance Supplement- Allowable Costs/Cost Principles, Uniform Minimum Chart of Accounts for New Jersey Public Schools.
Condition:
See Finding 2017-003.
Questioned Costs:
Unknown.
Context:
Effect:
Cause:
Multiple disbursements for equipment to one (1) vendor totaling $69,046 were incorrectly charged to the supply expenditure line.
Expenditures charged to Federal grants may not be for allowable grant charges.
Unknown.
Recommendation:
Greater care be exercised over classifying payments to ensure amounts are budgeted and charged to the proper budget lines in accordance with Unifmm Minimum Chart of Accounts.
View of Responsible Officials and Planned Corrective Action:
Management has reviewed this finding and indicated it will review and revise its procedures to ensure corrective action is taken.
128

BELLEVILLE TOWNSHIP SCHOOL DISTRICT SCHEDULE OF FINDINGS AND QUESTIONED COSTS (CONT'D)
FOR THE FISCAL YEAR ENDED JUNE 30, 2017
Part 3- Schedule of Federal and State Award Findings and Questioned Costs
EXHIBITK-7
This section identifies the significant deficiencies, material weaknesses, and instances of noncompliance, including questioned costs, related to the audit of major federal and state programs, as required by U.S. Uniform Guidance and New Jersey OMB's Circular 15-08, as amended.
CURRENT YEAR FEDERAL AWARDS
Finding 2017-003
We noted the salaries charged to the IDEA Preschool grant program were not charged by pay period. The salary amount charged was made through a one-time redistribution of salaries previously recorded to budget account child study team- salaries of other professional staff.
Federal Program Information:
IDEA Preschool 84.173
Criteria or Specific Requirement
Federal Grant Compliance Supplement- Allowable Costs/Cost Principles
Condition:
See Finding 2017-004.
Questioned Costs:
Undeterminable.
Context:
Effect:
Cause:
The District was unable to provide us with documentation to support the amount charged to the Federal grant program for payroll charges for the employees salaries reallocated for the extended summer program in the amount of $20,550.
Payroll amounts charged to Federal grants may not be for allowable charges.
District did not prepare a detailed analysis of payroll costs allocated to the grant program or basis for the compensation for the grant program.
Recommendation:
Salaries charged to the IDEA Preschool grant program be supported by time and effort calculations and be charged by pay period throughout the grant period.
View of Responsible Officials and Planned Corrective Action:
Management has reviewed this finding and indicated it will review and revise its procedures to ensure corrective action is taken.
129

BELLEVILLE TOWNSHIP SCHOOL DISTRICT SCHEDULE OF FINDINGS AND QUESTIONED COSTS (CONT'D)
FOR THE FISCAL YEAR ENDED JUNE 30, 2017
Part 3- Schedule of Federal and State Award Findings and Questioned Costs
EXHIBITK-7
This section identifies the significant deficiencies, material weaknesses, and instances of noncompliance, including questioned costs, related to the audit of major federal and state programs, as required by U.S. Uniform Guidance and New Jersey OMB's Circular 15-0S, as amended.
CURRENT YEAR STATE AWARDS
Finding 2017-004
Our audit of purchases and procedures related to compliance with the Public School Contracts Law revealed the following:
• We noted numerous instances where contract awards and purchases were made in excess of the bid threshold where there was no documentation provided to support publicly advertised bids were sought, State contract or cooperative purchasing contracts were awarded or a competitive contracting process was conducted in accordance with the requirements of the Public School Contracts Law (N.J.S.A. !SA: I SA), nor approved by Board resolution.
• We noted instances where contract awards and purchases were made in excess of the quote threshold where there was no documentation to support competitive quotations were solicited by the District in accordance with N.J.S.A. 1SA:!SA-37(a).
• We noted purchases made through National Purchasing Cooperative agreements were not publically advertised for intent to purchase. In addition, documentation was not provided to support verification of bid process or proof of cost savings.
• We noted professional service contract awards were not approved by Board in certain instances and contract awards were not publically advertised as required.
• We noted numerous exceptions where vendor Political Contribution Disclosure Forms (PCDF) and Business Registration Certificates (BRC) were not on file.
State program information:
Equalization Aid Under Adequacy Aid Special Education Aid Security Aid Professional Learning Community Aid P ARCC Readiness Aid Per Pupil Growth Aid
Criteria or specific requirement:
495-034-5120-078 495-034-5120-096 495-034-5120-0S9 495-034-5120-0S4 495-034-5120-101 495-034-5120-09S 495-034-5120-097
State Grant Compliance Supplement- State Aid Public- Special Tests and Provisions NJSA !SA: !SA- Public School Contracts Law
Condition:
Purchases of various goods and services were made which were not in accordance with the procedures specified in the Public School Contracts Law.
130

BELLEVILLE TOWNSHIP SCHOOL DISTRICT SCHEDULE OF FINDINGS AND QUESTIONED COSTS (CONT'D)
FOR THE FISCAL YEAR ENDED JUNE 30, 2017
Part 3- Schedule of Federal and State Award Findings and Questioned Costs
EXHIBITK-7
This section identifies the significant deficiencies, material weaknesses, and instances of noncompliance, including questioned costs, related to the audit of major federal and state programs, as required by U.S. Uniform Guidance and New Jersey OMB's Circular 15-08, as amended.
CURRENT YEAR STATE AWARDS
Finding 2017-004 (Continued)
Onestioned Costs:
Unknown.
Context:
Effect:
Cause:
l' Purchases and contracts for gym supplies, computer supplies, computer student information systems, smartboards and other services were made in excess of the bid threshold for which documents were unavailable to detennine if awards were procured through public bids advertised or other required processes in accordance with Public School Contracts Law and awarded by Board resolution.
l' Purchases for smartboards, grant writing and online professional development were made in excess of the quote threshold for which documents were unavailable to detennine if quotations were solicited in accordance with the Public School Contracts Law.
Noncompliance with requirements of the Public School Contracts Law.
Unknown.
Recommendation:
Internal control procedures over purchasing be reviewed and revised to ensure all contract awards and purchases which exceed the bid and quote thresholds are made in accordance with the requirements of the Public School Contracts Law. In addition, documentation be maintained on file and made available for audit to support the District's compliance with the procedures required under the Public School Contracts Law (N.J.S.A. 18A: 18A).
Views of Responsible Officials and Planned Corrective Action Plan:
Management has reviewed this finding and has indicated it will review and revise its procedures to ensure corrective action is taken.
131

BELLEVILLE TOWNSHIP SCHOOL DISTRICT SCHEDULE OF FINDINGS AND QUESTIONED COSTS
FOR THE FISCAL YEAR ENDED JUNE 30, 2017
Part 3- Schedule of Federal and State Award Findings and Questioned Costs
This section identifies the significant deficiencies, material weaknesses, and instances of noncompliance, including questioned costs, related to the audit of major federal and state programs, as required by U.S. Uniform Guidance and New Jersey OMB's Circular 15-08.
CURRENT YEAR STATE AWARDS
Finding 2017-005
Our audit of T.P.A.F. FICA reimbursements revealed the salaries used to determine the amount reimbursed by the State for FICA included certain non-pensionable compensation.
State Program Information
Reimbursed TP AF Social Security Contributions 495-034-5094-003
Criteria or Specitlc Requirement
State Grant Compliance Supplement
Condition
Salaries used to determine State reimbursements for FICA paid for T.P.A.F. members included certain nonpensionable wages.
Questioned Costs
Unknown.
Context
Imputed income and merit pay, non-pensionable wages, were included in the salaries used to determine the amount to be reimbursed by the State.
Amonnts reimbursed by State did not reflect actual FICA paid on T.P.A.F. members' pensionable wages.
See context.
Recommendation
The District review with its financial accounting software vendor the T.P.A.F. FICA calculation to ensure T.P.A.F. FICA reimbursements are based only on pensionable wages subject to FICA.
View of Responsible Officials and Planned Corrective Action
Management agrees with this finding and had indicated that procedures will be implemented to take corrective action.
132

BELLEVILLE TOWNSHIP SCHOOL DISTRICT SUMMARY SCHEDULE OF PRIOR AUDIT FINDINGS
FOR THE FISCAL YEAR ENDED JUNE 30, 2017
EXHIBITK-8
This section identifies the status of prior-year findings related to the basic financial statements and federal and state awards that are required to be reported in accordance with Chapter 6.12 of Government Auditing Standards, U.S. Uniform Guidance and New Jersey OMB's Circular 15-08.
STATUS OF PRIOR YEAR FINDINGS
Finding 2016-001
Condition
Our review of the June Treasurer's report and supporting bank account reconciliations revealed they were not in agreement.
Current Status
Corrective action was taken.
Finding 2016-002
Condition
We noted certain bank account reconciliations at year end were incomplete as a number of significant invalid reconciling items were noted during the audit that were not properly accounted for in the District's intemal records.
Current Status
Corrective action was taken.
Finding 2016-003
Condition
Our audit of payments made subsequent to June 30, 2017 revealed unrecorded liabilities and encumbrances that were not reflected in the District's accounting records at year end.
Current Status
Corrective action was taken.
133

BELLEVILLE TOWNSHIP SCHOOL DISTRICT SUMMARY SCHEDULE OF PRIOR AUDIT FINDINGS
FOR THE FISCAL YEAR ENDED JUNE 30, 2017
EXHIBITK-8
This section identifies the statns of prior-year findings related to the basic financial statements and federal and state awards that are required to be reported in accordance with Chapter 6.12 of Government Auditing Standards, U.S. Uniform Guidance and New Jersey OMB's Circular 15-08.
STATUS OF PRIOR YEAR FINDINGS
Finding 2016-004
Condition
Our review of the year end outstanding check list and related supporting documentation revealed the District is backdating checks issued after year end.
Current Status
CmTective action was taken.
Finding 2016-005
Condition
We noted several of the financial transactions of a $2,150,000 capital lease with First Hope Bank for the boiler replacement at School Number Eight and the Middle School were not being recorded in the District's accounting records.
Current Status
Corrective action was taken.
Finding 2016-006
Condition
Our audit of employee salary charges to the Title I grant program revealed the following:
• Time and effort calculations were not specifically completed to support salruy allocations for the Title I program for certain employees.
• Time sheets for certain hourly employees charged to the Title I program were not available for our review.
Current Status
Corrective action was taken.
134

BELLEVILLE TOWNSHIP SCHOOL DISTRICT SUMMARY SCHEDULE OF PRIOR AUDIT FINDINGS
FOR THE FISCAL YEAR ENDED JUNE 30, 2017
EXHIBITK-8
This section identifies the status of prior-year findings related to the basic financial statements and federal and state awards that are required to be reported in accordance with Chapter 6.12 of Government Auditing Standards, U.S. Uniform Guidance and New Jersey OMB's Circular 15-08.
STATUS OF PRIOR YEAR FINDINGS
Finding 2016-007
Condition
Our audit of Title I and Title II grant programs revealed expenditures for supplies and equipment were not charged to the proper expenditure lines.
Current Status
See Finding 2017-002.
Finding 2016-008
Condition
Our audit of the applications for free and reduced price meals noted the following exceptions:
• One (I) application approved as free did not meet the eligibility requirement for free meals. This application should have been approved for reduced priced meals.
• One (I) application approved as free did not meet eligibility requirements for free meals. This application should have been denied.
• Two (2) applications approved as reduced met the eligibility requirements of free meals. These applications should have been approved for free meals.
• Seven (7) applications were not located and, therefore, were unavailable for audit. • Two (2) applications approved were not signed by the parent or guardian.
Current Status
Corrective action was taken.
Finding 2016-009
Condition
Our audit of the District's Application for State School Aid (ASSA) revealed several discrepancies between the ASSA enrollment counts, District workpapers and the supporting District records.
Current Status
Corrective action was taken.
135

BELLEVILLE TOWNSHIP SCHOOL DISTRICT SUMMARY SCHEDULE OF PRIOR AUDIT FINDINGS
FOR THE FISCAL YEAR ENDED JUNE 30, 2017
EXHIBITK-8
This section identifies the status of prior-year findings related to the basic financial statements and federal and state awards that are required to be reported in accordance with Chapter 6.12 of Government Auditing Standards, U.S. Uniform Guidance and New Jersey OMB's Circular 15-08.
STATUS OF PRIOR YEAR FINDINGS
Finding 2016-010
Condition
One audit of travel reimbursements revealed the following:
• Total travel expenses exceed the Board approved maximum for 2016/17. • Purpose and relevance statements were not attached to the travel reimbursement requests or purchase
orders as required by Board policy. • Noted instances for reimbursement of travel expenses to certain individuals for travel events that were
not pre-approved by the Board as required by Board policy. • In certain instances, travel expenses are not being charged to the correct budget account line.
Current Status
Corrective action was taken.
136