Behaviour difficulties in children with special education needs ...
403
Behaviour difficulties in children with special education needs and disabilities: assessing risk, promotive and protective factors at individual and school levels A thesis submitted to the University of Manchester for the degree of PhD in the Faculty of Humanities 2012 Jeremy Oldfield School of Education
-
Upload
khangminh22 -
Category
Documents
-
view
2 -
download
0
Transcript of Behaviour difficulties in children with special education needs ...
Behaviour difficulties in children with special education needs and disabilities: assessing risk,
promotive and protective factors at individual and school levels
A thesis submitted to the University of Manchester for the degree of
PhD in the Faculty of Humanities
2012
Jeremy Oldfield
School of Education
1
Table of Contents
LIST OF TABLES…………………………………..……………………………….…6 LIST OF FIGURES……………………………………………………………….……8 ABSTRACT…………………………………………………………….………………9 DECLARATION………………………………………………………………………10 COPYRIGHT STATEMENT…………………………………………………………10 ABBREVIATIONS……………………………………………………………………11 ACKNOWLEDGEMENTS……………………………………………………...……13 CHAPTER 1 1.1 Introduction to chapter ................................................................................ 14
1.2 Behaviour Problems .................................................................................... 16
1.2.1 Definitions and Terminologies .............................................................. 16
1.2.2 Prevalence rates and time trends in behaviour difficulties .................... 29
1.2.3 Outcomes associated with childhood behaviour difficulties .................. 32
1.2.4 Summary Statements ........................................................................... 35
1.3 Special Educational Needs and Disabilities (SEND) ................................... 36
1.3.1 Overview of the concept of SEND ........................................................ 36
1.3.2 Justification of SEND population within the study................................. 46
1.3.3 Summary statements ........................................................................... 49
1.4 Risk, Promotion and Protection .................................................................. 50
1.4.1 Risk ...................................................................................................... 50
1.4.2 Promotion and Protection ..................................................................... 54
1.4.3 Summary statements ........................................................................... 60
1.5 Aim of study and Research Questions ........................................................ 61
1.5.1 Aim ....................................................................................................... 61
1.5.2 Research Questions ............................................................................. 63
CHAPTER 2
2.1 Introduction to chapter ................................................................................ 64
2.2 Individual level risk and promotive factors .................................................. 66
2.2.1 Age ....................................................................................................... 66
2.2.2 Relative age in the school year ............................................................ 67
2.2.3 Gender ................................................................................................. 69
2.2.4 Ethnicity ................................................................................................ 70
2.2.5 Academic achievement ........................................................................ 71
2.2.6 Attendance ........................................................................................... 72
2
2.2.7 Positive relationships ............................................................................ 74
2.2.8 Bullying ................................................................................................. 75
2.2.9 Special Educational Needs and Disabilities .......................................... 77
2.2.10 Other individual level risk factors ........................................................ 79
2.3 Family level risk factors ............................................................................... 80
2.3.1 Socio-economic status ......................................................................... 80
2.3.2 Other familial level risk factors .............................................................. 81
2.4 School level risk factors .............................................................................. 82
2.4.1 School Urbanicity ................................................................................. 82
2.4.2 School size ........................................................................................... 83
2.4.3 School level socio economic status ...................................................... 84
2.4.4 School EAL composition....................................................................... 85
2.4.5 Proportion of SEND pupils .................................................................... 86
2.4.6 School level achievement ..................................................................... 88
2.4.7 School level attendance ....................................................................... 89
2.4.8 School level behaviour difficulties ......................................................... 90
2.4.9 Other school level risk and promotive factors ....................................... 92
2.5 Neighbourhood level risk and promotive factors ......................................... 93
2.5.1 Neighbourhood disadvantage ............................................................... 93
2.5.2 Other neighbourhood level risk and promotive factors ......................... 94
2.6 The relative importance of the individual versus the school ecological level in accounting for behaviour difficulties .............................................................. 95
2.7 Summary Statements ................................................................................. 98
CHAPTER 3
3.1 Introduction to chapter ................................................................................ 99
3.2 Multiple risk factors ..................................................................................... 99
3.3 What is cumulative risk? ........................................................................... 101
3.4 Measurement of cumulative risk .............................................................. 102
3.5 Evaluation of cumulative risk .................................................................... 103
3.6 The functional form of cumulative risk models .......................................... 106
3.7 Cumulative risk across different ecological levels ..................................... 109
3.8 Conclusions .............................................................................................. 110
3.9 Chapter Summary and research questions ............................................... 112
3
CHAPTER 4
4.1. Introduction to chapter ............................................................................. 113
4.2 Protective factors and resilience ............................................................... 113
4.3 Measuring risk contexts for protective factor research .............................. 115
4.4 Measuring outcomes for protective factor research .................................. 117
4.5 Approaches to protective factor research ................................................. 118
4.5.1 Variable focused approaches ............................................................. 118
4.5.2. Person focused approaches .............................................................. 123
4.6 Protective factors and behaviour difficulties .............................................. 123
4.7 School level protective factors .................................................................. 127
4.8 Conclusions .............................................................................................. 129
4.9 Summary Statements ............................................................................... 130
CHAPTER 5
5.1 Introduction to chapter .............................................................................. 131
5.2 Theoretical framework .............................................................................. 132
5.2.1 Ecological Systems Theory ................................................................ 132
5.2.2 Framing the present study within Ecological Systems Theory ........... 135
5.3 Context of the Present Study .................................................................... 138
5.3.1What is Achievement for All? .............................................................. 138
5.3.2 Achievement for All evaluation study .................................................. 140
5.3.3 Overview of Methodology ................................................................... 141
5.3.4 How is the present study different from the AfA evaluation study? .... 142
5.4 Design ....................................................................................................... 144
5.4.1 Epistemology ...................................................................................... 144
5.4.2 Post-Positivist Approach .................................................................... 145
5.4.3 Quantitative Methodology ................................................................... 146
5.4.4 Survey design..................................................................................... 147
5.4.5 Teacher, parent or self-report ............................................................. 149
5.4.6 Longitudinal study .............................................................................. 150
5.4.7 Variables in the study ......................................................................... 151
5.5 Participants ............................................................................................... 155
5.5.1 Local Authorities ................................................................................. 155
5.5.2 Schools .............................................................................................. 155
5.5.3 Pupils ................................................................................................. 155
5.5.4 Attrition ............................................................................................... 156
4
5.5.5 Characteristics of final sample ............................................................ 157
5.6 Materials ................................................................................................... 164
5.6.1 Overview ............................................................................................ 164
5.6.2 Wider Outcomes Survey for Teachers (WOST) ................................. 164
5.6.3 Scoring ............................................................................................... 165
5.6.4 Psychometric properties of the WOST ............................................... 165
5.7 Procedure ................................................................................................. 170
5.8 Ethics ........................................................................................................ 173
5.9 Analytical Strategy .................................................................................... 176
5.9.1 Introduction ......................................................................................... 176
5.9.2 Primary and Secondary schools ......................................................... 176
5.9.3 What are Multi-Level Models? ............................................................ 177
5.9.4 How to interpret the outcome: Key concepts in Multi-Level Models ... 180
5.10 Chapter Summary ................................................................................... 183
CHAPTER 6 6.1 Introduction to chapter .............................................................................. 184
6.2 Missing Data ............................................................................................. 184
6.3 Data Assumptions for Multi-Level Models ................................................. 186
6.4 Risk and Promotive Factors ...................................................................... 193
6.4.1 Introduction to the section .................................................................. 193
6.4.2 Descriptive Statistics .......................................................................... 193
6.4.3 Research question 1a......................................................................... 197
6.4.4 Research Question 1b. ....................................................................... 199
6.4.5 Research Question1c ......................................................................... 216
6.4.6 Summary Statements ......................................................................... 218
6.5 Cumulative effects of risk factors: ............................................................. 219
6.5.1 Introduction to section ........................................................................ 219
6.5.2 Cumulative Risk Score ....................................................................... 219
6.5.3 Descriptive Statistics .......................................................................... 221
6.5.4 Research Question 2a ........................................................................ 222
6.5.5 Research Question 2b ........................................................................ 224
6.5.6 Research Question 2c. ....................................................................... 228
6.5.7 Summary Statements ......................................................................... 231
6.6 Protective Factors ..................................................................................... 232
6.6.1. Introduction to section ....................................................................... 232
6.6.2 Research Question 3a ........................................................................ 233
5
6.6.3 Research Question 3b ........................................................................ 239
6.6.4 Summary Statements ......................................................................... 245
CHAPTER 7 7.1 Introduction to the Chapter ....................................................................... 246
7.2 Summary of results ................................................................................... 246
7.2.1 Research Question 1 .......................................................................... 246
7.2.2 Research Question 2 .......................................................................... 247
7.2.3 Research Question 3 .......................................................................... 248
7.3 Discussion of results in relation to previous literature. .............................. 249
7.3.1 Research question 1a: ....................................................................... 249
7.3.2 Research question 1b: ....................................................................... 251
7.3.3 Research question 1c: ........................................................................ 271
7.3.4 Research question 2a: ....................................................................... 273
7.3.5 Research question 2b ........................................................................ 275
7.3.6 Research question 2c ......................................................................... 277
7.3.7 Research Questions 3a and 3b .......................................................... 279
7.4 Limitations ................................................................................................. 285
7.3.1. Methodological limitations ................................................................. 285
7.3.2. Conceptual limitations ....................................................................... 293
7.5 Future research ........................................................................................ 297
7.6 Chapter summary ..................................................................................... 304
CHAPTER 8 8.1. Introduction to chapter ............................................................................. 305
8.2 Implications ............................................................................................... 305
8.2.1 Implications from Research Question 1 .............................................. 305
8.2.2 Implications from Research Question 2 .............................................. 309
8.2.3 Implications from Research Question 3 .............................................. 310
8.2.4 Summary statements of key implications ........................................... 312
8.3 Contribution to Knowledge ........................................................................ 314
8.4 Summary of study ..................................................................................... 321
8.5 Summary Statements ............................................................................... 323
REFERENCES…………… ………………………………………………………324
APPENDICES………………………………………………………………………352
Word Count 86,663
6
LIST OF TABLES
Table 1.1 Percentage of SEND by Primary need
44
Table 4.1: Examples of protective factors that foster resilience for children at risk
124
Table 5.1 An overview of how the present study differs from the AfA evaluation
142
Table 5.2 Pupil level predictor variables: descriptions and sources of data collection
152
Table 5.3 School level predictor variables: descriptions and sources of data collection
154
Table 5.4 Participant attrition rates by total sample and school type
157
Table 5.5 Sample proportion within each group of the categorical predictor variables at the individual and school level (primary schools)
159
Table 5.6 Means and standard deviations of continuous predictor variables, with national averages and effect size comparisons (primary schools)
160
Table 5.7 Sample proportion within each group of the categorical predictor variables at the individual and school level (secondary schools)
161
Table 5.8 Means and standard deviations of continuous predictor variables, with national averages and effect size comparisons (secondary schools)
162
Table 5.9 Confirmatory factor analysis fit indices for the WOST
167
Table 6.1 Summary of data assumptions and requirements
192
Table 6.2 Mean and standard deviations for the behaviour difficulties score at baseline and follow up within the primary and secondary data sets
193
Table 6.3 Bivariate correlations between the behaviour difficulties mean score (at baseline and follow up) and all predictor variables within the primary and secondary data sets
194
Table 6.4 Empty multi-level model for primary school data
197
Table 6.5 Empty multi-level model for secondary school data 198
7
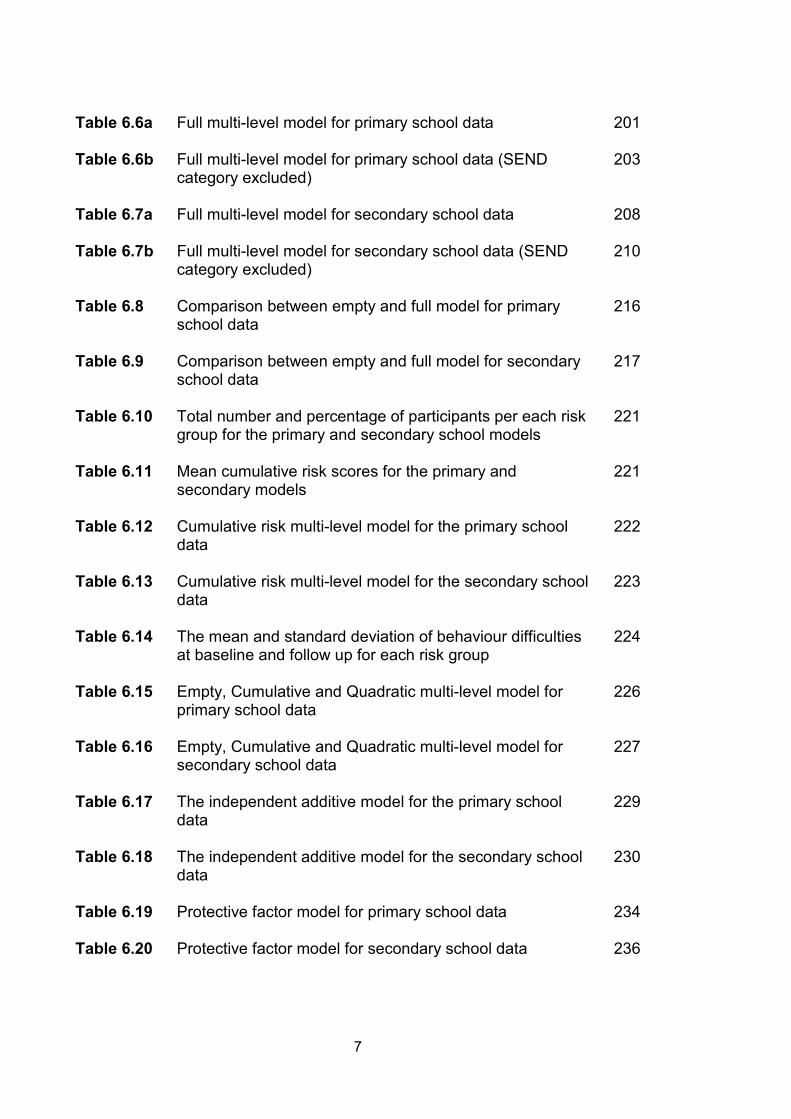
Table 6.6a Full multi-level model for primary school data
201
Table 6.6b Full multi-level model for primary school data (SEND category excluded)
203
Table 6.7a Full multi-level model for secondary school data
208
Table 6.7b Full multi-level model for secondary school data (SEND category excluded)
210
Table 6.8 Comparison between empty and full model for primary school data
216
Table 6.9 Comparison between empty and full model for secondary school data
217
Table 6.10 Total number and percentage of participants per each risk group for the primary and secondary school models
221
Table 6.11 Mean cumulative risk scores for the primary and secondary models
221
Table 6.12 Cumulative risk multi-level model for the primary school data
222
Table 6.13 Cumulative risk multi-level model for the secondary school data
223
Table 6.14 The mean and standard deviation of behaviour difficulties at baseline and follow up for each risk group
224
Table 6.15 Empty, Cumulative and Quadratic multi-level model for primary school data
226
Table 6.16 Empty, Cumulative and Quadratic multi-level model for secondary school data
227
Table 6.17 The independent additive model for the primary school data
229
Table 6.18 The independent additive model for the secondary school data
230
Table 6.19 Protective factor model for primary school data
234
Table 6.20 Protective factor model for secondary school data 236
8
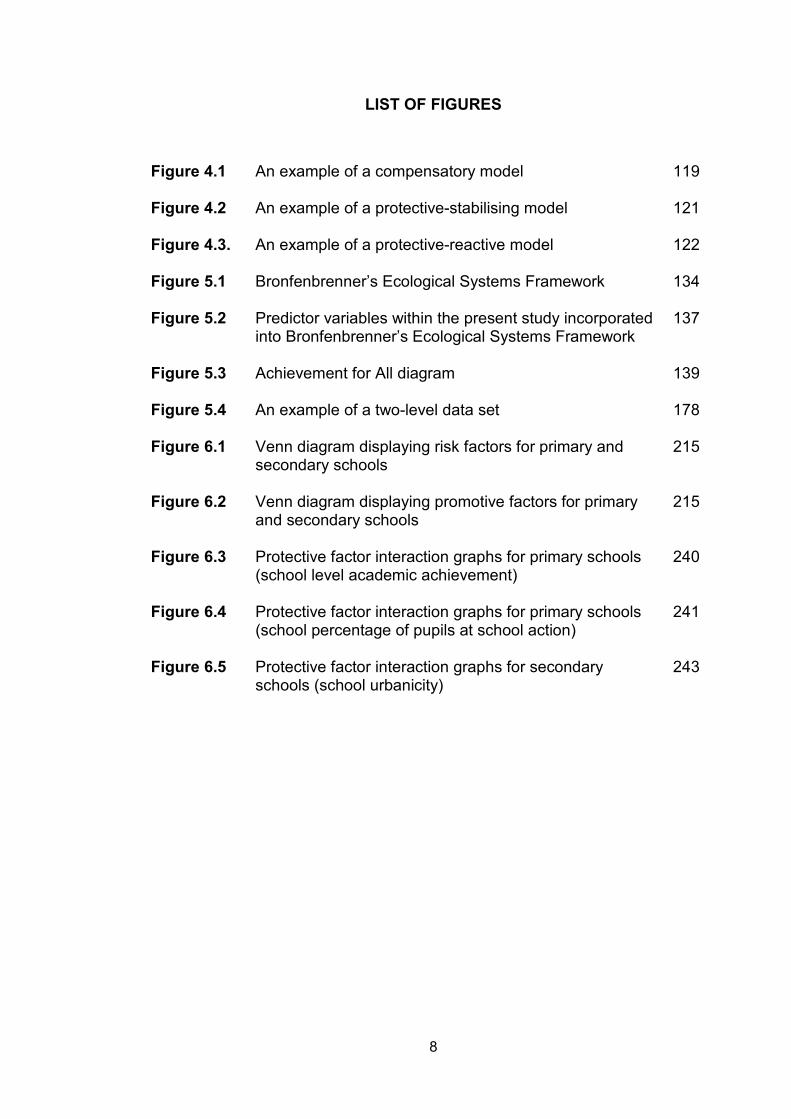
LIST OF FIGURES
Figure 4.1 An example of a compensatory model
119
Figure 4.2 An example of a protective-stabilising model
121
Figure 4.3. An example of a protective-reactive model
122
Figure 5.1
Bronfenbrenner’s Ecological Systems Framework 134
Figure 5.2
Predictor variables within the present study incorporated into Bronfenbrenner’s Ecological Systems Framework
137
Figure 5.3 Achievement for All diagram
139
Figure 5.4 An example of a two-level data set
178
Figure 6.1 Venn diagram displaying risk factors for primary and secondary schools
215
Figure 6.2 Venn diagram displaying promotive factors for primary and secondary schools
215
Figure 6.3 Protective factor interaction graphs for primary schools (school level academic achievement)
240
Figure 6.4 Protective factor interaction graphs for primary schools (school percentage of pupils at school action)
241
Figure 6.5 Protective factor interaction graphs for secondary schools (school urbanicity)
243
9
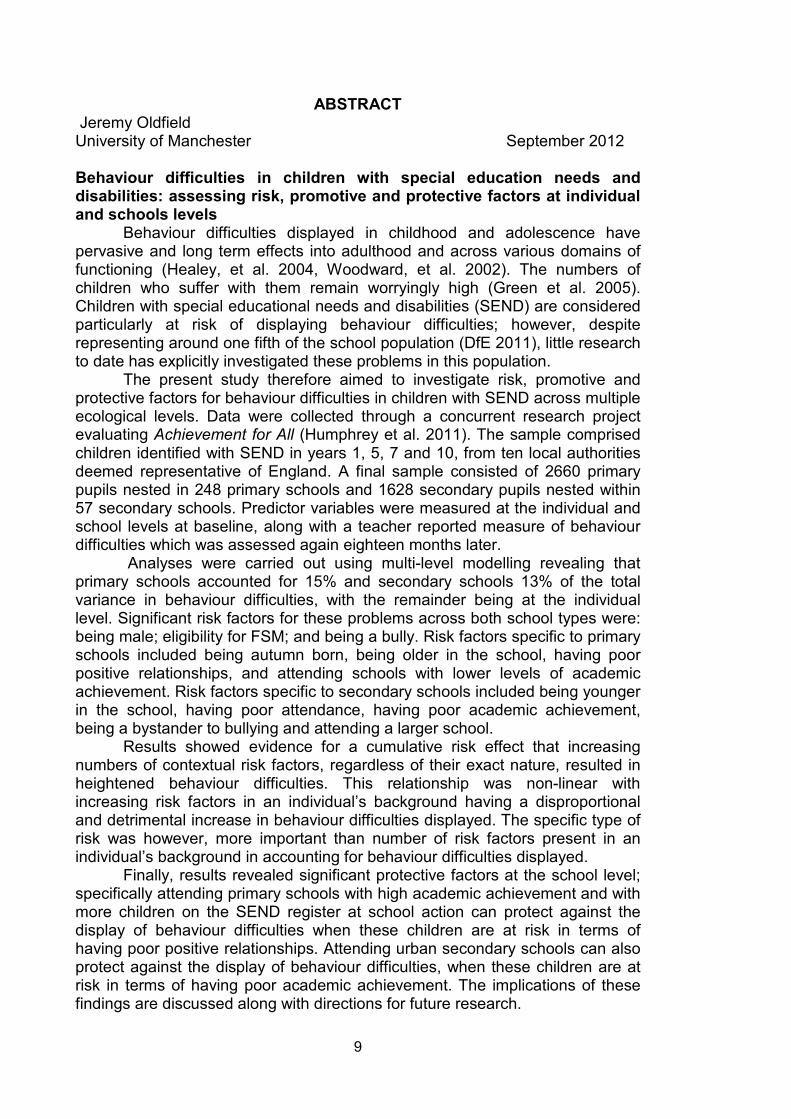
ABSTRACT Jeremy Oldfield University of Manchester September 2012 Behaviour difficulties in children with special education needs and disabilities: assessing risk, promotive and protective factors at individual and schools levels
Behaviour difficulties displayed in childhood and adolescence have pervasive and long term effects into adulthood and across various domains of functioning (Healey, et al. 2004, Woodward, et al. 2002). The numbers of children who suffer with them remain worryingly high (Green et al. 2005). Children with special educational needs and disabilities (SEND) are considered particularly at risk of displaying behaviour difficulties; however, despite representing around one fifth of the school population (DfE 2011), little research to date has explicitly investigated these problems in this population.
The present study therefore aimed to investigate risk, promotive and protective factors for behaviour difficulties in children with SEND across multiple ecological levels. Data were collected through a concurrent research project evaluating Achievement for All (Humphrey et al. 2011). The sample comprised children identified with SEND in years 1, 5, 7 and 10, from ten local authorities deemed representative of England. A final sample consisted of 2660 primary pupils nested in 248 primary schools and 1628 secondary pupils nested within 57 secondary schools. Predictor variables were measured at the individual and school levels at baseline, along with a teacher reported measure of behaviour difficulties which was assessed again eighteen months later.
Analyses were carried out using multi-level modelling revealing that primary schools accounted for 15% and secondary schools 13% of the total variance in behaviour difficulties, with the remainder being at the individual level. Significant risk factors for these problems across both school types were: being male; eligibility for FSM; and being a bully. Risk factors specific to primary schools included being autumn born, being older in the school, having poor positive relationships, and attending schools with lower levels of academic achievement. Risk factors specific to secondary schools included being younger in the school, having poor attendance, having poor academic achievement, being a bystander to bullying and attending a larger school.
Results showed evidence for a cumulative risk effect that increasing numbers of contextual risk factors, regardless of their exact nature, resulted in heightened behaviour difficulties. This relationship was non-linear with increasing risk factors in an individual’s background having a disproportional and detrimental increase in behaviour difficulties displayed. The specific type of risk was however, more important than number of risk factors present in an individual’s background in accounting for behaviour difficulties displayed.
Finally, results revealed significant protective factors at the school level; specifically attending primary schools with high academic achievement and with more children on the SEND register at school action can protect against the display of behaviour difficulties when these children are at risk in terms of having poor positive relationships. Attending urban secondary schools can also protect against the display of behaviour difficulties, when these children are at risk in terms of having poor academic achievement. The implications of these findings are discussed along with directions for future research.
10
DECLARATION
No portion of the work referred to in the thesis has been submitted in support of an application for another degree or qualification of this or any other university or other institute of learning.
COPYRIGHT STATEMENT
The following four notes on copyright and the ownership of intellectual property rights must be included as written below:
i. The author of this thesis (including any appendices and/or schedules to this thesis) owns certain copyright or related rights in it (the “Copyright”) and s/he has given The University of Manchester certain rights to use such Copyright, including for administrative purposes.
ii. Copies of this thesis, either in full or in extracts and whether in hard or electronic copy, may be made only in accordance with the Copyright, Designs and Patents Act 1988 (as amended) and regulations issued under it or, where appropriate, in accordance with licensing agreements which the University has from time to time. This page must form part of any such copies made.
iii. The ownership of certain Copyright, patents, designs, trade marks and other intellectual property (the “Intellectual Property”) and any reproductions of copyright works in the thesis, for example graphs and tables (“Reproductions”), which may be described in this thesis, may not be owned by the author and may be owned by third parties. Such Intellectual Property and Reproductions cannot and must not be made available for use without the prior written permission of the owner(s) of the relevant Intellectual Property and/or Reproductions.
iv. Further information on the conditions under which disclosure, publication and commercialisation of this thesis, the Copyright and any Intellectual Property and/or Reproductions described in it may take place is available in the University IP Policy (see http://documents.manchester.ac.uk/DocuInfo.aspx?DocID=487), in any relevant Thesis restriction declarations deposited in the University Library, The University Library’s regulations (see http://www.manchester.ac.uk/library/aboutus/regulations) and in The University’s policy on Presentation of Theses.
11
ABBREVIATIONS
ADHD: Attention Deficit Hyperactivity Disorder
AfA: Achievement for All
APP: Assessing Pupil Progress
ASD: Autistic Spectrum Disorder
BESD: Behaviour Emotional and Social Difficulty
CD: Conduct Disorder
DfE: Department for Education
DfES: Department for Education and Skills
DCSF: Department for Children Schools and Families
DSM-IV-TR: Diagnostic and Statistical Manual of Mental Disorders IV Text Revision
EAL: English as an Additional Language
EBD: Emotional Behavioural Difficulty
FSM: Free School Meals
HI: Hearing Impairment
ICC: Intraclass Correlation Coefficient
ICD-10: International Classification of Diseases 10
IQ: Intelligence Quotient
LA: Local Authority
SEN: Special Educational Needs
SENCO: Special Educational Needs Co-ordinator
SEND: Special Educational Needs and Disabilities
SA: School Action
SAP: School Action Plus
SEAL: Social Emotional Aspects of Learning

12
SEL: Social Emotional Learning
ST: Statement of SEND
MCAR: Missing Completely At Random
MLD: Moderate Learning Difficulty
MLM: Multi-level Modelling
MSI: Multi-Sensory Impairment
NPD: National Pupil Database
ODD: Oppositional Defiant Disorder
PATHS: Promoting Alternative Thinking Strategies
PD: Physical Disability
PMLD: Profound and Multiple Learning Difficulty
PRU: Pupil Referral Unit
SES: Socio-Economic Status
SpLD: Specific Learning Difficulty
SLCN: Speech, Language and Communication Needs
SLD: Severe Learning Difficulty
VI: Visual Impairment
WOST: Wider Outcome Survey for Teachers

13
ACKNOWLEDGEMENTS
Thanks go to my first and second supervisors; Prof. Neil Humphrey and Dr Michael Wigelsworth, who have supported and advised me throughout this project. Thanks also to Dr Alex Barlow for help with organising the data and Dr Ann Lendrum for her advice in writing a PhD.
I would also like to acknowledge the contribution that my two colleagues have made to my thesis; Judith Hebron and William Bulman. Without them the thesis would be greatly impoverished.
Finally, thanks go to my Mum and Dad, family and friends for their constant encouragement. Also to God for guiding me through these three years, without him I couldn’t have written this thesis and would be completely lost. It’s true I can do all this through Him who gives me strength, (Philippians 4 verse 13).
14
1. Key Concepts: Behaviour Difficulties; Special Educational Needs and Disabilities;
Risk, Promotive, and Protective factors.
1.1 Introduction to chapter
The aim of this chapter is to outline the key concepts within the present study.
These are: section 1.2 behaviour difficulties; section 1.3 risk, promotion and
protection; and section 1.4, special educational needs and disabilities.
Section 1.2.1 begins by discussing the various terminology and definitions that
have been used to describe a child or adolescent with a behaviour difficulty.
This section acknowledges the considerable inconsistency within the field and
how any definition or terminology applied reflects the researcher’s professional
background. A conclusion is then reached on an appropriate terminology and
definition that will be used throughout the remainder of the present study.
Within section 1.2.2, there is a discussion of current prevalence rates and time
trends within these problems and in section 1.2.3, the associated outcomes for
children with behaviour difficulties, both immediate and longer term are
highlighted. 1.2.4 completes this section with summary statements.
Section 1.3.1 begins with a brief overview 1
1 It is beyond the scope of this study to discuss all the complexities and contradictions within this term SEND. It is considerably more complex than this brief overview can give credit for, and so for a more in-depth review of the issues and contentions, the reader is referred to Peer & Reid (2012), Armstrong & Squires (2012), and Warnock, Norwich & Terzi (2010).
of the concept of Special
Educational Needs and Disabilities (SEND). Within this section a brief
description of the study’s population is provided in terms of: a) definitions, b)
historical overview of the concept, c) types or categories of specific need, d)
identification and assessment strategies, e) levels of support or provision, and f)

15
prevalence rates. Section 1.3.2 justifies the use of a SEND population within the
present study and section 1.3.3 provides summary statements for this section.
Section 1.4.1 begins with a discussion of the concept of risk and the inception
of risk factor research. Definitions are provided and discussion is undertaken of
the key theoretical and methodological issues which are essential in its
understanding. Section 1.4.2 discusses the concepts of promotion and
protection, highlighting the important differences between these terms and how
they will be conceptualised within the present study. Finally section 1.4.3
provides summary statements to this section.
16
1.2 Behaviour problems
1.2.1 Definitions and terminologies Psychologists have commonly referred to childhood and adolescent behaviour
problems as ‘acting out’ or ‘externalising behaviours’ that have disruptive and
disturbing affects on others (Papatheodorou, 2005). The types of behaviours
incorporated within this concept can include physical and verbal abuse,
vandalism, lying, fighting and stealing (Goodman, 2001). Specifically, in
schools, these behaviours could involve persistent low-level disruption - such as
students talking when not authorised to do so, avoiding and preventing others
from working, challenging the authority from teachers, making inappropriate
remarks, or being defiant, rowdy and generally disobedient (DES 1989, Cooper
1999a, Long, Wood, Littleton, Passenger & Sheehy 2011).
There has been considerable study of these types of problems, which have
often fallen under the broad umbrella term behaviour problems. Nonetheless,
despite an abundance of research, it remains a vague concept. There have
been substantial variations in how researchers have defined it, and also major
differences in the terms and precise behaviours used within this research
(Ayers, Clarke & Murray 2000). An established and universally agreed upon
definition of what behaviour problems actually means, has not been forthcoming
within the literature, and appears to elude current research (Howarth & Fisher
2005).
A rich tapestry of concepts and definitions has been applied to this field (Hawes
& Dadds 2005), which makes it a particularly difficult area to research.
Conducting even the briefest literature search within this field reveals a number
of distinct terms that appear to be used somewhat interchangeably. It is often
unclear, for example, whether terms such as ‘behaviour problems‘; ‘behaviour,
emotional social difficulties’; ‘externalising problems’; ‘challenging behaviour’;
‘anti-social behaviour’; ‘conduct problems’; and ‘aggression’ to name but a few,
have synonymous meanings, and can therefore be used interchangeably in

17
discussing research on childhood and adolescent behaviour problems. Kavale,
Forness & Alper (1986) reported 25 years ago, in a review of relevant studies,
that approximately fifty terms have been used to describe ‘behaviour problems’.
This number is only likely to have increased in recent years, as different
terminology is introduced to fit with current government and research aims. The
terms appear to share some commonality in the types of behaviours they
encompass; nonetheless, a closer look reveals that each has its own distinct
definition which means they are not completely interchangeable.
The huge variations in the terminology used within this field ultimately reflect the
professional background of the researcher in question. Different disciplines
describe children with behaviour problem using their own distinct terminologies
and definitions (Connor, 2004, Munn & Lloyd 1998). This can be a hindrance for
professionals across the disciplines particularly in terms of how they accurately
communicate to one another regarding a certain child with a particular difficulty
(Papatheodorou, 2005). Visser (2002) argues that it is even questionable
whether professionals within the same field, let alone those across different
disciplines, understand and apply these terms in the same way. The use of the
concept challenging behaviour (Ofsted 2005) is one such example. It was
reported there is a lack of an agreed definition of this concept by schools that
have used and understood this term in various ways across settings. In order to
avoid further confusion concerning terms and definitions used to describe
behaviour problems it is essential to have an explicit definition of behaviour
problems (or whichever other term is chosen for the research), (Visser & Stokes
2003).
The present study will adhere to this principle, and provide both an
acknowledgment of the term chosen to describe behaviour problems, and also
a definition of this term. It should be pointed out here that adopting the term
behaviour problems to describe the types of behaviour of interest has been
dismissed, as although a fairly self-explanatory term, theoretically, it is
problematic. Psychologists have long debated over a viable definition of
‘behaviour’, and there is controversy as to whether ‘behaviour’ refers uniquely to
responses that are overt and objectively measureable, or whether it also

18
includes internal states and mental constructs/representations and even
physiological and neurological processes (Reber & Reber 2001). It is logical to
suggest that adding the word ‘problem’ to this conceptualisation of behaviour
could imply a number of clearly distinct and vastly different types of behaviours
that might not resemble what is assumed to be behaviour problems. As such it
becomes extremely difficult to define it in a meaningful or constructive way, and
is therefore perhaps not the most useful term to employ for the present
research.
Nonetheless, an appropriate term needs to be found and applied within this
study. By reviewing other terms applied to this field and across a range of
different disciplines, greater understanding of behaviour problems, will be
realised (Connor, 2004), thus allowing the most suitable term to be settled
upon. What follows then is a discussion of the various terminologies and
definitions relevant to the field of behaviour problems that have been utilised
within educational, community and clinical settings. A conclusion will then be
drawn as to which terminology and definition is most relevant and whether it is
appropriate to use such a concept within the present study.
Behaviour problems defined within educational settings It is often within schools where behaviour problems are most commonly
witnessed and where the issues are perhaps the most salient. Examining how
professionals within education contexts have identified the problem and
whether terminology applied within these settings could be adopted by the
present study is important to note.
Over the past 75 years, various terminology and definitions have been applied
to children and adolescents within educational settings, who present some
difficulty with their behaviour. The term ‘Maladjustment’ was first used to
describe such problems in Britain around the time of the 1944 Education Act.
This term was considered an official way to describe children with behaviour
problems or those who displayed evidence of some kind of psychological
disturbance or emotional instability, and therefore demanded special
19
educational provision in order for them to become ‘readjusted’ (Papatheodorou
2005, Visser 2002). There was criticism of this term, however, as it included no
exact definition or identifying criteria and only the children most severely
affected were acknowledged, whereas less serious cases, which were in fact
more common, were not. Furthermore, individual circumstances and contexts
were often not taken into account (Papatheodorou 2005), and the term reflected
a commonly held view at the time that these behaviours stemmed mainly from
within the child, and were not influenced by environmental conditions. Around
40 years later, the term lost favour when the Warnock report came out in 1978,
(DES 1978) and the Education Act was published in 1981. These reports
advocated the term ‘emotional or behavioural disorders’ which soon became
Emotional Behavioural Difficulties (EBD), (Frederickson & Cline 2009).
The term EBD has been defined in various ways, The DfE (1994) in Circular
9/94, entitled ‘Pupils with Problems: the Education of Children with Emotional
and Behavioural Difficulties’ proposed an all-encompassing definition that
“children with emotional behavioural difficulties are on a continuum. Their
problems are clearer and greater than sporadic naughtiness or moodiness and
yet not so great as to be classed as mental illness…EBD range from social
maladaption to abnormal emotional stresses. They are persistent (if not
necessarily permanent) and constitute learning difficulties”, (page 7). EBD may
not be seen as a single disorder, but rather as a diverse collection of
characteristics. These may have arisen from either within the child, from a
response to their environment, or result in an interaction between the two
(Cooper 1999b). This definition is problematic however, as it is unclear when
‘sporadic naughtiness or moodiness’ become EBD, or even when a child’s
behaviour is bordering on mental illness (Chaplain 2003). Cooper (1996) also
criticises the definition of EBD describing it as a “crude, ill-defined and not very
useful descriptor. Current definitions of the terms are vague and undeveloped.”
(page 147).
The DfE (1994) state that “Whether the child is judged to have EBD will depend
on the nature, frequency, and persistence, severity, abnormality or cumulative
effect of the behaviour compared with normal expectations of a child of the age

20
concerned. There is no absolute definition”, (page 4). With no conclusive
definition of what EBD actually is, and the fact that it incorporates a wide range
of behaviour problems such as social withdrawal, school refusal, depression,
and anxiety, as well as more externalised behaviours such as being non-
cooperative and oppositional, talking when not authorised to do so, challenging
authority of the teacher, and preventing others from working, (Cooper 1999a), it
is not the most useful term that can be applied to the present study.
The publication of the Special Educational Needs Code of Practice (DfES
2001a) brought with it the term behaviour, emotional and social difficulties
(BESD). Schools within the UK use the Special Education Needs code of
practice (DfES 2001a) in order to define and identify those children and
adolescents with behaviour problems - placing them in the BESD group. BESD
refers to “Children and young people who demonstrate features of emotional
and behavioural difficulties, who are withdrawn or isolated, disruptive and
disturbing, hyperactive and lack concentration; those with immature social skills;
and those presenting challenging behaviours arising from other complex special
needs” (DfES 2001a, page 87). A more recent government report entitled ‘The
Education of Children and Young People with Behaviour, Emotional and Social
Difficulties as a Special Educational Need’ (DCSF 2008a), also suggests that
the term BESD includes children with conduct related disorders, hyperkinetic
disorders (e.g. attention deficit disorder/attention deficit hyperactivity disorder),
as well as those with emotional disorders such as depression, anxiety, school
phobia and those that self-harm. Children within this category have not
necessarily been given a medical diagnosis but those with this diagnosis are
likely to be defined as having BESD by their school. The report also suggests
that children will be considered to have BESD not only due to the nature and
severity of the problems but also frequency and persistence of the difficulties.
The BESD group includes a very heterogeneous sample of children,
incorporating pupils with a broad range of disabilities across a wide continuum
of severity. The BESD label makes no distinction between those individuals who
display aggressive, disruptive, attention-seeking, hyperactive, delinquent and
oppositional behaviours or so-called externalising problems (Achenbach 1991a,
21
1991b, Liu 2004) and those children that display anxious, depressed,
unmotivated, withdrawn behaviours and psychosomatic complaints or so called
internalising problems, (Achenbach 1991a, 1991b, Eisenberg et al. 2001). As
the BESD category comprises at least two distinct groups (externalising versus
internalising problems) it is not an adequate term and its definition cannot be
applied for research that is interested in exclusively the externalising type of
behaviour problems.
Another term commonly found within the research literature which assumes a
synonymous meaning to BESD is ‘social emotional behavioural difficulties’
(SEBD), a term used by the SEBD association (SEBDA). There is some
discussion from this organisation in terms of the exact order of the words
‘social’, ‘emotional’ and ‘behaviour’. Cole (2003) suggests that it is ultimately
social and emotional experiences interacting with environment conditions that
affect behaviour, therefore ‘social’ and ‘emotional’ should come before
‘behaviour’. Although the use of ‘social’ is included in the BESD definition this
has not been broadly used in the research literature (Visser 2003).
Behaviour problems defined within community settings It is within schools that terms such as EBD and BESD have been used. Outside
these settings, within the community, they could be referred to and may have
equivalent meaning as anti-social behaviour (Chaplain 2003). Indeed, Reber &
Reber (2001), in their definition of behaviour problems, argue, for the concept of
anti-social behaviour - defining an individual with behaviour problems as “a
person usually a child or adolescent, whose behaviour is persistently anti-
social” (page 85). According to the Home Office a definition of anti-social
behaviour is “aggressive, intimidating or destructive activity that damages or
destroys another person's quality of life” (Home Office 2011, page 1). This
definition appears to convey a similar meaning to what is understood by
behaviour problems within schools. Specifically antisocial behaviours include
behaviours more frequently, although not exclusively, displayed outside the
school environment e.g. threatening behaviour, verbal abuse, vandalism,
graffiti, and intimidating behaviour, (Millie, Jacobson, McDonald & Hough 2005).
22
There are problems however, with using this term to describe behaviour
problems within the context of the present study. According to Hagell (2007),
anti-social behaviour is socially determined, and if a particular behaviour does
not impact negatively on another person then it is not seen as anti-social. This
idea could be problematic in terms of cheating behaviour, where it does not
necessarily have a direct impact upon others, but nevertheless is a clear
problem behaviour. Furthermore, what one individual interprets as anti-social
behaviour may be considered as appropriate behaviour by a different person,
as what is understood to comprise ‘anti-social behaviour’ is ultimately a product
of contextual factors, the tolerance of the community, location and the quality of
life expectations (Home Office 2004). There is a great deal of subjectivity
therefore in how it is defined and what specific behaviours are included within it.
The term antisocial behaviour also appears to relate more specifically to adults
than children and young people, who are the focus of the present study.
Although anti-social behaviour may be a term used in community settings and is
at least partially consistent with EBD or BESD in schools, it is not an
appropriate term for the present study that is interested in school behaviour
problems.
Delinquent behaviour is another descriptor that has been used to account for
children and adolescents with behaviour problems, (Visser 2002). There is
however, uncertainty as to when behaviour is considered delinquent or when it
is called anti-social. There seems to be some cross-over between these
constructs. There is further confusion, as highlighted by Campbell, Shaw &
Gilliom (2000), who argue that the term delinquency is flawed as it is often used
interchangeably for children who have been arrested for anti-social acts, as well
as being a clinical label used to describe certain behaviours. Many children
given the label delinquent have never been arrested, and those children that
have been arrested for anti-social acts and called delinquent in the legal sense
do not always meet the clinical criteria to gain the label in this domain.
Definitions of delinquency therefore relate to illegal acts and, sometimes, clinical
labels for behaviour problems. They are not suitable terms to use for the
present study that is investigating behaviour problems in schools, and aims to
23
incorporate a range of problematic behaviours from the less severe to the more
extreme.
Behaviour problems defined within clinical settings Professionals from clinical approaches often use the term mental disorders to
categorise children with behaviour difficulties into different groups. These
categorisations often depend upon the severity of their disabilities displayed.
The mental disorders that are relevant to the field of behaviour problems in
childhood include so called disruptive behaviour disorders such as oppositional
defiant disorder (ODD), conduct disorder (CD) and attention deficit hyperactivity
disorder (ADHD). Clinical professionals either use the Diagnostic and Statistical
Manual of Mental Disorders IV Text Revision (DSM–IV-TR, American
Psychiatric Association 2000) or the International Classification of Diseases 10
(ICD 10, World Health Organisation 1992) to diagnose these problems. The
manuals provide standardised frameworks for identifying and categorising
mental disorders, based upon specific behaviours displayed.
The DSM-IV-TR therefore defines ODD as “a recurrent pattern of negativistic,
defiant, disobedient, and hostile behaviour toward authority figures that persists
for at least 6 months” (page 100). CD (considered more severe than ODD) is
defined as “repetitive and persistent pattern of behaviour in which the basic
rights of others or major age-appropriate societal norms or rules are violated”
(page 93) and ADHD is defined as “persistent pattern of inattention and/or
hyperactivity-impulsivity that is more frequently displayed and is more severe
than is typically observed in individuals at comparable level of development”
(page 85).
Of particular relevance to the present study are behaviours associated with CD
and ODD. The specific types of behaviours included in the CD classification fall
in to 4 broad areas; these have been termed aggression to people and animals;
destruction of property; deceitfulness or theft; and serious violations of rules
(DSM-IV-TR 2000). Individuals who display these problem behaviours, although
to a lesser degree, may meet the criteria for ODD, or if they do not meet the
24
diagnostic criteria for either of these disorders, but display some of the
behaviours listed, they could be described as having or displaying conduct
problems. Although these terms have been clearly defined and contain details
of specific behaviour that are similar to those of interest within the present
study; using them is not a feasible option for an educational focussed study that
does not have the expertise in using the DSM-IV-TR or ICD-10 correctly.
A further alternative label often used within clinical settings is externalising
behavioural disorders (King, Iacono, & McGue 2004). This phrase is often used
to refer to those who display oppositional, aggressive, and destructive
behaviours (Calkins, Blandon, Wiliford & Keane 2007). This label maybe a
useful means of explaining behaviour problems within the present study, as the
term refers solely to those children who have problems in ‘acting out’
behaviours and not those with emotional difficulties such as depression and
anxiety (i.e. internalising problems). This concept therefore overcomes the
inherent problems with the definitions such as BESD, as it is able to distinguish
externalising from internalising behaviours. Nonetheless, some researchers
have argued that these constructs may not be mutually exclusive categories
and are often comorbid (Gilliom & Shaw 2004).
There are concerns with using the term externalising problems for the present
study; as Fergusson, Horwood & Ridder (2007) argue that this term can be
broken down or subdivided into conduct problems such as aggressive
behaviours (which would include CD and ODD) and attentional problems, such
as overactivity (which would include ADHD). The focus of the present study is
exclusively on behaviours making up the conduct component, therefore the
broader term externalising problems is not appropriate here.
The conduct construct remains the primary interest of the present study;
however, this term can also be further subdivided to include overt aggressive
behaviours, such as fighting and cruelty, and covert delinquent behaviours such
as lying, cheating or stealing (Barnow, Lucht & Freyberger 2005). Both of these
sub-domains are of interest to the present study. However, using such a term
as conduct within the present study was dismissed due to its inherent
25
association with clinical settings whereas the focus of the present study remains
an educational based piece of research.
Conclusions The amount of terminologies and definitions applied to this field of behaviour
problems is enormous, and “the diversity in this language reflects not only the
historical trends, but also conceptual distinctions between and within
disciplines” (Hawes & Dadds, 2005, page 74). Although there has been some
consistency between those from educational, community and clinical
backgrounds in their interest in, and how, they define behaviour problems
(Visser 2003), the exact terminology often varies significantly.
The lack of consistency in terminology used across studies will have a
detrimental effect on the search for new knowledge in this area. New research
should therefore clearly and coherently state the terminology and definition
applied at the outset. In making these explicit, results from these studies will be
interpreted more accurately allowing knowledge to advance further in this area.
Having reviewed the various terminologies and definitions found within the
literature, the term ‘behaviour difficulties’ will be adopted by the present study,
and will be used throughout the remainder of this report. Other terms signifying
similar meaning to behaviour difficulties will only be used when discussing
previous research that has defined the problem using that terminology.
Using the term behaviour difficulties was selected to bridge the gap between
different perspectives and incorporate terminology from educational concepts
such as BESD, clinical ones such as CD, and community ones such as anti-
social behaviour. Focusing upon the common features between these
approaches will allow the present study to have a broader focus, incorporating a
larger evidence base and be of greater benefit to children experiencing these
problems, both within and outside of education.
26
The choice of the word behaviour was selected, as discussed above it appears
to reflect a broadly understood construct. Although it could be interpreted in a
number of different ways, alongside a clear definition it will be a constructive
word to use. Furthermore, it also appears in a number of terms already used
within this area, such as emotional behaviour difficulties, and behaviour,
emotional and social difficulties, as well as anti-social behaviour. The word
difficulty was chosen over words such as problem and disorder, not only as
these words are not commonly used within the UK government’s educational
guidelines (Visser 2003), but because of their underlying inherent meaning.
According to Delfos (2004), using the word disorder signifies that the researcher
sees the source of a child’s behaviour coming to a greater extent from within the
person and is therefore predispositional. Whereas the word problem carries a
different value judgment - that the child’s behaviour stems more from
environmental factors outside of the child. The present study is not attempting,
as yet, to make any inferences as to where the main source of the behaviour in
question lies – whether it is predispositional, or environmental - but by utilising
the term difficulty it adopts an interaction perspective acknowledging the
importance of both aspects.
A definition of behaviour difficulties for the present study will therefore be:
An individual’s behaviour that is persistently aggressive, destructive,
dishonest or disobedient, and is deemed inappropriate for their age or
cultural background. These behaviours will have a negative affect upon
themselves, others or property, and may occur solely within a unique or
across multiple contexts.
Behaviour difficulties is used here as a kind of umbrella concept to describe a
number of behaviours that refer more generally to externalised behaviour
problems, rather than internalising ones, and within the externalising framework
refer more specifically to behaviours that are conduct-related such as physical
abuse and cheating (therefore including both covert and overt behaviours)
rather than inattentional problems such as hyperactivity.
27
This definition highlights that children will therefore vary in the degree to which
they are displaying behaviour difficulties, and does not categorise children as
always displaying a problem. This is because all children at some point will
display behaviour difficulties. They become more severe problems when they
are persistent and fairly common patterns in that individual’s behaviour, and not
appropriate for their age and cultural background.
This definition is attempting to provide a general overview of what behaviour
difficulties look like and the types of problem behaviours they encompass.
Highlighting the key behaviours that are associated with this term, will aid
researchers in adopting a more consistent approach, which is what Ayers, et al.
(2000) state that when defining behaviour difficulties “specific, descriptive
phrases should be used instead of vague colloquialisms” (page vii). Therefore
in relation to the present study and the above definition, the behaviours that are
of particular interest are disobedience, cheating and lying, stealing, physical
and verbal aggression and vandalism, all of which are measured within the
WOST survey, (see chapter 5). These types of behaviours are termed
behaviour difficulties as they have a significant and detrimental effect on the
individual child as well as other people’s general well-being.
Providing a single definition for any construct within the broad area of childhood
and adolescent behaviour problems has been argued against by some
researchers (Visser 2003, Munn & Lloyd 1998). They acknowledge that distinct
terms will inevitably be used in the literature and be understood in diverse ways
by different professionals (Daniels, Visser, Cole & DeReybekill 1999). If new
descriptive labels are sought and applied, researchers may begin to investigate
interventions for these new terms, when essentially they are referring to the
same children as before but under different labels. Important knowledge from
previous research may then be lost (Visser 2002). Furthermore, criticism has
been levelled against adding a new terminology to the literature base. Connors
(2004) argues that it is unlikely that any term will adequately and sufficiently
incorporate the wide range of behaviours generally included within this concept.
28
Nonetheless, despite these criticisms it is argued here that researchers need to
define the problem for their own research, so that there can be some
meaningful comparison between studies that is not based upon assumptions
and subjective interpretations of the various terminologies applied. If definitions
for behaviour difficulties have clarity of meaning, and a shared understanding,
by professionals working within the same field, as well as those across
disciplines, this will ultimately aid reliability and accuracy in reporting on, and
then supporting, children with these difficulties. Without a clear definition, there
is a danger that all children categorised as having some kind of behaviour
difficulty are assumed to be somewhat similar and therefore requiring
comparable interventions whereas in reality their problems could be quite
distinct, (Cooper 1996).
29
1.2.2 Prevalence rates and time trends in behaviour difficulties
Prevalence Establishing the current prevalence rates of childhood and adolescent
behaviour difficulties is a valuable exercise as they can help elucidate the
aetiological and potential protective factors involved (Achenbach, Dumenci &
Rescorla, 2003). In a report carried out on behalf of the Department of Health,
Green, McGinnity, Meltzer, Ford & Goodman (2005) showed the current
prevalence rates of childhood and adolescent mental health problems within the
UK to be around 10%. That is one in ten children and young people aged 5-16
had a clinically diagnosed mental disorder. Specifically, in terms of conduct
disorders they found a 6% diagnosis rate. The sample was split by age group
and it was found that in children (5-10 year olds) the rate of conduct disorders
was 4.9% whereas it was even higher, 6.6%, for adolescents (11-16 year olds).
These findings reflect similar figures within schools, where the percentage of
children categorised as BESD (and therefore likely to be displaying some
behaviour difficulties) is around 4.7% of the school population (DfE 2011a).
There is however, some confusion about the extent of childhood behaviour
difficulties. In a review of 52 studies investigating child and adolescent mental
disorders the prevalence rates ranged from 1-50% (Roberts, Attkisson &
Rosenblatt 1998). These authors suggested that the reason for this variation in
results was the studies in question used different methods and a range of
different definitions. It is important, therefore, that further prevalence studies (or
indeed any research around this topic) to have standardised assessment
measures with clear definitions, using representative samples across different
time points, to assess the reliability of whether behaviour disorders are in fact
increasing (Collishaw, Goodman, Pickles & Maughan, 2007).
30
Time trends Whether the prevalence of behaviour difficulties have increased in recent years
has attracted considerable attention. Indeed investigating the potentially
changing extent of childhood and adolescent behaviour difficulties across years
may help to establish causal factors or highlight clear associations between
them and aspects of a changing society.
Smith & Rutter (1995) conducted a review of the literature spanning 50 years
and argued that there had been a considerable increase in the number of young
people affected by psychosocial disorders. This evidence has more recently
been supported by Collishaw, Maughan, Goodman & Pickles (2004) who
collated data spanning 25 years, from 1974-1999 within the UK, and showed
that mental health problems in adolescence, especially conduct problems, had
substantially increased, and this effect was evident across both genders and
was not related to family type or social class. Further support for this view
comes from outside the UK, where Tick, van de Ende, & Verhulst (2007), who
investigated trends in emotional and behavioural problems in Dutch children
across 20 years, found small increases in children’s emotional and behavioural
problems across the years.
Not all evidence is in support of this view, as Green et al.’s (2005) study looked
at the changes between 1999 and 2004, finding little difference in prevalence of
conduct disorders between those years. This evidence has been further
supported by Sourander et al. (2004), who conducted a 10-year comparison
study investigating time trends in mental health problems among children by
taking a representative sample of 8-9 year olds from Finland in 1989 and then
again in 1999. A significant finding to emerge was that among boys, the 1989
sample showed higher levels of conduct problems than the 1999 sample (for
both the teacher and parent report). However, teacher and parent report for
girls’ conduct problems over this period remained constant with no significant
change over time.
Achenbach, Dumenci & Rescorla (2002, 2003), showed that in samples of 11-
18 year olds a small decline in psychological problems was evident between
31
1989 and 1999. Specifically, they demonstrated that in samples of three cohorts
of 7-16 year olds, in 1976, 1989 and 1999, problem behaviour scores had
increased from 1976 to 1989 but decreased again in the 1999 sample (although
not to the same levels as in 1976). These studies suggest that externalising
problems had risen between the late 1970s and 1980s but had fallen again by
late the 1990s. Finally, Maughan, Collishaw, Meltzer & Goodman (2008), using
data collected from two nationally representative samples in 1999 (Ford et al.
2003) and 2004 (Green et al. 2005) found that the differences were marginal
between the year groups. Teachers reported that conduct problems remained
at the same level in both cohorts, whereas parents reported a slight drop from
the 1999 to the 2004 sample, which was a similar finding for the adolescent
self-report. The authors of this study suggested that the initial increase in
conduct problems seen before and throughout the 1980s may have plateaued
and possibly reversed.
Conclusions In concluding this research, it is important to note that there are difficulties in
comparing prevalence studies of childhood and adolescent mental health
problems, as there is often a wide variation in sampling, measurements used,
diagnostic criteria/definitions applied, how studies have combined informant
reports, and distinct types of disorder investigated, (Ford, Goodman & Meltzer,
2003). Furthermore, the changing levels of behaviour difficulties may be due to
an increased awareness or people being more willing to report on these
problems. These ideas should be taken into account before coming to a firm
conclusion.
Overall, although there is some evidence that conduct-related problems appear
to be decreasing or at least plateauing, concern remains that the number of
children and adolescences with behaviour difficulties remains worryingly high.
Further research, which can attempt to explain why this may be the case -
especially in terms of the prominent risk, promotive and protective factors
relevant to this current time period is therefore justified.
32
1.2.3 Outcomes associated with childhood behaviour difficulties
Immediate term Childhood and adolescent behaviour difficulties remain a particular concern due
to the various negative outcomes associated with them. These behaviours have
immediate and profound influences in schools, especially on the learning
environment, achievement and children’s social development, (Calkins, et al.
2007). It has been reported that children with behaviour difficulties are more
likely to be involved in bullying both as a victim (Humphrey et al. 2011) and
perpetrator (Laukkanen et al. 2002), have poorer positive relationships
(Humphrey et al. 2011) and perform less well academically (Humphrey et al.
2011). Childhood and adolescent behaviour difficulties also causes significant
stress to teachers (Chaplain 2003, Cooper 1999b) who may then perceive
these children more negatively resulting in the child acting in line with their
teachers negative expectations (Soles, Bloom, Heath & Karagiannakis 2008).
The effect of these types of behaviour also causes more stress and conflict with
parents (Hastings 2002), and can have significant detrimental affects when
displayed in the wider community, particularly if expressed as vandalism and
arson (Delfos 2004).
Long term These difficulties not only have immediate impacts on the individual displaying
them, their family, school and wider community but also often lead to various
deleterious outcomes later in life, (Fergusson et al. 2007). This is because
childhood behaviour difficulties are generally considered to remain relatively
stable and persist into adulthood, displaying long-term continuity at least up to
middle adulthood (Reef, Diamantopoulou, van Meurs, Verhulst & Ende, 2010).
Research has therefore begun to explore the long-term outcomes that are
associated with behaviour difficulties in childhood.
• Cost to society: Scott, Knapp, Henderson & Maughan (2001) argue that
behaviour difficulties in childhood are a powerful predictor of how much an
individual will cost society. They found that those individuals at aged ten who
33
had been rated as having the most severe behaviour problems had cost
society 10 times more by the time they were twenty-eight, compared against
those rated as having no behaviour difficulties in childhood.
• Unemployment: Healey, Knapp & Farrington, (2004), have suggested
that those children who were reported to have behaviour difficulties (and then
engaged in criminal activity throughout their adolescence), were more likely
to suffer long term unemployment prior to age 32. Unemployment may
however, have been mediated through low academic attainment at
secondary school, and being convicted of criminal acts in early adulthood.
• Adult mental health problems: Research has shown that behaviour
difficulties in childhood are a strong predictor of an increased risk of suicide,
(Darke, Ross & Lynskey, 2003) and increased risk of experiencing a
psychiatric disorder in early adulthood (Sourander et al. 2005).
• Crime: Fergusson, Horwood & Ridder (2005) investigated the
relationship between behaviour difficulties in middle childhood and later
psychosocial outcomes into adulthood across a 25 year period. They found
associations between behaviour difficulties in childhood and later criminal
behaviour, (individual, family or social factors did not confound these
negative outcomes in adulthood). Other studies have found an association
with childhood behaviour difficulties and substance abuse, (Flory, Milich,
Lynam, Leukefeld & Clayton 2003).
• Poor relationships: Associations between childhood behaviour difficulties
and poor adult relationships such as more negative romantic relationships in
adulthood have been established. These relationships are often
characterised by violence, both in terms of an increase in being the victim as
well as the perpetrator of the violent acts, (Woodward, Fergusson &
Horwood, 2002).
34
From the research highlighted above there has been criticism that a number of
these studies have used clinical and ‘high risk’ samples from more
disadvantaged populations, which lead to a bias in the results. Nonetheless,
Colman et al. (2009), using a sample with a range of participants from no to
severe conduct problems maintain that adolescents who had been rated by
their teacher as having more severe externalising problems were more likely to
experience family and relationship problems, leaving school without
qualifications, and mental health difficulties than those with less severe or no
behaviour problems.
The evidence remains fairly consistent that behaviour difficulties in childhood
and adolescence are associated with a number of detrimental outcomes in
adulthood. A clear need therefore exists for research to further investigate
behaviour difficulties in order to attempt to combat these problems before they
outwork their influence into adulthood. With a broader and more in-depth
knowledge of this phenomenon, particularly in terms of risk, promotive and
protective factors, effective interventions can be sort that will overcome these
negative effects.
35
1.2.4 Summary statements
• Definitions: A vast breadth of terminology is used to describe a child or
adolescent with behaviour difficulties. The terminology selected by any
individual is likely to reflect their educational, community or clinical
background. The term ‘behaviour difficulties’ has been selected for use
within the present study, and a justification and definition for this concept
has been provided
• Prevalence: There exists a high prevalence rate of these problems
within the UK, which may be up to 6% of children (Green et al. 2005).
The exact figures however, are dependent upon the methodology utilised
in prevalence studies.
• Time trends: There is evidence that behaviour difficulties displayed by
children and adolescents have changed over time, with this effect
appearing to have plateaued in recent years, although at relatively high
levels.
• Outcomes: Children with behaviour difficulties not only suffer with
immediate negative consequences such as poor academic achievements
and negative outcomes within their schools, families and wider
communities. There are also a number of long term detrimental
consequences to their behaviour difficulties in childhood that have
significant effects into adulthood.
36
1.3 Special Educational Needs and Disabilities (SEND)
1.3.1 Overview of the concept of SEND
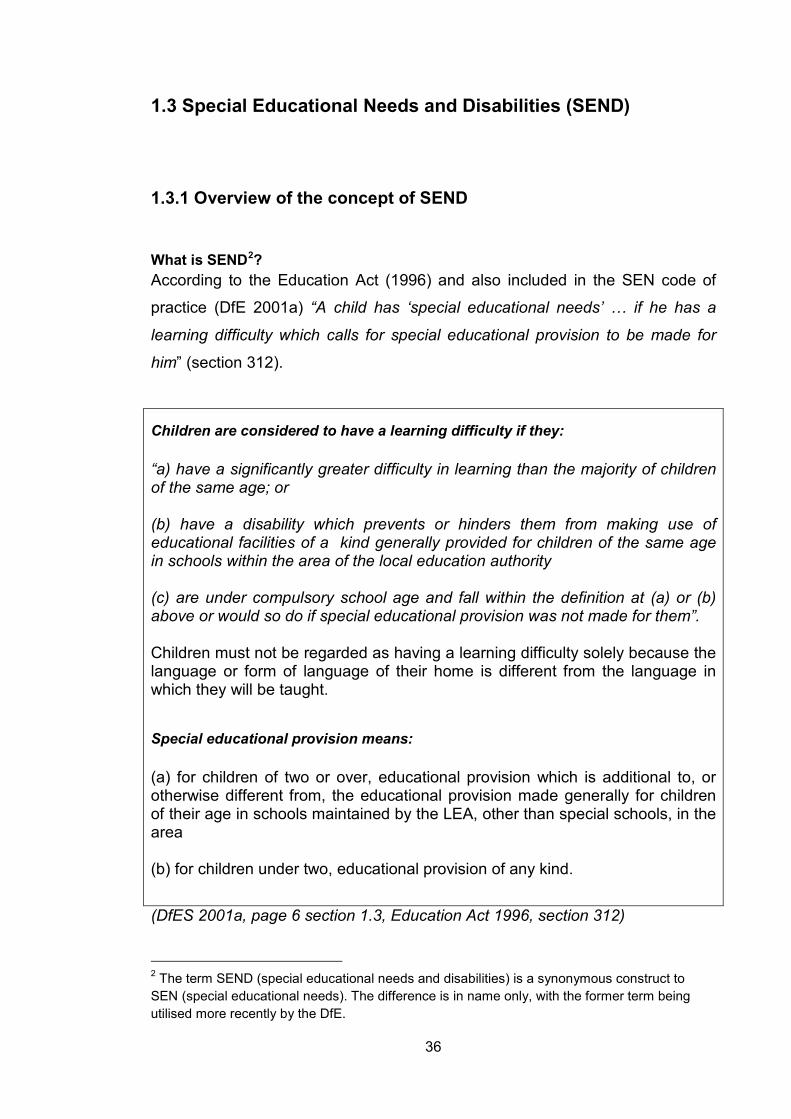
What is SEND2
According to the Education Act (1996) and also included in the SEN code of
practice (DfE 2001a) “A child has ‘special educational needs’ … if he has a
learning difficulty which calls for special educational provision to be made for
him” (section 312).
?
Children are considered to have a learning difficulty if they: “a) have a significantly greater difficulty in learning than the majority of children of the same age; or (b) have a disability which prevents or hinders them from making use of educational facilities of a kind generally provided for children of the same age in schools within the area of the local education authority (c) are under compulsory school age and fall within the definition at (a) or (b) above or would so do if special educational provision was not made for them”. Children must not be regarded as having a learning difficulty solely because the language or form of language of their home is different from the language in which they will be taught.
Special educational provision means: (a) for children of two or over, educational provision which is additional to, or otherwise different from, the educational provision made generally for children of their age in schools maintained by the LEA, other than special schools, in the area (b) for children under two, educational provision of any kind.
(DfES 2001a, page 6 section 1.3, Education Act 1996, section 312)
2 The term SEND (special educational needs and disabilities) is a synonymous construct to SEN (special educational needs). The difference is in name only, with the former term being utilised more recently by the DfE.
37
This definition is included within the Education Act (1996), SEN code of practice
(DfES 2001a) and the Special Education Needs and Disabilities Act (DfES
2001b). Despite its use within these documents, it remains a contentious
definition. It has been criticised for being open ended, and lacking an absolute
characterization. It therefore includes a particularly large and diverse group of
individuals (Halliwell 2003), who are affected by their SEND to various degrees
(O’Regan 2005), with considerable variation found across schools (Ofsted
2005).
The history of SEND SEND has a detailed and complex history, and has been named, defined and
conceptualised in distinct ways throughout modern educational history. The
purpose of this section is to give a very brief overview of its development, noting
where this term originated and therefore providing some background context.
For a more detailed review, see Squires (2012).
Compulsory education was introduced for all children in 1870 with the
introduction of the Forster Act (Spooner 2006). It was not until 1880 however,
that compulsory attendance was required for all children between 5 and 10,
(Squires 2012). Children with more severe SEND where largely ignored during
this time and deemed not able to be educated. It was not until the education act
of 1944 that a shift in this focus emerged; highlighting the requirement of
meeting the needs of ‘handicapped children (Hodkinson & Vickerman 2009).
Within this act it was asserted that children considered maladjusted, subnormal
or physically handicapped were entitled to receive education (Squires 2012).
Nonetheless, as the focus remained upon a medical model of disability, the act
recommend children to be placed into one of eleven categories of handicap.
This enabled educationists to establish what ‘treatment’ these children required.
The emphasis was upon educating these pupils in special schools rather than
within mainstream schools (House of Common report 2006).
The next major shift in educational policy for children with SEND emerged with
the publication of the Warnock report (DES 1978) and its subsequent
38
recommendations for the 1981 Education Act. There was now a growing
emphasis towards the individual child and an acknowledgment of a continuum
of need rather than discreet categories. The assertion was made that children
should be educated in mainstream schools where possible (House of Common
report 2006). This report coined the term special educational needs in a bid to
remove the deficit focus terminology. A more needs focus approach was
adopted where children were supported according to their individual needs
(Warnock 2010). The Warnock report was particularly influential throughout the
1980’s and 1990’s as the intake of special schools reduced and the number of
children identified and educated within mainstream schools increased (House of
Commons report 2006). Indeed Warnock (2010) notes that the framework of the
1981 education act remains in particular force even today more than 30 years
since its implementation.
In 1996, with the publication of The Education Act a definition of SEN was
offered. This definition was also applied to the SEN code of practice (DfES
2001a), and is still used to date. The code of practice was established as a
guide for assessing children with SEND, it does not make any rigid rules about
the category of need in which a child may fall, (but it does acknowledge four
different broad areas of need where a child may have a particular need). The
focus is upon teaching and learning and individual development, a move away
from any medical model’s emphasis on disability, (Squires 2012).
Categories of SEND Within the SEN code of practice (DfES 2001a), it is suggested that there are no
rigid categories of SEND, but rather a broad range of needs which are often
interrelated (Hodkinson & Vickerman 2009). Nonetheless, need should be
considered to fall within at least one of four main domains, these are termed, a)
cognition and learning, b) behaviour, emotional and social development c)
communication and interaction d) sensory and /or physical needs. Despite the
move away from a medical model of categorisation of disability, these 4 broad
domains have been further broken down in to eleven more specific categories
denoting primary need. The reason for this emphasis on categorisation stems
39
from some who want specific disorders to be recognised e.g. autism spectrum
disorders, as well as the government’s desire to collect more detailed
information on pupils and their educational needs. It has also been argued that
a closer monitoring of SEND will allow assessments of initiatives and
interventions for specific types of SEND to be carried out more effectively
(Riddell, Weedon & Harris 2012, DfES 2003).
Space limits a detailed discussion of these terms, although each of the 12
categories will be briefly described to give the reader a flavour of the types of
needs that children placed within these groups require. Within each category
there is a range of need from mild to severe. For more detail on this categories
refer to the SEN code of practice, (DfES 2001a).
Cognition and Learning Needs Specific Learning Difficulty (SpLD): Children with SpLD may have difficulties
with reading, writing, spelling and/or number work that are not related to their
genuine level of ability. Dyslexia, dyscalculia, and dyspraxia would be
considered under this title.
Moderate Learning Difficulty (MLD): Children with MLD have some kind of
developmental delay across multiple areas, and are therefore below the
expected curriculum level. They often have particular difficulty with basic literacy
and numeracy; and may have a number of other needs i.e. language, self-
esteem or concentration problems.
Severe Learning Difficulty (SLD): Children with SLD, have considerable global
delay, often involving communication difficulties and mobility or coordination
problems. They will typically be working on the upper P scales (below level 1 on
the national curriculum), and will need significant help in order to access the
curriculum.
40
Profound and Multiple Learning Difficulty (PMLD): Children with PMLD have
particularly complex needs, combining significant learning difficulty alongside
severe physical difficulty or sensory impairments. They will also require a high
level of adult support and are typically working on the lower P scales.
Behaviour, Emotional and Social Development Behaviour, Emotional and Social Difficulty (BESD): Children with BESD have
particular difficulty with social interactions, they may have concentration
problems, display temper tantrums, be aggressive, disruptive and defiant.
Children who are also withdrawn and depressed would be included in this
category. Disorders such as Attention Deficit Hyperactivity Disorder, Conduct
Disorder and, Oppositional Defiant Disorder would be included here.
Communication and Interaction Needs Speech, Language and Communication Needs (SLCN): Children with SLCN
have problems in communicating through language, either as being understood
or in understanding others. They may have particular difficulties with certain
sounds or pitches and make vocabulary and grammatical errors. They will
generally be behind their peers in oral language skills.
Autistic Spectrum Disorder (ASD): Children with ASD can be assumed to have
a triad of impairments of various degrees. These include difficulty in
understanding non-verbal communication, particularly body language; difficulty
in interacting with others and using appropriate social behaviour; and difficulty
in being flexible and imaginative, preferring routine and involving logical and
repetitive activities. Asperger’s syndrome would be included here.
Sensory and/or Physical Needs Visual Impairment (VI): Children with VI require alterations to be made to their
learning environment on the basis of visual aspects. Although children with
glasses are not included within this category, it does consist of children who are
partially sighted to blind.

41
Hearing Impairments (HI): Children with HI need alterations to be made to their
learning environment and may require particular teaching strategies or may
wear hearing aids. Hearing loss ranges in ability from having slight to profound.
Multi-Sensory Impairment (MSI): Children with MSI have impairments with
hearing and sight and may be both deaf and blind. Particular difficulties for
these children are in, communicating and acquiring information.
Physical Disability (PD): Children with PD have mobility problems that may, or
may not, involve using a wheelchair. Conditions such as Spina Bifida, and
Cerebral Palsy would be included under this heading.
Other Children within the other category have unusual special educational needs that
are significantly different from the categories defined above. (DfES 2003, O’Regan 2005, Spooner 2006, Hodkinson & Vickerman 2009)
Identification and assessment of SEND Identification of SEND often starts with observations from the class teacher.
These include noting whether the child is learning or progressing in a similar
manner to their peers, whether their behaviour can be managed by the normal
behaviour policy, whether they have any problems in communication and
interaction with other students and whether they have any sensory needs i.e.
hearing or vision that do not improve with glasses or hearing aids (Halliwell
2003).
If problems are noted within any of these areas teachers will become aware that
a child may have a SEND. More formal techniques for identification however,
have been outlined within the SEN code of practice (DfES 2001a). Within this
document strategies that teacher and schools can use include teacher
observations, standardised tests and tools, progress on National Literacy and
Numeracy Strategy Frameworks, performance on National Curriculum levels or
baseline screening tests (DfES 2001a). According to the SEN code of practice
42
(2001a) assessment should be carried out as a continuous process and not
based on a single event or time point. Furthermore, taking into account the
severity, frequency and context in which needs occur, as well as the age of the
child are important when identifying a child with SEND.
The Department for Education has provided guidelines in terms of identification
and categorisation of SEN (DfES 2001a, DfES 2003). However, whether a child
is deemed to have SEND, or indeed categorised within a certain SEND group,
is an arbitrary process, often depending upon the school and their ability to
provide for the child’s needs. Furthermore, as many children have multiple
needs that may overlap in a number of categories, it is the schools decision
which they feel is the child’s primary need and again this could be seen as an
arbitrary judgment. Primary need is only required to be recorded in the SEND
register at the school action plus level of provision, and those at school action
may not be categorized at this stage (DfES 2003).
Levels of SEND support Pupils, who have been defined as having SEND, are offered provision at one of
three levels, termed School Action, School Action Plus or Statement of Special
Educational Need (DfES 2001a, Frederickson & Cline 2009). This is a
graduated response to their needs with more help being offered to the child as
they move through the levels.
• The school action (SA) level of support asserts that children should
receive additional and different help, which goes beyond the normal
differentiated curriculum (DfES 2001a). The basic assumption behind this
level is that a child is not making sufficient progress despite the
differentiated teaching in place. It is the school’s responsibility to provide an
intervention or plan in order to provide for their additional needs, setting this
out within an IEP (individual education plan), (Halliwell 2003). Children who
continue to make little or no progress despite being at school action, would
be placed at the next level school action plus.
43
• The school action plus (SAP) level of provision is received from outside
agencies, such as educational psychologists or speech and language
therapists. This specialist support may take the form of advising the
teacher/SENCO or supporting the child directly. Interventions need to be
different and additional to those being supported at school action alone
(DfES 2001a, Farrell 2004).
• A statement of special educational needs (ST) is given for children with
the most severe and complex needs, and when the additional help from
school action plus is having a limited effect. The school or parent(s) notifies
the local authority and an assessment is made and a formal document
written which highlights the additional help they require (DfES 2001a). This
type of help may involve interventions such as direct teaching from a
specialist teacher, or therapy from a specialised professional (Farrell 2004).
The level of provision that a child receives does not necessarily reflect their
severity of need, and comparisons across schools of children at the same level
of provision may not be equivalent. This is because the level of provision
inherently reflects the school’s ability to meet a particular child’s needs. A child
may be at the school action level at one school, however, if moved to another
school, would be placed at the school action plus level as this school needs
more support from outside agencies to meet the child’s needs.
Prevalence rates In a recent government report (DfE 2011a), prevalence rates of the different
SEND groups were recorded. It has been reported that approximately 21% of all
school pupils in 2011 had been recorded as having SEND (this included those
at school action, school action plus and statement) specifically this equates to
1.67 million children. There has been an increase in the number of children with
SEND as in 2006; this number was significantly lower, 1.53 million, (equating to
19% of school population).
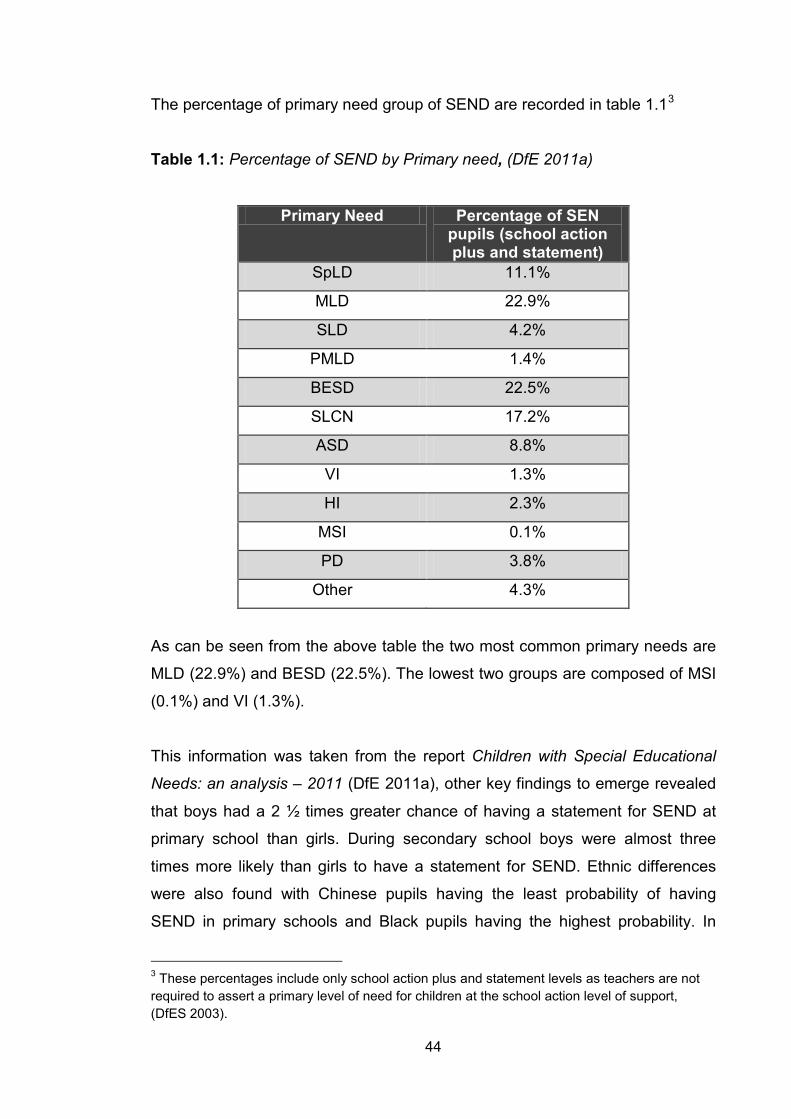
44
The percentage of primary need group of SEND are recorded in table 1.13
Table 1.1: Percentage of SEND by Primary need, (DfE 2011a)
Primary Need Percentage of SEN pupils (school action plus and statement)
SpLD 11.1%
MLD 22.9%
SLD 4.2%
PMLD 1.4%
BESD 22.5%
SLCN 17.2%
ASD 8.8%
VI 1.3%
HI 2.3%
MSI 0.1%
PD 3.8%
Other 4.3%
As can be seen from the above table the two most common primary needs are
MLD (22.9%) and BESD (22.5%). The lowest two groups are composed of MSI
(0.1%) and VI (1.3%).
This information was taken from the report Children with Special Educational
Needs: an analysis – 2011 (DfE 2011a), other key findings to emerge revealed
that boys had a 2 ½ times greater chance of having a statement for SEND at
primary school than girls. During secondary school boys were almost three
times more likely than girls to have a statement for SEND. Ethnic differences
were also found with Chinese pupils having the least probability of having
SEND in primary schools and Black pupils having the highest probability. In
3 These percentages include only school action plus and statement levels as teachers are not required to assert a primary level of need for children at the school action level of support, (DfES 2003).

45
secondary schools, Chinese pupils again had the least likelihood of having
SEND, and Black pupils the greatest chance of having SEND without a
statement and White, Black and Mixed race the highest likelihood of having
SEND with a statement. Children who were entitled to free school meals were
also at an increased likelihood of having SEND compared with those not
entitled to free school meals (DfE 2011a).
46
1.3.2 Justification of SEND population within the study
The current section attempts to highlight the key arguments as to why this
population was chosen for use within the present study that is attempting to
identify the key risk, promotive and protective factors for behaviour difficulties
for this population.
Large number: The number of children within England who have been identified
as having SEND is estimated to be approximately 1.67 million (DfE 2011a). This
population makes up approximately one fifth (21%) of the school population in
England, including those children at school action, school action plus and those
with a statement for SEND. This is not a small or insignificant population as one
fifth represents a considerable number of school pupils. They all have a least
one thing in common - special education provision is being made for them. Any
research adopting an appropriate sampling method from this population will be
able to generalise its findings to a large number of children, making it a
particularly beneficial study.
Little research: To my knowledge there has been no study that has specifically
utilised a SEND population to investigate risk, promotive and protective factors
for behaviour difficulties within England. Therefore, research using the whole
range of children with SEND to investigate risk, promotive and protective factors
for behaviour difficulties is warranted and will add to the literature base.
Overlap: There is overlap between the risk factors for children with SEND and
the risk factors for those developing behaviour difficulties. Evidence shows that
being male (Ehrensaft 2005), having lower economic status (Schonberg &
Shaw 2007), speaking English as an additional language (Brown & Schoon
2008), and lower academic achievement (McIntosh, et al. (2008) are key risk
factors for developing behaviour difficulties and also salient characteristics of
the SEND population (DfE 2011a). Furthermore, a study investigating the
mental health of children and young people within the UK found clear overlaps
between those individuals identified as having conduct problems and those
identified as having SEND e.g. 52% of children who were reported to have
47
conduct problems were also identified at their school as having SEND (Green et
al. 2005). The same study showed that of the children identified as having
conduct problems, 66% also had developmental problems, and 59% were
behind their peers in school (both key issues within the SEND population). It
would therefore be beneficial for further research to add to the literature base
for this group of ‘at risk’ individuals.
Outcomes: It is important that future enquiries are able to identify key risk,
promotive and protective factors for behavioural difficulties within the SEND
population as current research shows that these children not only have an
increased likelihood to being excluded from school (DfE, 2011a) but also in
developing mental health problems (Rose, Howley, Fergusson, & Jament,
2009). These negative outcomes could be abated once the aetiology of
behaviour difficulties is established (from risk, promotive and protective factor
identification). These findings will help in the development of effective
interventions that will combat or alleviate the potential negative outcomes.
Group variations: Evidence has suggested that risk, promotive and protective
factors for behaviour difficulties vary as a function of gender (Storvoll &
Wichstrom 2002) and socio-economic status (SES) (Schonberg & Shaw 2007)
i.e. these factors have differing effects for, males versus females and those
from high versus low SES backgrounds. It is likely therefore that a different
population such as those within school identified as having SEND may be
affected by distinct risk, promotive and protective factors, which may be distinct
from the general population. Research therefore is required to investigate this
pertinent issue.
All SEND vs. Just BESD: Children with SEND are potentially the most ‘at risk’
students within school in terms of displaying behaviour difficulties, (Murray &
Greenberg 2006). Indeed any child who is suffering from the most severe
behaviour difficulties will be likely to have been identified as having SEND and
specifically placed within the BESD category. This research will therefore target
those children who are most likely to display behaviour difficulties. The entire
population of SEND was selected, however, over those solely identified as
48
having BESD, as other groups such as those with ASD also often display
significant problems with their behaviour. Furthermore, children are recorded as
having SEND and placed into a category based on their primary need, it is often
the case that needs extend across categories with children having needs in
multiple areas, e.g. a child with MLD may also be experiencing BESD. What is
ultimately decided as the child’s primary need maybe an arbitrary judgment.
Consequently it cannot be assumed that only children with BESD will have
behaviour difficulties, these problems are also likely to occur in the other
groups. Identification of SEND is a problematic matter and despite the DfE
providing guidelines on the issues of SEND (DfES 2001a, DfES 2003), whether
a child is identified and categorised depends more upon the schools ability to
provide for their needs (Ofsted 2005). Therefore the same child with the same
difficulty may not be recorded as having SEND if placed in a different school.
An individual is placed into a category on the SEND register in a fairly arbitrary
fashion, because of the interrelationship of these categorises, and as definitions
are based upon schools capacity to provide for the needs. It could be argued
therefore, that basing any findings on a specific group of SEND children is
flawed, and a more appropriate method would be to focus on the whole
population of SEND children.
49
1.3.3 Summary statements
• This section has provided a brief overview of the concept of special educational
needs and disabilities. Important issues have been acknowledged including:
definitions of the concept, the historical background, categories of need,
identification and assessment, levels of support and prevalence.
• A justification for why this population has been included within the present study
has been provided. This includes children with SEND representing a large
under researched population, with considerable overlap between the risk
factors for behaviour difficulties generally and for having a SEND. Children with
SEND are also likely to be the most ‘at risk’ students within their school in terms
of displaying behaviour difficulties.
50
1.4 Risk, promotion and protection
1.4.1 Risk
Overview Risk is a popular term in the psychological literature (Keyes 2004), although it is
also a potentially confusing concept that has numerous definitions and can be
operationalized in many different ways (Kraemer, Lowe & Kupfer 2005). It is
generally defined as the “probability of an outcome within a population”
(Kraemer et al. 2005, page 5). Of particular relevance to the present study are
the factors that contribute to enhancing the probability of the outcome in a
specific population, i.e. the focus is on so called risk factors.
Risk factor research stems from the field of epidemiology that attempts to
distinguish certain factors that heighten the chances of disease in an individual.
This type of research aimed to indentify a broad range of possible factors that
individuals are exposed to that ultimately leads to disease. It was from this
research that the early risk factor models emerged within the psychological
literature; and they were made up of lists of predictor variables for certain
outcomes, such as mental illness (Garmezy 1996).
Risk factors Risk factors are defined as “any event, condition or experience that increases
the probability that a problem will be formed, maintained or exacerbated”
(Fraser & Terzian 2005, page 56). Wright & Masten (2005) emphasise the
importance of measurement defining a risk factor as “a measureable
characteristic in a group of individuals or their situation that predicts negative
outcome on a specific outcome criteria” (Wright & Masten 2005 page 9). These
definitions convey the generally accepted conceptualisation that anyone
exposed to a risk factor has a higher probability of suffering with a negative
developmental outcome (Schoon 2006, Deater-Deckard, Dodge, Bates & Pettit
1998, Atzaba-Poria, Pike & Deater-Deckard 2004, Gerard & Buehler 2004a). It
has also been argued that risk factors are not only associated with a higher
51
probability of developing a poor outcome, but also with increased severity and
longevity of that outcome as well (Coie et al. 1993). Key to risk factor related
research is that these factors ultimately reflect probabilities and not certainties,
they influence the outcome but they do not necessarily guarantee it will occur,
(Kraemer et al. 1997).
More specifically, risk factors are comprised of traits, experiences, situations or
relationships that are ultimately measurable (Keyes 2004). They impinge on
development contributing to negative trajectories, (Murray, 2003). These factors
will be present and operate across different ecological domains including
individual, familial, school, and neighbourhood levels (Raviv, Taussig, Culhane
& Garrido 2010, Jenson & Fraser 2011). They may stem from genetic,
biological, psychological, environmental, socio-economic and social-cultural
influences (Schoon 2006) or indeed combinations of these (Richman & Fraser
2001).
Correlates, Predictors, Causes Although the term risk factor is a particularly prolific one found within the
psychological literature (Kraemer et al. 1997), there has been considerable
imprecision and inconsistency in its conceptualisation. Some researchers have
used this term to reflect basic correlates of a specific outcome, whereas others
use this to indicate predictors or even causes of the outcome (Ribeaud & Eisner
2010, Murray et al. 2009). The result of this confusion has led to a general
consensus in the literature that some distinction should be made between
correlates, predictive risk factors and causal risk factors, (Murray, Farrington &
Eisner 2009).
Correlates are established when a significant relationship (either positive or
negative) is determined with the outcome in question, and at a certain point in
time, (Offord & Kraemer 2000). No judgment however, can be made as to which
(the factor or outcome) preceded the other, and therefore these factors cannot
be predictive of the outcome or assumed causal in anyway, (Murray et al.
52
2009). They should not therefore be referred to as risk factors, but correlates
(Kraemer et al. 1997).
In order for the term risk factor to be applied to any variable it is required not
only to be significantly related to the outcome, but importantly to also precede it
(Offord & Kraemer 2000). Risk factors can then be defined as predicting the
negative outcome in question. In order to apply such terminology to any
investigation the use of longitudinal data is therefore a prerequisite (Murray et
al. 2009). According to Kraemer et al. (2005), a common error of investigations
are their use of the term ‘risk factor’ when they are actually measuring
correlates as no temporal issues of when risk factor and outcome occurred are
taken into account.
This conceptualisation of risk factors is fairly simplistic and in fact there are two
different types can be distinguished; fixed markers and variable markers,
(Kraemer et al. 1997). Fixed markers are variables such as gender or ethnicity
that are related to outcome and precede it although cannot change or be
changed, whereas variable markers are related to the outcome and precede it
although can change or be changed, (Kraemer et al. 1997).
There is a final type of risk factor, which has been termed a causal risk factor.
These are so called when they are manipulated in some way cause a change in
the outcome (Murray et al. 2009). The use of the term causal risk factor is
favoured over cause to prevent a deterministic effect creeping in to
psychological research that is ultimately based on probabilities, (Murray et al.
2009). Using the term cause however, in causal risk factors does not indicate
that it is the only or unique cause to the outcome in question (Offord & Kraemer
2000).
Conclusion The conceptualisation of risk factor terminology has experienced a number of
changes and modifications from its inception (Wright & Masten 2005). The
original researchers within this field often investigated broad correlates of the
53
outcome in question and paid little attention to the temporal relationships
between risk factors and outcome (Jenson & Fraser 2011). In order for any
variable to be accurately conceptualised as a risk factor it needs to not only be
related to the outcome but also precede it. Defining the concept in this way is
not an inconsequential matter, (Schoon 2006), and it remains particularly
important that a distinction can be made between correlates, risk factors and
causal risk factors (Wright & Masten 2005). Researchers need to use these
terms precisely and consistently (Offord & Kraemer 2000), and explicitly state
the type of risk factors that are present in their research, i.e. whether they are,
fixed/variable markers, or causal risk factors (or even correlates) (Kraemer et al.
1997).
If there continues to be imprecision in terminology used to explain risk factors,
distinct differences in this research may emerge, that will not only fail to give an
accurate account of the very outcome under investigation, but also fall short of
providing effective interventions to help those suffering with the negative
outcome (Kraemer et al. 1997). In the context of the present study the term risk
factors will be utilised where variables predict a heightened probability of later
behaviour difficulties, some being fixed markers and others variable markers.
54
1.4.2 Promotion and protection
Overview Any study solely acknowledging the impact of risk factors on a developmental
outcome will provide an insufficient account of this behaviour. An additional
requirement is for research to account for the variables and processes that
enhance positive outcomes (Leshner 2002, Murray 2003). Such variables have
been traditionally termed protective factors as they are related in a positive way
to the outcome in question (Schoon 2006).
The inception of protective factor research was focused upon searching for
personal characteristics of individuals that would help to overcome their risk
experience, this narrow focus however, soon shifted to incorporate features of
the social environment as well as within person factors (Schoon 2006).
Protective factors have now been acknowledged to originate from three broad
domains; at the individual level (e.g. positive temperament or intellectual skills)
at the family level, (e.g. parental involvement or positive family relationships)
and wider community level (e.g. school belonging and community resources).
The factors referring to the individuals personal characteristics such as coping
skills or self-efficacy have also be termed assets whereas resources are factors
external to the child such as positive parenting, and community support
organisations (Fergus & Zimmerman 2005, Windle 2011).
The definitions provided for the concept ‘protective factors’ have been
considerably more controversial than those used for risk factors, (Dekovic
1999). Indeed protective factors have been conceptualised in distinct ways by
various researchers who disagree on the exact processes involved,
(Stouthamer-Loeber et al. 2002, Vanderbilt-Adriance & Shaw 2008). The two
contentious questions surrounding the conceptualisation of these factors are
firstly whether they are qualitatively different from risk factors or whether they
are in fact the same concept but at different poles of the continuum; and
secondly, do protective factors promote competence for all individuals
regardless of risk status, or are they are more specific and only operate in
context of high risk (Colman & Hagell 2007).
55
Turning initially to the first question addressed, there is considerable evidence
that risk and protective factors are the two polar opposites on a given variable
(Luthar & Zelzo 2003, Stouthamer-Loeber, et al. 1993). A variable is termed risk
or protective on the basis of the end that is emphasised. Using the example of
intelligence, above average levels are often conceptualised as a protective
factor for behaviour difficulties whereas low intelligence is seen as a risk factor
(McIntosh, et al. 2008). There are also a number of dichotomised variables
where the two categories represent risk and protection respectively e.g. gender,
evidence shows being male is a risk factor for behaviour difficulties where as
being female is a protective factor (Brown & School 2008). Protective factors
have also been identified by some as purely protective, offering enhanced
adjustment when present but no detrimental effect when absent, i.e. a musical
talent, or religious involvement (Masten 2001). This may be the case when
measuring categorical variables, with certain ‘groups’ being related to
decreases in the favourable outputs and therefore being noted as risk, and
certain ‘groups’ being related to increases in the favourable outcome and
therefore being coded as protective, and other groups having no relationship
with the outcome.
There are cases in the literature where variables evidence a non-linear pattern,
and are not bipolar. Therefore these factors offer protection in middle values but
risk at either extreme, e.g. parental control, too controlling or too lax parenting
may be risks whereas a healthy balance offers protection. Risk and protective
factors are not always opposite ends of the same variable, with some being
uniquely risk related or uniquely protective related.
The second pertinent question is whether protective factors promote positive
outcomes for all individuals or if they only offer protection in the context of risk.
Originally the term protective was only used in the context where interaction
effects occurred between protective variables and risk in influencing outcome,
(Garmezy, Masten & Tellegen 1984) although other researchers (e.g. Werner &
Smith 1992) referred to protective factors as those that had direct positive
effects on outcome regardless of risk experienced. Distinguishing between
56
these two is important in highlighting most accurately how protective factors
function.
There are at least two different processes that can explain how protective
factors work, (Fergusson & Horwood 2003). They can either be protective
processes; where protective factors assist those in high risk situations to
develop positive adaption but offer limited help to those in low risk situation, or
promotive processes; where the protective factor is beneficial to all individuals
regardless of their risk status. Protective processes aim to establish interaction
effects between protective factor and risk in influencing outcome, whereas
promotive process aim to establish main direct effects of protective factor on
outcome. The difference between the two will be drawn within the present
study.
Protective factors The term protective factors should be applied to variables that have particular
salience, though only in contexts of high risk, in moderating the impact of risk
exposure on outcomes, (Sameroff, Bartko, Baldwin, Baldwin & Seifer 1998). A
definition will be applied to the present study which states a protective factor is
a “quality of a person or context or their interaction that predicts better
outcomes, particularly in situations of risk or adversity, (Wright & Masten 2005,
page 19). Protective factors are therefore features of the individual or their
environment that are associated with overall better than expected outcomes for
those considered at high risk (Jenson & Fraser 2011). It has been suggested
that in order to have some meaning, protective factors must be defined by the
interaction process of modifying risk situations to influence the outcome in a
positive direction (Stouthamer-Loeber et al. 2002). Statistical models including
these types of factors investigate them through interaction terms rather than
main effects terms.
In low risk contexts the effect of the protective factor is either non-existent or
offers limited extra advantage, (Fergusson & Horwood 2003). It may even be
undetectable in the absence of risk as the factor modifies risk experience rather
than enhancing typical development generally (Rutter 1985). When risk is
57
present however, the protective factor interacts with it modifying or buffering its
potential impact on the outcome. Protective factors therefore provide a shield or
barrier that impedes or halts the effect of risk (Schoon 2006), and offsets the
negative trajectory (Hanewald 2011). The impact that the protective factor has
depends on whether risk is present or absent, offering protection largely in
situations of risk (Herrenkohl et al. 2003, Rutter 2003, Van der Lann, Veenstra,
Bogaerts, Verhulst & Ormel 2010). An example of this effect has been showed
by Criss, Pettit, Bates, Dodge & Lapp (2002) who report that high levels of peer
acceptance (a protective factor) is particularly beneficial for children exposed to
significant family adversity (i.e. at high risk). These factors when present reduce
the likelihood of negative outcomes as they are offering some kind of protection
over risk (Luthar & Cicchetti 2000, Greenberg 2006, Windle 2011, Murray 2003,
Coleman & Hagell 2007, Schoon 2006).
Promotive factors The debate whether protective factors are concerned with main or interaction
effects has led some to argue for the use of different terminology to explain
these different effects and clear up some of the confusion (Sameroff et al.
1998). Factors that promote positive outcomes regardless of any risk
experienced have therefore been called promotive factors, (Sameroff et al.
1998) and should be used when discussing main effects. Promotive factors can
be defined as “a measureable characteristics in a group of individuals or their
situation that predicts general or specific positive outcomes” (Wright & Masten
2005, page 19). These types of factors when present decrease chances of
negative outcomes for all individuals regardless of their different risk exposure
and foster positive adaption. e.g. high self-esteem (Donnellan, Trzeniewski,
robins, Moffitt & Caspi 2005). Statistical models including these types of factors
look for direct main effects and not interaction effects (Luthar & Cicchetti 2000).
Promotive factors rely upon main effects findings, as does risk related research
(albeit in the opposite direction). There is an argument that if promotive and risk
factors are just opposite ends of the same variable then both terms do not need
to be explicitly acknowledged, and either one would suffice. In the majority of
58
cases these variables are bipolar in nature (Masten 2001) with the positive end
of variable being promotive and the negative end being risk related. The same
variable can therefore signify risk to one individual (i.e. low academic ability),
whereas to another act as a promotive factor (high academic ability), and a third
a neutral factor (i.e. medium level of academic ability) (Van der Laan et al.
2010, Stouthamer-Loeber et al. 2002). Nonetheless this does not however
mean risk and promotive factors are direct opposites or mirror images of one
another (Stouthamer-Loeber et al. 1993, 2002). The intensity of effect at each
pole of the continuum (on continuous variables) may be different suggesting
variability in magnitude (Loeber, Slot & Stouthamer-Loeber 2008). Emphasizing
this effect can more accurately account for when variables are not normally
distributed as well as when the variable and outcome are not related in a linear
pattern (Van der Laan, et al. 2010). Finally, some variables are uniquely
promotive i.e. musical talent which may offer a positive outcome when present
but no detriment when absent.
Conclusion Controversy exists in the literature as to whether protective factors are
independent from risk factors or whether they depend on them in order to be
determined as protective (Jenson & Fraser 2011). This debate stems around
the mechanisms in how these variables function, (Van der Laan et al. 2010), as
protective factors moderate effects of risk, whereas promotive factors decrease
chances of negative outcomes regardless of risk. Studies may choose to
investigate either main or interaction effects however, Luthar, Cicchetti &
Becker (2000b) suggests that both types are important and beneficial, and they
equally may yield important findings. Furthermore, some factors could be both
promotive and protective depending on the context and are not necessarily
mutually exclusive (Wright & Masten 2005).
To conclude distinctions will be made between promotive and protective factors
within the context of the present study, which will attempt to measure main as
well as interaction effects on the outcome behaviour difficulties with a sample of
children with SEND. An example of a promotive factor with the present study
59
may be academic achievement which promotes positive behaviour regardless
of other risks experienced. An example of a protective factor with the present
study could be small school size which may be particularly beneficial for
children at high risk but not provide any additional advantage for those in low
risk situations.
The focus of the current study is upon the key risk, promotive and protective
factors for the display of behaviour difficulties in a population with children with
SEND. Chapter 2 contains a discussion of various risk and promotive factors for
these behaviours as these terms are conceptualised as either opposite ends of
the same variable, or variables that are uniquely risk related or uniquely
promotive. Variables that may be considered protective, (i.e. that have a
greater impact on outcomes in contexts of high risk) are discussed in Chapter 4.
60
1.4.3 Summary statements
• Risk factors: A definition of a ‘risk factor’ has been provided, which
broadly acknowledges that in their presence they are related to more
negative outcomes. Importantly, to be classified as a true risk factor, they
must not only be significantly related to the outcome in question but also
precede it.
• Promotive factors: A definition of a ‘promotive factor’ has been provided
which broadly conceptualises it as the opposite to a risk factor and in its
presence related to more positive outcomes.
• Protective factors: A definition of a ‘protective factor’ has been provided
which acknowledges the interaction or moderation effects that these
have on reducing risk and therefore improving outcomes.
61
1.5 Aim of study and research questions
1.5.1 Aim
The broad aim of this study is to investigate risk, promotive and protective
factors for behaviour difficulties in children with SEND. The purpose was to gain
a better understanding of how to reduce such problems, and therefore enable
better outcomes in this large but under researched group of children.
The justification for investigating the concept of behaviour difficulties was
discussed within section 1.2, where it was highlighted there is a serious concern
that these behaviours displayed in childhood have pervasive and long-term
effects into adulthood and across various domains of functioning. More in-depth
investigations into behaviour difficulties particularly in terms of risk, promotive
and protective factors will allow the most effective intervention programmes to
emerge. These will ultimately be able to combat problem behaviours before
their influences become entrenched into adulthood. Despite some evidence
suggesting these behaviours in childhood might have decreased in recent years
or at least plateaued, there still remains large numbers of children who
experience these difficulties, and therefore research should continue to attempt
to combat these problems. Including a SEND population was justified in section
1.3, as little research has explicitly investigated behaviour difficulties within this
large group of children who are considered particularly at risk of displaying
behaviour difficulties. Unsurprisingly there is also considerable overlap in the
risk factors for those who develop behaviour difficulties generally and those who
develop a SEND, making them a population of considerable interest.
The more specific aims are: firstly to investigate a number of potential risk and
promotive factors for behaviour difficulties across the school and individual
ecological levels. Chapter 2 provides an overview of these factors and a
justification for their inclusion within the present study. Secondly, to investigate
the cumulative effects of contextual risk factors on behaviour difficulties,
whether number of risks or specific types of risk is a more salient issue, and
62
assessing the functional form of the relationships between increasing risk and
behaviour displayed. Chapter 3 discusses these issues justifying their presence
within the study. Thirdly and finally; to investigate school level protective factors
and whether these are particularly beneficial for children who are considered at
high risk in reducing their behaviour difficulties. Chapter 4 provides a discussion
of the pertinent issues in this regard.
The research questions that have come from these three chapters are
presented in the summary section at the end of each chapter respectively. For
the purposes of clarity, however, all the research questions included within the
study are presented within this section as a complete whole. Although these
questions have emerged from the literature a salient point is that they have not
been previously acknowledged with a special needs population within England.
This provides a justification that the present study is unique and offering a
significant contribution to knowledge.
63
1.5.2 Research questions4
Research question 1: Risk and Promotive Factors
a) What proportions of variance in behaviour difficulties are attributable to
the school and individual levels?
b) Which school and individual level predictors explain a statistically
significant proportion of variance in behaviour difficulties?
c) Of the variance initially attributed to the individual and school levels, how
much can be accounted for by the predictors used in the study?
Research question 2: Cumulative Risk
a) Is there a cumulative effect of contextual risk factors on behaviour
difficulties, where higher numbers of risk factors present are associated
with increased levels of behaviour difficulties?
b) What is the nature of the relationship between exposure of cumulative
risk and behaviour difficulties?
c) Is the number of risks present within an individual’s background more
important than the specific types of risks in accounting for behaviour
difficulties?
Research Question 3: School Protective Factors
a) Which school level predictor variables have a statistically significant
interaction effect with contextual risk?
b) Do the significant interactions display evidence of protective-
stabilising or protective-reactive effects?
4 The research questions are included here as a whole, however, each of the broad questions are justified for use in the present study after discussing the literature from which they emerged in chapter 2, 3 and 4.
64
2. Risk and Promotive factors
2.1 Introduction to chapter The aim of this chapter is to provide an overview of some of the most salient
risk and promotive factors for behaviour difficulties among children and young
people. As discussed in section 1.4, risk and promotion are often
conceptualised as the opposite ends of the same construct, and this approach
has been adopted within the present study. As such when any factor is
discussed in terms of being a risk factor for behaviour difficulties i.e. being male
or low academic achievement, the opposite end of the construct is assumed to
be a promotive factor i.e. being female or high academic achievement. These
factors are noted in terms of whether they are fixed (i.e. cannot change or be
changed) or variable (i.e. can change of be changed).
As this field is vast it is important to categorise these factors in some meaningful
way in order to aid understanding. The present study has clustered these
factors to different ecological levels in which they operate. Commonly within the
literature they have been referred to as individual level factors, (discussed in
section 2.2) family level factors, (discussed in section 2.3) school level factors
(discussed in section 2.4) and neighbourhood level factors, (discussed in
section 2.4) (Jenson & Fraser 2011, Coleman & Hagell 2007, Murray 2003). It
has been argued that accounting for various influences across multiple
ecological levels is essential in order to capture some of the complexity behind
the display of behaviour difficulties (Ribeaud & Eisner 2010).
The present study does not aspire to conduct an exhaustive review of all the
relevant risk and promotive factors for behaviour difficulties; the field is too vast
65
and the space too limited. The current review provides a synopsis of the most
salient risk and promotive factors at each ecological level, in order to justify the
inclusion of some of these variables into the current study. To some extent the
investigation may appear speculative due to the breadth of variables included,
however, the ends ultimately justify the means; the current study is looking to
provide evidence around risk and promotive factors for behaviour difficulties
exclusively for an under-researched population; children with SEND. There has
been a lack of research specifically utilising a sample of these children. As such
the present study will be able to provide a significant contribution to knowledge
in this area.
A particular focus of the present study is upon the individual and school
ecological levels; although other influences such as the neighbourhood and
family levels are acknowledged, these have been paid less attention in favour of
a more in-depth analysis of individual and school influences. The justification for
a focus on the individual level is that studies have consistently found variables
within this level are more powerful predictors of behaviour difficulties than in
other ecological levels (Reis, Trockel & Mulhall 2007, Maes & Lievens 2003,
Gottfredson & DiPietro 2011, Aveyard, Wolgang, Markham & Cheng 2004). The
justification for the school level variables is that the population of interest
(children with SEND) is identified within the school context, so it is likely these
institutions have some effect on behaviour. Furthermore, studies specifically
investigating school level influences on behaviour problems have not been
forthcoming (Reinke & Herman 2002), with a stronger focus on family over
school level influences (Bronfenbrenner 1994). Children spend a considerable
amount of their time within a school context, with levels of behaviour difficulties
varying remarkably between schools, (McEvoy & Welker 2000). It is not
surprising therefore that these institutions will exert their unique and powerful
influence on childhood and adolescent outcomes, (DeWitt et al. 2000). Section
2.6 within this chapter therefore discusses the relative importance of the
individual and school ecological levels in accounting for behaviour difficulties.
The final section 2.7 concludes the chapter by providing summary statements,
and related research questions.
66
2.2 Individual level risk and promotive factors
2.2.1 Age
There has been considerable research that has explicitly investigated whether
an individual’s age is a fixed risk factor for behaviour difficulties. Studies have
often suggested that older children are more likely to display behaviour
difficulties than younger children, (Green et al. 2005, Maughan, Rowe, Messer,
Goodman & Meltzer 2004). Nonetheless, there is accumulating evidence to
suggest that age exerts its effects to a differing degree depending on the
behaviour in question (Bongers, Koot, van der Ende, & Verhulst 2004). It
appears that more aggressive behaviour difficulties decline with age as non-
aggressive problems increase. For example Bongers, et al. (2004) argue that
aggression, oppositional behaviours and property violations all decline with
increasing age whereas status violations (such as truancy, running away from
home and alcohol and drug use) increase with age. This finding is fairly
consistent as Tremblay (2000) reports as a child becomes older they are less
likely to engage in physically aggressive acts although more likely to show other
behaviour difficulties such as drug use and truancy. Not all the evidence
however, is in total agreement with this view, as Lahey et al. (2000) showed that
although younger children received higher scores on parent report of
oppositional behaviours, no age differences were found for aggressive
behaviours, and the middle ages of a 9-17 year old sample had the most
aggressive behaviours.
Lahey et al. (2000) have argued that attempting to understand how age effects
the development of behaviour difficulties is futile if not considered from a
developmental perspective. The types of behaviour difficulties displayed change
across the course of development so researchers need to be aware there are
multiple developmental pathways for these problems, with at least two groups,
which have been termed early onset (i.e. within childhood) and late onset
(within adolescence). The causes or risk factors associated with them are likely
to be distinct (Lahey & Waldman 2003). In acknowledging this stance behaviour
67
difficulties will be assessed using two separate analyses, a primary school
model and a secondary school model within the present study (see section
5.9.2).
Whether age is a fixed risk factor for behaviour difficulties is a complicated
issue. As the measure of behaviour difficulties used within the present study
includes overt aggressive acts such as fighting and vandalism as well as covert
acts such as lying and stealing, it is not possible to establish whether overt acts
decrease with age and covert ones increase as the majority of evidence
suggests. Nonetheless, it is anticipated that age will have some effect on global
behaviour difficulties displayed, with older children being more at risk than their
younger counterparts.
2.2.2 Relative age in the school year
Research has shown that the month in which a child is born affects academic
and behavioural outcomes (Martin, Foels, Clanton, & Moon 2004, Goodman,
Gledhill & Ford 2003). Specifically, children born at the latter part of the school
year (who are the youngest in their classes) have a significant academic
disadvantage (Martin, et al. 2004), with the effects appearing to be long-term
even influencing university entrance (Russel & Startup 1986).
In terms of behavioural outcomes, Goodman, et al. (2003) showed that in a
large sample of 5-15 year olds, the younger children in the year were more
likely to be at an increased risk of psychiatric problems, including conduct
difficulties. This evidence is fairly consistent with Menet, Eakin, Stuart & Rafferty
(2000), who found that children younger in the school year were not only rated
by their teachers as having more behaviour problems, but are also referred to
Educational Psychology Services to a greater extent. Another study suggesting
that younger relative age in a school year is a significant risk factor in the
display of behaviour difficulties, found that children with emotional and
behaviour difficulties, were over-represented within the later part of the school
year (Polizzi, Martin & Dombrowski 2007).
68
Despite this fairly consistent evidence, Lien, Tambs, Oppedal, Heyerdahl &
Bjertness (2005) demonstrated that although relative age in the school year had
some effect on academic outcomes, it exerted no influence on behaviour
outcomes. While these results may appear contradictory, their study used a
somewhat limited sample of only 15-16 year olds and not a representative one
across all year groups within the school system. There could be an argument
here that relative age in a school year has more pronounced effects on younger
children rather than older children. Menet et al.’s (2000) study, which found the
differences between the youngest and oldest children in each school year, was
more marked for children in year 1 compared with those in year 3 and 5. They
suggested this could reflect maturity levels; as the difference between the
oldest and youngest children in year 1 is proportionally greater (in terms of their
overall age) than the differences found in older school years. This is a plausible
explanation, although in Lien et al.’s (2005) study, a physical measure of
maturity was taken, which showed no differences between younger and older
children in the same school year, suggesting that maturity was not the key
issue. Nonetheless their sample did include older adolescents rather than
younger children, which may explain the lack of a significant finding.
A slightly alternative explanation has been offered which suggests that younger
children within a school year are more likely to display behaviour difficulties as
they are less socially and physically skilled and therefore have a social
disadvantage particularly in terms of peer relationships (Martin et al. 2004).
These influences on their peer relationships could in turn have an influence on
them displaying more inappropriate behaviours. This argument has been
supported by Lien et al. (2005), as although they did not find behaviour
differences between younger and older children in the school year, differences
between problems with peers were noted, with older children having fewer
problems.
In concluding this debate Goodman et al. (2003) suggests that relative age is
an independent fixed risk factor of behaviour difficulties, although the effects are
fairly small in comparison to other established risk factors. The present study
takes Goodman et al.’s (ibid.) view and predicts that younger children in the
69
school year will be at an increased likelihood of displaying behaviour difficulties
compared with their older peers.
2.2.3 Gender
Gender is a commonly reported predictor or fixed risk factor of behaviour
difficulties. Research has overwhelmingly showed that boys are more at risk of
displaying problem behaviours compared with girls (Brown & School 2008,
Green et al. 2005). Evidence has demonstrated that gender differences are
evident in the display of aggressive behaviour for children as young as 1 and a
half years of age, (Baillargeon et al. 2007). This study showed that 5% of boys
compared with only 1% of girls were regularly displaying serious aggressive
behaviours. Other research is in agreement, finding that boys are more likely to
display aggressive behaviours and partake in vandalism (Lahey et al. 2000),
and are more likely to be exposed and vulnerable to specific risks for behaviour
difficulties (Storvoll & Wichman 2002).
Within the UK, in a study investigating the prevalence of mental health problems
in children and adolescence, Green et al. (2005), showed that the rates of those
identified with a conduct disorder were significantly higher in males compared
with females. Indeed of those identified with this disorder 63% were boys. More
recently in the fourth update from the millennium cohort study, of those children
at age 7 who had a serious behaviour problem, twice as many were boys
compared with girls (Brown & Schoon 2008).
Researchers in this field have suggested a number of reasons why males may
be at an increased risk of displaying a behaviour difficulty compared with
females. It has been argued this could relate to biological and hormonal
differences, (Book, Starzyk & Quinsey 2001), as well as variations in parenting
practices that may reflect gender stereotypes (Crick & Zahn-Waxler 2003).
There is a suggestion that girls display higher levels of prosocial behaviour,
which could potentially protect them against the display of behaviour difficulties
(Messer, Goodman, Rowe, Meltzer & Maughan 2006). One study has also

70
argued that boys and girls may be exposed to other risk factors for behaviour
difficulties to different degrees, which could explain the differences in some of
these findings (Storvoll & Wichstrom 2002). As the evidence presented above is
fairy unequivocal, the present study predicts that males will experience more
significant behaviour difficulties than females.
2.2.4 Ethnicity
A number of researchers have investigated the extent to which a child’s
ethnicity impacts upon their behaviour difficulties displayed, and whether it can
be noted as a fixed risk factor. Some studies have argued that clear ethnic
differences exist in the display of behaviour difficulties (Zwirs et al. 2011).
However, this is not a consistently held view, with others finding limited effects
of this variable in influencing problem behaviours displayed, (Dekovic, Wissink,
& Meijer 2004).
Within the UK, evidence from the millennium cohort study (Brown & Schoon
2008) found significant differences between children from different ethnic
backgrounds in their prevalence of behaviour difficulties. These children were
assessed at age 7 by being rated on the Strengths and Difficulties
Questionnaire (SDQ) (Goodman 2001), by their mothers. Results revealed that
Black African children had the least behaviour problems; White children also
had low levels of behaviour difficulties with a mean score below the overall
mean. However, the mean scores for Pakistani, Bangladeshi and Black
Caribbean children were considerably higher than the overall population mean.
As this study used a large representative sample, it provides strong evidence
that ethnic difference in the prevalence of problem behaviours in childhood do
exist. Nonetheless, Greenberger, Chen, Beam, Whang & Dong (2000)
suggested that differences in problem behaviour between ethnic groups may
not emerge until later on in development, and in fact well into adolescence.
A number of reasons have been proposed for the potential differences found. It
has been argued that definitions and measurements of behaviour difficulties
71
may vary by ethnic groups. Parents from different ethnicities may rate their
children in regard to their own cultural expectations of what is acceptable and
developmentally appropriate behaviour, and these may not be consistent or
comparable across all ethnic groups (Guttmannova, Szanyi & Cali 2007).
Furthermore, ethnic differences in behaviour difficulties could actually reflect
and be a response to parenting practices. There is evidence to suggest that at
least one aspect of parenting; physical discipline varied according to ethnicity
(McLoyd & Smith 2002), and this could account for the behaviours displayed.
With regard to the present study, ethnic difference may have some influence on
behaviour difficulties displayed, although whether or not significant findings are
discovered may depend upon whether the sample sizes for each ethnic group
are large enough to be included within any analysis.
2.2.5 Academic achievement
A fairly prominent finding from previous research is that academic achievement
and behaviour problems are related to one another, (Hinshaw 1992, Reid,
Gonzalez, Nordness, Trout, & Epstein 2004). Evidence suggests that those
children who have a reading problem (Morgan, Farkas, Tufis & Sperling 2008),
or generally a lower level of academic performance (McIntosh, Flannery, Sugai,
Braun & Cochrane 2008) will be more likely to display behavioural difficulties
than those children who experience academic success at school. These effects
have also been investigated longitudinally, with findings showing that their
influence is significant and long-term. Specifically Morgan et al. (2008)
investigated whether children in their first year at school with a reading problem
would be more likely to display a behaviour problem two years later. After
controlling for a number of possible confounding variables they found this to be
the case.
Other studies, however, have suggested that it is the display of behaviour
problems that actually predicts poorer academic achievement. Breslau, Breslau,
Miller & Raykov (2011) conducted a longitudinal study aiming to assess the
effects of behaviour problems at ages 6 and 11 on later academic achievement.
72
They demonstrated that problems at each of these ages were independent risk
factors for academic achievement even after controlling for a number of
potentially confounding variables. They concluded that children who display
behaviour problems early in their developmental history will experience long
lasting effects on their academic achievement. Support for this argument comes
from McLoed & Kaiser (2004) who demonstrated that behaviour problems at
ages 6-8 predicted a decrease in the probability of gaining a high school
degree, as well as enrolment in to further education.
The relationships between academic outcomes and behaviour difficulties are
clearly evident in the literature, what is currently being debated are whether
academic problems are a cause for behaviour difficulties or whether it is the
display of behaviour difficulties that impinges on academic outcomes. It has
been suggested that a child with behaviour problems will display behaviours
that prevent them from making and sustaining social relationships with peers
and teachers, and it is this that untimely impinges on their learning process and
the gaining of academic skills, (Reid et al. 2004, Breslau, et al. 2011). Morgan
et al. (2008), on the other hand, highlights that academic difficulty could be the
cause of behaviour problems, as children begin to ‘act out’ as they become
increasingly frustrated with their perceived failure on a task. A third plausible
explanation is that poorer levels of attention could be a cause for both
behaviour difficulties and academic problems. From the discussed literature
presented above, there appears to be a fairly strong relationship between these
variables and therefore academic failure or underachievement is predicted to be
a variable risk factor for behaviour difficulties within the present study.
2.2.6 Attendance
Research has suggested that children and adolescents with poorer levels of
school attendance and consequently higher truancy levels or unauthorised
absence have a negative impact on pupil outcomes, (Wilson, Malcom, Edward
& Davidson 2008). Specifically previous research has showed a relationship
between poor attendance and academic underachievement, difficulty making
73
friends, loss of confidence, stress and low self-esteem, as well as some kinds of
behaviour problems, (Malcolm, Wilson, Davidson & Kirk 2003).
Some research has shown that children who are poor attendees at school
(having higher unauthorised absences) experience more significant behaviour
problems (Miller & Plant 1999). Indeed, higher levels of truancy have also been
considered an early warning sign for delinquency and substance abuse, (Yeide
& Kobrin 2009). A great deal of this research, however, has focused specifically
on smoking, alcohol and drug abuse, (McAra 2004, Chou, Ho, Chen, Chen
2006, Henry 2007, Henry & Huizinga 2007, Henry & Thornberry 2010), rather
than behaviour difficulties in schools. Nonetheless all these studies showed that
poorer attendance was associated with higher levels of drug abuse, smoking
and underage drinking, all considered problem behaviours.
Although the evidence appears to suggest that children missing school through
truancy are at an increased risk of displaying problem behaviours such as drug
abuse, the relationship between these two variables maybe more complex. It
could be argued that those with behaviour problems truant more and truancy is
a consequence and not a cause of these problems. Nonetheless, others have
argued that children who are truanting will have more time unsupervised by
adults and therefore have an increased likelihood of engagement in such
problem behaviours (McAra 2004).
In evaluating this research note should be taken of the difference between
absences that parents are aware of (although not preventing) and absences
that parents are unaware of (Wilson et al. 2008). These different ‘types’ of
truancy could affect whether it emerges as a significant risk factor for behaviour
difficulties. With a plethora of research showing that higher levels of absence
from schools are associated with delinquent and substance abuse behaviours,
it is conceivable that despite limited research children who truant more often will
be at an increased likelihood of displaying behaviour difficulties in school. Poor
attendance can therefore be seen as a variable risk factor.
74
2.2.7 Positive relationships
Research has suggested that a child’s relationship with their teacher has a
significant impact on their behavioural outcomes, and can be conceived as a
variable risk factor. Hamre & Pianta (2001) established that teacher child
relationships are unique predictors of later behaviour outcomes in children.
Furthermore, Silver, Measelle, Armstrong & Essex (2005) have showed that
more conflict between teachers and children, specifically during school
transition, increased the likelihood of earlier development of externalizing
behaviour problems. It has been argued that certain qualities of teacher-student
relationships are able to predict adjustment outcomes for children in school,
(Baker, Grant & Morlock 2008). Specifically relationships that comprise of
higher degrees of trust, warmth and less conflict are related to more positive
outcomes for children. Indeed positive teacher classroom relationships are
characterized by closeness between the child and teacher, whereas negative
teacher classroom relationships are characterized by conflict and dependency
(Buyse, Verschueren, Doumen, Damme & Maes 2008).
Although some studies have found a relationship between behaviour difficulties
and child-teacher relationships, (Buyse et al. 2008, Ladd & Burgess 1999), it is
not clear in which direction the effect lies, and whether poor teacher-pupil
relationships are a cause or consequence of behaviour difficulties. Some
researchers have demonstrated that this relationship is in fact bidirectional with
both concepts influencing one another. Doumen et al. (2008) showed that
aggressive behaviour at the beginning of the school year resulted in an
increase in child-teacher conflict that in turn lead to further increases in
aggressive behaviour at the end of the school year.
Researchers have also been interested in explaining how and why child-teacher
relationships can influences behaviour difficulties. One suggestion is that
children with more secure attachments with their primary care giver will be able
to form more secure relationship with other adults such as teachers, which in
turn leads them to more positive behavioural outcomes, (Hamre & Pianta 2001).
75
There is also evidence to suggest that poor relationships with peers can be a
variable risk factor for the display of behaviour difficulties. Silver, et al. (2010)
showed that negative peer relationships increased the likelihood that an
individual would display higher levels of behavioural difficulties. In a review of
the literature specifically regarding children with learning difficulties, it was noted
that positive peer relationships may act as a promotive factor for behavioural
competence, and therefore reduce the risks of displaying behaviour difficulties
(Wiener 2004).
Further evidence for this relationship comes from Laird, Jordan, Dodge, Pettit, &
Bates (2001), who conducted a longitudinal study to assess the influence of
rejection by peers in middle childhood and being involved with anti-social peers
in adolescence on the development of behaviour difficulties. They showed that
being rejected by peers in middle childhood was a more important factor than
involvement with anti-social peers in predicting display of behaviour difficulties.
It may be that children who are rejected by their peers and have more negative
classroom peer relationship are at a heightened risk of developing behaviour
difficulties. In support of this view, Dodge et al. (2003), have also found that
peer rejection was a predictor of increased aggression.
Evidence has been presented as to why positive peer relationships are of
particular importance in reducing the risk of behaviour difficulties. It is
suggested that they are able to moderate some of the risks associated with
behaviour difficulties particularly family adversity (Criss, et al. 2002). From the
evidence discussed above within the present study it is predicted that poor
teacher and peer relationships will be a significant variable risk factor for
displaying behaviour difficulties.
2.2.8 Bullying
Research has suggested that children involved in bullying as either victims or
bullies are at risk of displaying behaviour difficulties (Gini 2008, Kim, Leventhal,
Koh, Hubbard & Boyce 2006). Bullying is typically defined as the display of
76
aggressive acts that are intended to harm another person. They are typically
repeated over time and occur in interpersonal relationships where there is an
imbalance of power (Olweus 1993, Smith 2004). Bullying may involve both
physical and verbal behaviours as well as socially excluding others (Kim et al.
2006). It is not surprising that those who are rated as bullies have the most
severe behaviour difficulties, as bullying behaviour at least to some extent, is
comprised of aggressive acts that are also a measure of behaviour difficulties.
Wolke, Woods, Bloomfield, & Karstadt (2000) showed that from a sample of 6-9
years olds those children that were involved in direct bullying had significantly
higher scores on conduct problems, hyperactivity, peer problems, and the total
behaviour problems scale, compared with those children who were not involved
in bullying. Further support comes from Hampel, Manhal & Hayer (2009) who
showed children characterized as bullies also showed a higher likelihood of
problem behaviours. In a study by Kim et al. (2006), children who had either
been bullies or victim-bullies at a baseline measure, were significantly more
likely to display more aggressive behaviour ten months later. In their analysis
they were able to provide evidence that bullying behaviour was not a just a
correlate to behaviour problems but a cause of these problems.
In terms of being a victim to bullying incidents evidence seems fairly consistent
that these children are at a significantly higher risk of displaying behaviour
difficulties, than those not involved in bullying incidents. Gini (2008) conducted
an investigation where primary school children completed a self-report about
their experiences of bullying whilst teachers completed the SDQ on their behalf.
Findings showed that victims, compared with those not being bullied, had a
higher likelihood of displaying problem behaviours. Further evidence has
suggested that being a victim of bullying is associated with mental health
problems including aggressive and violent behaviour (Arseneault, Bowes &
Shakoor 2010). It has been suggested that victims are at risk of displaying
behaviour difficulties as they may suffer from maladaptive coping responses
which lead to increases in emotional and behavioural problems (Hampel et al.
2009). Specifically within a SEND population, Hebron (2012) has noted that
victims of bullying are most likely to be children classified with either BESD or
77
ASD, and it is within these groups of SEND where children display the most
severe behaviour difficulties.
Evidence suggests that those children who are rated as ‘bully-victims’ (i.e.
sometimes the perpetrators of aggressive acts and sometimes the victims of
bullying incidents) are the most at risk group in terms of adjustment problems
(Gini 2008). In relation to the present study it is therefore predicted that children
who are bullies as well as children who are victims of bullying and bully-victims
will be more likely to display behaviour difficulties than those children not
involved in these incidents. Involvement in bullying is therefore seen as a
variable risk factor.
2.2.9 Special Educational Needs and Disabilities
The category in which a child with SEND is placed is likely to be related to their
behaviour difficulties displayed. Children are placed on the SEND register,
within one of four broad areas of need, and these can be broken down in to
eleven more specific categories of need (DfE 2001a) (see section 1.3.1 for an
overview). One of these categories has been termed Behavioural, Emotional
and Social Difficulties (BESD). Children who have any difficulties with their
behaviour, such as displaying temper tantrums, being aggressive, disruptive or
defiant are placed into this category (DfES 2003).
It is probable therefore that this group of individuals will be the most likely to
display behaviour difficulties, and a child with severe behaviour difficulties as
measured in the present study would likely be placed in the BESD group on the
SEN register. Behaviour difficulties as measured within the present study may
be a synonymous term with an SEND measure, and as such it would be
inappropriate to use the SEND category variable as a predictor of behaviour
difficulties. Nonetheless, there is some concern, that the BESD group will not be
a reliable predictor of behaviour difficulties, as children could be included within
this group on the basis that they are displaying internalising behaviours such as
anxiety and depression, as well as, or in isolation to, behaviour difficulties
78
displayed (DfES 2003). Children displaying these types of behaviours are not
measured within the present study’s construct of behaviour difficulties, which
may cloud the findings as whether SEND category (and specifically being the in
BESD group) is a useful predictor of behaviour difficulties displayed.
An interesting investigation will be carried out here; by assessing whether being
in the BESD group as defined by the SEN code of practice is related to
behaviour difficulties measured in the present study. A strong relationship would
reflect these may be synonymous constructs. If such a relationship is
established between BESD and behaviour difficulties measured within the
present study, it may be appropriate to remove this variable, and rerun the
models comparing and contrasting the findings. If the BESD group fails to have
a strong relationship with behaviour difficulties in the present study, this could
be a more worrying finding, suggesting that BESD is not a good indicator of
whether a child has behaviour difficulties.
The level of support that a child with SEND receives could also be considered a
related factor with behaviour difficulties. For an overview of level of support for
SEND, see section 1.3.1. It could be conceived that those at the higher level of
support (i.e. those statemented), are more severely affected by their SEND than
those at low levels (i.e. those at school action plus or school action), as pupils
move through the levels of support as their needs become more severe (DfES
2001a, Frederickson & Cline 2009). Therefore those with the most severe
behaviour difficulties are likely to be statemented. Nonetheless, it has been
noted that level of support may not be an accurate reflection of a child’s severity
of need but in fact a schools ability to cope with the need that they present. As
such there is considerable variation across schools in how they define and
assess a child’s level of SEND (Ofsted 2005). There could be an argument that
as the most severely affected children are receiving the most amount of
support, this could act as a protective factor and reduce their likelihood of
displaying behaviour difficulties. In such a case those children at school action
may be the most at risk of displaying behaviour difficulties, as they are receiving
less support. The present study predicts that this variable will have some

79
influence on behaviours displayed but exactly which group of children are most
at risk remains to be established.
2.2.10 Other individual level risk factors
This review of risk and promotive factors around behaviour difficulties is not an
exhaustive one. The factors highlighted above are some of the most salient;
however, there are a plethora of other significant predictors of behaviour
difficulties. Although these go beyond the scope of the study, they are
acknowledged nonetheless to highlight the fact that considerable diversity in
risk and promotive factors for behaviour difficulties exist within the literature. For
example low birth weight, (Hille et al. 2001), certain personality traits (Viding,
Frick, & Plomin, 2007), low self-esteem, (Schonberg & Shaw 2007)
hyperactivity (Thorell & Rydell 2008), lack of involvement in school activities
(Mahoney 2000) and association with delinquent peers (Laird et al. 2001) all
pose risks for behaviour difficulties. There are also genetic effects (Arseneault
et al. 2003) hormonal influences (Book et al. 2001) and neurological influences
(Dodge & Petit 2003) that predict behaviour difficulties at the individual level.
80
2.3 Family level risk and promotive factors
2.3.1 Socio-economic status
There is evidence to suggest that family socio-economic status (SES) has a
substantial influence on a number of childhood outcomes. In a comprehensive
review on SES and its effects on child development, Bradley & Corwyn (2002)
demonstrate the importance of this construct in predicting health, cognitive and
socio-emotional outcomes in children. Specifically in terms of behaviour
outcomes research has been fairly consistent in showing that children who are
living in families of lower SES are at a greater risk of developing behaviour
problems than those living in more affluent families (Propper & Rigg 2007,
Brooks-Gunn & Duncan 1997).
Brown & Schoon (2008) have also showed that children who were classified as
living in households of poverty had significantly higher mean total difficulty
scores, (as measured on the SDQ), compared with children not classified as
living in such circumstances. Characteristics of these families included parents
who had no formal qualifications and who were not working. In another large-
scale study, Green et al. (2005) also demonstrated that children identified as
having a conduct disorder were more likely to live in families that had lower
income, with parents who had no qualifications, and who were also not working.
Further support for this view comes from a non-correlational study using a
quasi-experimental design which demonstrated that children living in lower
income families were at an increased risk of developing a behaviour difficulty
(D’Onofrio, et al. 2009). Finally, in a comprehensive review of studies
investigating SES effects on child behaviour, Qi & Kaiser (2003) concluded that
around 30% of pre-school children who are living in low SES backgrounds
experience some behaviour difficulty compared with 3-6% of children in the
general population. Family income can have substantial effects on childhood
well-being, and those children living in poverty for longer amounts of time
appear to be at the greatest risk of these negative outcomes (Brooks-Gunn &
Duncan 1997). Poverty has also been demonstrated to have differential effects
81
depending on when it occurs, with onset during early school years particularly
detrimental (Brooks-Gunn & Duncan 1997).
Evidence appears fairly consistent that lower socio-economic status is
associated with behaviour problems. Research has therefore begun to
investigate why this is the case and how SES exerts its effects on behaviour
difficulties. Poorer children are often exposed to more negative influences in
their immediate environment than their more affluent peers, including more
familial stress, chaotic/unstable households, poorer parenting behaviours, and
lack of cognitive stimulation. It may be the accumulation of these risks that
results in behaviour difficulties (Evans 2004). There may be a mediating role of
some of these variables whereby lower SES and poverty causes chronic stress
that impacts on parenting skills that ultimately affect child behaviour (Jensen
2009).
Within the school context, socio-economic status is measured by whether a
child is eligible for receiving free school meals (FSM). This is assumed to be a
family level factor as FSM is calculated on parental income; nonetheless this
variable will be included at the individual level to allow for a more coherent
analysis. Within the context of the present study SES is noted as a variable risk
factor and it is predicted that children of FSM status will be at a higher risk of
displaying a behaviour difficulties than their peers.
2.3.2 Other familial level risk factors
There are numerous additional familial level risk and promotive factors for
behaviour difficulties which are beyond the scope of this study. Important
familial level factors include poor child-parental attachment (Moss, et al. 2006),
lack of parental monitoring (Pettit, Laird, Dodge, Bates & Criss 2001), parental
mental health problems (Kim-Cohen, Moffitt, Taylor, Pawlby, & Caspi, 2005)
inconsistent or harsh discipline (Chang, Schwartz, Dodge, & McBride-Change
2003), and lack of parental involvement in their child’s education (Hill et al.
2004).
82
2.4 School level risk and promotive factors
2.4.1 School urbanicity
School location, and whether it is found with an urban or rural setting, has been
investigated as a risk factor for behaviour difficulties. It has been suggested that
within urban schools children will be more exposed to anti-social and
aggressive role models. The result of such an effect is that a larger number of
individuals within the schools will be influenced by these problem behaviours,
leading to more behaviours difficulties displayed within the school, (Hope &
Bierman 1998). Support for this evidence comes from a number of studies,
reporting that schools situated in urban areas are better predictors of more
severe behaviour difficulties, than schools in rural areas, (Stewart 2003,
Larsson & Frisk, 1999, Hope & Bierman 1998). Urban schools with higher rates
of behaviour difficulties have similarly been suggested to reflect the higher rates
of violence already displayed in urban community settings (Warner, Weist &
Krulak 1999).
Despite this evidence, not all research is in support of the view that urban
schools are associated with poorer outcomes for students. Sellstom &
Bremberg (2006), in a review of a number of studies investigating school effects
on pupil outcomes, suggested that schools within urban locations actually had
more positive effects on pupils than rural schools. This effect may result from
more resources being made available to inner city and urban schools. This
evidence could also reflect the fact that studies included within this review
measured a broad range of outcomes for children rather than specifically
behavioural ones. Nonetheless, this evidence that rural school students are not
better off than their urban counterparts is consistent with another group of
studies reporting no differences between urban and rural students, in terms of
alcohol use (Wilcox-Rountree & Clayton 1999), and fighting behaviour, (Swahn,
Gaylor & Bossarte 2010). The evidence discussed above is fairly mixed and no
clear pattern has emerged in terms of which school type will have the most
influence on pupil behaviour difficulties, as such within the present study it is
83
predicted no significant difference will emerge between rural and urban schools
in their behaviour difficulties displayed.
2.4.2 School size
School size (in terms of numbers of pupils on roll) is potentially a significant
predictor for individual behaviour difficulties. There is some evidence suggesting
that larger schools are a risk factor for behaviour problems and violence
(Stewart 2003, Haller 1992, George & Thomas 2000), as well as victimisation
(Bowes et al. 2009). Although victimisation is not a ‘type’ of behaviour difficulty,
it could be considered associated with behaviour problems, (i.e. the children
displaying behaviour difficulties cause others to experience victimization).
Furthermore, victimization has been showed to be interrelated with a deviant
lifestyle (George & Thomas 2000).
Other studies however, have either found no effect of school size on student
victimisation, (Khoury-Kassabri, Benbenishty, Astor & Zeira 2004), or found a
relationship between smaller schools and student victimisation (Gottfredson &
DiPietro 2011). In terms of other types of behaviour difficulties; no relationship
has been found with aggression and school size (Wilson 2004) or smoking and
drinking behaviour in adolescents and school size (Maes & Lievens 2003).
The inconsistency in these findings could reflect the fact that larger schools
often have more comprehensive policies and interventions for students with
behaviour difficulties, and therefore reducing the risks. However, smaller
schools will be able to develop more positive relationships between teachers
and students, hence also countering some of the potential risks (Gottfredson &
DiPietro 2011). The evidence presented here remains fairly inconclusive,
therefore it is predicted in the present study that school size will have a limited
effect on behaviour difficulties displayed.
84
2.4.3 School level SES
As stated earlier, socio-economic status (SES) is often calculated within
educational research by assessing whether the family has eligibility to, and is
claiming free school meals for their child (Hobbs & Vignoles 2007). At a school
level, the percentage of the total number of students claiming free school meals
(FSM) is calculated and used as a school level variable of SES. A higher
percentage would indicate that a greater number of students are claiming FSM
and the overall level of SES in the school is low.
High average SES within schools is generally associated with positive
outcomes for students (Sellstom & Bremberg 2006), and there is considerable
evidence to suggest that low average school SES is a significant risk factor for
childhood and adolescent behaviour difficulties. Barnes, Belsky, Broomfield &
Melhuish (2006) showed that a measure of school disorder, (including
measures of bullying, exclusions and aggressive behaviour displayed by
pupils), was linked to schools that had higher percentages of children claiming
free school meals. Other studies have found that higher proportions of students
whose families are claiming FSM in the school are associated with increased
levels of delinquency (Felson, Liska, South & McNulty 1994), higher levels of
victimisation (George & Thomas 2000), (which could be considered a proxy for
behaviour difficulties), and increases in weapon carrying into school (Wilcox &
Clayton 2001), (although not a direct measure of behaviour difficulties, likely to
be linked with anti-social behaviour). Specifically within the UK context a recent
government report found a positive relationship between the number of
exclusions in schools (presumably for some kind of behaviour problem) and the
percentage of students claiming FSM within the school, (DfE 2012). Not all the
evidence is consistent, however as Stewart (2003) showed that although a
number of school level variables can account for school misbehaviour, poverty
levels were not significant in predicting behaviour problems at the individual
level.
85
Some discussion needs to take place as to why this variable may predict the
display of behaviour difficulties at the individual level. It could be quite obvious
that schools with a higher overall level of students claiming FSM, will comprise
of more individuals of lower SES, and this is a known risk factor for behaviour
difficulties at the individual level (Propper & Rigg 2007). Alternatively, a
speculative argument suggests schools with a higher percentage of students
claiming FSM may create a culture or climate within the school of dependency.
This could have a negative influence on other children, who are not eligible or
claiming FSM, resulting in more behaviour difficulties displayed. Although the
exact mechanisms by which this variable has an influence on behaviour
outcomes is unknown, the evidence discussed above generally shows lower
school SES is associated with an increase in behaviour difficulties and this is
what is predicted for the present study.
2.4.4 School level EAL composition
Evidence has been presented to suggest that the percentage of children within
a school speaking English as an additional language (EAL) may pose a
significant risk factor for behaviour difficulties. One study showed that the
number of children in a class with EAL was of particular importance at the
school level in accounting for aggression in young children starting school. This
study found that schools with a higher proportion of students learning English
as an additional language had lower individual aggressive scores, (Kohen,
Oliver & Pierre 2009). However, another study investigating individual, school
and neighbourhood effects on student aggressive behaviour failed to find any
impact from a school level variable of percentage of EAL in the school (Barnes
et al. 2006). Other evidence has shown that schools with 50% or more students
from ethnic minority backgrounds (and presumably reflecting higher levels of
EAL) had significantly more students with behaviour problems compared with
school with less than 50% ethnic minority students, (Ma, Truong & Strurm
2007).
86
A discussion needs to take place to decipher whether it is the aggregation of
individual children with EAL at the school level which maybe a risk or promotive
factor for behaviour difficulties, or whether schools with a higher percentage of
EAL have a distinct culture or climate which affects other non EAL students
behaviour difficulties. Some studies have shown individuals with EAL are more
at risk of behavioural problems (Brown & Schoon 2008). If these individual
effects were aggregated to a school level it could explain why percentage of
EAL students is a potential predictor for behaviour difficulties. Nonetheless
there is an argument that schools with higher EAL students may adopt a more
inclusive ethos and celebrate difference and diversity. This may have a positive
effect on all students and reduce the risk of displaying behaviour difficulties.
From the evidence discussed above the present study predicts the percentage
of students with EAL within a school is unlikely to have a significant effect on
behaviour difficulties.
2.4.5 Proportion of SEND pupils
Another potential risk factor at the school level could be the proportion of pupils
with special education needs or disabilities (SEND) within the school. One study
that has investigated SEND proportion at a school level, (Barnes et al. 2006)
showed a positive relationship between a measure of school disorder, including
aggressive behaviour displayed by pupils and more children on the SEND
register.
It would be interesting to note whether percentage of SEND children in the
school is a predictor for behaviour difficulties due to the individual-level risk
being aggregated up to a school level, or whether there is something
qualitatively different about this variable when assessed at a school level. As
already mentioned in section 2.2.9 at the individual level children with a SEND
are more at risk of displaying a behaviour problem than those children without,
(Green et al. 2005). It could therefore be conceived that if these influences are
aggregated up to a school level, more children with SEND will result in more
behaviour difficulties. However, the question is also asked whether the impact
87
of having more children with SEND influences other students in displaying
behaviour problems.
A number of inclusion based studies have assessed the impact on the ‘other’
students who are in classes with more SEND children. Some studies have
suggested that the inclusion of more pupils with SEND into the classroom has
no effect on behaviour outcomes of the other students (Sharpe, York & Knight
1994, Tapasak & Walther-Thomas 1999). Other studies however, have noted
significant negative effects on pupils with higher proportions of SEND pupils
included within their classrooms (Daniel & King 1997, Brown 1982). Although
these studies were investigating the impact of behaviour problems on children
specifically without SEND they do go some way to explain how this school level
factor may operate in being a predictor for behaviour difficulties. In a review
investigating the effects of inclusion on other pupils and incorporating some of
the studies above, Kalambouka, Farrell, Dyson & Kaplan (2005) suggest that
the impact of including children with SEND will not have a major impact on the
majority of pupils in the school without SEND, however this report does
acknowledge that the impact on behaviour outcomes is more pronounced than
that of academic outcomes.
It is perhaps logical to suggest therefore that a higher number of SEND pupils in
the school will lead to an increase in behaviour difficulties. This may reflect an
aggregation effect of the individual level but also that a higher proportion of
SEND children in a school can affect other students. This could be in a negative
direction, placing an extra burden on teachers who have less time to spend
supporting other students. Alternatively schools with more SEND pupils may
adopt more inclusive policies and have access to resources within them that
creates a more constructive climate which affects other pupils in a positive
direction. The present study predicts that a school’s percentage of SEND pupils
will be a significant predictor of behaviour difficulties although the direction of
this relationship awaits further research.

88
2.4.6 School level achievement
The average academic achievement level within a school has been assessed
as an important influence on an individual’s behaviour difficulties. It has long
been argued that an ethos within a school that promotes academic
achievement is associated with lower levels of problematic behaviour in schools
(Rutter, Maughan, Mortimore, Ouston & Smith 1979). Furthermore, studies that
have used a ‘value added 5
’ measure have suggested that value added
education is associated with lower levels of adolescent substance use (Bisset,
Markham & Aveyard 2007). Mooij (1998) has also suggested that attending a
lower achieving secondary school is a particularly important school level risk
factor for aggressive behaviour. A further study has shown that measures of
school disorder including aggressive behaviour and bullying displayed by pupils
was related to lower academic levels in key stage 1 and key stage 2 (Barnes et
al. 2006). As this study was correlational, causation cannot be inferred and it is
entirely possible that lower academic standards in the school were the
predictors of more school level disorder. Nonetheless this evidence taken
together does suggest that an individual’s behaviour difficulties are negatively
affected by attending low-achieving schools. In higher achieving schools pupils
with SEND may benefit by having peers around them that are more able to help
them with their academic work, as such any frustration they have with their work
would be reduced leading away from the display of behaviour difficulties.
This evidence has however, been disputed by others researching in this field.
Wilson (2004) has argued that school performance measures are not related to
aggression scores. A further alternative view is that attending a higher
achieving school can actually have a detrimental effect on pupil behaviour.
Felson et al. (1994) found that students would be more likely to engage in
delinquent behaviour when the school had a culture of high academic
achievement. The authors suggest that in such competitive climates when a 5 Schools show evidence of ‘value added’ education when the average overall student performance in a school is better than would be expected from their particular socio-demographic composition.
89
student does not have the capability to compete with others they ultimately
suffer in comparison to their classmates. This could lead them to display more
behaviour difficulties as they are suffering from increased pressure and a sense
of failure. It is likely that school level academic achievement will have a
significant effect upon an individual’s behaviour difficulties although it is unclear
in which direction the effect will have.
2.4.7 School level attendance
Overall attendance rates are a concern for all schools. Improving these rates
will not only allow schools greater standing in any league tables, but also
improve the academic and behavioural outcomes for their pupils. Evidence
clearly shows that children who are not regular attendees to school are more at
risk of developing behaviour problems than children who are regular attendees
(Yeide & Kobrin 2009). A pertinent question is whether or not children who are
in classes and schools with poorer overall rates of attendance are at a greater
risk of developing a behaviour problem than they would be if in a school with
higher overall attendance.
A number of studies have investigated school level attendance rates and their
influence upon pupil outcomes. These studies have utilised the concept of
truancy; generally defined as “any unexcused or undocumented absence from
school” (Claes, Hooghe & Reeskens 2009, page 124). Truancy rates or
unauthorised absence rates at a school level have been found to a have
significant effects on other pupils within the school. Wilson et al. (2008)
investigated effects of truancy on other non-truanting pupils finding that
although some pupils said they were not affected by those truanting, a
predominant emotion to emerge was irritation at these pupils and disruption in
class when they came back and needed additional help with their work. There
was also concern that the poor attendees could become negative role models
for the better attendees. Furthermore, these schools effects have also been
noted in terms of influencing school performance (Claes et al. 2009). Although
these studies are not directly measuring behaviour problems displayed they do
90
suggest that school-level truancy impacts upon individual students within the
school.
Some studies have begun to address the issue of school level attendance on
individual behavioural outcomes. Bisset et al. (2007), investigated adolescent
substance use (an aspect considered to be related to behaviour problems), and
whether this was influenced by what they termed ‘value added’. A school would
achieve this status when their students achieve higher academic outcomes and
truant less than would be expected from their particular socio-demographic
composition. They found evidence that value added education was associated
with lower levels of alcohol consumption and illegal drug use. In support of this
evidence that school truancy levels can impact upon pupils behaviour
difficulties, Maes & Lievens (2003) argue that truancy levels between different
schools could account for differences in smoking and drinking behaviour. They
suggested that truancy is not solely an individual characteristic, but a school-
related one as well, and therefore smoking and drinking behaviour is influenced
by school truancy levels which perhaps reflects school climate. Within the
present study it is predicted that higher levels of school-unauthorised absences
will be related to an increase in behaviour difficulties.
2.4.8 School level behaviour difficulties
Whether an aggregated level of behaviour difficulties at a school level has any
influence on individual behaviour has generated some exposure in the
psychological literature (Hoglund & Leadbeater 2004, Kellam, Ling, Merisca,
Brown & Ialongo 1998). It has been argued that schools are vastly different in
their overall levels of behaviour difficulties displayed and these effects are likely
to have influence upon the pupils attending them (Reid 2010).
Studies have aimed to assess whether a school or indeed a classroom with a
higher overall rating of more severe behaviour problems has a negative
influence upon the individuals within them. Mooij (1998) provided some
evidence for such a suggestion that being in a class with a larger number of
91
disruptive pupils will have negative effects on individual behaviour. DeWit et al.
(2000) conducted a study to assess the effects of school culture and mediating
mechanisms on behaviour problems in adolescence. They found that school
culture (comprised of a number of concepts including school and classmate
behaviour problems) had direct effects as well as indirect effects on a number of
their measures of problem behaviour. They suggested that perceptions of a
more negative school culture are associated with more behaviour problems
displayed. On a slightly different yet related track, Theriot, Craun & Dupper
(2010), investigating school exclusion using a multilevel study, showed that
school suspension rate (calculated by dividing total exclusion by number of
pupils) is a significant predictor of individual level exclusion. Although school
exclusion is not a synonymous term with behaviour difficulties, the relationship
is likely to be very strong.
Other studies have provided compelling evidence that more aggressive
classrooms and schools have influences on individual aggression. Barth,
Dunlap, Dane, Lochman & Wells (2004) found evidence that aggregated
classroom level behaviour problems had a significant impact on students within
them over time. Specifically, classrooms rated as poorer environments with
more behaviour problems were associated with more individual level problem
behaviours. The authors suggest that peers within these contexts may become
effective role models, and reinforce the display of problem behaviours. Thomas
& Bierman (2006) provided evidence that being in a more aggressive classroom
for a greater number of years held stronger associations with individual
aggression than being in an aggressive classroom for a shorter period. Mercer,
McMillen & DeRosier (2009) showed that children within classrooms with a
higher initial aggregated score for behaviour problems reported more significant
increases in levels of behaviour problems over the year. The evidence is fairly
compelling, and therefore in the present study - children in schools with more
behaviour difficulties are at a greater risk of developing a behaviour difficulty
themselves.
92
2.4.9 Other school level risk factors
There are a number of other school level variables that have been linked to
pupils’ behaviour difficulties. A good school climate (often including quality
interactions between students and teachers) has a positive influence on pupils
outcomes, and results in fewer externalising problems (Kuperminc, Leadbeater,
& Blatt (2001). Perceptions of school fairness and student involvement has
been related to reductions in problem behaviour, (Dewit et al. 2000) and also
predicted lower levels of offending and misconduct behaviours (Welsh 2000).
Measures of school connectedness where students feel a sense of belonging to
the school have been associated with lower levels of violence and substance
use (Bond et al. 2007), and fewer risk taking and problem behaviours (Denny et
al. 2011). Finally, schools that have effective policies on behaviour and anti-
smoking and drugs appear to experience fewer school level problem
behaviours than schools without effective policies in these areas (Evans-Whipp
et al. 2004).
93
2.5 Neighbourhood level risk and promotive factors
2.5.1 Neighbourhood disadvantage
Risk factors associated with behaviour difficulties have also been
acknowledged at a neighbourhood level. Neighbourhoods are geographical
areas in which groups of people reside, where people experience shared social
environments (Drukker, Kaplan, Feron & van Os, 2003). It is therefore probable
that these shared social environments will have some influence upon the
individuals living within them. In an extensive review of the literature within this
area Leventhal & Brooks-Gunn (2000) have argued that of all the
neighbourhood factors, neighbourhood disadvantage or neighbourhood socio-
economic status as it is sometimes referred to holds the strongest
neighbourhood influence over behavioural outcomes of children and
adolescents. Indeed, Edwards & Bromfield (2010) showed that significant
differences emerged between children living in more deprived neighbourhoods
compared with those from more affluent neighbourhoods across a number of
domains including, peer problems, emotional problems and hyperactivity.
Evidence is fairly consistent that children living in more disadvantaged
neighbourhoods are more at risk of developing behaviour problems (Schonberg
& Shaw 2007, Drukker et al. 2003, Stewart, Simons & Conger 2002). It has
been suggested that living in poorer communities increases the risk of
behaviour difficulties as within such areas there is a lack of institutional
resources available, poorer quality housing and greater exposure to anti-social
peers. Others have suggested that effects such as poverty, crime and violence
often found in lower SES neighbourhoods can be mediated through another
variable such as parental stress (Schonberg & Shaw 2007).
94
2.5.2 Other neighbourhood level risk factors
Other important neighbourhood factors have included residential instability, with
those living in communities with higher levels of instability (i.e. with large
amounts of changes in house occupancy within short periods of time) are more
at risk of problem behaviours, (Brooks-Gunn, Duncan, Leventhal & Aber 1997).
Furthermore, exposure to violence is an important issue, those children more
exposed to neighbourhood violence have an increased likelihood of engaging in
violent behaviour themselves (Patchin, Huebner, McCluskey, Varano, & Bynum
2006). Finally, children and adolescents who have greater exposure to anti-
social peers within their neighbourhood are more likely to engage in anti-social
behaviour (Ingoldsby et al. 2006).
95
2.6 The relative importance of the individual versus the school ecological level in accounting for behaviour difficulties
There is a fairly unanimous view amongst researchers that the most salient
predictors of behaviour difficulties are found within more proximal ecological
levels such as those within the individual, rather than more distal contextual
influences such as the school influences (Andersson, et al. 2010). Nonetheless,
it has been suggested that attempting to explain these difficulties by accounting
solely for factors considered proximal to the child and excluding the influence of
the contextual factors is a poor oversight (Aveyard et al. 2004). Contextual
influences have significant influences on childhood developmental outcomes
(Theriot et al. 2010) and particularly in the development of behaviour difficulties
(Mooij 1998).
Over thirty years ago it was suggested that one such contextual influence i.e.
the school environment had a powerful influence on school behaviour (Rutter et
al. 1979). It is only fairly recently, however, that the effects of the school context
on childhood behaviour difficulties has gained greater attention within the
academic literature (Sellstrom & Bremberg 2006). It still appears that relatively
little is known in terms of exactly how school environments impact on childhood
developmental outcomes, (Maes & Lievens 2003). Furthermore, the relative
strength of school level factors compared with individual level factors in
predicting the display of behaviour difficulties has not been extensively
investigated.
It has only been fairly recently that appropriate statistical measures have been
applied to this field, which have used hierarchical linear modelling techniques
i.e. multi-level modelling (Twisk 2006). These techniques are able to
acknowledge that data is organised hierarchically, with pupils being found
nested within schools, (and indeed schools being nested within
neighbourhoods). The hierarchical structure of this data needs to be
acknowledged in order to tease apart the relative influences of each level and
assess how important each level is in accounting for childhood and adolescent
behaviour difficulties.
96
Studies that have used these techniques have been fairly consistent in their
findings, suggesting that school level variables can be significant risk factors for
the display of behaviour difficulties, although once individual level variables are
accounted for their relative influence is fairly small, (Reis et al. 2007, Maes &
Lievens 2003, Gottfredson & DiPietro 2011, Aveyard, et al. 2004). Research
that acknowledges the importance of multiple ecological levels in influencing
behaviour difficulties consistently finds the individual level accounts for the
largest proportion of this variance (Andersson, et al. 2010).
Although small in comparison to the weight of the individual level, schools are
important contextual influences in accounting for behaviour difficulties
(Gottfredson 2001). School level studies have provided evidence that this
ecological level accounts for variance on a number of behavioural outcomes.
Typically it has been suggested that the amount of variance accounted for at
the school level for individual behaviour is around 8-15% (Gottfredson 2001).
This figure is consistent with Felson et al. (1994) who argue contextual
variables usually only account for between 5-10% of the outcome in question,
and Khoury-Kassabri et al. (2004) who found between 9-15% of variance was
accounted for at the school level when the outcome was student victimization.
Kuperminc, et al. (2001), assessed the effects of children’s psychological
vulnerabilities and school climate perceptions to their externalising behaviour.
They found that school climate was able to add 5% to the model explaining
externalising problems, with more positive perceptions of school climate related
to fewer behaviour problems. Kohen et al. (2009) investigated the effects of a
number of school and neighbourhood variables of different outcomes for
kindergarten children. They found that although 95% of the variance in physical
aggression was attributed to the individual/family level, 3% was accounted for at
the school level. Specifically schools that had a higher proportion of students
with English as an additional language had lower aggressive scores. The
remaining 2% was attributable to the neighbourhood level. Other studies have
found a significant but small effect at the school level. Resis et al. (2007) found
97
the school ICC 6
was about 2% with the outcome of aggressive behaviour.
Payne (2008) found an ICC of around 6.3% in delinquency, while Andersson et
al. (2010) suggested that school level factors account for 6-8% of variance in
mental health difficulties, which in fact dropped to 2-3% when confounding
factors were taken into account.
In an investigation attempting to account for variance in aggressive behaviour
by the individual, class and school level factors, (Mooij 1998), it was shown that
although the school level was important, the individual level had the strongest
effect. Furthermore the classroom level was more powerful than the school level
but not as powerful as the individual level. This evidence suggests that as the
influences become more distal on the individual, the effects become less
pronounced, as influences within the individual level have a direct effect
whereas contextual effects are often more indirect being mediated through a
third variable. Finally, Sellstom & Bremberg’s (2006) extensive review of
multilevel studies investigating the school effects on behaviour outcomes, report
that the schools effect on problem behaviour did not exceed 8% across 4
studies. Only in one study, investigating weapon carrying in school, did the
school effect reach 25%.
It appears from the evidence discussed above that schools do exert a powerful
influence on individual behaviour difficulties, although their effects are
considerably weaker than those found within the individual level. A key
objective for the present study is to calculate the amount of variance in
individual display of behaviour difficulties that is attributable at the individual and
school levels respectively, within a population of children identified as having
SEND. It is predicted within the present study that the individual level will
account for more variance in behaviour difficulties than the school level.
6 Inter Cluster Correlation (see section 5.9.4 for an explanation)
98
2.7 Summary statements and research questions
• Behaviour difficulties cannot be fully accounted for by a single ecological
level, the influence of multiple levels; including factors at the individual,
familial, school and neighbourhood level are required
• A justification has been presented for a particular focus on the individual
and school ecological levels and the relative importance of these in
accounting for behaviour difficulties.
• At the individual level variables that have been associated with behaviour
difficulties and may be particularly salient for a SEND population include,
age, relative age within a school year, gender, ethnicity, academic
achievement, attendance, positive relationships and bullying. Socio-
economic status of the individual (although technically a familial level
factor) is also an important influence.
• At a school level, school urbanicity, size, numbers of children from lower
socio-economic backgrounds, percentages of students with English as
an additional language, as well as school level overall academic,
attendance and behaviour rates are also important factors to consider
when accounting for behaviour difficulties.
• The research questions to emerge from this chapter (labelled research
questions 1a, 1b, and 1c) are presented below:
a) What proportions of variance in behaviour difficulties are attributable to
the school and individual levels?
b) Which school and individual level predictors explain a statistically
significant proportion of variance in behaviour difficulties?
c) Of the variance initially attributed to the individual and school levels, how
much can be accounted for by the predictors used in the study?

99
3. Cumulative Risk
3.1 Introduction to chapter
The overall aim of this chapter is to introduce the concept of cumulative risk and
discuss the pertinent issues surrounding it. The chapter begins with section 3.2
explaining the importance of acknowledging multiple rather than single risks in
analyses. Section 3.3 describes what the cumulative risk score is and identifies
its principle feature. Section 3.4 evaluates the cumulative risk model in terms of
its evidence and theoretical concerns. Section 3.5 gives an overview of how
cumulative risk is measured. Section 3.6 discusses the functional relationship
between cumulative risk and behaviour difficulties and whether this conforms to
a linear or non-linear pattern. Section 3.7 examines cumulative risk across
ecological levels, and whether the same amount of risk in one level has the
equivalent effect when spread across multiple levels. Section 3.8 concludes
these issues and section 3.9 provides summary statements and research
questions that have emerged from the chapter.
3.2 Multiple risk factors
Research has been fairly prolific in investigating the causes and correlates of
childhood and adolescent behaviour difficulties (for an overview see chapter 2).
A criticism of some of this research however, is that these factors have often
been studied in isolation whereas in reality they are not independent of one
another and often cluster together within the same individual (Flouri & Kallis
2007). As young people often experience multiple risks within their backgrounds
and across distinct contexts which impinge on their lives (Sameroff, Gutman &
Peck 2003), acknowledging the unique influence of a single factor will provide
an insufficient account of these problems. Kraemer, Stice, Kazdin, Offord &
Kupfer (2001) argue that it is not possible to fully understand the effects of any
100
single risk factor outside of the context of all the others, and failing to account
for them increases the chances of over-emphasising the importance of any one
risk factor (Sameroff et al. 2003).
Investigating single risk factors for behaviour difficulties in isolation suffers from
another drawback in that no one factor is deemed necessary or indeed
sufficient to cause these problems (Sameroff et al. 2003). Sameroff and
colleagues cite evidence from the Framingham Study of heart disease (Dawber
1980) to explain the functioning of risk factors for childhood developmental
outcomes. In the Framingham study a number of risks such as smoking, lack of
exercise, hypertension, and obesity all contributed to heart disease, although,
no single factor in isolation was sufficient to account for the disease. It was the
combination of multiple risks which was the salient issue, as every individual
with this disease had a different array of risk factors within their background.
Other researchers within the field of developmental psychopathology, also
argue that no single factor when present can completely account for the display
of behaviour difficulties, and that these problems are the result of numerous
influences acting on the individual (Dodge & Pettit 2003, Ackerman, Izard,
Schoff, Youngstrom & Kogos 1999). The general consensus is that to further
our understanding of risk, and how these factors impact on behavioural
outcomes research needs to move beyond identifying single risk factors and
include multiple factors simultaneously within the same model, (MacKenzie et
al. 2011, Gutman. Sameroff & Cole 2003).
A number of analytical methodologies have been proposed in the literature in
order to assess the effects of multiple risk, (Jones, Forehand, Brody &
Armistead 2002, Farris, Smith & Weed 2007). One approach is to use a
regression analysis where multiple variables are put independently into the
model (Gutman et al. 2003). Placing risk variables into a multiple regression
analyses allows the unique relationships between contextual risks and problem
behaviours to be observed. This method is particularly useful for establishing
the specific risk factors that are the strongest predictors of a certain outcome as
101
well as acknowledging the combination of factors that can account for the most
variance: such models have been termed independent additive models.
This approach of inputting multiple variables independently into a regression
analysis does however, give rise to a number of shortcomings. Firstly, although
statistically significant relationships are often found between risk variables and
the outcome in question in such analyses, in isolation they are only able to
account for small amounts of variance (Sameroff, et al. 1998, Forehand, Biggar
& Kotchick 1998, Dodge & Pettit 2003, Fergusson & Horwood 2003). Secondly,
there may also be power issues which limit the number of factors that can be
included in a model at the same time (Ackerman et al. 1999). Finally, as this
method assumes variables are independent from one another, this neglects the
fact that risks are often found to cluster within individuals and are therefore
likely to be related in some way (Flouri & Kallis 2007). This type of model is
utilised within the present study to acknowledge the significant risk factors for
behaviour difficulties. Nonetheless, an alternative method is needed to
overcome some of these limitations. One such approach has been termed the
cumulative risk model.
3.3 What is cumulative risk?
The basic premise of cumulative models (Gerard & Buehler 2004a) is that by
assessing contextual risk variables in combination with one another, specifically
by adding them up to produce a cumulative risk score, will result in a better
predictive model than could be achieved if their influences were assessed
independently (Appleyard, Egeland, Van Dulmen & Sroufe 2005). There are two
basic underlying assumptions of cumulative risk models, firstly that the total
number of risk factors within an individual’s background holds a greater
influence over development than any specific risk factor or particular
combination of risk factors. Number is therefore seen as more important than
type or kind of risk, (Morales & Guerra 2006). This idea is rooted in the principle
of equifinality (Dodge & Pettit 2003), that proposes a negative behavioural
102
outcome can occur via a number of distinct pathways. It is not the specific type
of risk that is important but the number of increasing risks that an individual is
exposed to, because as stresses build up in a child’s background they
overwhelm coping mechanisms which leads to disorder, (Flouri & Kallis 2007).
The second assumption is that those individuals with backgrounds comprising
more risks for behaviour difficulties are at an increased likelihood of suffering
problems than those with fewer risks in their background; i.e. the larger the
number of risks the greater the prevalence of problem behaviour (Trentacosta,
et al. 2008). Multiple risk factors therefore influence behaviour problems by
working in a cumulative manner where the addition of each extra risk factor
results in an increase in the problem behaviour, (Atzaba-Poria, et al. 2004).
3.4 Measurement of cumulative risk
Cumulative risk approaches maintain that the contextual risk factors within an
individual’s background can be assessed, measured then summed together to
form a cumulative risk score which is used as a predictor variable (Gerard &
Buelher 2004a). These risks are not weighted and each factor is acknowledged
as having no greater importance than any other (Flouri & Kallis 2007). Although
this could be seen as a criticism, it is in fact consistent with what the model
suggests; that number rather than any single risk, regardless of its intensity, is
what best predicts an outcome, (Flouri 2008, Evans 2003). Cumulative indices
do not comprise of an exhaustive lists of risks, and there is no consistently
identified set of risks which could be considered the ‘gold standard’ and be
included within any cumulative risk model (Lima et al. 2010). Indeed the number
of risk variables that have been included within any model has ranged from 2 up
in excess of 15 (Lima et al. 2010), with larger models not necessarily better at
predicting outcomes than smaller ones, as the addition of extra variables can
sometimes create ‘noise’ that ultimately distracts from the findings (Farris et al.
2007). The indices are made up of potentially important variables that
accumulate to better predict an outcome, they may therefore be

103
interchangeable, as what is of interest is not the individual factors themselves
but their cumulative effect on the outcome.
In order to measure contextual cumulative risk, each factor or variable within the
study needs to be defined as a ‘risk variable’. Usually risk variables are defined
as such when the correlation between them and the dependent variable is
significant (Lima et al. 2010) or equal to or exceeds .25 (Atzaba-Poria et al.
2004). On binary risk variables risk is coded as 1 if present, and 0 if absent,
whereas on continuous variables scores that are in the worst 25% of the sample
are deemed to be ‘risk’ and are coded as 1, with the remainder of the sample
coded as 0. Where risks can be defined using clinical cut offs such as when an
individual’s IQ falls below 85, (Raviv et al. 2010) or on conceptual means such
as being below the poverty line, or being in a single parent household (Flouri
2008), risk is defined using these methods. These total scores are then
summed for each individual to produce their overall cumulative risk score.
Although alternative methods to generate a cumulative score exist within the
literature (Atzaba-Poria et al. 2004), the method described above is by far the
most common (Raviv et al. 2010, Whipple et al. 2010, Lima, et al. 2010, Gerard
& Buelher 2004a, 2000b, Forehand et al. 1998), and in order to remain
consistent with previous studies it was used within the present study.
3.5 Evaluation of cumulative risk
Cumulative approaches are often overlooked within the literature, despite
evidence in their favour suggesting these models can be powerful predictor of
developmental outcomes (Appleyard et al. 2005). These models show that as
the number of risks increase within a child’s background the severity of
behaviour difficulties displayed also augments, and this is regardless of the
specific risks which make up the cumulative score (Raviv et al. 2010, Lima,
Caughy, Nettles & O’Campo 2010, McCrae & Barth 2008, Appleyard et al.
2005, Atzaba-Poria et al. 2004, Kerr, Black & Krishnakumar 2000, Forehand et
al. 1994). The present study aims to test these two assumptions that increasing
risk is associated with increased behaviour difficulties and whether number i.e.
104
a cumulative model is a more powerful predictor than type i.e. an independent
additive model.
There is a growing body of evidence arguing that studies incorporating multiple
risk factors using a cumulative metric are better able to account for negative
behavioural outcomes than studies acknowledging solely single factors
(Whipple, Evans, Barry, & Maxwell 2010, Evans, Kim, Ting, Tesser & Shanis
2007, Evans 2003, Forehand et al. 1998). The cumulative risk index can also
effectively predict other developmental outcomes including academic outcomes
(Gutman et al. 2003) IQ (Sameroff, Seifer, Baldwin & Baldwin 1993) and early
sexual experience (Price & Hyde 2009).
Cumulative approaches are also particularly beneficial as they acknowledge
that risk variables naturally co-vary, (Flouri 2008) e.g. in the case of behaviour
problems, risk factors such as having reading problems and poorer peer
relationships are often related (Messer et al. 2006). These models are able to
simultaneously utilise large numbers of risk factors, (Sameroff et al. 2003,
Evans 2003), even when small samples are used. Independent additive models
hoping to include a large number of variables with a small sample size would
struggle not to violate sample size assumptions of multiple regression analyses
(Gutman et al. 2003).
Cumulative risk scales have been praised for having high face validity and
being more likely to predict problem behaviours than any single risk factor, as
scales that incorporate more items by and large generate more reliable scores,
(Luthar 1993). As cumulative scores will be summed across a number of
variables they have the advantage of not only being a more stable measure, but
being better able to detect any effects, as measurement errors are reduced as
scores are added together (Flouri, Tzavidis & Kallis 2010). Nonetheless, it has
been argued that critical information can be sacrificed when more powerful
continuous variables are dichotomized in order to generate a cumulative risk
score (Raviv et al. 2010). Furthermore, it has been argued that questionable
statistical relationships can emerge when utilising this method (MacCallum,
Zhang, Preacher, & Rucker 2002). Cumulative risk scores that use the worst
105
25% as a cut off to signify risk are limited to the sample in which the data were
collected and may not reflect the entire population, limiting generalizability
(Raviv et al. 2010).
Cumulative models have also been criticised for not taking into account the
relative importance or power of each individual risk factor. This could be a
flawed assumption by the cumulative model that type of risk is not an important
issue as there is some evidence that different risks do pose different effects on
outcomes (Hooper, Burchinal, Erwick-Roberts, Zeisel & Neebe 1998, Ackerman
et al. 1999, Hall et al. 2010, Rousse & Fantuzzo 2009), and that cumulative risk
models are not always the most powerful predictive models (Hall et al. 2010).
This evidence at least to a degree disputes the claim that risks within
cumulative models are interchangeable and that number of risks is more
important than type. Kraemer et al. (2001) argue against the use of cumulative
risk models suggesting that these approaches, which ultimately involve scoring
and summing risk factors, do not help in understanding the aetiology of any
problem behaviour, or indeed are effective at explaining how the process of risk
are interrelated and operate to influence outcomes (Loukas, Prelow, Suizzo &
Allua 2008, Olson, Ceballo & Park 2002, Masten & Wright 1998).
Within a cumulative score all variables are assumed equal, which could result in
a problem when proximal and distal variables are both included within the risk
indices and assumed to have equivalent impact on outcomes (Hall et al. 2010).
In acknowledgement of this issue, within the present study cumulative risk
scores were generated as domain specific scores, to tease apart the more
proximal and distal influences on development. This approach is consistent with
Deater-Deckard et al. (1998), Atzaba-Poria et al. (2004), and Ribeaud & Eisner
(2010).
Flouri & Kallis (2007) maintain the importance of investigating risk accumulation
alongside risk specificity as evidence is fairly consistent in showing risk models
of accumulation provide a better fit to outcomes compared with specificity
models. As such both models will be acknowledged within the present study.
106
3.6 The functional form of cumulative risk models
Perhaps the most interesting, although often neglected aspect of cumulative
risk research is establishing the function of the relationship between contextual
risk and behaviour difficulties (Gerard & Buehler 1999, Jones et al. 2002). Tests
can be carried out to find this functional form (Flouri et al. 2010), assessing
whether the relationship is linear or non-linear, and if a non-linear pattern is
observed establishing at what point a ‘threshold’ may occur. Whether a linear or
non-linear model best describes the data is an important issue that remains a
disputed aspect within the literature (Gerard & Buelher 2004a, Appleyard et al.
2005).
If the relationship between cumulative risk and behaviour difficulties was linear
then the proportion of cumulative risk would be equal to that of the problem
behaviour; any increase in number of risks an individual is exposed to would be
mirrored in the extent of problem behaviour displayed (Appleyard et al. 2005).
Cumulative risk researchers have found evidence for such linear effects, that as
the number of risks increases within an individual’s background there is a
similar additive effect on problem behaviour, (Raviv et al. 2010, Flouri & Kallis
2007, Appleyard et al. 2005, Gerard & Buehler 1999, 2004a, 2004b, Dekovic
1999).
A viable alternative to a linear relationship between cumulative risk and
behaviour difficulties is a non-linear (or curvilinear) relationship (Rutter 1979,
Bierderman, et al. 1995, Forehand et al. 1998, Jones et al. 2002). Although
there are numerous patterns of non-linear relationships which could explain the
data, a quadratic type relationship, is often discussed in the context of these
variables. This relationship suggests that there is a disproportionate increase in
problem behaviour displayed after a certain number of risks or level of
cumulative risk is reached, i.e. it occurs only after a certain threshold is attained,
(Raviv et al. 2010, Morales & Guerra 2006). The combined effect of risk on a
certain outcome has been termed mass accumulation (Gerard & Buelher
2004a) signifying that the total effect of cumulative risk exerts influences on
107
problem behaviour greater than the sum of their individual parts (Lima et al.
2010, Flouri & Kallis 2007). This model therefore suggests that risk variables
potentiate one another to produce a more serious effect on behaviour.
Numerous studies have found evidence for this view, with Rutter (1979) being
one of the first to note this relationship. Rutter initially identified 6 family
correlates of childhood psychiatric disorders, then made comparisons on rates
of these problems between groups of participants holding differing numbers of
risks. Findings showed that children with one risk factor were no more likely that
those with zero to have any psychiatric disorder. However, when any two risks
were present there was a fourfold increase in rates of psychiatric disorders and
the presence of any four risks resulted in a tenfold increase. According to Rutter
risks potentiated one another so in combination their effects were more
powerful than the sum of the individual parts. This study provided evidence that
a threshold effect exists and that after 4 risks are reached there is a dramatic
increase in risk of adjustment problems.
Bierderman et al. (1995), utilising the same risk factors as Rutter showed that
the odds of having ADHD was 9.5 time higher for children with 2 risk factors
compared with those with none, but 34.6 times higher for those with 3 risk
factors compared with those with none. This has been supported by Forehand
et al. (1998) who showed that as the number of risks increased from 3 to 4
there was a dramatic increase in the amount of problem behaviour displayed.
These authors suggest that young people may have the resources to counter
three risks, however once four risks are reached, this could be the trigger point
when their coping mechanisms fail to overcome the risk exposure. Greenberg,
Speltz, Deklyen & Jones (2001) also found evidence of a non-linear relationship
between risk and problem behaviour (specifically in this case oppositional
defiant disorder). The study showed that when three or more risk factors were
present there was a large increase in problem behaviours. Finally Jones et al.
(2002) investigated the number of risks that children can tolerate before their
adjustment is significantly compromised. This study found that although the
cumulative risk score was not significantly related to externalising problems
there was nonetheless a dramatic increase in problem behaviour after 4 risks
108
were encountered. The above studies, despite utilising different individual
factors to make up the cumulative score and investigating distinct outcomes,
are remarkably consistent in arguing that dramatic increases in problem
behaviour occur when a trigger or threshold point is reached around 3 to 4
risks.
An alternative non-linear relationship between cumulative risk and behaviour
difficulties has also been discussed in the literature. This way of explaining the
data has been termed a saturation model; that after a certain amount of
cumulative risk there is not a sudden increase in problem behaviour but a
levelling off or plateau effect, (Evans 2003). In the first incidence a linear
relationship would describe the pattern between cumulative risk and problem
behaviour, however at a certain point a threshold is reached whereby any
additional risk has no further detrimental effect on problem behaviour (Gerard &
Buelher 2004a). Some evidence has been provided for this relationship as
Morales & Guerra (2006) found that initially there was a linear relationship
between cumulative risk and adjustment problems but once three risks in a
child’s background was reached this was a threshold, after which there was a
levelling off or plateau effect where additional risks (at least up to 5) had no
further negative effect on adjustment. Evans (2003) also showed that as the
number of risks increased in the sample of children so did mother report of
psychological distress in the child - this was true up to about 4 risk factors when
reports of psychological distress began to level off.
The present study aims to bring more lucidity to this discussion and assess
whether the relationship between cumulative risk and behaviour difficulties is
linear or conforms to a non-linear pattern.
109
3.7 Cumulative risk across different ecological levels
Addressing differences in cumulative risk exposure across ecological levels and
ultimately how problem behaviour is influenced differently by each cumulative
score at each ecological level has not received much attention within the
literature (Gerard & Buehler 2004a, 2004b). A few studies have measured a
cumulative score within each ecological level, for example Ribeaud & Eisner
(2010) generated a cumulative risk scores across different domains, finding that
the presence of more risks across the domains and a higher cumulative risk
index is associated with more aggressive behaviours. Deater-Deckard et al.
(1998) also found evidence that each of the cumulative scores at the 4
ecological levels, (individual, parenting, peer and socio-cultural) all made up of
differing number of risks nonetheless all contributed uniquely to the variance in
explaining behaviour problems. These authors suggest that risk factors at all
these levels are important in understanding the aetiology of this problem.
Atzaba-Poria et al. (2004) aimed to assess whether cumulative risk at different
ecological levels has different effects on behaviour problems. They found
evidence that cumulative risk at the different ecological levels was related
differently to the various outcome measures; specifically the microsystem level
(Bronfenbrenner 1979) was the best predictor for externalising problems. Other
researchers show that problems are particularly evident for youth who have
accumulated risks across multiple domains (Gerard & Buelher 2004b, Whipple
et al. 2010).
It is an interesting idea that cumulative risk varies in its impact at each
ecological level, although perhaps a more salient issue has been acknowledge
by Morales & Guerra (2006) who highlighted the importance of discovering
whether the same number of risks across multiple contexts has the same effect
as when observed in a single context. For example an individual may be
exposed to 2 risks within their school and 2 within their neighbourhood,
whereas another individual is not exposed to any risks at the school although 4
in the neighbourhood. An interesting investigation would be to assess how
these two compare, acknowledging the spread of risk across contexts.
110
Individuals may need a ‘safe haven’ or an ecological context where no risks are
present in order to protect against the risks experienced in other contexts (Call
& Mortimer 2001). The present study aimed to assess this idea of cumulative
risk within different ecological levels, it is anticipated a cumulative risk score
would be generated at the individual and school levels and compared with one
another to highlight the most important level.
3.8 Conclusions
This chapter presented and discussed the concept of cumulative risk identifying
it as a salient construct as a means of organising multiple factors into a
framework to account for behaviour difficulties. From the literature reviewed,
there appears a strong argument that cumulative risk is an important predictor
of developmental outcomes, with compelling evidence in its favour. This makes
it a particularly effective model for accounting for behaviour difficulties.
A cumulative risk model in isolation however, may not always provide the most
comprehensive account of how multiple factors influence behaviour difficulties,
and evidence has shown number is not always more important than type of risk.
Schoon (2006) therefore suggests that assessing risk most accurately needs to
be undertaken by utilising multiple models, (i.e. a cumulative model alongside
an independent additive model) that can account not only for the intensity but
also the number of factors that best predict the outcome.
Discussion has also taken place on a number of other issues which remain
pertinent with a cumulative framework; these issues include the nature of the
relationship between cumulative risk and behaviour difficulties and whether it is
linear or non-linear, and whether a certain number of risks in one ecological
domain are equivalent to the same number spread across multiple domains.
Of particular interest for the present study is whether cumulative risk is
predictive of behaviour difficulties displayed in children with SEND. Within the
111
present study a cumulative risk score will be generated by using the principles
highlighted above. In analysing the data using cumulative risk models, tests can
be carried out to assess whether increasing risk is related to increases in
behaviour difficulties displayed. An analysis can be undertaken to assess the
relational pattern between cumulative risk and behaviour difficulties, noting
whether a linear or non-linear model best describes the data. Finally, comparing
these models with independent additive models allows comment to be made on
whether it is the number of factors or the type of factors that are most powerful
in predicting behaviour difficulties.
Incorporating Bronfenbrenner’s ecological systems theory into the cumulative
model, shows how the different ecological levels of cumulative risk account for
behaviour difficulties, and whether the spread of factors across different
ecological levels is a significant issue in explaining behaviour difficulties.
However, it was only possible to generate an individual cumulative risk score
(see section 6.5.2). Therefore, whether the same number of risks concentrated
within a single domain, is equivalent to those spread across multiple domains,
in terms of their effect on behaviour difficulties could not be assessed, and
awaits further research.

112
3.9 Summary statements and research questions
• There is a need to acknowledge multiple risks in influencing behaviour
difficulties within the same study.
• There is a requirement to test the assumptions of a cumulative risk
approach and specifically for the present study that increasing risk
results in heightened behaviour difficulties.
• It is important to acknowledge the issue of the functional form of the
relationship between cumulative risk and behaviour difficulties and
whether this is linear or non-linear.
• A comparison between the cumulative risk model and the independent
additive model will test whether the number of risks is more important
than the type of kind of risk.
• Future research should investigate the cumulative risk and its relative
importance across different ecological levels.
• The research questions that have emerged from this chapter (labelled
research questions 2a, 2b and 2c), are presented below:
a) Is there a cumulative effect of contextual risk factors on behaviour
difficulties, where higher numbers of risk factors present are associated
with increased levels of behaviour difficulties?
b) What is the nature of the relationship between exposure of cumulative
risk and behaviour difficulties?
c) Is the number of risks present within an individual’s background more
important than the specific types of risks in accounting for behaviour
difficulties?
113
4. Protective Factors
4.1. Introduction to chapter
The aim of this chapter is to investigate the role of protective factors that
moderate risk experience to enhance positive adaption and therefore reduce
behaviour difficulties. The chapter begins with section 4.2 explaining the
importance of resilience as a construct and how studies in this field have
searched for salient protective factors that promote it. Section 4.3 and 4.4
describe the key issues of risk measurement and appropriate outcome when
investigating protective factors within the context of resilience. Section 4.5
discusses the variable and person focused approaches that have been taken to
account for protective factors. Section 4.6 discusses the salient protective
factors for behaviour difficulties. Section 4.7 adopts a more specific focus for the
present study discussing the school related protective factors. Finally section
4.8 provides a conclusion and 4.9 summary statements and related research
questions.
4.2 Protective factors and resilience
Protective factors have already been defined in chapter 1 as a “quality of a
person or context or their interaction that predicts better outcomes, particularly
in situations of risk or adversity”, (Wright & Masten 2005, page 19). The search
for these factors often falls within resilience research and so briefly discussing
the issues surrounding resilience and how it relates to protective factors is an
important issue.
There is no universally accepted definition of resilience (Naglieri & LeBuffe
2005), however, for the purpose of the present study resilience will be defined
as “a dynamic process encompassing positive adaption within the context of
114
significant adversity” (Luthar, Cicchetti & Becker 2000a, page 543). Resilience
cannot be directly measured; it is inferred on the basis of the how protective
factors interact with risk to influence positive adaption (Naglieri & LeBuffe 2005).
An acknowledgment also needs to be made of the context in which resilience is
occurring, as well as the population of interest, as some individuals will be
resilient only in regards to certain outcomes and to only to certain risks
experienced (Fergus & Zimmerman 2005, Luthar & Cicchetti 2000).
Acknowledging the interaction therefore of risk variables that (promote
vulnerability) and protective factors that (moderate this risk and promote
competence) is key to resilience research (Werner 2000). The broad aim of
research in this field is to establish how these interactions occur, and what
protective factors are present for children who maintain typical development
(Wright & Masten 2005).
The inception of resilience research began around 40 years ago, when
researchers noted that some children despite experiencing significant adversity
in their lives were able to achieve positive outcomes and not suffer with the
predicted psychopathology, (Werner 1993, Wright & Masten 2005, Schoon
2006). Resilience research therefore asks the question why these children who
are experiencing significant risk or adversity in their backgrounds achieve
positive developmental outcomes (Masten 2001). These children have not
avoided risk, but rather in some way responded to it in a positive way and
overcome the odds (Rutter 1999). The variables that promote resilience have
been termed protective factors, and may be composed of factors within the
individual, (i.e. IQ, Tiet et al. 2001) within the family (i.e. parental involvement,
Domina 2005), at school (i.e. participation in extracurricular activities, Mahoney
2000) or within the community (i.e. high SES, Masten 2006).
The present study will focus on searching for protective factors that promote
resilience as according to Masten (2001) this is a common phenomena and
“does not come from rare and specific qualities, but from everyday magic of
ordinary, normative human resources in the minds, brains, and bodies of
children, in their families and relationships, and in their communities” (page
235). Therefore factors within different ecological levels are worthy of
115
investigation as potential protective factors for behaviour difficulties. This type of
research is particularly appealing as it focuses upon healthy development and
the investigation of strengths rather than the deficits within individuals, (Fergus
& Zimmerman 2005, Evans & Pinnock 2007).
4.3 Measuring risk contexts for protective factor research
If any factor is to be labelled a protective factor it must be assessed in relation
to risk. How these constructs interact with one another and influence an
outcome in a positive direction equates to resilience. Measuring this risk,
however, has not been a simple exercise. Risk situations have been variously
defined; as being exposed to a single significant adverse situation, e.g. poverty;
aggregating a score of multiple risks, e.g. from a check list of negative life
events; or a cumulative risk score from various socio-demographic risks
(Masten 2001, Luthar & Cushing 2002). These differences in risk measurement
could pose a problem for research, as without consistency across studies
interpretation and generalisation of findings is problematic, (Olsson, Bond,
Burns, Vella-Brodrick & Sawyer 2003). Luthar et al. (2000a) however, argue
that with diversity in risk measurement that nonetheless highlights similar
protective factors, the stability of the resilience construct will only be enhanced.
In measuring risk an important issue is acknowledged; not all children assumed
to have similar experiences of adversity will necessarily have been subjected to
the same degree of risk, (Luthar & Zelazo 2003). Risk exposure has been
defined in various ways by researchers within this field, some have used
measures of ‘actual’ whereas others use ‘statistical’ measures (Luthar et al.
2000a). Measures of ‘actual’ risk are open to subjective interpretation (Luthar et
al. 2000a) and could be interpreted differently e.g. parental divorce; the majority
of children see this as a negative event, whereas for a child who was being
abused by that parent this could in fact be interpreted positively. The salient
issue remains that despite similar ‘risk’ experiences actual risk may be
somewhat different between individuals (Fergus & Zimmerman 2005). Statistical
116
risk on the other hand, is defined when significant correlations are found
between the measured variable and the outcome in question across the whole
population. Within this group however, an individual’s exposure to ‘actual’ risk
may vary considerably (Luthar et al. 2000a), with no guarantee any risk was in
fact experienced (Kaplan 2002). As risk factors are probabilities and not
certainties, (Schoon 2006), there is likely to be considerable heterogeneity in
risk experience for a population that has a particular risk factor in their
background.
Within the present study risk is measured using the various factors that
displayed a significant relationship to behaviour difficulties in research question
1. In research question 2 a comparison will be made between the cumulative
risk score (comprised of the number of contextual risk factors added together
e.g. FSM, poor relationships and experiences of bullying) and the additive
model where risks are acknowledged independently in their original form.
Whichever is the most parsimonious model will be used as a measure of risk
within the present study.
117
4.4 Measuring outcomes for protective factor research
If any factor is to be labelled a protective factor there must not only be a
significant interaction with risk context but also a better than expected or
positive outcome. For example, those with high levels of cumulative risk do
better than expected in terms of behaviour difficulties displayed in the presence
of the protective factor i.e. higher school SES. The focus therefore is not upon
those who display solely positive adaption but those who display it despite
experiencing significant risk (Luthar & Cicchetti 2000). Within the context of the
present study a multiple item measure of behaviour difficulties is used as the
measures of adjustment. This measurement is a rating scale and provides a
continuation from adjustment to maladjustment in the context of behaviour
difficulties.
Utilising a single outcome i.e. behaviour difficulties could be criticised, as some
researchers have argued that multiple domains of functioning are required in
order to label a protective factor as such (Luthar & Zelazo 2003). Nonetheless
others argue that resilience and the protective factors that support it are context
specific and will affect only a single domain of functioning (Vanderbilt-Adriance
& Shaw 2008). Therefore, terms such as behavioural resilience or academic
resilience should be used and protective factors only acknowledged within
these specific contexts (Vanderbilt-Adriance & Shaw 2008, Windle 2002). It is
important therefore that findings are only generalised across conceptually
similar domains of functioning and not across distinct ones as this could lead to
misleading findings, (Windle 2011, Luthar et al. 2000a, Rutter 1993).
118
4.5 Approaches to protective factor research
There are two broad approaches that can be taken when designing resilience
studies, in order to highlight the key protective factors and processes involved.
These have been termed person-focused and variable-focused approaches
(Masten 2001).
4.5.1 Variable focused approaches
Variable based approaches aim to establish statistical links between risks,
outcome and protective factors that may either compensate or protect the
individual from the negative outcomes associated with risk (Masten 2001). This
approach takes account of the whole sample of ‘at risk’ individuals and is
predominantly beneficial for investigating particular protective factors for
particular outcomes (Masten & Reed 2002). Within variable based approaches
there are various models which attempt to account for how factors function to
modify the trajectory from risk experience to negative outcome (Garmezy et al.
1984, Masten et al. 1988, Luthar et al. 2000a, Masten & Powell 2003, Schoon
2006). These include:, compensatory; protective; challenge; and inoculation
models. The two most dominant, however, which will be discussed further here
are the compensatory and protective models, (Zimmerman & Arunkumar 1994,
Fergus & Zimmerman 2005, Windle 2011). These models are not necessarily
mutually exclusive and “They may operate simultaneously or successively in the
adaptive repertoire of a resilient individual, depending on his or her stage of
development”, (Werner 2000, page 116).
Compensatory model The compensatory model assumes that protective factors have direct and
independent effects on the outcome variable, and they do not interact with risk,
(Fergus & Zimmerman 2005). These factors have been termed promotive
factors within the present study and are beneficial in both high and low
adversity situations (Windle 2011). By increasing the number or intensity of
these factors within a child’s background the effects of risk can be averted or

119
neutralised in high risk situations, and to the same degree improve outcomes in
general for those in low risk situations (Schoon 2006).
Compensatory models are often measured using independent direct effects in
multiple regressions (Fergus & Zimmerman 2005). These models take into
account the independent contributions of three types of predictors, pure risk i.e.
premature birth, (a risk when present, not when absent), pure protection i.e. a
musical talent (protective when present, no risk when absent) and bipolar
variables that denote risk at one pole and protection at the other (Zimmerman &
Arunkumar 1994). These variables function equally across high and low risk
situations, (Masten 2001, Masten 2002), therefore on the graph below the lines
(representing protective factor being present or absent) run parallel and have
equivalent slopes. For the purposes of clarity these types of effects are
discussed in chapter 2. See figure 4.1 for the compensatory model
Figure 4.1: An example of a compensatory model
Low Risk High Risk
Beha
viou
r Diff
icul
ties
The Compensatory Model
Attribute Present
Attribute Absent
120
Protective Model The protective model explains a process whereby a protective factor interacts
and moderates the influence of risk upon the outcome (Zimmerman &
Arunkumar 1994, Fergus & Zimmerman 2005). This model argues protective
factors are generally more effective in moderating the impact of risk in high-risk
situations compared with low-risk situations. The presence of the risk factor
could be said to potentiate the impact that the protective factor has upon the
outcome. These interaction effects are seen as the heart of protective factor
research (Luthar 2006, Luthar et al. 2000b) as certain factors are context
specific often operating more profoundly in high compared with low risk
contexts.
Within this broad model, there are various ways in which protective factors work
to influence outcomes, these have been termed protective-stabilizing, and
protective-reactive (Luthar et al. 2000a). Protective-stabilizing models show that
increasing levels of risk are linked with increases in problem outcomes although
only when the protective factor is absent. In its presence this relationship
between risk factor and outcome is neutralised (Fergus & Zimmerman 2005).
There is stability therefore in outcome despite increases in risk as protective
factors have overcome this relationship, (Windle 2011).
A protective-stabilising effect displays little variation in outcome between
different levels of the protective factor within low risk situations; however, large
differences in outcomes between different levels of the protective factor in high
risk situations. An example of this model is anti-social peers (risk) is related to
behaviour difficulties (outcome), however, in presence of quality parenting
(protective factor) the relationship between risk and outcome is neutralised.
See figure 4.2. In low risk situations the two lines are almost touching, with a
larger difference between them in high risk situations.
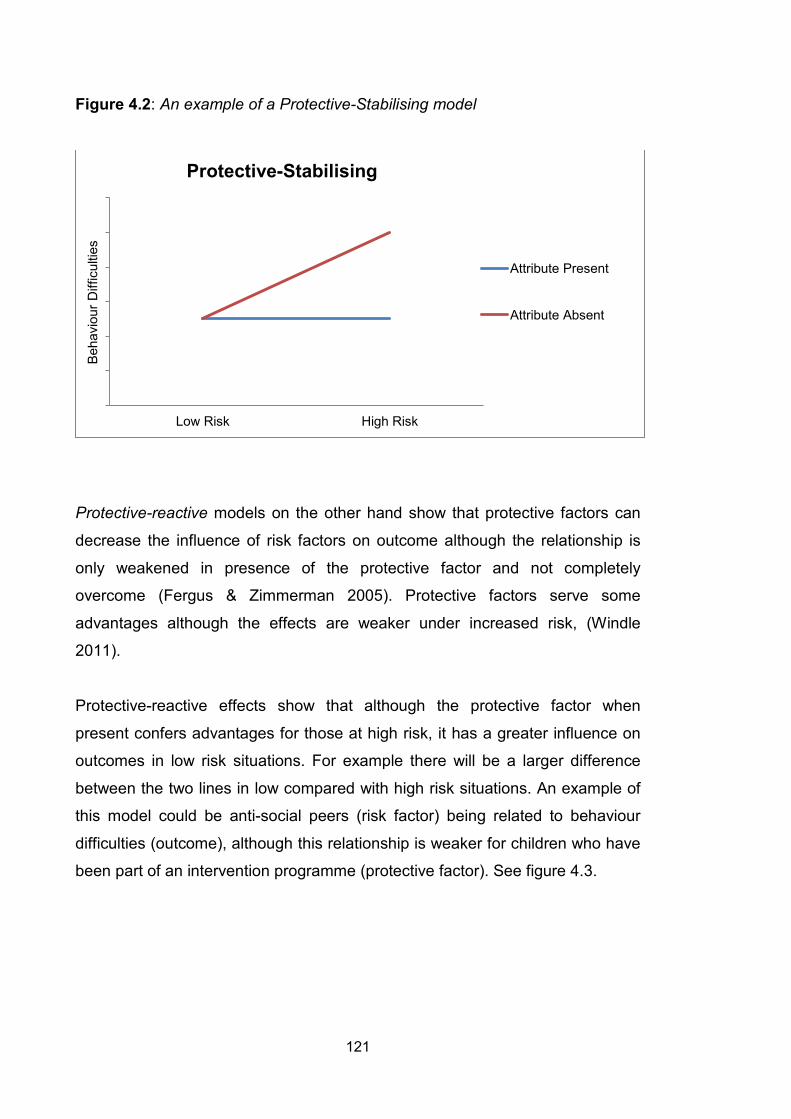
121
Figure 4.2: An example of a Protective-Stabilising model
Protective-reactive models on the other hand show that protective factors can
decrease the influence of risk factors on outcome although the relationship is
only weakened in presence of the protective factor and not completely
overcome (Fergus & Zimmerman 2005). Protective factors serve some
advantages although the effects are weaker under increased risk, (Windle
2011).
Protective-reactive effects show that although the protective factor when
present confers advantages for those at high risk, it has a greater influence on
outcomes in low risk situations. For example there will be a larger difference
between the two lines in low compared with high risk situations. An example of
this model could be anti-social peers (risk factor) being related to behaviour
difficulties (outcome), although this relationship is weaker for children who have
been part of an intervention programme (protective factor). See figure 4.3.
Low Risk High Risk
Beha
viou
r Diff
icul
ties
Protective-Stabilising
Attribute Present
Attribute Absent
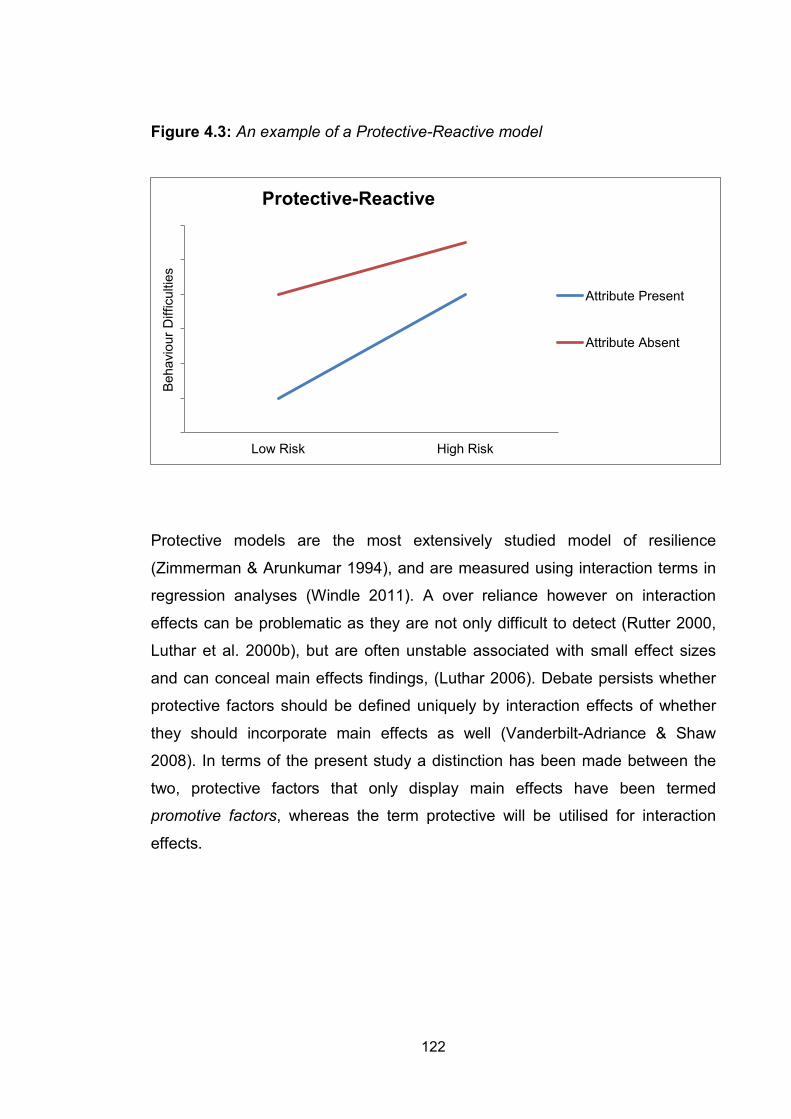
122
Figure 4.3: An example of a Protective-Reactive model
Protective models are the most extensively studied model of resilience
(Zimmerman & Arunkumar 1994), and are measured using interaction terms in
regression analyses (Windle 2011). A over reliance however on interaction
effects can be problematic as they are not only difficult to detect (Rutter 2000,
Luthar et al. 2000b), but are often unstable associated with small effect sizes
and can conceal main effects findings, (Luthar 2006). Debate persists whether
protective factors should be defined uniquely by interaction effects of whether
they should incorporate main effects as well (Vanderbilt-Adriance & Shaw
2008). In terms of the present study a distinction has been made between the
two, protective factors that only display main effects have been termed
promotive factors, whereas the term protective will be utilised for interaction
effects.
Low Risk High Risk
Beha
viou
r Diff
icul
ties
Protective-Reactive
Attribute Present
Attribute Absent
123
4.5.2. Person focused approaches
Person focused approaches involve isolating a group of resilient individuals
(deemed as having high risk statuses but high competence levels) and
comparing them with so-called competent individuals (low risk, high
competence) and maladaptive individuals (high risk, low competence), (Masten
& Obradovic 2006, Jaffee et al. 2007). These analyses are conducted in order
to highlight the protective factors that lead away from poor outcomes (Windle
2011). These findings often show salient similarities between resilient and
competent individuals even with differences in risk exposure, and significant
differences between resilient and maladaptive children despite having similar
risk exposure (Masten & Obradovic 2006). This approach is often utilised when
assessing the percentage of individuals within the study termed resilient (Windle
2011), and is particularly good at looking at multiple outcomes across long time
periods (Masten & Reed 2002). Defining whether someone is at high or low risk,
and whether they are displaying high or low competence is often defined fairly
arbitrarily. With no conclusive means of conceptualising either of these
constructs as high or low within the present study, this approach will not be
investigated.
4.6 Protective factors and behaviour difficulties
The variation in outcomes experienced by individuals at risk was a particularly
salient finding in research investigating effects of adversity on developmental
(Rutter 2007). This led to the search for so called protective factors that could
potentially mitigate against the effects of adversity and lead to resilience.
From the vast array of studies on resilience conducted, a fairly consistent
pattern has emerged to the kinds of factors that aid positive adaption for
children exposed to risk (Masten 2006). This list of factors termed the ‘short list’
by Masten (2001), is a relatively small number of protective factors that have
been corroborated across distinct studies, using heterogeneous designs,
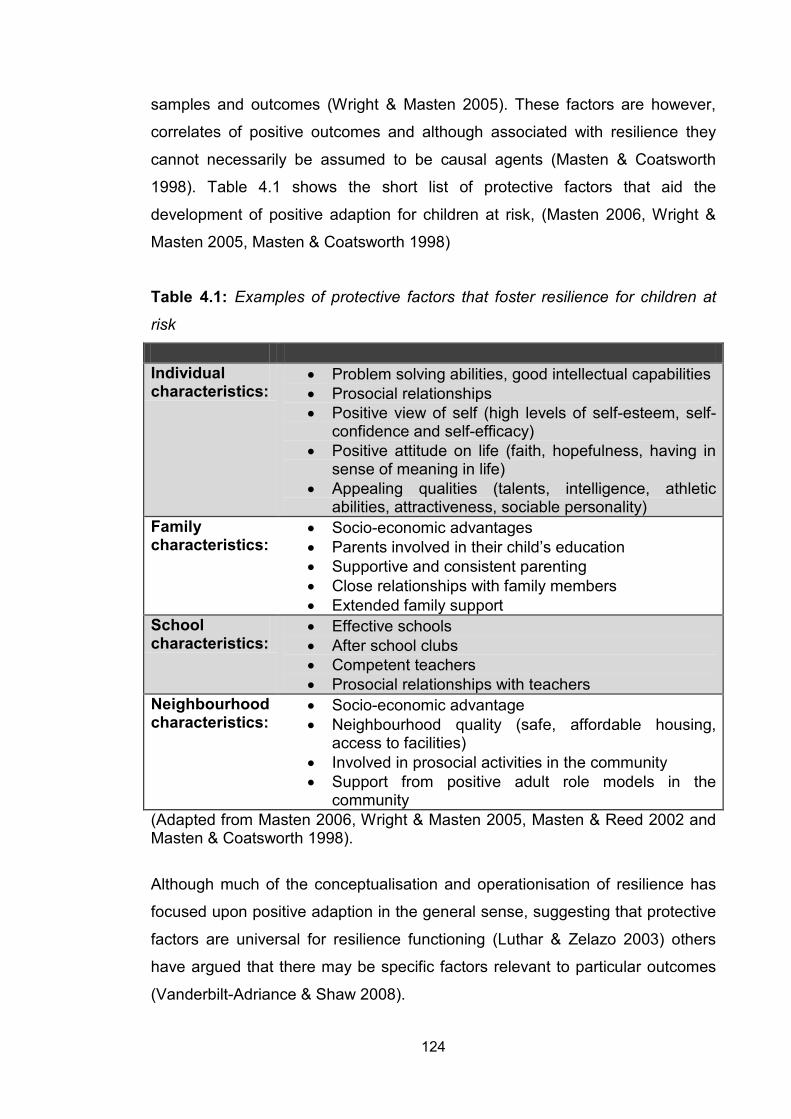
124
samples and outcomes (Wright & Masten 2005). These factors are however,
correlates of positive outcomes and although associated with resilience they
cannot necessarily be assumed to be causal agents (Masten & Coatsworth
1998). Table 4.1 shows the short list of protective factors that aid the
development of positive adaption for children at risk, (Masten 2006, Wright &
Masten 2005, Masten & Coatsworth 1998)
Table 4.1: Examples of protective factors that foster resilience for children at
risk
Individual characteristics:
• Problem solving abilities, good intellectual capabilities • Prosocial relationships • Positive view of self (high levels of self-esteem, self-
confidence and self-efficacy) • Positive attitude on life (faith, hopefulness, having in
sense of meaning in life) • Appealing qualities (talents, intelligence, athletic
abilities, attractiveness, sociable personality) Family characteristics:
• Socio-economic advantages • Parents involved in their child’s education • Supportive and consistent parenting • Close relationships with family members • Extended family support
School characteristics:
• Effective schools • After school clubs • Competent teachers • Prosocial relationships with teachers
Neighbourhood characteristics:
• Socio-economic advantage • Neighbourhood quality (safe, affordable housing,
access to facilities) • Involved in prosocial activities in the community • Support from positive adult role models in the
community (Adapted from Masten 2006, Wright & Masten 2005, Masten & Reed 2002 and Masten & Coatsworth 1998).
Although much of the conceptualisation and operationisation of resilience has
focused upon positive adaption in the general sense, suggesting that protective
factors are universal for resilience functioning (Luthar & Zelazo 2003) others
have argued that there may be specific factors relevant to particular outcomes
(Vanderbilt-Adriance & Shaw 2008).
125
The present study aimed to investigate the protective factors that foster
resilience with the specific outcome behaviour difficulties, and with an under
researched group, children with SEND. These factors may or may not be
consistent with the short list which argues these are general protective factors
important for multiple outcomes. A number of these factors within the short list
have been previously acknowledged (see chapter 2), as having main effects
(i.e. promotive effects) on behaviour difficulties, and were termed promotive
factors. What is yet to be discussed is the degree to which they can also offer
protective effects whereby they are particularly beneficial for children at high
levels of risk in reducing behaviour difficulties. Although the same factor can be
both promotive and protective (Wright & Masten 2005) depending on the
context, sample or outcome chosen for a study, in the review that follows only
their influence as protective factors will be acknowledged (i.e. interaction
effects).
Intelligence: Intelligence is probably the most cited protective factor in the
literature (Luthar 2006). Specifically research has, provided evidence that
higher IQ is related to the absence of any psychiatric disorder particularly for
children at high levels of risk (Tiet et al. 2001, Rutter 2000, Garmezy et al. 1984,
Masten et al. 1988, Tiet et al. 1998). However, others have argued that
intelligence levels may not able to remain protective in context of particularly
high risks (Vanderbilt-Adriance & Shaw 2008).
Relationships: Werner (2000) cites evidence that peer relationships marked by
closeness and competence, acceptance and likeability are associated with
resilient children. This has been further supported with evidence showing
positive peer relationships were able to moderate the negative effects of family
adversity on behaviour problems, i.e. children who had greater levels of
acceptance and friendships were not as affected by family adversity as those
children who were less accepted and had poorer friendships (Criss et al. 2002).
However, others have found no evidence of a protective effect of either peer
acceptance or peer attachment on moderating the influence of risk (Dekovic
1999).
126
Socio-economic status: SES can also be conceptualised as a protective factor.
In an extensive review of the literature Eriksson, Carter, Andershed &
Andershed (2011) highlighted high familial socio-economic status as a key
protective variable for children at risk. Other research however, has failed to
find a strong effect of SES as a protective factor (Tiet et al. 2001, Maggs,
Frome, Eccles & Barber 1997).
Parental Involvement: It has been suggested that effective parenting
(composing of parental support, monitoring and involvement) is a protective
factor for anti-social behaviour (Masten 2001), being especially effective in
promoting competence in children from higher risk backgrounds (Domina 2005).
When the risk measured is community violence, Kliewer, Ramirez, Obando,
Sandi & Karenkeris (2006) found that although exposure to this was associated
with maladaptive behaviour, parental monitoring could weaken this effect.
Others have suggested that when risk (in this case community violence
exposure) reached particularly high levels, the protective effects of parental
monitoring was attenuated, (Ceballo, Ramirez, Hearn & Maltese 2003, Sullivan,
Kung, Farrell 2004).
Extracurricular activities: In terms of school influences as protective effects a
particular focus has been upon participation in extracurricular activities. These
activities may be primarily beneficial for ‘at risk’ children, not only providing
them with a sense of belonging to a particular group, but also teaching them a
range of intellectual, social and physical skills which might be lacking, and could
be applied in other settings (Eccles, Barber, Stone & Hunt 2003). There is fairly
consistent evidence for this view that high risk children will benefit more from
extracurricular activities than low risk children (Luthar & Cicchetti 2000), and
particularly in terms of reduction in later involvement in criminal behaviour as
young adults (Mahoney 2000).
127
4.7 School level protective factors
The majority of the evidence specifically investigating protective factors for
behaviour difficulties appears to have focused upon the individual and family
levels. There has been a weaker focus on school level characteristics on
problem behaviour in comparison to other ecological domains. The effects of
how school level variables can potentially exacerbate risk experienced or
indeed protect against it has often been overlooked within the literature (Reinke
& Herman 2002).
The present study has opted for a particular focus on school level protective
effects. Children spend a substantial amount of time within schools and it is
likely that they have a significant impact upon a child’s behaviour. There is
strong evidence for the position that school level characteristics have an
influence upon an individual’s problem behaviour, in terms as acting as both
risk and promotive factors (Sellstrom & Bremberg 2006, Payne 2008, Bisset et
al. 2007, Evans-Whipp et al. 2004, Aveyard et al. 2004). A criticism of this
research investigating school influences on pupil outcomes is its focus upon
main effects findings, and not deciphering between the different effects school
characteristics have for those children at high compared with low risk. Those
studies that do acknowledge high risk children in investigating schools effects
on pupil outcomes such as behaviour difficulties, often only include this group in
isolation having no comparison with those children at low risk. These studies
have therefore looked for main effects within a group of at risk children rather
than an interaction effect between risk and protective factor.
It could be assumed that if there are school level promotive effects on
behaviour difficulties, then the search for school level protective effects could
also be justified. Whether certain school level influences are more beneficial for
children who are at high compared with those at low risk has been investigated
at least to a degree, with evidence from the ‘short list’ highlighting that effective
schools are salient protective factors. Other school based factors are present in
the shortlist; however, they often include variables such as attending school
128
extracurricular activities (Mahoney 2000) rather than school level variables such
as poverty levels within the school. The present study will therefore attempt to
fill this gap within the literature and investigate how school level variables such
as school level attendance, school level academic achievement, school size
etc. can be particularly important for those children experiencing high degrees
of risk, reducing their chance of displaying behaviour difficulties and therefore
acting as protective factors.
As schools “provide a unique opportunity for the state to deliver psychologically-
informed interventions that can span almost entire generations for the
betterment of individuals, communities and society” (Bulman 2012, page 18) it
is likely they will have salient influences on pupil behaviour. Identifying
protective factors within this domain will be important in reducing the chance of
behaviour difficulties for those most at risk. There is also evidence to suggest
that protective factors may have differing influences within specific contexts
(Fergus & Zimmerman 2005, Vanderbilt-Adriance & Shaw 2008, Sameroff et al.
2003, Masten, Best & Garmezy 1990), within certain populations (Tiet et al.
2001), for specific outcomes (Rutter 2000) as well as across distinct
developmental periods (Vanderbilt-Adriance & Shaw 2008). If this is true, that
protective factors have differing effects depending on context, outcome,
population, and development then a study investigating specifically school level
protective factors with children with SEND looking at the outcome of behaviour
difficulties across different developmental periods would add to the literature
base.
129
4.8 Conclusions
Within the context of this brief review two important issues are noted, firstly a
difference may need to be made with so called general protective factors that
are able to protect against risk from various sources and more specific
protective factors that only operate in the context of a single type of risk
(Erikson et al. 2011). Secondly, some protective factors may operate effectively
in the context of a specific outcome such as behaviour difficulties, but fail to
offer protection when the outcome is distinct such as academic outcomes
(Erikson et al. 2011). There is a clear need for studies to be specific about the
types of factors that provide protection to which outcome and under what
degree and type of risk. This will not only enhance the research within this area
but also allow more effective interventions to develop.
Any research conducted into protective factors and resilience needs to be
conducted within the context of a theoretical framework, (Luthar et al. 2000a).
Without such an approach, and with an over reliance on empirical evidence the
development of these constructs will be somewhat limited (Schoon 2006).
Researchers have often organised protective factors and processes relevant to
the study of resilience into three broad domains, i.e. individual, family and
community (Werner & Smith 1992), whereas others have adopted a more
ecological approach i.e. Bronfenbrenner’s ecological systems theory (Windle
2011) and accounted for the interactions between the different domains and the
developing child. Ultimately the ecological systems model attempts to
understand the individual person in the context where they live and therefore
accounts for the interactions they have with their physical, social and
environmental contexts. This model will therefore be utilised within the context
of the present study and will be further discussed within the methodology
section.

130
4.9 Summary statements and research questions
• An investigation of protective as well as promotive factors needs to be
undertaken within research, so interactive alongside main effects of
variables should be tested.
• A justification of how risk is conceptualised and what constitutes positive
adaption and whether it equates to a single or multiple outcome should
be acknowledged.
• There is a need for research to acknowledge the specific protective
factors within schools that can overcome risk and reduce the likelihood of
behaviour difficulties.
• These effects can be tested using a variable based design, looking for
interaction effects between risk and the protective factor in influencing
behaviour difficulties.
• Protective-stabilizing and protective-reactive effects should be
acknowledged within the broader protective model.
• The research questions that have emerged from this chapter (labelled
research questions 3a and 3b) are presented below:
a) Which school level predictor variables have a statistically significant
interaction effect with contextual risk?
b) Do the significant interactions display evidence of protective-
stabilising or protective-reactive effects?
131
5. Methodology
5.1 Introduction to chapter
The intention of this chapter is to provide a detailed description of the
methodology selected for this study, justifying it as the most appropriate to
answer the research questions presented in section 1.5.
The chapter is split into eight broad sections. Section 5.2 begins with describing
and justifying the adoption of Bronfenbrenner’s Ecological Systems Theory, for
the present study; as a means of organizing the predictor variables across
different ecological levels. Section 5.3 frames the present study within the
context of a wider study from which it emerged (the AfA evaluation study,
Humphrey et al. 2011). The aim here is not only to acknowledge where the
present study originated, but to justify it as an independent, original and distinct
piece of research.
The third part of the methodology is section 5.4, the design section. This
highlights the importance of epistemology, and provides justification for a
quantitative methodology, using a survey design. Within this section details of
the variables measured within the present study are also provided. Section 5.5
provides information on the participants of the study, including sampling,
attrition issues and how characteristics of the final sample compare to national
averages. Section 5.6 presents information around the materials used within the
study, including a detailed description of the measurement tool (i.e. the WOST)
and information about its psychometric properties.
The sixth part, section 5.7, includes the procedure of the present study, being
clearly described in order to allow for replication. Within section 5.8 the ethical
considerations for the study are presented, with a discussion of how they have
been met, this certifies the integrity of the study. The penultimate section, 5.9,
132
includes a discussion of multi-level modelling (MLM), which is the major
analytical technique applied within the present study. This section provides a
brief description of this complex analytical technique, offering definitions of the
terminology used, and explanations of how to interpret model outputs. Finally in
section 5.10, summary statements of the methodology are presented.
5.2 Theoretical framework
Adopting a theoretical model for the present piece of research is deemed
appropriate as a means of organising the numerous variables measured within
the study. These variables all have empirical justifications, (as evidenced within
the literature review), for being included as either: a risk factor; a promotive
factor; or a protective factor for behaviour difficulties. However, organising these
variables into a coherent whole within a theoretical framework provides a
stronger justification for including them within the study.
5.2.1 Ecological Systems Theory
The present study will be framed within the context of Bronfenbrenner’s (1979)
Ecological Systems Theory. This is a theoretically compelling approach to
development, and more specifically can be utilised to account for childhood and
adolescent behaviour difficulties. The theory acknowledges how multiple risk,
promotive and protective variables for behaviour difficulties in children with
SEND, can be organised across the different ecological levels within the study.
Ecological Systems Theory (Bronfenbrenner 1979), or Bioecological Theory as
it has become known, (Bronfenbrenner 2005), is a developmental approach
with a specific acknowledgment of the multiple contextual influences that affect
a child’s behaviour. This theory views “the child as developing within a complex
system of relationships affected by multiple levels of the surrounding
environment” (Berk 2009, page 26). The environmental context has been
133
described as similar to “a set of nested structures, each inside the next, like a
set of Russian dolls” (Bronfenbrenner 1979 page 3).
Bronfenbrenner's theory therefore argues that an individual is found nested
within various ecological systems. Some are more proximal, having a direct
influence e.g. the family or school (these have been termed ‘Microsystems’).
Other are more distal having an indirect effect on behaviour, e.g. cultural norms
and values (these have been termed ‘Macrosystems’). The relationships
between these various levels are interdependent, involving reciprocal
interactions rather than unidirectional influences (Bronfenbrenner 1979).
Therefore each individual system does not account for development in isolation,
but the interactions between and within systems have a profound influence
upon the individual and their behaviour and development. The theory not only
recognizes the importance of environmental variables, but also biological
influences within the child that interact with the environmental factors in order to
shape development.
Figure 5.1 shows Bronfenbrenner’s Ecological System Framework, and how the
various environmental contexts i.e. school, family, peer group (as well as
biological influences within the person), and the more distal influences interact
with one another to shape development. A brief description of the various terms
used within the model is also included.

134
Figure 5.1: Bronfenbrenner’s Ecological Systems Framework
The Microsystem comprises the individual child’s immediate social context such
as their family, peer group and school. These relationships have a direct
influence upon their behaviour, and as they are bidirectional, the child’s
behaviour also has an influence upon those within their Microsystem,
(Bronfenbrenner 2005).
The Exosystem refers to the wider setting in which the child is not directly
involved, but nonetheless has an influence upon their development
(Frederickson & Cline 2009). Parent’s social networks could have an indirect
influence on their child’s behaviour difficulties, as friends and relatives who give
advice on bringing up children may influence parenting behaviours which in turn
has an effect on a child’s behaviour (Beck 2009).
Individual
School
Family
Peer group
Macrosystem
Exosystem
Microsystems Mesosystems
135
The Macrosystem is the outermost level on the diagram and is comprised of
wider social systems such as: the cultural context; the political system; or
economic patterns. These systems encompass norms, values, beliefs and goals
that influence and shape development (Boyd & Bee 2009). For example,
cultural or political values on the importance of childcare will have some
influence on how a child is brought up within their immediate setting.
The Mesosystem refers primarily to the relationships among Microsystems
(Berger 2011), such as the relationships between school and family or parents.
If a parent is more involved with their child’s school, this relationship could
promote behavioural competence in the child as both school and parent
become consistent in their approach to managing behaviour. The Mesosystem
also refers to the dynamic relationships between Microsystems and the
Exosystem/Macrosystem and how these shape development.
The Chronosystem (not shown in the diagram) is an additional system within the
theory that broadly refers to the temporal dimension within the model.
Environmental influences are not seen as static but as always changing. New
events such as births within the family or starting school influence pre-existing
relationships between the child and their immediate environment (Berk 2009).
Furthermore, cultural norms and expectations can and will change over time.
5.2.2 Framing the present study within Ecological Systems Theory
The present study will be framed within Ecological Systems Theory. An
advantage of being guided by this theory is its ability to acknowledge multiple
factors involved in influencing behaviour difficulties. It is not one single factor
that is uniquely important but the combination and interaction of multiple factors
across different ecological levels of development that account for these
problems, (Ribeaud & Eisner 2010). The theory is able to recognise variables
beyond those embedded within the individual (and their biological
predispositions) and to include variables occurring in multiple settings such as
136
within the peer group, family, school, and neighbourhood, as well as those
cultural and wider family values affecting the child.
Adopting the Ecological Systems Theory (Bronfenbrenner 1979, 2005) is further
justified by the evidence that it is a prominent model of child development that
has been adopted by numerous researchers investigating different types of risk
factors that have an influence on a child’s behaviour difficulties (e.g. Atzaba-
Poria et al. 2004, Ribeaud & Eisner 2010, Trentacosta et al. 2008, Gerard &
Buelher 2004a). Indeed Atzaba-Poria et al. (2004) point out that if risk factors
are investigated within this framework a more comprehensive inspection of
possible variables can be ensured. Furthermore, if the multiple ecological levels
that potentially influence behaviour difficulties are ignored it will not be possible
to fully account for this behaviour.
The present study however, has opted to investigate specifically variables within
the various Microsystems (i.e. family, peer group and school level), as well as
variables that reside within the individual, such as gender or ethnicity. Variables
within the broader ecological levels (Exosystem and Macrosystem levels) go
beyond the scope of the present study and have not been included here.
The present study’s major focus however is upon the school microsystem level.
This emphasis on schools in preference to other Microsystems has been
justified on the premise that according to Bronfenbrenner (1994), there has
been considerably less research on school influences in comparison to family
influences on child development. Therefore a more school specific study will be
offering a significant contribution to knowledge in this area. With only a few
variables measured at the familial level (i.e. FSM) and peer group level (i.e.
positive relationships), in order to make for a more coherent analysis these are
included within the individual level. Therefore, two ecological levels are evident;
the individual level; and the school level.
Figure 5.2 shows part of Bronfenbrenner’s Ecological System Framework,
specifically focusing on the individual and school levels, and the factors
measured within the present study at these levels.

137
Figure 5.2. Predictor variables within the present study incorporated into Bronfenbrenner’s Ecological System Framework
As the diagram shows, the individual level is nested within the school level. The
nesting of individuals within schools assumes a hierarchical structure to the
data that requires an appropriate analytical strategy to analyse the data. Within
the present study the chosen method was multi-level modelling (see section
5.9). It is also noted here that modelling data within such a framework allows for
both the proximal (i.e. individual level), as well as more distal (i.e. school level)
influences on behaviour difficulties to be taken into account.
School size
School urbanicity
School % SA School % EAL
School % FSM
School level achievement
School absence
School exclusions
School % SAP & ST
SEND Category
FSM
SEND Support
Attendance
Academic Achievement
Positive relationships
Bullying
Bully Role Gender
Year Group
Season of Birth
Ethnicity
School
Individual
138
5.3 Context of the present study
This section has been included in order to provide an overview of the context
for the present study and acknowledge from where it emerged. The present
study utilised data collected from a larger evaluation project that was carried out
by a research team at the University of Manchester, on behalf of the
Department for Education DfE (formerly the Department for Children Schools
and Families, DCSF). The research evaluated Achievement for All (AfA), a
Special Educational Needs and Disabilities (SEND) initiative. As such, it is
deemed necessary to briefly7
describe this project, and how the evaluation was
conducted, before highlighting the differences between the present study and
the evaluation, in order to justify it as an original and independent piece of
research.
5.3.1 What is Achievement for All?
Achievement for All (AfA) was a SEND project, established by the Department
for Children, Schools and Families (DCSF), (now the Department for Education
DfE) with the aim of improving outcomes for these children. It was piloted in ten
local authorities (LAs) across England (sampled to be representative of LAs
nationally), and four hundred and fifty-four schools were selected from these
areas (including primary, secondary, and special schools, and also pupil referral
units). Certain year groups were specifically targeted within these schools,
years 1 and 5 within the primary sector, and years 7 and 10 within the
secondary sector 8
. Pupils, schools and LAs were involved for the two-year
duration of the project, from September 2009 until August 2011. The total
funding budget was £31,000,000.
7 The aim here is to provide a brief overview of the project. For a more detailed explanation of the AfA project and its national evaluation refer to DCSF (2009a) & (2009b) and Humphrey et al. (2011). 8 In year 1 children are between five - six years old, in year 5 children are between nine-ten years old, in year 7 children are between eleven-twelve years old and in year 10 children are between fourteen - fifteen years old.
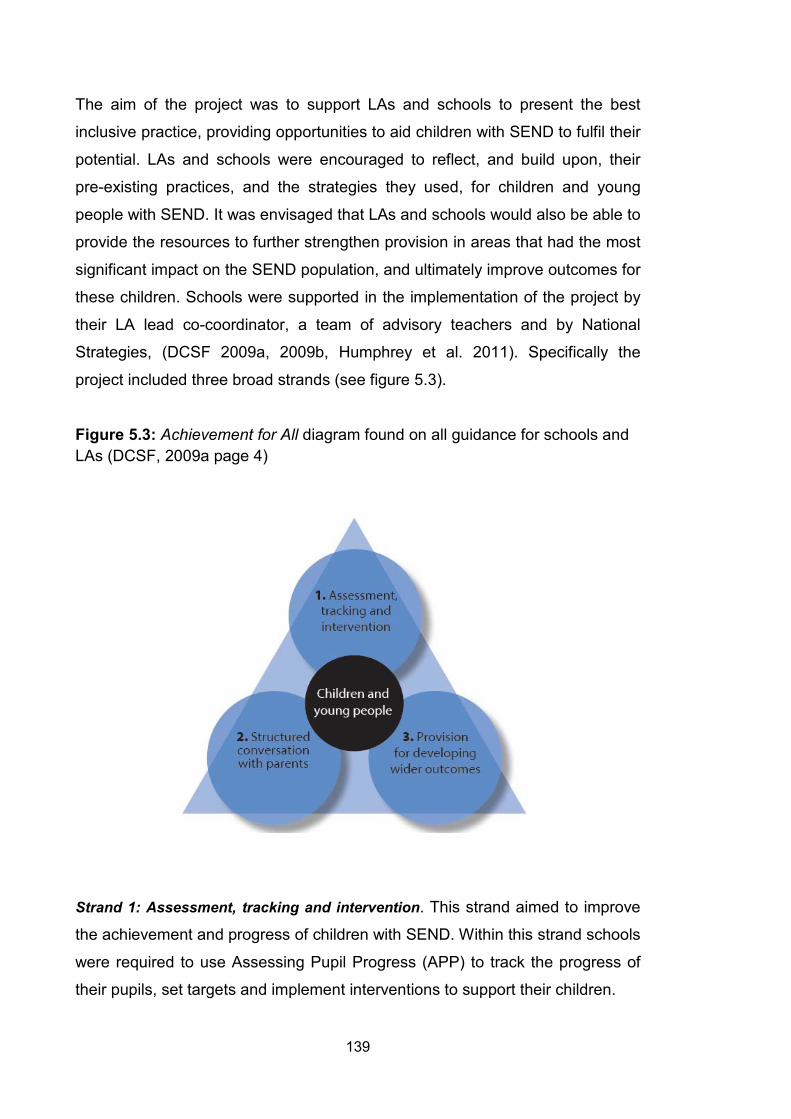
139
The aim of the project was to support LAs and schools to present the best
inclusive practice, providing opportunities to aid children with SEND to fulfil their
potential. LAs and schools were encouraged to reflect, and build upon, their
pre-existing practices, and the strategies they used, for children and young
people with SEND. It was envisaged that LAs and schools would also be able to
provide the resources to further strengthen provision in areas that had the most
significant impact on the SEND population, and ultimately improve outcomes for
these children. Schools were supported in the implementation of the project by
their LA lead co-coordinator, a team of advisory teachers and by National
Strategies, (DCSF 2009a, 2009b, Humphrey et al. 2011). Specifically the
project included three broad strands (see figure 5.3).
Figure 5.3: Achievement for All diagram found on all guidance for schools and LAs (DCSF, 2009a page 4)
Strand 1: Assessment, tracking and intervention. This strand aimed to improve
the achievement and progress of children with SEND. Within this strand schools
were required to use Assessing Pupil Progress (APP) to track the progress of
their pupils, set targets and implement interventions to support their children.
140
Strand 2: Structured conversations with parents. This strand aimed to improve
the confidence in, and engagement of, parents of children with SEND in the
school. Within this strand teachers were trained in the techniques of holding a
structured conversation with parents, which involved the teacher using active
listening skills, identifying priorities, then planning and agreeing with the parent
on targets for how best to support the child with SEND. The structured
conversations allowed parents to open up and talk about their child so teacher
and parent could plan together the best means of support.
Stand 3: Provision for developing wider outcomes. The aim of this stand was to
improve outcomes in two of a possible five areas9
. Schools had considerable
flexibility and focused on the two areas that they felt would have the biggest
impact upon their pupils, tailoring interventions to meet their school and
individual needs.
5.3.2 Achievement for All evaluation study
The University of Manchester were commissioned to carry out the formal
evaluation of this project. The aim of the evaluation was to firstly, assess the
impact of AfA on outcomes for pupils with SEND, and secondly to identify the
processes and practices at LA, school and classroom levels that are most
effective in meeting and improving these outcomes.
The first research question was analysed quantitatively, assessing the impact of
AfA on outcomes for pupils with SEND, in terms of a) attainment in English and
mathematics, b) in relation to wider outcomes such as behaviour, bullying,
attendance, positive relationships, and wider participation, and c) in relation to
parental engagement. These variables were measured utilising teacher and
parent surveys, as well as collecting data on academic and attendance levels,
and other background and contextual variables at the individual and school
9 These included, attendance, behaviour, bullying, positive relationships and participation in extended services.
141
level over the course of the project. Parent and teacher surveys were completed
at three time points throughout the project, January 2010, January 2011 and
June 2011. Analyses compared the impact of AfA on these outcomes
longitudinally and also compared the impact of AfA on these outcomes with a
group of children in comparison schools10
.
The second research question attempted to identify the main processes and
practices that were particularly effective in improving the outcomes within
research question 1. This section of the research was primarily qualitative and
comprised of various research methods including: interviews with local authority
co-coordinators and National Strategy regional advisors; school case studies
(assessing the implementation, perceived impact and sustainability in specific
schools); and pupil case profiles (showing how AfA was working for specific
individuals). The findings of this study as an interim report (Humphrey et al.
2010) and final report (Humphrey et al. 2011) have been published by the
DfE11
.
5.3.3 Overview of methodology
The present study emerged from the AfA evaluation study, utilising some of the
data collected. It is very much a distinct piece of research however, with the
specific details of the methodology included within the relevant sections below.
Presented here, is a very brief overview of the study in order to aid
understanding, before verifying how it is different from the AfA evaluation study.
The present study aimed to investigate risk, promotive and protective factors for
behaviour difficulties in children with SEND. A longitudinal survey design was
utilised with approximately eighteen months between baseline and follow-up. A
measure of behaviour difficulties were collected via teacher reported surveys
that also measured predictor variables used within the study such as bullying 10 Comparison schools were recruited within the same LAs but not participating within the AfA project. 11 The author of the present study worked as a researcher on this project and was involved in analysing the data and writing the interim and final reports
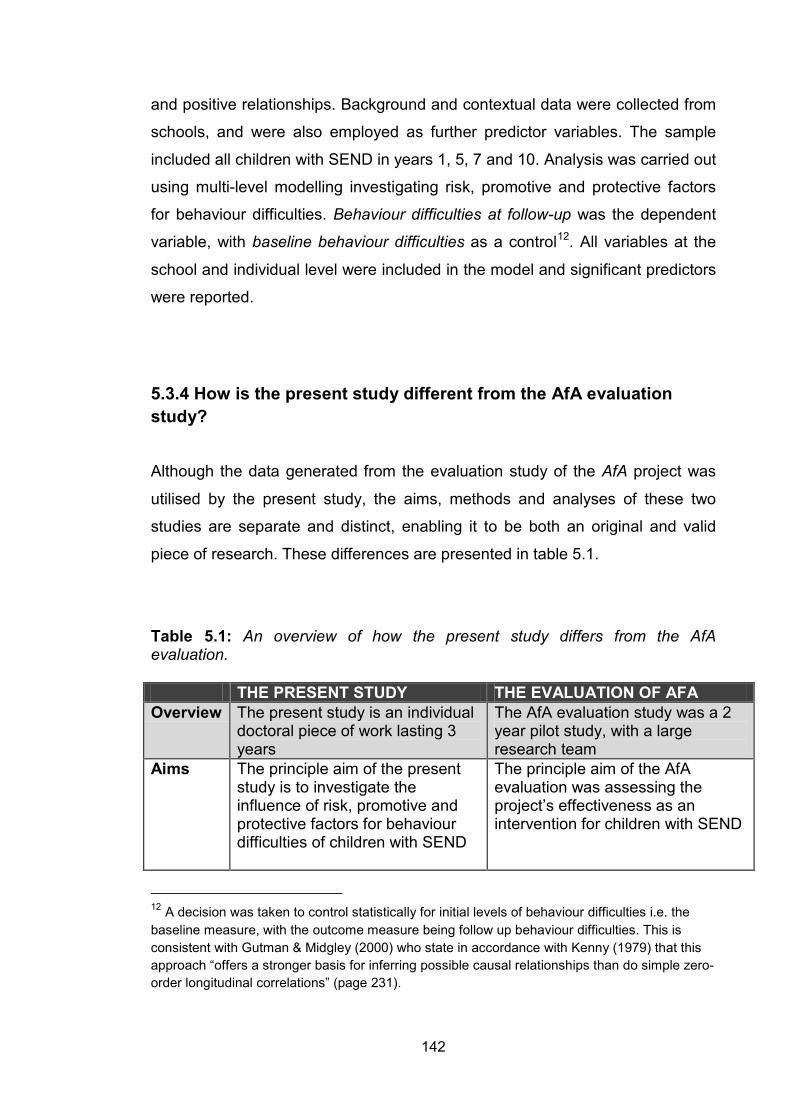
142
and positive relationships. Background and contextual data were collected from
schools, and were also employed as further predictor variables. The sample
included all children with SEND in years 1, 5, 7 and 10. Analysis was carried out
using multi-level modelling investigating risk, promotive and protective factors
for behaviour difficulties. Behaviour difficulties at follow-up was the dependent
variable, with baseline behaviour difficulties as a control12
. All variables at the
school and individual level were included in the model and significant predictors
were reported.
5.3.4 How is the present study different from the AfA evaluation study?
Although the data generated from the evaluation study of the AfA project was
utilised by the present study, the aims, methods and analyses of these two
studies are separate and distinct, enabling it to be both an original and valid
piece of research. These differences are presented in table 5.1.
Table 5.1: An overview of how the present study differs from the AfA evaluation. THE PRESENT STUDY THE EVALUATION OF AFA Overview The present study is an individual
doctoral piece of work lasting 3 years
The AfA evaluation study was a 2 year pilot study, with a large research team
Aims The principle aim of the present study is to investigate the influence of risk, promotive and protective factors for behaviour difficulties of children with SEND
The principle aim of the AfA evaluation was assessing the project’s effectiveness as an intervention for children with SEND
12 A decision was taken to control statistically for initial levels of behaviour difficulties i.e. the baseline measure, with the outcome measure being follow up behaviour difficulties. This is consistent with Gutman & Midgley (2000) who state in accordance with Kenny (1979) that this approach “offers a stronger basis for inferring possible causal relationships than do simple zero-order longitudinal correlations” (page 231).
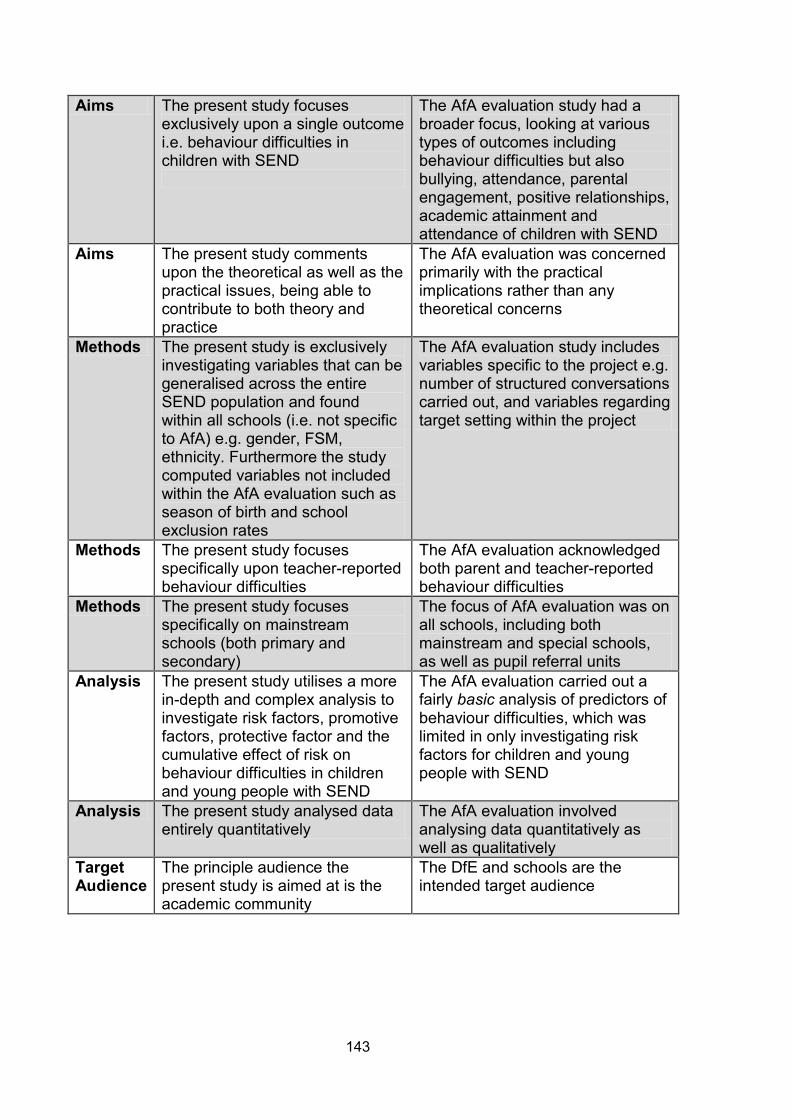
143
Aims The present study focuses exclusively upon a single outcome i.e. behaviour difficulties in children with SEND
The AfA evaluation study had a broader focus, looking at various types of outcomes including behaviour difficulties but also bullying, attendance, parental engagement, positive relationships, academic attainment and attendance of children with SEND
Aims The present study comments upon the theoretical as well as the practical issues, being able to contribute to both theory and practice
The AfA evaluation was concerned primarily with the practical implications rather than any theoretical concerns
Methods The present study is exclusively investigating variables that can be generalised across the entire SEND population and found within all schools (i.e. not specific to AfA) e.g. gender, FSM, ethnicity. Furthermore the study computed variables not included within the AfA evaluation such as season of birth and school exclusion rates
The AfA evaluation study includes variables specific to the project e.g. number of structured conversations carried out, and variables regarding target setting within the project
Methods The present study focuses specifically upon teacher-reported behaviour difficulties
The AfA evaluation acknowledged both parent and teacher-reported behaviour difficulties
Methods The present study focuses specifically on mainstream schools (both primary and secondary)
The focus of AfA evaluation was on all schools, including both mainstream and special schools, as well as pupil referral units
Analysis The present study utilises a more in-depth and complex analysis to investigate risk factors, promotive factors, protective factor and the cumulative effect of risk on behaviour difficulties in children and young people with SEND
The AfA evaluation carried out a fairly basic analysis of predictors of behaviour difficulties, which was limited in only investigating risk factors for children and young people with SEND
Analysis The present study analysed data entirely quantitatively
The AfA evaluation involved analysing data quantitatively as well as qualitatively
Target Audience
The principle audience the present study is aimed at is the academic community
The DfE and schools are the intended target audience

144
5.4 Design
Within this section the design is discussed, beginning with epistemology and
how this influences the broad methodology and individual methods applied to
the study. The specific variables measured within the study are also described
in this section.
5.4.1 Epistemology
Epistemology refers to the theory of knowledge. It asks questions about what it
signifies to know something or to research something and whether facts do
really exist (Jones & Forshaw 2012). There is much discussion around
epistemology and its various frameworks and conceptualisations across
numerous disciplines. Within the context of the present study, the definition set
out by Morgan (2007) will be utilised: this states that epistemological stances
are “distinctive belief systems that influence how research questions are asked
and answered and takes a narrower approach by concentrating on one’s
worldviews about issues within the philosophy of knowledge” (Morgan 2007,
page 52). Ascribing to any specific epistemology will therefore have
considerable influence on the soundness of any research carried out, and how
its findings are reported (Crotty 1998). Acknowledging this, the view point being
taken within the present study, is deemed appropriate and will ultimately guide
the methodological decisions and have influences on how results are
interpreted. There are four main epistemological paradigms found within
educational and psychological research. These are: post-positivist;
constructivist; transformative; and pragmatic (Mertens 2005). These are ways
in which the world is viewed and their overarching philosophical views shape
how research is undertaken. Whilst it is beyond the scope of this study to
discuss these paradigms, the author recommends Mertens (2005) for further
reading on the matter.
145
5.4.2 Post-positivist approach
In a great deal of published literature, (at least within psychology) a researcher’s
epistemological position for their study is not explicitly acknowledged. It is
mentioned here nonetheless, to allow the present study to be interpreted more
accurately.
The present study is being framed within a post-positivist epistemological
position. This position argues there is a definitive reality, but this truth can only
be known imperfectly, and inferred on the basis of probabilities (Robson 2011).
Ultimately this approach conforms to a more scientific method, in which: a
theory is presented; precise hypotheses are generated; and data is then
collected and analysed which will support, refute or redefine the original theory
(Robson 2011). Although any one individual study is not able to find the truth in
the situation, the post-positive approach emphasises that the more studies that
exist in support of a certain finding, the more likely it is that the truth has been
discovered. Objectivity is a key issue for this approach, with as many aspects of
the study being strictly controlled and the researcher having as little influence
on the participants as possible, whilst being aware that total objectivity is an
impossibility (Muijs 2011). This approach relies on the assumption of deductive
reasoning: assuming a phenomenon can be reduced to something
measureable. It can therefore be criticised for ignoring the complex detail in
everyday life, preferring a broader approach that can be generalised.
146
5.4.3 Quantitative methodology
In adopting a post-positive view, the present study utilises a quantitative
methodology. The advantages of such an approach will allow a substantial
number of participants to be included within the study, which will ultimately
result in a more reliable data set and improve the study’s generalizability.
Quantitative approaches are also easily replicable and objective conclusions
can be drawn from the research. As the focus of the present study is upon
behaviour difficulties, (i.e. behaviours that are observable and tangible, see
section 1.2.1 for a description), a quantitative methodology would be more
appropriate for this study. In adopting a deductive approach, pre-existing ideas,
predictions and hypotheses grounded within the literature can to be tested
(Robson 2011). Ultimately in adopting this approach the present study is
consistent with previous research within this area, adding to and extending the
literature base.
However, it is acknowledged that there are weaknesses to such approaches, as
they take limited information about the context where the phenomenon is being
investigated (Robson 2011) and are often criticised for producing inadequate
findings due to the closed type of questions asked (Jones & Forshaw 2012).
Reducing participants’ experiences down to their measured outcome on a
specified variable (Howitt & Cramer 2011) is also considered a disadvantage.
Nonetheless, despite these criticisms it is maintained that for the purposes of
the present study a quantitative approach is the most appropriate methodology,
whereas future research could look at this study from a more qualitative angle.
147
5.4.4 Survey design
Within the quantitative framework a survey design was selected as a means of
collecting the data. Survey designs are a particularly useful method within
research, and are perhaps the most prolific quantitative research method, within
social research (Robson 2011). A bespoke survey was designed for the
purposes of the study (see section 5.6) which measured the dependent variable
- behaviour difficulties, as well as other independent variables within the study,
i.e. positive relationships, bullying and role within bullying incidents. The other
variables within this study were collected by contacting schools, LAs, or
National Strategies, or taken from the DfE website, the National Pupil Database
or EduBase13
.
Specifically within the survey, three separate rating scales were used to
measure behaviour difficulties, positive relationships and bullying. These scales
are dimensional systems as they can acknowledge that behaviour lies across a
continuum and varies in degree. These measures describe specific behaviours
to which an informant who knows the child well (e.g. a teacher) rates each
descriptive statement in terms of the extent to which it relates to the child.
Rating scales are the most common way of assessing children with behaviour
difficulties, and this method has dramatically increased in popularity since the
mid-1980s (Merrell 2003).
There are a number of advantages in collecting data through a survey design,
not least because it is an easy, efficient and effective means of collecting large
amounts of information. This method was also selected as it could be flexibly
implemented, and options were provided to complete the surveys on paper or
on-line, whilst maintaining its standardised format. Using a survey approach
allows many different types of variables to be measured at the same time with
relative ease, and findings are therefore more generalizable, as information
comes directly from the ‘real’ world (Muijs 2011). The rating scales within the
13 The National Pupil Database contains details about pupil demographic characteristics and information such as academic progress. EduBase is a school level data base, containing information about all educational establishments in England and Wales.
148
survey are able to take into account a wide range of behaviours that may have
occurred over a long period of time and across various situations,
acknowledging lower frequency behaviours as well as asking about the
behaviour of the child in general. The standardised approach this method
adopts allows for objective and reliable data to be generated and comparisons
to be drawn between studies.
Rating scales however, could be considered subjective, as they comprise of the
respondents’ judgments of behaviour displayed, and measure perceptions
rather than actual behaviour, relying on the memory of the person completing
the survey (Robson 2011). This is not conceived to be a concern within the
present study however, as a reliable and valid measurement tool was created
for the purposes of the study that asked about specific behaviours displayed
(see section 5.6), and used a teacher report who have daily contact with their
children are know them well. A further criticism of this type of design is that
surveys using rating scales can also suffer from low response rates. However,
in the present study despite the high attrition rates predicted the sample sizes
were deemed to be appropriate for the analyses undertaken (see section 6.3).
Using a survey design was therefore deemed appropriate for the purposes of
the study.
149
5.4.5 Teacher, parent or self-report
The decision to utilise teacher report over parent or self-report report was made
on a number of grounds. First, the focus of the present study is upon behaviour
difficulties displayed within schools; teachers are therefore arguably better
placed to comment on behaviour in this context. Secondly, teachers are less
likely to be biased in reporting on negative behaviours than parents - who might
be more inclined to portray their own child in an overly positive light. There may
also be considerable variation between parents in what is deemed acceptable
or unacceptable behaviour, which may reflect ethnic differences (Guttmannova
et al. 2007). Teachers, however, are likely to adopt a more consistent approach
as they witness a wide range of behaviours displayed from numerous children
across the school. Finally, the present study incorporated a wide age range of
children with various disabilities, including children as young as 5 and those
with multiple and profound learning difficulties. It would be inappropriate to ask
these children to accurately comment on their behaviour difficulties displayed.
Therefore, in order to maintain consistency and accuracy across the study, a
decision was taken for teachers to provide the rating of their pupils’ behaviour.
150
5.4.6 Longitudinal study
The majority of studies in developmental psychology have utilised a cross-
sectional approach (Harris & Butterworth 2002). However, this design can be
considered somewhat limited, as it does not provide any information about the
temporal order of events. This is a particularly salient issue in risk research and
Kraemer et al. (2005) have argued that a risk factor cannot be called as such if
it cannot be established it came before the outcome.
Consequently the present study has opted for a longitudinal approach which
can be defined as “a research design in which data are collected on a sample
(of people, documents etc.) on at least two occasions”, (Bryman 2012, page
712). Specifically, the design can be noted as a Cohort Study, as the entire
cohort of SEND children (within the sampled schools) in year groups 1,5,7 & 10
were sampled, with the dependent variable being measured at multiple time
points, in January 2010 (baseline) and again in June 2011 (follow-up).
There are numerous advantages of a longitudinal design, including being able
to acknowledge the chronological order of events, and sometimes establish
cause and effect, (if cause is noted to precede the effect, and the effect is noted
as coming after the cause). These designs generate rich data that are able to
better account for the complexity of human behaviour (Cohen et al. 2011).
Longitudinal designs are considered particularly valuable in explaining
predictors of outcomes and the relationships between variables within studies
(Nazroo 2011). Disadvantages within longitudinal designs could include
significant outlays in terms of cost and time. There are also issues with attrition,
whereby collecting data on multiple occasions will often reduce the sample size
drastically (Cohen et al. 2011). Furthermore, these studies may be impacted by
other unmeasured factors such as any major life events which could have
occurred in between time points which affect the outcome. Nonetheless, despite
these limitations a longitudinal approach was utilised within the present study as
it is deemed a sophisticated design that can “separates real trends from chance
occurrence” (Cohen et al. 2011, page 219).
151
5.4.7 Variables in the study
The dependent variables within the present study are teacher reported
behaviour difficulties at baseline (January 2010) and follow-up (June 2011) from
the WOST (see materials section). Scores ranged from 0-3 with higher values
indicating greater behaviour difficulties. For the purposes of the analysis
behaviour difficulties at follow-up was added as the dependent variable and
behaviour difficulties at baseline was added as a control. Therefore any
influence on behaviour difficulties at follow-up that were above and beyond the
effect of baseline behaviour difficulties may be attributable to the various
predictor variables within the study.
The independent variables in the study comprised of twelve predictor variables
at the individual level, and nine predictor variables at the school level. Table 5.2
shows the individual level variables, a description of each, and how they were
measured. Table 5.3 displays the same information for the school level
variables.
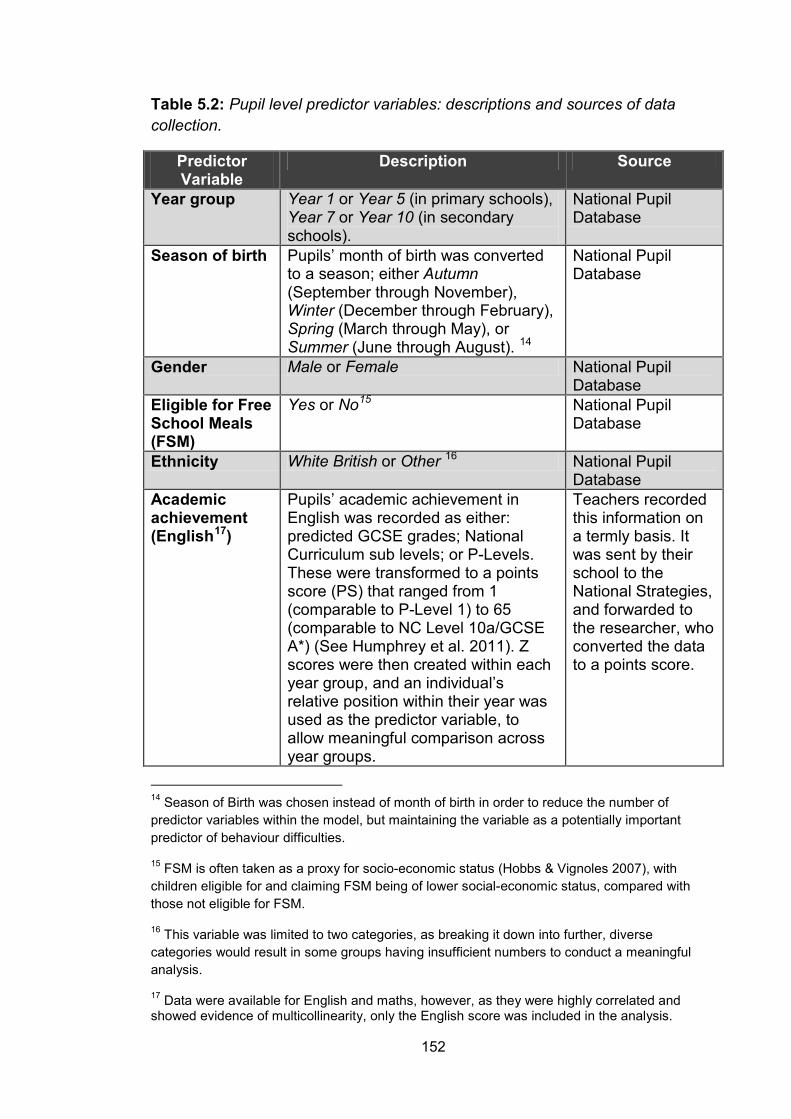
152
Table 5.2: Pupil level predictor variables: descriptions and sources of data collection.
Predictor Variable
Description Source
Year group Year 1 or Year 5 (in primary schools), Year 7 or Year 10 (in secondary schools).
National Pupil Database
Season of birth Pupils’ month of birth was converted to a season; either Autumn (September through November), Winter (December through February), Spring (March through May), or Summer (June through August). 14
National Pupil Database
Gender Male or Female National Pupil
Database Eligible for Free School Meals (FSM)
Yes or No15 National Pupil Database
Ethnicity White British or Other 16 National Pupil Database
Academic achievement (English17
Pupils’ academic achievement in English was recorded as either: predicted GCSE grades; National Curriculum sub levels; or P-Levels. These were transformed to a points score (PS) that ranged from 1 (comparable to P-Level 1) to 65 (comparable to NC Level 10a/GCSE A*) (See Humphrey et al. 2011). Z scores were then created within each year group, and an individual’s relative position within their year was used as the predictor variable, to allow meaningful comparison across year groups.
)
Teachers recorded this information on a termly basis. It was sent by their school to the National Strategies, and forwarded to the researcher, who converted the data to a points score.
14 Season of Birth was chosen instead of month of birth in order to reduce the number of predictor variables within the model, but maintaining the variable as a potentially important predictor of behaviour difficulties.
15 FSM is often taken as a proxy for socio-economic status (Hobbs & Vignoles 2007), with children eligible for and claiming FSM being of lower social-economic status, compared with those not eligible for FSM.
16 This variable was limited to two categories, as breaking it down into further, diverse categories would result in some groups having insufficient numbers to conduct a meaningful analysis.
17 Data were available for English and maths, however, as they were highly correlated and showed evidence of multicollinearity, only the English score was included in the analysis.
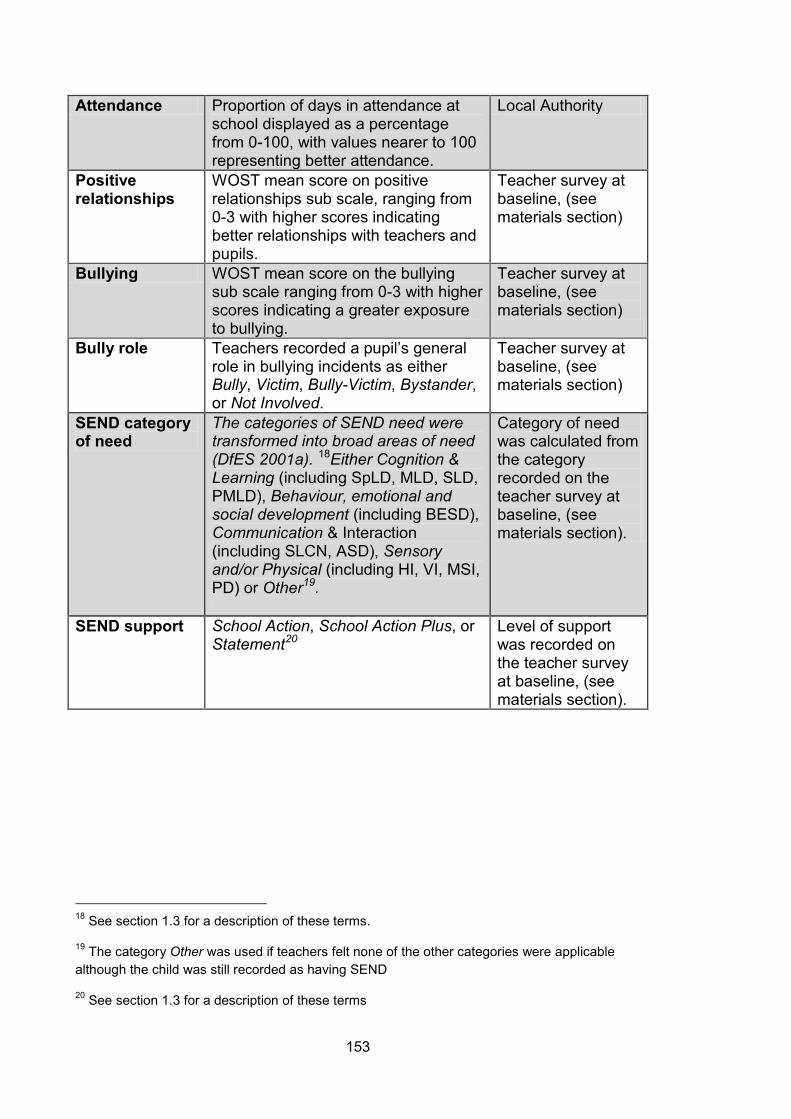
153
Attendance Proportion of days in attendance at school displayed as a percentage from 0-100, with values nearer to 100 representing better attendance.
Local Authority
Positive relationships
WOST mean score on positive relationships sub scale, ranging from 0-3 with higher scores indicating better relationships with teachers and pupils.
Teacher survey at baseline, (see materials section)
Bullying WOST mean score on the bullying sub scale ranging from 0-3 with higher scores indicating a greater exposure to bullying.
Teacher survey at baseline, (see materials section)
Bully role Teachers recorded a pupil’s general role in bullying incidents as either Bully, Victim, Bully-Victim, Bystander, or Not Involved.
Teacher survey at baseline, (see materials section)
SEND category of need
The categories of SEND need were transformed into broad areas of need (DfES 2001a). 18Either Cognition & Learning (including SpLD, MLD, SLD, PMLD), Behaviour, emotional and social development (including BESD), Communication & Interaction (including SLCN, ASD), Sensory and/or Physical (including HI, VI, MSI, PD) or Other19
.
Category of need was calculated from the category recorded on the teacher survey at baseline, (see materials section).
SEND support School Action, School Action Plus, or Statement20
Level of support was recorded on the teacher survey at baseline, (see materials section).
18 See section 1.3 for a description of these terms.
19 The category Other was used if teachers felt none of the other categories were applicable although the child was still recorded as having SEND
20 See section 1.3 for a description of these terms
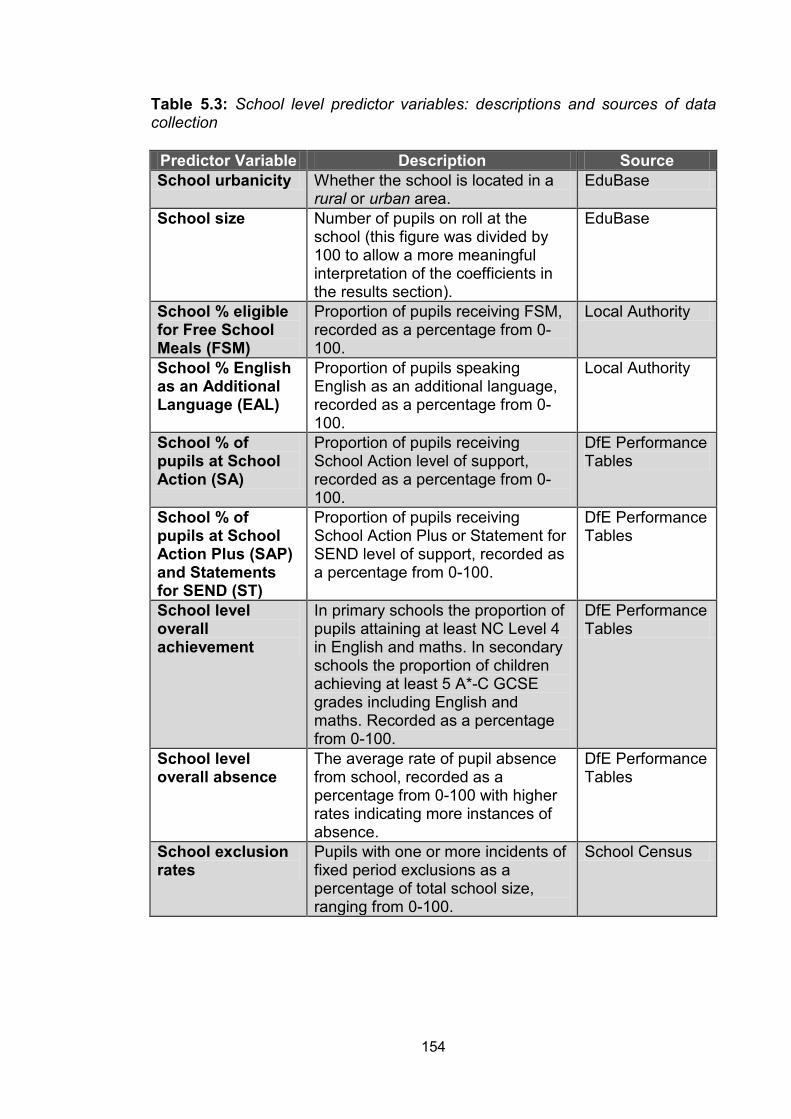
154
Table 5.3: School level predictor variables: descriptions and sources of data collection
Predictor Variable Description Source School urbanicity Whether the school is located in a
rural or urban area. EduBase
School size Number of pupils on roll at the school (this figure was divided by 100 to allow a more meaningful interpretation of the coefficients in the results section).
EduBase
School % eligible for Free School Meals (FSM)
Proportion of pupils receiving FSM, recorded as a percentage from 0-100.
Local Authority
School % English as an Additional Language (EAL)
Proportion of pupils speaking English as an additional language, recorded as a percentage from 0-100.
Local Authority
School % of pupils at School Action (SA)
Proportion of pupils receiving School Action level of support, recorded as a percentage from 0-100.
DfE Performance Tables
School % of pupils at School Action Plus (SAP) and Statements for SEND (ST)
Proportion of pupils receiving School Action Plus or Statement for SEND level of support, recorded as a percentage from 0-100.
DfE Performance Tables
School level overall achievement
In primary schools the proportion of pupils attaining at least NC Level 4 in English and maths. In secondary schools the proportion of children achieving at least 5 A*-C GCSE grades including English and maths. Recorded as a percentage from 0-100.
DfE Performance Tables
School level overall absence
The average rate of pupil absence from school, recorded as a percentage from 0-100 with higher rates indicating more instances of absence.
DfE Performance Tables
School exclusion rates
Pupils with one or more incidents of fixed period exclusions as a percentage of total school size, ranging from 0-100.
School Census
155
5.5 Participants
5.5.1 Local Authorities
Participants for the present study were sampled through the AfA evaluation
project (Humphrey et al. 2011) (see section 5.3 for an overview). At the outset
of the project the Department for Children Schools and Families (DCFS)
selected ten Local Authorities in England to be involved in the project. These
LAs varied in terms of geographical location, population density, and proportion
of ethnic minorities, and are deemed representative of England (DCSF 2009b).
5.5.2 Schools
Each LA sampled approximately forty-five schools to take part in the project.
They were selected to “reflect the range and proportion of schools in the area
and the current range of provision” (DCSF 2009b, page 9). These schools
comprised mainly primary and secondary schools with a handful of special
schools and pupil referral units (PRU). They were deemed representative of the
local authority, including schools in affluent as well as more deprived areas. As
part of the evaluation project it was also necessary to recruit a sample of
comparison schools, and these were recruited from the same local authorities
involved in the AfA project. Data from special schools and PRUs were excluded
at this stage, as the focus of the present study was solely upon mainstream
schools, i.e. primary and secondary schools. The total number of schools
represented within the present study numbered 305 (248 of which were primary
schools, and 57 if which were secondary schools).
5.5.3 Pupils
The participants within this study comprised children already identified by their
school as having a special educational need or disability and were accordingly
placed on the SEND register. Participants included all SEND children from
156
years 1 and 5 in primary schools and 7 and 10 in secondary schools. Teachers
completed a survey for each child within the sample and socio-demographic
data was also collected for each pupil from the school or National Pupil
Database (NPD). The total possible sample was 13223 although the final
sample for the present study only included 4288 of these pupils (2660 in
primary schools, and 1628 in secondary schools), due to the attrition rates.
5.5.4 Attrition
Background socio-demographic information was obtained from 13223 pupils
attending either primary or secondary schools within the AfA project. This
represented the maximum number of possible participants. From this number
4374 did not have a valid survey completed on their behalf at baseline and were
therefore excluded from the study 21. Of the remaining sample 474 did not
complete the behaviour difficulties sub scale in sufficient detail for a mean to be
generated and were also excluded22
. After baseline data were collected the
sample stood at 8375. The attrition rate was therefore 36.7% (i.e. 36.7% of
participants eligible for the study were excluded after wave one was completed).
From this number 3767 did not have a valid survey completed on their behalf at
follow-up and were therefore excluded. Of the remaining sample a further 137
did not have a completed behaviour difficulties sub-section, or it was completed
in insufficient detail to generate a mean score. The sample after follow-up stood
at 4471. The attrition rate was therefore 46.7% (i.e. 46.7% of participants
eligible for the study after baseline were excluded after follow-up was
completed).
Finally, a further 183 were excluded based on the data requirements and
assumptions (see section 6.3) leaving a final sample of 4288 (2660 in primary 21 The behaviour difficulties sub-domain on the survey was required to be competed for each pupil at baseline in order to be a valid case within the study, (as this represents the dependent variable). If pupils had any other missing data they were still included within the study. See section 6.2 for a more in depth analysis of the missing data. 22 If more than 2 items on the behaviour scale were missing a mean score could not be generated
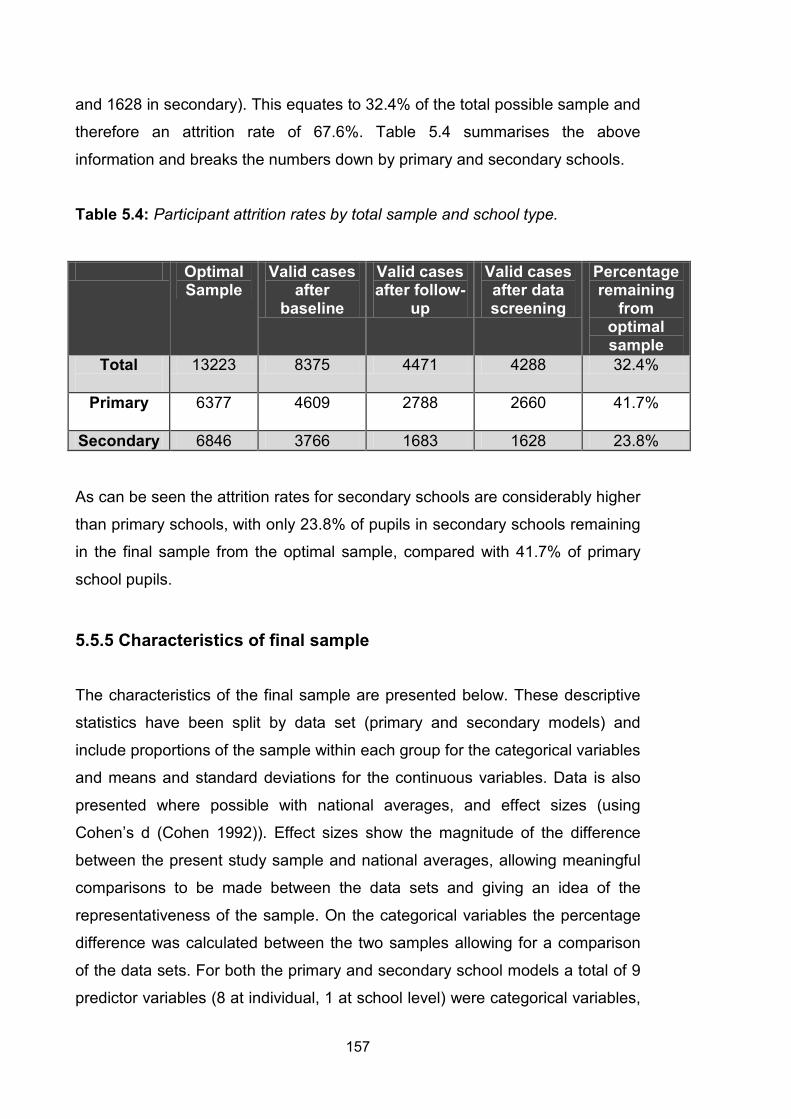
157
and 1628 in secondary). This equates to 32.4% of the total possible sample and
therefore an attrition rate of 67.6%. Table 5.4 summarises the above
information and breaks the numbers down by primary and secondary schools.
Table 5.4: Participant attrition rates by total sample and school type.
As can be seen the attrition rates for secondary schools are considerably higher
than primary schools, with only 23.8% of pupils in secondary schools remaining
in the final sample from the optimal sample, compared with 41.7% of primary
school pupils.
5.5.5 Characteristics of final sample
The characteristics of the final sample are presented below. These descriptive
statistics have been split by data set (primary and secondary models) and
include proportions of the sample within each group for the categorical variables
and means and standard deviations for the continuous variables. Data is also
presented where possible with national averages, and effect sizes (using
Cohen’s d (Cohen 1992)). Effect sizes show the magnitude of the difference
between the present study sample and national averages, allowing meaningful
comparisons to be made between the data sets and giving an idea of the
representativeness of the sample. On the categorical variables the percentage
difference was calculated between the two samples allowing for a comparison
of the data sets. For both the primary and secondary school models a total of 9
predictor variables (8 at individual, 1 at school level) were categorical variables,
Optimal Sample
Valid cases after
baseline
Valid cases after follow-
up
Valid cases after data screening
Percentage remaining
from optimal sample
Total
13223 8375 4471 4288 32.4%
Primary
6377 4609 2788 2660 41.7%
Secondary 6846 3766 1683 1628 23.8%
158
and 12 predictor variables (4 at individual, 8 at school) were continuous
variables.
For the primary model: Table 5.5 shows the proportion within each group for the
categorical variables, compared with the national averages, with the percentage
difference also displayed. Table 5.6 shows the means and standard deviations
for each of the continuous variables, alongside national averages and effect
size differences.
For the secondary model: Table 5.7 shows the proportion within each group for
the categorical variables, with the percentage difference also displayed. Table
5.8 shows the means and standard deviations for each of the continuous
variables, alongside national averages and effect size differences.
The source of the national average data come from DfE (2010a) indicated by ♠;
from DfE (2010b) indicated by ♥; from DfE (2010c) indicated by ♦; from DfE
(2010d) indicated by ♣; from DfE (2011b) indicated by∇; or when this data was
not available indicated by ⊗.
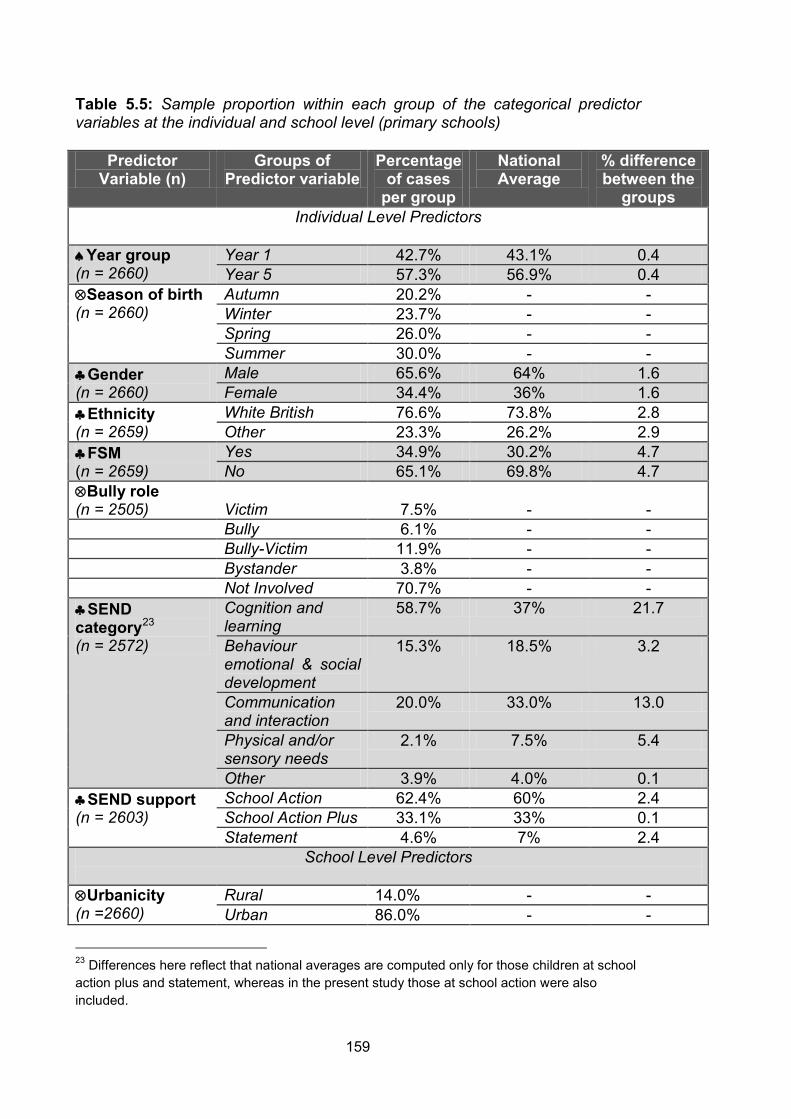
159
Table 5.5: Sample proportion within each group of the categorical predictor variables at the individual and school level (primary schools)
Predictor Variable (n)
Groups of Predictor variable
Percentage of cases
per group
National Average
% difference between the
groups Individual Level Predictors
♠Year group (n = 2660)
Year 1 42.7% 43.1% 0.4 Year 5 57.3% 56.9% 0.4
⊗Season of birth (n = 2660)
Autumn 20.2% - - Winter 23.7% - - Spring 26.0% - - Summer 30.0% - -
♣Gender (n = 2660)
Male 65.6% 64% 1.6 Female 34.4% 36% 1.6
♣Ethnicity (n = 2659)
White British 76.6% 73.8% 2.8 Other 23.3% 26.2% 2.9
♣FSM (n = 2659)
Yes 34.9% 30.2% 4.7 No 65.1% 69.8% 4.7
⊗Bully role (n = 2505)
Victim
7.5%
-
-
Bully 6.1% - - Bully-Victim 11.9% - - Bystander 3.8% - - Not Involved 70.7% - - ♣SEND category23
(n = 2572)
Cognition and learning
58.7% 37% 21.7
Behaviour emotional & social development
15.3% 18.5% 3.2
Communication and interaction
20.0% 33.0% 13.0
Physical and/or sensory needs
2.1% 7.5% 5.4
Other 3.9% 4.0% 0.1 ♣SEND support (n = 2603)
School Action 62.4% 60% 2.4 School Action Plus 33.1% 33% 0.1 Statement 4.6% 7% 2.4
School Level Predictors ⊗Urbanicity (n =2660)
Rural 14.0% - - Urban 86.0% - -
23 Differences here reflect that national averages are computed only for those children at school action plus and statement, whereas in the present study those at school action were also included.
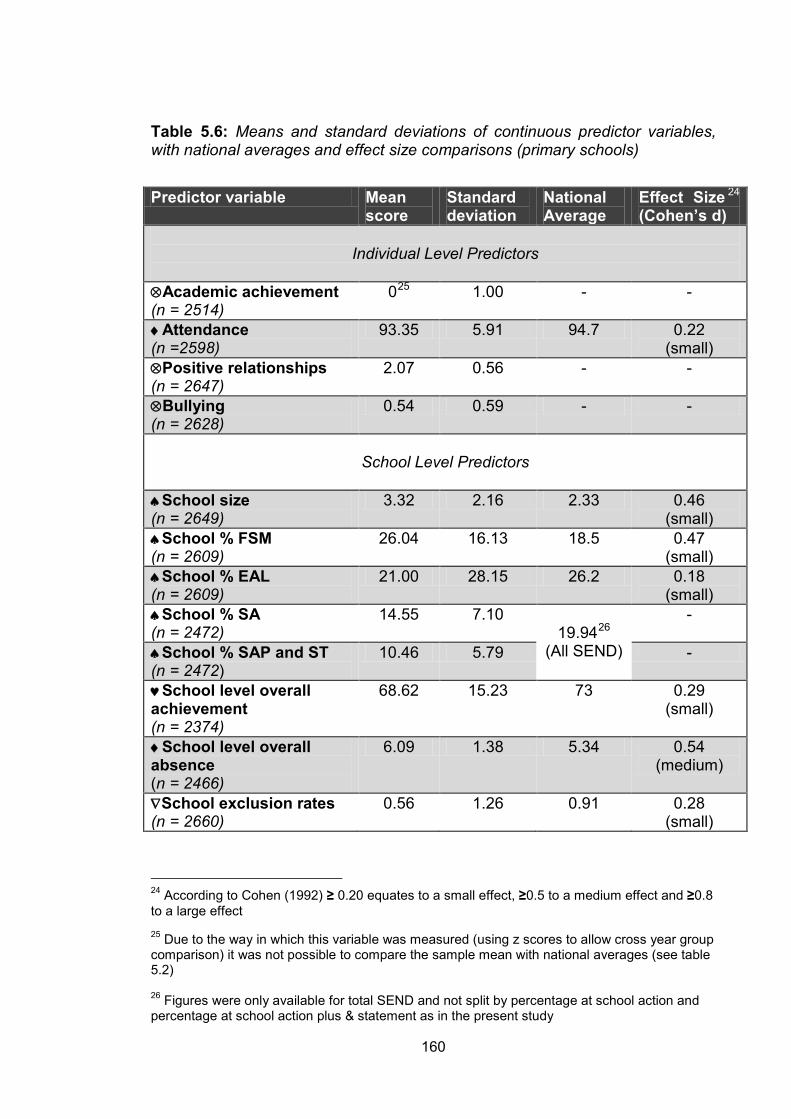
160
Table 5.6: Means and standard deviations of continuous predictor variables, with national averages and effect size comparisons (primary schools)
Predictor variable Mean score
Standard deviation
National Average
Effect Size 24
(Cohen’s d)
Individual Level Predictors ⊗Academic achievement (n = 2514)
025 1.00 - -
♦Attendance (n =2598)
93.35 5.91 94.7 0.22 (small)
⊗Positive relationships (n = 2647)
2.07 0.56 - -
⊗Bullying (n = 2628)
0.54 0.59 - -
School Level Predictors
♠School size (n = 2649)
3.32 2.16 2.33 0.46 (small)
♠School % FSM (n = 2609)
26.04 16.13 18.5 0.47 (small)
♠School % EAL (n = 2609)
21.00 28.15 26.2 0.18 (small)
♠School % SA (n = 2472)
14.55 7.10 19.9426
(All SEND)
-
♠School % SAP and ST (n = 2472)
10.46 5.79 -
♥School level overall achievement (n = 2374)
68.62 15.23 73 0.29 (small)
♦School level overall absence (n = 2466)
6.09 1.38 5.34 0.54 (medium)
∇School exclusion rates (n = 2660)
0.56 1.26 0.91 0.28 (small)
24 According to Cohen (1992) ≥ 0.20 equates to a small effect, ≥0.5 to a medium effect and ≥0.8 to a large effect 25 Due to the way in which this variable was measured (using z scores to allow cross year group comparison) it was not possible to compare the sample mean with national averages (see table 5.2) 26 Figures were only available for total SEND and not split by percentage at school action and percentage at school action plus & statement as in the present study
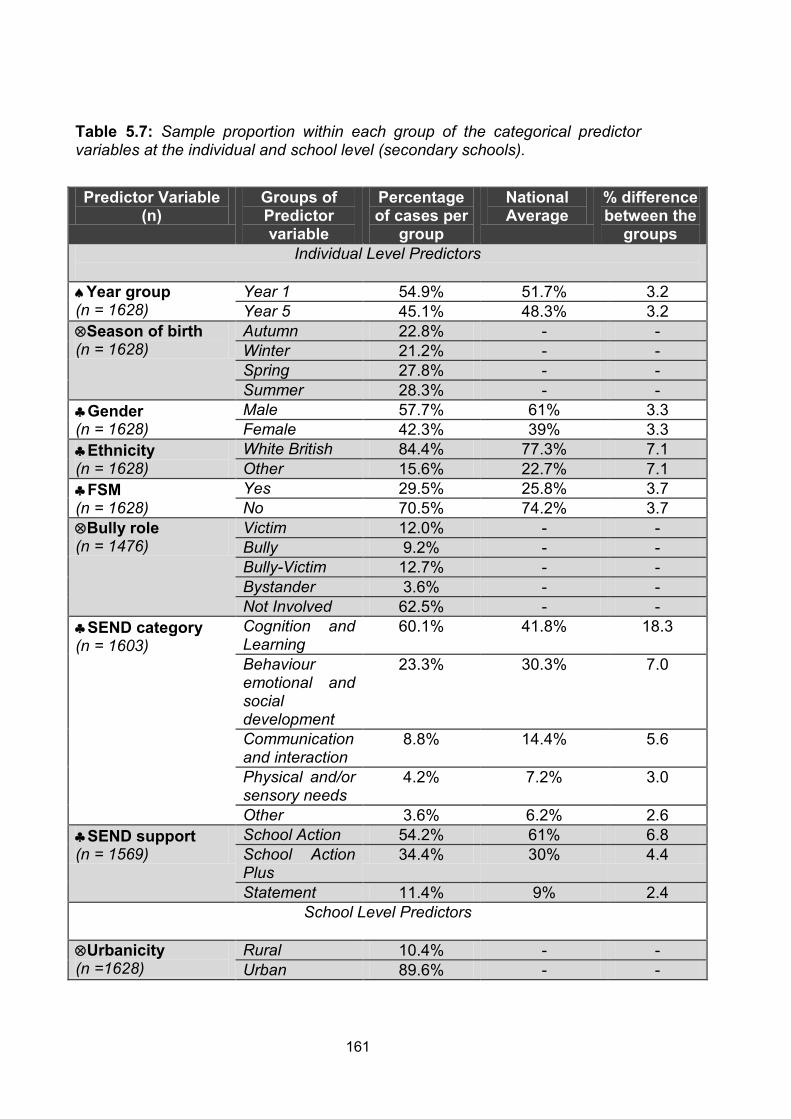
161
Table 5.7: Sample proportion within each group of the categorical predictor variables at the individual and school level (secondary schools).
Predictor Variable (n)
Groups of Predictor variable
Percentage of cases per
group
National Average
% difference between the
groups Individual Level Predictors
♠Year group (n = 1628)
Year 1 54.9% 51.7% 3.2 Year 5 45.1% 48.3% 3.2
⊗Season of birth (n = 1628)
Autumn 22.8% - - Winter 21.2% - - Spring 27.8% - - Summer 28.3% - -
♣Gender (n = 1628)
Male 57.7% 61% 3.3 Female 42.3% 39% 3.3
♣Ethnicity (n = 1628)
White British 84.4% 77.3% 7.1 Other 15.6% 22.7% 7.1
♣FSM (n = 1628)
Yes 29.5% 25.8% 3.7 No 70.5% 74.2% 3.7
⊗Bully role (n = 1476)
Victim 12.0% - - Bully 9.2% - - Bully-Victim 12.7% - - Bystander 3.6% - - Not Involved 62.5% - -
♣SEND category (n = 1603)
Cognition and Learning
60.1% 41.8% 18.3
Behaviour emotional and social development
23.3% 30.3% 7.0
Communication and interaction
8.8% 14.4% 5.6
Physical and/or sensory needs
4.2% 7.2% 3.0
Other 3.6% 6.2% 2.6 ♣SEND support (n = 1569)
School Action 54.2% 61% 6.8 School Action Plus
34.4% 30% 4.4
Statement 11.4% 9% 2.4 School Level Predictors
⊗Urbanicity (n =1628)
Rural 10.4% - - Urban 89.6% - -
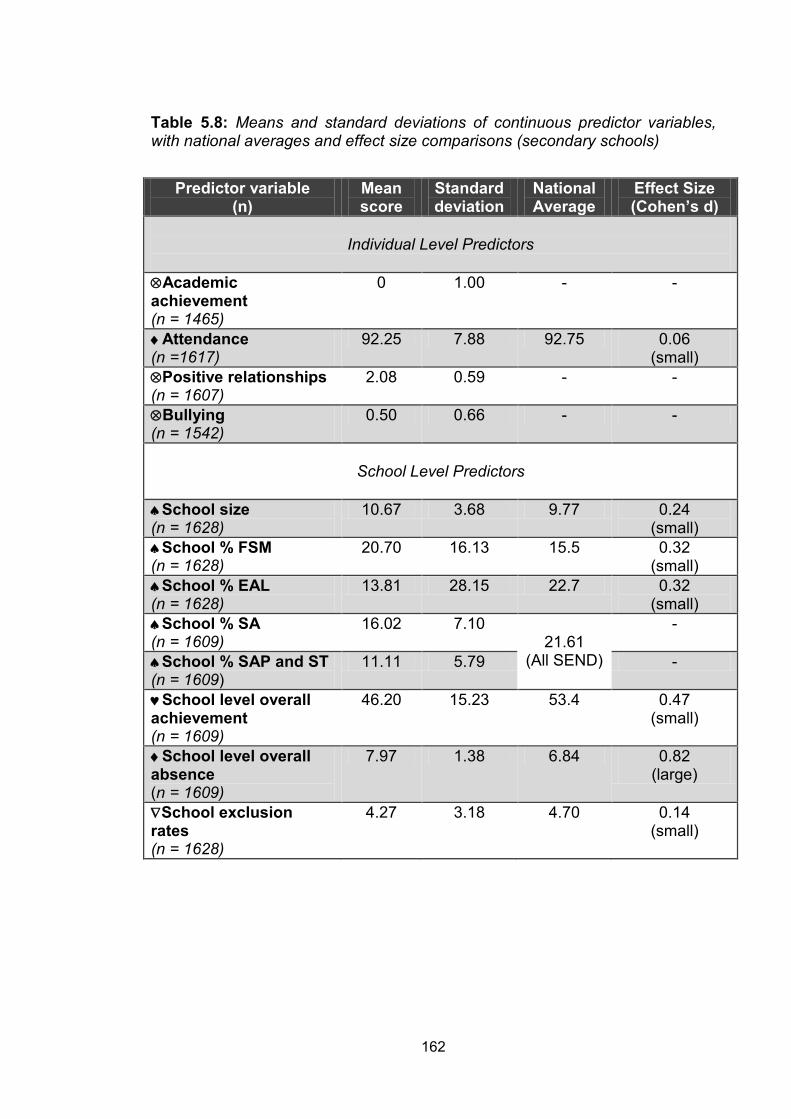
162
Table 5.8: Means and standard deviations of continuous predictor variables, with national averages and effect size comparisons (secondary schools)
Predictor variable (n)
Mean score
Standard deviation
National Average
Effect Size (Cohen’s d)
Individual Level Predictors
⊗Academic achievement (n = 1465)
0 1.00 - -
♦Attendance (n =1617)
92.25 7.88 92.75 0.06 (small)
⊗Positive relationships (n = 1607)
2.08 0.59 - -
⊗Bullying (n = 1542)
0.50 0.66 - -
School Level Predictors
♠School size (n = 1628)
10.67 3.68 9.77 0.24 (small)
♠School % FSM (n = 1628)
20.70 16.13 15.5 0.32 (small)
♠School % EAL (n = 1628)
13.81 28.15 22.7 0.32 (small)
♠School % SA (n = 1609)
16.02 7.10 21.61
(All SEND)
-
♠School % SAP and ST (n = 1609)
11.11 5.79 -
♥School level overall achievement (n = 1609)
46.20 15.23 53.4 0.47 (small)
♦School level overall absence (n = 1609)
7.97 1.38 6.84 0.82 (large)
∇School exclusion rates (n = 1628)
4.27 3.18 4.70 0.14 (small)
163
As can be seen from the above tables, for both primary and secondary schools
the differences between the present study and national averages are broadly
comparable. The majority of effect size differences are considered small (Cohen
1992), with only one medium effect difference (primary school attendance) and
one large effect difference (secondary school attendance). In both cases,
schools in the sample were more likely to have higher overall absence rates
than national averages. The differences here could reflect that schools selected
by their LA to be part of AfA could have been biased in favour of schools with
poorer attendance rates. These schools would benefit to a greater extent from
the AfA initiative which ultimately aimed to improve attendance.
In terms of the categorical variables, the vast majority of variables showed less
than 5% difference between the present study and national average. There
were a couple of notable exceptions, however. The secondary data showed a
7.1% disparity in ethnicity where the present study had a higher number of
white British students compared with the national average. There was also a
6.8% difference in numbers of children at the school action level of SEND
support, where fewer children were recorded at this level in the present study
compared with the national average. The most notable difference across both
primary and secondary data sets was for the SEND category variable. This is
likely to reflect that data for national averages was computed for those at school
action plus and statement, whereas for the present study these groups were
computed together along with school action.
164
5.6 Materials
5.6.1 Overview
The present study utilised a teacher-reported survey to collect a number of the
variables under investigation. The survey included the Wider Outcomes Survey
for Teachers (WOST) (see below) as well as additional information including;
year group; date of birth (in which the variable season of birth was generated);
gender; SEND category, (in which the broad area of SEND was calculated);
SEND level of support and typical role in bully incidents (i.e. Victim, Bully, Bully-
victim, Bystander, or not involved) (See appendix 1).
The remaining factors under investigation included, (at the individual level)
FSM, ethnicity, attendance, academic achievement, and (at the school level)
urbanicity, school size, school % of FSM, school % of EAL, school % of SA,
school % of SAP and ST, school level overall achievement, school level overall
absence and school exclusion rates. These were collected either through the
school directly, the LA, via EduBase, the DCSF statistics Gateway or from the
DfE performance tables on-line (see section 5.4).
5.6.2 Wider Outcomes Survey for Teachers (WOST)
The Wider Outcome Survey for Teachers (WOST) (Humphrey et al. 2011) (see
appendix 1), was originally designed as a bespoke measure27
27 A bespoke measure was called for as no pre-existing measured covered the concepts required within a single format. Utilizing separate surveys for these concepts would be longer and waste teacher time.
for the national
evaluation of AfA. It is a teacher report questionnaire that assesses three broad
areas of pupils’ social outcomes. These include behaviour difficulties, positive
relationships, and bullying (specifically victimisation rather than perpetration).
The behaviour difficulties sub-section comprises 6 items (including: “The pupil
cheats and tells lies” and “The pupil gets into fights with other children”). The
165
positive relationships sub section incorporates 7 items (including: “The pupil is
kind towards others”, and “The pupil makes friends easily”). The bullying sub
scale also comprises 7 items (including: “The pupil is picked on by other
children” and ”The pupil is actively disliked by other children”). Specifically on
this sub domain a definition was given which stated “By bullying we mean
‘behaviour by an individual or group, usually repeated over time, that
intentionally hurts another individual or group either physically or emotionally’
(DCSF, 2008b, page 1)”. This definition was given to avoid confusion with a
potentially ambiguous and contentious topic. Items for all sub domains are rated
on a four point Likert scale using the categories, Never, Rarely, Sometime, and
Often, (for the behaviour difficulties and bullying scales), and Strongly Disagree,
Disagree, Agree, and Strongly Agree, (for the positive relationships scale).
5.6.3 Scoring
A score was composed for each of the three broad sub domains. For the
behaviour difficulties, and bullying sub sections a score was given for each item
as follows: Never = 0; Rarely = 1; Sometimes = 2; and Often = 3. For the
positive relationships scale a score was given for each item as follows: Strongly
Disagree = 0; Disagree = 1; Agree = 2; Strongly Agree = 3. A mean score was
then created for each individual, which ranged from 0-3. A decision was made
in accordance with other similar questionnaires (i.e. SDQ, Goodman 2001), that
if two or less items were missing, a mean score would still be generated but
three or more items missing a mean score would not be generated for that
subscale.
5.6.4 Psychometric properties of the WOST
Information regarding the psychometric properties of the WOST are required in
order to justify it as a reliable and valid tool. Presented below is evidence of the
criteria which the WOST was measured against, drawing upon some of the
criteria set out by Terwee et al. (2007). The information draws heavily upon the
same information, which has been presented in Humphrey et al. (2011) (the
166
evaluation of AfA page 117-122), the reader is referred there for more detailed
information and validation of this measurement tool.
Content Validity Content validity refers to “the extent to which the domain of interest is
comprehensively sampled by the items in the questionnaire” (Terwee et al.
2007, page 39). The WOST is considered to have good content validity and
was designed specifically to measure behaviour difficulties, positive
relationships and bullying. Items for each of the sub domains were generated
using a number of techniques. Firstly, there was discussion within the research
team and ‘brainstorming’ of potential topics within these sub domains (i.e. within
behaviour difficulties, lying, fighting, stealing etc.). Pre-existing measures were
then referred to which measured similar constructs (i.e., for the behaviour
difficulties sub-domain the Conduct problems scale within the Strengths and
Difficulties Questionnaire was referred to). The literature, which related
specifically to these sub domains, was also extensively researched and key
concepts and ideas for items were generated from within it. The team of
researchers then generated approximately ten questions per each sub domain,
which were designed to be comprehensible by the lowest possible reading age.
After an initial pilot of the survey and a basic psychometric analysis, the survey
was deemed valid and fit for purpose (Humphrey et al. 2011). The initial version
of the WOST contained 28 items (9 for behaviour difficulties, 10 for positive
relationships and 9 for bullying). These were later reduced once a confirmatory
factor analysis was carried out after data collection was complete. The final
version contains 20 items (6 behaviour difficulties, 7 positive relationships and 7
bullying) see appendix 1b.
Construct validity Construct validity refers to “the extent to which scores on a particular
questionnaire relate to other measures in a manner that is consistent with
theoretically derived hypotheses concerning the concepts that are being
measured” (Terwee et al. 2007, page 39). Humphrey et al. (2011) tested the
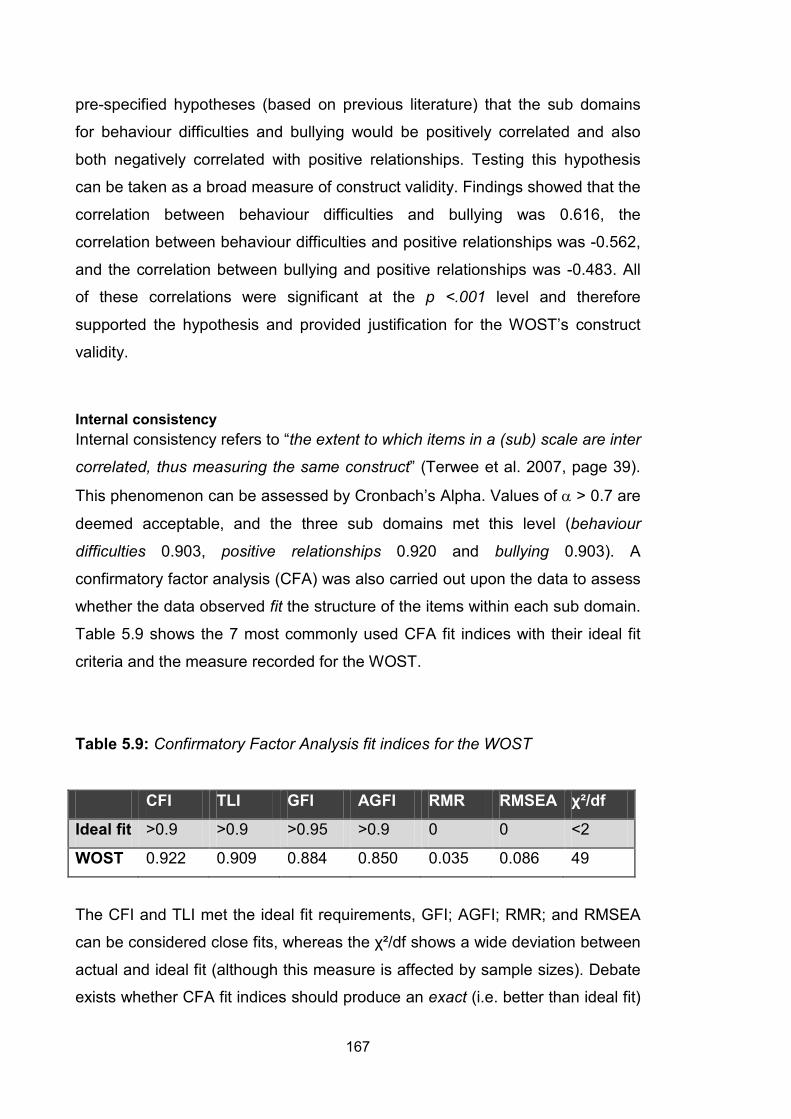
167
pre-specified hypotheses (based on previous literature) that the sub domains
for behaviour difficulties and bullying would be positively correlated and also
both negatively correlated with positive relationships. Testing this hypothesis
can be taken as a broad measure of construct validity. Findings showed that the
correlation between behaviour difficulties and bullying was 0.616, the
correlation between behaviour difficulties and positive relationships was -0.562,
and the correlation between bullying and positive relationships was -0.483. All
of these correlations were significant at the p <.001 level and therefore
supported the hypothesis and provided justification for the WOST’s construct
validity.
Internal consistency Internal consistency refers to “the extent to which items in a (sub) scale are inter
correlated, thus measuring the same construct” (Terwee et al. 2007, page 39).
This phenomenon can be assessed by Cronbach’s Alpha. Values of α > 0.7 are
deemed acceptable, and the three sub domains met this level (behaviour
difficulties 0.903, positive relationships 0.920 and bullying 0.903). A
confirmatory factor analysis (CFA) was also carried out upon the data to assess
whether the data observed fit the structure of the items within each sub domain.
Table 5.9 shows the 7 most commonly used CFA fit indices with their ideal fit
criteria and the measure recorded for the WOST.
Table 5.9: Confirmatory Factor Analysis fit indices for the WOST
CFI TLI GFI AGFI RMR RMSEA χ²/df
Ideal fit >0.9 >0.9 >0.95 >0.9 0 0 <2
WOST 0.922 0.909 0.884 0.850 0.035 0.086 49
The CFI and TLI met the ideal fit requirements, GFI; AGFI; RMR; and RMSEA
can be considered close fits, whereas the χ²/df shows a wide deviation between
actual and ideal fit (although this measure is affected by sample sizes). Debate
exists whether CFA fit indices should produce an exact (i.e. better than ideal fit)
168
or close fit (i.e. approaching the ideal fit figure) when confirming the internal
consistency of a measure (Fife-Schaw 2006). In the case of the present study,
and consistent with Humphrey et al. (2011), adopting the stance that a close fit
is sufficient was taken as this will reduce the likelihood of Type 2 errors.
Inter-rater reliability Inter-rater reliability refers to the degree to which two individuals are consistent
and produce similar results when rating an outcome. This agreement between
raters is considered an aspect of reproducibility (Terwee et al. 2007). Humphrey
et al. (2011) have reported on the inter-rater reliability between teachers and
parents in reporting behaviour difficulties, positive relationships and bullying.
They found significant (p < .001) Pearson Product Moment Correlations of
0.483 for behaviour difficulties, 0.344 for positive relationships and 0.368 for
bullying. The authors suggest that as these values are above 0.27 (the average
correlation between teachers and parents in a meta-analysis assessing similar
sub domains (Achenbach, McConaughty & Howell 1987)) they are deemed
acceptable in meeting the inter-rater reliability criteria.
Floor and ceiling effects Floor and ceiling effects occur when a large percentage of the sample obtain
scores at the highest (ceiling) or lowest (floor) possible score of a scale. It has
been argued that where more than 15% of the sample has the highest possible
or lowest possible score a floor or ceiling effect has occurred (Terwee et al.
2007). These can be problematic in a data set and limits the model’s sensitivity.
Floor and ceiling effects for the WOST were only observed for behaviour
difficulties (35% floor) and bullying (37% floor). It should however, also be
pointed out that the subscales in question measure behaviour difficulties and
bullying where it is expected a floor effect would exist, as most children do not
have any behaviour difficulties or are bullied. Furthermore in another well-
validated behaviour scale, the Conduct Problem scale on the SDQ (measured
by teachers) there is a floor effect of about 64.2% (www.sdqinfo.org). Despite
some observed floor effects the WOST was therefore retained.

169
Interpretability Interpretability refers to “The degree to which one can assign qualitative
meaning to quantitative scores” (Terwee et al. 2007, page 39). The WOST
provides normative information in terms of means and standard deviations for
the various sub groups of primary SEND (see Humphrey et al. 2011). This
information will allow comparisons to be made between a certain score
obtained, and the normative score, or what would be expected. Therefore
allowing interpretability of the data.
170
5.7 Procedure
In October 2009 schools participating in AfA were sent information about the
evaluation study, to be carried out by the University of Manchester (see
appendix 2). In January 2010 participating schools within the 10 local
authorities were sent parental information letters about the study (see appendix
3). Schools were requested to forward this information to parents of children on
the SEND register in years 1 and 5 (within primary schools) and 7 and 10
(within secondary schools). The information sheets provided parents with the
precise details of the study, including how and when data was going to be
collected and what would be done with this data once collected. An opt-out form
was provided at this stage so parents not wishing for their child to be included in
the study could withdraw. The opt-out forms were either returned directly to the
researcher or via the child’s school.
Teachers also received consent forms, and information letters about the study
(see appendix 4). These information letters also included the specific details of
the study, and explained what information the study was asking teachers to
provide. The opt out form allowed teachers not wishing to complete the survey
to inform the researcher directly, Teachers also received information on
precisely how to complete the survey (see appendix 5), and were encouraged
to complete the surveys on-line wherever possible. If this was not going to be
achievable then copies of the survey were either emailed (so they could be
printed) or posted so teachers could complete these on paper and return them.
A final option to aid survey completion was offering teachers the option to
complete the surveys over the telephone. Each school was given a unique
password so teachers wishing to complete the survey on-line could do so. It
was highlighted that a teacher completing the survey on behalf of any child
should be someone who knows the child well and would be able to comment on
their behaviour, positive relationships and bullying. Technical support was made
available if teachers had concerns or difficulties with the survey completion.
Schools were reminded of pupils opting out so surveys for these children were
not completed.

171
The baseline survey was open for 2 months from the middle of January to the
middle of March 2010 (see appendix 1). Teachers provided the child’s UPN,
and the first initial of the child’s first and surname in order for surveys to be
matched to the later time point and with the additional information collected for
the study. The survey included 3 sub-domains, which included items for
behaviour difficulties (the dependent variable) positive relationships and
bullying. There were additional questions on the survey which asked about a
pupil’s typical role in bullying incidents, the child’s level of SEND support and
their category of need. The child’s gender, year, date of birth were also
required.
Academic data for individual pupils involved in the project was collected
alongside the survey data. Schools were asked to provide children’s academic
achievement in English, according to the National Curriculum sub levels. This
data was sent directly to the National Strategies and was subsequently
forwarded to the researcher. These levels were converted into a standardised
point score (see Humphrey et al. 2011). Individual attendance data were
collected from the Local Authority once it had been calculated for the baseline
year of 2009/2010.
In July and August 2010, the additional variables measured within the study
were collected; these included the majority of the school level28 and individual
level29
variables, collected via the National Pupil Database, EduBase or the
School Census. The remaining variables i.e. school level overall achievement,
school level overall absence and school exclusion rates were collected from the
DfE website when this data was made available for the baseline year in
question (2009/2010).
Approximately eighteen months later in June 2011, letters were sent out again
to schools. The information that teachers received asked them to complete the
same survey for an additional time for the same pupils as at the baseline
28 School urbanicity, school size, school % FSM, school % EAL, school % SA, and school % SAP & ST, 29 Year group, season of birth, gender, ethnicity, and FSM,
172
survey. The procedure for this was equivalent to the baseline survey as
presented above.
Once the data were collected a matching procedure took place, where a pupil’s
baseline survey, was matched with their follow-up survey, and with the
additional pupil and school level variables collected. Matching was done based
on UPN provided. Once the final data base was established UPNs were deleted
in order to maintain confidentiality. Data were then analysed within SPSS using
multi-level modelling.
173
5.8 Ethics
The data collected from the present study formed part of a larger study 30
(Humphrey et al. 2011) and ethical approval was given via the University of
Manchester Ethics Committee (Ref: 09226). The ethical considerations relevant
to the present study have however been acknowledged and addressed here
and are discussed below. Recognizing the importance of these ethical
considerations and attending to them is a salient issue that ultimately enhances
the study’s quality, strength, and legitimacy.
Fully informed consent In order to gain fully informed consent from the participants within the study,
information letters were sent out to parents and teachers of the selected pupils.
These letters clearly outlined the purpose of the study, including how and what
data would be collected (see appendix 3). These letters were available in 10 of
the most commonly spoken languages within the 10 Local Authorities sampled
in the study31
. This was implemented to ensure all parents were fully informed
about the nature of the study. Teachers were also sent an information letter
explaining the nature of the study and specifically what was expected of them,
as they would be completing the surveys on behalf of their pupils. Consent was
established through an opt-out form (see appendix 4), and anyone not
completing this form consented to being part of the study.
Right to withdraw An opt-out form (see appendix 3) was presented along with the information
letter to parents available in the same 10 languages. This opt-out consent form
asked parents to sign and return, either to the school directly, or to the
University of Manchester (via telephone, email or post) if they did not wish their
child to be part of the study (and have a teacher complete a survey on behalf of
their child). It was made clear to parents at this stage that they could withdraw
from the study at any specified time in the future if they so desired, and they 30 This study was the AfA evaluation study 31 The ten languages were Arabic, Bengali, Chinese Traditional, Chinese Simplified, English, French, Gujarati, Polish, Somali & Urdu,
174
would not suffer any penalty or have to give a specific reason. A total of 217
parents returned the withdrawal form indicating they did not give consent for
their child to be involved in the study. Teachers were also given the opportunity
to withdraw from the study, (by contacting the researcher directly) and in such
as case another key adult would complete the survey for that specified child.
No teacher did contact the researcher directly to withdraw from the study.
Anonymity The design of this study initially meant it was necessary for teachers and
parents to provide some potentially identifying information about their children,
such as date of birth, unique pupil number and first letter of forename and
surname. However, this information was only necessary to allow for data to be
matched correctly, i.e. across the different survey time points within the study
and with background information collected through the school. Once the data
set was completed, this information was destroyed so pupils and school were
completely anonymous within the study.
Confidentiality Parents and teachers were informed (through the information letters) that their
answers to the questions on the survey would be kept confidential and would
not be seen by anyone outside the University of Manchester. They were also
informed that the data from the questionnaire might be published although it
would not be possible to identify individual responses from this. The raw data
for the study was kept strictly confidential and stored in a password-protected
file.
Incentives for participation No incentive was given to the parents for agreeing to their child being involved
in the study, so opting out did not result in withdrawal of a potential reward. For
teachers however, although not directly rewarded for their participation, the
school in which they worked were receiving significant funding to be part of the
AfA project, which could have affected their decision about withdrawal.
Nonetheless there were a significant number of schools that despite receiving
175
the funding still did not return any of the surveys. This suggests that funding
received was not a significant factor on whether surveys were completed or not.
Protection of Participants The role of teachers within the study could have implications concerning
participant protection. This is because teachers were ‘obliged’ to complete a
survey for the evaluation project as specified by their LA32. The pressure placed
upon teachers could have had a potentially harmful effect. They may have felt
their individual practice was being assessed through their pupils’ performances,
or feel the stress that the effectiveness of the AfA project was dependent upon
their responses. These issues were addressed by the present study as far as
possible and their potential impact reduced. Firstly, teachers were not
pressurised into completing the survey by the researcher; secondly, they were
given the choice to opt out by contacting the University directly33
; thirdly, they
were informed that their individual responses were not being analysed in
isolation; and finally, teachers were made aware that any feedback given to the
school was at a school level and completely anonymised.
Best practice The study was conducted using the guidelines and principles of best practice
laid out in the Code of Ethics and Conduct (British Psychological Society, 2009)
and the Ethical Guidelines for Educational Research (British Educational
Research Association, 2011).
32 Schools received funding for the AfA project had a requirement placed upon them by the LA that they completed surveys for the evaluation. (These surveys were used within the present study). They were however, told of the opt-out option. 33 In such a case a colleague of the teacher in question would be asked to complete the survey in their place, which may have made opting out unlikely to occur.

176
5.9 Analytical strategy
5.9.1 Introduction
The purpose of section 5.9.2 is to justify why the analyses for this study were
carried out on the primary and secondary data sets separately. Section 5.9.3
provides a brief overview of the chosen analytical strategy, which is multi-level
modelling. This section will discuss what multi-level modelling (MLM) is and a
justification for its use within the present study. In a similar vein, section 5.9.4
gives definitions for key terminology within MLM, and in doing so shows how the
models can be interpreted.
5.9.2 Primary and secondary schools
The data for the present study has been split between primary and secondary
schools. The generation of two separate and distinct analyses, which run
throughout the present study is justified by the fact that there are important and
significant differences between these school types.
Compared with secondary schools, primary schools are generally smaller in
size, both in terms of physical space and numbers of pupils on roll (DfE 2010a).
Students in primary schools often have one class teacher for a whole academic
year, whereas in secondary schools students move to different classrooms in
the day and are taught by a number of specialist teachers. Primary school
teachers generally have fewer students in total compared with secondary
teachers. Therefore each pupil they have will received a greater proportion of
their time. As a result primary teachers may know their children better, and be
more accurate in rating their behaviour, positive relationships and bullying
experiences.
In primary schools, pupils are generally together in one class throughout the
day and may know one another better than students in secondary schools. In
secondary schools however, pupils have more chance to interact with a
177
multitude of other students, and there is likely to be a wider range of students
travelling in from further away to attend the school. Finally, and perhaps most
obviously, the majority of primary schools contain pupils from 5-11 years of age
whereas secondary schools usually include pupils 11-16 (DfE 2010a).
These differences are important to note, not least as the present study is an
educational-based piece of research with a salient focus on school effects.
These differences are likely to have distinct influences on the pupils who attend
them, particularly in terms of their behaviour difficulties displayed. Furthermore,
an advantage of splitting data between primary and secondary schools, allows
the effect of different developmental stages that influence behaviour difficulties
in distinct ways to be acknowledged. Lahey & Waldman (2003) have argued
there are multiple developmental pathways for behaviour difficulties, with at
least two groups emerging. These have been termed early onset i.e. within
childhood (accounted for by the primary model) and late onset i.e. within
adolescence (accounted for in the secondary model).The causes or risk factors
associated across these levels maybe significantly different. Splitting the data
between school type is therefore essential in order to maintain a coherent and
accurate analysis throughout the study.
5.9.3 What are multi-level models?
As multi-level modelling (MLM) is a complex statistical method, (Tabachnick &
Fidell (2007), some discussion is warranted. However, due to spatial limitations,
this will be kept to a minimum for further information on the underlying theory
and mathematical explanation the reader is referred to (Rasbash, Steele,
Browne, & Goldstein, 2009).
MLM is seen as an extension of multiple regression: an analytical tool which
aims to assess how much variance in the dependent variable can be accounted
for by the independent variables measured. The difference with MLM is that
predictor variables can be accounted for across a number of levels within the
analysis (Tabachnick & Fidell 2007). For example the influence of individual
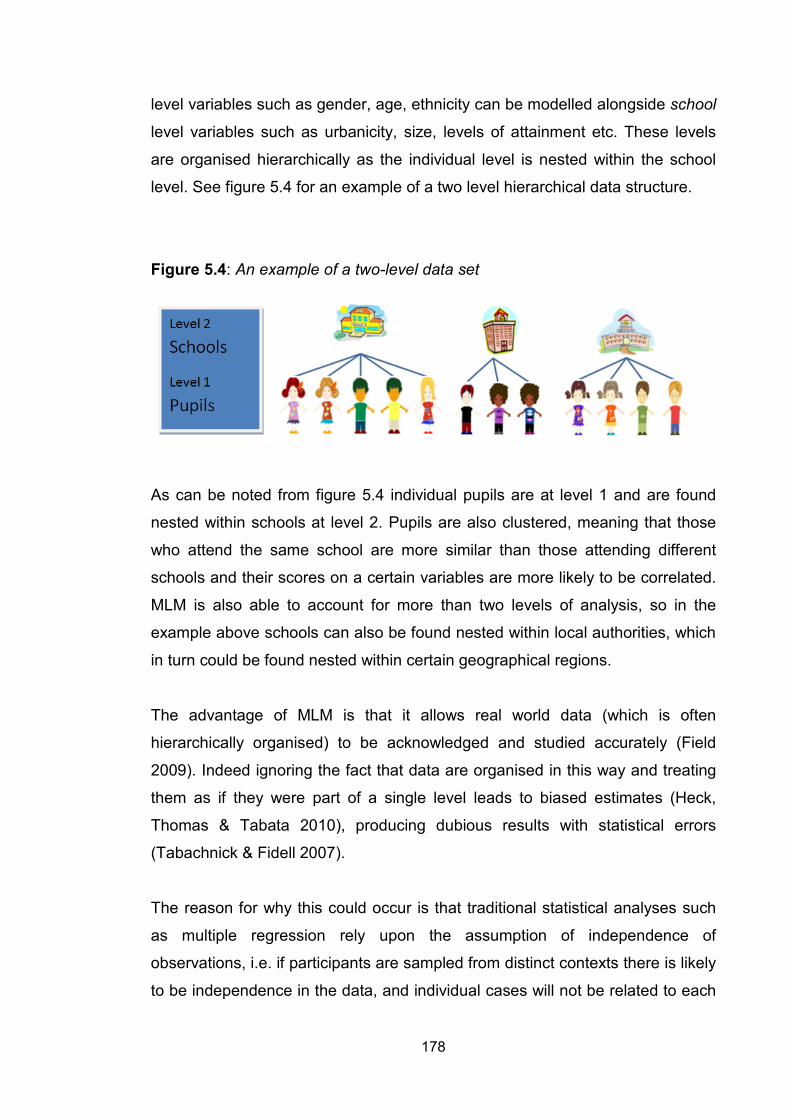
178
level variables such as gender, age, ethnicity can be modelled alongside school
level variables such as urbanicity, size, levels of attainment etc. These levels
are organised hierarchically as the individual level is nested within the school
level. See figure 5.4 for an example of a two level hierarchical data structure.
Figure 5.4: An example of a two-level data set
As can be noted from figure 5.4 individual pupils are at level 1 and are found
nested within schools at level 2. Pupils are also clustered, meaning that those
who attend the same school are more similar than those attending different
schools and their scores on a certain variables are more likely to be correlated.
MLM is also able to account for more than two levels of analysis, so in the
example above schools can also be found nested within local authorities, which
in turn could be found nested within certain geographical regions.
The advantage of MLM is that it allows real world data (which is often
hierarchically organised) to be acknowledged and studied accurately (Field
2009). Indeed ignoring the fact that data are organised in this way and treating
them as if they were part of a single level leads to biased estimates (Heck,
Thomas & Tabata 2010), producing dubious results with statistical errors
(Tabachnick & Fidell 2007).
The reason for why this could occur is that traditional statistical analyses such
as multiple regression rely upon the assumption of independence of
observations, i.e. if participants are sampled from distinct contexts there is likely
to be independence in the data, and individual cases will not be related to each
179
other in any way. Data, which are hierarchical in nature however, violate this
assumption of independence and in the case of the present study, two
individuals who attend the same school are more likely to be similar in terms of
socio demographics or attitudes than two children attending different schools
(Field 2009, Heck et al. 2010). MLM is therefore able to account for this inherent
clustering or dependency within the data and factors in the importance of
contextual variables (i.e. school level variables) (Field 2009). MLM is then able
to account for individual scores by adjusting for school differences and also
predict school scores by accounting for the individuals within the school
(Tabachnick & Fidell 2007).
Using MLM allows predictor variables to be included at each level of the
analysis and also breaks down the variance in the dependent variable to the
various levels of interest within the study. Portioning variance in this way to the
different levels within the study is the first step of the analysis, before searching
for the significant predictors (Heck et al. 2010). The statistic that measures this
has been called the intraclass correlation coefficient (ICC) (see below) and can
also be seen as a measure of dependency within the data (Field 2009). It
represents the proportion of variance from total variance explained attributable
to the school and individual level. If this figure is large for the contextual level
(i.e. school level) it would suggest schools do have a large influence on
behaviour difficulties, and children who go to the same school are likely to
behave in a similar manner.
MLM is fast becoming the standard analytical procedure used within
psychological and educational research (Heck et al. 2010). It is only fairly
recently however, that this technique has become so popular, due to the
development of appropriate software programmes, enabling data to be
analysed hierarchically (Twisk 2006). MLM can be applied to numerous types of
research design (Heck et al. 2010) and as such it is deemed the most
appropriate for the present study adopting a two level (school and individual)
longitudinal design.
180
MLM is being used with the present study as it is considered the most
appropriate and indeed the most effective analytical strategy or tool in
‘uncovering’ the salient factors involved (Twisk 2006). It was selected as it fits
the design of the study and enables the research questions to be answered in
the greatest detail. Nonetheless the emphasis of the present study remains
upon the individual children within it and how their behaviour is affected by the
various risk, promotive and protective factors. The focus persists on the
practical application of the results and the variables of interest and how they
can be generalised to other children with SEND, rather than the technique
applied which leads to the uncovering of the results.
5.9.4 How to interpret the outcome: key concepts in multi-level models
The aim of this section is to provide a basic overview of the terminology used
within a multi-level model, in order to make the outputs presented later in the
results chapter readable and interpretable.
Empty and Full models. Multi-level models are usually built up in a number of
stages (Heck et al. 2010). Firstly the empty or null model is computed where no
predictor variables are included but the amount of unexplained variance that is
attributable to each level of the analysis in the study (i.e. individual and school
levels) is recorded. This is conducted to see what proportion of variance in
behaviour difficulties lies within the individual and between schools. This figure
is the ICC (see below) giving a percentage of variance to be explained at each
level of the analysis. Secondly, the full model is generated whereby all predictor
variables are added at their relevant levels i.e. gender at the individual level and
school size at the school level. At this stage the significant predictors are noted.
The empty and full models can be compared using the -2*log likelihood statistic
(see below), with the difference between the coefficients being a measure of
total amount of variance explained.
181
Intraclass correlation coefficient (ICC) refers to the coefficients that are used to
explain the amount of unexplained variance that is ascribed to each level of
analysis. In the context of the present study this equates to the individual or
school levels, before the predictors are added. This can be converted to a
percentage at each level, and therefore equates to the proportion of variance at
each level compared to total variance explained (Heck et al. 2010).
The coefficients β signify the quantity of variance in the dependent variable,
which can be ascribed to each of the predictor variables. The values indicate
the amount of change in the dependent variable as a result of one unit change
in the predictor variable. For example a coefficient value of -0.09 in positive
relationships signifies that a 1 point increase in positive relationships would
result in a 0.09 unit decrease in behaviour difficulties. As multi-level models only
give unstandardized coefficients these need to be interpreted as raw scores
and are not directly comparable across predictors. Consequently an
understanding on the scale to which the variables are measured is essential
this has been provided in table 5.2 and 5.3, (see section 5.4.7). The advantages
of using unstandardized coefficients are that they display actual scores on the
dependent variable. The resulting coefficient is therefore an estimate of the
changes in the dependent variable as a result of one unit change in the
predictor variable (Heck et al. 2010).
The standard error refers to the average amount of variance that coefficients
vary from the mean. If the standard error is small in comparison to the
coefficient then the predictor is likely to be significant within the model.
Specifically if the standard error is multiplied by 1.96 and results in a larger
value than the coefficient, the variable will be a non-significant predictor in the
model.
The p significance statistic assesses the statistical significance of the
coefficients within the model. It can be calculated by first dividing the coefficient
by its standard error to give the t statistic which is then assessed with the
appropriate degrees of freedom to generate the p value. The t statistic and
degrees of freedom are shown in the appendices (see appendix 6 for model
182
outputs). Within psychological research p values are regarded as being
significant when they are less than .05, being reported as p <.05 however, in
the case of the present study, actual values will be acknowledged in order to
highlight any marginal non-significant but potentially important trends i.e. values
that are not less than .05 but are less than .10. There is an argument that
deciding whether a value is significant or not based upon being greater or less
than .05 is ultimately arbitrary, although this is the consistently held view within
published psychological research. P values will be recorded up to 3 decimal
places, i.e. p < .001 or p = .345 consistent with SPSS and MLwiN outputs.
The -2*log likelihood statistic provides a value taken as the overall fit of the
model. It results from the comparison of observed data with the expected
values. If the statistic has a large value this can be interpreted as a poor fitting
model as there will be major deviations from expected values (Field 2009). In
such a case the model is likely to be comprised of considerable amounts of
unexplained variance and non-significant predictors. This statistic is used to
compare across models i.e. from the empty to full model and establish the best
fitting model.
The Chi Square statistic is a measure of whether a significant difference exists
between two models. In the case of the present study, this would be between
the empty and full models by comparing the -2*log likelihood statistic. It can
therefore note whether there has been any significant change when all
predictors are included within the model.
The intercept β0ij is displayed in the heading of each multi-level model and
reflects the overall average score for the average pupil (i) within the average
school (j) before the addition of any predictor variables. A precise score for any
individual could be calculated by using this figure and adding each of the
relevant coefficients noted in the table. Standard deviations are shown in the
brackets.
183
5.10 Summary statements
This section provides a brief overview of the eight main sections included within
the methodology section.
• Theoretical perspective: this section provided a justification for framing
the study with Bronfenbrenner’s Ecological Systems Theory.
• Context: this section provided a context for the present study, giving a
brief description of the AfA evaluation study from which the present study
emerged, but justifying the present study as an independent and original
piece of research.
• Design: this section justified the use of a longitudinal quantitative
methodology using a survey to collect the data. It also provided a detail
description of the variables within the study.
• Participants: this section provided an overview of the participants within
the study, how they were sampled and how they compare with national
averages. Information was also reported on attrition rates.
• Materials: this section provided a description of the WOST and justified
its use by highlighting its psychometric properties.
• Procedure: this section gave a detailed description of the study to allow
future replication.
• Ethical issues: this section showed that the study met the basic ethical
requirements.
• Analytical strategy: this section provided a description of multi-level
modelling including the terminology used in its outputs, and also
provided a justification for its use as an analytical strategy.
184
6. Results
6.1 Introduction to chapter
In this chapter the findings of the current study are presented. For purposes of
clarity the chapter has been broken up into a number of sections. Section 6.2 is
an analysis of missing data within the study. Section 6.3 focuses on the
assumptions for multi-level modelling (the analytical strategy selected for this
study). Section 6.4 comprises research question 1 and its sub questions,
investigating risk and promotive factors for behaviour difficulties in children with
SEND. Section 6.5 comprises research question 2 and its sub questions,
investigating cumulative effects of risk on behaviour difficulties for children with
SEND. Finally Section 6.6 comprises research question 3 and its sub questions
investigating school level protective factors for behaviour difficulties in children
with SEND.
6.2 Missing data
Missing data refers to observations of any variable where no value is recorded.
It is a fairly common phenomenon within psychological and educational
research (Peugh & Endes, 2004) and a particularly salient issue within
longitudinal studies, where attrition rates can be high (Twisk & Vente, 2002).
There has been a call for studies to explicitly acknowledge missing data as
failing to account for it could lead to biases in reported results (Wilkinson 1999).
Nonetheless, many studies still do not provide any information on this issue
(Schlomer, Bauman & Card 2010).
185
A detailed missing data analysis was carried out in the present study. Due to
spatial limitations these analyses are not included within the main body of this
report; instead they appear in appendix 8.
In summary, this analysis was conducted in three phases. Phase 1 assessed
whether those participants with a valid survey34 at baseline differed from those
who did not have a valid survey at this time point. Results revealed that the
difference between the optimum sample and the sample with a baseline survey
completed can be considered comparable. Phase 2 assessed whether those
participants with a valid survey at baseline and follow-up differed from those
who had a valid survey at baseline but not at follow-up. The results revealed
that the difference between the sample with solely a valid survey at baseline
and those with a valid survey at baseline and follow-up were comparable, with
only one notable exception; that pupils attending larger schools were less likely
to have a survey completed at follow-up. Phase 3 assessed whether any
meaningful patterns in missing data existed between the final sample35
across
all the predictor variables. Results revealed that data were not missing
completely at random (MCAR), but this was likely to reflect a whole school not
completing and returning the school level data rather than being related to a
specific pupil. In conclusion, missing data is unlikely to have had a detrimental
effect upon the results found within the present study.
34 Valid surveys refer to any survey that was submitted which generated sufficient information for a behaviour difficulties mean score to be generated i.e. not more than 2 items missing. 35 Due to the longitudinal nature of this study, the final sample consisted of only those individuals with a valid survey at baseline and follow-up (with a behaviour difficulties mean at both these time points).
186
6.3 Data assumptions for Multi-Level Models
Introduction There are a number of data requirements and assumptions that are integral to
analyses of data using multi-level modelling, the majority of which are
synonymous with those of multiple regression analyses (Tabachnick & Fidell
2007). It is important to check these assumptions and interpret results in the
light of these findings, noting the possible implications they have upon the
study. Violations of these assumptions however, are fairly widespread in
psychological research, but failing to meet them weakens rather than
invalidates results generated from the data (Field 2009).
The requirements for the present study are presented below with a brief
description of the concept, followed by whether they were met in the primary
and secondary data set.
Multicollinearity Multicollinearity occurs when predictor variables are highly correlated with one
another. The acceptable limit for bivariate correlations is considered to be .7
(Tabachnick & Fidell 2007). Anything below this level can be included within a
model, but with correlations above this level one of the predictors should be
removed. Evidence of multicollinearity can also be examined more precisely
using the Variance Inflation Factor (VIF). Values greater than 10 suggest there
is multicollinearity between variables (Pallant 2010).
Primary and Secondary Models: No variable for either the primary or secondary
model exceeded the correlation of .7. The VIF statistic also showed the values
were within an acceptable range (1.020-3.511, for primary and 1.032-9.292 for
secondary) and did not exceed 10, which would display evidence of
multicollinearity. Therefore this assumption was met.
187
Normality Normality is evident in the data when the difference between the ‘observed’ and
‘expected’ values (i.e. the residuals) is normally distributed with a mean of 0.
Looking at a histogram (displaying whether the standardized residuals are
normally distributed), and the Normal P-P plot of Regression Standardised
Residuals (showing whether the values fit along a straight line) can assess the
assumption of normality.
Primary and Secondary Models: See appendix 7. Although there is some
deviation from normality and a slight positive skew for both data sets, the
histograms show evidence that residuals are approximately normally
distributed. The overall trend in the graphs shows the points fit along a straight
line, with marginal deviation from normality. Furthermore, the standardised
residual mean is 0.02 (standard deviation of 0.98) for the primary model and
0.02 (standard deviation of 0.96) for the secondary model. Therefore it can be
concluded this assumption was met.
Linearity The relationship between variables being assessed should be linear in nature,
as this is the principle underlying regression analyses. This assumption
therefore assesses whether the residuals conform to a linear relationship
(Pallant 2010). Observing the scatterplot measuring the standardised residual
versus the standardised predicted values can assess this assumption. If the
overall shape of the scatterplot is rectangular rather than curved in any degree
this displays evidence of linearity, (Tabachnick & Fiddell 2007). When linearity
cannot be inferred the overall model is weakened but not invalidated (ibid).
Primary and Secondary Models: See appendix 7. The overall pattern of the
scatterplots are rectangular in shape although a very slight deviation from this
pattern in the bottom left corner of both plots, suggesting a slight deviation from
a linear pattern.
188
Homoscedasticity Homoscedasticity assesses whether residuals have approximately equal
variances across all predicted dependent variable scores (Tabachnick & Fiddell
2007). This assumption is assessed by observing whether the points within the
scatterplot (measuring the standardised residual versus the standardised
predicted value), are approximately equal in width at all values of the expected
dependent variable scores.
Primary and Secondary Models: See appendix 7. The overall pattern of the
scatterplot shows that points on the graph are approximately equal across all
expected dependent variable scores for both models. There are slight
deviations in the bottom left corners of the graphs, although this is not
considered serious because the thinnest point on the graph is not three times
smaller than the widest point, which would signify a more serious violation of
this assumption (Tabachnick & Fidell 2007).
Independence of residuals This assumption is tested using the Durbin-Watson statistic and refers to
whether the relationship between the residuals of any two observations are
independent from one another and do not correlate (Field 2009). The Durbin-
Watson statistic varies between 0 and 4, with a value between 1 and 3 being
deemed adequate and displaying evidence of independence of residuals (ibid).
Primary and Secondary Models: The Durbin-Watson statistic was 1.856 for the
primary model and 2.028 for the secondary model therefore the data for both
models can be assumed to have independence of residuals.
Multivariate outliers An outlier is so called when the case differs considerably from the pattern or
trend within the data. Outliers can be identified in the data set by noting the
cases that the overall model predicts poorly. As 99.9% of cases should fall
between 3.29+/- (on a measure of standardized residuals) cases outside of this
range are considered outliers, (Field 2009). The Mahalanobis distance also
189
identifies multivariate outliers and specifically measures the distance between
scores and mean values of predictor variables. Cases that score above the
critical value (χ² (df 40) = 73.402, p<.001) (which is based on the number of
predictors in the model) are removed (Tabachnick & Fiddell 2007: Table C4).
Primary and Secondary Models: 12 cases in the primary and 3 cases in the
secondary model had standardised residual scores above the critical level and
were therefore removed. 114 cases in primary and 52 cases in secondary had
a score above the critical value of the Mahalanobis distance and were also
removed from the model.
Influential cases Influential cases refer to those that have an excessive influence on a model’s
predictions. Cook’s distance measures the influence of each case on the model;
values above 1 are cause for concern (Field 2009).
Primary and Secondary Models: Cook’s distance showed all cases within both
models had scores less than 1, suggesting no cases had an excessive
influence on the model’s predictions.
Random intercepts This assumption is additional to that of multiple regression which states that the
random intercepts must be normally distributed around the overall model (Field
2009). The random intercepts are referring to the schools in the study.
Primary and Secondary Model: The overall pattern of the histogram showed the
intercepts are broadly normally distributed for both the primary and secondary
models, therefore meeting this requirement.
Sample size The final sample size contained 4288 participants: 2660 participants nested in
248 primary schools, and 1628 participants nested in 57 secondary schools. An
analysis was undertaken to assess whether the number of participants and
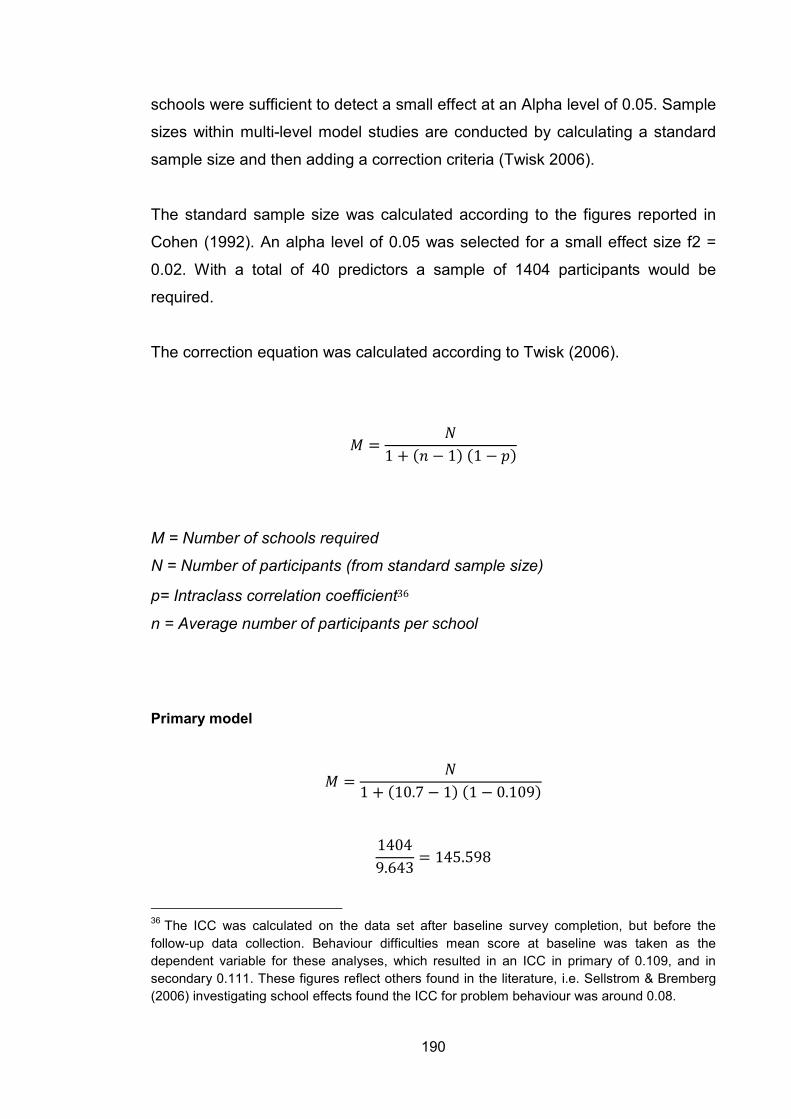
190
schools were sufficient to detect a small effect at an Alpha level of 0.05. Sample
sizes within multi-level model studies are conducted by calculating a standard
sample size and then adding a correction criteria (Twisk 2006).
The standard sample size was calculated according to the figures reported in
Cohen (1992). An alpha level of 0.05 was selected for a small effect size f2 =
0.02. With a total of 40 predictors a sample of 1404 participants would be
required.
The correction equation was calculated according to Twisk (2006).
𝑀 =𝑁
1 + (𝑛 − 1) (1 − 𝑝)
M = Number of schools required
N = Number of participants (from standard sample size)
p= Intraclass correlation coefficient36
n = Average number of participants per school
Primary model
𝑀 =𝑁
1 + (10.7 − 1) (1 − 0.109)
14049.643
= 145.598
36 The ICC was calculated on the data set after baseline survey completion, but before the follow-up data collection. Behaviour difficulties mean score at baseline was taken as the dependent variable for these analyses, which resulted in an ICC in primary of 0.109, and in secondary 0.111. These figures reflect others found in the literature, i.e. Sellstrom & Bremberg (2006) investigating school effects found the ICC for problem behaviour was around 0.08.

191
At least 1404 participants and 146 schools are needed within the primary model
to obtain a small effect size at .05 level. The final primary model contained 2660
participants and 248 schools and therefore the sample size was sufficient for
the analyses
Secondary model
𝑀 =𝑁
1 + (28.6 − 1) (1 − 0.111)
1404
25.536= 54.981
At least 1404 participants and 55 schools are needed within the secondary
model to obtain a small effect size at .05 level. The secondary model contained
1628 participants and 57 schools and therefore the sample size was sufficient
for the analyses.
Floor and ceiling effects Floor and ceiling effects occur when a large percentage of the sample have
scores at the highest (ceiling) or lowest (floor) possible score of a scale. It has
been argued that where more than 15% of the sample has the highest possible
or lowest possible score, a floor or ceiling effect has occurred (Terwee et al.
2007). These can be problematic in a data set because they limit the model’s
sensitivity.
Primary and Secondary Models: In the primary model 36% of the sample
achieved a score of 0, whereas in the secondary model this was 39%. Although
these are clear floor effects within the data set, it should be pointed out that the
scale in question measures behaviour difficulties where it is expected a floor
effect should exist, as most children do not suffer with these problems.
Furthermore, floor effects can be justified as in another well validated behaviour
scale; the conduct problem scale on the Strengths and Difficulties
Questionnaire (SDQ), a floor effect of 64.2% exists on the teacher reported
measure of these problems (www.sdqinfo.org). One potential means of
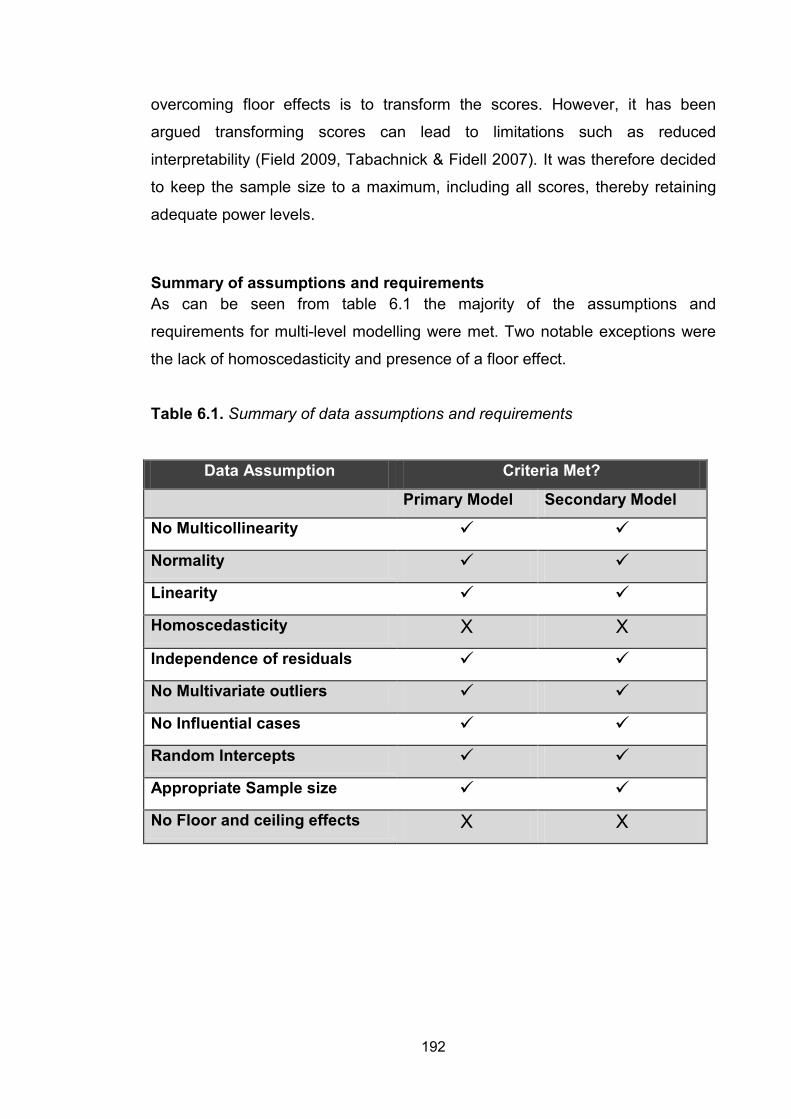
192
overcoming floor effects is to transform the scores. However, it has been
argued transforming scores can lead to limitations such as reduced
interpretability (Field 2009, Tabachnick & Fidell 2007). It was therefore decided
to keep the sample size to a maximum, including all scores, thereby retaining
adequate power levels.
Summary of assumptions and requirements As can be seen from table 6.1 the majority of the assumptions and
requirements for multi-level modelling were met. Two notable exceptions were
the lack of homoscedasticity and presence of a floor effect.
Table 6.1. Summary of data assumptions and requirements
Data Assumption Criteria Met?
Primary Model Secondary Model
No Multicollinearity Normality Linearity Homoscedasticity Х Х
Independence of residuals No Multivariate outliers No Influential cases Random Intercepts Appropriate Sample size No Floor and ceiling effects Х Х
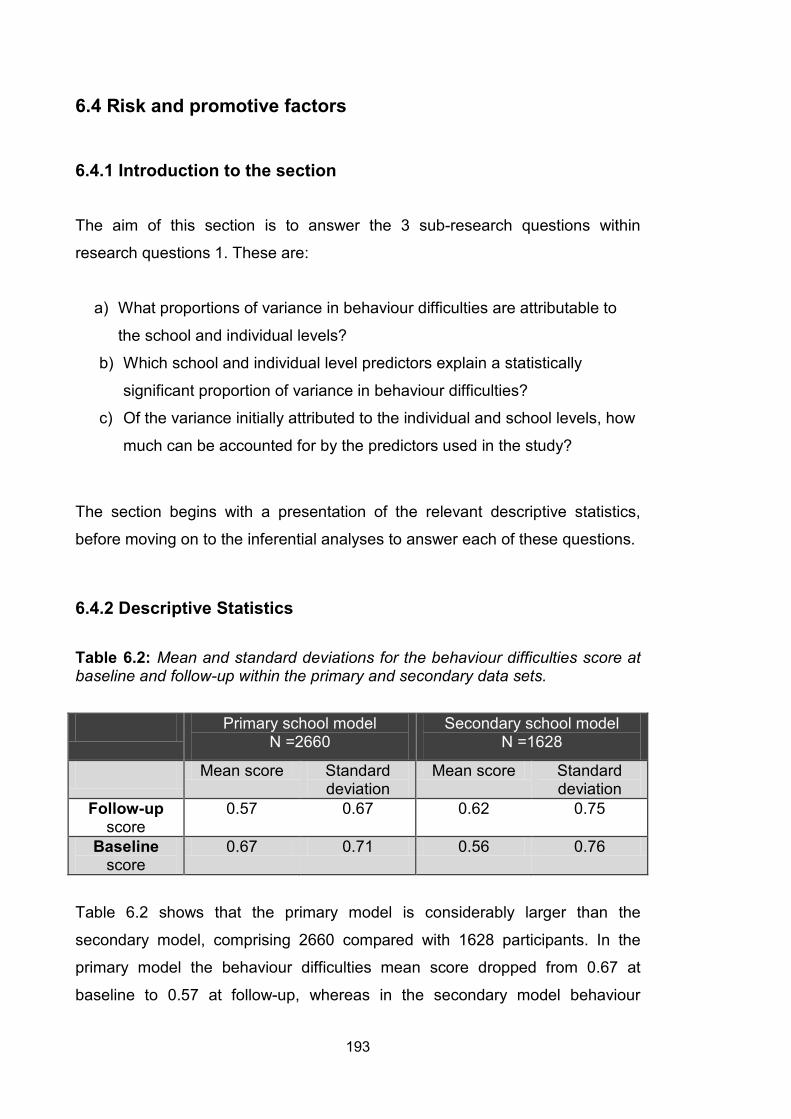
193
6.4 Risk and promotive factors
6.4.1 Introduction to the section
The aim of this section is to answer the 3 sub-research questions within
research questions 1. These are:
a) What proportions of variance in behaviour difficulties are attributable to
the school and individual levels?
b) Which school and individual level predictors explain a statistically
significant proportion of variance in behaviour difficulties?
c) Of the variance initially attributed to the individual and school levels, how
much can be accounted for by the predictors used in the study?
The section begins with a presentation of the relevant descriptive statistics,
before moving on to the inferential analyses to answer each of these questions.
6.4.2 Descriptive Statistics
Table 6.2: Mean and standard deviations for the behaviour difficulties score at baseline and follow-up within the primary and secondary data sets.
Primary school model N =2660
Secondary school model N =1628
Mean score Standard deviation
Mean score Standard deviation
Follow-up score
0.57 0.67 0.62 0.75
Baseline score
0.67 0.71 0.56 0.76
Table 6.2 shows that the primary model is considerably larger than the
secondary model, comprising 2660 compared with 1628 participants. In the
primary model the behaviour difficulties mean score dropped from 0.67 at
baseline to 0.57 at follow-up, whereas in the secondary model behaviour
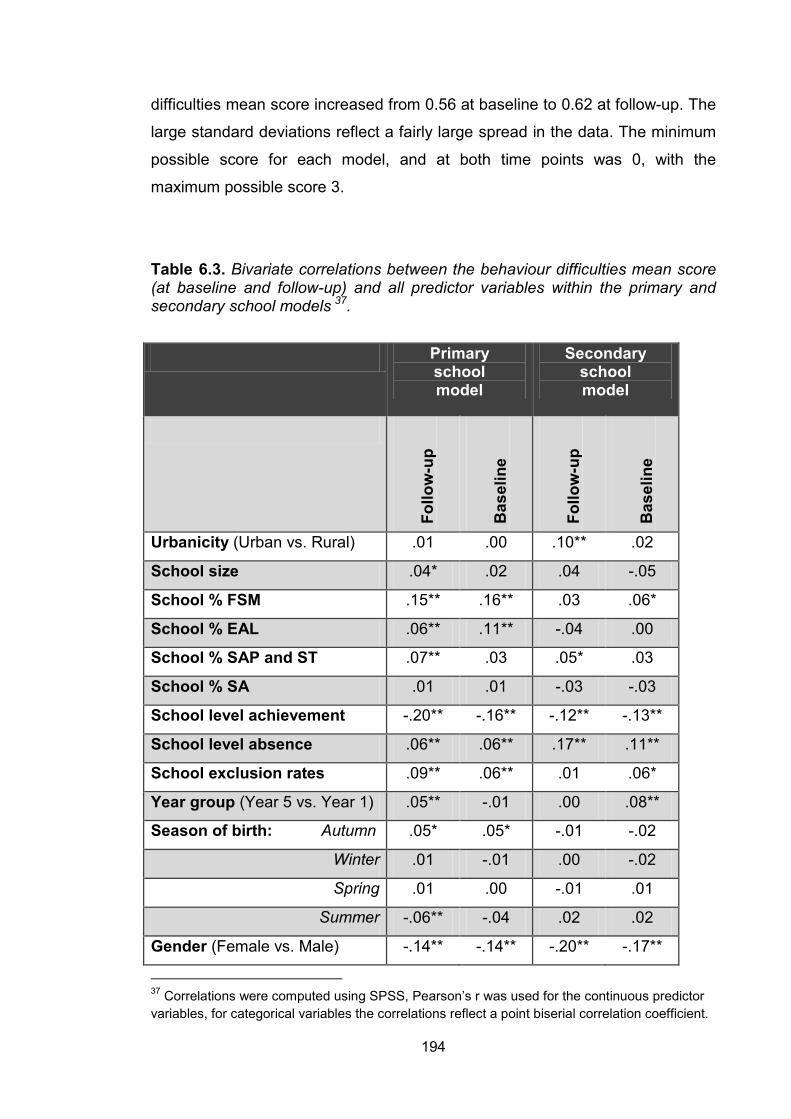
194
difficulties mean score increased from 0.56 at baseline to 0.62 at follow-up. The
large standard deviations reflect a fairly large spread in the data. The minimum
possible score for each model, and at both time points was 0, with the
maximum possible score 3.
Table 6.3. Bivariate correlations between the behaviour difficulties mean score (at baseline and follow-up) and all predictor variables within the primary and secondary school models 37
.
Primary school model
Secondary school model
Fo
llow
-up
Bas
elin
e
Follo
w-u
p
Bas
elin
e
Urbanicity (Urban vs. Rural) .01 .00 .10** .02
School size .04* .02 .04 -.05
School % FSM .15** .16** .03 .06*
School % EAL .06** .11** -.04 .00
School % SAP and ST .07** .03 .05* .03
School % SA .01 .01 -.03 -.03
School level achievement -.20** -.16** -.12** -.13**
School level absence .06** .06** .17** .11**
School exclusion rates .09** .06** .01 .06*
Year group (Year 5 vs. Year 1) .05** -.01 .00 .08**
Season of birth: Autumn .05* .05* -.01 -.02
Winter .01 -.01 .00 -.02
Spring .01 .00 -.01 .01
Summer -.06** -.04 .02 .02
Gender (Female vs. Male) -.14** -.14** -.20** -.17**
37 Correlations were computed using SPSS, Pearson’s r was used for the continuous predictor variables, for categorical variables the correlations reflect a point biserial correlation coefficient.
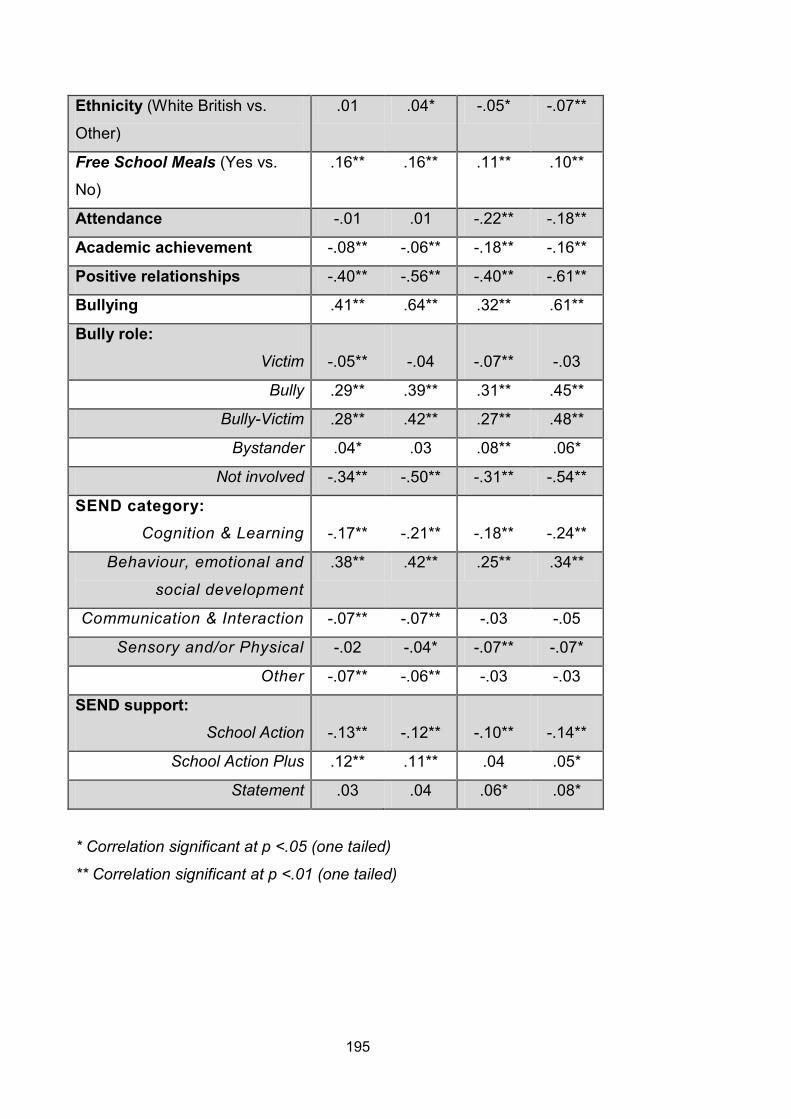
195
Ethnicity (White British vs.
Other) .01 .04* -.05* -.07**
Free School Meals (Yes vs.
No) .16** .16** .11** .10**
Attendance -.01 .01 -.22** -.18**
Academic achievement -.08** -.06** -.18** -.16**
Positive relationships -.40** -.56** -.40** -.61**
Bullying .41** .64** .32** .61**
Bully role: Victim
-.05**
-.04
-.07**
-.03
Bully .29** .39** .31** .45**
Bully-Victim .28** .42** .27** .48**
Bystander .04* .03 .08** .06*
Not involved -.34** -.50** -.31** -.54**
SEND category: Cognition & Learning
-.17**
-.21**
-.18**
-.24**
Behaviour, emotional and
social development
.38** .42** .25** .34**
Communication & Interaction -.07** -.07** -.03 -.05
Sensory and/or Physical -.02 -.04* -.07** -.07*
Other -.07** -.06** -.03 -.03
SEND support: School Action
-.13**
-.12**
-.10**
-.14**
School Action Plus .12** .11** .04 .05*
Statement .03 .04 .06* .08*
* Correlation significant at p <.05 (one tailed)
** Correlation significant at p <.01 (one tailed)
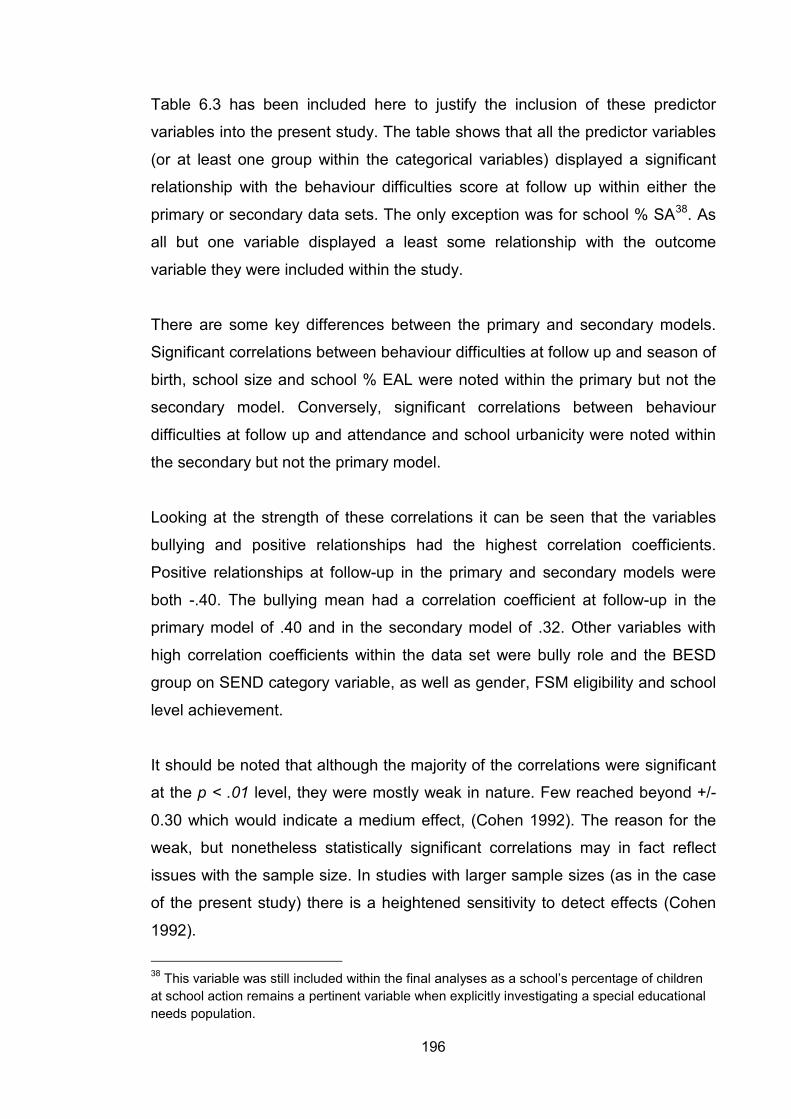
196
Table 6.3 has been included here to justify the inclusion of these predictor
variables into the present study. The table shows that all the predictor variables
(or at least one group within the categorical variables) displayed a significant
relationship with the behaviour difficulties score at follow up within either the
primary or secondary data sets. The only exception was for school % SA38
. As
all but one variable displayed a least some relationship with the outcome
variable they were included within the study.
There are some key differences between the primary and secondary models.
Significant correlations between behaviour difficulties at follow up and season of
birth, school size and school % EAL were noted within the primary but not the
secondary model. Conversely, significant correlations between behaviour
difficulties at follow up and attendance and school urbanicity were noted within
the secondary but not the primary model.
Looking at the strength of these correlations it can be seen that the variables
bullying and positive relationships had the highest correlation coefficients.
Positive relationships at follow-up in the primary and secondary models were
both -.40. The bullying mean had a correlation coefficient at follow-up in the
primary model of .40 and in the secondary model of .32. Other variables with
high correlation coefficients within the data set were bully role and the BESD
group on SEND category variable, as well as gender, FSM eligibility and school
level achievement.
It should be noted that although the majority of the correlations were significant
at the p < .01 level, they were mostly weak in nature. Few reached beyond +/-
0.30 which would indicate a medium effect, (Cohen 1992). The reason for the
weak, but nonetheless statistically significant correlations may in fact reflect
issues with the sample size. In studies with larger sample sizes (as in the case
of the present study) there is a heightened sensitivity to detect effects (Cohen
1992).
38 This variable was still included within the final analyses as a school’s percentage of children at school action remains a pertinent variable when explicitly investigating a special educational needs population.
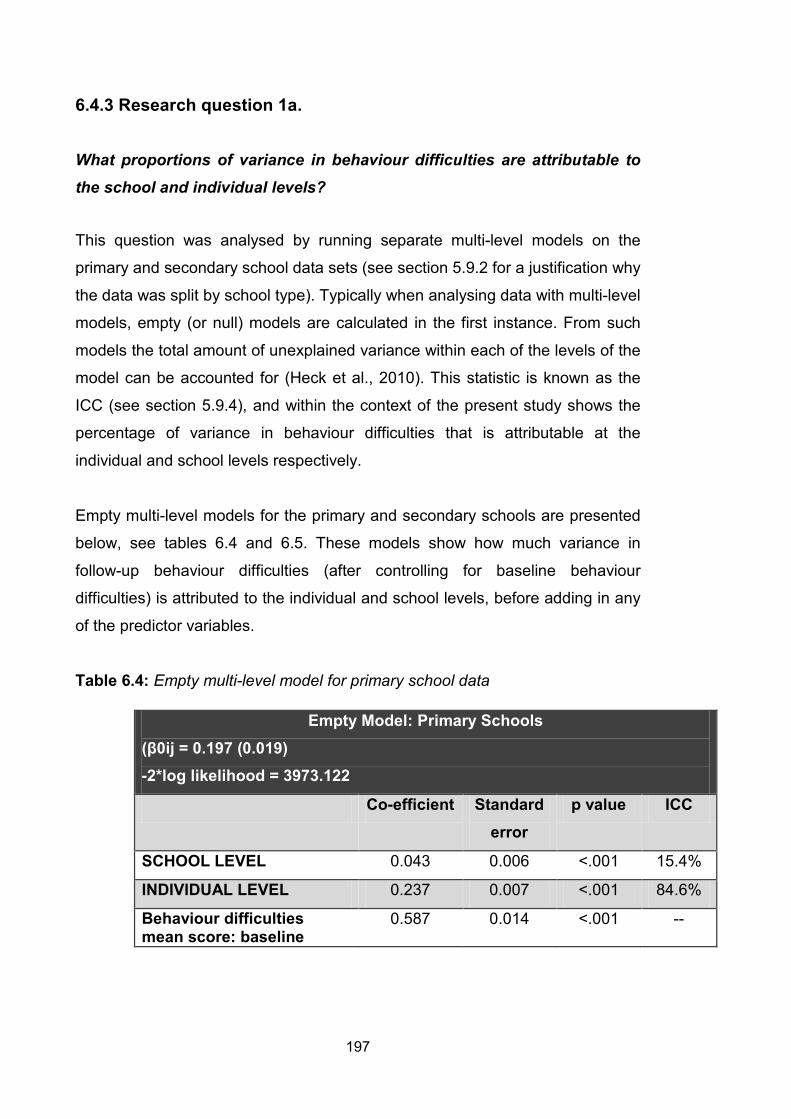
197
6.4.3 Research question 1a.
What proportions of variance in behaviour difficulties are attributable to the school and individual levels?
This question was analysed by running separate multi-level models on the
primary and secondary school data sets (see section 5.9.2 for a justification why
the data was split by school type). Typically when analysing data with multi-level
models, empty (or null) models are calculated in the first instance. From such
models the total amount of unexplained variance within each of the levels of the
model can be accounted for (Heck et al., 2010). This statistic is known as the
ICC (see section 5.9.4), and within the context of the present study shows the
percentage of variance in behaviour difficulties that is attributable at the
individual and school levels respectively.
Empty multi-level models for the primary and secondary schools are presented
below, see tables 6.4 and 6.5. These models show how much variance in
follow-up behaviour difficulties (after controlling for baseline behaviour
difficulties) is attributed to the individual and school levels, before adding in any
of the predictor variables.
Table 6.4: Empty multi-level model for primary school data
Empty Model: Primary Schools (β0ij = 0.197 (0.019) -2*log likelihood = 3973.122
Co-efficient Standard error
p value ICC
SCHOOL LEVEL 0.043 0.006 <.001 15.4%
INDIVIDUAL LEVEL 0.237 0.007 <.001 84.6%
Behaviour difficulties mean score: baseline
0.587 0.014 <.001 --

198
As can be seen from table 6.4 a multi-level analysis showed that for the primary
model there was a significant school (µ0j = 0.043, p <.001) and individual effect
(µ0ij = 0.237, p <.001) on behaviour difficulties. The ICC showed that the overall
school variance accounted for 15.4% of total variance in follow-up behaviour
problems (after controlling for baseline behaviour), whereas 84.6% of the
variance lay at the individual level.
Table 6.5. Empty multi-level model for secondary school data
As can be seen from table 6.5 a multi-level analysis showed that for the
secondary model there was a significant school (µ0j = 0.050, p <.001) and
individual effect (µ0ij = 0.336, p <.001) on behaviour difficulties. The ICC
showed that the overall school variance accounts for 13.0% of total variance in
follow-up behaviour difficulties (after controlling for baseline behaviour
difficulties), whereas 87.0% lay at the individual level.
Empty Model: Secondary Schools (β0ij = 0.327 (0.038) -2*log likelihood = 2926.001
Co-efficient Standard error
p value ICC
SCHOOL LEVEL 0.050 0.014 <.001 13.0%
INDIVIDUAL LEVEL 0.336 0.012 <.001 87.0%
Behaviour Difficulties Mean Baseline
0.531 0.020 <.001 --
199
6.4.4 Research question 1b.
Which school and individual level predictors explain a statistically significant proportion of variance in behaviour difficulties?
The second step with multi-level models is to run a full model with all predictors
at the various levels included. From such models the significant predictors can
be acknowledged at both the individual and school levels. As before, the
behaviour difficulties mean score at follow up was the outcome, controlling for
baseline behaviour difficulties. Variables at the school level and individual level
were then added to the model. Continuous and binary variables are easily
added whereas for categorical variables with more than two groups a reference
category is required. In each case the group with the largest sample size was
selected (Field 2009). This was the ‘summer’ group, for the season of birth
variable; the ‘cognition and learning’ group for SEND category variable; ‘school
action’ for the SEND support variable; and ‘not involved’ for the bullying role
variable.
The full multi-level models indicate whether the independent variables are
significant predictors of behaviour difficulties. Variables that are significantly
related to behaviour difficulties in a positive direction, i.e. predicting increases in
these problems have been termed risk factors. The factors that are related to
behaviour difficulties in a negative direction, i.e. predicting decreases in
behaviour difficulties have been termed promotive factors.
This conceptualisation between risk and promotive factors is straightforward for
continuous variables (i.e. high attendance versus low attendance) and binary
variables (i.e. male versus female) as risk is labelled at one end and promotive
at the opposite end. The issue becomes more complex with categorical
variables with multiple groups, as these categories do not have a clearly
defined opposite group. Categorical variables are however, added to MLM by
using a reference group. Therefore, the groups within the categorical variables
that remain significantly significant and related to increases in behaviour
difficulties are noted as risk factors, (and the reference group becomes a
200
promotive factor). Alternatively the groups of the categorical variables that are
statistically significant but related to decreases in behaviour difficulties are
noted as promotive factors (and the reference group therefore becomes a risk
factor).
Two full multi-level models have been produced for the primary school data,
and two for the secondary school data. The different models have been
presented to show the effect when the SEND category variable is included and
when it is excluded from the analysis. This decision was made in order to better
understand whether BESD (one of the groups of the SEND category variable) is
a synonymous term with behaviour difficulties as measured in the present
study, or whether it is conceptually distinct. See section 2.2.9 for a further
justification for including both models.
The primary school models are display in table 6.6a and 6.6b, and the
secondary school models is table 6.7a and 6.7b. Results are compared before
a decision is taken as which full multi-level model will be selected for
interpretation for the primary data and which model will be selected for
interpretation for the secondary data.
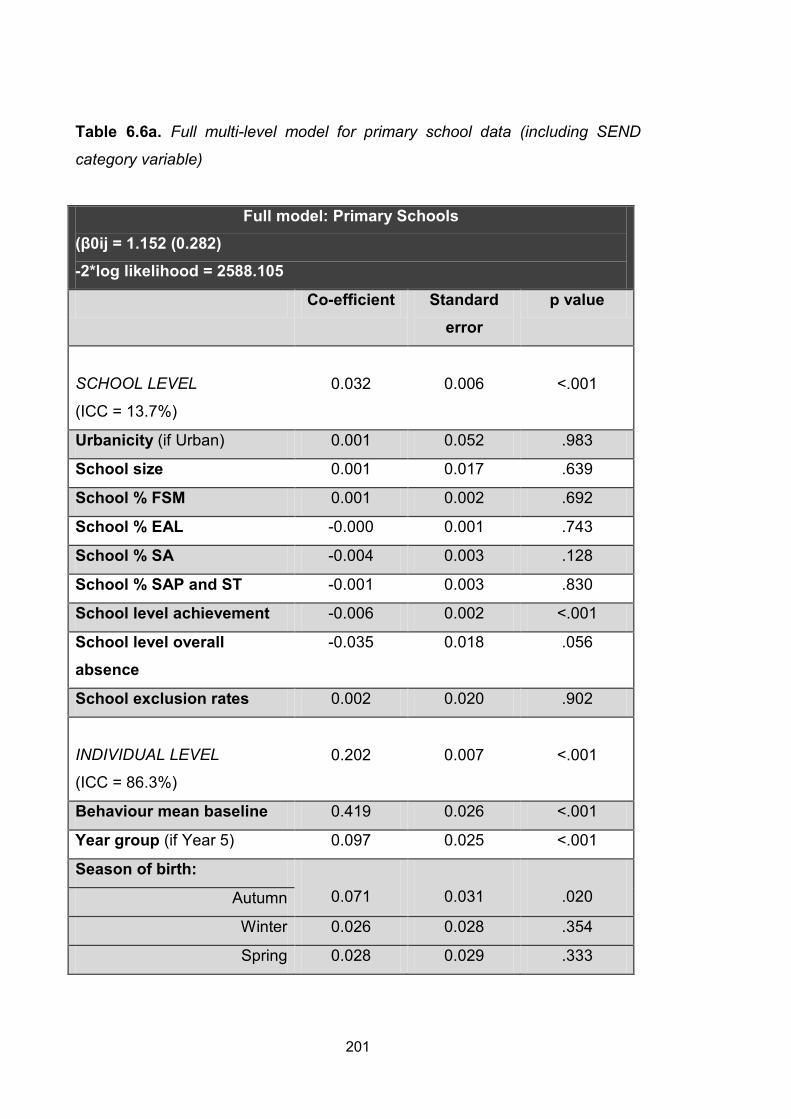
201
Table 6.6a. Full multi-level model for primary school data (including SEND
category variable)
Full model: Primary Schools (β0ij = 1.152 (0.282) -2*log likelihood = 2588.105
Co-efficient Standard error
p value
SCHOOL LEVEL
(ICC = 13.7%)
0.032
0.006
<.001
Urbanicity (if Urban) 0.001 0.052 .983
School size 0.001 0.017 .639
School % FSM 0.001 0.002 .692
School % EAL -0.000 0.001 .743
School % SA -0.004 0.003 .128
School % SAP and ST -0.001 0.003 .830
School level achievement -0.006 0.002 <.001
School level overall absence
-0.035 0.018 .056
School exclusion rates 0.002 0.020 .902
INDIVIDUAL LEVEL
(ICC = 86.3%)
0.202
0.007
<.001
Behaviour mean baseline 0.419 0.026 <.001
Year group (if Year 5) 0.097 0.025 <.001
Season of birth:
0.071
0.031
.020 Autumn
Winter 0.026 0.028 .354
Spring 0.028 0.029 .333
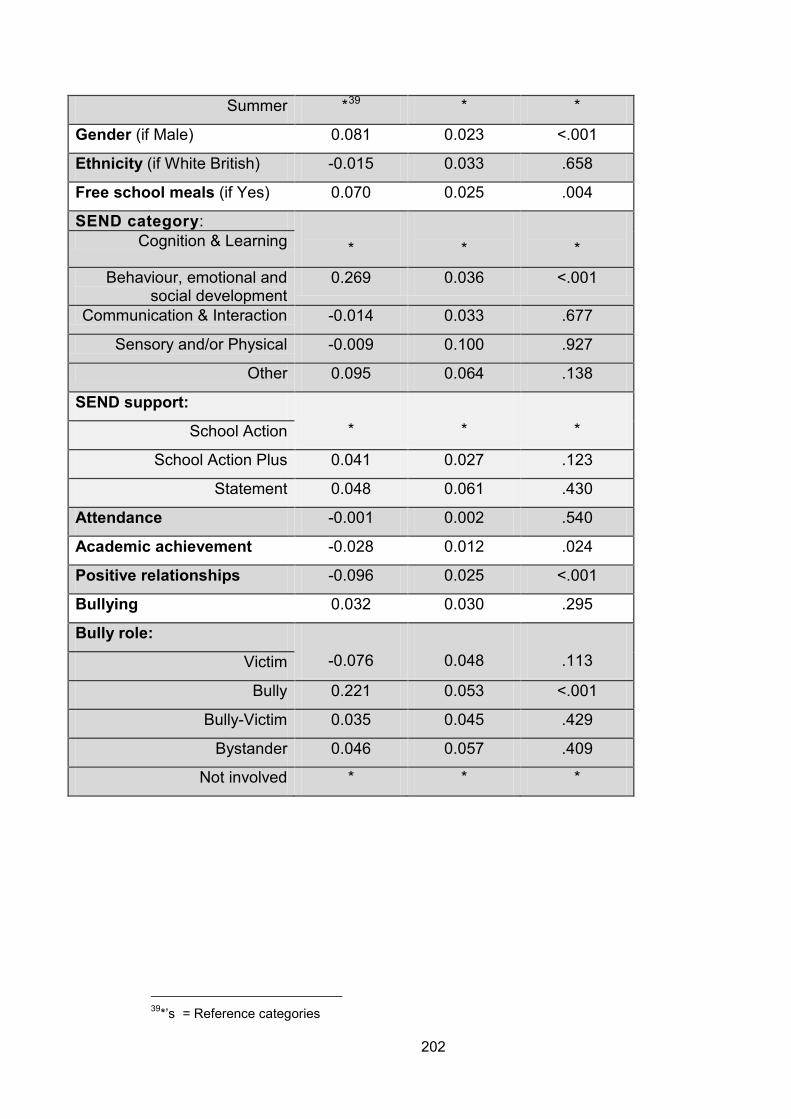
202
39*’s = Reference categories
Summer *39 * *
Gender (if Male) 0.081 0.023 <.001
Ethnicity (if White British) -0.015 0.033 .658
Free school meals (if Yes) 0.070 0.025 .004
SEND category:
*
*
* Cognition & Learning
Behaviour, emotional and social development
0.269 0.036 <.001
Communication & Interaction -0.014 0.033 .677
Sensory and/or Physical -0.009 0.100 .927
Other 0.095 0.064 .138
SEND support:
*
*
* School Action
School Action Plus 0.041 0.027 .123
Statement 0.048 0.061 .430
Attendance -0.001 0.002 .540
Academic achievement -0.028 0.012 .024
Positive relationships -0.096 0.025 <.001
Bullying 0.032 0.030 .295
Bully role:
-0.076
0.048
.113 Victim
Bully 0.221 0.053 <.001
Bully-Victim 0.035 0.045 .429
Bystander 0.046 0.057 .409
Not involved * * *
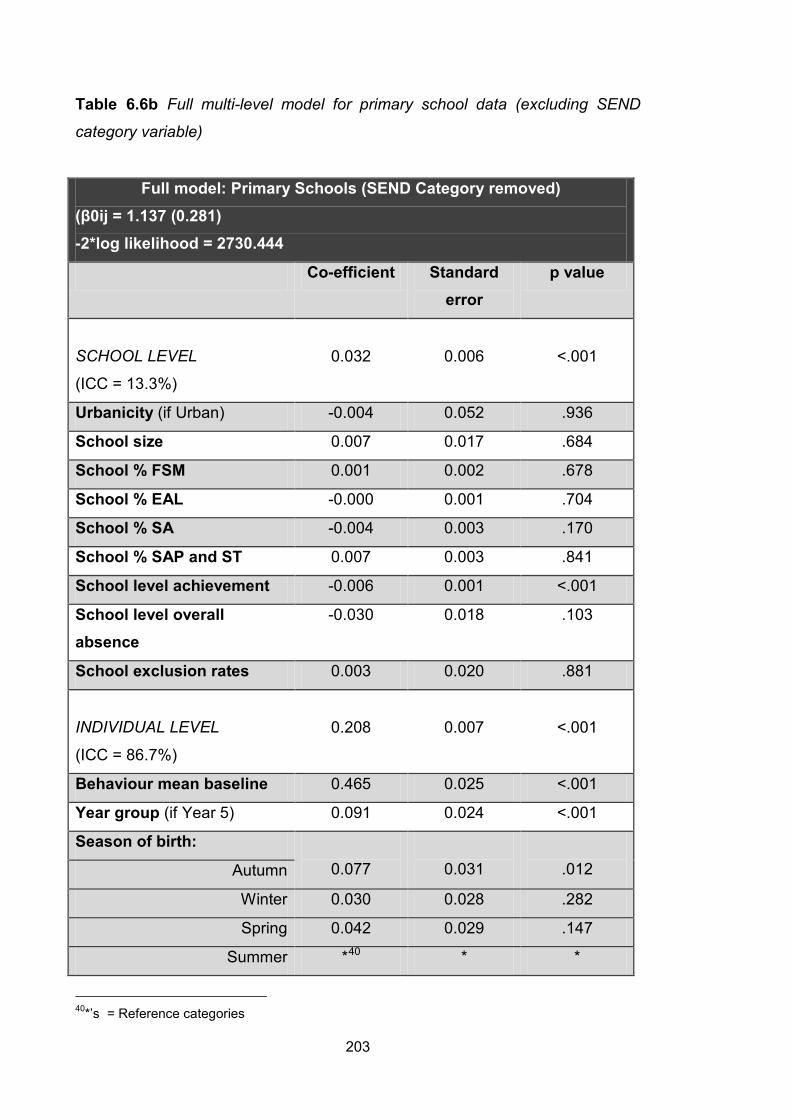
203
Table 6.6b Full multi-level model for primary school data (excluding SEND
category variable)
40*’s = Reference categories
Full model: Primary Schools (SEND Category removed) (β0ij = 1.137 (0.281) -2*log likelihood = 2730.444
Co-efficient Standard error
p value
SCHOOL LEVEL
(ICC = 13.3%)
0.032
0.006
<.001
Urbanicity (if Urban) -0.004 0.052 .936
School size 0.007 0.017 .684
School % FSM 0.001 0.002 .678
School % EAL -0.000 0.001 .704
School % SA -0.004 0.003 .170
School % SAP and ST 0.007 0.003 .841
School level achievement -0.006 0.001 <.001
School level overall absence
-0.030 0.018 .103
School exclusion rates 0.003 0.020 .881
INDIVIDUAL LEVEL
(ICC = 86.7%)
0.208
0.007
<.001
Behaviour mean baseline 0.465 0.025 <.001
Year group (if Year 5) 0.091 0.024 <.001
Season of birth:
0.077
0.031
.012 Autumn
Winter 0.030 0.028 .282
Spring 0.042 0.029 .147
Summer *40 * *
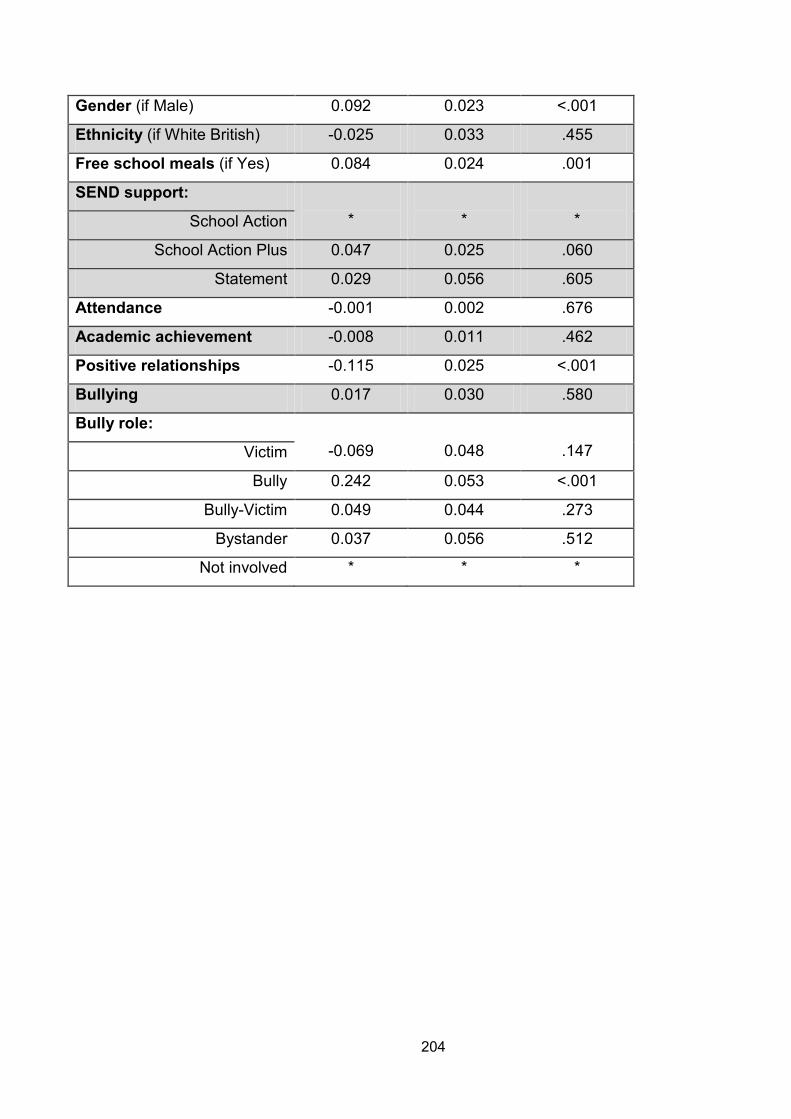
204
Gender (if Male) 0.092 0.023 <.001
Ethnicity (if White British) -0.025 0.033 .455
Free school meals (if Yes) 0.084 0.024 .001
SEND support:
*
*
* School Action
School Action Plus 0.047 0.025 .060
Statement 0.029 0.056 .605
Attendance -0.001 0.002 .676
Academic achievement -0.008 0.011 .462
Positive relationships -0.115 0.025 <.001
Bullying 0.017 0.030 .580
Bully role:
-0.069
0.048
.147 Victim
Bully 0.242 0.053 <.001
Bully-Victim 0.049 0.044 .273
Bystander 0.037 0.056 .512
Not involved * * *
205
Model comparison: Primary schools Comparing between the models (when SEND category variable is included and
excluded), the results are fairly similar; all but one predictor variable remained
significant in both models. This variable academic achievement was significant
when the SEND category variable was included (β0ij = -0.028, p < 0.024)
although failed to reach significance when it was excluded (β0ij = -0.008, p <
0.462). This suggests there is a confounding relationship between SEND
category and academic achievement, with academic achievement only being a
risk factor when SEND category is acknowledged. For all other variables there
was minimal change in the strength of the coefficients between these two
models. None of these coefficients either became significant or ceased being
significant when the SEND category variable was removed.
Table 6.6a shows that when the SEND category variable was included in the
analyses it became a significant predictor of behaviour difficulties; specifically
being in the BESD group was related to significantly higher behaviour difficulties
(β0ij = 0.269, p < .001). This is not a surprisingly finding and provides evidence
that the dependent variable in the present study i.e. behaviour difficulties, is
strongly related to a SEND measure of behaviour difficulties i.e. being a
member of the BESD group. As this was a significant statistical relationship,
alongside a strong theoretical reason that these concepts are broadly
measuring the same thing, (despite the BESD category potentially incorporating
children displaying internalising as well as externalising type behaviour
problems) using the SEND category variable cannot reliably be conceived as a
risk factor for behaviour difficulties. It could more appropriately be
conceptualised as an alternative measure of these problems. Indeed a child in
the BESD group is likely to display temper tantrums, be aggressive, disruptive
and defiant (DfES 2003) and these are key behaviours measured within the
present study. As SENS category is a potential confound in these models it was
removed from any further analyses, and significant results are reported from the
model with it excluded i.e. table 6.6b.
206
Final predictions (SEND category removed): Primary schools As can be seen from the above model in table 6.6b, there is one significant
predictor at the school level, school level achievement (β0j = -0.006, p < .001).
The negative coefficient shows that as school level achievement increases by
1% (i.e. improves) there is a resulting 0.006 decrease in the behaviour
difficulties mean score. This indicates that higher school achievement is a
promotive factor and lower school achievement is a risk factor for behaviour
difficulties.
There are a total of six significant predictors at the individual level. One of these
is a continuous predictor variable: positive relationships (β0ij = -0.115, p <
.001). The coefficient for this variable is negative showing that a one point
increase in this variable results in a 0.115 decrease in behaviour difficulties.
Higher levels of positive relationships are therefore a promotive factor, with
lower levels are a risk factor, for behaviour difficulties.
There were three significant binary predictor variables of behaviour difficulties.
Firstly, gender, (β0ij = 0.092 p < .001). As the coefficient was positive it shows
being male is a risk factor and being female promotive. Specifically being a
member of the risk group results in a 0.092 increase in the behaviour difficulties
mean score. Secondly, year group (β0ij = 0.091, p < .001). As the coefficient
was positive it shows being in year 5 is a risk factor and being in year 1 is
promotive. Specifically, being a member of the risk group results in a 0.091
increase in the behaviour difficulties mean score. Thirdly, FSM eligibility (β0ij =
0.084, p = .001). The coefficient was positive again, showing eligibility for FSM
is a risk factor and non-eligibility is promotive. Being a member of the risk group
therefore results in a 0.084 increase in the behaviour difficulties mean score.
Finally, two categorical variables emerged as significant predictors of behaviour
difficulties. Firstly, season of birth (β0ij = 0.077, p = .012). This variable showed
that being born in the autumn was a risk factor and the reference category
being born in the summer is promotive. Being a member of the risk group
therefore results in a 0.077 increase in the behaviour difficulties mean score.
Secondly, bullying role was noted as a significant predictor, with being classified
207
as a bully a risk factor (β0ij = 0.242, p < .001). The behaviour difficulties mean
score increasing by 0.242 for those in this group. The reference category was
not involved in bullying which is therefore a promotive factor.
Finally, the coefficient for baseline behaviour difficulties was significant (β0ij =
0.465, p < .001), showing that behaviour difficulties at baseline are a powerful
predictor of later behaviour difficulties at follow-up. As this score was used as a
control in the model, variables that explain follow-up behaviour beyond
controlling for baseline are particularly salient.
The coefficients presented above for the different predictor variables can be
treated as effect sizes. It should be pointed out that the majority are fairly small
in magnitude. This means that large changes on the predictor variables may
only bring about relatively small changes in behaviour difficulties displayed.
Each coefficient however, needs to be interpreted independently on the scale
on which it was measured (see table 5.2), in order to assess its importance in
accounting for behaviour difficulties. Indeed it should be recalled here that the
behaviour difficulties mean score was measured on a scale from 0-3. The risk
and promotive factors are summarised in figures 6.1 and 6.2.
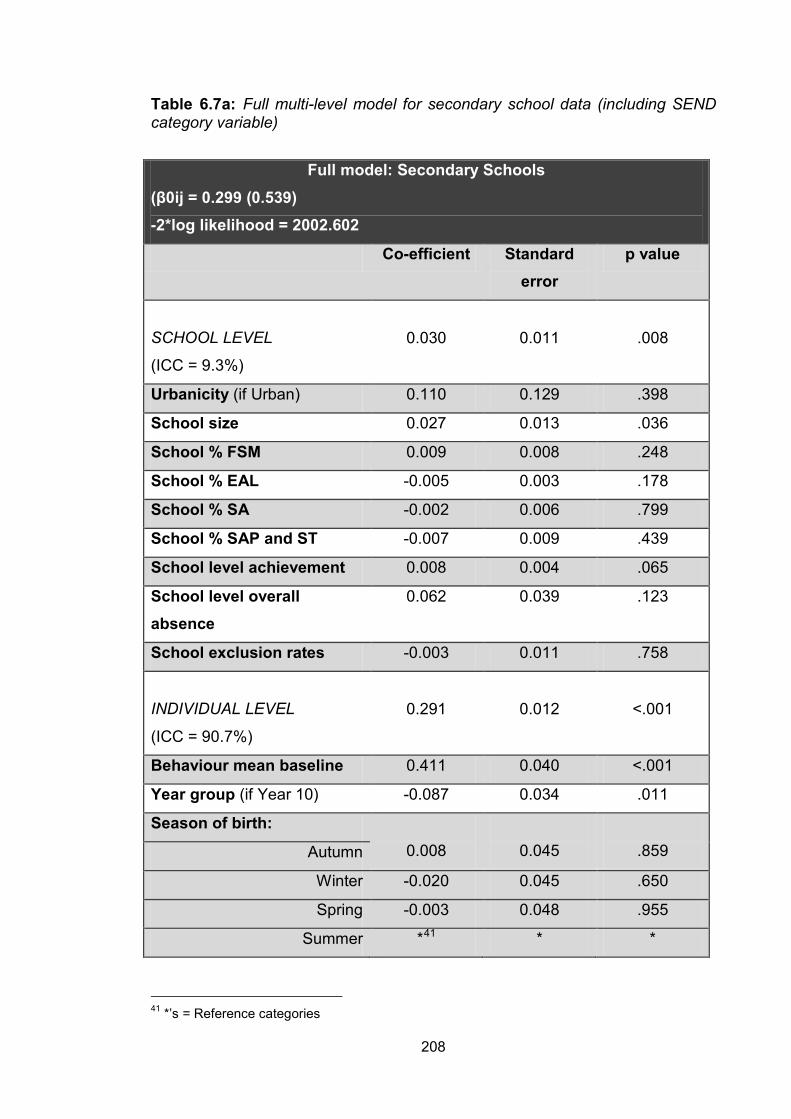
208
Table 6.7a: Full multi-level model for secondary school data (including SEND category variable)
41 *’s = Reference categories
Full model: Secondary Schools (β0ij = 0.299 (0.539) -2*log likelihood = 2002.602
Co-efficient Standard error
p value
SCHOOL LEVEL
(ICC = 9.3%)
0.030
0.011
.008
Urbanicity (if Urban) 0.110 0.129 .398
School size 0.027 0.013 .036
School % FSM 0.009 0.008 .248
School % EAL -0.005 0.003 .178
School % SA -0.002 0.006 .799
School % SAP and ST -0.007 0.009 .439
School level achievement 0.008 0.004 .065
School level overall absence
0.062 0.039 .123
School exclusion rates -0.003 0.011 .758
INDIVIDUAL LEVEL
(ICC = 90.7%)
0.291
0.012
<.001
Behaviour mean baseline 0.411 0.040 <.001
Year group (if Year 10) -0.087 0.034 .011
Season of birth:
0.008
0.045
.859 Autumn
Winter -0.020 0.045 .650
Spring -0.003 0.048 .955
Summer *41 * *
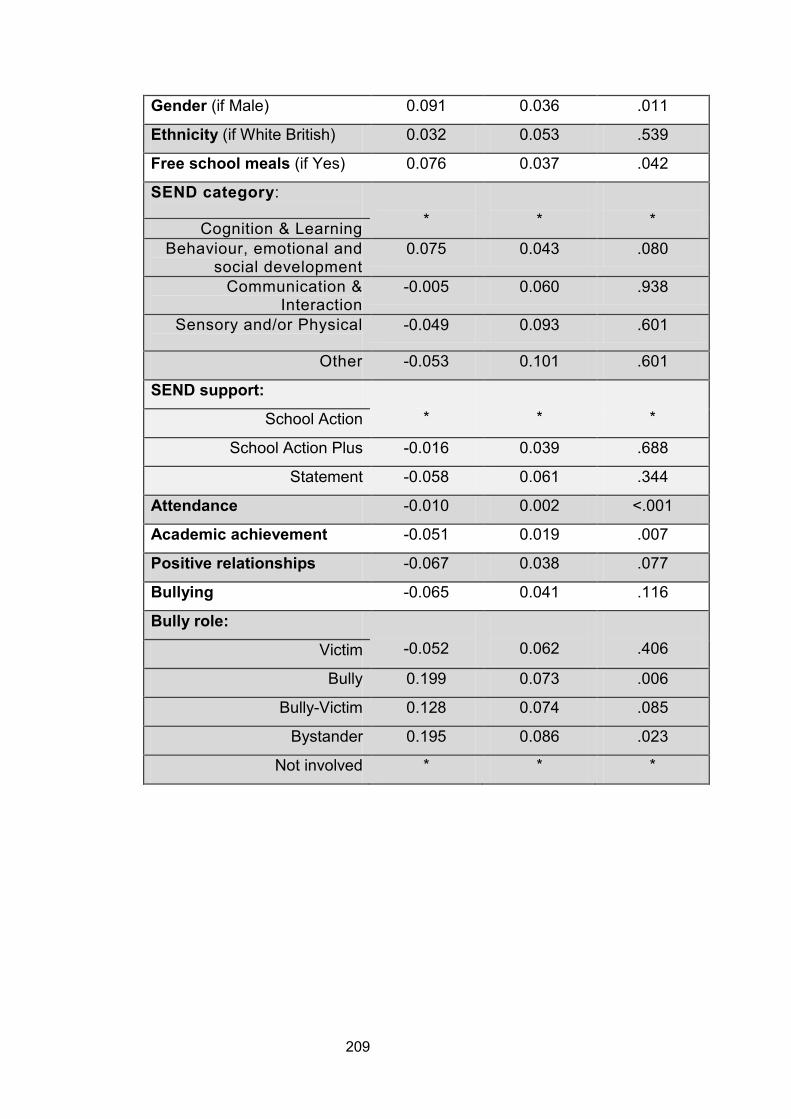
209
Gender (if Male) 0.091 0.036 .011
Ethnicity (if White British) 0.032 0.053 .539
Free school meals (if Yes) 0.076 0.037 .042
SEND category:
*
*
* Cognition & Learning Behaviour, emotional and
social development 0.075 0.043 .080
Communication & Interaction
-0.005 0.060 .938
Sensory and/or Physical
-0.049 0.093 .601
Other -0.053 0.101 .601
SEND support:
*
*
* School Action
School Action Plus -0.016 0.039 .688
Statement -0.058 0.061 .344
Attendance -0.010 0.002 <.001
Academic achievement -0.051 0.019 .007
Positive relationships -0.067 0.038 .077
Bullying -0.065 0.041 .116
Bully role:
-0.052
0.062
.406 Victim
Bully 0.199 0.073 .006
Bully-Victim 0.128 0.074 .085
Bystander 0.195 0.086 .023
Not involved * * *

210
Table 6.7b: Full multi-level model for secondary school data (excluding SEND category variable)
42 *’s = Reference categories
Full model: Secondary Schools (SEND Category removed) (β0ij = 0.262 (0.553) -2*log likelihood = 2047.946
Co-efficient Standard error
p value
SCHOOL LEVEL
(ICC = 10.3%)
0.034
0.013
.007
Urbanicity (if Urban) 0.116 0.134 .392
School size 0.031 0.013 .018
School % FSM 0.014 0.008 .092
School % EAL -0.006 0.004 .072
School % SA -0.003 0.006 .579
School % SAP and ST -0.009 0.009 .338
School level achievement 0.008 0.004 .064
School level overall absence
0.056 0.041 .174
School exclusion rates 0.004 0.011 .708
INDIVIDUAL LEVEL
(ICC = 89.7%)
0.297
0.012
<.001
Behaviour mean baseline 0.430 0.039 <.001
Year group (if Year 10) -0.092 0.034 .007
Season of birth:
0.001
0.045
.980 Autumn
Winter -0.027 0.045 .543
Spring -0.011 0.048 .814
Summer *42 * *

211
Gender (if Male) 0.092 0.036 .010
Ethnicity (if White British) 0.046 0.053 .384
Free school meals (if Yes) 0.082 0.037 .029
SEND support:
*
*
* School Action
School Action Plus -0.009 0.038 .816
Statement -0.065 0.059 .266
Attendance -0.010 0.002 <.001
Academic achievement -0.044 0.019 .017
Positive relationships -0.072 0.038 .059
Bullying -0.049 0.041 .232
Bully role:
-0.068
0.062
.271 Victim
Bully 0.189 0.072 .009
Bully-Victim 0.111 0.073 .130
Bystander 0.209 0.085 .014
Not involved * * *
212
Model comparison: Secondary schools Comparing between the models (when SEND category variable is included and
excluded), the results are fairly similar. There was no change in whether any of
the predictor variables became or ceased becoming significant as a result of
exclusion of the SEND category variable.
Table 6.7a shows a surprising finding that when the SEND category variable
was included within the analyses, being in the BESD category was not
established as a risk factor. Being in this group did approach statistical
significance, although remained a marginal non-significant trend (p = .080). One
explanation why this factor failed to emerge as significant is that the BESD
group does not only include those children who display externalising problems,
such as the behaviour difficulties measured within the present study, but also
internalising behaviours such as anxiety and depression (DfES 2003), and
these behaviours were not accounted for within the present study. Furthermore,
internalising behaviours such as anxiety and depression are more abundant in
secondary compared with primary students (Green et al. 2005), which could
account for the null finding in the secondary compared with the primary model.
If the BESD group of the SEND category variable (which is designed to include
those with behaviour difficulties), fails to become a significant predictor of these
behaviours something is not right. There is perhaps a requirement for an
overhaul of SEND categorisation, particularly around the BESD group, which is
an issue that has been recently acknowledged by the Department for
Education’s green paper entitled ‘support and aspiration: A new approach to
special educational needs and disability’ (DfE 2011c). Conceptualising the
BESD group as a predictor for behaviour difficulties is therefore not the most
useful finding. It is confounded as it does include those children displaying
behaviour difficulties as measured in the present study although alongside
internalising problems such as anxiety and depression. As such the SEND
category variable is seen more as an alternative measure of behaviour
problems rather than a risk factor. Therefore, as in the primary model this
variable was excluded from any further analyses, and significant results are
reported from the model with it excluded i.e. table 6.7b.
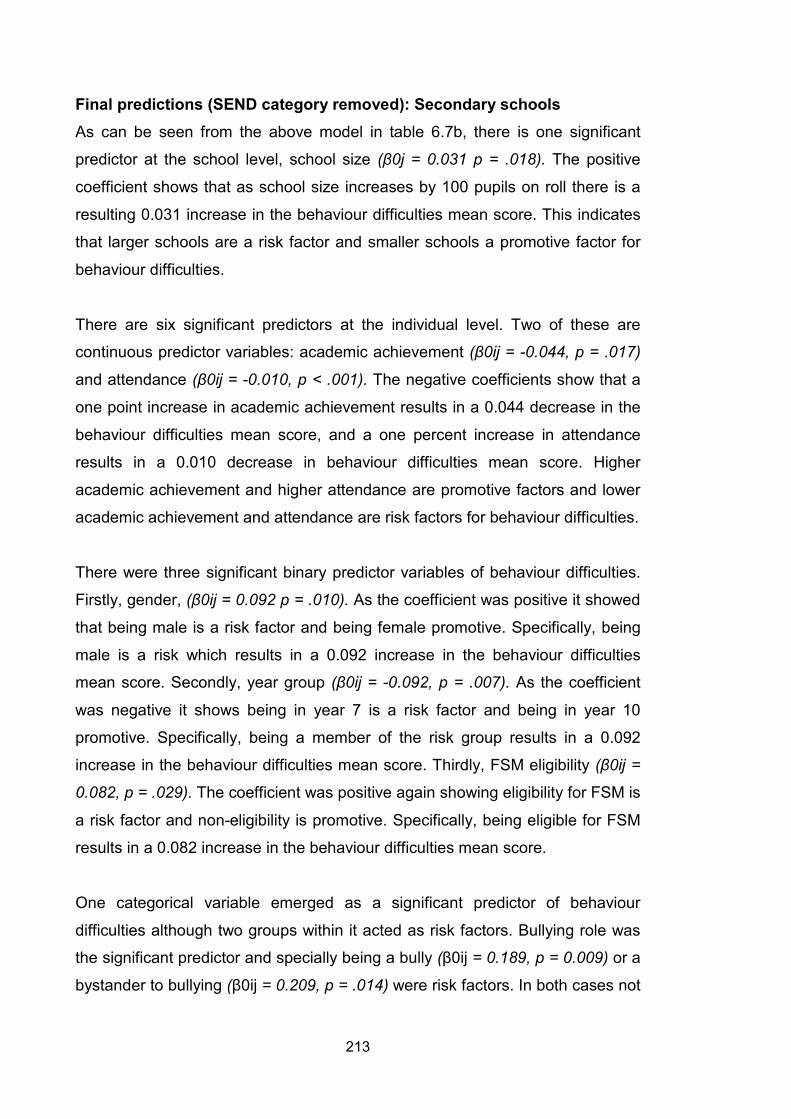
213
Final predictions (SEND category removed): Secondary schools As can be seen from the above model in table 6.7b, there is one significant
predictor at the school level, school size (β0j = 0.031 p = .018). The positive
coefficient shows that as school size increases by 100 pupils on roll there is a
resulting 0.031 increase in the behaviour difficulties mean score. This indicates
that larger schools are a risk factor and smaller schools a promotive factor for
behaviour difficulties.
There are six significant predictors at the individual level. Two of these are
continuous predictor variables: academic achievement (β0ij = -0.044, p = .017)
and attendance (β0ij = -0.010, p < .001). The negative coefficients show that a
one point increase in academic achievement results in a 0.044 decrease in the
behaviour difficulties mean score, and a one percent increase in attendance
results in a 0.010 decrease in behaviour difficulties mean score. Higher
academic achievement and higher attendance are promotive factors and lower
academic achievement and attendance are risk factors for behaviour difficulties.
There were three significant binary predictor variables of behaviour difficulties.
Firstly, gender, (β0ij = 0.092 p = .010). As the coefficient was positive it showed
that being male is a risk factor and being female promotive. Specifically, being
male is a risk which results in a 0.092 increase in the behaviour difficulties
mean score. Secondly, year group (β0ij = -0.092, p = .007). As the coefficient
was negative it shows being in year 7 is a risk factor and being in year 10
promotive. Specifically, being a member of the risk group results in a 0.092
increase in the behaviour difficulties mean score. Thirdly, FSM eligibility (β0ij =
0.082, p = .029). The coefficient was positive again showing eligibility for FSM is
a risk factor and non-eligibility is promotive. Specifically, being eligible for FSM
results in a 0.082 increase in the behaviour difficulties mean score.
One categorical variable emerged as a significant predictor of behaviour
difficulties although two groups within it acted as risk factors. Bullying role was
the significant predictor and specially being a bully (β0ij = 0.189, p = 0.009) or a
bystander to bullying (β0ij = 0.209, p = .014) were risk factors. In both cases not
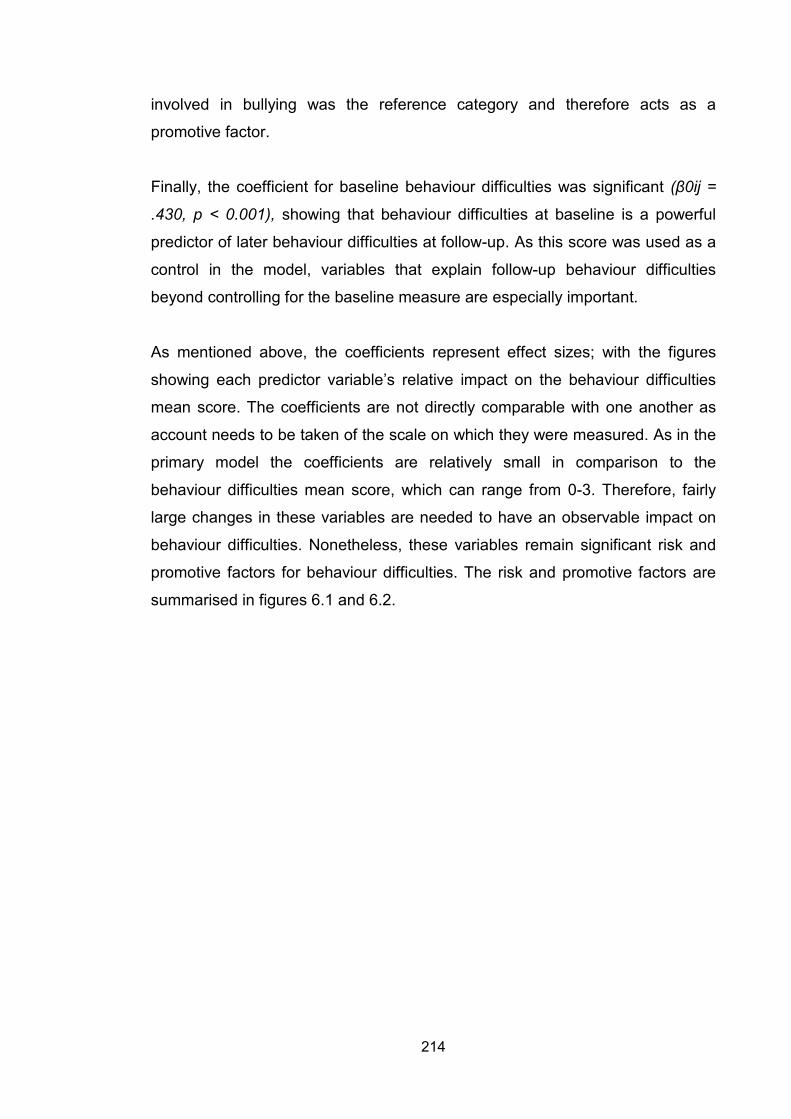
214
involved in bullying was the reference category and therefore acts as a
promotive factor.
Finally, the coefficient for baseline behaviour difficulties was significant (β0ij =
.430, p < 0.001), showing that behaviour difficulties at baseline is a powerful
predictor of later behaviour difficulties at follow-up. As this score was used as a
control in the model, variables that explain follow-up behaviour difficulties
beyond controlling for the baseline measure are especially important.
As mentioned above, the coefficients represent effect sizes; with the figures
showing each predictor variable’s relative impact on the behaviour difficulties
mean score. The coefficients are not directly comparable with one another as
account needs to be taken of the scale on which they were measured. As in the
primary model the coefficients are relatively small in comparison to the
behaviour difficulties mean score, which can range from 0-3. Therefore, fairly
large changes in these variables are needed to have an observable impact on
behaviour difficulties. Nonetheless, these variables remain significant risk and
promotive factors for behaviour difficulties. The risk and promotive factors are
summarised in figures 6.1 and 6.2.
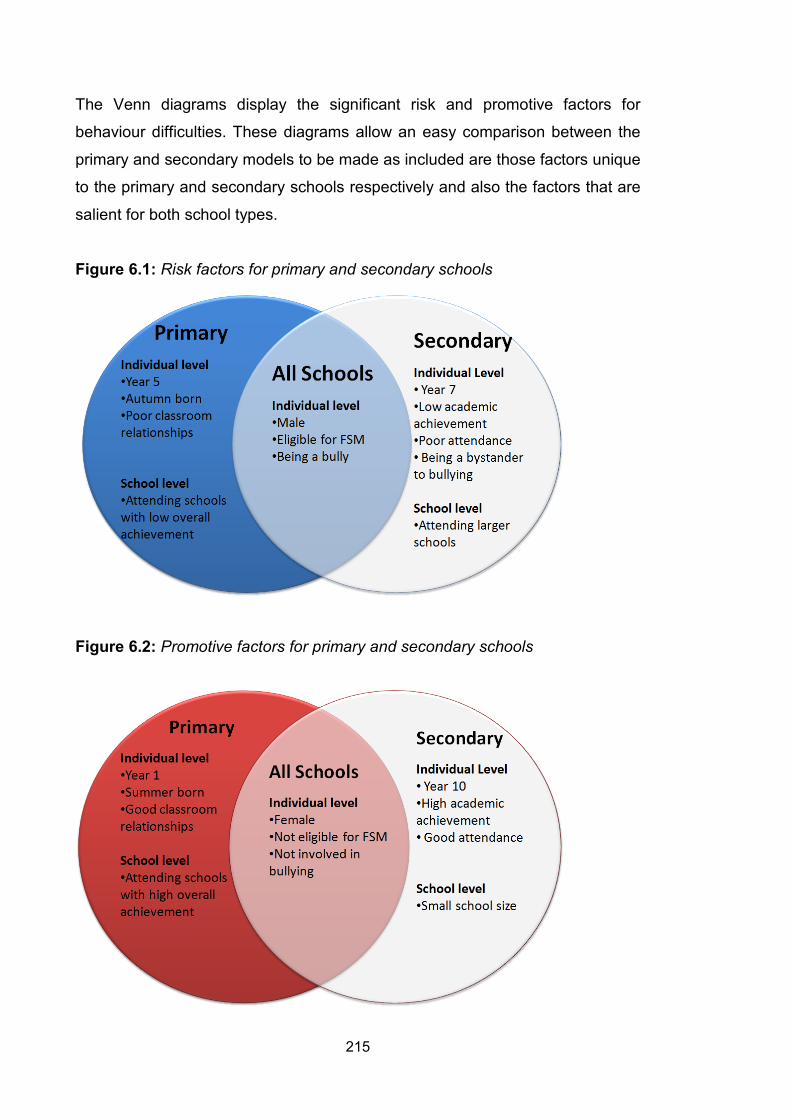
215
The Venn diagrams display the significant risk and promotive factors for
behaviour difficulties. These diagrams allow an easy comparison between the
primary and secondary models to be made as included are those factors unique
to the primary and secondary schools respectively and also the factors that are
salient for both school types.
Figure 6.1: Risk factors for primary and secondary schools
Figure 6.2: Promotive factors for primary and secondary schools
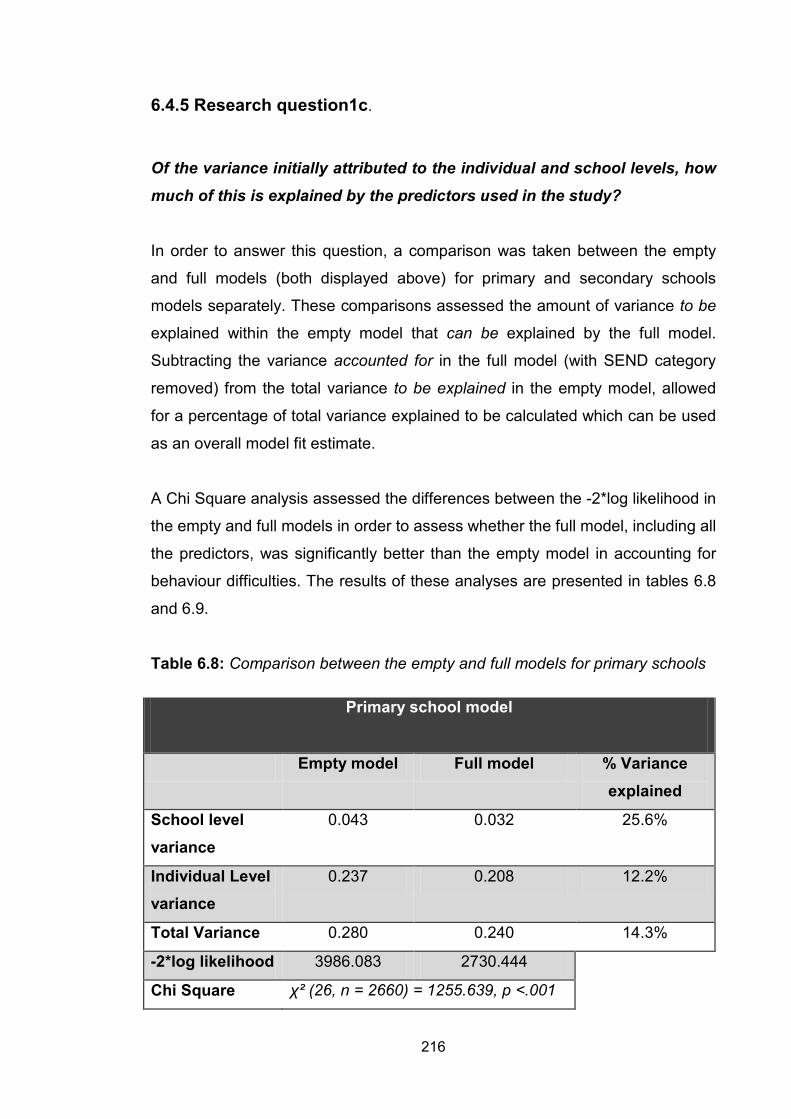
216
6.4.5 Research question1c.
Of the variance initially attributed to the individual and school levels, how much of this is explained by the predictors used in the study?
In order to answer this question, a comparison was taken between the empty
and full models (both displayed above) for primary and secondary schools
models separately. These comparisons assessed the amount of variance to be
explained within the empty model that can be explained by the full model.
Subtracting the variance accounted for in the full model (with SEND category
removed) from the total variance to be explained in the empty model, allowed
for a percentage of total variance explained to be calculated which can be used
as an overall model fit estimate.
A Chi Square analysis assessed the differences between the -2*log likelihood in
the empty and full models in order to assess whether the full model, including all
the predictors, was significantly better than the empty model in accounting for
behaviour difficulties. The results of these analyses are presented in tables 6.8
and 6.9.
Table 6.8: Comparison between the empty and full models for primary schools
Primary school model
Empty model Full model % Variance explained
School level variance
0.043 0.032 25.6%
Individual Level variance
0.237 0.208 12.2%
Total Variance 0.280 0.240 14.3%
-2*log likelihood 3986.083 2730.444
Chi Square χ² (26, n = 2660) = 1255.639, p <.001

217
The decrease in -2*log likelihood from empty to full models indicates that adding
in the predictors to the model resulted in a better model fit. This is confirmed by
the Chi Square test showing this decrease to be significant. Subtracting the
total variance accounted for in the full model from the variance to be explained
from the empty model allows a percentage of total variance that the full model
can explain to be calculated. This figure was 25.6% at the school level and
12.2% at the individual level. This equates to a total model fit of 14.3%. That is
when all the predictors were added they could explain 14.3% of the variance in
behaviour difficulties across both school and individual levels.
Table 6.9: Comparison between the empty and full models for secondary
schools
The decrease in -2*log likelihood from empty to full models indicates that adding
in the predictors to the model resulted in a better model fit. This is confirmed by
the Chi Square test showing this decrease to be significant. Subtracting the
total variance accounted for in the full model from the variance to be explained
from the empty model allows a percentage of total variance that the full model
can explain to be calculated. This figure was 32.0% at the school level and
11.6% at the individual level. This equates to a total model fit of 14.2%. That is,
when all the predictors were added they could explain 14.2% of the variance in
behaviour difficulties across both school and individual levels.
Secondary school model
Empty model Full model % Variance explained
School level variance
0.050 0.034 32.0%
Individual Level variance
0.336 0.297 11.6%
Total Variance 0.386 0.331 14.2%
-2*log likelihood 2926.001 2047.946
Chi Square χ² (26, n = 1628) = 878.055, p <.001
218
6.4.6 Summary statements
• Within the primary and secondary models both school and individual
levels significantly contributed to explaining variance in behaviour
difficulties at follow-up.
• Within both primary and secondary school models, the individual level
explains a considerably larger proportion of this variance compared with
the school level (primary = 15.4% at school level versus 84.6% at
individual level, secondary = 13.0% at school level versus 87% at
individual level).
• In the primary school model, one significant risk factor was found at the
school level: low school level achievement. Six significant risk factors
were found at the individual level. These were: being male, being born in
the autumn, being in year 5, eligible for FSM, being a bully, and having
poor positive relationships.
• In the secondary school model, large school size was the only significant
risk factor at the school level. Seven significant risk factors were found
within the individual level. These were, being male, being in year 7,
eligible for FSM, being a bully or bystander, having low academic
achievement, and poor attendance.
• The size of the coefficients are all relatively small, suggesting that large
changes in the predictor variables are needed for relatively small
changes in the behaviour difficulties mean score.
• The full primary model can account for 14.3% of total variance in
behaviour difficulties at follow-up after controlling for baseline behaviour,
whereas the full secondary model can account for 14.2%.
219
6.5 Cumulative effects of risk factors:
6.5.1 Introduction to section
The aim of this section is to answer the 3 sub-questions within research
question 2, these are:
a) Is there a cumulative effect of contextual risk factors on behaviour
difficulties, where higher numbers of risk factors present are associated
with increased levels of behaviour difficulties?
b) What is the nature of the relationship between exposure of cumulative
risk and behaviour difficulties?
c) Is the number of risks present within an individual’s background more
important than the specific types of risks in accounting for behaviour
difficulties?
The section begins with a description of how a cumulative risk score is
generated before presenting the descriptive statistics followed by each sub
question and the analysis undertaken to answer it. The section concludes with a
summary of the findings.
6.5.2 Cumulative risk score
A cumulative risk score was generated in accordance with previous studies laid
out in the literature review (see section 3.4). The first step involved selecting the
significant risk factors for behaviour difficulties highlighted in research question
1. There were a total of seven risk factors in the primary school model (6 at the
individual level and 1 at the school level) and eight risk factors within the
secondary school model (7 at the individual level and 1 at the school level).
In keeping with previous literature (Ribeaud & Eisner 2010, Deater-Deckard et
al. 1998, Atzaba-Poria et al. 2004) cumulative risk scores were generated within
a specified ecological domain, i.e. within the individual level or within the school
220
level, but not across levels. With only one significant predictor at the school
level for both primary and secondary schools it was not possible to generate a
cumulative score for at this level. Although these factors are important in
explaining variance in individual behaviour difficulties, the pertinent issue within
this section remains the cumulative effects of predictors and how they work
together within a single ecological level. Secondly only contextual risk factors
are used within cumulative risk scores (Flouri & Kallis 2007). Therefore, three
risk variables from the primary school model (i.e. gender, year group and
season of birth) and two from the secondary model (i.e. gender and year group)
were not added to the cumulative risk score but added to these models as
covariates.
The contextual risk factors in the primary model that comprise the cumulative
risk score were low positive relationships, being eligible for FSM and being a
bully. In the secondary model the contextual risk factors composed of low
academic achievement, low attendance, eligibility for FSM and being a bully or
bystander. These risk factors were therefore calculated into a cumulative risk
score. For binary and categorical variables, the group which denoted risk was
coded as 1 and all other categories as 0. For continuous variables the top (or
bottom) 25% of cases that were related to increased behaviour difficulties were
coded as 1 and other scores as 0. Risks were added together to generate a
cumulative score for each participant. Higher numbers indicated the individual
was at an increased risk.
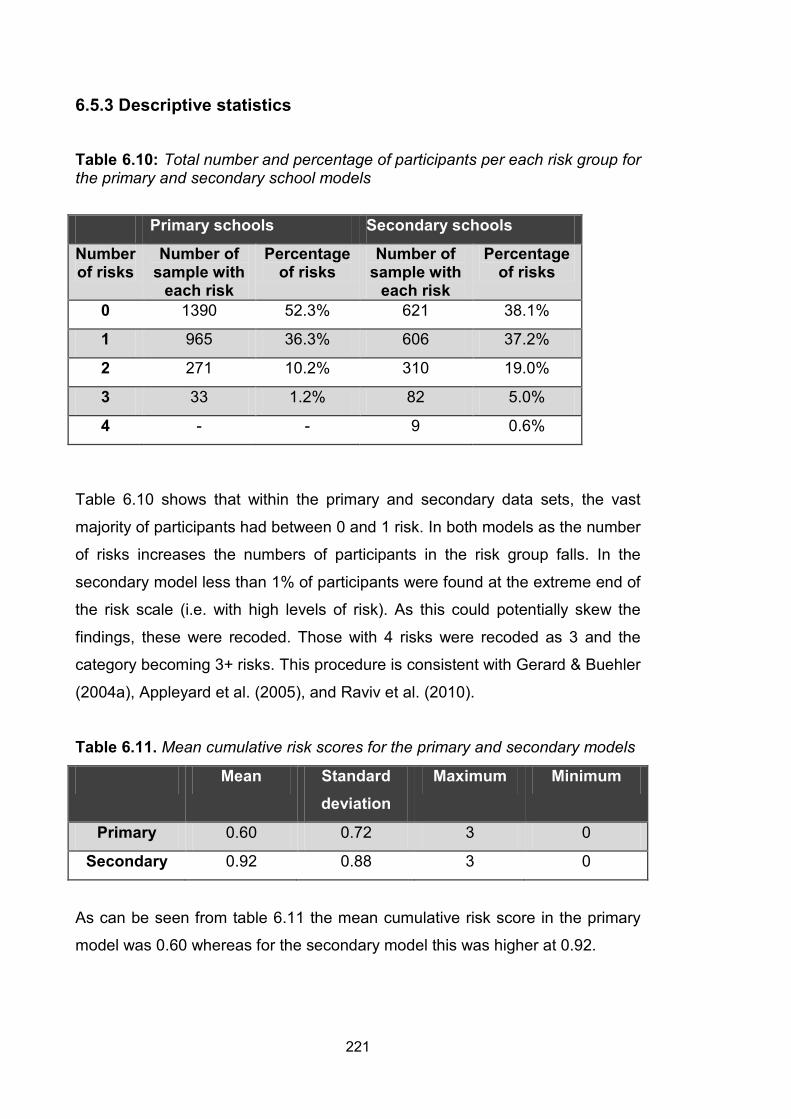
221
6.5.3 Descriptive statistics
Table 6.10: Total number and percentage of participants per each risk group for the primary and secondary school models
Table 6.10 shows that within the primary and secondary data sets, the vast
majority of participants had between 0 and 1 risk. In both models as the number
of risks increases the numbers of participants in the risk group falls. In the
secondary model less than 1% of participants were found at the extreme end of
the risk scale (i.e. with high levels of risk). As this could potentially skew the
findings, these were recoded. Those with 4 risks were recoded as 3 and the
category becoming 3+ risks. This procedure is consistent with Gerard & Buehler
(2004a), Appleyard et al. (2005), and Raviv et al. (2010).
Table 6.11. Mean cumulative risk scores for the primary and secondary models
Mean Standard deviation
Maximum Minimum
Primary 0.60 0.72 3 0
Secondary 0.92 0.88 3 0
As can be seen from table 6.11 the mean cumulative risk score in the primary
model was 0.60 whereas for the secondary model this was higher at 0.92.
Primary schools Secondary schools
Number of risks
Number of sample with
each risk
Percentage of risks
Number of sample with
each risk
Percentage of risks
0 1390 52.3% 621 38.1%
1 965 36.3% 606 37.2%
2 271 10.2% 310 19.0%
3 33 1.2% 82 5.0%
4 - - 9 0.6%
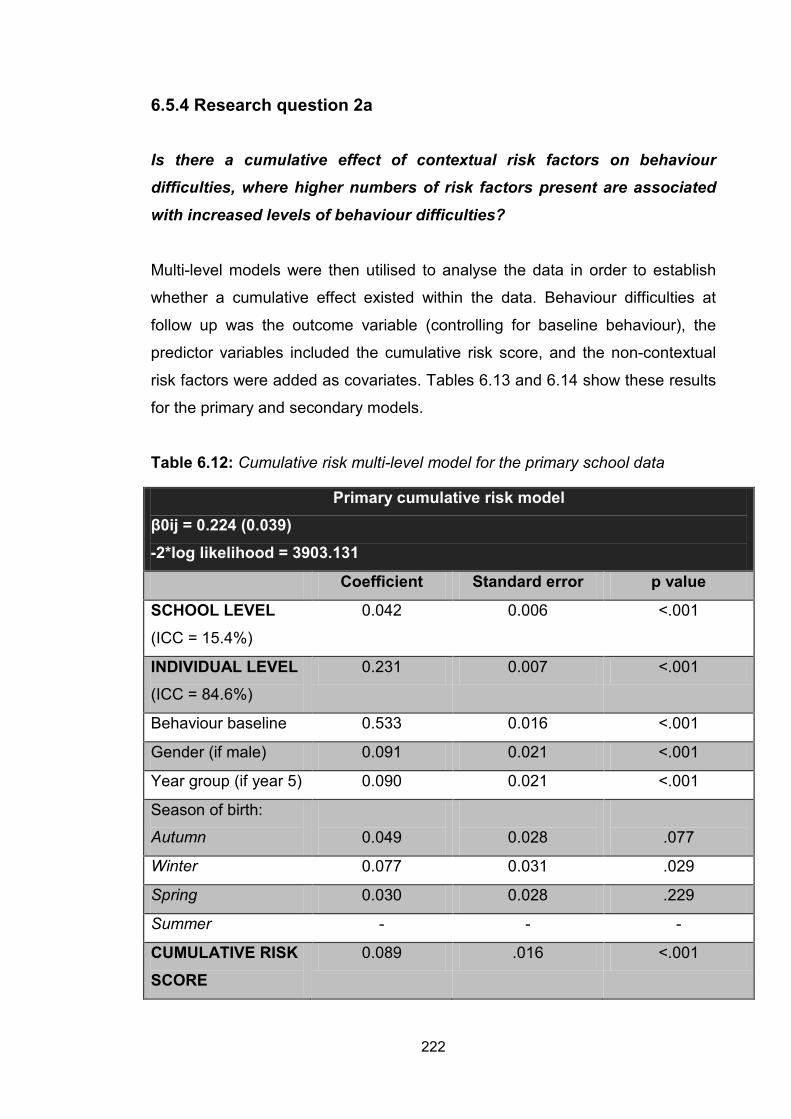
222
6.5.4 Research question 2a
Is there a cumulative effect of contextual risk factors on behaviour difficulties, where higher numbers of risk factors present are associated with increased levels of behaviour difficulties?
Multi-level models were then utilised to analyse the data in order to establish
whether a cumulative effect existed within the data. Behaviour difficulties at
follow up was the outcome variable (controlling for baseline behaviour), the
predictor variables included the cumulative risk score, and the non-contextual
risk factors were added as covariates. Tables 6.13 and 6.14 show these results
for the primary and secondary models.
Table 6.12: Cumulative risk multi-level model for the primary school data
Primary cumulative risk model β0ij = 0.224 (0.039) -2*log likelihood = 3903.131
Coefficient Standard error p value
SCHOOL LEVEL (ICC = 15.4%)
0.042 0.006 <.001
INDIVIDUAL LEVEL (ICC = 84.6%)
0.231 0.007 <.001
Behaviour baseline 0.533 0.016 <.001
Gender (if male) 0.091 0.021 <.001
Year group (if year 5) 0.090 0.021 <.001
Season of birth:
Autumn
0.049
0.028
.077
Winter 0.077 0.031 .029
Spring 0.030 0.028 .229
Summer - - -
CUMULATIVE RISK SCORE
0.089 .016 <.001

223
Table 6.13: Cumulative risk multi-level model for the secondary school data
The above two models show that the cumulative risk score is a strongly
significant predictor of behaviour difficulties for both the primary and secondary
models. Specifically a positive relationship emerges for both the primary (β0ij =
0.089, p = <.001) and secondary models. (β0ij = 0.124, p = <.001). This
evidence shows that each additional risk increases the behaviour difficulties
score at follow-up by 0.089 in primary schools and 0.124 in secondary schools.
Results therefore support the cumulative risk hypothesis and that number of
risks within an individual’s background is predictive of increased behaviour
difficulties.
Secondary cumulative risk model β0ij = 0.418 (0.061) -2*log likelihood = 2864.192
Coefficient Standard error p value
SCHOOL LEVEL (ICC = 11.4%)
0.042 0.012 <.001
INDIVIDUAL LEVEL (ICC = 88.6%)
0.325 0.012 <.001
Behaviour baseline 0.476 0.021 <.001
Gender (if male) 0.099 0.032 .002
Year group (if year 10) 0.066 0.030 .027
CUMULATIVE RISK SCORE
0.124 0.018 <.001
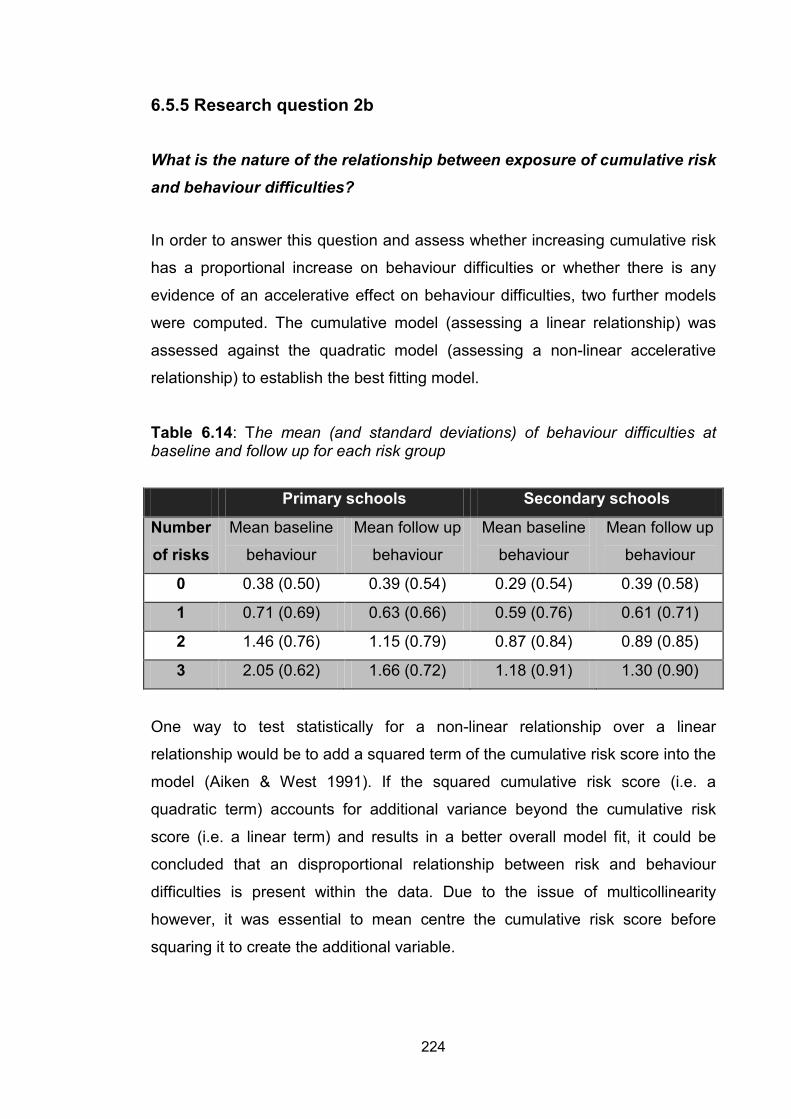
224
6.5.5 Research question 2b
What is the nature of the relationship between exposure of cumulative risk and behaviour difficulties?
In order to answer this question and assess whether increasing cumulative risk
has a proportional increase on behaviour difficulties or whether there is any
evidence of an accelerative effect on behaviour difficulties, two further models
were computed. The cumulative model (assessing a linear relationship) was
assessed against the quadratic model (assessing a non-linear accelerative
relationship) to establish the best fitting model.
Table 6.14: The mean (and standard deviations) of behaviour difficulties at baseline and follow up for each risk group
Primary schools Secondary schools
Number of risks
Mean baseline
behaviour
Mean follow up
behaviour
Mean baseline
behaviour
Mean follow up
behaviour
0 0.38 (0.50) 0.39 (0.54) 0.29 (0.54) 0.39 (0.58)
1 0.71 (0.69) 0.63 (0.66) 0.59 (0.76) 0.61 (0.71)
2 1.46 (0.76) 1.15 (0.79) 0.87 (0.84) 0.89 (0.85)
3 2.05 (0.62) 1.66 (0.72) 1.18 (0.91) 1.30 (0.90)
One way to test statistically for a non-linear relationship over a linear
relationship would be to add a squared term of the cumulative risk score into the
model (Aiken & West 1991). If the squared cumulative risk score (i.e. a
quadratic term) accounts for additional variance beyond the cumulative risk
score (i.e. a linear term) and results in a better overall model fit, it could be
concluded that an disproportional relationship between risk and behaviour
difficulties is present within the data. Due to the issue of multicollinearity
however, it was essential to mean centre the cumulative risk score before
squaring it to create the additional variable.
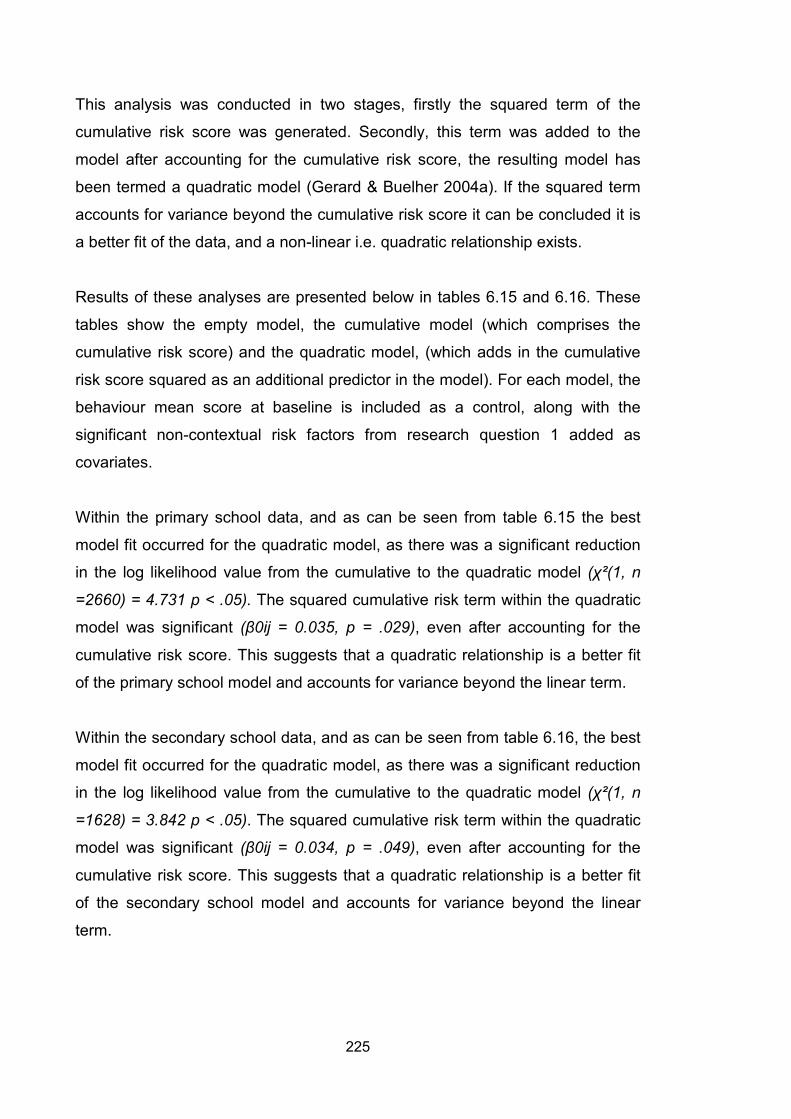
225
This analysis was conducted in two stages, firstly the squared term of the
cumulative risk score was generated. Secondly, this term was added to the
model after accounting for the cumulative risk score, the resulting model has
been termed a quadratic model (Gerard & Buelher 2004a). If the squared term
accounts for variance beyond the cumulative risk score it can be concluded it is
a better fit of the data, and a non-linear i.e. quadratic relationship exists.
Results of these analyses are presented below in tables 6.15 and 6.16. These
tables show the empty model, the cumulative model (which comprises the
cumulative risk score) and the quadratic model, (which adds in the cumulative
risk score squared as an additional predictor in the model). For each model, the
behaviour mean score at baseline is included as a control, along with the
significant non-contextual risk factors from research question 1 added as
covariates.
Within the primary school data, and as can be seen from table 6.15 the best
model fit occurred for the quadratic model, as there was a significant reduction
in the log likelihood value from the cumulative to the quadratic model (χ²(1, n
=2660) = 4.731 p < .05). The squared cumulative risk term within the quadratic
model was significant (β0ij = 0.035, p = .029), even after accounting for the
cumulative risk score. This suggests that a quadratic relationship is a better fit
of the primary school model and accounts for variance beyond the linear term.
Within the secondary school data, and as can be seen from table 6.16, the best
model fit occurred for the quadratic model, as there was a significant reduction
in the log likelihood value from the cumulative to the quadratic model (χ²(1, n
=1628) = 3.842 p < .05). The squared cumulative risk term within the quadratic
model was significant (β0ij = 0.034, p = .049), even after accounting for the
cumulative risk score. This suggests that a quadratic relationship is a better fit
of the secondary school model and accounts for variance beyond the linear
term.
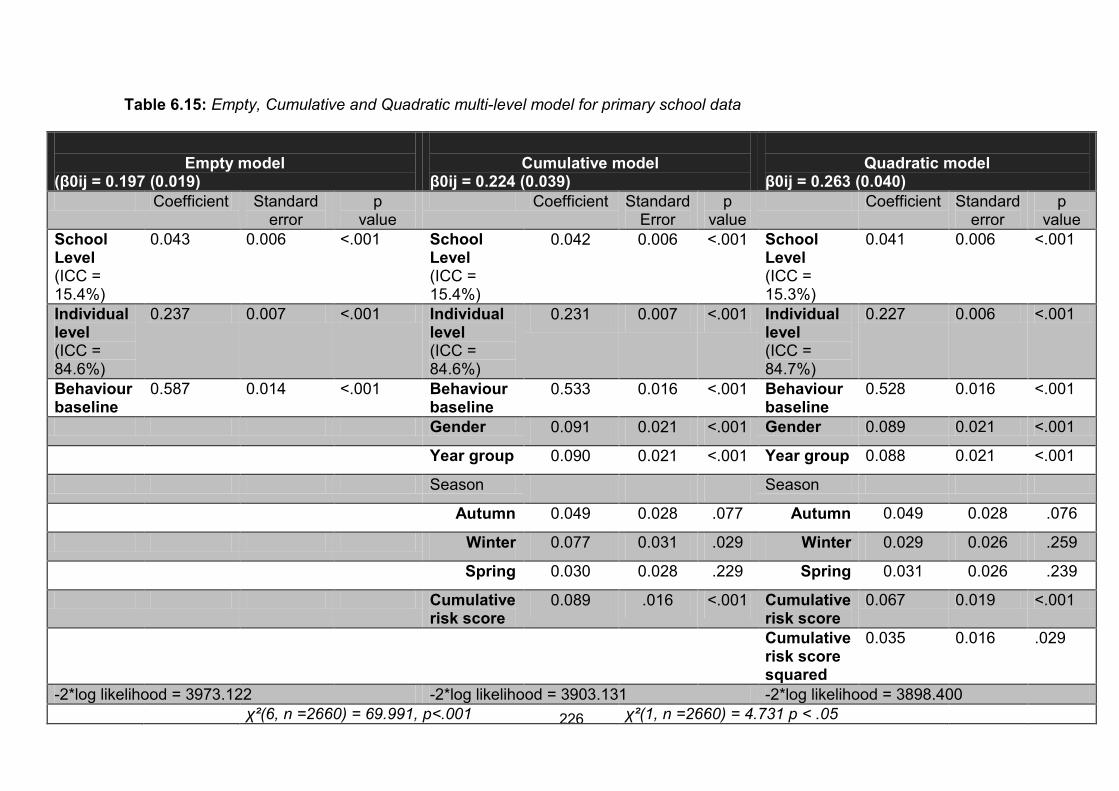
226
Table 6.15: Empty, Cumulative and Quadratic multi-level model for primary school data
Empty model
(β0ij = 0.197 (0.019)
Cumulative model
β0ij = 0.224 (0.039)
Quadratic model
β0ij = 0.263 (0.040) Coefficient Standard
error p
value Coefficient Standard
Error p
value Coefficient Standard
error p
value School Level (ICC = 15.4%)
0.043 0.006 <.001 School Level (ICC = 15.4%)
0.042 0.006 <.001 School Level (ICC = 15.3%)
0.041 0.006 <.001
Individual level (ICC = 84.6%)
0.237 0.007 <.001 Individual level (ICC = 84.6%)
0.231 0.007 <.001 Individual level (ICC = 84.7%)
0.227 0.006 <.001
Behaviour baseline
0.587 0.014 <.001 Behaviour baseline
0.533 0.016 <.001 Behaviour baseline
0.528 0.016 <.001
Gender 0.091 0.021 <.001 Gender 0.089 0.021 <.001
Year group 0.090 0.021 <.001 Year group 0.088 0.021 <.001
Season Season
Autumn 0.049 0.028 .077 Autumn 0.049 0.028 .076
Winter 0.077 0.031 .029 Winter 0.029 0.026 .259
Spring 0.030 0.028 .229 Spring 0.031 0.026 .239
Cumulative risk score
0.089 .016 <.001 Cumulative risk score
0.067 0.019 <.001
Cumulative risk score squared
0.035 0.016 .029
-2*log likelihood = 3973.122 -2*log likelihood = 3903.131 -2*log likelihood = 3898.400 χ²(6, n =2660) = 69.991, p<.001 χ²(1, n =2660) = 4.731 p < .05
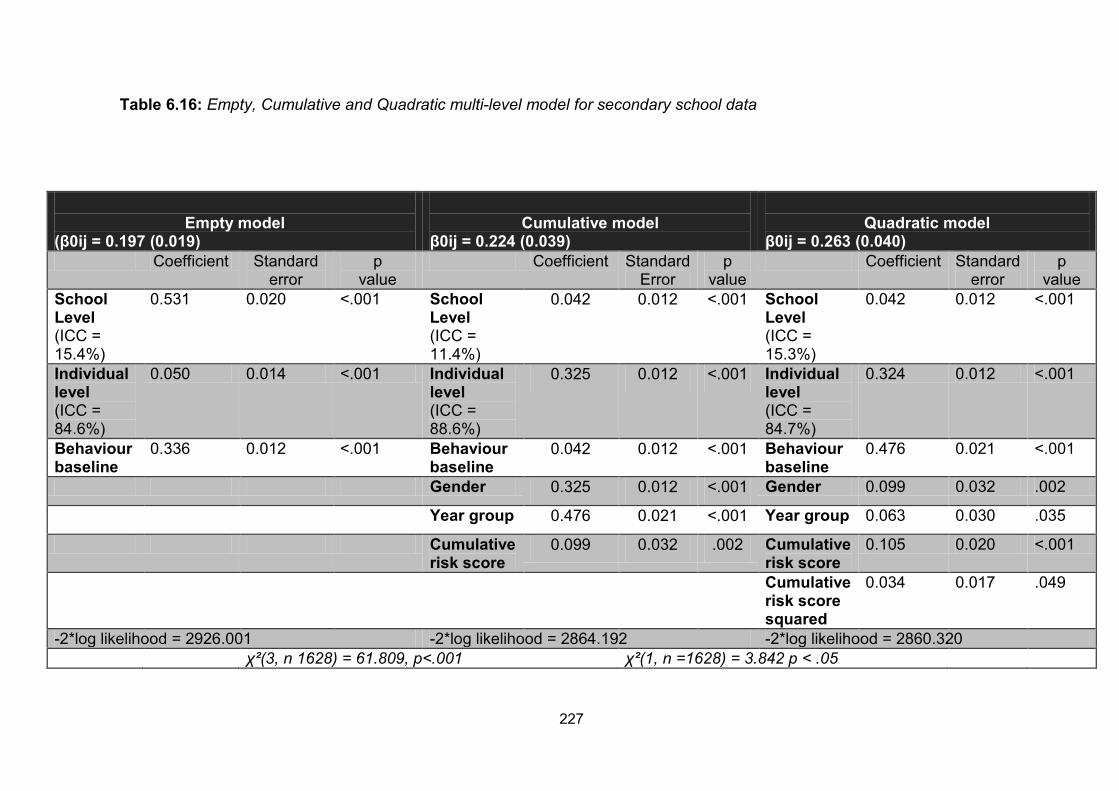
227
Table 6.16: Empty, Cumulative and Quadratic multi-level model for secondary school data
Empty model
(β0ij = 0.197 (0.019)
Cumulative model
β0ij = 0.224 (0.039)
Quadratic model
β0ij = 0.263 (0.040) Coefficient Standard
error p
value Coefficient Standard
Error p
value Coefficient Standard
error p
value School Level (ICC = 15.4%)
0.531 0.020 <.001 School Level (ICC = 11.4%)
0.042 0.012 <.001 School Level (ICC = 15.3%)
0.042 0.012 <.001
Individual level (ICC = 84.6%)
0.050 0.014 <.001 Individual level (ICC = 88.6%)
0.325 0.012 <.001 Individual level (ICC = 84.7%)
0.324 0.012 <.001
Behaviour baseline
0.336 0.012 <.001 Behaviour baseline
0.042 0.012 <.001 Behaviour baseline
0.476 0.021 <.001
Gender 0.325 0.012 <.001 Gender 0.099 0.032 .002
Year group 0.476 0.021 <.001 Year group 0.063 0.030 .035
Cumulative risk score
0.099 0.032 .002 Cumulative risk score
0.105 0.020 <.001
Cumulative risk score squared
0.034 0.017 .049
-2*log likelihood = 2926.001 -2*log likelihood = 2864.192 -2*log likelihood = 2860.320 χ²(3, n 1628) = 61.809, p<.001 χ²(1, n =1628) = 3.842 p < .05
228
6.5.6 Research question 2c. Is the number of risks present within an individual’s background more important than the specific types of risks in accounting for behaviour difficulties?
In order to answer this question a comparison was made between the
cumulative risk model assessing the importance of number of risk factors within
an individual’s background versus an independent additive model that accounts
for the specific types of risks. Both models acknowledge the same risk factors,
however, in the cumulative model (presented in section 6.5.4) contextual risks
are dichotomised and entered as a single predictor, and non-contextual risks
are added as covariates. In the independent additive risk model, risks are
added in their original form as separate predictors.
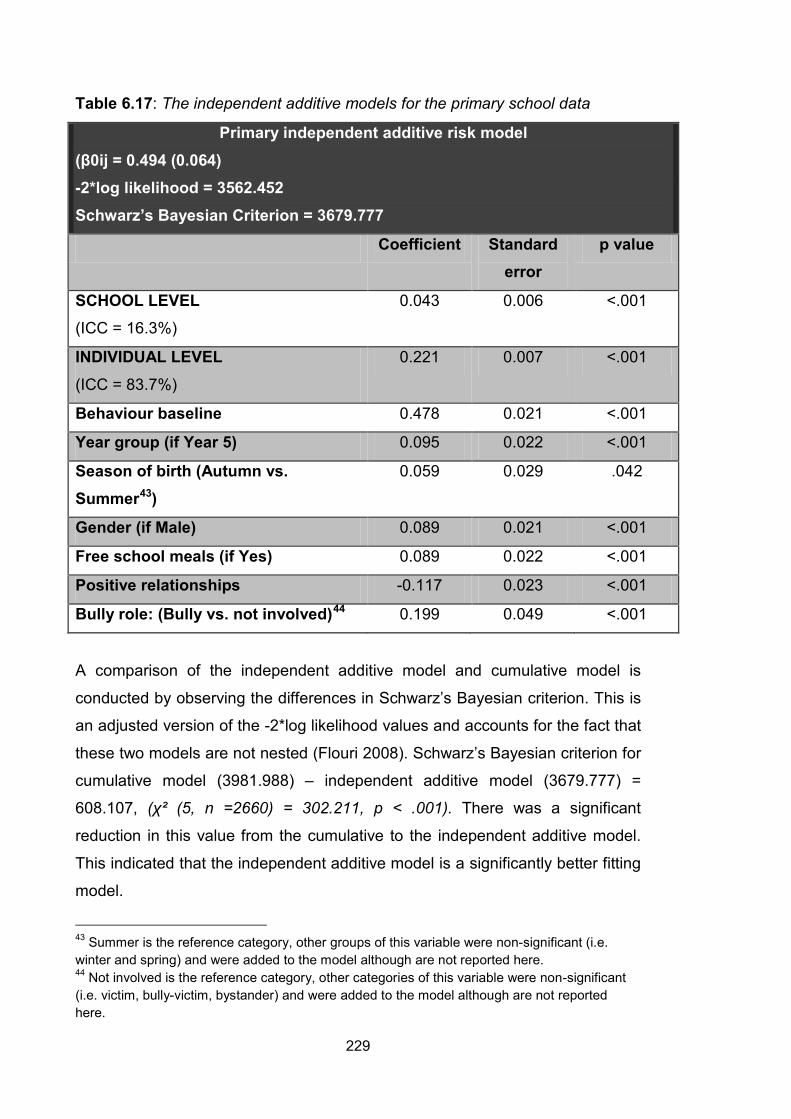
229
Table 6.17: The independent additive models for the primary school data
A comparison of the independent additive model and cumulative model is
conducted by observing the differences in Schwarz’s Bayesian criterion. This is
an adjusted version of the -2*log likelihood values and accounts for the fact that
these two models are not nested (Flouri 2008). Schwarz’s Bayesian criterion for
cumulative model (3981.988) – independent additive model (3679.777) =
608.107, (χ² (5, n =2660) = 302.211, p < .001). There was a significant
reduction in this value from the cumulative to the independent additive model.
This indicated that the independent additive model is a significantly better fitting
model.
43 Summer is the reference category, other groups of this variable were non-significant (i.e. winter and spring) and were added to the model although are not reported here. 44 Not involved is the reference category, other categories of this variable were non-significant (i.e. victim, bully-victim, bystander) and were added to the model although are not reported here.
Primary independent additive risk model (β0ij = 0.494 (0.064) -2*log likelihood = 3562.452 Schwarz’s Bayesian Criterion = 3679.777
Coefficient Standard error
p value
SCHOOL LEVEL (ICC = 16.3%)
0.043 0.006 <.001
INDIVIDUAL LEVEL (ICC = 83.7%)
0.221 0.007 <.001
Behaviour baseline 0.478 0.021 <.001
Year group (if Year 5) 0.095 0.022 <.001
Season of birth (Autumn vs. Summer43
0.059
) 0.029 .042
Gender (if Male) 0.089 0.021 <.001
Free school meals (if Yes) 0.089 0.022 <.001
Positive relationships -0.117 0.023 <.001
Bully role: (Bully vs. not involved)44 0.199 0.049 <.001
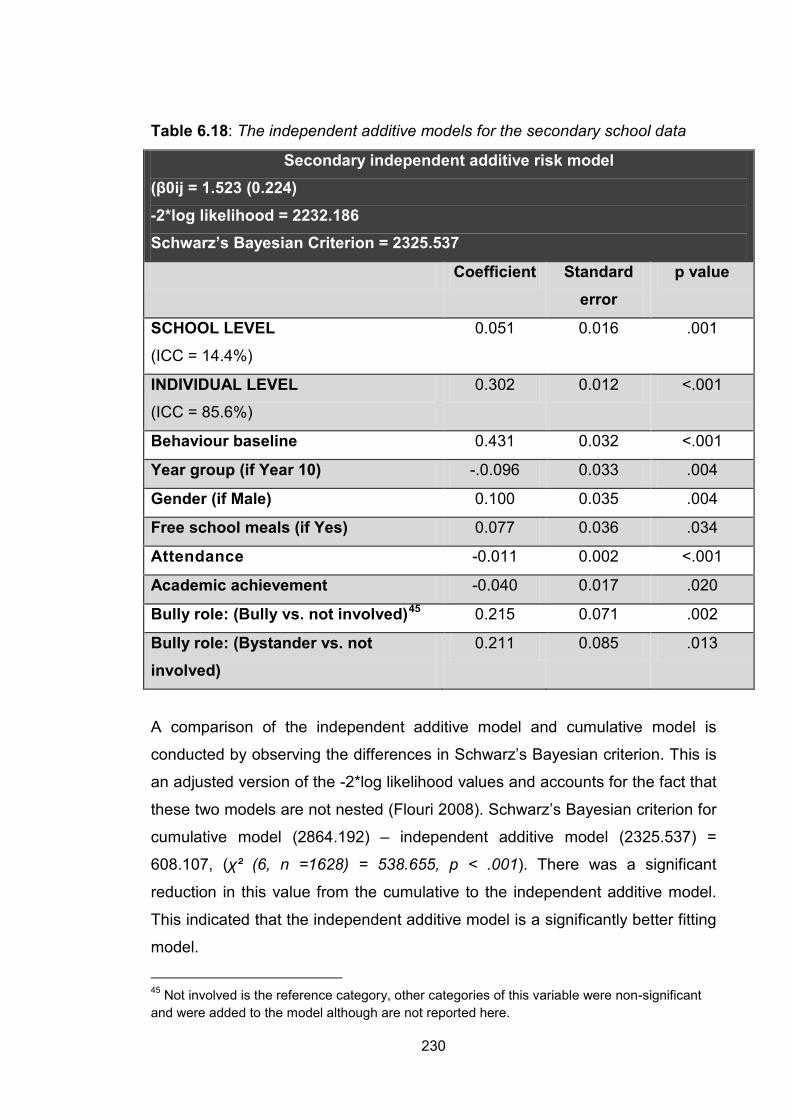
230
Table 6.18: The independent additive models for the secondary school data
A comparison of the independent additive model and cumulative model is
conducted by observing the differences in Schwarz’s Bayesian criterion. This is
an adjusted version of the -2*log likelihood values and accounts for the fact that
these two models are not nested (Flouri 2008). Schwarz’s Bayesian criterion for
cumulative model (2864.192) – independent additive model (2325.537) =
608.107, (χ² (6, n =1628) = 538.655, p < .001). There was a significant
reduction in this value from the cumulative to the independent additive model.
This indicated that the independent additive model is a significantly better fitting
model.
45 Not involved is the reference category, other categories of this variable were non-significant and were added to the model although are not reported here.
Secondary independent additive risk model (β0ij = 1.523 (0.224) -2*log likelihood = 2232.186 Schwarz’s Bayesian Criterion = 2325.537
Coefficient Standard error
p value
SCHOOL LEVEL (ICC = 14.4%)
0.051 0.016 .001
INDIVIDUAL LEVEL (ICC = 85.6%)
0.302 0.012 <.001
Behaviour baseline 0.431 0.032 <.001
Year group (if Year 10) -.0.096 0.033 .004
Gender (if Male) 0.100 0.035 .004
Free school meals (if Yes) 0.077 0.036 .034
Attendance -0.011 0.002 <.001
Academic achievement -0.040 0.017 .020
Bully role: (Bully vs. not involved)45 0.215 0.071 .002
Bully role: (Bystander vs. not involved)
0.211 0.085 .013
231
6.5.7 Summary statements
• Increasing levels of cumulative risk result in more severe behaviour
difficulties displayed within both primary and secondary schools.
• This relationship represents a non-linear quadratic pattern as with
increasing risk, there is a disproportional increase in behaviour difficulties
displayed. This suggests that as risk increases there is a point of mass
accumulation where the cumulative risk scores had a greater effect than
the sum of its individual parts.
• The independent additive model was a statistically significant better
fitting model than the cumulative model in both primary and secondary
schools. This suggests that the specific type of risk is more important
than number of risk factors present, in accounting for behaviour
difficulties displayed.

232
6.6 Protective factors
6.6.1. Introduction to section
The aim of this section is to answer the 2 sub-questions within research
question 3, these are: a) Which school level predictor variables have a statistically significant
interaction effect with contextual risk?
b) Do the significant interactions display evidence of protective-
stabilising or protective-reactive effects?
The purpose of this section is to establish if any of the school level variables
within the study act as protective factors (moderators), that reduce the influence
risk has on behaviour difficulties. Moderators will therefore be particularly
beneficial for those experiencing high degrees of risk.
The following analyses looked for interaction effects between the school level
predictor variables and the variables which made up the contextual cumulative
risk score. The decision to look at these risk variables in isolation rather than as
a cumulative risk score was taken on the basis that the independent additive
model was a better fitting model than the cumulative model in accounting for
behaviour difficulties displayed (see section 6.5.6). Therefore, in the primary
school model, risk is associated with being eligible for FSM, being a bully and
having low positive relationships. In the secondary school model risk is
associated with being eligible for FSM, being a bully or a bystander, low
academic achievement and low attendance.
The focus within the present study remains on the school level variables
investigating whether factors at this ecological level can moderate the risk
experienced at the individual level. This focus has been justified within the
literature review (see section 2.1 and section 4.7), as little research has
explicitly acknowledged the importance of school influences in reducing
behaviour difficulties, particularly for those at high degrees of risk.
233
6.6.2 Research question 3a Which school level predictor variables have a statistically significant interaction effect with contextual risk?
The variables within these analyses included, firstly measures of risk which
were noted as the contextual risk factors in research question 2 and comprised
the cumulative risk score46. Secondly, the significant risk factors which were
non-contextual and did not make up the cumulative score and were added as
covariates47. Thirdly, all the school level variables48
. Fourthly, the interaction
terms between the contextual risk factors and the school level variables, (all
centred before being added to the model). Finally, the other variables measured
within this study and included in the full model in research questions 1 (see
section 6.4.4) were also added as covariates.
Two multi-level models (one for primary and one for secondary schools) were
then computed to find any statistically significant interaction effects between the
school level variables and the contextual risk factors. Significant interaction
effects can be taken as evidence that the variables are acting in a protective
manner, moderating the influence risk has on outcome. Results are presented
in table 6.19 and 6.20.
46 These variables included in primary schools, FSM eligibility, being a bully, low positive relationships, and in secondary schools FSM eligibility, being a bully or bystander, low attendance and low academic achievement. 47 These variables were gender, year group and season of birth for primary schools, and gender and year group for secondary schools 48 These included school urbanicity, school size, school % FSM, school % EAL, school % SA, school % SAP & ST, school level overall achievement, school level overall absence and school exclusion rates.
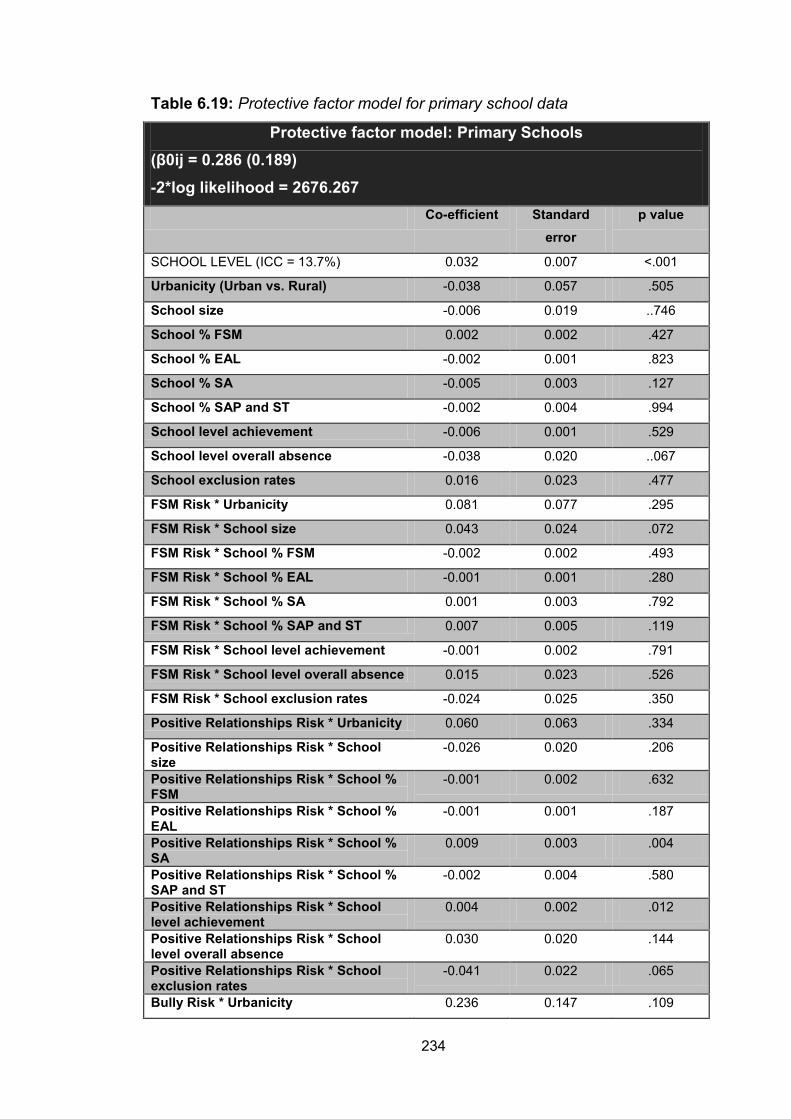
234
Table 6.19: Protective factor model for primary school data
Protective factor model: Primary Schools (β0ij = 0.286 (0.189) -2*log likelihood = 2676.267
Co-efficient Standard error
p value
SCHOOL LEVEL (ICC = 13.7%) 0.032 0.007 <.001
Urbanicity (Urban vs. Rural) -0.038 0.057 .505
School size -0.006 0.019 ..746
School % FSM 0.002 0.002 .427
School % EAL -0.002 0.001 .823
School % SA -0.005 0.003 .127
School % SAP and ST -0.002 0.004 .994
School level achievement -0.006 0.001 .529
School level overall absence -0.038 0.020 ..067
School exclusion rates 0.016 0.023 .477
FSM Risk * Urbanicity 0.081 0.077 .295
FSM Risk * School size 0.043 0.024 .072
FSM Risk * School % FSM -0.002 0.002 .493
FSM Risk * School % EAL -0.001 0.001 .280
FSM Risk * School % SA 0.001 0.003 .792
FSM Risk * School % SAP and ST 0.007 0.005 .119
FSM Risk * School level achievement -0.001 0.002 .791
FSM Risk * School level overall absence 0.015 0.023 .526
FSM Risk * School exclusion rates -0.024 0.025 .350
Positive Relationships Risk * Urbanicity 0.060 0.063 .334
Positive Relationships Risk * School size
-0.026 0.020 .206
Positive Relationships Risk * School % FSM
-0.001 0.002 .632
Positive Relationships Risk * School % EAL
-0.001 0.001 .187
Positive Relationships Risk * School % SA
0.009 0.003 .004
Positive Relationships Risk * School % SAP and ST
-0.002 0.004 .580
Positive Relationships Risk * School level achievement
0.004 0.002 .012
Positive Relationships Risk * School level overall absence
0.030 0.020 .144
Positive Relationships Risk * School exclusion rates
-0.041 0.022 .065
Bully Risk * Urbanicity 0.236 0.147 .109
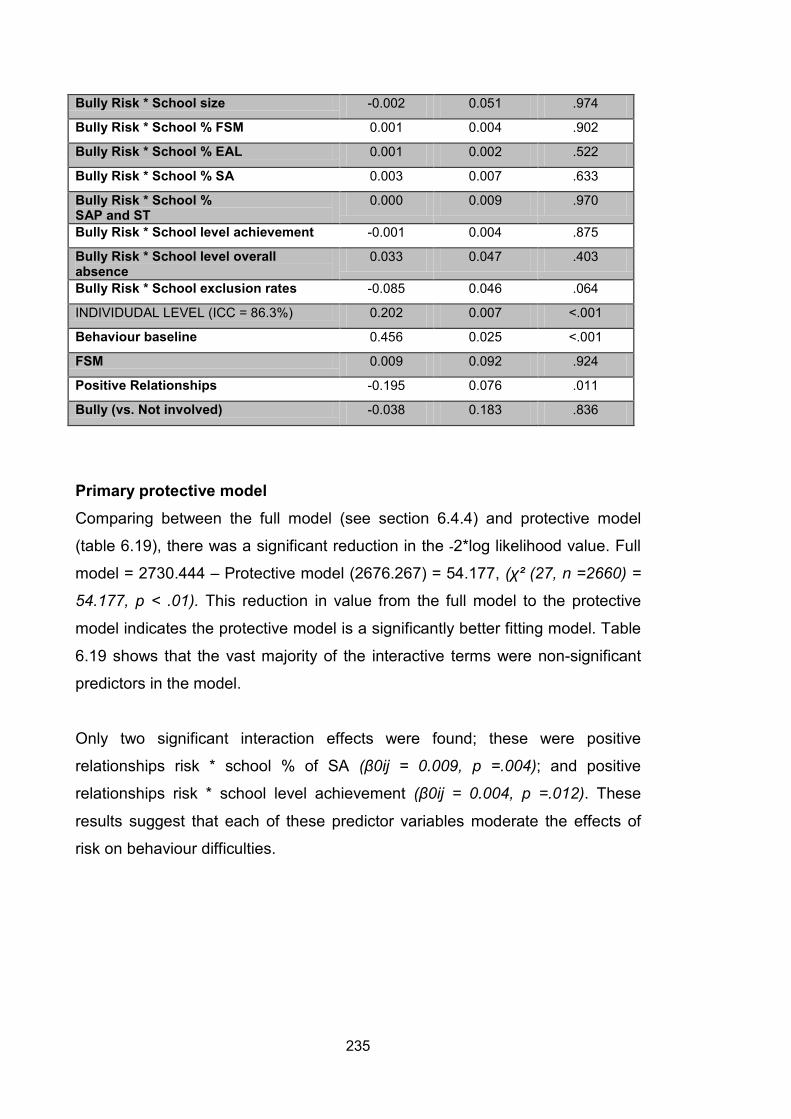
235
Bully Risk * School size -0.002 0.051 .974
Bully Risk * School % FSM 0.001 0.004 .902
Bully Risk * School % EAL 0.001 0.002 .522
Bully Risk * School % SA 0.003 0.007 .633
Bully Risk * School % SAP and ST
0.000 0.009 .970
Bully Risk * School level achievement -0.001 0.004 .875
Bully Risk * School level overall absence
0.033 0.047 .403
Bully Risk * School exclusion rates -0.085 0.046 .064
INDIVIDUDAL LEVEL (ICC = 86.3%) 0.202 0.007 <.001
Behaviour baseline 0.456 0.025 <.001
FSM 0.009 0.092 .924
Positive Relationships -0.195 0.076 .011
Bully (vs. Not involved) -0.038 0.183 .836
Primary protective model Comparing between the full model (see section 6.4.4) and protective model
(table 6.19), there was a significant reduction in the -2*log likelihood value. Full
model = 2730.444 – Protective model (2676.267) = 54.177, (χ² (27, n =2660) =
54.177, p < .01). This reduction in value from the full model to the protective
model indicates the protective model is a significantly better fitting model. Table
6.19 shows that the vast majority of the interactive terms were non-significant
predictors in the model.
Only two significant interaction effects were found; these were positive
relationships risk * school % of SA (β0ij = 0.009, p =.004); and positive
relationships risk * school level achievement (β0ij = 0.004, p =.012). These
results suggest that each of these predictor variables moderate the effects of
risk on behaviour difficulties.

236
Table 6.20: Protective factor model for secondary school data
Protective factor model: Secondary schools (β0ij = 0.717 (0.119) -2*log likelihood = 2004.807
Co-efficient Standard error
p value
SCHOOL LEVEL (ICC = 8.4%) 0.026 0.011 .019
Urbanicity (Urban vs. Rural) 0.123 0.130 .349
School size 0.020 0.013 .136
School % FSM 0.010 0.009 .287
School % EAL -0.004 0.004 .367
School % SA -0.004 0.007 .563
School % SAP and ST -0.009 0.009 .346
School level achievement 0.007 0.004 .103
School level overall absence 0.046 0.042 .283
School exclusion rates -0.000 0.011 .967
FSM Risk * Urbanicity -0.006 0.134 .500
FSM Risk * School size -0.091 0.018 .736
FSM Risk * School % FSM -0.001 0.011 .963
FSM Risk * School % EAL -0.002 0.005 .662
FSM Risk * School % SA -0.009 0.008 .261
FSM Risk * School % SAP and ST 0.001 0.011 .893
FSM Risk * School level achievement 0.000 0.005 .943
FSM Risk * School level overall absence 0.062 0.048 .197
FSM Risk * School exclusion rates -0.000 0.014 .978
Attendance Risk * Urbanicity 0.004 0.008 .626
Attendance Risk * School size 0.001 0.001 .396
Attendance Risk * School % FSM 0.000 0.001 .674
Attendance Risk * School % EAL -0.000 0.000 .619
Attendance Risk * School % SA -0.000 0.001 .424
Attendance Risk * School % SAP and ST -0.000 0.001 .988
Attendance Risk * School level achievement
0.000 0.000 .597
Attendance Risk * School level overall absence
0.003 0.003 .408
Attendance Risk * School exclusion rates
-0.000 0.001 .928
Academic Risk * Urbanicity -0.138 0.067 .038
Academic Risk * School size -0.002 0.009 .774
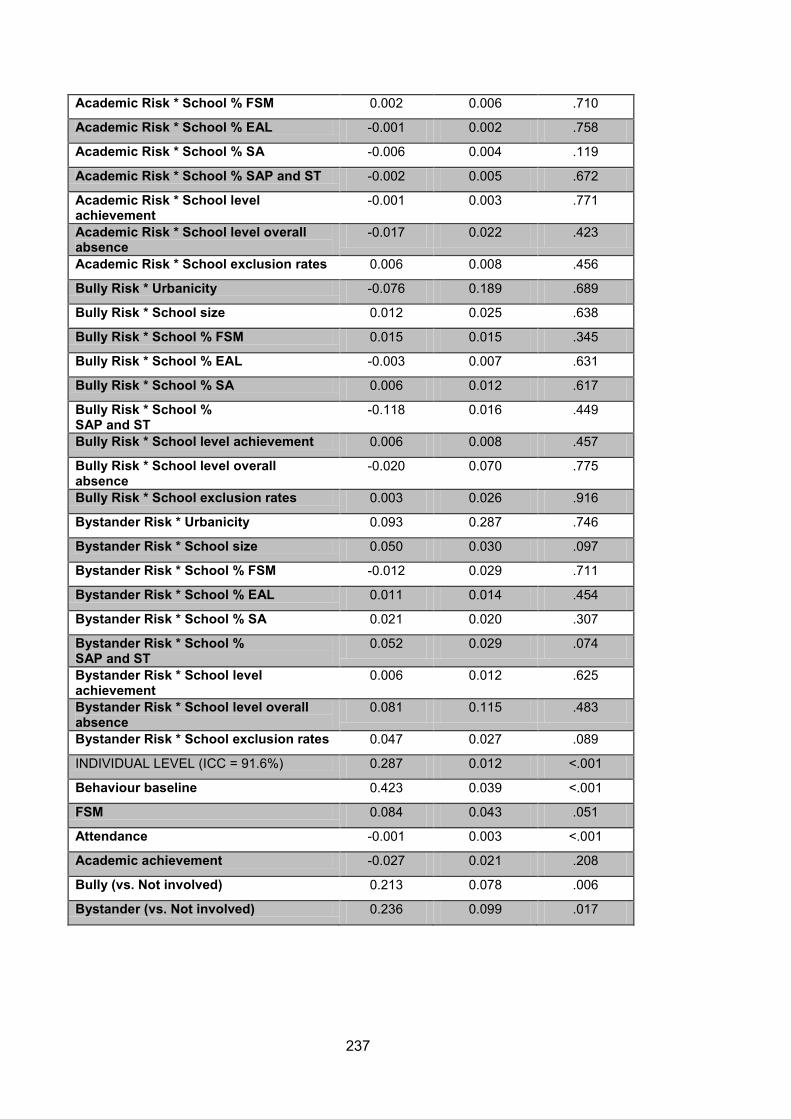
237
Academic Risk * School % FSM 0.002 0.006 .710
Academic Risk * School % EAL -0.001 0.002 .758
Academic Risk * School % SA -0.006 0.004 .119
Academic Risk * School % SAP and ST -0.002 0.005 .672
Academic Risk * School level achievement
-0.001 0.003 .771
Academic Risk * School level overall absence
-0.017 0.022 .423
Academic Risk * School exclusion rates 0.006 0.008 .456
Bully Risk * Urbanicity -0.076 0.189 .689
Bully Risk * School size 0.012 0.025 .638
Bully Risk * School % FSM 0.015 0.015 .345
Bully Risk * School % EAL -0.003 0.007 .631
Bully Risk * School % SA 0.006 0.012 .617
Bully Risk * School % SAP and ST
-0.118 0.016 .449
Bully Risk * School level achievement 0.006 0.008 .457
Bully Risk * School level overall absence
-0.020 0.070 .775
Bully Risk * School exclusion rates 0.003 0.026 .916
Bystander Risk * Urbanicity 0.093 0.287 .746
Bystander Risk * School size 0.050 0.030 .097
Bystander Risk * School % FSM -0.012 0.029 .711
Bystander Risk * School % EAL 0.011 0.014 .454
Bystander Risk * School % SA 0.021 0.020 .307
Bystander Risk * School % SAP and ST
0.052 0.029 .074
Bystander Risk * School level achievement
0.006 0.012 .625
Bystander Risk * School level overall absence
0.081 0.115 .483
Bystander Risk * School exclusion rates 0.047 0.027 .089
INDIVIDUAL LEVEL (ICC = 91.6%) 0.287 0.012 <.001
Behaviour baseline 0.423 0.039 <.001
FSM 0.084 0.043 .051
Attendance -0.001 0.003 <.001
Academic achievement -0.027 0.021 .208
Bully (vs. Not involved) 0.213 0.078 .006
Bystander (vs. Not involved) 0.236 0.099 .017
238
Secondary protective model Comparing between the full model (see section 6.4.4) and protective model
(table 6.20), there was a non- significant reduction in the -2*log likelihood value.
Full model = 2047.946– Protective model (2004.807) = 43.139, (χ² (45, n
=1628) = 43.139, p > .05). As the reduction in value from the full model to the
protective model was non-significant, this suggests the protective model should
not be favoured over the full model, as it is a poorer fitting model. It is perhaps
unsurprising that the protective model is no better than the full model in terms of
model fit, as of the additional 45 predictors comprising the interaction terms only
one reached statistical significance. As this model therefore contained many
non-significant terms it was expected to be a poorer fitting model (Field 2009).
Nonetheless, as the 2*log likelihood value did decrease albeit not significantly,
the significant interaction effects were observed. Only one significant interaction
effect was noted (see table 6.20) which shows school urbanicity * academic risk
reached statistical significance, (β0ij = -0.138, p =.038). The result suggests that
this predictor variable moderates the effects of risk on behaviour difficulties.
This result should be interpreted however, with considerable caution. As the
alpha level was set at .05, and with the addition of 45 extra predictors it would
be expected at least one result would emerge as a significant finding. On the
other hand as this protective model only had sufficient power to detect medium
effects (not small effect like in the other models) a number of type 2 errors could
be present, where a finding has been reported as non-significant when in fact
this effect does exist. In conclusion this result needs to be interpreted in the light
of these issues.
239
6.6.3 Research question 3b
Do the significant interactions display evidence of protective-stabilising or protective-reactive effects?
Interaction graphs were computed in order to answer this question. These
graphs allow for an easy visualisation of the interaction effects, and show how
behaviour difficulties are affected by different levels of the moderator variable
for those at high and low risk. These graphs also display the direction of the
effect and whether high or low levels of the moderator variable confer the extra
advantage to those at high risk.
The graphs for significant moderating variables for both the primary and
secondary model are presented in figure 6.3-6.5. They show the protective
effects for school related variables on behaviour difficulties at different degrees
of risk. The ‘Y’ axis represents the dependent variable mean score (i.e.
behaviour difficulties). The ‘X’ axis represents the independent variable (i.e. the
risk variable), which was mean centred as is the procedure when looking for
interaction effects (Aiken & West 1991, Tabachnick & Fidell 2007). Two points
were created which represent high and low levels of the risk score that are +/-1
standard deviations above/below the mean for continuous risk variables, or
represented risk being present (high risk) or risk being absent (low risk) for the
categorical variables. The two lines on the graph represent the moderator
variable ‘Z’. This variable was also mean centred with the two lines representing
high levels of the variable, i.e. +1 standard deviation above the mean, and low
levels of the variable i.e. -1 standard deviation below the mean. For binary
moderators the two lines represent the two groups of the moderating variable
i.e. urban and rural for the variable school urbanicity.
Interaction graphs are only interpretable if the interaction term is statistically
significant; therefore graphs are only presented for the significant findings.
These graphs include 2 within the primary school model and 1 within the
secondary school model. They are also able to assess whether a ‘protective-
stabilising’ or a ‘protective-reactive’ effect has occurred on any of these
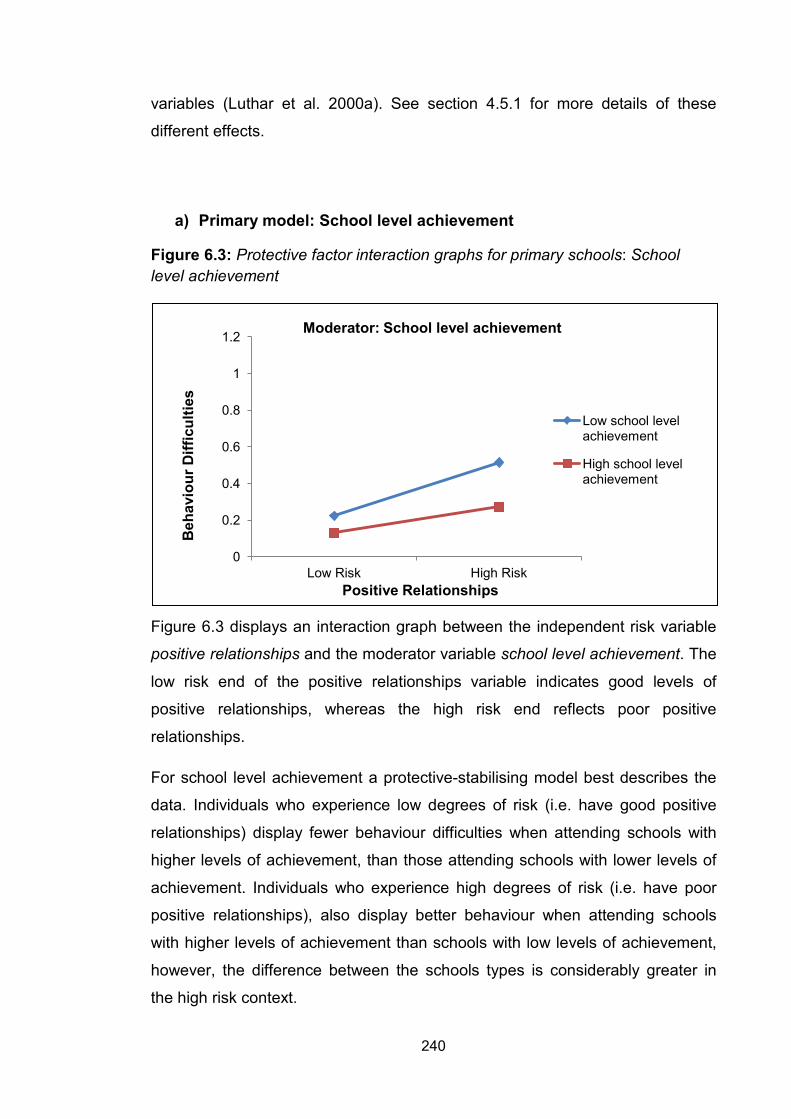
240
variables (Luthar et al. 2000a). See section 4.5.1 for more details of these
different effects.
a) Primary model: School level achievement
Figure 6.3: Protective factor interaction graphs for primary schools: School level achievement
Figure 6.3 displays an interaction graph between the independent risk variable
positive relationships and the moderator variable school level achievement. The
low risk end of the positive relationships variable indicates good levels of
positive relationships, whereas the high risk end reflects poor positive
relationships.
For school level achievement a protective-stabilising model best describes the
data. Individuals who experience low degrees of risk (i.e. have good positive
relationships) display fewer behaviour difficulties when attending schools with
higher levels of achievement, than those attending schools with lower levels of
achievement. Individuals who experience high degrees of risk (i.e. have poor
positive relationships), also display better behaviour when attending schools
with higher levels of achievement than schools with low levels of achievement,
however, the difference between the schools types is considerably greater in
the high risk context.
0
0.2
0.4
0.6
0.8
1
1.2
Low Risk High Risk
Beh
avio
ur D
iffic
ultie
s
Positive Relationships
Moderator: School level achievement
Low school level achievement
High school level achievement
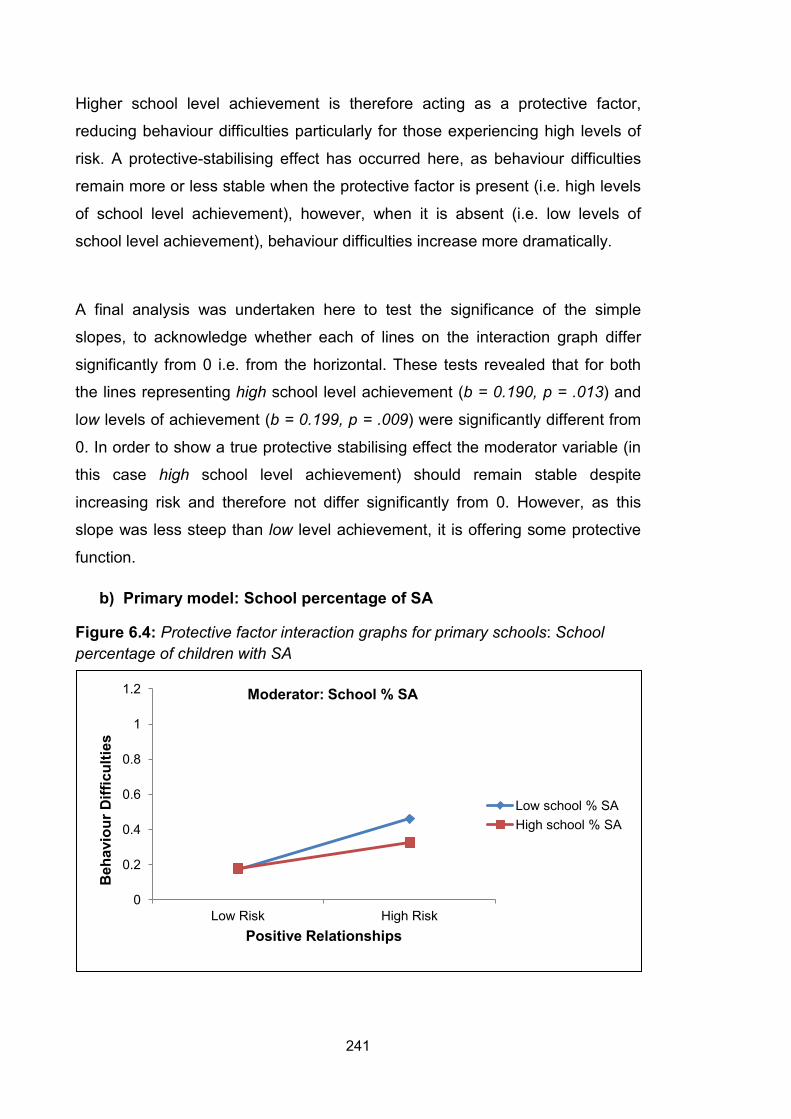
241
Higher school level achievement is therefore acting as a protective factor,
reducing behaviour difficulties particularly for those experiencing high levels of
risk. A protective-stabilising effect has occurred here, as behaviour difficulties
remain more or less stable when the protective factor is present (i.e. high levels
of school level achievement), however, when it is absent (i.e. low levels of
school level achievement), behaviour difficulties increase more dramatically.
A final analysis was undertaken here to test the significance of the simple
slopes, to acknowledge whether each of lines on the interaction graph differ
significantly from 0 i.e. from the horizontal. These tests revealed that for both
the lines representing high school level achievement (b = 0.190, p = .013) and
low levels of achievement (b = 0.199, p = .009) were significantly different from
0. In order to show a true protective stabilising effect the moderator variable (in
this case high school level achievement) should remain stable despite
increasing risk and therefore not differ significantly from 0. However, as this
slope was less steep than low level achievement, it is offering some protective
function.
b) Primary model: School percentage of SA
Figure 6.4: Protective factor interaction graphs for primary schools: School percentage of children with SA
0
0.2
0.4
0.6
0.8
1
1.2
Low Risk High Risk
Beh
avio
ur D
iffic
ultie
s
Positive Relationships
Moderator: School % SA
Low school % SA High school % SA
242
Figure 6.4 displays an interaction graph between the independent risk variable
positive relationships and the moderator variable school % SA. The low risk end
of the positive relationships variable indicates good levels of positive
relationships, whereas the high risk end reflects poor positive relationships.
For school % SA a protective-stabilising model best describes the data. There is
little difference between individuals who experience low degrees of risk (i.e.
have good positive relationships) in attending either a school with high or low
levels of children on the SEN register at SA. However, individuals who
experience high degrees of risk (i.e. have poor positive relationships), display
better behaviour when attending schools with higher levels of children on the
SEN register at SA.
Higher school % SA is therefore acting as a protective factor, reducing
behaviour difficulties particularly for those experiencing high levels of risk. A
protective-stabilising effect has occurred here, as behaviour difficulties remain
more or less stable when the protective factor is present (i.e. high levels of
school % SA), however, when it is absent (i.e. low levels of school % SA),
behaviour difficulties increase more dramatically.
A final analysis was undertaken here to test the significance of the simple
slopes, to acknowledge whether each of lines on the interaction graph differ
significantly from 0 i.e. from the horizontal. These tests revealed that for both
high school percentage of SA (b = 0.186, p = .015) and low school percentage
of SA (b = 0.203, p = .008) the lines differed significantly from 0. In order to
show a true protective stabilising effect the moderator variable (in this case high
school percentage of SA) should remain stable despite increasing risk and
therefore not differ significantly from 0. However, as this slope was less steep
than low school percentage of SA, it is offering some protective function,
although not a full protective stabilising effect
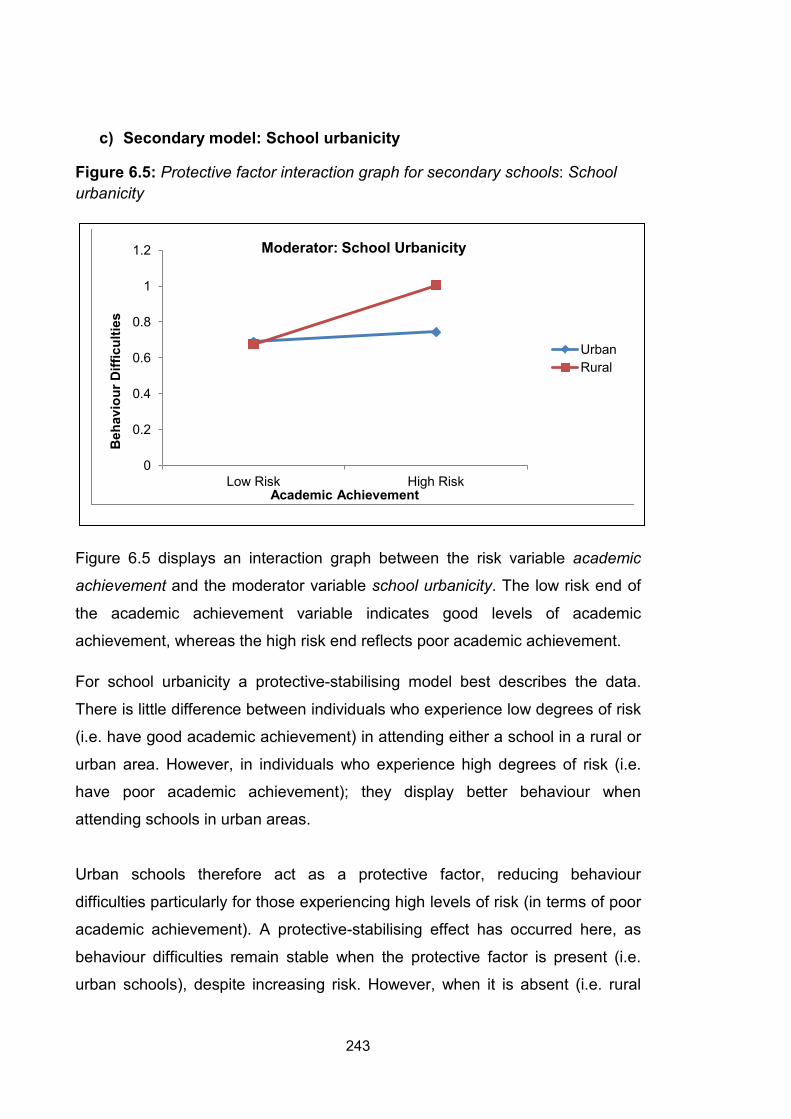
243
c) Secondary model: School urbanicity
Figure 6.5: Protective factor interaction graph for secondary schools: School urbanicity
Figure 6.5 displays an interaction graph between the risk variable academic
achievement and the moderator variable school urbanicity. The low risk end of
the academic achievement variable indicates good levels of academic
achievement, whereas the high risk end reflects poor academic achievement.
For school urbanicity a protective-stabilising model best describes the data.
There is little difference between individuals who experience low degrees of risk
(i.e. have good academic achievement) in attending either a school in a rural or
urban area. However, in individuals who experience high degrees of risk (i.e.
have poor academic achievement); they display better behaviour when
attending schools in urban areas.
Urban schools therefore act as a protective factor, reducing behaviour
difficulties particularly for those experiencing high levels of risk (in terms of poor
academic achievement). A protective-stabilising effect has occurred here, as
behaviour difficulties remain stable when the protective factor is present (i.e.
urban schools), despite increasing risk. However, when it is absent (i.e. rural
0
0.2
0.4
0.6
0.8
1
1.2
Low Risk High Risk
Beh
avio
ur D
iffic
ultie
s
Academic Achievement
Moderator: School Urbanicity
Urban Rural
244
schools), behaviour difficulties increase more dramatically when moving from
low to high risk.
A final analysis was undertaken here to test the significance of the simple
slopes, to acknowledge whether each of lines on the interaction graph differ
significantly from 0 i.e. from the horizontal. These tests revealed that for rural
schools (b = 0.165, p = .007) the line significantly differed from 0. This effect
was not observed for urban schools (b = -0.027, p = .208), where the line did
not differ significantly from 0. This provides further evidence that in urban
schools, despite increasing risk the level of behaviour difficulties remains stable
and does not increase showing evidence of a full protective stabilising effect.
245
6.6.4 Summary statements
• Significant interaction effects for the primary school model were found
between positive relationship risk and school level achievement; and
positive relationship risk and school level percentage of SA.
o Higher school level achievement reduces behaviour difficulties for both
individuals experiencing high and low levels of risk. The effect of this
variable in reducing behaviour difficulties has an even more profound
and positive effect for those at high compared with low risk.
o This is evidence of a protective-stabilising effect that higher levels of
school level achievement moderates the influence poor positive
relationships has upon behaviour difficulties.
o Higher levels of school percentage of SA reduces behaviour difficulties
for those individuals experiencing high degrees of risk (in terms of poor
positive relationships). However, percentage of SA makes no difference
to an individual’s behaviour difficulties when experiencing low degrees
of risk (i.e. good positive relationships).
o This is evidence of a protective-stabilising effect, that higher levels of
school percentage of SA moderate the influence poor positive
relationships has upon behaviour difficulties.
• Significant interaction effects for the secondary school model where found
between academic risk and school urbanicity.
o Attending urban schools reduces behaviour difficulties for those
individuals experiencing high degrees of risk (in terms of poor academic
achievement), but type of school attended (i.e. urban or rural) makes no
difference to an individual’s behaviour difficulties when experiencing low
degrees of risk (i.e. good academic achievement).
o This is evidence of a protective-stabilising effect, that urban schools
moderate the influence poor academic achievement has upon
behaviour difficulties.
246
7. Discussion
7.1 Introduction to the Chapter
This chapter is subdivided into five main sections. The first section, 7.2 provides
a brief summary of the results, broken down by the three main research
questions. The second section, 7.3 then discusses the findings of the three
broad research questions in relation to the existing literature (previously
addressed in chapters 1 to 4), noting whether the results converge or diverge
from these studies. The third section, 7.4 acknowledges the limitations of the
study, from both a methodological and conceptual standpoint. The final section
7.5 highlights possibilities and recommendations for future research. Within the
fifth section, 7.6 summary statements of the chapter are provided.
7.2 Summary of results
7.2.1 Research question 1
The primary model revealed there was a statistically significant school and
individual effect with 15.4% of the variance in behaviour difficulties attributable
to the school level, and 84.6% to the individual level. The secondary model also
revealed a significant school and individual effect with 13.0% of the variance in
behaviour difficulties attributable to the school level and 87.0% to the individual
level.
Within primary schools the significant risk factors at the individual level were:
being in year 5, being born in the autumn, being male, being eligible for FSM,
poor positive relationships and being a bully. The only significant risk factor at
the school level was attending a school with low levels of academic
247
achievement. The significant promotive factors at the individual level were
therefore: being in year 1, being born in the summer months, being female, not
being eligible for FSM, good positive relationships and not involved in bullying.
At a school level, attending a school with a high level achievement was a
promotive factor.
Within secondary schools the significant risk factors at the individual level
included: being in year 7, being male, being eligible for FSM, low levels of
academic achievement, low levels of attendance and being a bully or a
bystander to bullying. The only significant risk factor at the school level was
attending a large school (in terms of pupils on role). The significant promotive
factors at the individual level were therefore: being in year 10, being female, not
being eligible for FSM, high levels of academic achievement, high levels of
attendance, and not involved in bullying incidences. At a school level, attending
a smaller school was a promotive factor.
The percentage of variance in behaviour difficulties that could be explained
when all predictors were added was 14.3% in primary schools (25.6% at the
school level and 12.2% at the individual level). In the secondary school data set,
the percentage of variance which could be explained when all predictors were
added was 14.2% (32% at the school level and 11.6% at the individual level).
7.2.2 Research question 2
The results revealed for both primary and secondary models that the cumulative
risk score was a significant predictor of behaviour difficulties. Specifically when
higher numbers of risk factors are present within an individual’s background,
regardless of their exact nature, this resulted in more severe behaviour
difficulties displayed.
The functional form of the relationship between cumulative risk and behaviour
difficulties was tested by adding in a quadratic term to see if this or a linear term
best described the data. The quadratic term reached statistical significance for
248
both the primary and secondary models. This suggests that with each increment
of risk there is an acceleration of behaviour difficulties displayed. Risks
therefore potentiate one another, exerting a greater influence on behaviour
difficulties collectively than the sum of their individual parts.
Finally, results revealed that type of risk was more important than number of
risk in explaining behaviour difficulties. For both the primary and secondary
school models the independent additive model (when risks were put
independently in to the model) was a significantly better fit of the data, and
accounted for more variance in explaining behaviour difficulties, than the
cumulative model (where risks were either present or absent and then added
together to form a single risk score).
7.2.3 Research question 3
Within the primary school model there were two significant protective variables.
Firstly, the variable school level achievement showed that attending schools
with higher academic achievement was beneficial to all children, although
especially for those considered at high risk. Higher school level achievement is
a key protective factor for behaviour difficulties in children with SEND who are
at risk in terms of having poor positive relationships. This factor showed
evidence of a protective-stabilising effect, that attending schools with higher
levels of academic achievement moderates the relationship between risk and
behaviour difficulties.
Secondly, the variable school percentage of SA showed that attending schools
with higher numbers of children at school action on the SEND register was a
key protective factor. High levels of this variable moderate the influence that risk
(in terms of poor positive relationships) has upon behaviour difficulties. In low
risk contexts (i.e. having good positive relationships) attending schools with
either high or low percentages of children at SA makes no difference to
behaviour difficulties displayed. This variable showed evidence of a protective-
249
stabilising effect, that attending schools with higher percentage of children with
SA moderates the relationship between risk and behaviour difficulties.
Within the secondary school model one significant protective factor emerged.
The variable school urbanicity showed that attending schools in urban areas
acted as a protective factor for those children considered at high risk (in terms
of poor academic achievement), but made no difference for those considered at
low risk. This factor showed evidence of a full protective-stabilising effect, with
attending urban schools being particularly beneficial in reducing behaviour
difficulties for those at high levels of risk.
7.3 Discussion of results in relation to previous literature.
7.3.1 Research question 1a:
What proportions of variance in behaviour difficulties are attributable to the school and individual levels?
Empty multi-level models with behaviour difficulties at follow-up as the outcome
(controlling for previous behaviour difficulties at baseline), were computed for
each of the primary and secondary data sets. These findings showed that for
the primary and secondary schools, both the individual level and the school
level significantly contributed to variance in behaviour difficulties. Nonetheless,
the individual level exerted a far greater influence than the school level on
behaviour difficulties.
This is not a surprising finding, and is consistent with the vast majority of studies
within this area that suggest the individual level accounts for more variance in a
number of childhood outcomes compared with the school level (Reis, et al.
2007, Maes & Lievens 2003, Gottfredson & DiPietro 2011, Aveyard, et al.
2004). It has been suggested that although schools play some influence in
accounting for problem behaviour, ecological levels that are more proximal to
250
the individual have more profound and direct effects on pupils. Contextual
influences such as the school environment often exert their influence indirectly
being mediated through another variable therefore; their influence is less
pronounced (Mooij et al. 1998).
The ICC at the school level in primary schools was 15.6% and in secondary
schools 13.0%, this statistic shows the amount of variance in behaviour
difficulties attributable to the school compared with individual level. These
figures compare with others found previously, i.e. Gottfredson (2001)
acknowledged that the variance attributable to the school level for individual
behaviour is around 8-15%, and Khoury-Kassabri et al. (2004) who found
schools account for about 9-15% of variance when the outcome was student
victimization.
The figures found within the present study are however, slightly higher than
some previous studies e.g. 5-10% suggested by Felson et al. (1994) in terms of
any childhood outcome, 3% in Kohen et al. (2009) investigating physical
aggression in young children, <8% in Sellstrom & Bremberg’s (2006) review of
multi-level studies, investigating different behaviour outcomes, 2%
acknowledged by Reis et al. (2007) when the outcome is aggressive behaviour,
6.3% by Payne (2008) when using a measure of delinquency, and finally 2-3%
by Anderson et al. (2010) when the outcome was mental health difficulties.
Nonetheless, another study included within the review by Sellstrom & Bremberg
(2006) suggested that a measure of problem behaviour (specifically weapon
carrying) had an ICC at the school level as high as 25%.
Within the previous studies acknowledged above, large differences exist in the
ICC reported at the school level when the outcome concerns behavioural issues
in children and adolescence. This is perhaps unsurprising as often different
studies have used distinct outcomes, chosen with specific populations, across
different types of schools with various countries around the world. Furthermore,
there has been differences in how the outcomes were measured i.e. teacher
verses self-report, and whether previous outcomes were controlled for. All these
issues will affect the actual size of the ICC reported. The slightly higher ICC
251
found within the present study may reflect the population under investigation. As
children with SEND obtain additional support from within their school, they could
build stronger relationships with staff, and therefore become more prone to the
effects of school level influences on their behaviour, than children not receiving
the extra support. However, the ICC within the present study is only a little
higher than the majority of the previous literature, and in fact still within a similar
range. What can be concluded here is that within the present study and the
previous literature the school ecological level remains an important influence on
problem behaviour, although to a lesser degree than at the individual level.
7.3.2 Research question 1b:
Which school and individual level predictors explain a statistically significant proportion of variance in behaviour difficulties?
Full multi-level models were computed by imputing all predictor variables in to
the analyses. Variables that showed a statistically significant positive
relationship with increased levels of behaviour difficulties were termed risk
factors and when that relationship was negative, resulting in decreases in
behaviour difficulties, the term promotive factors was used (see section 1.4 for a
definition of these terms).
a) Consistent findings across primary and secondary models
Gender A salient finding to emerge from the present study was that participants’ gender
was a significant predictor of behaviour difficulties, and remained as such even
after controlling for previous behaviour difficulties displayed. Specifically it was
being male which led to increases in these problems, with reductions related to
being female. Being male is therefore a risk factor for displaying behaviour
difficulties (and being female a promotive factor). These findings are consistent
with other studies that have found such differences (e.g. Brown & Schoon 2008,
Green et al. 2005, & Loeber et al. 2000). It is therefore not only within the
252
general population, but also within the SEND population where being male is a
risk factor for behaviour difficulties.
As gender was a significant predictor across both primary and secondary school
models, this implicates it as a particularly important finding –influencing
behaviour difficulties across different developmental stages. This evidence, is
not that surprising, as Baillargeon, et al. (2007) found such gender differences
in the display of aggressive behaviours to be evident at around 1 and a half
years of age - suggesting they are likely to be even more evident by the time a
child reaches school age. The reasons why being male is a risk factor for
behaviour difficulties lies beyond the scope of the present study, but previous
researchers have suggested that males may be exposed to, or vulnerable to
additional risk factors, which are mediated through their gender (Storvoll &
Wichman 2002). These could include hormones (Book et al. 2001), parenting
practices (Crick & Zahn-Waxler 2003), or the fact that girls often display more
prosocial behaviour which could protect against the display of behaviour
difficulties (Messer et al. 2006). Nonetheless, the present study has shown that
for a group of children with SEND behaviour difficulties will be predicted by
gender, with being male a significant risk factor.
Free School Meals eligibility FSM eligibility was established within the present study as a significant predictor
of behaviour difficulties across both primary and secondary school models.
Those children eligible and claiming FSM are at an increased risk of displaying
more severe behaviour difficulties. FSM is often taken as a proxy for social
economic status (Hobbs & Vignoles 2007), with children eligible for and
claiming FSM being of lower social-economic status, compared with those not
eligible. The findings within the present study therefore provide further support
for the consistently held view that children of lower SES are at an increased risk
of displaying problem behaviours, (e.g. Brooks-Gunn & Duncan 1997, Klaff et
al. 2001, and Huaqing-Qi & Kaiser 2003). More recent research, including the
large cohort studies by Brown & Schoon (2008) and Green et al. (2005) can
also be supported, as these studies found that children living in poverty or
253
residing with parents on lower incomes were at increased risks of displaying
problem behaviours compared to those children from more affluent
backgrounds. Finally, support is offered for a non-correlational study using a
quasi-experimental design, which showed a positive relationship between lower
SES and behaviour difficulties (D’Onofrio, et al. 2009). The consistency
displayed between the results of the present study and those from previous
literature, goes to show that children of lower socio-economic status are at an
increased risk of displaying behaviour difficulties and this is true across a wide
range of populations including children with SEND.
The present study was not able to provide evidence why this relationship
occurred; nonetheless, it has been argued that family income can have
substantial effects on children particularly during the school years (Brooks-Gunn
& Duncan 1997). Those children from poorer backgrounds are more likely to
experience more severe familial stress, live within chaotic and unstable
households, experience poorer parenting behaviours, and have a lack of
cognitive stimulation. These factors will accumulate and their multiple influences
may exacerbate coping resources and result in the display of behaviour
difficulties (Evans 2004).
Bullying Within both the primary and secondary models, being a bully, (as rated by
teachers) was a significant risk factor for behaviour difficulties. Children who
were rated as such were considered the instigator or perpetrator of bullying
incidents and were noted as the children with the most severe behaviour
difficulties. This evidence is consistent with Wolke et al. (2000), and Hampel et
al. (2009) who have also showed a direct relationship between being a bully
and the display of more severe behaviour difficulties. A study by Kim et al.
(2006) (who had a similar methodology with the present study), found children
rated as being a bully at baseline were significantly more likely to display more
aggressive behaviour ten months later. Being a bully is therefore a precursor to
anti-social behaviour. The consistency in evidence displayed suggests this is a
particularly pertinent finding, and extends across distinct populations, with
254
children with SEND no more or any less affected by this variable than typically
developing children. Indeed the evidence that being a bully is a predictor of
more severe behaviour difficulties is perhaps not a surprising one; bullying
behaviour is often comprised of aggressive acts, which at least to some degree
are also salient features of behaviour difficulties measurements.
Within the secondary model, although not the primary model, being rated by
teachers as a bystander to bullying was also a significant risk factor. Bystanders
of bullying are conceptualised as being present in bullying incidents although
not partaking in them directly. It is unclear why being a bystander to bullying is a
risk factor for behaviour difficulties, and with a lack of research specifically
within this area, the issue remains particularly cloudy. Nonetheless, it could be
surmised here that bystanders are friends of bullies in which case they are
present at bullying incidents although not directly involved themselves. They
may be influenced by the negative behaviour they witness and display similar
negative behaviour within other contexts. Bystanders could therefore be rated
as having more severe behaviour difficulties. However, if this was the case why
is being a bystander only a significant risk factor in secondary schools and not
in primary schools? One argument could be that primary school teachers are
more reliable raters of a child’s role in bullying incidents, as they teach the same
pupils throughout the day. They may therefore know these pupils better and can
more accurately rate their child’s role in bullying incidents.
In contrast to a number of previous studies being a victim of bullying did not
emerge as a significant risk factor. This evidence disputes the majority of
previous research in suggesting that those individuals rated as being victims of
bullying have more significant behaviour difficulties, (Gini 2008, Hampel et al.
2009, and Areseneault et al. 2010). The reasons for these differences are not
abundantly clear, although they may well be surrounded within the
measurement issues of bullying roles. Within the present study teachers were
the raters of a pupils role in bullying incidents, as bullying may be a subjective
experience it is difficult to know when someone has been bullied or whether
they were doing the bullying or indeed whether they were a bully-victim or
bystander. As this variable only involved teachers ticking one box for a pupil’s
255
typical role in bullying incidents care should be taken in the interpretation of this
finding. Finally and perhaps unsurprisingly being rated as ‘not involved’ in
bullying incidents emerged as a promotive factor for children in both primary
and secondary schools, and these children experienced fewer behaviour
difficulties
Year Group Within both the primary and secondary models the variable year group (taken
as a measure of age) was a significant predictor of behaviour difficulties.
Previous studies have also showed age to be related to behaviour difficulties
(Green et al. 2005, Maughan et al. 2004). The present study adds to this
literature in suggesting year group or age is an important predictor of behaviour
difficulties in children with SEND. Specifically, within the primary school model
those in year 5 (compared with year 1) were at risk and in the secondary model
those in year 7 (compared with year 10) were at risk. This is an interesting
finding as within primary schools the older children were worse off, whereas in
secondary schools it is the younger children that are more at risk of displaying
behaviour difficulties.
The finding in relation to the secondary school model is consistent with
Bongers, et al. (2004) who suggest that there are different age effects on
behaviour difficulties depending on the exact nature of the difficulties displayed.
As children become older they may be less likely to engage in physically
aggressive acts but more likely to display non-aggressive acts such as truancy
and drug abuse. In terms of the behaviour difficulties measured within the
present study from the WOST, 4 of the 6 items were related to aggressive
behaviours and 2 were related to non-aggressive acts. This bias in favour of
more aggressive behaviour difficulties could be used to explain why in the
secondary school model at least, the younger children were considered more at
risk as the majority of items measured behaviours which they were likely to
score worse on compared with the older children. Nonetheless, this would not
explain the finding within primary schools where the older children were most at
risk. Indeed the results of the present study are inconsistent with
256
Papatheodorou (2005) who states younger children may display more
behaviour difficulties, as they will not yet have learnt socially acceptable
behaviours, although this is more relevant to preschool aged children.
In the context of the present study the difference between year 1 and year 5
scores could reflect not the disparity between aggressive and non-aggressive
acts within the measurement tool, but how well the teachers know the children
within their class. There could be an argument that teachers are more familiar
with their year 5 classes having got to know them throughout their school career
compared with teachers of year 1 children who are teaching children fairly new
to the school. Children who have been in the school longer may become
‘known’ with teachers rating their behaviour upon negative reputations and
stereotypes rather than actual behaviours.
A further alternative view is that the decrease of aggressive acts and increase
of non-aggressive acts with increasing age may only come about at a certain
threshold. For example both these types of behaviours may augment with age
until a threshold time (i.e. at the transition time to secondary schools), where
aggressive acts then begin to decrease and non-aggressive acts increase
further. Indeed Lahey et al. (2000) in a study of 9-17 year olds suggested that it
is the middle years of this age range where the problems are most pronounced.
This is consistent with the present study that found those children in years 5
and 7 had more problems with their behaviour than children in years 1 and 10.
In drawing this section to a conclusion it is essential that age effects on
behaviour difficulties are considered from a developmental perspective,
acknowledging so called early onset (within childhood) and late onset (within
adolescence), behaviour difficulties and taking into account that the causes of
both maybe different (Lahey & Waldman 2003).
257
b) Unique predictors within primary schools
Season of birth Season of birth (broken down into the 4 distinct seasons see table 5.2) was an
established risk factor for behaviour difficulties only within the primary school
model. Those born in the autumn months (September through November) had
significantly worse behaviour difficulties than those born within the summer
months (June through August). The academic year within the UK begins in
September; therefore those born in the autumn months are the oldest in their
year, with summer born children the youngest. It is the oldest children within the
school year in primary schools who are at risk and display the most severe
behaviour difficulties.
This evidence is in fact contrary to a number of previous studies who have
showed the youngest children within any school year display the most severe
behaviour difficulties (Goodman, et al. 2003, Menet, et al. 2000, Polizzi, and
Martin & Dombrowski 2007). These studies however, did not explicitly use a
SEND population which could account for the difference in findings. The
disparity in findings could reflect issues with maturity levels and that younger
children within the school year are less socially and physically skilled and may
suffer social disadvantages in terms of peer relationships (Martin et al. 2004).
This is not necessarily an explanation as to why younger children display
behaviour difficulties, (as they have not yet learned appropriate behaviours) but
that the younger children’s lack of maturity may cause them to become victims
of aggressive acts as they are seen as the most physically weak children. The
autumn born children may be the perpetrators of such incidents being physically
stronger and often nearly a whole year older than summer born children.
This may be a credible explanation within primary schools where relative age in
a school year has a more pronounced effect, particularly within year 1 where
nearly a year’s difference in age is a substantial proportion of a child’s life.
These differences however, become less pronounced as children get older
(Menet et al. 2000), and differences in maturity levels become less extreme
within a single school year. These null findings within the secondary model
258
support other researchers who have failed to find a relative age within the year
effect with secondary age children (Lien et al. 2005).
Positive relationships Positive relationships became a significant predictor of behaviour difficulties
within the primary school model. Those with lower levels of positive
relationships were significantly more likely to display more severe behaviour
difficulties than those with higher levels. Within the secondary model the
relationship between poorer relationships and behaviour difficulties approached
significance, although this value was not p <.05 therefore cannot be
conceptualised as a risk factor. The present study therefore provides further
support for the consistently held view that children with more positive peer and
teacher relationships will experience fewer behaviour difficulties (Ladd &
Burgess 1999, Hamre & Pianta 2001, Criss, et al. 2002, Dodge, et al. 2003,
Buyse, et al. 2008, Baker, et al. 2008, Silver, et al. 2010). The focus within the
present study on children with SEND shows that for this group of children, like
all children, positive relationships are important in reducing behaviour
difficulties. Indeed Wiener (2004) has reported that for children with learning
difficulties, risks for behaviour difficulties can be reduced with positive social
relationships.
A number of explanations have been offered as to why more positive
relationships with peers and teachers have an effect on behaviour difficulties.
One idea is that the influence of positive relationships on behaviour difficulties is
mediated through attachment relationships. Those children with a more secure
attachment with their primary caregiver will be able to form other secure
attachments with teachers and peers which lead to the increasing likelihood of
displaying positive behaviours, and reducing the likelihood of negative
behaviours (Hamre & Pianata 2001). Nonetheless, whether lower levels of
positive relationships result in increases in behaviour difficulties or whether
behaviour difficulties lead to a decrease in positive relationships is a contentious
issue. Doumen et al. (2009) found that aggressive behaviour at the beginning of
the school year resulted in an increase in child-teacher conflict that then lead to
259
further increases in aggressive behaviour at the end of the school year. This
confusion in the literature would benefit from further longitudinal evidence to
suggest the time order in effects. Possibly there exists a bidirectional
relationship with both concepts (i.e. positive relationships and behaviour
difficulties) impinging on one another.
Finally, it is interesting to note that the influence of positive relationships on
behaviour difficulties was more important within primary than in secondary
schools (indeed failing to be a significant predictor in the secondary school
model). There is a lack of evidence in the previous literature to account for why
differences across age groups could affect how relationships influence
behaviour difficulties. One study has shown that younger children are more
affected by negative peer influences than older children, which may then be
manifested in the display of behaviour difficulties (Laird, et al. (2001).
School level achievement A particularly strong and significant predictor of behaviour difficulties within the
primary model is school level achievement. Lower levels of school achievement
are a risk factor for increases in behaviour difficulties within primary schools.
Although some studies have failed to find that school level achievement is
related to behaviour difficulties (Wilson 2004), the present study is consistent
with a number of previous studies that have showed higher school level
achievement to be related to fewer problem behaviours within schools (Rutter et
al. 1979, Mooij, 1998, Barnes et al. 2006, Bisset et al. 2007). Within primary
schools, pupils (in the same year) are usually taught all together in the same
class and not split into sets of ability. Being in a mixed ability class where the
overall standard is relatively high could result in lower achieving pupils (such as
children with SEND) gaining by having peers of higher ability to help with their
academic difficulties. This could lead away from frustration in their work and
ultimately the display of problem behaviours, when teachers are unavailable to
support them.
260
A concerning finding, however, was that no such significant relationship within
the secondary model was established. In fact although the coefficient
approached significance, this effect was in the opposite direction to primary
schools, suggesting that higher levels of school level academic achievement
would be associated with more severe behaviour difficulties. Felson et al.
(1994) provide a hypothesis for this effect arguing that attending a school with
high achievement amongst its pupils is not always an advantage and could
have some detrimental effects upon student behaviour. This study showed that
when the school culture promoted high academic achievement a negative
influence upon student behaviour was observed. The authors suggested that
those students who are not achieving at a high level and are surrounded by
others who are, may suffer in comparison, seeing themselves as failing. The
sense of frustration they feel is then manifested in the displayed of problem
behaviours. This may explain the situation within the secondary model; as
secondary school pupils, will be aware of their performance in comparison to
others at the school. If overall academic achievement is low, pupils with SEND
(who are often behind their peers in academic achievements) will not consider
themselves as behind when they are in higher achieving schools. Ultimately this
may reduce frustration and the display of problem behaviours.
c) Unique predictors within secondary schools
School size Within the secondary model, although not in the primary model, school size was
a significant predictor of behaviour difficulties. The direction of effect was that
larger secondary schools are considered a risk factor for behaviour difficulties
with those attending smaller schools better off. The previous literature
surrounding the effect of this variable on behaviour difficulties is considerably
mixed with some evidence arguing, as in the present study, that larger schools
are a risk factor for behaviour difficulties and violence (Stewart 2003, George &
Thomas 2000), whereas others maintain no effect of school size on student
victimisation, aggression, or smoking and drinking behaviours (Khoury-Kassabri
et al. 2004, Wilson 2004, Maes & Lievens 2003). As these studies all focused
261
on secondary age school students, their findings only relate to this school type.
Further research is needed specifically on the effect of school size on primary
age students.
There are a number of reasons which can be proposed as to why in the present
study large school size was related to the display of behaviour difficulties. This
could have emerged as a significant finding as being within a larger school may
facilitate a degree of anonymity, where students feel less valuable and involved
within their school. Children with SEND may be particularly vulnerable to these
influences, and these feelings could manifest themselves in the display of
behaviour difficulties, with students rivalling for teacher attention. Within large
schools there is also the opportunity to meet and interact with a wider range of
people from different backgrounds. This can lead to a higher likelihood of
meeting and being influenced by negative peers which could have an influence
on individual problem behaviour.
Despite these ideas, the issue remains why the effects were not observed
within primary schools. It could be argued the variability in size could be an
important explanation. The difference in size between the largest and smallest
secondary schools is considerably greater than the difference between largest
and smallest primary schools. The lack of variability in size within primary
schools could be a reason why no effect was noted. Furthermore, within smaller
schools there maybe the opportunity for students to develop better relationships
with their peers and their teachers and these more positive relationships could
counteract some of the potential risks associated with larger schools
(Gottfredson & DiPietro 2011).
Attendance Within the secondary model, although not the primary model, attendance was a
significant predictor of behaviour difficulties. Those pupils who had poorer
attendance levels in secondary schools were at risk of displaying more severe
behaviour difficulties. This evidence is consistent with others who have found
similar negative effects on behaviour from greater amounts of school
262
unauthorised absences (Malcolm, et al. 2003, Miller & Plant 1999). Numerous
studies have presented evidence that those who have poorer attendance are
also more likely to engage in other problem behaviours such as drug abuse,
smoking and underage drinking (Chou, et al. 2006, Henry 2007, Henry &
Huizinga 2007). Although these behaviours are not synonymous with behaviour
difficulties in schools they are nonetheless problematic behaviours. The
considerable consistency in evidence present here, suggests that poor
attendance is a risk factor that extends beyond children with SEND, and is a
salient issue for all children.
Despite the evidence appearing in support of this relationship it could be
surmised that poor attendance is a consequence of behaviour difficulties and
not a cause. Those children, who have behaviour difficulties in schools to begin
with, attract negative attention from their teachers, leading to an overall
negative experience of school. As they begin to feel less connected they may
be more inclined to not attend school. Although a feasible possibility, the
present study was longitudinal in design and measured attendance levels
before the final outcome of behaviour difficulties was assessed, whilst
controlling for previous behaviour difficulties displayed. It is therefore suggested
here that poorer attendance is a risk factor for the display of behaviour
difficulties.
In secondary schools when children choose not to attend school, they are likely
to be unsupervised by adults and therefore have more opportunity to engage in
negative behaviours (McAra 2004). In such situations they are likely to have a
greater exposure to negative peer experiences and suffer a diminished positive
effect of school influences (Henry & Thronberry 2010). An issue that however
remains is why the relationship between poor attendance and behaviour
difficulties was not evident within the primary model. It could be that primary
school children are supervised to a greater extent than secondary children both
by their parents who often bring them and collect them directly from school, and
also by their teachers within school who see them in the same class throughout
the day. This may give primary school students considerably less opportunity to
abscond from school. Indeed primary school children with SEND may receive
263
additional supervision as they are often perceived as being more vulnerable
than their non-SEND peers.
Academic achievement Lower levels of academic achievement were established as a salient risk factor
for behaviour difficulties within the secondary but not the primary school
models. This finding is consistent with a number of other researchers within the
literature who have all shown that those individuals with lower levels of
academic achievement are also more likely to display behaviour difficulties
(Hinshaw 1992, Reid, et al. 2004, & McIntosh, et al. 2008). In relation to the
present study academic achievement was taken as a measure of an individual’s
point score in English, therefore showing that lower English abilities are a risk
factor for behaviour difficulties. This is consistent with Morgan et al. (2008) who
found those with reading problems (a sub domain of academic achievement in
English) at the beginning of school were more likely to display behaviour
difficulties 2 years later than those without these problems at the beginning of
school.
The major debate within this area concerns the direction of effect and whether
academic achievement predicts behaviour difficulties or if behaviour difficulties
predicts academic achievement. Breslau, et al. (2010) and McLoed & Kaiser
(2004) who both conducted longitudinal studies suggest it is behaviour
difficulties which predict academic achievement. This stance is nonetheless
disputed within the present study, which also implemented a longitudinal design
measuring the academic achievement as a predictor before the outcome
behaviour difficulties (and controlling for behaviour difficulties displayed at
baseline). As the predictor was measured before the outcome, lower levels of
academic achievement can be established as a risk factor rather than a
correlate of behaviour difficulties. The differences in these results could reflect
the population under investigation. The present study in utilising a SEND
population provides support for the argument presented by Morgan et al. (2008)
that the cause of behaviour difficulties is poor academic achievement, and when
children become frustrated with increased difficulty of a task they start to ‘act
264
out’ displaying behaviour difficulties. This argument particularly resonates
concerning children with SEND, as they are more likely to struggle academically
that their non-SEND peers. An alternative argument is that behaviour difficulties
displayed in children and adolescents have negative effects on their teachers
and this ultimately impinges on their learning (Reid et al. 2004, Breslau, et al.
2010).
A surprising finding however is why in the primary school model this effect failed
to reach statistical significance. There could be an argument here when children
become aware they are academically behind their peers this leads to a sense of
frustration which manifests itself in behaviour difficulties. Secondary school
pupils will have better awareness of their relative performance in comparison to
their peers, which could explain why this variable was related to behaviour
difficulties in the secondary schools. In primary schools however, pupils who are
further behind academically may not fully comprehend the situation and
therefore this influence has a lesser effect upon their behaviour. This is a fairly
speculative argument and further research is warranted in this area.
d) Non-significant predictors
There are a number of variables within the study that despite having both
empirical and theoretical justifications for their inclusion, failed to emerged as
significant predictors of behaviour difficulties for either of the primary or
secondary models. Nonetheless, they are discussed here and reasons are
offered as to why they may have remained non-significant predictors.
Ethnicity Ethnicity, failed to become a significant predictor of behaviour difficulties across
either the primary or secondary model. This evidence is contrary to other
researchers in the field, who argue that such differences do exist (e.g. Zwirs, et
al. 2011). Within the UK context Brown and Schoon’s (2008) noted key ethnic
differences in the prevalence of behaviour difficulties. Specifically, Black African
children had the least behaviour problems, followed by White children, with

265
Pakistani, Bangladeshi and Black Caribbean children having considerably
higher levels. The present study is unable to support these findings as found no
such ethnic differences. Nonetheless, it was not possible to break the ethnicities
down to the degree shown by Brown and Schoon, and just two labels White
British and Other were used within the present study. The advantages that
Black African children had within the Brown and Schoon study could have been
obscured in the present study as they were included within the other ethnic
groups that are more prone to such problems. Therefore, how ethnicity was
coded and categorised could be the influencing factor.
A further reason for the null finding within the present study has been argued by
Greenberger et al. (2001), who suggested that ethnic differences in terms of
problem behaviours may not emerge until well into adolescence. This may
explain why no significant effect was found within primary schools, although
fails to account for the non-significant finding in secondary schools, where
pupils are considered adolescents. Another explanation is that within a number
of the previous studies a parental report rather than teacher report has been
used to assess behaviour. Guttmannova et al. (2007) has suggested that
definitions and measurements of behaviour difficulties can vary across ethnic
groups, particularly in terms of what is deemed acceptable and developmentally
appropriate behaviour, with parents of different ethnicities rating children in
different ways. Within the present study teachers did the rating of a child’s
behaviour difficulties, as they are arguably in a better position to accurately
evaluate an individual’s behaviour, and assessing behaviour in relation to all
children in the class. The differences in findings reported across studies may
therefore be due to who was rating the behaviour of the child i.e. parent or
teacher. Finally, as no previous study has explicitly investigated risk factors for
a SEND population it could be reliably conceived that within this group of
children, ethnic differences as a risk factor for behaviour difficulties are non-
existent, and this is consistent with the stance of Dekovic, et al. (2004).
266
Level of SEND support Within both primary and secondary models the SEND level of support variable
(including school action, school action plus, and statement) failed to reach
significance as a predictor of behaviour difficulties. This is perhaps not a
surprising finding; although it is often assumed that children with higher levels of
support are more severely affected by their SEND than those at low levels, this
is not necessarily true. The level of support a child receives reflects the schools
ability to provide for the individual child’s needs, comparing across schools with
children at the same level of support could therefore be almost meaningless; as
considerable variation exists in a how schools define SEND (Ofsted 2005).
Nonetheless, in general, pupils move through the levels of support as their need
becomes greater (Frederickson & Cline 2009, DfES 2001a). It could be reliably
assumed that those with the most severe behaviour difficulties will be at the
statement level of support and those with the least problems at the school
action stage. Although despite this suggestion that children with a statement for
SEND are most likely to display behaviour difficulties, they may however, be
protected from displaying these problems due to their significant support
package in place.
Urbanicity The role of school location and whether it was situated with a rural or urban
setting had no influence on SEND pupil’s behaviour difficulties, either within the
primary or secondary models. The present study provides support therefore for
Wilcox-Rountree and Clayton (1999) and Swahn et al. (2010). These studies
also found no evidence of a school location effect, and that rural students are
not any better or worse off than their urban counterparts in terms of alcohol use
or aggression. Nevertheless, some previous literature has suggested there is a
school urbanicity effect on behaviour, with those in urban schools displaying
more severe behaviour difficulties (Stewart 2003, Larsson & Frisk, 1999, Hope
& Bierman 1998). These effects may occur as urban schools are more likely to
reflect the significantly higher rates of violence displayed within their wider
community (Warner, et al. 1999). Furthermore, urban school children may have
a greater exposure of anti-social and aggressive peers (Hope & Bierman 1998).
Other researchers however, have argued that children attending schools within
267
urban settings are actually at an advantage. Within these schools there is a
more of an abundance of resources available which leads to a more positive
effect on pupils (Sellstom & Bremberg 2006). There is considerable
inconsistency in this debate, but within the present study at least school location
has no effect on SEND children’s behaviour difficulties.
Percentage of FSM students within the school Another non-significant predictor of behaviour difficulties across both the
primary and secondary models was that the percentage of students within the
school eligible and claiming free school meals. It has been suggested that FSM
can be taken as a proxy for socio-economic status (Hobbs & Vignoles 2007)
with those eligible noted as being of lower SES. The majority of previous
evidence surrounding this variable argues that schools with higher average SES
influenced student behaviour in positive ways (Sellstom & Bremberg 2006) with
lower levels of SES within the school considered to be a risk factor for
behaviour difficulties (Felson, et al. 1994, George & Thomas 2000, and Wilcox
& Clayton 2001). Why this is the case however, is not abundantly clear, perhaps
the collective effect of many students who are of lower SES results in them
being at risk individually, resulting in a more aggressive culture within the
school, influencing even those of higher SES.
The present study is not able to offer support for these findings and instead has
returned a null result; suggesting at least for a group of children with SEND the
SES level of the school plays no influence on their behaviour displayed. It is
interesting why this disparity between the present study and previous literature
exists. The difference could reflect the measurement tool used, as FSM
eligibility may not be the most accurate measure of SES. It accounts for not only
those individuals who are eligible, but also those who are actively receiving it.
Concluding this issue the present study offers support for the view posed by
Stewart (2003) who reported a number of school level variables could account
for school problem behaviour although SES was not one of them.
268
Percentage of EAL students within the school Within both the primary and secondary models the percentage of pupils within
the school who have English as an Additional Language (EAL) was a non-
significant predictor of behaviour difficulties. These findings are consistent with
the previous work of Barnes et al. (2006) and Stewart (2003) who failed to find
any support for the idea that behaviour difficulties were related to the number of
children within the school with EAL or from different ethnicities. Nevertheless,
the debate within this area is particularly contentious as other researchers have
found that schools with more than 50% of students from ethnic minority
backgrounds (and therefore presumably higher numbers of EAL students) had
significantly worse behaviour problems than those with fewer students from
ethnic minority backgrounds (Ma et al. 2007).
It is not clear why differences within this variable would predict increases or
decreases in behaviour difficulties. Perhaps those who have EAL initially find it
difficult to understand appropriate behaviour within a classroom and culture they
are just beginning to learn. A greater number of children within the school with
EAL could have an additive effect on behaviour difficulties displayed, and
indeed this could have a negative influence on other children without EAL. This
explanation would not however, account for why older children who are more
likely to be well equipped with the English language and culture and do
understand behavioural expectations within the school. Contrary to the view that
more EAL students in a school reflects greater behaviour difficulties is the
evidence from Kohen et al. (2009). They have argued that actually schools with
a higher percentage of EAL students had significantly lower levels of aggressive
behaviour. There is considerable confusion with this variable, and its effects on
behaviour difficulties are unclear, further research is needed to elucidate this
debate. Nonetheless, the present study maintains that for children with SEND
the percentage of students with EAL makes little difference to their behaviour
displayed.
Percentage of SEND students within the school Within the present study two variables measured the number of students within
the school as having SEND. These were the percentage of students within the
269
school at the school action level of SEND and the percentage of students in the
school at the school action plus and statement level of SEND. Both these
variables were non-significant predictors of behaviour difficulties for both the
primary and the secondary models. This evidence is consistent with others in
the field who have suggested that schools with more SEND pupils within the
classroom have a limited effect on behaviour of other students (Sharpe et al.
1994, Tapasak & Walther-Thomas 1999).
However, previous research has found that children with SEND are more likely
to display behaviour difficulties than those without (Green et al. 2005).
Therefore a school with more SEND pupils is likely to have more significant
behaviour difficulties on the basis of a simple aggregation effect. As the number
of these pupils increase this could influence other students in a negative
manner. Indeed one study found that having more children on the SEND
register was related to school problem behaviour (Barnes et al. 2006). A
number of inclusion based studies have also shown that there are significant
negative effects on pupils when higher proportions of SEND pupils are included
within their classrooms (Daniel & King 1997, Brown 1982). The reason for such
negative influences is, that having more SEND pupils within a school can create
additional work for teachers, leaving considerably less time for other pupils, who
may then become frustrated or bored and act out problem behaviours in
response (Daniel & King 1997). The sample for the present study however, was
children with SEND, not children without SEND as in these studies described
above. Perhaps children with SEND do benefit to a greater extent when more
children also have SEND, as additional resources and interventions will be put
in place which they could benefit from either directly or indirectly. Nonetheless,
despite these suggestions the present study found a null result suggesting no
impact of school level SEND on pupil behaviour.
270
School level overall absence Within the present study differences between schools in their levels of absence
was a non-significant predictor of behaviour difficulties across both primary and
secondary schools. Therefore, whether the school level of overall absence was
high or low makes no difference to SEND pupils behaviour difficulties. This
evidence is contrary to the majority of the previous research which suggests
that children who attend schools with higher rates of absence are at a
heightened risk of displaying behaviour difficulties, than a child attending a
school with lower rates of absence (Bisset, et al. 2007, Maes & Lievens 2003).
Presumably higher rates of truancy or unauthorised absence could affect other
pupils in negative ways as they become annoyed with the disruption to the class
when the truanting pupils return and need additional help (Wilson et al. 2008).
No such effect was witnessed in the present study and the behaviour difficulties
displayed by children with SEND are not affected by the overall absence rate
within their school. The reasons why no such effect was observed within the
present study are hard to attribute. One possible explanation is that there could
be a lack of variability in overall absence scores across the schools in the
sample to detect a significant effect. This may be evidenced by the difference
between the present sample mean and figures found nationally. The difference
equates to a large effect size within the secondary model and a medium effect
size within the primary model. Mean scores within the present study were
considerably higher than national averages, suggesting that schools in the
present study have poorer attendance.
School exclusion rates The final non-significant predictor across both school models is school
exclusion rates. Within the present study this variable was taken as proxy for a
schools level of behaviour difficulties. Both within the primary school and
secondary school models non-significant findings emerged. This suggests that
exclusion rates have no influence on the behaviour difficulties displayed of
children with SEND. The present study is therefore unable to support the
majority of the previous literature which suggests that higher overall levels of
behaviour difficulties within a school will have a more negative influence on the
individual children within them (Mooij 1998). A considerable amount of this
271
research however, is classroom rather than school based suggesting that being
a member of a class with high levels of aggressive classroom for a longer
period of time has a strong influence on individual level aggression scores,
(Thomas & Bierman 2006, Mercer et al. 2009). It may be that peers within these
contexts become effective role models for other students, and reinforce the
display of behaviour difficulties (Barth, et al. 2004). Finally, the most directly
comparable piece of research to the present study comes from Theriot, et al.
(2010) who argued that school level exclusion is a significant predictor to
explain individual level exclusion; however, this can also not be supported.
Although the evidence from previous studies is overwhelmingly in support of the
idea that schools with higher levels of behaviour difficulties have negative
effects on individual behaviour, the present study failed to find such an effect.
This could be for a number of reasons, but perhaps the most likely is the lack of
variability within this predictor. Most schools did not report a single exclusion
over the school year which resulted in this variable having a fairly large floor
effect. Furthermore, the reporting of exclusions is surrounded in controversy
with many inaccuracies recorded, and schools failing to record them
appropriately for fear of negative consequences (Harris, Eden & Blair 2000). In
sum perhaps this variable is not the most appropriate to use when attempting to
gauge a measure of school level behaviour problems, and how it could
potentially influence the behaviour difficulties displayed of children with SEND.
7.3.3 Research question 1c:
Of the variance initially attributed to the individual and school levels, how much of this is explained by the predictors used in the study? An analysis was undertaken to calculate the amount of variance to be explained
(as evidenced by the empty model) that was explained when all the predictors
were added (i.e. the full model). The primary model including both school and
individual predictors can explain 14.3% of variance in behaviour difficulties
whereas the secondary model can account for 14.2%.
272
This is a fairly disappointing finding; a substantial proportion of variance
remains unexplained within the present study. However, as discussed in
chapter 2 there are numerous risk factors for behaviour difficulties that were not
measured within the present study; although still remain important in accounting
for behaviour difficulties. These may include hormonal influences (Book et al.
2001), certain personality traits (Viding, Frick, & Plomin, 2007), low self-esteem,
(Schonberg & Shaw 2007) association with delinquent peers (Laird et al. 2001),
and poor attachment relationships (Moss, et al. 2006). There are also further
school related variables which could be included e.g. school climate (Sellstom
and Bremberg 2006), school connectedness (Bond et al. 2007), and presence
of effective school policies (Evans-Whipp et al. (2004). If all these variables
were added the amount of variance that was explained within the present study
is likely to substantially increase.
Comparing between the primary and secondary models shows that total
variance explained was roughly comparable 14.3% within primary schools and
14.2% within secondary schools. Greater differences emerge when the
explained variance is broken down across the individual and school levels. The
secondary school model was able to account for 32.0% at the school level
compared with the primary school which could account for 25.6% at this level.
The difference between these models at the individual level is more comparable
with the primary model being able to explain 12.2% and secondary model
11.6%. At least two interesting findings are noteworthy here. Firstly, despite the
same variables being used within both primary and secondary models, more
variance could be explained at the school level for secondary compared with
primary schools. This suggest the school level variables selected are perhaps
more pertinent in accounting for behaviour difficulties in secondary school
students compared with primary school students. Secondly, despite more
variance to be explained at the individual level compared with school level (see
research question 1a) proportionally more of this variance was explained at the
school level compared with the individual level, for both the primary and
secondary models. This suggests that the school level predictors selected for
the study are more comprehensive of this level, than the individual predictors
273
are within the individual level in accounting for the variance in behaviour
difficulties. This is not surprising as the individual level is considerably more
complex incorporating many more potential risk factors for behaviour difficulties
than within a contextual level such as the school level.
Sellstom & Bremberg (2006) propose that multi-level studies which investigate
individual and school effects on pupil outcomes should report how much
variance was partitioned between these levels in the null and full models in
order to account for the amount of variance each level can explain. This type of
analysis has not been forthcoming in a number of investigations using a multi-
level approach which makes it difficult to compare the results within the present
study to those found previously in the literature. Nevertheless, although only a
relatively small proportion of variance was explained this is a salient finding, and
these factors do account for some of the variation in behaviour difficulties.
Clearly further study should extend this work adding in additional variables that
may be potentially important.
7.3.4 Research question 2a:
Is there a cumulative effect of contextual risk factors on behaviour difficulties, where higher numbers of risk factors present are associated with increased levels of behaviour difficulties? The findings in relation to the above question showed that for both primary and
secondary models, higher numbers of risk factors present within an individual’s
background, regardless of the specific make up of the risk, resulted in more
severe behaviour difficulties displayed. This is clear evidence of a cumulative
effect of risk factors on behaviour difficulties, and provides support for the
cumulative risk hypothesis, and previous literature which has found this same
effect (Trentacosta, et al. 2008, Raviv et al. 2010, Lima et al. 2010, McCrae &
Barth 2008, Appleyard et al. 2005, Atzaba-Poria et al. 2004, Gerard & Buelher
2004b, Kerr & Black 2000, Forehand et al. 1994). The present study is the first
piece of research to utilise a cumulative risk model to assess behaviour
274
difficulties in a population of children with SEND. In establishing such an effect,
it adds to the literature base, highlighting the salience of cumulative risk models
in accounting for behaviour difficulties across distinct populations.
Previous research has suggested that multiple risk factor models are better than
single risk factor models in accounting for the display of behaviour difficulties
(Dodge & Pettit 2003, Wachs 2000, Ackerman et al. 1999, Whipple, et al. 2010,
Evans, Kim, et al. 2007, Evans 2003, Forehand et al. 1998). This is because
problem behaviours result from numerous negative pathways. It is not any
specific risk factor that leads to these problems but the sheer number of risks
that build up within an individual’s background that overwhelm their coping
mechanisms and lead to problems in their behaviour (Flouri & Kallis 2007).
Within the present study the cumulative risk score was comprised of various
types of risks, with each individual having their unique set. The key issue was
not that any specific kind of risk lead to the problem behaviour but increasing
the number of risks in an individual’s background resulted in more significant
behaviour difficulties.
The present study argues that research should be conducted by investigating
risk factors in combination rather than in isolation. This is because risks are not
independent from one another, and cluster together within individuals (Flouri &
Kallis 2007). Risk factors need therefore to be acknowledged within the context
of all other possible risk (Kraemer et al. 2001, MacKenzie et al. 2011, Gutman
et al. 2003), and this will enable a better understanding of how these factors
work in combination to influence behaviour difficulties.
275
7.3.5 Research question 2b
What is the nature of the relationship between exposure of cumulative risk and behaviour difficulties?
The functional form of cumulative risk on behaviour difficulties and whether this
relationship is linear or nonlinear remains a particularly disputed aspect with the
literature (Gerard & Buelher 2004a, Appleyard et al. 2005). Within the present
study research question 2b revealed that a quadratic pattern best described the
data. Therefore, as risks accumulate within individuals their combined effect
becomes increasingly detrimental.
This evidence is contrary to the linear pattern observed in a number of previous
studies (e.g. Raviv et al. 2010, Flouri & Kallis 2007, Appleyard et al. 2005,
Gerard & Buehler 1999, 2004a, 2004b, Dekovic 1999) where increments in risk
had a similar additive effect on problem behaviour observed. The present study
also found no evidence of a saturation model signifying a levelling off or plateau
effect, after the threshold is reached (Evans 2003, Morales & Guerra 2006).
Within such models after the threshold further risk causes no increased
negative effect on behaviour, but this was not witnessed within the present
study, where adding in each additional risk increases in behaviour difficulties
were reported.
The present study therefore provides support for the alternative view that a
nonlinear relationship exists between cumulative risk and behaviour difficulties.
Specifically, the quadratic term was significant suggesting that there is an
acceleration of behaviour difficulties as number of risks increase linearly. Risks
therefore potentiate one another with their combined effect being more severe
than the sum of their individual effects.
This means that as risk increases beyond a certain level behaviour difficulties
displayed become increasingly more severe (Raviv et al. 2010). Evidence of a
mass accumulation effect (Gerard & Buelher 2004a) was therefore observed
where the total effect of cumulative risk exerted an influence on behaviour
276
difficulties greater than the sum of its individual parts (Lima et al. 2010, Flouri &
Kallis 2007). The present study therefore provides support for a number of
others within the field who have found the same nonlinear relationship with
cumulative risk and various types of problem behaviours (Rutter 1979,
Bierderman et al. 1995, Forehand et al. 1998, Greenberg et al. 2001, Jones et
al. 2002).
What is particularly remarkable about a number of previous studies is their
apparent consistency in where the threshold occurred; despite being comprised
of various different types of risks, and outcomes. Rutter (1979) showed a
threshold after 4 risks are reached, Bierderman, et al. (1995) suggested it was
around 3, Forehand et al. (1998) noted that as the number of risks increased
from 3 to 4 there was a dramatic increase in the amount of problem behaviour,
Greenberg et al. (2001) showed that when 3 or more risk factors were present
there was a dramatic increase in problem behaviour, and Jones et al. (2002)
proposed that after 4 risks were encountered there would be significant
increases in problem behaviour.
The present study is in agreement that there is an acceleration of problem
behaviour at a critical level of risk although is not able to comment on exactly
where this effect occurred as the cumulative risk score incorporated fewer risks
than the studies mentioned above. Nonetheless, a similar nonlinear effect was
noted that is consistent within these previous studies, despite the present study
using a distinct population of children with SEND and different types of risks. It
appears that regardless of the types of risks included within these models a
point is reached where risks potentiated one another creating a more severe
effect on behaviour difficulties. It could be the coping resources children and
young people have displayed to counter lower levels of risk may fail once the
threshold is reached, and they are unable to overcome the negative influences
in their lives.
277
7.3.6 Research question 2c
Is the number of risks present within an individual’s background more important than the specific types of risks in accounting for behaviour difficulties? Research question 2c found that within both the primary and secondary school
models the independent additive model was a significantly better fitting model in
accounting for behaviour difficulties than the cumulative risk model. These
results suggest that putting multiple risks in to a statistical model independently
can account for more variance in behaviour difficulties than when a single
cumulative risk score (comprised of multiple risks) is used. Therefore, number
of risks (as assessed through the cumulative model) is not more important than
type of risk (as assessed through independent additive model) in accounting for
behaviour difficulties. This evidence that type of risk remains an important issue,
having different effects on outcomes is consistent with a number of other
researchers in this field (Hooper et al. 1998, Ackerman et al. 1999, Hall et al.
2010, Rousse & Fantuzzo 2009).
The evidence presented here suggests that type of risk is more important than
number of risk when attempting to account for variance in behaviour difficulties.
Although this is in direct contrast with the cumulative risk model, (where number
is seen as more important than type of risk), (Morales & Guerra 2006,
Appleyard, et al. 2005), the present study suggest that both types of models are
important. Using a cumulative model acknowledges the number of risks that
are present in an individual’s background and how these interact together to
predict behaviour difficulties. In such a case risks are seen as interchangeable,
and an effective picture of an individual’s behaviour difficulties could be
predicted if the number of risks in their background was acknowledged.
However, the independent additive model argues that if the specific types of
risks are known behaviour difficulties can be better accounted for in such
models.
278
It is perhaps pertinent to mention here that criticisms have been levelled at both
these types of models. Despite the independent additive model being able to
account for the relative importance of each risk variable independently (Gutman
et al. 2003), it is criticised for assuming risks are independent from one another,
whereas in reality they are interdependent (Flouri & Kallis 2007). The
cumulative model has also been criticised in the way in which cumulative scores
are generated which can sacrifice critical information when continuous scores
are dichotomized (Raviv et al. 2010). In fact the differences in measurement
between the two models may make it particularly difficult to reliably compare
between them. Perhaps the best approach to adopt is to use these two types of
risk models alongside one another, that way the intensity or specific type of risk
factors can be acknowledged along with the number of factors combined that
best predict the outcome (Schoon 2006). Indeed these two models are not
mutually exclusive and serve two different functions. The cumulative model is
interested in numbers of risks factors that accumulate within individuals to
predict outcomes. Whereas the independent additive model is useful in
assessing the intensity of specific types of risk factors that have the most
powerful influence.
279
7.3.7 Research questions 3a and 3b
Which school level predictor variables have a statistically significant interaction effect with contextual risk? Do the significant interactions display evidence of protective-stabilising or protective-reactive effects?
Within the primary model two school level protective factors were noted. There
were significant interactions between risk and school level academic
achievement, and risk and the percentage of children within the school at the
school action level of support. Within the secondary model only one significant
interaction term was noted. There was a significant interaction between risk and
the schools’ location (whether urban or rural).
The significant interaction effects show evidence that different levels of these
variables interact with the risk variable and influence behaviour difficulties in
distinct ways. Interaction graphs were computed to assess whether behaviour
difficulties are affected by different levels of the moderator variable for those at
high and low risk. The graphs displayed the direction of the effect and whether
high or low levels of the moderator variable confer an extra advantage to those
at high risk. Within primary schools, higher school level academic achievement
and higher percentage of children at SA within the school both moderate the
effect risk (in terms of poor positive relationships) has upon behaviour
difficulties. Both these interactions conform to a protective stabilising effect. In
secondary schools attending urban schools moderates the relationship between
risk (in terms of poor academic achievement) and behaviour difficulties and also
conforms to a protective stabilising effect.
Primary school level academic achievement The first significant interactive term to emerge was that risk significantly
interacted with school level achievement. This interaction effect indicated that
all students, regardless of their risk status benefit more from attending a school
with high academic achievement. In low risk contexts (i.e. having good positive
relationships) there is only a small difference between behaviour difficulties
280
displayed in those attending high and those attending low achieving schools.
However, in high risk contexts (i.e. having poor positive relationships) the
difference in behaviour difficulties displayed in those attending high and low
achieving schools is considerably greater. Those children at high risk attending
low achieving schools are significantly worse off compared with those attending
high achieving schools. In this context a higher degree of school level academic
achievement acts as a protective factor, and reduces the display of behaviour
difficulties.
This type of interaction, where different levels of the protective factor have a
relatively similar effect in low risk situations, although large differences in high
risk situations, has been termed a protective-stabilising effect (Luthar et al.
2000). For low risk children whether the protective factor was present i.e. higher
levels of school academic achievement did make some improvements to their
behaviour, but less so compared with when it was present amongst the high risk
children. In order for a fully protective-stabilising effect to occur the protective
factor i.e. high levels of school level overall achievement should remain stable
across high and low risk contexts, this was not the case in the present study.
There was a slight increase in behaviour difficulties displayed from children with
low to high risk statuses, when this variable was present. However, in its
absence (i.e. low levels of school level achievement); there was a more
dramatic increase in behaviour difficulties children from low to high risk
statuses.
Evidence has already been suggested for the promotive effects (main effects) of
school level achievement on behaviour difficulties in primary schools (see
section 6.4.4). Indeed a particularly strong effect was noted that higher levels of
achievement within schools are associated with fewer behaviour difficulties for
all children, which supports the majority of previous literature (e.g. Bisset et al.
2007). What needs to be justified here however, is why this variable was a
significant protective factor being particularly beneficial for those with poor
levels of positive relationships. Why does attending a school with high levels of
achievement have an even greater influence on those at high risk compared
with those at low risk? High risk children, who may struggle socially, may benefit
281
from a school that has a focus upon academic outcomes as this in some way
could distract them from their weakness in the social domain and perhaps focus
upon their strengths in a more academic domain. They may be less inclined to
display behaviour difficulties as the focus is upon academic skills. High
achieving schools are also likely to be the ‘better’ schools not solely in terms of
academic outcomes but in terms of how they support their pupils with social and
behavioural difficulties, and in such schools more effective interventions may be
provided which will reduce the display of behaviour difficulties. This is a
speculative argument and further research is needed however, to support to
refute this claim.
Primary school percentage of pupils as school action The second significant interactive term to emerge was risk with school % of SA.
This interaction effect indicated that for those children experiencing low levels of
risk (i.e. having good positive relationships), attending schools within either a
high or low percentage of children at SA has little impact upon their behaviour.
However, for children with high levels of risk (i.e. poor positive relationships)
behaviour difficulties are significantly worse for those attending schools with low
percentages of SA. Schools with a higher percentage of students at SA are
therefore acting as a protective factor. High risk children will have better
behaviour when attending such schools.
It is therefore advantageous for a child experiencing high levels of risk to attend
a school with more children at SA. The type of interaction, where the protective
factors confers advantages but considerably more so in high risk compared with
low risk situations has been termed a protective-stabilising effect (Luthar et al.
2000, Fergus & Zimmerman 2005, Windle 2011). The present study
acknowledges that the protective factor, ‘higher percentage of SA students’
conforms partially to this type of effect, offering more protection for those at high
compared with low risk. This evidence is reflected in the simple slope analysis
that showed that the line representing the moderator higher percentage of SA
was less steep than the line representing lower percentage of SA, and therefore
is offering some protection (see section 6.6.3b).
282
Some justification for why different levels of school % SA have distinct effects
on those children experiencing high and low risk is warranted. As noted above
in section 6.4.4 there was no independent risk or promotive effect of school %
SA on behaviour difficulties, (i.e. no main effect was established). The
significant interaction effect of this variable with risk, suggests that something
distinct is occurring, which influences those at high and those at low risk in
different ways.
Little research has been conducted surrounding the proportion of SEND
children in a school as a protective factor. As there is no explicit research to
compare with, provided below are some speculative reasons for this effect
which could be assessed within a future study. In low risk situations school
percentage of SA makes little difference to behaviour displayed; however, for
high risk children attending schools with a larger percentage of children at SA
has positive impacts on behaviour difficulties. In this case schools with higher
proportions of SEND children may have more resources available within them;
such resources, although of benefit for all children, are particularly beneficial for
high risk children in reducing behaviour difficulties displayed. In these schools it
is likely a more inclusive ethos is adopted that encourages support for peers
and participation in activities, and may help to replenish coping mechanisms
which may have become depleted in high risk children. Indeed this finding hints
towards an inclusivity effect whereby schools with higher degrees of diversity (in
this case, a larger percentage of SEND children) confer advantages to pupils
particularly at high risk. Indeed a similar finding has been presented in terms of
academic outcomes (Humphrey, Wiglesworth, Barlow & Squires 2012).
Secondary school urbanicity
One significant secondary school level protective factor was noted; an
interaction between risk and the schools location, whether urban or rural. This
interaction effect indicated that for those children experiencing low levels of risk
(i.e. having high academic achievement); attending schools within either urban
or rural locations has little impact upon their behaviour. However, for those
283
experiencing high degrees of risk (i.e. poor academic achievement) behaviour
difficulties are significantly worse for those attending rural schools. Urban
schools are therefore acting as a protective factor showing that high risk
children will have improved behaviour when attending such schools.
The interaction graph displayed shows evidence of a protective-stabilising effect
(Luthar et al. 2000), that despite increasing risk, the protective factor when
present (i.e. urban schools) maintained the degree of behaviour difficulties at a
stable level. The simple slope analysis showed that for urban schools,
behaviour difficulties remain stable in low and high risk, and therefore did not
deviate from the horizontal. When the protective factor was absent (i.e. rural
schools) there was a large increase in behaviour difficulties from low to high
risk, and the simple slope analysis showed that this did differ from the
horizontal. In conclusion at low risk a child’s behaviour will be unaffected by
school urbanicity, whereas at high risk a child would have better behaviour in an
urban school.
A discussion needs to take place as to why these effects have occurred and
particularly why urban schools offer some advantage over rural schools to those
at risk in terms of having poor academic achievement. The main effects of
school urbanicity have been discussed previously (see section 7.3.2), and
within the present study at least, this variable failed to emerge as a significant
finding. What is pertinent in this section therefore, is why attending a school in
an urban area would be particularly beneficial for those at high risk? Sellstom &
Bremberg (2006) provided evidence that urban schools have positive influences
on pupil outcomes, and within such contexts more resources are made
available to support the most at risk students. In rural schools, however, the
most at risk students may suffer in comparison, as often within these schools
fewer resources are available and they may have less access to intervention
programmes to support behaviour. Rural school pupils at high risk (particularly
in terms of having poor academic achievement) may not have certain coping
resources replenished (which combat the display of behaviour difficulties) as in
the case of urban schools. Consequently, high risk children are worse off and
display greater behaviour difficulties in rural compared with urban schools.
284
Although the effect of this variable was significant within the present study, the
exact mechanisms in terms of its functioning are speculative and further study is
needed to shed light on this area. It should also be mentioned here that this
finding is a particularly tentative one. The overall model from where this
significant effect emerged was not significantly better than full model in
accounting for variance explained in behaviour difficulties, for this reason and
those already mentioned in section 6.6.2, this finding should be interpreted with
considerable caution.
In conclusion these are interesting findings, although they have received little
attention within the published literature. The ‘short list’ of key protective factors
for general resilience functioning provided by Masten and colleagues (Masten
2006, Wright & Masten 2005, Masten & Reed 2002 and Masten & Coatsworth
1998), makes little mention of any school level factors suggesting they may not
be particularly important. In terms of behavioural outcomes a review of the most
salient protective factors does not acknowledge school level variables.
Evidence has suggested that protective factors may have a differing effect
within specific contexts, populations and outcomes (Fergus & Zimmerman
2005, Tiet et al. 2001 Rutter 2000); therefore the factors presented here may be
particularly important for children with SEND.
285
7.4 Limitations Psychological and educational research is often fraught with limitations, indeed
the very nature of research with human participants leads to a number of
constraints. No study can fully escape limitations in terms of its chosen
methodology and analysis of results. Addressing them however, enables their
relative importance to be assessed and results interpreted more reliably. Within
the present study limitations are discussed in terms of methodological and then
conceptual issues.
7.3.1. Methodological limitations
Sample representativeness There are potential limitations which are particularly pertinent concerning the
representativeness of the sample. The ten local authorities included within the
study were selected by the DfE (formally the DCSF) for the AfA project. These
local authorities are deemed representative of England (DCSF 2009b), although
the exact sampling criteria were not provided, so this claim is taken with some
caution. The schools selected from within each LA were also sampled to reliably
reflect the area in which they are located; some guidelines were given on school
selection, however, again the exact specifying criteria were not provided (DCSF
2009b). The AfA project had a particular focus on key outcomes such as
improving attendance or reducing bullying (see section 5.3 for more detail), it
could be surmised that LAs picked schools that were more likely to benefit from
the project as they had more significant problems in these areas. As such the
sample of selected schools may not be representative of the area in which they
are located. All children on the SEND register in years 1, 5, 7 or 10 within these
schools were the selected participants for the study. As SEND is fairly arbitrarily
defined (see section 1.3 for an overview) and is affected by a schools ability to
provide support for such pupils, the final sample may not be representative of
the picture found nationally.
286
Although there are potential concerns with the representativeness of the
sample, tables 5.5-5.8, provide an analysis to assess the deviation of the
present study’s sample in comparison to national averages. These analyses
were carried out across variables included within the study (at the individual and
school levels). Results showed that for all variables, only small effect size
differences existed between present study and national average, therefore
suggesting a representative sample. The only notable exception was school
level attendance which was poorer in the present study compared with national
averages.
Attrition rates Within any longitudinal study high levels of attrition are a common theme
(Cohen et al. 2011). Within the present study attrition rates were 58.3% for the
primary data set and 76.2% within the secondary data set. These figures
represent the percentage of participants who dropped out throughout the course
of the study due to non-completion of the WOST survey at either baseline or
follow-up. This is a clear limitation of the present study that a substantial
proportion of the optimum sample was not included within the present study,
and this may have led to biases within the sample. Nevertheless, the missing
data analysis (see appendix 8), showed missing data and attrition did not have
a significant impact on the results.
Despite sample characteristics being broadly comparable between those with
valid surveys present and those not, these comparisons were only made upon
measured variables within the study. It could be argued that some other
unmeasured variable could be attributable to the difference in those who
dropped out, and those who remained in the study. Nonetheless, as the present
study included a vast array of variables, it is difficult to conceive what these
potential unmeasured variables would be.
287
Achievement for all: An intervention? The data from the present study came from a wider project evaluating the
impact of AfA (Humphrey et al. 2011). One of the principle aims of the AfA
initiative was to improve a number of wider social outcomes for children with
SEND, one of these being behaviour difficulties. Schools that focused
specifically on improving behaviour difficulties could have experienced more
pronounced reductions in these problems compared to schools with a different
focus. The present study however, did not take into account which schools had
a specific AfA behaviour difficulties intervention. This decision was taken on a
number of grounds, firstly, all SEND children regardless of attending an AfA
school or not, will be subject to some kind of intervention. The vast majority of
participants in the present study received AfA as ‘the intervention’ but schools
outside of this project will have implemented some other plan or programme to
meet the specific needs for their pupils. In this regard AfA is not different from
any other intervention experienced by children outside of this project, and
results are generalisable to all children with SEND. Within the present study the
vast majority of children did attend schools which were implementing AfA,
(although not necessarily ones that were implementing a behaviour
intervention), however there was a minority of children which comprised the
control school sample for the AfA evaluation study. The inclusion of these
children within the present study limits the potential impact that AfA may have
had upon the present study’s findings.
Schools within the AfA sample did not always provide accurate information on
the two wider outcomes they were focusing upon, often being unsure of the
precise strategies being used to improve these wider outcomes. These
strategies varied widely between schools, with different amounts of time, energy
and resources being invested in them across the schools in the sample. Many
schools saw the wider outcomes as interrelated, whereby improving positive
relationships would have an effect on behaviour difficulties anyhow, e.g.
“several schools viewed the outcomes as mutually supportive and interrelated”
(Humphrey et al. 2011, page 65), and “schools drew clear links between the
different wider outcomes and strands of AfA, and many saw work in one area
directly impacting in others” (Humphrey et al. page 66). As these broad domains
288
were interdependent, some of the same strategies used by one school to
reduce behaviour difficulties may have been used in another to improve positive
relationships. As such it was deemed inappropriate to use a variable of whether
the schools’ explicit focus was on behaviour difficulties as a predictor.
The AfA intervention did reported a significant reduction in teacher reported
behaviour difficulties from baseline to follow up. This suggests that AfA appears
to be a successful intervention to reduce problem behaviour. However, on
closer inspection in comparison to non AfA schools the reduction in behaviour
difficulties from baseline to follow up, reflected a small change (mean = - 0.02)
and this equates to a small effect size. Furthermore, this finding found have
been influenced by sample sizes as there was considerable difference in the
AfA sample (4,426 pupils) compared with the control sample (194 pupils).
Humphrey et al. (2011) do acknowledge this issue and therefore suggest that
“given the relatively small number of respondents in the comparison school
sample, results should be treated as indicative rather than definitive” (page 78).
It is acknowledged within the present study that although the AfA intervention
may have had some effect on the data, these are likely to be very small.
Finally, the “emphasis throughout the project [AfA] was on the importance of
leadership and building upon existing good practice within schools to improve
outcomes for such children and young people” (Humphrey et al. 2011, page
18). The focus of AfA was hence upon existing good practice rather than
implementing something new and distinct for children within AfA schools. The
argument that the sample in the present study is not that much different from
any other sample of SEND children therefore holds, and enables the present
study’s findings to be generalised to all SEND children within schools in
England.
Additional variables The present study could be criticised for not including sufficient variables to fully
account for behaviour difficulties displayed. There is evidence (see chapter 2 for
more detailed discussion) that biological influences i.e., hormones (Book et al.
2001), neighbourhood influences i.e., exposure to violence (Patchin et al. 2006),
289
as well as family influences i.e., poor parenting (Pettit et al. 2001) and peer
influences i.e. being involved with anti-social peers (Ingoldsby et al. 2006) all
contribute to behaviour difficulties displayed. The present study acknowledges
that these are important variables; nonetheless it would be impossible within a
single study to include every potential influence on behaviour difficulties, and
attempting to do so would go beyond the scope of the study.
The target population was children with SEND, as little research has explicitly
utilised this population the variables included within the present study make an
important contribution to explaining these behaviours within a school context.
Research into behaviour difficulties, (a well-established albeit complex field)
results in a compromise between searching for new potentially important
predictor variables of these difficulties versus establishing existing ones within a
specific population i.e. children with SEND. In the case of the present study
twenty variables that all had a theoretical justification for inclusion within the
study as possible predictors of behaviour difficulties for typically developing
children were assessed in terms of a population of children with SEND.
Teacher effects There are potential limitations concerning the collection of data from the surveys
and particularly surrounding the teachers who completed these for their key
pupils. Teachers rated pupils on their behaviour difficulties, positive
relationships and bullying behaviour at baseline, and at follow-up, behaviour
difficulties were rated again. As follow-up was 18 months after baseline children
had moved year groups and were likely to have a different teacher who would
have rated them across this construct. It could be argued that change in
behaviour difficulties was therefore due to change in rater, rather than real
change in behaviour. This argument is however, countered with information on
the psychometric properties of the WOST, which have shown good inter rater
reliability between teachers and parents of 0.483. It is likely that inter rater
reliability between teachers would be even higher as they would be observing
behaviour within the same context.
290
A second potential limitation concerns the accuracy of the information provided
by teachers. Some teachers especially in secondary schools were the key
teachers for large numbers of children with SEND. Teachers, who completed
the survey on multiple occasions for multiple children, could have experienced a
fatigue effect, and possibly lacked the motivation to complete the surveys
accurately. Although this may have been an issue, realistically each survey was
very short and would take no more than 5 minutes to complete per child, so it is
unlikely that fatigue dramatically affected the results. Thirdly, teachers could
have experienced some conflict in completing the survey, being concerned that
their individual performance was being assessed (although the information
sheet they received clearly told them this was not the case). They could have
therefore rated pupils more favourably in order for their own performance as a
teacher to appear more positive. Teachers holding pre-existing ideas about the
AfA initiative or in some way having a vested interest in the outcome could have
rated their pupils in accordance with their personal view.
Using a teacher report of behaviour difficulties could be criticised as being less
accurate than a pupils own self report. Nonetheless, teacher reports were
chosen within the present study in order to maintain consistency, as younger
pupils (those in year 1) and those with the most complex SEND (i.e. PMLD)
would not be able to complete the task which would result in a significant loss of
information. Furthermore, if a self-report was used there could have been a
developmental effect, i.e. as children mature they become increasing more
accurate in their self-reporting. Therefore changes in behaviour difficulties may
reflect accuracy of the rater rather than any actual behaviour change. Teachers
are in the best position to reflect on behaviour difficulties which occur in their
classroom and around the school. They are also likely to be less biased in their
judgments, and as they see a wide spectrum of behaviours displayed they are
able to reliably assess degrees of behaviour difficulties displayed in relation to
other children.
291
Analytical Strategy The analytical strategy chosen for the present study was MLM, using such a
method allowed for variance to be explained at individual and school levels
respectively. A criticism concerns the fact no classroom level was
acknowledged. This ecological layer would fall between the individual and
schools levels. Students are clustered within their classrooms which in turn are
clustered within schools; consequently the effects observed at the school level,
may in fact reflect classroom level differences.
However, the decision to exclude this potential source of variance was taken as
to include a classroom level when already over 300 schools were included
within the study could be counterproductive and goes beyond the scope of the
study. Classrooms are variously defined and there are vast differences in
‘classrooms’ between primary and secondary schools (see section 5.9.2). Due
to the consistency between the primary and secondary models, and classrooms
being hard to define in secondary schools, this ecological level was excluded
within the present study. It is however, acknowledged as a potential source of
variation, which maybe particularly important within education based studies,
and is therefore an idea for future research. However, to account for a
classroom level for secondary school students who may be in around 10
different classrooms each of different compositions would require some kind of
cross classification multi-level model which are incredibly complex and require
very large sample sizes. As such this type of investigation may be out of reach
to many researchers.
Although not an explicit research question, the present study could be criticised
for not accounting for the relative importance of each of the significant risk
factors, and how they compare with one another. MLM outputs in MLwiN and
SPSS do not produce standardised coefficients and therefore it is not possible
to compare between variables that were measured on different scales. One way
to overcome this issue would be to standardise the variables before they are
added to the model, however a certain amount of meaning in the data is lost as
standardised coefficients are difficult to interpret in isolation.
292
Wider Outcome Survey for Teachers (WOST) A potential limitation of the present study concerns the measurement tool used
to assess behavioural difficulties. As previously discussed in section 5.6.2, the
WOST (Humphrey et al. 2011) was assessed for its psychometric properties,
with the conclusion that was deemed acceptable. Specifically it has been
argued there exists good content validity, adequate construct validity, good
internal consistency, respectable inter-rater reliability, good interpretability and it
acknowledges the impact of floor and ceiling effects (Humphrey et al. 2011).
Nonetheless, despite these findings there are a number of criticisms of these
analyses. Firstly, construct validity was measured by computing correlations
between the different constructs within the same survey. As they conformed to
the hypothesised expected direction, i.e. behaviour difficulties was positively
correlated with bullying and negatively correlated with positive relationships, this
was taken as a measure of adequate construct validity. Validating a survey
construct on other constructs within the same measure may not be a useful
exercise, and should be assessed against an external measurement. As such
the claim that this measure has construct validity must be interpreted in this light
and with considerable caution.
Secondly, in relation to internal consistency, although all Cronbach’s Alphas are
>0.7 which is deemed acceptable, the confirmatory factor analysis indicated that
only 2 of the most common 7 fit indices met the desired criteria. Whereas the
remaining 5 only approached the ideal fit criteria (see section 5.6.2). This could
have implications for the study in whether internal consistency actually exists
within this measure. Thirdly, there are other psychometric measures such as
criterion validity, test‐retest reliability and responsiveness which were not
carried out when the validation of the WOST was undertaken. Without such
evidence the psychometric properties of the WOST are weakened.
Further analyses needs to be undertaken with the WOST in order to overcome
some of these limitations. The collection of further data to validate the survey
against an external measure such as the SDQ would be particularly beneficial.
As such the conclusions drawn from this study need to be interpreted in the light
of the limited psychometric properties of this survey.
293
7.3.2. Conceptual limitations
Behaviour difficulties A key conceptual limitation within the present study concerns the major concept
under investigation i.e. behaviour difficulties. These types of behaviours can be
interpreted subjectively, and a similar issue identified by one person could be
seen as a major incident, whereas to a different person it is regarded as minor.
This point was expressed by Cooper, Smith & Upton (1994) who state “different
teachers (and schools) have different standards for, and expectations of, the
behaviour of their pupils whereby differences in reported behaviour may reflect
differences in the degree to which a behaviour is tolerated”, (page 17). This
could have been an issue within the present study, however as a reliable and
valid measurement tool was used (i.e. the WOST) it is hoped that subjective
interpretations were kept to a minimum.
It has also been noted that assessments of behaviour difficulties are affected by
the child’s age, gender and ethnic background (Papatheodorou 2005, Green et
al. 2005, Zeitlin & Refaat 1999), with certain behaviours judged as more
problematic depending on who is exhibiting them. Teachers may have rated an
individual’s behaviour objectively and not accounted for their age, gender or
ethnicity, or could have interpreted these behaviours in the light of these
individual characteristics. In either case there could be some bias in the
recording by either over or under reporting behaviour difficulties. Nonetheless,
the present study acknowledges using a teacher report will result in the best
possible measure of behaviour difficulties displayed. Teachers are in the best
position to know each child and observe their behaviour and can account for
appropriate age, gender and ethnic effects in behaviour difficulties displayed.
A limitation within the present study could be the use of the measurement tool
to assess behaviour difficulties. There are numerous assessment methods
available for researchers in this area, which include rating scales, observations,
interviews and socio-metric techniques (Merrell 2003). The method selected by
a piece of research to assess behaviour difficulties will affect who is defined as
294
having behaviour difficulties and also the degree to which their behaviour is
posing a problem. The present study utilised a rating scale, (i.e. the WOST),
and these types of assessments are the most commonly used (Merrell 2003).
Being aware of how behaviour difficulties have been assessed is important, not
only in order to gain a greater appreciation of this construct, but also to allow
meaningful comparisons between previous studies.
Special Educational Needs and Disabilities
As already mentioned in section 1.3, there are many issues surrounding the
concept of special educational needs and disabilities. Within the present study
the definition set out within the SEN code of practice was adopted and states “A
child has ‘special educational needs’ … if he has a learning difficulty which calls
for special educational provision to be made for him” (DfE 2001a page 6 section
1.3). There is an implicit assumption within this definition that if schools are able
to cope with the child and meet his/her needs, no additional support is required.
However, if they are unable to meet the child’s needs, he/she will be defined as
having SEND and extra support will be put in place. The definition also states
“Children are considered to have a learning difficulty if they a) have a
significantly greater difficulty in learning than the majority of children of the
same age”. This could be problematic as using the term ‘majority of children’,
could refer to those within the same school or children across the whole
country. As schools have vastly different numbers of children with SEND, what
is considered the majority of children will vary by school, which will then have an
influence on who is defined as having SEND.
The SEND definition is contentious and, as mentioned previously, is criticised
for allowing considerable variation across schools in who is defined as such
(Ofsted 2005). There does not appear to be a consistently applied approach to
identifying and assessing children with SEND, which include teacher
observations, standardised tests and tools, progress on National Literacy and
Numeracy Strategy Frameworks, performance in National Curriculum levels or
baseline screening tests (DfES 2001a). The lack of consistency here makes the
concept more of a school-based variable than an individual one, and becomes
295
more about whether the school has the resources available to support the
child’s needs, therefore reflecting an arbitrary process. The SEN code of
practice does give some more specific guidance that needs should fall within at
least one of four main domains: a) cognition and learning, b) behaviour,
emotional and social development c) communication and interaction or d)
sensory and /or physical needs. The sample within the study is consistent in at
least one regard, that they have experienced problems in a minimum of one of
these areas, and this makes them in some way a distinct population within the
school.
Cumulative Risk Score
The present study relied heavy on the cumulative risk score as a measure of an
individual’s degree of contextual risk experienced. There is concern that as risk
factors are not certainties but probabilities (Schoon 2006), there may be
considerable variability in what actual risk an individual experienced as a result
of having a certain factor present. However, by using a cumulative risk score,
variables are aggregated into one unified score. This has the effect of
diminishing the unique importance of any single factor, and therefore by adding
multiple risks together, allows a more accurate picture of the amount of risk an
individual is experiencing to be acknowledged.
Criticism has however, been levelled against the cumulative risk score
concerning the accuracy in how it is measured. Debate surrounds whether the
risk variables that make up the cumulative score should be noted as such on
empirical or theoretical grounds (Stouthamer-Loeber et al. 2002). Although the
most popular method is upon empirical grounds, issues remain whether risk is
conceptualised when the correlation between risk and the dependent variable is
significant (Lima et al. 2010) or when it is equal to or exceeds .25 (Atzaba-Poria
et al. 2004). Differences in how the score is computed could affect the reliability
when comparing between studies.
On ‘risk’ variables the top 25% of the sample are given a score of 1 denoting
‘risk’ and a score of 0 to denotes its absence. Total scores are added across
296
variables resulting in a cumulative risk score. There is criticism that
measurement techniques taking the top 25% to represent risk is an arbitrary
decision (Sullivan & Farrell 1999), and dichomising variables in this way results
in oversimplifying the data set, resulting in information loss (Pollard et al. 1999).
In response to some of the criticisms however, Farrington & Loeber (2000)
argue that splitting data by means of dichotomisation results in a minimal effect
on the data and does not affect the conclusions drawn from these studies. The
cumulative risk approach highlighted here is the most prolific found within the
literature and was therefore utilised within the present study.
297
7.5 Future research
Additional variables In the present study over twenty variables were measured as potential risk,
promotive or promotive factors for behaviour difficulties in a population of
children with SEND. There is scope however, for further investigations to
include more variables that are particularly pertinent to a SEND population.
More detailed information on ethnicity, and first language spoken and whether
children are “looked after” could be collected, as these are salient issues for the
SEND population (DfE 2010d). Additionally, variables such as self-esteem
(Schonberg & Shaw 2007), or certain personality traits (Viding et al. 2007) could
be collected. Furthermore school level variables might include the extent to
which a child with SEND participates in extracurricular activities at their school,
as this could be a promotive or protective factor (Mahoney 2000). The gender
composition of the school could also be measured, as at the individual level this
factor predicted behaviour difficulties, therefore investigating whether schools or
classes with a higher proportion of males could experience more behaviour
difficulties would be of benefit (Andersson et al. 2010, Hoxby 2002). Finally,
effective school characteristics such as having comprehensive policies, strong
leadership, or a climate of fairness and consistency, where pupils feel safe and
a have sense of belonging could all affect behaviour difficulties displayed, and
be important for a SEND population (Denny et al. 2011, Evans-Whipp et al.
2004).
There is also scope for future research to take into account the effects of
additional ecological levels. Indeed Bronfenbrenner (1979) has stated that
behaviour cannot be fully understood without the acknowledgement of multiple
ecological levels. Perhaps most pertinent with a sample of children with SEND
would be to include a classroom level. The school level influences already
measured could then be broken down to this level and the more proximal
influences of a classroom could be compared with the more distal effects of the
school level. Introducing a family level and variables that are nested within this
level would add to the research base. A number of potentially important
298
variables at this level have previously been acknowledged (see section 2.3) and
have included attachment relationships, mental health problems in parents,
parental discipline and family disruption. A particularly important factor for
children with SEND is the extent of parental engagement, and specifically how
involved parents are with their child’s education (Humphrey et al. 2011).
Including all these variables may add to the variance explained in behaviour
difficulties.
Further research could also pay greater attention to the influences of behaviour
difficulties at the neighbourhood level, as attempting to explain childhood and
adolescent behaviour difficulties without such effects cannot fully account for
the problem (Klaff et al. 2001). Factors that are important here include
neighbourhood disadvantage, (Drukker et al. 2003), residential instability;
(Brooks-Gunn et al. 1997), exposure to violence, (Patchin et al. 2006),
interaction with deviant peers in the neighbourhood; (Ingoldsby et al. 2006),
living in areas with higher crime and poverty levels (Beyers, Loeber, Wikstrom &
Stouthamer-Loeber 2001), more neighbourhood structural disadvantage (Mrug
& Windle 2009) and poorer access to facilities (Renzaho & Karantas 2010).
Children will have a least some exposure to the neighbourhood in which they
live, with these effects manifesting themselves directly or indirectly through
other variables. It may be important to investigate how these factors influence
behaviour whether directly or mediated through another variable (Vanfossen,
Brown, Kellam, Sokoloff & Doering 2010). Furthermore, knowledge could be
gained by assessing the relative strength of these factors, and it is hoped that
as research into MLM develops an effective way of comparing across variables
perhaps by using standardised coefficients would be a useful pursuit.
Processes of risk variables Although further research would benefit from establishing more variables across
additional ecological levels as risk, promotive or protective factors for behaviour
difficulties in children with SEND, it would also be productive to investigate
some of the reasons why these factors are significant. Kraemer et al. (2005)
have argued that there needs to be a ‘fundamental shift in risk research’ (page

299
69), as adding in new risk factors does not necessarily help to further account
for a particular disorder, as often these ‘new’ factors have little potency on the
outcome.
Kraemer et al. (2001) suggest in order to gain a better understanding of risk
factors a concentration on the processes of moderation and mediation need to
take place. Acknowledging how proximal and distal influences interact to
influence developmental problems is an important pursuit (Flouri et al. 2010).
Indeed, investigating the mechanisms by which these specific risk factors
function (Raviv et al. 2010) will lead to a greater understanding of the pathways
that lead to the display of behaviour difficulties and ultimately be an essential
precursor to any intervention designed to combat the problems (Sameroff et al.
2003). Evidence suggests that risk factors do not always exert their influence on
an outcome variable in isolation but there are potentially numerous ways that
risk factors work together, which often include complex relationships and
interactions between variables (Kraemer et al. 2001, Atzaba-Poria et al. 2004).
Therefore, what is needed is further research on how the risk, promotive or
protective factors interact to predict an outcome.
Cumulative Promotion A potential area for future research, to extend the findings within the present
study, would be to acknowledge the impact of multiple ‘positive’ factors that
promote behavioural competence and subsequently reduce the chance of
behaviour difficulties displayed. There is a high probability that promotive
factors like risk factors accumulate within individuals (Werner 2000). Some
studies have acknowledged these promotive factors within a cumulative
framework, although to a much lesser degree than studies using risk factors
within a cumulative framework (Beam, Gil-Rivas, Greenberger & Chen 2002,
Loeber et al. 2008, Van der Molen, Hipwell, Vermeiren & Loeber 2011).
Previous studies have shown a cumulative promotion effect in terms of reducing
delinquency. Specifically that a higher number of cumulative promotive factors
at the individual and family level predicted a decreased likelihood of being a
300
minor or serious delinquent, and an increased probability of being a non-
delinquent (Van der Laan, et al. 2010). Within a school context, evidence
suggests that an increasing number of promotive factors resulted in reductions
in the chance of disruptive behaviour (Van der Molen 2011). Further support for
this phenomenon also comes from Jessor, Van Den Bos, Vanderryn, Costa &
Turbin (1995), Sameroff et al. (1998) Herrenkohl et al. (2003) & Fergusson,
Vitaro, Wanner & Brendgen (2007) who all investigated the cumulative effects
of promotive factors finding that as these factors increased, the likelihood of
displaying problem behaviour was reduced. Research surrounding cumulative
promotion, specifically for children with SEND, investigating whether it reduces
the chance of displaying behaviour difficulties, would therefore add to the
literature base.
An analysis could be undertaken to assess the exact relationship between
number of promotive factors and outcome, as some have argued that this
relationship is linear (Stouthamer-Loeber et al. 2002, Loeber et al. 2008),
whereas others have suggested there could exist a curvilinear relationship
(Luthar & Cicchetti 2000). Future research could also assess whether the
effects of cumulative promotion or cumulative risk hold the greatest influence
over an outcome as, there is a particularly small literature base in terms of how
cumulative promotion relates to cumulative risk (Flouri 2008, Epstein, Botwin,
Griffin & Diaz 2001). It has been suggested that there may well be differences in
the strength of risk versus promotive effects in influencing behaviour problems
(Van der Put, Van der Laan, Stams, Dekovic & Hoeve 2011). Furthermore a
counterbalancing effect may exist whereby the specific number of risk factors,
or the number of domains considered denoting risk can be cancelled out with an
equal number of promotive factors, or domains denoting promotion
(Stouthamer-Loeber et al. 2002).
Ecological effects of cumulative risk In the present study it was not possible to assess the differing effects of
cumulative risk across distinct ecological levels. Cumulative risk was assessed
at the individual level, although as only one significant predictor was established

301
at the school level, for both the primary and secondary models, a cumulative
score could not be generated at this level. Future research could measure a
greater number of variables at the school level and the significant factors could
be calculated to form a cumulative risk score. Furthermore, if variables were
assessed at the neighbourhood and family level, a cumulative risk score could
also be generated for these levels. Deater-Deckard et al. (1998) have
suggested that cumulative scores across multiple ecological levels all contribute
to variance in explaining behaviour problems and are important in
understanding the aetiology of these behaviours.
If a cumulative score was to be established across multiple ecological levels
then an analysis could assess the relative importance of each of these levels
(Atzaba-Poria et al. (2004). Finally, testing the idea whether the same number
of risks within a single ecological context has similar effects on behaviour
difficulties compared to the same number of risks but spread across multiple
ecological contexts would be an interesting pursuit (Morales & Guerra 2006).
This idea for future research could test the hypothesis proposed by Call and
Mortimer (2001) that individuals need a ‘safe haven’ or an ecological context
where no risk is present, as this is essential to protect against risks experienced
in other ecological contexts.
Protective factors Further research could be conducted to assess the influences of protective
factors for behaviour difficulties. In order for a protective factor to be
conceptualised as such, there needs to be evidence of risk. There are a number
of ways that risk can be assessed which include being exposed to a single
significant adverse situation (i.e. death of a parent), or generating a score on a
checklist of multiple negative life events, or a cumulative risk score (Masten
2001, Luthar & Cushing 2002). The different ways in which risk has been
measured could be compared with one another, to assess the salience of any
identified protective factor. Within the present study, a gap within the literature
was noted that school level protective factors had not been explicitly highlighted
with the outcome behaviour difficulties. As such, the analyses presented here
302
maintained a focus on school level variables. It is known that protective factors
are relevant across numerous ecological levels (Wright & Masten 2005), and
therefore some acknowledgment of these specifically for a sample of children
with SEND is warranted.
It is not only important to uncover the protective factors that can moderate risk
experience and lead to better behavioural outcomes, but also to understand
exactly how these underlying processes or mechanisms of these factors work
(Vanderbilt-Adriance & Shaw 2008, Luthar, Sawyer, Brown 2006, Kaplan 2002).
Luthar et al. (2006) cite an example where if a high level of family support is
considered a prominent protective factor the question should be asked, what is
it about this variable that fosters resilience? 49
Could it be self-esteem, security,
or feelings of control? Where appropriate, future studies should look for these
underlying mechanisms and processes, not solely being focused if a factor
plays a role but how it does.
Within the present study a variable-focused approach was taken as a means of
highlighting the significant factors that protect against behaviour difficulties. An
alternative approach however, could be utilised within further study, such as a
person-focused approach. Within such analyses groups of individuals are
established on whether they are experiencing high degrees of risk or not, and
whether they are displaying behavioural competence or not. As such 4 distinct
groups are compared with one another, i.e. resilient individuals (high risk, high
competence) are compared with competent individual (low risk, high
competence) and again with maladaptive individuals (high risk, low
competence) (Masten & Obradovic 2006, Jaffee et al. 2007). It is anticipated
that similarities will emerge between resilient and competent individuals and
differences between resilient and maladaptive individuals. These analyses can
assess the percentage of individuals deemed resilient (Windle 2011), and they
can be effective when assessing multiple outcomes over substantial time
periods (Masten & Reed 2002).
49 Resilience is defined as “a dynamic process encompassing positive adaption within the context of significant adversity” (Luthar, et al. 2000, page 543). Individuals are therefore able to achieve a better outcome than would be expected from their risk experienced.

303
Comparing between individuals is an important issue as Luthar et al. (2006) cite
an example whereby for ‘high risk youth’ greater exposure to stringent limit
setting by parents is related to increases in prosocial behaviours, but for ‘low
risk youth’ it leads to decreases. In order to assess interaction effects however,
both groups need to be included together, and in this instance at least the
effects would counteract one another leading to non-significant main effect
findings. Therefore searching for interaction effects in this instance would
obscure the fact that limit setting was important for low-risk youth. It has been
argued that using a within group analytical approach of just those at high risk,
will be able to shed light on the relative importance of certain protective factors
in relation to the other variables, rather than comparisons between the relative
importance of a certain factor in high and low risk groups (Luthar et al. (2006).
304
7.6 Summary statements
• Summary of results: This section presented a brief summary of the
results, divided up according to the three broad research questions.
• Discussion of findings: This section discussed the findings of the
present study in relation to previous literature. Discussion was set out by
research question, with each of the risk, promotive and protective factors
discussed in turn.
• Limitations: This section focused on the limitations of the study,
beginning by discussing methodological concerns such as the sample
representativeness, attrition levels, whether AfA being an intervention
influenced the results, possible teacher reporting effects, and the
analytical strategy. Conceptual concerns were acknowledged around the
key concepts of the research behaviour difficulties and special
educational needs and disabilities and the cumulative risk score,
• Future research: In this section, further ideas for additional research
were discussed, including a) using previously unacknowledged variables
in accounting for behaviour difficulties for children with SEND, b)
accounting for the processes involved within the significant risk,
promotive and protective factors identified in the present study, c) using a
cumulative promotion metric to assess multiple positive influences on
behaviour difficulties, d) assessing risk across multiple ecological levels
and e) more in depth study of possible protective factors.
305
8. Conclusions
8.1. Introduction to chapter
In this chapter the final conclusions of this study are brought together. In section
8.2 the implications of the study are discussed. In section 8.3 the study’s
contributions to knowledge are outlined. Section 8.4 provides an overview and
summary of the study. Finally section 8.5 provides summary statements for the
chapter.
8.2 Implications
Given the present study utilised a nationally representative sample of children
with SEND; the resulting implications are extensive and wide reaching. For
purposes of clarity the implications of the present study are organized by
research question, from which they emerged.
8.2.1 Implications from Research Question 1
Acknowledging a school effect Interventions to reduce behaviour difficulties in children with SEND need to take
into consideration that the school in which they attend alongside factors within
them as individuals, make a significant contribution to their behaviour displayed.
The results of the present study showed that the individual and school
ecological levels, (within both the primary and secondary schools) significantly
contributed to a proportion of variance in behaviour difficulties. Therefore,
regardless of the type of school i.e. whether primary or secondary schools need
to take seriously their influence in the display of negative behaviour of their
children with SEND. They must not assume such behaviours are displayed
solely due to a child’s individual characteristics or their family background, as
evidence shows school level variables play a significant role in influencing these
problems. Interventions that adopt a whole school focus will be beneficial to all
306
pupils directly, as well as having a positive effect on the school culture or ethos.
Schools could adopt any of the numerous behaviour problem interventions that
are discussed and evaluated within two important reviews of the literature (e.g.
Greenberg Domitrovich & Bumbarger 2000, Maag & Katsiyannis 2010).
It is however, noted that the effects at the individual level are considerably
greater than school level influences. Although this does not dismiss the school
effects as unimportant, and whole school approaches should be adopted to
reduce behaviour difficulties, interventions that target specific individuals may
be the most effective in reducing behaviour difficulties displayed (Losel &
Beelman 2003). Indeed one study assessing the impact of the small group
aspects of primary SEAL (Social Emotional Aspects of Learning, DfES 2005),
showed evidence that targeted individuals did experience reductions in their
behaviour difficulties, as presumably they had more to gain than other pupils
(Humphrey et al. 2008).
Risk and promotive factors important for primary and secondary schools The findings from the present study show that for SEND children, being ‘male’ is
a risk factor for displaying behaviour difficulties across both primary and
secondary school. As this variable is a fixed marker (i.e. a risk factor that cannot
be changed), interventions should specifically target this group of individuals.
The aim of such interventions would be to enhance positive factors which
hopefully promote competence and protect against behaviour difficulties, such
as improving relationships or academic outcomes. Year group is another fixed
marker, and significant risk factor for both primary and secondary schools. The
older children in primary school and the younger children in secondary schools
are more likely to display behaviour difficulties. It is important to specifically
target this transition period and the end of childhood/beginning of adolescence.
Consideration needs to be taken that the type of behaviour difficulties displayed
may be different across primary and secondary schools, and targeting
aggressive behaviours particularly in primary schools and non-aggressive
behaviour difficulties in secondary schools may be the most effective approach.
FSM eligibility is also a key risk factor for behaviour difficulties, although this

307
variable could change, it is not within the power of the schools to do so. If
however, schools employed family support workers who work with at risk
families to diminish some of the negative influences often mediated through
lower SES, such as poorer parenting skills, this may improve the situation.
Perhaps the pertinent issue here for schools is that males, those of lower SES,
those within year 5 in primary and year 7 in secondary are the groups who
would benefit to the greatest extent from a targeted intervention programme.
A further significant risk factor across both primary and secondary schools is
being a bully (or a bystander to bullying incidents, specifically for secondary
school children). This variable is considered a variable marker (i.e. risk factors
that can be changed). Interventions that reduce bullying will therefore have a
subsequent positive influence on behaviour difficulties displayed. These
interventions, could be specifically targeted at those who have been termed
‘bullies’, as this will ultimately reduce behaviour difficulties. In secondary
schools pupils should be educated about the effects of being a bystander to
bullying and why this is considered problem behaviour. Programmes such as
Positive Behaviour Supports (PBIS) may be particularly effective in this regard
(Pugh & Chitiyo 2012).
Risk and promotive factors uniquely important for primary schools Within primary schools (and not within secondary schools) a further fixed
marker risk factor emerged; being born in the autumn. Those children born
within the autumn months are the oldest in their year and were more likely to
display behaviour difficulties than those born in the summer months and the
youngest in their school year. This variable cannot be changed, nonetheless
specially targeting the older children within a school year and educating them
around the issues of behaviour difficulties may help to reduce these problems.
Furthermore, separating children into classes or groups by season of birth,
particularly when developmental differences are most profound, in the earlier
years of primary school, may help to reduce problem behaviours displayed.

308
The quality of pupil relationships with peers and teachers within schools
(particularly primary schools), is a variable risk factor. Improving these
relationships will have an effect of reducing behaviour difficulties. Teachers
should be aware of their influence in this regard, and having better relationships
with the children in their class, and promoting effective peer-peer
communication and working will reduce behaviour difficulties displayed.
Teachers should be given opportunities to engage positively with their pupils,
and encourage positive peer relationships through effective interventions such
as Promoting Alternative Thinking Strategies (PATHS), (Kam, Greenberg &
Kusche 2004). Finally, at a school level, schools that improve academic
achievements in all their pupils regardless of their SEND status, and help them
to achieve their full potential, will have a positive influence on all children who
attend, and evidence suggest this will reduce behaviour difficulties displayed.
Risk and promotive factors uniquely important for secondary schools Within secondary schools those attending larger schools are considerably more
at risk than those within smaller schools. As this is a variable risk factor, where
possible, school size, (in terms of pupil numbers), should be kept to a minimum.
This is in order to reduce feelings amongst pupils of anonymity and promote
feelings of being valued and involved in the school. Having a key worker for
each child with SEND may prevent them getting ‘lost’ in the school system.
Encouraging teachers to take an active interest particularly of pupils with SEND
may reduce this effect.
Within secondary schools low attendance levels were a variable risk factor for
behaviour difficulties displayed. Promoting attendance will therefore have a
positive effect on children who are display behaviour difficulties. Employing
educational welfare officers within schools to help keep attendance to a
maximum will be beneficial, as well as counsellors to find the reasons why
children are not attending in the hope of improving the situation.
The final variable risk factor within secondary schools was poor academic
achievement. Schools should therefore provide interventions to support the
309
academic achievements of their children with SEND, such as implementing
Achievement for All 3A’s as improving their academic levels will have an effect
on reducing behaviour difficulties.
8.2.2 Implications from Research Question 2
Findings from the present study show that more risk in an individual’s
background, regardless of the specific nature of that risk, equates to more
severe behaviour difficulties. In order to reduce behaviour difficulties
interventions need to take into consideration multiple risk variables, attempting
to reduce any which are evident in a particular individual’s background. It is not
important exactly what risk variable is minimised, as the evidence suggests that
multiple risk factors work together, and when they accumulate within an
individual this will result in more severe behaviour difficulties displayed.
Therefore, to some extent, regardless of the specific type of risk, interventions
should reduce what they can. As some risk variables are fixed markers and
cannot be changed there is requirement to pay particular attention to those
variables which can be changed. Furthermore, when risks are unknown any
global approach that aims to reduce behaviour difficulties such as Social and
Emotional Learning (SEL) programs may be particularly effective (Durlak,
Weissberg, Dymnicki, Taylor & Schellinger 2011).
The relationship between cumulative risk and behaviour difficulties was non-
linear and behaviour difficulties increased disproportionally with increasing risk.
This is a worrying trend if interventions do not pay particular attention to it.
Indeed those individuals who have a large numbers of risk factors in their
background are at a proportionally greater disadvantage that those with fewer
risks. Tailoring any intervention towards those considered most at risk would
have the effect of reducing the disproportionate relationship between increasing
risk and behaviour difficulties. Indeed evidence suggests that higher risk youth
will benefit to the greatest extent from any intervention designed to reduce
aggressive behaviour (Wilson, Lipsey & Derzon 2003). It would be fairly easy in
schools to make a list of a child’s risk factors and those who have particularly
310
high levels of risk should be provided with interventions. Indeed Wilson & Lipsey
(2007) have argued that the most effective intervention programmes involve a
general or universal approach alongside a more targeted approached directed
at specific individuals considered at high risk. Nonetheless, it should be
acknowledged that severe levels of risk are experienced by relatively few
individuals. Therefore, tailoring interventions towards this group of children
alone, although beneficial to those directly involved, will make only a small
impact on these problems (Flouri 2008).
Despite the focus on reducing the risks present in an individual’s background
regardless of what they are, it is also important to acknowledge that specific
types of risk factors do hold differing degrees of influence over an outcome in
question. Behavioural improvements may be more effectively accomplished by
targeting the risks deemed the most powerful. However, where it is not obvious
which of the risk factors is holding the greatest influence just reducing the
number of risks as the cumulative model suggests would be appropriate and
beneficial for the individual concerned.
8.2.3 Implications from Research Question 3 Attending primary schools with high overall levels of academic achievement are
beneficial to all children with SEND; therefore global school level interventions
that aim to improve academic levels will be effective for every child in reducing
their behaviour difficulties. However, for those considered at high risk (in terms
of poor positive relationships), schools with higher overall academic
achievement can act as a salient protective factor, reducing the display of
behaviour difficulties. It is particularly important therefore that these high risk
children attend schools with high levels of academic achievement.
One option would be to adopt positive discrimination in this regard. Where
places at certain schools are limited, those considered at higher risk could be
given the preference to attend the higher academic achieving schools.
However, moving a child to a higher achieving school on the basis of their ‘at
311
risk’ status is not necessarily a feasible option. It would be more appropriate to
investigate the characteristics of higher achieving schools and implement some
of their policies and procedures in lower achieving schools. This would be
beneficial for all children and particularly for those considered at high risk. As
higher school level achievement is a significant protective factor, poorer
achieving schools have further incentive to increase their overall academic
achievement. This could result in significant reductions in behaviour difficulties
displayed by their children at high risk. Primary schools that have more
significant behaviour problems may be able to use interventions that aim to
improve academic attainment as an effective means of reducing behaviour
difficulties displayed by their pupils.
Within primary schools attending schools with a larger percentage of pupils with
SEND (particularly at the school action level of support) are beneficial for
children considered at high risk (in terms of poor positive relationships). This
variable acts as a protective factor, and has a positive effect in reducing the
display of behaviour difficulties. It is therefore beneficial for children considered
at high risk to attend a school with greater numbers of pupils with SEND. This is
an important finding within the present study, however, moving a child to a
school on the basis they have higher numbers of children on the SEN register at
SA because of their ‘at risk’ status is perhaps not a feasible option. Instead
looking at the characteristics of schools that have higher numbers of SEND
pupils, and applying these in the schools with lower percentage of SA pupils
would be beneficial for high risk children. It may be within such schools there
are greater levels of inclusion whereby an ethos is created within the school that
celebrates diversity and difference and supports children with their individual
needs. It is likely that in such inclusive schools more energy and resources are
spent on interventions that are designed to reduce behaviour difficulties.
Adopting a more inclusive approach in schools and implementing programmes
such as PATHS, which is designed to help reduced behaviour difficulties and
has been noted as being effective with in the UK context (Curtis & Norgate
2007) would be particularly beneficial.
312
Within secondary schools, attending schools within urban locations are
beneficial for children considered at high risk (in terms of poor academic
achievement). This variable acts as a protective factor, and has a positive effect
in reducing the display of behaviour difficulties. It is therefore beneficial for
children considered at high risk to attend a school in an urban area. Although
this is a key finding within the present study, moving a child to an urban school
on the basis of their ‘at risk’ status is not a feasible option. Instead investigating
the characteristics of urban schools which are distinct from rural schools and
implementing these in the rural schools would be beneficial for high risk
children. It may be within such urban schools there are greater levels of
resources available where high risk individuals can be supported best. In such
schools more energy and resources may be spent on interventions that are
designed to reduced behaviour difficulties. Rural secondary schools should pay
particular attention to this finding and increase the resources available on
intervention programmes such as PATHS, which is designed to help reduce
behaviour difficulties as this would help to reduce the difficulties displayed.
8.2.4 Summary statements of key implications
Research questions 1
1. Schools need to be aware that their characteristics have an influence
on pupil level behaviour difficulties. School level interventions should
therefore be implemented.
2. Interventions that specifically target children who are male, eligible for
FSM and in years 5 in primary and 7 in secondary will be the most
effective. In primary schools those children born in the autumn and
who are older in the school year, would benefit most from these
interventions.
313
3. Schools should provide interventions to all children that aim to reduce
bullying, as this will have positive influences on pupil behaviour.
4. Specific interventions at the primary school level should include
improving pupils’ relationships with peers and teachers and targeting
overall school level academic achievement.
5. In secondary schools a focus should be placed on keeping school
size to a minimum and individual attendance and academic
achievement to a maximum.
Research questions 2
6. Interventions need to account for multiple risks and reduce risk
whenever it can be changed.
7. Targeting those at high levels of risk, will diminish the disproportional
effect that increasing risk has upon behaviour difficulties displayed
8. When it is known which risks have the most powerful influence on
behaviour difficulties these should be targeted first as this will have
the biggest impact on reducing behaviour difficulties.
Research questions 3
9. In primary schools overall academic achievement in schools should
be promoted in all schools, and inclusivity encouraged, as these will
have a particularly positive effect on pupil behaviour.
10. Rural secondary schools should spend more on interventions
particularly tailored at high risk children to reduce their behaviour
difficulties.
314
8.3 Contribution to Knowledge
The present study has provided a unique and significant contribution to
knowledge advancing the evidence base surrounding risk, promotive and
protective factors for behaviour difficulties in children with SEND. Firstly the
present study has set out at its inception, a name for the concept under
investigation i.e. behaviour difficulties, justifying why this was used over and
above other terms within the literature. Furthermore, a clear and unambiguous,
definition of behaviour difficulties has been provided: “A behaviour difficulty
refers to an individual’s behaviour that is persistently aggressive, destructive,
dishonest or disobedient, and is deemed inappropriate for their age or cultural
background. These behaviours will have negative affects upon themselves,
others or property, and may occur solely within a unique or across multiple
contexts”. In providing such a definition the present study has clearly set out
what this term signifies and how it is conceptualised, and in offering a definition
at the outset, misconceptions and any ambiguity that this term carries can be
discarded. Theoretical advances can be made within this field when
researchers clearly and consistency state the definition of their concept.
A major contribution to knowledge within the present study was its focus on
children with SEND. Despite representing a significant proportion of the school
population, (approximately one fifth of all school pupils, DfE 2011), there
remains a dearth of study with this under researched group. SEND pupils all
have at least one thing in common, that additional support is being offered to
them, and in utilising such a population in research, the resulting implications
are relevant not only to large numbers of children but to a range of
professionals who are currently working with them. To my knowledge no study
has specifically investigated risk, promotive and protective factors for behaviour
difficulties with a SEND population within England. The present study therefore
offers a significant contribution to knowledge.
The present study has also been able to distinguish between risk, promotive
and protective effects within the same study which offers an important
contribution to knowledge. Often within a single study only the influences of
315
either risk factors or promotive/protective factors are noted. It is unusual for a
study to acknowledge all types of influences within the same piece of research,
so the present study is able to add to the literature in this regard.
The present study has also been able to contribute to the field of explaining risk,
promotive and protective factors for behaviour difficulties across multiple
ecological levels (i.e. individual and school levels). In adopting Bronfenbrenner’s
(1979) Ecological Systems Theory as a framework for organising variables
across the individual and school level this is consistent with Ribeaud & Eisner
(2010) who argue multiple factors across distinct ecological levels should be
accounted for when attempting to explain behaviour difficulties in children and
adolescents. Relatively few studies have acknowledged multiple ecological
levels within the same study, and in this regard the present study adds to the
literature. The present study also commented on the relative importance of the
two ecological levels within the study (individual and school) assessing which
holds the greatest influence in accounting for variance in behaviour difficulties.
Few studies have explicitly acknowledged the relative influence of broad
ecological levels, so the present study contributes to the literature base in this
regard.
The present study has contributed to the field in terms of methodological
advancements by utilising the WOST, a new measure of behaviour difficulties
(Humphrey et al. 2011)50
50 Wider Outcome Survey for Teachers (Humphrey et al. 2011).
. This was a bespoke survey that was specifically
designed for children with SEND. In utilising such a measure the key issues
relevant to children with SEND can be captured. This survey has been validated
psychometrically with promising findings (Wiglesworth, Oldfield & Humphrey
2012), suggesting it is an appropriate tool to use when assessing behaviour
difficulties in children with SEND. The present study is one of the first to use the
measure. As such it is able to provide a significant contribution to the field of
behaviour difficulties in children with SEND as provides the first
psychometrically sound measure of behaviour difficulties that is specifically
tailored to this group.
316
In adopting a longitudinal design the present study was able to establish a
number of variables as true risk factors. Such a design is deemed important as
a risk factor can only be defined as such when it is significantly related to
outcome as well as preceding it (Offord & Kraemer 2000). A longitudinal design
is therefore essential to truly classify a variable as a risk factor (Murray et al.
2009). As a number of studies investigating ‘risk factors’ have adopted a cross
sectional design they are only really highlighting correlates of behaviour
difficulties. The present study has contributed to this field by using an
appropriate design to establish true risk factors. The design of this study also
used an analytical technique called multi-level modelling (see section 5.9 for an
overview). Using such a technique has enabled researchers to accurately
proportion variance across different ecological levels and is essential in
analysing data within educational studies where pupils are found nested within
schools. This is a fairly new technique and as such the present study is one of
the first to use it to highlight risk, promotive and protective factors for behaviour
difficulties and the first to do so with a SEND population.
Evidence clearly shows that risk factors for behaviour difficulties do not work in
isolation (Flouri & Kallis 2007). These factors accumulate within individuals to
impact the behaviour displayed. Failing to acknowledge how risk factors may
work together will therefore offer an incomplete account of how risk factors
influence behaviour difficulties. The present study has been able to contribute to
knowledge here in assessing the cumulative risk hypothesis, and that increased
risk leads to increased behaviour difficulties. This is the first study using a
SEND population to do this. Only a handful of research studies have assessed
whether increasing risk within an individual’s background leads to a linear or
nonlinear increase in problem behaviours, and no study has conducted such an
analysis with a SEND population. In assessing these effects the present study
found that a quadratic effect best fits the data and that as risk increases there is
a disproportional increase in behaviour difficulties displayed. This has therefore
provided a significant contribution to knowledge in the field.

317
A further analysis within the present study was to discover school protective
factors, these are influences that affect all pupils attending the school, although
are particularly beneficial for those considered at high risk, in reducing their
display of behaviour difficulties. In conducting such an analysis an important
contribution to knowledge is offered as very few studies have explicitly
acknowledged school level protective factors and no study has done so with a
SEND population.
The present study not only had a particular focus upon school level effects but
also distinguished between primary and secondary schools. This decision was
taken on a number of grounds due to differences in school size (building and
pupil numbers), teachers and mix of pupils (see section 5.9.2 for an overview).
The variables that influence behaviour difficulties at the school level are
therefore likely to be different across school type, and this was in fact what the
present study found. Previous research when acknowledging a school effect in
accounting for behaviour difficulties has often made no comparison between
primary and secondary schools, and generally focuses on a single school type.
By acknowledging differences between school types and how variables within
this ecological level affect behaviour difficulties a significant contribution to
knowledge has been made.
The present study is also unique in the literature in utilising a large and
representative sample of SEND pupils across England. Participants were drawn
from schools within 10 local authorities deemed representative of England in
terms of geographical location, proportion of ethnic minorities and population
density (DCSF 2009b). Within each local authority primary and secondary
schools were selected which again were representative of the area including
those in affluent as well as deprived areas. The total number of schools
included within the present study was 305 (248 primary and 57 secondary).
Pupils in years 1, 5, 7, and 10 from these schools who were on the register as
having SEND became the participants for the study. The final sample can be
deemed representative of SEND pupils found nationally. The study was also
fairly large with a final sample of 4288 pupils, (2660 in primary schools, and
1628 in secondary schools), which is one of the largest studies of its kind.
318
A further contribution to knowledge offered by the present study is its focus on a
wide range of variables within the same study. A number of these have been
previously highlighted as important factors in accounting for behaviour
difficulties (i.e. gender, academic achievement, attendance etc.), although
others are new and distinct such as positive relationships (as measured by the
WOST). Assessing the influence of established predictors of behaviour
difficulties from the general population as well as potentially ‘new’ predictors
within the same study, and particularly for children with SEND has not been
conducted previously.
The present study has offered a further significant contribution by maintaining a
particular focus on school level effects. There has been significantly less
research investigating school as an important ecological level compared with
family influences on child development (Bronfenbrenner 1994), therefore the
present study may be useful to the field. Acknowledging the importance of a
school level has uncovered risk and promotive factors that are present at this
level, and have a significant influence on an individual’s behaviour.
As highlighted above the present study has provided a significant contribution to
knowledge and has furthered our understanding of why children and
adolescents develop behaviour difficulties. This study was unique in its explicit
focus on children with SEND which represent a substantial proportion of the
school population. With a sampling methodology deemed representative of
England there is real power in the study’s ability to generalise its findings. A
particular focus was placed upon the school and individual ecological levels,
and splitting up school in to primary and secondary models to uncover
significant variables was a unique feature of the research. Assessing the
importance of a number of established as well as ‘new’ variables in accounting
for behaviour problems has added to the literature base. Utilising a longitudinal
design enabled true risk factors to emerge, and analysing the data using MLM
allowed the school level effect to be appropriately acknowledged. Testing risk,
promotive and protective factors within the same study for children with SEND
is unique in the literature. The present study has therefore informed the debate
around risk, promotive and protective factors for behaviour difficulties providing
319
up-to-date research into this field, and suggests interventions that could be put
in place to combat these problems.
In summary the present study has contributed to knowledge in theoretical,
methodological and practical terms:
Theoretical
1. Clearly defining and justifying the concept of ‘behaviour difficulties’,
clearing up any misconceptions or ambiguity within the field.
2. Focusing specifically on children with SEND: these children represent a
large but often under researched group of children
3. Being the first study to investigate risk, promotive and protective factors
for behaviour difficulties in children with SEND within England.
4. Distinguishing between risk, promotive and protective effects of predictor
variables within the same study.
5. Accounting for risk, promotive and protective factors for behaviour
difficulties across multiple ecological levels, and assessing the relative
importance of the individual and school ecological levels.
Methodological
6. Using a new psychometrically sound measurement of behaviour
difficulties (i.e. WOST), specially designed for children with SEND,
therefore encouraging methodological advancements within this field.
7. Adopting a longitudinal design, allowing true risk factors to emerge.
8. Using multi-level modelling to analyse the data, and therefore accounting
for the inherent clustering of data which are present in many educational
based studies.
9. Assessing the effects of cumulative risk within a SEND population, and
whether increasing risk within an individual’s background leads to a
linear or disproportional increase in problem behaviours.
10. Testing for interaction effects at the school level, in order to highlight
salient school level protective factors for different school types

320
Practical
11. Being one of the biggest studies of its kind, incorporating a large and
representative sample of SEND pupils across England, including children
in different years and at different school types, increasing the
generalisablity of the study.
12. Incorporating a wide range of variables within the same study, including
‘established’ predictors of behaviour difficulties from the general
population, as well as potentially ‘new’ predictors particularly relevant for
children with SEND.
13. Having a particular focus on school level effects, uncovering school level
protective factors, that are particularly beneficial for those considered at
high risk.
14. Offering an important contribution to the where intervention programmes
should be directed and who would benefit to the greatest degree from
these.
321
8.4 Summary of study
In summary the present study aimed firstly to highlight the salient risk and
promotive factors for behaviour difficulties in children with SEND across the
individual and school ecological levels. Secondly, the study aimed to assess the
cumulative effects of risk factors, in terms of whether increasing risk is
predictive of increased behaviour problems and whether this relationship
conforms to a linear or nonlinear pattern. Finally, the study aimed to highlight
any school level protective factors that are particularly beneficial to children
considered at high risk in reducing their behaviour difficulties.
These aims were achieved by collecting baseline data on 20 distinct variables,
(9 at the school level and 11 at the individual level), as well as a measure of
behaviour difficulties assessed by teachers and measured at baseline and
follow-up 18 months later. Analysis was carried out using MLM, with the
outcome being ‘follow-up’ behaviour difficulties, controlling for ‘baseline’
behaviour difficulties. Significant risk and promotive factors at the individual and
school level were acknowledged. A cumulative risk score was generated on the
basis of the significant contextual risks assessed. Finally an analysis involving
school level factors in interacting with risk was taken to establish some school
level protective factors.
Results revealed that risk factors for behaviour difficulties across all schools
were, being male, eligible for FSM and being a bully. In primary schools
additional significant risk factors included having poorer positive relationships,
being born in the autumn months, being in year 5 and attending a school with
low levels of academic achievement. In secondary schools additional risk
factors included having low overall attendance, lower individual level academic
achievement, being in year 7, being a bystander to bullying and attending a
school with a greater number of children on role. School level factors accounted
for 15% of total variance in behaviour difficulties in primary schools and 13% in
secondary schools, with the remainder being at the individual level.

322
The cumulative risk model for both primary and secondary school revealed
increasing risk regardless of its exact nature resulted in increased behaviour
difficulties. Type of risk was however, still important, as when risks were added
independently to a statistical model they accounted for more variance then the
cumulative risk model. Nonetheless the importance of the cumulative risk model
was in showing that the relationship between increasing cumulative risk and
behaviour difficulties was not proportional and those with higher levels of risks
present are at a disproportional disadvantage.
Finally, protective factors were assessed at the school level revealing that in
primary schools, attending a school with high academic achievement is
particularly beneficial for children considered at high risk (in terms of having
poor positive relationships). Attending schools with high levels of SEND children
on role is also beneficial for children considered at high risk (in terms of having
poor positive relationships). In secondary schools pupils attending urban
schools were at an advantage in terms of reducing their behaviour difficulties
when considered at high risk (i.e. having poor academic achievement)
compared with their rural counterparts.
Despite a number of limitations within this study, including the large attrition
rates, results being potentially influenced by the AfA intervention, and some
concerns about the true representativeness of sample, the findings are
generalisable to all children with SEND in England. It can be concluded
therefore that this study offers a significant contribution to knowledge in terms of
understanding to a greater extent the risk, promotive and protective factors that
influence behaviour difficulties of children with SEND.
Behaviour difficulties are ultimately affected by multiple factors, therefore
addressing any one of these potential influences will be beneficial in reducing
the problems displayed (Rutter 2000). It is important that future studies continue
to move beyond a uniquely individual variable focus and acknowledge
environmental influences within families schools and communities that promote
positive adaption, (Olsson et al. 2003). Interventions designed to reduce such
problems should not only attempt to reduce risk, but where it is not possible to

323
prevent certain adversities or when risks are unknown, also encourage
protection (Masten & Reed 2002, Van der Laan, et al. 2010), breaking chain
reactions of negative life events, and promoting positive adaption, (Olsson et al.
2003, Colman & Hagell 2007, Murray 2003, Rutter 1999). These interventions
need to be both context and outcome specific (Rutter 2000), helping those
currently struggling as well as others to follow adaptive pathways that lead away
from these problems. Interventions will be of the greatest benefit if they promote
positive adaption, and focus on protective factors, rather than treating problems
once they have already occurred, (Luthar 2006).
8.5 Summary statements
• Implications: This section highlighted the key implications that have
emerged from the study, within research question 1, 2 and 3.
• Contribution to knowledge: This section has set out multiple reasons why
the present study has offered a significant contribution to knowledge
• Summary of study: This is the final section of the thesis and gives a
broad overview of the study.
324
REFERENCES
Achenbach, T., McConaughy, S., & Howell, C. (1987). Child/adolescent behavioral and emotional problems: Implications of cross‐informant correlations for situational specificity. Psychological Bulletin, 101, 213‐232.
Achenbach, T. M. (1991a). Manual for the Child Behaviour Checklist/4-18 and 1991, profile. Burlington, VT, USA: University of Vermont, Department of Psychiatry.
Achenbach, T. M. (1991b). Manual for the Teacher's Report Form and 1991 Profile. Burlington, VT, USA: University of Vermont Department of Psychiatry.
Achenbach, T., M., Dumenci, L., & Rescorla, L., A. (2002). Ten-year comparisons of problems and competencies for nation samples of youth: self, parent and teacher reports. Journal of Emotional and Behavioural Disorders, 10, 194-203.
Achenbach, T., M., Dumenci, L., & Rescorla, L., A. (2003). Are American children’s problems still getting worse? A 23-year comparison. Journal of Abnormal Child Psychology, 31, 1-11.
Ackerman, B. P. Izard, C. E., Schoff, K., Youngstrom, E. A., & Kogos, J. (1999). Contextual risk, caregiver emotionality, and problem behaviors of six and seven year old children from economically disadvantaged families. Child Development. 70, 1415-1427.
Aiken, L. S., & West, S. G. (1991). Multiple regression: Testing and interpreting interactions. London: Sage.
American Psychiatric Association. (2000). Diagnostic and statistical manual of mental disorders (4th ed., text revision). Washington, DC: American Psychiatric Association.
Andersson, H. W., Bjørngaard, J. H., Kaspersen, S. L., Wang, C. E. A, Skre, I., & Dahl, T. (2010). The effects of individual factors and school environment on mental health and prejudiced attitudes among Norwegian adolescents. Social Psychiatry & Psychiatric Epidemiology, 45, 569–77.
Appleyard, K., Egeland, B., van Dulmen, M. H. M., & Sroufe, L. A. (2005). When more is not better: the role of cumulative risk in child behavior outcomes. Journal of Child Psychology & Psychiatry, 46, 235–45.
Armstrong, D. & Squires, G. (2012). Contemporary Issues in Special Educational Needs: considering the whole child. Maidenhead: Open University Press.
Arseneault, L., Bowes, L., Shakoor, S. (2010) Bullying victimization in youths and mental health problems: ’Much ado about nothing?’ Psychological Medicine, 40, 717-729.
Arsenault, L., Moffitt, T.E., Caspi, A., Taylor, A., Rijsdijk, F.V., Jaffee, S.R., Ablow, J.C., & Measelle, J.R. (2003). Strong genetic effects on cross-situational antisocial behaviour among 5- year-old children according to mothers, teachers, examiner-observers, and twins’ self-reports. Journal of Child Psychology & Psychiatry, 44, 832-848.
325
Atzaba-Poria, N., Pike, A., & Deater-Deckard, K. (2004). Do risk factors for problem behaviour act in a cumulative manner? An examination of ethnic minority and majority children through an ecological perspective. Journal of Child Psychology & Psychiatry, 45, 707–18.
Aveyard, P., Markham, W. a, & Cheng, K. K. (2004). A methodological and substantive review of the evidence that schools cause pupils to smoke. Social Science & Medicine, 58, 2253–65.
Ayers, H., Clarke, D., & Murray, A. (2000). Perspectives on behaviour: A practical guide to effective interventions for teachers. London: David Fulton Publishers.
Baillargeon, R. H., Zoccolillo, M., Keenan, K., Côté, S., Pérusse, D., Wu, H.-X., Boivin, M., et al. (2007). Gender differences in physical aggression: A prospective population-based survey of children before and after 2 years of age. Developmental Psychology, 43, 13–26.
Baker, J. A., Grant, S., & Morlock, L. (2008). The teacher-student relationship as a developmental context for children with internalizing or externalizing behavior problems. School Psychology Quarterly, 23, 3–15.
Barnes, J., Belsky, J., Broomfield, K. A., & Melhuish, E. (2006). Neighbourhood deprivation, school disorder and academic achievement in primary schools in deprived communities in England. International Journal of Behavioral Development, 30, 127–136.
Barnow, S., Lucht, M., Freyberger, H. J. (2005). Correlates of aggressive and delinquent conduct problems in adolescence. Aggressive Behavior, 1, 24-39.
Barth, J., Dunlap, S. T., Dane, H., Lochman, J. E., & Wells, K. C. (2004). Classroom environment influences on aggression, peer relations, and academic focus. Journal of School Psychology, 42, 115–133.
Beam, M. R., Gil-rivas, V., Greenberger, E., & Chen, C. (2002). Adolescent Problem Behavior and Depressed Mood : Risk and Protection Within and Across Social Contexts. Journal of Youth & Adolescence, 31, 343–357.
Berger, K. (2011). The developing person through the lifespan. New York: Worth Publishers.
Berk, L. E. (2009). Child Development. London: Pearson Education
Beyers, J. M., Loeber, R., Wikström, P. O., & Stouthamer-Loeber, M. (2001). What predicts adolescent violence in better-off neighborhoods? Journal of Abnormal Child Psychology, 29, 369–81.
Bierderman, J., Milberger, S., Faraone, S. V., Kiely, K., Guite, J., Mick, E., Ablon, S., Warburton, R., & Reed, E. (1995). Family-environment risk factors for attention deficit hyperactivity disorder: A test of Rutter’s indicators of adversity. Archives of General Psychiatry, 52, 464-470.
Bisset, S., Markham, W. A., & Aveyard, P. (2007). School culture as an influencing factor on youth substance use. Journal of Epidemiology & Community Health, 7, 485–490.
326
Bond, L., Butler, H., Thomas, L., Carlin, J., Glover, S., Bowes, G., & Patton, G. (2007). Social and school connectedness in early secondary school as predictors of late teenage substance use, mental health, and academic outcomes. The Journal of Adolescent Health: Official Publication of the Society for Adolescent Medicine, 40, 357.e9–18.
Bongers, I. L., Koot, H. M., van der Ende, J., & Verhulst, F. C. (2004). Developmental trajectories of externalizing behaviors in childhood and adolescence. Child Development, 75, 1523–37.
Book, A., Starzyk, K., Quinsey, V., 2001. The relationship between testosterone and aggression: a meta-analysis. Aggression & Violent Behavior, 6, 579–599.
Bowes, L., Arseneault, L., Maughan, B., Taylor, A., Caspi, A., & Moffitt, T. E. (2009). School, neighborhood, and family factors are associated with children’s bullying involvement: a nationally representative longitudinal study. Journal of the American Academy of Child & Adolescent Psychiatry, 48, 545–53.
Boyd, D., & Bee H. (2009). Lifespan development. London: Pearson Education.
Bradley, R. H., & Corwyn, R. F. (2002). Socioeconomic status and child development. Annual Review of Psychology, 53, 371–99.
Breslau, N., Breslau, J., Miller, E., & Raykov, T. (2011) . Behavior problems at ages 6 and 11 and high school academic achievement: Longitudinal latent variable modelling. Psychiatry Research, 185, 433–437.
British Educational Research Association. (2011). Ethical guidelines for educational research. London: British Educational Research Association.
British Psychological Society. (2009). Code of ethics and conduct: Guidance published by the Ethics Committee of the British Psychological Society. Leicester: The British Psychological Society.
Bronfenbrenner, U. (1979). The ecology of human development: experiments by nature and design. London: Harvard University Press.
Bronfenbrenner, U. (1994). Ecological models of human development. In International Encyclopaedia of Education, Vol 3, 2nd edition. Oxford: Elsevier.
Bronfenbrenner, U. (2005). Making human beings human: biological perspectives on human development. London: Sage.
Brooks-Gunn, J., & Duncan, G. J. (1997). The Effects of Poverty on Children. Future of Children, 7, 55-71.
Brooks-Gunn, J., Duncan, G. J., Leventhal, T., & Aber, J. L. (1997). Lessons Learned and Future Directions for Research on the Neighborhoods in which Children Live. In J. Brooks-Gunn, G. J. Duncan, & J. L. Aber (Eds.), Neighborhood Poverty, Vol 1. Context and Consequences for Children (pp279-297). New York: Russell Sage Foundation.
Brown, W. (1982). Classroom climate: possible effects of special needs on the mainstream. Journal for Special Educators, 19, 20–27.
Brown, M. & Schoon, I. (2008). Child Behaviour. In K. Hansen, E. Jones, H. & Joshi (Eds.), Millennium Cohort Study Fourth Survey : A User’s Guide to Initial Findings (p165-176). London: Centre for Longitudinal Studies.
327
Bryman, A. (2012). Social Research Methods. Oxford: Oxford University Press.
Bulman, W. (2012). Exploring associations between classroom relationships and learning for children with Autism Spectrum Disorders and Behavioural, Emotional and Social Difficulties. Unpublished thesis. University of Manchester: School of Education.
Buyse, E., Verschueren, K., Doumen, S., Damme, J. V., & Maes, F. (2008). Classroom problem behavior and teacher-child relationships in kindergarten : The moderating role of classroom climate. Journal of School Psychology, 46, 367 – 391.
Calkins, S. D., Blandon, A. Y., Williford, A. P., & Keane, S. P. (2007). Biological, behavioural, and relational levels of resilience in the context of risk for early childhood behaviour problems. Development & Psychopathology, 19, 675-700.
Call, K. T., & Mortimer, J. T., (2001). Arenas of comfort in adolescence: A study of adjustment in context. London: Lawrence Erlbaum Associates
Campbell, S. B., Shaw, D. S., & Gilliom, M. (2000). Early externalizing behavior problems: toddlers and preschoolers at risk for later maladjustment. Development & Psychopathology, 12, 467-488.
Ceballo, R., Ramirez, C., Hearn, K. D., & Maltese, K. L. (2003). Community violence and children’s psychological well-being: does parental monitoring matter? Journal of Clinical Child & Adolescent Psychology, 32, 586-592.
Chang, L., Schwartz, D., Dodge, K., & McBride-Chang, C. (2003). Harsh parenting in relation to child emotion regulation and aggression. Journal of Family Psychology, 17, 598–606.
Chaplain, R. (2003). Teaching without disruption in the primary school: A model for managing pupil behaviour. London: RoutledgeFalmer.
Chou, L.-C., Ho, C.-Y., Chen, C.-Y., & Chen, W. J. (2006). Truancy and illicit drug use among adolescents surveyed via street outreach. Addictive Behaviors, 31, 149–54.
Claes, E., Hooghe, M., & Reeskens, T. (2009). Truancy as a contextual and school‐related problem: a comparative multilevel analysis of country and school characteristics on civic knowledge among 14 year olds. Educational Studies, 35, 123–142.
Cohen, J. (1992). A power primer. Psychological Bulletin, 112, 155-159.
Cohen, L., Manion, L., & Morrison, K. (2011). Research methods in education. London: Routledge.
Coie, J. D., Watt, N. F., West, S. G., Hawkins, J. D., Asarnow, J. R., Markman, H. J., Ramey, S. L., et al. (1993). The science of prevention. A conceptual framework and some directions for a national research program. The American Psychologist, 48, 1013–22.
Coleman, J., & Hagell, A. (2007). The nature of risk and resilience in adolescence. In J. Coleman, & A. Hagell (Eds). Adolescence risk and resilience: Against the odds (pp2-16). Chichester: John Wiley & Sons.
328
Colman, I., Murray, J., Abbott, R., Maughan, B., Kuh, D., Croudace, T., & Jones, P. (2009). Outcomes of conduct problems in adolescence: 40 year follow-up of national cohort. British Medical Journal, 338, 1-10.
Cole, T. (2003) ‘The future: new name – same aims’, SEBDA News. Penrith: The Social Emotional and Behavioural Difficulties Association.
Collishaw, S., Maughan, B., Goodman, R., & Pickles, A. (2004). Time trends in adolescent mental health. Journal of Child Psychology & Psychiatry, 45, 1350-1362.
Collishaw, S., Goodman, R., Pickles, A., & Maughan, B. (2007) Modelling the contribution of changes in family life to time trends in adolescent conduct problems. Social Science & Medicine, 65, 2576-2587.
Connor, D. F. (2004). Aggression and antisocial behaviour in children and adolescents: Research and treatment. New York: The Guilford Press.
Cooper, P., Smith, G., & Upton, C. J., (1994). Emotional and behavioural difficulties: theory to practice. London: Routledge.
Cooper, P. (1996). Giving it a name: The value of descriptive categories in educational approaches to emotional and behavioural difficulties. Support for Learning, 11, 146-150.
Cooper, P. (1999a). What do we mean by emotional behavioural difficulties? In P. Cooper (Ed). Understanding and supporting children with emotional and behavioural difficulties (pp9-12). London: Jessica Kingsley Publishers.
Cooper, P. (1999b). Changing perceptions of EBD: Maladjustment, EBD and beyond. Emotional & Behavioural Difficulties, 4, 3-11.
Crick, N. R., & Zahn-Waxler, C. (2003). The development of psychopathology in females and males: Current progress and future challenges. Development & Psychopathology, 15, 719–742.
Criss, M. M., Pettit, G. S., Bates, J. E., Dodge, K. A., & Lapp, A. L. (2002). Family Adversity, Positive Peer Relationships, and Children’s Externalizing Behavior: A Longitudinal Perspective on Risk and Resilience. Child Development, 73, 1220–1237.
Crotty, M. (1998). The Foundations of Social Research: Meaning and Perspective in the Research Process. London: Sage.
Curtis, C., & Norgate, R. (2007). An Evaluation of the Promoting Alternative Thinking Strategies Curriculum at Key Stage 1. Educational Psychology in Practice, 23, 33–44.
Daniels, H., Visser, J., Cole, T., De Reybekill, N. (1999). Emotional and Behavioural Difficulties in Mainstream Schools. Research Report No 90. London: DfEE.
Daniel, L. G. & King, D. A. (1997) Impact of inclusion education on academic achievement, student behaviour and self-esteem, and parental attitudes, Journal of Educational Research, 91, 67–80.
Darke, S., Ross, J., & Lynskey, M. (2003). The relationship of conduct disorder to attempted suicide and drug use history among methadone maintenance patients. Drug & Alcohol Review, 22, 21-25.
329
DCSF, (2008a). The Education of Children and Young People with Behavioural, Emotional and Social Difficulties as a Special Educational Need. Nottingham: DCSF Publications.
DCSF, (2008b). Bullying involving children with special educational needs and disabilities. Safe to learn: embedding anti-bullying work in schools. Nottingham: DCSF Publications.
DCSF. (2009a). Achievement for All: Guidance for Schools. Nottingham: DCSF Publications.
DCSF. (2009b). Achievement for All: Local Authority Prospectus. Nottingham: DCSF Publications.
Deater-Deckard, K., Dodge, K. A, Bates, J. E., & Pettit, G. S. (1998). Multiple risk factors in the development of externalizing behavior problems: group and individual differences. Development & Psychopathology, 10, 469–93.
Dekovic, M. (1999). Risk and Protective Factors in the Development of Problem Behavior During Adolescence. Journal of Youth & Adolescence, 28, 667–685.
Deković, M., Wissink, I. B., & Marie Meijer, A. (2004). The role of family and peer relations in adolescent antisocial behaviour: comparison of four ethnic groups. Journal of Adolescence, 27, 497–514.
Delfos, M. F. (2004). Children and behavioural problems: Anxiety, aggression, depression and ADHD, a biopsychogical model with guidelines for diagnostics and treatment. London: Jessica Kingsley Publishers.
Denny, S. J., Robinson, E. M., Utter, J., Fleming, T. M., Grant, S., Milfont, T. L., Crengle, S., et al. (2011). Do schools influence student risk-taking behaviors and emotional health symptoms? The Journal of Adolescent Health, 48, 259–67.
DES, (1978). Special Educational Needs (The Warnock Report). London: HMSO.
DES, (1989). Discipline in Schools: Report of the Committee of Enquiry Chaired by Lord Elton, ‘The Elton Report’. London: HMSO.
DeWit, D. J., Offord, D. R., Sanford, M., Rye, B. J., Shain, M., & Wright, R. (2000). The effect of school culture on adolescent behavioural problems: self-esteem, attachment to learning, and peer approval of deviance as mediating mechanisms. Canadian Journal of School Psychology, 16, 15–38.
DfE, (1994). Circular 9/94, Pupils with Problems: the Education of Children with Emotional and Behavioural Difficulties. London: HMSO.
DfES (2001a). Special Educational Needs: code of practice. Nottingham: DfES Publications.
DfES (2001b). Special Education Needs and Disabilities Act (SENDA). London: HMSO
DfES (2003). Data collection by type of Special Educational Need. Nottingham: DfES Publications.
DfES (2005). Excellence and enjoyment: social emotional aspects of learning. Nottingham: DfES Publications.
330
DfE. (2010a). Schools, pupils and their characteristics. Nottingham. DfE Publications.
DfE. (2010b). National curriculum assessments at Key Stage 2 in England, 2009/10 (revised). Nottingham. DfE Publications.
DfE. (2010c). Pupil absence in schools in England, autumn term 2009 and spring term 2010. London: Department for Education Publications.
DfE. (2010d). Children with special needs 2010: an analysis. Nottingham. DfE Publications.
DfE (2011a). Special Educational Needs Information Act: An Analysis 2011. Nottingham. DfE Publications.
DfE. (2011b). Permanent and Fixed Period Exclusions from Schools in England 2009/10. London: Department for Education Publications.
DfE (2011c). Support and aspiration: A new approach to special educational needs and disability. London: Department for Education Publications
DfE (2012). Permanent and Fixed Period Exclusions from Schools and Exclusion Appeals in England 2010/11. London: Department for Education.
Dodge, K. A, Lansford, J. E., Burks, V. S., Bates, J. E., Pettit, G. S., Fontaine, R., & Price, J. M. (2003). Peer rejection and social information-processing factors in the development of aggressive behavior problems in children. Child Development, 74, 374–393
Dodge, K. A., & Pettit, G. S. (2003). A biopsychosocial model of the development of chronic conduct problems in adolescence. Developmental Psychology, 39, 349–371.
Domina, T. (2005). Leveling the Home Advantage: Assessing the Effectiveness of Parental Involvement in Elementary School. Sociology of Education, 78, 233–249.
Donnellan, M. B., Trzesniewski, K. H., Robins, R. W., Moffitt, T. E., & Caspi, A. (2005). Self-Esteem Antisocial Behavior, Aggression and Delinquency. Psychological Science, 16, 328–335.
D’Onofrio, B. M., Goodnight, J. A.,Van Hulle, C. A., Rodgers, J. L., Rathouz,P. J., Walderman, I. D., & Lahey, B. B. (2009). A Quasi-Experimental Analysis of the Association Between Family Income and Offspring Conduct Problems. Journal of Abnormal Child Psychology, 37, 415-429.
Doumen, S., Verschueren, K., Buyse, E., Germeijs, V., Luyckx, K., & Soenens, B. (2008). Reciprocal Relations Between Teacher – Child Conflict and Aggressive Behavior in Kindergarten : A Three- Wave Longitudinal Study. Journal of Clinical Child & Adolescent Psychology, 37, 588–599.
Drukker, M., Kaplan, C., Feron, F., & Os, J. V. (2003). Children’ s health-related quality of life, neighbourhood socio-economic deprivation and social capital . A contextual analysis. Social Science & Medicine, 57, 825–841.
Durlak, J. A., Weissberg, R. P., Dymnicki, A. B., Taylor, R. D., & Schellinger, K. B. (2011).The Impact of Enhancing Students’ Social and Emotional Learning: A Meta-Analysis of School-Based Universal Interventions. Child Development, 82, 405–432.
331
Eccles, J. S., Barber, B. L., Stone, M., & Hunt, J. (2003). Extra-curricular activities and adolescent development. Journal of Social Issues, 59, 865-889.
Education Act (1981). London: HMSO.
Education Act (1996). London: HMSO.
Edwards, B., & Bromfield, L. M. (2010). Neighbourhood influences on young children’s emotional and behavioural problems. Family Matters, 84, 7–19.
Ehrensaft, M. K. (2005). Interpersonal relationships and sex differences in the development of conduct problems. Clinical Child & Family Psychology Review, 8, 39–63.
Eisenberg, N., Cumberland, A., Spinrad, T. L., Fabes, R., Shepard, S., Reiser, M., Murphy, B. C., Losoya, S. H., & Guthrie, I. K., (2001). The relations of regulation and emotionality to children's externalizing and internalizing problem behavior. Child Development, 72, 1112-1134.
Epstein, J. a., Botvin, G. J., Griffin, K. W., & Diaz, T. (2001). Protective factors buffer effects of risk factors on alcohol use among inner-city youth. Journal of Child & Adolescent Substance Abuse, 11, 77–90.
Eriksson, I., Cater, Å., Andershed, A., & Andershed, H. (2011). What protects youths from externalising and internalising problems ? A critical review of research findings and implications for practice. Australian Journal of Guidance and Counselling, 21, 113–125.
Evans, G. W. (2003). A multimethodological analysis of cumulative risk and allostatic load among rural children. Developmental Psychology, 39, 924–933.
Evans, G. W., & Gary, W. (2004). The environment of childhood poverty. American Psychologist, 59, 77–92.
Evans, G. W., Kim, P., Ting, A. H., Tesher, H. B., & Shannis, D. (2007). Cumulative risk, maternal responsiveness, and allostatic load among young adolescents. Developmental Psychology, 43, 341–51.
Evans, R., & Pinnock, K. (2007). Promoting resilience and protective factors in the children’s fund. Journal of Children & Poverty, 13, 21–36.
Evans-Whipp, T., Beyers, J. M., Lloyd, S., Lafazia, A. N., Toumbourou, J. W., Arthur, M. W., & Catalano, R. F. (2004). A review of school drug policies and their impact on youth substance use. Health Promotion International, 19, 227–234.
Farrell, M. (2004). Special Educational Needs: A Resource for Practitioners. London: Sage.
Farrington, D. P., & Loeber, R. (2000). Some benefits of dichotomization in psychiatric and criminological research. Criminal Behavior and Mental Health, 10, 100–122.
Farris, J. R., Smith, L. E., Weed, K. (2007). Resilience and vulnerability in the context of multiple risks. In J. G. Borkowski, J. R. Farris, T. L. Whitman, S. S. Carothers, K. Weed & D. A. Keogh, (Eds.). Risk and resilience: adolescent mothers and their children grow up (pp179-204). London: Lawrence Erlbaum Associates.
332
Felson, R. B., Liska, A. E., South, S. J., & McNulty, T. L. (1994). The subculture of violence and delinquency: individual vs. school context effects. Social Forces, 73, 155-173.
Fergus, S., & Zimmerman, M. A., (2005). Adolescent resilience: A framework for understanding healthy development in the face of risk. Annual Review of Public Health, 26, 399-419.
Fergusson, M. F., & Horwood, L., J. (2003). Resilience to childhood adversity: results of a 21 year study. In S. S. Luthar (Ed). Resilience and Vulnerability, (pp130-155). Cambridge: Cambridge University Press.
Fergusson, D. M., Horwood, L.J., Ridder, E. (2005). Show me the child at seven: The consequences of conduct problems in childhood for psychosocial functioning in adulthood. Journal of Child Psychology & Psychiatry, 46, 837-849.
Fergusson, D. M., Horwood, L. J., & Ridder, E. M. (2007). Conduct and attentional problems in childhood and adolescence and later substance use, abuse and dependence: Results of a 25-year longitudinal study. Drug & Alcohol Dependence 88S, S14–S26.
Fergusson , D. M., Vitaro, F., Wanner, B., & Brendgen, M. (2007). Protective and compensatory factors mitigating the influence of deviant friends on delinquent behaviours during early adolescence. Journal of Adolescence, 30, 33-50
Field, A. (2009). Discovering statistics using SPSS. London: Sage.
Fife‐Schaw, C. (2006) Introduction to Structural Equation Modelling. In G. M. Brakewell, C. Hammond, C. Fife-Schaw, & J. Smith. (2006). Research Methods in Psychology (pp444-465). London: Sage.
Flory, K., Milich, R., Lynam, D., R., Leukefeld, C., & Clayton, R. (2003). Relation between childhood disruptive behaviour disorders and substance use and dependence symptoms in young adulthood: Individuals with symptoms of attention deficit/hyperactivity disorder and conduct disorder are uniquely at risk. Psychology of Addictive Behaviors, 17, 151-158.
Flouri, E., & Kallis, C. (2007). Adverse life events and psychopathology and prosocial behavior in late adolescence: testing the timing, specificity, accumulation, gradient, and moderation of contextual risk. Journal of the American Academy of Child and Adolescent Psychiatry, 46, 1651–9.
Flouri, E. (2008). Contextual risk and child psychopathology. Child Abuse & Neglect, 32, 913-7.
Flouri, E., Tzavidis, N., & Kallis, C. (2010). Area and family effects on the psychopathology of the Millennium Cohort Study children and their older siblings. Journal of Child Psychology & Psychiatry, 51, 152–61.
Ford, T., Goodman, R., & Meltzer, H., (2003). The British child and adolescent mental health survey 1999: The prevalence of DSM-IV disorders. Journal of the American Academy of Child & Adolescent Psychiatry, 42, 1203-1211.
Forehand, R., Biggar, H., & Kotchick, B. A. (1998). Cumulative risk across family stressors: short- and long-term effects for adolescents. Journal of Abnormal Child Psychology, 26, 119–28.
333
Fraser, M. W., & Terzian, M. A. (2005). Risk and Resilience in Child Development: Principles and Strategies of Practice. In G. P. Mallon & P. McCartt-Hess (Eds). Child Welfare for the 21st Century: A handbook of Practices, Policies and Programs, (p55-71). Chichester: Columbia University Press.
Frederickson, N., & Cline, T. (2009). Special educational needs, inclusion and diversity. Maidenhead: Open University Press.
Garmezy, N., Masten, A. S., & Tellegen, A. (1984). The study of stress and competence in children: a building block for developmental psychopathology. Child Development, 55, 97-111.
Garmezy, N. (1996). Reflections and commentary on risk, resilience and development. In R. J. Haggerty, L. R. Sherrod, N., Garmezy, & M. Rutter. (Eds.). Stress, risk and resilience in children and adolescents: Processes, mechanisms and interventions. Cambridge: Cambridge University Press.
George, R., & Thomas, G. (2000). Victimization in Middle and High School students: A Multilevel Analysis. Educational Research, 84, 48–57.
Gerard, J. M., & Buehler, C. (1999). Multiple risk factors in the family environment and youth problem behaviors. Family Relations, 61, 343–361.
Gerard, J. M., & Buehler, C. (2004a). Cumulative Environmental Risk and Youth Problem Behavior. Journal of Marriage and Family, 66, 702–720.
Gerard, J. M., & Buehler, C. (2004b). Cumulative environmental risk and youth maladjustment: the role of youth attributes. Child Development, 75, 1832–1849.
Gilliom, M., & Shaw, D. (2004). Co-development of externalizing and internalizing problems in early childhood. Development & Psychopathology, 16, 313-333.
Gini, G. (2008). Associations between bullying behaviour, psychosomatic complaints, and emotional and behavioural problems. Paediatrics & Child Health, 44, 492–497.
Goodman R (2001) Psychometric properties of the Strengths and Difficulties Questionnaire (SDQ). Journal of the American Academy of Child & Adolescent Psychiatry, 40, 1337-1345.
Goodman, R., Gledhill, J., & Ford, T. (2003). Child psychiatric disorder and relative age within school year: cross sectional survey of large population sample. British Medical Journal, 327, 1-4
Gottfredson, D. C., & DiPietro, S. M. (2011). School size, social capital, and student victimization. Sociology of Education, 84, 69–89.
Gottfredson, D. C. (2001). Schools and delinquency. Cambridge: Cambridge University Press.
Green, H., McGinnity, A., Meltzer, H., Ford, T., & Goodman, R. (2005). Mental health of children and young people in Great Britain (2004). London: Office for national statistics.
334
Greenberg, M., Domitrovich, C., & Bumbarger, B. (2000). Preventing mental disorders in school-aged children: a review of the effectiveness of prevention programs. Pennsylvania State University: Prevention Research Centre for the Promotion of Human Development.
Greenberg, M. T., Speltz, M. L., DeKlyen, M., & Jones, K. (2001). Correlates of clinic referral for early conduct problems: variable- and person-oriented approaches. Development & Psychopathology, 13, 255–76.
Greenberg, M. T. (2006). Promoting resilience in children and youth: prevention interventions and their interface with neuroscience. Annals New York Academy of Science, 1094, 139-150.
Greenberger, E., Chen, C., Beam, M., Whang, S-M., & Dong, Q. (2000). The perceived social contexts of adolescents' misconduct: A comparative study of youths in three cultures. Journal of Research on Adolescence, 10, 369-392.
Gutman, L. M., Sameroff, A. J., & Cole, R. (2003). Academic growth curve trajectories from 1st grade to 12th grade: Effects of multiple social risk factors and preschool child factors. Developmental Psychology, 39, 777–790.
Gutman, L. M., Midgley, C. (2000). The role of protective factors in supporting the academic achievement of poor African American students during the middle school transition. Journal of Youth & Adolescence, 29, 223-248
Guttmannova, K., Szanyi, J. M., & Cali, P. W. (2007). Internalizing and externalizing behavior problem scores: Cross-ethnic and longitudinal measurement invariance of the behavior problem index. Educational & Psychological Measurement, 68, 676–694.
Hagell, A. (2007). Antisocial behaviour. In J. Colman & A. Hagell (Eds.). Adolescence, risk and resilience: Against the odds, (pp125-142). Chichester: John Wiley & Sons.
Hall, J. E., Sammons, P., Sylva, K., Melhuish, E., Taggart, B., Siraj-Blatchford, I., & Smees, R. (2010). Measuring the combined risk to young children’s cognitive development: an alternative to cumulative indices. British Journal of Developmental Psychology, 28, 219-238.
Haller, E. J. (1992). High school size and student indiscipline: Another aspect of the school consolidation issue? Educational Evaluation & Policy Analysis, 14, 145.
Halliwell, M. (2003). Supporting children with special educational needs: a guide for assistants in schools and pre-schools. London: David Fulton.
Hampel, P., Manhal, S., & Hayer, T. (2009). Direct and relational bullying among children and adolescents: Coping and psychological adjustment. School Psychology International, 30, 474–490.
Hamre, B. K., & Pianta, R. C. (2001). Early teacher – child relationships and the trajectory of children’s school outcomes through Eighth Grade. Child Development, 72, 625–638.
Hanewald, R. (2011). Reviewing the literature on “at-risk” and resilient children and young people. Australian Journal of Teacher Education, 36, 16-29.
Harris, N., Eden, K., & Blair, A. (2000). Challenges to School Exclusion: Exclusion, Appeals and the Law. London: RoutledgeFalmer.
335
Harris, M., & Butterworth, G. (2002). Developmental Psychology: A student handbook. Hove: Psychology Press Limited.
Hastings, R, P. (2002). Parental stress and behaviour problems of children with developmental disability. Journal of Intellectual & Developmental Disability. 27, 149-160.
Hawes, D. J., & Dadds, M.R., (2005). Oppositional and conduct problems. In J. Hudson & R. Rapee (Eds.), Current thinking on psychopathology and the family. New York: Elsevier.
Healey, A., Knapp, M., & Farrington, D. (2004) Adult labour market implications of antisocial behaviour in childhood and adolescence: findings from a UK longitudinal study. Applied Economics, 36, 93-105.
Hebron, J. S. (2012). Bullying among children and young people with autism spectrum disorders: an investigation into prevalence, victim role, risk and protective factors. Unpublished thesis. University of Manchester: School of Education.
Heck, R. H., Thomas, S. L. & Tabata, L. N. (2010). Multilevel and longitudinal modelling with IMB SPSS. London: Routledge.
Henry, K. L. (2007). Who’s skipping school: characteristics of truants in 8th and 10th grade. The Journal of School Health, 77, 29–35.
Henry, K. L., & Huizinga, D. H. (2007). Truancy’s effect on the onset of drug use among urban adolescents placed at risk. The Journal of Adolescent Health, 40, 358e9–358e17.
Henry, K. L., & Thornberry, T. P. (2010). Truancy and escalation of substance use during adolescence. Journal of Studies on Alcohol & Drugs, 71, 115–24.
Herrenkohl, T. I., Hill, K. G., Chung, I., Guo, J., Abbott, R. d., & Hawkins, D., (2003). Protective factors against serious violent behavior in adolescence: a prospective study of aggressive children. Social Work Research, 27, 179-191.
Hill, N. E., Castellino, D. R., Lansford, J. E., Nowlin, P., Dodge, K. A, Bates, J. E., & Pettit, G. S. (2004). Parent academic involvement as related to school behavior, achievement, and aspirations: demographic variations across adolescence. Child Development, 75, 1491–509.
Hille, E. T., den Ouden, a L., Saigal, S., Wolke, D., Lambert, M., Whitaker, A, Pinto-Martin, J. A, Hoult, L., Meyer, R., Feldman, J. F., Verloove-Vanhorick, S. P., & Paneth, N. (2001). Behavioural problems in children who weigh 1000 g or less at birth in four countries. Lancet, 357, 1641–16433.
Hinshaw, S. P. (1992). Externalising behaviour problems and academic underachievement in childhood and adolescence: causal relationships and underlying mechanisms. Psychological Bulletin, 111, 127-155.
Hobbs, G., & Vignoles, A. (2007). Is free school meal status a valid proxy for socio-economic status (in schools research)? London: Centre for the Economics of Education.
Hodkinson, A & Vickerman, P (2009). Key Issues in Special Educational Needs and Inclusion. London: Sage.
336
Hoglund, W. L., & Leadbeater, B. J. (2004). The effects of family, school, and classroom ecologies on changes in children’s social competence and emotional and behavioral problems in first grade. Developmental Psychology, 40, 533–44.
Home Office (2004) Defining and Measuring Anti-Social Behaviour. Development & Practice Report 26. London: Home Office.
Home Office (2011). Downloaded from http://www.homeoffice.gov.uk/crime/anti-social-behaviour/(1st June 2011)
Hooper, S. R., Burchinal, M. R., Erwick-Roberts, J., Zeisel, s., & Neebe, E. C. (1998). Social and family risk factors for infant development at one year: an application of the cumulative risk model. Journal of Applied Developmental Psychology, 19, 85-96.
Hope, T. L., & Bierman, K. L. (1998). Patterns of Home and School Behavior Problems in Rural and Urban Settings. Journal of School Psychology, 36, 45–58.
House of Commons (2006). Education and Skills Committee: Special Educational Needs. Third Report of Session 2005–06, Volume I. London: The Stationery Office Limited.
Howarth, R., & Fisher, P. E. (2005). Emotional and behaviour difficulties. London: Continuum.
Howitt, D., & Cramer, D. (2011). Introduction to Research Methods in Psychology. Harlow: Pearson Education.
Hoxby, C. M. (2002). The power of peers: How does the makeup of the classroom influence achievement? Education Next, 2, 57–63.
Humphrey, N., Kalambouka, A., Bolton, J., Lendrum, A., Wigelsworth, M., Lennie C., et al. (2008). Primary social and emotional aspects of learning: evaluation of small group work. Nottingham: DCSF Publications.
Humphrey, N., Squires, G., Barlow, A., Bulman, W. F. L., Hebron, J. S., Oldfield, J., et al. (2010). Achievement for All national evaluation: Interim report (RR028). London: DfE.
Humphrey, N., Squires, G., Barlow, A., Bulman, W. F. L., Hebron, J. S., Oldfield, J., et
al. (2011). Achievement for All National Evaluation: Final Report (DfE-RR176). London: DfE.
Humphrey, N, Wigelsworth, M, Barlow, A., & Squires, G. (2012). The role of school
and individual differences in the academic attainment of learners with special educational needs and disabilities: a multi-level analysis. International Journal of Inclusive Education, 1, 1–23,
Ingoldsby, E. M., Shaw, D. S., Winslow, E., Schonberg, M., Gilliom, M., & Criss, M. M. (2006). Neighborhood disadvantage, parent-child conflict, neighborhood peer relationships, and early antisocial behavior problem trajectories. Journal of Abnormal Child Psychology, 34, 303–19.
337
Jaffee, S. R., Caspi, A., Moffitt, T. E., Polo-Tomás, M., & Taylor, A. (2007). Individual, family, and neighborhood factors distinguish resilient from non-resilient maltreated children: a cumulative stressors model. Child Abuse & Neglect, 31, 231–53.
Jensen, E. (2009). Teaching with poverty in mind: What being poor does to kids' brains and what schools can do about it. Alexandria, Virginia: ASCD.
Jenson, J. M., & Fraser, M. W., (2011). A risk and resilience framework for child, youth and family policy. In J. M. Jenson & M. W. Fraser (Eds.), Social policy for children and families: a risk and resilience perspective. London: Sage.
Jessor, R., Van Den Bos, J., Vanderryn, J., Costa, F. M., & Turbin, M. S. (1995). Protective factors in adolescent problem behavior: Moderator effects and developmental change. Developmental Psychology, 31, 923-933.
Jones, D. J., Forehand, R., Brody, G., & Armistead, L. (2002). Psychosocial adjustment of African American children in single-mother families: a test of three risk models. Journal of Marriage & Family, 64, 105-115.
Jones, S., & Forshaw, M. (2012). Research Methods in Psychology. Harlow: Pearson Education.
Kalambouka, A., Farrell, P., Dyson, A. & Kaplan, I. (2005). The impact of population inclusivity in schools on student outcomes. London: University of London Institute of Education, EPPI Centre, Social Science Research Unit.
Kam, C., Greenberg, M. T., & Kusche, C. A. (2004). Sustained effects of the PATHS curriculum on the social and psychological adjustment of children in special education Journal of Emotional and Behavioral Disorders, 12, 66-78.
Kaplan, H. B. (2002). Toward an Understanding of Resilience: A critical review of definitions and models. In M. D. Glantz, & J. L. Johnson (Eds.), Resilience and development: Positive life adaptations, (pp 17-83). London: Kluwer Academic Publishers.
Kavale, K. A., Forness, S. R., & Alper, A. E. (1986). Research in behavioural disoders/emotional disturbance: A survey of subject identification criteria. Behavioral Disorders, 11, 159-167.
Kellam, S. G., Ling, X., Merisca, R., Brown, C. H., & Ialongo, N. (1998). The effect of the level of aggression in the first grade classroom on the course and malleability of aggressive behavior into middle school. Development & Psychopathology, 10, 165–85.
Kenny, D. A. (1979). Correlation and Causality. Wiley, New York.
Kerr, M. A, Black, M. M., & Krishnakumar, A. (2000). Failure-to-thrive, maltreatment and the behavior and development of 6-year-old children from low-income, urban families: a cumulative risk model. Child Abuse & Neglect, 24, 587–98.
Keyes, C. L. M. (2004). Risk and resilience in human development: an introduction. Research in Human Development, 1, 223-227.
Khoury-Kassabri, M., Benbenishty, R., Astor, R. A., & Zeira, A. (2004). The contributions of community, family, and school variables to student victimization. American Journal of Community Psychology, 34, 187–204.
338
Kim, Y. S., Leventhal, B. L., Koh,Y. J., Hubbard, A., & Boyce, W. T. (2006). School bullying and youth violence: causes or consequences of psychopathologic behavior? Archives of General Psychiatry, 63, 1035-41.
Kim-Cohen, J., Moffitt, T. E., Taylor, A., Pawlby,S. J., & Caspi, A. (2005). Maternal depression and children’s antisocial behavior: nature and nurture effects. Archives in General Psychiatry, 62, 173-181.
King, S. M., Iacono, W. G., & McGue, M. (2004). Childhood externalizing and internalizing psychopathology in the prediction of early substance use. Addiction, 99, 1548-59.
Klaff, A. C., Kroes, M., Vles, J. S., Hendriksen, J. G. M., Feron, F. J. M., Steyaert, J., van Zeben, T. M. C. B., Jolles, J., & van Os, J. (2001). Neighbourhood level and Individual level SES effects on child problem behaviour: A multilevel analysis. Journal of Epidemiology & Community Health, 55, 246-250.
Kliewer, W., Ramirez, M., Obando, P., Sandi, L., & Karenkeris, C. (2006). Violence exposure and drug use in Central American youth: Family cohesion and parental monitoring as protective factors. Adolescence, 16, 455–478.
Kohen, D., Oliver, L., & Pierre, F. (2009). Examining the effects of schools and neighbourhoods on the outcomes of kindergarten children in Canada. International Journal of Speech-Language Pathology, 11, 404–418.
Kraemer, H., Stice, E., Kazdin, A., Offord, D., & Kupfer, D. (2001). How do risk factors work together? Mediators, moderators and independent, overlapping and proxy risk factors. American Journal of Psychiatry, 158, 848-856.
Kraemer, H., Lowe, K., & Kupfer, D. J. (2005). To your health: how to understand what research tells us about risk. Oxford: Oxford University Press.
Kraemer, H., Kazdin, A. E., Offord, D. R., Kessler, R. C., Jensen, P. S., & Kupfer, D., J. (1997). Coming to Terms with the Terms of Risk. Archives of General Psychiatry, 54, 337-343.
Kuperminc, G., Leadbeater, B. J., Blatt, S. J. (2001). School Social Climate and Individual Differences in Vulnerability to Psychopathology among Middle School Students. Journal of School Psychology, 39, 141–159.
Ladd, G. W. & Burgess, K. B. (1999). Charting the relationship trajectories of aggressive, withdrawn, and aggressive/withdrawn children during early grade school. Child Development, 70, 910-929.
Lahey, B. B., Schwab-Stone, M., Goodman, S. H., Waldman, I. D., Canino, G., Rathouz, P. J., Miller, T. L., et al. (2000). Age and gender differences in oppositional behavior and conduct problems: A cross-sectional household study of middle childhood and adolescence. Journal of Abnormal Psychology, 109, 488–503.
Lahey, B. B., & Waldman, I. D. (2003). A Developmental Propensity Model of the Origins of Conduct Problems During Childhood and Adolescence. In B. B. Lahey, T. E. Moffitt, & A. Caspi, (Eds.). Causes of Conduct Disorder and Juvenile Delinquency, (pp76-117). New York: Guildford Press.
339
Laird, R. D., Jordan, K. Y., Dodge, K. A., Pettit, G. S. & Bates, J. E. (2001). Peer rejection in childhood, involvement with antisocial peers in early adolescence, and the development of externalizing behaviour problems. Development & Psychopathology, 13, 337–354.
Larsson, B., & Frisk, M. (1999). Social competence and emotional/behaviour problems in 6-16 year-old Swedish school children. European Child & Adolescent Psychiatry, 33, 24–33.
Laukkanen, E., Shemeikka, S., Notkola, I., Koivumaa-Honkanen, H., & Nissinen, A. (2002). Externalizing and internalizing problems at school as signs of health-damaging behaviour and incipient marginalization. Health Promotion International, 2, 139-146.
Leshner , A. I., (2002). Introduction. In M. D., Glantz, & J . L. Johnson (Eds.), Resilience and development: positive life adaptations (p1-3). New York: Kluwer Academic Publishers.
Leventhal, T., & Brooks-Gunn, J. (2000). The neighborhoods they live in: the effects of neighborhood residence on child and adolescent outcomes. Psychological Bulletin, 126, 309–37.
Lien, L., Tambs, K., Oppedal, B., Heyerdahl, S., & Bjertness, E. (2005). Is relatively young age within a school year a risk factor for mental health problems and poor school performance? A population-based cross-sectional study of adolescents in Oslo, Norway. BMC public health, 5, 102
Lima, J., Caughy, M., Nettles, S. M., & O’Campo, P. J. (2010). Effects of cumulative risk on behavioral and psychological well-being in first grade: moderation by neighborhood context. Social Science & Medicine, 71, 1447–54.
Little, R. J. A. (1988). A test of completely missing at random for multivariate data with missing values. Journal of the American Statistical Association, 83, 1198-1202.
Liu, J. (2004). Childhood Externalising Behavior: theory and implications. Journal of Child and Adolescent Psychiatric Nursing, 17, 99-103.
Loeber, R., Slot, W., & Stouthamer-Loeber, M., (2008). A cumulative developmental model of risk and promotive factors. In R. Loeber, W. Slot, P. van der Laan & M. Hoeve (Eds.) Tomorrow’s criminals (p133-161). Farnham: Ashgate Publishing Limited.
Long, M., Wood, C., Littleton, K., Passsenger, T., & Sheehy, K. (2011). The psychology of education. London: Routledge.
Losel, F., & Beelman, A. (2003). Effects of child skills training in preventing antisocial behavior: A systematic review of randomized evaluations. Annals of the American Academy of Political & Social Science, 587, 84–109.
Loukas, A., Prelow, H. M., Suizzo, M., & Allua, S. Mothering and peer associations mediate cumulative risk effects for Latino youth. Journal of Marriage & Family, 70, 76-85.
Luthar, S. S. (1993). Annotation: methodological and conceptual issues in research on childhood resilience. Journal of Child Psychology & Psychiatry, 34, 441–53.
340
Luthar, S. S. & Cicchetti, D. (2000). The construct of resilience: Implications for interventions and social policies. Development & Psychopathology, 12, 857-885.
Luthar, S. S., Cicchetti, D., & Becker, B. (2000a). The construct of resilience: a critical evaluation and guidelines for future work. Child Development, 71, 543–562.
Luthar, S. S, Cicchetti, D., & Becker, B. (2000b). Research on Resilience: Response to Commentaries. Child Development, 71, 573-575.
Luthar, S. S., & Cushing, G. (2002). Measurement Issues in the Empirical Study of Resilience: An Overview. In M. D. Glantz, & J. L. Johnson (Eds). Resilience and Development: Positive Life Adaptations, (pp129-160). London: Kluwer Academic Publishers.
Luthar, S. & Zelzo, L. (2003). Research on Resilience: An Integrative Review. In S. S. Luthar (Ed). Resilience and Vulnerability, (pp510-550). Cambridge: Cambridge University Press
Luthar, S. S. (2006). Resilience in development: A synthesis of research across five decades. In D. Cicchetti & D. J. Cohen (Eds.), Developmental Psychopathology, Vol III, Risk, Disorder, and Adaptation, (pp739-795). Hoboken, NJ: John Wiley & Sons
Luthar, S. S., Sawyer, J. A., & Brown, P. J., (2006). Conceptual Issues in Studies of Resilience: Past, Present and Future Research. Annuals of the New York Academy of Sciences, 1094, 105-115.
Ma, S., Truong, K., & Strurm, R. (2007). School characteristics and behavior Problems of U.S. Fifth-Graders. Psychiatric Services, 58, 610.
Maag, J. W., & Katsiyannis, A. (2010). Early intervention programs for children with behavior problems and at risk for developing antisocial behaviors: Evidence and research-based practices. Remedial and Special Education, 31,464–475
MacCallum, R. C., Zhang, S., Preacher, K. J., & Rucker, D. D., (2002). On the practice of dichotomization of quantitative variables. Psychological Methods, 7, 19-40.
MacKenzie, M. J., Kotch, J. B., Lee, L.-C., Augsberger, A., & Hutto, N. (2011). A cumulative ecological-transactional risk model of child maltreatment and behavioral outcomes: Reconceptualizing early maltreatment report as risk factor. Children & Youth Services Review, 33, 2392–2398.
Maes, L., & Lievens, J. (2003). Can the school make a difference? A multilevel analysis of adolescent risk and health behaviour. Social Science & Medicine, 56, 517–29.
Maggs, J. L., Frome, P. M., Eccles, J. S., & Barber, B. L. (1997). Psychosocial resources, adolescent risk behaviour and young adult adjustment: is risk taking more dangerous for some than others? Journal of Adolescence, 20, 103-119.
Mahoney, J. L. (2000). School extracurricular activity participation as a moderator in the development of antisocial patterns. Child Development, 71, 502–16.
Malcolm, H., Wilson, V., Davidson, J., & Kirk, S. (2003). Absence from School : A study of its causes and effects in seven LEAs. Nottingham: DfES Publications
341
Martin, R. P., Foels, P., Clanton, G., & Moon, K. (2004). Season of birth is related to child retention rates, achievement, and rate of diagnosis of specific LD. Journal of Learning Disabilities, 37, 307–317.
Masten, A. S., Garmezy, N., Tellegen, a, Pellegrini, D. S., Larkin, K., & Larsen, A. (1988). Competence and stress in school children: the moderating effects of individual and family qualities. Journal of Child Psychology & Psychiatry, 29, 745–64.
Masten, A. S., Best, K. M., & Garmezy, N. (1990). Resilience and development: contributions from the study of children who overcome adversity. Development & Psychopathology, 2, 425-444.
Masten, A. S., & Wright, M. (1998). Cumulative risk and protection models of child maltreatment. Journal of Aggression, Maltreatment & Trauma, 2, 7-30.
Masten, A. S., & Coatsworth, J. D. (1998). The development of competence in favorable and unfavorable environments. Lessons from research on successful children. The American Psychologist, 53, 205–20.
Masten, A. S. (2001). Ordinary magic: Resilience processes in development. American Psychologist, 56, 227–238.
Masten, A. S. (2002). Resilience Comes of Age: Reflections on the Past and Outlooks for the Next Generation of Research. In M. D. Glantz, & J. L. Johnson (Eds.). Resilience and Development: Positive Life Adaptations, (pp281-296). London: Kluwer Academic Publishers.
Masten, A. S., & Reed, M. G. (2002). Resilience in development. In S. R. Snyder & S. J. Lopez (Eds.), The handbook of positive psychology, (pp74-88). Oxford: Oxford University Press.
Masten, A. S., & Powell. J. L. (2003). A resilience framework for research, policy and practice. In S. S. Luthar (Ed). Resilience and Vulnerability, (pp1-28). Cambridge: Cambridge University Press.
Masten, A. S., & Obradovic, J. (2006). Competence and resilience in development. Annals of the New York Academy of Sciences, 1094, 13–27.
Masten, A. S. (2006). Promoting Resilience in development: A general framework for systems of care. In R. J. Flynn, P. M. Dudding, & J. g. Barber. (Eds.), Promoting Resilience in Child Welfare, (pp3-17). Ottawa: University of Ottawa Press.
Maughan, B., Rowe, R., Messer, J., Goodman, R., & Meltzer, H. (2004). Conduct disorder and oppositional defiant disorder in a national sample: developmental epidemiology. Journal of Child Psychology & Psychiatry, 45, 609–21.
Maughan, B., Collishaw, S., Meltzer, H., & Goodman, R. (2008). Recent trends in UK and child adolescent mental health. Social Psychiatry & Psychiatric Epidemiology, 43, 305-310.
McAra, L (2004). Truancy, School Exclusion and Substance Misuse. The Edinburgh Study of Youth Transitions and Crime. Edinburgh: Centre for Law and Society, The University of Edinburgh.
342
McCrae, J. S., & Barth, R. P. (2008). Using a cumulative risk to screen for mental health problems in child welfare. Research on Social Work Practice, 18, 144-159.
McLeod, J. D., & Kaiser, K. (2004). Childhood Emotional and Behavioral Problems and Educational Attainment. American Sociological Review, 69, 636–658.
McEvoy, a., & Welker, R. (2000). Antisocial behavior, academic failure, and school climate: A critical review. Journal of Emotional & Behavioral Disorders, 8, 130–140.
Mcintosh, K., Flannery, K. B., Sugai, G., Braun, D. H., & Cochrane, K. L. (2008). Relationships between academics and problem behavior in the transition from Middle school to High school. Journal of Positive Behavior Interventions, 10, 243–255.
Mcloyd, V. C., & Smith, J. (2002). Physical discipline & behavior problems in African American European American and Hispanic children: Emotional support as a moderator. Family Relations, 64, 40–53.
Menet, F., Eakin, J., Stuart, M., & Rafferty, H. (2000). Month of birth and effect on literacy, behaviour and referral to psychological service. Educational Psychology in Practice, 16, 225–234.
Mercer, S. H., McMillen, J. S., & DeRosier, M. E. (2009). Predicting change in children’s aggression and victimization using classroom-level descriptive norms of aggression and pro-social behavior. Journal of School Psychology, 47, 267–89.
Merrell, K, W. (2003). Behavioral, social, and emotional assessment of children and adolescents. London: Lawrence Erlbaum Associates Publishers.
Mertens, D. M. (2005). Research and evaluation in education and psychology: Integrating diversity with quantitative, qualitative, and mixed methods. London: Sage.
Messer, J., Goodman, R., Rowe, R., Meltzer, H., & Maughan, B. (2006). Preadolescent conduct problems in girls and boys. Journal of the American Academy of Child & Adolescent Psychiatry, 45, 184–91.
Miller, P., & Plant, M. (1999). Truancy and perceived school performance: an alcohol and drug study of UK teenagers. Alcohol & Alcoholism, 34, 886–893.
Millie, A., Jacobson, J, McDonald, E & Hough, M. (2005). Antisocial behaviour strategies: finding a balance. Bristol: Policy Press.
Mooij, T. (1998). Pupil-class determinants of aggressive and victim behaviour in pupils. British Journal of Educational Psychology, 68, 373–85.
Morales, J. R., & Guerra, N. G. (2006). Effects of multiple context and cumulative stress on urban children’s adjustment in elementary school. Child Development, 77, 907–23.
Morgan, D., L. (2007). Paradigms lost and paradigms regained: Methodological implications for combining qualitative and quantitative designs. Journal of Mixed Methods Research, 1, 48-76.
343
Morgan, P. L., Farkas, G., Tufis, P. A., & Sperling, R. A. (2008). Are reading and behaviour problems risk factors for each other? Journal of Learning Disabilities, 41, 417-436.
Moss, E., Smolla, N.,, Cyr, C.,, Dubois-Comtois, K., Mazzarello, T., & Berthiaume, C. (2006). Attachment and behavior problems in middle childhood as reported by adult and child informants. Development & Psychopathology, 18, 425-44.
Mrug, S., & Windle, M. (2009). Mediators of neighborhood influences on externalizing behavior in preadolescent children. Journal of Abnormal Child Psychology, 37, 265–80.
Muijs, D. (2011). Doing quantitative research in education with SPSS. London: Sage.
Munn,P & Lloyd,G. (1998). Discipline In Schools. A Review of extent, causes and cures. A Literature Review for the Scottish Office. Moray House Publications.
Murray, C. (2003). Risk factors, protective factors, vulnerability, and resilience: A framework for understanding and supporting the adult transitions of youth with high-incidence disabilities. Remedial and Special Education, 24, 16–26
Murray, C., & Greenberg, M. T. (2006). Examining the Importance of Social Relationships and Social Contexts in the Lives of Children With High-Incidence Disabilities. The Journal of Special Education, 39, 220–233.
Murray, J., Farrington, D. P., & Eisner, M. P. (2009). Drawing conclusions about causes from systematic reviews of risk factors: The Cambridge Quality Checklists. Journal of Experimental Criminology, 5, 1–23.
Naglieri, J. A., & LeBuffe, P. A. (2005). Measuring Resilience in children: From theory to practice. In S., Goldstein, & S. B., Brooks. (Eds.) Handbook of resilience in children (p107-121). New York: Springer.
Nazroo, J. (2011). Using Longitudinal Survey Data, In J. Mason, & A. Dale (Eds.). Understanding Social Research: Thinking Creatively about Method (pp 225-242). London: Sage.
Offord, D. R., & Kraemer, H. (2000). Risk factors and prevention. Evidenced Based Mental Health, 3, 70-71.
Ofsted (2005). Managing Challenging Behaviour. London: Ofsted.
Olson, S. L., Ceballo, R., & Park, C. (2002). Early problem behavior among children from low-income, mother- headed families : A multiple risk perspective. Journal of Clinical Child & Adolescent Psychology, 31, 419-430.
Olsson, C. a, Bond, L., Burns, J. M., Vella-Brodrick, D. A, & Sawyer, S. M. (2003). Adolescent resilience: a concept analysis. Journal of Adolescence, 26, 1–11.
Olweus, D. (1993). Bullying at school: what we know and what we can do. Oxford: Blackwell.
O'Regan, F. J. (2005). Surviving and succeeding in special educational needs. London: Continuum.
Pallant, J. (2010). SPSS Survival Manual. Maidenhead: Open University Press
344
Papatheodorou, T. (2005). Behaviour problems in the early years: A guide for understanding and support. London: RoutledgeFalmer.
Patchin, J. W., Huebner, B. M., McCluskey, J. D., Varano, S. P., & Bynum, T., S. (2006). Exposure to community violence and childhood delinquency. Crime & Delinquency, 52, 307-332.
Payne, A. A. (2008). A multilevel analysis of the relationships among communal school organization, student bonding, and delinquency. Journal of Research in Crime & Delinquency, 45, 429–455.
Peer, L. & Reid, G. (2012). Special educational needs: a guide for inclusive practice. London: Sage.
Pettit, G. S., Laird, R. D., Dodge, K. A, Bates, J. E., & Criss, M. M. (2001). Antecedents and behavior-problem outcomes of parental monitoring and psychological control in early adolescence. Child Development, 72, 583–98.
Peugh, J.L., & C.K. Enders (2004), Missing data in educational research: A review of reporting practices and suggestions for improvement. Review of Educational Research, 74, 525-556.
Pollard, J. A., Hawkins, D. & Arthur, M. W., (1999). Risk and protection: are both necessary to understand diverse behavioural outcomes in adolescence? Social Work Research, 23, 145-158.
Polizzi, N., Martin, R. P., & Dombrowski, S. C. (2007). Season of birth of students receiving special education services under a diagnosis of emotional and behavioral disorder. School Psychology Quarterly, 22, 44–57.
Price, M. N., & Hyde, J. S. (2009). When two isn’t better than one: predictors of early sexual activity in adolescence using a cumulative risk model. Journal of Youth & Adolescence, 38, 1059–71.
Propper, C., & Rigg, J. (2007). Socio-Economic Status and Child Behaviour: Evidence from a contemporary UK cohort. Centre for Analysis of Social Exclusion (CASE), 125, 1-16.
Pugh, R. & Chitiyo, M. (2012).The problem of bullying in schools and the promise of positive behaviour supports. Journal of Research in Special Educational Needs, 12, 47–53.
Qi, C. H., & Kaiser, A. P. (2003). Behavior problems of preschool children from low-income families: Review of the literature. Topics in Early Childhood Special Education, 23, 188-216
Rasbash, J., Steele, F., Browne, W.J. and Goldstein, H. (2009) A User’s Guide to MLwiN, v2.10. Centre for Multilevel Modelling. Bristol: University of Bristol.
Raviv, T., Taussig, H. N., Culhane, S. E., & Garrido, E. F. (2010). Cumulative risk exposure and mental health symptoms among maltreated youth placed in out-of-home care. Child Abuse & Neglect, 34, 742–51.
Reber, A. S., & Reber, E. S. (2001). The penguin dictionary of psychology. London: Penguin Books.
345
Reef, J., Diamantopoulou, S., van Meurs, I., Verhulst, F., & van der Ende, J. (2010). Predicting adult emotional and behavioral problems from externalizing problems trajectories in a 24 year longitudinal study. European Child & Adolescent Psychiatry, 19, 577-585.
Reid, K. (2010). Improving attendance and behaviour in Wales: the action plan. Educational Studies, 36, 233–247.
Reid, R., Gonzalez, J. E., Nordness, P. D., Trout, a., & Epstein, M. H. (2004). A Meta-Analysis of the Academic Status of Students with Emotional/Behavioral Disturbance. The Journal of Special Education, 38, 130–143.
Reinke, W. M., & Herman, K. C. (2002). Creating school environments that deter antisocial behaviors in youth. Psychology in the Schools, 39, 549–559.
Reis, J., Trockel, M., & Mulhall, P. (2007). Individual and School Predictors of Middle School Aggression. Youth & Society, 38, 322–347.
Renzaho, A. M. N., & Karantzas, G. (2010). Effects of parental perception of neighbourhood deprivation and family environment characteristics on pro-social behaviours among 4-12 year old children. Australian & New Zealand Journal of Public Health, 34, 405–11.
Ribeaud, D., & Eisner, M. (2010). Risk factors for aggression in pre-adolescence: Risk domains, cumulative risk and gender differences - Results from a prospective longitudinal study in a multi-ethnic urban sample. European Journal of Criminology, 7, 460–498.
Richman, J. M., & Fraser, M. W., (2001). Resilience in childhood: the role of risk and protection. In J. M. Richman, & M. W. Fraser (Eds.), The context of youth violence: Resilience, Risk and Protection (pp1-12). West point, CT: Greenwood.
Riddell, S., Weedon, E., & Harris, N. (2012). Special and additional support needs in England and Scotland: current dilemmas and solutions. In L. Peer & G. Reid (Eds). Special Educational Needs: A guide for inclusive practice, (pp9-23). London: Sage.
Roberts, R. E., Attkisson, C. C., & Rosenblatt, A. (1998). Prevalence of Psychopathology among children and adolescents. American Journal of Psychiatry, 115, 715-725.
Robson, C. (2011). Real world research. Chichester: Wiley.
Rose, R., Howley, M., Fergusson, A., & Jament, J. (2009) Mental health and special educational needs: exploring a complex relationship. British Journal of Special Education, 36, 3-8.
Rouse, H. L., & Fantuzzo, J. W. (2009). Multiple risks and educational wellbeing: A population-based investigation of threats to early school success. Early Childhood Research Quarterly, 24, 1–14.
Russell, R.J.H. and Startup, M.J. (1986). Month of birth and academic achievement. Personality & Individual Differences, 7, 839-846
Rutter, M., Maughan, B., Mortimore, P., Ouston., J., & Smith, A. (1979). Fifteen thousand hours: Secondary schools and their effects on children. Boston, MA: Harvard University Press.
346
Rutter, M. (1979). Protective factors in children’s response to stress and disadvantage. In M. W. Kent & J. E. Rolf (Eds.), Primary prevention of psychopathology: Vol 3, Promoting social competence and coping in children (pp49-74). Hanover, NH: University Press of New England
Rutter, M. (1985). Resilience in the Face of Adversity. British Journal of Psychiatry, 147, 598-611.
Rutter, M. (1993). Resilience: Some conceptual considerations. Journal of Adolescent Health, 14, 626–631
Rutter, M. (1999). Resilience concepts and findings: implications for family therapy. Journal of Family Therapy, 21, 119–144.
Rutter, M. (2000). Resilience reconsidered: conceptual considerations, empirical findings, and policy implications. In J. P. Shonkoff & S. J. Meisels (Eds.). Handbook of early childhood intervention, (pp651-682). Cambridge: Cambridge University Press.
Rutter, M. (2007). Resilience, competence, and coping. Child Abuse & Neglect, 31, 205–209.
Sameroff, A. J. Seifer, R., Baldwin, A., & Baldwin, C. (1993). Stability of intelligence from preschool to adolescence: the influence of social and family risk factors. Child Development, 64, 80-97.
Sameroff, A., Bartko, W. T., Baldwin, A., Baldwin, C., & Seifer, R. (1998). Family and social influences on development of child competence. In M. Lewis, & C. Feiring (Eds). Families, risk and competence. (pp161-185). London: Lawrence Erlbaum Associates.
Sameroff, A., Gutman, L., & Peck, S. C. (2003). Adaptation among youth facing multiple risks: protective research findings. In S. S. Luthar (Ed). Resilience and Vulnerability. (pp130-155). Cambridge: Cambridge University Press.
Schlomer, G.L., Bauman, S.,, Card, N. A. (2010). Best practices for missing data management in counseling psychology. Journal of Counseling Psychology, 57, 1-10.
Schonberg, M. a, & Shaw, D. S. (2007). Do the predictors of child conduct problems vary by high- and low-levels of socioeconomic and neighborhood risk? Clinical Child & Family Psychology Review, 10, 101–36.
Schoon, I. (2006). Risk and resilience: adaptations in changing times. Cambridge: Cambridge University Press.
Scott, S., Knapp, M., Henderson, J., & Maughan, B. (2001). Financial cost of social exclusion: follow up study of antisocial children into adulthood. British Medical Journal, 323, 191.
Sellström, E., & Bremberg, S. (2006). Is there a “school effect” on pupil outcomes? A review of multilevel studies. Journal of Epidemiology & Community Health, 60, 149–55.
Sharpe, M. N., York, J. L. & Knight, J. (1994) Effects of inclusion on the academic performance of classmates without disabilities: a preliminary study. Remedial & Special Education, 15, 281–287.
347
Silver, R. B., Measelle, J. R., Armstrong, J. M., & Essex, M. J. (2005). Trajectories of classroom externalizing behavior : Contributions of child characteristics, family characteristics , and the teacher – child relationship during the school transition. Journal of School Psychology, 43, 39 – 60.
Smith, P. K. (2004). Bullying: Recent developments. Child & Adolescent Mental Health, 9, 98–103.
Smith, D. J., &Rutter, M. (1995). Time trends in psychosocial disorders of youth. In M. Rutter & D. J. Smith (Eds.). Psychosocial disorder in young people: Time trends and their causes. Chichester: John Wiley & Sons.
Soles, T., Bloom, E. L., Heath, N. L., & Karagiannakis, A. (2008). An exploration of teachers’ current perceptions of children with emotional and behavioural difficulties. Emotional & Behavioural Difficulties, 13, 275-290.
Sourander, A., Santalahti, P., Haavisto, A., Piha, J., Ikaheimo, K., & Helenius, H. (2004). Have there been changes in children’s psychiatric symptoms and mental health service use? A 10 year comparison from Finland. Journal of the American Academy of Child & Adolescent Psychiatry, 43, 1134-1145.
Sourander, A., Multimaki, P., Nikolakaros, G., Haavisto, A., Ristkari, T., Helenius, H., Parkkola, K., Piha, J., Tamminen, T., Moilanen, I., Kumpulainen, K., & Almqvist, (2005). Childhood predictors of psychiatric disorders among boys: a prospective community based follow up study from aged 8 years to early adulthood. Journal of the American Academy of Child & Adolescent Psychiatry, 44, 756-767.
Spooner, W. (2006). The SEN handbook for trainee teachers, NQTs and TAs. London: David Fulton.
Squires, G. (2012). Historical and socio-political agendas around defining and including children with special educational needs. In D. Armstrong, & G. Squires (Eds.). Contemporary Issues in Special Educational Needs: considering the whole child (pp9-24). Maidenhead: Open University Press
Stewart, E. A., Simons, R. L., & Conger, R. D., (2002). Assessing Neighbourhood and Social Psychological Influences on Childhood Violence in an African-American Sample. Criminology, 40, 801-830.
Stewart, E. A. (2003). School social bonds, school climate, and school misbehavior a multilevel analysis. Justice Quarterly, 20, 575-604.
Storvoll, E. E., & Wichstrøm, L. (2002). Do the risk factors associated with conduct problems in adolescents vary according to gender? Journal of Adolescence, 25, 183–202.
Stouthamer-Loeber, M., Loeber, R., Farrington, D. P., Zhang, Q., Van Kammen, W., & Maguin, E. (1993). The double edge of protective and risk factors for delinquency: Interrelations and developmental patterns. Development & Psychopathology, 5, 683-701.
Stouthamer-Loeber, M., Loeber, R., Wei, E., Farrington, D. P., & Wikström, P.-O. H. (2002). Risk and promotive effects in the explanation of persistent serious delinquency in boys. Journal of Consulting & Clinical Psychology, 70, 111–123.
348
Sullivan, T. N., Kung, E. M., & Farrell, A. D. (2004). Relation between witnessing violence and drug use initiation among rural adolescents: parental monitoring and family support as protective factors. Journal of Clinical Child & Adolescent Psychology, 33, 488-498.
Sullivan, T. N., & Farrell, A. D. (1999). Identification and Impact of Risk and Protective Factors for Drug Use Among Urban African American Adolescents. Journal of Clinical Child Psychology, 28, 122-136.
Swahn, M. H., Gaylor, E., & Bossarte, R. M., (2010). Co-occurring suicide attempts and physical fighting : a comparison between urban, suburban, and rural high school students. Vulnerable Children & Youth Studies, 5, 353-362.
Tabacnick, B. G, & Fidell, L. S. (2007). Using multivariate statistics. London: Pearson Education.
Tapasak, R. C. & Walther-Thomas, C. S. (1999). Evaluation of a first-year inclusion programme: student perceptions and classroom performance. Remedial & Special Education, 20, 216– 225.
Terwee, C., Bot, S., de Boer, M., van der Windt, D., Knol, D, Dekker, J., Bouter, L. et al. (2007). Quality criteria were proposed for measurement properties of health status questionnaires. Journal of Clinical Epidemiology, 60, 34‐42.
Theriot, M. T., Craun, S. W., & Dupper, D. R. (2010). Multilevel evaluation of factors predicting school exclusion among middle and high school students. Children & Youth Services Review, 32, 13–19.
Thomas, D. E., & Bierman, K. L. (2006). The impact of classroom aggression on the development of aggressive behavior problems in children. Development & Psychopathology, 18, 471–87.
Thorell, L. B., & Rydell, A.M. (2008). Behaviour problems and social competence deficits associated with symptoms of attention-deficit/hyperactivity disorder: Effects of age and gender. Child Care, Health & Development, 34, 584–95.
Tick, N. T., van de Ende, J., & Verhulst, F. C. (2007). Twenty-year trends in emotional and behavioral problems in Dutch children in a changing society. Acta Psychiatrica Scandinavica, 116, 473-482.
Tiet, Q. Q., Bird, H. R., Davies, M., Hoven, C., Cohen, P., Jensen, P. S., & Goodman, S. (1998). Adverse life events and resilience. Journal of the American Academy of Child & Adolescent Psychiatry, 37, 1191-1200.
Tiet, Q. Q., Bird, H. R., Hoven, C. W., Wu, P., Moore, R., & Davies, M. (2001). Resilience in the Face of Maternal Psychopathology and Adverse Life Events. Journal of Child & Family Studies, 10, 347–365.
Tremblay, R. E. (2000). The development of aggressive behaviour during childhood : What have we learned in the past century. International Journal of Behavioral Development, 24, 129–141.
Trentacosta, C. J., Hyde, L. W., Shaw, D. S., Dishion, T. J., Gardner, F., & Wilson, M. (2008). The relations among cumulative risk, parenting, and behavior problems during early childhood. Journal of Child Psychology & Psychiatry, 49, 1211–1219.
349
Twisk, J. W. R. (2006). Applied multilevel analysis: a practical guide. Cambridge: Cambridge University Press.
Twisk, J. & de Vente, W. (2002). Attrition in longitudinal studies. How to deal with missing data. Journal of Clinical Epidemiology, 55, 329-37
Vanderbilt-Adriance, E., & Shaw, D. S. (2008). Conceptualizing and re-evaluating resilience across levels of risk, time, and domains of competence. Clinical Child & Family Psychology Review, 11, 30–58.
Van der Laan, A. M., Veenstra, R., Bogaerts, S., Verhulst, F. C., & Ormel, J. (2010). Serious, minor, and non-delinquents in early adolescence: the impact of cumulative risk and promotive factors. The TRAILS study. Journal of Abnormal Child Psychology, 38, 339–51.
Van der Molen, E., Hipwell, A. E., Vermeiren, R., & Loeber, R. (2011). Cumulative effects of mothers’ risk and promotive factors on daughters' disruptive behavior. Journal of Abnormal Child Psychology, 40, 727-739.
Van der Put, C., Van der Laan, P., Stams, G, Dekovic, M., & Hoeve, M. (2011). Promotive factors during adolescence: are there changes in impact and prevalence during adolescence and how does this related to risk factors? International Journal of Child, Youth and Family Studies, 1 & 2, 119-141.
Vanfossen, B., Brown, C. H., Kellam, S., Sokoloff, N., & Doering, S. (2010). Neighbourhood context and the development of aggression in boys and girls, Journal of Community Psychology, 38, 329–349.
Viding, E., Frick, P. J., & Plomin, R. (2007). Aetiology of the relationship between callous-unemotional traits and conduct problems in childhood. The British Journal of Psychiatry, Supplement, 49, 33–8
Visser, J. (2002). The David Wills lecture 2001. Eternal verities: the strongest links. Emotional & Behavioural Difficulties, 7, 68-84.
Visser, J. (2003). A study of children and young people who present challenging behaviour. Birmingham: University of Birmingham.
Visser, J., & Stokes, S. (2003). Is education ready for the inclusion of pupils with emotional and behavioural difficulties: a rights perspective? Educational Review, 55, 65-75.
Warner, B. S., Weist, M. D., & Krulak, A. (1999). Risk factors for school violence. Urban Education, 34, 52–68.
Warnock, M., (2010). Special Educational Needs: A new look. In M. Warnock, B. Norwich & L. Terzi (Eds.), Special Educational Needs: A New Look: Key Debates in Educational Policy (pp11-46). London: Continuum.
Warnock, M., Norwich, B., & Terzi, L. (2010). Special Educational Needs: A New Look: Key Debates in Educational Policy. London: Continuum.
Welsh, W. N. (2000). The effects of school climate on school disorder. The Annals of the American Academy of Political and Social Science, 567, 88-107.
Werner, E. E., & Smith, R. S., (1992). Overcoming the odds: High-risk children from birth to adulthood. Ithaca, NY: Cornell University Press.
350
Werner, E. E. (1993). Risk, resilience, and recovery: perspectives from the Kauai longitudinal study. Development & Psychopathology, 5, 503-515
Werner, E. E., (2000). Protective Factors and Individual Resilience. In J. P. Shonkoff & S. J. Meisels (Eds.), Handbook of early childhood intervention (2nd edition) (pp115-132). Cambridge: Cambridge University Press.
Wiener, J. (2004). Do Peer Relationships Foster Behavioural Adjustment in Children with Learning Disabilities? Learning Disability Quarterly, 27, 21-30
Wiglesworth, M., Oldfield, J., & Humphrey, N. (2012). Validation of the Wider Outcomes Survey for Teachers (WOST): A measure for assessing the behaviour, relationships and exposure to bullying of children and young people with Special Educational Needs or Disabilities (SEND). Manuscript submitted for publication
Wilson, S. J.,& Lipsey, M. W., & Derzon, J. H. (2003). The effects of school-based intervention programs on aggressive behavior: A meta-analysis. Journal of Consulting and Clinical Psychology, 71, 136–149.
Wilson, S. J.,& Lipsey, M. W (2007). School-based interventions for aggressive and disruptive behavior: update of a meta-analysis. American Journal of Preventive Medicine, 33, S130–S143
Windle, M. (2002) Critical conceptual and measurement issues in the study of resilience. In M. D. Glantz, & J. L. Johnson (Eds.). Resilience and development: Positive life adaptations (pp161-178). London: Kluwer Academic Publishers
Windle, G. (2011). What is resilience? A review and concept analysis. Reviews in Clinical Gerontology, 21, 152-169.
Wilcox-Rountree, P., & Clayton, R. R. (1999). A Contextual Model of Adolescent Alcohol Use across the Rural-Urban Continuum. Substance Use & Misuse, 34, 495-519.
Wilcox, P., & Clayton, R. R. (2001). A multilevel analysis of school- based weapon possession. Substance Abuse, 18, 509-541.
Wilson, D. (2004). The Interface of school climate and school connectedness and relationships with aggression and victimization. Journal of School Health, 74, 293–299.
Wilson, V., Malcolm, H., Edward, S., & Davidson, J. (2008). “Bunking off”: the impact of truancy on pupils and teachers. British Educational Research Journal, 34, 1–17.
Wilkinson, L. (1999). Statistical methods in psychology journals: Guidelines and explanations. American Psychologist, 54, 594-604.
Whipple, S. S., Evans, G. W., Barry, R. L., & Maxwell, L. E. (2010). An ecological perspective on cumulative school and neighborhood risk factors related to achievement. Journal of Applied Developmental Psychology, 31, 422–427.
Wolke, D., Woods, S., Bloomfield, L., & Karstadt, L. (2000). The association between direct and relational bullying and behaviour problems among primary school children. Journal of Child Psychology & Psychiatry, 41, 989–1002.

351
Woodward, L. J., Fergusson, D. M., & Horwood, L. J. (2002). Romantic relationships of young people with childhood and adolescent onset antisocial behavior problems. Journal of Abnormal Child Psychology, 30, 231-243.
World Health Organisation (1992). ICD-10 Classification of mental and behaviour disorders: clinical descriptors and diagnostic guidelines. Geneva: WHO.
Wright, M., & Masten, A., (2005). Resilience process in development: fostering positive adaptation in the context of adversity. In S., Goldstein, & S. B., Brooks (Eds.). Handbook of resilience in children (p17-37). New York: Springer.
Yeide, M., & Kobrin, M. (2009). Truancy Literature Review, (Prepared for U.S. Department of Justice). Washington, DC: Office of Juvenile Justice & Delinquency Prevention.
Zeitlin, H., & Refaat, R. (1999). Cultural issues in child and adolescent psychiatry. In P. Cooper (Ed.), Understanding and supporting children with emotional and behavioural difficulties. London: Jessica Kingsley Publishers
Zimmerman, M. A., & Arunkumar, R. (1994). Resiliency research: Implications for schools and policy. Social Policy Report: Society for Research in Child Development, 8, 1-20.
Zwirs, B., Burger, H., Schulpen, T., Vermulst, a. a., HiraSing, R. a., & Buitelaar, J. (2010). Teacher ratings of children’s behavior problems and functional impairment across gender and ethnicity: Construct equivalence of the SDQ Journal of Cross-Cultural Psychology, 42, 466–481.
352
APPENDICES
Appendix 1: a) Original WOST questionnaire 353
b) Retained items after psychometric analysis 356
Appendix 2: School information regarding Achievement for All 357
Appendix 3: Parent information and consent form 360
Appendix 4: Teacher information and consent form 364
Appendix 5: Survey instructions for teachers 368
Appendix 6: Multilevel model outputs 371
Appendix 7: Data assumptions and requirements 394
Appendix 8: Missing data analysis 396

353
Appendix 1a: Original WOST questionnaire
Achievement for All Survey for Teachers of Children and Young People with Special Educational Needs and
Disabilities (SEND)
This survey is being conducted with teachers of children and young people with a range of SEND. It is for use in the national evaluation of a government initiative called Achievement for All. The first few questions in the survey are designed to allow us to match your responses to data about your pupils that are held within our secure database. Please note that you will not be asked to provide your pupil name. All responses will be completely anonymous and treated as confidential.
Section 1 – ABOUT THE PUPIL
1. Please select your Local Authority
2. Please tell us the name of your pupil’s school
3. Please tell us the year group that your pupil is currently in
4. Please tell us your pupil’s date of birth 5. If you know, please indicate your pupil’s
primary SEND (special educational need or disability)
6. If you know, what level of support is your pupil getting at school? School Action (my pupil is supported by teachers and teaching assistants in school) School Action Plus (my pupil is supported by teachers and teaching assistants in school AND at least one other specialist visits the school to provide support)
Statement of SEND (my pupil has a Statement of Special Educational Needs issued by the Local Authority) No longer on the special needs register Don't know
7. Please select your pupil’s gender
Bexley Coventry Essex Nottinghamshire Redcar & Cleveland
Camden East Sussex Gloucestershire Oldham Sheffield
School name
Year 1 Year 5 Year 7 Year 10
Year 2 Year 6 Year 8 Year 11
Date of birth d d / m m / y y
Specific Learning Difficulty (e.g. dyslexia) Autistic Spectrum Disorder
Moderate Learning Difficulties Visual Impairment
Severe Learning Difficulties Hearing Impairment
Profound and Multiple Learning Difficulties Multi‐Sensory Impairment
Behavioural, Emotional and Social Difficulties Physical Disability
Speech, Language and Communication Difficulties Don't know
Male Female

354
8. Please tell us your pupil’s UPN (13 character unique pupil number)
Section 2 – ABOUT YOUR PUPIL’S BEHAVIOUR
Please read each of the following statements about your pupil’s behaviour and indicate how often each occurs.
Section 3 – ABOUT YOUR PUPIL’S RELATIONSHIPS WITH OTHER PEOPLE
Please read each of the following statements about your pupil’s relationships with other people and indicate the extent to which you agree.
Strongly Disagree
Disagree Agree Strongly Agree
10 The pupil has at least one good friend 11 The pupil can compromise with other children (e.g.
take turns)
12 The pupil is helpful towards others 13 The pupil is popular with other children 14 The pupil has a good relationship with at least one
teacher
15 The pupil can compromise with teachers (e.g. will complete a difficult task before moving on to a preferred activity)
16 The pupil is kind towards others 17 The pupil makes friends easily 18 The pupil will approach groups of children 19 The pupil can join in other children’s activities
Never Rarely Sometimes Often 1 The pupil does as he/she is asked 2 The pupil cheats and tells lies 3 The pupil takes things that do not belong to
him/her
4 The pupil breaks or spoils things on purpose 5 The pupil behaves well when unsupervised 6 The pupil gets angry and has tantrums 7 The pupil gets in fights with other children 8 The pupil says nasty things to other children 9 The pupil takes responsibility for his/her actions

355
Section 4 – ABOUT YOUR PUPIL’S EXPERIENCE OF BULLYING
By bullying we mean “behaviour by an individual or group, usually repeated over time, that intentionally hurts another individual or group either physically or emotionally” (DCSF, 2008, p.1). Please estimate how frequently your pupil is involved in incidents of bullying.
Please indicate his/her typical role in such incidents.
Please read each of the following statements about your pupil’s experiences of bullying and indicate how often each example occurs.
Never Rarely Sometimes Often
36 The pupil is picked on by other children
37 The pupil is hurt by other children (e.g. gets pushed or kicked)
38 The pupil is called names or teased by other children.
39 Other children spread unkind gossip about the pupil.
40 The pupil is bullied over the internet and/or by text message
41 Other children stop the pupil from joining in their games and activities at break‐times.
42 The pupil is actively disliked by other children
43 Other children stop the pupil from joining in during class activities
44 The pupil is picked on because of his/her special needs
Thank you very much for completing the survey.
Your responses are completely anonymous and will be treated as confidential. Please return the completed survey to: FREEPOST RLYU-KAAB-AXRC University of Manchester Dr. Alexandra Barlow, School of Education, Oxford Road, Manchester, M13 9PL This is the final Achievement for All pupil survey. Your input has been vital to the robust evaluation of this initiative and we greatly appreciate you cooperation. If you have any queries about this research project, please contact Dr. Alexandra Barlow on 0161 273 5304.
Daily Weekly Termly Not involved
Victim Bully Bully and victim Bystander Not involved
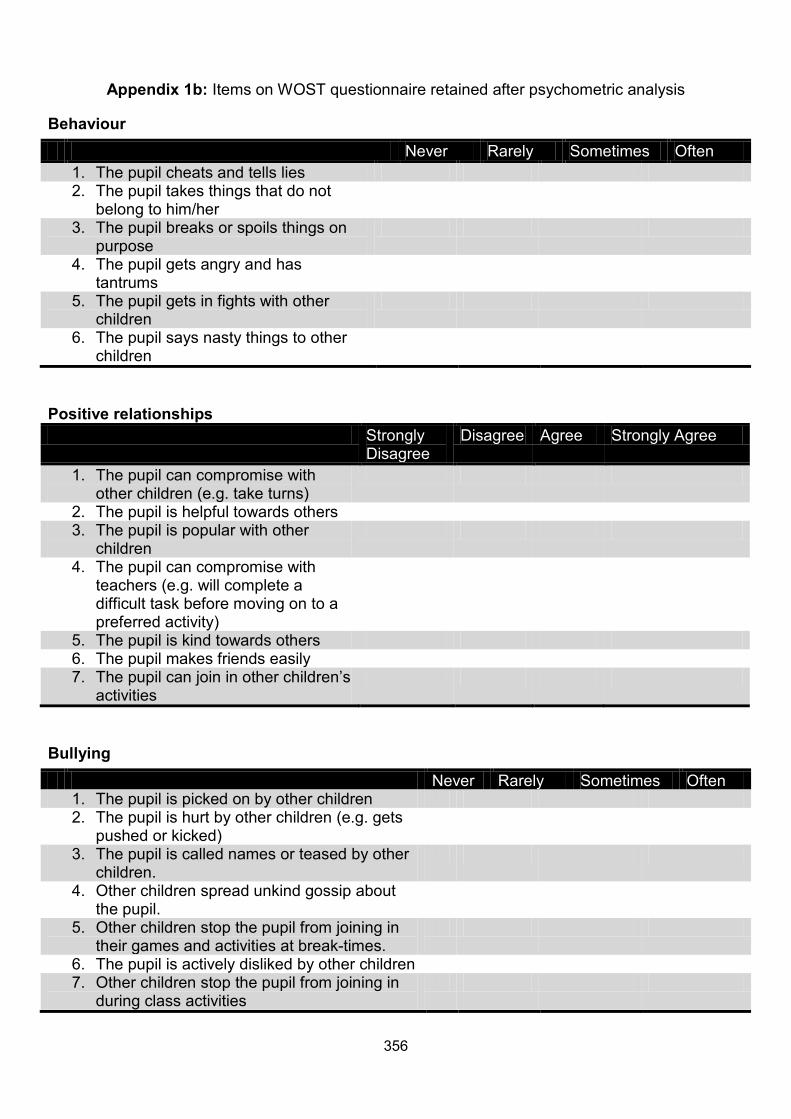
356
Appendix 1b: Items on WOST questionnaire retained after psychometric analysis
Behaviour
Positive relationships Strongly
Disagree Disagree Agree Strongly Agree
1. The pupil can compromise with other children (e.g. take turns)
2. The pupil is helpful towards others 3. The pupil is popular with other
children
4. The pupil can compromise with teachers (e.g. will complete a difficult task before moving on to a preferred activity)
5. The pupil is kind towards others 6. The pupil makes friends easily 7. The pupil can join in other children’s
activities
Bullying
Never Rarely Sometimes Often 1. The pupil cheats and tells lies 2. The pupil takes things that do not
belong to him/her
3. The pupil breaks or spoils things on purpose
4. The pupil gets angry and has tantrums
5. The pupil gets in fights with other children
6. The pupil says nasty things to other children
Never Rarely Sometimes Often 1. The pupil is picked on by other children 2. The pupil is hurt by other children (e.g. gets
pushed or kicked)
3. The pupil is called names or teased by other children.
4. Other children spread unkind gossip about the pupil.
5. Other children stop the pupil from joining in their games and activities at break-times.
6. The pupil is actively disliked by other children 7. Other children stop the pupil from joining in
during class activities

357
Appendix 2: School information letter about Achievement for All
Achievement for All National Evaluation
28th October 2009
Dear colleague
I am writing to invite your school to participate in the national evaluation of Achievement for All (AfA). This research project is being led by the University of Manchester and funded by the Department for Children, Schools and Families. It began in September 2009 and will conclude in August 2011. You may remember our brief presentation about the project at the recent NCSL launch event in Coventry. If you are not the AfA lead in your school, please pass this letter on to the appropriate person and contact us using the email address provided below so that we can amend our records.
Our records show that your school is receiving funding from Coventry to implement AfA. The LA Project lead for AfA, Susan Briggs, has endorsed this research project and is keen for all AfA schools to participate. In this letter we describe what participation in the project will entail and the benefits of your school becoming involved. This will enable you to make a fully informed decision regarding participation.
What is the aim of the research?
Our main aim is to examine the impact of AfA on a variety of outcomes (e.g. academic attainment, behaviour, positive relationships, parental engagement and confidence) for children and young people with special educational needs and disabilities (SEND). We also aim to find out what processes and practices in schools are most effective in improving these outcomes.
What will participation entail for my school?
We will be conducting surveys focusing upon outcomes related to Strands 2 and 3 of AfA51
51 Outcome data relating to Strand 1 of AFA – pupil’s academic attainment scores – will be collected by the National Strategies. They will contact you independently to discuss this matter.
. The surveys will be completed three times – in January 2010, November 2010 and June 2011. We will be asking the designated AfA key teachers and parents of pupils with SEND to complete the surveys online on a secure, password-protected website. The key teacher surveys will take approximately 5 minutes per pupil and will focus upon behaviour, positive relationships and bullying. The parental surveys will take approximately 10 minutes per pupil and will focus upon behaviour, positive relationships, bullying, extended services participation and parental engagement and confidence. In line with the AfA guidance, our target sample are all pupils with SEND in Years 1, 5, 7 and 10.

358
If you agree to your school’s participation in the study, you will be sent further details covering the practicalities of notifying parents and completing the surveys in the near future. Briefly, survey access will be facilitated by a unique school password that will be sent prior to each wave of data collection. The password will allow each designated AfA key teacher to log into the website and view a list of pupils with SEND in the target year groups in your school (this is made possible because we have agreement from DCSF to use the National Pupil Database to populate our survey). They will then be able to quickly and easily complete a survey on each of their designated pupils before logging off.
In relation to parents, we will provide information sheets and opt-out consent forms prior the first wave of data collection. Parents will also receive a unique school password to allow them to access the survey site. However, in the interests of privacy and data protection they will not be able to view a list of pupils with SEND in the target year groups in your school. Instead, they will be asked to provide some key pieces of information (e.g. their child’s gender, year group, and date of birth) that will allow us to later match their survey responses to background information about their child.
In addition to the above outcomes surveys, we will also be conducting two surveys focusing on AfA implementation – one in March 2010 and one in March 2011. This survey needs to be completed by the AfA project lead in your school, and will take around 30 minutes to complete. It will focus upon activity in each of the three strands of AfA (assessment, tracking and intervention; structured conversations with parents; provision for developing wider outcomes), in addition to broader issues such as the climate of the school (e.g. relationships between pupils and staff).
Alongside our survey research, we will also be conducting case studies of a small number of schools (2 per Local Authority). We are currently working with the AfA Project Lead in each Local Authority to identify potential case study schools, and will contact you separately should your school be nominated for this strand of the research.
What happens to the data collected?
The data will be analysed by our research team at the University of Manchester. We will write a report based on our analyses for the Department for Children, Schools and Families. It is also likely that we will write articles for academic journals based on the project findings. Finally, it is possible that we will write a book about the research.
How is confidentiality maintained?
All data provided will be treated as confidential and will be completely anonymous. Identifying information (e.g. pupils’ names) will only be used in order to match responses about the same individual from different respondents (e.g. parents and teachers) and across different times (e.g. January 2010, November 2010, June 2011). After this matching process is complete all identifying information will be destroyed.
The website that houses the survey will be completely secure and password protected. All survey data will be stored on a secure, password protected drive to which only senior members of the research team have access.

359
Criminal Records Check
Every member of our research team has undergone a Criminal Records Bureau check at the Enhanced Disclosure level.
What are the benefits of participation?
There are many good reasons to get involved in this evaluation. These include:
• Minimal data collection burden – each survey is designed to be as brief and user friendly as possible, with a window of 1 month for completion of surveys at each wave of data collection
• Your school will receive bespoke, aggregated feedback following each wave of data collection, comparing your findings to the average within your LA and the national sample as a whole; this feedback should be very useful to help in your future planning and can be used in your school’s Self Evaluation Form.
• Data will be available on outcomes pertaining to all three strands of AfA – allowing you to judge its impact in your school.
• We will make every effort to include your ‘hard to reach’ parents - including translated information sheets and surveys for parents whose first language is not English, paper versions for parents without access to the internet, and telephone surveys for parents with literacy difficulties
• The opportunity to take part in what we think will be the largest study of its kind ever conducted in England
• All data will be treated in the strictest confidence and will be completely anonymised prior to analysis and reporting.
What happens next?
We would like you to take some time to think about your school’s participation in this project and perhaps discuss it with colleagues. One of our research team will contact you by telephone and/or email within the next couple of weeks to follow up this invitation. If you decide to participate, we will give you information about the next steps involved.
Alternatively, you can contact Jeremy Oldfield by telephone on 0161 275 3522 or by email at [email protected] to let us know about your decision.
Many thanks for taking the time to read this invitation. We sincerely hope your school will participate in the research and wish you the best of luck in implementing Achievement for All.
Yours sincerely
On behalf of the Achievement for All National Evaluation team

360
Appendix 3: Parent information and consent letters
ACHIEVEMENT FOR ALL – NATIONAL EVALUATION
INFORMATION SHEET FOR PARENTS
Your child’s school is involved in an exciting project called Achievement for All. This project hopes to improve children’s learning and experience of school. The government has asked us to evaluate how well this project works.
We are writing to you because your child is involved in the project and we would like to know what you think about it. We will collect your views in a 10 minute survey in February/March 2010, November 2010 and June 2011 (see below).
Please take time to read the following information carefully and decide whether or not you would like to take part.
If you would like any more information or have any questions about the research project, please telephone Jeremy Oldfield on 0161-275-3522 or email him at [email protected].
Who will conduct the research?
The research will be conducted by Dr. Neil Humphrey and other staff in the School of Education, University of Manchester, Oxford Road, Manchester M13 9PL.
Title of the research
Achievement for All – National Evaluation
What is the aim of the research?
Our main aim is to find out what impact Achievement for All has on outcomes for children and young people with SEND. We also aim to find out what processes and practices in schools are most effective in improving these outcomes.
Where will the research be conducted?
450 schools across 10 Local Authorities in England are involved.
What is the duration of the research?
The project itself runs from September 2009 until August 2011.

361
Why have I been chosen?
We are writing to you because your child’s school is taking part in the AfA initiative, he/she is on the school’s SEND register and also is in one of the AfA target year groups (Years 1 and 5 in primary schools; Years 7 and 10 in secondary schools).
What would I be asked to if I took part?
You will be asked to complete a brief online survey about:
• your child’s behaviour, • positive relationships, • bullying, • participation in wider activities, and • your engagement and confidence in the school.
This survey will be completed three times – in February/March 2010, November 2010 and June 2011. It will take approximately 10 minutes to complete.
In consenting to take part you are also giving your permission for a key teacher at your child’s school to complete a similar but briefer survey (that only covers behaviour, bullying and positive relationships) at the times noted above.
There will be no direct contact between any of our research team and your child for this part of the research project.
The survey will be available in the following additional languages: Arabic, Bengal, Chinese traditional and simplified, French, Gujarati, Polish, Somali and Urdu. If you do not have access to the internet we will be happy to either provide a paper copy or complete it over the telephone with you at an agreed time. If you would like to do this please contact Jeremy Oldfield (details above) and he will arrange this for you.
There is another part of the project which involves case studies that will involve direct contact – if your child’s school becomes involved in this element you will receive a separate information sheet and consent form.
What happens to the data collected?
The data will be analysed by our research team at the University of Manchester. We will write a report based on our analyses for the Department for Children, Schools and Families. It is also likely that we will write articles for academic journals based on what we find out in the project. Finally, it is possible that we will write a book about the research. Your child’s name will not be used in any of the reports that we write.
How is confidentiality maintained?
All data provided will be treated as confidential and will be completely anonymous. Identifying information (e.g. your child’s name) will only be used in order to match responses about the same individual from different respondents (e.g. parents and teachers) and across different times (e.g. February/March 2010, November 2010, June 2011). After this matching process is complete all identifying information will be destroyed.
The website that houses the survey will be completely secure and password protected. All survey data will be stored on a secure, password protected drive to which only senior members of the research team have access.

362
What happens if I do not want to take part or I change my mind?
It is up to you if you want to take part. If you decide to take part you do not need to do anything – you will be sent further details about when and how to complete the survey in the near future.
If you decide not to take part then you need to either complete the opt-out consent form enclosed and return it to our research team at the address above or contact Jeremy Oldfield by telephone or email (details above) by 12th March 2010.
If you decide to take part and then change your mind, you are free to withdraw at any time without needing to give a reason. If you do this please rest assured that we will destroy any data generated in relation to your child as part of the study.
Will I be paid for participating in the research?
We are not able to offer any payment or incentive for participating in this study.
Criminal Records Check
Every member of our research team has undergone a Criminal Records Bureau check at the Enhanced Disclosure level.
Contact for further information
Jeremy Oldfield Educational Support and Inclusion School of Education University of Manchester Oxford Road Manchester M13 9PL Tel: 0161 275 3522 Email: [email protected]
What if something goes wrong?
If completing the survey makes you worry about your child’s wellbeing then you should contact his/her school in the first instance and ask to speak to the Achievement for All co-ordinator.
If you ever wish to make a formal complaint about the conduct of the research you should contact the Head of the Research Office, Christie Building, University of Manchester, Oxford Road, Manchester M13 9PL.

363
ACHIEVEMENT FOR ALL – NATIONAL EVALUATION
PARENTAL CONSENT FORM
An information sheet is attached to this form. Please read it carefully before making a decision about taking part in the study.
If you are willing to take part then you do not need to do anything at the moment. You will be sent further details about when and how to complete the survey in the near future. In consenting to take part, you are also giving your permission for a teacher at your child’s school to complete a survey about your child.
If you decide not to take part, then you need to complete the opt-out consent form below and return it to Jeremy Oldfield, Educational Support and Inclusion, School of Education, University of Manchester, Oxford road, Manchester, M13 9PL. Alternatively, Jeremy can be contacted by telephone on 0161 275 3522 or email at [email protected]. If you do not wish to participate please let us know by 12th March 2010.
Finally, please also remember that if you do decide to take part, you are free to change your mind at any point in the study. Just let us know and we will destroy any data generated in relation to your child.
------------------------------------------------------------------------------------------------------------------------
I do not wish to participate in the Achievement for All national evaluation. Furthermore, I do not give consent for a key teacher at my child’s school to complete a survey about him/her in relation to this study.
Name of child
Sex of child
Year group
Name of school
Local Authority (if known)
Signed: __________________________________ (parent/guardian) Date: __________
Please return this form to Jeremy Oldfield, Educational Support and Inclusion, School of Education, University of Manchester, Manchester M13 9PL by 12th March 2010.

364
Appendix 4: Teacher information letter and consent form ACHIEVEMENT FOR ALL – NATIONAL EVALUATION INFORMATION SHEET FOR AfA KEY TEACHERS Your school is involved in the national evaluation of Achievement for All (AfA). This research project is being led by the University of Manchester and funded by the Department for Children, Schools and Families. We are writing to you because your school’s AfA co-ordinator has indicated that you are the designated key teacher for one or more pupils with special educational needs and disabilities (SEND). We would like to collect your views about the behaviour, positive relationships and bullying of each of the pupils with SEND for whom you are the key teacher. We will do this via a 5 minute survey in January 2010, November 2010 and June 2011 (see below). Please take time to read the following information carefully and decide whether or not you would like to take part. If you would like any more information or have any questions about the research project, please telephone Jeremy Oldfield on 0161 275 3522 or email him at [email protected]. Who will conduct the research? The research will be conducted by Dr. Neil Humphrey and other staff in the School of Education, University of Manchester, Oxford Road, Manchester M13 9PL. Title of the research Achievement for All – National Evaluation What is the aim of the research? Our main aim is to find out what impact Achievement for All has on outcomes for children and young people with SEND. We also aim to find out what processes and practices in schools are most effective in improving these outcomes. Where will the research be conducted? 450 schools across 10 Local Authorities in England are involved. What is the duration of the research? The project itself runs from September 2009 until August 2011.

365
Why have I been chosen? We are writing to you because your school’s AfA co-ordinator has indicated that you are the designated key teacher for one or more pupils with special educational needs and disabilities (SEND). What would I be asked to if I took part? You will be asked to complete a brief online survey about each pupil with SEND for whom you are the key teacher, covering: behaviour, positive relationships, and bullying This survey will be completed three times – in January 2010, November 2010 and June 2011. It will take approximately 5 minutes to complete per pupil. What happens to the data collected? The data will be analysed by our research team at the University of Manchester. We will write a report based on our analyses for the Department for Children, Schools and Families. It is also likely that we will write articles for academic journals based on the project findings. Finally, it is possible that we will write a book about the research. In all publications and reports data will be presented anonymously. How is confidentiality maintained? All data provided will be treated as confidential and will be completely anonymous. Identifying information (e.g. pupils’ names) will only be used in order to match responses about the same individual from different respondents (e.g. parents and teachers) and across different times (e.g. January 2010, November 2010, June 2011). After this matching process is complete all identifying information will be destroyed. The website that houses the survey will be completely secure and password protected. All survey data will be stored on a secure, password protected drive to which only senior members of the research team have access. Criminal Records Check Every member of our research team has undergone a Criminal Records Bureau check at the Enhanced Disclosure level. What happens if I do not want to take part or I change my mind? It is up to you if you want to take part. If you decide to take part you do not need to do anything – you will be sent further details about when and how to complete the survey in the near future.

366
If you decide not to take part then you need to either complete the opt-out consent form enclosed and return it to our research team at the address above or contact Jeremy Oldfield by telephone or email (details above) by (date). If you decide to take part and then change your mind, you are free to withdraw at any time without needing to give a reason. Will I be paid for participating in the research? We are not able to offer any payment or incentive for participating in this study. Criminal Records Check Every member of our research team has undergone a Criminal Records Bureau check at the Enhanced Disclosure level. Contact for further information Jeremy Oldfield Educational Support and Inclusion School of Education University of Manchester Oxford Road Manchester M13 9PL Tel: 0161 275 3522 Email: [email protected] What if something goes wrong? If completing the survey makes you worry about any of your pupils’ wellbeing then you should speak to your school’s AfA co-ordinator in the first instance. If you ever wish to make a formal complaint about the conduct of the research you should contact the Head of the Research Office, Christie Building, University of Manchester, Oxford Road, Manchester M13 9PL.

367
ACHIEVEMENT FOR ALL – NATIONAL EVALUATION
TEACHER CONSENT FORM An information sheet is attached to this form. Please read it carefully before making a decision about taking part in the study. If you are willing to take part then you do not need to do anything at the moment. You will be sent further details about when and how to complete the survey in the near future. If you decide not to take part, then you need to complete the opt-out consent form below and return it to Jeremy Oldfield, Educational Support and Inclusion, School of Education, University of Manchester, Oxford road, Manchester, M13 9PL. Alternatively, Jeremy Oldfield can be contacted by telephone on 0161 275 3522 or email at [email protected]. If you do not wish to participate please let us know by (date). Finally, please also remember that if you do decide to take part, you are free to change your mind at any point in the study. --------------------------------------------------------------------------------------------------------------------------- I do not wish to participate in the Achievement for All national evaluation. My details are as follows:
My name Name of my school Local Authority I am AfA key teacher for the following pupil(s):
1.
2. 3. 4. 5.
Signed: __________________________________ Date: __________ Please return this form to Jeremy Oldfield, Educational Support and Inclusion, School of Education, University of Manchester, Manchester M13 9PL by (date).

368
Appendix 5: Survey instructions for teachers
ACHIEVEMENT FOR ALL – NATIONAL EVALUATION
On-line Teacher Survey Instructions Dear Colleague, This letter tells you how to complete our on-line teacher survey. These surveys are to be completed for all students receiving SEN provision at your school in year groups 1, 5, 7 and 10. The survey should be filled in by the key teacher for each student. Each survey should take approximately 2 to 3 minutes to complete per student. This survey will go live from Monday 18th January 2010 to Sunday 14th February, and can be accessed 24 hours a day, 7 days a week during this period. Completing the survey Follow the steps below. If you have any problems or queries please contact Jeremy Oldfield (Tel: 0161 275 3522, email: [email protected]) or for technical help contact Lawrence Wo (Tel: 0161 275 3415, email: [email protected]). Step 1 Please go to the following website http://www.afa.uk.net/ Click on the ‘teacher’ image as shown below

369
Step 2 When you arrive at the survey website you will be asked for your school's password. Enter your school’s password and then click ‘Next’. The password is: XXXXX
Step 3 The name of your school should now be displayed. If this is correct click 'Next'. If the school name is incorrect, click on the blue ‘click here’ hyperlink and this will take you back to the log in screen where you can re-enter your school password. If you still have problems finding your school please contact Lawrence Wo (Tel: 0161 275 3415, email: [email protected]) for technical support. Step 4 You will then see a list of student names. These are students in Years 1, 5, 7 and 10 who have been identified as receiving SEN provision at your school.
You will complete the survey for one student at a time. To select a student to survey click the radio button next to their name. Click 'Next'. If there are students receiving SEN provision who are not on the list, you will have the option to add these students. This option (‘Add a student’) will appear at the bottom of the list of

370
student names. If you select this option and then click ‘Next’ you will be asked to enter the student's first name, surname and UPN (single letter and 12 digit unique pupil number) before clicking ‘Submit’. The survey for the additional student will then start. Step 5 This will take you to the survey about this student. Click to select your answers.
When you have completed the survey for that student, click ‘Submit’. You will be asked if you want to complete a survey for another student. Click ‘Return to login’ and you will be taken back to the login screen, where you will be asked to re-enter your password. This step is to improve security. Please follow the above instructions to complete the survey again for another student.
Once you have completed all the surveys about students for whom you are the key teacher, please close your browser window. Thank you very much for completing these surveys. All responses are completely anonymous and will be treated as confidential. There will be two more surveys that you will be asked to complete, one in November 2010 and June 2011. We will send you a reminder about these surveys closer to the time.

371
Appendix 6ai: Empty Primary Model
Estimates of Fixed Effectsa
Parameter Estimate Std. Error df t Sig.
95% Confidence Interval
Lower Bound Upper Bound
Intercept .196935 .019255 364.701 10.228 .000 .159071 .234799
XBeh_mean_T1 .586988 .014313 2653.771 41.011 .000 .558922 .615054
a. Dependent Variable: Behaviour mean T3 (items: 2, 3, 4, 6, 7, 8).
Information Criteriaa
-2 Log Likelihood 3973.122
Akaike's Information
Criterion (AIC) 3981.122
Hurvich and Tsai's Criterion
(AICC) 3981.137
Bozdogan's Criterion (CAIC) 4008.667
Schwarz's Bayesian Criterion
(BIC) 4004.667
Estimates of Covariance Parametersa
Parameter Estimate Std. Error Wald Z Sig.
95% Confidence Interval
Lower Bound Upper Bound
Residual .237428 .006812 34.856 .000 .224445 .251161
Intercept [subject =
School_No]
Variance .043416 .006257 6.939 .000 .032733 .057586
a. Dependent Variable: Behaviour mean T3 (items: 2, 3, 4, 6, 7, 8).

372
Appendix 6aii: Empty Secondary Model
Estimates of Fixed Effectsa
Parameter Estimate Std. Error df t Sig.
95% Confidence Interval
Lower Bound Upper Bound
Intercept .327105 .038018 56.625 8.604 .000 .250965 .403246
XBeh_mean_T1 .530592 .020389 1612.339 26.024 .000 .490601 .570584
a. Dependent Variable: Behaviour mean T3 (items: 2, 3, 4, 6, 7, 8).
Information Criteriaa
-2 Log Likelihood 2926.001
Akaike's Information
Criterion (AIC) 2934.001
Hurvich and Tsai's Criterion
(AICC) 2934.025
Bozdogan's Criterion (CAIC) 2959.581
Schwarz's Bayesian Criterion
(BIC) 2955.581
Estimates of Covariance Parametersa
Parameter Estimate Std. Error Wald Z Sig.
95% Confidence Interval
Lower Bound Upper Bound
Residual .336411 .012007 28.018 .000 .313682 .360787
Intercept [subject =
School_No]
Variance .049595 .013749 3.607 .000 .028805 .085390
a. Dependent Variable: Behaviour mean T3 (items: 2, 3, 4, 6, 7, 8).
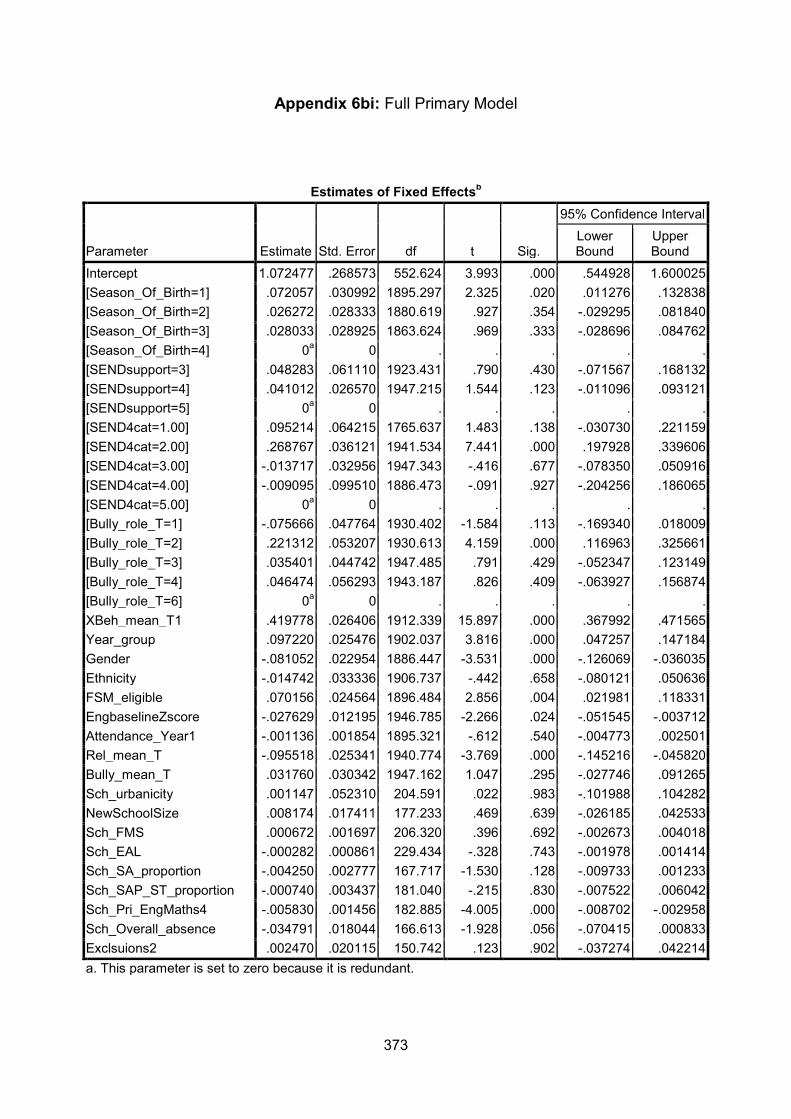
373
Appendix 6bi: Full Primary Model
Estimates of Fixed Effectsb
Parameter Estimate Std. Error df t Sig.
95% Confidence Interval Lower Bound
Upper Bound
Intercept 1.072477 .268573 552.624 3.993 .000 .544928 1.600025 [Season_Of_Birth=1] .072057 .030992 1895.297 2.325 .020 .011276 .132838 [Season_Of_Birth=2] .026272 .028333 1880.619 .927 .354 -.029295 .081840 [Season_Of_Birth=3] .028033 .028925 1863.624 .969 .333 -.028696 .084762 [Season_Of_Birth=4] 0a 0 . . . . . [SENDsupport=3] .048283 .061110 1923.431 .790 .430 -.071567 .168132 [SENDsupport=4] .041012 .026570 1947.215 1.544 .123 -.011096 .093121 [SENDsupport=5] 0a 0 . . . . . [SEND4cat=1.00] .095214 .064215 1765.637 1.483 .138 -.030730 .221159 [SEND4cat=2.00] .268767 .036121 1941.534 7.441 .000 .197928 .339606 [SEND4cat=3.00] -.013717 .032956 1947.343 -.416 .677 -.078350 .050916 [SEND4cat=4.00] -.009095 .099510 1886.473 -.091 .927 -.204256 .186065 [SEND4cat=5.00] 0a 0 . . . . . [Bully_role_T=1] -.075666 .047764 1930.402 -1.584 .113 -.169340 .018009 [Bully_role_T=2] .221312 .053207 1930.613 4.159 .000 .116963 .325661 [Bully_role_T=3] .035401 .044742 1947.485 .791 .429 -.052347 .123149 [Bully_role_T=4] .046474 .056293 1943.187 .826 .409 -.063927 .156874 [Bully_role_T=6] 0a 0 . . . . . XBeh_mean_T1 .419778 .026406 1912.339 15.897 .000 .367992 .471565 Year_group .097220 .025476 1902.037 3.816 .000 .047257 .147184 Gender -.081052 .022954 1886.447 -3.531 .000 -.126069 -.036035 Ethnicity -.014742 .033336 1906.737 -.442 .658 -.080121 .050636 FSM_eligible .070156 .024564 1896.484 2.856 .004 .021981 .118331 EngbaselineZscore -.027629 .012195 1946.785 -2.266 .024 -.051545 -.003712 Attendance_Year1 -.001136 .001854 1895.321 -.612 .540 -.004773 .002501 Rel_mean_T -.095518 .025341 1940.774 -3.769 .000 -.145216 -.045820 Bully_mean_T .031760 .030342 1947.162 1.047 .295 -.027746 .091265 Sch_urbanicity .001147 .052310 204.591 .022 .983 -.101988 .104282 NewSchoolSize .008174 .017411 177.233 .469 .639 -.026185 .042533 Sch_FMS .000672 .001697 206.320 .396 .692 -.002673 .004018 Sch_EAL -.000282 .000861 229.434 -.328 .743 -.001978 .001414 Sch_SA_proportion -.004250 .002777 167.717 -1.530 .128 -.009733 .001233 Sch_SAP_ST_proportion -.000740 .003437 181.040 -.215 .830 -.007522 .006042 Sch_Pri_EngMaths4 -.005830 .001456 182.885 -4.005 .000 -.008702 -.002958 Sch_Overall_absence -.034791 .018044 166.613 -1.928 .056 -.070415 .000833 Exclsuions2 .002470 .020115 150.742 .123 .902 -.037274 .042214 a. This parameter is set to zero because it is redundant.
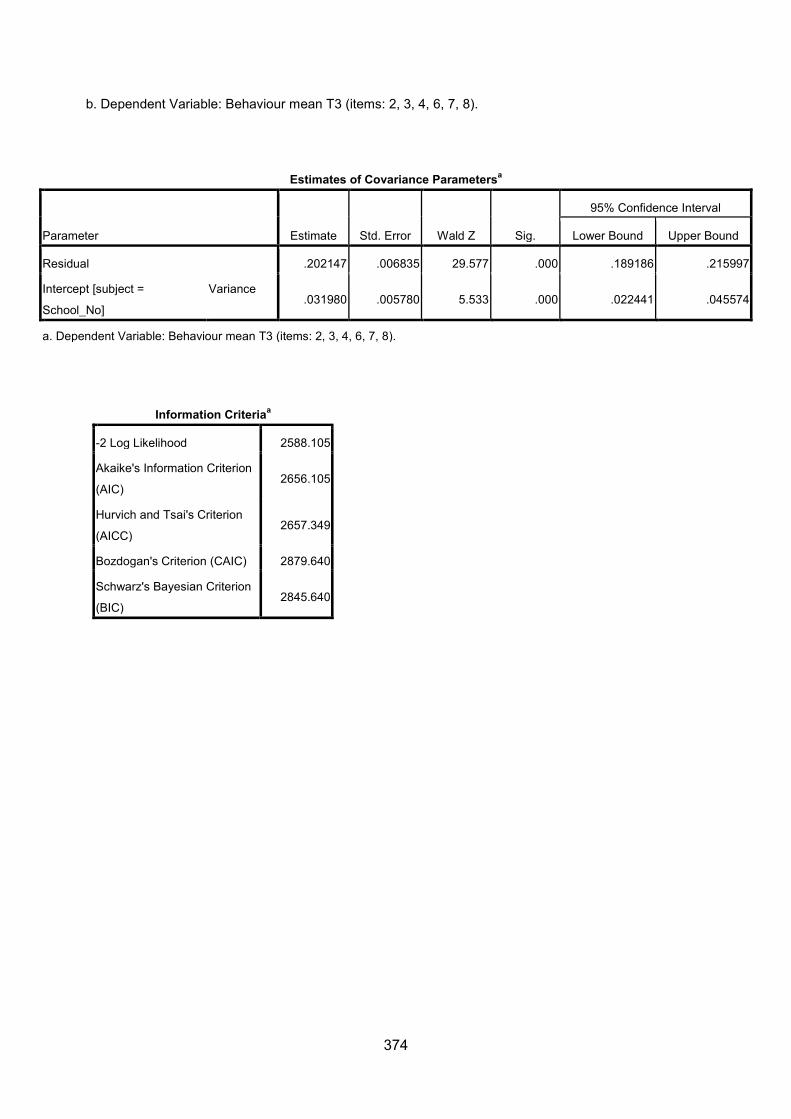
374
b. Dependent Variable: Behaviour mean T3 (items: 2, 3, 4, 6, 7, 8).
Estimates of Covariance Parametersa
Parameter Estimate Std. Error Wald Z Sig.
95% Confidence Interval
Lower Bound Upper Bound
Residual .202147 .006835 29.577 .000 .189186 .215997
Intercept [subject =
School_No]
Variance .031980 .005780 5.533 .000 .022441 .045574
a. Dependent Variable: Behaviour mean T3 (items: 2, 3, 4, 6, 7, 8).
Information Criteriaa
-2 Log Likelihood 2588.105
Akaike's Information Criterion
(AIC) 2656.105
Hurvich and Tsai's Criterion
(AICC) 2657.349
Bozdogan's Criterion (CAIC) 2879.640
Schwarz's Bayesian Criterion
(BIC) 2845.640
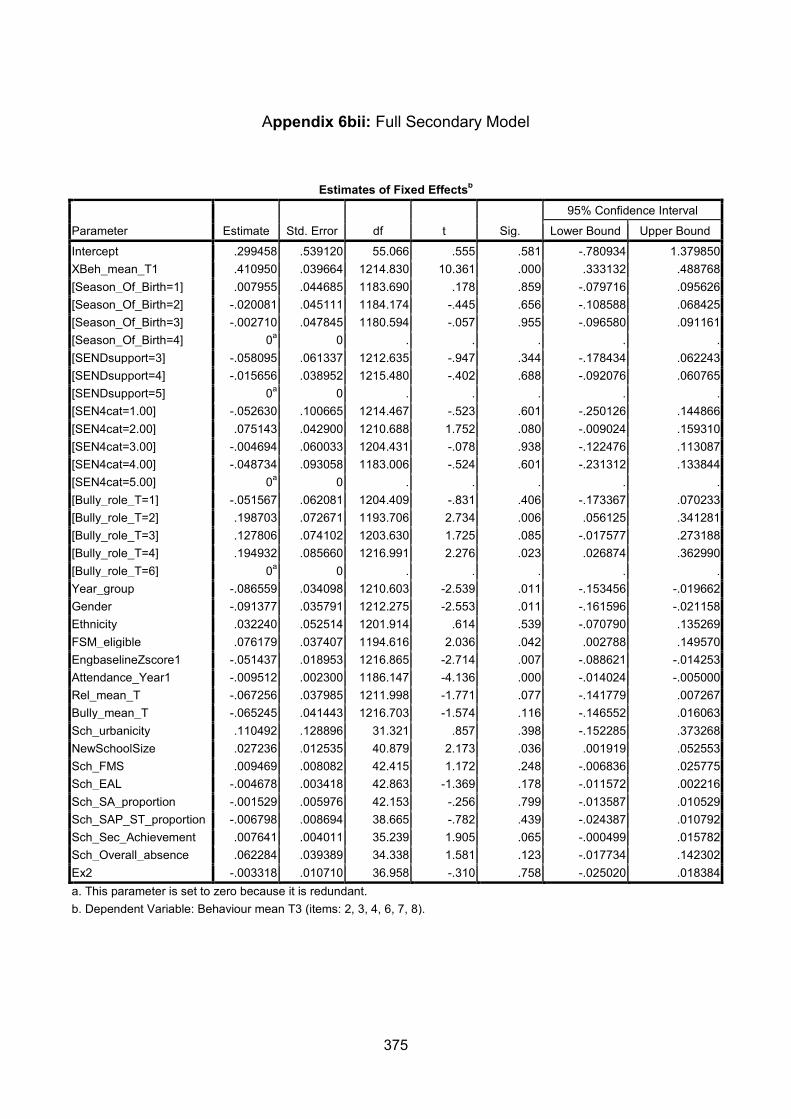
375
Appendix 6bii: Full Secondary Model
Estimates of Fixed Effectsb
Parameter Estimate Std. Error df t Sig.
95% Confidence Interval
Lower Bound Upper Bound
Intercept .299458 .539120 55.066 .555 .581 -.780934 1.379850 XBeh_mean_T1 .410950 .039664 1214.830 10.361 .000 .333132 .488768 [Season_Of_Birth=1] .007955 .044685 1183.690 .178 .859 -.079716 .095626 [Season_Of_Birth=2] -.020081 .045111 1184.174 -.445 .656 -.108588 .068425 [Season_Of_Birth=3] -.002710 .047845 1180.594 -.057 .955 -.096580 .091161 [Season_Of_Birth=4] 0a 0 . . . . . [SENDsupport=3] -.058095 .061337 1212.635 -.947 .344 -.178434 .062243 [SENDsupport=4] -.015656 .038952 1215.480 -.402 .688 -.092076 .060765 [SENDsupport=5] 0a 0 . . . . . [SEN4cat=1.00] -.052630 .100665 1214.467 -.523 .601 -.250126 .144866 [SEN4cat=2.00] .075143 .042900 1210.688 1.752 .080 -.009024 .159310 [SEN4cat=3.00] -.004694 .060033 1204.431 -.078 .938 -.122476 .113087 [SEN4cat=4.00] -.048734 .093058 1183.006 -.524 .601 -.231312 .133844 [SEN4cat=5.00] 0a 0 . . . . . [Bully_role_T=1] -.051567 .062081 1204.409 -.831 .406 -.173367 .070233 [Bully_role_T=2] .198703 .072671 1193.706 2.734 .006 .056125 .341281 [Bully_role_T=3] .127806 .074102 1203.630 1.725 .085 -.017577 .273188 [Bully_role_T=4] .194932 .085660 1216.991 2.276 .023 .026874 .362990 [Bully_role_T=6] 0a 0 . . . . . Year_group -.086559 .034098 1210.603 -2.539 .011 -.153456 -.019662 Gender -.091377 .035791 1212.275 -2.553 .011 -.161596 -.021158 Ethnicity .032240 .052514 1201.914 .614 .539 -.070790 .135269 FSM_eligible .076179 .037407 1194.616 2.036 .042 .002788 .149570 EngbaselineZscore1 -.051437 .018953 1216.865 -2.714 .007 -.088621 -.014253 Attendance_Year1 -.009512 .002300 1186.147 -4.136 .000 -.014024 -.005000 Rel_mean_T -.067256 .037985 1211.998 -1.771 .077 -.141779 .007267 Bully_mean_T -.065245 .041443 1216.703 -1.574 .116 -.146552 .016063 Sch_urbanicity .110492 .128896 31.321 .857 .398 -.152285 .373268 NewSchoolSize .027236 .012535 40.879 2.173 .036 .001919 .052553 Sch_FMS .009469 .008082 42.415 1.172 .248 -.006836 .025775 Sch_EAL -.004678 .003418 42.863 -1.369 .178 -.011572 .002216 Sch_SA_proportion -.001529 .005976 42.153 -.256 .799 -.013587 .010529 Sch_SAP_ST_proportion -.006798 .008694 38.665 -.782 .439 -.024387 .010792 Sch_Sec_Achievement .007641 .004011 35.239 1.905 .065 -.000499 .015782 Sch_Overall_absence .062284 .039389 34.338 1.581 .123 -.017734 .142302 Ex2 -.003318 .010710 36.958 -.310 .758 -.025020 .018384 a. This parameter is set to zero because it is redundant. b. Dependent Variable: Behaviour mean T3 (items: 2, 3, 4, 6, 7, 8).
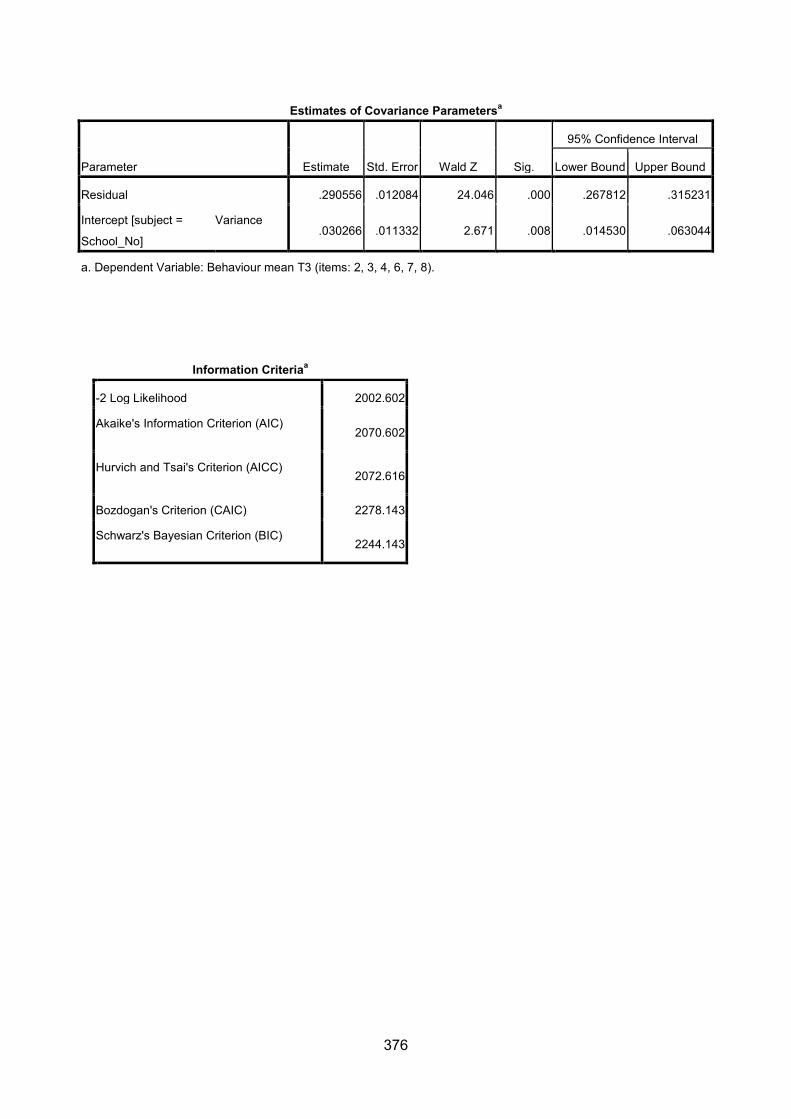
376
Estimates of Covariance Parametersa
Parameter Estimate Std. Error Wald Z Sig.
95% Confidence Interval
Lower Bound Upper Bound
Residual .290556 .012084 24.046 .000 .267812 .315231
Intercept [subject =
School_No]
Variance .030266 .011332 2.671 .008 .014530 .063044
a. Dependent Variable: Behaviour mean T3 (items: 2, 3, 4, 6, 7, 8).
Information Criteriaa
-2 Log Likelihood 2002.602
Akaike's Information Criterion (AIC) 2070.602
Hurvich and Tsai's Criterion (AICC) 2072.616
Bozdogan's Criterion (CAIC) 2278.143
Schwarz's Bayesian Criterion (BIC) 2244.143
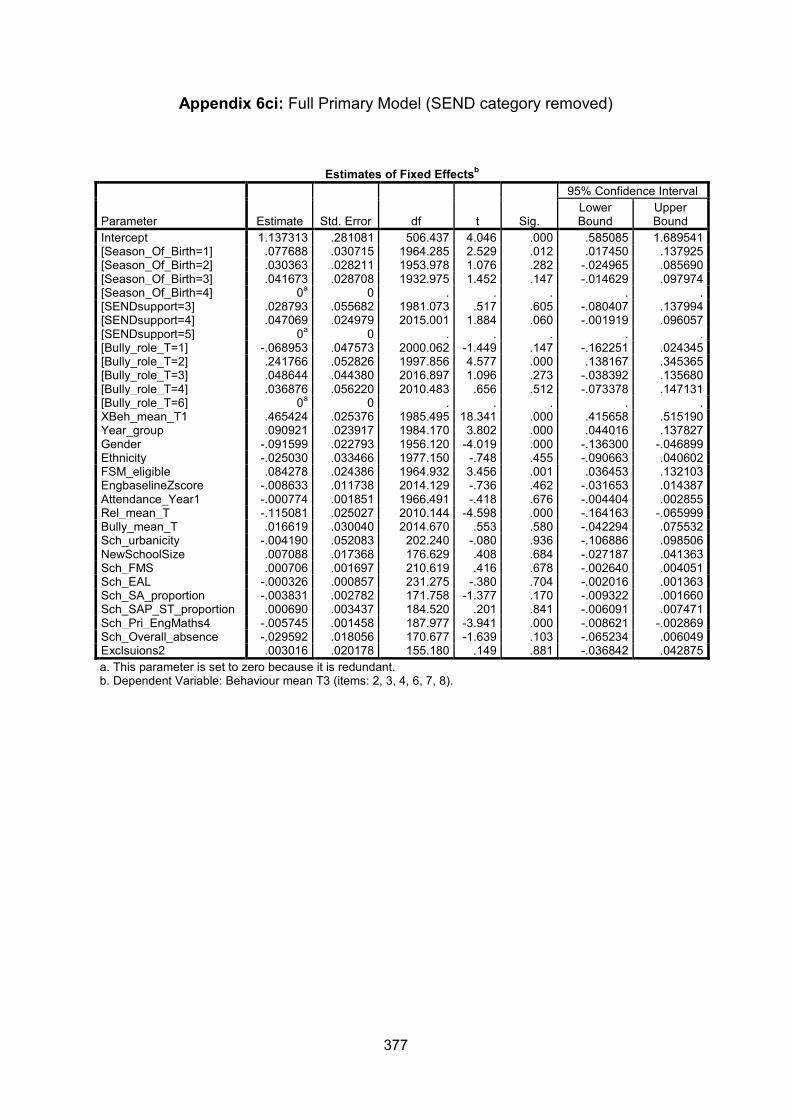
377
Appendix 6ci: Full Primary Model (SEND category removed)
Estimates of Fixed Effectsb
Parameter Estimate Std. Error df t Sig.
95% Confidence Interval Lower Bound
Upper Bound
Intercept 1.137313 .281081 506.437 4.046 .000 .585085 1.689541 [Season_Of_Birth=1] .077688 .030715 1964.285 2.529 .012 .017450 .137925 [Season_Of_Birth=2] .030363 .028211 1953.978 1.076 .282 -.024965 .085690 [Season_Of_Birth=3] .041673 .028708 1932.975 1.452 .147 -.014629 .097974 [Season_Of_Birth=4] 0a 0 . . . . . [SENDsupport=3] .028793 .055682 1981.073 .517 .605 -.080407 .137994 [SENDsupport=4] .047069 .024979 2015.001 1.884 .060 -.001919 .096057 [SENDsupport=5] 0a 0 . . . . . [Bully_role_T=1] -.068953 .047573 2000.062 -1.449 .147 -.162251 .024345 [Bully_role_T=2] .241766 .052826 1997.856 4.577 .000 .138167 .345365 [Bully_role_T=3] .048644 .044380 2016.897 1.096 .273 -.038392 .135680 [Bully_role_T=4] .036876 .056220 2010.483 .656 .512 -.073378 .147131 [Bully_role_T=6] 0a 0 . . . . . XBeh_mean_T1 .465424 .025376 1985.495 18.341 .000 .415658 .515190 Year_group .090921 .023917 1984.170 3.802 .000 .044016 .137827 Gender -.091599 .022793 1956.120 -4.019 .000 -.136300 -.046899 Ethnicity -.025030 .033466 1977.150 -.748 .455 -.090663 .040602 FSM_eligible .084278 .024386 1964.932 3.456 .001 .036453 .132103 EngbaselineZscore -.008633 .011738 2014.129 -.736 .462 -.031653 .014387 Attendance_Year1 -.000774 .001851 1966.491 -.418 .676 -.004404 .002855 Rel_mean_T -.115081 .025027 2010.144 -4.598 .000 -.164163 -.065999 Bully_mean_T .016619 .030040 2014.670 .553 .580 -.042294 .075532 Sch_urbanicity -.004190 .052083 202.240 -.080 .936 -.106886 .098506 NewSchoolSize .007088 .017368 176.629 .408 .684 -.027187 .041363 Sch_FMS .000706 .001697 210.619 .416 .678 -.002640 .004051 Sch_EAL -.000326 .000857 231.275 -.380 .704 -.002016 .001363 Sch_SA_proportion -.003831 .002782 171.758 -1.377 .170 -.009322 .001660 Sch_SAP_ST_proportion .000690 .003437 184.520 .201 .841 -.006091 .007471 Sch_Pri_EngMaths4 -.005745 .001458 187.977 -3.941 .000 -.008621 -.002869 Sch_Overall_absence -.029592 .018056 170.677 -1.639 .103 -.065234 .006049 Exclsuions2 .003016 .020178 155.180 .149 .881 -.036842 .042875 a. This parameter is set to zero because it is redundant. b. Dependent Variable: Behaviour mean T3 (items: 2, 3, 4, 6, 7, 8).
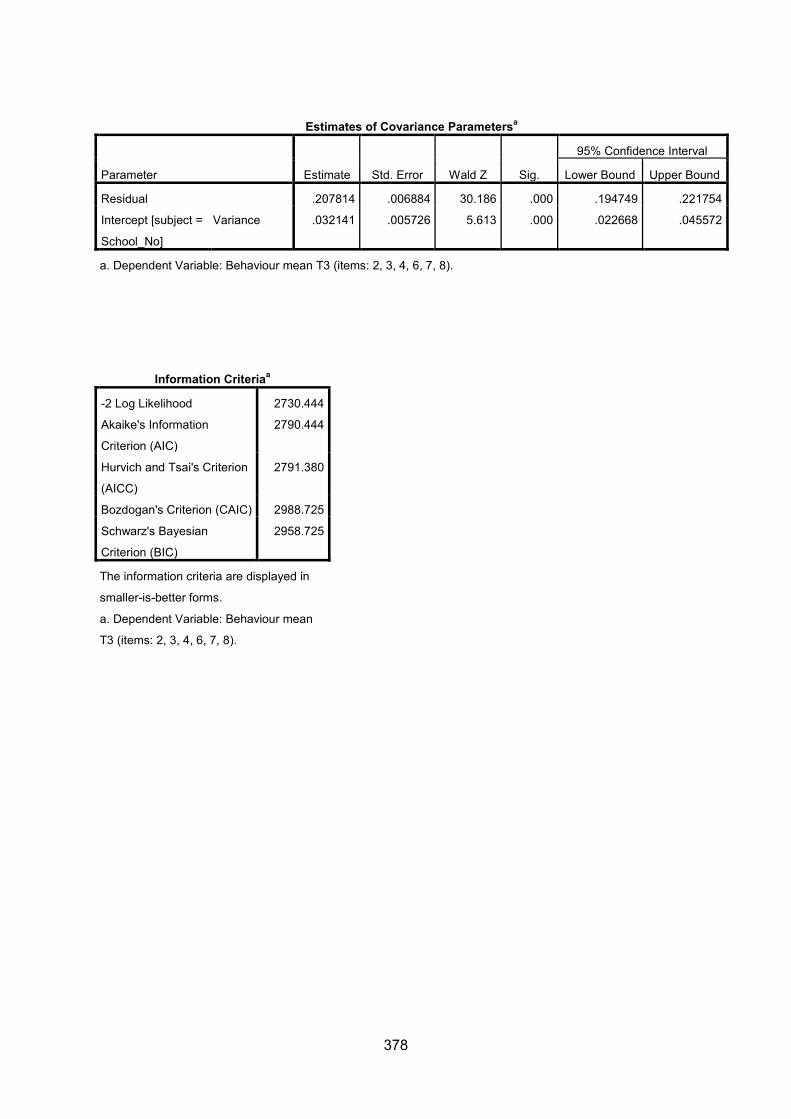
378
Estimates of Covariance Parametersa
Parameter Estimate Std. Error Wald Z Sig.
95% Confidence Interval
Lower Bound Upper Bound
Residual .207814 .006884 30.186 .000 .194749 .221754
Intercept [subject =
School_No]
Variance .032141 .005726 5.613 .000 .022668 .045572
a. Dependent Variable: Behaviour mean T3 (items: 2, 3, 4, 6, 7, 8).
Information Criteriaa
-2 Log Likelihood 2730.444
Akaike's Information
Criterion (AIC)
2790.444
Hurvich and Tsai's Criterion
(AICC)
2791.380
Bozdogan's Criterion (CAIC) 2988.725
Schwarz's Bayesian
Criterion (BIC)
2958.725
The information criteria are displayed in
smaller-is-better forms.
a. Dependent Variable: Behaviour mean
T3 (items: 2, 3, 4, 6, 7, 8).
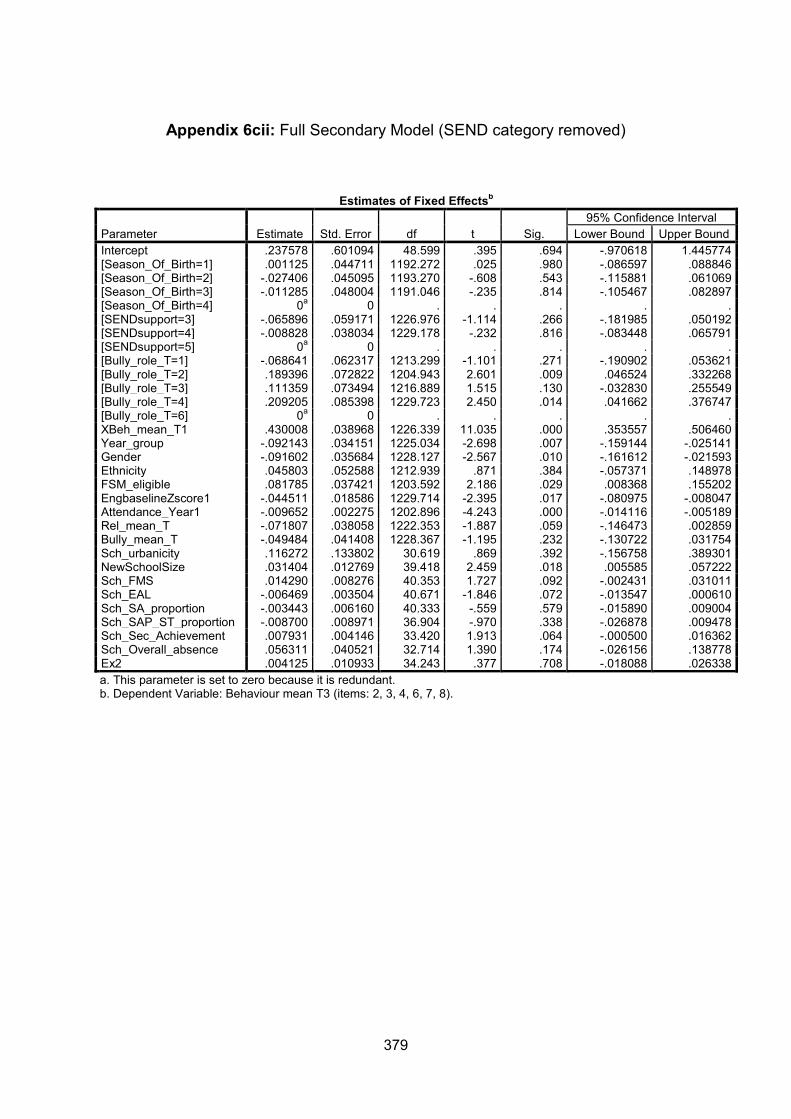
379
Appendix 6cii: Full Secondary Model (SEND category removed)
Estimates of Fixed Effectsb
Parameter Estimate Std. Error df t Sig. 95% Confidence Interval
Lower Bound Upper Bound Intercept .237578 .601094 48.599 .395 .694 -.970618 1.445774 [Season_Of_Birth=1] .001125 .044711 1192.272 .025 .980 -.086597 .088846 [Season_Of_Birth=2] -.027406 .045095 1193.270 -.608 .543 -.115881 .061069 [Season_Of_Birth=3] -.011285 .048004 1191.046 -.235 .814 -.105467 .082897 [Season_Of_Birth=4] 0a 0 . . . . . [SENDsupport=3] -.065896 .059171 1226.976 -1.114 .266 -.181985 .050192 [SENDsupport=4] -.008828 .038034 1229.178 -.232 .816 -.083448 .065791 [SENDsupport=5] 0a 0 . . . . . [Bully_role_T=1] -.068641 .062317 1213.299 -1.101 .271 -.190902 .053621 [Bully_role_T=2] .189396 .072822 1204.943 2.601 .009 .046524 .332268 [Bully_role_T=3] .111359 .073494 1216.889 1.515 .130 -.032830 .255549 [Bully_role_T=4] .209205 .085398 1229.723 2.450 .014 .041662 .376747 [Bully_role_T=6] 0a 0 . . . . . XBeh_mean_T1 .430008 .038968 1226.339 11.035 .000 .353557 .506460 Year_group -.092143 .034151 1225.034 -2.698 .007 -.159144 -.025141 Gender -.091602 .035684 1228.127 -2.567 .010 -.161612 -.021593 Ethnicity .045803 .052588 1212.939 .871 .384 -.057371 .148978 FSM_eligible .081785 .037421 1203.592 2.186 .029 .008368 .155202 EngbaselineZscore1 -.044511 .018586 1229.714 -2.395 .017 -.080975 -.008047 Attendance_Year1 -.009652 .002275 1202.896 -4.243 .000 -.014116 -.005189 Rel_mean_T -.071807 .038058 1222.353 -1.887 .059 -.146473 .002859 Bully_mean_T -.049484 .041408 1228.367 -1.195 .232 -.130722 .031754 Sch_urbanicity .116272 .133802 30.619 .869 .392 -.156758 .389301 NewSchoolSize .031404 .012769 39.418 2.459 .018 .005585 .057222 Sch_FMS .014290 .008276 40.353 1.727 .092 -.002431 .031011 Sch_EAL -.006469 .003504 40.671 -1.846 .072 -.013547 .000610 Sch_SA_proportion -.003443 .006160 40.333 -.559 .579 -.015890 .009004 Sch_SAP_ST_proportion -.008700 .008971 36.904 -.970 .338 -.026878 .009478 Sch_Sec_Achievement .007931 .004146 33.420 1.913 .064 -.000500 .016362 Sch_Overall_absence .056311 .040521 32.714 1.390 .174 -.026156 .138778 Ex2 .004125 .010933 34.243 .377 .708 -.018088 .026338 a. This parameter is set to zero because it is redundant. b. Dependent Variable: Behaviour mean T3 (items: 2, 3, 4, 6, 7, 8).
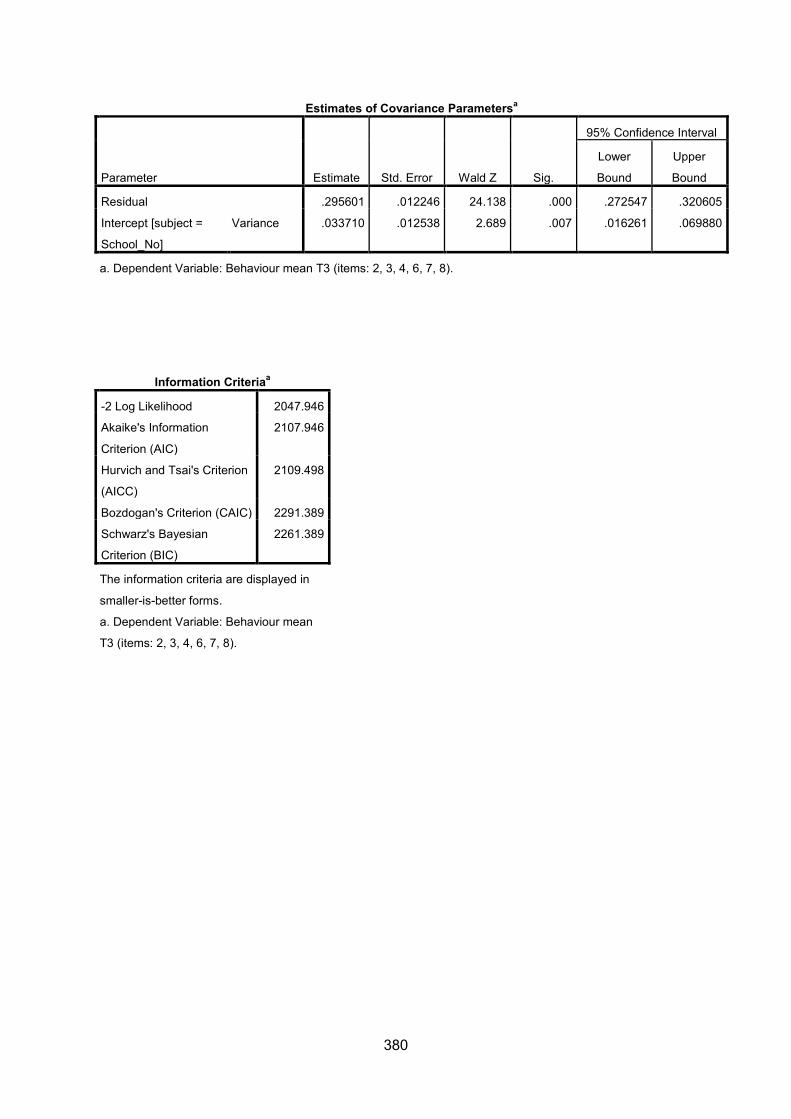
380
Estimates of Covariance Parametersa
Parameter Estimate Std. Error Wald Z Sig.
95% Confidence Interval
Lower
Bound
Upper
Bound
Residual .295601 .012246 24.138 .000 .272547 .320605
Intercept [subject =
School_No]
Variance .033710 .012538 2.689 .007 .016261 .069880
a. Dependent Variable: Behaviour mean T3 (items: 2, 3, 4, 6, 7, 8).
Information Criteriaa
-2 Log Likelihood 2047.946
Akaike's Information
Criterion (AIC)
2107.946
Hurvich and Tsai's Criterion
(AICC)
2109.498
Bozdogan's Criterion (CAIC) 2291.389
Schwarz's Bayesian
Criterion (BIC)
2261.389
The information criteria are displayed in
smaller-is-better forms.
a. Dependent Variable: Behaviour mean
T3 (items: 2, 3, 4, 6, 7, 8).
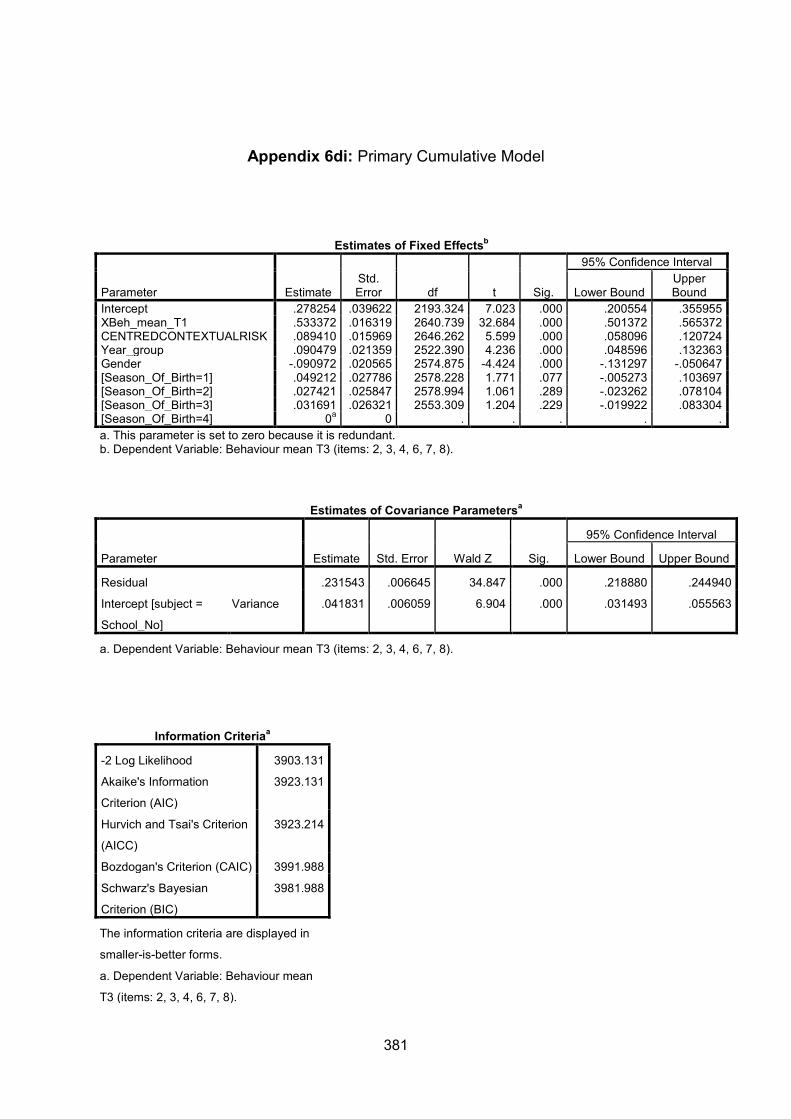
381
Appendix 6di: Primary Cumulative Model
Estimates of Fixed Effectsb
Parameter Estimate Std. Error df t Sig.
95% Confidence Interval
Lower Bound Upper Bound
Intercept .278254 .039622 2193.324 7.023 .000 .200554 .355955 XBeh_mean_T1 .533372 .016319 2640.739 32.684 .000 .501372 .565372 CENTREDCONTEXTUALRISK .089410 .015969 2646.262 5.599 .000 .058096 .120724 Year_group .090479 .021359 2522.390 4.236 .000 .048596 .132363 Gender -.090972 .020565 2574.875 -4.424 .000 -.131297 -.050647 [Season_Of_Birth=1] .049212 .027786 2578.228 1.771 .077 -.005273 .103697 [Season_Of_Birth=2] .027421 .025847 2578.994 1.061 .289 -.023262 .078104 [Season_Of_Birth=3] .031691 .026321 2553.309 1.204 .229 -.019922 .083304 [Season_Of_Birth=4] 0a 0 . . . . . a. This parameter is set to zero because it is redundant. b. Dependent Variable: Behaviour mean T3 (items: 2, 3, 4, 6, 7, 8).
Estimates of Covariance Parametersa
Parameter Estimate Std. Error Wald Z Sig.
95% Confidence Interval
Lower Bound Upper Bound
Residual .231543 .006645 34.847 .000 .218880 .244940
Intercept [subject =
School_No]
Variance .041831 .006059 6.904 .000 .031493 .055563
a. Dependent Variable: Behaviour mean T3 (items: 2, 3, 4, 6, 7, 8).
Information Criteriaa
-2 Log Likelihood 3903.131
Akaike's Information
Criterion (AIC)
3923.131
Hurvich and Tsai's Criterion
(AICC)
3923.214
Bozdogan's Criterion (CAIC) 3991.988
Schwarz's Bayesian
Criterion (BIC)
3981.988
The information criteria are displayed in
smaller-is-better forms.
a. Dependent Variable: Behaviour mean
T3 (items: 2, 3, 4, 6, 7, 8).
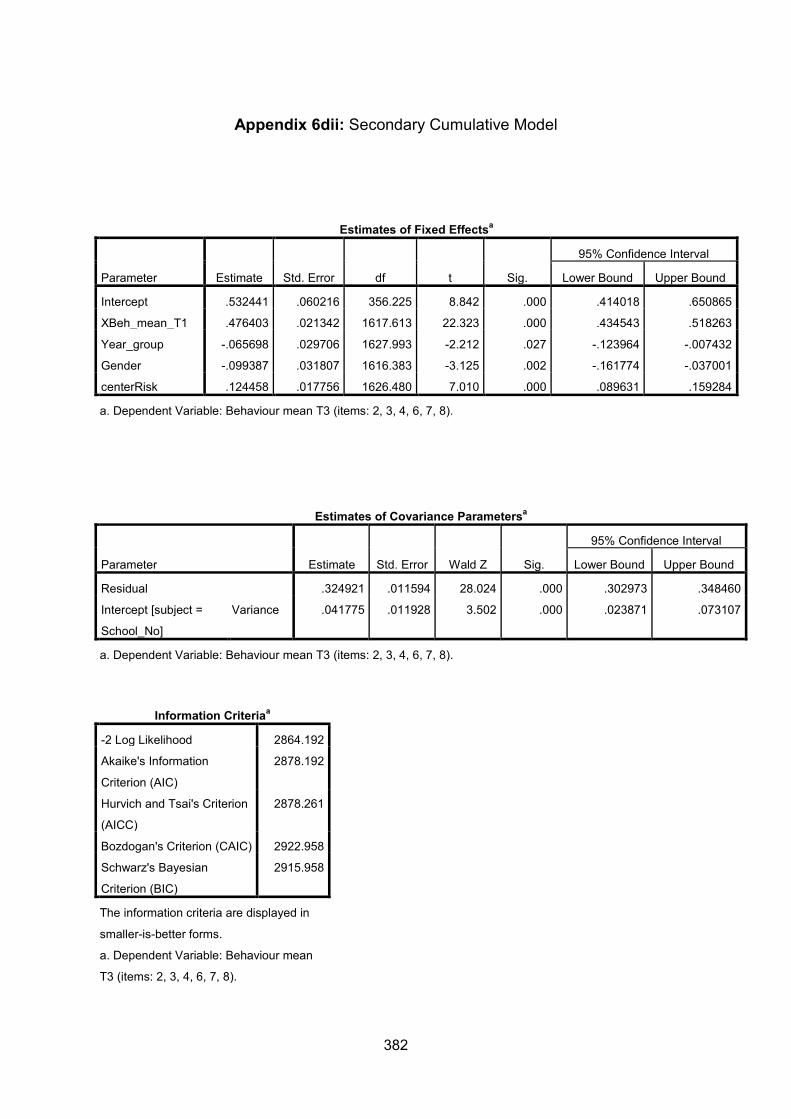
382
Appendix 6dii: Secondary Cumulative Model
Estimates of Fixed Effectsa
Parameter Estimate Std. Error df t Sig.
95% Confidence Interval
Lower Bound Upper Bound
Intercept .532441 .060216 356.225 8.842 .000 .414018 .650865
XBeh_mean_T1 .476403 .021342 1617.613 22.323 .000 .434543 .518263
Year_group -.065698 .029706 1627.993 -2.212 .027 -.123964 -.007432
Gender -.099387 .031807 1616.383 -3.125 .002 -.161774 -.037001
centerRisk .124458 .017756 1626.480 7.010 .000 .089631 .159284
a. Dependent Variable: Behaviour mean T3 (items: 2, 3, 4, 6, 7, 8).
Estimates of Covariance Parametersa
Parameter Estimate Std. Error Wald Z Sig.
95% Confidence Interval
Lower Bound Upper Bound
Residual .324921 .011594 28.024 .000 .302973 .348460
Intercept [subject =
School_No]
Variance .041775 .011928 3.502 .000 .023871 .073107
a. Dependent Variable: Behaviour mean T3 (items: 2, 3, 4, 6, 7, 8).
Information Criteriaa
-2 Log Likelihood 2864.192
Akaike's Information
Criterion (AIC)
2878.192
Hurvich and Tsai's Criterion
(AICC)
2878.261
Bozdogan's Criterion (CAIC) 2922.958
Schwarz's Bayesian
Criterion (BIC)
2915.958
The information criteria are displayed in
smaller-is-better forms.
a. Dependent Variable: Behaviour mean
T3 (items: 2, 3, 4, 6, 7, 8).
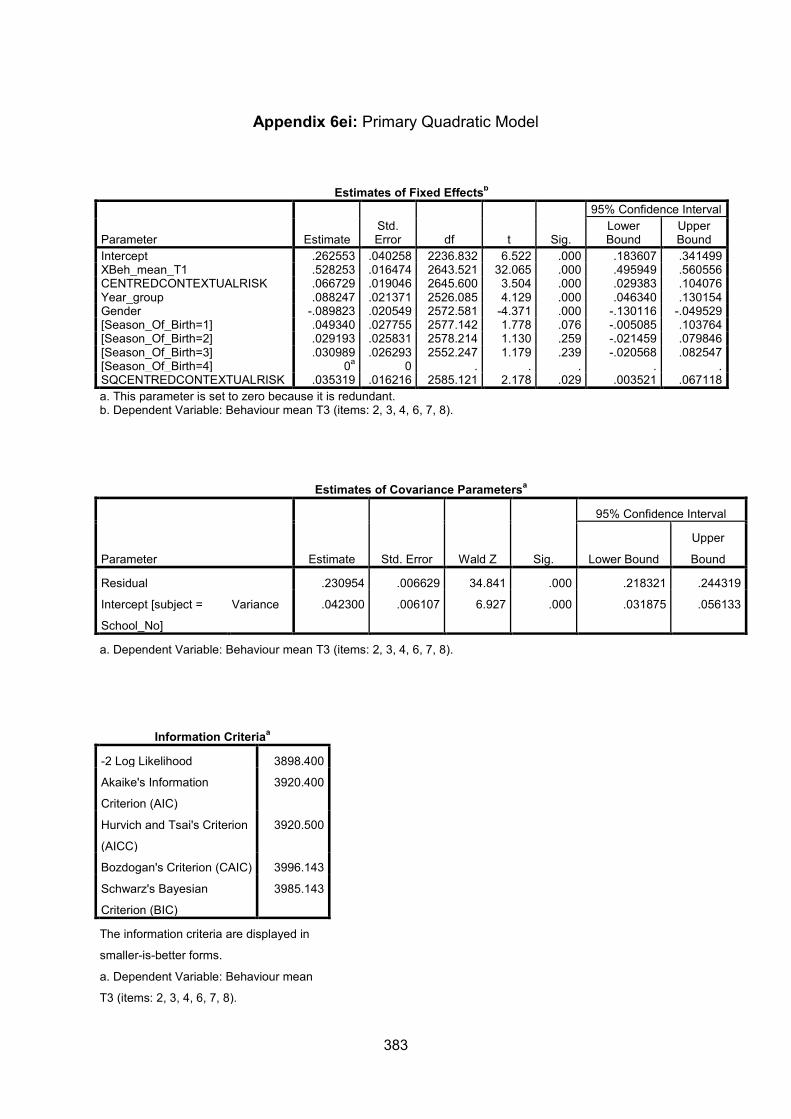
383
Appendix 6ei: Primary Quadratic Model
Estimates of Fixed Effectsb
Parameter Estimate Std. Error df t Sig.
95% Confidence Interval Lower Bound
Upper Bound
Intercept .262553 .040258 2236.832 6.522 .000 .183607 .341499 XBeh_mean_T1 .528253 .016474 2643.521 32.065 .000 .495949 .560556 CENTREDCONTEXTUALRISK .066729 .019046 2645.600 3.504 .000 .029383 .104076 Year_group .088247 .021371 2526.085 4.129 .000 .046340 .130154 Gender -.089823 .020549 2572.581 -4.371 .000 -.130116 -.049529 [Season_Of_Birth=1] .049340 .027755 2577.142 1.778 .076 -.005085 .103764 [Season_Of_Birth=2] .029193 .025831 2578.214 1.130 .259 -.021459 .079846 [Season_Of_Birth=3] .030989 .026293 2552.247 1.179 .239 -.020568 .082547 [Season_Of_Birth=4] 0a 0 . . . . . SQCENTREDCONTEXTUALRISK .035319 .016216 2585.121 2.178 .029 .003521 .067118 a. This parameter is set to zero because it is redundant. b. Dependent Variable: Behaviour mean T3 (items: 2, 3, 4, 6, 7, 8).
Estimates of Covariance Parametersa
Parameter Estimate Std. Error Wald Z Sig.
95% Confidence Interval
Lower Bound
Upper
Bound
Residual .230954 .006629 34.841 .000 .218321 .244319
Intercept [subject =
School_No]
Variance .042300 .006107 6.927 .000 .031875 .056133
a. Dependent Variable: Behaviour mean T3 (items: 2, 3, 4, 6, 7, 8).
Information Criteriaa
-2 Log Likelihood 3898.400
Akaike's Information
Criterion (AIC)
3920.400
Hurvich and Tsai's Criterion
(AICC)
3920.500
Bozdogan's Criterion (CAIC) 3996.143
Schwarz's Bayesian
Criterion (BIC)
3985.143
The information criteria are displayed in
smaller-is-better forms.
a. Dependent Variable: Behaviour mean
T3 (items: 2, 3, 4, 6, 7, 8).
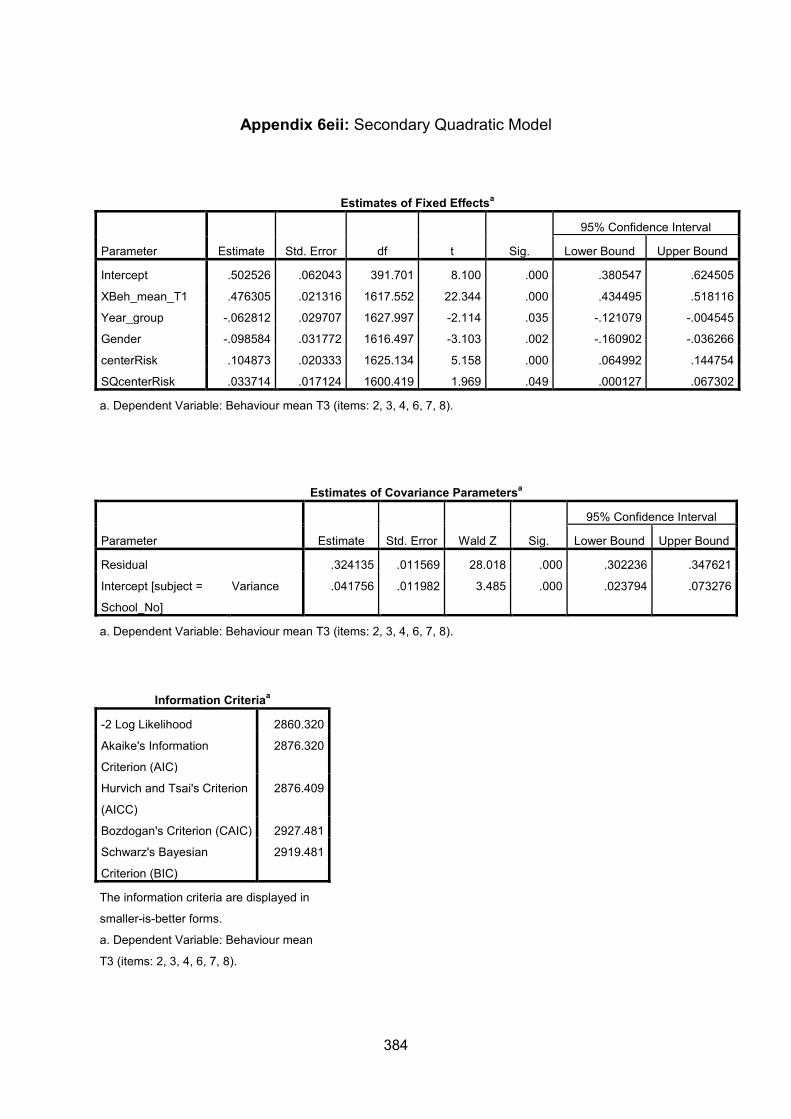
384
Appendix 6eii: Secondary Quadratic Model
Estimates of Fixed Effectsa
Parameter Estimate Std. Error df t Sig.
95% Confidence Interval
Lower Bound Upper Bound
Intercept .502526 .062043 391.701 8.100 .000 .380547 .624505
XBeh_mean_T1 .476305 .021316 1617.552 22.344 .000 .434495 .518116
Year_group -.062812 .029707 1627.997 -2.114 .035 -.121079 -.004545
Gender -.098584 .031772 1616.497 -3.103 .002 -.160902 -.036266
centerRisk .104873 .020333 1625.134 5.158 .000 .064992 .144754
SQcenterRisk .033714 .017124 1600.419 1.969 .049 .000127 .067302
a. Dependent Variable: Behaviour mean T3 (items: 2, 3, 4, 6, 7, 8).
Estimates of Covariance Parametersa
Parameter Estimate Std. Error Wald Z Sig.
95% Confidence Interval
Lower Bound Upper Bound
Residual .324135 .011569 28.018 .000 .302236 .347621
Intercept [subject =
School_No]
Variance .041756 .011982 3.485 .000 .023794 .073276
a. Dependent Variable: Behaviour mean T3 (items: 2, 3, 4, 6, 7, 8).
Information Criteriaa
-2 Log Likelihood 2860.320
Akaike's Information
Criterion (AIC)
2876.320
Hurvich and Tsai's Criterion
(AICC)
2876.409
Bozdogan's Criterion (CAIC) 2927.481
Schwarz's Bayesian
Criterion (BIC)
2919.481
The information criteria are displayed in
smaller-is-better forms.
a. Dependent Variable: Behaviour mean
T3 (items: 2, 3, 4, 6, 7, 8).
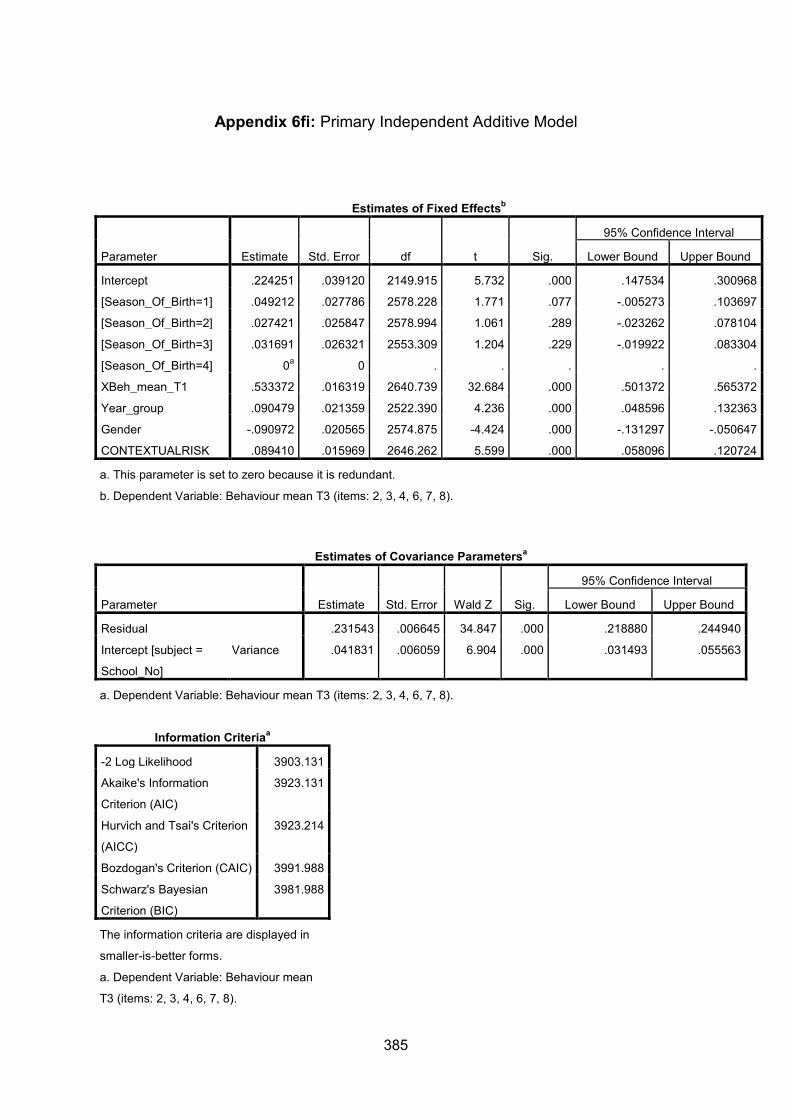
385
Appendix 6fi: Primary Independent Additive Model
Estimates of Fixed Effectsb
Parameter Estimate Std. Error df t Sig.
95% Confidence Interval
Lower Bound Upper Bound
Intercept .224251 .039120 2149.915 5.732 .000 .147534 .300968
[Season_Of_Birth=1] .049212 .027786 2578.228 1.771 .077 -.005273 .103697
[Season_Of_Birth=2] .027421 .025847 2578.994 1.061 .289 -.023262 .078104
[Season_Of_Birth=3] .031691 .026321 2553.309 1.204 .229 -.019922 .083304
[Season_Of_Birth=4] 0a 0 . . . . .
XBeh_mean_T1 .533372 .016319 2640.739 32.684 .000 .501372 .565372
Year_group .090479 .021359 2522.390 4.236 .000 .048596 .132363
Gender -.090972 .020565 2574.875 -4.424 .000 -.131297 -.050647
CONTEXTUALRISK .089410 .015969 2646.262 5.599 .000 .058096 .120724
a. This parameter is set to zero because it is redundant.
b. Dependent Variable: Behaviour mean T3 (items: 2, 3, 4, 6, 7, 8).
Estimates of Covariance Parametersa
Parameter Estimate Std. Error Wald Z Sig.
95% Confidence Interval
Lower Bound Upper Bound
Residual .231543 .006645 34.847 .000 .218880 .244940
Intercept [subject =
School_No]
Variance .041831 .006059 6.904 .000 .031493 .055563
a. Dependent Variable: Behaviour mean T3 (items: 2, 3, 4, 6, 7, 8).
Information Criteriaa
-2 Log Likelihood 3903.131
Akaike's Information
Criterion (AIC)
3923.131
Hurvich and Tsai's Criterion
(AICC)
3923.214
Bozdogan's Criterion (CAIC) 3991.988
Schwarz's Bayesian
Criterion (BIC)
3981.988
The information criteria are displayed in
smaller-is-better forms.
a. Dependent Variable: Behaviour mean
T3 (items: 2, 3, 4, 6, 7, 8).
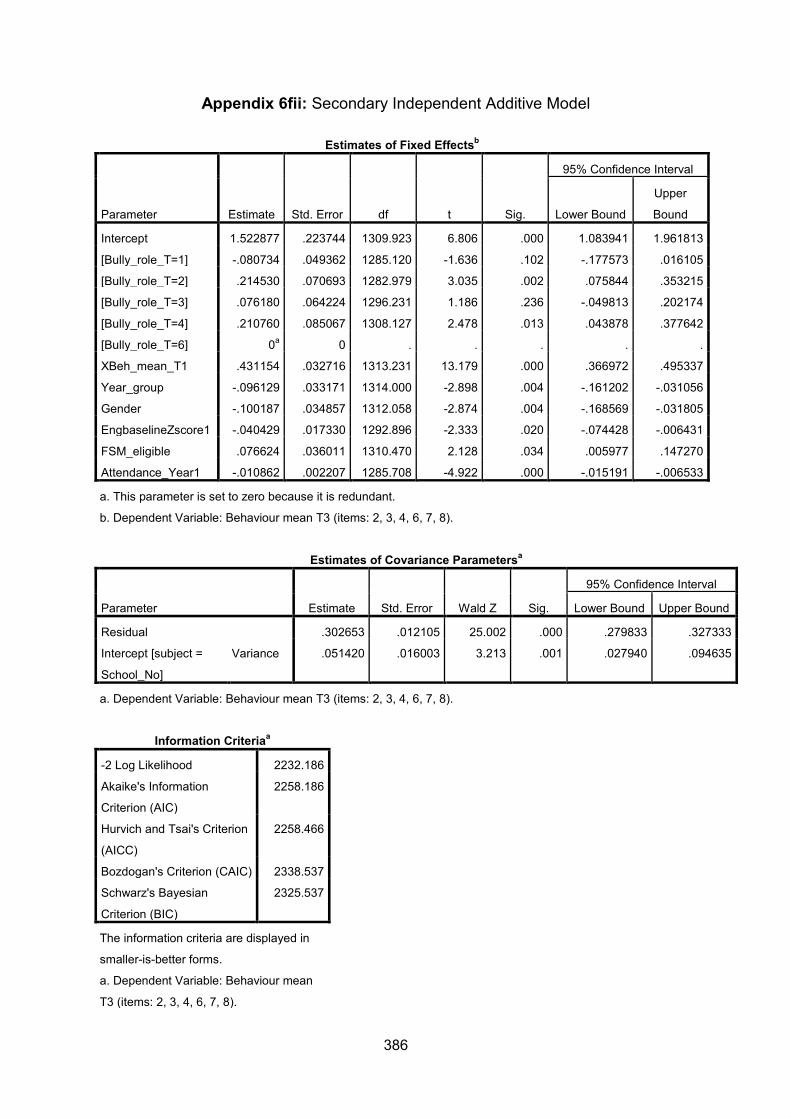
386
Appendix 6fii: Secondary Independent Additive Model
Estimates of Fixed Effectsb
Parameter Estimate Std. Error df t Sig.
95% Confidence Interval
Lower Bound
Upper
Bound
Intercept 1.522877 .223744 1309.923 6.806 .000 1.083941 1.961813
[Bully_role_T=1] -.080734 .049362 1285.120 -1.636 .102 -.177573 .016105
[Bully_role_T=2] .214530 .070693 1282.979 3.035 .002 .075844 .353215
[Bully_role_T=3] .076180 .064224 1296.231 1.186 .236 -.049813 .202174
[Bully_role_T=4] .210760 .085067 1308.127 2.478 .013 .043878 .377642
[Bully_role_T=6] 0a 0 . . . . .
XBeh_mean_T1 .431154 .032716 1313.231 13.179 .000 .366972 .495337
Year_group -.096129 .033171 1314.000 -2.898 .004 -.161202 -.031056
Gender -.100187 .034857 1312.058 -2.874 .004 -.168569 -.031805
EngbaselineZscore1 -.040429 .017330 1292.896 -2.333 .020 -.074428 -.006431
FSM_eligible .076624 .036011 1310.470 2.128 .034 .005977 .147270
Attendance_Year1 -.010862 .002207 1285.708 -4.922 .000 -.015191 -.006533
a. This parameter is set to zero because it is redundant.
b. Dependent Variable: Behaviour mean T3 (items: 2, 3, 4, 6, 7, 8).
Estimates of Covariance Parametersa
Parameter Estimate Std. Error Wald Z Sig.
95% Confidence Interval
Lower Bound Upper Bound
Residual .302653 .012105 25.002 .000 .279833 .327333
Intercept [subject =
School_No]
Variance .051420 .016003 3.213 .001 .027940 .094635
a. Dependent Variable: Behaviour mean T3 (items: 2, 3, 4, 6, 7, 8).
Information Criteriaa
-2 Log Likelihood 2232.186
Akaike's Information
Criterion (AIC)
2258.186
Hurvich and Tsai's Criterion
(AICC)
2258.466
Bozdogan's Criterion (CAIC) 2338.537
Schwarz's Bayesian
Criterion (BIC)
2325.537
The information criteria are displayed in
smaller-is-better forms.
a. Dependent Variable: Behaviour mean
T3 (items: 2, 3, 4, 6, 7, 8).
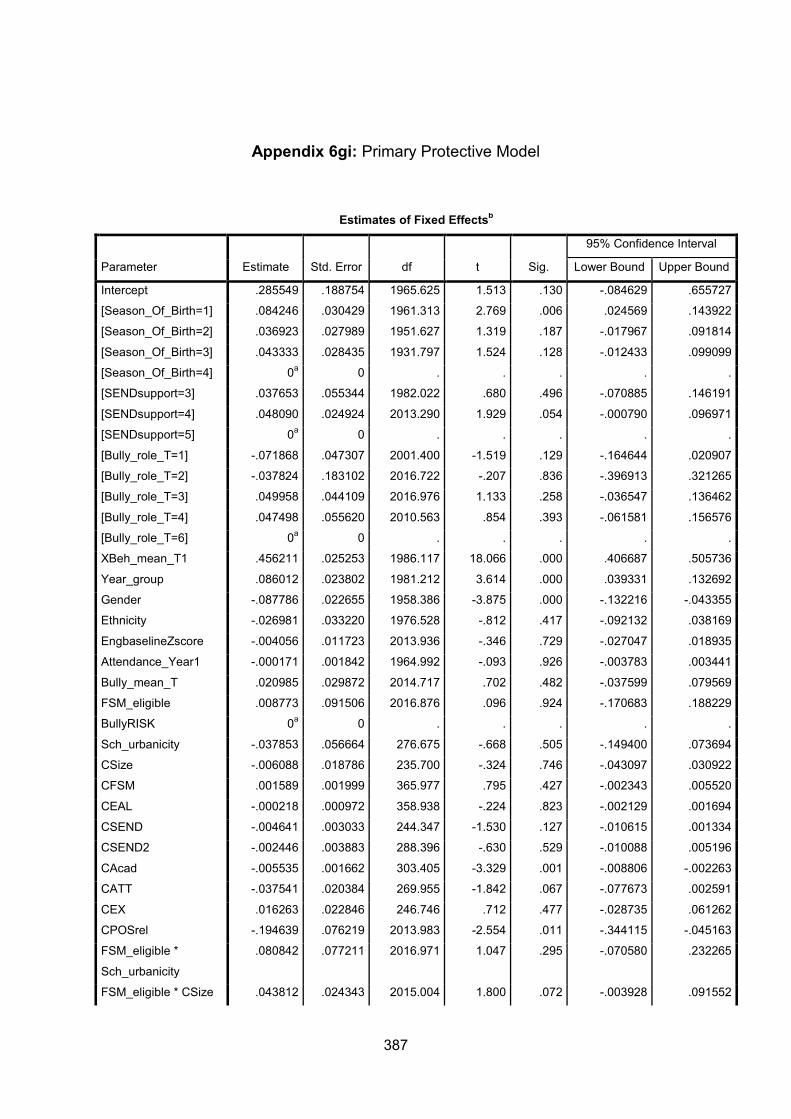
387
Appendix 6gi: Primary Protective Model
Estimates of Fixed Effectsb
Parameter Estimate Std. Error df t Sig.
95% Confidence Interval
Lower Bound Upper Bound
Intercept .285549 .188754 1965.625 1.513 .130 -.084629 .655727
[Season_Of_Birth=1] .084246 .030429 1961.313 2.769 .006 .024569 .143922
[Season_Of_Birth=2] .036923 .027989 1951.627 1.319 .187 -.017967 .091814
[Season_Of_Birth=3] .043333 .028435 1931.797 1.524 .128 -.012433 .099099
[Season_Of_Birth=4] 0a 0 . . . . .
[SENDsupport=3] .037653 .055344 1982.022 .680 .496 -.070885 .146191
[SENDsupport=4] .048090 .024924 2013.290 1.929 .054 -.000790 .096971
[SENDsupport=5] 0a 0 . . . . .
[Bully_role_T=1] -.071868 .047307 2001.400 -1.519 .129 -.164644 .020907
[Bully_role_T=2] -.037824 .183102 2016.722 -.207 .836 -.396913 .321265
[Bully_role_T=3] .049958 .044109 2016.976 1.133 .258 -.036547 .136462
[Bully_role_T=4] .047498 .055620 2010.563 .854 .393 -.061581 .156576
[Bully_role_T=6] 0a 0 . . . . .
XBeh_mean_T1 .456211 .025253 1986.117 18.066 .000 .406687 .505736
Year_group .086012 .023802 1981.212 3.614 .000 .039331 .132692
Gender -.087786 .022655 1958.386 -3.875 .000 -.132216 -.043355
Ethnicity -.026981 .033220 1976.528 -.812 .417 -.092132 .038169
EngbaselineZscore -.004056 .011723 2013.936 -.346 .729 -.027047 .018935
Attendance_Year1 -.000171 .001842 1964.992 -.093 .926 -.003783 .003441
Bully_mean_T .020985 .029872 2014.717 .702 .482 -.037599 .079569
FSM_eligible .008773 .091506 2016.876 .096 .924 -.170683 .188229
BullyRISK 0a 0 . . . . .
Sch_urbanicity -.037853 .056664 276.675 -.668 .505 -.149400 .073694
CSize -.006088 .018786 235.700 -.324 .746 -.043097 .030922
CFSM .001589 .001999 365.977 .795 .427 -.002343 .005520
CEAL -.000218 .000972 358.938 -.224 .823 -.002129 .001694
CSEND -.004641 .003033 244.347 -1.530 .127 -.010615 .001334
CSEND2 -.002446 .003883 288.396 -.630 .529 -.010088 .005196
CAcad -.005535 .001662 303.405 -3.329 .001 -.008806 -.002263
CATT -.037541 .020384 269.955 -1.842 .067 -.077673 .002591
CEX .016263 .022846 246.746 .712 .477 -.028735 .061262
CPOSrel -.194639 .076219 2013.983 -2.554 .011 -.344115 -.045163
FSM_eligible *
Sch_urbanicity
.080842 .077211 2016.971 1.047 .295 -.070580 .232265
FSM_eligible * CSize .043812 .024343 2015.004 1.800 .072 -.003928 .091552
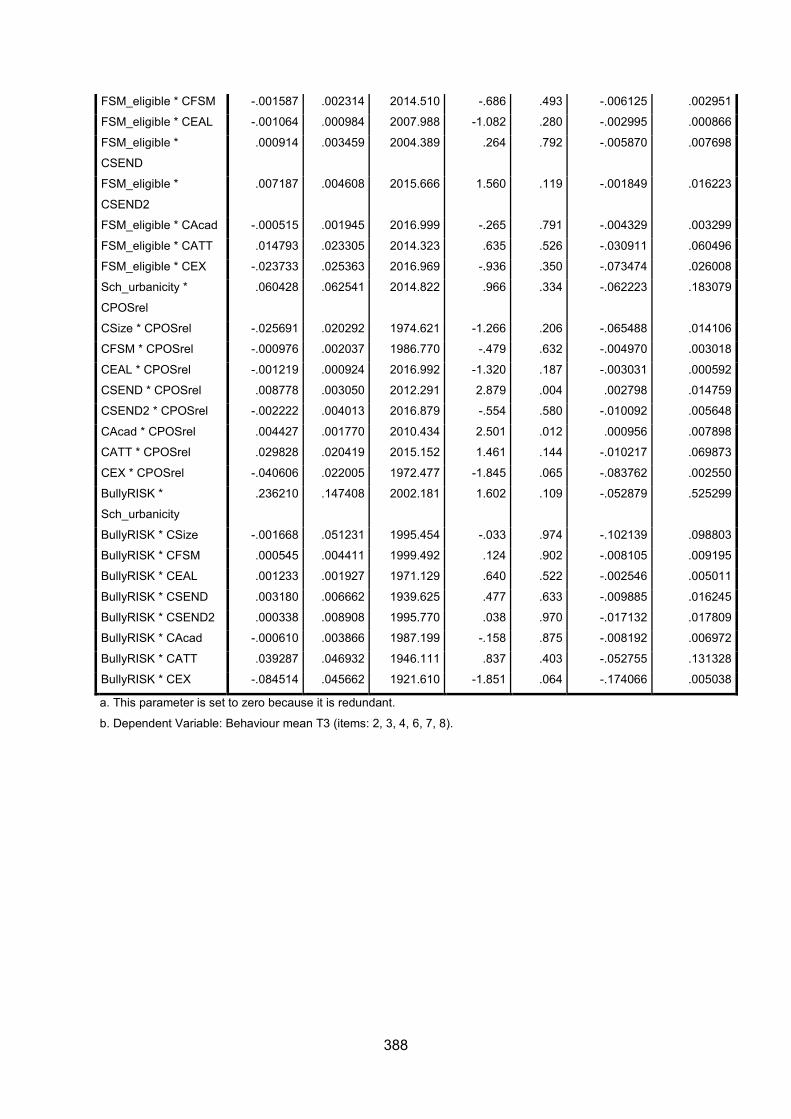
388
FSM_eligible * CFSM -.001587 .002314 2014.510 -.686 .493 -.006125 .002951
FSM_eligible * CEAL -.001064 .000984 2007.988 -1.082 .280 -.002995 .000866
FSM_eligible *
CSEND
.000914 .003459 2004.389 .264 .792 -.005870 .007698
FSM_eligible *
CSEND2
.007187 .004608 2015.666 1.560 .119 -.001849 .016223
FSM_eligible * CAcad -.000515 .001945 2016.999 -.265 .791 -.004329 .003299
FSM_eligible * CATT .014793 .023305 2014.323 .635 .526 -.030911 .060496
FSM_eligible * CEX -.023733 .025363 2016.969 -.936 .350 -.073474 .026008
Sch_urbanicity *
CPOSrel
.060428 .062541 2014.822 .966 .334 -.062223 .183079
CSize * CPOSrel -.025691 .020292 1974.621 -1.266 .206 -.065488 .014106
CFSM * CPOSrel -.000976 .002037 1986.770 -.479 .632 -.004970 .003018
CEAL * CPOSrel -.001219 .000924 2016.992 -1.320 .187 -.003031 .000592
CSEND * CPOSrel .008778 .003050 2012.291 2.879 .004 .002798 .014759
CSEND2 * CPOSrel -.002222 .004013 2016.879 -.554 .580 -.010092 .005648
CAcad * CPOSrel .004427 .001770 2010.434 2.501 .012 .000956 .007898
CATT * CPOSrel .029828 .020419 2015.152 1.461 .144 -.010217 .069873
CEX * CPOSrel -.040606 .022005 1972.477 -1.845 .065 -.083762 .002550
BullyRISK *
Sch_urbanicity
.236210 .147408 2002.181 1.602 .109 -.052879 .525299
BullyRISK * CSize -.001668 .051231 1995.454 -.033 .974 -.102139 .098803
BullyRISK * CFSM .000545 .004411 1999.492 .124 .902 -.008105 .009195
BullyRISK * CEAL .001233 .001927 1971.129 .640 .522 -.002546 .005011
BullyRISK * CSEND .003180 .006662 1939.625 .477 .633 -.009885 .016245
BullyRISK * CSEND2 .000338 .008908 1995.770 .038 .970 -.017132 .017809
BullyRISK * CAcad -.000610 .003866 1987.199 -.158 .875 -.008192 .006972
BullyRISK * CATT .039287 .046932 1946.111 .837 .403 -.052755 .131328
BullyRISK * CEX -.084514 .045662 1921.610 -1.851 .064 -.174066 .005038
a. This parameter is set to zero because it is redundant.
b. Dependent Variable: Behaviour mean T3 (items: 2, 3, 4, 6, 7, 8).

389
Estimates of Covariance Parametersa
Parameter Estimate Std. Error Wald Z Sig.
95% Confidence Interval
Lower Bound
Upper
Bound
Residual .202101 .006701 30.160 .000 .189385 .215671
Intercept [subject =
School_No]
Variance .031831 .005677 5.607 .000 .022442 .045150
a. Dependent Variable: Behaviour mean T3 (items: 2, 3, 4, 6, 7, 8).
Information Criteriaa
-2 Log Likelihood 2676.267
Akaike's Information Criterion (AIC) 2790.267
Hurvich and Tsai's Criterion (AICC) 2793.642
Bozdogan's Criterion (CAIC) 3167.001
Schwarz's Bayesian Criterion (BIC) 3110.001
The information criteria are displayed in smaller-is-
better forms.
a. Dependent Variable: Behaviour mean T3 (items: 2,
3, 4, 6, 7, 8).
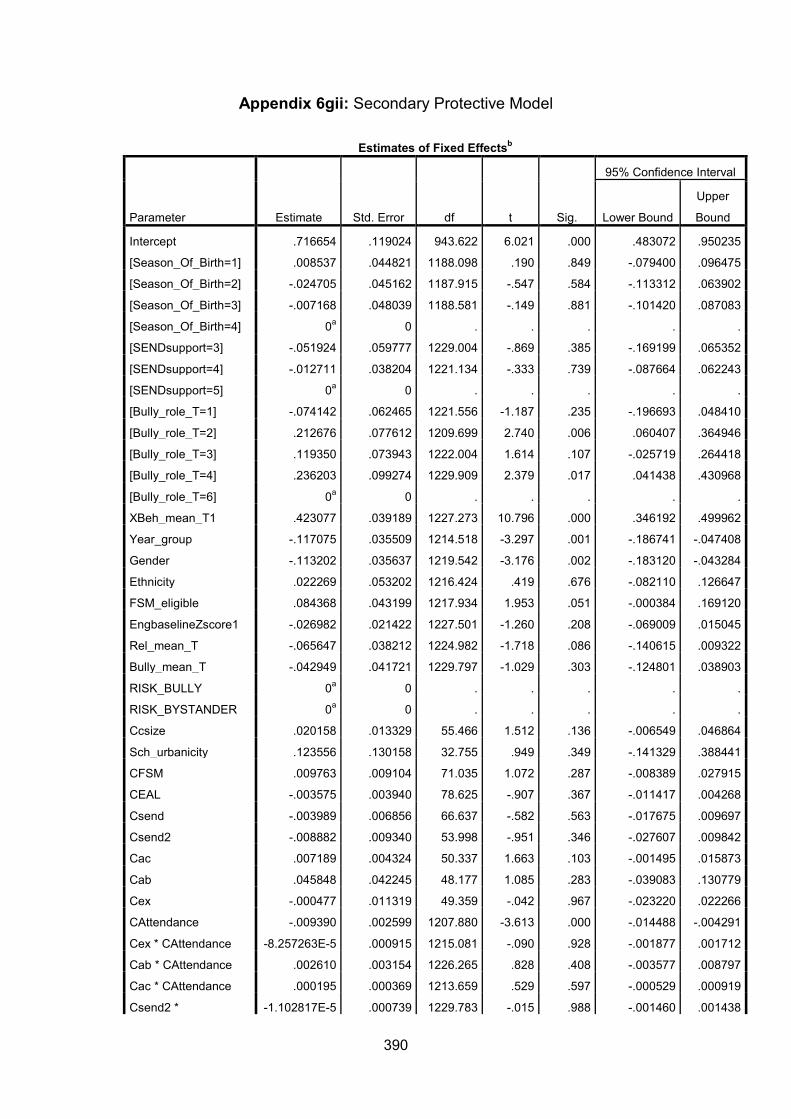
390
Appendix 6gii: Secondary Protective Model
Estimates of Fixed Effectsb
Parameter Estimate Std. Error df t Sig.
95% Confidence Interval
Lower Bound
Upper
Bound
Intercept .716654 .119024 943.622 6.021 .000 .483072 .950235
[Season_Of_Birth=1] .008537 .044821 1188.098 .190 .849 -.079400 .096475
[Season_Of_Birth=2] -.024705 .045162 1187.915 -.547 .584 -.113312 .063902
[Season_Of_Birth=3] -.007168 .048039 1188.581 -.149 .881 -.101420 .087083
[Season_Of_Birth=4] 0a 0 . . . . .
[SENDsupport=3] -.051924 .059777 1229.004 -.869 .385 -.169199 .065352
[SENDsupport=4] -.012711 .038204 1221.134 -.333 .739 -.087664 .062243
[SENDsupport=5] 0a 0 . . . . .
[Bully_role_T=1] -.074142 .062465 1221.556 -1.187 .235 -.196693 .048410
[Bully_role_T=2] .212676 .077612 1209.699 2.740 .006 .060407 .364946
[Bully_role_T=3] .119350 .073943 1222.004 1.614 .107 -.025719 .264418
[Bully_role_T=4] .236203 .099274 1229.909 2.379 .017 .041438 .430968
[Bully_role_T=6] 0a 0 . . . . .
XBeh_mean_T1 .423077 .039189 1227.273 10.796 .000 .346192 .499962
Year_group -.117075 .035509 1214.518 -3.297 .001 -.186741 -.047408
Gender -.113202 .035637 1219.542 -3.176 .002 -.183120 -.043284
Ethnicity .022269 .053202 1216.424 .419 .676 -.082110 .126647
FSM_eligible .084368 .043199 1217.934 1.953 .051 -.000384 .169120
EngbaselineZscore1 -.026982 .021422 1227.501 -1.260 .208 -.069009 .015045
Rel_mean_T -.065647 .038212 1224.982 -1.718 .086 -.140615 .009322
Bully_mean_T -.042949 .041721 1229.797 -1.029 .303 -.124801 .038903
RISK_BULLY 0a 0 . . . . .
RISK_BYSTANDER 0a 0 . . . . .
Ccsize .020158 .013329 55.466 1.512 .136 -.006549 .046864
Sch_urbanicity .123556 .130158 32.755 .949 .349 -.141329 .388441
CFSM .009763 .009104 71.035 1.072 .287 -.008389 .027915
CEAL -.003575 .003940 78.625 -.907 .367 -.011417 .004268
Csend -.003989 .006856 66.637 -.582 .563 -.017675 .009697
Csend2 -.008882 .009340 53.998 -.951 .346 -.027607 .009842
Cac .007189 .004324 50.337 1.663 .103 -.001495 .015873
Cab .045848 .042245 48.177 1.085 .283 -.039083 .130779
Cex -.000477 .011319 49.359 -.042 .967 -.023220 .022266
CAttendance -.009390 .002599 1207.880 -3.613 .000 -.014488 -.004291
Cex * CAttendance -8.257263E-5 .000915 1215.081 -.090 .928 -.001877 .001712
Cab * CAttendance .002610 .003154 1226.265 .828 .408 -.003577 .008797
Cac * CAttendance .000195 .000369 1213.659 .529 .597 -.000529 .000919
Csend2 * -1.102817E-5 .000739 1229.783 -.015 .988 -.001460 .001438

391
CAttendance
Csend * CAttendance -.000420 .000525 1227.672 -.799 .424 -.001450 .000611
CEAL * CAttendance -.000156 .000313 1224.887 -.498 .619 -.000771 .000459
CFSM * CAttendance .000328 .000779 1229.950 .421 .674 -.001200 .001856
Sch_urbanicity *
CAttendance
.004062 .008340 1188.241 .487 .626 -.012300 .020425
Ccsize * CAttendance .000932 .001098 1221.287 .849 .396 -.001222 .003085
EngbaselineZscore1 *
Sch_urbanicity
-.137960 .066580 1219.761 -2.072 .038 -.268583 -.007337
EngbaselineZscore1 *
Ccsize
-.002445 .008508 1219.126 -.287 .774 -.019137 .014247
EngbaselineZscore1 *
CFSM
.002192 .005885 1158.384 .372 .710 -.009355 .013739
EngbaselineZscore1 *
CEAL
-.000728 .002365 1167.403 -.308 .758 -.005367 .003911
EngbaselineZscore1 *
Csend
-.006078 .003893 1082.035 -1.561 .119 -.013717 .001561
EngbaselineZscore1 *
Csend2
-.002234 .005274 1215.298 -.424 .672 -.012581 .008113
EngbaselineZscore1 *
Cac
-.000786 .002700 1140.942 -.291 .771 -.006083 .004512
EngbaselineZscore1 *
Cab
-.017310 .021613 1186.814 -.801 .423 -.059714 .025094
EngbaselineZscore1 *
Cex
.005888 .007892 1184.646 .746 .456 -.009597 .021372
FSM_eligible * Ccsize -.006012 .017850 1229.606 -.337 .736 -.041032 .029008
FSM_eligible *
Sch_urbanicity
-.090528 .134267 1204.195 -.674 .500 -.353952 .172896
FSM_eligible * CFSM -.000528 .011405 1159.804 -.046 .963 -.022905 .021848
FSM_eligible * CEAL -.001998 .004565 1197.816 -.438 .662 -.010953 .006958
FSM_eligible * Csend -.008825 .007845 1160.034 -1.125 .261 -.024217 .006567
FSM_eligible *
Csend2
.001489 .011075 1224.183 .134 .893 -.020239 .023216
FSM_eligible * Cac .000376 .005245 1226.970 .072 .943 -.009915 .010666
FSM_eligible * Cab .062287 .048280 1215.339 1.290 .197 -.032435 .157009
FSM_eligible * Cex -.000398 .014327 1229.551 -.028 .978 -.028507 .027711
RISK_BULLY * Ccsize .011666 .024764 1222.389 .471 .638 -.036919 .060250
RISK_BULLY *
Sch_urbanicity
-.075637 .188836 1225.289 -.401 .689 -.446114 .294841
RISK_BULLY * CFSM .014457 .015303 1227.727 .945 .345 -.015567 .044480
RISK_BULLY * CEAL -.003304 .006874 1229.293 -.481 .631 -.016791 .010182
RISK_BULLY * Csend .006028 .012036 1221.568 .501 .617 -.017586 .029642
RISK_BULLY * -.011769 .015528 1229.874 -.758 .449 -.042233 .018696
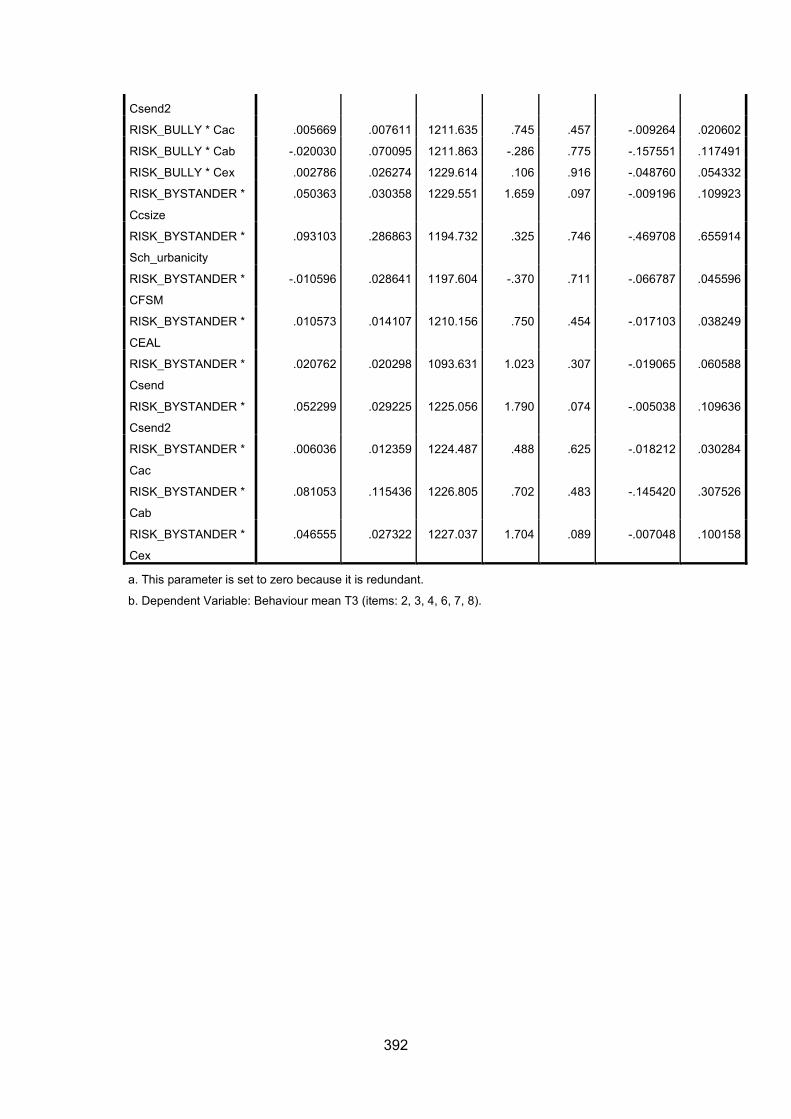
392
Csend2
RISK_BULLY * Cac .005669 .007611 1211.635 .745 .457 -.009264 .020602
RISK_BULLY * Cab -.020030 .070095 1211.863 -.286 .775 -.157551 .117491
RISK_BULLY * Cex .002786 .026274 1229.614 .106 .916 -.048760 .054332
RISK_BYSTANDER *
Ccsize
.050363 .030358 1229.551 1.659 .097 -.009196 .109923
RISK_BYSTANDER *
Sch_urbanicity
.093103 .286863 1194.732 .325 .746 -.469708 .655914
RISK_BYSTANDER *
CFSM
-.010596 .028641 1197.604 -.370 .711 -.066787 .045596
RISK_BYSTANDER *
CEAL
.010573 .014107 1210.156 .750 .454 -.017103 .038249
RISK_BYSTANDER *
Csend
.020762 .020298 1093.631 1.023 .307 -.019065 .060588
RISK_BYSTANDER *
Csend2
.052299 .029225 1225.056 1.790 .074 -.005038 .109636
RISK_BYSTANDER *
Cac
.006036 .012359 1224.487 .488 .625 -.018212 .030284
RISK_BYSTANDER *
Cab
.081053 .115436 1226.805 .702 .483 -.145420 .307526
RISK_BYSTANDER *
Cex
.046555 .027322 1227.037 1.704 .089 -.007048 .100158
a. This parameter is set to zero because it is redundant.
b. Dependent Variable: Behaviour mean T3 (items: 2, 3, 4, 6, 7, 8).
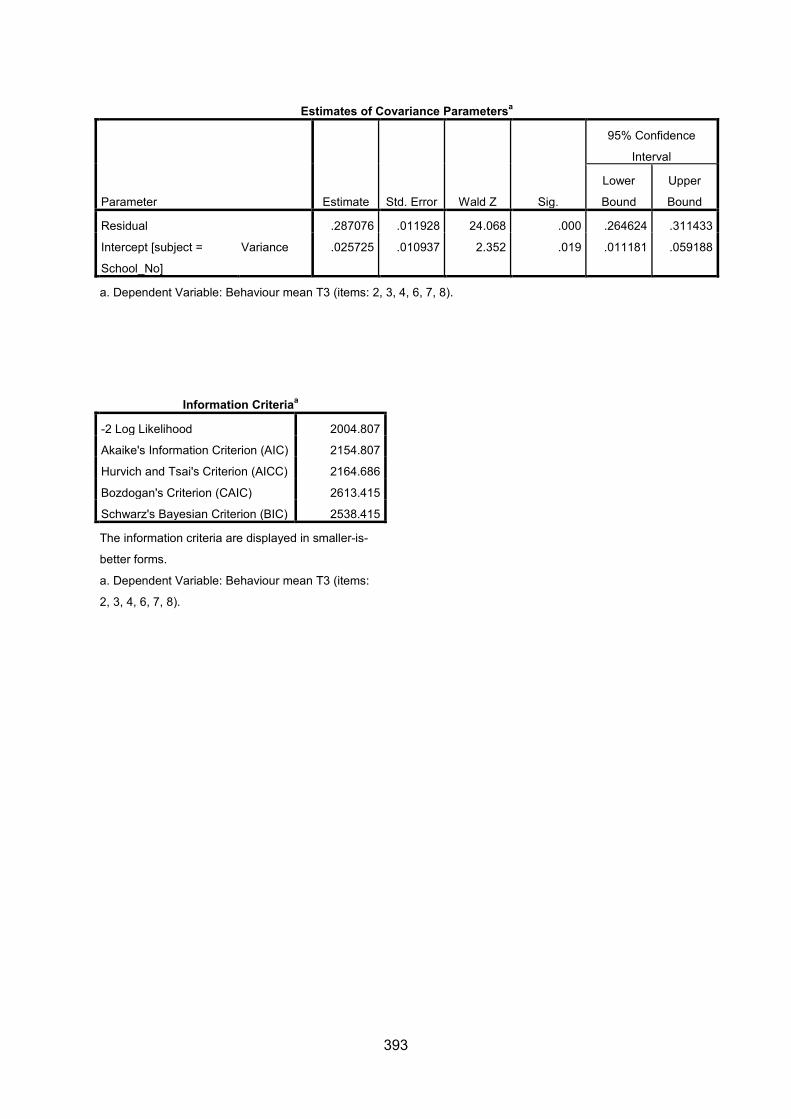
393
Estimates of Covariance Parametersa
Parameter Estimate Std. Error Wald Z Sig.
95% Confidence
Interval
Lower
Bound
Upper
Bound
Residual .287076 .011928 24.068 .000 .264624 .311433
Intercept [subject =
School_No]
Variance .025725 .010937 2.352 .019 .011181 .059188
a. Dependent Variable: Behaviour mean T3 (items: 2, 3, 4, 6, 7, 8).
Information Criteriaa
-2 Log Likelihood 2004.807
Akaike's Information Criterion (AIC) 2154.807
Hurvich and Tsai's Criterion (AICC) 2164.686
Bozdogan's Criterion (CAIC) 2613.415
Schwarz's Bayesian Criterion (BIC) 2538.415
The information criteria are displayed in smaller-is-
better forms.
a. Dependent Variable: Behaviour mean T3 (items:
2, 3, 4, 6, 7, 8).
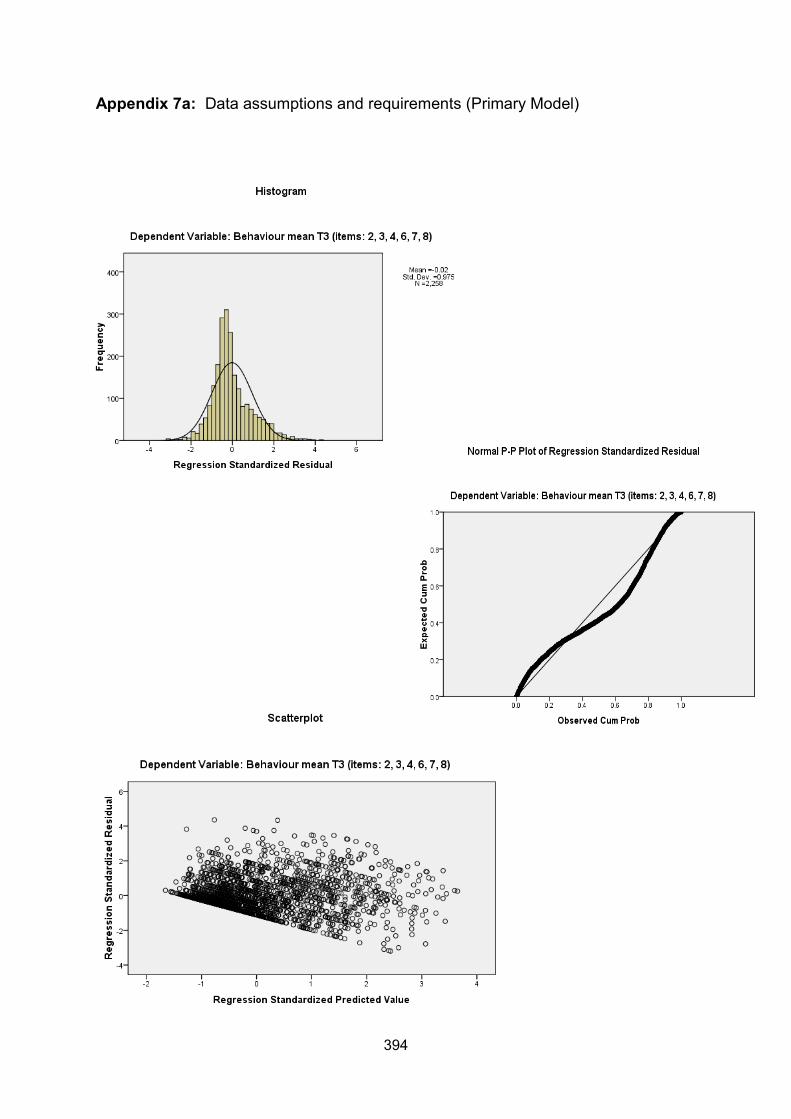
394
Appendix 7a: Data assumptions and requirements (Primary Model)
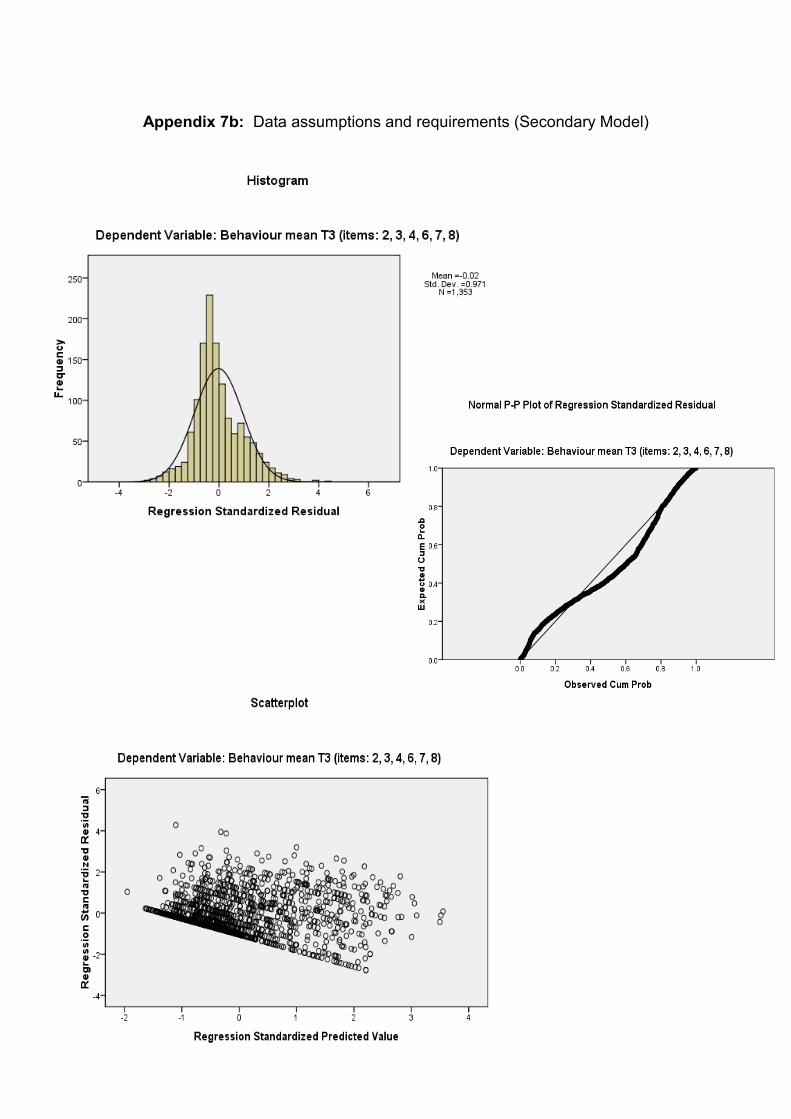
395
Appendix 7b: Data assumptions and requirements (Secondary Model)
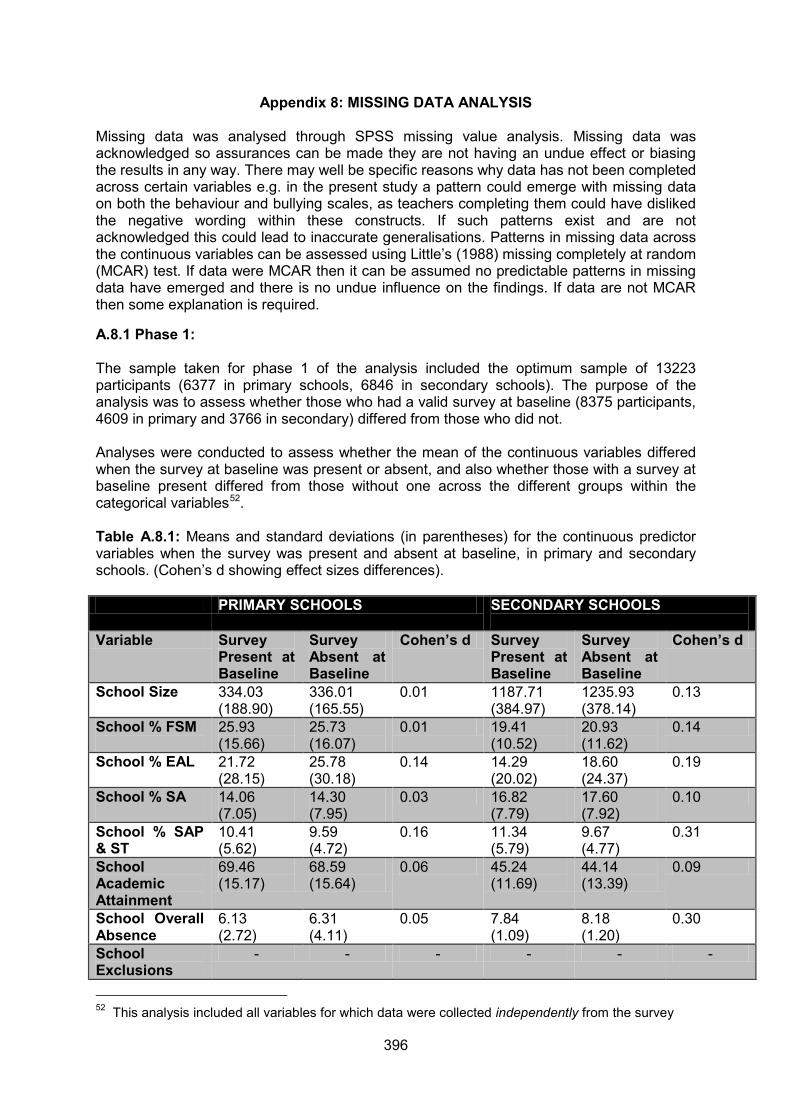
396
Appendix 8: MISSING DATA ANALYSIS Missing data was analysed through SPSS missing value analysis. Missing data was acknowledged so assurances can be made they are not having an undue effect or biasing the results in any way. There may well be specific reasons why data has not been completed across certain variables e.g. in the present study a pattern could emerge with missing data on both the behaviour and bullying scales, as teachers completing them could have disliked the negative wording within these constructs. If such patterns exist and are not acknowledged this could lead to inaccurate generalisations. Patterns in missing data across the continuous variables can be assessed using Little’s (1988) missing completely at random (MCAR) test. If data were MCAR then it can be assumed no predictable patterns in missing data have emerged and there is no undue influence on the findings. If data are not MCAR then some explanation is required.
A.8.1 Phase 1: The sample taken for phase 1 of the analysis included the optimum sample of 13223 participants (6377 in primary schools, 6846 in secondary schools). The purpose of the analysis was to assess whether those who had a valid survey at baseline (8375 participants, 4609 in primary and 3766 in secondary) differed from those who did not. Analyses were conducted to assess whether the mean of the continuous variables differed when the survey at baseline was present or absent, and also whether those with a survey at baseline present differed from those without one across the different groups within the categorical variables52
.
Table A.8.1: Means and standard deviations (in parentheses) for the continuous predictor variables when the survey was present and absent at baseline, in primary and secondary schools. (Cohen’s d showing effect sizes differences). PRIMARY SCHOOLS SECONDARY SCHOOLS
Variable Survey
Present at Baseline
Survey Absent at Baseline
Cohen’s d Survey Present at Baseline
Survey Absent at Baseline
Cohen’s d
School Size
334.03 (188.90)
336.01 (165.55)
0.01 1187.71 (384.97)
1235.93 (378.14)
0.13
School % FSM
25.93 (15.66)
25.73 (16.07)
0.01 19.41 (10.52)
20.93 (11.62)
0.14
School % EAL
21.72 (28.15)
25.78 (30.18)
0.14 14.29 (20.02)
18.60 (24.37)
0.19
School % SA
14.06 (7.05)
14.30 (7.95)
0.03 16.82 (7.79)
17.60 (7.92)
0.10
School % SAP & ST
10.41 (5.62)
9.59 (4.72)
0.16 11.34 (5.79)
9.67 (4.77)
0.31
School Academic Attainment
69.46 (15.17)
68.59 (15.64)
0.06 45.24 (11.69)
44.14 (13.39)
0.09
School Overall Absence
6.13 (2.72)
6.31 (4.11)
0.05 7.84 (1.09)
8.18 (1.20)
0.30
School Exclusions
- - - - - -
52 This analysis included all variables for which data were collected independently from the survey
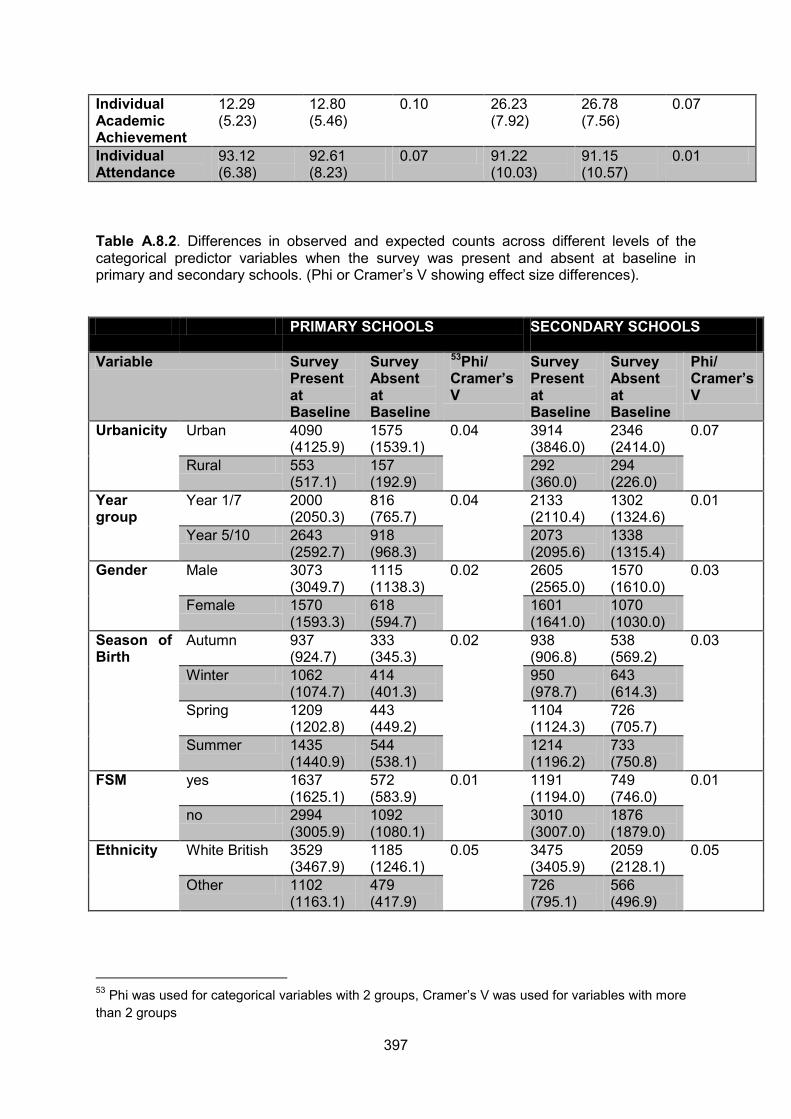
397
Individual Academic Achievement
12.29 (5.23)
12.80 (5.46)
0.10 26.23 (7.92)
26.78 (7.56)
0.07
Individual Attendance
93.12 (6.38)
92.61 (8.23)
0.07 91.22 (10.03)
91.15 (10.57)
0.01
Table A.8.2. Differences in observed and expected counts across different levels of the categorical predictor variables when the survey was present and absent at baseline in primary and secondary schools. (Phi or Cramer’s V showing effect size differences). PRIMARY SCHOOLS SECONDARY SCHOOLS
Variable Survey
Present at Baseline
Survey Absent at Baseline
53
Cramer’s V
Phi/ Survey Present at Baseline
Survey Absent at Baseline
Phi/ Cramer’s V
Urbanicity Urban 4090 (4125.9)
1575 (1539.1)
0.04 3914 (3846.0)
2346 (2414.0)
0.07
Rural 553 (517.1)
157 (192.9)
292 (360.0)
294 (226.0)
Year group
Year 1/7 2000 (2050.3)
816 (765.7)
0.04 2133 (2110.4)
1302 (1324.6)
0.01
Year 5/10 2643 (2592.7)
918 (968.3)
2073 (2095.6)
1338 (1315.4)
Gender
Male 3073 (3049.7)
1115 (1138.3)
0.02 2605 (2565.0)
1570 (1610.0)
0.03
Female 1570 (1593.3)
618 (594.7)
1601 (1641.0)
1070 (1030.0)
Season of Birth
Autumn 937 (924.7)
333 (345.3)
0.02 938 (906.8)
538 (569.2)
0.03
Winter 1062 (1074.7)
414 (401.3)
950 (978.7)
643 (614.3)
Spring 1209 (1202.8)
443 (449.2)
1104 (1124.3)
726 (705.7)
Summer 1435 (1440.9)
544 (538.1)
1214 (1196.2)
733 (750.8)
FSM yes 1637 (1625.1)
572 (583.9)
0.01 1191 (1194.0)
749 (746.0)
0.01
no 2994 (3005.9)
1092 (1080.1)
3010 (3007.0)
1876 (1879.0)
Ethnicity White British 3529 (3467.9)
1185 (1246.1)
0.05 3475 (3405.9)
2059 (2128.1)
0.05
Other 1102 (1163.1)
479 (417.9)
726 (795.1)
566 (496.9)
53 Phi was used for categorical variables with 2 groups, Cramer’s V was used for variables with more than 2 groups
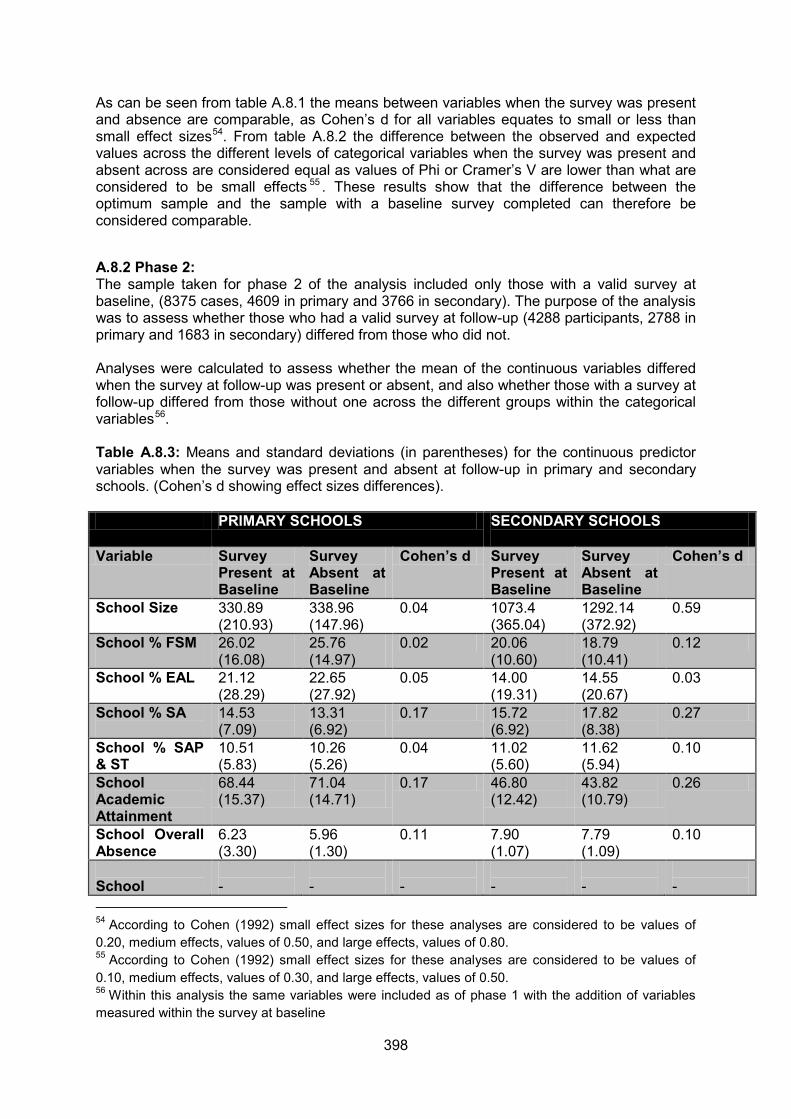
398
As can be seen from table A.8.1 the means between variables when the survey was present and absence are comparable, as Cohen’s d for all variables equates to small or less than small effect sizes54. From table A.8.2 the difference between the observed and expected values across the different levels of categorical variables when the survey was present and absent across are considered equal as values of Phi or Cramer’s V are lower than what are considered to be small effects 55
. These results show that the difference between the optimum sample and the sample with a baseline survey completed can therefore be considered comparable.
A.8.2 Phase 2: The sample taken for phase 2 of the analysis included only those with a valid survey at baseline, (8375 cases, 4609 in primary and 3766 in secondary). The purpose of the analysis was to assess whether those who had a valid survey at follow-up (4288 participants, 2788 in primary and 1683 in secondary) differed from those who did not. Analyses were calculated to assess whether the mean of the continuous variables differed when the survey at follow-up was present or absent, and also whether those with a survey at follow-up differed from those without one across the different groups within the categorical variables56
.
Table A.8.3: Means and standard deviations (in parentheses) for the continuous predictor variables when the survey was present and absent at follow-up in primary and secondary schools. (Cohen’s d showing effect sizes differences). PRIMARY SCHOOLS SECONDARY SCHOOLS
Variable Survey
Present at Baseline
Survey Absent at Baseline
Cohen’s d Survey Present at Baseline
Survey Absent at Baseline
Cohen’s d
School Size
330.89 (210.93)
338.96 (147.96)
0.04 1073.4 (365.04)
1292.14 (372.92)
0.59
School % FSM
26.02 (16.08)
25.76 (14.97)
0.02 20.06 (10.60)
18.79 (10.41)
0.12
School % EAL
21.12 (28.29)
22.65 (27.92)
0.05 14.00 (19.31)
14.55 (20.67)
0.03
School % SA
14.53 (7.09)
13.31 (6.92)
0.17 15.72 (6.92)
17.82 (8.38)
0.27
School % SAP & ST
10.51 (5.83)
10.26 (5.26)
0.04 11.02 (5.60)
11.62 (5.94)
0.10
School Academic Attainment
68.44 (15.37)
71.04 (14.71)
0.17 46.80 (12.42)
43.82 (10.79)
0.26
School Overall Absence
6.23 (3.30)
5.96 (1.30)
0.11 7.90 (1.07)
7.79 (1.09)
0.10
School
-
-
-
-
-
-
54 According to Cohen (1992) small effect sizes for these analyses are considered to be values of 0.20, medium effects, values of 0.50, and large effects, values of 0.80. 55 According to Cohen (1992) small effect sizes for these analyses are considered to be values of 0.10, medium effects, values of 0.30, and large effects, values of 0.50. 56 Within this analysis the same variables were included as of phase 1 with the addition of variables measured within the survey at baseline
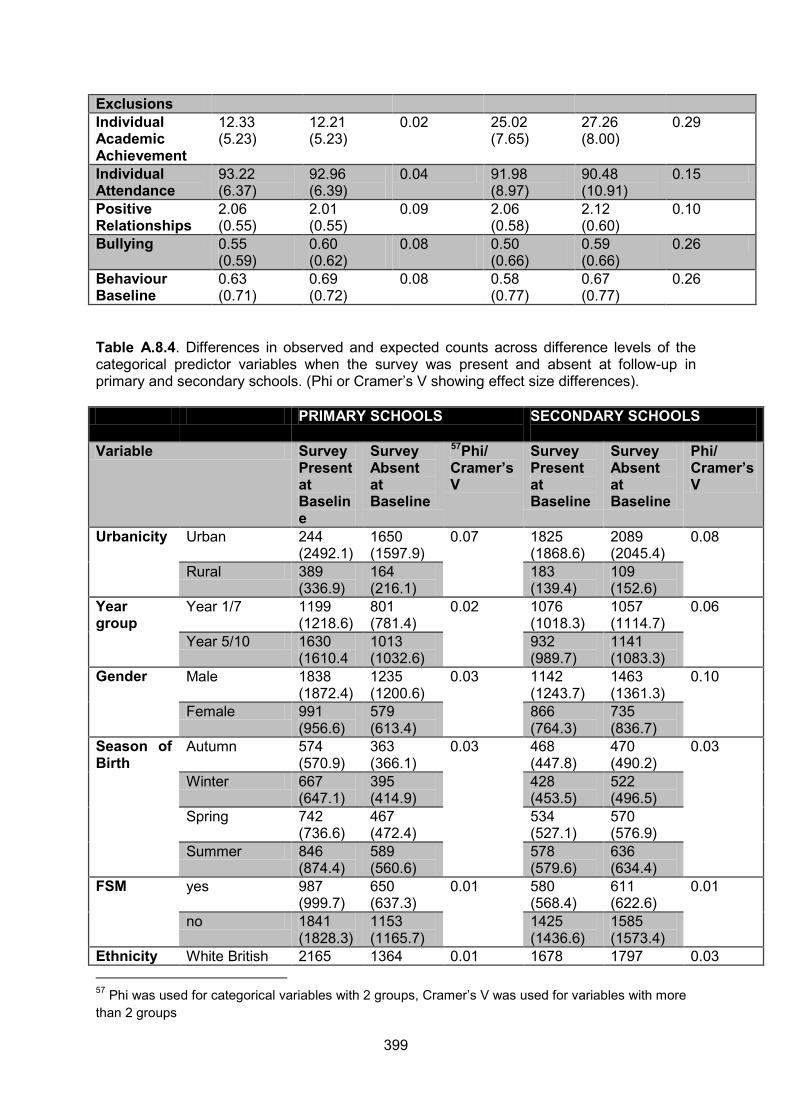
399
Exclusions Individual Academic Achievement
12.33 (5.23)
12.21 (5.23)
0.02 25.02 (7.65)
27.26 (8.00)
0.29
Individual Attendance
93.22 (6.37)
92.96 (6.39)
0.04 91.98 (8.97)
90.48 (10.91)
0.15
Positive Relationships
2.06 (0.55)
2.01 (0.55)
0.09 2.06 (0.58)
2.12 (0.60)
0.10
Bullying 0.55 (0.59)
0.60 (0.62)
0.08
0.50 (0.66)
0.59 (0.66)
0.26
Behaviour Baseline
0.63 (0.71)
0.69 (0.72)
0.08
0.58 (0.77)
0.67 (0.77)
0.26
Table A.8.4. Differences in observed and expected counts across difference levels of the categorical predictor variables when the survey was present and absent at follow-up in primary and secondary schools. (Phi or Cramer’s V showing effect size differences). PRIMARY SCHOOLS SECONDARY SCHOOLS
Variable Survey
Present at Baseline
Survey Absent at Baseline
57
Cramer’s V
Phi/ Survey Present at Baseline
Survey Absent at Baseline
Phi/ Cramer’s V
Urbanicity Urban 244 (2492.1)
1650 (1597.9)
0.07 1825 (1868.6)
2089 (2045.4)
0.08
Rural 389 (336.9)
164 (216.1)
183 (139.4)
109 (152.6)
Year group
Year 1/7 1199 (1218.6)
801 (781.4)
0.02 1076 (1018.3)
1057 (1114.7)
0.06
Year 5/10 1630 (1610.4
1013 (1032.6)
932 (989.7)
1141 (1083.3)
Gender
Male 1838 (1872.4)
1235 (1200.6)
0.03 1142 (1243.7)
1463 (1361.3)
0.10
Female 991 (956.6)
579 (613.4)
866 (764.3)
735 (836.7)
Season of Birth
Autumn 574 (570.9)
363 (366.1)
0.03 468 (447.8)
470 (490.2)
0.03
Winter 667 (647.1)
395 (414.9)
428 (453.5)
522 (496.5)
Spring 742 (736.6)
467 (472.4)
534 (527.1)
570 (576.9)
Summer 846 (874.4)
589 (560.6)
578 (579.6)
636 (634.4)
FSM yes 987 (999.7)
650 (637.3)
0.01 580 (568.4)
611 (622.6)
0.01
no 1841 (1828.3)
1153 (1165.7)
1425 (1436.6)
1585 (1573.4)
Ethnicity White British 2165 1364 0.01 1678 1797 0.03 57 Phi was used for categorical variables with 2 groups, Cramer’s V was used for variables with more than 2 groups
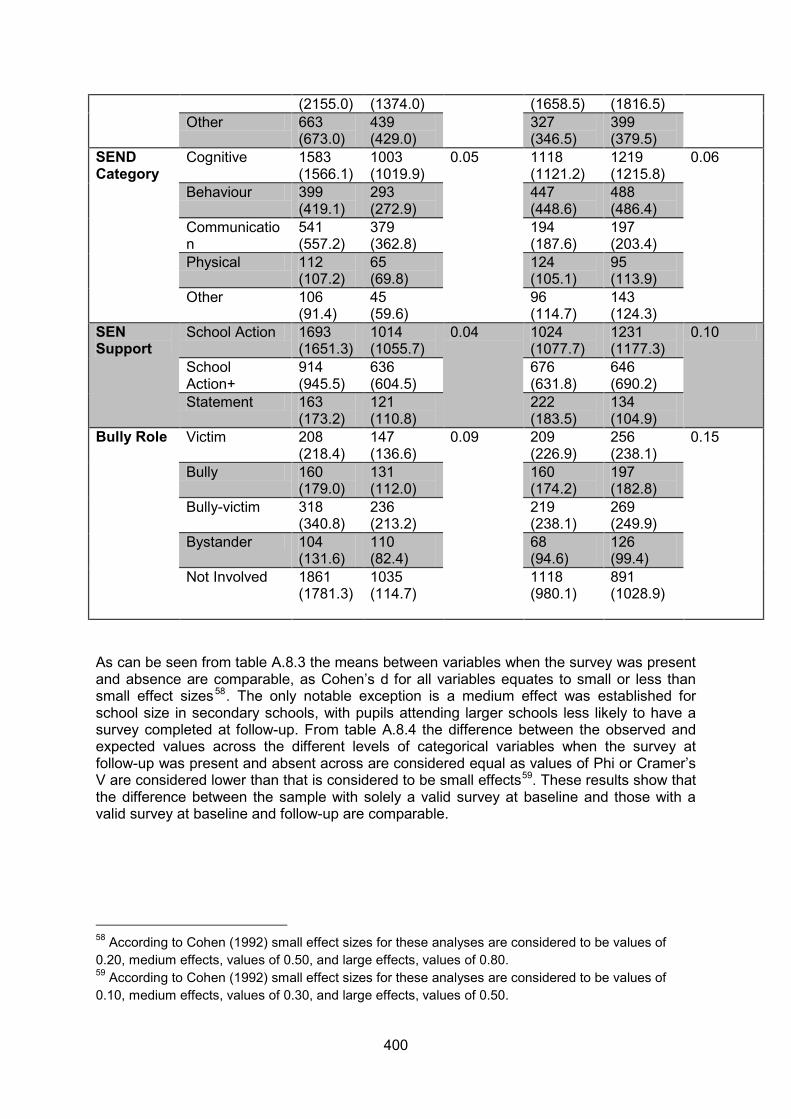
400
(2155.0) (1374.0) (1658.5) (1816.5) Other 663
(673.0) 439 (429.0)
327 (346.5)
399 (379.5)
SEND Category
Cognitive 1583 (1566.1)
1003 (1019.9)
0.05 1118 (1121.2)
1219 (1215.8)
0.06
Behaviour 399 (419.1)
293 (272.9)
447 (448.6)
488 (486.4)
Communication
541 (557.2)
379 (362.8)
194 (187.6)
197 (203.4)
Physical 112 (107.2)
65 (69.8)
124 (105.1)
95 (113.9)
Other 106 (91.4)
45 (59.6)
96 (114.7)
143 (124.3)
SEN Support
School Action 1693 (1651.3)
1014 (1055.7)
0.04 1024 (1077.7)
1231 (1177.3)
0.10
School Action+
914 (945.5)
636 (604.5)
676 (631.8)
646 (690.2)
Statement 163 (173.2)
121 (110.8)
222 (183.5)
134 (104.9)
Bully Role Victim 208 (218.4)
147 (136.6)
0.09 209 (226.9)
256 (238.1)
0.15
Bully 160 (179.0)
131 (112.0)
160 (174.2)
197 (182.8)
Bully-victim 318 (340.8)
236 (213.2)
219 (238.1)
269 (249.9)
Bystander 104 (131.6)
110 (82.4)
68 (94.6)
126 (99.4)
Not Involved 1861 (1781.3)
1035 (114.7)
1118 (980.1)
891 (1028.9)
As can be seen from table A.8.3 the means between variables when the survey was present and absence are comparable, as Cohen’s d for all variables equates to small or less than small effect sizes58. The only notable exception is a medium effect was established for school size in secondary schools, with pupils attending larger schools less likely to have a survey completed at follow-up. From table A.8.4 the difference between the observed and expected values across the different levels of categorical variables when the survey at follow-up was present and absent across are considered equal as values of Phi or Cramer’s V are considered lower than that is considered to be small effects59
. These results show that the difference between the sample with solely a valid survey at baseline and those with a valid survey at baseline and follow-up are comparable.
58 According to Cohen (1992) small effect sizes for these analyses are considered to be values of 0.20, medium effects, values of 0.50, and large effects, values of 0.80. 59 According to Cohen (1992) small effect sizes for these analyses are considered to be values of 0.10, medium effects, values of 0.30, and large effects, values of 0.50.
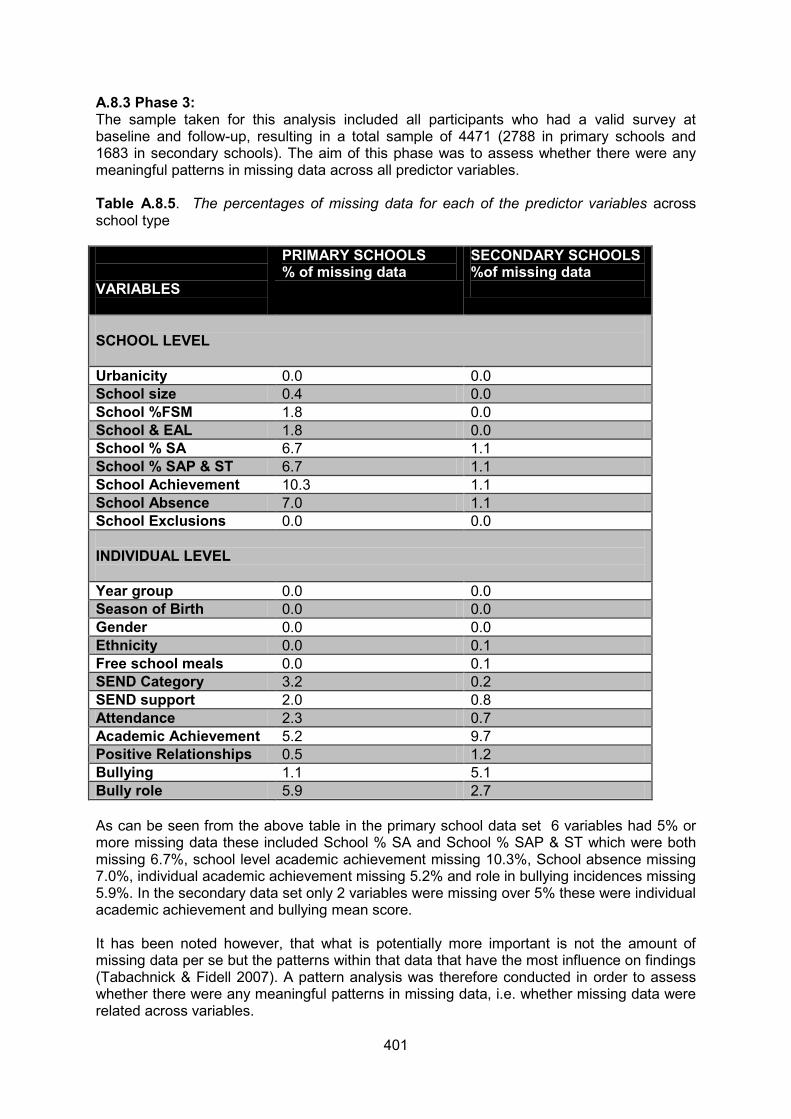
401
A.8.3 Phase 3: The sample taken for this analysis included all participants who had a valid survey at baseline and follow-up, resulting in a total sample of 4471 (2788 in primary schools and 1683 in secondary schools). The aim of this phase was to assess whether there were any meaningful patterns in missing data across all predictor variables. Table A.8.5. The percentages of missing data for each of the predictor variables across school type VARIABLES
PRIMARY SCHOOLS % of missing data
SECONDARY SCHOOLS %of missing data
SCHOOL LEVEL Urbanicity 0.0 0.0 School size 0.4 0.0 School %FSM 1.8 0.0 School & EAL 1.8 0.0 School % SA 6.7 1.1 School % SAP & ST 6.7 1.1 School Achievement 10.3 1.1 School Absence 7.0 1.1 School Exclusions 0.0 0.0 INDIVIDUAL LEVEL Year group 0.0 0.0 Season of Birth 0.0 0.0 Gender 0.0 0.0 Ethnicity 0.0 0.1 Free school meals 0.0 0.1 SEND Category 3.2 0.2 SEND support 2.0 0.8 Attendance 2.3 0.7 Academic Achievement 5.2 9.7 Positive Relationships 0.5 1.2 Bullying 1.1 5.1 Bully role 5.9 2.7 As can be seen from the above table in the primary school data set 6 variables had 5% or more missing data these included School % SA and School % SAP & ST which were both missing 6.7%, school level academic achievement missing 10.3%, School absence missing 7.0%, individual academic achievement missing 5.2% and role in bullying incidences missing 5.9%. In the secondary data set only 2 variables were missing over 5% these were individual academic achievement and bullying mean score. It has been noted however, that what is potentially more important is not the amount of missing data per se but the patterns within that data that have the most influence on findings (Tabachnick & Fidell 2007). A pattern analysis was therefore conducted in order to assess whether there were any meaningful patterns in missing data, i.e. whether missing data were related across variables.
402
The pattern analysis revealed that in primary schools about 5% of cases were missing on the school level variables of % of SA, % of SAP & ST, School absence and School academic achievement. It is likely that it was the same schools where this data were unavailable, i.e. a failure by the school to return this information, the pattern is therefore unlikely to be related to individual pupils, but only to the school pupils are attending. No pattern over 5% was found within the secondary data set. The final analysis therefore involved conducting Little’s (1988) test whether these patterns of missing data are missing completely at random or not. This test revealed data for primary schools were not missing completely at random (χ₂ =2195.609, (df 131), p < .001). This is not a surprising finding from the information provided above about patterns of missing data across schools, rather than for specific characteristics of pupils. For secondary schools the test also revealed data were also not missing completely at random (χ₂ =446.678, (df 95), p < .001). This is perhaps a more surprising finding as no pattern in missing data in secondary schools was observed for over 5% of cases. Nonetheless patterns of missing data could have emerged more frequently at values of less than 5% of cases, and in combination these could have resulted in data not being missing completely at random. The results from these analyses reveal that although the missing data was not MCAR, it is likely to be a product of schools not completing and returning the school level data rather than being related to a specific individual. Furthermore with the majority of missing data less than 5% and only a few notable patterns in missing data it is unlikely that missing data has had an excessive influence on the results.