
Bc. Martin Polanka Performance Testing for LTE Infrastructure
136
MASTER THESIS Bc. Martin Polanka Performance Testing for LTE Infrastructure Department of Distributed and Dependable Systems Supervisor of the master thesis: prof. Ing. Petr T˚ uma, Dr. Study programme: Computer Science Study branch: ISS Prague 2018
-
Upload
khangminh22 -
Category
Documents
-
view
0 -
download
0
Transcript of Bc. Martin Polanka Performance Testing for LTE Infrastructure

MASTER THESIS
Bc. Martin Polanka
Performance Testingfor LTE Infrastructure
Department of Distributed and Dependable Systems
Supervisor of the master thesis: prof. Ing. Petr Tuma, Dr.Study programme: Computer Science
Study branch: ISS
Prague 2018


I declare that I carried out all work on this master thesis independently, and onlywith the cited sources, literature and other professional sources.I understand that my work relates to the rights and obligations under the ActNo. 121/2000 Sb., the Copyright Act, as amended, in particular the fact that theCharles University has the right to conclude a license agreement on the use ofthis work as a school work pursuant to Section 60 subsection 1 of the CopyrightAct.
In ........ date ............ Bc. Martin Polanka
i

ii

First and foremost, I would like to thank my thesis supervisor prof. Petr Tumafor his invaluable support throughout the thesis and especially for his numerousideas and proposed improvements. I would also like to thank Mr. Radim Kalfusand Mr. Lukas Brezina from the major Czech telecommunication provider fortheir advice and hours of provided consultations.
I highly appreciate all my professors at my Alma Mater for the knowledgethey passed to us students and I hope they will continue to do a great job ofpreparing students for future jobs. Last but not least, my great gratitude goesto my parents who supported me through all the years of my studies and raisedme the way they did.
iii

iv
Title: Performance Testing for LTE Infrastructure
Author: Bc. Martin Polanka
Department: Department of Distributed and Dependable Systems
Supervisor: prof. Ing. Petr Tuma, Dr., Department of Distributed and Depend-able Systems
Abstract: In the past few years, new standards of telecommunication networksbrought new approaches to the internal architecture and introduced new compo-nents. One of them is the PCRF server component which manages an allocationof bandwidth for all user devices, therefore, it is a performance sensitive applica-tion. Yet there are no suitable smart traffic generators for such server and thereis no comprehensive study of implementations. Based on the server provided byone of the major Czech telecommunication providers, the traffic generator for realscenarios and performance testing was designed and implemented. In addition,the statistics collection from the server was realized with the use of instrumen-tation. Both of these parts were put together in the form of testing frameworkwhich was used for measurements of the designed test cases. The results from themeasurement were evaluated and describe the behavior of the server in a real-lifeutilization and also under heavy load. Based on the evaluation, the provider canimprove the server implementation and perform further analysis. The traffic gen-erator can be extended to support more test cases and even reused by differenttelecommunication providers.
Keywords: LTE, VoLTE, PCRF, performance testing, performance evaluation,traffic generation
v

vi

Contents
Introduction 3
1 Context 51.1 Diameter Protocol . . . . . . . . . . . . . . . . . . . . . . . . . . 7
1.1.1 Base Protocol . . . . . . . . . . . . . . . . . . . . . . . . . 71.2 LTE . . . . . . . . . . . . . . . . . . . . . . . . . . . . . . . . . . 11
1.2.1 PCRF . . . . . . . . . . . . . . . . . . . . . . . . . . . . . 121.2.2 PCEF . . . . . . . . . . . . . . . . . . . . . . . . . . . . . 131.2.3 CSCF . . . . . . . . . . . . . . . . . . . . . . . . . . . . . 131.2.4 Diameter Applications . . . . . . . . . . . . . . . . . . . . 13
1.3 PCRF Implementation . . . . . . . . . . . . . . . . . . . . . . . . 161.3.1 MediationZone . . . . . . . . . . . . . . . . . . . . . . . . 161.3.2 High-availability . . . . . . . . . . . . . . . . . . . . . . . 171.3.3 Sessions Storage . . . . . . . . . . . . . . . . . . . . . . . . 171.3.4 Provided Tests . . . . . . . . . . . . . . . . . . . . . . . . 17
1.4 Related Work . . . . . . . . . . . . . . . . . . . . . . . . . . . . . 18
2 Analysis 192.1 Traffic Generation Analysis . . . . . . . . . . . . . . . . . . . . . 20
2.1.1 PCRF Communication Flows . . . . . . . . . . . . . . . . 202.1.2 Scenarios Description . . . . . . . . . . . . . . . . . . . . . 262.1.3 Test Profiles . . . . . . . . . . . . . . . . . . . . . . . . . . 35
2.2 PCRF Data Collection . . . . . . . . . . . . . . . . . . . . . . . . 372.2.1 Collected Output . . . . . . . . . . . . . . . . . . . . . . . 392.2.2 Measurement Options . . . . . . . . . . . . . . . . . . . . 41
3 Implementation 433.1 Traffic Generator . . . . . . . . . . . . . . . . . . . . . . . . . . . 43
3.1.1 jDiameter . . . . . . . . . . . . . . . . . . . . . . . . . . . 433.1.2 Configuration . . . . . . . . . . . . . . . . . . . . . . . . . 443.1.3 Generator Logic . . . . . . . . . . . . . . . . . . . . . . . . 44
3.2 Testing Framework . . . . . . . . . . . . . . . . . . . . . . . . . . 453.2.1 Test Profiles . . . . . . . . . . . . . . . . . . . . . . . . . . 453.2.2 DiSL Instrumentation . . . . . . . . . . . . . . . . . . . . 463.2.3 Scripts . . . . . . . . . . . . . . . . . . . . . . . . . . . . . 48
4 Evaluation 514.1 Initial Tuning . . . . . . . . . . . . . . . . . . . . . . . . . . . . . 514.2 Test Profiles Evaluation . . . . . . . . . . . . . . . . . . . . . . . 53
4.2.1 Real-life Profile . . . . . . . . . . . . . . . . . . . . . . . . 544.2.2 Big Event Profile . . . . . . . . . . . . . . . . . . . . . . . 584.2.3 Call Performance Test . . . . . . . . . . . . . . . . . . . . 604.2.4 Stress Test . . . . . . . . . . . . . . . . . . . . . . . . . . . 64
4.3 Additional Results Evaluation . . . . . . . . . . . . . . . . . . . . 694.3.1 Database Overhead . . . . . . . . . . . . . . . . . . . . . . 69
1

4.3.2 Histogram Clusters . . . . . . . . . . . . . . . . . . . . . . 704.3.3 Normal Distribution in Histograms . . . . . . . . . . . . . 764.3.4 Real-life and Big Event Comparison . . . . . . . . . . . . . 774.3.5 Maximum Values for MediationZone . . . . . . . . . . . . 784.3.6 Hardware Resources . . . . . . . . . . . . . . . . . . . . . 804.3.7 Couchbase Memory Consumption . . . . . . . . . . . . . . 82
Conclusion 85
Bibliography 87
List of Figures 91
Terminology 93
A Attachments 97
B User Documentation of Traffirator 99B.1 Installation and Compilation . . . . . . . . . . . . . . . . . . . . . 99B.2 Configuration . . . . . . . . . . . . . . . . . . . . . . . . . . . . . 100
B.2.1 Traffirator Configuration . . . . . . . . . . . . . . . . . . . 100B.2.2 Log4j Configuration . . . . . . . . . . . . . . . . . . . . . . 101B.2.3 jDiameter Configuration . . . . . . . . . . . . . . . . . . . 101
B.3 Execution . . . . . . . . . . . . . . . . . . . . . . . . . . . . . . . 102B.4 Outputs . . . . . . . . . . . . . . . . . . . . . . . . . . . . . . . . 102
C User Documentation of Testing Framework 103C.1 Dependencies . . . . . . . . . . . . . . . . . . . . . . . . . . . . . 103C.2 Execution . . . . . . . . . . . . . . . . . . . . . . . . . . . . . . . 104
D Description of PCRF Flows 105D.1 Connect . . . . . . . . . . . . . . . . . . . . . . . . . . . . . . . . 105D.2 Disconnect . . . . . . . . . . . . . . . . . . . . . . . . . . . . . . . 107D.3 Update . . . . . . . . . . . . . . . . . . . . . . . . . . . . . . . . . 108D.4 Lost Connection . . . . . . . . . . . . . . . . . . . . . . . . . . . . 109D.5 Call . . . . . . . . . . . . . . . . . . . . . . . . . . . . . . . . . . 111
D.5.1 Call Init . . . . . . . . . . . . . . . . . . . . . . . . . . . . 111D.5.2 Call Update Codec . . . . . . . . . . . . . . . . . . . . . . 117D.5.3 Call Termination . . . . . . . . . . . . . . . . . . . . . . . 122D.5.4 Call Lost Connection . . . . . . . . . . . . . . . . . . . . . 123
2
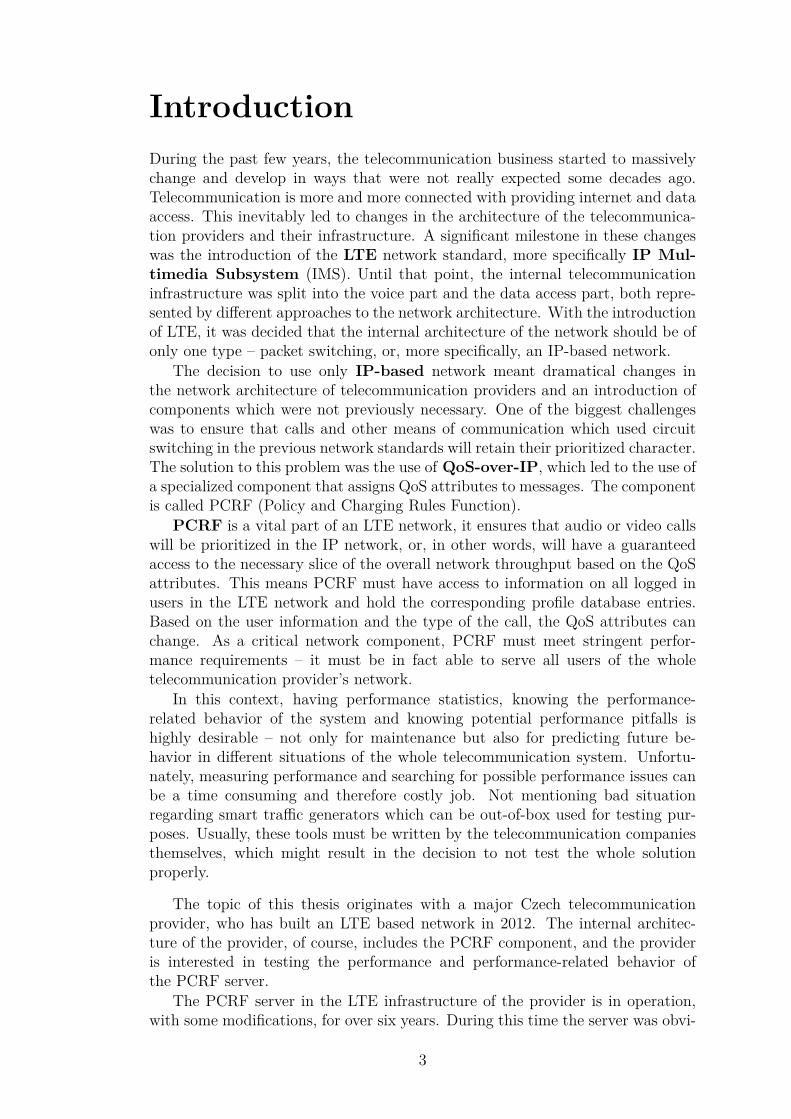
IntroductionDuring the past few years, the telecommunication business started to massivelychange and develop in ways that were not really expected some decades ago.Telecommunication is more and more connected with providing internet and dataaccess. This inevitably led to changes in the architecture of the telecommunica-tion providers and their infrastructure. A significant milestone in these changeswas the introduction of the LTE network standard, more specifically IP Mul-timedia Subsystem (IMS). Until that point, the internal telecommunicationinfrastructure was split into the voice part and the data access part, both repre-sented by different approaches to the network architecture. With the introductionof LTE, it was decided that the internal architecture of the network should be ofonly one type – packet switching, or, more specifically, an IP-based network.
The decision to use only IP-based network meant dramatical changes inthe network architecture of telecommunication providers and an introduction ofcomponents which were not previously necessary. One of the biggest challengeswas to ensure that calls and other means of communication which used circuitswitching in the previous network standards will retain their prioritized character.The solution to this problem was the use of QoS-over-IP, which led to the use ofa specialized component that assigns QoS attributes to messages. The componentis called PCRF (Policy and Charging Rules Function).
PCRF is a vital part of an LTE network, it ensures that audio or video callswill be prioritized in the IP network, or, in other words, will have a guaranteedaccess to the necessary slice of the overall network throughput based on the QoSattributes. This means PCRF must have access to information on all logged inusers in the LTE network and hold the corresponding profile database entries.Based on the user information and the type of the call, the QoS attributes canchange. As a critical network component, PCRF must meet stringent perfor-mance requirements – it must be in fact able to serve all users of the wholetelecommunication provider’s network.
In this context, having performance statistics, knowing the performance-related behavior of the system and knowing potential performance pitfalls ishighly desirable – not only for maintenance but also for predicting future be-havior in different situations of the whole telecommunication system. Unfortu-nately, measuring performance and searching for possible performance issues canbe a time consuming and therefore costly job. Not mentioning bad situationregarding smart traffic generators which can be out-of-box used for testing pur-poses. Usually, these tools must be written by the telecommunication companiesthemselves, which might result in the decision to not test the whole solutionproperly.
The topic of this thesis originates with a major Czech telecommunicationprovider, who has built an LTE based network in 2012. The internal architec-ture of the provider, of course, includes the PCRF component, and the provideris interested in testing the performance and performance-related behavior ofthe PCRF server.
The PCRF server in the LTE infrastructure of the provider is in operation,with some modifications, for over six years. During this time the server was obvi-
3
ously tested in production by real users. Regression tests and simple performancetests also exist. However, there is no study or research concerning the overall per-formance and tests approximating real-life scenarios are also missing. Remedyingthis situation is the goal of this thesis.
Scope of the ThesisThe initial discussions with the telecommunication provider concerned only a ba-sic study of the performance and performance-related behavior of the PCRFserver. For this task, we needed tests, which were provided in the form of regres-sion and performance tests. Later, however, it turned out that these tests are notsuitable for studying the behavior of the system under real-life load. The syn-thetic workloads generated by the tests do not really reflect everyday usage.
To complement the synthetic tests, the thesis includes an implementation ofreal-life test scenarios in the form of a traffic generator, which will be used toexecute the tests and provide data for further research of PCRF behavior andperformance. The implemented solution can be used by the telecommunicationprovider for further testing and possibly further development. Considering this,the implemented traffic generator should be reasonably general and allow to easilyimplement new testing scenarios.
The thesis structure reflects the goals in four main chapters: Context, Analy-sis, Implementation, and Evaluation. The Context chapter will describe the LTEarchitecture and the position of the PCRF server. Additionally, it will describethe current PCRF solution deployed by the telecommunication provider, togetherwith the existing testing solutions. The Analysis chapter will analyze the testsscenarios and describe the measurement methods. The implementation outlinestwo main entities that warrant attention: the traffic generator and the measure-ment framework.
Finally, the Evaluation chapter will hold the evaluation of performed testing.There will be detailed analysis of results from all tested cases accompanied byplots with interesting metrics. The thesis ends with a glossary of terminologyand four appendices. The first appendix describes files attached to the thesisand their directory tree. Second and third appendices are user documentation ofthe traffic generator and user documentation of the testing framework. And thelast appendix contains detailed description of the messages which might be sentor received by the PCRF server
4
1. ContextThe whole thesis is centered around the PCRF component, which is part of the IPMultimedia Subsystem (IMS). IMS is typically placed within LTE network ornew generation networks in general, but can also be used in older telecommuni-cation network architectures (2G, 3G). Therefore, IMS is a separate component,which ensures multimedia transfer and management within telecommunicationprovider network. IMS, as the name suggests, is based on the IP protocol.
The PCRF component is part of the more general system called Policy andCharging Control (PCC), which is a subpart of IMS. PCC is a system used forcharging users according to the network usage and applying policies. Policies arerules applied to a particular network transport, they can have a form of QoSattributes or bandwidth allocation. The PCC system contains three components– PCRF, PCEF, and CSCF.
The PCRF component is connected with PCEF and CSCF, this connectionis done with the use of the Diameter protocol. Diameter is the new Authen-tication, Authorization, and Accounting (AAA) protocol built on the successfulpredecessor RADIUS. AAA family of protocols generally manages an access tothe network for end-user devices and they can also be used for tracking of the net-work usage.
Considering the previous description, the user device, once it is connected tothe network, established a communication with the IMS network. This commu-nication channel is prioritized and therefore it has to have assigned bandwidthand QoS attributes. The enforcement of the prioritization is done on the PCEFcomponent, which is also referred to as a packet gateway. All the communicationfrom the user device to the IMS network goes through PCEF.
PCEF itself only enforces rules which come from PCRF, therefore, the con-nection of the device is signaled from the PCEF to the PCRF, which sends backthe right QoS attributes and bandwidth. The initial established connection isheld active for the whole time, while the user device is alive and all consecutiverequests on the IMS are done through this connection.
If a call or video call is requested on the user device, the request goes tothe IMS, more specifically, to the CSCF component, which manages the calls.The CSCF requests a new transport channel through packet gateway dedicated tothe call, this request goes to PCRF. If PCRF decides to allow the call, proper QoSattributes and bandwidth is sent to the PCEF component, which then enforcesthem on the established call.
5
1.1 Diameter ProtocolThe Diameter protocol is a successor of the RADIUS [1] protocol, also used forAAA – Authentication, Authorization, and Accounting. The name of the pro-tocol is a word pun, the diameter is double the radius, which should express itssuperiority. As the predecessor, RADIUS was taken as a basis for the Diameterprotocol and considerable effort was put into making the Diameter similar tothe RADIUS, which should make a transition between these two protocols easier.The Diameter protocol is defined as an internet standard managed by the IETF,in RFC 6733 [2] which obsoletes the original RFC 3588 [3].
The Diameter protocol extends and modifies RADIUS extensively. Both ofthem has support for additional content in the messages with the use of Attribute-Value Pairs (AVPs for short). In addition to RADIUS, there is support forcapabilities negotiation between two Diameter peers. Another feature is peer dis-covery and autoconfiguration, which in many cases replaces manual configuration.Diameter is also transmitted over TCP and not UDP, which was the protocol ofchoice for RADIUS. And last but not least, Diameter supports agents such asproxies or redirects. In this thesis, we will focus on the format of the Diame-ter messages and applications which use Diameter, other advanced features likeagents are out of the scope of the thesis and will not be discussed.
RFC 6733 defines only the Diameter base protocol. On top of that, customapplications can define their own message structure and content. An applicationcan be defined either in an internet standard by IETF, or by the 3GPP organi-zation, or it can be defined in an entirely custom way. The official applicationsand their assigned identifications are managed by IANA in a corresponding doc-ument. The default identification is number 0 and represents Diameter commonmessage, which can be used for capabilities negotiation, etc.
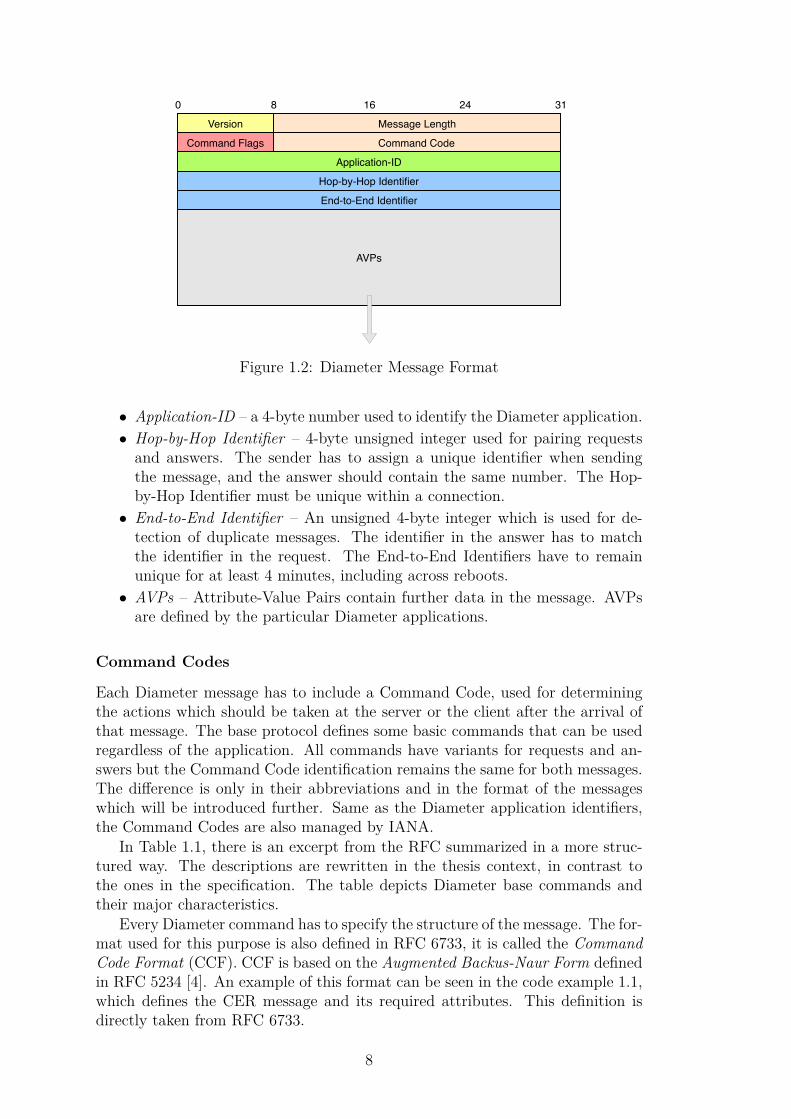
1.1.1 Base ProtocolThe base protocol defines the mandatory message header that has to be includedin every message, and, optionally, additional AVPs. The header is 20 bytes longand is depicted in Figure 1.2. The whole structure of the Diameter message isdiscussed in more detail:
• Version – Indicates the version of Diameter, at the time being, this isnumber 1.
• Message Length – a 3-byte number which gives the length of the message,including the header and the padded AVPs.
• Command Flags – Eight flags which determine further characteristics ofthe message, four are used, and four are reserved.
– Request – If set, the message is a request, otherwise, it is an answer.– Proxiable – The message can be proxied, relayed, or redirected.– Error – Set only if the message contains a protocol error.– Potentially Retransmitted Message – Set in case the message is resent
and not yet acknowledged.• Command Code – Again a 3-byte number which should be used for distin-
guishing between message types.
7
Version Message Length
Command Flags Command Code
Application-ID
Hop-by-Hop Identifier
End-to-End Identifier
AVPs
0 168 24 31
Figure 1.2: Diameter Message Format
• Application-ID – a 4-byte number used to identify the Diameter application.• Hop-by-Hop Identifier – 4-byte unsigned integer used for pairing requests
and answers. The sender has to assign a unique identifier when sendingthe message, and the answer should contain the same number. The Hop-by-Hop Identifier must be unique within a connection.
• End-to-End Identifier – An unsigned 4-byte integer which is used for de-tection of duplicate messages. The identifier in the answer has to matchthe identifier in the request. The End-to-End Identifiers have to remainunique for at least 4 minutes, including across reboots.
• AVPs – Attribute-Value Pairs contain further data in the message. AVPsare defined by the particular Diameter applications.
Command Codes
Each Diameter message has to include a Command Code, used for determiningthe actions which should be taken at the server or the client after the arrival ofthat message. The base protocol defines some basic commands that can be usedregardless of the application. All commands have variants for requests and an-swers but the Command Code identification remains the same for both messages.The difference is only in their abbreviations and in the format of the messageswhich will be introduced further. Same as the Diameter application identifiers,the Command Codes are also managed by IANA.
In Table 1.1, there is an excerpt from the RFC summarized in a more struc-tured way. The descriptions are rewritten in the thesis context, in contrast tothe ones in the specification. The table depicts Diameter base commands andtheir major characteristics.
Every Diameter command has to specify the structure of the message. The for-mat used for this purpose is also defined in RFC 6733, it is called the CommandCode Format (CCF). CCF is based on the Augmented Backus-Naur Form definedin RFC 5234 [4]. An example of this format can be seen in the code example 1.1,which defines the CER message and its required attributes. This definition isdirectly taken from RFC 6733.
8
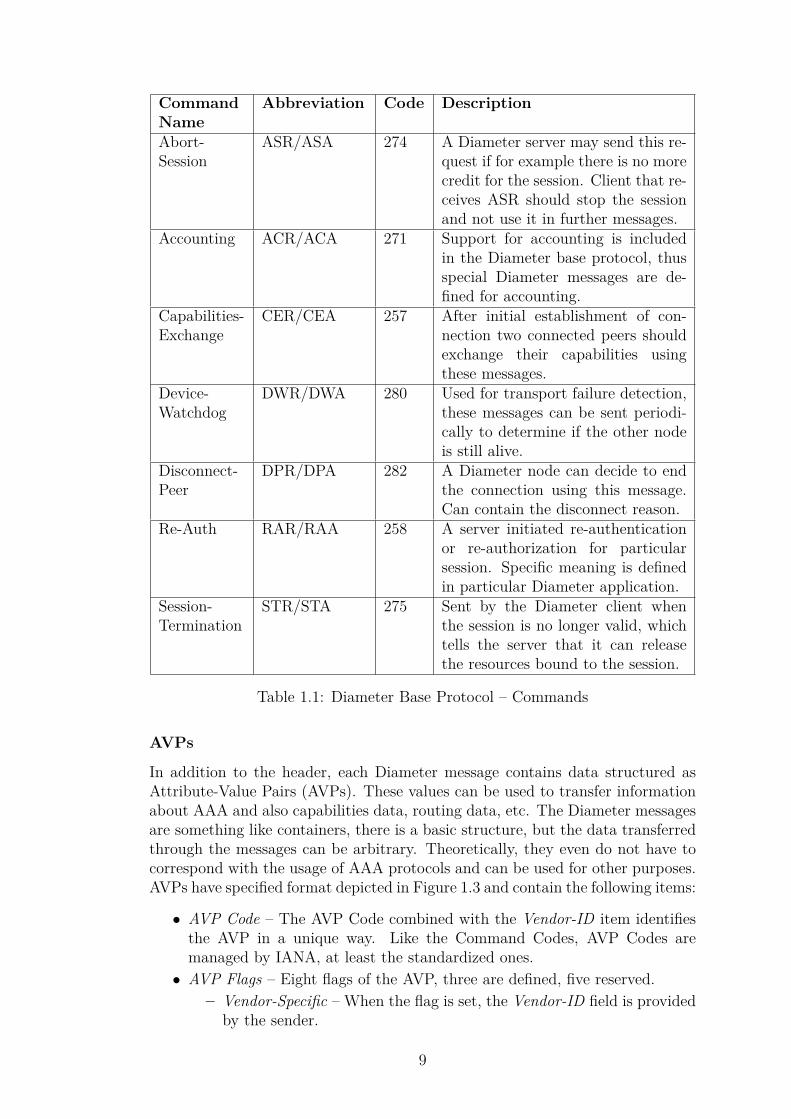
CommandName
Abbreviation Code Description
Abort-Session
ASR/ASA 274 A Diameter server may send this re-quest if for example there is no morecredit for the session. Client that re-ceives ASR should stop the sessionand not use it in further messages.
Accounting ACR/ACA 271 Support for accounting is includedin the Diameter base protocol, thusspecial Diameter messages are de-fined for accounting.
Capabilities-Exchange
CER/CEA 257 After initial establishment of con-nection two connected peers shouldexchange their capabilities usingthese messages.
Device-Watchdog
DWR/DWA 280 Used for transport failure detection,these messages can be sent periodi-cally to determine if the other nodeis still alive.
Disconnect-Peer
DPR/DPA 282 A Diameter node can decide to endthe connection using this message.Can contain the disconnect reason.
Re-Auth RAR/RAA 258 A server initiated re-authenticationor re-authorization for particularsession. Specific meaning is definedin particular Diameter application.
Session-Termination
STR/STA 275 Sent by the Diameter client whenthe session is no longer valid, whichtells the server that it can releasethe resources bound to the session.
Table 1.1: Diameter Base Protocol – Commands
AVPs
In addition to the header, each Diameter message contains data structured asAttribute-Value Pairs (AVPs). These values can be used to transfer informationabout AAA and also capabilities data, routing data, etc. The Diameter messagesare something like containers, there is a basic structure, but the data transferredthrough the messages can be arbitrary. Theoretically, they even do not have tocorrespond with the usage of AAA protocols and can be used for other purposes.AVPs have specified format depicted in Figure 1.3 and contain the following items:
• AVP Code – The AVP Code combined with the Vendor-ID item identifiesthe AVP in a unique way. Like the Command Codes, AVP Codes aremanaged by IANA, at least the standardized ones.
• AVP Flags – Eight flags of the AVP, three are defined, five reserved.– Vendor-Specific – When the flag is set, the Vendor-ID field is provided
by the sender.
9
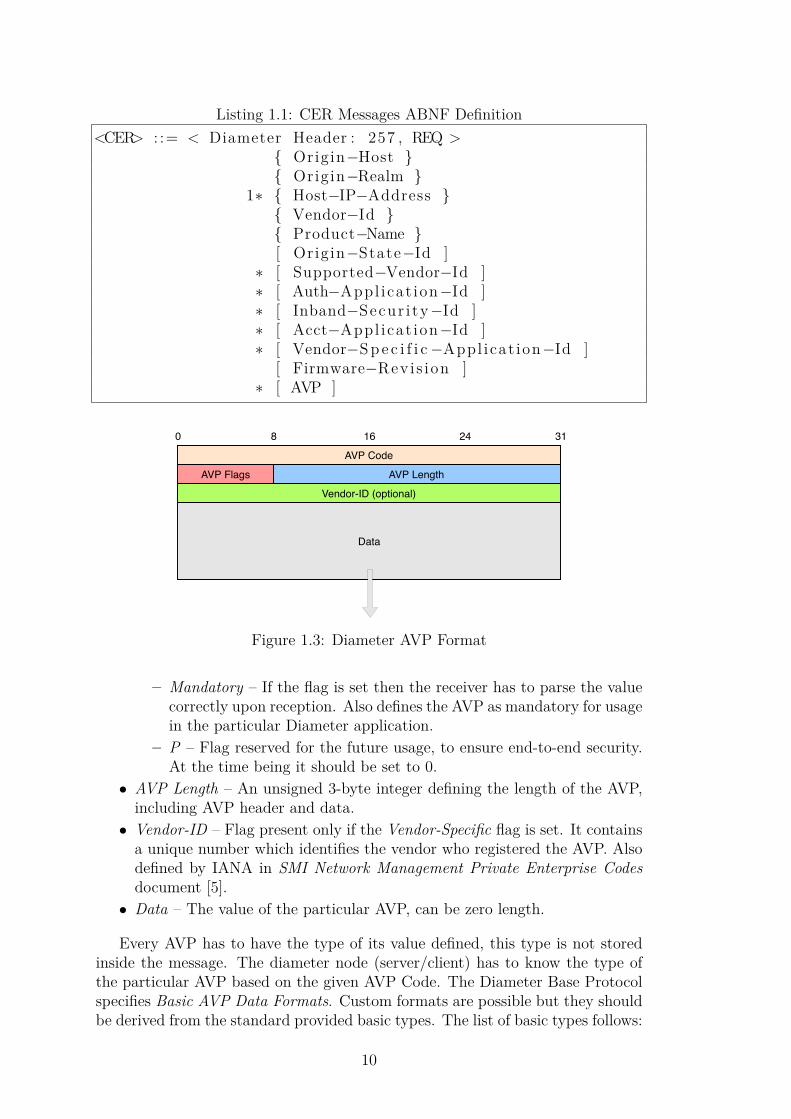
Listing 1.1: CER Messages ABNF Definition<CER> : := < Diameter Header : 257 , REQ >
{ Origin−Host }{ Origin−Realm }
1∗ { Host−IP−Address }{ Vendor−Id }{ Product−Name }[ Origin−State−Id ]
∗ [ Supported−Vendor−Id ]∗ [ Auth−Appl icat ion−Id ]∗ [ Inband−Secur i ty −Id ]∗ [ Acct−Appl icat ion−Id ]∗ [ Vendor−S p e c i f i c −Appl icat ion−Id ]
[ Firmware−Revis ion ]∗ [ AVP ]
AVP Flags AVP Length
AVP Code
Vendor-ID (optional)
Data
0 168 24 31
Figure 1.3: Diameter AVP Format
– Mandatory – If the flag is set then the receiver has to parse the valuecorrectly upon reception. Also defines the AVP as mandatory for usagein the particular Diameter application.
– P – Flag reserved for the future usage, to ensure end-to-end security.At the time being it should be set to 0.
• AVP Length – An unsigned 3-byte integer defining the length of the AVP,including AVP header and data.
• Vendor-ID – Flag present only if the Vendor-Specific flag is set. It containsa unique number which identifies the vendor who registered the AVP. Alsodefined by IANA in SMI Network Management Private Enterprise Codesdocument [5].
• Data – The value of the particular AVP, can be zero length.
Every AVP has to have the type of its value defined, this type is not storedinside the message. The diameter node (server/client) has to know the type ofthe particular AVP based on the given AVP Code. The Diameter Base Protocolspecifies Basic AVP Data Formats. Custom formats are possible but they shouldbe derived from the standard provided basic types. The list of basic types follows:
10
• OctetString – Arbitrarily long string• Integer32 – 32-bit signed value• Integer64 – 64-bit signed value• Unsigned32 – 32-bit unsigned value• Unsigned64 – 64-bit unsigned value• Float32 – single precision floating point number as described by IEEE 754-
1985 [6]• Float64 – double precision floating point number as described by IEEE
754-1985• Grouped – Grouped AVP data format is the way the AVPs can include
the sequence of another AVPs, therefore, AVPs supports nesting
Based on the basic data formats, the Diameter Base Protocol also definesCommon Derived AVP Data Formats which could be useful for further usage.A list of the derived formats follows, the description of the types is omitted andcan be found in the appropriate RFC.
• Address – Derived from OctetString• Time – Derived from OctetString• UTF8String – Derived from OctetString• DiameterIdentity – Derived from OctetString• DiameterURI – Derived from OctetString• Enumerated – Derived from Integer32• IPFilterRule – Derived from OctetString
1.2 LTELTE stands for Long-term Evolution, a telecommunication standard which su-persedes the 3G1 networks. Formally LTE does not comply with the 4G2 net-works specification, due to high-speed expectancy for 4G networks, but it wasretroactively accepted as the new generation network. At this time, the LTEis commonly advertised as the 4G network by the telecommunication providers.LTE was first introduced by 3GPP in Release 8 of the standard specifications. Inthe following chapter, we will cover only a few important areas which are neededfor better understanding of the thesis.
LTE is a major step forward in the telecommunication industry. Up to thispoint, the architecture of the network had to handle two types of communica-tion. One based on circuit switching, such as calls and messages, and the otherbased on packet switching, used for data transfer. Keeping two separate andeven contradictory network approaches had, of course, high maintenance costs,thus the main change in the LTE architecture was the use of only one networkapproach, based on packet switching. This little change had major impact onthe whole telecommunication provider network architecture and led to massivechanges and an introduction of new network components.
1ITU standard IMT-20002ITU standard IMT-Advanced
11
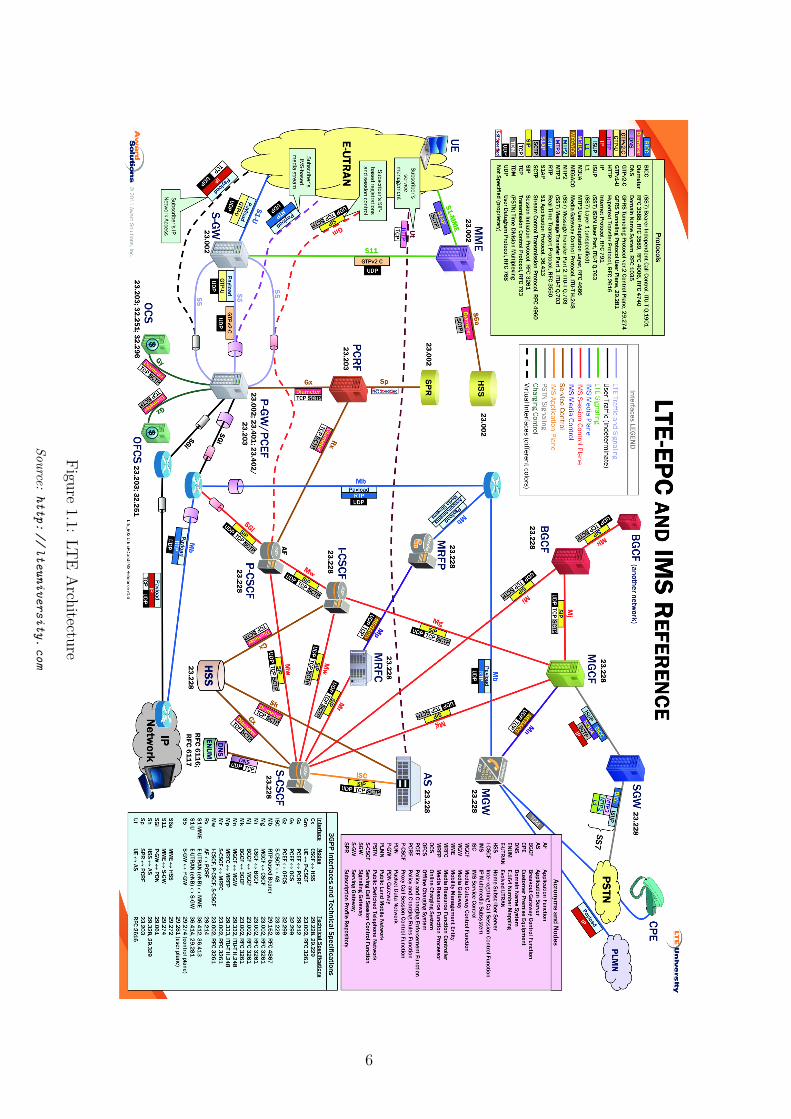
The LTE architecture is defined by the 3GPP TS 23.002 [7] and is composedof the following main components: E-UTRAN, EPC, and IMS. E-UTRAN isan acronym for Evolved Universal Mobile Telecommunications System TerrestrialRadio Access Network and it is specified by the 3GPP TS 36.401 [8]. E-UTRAN isa new access network designed for the purposes of LTE and has higher throughputthan the previous telecommunication standards. Another part of LTE is EPC,which stands for Evolved Packet Core – the core part of the telecommunicationnetwork which manages the user equipment and appropriate communication.
The changes of the network architecture are most visible in the EPC andIMS parts of LTE. IP Multimedia Subsystem (IMS) is the system that ensuresthe transport of the calls, messages, and multimedia over the IP network and itis contained within LTE architecture. Both of EPC and IMS rely only on packetswitching, which in some parts simplifies the overall architecture significantly.EPC manages the user equipment, its authentication, authorization, and datatransport through the border gateways. The overall LTE architecture is depictedon Figure 1.1.
In the overall LTE architecture, the PCRF component is placed within EPCand with other elements like the PCEF and the CSCF, it is part of the moregeneral system called Policy and Charging Control (PCC). The PCC is a generalsystem used for charging users according to the network usage and applyingpolicies. In the context of LTE, PCC was defined by 3GPP TS 23.203 [9]. Inthis standard, we can find description of PCRF and also basic definitions ofthe interfaces between the network elements.
1.2.1 PCRFThe PCRF is an acronym of Policy and Charging Rules Function and in the con-text of the PCC, it is responsible for determining the right QoS attributes andbandwidth based on given user information. The PCRF is connected with twoother components, through the Gx interface with the PCEF and through the Rxinterface with the CSCF, both will be described later.
The PCRF is a newly introduced component in the LTE telecommunicationnetwork. In cooperation with the PCEF and CSCF, PCRF ensures that calls andmessages, which had dedicated circuit-switching-based network in the previousnetwork standards, are prioritized before any other data transfer. Higher priorityis provided by the QoS-over-IP protocol, which has to be supported in the EPCand the IMS part of the new telecommunication network. The main QoS param-eter is the bandwidth dedicated to the transfer. There is an expression used fordedicated transfer – the bearer.
The whole PCRF functionality is focused around bearers. When the userdevice initially connects to the network, the PCEF notifies the PCRF about this.On the PCEF the default bearer is created and used for communication betweenthe user device and the network of the telecommunication provider. This bearer isused whenever the user requests some action from the IMS, like call or message. Inthe former case, the CSCF will request a dedicated call bearer from the PCRF.If the processing on the PCRF is successful, then the PCEF is notified abouta new bearer, which should be established at the packet gateway. In addition,the PCRF also handles updates of the used codec during the call, which might
12
or might not change the bearer bandwidth. When the user device disconnects,the PCRF is notified about this again by the PCEF.
PCRF can implement relatively advanced logic based on the provided userdata. In the reference architecture, the PCRF is connected to the SubscriptionProfile Repository (SPR). The SPR is a database of all user devices registeredin the network of the telecommunication provider. Based on this repository,the PCRF can decide what policies and QoS attributes will be used for the userdevice. In addition, the PCRF has to handle and store the information aboutactive sessions, this can be managed by the SPR or a different kind of persistentcache.
PCRF communicates through two interfaces, Gx and Rx. The Gx interfacefaces the PCRF and uses session identifiers to distinguish individual user devices,while the Rx interface connects to the CSCF and uses session identifiers to refer tocalls or messages. Both interfaces within the PCRF server use Diameter protocolfor network communication.
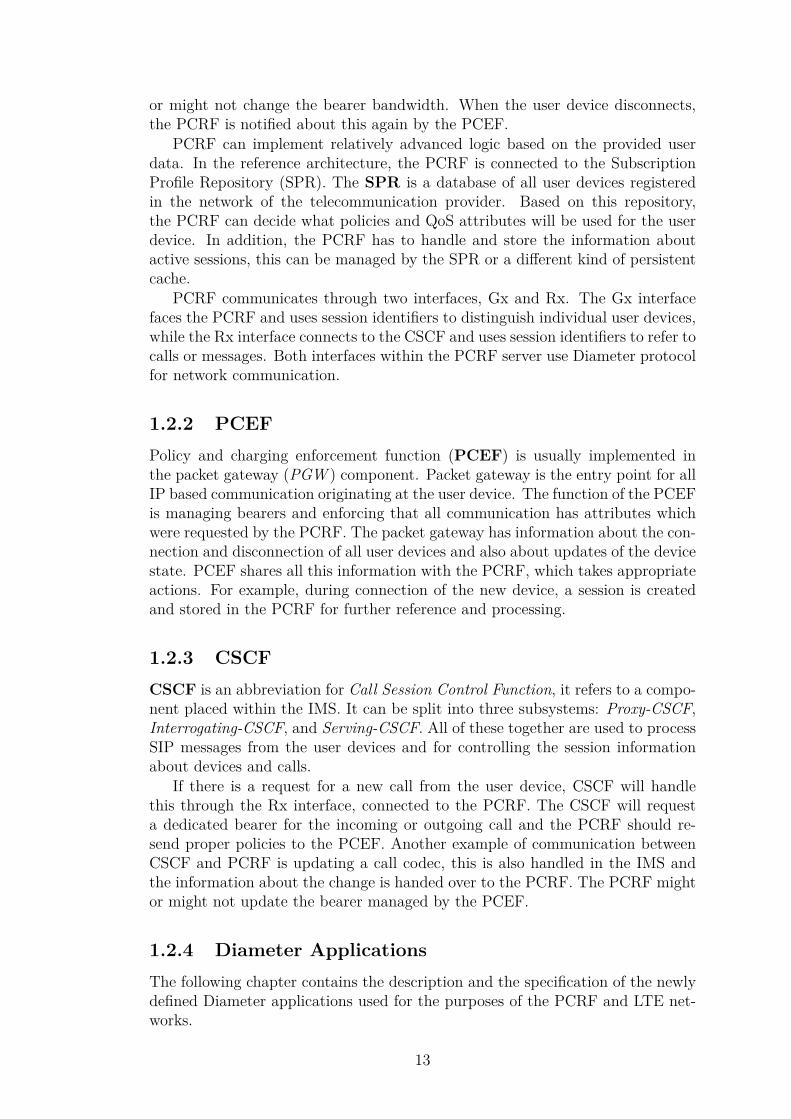
1.2.2 PCEFPolicy and charging enforcement function (PCEF) is usually implemented inthe packet gateway (PGW ) component. Packet gateway is the entry point for allIP based communication originating at the user device. The function of the PCEFis managing bearers and enforcing that all communication has attributes whichwere requested by the PCRF. The packet gateway has information about the con-nection and disconnection of all user devices and also about updates of the devicestate. PCEF shares all this information with the PCRF, which takes appropriateactions. For example, during connection of the new device, a session is createdand stored in the PCRF for further reference and processing.
1.2.3 CSCFCSCF is an abbreviation for Call Session Control Function, it refers to a compo-nent placed within the IMS. It can be split into three subsystems: Proxy-CSCF,Interrogating-CSCF, and Serving-CSCF. All of these together are used to processSIP messages from the user devices and for controlling the session informationabout devices and calls.
If there is a request for a new call from the user device, CSCF will handlethis through the Rx interface, connected to the PCRF. The CSCF will requesta dedicated bearer for the incoming or outgoing call and the PCRF should re-send proper policies to the PCEF. Another example of communication betweenCSCF and PCRF is updating a call codec, this is also handled in the IMS andthe information about the change is handed over to the PCRF. The PCRF mightor might not update the bearer managed by the PCEF.
1.2.4 Diameter ApplicationsThe following chapter contains the description and the specification of the newlydefined Diameter applications used for the purposes of the PCRF and LTE net-works.
13
Diameter Gx Application
As previously stated, specialized applications can be defined for practical useof Diameter. For the PCRF and its interfaces, two Diameter applications aredefined: Gx and Rx. Both applications define new message types and theirstructure. There are also defined new AVPs which can be used within messages.
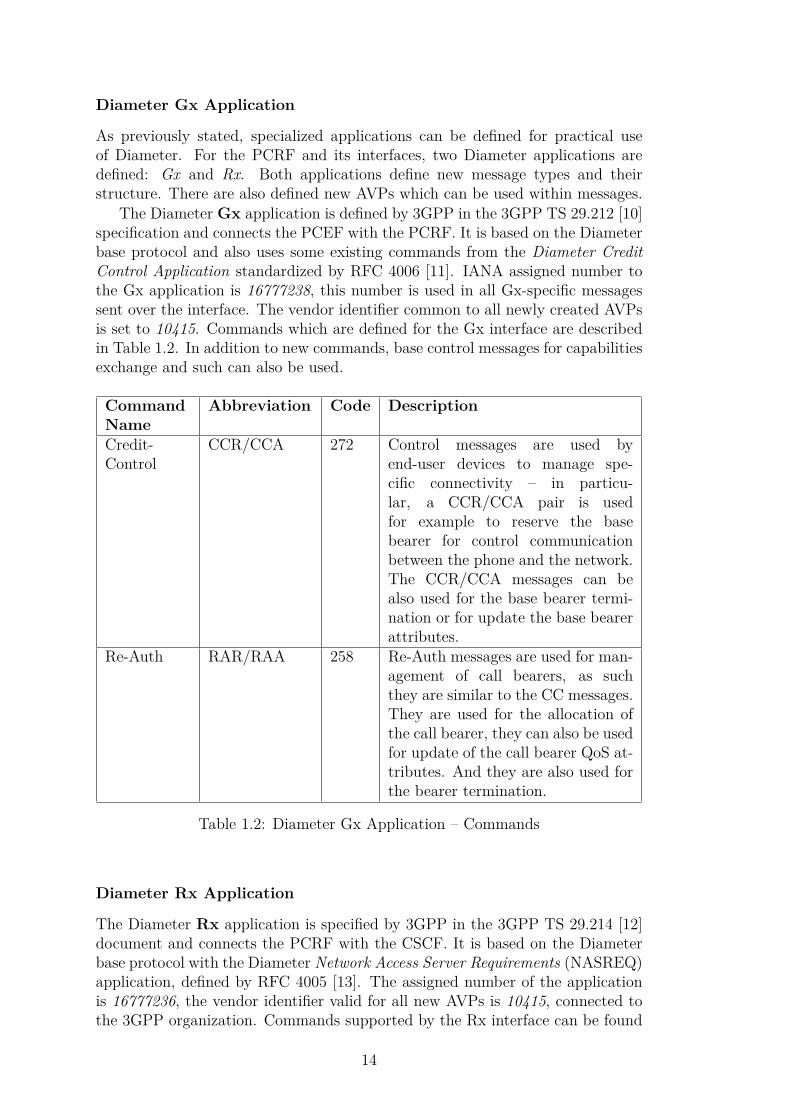
The Diameter Gx application is defined by 3GPP in the 3GPP TS 29.212 [10]specification and connects the PCEF with the PCRF. It is based on the Diameterbase protocol and also uses some existing commands from the Diameter CreditControl Application standardized by RFC 4006 [11]. IANA assigned number tothe Gx application is 16777238, this number is used in all Gx-specific messagessent over the interface. The vendor identifier common to all newly created AVPsis set to 10415. Commands which are defined for the Gx interface are describedin Table 1.2. In addition to new commands, base control messages for capabilitiesexchange and such can also be used.
CommandName
Abbreviation Code Description
Credit-Control
CCR/CCA 272 Control messages are used byend-user devices to manage spe-cific connectivity – in particu-lar, a CCR/CCA pair is usedfor example to reserve the basebearer for control communicationbetween the phone and the network.The CCR/CCA messages can bealso used for the base bearer termi-nation or for update the base bearerattributes.
Re-Auth RAR/RAA 258 Re-Auth messages are used for man-agement of call bearers, as suchthey are similar to the CC messages.They are used for the allocation ofthe call bearer, they can also be usedfor update of the call bearer QoS at-tributes. And they are also used forthe bearer termination.
Table 1.2: Diameter Gx Application – Commands
Diameter Rx Application
The Diameter Rx application is specified by 3GPP in the 3GPP TS 29.214 [12]document and connects the PCRF with the CSCF. It is based on the Diameterbase protocol with the Diameter Network Access Server Requirements (NASREQ)application, defined by RFC 4005 [13]. The assigned number of the applicationis 16777236, the vendor identifier valid for all new AVPs is 10415, connected tothe 3GPP organization. Commands supported by the Rx interface can be found
14
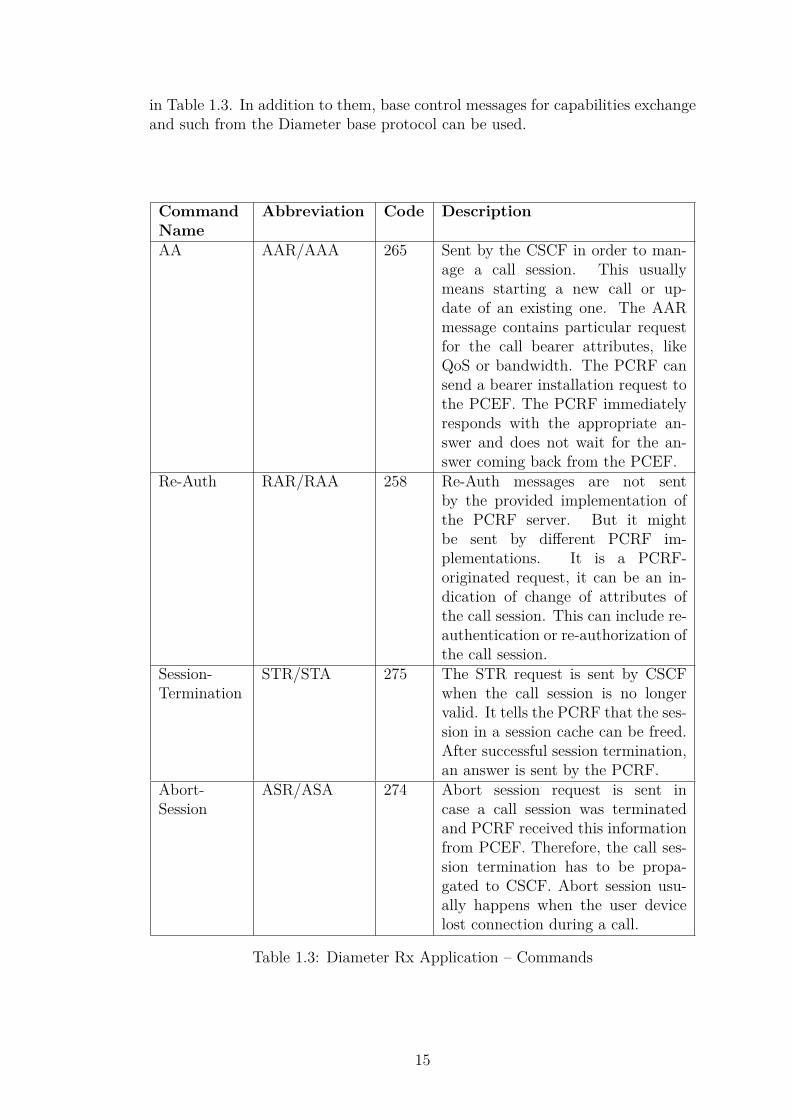
in Table 1.3. In addition to them, base control messages for capabilities exchangeand such from the Diameter base protocol can be used.
CommandName
Abbreviation Code Description
AA AAR/AAA 265 Sent by the CSCF in order to man-age a call session. This usuallymeans starting a new call or up-date of an existing one. The AARmessage contains particular requestfor the call bearer attributes, likeQoS or bandwidth. The PCRF cansend a bearer installation request tothe PCEF. The PCRF immediatelyresponds with the appropriate an-swer and does not wait for the an-swer coming back from the PCEF.
Re-Auth RAR/RAA 258 Re-Auth messages are not sentby the provided implementation ofthe PCRF server. But it mightbe sent by different PCRF im-plementations. It is a PCRF-originated request, it can be an in-dication of change of attributes ofthe call session. This can include re-authentication or re-authorization ofthe call session.
Session-Termination
STR/STA 275 The STR request is sent by CSCFwhen the call session is no longervalid. It tells the PCRF that the ses-sion in a session cache can be freed.After successful session termination,an answer is sent by the PCRF.
Abort-Session
ASR/ASA 274 Abort session request is sent incase a call session was terminatedand PCRF received this informationfrom PCEF. Therefore, the call ses-sion termination has to be propa-gated to CSCF. Abort session usu-ally happens when the user devicelost connection during a call.
Table 1.3: Diameter Rx Application – Commands
15
1.3 PCRF ImplementationAs stated in Introduction, the thesis topic was motivated by the situation at cer-tain major Czech telecommunication provider. In the context of the cooperation,a real-life implementation of the PCRF server component was provided to beinstrumented and experimented with.
The production PCRF server runs in a virtual machine environment andincludes a persistent cache for sessions. The provider recommended using atleast three machines for the PCRF evaluation purposes. On two machines arethe PCRF servers, one in active mode and one idle. The third machine andboth PCRF servers also hold the replicated and distributed persistent cache forsessions.
1.3.1 MediationZoneThe implementation of the PCRF component itself is based on an agent systemdeveloped by the DigitalRoute company. The agent system, called Media-tionZone, is proprietary and works as a framework with its own graphical userinterface. The GUI allows visual programming in the form of connecting process-ing boxes. The business logic of the boxes can be predefined or custom-definedwith the help of a domain-specific language (DSL). The agent system is imple-mented in Java and the DSL is Java-like, but without classes and class methods.In addition, custom plugins for the agent system can be written in Java andimported into the system as an alternative custom-defined logic.
MediationZone is in divided into three distinct components: The Platform,The Execution Context Standalone, and The Execution Context. The Platform isthe main component that handles all subcomponents and manages the whole sys-tem. The Execution Context Standalone (ECSA) and Execution Context (EC)components are workers that execute work assigned by the Platform. Both ofthem can run as standalone applications on separate servers and have to be con-nected to the Platform. ECSA is able to continue to work even if the connectionwith the Platform was lost, but EC will stop its execution during connectionproblems.
The processing logic of the system is represented by workflows that containthe individual processing boxes. There can be multiple processing units (work-flows) in the application. The communication between the boxes uses the conceptof queues, which are transparent for the boxes and are handled by the system it-self. This includes even the communication between different machines in the caseof the standalone ECSA worker. Every box handles the given input and can havemultiple outputs which are sent to other boxes or network interfaces.
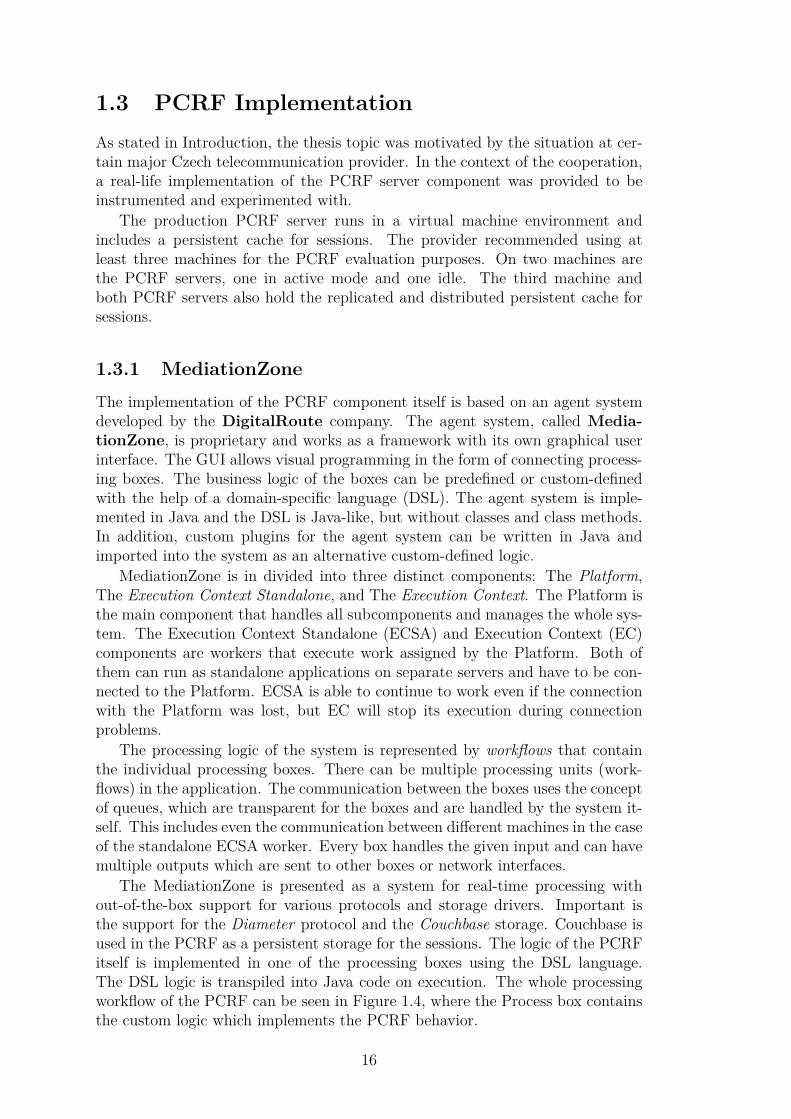
The MediationZone is presented as a system for real-time processing without-of-the-box support for various protocols and storage drivers. Important isthe support for the Diameter protocol and the Couchbase storage. Couchbase isused in the PCRF as a persistent storage for the sessions. The logic of the PCRFitself is implemented in one of the processing boxes using the DSL language.The DSL logic is transpiled into Java code on execution. The whole processingworkflow of the PCRF can be seen in Figure 1.4, where the Process box containsthe custom logic which implements the PCRF behavior.
16
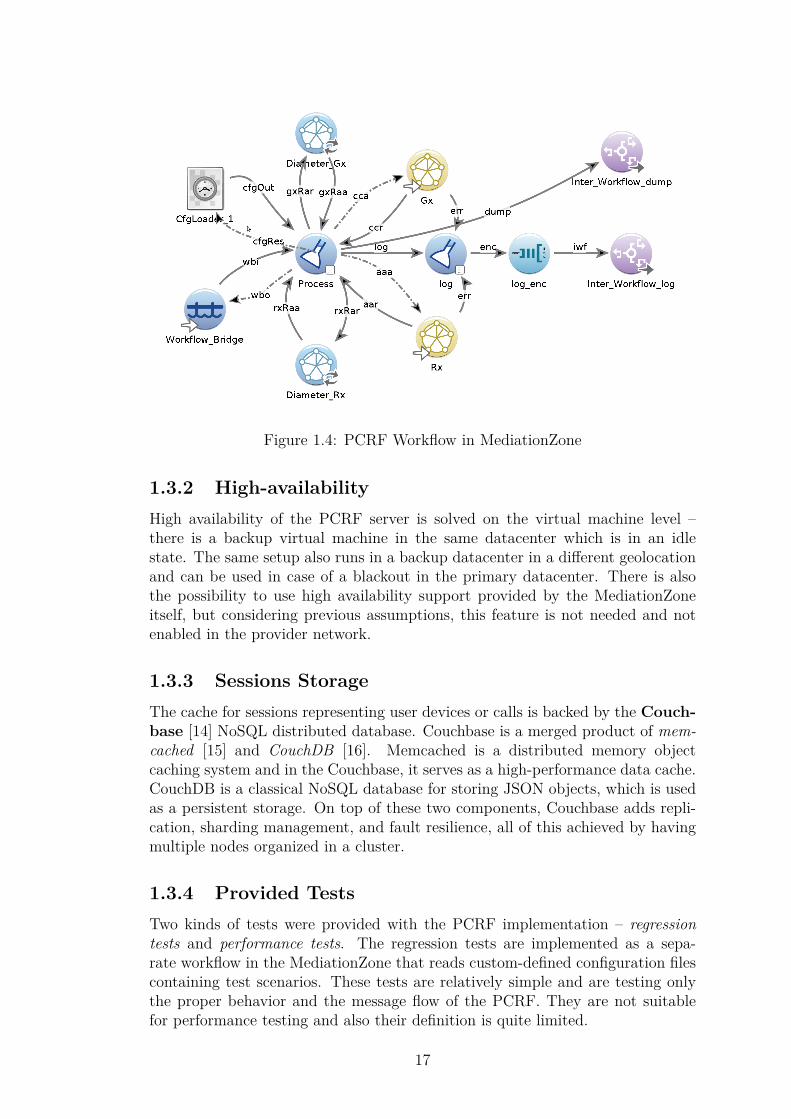
Figure 1.4: PCRF Workflow in MediationZone
1.3.2 High-availabilityHigh availability of the PCRF server is solved on the virtual machine level –there is a backup virtual machine in the same datacenter which is in an idlestate. The same setup also runs in a backup datacenter in a different geolocationand can be used in case of a blackout in the primary datacenter. There is alsothe possibility to use high availability support provided by the MediationZoneitself, but considering previous assumptions, this feature is not needed and notenabled in the provider network.
1.3.3 Sessions StorageThe cache for sessions representing user devices or calls is backed by the Couch-base [14] NoSQL distributed database. Couchbase is a merged product of mem-cached [15] and CouchDB [16]. Memcached is a distributed memory objectcaching system and in the Couchbase, it serves as a high-performance data cache.CouchDB is a classical NoSQL database for storing JSON objects, which is usedas a persistent storage. On top of these two components, Couchbase adds repli-cation, sharding management, and fault resilience, all of this achieved by havingmultiple nodes organized in a cluster.
1.3.4 Provided TestsTwo kinds of tests were provided with the PCRF implementation – regressiontests and performance tests. The regression tests are implemented as a sepa-rate workflow in the MediationZone that reads custom-defined configuration filescontaining test scenarios. These tests are relatively simple and are testing onlythe proper behavior and the message flow of the PCRF. They are not suitablefor performance testing and also their definition is quite limited.
17

The second kinds of tests are performance tests, these are implemented us-ing the seagull [17] multi-protocol traffic generator. Seagull is well known inthe telecommunication industry as it aims to generate workload for the IMS. Seag-ull supports multiple network protocols including Diameter and thus is suitablefor testing of PCRF. Seagull is presented as a high-performance traffic generatorwritten in the C++ language and can be used for functional, load, endurance,stress, performance, and benchmark tests.
The definition of the test cases in seagull is wrapped in scenarios, which canrepresent for example a user device. One execution of seagull can use only onescenario, which can be executed multiple times in a sequence or concurrently.In addition, messages can be sent and received to and from multiple networkinterfaces.
As a significant limitation, the list of actions defined in a scenario has to beprocessed one by one. This means that it is not possible to define reaction totwo messages received concurrently or in a different order than that defined inthe scenario. This is a problem for PCRF testing because messages on the Rxand Gx interfaces sent by the PCRF can be received in any order. If seagullencounters this situation, it will report test failure. As a workaround, separateinstances of seagull could be run, each handling one interface, but that gives riseto problems with synchronization and control over the scenarios, to which seagullhas no useful solution.
The provided performance tests used two separate instances of the seagullgenerator, but in order to keep at least some synchronization, the tests had tobe very simple and straightforward. Therefore, they are not suitable for real-lifescenarios testing, which can be sometimes quite complex and hard to synchronize.Considering this, writing new PCRF specific generator seems like the only viableoption.
1.4 Related WorkWeb document [18] from the EFORT company presents comprehensive overviewof Diameter Base Protocol. Regarding Diameter there is also a bit more officialtutorial [19] presented by the IETF organization. Overview about seagull trafficgenerator can be found in web document [20] written by the HP company.
LTE and related technologies are very popular in a modern telecommunicationworld, therefore, there are multiple articles and documents regarding this topic.There is a couple of web articles [21] [22] from the 3GPP organization whichgive overall description about LTE and its core components. Netmanias.com isa portal aimed to network and communication which introduce many useful webarticles [23] [24] about PCRF and its position within LTE network. There isalso large article [25] at Netmanias.com about PCRF which covers its history,placement within EPC and also its function and architecture.
18
2. AnalysisIn this chapter, we will perform an analysis of the traffic generation and alsodiscuss the options for data collection from the PCRF server. For the trafficgeneration, we need to decide how and what workload will be generated. The re-gression tests from the provider can work as a base for this decision, there werealso provided base workflows which are processed by the PCRF server.
Based on the provided base workflows, we have to identify flows representingstates or particular actions. For example, during a connection of a device, there isa flow of messages which consists of CCR and CCA messages, the request is sentby PCEF and answer by PCRF. These flows were identified and are described inthe following sections.
When we have the communication flows identified, we need to decide howthese flows will be connected. For example, we can make two calls right aftereach other in a combined flow. The basic connection of the flows is by makinga sequence. This approach is used by the seagull traffic generator but does notconform to the real-life use, because it is not flexible enough and does not simulatea real user device.
Other option to connect the states is by forming a graph with directed connec-tions. Considering this, there might be nodes with multiple children, therefore,we need to be able to decide what will be the next processed node. This leadsus to the automatons with custom defined transition function. For the thesisneeds, the transition function can be defined in form of probabilities of transitionsbetween the nodes. In this form, the automaton is defining a particular usage ofa phone in a telecommunication network.
Based on the transition function, we can simulate distinct types of users withdistinct automatons. For example, we can make users which are calling a lot, orclassical user of the network with a reasonable flow of the calls and other actions.There can also be a special scenario which is designed only to test the performanceof the server, etc.
With defined automatons, we need to have a way how to execute them asyn-chronously and also a way to define when and what automatons will be active.This definition shall be called test profile and will be used by the traffic gener-ator to spawn new automatons or destroy currently active automatons.
Test profiles which will be defined in the thesis should reflect the need for real-life testing, therefore, there should definitely be a profile which simulates a day inthe telecommunication network. Other interesting cases might be a performancetesting of the PCRF server or stress testing.
The metrics which should be collected from the PCRF server are essential forthe performance evaluation performed in the thesis. The analysis of the metricsshould be done in consideration of real-life performance evaluation. Therefore,useful metrics like latency of the messages or number of the processed messageshave to be collected. The analysis also has to include approaches which might beused for data collection and what are the specifics of different approaches.
19

2.1 Traffic Generation AnalysisThe base for the traffic generation design is an analysis of how the data should begenerated and what are the flows of the messages used within the PCRF communi-cation. Basic flows of the messages are defined by the 3GPP TS 29.213 [26] specifi-cation, specialized flows for the Gx interface can be found in 3GPP TS 29.212 [10]and for the Rx interface in 3GPP TS 29.214 [12].
On top of the specifications, we can specify how the basic flows will be con-nected to represent a usual communication of one user device. The representationof a user device and connections between the basic flows shall be called a sce-nario. Additionally, a scenario can specify some parameters of the flows or theirconnections.
Assuming that each scenario represents one specialized user type, the imple-mentation of the traffic generator can contain multiple templates of scenarioswhich can be instantiated and executed. The definition of the scenarios flow andtheir numbers shall be called a test profile. A test profile is a definition of whatscenarios should be active at what time during a test. Based on this, the generatorshould create or destroy scenarios at times specified in the test profile providedat the beginning of the test execution.
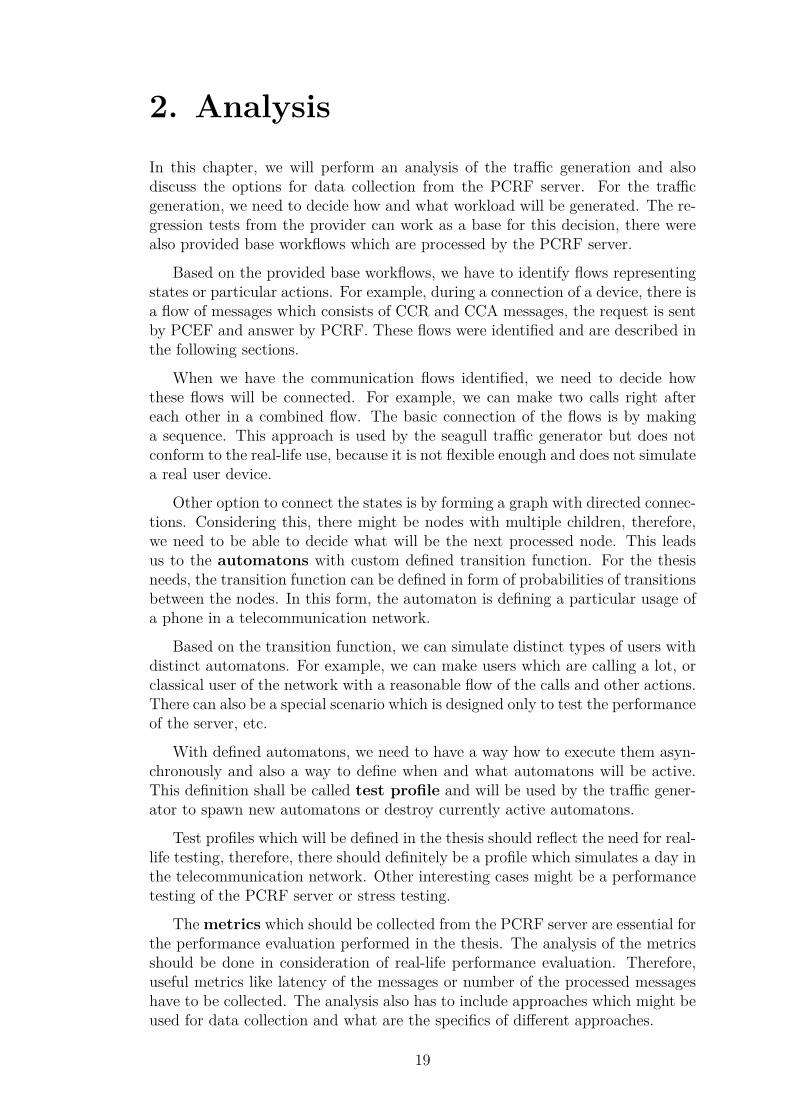
2.1.1 PCRF Communication FlowsFrom a high-level point of view, there are only four major states that appear inthe communication flow of a single user device. These are denoted as Connect,Update, Disconnect, Lost Connection and Call. A basic depiction of the statesand proposed connections between them can be found in Figure 2.1. Except forthe Call state, the states are simple request-answer message flows. The Call canbe a bit more complex and as such, it can be viewed as an independent unit withnested states inside.
The call state can have multiple types based on the call attributes, the basicdistinction is between a Regular Call and a Conference Call. The ConferenceCall connects multiple users in one conversation and the message flow is quitecomplex. In real life, conference calls are very rare and therefore out of the scopeof this thesis. The Regular Call state contains four sub-states: Call Init, CallUpdate Codec, Call Termination, and Lost Connection. These sub-states withtheir proposed connections are shown in Figure 2.2.
All states define message flows and can contain an arbitrary number of stepswhich are executed when entering the state. Steps can be represented as requestsor answers, both can be sent from or to the Gx or Rx interfaces. The descriptionof the particular states with their flows depicted using UML sequence diagramsfollows (a detailed description of the messages and their AVPs with values canbe found in Appendix D).
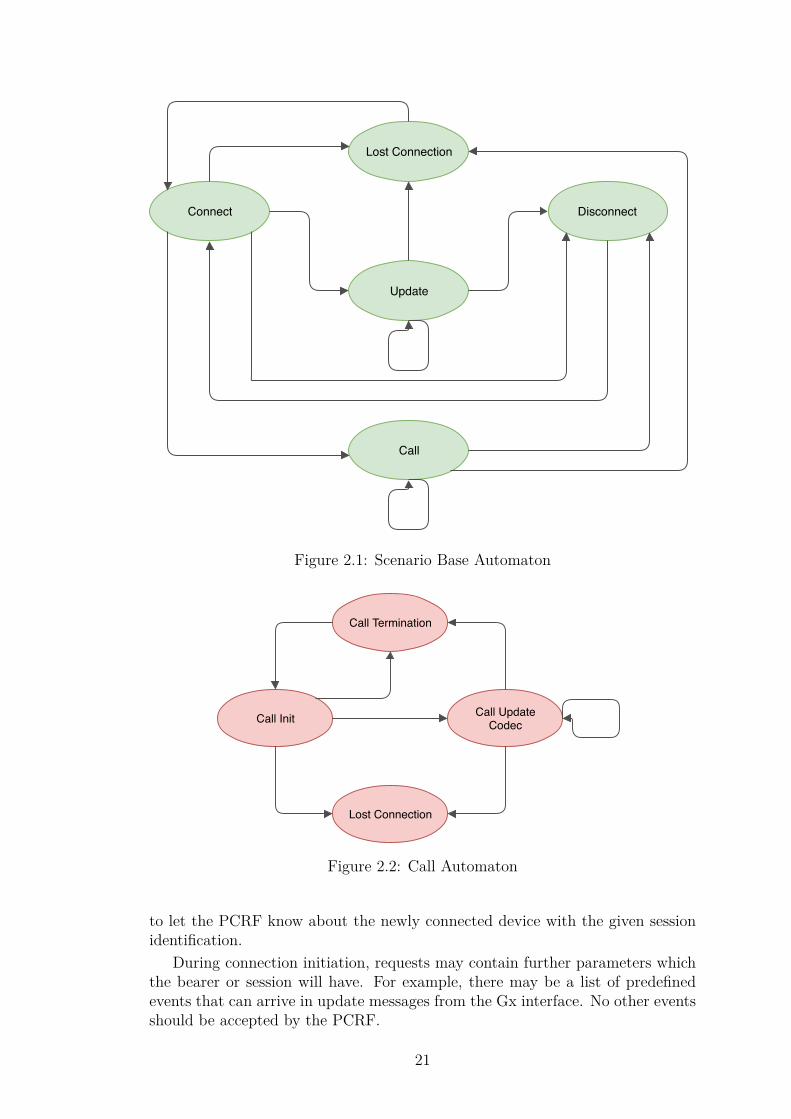
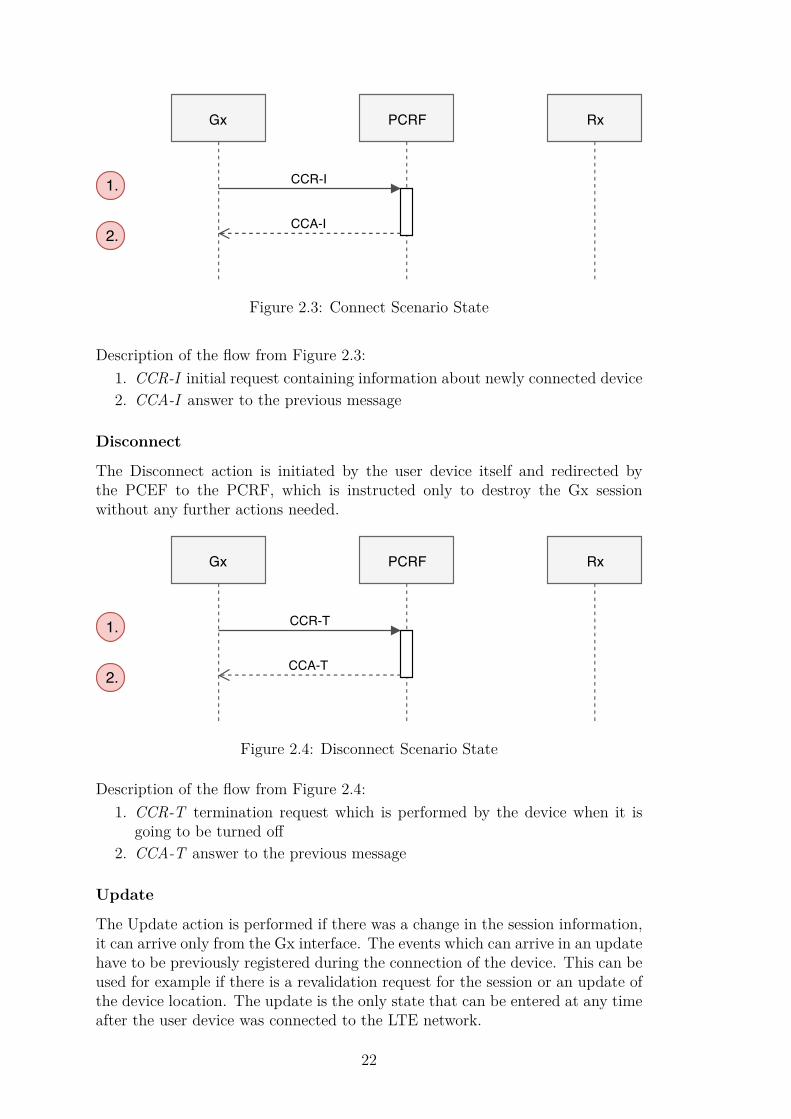
Connect
The Connect action is performed when the device connects to the LTE network,after it gets an IP address from the PGW. The initial connection comes fromthe Gx interface and is established to allocate the default network bearer and
20
Connect
Lost Connection
Disconnect
Update
Call
Figure 2.1: Scenario Base Automaton
Call Init
Call Termination
Call UpdateCodec
Lost Connection
Figure 2.2: Call Automaton
to let the PCRF know about the newly connected device with the given sessionidentification.
During connection initiation, requests may contain further parameters whichthe bearer or session will have. For example, there may be a list of predefinedevents that can arrive in update messages from the Gx interface. No other eventsshould be accepted by the PCRF.
21
Gx PCRF Rx
CCR-I
CCA-I2.
1.
Figure 2.3: Connect Scenario State
Description of the flow from Figure 2.3:1. CCR-I initial request containing information about newly connected device2. CCA-I answer to the previous message
Disconnect
The Disconnect action is initiated by the user device itself and redirected bythe PCEF to the PCRF, which is instructed only to destroy the Gx sessionwithout any further actions needed.
Gx PCRF Rx
CCR-T
CCA-T2.
1.
Figure 2.4: Disconnect Scenario State
Description of the flow from Figure 2.4:1. CCR-T termination request which is performed by the device when it is
going to be turned off2. CCA-T answer to the previous message
Update
The Update action is performed if there was a change in the session information,it can arrive only from the Gx interface. The events which can arrive in an updatehave to be previously registered during the connection of the device. This can beused for example if there is a revalidation request for the session or an update ofthe device location. The update is the only state that can be entered at any timeafter the user device was connected to the LTE network.
22
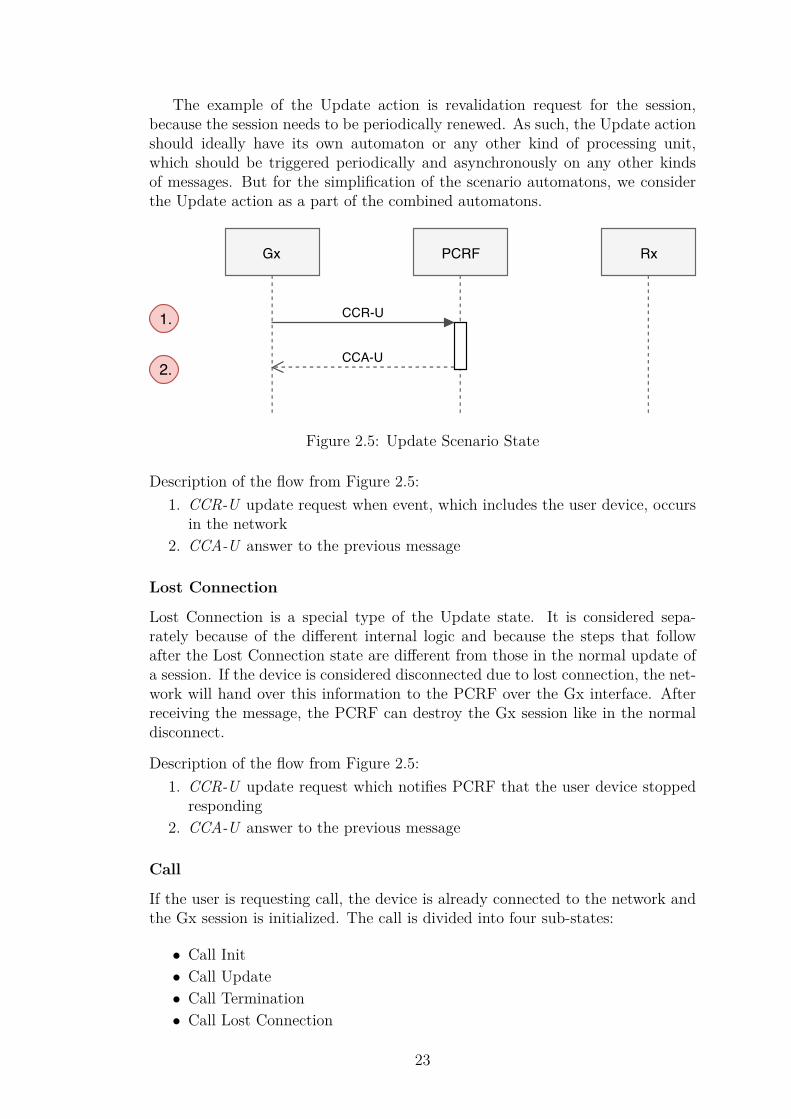
The example of the Update action is revalidation request for the session,because the session needs to be periodically renewed. As such, the Update actionshould ideally have its own automaton or any other kind of processing unit,which should be triggered periodically and asynchronously on any other kindsof messages. But for the simplification of the scenario automatons, we considerthe Update action as a part of the combined automatons.
Gx PCRF Rx
CCR-U
CCA-U2.
1.
Figure 2.5: Update Scenario State
Description of the flow from Figure 2.5:1. CCR-U update request when event, which includes the user device, occurs
in the network2. CCA-U answer to the previous message
Lost Connection
Lost Connection is a special type of the Update state. It is considered sepa-rately because of the different internal logic and because the steps that followafter the Lost Connection state are different from those in the normal update ofa session. If the device is considered disconnected due to lost connection, the net-work will hand over this information to the PCRF over the Gx interface. Afterreceiving the message, the PCRF can destroy the Gx session like in the normaldisconnect.
Description of the flow from Figure 2.5:1. CCR-U update request which notifies PCRF that the user device stopped
responding2. CCA-U answer to the previous message
Call
If the user is requesting call, the device is already connected to the network andthe Gx session is initialized. The call is divided into four sub-states:
• Call Init• Call Update• Call Termination• Call Lost Connection
23

Call Init The initiation of the call originates from the Rx interface, the CSCFrequests a bearer with a predefined bandwidth and codec from the PCRF. On topof that, a new Rx call session is created. When the bearer allocation is acknowl-edged by the PCRF, the provisioning and charging rules are sent to the PCEF,where they should be enforced.
Gx PCRF Rx
1.AAR
AAARAR
RAA
AAR
AAA
2.
3.
4.
5.
2.
Figure 2.6: Call Init Scenario State
Description of the flow from Figure 2.6:1. AAR request indicates start of the a call and the need of individual bearer
for voice data, the request comes with the information about used codecand bandwidth
2. RAR sends provisioning rules installation request to the PCEF, AAA issuccessful answer to the previous Rx request
3. RAA answer to the rules installation request4. AAR can be noop or some initial change of the call attributes, like enabling
uplink and downlink voice channels5. AAA answer to the previous request
Call Update Codec Just like call initiation, call update also comes fromthe Rx interface and usually happens if a change of the codec is requested orif different bandwidth should be used. The request for change may or may nottrigger the installation of rules to the PCEF. For simplicity, we assume a rulechange is always propagated to the PCEF.
Description of the flow from Figure 2.7:1. AAR request indicates change of the codec during the call2. RAR sends provisioning rules installation request to the PCEF, AAA is
successful answer to the previous Rx request3. RAA is an answer to the rules installation request
Call Termination When a user decides to end a call, the CSCF will sendthe session termination request which destroys the established Rx call session
24

Gx PCRF Rx
1.AAR
AAARAR
RAA
2.
3.2.
Figure 2.7: Call Update Codec Scenario State
and let the PCEF know that the established bearer can be destroyed.
RAR
Gx PCRF Rx
1.STR
STA
RAA
2.
3.2.
Figure 2.8: Call Termination Scenario State
Description of the flow from Figure 2.8:1. STR the device requested end of the call which is delivered to the PCRF
in form of this message2. RAR requests bearer destruction by sending message to the PCEF, STA is
successful answer to the previous termination request3. RAA answer to the bearer destruction
Call Lost Connection Lost Connection during a call is a bit different fromgeneral Lost Connection. The initial steps are the same – the PCEF signalsto the PCRF that the user device stopped responding and therefore requestsa destruction of the session. This destroys only the session attached to the Gxinterface, if we are in the middle of the call there is also the call session whichmust be destroyed by sending a proper request to the Rx interface. At the end ofthe exchange there is a (strictly unnecessary) no-op session termination requestoriginating on the CSCF with appropriate request for termination of bearer di-recting to the PCEF.
Description of the flow from Figure 2.9:1. CCR-U update request which is the same as for general lost connection
state
25
ASR
Gx
RAR
RAA
PCRF
STR
STA
Rx
CCR-U
CCA-U2.
1.
ASA3.
2.
5.
4.5.
6.
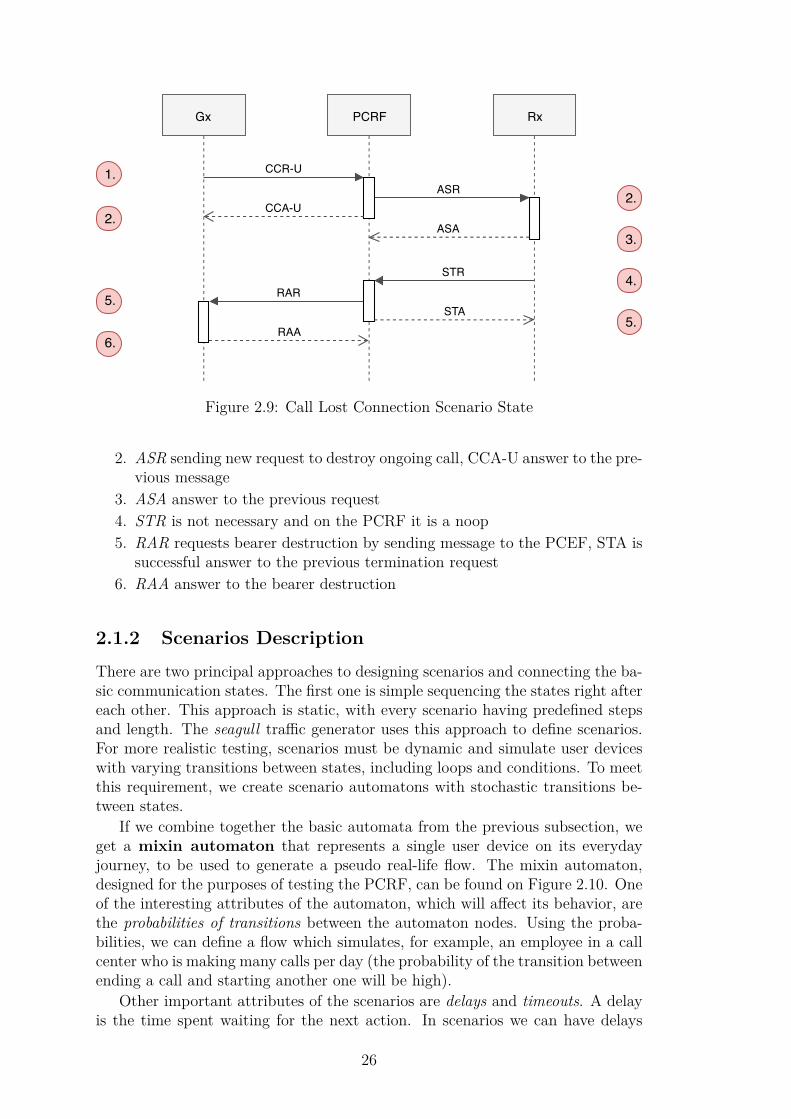
Figure 2.9: Call Lost Connection Scenario State
2. ASR sending new request to destroy ongoing call, CCA-U answer to the pre-vious message
3. ASA answer to the previous request4. STR is not necessary and on the PCRF it is a noop5. RAR requests bearer destruction by sending message to the PCEF, STA is
successful answer to the previous termination request6. RAA answer to the bearer destruction
2.1.2 Scenarios Description
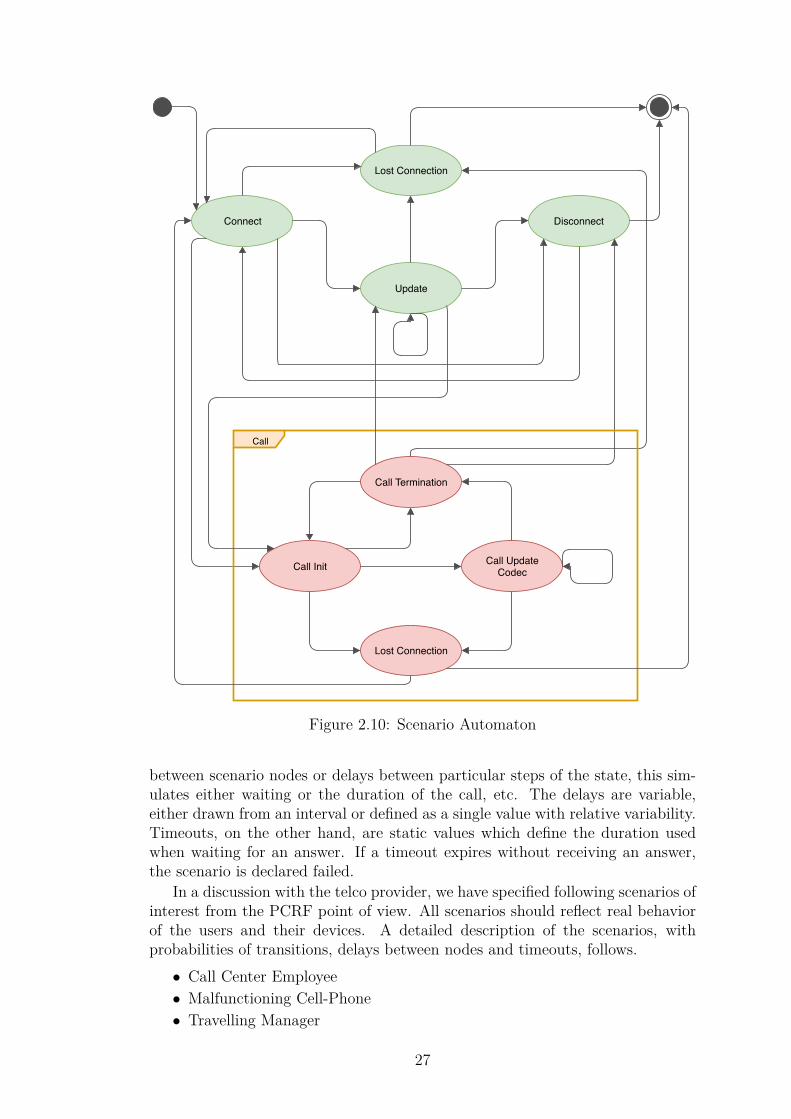
There are two principal approaches to designing scenarios and connecting the ba-sic communication states. The first one is simple sequencing the states right aftereach other. This approach is static, with every scenario having predefined stepsand length. The seagull traffic generator uses this approach to define scenarios.For more realistic testing, scenarios must be dynamic and simulate user deviceswith varying transitions between states, including loops and conditions. To meetthis requirement, we create scenario automatons with stochastic transitions be-tween states.
If we combine together the basic automata from the previous subsection, weget a mixin automaton that represents a single user device on its everydayjourney, to be used to generate a pseudo real-life flow. The mixin automaton,designed for the purposes of testing the PCRF, can be found on Figure 2.10. Oneof the interesting attributes of the automaton, which will affect its behavior, arethe probabilities of transitions between the automaton nodes. Using the proba-bilities, we can define a flow which simulates, for example, an employee in a callcenter who is making many calls per day (the probability of the transition betweenending a call and starting another one will be high).
Other important attributes of the scenarios are delays and timeouts. A delayis the time spent waiting for the next action. In scenarios we can have delays
26
Call Init
Call Termination
Call UpdateCodec
Lost Connection
Connect
Lost Connection
Disconnect
Update
Call
Figure 2.10: Scenario Automaton
between scenario nodes or delays between particular steps of the state, this sim-ulates either waiting or the duration of the call, etc. The delays are variable,either drawn from an interval or defined as a single value with relative variability.Timeouts, on the other hand, are static values which define the duration usedwhen waiting for an answer. If a timeout expires without receiving an answer,the scenario is declared failed.
In a discussion with the telco provider, we have specified following scenarios ofinterest from the PCRF point of view. All scenarios should reflect real behaviorof the users and their devices. A detailed description of the scenarios, withprobabilities of transitions, delays between nodes and timeouts, follows.
• Call Center Employee• Malfunctioning Cell-Phone• Travelling Manager
27
• Classic User• Call Performance Scenario
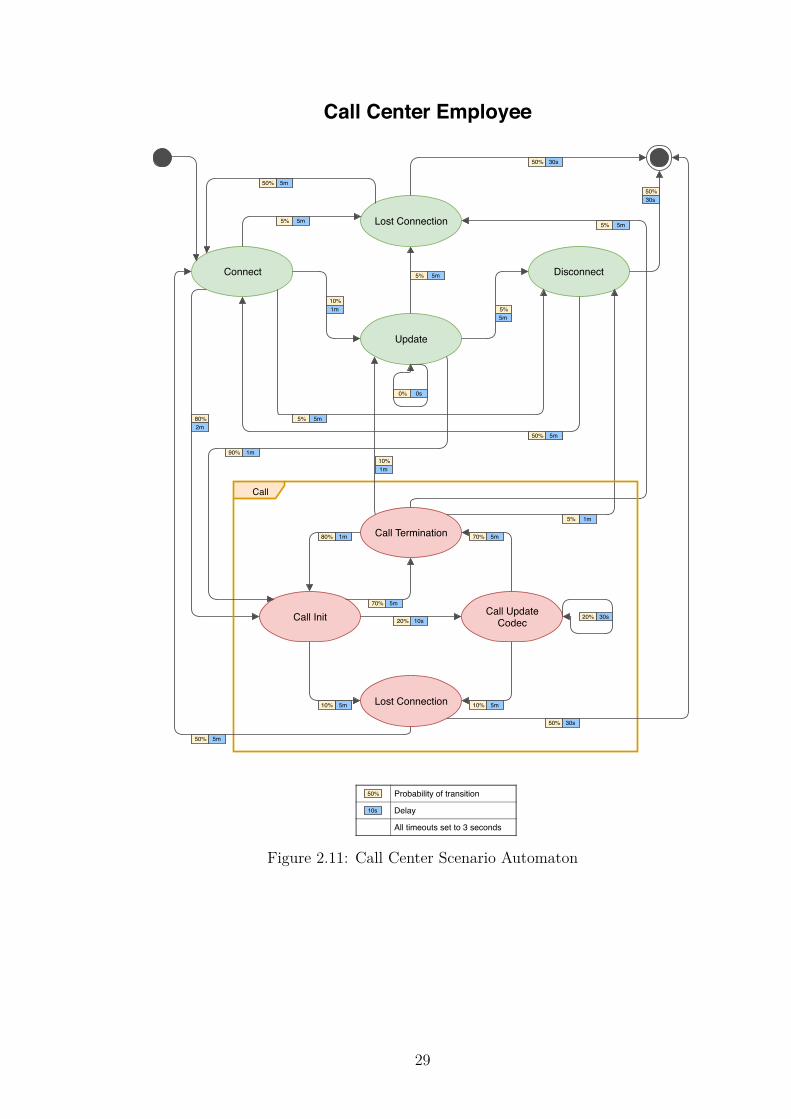
Call Center Employee
This scenario models a call center employee who is making multiple calls in a rowwith little or no delays. After a successful connection to the network, the cellphone has a high chance to initiate a call. The calls in this scenario are ofmedium length, expressed in several minutes. During the call, the chances ofupdate of the codec are low. The aim of the scenario is to make many calls withinshort time and nothing else. The resulting automaton is depicted in Figure 2.11.The variability for all delays is 20% and the timeouts for all answers are set to 3seconds.
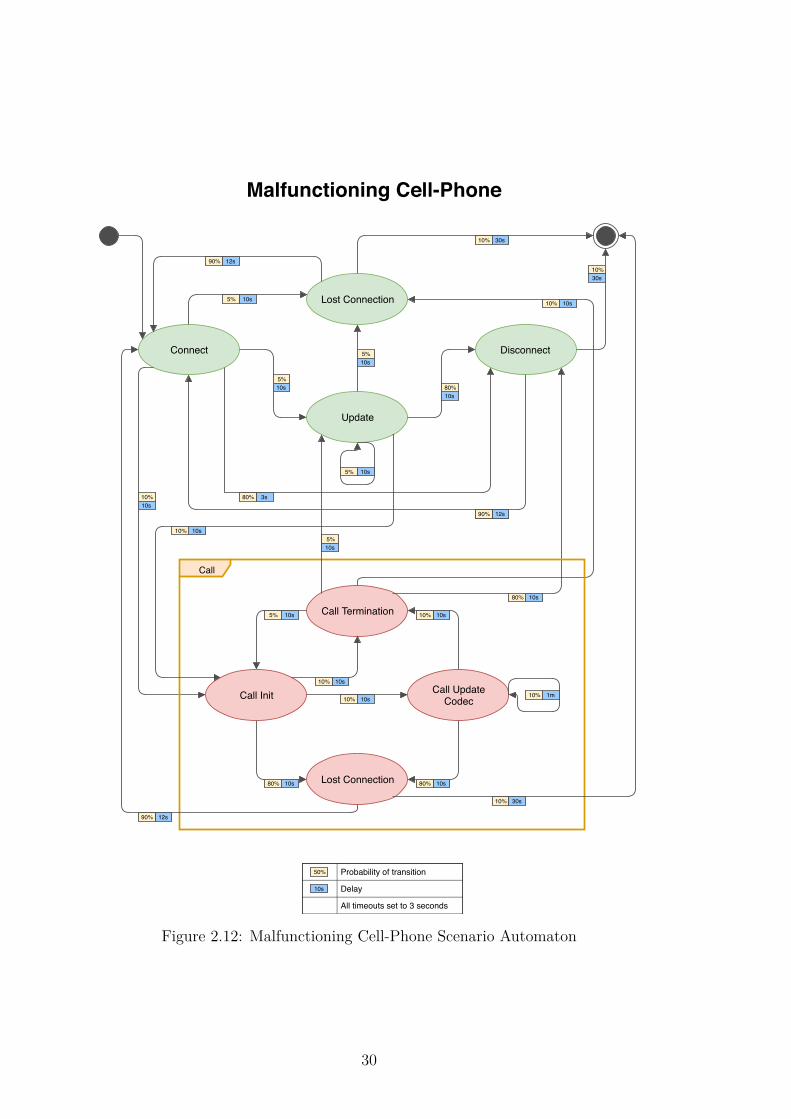
Malfunctioning Cell-Phone
The scenario simulates a malfunctioning cell phone in the provider network.A malfunctioning cell phone behaves incorrectly, it has very high probabilityof disconnection. Calls are rare and if they do happen, they are stopped dueto a lost connection. On top of that, the delays are very small and all actionsare done almost instantly. The resulting automaton is depicted in Figure 2.12.The variability for all delays is 20% and the timeouts for all answers are set to 3seconds.
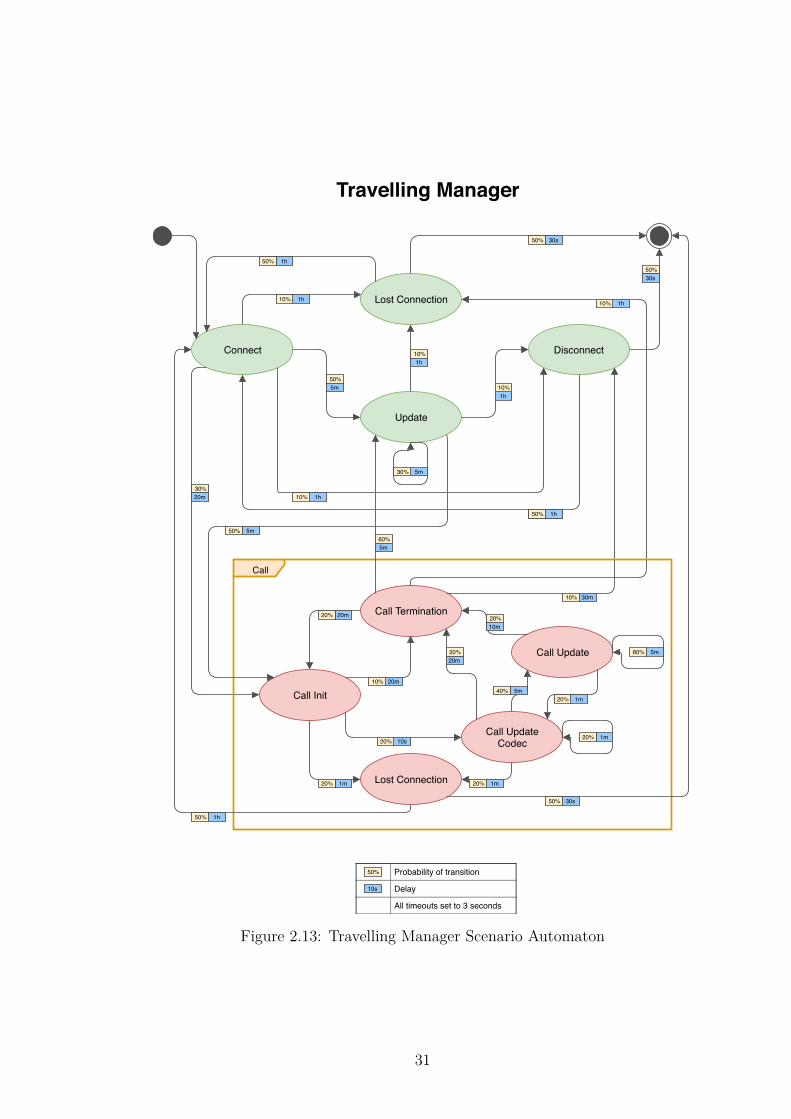
Travelling Manager
The scenario is centered on users of the network who are calling a lot and oftenchanging locations. In the real-life, this scenario can be applied to managers, whoare travelling to distinct locations and in the process they are making calls. Tomodel this, the updates have a high probability and the same goes for calls.
Unique to this scenario is a special state in the call which performs an updateof the user location. The probability of processing this state is quite high duringthe call and the update can be done repeatedly. The resulting automaton isdepicted in Figure 2.13. The variability for all delays is 20% and the timeoutsfor all answers are set to 3 seconds.
28
Call Init
Call Termination
Call UpdateCodec
Lost Connection
Connect
Lost Connection
Disconnect
Update
Call
Probability of transition
Delay
All timeouts set to 3 seconds
50%
10s
5m5%
10%
5m5%
5m50%
80%
5m50%
1m90%
0s0%
1m80%
10s20%
5m70%
5m10%
30s20%
5m50%
5m5%
5m5%
1m5%
5m
5m10%
Call Center Employee
5m70%
50%
50%
50%
30s
30s
30s
5%1m
2m
10%1m
Figure 2.11: Call Center Scenario Automaton
29
Call Init
Call Termination
Call UpdateCodec
Lost Connection
Connect
Lost Connection
Disconnect
Update
Call
Probability of transition
Delay
All timeouts set to 3 seconds
50%
10s
10s5%
5%
3s80%
12s90%
10%
12s90%
10s10%
10s5%
10s5%
10s10%
10s10%
10s80%
1m10%
12s90%
5%
10s10%
10s80%
10s
10s80%
Malfunctioning Cell-Phone
10s10%
10%
10%
10%
30s
30s
30s
10s
80%10s
10s
5%10s
Figure 2.12: Malfunctioning Cell-Phone Scenario Automaton
30
Call Init
Call Termination
Call UpdateCodec
Lost Connection
Connect
Lost Connection
Disconnect
Update
Call
Probability of transition
Delay
All timeouts set to 3 seconds
50%
10s
1h10%
50%
1h10%
1h50%
1h50%
5m50%
5m30%
20m20%
10s20%
1m20%
1m20%
1h50%
10%
1h10%
30m10%
1h
1m20%
Travelling Manager
20m10%
50%
50%
50%
Call Update 5m60%20m
5m40%1m20%
10m
30s
30s
30s
30%20m
1h
5m 10%
60%5m
20%
20%
Figure 2.13: Travelling Manager Scenario Automaton
31
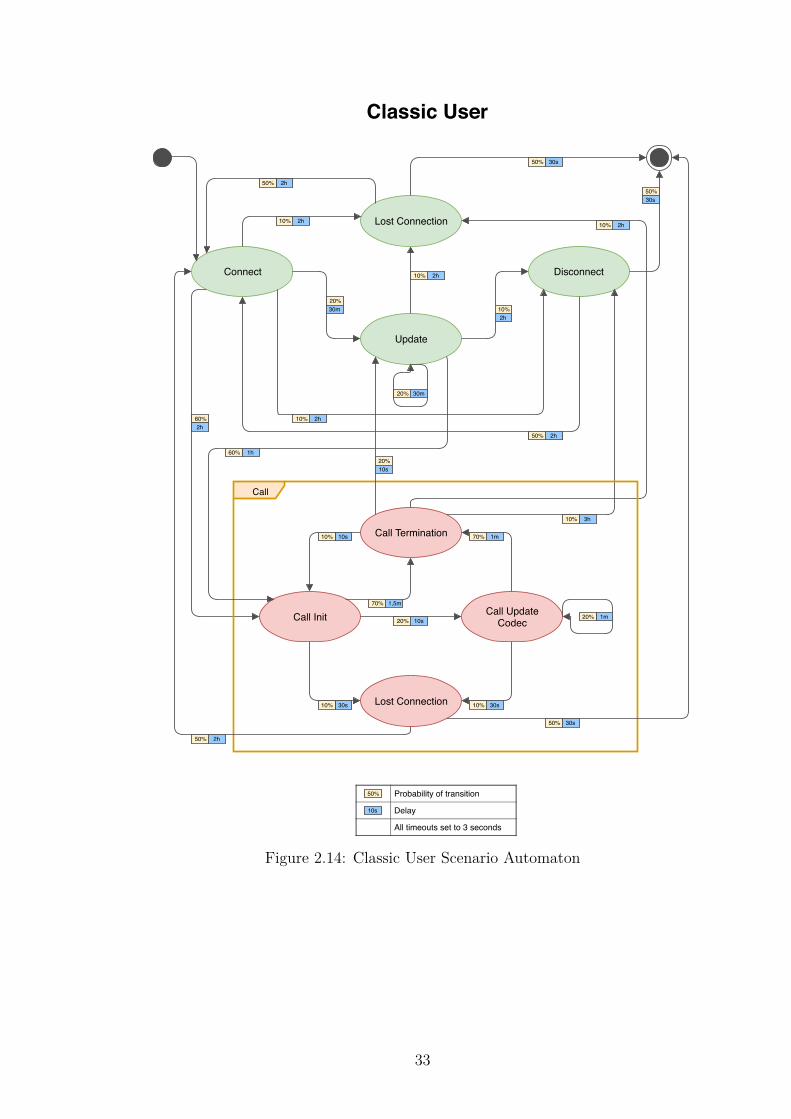
Classic User
Classic User is a scenario which should represent a normal everyday user ofthe network. After successful connection, there is a high chance of startingthe call, but with significant delay. During the call, updates of the codecs arerare and after the call ends, there is a high chance of starting another call, againwith a significant delay. The resulting automaton is depicted on Figure 2.14.The variability for all delays is 20% and the timeouts for all answers are set to 3seconds.
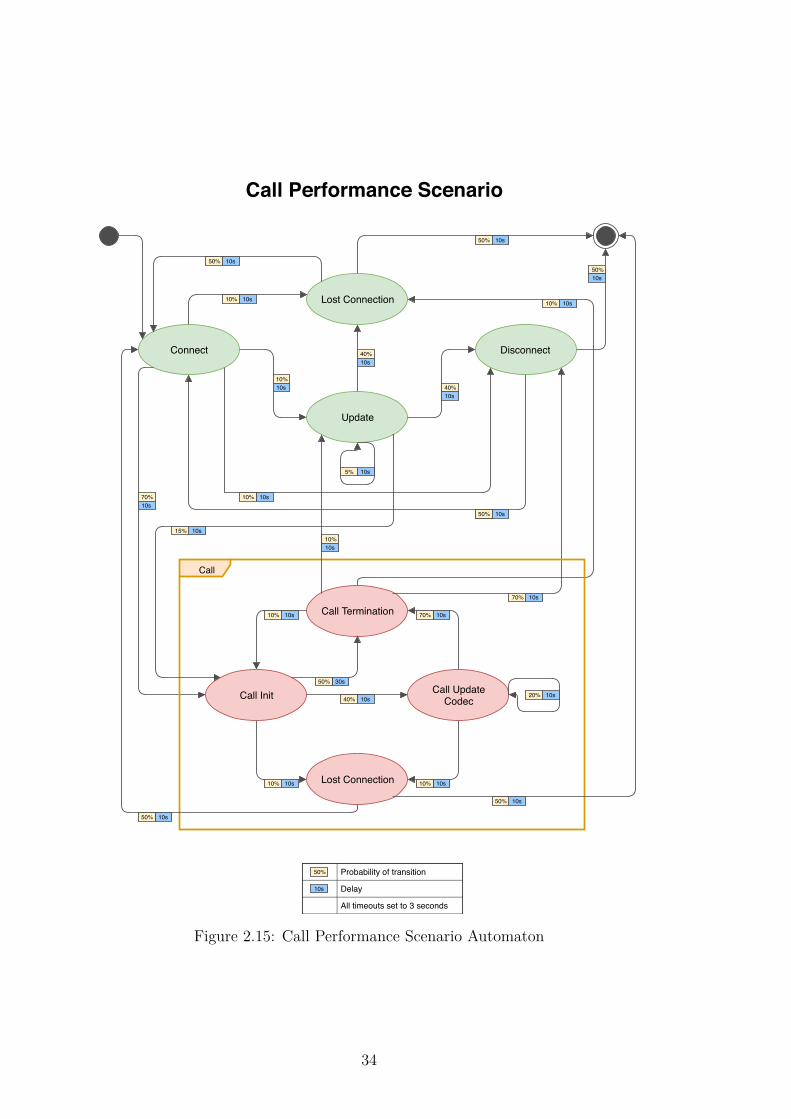
Call Performance Scenario
Rather than approximating a real use case, this scenario is designed for perfor-mance and stress testing. After the initial connection, the scenario starts a callwith high probability. Codec update during the call is quite likely, but afterthe first update, the call is likely to end. When the call finishes, the highestprobability is to disconnect the device from the network. In brief, this scenario issupposed only to connect, make one call and disconnect, making it easy to relatethe scenario execution frequency with the call throughput.
Almost all delays in the scenario are set to 10 seconds, which should ensurea quick rotation of the states. Due to the low delays, the performance in thisscenario is not directly comparable to other scenarios. The resulting automatonis depicted in Figure 2.15. The variability for all delays is 20% and the timeoutsfor all answers are set to 3 seconds.
32
Call Init
Call Termination
Call UpdateCodec
Lost Connection
Connect
Lost Connection
Disconnect
Update
Call
Probability of transition
Delay
All timeouts set to 3 seconds
50%
10s
2h10%
20%
2h10%
2h50%
60%
2h50%
1h60%
30m20%
10s10%
10s20%
1m70%
30s10%
1m20%
2h50%
2h10%
2h10%
3h10%
2h
30s10%
Classic User
1,5m70%
50%
50%
50%
30s
30s
30s
10%30m
2h
20%10s
Figure 2.14: Classic User Scenario Automaton
33
Call Init
Call Termination
Call UpdateCodec
Lost Connection
Connect
Lost Connection
Disconnect
Update
Call
10s10%
10%
10s10%
50%
70%
10s50%
10s15%
10s5%
10s10%
10s40%
10s70%
10s10%
10s20%
10s50%
40%
10s10%
10s70%
40%
10s10%
Call Performance Scenario
10s
30s50%
Probability of transition
Delay
All timeouts set to 3 seconds
50%
10s
50%
50%
10s
10s
50%10s
10s
10s
10s
10%10s
10s
Figure 2.15: Call Performance Scenario Automaton
34
2.1.3 Test ProfilesThe test profiles are predefined sequences of scenarios, which should be startedat given experiment time. In more detail, a profile consists of profile entries,one profile entry is uniquely identified by its start time and contains the listof scenarios (with their counts) which should be active from that time on. Ifthe profile entry requests a higher scenario count than in the previous entry,new scenarios should be spawned. Similarly, if the profile entry requests a lowerscenario count, some currently active scenarios should be destroyed to reflectthe prescribed scenario count. Based on this, custom profiles can be defined toreflect for example a normal day in the telecommunication network. The followinglist contains the profiles defined for the purposes of the PCRF testing:
• Call performance testing• Stress testing• Basic real-life testing• Big event or catastrophe
The description of the listed profiles follows. The profiles were created andconsulted together with the representatives from the telecommunication provider.Some of the profiles should reflect real numbers (or slightly higher) of the userdevices that can be seen in everyday traffic.
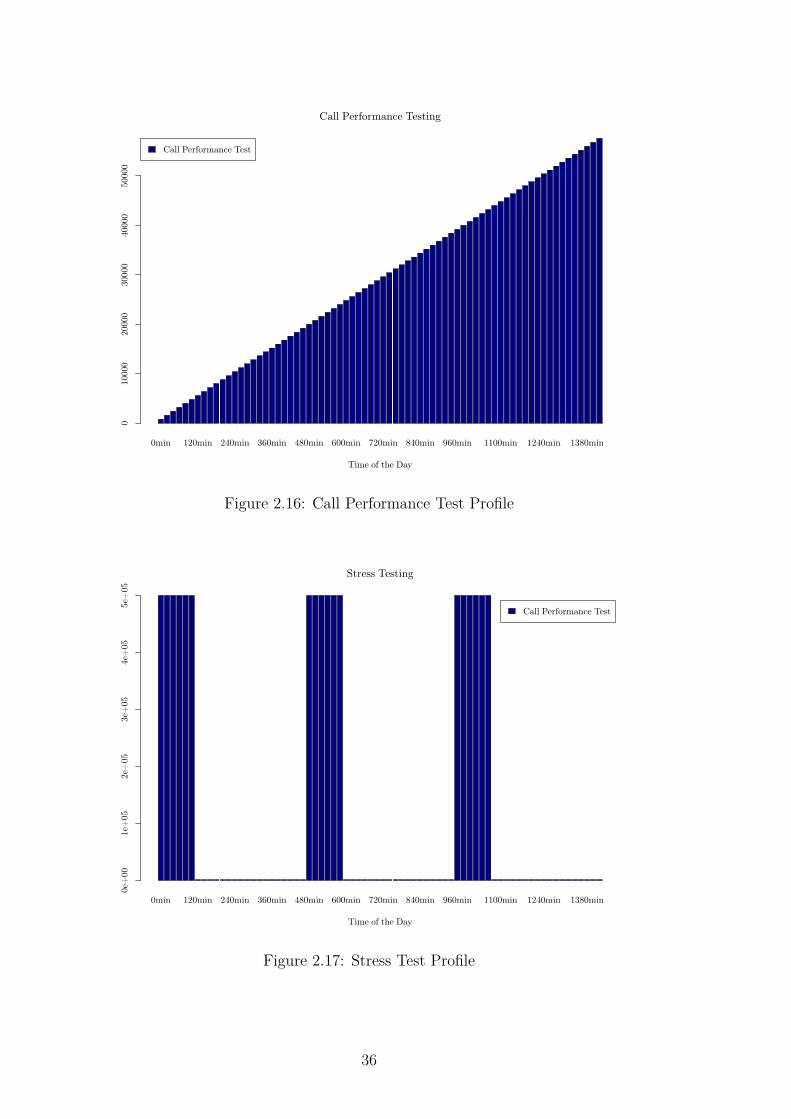
Call Performance Testing
A profile designed to test the performance of the PCRF server and determinethe maximum number of messages which the server is able to process. The flowof the profile is as follows – every 20 minutes the number of active scenariosincreases by 800. The total duration of the test is 24 hours and the profile usesonly the Call Performance scenario. The number of scenarios at the end of the testis 57600. The intensity of the profile is shown on Figure 2.16.
Stress Testing
A profile designed to test the stability of the server and its ability to compensateand recover from a massive number of connected user devices. At the beginning,there are 500000 active scenarios which are executed for 100 minutes, after thistime the count is decreased to 1000 active scenarios. This action is repeated threetimes, each after 8 hours. The profile uses only the Call Performance scenarioto simulate users and the duration is 24 hours. The intensity of the profile isdepicted in Figure 2.17.
35
0min 120min 240min 360min 480min 600min 720min 840min 960min 1100min 1240min 1380min
Call Performance Test
Call Performance Testing
Time of the Day
010000
20000
30000
40000
50000
Figure 2.16: Call Performance Test Profile
0min 120min 240min 360min 480min 600min 720min 840min 960min 1100min 1240min 1380min
Call Performance Test
Stress Testing
Time of the Day
0e+
00
1e+
05
2e+
05
3e+
05
4e+
05
5e+
05
Figure 2.17: Stress Test Profile
36

Real-life Testing
The Real-life Testing profile is simulated through the whole day (24 hours) andshould simulate a real-life usage profile of the telecommunication provider net-work. The described profile contains real numbers provided by the telecommuni-cation provider. At the peak of the day, there are around 1.1 million users andthe number of active users is never lower than 50 thousand. The flow of the pro-file is depicted in Figure 2.18. Table 2.1 contains the exact numbers of scenariosat given times.
00:00 02:00 04:00 06:00 08:00 10:00 12:00 14:00 16:00 18:00 20:00 22:00
Classic UserTravelling ManagerMalfunctioning Cell−PhoneCall Center Employee
Real−life Testing
Time of the Day
0e+
00
2e+
05
4e+
05
6e+
05
8e+
05
1e+
06
Figure 2.18: Real-life Test Profile
Big Event or Catastrophe
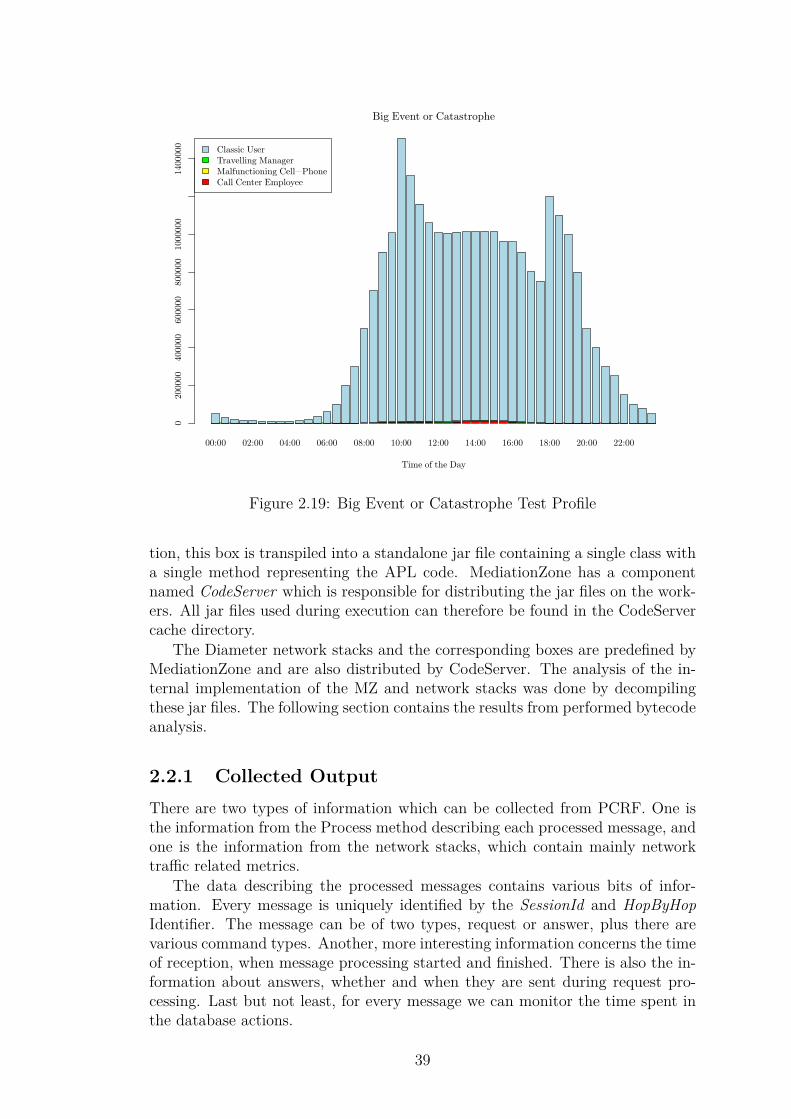
The base profile for Big event or Catastrophe is the Real-life Testing profileintroduced in the previous section. In addition to real-life usage activity, there aretwo events in the network that lead to the appearance of active devices. The firstevent happens at 10 AM and lasts for an hour, the second event is scheduled for6 PM and lasts for two hours. Both events are identified by an increased numberof active devices, which is continually decreasing during the event. The intensityof the profile is depicted in Figure 2.19. Table 2.2 contains the exact numbers ofscenarios at given times.
2.2 PCRF Data CollectionAs described in Figure 1.4, the workflow which implements the PCRF functionhas one main processing box called Process. All other boxes are used either
37
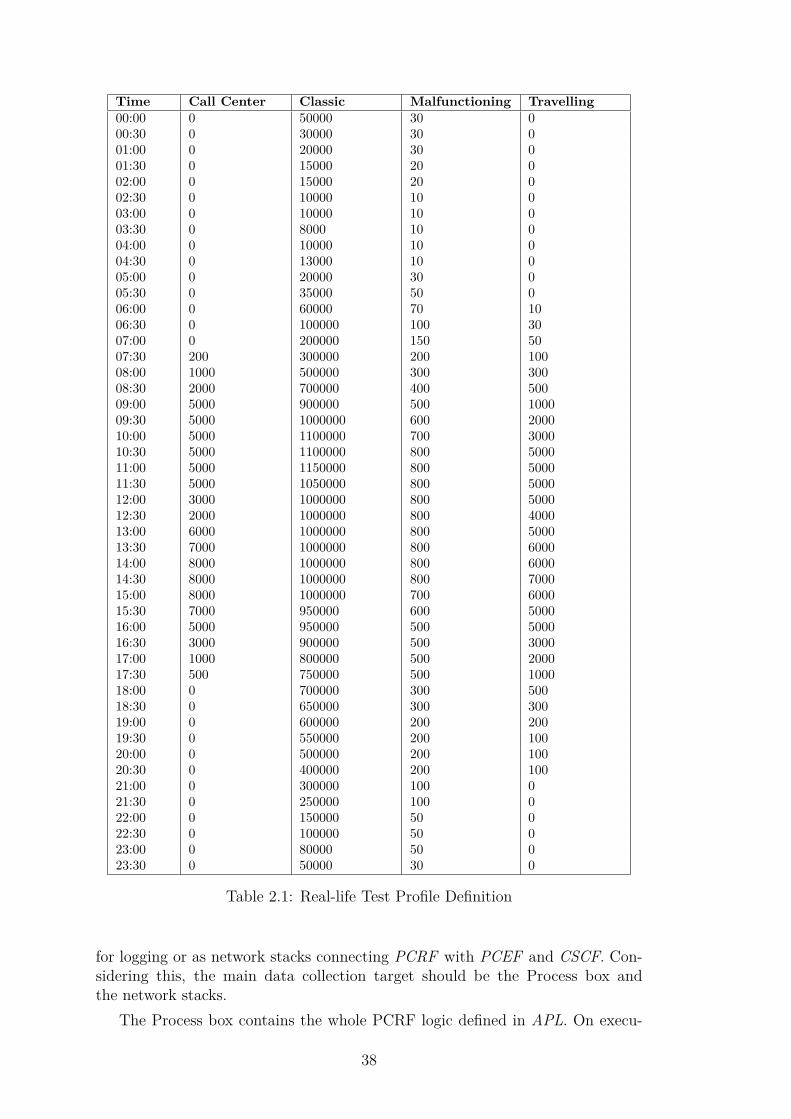
Time Call Center Classic Malfunctioning Travelling00:00 0 50000 30 000:30 0 30000 30 001:00 0 20000 30 001:30 0 15000 20 002:00 0 15000 20 002:30 0 10000 10 003:00 0 10000 10 003:30 0 8000 10 004:00 0 10000 10 004:30 0 13000 10 005:00 0 20000 30 005:30 0 35000 50 006:00 0 60000 70 1006:30 0 100000 100 3007:00 0 200000 150 5007:30 200 300000 200 10008:00 1000 500000 300 30008:30 2000 700000 400 50009:00 5000 900000 500 100009:30 5000 1000000 600 200010:00 5000 1100000 700 300010:30 5000 1100000 800 500011:00 5000 1150000 800 500011:30 5000 1050000 800 500012:00 3000 1000000 800 500012:30 2000 1000000 800 400013:00 6000 1000000 800 500013:30 7000 1000000 800 600014:00 8000 1000000 800 600014:30 8000 1000000 800 700015:00 8000 1000000 700 600015:30 7000 950000 600 500016:00 5000 950000 500 500016:30 3000 900000 500 300017:00 1000 800000 500 200017:30 500 750000 500 100018:00 0 700000 300 50018:30 0 650000 300 30019:00 0 600000 200 20019:30 0 550000 200 10020:00 0 500000 200 10020:30 0 400000 200 10021:00 0 300000 100 021:30 0 250000 100 022:00 0 150000 50 022:30 0 100000 50 023:00 0 80000 50 023:30 0 50000 30 0
Table 2.1: Real-life Test Profile Definition
for logging or as network stacks connecting PCRF with PCEF and CSCF. Con-sidering this, the main data collection target should be the Process box andthe network stacks.
The Process box contains the whole PCRF logic defined in APL. On execu-
38
00:00 02:00 04:00 06:00 08:00 10:00 12:00 14:00 16:00 18:00 20:00 22:00
Classic UserTravelling ManagerMalfunctioning Cell−PhoneCall Center Employee
Big Event or Catastrophe
Time of the Day
0200000
400000
600000
800000
1000000
1400000
Figure 2.19: Big Event or Catastrophe Test Profile
tion, this box is transpiled into a standalone jar file containing a single class witha single method representing the APL code. MediationZone has a componentnamed CodeServer which is responsible for distributing the jar files on the work-ers. All jar files used during execution can therefore be found in the CodeServercache directory.
The Diameter network stacks and the corresponding boxes are predefined byMediationZone and are also distributed by CodeServer. The analysis of the in-ternal implementation of the MZ and network stacks was done by decompilingthese jar files. The following section contains the results from performed bytecodeanalysis.
2.2.1 Collected OutputThere are two types of information which can be collected from PCRF. One isthe information from the Process method describing each processed message, andone is the information from the network stacks, which contain mainly networktraffic related metrics.
The data describing the processed messages contains various bits of infor-mation. Every message is uniquely identified by the SessionId and HopByHopIdentifier. The message can be of two types, request or answer, plus there arevarious command types. Another, more interesting information concerns the timeof reception, when message processing started and finished. There is also the in-formation about answers, whether and when they are sent during request pro-cessing. Last but not least, for every message we can monitor the time spent inthe database actions.
39
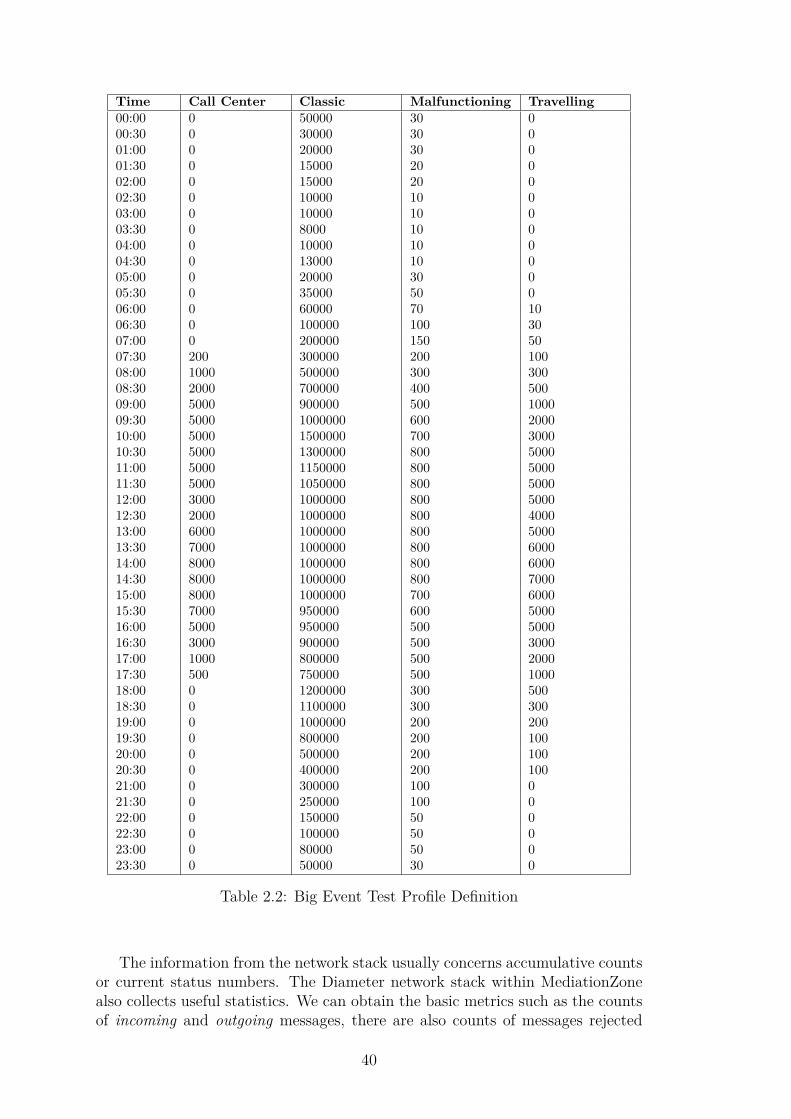
Time Call Center Classic Malfunctioning Travelling00:00 0 50000 30 000:30 0 30000 30 001:00 0 20000 30 001:30 0 15000 20 002:00 0 15000 20 002:30 0 10000 10 003:00 0 10000 10 003:30 0 8000 10 004:00 0 10000 10 004:30 0 13000 10 005:00 0 20000 30 005:30 0 35000 50 006:00 0 60000 70 1006:30 0 100000 100 3007:00 0 200000 150 5007:30 200 300000 200 10008:00 1000 500000 300 30008:30 2000 700000 400 50009:00 5000 900000 500 100009:30 5000 1000000 600 200010:00 5000 1500000 700 300010:30 5000 1300000 800 500011:00 5000 1150000 800 500011:30 5000 1050000 800 500012:00 3000 1000000 800 500012:30 2000 1000000 800 400013:00 6000 1000000 800 500013:30 7000 1000000 800 600014:00 8000 1000000 800 600014:30 8000 1000000 800 700015:00 8000 1000000 700 600015:30 7000 950000 600 500016:00 5000 950000 500 500016:30 3000 900000 500 300017:00 1000 800000 500 200017:30 500 750000 500 100018:00 0 1200000 300 50018:30 0 1100000 300 30019:00 0 1000000 200 20019:30 0 800000 200 10020:00 0 500000 200 10020:30 0 400000 200 10021:00 0 300000 100 021:30 0 250000 100 022:00 0 150000 50 022:30 0 100000 50 023:00 0 80000 50 023:30 0 50000 30 0
Table 2.2: Big Event Test Profile Definition
The information from the network stack usually concerns accumulative countsor current status numbers. The Diameter network stack within MediationZonealso collects useful statistics. We can obtain the basic metrics such as the countsof incoming and outgoing messages, there are also counts of messages rejected
40
by the stack and messages to which the stack replied with the TooBusy answer.From the Process box, we can get the counts of messages which are currently beingprocessed, which are waiting for processing, and which were already processed.
To determine the sizes of the network queues in the operating system, we canaccess the network interface information. Again for both stacks we can get the in-formation about the number of bytes in the receive and send queues. On Linux,this information can be obtained either with a system call or with a specializedapplication.
2.2.2 Measurement OptionsIn order to get the data on the performance of the PCRF server, we needa measurement framework able to collect data from the PCRF server on the go.The measurement framework should be automatically pluggable during the ex-ecution with no or little work. Manual interaction of the person who is execut-ing the measurement should not be needed and the whole process of collectingthe data should be automatic.
The measurement and collection of data from the PCRF have to account forthe presence of the MediationZone, which is running the PCRF. As describedin Section 1.3, MediationZone is an agent system framework written in the Javaprogramming language. There is a concept of workflows which define functionalityby connecting processing boxes. Processing boxes contain the business logic whichis defined in a Java-like DSL and transpiled into Java bytecode.
Because the PCRF does not offer any monitoring infrastructure directly, wehave to instrument it by injecting custom probe code, which will then measure andcollect the required information. There are only a few options which can be takenin order to inject custom code into the agent system. The MediationZone providestwo options, apart from that we can also use Aspect Oriented Programming (AOP)or similar code instrumentation tools.
MediationZone Plugin System
The first MZ option is to write code using the provided DSL, called AnalysisProgramming Language (APL). The code in APL has to be written in the GUI ofMediationZone and is transpiled into Java bytecode on the beginning of the exe-cution.
The second MZ option is to write a custom Java plugin. This plugin hasto possess a defined interface and structure and has to be registered in the Me-diationZone. In addition to registration, it also has to be manually integrated(connected) within the processing boxes or the already-defined APL logic. Bothprevious options cannot be simply plugged in or out and therefore are not suitablefor real-life data collection from the PCRF.
Aspect Oriented Programming
AOP [27] is a programming paradigm which is supposed to address the sepa-ration of concerns. This is achieved by weaving custom code into predefinedcode locations, without modifying the original code. The most famous aspectimplementation for Java is the AspectJ framework.
41
AOP is centered around pointcuts, the specification of locations where the cus-tom logic should be put. The pointcut is composed of join points, which arethe specific places where the advice code is put. The joint points in the classicalAOP are quite restricted and generally available only for methods and alike.
DiSL
Also based on the AOP concepts is DiSL [28] – a domain-specific language forcode instrumentation. Compared to AspectJ, DiSL allows a more flexible defi-nition of join points and generally provides more control over instrumentation.DiSL is an academic project developed in cooperation between the University ofLugano, Charles University in Prague and Shanghai Jiao Tong University.
Among the previously outlined options, the DiSL instrumentation frameworkseems to be the only viable choice. Like AOP, DiSL instrumentation can beautomated with no need for further actions or code modifications. We thereforeimplement the data collection with DiSL. One small disadvantage of using DiSLis the need to restart ECSA within the MediationZone to apply the instrumentedcode.
42
3. ImplementationThere are two implementation parts of the thesis. First one is implementationof the traffic generator and second is implementation of the testing frame-work. Traffic generator is used for generation of a traffic for the PCRF server.It can generate messages for two Diameter interfaces – Gx and Rx. The trafficis generated based on the concept of test profiles which includes scenarios, bothwere defined in Chapter 2.
The main function of testing framework is to combine, manage and prepareall things necessary to perform the test profiles and, of course, perform them.The test profiles are executed one by one once the testing framework was started.There is also integrated instrumentation of the MediationZone, that collects usefulmetrics. The resulting statistics and graphs from the metrics are outputted forall performed test profiles.
3.1 Traffic GeneratorThe implementation of a traffic generator for this thesis was named traffiratorand its placed on GitHub service under MIT license. The home of the projectis https://github.com/Neloop/traffirator, where all source codes can befound. A user documentation of traffirator is present in Appendix B.
Traffirator is written in the Java programming language with a huge help ofthe jDiameter library. The choice of Java and the jDiameter library was madewith considerations to the telecommunication provider, they are familiar withJava and were considering the jDiameter library as a base for testing anyway.The build system for traffirator is maven with the usage of a custom repositorydefinition for the jDiameter dependency.
3.1.1 jDiameterFor the Java programming language, there are only a few generally accessibleDiameter implementations. The first one is included in Oracle CommunicationsConverged Application Server (OCCAS) which is a framework used for buildingreal-time applications mainly for IMS1 network. In here, we can find API forDiameter Base Protocol alongside with Rf, Ro, and Sh Diameter applications.But this Diameter implementation is not available in form of a library.
Another implementation is JavaDiameter2 – very simple library which sup-ports only Diameter Base Protocol. Every other application has to build uponthat. The author himself acknowledge that he is not a Java programmer. Bythe time of writing of the thesis, the project is abandoned, therefore not suitablefor usage.
The last usable implementation of Diameter in Java is jDiameter3. jDiameter1IMS is a separate component which ensures multimedia transfer and management within
telecommunication provider network. IMS is based on the IP protocol as opposed to oldermedia transport systems.
2https://github.com/isj4/JavaDiameter3https://github.com/RestComm/jdiameter
43
is managed by the RestComm company under the AGPL-3.0 license. The imple-mentation of the jDiameter supports the Diameter Base Protocol and in addition,also many applications including Gx and Rx.
The jDiameter library is quite heavy-weight, it is supposed to be run withinJBoss server and has many dependencies on the JBoss utilities. If used withJBoss, jDiameter can be used in cluster mode with the high-availability featureenabled. In addition, jDiameter has an implementation of a multiplexer whichexposes the Diameter stack to the multiple listeners if necessary.
A documentation of jDiameter is not very intuitive, but at least expose the de-sign of the whole library. In addition to the documentation, there are few exam-ples in the repository of the library, which are useful and can be used for furtherimplementation.
3.1.2 ConfigurationThe configuration of the whole generator is unified into single YAML [29] con-figuration file. There are some settings for the generator environment, such asthe number of threads and alike, and there is also definition of the test profilewhich will be used for an execution. The configuration file has to be included asa command line argument during program startup.
Apart of the YAML configuration, the logging framework can be configuredwith the separated configuration file. The logging framework is log4j [30] whichis already used within jDiameter dependencies, so the traffirator adopted it.The configuration file is traditional and can be found in the resources directory.The structure of the configuration is defined in the appropriate logger documen-tation.
In traffirator, there is also a third kind of configuration, the configuration ofjDiameter client stacks. For each used stack/application there has to be separateXML [31] configuration. This configuration specifies the other side of the con-nection, its IP address or domain name and the application identification. Therecan also be set some internal values used within jDiameter for the correspondingapplication, such as timeouts setup for base messages and threads setup. Traffi-rator expects configurations for Gx and Rx stacks on the classpath, therefore inthe resources directory.
The test profiles are implemented in traffirator in form of a configuration. Asstated, test profiles are specified in the YAML configuration file which is providedon the execution. Therefore, the test profiles are dynamical and can be specifieddifferently on every execution. There are example configurations in the projectwhich can be out-of-box used for traffic generation.
3.1.3 Generator LogicThe concept of scenarios is implemented in-code and cannot be redefined bythe configuration. The scenario templates are hard-coded and thus can be usedonly predefined ones. For now, real scenarios include only Call Center Employee,Call Performance, Classic User, Travelling Manager and Malfunctioning Cell-Phone. In addition, there are two simple debugging scenarios.
Instances of the scenarios are constructed using a factory, which instantiates a
44
scenario template. Scenario templates define the whole scenario automaton andits nodes. In scenario nodes, there are defined steps, which has to be done whenthe node is processed. The scenario automaton is a statical entity, which is sharedamongst all instantiated scenarios of given type. The instance of the scenariocontains the reference to the node, which is currently in processing. And there isalso a state of the scenario, which can be accessed within scenario steps.
The traffirator client logic is centered around test profiles and scenarios. Onevery execution, a test profile is loaded and processed in a given order. When-ever traffirator comes up to the moment, where the change of active scenariosis required, then it determines, if the number of active scenarios of a given typeshould be lower or higher and makes the change.
Internally traffirator contains scheduler for high-level tasks, this ensures scal-ability and also full control over a threading model of an application. The mainusage of the scheduler is executing steps defined in the scenarios instance. Traf-firator holds a list of references to the active sessions and scenarios. Therefore,synchronization in form of locks takes place to ensure race-free execution, whileworking concurrently on lists of scenarios. Also, every scenario has its own lockwhich should be acquired while processing the scenario instance.
Steps in a particular scenario are executed one by one, logically there areonly two types of steps, sending and receiving a message. If there is a newmessage, which ought to be sent, then the sending itself is queued in the scheduler.The receival of the messages is solved with listeners, interfaces for the listeners areprovided and called by the jDiameter library. Received messages are also handedover to the scheduler in form of a task. After successful reception of the message,if the next step is sending, then it is scheduled for processing.
Additionally to the received messages, there are also timeouts, which mightbe defined in the context of the scenario. If the next message in the scenario isnot received in the time defined by the timeout, then appropriate actions haveto be done. Traffirator implements timeouts in the way, that it means failure ofthe whole scenario and there is created a brand new scenario instance.
Traffirator provides also a basic support for traffic statistics. Statistics aresampled with a period based on a value given in the YAML configuration file.A filename used for the statistics log is also defined in the configuration. Forthe time being the statistics contain the number of overall failures, the numberof timeouts, the number of sent messages and the number of received messages.
3.2 Testing FrameworkTesting framework developed in the context of this thesis is a collection of shellscripts which sequentially perform all defined test profiles from Subsection 2.1.3and needed maintenance between executions. Testing framework and other filesconnected to the thesis are in the file attachments. User documentation ofthe framework can be found in Appendix C.
3.2.1 Test ProfilesIntroduced testing profiles and scenarios are based on the real-life usage and ex-pectancy. Based on the defined test profiles, it would take 4 days to execute
45
the whole testing on a single machine, which seems a bit exaggerated. Not men-tioning that the server needed for testing the real traffic might not be availableat the faculty.
Considering the time consumption and the lack of performance, the solu-tion can be to shorten the times and lowering the counts of active devices. Forthe times, division by the number 10 seems to be quite a good choice, it is simpleand the resulting times are acceptable. The whole execution after this shorteningis done in roughly 10 hours.
After shortening of the times by the factor of 10, it seems only logical tolower the numbers of the devices also by dividing by 10. But considering ourpossibilities in the context of the measuring hardware, the resulting numbersmay be lowered even more. Therefore, the number 10 can be further revised, ifneeded.
Test profiles used for the PCRF performance evaluation can be found inpcrf-mff/real-scenarios/config directory in appropriate configuration files.
3.2.2 DiSL InstrumentationAn implementation of the DiSL instrumentation contains three main entities.The base instrumentation module which marks particular places of code wherethe instrumented code should be put. And then two analysis classes which handleprocessing and logging of the information collected during instrumentation.
There are two kinds of analysis, the analysis of the network interfaces andthe analysis of the PCRF Process method. The analysis of the network inter-faces includes various metrics usually regarding the counts, for example, countof the incomings messages, etc. The analysis of the processing method logs allprocessed messages and information about them.
DiSL works in the following way. Instrumentation of the code is done onthe separate server, which has to be run before the application, which should beinstrumented. The definition of instrumentation has to be provided to the DiSLserver. The instrumented application is then run with injected DiSL agent, whichensures that every loaded Java class is sent to the DiSL server, possibly instru-mented and sent back.
Instrumentation and MediationZone
When instrumenting MediationZone a small problem emerged. The problem wasin the usage of analysis modules. These modules are placed in separate Javaclasses, therefore, they are called within the code which is injected in MZ. Thatmeans, the analysis classes has to be accessible on the classpath of MZ.
Unfortunately, only adding the analysis classes to the classpath does not solvethe problem. The analysis uses internal classes of MZ to collect the data fromthem. The problem is that the internal classes of MZ are loaded with differentJava classloader than the analysis, if it is placed on the classpath. Therefore,when we try to use the internal class of MZ within analysis we get “Class notfound error” exception, because the analysis is loaded with default classloader.And the default classloader does not see classes loaded with its descendants, whichare used within MZ.
46

The solution to this problem is load the analysis module of the instrumentationwith the classloader used by MZ. Fortunately, there is a concept of plugins in MZ,which can also be used to get custom Java jars into the system. MediationZoneuses this approach to inject Apache libraries. Therefore, after the successfulcommit of the analysis module in MZ, the analysis started to see the internalMZ classes. This is the reason why the instrumentation module and the analysismodules are separated into different jar files.
Instrumentation Output
The output files, where all the logs from instrumentation are stored, are hard-coded in instrumentation classes. For the time being, they are set up to be storedin the /tmp/pcrf-mff-out directory. The output directory is not configurableby some configuration file or option, because it is hard to define where the con-figuration should be stored and how it should be read. The only option wouldbe to again hardcode the path to the configuration, which is kind of the same ashardcoding the directory for log files.
In conclusion, the instrumentation is sampling and storing following valuesfor both (Gx, Rx) network interfaces:
• Incoming – Count of incoming messages.• Outgoing – Count of outgoing messages.• IncomingDecoder – Count of incoming messages to the decoder of the Di-
ameter messages.• Rejected – Count of rejected messages by the Diameter stack.• TooBusy – Count of messages to which the server responded with Too Busy
Diameter message.• InProcessing – Count of messages which are currently in processing.• InQueue – Count of messages which are waiting for processing, therefore are
in between the receival and processing by the Process method in the PCRFserver.
• Processed – Count of messages which were processed by the main processingmethod of the PCRF.
• Recv-Q – Number of bytes in the receive queue of the operating system.• Send-Q – Number of bytes in the send queue of the operating system.
In addition to the information from the network interfaces, there are also datafrom the Process method. These are monitored for each processed message:
• SessionId – Session identification of the message.• HbH – HopByHop Identifier of the message.• R/A – Request or Answer flag.• CommandId – Command identification to which the message belongs to.• BeforeTime – Time which was measured right before the Process method,
it is defined in nanoseconds.• AfterTime – Time measured right after the Process method, it is defined
in nanoseconds.
47

• ReqReceivedTime – Time of the receival (in nanoseconds) of the request,for the received request, this is the time, where the message was receivedby the Diameter stack in MZ. For the received answer this time should bezero.
• ReqSentTime – The exact point in time (in nanoseconds) when the requestwas sent to the client, non-zero only for the received answer. The Medi-ationZone remembers sent requests and pair them with received answer,therefore it can populate this value.
• AnsReceivedTime – The time when the answer was received, defined innanoseconds.
• AnsSentTime – Non-zero value only for the received requests, it is the timeof sending the answer to the request back to the client. The value is definedin nanoseconds.
• PccTime – Duration of all methods concerning the database, it can belookups, saving the data or committing the transaction. It is defined innanoseconds.
3.2.3 ScriptsAll the scripts and the structure within the file attachments of this thesis isshown in Figure 3.1. All these scripts are used in the testing framework duringmeasurement of test profiles.
pcrf-mffdisl
make.shpost-run.shpre-run.sh
plotsplot-all.rplots.shutils.r
real-scenariosrun.sh
Figure 3.1: Folder Structure of Testing Framework Scripts
The measurement entry point is pcrf-mff/real-scenarios/run.sh, thisscript contains almost all logic regarding test profiles, preparation of Mediation-Zone, Couchbase and traffirator. From the base shell script, all others are calledon execution.
The logic of the DiSL instrumentation is located in the pcrf-mff/disl di-rectory and contains make.sh script, which compiles instrumentation classes.There are also pre-run.sh and post-run.sh scripts which should be run be-fore a startup of the testing profile and after, respectively.
The processing of the outputted data to graphs is handled by scripts inpcrf-mff/plots directory. The plots.sh script will find and hand over the datato the plots.r R script which will plot the data into PDF files.
48
Framework Flow
Follows the list of steps which has to be done during an execution of the wholemeasurement. Following list is also comprehensive description of all standalonemeasurement scripts. The main script is pcrf-mff/real-scenarios/run.sh,where all execution begins:
• Load command line arguments, there are three of them and are mandatory.The first one is taskset mask for traffirator, the second one is taskset maskfor PCRF and the third one is the amount of RAM which should be usedfor the bucket in Couchbase.
• Initialize logging path, if it is not already initialized. The logging pathshould be set to /tmp/pcrf-mff-out, as it is hardcoded into the instru-mentation modules.
• Compile traffirator which should be placed in /opt/traffirator folder.The compilation is done with maven build system, which will package traf-firator into jar file.
• Call the pcrf-mff/disl/make.sh script:– Find all Java source files concerning the instrumentation and compile
them using the javac compiler.– Compress compiled class files of the instrumentation module to the jar
file, which will be given to the classpath of the DiSL server.– Generate jar file based on compiled class files of the analysis module,
the jar file will be committed as a plugin to MediationZone.– Create the MediationZone plugin based on the jar file generated from
the analysis module and commit it to MediationZone.• Define the configuration files for traffirator and iterate over them.
– If the iteration is consecutive and not the first one, wait before doingany other steps. Basically, this wait is here to give a server a littlepause to recover between executions.
– Call the pcrf-mff/disl/pre-run.sh script:∗ Make a backup copy of the EC workers configuration located in file
(executioncontext.xml), which is placed in configuration folderof MediationZone.
∗ Copy new configuration, which has options for JVM with includedDiSL agent and instrumented code. The configuration which iscopied is placed in pcrf-mff/disl/config.
∗ Start the DiSL instrumentation server.∗ Restart ECSA which is executing the PCRF logic, the restart will
load the configuration file and apply JVM options to the newlystarted ECSA server. The restart is also run with the tasksetutility with the mask given as a command line argument.
– Run a single testing profile from the defined configuration files:∗ Clean Couchbase from the previous run by deleting the whole
bucket containing the information from the PCRF server.∗ Enable the dump and log workflows in MediationZone, which are
used for logging in the real PCRF.
49
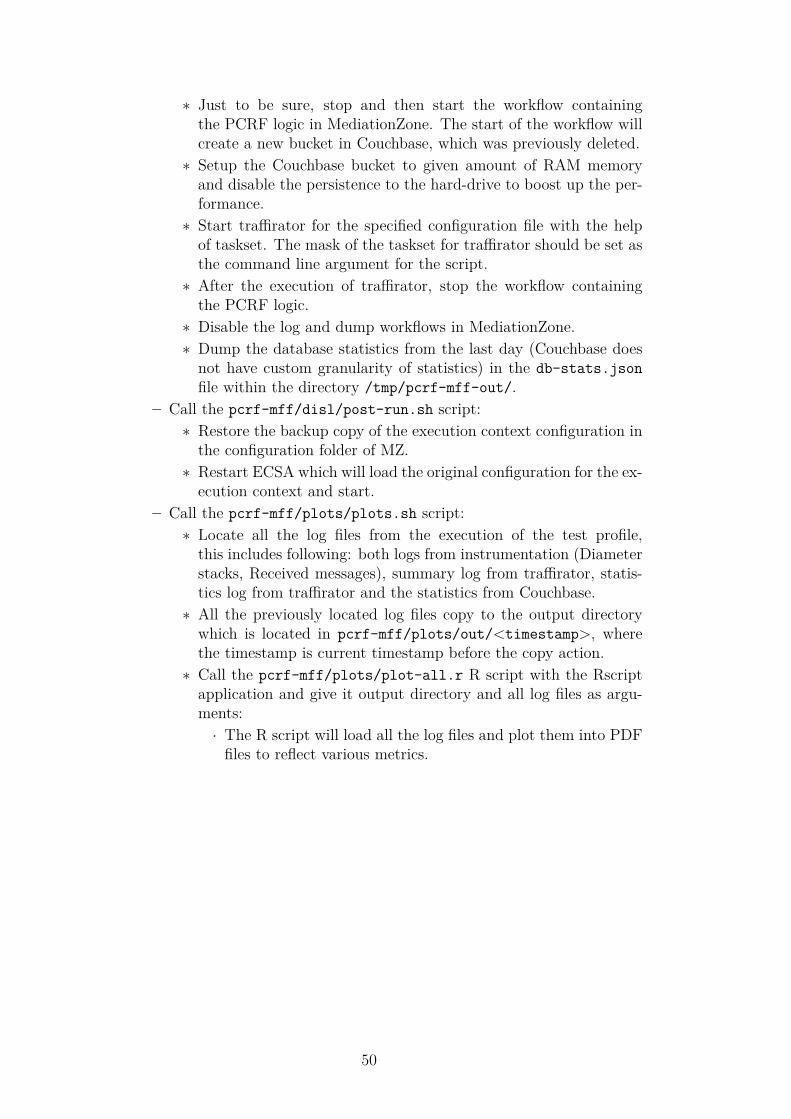
∗ Just to be sure, stop and then start the workflow containingthe PCRF logic in MediationZone. The start of the workflow willcreate a new bucket in Couchbase, which was previously deleted.
∗ Setup the Couchbase bucket to given amount of RAM memoryand disable the persistence to the hard-drive to boost up the per-formance.
∗ Start traffirator for the specified configuration file with the helpof taskset. The mask of the taskset for traffirator should be set asthe command line argument for the script.
∗ After the execution of traffirator, stop the workflow containingthe PCRF logic.
∗ Disable the log and dump workflows in MediationZone.∗ Dump the database statistics from the last day (Couchbase does
not have custom granularity of statistics) in the db-stats.jsonfile within the directory /tmp/pcrf-mff-out/.
– Call the pcrf-mff/disl/post-run.sh script:∗ Restore the backup copy of the execution context configuration in
the configuration folder of MZ.∗ Restart ECSA which will load the original configuration for the ex-
ecution context and start.– Call the pcrf-mff/plots/plots.sh script:
∗ Locate all the log files from the execution of the test profile,this includes following: both logs from instrumentation (Diameterstacks, Received messages), summary log from traffirator, statis-tics log from traffirator and the statistics from Couchbase.
∗ All the previously located log files copy to the output directorywhich is located in pcrf-mff/plots/out/<timestamp>, wherethe timestamp is current timestamp before the copy action.
∗ Call the pcrf-mff/plots/plot-all.r R script with the Rscriptapplication and give it output directory and all log files as argu-ments:
· The R script will load all the log files and plot them into PDFfiles to reflect various metrics.
50

4. EvaluationIn this section, we present and discuss the measurement data collected usingthe test profiles from Section 2.1.3 and the implemented testing framework.The measurement was performed on a server hosted by the faculty. As opposedto the telecommunication provider setup, our measurement was not performedon a virtual server, but on a bare hardware Linux server.
The server has following specification:• Dual Intel Xeon E5620 CPU• 48 GB RAM• Red Hat 6.4 with Linux kernel 4.13
To minimize the interference between the traffic generator and PCRF, we runthe generator on one of the server processors and MediationZone with Couchbaseon the other one. Processors number 0,2,4,6,8,10,12,14 were assigned tothe traffic generator and processors number 1,3,5,7,9,11,13,15 to Couchbaseand MediationZone. This setup is used in all of the following measurements.
4.1 Initial TuningThe initial measurements were used to tune the experiment infrastructure. Theserevealed some serious issues with our server setup – the performance test showedthat the server was able to process only 1500 messages per second, which is muchlower than expected. The estimates of the telecommunication provider on per-formance are 5000 messages per second on their setup. The telecommunicationprovider also commented on possible issues with the Couchbase database andthe performance of disk writes.
To locate the problem, a special testing profile was designed. The profile gen-erates a constant load of roughly 250 messages per second, realized by 500 activeCallPerformance scenarios. This load is small enough and should be processedby the server without any problems.
The processing of the constant load was fine for roughly sixty minutes. Afterthat, the performance degraded and the server did not process any message forquite some time. This behavior can be seen in Figure 4.1, where the numberof processed messages per second is depicted. This graph shows that the prob-lem appears after some execution time or after a certain amount of processedmessages.
The next logical action was to take a look at the logs from MediationZone andCouchbase. The relevant log messages from MediationZone, which first appearedaround the time the server ceased processing messages, are shown in Listing 4.1and Listing 4.2. They suggest that the database did not reply in a given timeand even failed after thirty consecutive retries. The reason for the failure is notspecified.
The log message in Listing 4.3 is from Couchbase, this message and similarones started to appear right at the point where the PCRF server stopped process-ing messages. As the log states, there seems to be a problem with the assigned
51
0e+00 2e+06 4e+06 6e+06 8e+06
010
020
030
040
050
0PCRF Processed
Time [ms]
Pro
cess
ed p
er S
econ
d
StartEndSmoothing Interpolation
Figure 4.1: Constant 500 Profile – Processed Messages
Listing 4.1: MediationZone – Database Timeout Log MessageID : 21787Log type : WorkflowSeve r i t y : ErrorRepeated : 1Creat ion date : 2018−06−21 13 : 39 : 49Lates t occur rence : 2018−06−21 13 : 39 : 49Message : Transact ion timed out on lookupMany ( keys = [ 5 . 8 . 1 . 2 ] ) .In s tance : CZ PCV.WFL GxRx.01Agent : ProcessIP : gx :35097Pico name : ECSA1
amount of memory in the bucket containing the data from PCRF. The first the-ory was that there are problems with the disk write performance of Couchbase,as the telecommunication provider suggested.
To provide more insight, we have extended the measurement framework tocollect statistics from the Couchbase database. For our use, we focused on the sizeof the disk write queues and the number of operations performed on the bucket.Interestingly, these values were zero at the time of the event. Therefore, the initialtheory was rejected.
The next step in the investigation was to find a suspiciously behaving metricfrom the Couchbase database which could explain the observed problems. Aftersome research, this was a number of out-of-memory errors sent back to the client.These errors are sent to the client when the bucket is not big enough to contain all
52
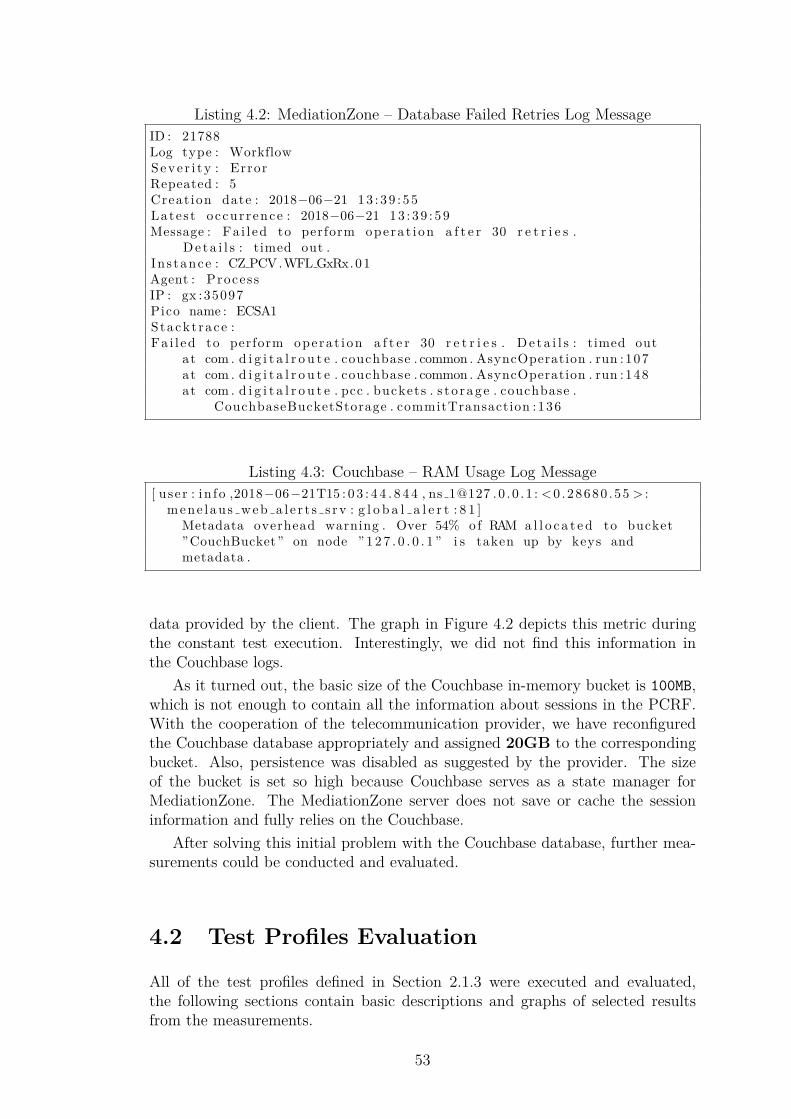
Listing 4.2: MediationZone – Database Failed Retries Log MessageID : 21788Log type : WorkflowSeve r i t y : ErrorRepeated : 5Creat ion date : 2018−06−21 13 : 39 : 55Lates t occur rence : 2018−06−21 13 : 39 : 59Message : Fa i l ed to perform operat i on a f t e r 30 r e t r i e s .
D e t a i l s : timed out .In s tance : CZ PCV.WFL GxRx.01Agent : ProcessIP : gx :35097Pico name : ECSA1Stackt race :Fa i l ed to perform operat i on a f t e r 30 r e t r i e s . D e t a i l s : timed out
at com . d i g i t a l r o u t e . couchbase . common . AsyncOperation . run :107at com . d i g i t a l r o u t e . couchbase . common . AsyncOperation . run :148at com . d i g i t a l r o u t e . pcc . buckets . s t o rage . couchbase .
CouchbaseBucketStorage . commitTransaction :136
Listing 4.3: Couchbase – RAM Usage Log Message[ u se r : in fo ,2018−06−21T15 : 0 3 : 4 4 . 8 4 4 , ns 1@127 .0 . 0 . 1 : <0 .28680 .55 > :
mene l au s web a l e r t s s rv : g l o b a l a l e r t : 8 1 ]Metadata overhead warning . Over 54% of RAM a l l o c a t e d to bucket”CouchBucket” on node ” 1 2 7 . 0 . 0 . 1 ” i s taken up by keys andmetadata .
data provided by the client. The graph in Figure 4.2 depicts this metric duringthe constant test execution. Interestingly, we did not find this information inthe Couchbase logs.
As it turned out, the basic size of the Couchbase in-memory bucket is 100MB,which is not enough to contain all the information about sessions in the PCRF.With the cooperation of the telecommunication provider, we have reconfiguredthe Couchbase database appropriately and assigned 20GB to the correspondingbucket. Also, persistence was disabled as suggested by the provider. The sizeof the bucket is set so high because Couchbase serves as a state manager forMediationZone. The MediationZone server does not save or cache the sessioninformation and fully relies on the Couchbase.
After solving this initial problem with the Couchbase database, further mea-surements could be conducted and evaluated.
4.2 Test Profiles Evaluation
All of the test profiles defined in Section 2.1.3 were executed and evaluated,the following sections contain basic descriptions and graphs of selected resultsfrom the measurements.
53
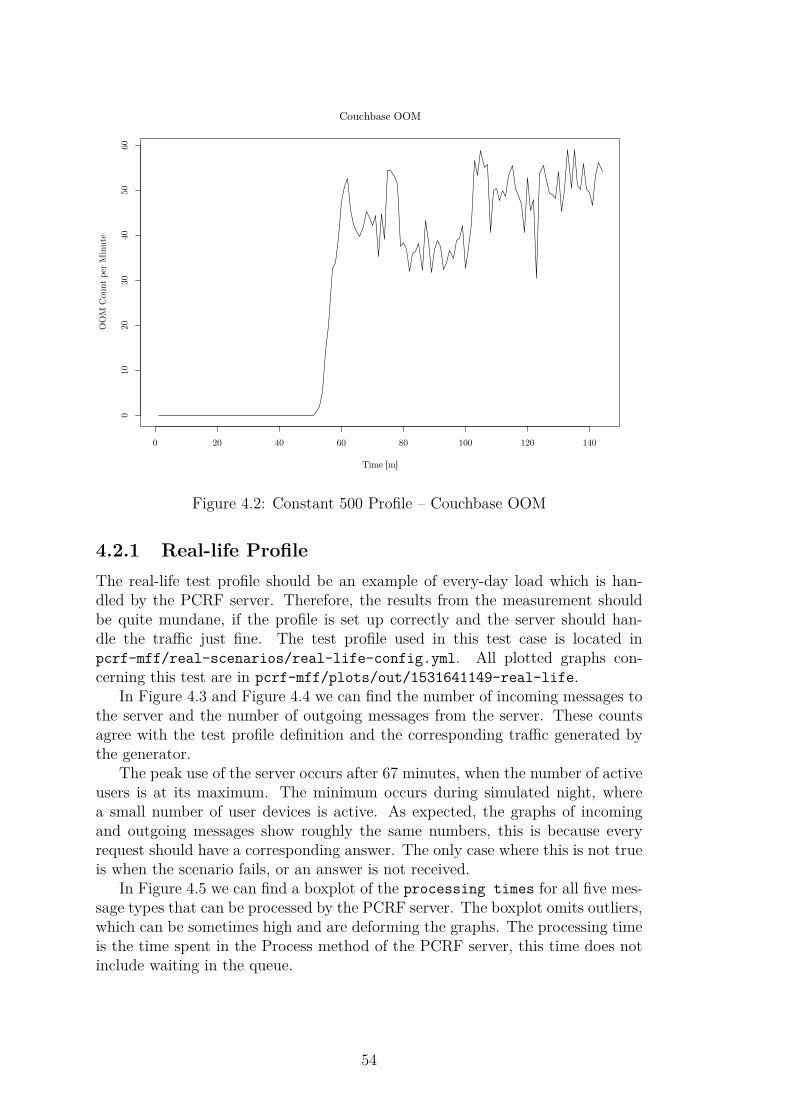
0 20 40 60 80 100 120 140
010
2030
4050
60Couchbase OOM
Time [m]
OO
M C
ount
per
Min
ute
Figure 4.2: Constant 500 Profile – Couchbase OOM
4.2.1 Real-life ProfileThe real-life test profile should be an example of every-day load which is han-dled by the PCRF server. Therefore, the results from the measurement shouldbe quite mundane, if the profile is set up correctly and the server should han-dle the traffic just fine. The test profile used in this test case is located inpcrf-mff/real-scenarios/real-life-config.yml. All plotted graphs con-cerning this test are in pcrf-mff/plots/out/1531641149-real-life.
In Figure 4.3 and Figure 4.4 we can find the number of incoming messages tothe server and the number of outgoing messages from the server. These countsagree with the test profile definition and the corresponding traffic generated bythe generator.
The peak use of the server occurs after 67 minutes, when the number of activeusers is at its maximum. The minimum occurs during simulated night, wherea small number of user devices is active. As expected, the graphs of incomingand outgoing messages show roughly the same numbers, this is because everyrequest should have a corresponding answer. The only case where this is not trueis when the scenario fails, or an answer is not received.
In Figure 4.5 we can find a boxplot of the processing times for all five mes-sage types that can be processed by the PCRF server. The boxplot omits outliers,which can be sometimes high and are deforming the graphs. The processing timeis the time spent in the Process method of the PCRF server, this time does notinclude waiting in the queue.
54
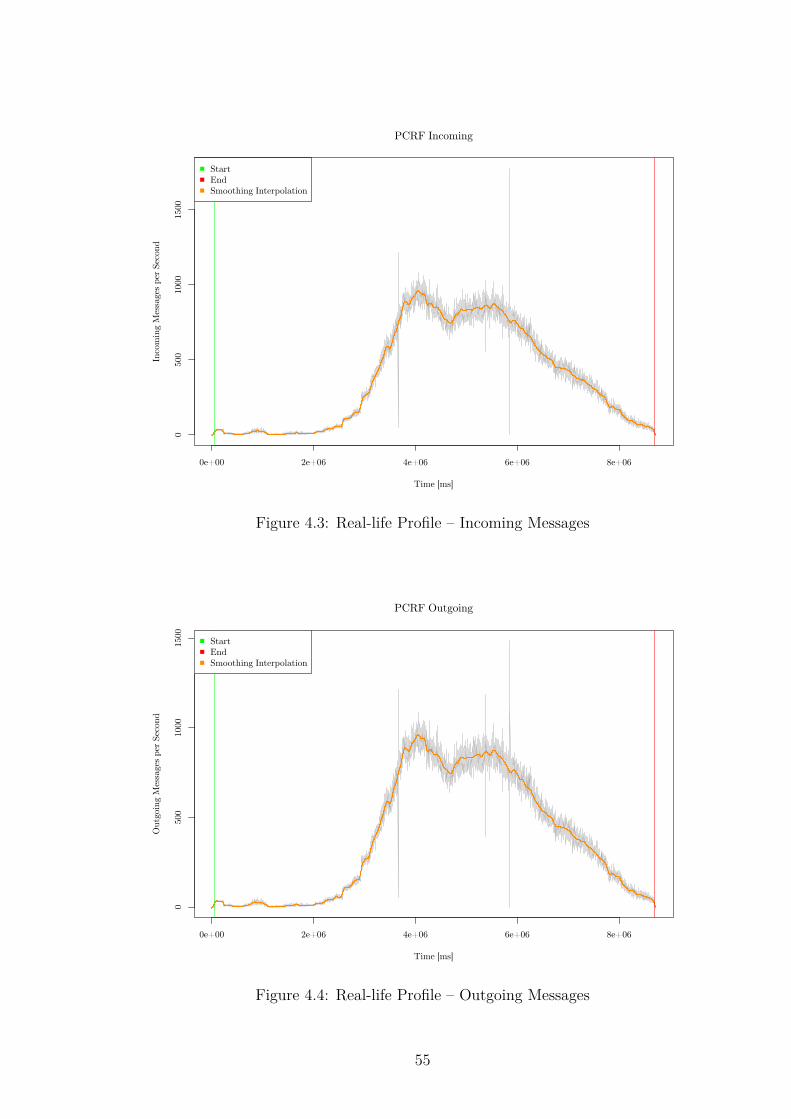
0e+00 2e+06 4e+06 6e+06 8e+06
050
010
0015
00
PCRF Incoming
Time [ms]
Inco
min
g M
essa
ges
per
Sec
ond
StartEndSmoothing Interpolation
Figure 4.3: Real-life Profile – Incoming Messages
0e+00 2e+06 4e+06 6e+06 8e+06
050
010
0015
00
PCRF Outgoing
Time [ms]
Outg
oing
Mes
sage
s per
Sec
ond
StartEndSmoothing Interpolation
Figure 4.4: Real-life Profile – Outgoing Messages
55
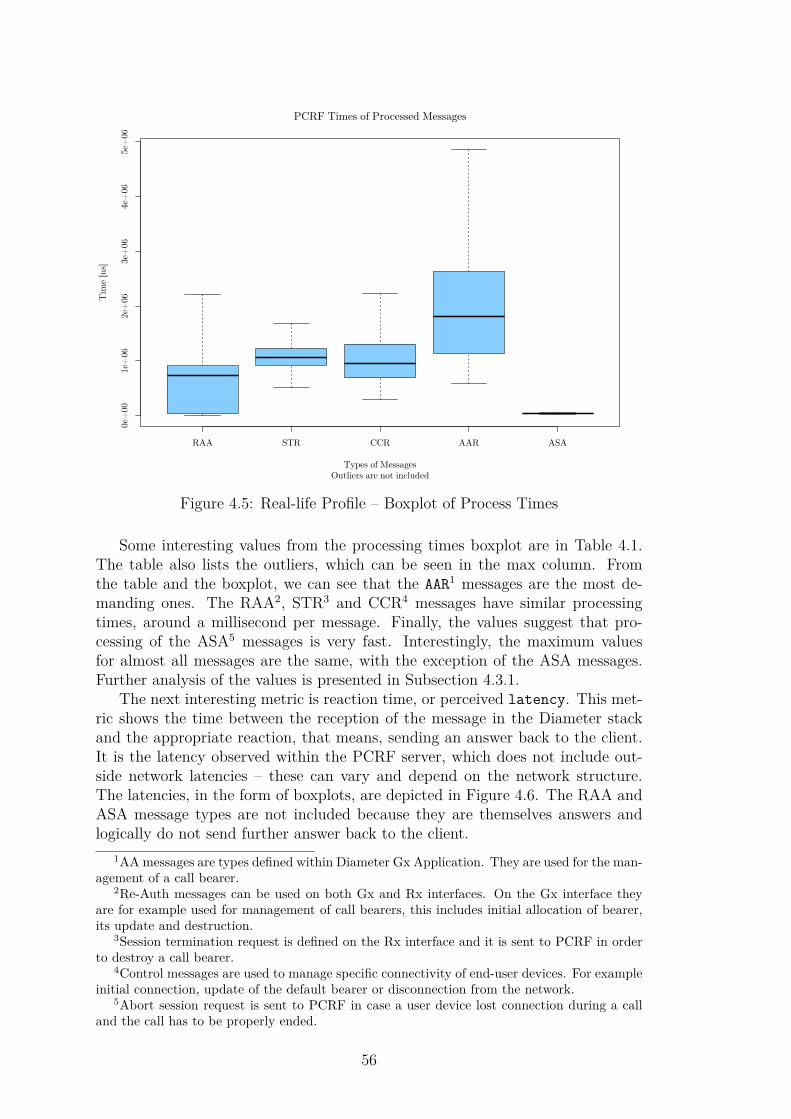
RAA STR CCR AAR ASA
0e+
001e
+06
2e+
063e
+06
4e+
065e
+06
PCRF Times of Processed Messages
Outliers are not includedTypes of Messages
Tim
e [n
s]
Figure 4.5: Real-life Profile – Boxplot of Process Times
Some interesting values from the processing times boxplot are in Table 4.1.The table also lists the outliers, which can be seen in the max column. Fromthe table and the boxplot, we can see that the AAR1 messages are the most de-manding ones. The RAA2, STR3 and CCR4 messages have similar processingtimes, around a millisecond per message. Finally, the values suggest that pro-cessing of the ASA5 messages is very fast. Interestingly, the maximum valuesfor almost all messages are the same, with the exception of the ASA messages.Further analysis of the values is presented in Subsection 4.3.1.
The next interesting metric is reaction time, or perceived latency. This met-ric shows the time between the reception of the message in the Diameter stackand the appropriate reaction, that means, sending an answer back to the client.It is the latency observed within the PCRF server, which does not include out-side network latencies – these can vary and depend on the network structure.The latencies, in the form of boxplots, are depicted in Figure 4.6. The RAA andASA message types are not included because they are themselves answers andlogically do not send further answer back to the client.
1AA messages are types defined within Diameter Gx Application. They are used for the man-agement of a call bearer.
2Re-Auth messages can be used on both Gx and Rx interfaces. On the Gx interface theyare for example used for management of call bearers, this includes initial allocation of bearer,its update and destruction.
3Session termination request is defined on the Rx interface and it is sent to PCRF in orderto destroy a call bearer.
4Control messages are used to manage specific connectivity of end-user devices. For exampleinitial connection, update of the default bearer or disconnection from the network.
5Abort session request is sent to PCRF in case a user device lost connection during a calland the call has to be properly ended.
56
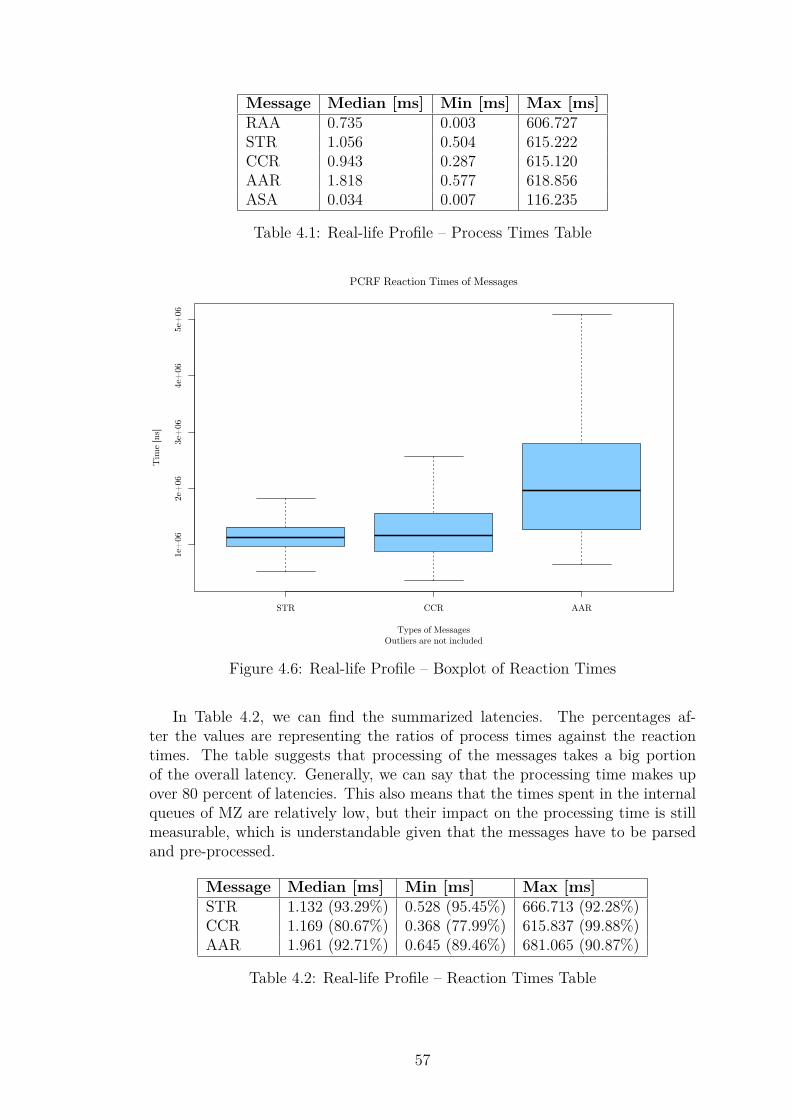
Message Median [ms] Min [ms] Max [ms]RAA 0.735 0.003 606.727STR 1.056 0.504 615.222CCR 0.943 0.287 615.120AAR 1.818 0.577 618.856ASA 0.034 0.007 116.235
Table 4.1: Real-life Profile – Process Times Table
STR CCR AAR
1e+
062e
+06
3e+
064e
+06
5e+
06
PCRF Reaction Times of Messages
Outliers are not includedTypes of Messages
Tim
e [n
s]
Figure 4.6: Real-life Profile – Boxplot of Reaction Times
In Table 4.2, we can find the summarized latencies. The percentages af-ter the values are representing the ratios of process times against the reactiontimes. The table suggests that processing of the messages takes a big portionof the overall latency. Generally, we can say that the processing time makes upover 80 percent of latencies. This also means that the times spent in the internalqueues of MZ are relatively low, but their impact on the processing time is stillmeasurable, which is understandable given that the messages have to be parsedand pre-processed.
Message Median [ms] Min [ms] Max [ms]STR 1.132 (93.29%) 0.528 (95.45%) 666.713 (92.28%)CCR 1.169 (80.67%) 0.368 (77.99%) 615.837 (99.88%)AAR 1.961 (92.71%) 0.645 (89.46%) 681.065 (90.87%)
Table 4.2: Real-life Profile – Reaction Times Table
57
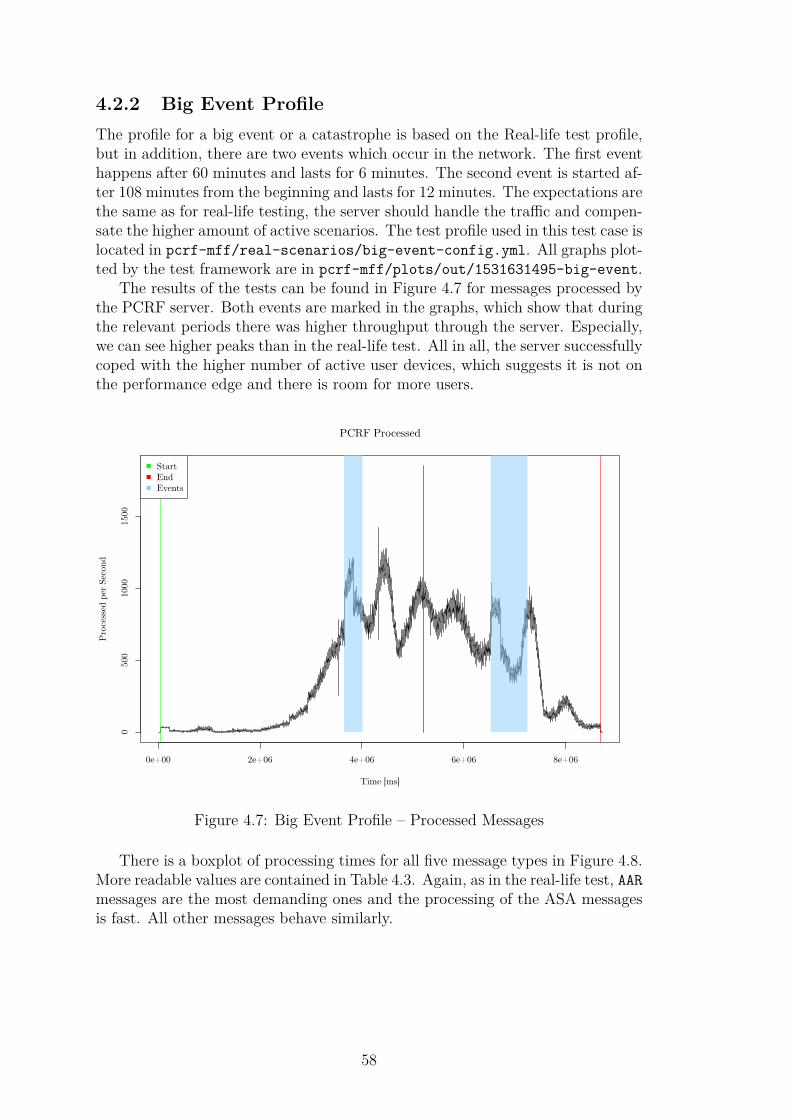
4.2.2 Big Event ProfileThe profile for a big event or a catastrophe is based on the Real-life test profile,but in addition, there are two events which occur in the network. The first eventhappens after 60 minutes and lasts for 6 minutes. The second event is started af-ter 108 minutes from the beginning and lasts for 12 minutes. The expectations arethe same as for real-life testing, the server should handle the traffic and compen-sate the higher amount of active scenarios. The test profile used in this test case islocated in pcrf-mff/real-scenarios/big-event-config.yml. All graphs plot-ted by the test framework are in pcrf-mff/plots/out/1531631495-big-event.
The results of the tests can be found in Figure 4.7 for messages processed bythe PCRF server. Both events are marked in the graphs, which show that duringthe relevant periods there was higher throughput through the server. Especially,we can see higher peaks than in the real-life test. All in all, the server successfullycoped with the higher number of active user devices, which suggests it is not onthe performance edge and there is room for more users.
0e+00 2e+06 4e+06 6e+06 8e+06
050
010
0015
00
PCRF Processed
Time [ms]
Pro
cess
ed p
er S
econ
d
StartEndEvents
Figure 4.7: Big Event Profile – Processed Messages
There is a boxplot of processing times for all five message types in Figure 4.8.More readable values are contained in Table 4.3. Again, as in the real-life test, AARmessages are the most demanding ones and the processing of the ASA messagesis fast. All other messages behave similarly.
58
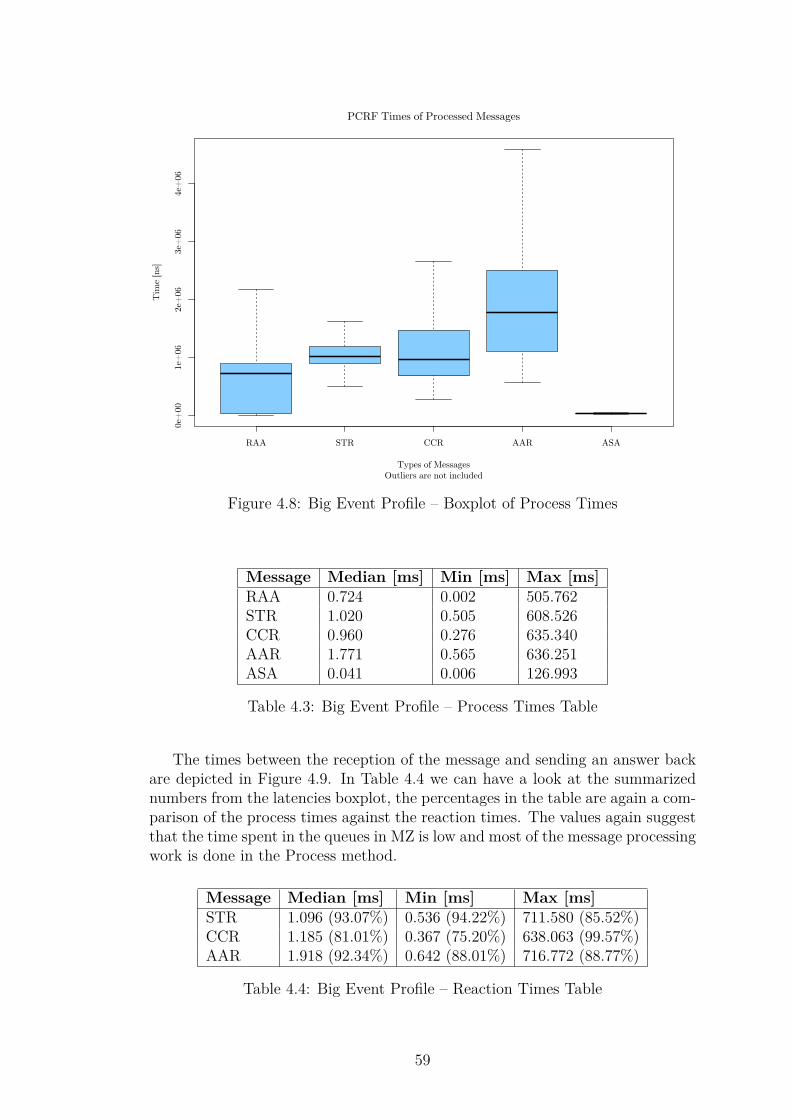
RAA STR CCR AAR ASA
0e+
001e
+06
2e+
063e
+06
4e+
06
PCRF Times of Processed Messages
Outliers are not includedTypes of Messages
Tim
e [n
s]
Figure 4.8: Big Event Profile – Boxplot of Process Times
Message Median [ms] Min [ms] Max [ms]RAA 0.724 0.002 505.762STR 1.020 0.505 608.526CCR 0.960 0.276 635.340AAR 1.771 0.565 636.251ASA 0.041 0.006 126.993
Table 4.3: Big Event Profile – Process Times Table
The times between the reception of the message and sending an answer backare depicted in Figure 4.9. In Table 4.4 we can have a look at the summarizednumbers from the latencies boxplot, the percentages in the table are again a com-parison of the process times against the reaction times. The values again suggestthat the time spent in the queues in MZ is low and most of the message processingwork is done in the Process method.
Message Median [ms] Min [ms] Max [ms]STR 1.096 (93.07%) 0.536 (94.22%) 711.580 (85.52%)CCR 1.185 (81.01%) 0.367 (75.20%) 638.063 (99.57%)AAR 1.918 (92.34%) 0.642 (88.01%) 716.772 (88.77%)
Table 4.4: Big Event Profile – Reaction Times Table
59
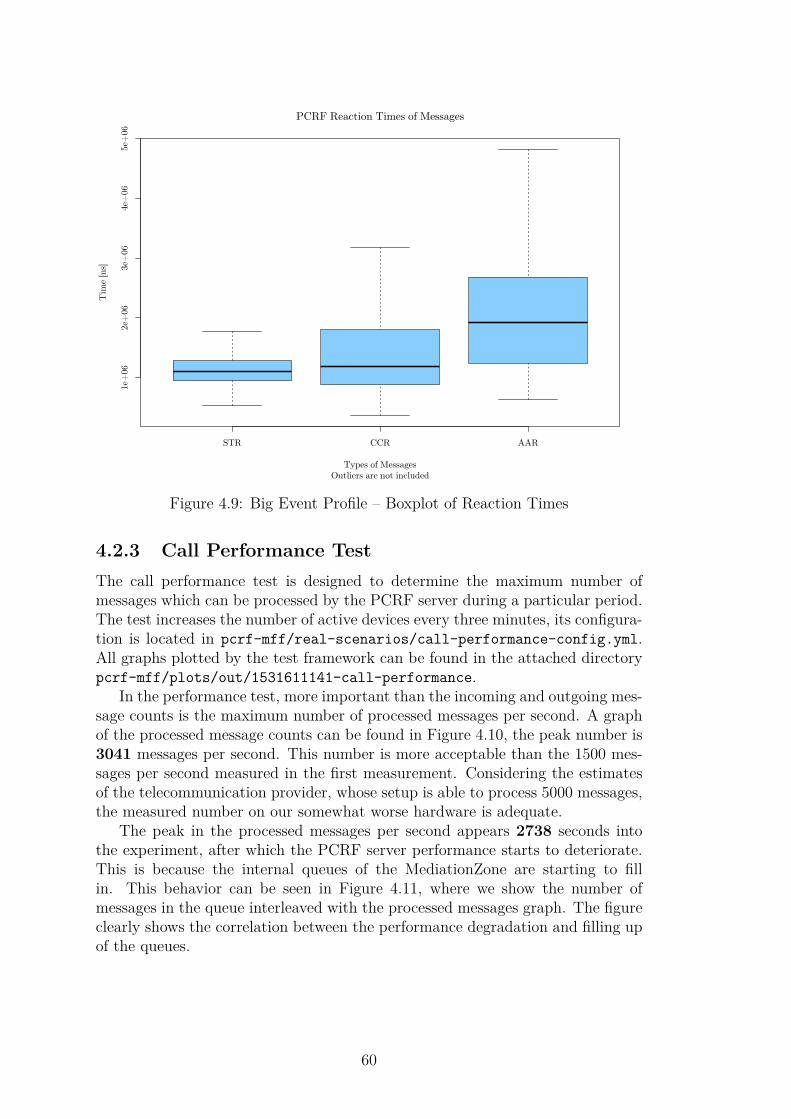
STR CCR AAR
1e+
062e
+06
3e+
064e
+06
5e+
06PCRF Reaction Times of Messages
Outliers are not includedTypes of Messages
Tim
e [n
s]
Figure 4.9: Big Event Profile – Boxplot of Reaction Times
4.2.3 Call Performance TestThe call performance test is designed to determine the maximum number ofmessages which can be processed by the PCRF server during a particular period.The test increases the number of active devices every three minutes, its configura-tion is located in pcrf-mff/real-scenarios/call-performance-config.yml.All graphs plotted by the test framework can be found in the attached directorypcrf-mff/plots/out/1531611141-call-performance.
In the performance test, more important than the incoming and outgoing mes-sage counts is the maximum number of processed messages per second. A graphof the processed message counts can be found in Figure 4.10, the peak number is3041 messages per second. This number is more acceptable than the 1500 mes-sages per second measured in the first measurement. Considering the estimatesof the telecommunication provider, whose setup is able to process 5000 messages,the measured number on our somewhat worse hardware is adequate.
The peak in the processed messages per second appears 2738 seconds intothe experiment, after which the PCRF server performance starts to deteriorate.This is because the internal queues of the MediationZone are starting to fillin. This behavior can be seen in Figure 4.11, where we show the number ofmessages in the queue interleaved with the processed messages graph. The figureclearly shows the correlation between the performance degradation and filling upof the queues.
60
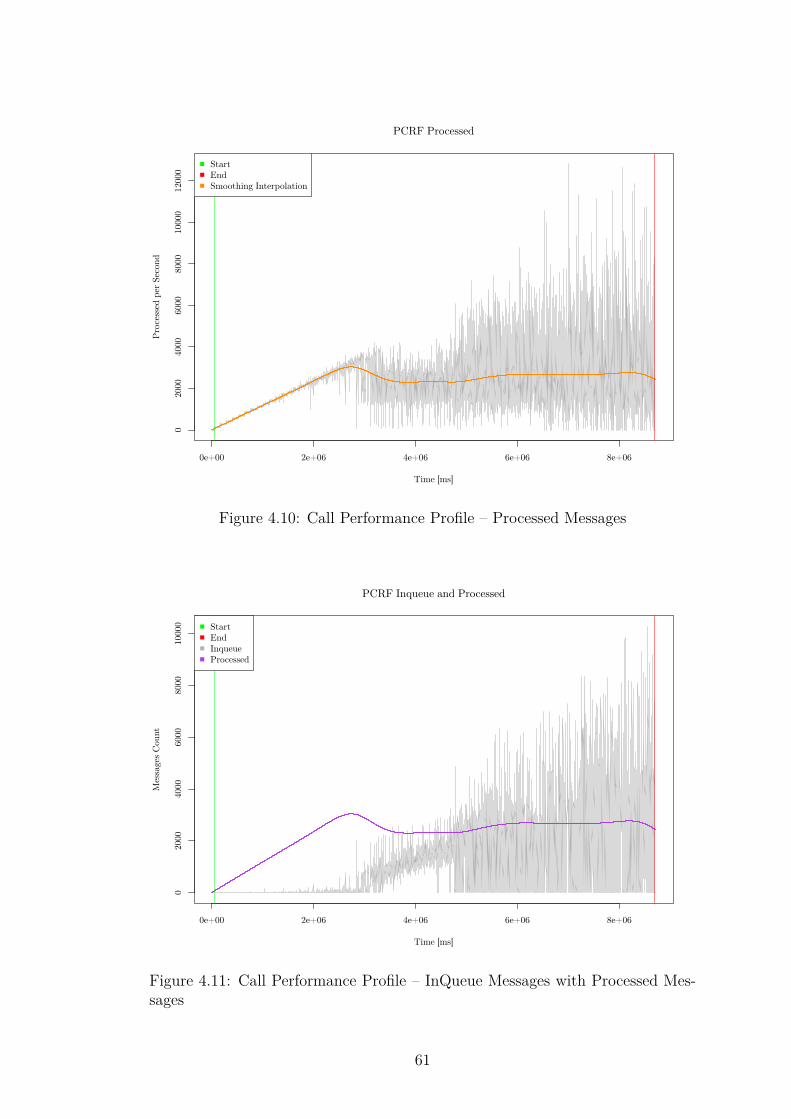
0e+00 2e+06 4e+06 6e+06 8e+06
020
0040
0060
0080
0010
000
1200
0
PCRF Processed
Time [ms]
Pro
cess
ed p
er S
econ
dStartEndSmoothing Interpolation
Figure 4.10: Call Performance Profile – Processed Messages
0e+00 2e+06 4e+06 6e+06 8e+06
020
0040
0060
0080
0010
000
PCRF Inqueue and Processed
Time [ms]
Mes
sage
s C
ount
StartEndInqueueProcessed
Figure 4.11: Call Performance Profile – InQueue Messages with Processed Mes-sages
61
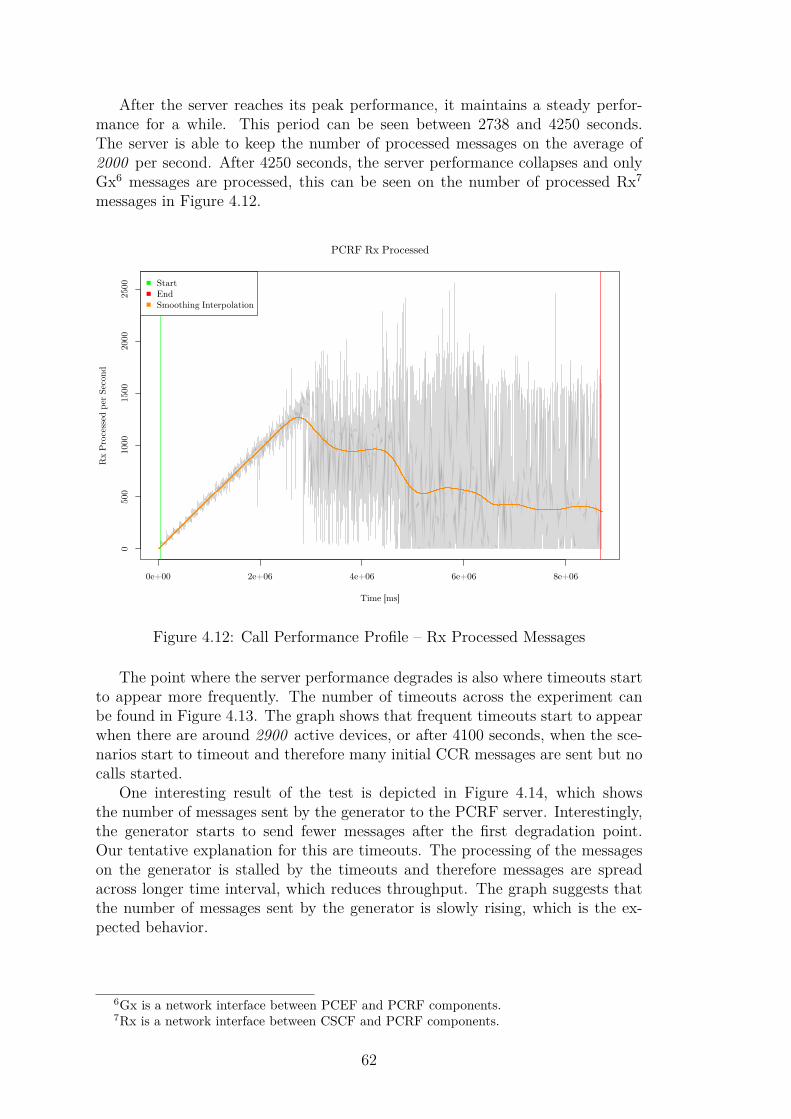
After the server reaches its peak performance, it maintains a steady perfor-mance for a while. This period can be seen between 2738 and 4250 seconds.The server is able to keep the number of processed messages on the average of2000 per second. After 4250 seconds, the server performance collapses and onlyGx6 messages are processed, this can be seen on the number of processed Rx7
messages in Figure 4.12.
0e+00 2e+06 4e+06 6e+06 8e+06
050
010
0015
0020
0025
00
PCRF Rx Processed
Time [ms]
Rx P
roce
ssed
per
Sec
ond
StartEndSmoothing Interpolation
Figure 4.12: Call Performance Profile – Rx Processed Messages
The point where the server performance degrades is also where timeouts startto appear more frequently. The number of timeouts across the experiment canbe found in Figure 4.13. The graph shows that frequent timeouts start to appearwhen there are around 2900 active devices, or after 4100 seconds, when the sce-narios start to timeout and therefore many initial CCR messages are sent but nocalls started.
One interesting result of the test is depicted in Figure 4.14, which showsthe number of messages sent by the generator to the PCRF server. Interestingly,the generator starts to send fewer messages after the first degradation point.Our tentative explanation for this are timeouts. The processing of the messageson the generator is stalled by the timeouts and therefore messages are spreadacross longer time interval, which reduces throughput. The graph suggests thatthe number of messages sent by the generator is slowly rising, which is the ex-pected behavior.
6Gx is a network interface between PCEF and PCRF components.7Rx is a network interface between CSCF and PCRF components.
62
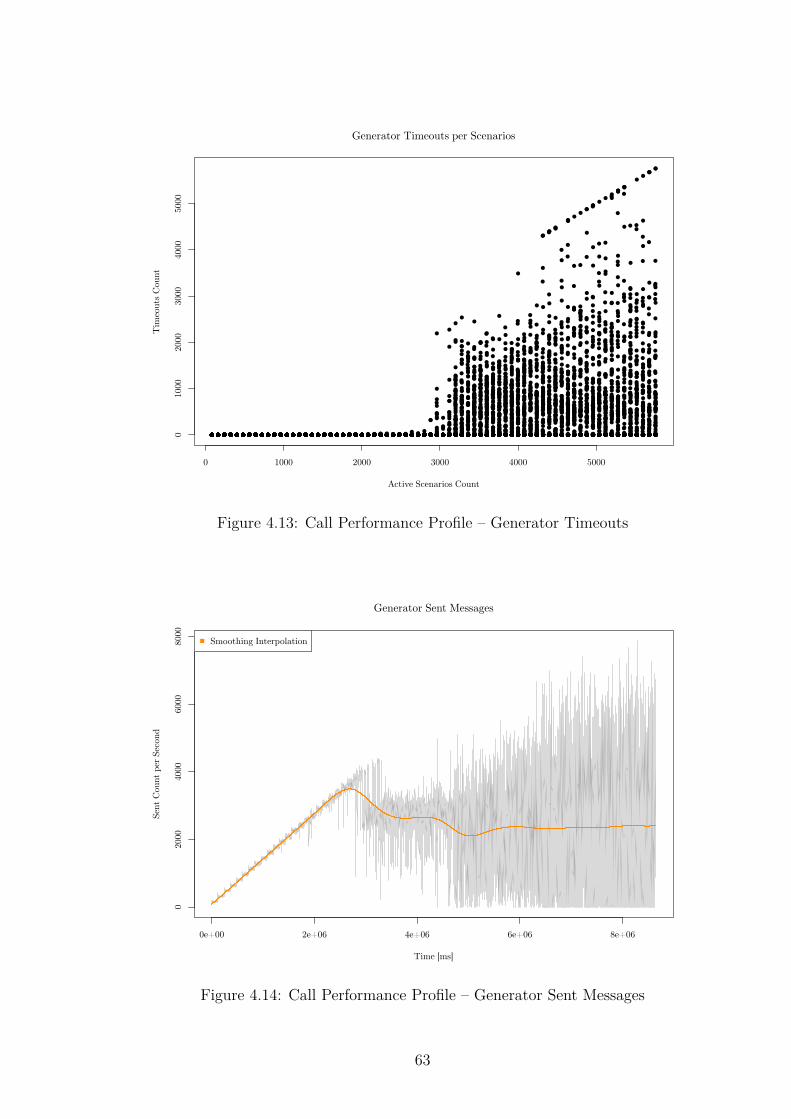
●●●●●●●●●●●●●●●●●●●●●●●●●●●●●●●●●●●●●●●●●●●●●●●●●●●●●●●●●●●●●●●●●●●●●●●●●●●●●●●●●●●●●●●●●●●●●●●●●●●●●●●●●●●●●●●●●●●●●●●● ●●●●●●●●●●●●●●●●●●●●●●●●●●●●●●●●●●●●●●●●●●●●●●●●●●●●●●●●●●●●●●●●●●●●●●●●●●●●●●●●●●●●●●●●●●●●●●●●●●●●●●●●●●●●●●●●●●●●●●●● ●●●●●●●●●●●●●●●●●●●●●●●●●●●●●●●●●●●●●●●●●●●●●●●●●●●●●●●●●●●●●●●●●●●●●●●●●●●●●●●●●●●●●●●●●●●●●●●●●●●●●●●●●●●●●●●●●●●●●●●● ●●●●●●●●●●●●●●●●●●●●●●●●●●●●●●●●●●●●●●●●●●●●●●●●●●●●●●●●●●●●●●●●●●●●●●●●●●●●●●●●●●●●●●●●●●●●●●●●●●●●●●●●●●●●●●●●●●●●●●●● ●●●●●●●●●●●●●●●●●●●●●●●●●●●●●●●●●●●●●●●●●●●●●●●●●●●●●●●●●●●●●●●●●●●●●●●●●●●●●●●●●●●●●●●●●●●●●●●●●●●●●●●●●●●●●●●●●●●●●●●● ●●●●●●●●●●●●●●●●●●●●●●●●●●●●●●●●●●●●●●●●●●●●●●●●●●●●●●●●●●●●●●●●●●●●●●●●●●●●●●●●●●●●●●●●●●●●●●●●●●●●●●●●●●●●●●●●●●●●●●●● ●●●●●●●●●●●●●●●●●●●●●●●●●●●●●●●●●●●●●●●●●●●●●●●●●●●●●●●●●●●●●●●●●●●●●●●●●●●●●●●●●●●●●●●●●●●●●●●●●●●●●●●●●●●●●●●●●●●●●●●● ●●●●●●●●●●●●●●●●●●●●●●●●●●●●●●●●●●●●●●●●●●●●●●●●●●●●●●●●●●●●●●●●●●●●●●●●●●●●●●●●●●●●●●●●●●●●●●●●●●●●●●●●●●●●●●●●●●●●●●●● ●●●●●●●●●●●●●●●●●●●●●●●●●●●●●●●●●●●●●●●●●●●●●●●●●●●●●●●●●●●●●●●●●●●●●●●●●●●●●●●●●●●●●●●●●●●●●●●●●●●●●●●●●●●●●●●●●●●●●●●● ●●●●●●●●●●●●●●●●●●●●●●●●●●●●●●●●●●●●●●●●●●●●●●●●●●●●●●●●●●●●●●●●●●●●●●●●●●●●●●●●●●●●●●●●●●●●●●●●●●●●●●●●●●●●●●●●●●●●●●●● ●●●●●●●●●●●●●●●●●●●●●●●●●●●●●●●●●●●●●●●●●●●●●●●●●●●●●●●●●●●●●●●●●●●●●●●●●●●●●●●●●●●●●●●●●●●●●●●●●●●●●●●●●●●●●●●●●●●●●●●● ●●●●●●●●●●●●●●●●●●●●●●●●●●●●●●●●●●●●●●●●●●●●●●●●●●●●●●●●●●●●●●●●●●●●●●●●●●●●●●●●●●●●●●●●●●●●●●●●●●●●●●●●●●●●●●●●●●●●●●●● ●●●●●●●●●●●●●●●●●●●●●●●●●●●●●●●●●●●●●●●●●●●●●●●●●●●●●●●●●●●●●●●●●●●●●●●●●●●●●●●●●●●●●●●●●●●●●●●●●●●●●●●●●●●●●●●●●●●●●●●● ●●●●●●●●●●●●●●●●●●●●●●●●●●●●●●●●●●●●●●●●●●●●●●●●●●●●●●●●●●●●●●●●●●●●●●●●●●●●●●●●●●●●●●●●●●●●●●●●●●●●●●●●●●●●●●●●●●●●●●●● ●●●●●●●●●●●●●●●●●●●●●●●●●●●●●●●●●●●●●●●●●●●●●●●●●●●●●●●●●●●●●●●●●●●●●●●●●●●●●●●●●●●●●●●●●●●●●●●●●●●●●●●●●●●●●●●●●●●●●●●● ●●●●●●●●●●●●●●●●●●●●●●●●●●●●●●●●●●●●●●●●●●●●●●●●●●●●●●●●●●●●●●●●●●●●●●●●●●●●●●●●●●●●●●●●●●●●●●●●●●●●●●●●●●●●●●●●●●●●●●●● ●●●●●●●●●●●●●●●●●●●●●●●●●●●●●●●●●●●●●●●●●●●●●●●●●●●●●●●●●●●●●●●●●●●●●●●●●●●●●●●●●●●●●●●●●●●●●●●●●●●●●●●●●●●●●●●●●●●●●●●● ●●●●●●●●●●●●●●●●●●●●●●●●●●●●●●●●●●●●●●●●●●●●●●●●●●●●●●●●●●●●●●●●●●●●●●●●●●●●●●●●●●●●●●●●●●●●●●●●●●●●●●●●●●●●●●●●●●●●●●●● ●●●●●●●●●●●●●●●●●●●●●●●●●●●●●●●●●●●●●●●●●●●●●●●●●●●●●●●●●●●●●●●●●●●●●●●●●●●●●●●●●●●●●●●●●●●●●●●●●●●●●●●●●●●●●●●●●●●●●●●● ●●●●●●●●●●●●●●●●●●●●●●●●●●●●●●●●●●●●●●●●●●●●●●●●●●●●●●●●●●●●●●●●●●●●●●●●●●●●●●●●●●●●●●●●●●●●●●●●●●●●●●●●●●●●●●●●●●●●●●●● ●●●●●●●●●●●●●●●●●●●●●●●●●●●●●●●●●●●●●●●●●●●●●●●●●●●●●●●●●●●●●●●●●●●●●●●●●●●●●●●●●●●●●●●●●●●●●●●●●●●●●●●●●●●●●●●●●●●●●●●● ●●●●●●●●●●●●●●●●●●●●●●●●●●●●●●●●●●●●●●●●●●●●●●●●●●●●●●●●●●●●●●●●●●●●●●●●●●●●●●●●●●●●●●●●●●●●●●●●●●●●●●●●●●●●●●●●●●●●●●●● ●●●●●●●●●●●●●●●●●●●●●●●●●●●●●●●●●●●●●●●●●●●●●●●●●●●●●●●●●●●●●●●●●●●●●●●●●●●●●●●●●●●●●●●●●●●●●●●●●●●●●●●●●●●●●●●●●●●●●●●● ●●●●●●●●●●●●●●●●●●●●●●●●●●●●●●●●●●●●●●●●●●●●●●●●●●●●●●●●●●●●●●●●●●●●●●●●●●●●●●●●●●●●●●●●●●●●●●●●●●●●●●●●●●●●●●●●●●●●●●●● ●●●●●●●●●●●●●●●●●●●●●●●●●●●●●●●●●●●●●●●●●●●●●●●●●●●●●●●●●●●●●●●●●●●●●●●●●●●●●●●●●●●●●●●●●●●●●●●●●●●●●●●●●●●●●●●●●●●●●●●● ●●●●●●●●●●●●●●●●●●●●●●●●●●●●●●●●●●●●●●●●●●●●●●●●●●●●●●●●●●●●●●●●●●●●●●●●●●●●●●●●●●●●●●●●●●●●●●●●●●●●●●●●●●●●●●●●●●●●●●●● ●●●●●●●●●●●●●●●●●●●●●●●●●●●●●●●●●●●●●●●●●●●●●●●●●●●●●●●●●●●●●●●●●●●●●●●●●●●●●●●●●●●●●●●●●●●●●●●●●●●●●●●●●●●●●●●●●●●●●●●● ●●●●●●●●●●●●●●●●●●●●●●●●●●●●●●●●●●●●●●●●●●●●●●●●●●●●●●●●●●●●●●●●●●●●●●●●●●●●●●●●●●●●●●●●●●●●●●●●●●●●●●●●●●●●●●●●●●●●●●●● ●●●●●●●●●●●●●●●●●●●●●●●●●●●●●●●●●●●●●●●●●●●●●●●●●●●●●●●●●●●●●●●●●●●●●●●●●●●●●●●●●●●●●●●●●●●●●●●●●●●●●●●●●●●●●●●●●●●●●●●● ●●●●●●●●●●●●●●●●●●●●●●●●●●●●●●●●●●●●●●●●●●●●●●●●●●●●●●●●●●●●●●●●●●●●●●●●●●●●●●●●●●●●●●●●●●●●●●●●●●●●●●●●●●●●●●●●●●●●●●●● ●●●●●●●●●●●●●●●●●●●●●●●●●●●●●●●●●●●●●●●●●●●●●●●●●●●●●●●●●●●●●●●●●●●●●●●●●●●●●●●●●●●●●●●●●●●●●●●●●●●●●●●●●●●●●●●●●●●●●●●● ●●●●●●●●●●●●●●●●●●●●●●●●●●●●●●●●●●●●●●●●●●●●●●●●●●●●●●●●●●●●●●●●●●●●●●●●●●●●●●●●●●●●●●●●●●●●●●●●●●●●●●●●●●●●●●●●●●●●●●●● ●●●●●●●●●●●●●●●●●●●●●●●●●●●●●●●●●●●●●●●●●●●●●●●●●●●●●●●●●●●●●●●●●●●●●●●●●●●●●●●●●●●●●●●●●●●●●●●●●●●●●●●●●●●●●●●●●●●●●●●● ●●●●●●●●●●●●●●●●●●●●●●●●●●●●●●●●●●●●●●●●●●●●●●●●●●●●●●●●●●●●●●●●●●●●●●●●●●●●●●●●●●●●●●●●●●●●●●●●●●●●●●●●●●●●●●●●●●●●●●●● ●●●●●●●●●●●●●●●●●●●●●●●●●●●●●●●●●●●●●●●●●●●●●●●●●●●●●●●●●●
●●●●●●●●●●●●●●●●●●●●●●●●●●●●●●●●●●●●●●●●●●●●●●●●●●●●●●●●●●●●●● ●●●●●●●●●●●●●●●●●●●●●●●●●●●●●●●●●●●●●●●●●●●●●●●●●●●●●●●●●●●●●●●●●●●●●●●●●●●●●●●●●●●●●●●●●●●●●●●●
●●
●●●●●●●●●●●●●●●●●●●●●● ●●●●●●●●●●●●●●●●●●●●●●●●●●●●●●
●
●
●●●●
●
●●●●●●●●●●●●●●●●●●●●
●
●
●
●●●●●●●●●●●
●
●
●●●●●●●●●●●●●●●●●●●●●●●●●●●●●●●●●●●●●●●
●
●●
●
●●●● ●●●●●●●●●●●●●●●●●●●●●
●
●●●●●●●●●●●●●●●●●●●●●●●●●●●●●●●●●●●●●●●●●●●●●●●●●●●●●●●●●●
●●●
●●●●●●●●●●●●●●●●●●●●●●●●●●●●●●●●●●●●● ●●●●●●●●●●●●●●●●●●●●●●●●●●●●●●●●●●●●●●●●●●●●●●●●●●●●●
●●
●
●●
●
●
●●●●●
●
●
●
●●●●●●●●●●
●
●
●●
●
●●●
●
●
●
●●●●●●●●●●●●●●●●●●●●●●●●●●●●●●● ●●●●●●●●●●●●●●●●●●●●●●●
●
●
●
●
●●●●
●
●
●
●●●●
●
●
●
●
●
●
●●
●●●
●
●
●●
●
●
●●●●●
●
●●●
●
●
●●●●
●
●
●
●●●
●
●
●
●●●●
●●
●●●●
●
●
●
●
●
●
●●●●●
●
●●
●
●
●
●●
●●
●●
●
●●●●
●
●
●
●●
●
●●●●
●
●
●●●●
●●
●
●
●
●
●
●●●●●
●
●
●●●●●●●●●●
●●
●●●●●
●
●●
●
●
●
●●
●
●
●
●
●
●●●
●
●
●
●
●
●
●
●●●●
●
●
●●
●●
●
●●
●
●●●
●
●
●●●●
●
●
●●
●
●
●
●
●●●●
●
●
●
●●●●●●●●●●●●●●● ●●●●●●●●●
●●
●●
●●
●●●●●
●
●
●●●●●●●●●●●
●
●
●
●●●●
●
●
●
●
●
●
●●
●
●
●●
●●●●
●
●
●
●●●●
●
●
●●●●●●
●
●
●●
●●●
●
●
●
●
●
●
●●●●
●
●
●
●
●●
●
●
●
●
●●●●●
●
●
●
●●●●
●
●
●
●
●
●
●
●
●● ●
●●
●
●
●
●
●
●●●●
●
●●
●
●●
●
●
●
●●●●●
●
●
●●
●
●●●
●
●
●
●
●●●●●
●●
●
●
●
●
●
●
●●●●
●
●
●
●
●
●
●
●
●
●●●
●
●
●
●
●
●
●
●
●
●
●●●●
●●
●
●●●●
●
●
●
●
●●●●●
●
●
●●●●
●
●
●
●
●
●
●●●●
●
●
●●
●
●
●
●●
●
●●●●●
●
●
●
●●●●
●
●
●●
●
●
●●●●●
●
●
●
●
●
●
●●●●
●
●
●
●
●
●
●●
●●
●
●●●
●
●
●
●
●
●●●●●●
●
●
●●●●
●
●
●
●●
●
●
●
●●●●
●
●
●
●
●
●
●
●●●●
●
●
●●
●
●
●●●●●
●
●●
●
●
●
●
●
●●●
●
●●
●
●
●●● ●
●
●
●●
●
●
●
●●●●
●
●●
●
●
●
●●●●
●
●
●
●
●
●●
●
●●●●
●
●●
●
●
●
●
●
●●●
●
●
●●
●
●
●
●●●●
●
●
●●
●●
●
●
●●●
●
●
●
●
●
●
●●●●●
●
●
●
●
●
●
●
●
●●●
●
●
●
●
●
●
●
●
●
●●●
●
●
●
●
●
●
●
●
●
●
●
●●●●●
●
●
● ●●●●
●
●
●
●
●
●
●●●●
●
●
●●
●●
●●
●
●●●●●
●
●●
●
●●●
●
●
●
●
●
●
●●
●●●
●
●
●
●●
●
●
●
●●●●
●●
●
●
●
●
●
●
●●●●●
●
●
●
●
●●●●
●
●●
●
●
●
●●●●
●
●●
●
●
●
●
●
●●●●
●
●
●
●
●
●
●
●●●●
●
●
●
●
●●
●
●
●
●●●●●
●
●
●
●●●●
●
●
●
●
●
●
●
●●●●
●
●
●●●
●
●
●
●
●●●
●
●
●
●
●
●
●
●●●●
●
●
●●●
●
●
●
●
●
●●●●●
●●
●
●●●●
●
●
●
●
●
●
●●●●
●
●●●
●
●
●
●
●
●
●●●●
●
●
●
●
●●●
●●●
●
●
●
●
●
●
●
●●●●●●●●●
●
●
●
●●●●
●
●
●
●
●●
●
●
●
●●●●●
●
●
●
●●●●
●
●
●●●●●
●
●
●
●
●
●
●●●●
●
●
●
●
●
●
●●●●
●●●
●
●
●
●
●
●
●
●●●
●●
●
●
●
●
●●●
●
●
●●
●
●
●
●
●
●●●●
●
●●
●
●
●●●
●●
●●
●
●●
●
●●●
●
●
●
●
●
●●
●●
●
●● ●●
●●
●
●
●●●●
●
●
●
●
●●
●
●●●
●
●●●
●
●
●
●
●
●
●●●
●
●●
●
●
●
●●●
●
●
●
●
●●
●
●●●
●●
●
●
●
●
●
●
●
●●●●●
●
●
●
●
●●●
●
●
●
●
●
●
●●
●●●
●
●●
●
●
●
●
●
●●●●
●
●
●
●
●
●●●●
●●
●
●
●
●●●
●
●
●●
●
●
●
●●●●
●
●
●
●
●
●
●●●●
●●
●
●
●
●●
●
●●●
●
●
●
●
●
●
●●●●
●
●
●
●
●
●
●●●●
●
●
●
●
●
●
●●●●
●
●
●
●
●
●
●
●
●●●
●
●
●
●
●
●
●
●
●
●●●●
●
●●
●
●
●
●●●●
●
●
●●
●
●
●
●
●
●
●
●●●
●
●
●●●●
●
●
●
●
●●●●
●
●
●
●
●
●
●
●
●●●●
●
●
●
●
●
●
●
●
●●●●●
●
●
●
●●●●
●
●
●
●●
●
●●●●
●
●●
●
●
●●●●●
●
●
●
●
●●
●
●●●●
●
●
●
●
●
●
●●●●
●
●
●
●
●●
●
●
●
●●●
●
●
●
●
●
●●●●
●
●
●
●●●●●
●
●
●
●●●●●
●
●
●
●●●●
●●
●
●●● ●
●
●●
●
●
●●●●●
●
●
●
●
●●●●
●
●
●
●
●●●●
●
●
●
●
●
●
●
●●●●
●
●●
●
●
●
●
●
●●●
●
●
●
●
●
●
●
●●●●
●
●
●
●
●
●
●
●●●
●
●
●
●
●
●
●
●●●●●
●
●
●
●
●
●●●●●
●
●
●
●●●●
●●
●
●
●
●
●
●●●
●
●
●●
●
●
●●●●
●
●
●
●
●
●
●●●●
●
●
●
●
●
●
●
●●●●
●
●
●●
●●●●●
●
●
●
●
●
●●●●●
●
●
●
●●●●●
●
●
●
●
●●●●
●
●
●
●
●●●●
●
●
●
●
●
●●●●
●
●
●
●
●●
●●●●
●
●
●
●
●
●
●
●
●●●
●
●
●
●
●
●●
●●●●
●
●
●
●
●
●●●●
●
●
●
●●●●
●
●
●
●
●●●●
●
●
●
●●●●
●
●
●●●●
●
●
●●
●
●
●
●
●●●
●
●
●
●
●
●
●
●
●
●
●●●●
●●
●
●●●●
●
●
●
●
●●●●
●●
●
●
●●
●
●
●
●
●●●●●
●
●●●
●
●
●
●
●
●
●
●●●
●
●●●●●
●
●●●●●
●
●
●
●
●
●●
●●●
●
●
●
●●
●
●
●●
●
●
●●
●
●
●●●
●
●
●●●●●
●
●●
●
●
●
●
●
●
●
●
●
●●
●
●●
●●●●●●●
●
●●●●●
●
●●●●●●
●
●
●●
●
●
●
●●●
●
●
●
●
●●
●
●●●
●
●
●●●●●●
●
●
●
●
●
●
●●
●
●
●
●
●
●
●
●●●●
●
●●●●●
●
●
●
●
●●
●
●●●
●
●
●
●
●
●
●●●●●●●
●
●●●●●
●
●●●●●
●
●
●
●
●
●
●
●
●●
●
●
●
●
●●
●
●
●●●
●
●●
●●
●●●●
●
●●●●●
●
●
●
●
●
●
●
●●
●
●
●
●
●
●
●●●
●
●●
●
●
●●●●●
●●
●
●
●
●
●
●
●●●●
●
●
●
●
●
●
●
●●●●
●
●
●
●
●
●
●●●
●
●
●
●
●
●
●●●●●
●
●
●
●●●●●
●
●
●●
●●●●
●
●
●
●
●●●
●
●
●●●●●
●
●
●●
●
●
●
●●
●●●●
●
●●●
●●●
●
●
●
●●●●
●
●
●●
●
●
●
●
●
●
●●
●●●
●
●●●
●
●
●
●
●●●
●
●●
●●
●
●
●
●
●
●●●
●
●
●●●●
●
●●●●●●
●
●
●
●●
●
●●●
●
●
●
●
●
●
●
●
●
●●●
●
●●●●●●
●
●
●●
●
●
●
●
●●
●●
●
●
●
●
●●●●
●
●●●●●
●
●
●●
●●
●
●
●●●
●
●
●
●
●
●●●●●●●
●
●●●●●
●
●●●●●
●
●
●
●●
●
●
●●
●
●
●●
●
●
●●
●●
●
●
●●●
●
●●●●
●●
●●●●●
●
●
●
●
●●
●
●●●
●
●
●
●
●
●
●
●
●
●●●●●
●●●
●●●●
●
●
●●
●
●
●●
●●●
●
●
●
●
●
●
●●●●
●
●
●
●
●
●●●
●●
●
●●●●
●
●
●
●
●
●
●●●●●
●
●
●
●
●●
●●●
●
●
●
●
●●
●
●
●●●●●
●
●
●
●
●●
●
●
●
●
●●
●
●●
●
●●●
●
●● ●●●●
●
●
●
●
●
●
●
●
●
●
●
●
●
●
●
●
●
●●●
●
●
●●●
●
●
●●●●●
●
●
●
●
●
●
●
●
●●
●
●
●
●
●
●
●●●●●●●
●
●●●●
●
●●●●●●●
●
●
●
●
●
●●
●
●
●
●
●
●
●
●
●
●●
●
●
●●●●●●
●
●●●●
●
●
●
●
●
●
●●●
●
●●●●
●
●
●
●●●●
●
●●●
●
●
●●
●
●
●
●
●
●
●
●●●●●●
●
●
●
●
●
●
●
●
●
●
●
●
●
●
●
●
●●
●
●●
●
●
●●●
●
●
●●●●●
●
●
●
●
●
●
●
●
●
●
●
●
●
●
●
●
●
●●
●●
●
●●●●
●
●
●●●●●
●
●
●
●●
●
●
●●
●
●
●
●
●
●
●
●●●
●
●●●
●
●●●●
●
●● ●●●●●
●
●●●
●
●
●
●
●
●
●●
●●●
●
●●●
●
●●●●●●●
●
●●
●
●
●
●
●
●
●●
●
●
●●
●
●●
●
●
●
●
●
●●●
●
●●●●●
●
●
●
●
●
●
●
●
●
●
●
●
●
●●●
●
●●●●
●
●●●●●●
●
●
●
●
●
●
●
●
●
●
●
●
●
●
●
●●●
●
●●
●
●●●●●
●
●● ●●●●●
●
●
●
●
●
●
●
●
●●
●
●
●
●●●●●●●
●
●●●●
●
●●●●●●
●
●
●
●
●
●
●
●
●
●
●
●
●
●
●
●
●●
●
●
●●●
●
●●●●
●
●
●●●●●●
●
●
●
●
●●
●
●
●
●
●
●
●
●
●
●
●●
●
●
●
●●●●●
●
●
●●
●
●
●
●●
●
●
●
●
●
●
●
●
●
●●
●
●
● ●●
●
●
●●●●●
●
●
●
●
●
●●
●
●
●
●
●●
●
●
●
●
●●●●●●
●
●
●●●●
●
●●●●●●
●
●
●
●
●
●
●
●●
●
●
●
●
●●●●●
●
●●●●●
●
●
●
●
●
●
●
●
●●●
●
●
●
●
●
●●●
●
●●
●
●●●●●
●
●●●●●●
●
●
●
●●
●
●
●●
●
●
●
●
●
●
●
●
●
●●
●
●●●●●
●
●●●●●
●
●
●●●
●
●
●
●
●
●
●
●
●
●
●●
●●●●●●●
●
●●●●
●
●●●●●●
●
●
●
●
●●
●
●
●●
●
●●●
●
●●
●
●
●●●●●
●
●
●
●
●
●
●
●
●
●
●●
●
●
●●●
●
●●
●
●
●●●●
●
●●●●●●●
●
●
●●●
●
●
●
●
●
●
●
●
●
●
●
●●●
●
●●
●
●●●●
●
●●●●●●●
●
●
●
●
●
●
●
●
●
●
●
●●●●
●
●●
●
●●●●●●
●
●●
●
●●
●
●
●
●
●
●
●
●
●●●●●●
●
●●●●●
●
●
●
●
●
●
●
●
●
●
●
●
●
●
●●●●●●
●
●●●●●
●
●●●●●●
●
●
●
●
●
●
●
●
●
●●
●
●
●
●
●●●
●
●●●
●
●●●●●
●
●●●●●
●
●
●
●
●●●
●
●
●
●
●
●
●
●●
●
●
●●●
●
●●●●
●
●
●
●●●●●
●
●●●●
●
●
●
●
●
●
●
●
●
●
●
●●●●●●●
●
●●●●●
●
●●●●
●
●
●
●
●●●●
●
●
●
●
●
●
●
●
●
●
●
●
●
●●●●●●
●
●●●●●
●
●
●
●
●
●
●
●
●
●
●
●
●
●
●●
●
●●
●
●
●●●
●
●
●●●
●
●
●●●●●
●
●
●
●
●
●
●
●
●
●
●●
●
●
●
●
●●●●
●
●●●●
●
●
●●
●
●
●●
●●●●
●
●
●
●
●
●●●
●
●
●●●●●
●
●
●
●
●●●●
●
●
●
●
●
●
●●●
●
●●●●●
●
●
●
●
●
●
●
●
●
●
●
●
●
●
●●●
●
●
●
●●●●●●
●
●
●
●●
●
●
●●
●
●
●
●●
●
●●
●
●●
●
●●●●
●
●
●●●●●●
●
●
●
●●
●
●
●
●
●
●
●
●●
●●
●
●
●●●
●
●●●●●●●●●●
●
●
●●
●
●
●
●
●●●●
●
●
●
●
●●●●
●
●
●●●●
●
●●
●●●●●
●
●
●
●
●●
●
●
●●●●
●
●
●●●●●
●
●●
●
●
●
●
●
●
●
●
●
●
●
●
●●
●
●●
●
●
●●●
●
●
●
●●●●●●
●
●
●
●●
●
●
●
●
●
●
●
●
●●
●●●●●
●
●●●●
●
●
●●●●●
●
●
●
●
●
●●
●
●
●
●
●
●
●
●
●
●
●
●
●●
●
●
●●●●
●
●●●●
●
●●●●●
●
●
●
●
●
●●
●
●
●
●
●
●
●
●
●
●
●●●●●●●
●
●●●●●●●●●
●
●●●●●●
●
●
●●
●
●●
●
●
●
●●
●
●
●
●
●
●
●●●
●●●
●
●●●●●
●
●●●●
●
●
●
●
●●
●
●
●
●
●
●
●
●
●●●●●●
●
●●
●
●
●●
●
●
●
●
●
●●●●●●●
●
●●●●
●
●
●● ●●●
●
●
●
●
●
●
●
●●
●
●
●
●
●
●
●●●●●●
●
●●●●●
●
●●●●●
●
●
●
●
●
●●
●
●
●●●
●
●
●
●●●
●
●
●
●●●●●
●
●
●
●
●
●●
●
●
●
●
●
●
●
●●●●●●●
●
●●●●●
●
●●●●●
●
●
●
●
●
●
●
●
0 1000 2000 3000 4000 5000
01000
2000
3000
4000
5000
Generator Timeouts per Scenarios
Active Scenarios Count
Tim
eouts
Count
Figure 4.13: Call Performance Profile – Generator Timeouts
0e+00 2e+06 4e+06 6e+06 8e+06
020
0040
0060
0080
00
Generator Sent Messages
Time [ms]
Sen
t C
ount
per
Sec
ond
Smoothing Interpolation
Figure 4.14: Call Performance Profile – Generator Sent Messages
63
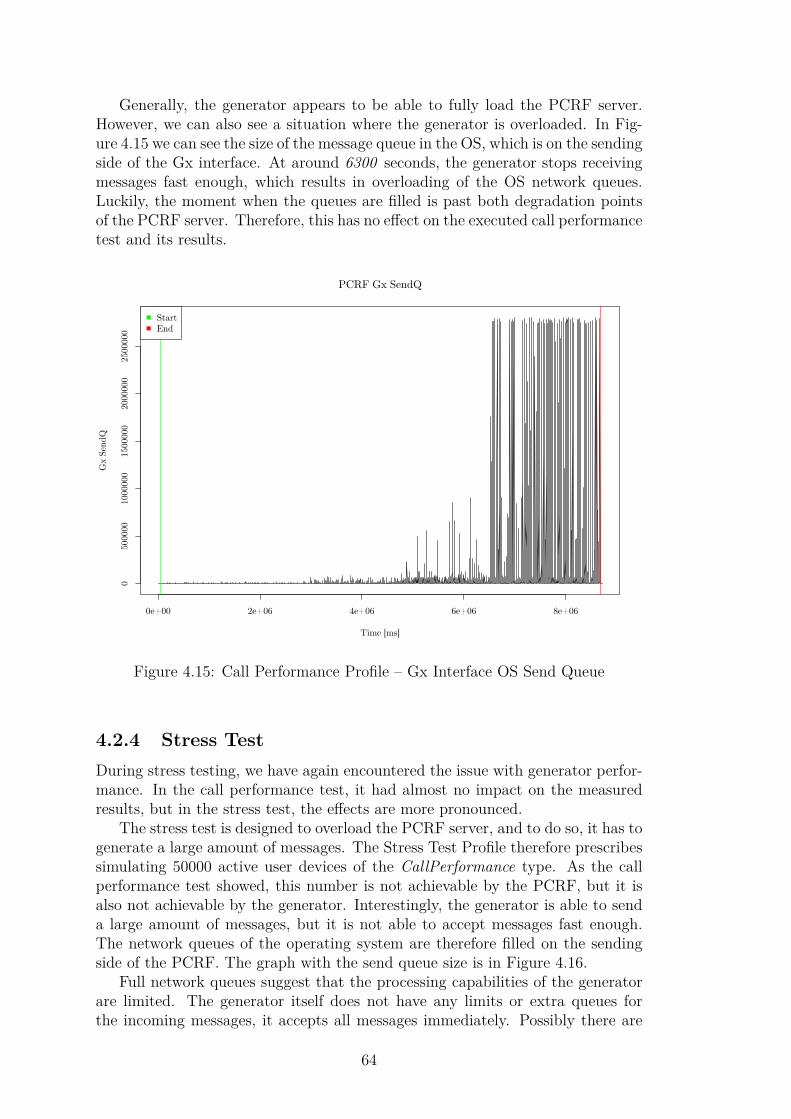
Generally, the generator appears to be able to fully load the PCRF server.However, we can also see a situation where the generator is overloaded. In Fig-ure 4.15 we can see the size of the message queue in the OS, which is on the sendingside of the Gx interface. At around 6300 seconds, the generator stops receivingmessages fast enough, which results in overloading of the OS network queues.Luckily, the moment when the queues are filled is past both degradation pointsof the PCRF server. Therefore, this has no effect on the executed call performancetest and its results.
0e+00 2e+06 4e+06 6e+06 8e+06
050
0000
1000
000
1500
000
2000
000
2500
000
PCRF Gx SendQ
Time [ms]
Gx S
endQ
StartEnd
Figure 4.15: Call Performance Profile – Gx Interface OS Send Queue
4.2.4 Stress TestDuring stress testing, we have again encountered the issue with generator perfor-mance. In the call performance test, it had almost no impact on the measuredresults, but in the stress test, the effects are more pronounced.
The stress test is designed to overload the PCRF server, and to do so, it has togenerate a large amount of messages. The Stress Test Profile therefore prescribessimulating 50000 active user devices of the CallPerformance type. As the callperformance test showed, this number is not achievable by the PCRF, but it isalso not achievable by the generator. Interestingly, the generator is able to senda large amount of messages, but it is not able to accept messages fast enough.The network queues of the operating system are therefore filled on the sendingside of the PCRF. The graph with the send queue size is in Figure 4.16.
Full network queues suggest that the processing capabilities of the generatorare limited. The generator itself does not have any limits or extra queues forthe incoming messages, it accepts all messages immediately. Possibly there are
64
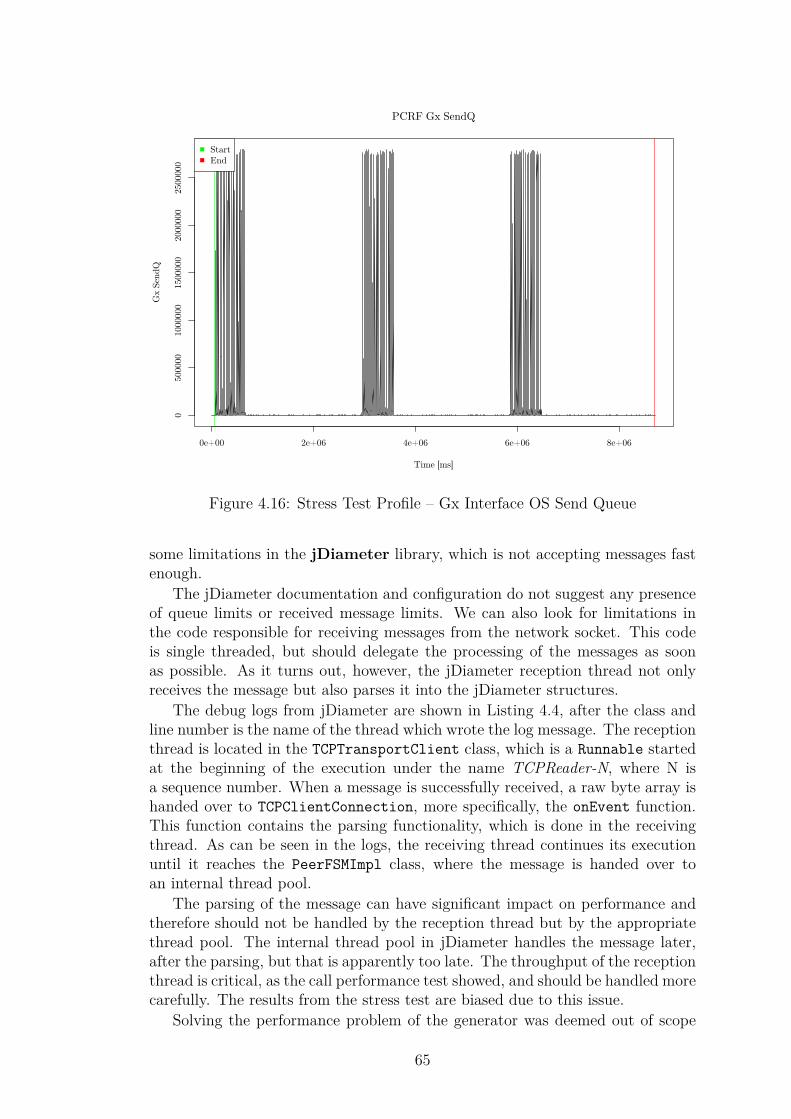
0e+00 2e+06 4e+06 6e+06 8e+06
050
0000
1000
000
1500
000
2000
000
2500
000
PCRF Gx SendQ
Time [ms]
Gx S
endQ
StartEnd
Figure 4.16: Stress Test Profile – Gx Interface OS Send Queue
some limitations in the jDiameter library, which is not accepting messages fastenough.
The jDiameter documentation and configuration do not suggest any presenceof queue limits or received message limits. We can also look for limitations inthe code responsible for receiving messages from the network socket. This codeis single threaded, but should delegate the processing of the messages as soonas possible. As it turns out, however, the jDiameter reception thread not onlyreceives the message but also parses it into the jDiameter structures.
The debug logs from jDiameter are shown in Listing 4.4, after the class andline number is the name of the thread which wrote the log message. The receptionthread is located in the TCPTransportClient class, which is a Runnable startedat the beginning of the execution under the name TCPReader-N, where N isa sequence number. When a message is successfully received, a raw byte array ishanded over to TCPClientConnection, more specifically, the onEvent function.This function contains the parsing functionality, which is done in the receivingthread. As can be seen in the logs, the receiving thread continues its executionuntil it reaches the PeerFSMImpl class, where the message is handed over toan internal thread pool.
The parsing of the message can have significant impact on performance andtherefore should not be handled by the reception thread but by the appropriatethread pool. The internal thread pool in jDiameter handles the message later,after the parsing, but that is apparently too late. The throughput of the receptionthread is critical, as the call performance test showed, and should be handled morecarefully. The results from the stress test are biased due to this issue.
Solving the performance problem of the generator was deemed out of scope
65

Listing 4.4: jDiameter Message Receive Log2018−07−07 18 : 01 : 39 DEBUG TCPTransportClient :218 − TCPReader−4
− Just read [ 4 4 4 ] bytes on[ Socket [ addr=pc r f . gx / 1 0 . 0 . 0 . 3 , port =3868 , l o c a l p o r t =58562] ]
2018−07−07 18 : 01 : 39 DEBUG TCPTransportClient :439 − TCPReader−4− Pass ing message on to parent
2018−07−07 18 : 01 : 39 DEBUG TCPClientConnection :307 − TCPReader−4− Received message o f s i z e [ 1 4 6 8 ]
2018−07−07 18 : 01 : 39 DEBUG TCPClientConnection :333 − TCPReader−4− In onEvent f o r connect ion [ aaa :// pc r f . gx : 3 8 6 8 ] . Gett ing lock
2018−07−07 18 : 01 : 39 DEBUG TCPClientConnection :336 − TCPReader−4− Got lock
2018−07−07 18 : 01 : 39 DEBUG TCPClientConnection :392 − TCPReader−4− proces sBuf f e redMessages i s r e tu rn ing true on connect ion
[ aaa :// pc r f . gx : 3 8 6 8 ] as the re are l i s t e n e r s2018−07−07 18 : 01 : 39 DEBUG TCPClientConnection :342 − TCPReader−4
− Pass ing event to l i s t e n e r . Event type i s [MESSAGE RECEIVED]2018−07−07 18 : 01 : 39 DEBUG PeerImpl :219 − TCPReader−4
− Receive message type [ 2 5 8 ] to peer [ aaa :// pc r f . gx : 3 8 6 8 ]2018−07−07 18 : 01 : 39 DEBUG PeerFSMImpl :331 − TCPReader−4
− Handling event with type [RECEIVE MSG EVENT]2018−07−07 18 : 01 : 39 DEBUG PeerFSMImpl :355 − TCPReader−4
− Not per forming incoming v a l i d a t i o n on message .Va l idator Enabled [ f a l s e ] Incoming [ t rue ]Incoming Level [ Va l ida to rLeve l [ name=OFF ] ]
2018−07−07 18 : 01 : 39 DEBUG PeerFSMImpl :363 − TCPReader−4− Plac ing event [ Event{name :RECEIVE MSG EVENT, key : nu l l ,
ob j e c t : MessageImpl{commandCode=258 , f l a g s =192}}]i n t o l i nked b lock ing queue with remaining capac i ty : [ 1 0 0 0 0 ] .
for the thesis. Even if the jDiameter implementation were improved, it mightmake only a small difference in the overall performance. A better solution tothe problem would be to use a more powerful server for generating the workload.
Partial Results
The stress test definition of the test profile is located in the configuration filepcrf-mff/real-scenarios/stress-test-config.yml. All graphs plotted bythe test framework are in pcrf-mff/plots/out/1531816106-stress-test. Ifwe go back to the original purpose of the stress test – finding the time neededfor recovery – we can make some assumptions from the measured results. InFigure 4.17 we can see that the maximum number of messages in the queueinside MediationZone is around 20000. This is a real limit because the numberof messages sent to the MZ is 50000 in the stress test.
We can safely assume that the limit for queued messages is 20000 and thatit is reached during our biased stress test. Based on this, we can find a spot inthe testing timeline at which MZ starts to process the queue of messages and wecan compute the time needed to process the entire queue.
In Figure 4.18, there is a close up of the message counts in the MediationZoneGx queue, the figure is centered around the point in time where the stress testconfiguration stops generating big load and gets back to normal load. The graph
66
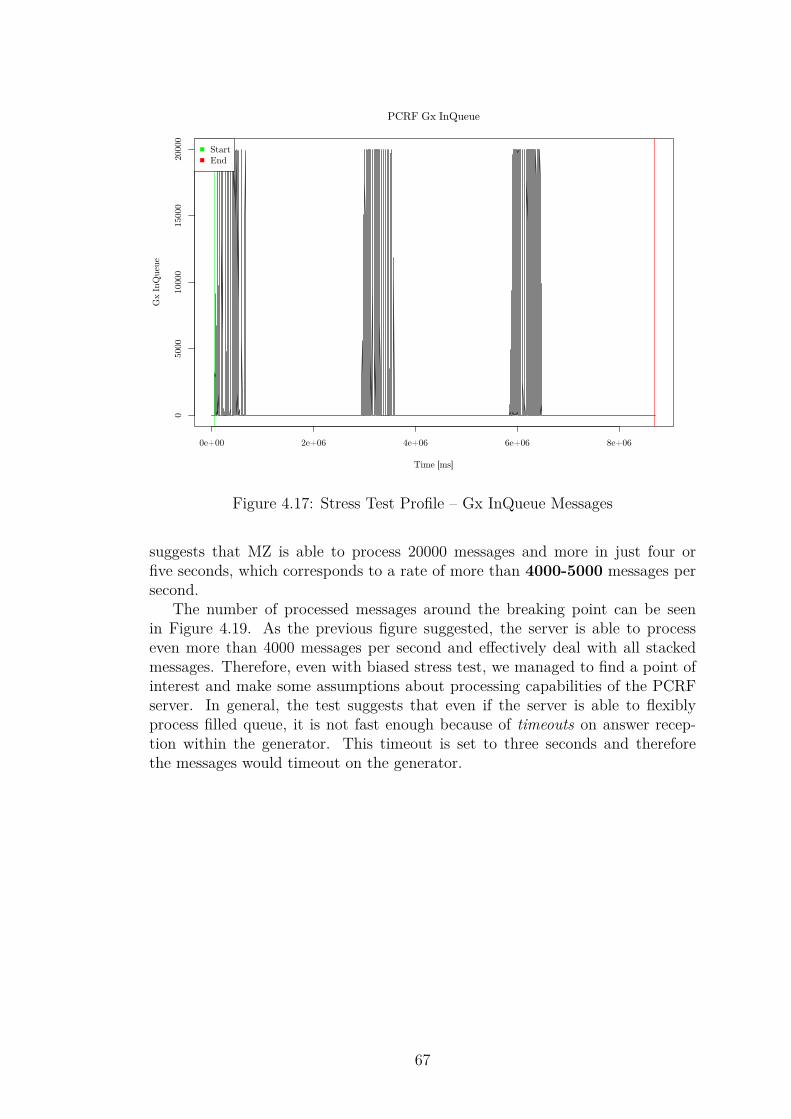
0e+00 2e+06 4e+06 6e+06 8e+06
050
0010
000
1500
020
000
PCRF Gx InQueue
Time [ms]
Gx I
nQ
ueu
eStartEnd
Figure 4.17: Stress Test Profile – Gx InQueue Messages
suggests that MZ is able to process 20000 messages and more in just four orfive seconds, which corresponds to a rate of more than 4000-5000 messages persecond.
The number of processed messages around the breaking point can be seenin Figure 4.19. As the previous figure suggested, the server is able to processeven more than 4000 messages per second and effectively deal with all stackedmessages. Therefore, even with biased stress test, we managed to find a point ofinterest and make some assumptions about processing capabilities of the PCRFserver. In general, the test suggests that even if the server is able to flexiblyprocess filled queue, it is not fast enough because of timeouts on answer recep-tion within the generator. This timeout is set to three seconds and thereforethe messages would timeout on the generator.
67
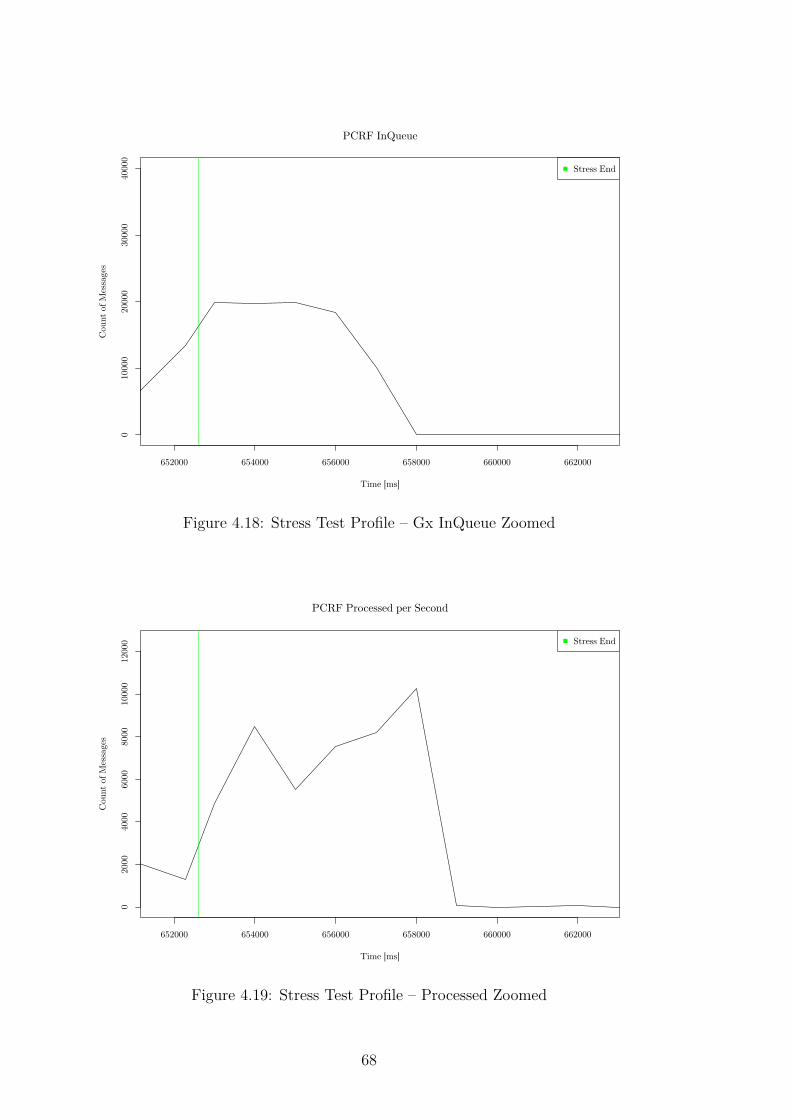
652000 654000 656000 658000 660000 662000
010
000
2000
030
000
4000
0
PCRF InQueue
Time [ms]
Cou
nt
of M
essa
ges
Stress End
Figure 4.18: Stress Test Profile – Gx InQueue Zoomed
652000 654000 656000 658000 660000 662000
020
0040
0060
0080
0010
000
1200
0
PCRF Processed per Second
Time [ms]
Cou
nt
of M
essa
ges
Stress End
Figure 4.19: Stress Test Profile – Processed Zoomed
68
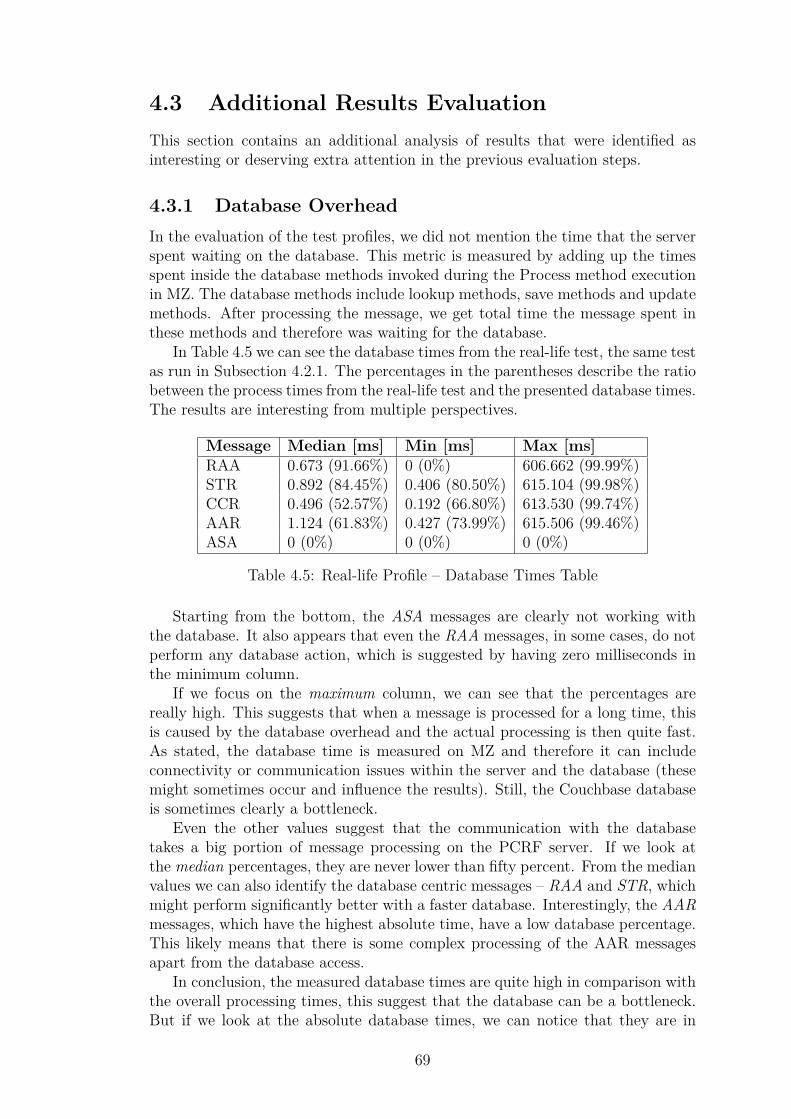
4.3 Additional Results EvaluationThis section contains an additional analysis of results that were identified asinteresting or deserving extra attention in the previous evaluation steps.
4.3.1 Database OverheadIn the evaluation of the test profiles, we did not mention the time that the serverspent waiting on the database. This metric is measured by adding up the timesspent inside the database methods invoked during the Process method executionin MZ. The database methods include lookup methods, save methods and updatemethods. After processing the message, we get total time the message spent inthese methods and therefore was waiting for the database.
In Table 4.5 we can see the database times from the real-life test, the same testas run in Subsection 4.2.1. The percentages in the parentheses describe the ratiobetween the process times from the real-life test and the presented database times.The results are interesting from multiple perspectives.
Message Median [ms] Min [ms] Max [ms]RAA 0.673 (91.66%) 0 (0%) 606.662 (99.99%)STR 0.892 (84.45%) 0.406 (80.50%) 615.104 (99.98%)CCR 0.496 (52.57%) 0.192 (66.80%) 613.530 (99.74%)AAR 1.124 (61.83%) 0.427 (73.99%) 615.506 (99.46%)ASA 0 (0%) 0 (0%) 0 (0%)
Table 4.5: Real-life Profile – Database Times Table
Starting from the bottom, the ASA messages are clearly not working withthe database. It also appears that even the RAA messages, in some cases, do notperform any database action, which is suggested by having zero milliseconds inthe minimum column.
If we focus on the maximum column, we can see that the percentages arereally high. This suggests that when a message is processed for a long time, thisis caused by the database overhead and the actual processing is then quite fast.As stated, the database time is measured on MZ and therefore it can includeconnectivity or communication issues within the server and the database (thesemight sometimes occur and influence the results). Still, the Couchbase databaseis sometimes clearly a bottleneck.
Even the other values suggest that the communication with the databasetakes a big portion of message processing on the PCRF server. If we look atthe median percentages, they are never lower than fifty percent. From the medianvalues we can also identify the database centric messages – RAA and STR, whichmight perform significantly better with a faster database. Interestingly, the AARmessages, which have the highest absolute time, have a low database percentage.This likely means that there is some complex processing of the AAR messagesapart from the database access.
In conclusion, the measured database times are quite high in comparison withthe overall processing times, this suggest that the database can be a bottleneck.But if we look at the absolute database times, we can notice that they are in
69
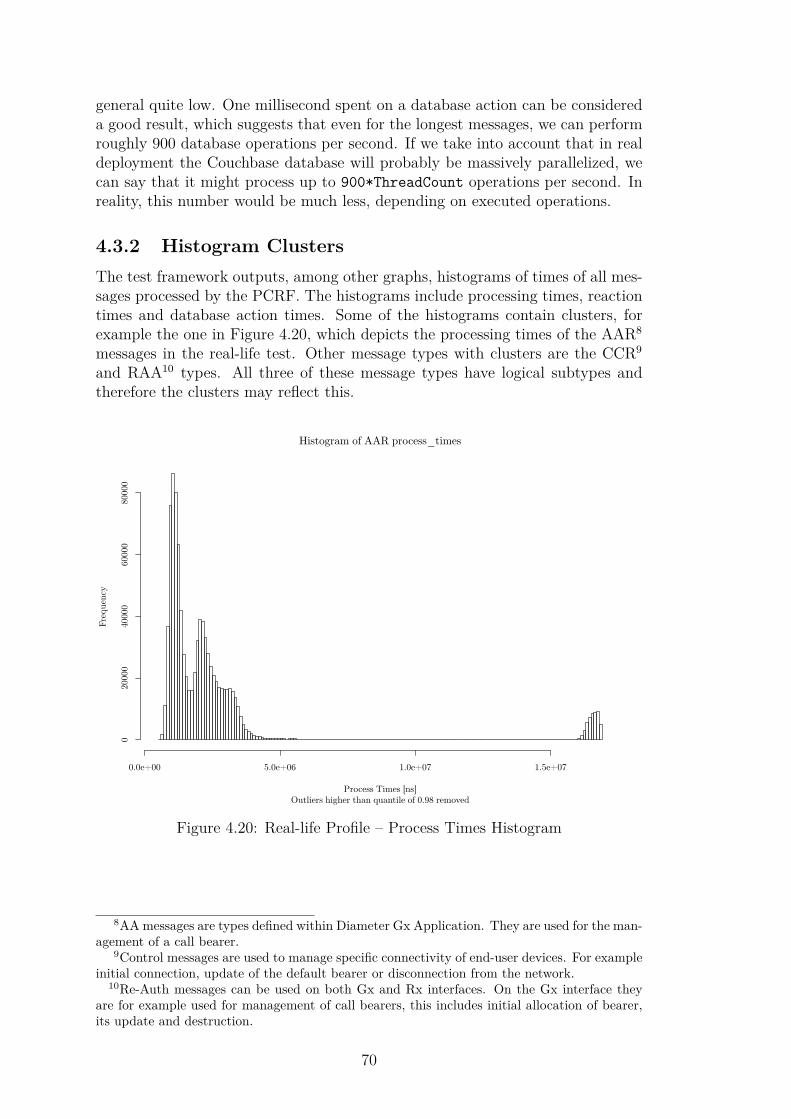
general quite low. One millisecond spent on a database action can be considereda good result, which suggests that even for the longest messages, we can performroughly 900 database operations per second. If we take into account that in realdeployment the Couchbase database will probably be massively parallelized, wecan say that it might process up to 900*ThreadCount operations per second. Inreality, this number would be much less, depending on executed operations.
4.3.2 Histogram ClustersThe test framework outputs, among other graphs, histograms of times of all mes-sages processed by the PCRF. The histograms include processing times, reactiontimes and database action times. Some of the histograms contain clusters, forexample the one in Figure 4.20, which depicts the processing times of the AAR8
messages in the real-life test. Other message types with clusters are the CCR9
and RAA10 types. All three of these message types have logical subtypes andtherefore the clusters may reflect this.
Histogram of AAR process_times
Outliers higher than quantile of 0.98 removedProcess Times [ns]
Fre
quen
cy
0.0e+00 5.0e+06 1.0e+07 1.5e+07
020
000
4000
0600
0080
000
Figure 4.20: Real-life Profile – Process Times Histogram
8AA messages are types defined within Diameter Gx Application. They are used for the man-agement of a call bearer.
9Control messages are used to manage specific connectivity of end-user devices. For exampleinitial connection, update of the default bearer or disconnection from the network.
10Re-Auth messages can be used on both Gx and Rx interfaces. On the Gx interface theyare for example used for management of call bearers, this includes initial allocation of bearer,its update and destruction.
70
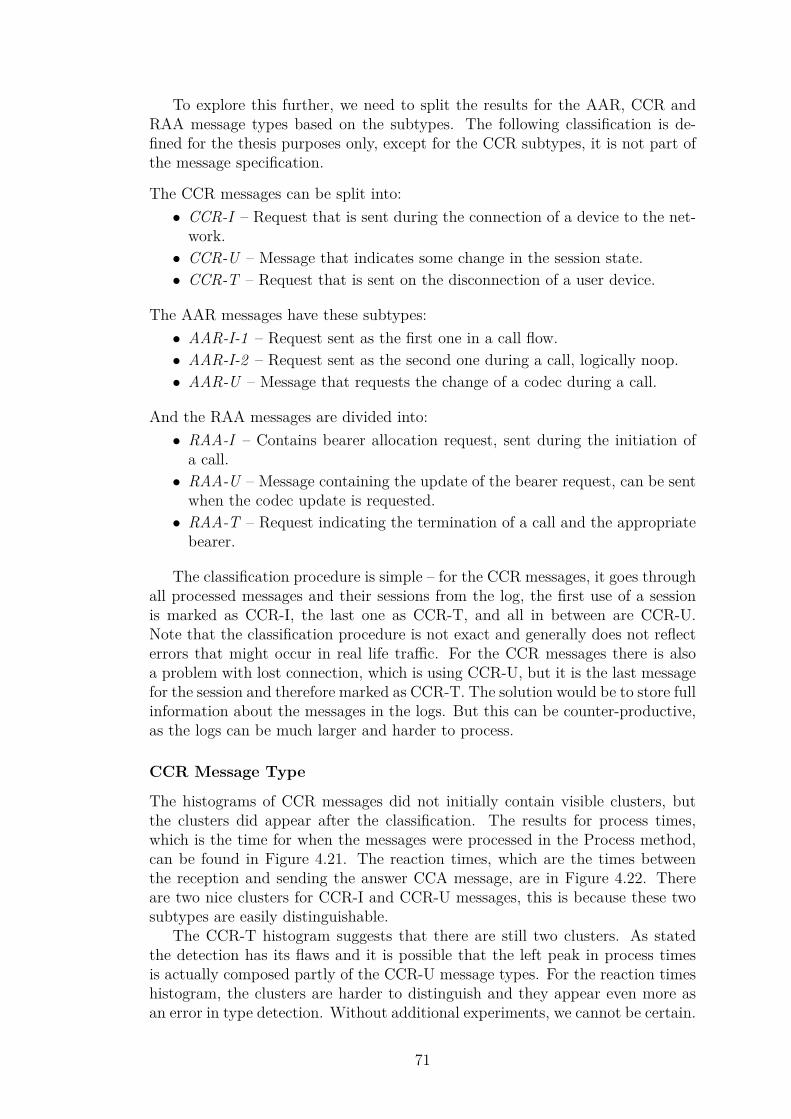
To explore this further, we need to split the results for the AAR, CCR andRAA message types based on the subtypes. The following classification is de-fined for the thesis purposes only, except for the CCR subtypes, it is not part ofthe message specification.
The CCR messages can be split into:• CCR-I – Request that is sent during the connection of a device to the net-
work.• CCR-U – Message that indicates some change in the session state.• CCR-T – Request that is sent on the disconnection of a user device.
The AAR messages have these subtypes:• AAR-I-1 – Request sent as the first one in a call flow.• AAR-I-2 – Request sent as the second one during a call, logically noop.• AAR-U – Message that requests the change of a codec during a call.
And the RAA messages are divided into:• RAA-I – Contains bearer allocation request, sent during the initiation of
a call.• RAA-U – Message containing the update of the bearer request, can be sent
when the codec update is requested.• RAA-T – Request indicating the termination of a call and the appropriate
bearer.
The classification procedure is simple – for the CCR messages, it goes throughall processed messages and their sessions from the log, the first use of a sessionis marked as CCR-I, the last one as CCR-T, and all in between are CCR-U.Note that the classification procedure is not exact and generally does not reflecterrors that might occur in real life traffic. For the CCR messages there is alsoa problem with lost connection, which is using CCR-U, but it is the last messagefor the session and therefore marked as CCR-T. The solution would be to store fullinformation about the messages in the logs. But this can be counter-productive,as the logs can be much larger and harder to process.
CCR Message Type
The histograms of CCR messages did not initially contain visible clusters, butthe clusters did appear after the classification. The results for process times,which is the time for when the messages were processed in the Process method,can be found in Figure 4.21. The reaction times, which are the times betweenthe reception and sending the answer CCA message, are in Figure 4.22. Thereare two nice clusters for CCR-I and CCR-U messages, this is because these twosubtypes are easily distinguishable.
The CCR-T histogram suggests that there are still two clusters. As statedthe detection has its flaws and it is possible that the left peak in process timesis actually composed partly of the CCR-U message types. For the reaction timeshistogram, the clusters are harder to distinguish and they appear even more asan error in type detection. Without additional experiments, we cannot be certain.
71
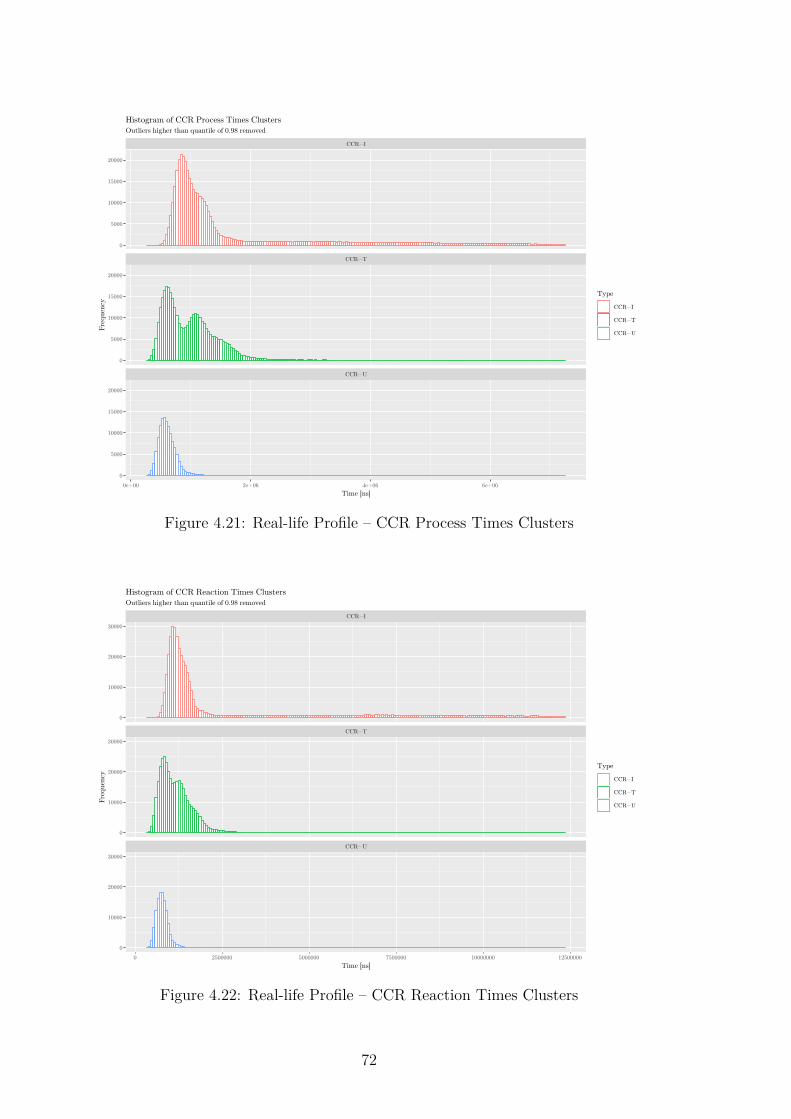
CCR−U
CCR−T
CCR−I
0e+00 2e+06 4e+06 6e+06
0
5000
10000
15000
20000
0
5000
10000
15000
20000
0
5000
10000
15000
20000
Time [ns]
Fre
quen
cy
Type
CCR−I
CCR−T
CCR−U
Outliers higher than quantile of 0.98 removed
Histogram of CCR Process Times Clusters
Figure 4.21: Real-life Profile – CCR Process Times Clusters
CCR−U
CCR−T
CCR−I
0 2500000 5000000 7500000 10000000 12500000
0
10000
20000
30000
0
10000
20000
30000
0
10000
20000
30000
Time [ns]
Fre
quen
cy
Type
CCR−I
CCR−T
CCR−U
Outliers higher than quantile of 0.98 removed
Histogram of CCR Reaction Times Clusters
Figure 4.22: Real-life Profile – CCR Reaction Times Clusters
72
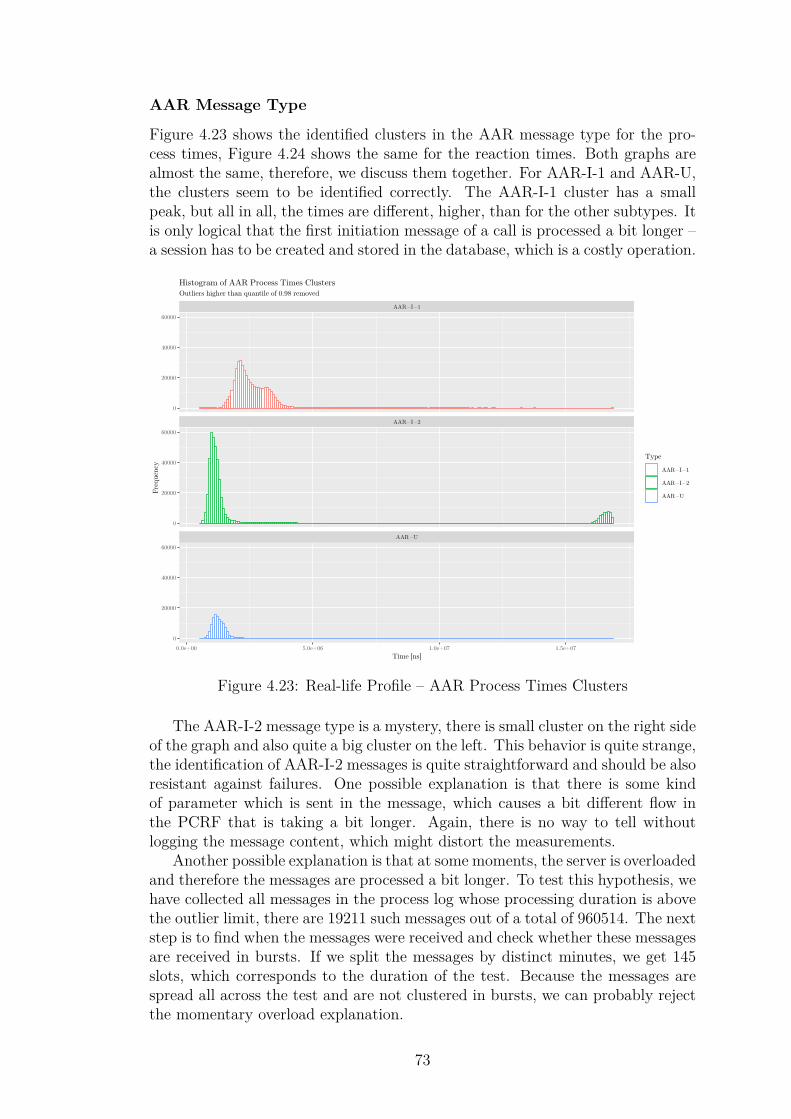
AAR Message Type
Figure 4.23 shows the identified clusters in the AAR message type for the pro-cess times, Figure 4.24 shows the same for the reaction times. Both graphs arealmost the same, therefore, we discuss them together. For AAR-I-1 and AAR-U,the clusters seem to be identified correctly. The AAR-I-1 cluster has a smallpeak, but all in all, the times are different, higher, than for the other subtypes. Itis only logical that the first initiation message of a call is processed a bit longer –a session has to be created and stored in the database, which is a costly operation.
AAR−U
AAR−I−2
AAR−I−1
0.0e+00 5.0e+06 1.0e+07 1.5e+07
0
20000
40000
60000
0
20000
40000
60000
0
20000
40000
60000
Time [ns]
Fre
quen
cy
Type
AAR−I−1
AAR−I−2
AAR−U
Outliers higher than quantile of 0.98 removed
Histogram of AAR Process Times Clusters
Figure 4.23: Real-life Profile – AAR Process Times Clusters
The AAR-I-2 message type is a mystery, there is small cluster on the right sideof the graph and also quite a big cluster on the left. This behavior is quite strange,the identification of AAR-I-2 messages is quite straightforward and should be alsoresistant against failures. One possible explanation is that there is some kindof parameter which is sent in the message, which causes a bit different flow inthe PCRF that is taking a bit longer. Again, there is no way to tell withoutlogging the message content, which might distort the measurements.
Another possible explanation is that at some moments, the server is overloadedand therefore the messages are processed a bit longer. To test this hypothesis, wehave collected all messages in the process log whose processing duration is abovethe outlier limit, there are 19211 such messages out of a total of 960514. The nextstep is to find when the messages were received and check whether these messagesare received in bursts. If we split the messages by distinct minutes, we get 145slots, which corresponds to the duration of the test. Because the messages arespread all across the test and are not clustered in bursts, we can probably rejectthe momentary overload explanation.
73
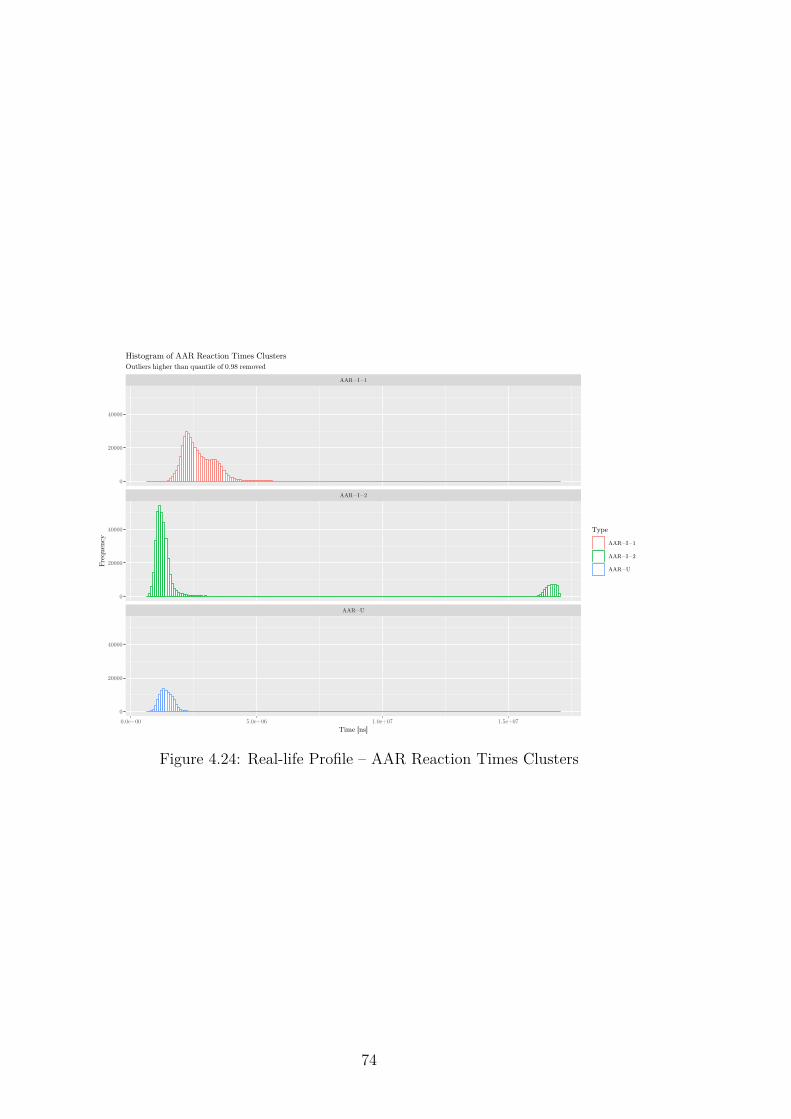
AAR−U
AAR−I−2
AAR−I−1
0.0e+00 5.0e+06 1.0e+07 1.5e+07
0
20000
40000
0
20000
40000
0
20000
40000
Time [ns]
Fre
quen
cy
Type
AAR−I−1
AAR−I−2
AAR−U
Outliers higher than quantile of 0.98 removed
Histogram of AAR Reaction Times Clusters
Figure 4.24: Real-life Profile – AAR Reaction Times Clusters
74
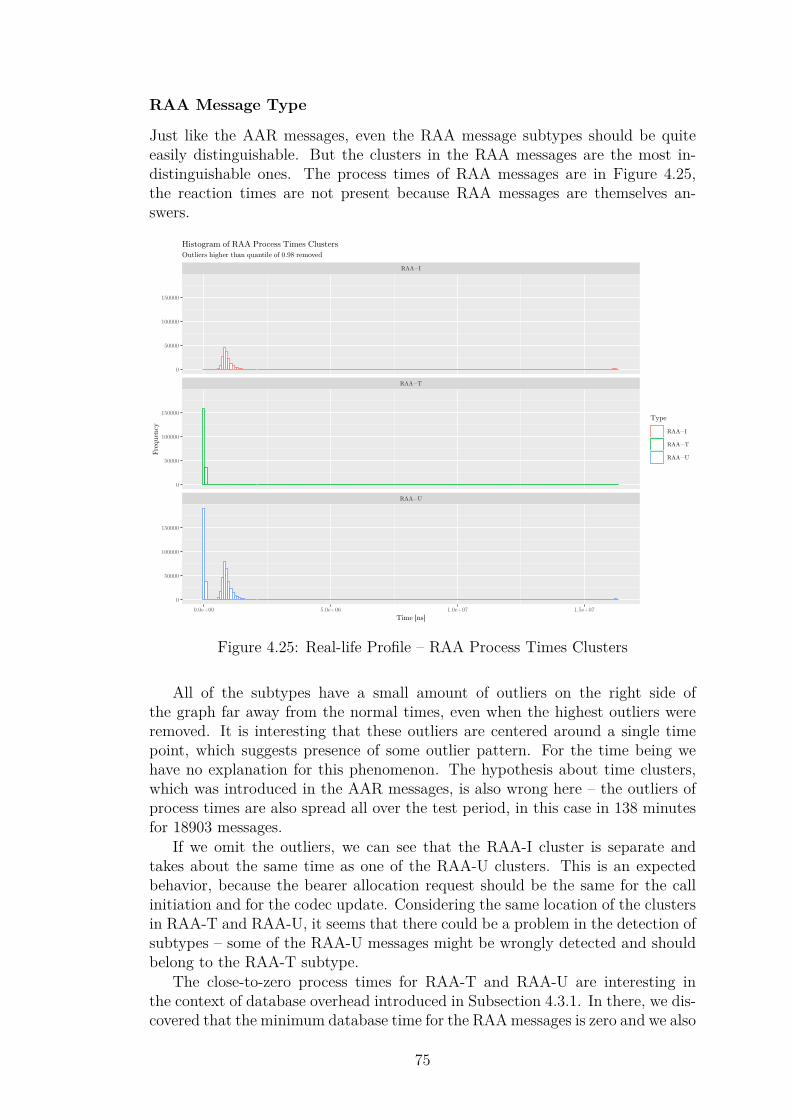
RAA Message Type
Just like the AAR messages, even the RAA message subtypes should be quiteeasily distinguishable. But the clusters in the RAA messages are the most in-distinguishable ones. The process times of RAA messages are in Figure 4.25,the reaction times are not present because RAA messages are themselves an-swers.
RAA−U
RAA−T
RAA−I
0.0e+00 5.0e+06 1.0e+07 1.5e+07
0
50000
100000
150000
0
50000
100000
150000
0
50000
100000
150000
Time [ns]
Fre
quen
cy
Type
RAA−I
RAA−T
RAA−U
Outliers higher than quantile of 0.98 removed
Histogram of RAA Process Times Clusters
Figure 4.25: Real-life Profile – RAA Process Times Clusters
All of the subtypes have a small amount of outliers on the right side ofthe graph far away from the normal times, even when the highest outliers wereremoved. It is interesting that these outliers are centered around a single timepoint, which suggests presence of some outlier pattern. For the time being wehave no explanation for this phenomenon. The hypothesis about time clusters,which was introduced in the AAR messages, is also wrong here – the outliers ofprocess times are also spread all over the test period, in this case in 138 minutesfor 18903 messages.
If we omit the outliers, we can see that the RAA-I cluster is separate andtakes about the same time as one of the RAA-U clusters. This is an expectedbehavior, because the bearer allocation request should be the same for the callinitiation and for the codec update. Considering the same location of the clustersin RAA-T and RAA-U, it seems that there could be a problem in the detection ofsubtypes – some of the RAA-U messages might be wrongly detected and shouldbelong to the RAA-T subtype.
The close-to-zero process times for RAA-T and RAA-U are interesting inthe context of database overhead introduced in Subsection 4.3.1. In there, we dis-covered that the minimum database time for the RAA messages is zero and we also
75
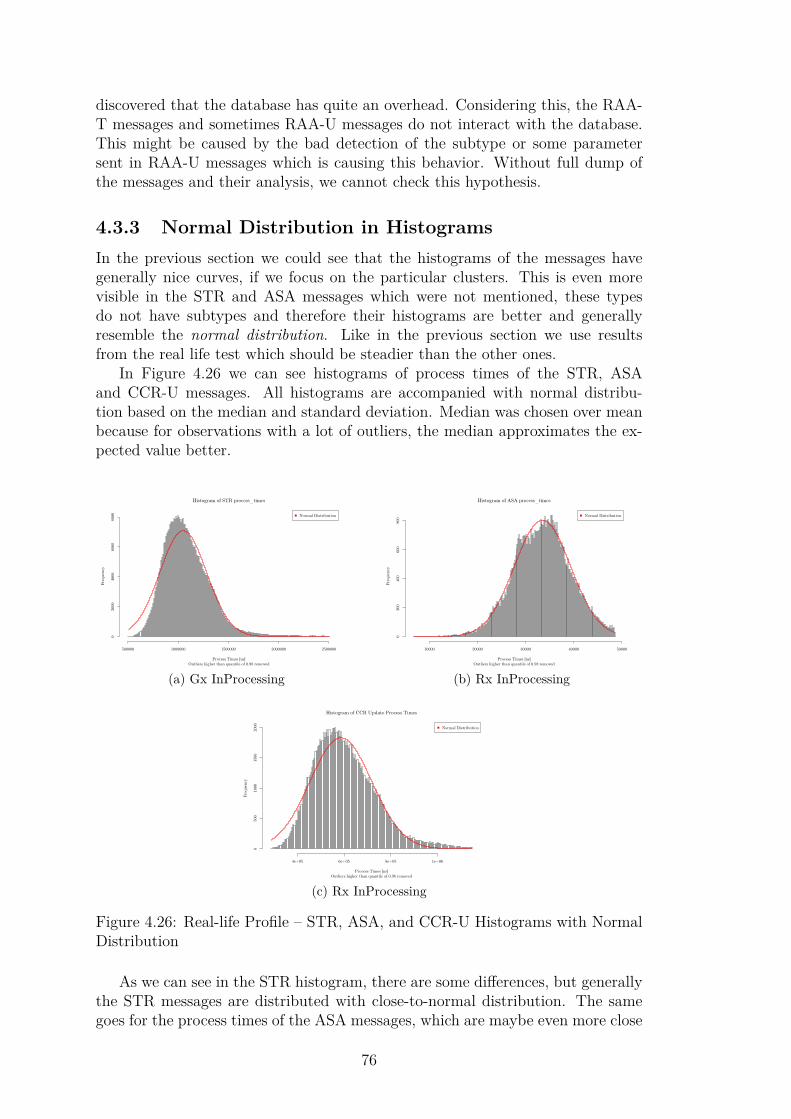
discovered that the database has quite an overhead. Considering this, the RAA-T messages and sometimes RAA-U messages do not interact with the database.This might be caused by the bad detection of the subtype or some parametersent in RAA-U messages which is causing this behavior. Without full dump ofthe messages and their analysis, we cannot check this hypothesis.
4.3.3 Normal Distribution in HistogramsIn the previous section we could see that the histograms of the messages havegenerally nice curves, if we focus on the particular clusters. This is even morevisible in the STR and ASA messages which were not mentioned, these typesdo not have subtypes and therefore their histograms are better and generallyresemble the normal distribution. Like in the previous section we use resultsfrom the real life test which should be steadier than the other ones.
In Figure 4.26 we can see histograms of process times of the STR, ASAand CCR-U messages. All histograms are accompanied with normal distribu-tion based on the median and standard deviation. Median was chosen over meanbecause for observations with a lot of outliers, the median approximates the ex-pected value better.
Histogram of STR process_times
Outliers higher than quantile of 0.98 removedProcess Times [ns]
Fre
quen
cy
500000 1000000 1500000 2000000 2500000
020
0040
0060
0080
00 Normal Distribution
(a) Gx InProcessing
Histogram of ASA process_times
Outliers higher than quantile of 0.98 removedProcess Times [ns]
Fre
quen
cy
10000 20000 30000 40000 50000
020
040
060
080
0
Normal Distribution
(b) Rx InProcessing
Histogram of CCR Update Process Times
Outliers higher than quantile of 0.98 removedProcess Times [ns]
Fre
quen
cy
4e+05 6e+05 8e+05 1e+06
050
010
0015
0020
00 Normal Distribution
(c) Rx InProcessing
Figure 4.26: Real-life Profile – STR, ASA, and CCR-U Histograms with NormalDistribution
As we can see in the STR histogram, there are some differences, but generallythe STR messages are distributed with close-to-normal distribution. The samegoes for the process times of the ASA messages, which are maybe even more close
76
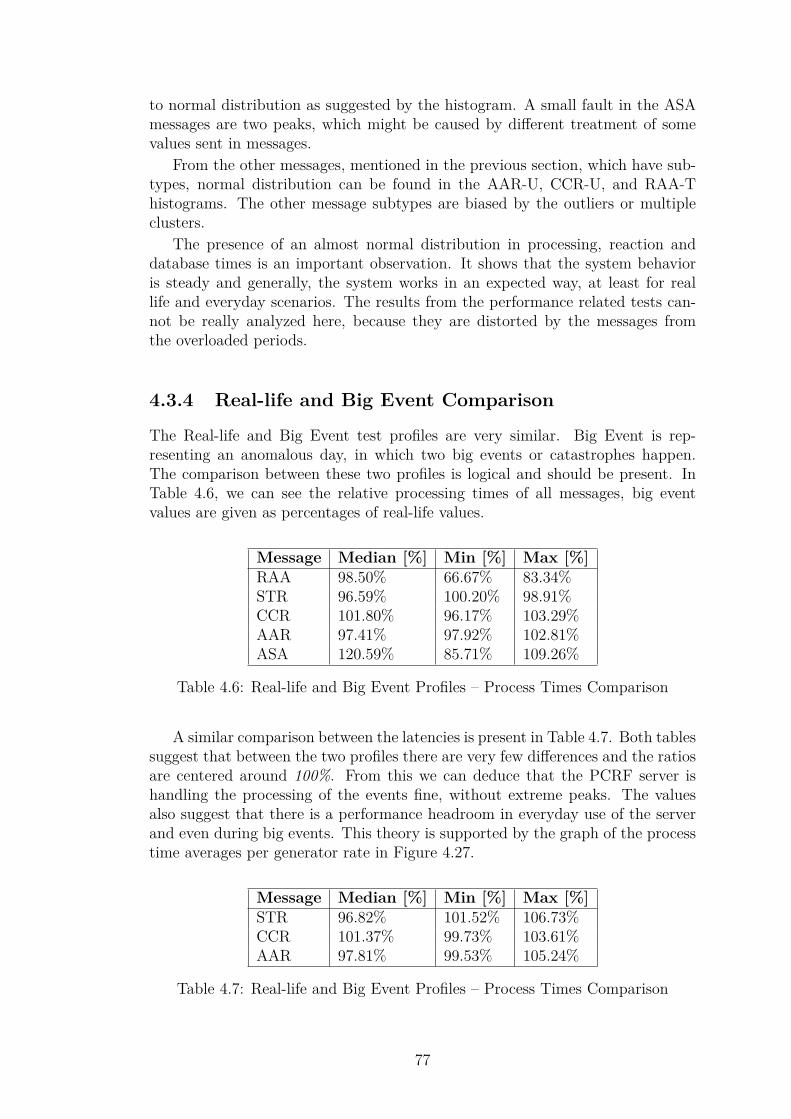
to normal distribution as suggested by the histogram. A small fault in the ASAmessages are two peaks, which might be caused by different treatment of somevalues sent in messages.
From the other messages, mentioned in the previous section, which have sub-types, normal distribution can be found in the AAR-U, CCR-U, and RAA-Thistograms. The other message subtypes are biased by the outliers or multipleclusters.
The presence of an almost normal distribution in processing, reaction anddatabase times is an important observation. It shows that the system behavioris steady and generally, the system works in an expected way, at least for reallife and everyday scenarios. The results from the performance related tests can-not be really analyzed here, because they are distorted by the messages fromthe overloaded periods.
4.3.4 Real-life and Big Event Comparison
The Real-life and Big Event test profiles are very similar. Big Event is rep-resenting an anomalous day, in which two big events or catastrophes happen.The comparison between these two profiles is logical and should be present. InTable 4.6, we can see the relative processing times of all messages, big eventvalues are given as percentages of real-life values.
Message Median [%] Min [%] Max [%]RAA 98.50% 66.67% 83.34%STR 96.59% 100.20% 98.91%CCR 101.80% 96.17% 103.29%AAR 97.41% 97.92% 102.81%ASA 120.59% 85.71% 109.26%
Table 4.6: Real-life and Big Event Profiles – Process Times Comparison
A similar comparison between the latencies is present in Table 4.7. Both tablessuggest that between the two profiles there are very few differences and the ratiosare centered around 100%. From this we can deduce that the PCRF server ishandling the processing of the events fine, without extreme peaks. The valuesalso suggest that there is a performance headroom in everyday use of the serverand even during big events. This theory is supported by the graph of the processtime averages per generator rate in Figure 4.27.
Message Median [%] Min [%] Max [%]STR 96.82% 101.52% 106.73%CCR 101.37% 99.73% 103.61%AAR 97.81% 99.53% 105.24%
Table 4.7: Real-life and Big Event Profiles – Process Times Comparison
77
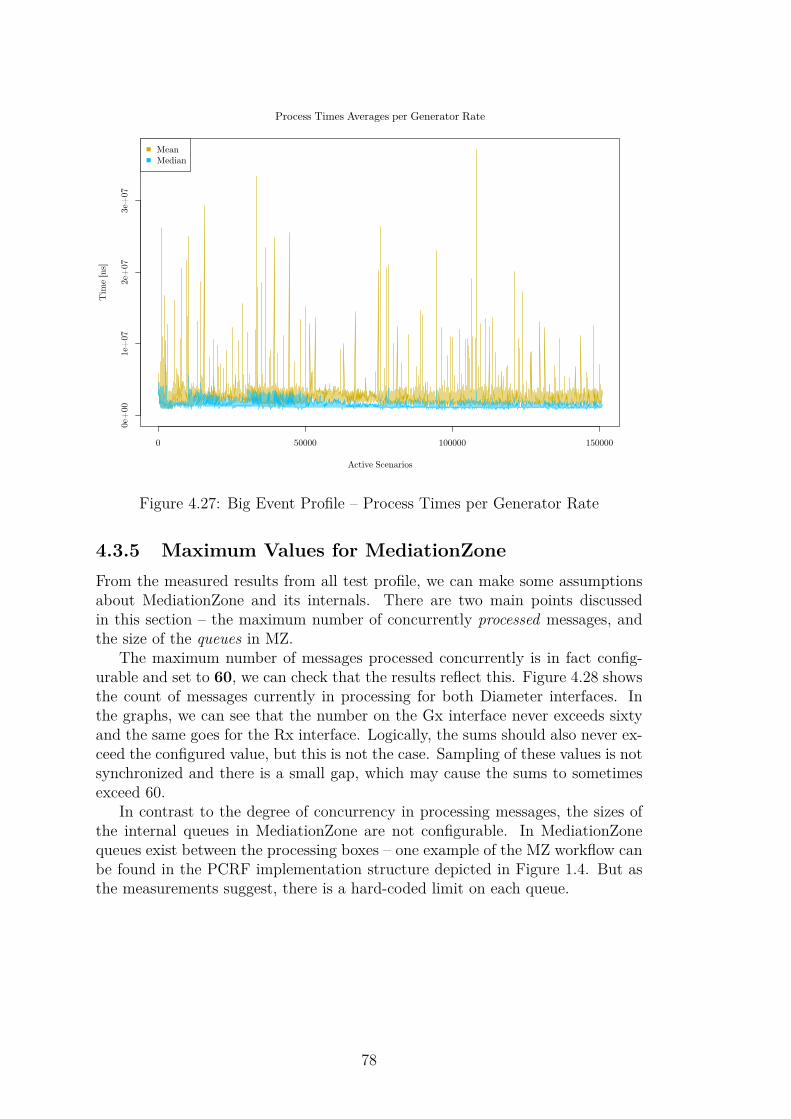
0 50000 100000 150000
0e+
00
1e+
072e
+07
3e+
07Process Times Averages per Generator Rate
Active Scenarios
Tim
e [n
s]
MeanMedian
Figure 4.27: Big Event Profile – Process Times per Generator Rate
4.3.5 Maximum Values for MediationZoneFrom the measured results from all test profile, we can make some assumptionsabout MediationZone and its internals. There are two main points discussedin this section – the maximum number of concurrently processed messages, andthe size of the queues in MZ.
The maximum number of messages processed concurrently is in fact config-urable and set to 60, we can check that the results reflect this. Figure 4.28 showsthe count of messages currently in processing for both Diameter interfaces. Inthe graphs, we can see that the number on the Gx interface never exceeds sixtyand the same goes for the Rx interface. Logically, the sums should also never ex-ceed the configured value, but this is not the case. Sampling of these values is notsynchronized and there is a small gap, which may cause the sums to sometimesexceed 60.
In contrast to the degree of concurrency in processing messages, the sizes ofthe internal queues in MediationZone are not configurable. In MediationZonequeues exist between the processing boxes – one example of the MZ workflow canbe found in the PCRF implementation structure depicted in Figure 1.4. But asthe measurements suggest, there is a hard-coded limit on each queue.
78
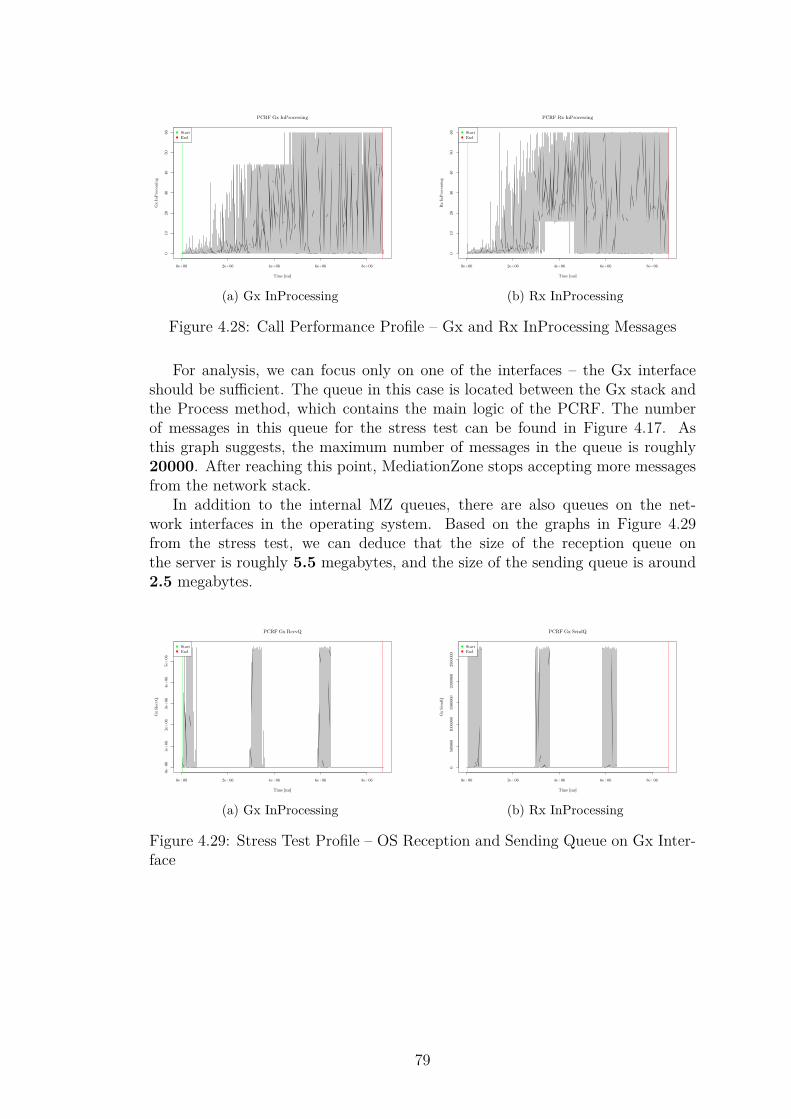
0e+00 2e+06 4e+06 6e+06 8e+06
010
2030
4050
60
PCRF Gx InProcessing
Time [ms]
Gx I
nP
roce
ssin
g
StartEnd
(a) Gx InProcessing
0e+00 2e+06 4e+06 6e+06 8e+06
010
2030
4050
60
PCRF Rx InProcessing
Time [ms]
Rx I
nP
roce
ssin
g
StartEnd
(b) Rx InProcessing
Figure 4.28: Call Performance Profile – Gx and Rx InProcessing Messages
For analysis, we can focus only on one of the interfaces – the Gx interfaceshould be sufficient. The queue in this case is located between the Gx stack andthe Process method, which contains the main logic of the PCRF. The numberof messages in this queue for the stress test can be found in Figure 4.17. Asthis graph suggests, the maximum number of messages in the queue is roughly20000. After reaching this point, MediationZone stops accepting more messagesfrom the network stack.
In addition to the internal MZ queues, there are also queues on the net-work interfaces in the operating system. Based on the graphs in Figure 4.29from the stress test, we can deduce that the size of the reception queue onthe server is roughly 5.5 megabytes, and the size of the sending queue is around2.5 megabytes.
0e+00 2e+06 4e+06 6e+06 8e+06
0e+
001e
+06
2e+
063e
+06
4e+
065e
+06
PCRF Gx RecvQ
Time [ms]
Gx R
ecvQ
StartEnd
(a) Gx InProcessing
0e+00 2e+06 4e+06 6e+06 8e+06
050
0000
1000
000
1500
000
2000
000
2500
000
PCRF Gx SendQ
Time [ms]
Gx S
endQ
StartEnd
(b) Rx InProcessing
Figure 4.29: Stress Test Profile – OS Reception and Sending Queue on Gx Inter-face
79
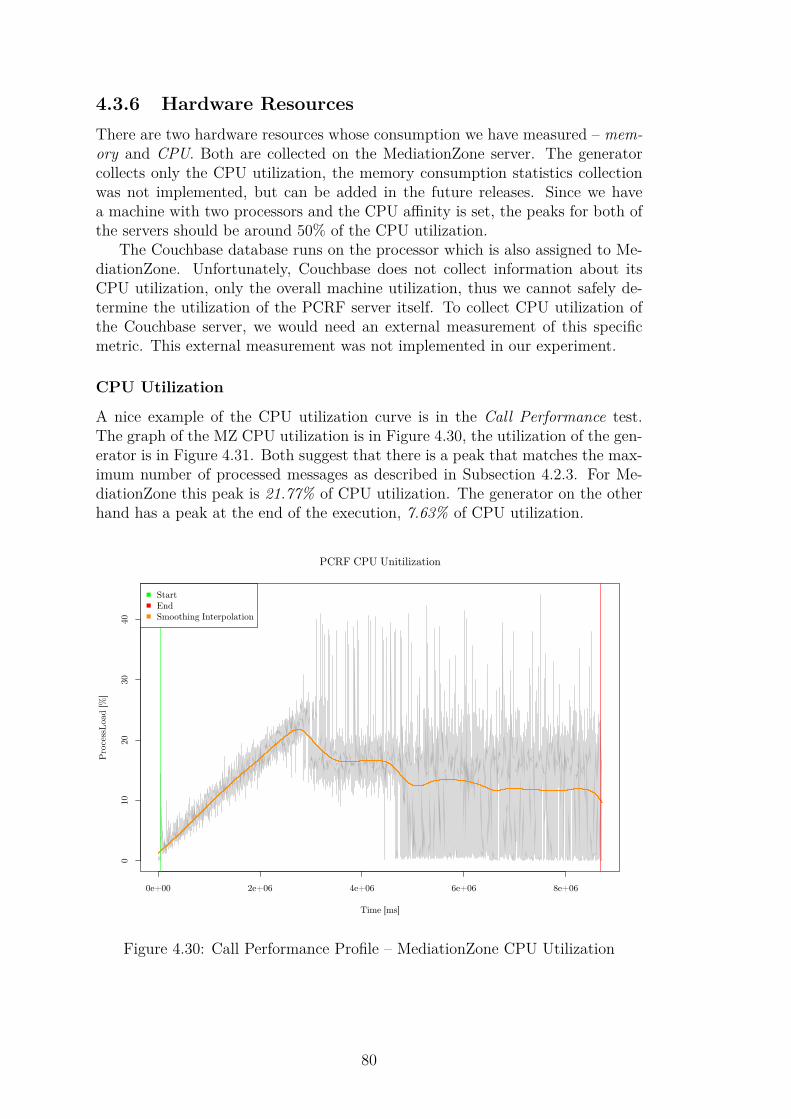
4.3.6 Hardware ResourcesThere are two hardware resources whose consumption we have measured – mem-ory and CPU. Both are collected on the MediationZone server. The generatorcollects only the CPU utilization, the memory consumption statistics collectionwas not implemented, but can be added in the future releases. Since we havea machine with two processors and the CPU affinity is set, the peaks for both ofthe servers should be around 50% of the CPU utilization.
The Couchbase database runs on the processor which is also assigned to Me-diationZone. Unfortunately, Couchbase does not collect information about itsCPU utilization, only the overall machine utilization, thus we cannot safely de-termine the utilization of the PCRF server itself. To collect CPU utilization ofthe Couchbase server, we would need an external measurement of this specificmetric. This external measurement was not implemented in our experiment.
CPU Utilization
A nice example of the CPU utilization curve is in the Call Performance test.The graph of the MZ CPU utilization is in Figure 4.30, the utilization of the gen-erator is in Figure 4.31. Both suggest that there is a peak that matches the max-imum number of processed messages as described in Subsection 4.2.3. For Me-diationZone this peak is 21.77% of CPU utilization. The generator on the otherhand has a peak at the end of the execution, 7.63% of CPU utilization.
0e+00 2e+06 4e+06 6e+06 8e+06
010
2030
40
PCRF CPU Unitilization
Time [ms]
Pro
cess
Loa
d [%
]
StartEndSmoothing Interpolation
Figure 4.30: Call Performance Profile – MediationZone CPU Utilization
80
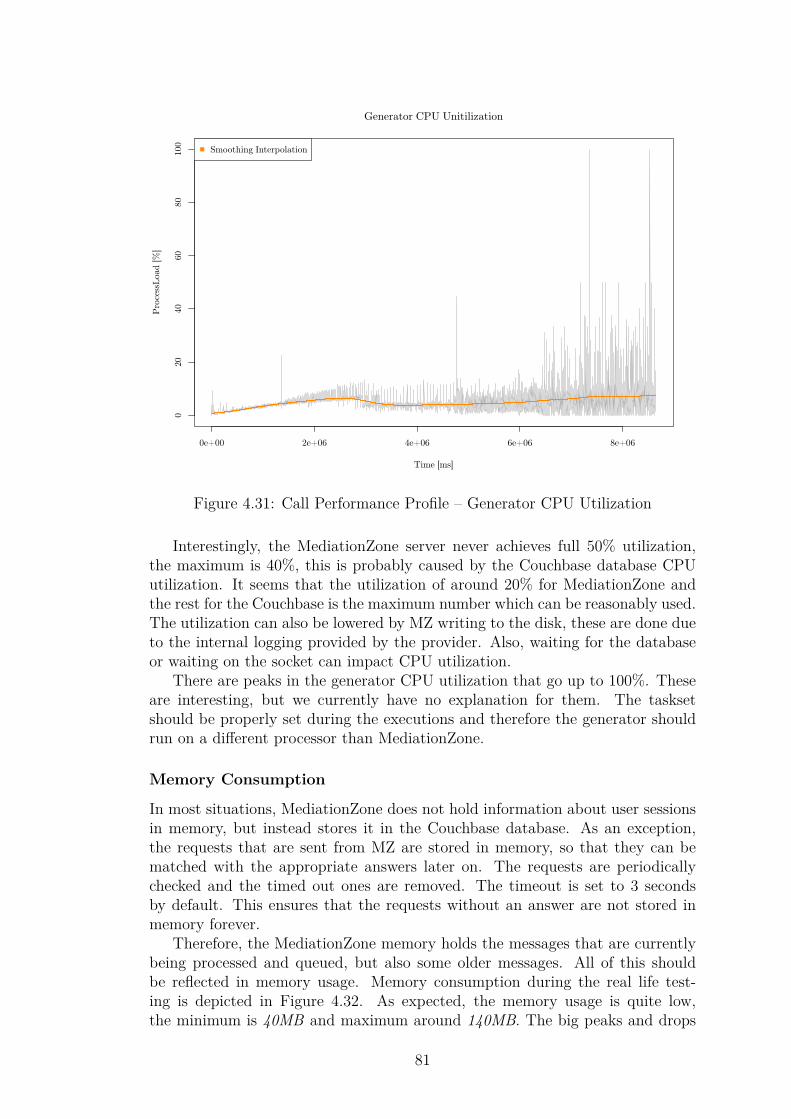
0e+00 2e+06 4e+06 6e+06 8e+06
020
4060
8010
0
Generator CPU Unitilization
Time [ms]
Pro
cess
Loa
d [%
]Smoothing Interpolation
Figure 4.31: Call Performance Profile – Generator CPU Utilization
Interestingly, the MediationZone server never achieves full 50% utilization,the maximum is 40%, this is probably caused by the Couchbase database CPUutilization. It seems that the utilization of around 20% for MediationZone andthe rest for the Couchbase is the maximum number which can be reasonably used.The utilization can also be lowered by MZ writing to the disk, these are done dueto the internal logging provided by the provider. Also, waiting for the databaseor waiting on the socket can impact CPU utilization.
There are peaks in the generator CPU utilization that go up to 100%. Theseare interesting, but we currently have no explanation for them. The tasksetshould be properly set during the executions and therefore the generator shouldrun on a different processor than MediationZone.
Memory Consumption
In most situations, MediationZone does not hold information about user sessionsin memory, but instead stores it in the Couchbase database. As an exception,the requests that are sent from MZ are stored in memory, so that they can bematched with the appropriate answers later on. The requests are periodicallychecked and the timed out ones are removed. The timeout is set to 3 secondsby default. This ensures that the requests without an answer are not stored inmemory forever.
Therefore, the MediationZone memory holds the messages that are currentlybeing processed and queued, but also some older messages. All of this shouldbe reflected in memory usage. Memory consumption during the real life test-ing is depicted in Figure 4.32. As expected, the memory usage is quite low,the minimum is 40MB and maximum around 140MB. The big peaks and drops
81
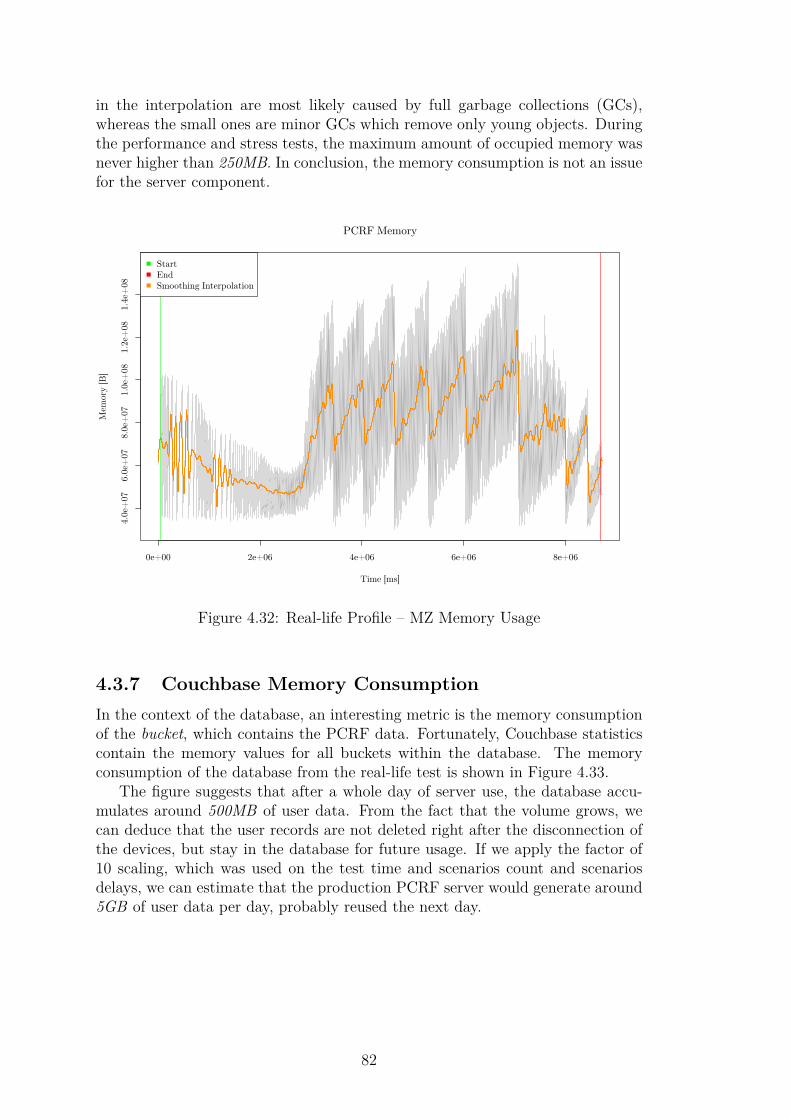
in the interpolation are most likely caused by full garbage collections (GCs),whereas the small ones are minor GCs which remove only young objects. Duringthe performance and stress tests, the maximum amount of occupied memory wasnever higher than 250MB. In conclusion, the memory consumption is not an issuefor the server component.
0e+00 2e+06 4e+06 6e+06 8e+06
4.0e
+07
6.0e
+07
8.0e
+07
1.0e
+08
1.2e
+08
1.4e
+08
PCRF Memory
Time [ms]
Mem
ory [B
]
StartEndSmoothing Interpolation
Figure 4.32: Real-life Profile – MZ Memory Usage
4.3.7 Couchbase Memory ConsumptionIn the context of the database, an interesting metric is the memory consumptionof the bucket, which contains the PCRF data. Fortunately, Couchbase statisticscontain the memory values for all buckets within the database. The memoryconsumption of the database from the real-life test is shown in Figure 4.33.
The figure suggests that after a whole day of server use, the database accu-mulates around 500MB of user data. From the fact that the volume grows, wecan deduce that the user records are not deleted right after the disconnection ofthe devices, but stay in the database for future usage. If we apply the factor of10 scaling, which was used on the test time and scenarios count and scenariosdelays, we can estimate that the production PCRF server would generate around5GB of user data per day, probably reused the next day.
82
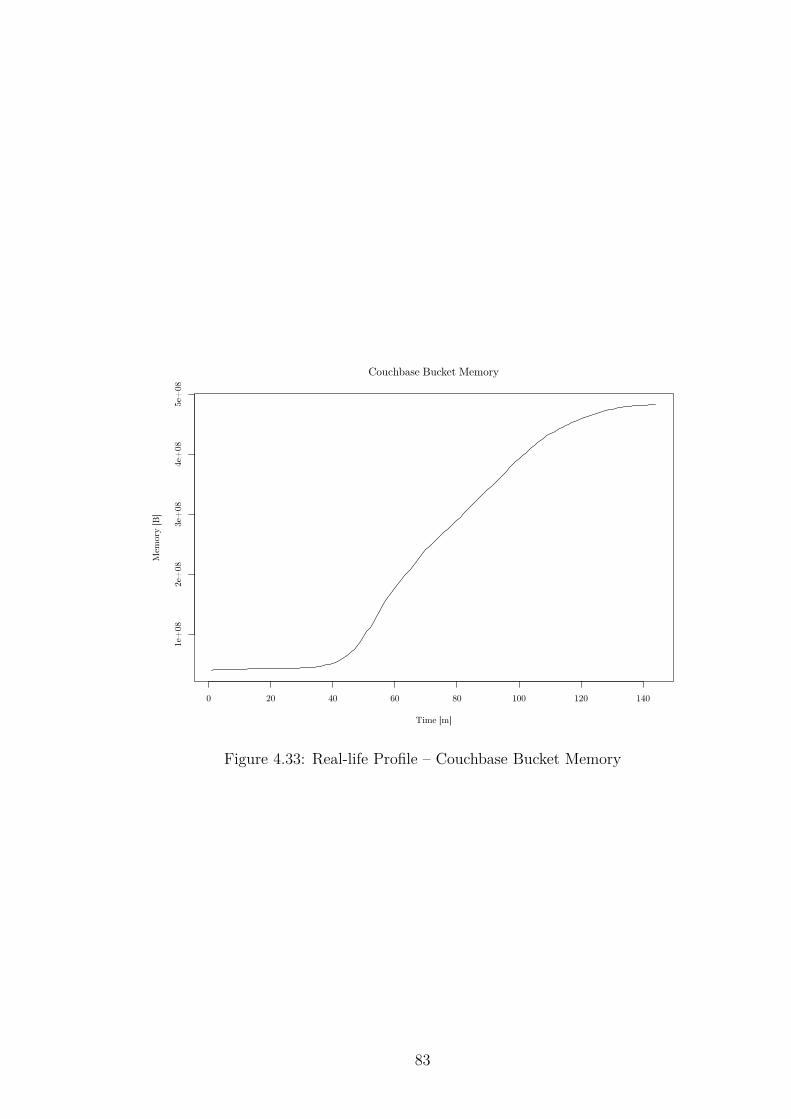
0 20 40 60 80 100 120 140
1e+
082e
+08
3e+
084e
+08
5e+
08
Couchbase Bucket Memory
Time [m]
Mem
ory [B
]
Figure 4.33: Real-life Profile – Couchbase Bucket Memory
83

84
ConclusionWe have performed an analysis of the PCRF server provided by a major Czechtelecommunication provider. The analysis revealed that the existing tests, de-signed for simple functionality testing, were not suitable for complex testing ofreal-life scenarios and performance (load) testing. Therefore, we had to imple-ment a new, more complex and more realistic traffic generator, which can be usedfor load testing of the PCRF implementation.
To implement the traffic generator, we had to analyze the available means ofgenerating the traffic data. First, we performed an analysis to fully understandthe flow of the messages and their states during regular communication. Basedon this analysis, we have decided to represent user devices by communication sce-narios, which are grouped into test cases by configurable profiles. In cooperationwith the telecommunication provider, we have defined five common scenarios andfour major test profiles to test the PCRF server. The test profiles are designedto test the provided PCRF server in various situations.
One of the thesis goals was to collect statistical data from the PCRF server.To do this, we have analyzed the MediationZone server, defined the metrics usedfor performance evaluation, and implemented an instrumentation tool for datacollection at selected points of interest in the server bytecode representation.
The implemented measurement framework consists of three main parts –the traffic generator, the instrumentation harness for the server, and the testexecution framework:
• The generator realizes the concepts of test profiles and scenarios defined inthe analysis, and uses the jDiameter library for communication with PCRF.
• The instrumentation harness uses the DiSL framework for injecting probecode at the points of interest in the server, and implements the probesthemselves.
• The test execution framework is composed of shell scripts which managethe execution of the four defined profiles and the steps which have to be donebefore and after each test case. For each test profile, the framework pre-pares execution, instruments the code, runs the traffic generator, executesthe profile and at the end plots the collected data using the R statisticalsoftware.
The final part of the thesis is the evaluation of the measurement results.The initial evaluation served to diagnose and remedy problems with the databaseconfiguration. Further in the Evaluation chapter, we have analyzed the resultsfrom all four defined test profiles, and also commented on several interestingobservations collected from across all the profiles.
The thesis also opens multiple venues for further exploration:
• The analysis of the test profiles and scenarios could be extended by compar-ing it with existing behavioral models of the telecommunication network.This comparison would ideally support the correctness of the scenarios de-fined in the thesis.
85
• The evaluation of the test profile measurements can be supplemented withanalysis of the remaining unidentified clusters in the messages histograms.
• Last but not least, the stress test, which suffered from generator perfor-mance issues on our hardware, could be evaluated in more robust settings.
In conclusion, we believe that the thesis will prove to be useful to the telecom-munication provider. The existing evaluation of the tests can help improvethe implementation of the server, or at least provide in-depth knowledge aboutthe server behavior in different situations. The developed testing framework canalso be useful in further testing and evaluation, possibly even regular testingduring the PCRF development process. Naturally, the tests can be executed ona setup that is closer to the one used in production, which should give even morerelevant results on the server performance and capabilities.
Regarding the traffic generator, it can be used by the telecommunicationprovider or even by other providers for comprehensive PCRF testing. The gener-ator is extensible and due to its open license, it can be further developed by eitherthe providers or the general community. Hopefully, this project does not perishwith the thesis and continues to live and serve its original purpose of generatingrealistic traffic for PCRF servers.
86
Bibliography[1] C. Rigney, S. Willens, A. Rubens, and W. Simpson. Remote authentication
dial in user service (radius). RFC 2865, RFC Editor, June 2000. URLhttp://www.rfc-editor.org/rfc/rfc2865.txt.
[2] V. Fajardo, J. Arkko, J. Loughney, and G. Zorn. Diameter base protocol.RFC 6733, RFC Editor, October 2012. URL http://www.rfc-editor.org/rfc/rfc6733.txt.
[3] P. Calhoun, J. Loughney, E. Guttman, G. Zorn, and J. Arkko. Diameterbase protocol. RFC 3588, RFC Editor, September 2003. URL http://www.rfc-editor.org/rfc/rfc3588.txt.
[4] D. Crocker and P. Overell. Augmented bnf for syntax specifications: Abnf.STD 68, RFC Editor, January 2008. URL http://www.rfc-editor.org/rfc/rfc5234.txt.
[5] IANA. Smi network management private enterprise codes. https://www.iana.org/assignments/enterprise-numbers, 2018. [Online; accessed 14-July-2018].
[6] IEEE. Ieee standard for binary floating-point arithmetic. ANSI/IEEE Std754-1985, 1985. doi: 10.1109/IEEESTD.1985.82928.
[7] 3GPP. Network architecture. Technical Specification (TS) 23.002, 3rd Gen-eration Partnership Project (3GPP), 03 2018. URL http://www.3gpp.org/DynaReport/23002.htm. Version 15.0.0.
[8] 3GPP. Evolved Universal Terrestrial Radio Access Network (E-UTRAN); Architecture description. Technical Specification (TS)36.401, 3rd Generation Partnership Project (3GPP), 03 2017.URL https://portal.3gpp.org/desktopmodules/Specifications/SpecificationDetails.aspx?specificationId=2442. Version 14.0.0.
[9] 3GPP. Policy and charging control architecture. Technical Specification(TS) 23.203, 3rd Generation Partnership Project (3GPP), 06 2018. URLhttp://www.3gpp.org/DynaReport/23203.htm. Version 15.3.0.
[10] 3GPP. Policy and Charging Control (PCC); Reference points. TechnicalSpecification (TS) 29.212, 3rd Generation Partnership Project (3GPP), 062018. URL http://www.3gpp.org/DynaReport/29212.htm. Version 15.3.0.
[11] H. Hakala, L. Mattila, J-P. Koskinen, M. Stura, and J. Loughney. Diame-ter credit-control application. RFC 4006, RFC Editor, August 2005. URLhttps://www.rfc-editor.org/rfc/rfc4006.txt.
[12] 3GPP. Policy and charging control over Rx reference point. Technical Spec-ification (TS) 29.214, 3rd Generation Partnership Project (3GPP), 06 2018.URL http://www.3gpp.org/DynaReport/29214.htm. Version 15.4.0.
87
https://portal.3gpp.org/desktopmodules/Specifications/SpecificationDetails.aspx?specificationId=2442
[13] P. Calhoun, G. Zorn, D. Spence, and D. Mitton. Diameter network accessserver application. RFC 4005, RFC Editor, August 2005. URL https://www.rfc-editor.org/rfc/rfc4005.txt.
[14] NoSQL Engagement Database | Couchbase. https://www.couchbase.com/,. [Online; accessed 14-July-2018].
[15] memcached - a distributed memory object caching system. https://memcached.org/. [Online; accessed 14-July-2018].
[16] Apache CouchDB. http://couchdb.apache.org/, . [Online; accessed 14-July-2018].
[17] Seagull: an Open Source Multi-protocol traffic generator. http://gull.sourceforge.net/. [Online; accessed 14-July-2018].
[18] EFORT. Diameter – Architecture and Base Protocol. http://www.efort.com/media_pdf/DIAMETER_EFORT_ENG.pdf. [Online; accessed 19-July-2018].
[19] IETF67 – Diameter Tutorial. https://www.ietf.org/proceedings/67/slides/dime-3/sld1.htm. [Online; accessed 19-July-2018].
[20] HP. Seagull – Open Source tool for IMS testing. http://gull.sourceforge.net/doc/WP_Seagull_Open_Source_tool_for_IMS_testing.pdf. [Online; accessed 19-July-2018].
[21] 3GPP. LTE. http://www.3gpp.org/technologies/keywords-acronyms/98-lte, . [Online; accessed 19-July-2018].
[22] 3GPP. The Evolved Packet Core. http://www.3gpp.org/technologies/keywords-acronyms/100-the-evolved-packet-core, . [Online; accessed19-July-2018].
[23] PCRF is an important Entity in LTE Network. https://www.netmanias.com/en/?m=view&id=techdocs&no=11863, . [Online; accessed 19-July-2018].
[24] Policy Control over the Rx Interface Using Diameter for VoLTE.http://www.netmanias.com/en/post/blog/11082/lte-pcrf-volte/policy-control-over-the-rx-interface-using-diameter-for-volte,. [Online; accessed 19-July-2018].
[25] Policy and Charging Rules Function (PCRF) in LTE EPC Core NetworkTechnology. http://www.netmanias.com/en/?m=view&id=techdocs&no=10997, . [Online; accessed 19-July-2018].
[26] 3GPP. Policy and charging control signalling flows and Quality of Service(QoS) parameter mapping. Technical Specification (TS) 29.213, 3rd Gener-ation Partnership Project (3GPP), 06 2018. URL http://www.3gpp.org/DynaReport/29213.htm. Version 15.3.0.
88
[27] Gregor Kiczales, John Lamping, Anurag Mendhekar, Chris Maeda, CristinaLopes, Jean-Marc Loingtier, and John Irwin. Aspect-oriented programming.In Mehmet Aksit and Satoshi Matsuoka, editors, ECOOP’97 — Object-Oriented Programming, pages 220–242, Berlin, Heidelberg, 1997. SpringerBerlin Heidelberg. ISBN 978-3-540-69127-3.
[28] DiSL. https://disl.ow2.org/. [Online; accessed 14-July-2018].
[29] The Official YAML Web Site. http://yaml.org/. [Online; accessed 14-July-2018].
[30] Apache log4j 1.2. http://logging.apache.org/log4j/1.2/. [Online; ac-cessed 14-July-2018].
[31] Extensible Markup Language (XML). https://www.w3.org/XML/. [Online;accessed 14-July-2018].
89

90
List of Figures
1.1 LTE Architecture . . . . . . . . . . . . . . . . . . . . . . . . . . . 61.2 Diameter Message Format . . . . . . . . . . . . . . . . . . . . . . 81.3 Diameter AVP Format . . . . . . . . . . . . . . . . . . . . . . . . 101.4 PCRF Workflow in MediationZone . . . . . . . . . . . . . . . . . 17
2.1 Scenario Base Automaton . . . . . . . . . . . . . . . . . . . . . . 212.2 Call Automaton . . . . . . . . . . . . . . . . . . . . . . . . . . . . 212.3 Connect Scenario State . . . . . . . . . . . . . . . . . . . . . . . . 222.4 Disconnect Scenario State . . . . . . . . . . . . . . . . . . . . . . 222.5 Update Scenario State . . . . . . . . . . . . . . . . . . . . . . . . 232.6 Call Init Scenario State . . . . . . . . . . . . . . . . . . . . . . . . 242.7 Call Update Codec Scenario State . . . . . . . . . . . . . . . . . . 252.8 Call Termination Scenario State . . . . . . . . . . . . . . . . . . . 252.9 Call Lost Connection Scenario State . . . . . . . . . . . . . . . . . 262.10 Scenario Automaton . . . . . . . . . . . . . . . . . . . . . . . . . 272.11 Call Center Scenario Automaton . . . . . . . . . . . . . . . . . . . 292.12 Malfunctioning Cell-Phone Scenario Automaton . . . . . . . . . . 302.13 Travelling Manager Scenario Automaton . . . . . . . . . . . . . . 312.14 Classic User Scenario Automaton . . . . . . . . . . . . . . . . . . 332.15 Call Performance Scenario Automaton . . . . . . . . . . . . . . . 342.16 Call Performance Test Profile . . . . . . . . . . . . . . . . . . . . 362.17 Stress Test Profile . . . . . . . . . . . . . . . . . . . . . . . . . . . 362.18 Real-life Test Profile . . . . . . . . . . . . . . . . . . . . . . . . . 372.19 Big Event or Catastrophe Test Profile . . . . . . . . . . . . . . . . 39
3.1 Folder Structure of Testing Framework Scripts . . . . . . . . . . . 48
4.1 Constant 500 Profile – Processed Messages . . . . . . . . . . . . . 524.2 Constant 500 Profile – Couchbase OOM . . . . . . . . . . . . . . 544.3 Real-life Profile – Incoming Messages . . . . . . . . . . . . . . . . 554.4 Real-life Profile – Outgoing Messages . . . . . . . . . . . . . . . . 554.5 Real-life Profile – Boxplot of Process Times . . . . . . . . . . . . 564.6 Real-life Profile – Boxplot of Reaction Times . . . . . . . . . . . . 574.7 Big Event Profile – Processed Messages . . . . . . . . . . . . . . . 584.8 Big Event Profile – Boxplot of Process Times . . . . . . . . . . . 594.9 Big Event Profile – Boxplot of Reaction Times . . . . . . . . . . . 604.10 Call Performance Profile – Processed Messages . . . . . . . . . . . 614.11 Call Performance Profile – InQueue Messages with Processed Mes-
sages . . . . . . . . . . . . . . . . . . . . . . . . . . . . . . . . . . 614.12 Call Performance Profile – Rx Processed Messages . . . . . . . . . 624.13 Call Performance Profile – Generator Timeouts . . . . . . . . . . 634.14 Call Performance Profile – Generator Sent Messages . . . . . . . . 634.15 Call Performance Profile – Gx Interface OS Send Queue . . . . . 644.16 Stress Test Profile – Gx Interface OS Send Queue . . . . . . . . . 654.17 Stress Test Profile – Gx InQueue Messages . . . . . . . . . . . . . 674.18 Stress Test Profile – Gx InQueue Zoomed . . . . . . . . . . . . . . 68
91

4.19 Stress Test Profile – Processed Zoomed . . . . . . . . . . . . . . . 684.20 Real-life Profile – Process Times Histogram . . . . . . . . . . . . 704.21 Real-life Profile – CCR Process Times Clusters . . . . . . . . . . . 724.22 Real-life Profile – CCR Reaction Times Clusters . . . . . . . . . . 724.23 Real-life Profile – AAR Process Times Clusters . . . . . . . . . . 734.24 Real-life Profile – AAR Reaction Times Clusters . . . . . . . . . . 744.25 Real-life Profile – RAA Process Times Clusters . . . . . . . . . . 754.26 Real-life Profile – STR, ASA, and CCR-U Histograms with Normal
Distribution . . . . . . . . . . . . . . . . . . . . . . . . . . . . . . 764.27 Big Event Profile – Process Times per Generator Rate . . . . . . 784.28 Call Performance Profile – Gx and Rx InProcessing Messages . . 794.29 Stress Test Profile – OS Reception and Sending Queue on Gx In-
terface . . . . . . . . . . . . . . . . . . . . . . . . . . . . . . . . . 794.30 Call Performance Profile – MediationZone CPU Utilization . . . . 804.31 Call Performance Profile – Generator CPU Utilization . . . . . . . 814.32 Real-life Profile – MZ Memory Usage . . . . . . . . . . . . . . . . 824.33 Real-life Profile – Couchbase Bucket Memory . . . . . . . . . . . . 83
A.1 Folder Structure of Electronic Attachments . . . . . . . . . . . . . 97
92
Terminology
2G 2G is second generation of wireless communication technol-ogy which was first used in 1991.
3G 3G is third generation of wireless communication technologyspecified by ITU in the IMT-2000. The first 3G networkswere launched after 2001.
4G 4G is fourth generation of wireless communication technol-ogy specified by ITU in the IMT-Advanced. The first 4Gnetworks were launched in 2009. LTE is considered as a 4Gcandidate system.
3GPP The 3rd Generation Partnership Project3GPP is a project used for collaboration between telecom-munications standards associations. 3GPP is managingthe specification concerning GSM, UMTS and LTE networks,it will also handles future network specifications based on fu-ture telecommunication standards (5G, etc.).
3GPP TS 3GPP Technical SpecificationTechnical Specification is a document developed by the 3GPPassociation. Specifications are numbered and can be refer-enced by this number.
AAA Authentication, Authorization and AccountingAAA is a family of protocol used for mediation of networkaccess for end-user devices.
AAR/AAA AA Request, AA AnswerAA messages are types defined within Diameter Gx Applica-tion. They are used for the management of a call bearer.
AOP Aspect Oriented ProgrammingAOP is a programming paradigm that solves the separationof concerns by increasing modularity. This is achieved byadding functionality to already existing code.
APL Analysis Programming LanguageAPL is domain specific language developed for the needs ofMediationZone.
ASR/ASA Abort-Session Request/Abort-Session AnswerAbort session request is sent to PCRF in case a user devicelost connection during a call and the call has to be properlyended.
AVP Attribute-Value PairAVP is a basic data representation and it is a pair withthe name of the attribute and its value. AVPs are used withinDiameter protocol as a carrier for data in messages.
CCR/CCA Credit-Control Request/Credit-Control AnswerControl messages are used to manage specific connectivity ofend-user devices. For example initial connection, update ofthe default bearer or disconnection from the network.
Couchbase Couchbase is modern highly scalable NoSQL database.
93

CSCF Call Session Control FunctionCSCF is a component within IMS which ensures managementof calls and process SIP messages from end-user devices.
Diameter Diameter is a protocol used for AAA, it is a successor ofthe RADIUS protocol. Diameter protocol is used on bothGx and Rx interfaces of the PCRF server.
DigitalRoute DigitalRoute is Swedish company which developed the Medi-ationZone agent system.
DiSL DiSL is a domain specific language for Java bytecode instru-mentation. It based on similar concepts as an AOP program-ming, but provides more flexible way of code instrumentation.
DSL Domain Specific LanguageDSL is a specialized language developed for a particular ap-plication.
EC Execution ContextEC is a worker server application deployed within the Medi-ationZone agent system. If EC loses connection to core MZcomponent, it will stop its execution until again connected.
ECSA Execution Context StandaloneECSA is a worker server application deployed within the Me-diationZone agent system. In contrast to EC, ECSA willcontinue working even if the connection to core Platform waslost.
EPC Evolved Packet CoreEPC is a core part of the telecommunication network whichmanages the user equipment and appropriate communication.It is based only on packet switching for all types of communi-cation, calls are also transferred using packet switching withproper QoS attributes.
E-UTRAN Evolved Universal Mobile Telecommunications System Ter-restrial Radio Access NetworkE-UTRAN is a radio access network specified in context ofthe LTE network architecture.
GC Garbage CollectionGC is an system for automatic memory management.Garbage collection is automatic and ensures that objects cre-ated by a programmer are properly removed from memoryon destruction or when they are not further used.
GUI Graphical User InterfaceGUI is a type of user interface which is used by users tointeract with the software in a graphical way rather thansimple textual way.
Gx Gx is a network interface between PCEF and PCRF compo-nents. It is based on the Diameter protocol.
IANA Internet Assigned Numbers AuthorityIANA is a function provided by a non-profit corporation.IANA manages IP addresses and numbers used within the in-ternet. For example port numbers are defined by IANA.
94
IEEE Institute of Electrical and Electronics EngineersIEEE is an institute responsible for the technical advance-ment of computer and electronic engineering. It is also an as-sociation which produces various tutorials and standards.
IETF Internet Engineering Task ForceIETF is an organisation which is responsible for proposinginternet standards in the form of RFC documents.
IMS IP Multimedia SubsystemIMS is a separate component which ensures multimedia trans-fer and management within telecommunication provider net-work. IMS is based on the IP protocol as opposed to oldermedia transport systems.
IP Internet ProtocolIP is a main communication protocol on network layer usedwithin the internet.
jDiameter jDiameter is complex framework/library which is used asa processing interface for Diameter protocol messages.
LTE Long Term EvolutionLTE is a standard for wireless communication technology,which is usually presented as a 4G compliant, but does notmeet the needed technical criteria.
MZ MediationZoneMZ is an agent system for data mediation developed bythe DigitalRoute company.
PCC Policy and Charging ControlPCC ensures that provider can control network resources ofend-user devices. For example assigning bandwidth and QoSattributes to calls initiated by end-user devices.
PCEF Policy and Charging ControlOne part of the EPC system is PCEF, which is usually im-plemented in PGW and ensures allocation of bearers andenforcing of QoS attributes on particular transports.
PCRF Policy and Charging Rules FunctionPCRF is a part of IMS system and it is a key part at manag-ing network resources within providers network. It providespolicy and charging control of connections between end-userdevices and IMS.
PGW Packet GatewayPGW is a general component located at the borders of net-works. In the EPC context, packet gateway usually ensuresPCEF function and therefore serves as a gate between userdevices and core provider network.
QoS Quality of ServiceQoS is used for ensuring the quality of provided services, forexample QoS attributes might be used within IP communi-cation to ensure high throughput of particular messages.
95

TCP Transmission Control ProtocolTCP is a protocol used on a transport layer which is reliableand maintains a state of a connection.
R R is statistical software and programming language used fordata processing and plotting of graphs.
RADIUS Remote Authentication Dial In User ServiceRADIUS is a protocol used for AAA, it is a predecessor ofthe Diameter protocol.
RAR/RAA Re-Auth Request/Re-Auth AnswerRe-Auth messages can be used on both Gx and Rx interfaces.On the Gx interface they are for example used for manage-ment of call bearers, this includes initial allocation of bearer,its update and destruction.
RFC Request For CommentsRFC is a publication from the technology community. RFCsare used by IETF for defining internet drafts and standards.
Rx Rx is a network interface between CSCF and PCRF compo-nents. It is based on the Diameter protocol.
Seagull Seagull is a traffic generator used primarily for protocolswithin IMS system.
SPR Subscription Profile RepositorySPR is a database of all users registered in the network ofthe telecommunication provider. It might be connected tothe PCRF server, which can use this database to control userbearers allocations.
STR/STA Session-Termination Request/Session-Termination AnswerSession termination request is defined on the Rx interface andit is sent to PCRF in order to destroy a call bearer.
UDP User Datagram ProtocolUDP is a protocol used on a transport layer which is unreli-able and stateless.
UML Unified Modeling LanguageUML is a general purpose modeling language which is usedin software engineering for visualization of a system design.
VoLTE Voice over LTEVoLTE is a technology for transferring a voice over LTE net-work. It is based on the use of IMS and packet-switchingapproach to the transfer.
XML Extensible Markup LanguageXML is a general markup language, which defines a set ofrules for encoding various data.
YAML YAML Ain’t Markup LanguageYAML is a human readable data serialization language, whichmight be used for configuration files or data exports.
96
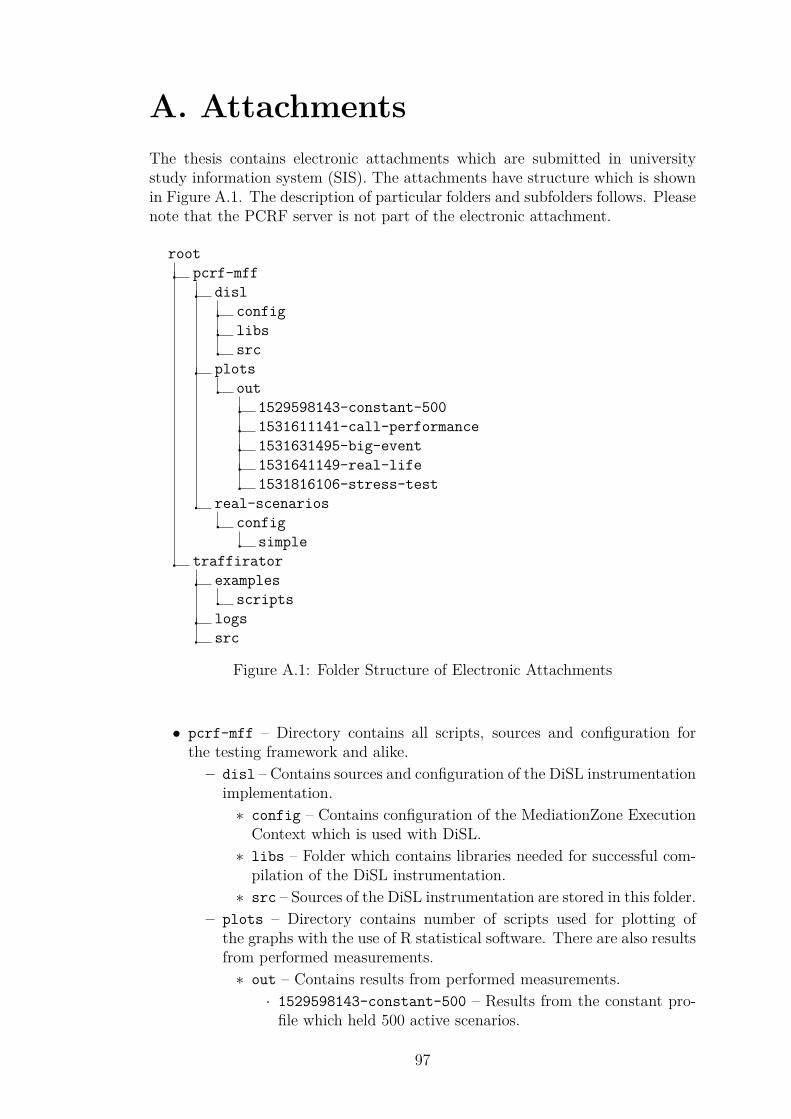
A. AttachmentsThe thesis contains electronic attachments which are submitted in universitystudy information system (SIS). The attachments have structure which is shownin Figure A.1. The description of particular folders and subfolders follows. Pleasenote that the PCRF server is not part of the electronic attachment.
rootpcrf-mff
dislconfiglibssrc
plotsout
1529598143-constant-5001531611141-call-performance1531631495-big-event1531641149-real-life1531816106-stress-test
real-scenariosconfig
simpletraffirator
examplesscripts
logssrc
Figure A.1: Folder Structure of Electronic Attachments
• pcrf-mff – Directory contains all scripts, sources and configuration forthe testing framework and alike.
– disl – Contains sources and configuration of the DiSL instrumentationimplementation.
∗ config – Contains configuration of the MediationZone ExecutionContext which is used with DiSL.
∗ libs – Folder which contains libraries needed for successful com-pilation of the DiSL instrumentation.
∗ src – Sources of the DiSL instrumentation are stored in this folder.– plots – Directory contains number of scripts used for plotting of
the graphs with the use of R statistical software. There are also resultsfrom performed measurements.
∗ out – Contains results from performed measurements.· 1529598143-constant-500 – Results from the constant pro-
file which held 500 active scenarios.
97

· 1531611141-call-performance – Results from the call per-formance test profile.
· 1531631495-big-event – Results from the big event profile.· 1531641149-real-life – Results from the real-life profile.· 1531816106-stress-test – Results from the stress test pro-
file.– real-scenarios – The main content of this directory is execution
script for the testing framework and configuration needed for the exe-cution.
∗ config – Folder contains configuration used in the testing frame-work.
· simple – Contains simple scenarios for the generator whichcan be used as a proof of concept.
• traffirator – Root directory of traffic generator implementation.– examples – Contains some example configurations for the generator.
∗ scripts – Folder with helper scripts for generating a more com-plex test profiles.
– logs – After the execution of the generator, the logs will be storedhere.
– src – Sources of traffirator are stored in this folder and subfolderscorresponding to the Java packages.
98
B. User Documentation ofTraffiratorTraffirator is a traffic generator for the PCRF server placed within the LTEnetwork. Traffirator generates traffic for the Gx and Rx interfaces of the PCRFserver. It simulates user equipments connected to the LTE network, which mightperform calls and usual maintenance of the user sessions.
The generator is built on a concept of test profiles and scenarios. For eachexecution, there has to be defined a test profile. Test profiles are sequences ofpoints in time, for each time, the count of active scenarios, which should be keptup, has to be specified. The scenario represents a single user device and it is, infact, an automaton. The nodes of the automaton can define a sequence of stepswhich will be done when the node is processed. The steps are only of two types– receive a message and send a message.
Unlike test profiles, scenarios cannot be defined dynamically and are hard-coded in traffirator. In the definition of the test profile, we can only specifythe type of the scenario, which will be used. For the time being there are only5 types of scenarios – Call Center Employee, Call Performance Scenario, ClassicUser, Malfunctioning Cell-phone, Travelling Manager.
The project is released under the MIT license and uses the jDiameter libraryfor the communication over the Gx and Rx interfaces.
B.1 Installation and CompilationFor the time being, traffirator is distributed only in the form of the GitHubrepository. If we want to use traffirator we have to clone the repository. Bythe following command, we clone the repository to the current directory.
> g i t c l one https : // github . com/Neloop/ t r a f f i r a t o r . g i t
After downloading the sources of traffirator we can build the whole projectwith maven. Maven has to be executed in the root directory of the project.During the first execution, maven will download all dependencies of the project,mainly including jDiameter and its dependencies.
> mvn c l ean package
The previous command will compile Java sources into class files and pack-age the whole solution into jar file placed in target directory. The resultingjar file does not contain the dependencies of the project, these are placed inthe maven repository folder. To get the dependencies closer to the project,we can run following command, which will copy all the project dependenciesin the target/dependency directory.
> mvn dependency : copy−dependenc ies
99
Copying the dependencies is optional and should be used only if the projectjar file will not be executed using maven.
B.2 ConfigurationThe traffirator project contains three configuration methods. There is a configu-ration of traffirator itself, a configuration of the logging framework and a config-uration of the jDiameter stacks. All three has to be provided upon execution.
B.2.1 Traffirator ConfigurationThe configuration of the generator is defined in the YAML configuration format.The YAML file has to be provided upon execution as a command line argument.The configuration configures some general attributes of the execution and alsothe test profile, which will be used. The items of the configuration are as follows:
• description – Textual description of this configuration and the test profiledefined in this file.
• threadCount – Number of threads, which will be created in the commonexecutor service.
• summary – Contains path, where the summary log file should be placed afterexecution.
• statistics – Defines the options for statistics outputs from the traffirator.– logFile – The path, where the statistics file will be placed.– samplingPeriod – Sampling period in milliseconds, which will be used
as period between the collections of information from the generator.• profile – Definition of the profile, which will be executed.
– burstLimit – Burst limit corresponds to the maximum number of newscenarios that can be created in one second.
– end – Defines the point in time, when the execution should end, it isdefined in seconds.
– flow – Contains the list of the profile entries.∗ start – The time, when this profile item begins and should be
applied, it is defined in seconds.∗ scenarios – Contains the list of scenarios used in this profile item.
· type – The type of scenarios to which the amount in the itemcount is related.
· count – The number of scenarios with particular type, whichwill be spawned in the time defined in start item. The countis defined in absolute numbers and not incremental numbers.
The example configuration, which can be taken as a reference, is placed inthe examples/example-config.yml file.
For the definition of the scenarios, following types can be used:
• CallCenterEmployee – Represents a user device, which is used by the callcenter employee. The device is making a lot of calls with a very small delaysbetween the calls.
100
• CallPerformance – Scenario used for intense testing of the PCRF server,all the delays are small and it is focused on making a single call and thenend.
• ClassicUser – Scenario used for real-life testing, it represents classical userof the telecommunication network, who is making some normal amount ofcalls and have a high delays between operations.
• MalfunctioningCellPhone – The device, which is behaving in an unexpectedway, it is frequently disconnecting and connecting and also losing a signal.The probability of making a call is very low.
• TravellingManager – The travelling manager scenario is a lot like call cen-ter employee, manager makes a lot of calls, but with a difference of oftenchanges of the location. This is done by updating the session information,which are highly probable in this scenario.
B.2.2 Log4j Configuration
The configuration of the log4j logging framework is defined in the resources di-rectory of the project (src/main/resources/log4j.properties) and can bemodified before the execution, to meet the current needs. The description ofthe configuration items can be found in the appropriate project documentationof log4j.
B.2.3 jDiameter Configuration
Traffirator contains two Diameter stacks – Gx and Rx. Both of them are used fromthe jDiameter library, which has its own configuration of these stacks. The config-uration for a stack is in XML, in which the peer to which the stack will connectis defined. In addition, there are also some attributes of the connection, suchas the Diameter application used during the capabilities exchange. There arealso defined some internals, such as timeouts for default Diameter messages orconfiguration of threading.
Both of the configuration files must be placed in the resources directory.The Gx stack should be configured in the gx-client-config.xml and the Rxstack in the rx-client-config.xml file. Both of the files should be revised be-fore the execution to apply correct domain names and IP addresses of the PCRFserver.
The definition of the format can be found in the documentation of jDiameter.It is defined as AsciiDoc in the documentation directory1 within the official sourcecodes of jDiameter. The whole documentation is also accessible as a web-pageon the RestComm webpages2.
1https://github.com/RestComm/jdiameter/tree/master/core/docs/sources-asciidoc/src/main/asciidoc
2https://www.restcomm.com/docs/core/diameter/Diameter_User_Guide.html#_jdiameter_configuration
101
B.3 ExecutionRunning traffirator is rather easy, we just have to know the path to the con-figuration file, which we want to use. Maven project in traffirator is setup withthe support of the maven exec plugin, so the execution can be started by executingthe following command.
> mvn exec : java −q−Dexec . args=”−−c o n f i g =./ examples /example−c o n f i g . yml”
The argument -Dexec.args is used to specify the command line argumentsfor the execution of the project. There are only two arguments, which are definedin the traffirator application: help and config. If the help option is given,traffirator will display its help message with usage and description of all options.The config option is used to hand over the path for the YAML configurationto the application. The given configuration file is loaded and defined test profileexecuted.
B.4 OutputsFor the time being, traffirator supports only one output file, if we omit the clas-sical log. The output is statistics log, which contains some interesting or usefulstatistics from the whole execution. The statistics will be stored in the pathwhich was given in the configuration. The log contains named columns withthe corresponding values in the rows, columns are separated by the tabulatorcharacter.
The statistics log has following columns:
• Time – This column contains the current timestamp when the row wassampled, in milliseconds.
• ScenariosCount – The scenarios count column contains the number ofcurrently active scenarios.
• TimeoutsCount – The column containing the number of timeouts sincethe last sampled point in time.
• SentCount – Contains the number of sent messages, which was sent sincethe previous sampling.
• ReceivedCount – Relative number of received message since the last sam-pling.
• FailuresCount – The column contains the number of failures, which wasobserved since the last sampling time.
• ProcessLoad – This column contains the current load of the traffiratorprocess.
102
C. User Documentation ofTesting FrameworkThe testing framework for the PCRF server developed in the context of thethesis is a collection of shell scripts, which generally run defined test profilesusing traffirator against PCRF. During the testing, the instrumentation usingDiSL takes place, which will mine the data from MediationZone used as a PCRFruntime.
The testing is designed and supposed to be used only with the PCRF imple-mentation provided by the telecommunication provider. There are hard-codedpaths and some expectations, which prohibit out-of-box usage on a server witha different setup.
The provided testing framework will, for all test profiles, instrument Medi-ationZone, cleanup the database before running traffirator. Then traffirator isexecuted with the definition of some particular test profile. After that, data fromtraffirator, MediationZone and Couchbase are collected and plotted in form ofPDF files with the use of the R statistics software.
C.1 DependenciesBefore executing the testing framework there are few dependencies which haveto be satisfied. Operating system under which the framework runs is supposedto be Linux, preferably CentOS. The testing framework itself should be placedin the /opt/pcrf-mff directory, this path is hard-coded in some of the scripts orconfiguration and should not be changed.
As stated, the framework should be executed only on the server with in-stalled MediationZone, which contains the PCRF logic. MZ has to be installedin the /opt/CZaPCRF/mz directory and has to contain following workflows –CZ PCV.WFL GxRx, CZ PCV.WFL Log and CZ PCV.WFL Dump.
Another dependency is Couchbase NoSQL database. The Couchbase has tobe installed in the /opt/couchbase directory and it must run as a server on a lo-calhost. All other configuration of Couchbase is handled by the testing frameworkor MediationZone.
Because we use traffirator for the traffic generation we have to have it in-stalled. Traffirator has to be placed in the /opt/traffirator directory alongsidethe testing framework. Again, some paths are hard-coded and it is expected thattraffirator is on the same directory level as the root of the framework.
For the successful build and execution of traffirator and DiSL instrumentation,we need to install maven build system, and Java JDK. Maven, Java compiler andJava runtime have to be present on the system path.
For plotting the data into sensible plots within PDF files, the R statisticalsoftware is used. R and Rscript have to be present on the system path in orderto plot the graphs successfully. In addition to the base R application, there hasto be installed following plugins – foreach, ggplot2 and jsonlite.
The DiSL instrumentation framework can be installed and built by the pro-vided script in the file pcrf-mff/disl/prepare.sh. This script will download
103
two versions of the DiSL, the stable 2.1 version and the latest version fromthe source subversion repository. After downloading the sources, both DiSL ver-sions are built, this includes both parts, the part written in Java and the agentpart written in C. DiSL resides in the /opt/disl directory and there are twosubdirectories, disl-2.1 for the stable version and trunk for the latest version.
C.2 ExecutionThe testing framework has predefined test profiles which are executed in a loop.Before each execution of the test profile, the server is properly setup and afterthe execution, the cleanup and analysis of the results are performed. There aretwo main components, the traffic generator, and the PCRF server, both of themcan be run with specific CPU affinity. The setup of the affinity is used forthe load distribution if the underlying server contains two or more processors.Both components can then operate on the different processors and do not affecteach other.
The framework should be run with the pcrf-mff/real-scenarios/run.shscript, there are three mandatory positional parameters – taskset mask for traf-firator, taskset mask for the PCRF and RAM quota for the Couchbase bucket.Follows the description of the parameters:
• Taskset mask for traffirator – The processor affinity mask which will behanded over to the taskset command with -c option enabled upon executionof traffirator.
• Taskset mask for PCRF – The affinity of the processor which will be appliedto the restarted ECSA within MediationZone. The taskset command isexecuted with -c option enabled.
• RAM quota for the Couchbase bucket – The default amount of RAM whichis assigned to the newly created bucket in Couchbase is 100MB, which isvery low and not sufficient for the testing. Therefore, the default value canbe redefined by this parameter, which is also in megabytes. The actualvalue should be influenced by the amount of available RAM on the serverand expected number of data stored in the database.
The script will execute the measurement for all defined test profiles, forthe time being, there are only 4 test profiles. Every test profile has a dura-tion of 2.4 hours, in addition, there are 10 minutes pauses between executions.The total execution time of the testing suite is roughly 10 hours.
The results will be accessible in the pcrf-mff/plots/out/<timestamp> di-rectory, where timestamp was captured on the directory creation. This directorywill contain all copied logs from traffirator, instrumentation, and statistics fromCouchbase. In addition, there should be PDF files with graphs plotted with theR statistical software. Graphs contain some useful and suitable metrics.
Note that the execution will overwrite the configuration of the execution con-texts from MediationZone. It is strongly advised to backup the original config-uration placed in /opt/CZaPCRF/mz/etc/executioncontext.xml to a differentdirectory as the execution might fail and the original configuration will not becopied back.
104
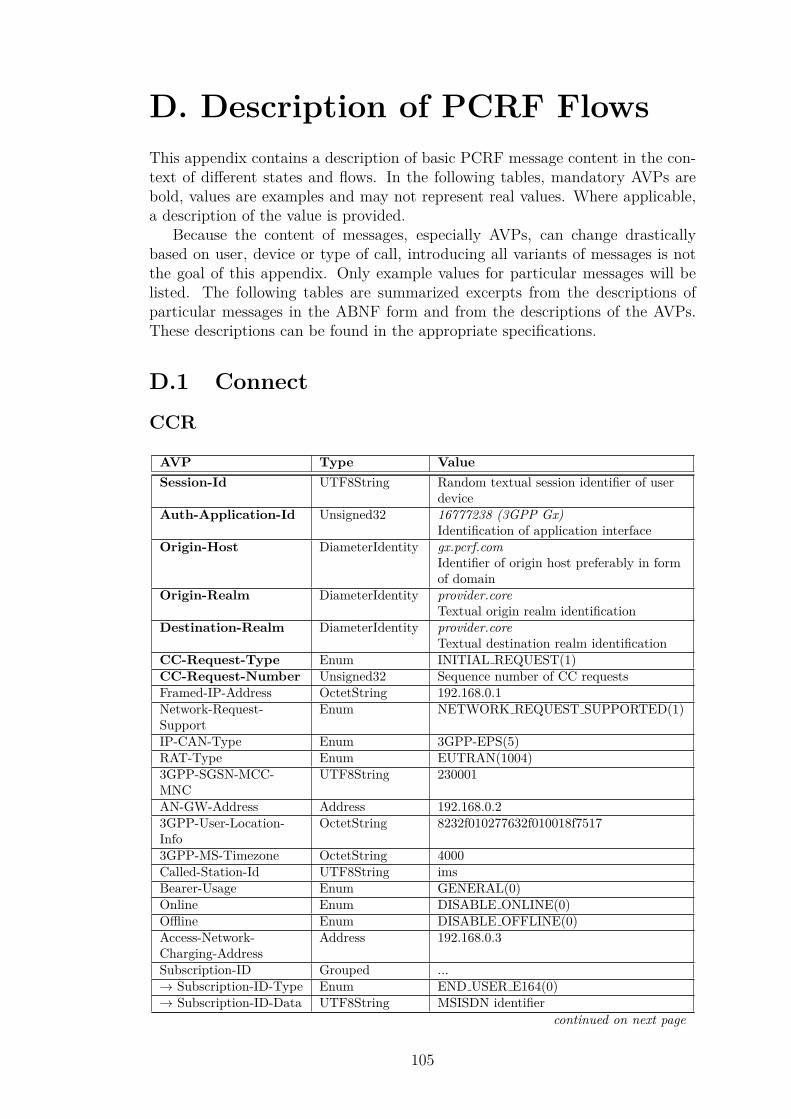
D. Description of PCRF FlowsThis appendix contains a description of basic PCRF message content in the con-text of different states and flows. In the following tables, mandatory AVPs arebold, values are examples and may not represent real values. Where applicable,a description of the value is provided.
Because the content of messages, especially AVPs, can change drasticallybased on user, device or type of call, introducing all variants of messages is notthe goal of this appendix. Only example values for particular messages will belisted. The following tables are summarized excerpts from the descriptions ofparticular messages in the ABNF form and from the descriptions of the AVPs.These descriptions can be found in the appropriate specifications.
D.1 Connect
CCR
AVP Type ValueSession-Id UTF8String Random textual session identifier of user
deviceAuth-Application-Id Unsigned32 16777238 (3GPP Gx)
Identification of application interfaceOrigin-Host DiameterIdentity gx.pcrf.com
Identifier of origin host preferably in formof domain
Origin-Realm DiameterIdentity provider.coreTextual origin realm identification
Destination-Realm DiameterIdentity provider.coreTextual destination realm identification
CC-Request-Type Enum INITIAL REQUEST(1)CC-Request-Number Unsigned32 Sequence number of CC requestsFramed-IP-Address OctetString 192.168.0.1Network-Request-Support
Enum NETWORK REQUEST SUPPORTED(1)
IP-CAN-Type Enum 3GPP-EPS(5)RAT-Type Enum EUTRAN(1004)3GPP-SGSN-MCC-MNC
UTF8String 230001
AN-GW-Address Address 192.168.0.23GPP-User-Location-Info
OctetString 8232f010277632f010018f7517
3GPP-MS-Timezone OctetString 4000Called-Station-Id UTF8String imsBearer-Usage Enum GENERAL(0)Online Enum DISABLE ONLINE(0)Offline Enum DISABLE OFFLINE(0)Access-Network-Charging-Address
Address 192.168.0.3
Subscription-ID Grouped ...→ Subscription-ID-Type Enum END USER E164(0)→ Subscription-ID-Data UTF8String MSISDN identifier
continued on next page
105
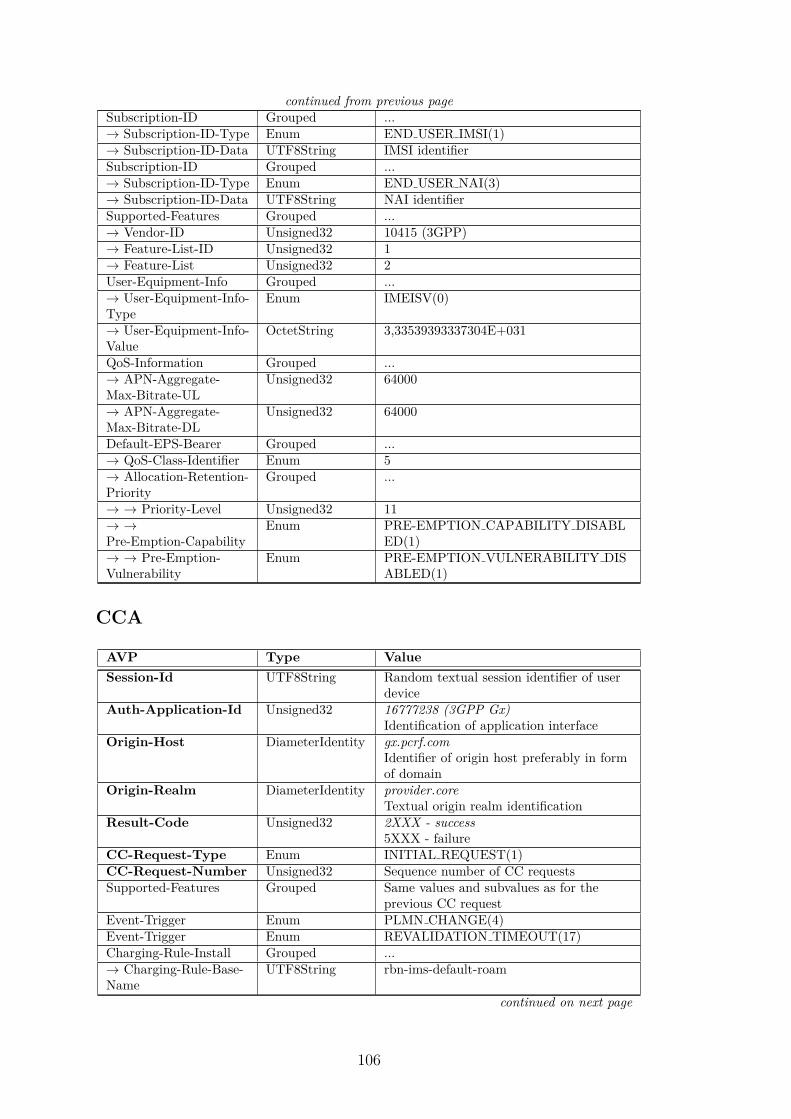
continued from previous pageSubscription-ID Grouped ...→ Subscription-ID-Type Enum END USER IMSI(1)→ Subscription-ID-Data UTF8String IMSI identifierSubscription-ID Grouped ...→ Subscription-ID-Type Enum END USER NAI(3)→ Subscription-ID-Data UTF8String NAI identifierSupported-Features Grouped ...→ Vendor-ID Unsigned32 10415 (3GPP)→ Feature-List-ID Unsigned32 1→ Feature-List Unsigned32 2User-Equipment-Info Grouped ...→ User-Equipment-Info-Type
Enum IMEISV(0)
→ User-Equipment-Info-Value
OctetString 3,33539393337304E+031
QoS-Information Grouped ...→ APN-Aggregate-Max-Bitrate-UL
Unsigned32 64000
→ APN-Aggregate-Max-Bitrate-DL
Unsigned32 64000
Default-EPS-Bearer Grouped ...→ QoS-Class-Identifier Enum 5→ Allocation-Retention-Priority
Grouped ...
→ → Priority-Level Unsigned32 11→ →Pre-Emption-Capability
Enum PRE-EMPTION CAPABILITY DISABLED(1)
→ → Pre-Emption-Vulnerability
Enum PRE-EMPTION VULNERABILITY DISABLED(1)
CCA
AVP Type ValueSession-Id UTF8String Random textual session identifier of user
deviceAuth-Application-Id Unsigned32 16777238 (3GPP Gx)
Identification of application interfaceOrigin-Host DiameterIdentity gx.pcrf.com
Identifier of origin host preferably in formof domain
Origin-Realm DiameterIdentity provider.coreTextual origin realm identification
Result-Code Unsigned32 2XXX - success5XXX - failure
CC-Request-Type Enum INITIAL REQUEST(1)CC-Request-Number Unsigned32 Sequence number of CC requestsSupported-Features Grouped Same values and subvalues as for the
previous CC requestEvent-Trigger Enum PLMN CHANGE(4)Event-Trigger Enum REVALIDATION TIMEOUT(17)Charging-Rule-Install Grouped ...→ Charging-Rule-Base-Name
UTF8String rbn-ims-default-roam
continued on next page
106
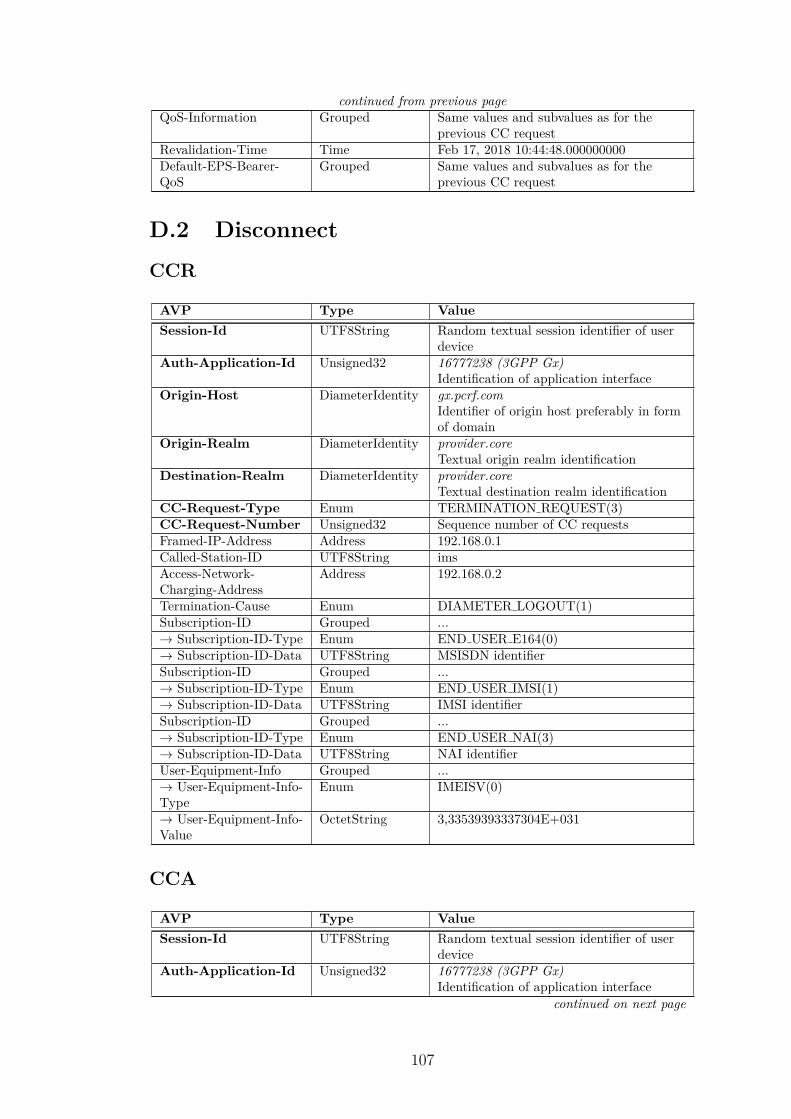
continued from previous pageQoS-Information Grouped Same values and subvalues as for the
previous CC requestRevalidation-Time Time Feb 17, 2018 10:44:48.000000000Default-EPS-Bearer-QoS
Grouped Same values and subvalues as for theprevious CC request
D.2 Disconnect
CCR
AVP Type ValueSession-Id UTF8String Random textual session identifier of user
deviceAuth-Application-Id Unsigned32 16777238 (3GPP Gx)
Identification of application interfaceOrigin-Host DiameterIdentity gx.pcrf.com
Identifier of origin host preferably in formof domain
Origin-Realm DiameterIdentity provider.coreTextual origin realm identification
Destination-Realm DiameterIdentity provider.coreTextual destination realm identification
CC-Request-Type Enum TERMINATION REQUEST(3)CC-Request-Number Unsigned32 Sequence number of CC requestsFramed-IP-Address Address 192.168.0.1Called-Station-ID UTF8String imsAccess-Network-Charging-Address
Address 192.168.0.2
Termination-Cause Enum DIAMETER LOGOUT(1)Subscription-ID Grouped ...→ Subscription-ID-Type Enum END USER E164(0)→ Subscription-ID-Data UTF8String MSISDN identifierSubscription-ID Grouped ...→ Subscription-ID-Type Enum END USER IMSI(1)→ Subscription-ID-Data UTF8String IMSI identifierSubscription-ID Grouped ...→ Subscription-ID-Type Enum END USER NAI(3)→ Subscription-ID-Data UTF8String NAI identifierUser-Equipment-Info Grouped ...→ User-Equipment-Info-Type
Enum IMEISV(0)
→ User-Equipment-Info-Value
OctetString 3,33539393337304E+031
CCA
AVP Type ValueSession-Id UTF8String Random textual session identifier of user
deviceAuth-Application-Id Unsigned32 16777238 (3GPP Gx)
Identification of application interfacecontinued on next page
107

continued from previous pageOrigin-Host DiameterIdentity gx.pcrf.com
Identifier of origin host preferably in formof domain
Origin-Realm DiameterIdentity provider.coreTextual origin realm identification
Result-Code Unsigned32 2XXX - success5XXX - failure
CC-Request-Type Enum INITIAL REQUEST(1)CC-Request-Number Unsigned32 Sequence number of CC requests
D.3 Update
CCR
AVP Type ValueSession-Id UTF8String Random textual session identifier of user
deviceAuth-Application-Id Unsigned32 16777238 (3GPP Gx)
Identification of application interfaceOrigin-Host DiameterIdentity gx.pcrf.com
Identifier of origin host preferably in formof domain
Origin-Realm DiameterIdentity provider.coreTextual origin realm identification
Destination-Realm DiameterIdentity provider.coreTextual destination realm identification
CC-Request-Type Enum UPDATE REQUEST(2)CC-Request-Number Unsigned32 Sequence number of CC requestsFramed-IP-Address Address 192.168.0.1Network-Request-Support
Enum NETWORK REQUEST NOTSUPPORTED(0)
Called-Station-ID UTF8String imsAccess-Network-Charging-Address
Address 192.168.0.2
Subscription-ID Grouped ...→ Subscription-ID-Type Enum END USER E164(0)→ Subscription-ID-Data UTF8String MSISDN identifierSubscription-ID Grouped ...→ Subscription-ID-Type Enum END USER IMSI(1)→ Subscription-ID-Data UTF8String IMSI identifierSubscription-ID Grouped ...→ Subscription-ID-Type Enum END USER NAI(3)→ Subscription-ID-Data UTF8String NAI identifierUser-Equipment-Info Grouped ...→ User-Equipment-Info-Type
Enum IMEISV(0)
→ User-Equipment-Info-Value
OctetString 3,33539393337304E+031
Event-Trigger Enum REVALIDATION TIMEOUT(17)
CCA
108
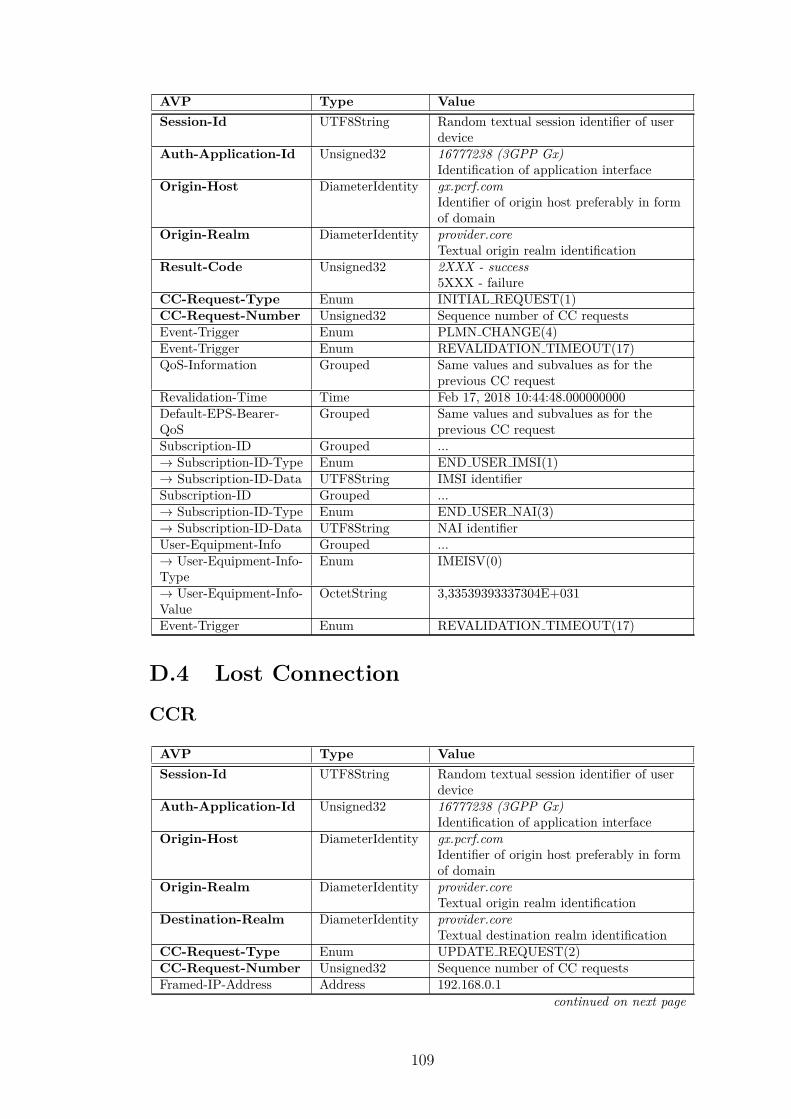
AVP Type ValueSession-Id UTF8String Random textual session identifier of user
deviceAuth-Application-Id Unsigned32 16777238 (3GPP Gx)
Identification of application interfaceOrigin-Host DiameterIdentity gx.pcrf.com
Identifier of origin host preferably in formof domain
Origin-Realm DiameterIdentity provider.coreTextual origin realm identification
Result-Code Unsigned32 2XXX - success5XXX - failure
CC-Request-Type Enum INITIAL REQUEST(1)CC-Request-Number Unsigned32 Sequence number of CC requestsEvent-Trigger Enum PLMN CHANGE(4)Event-Trigger Enum REVALIDATION TIMEOUT(17)QoS-Information Grouped Same values and subvalues as for the
previous CC requestRevalidation-Time Time Feb 17, 2018 10:44:48.000000000Default-EPS-Bearer-QoS
Grouped Same values and subvalues as for theprevious CC request
Subscription-ID Grouped ...→ Subscription-ID-Type Enum END USER IMSI(1)→ Subscription-ID-Data UTF8String IMSI identifierSubscription-ID Grouped ...→ Subscription-ID-Type Enum END USER NAI(3)→ Subscription-ID-Data UTF8String NAI identifierUser-Equipment-Info Grouped ...→ User-Equipment-Info-Type
Enum IMEISV(0)
→ User-Equipment-Info-Value
OctetString 3,33539393337304E+031
Event-Trigger Enum REVALIDATION TIMEOUT(17)
D.4 Lost Connection
CCR
AVP Type ValueSession-Id UTF8String Random textual session identifier of user
deviceAuth-Application-Id Unsigned32 16777238 (3GPP Gx)
Identification of application interfaceOrigin-Host DiameterIdentity gx.pcrf.com
Identifier of origin host preferably in formof domain
Origin-Realm DiameterIdentity provider.coreTextual origin realm identification
Destination-Realm DiameterIdentity provider.coreTextual destination realm identification
CC-Request-Type Enum UPDATE REQUEST(2)CC-Request-Number Unsigned32 Sequence number of CC requestsFramed-IP-Address Address 192.168.0.1
continued on next page
109
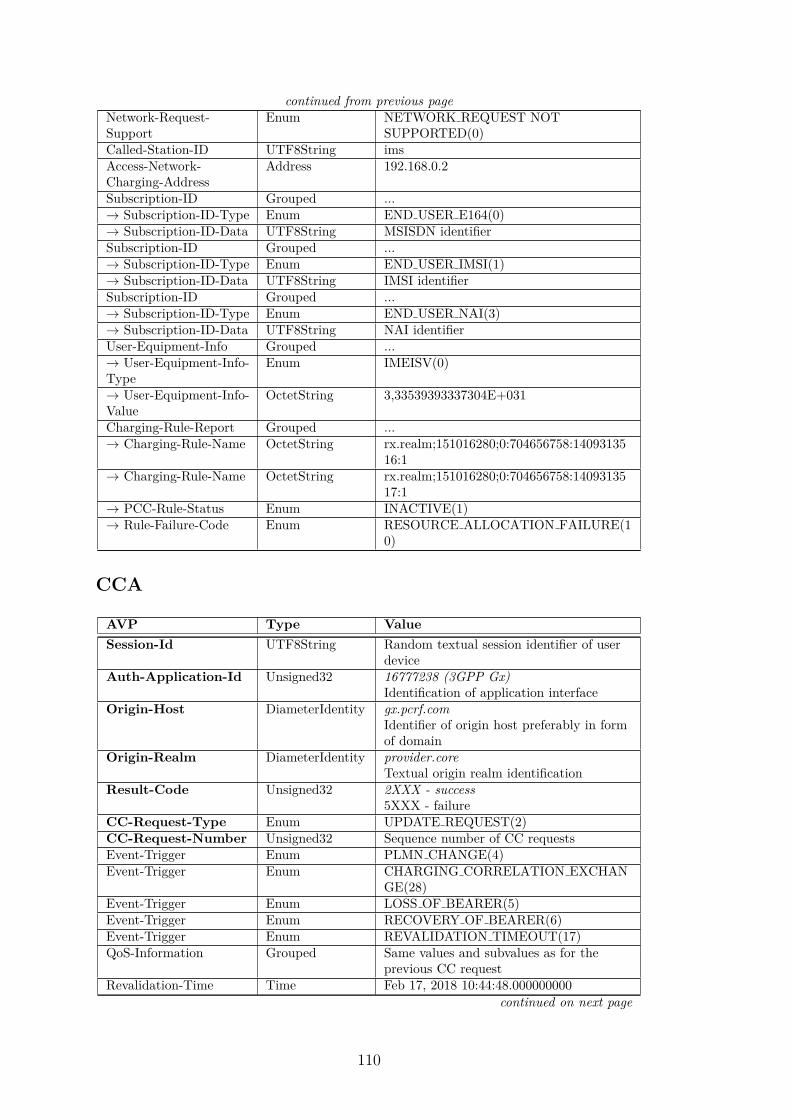
continued from previous pageNetwork-Request-Support
Enum NETWORK REQUEST NOTSUPPORTED(0)
Called-Station-ID UTF8String imsAccess-Network-Charging-Address
Address 192.168.0.2
Subscription-ID Grouped ...→ Subscription-ID-Type Enum END USER E164(0)→ Subscription-ID-Data UTF8String MSISDN identifierSubscription-ID Grouped ...→ Subscription-ID-Type Enum END USER IMSI(1)→ Subscription-ID-Data UTF8String IMSI identifierSubscription-ID Grouped ...→ Subscription-ID-Type Enum END USER NAI(3)→ Subscription-ID-Data UTF8String NAI identifierUser-Equipment-Info Grouped ...→ User-Equipment-Info-Type
Enum IMEISV(0)
→ User-Equipment-Info-Value
OctetString 3,33539393337304E+031
Charging-Rule-Report Grouped ...→ Charging-Rule-Name OctetString rx.realm;151016280;0:704656758:14093135
16:1→ Charging-Rule-Name OctetString rx.realm;151016280;0:704656758:14093135
17:1→ PCC-Rule-Status Enum INACTIVE(1)→ Rule-Failure-Code Enum RESOURCE ALLOCATION FAILURE(1
0)
CCA
AVP Type ValueSession-Id UTF8String Random textual session identifier of user
deviceAuth-Application-Id Unsigned32 16777238 (3GPP Gx)
Identification of application interfaceOrigin-Host DiameterIdentity gx.pcrf.com
Identifier of origin host preferably in formof domain
Origin-Realm DiameterIdentity provider.coreTextual origin realm identification
Result-Code Unsigned32 2XXX - success5XXX - failure
CC-Request-Type Enum UPDATE REQUEST(2)CC-Request-Number Unsigned32 Sequence number of CC requestsEvent-Trigger Enum PLMN CHANGE(4)Event-Trigger Enum CHARGING CORRELATION EXCHAN
GE(28)Event-Trigger Enum LOSS OF BEARER(5)Event-Trigger Enum RECOVERY OF BEARER(6)Event-Trigger Enum REVALIDATION TIMEOUT(17)QoS-Information Grouped Same values and subvalues as for the
previous CC requestRevalidation-Time Time Feb 17, 2018 10:44:48.000000000
continued on next page
110
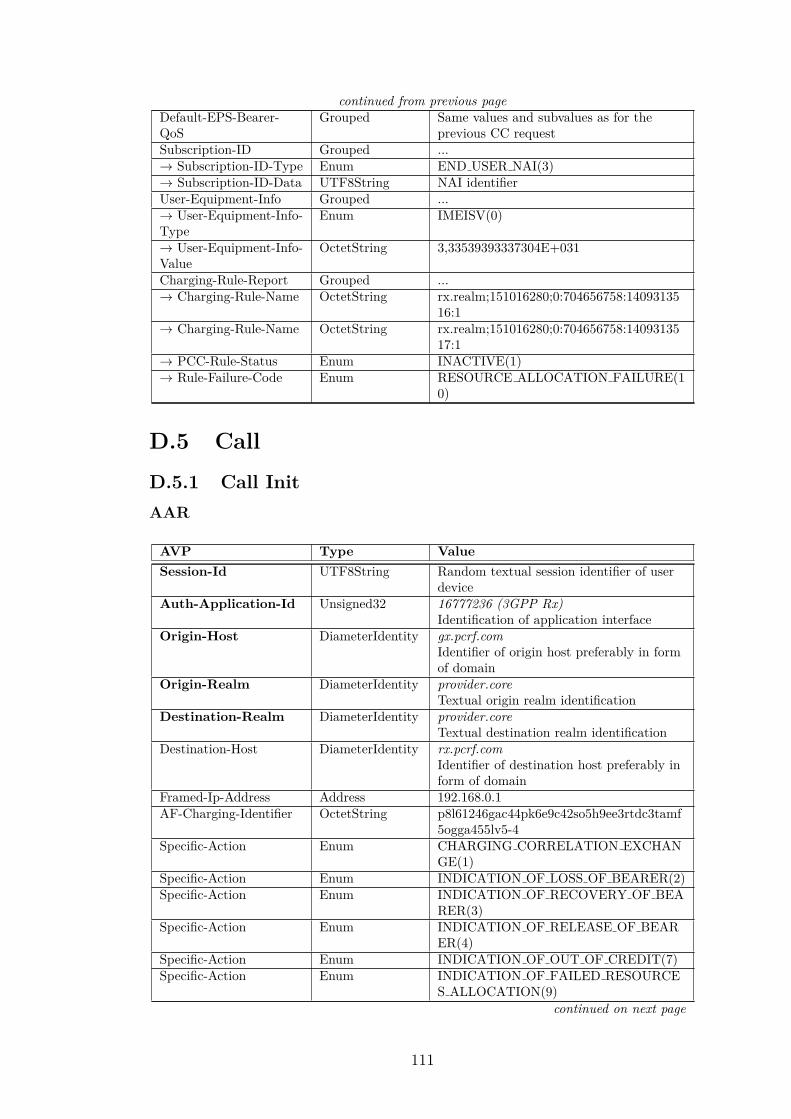
continued from previous pageDefault-EPS-Bearer-QoS
Grouped Same values and subvalues as for theprevious CC request
Subscription-ID Grouped ...→ Subscription-ID-Type Enum END USER NAI(3)→ Subscription-ID-Data UTF8String NAI identifierUser-Equipment-Info Grouped ...→ User-Equipment-Info-Type
Enum IMEISV(0)
→ User-Equipment-Info-Value
OctetString 3,33539393337304E+031
Charging-Rule-Report Grouped ...→ Charging-Rule-Name OctetString rx.realm;151016280;0:704656758:14093135
16:1→ Charging-Rule-Name OctetString rx.realm;151016280;0:704656758:14093135
17:1→ PCC-Rule-Status Enum INACTIVE(1)→ Rule-Failure-Code Enum RESOURCE ALLOCATION FAILURE(1
0)
D.5 Call
D.5.1 Call InitAAR
AVP Type ValueSession-Id UTF8String Random textual session identifier of user
deviceAuth-Application-Id Unsigned32 16777236 (3GPP Rx)
Identification of application interfaceOrigin-Host DiameterIdentity gx.pcrf.com
Identifier of origin host preferably in formof domain
Origin-Realm DiameterIdentity provider.coreTextual origin realm identification
Destination-Realm DiameterIdentity provider.coreTextual destination realm identification
Destination-Host DiameterIdentity rx.pcrf.comIdentifier of destination host preferably inform of domain
Framed-Ip-Address Address 192.168.0.1AF-Charging-Identifier OctetString p8l61246gac44pk6e9c42so5h9ee3rtdc3tamf
5ogga455lv5-4Specific-Action Enum CHARGING CORRELATION EXCHAN
GE(1)Specific-Action Enum INDICATION OF LOSS OF BEARER(2)Specific-Action Enum INDICATION OF RECOVERY OF BEA
RER(3)Specific-Action Enum INDICATION OF RELEASE OF BEAR
ER(4)Specific-Action Enum INDICATION OF OUT OF CREDIT(7)Specific-Action Enum INDICATION OF FAILED RESOURCE
S ALLOCATION(9)continued on next page
111
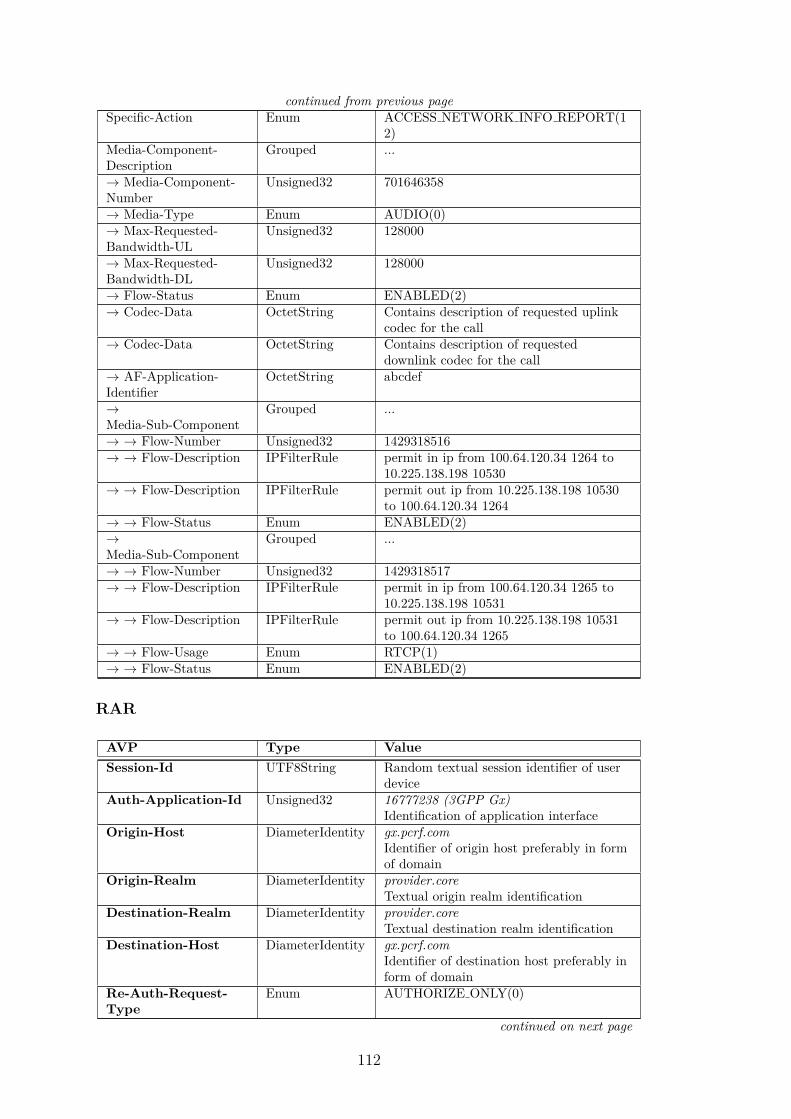
continued from previous pageSpecific-Action Enum ACCESS NETWORK INFO REPORT(1
2)Media-Component-Description
Grouped ...
→ Media-Component-Number
Unsigned32 701646358
→ Media-Type Enum AUDIO(0)→ Max-Requested-Bandwidth-UL
Unsigned32 128000
→ Max-Requested-Bandwidth-DL
Unsigned32 128000
→ Flow-Status Enum ENABLED(2)→ Codec-Data OctetString Contains description of requested uplink
codec for the call→ Codec-Data OctetString Contains description of requested
downlink codec for the call→ AF-Application-Identifier
OctetString abcdef
→Media-Sub-Component
Grouped ...
→ → Flow-Number Unsigned32 1429318516→ → Flow-Description IPFilterRule permit in ip from 100.64.120.34 1264 to
10.225.138.198 10530→ → Flow-Description IPFilterRule permit out ip from 10.225.138.198 10530
to 100.64.120.34 1264→ → Flow-Status Enum ENABLED(2)→Media-Sub-Component
Grouped ...
→ → Flow-Number Unsigned32 1429318517→ → Flow-Description IPFilterRule permit in ip from 100.64.120.34 1265 to
10.225.138.198 10531→ → Flow-Description IPFilterRule permit out ip from 10.225.138.198 10531
to 100.64.120.34 1265→ → Flow-Usage Enum RTCP(1)→ → Flow-Status Enum ENABLED(2)
RAR
AVP Type ValueSession-Id UTF8String Random textual session identifier of user
deviceAuth-Application-Id Unsigned32 16777238 (3GPP Gx)
Identification of application interfaceOrigin-Host DiameterIdentity gx.pcrf.com
Identifier of origin host preferably in formof domain
Origin-Realm DiameterIdentity provider.coreTextual origin realm identification
Destination-Realm DiameterIdentity provider.coreTextual destination realm identification
Destination-Host DiameterIdentity gx.pcrf.comIdentifier of destination host preferably inform of domain
Re-Auth-Request-Type
Enum AUTHORIZE ONLY(0)
continued on next page
112
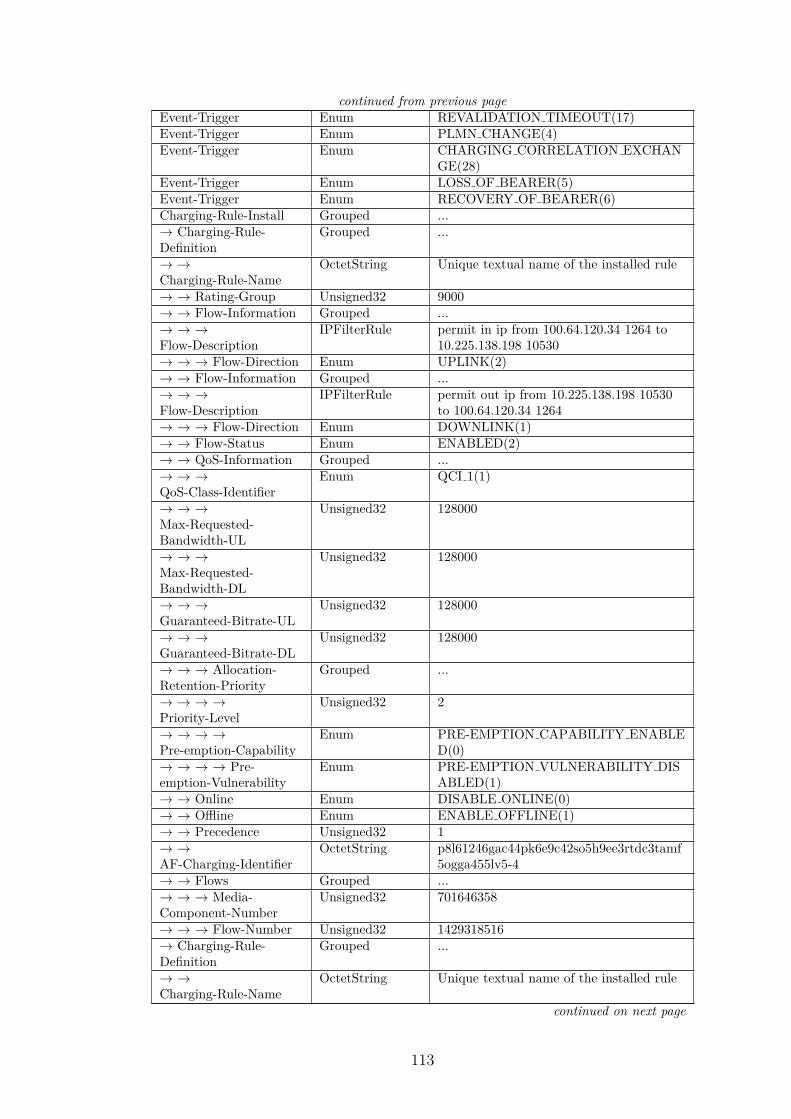
continued from previous pageEvent-Trigger Enum REVALIDATION TIMEOUT(17)Event-Trigger Enum PLMN CHANGE(4)Event-Trigger Enum CHARGING CORRELATION EXCHAN
GE(28)Event-Trigger Enum LOSS OF BEARER(5)Event-Trigger Enum RECOVERY OF BEARER(6)Charging-Rule-Install Grouped ...→ Charging-Rule-Definition
Grouped ...
→ →Charging-Rule-Name
OctetString Unique textual name of the installed rule
→ → Rating-Group Unsigned32 9000→ → Flow-Information Grouped ...→ → →Flow-Description
IPFilterRule permit in ip from 100.64.120.34 1264 to10.225.138.198 10530
→ → → Flow-Direction Enum UPLINK(2)→ → Flow-Information Grouped ...→ → →Flow-Description
IPFilterRule permit out ip from 10.225.138.198 10530to 100.64.120.34 1264
→ → → Flow-Direction Enum DOWNLINK(1)→ → Flow-Status Enum ENABLED(2)→ → QoS-Information Grouped ...→ → →QoS-Class-Identifier
Enum QCI 1(1)
→ → →Max-Requested-Bandwidth-UL
Unsigned32 128000
→ → →Max-Requested-Bandwidth-DL
Unsigned32 128000
→ → →Guaranteed-Bitrate-UL
Unsigned32 128000
→ → →Guaranteed-Bitrate-DL
Unsigned32 128000
→ → → Allocation-Retention-Priority
Grouped ...
→ → → →Priority-Level
Unsigned32 2
→ → → →Pre-emption-Capability
Enum PRE-EMPTION CAPABILITY ENABLED(0)
→ → → → Pre-emption-Vulnerability
Enum PRE-EMPTION VULNERABILITY DISABLED(1)
→ → Online Enum DISABLE ONLINE(0)→ → Offline Enum ENABLE OFFLINE(1)→ → Precedence Unsigned32 1→ →AF-Charging-Identifier
OctetString p8l61246gac44pk6e9c42so5h9ee3rtdc3tamf5ogga455lv5-4
→ → Flows Grouped ...→ → → Media-Component-Number
Unsigned32 701646358
→ → → Flow-Number Unsigned32 1429318516→ Charging-Rule-Definition
Grouped ...
→ →Charging-Rule-Name
OctetString Unique textual name of the installed rule
continued on next page
113
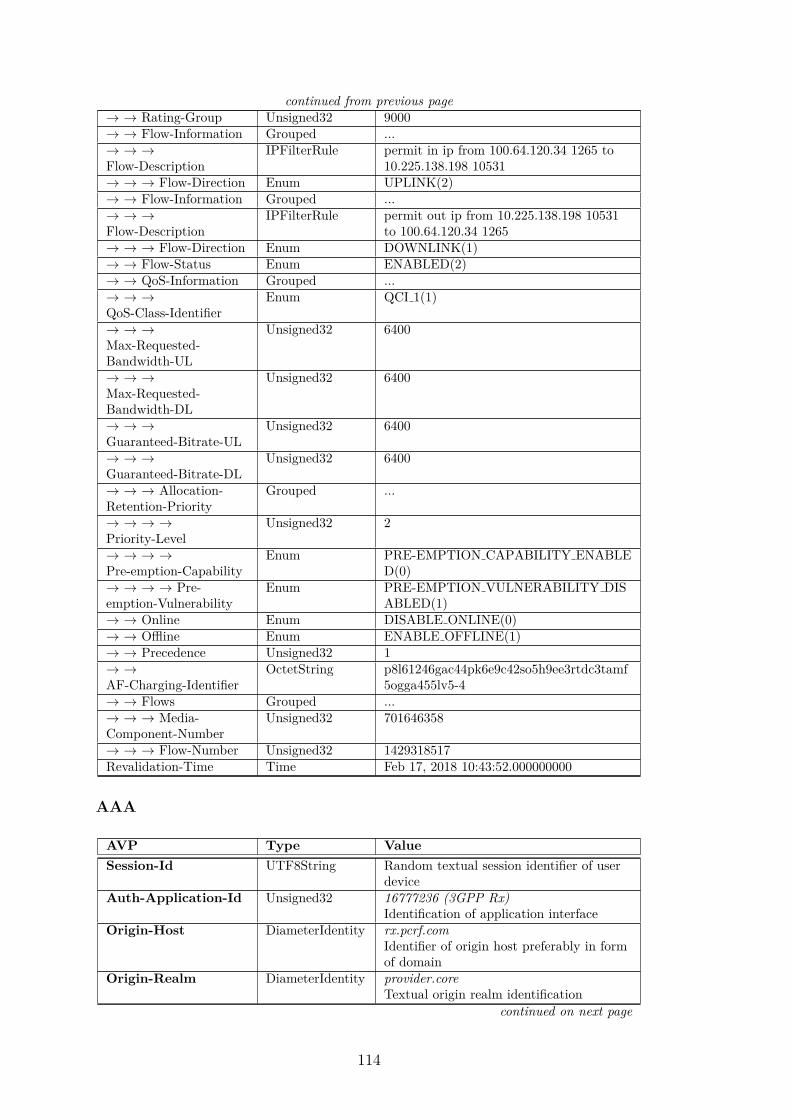
continued from previous page→ → Rating-Group Unsigned32 9000→ → Flow-Information Grouped ...→ → →Flow-Description
IPFilterRule permit in ip from 100.64.120.34 1265 to10.225.138.198 10531
→ → → Flow-Direction Enum UPLINK(2)→ → Flow-Information Grouped ...→ → →Flow-Description
IPFilterRule permit out ip from 10.225.138.198 10531to 100.64.120.34 1265
→ → → Flow-Direction Enum DOWNLINK(1)→ → Flow-Status Enum ENABLED(2)→ → QoS-Information Grouped ...→ → →QoS-Class-Identifier
Enum QCI 1(1)
→ → →Max-Requested-Bandwidth-UL
Unsigned32 6400
→ → →Max-Requested-Bandwidth-DL
Unsigned32 6400
→ → →Guaranteed-Bitrate-UL
Unsigned32 6400
→ → →Guaranteed-Bitrate-DL
Unsigned32 6400
→ → → Allocation-Retention-Priority
Grouped ...
→ → → →Priority-Level
Unsigned32 2
→ → → →Pre-emption-Capability
Enum PRE-EMPTION CAPABILITY ENABLED(0)
→ → → → Pre-emption-Vulnerability
Enum PRE-EMPTION VULNERABILITY DISABLED(1)
→ → Online Enum DISABLE ONLINE(0)→ → Offline Enum ENABLE OFFLINE(1)→ → Precedence Unsigned32 1→ →AF-Charging-Identifier
OctetString p8l61246gac44pk6e9c42so5h9ee3rtdc3tamf5ogga455lv5-4
→ → Flows Grouped ...→ → → Media-Component-Number
Unsigned32 701646358
→ → → Flow-Number Unsigned32 1429318517Revalidation-Time Time Feb 17, 2018 10:43:52.000000000
AAA
AVP Type ValueSession-Id UTF8String Random textual session identifier of user
deviceAuth-Application-Id Unsigned32 16777236 (3GPP Rx)
Identification of application interfaceOrigin-Host DiameterIdentity rx.pcrf.com
Identifier of origin host preferably in formof domain
Origin-Realm DiameterIdentity provider.coreTextual origin realm identification
continued on next page
114
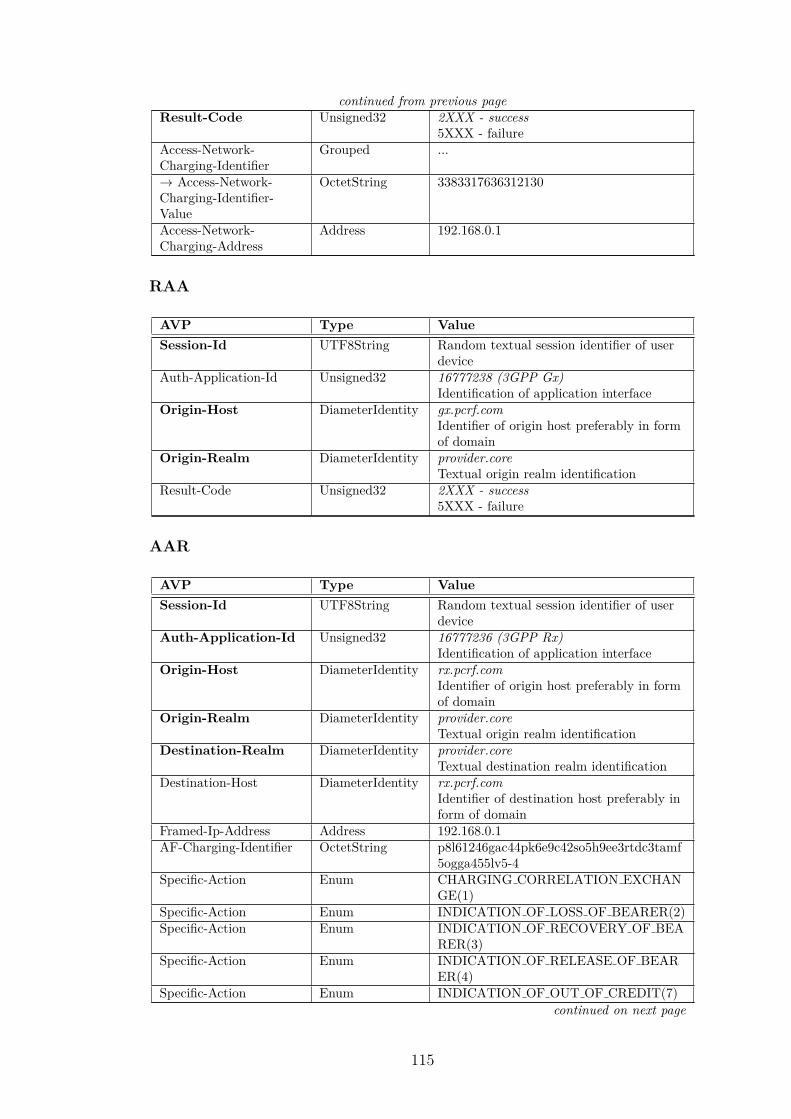
continued from previous pageResult-Code Unsigned32 2XXX - success
5XXX - failureAccess-Network-Charging-Identifier
Grouped ...
→ Access-Network-Charging-Identifier-Value
OctetString 3383317636312130
Access-Network-Charging-Address
Address 192.168.0.1
RAA
AVP Type ValueSession-Id UTF8String Random textual session identifier of user
deviceAuth-Application-Id Unsigned32 16777238 (3GPP Gx)
Identification of application interfaceOrigin-Host DiameterIdentity gx.pcrf.com
Identifier of origin host preferably in formof domain
Origin-Realm DiameterIdentity provider.coreTextual origin realm identification
Result-Code Unsigned32 2XXX - success5XXX - failure
AAR
AVP Type ValueSession-Id UTF8String Random textual session identifier of user
deviceAuth-Application-Id Unsigned32 16777236 (3GPP Rx)
Identification of application interfaceOrigin-Host DiameterIdentity rx.pcrf.com
Identifier of origin host preferably in formof domain
Origin-Realm DiameterIdentity provider.coreTextual origin realm identification
Destination-Realm DiameterIdentity provider.coreTextual destination realm identification
Destination-Host DiameterIdentity rx.pcrf.comIdentifier of destination host preferably inform of domain
Framed-Ip-Address Address 192.168.0.1AF-Charging-Identifier OctetString p8l61246gac44pk6e9c42so5h9ee3rtdc3tamf
5ogga455lv5-4Specific-Action Enum CHARGING CORRELATION EXCHAN
GE(1)Specific-Action Enum INDICATION OF LOSS OF BEARER(2)Specific-Action Enum INDICATION OF RECOVERY OF BEA
RER(3)Specific-Action Enum INDICATION OF RELEASE OF BEAR
ER(4)Specific-Action Enum INDICATION OF OUT OF CREDIT(7)
continued on next page
115
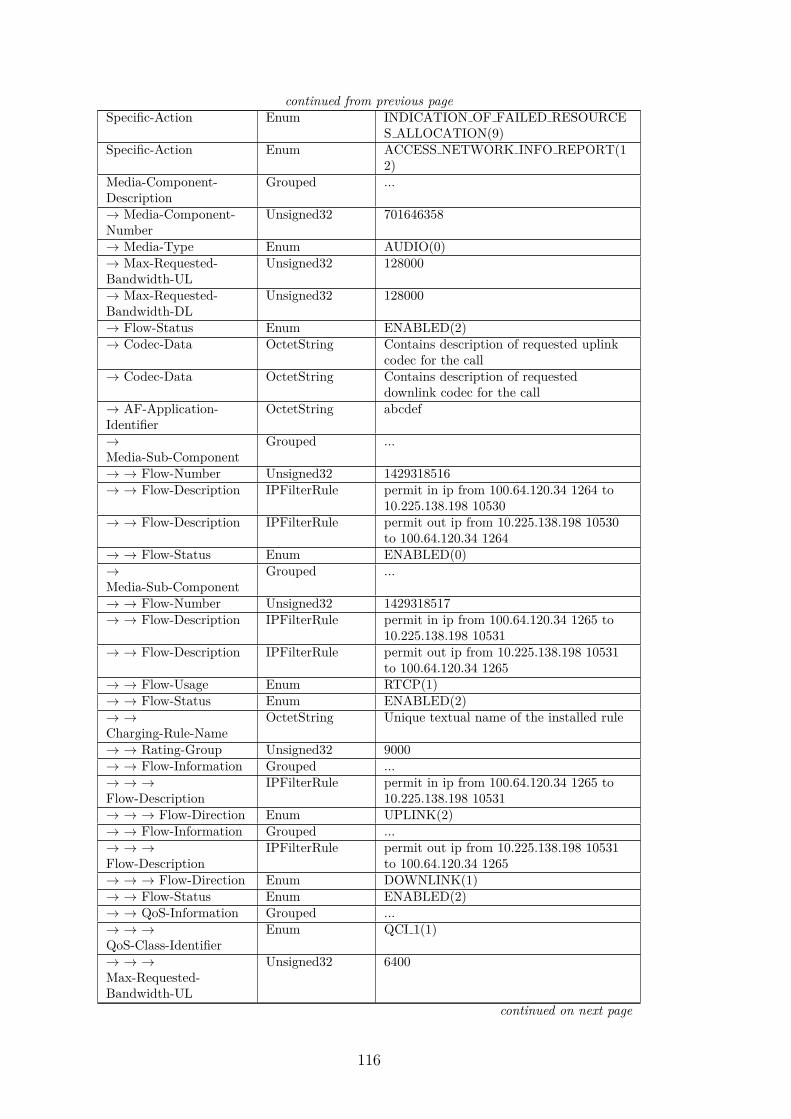
continued from previous pageSpecific-Action Enum INDICATION OF FAILED RESOURCE
S ALLOCATION(9)Specific-Action Enum ACCESS NETWORK INFO REPORT(1
2)Media-Component-Description
Grouped ...
→ Media-Component-Number
Unsigned32 701646358
→ Media-Type Enum AUDIO(0)→ Max-Requested-Bandwidth-UL
Unsigned32 128000
→ Max-Requested-Bandwidth-DL
Unsigned32 128000
→ Flow-Status Enum ENABLED(2)→ Codec-Data OctetString Contains description of requested uplink
codec for the call→ Codec-Data OctetString Contains description of requested
downlink codec for the call→ AF-Application-Identifier
OctetString abcdef
→Media-Sub-Component
Grouped ...
→ → Flow-Number Unsigned32 1429318516→ → Flow-Description IPFilterRule permit in ip from 100.64.120.34 1264 to
10.225.138.198 10530→ → Flow-Description IPFilterRule permit out ip from 10.225.138.198 10530
to 100.64.120.34 1264→ → Flow-Status Enum ENABLED(0)→Media-Sub-Component
Grouped ...
→ → Flow-Number Unsigned32 1429318517→ → Flow-Description IPFilterRule permit in ip from 100.64.120.34 1265 to
10.225.138.198 10531→ → Flow-Description IPFilterRule permit out ip from 10.225.138.198 10531
to 100.64.120.34 1265→ → Flow-Usage Enum RTCP(1)→ → Flow-Status Enum ENABLED(2)→ →Charging-Rule-Name
OctetString Unique textual name of the installed rule
→ → Rating-Group Unsigned32 9000→ → Flow-Information Grouped ...→ → →Flow-Description
IPFilterRule permit in ip from 100.64.120.34 1265 to10.225.138.198 10531
→ → → Flow-Direction Enum UPLINK(2)→ → Flow-Information Grouped ...→ → →Flow-Description
IPFilterRule permit out ip from 10.225.138.198 10531to 100.64.120.34 1265
→ → → Flow-Direction Enum DOWNLINK(1)→ → Flow-Status Enum ENABLED(2)→ → QoS-Information Grouped ...→ → →QoS-Class-Identifier
Enum QCI 1(1)
→ → →Max-Requested-Bandwidth-UL
Unsigned32 6400
continued on next page
116
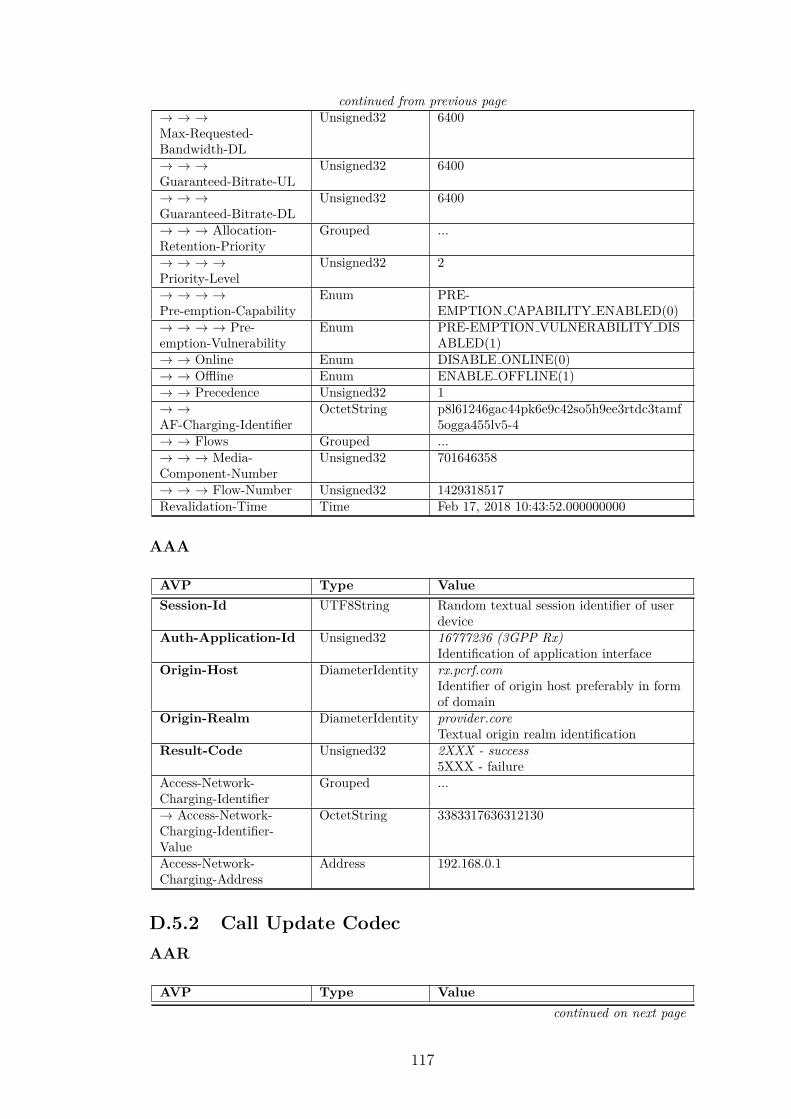
continued from previous page→ → →Max-Requested-Bandwidth-DL
Unsigned32 6400
→ → →Guaranteed-Bitrate-UL
Unsigned32 6400
→ → →Guaranteed-Bitrate-DL
Unsigned32 6400
→ → → Allocation-Retention-Priority
Grouped ...
→ → → →Priority-Level
Unsigned32 2
→ → → →Pre-emption-Capability
Enum PRE-EMPTION CAPABILITY ENABLED(0)
→ → → → Pre-emption-Vulnerability
Enum PRE-EMPTION VULNERABILITY DISABLED(1)
→ → Online Enum DISABLE ONLINE(0)→ → Offline Enum ENABLE OFFLINE(1)→ → Precedence Unsigned32 1→ →AF-Charging-Identifier
OctetString p8l61246gac44pk6e9c42so5h9ee3rtdc3tamf5ogga455lv5-4
→ → Flows Grouped ...→ → → Media-Component-Number
Unsigned32 701646358
→ → → Flow-Number Unsigned32 1429318517Revalidation-Time Time Feb 17, 2018 10:43:52.000000000
AAA
AVP Type ValueSession-Id UTF8String Random textual session identifier of user
deviceAuth-Application-Id Unsigned32 16777236 (3GPP Rx)
Identification of application interfaceOrigin-Host DiameterIdentity rx.pcrf.com
Identifier of origin host preferably in formof domain
Origin-Realm DiameterIdentity provider.coreTextual origin realm identification
Result-Code Unsigned32 2XXX - success5XXX - failure
Access-Network-Charging-Identifier
Grouped ...
→ Access-Network-Charging-Identifier-Value
OctetString 3383317636312130
Access-Network-Charging-Address
Address 192.168.0.1
D.5.2 Call Update CodecAAR
AVP Type Valuecontinued on next page
117
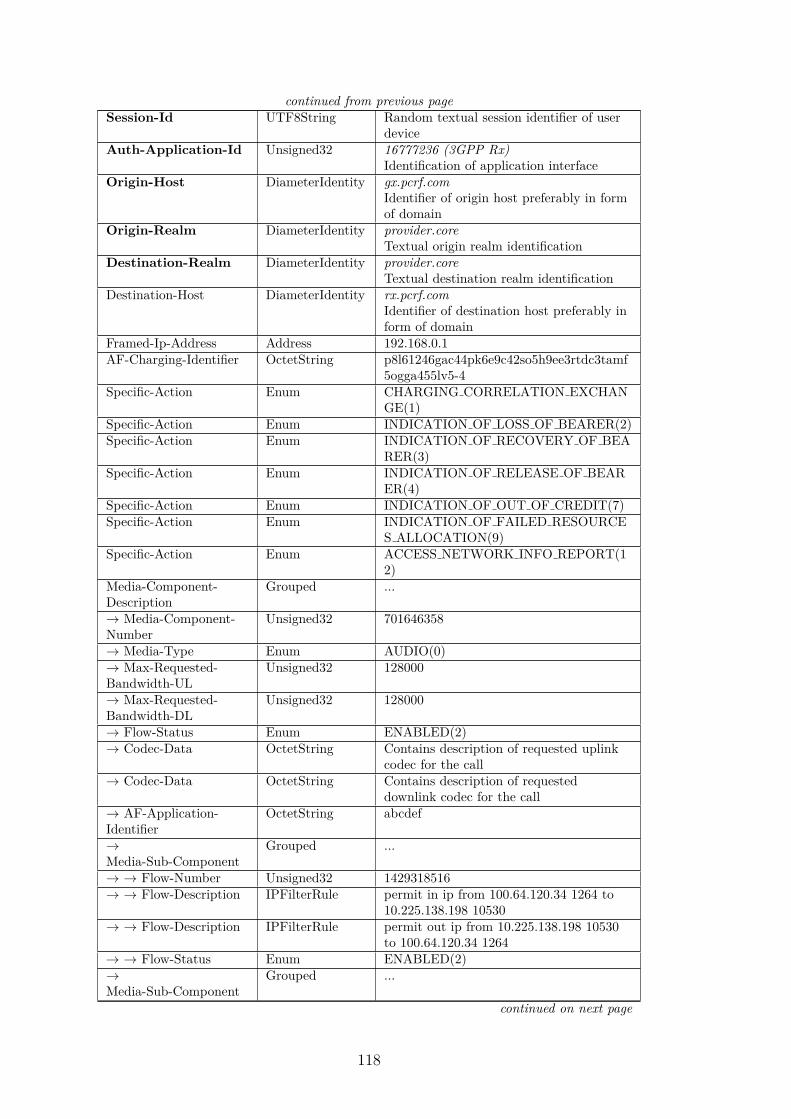
continued from previous pageSession-Id UTF8String Random textual session identifier of user
deviceAuth-Application-Id Unsigned32 16777236 (3GPP Rx)
Identification of application interfaceOrigin-Host DiameterIdentity gx.pcrf.com
Identifier of origin host preferably in formof domain
Origin-Realm DiameterIdentity provider.coreTextual origin realm identification
Destination-Realm DiameterIdentity provider.coreTextual destination realm identification
Destination-Host DiameterIdentity rx.pcrf.comIdentifier of destination host preferably inform of domain
Framed-Ip-Address Address 192.168.0.1AF-Charging-Identifier OctetString p8l61246gac44pk6e9c42so5h9ee3rtdc3tamf
5ogga455lv5-4Specific-Action Enum CHARGING CORRELATION EXCHAN
GE(1)Specific-Action Enum INDICATION OF LOSS OF BEARER(2)Specific-Action Enum INDICATION OF RECOVERY OF BEA
RER(3)Specific-Action Enum INDICATION OF RELEASE OF BEAR
ER(4)Specific-Action Enum INDICATION OF OUT OF CREDIT(7)Specific-Action Enum INDICATION OF FAILED RESOURCE
S ALLOCATION(9)Specific-Action Enum ACCESS NETWORK INFO REPORT(1
2)Media-Component-Description
Grouped ...
→ Media-Component-Number
Unsigned32 701646358
→ Media-Type Enum AUDIO(0)→ Max-Requested-Bandwidth-UL
Unsigned32 128000
→ Max-Requested-Bandwidth-DL
Unsigned32 128000
→ Flow-Status Enum ENABLED(2)→ Codec-Data OctetString Contains description of requested uplink
codec for the call→ Codec-Data OctetString Contains description of requested
downlink codec for the call→ AF-Application-Identifier
OctetString abcdef
→Media-Sub-Component
Grouped ...
→ → Flow-Number Unsigned32 1429318516→ → Flow-Description IPFilterRule permit in ip from 100.64.120.34 1264 to
10.225.138.198 10530→ → Flow-Description IPFilterRule permit out ip from 10.225.138.198 10530
to 100.64.120.34 1264→ → Flow-Status Enum ENABLED(2)→Media-Sub-Component
Grouped ...
continued on next page
118
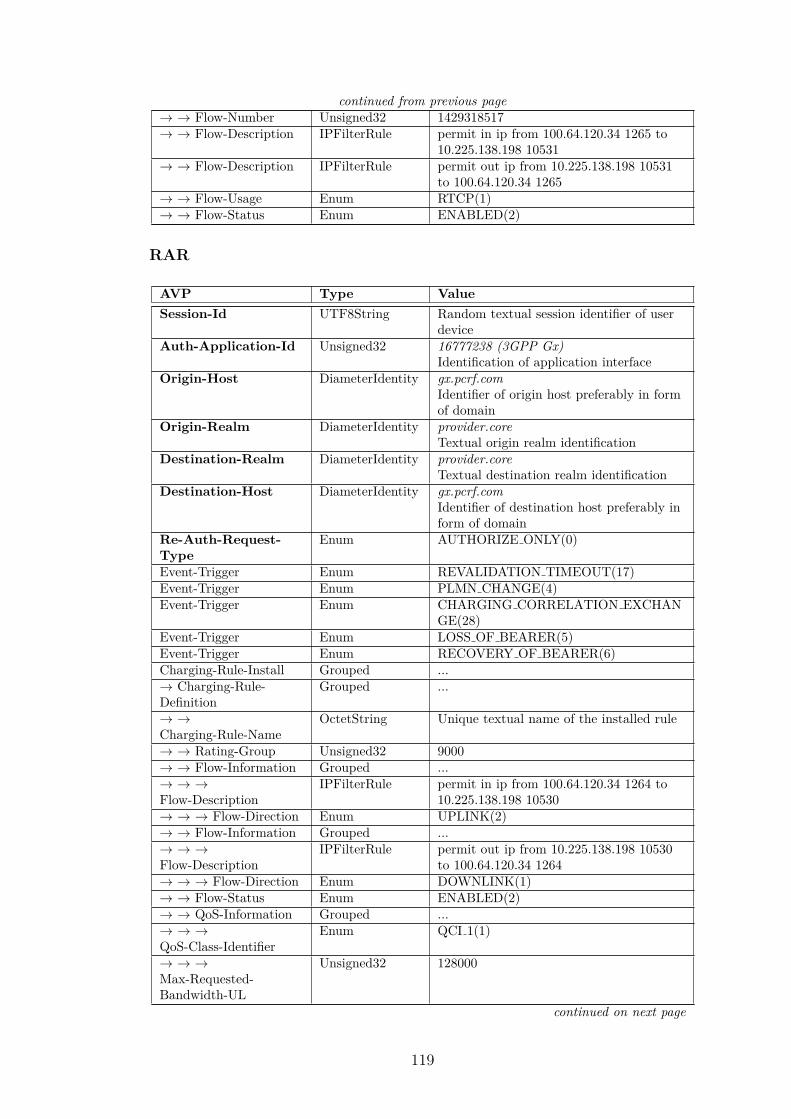
continued from previous page→ → Flow-Number Unsigned32 1429318517→ → Flow-Description IPFilterRule permit in ip from 100.64.120.34 1265 to
10.225.138.198 10531→ → Flow-Description IPFilterRule permit out ip from 10.225.138.198 10531
to 100.64.120.34 1265→ → Flow-Usage Enum RTCP(1)→ → Flow-Status Enum ENABLED(2)
RAR
AVP Type ValueSession-Id UTF8String Random textual session identifier of user
deviceAuth-Application-Id Unsigned32 16777238 (3GPP Gx)
Identification of application interfaceOrigin-Host DiameterIdentity gx.pcrf.com
Identifier of origin host preferably in formof domain
Origin-Realm DiameterIdentity provider.coreTextual origin realm identification
Destination-Realm DiameterIdentity provider.coreTextual destination realm identification
Destination-Host DiameterIdentity gx.pcrf.comIdentifier of destination host preferably inform of domain
Re-Auth-Request-Type
Enum AUTHORIZE ONLY(0)
Event-Trigger Enum REVALIDATION TIMEOUT(17)Event-Trigger Enum PLMN CHANGE(4)Event-Trigger Enum CHARGING CORRELATION EXCHAN
GE(28)Event-Trigger Enum LOSS OF BEARER(5)Event-Trigger Enum RECOVERY OF BEARER(6)Charging-Rule-Install Grouped ...→ Charging-Rule-Definition
Grouped ...
→ →Charging-Rule-Name
OctetString Unique textual name of the installed rule
→ → Rating-Group Unsigned32 9000→ → Flow-Information Grouped ...→ → →Flow-Description
IPFilterRule permit in ip from 100.64.120.34 1264 to10.225.138.198 10530
→ → → Flow-Direction Enum UPLINK(2)→ → Flow-Information Grouped ...→ → →Flow-Description
IPFilterRule permit out ip from 10.225.138.198 10530to 100.64.120.34 1264
→ → → Flow-Direction Enum DOWNLINK(1)→ → Flow-Status Enum ENABLED(2)→ → QoS-Information Grouped ...→ → →QoS-Class-Identifier
Enum QCI 1(1)
→ → →Max-Requested-Bandwidth-UL
Unsigned32 128000
continued on next page
119
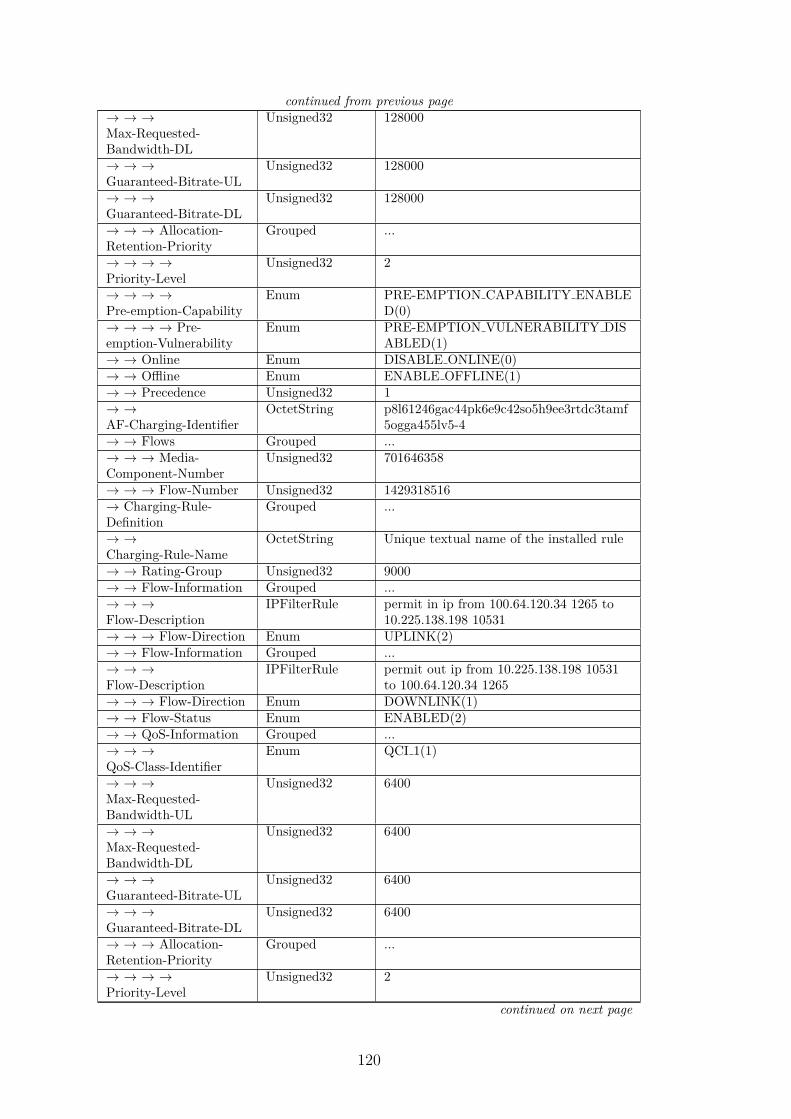
continued from previous page→ → →Max-Requested-Bandwidth-DL
Unsigned32 128000
→ → →Guaranteed-Bitrate-UL
Unsigned32 128000
→ → →Guaranteed-Bitrate-DL
Unsigned32 128000
→ → → Allocation-Retention-Priority
Grouped ...
→ → → →Priority-Level
Unsigned32 2
→ → → →Pre-emption-Capability
Enum PRE-EMPTION CAPABILITY ENABLED(0)
→ → → → Pre-emption-Vulnerability
Enum PRE-EMPTION VULNERABILITY DISABLED(1)
→ → Online Enum DISABLE ONLINE(0)→ → Offline Enum ENABLE OFFLINE(1)→ → Precedence Unsigned32 1→ →AF-Charging-Identifier
OctetString p8l61246gac44pk6e9c42so5h9ee3rtdc3tamf5ogga455lv5-4
→ → Flows Grouped ...→ → → Media-Component-Number
Unsigned32 701646358
→ → → Flow-Number Unsigned32 1429318516→ Charging-Rule-Definition
Grouped ...
→ →Charging-Rule-Name
OctetString Unique textual name of the installed rule
→ → Rating-Group Unsigned32 9000→ → Flow-Information Grouped ...→ → →Flow-Description
IPFilterRule permit in ip from 100.64.120.34 1265 to10.225.138.198 10531
→ → → Flow-Direction Enum UPLINK(2)→ → Flow-Information Grouped ...→ → →Flow-Description
IPFilterRule permit out ip from 10.225.138.198 10531to 100.64.120.34 1265
→ → → Flow-Direction Enum DOWNLINK(1)→ → Flow-Status Enum ENABLED(2)→ → QoS-Information Grouped ...→ → →QoS-Class-Identifier
Enum QCI 1(1)
→ → →Max-Requested-Bandwidth-UL
Unsigned32 6400
→ → →Max-Requested-Bandwidth-DL
Unsigned32 6400
→ → →Guaranteed-Bitrate-UL
Unsigned32 6400
→ → →Guaranteed-Bitrate-DL
Unsigned32 6400
→ → → Allocation-Retention-Priority
Grouped ...
→ → → →Priority-Level
Unsigned32 2
continued on next page
120
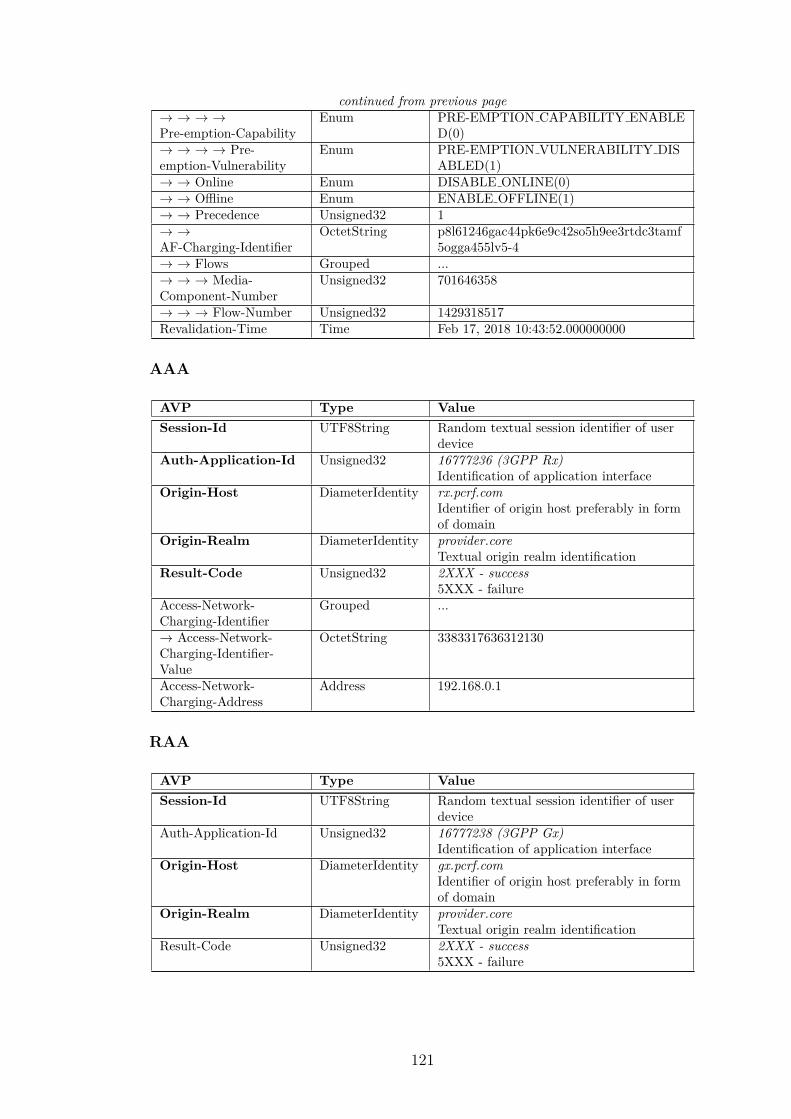
continued from previous page→ → → →Pre-emption-Capability
Enum PRE-EMPTION CAPABILITY ENABLED(0)
→ → → → Pre-emption-Vulnerability
Enum PRE-EMPTION VULNERABILITY DISABLED(1)
→ → Online Enum DISABLE ONLINE(0)→ → Offline Enum ENABLE OFFLINE(1)→ → Precedence Unsigned32 1→ →AF-Charging-Identifier
OctetString p8l61246gac44pk6e9c42so5h9ee3rtdc3tamf5ogga455lv5-4
→ → Flows Grouped ...→ → → Media-Component-Number
Unsigned32 701646358
→ → → Flow-Number Unsigned32 1429318517Revalidation-Time Time Feb 17, 2018 10:43:52.000000000
AAA
AVP Type ValueSession-Id UTF8String Random textual session identifier of user
deviceAuth-Application-Id Unsigned32 16777236 (3GPP Rx)
Identification of application interfaceOrigin-Host DiameterIdentity rx.pcrf.com
Identifier of origin host preferably in formof domain
Origin-Realm DiameterIdentity provider.coreTextual origin realm identification
Result-Code Unsigned32 2XXX - success5XXX - failure
Access-Network-Charging-Identifier
Grouped ...
→ Access-Network-Charging-Identifier-Value
OctetString 3383317636312130
Access-Network-Charging-Address
Address 192.168.0.1
RAA
AVP Type ValueSession-Id UTF8String Random textual session identifier of user
deviceAuth-Application-Id Unsigned32 16777238 (3GPP Gx)
Identification of application interfaceOrigin-Host DiameterIdentity gx.pcrf.com
Identifier of origin host preferably in formof domain
Origin-Realm DiameterIdentity provider.coreTextual origin realm identification
Result-Code Unsigned32 2XXX - success5XXX - failure
121
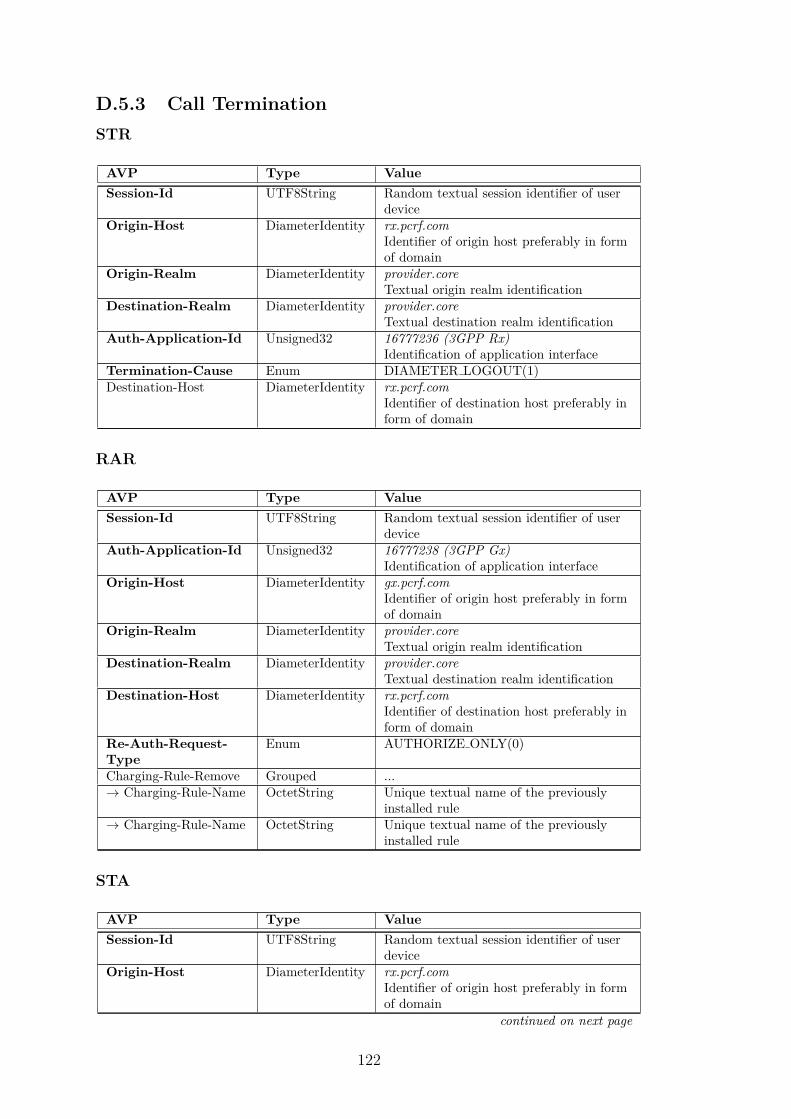
D.5.3 Call TerminationSTR
AVP Type ValueSession-Id UTF8String Random textual session identifier of user
deviceOrigin-Host DiameterIdentity rx.pcrf.com
Identifier of origin host preferably in formof domain
Origin-Realm DiameterIdentity provider.coreTextual origin realm identification
Destination-Realm DiameterIdentity provider.coreTextual destination realm identification
Auth-Application-Id Unsigned32 16777236 (3GPP Rx)Identification of application interface
Termination-Cause Enum DIAMETER LOGOUT(1)Destination-Host DiameterIdentity rx.pcrf.com
Identifier of destination host preferably inform of domain
RAR
AVP Type ValueSession-Id UTF8String Random textual session identifier of user
deviceAuth-Application-Id Unsigned32 16777238 (3GPP Gx)
Identification of application interfaceOrigin-Host DiameterIdentity gx.pcrf.com
Identifier of origin host preferably in formof domain
Origin-Realm DiameterIdentity provider.coreTextual origin realm identification
Destination-Realm DiameterIdentity provider.coreTextual destination realm identification
Destination-Host DiameterIdentity rx.pcrf.comIdentifier of destination host preferably inform of domain
Re-Auth-Request-Type
Enum AUTHORIZE ONLY(0)
Charging-Rule-Remove Grouped ...→ Charging-Rule-Name OctetString Unique textual name of the previously
installed rule→ Charging-Rule-Name OctetString Unique textual name of the previously
installed rule
STA
AVP Type ValueSession-Id UTF8String Random textual session identifier of user
deviceOrigin-Host DiameterIdentity rx.pcrf.com
Identifier of origin host preferably in formof domain
continued on next page
122
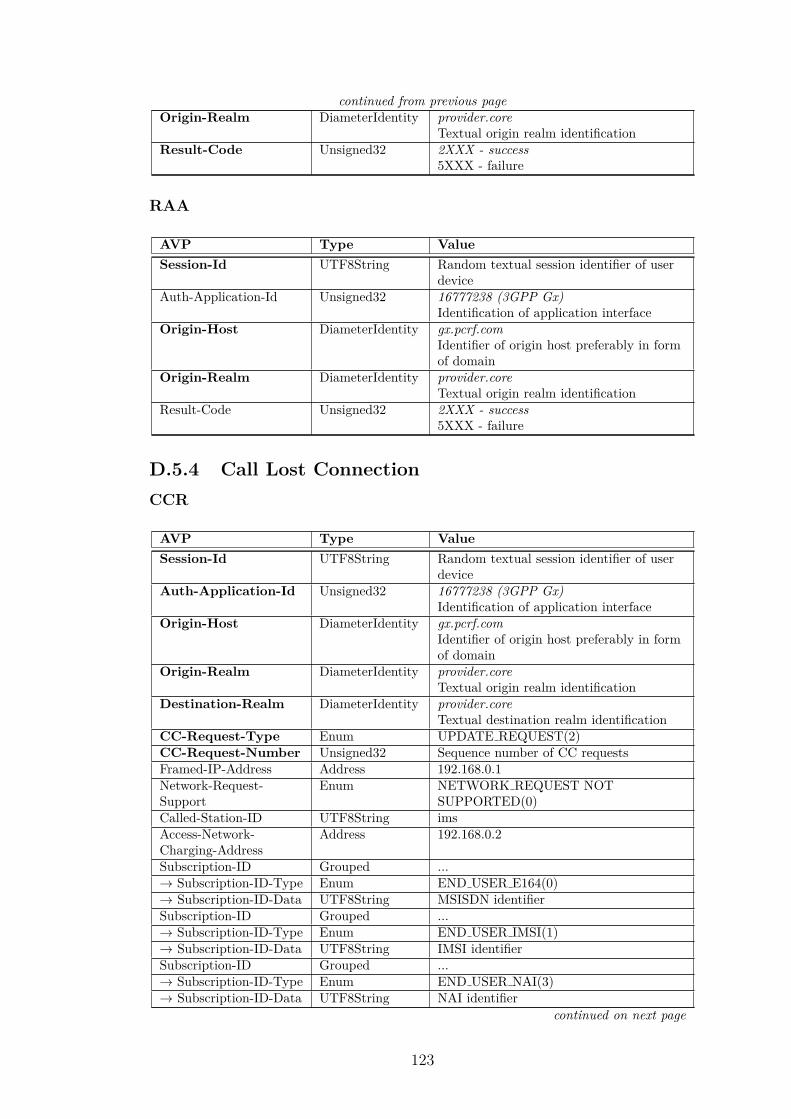
continued from previous pageOrigin-Realm DiameterIdentity provider.core
Textual origin realm identificationResult-Code Unsigned32 2XXX - success
5XXX - failure
RAA
AVP Type ValueSession-Id UTF8String Random textual session identifier of user
deviceAuth-Application-Id Unsigned32 16777238 (3GPP Gx)
Identification of application interfaceOrigin-Host DiameterIdentity gx.pcrf.com
Identifier of origin host preferably in formof domain
Origin-Realm DiameterIdentity provider.coreTextual origin realm identification
Result-Code Unsigned32 2XXX - success5XXX - failure
D.5.4 Call Lost ConnectionCCR
AVP Type ValueSession-Id UTF8String Random textual session identifier of user
deviceAuth-Application-Id Unsigned32 16777238 (3GPP Gx)
Identification of application interfaceOrigin-Host DiameterIdentity gx.pcrf.com
Identifier of origin host preferably in formof domain
Origin-Realm DiameterIdentity provider.coreTextual origin realm identification
Destination-Realm DiameterIdentity provider.coreTextual destination realm identification
CC-Request-Type Enum UPDATE REQUEST(2)CC-Request-Number Unsigned32 Sequence number of CC requestsFramed-IP-Address Address 192.168.0.1Network-Request-Support
Enum NETWORK REQUEST NOTSUPPORTED(0)
Called-Station-ID UTF8String imsAccess-Network-Charging-Address
Address 192.168.0.2
Subscription-ID Grouped ...→ Subscription-ID-Type Enum END USER E164(0)→ Subscription-ID-Data UTF8String MSISDN identifierSubscription-ID Grouped ...→ Subscription-ID-Type Enum END USER IMSI(1)→ Subscription-ID-Data UTF8String IMSI identifierSubscription-ID Grouped ...→ Subscription-ID-Type Enum END USER NAI(3)→ Subscription-ID-Data UTF8String NAI identifier
continued on next page
123
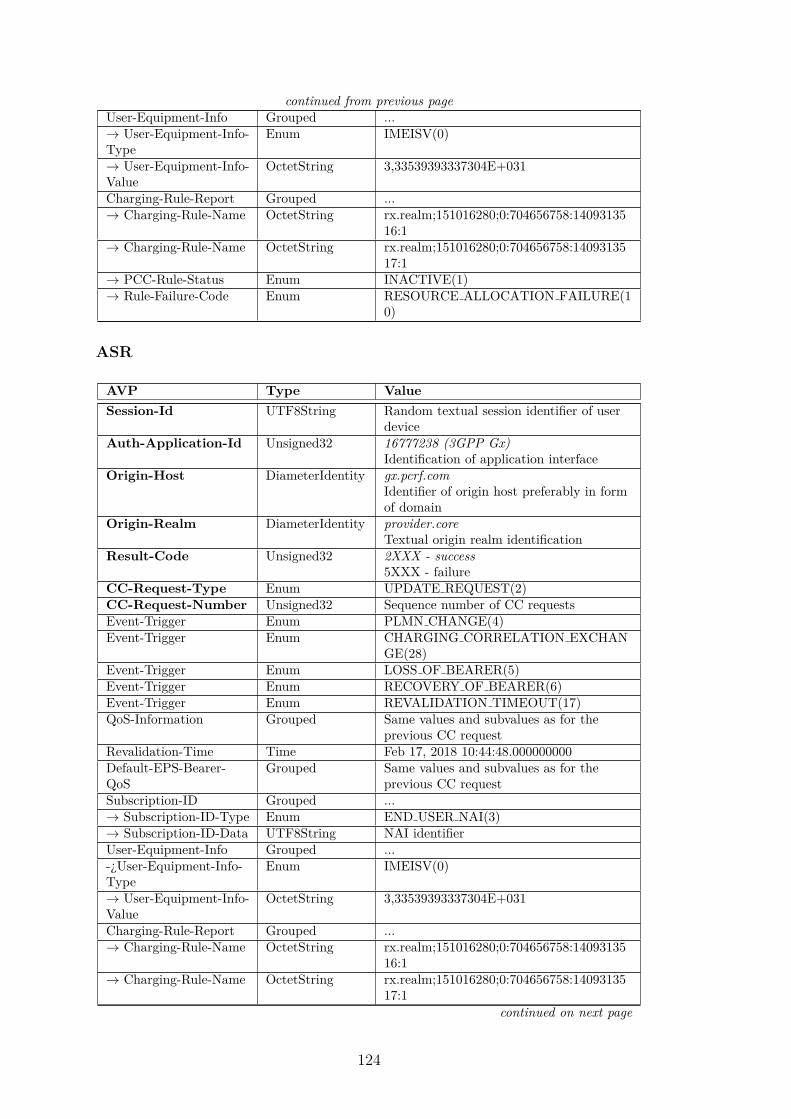
continued from previous pageUser-Equipment-Info Grouped ...→ User-Equipment-Info-Type
Enum IMEISV(0)
→ User-Equipment-Info-Value
OctetString 3,33539393337304E+031
Charging-Rule-Report Grouped ...→ Charging-Rule-Name OctetString rx.realm;151016280;0:704656758:14093135
16:1→ Charging-Rule-Name OctetString rx.realm;151016280;0:704656758:14093135
17:1→ PCC-Rule-Status Enum INACTIVE(1)→ Rule-Failure-Code Enum RESOURCE ALLOCATION FAILURE(1
0)
ASR
AVP Type ValueSession-Id UTF8String Random textual session identifier of user
deviceAuth-Application-Id Unsigned32 16777238 (3GPP Gx)
Identification of application interfaceOrigin-Host DiameterIdentity gx.pcrf.com
Identifier of origin host preferably in formof domain
Origin-Realm DiameterIdentity provider.coreTextual origin realm identification
Result-Code Unsigned32 2XXX - success5XXX - failure
CC-Request-Type Enum UPDATE REQUEST(2)CC-Request-Number Unsigned32 Sequence number of CC requestsEvent-Trigger Enum PLMN CHANGE(4)Event-Trigger Enum CHARGING CORRELATION EXCHAN
GE(28)Event-Trigger Enum LOSS OF BEARER(5)Event-Trigger Enum RECOVERY OF BEARER(6)Event-Trigger Enum REVALIDATION TIMEOUT(17)QoS-Information Grouped Same values and subvalues as for the
previous CC requestRevalidation-Time Time Feb 17, 2018 10:44:48.000000000Default-EPS-Bearer-QoS
Grouped Same values and subvalues as for theprevious CC request
Subscription-ID Grouped ...→ Subscription-ID-Type Enum END USER NAI(3)→ Subscription-ID-Data UTF8String NAI identifierUser-Equipment-Info Grouped ...-¿User-Equipment-Info-Type
Enum IMEISV(0)
→ User-Equipment-Info-Value
OctetString 3,33539393337304E+031
Charging-Rule-Report Grouped ...→ Charging-Rule-Name OctetString rx.realm;151016280;0:704656758:14093135
16:1→ Charging-Rule-Name OctetString rx.realm;151016280;0:704656758:14093135
17:1continued on next page
124

continued from previous page→ PCC-Rule-Status Enum INACTIVE(1)→ Rule-Failure-Code Enum RESOURCE ALLOCATION FAILURE(1
0)
CCA
AVP Type ValueSession-Id UTF8String Random textual session identifier of
particular callAuth-Application-Id Unsigned32 16777236 (3GPP Rx)
Identification of application interfaceOrigin-Host DiameterIdentity rx.pcrf.com
Identifier of origin host preferably in formof domain
Origin-Realm DiameterIdentity provider.coreTextual origin realm identification
Destination-Host DiameterIdentity rx.pcrf.comIdentifier of destination host preferably inform of domain
Destination-Realm DiameterIdentity provider.coreTextual destination realm identification
Abort-Cause Enum BEARER RELEASED(0)
ASA
AVP Type ValueSession-Id UTF8String Random textual session identifier of
particular callAuth-Application-Id Unsigned32 16777236 (3GPP Rx)
Identification of application interfaceOrigin-Host DiameterIdentity rx.pcrf.com
Identifier of origin host preferably in formof domain
Origin-Realm DiameterIdentity provider.coreTextual origin realm identification
Result-Code Unsigned32 2XXX - success5XXX - failure
STR
AVP Type ValueSession-Id UTF8String Random textual session identifier of user
deviceOrigin-Host DiameterIdentity rx.pcrf.com
Identifier of origin host preferably in formof domain
Origin-Realm DiameterIdentity provider.coreTextual origin realm identification
Destination-Realm DiameterIdentity provider.coreTextual destination realm identification
Auth-Application-Id Unsigned32 16777236 (3GPP Rx)Identification of application interface
Termination-Cause Enum DIAMETER LOGOUT(1)continued on next page
125
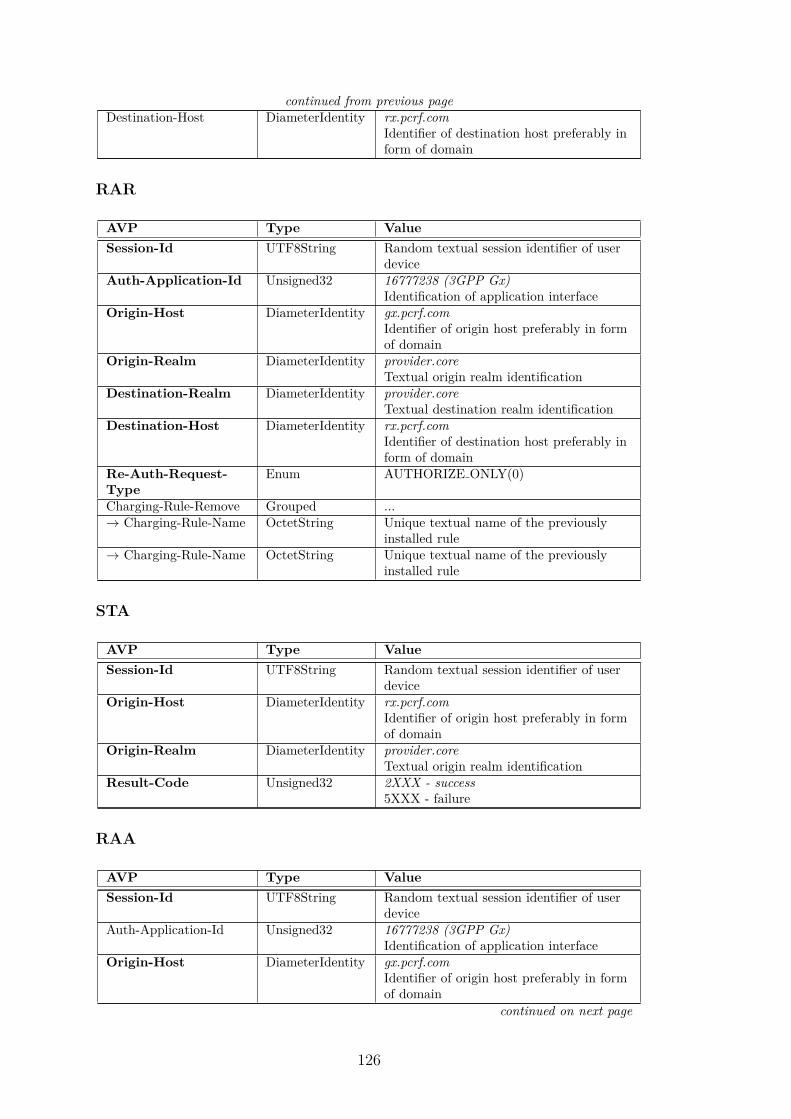
continued from previous pageDestination-Host DiameterIdentity rx.pcrf.com
Identifier of destination host preferably inform of domain
RAR
AVP Type ValueSession-Id UTF8String Random textual session identifier of user
deviceAuth-Application-Id Unsigned32 16777238 (3GPP Gx)
Identification of application interfaceOrigin-Host DiameterIdentity gx.pcrf.com
Identifier of origin host preferably in formof domain
Origin-Realm DiameterIdentity provider.coreTextual origin realm identification
Destination-Realm DiameterIdentity provider.coreTextual destination realm identification
Destination-Host DiameterIdentity rx.pcrf.comIdentifier of destination host preferably inform of domain
Re-Auth-Request-Type
Enum AUTHORIZE ONLY(0)
Charging-Rule-Remove Grouped ...→ Charging-Rule-Name OctetString Unique textual name of the previously
installed rule→ Charging-Rule-Name OctetString Unique textual name of the previously
installed rule
STA
AVP Type ValueSession-Id UTF8String Random textual session identifier of user
deviceOrigin-Host DiameterIdentity rx.pcrf.com
Identifier of origin host preferably in formof domain
Origin-Realm DiameterIdentity provider.coreTextual origin realm identification
Result-Code Unsigned32 2XXX - success5XXX - failure
RAA
AVP Type ValueSession-Id UTF8String Random textual session identifier of user
deviceAuth-Application-Id Unsigned32 16777238 (3GPP Gx)
Identification of application interfaceOrigin-Host DiameterIdentity gx.pcrf.com
Identifier of origin host preferably in formof domain
continued on next page
126

continued from previous pageOrigin-Realm DiameterIdentity provider.core
Textual origin realm identificationResult-Code Unsigned32 2XXX - success
5XXX - failure
127

128