![jf cfof]]u - wgs''6f sfof{{no, wgs''6f - Collegenp](https://static.fdokumen.com/doc/165x107/6322280c28c445989105a57f/jf-cfofu-wgs6f-sfofno-wgs6f-collegenp.jpg)
Batty, JF TITLE A Cost Analyses of the Five Public Colleges in A
151
DOCUMENT RESUME ED 072 736 HE 003 784 AUTHOR Cornish, D. J.; Batty, J. F. TITLE A Cost Analyses of the Five Public Colleges in Alberta 1970-71. Resource Allocations. Master Planning Monograph 8. INSTITUTION Alberta Colleges Commission, Edmonton. PUB CATE Jun 72 NOTE 148p. ECRS PRICE MF-$0.65 HC-$6.58 DESCRIPTORS *Cost Effectiveness; Educational Adminit-, :ation; *Educational Finance; Educational Planning; *Higher Education; *International Education; *Resource Allocations ABSTRACT Educational planning, whether conducted on an institutional or systemwide basis, is synonymous with the future allocation of human and physical resources for the purpose of achieving a desired future state. In order that allocative decisions might be made on rational grounds, it is necessary to identify and assess the implications of current and alternative resource allocations. The findings reported in this monograph provide intra-institutionally comparable expenditure data for each of the 5 public colleges in Alberta, and by so doing, provide a quantitative analysis of current resource allocation. In addition, the study details the specific data elements required and the collection and analysis procedures to be followed in conducting an expenditure analysis on an annual basis. The findings reported in this study should prove useful to administrators, faculty, and students in each public college as information for reviewing resource allocations and for relating expenditures to output measures and indicators. The methodology used in conducting the analysis should prove useful to administrators throughout the system of postsecondary education in their efforts to make the best possible use of the human and physical resources that are allocated to the educational enterprise. (Author/HS)
-
Upload
khangminh22 -
Category
Documents
-
view
4 -
download
0
Transcript of Batty, JF TITLE A Cost Analyses of the Five Public Colleges in A

DOCUMENT RESUME
ED 072 736 HE 003 784
AUTHOR Cornish, D. J.; Batty, J. F.TITLE A Cost Analyses of the Five Public Colleges in
Alberta 1970-71. Resource Allocations. MasterPlanning Monograph 8.
INSTITUTION Alberta Colleges Commission, Edmonton.PUB CATE Jun 72NOTE 148p.
ECRS PRICE MF-$0.65 HC-$6.58DESCRIPTORS *Cost Effectiveness; Educational Adminit-, :ation;
*Educational Finance; Educational Planning; *HigherEducation; *International Education; *ResourceAllocations
ABSTRACTEducational planning, whether conducted on an
institutional or systemwide basis, is synonymous with the futureallocation of human and physical resources for the purpose ofachieving a desired future state. In order that allocative decisionsmight be made on rational grounds, it is necessary to identify andassess the implications of current and alternative resourceallocations. The findings reported in this monograph provideintra-institutionally comparable expenditure data for each of the 5public colleges in Alberta, and by so doing, provide a quantitativeanalysis of current resource allocation. In addition, the studydetails the specific data elements required and the collection andanalysis procedures to be followed in conducting an expenditureanalysis on an annual basis. The findings reported in this studyshould prove useful to administrators, faculty, and students in eachpublic college as information for reviewing resource allocations andfor relating expenditures to output measures and indicators. Themethodology used in conducting the analysis should prove useful toadministrators throughout the system of postsecondary education intheir efforts to make the best possible use of the human and physicalresources that are allocated to the educational enterprise.(Author/HS)

1
II II
MASTER PLANNING MONOGRAPH 8Resource Allocations
A Cost Analysis of theFive Public Colleges
in Alberta 1970-71
i
1
U S DEPARTMENT OF HEALTHEDUCATION & WELFAREOFFICE OF EDUCATION
THIS DOCUMENT HAS BEEN REPRODUCED EXACTLY AS RECEIVED FROMTHE PERSON OR ORGANIZATION ORIGMATING IT POINTS OF VIEW OR OPINIONS STATED DO NOT NECESSARILYREPRESENT OFFICIAL OFFICE OF EDUCATION POSITION OR POLICY
June 1972Alberta Colleges Commission

I
I
I
MASTER PLANNING MONOGRAPH #8
COST ANALYSES
A COST ANALYSES OF THE FIVE
PUBLIC COLLEGES IN ALBERTA
1970-71
Prepared By
D. J. CORNISH & J. F. BATTY
for the
ALBERTA COLLEGES COMMISSION
June, 1972
1,

Any views expressed in this paper are those of
the-authors. They should not be interpreted as reflect-
ing the views of the Commission or the official opinion
of any of its governmental or research agencies.

Educational planning, whether conducted on an institutional or system-
wide basis, is synonymous with the future allocation of human and physical
resources for the purpose of achieving a desired future state. In order that
allocative decisions might be made on rational grounds, it is necessary to
identify and assess the implications of current and alternative resource allo-
cations.
The findings reported in this monograph provide antra- institutionally
comparable expenditure data for each public college and by so doing provide a
quantitative analysis of current resource allocations. The value of this
analysis lies in its usefulness as a management information tool for reviewing,
assessing, and improving resource utilization within each institution.
In addition, the study details the specific data elements required and
the collection and analysis procedures to be followed in conducting an expendi-
ture analysis on an annual basis. If followed, these procedures will develop
an extensive data base for both institutional'and system educational planning.
The findings reported in this study should prove useful to administra-
tors, faculty, and students in each public college as information for review-
ing resource allocations and for relating expenditures to output measures and
indicators. The methodology used in conducting the analysis should prove
useful to administrators throughout the system of post-secondary education in
their efforts to make the best possible use of the human and physical resources
which are allocated to the educational enterprise.
R. A. Bosetti,
Director of Planning and Research,Alberta Colleges Commission.

ACKNOWLEDGEMENTS
The authors of this study wish to make specific acknowledgement of
the contribution made by many people to the success of this study. Generally
much thanks must be extended to the clerical staffs in the Finance Divisions
and Registrar's Offices of each college who gave so willingly of their time
and knowledge. More specifically a special thanks is extended to the Finan-
cial Officers and Vice-Presidents in each institution who were so helpful:
Mr. N. Hastings, Mr. N. Romalo, Mr. W. G. Rae, Mr. W. Stewart, Mr. D. Cooper,
and Mr. G. Dean. Also thanks is most surely extended to the Registrars of
each college: Mr. D. Harper, Mr. J. Bolding, Mr. R. Cooke, Mr. B. Perrin and
Mr. A. Blakie.
A special note of appreciation is due the4fine cooperation received
from Mr. J. Harvey's staff at the Northern Alberta Institute of Technology
Data Centre. The special perseverance and understanding of Mrs. Faye,;
MacDonald and Mr. D. Gordon were not only appreciated but also necessary.
Finally the authors would be terribly remiss if they did not acknow-
ledge the significant contribution made by Mrs. J. Bykewich of the Alberta
Colleges Commission. Her advice and good humor throughout the study were
invaluable.
D. J. CornishJ. F. Batty

TABLE OF CONTENTS
Page
List of Tables
Chapter
1 INTRODUCTION 1
2 COST ANALYSIS - A BRIEF EXAMINATION 3
3 RESEARCH PROCEDURES 11
RANGE OF THE METHODOLOGY -11
Limitations 11
Delimitations 12
METHODOLOGY 13
Estimation of Course Costs 13
Estimation of Program Costs 17
4 COST ANALYSIS - FINDINGS 20
COURSE COSTS 20
Range.of Full-Time Course Cost Per StudentContact Hour 21
Enrolment Distributions 23
Cost Distributions 27
Conclusions 31
SUPPORTING SERVICES 32
Counselling 32
Library . 34
Conclusion 34
iii

7
4
iv
Chapter Page
4 Continued:
PROGRAM COSTS 36 r
Grande Prairie 37
Red Deer 37
'Mount Royal
Medicine Hat
Lethbridge
Conclusions
SUBSIDY EFFECTS
40
45
47
49
50
S RECOMMENDATIONS 51
SPECIFIC PROCEDURES FOR THE 1971-72COST' ANALYSIS 55
RECOMMENDATIONS RELATING TO EVENTUALIMPLEMENTATION OF THE WICHE MODEL RRPM 1.3 56
REFERENCES 59
APPENDIX A: GRArDE PRAIRIE 61
APPENDIX B: RED DEER 67
APPENDIX C: MOUNT ROYAL 79
APPENDIX D: MEDICINE HAT 102
APPENDIX E: LETHBRIDGE 112
APPENDIX F: PROCEDURES AND INSTRUMENTS 130

1
11,
"srLIST OF TABLES/7
Table
1 Range of Per Student,Contact Hour Full-Time
Page
Course Costs with Enrolments 22
2 Range of Per Student Contact Hour Half-TimeCourse Costs with Enrolments 22
3 Distribution of Full Year Courses by Enrolment 24
4 Distribution of 1/2 Year Courses by Enrolment 26
5 Distribution of ellyear Courses by CostPer Student Contac Hour 28
6 Distribution of 1/2 Year Courses by CostPer Student Contact Hour 30
7 Actual Total and Per Student Expenditureon Supporting Services
-- - \33
8 Analysis of Total Expenditure by Types ofInput 35
9 Range of Program Costs in Grande Prairie College 38
10. Range of Program Costs in Red Deer College 39
1 1 Range of Program Costsin Mount Royal College 41
12 Range of Program Costs in Medicine Hat College 46
13 Range of Program Costs in Lethbridge Community College . . . . 48
A-1 ) Cost-Revenue Analysis for Grande Prairie College 62
A-2 CoursesOffered By Grande Prairie College in 1970 71with Enrolments, Total Costs, Cost Per Student,and Cost Per Student Contact Hour, 63
8-1 Cost-Revenue Analysis for Red Deer College 69
B-2 Courses Offered by Red Deer College in 1970-71 withEnrolments, Total Cost, Cost Per Student, andCost Per Student Contact Hour 71
40

.7
vi
Table Page
Cost Revenue Analysis for Mount Royal College 81
C-2 Courses Offered By Moult Royal College in 1970-71with Enrolments, Total Cost, Cost Per Student,and Cost Per-Student Contact Hour 85
D-1 Cost Revenue Analysis for Medicine Hat College 104
D-2 Courses'Offered by Medicine Hat College in 1970-71with Enrolment, Total Cost, Cost Per Student,and Cost Per Student Contact Hour 105
E-1 Cost Revenue Analysis for Lethbridge Community College . 113
E-2 Courses Offered by Lethbridge Community College in1970-71 with Enrolment, Total-Cost, Cost PerStudent, and Cost Per Student Contact Hour . < o . 115

Chapter 1
INTRODUCTION
In the early part of 1971 the Finance Committee of the Alberta
Colleges Commission decided to do a case study on course cost accounting in
one of the public colleges. The Finance Committee made up of the Finance
Officers from all of the colleges and chaired by the Director of Financial
Services for the Alberta Colleges Commission hoped to assess the feasibility
of such a study and then to consider its general application to the analysis
of all the colleges for the 1970-71 year.
The case study was completed on May 7, 1971 and it identified a
fairly clear-cut methodology for use in a system-wide analysis of course
costing. The development of such a methodology and the interest of the
various colleges was rather propitious at this particular time. The Master
Planning Project being conducted by the Division. of Planning and Research
was well underway by the time the case study had been concluded. Part of
the Master Plan required that a Cost Analysis be done for the system of
colleges in Alberta.
As a consequence of this background, an Expenditure Analysis using
individual courses as the lowest level of analysis was proposed and placed
under the aegis of the Director of Financial Services. The actual study
was jointly conducted by J. F. Batty, Director of Financial Services, and
D. J. Cornish, Intern, of the Alberta Colleges Commission.
1

2
The report had a number of purposes:
1. To provide to each. college a body of data based on course cost
analysis in each of the five public colleges which were operating in Alberta
in the 1970-71 academic year. These colleges were:
Grande Prairie Regional College;
Red Deer College;
Mount Royal College;
Medicine Hat College; and,
Lethbridge Community College.
2. To produce a body of data for the 1970-71 year and following
years on the college system for use by the Master Planning Project in assess-
ing current costs with a view to developing future costs.
3. To determine a technique, including data collection and analysis,
which could be employed on a yearly basis in each of the colleges thus pro-
viding ongoing data for institutional planning and consistent input to the
evolving aspects of the Master Plan.

. tA.'.41NA-104
t Iv,. it, and examination
endar ,. educ at ion has been
t .1., put, I I, i....orinipped at the shrine
1;1' i re for so c ial and mate-
'.3 t r .1t 1 I t.
F.,
ommitted to "the cause."
Ce4 r ow ing demand
tt. r+ o he an increas-
/: tt r'. s t. ondary ten-
unit costs in higher
t `thy resources invested
t-tt Tht. tIrt ()Ut. put such as a
. r ts t_ {:fir or rtIrkrir . rhe uni is
r whi t,,s data f lowed from the
r., r1
.t f t,
t it lu 1- !Jut In quite
tvlie of unit cost faced
int the un I t ; the ,,cond was to
111.Wt_.! then, .1ti W Crier
ot --Ample ion In the
unit t o whit Ii costs were
3' :tir-e co,t also made it

4
possible to determine program costs which were, in their own right, another
type of unit cost.
Cost analyses found their clearest application in those areas of the
business world where a product was clearly identifiaJ1e. The same ease of
product identification was not so readily available in the educational pro-
cess. Consequently, there was generally a need to establish some conceptual
position on this problem when a cost analysis was carried out in a college.
The following reasoning was used by Herschl (1965: iv) for a costing study
in a university setting and the logic appeared to be applicable to the pre-
sent study:
1. The nature of a (college) is an environment for learning.
2. The product in this environment is the intellectual growth
of those participating in the environment, namely students and staff.
3. The process involved is essentially intellectual and it is
therefore difficult to quantify.
4. As a result, instead of assigning costs to the product,
the costs are assigned to a quantity that represents the product.
5. The quantity used in this analysis is the class as defined
by a meeting of students and teachers.
6. Many types of students are served by the college thus the
environment can be separated into many processes equal to the various
programs offered. The total cost of each program is constructed by
combining the costs of the smallest economic units--individual
classes.

An additional though not insurmountable problem in doing cost analysis
on educational institutions was the fact that very few, if any, of these '
operations maintained financial records which could be claS'sified as cost
account systems. The problem of placing labor charges (instructor salaries)
against a particular unit of operation (class) was not difficult under the
existing methods of keeping financial records in colleges. The most diffi
cult problems arose in the apportioning of overhead and materials charges-
against the defin'd unit of production (the class). In a cost accounting
system these expenditures would be charged against the particular aspect of
production which required it. In such a'system, cost accounting would be an
obvious facilitator in the endeavor to do.a cost analysis and thereby arrive
at unit costs. Under present methods of financial record keeping in colleges,
charges like overhead and materials were maintained under gross account items
labeled as instructional supplies, plant maintenance, instructional support,
etc. The problem in doing a unit cost analysis in a college then became one
of taking gross data and on the basis of certain assumptions assigning por-
tions of these costs to various units (classes). Proper cost accounting
techniques in the colleges could make financial analysis much simpler and
far more accurateby avoiding the need to make proration assumptions related.
to apportionment of these indirect costs (overhead and material).
Thus the three variables which affected the cost of units (classes)
in an educational setting were: (1) salaries, (2) time required to teach a
class, and (3) other variable supply or expense items. In terms of assign-
ing labels to the various kinds of cost data required for an analysis, some
variety exists. However, for the purpose of this study, the following two

6
basic terms were employed: (1) Direct Expenditures were the actual charges
against a course created by instructional salaries and fringe benefits to
these salaries; and, (2) Indirect Expenditures were the charges related to
the usual business categories of overhead and material. Unit Costs were
then determined'by dividing student enrolment figures into the course cost
figure derived by adding the Direct and Indirect Expenditures. The final
product was a unit cost per student. In the present study, an additional
division was also made to determine a unit cost per student contact hour.
Herschl (1965: 2) also indicated that determination of these costs
required that data be supplied on three different categories: (1) Faculty
information on salaries, term of employment, fringe benefits, and assignment
to classes and other duties; (2) Student information by course and by program;
and, (3) Fiscal information on income and expenditures.
Atherton (1970: 6) indicated that4/t least two methods existed for
apportioning the direct costs to the various courses. The first was on a per
student basis with resulting proportionate sharing of instructional salary or
direct expenditure by all courses arising from enrolments in each course. A
second method assumed that any given program had a set of basic courses.
These courses were justifiable components of the program cost. Enrolment of
students from other programs did occur and could continue to occur with no
change in charging procedures until the cross use of courses resulted in the
need to provide additional sections of a particular course. When this point
was reached in the second method the additional charges of offering increased
course sections would not be charged to the original program containing the
course but would becharged to the other program generating the additional

7
course demand.
In this study the first method was used. However, a variation-was
effected in that assigned instructor hours were used to prorate the direct
costs to individual courses and not student enrolmenc. The first method was
chosen over method two since original interest was in providing course costs
per student year rather than per program. As a result where the course costs
were reaggregated. into program costs, the cross-over demand of additional
courses was not separated out as an additional charge to the program genera-
ting the demand since by methodology the course costs used were the average
cost of offering all sections of any one course. The first method does, how-
ever, allow for the identification of high cost-low enrolment courses.
The basic difference that emerges between various types of expendi-
ture analyses lies in the method used to apportion Indirect Expenditures to
the chosen unit of analysis. Evans' (Atherton, 1970: 7) discussion of cost
analyses indicated that differences usually occurred from the selection of:'
. . . a justifiable method of allocating the costs of generaladministration, student services, staff welfare and services, publicservice and information, general institutional expense, libraryexpense, and physical plant expense to instructional programs withoutincurring burdensome and analytical procedures and expense.
Three general classification categories varying in depth of analyti-
cal computation were discussed by Atherton (1970: 8-12).
The straight-line method. This method used only one base in the
allocation of Indirect Expenditures. The allocation occurred on a per pupil,
per square foot of instructional area, per faculty member, or per hour of

I
8
instruction basis. The assumption was that a linear relationship existed be-
tween the quantities of indirect services consumed and the amount of indirect
expense allocated to each course.
The Primary Use Plan. This plan attempted to introduce more equity
into ay.: allocation than did the straight line method. The Primary Use Plan
employed many bases for allocation and the indirect expenses were allocated
by the differing base used for each category of indirect expense.
Major problems existed in determining the bases to be used for
different indirect expense categories: how many bases should be used (par-
tially a function of data available), and hen: was the relative weight of each
base to be established? An additional problem was the indirect expense
related to Physical Plant expenditures. These problems were not dealt with
under the Primary Use Plan.
A very simplified version of the Primary Use Plan was used in this
study. In fact it could also be argued that the. methodology was'also a modi-
fication of the straight line method except that two bases were used. All
indirect expenses other than plant maintenance were allocated to courses on a
per pupil basis. Plant maintenance charges were allocated onthe basis of
hours of operation of a class since these indirect services were required if
the class was small or-large, although particularly large classes could
easily require more plant maintenance than normal sized classes. In any event
the per hour usuage was assumed to have a more direct relationship in this
study.

The Progressive Primary Use Plan. In this plan, the approach was the
same as the Primary Use Plan except that indirect expenses were not only
allocated to instructional units but they were also allocated to other non-
instructional areas which made use of certain indirectly charged services.
This final method was felt to be most accurate. However, its use appeared to
be most suited to large institutions where many categories of indirect expen-.,
diture occurred, and in particular where large departments charged with only
indirect services existed but which in turn also required services.
In this study no highly complex allocation method was determined to
be required. The number of departments requiring indirect expenditures was
small; the per pupil and per hour bases used were felt to be reflective of
the situation in each college; and since some comparisons were bound to occur
either formally or informally, a common basis of allocation was desirable.
Witner (1967: 1) indicated that cost studies were useful when they
provided: (1) information that could be related to the educational goals of
the institution in major policy formation; (2) a basis for the evaluation of
efficiency at different levels; X3) data useful to the study of alte- natives;
and (4) data useful in program planning and budget preparation.
More recently the Committee on Standards of the College DelegAte from
the Southern Association of Colleges and Schools were reported by Cage and
Fowler (1971: 11-12) to have indicated that expenditure analysis was becoming
a must in their organization. It was their belief that the financial
resources of a college or a university determined, in part, the quality of
its educational programs. The adequacy of the resources of an institution
was to be judged in relation to the basic purposes of its students. The

10
financial resources could best be afforded to the institutions when they
could show a detailed analysis of their expenditures to the legislature.
Expenditure analyses can obviously be of considerable benefit to the
institution using them. However, cost data produced by them does not solve
problems of allocation. Johnson (1970: 1-2) very aptly indicated that educat
tional cost analysis does have a number 'of limitations: (1) Costs seldom
occur in a linear fashion; (2) Cost records are generally insufficient, with-
out adequate detail or not old enough; (3) Not all relevant costs appear in
the accounts, i.e., the hidden costs of having some personnel administering
and not teaching; and (4) Teacher load data is often not reliable. In actual
fact the institutions doing cost or expenditure analysis must keep quite
clearly in mind that decisions are seldom, if ever, based on cost alone.
Expenditure data does not, nor ever will, make allocative or cost decisions.
Cost-quality questions which attempt to determine what method, at what cost
will produce the best results cannot, however, even be seriously posed until
cost data is available.
40

Chapter 3
RESEARCH PROCEDURES
RAN OF THE METHODOLOGY
Limitations
The limitations of the analysis referred to the restrictions placed
on the study due to uncontrollable factors related to the circumstances in
general and the data in particular.
1. The findings of the study could be slightly affected by the con-
dition of various records in the colleges. In particular, record4 relating
to faculty assignments were not as specific as one would have hoped they
might be. This was likely due to the fact that the specificity of faculty
assignments required to allocate course costs had not been necessary in the
college up to that time. A higher degree of specificity could have been
effected but'only after large demands on time, money, and much inconvenience
of college personnel. Such an additional effort was not considered necessary
since the majority of data collected was adequate for the degree of precision
inherent in the costing technique.
2. Also of a theoretically limiting nature was the accuracy of data
on financial expenditures. In most instances this material came from audited
statements and other financial records and, if any errors occurred, they were
clerical in nature and generally insignificant.
g 11

,r)
12
Delimitations
The delimitations of the study related to conscious decisions on the
part of the researchers to define the scope of the study.
1. The study was conducted on the year of operation from July 1,
1970 to June 30, 1971.
2. All courses were costed except those associated with Departments
or Divisions of Continuing Education.
3. Acceptable enrolment figures used were those reported after 25
percent of the course had elapsed.
4. Capital costs were not included in the study for the following
reasons noted by Cage and Fowler (1971: 5-8): (a) Colleges have not experi-
enced the income tax and audit demands required to maintain depreciation
records; (b) it was often difficult to determine who actually used some capi-
tal equipment; (c) some equipment like data processing hardware was used on a
lease or rental basis; and (d) it was often difficult to get agreement on the
"life" of equipment.
5. A number of limiting decisions were made in the methodology used
to allocate expenditures to courses and these delimitations are indicated
below in the explanation of the method.
6. An additional delimitation related to the decision to allocate.
all faculty salaries as instructional costs. Under the assumption that a
large majority of faculty time was in instruction, it was considered justifi-
able to use total salary as a direct charge against the courses an instructor
taught. Instructors clearly do spend time in non-instructional duties and to
the extent that this factor was not removed, the cost estimates produced by

13
this report are overestimated.
7. A final delimitation related to #6 above was based on the assump-
tion that tine spent by instructors in different classes was directly related
and in proportion to pre and post-instructional activities.
The following statement drawn from a Cost Study Manual produced by
the Illinois State Board of Education does, however, place the general limit-
ing and delimiting problems associated with unit cost studies in perspective:
. . . unit costs may be derived in a variety of ways, some no doubtmore valid than others. The host of arbitrary decisions which must bemade in conducting such a study reflect the experiences and biases a-rising out of [Alberta] practice and [Alberta] needs. Consequently,other researchers may not endorse our "reasons" for particular decisions.Nevertheless if comparative . . . data are to be available, some commonsets of assumptions and procedures must be adopted for conducting coststudies. (Illinois State Board of Education: 1966, Preface).
METHODOLOGY
Estimation of Course Costs
The method used to derive the individual course costs was essentially
a two step process: (1) Direct Instfuctional CoSts were determined for each
course on the basis of a proration technique, and (2) Indirect Costs were
established on two bases for each course. The products of these two steps
were then added to give a Total Course Cost.
Direct Instructional Costs. These costs were determined by taking an
instructor's salary and adding a specified percentage for fringe benefits.
Additional pay for overload was also added to this figure to arrive at the
instructor's total salary for the 1970-71 contract year. Extra pay for even-
Iin or summer courses was not added directly to the instructor's contract

4
salary but was charged directly to the course.
With a total salary for each instructor, the next step was to deter-
mine what the instructor's teaching assignments were for both terms. filaving
determined each instructor's assignment by course, it was posSible to\deter-
mine the total hours an instructor taught in each course (hours assigned per
course x the length of the course in weeks) and also the total instructional
hours assigned for all courses (sum of hours spent in each course).
The portion of the instructor's salary assigned 'as Direct Instruc-
tional Cost to each course was the percentage that the hours for each course
represented of the total hours assigned to the instructor:
Total Hours AssignedPer Course
Total Hours Assigned toInstructor for the Year
Instructor's Total Direct Instruc-
Salaty = tional Cost PerCourse
An important methodological decision was made at this point in the
proration of direct instructional cost. If a college used contact hours to
assign workloads, then these were used as the basis of proration. Contact
hours were used in all colleges except Medicine Hat which had a contract
formula for equating contact to credit hours. Credit hours were used as a
basis for proration in Medicine Hat.
At the end of this proration process additional costs for markers,
laboratory assistants, etc. were added to the Direct. Instructional Cost perCoursCourse.
Indirect Costs. These costs were prorated to each course on the
basis of enrolments and class hours (time):

15
(1) Enrolments: Proration by enrolments assumed that certain
charges against revenue were directly related to the number of students being
served by the college. The number of dollars prorated by enrolments included
such items as: Administrative costs, Instructional support, Community Ser-
vices, and Counselling. The difference between the Instruction Item in the
coliege's financial statement and the total of all instructor salaries andNM
additional costs assigned to individual courses was also prorated by enrol-.
ment.
(2) Time: Proration of certain dollars by class hours assumed that
the number of hours of usuage was directly related to Plant Maintenance, the
only item prorated by class hours.
Once these two base figures representing Indirect Costs to be appor-
tioned by enrolment and hours were determined, the following technique was
used:
By Student Enrolments as follows:
(a) Total dollars to be apportioned on student enrolment basis.
(h) Total students in total courses.
(c) Divide (a) by (b) = Indirect per pupil cost based on enrol-
ment.
(d) Multiply the result of (c) by the enrolment in each course
to yield the amount of indirect costs to be apportioned to
each courie on the basis of student enrolments.

16
On a Time Basis as follows:
(a) Total dollars to be apportioned on class hours basis.
(b) Determine the number of hours assigned to.each course on
a weekly basis x the length-of that course in weeks.
(c) Total the results of (b) for all courses.
(d) Divide (a) by (c) to determine the indirect cost factor
to be apportioned to each course on a time basis.
(e) Multiply the factor of (d) by the (b) result for each
course to determine' indirect costs to be apportioned for
specific courses on a time basis.
Cost Indicators. The resulting information on course costs was then_
reworked into the following measurements of course cost:
(1) Total Course Cost: The total course cost was the result of add-
ing three figures: (a) Direct Instructional Costs per Course,
(b) Indirect Costs by Enrolment, and
(c) Indirect Costs by Class Hour.
- (2) Costs per Student: The cost per student was the result of
dividing: Total Course Cost
Number of Students Enrolled in the Course
(3) Cost per Student Hour: This cost was derived by dividing:
Total Course Cost
No. of Students No. of Hours Length inPer Course
xCourse Taught Weeks
or, more simply:

------------ urse cost
17
tuJtnt Contact Hours per Course
' t
rniued hv is in,' a sampling technique. The
r at to.a,i lv :1--,ed by Lir ions programs was nearly im-
: t t t,-;! in ,al.ndar. As a result, a decision was made
!it trudtnt i!our or more courses) who were enrolled in
t'vr(vt.t. -,Ampiv of ill the students in the program, if
't- than EiA,. t.:3, drawn using a table of random numbers. Actual
tt t.r ;tudent were examined to determine what courses
r on't- ;,rogram, These IndiviAal program costs were examined
and average program cost.
apptoach appeared ,;traighttorward, there were a number of .
ouId t.I nentioned.
the ,p;ic problems wa to determine what year a student was
Ini,-tr7.aticr v ?bit. regard occurred in a number of formats:
11 -tudent iwts-* In the college which did not necessarily coincide
- ?.!) the year a student was in a program--the
that -t,dvn:- often had a mixture of year one and year two
a', :rovram of high --(hoe] equivalence and university
r t" k r
t it, w is made to accept the colleges' Near of
11 1 rout to eximine the programs of --mph. t;tudents to be sure
't 't-=, u -%Jct vx-irloJtloo wa' the year of program. This was possible

18
in all colleges except Calgary. In that college, where the volume of work
made' it possible, student programs were individually examined to take out
first and second year costs. Additionally, the flexibility of Calgary's
program offerings allowed students to start a year in a semester of one
academic year and finish the year in another semester of a different academic
year. This created some difficulty in finding students who had full years
which coincided with the 1970' -71 year of the Costing Study. As a result, a
decision was made to determine program costs by semester in Calgary and
to arrive at an average semester cost for a program. The assumption was
then made that a normal program year was equal to twice the semester cost for
any specific program.
Also the student lists by program used for sampling did not designate
the year of program. Where it became evident by examination of individual
prcgrams what the year was, a program cost by year was produced. Where the
sample did not yield clear demarcation between years of a program, a single
program cost, representative of both first and second years, was developed.
Often some program costs could not be produced simply because the high degree
of program flexibility offered to students in Calgary meant that most or all
of the sample was attending on a part-time basis. This was particularly so
with many of the Certificate Programs.
Finally, one should be most aware that due to the sampling technique
used, the figures produced represent what programs actually cost in the 1970-
1971 year, The Program costs do not represent the "normal" program as
listed in respective college calendars. The actual program costs produced

by this study represent the inclusion of failure and repeat courses as well
the "normal" pro am.
4
o
k
19

Chapter 4
COST ANALYSIS - FINDINGS
Actual details of course and program costs are Included in Appendices
A, B, C, D, and E. Course costs were reported with the following data and
cost indicators: (a) full or one-half course was designated, (h) enrolment,
(c) total cost per course, (d) cost per student, and (e) cost per student
contact hour. Program costs were reported with a high, low and average cost
for each college.
COURSE COSTS
As related earlier course costs were derived by prorating direct and
indirect costs to each course using the faculty member's assigned class con-
tact hours to prorate the direct cost and using enrolment and total student
contact hours to prorate the indirect costs. Salary charges for markers aid
and instructional assistants were also assigned to the cirect cost.
The costing details for all of the courses are included in Table 2
of Appendix A, Table 2 of Appendix B, Table 2 of Appendix C, Table 2 of
Appendix D, and Table 2 of Appendix E. Courses are listed alphabetically in
these tables. In the following analyses full-time and one-half time courses
were separated. Essentially a full-time course was one offered for both (two)
semesters, while a one-half course was only offered for one. Also the follow-
ing analyses were reported using the cost per student contact hour or unit
since this was determined to be more comparable than just per student cost
since the former measure included the time factor ays well as the enrolment
factor to give a more refined measure.
20

461
21
Range of Full-Time Course Cost Per StudentContact Hour
Generally speaking, there was a wide range in course costs though a
relationship did exist between high cost and low enrolment, and low cost and
high enrolment as indicated in Tables 1 and 2. Since only Grande Prairie
and Red peer offered any number of full courses it was difficult to determine
if full courses were more or less expensive to offer than half courses. The
most expensive full courses were lower than the most expensive half courses.
However, this relationship was not at all clear upon comparision of the lowest
cost full and half-time courses. Comment on Medicine Hat's full-half course
arrangement was difficult since only four full courses were offered.
An enrolment-cost relationship did appear evident in both full and
half-time courses. At least two problems arose, however, in that the lowest
cost course did not always have the highest enrolment or other courses with
similarly low costs had only half the enrolment of the lowest cost course.
This might suggest that in any particular college there was a maximum class
size beyond which cost reductions were affected very minimally.
A similar problem also occurred with the highest cost courses. Often
other courses of equally low enrolment existed but the cost of these courses,
while still high, was considerably lower than the highest cost course. Taken
together the problems outlined above added considerable strength to the obser-
vation that the enrolment-cost relationship was not linear. The relationship
would appear to be multi-variate in nature with other factors such as hours
devoted to a course, cost of the instructor, and charging of additional costs
(markers, assistants) having a mediating effect on the more obvious cost-
enrolment relationsip.

22
Table 1
Range of'Per Student Contact Hour Full-Time Course Costswith Enrolments
College
No. of Full
CoursesTaught
Lowest Cost Highest Cost
Cost Enrolment Cost Enrolment
Grande Prairie 60 0.59 97 10.04 4
Red Deer 55 0.24 289 10.50 4
Mount Royal 0
Medicine Hat 4 2.51 17 2.93 15
Lethbridge 0
Table 2
Range of Per Student Contact Hour Half-Time Course Costawith Enrolments
College
No. of Half
CoursesTaught
Lowest Cost Highest Cost
Cost Enrolment Cost E'irolment
Grande Prairie 37 0.59 53 11.95 4
Red Deer 106 0.34 482 13.16 3
Mount Royal 350 0.15 . 625 51.20 1
Medicine Hat 122 0.37 152 16.55 2
Lethbridge 248 0.28 123 8.14 4

23
It was very difficult to generalize to a category of courses as more
expensive because of the mix of low and high cost courses. In Grande Prairie
the low cost courses were in Business and Sociology, in Red Deer, Physical
Education and English courses; in Mount Royal, an English course; in Medicine
Hat an Adult Upgrading course and Math 99; and in Lethbridge a welding course.
High cast courses were equally mixed with a Business and Mechanical
Engineering course in Grande Prairie; Secretarial Science and Physics in Red
Deer; Math in Mount Royal; Secretarial Science and Biology in Medicine Hat;
and an Outdoor Recreation and Conservation course in Lethbridge. The highest
cost course in Calgary was clearly due to the one-to-one instructor-student
ratio. The next highest Calgary course was in Secretarial Science.
It would appear that certain business courses and Math-Science orien-
ted courses did tend to Cost more, although exceptions occurred. The domi-
nance of a particular low cost courses category was just not clear. The high
and low cost of course categories became more clear in the Program Costs.
Enrolment Distributions
Full Year Courses. Tabley3 shows the distribution by number and per-
centages of enrolment in full year courses. Mount Royal and Lethbridge had
no full courses; Medicine Hat offered only four with three having less than
ten students while the other had between 30 and 99. Grande Prairie's full
courses comprised 62 percent of its total course offerings, while Red Deer's
full courses constituted only 34 percent. Grande Prairie had a greater per-
centage (71.6) of its full-time classes below 30 pupils while Red Deer had a
greater percentage (50.9) of its full-time courses with enrolments over 30.

0111
1111
111
Table 3
lorii
rs4
4ara
kvo4
taw
ar.i
Distribution of Full Year Courses By Enrolment
mire
1110
College
Total
Total of
Total No. of
College
Full &
Full Courses
Enrol-
1/2
N% of All
ment
Courses
Courses
N%f
N%f
N%f
N%f
N%f
Enrolments
1 -'9
10 - 19
20 - 29
30 - 99
,100 +
Grande Prairie
323
97
60
61.9
813.3
24
40.0
11
18.3
16
26.7
11.7
Red Deer
904
161
55
34.0
712.7
916.4
11
20.0
21
38.2
712.7
Mount Royal
2,306
350
0'0
--
--
--
Medicine Hat
477
126
43.2
375.0
--
--
125.0
-
Lethbridge
1,040
248
00
--
--
--
--

25
Half Year Courses. As Table 4 indicates, Grande Prairie had 38.1
percent of its course offerings made up of half courses. Red Deer had 65.8
percent, TYhile Mount Royal, Medicine Hat and Lethbridge had 100 percent, 96.8
percent and 100 percent respectively. There would appear to be a strong
trend toward the use of half courses.
Mount Royal had the greatest number of half-year courses with 30 or
more students and also the smallest percentage of classes below 30 students
and below 20 students. Mount Royal also had the smallest group of courses
with nine or les's students.When Atherton (1970: 22) found Mount Royal to
have the highest number of students in this category, he suggested that the
economies of scale resulting from large enrolments were likely offset by the
need to offer a wider variety of courses. If Atherton was correct, it would
appear that economies of scale occur in plateaus. In this study, the number
of students appeared to come into line with course offerings so that the
economies of scale were no longer offset by the need for a wider variety of
courses. It could also be a clear indication that at .a certain level of en
rolment, sufficient courses exist to allow for quite efficient cross-usage of
courses from department to department. This would tend to he supported by
the fact that Grande Prairie, the smallest and newest college, had more stu-
dents in smaller classes and lest in the larger classes than did any of the
other colleges.
In Red Deer and Medicine Hat, the break between the percentage of
courses with 30 or more and less than 30 students was almost exactly the same.
Both colleges had 41 percent of their courses with enrolments above 20. This
was very interesting in view of the similarity of programs in both colleges

11.1
...4
Table 4
Distribution of 1/2 Year Courses by Enrolment
College
Total
College
Enrol-
ment
Total of
Full &
1/2
Courses
Grande Prairie
323
97
Red Deer
904
161
Mount Royal
2,306
349
Medicine Hat
477
126
Lethbridge
1,040
248
Total No. of
1/2
Courses
N% of All
Courses
,
37
38.1
106
65.8
349
100.0
122
96.8
248 100.0
Enrolments
1 - 9
10- 19
20
- 29
30- 99
100 +
N%f
N%f
N%f
N%f
N%f
924.4
821.6
821.6
12
32.4
00
14 '13.2
23
21.7
25
23.6
37
34.9
76.6
29
8.3
63
18.1
59
16.9
135
38.7
63
18.0
23
18.9
34
27.9
15
12.3
42
34.4
86.6
37
15.0
85
34.3
45
18.1
63
25.4
17
6.9
NJ

27
and in view of the total enrolments, Red Deer's being almost double Medicine
Hat's. These figures seemed to point to the existence of developmental
levels and to suggest that levels of growth occur where economies of scale
can be expected to emerge. It could also suggest a clear difference in
economy of operation between the two colleges.
The issue was not quite that simple, however, because Lethbridge had
67.7 percent of its classes-with fewer than 30 students. Since Lethbridge
was similar in size to Red Deer, this could suggest that economies of scale
begin to be negated by increased course offerings beyond the 1000 student
level. It also suggested quite clearly that different program and course
orientation can be important variables because Lethbridge was geared to more
small-class, skill-oriented program than were Red.Deer and Medicine Hat.
Regardless of the dissimilarities of enrolment distributions, college
size does appear to be a factor in class size. Grande Prairie as the smallest
college did not tend to the class sizes of Mount Ispyal. While Red Deer and
Medicine Hat did not have similar distributions, the Red Deer trend to larger
classes identified by Atherton (1970: 22) seemed to be slowing down, and the
bimodal distribution found by Atherton (1970: 22) in Medicine Hat seemed
to be smoothing out towards larger classes. Quite -clearly, however, as the
Lethbridge situation indicated the relationship did not turn on college size
alone but was strongly influenced by course and program type.
Cost Distribution
Full Year Courses. The cost of full year courses as detailed in Table
5 was only open to examination in Grande Prairie and Red Deer. In this case,

Table 5
Distribution of Full Year Courses by Cost Per Student Contact Hour
Col
lege
Total
Toal
Course Costs Per Student Contact Hour
tCollege
Full
es
$0Less
.49 or
Enrol-
Cours
0.50-0.99
1.00-1.99
2.00-2.99
3.00-3.99
4.00-4.99
5..00-9.99
10.00+
scent
N2f
N2f
N2f
N2f
NXf
NXf
NXf
NZf
.
Grat:de Prairie
323
60
00
58.3
610.0
23
38.3
13
21.7
46.7
813.3
11.7
Red Deer
904
55
35.5
10
18.2
10
18.2
14
25.5
610.9.
2,
3.6
712.7
35.5
Mount Royal
2,306
0
-Medicine Hat
477
44
1.00.0
Lethbridge
.1,040
0

29
Red Deer had more low cost courses than did Grande Prairie, but Red Deer also
had more high cost courses. In spite of this,Iled Deer's distribution was
slightly skewed in favor of low cost courses while Grande Prairie's tended to
skew slightly in the'opposite direction. Howe(rer, in both colleges, the bulk
of course costs ranged between $1.00 and' $3.99 per student contact hour.
Half Yeaf Courses. The most striking observation taken from Table 6
was that Mount Royal had '53.6 perkent 'of its courses at a cost level below
$1.99 per contact hour and only 14.9 percent over $4.00. Course costs tended
to skew to high costs per student contact hour in Grande Prairie. This
college had the fewest number of courses cbstin less than $1.99 per student
contact hour. Thie trend was strengthened when all the full and half courses 14
were equated. The cost trends or both the smalleat and least varied and the
largest and most diversified colleges were consistent with expectations rela-
ted to economies of_ scale.
The majority of courses in Medicine Hat and'Red Deer cost $2.99 per
student contact hour or, less, the percentages being 76.3 and 68.9 respective-
ly. Medicine Hat tended to have somewhat lows course costs, a factor likely
explained by differences in wages paid to faculty. The course cost distribu-
tion in Lethbridge was not too dissimilar from that of Medicine Hat. It was
somewhat lower than Red Deer's distribution and slightly less than Medicine4
Hat's. However, Lethbridge was the only college that had no course costs in
the $10.00 plus cost per student contact hour.
Many af these relationships became readily apparent when the average
1970-71 salaries of full-time faculty, excluding administrators, were examined.
Grande Prairie had the highest average salary at $12,874 and it also hadoghe

Col
lege
Dis
trib
utio
n of
1/2
Yea
r C
ours
es b
y C
ost P
er S
tude
nt C
onta
ct H
our
ii
Tot
alT
otal
Cou
rse
Cos
ts P
er S
tude
tt C
onta
ct H
our
Col
lege
1/2
.49
Enr
ol-
Cou
rses
$0L
ess
or0.
50-0
.99
1.00
-1.9
92.
00-2
.99
3.00
-3.9
94.
00-4
.99
5.00
-9.9
910
.0:2
1--
ntN
Zf
NZ
fN
Xf
NZ
fN
Xf
NZ
fN
Zf
NZ
:
Gra
n 3e
Pra
irie
323
370
03
8.1
2, 5
.47
18.9
1027
.15
13.5
821
.62
5.4
Red
Dee
r90
410
62
1.9
76.
624
22.6
1817
.022
20.8
1514
.216
15.1
21.
S
.v.o
unt R
oyal
2,30
635
043
12.3
6017
.184
24.2
''5
215
.258
16.3
133.
729
8.0
113.
2
Y.e
dici
ne c
at47
712
25
4.1
1411
.529
23.8
2117
.224
19.7
9;.4
119.
09
'.4
.L
ethb
riag
e1,
040
248
83.
235
14.1
5421
.856
22.6
4S18
.128
11.3
228.
90
cm°

31
.7 :ssr listtihuti, n. Mount Koval and Red Deer had very
1U-frit, tig.tres at 511,959 and 11,994 respectively.
t;- r, indicated, had the lowest course cost dis-
f Ittf an average salary of $11,344 and Medicine Hat's
ranited econd below Grande Prairie in course cost
s ilar-; 4 ft1 "nit.**1 at In spite of this relationship,
,,ornewhat lower than Medicine Hat's.
telirJoh-N1p,-. ;%etween (.,1)ege Aze, average salary, and course
Int!!.-e! number of things. ';iie of the institution was
finitilv !nitor wi k_ould wotk to favor the economical opera' an of the
ih ,rumo .lear in the c.n: of Calgary with the second highest
tlttt v.t :4.4k, evit distraottion: Salary rails paid faculty were also
ct.:r f rrz the site or alone one would expect Red Deer to
e a 1,,wt s-of.t di,trfhotid<n than Medicine Hat had. This was not
_ re.o..on t.tqamv appa:.ent when an examination of Red Deer's
s'-', is sty r 4`V4 ICJ it to /II percent. higle-r than Medicine Hat.
,I1- tilt rank from Li..j.st to lowest for average salary was main-
s !fur, ranke,i ,'ourst cost dist-ibution. The one
«e ;:Sr- VIt% tn,t u.trd highest average salary but the lowest
wa., the obvious economy factor in Calgary as
«t :.ethist,dge. However, the size difference was not so
, Ind ; tohti thus; lendint; mire support to the consi-
,It r sr p.tv rates were also 4 definite factor in economy.

32
One final economy factor was the practice carried out by both Mount
Royal and Lethbridge of hiring a large number of sessional instructors. The
salaries of these people generally related to the offering of one specific
course and the unit cost of these courses was quite naturally much lower than
courses tau^ht by full-time instructors. The widespread use of this practice
was an obvious influence on the larger number of low cost courses which
occurred in the distributions of Mount Royal and Lethbridge. The three most
apparent variables affecting course cost distribution were size, faculty sala-
ries, and staffing practices.
SUPPORTING SERVICES
Data for an examination of supporting services were drawn from the
1970-71 financial statements of the colleges. The specific services chosen
for examination were Counselling, Library, and Health Services. The per
student figures in Table 7 were derived by dividing the financial statement
data by the enrolments provided earlier in Table 6.
Counselling
High counselling costs appeared initially to be related to high enrol-
ment and to a certain extent this was borne out since Calgary had the highest
per student cost. However, beyond that similarity the cost and enrolment
rankings deviated. Grande Prairie, the smallest college, had the third
highest counselling cost. An enrolment relationship might still exist only
in an inverse way in that a smaller colt ,e, should it choose to give coun-
selling a high priority by hiring full-time staff, will have to spread the
cost out over a smaller population thus giving rise to a higher per student

Table 7
Actual Total and Per Student Expenditure on Supporting Services
College
Counselling
Library
Health
All Services
Per
Total
Student
Per
Total
Student
Total
Per
Student
Per
Total
Student
Grande Prairie
$ 14,041
$43
$ 29,087
$90
$-
-$ 43,128
$134
Red Deer
43,395
48
86,531
96
--
129,926
144
Mount Royal
200,445
87
150,646
65
18,057
$8
369,148
160
Medicine Hat
10,701
22
48,765
102
--
59,468
125
Lethbridge
30,709
30
25,067
24
--
55,776
54

34
expenditure. Also, if a college determined that its 'Counselling service was
to serve the community and the college student, costs could be considerably
higher. This would appear to have been a factor in Calgary.
Library
Clear patterns of expenditure were much more difficult to determine
in regard to liPrary. The one key factor was the need for large initial and
ongoing expenditures for any library regardless of college size. Five hundred
students need an adequate basic library equally as much as do 2000 students.
Furthermore, libraries can often -be supported by the local community in ways
which will increase library service and quality without increasing per student
'costs. The striking difference between Medicine Hat and Lethbridge was under-
standable in light of the establishment of Medicine Hat's new facilities and
in view of past sharing arrangements Lethbridge has had with the University
of Lethbridge. The fact that Lethbridge College was a considerably older
institution would also be significant.
Conclusion
One final set of relationships were revealed in the data compiled in
Table 8. The most Interesting factor related to the percentage of total
college budgets that was allocated to direct instructional expenditure. Since
this direct expenditure was very carefully "cleared" of any non - instructional
charges before prorating it to individual courses, the data in Table 8 gives
an excellent picture of what portion of a college operation was devoted to
actual instructional salary. The ranking order of college by percentage of
budget on instructional salaries was consistent with the ranking of average
I

Table 8
Analysis of Total Expenditure by Types of Input
College
Direct Instructional1
Amount
y
Indirect2
Total
Supporting Services3
Amount
Balance of Indirect
Amount
Grande Prairie
284,535
42.2
43,128
6.4
347,295
51.4
674,958
Red Deer
770,857
50.1
129,926
8.4
637,863
41.5
1,538,646
Mount Koyal
1,625,523
44.9
369,148
10.1
1,638,980
45.0
3,643,6515
Medicine Hat
399,934
52.7
59,4'68
7.8
299,253
39.4
758,6555
Lethbridge
654,076
43.6
55,776
3.7
790,711
52.7
1,500,563
1Direct Instructional is comprised ally of
instruction salaries and benefits as used in
the study.
2Indirect is the amount prorated to courses on the
indirect basis outlined in the study.
3Supporting Services are from Table 6 and include Counselling,
Library and Health Services charges
as they appeared in the
financial statements.
4Balance of Indirect was the remaindt-r of the indirect charges
after removing the specified support-
ing services.
5These two totals do not include rental facilities as part
of plant maintenance and cafeterias and
residences were "netted out.."

36
salaries for Red Deer, Mount Royal and Lethbridge. For Grande Prairie and
Medicine Hat, the situation was completely reverse. Medicine Hat devoted
the largest portion of its budget to salary (52.7 percent) but had the
lowest average instructional salary. Grande Prairie had the highest average
salary but devoted the lowest portion of its budget to ins'-ictional
salary.
PROGRAM COSTS
As indicated earlier, program costs were determined by using a sam-
pling technique and then by assigning course costs to the programs of the
individuals in each sample. This method produced an actual program cost
representative of such factors as failures, repeat courses, and the wide
variety of option choice available to students in the development of their
individual programs. Thus the cost of an individual student's program was
the combined cost of the various courses included in the program; the course
cost information coming from the data in Appendices A, B, C, D, and E. The
final output was an average program,cost representative of the sample, a low
program cost equal to the lowest program in the sample, and a high program
cost equal to the highest program.
No attempt was made to cost only comparable programs. All programs
were costed in an effort to provide as much information as possible to in-
dividual colleges. 'While comparison of programs in each college was inevi-
table, this was not the primary purpose in costing various programs.

37
Grande Prairie
The data on program costs for Grande Prairie are included in Table 9.
The most striking feature "of the program costs at this instittition was the
sharp distinction in cost between the relatively low Arts and Social Science
programs and the high cost Math/Science and Vocational-skill programs. Aside
from the high cost of instructional salaries, it was also evident that small
enrolments figured significantly in the high cost of the Science-Vocational
programs. In addition, the added time requirements of laboratories, skill-
building and experimental, tended to compound the other factors. Unlike some
other colleges where students appear to use low cost Social Science options
in the first year of a Math/Science program, students in Grande Prairie had
extremely high cost courses which serviced only the specific programs. How-
ever, the most obvious factors seemed to be related to high instructional
salaries, low enrolments, and generally the small college problem of having
to provide specific courses basic to programs without being able to use these ,.
courses for inclusion in other programs.
Red Deer
Program costs for Red Deer College are included in Table 10. Th
Social Science -Math /Science cost distinction was evident in Red Deer as well,
though ncre the difference was not nearly so large. This was due in part to
two factors: (1) A better mix of lower cost Social Science options for
students taking Science oriented programs with higher cost laboratory courses
to be taken after transferring to a university; and (2) the influence of
larger enrolments on the cost of various courses.

38
Table 9
Range of Program Costs in Grande Prairie College
Year Low Average High
Transfer Programs:
Arts BA General
Commerce
Education
Engineering
Forestry
Home Economics
Physical Education
Pre-Law
Pre-Medicine
Science BSc General
Diploma Programs:
Business Administration
Business Administration
Secretarial Science
Secretarial Science
Combined University Transferand Matriculation Program
.0
1
1
1
1
1
1
1
1
1
1
1
2
1
2
1,837
1,504
1,770
4,735
2,573
2,105
1,083
2,042
3,267
2,414
1,448
3,340
1,444
1,652
1,723
1,842
1,975
2,160
4,735
2,573
2,105
2,124
2,285
3,267
2,995
2,191
3,642
2,427
2,040
2,501
1,847
2,189
2,839
4,735
2,573
2,105
2,855
2,508
3,267
4,363
2,932
3,935
3,022
2,433
4,111

I
I
' Range of Program Costs in Red Deer College
Table 10
39
Year Low Average High
1Transfer Programs:
1
1
1
1
1
1
1
I
ITable 10 Continued . . .
Agri6ulture 1 1,634 1,695 1,803
Agriculture 2 1,448 1,520 1,579
Architecture (one student) 1 1,236 1,236 1,236
Arts 1 945 1,227 1,536
Arts 2 970 1,249 1,656
ICommerce 1 1,057 1,338 1,659
Education 1 1,127 1,405 2,449
Education 1 954 1,220 1,5b3
Engineering 1 1,874 1,874 1,874
IEngineering (one student) 2 1,867 , 1,867 1,867
Household Economics 1,178 1,385 1,466
Law 1,261 1,431 1,922
IMedicine 1 1,351 1,437 1,622
Medicine 2 1,805 1,842 1,880
Pharmacy 1,742 1,807 1,873
Physical Education 1 1,394 1,556 1,809
Physical Education 2 1,529 1,747 2,001
Recreational Administration 1,088 1,283 1,526
Science 1 1,093 1,501 1,852
Science 2 1,534 2,121 3,380

1
39(a)
Table 10 (Concluded)
Year Low Average High
Diploma Programs:
Arts and Science 1 1,681 2,213 2,853
Business Administration 1 1,811 2,300 2,495
Business Administration 2 1,819 2,148 2,532
Nursing 1 2,835 2 835 2,835
Nursing 2 3,588 3,721 3,/36
Secretarial Science 1 1,698 2,429 2,874
Secretarial Science 2 2,424 3,225 .4,314
Social Services 1 . 1,740 2,291 2,540
Social Services 2 1,884 1,900 1,968
Combined University and High -
School Equivalent Programs 1 1,103 1,546 1,844
2 1,270 2,041 3,739

Diploma or career programs tended to be considerably more expensive
than transfer courses. For example, the general diploma in Arts and Science
was close to $1,000 higher than the first year in an Arts transfer program.
This suggested that transfer courses which could have been used to service
various diploma programs were not being used to accomplish this purpose.
This situation also raised a question about the amount of similarity that
should or could exist between transfer and diploma programs. In addition, it
should be noted that in 1970-71 the diploma programs were relatively new and
higher costs due to implementation could be expected. Some of the diploma
programs also carried high cost laboratories necessary for skill development.
/- Nursing was the most outstanding program for cost and the factors involved
were low pupil- instructor ratios reflected in the tean approach for instruc-
tion and traditionally low ratios related to laboratory (hospital) instruction.
In addition the need for an extra-cost summer program resulted in higher costs.
Mount Royal
The program costs for Calgary are shown in Table ll,tthough it should
be noted that Calgary was in the process of clearing up ambiguities in pro-
gram designation at the time program costs were generated. Programs for
transfer to the University of Calgary were self-explanatory as was the meaning
of Certificate Programs. However, a wide variety of diploma programs in Cal-
gary carried transferability to universities in Eastern Canada and the United
States. These programs were designated as Transfer to Other Universities in
this study and included students enrolled in the old B program and the new T
program. programs designated as D by Mount Royal referred to students in a
two year diploma program with no intent to transfer.

41
Table 11
Range of Program Costs in Mount Royal College
Year Low Average High ,
Transfer Programs to theUniversity of Calgary:
Arts 1,194 1,478 1,878
Business Administration 1,004 1,247 1,574 .
Household Economics 1,241 1,241 1,241
Pharmacy 1,218 1,615 2,200
Physical Education 1,398 1,611 1,894
Pre-Dentistry 1,136 1,608 1,800
Pre-Veterinary 1,200 1,509 1,722
Science 1,014 1,579 1,866
Miscellaneous (no major specified) 1,238 1,238 1,238
Combined High School Equivalentand Transfer Programs to U of C:
Agriculture 1,304 1,389 1,446
Arts 1,246 1,491 1,614
Business Administration 926 1,158 1,460
Education 1,134 1,355 1,690
Pharmacy 1,692 1,883 1,940
Physical Education 1,298 1,579 1,998
Pre-Dentistry . 1,623 1,623 1,623
Pre-Medicine 1,364 1,764 2,482
Pre-Veterinary 1,690 1,690 1,690
Science 1,014 1,306 2,404
Table 11 Continued . . .

42
Table 11 (Continued).
Year Low
Transfer Programs to OtherUniversities:
Applied Social Sciences 1 798
Applied Social Sciences 2 ' 1,348
Arts 1,072
Broadcasting
Business Administration
. ..
,020
Computer Science 1,142
Correctional Careers 1,500
Engineering 1 1,272
Engineering, 2f 7,180
Interior Design 1 976
Interior Design 2 1,202
Journalism 1 1,046
Journalism 2 1,272
Optometry 1,168
Petroleum Land Management 1,066
Physical Education 1 1;148
Physical Education 2 1,104
Police Science 1,618
Public Relations 1,186
Recreation and Outdoor Education 1 1,134
Recreation and Outdoor Education 2 1,196
Secretarial Science 1,066
Social Work / 1,560
Miscellaneous (no majors specified) 794
Average High
1,436 1,884
1,651 2,318
1,820 3,318
1, 638 2,628
1,358 2,226
1,626 1,964
1,627 1,728
2,056 3,758
,697 3,022
1,529 2,306
4 1,566 1,852
1,443 1,926
1,824 2,312
1,649 2,386
1,350
1,396
.......1088
2,080
1,600 2,204 1
2,103 2,090
1,495 1,884
1,585 2,128
1,517 1,758
1,365 1,830
1,967, 2,362
1,400 2,072
Table 11 Concluded . .
I

43
Table 11 (Concluded):
Year Low Average High
Diploma Programs-Two Year Terminalwith NO Transfer:
Broadcasting 1 1,216 1,650 2,112
Broadcasting 2 2,168 2,547 3,028
Business Administration 756 1,305 1,946
Correctional Careers 1 1,230 1,576 1,878
Correctional Careers 2 1,986 2,142 2,412
Day Care 1,176, 1,331 1,570
Insurance 1,028 1,028 1,028
Interior Design 1 990 1,747 2,532
Interior Design 2 936 1,825 4,014
Journalism 970 1,711' 2,380
Nursing 1 2,508 - 2,508 2,508
Nursing 2 2,342 3,395 5,548
Police Science 1,374 1,844 2,114
Public Relations 1g
1,360, 1,593 2;116
Public Relations 2 1,498 2,301 2,914
Real Estate & PropertyManagement 1,250 , 1,250 1,250
Recreation & Outdoor Education 1,308 1,740 2,182
Secretarial Science 1,018 1,477 1,880
Social Work 1 1,444 1,980 2,332
Social Work 2 1,348 1,799 2,803
Urban Planning 1,584 1,823 2,188
One Year Certificate Programs:
Architecture 1,266 1,728 2,164
Business Administration 1,022 1,282. 1,510
Residential Child Care 1,804 1,890 2,030
Stenographer 1,048 1,454 1,778

44
, ! tftt t if warietv of offerings at Mount Royal, comparison among
vt Imrun4tiv dittirtilt. Within the "transfer to the ' iiversity of
the dltcinction betwcen the Social Science -Math/Science
ident: Thls- was due to higher e,rolmept and the
t. tt.t :-Itortlf tor tro-it-t-uttli.tation of courses from different programs.
rhivt,ttv t t Calv,ary transfer and high school equi-
Where ii-tejamt, were available for comparison, the
, fi,/Ztl, plogramt- were slightly more expenseve than similar
pr-,!rim, r- the Vniversity of Calgary. Social Science combined pro-
f lt,!Nzl,.. i. .0stiv than gimilar transfer'programs.
u, thftr differert natures, comparison between "transfer to
promraml, and "transfer to other universities" programs
.%;
nowevr, wa, interesting to note that the Arts program
t the !Iniverstty of Calgary was considerably less costly than
rr.-rif! t fraf..,fer 'e other universities. This would seem to sug-
Lick -f (r0-04-ufllization of courses but also the possibility
frrame-s were quite dlssimilar.
_erlp4rit.on was possible between "transfer to other universities"
attl -!Ipittrlo provraml-t, the majority of the diploma programs tended to
wa tonsil,tent with the reasoning that a terminal diploma
;'11)'? rr. a;,-,!;1.! ;-rohahlv have more high cost skill courses than would a program
Yrtto-terred for an additional one or two years of training. Cross-
with other tr. 1sfer programs at Mount Royal would also be more
f,,r Th. "tern -f. r to other universities" than would be possible for
'sh/ "j,1

45
As usual, programs that required the additional time of laboratories
in combination with low enrolments were somewhat more expensive in Calgary,
although the difference was less marked than in other colleges. Nursing was
the highest cost program in Mount Royal College and the factors were similar
to those in Red Deer. However, costs were kept down somewhat by using lower
cost sessional instructors in first year Nursing and with a time release
arrangement in second year to handle the spring-summer session. ti
Medicine Hat
Program costs For Medicine Hat College as reported in Table 12 showed
.' the same Social Science-Math!Science dichotomy. Education was the highest
cost transfer program. In most cases, the differences were not extreme. This
was partly due to the loading or credit system used to assign faculty loads.
The formula tended to give less credit for salary purposes to time spent in
laboratory oriented courses. It made possible a larger hour'load per instruc-
tor thereby reducing commitment of dol4ars to generally high cost laboratory
programs. Since salaries in Medicine Hat were the lowest in the province, this
also contributed to the generally lower program costs. There also appeared to
be a good mix of courses between programs.
Diploma programs were quite new in Medicine Hat for 1970-71 and,
except for first year Business Administration and Nursing, the costs were
quite similar to other programs. Nursing was susceptable to the same obser-
vation as in other colleges except that the pupil-instructor ratio was lower
due to the basic staff requirements necessary to start the program and low
initial enrolments. As the Nursing program matures, a considerable decline
in costs can be expected.

1
46
Table 12
Range of Program Costs in Medicine Hat College
Year Low Average High
Transfer Programs:
Agriculture (one student) 1,636 1,636 1,636
Arts J,320* 1,653 2,226*
Commerce 1,411 1,580 1,896
Education 1,464 1,944 3,188
Engineering 1,591 1,855 2,290
Fine Arts (one student) 1,633 1,633 1,633
Home Economics 1,653 1,861 2,068
Physical Education 1,074 1,662 2,034
Pre-Dentistry andPre-Medicine 1,680 1,806 1,974
Science 1,596 1,884 2,195
Diploma Programs:
Business Administration 1 1,261 2,058 2,493
Business Administration 2 1,802 1,809 14817
Nursing 1 5,799 5,964 6,030
Secretarial Science 1 1,011 1,812 3,563
Matriculation-High SchoolEquivalent Program: 1,108 1,436 2,181
Adult Upgrading Program: 135 513 1,020
(1 course) (6 courses)
*Based on 1/2 year or 1 semester.

I
47
Lethbridge
Program costs for Lethbridge are included in Table 13 and, unlike
other colleges, Lethbridge had a very general emphasis on university transfer.
Students in,this program were classified as College and University Prepara-
tion and it was the least expensive program in the college. This was due to
at least two factors: (l) a good availability of low cost, non-laboratory
solcourses in the Social Science tradition, and (2) the fact that students in
O
this program clearly took fewer courses in a year than did students in other
programs.
The differences in the cost of other courses tended to be associated
with the inclusion of higher cost, skill-oriented laboratory sections. Al-
though the cost of specific courses in Lethbridge was not extreme, high cost
programs tended to result from student programs which contained a large number
of courses. This was particularly the case with Architecture and Drafting
Technology and many of the other_career programs.
Nursing was obvious by the fact that it was not the most expensive
program in the college. This was, likely due to larger workloads, the fact
that no additional pay was made for summer courses, and reasonably high.enrol-
ments.
With one exception, and that being Vocational Agriculture, the second
year of all two year programs was considerably more expensive than the first.
This seemed to suggest that fewer, more theoretically oriented a,d thus lower
cost courses were part of the first year. In the second year a larger number
of courses was taken with emphasis on skill-building.

48
Table 13
Range of Program Costs in Lethbridge Community College
Year Law Average High
Accounting Secretarial 1,187 1,464 1,659
Automotives 2,065 2,171 2,399
Architecture & Drafting Tech. 2,610 3,851 4,196
Business Administration 1,423 1,483 1,576
College & University Prep. 640 1,051 1,496
Commercial Cooking 1,243 1,383 1,404
Data Processing 1,552 1,631 2,214
Data Processing Secretary 1,347 1,612 2,047
Electronic Technology 2Y90 2,549 1,964
Journalism 1 1,252 1,585 2,429
Journalism 2 1,506 2,132 2,112
Law Enforcement 1 1,850 2,062 2,640
Law Enforcement 2 2,153 2,633 3,388
Marketing Administration 2,222 2,397 2,505
Meat Technology 1,752 1,752 1,752
Nursing 1 2,092 2,092 2,092
Nursing 2 2,216 2,317 2,340
Office Administration 1,570 1,759 2,150
Outdoor Recreation andConservation 1 1,560 1,957 2,327
Outdoor Recreation andConservation 2 1,385 1,864 2,352
Radio-TV Broadcasting 1 1,261 1,412 1,516
Radio-TV Broadcasting 2 2,006 2,090 2,133
Shorthand Secretarial 1,351 1,620 1,717
Six Week Welding 332 332 332
Vocational Agriculture 1 2,261 2,401 2,635
Vocational Agriculture 2 2,045 2,384 2,743

49
Conclusions
Generally speaking, the cost factors most closely related to programs
were enrolments and hours. Mere specifically:
1. Low enrolments tended to produce high costs in specialized courses
related to career programs, technologies, sciences and to some limited extent
second year transfer courses. The inclusion of these high cost courses in a
program had the obvious result of pushing up the program cost.
2. A high concentration of time occurred in one or both of two ways:
(a) A type of science/technological/career course mentioned above that needed
additional allocation of time and salary to ensure proper growth of concepts
and skills tended to concentrate time and thus escalate costs, and (b) The
allocation of time to programs resulting from the inclusion of a large number
of courses. Basically, this meant that the more courses in a program, the
higher would be the cost. Where a large number of courses in a program tended
to combine with one or two high cost courses, the result was an obviously high
'cost program.
3. An additional factor in program cost was faculty salaries. High
salaries without the offsetting benefits of larger enrolments produced very
high cost programs.
4. The particular age of programs was another cost factor. Newer
programs tended to be higher in cost than did other more established programs.
The nature of the program was also a factor. If crossutilization of courses
from other areas was possible and was a reality, then costs appeared to be
somewhat lower. The availability of this crossutilization would seem to be
an important factor related to controlling costs of new programs. On the

50
other hand, new programs may require high initial costs simply because cross-
utilization is not possible and initial enrolments may be low.
SUBSIDY EFFECTS
The details of subsidy effects were not included in the body of the
report. Estimates of cost revenue analysis are contained in the appropriate
appendices. Essentially a subsidy effect took place when the cost of a pro-
gram was less than the combined revenue resulting from fees plus grants from
the Alberta Colleges Commission. In 1970-71, both the fee structure and the
grant structure varied from college to college making inter-college compari-
sons difficult but obviously allowing for differences in college age, size,
and program mix.
The value of the cost revenue analysis lies in the fact that it is
possible for an individual college to assess which programs tend to support
other programs in the college. While the interrelationship of factors in-
volved in the creation of a subsidy or deficit effect was complex, the know-
ledge of where specific programs were should aid in the establishment of
priorities related to program development. The establishment of a historical
body of such data should also he of value on an institutional level as well
as on a system level. Such information does not make institutional or system
level allocation decisions but it does much to aid such decisions.

I
ti
Chapter 5
RECOMMENDATIONS
One of the original purposes of this study was to present individual
colleges with a body of costing or expenditure data. The main body of this
purpose has been accomplised in the previous chapters. Little emphasis has
been placed on specifiC comparison of colleges with each other. The authors
have consistently felt that the most valuable kinds of comparison would and
should occur within individual colleges. There is a real danger that in pur-
suing cross-college comparisons erroneous conclusions can arise. The most
value in a cost analysis of this nature lies with each institution as the
data in the study affords college personnel the opportunity to assess priori-
ties and basic directions of college growth. It has been for these reasons
that conclusions to this point have been very general in nature.
One obvious type of analysis open to colleges is to examine both pro-
grams and costs in terms of:
1. amounts of direct expenditure;
2. amounts of indirect expenditure;
3. the number of hours devoted to courses;
4. the number of students;
5. the cost for first and second years;
6. the cost of implementing new courses and programs; and
7. the cost of established programs.
Not all of the above information has been included in this report for
lack of space and time. A yearly costing study would, however, produce a
51

52
report which includes many of the above variables. Others are readily avail-
able on college files.
Consideration of these issues in addition to other problems indicated
in the report should enable individual colleges to establish guidelines
related to course and program implementation. Such an analysis would go a
considerable way to providing information necessary to decide what costs can
be acceptable to start, and continue to operate new courses and programs.
An additional purpose of this study was to rationalize and improve
upon the costing technique originated by the Finance Committee of the Alberta
Colleges Commission. By doing this, the colleges would be provided with a
reasonably straightforward technique for doing an annual cost analysis. It
is in the yearly maintenance and operation of such a system that will allow
colleges to build the cost data vital to making cost-quality and cost-benefit
decisions. The consistent orientation of th? authors has been that cost-
quality and cost-benefit decisions are being made constantly in the colleges.
The operation of a costing study does not, nor will it ever, make these kinds
of decisions occur. Conducted on a yearly basis to provide longitudinal data
on college expenditure patterns, the costing study can be an extremely valuable
aid to the kinds of quality, benefit, and allocation decisions required within
individual colleges. Such information would also be of obvious value to the
Colleges Commission when it reaches the yearly point of making funding alloca-
tions to individual colleges. Properly operated and properly understood, a
regular costing procedure would be very beneficial to orderly growth within
colleges and within the system.

P
53
In this direction, the major recommendation of this chapter will re-
late directly to the procedures required to conduct, at minimum effort for all
concerned, a yearly costing analysis.
The present study had developed the following items which are integral
to a yearly cost analysis:
1. A data collection instrument accompanied with appropriate instruc-
tions. This instrument is included in Appendix F;
2. A master list of courses, including computer codes, that were
offered in the college system in 1970-71. The data collection instrument
makes provision for this list to be up-dated on a yearly basis;
3. A computer program has been developed by the Data Centre at the
Northern Alberta Institute of Technology. This program is available for year-
ly use.
With the preceding information in mind, the following procedure is
recommended for implementation of a yearly costing study:
1. The decision to implement the costing study should be made in
each college but the actual analysis should be iniated and coordinated by the
Alberta Colleges Commission with the necessary data collection being the
responsibility of each college.
2. An individual should be assigned responsibility for the analysis
at the Commission level. As well someone in each ,:ollege should be designated
the responsibility of receiving and handling the data collection instrument.
This pe;son in the college should have access to faculty loading data, faculty
salaries, and enrolment data. Ideally, the individual should be acceptable to

54
the Finance, Registrar, and Instructional Divisions of the college. Data for
the eost analysis tends to come from these three areas.
3. The data collection instrument and master course list from the
1970-71 cost analysis should be mailed to individual colleges in mid-August
and it will apply to the preceding academic year from July 1 to June 30. The
data should be returned to the Alberta Colleges Commission by September 30.
4. The fourth step relates to the duties of the secretariat staff of
the Alberta Colleges Commission in preparation of the data for submission to
the Data Centre. These duties are included in Appendix F and essentially
relate to the preparation of course and faculty lists from each college. All
data must be in from the 'colleges before this step can be completed.
5. Liaison should be established between the Data Centre and the
tAlberta Colleges Commission, and the information resulting from step four
should be sent to the Northern Alberta Institute of Technology according to
the instructions in Appendix F.
6. Individual data sheets should be delivered to NAIT as soon as the
Data Centre indicates readiness to start punching data. It is essential that
the individual data follow the delivery of course and faculty lists.
7. Punching of data and the actual analysis of the data at NAIT
should take no more than a month: At the end of this time the final costing
report would be available for distribution to each college.
8. Distribution of results and discussions relating to improvement
of the analysis should take place on a yearly basis immediately following the
output of the final report.
9.' Once colleges are familiar with the information flow required by

1
55
the costing program it would likely be possible to have the data available in
this format on an up-to-date basis. This would mean that the cost analysis
could be ready one month from the end of the academic year and not in October
as the present procedure indicates.
The above steps have been generalized somewhat and should make clear
the following specific and concise procedure for conducting the 1971-72 cost
analysis.
SPECIFIC PROCEDURE FOR THE 1971-72 COST ANALYSIS
1. Distribute the 1970-71 Costing Report.
2. Hold a conference of all concerned in July, 1972.
3. Gain college approval of the analysis on a yearly basis.
4. Appoint liaison people in each college during the conference.
5. Send out data collection forms and master course list by mid-August.
'. Preparation of an alphabetical list of all courses in each college from
the college calendars by Alberta Colleges Commission secretarial staff.
7. Return the data sheets by September 30 at the latest.
8. Preparation of alphabetical faculty lists by Commission secretarial staff.
9. Minor financial calculations on data sheets by Commission secretarial
staff. See Appendix F.
10. Submission of course and faculty lists to Data Centre at NATT.
11. Submission of data sheets to NAIT with the waiting period after Step 10
mutually agreed upon.
12. Punching data and running of the costing programs.
13. Output of final Costing report.
14. Conference of individuals in the colleges associated with the cost analysis.
15. Subsequent modification and yearly running of the cost analysis.

F
56
RECOMMENDATIONS RELATING TO EVENtUAL IMPLEMENTATION
OF THE WICHE MODEL RRPM.1.3,
In view of the fact iat a costing and simulation model is being
piloted in LethbrIdge dpring the 1972-73 year, other colleges would be well
advised of the information requirements of the Resource Requirement Prediction
Model (RRPM). Some of the data necessary for the RRP Model is already being
collected Uy the costing study, However, somewhat more data is requited to
allow the RRPM to simulate.
A primary recommendation.which is consistent with cost analysis (PPBS,
RRPM, or the analysis of this report), financial planning and academic plan-
ning relates to the development of an institutional MIS (Management Informa-
tion SyStem). Lack of such a system makes integration and implementation of
these various areas extremely difficult.. Hussain (1971: 20-22) indicated
that most of the_ information necessary for an ROM system is generally Avail-
able in college files for operational, ifnot4nagement decision-making pur-
poses. In a typical operation, this information tendg<o be organized into
five files:
1. Student File.
2. Courses Taught File.
3. Personnel File.
4. Space File.
5. Financial File.
e
G1
While all files may exist, two problems can arise:
1. The data may not be machlpe readable. This problem will have to
0

7- 57
be solved should a college, decide to implement an RRPM system._
2. In addition, the existing files may not be integrated. Integra-
tion can be accomplished by use of the PCS (Program Classification Structure)
developed by the NCHEMS (National, Centre for Higher Education Management
Systems). Such a PCS is already being used by a large number of post-
secondary institutions reporting annually to the United States Federal Govern-
ment. The advantage of such an integrated system for the Alberta Colleges
should be obvious simply in relation to the requirements of the Department of
Manpower and Immigration.
Thus, as a final recommendatign flowing from the 1970-71 Cost Analy-
sis, it is recommended that all colleges begin to examine the implications'
and requirements related to the development of a Management Information
System with the linking of all pertinent files by a Program Classification
System such as that developed by NCHEMS at WICHE (Western Interstate
Commission on Higher Education).
Specifically, colleges should be aware of the following information
about each of the five information files:
1. Student Files, generally speaking, already contain the necessary
data.
2. The Courses Taught File enables the development of:
(a) Weekly Student Hours by Department, Course Level, and
Instructional Type;
(b) Student Credit Hours by Department, Course Level, and
Instructiomal Type; and,
7
4

1
58
) Average Section Size by Department, Course Level, and
:n!,trucr.ionaI Type.
). The Finance File should give information on the expenses of:
(a) Travel; and,
(h) tipplies and Equipment.
`,pace File sould have data relating to:
k i 0 'pace Allocation Factors;
(b) :;p4ce Inventory; and,
(c) ',pact Occupied.
The Personnel File should have data to produce:
la/ Faculty Load Distribution;
(b) Faculty Load by Department, Instruction Type, Course Level,
and Faciiltv Rank; and,
(c) Faculty Salary Schedule by Department and Faculty Rank.
AII tht! information must be integrated on some b-isis, preferrably
th d.civ.nated by the PCS.
ohviow.ly the demands of such an MIS are considerable. The return
in information n0 more knowledgeable decisions between alternatives should
tu,,tifv the ettort. such an information system mqst ultimately produce more
integrated finan(ial and academic planning. The system is not and should
never be viewed a substitute for decisionmaking, nor should it be allowed
to become in end in itself.

REFERENCES
,41
0
\

I
60
REFERENCES
Atherton, P. J.1970 Alberta Junior College Cost Studies, Number III Financing Junior
Colleges in Alberta. Research Studies in Post-Secondary EducationNo. 6, Edmonton: Alberta Collcbes Commission.
Cage, B. N. and H. R. Fowler.1971 "Cost Analysis - The First Step to Differential, Funding." Education
Resources Information Centre, ED 048 863.
Herschel, H. H.
1965 "Some Economic Consideration and a Procedure for a University Cost-ing Study." Education Resources Information Centre, ED 025 847.
Hussain, K. M.1971 A Resource Requirements Prediction Model (RRPM-1) - Guide for the
Project Manager. Boulder: National Centre for Higher EducationManagement Systems.
Illinois State Board of Higher Education.1966 "Cost Study Manual." Education Resources Information Centre,
ED 025 832.
Johnson, F. C.1970 "Cost Analysis of Instructional Technology." Education Resources
Information Centre, ED 039 730.
Witner, David.1967 "Unit Cost Studies," Wisconsin Board of Regents of State Universities,
Education Resources Information Centre, ED 013 492.

APPENDIX A
GRANDE PRAIRIE

62
Table A-1
Cost-Revenue Analysis for Grande Prairie College
Year Average CostPet Student
Fees GrantSubsidyEffect
Transfer Programs:
Arts BA General 1,842 200 2,363 + 721
Commerce 1,975 200 2,363 + 588
Education 2,160 200 2,363 + 403
Engineering 4,735 200 2,363 -2,17?
Forestry 2,573 200 2,363 - 10
Home Economics 2,105 200 2,363 + 458
Physical Education 2,124 200 2,363 + 439
Pre-Law 2,285 200 2,363 + 278
Pre-Medicine 3,267 200 2,363 - 704
Science BSc General . 2,995 200 2,363 - 432
Diploma Program:
Business Administration 1 2,191 200 2,363 + 372
Business AdministrationIt
2 3,642 200 2,363 -1,079
Secretarial Science 1 2,427 200 2,363 + 136
Secretarial Science 2 2,040 200 2,363 + 523
Combined University Transferand Matriculation Program: 2,501 200 2,363 + 62

IIMIO
NM
O..
111.
,...'
Table
A-2
Courses Offered by Grande Prairie College in 1970-71 with Enrolments,
Total Cost, Cost Per Student and Cost Per Student Contact Hour
Nom
MEI
Course
Full or
1/2
Enrolment
Total Cost
Cost Per
Student
Cost Per Student
Contact Hour
Accounting 202
1/2
15
4,233.03
282.20
4.41
Biology 100
F10
8,902.30
890.23
5.56
Biology 130
F42
12,664647
301.48
1.57
Biology 298
1/2
85
19,752.46
232.38
0.97
Biology 299
1/2
42
7,3-'1.75
175.56
3.66
Business Admin. 104
1/2
30
5,433.83
181.12
3.77
Business Admin. 105
F17
4,554.87
267.93
3.35
Business Admin. 111
1/2
56
10,880.81
194.30
0.81
Business Admin. 111/112
F31
8,373.30
270.10
2.11
Business Admin. 112
1/2
14
2,832.39
202.31
3.16
Business Admin. 142
1/2
53
11,56'..96
218.15
0.59
Business Admin. 152
1/2
20
4.080.50
204.02
4.25
Business Admin. 203
1/2
72,582.94
368.99
7.69
Business Admin. 205
1/2
53,381.70
676.34
10.57
Business Admin. 206
1/2
92,680.57
297.84
4.65
Business Admin. 208
1/2
13
3,235.40
248.87
5.18
Business Admin. 209
1/2
2E
4,684.31
187.37
3.90
Business Admin. 210
1/2
20
4,080.50
204.02
4.25
Business Admin. 211/212
F7
5,475.47
782.21
6.11
Business Admin. 222
1/2
42,294.71
573.67
11..,5
a'
(....)
Continued ...

Table A -2 (Continued)
Course
Full or
1/2
Enrolment
Total Cost
Cost Per
Student
Cost Per Student
Contact Hour
Chemistry 130
F15
4,809.63
320.64
3.34
Chemistry 200/202
F18
17,001.61
944.53
2.68
Chemistry 250
F18
11,593.23
644.06
2.88
Creative Writing
1/2
12
3,642.46
30.3.53
6.32
Drawing
F23
4,434.67
192.81
2.01
Economics & Business
151
F45
7,098.98
157.75
3.29
Economics & Business
200
,F
45
7,098.98
157.75
3.29
Economics 200
F19
6,730.39
354.23
2.77
English
101/103
F32
6,250.35
195.32
2.03
English 102
1/2
61,870.59
311.76
3.90
English 103
1/2
30
4,809.83
160.32
3.34
English 104
1/2
30
4,809.83
'
160.32
3.34
English 110
F12
3,649.05
304.08
3.80
English 110/120
F22
4,856.68
220.75
2.76
English 110/120/135
F23
4,977.32
216.40
2.71
English 120
F17
n4,252.87
250.16
3.13
English 130
F40
I7,475.40
186.88
1.95
English 200
F48
14,596.93
304.10
1.58
English 210
F87
25,313.25
290.95
0.61
English 383
F35
8,626.58
246.47
2.57
English Continued ...

14.4
.444
.4I
1.44
4444
4414
1&
44.4
444.
44i4
44 M
.,. 4
1444
4 v.
. 4
Table A-2(Continued)
Wm
.11111111111
tor
Course
Full or
1/2
Enrolment
Total Cost
Cost Per
Cost Per Student
Student
Contact Hour
English (Concluded):
English
90
F13
3,769.99
289.99
3.62
English 90/110
F22
4,856.68
220.75
2.76
French 100
F18
7,350.04
408.33
2.55
French 200
F31
10,996.09
354.71
1.58
German 100
F12
3,991.58
332.63
2.08
History 200
F30
12,012.96
400.43
2.50
History 201
F15
6,839.63
455.97
4.75
History 370
F45
10,461.91
232.48
2.42
Legal Secretary
1/2
20
3,681.84
184.09
2.88
Landscaping
F21
4,193.08
199.67
2.08
Mathematics 100
F9
3,617.82
401.98
5.02
Mathematics 110/120
F17
6,753.40
397.25
2.48
Mathematics 120
F9
3,436.82
381.86
4.77
Mathematics 130
F24
8,073.75
336.40
1.91
Mathematics 180/100
F6
6,281.53
1,046.92
8.18
Mathematics 201
F25
8,848.44
353.93
2.21
Mathematics 205
1/2
62,808.00
468.00
9.75
Mathematics 240
1/2
14
4,468.39
319.17
4.99
Mathematics 274
F5
4,771.29
954.25
9.94
Mathematics Continued ...
cr.

La.
.. um
..%
4111
01M
1.4.
446
.111
.1.6
,1...
.11
Table A-2(Continued)
L/'
Course
Full or
1/2
Enrolment
Total Cost
Cost Per
Student
Cost Per Student
Contact Hour
mathematics (Concluded):
Mathematics 90
F13
4,100.99
15.46
3.94
Mathematics 90/100
F23
5,308.32
230.79
2.88
Mathematics 90/110
F32
6,214.01
.194.18
2.43
Mechanical Eng. 154
F4
5,139.23
1,284.61
10.04
Music 205
F13
3,588.93
275.07
2.15
Music 210
F29
5,015.13
172.93
1.80
Physical Education 211
F16
5,487.57
342.97
3.57
Physical Education 213
F6
3,652.94
608.82
6.34
Physical Education 217
F10
4,799.11
479.91
5.00
Physical Ed. 218/228
F101
22,271.18
220.50
0.77
Physical Education 243
F19
4,688.20
246.74
3.86
Physical Sciences
F18
4,675.51
259.75
3.25
..4,
Physics 100
F15
3,711.63
247.44
2.58
Physics 110/120
F15
4,161.28
277.41
3.47
Physics 130
F11
3,830.41
348.21
,4.35
Physics 200
F10
8,190.89
819.08
4.27
Physics 240
F6
7,707.72
1,284.62
6.69
Psychology 101
1/2
61
10,872.00
178.22
1.86
Psychology 202
F93
24,762.92
266.26
0.69
Psychology 211
1/2
82,660.59
332.57
6.93
ConLinued
o.,

4.0%
.....1
1
cable A-3(Concludej)
lobw
roar
i.ho
irosl
iN
EM
O
Course
Full or
1/2
Enrolment
Total Cost
Cost Per
Student
Cost Per Student
Contact Hour
Reading
F75
13,385.58
178.47
0.80
Secretarial Science 101
1/2
18
3,361.92
186.77
3.89
Sec. Sc. 101/102/101/201
F21
3,724.14
177.34
3.69
Secretarial Science 102
1/2
28
5,758.48
205.66
2.14
Secretarial Sc. 111/211
1/2
27
11,136.57
412.46
1.98
Secretarial Sc. 113/212
1/2
23
10,653.70
463.20
2.23
Secretarial Sc. 122
1/2
33
5,796.06
175.63
3.66
Secretarial Sc. 129
1/2
37
6,205.23
167.70
3.49
Secretarial Sc. 130
1/2
37
7,943.17
214.58
2.24
Secretarial Sc. 131
1/2
31
5,205.37
167.91
2.10
Secretarial Sc. 141
1/2
15
3,336.63
222.44
2.32
Secretarial Sc. 201
1/2
26
5,516.90
212.18
2.21
Secretarial Sc. 202
1/2
13
2,758.40
212.18
4.42
Shorthand 111
'6
1,991.34
331.89
5.19
Shorthand 112
1/2
51,870.70
374.14
5.85
Sociology 202
F97
27,449.87
282.98
0.59
Social Science 110
F20
7,491.63
374.58
2.34
Social Science 130
F16
7,008.75
438.04
2.74

APPENDIX B
RED DEER
,
4
(..

t
1/
69
Table R-1
Cost-Revenue Analysis for Red Deer College
YearAverage CostPer Student
Fees CrantSubsidyEffect
Transfer Programs:
Agriculture 1 1,695 200 1,464 - 31
Agriculture 2 1,520 200 1,464 + 144
Architecture 1,236 200 1,464 + 428
Arts 1 1,227 200 1,464 + 437
Arts 2 1,249 200 1,464 + 415
Commerce 1,338 200 1,464 + 326
Education 1 1,405 200 1,464 + 259
Education 2 1,220 200 1,464 + 444
Engineering 1 1,874 200 L,464 - 210
Engineering 2 1,867 200 1,464 - 203
Household Economics 1,385 200 1,464 + 279
Law 1,431 2.o 1,464 + 233
Medicine 1 1,437 200 1,464 + 227
Medicine 2 1,842 200 1,464 178
Pharmacy 1,807 200 1,464 43
Physical Education 1 1,556 (20 1,k64 + 108
Physical Education 2 1,747 .2..Q0 1,464 - 8T.-,
Recreation Administration 1,283 200 \ 1,464 + 381.
Science.
1 1,501 200 \\1,464 + 163
Science 2 2,121 200 /I,464 - 457
Table B-1 (Concluded)...

Table B-I (Concluded)
0 Year
Diploma Programs:
Average CostPer Student
Fees
41.
711"
Subsidy
Effect
1Arts & Science 2,213 200 1,464 - 549
Business Administration 1. 2,300 200 1,464 - 636
Business Administration 2 2,148 200 1,464 - 484
Nursing 1 2,835 200 1,464 -1,171
Nursing 2 3,721 200 1,464 -2,057
Social Services 1 2,291 200 1,464 - 627
Social Services 2 1,900 200 1.464 - 236
Secretarial Science 1 2,429 200 1,464 - 765
Secretarial Science 2 3,225 200 1,464 -1,561
Combined University Transfer& High School Equivalent: 1 1,546 200 1,464 + 118
2 2,041 200 1,464 - 377

Table
B-2
Courses Offered by Red Deer College in 1970-71 with
Enrolments,
Total Cost, Cos.. Per Student and Cost Per Student
Contact Hour
IMO
Mil
Nal
IMM
MIN
Course
Full or
1/2
Enrolment
Total Cost
Cost Per
Student
Cost Per Student
Contact Hour
Accounting 102
1/2
77
11,788.90
153.10
1.02
Accounting 103
1/2-
37
5,938.26
160.49
2.03
Accounting 202
1/2
21
3,910.79
186.22
3.10
Accounting 204
1/2
19
4,111.42
216.39
3.09
Accounting 205
1/2
15
3,784.51
252.30
3.60
0
Anthropology 202
F154
20,957.59
136.08
0.81
Art 200
F14
7,572.99
540.92
1.66
Art 231
F46
13,061.17
283.93
1.69
Biochemistry 300
F5
6,075.16
1,215.03
10.21
Biology 130
1/2
76
11,342.13
149.23
1.07
Biology 131
1/2
63
10,278.65
163.15
1.17
Biology 230
F153
3P,955.34
254.61
0.41
Business Admin.
110
1/2
35
6,099.21
174.26
1.94
Busine..- Admin.
111
1/2
36
5,970.68.
165.85
1.97
Business Admin.
130
1/2
39
8,561.71
219.53
2.44
Business Admin.
131
1/2
33
7,711.35
233.67
2.78
Business Admin.
140
1/2
87
'11,290.97
129.78
1.44
Business Admin.
141
1/2
87
1,1,009.27
1t6.54
1.51
Business Admin. Continued
...
s-4

Alrin.
Business Adm;n.
Business Admin. 23
Busines:, Admin. 241
Business Admin. 2fl
Business Admin. 26.
Business Admin. .:61
I 42!
Fr,r
1,tJavnt
Chemistry 130
1,2
Chemistry 131
1/2
Chemistry 200
F
Chemistry 202
F
Chemistry 250
F
Chemistry 312
F
Zhemistry '50
F
Chemistry 370
F
Chemistry
75
1/2
Economics 100
1/2
Economics 101
1/2
Economics 200
F
_Economics 301
F
(7,4711.43
3.42.2.1.)
136.22
380.23
s: .?1
8.4'.'
14
3,44.25
262.3)
6.20
4,12.33
165.05
3.67
17
3,93
16
176.00
4.19
26
199.16
2.21
26
5,178.23
199.16
2 .21
57
23,444 60
411.30
1 .13
76
30,263.63
398.20
0.84
2's?
12,465.74
429.85
2.05
87,718.56
964.82
6.89
27
10,936.66
405.06
2 .23
67,858.40
1,309.73
9.36
23
7,985.33
347.18
1 .93
41
6,379.75
155.60
1.85
35
5,935.51
169.58
2.02
103
17,816.92
172.97
0.69
15
4,358.37
-290.55
3.46
Continued ...

1..*
Who
gi,
Lad
s....
11S
MO
MM
INA
OM
MO
MM
M.
IMMO
IMMO
Table B-2 (Continued)
Course
Full or
1/2
Enrolment
Total Cost
Cost Per
Student
Cost Per Student
Contact Hour
Educational Admin. 261
1/2
154
21,798.59
141.54
0.84
Educational Foundations
201
1/2
156
20,467.33
131.20
0.78
Educational Psychology
269
172
188
n,323.55
118.74
1.06
Educational Psychology
271
1/2
94
.14,636.19
155.70
1.39
English 110
1/2
62
11,953.98
192.80
1.15
English 120
1/2
47
17,230.10
366.59
1.16
English 121
1/2
12
2,433.08
202.75
4.83
English 200
F137
31,928.74
233.05
0.50
English 210
F289
63,541.48
219.86
0.24
English 288
F20
6,218.87
310.94
3.70
English 332
F25
6,627.94
265.11
3.16
English 383
F31
5,438.60
175.43
2.09
English 384
F36
7,549.68
209.71
2.50
English 394
F34
6,429.93
!'
189.11
2.25
English
50
1/2
30
7,748.15
258.27
1.43
English
75
1/2
60
10,201.44
170.02
.0
0.94
English
90
1/2,
145
20,087.75
138.53
0.63
Ergineering 152
1/2
30
6,933.12
231.10
2.06
French 100
"
F30
9,156.22
305.20
2.10
French 200
F30
8,921.03
297.36
2.12
French Continued ...

Table 8-2(Continued)
Course
Full or
1/2
Enrolment
',
Total Cost
Cost Per
Student
Cost Pe' Student
Contact Hour
French tConcluded):
French 201
F5
6,876.24
1,375.24
9.82
French 330
F20
8,102.88
405.14
2.89
Genetics 351
F30
8,426.03
280.86
2.01
Geography 201
F54
20f203.42
374.13
1.11
Geography 300
F18
C419.70
301.09
3.58
History 130
1/2
13
4,280.63
329.27
3.92
,History 200
...,
73
1(,263.63
222.78
0.88
History 300"
F28
6,145.27
219. '
2 .61
History 37._
F44
6,242.0P
141.86
1.69
Mathematics 120
1/2
15
' 3,167.76
211.18
4.69
Mathematics 121
1/2
15
3,045.41
203.02
4.83
MathematiL.s 130
1/2
36
8,222:81
228.41
1.27
Mathematics,131
1/2
29
3,891.89
134.20
3.20
Mathematics 180
F10
5,659.40
565.94
5.05
Mathematics 201
F67
13,540.48
202.09
0.90
Mathematics 214
F37
11,461.19
309.76
1.38
Mathematics 240
1/2
22
4,056.70
184.39
3 .23
Mathematics 274
F49
10,078.59
205.68
1.47
Mathematics 304
F18
6,549.71
363.87.
2 .-')0
Mathematics 374
F4
3,368.64
842.16
10.03
Mathematics Continued ...

imai
mm
.41
1.41
.444
.I
41.1
...n
41.
..
Table B -2 (Continued)
1,44
.001
4,,,t
111.
111.
im,
emor
mir
iono
mm
al
Course
Full or
1/2
Enrolment
Total Cost
Cost Per
Student
Cost Per Student
Contact Hour
Mathematics (Concluded):
Mathematics 65
1/2
46
9,440.38
205.22
1.14
Mathematics 75
1/2
86
12,311.82
143.16
0.80
Mathematics 85
1/2
44
8,877.21
201.75
1.12
Mechanical Eng. 154
1/2
30
7,509.03
250.30
1.79(
Microbiology 293
1/2
25
5,404.08
216.16
3.09
Nursing 190
1/2
41
28,124.44
685.96
1.63
Nursing 191
1/2
41
28,836.57
703.33
1.34
Nursing 192
n41
18,429.66
449.50
0.74
Nursing 290
1/2
25
29,448.46
1,177.93
1 .84
Nursing 291
1/2
25
33,260.60
1,330.40
2 .09
c.
Nursing 292
F25
12,226.06
489.04
0 .79
Physical Education 101
1/2
297
38,768.46
130.53
0.36
Physical Education 103
1/2
482
52,347.14
108.60
0.34
Physical Education 205
1/2
21
3,426.07.
163.14
3 .88
Physical Education 209
'1/2
14
2,757.25
196.94
4.69
Physical Education 211
1/2
29
5,630.86
194.16
2.31
Physir...al Education 213
1/2
92,207.75
245.30
5.84
Physical Education 215
1/2
41
5,106.79
124.55
2 .97
Physical Education 217
1/2
19
3,454.16
'181.79
4.13
Physical Education Continued ...

Table B-2 (Continued)
c
Course
Full or
1/2
Enrolment
Total Cost
Cost Per
Student
Cost Per Student
Contact Hour
Physical Education (Concluded):
Physical Education 243
1/2
37
4,313.44
116.57
4.16
Physical Education 305
1/2
28
4,221.31
150.76
3.59
Physical EdUcation 307
1/2
24
3,527.24
146.96
3.34
Physical Education 345
.1/2
16
3,096.00
193.50
4.61
Physical Education 362
1/2
46
7,569.25
164.54
1.96
Physical Education 381
1/2
19
3,642.16
191.69
4.36
Philosophy 240
F80
12,979.95
162.24
0.97
Physiology 294
1/2
25
5,038.08
201.52
2.69
Physics 100
F8
6,168.33
771.04
6.65
Physics 130
1/2
38
8,586.56
225.96
1.26
Physics 200
F25
10,643.50
425.74
1.99
Physics 240
F70
20,4.10.45
291.57
!.08
Physics 300
,F
46,470.51
1,617.62
10.50
Physics 340
F10
7,675;26
767.52
6.09
Physics
75
1/2
60
10,585.44
176.42
0.98
Political Science 200
.F
65
13,505.30
207.77
1.24
Political Science 310
F16
5,401.96
337.62
4.02
Political science 320
F11
4,992.88
453.89
5.40
, Continued ...

1.11
1111
11M
di41
.111
.1.6
table B -2 (Continued)
Course
Full or
1/2
Enrolment
Total Cost
Cost Per
Student
Cost Per Student
Contact Hour
Psychology 130
1/
28
8,421.66
300.77
6.68
Psychology 131
1/2
28
8,421.66
300.77
6.68
Psy-hology 193
1/2
443
6,308.31
146.70
3.26
Psychology 202
F201
27,107.11
134.86
0.40
Psychology 210
1/2
23
5,224.59
227.15
5.05
Psycho]ogy 337
1/2
40
4,604.63
115.11
2.74
Psychology 341
1/2
19
4,149.32
218.38
5.20
Psychology 353
1/2
12
3,577.08
298.09
7.10
Psychology 383
1/2
39
4,523.04
115.97
*2.76
Science 50
1/2
42
9,113.47
216.98
1.21
Secretarial Science
110
1/2
20
4,677.01
233.85
3.12
Secretarial Science
111
1/2
20
4,486.01
224.30
3.20
Secretarial Science
120
1/2
28
5,095.41
181.97
2.43
Secretarial Science
121
1/2
28
4,918.41
175.65
2.5k
Secretarial Science
130
1/2
25
3,618.98
144.75
3.45
Secretarial Science
110
1/2
21
3,292.07
156.76
3.73
Secretarial Science
160
1/2
62,198.43
366.40
8.72
Secretarial Science
210
1/2
10
3,859.44
385.94
5.15
Secretarial Science
211
1/2
10
3,668.44
366.84
5.24
Secretarial Science
220
1/2
34,737.51
1,579.17
13.16
Secretarial Science
221
1/2
63,119.53
519.92
7.43
Secretarial Science Continued ...

waw
a.W
ewar
dp
wow
..w
ww
.w
wW
WW
Ww
Ww
liA
v.*.
Table B-2(Continued)
4161
0101
1
Course
Full or
1/2
Enrolment
Total Cost
Cost Per
Student
Cost Per Student
Contact Hour
Secretarial Science (Concluded):
Secretaria4 Science 230
1/2
Secretarial Science 231
1/2
Sociology 130
1/2
Sociology 202
F
Sociology 320
F
Sociology 370
F
10
10
25
143 37
40
2,645.69
2,525.34
3,666.98
26,450.28
7,345.61
6,912.94
264.56
252.53
146.67
184.96
198.53
172.82
4.
5.88
6.01
3.49
0.55
2.28
1.99
Social Services 110
1/2
19
3,289.67
173.14
3.85
Social Services 111
1/2
19
3,176.32
]A7.17
3.98
Socia_ Services 120
.'
1/2
19
3,289.67
173.14
3.85
Social Services 121
1/2
19
3,176.32
167.17
3.98
Social Services 130
1/2
38
6,004.56
158.01
2.11
Social Services 131
1/2
38
5,808.56
152.85
2.18
Social Services 210
1/2
91,894.10
210.45
4.68
Social Services 211
1/2
91,812.75
201.41
480
Social Services 220
1/2
1,894.10
210.45
4.68
Social Services 221
1/2
91,812.75
201.41
4.80
Social Services 230
1/2
91,507.73
167.52-
5.58
Social Services 231
1/2
91,451.0
161.32
5.76
Social Services 240
1/2
91 894.10
210.45
4.68
Social Services 241
1/2
91,812.75
201.41
4.80
Continued ...

Table 8-2(Concluded)
Courses
Full or
1/2
Enrolment
Total Cost
Cost Per
Student
Cost Per Student
Contact Hour
Social E...udies 130
1/2
109
12,102.37
119.05
2.54
Statistics 241
1/2
72,830.06
404.29
7.22
Statistics 255
F26
8,921.45
343.13
2.04
Zoology 320
F27
8,444.70
312.76
2.23
Zoology 350
F18
8,198.71
455.48
3.25

APPLNDI X C
MIK- ROY PL.
r
I

7
81
Table C-1
Cost Revenue Analysis for Modnt Royal College
YearAverage CostPer Student
Fees GrantSubsidyEffect
Transfer Programs to theUniversity of Calgary:
Arts 1,478 300 1,261 + 83
Business Administration 1,247 300 1,261 +314
Household Economics 1,241 300 1,261 +320
Pharmacy 1,615 300 1,261 - 54
Physical Education 1,611 300 1,261 - 50
'Pre-Dentistry 1,608 300 1,261 - 47
Pre-Veterinary 1,509 300 1,261 + 52
Science 1,579 300 1,261 - 18
Miscellaneous (no major specified) 1,238 300 1,261 +323
Combined High Scnool E;uivalent& Transfer to U of Calgary:
Agriculture 1,339 300 1,261 +172
Arts 1,491 300 1,261 + 70
Businesg Administration 1,158 300 1,261 +403
Education 1,355 300 1,261 +206
Pharmacy 1,883 300 1,261 -322.
,
Physical Education 1,579 300. 1,261 - 18
Pre-Dentistry 1,623 300 1,261 - 62
Pre-Medicine 1,764 300 1,261 -203
Pre-Veterinary 1,690 300 1,261 -129
Tabli: C-1 (Continued)...
IP

7
Table C-1 (Continued)
82
IYear
Average CostPer Student
Fees GrantSubsidyEffect
Transfer Programs toOther Universities:
Applied Social Science 1 1,436 300 1,261 +125
Applied Social Science 2 1,651 300 1,261 - 90
Arts 1,820 300 1,261 -259
Broadcasting 1,638 300 1,261 -377
Business Administration 1,358 300 1,261 +203c
Computer Science 1,626 300 1,261 - 65
Correctional Careers 1,627 300 1,261 - 66
Engineering 1 2,056 300 1,261 -495
Engineering 2 2,697 300 1,261 -1,136
Interior Design 1 1,529 300 1,261 + 32
Interior Design 2 1,566 300 1,261 - 5
IJournalism 1 1,443 300 1,261 +118
iJourna) ism 2 1,824 300 1,261 -263
Optometry 1,649 300 1,261 - 88
Petroleum Land Mangement 1,350 300 1,261 +211
Physical Education# 1 1,396 300 1,261 +165
..
Physical Education.
2 1,600 300 1,261 - 39
Police Science 2,103 300 1,261 -542
Public Relations 1,495 300 1,261 + 66
Recreation & Outdoor Ed. 1 1,585 300 1,261 - 24
Recreation & Outdoor Ed. 2 1,517 300 1,261 + 44
1
Transfer to Other Universities Concluded ...

83
Table C-1 (continued)
YearAverage CostPer Student
Fees GrantSubsidyEffect
Transfer to Oth4-Univer-sities Conc(td:
Secretarial Science 1,365 300 1,261 +196
Social Work 1,907 300 1,261 -346
Miscellaneous (no major specified) 1,400. 300 1,261 +161
Diploma Programs - Two Year Terminalwith NO Transfer:
Broadcasting 1 1,650 300 1,261 - 89
Broadcasting 2 2,547 300 . 1,261261 -986
Business Administration 1,305 300 1,261 +256
Correctional Careers 1 1,576 300 1,261 - 15
-*-Correctional Careers 2 z,142 300 1,261 -581
Day Care 1,331 300 1,261 +230
Insurance 1,028 300 1,261; +533
Interior Design 1 1,747 300 1,261 , -186
Interior Design 2 1,825 300 1,261 -264
Journalism 1,711 300 1,261 ' -150
Nursing 1 2,508 - 300 1,261 -947
Nursing 2 3,395 300 1,261 -1,834
Police Science 1,844 300 1,261 -283
Public Relations 1 1,593 300 1,261 - 32
Public Relations 2 2,301 3% 1,261 -740
Diploma Programs Concluded . . .

84
Table C-1 (Concluded)
YearAverage CostPer Student
Fees GrantSubsidy
Effect
Diploma Programs (No Transfer)
u Concluded:
Real Estate & PropertyManagement 1,250 300 1,261 4311
Recreation & OutdoorEducation - 1,740 300 1,261 -179
Secretarial Science 1,477. 300 1,261 + 84
Social Work 1 1,980 300 1,261 -419
Social Work ) 2 1 799 300 1,261 -238
Urban Planning . 1,823 300 1,261 -262
One Year Certificate:
Architecture
Business Administration
Residential Child Care,
Stenographer
1,728
1,282
\1,890
1,454
.,.\..,
3A 1,261 -167
'--. 30 1,261 +279
300 1,261 -329
30 1,261 . +107

10.1
*4ou
ci...
-*a
s
Table
C72
Couries Offered by Mount Royal College-in 1970-71 with
Enrolments,
Total Cost, Cost Per Student and Cost Per Student Contact Hour
11
Course
Full or
1/2
Enrolment
Total Cost
Cost Per
Student
Cost Per Student
Contact Hour
iAnthropology 110
1/2
96
12,076.85
125.80
0.66
Anthropology 201
1/2
242
22,636.62
91.53
0.49
Anthropology 212
1/2
22
3,245.91
147.54
3.07
Anthropology 213
1/2
38
4,401.67
115.83
2.41
Behavioral Science
150
1/2
120
29,459.30
245.49
0.43
Behavioral Science
250
1/2
30
6,819.90"-
227.33
1.58
Behavioral Science
251
1/2
112
21,510.47
-
192.05
0.57
Biology 110
1/2
483
80,406.90
166.47
2.14
Biology 130
1/2
13
2,095.61
161.20
3.22
Biology 201
1/2
183
-) 34,557.07
188.83
0.18
1.
Biology 210
1/2
36
.5,658.70
157.1.8
0.82
Biology 212
1/2
59
12,694.97
215.16
0.64
Biology 213
1/2
15
1,779.21
118.61
7.41
Biology 214
1/2
116
24,296.85
209.45
0.30
Biology 215
1/2
60
7,199.58
119.99
1.25
Biology
216.
1/2
118
23,375.89
198.10
0.32
Biology 241
1/2
38
7,312.16
192.42
1.09
Biology 273
1/2
65
11,727.68
180.42
0.59
Continued ...

IMM
OM
OW
1410
11.1
.114
1111
1111
1110
1111
4E
au.
.vra
.4P
.111
11,1
4
Table C-2(Continued)
Course
Full or
1/2
Enrolment
Total Cost
Cost Per
Student
Cost Per Student
Contact Hour
Business Admin. 110
1/2
260
29,856.42
114.83
0./0
Business Admin. 111
1/2
126
17,086.32
135.60
0.57
Business Admin. 150
1/2
104
13,839.78
133.07
0.59
Business Admin. 172
1/2
69
7,309.38
105.93
1.10
Business Admin. 220
1/2
18
2,357.29
130.96
2.73
Business Admin. 222 s
o
1/2
240
27,373.46
114.05
0.25
Business Admin. 223
1/2
84
11,713.77
139.44
0.54
Business Admin. 224
1/2
12
2,026.88
168.90
3.52
Business Admin. 230
1/2
43
5,028.52
116.94
2.44
Business Admin. 240
1/2
112
14,629.73
130.62
0.47
Business Admin. 250
1/2
52
6,735.70
129.53
1.35
Business Admin. 251
1/2
67
8,308.58
124.00
1.15
Business Admin. 254
1/2
11
1,954.64
177.69
3.70
Business Admin. 256
1/2
35
3,689.96
105.42
2.20
Business Admin. 257
1/2
21
2,678.67
127.55
2.66
Business Awtun. 260
1/2
13
1,996.11
153.54
3.20
Business Admin. 275
1/2
59
7,539.40
127.78
0.89
Business Admin. 276
1/2
13
1,996.11
153.54
3.20
Business Admin. 278
1/2
30
.4,385.85
146.19
1.52
Business Admin. 288
1/2
12
2,026.88
168.90
3.52
Business Admin. 295
1/2
29
4,313.6a
148.74
1.55
CO
Continued ...
Cr%

MI
woo
ammo
Ww
W4
low
NW
4orr
imm
aw
om.1
1I
WO
ME
NS
IMM
SS
IM N
M U
MW
MN
EM
I O
M M
ID
Table C -2 ( Continued)
Course
Full or
1/2
Enrolment
Total Cost
Child Care 112
1/2
52
5,753.64
Child Care 120
1/2
26
3,873.85
Child Care 121
1/2
23
3,657.14
Child Care 124
1/2
26
3,873.85
/Child Care 231
1/2
37
4,994.49
Chemistry 100
14
52
12,788.26
Chemistry 101
1/2
18
2,236.92
Chemistry 110
1/2
141
39,739.19
Chemistry 130
1/2
20
3,642.56
Chemistry 201
1/2
115
21,012.42
Chemistry 203
1/2
26
6,660.99
Chemistry 210
1/2
20
2,870.60
Chemistry 211
1/2
12
2,369.81
Chemistry 212
1/2
11
4,519.38
Cdmmunications 110
1/2
93
13,241.14
Ccorunications 111
1/2
76
14,011.47
--,
Communications 120
1/2
67
9,944.96
/
Communications,121
1/2
49
8,643.05
Communications 151
1/2
45
8,218.11
Communications 210
1/2
..,,
_/
24
16,842.44
t),
Cost Per
Student
Cost Per Student
Contact Hour
110.64
2.31
148.99
3.10
159.00
3.31
148.99
3.10
134.98
1.41
245.92
0.85
124.27
6.21
281.83
0.26
182.12
1.82
182.71
0.34
256.19
1.52
143.53
2.66
197.48
3.04
410.85
3.67
163.88
0.85
184.36
0.96
148.43
1.03
176.38
1.22
182.62
1.27
701.76
1.83
Communications Continued
CO

Table c-2(Continued)
Course
Full or
1/2
Enrolment
Total Ctet
Cost Per
Student
Cost Per .Student
Contact Hour
Communications (Concluded):
Communications 211
1/2
23
16,770,21
729.13
1.90
Communications 220
1/2
18
2,460.29
136.68
2.85
Communications 221
1/2
14
2,711.35
193.66
Communications 222
1/2
10
2,422.40
242.24
54..03
Communications 223
1/2
11
1,954.64
177.69
70
Communications 230
1/2
34
4,775.79
140.46
1.46
Communications 231,
1/2
11
1,953.64
...
177.60
3.70
Communications 241
1/2
73
10,804.82
148.01
0.62
Communications 24?
1/Z
33
5,092.24
154.31
1.38
Communications 250
1/2
195
24,698.02
126.65
0.40
.....,...
'
Communications 251
1/2
263
31,594.49
120.13
j0.30
(
Computer Science 180
1/2
86
11,585.88
134:71
0.59
Computer Science 181
1/2
41
5,825.11
142,07
0 1.48
Computer Science 183
1/2
21
3,733.73
177.79
1.85.ei
Computer Science 281
1/2
24
04,812.44
200.51
2.09
'
Computer Science 284
1/2
15
2,241.58
149.43
3.11
\
Drama 114
1/2
13
2,658.11
204.47
4.26
Drama 115
1/2
16
2,874.82
179.67
3.74
Drama 118
1/2,
72,224.70
317.81
6.62
Drama 119
1/2-
16
2,874.82
179.67
3.74
Drama Continued ...

NM MI 1=1
ISO
MIMI
las
emu
swim
aro
Table C-2(Continued)
NE
NE
rni
elles
Cours e
Full or
1/2
Enrolment
°Total Cost
Cost Per
Student
Cost Per Student
Contact Hour
Drama (Concluded) :
Drama 210
'Drama 211
Drama 216
Drama 217
Economics 110
Economics 111
Economics 150
Economics 201
Economics 203
Economics 220
Economics 221
English 101
English 104
English 105
English 110
English 111
English 118
English 130
English 210
English 211
1/2
1/2
1/2
1/2
1/2
1/2
1/2
1/2
1/2
1/2
1/2
1/2
1/2
1/2
1/2
1/2
1/2
1/2
,. 1/2
1/2
39
10
23 23
198
127
23
191
110 9 6 40
167
29
1,261
625
166
31
113
69
0
6,256.96
2,441.40
3,382.14
3,382.14
21,508.35
15,704.94
3,165.14
20,636.65
12,460.44
1,810.17
1,179.44
7,571.76
21,779.10
5,736.92
42,390.53
72,647.98
31,068.56
4,438.83
14,570.14
11,388.43
160.43
244.14
.147.04
147.04
108.62
123.66
137.61
108.04
113.27
201.13
196.57
189.29
130.41
197.82
33.61
116.23
187.16
143.18
128.93
165.04
1.67
5.09
3.06
3.06
0.38
0.45
2.87
0 .45
0.79
4.19
8.19
0.66
0.40
2.47
18.27
0.15
0.38
1.51
0.90
1.15
00
English Continuedi...

OEM
MIN
ONO
OEM
in=
sum
own
NMI
rMIN
MI
NMIs
-Nor
Table C- 2(Continued)
Course
.Full or
1/2
English
English
English
English
(Concluded) :
212
213
214
English 215
1/2
English 218
1/2
English 219
1/2
English 231
1/2
English 241
1/2
English 243
1/2
Engineering 110
1/2
Engineering 114
1/2
Engineering 120
1/2
Engineering 152
1/2
Engineering 210
1/2
Engineering 214
1/2
Engineering 215
1/2
Engineering 25:
/2
French 101
1/2
FrSnch 103
1/:
French 11;)
Enrsb1ment
Total Cost
Cost Per
,Student
Cost Per Student
Contact Hour
68
50
24
8,744.14
7,442.23
3,729438
128.59
148.84
155.39
1.34
'1.55
3.24
20
3,438.76
171.93
43.58
33
4,311.49
130.65
2.72
19
3,298.52
173.60
3.62
25
2,967.61
11840
2.47
527
64,221.15
121.86
0.16
244
32,048.65
131.34
0.34
94,269.54
474.39
5.93
25
3,507.61
140.30
2.92
10
1,437.03
143.70
8.98
34
3,677.04
108.14
3.38
11
2,968.64
269.87
5.62
24
3,711.22
154.63
2.86
05,593.85
186.46
1.94
11
2,013.95
183.0P
51,1-1.77
2:
1.
12'2.21
1.1.01
French ContInu,:fc

1.11
1.11
.11.
mor
row
..1.
11*.
1,.1
111.
1.11
4,..
Table c-2(Continued)
Course
Pull or
1/2
Enrolment
Total Cost
French (Concluded):
i
French 111
1/2
21,502.01
French 130
1/2
18
2,319.70
French 205
1/2
it48
9,110.82
French 207
1/2
i21
4,915.20
French 210
1/2
/35
5,929.34
French 211
1/2
51589.45
/\...
French 230
1/2
93;401.86
French 231
1/2
11
2,17,4.95
Geography 110
1/2
47
8,342.04
Geography 120
1/2"
21,010.21
Geography 121
1i,2
81,508.91
/Geography 201
2/2
89
15,373.77
Geography 203
1/2
31
3,885.77
Geography 210
,//
,1/2
24
3,628.12
Geography 211
/
Geography 214
1/2
1/2
2
54
828.15
10,688.60
'Geography 215,/
1/2
47
10,182.95
Geology 120/
1/2
129
19,758.14
Geology 124
1/2
23
5,020.39
Geology, 0l
t1/2
82,718.70
01
0111
.101
111=
111
,Cost per
Student
Cost Per Studeht
Contact Hour
208.75
-1 ,
0.64
128.87
,3.00
189.80
1.32
234.05
3.34
169.44
.12
317.89
12.72
377.98
5.91
195.90
6.12
177.49
0.99
505.10
7.89
188.61
7.86
172.73
0.45
125.34
1.12
151.17
1.35
414.07
25.8t
197.93
1.12
216.65
1.23
153.1E
e.4
216.27
/1.9i,
142.90
c0.56
Geology Continued

c
.1
*JIM
A{
P..1
0.4
1-40
0110
.411
..06.
1IN
olli.
44J.**. 1
briar*
limmomW
444
44.4
,41
.44.
.
Table C- 2(Continued)
Course
Full or
1/2
Enrolment
Total Cost
Cost Per
Student
Geology (Concluded):
)
...
)Geology
205
1/2
16
3,284.60
205.28
Geology 206
1/2
81,157.56
144.69
Geology 210.
Is'
1/2
43,767.00
941.75
Geology 211
1/2
4835.62
208.90
0.
German 101
1/2
11
2,531.82
230.16
German 103
1/2
81,451.25
181.40
German 110
1/2
30
4,794.09
159.80
German 111
1/2
22
5,368.34
244.01
German
201
27
3,257.39
(465.34
German 203'
/2
N6
1,793.78
298.96
History 116
1/2e
16
3,167.56
.1.±
,197.97
History 117
1/2
21'
3,331.67
158.65
History 201
1/2,
153
20,216.67
132.13
History 203
1/2
99
13,002.17
131.33
History 212
1/2
144
21,465.61
149.06
History 213
1/2
184
15,292.40
147.04
History 220
1/2
40
7,191.20
179.78
History 221
1/2
32
4,463.26
139.'47
Humanities 150
1/2
208
23,039.95
110.76
Humanities 250
1/2
40
8,770.26
219.25
Humanities 251
1/2
139
14,194.88
102.12
Aol
iar.
,4.1
11
Co t Per Student
Con
ct Hour
dON 2.74
\).04
\0.81
13.06
3.71
5.67
1.72
1.91
7.27
9.34
4.21
3.31
0.61
0.91
0.55
0.84
1187
2. 0.53
1.
Continged

MOO
11111
VIM
IMO
Irma
ormirma
tAmmilw
vrat
a
Table C2(Continued)
Course
Full or
1/2
.
Enrolment
Images of Women 150
.28
Iniurance 110
1/2
36
Insurance 120
1/2
12
Insurance 121
1/2
6
Insurance 130
1/2
13
Insurance 203
1/2
23
Interior Design 110
1/2
126
Interior Design 111
1/2
83
Interior Design 112
1/2
59
Interior Design 113
1/2
58
Interior Design 114
1/2 '
98
Interior Design 115
1/2
57
Interior Design 116
1/2
103
Interior,Design 117
1/2
55
Interior Design 118
1/2
197
Interior Design 119
1/2
Interior Design 210
1/2
8
Interior Deslgn 211
1/2
Interior Design 212
,..4
1/2
48
Interior Design 213
1/2
40
Interior Design 218
1/2
52
Total Cost
Cost Per
Student
Cost Per Student
Contact Hour
l2,601.32
92.90
1.94
4,148.88
115.24
1.80
2,026.88
168.90
3.52
1,490.46
248.41
5.18
2,099.11
161.47
3.36
2,402.46
"104.45
3.26
13,789.56
109.44
'0.68
11,474.17
138.24
0.61
8,480.40
143.73
1.00
8,708.17
150.14
1.04
18,043.02
184.11
0.51
9,252.25
162.32
1.27
11,098.10
107.74
0.84
6,4 7.40
117.77
1.23
NIL
21,668.37
1E9.99°
0.49
6,376.73
1.37.80
1.75
5,788.76
120.59
1.26
7,171.4
170.74
1.19
6,196.76
129.09
1.34
'5,617.20
140.43
1.46
61282.70
120.82
1.26
Defliqn Continued
...
of
lo4

6440
401
Wol
mo
smir
wm
A6
4om
m..6
6
Table C-2(Continued)
4
Full or
Course
1/2
Enralment
Total Cost
CcA Pe-
Cost Per Student
Student
Contact Hour
Interior Design (Concluded):
Interior Design 219
1/2
45
5,777.05
128.37
1.34
Interior Design 220
1/2
80
10,505.02
131.31
0.91
Interior Design 221
1/2
66
8,252.73
125.04
0.87
Interior Design 223
1/2
41
5,501.74
134.18
2.10
Interior Design 224
1/2
108
21,843.35
202.25
0:44
Interior Design. 225
1/2
88
19,774.28
224.70
0.50
Library Science 110
1/2
91,354.48
150.49
4.70
Mathematics 112
1/2
27
4,050.08
150.00
3.13
ati
113
1/2
82,479.93
309.99
6.46
Mathemati
114
'1/2
281
34,305.47
122.08
0.26
Mathematics 115
1/2
192
24,322.77
126.68
0.30
Mathematics 118
1/2
565
68,271.82
120.83
0.15
Mathematics 119
1/2
222
32,912.E6
148.25
0.34
Mathematics 120
1/2
22
3,081.98
140.09
4.00
Mathematics 121
1/2
10
3,792.43
379.24
5.27.
Mathematics 122
1/2
21
3,612.68
172.03
3.31
Mathematics 123
1/2
1409.57
/409.57
51.20
Mathematics 130
1/2
32
4,511.06
140.97
1.48
Mathematics 131
1/2
21
3,716.48
176.97
1.86
Mathematics 201
1/2
2R3
32,162.08
113.64
0.38
.Mathematics Continued
...

1.10
11.1
.
Table C-2(Continued)
Course
Full or
1/2
Enrolment'
Total Cost
Cost Per
Student
Cost Per Student
Contact, Hour
Mathematics (Concluded);
Mathematics 203
1/2
95
14,435.62
151.95
0.79
001'
Mathematics 220
1/2
21
4,927.04
234.62
2.93
Mathematics. 221
1/2
11
,4,203.01
382,09
4.78
,,
Mathematics 224
1/2
92
15,530.28
168.80
0.75
Mathematics 240
1/2
30
4,210.79
140.35
2.92
Natural Science 150
1/2
80
13,210.66
165.13
0.86
Natural Science 250
1/2
40
9,976.33
249.40
1.20
Nursing 110
1/2
72
34,083.32
473.37
0.51
Nursing 111
1/2
67
83,650.65
1,248.51
0.49
Nursing 212
1/2
28
41,757.03
1,491.32
1.40
Nursing 213
1/2
39
36,372.09
932.61
''a
0.90
Petroleum 110
1/2
.40
6,399.26
159.98
1.11
Petroleum 210
1/2
48
2,942.00
163.44'
3.41
Physidal Education 170
1/2
108
13,284.24
123.00
0.75
Physical Education 171
1/2
'96
11,252.53
117.21
0.92
Physical Education 174
1/2
72
9,969.53
138.46
0.72
Physical Education 175
,1/2
58
9,274.56
159.90
0.83
Physical Education177
1/2
43
5,178.15
120.42
1.49
Physical Education 178
1/2
47
5,632.43
119.83
1.35
Physical Education 203
1/2
32
3,610.44
112.82
1.82
Physical Education Concluded ...

11/0
1010
11.1
4
Table C-2 (Continued)
14%
040
,1.
141I
CO
Course
Full or
1/2
Enrolment
Total Cost
Cost Per
Student
Cost Per Student
Contact Hour
Physical Education (Concluded):
Physical Education 204
1/2
93
12,559.21
135.04
0.75
0Physical Education 205
1/2
30
3,335.80
111.19
2.14
Physical Education 207
1/2
22
2,090.47
95.02
2.88
Physical Education 209
1/2
34
3,199.67
94.10
1.45
Phsyical Education 210
1/2
43
6,272.58
145.87
1.52
Physical Education 239
1/2
60
6,775.64
112.92
0.78
Physical Education 242
1/2
26
3,517.85
135.30
2.82
Physical Education 243
1/2
26,
3,676.85
141.41
2.95
Physical Education 246
1/2
24
2,792.38
116.34
2.42
Physical Education 247
1/2
32
3,963.26
123.85
2.58
Physical Education 254
1/2
74
iy
6,748.92
91.20
0.74
Physical Education 255
1/2
48
5,455.73
113.66
1.58
Physical Education 262
1/2
15
2,721.58
181.43
3.78
Physical Education 270
1/2
36
3,529.80
98.05
1.61
Physical Education 271
1/2
62
8,909.73
143.70
1.50
Philosophy 110
1/2
144
.18,853.86
130.92
0.63
Philosophy 111
1/2
23
4.574.83
198.90
3.11
Philosophy 121
1/2
25
3,905.30
156.21
.2.44
Philosophy 201
1/2
212
26,498.41
124.99
0.35
Philosophy 203
1/2
95
13,537.64
142.50
0.66
Philosophy 201
1/2
36
4,710.88
130.85
2.04
Philosophy 211
1/2
15
4,122.95
274.86
3.44
Continued ...

1
'
Table C-2(Continued)
Course
Full or
1/2
Enrolment
Total Cost
Cost Prx
Student
Cost Per Student
Contact Hour
Physical Education (Concluded):
Physical Education 204
1/2
93
12,559.21
135.04
0.75
Physical Education 205
1/2
30
3,335.80
111.19
2.14
Physical Education 207
1/2
22
2,090.47
95.02
2.88
PhysiCal Education 209
1/2
34
3,199.67.
94.10
1.45
Phsyical Education 210
1/2
43
6,272.58
145.8/
1.52
Physical Education 239'
1/2
60
6,775.64
112.92
0.78
Physical Education ,242
1/2
26
3,517.P5
135.30
2.82
Physical Education 243
1/2
26
3,676.85
141.41
2.95
Physical Education 246
1/2
24
2,792.30
116.34
2.42
Physical Education 247
1/2
32
3,963.26
123.85
2.58
Physical Education,254
1/2
74
6,748.92
-,
91.20
0.74
Physic-ml Education 255
1/2
48
5,455.73
.
113.66
1.58
Physical Education 262
1/2
15
2,721.58
.181.43
3.78
Physical Education 270
1/2
36
3,529.80
98.05
1.61
Physical Education 271
1/2
62
8,909.73
143.70
1.50
Philosophy 110
1/2
144
18,853.86
130.92
0.63
Philosophy 111
1/2
23
4,574.83
198.90
3.11
Philosophy 121
1/2
25
3,905.30
156.21
2.44
Philosophy 201
1/2
212
26,498.41
124.99.
0.35
Philosophy 203
1/2
95
13,537.64
142.50
0.66
Philosophy 201
1/2
36
4,710.88
130.85
v2.04
Philosophy 211
1/2
15
4,122.95
274.86
3.44
Continued

Table
'-2(Continipd
Course
Full or
1,2
Enr ,1r'1
t:
Total l'ost
'0,,,t Per
"'cl5t
1,er :;tulent
:,::ntact
our
Physics 110
1/2
120
3'14'8.11
23-,.1:
.41
Physics 111
1/2
4,492.69
(41.d1
5.84
Physics 130
1/2
14
2,167.85
154.84
3.10
Physics 241
1/2
74
18,716.84
252.93
0.62
Physics 247
1/2
20
5,011.81
250.59
2.61
Physics 253
1/2
22,996.90
1,493.45
18.73
Planning 110
1/2
20
4,898.32
244.91
1.02
Planning 230
1/2
14
3,480.40
248.60
2.59
%
Planning 240
1/2
30
4,338.85
144.62
1.51
Police Science 110
1/2
104
17,616.47
169.38
0.71
Police Science 113
1/2
128
15,313.35
119.63
0.83
Police Science 150
L,..,, 1/2
52,380.23
476.04
9.92
Political Science 110
1/2
60
8,867.58
147.79
1.54
Political Science 111
1/2
39
7,348.96
188.43
1.96
Political Science 201
1/2
7---:
75
9,285'..16
123.80
0.97
Political Science 203
1/2
47
4,676.15
99.49
L.55
Political Science 210
1/2
10
2,987.40
298.74
..
6.22
Political Science 211
1/2
12
3,131.88
260.99
5.44
1
Political Sciel 221
1/2
86
10,784.11
125.39
0.87
Property Management 202
1/2
47
5,718.52
121.67
1.27
Continued ...

NM
I=
II m
amoo
6100
64a
iiidA
tla
siki
re.4
Table C- 2(Continued)
i.ssi
ateL
itir
laur
sow
NIB
Course
Full or
1/2
Enrolment
Total Cost
Cost Per
Student
Cost Per St, 't_nt
Contact Ho
Project Go Ahead
1/2
28
45,654.95
1,630.53*
0.96
Psychology 110
1/2
343
39,358.45
1174\
0.24
Psychology 111
1/2
199
28,532 78
143.38
0.32
Psychology 210
1/2
74
8,887.
120
1.25
Psychology 211
1/2
134
14,769.76
1110.22
0.77
Psychology 212
1/2
C.14
1,599.35
4231
2.38
Psychology 213
1/2
61,976.46
/A0.41
'3',-/
6.86
Psychology 214
1/2
51
8,081.46
158.46
1.65
Psychology 215
1/2
59
8,659.35
146.76
1.53
Psychology 235
1/2
303
54,765.12
180.74
0.21
Recreation 110
1/2
85
13,140.29
154.59
0.72
Recreation 111
1/2
68
11,910.62
175.15
0.81
Recreation 130
1/2
101
16,952.82
167.84
0.58
Recreation 131
1/2
116
20,863.82
179.86
0.44
Recreation 210
1/2
21
3,910.70
186.22
2.59
Recreation 211
1/2
30
4,569.13
152.30
2.72
Recreation 240
1/2
24
3,965.72
165.23
2.95
Recreation 241
1/2
18
3,530.63
196.14
3.50
Religion 220
1/2
20
3,406.76
170.33
3.55
Religion 221
1/2
10
1,882.40
188.24
3.92
Religion 250
1/2
13
2,098.11
161.39
3.36
Religion 251
1/2
14
2,170.35
1.55.02
3.23
%c.
oo
Continued ...

KO
MA
AW
bram
arila
Cm
ArA
mm
u
Table C -2 (Continued)
ilvom
asam
.A.
-...1
.+4
Course
Full or
1/2
Enrolment
Total Cost
Cost Per
Student
Cost Per Student
Contact Hour
Secretarial Science 112
1/2
73
10,325.24
141.44
0.81
Secretarial Science 113
1/2
3717.90
239.30
10.80
Secretarial Science 114
1/2
54
6,224.17
115.26
1.20
Secretarial Science 122
1/2
32
5,269.69
164.67
1.29
Secretarial Science 136
1/2
66
11,351.42,
171.99
1.07
Secretarial Science 148
1/2
16
2,565.50
160.34
2.51
Secretarial Science 160
1/2
36
4,140.20
115.00
2.40
Secretarial Science 212
1/2
164
19,653.30
119.83
0.47
Secretarial Science 222
1/2
6758.75
126.45
15.81
Secretarial Science 224
1/2
64
7,812.20
122.06
1.27
Secretarial Science 236
1/2
42
5,341.63
127.18
2.27
Secretarial Science 238
1/2
81,030.97
128.87
11.72
Secretarial Science 240
1/2
34(19,71
136.57
34.14
LSecretarial Science 250
1/2
32
3,851.26
120.35
2.51
Secretarial Science 251
1/2
16
1,765.20
110.32
5.81
Secretarial Science 272
1/2
49
8,039.74
164.07
.1.03
Secretarial Science 280
1/2
11
1,567.95
142.54
4.45
Secretarial Science 284
1/2
81,282.25
160.28
5.01
Sociology 110
1/2
465
48,734.66
104.80
0.18
Sociology 201
1/2
404
48,264.34
119.46
0.19
Sociology 210
1/2
52
7,839.70
150.76
1.57
Sociology Continued ...

11111
MOM
umms
mum
NOMA
SOU,
Mama
wroill
Yrr.rw
sordimi
umwowe
wurird
worm
Table C-2(Continued)
Course
Full or
1/2
Sociology (Concluded):
Sociology 211
1/2
Sociology 218
1/2
Sociology 219
1/2
Sociology 230
1/2
Social Work 100
1/2
Social Work 101
1/2
Social Work 102
1/2
Social Work 103
1/2
Social Work 104
1/2
Social Work 105
1/2
Social Work 106
1/2
Social Work 107
1/2
Social Work 108
1/2
Social Work 109
1/2
Social Work 110
1/2
Social Work 111
1/2
Social Work 112
1/2
Social Work 113
1/2
Social Work 114
1/2
Social Work 115
1/2
Enrolment
158
59
57
12
33
29
31
....-s21/
32
29
21
40
21
20
119
120
18
19 30
26
Nem
lila
MP
am
p
Total Cost
18,620.53
7,703.35
7,558.87
2,585.88
6,883.55
5,190.58
4,430.02
4,285.55
5,240.94
5,024.24
3,112.67
4,485.14
3,123.67
3,049.76
27,111.81
21,377.74
3,436.97
3,509.21
5,098.16
5,912.59
Cost Per
Student
117.85
130.56
132.61
215.49
,Cctt Per Student
Contact Hour
0.49
1.36
1.38
4.49
208.59
2.17
178.98
2.49
142.90
211)58
10\71
3.08
163.77
2.56
173.24
2.71
148.22
3.09
112.12
2.34
148.74
3.10
152.48
3.18
227.83
0.36
178.14
0.46
?-
190.94
2.98
184.69
2.89
169.93
2.12
227.40
2.03
fr
Social Work Continued ...
4(

Table C-2(Continued)
Course
Full or
1/2
Enrolment
Total Cost
Social Work (doncluded) :
Social Work 116
1/2
38
4,463.67
Socitl Work 117
1/2
30
3,885.79
Social Work 118
1/2
30
9,161.29
Social Work 119
1/2
27
8,944.59
Social Work 206
1/2
13
2,818.11
Social Work 207
1/2
13
2,818.11
Social Work 208
1/2
14
2,890.35
Social Work 209
1/2
14
2,890.35
Social Work 210
1/2
82
15,441.68
Social Work 211
1/2
73
14,789.88
Social Work 212
1/2
14
3,535.03
Social Work 213
1/2
14
3,535.03
Social Work 214
3/2
19
3,394.52
Social Work 215
1/2
20
3,466.76
Social Work 216
1/2
19
3,394.52
Social Work 217
1/2
21
3,540.67
Social Work 218
1/2
19
4,059.21
Social Work 219
1/2
19
4,059.21
Social Science 118
1/2
247
35,020.79
Social Science 130
1/2
14
2,167.85
S
Cost Per
tudent)
Cost Per Student
Contact Hour
117.46
129.52
305.37
331.28
216.7
211.77
2 206.45
188.31
202.69/
252.50
252.50
178.65
173.33
178.65
168.60
213.64
213.64
2.45
2.70
1.59
1.73
4.52
4.52
4.30
4.30
0.65
0.70
3.95
3.95
3.72
3.61
3.72
3.51
3.34
3.34
141.78
0.31
154.84
3.10
Continued ...

mAimio4
4.111~
Wirdworil
Table C-2(Concluded)
arms
Nom
MI M
IN=lb
Course
Full or
1/2
Enrolment
Total Cost
Cost Per
Student
Cost Per Student
Contact Hour
Spanish 110
1/2
14
2,171.35
155.09
3.23
Spanish 111
1/2
91,894.86
210.54
3.29
Speech 110
1/2
74
10,885.61
147.10
1.02
,Speech X11
1/2
37
8,209.55
221.87
1.54
IJ
4
I.
1
frardre'e
APPENDI X D
MEDICINE HAT
.3
a

I Table D-1
Cost Revenue Analysis for Medicine Hat college
Transfer Programs:
.
Agriculture (1 student)
, Arts (based on 1 semester)
Commerce
Education
Year
)
Average CostPer Student
1,636
1,653
1,580
1,144
Engineering 4----.:1 1,855
Fine Arts (1 student 1,633
Home Economics '1,861
Physical EducatiOn 1,662
Pre-Dentistry 5Pre-Medicine 1,806
Science 1,884
DiplaRkProgr.ms: 'C,7
IBusingss Administration 1 2,058
Business Admthistration 2 1,809
Nursing 5,964
ISecretarial Science 1,812
Matriculation High SchoolEquivalent Program:
Adult Upgrading Program
1,436
513
104
FeesSubsidyEffect
'
200
200
200
200
1,792
1,712
1,792
1,792
+ 356
+ 339
+ 412
+ 48
200 1,792 + 137
200 '1,792 + 359
200 1,792 '+ 131
200 1,792 + 330
200 1,792 + 186.
200 1,792 + 108
. 200 1,792 -- 66
200 1,792 + 175
200 1,792 -3972
200 1,792 + 180
200 1,792 + 556
200 1,792 +1479

a
Woo
fM
ama
Table
D-2
c-
Courses Offered by Medicine Hat College in 1970-71 with Enrolment,
Total Cost, Cost Per Student, and Cost Per Student Contact Hour
-surea.,
Course
Full or
1/2
Enrolment
Total Cost
Cost Per
Student
CostPer Student
Contact Hour
Accounting 101
1/2
54
7,713.01
1424 83
0.81
Accounting 201
1/2
24
3,293.97
137.24
2.86
Accounting 203
1/2
17
2,779.73
163.51
.3.41
Anthropology 201
1/2
17
2,129.76
125.28
4.64
Anthr8pology 202
F37
4,447.92
120.21
2.86
Anthropology 203
1/2
16
2,056.16
128.51
4.76
Art 230
F18
3,343.71
185.76
2.65
Astronomy 201
1/2
20
-4.
5,549.01
277.45
2.17
4Academic UPgrad
: English
1/2
130
25,014.28
192.41
0.40
roe`
Academic Upgrading: Math
1/2
152
20,372.71
134.03
0.37
Academic Upgrading: Science
1/2
152
20,290.71
133.49
0.37-
Biology 100
F15
3,077%;23
205.14
2.93
Biology 101
1/2
82
10,613.17
129.42
0.82
Biology 103
1/2
36
6,180.40
./
171.67
1.37
Biology 201
1/2
97
17,957.15
185.12
0.58
\Business Admin. 105
1/2
30
4,126.92
,137.56
.2.87
Business Admin. 107
1/2
45
'4,783.31
106.29
2.21'
Business Admin. Continued
...

ME
I MN
=I
.111
1M
Oam
err
Table D-2(ContinUe0)
Full or
Course
1/2
Enrolment
Total Cost
Cost Per
Student
Cost Per Student
Contact Hour
Business Admin. (Concluded):
Business Admi74--111
1/2
5875.82
175.16
3.65
Business Admin. 113
1/2
61,881.10
313.51
6.53
Business Admin. 121
1/2
30
4,126.92
137.56
2.87
Business Admin. 123
1/2
23
3,612.69
157.07
3.27
Business Admin. 161
r.
1/2
17
3,171.73
186.57
3.89
Business Admin. 175
1/2
53
6,219.64
117.35
1.56
Business Admin. )105
1/2
92,191.58
243.50
5.07
Business Admin. 207
1/2
92,583.58
287.06
5.98
Business Admin. 211'
1/2
33
5,377.87
162.96
1.70
BusinesiAdmin. 219
1/2
1,746.78
158.79
3.31
Business Admin- 223
1/2.
12,65.7.18
265.71
5.54
Business Admin. 2 1
1/2
21
5,387.96
256.56
2.67
Business Admin.
1p1/2
92,137.58
237.50
4.95
Business Admin. 261
1/2
18
3,245.01
180.27
3.76
Business Adtnin. 301
1/2
21
2,062.49
98.21
2.05
Chemistry 101
1/2
25
5,321.76
212.87
2.29
Chemistry 103
1/2
19
6,083.13
320.16
2.56
Chemistry i01
1/2
472
14,557.82'
202.19
0.74
Chemistry 203
1/2
39
5,740.97
147.20
1.31
I
Chemistry 250
1/2
94,358.52
484.28
3.36
Chemistry 2\ 1
1/2
82,639.63
329.95
4.12
cr
Continued

MIMI
11111
MONO
MOMS -mom - tumor
woo*
Armor
airs
mom
OEM
MIN
MN
MIS
mai
Table 0-2(Continued)
Course
Full or
1/2
-Enrolment
Total Cost
Cost Per
Student
Cost Per Student
Contact Hour
Conservatory
1/2
310,855.04
3,618.34
618.85
Drama PrwluCtion
1/2
10
2,808,40
28u.84
3.90
Drama 221
1/2
11
2,188.78
198.98
4.15
Drama 223
1/2
22
2,997.09.
136.23
2.84
Economics 101,
1/2
40
4,415.95
110.39
2.30
Economics 103
1/2
28
3,534.04
126.21
2.63
Economics 201
1/2
74
12,374,43
167.22
0.76
6)1
Economics 203
1/2
45
5,822.81
129.39
1.73
Educational Admin. 261
1/2
60
9,520.64
158.67
1.10
Educational Foundations
201
1/2
.)
666
12 670.58
191.97
0.80
..--
,--
Educational Psychology
211
1/2
67
9,984.93
135.59
1.10
tia
Educational Psychology
213
1/2
47
7,615.19
162.02
1.32
English 101
1/2
64
11,204.74
175.07
0.87
English 103
1/2
60
10,910.98
181.84
0.90
English 211
1/2
21
2,051.49
97.69
2.04
English 231
1/2
17
2,129.76
125.28
4.64
English 233
1/2
140"
18,702.62
133.59
0.61
English 243
1/2
if
110
15,617.64
141,97
0.74
English 251
1/2
16
2,976.24
186.01
3.10
English
99
1/2
10
4,722.84
472.28
7.16
0
Continued ...
(

13
MOM
Mil!
MONO
MIMI
MOO
NINO
MIMI
OM
MIlli EMI MO
IMO
MOO
OM
Table D72.(Continued)
4111
111M
s.
Course
Full
1/2
or
Eprolment
Total Cost-
Cost Per.
Student
Cost Per Student
Contact Hour
rf
Engineering 154
1/2
13
3,204.98
246.53
3.08
Engineering 154
1/2
12
3,131.38
260.94
3.26
French 101
1/2
18
-2,981.34
165.63
2.07
French 103
1/2
14
2,687.58
191.97
2.40
French 201
1/2
21,805.67
902:83
11.29
French 203
1/2
21,805.67
902.83
11.29
.
French 205
1/2
92,319.90
257.76
3.22
French 207
r\
1/2
72,173.03
310.43
3.88
_Geography 201
1/2
38
7,025.95
184.89
1.10
Geography 203
1/2
O30
4,816.15
160.53
'1.66
German 101
1/2
10
1,560.50
'
156.05
1.95
German 103
1/2
81,563.63
195.45
2.44
History 101
1/2
47
5,308.68
112.95
1.51
History 103
1/2
.38
4,647.25
122.29
1.63
History 201
1/2
61
8,175.98
134.03
1.09
History 203
1/2
56
7,808.62
139.43
1.13
Linguistics 281
1/2
19
2,836.61
149.29
3.11
Linguistics 283
1/2
14
2,469.26
176.37
3.67
'-
Continued a...
a-,

-4
Table D-2 (Continued)
gilM
ON
110
Course
Full1/2or
Enrolment
Total Cost
Cost Per
Student
Cost Per Student
Contact Hour
Mathematics 101
1/2
104
14,045.21
135.05
0.62
Mathematics 103
1/2
16
1,1653.16
103.32
3.83
4
Mathematics 111
1/2
35
5,058.12
144.51
1.76
Mathematics 201
1/2
75
10,892.12
145.22
0.82
Mathematics 203
1/2
63
9,337.71
148.21
0.96
Mathematics
99
17
2,300.29
135.31
2.51
Music 201
1/2
83,239.30
404.91
8.44
Music 243
1/2
53,018.82
603.76
12.58
Natural Science /75
1/2
16
3,734.05
233.37
2.59
Natural Science 277
1/2
11
2,755.96
250.54
3.68
Physical Education 203
1/2
16
2,135.95
133.49
4.17
PhysicalEducation 205
1/2
48
5,156.86
107.43
1.92
Physical. Education 207
Z,
1/2
25
2,212.24
88.48
5.53
Physical Education 209
1/2
29
2,889.14
99.62
3.11
Physical Education 215s
1/2
25
3,901.51
156.06
2.26
Physical Education 217
1/2
99
10,643.20
107.50
0.9b
Physical Education 218
1/2
11
1,006.62
91.51
13.07
Physical Education 219
1/2
46
6,748.53
146.70
1.31
Physical Education 222
1/2
11
1,006.62
91.51
13.07
..,
Physical Education 228
1/2
50
5,956.14
119.12
1.24
Physical'Education.229
1/2
45
5,205.64
115.68
'
Physical
Education Continued ...

twav
irob
ow4
Ilia
r+ e
raa
Iren
een
amor
NM
I.
Table 0-2(Continued)
sow
NM
MD
IMI0
Course
Full or
1/2
EnrolmenX
Total Cost
Cost Per
Student
Cost Per Student
Contact Hour
Phsiical Education (Concluded):
Physical Education 243
1/2
29
3,073.14
105.97
3.31
Physical Education 245
1/2
92
8,810.54
95.7A
1.41
Physical Education 311
1/2
64
6,403.60
100.05
1.56
Philos phy 201
1/2
45
5,855.78
130.12
.1.36
Physics 100
1/2
82,560.00
1320.00
4.57
Physics 101
1/2
17
3,499.06
205.82
2.57
Physics 103
1/2
62/690.42
448.40
5.61
Physics 221
1/2
11
3,366.10
306.00
3.83
Physics 223,
1/2
72,901.03
414.43
5.18
Physics, 241
1/2
56
7,499.24
133.91
1.20
Physics 247
1/2
48
6,797.41
141.61
1.26
Political Science 200
1/2
16
2,430.58
151.91
3.62
Political Science 203
1/2
33
5,315.87
161.08
1.68
Political Science 221
1/2
36
'5,709.35
%158.59
1.65
Psychology 235
1/2
112
18,770.02
167.58
0.53
Psychology 237
1/2
11
2,406.78
218.79
4.56
Secretfrial Science 101
1/2
18
4,205.48
233.63
2.43
Secretarial Science 103
1/2
13
3,838.13
295.24
3.08
Secretarial Science 111
1/2
21
.5,598.90
266.61
1.39
Secretarial Science Continued ...

-t. At,tArial
,.cl,tarial :,cier,
,'
113
1/2
14
3,056.73
218.33
:=e, rotarial ccien,e 131
1/2
17
2,690.73
158.27
-,e-..-retarlal Science 133
1/2
14
2,470.26
/176.44
ecretarial Science 231
1/2
71,955.70
27408
ASecretarial Science 203
1/2
71,955.70
279.38
Secretarial Science 213
1/2
22,174.82
1,087.41
Secretarial Science 231
1/2
31,661.62
553.87
Secretarial Science 233
1/2
21,588.34
794.17
1/2
159
20,396.56
128.28
1. n,
4''
F,111 or
1/2
((:oncludeli
Frtroltrint
Total Co.,,t
() -
tPer
=,;tudeNt
co,;t Pot
`tud,,nt
cg,i4t,1
t Hour
Sociology 201
Zoology 273
Nursing 201
NursLag 203
Nursing 205
2.27
3.30
3.68
5.82
11.33
11.54
16.55
0.48
1/2
53
9,255.99
174.64
1.11
1/2
16
23,115.66
1/2
11
.27,609.31
1/2
11
7,258.31
1,444.72
2,509.93
659.84
Nursing costs included only an equal division of salaries amongst the courses.
No hours were used
to prorate since 1970-71 was the first year for Nursing and faculty loads were difficult to determine.
As a result the costs for Nursing do not include any Indirect charges.

I
i
I
APPENDIX X E
\I DGE COMMUNITY COLLEGE{-mg
i

113
Table E-1
Cost Revenue Analysis for Lethbridge Community College
$
YearAverage CostPer Student
Fees GrantsSubsidyEffect
Accounting Secretarial 1,464 120 1,595 + 251
Automotives 2,171 120 1,595 - 456
Architecture &Drafting Technology ,851 120 1,595 -2136
Business Administration 1,483 120 1,595 + 232
College & University Prep. 1,051 120 1,595 + 664
Commercial Cooking 1,383 120 1,595 + 332
Data Processing 1,631 120 1,595 + 84
Data Processing Secretary 1,612 120 1,595 +,103
Electronic Technology 2,549 120 1,595 - 834
Journalism 1 1,585 120 1,595 + 130
Journalism 2 2,132 120 1,595 - 417
Law Enforcement 1 2,062 120 1,595 - 347
Law Enforcement 2 2,633 120 1,595 - 918
Marketing Administration 2,397 120 1,595 - 682
Meat Technology '1,752 120 1,595 + 37
Nursing 1 2,092 120.,
1,595 - 377
Nursing 2 2,317 120 1,595 - 602
Office Administration 1,759 120 1,595 - 44
Outdoor Recreation &Conservation 1 1,951 120 1,595 - 242
Outdoor Recreation &Conservation 2 1,864 120 ,1,595 - 149
Table -1 Continued ...
C
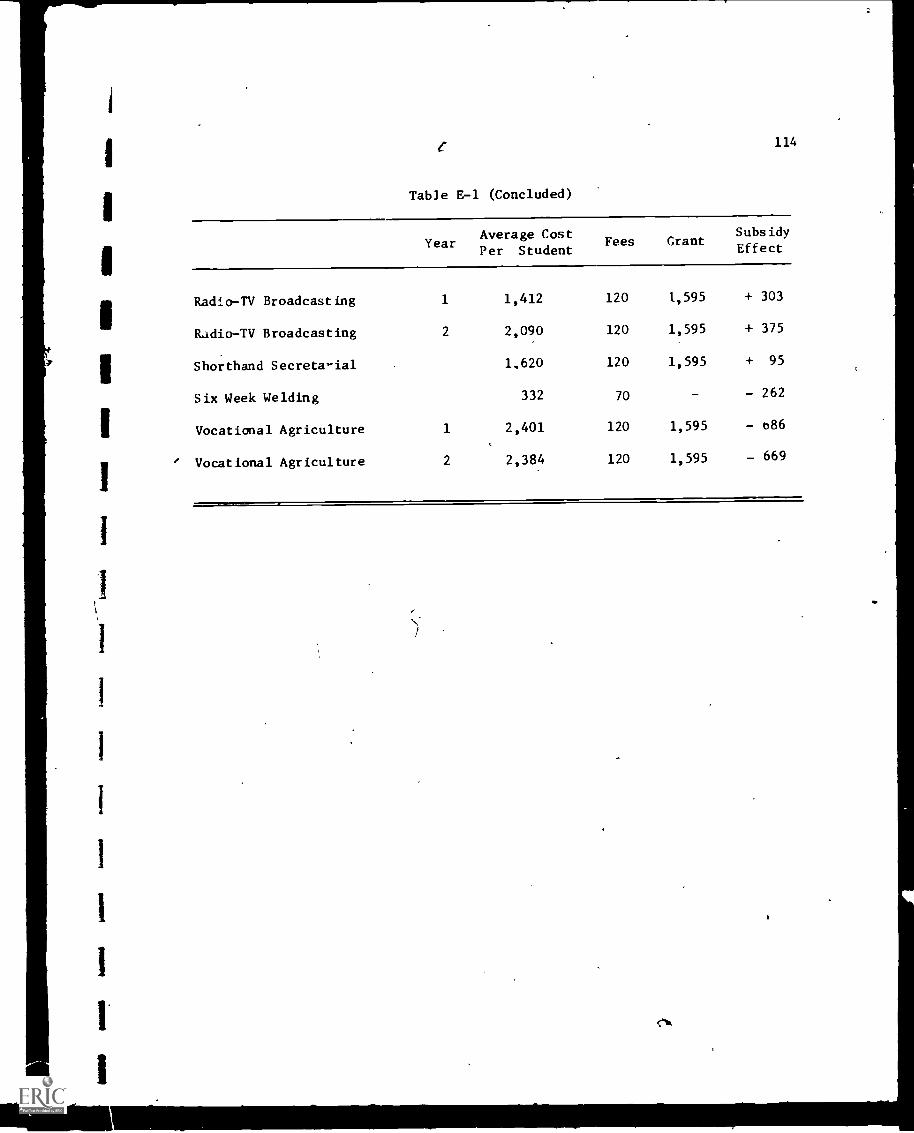
L 114
Table E-1 (Concluded)
YearAverage CostPer Student
Fees GrantSubsidyEffect
Radio-TV Broadcasting 1 1,412 120 1,595 + 303
Radio-TV Broadcasting 2 2,090 120 1,595 + 375
Shorthand Secreta-ial 1.620 120 1,595 + 95
Six Week Welding 332 70 - - 262
Vocational Agriculture 1 2,401 120 1,595 - b86
' Vocational Agriculture 2 2,384 120 1,595 - 669
IP

6
1011
1111
.1M
rrw
.lM
ostr
il
Table
E-2
Courses Offered by Lethbridge Community College in 1970-71 with Enrolment,
Total Cost, Cost Per Student and Cost Per Student Contact Hour
Course
Full or
1/2
Enrolment
Tot41 Cost_
Cost Per
Student
Cost Per Student
Contact Hour
Accounting 126/127
1/2
73
9,286.57
127.21
0.80
Accounting 128/129
1/2
6,395.14
163.97
1.02
Accounting 131/132
1/2
112
22,857.76
204.08
0.36
Accounting 133/134
1/2
82
11,915.01
145.31
0.61
Accounting 234/235
1/2
40
10,449.02
261.22
0.78
Accounting 236/237
1/2
33
4,837.00
146.57
1.31
Accounting 238/239
1/2
14
3,328.91
237.77
2.97
Automated Data Processing
149
1/2
82
10,824.94
132.01
0.83
Automated Data Processing
240
1/2
16
2,507.70
156.73
3.27
Automated Data Processing
240/245
1/2
22
3,783.25
111.96
2.15
Automated Data ProTssing
246/247
1/2
22
3,783.25
171.96
2.15
Advertising 283
1/2
10
2,205.45
220.54
4.59
r.
Advertising 284
1/2
17
2,800.75
164.75
3.43
Agricultural Marketing 230
1/2
17
2,256.75
132.75
2.77
Animal Breeding 205/206
1/2
10
3,929.76
392.97
6.55
Continued ..

Table E-2(Continued)
Course
Full or
1/2
Enrolment
Total Cost
Cost Per
Student
Cost Per Student
Contact Hour
AnimalNutrition 201/202
1%2
12
4,099.84
341.65
5,69
Animal Science 100/101
1/2
12
4,099.84
34) .65
5.69
Automotive Lab. 111/113/115
1/2
86,058.91
757.36
3.16
Automotive Lab. 112/114/116
1/2
13
6,484.12
498.77
2.08
Automotive Lab. 100/103
1/2
10
2,568.75
256.87
3.21
Automotive Lab. 101/104
1/2
13
2,823.87
217.22
2.72
Baking 105
1/2
0A
16
2;572.00
160.75
2.01
Biology 120/121
1/2
56
9,597.85
171.39
,1.07
Biology 130/131
1/2
183
23,254.36
127.07
0.66
BiAkogical
Science 160
1/2
90
15,016.09
153.22
0.68
Bookkeeping 120/121
3/2
52
5,547.51
106.68
1.33
Botany 100/101
1/2
91,777.72
197.52
3.29
Business Knowledge-
Mechanics Apprentice 17
1/2
29
3,076.86
106.09
4.40
Business Knowledge-
Mechanics Apprentice 27
1/2
19
2,022.65
106.45
6.65
)Business Knowledge 100
1/2
23
2,431.41
105.71
3.30
Business -aw 162
1,01
123
11,895.89
96.71
1.51
Business Law 166
1/2
86
9,467.52
110.08
1.15
Continued ...

4
NM
=I M
ID -
wow
Nor
dM
adW
ard
Wor
ldW
irsol
Wrr
.ri
iiim
orks
war
Sal
mi- WM
NM
I
Table E -2 (Continued)
Course
Full or
1/2
Enrolment)
Total Cost
Cost Per
.Student
Cost Per Student
Contact Hour
Business Admin. 165
1/2
202
21,654.27
107.19
0.74
Communication Arts 100/101
1/2,
23
4,066.29
176.79
2,21
f
Communication Arts 102/103
1/2
10
2,928.75
292.87
3.66
Communication Arts 104/105
1/2
24
-3,833.33
159.72
2.00<
Communication Arts 106/107
1/2
25
3,918.38
156.73
1.96
Communication Arts 108/109
1/2
27
4,088.46,
151.42
1.89
Communication Arts 110/111
1/2
18
3,323.08
184.61
2.31
Communication Arts 118
'
1/2-
,18
2,605.79
144.76
3.02
Communication Arts 127
1/2
21
2,860.91
136.23
2.84
Communication Arts 128
1/2
22
2,945.96
133.90
2.79
Communication Arts150/151
1/2
12
3,112.83
259.40
3.24
Communication Arts 152/153
1/2
44
5,534.17
125.77
1.57
Communication Arts 200
1/2
61,588.49
264.74,
6.62
Communication Arts 201
1/2
11
1,226.58
293.32
3.33 .
Communication Arts 202
1/2
13
3,594.46
276.49
2.88
Communication Arts 204/205
1/2
b2,302.58
383.76
4.80
Communication Arts 206/207
1/2
42,132.50
533.12
.6.66
Communication Arts 2C'3/209
1/2
52,576.13
515.22
5.37
foe's
Chemistry 110/111
1/2
43
9,818.31
228.33
1.43
Ch.mistry 120/121
]/2
29
8,627.72
297.50
1.86
Chemistry 130/131
1/2
62
14,074.58
227.00
1.01
Continued ...

Table E -2 (Continued)
anis
MI
NIN
Iim
p
Full or
Course
1/2
Enrolment
Total Cost
Cost
Per
Student
Cost Per Student
Contact Hour
Circuit Theory 129/130/131
1/2
74,360.98
622.99
3.24
\
Computer Mathematics, 241/242
1/2
23
~4,161 .29
180.92
2.26
Computer Science 248/249
1/2
22
3,783.25
\171.96
2.15
4
Cooking.101/103
1/2
16
4,996.24
'
312.26
,
1.30,
Cooking 102/104
1/2
20
'
6,310.89
315.54
1.04
Data Processing 141
1/2
132
22,034.35
166.92
0.42
Data Processing 144/145
1/2
50
8,283.60
165.67
1.04
Design 131
1/2
71,402.74
200.39,
6.26
Drafting 129
1/2
12
3,058.83
254.90
3.19
Drafting 130
1/2
72,633.62
376.23
4.70
/
Drawing 100
1/2
12
2,238.54
186.54
3.89
Economics 151/152
1/2
97
11,134.57
114.78
0.72
Economics 230
1/2
,18
2,341.79
130.09
2.71
Electrical Apprentice 13
1/2
23
3,638.29
158.18
1.98
Electrical Apprentice 14
1/2
23
2,995.70
130.24
2.04
Electrical Apprentice 19
1/2
23
3,643.68
158.42
1.52
Electrical Apprentice 23
1/2
25
4,068.97
162.75
1.70
Electrical Apprentice 24
1/2
425
3,165.78
126.63
1.98
Electrical Apprentice 29
1/2
25
2,512.70
100.50
4.19
Continudd

Table E-2(Continued)
.
Full or
Course
1/2
Enrolment
Total'Cost
Cost Per
Student
Cost Per Student
Contact Hour
Electronic Lab. 131
1/2
10
2,414.75
241.47
3.02
Electronic Lab. 132/133/134
1/2
74,360.98
622.99
3.24
Eleronic Theory
.
129/130/131
i 1/2
.....//
.,.:10
/4,616.11
,
461.61
ka(2.40
Electricity 130
1/2
"0/ 10
2,414.75
241.47
3.02
English 103
1/2
i18
71
2,877,79
159.8
3.33
English 104
1/2
109
'
16,545.44
151,79
0.56
English 105
1/2
1&14
14,967.47.
131.29
0.68
English 106
1/2
82
12,110.12
147.68
0.77
English 120/121
1/2
- 93
13,363.47
143.69
0.60
English 130/131
1/2
195
34,196.17
175.36
0.37
aglish 133/134
1/2
12
3,257.83
271.48
3.39
English 150/151
1/2
81
.14,072.15
173.73
0.54
English 160
1/.?
159
/21,540.65
135.47
0.60
/
English 208
1/2
31
6,990.51
225.50
1.76
English 209
1/2
33
4,442.42
134.61
2.80
Egnlish 80/81
1/2
45
I
9,205.57
204.56
1.07
Electrician Apprentice 12
1/2
23
2,353.82
.102.31
6.40
Field Crops.2311/231
1/2
,10
1,86$..76'
14.57
3.11
u.
Continued ...
LP

}mom,
foamy
ommilo
wows*
brimm4
irorW
Moira
illimmW
bard
Table E-2(Continu
0
ma
1111
111
mar
Course
Full or
1/2
Enrolment
Total Cost
Cost Per
Student
Cost Per StudOnt
Contact Hour
Finance 271
1/2
31,119.16
373.05
7.77
Finance 272
1/2
51;289.24
257.84
5.3i
Farm Structures 160/161
1/2
10
3,323.95
332.39
4.62
Food Theory 107
1/2
16
2,572.00
160.75
2.01
Food Theory 108
1/2
20
2,92.17
145.60
e,
1.82
Forage Crops 231/232
1/2
20
2,713.18
135.65
2.26
French 110/111
1/2
16
3,447.00
215.43
2.69
French 130/131
1/2
26
6,384.60
245.56
1.53
Farm M
hinery 130/131
1/2
19
3,667.14
193.00
3.22
Farm Management 100/101
1/2
17
2,458.05
144.59
2.41
Graphics 100
1/2
12
3,058.83
254.90
3.19
Graphics 107
1/2
72,633.62
376.23
,4.70
Growth & Development 100
1/2
48
4,770.05
99.37
2.07
History 100/101
1/2
39
5,394.96
138.33
1.73
History 200/201
1/2
16
3,504.00
219.00
2.74
Human Relations 168
1/2
109
a1,980.49
109.91
1.14
Industrial Organization
Management 291/292
1/2
-14
3,253.91
232.42
2.91
Continued ...

Table E-2(Continued
44.4
441.
4644
ON
*111
1104
.
"Ime
SONO 'sr
Course
Full or
1/2
Enrolment
Total Cost
Cost
Per
Student
Ccist Per Student
Contact Hour .
Law Enforcement 100
1/2
18
2,513.79
139.65
2.91
Law Enforcement 101
1/2
18
2,185.20
121.40
:3.79
Law Enforcement 103
1/2
12
2,003.54
166.96
3.48
Law Enforcement 105
1/2
12
1,674.95
139.57
4.36
Law Enforcement 106
1/2
30
3,534.29
117.80
2.45
Law enforcement 107
1/2
30
3,205.70
106.85
3.34
Law Enforcement :08
1/2
30
3,534.29
117.80
) 2.45
Law Enforcement 109
1/2
30
3,205.70
106.85
3.34
Law Enforcement 114
1/2
13
2,240.58
172.35
3.59
Law Enforcement 206
1/2
81,663.37
207.92
4.33
Law Enforcement 207
1/2
81,334.78
166.84
5.21
Law Enforcement 208
1/2
91,419.82
157.75
4.93
Law Enforcement 209
1/2
91,748.41
'194.26
4.05
Law Enforcement 210
1/2
81,663.37
207.92
4.33
Law Enforcement 211
1/2
81,334.78
166.84
5.21
Law Enforcement 212
1/2
81,334.78
166.84
5.21
Law Enforcement 213
1/2
81,282.37
160.29
3.34
Law Enforcement 214
1/2
81,848.37
231.04
4.81
Law Enforcement 215
1/2
81,663.37
207.92
4.33
Machine Shop Thebry
131
1/2
12
2,242.54
186.87
3.89
Machine Shop Theory
132
1/2
,8
1,902.6'37
237.79
4.95
Continued ...

ti
f PTable E-2(Continued)
Course
Pull or
1/2
Enrolment
Total Cost
Cost Per
Student
Cost Per Student
Contact Hour
Machine Shop 120
1/2
81,494.78
186.84
5.84
Machine Shop 121
1/2
13
1,919.99
147.69
4.62
0 Machine Shop 131
1/2
12
2,242.54
186.87
3.89
Machine Shop 132
1/2
81,902.37,
237.79
4.95'
Marketing 188/789
1/2
87
11,676.1E
134.20
0.84
Marketing 282
1/2
14
2,545.62
181.83
3..79
Marketing 288/289
1/2
14
3,328.91
237.77
2.97
Mathematics-Electrician
Apprentice 15
1/2
23
3,378.91
146.90
2.62
Mathematics-Electrician
Apprentice 25
1/2
25
3,656.99
146.27
2.61
Mathematics-Mechanics
,--,
/ Apprentice 15
1/2
29
4,136.66
142.64
4.46
AMathematics - Mechanics
Apprentice 2.5
1/2
19
2,506.24
131.90
4.12
Mathematics 100
1/2
41
4,166.79
101.62
3.08
Mathematics 110/111
1/2'
74
10,648.61
143.90
0.90
Mathematics 120/121
1/2
96
16,987,.78
176.95
0.55
Mathematics 130
-1/2
132
20,233.28
153.28
0.48
Mathematics 131A/131B
1/2
55
9,088.81
165.25
1.03
Mathematics 133/134
1/2
17
3,671.04
215.94
2.70
Mathematics 80/81
1/2
53
8,958.'3
169.03
1.06
1--
r...,
t.)
Continued ...

r.
4.16
0041
.1
Table E-2(Continued)
emor
NM
MO
Waft
Course
Full or
1/2
Enrolment
Tota4. Cost
Cost Per
Student
Cost Per Student
Contact Hour
Materials 131
1/2
12
2,256.34
188.02
5.22
Materials 133
1/2
82,324.37
290.54
6.05
Merchandising Administra-
tion & Accounting 277
1/2
82,120.41
235.60
4.91
Merchandising Administra-
tion & Accounting 278
1/2
14
2,545.62
181.83
3.79
Meat Technology 100/102
1/2
13,
4,183.59
321.81
1.06
Meat Technology 101
1/2
82,140.14
267.51
1,86
Meat Technology 103
1/2
13
2,723.05
209.46
1.31
Meat Technology 104
1/2
13
2,283.46
175.65
1.83
Meat Technology 105
1/2
13
2,283.46
175.65
1.83
Meat Technology 106
1/2
13
1,913.87
147.22
1.84
Meat Technology 107
1/2
13
1,913.87
147.22
1.84
Microbiology 260
1/2
24
3,216.74
,134.03
2.09
MotOr Mechanics Field
Work
1/2c;,
32
'6,914.34
216.07
1.39
Motor Mechanics 13
1/2
29
.N.
9,104.79
313.95
1.31
Motor Mechanics 14
1/2
29
6,575.72
226.74
1.42
i
Motor Mechanics 23
1/2
-19
5,412.37
284.8C
1.19
Motor Mechanics 24
1/2
19
,839.30
202.06
1.26
Note Taking 116/117
1/2
88
10,669.20
121.24
0.76
Continued ...

VII
IM
OM
- m
omom
m*
-
1101
1111
1to
rbri
bier
war
ig,
WW
IIM
N M
N
Table E-2(Continued)
itt
Course
Full or
1/2
Enrolment
Total Cost
Cost Per
Student
Cost Per Student
Contact Hour
Nursifig 110/111
1/2
52
18,805.33
361.64
0.60
I
Nursing 112/113
1/2
46
26,677.44
579.94
0.59
Nursing 114/115
1/2
40
18,706.16
467.65
0.66
Nursing 211/212
1/2
- 24
'
13,547.84
564.49
0.86
Nursing 213/214
1/2
24
15,956.99
664.87
0.91
Nursing 215
,1/2
23
19,626.65
853.33
0.92
Office Procedure 102
1/2
108
11,168.33
103.41
0.72
Outdoor Recreation & Con -
servation Education
Education 110
-1777
40
6,146.59
153.66
1.60
Outdoor Recreation & Con-
servation Education 111
la
86
13,131.11
152.68
0.95
Outdoor Recreation & Con:-
servation Education 120
1/2
65
8,450.64
130.00
1.3r.
Outdoor Recreation & Con-
servation Education 122
1/2
63
9,975.15
158.33
0.99
Outdoor Recreation & Con-
servation Education 224
1/2
43,413.04
142.21
2.96
Outdoor Recreation & Con-
servation Education 228
1/2
28
i4,689.50
167.48
2.09
outdoor Recreation & Con-
.
servation 2ducation 232
1/2
9'
'2137.41
4%137.41
247.49
4.95
Outdoor Recreation
Con-
servation Educati
233
1/2
22
"993.96
136.08
2.84
ORCE Continued ...

MIN
IIM
Oer
ear
sIM
OM
EM
MO
Ow
rrrr
hirs
ior
Mow
1111
1110
01ai
mam
mo
=11
1M
IMI
NIN
OM
O
1,11i0
F,J1 I 172
Enrolmenr
Total Co6t
-43,;t /or
:;tudent
rt.?
t,Kient
':k1ntact
ricer
.'utdoor kecreatIon
Con
servation Education 234
1/2
2'
4,601.17
230.45
2.84
..)utdoor Recre,ition & Con-
servation Education 236
1/2
10
1,973.45
197.34
4.11
Outdoor Recreation & C re-
servation Education 243
1/2
18
2,972.79
165.15
3.44
Outdoor Recreation & Con-
servation Education 246
1/2
24
3,263.04
135.96
2.83
Outdoor Recrea*
1 & Con-
servation Education 247
1/2
41,562.20
390.55
8.14
Outdoor Recreation & Con-
servation Education 268
1/2
20
3,739.17
186.95
2.34
Outdoor Recreation & Con -
se'vation education 269
1/2
10
2,072.45
207.24
4.32
Outdoor Recreation & Con-
servation Education 270
1/2
14
3,563.91
255.99
3.20
Outdoor Recreation & Con-
servation Education 272
1/2
43
5,070.31
117.91
0.74
Outdoor Recreation & Con-
servation Education 276
1/2
32
5,329.67
175.92
2.20
Outdoor Recreation & Con-
servation Education 2-77
1/2
18
4,439.08
246.61
3.08
Outdoor Recreation & Con-
servation Education 279
1/2
18
4,439.08
246.61
3.08
Outdoor Recreation & Con-
servation Education 282
1/2
16
3,754.00
.234.62
2.93
a
ORCE Continued ...

Table E-2 (Continued)
Course
full or
1/2
Enrolment
Total Cost
Cost Per
Student
Cost Per Student
Contact Hour
ORCE (Concluded):
Outdoor Recreation & Con-
servation Education 283
1/2
15
2,624.96
174.99
2.19
Outdoor Recreation & Con-
servation Education 285
1/2
11
3,328.79
302.61
3.78
Outdoor Recreation & Con-
servation Education 292
1/2
73,356.21
4i9.45
4.99
Outdoor Recreation & Con-
servation Education 293
1/2
28
5,126.09
1.91
Organizational Behavior
268/269
1/2
54
8,429.77
156.10
0.98
Personnel Admin. 298/299
1/2
23
3,745.29
162.83
2.04
Physical Education 100
1/2
38
4,306.92
113.34
1.42
Physical Education 102
1/2
50
8,499.60
169.99
1.06
Physical Education 104
1/2
27
3,757.17
139.15
2.90
Physical Education 105
1/2
11
1,580.49
143.68
2.99
Physical Education 200
1/2
34
7,774.93
228.67
1.43
Physical Education 204
1/2
18
3,972.08
220.67
2.76
Physical Education 206
1/2
17
2,523.04
148.41
1.86
..
Physical Education 210
1/2
67
6,501.14
97.03
1.21
Physical Education 212
1/2
31
3,455.04
111.45
1.74
Physical Education 213
1/2
12
1,634.54
136.21
.2.84
Physical Education Continued ..

IAM
MW
4.1
.111
.10.
4114
.1im
aili4
limoi
mad
ri
Table E-2(Continued)
ma*
MN
EM
Im
egm
..
Course
Full or
1/2
Enrolment
Total Cost
Cost Per
Student
Cost Per Student
Contact Hour
Physical Education (Concluded):
Physical Education 215
1/2
17
1,927.75
113.39
2.36
Physical Education 216
1/2
32
5,162.67
161.33
2.02
Physical Education 218
1/2
11
2,058.49
187.13
3.90
.'hysics 110/111
1/2
60
9,554.02
159.23
1.00
Physics 120/121
1/2
44
8,223.35
186.89
1.17
Physics 130/131
1/2
76
14,058.42
184.97
0.68
Physics 132/133
1/2
11
3,160.79
287.34
3.59
Political Science 100/101
1/2
23
5,140.29
223.49
2.79
Per Units 120/121
1/2
17
3,919.24
230.54
3.20
Psychology 100/101
1/2
.221
31,978.02
144.69
0.45
Public Speaking 160
"1/2
12
2,447.34
203.94
5.67
Real Estate 275/276
1/2
62,648.58
441.43
5.52
Salesmanship 279/280
1/2
14
3,449.91
246.42
3.08
Sanitation 100
1/2
'27
2,771.57
102.65
3.21
Sanitation 101
1/2
33
99.44
3.11
,281.83
-
Science-Motor Mechanics 16
1/2
29
3,342.66
115.26
3.60
Science-Motor Mechanics 26
1/2
19
2,430.24
127.90
4.00
Continued ...
fi

MEMO
IMMO
am mow
0111110
amod
boded
0004
immid
Mood
Table E-2(Continued)
Course
Full or
1/2
Enrolment
Total Cost
Cost Per
Student
Cost Per Student
Contact Hour
Science 80/81
1/2
42
8;053.27
191.74
1.20
Shortorder Cook
1/2
12
2,380.88
198.40
2.20
(
Sketching 131
1/2
12
1,827.95
152.32
4.76
Sociology 100/101
1/2
160
19,880.28
124.25
0.52
Sociology 100BE
1/2
99
10,928.07
10.38
1.15
Soils 100/101
1/2
19
2,628.14
v 138.32
2.31
Soils 226/227
1/2
15
2,490.16
'''
166.01
2.31
Social Studies 130/131
1/2
207
25,345.18
122.44
0.77
Shorthand 110/111
1/2
36
9,079.49
252.20
1.13
Shorthand 112/113
1/2
30
5,939.07
197.96
1.17
Shorthand 212/213
1/2
61,581.94
263.65
4.88
Statistics 250/251
1/2
54
8,429.77
156.10
0.98
Structures 133
1/2
12
2,256.34
188.02
5.22
Structures 134
1/2
82,324.37
290.54
6.05
Transportation &
Management 281
1/2
92,120.41
235.60
4.91
Typing 100
1/2
138
20,670.78
149.78
0.31
Typing 101
1/2
89
15,783.55
177.34
0.44
Typing 106
i1/2
83
11,353.99
136.79
0.85
Continued

Talqe
E-2 (Concluded)
Course
Full or
1/2
Enrolment
Total Cost
Cost Per
Student
Weeds 220/221
1/2
11
1,947.80
177.07
Welding 100/102
1/2
123
28,289.69
229.99
Welding 170/171
1/2
92,115.91
235.10
Welding Apprentice
1/2
73
17,009.40
233.00
Welding-Special
1/2
12
4,278.50
356.54
Cost Per Student
Contact Hour
2.95
0.28
13.27
0.49
2.29

I
I
I
1
I
1
i
I
I
I
I
1
I
I
I
I
I
I
(
APPENDIX F
PROCEDURES AND INSTRUMENTS RELATED TO A
YEARLY COST ANALYSIS.
,

I
131
INSTRUCTIONS
for Data Collection -- College Costing System
Attached a Data Collection Instrument for use in the College Costing System.The sheet requires information on individual faculty assignments of an Instruc-tional and Non-Instructional Nature. Please note the following items beforecompleting the Data Sheet.
1. SALARY. The salary figure MUST NOT incliide fringe benefits and thesalary should cover the contract year 197_ to 197.. _DO NOT includepayment for evening or summer courses, etc. if they received extrapay.
2. INSTRUCTOR NUMBER. DO NOT FILL 1N THIS NUMBER. FOR COMPUTER USE ONLY.
6. COURSE NAME. List all course names and numbers using the enclosed codesheet and indicate if the assignment is a lecture, laboratory, orseminar by ticking the appropriate column. If a course name is newand does not appear on the code sheet write it out in full. Pleaseindicate if the course is Full (F) or 1/2 Time.
7. HOURS CR UNITS. This item refers to hours or equated units assigned tovarious courses. Specify this figure in CLOCK HOURS if they were thebasis of assignment or UNITS if they were the basis of assignment.
8. NUMBER OF WEEKS. Refers to the length of time the course was offered.
9. and 10. ENROLMENT AND T CODE. Enrolments are to be reported AFTER 25percent of the course lids elapsed. If a course has lectures andlaboratories or seminars enter a T in the T Code Column. BE CERTAINthat the total of lecture enrolments is the same as laboratory orseminar enrolments. If a difference exists, please explain.
11. ADDITIONAL COSTS. Report this figure in a lump sum. If fringe benefitsare paid, please include. Items included here include markers,laboratory assistants, etc.
12. to 13. EXTRA-PAY INSTRUCTION. This refers to evening or summer courseswhich received extra pay. All categories are filled the same asRegular Contract Assignments.
13. SALARY. Include salary paid for the Extra-Pay Instruction. DO NOTADD FRINGE BENEFITS.
18. ADDITIONAL COSTS. Treat the same as #11 -- LUMP SUM.
PLEASE RETURN ONLY INDIVIDUAL DATA SHEETS.

i11.
1.10
16,
11
DATA ODLLECTION - COLLEGE COSTING SYSTEM, 197_ to 197._
1.
2.
3.
4.
Instructor Name
Instructor Number
Contract S lary
.
INSTRUCTIONAL ASSIGNMENT
REGULAR CONTRACT:
6. Course Name
1111111111111101
lam
amm
o."
?
F or
No.
Lee,
Lab.
Sem.
1/2
1I
I1
JI
1I
I1
I1
1I
1I
11
1I t
LII
II
II _
I1
II
I_1
t.1
II
!lilt
14-1'
111'
1+
, "01
11
11
II
7c,..
21
11
I1
II
II
1I
I1
11
1I
I1
Ii
IL
II
..)1
I1
..I
I1
I1
11
I1
1t
11
11
11
11
II
11
11
11
1I
II
1I
IJ
11
1...
t
II
I1
11
11
11
I1
11
Ii
11
12. EXTRA-PAY
I11
1111
1!I
1 til
li1il
11
,L.
1
II
III
IIII
IIII
iltil.
NON-INSTRUCTIONAL ASSIGNMENT
19. What percentage of total workload is spent in Non-Instructional Activities?
INSTRUCTION (Summer, Evening Courses, Etc.)
13. Extra Pay Salary
r
20. Please check the appropriate Non-Instructional Activity(ies) or add if not included:
Administration
Counselling
Release (Preparation)
College
7. Hrs.
or Units
11.
II.
It.
II.
II.
I1.
8. No.
of Weeks
1I. 1.
I1.
r,
1.
1I.
11.
11.
15. J
1,
1I.
Library
1I.
5.Admin. Title (if any)
9. En-
rolment
I 1
16. 1
1.
10. T
Code
7.
Coaching
Research i Development (Program)'
Other (Specify)
21. What percentage is representative of fringe benefits paid in your college?
1I
LI
12
ce2

133
DUTIES OF ACC SECRETARIAL STAFF
RE: Preparation of Costing Data for NAIT
Prior to sending the individual data sheets from each college to NAIT, oneof the secretarial staff should prepare:
1. n alphabetical list of instructors from each college with an I.D.number for each instructor. The I. D. number to be the first letter ofe College's location and then a number resulting from a straight
forward ranking of the alphabetical list.
2. The list of instructors to include instructor salaries and where aninstructor receives a normal.contract salary and payment for summer or->evening courses both items should be listed separately. The salariesreported in the list will be processed according to #3 below beforeinclusicn in the list.
. 3. The instructional salaries so that the amount of money representativeof the percentage of time spent in noninstructional activity isremoved. This would involve determining the percentage of timereported for noninstructional-activity (question 18), calculatingthe amount this is of the reported salary, subtracting the amount,and finally listing the resulting instructional salary with theinstructor's name as directed in #2 above.
ie
4. An alphabetical list of all courses offered in each college Prom thecollege calendar fot'the particular year being analyzed. These listsshould be prepared in the first week of September following the yearbeing analyzed. The lists :,Would then be sent to the Data Center atNAIT.
5. A list of courses and codes from each college for inclusion with theData Collection Instrument to be sent to each college early inSeptember.

MASTER LIST - COLLEGE COURSES
Academic Upgrading - English - AUENGL
Academic Upgrading - Mathematics - AUMATH
Academic Upgrading - Science - AUSCI
Accounting ACCT
Advertising - ADVT
Agricultural Marketing AGMRKT
Animal Breeding ANBRD
Animal Nutrition ANNUT
Animal Science - ANSCI
Anthropology ANTH
Automated Data Processing - ADATPRO
Automotive Laboratory - AUTOL
Automotive Theory - AUTOT
Art - ART
`Astronomy - ASTROM
Baking - BAKE
Behavioral Science - BEHAV
Biochemistry BIOCH
Biological Science - BIOSCI
Biology - BIOL
Bookkeeping - BOOK
Botany - BOTA
Business Administration BUSN
Business Knowledge - BUSK
Business Knowledge -Mechanics Apprentice BUSK(MMP)
Business Law - BUSL
134
Master-List Continued . . .

135
.Master List - Continued:
C
D
E
Chemistry
child4are
Circuit Theory
Communications
Communication Arts
Computer Mathematics
Computer Science
Creative Writing
Data Processing
Design
Diafting
Drama
Drawing
CHEM
CHCA
CIRTH
COMM
COMAT
COMAT
COMP
CRWRT
DATP RO
DESIGN
DRAFT
DRMA
DRAW
Economics ECON
Economics & Business ECBS
Educational Administration, EDADMIN
Educational Foundations - EDFDN
Educational Psychology . - EDPSY
Electrical Apprentice ELECEP
Electricity - ELEC
Electronic Laboratoiy - 'ELECL
Electronic Theory - ELECT
Engineering - ENGR
English -
Master List Continued . (.

S.
Master List - Continued:
F
H
I
FarM Machinery FRMMCH
Farm Management FRMMNG
Farm Structures - FRMS1
Field Crops FIEL
Finance FINAN
Food Theory FOODT
Forage Crops FORG
French FREN
geography
Geology
General, Education
Genetics
German
Graphics
Growth & Development
History
Human Relations
Humanities
GEOG
GEOL
GNED
GENE
- GERM
GRAPH
GRDE
- HIST
HUMR
- HUMN
Images of Women - IMWO
Industrial Organizationand Management - IOMNG
Insurance - INSR
Interior Design - INDS
0
136
_Master List Continued . . .

Master List - Continued:
L
M
N
Landscaping LNDSCP
Law Enforcement - LE
Legal Secretary - LEGSC
Library Science - LBSC
Linguistics LING
Machine Shop - MACH
Machine Shop Theory MACHT
Marketing MARKT
Mathematics MATH
Mathematics - ElectricianApprentice - MATHEP
Mathematics - MechanicsApprentice - MATHMMP
Materials - MATS
Meat Technology - MEAT
Mechanical Engineering - MECHE
Merc*andising Administrationand Accounting MDSE
Microbiology MICROB
Motor Mechanics - MMP
Mow Mechanics Field Work - MMPF
Music - MUSIC
Natural Science a e - NTSC
Nursing NUR'S,
Note Taking - NOTE
Master List 'Continued
137
3

Master List Continued:
0 Office Proceoure
Organizational Behavior
Outdoor Recreation &Conservation Education
P Petroleum Administration
R
Petroleum
Philosophy
Physical Education
Physical Sciences
Physics
Physiology
Planning
Police Science
Political Science
Power Units
Property Management
Psychology
Public Speaking
Reading
Real Estate
Recreation
Religion
Al
- OFPRO414
- ORGN
- ORCE
- PERS
- PETR
- PHIL
- PHED
- PHYSCI
- PHYS
- PSYSIO
PLAN
PLES
PLS C
- POWR
PRMT
PSYCH
PUSP
READ
REAL
RECR
RLGN
dr
Ne
138
Master List Concluaee . . .

'lettr Ii.t < onclude1:
-,alesmanship - SALES
inttation - SAN
i ienc( - SCI
,,Ion,e Motor Mechanics - SCIMMP
Sec-eta.lal Science - SESC
Shc than.f - SRTHND
Shottorder Cook - SHRTOC
Sketching - SKETCH
Social Science - SOSC
Social Servi(es - SOCSER
1.cia1 Studies - SOST
Social Work - SLWK
Sociology - SLGY
Soils - SOILS
'Ipani.,h - SPAN
`' al
-;tatistics SIATS
Structures STRU /
Transportation 4, Management
Weed:,
Welning
We Apprentice
Welding - Special
ZoolOgY
- TRANS
- TYPE
WEEDS
WELD
WLDAPP
WLDSP
- ZOO
1 39


![g]kfn jfo';]jf lgud - Nepal Airlines](https://static.fdokumen.com/doc/165x107/631e912425add517740b1add/gkfn-jfojf-lgud-nepal-airlines.jpg)