Bajaj Auto Ltd. Waluj Plant - Active Ads
26
Aug-16 1 1 BAL-Waluj August 22, 2016 Bajaj Auto Ltd. Waluj Plant National Award for Excellence in Energy Management 2016 2 BAL-Waluj Contents Sr. No. Topics 1 Company profile 2 Manufacturing process 3 Energy Conservation cell 4 Scope 5 Energy Indices /Benchmarks 6 Energy Conservation Methodology 7 Energy Conservation Approach 8 Energy cost loss Tree 9 Innovative Projects 10 Other Encon Projects a) Electrical b) Use of renewable energy c) Thermal 11 Environment & Carbon Reduction 12 Utilization of waste 13 Results 14 Sustenance 15 Future Project 16 Achievements
-
Upload
khangminh22 -
Category
Documents
-
view
6 -
download
0
Transcript of Bajaj Auto Ltd. Waluj Plant - Active Ads

Aug-16
1
1
BAL-Waluj
August 22, 2016
Bajaj Auto Ltd.Waluj Plant
National Award for Excellence in Energy Management 2016
2
BAL-WalujContentsSr. No. Topics
1 Company profile2 Manufacturing process3 Energy Conservation cell4 Scope 5 Energy Indices /Benchmarks6 Energy Conservation Methodology7 Energy Conservation Approach8 Energy cost loss Tree 9 Innovative Projects
10 Other Encon Projectsa) Electricalb) Use of renewable energyc) Thermal11 Environment & Carbon Reduction12 Utilization of waste 13 Results14 Sustenance15 Future Project16 Achievements
Aug-16
2
3
BAL-Waluj
A Group Built on Trust• One of the oldest business
conglomerates in India• A group comprising of 25
companies• Turnover over INR 280 Billion • Around 36,000 Employees.
• Headed by Mr. RahulBajaj, Chairman of the Boardof many companies. Awarded
the third highest civilianaward ’Padma Bhushan’ in
2001.
Electrical & Home Appliances
Finance & Insurance
Power & Infrastructure
Bajaj Auto Ltd. is amongst the FIVE MostInnovative Indian Companies and the onlyautomotive company featuring in thecoveted list of Forbes World’s Top 100 MostInnovative Companies of the year 2014.(Announced by Forbes on August 21,2014)
Automotive
Steel & Engineering
Bajaj Auto Ltd. The flagship Company of the
Bajaj Group.
Company Profile
4
BAL-WalujApproach for Improvement
KeyManagement Index
KeyPerformance Index
KeyActivity Index
Company Vision
Company Mission
“Vendor Improvement” pillar is created to focus on “Vendor Supplies”
Individ
ual Im
provem
ent(Ko
betsu K
aizen)
Educat
ion & T
raining
Develo
pment
Ma
nagem
ent
Planne
d Main
tenanc
e
Autono
mous M
ainten
ance
(Jishu
Hozen)
Quality
Mainte
nance
(Hinshit
su Hoze
n)
Office
TPM
Safety
, Health
&Env
ironme
nt
Flexibility, Reliability, Capability, Profitability “ Safe and participative work environment ”
TPM - The Prime Mover Towards Excellence
Vendor
Impro
vement
ISO 9001
ISO 14001
OHSAS 18001ISO 50001- Initiated
Company Vision & Mission … through KMI, KPI & KAI

Aug-16
3
5
BAL-WalujManufacturing Process Flow Chart
Press & Fabrication
Aluminium Shop
Steel Shop
Heat Treatment
Central Gear Shop
Paint
Engine Assembly
•Vehicle Assembly•Export Assembly
•& Packing
Domestic Dispatch
Export Dispatch
Vendorparts
Total Number of Equipments - 1840 nos.
6
BAL-WalujFlow Chart - Energy Conservation Program
Company Vision/Mission
Plant Vision/Mission
Shop Level Target
Encon Projects Energy Manager
Management Review
Budget Allocation
Execution & Monitoring
Cost Reduction-KK Pillar
Environment Improvement Energy - SHE Pillar
Technical Improvement PM Pillar

Aug-16
4
7
BAL-WalujEnergy Conservation Cell
Monthly ReviewFortnightly
Bi-Monthly Review
Weekly
Daily
Div Head Div Head Div Head Div Head Div Head Div Head
CorporatePlant Head
Machine Shops CGS/HT Paint
Shop Press & Fab Assembly Utility
Dept Head Dept Head Dept Head Dept Head Dept Head Dept Head
Energy Captain Energy Captain Energy Captain Energy Captain Energy Captain Energy Captain
Energy Manager
8
BAL-Waluj1985-87 1988-2001 2002-09 After 2010
Measurement system (LAN based)Micro mapping through power analyzerEliminate needTechnology Up GradationsLCC (Life cycle cost ) analysisDeep mining of Solar & Wind Energy
Measurement at feeder (Manual) Sharing best practices with stake holders Energy Optimization Energy OptimizationSystem Auto controls System Auto controls Eliminate waste Eliminate waste
Eliminate resource wastage Eliminate resource wastage Eliminate resource wastage Localized control Localized control Localized control Human Dependent systems Human Dependent systems Human Dependent systems
Working on Legacy system
Details of year-wise efforts made in Technology Absorption relating to Energy

Aug-16
5
9
BAL-WalujEnergy Consumption per unit of production & Capacity Utilization
Specific Energy Consumption
Energy UnitBase Year Achieved Target2003-04 2007-08 2008-09 2009-10 2010-11 2011-12 2012-13 2013-14 2014-15 2015-16 2016-17
Electricity Kwh/veh 67.54 36.72 34.9 31.45 25.41 22.61 21.15 19.92 18.89 17.91 16.0
LPG Kg / veh 2.53 2.4 2.2 2.1 1.77 1.45 1.33 1.1 1.0 0.95 0.85
Water m3 / veh 0.89 0.54 0.52 0.41 0.35 0.41 0.27 0.18 0.17 0.15 0.10
Capacity Utilization % 92.3 64.75 76 96.15 100 98 98 100 85 82 100
Energy Consumption per unit of production & Capacity Utilization
Sr. Energy SEC Reduction % In 13 Year s In Last 3 Years In last year
1 Electrical ( Kwh/Veh) 73.5% 10% 5.2%2 Fuel ( LPG) ( Kg/Veh) 62.5% 14% 5%3 Water ( Cu.m /Veh) 83% 17% 12%
10
BAL-WalujAbsolute Energy Saving
Year Elect. Saving(Lacs Kwh)
Thermal(Fuel) saving
M KcalElect. Consumption
Lacs KwhThermal
(Fuel) Consumption M KcalElect.
Saving %Thermal Saving %
2010-11 18.9 646.1 573.56 41527 3 2
2011-12 24.1 255.2 587.14 39703 4 1
2012-13 18.7 816.8 540.93 36067 3 2
2013-14 22.63 586.5 510.8 31740 4 2
2014-15 20.2 638.0 503.8 30939 4 2
2015-16 25.2 560.0 457.0 27881 5.5 2.0

Aug-16
6
11
BAL-WalujSpecific Energy Consumption-Benchmark
Sr. Energy BAL , Waluj Nearest competitor Global 1 Electrical ( Kwh/Veh) 17.91 21.2 NA2 Fuel ( LPG) ( Kg/Veh) 0.95 1.9 NA3 Water ( Cub.Mtr/Veh.) 0.15 ( Water Positive ) 0.23 NA4 Diesel (Ltr/Veh) 0.09 2.3 NA
No Standard Benchmarks are available for Automobile sector , These are collected as per our information's
However, we are setting our own internal targets as:Min 5 % Reduction in specific energy consumption wrt last year
12
BAL-WalujStratification of Energy consumption
6 166
60
12
%
Lighting Compressed airCooling Process
22.8
75
2.2%
Heat treatment Paint shop Canteen
Electrical Energy consumption LPG Energy consumption

Aug-16
7
13
BAL-Waluj
Sr.No. Activity Methodology Tools/ Techniques used1 Audit To identify areas of energy conservation
potential ( Internal & External) Weekly / Monthly data through Pie charts & brainstorming
2 Analysis To identify equipments & Processes where energy conservation is possible Daily/weekly KWh, pressure, flow,volume etc.recording through bar charts,graphs
3 Action Plan Identify activities for individual equipments with time frame Resource planning & activity charts
4 Implementation Action for procurement & implementation 6W2H Way Activity Charts5 Evaluation To analyze plan V/S Actual Gap Analysis & countermeasures
6 Sustenance To Monitor the results Internal Audits
Energy Conservation Methodology
14
BAL-WalujEnergy Conservation Methodology & IdeaElectrical Energy
Operational Control Loss Reduction / Elimination
Sr. Idea 1 Light Power Loss2 Unwanted illumination 3 Compressed air energy 4 Inefficient Equipment 5 Transmission Loss
• Power Factor • Harmonics
6 Transformer Loss7 Micro Level Analysis
Sr. Idea1 Metering & Monitoring 2 Auditing 3 Energy Captain4 No Production on Off days 5 Sharing Best practices with stake holders
Sr. Idea 1 Biogas for Heating 2 Solar Lighting 3 Solar Power generation4 Wind Power Generation5 Solar Water Heating 6 LPG Heating 7 IR Heating 8 Energy Recovery-HeatPump
Technological Improvement
Sr. Idea 1 LED/CFL/Induction Lamps2 Efficient Motor/Pumps3 Screw Compressor4 Ceramic to Metal tube heater5 Aluminium Pipes for compressed air .air6 5 Star rating equipments 7 VFD for high HP Motors8 Use of Soft Starter 9 Scroll Compressors
10 LCCA
Alternate Source/Recovery Alternate Source/Recovery Efficient Equipment
Loss Idea
Visible Loss
Invisible LossDistribution
Loss

Aug-16
8
15
BAL-WalujEnergy Conservation Methodology & Idea
Fuel (LPG) Energy
Operational Control Loss
Sr. Idea 1 Heat Loss through oven skin2 Heat Loss Through Flue Gases3 Heat Loss to Jigs & Fixtures
Sr. Idea1 Metering & Monitoring 2 Auditing 3 Energy Captain4 No Production on Off days
Sr. Idea 1 Solar water heating2 Use LNG 3 Infrared Heating 4 Bio Gas
Technological Improvement
Sr. Idea 1 Direct heating IR2 Combustion Efficient Burner 3 Low Temperature process4 Cycle Time Optimization
Loss Elimination Alternate Source Efficient Equipment Monitoring & Audits
16
BAL-WalujTo achieve specific Electrical energy consumption per Vehicle to 16 Kwh in year 16-17 We require :
Consumption reduction
Operational Control Efficient Equipment Wastage reduction
Fix Load reductionVariable Load reduction
Consumption reduction Per month by 2.25 Lacs Kwh• Per Day by 9000 Kwh
• Per Hour by 562 Kwh Target
How to achieve
Alternate
Load Reduction by 200 Kwh Load Reduction by 362 Kwh
Target Setting

Aug-16
9
17
BAL-Waluj
Auto cycle element level Monitoring
Cell level Energy Monitoring
Periodic monitoring of energy using cell wise energy meters
Current meters are used for eqp. energy measurements
Hidden energy
loss
Equipment level Energy Monitoring
Objective - Energy cost reduction by micro level analysis
Monitor electrical parameters like current, voltage
Monitor energy consumption in different modes –Actual cycle, idle mode, power save mode, emergency off modeDetect instances when consumption is deviated from bench mark value
Equipment mapping of one cell
Set targets and execute action plan
Monitor energy consumption trends
Diagnose specific area of energy wastage
Monitor results
Micro Level monitoring
Methodology
Energy Saving through Micro level AnalysisInnovative Project 1
18
BAL-WalujEquipment Mapping – P6 Crank Case cellCell Layout – P6 crank case
Equipmentfamily Nishida Washing AMS FRD Brother MTD SPMNo. of Machines 1 1 1 16 1 1
KVA rating 40 37 25 13 9.5 5
FRD-5 LH FRD-RH OILHOLEBROTHER LH WASHINGAMS LH R-FACE
RHFINSH
FRD -RH R-FACE
NISHIDA LH RIVET PRESS
1 2 3 4 5
JH Cell Board Rej. AreaLH FIinishMaterial
Cell Monthly Board
A
FRD-1 LH FRD-3 LH
FRD-2 LH FRD-4 LH FRD-6 LH
FRD-RH FINE
FRD- 6RH
FRD-2 RHFRD-4 RHFRD-5RH
FRD-1RHFRD-3 RH
EmptybinRH Fine Bore
File Stand

Aug-16
10
19
BAL-Waluj
0.501.001.502.002.503.003.504.004.505.005.50
kW
12/6/2014 3:47.510 (min:s)
Fanuc Robo Drill 128251
Machine energy consumption trend
Idle mode One cycle
Scale – On X axis 1 div = 45 Sec. On Y axis 1 div = 0.50 Kw
X axis
Y axis
Time (Sec)0 9045 135 180
Micro level monitoring
• It is monitored using equipment Power Analyzer
• High current spikes, specific energy loss can be detected
• Monitoring of special parameters like KW, KVA, PF, Harmonics is possible Power analyzer
20
BAL-WalujMachine energy consumption in different modes
Optimum valueDeviated value (22 cases)High value (6 cases)
Sr. No Equipment Operation Actual Cycle Idle mode Power saving mode Emg. off modeKwh Kwh Kwh Kwh
1 Nishida Fine Boring 2.48 1.680 1.190 0.6102 CES Washing Washing 27.57 23.12 22.12 0.2353 AMS R-face 0.55 0.291 0.140 0.1104 Fanuc Robo Drill Fine Boring 1.95 1.780 0.270 0.1505 Fanuc Robo Drill Drill Tap 1.45 0.660 0.270 0.1506 Brother Fine Boring 2.44 0.790 0.290 0.1837 MTD Leak test 1.84 0.850 0.070 0.050
• Highest energy consumption machine is washing machine
• Green marked are the optimum values in Fanuc Robo Drill family
• Yellow marked are deviated values in Fanuc Robo Drill family
Aug-16
11
21
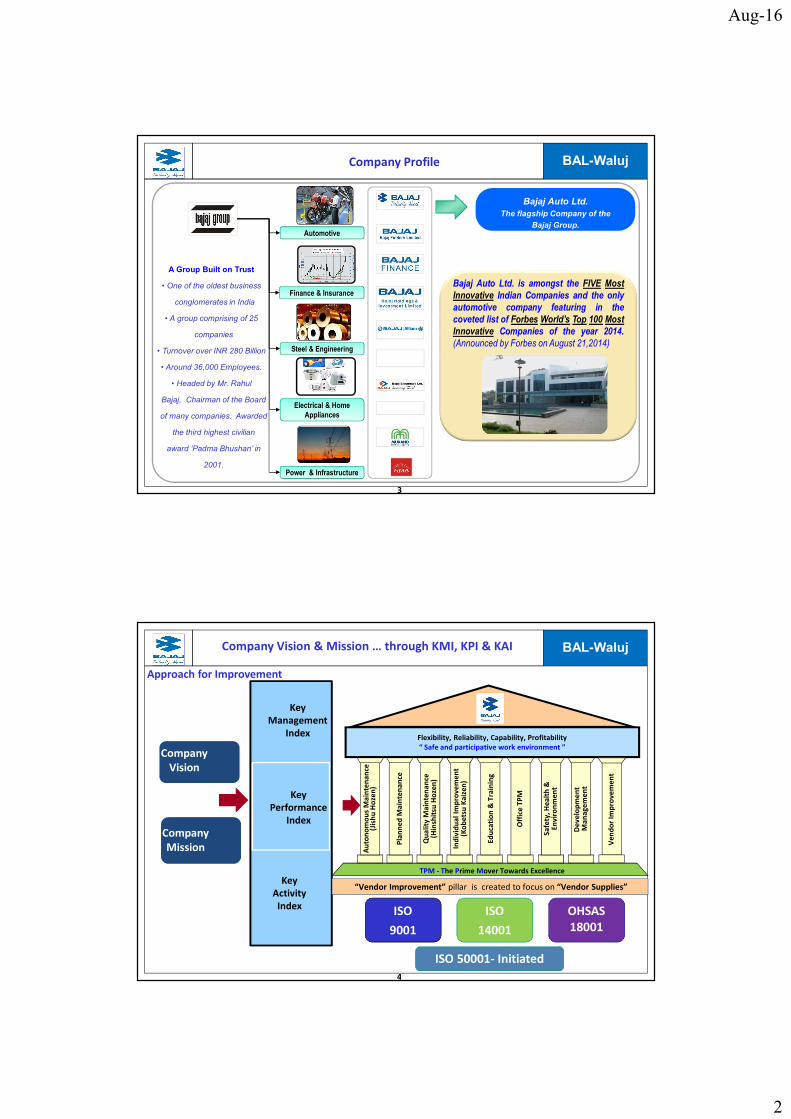
BAL-Waluj
ARestore deviation to bench mark
BOptimize high consumption
CImprove bench mark
BM
Deviation
0.660 Kwh
1.780 Kwh
Target
Consumption
20.0 Kwh
23.12 Kwh
BM
0.400 Kwh
0.660 Kwh
Target
Action plan
22
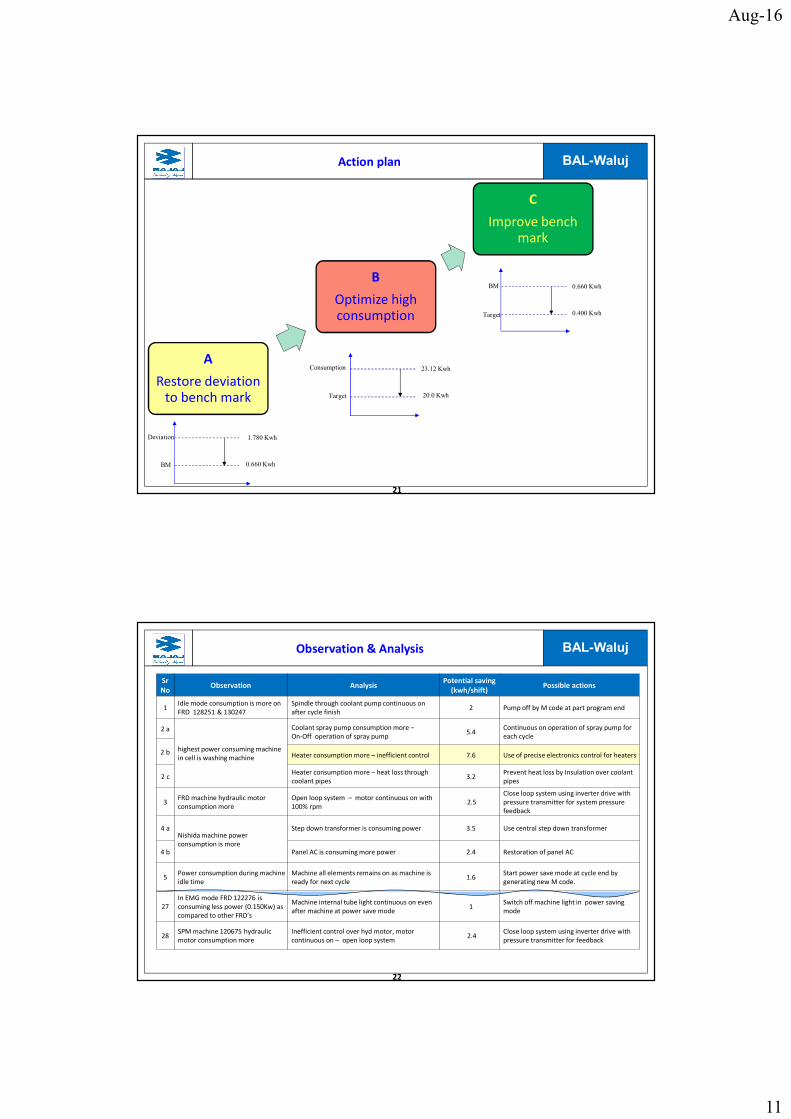
BAL-WalujObservation & AnalysisSr No Observation Analysis Potential saving (kwh/shift) Possible actions1 Idle mode consumption is more onFRD 128251 & 130247 Spindle through coolant pump continuous on after cycle finish 2 Pump off by M code at part program end
2 ahighest power consuming machine in cell is washing machine
Coolant spray pump consumption more –On-Off operation of spray pump 5.4 Continuous on operation of spray pump for each cycle2 b Heater consumption more – inefficient control 7.6 Use of precise electronics control for heaters2 c Heater consumption more – heat loss through coolant pipes 3.2 Prevent heat loss by Insulation over coolant pipes3 FRD machine hydraulic motor consumption more Open loop system – motor continuous on with 100% rpm 2.5 Close loop system using inverter drive with pressure transmitter for system pressure feedback
4 a Nishida machine power consumption is moreStep down transformer is consuming power 3.5 Use central step down transformer
4 b Panel AC is consuming more power 2.4 Restoration of panel AC
5 Power consumption during machine idle time Machine all elements remains on as machine is ready for next cycle 1.6 Start power save mode at cycle end by generating new M code.
27 In EMG mode FRD 122276 is consuming less power (0.150Kw) as compared to other FRD’s Machine internal tube light continuous on even after machine at power save mode 1 Switch off machine light in power saving mode
28 SPM machine 120675 hydraulicmotor consumption more Inefficient control over hyd motor, motor continuous on – open loop system 2.4 Close loop system using inverter drive with pressure transmitter for feedback
Aug-16
12
23
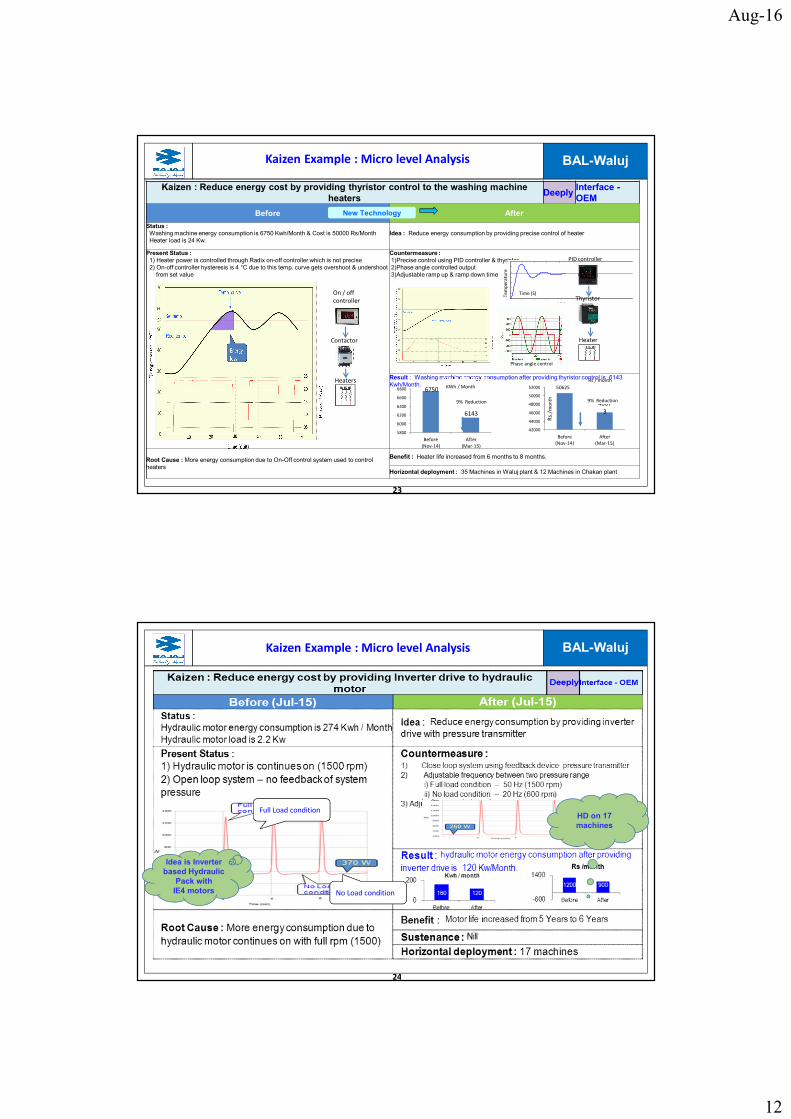
BAL-WalujKaizen : Reduce energy cost by providing thyristor control to the washing machine
heaters Deeply Interface -OEM
Before AfterStatus : Washing machine energy consumption is 6750 Kwh/Month & Cost is 50000 Rs/MonthHeater load is 24 Kw.
Idea : Reduce energy consumption by providing precise control of heater
Present Status : 1) Heater power is controlled through Radix on-off controller which is not precise 2) On-off controller hysteresis is 4 °C due to this temp. curve gets overshoot & undershoot
from set value
Countermeasure :1)Precise control using PID controller & thyristor2)Phase angle controlled output3)Adjustable ramp up & ramp down time
Result : Washing machine energy consumption after providing thyristor control is 6143 Kwh/Month.
Root Cause : More energy consumption due to On-Off control system used to control heaters
Benefit : Heater life increased from 6 months to 8 months.Horizontal deployment : 35 Machines in Waluj plant & 12 Machines in Chakan plant
Heaters
Contactor
On / off controller
New Technology
Temper
ature
Phase angle control
T i m e ( s e c . )0 0 . 2 0 . 4 0 . 6 0 . 80
0 . 2
0 . 4
0 . 6
0 . 8
1
1 . 2
1 . 4F r o m : U ( 1 )
Time (S)
PID controller
Thyristor
Heater
6750
6143580060006200640066006800
Before(Nov-14) After(Mar-15)
Energy consumption of washing machine9% Reduction
KWh / Month 5062546073
420004400046000480005000052000
Before(Nov-14) After(Mar-15)
Rs./mo
nth
Rs / month
9% Reduction
Kaizen Example : Micro level Analysis
24
BAL-Waluj
HD on 17 machines
Idea is Inverter based Hydraulic
Pack with IE4 motors
Full Load condition
No Load condition
Kaizen Example : Micro level Analysis

Aug-16
13
25
BAL-WalujResult- Micro Level Analysis
Cell Mar-15 May-15 Aug-16Model cell (P6 crank case) √Crank case P0, P2, P4, P5 (4 cells) √Remaining 18 cells WIPOverall results
10334
8835
6000
7000
8000
9000
10000
11000
Before After
Rs / shift
Before (Nov -14) After
(Till May -15)
46875
30000
35000
40000
45000
50000
Before After
Rs / shiftTill May-15 – HD 4 cells Expected result after all HD– Aug-16
Before (May -15)
Target (Aug-16)
Horizontal deployment status
14.5 %Better
14 %
40300
26
BAL-WalujKaizen : Energy cost reduction by eliminating IR Oven Deeply Interface – Decal Supplier
Before After Problem : More energy cost at IR heating of decals Idea: No heating to remove micro air & ink solvents entrapment in decal filmDecal film needs to heated to remove micro air bubble & ink solvent from decal film.
Kaizen : Changed decal film structure for easy removal of micro air & Ink solvents during application.
Root Cause: Heating required to remove micro air & ink solvents entrapment in decal film
Result : Energy cost reduced from 7.7 to 5.11 Rs./ Veh.Energy saving of Rs. 46.6 lakh / year.
|Date of kaizen :-10.10.2014 Horizontal deployment : Nil
Eliminate heating
ABC
IR Heating Oven Decal Application
Lacquer Line
Total Energy required for IR Oven - 105 Kw/Hr
ABC
Decal Application
Lacquer Line
IR Oven is eliminated No energy required for Decal heating
Eliminate need of Infrared heater oven
IR Heating oven to remove entrapped Ink solvent & micro air from Decals
Innovative Project 2
Aug-16
14
27
BAL-Waluj
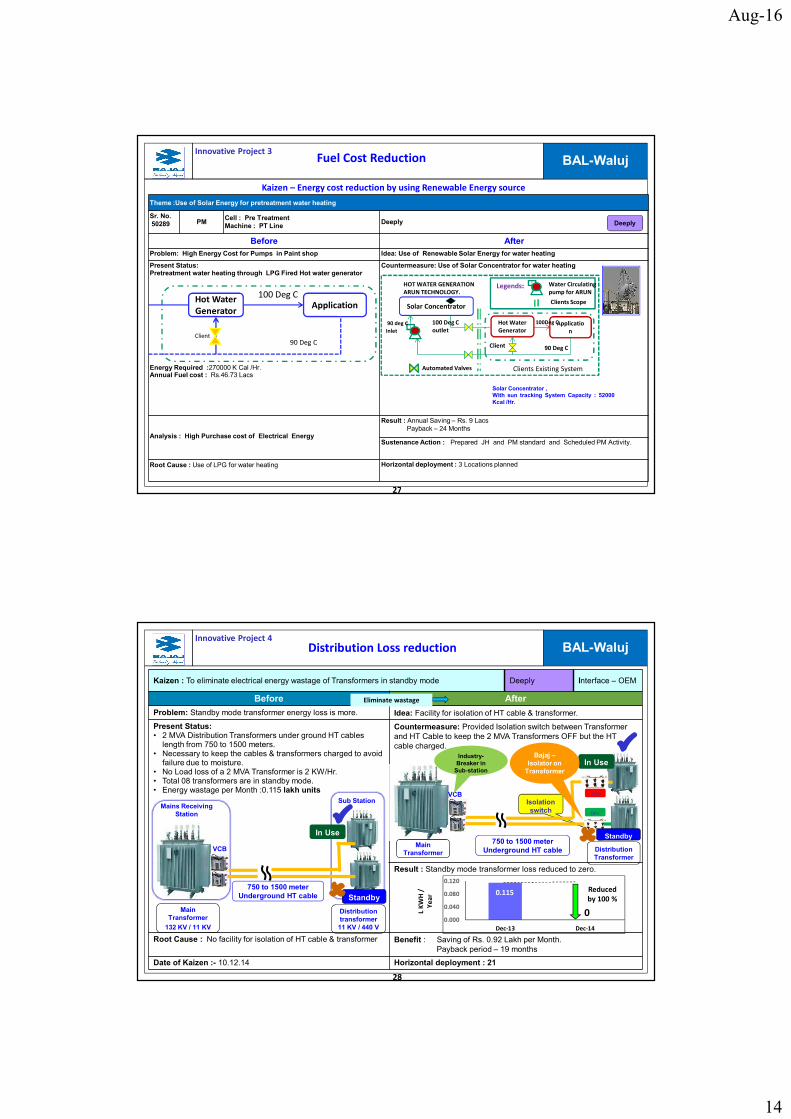
Theme :Use of Solar Energy for pretreatment water heating Sr. No. 50289 PM Cell : Pre Treatment
Machine : PT Line Deeply
Before After Problem: High Energy Cost for Pumps in Paint shop Idea: Use of Renewable Solar Energy for water heating Present Status: Pretreatment water heating through LPG Fired Hot water generator
Energy Required :270000 K Cal /Hr. Annual Fuel cost : Rs.46.73 Lacs
Countermeasure: Use of Solar Concentrator for water heating
Analysis : High Purchase cost of Electrical EnergyResult : Annual Saving – Rs. 9 Lacs
Payback – 24 Months Sustenance Action : Prepared JH and PM standard and Scheduled PM Activity.
Root Cause : Use of LPG for water heating Horizontal deployment : 3 Locations planned
Photo / Sketch Photo / Sketch
Solar Concentrator ,With sun tracking System Capacity : 52000Kcal /Hr.
Kaizen – Energy cost reduction by using Renewable Energy source
Hot Water Generator ApplicationClient
100 Deg C
90 Deg C
Solar ConcentratorHot WaterGenerator Application
Legends: Water Circulating pump for ARUNHOT WATER GENERATION ARUN TECHNOLOGY.
Clients Existing SystemAutomated Valves
Client
100Deg C100 Deg C outlet90 deg cInlet
90 Deg C
Clients Scope
Fuel Cost Reduction
Deeply
Innovative Project 3
28
BAL-WalujKaizen : To eliminate electrical energy wastage of Transformers in standby mode Deeply Interface – OEM
Before After Problem: Standby mode transformer energy loss is more. Idea: Facility for isolation of HT cable & transformer.Present Status:• 2 MVA Distribution Transformers under ground HT cables length from 750 to 1500 meters.• Necessary to keep the cables & transformers charged to avoid failure due to moisture. • No Load loss of a 2 MVA Transformer is 2 KW/Hr. • Total 08 transformers are in standby mode.• Energy wastage per Month :0.115 lakh units
Countermeasure: Provided Isolation switch between Transformer and HT Cable to keep the 2 MVA Transformers OFF but the HT cable charged.
Result : Standby mode transformer loss reduced to zero.
Root Cause : No facility for isolation of HT cable & transformer Benefit : Saving of Rs. 0.92 Lakh per Month.Payback period – 19 months
Date of Kaizen :- 10.12.14 Horizontal deployment : 21
Eliminate wastage
0.11500.000
0.0400.0800.120
Dec-13 Dec-14
Reduced by 100 %
L KWH /
Yea
r750 to 1500 meter Underground HT cable
Distribution transformer
11 KV / 440 VMain
Transformer132 KV / 11 KV
Main Transformer
Isolation switchMains Receiving
StationSub Station
750 to 1500 meter Underground HT cableVCB
VCB
Distribution Loss reduction
Standby
In Use
P
P
ODistribution Transformer
In Use
StandbyOON
OFF
Industry-Breaker in
Sub-station Bajaj –
Isolator on Transformer
Innovative Project 4

Aug-16
15
BAL-WalujKaizen : Energy cost reduction on centralized coolant system Deeply
Before After Status : Power consumption is High (58000 KWH/Month) Idea: Optimization of flow & pump capacity with closed loop control systemPresent Status:1. Coolant system was designed for High flow & head requirement. (Split casing Pump coupled with motor used)2. Open loop control, Pumps operating at full capacity even if machine requirement is reduced . 3. Power consumption more due to coolant supply to machine when not in use.
Countermeasure:1. Use of Optimum capacity pump & Motor for required head & Flow (Short coupled Pump)2. Closed loop control feedback to operate pump at reqd. set pressure.3. Stopped coolant through shutoff valve on individual machines when not in use.
Result :Investment -Rs. 16 LacsCost Saving – Rs. 2.06 Lac/MonthPayback -8 Months
Root Cause :• Higher capacity Pumps & Motor in use (440M3/hr. & 75KW) • Pump running to deliver full flow & head all the time. Throttling of Pump output• Wastage of coolant flow, Individual machine coolant ON when not in use.
Horizontal deployment :Centralized coolant system 2 Nos.
Energy Cost Reduction
Cr. Case P6 cellCr. Case P6 cell
Parameter UnitMotor Capacity 75KWMotor efficiency 89%Pump Capacity 440 M3/hr.Pump Flow 7333 LPMPump Efficiency 56%Head 40 Meter
Machine 1Machine 2
Parameter UnitMotor Capacity 45KWMotor efficiency 93.5 % Pump Capacity 381 M3/hr.Pump Flow 6344 LPMPump Efficiency 76.9%Head 30 Meter
Machine 1
Machine 2
58,00033,779
15,00030,00045,00060,000
Before (TillNov'14) After (Dec'14)
Kwh/MonthCoolant tank
PumpMotor
MotorpumpThrottle valve
Star delta contactor controlCoolant tank
MotorMulti pump control using VFD
pump
pump
MotorThrottle valve
Pressure switch
Feedback
Added Shutoff Valve
No Throttling
Hydro pressure monitoring
High efficient motor(IE1,93.5%) & Pump (76.9 %)
Innovative Project 5
BAL-WalujKaizen theme :To reduce energyconsumption by Efficiency Improvement Idea : High Efficiency Result :Power consumption reduced by : 2574 kWh / month
Before After
Power Saving : 30800 kWh/ Annum
Earlier blower consisted of • AC induction motor • Indirect drive through V belt• Heavy fan designAC motor loses torque as speed increases.Root Cause : Low Efficiency (75%)
AC blower replaced with BLDC motor blower.• It provides flat torque over a
wide range speed.• It has lightweight fan with
improved fins design.• BLDC motor has 90% efficiency
Power Consumption (kWh/month)
62263702
02000400060008000
Before After
Motor
Impeller & CasingShaft & pulley B
elt
BLDC Motor Impeller
Blower Capacity 15000CFM Single motor 15 KW
Blower Capacity 15000 CFM3 Motor 3.4 KW each
41 %
Innovative Project 6 Energy Cost Reduction - Efficiency Improvement

Aug-16
16
31
BAL-WalujGeneration of Electrical Energy with Windmill Power Project
Year Installed Capacity Wind power Generated Waluj Plant consumption Wind Power adjusted Contribution Equiv. CO2 emission reduction (MW) ( L kwh) ( L kwh) ( L kwh) % Tons
2010-11 65 949 573.48 239.28 41 191422011-12 65 1076 589.86 268.68 45 214942012-13 65 888 540.7 260.68 48 208542013-14 65 1043 510.8 278.32 54 222392014-15 65 980 503.8 0 Nil ***2015-16 65 860 455 177 39 14143
At SATARA & SUPA area in Maharashtra Wind mills are installedfor Electrical Power Generation.
41.00 45.00 48.00 54.0039.00
50.00
10
35
60
85
2010-11 2011-12 2012-13 2013-14 2014-15 2015 -16 2016 -17
Use of Renewable Energy
Target
*** Wind energy generated is transferred to other Bajaj auto associates for 2014-15
Wind energy generated is transferred to
other Bajaj auto associates for
2014-15
32
BAL-WalujSustenance Sustenance Activities
ReviewAuditsMonitoring & MeasurementLoss Identification& Corrective actions
Technology Up gradation
Education & Training
Regular Shop Audit Regular Shop Audit by Energy Captains
Internal Audits
Consumption Data Analysis
Daily/MonthlyElectrical Energy
Daily Review by Div Head
Adoption of Energy efficient Technology for Manufacturing,
Monitoring
Energy Managers Training
External Audits Daily/MonthlyLPG
Daily/MonthlyWater
Daily/MonthlyFuel
Daily/Weekly
Review by Plant Head
Energy Index Review by Corporate
Energy Captains Training Group
Leaders Training
LeakageIdentification
HD of Kaizen
Implement ENCON project
HD of ENCON project in other shops. Plant, Vendors
Vendor Training EMS

Aug-16
17
33
BAL-WalujEnergy consumption monitoring & Measurement
• 300 Electrical Energy Meters • Monitoring up to shop Feeder
• 55 Water meters• Monitoring up to shop
• 10 LPG Flow Meters • Monitoring up to Oven
• 14 Air Flow meters • Monitoring up to shop
On Line real Time Monitoring SCADA
34
BAL-WalujEnergy consumption monitoring & Measurement

Aug-16
18
35
BAL-WalujAwareness creation
Training
Kaizen
AppreciationEvent
Competition
• Awareness through communication• Energy Captains• 5 Axis Training• Latest Technology
• Small Group Activity• Karakuri• Engineering Kaizen• Managerial Kaizen• Energy Boards at shop
• Best Kaizen Award• Best Energy Captain • Energy Efficient Shop
• ENCON week• Poster display• Energy Seminar• New Product display
• Monthly Kaizen • Karakuri • State & National level
36
BAL-WalujKaizen Idea matrix
ENCON Awareness creation
4650 Kaizen implemented by all employees with support from 200 Energy Captains
Sr. LossElimination Alternate source Efficient Equipment Operational Control Total 1 Machining 30 2 18 4 542 Paint 28 2 21 2 533 Press & Fab. 19 0 8 3 304 Assembly 25 1 3 8 375 Utility 23 1 12 11 47
Total 126 5 62 28 221

Aug-16
19
37
BAL-WalujIdea By Energy Captains Kaizen theme : To reduce energy consumption by design change. Idea :- Less Weight Result : LPG consumption reduced by 0.16 kg / Dolly.
Before After
Fuel (LPG) Saving : 84240 Kg/Annum
Old Dolly used for top coat painting of sets on robotic conveyor Modified Dolly
Root Cause : More Weight Benefit : 1. EMS performance improved (No air pollution)
140 KG
95 KG
1 Old Dolly Weight 140 Kg2 Ambient Temp. 35 ‘C3 Dolly Temp in Heat up zone 89.7 ‘C4 Dolly Temp in Keep up zone 141 ‘C5 Heat Load per Dolly 5194 Kcal6 LPG Cons. Per dolly 0.49 Kg
1 New Dolly Weight 95 Kg2 Ambient Temp. 35 ‘C3 Dolly Temp in Heat up zone 89.7 ‘C4 Dolly Temp in Keep up zone 141 ‘C5 Heat Load per Dolly 3525 Kcal6 LPG Cons. Per dolly 0.34 Kg
LPG Consumption (Kg/Dolly)
Kg/Dolly0.49 0.34
00.20.40.6
Before After
31 %
38
BAL-WalujEnergy Conservation through external AuditsSr. Year Audit for Projects ( Nos. ) Saving Potential Status1 2011 Compressed Air 3 6.5 L Kwh 5.5 L KWh2 2011 Water system 3 1500 Cu Mtr/day 1500 Cu Mtr/d3 2012 Power System- PF & Harmonics 8 1.2 L Kwh 0.8 L Kwh4 2012 Process Pumps & Motors 10 2.7 L Kwh 2.15 L Kwh5 2012 Thermal - Thermography for Ovens 7 63456K Cal 61058 K Cal6 2012 Compressed Air System 3 7 L Kwh 6.2 L Kwh7 2012 Compressed Air Leakages(On going) 5 6 L KWh 3 L KWh8 2013 Chillers 1 2.62 L Kwh 2.1 L Kwh 9 2014 Lighting System 3 1.2 L Kwh 0.7 L Kwh
10 2015 Use Of Renewable energy 2 100 Ton LPG WIP11 2015 CII Water Audit 2 200 Cu Mtr/Day 237 Cu Mtr12 2016 Thermal Audit for HT & Paint Shop 4 20 Ton LPG WIP

Aug-16
20
39
BAL-WalujSr No. Environment Improvement
1 No water is discharged outside the company.-Water Positive Plant 2 Tree Plantation by all employees in plant – 75000 Plants 3 Rain water harvesting pond capacity increased to 50000 Cub Mtr 4 Implemented E-waste norms prescribed by MPCB.5 Ground water recharging with rain water (Patented with KEDIA FARM PATTERN) by deep percolation technique. Capacity -8 L kL 6 100 % recycling of Industrial effluent by Installation of RO + UF Plant of capacity 1000 M3
/ day. This being used for process. 7 Reduce consumption of packaging material by 40 % (Polythene bags, corrugated boxes) in last 8 years. No packaging materials for transporting material from vendors 8 Effluent treatment plant (ETP) has been upgraded to separate industrial & domestic effluent resulting in better quality of treated water. 9 Paint Sludge reduction by paint yield improvement – Use of high transfer efficiency painting bells
List of major environmental improvements 2011-16
40
BAL-WalujOur water conservation activities has grown from within fence to Out side Fence
• Measurement & monitoring• Operational control
• Using Innovative ideas
• Reduce Water consumption to • 1548 M3/Day in FY 15-16 (50% ) • Water Positive through harvesting
• Sharing learnings /Techniques /initiative of water conservation in Plant
• Water harvesting• Contribution in Draught free Maharashtra
• Creating awareness• Sharing Knowledge
• Finance support
Society-CSR Activities throughJBGVS
Vendors –Activities Through BAVABAL Waluj Plant
BAL Waluj Plant Vendors –Activities Through BAVA
BAL Waluj Plant
• Reduce Water consumption to 900 M3/Day in FY 15-16 (53% )
• Water harvesting Ponds -55000 M3
Approach
Target
Our water conservation activities has grown from within fence to Outside Fence
Aug-16
21
41
BAL-Waluj
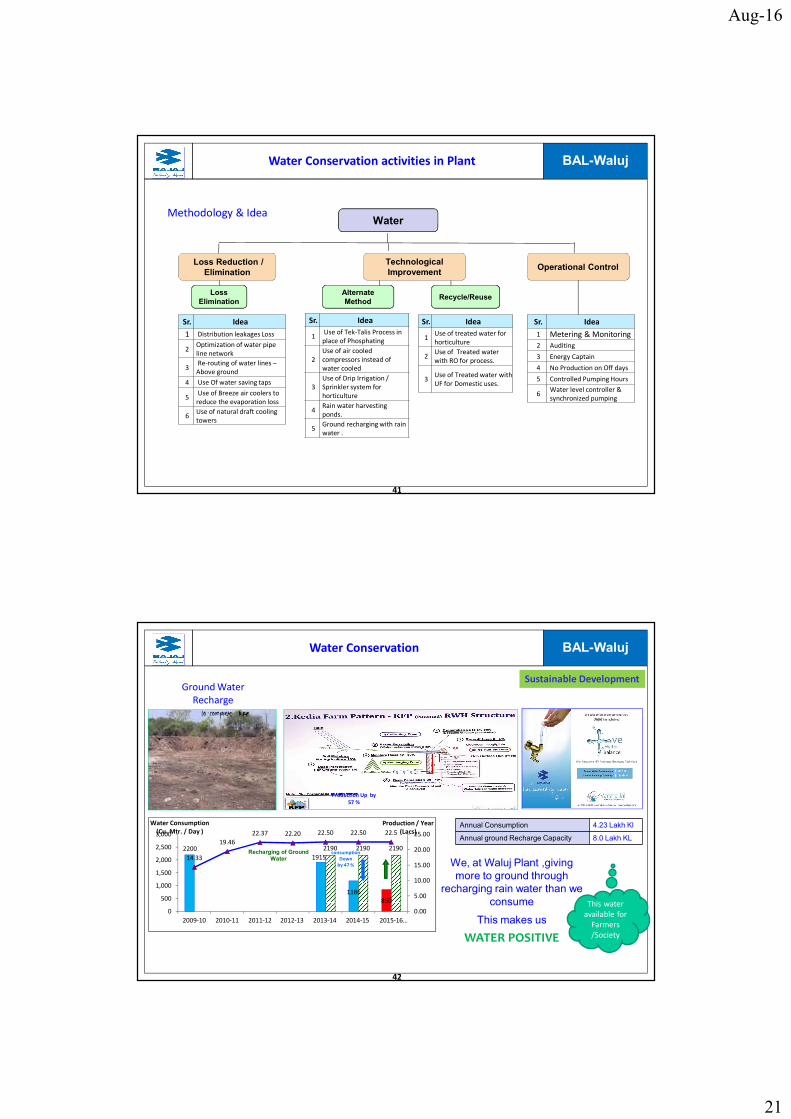
Water
Operational Control Loss Reduction / Elimination
Sr. Idea 1 Distribution leakages Loss2 Optimization of water pipe line network 3 Re-routing of water lines –Above ground4 Use Of water saving taps 5 Use of Breeze air coolers to reduce the evaporation loss6 Use of natural draft cooling towers
Sr. Idea1 Metering & Monitoring 2 Auditing 3 Energy Captain4 No Production on Off days 5 Controlled Pumping Hours6 Water level controller & synchronized pumping
Sr. Idea 1 Use of Tek-Talis Process in place of Phosphating 2 Use of air cooled compressors instead of water cooled 3 Use of Drip Irrigation / Sprinkler system for horticulture 4 Rain water harvesting ponds.5 Ground recharging with rain water .
Technological Improvement
Sr. Idea 1 Use of treated water for horticulture 2 Use of Treated water with RO for process.3 Use of Treated water with UF for Domestic uses.
Loss Elimination
Alternate Method Recycle/Reuse
Water Conservation activities in Plant
Methodology & Idea
42
BAL-WalujWater ConservationSustainable DevelopmentGround Water Recharge
2200 1915
1186 850
2190 2190 219014.33
19.4622.37 22.20 22.50 22.50 22.5
0.005.0010.0015.0020.0025.00
0500
1,0001,5002,0002,5003,000
2009-10 2010-11 2011-12 2012-13 2013-14 2014-15 2015-16…
Water Consumption (Cu. Mtr. / Day ) Production / Year (Lacs)consumption Down by 47 %
Production Up by 57 %
Recharging of Ground Water
Annual Consumption 4.23 Lakh KlAnnual ground Recharge Capacity 8.0 Lakh KL
We, at Waluj Plant ,giving more to ground through
recharging rain water than we consume
This makes usWATER POSITIVE
This water available for Farmers /Society

Aug-16
22
43
BAL-Waluj
Total Green Plantation Area 75% (Total tree planted :
more than 50000 nos.)
Environment Improvement through Green Initiatives
Rain Water Harvesting
Rain water Pond No. 1 : 10000 M3Rain water Pond No. 3 : 15000 M3
Rain water Pond No 2 : 10000 M3FY 12-13 ( Investment Rs 12 Lacs) FY 13-15( Investment Rs 24 Lacs)
Rain water Pond No. 4 : 14000 M3FY 15-16( Investment Rs 60 Lacs)
44
BAL-Waluj
Sr. Description Before After Remarks1 Waste paint separation at sedimentation tank / slugger
600 Kg /day(Wet) 300 Kg / day( Dry) Weight reduction of sludge : after use of centrifugal sludge dryer
2 Paint filling in cotton bag 150 Bags(4 kg paint sludge / bag) No bag(dry paint sludge) Saving of 2.28 Lacs / annum(150 Bags X 5 Rs / bag X 305 Days )
3 Transportation of wet paint sludge Wet sludge to weighing bridge & incinerator. Dry sludge to weighing bridge & incinerator.Wet sludge transportation : leakages / undesirable.
4 Storing of paint sludge Stored @ 15 to 30 days to get it semi dry. Dry sludge by centrifuge separator Undesirable to keep the stock for a month
Centrifuge separator
Environment Improvement Install Paint sludge dryer :

Aug-16
23
45
BAL-Waluj
Inventorisation Mitigation
Year* Scope 1 EmissionsCO2e (MT)
Scope 2 EmissionsCO2e (MT)
Scope 3 EmissionsCO2e (MT)**
Total reduction in emissions intensity since baseline year studyCO2e (MT)2010–11 12615 30078.4 NA Base Year2011-12 12139 28906.7 NA 16482012-13 11166 30394.7 NA 11332013-14 8948.5 23661.5 NA 100832014-15 9022 47610 NA -139382015-16 8173 27959 NA 6561.4
Carbon Foot print
46
BAL-WalujCarbon foot printCarbon foot print
CO2 Absorption
Direct Emissions
CO2 emission (owned / controlled by company)
Fuel consumption
CO2 emission sources (not owned / directly controlled by company)
1.Electricity losses in trans.& distribution2.External vendor part movement
3.Vehicle Distribution &Employee Commuting
CO2 absorption by tree plantation
Direct Absorption
CO2 Emission Better Better
Indirect Emissions
CO2 emissions (generation of purchased Electricity)
Purchased electricity Consumed in manufacturing of product
Internal Movement Testing
Material / Engine
HandlingVehicle Shifting
Manufacturing shops
M/c & Equipment Running
Lights, AC, Air circulators Running
Paint shop
Oven Heating Vehicle
testing Engine testing Compressors
Running
Approach for Carbon Reduction

Aug-16
24
47
BAL-Waluj
1) O2 releasing shrubs :"Tulsi gives out oxygen for 20
hours and ozone for four hours a day along with the formation of nascent oxygen which absorbs
harmful gases like carbon monoxide, carbon dioxide and
sulphur dioxide from the environment,"
"Tulsi gives out oxygen for 20 hours and ozone for four hours a day along with the formation of nascent oxygen which absorbs
harmful gases like carbon monoxide, carbon dioxide and
sulphur dioxide from the environment,"
Plantation of Tulsi Clusters 1. Near MCD Office : Completed2. Near CVD Office : Completed3. Near Works Office : Completed4. New Spares Ware House : Completed5. Near Dispensary : Completed
Plan for O2 releasing tree plantation
SrNo.
Name of plant
Year of plantation
Location Target of tree plantation (Nos.)
1 Peepal 2016-17 Near ETP area
1002 Banyan
(Vad)2016-17 Near ETP
area100
2) O2 releasing plants :
Tulsi Peepal Banyan
Carbon Reduction
48
BAL-Waluj
Heat recovery from waste flue gases at Low Temperature are installed in Paint shops
Waste utilization
SN Waste Heat Recovery System installed at LPG Saving Kg/Year Investment ( Rs. Lacs)
1 Paint shop ED oven exhaust 26100 9.752 HWG Aquatherm PTCED Exhaust 10416 5.53 HWG Aquatherm Paint shop Exhaust 10416 5.54 PTCED line Oven Exhaust 38626 95 Paint shop Exhaust Oven- 4 Locations 37135 12.5
Aug-16
25
49
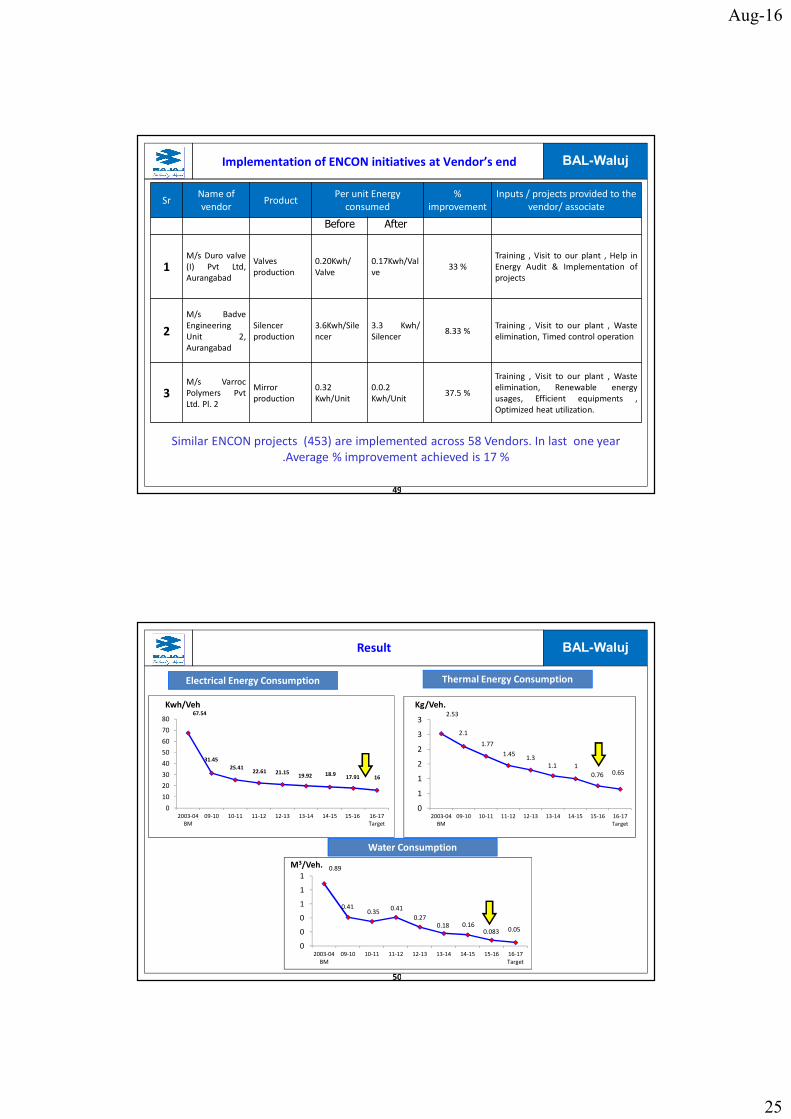
BAL-WalujImplementation of ENCON initiatives at Vendor’s endSr Name of vendor Product Per unit Energy consumed % improvement Inputs / projects provided to the vendor/ associate
Before After
1 M/s Duro valve(I) Pvt Ltd,AurangabadValvesproduction 0.20Kwh/Valve 0.17Kwh/Valve 33 % Training , Visit to our plant , Help inEnergy Audit & Implementation ofprojects
2M/s BadveEngineeringUnit 2,Aurangabad
Silencerproduction 3.6Kwh/Silencer 3.3 Kwh/Silencer 8.33 % Training , Visit to our plant , Wasteelimination, Timed control operation
3 M/s VarrocPolymers PvtLtd. Pl. 2Mirrorproduction 0.32Kwh/Unit 0.0.2Kwh/Unit 37.5 %
Training , Visit to our plant , Wasteelimination, Renewable energyusages, Efficient equipments ,Optimized heat utilization.
Similar ENCON projects (453) are implemented across 58 Vendors. In last one year .Average % improvement achieved is 17 %
50
BAL-Waluj
67.54
31.4525.41 22.61 21.15 19.92 18.9 17.91 16
01020304050607080
2003-04BM 09-10 10-11 11-12 12-13 13-14 14-15 15-16 16-17Target
Electrical Energy Consumption Result
Kwh/Veh 2.53
2.11.77
1.45 1.3 1.1 10.76 0.65
0112233
2003-04BM 09-10 10-11 11-12 12-13 13-14 14-15 15-16 16-17Target
Thermal Energy Consumption
0.89
0.41 0.35 0.410.27 0.18 0.16 0.083 0.05
000111
2003-04BM 09-10 10-11 11-12 12-13 13-14 14-15 15-16 16-17Target
Water Consumption
Kg/Veh.
M3/Veh.

Aug-16
26
51
BAL-WalujS.No. Title of Project Year
Annual Electrical Saving,
Million kWhAnnual Electrical
Cost Saving, Rs Million
Annual Thermal Saving,
Million kcal
Annual Thermal Saving,
Rs Million
Total Annual Savings, Million Rs
Investment Made (Rs
million)Payback months
1 Installation of inductuion high bay lamp 2016-17 0.0259 0.184 0.184 0.6 392 LED Task Lights for machines 2016-17 0.0173 0.123 0.123 0.21 213 LED lights in toilet blocks 2016-17 0.0219 0.155 0.155 0.2 154 Energy efficient LED lighting on assembly conveyours 2016-17 0.0499 0.354 0.354 1.3 445 Energy efficient Pump & Motor for central coolant System P2 2016-17 0.1920 1.363 1.363 1 96 Energy efficient Pumps & Motors for CGC rinse wash (HD) 2016-17 0.0384 0.273 0.273 0.4 187 Efficiency Improvementpf ARP through VFD 2016-17 0.0192 0.136 0.136 0.3 268 Energy efficient Blowers for exhaust oven(HD) 2016-17 0.0480 0.341 0.341 0.75 269 Replacement of Panel AC with efficient AC system 15 no. 2016-17 0.0903 0.641 0.641 1.75 3310 Heat Loss reduction through insulation on hot water lines of washing machines 2016-17 0.0744 0.528 0.528 0.62 1411 Use of heat Pump for washing machine -2 no. 2016-17 0.0720 0.511 0.511 1 2312 Solar water heating for Top up in washing machines 2016-17 0.0360 0.256 0.256 1 4713 Optimization of coolant system load through Coolant shutoff valve for machines 2016-17 0.0144 0.102 0.102 0.15 1814 Replacement of manual drain valves of Compressor Air receivers 2016-17 0.0144 0.102 0.102 0.525 6215 Micro mapping of air leakages & standardization of fittings 2016-17 0.0072 0.051 0.051 0.125 2916 Micro Mapping of Equipments in production cell & implement actions- 148 machines 2016-17 0.1000 0.710 0.710 0.2 317 Energy Efficient blowers & Motors 40 no. 2016-17 0.0720 0.511 0.511 0.3 718 HVLS fans -8 no. 2016-17 0.0720 0.511 0.511 0.3 719 Magnetic separator with earth magnet 2016-17 0.0150 0.107 0.107 0.8 9020 Thyrister controllers for heaters of washing machines - 10 no. 2016-17 0.0480 0.341 0.341 0.375 1321 ETP equipment mapping & actions 2016-17 0.0175 0.124 0.124 0.075 722 Actions on consumption reduction -Holidays 2016-17 0.0336 0.239 0.239 0 023 Air Leakage Audits & Countermeasures 2016-17 0.5759 4.089 4.089 0.6 224 Operation control in shops 2016-17 1.0000 7.100 7.100 0.5 125 Audits through Energy Captains & Countermeasures 2016-17 0.1200 0.852 0.852 0.8 1126 Magnetic Resonators for LPG fired burners -HD 2016-17 115 0.376 0.376 0.6 1927 Restoration of roof top Solar water heater 2016-17 86.25 0.282 0.282 0.8 3428 Heat Loss reduction through insulation on Oven 2016-17 230 0.752 0.752 1.5 24Total 2.7754 19.7052 431.2500 1.4108 21.116 16.780 643
Future Projects
52
BAL-WalujAwards & Accolades
CII- Efficient Unit Award 2012
MEDA- Excellence in Energy Conservation & Management Award 2013/2014/2015
CII- Excellence Unit Award 2013 CII- Excellence Unit Award 2014