Magnitude of cytopenias among HIV-infected children in Bahir ...
Upload
khangminh22Category
view
4download
0
BAHIR DAR UNIVERSITY
COLLEGE OF AGRICUTLURE AND ENVIRONMENTAL SCIENCES
Department of Plant Sciences
M.Sc. Program in Horticulture
ASSESSMENT OF PRODUCTION PRACTICES AND EFFECT OF N:P2O5:S RATES ON
YIELD AND YIELD COMPONENTS OF HEAD CABBAGE (Brassica Oleracea var.
capitata) UNDER IRRIGATION CONDITIONS IN LAY ARMACHIO DISTRICT, AMHARA
REGION, ETHIOPA.
M. Sc. Thesis
By
Demoz Kidanie Gebremeskel
March, 2016
Bahir Dar, Ethiopia
i
..............................
BAHIR DAR UNIVERSITY
COLLEGE OF AGRICUTLURE AND ENVIRONMENTAL SCIENCES
Department of Plant Sciences
M.Sc. Program in Horticulture
ASSESSMENT OF PRODUCTION PRACTICES AND EFFECT OF N:P2O5:S RATES ON
YIELD AND YIELD COMPONENTS OF HEAD CABBAGE (Brassica Oleracea var.
capitata) UNDER IRRIGATION CONDITIONS IN LAY ARMACHIO DISTRICT, AMHARA
REGION, ETHIOPA.
M. Sc. Thesis
By
Demoz Kidanie Gebremeskel
Submitted in Partial Fulfillment of the Requirement for the Degree of Master of Science (M.Sc.)
in Horticulture
Major Advisor: Dr. Melkamu Alemayehu Co- Advisor: Dr. Amare Haileselassie
March, 2016
Bahir Dar, Ethiopia
ii
THESIS APPROVAL SHEET
As member of the Board of Examiners of the Master of Sciences (M.Sc.) thesis open defense
examination, we have read and evaluated this thesis prepared by Mr. Demoz Kidanie
Gebremeskel “ASSESSMENT OF PRODUCTION PRACTICES AND EFFECTS OF
N:P2O5:S RATES ON YIELD AND YIELD COMPONENTS OF HEAD CABBAGE
(Brassica Oleracea var.capitata) UNDER IRRIGATION CONDITIONS IN LAY
ARMACHIO DISTRICT, AMHARA REGION, ETHIOPA. We hereby certify that, the thesis
is accepted for fulfilling the requirements for the award of the degree of Master of Sciences
(M.Sc.) in Horticulture.
Board of Examiners:
1. _________________________ _____________ _____________
Name of External Examiner Signature Date
2. _________________________ _____________ _____________
Name of Internal Examiner Signature Date
3. _________________________ _____________ _____________
Name of Chairman Signature Date
iii
DECLARATION
This is to certify that this thesis entitled “ASSESSMENT OF PRODUCTION PRACTICES
AND EFFECTS OF N:P2O5:S RATES ON YIELD AND YIELD COMPONENTS OF
CABBAGE (Brassica Oleracea var. capitata) UNDER IRRIGATION CONDITIONS IN
LAY ARMACHIO DISTRICT, AMHARA REGION, ETHIOPA” submitted in partial
fulfillment of the requirements for the award of the degree of Master of Science in
Horticulture to the Graduate Program of College of Agriculture and Environmental Sciences,
Bahir Dar University by Mr. Demoz Kidanie Gebremeskel (ID. No. BDU 0602059PR) is an
authentic work carried out by him under our guidance. The matter embodied in this project
work has not been submitted earlier for award of any degree or diploma to the best of our
knowledge and belief.
Name of the Student
_________________________
Signature & date _____________________
Name of the Advisors:
1_________________________ (Major Advisor)
Signature & date _____________________
2 _________________________ Co- Advisor)
Signature & date _____________________
iv
ACKNOWLEDGEMENTS
The first and foremost gratitude and praise goes to the Almighty of God, who is helping me in
every aspect of my life, including this thesis work.
It is my pleasure to express my heartfelt appreciation and special gratitude to my advisors Dr.
Melkamu Alemayehu and Dr.Amare Haileselassie for their enthusiastic effort, constructive
guidance, and encouragement, critical review of the manuscript and material support
throughout my research work. Their tireless effort and guidance greatly contributed to the
quality of this thesis work. My heartfelt thanks go to Mr.Yalwe Tezazu (MSc student in
Agronomy, Bahir Dar University College of agriculture and Environmental sciences) for his
technical guidance in SAS and SPSS software application.
I would like to thank North Gondar Zone Agricultural Development office for permitting me
to join the school of graduate studies and the LIVES project (Livestock and irrigation value
chains for Ethiopian smallholders led by the International Livestock Research Institute and
International Water management Institute for giving me the scholarship and covering full
funding of my MSc degree.
I would like also to thank Lay Armachiho District Agriculture and Development Office,
Horticulture and irrigation staff team who facilitated data collection smoothly in the field.
Finally, the completion of my study at the Graduate School of BDU would not have
been successful had it not been for the full understanding and encouragement of my
wife, W/O Meseret Tsehay. Therefore, special appreciation and most grateful
acknowledgements go to her. Deep gratitude and appreciation are conveyed to my brothers
Mamo Kidanie and Atrsaw kidanie my sisters, W/o. Yeashi kidanie and Hanna kidanie, who
have contributed directly and indirectly to my academic undertakings through all the stages.
v
DEDICATION
This thesis is dedicated with love to my mother Wr/o Leka Mengesha Engeda for nursing me
with affection and devoted her life above all to educate me and for her dedication in shaping
me from early school age and paving the way for the success of my life.
I also dedicate this thesis manuscript to my father the late Ato. Kidanie Gebremeskel, he
devoted his interest to my early education and success but not see as I am a man today heartily
wish that God give him peaceful rest forever.
vi
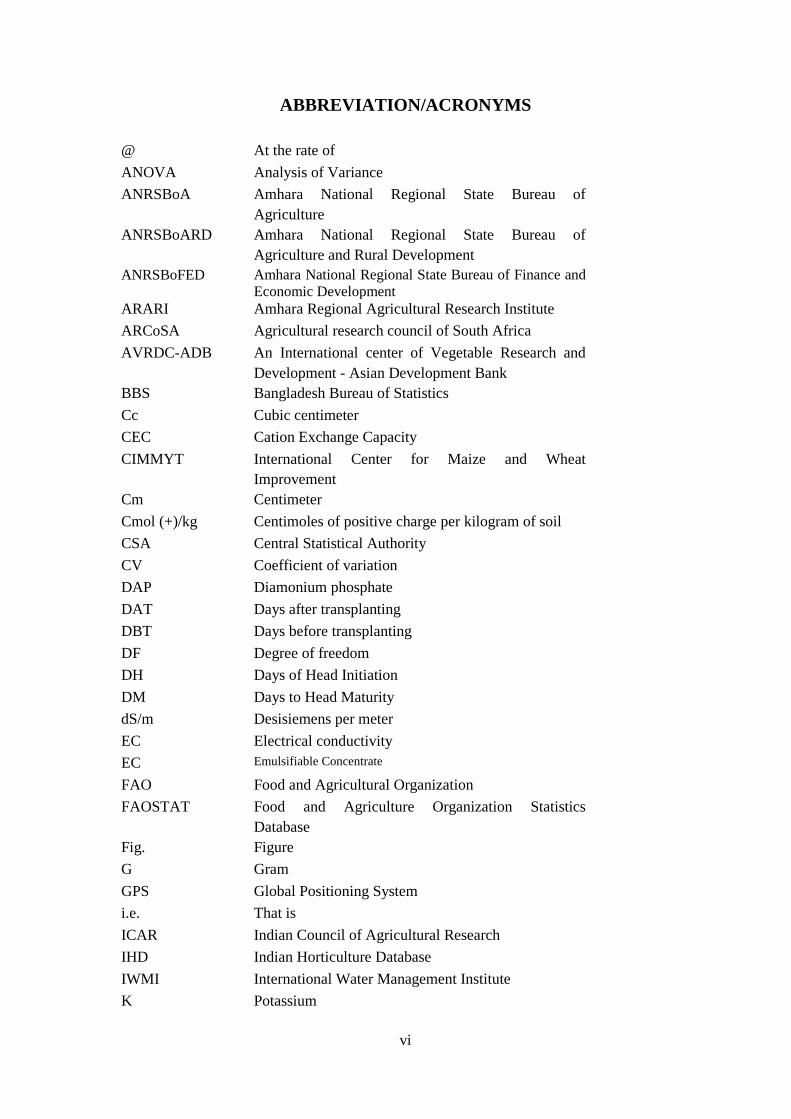
ABBREVIATION/ACRONYMS
@ At the rate of
ANOVA Analysis of Variance
ANRSBoA Amhara National Regional State Bureau of
Agriculture
ANRSBoARD Amhara National Regional State Bureau of
Agriculture and Rural Development
ANRSBoFED Amhara National Regional State Bureau of Finance and
Economic Development
ARARI Amhara Regional Agricultural Research Institute
ARCoSA Agricultural research council of South Africa
AVRDC-ADB An International center of Vegetable Research and
Development - Asian Development Bank
BBS Bangladesh Bureau of Statistics
Cc Cubic centimeter
CEC Cation Exchange Capacity
CIMMYT International Center for Maize and Wheat
Improvement
Cm Centimeter
Cmol (+)/kg Centimoles of positive charge per kilogram of soil
CSA Central Statistical Authority
CV Coefficient of variation
DAP Diamonium phosphate
DAT Days after transplanting
DBT Days before transplanting
DF Degree of freedom
DH Days of Head Initiation
DM Days to Head Maturity
dS/m Desisiemens per meter
EC Electrical conductivity
EC Emulsifiable Concentrate
FAO Food and Agricultural Organization
FAOSTAT Food and Agriculture Organization Statistics
Database
Fig. Figure
G Gram
GPS Global Positioning System
i.e. That is
ICAR Indian Council of Agricultural Research
IHD Indian Horticulture Database
IWMI International Water Management Institute
K Potassium

vii
ABBREVIATION/ACRONYMS (Continued)
K Potassium
Kg /ha Kilogram per hectare
LIVES Livestock and irrigation value chains for Ethiopian
smallholders
LSD Least significant difference
M Meter
M Metric tone
M2 Square meter
MANRS Ministry of Agriculture Natural Resource Sector
Mg Milligram
MoARD Ministry of Agriculture and Rural Development
MRR Marginal Rate of Returns
MS Mean square
N Nitrogen
NPS 19% N:38% P2O5:7% S
NLP Number of leave per plant
Nrf2 Nuclear factor erythroid 2
OoA Office of agriculture
P Phosphorus
pH Negative logarithm of hydrogen ion concentration
PPM Parts per million
PVSS Private Vegetable Seed Suppliers
RCBD Randomized Complete Block Design
S Sulfur
S.N.N.P.R Southern Nation Nationality, and Peoples’ Region
SAS Statistical Analysis System
SE ± Standard error of mean
SP Spread of plant
SPSS Statistical Package for the Social Science.
SS Sum of Square
t/ha Tons per hectare
viii
ASSESSMENT OF PRODUCTION PRACTICES AND EFFECTS OF
N2:P2O5:S RATES ON YIELD AND YIELD COMPONENTS OF HEAD
CABBAGE (Brassica Oleracea var. capitata) UNDER IRRIGATION
CONDITIONS IN LAY ARMACHIO DISTRICT, AMHARA REGION,
ETHIOPA. By Demoz kidanie Gebremeskel
Major advisor: Dr. Melkamu Alemayehu and Co-adviser: Dr. Amare Haileselassie
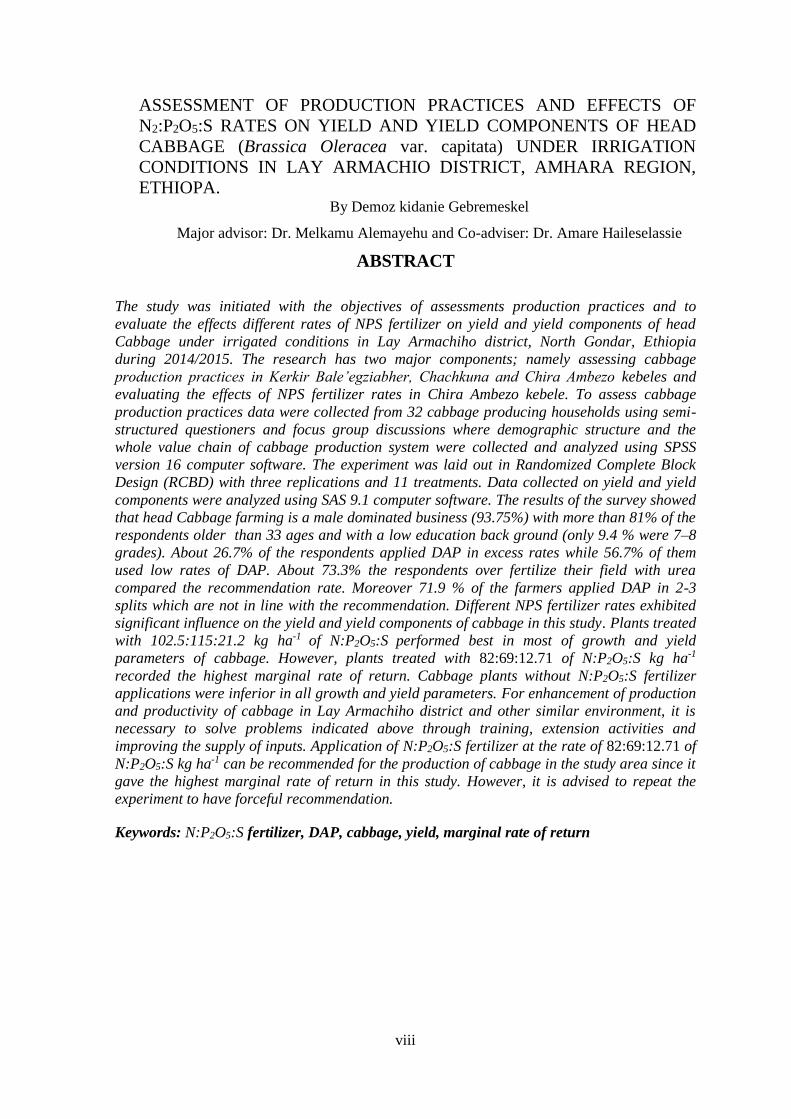
ABSTRACT
The study was initiated with the objectives of assessments production practices and to
evaluate the effects different rates of NPS fertilizer on yield and yield components of head
Cabbage under irrigated conditions in Lay Armachiho district, North Gondar, Ethiopia
during 2014/2015. The research has two major components; namely assessing cabbage
production practices in Kerkir Bale’egziabher, Chachkuna and Chira Ambezo kebeles and
evaluating the effects of NPS fertilizer rates in Chira Ambezo kebele. To assess cabbage
production practices data were collected from 32 cabbage producing households using semi-
structured questioners and focus group discussions where demographic structure and the
whole value chain of cabbage production system were collected and analyzed using SPSS
version 16 computer software. The experiment was laid out in Randomized Complete Block
Design (RCBD) with three replications and 11 treatments. Data collected on yield and yield
components were analyzed using SAS 9.1 computer software. The results of the survey showed
that head Cabbage farming is a male dominated business (93.75%) with more than 81% of the
respondents older than 33 ages and with a low education back ground (only 9.4 % were 7–8
grades). About 26.7% of the respondents applied DAP in excess rates while 56.7% of them
used low rates of DAP. About 73.3% the respondents over fertilize their field with urea
compared the recommendation rate. Moreover 71.9 % of the farmers applied DAP in 2-3
splits which are not in line with the recommendation. Different NPS fertilizer rates exhibited
significant influence on the yield and yield components of cabbage in this study. Plants treated
with 102.5:115:21.2 kg ha-1 of N:P2O5:S performed best in most of growth and yield
parameters of cabbage. However, plants treated with 82:69:12.71 of N:P2O5:S kg ha-1
recorded the highest marginal rate of return. Cabbage plants without N:P2O5:S fertilizer
applications were inferior in all growth and yield parameters. For enhancement of production
and productivity of cabbage in Lay Armachiho district and other similar environment, it is
necessary to solve problems indicated above through training, extension activities and
improving the supply of inputs. Application of N:P2O5:S fertilizer at the rate of 82:69:12.71 of
N:P2O5:S kg ha-1 can be recommended for the production of cabbage in the study area since it
gave the highest marginal rate of return in this study. However, it is advised to repeat the
experiment to have forceful recommendation.
Keywords: N:P2O5:S fertilizer, DAP, cabbage, yield, marginal rate of return

ix
TABLE OF CONTENTS
Contents page
THESIS APPROVAL SHEET ................................................................................................................. ii
DECLARATION..................................................................................................................................... iii
ACKNOWLEDGEMENTS .................................................................................................................... iv
DEDICATION .......................................................................................................................................... v
ABBREVIATION/ACRONYMS ........................................................................................................... vi
ABSTRACT .......................................................................................................................................... viii
TABLE OF CONTENTS ........................................................................................................................ ix
LIST OF TABLES .................................................................................................................................. xi
LIST OF FIGURES ................................................................................................................................ xii
LIST OF APPENDIX TABLES ............................................................................................................ xiii
CHAPTER 2: INTRODUCTION.............................................................................................................. 1
1.1 Background and Justification ................................................................................................... 1
1.2 Objective of the Study .............................................................................................................. 3
1.2.1 General objective of the study .......................................................................................... 3
1.2.2 Specific objectives ............................................................................................................ 3
CHAPTER 3: LITERATURE REVIEW ................................................................................................... 4
2.1 Origin, Distribution and Botany of Cabbage ............................................................................ 4
2.2 World Cabbage Production and Its Importance ........................................................................ 4
2.3 Head Cabbage Production in Ethiopia ...................................................................................... 5
2.4 Effects of Fertilizers on Growth and Yield Performance of Cabbage ...................................... 7
CHAPTER 4: MATERIAL AND METHODS ....................................................................................... 11
3.1 Description of the Study Area ................................................................................................ 11
3.2 Assessment of Production Practices of Cabbage .................................................................... 12
3.2.1 Sampling procedures ...................................................................................................... 12
3.2.2 Irrigation water measurement procedure ........................................................................ 13
3.2.3 Data collection and analysis ........................................................................................... 14
3.3 Response of Yield and Yield Components of Head Cabbage under NPS Fertilizer Rates ..... 14
3.3.1 Treatments and experimental design .............................................................................. 14
3.3.2 Management of the experimental plots .......................................................................... 16
3.3.3 Methods of data collection and analysis ......................................................................... 17
CHAPTER 5: RESULTS AND DISCUSSION ...................................................................................... 19
4.1 Assessment of Head Cabbage production practices ............................................................... 19
4.1.1 Demographic information .............................................................................................. 19
4.1.2 Farming practices ........................................................................................................... 20

x
TABLE OF CONTENTS (Continued)
4.1.3 Harvesting and postharvest operations of cabbage in the study area ............................. 32
4.1.4 Major constraints and opportunities of cabbage production in the study area ............... 35
4.2 Effects of NPS fertilizer rates on growth and yield components of cabbage .......................... 36
4.2.1 Growth parameters of head cabbage .............................................................................. 37
4.3. Cost benefit analysis ............................................................................................................... 45
CHAPTER 6: CONCLUSIONS AND RECOMMENADTIONS ........................................................... 49
5.1 Conclusion .............................................................................................................................. 49
5.2 Recommendations................................................................................................................... 49
REFERENCES ........................................................................................................................................ 51
APPENDIX ............................................................................................................................................. 60
ANNEX ................................................................................................................................................... 66
BIOGRAPHICAL SCKETCH ................................................................................................................ 69
xi
LIST OF TABLES
Table page
3.1.Total Household heads, head cabbage producers and interviews households ................................... 13
3.2 Treatment levels used in the study area ............................................................................................. 15
3.3 Field layout of the Experiment .......................................................................................................... 15
4.1 Sex, age, and family size of the respondent household heads .......................................................... 19
4.2 Educational status of the household head in the study kebele ......................................................... 20
4.3 Total landholding and land allocated for cabbage production by household heads in the study
kebeles .............................................................................................................................................. 21
4.4 Experiences of household heads in the production of cabbage and frequency of productionin
the study kebeles .............................................................................................................................. 22
4.5. Varieties used and source of seeds of head cabbage in the study area ............................................. 23
4.6. Practices of transplanting seedlings and production system ............................................................. 24
4.7. Frequency and methods of irrigation water application for cabbage production in the study area
................................................................................................................................................................. 26
4.8. Source of irrigation water for the production of cabbage in the study area ...................................... 27
4.9. Crop water productivity cabbage in the study area .......................................................................... 28
4.10. Fertilizer used for head cabbage ..................................................................................................... 28
4.11.Frequency of fertilizer application for head cabbage ...................................................................... 30
4.12. Insect occurrence and their measurement ....................................................................................... 32
4.13. Length of time to harvest and harvesting stage .............................................................................. 33
4.14. Major problems of head cabbage in the study area ........................................................................ 36
4.15 Effects of NPS fertilizer rate on Plant height, Plant spread and number of leaves per plant of head
Cabbage at 40 DAT ................................................................................................................................. 39
4.16. Effects of NPS fertilizer rates on 50% head initiation and 75% head maturity ............................. 41
4.17. Effects of NPS fertilizer rate on Diameter of Head, Volume of Head and Head Weight............... 43
4.18. Effects of NPS fertilizer rates on cabbage yield in the study area .................................................. 45
4.19. Cost gross income and net profit of cabbage as influenced by NPS fertilizer rates in Lay
Armachiho District ......................................................................................................................... 47
4.20. Marginal rate of return (MRR) of NPS fertilizer rates in Lay Armachiho District ....................... 48
xii
LIST OF FIGURES
Figures page
3-1. Location of the study Chira Ambezo, Kerkir Bale’egziabher, Chachkuna kebele and Lay
Armachiho district, North Gondar, Amhara Region , Ethiopia ........................................................ 12
4-1. Planting space for head cabbage in the study area ........................................................................... 25
4-2. Disease occurrence and their measurements .................................................................................... 31
4-3. Harvesting time of head cabbage .................................................................................................... 34
4-5. Transportation system ...................................................................................................................... 35

xiii
LIST OF APPENDIX TABLES
Appendix Tables page
1. Types and rates of fertilizers used for the production of cabbage in the study area ............. 60
2. ANOVA Table for plant height ............................................................................................ 61
3. ANOVA Table for plant spread ............................................................................................ 62
4. ANOVA Table for number of leaves per plant .................................................................... 62
5. ANOVA Table for 50 % Head initiation .............................................................................. 62
6. ANOVA Table for 75 % Head Maturity ............................................................................... 63
7. ANOVA Table for Volume of Head ..................................................................................... 63
8. ANOVA Table for Diameter of Head ................................................................................... 63
9. ANOVA Table for Weight of Head ...................................................................................... 64
10. ANOVA Table for Marketable Yield per Hectare .............................................................. 64
11. ANOVA Table for Unmarketable Yield per Hectare ......................................................... 64
12. ANOVA Table for Total Yield per Hectare ........................................................................ 65
1
CHAPTER 1: INTRODUCTION
1.1 Background and Justification
Cabbage (Brassica oleracea var. capitata Linn) is an important Cole crops which is a member
of the family Cruciferae or Brassicaceae with 2n=2x=18 chromosome number. It is native of
Western Europe and Northern Shore of Mediterranean Region (Chauhan, 1986; Schlegel,
2010; Singh et al., 2015). Cabbage was originated from the wild, leafy, non - heading types
‘Cole wart’ (Brassica oleracea var. sylvestris) (Grubben et al., 2004; Moamogwe, 2005). The
wild types are still found in Denmark, North-Western France and Eastern England. Cabbage is
one of the most ancient vegetables cultivated for more than 4,000 years (Jensen, 2004;
Schlegel, 2010). It was the first Cole crop to be cultivated by mankind (Silva, 1986) and it was
very popular by Romans (Anonymous, 2011).
Cabbage and other brassicae are produced in more than 145 countries in the world. The
leading cabbage producing countries in the world are China, India, Russian Federation, Japan
and Republic of Korea, respectively. According to FAOSTAT (2013-14), the total area
cultivated under Cabbages in the world is about 2,416,885 hectares with a production of about
70,644,191 metric tons with the average productivity of about 29.23 MT/ha. China and India
produced about 60% of the world cabbage production with share of 46.4 % and 12.8 %
respectively.
In Ethiopia, cabbage is cultivated on 38,000 hectares of land with mean average production of
395,000 tons with irrigation and rainfed. The productivity of cabbage in Ethiopia is very low
(10.4 t ha-1) (FAOSTAT, 2013-14) compared to the world average (29.23 t ha-1). In terms of
cabbage productivity, Republic of Korea and Japan are the leading countries in the world with
71.2 and 67.6t ha-1, respectively (FAOSTAT, 2013-14; IHD, 2014).
Cabbage is used commonly as vegetables. It is also used for salad mixed in tomato, green
chilies, beetroot etc. It is a rich source of sulfur containing amino acids, minerals, carotenes,
ascorbic acid and antioxidants, and is reported to have anti-carcinogenic property (Singh et al.,
2009 and Kopsell et al., 2004). Due to its antioxidant, anti-inflammatory and antibacterial
properties, Cabbage has widespread use in traditional medicine, in alleviation of symptoms
associated with gastrointestinal disorders (gastritis, peptic and duodenal ulcers, irritable bowel
syndrome) as well as in treatment of minor cuts and wounds and mastitis (Samec et al., 2011).
Also it has some medicinal value as it has a cooling effect, increases appetite, helps prevents
constipation, speeds up digestion and is very useful for diabetic patient (Jensen B, 2004;
2
Malik, 2008; BBS, 2009).
Cabbage is also an excellent source of vitamins A, C, K, B1, B2, B6, calcium, dietary fiber
and protein when it is eaten raw as salad and, boiled or cooked as stew or soup (Atkins, 1999;
Mateljan, 2007; Uddin et al., 2009). There are three types of heading cabbage, namely green,
red and savoy. They contain different amounts of nutrients with savoy being more superior
(Pierce, 2007).
Cabbage can be grown in wide range of soils from light sand to heavier clays. Soils with high
organic matter content give the best yields. Early cultivars grow well in light soils, whereas,
late cultivars perform better on heavy soils. Well-drained soils however give larger yields.
Although cabbage is relatively tolerant to salt, in saline soils cabbage plants show leaf margin
dieback and dark foliage which may increase the susceptibility of plants to diseases like black
leg (ARARI, 2005; Rail and Yadav, 2005). The optimum pH of soil for cabbage cultivation is
between 6.0 - 6.5 (Yano et al., 1999).
As cool season vegetable, cabbage grows best under cool moist conditions. The optimum
temperature ranges for growth and head formation of cabbage is 15-20OC. The growth of
most cabbage varieties is arrested when the temperature rises above 25OC (Chadha, 2006).
However above 270C it may bolt and causing the heads to split open (Ashworth, 2002). The
crop is grown in diverse ecologies with altitudinal range of 500 - 3000 m.a.s.l (MANRS,
2011).
Vegetables including cabbage are important crops for food security as well as to generate
income for subsistence farmers (FAO, 2009; Uddin et al., 2009). However the production and
productivity of vegetables including cabbage in Ethiopia is very low as indicated above. The
reasons for that are very complex. Among the bottlenecks improper agronomic practices, lack
of infrastructures, disease and insect pest incidence, improper postharvest handling practices
and etc are the most important once (Tesdeke Abate and Gashawbeza Ayalew, 1994; Akand et
al., 2015; Melkamu Alemayehu , 2015).
Although the amount of fertilizer required depends on the fertility status of the soils (Bok et
al., 2006), cabbage growers in Ethiopia including the study area use blanket recommendation
of 200 kg ha-1 DAP and 100 kg ha-1 Urea in split application is recommended as a source of
phosphorus and nitrogen, respectively, which may not satisfy the nutrient requirements of
cabbage plants (ARARI, 2005; MANRS, 2011). Recently, the Ministry of Agriculture
3
introduced a new fertilizer (NPS) that contains not only nitrogen and phosphorus but also
sulfur with the concentration of 19% N, 38% P2O5, and 7% S.
Moreover, the government of Ethiopia has plan to substitute DAP with NPS in the near future.
However its application rate for the production of cabbage in Ethiopia including the study area
is not yet known. The aim of this study is therefore to assess production practices of cabbage
in order to identify production constraints and to evaluate effects of NPS fertilizer rates on
growth and yield components of cabbage in Lay Armachiho District of North Gondar
Administrative Zone.
1.2 Objective of the Study
1.2.1 General objective of the study
To assess farmer’s production practices and evaluate the effects of NPS fertilizer rates on
growth and yield of head Cabbage under irrigation conditions]
1.2.2 Specific objectives
➢ To assess current farming practices and synthesize major potential and constraints in
farmer`s Head Cabbage production practices
➢ To evaluate the effects of different rates of NPS fertilizer on yield and yield components
of head Cabbage
➢ To determine economically optimum level of NPS fertilizer rate for the production of head
Cabbage in the study area
4
CHAPTER 2: LITERATURE REVIEW
2.1 Origin, Distribution and Botany of Cabbage
Head cabbage (Brassica oleracea var. capitata) is originated in the eastern Mediterranean
regions from a wild non-heading type, ‘Cole wart’ (Brassica oleracea var. sylvestries) where it
is still found in Denmark, North-Western France and Eastern England. It is ancient vegetable
crop cultivated long before the dawn of human history. The ancient Greeks regarded it as an
important vegetable crop gifted from God. They cultivated cabbage as early as 600 BC which
was described by Theophrastus in 350 BC (Romain, 2001, Rail and Yadav, 2005).
The wild cabbage is the ancestor of different types of Cole crops such as broccoli, Brussels
sprouts, head cabbage, cauliflower, kohlrabi and other which were the results of the breeding
activities of human being (Romain, 2001; Singh, 2015). In the early times, the ancient Romans
and Saxons cultivated and introduced the softy-headed forms to the British Isles. The hard-
headed types were only mentioned in the 9th century. Heading cabbage types were cultivated in
Germany and England by the 1150s and 14th century, respectively. Currently head cabbage is
produced in most temperate countries and becomes very popular in tropical Africa (Romain,
2001, Rail and Yadav, 2005). The genus Brassica as indicated above includes about 100
species. Most of them are native to the Mediterranean Region (Rail and Yadav, 2005).
The word cabbage is derived from the French word 'caboche', meaning head. Cabbage is a
biennial herb with a short, thickened stem surrounded by a series of overlapping leaves which
form a compact head. The head may be pointed or round. The plant has extensive root system
where the secondary roots can grow up to the depth of 45- 60cm below the soil surface.
Cabbage is not sensitive to photoperiod and flowering is triggered mainly by temperature
below 10oC. Therefore, cabbage seed production is difficult under tropical conditions. The
best yields are obtained in cool and dry season with heads weigh between 2 and 2.5 kg. During
the hot rainy season, the average weight of a head is between 1 and 1.5kg (Romain, 2001).
2.2 World Cabbage Production and Its Importance
Cabbage is a cool season vegetable and produced in most temperate countries. The annual
average world production of cabbage is estimated to be about 70,644,191 tons with the
average productivity of about 29.23 t ha-1. The major cabbage producing countries are China,
India, Russian Federation, Japan and Republic of Korea (FAOSTAT, 2013-14).

5
The Food and Agricultural Organization of the United Nations (FAO, 1988) identified
cabbage as one of the top twenty vegetables used as a source of food globally. Cabbage is
usually consumed as a cooked or stir fried vegetable, or eaten fresh as an ingredient of
coleslaw (a salad made of row sliced and chopped cabbage) and mixed salads (Grubben and
Denton, 2004). It can be also used as processed products such as prickling.
Cabbage supplies essential vitamins, proteins, carbohydrates and vital minerals (Norman,
1992). According to FAO (2000) and Tindall (1983): a 100 g edible portion of cabbage
contains vitamin A (2000 IU), thiamine (0.06 mg), riboflavin (0.03 mg), protein (1.8 g), fat (
0.1g), carbohydrate (4.6 g) and vitamin C (124 mg). Furthermore it contains phosphorus (44
mg), potassium (114 mg), calcium (39 mg), sodium (14.1 mg) and iron (0.8 mg).
Cabbage is known in neutralizing acids, has a cooling effect, it improves digestion and
appetite, prevents constipation and is very useful for diabetic patient (Malik, 2008; BBS, 2009;
Dhemre and Desale 2009). Researches also revealed that crucifer family including cabbage
provides significant cardiovascular benefits (Beecher 1994; Singh et al.,2015) and reduces the
risks of lung, colon, breast, ovarian and bladder cancers (Beecher, 1994).
Glucosinolates are the major organosulfur compounds found in cruciferous vegetables like
cauliflower, cabbage, broccoli, brussels sprout, kale, radish, turnip etc. Epidemiological
studies revealed that a diet rich in cruciferous vegetable can reduce several type of cancer like
lungs cancer, colon cancer. Cancer inhibition property of glucosinolate is due to its effect on
Nrf2, polymorphism, anti-inflammatory, inhibition of histone deacetylase activity and
influence on estrogen metabolism (Manchalia et al., 2011).
2.3 Head Cabbage Production in Ethiopia
Cabbage is cultivated in mid altitude and highland areas of Ethiopia. It is mostly produced by
stallholder farmers. Cabbage is mostly produced during the rainy season, although some
commercial farmers produce it during dry season using irrigation. According to CSA
(2012/2013), the average annual production of cabbage in the country during 2012/2013
production season was estimated to be 22,160.3 tons which was produced on 2,913 hectares of
land. Of which Oromia Region with 6,179.5 tons was the larger producer of cabbage followed
by Amhara Region, S.N.N.P.R and Benishangul-Gumuz with 6,179.5, 5,561.3, 110.2 tons,
respectively. However, in terms of productivity, Amhara Region was the leader with 10.7 t ha-
1 followed by Benishangul–Gumuz (7.8 t ha-1), S.N.N.P.R (7.2 t ha-1) and Oromia (6.6 t ha-1)
(CSA, 2012 / 2013).
6
Cabbage is adapted to a wide range of climatic conditions. However, cabbage grows best
under cool moist conditions with altitude under the range of 500 -3000 m.a.s.l (Copenhagen
market and 500-1700 m.a.s.l (Early drum head) (Molla Tefera, 2009). The optimum
temperature ranges for growth of cabbage is between 15oC and 20oC. The growth of most of
the cabbage verities is arrested when temperature rises above 30oC (Chadha, 2006).
Cabbage can be grown on a variety of soils but it does best on a well - drained, loam soil well
supplied with organic matter. Sandy loams are preferred for early crops, while heavy clay
soils may easily become waterlogged after heavy rain and thus encourage the serious diseases
such as black rot (Xanthomonas campestris) and soft rot (Erwinia carotovora) (Bok et al.,
2006). As cabbage is sensitive to soil acidity, soil pH should be between 6 and 6.5. When pH
falls below 5.5, lime should be applied a month before planting (ARARI, 2005 and
ANRSBoARD, 2013)
Generally cabbage can be either direct seeded or transplanted. However in Ethiopia, it is
mostly transplanted after seedlings are raised in nursery. Depending on the variety about 500-
700 gram of seed is adequate to produce enough seedlings to plant one hectare of land
(Chadha, 2006). Seeds are sown thinly in nursery seedbed at the depth of one centimeter. The
spacing between rows and plants within the rows is 10 cm and 3cm, respectively. Seedlings
are ready to transplanting when they produce two pairs of true leaves or when they attain the
height of 8-13 cm which will take about 4-5 weeks after sowing (ARARI, 2005 and
ANRSBoARD, 2013).
According to Tindall et al. (1987) cabbage is transplanted at the spacing of 60 -75 cm between
rows and 40-60 cm between plants within row depending on the types of cultivar used. The
wider spacing is used later maturing cultivars. Small-sized early maturing variety like
`Copenhagen`, commonly grown variety in Ethiopia, is planted at the spacing of 50cm x
50cm or 60 cm x 40cm (ARARI, 2005).
A continues supply of moisture is essential for proper development of cabbage-heads. It is
recommended to bring the soil to field capacity before transplanting and irrigate again
immediately after transplanting. Water requirement of cabbage depends upon the soil type, the
growth stage of plants and the environmental conditions of the growing area. Young plants
should receive enough water for vegetative growth before head formation. Excess moisture at
late stage of development may cause splitting or cracking of heads. Heavy irrigation at the
time of maturity should be avoided (Rail and Yadav, 2005).The irrigation frequency in
Ethiopia depending on the climatic condition, soil type and the growth stage of the crop it is
7
recommended to irrigate within the range from 3 to 12 days intervals which is mostly supplied
by furrow irrigation system (ARARI, 2005; MANRS, 2011).
Cabbage is a heavy feeder and requires supplemental fertilizer in the form of manure or
compost and inorganic fertilizers. The application rates of fertilizers should be determined
based on the fertility status of the soil (Bok et al., 2006). However such practice is not
common in Ethiopia. Fertilizers are mostly applied based on blanket recommendations which
are implemented for all types of soils. According to ARARI (2005), the rate of nitrogen and
phosphorous required for the production of cabbage in Ethiopia is categorized based on the
fertility of the soils. About 150 kg DAP and 100 kg urea is recommended for fertile while
200kg of DAP and 100 kg of urea ha-1of land is recommended for non-fertile soils. Half of the
urea and the whole DAP is applied at the time of planting and the remaining half of urea will
be applied 30 days after transplanting (ARARI, 2005).
Diseases like Black Rot (Xanthomonas campestris pv. campestris) and insect pests including
cabbage aphid (Brevicoryne brassicae) (Tesdeke Abate and Gashawbeza Ayalew, 1994;
ARARI, 2005) and Diamondback Moth are common in Ethiopian cabbage production
(Gashawbeza Ayalew and Ogol, 2006). Although most cabbage producing farmers do not use
chemicals, insects can be easily controlled using recommended insecticides such as
dimethoate, malathion, trichlorophon, Ethiosulfan 35% EC and Diazinon 60% (MANRS,
2011; ANRSBoA, 2014). Weeds are mostly controlled during land preparation and by
cultivating the free space between rows of cabbage.
2.4 Effects of Fertilizers on Growth and Yield Performance of Cabbage
Fertilizer usage plays a major role to increase food production and to meet the demands of the
growing world population. The extent to which fertilizers are used still differs considerably
between various regions of the world (Mengel and Kirkby, 1996). The quantity of fertilizer
nutrients required to optimize crop production depends on the inherent capacity of the soil to
supply adequate levels of nutrients to growing plants (Sanchez 1976; Baligar and Bennett,
1986), the yield potential of the crop variety grown (Amsal Tarekegne et at., 1995, 1997a;
Tilahun et at., 1996), the availability and cost of fertilizers (Gezahegn and Tekalign, 1995),
and climatic conditions prevailing during the crop growing season (Baligar and Bennett,
1986).
Crop species differ in their nutrient requirements depending on their stages of development
and high requirement for nitrogen while large amounts of potassium are a requisite for good
8
growth of marketable part is the underground organs like sweet potato and Irish potato (Preece
and Read, 2005) takes up high amounts of nutrients especially nitrogen and potassium (Hemy,
1984; Salunkhe et al., 1987). Prasad et al. (2009) maximum number of outer leaves, head
length, head width, total and net head weight and total yield were obtained with the
application of 120kg N/ha and 100kg P/ha. Whereas the maximum plant height, plant spread,
leaf area and head diameter were recorded with the application of 140kg N/ha and 120kg P/ha.
Application of 120kg nitrogen and 100kg phosphorous ha-1also gave the best yield of Chinese
cabbage in the Gangetic plains of West Bengal (Prasad et al., 2009). In the research from
Westerveld et al. (2003), cabbages received the highest nitrogen rates were larger and had a
darker green color compared to those received the lowest nitrogen rates
An experiment carried out at Bangladesh Agricultural University farm, the maximum
marketable yield of cabbage was obtained from the application of 336 kg ha-1 nitrogen
(Farooque and Mondal, 1978). They also observed increased plant height, number of loose
leaves, head size, marketable and total yield of cabbage with increased nitrogen level. In the
study conducted by Khokhar et al. (1970) in Taskent Region of Russia, application of 200 kg
ha-1 of nitrogen increased the growth and development of cabbage and thus increased the yield.
White and Forbes (1977) reported that cabbage responded positively to nitrogen application up
to the level of 308 kg ha-1 in Florida, USA. The higher rates reduced generally the proportion
of bigger cabbage heads.
Singh and Naik (1988) conducted an experiment on the nitrogen requirements of cabbage at
Ranchi, India. They observed that the head weight, number of marketable heads and total yield
were maximum at the rate of 180 kg ha-1nitrogen. Similarly, Khadir et al. (1989) studied the
effects of three levels of nitrogen (0, 138, and 376 kg ha-1) and found the highest mean leaf
number, head weight and head yield at the maximum rate of nitrogen.
Not only nitrogen and phosphorous but also other macro and micronutrients affect the growth
and development of crops including cabbage. Din et al. (2007) reported that the maximum
head yield was recorded in treatment receiving NPK level of 120-90-60 kg ha-1 in cabbage.
The minimum values of these parameters were recorded in control plants where no fertilizer
was applied. Rankov and Belichki (1980) also found that the highest yield of cabbage was
obtained when N: P2O5: K 2O was applied at the rate of 450:150:300 kg ha-1.
Similarly Hossain (2011) reported that maximum marketable yield of cabbage (87.09 t ha-1)
was recorded from plants which were received in receiving 240 kg N, 45 kg P, 180 kg K and
45 kg S ha-1. Application of fertilizer above these concentrations reduced the marketable yield
9
of cabbage. The increased marketable yield was expressed in terms of increased diameter and
thickness of heads and less number of loose leaves.
Organic fertilizers such as compost are also important in crop production including cabbage.
They not only add nutrients to the soil, but also improve the structure of the soil and the
availability of nutrients to plants and thus they improve the efficiency of the applied inorganic
fertilizers. In this regard Sarker et al. (2002) reported that highest marketable yield of cabbage
(86.68 t ha-1) was obtained from treatment combination of 60 cm x 45 cm plant spacing with
organic and inorganic fertilizers. In the study of Anonymous (1991), application of 240kg N,
60 kg P and 120 kg K ha-1along with cow dung @ 5 t ha-1 produced the highest cabbage head
yield (75 t ha-1).
Farmyard manure release nutrients slowly and steadily and activates soil microbial biomass
(Ayuso et al., 1996; Belay et al., 2001). Organic manures can sustain cropping systems
through better nutrient recycling and improvement of soil physical attributes (El-Shakweer,
1998). The use of inorganic fertilizer has not been helpful under intensive agriculture because
of its high cost and it is often associated with reduced crop yields, soil degradation, nutrient
imbalance and acidity (Kang and Juo, 1980; Obi and Ebo, 1995).
The effects of fertilizers on growth and development of crops including cabbages are affected
by the stage of development of the crop and the moisture content of the soil. In three years
fertilizer trails conducted on alluvial meadow soils (Radov and Turkmenbaen, 1973) found
that use of 180 kg nitrogen ha-1 applied in three splits of equal doses produced the highest head
yield of cabbage. Similarly, Vleck and Polack (1964) obtained the highest cabbage yields by
application of 75 kg N ha-1 three times during the growing season based on the stages of plant
development. Application of full dose of nitrogen at the time of planting in most cases results
nitrogen deficiency at late stage of crop development including cabbage because of leaching
through irrigation water. Application of nitrogen late in the growing season of cabbage may
solve deficiencies without yield loss.
The pre plant applications may lead to losses or immobilization before plant uptake, thus
greatly affecting N use efficiency (NUE). To avoid nitrogen losses as a result of leaching and
volatilization, split application is needed. Pre-plant applied N is subject to leaching and prone
to denitrification or immobilization before plant uptake, thus affecting N use efficiency
(Subedi et al., 2007).

10
Soil moisture also affects the effects of applied fertilizers on growth and development of crops
including cabbage. In this regard, Sammis et al. (1988) found that head size, yield and quality
of lettuce and cabbage were significantly decreased as soil moisture reduced. In another
experiment, Sammis and Wu (1989) found that marketable yield of cabbage was decreased
linearly with decreasing water application. In an experiment from Dragland (1976) the yield of
cabbage was gradually increased when the nitrogen supply was raised up to 380 kg ha-1.
However application of 470 kg ha-1 didn’t showed any yield advantage if moisture tension was
kept below 0.4 bars.
As indicated above the increase in fertilizer application increased the growth and development
of cabbage. However, excess nitrogen may adversely affects the head quality by producing
coarse and loose head, reduces keeping quality, and enhances the nitrate nitrogen content of
head (Chatterjee, 2009). In various studies similarly, high rates of nitrogen delayed maturity,
decrease storage life, and increase the incidence of disorders (Peck, 1981; Locascio, 1984;
Berard, 1990). In contrast to this, Zebarth et al. (1991) observed no quality deterioration in
cabbage with application of high rates of nitrogen.
Although high nitrogen rates and closer row spacing increased total yield, such condition also
delayed maturity of cabbage as indicated by White and Forbes (1976). In similar experiment
from Csizinszkys and Schuster (1985) high plant density reduced head size and head weight of
individual cabbage, but greater number of heads per unit area obtained from closer row
spacing increased total yield of cabbage. In contrary to this, an increase in spacing results in
increasing in percent marketable cabbage and the average weight of individual heads
(Stepanović et al., 2000).
The complementary use of organic and inorganic fertilizers has been recommended for
sustenance of long term cropping in the tropics (Ipimoroti et al., 2002). Fuchs et al. (1970)
reported that nutrients from mineral fertilizers enhance the establishment of crops while those
from mineralization of organic manures promoted yield when both fertilizers were combined.
It has been observed that addition of manure increases the soil water holding capacity and this
means that nutrients would be made more available to crops where manures have been added
to the soil (Costa et al., 1991). Murwira and Kirchman (1993) observed that nutrient use
efficiency might be increased through the combination of manure and inorganic fertilizer.
11
CHAPTER 3: MATERIAL AND METHODS
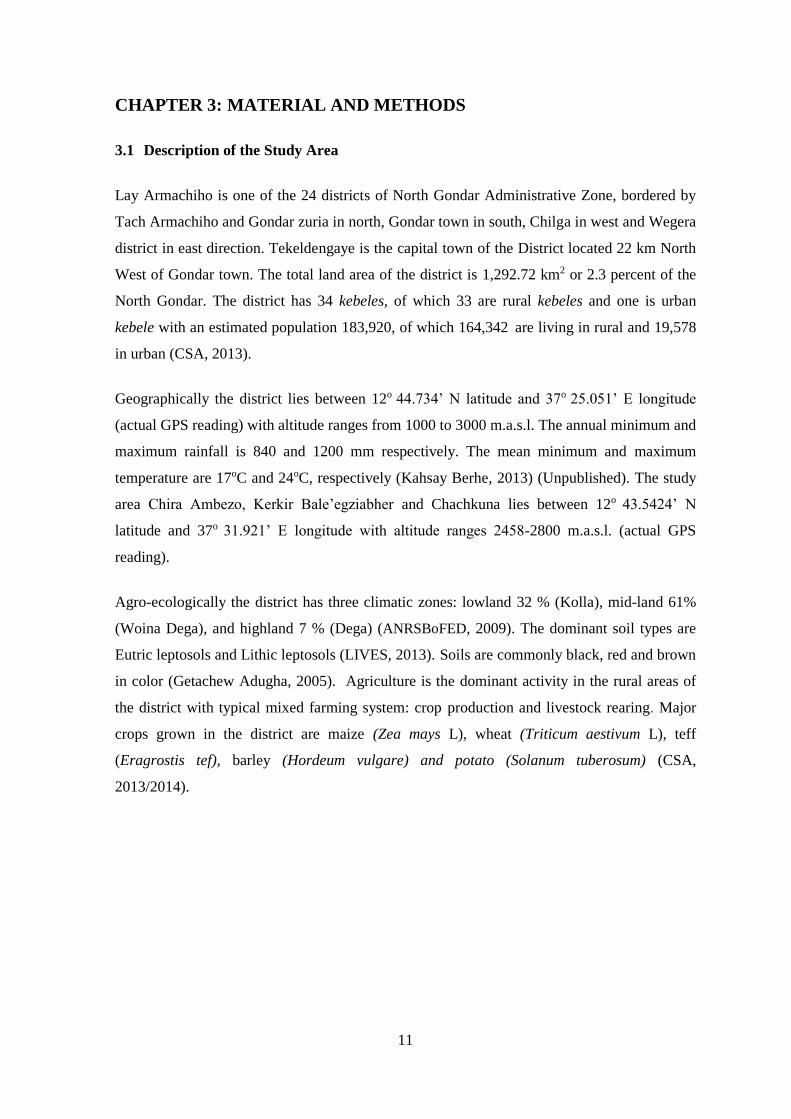
3.1 Description of the Study Area
Lay Armachiho is one of the 24 districts of North Gondar Administrative Zone, bordered by
Tach Armachiho and Gondar zuria in north, Gondar town in south, Chilga in west and Wegera
district in east direction. Tekeldengaye is the capital town of the District located 22 km North
West of Gondar town. The total land area of the district is 1,292.72 km2 or 2.3 percent of the
North Gondar. The district has 34 kebeles, of which 33 are rural kebeles and one is urban
kebele with an estimated population 183,920, of which 164,342 are living in rural and 19,578
in urban (CSA, 2013).
Geographically the district lies between 12o 44.734’ N latitude and 37o 25.051’ E longitude
(actual GPS reading) with altitude ranges from 1000 to 3000 m.a.s.l. The annual minimum and
maximum rainfall is 840 and 1200 mm respectively. The mean minimum and maximum
temperature are 17oC and 24oC, respectively (Kahsay Berhe, 2013) (Unpublished). The study
area Chira Ambezo, Kerkir Bale’egziabher and Chachkuna lies between 12o 43.5424’ N
latitude and 37o 31.921’ E longitude with altitude ranges 2458-2800 m.a.s.l. (actual GPS
reading).
Agro-ecologically the district has three climatic zones: lowland 32 % (Kolla), mid-land 61%
(Woina Dega), and highland 7 % (Dega) (ANRSBoFED, 2009). The dominant soil types are
Eutric leptosols and Lithic leptosols (LIVES, 2013). Soils are commonly black, red and brown
in color (Getachew Adugha, 2005). Agriculture is the dominant activity in the rural areas of
the district with typical mixed farming system: crop production and livestock rearing. Major
crops grown in the district are maize (Zea mays L), wheat (Triticum aestivum L), teff
(Eragrostis tef), barley (Hordeum vulgare) and potato (Solanum tuberosum) (CSA,
2013/2014).
12
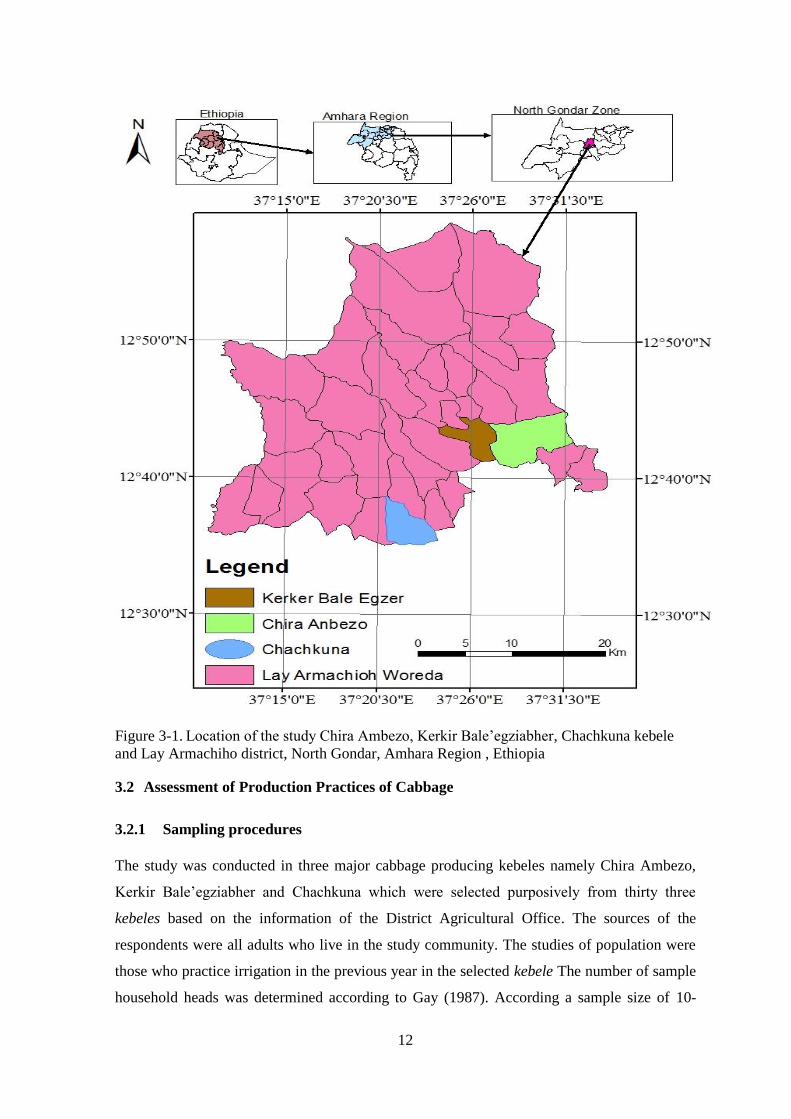
Figure 3-1. Location of the study Chira Ambezo, Kerkir Bale’egziabher, Chachkuna kebele
and Lay Armachiho district, North Gondar, Amhara Region , Ethiopia
3.2 Assessment of Production Practices of Cabbage
3.2.1 Sampling procedures
The study was conducted in three major cabbage producing kebeles namely Chira Ambezo,
Kerkir Bale’egziabher and Chachkuna which were selected purposively from thirty three
kebeles based on the information of the District Agricultural Office. The sources of the
respondents were all adults who live in the study community. The studies of population were
those who practice irrigation in the previous year in the selected kebele The number of sample
household heads was determined according to Gay (1987). According a sample size of 10-
13
20% household heads of the population should be taken as "rule of thumb" when the
population is between 101–1000. According to the District Agricultural Office (2014) a total
of 247 household heads are engaged in the production of cabbage in the selected kebele (Table
3.1). Therefore, ten household heads from each of the two kebeles, Kerkir Bale’egziabher and
Chachkuna, and twelve household heads from Chira Ambezo were used in the study. The
individual sample household heads were selected by lottery method from the document
obtained from the District Agriculture Office.
Table 3.1.Total Household heads, head cabbage producers and interviews households
Kebele Kerkir
Bale’egziabher
Chachkuna Chira Ambezo Total
Total Household heads 716 1052 1589 3357
Head cabbage growers 76 89 73 238
Interviews Households 10 12 10 32
3.2.2 Irrigation water measurement procedure
The amount of irrigation water in canal used by the farmers was estimated by float method.
This method is a quick and cheap way to estimate discharge in a canal (FAO, 1992). The
amount of water used in all selected farmers in the three Kebele was measured and the mean
value was taken for analysis. The discharge in a canal was carried out on 20 meter straight
canal where irrigation water flows. To estimate the average flow velocity, tennis ball was
released on water which flows in the canal and the time required to travel the 20 meter canal
was measured. The measurement was carried out three times and the mean flow velocity was
then multiplied with 0.85 (correction factor) to estimate the average water velocity in the
stream (FA0, 1992)
To measure the quantity of water flow (m3/s), depth of the canal at the center, left and right
edges was measured five times and the width was measured at ten points of the canal within
the 20 meter canal distance. Lastly the mean width and depth of the wetted canal were taken to
calculate the amount of water flowed.
This was combined with the number of application and duration for each irrigation event to
estimate the total applied water. Finally the water flow (m3), total irrigation water used and its
productivity were calculated using the formulas below (Bessembinder et al., 2005).
Water flow (m3/s) = water velocity (m/s) x width (m) x depth (m)….…………..... (1)
The total irrigation water used by the farmers then calculated by using the formula:
14
Total irrigation water used (m3) = time required to irrigate the land (s) x water flow (m3/s) x
number of irrigation multiplied………………………………….……………..... (2)
Crop Water Productivity (kg/m3) = yield (kg)/total water used (m3)……………… (3)
3.2.3 Data collection and analysis
Data were collected using semi-structured questionnaires, key informant interview and having
two parts. The first part deals with the socio - demographic structure of the participants. The
second part covered the whole value chain of cabbage production system such as cropping
system, cultivar used, time of planting, land preparation, planting method, fertilizer used,
disease control methods employed, harvesting methods, postharvest handling and marketing.
Interviewers were proceeding from house to house. They introduced them self and explained
the purpose of the interview and asked the questions using specific statements in a standard
procedure. Consent to participate were obtained from each interviewee. Before launching, the
actual survey questionnaires were pre tested and was improved accordingly.
Furthermore, secondary data was also collected from District Agriculture Office reports,
journals, publications of governmental and non-governmental organizations, statistical and
census reports.
At the end of each day, all questionnaires were checked for completeness, clarity and
consistency and recorded. The data were then coded and subjected to SPSS computer
software and descriptive statistics such as mean, standard deviation, frequency, etc. were used
to analyze the collected data.
3.3 Response of Yield and Yield Components of Head Cabbage under NPS Fertilizer
Rates
3.3.1 Treatments and experimental design
The field experiment was conducted at Chira Ambezo Kebele on the farmer`s field in 2015
during off season with irrigation. The experiment was consisted of ten NPS fertilizer rates and
one without fertilizer as control, a total of eleven fertilizer rates (Table 3.1). The NPS fertilizer
rates were determined by adding and subtracting 25% from the blanket recommendations of
cabbage (ARARI, 2005; ANRSBoARD, 2013). The experiment was laid out in a Randomized
Complete Block Design (RCBD) with three replications. Eleven treatments including a control
were assigned randomly to the unit plot of 2.5 m × 2.5 m = 6.25 m2 in size. The experimental
area was divided into three blocks. The total area of the experimental plot was 282.625 m2
with 74.25 m2 net plot area. The net size of the main plot was 206.25 m2. The blocks and plots
15
were spaced at 1m and 0.5m respectively. The seedlings were planted at 50 cm between plants
and 50 cm between rows. There were five rows per plot and five plants per row with a total of
25 plants per plot.
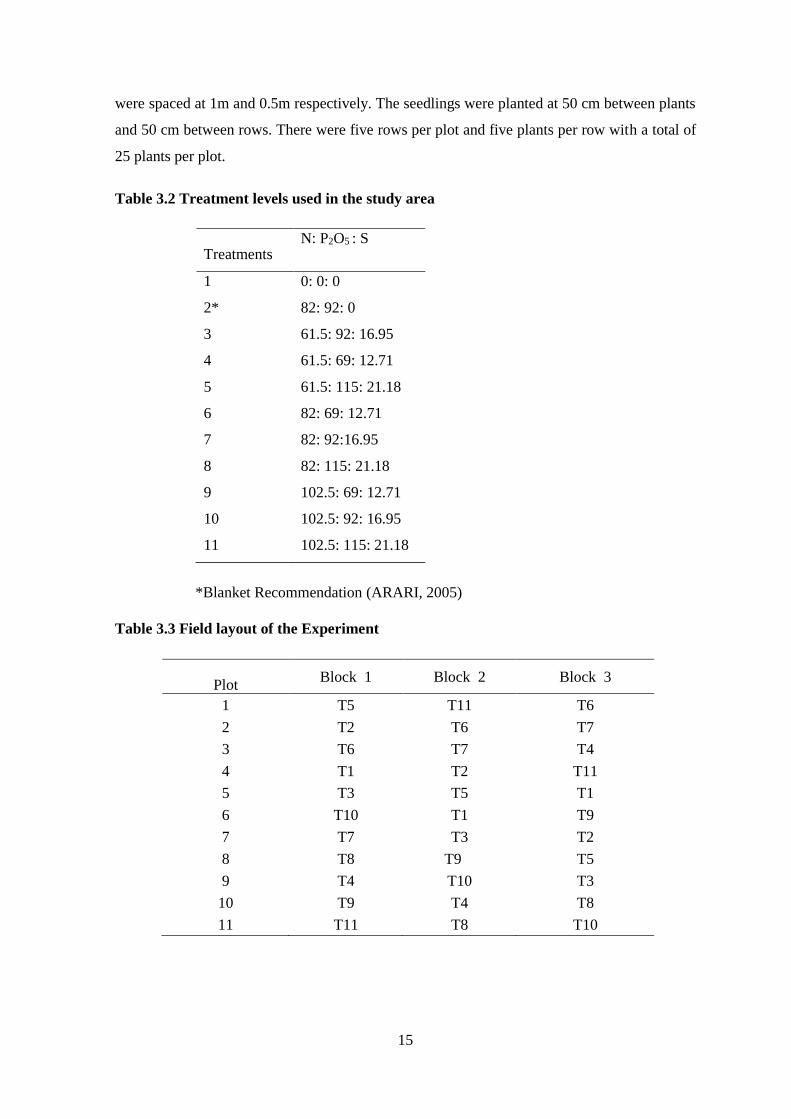
Table 3.2 Treatment levels used in the study area
*Blanket Recommendation (ARARI, 2005)
Table 3.3 Field layout of the Experiment
Plot Block 1 Block 2 Block 3
1 T5 T11 T6
2 T2 T6 T7
3 T6 T7 T4
4 T1 T2 T11
5 T3 T5 T1
6 T10 T1 T9
7 T7 T3 T2
8 T8 T9 T5
9 T4 T10 T3
10 T9 T4 T8
11 T11 T8 T10
Treatments N: P2O5 : S
1 0: 0: 0
2* 82: 92: 0
3 61.5: 92: 16.95
4 61.5: 69: 12.71
5 61.5: 115: 21.18
6 82: 69: 12.71
7 82: 92:16.95
8 82: 115: 21.18
9 102.5: 69: 12.71
10 102.5: 92: 16.95
11 102.5: 115: 21.18
16
3.3.2 Management of the experimental plots
The variety, `Copenhagen market` was used in this study. It is an early head forming type with
compact, round and large head (Rail and Yadav, 2005). Land preparation was ploughed three
times. Soil sample was taken randomly from 9 spots diagonally from the experimental area at
the depth of 15 - 20 cm before planting and mixed to make as a composite. Some physical and
chemical properties of the composite soil; namely pH, organic matter content, Nitrogen,
Phosphorus and Potassium contents were determined in North Gondar Zone soil laboratory.
Soil of the experimental site was clay loam and PH (6.7) neutral based on the laboratory test.
The organic matter (2.185 %) and total nitrogen (0.15%) contents of the experimental field
was very low while others were above critical level (Available P / PPM (23.669418), CEC
Cmol (+) kg-1 (51.5526) and K (Cmol (+) kg-1 (0.575232) according to Tekalign Mamo et al.
(1991) and Hazelton and Murphy (2007).
The required quantity of phosphorous in the form of DAP, NPS and half of the quantity of
urea as a main source of nitrogen were applied at the time of planting and the remaining half
of urea was side dressed 30 days after planting (ARARI, 2005; MANRS, 2011). Other
management activities like weeding, irrigation, cultivation and plant protection measures were
done uniformly for all plots as recommended for head cabbage.
Healthy and uniform sized seedlings (10-12cm) with two paired of leaves were transplanted
in to the experimental plots with the spacing of 50 cm between plants and 50 cm between rows
as recommended by ARARI (2005). Watering was done uniformly based on climatic
condition using furrow irrigation once within four days interval. Hand weeding was done
frequently as per the emergence of the weeds. To control aphids, flea beetles and termites
Ethiosulfan 35% EC @ 2.5 liter ha-1 and Diazinon 60% EC 20 ml per mound were applied
uniformly for the experimental plots as recommended by Tadesse Amera and Asferachew
Abate (2008).
The crop was harvested at maturity when the head become compact. Therefore, before
harvesting, head compactness of the cabbage was tested by pressing with the thumb where
compact or mature heads feel comparatively hard. After uprooting, the heads were cutoff at
their base and weighed for gross yield. For marketable yield, the loose leaves, open leaves and
whitish colored leaves were removed and the heads were weighed as recommended by Rail
and Yadav (2005).

17
3.3.3 Methods of data collection and analysis
Both vegetative and yield parameters of cabbages were collected in the study. Data on plant
height, plant spread, and number of leaves per plant, volume and diameters of cabbage heads
were collected from randomly selected five plants from net plot area.
Plant height (cm):
Plant height was recorded from five randomly selected plants from net plot area by measuring
the height of the largest leaf from ground level to the tip using ruler at 40 days after
transplanting (DAT) and the mean values were computed and used for further analysis.
Plant spread (cm):
Plant spread is the diameter of the space covered by the leaves of cabbage and it is measured
in north-south direction. The data were recorded from five randomly selected plants from net
plot area at 40 DAT and mean values were counted and used for analysis.
Number of leaves per plant:
The numbers of leaves of five randomly selected plants were counted from net plot area at 40
DAT and the average number of leaves per plant was calculated.
Days to 50 % head initiation:
The plants were observed daily to evaluate the initiation of heads. The number of days elapsed
from the DAT up to 50% of the plants in the net plot area initiated heads was counted and the
average number of days was used for analysis.
Days to 75% maturity:
Cabbage heads are said to be matured when the heads are compact or firm when pressed with
fingers. Matured heads feel comparatively hard. Days to 75% maturity was assessed by
counting the number of days elapsed from DAT up to 75% of the heads in the net plot matured
and the number of days were used for analysis.
Volume per head (cc):
The volume of cabbage heads was recorded by measuring the displaced water which was
obtained by dipping cabbage heads in known volume of water. The mean volume of cabbage
18
heads was calculated from five randomly selected heads from net plot area using the above
mentioned method and used for further analysis.
Head diameter (cm):
To measure head diameter five randomly selected heads in each plot were cut vertically at
their middle position with a sharp knife. The diameters of the heads were then measured with
a meter scale horizontally from one side to another side of the selected heads and mean values
were recorded.
Head weight (kg):
The heads of five randomly selected plants from net plot area were harvested and weighed
using weighing scale and the mean values were calculated and used for further analysis.
Marketable and unmarketable yield (t ha-1):
Heads which were free from any damages and decay as well as those which haven’t loose and
open heads were considered as marketable. Heads which fulfilled these characteristics were
harvested from net plot area and expressed as tone per hectare and used for further analysis.
Those head which did not fulfill the above criterion including the wrapper leaves were
considered as unmarketable and expressed as tone per hectare. The total yield was then
obtained by adding the marketable and unmarketable yields.
The data collected from the experimental plots were subjected to analysis of variance
(ANOVA) using the procedures as described by Gomez and Gomez (1984) with the help of
Statistical Analysis Software (SAS) version 9.2. Least significant difference (LSD) test at 5%
or 1% probability was used for mean separation when the analysis of variance indicated the
presence of significant differences
Economic analysis was made following CIMMYT methodology (CIMMYT, 1988). The costs
of fertilizers and labor were considered as variable cost. Marginal rate of return was calculated
as change of net benefit divided by change of cost in the treatments.
19
CHAPTER 4: RESULTS AND DISCUSSION
4.1 Assessment of Head Cabbage production practices
4.1.1 Demographic information
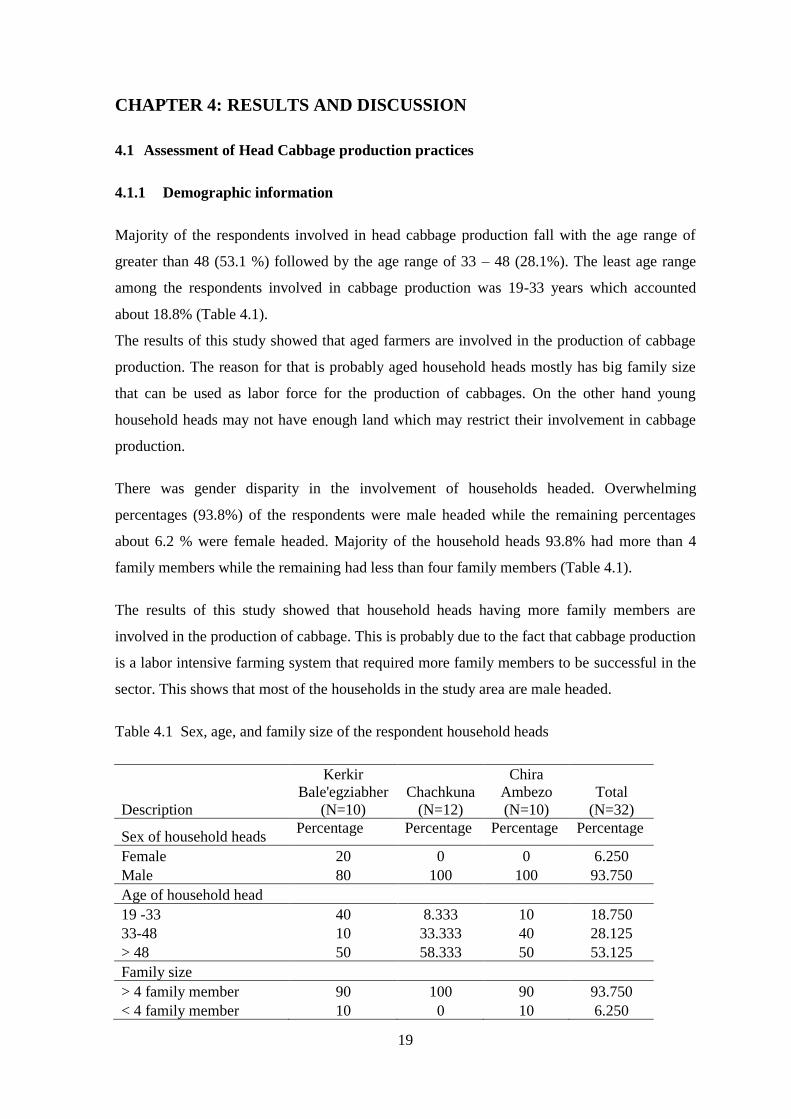
Majority of the respondents involved in head cabbage production fall with the age range of
greater than 48 (53.1 %) followed by the age range of 33 – 48 (28.1%). The least age range
among the respondents involved in cabbage production was 19-33 years which accounted
about 18.8% (Table 4.1).
The results of this study showed that aged farmers are involved in the production of cabbage
production. The reason for that is probably aged household heads mostly has big family size
that can be used as labor force for the production of cabbages. On the other hand young
household heads may not have enough land which may restrict their involvement in cabbage
production.
There was gender disparity in the involvement of households headed. Overwhelming
percentages (93.8%) of the respondents were male headed while the remaining percentages
about 6.2 % were female headed. Majority of the household heads 93.8% had more than 4
family members while the remaining had less than four family members (Table 4.1).
The results of this study showed that household heads having more family members are
involved in the production of cabbage. This is probably due to the fact that cabbage production
is a labor intensive farming system that required more family members to be successful in the
sector. This shows that most of the households in the study area are male headed.
Table 4.1 Sex, age, and family size of the respondent household heads
Description
Kerkir
Bale'egziabher
(N=10)
Chachkuna
(N=12)
Chira
Ambezo
(N=10)
Total
(N=32)
Sex of household heads Percentage Percentage Percentage Percentage
Female 20 0 0 6.250
Male 80 100 100 93.750
Age of household head
19 -33 40 8.333 10 18.750
33-48 10 33.333 40 28.125
> 48 50 58.333 50 53.125
Family size
> 4 family member 90 100 90 93.750
< 4 family member 10 0 10 6.250
20
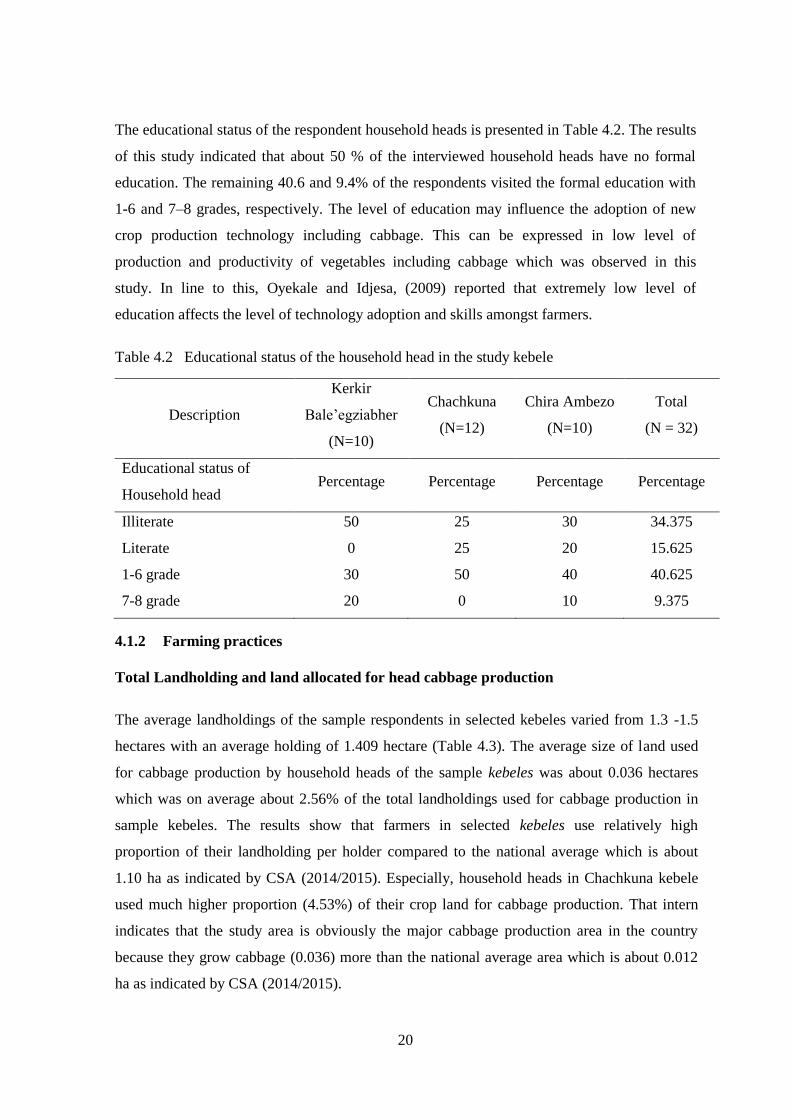
The educational status of the respondent household heads is presented in Table 4.2. The results
of this study indicated that about 50 % of the interviewed household heads have no formal
education. The remaining 40.6 and 9.4% of the respondents visited the formal education with
1-6 and 7–8 grades, respectively. The level of education may influence the adoption of new
crop production technology including cabbage. This can be expressed in low level of
production and productivity of vegetables including cabbage which was observed in this
study. In line to this, Oyekale and Idjesa, (2009) reported that extremely low level of
education affects the level of technology adoption and skills amongst farmers.
Table 4.2 Educational status of the household head in the study kebele
Description
Kerkir
Bale’egziabher
(N=10)
Chachkuna
(N=12)
Chira Ambezo
(N=10)
Total
(N = 32)
Educational status of
Household head Percentage Percentage Percentage Percentage
Illiterate 50 25 30 34.375
Literate 0 25 20 15.625
1-6 grade 30 50 40 40.625
7-8 grade 20 0 10 9.375
4.1.2 Farming practices
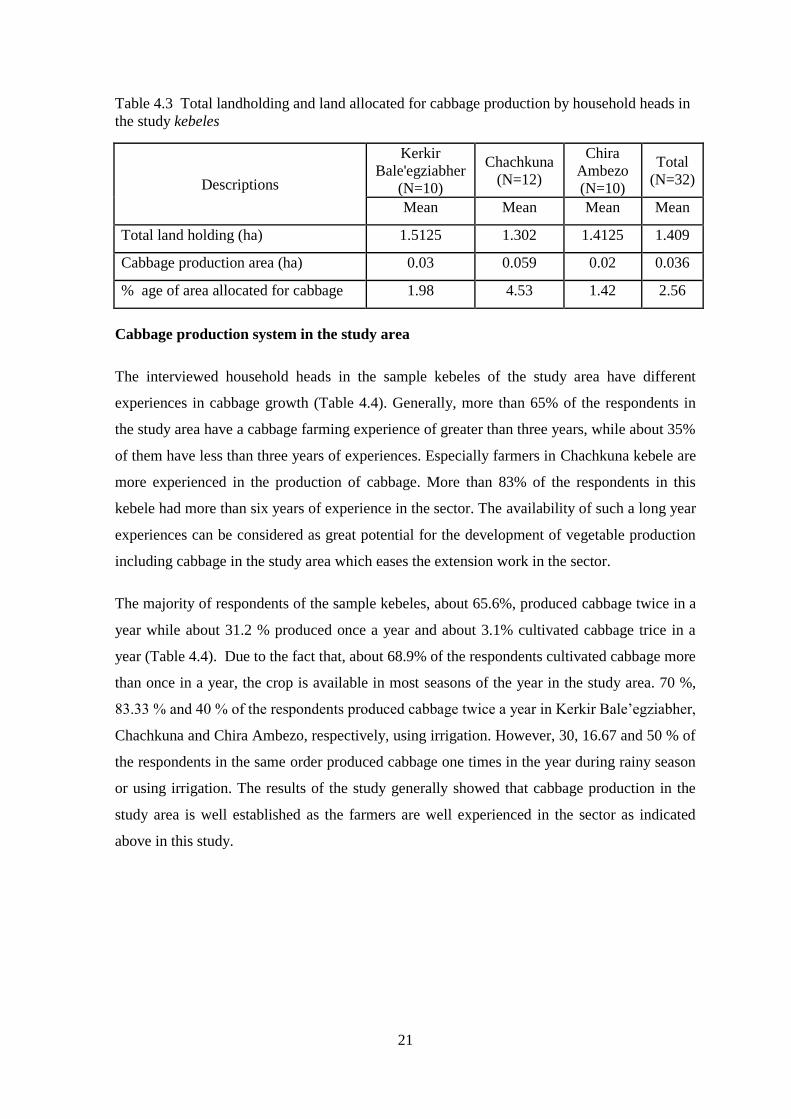
Total Landholding and land allocated for head cabbage production
The average landholdings of the sample respondents in selected kebeles varied from 1.3 -1.5
hectares with an average holding of 1.409 hectare (Table 4.3). The average size of land used
for cabbage production by household heads of the sample kebeles was about 0.036 hectares
which was on average about 2.56% of the total landholdings used for cabbage production in
sample kebeles. The results show that farmers in selected kebeles use relatively high
proportion of their landholding per holder compared to the national average which is about
1.10 ha as indicated by CSA (2014/2015). Especially, household heads in Chachkuna kebele
used much higher proportion (4.53%) of their crop land for cabbage production. That intern
indicates that the study area is obviously the major cabbage production area in the country
because they grow cabbage (0.036) more than the national average area which is about 0.012
ha as indicated by CSA (2014/2015).
21
Table 4.3 Total landholding and land allocated for cabbage production by household heads in
the study kebeles
Descriptions
Kerkir
Bale'egziabher
(N=10)
Chachkuna
(N=12)
Chira
Ambezo
(N=10)
Total
(N=32)
Mean Mean Mean Mean
Total land holding (ha) 1.5125 1.302 1.4125 1.409
Cabbage production area (ha) 0.03 0.059 0.02 0.036
% age of area allocated for cabbage 1.98 4.53 1.42 2.56
Cabbage production system in the study area
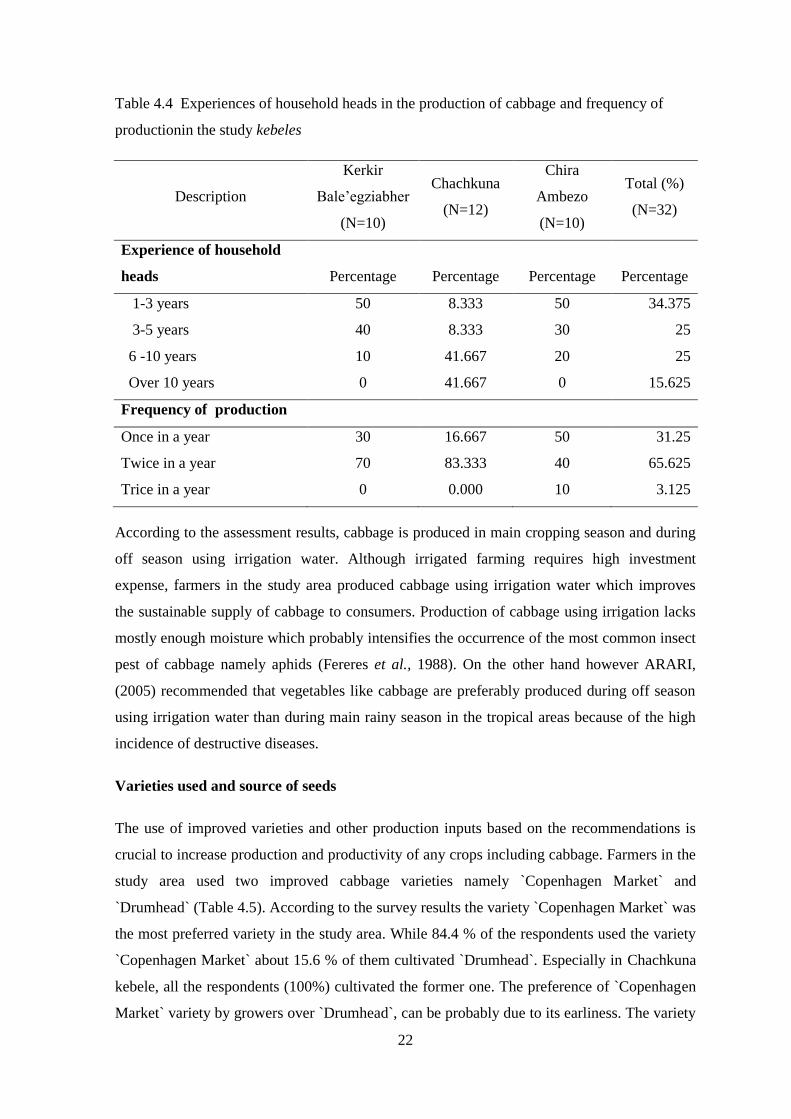
The interviewed household heads in the sample kebeles of the study area have different
experiences in cabbage growth (Table 4.4). Generally, more than 65% of the respondents in
the study area have a cabbage farming experience of greater than three years, while about 35%
of them have less than three years of experiences. Especially farmers in Chachkuna kebele are
more experienced in the production of cabbage. More than 83% of the respondents in this
kebele had more than six years of experience in the sector. The availability of such a long year
experiences can be considered as great potential for the development of vegetable production
including cabbage in the study area which eases the extension work in the sector.
The majority of respondents of the sample kebeles, about 65.6%, produced cabbage twice in a
year while about 31.2 % produced once a year and about 3.1% cultivated cabbage trice in a
year (Table 4.4). Due to the fact that, about 68.9% of the respondents cultivated cabbage more
than once in a year, the crop is available in most seasons of the year in the study area. 70 %,
83.33 % and 40 % of the respondents produced cabbage twice a year in Kerkir Bale’egziabher,
Chachkuna and Chira Ambezo, respectively, using irrigation. However, 30, 16.67 and 50 % of
the respondents in the same order produced cabbage one times in the year during rainy season
or using irrigation. The results of the study generally showed that cabbage production in the
study area is well established as the farmers are well experienced in the sector as indicated
above in this study.
22
Table 4.4 Experiences of household heads in the production of cabbage and frequency of
productionin the study kebeles
Description
Kerkir
Bale’egziabher
(N=10)
Chachkuna
(N=12)
Chira
Ambezo
(N=10)
Total (%)
(N=32)
Experience of household
heads Percentage Percentage Percentage Percentage
1-3 years 50 8.333 50 34.375
3-5 years 40 8.333 30 25
6 -10 years 10 41.667 20 25
Over 10 years 0 41.667 0 15.625
Frequency of production
Once in a year 30 16.667 50 31.25
Twice in a year 70 83.333 40 65.625
Trice in a year 0 0.000 10 3.125
According to the assessment results, cabbage is produced in main cropping season and during
off season using irrigation water. Although irrigated farming requires high investment
expense, farmers in the study area produced cabbage using irrigation water which improves
the sustainable supply of cabbage to consumers. Production of cabbage using irrigation lacks
mostly enough moisture which probably intensifies the occurrence of the most common insect
pest of cabbage namely aphids (Fereres et al., 1988). On the other hand however ARARI,
(2005) recommended that vegetables like cabbage are preferably produced during off season
using irrigation water than during main rainy season in the tropical areas because of the high
incidence of destructive diseases.
Varieties used and source of seeds
The use of improved varieties and other production inputs based on the recommendations is
crucial to increase production and productivity of any crops including cabbage. Farmers in the
study area used two improved cabbage varieties namely `Copenhagen Market` and
`Drumhead` (Table 4.5). According to the survey results the variety `Copenhagen Market` was
the most preferred variety in the study area. While 84.4 % of the respondents used the variety
`Copenhagen Market` about 15.6 % of them cultivated `Drumhead`. Especially in Chachkuna
kebele, all the respondents (100%) cultivated the former one. The preference of `Copenhagen
Market` variety by growers over `Drumhead`, can be probably due to its earliness. The variety
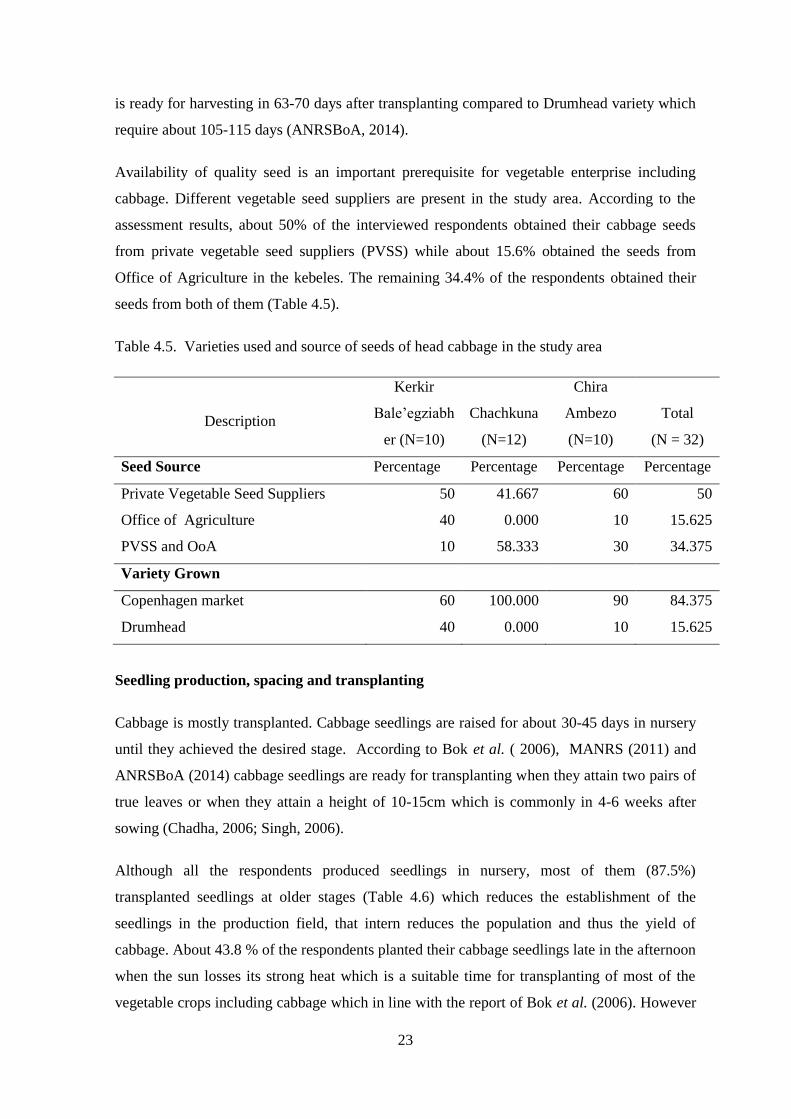
23
is ready for harvesting in 63-70 days after transplanting compared to Drumhead variety which
require about 105-115 days (ANRSBoA, 2014).
Availability of quality seed is an important prerequisite for vegetable enterprise including
cabbage. Different vegetable seed suppliers are present in the study area. According to the
assessment results, about 50% of the interviewed respondents obtained their cabbage seeds
from private vegetable seed suppliers (PVSS) while about 15.6% obtained the seeds from
Office of Agriculture in the kebeles. The remaining 34.4% of the respondents obtained their
seeds from both of them (Table 4.5).
Table 4.5. Varieties used and source of seeds of head cabbage in the study area
Description
Kerkir
Bale’egziabh
er (N=10)
Chachkuna
(N=12)
Chira
Ambezo
(N=10)
Total
(N = 32)
Seed Source Percentage Percentage Percentage Percentage
Private Vegetable Seed Suppliers 50 41.667 60 50
Office of Agriculture 40 0.000 10 15.625
PVSS and OoA 10 58.333 30 34.375
Variety Grown
Copenhagen market 60 100.000 90 84.375
Drumhead 40 0.000 10 15.625
Seedling production, spacing and transplanting
Cabbage is mostly transplanted. Cabbage seedlings are raised for about 30-45 days in nursery
until they achieved the desired stage. According to Bok et al. ( 2006), MANRS (2011) and
ANRSBoA (2014) cabbage seedlings are ready for transplanting when they attain two pairs of
true leaves or when they attain a height of 10-15cm which is commonly in 4-6 weeks after
sowing (Chadha, 2006; Singh, 2006).
Although all the respondents produced seedlings in nursery, most of them (87.5%)
transplanted seedlings at older stages (Table 4.6) which reduces the establishment of the
seedlings in the production field, that intern reduces the population and thus the yield of
cabbage. About 43.8 % of the respondents planted their cabbage seedlings late in the afternoon
when the sun losses its strong heat which is a suitable time for transplanting of most of the
vegetable crops including cabbage which in line with the report of Bok et al. (2006). However
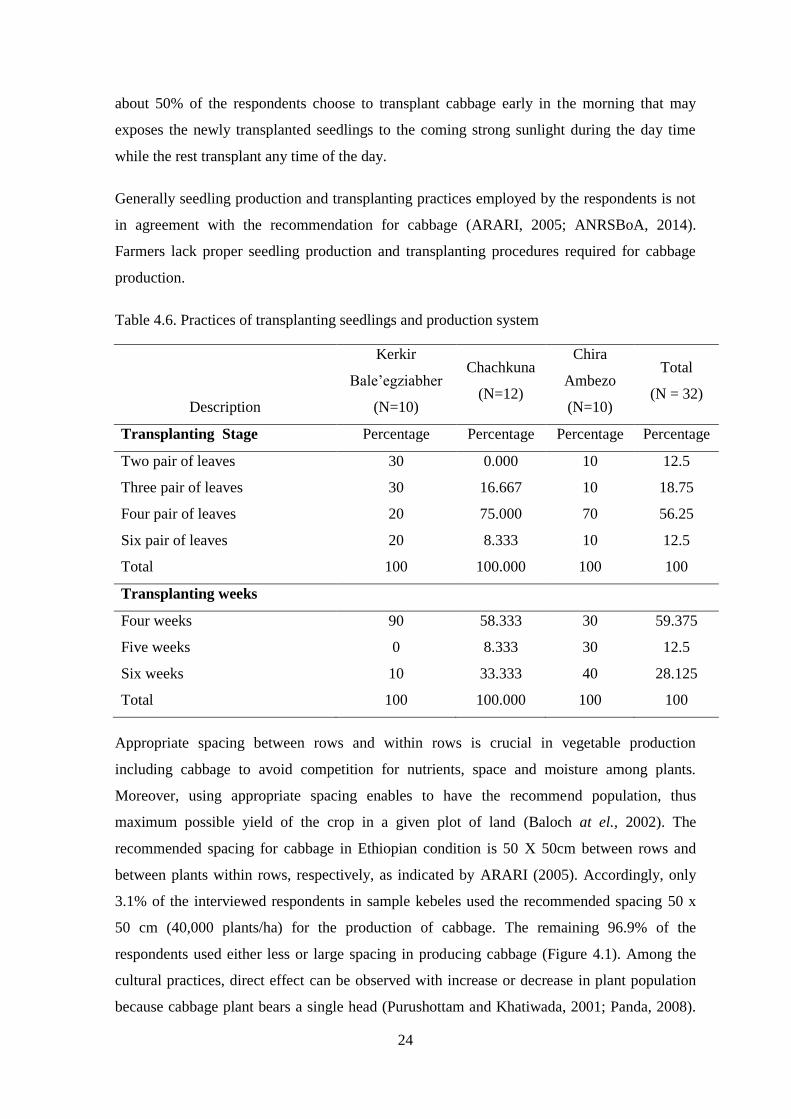
24
about 50% of the respondents choose to transplant cabbage early in the morning that may
exposes the newly transplanted seedlings to the coming strong sunlight during the day time
while the rest transplant any time of the day.
Generally seedling production and transplanting practices employed by the respondents is not
in agreement with the recommendation for cabbage (ARARI, 2005; ANRSBoA, 2014).
Farmers lack proper seedling production and transplanting procedures required for cabbage
production.
Table 4.6. Practices of transplanting seedlings and production system
Description
Kerkir
Bale’egziabher
(N=10)
Chachkuna
(N=12)
Chira
Ambezo
(N=10)
Total
(N = 32)
Transplanting Stage Percentage Percentage Percentage Percentage
Two pair of leaves 30 0.000 10 12.5
Three pair of leaves 30 16.667 10 18.75
Four pair of leaves 20 75.000 70 56.25
Six pair of leaves 20 8.333 10 12.5
Total 100 100.000 100 100
Transplanting weeks
Four weeks 90 58.333 30 59.375
Five weeks 0 8.333 30 12.5
Six weeks 10 33.333 40 28.125
Total 100 100.000 100 100
Appropriate spacing between rows and within rows is crucial in vegetable production
including cabbage to avoid competition for nutrients, space and moisture among plants.
Moreover, using appropriate spacing enables to have the recommend population, thus
maximum possible yield of the crop in a given plot of land (Baloch at el., 2002). The
recommended spacing for cabbage in Ethiopian condition is 50 X 50cm between rows and
between plants within rows, respectively, as indicated by ARARI (2005). Accordingly, only
3.1% of the interviewed respondents in sample kebeles used the recommended spacing 50 x
50 cm (40,000 plants/ha) for the production of cabbage. The remaining 96.9% of the
respondents used either less or large spacing in producing cabbage (Figure 4.1). Among the
cultural practices, direct effect can be observed with increase or decrease in plant population
because cabbage plant bears a single head (Purushottam and Khatiwada, 2001; Panda, 2008).
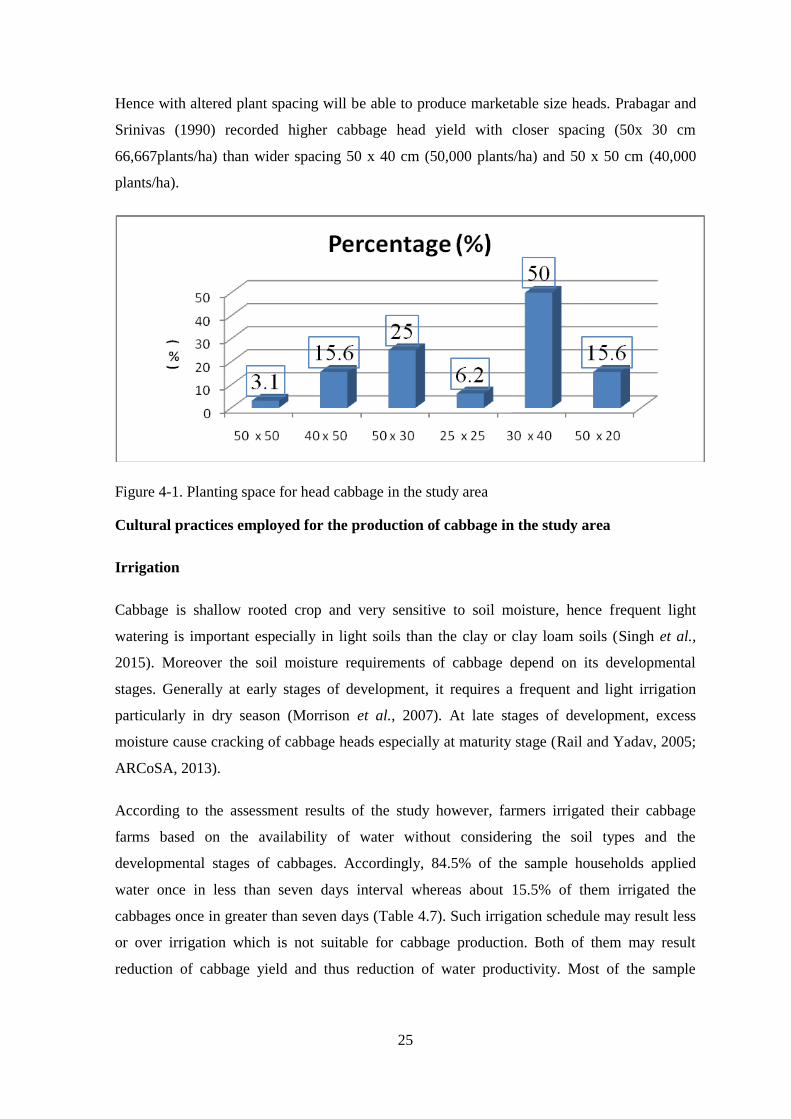
25
Hence with altered plant spacing will be able to produce marketable size heads. Prabagar and
Srinivas (1990) recorded higher cabbage head yield with closer spacing (50x 30 cm
66,667plants/ha) than wider spacing 50 x 40 cm (50,000 plants/ha) and 50 x 50 cm (40,000
plants/ha).
Figure 4-1. Planting space for head cabbage in the study area
Cultural practices employed for the production of cabbage in the study area
Irrigation
Cabbage is shallow rooted crop and very sensitive to soil moisture, hence frequent light
watering is important especially in light soils than the clay or clay loam soils (Singh et al.,
2015). Moreover the soil moisture requirements of cabbage depend on its developmental
stages. Generally at early stages of development, it requires a frequent and light irrigation
particularly in dry season (Morrison et al., 2007). At late stages of development, excess
moisture cause cracking of cabbage heads especially at maturity stage (Rail and Yadav, 2005;
ARCoSA, 2013).
According to the assessment results of the study however, farmers irrigated their cabbage
farms based on the availability of water without considering the soil types and the
developmental stages of cabbages. Accordingly, 84.5% of the sample households applied
water once in less than seven days interval whereas about 15.5% of them irrigated the
cabbages once in greater than seven days (Table 4.7). Such irrigation schedule may result less
or over irrigation which is not suitable for cabbage production. Both of them may result
reduction of cabbage yield and thus reduction of water productivity. Most of the sample
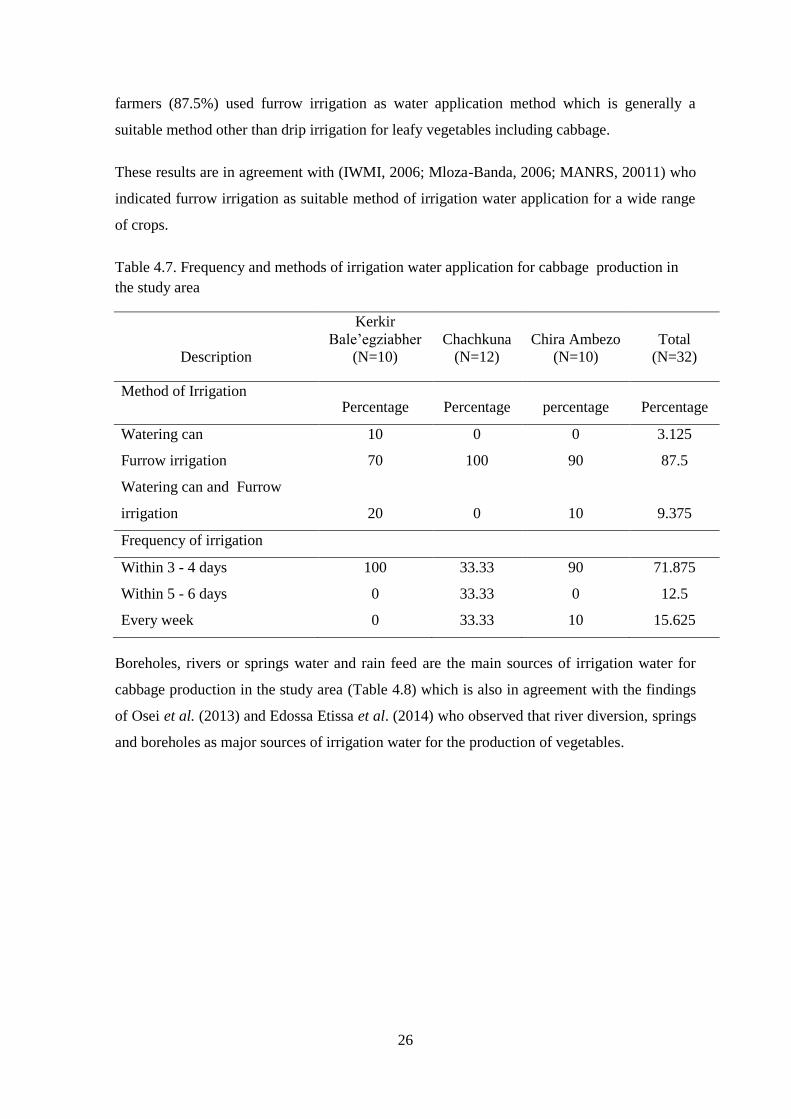
26
farmers (87.5%) used furrow irrigation as water application method which is generally a
suitable method other than drip irrigation for leafy vegetables including cabbage.
These results are in agreement with (IWMI, 2006; Mloza-Banda, 2006; MANRS, 20011) who
indicated furrow irrigation as suitable method of irrigation water application for a wide range
of crops.
Table 4.7. Frequency and methods of irrigation water application for cabbage production in
the study area
Description
Kerkir
Bale’egziabher
(N=10)
Chachkuna
(N=12)
Chira Ambezo
(N=10)
Total
(N=32)
Method of Irrigation Percentage Percentage percentage Percentage
Watering can 10 0 0 3.125
Furrow irrigation 70 100 90 87.5
Watering can and Furrow
irrigation 20 0 10 9.375
Frequency of irrigation
Within 3 - 4 days 100 33.33 90 71.875
Within 5 - 6 days 0 33.33 0 12.5
Every week 0 33.33 10 15.625
Boreholes, rivers or springs water and rain feed are the main sources of irrigation water for
cabbage production in the study area (Table 4.8) which is also in agreement with the findings
of Osei et al. (2013) and Edossa Etissa et al. (2014) who observed that river diversion, springs
and boreholes as major sources of irrigation water for the production of vegetables.
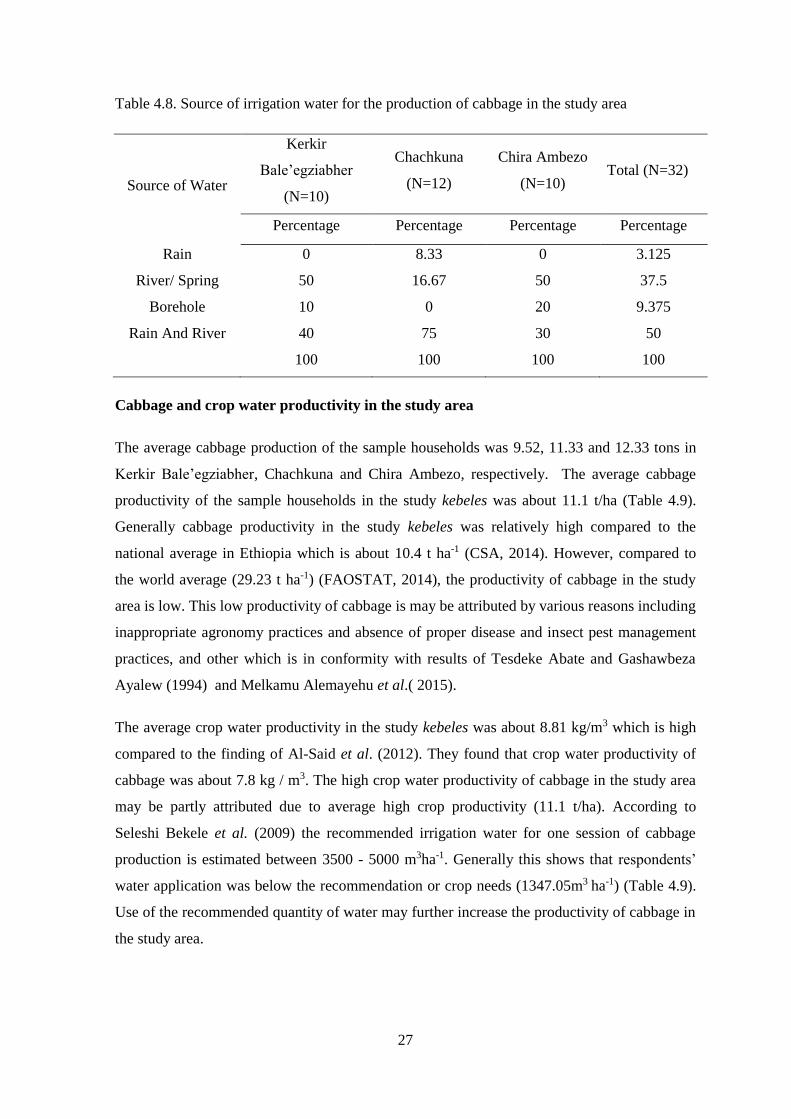
27
Table 4.8. Source of irrigation water for the production of cabbage in the study area
Source of Water
Kerkir
Bale’egziabher
(N=10)
Chachkuna
(N=12)
Chira Ambezo
(N=10) Total (N=32)
Percentage Percentage Percentage Percentage
Rain 0 8.33 0 3.125
River/ Spring 50 16.67 50 37.5
Borehole 10 0 20 9.375
Rain And River 40 75 30 50
100 100 100 100
Cabbage and crop water productivity in the study area
The average cabbage production of the sample households was 9.52, 11.33 and 12.33 tons in
Kerkir Bale’egziabher, Chachkuna and Chira Ambezo, respectively. The average cabbage
productivity of the sample households in the study kebeles was about 11.1 t/ha (Table 4.9).
Generally cabbage productivity in the study kebeles was relatively high compared to the
national average in Ethiopia which is about 10.4 t ha-1 (CSA, 2014). However, compared to
the world average (29.23 t ha-1) (FAOSTAT, 2014), the productivity of cabbage in the study
area is low. This low productivity of cabbage is may be attributed by various reasons including
inappropriate agronomy practices and absence of proper disease and insect pest management
practices, and other which is in conformity with results of Tesdeke Abate and Gashawbeza
Ayalew (1994) and Melkamu Alemayehu et al.( 2015).
The average crop water productivity in the study kebeles was about 8.81 kg/m3 which is high
compared to the finding of Al-Said et al. (2012). They found that crop water productivity of
cabbage was about 7.8 kg / m3. The high crop water productivity of cabbage in the study area
may be partly attributed due to average high crop productivity (11.1 t/ha). According to
Seleshi Bekele et al. (2009) the recommended irrigation water for one session of cabbage
production is estimated between 3500 - 5000 m3ha-1. Generally this shows that respondents’
water application was below the recommendation or crop needs (1347.05m3 ha-1) (Table 4.9).
Use of the recommended quantity of water may further increase the productivity of cabbage in
the study area.
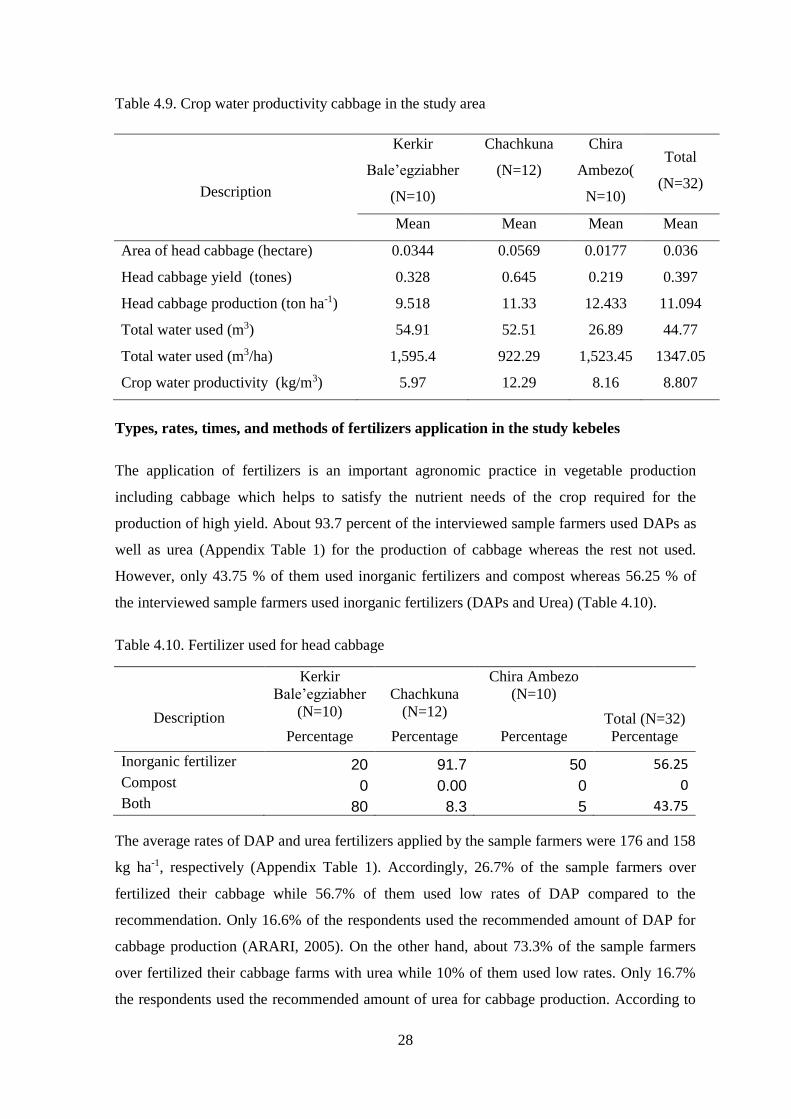
28
Table 4.9. Crop water productivity cabbage in the study area
Description
Kerkir
Bale’egziabher
(N=10)
Chachkuna
(N=12)
Chira
Ambezo(
N=10)
Total
(N=32)
Mean Mean Mean Mean
Area of head cabbage (hectare) 0.0344 0.0569 0.0177 0.036
Head cabbage yield (tones) 0.328 0.645 0.219 0.397
Head cabbage production (ton ha-1) 9.518 11.33 12.433 11.094
Total water used (m3) 54.91 52.51 26.89 44.77
Total water used (m3/ha) 1,595.4 922.29 1,523.45 1347.05
Crop water productivity (kg/m3) 5.97 12.29 8.16 8.807
Types, rates, times, and methods of fertilizers application in the study kebeles
The application of fertilizers is an important agronomic practice in vegetable production
including cabbage which helps to satisfy the nutrient needs of the crop required for the
production of high yield. About 93.7 percent of the interviewed sample farmers used DAPs as
well as urea (Appendix Table 1) for the production of cabbage whereas the rest not used.
However, only 43.75 % of them used inorganic fertilizers and compost whereas 56.25 % of
the interviewed sample farmers used inorganic fertilizers (DAPs and Urea) (Table 4.10).
Table 4.10. Fertilizer used for head cabbage
Description
Kerkir
Bale’egziabher
(N=10)
Chachkuna
(N=12)
Chira Ambezo
(N=10)
Total (N=32)
Percentage Percentage Percentage Percentage
Inorganic fertilizer 20 91.7 50 56.25 Compost 0 0.00 0 0 Both 80 8.3 5 43.75
The average rates of DAP and urea fertilizers applied by the sample farmers were 176 and 158
kg ha-1, respectively (Appendix Table 1). Accordingly, 26.7% of the sample farmers over
fertilized their cabbage while 56.7% of them used low rates of DAP compared to the
recommendation. Only 16.6% of the respondents used the recommended amount of DAP for
cabbage production (ARARI, 2005). On the other hand, about 73.3% of the sample farmers
over fertilized their cabbage farms with urea while 10% of them used low rates. Only 16.7%
the respondents used the recommended amount of urea for cabbage production. According to
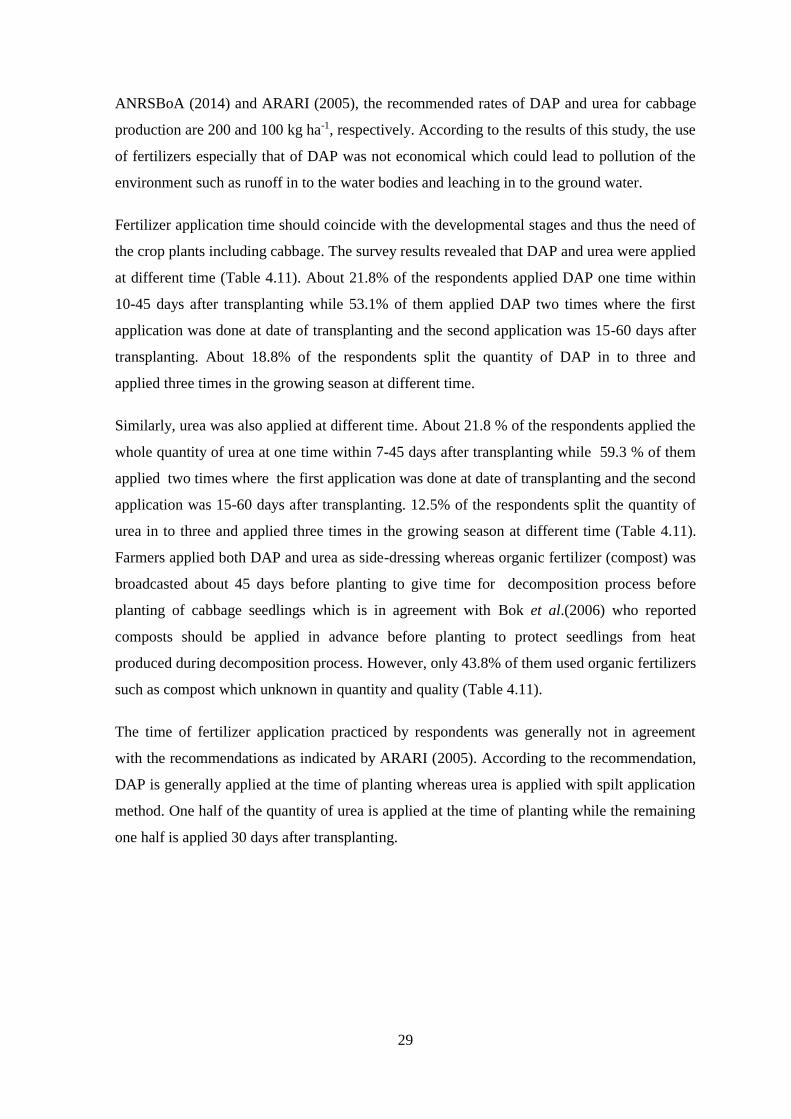
29
ANRSBoA (2014) and ARARI (2005), the recommended rates of DAP and urea for cabbage
production are 200 and 100 kg ha-1, respectively. According to the results of this study, the use
of fertilizers especially that of DAP was not economical which could lead to pollution of the
environment such as runoff in to the water bodies and leaching in to the ground water.
Fertilizer application time should coincide with the developmental stages and thus the need of
the crop plants including cabbage. The survey results revealed that DAP and urea were applied
at different time (Table 4.11). About 21.8% of the respondents applied DAP one time within
10-45 days after transplanting while 53.1% of them applied DAP two times where the first
application was done at date of transplanting and the second application was 15-60 days after
transplanting. About 18.8% of the respondents split the quantity of DAP in to three and
applied three times in the growing season at different time.
Similarly, urea was also applied at different time. About 21.8 % of the respondents applied the
whole quantity of urea at one time within 7-45 days after transplanting while 59.3 % of them
applied two times where the first application was done at date of transplanting and the second
application was 15-60 days after transplanting. 12.5% of the respondents split the quantity of
urea in to three and applied three times in the growing season at different time (Table 4.11).
Farmers applied both DAP and urea as side-dressing whereas organic fertilizer (compost) was
broadcasted about 45 days before planting to give time for decomposition process before
planting of cabbage seedlings which is in agreement with Bok et al.(2006) who reported
composts should be applied in advance before planting to protect seedlings from heat
produced during decomposition process. However, only 43.8% of them used organic fertilizers
such as compost which unknown in quantity and quality (Table 4.11).
The time of fertilizer application practiced by respondents was generally not in agreement
with the recommendations as indicated by ARARI (2005). According to the recommendation,
DAP is generally applied at the time of planting whereas urea is applied with spilt application
method. One half of the quantity of urea is applied at the time of planting while the remaining
one half is applied 30 days after transplanting.
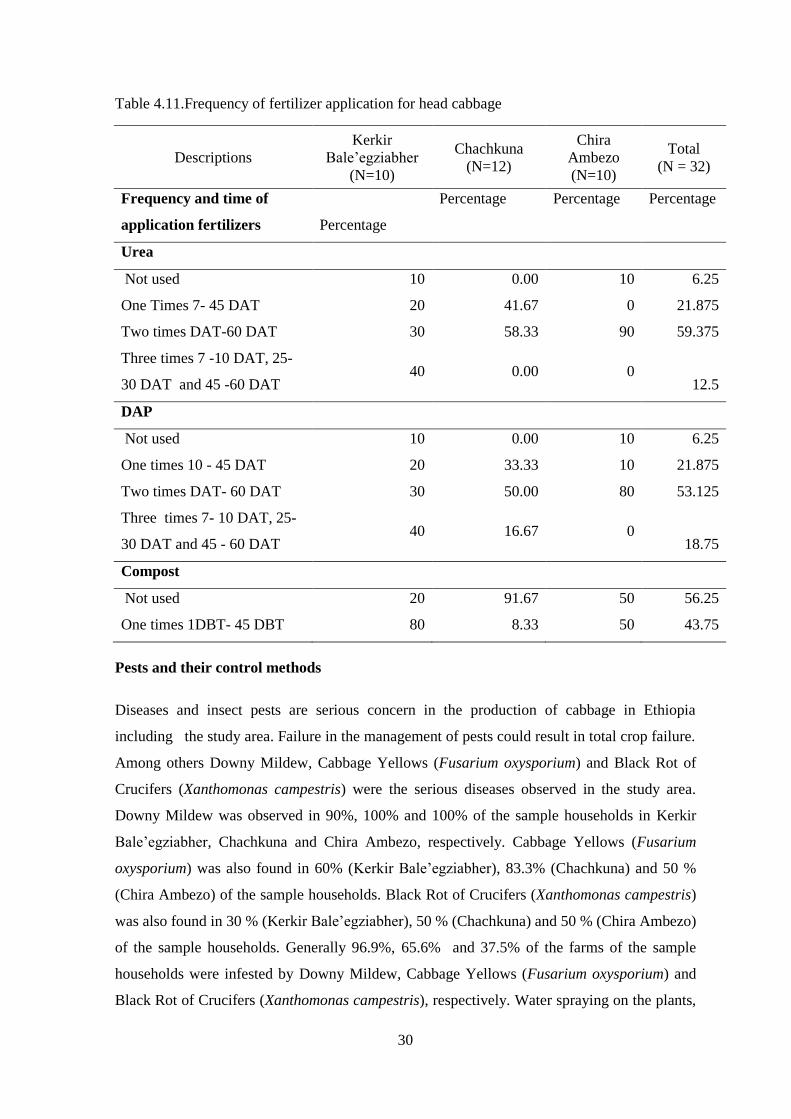
30
Table 4.11.Frequency of fertilizer application for head cabbage
Descriptions
Kerkir
Bale’egziabher
(N=10)
Chachkuna
(N=12)
Chira
Ambezo
(N=10)
Total
(N = 32)
Frequency and time of
application fertilizers Percentage
Percentage Percentage Percentage
Urea
Not used 10 0.00 10 6.25
One Times 7- 45 DAT 20 41.67 0 21.875
Two times DAT-60 DAT 30 58.33 90 59.375
Three times 7 -10 DAT, 25-
30 DAT and 45 -60 DAT 40 0.00 0
12.5
DAP
Not used 10 0.00 10 6.25
One times 10 - 45 DAT 20 33.33 10 21.875
Two times DAT- 60 DAT 30 50.00 80 53.125
Three times 7- 10 DAT, 25-
30 DAT and 45 - 60 DAT 40 16.67 0
18.75
Compost
Not used 20 91.67 50 56.25
One times 1DBT- 45 DBT 80 8.33 50 43.75
Pests and their control methods
Diseases and insect pests are serious concern in the production of cabbage in Ethiopia
including the study area. Failure in the management of pests could result in total crop failure.
Among others Downy Mildew, Cabbage Yellows (Fusarium oxysporium) and Black Rot of
Crucifers (Xanthomonas campestris) were the serious diseases observed in the study area.
Downy Mildew was observed in 90%, 100% and 100% of the sample households in Kerkir
Bale’egziabher, Chachkuna and Chira Ambezo, respectively. Cabbage Yellows (Fusarium
oxysporium) was also found in 60% (Kerkir Bale’egziabher), 83.3% (Chachkuna) and 50 %
(Chira Ambezo) of the sample households. Black Rot of Crucifers (Xanthomonas campestris)
was also found in 30 % (Kerkir Bale’egziabher), 50 % (Chachkuna) and 50 % (Chira Ambezo)
of the sample households. Generally 96.9%, 65.6% and 37.5% of the farms of the sample
households were infested by Downy Mildew, Cabbage Yellows (Fusarium oxysporium) and
Black Rot of Crucifers (Xanthomonas campestris), respectively. Water spraying on the plants,
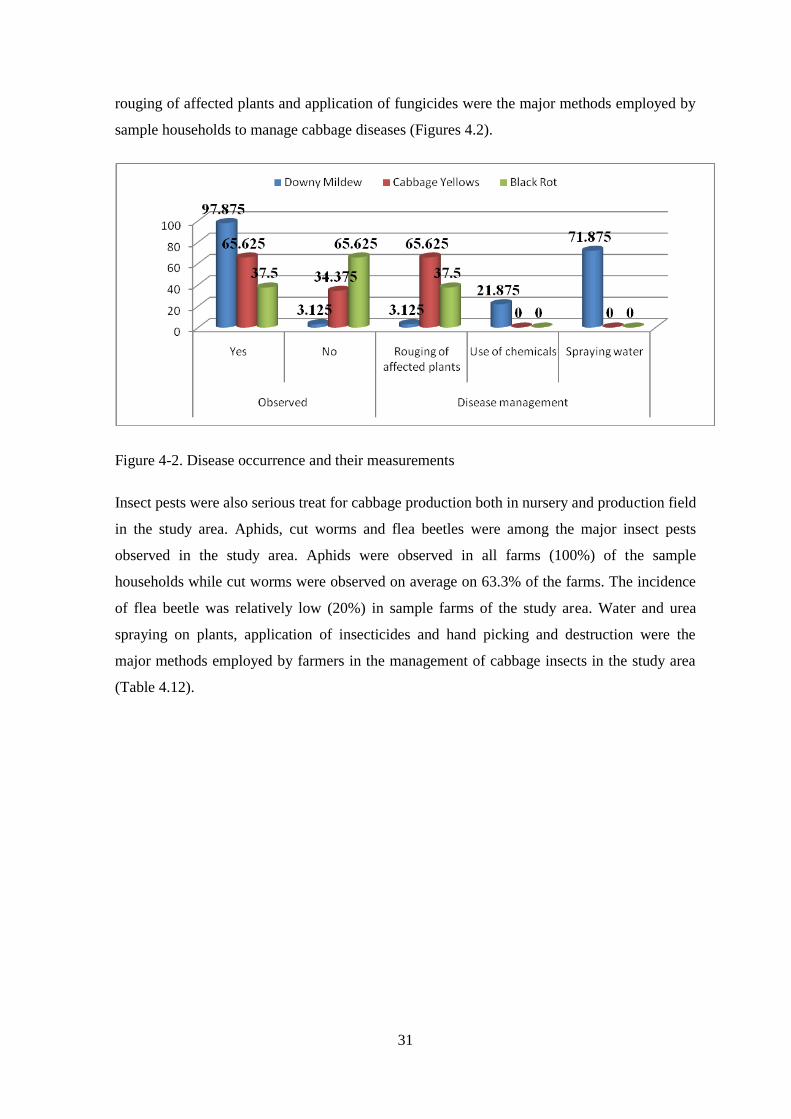
31
rouging of affected plants and application of fungicides were the major methods employed by
sample households to manage cabbage diseases (Figures 4.2).
Figure 4-2. Disease occurrence and their measurements
Insect pests were also serious treat for cabbage production both in nursery and production field
in the study area. Aphids, cut worms and flea beetles were among the major insect pests
observed in the study area. Aphids were observed in all farms (100%) of the sample
households while cut worms were observed on average on 63.3% of the farms. The incidence
of flea beetle was relatively low (20%) in sample farms of the study area. Water and urea
spraying on plants, application of insecticides and hand picking and destruction were the
major methods employed by farmers in the management of cabbage insects in the study area
(Table 4.12).
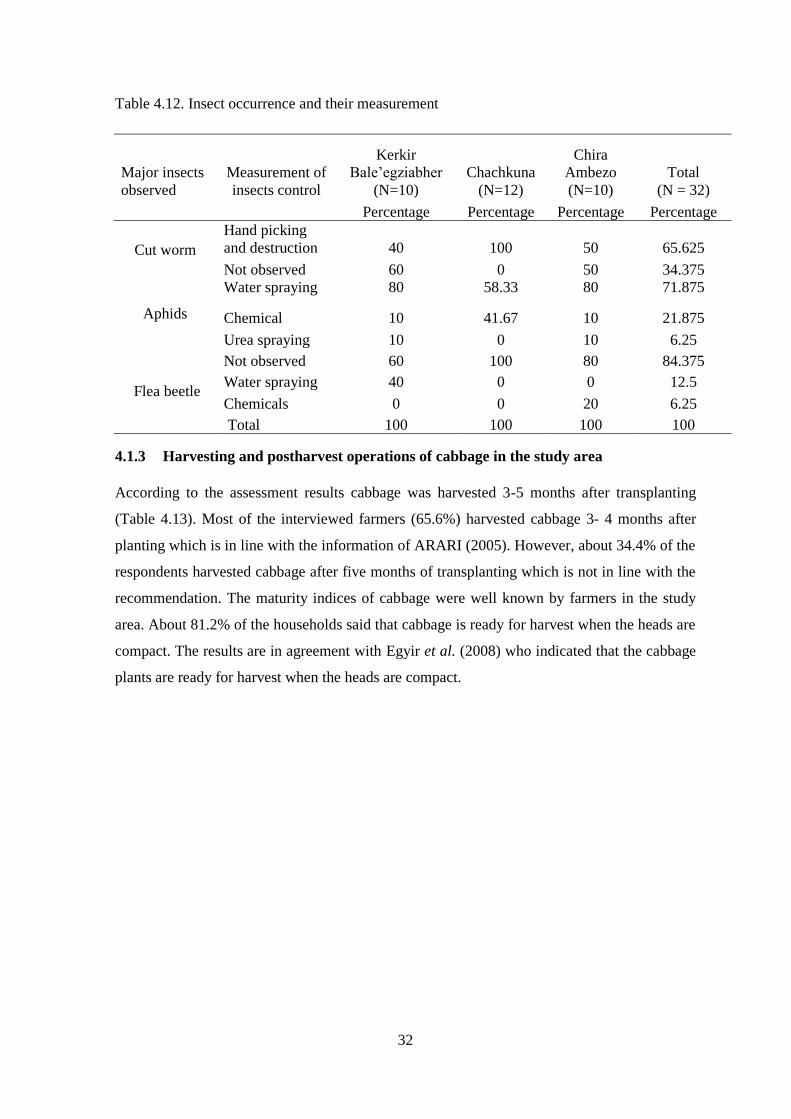
32
Table 4.12. Insect occurrence and their measurement
Major insects
observed
Measurement of
insects control
Kerkir
Bale’egziabher
(N=10)
Chachkuna
(N=12)
Chira
Ambezo
(N=10)
Total
(N = 32)
Percentage Percentage Percentage Percentage
Cut worm
Hand picking
and destruction 40 100 50 65.625
Not observed 60 0 50 34.375
Aphids
Water spraying 80 58.33 80 71.875
Chemical 10 41.67 10 21.875
Urea spraying 10 0 10 6.25
Flea beetle
Not observed 60 100 80 84.375
Water spraying 40 0 0 12.5
Chemicals 0 0 20 6.25
Total 100 100 100 100
4.1.3 Harvesting and postharvest operations of cabbage in the study area
According to the assessment results cabbage was harvested 3-5 months after transplanting
(Table 4.13). Most of the interviewed farmers (65.6%) harvested cabbage 3- 4 months after
planting which is in line with the information of ARARI (2005). However, about 34.4% of the
respondents harvested cabbage after five months of transplanting which is not in line with the
recommendation. The maturity indices of cabbage were well known by farmers in the study
area. About 81.2% of the households said that cabbage is ready for harvest when the heads are
compact. The results are in agreement with Egyir et al. (2008) who indicated that the cabbage
plants are ready for harvest when the heads are compact.
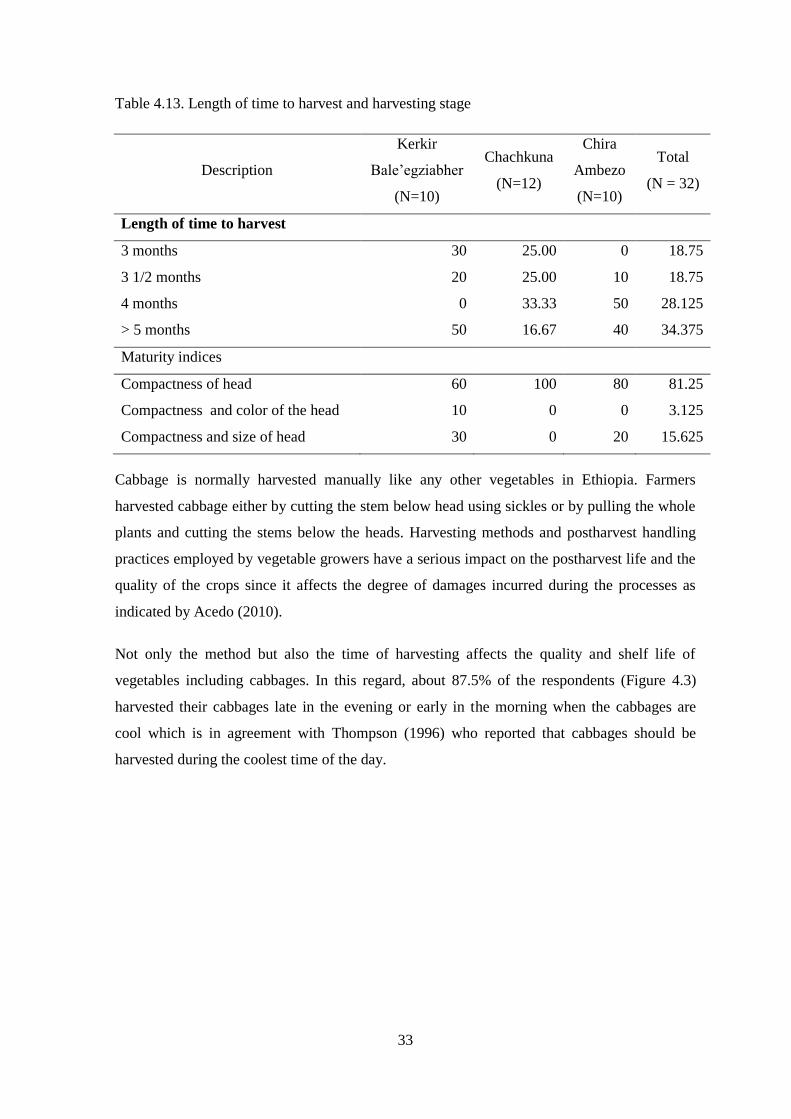
33
Table 4.13. Length of time to harvest and harvesting stage
Description
Kerkir
Bale’egziabher
(N=10)
Chachkuna
(N=12)
Chira
Ambezo
(N=10)
Total
(N = 32)
Length of time to harvest
3 months 30 25.00 0 18.75
3 1/2 months 20 25.00 10 18.75
4 months 0 33.33 50 28.125
> 5 months 50 16.67 40 34.375
Maturity indices
Compactness of head 60 100 80 81.25
Compactness and color of the head 10 0 0 3.125
Compactness and size of head 30 0 20 15.625
Cabbage is normally harvested manually like any other vegetables in Ethiopia. Farmers
harvested cabbage either by cutting the stem below head using sickles or by pulling the whole
plants and cutting the stems below the heads. Harvesting methods and postharvest handling
practices employed by vegetable growers have a serious impact on the postharvest life and the
quality of the crops since it affects the degree of damages incurred during the processes as
indicated by Acedo (2010).
Not only the method but also the time of harvesting affects the quality and shelf life of
vegetables including cabbages. In this regard, about 87.5% of the respondents (Figure 4.3)
harvested their cabbages late in the evening or early in the morning when the cabbages are
cool which is in agreement with Thompson (1996) who reported that cabbages should be
harvested during the coolest time of the day.
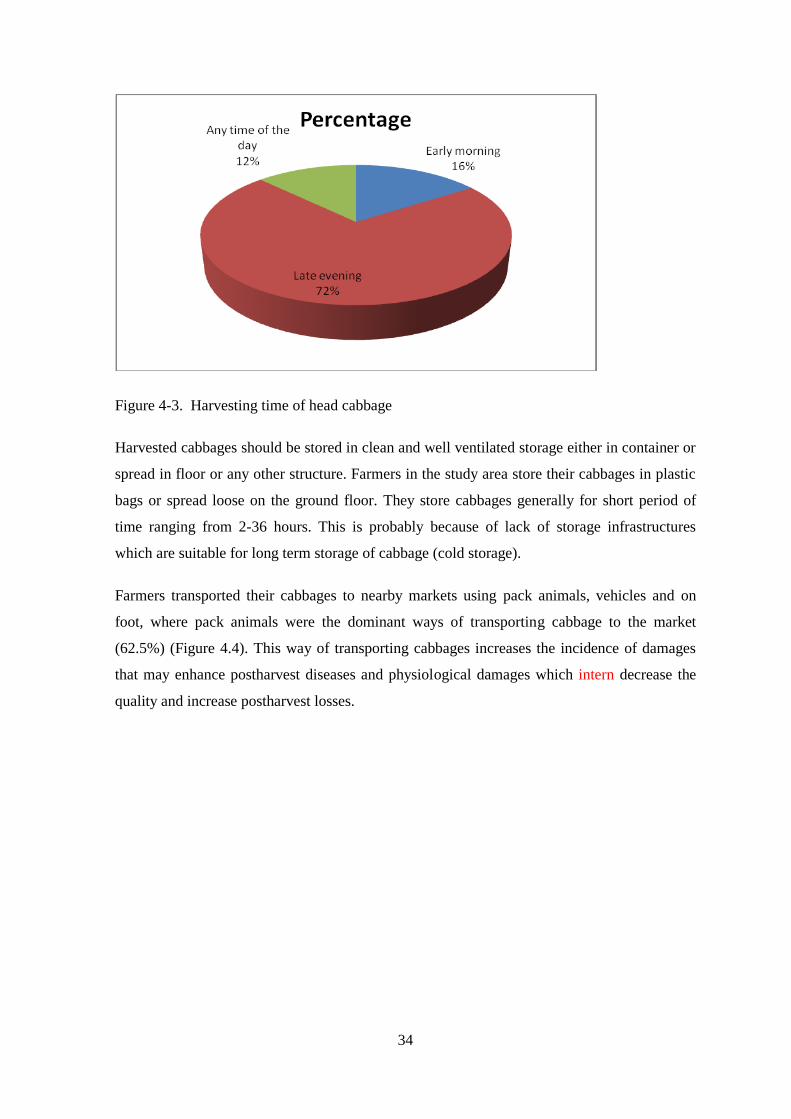
34
Figure 4-3. Harvesting time of head cabbage
Harvested cabbages should be stored in clean and well ventilated storage either in container or
spread in floor or any other structure. Farmers in the study area store their cabbages in plastic
bags or spread loose on the ground floor. They store cabbages generally for short period of
time ranging from 2-36 hours. This is probably because of lack of storage infrastructures
which are suitable for long term storage of cabbage (cold storage).
Farmers transported their cabbages to nearby markets using pack animals, vehicles and on
foot, where pack animals were the dominant ways of transporting cabbage to the market
(62.5%) (Figure 4.4). This way of transporting cabbages increases the incidence of damages
that may enhance postharvest diseases and physiological damages which intern decrease the
quality and increase postharvest losses.
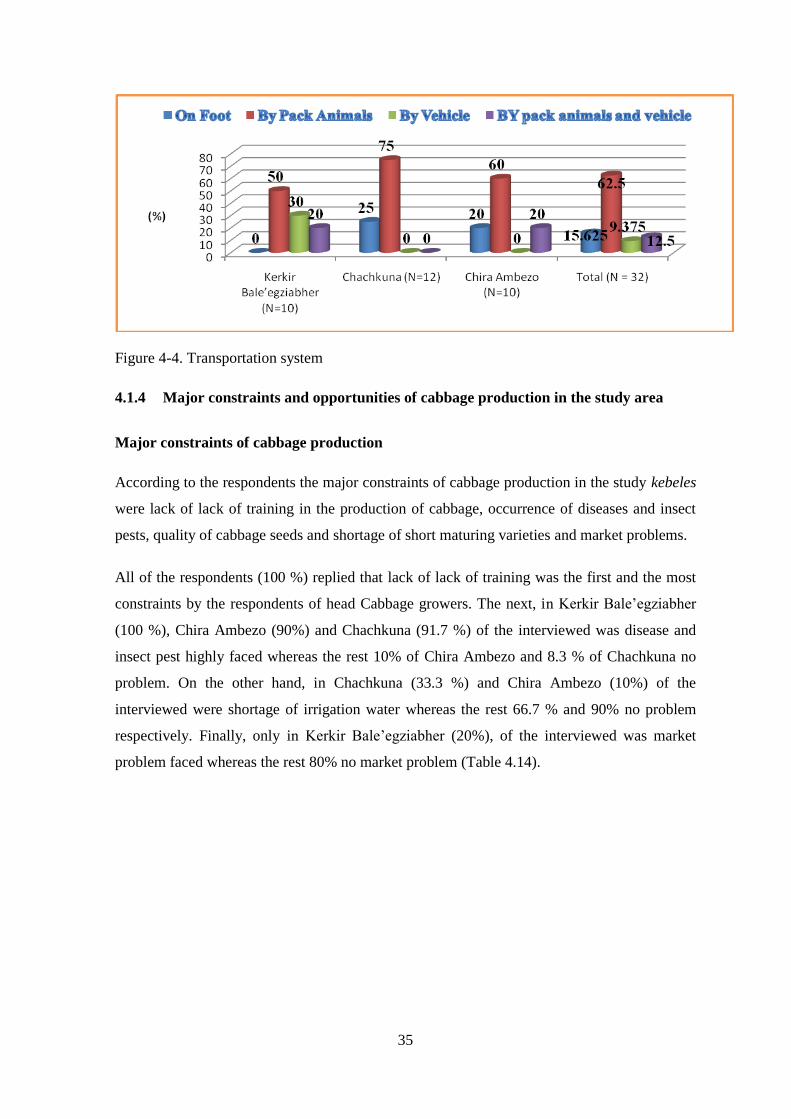
35
Figure 4-4. Transportation system
4.1.4 Major constraints and opportunities of cabbage production in the study area
Major constraints of cabbage production
According to the respondents the major constraints of cabbage production in the study kebeles
were lack of lack of training in the production of cabbage, occurrence of diseases and insect
pests, quality of cabbage seeds and shortage of short maturing varieties and market problems.
All of the respondents (100 %) replied that lack of lack of training was the first and the most
constraints by the respondents of head Cabbage growers. The next, in Kerkir Bale’egziabher
(100 %), Chira Ambezo (90%) and Chachkuna (91.7 %) of the interviewed was disease and
insect pest highly faced whereas the rest 10% of Chira Ambezo and 8.3 % of Chachkuna no
problem. On the other hand, in Chachkuna (33.3 %) and Chira Ambezo (10%) of the
interviewed were shortage of irrigation water whereas the rest 66.7 % and 90% no problem
respectively. Finally, only in Kerkir Bale’egziabher (20%), of the interviewed was market
problem faced whereas the rest 80% no market problem (Table 4.14).
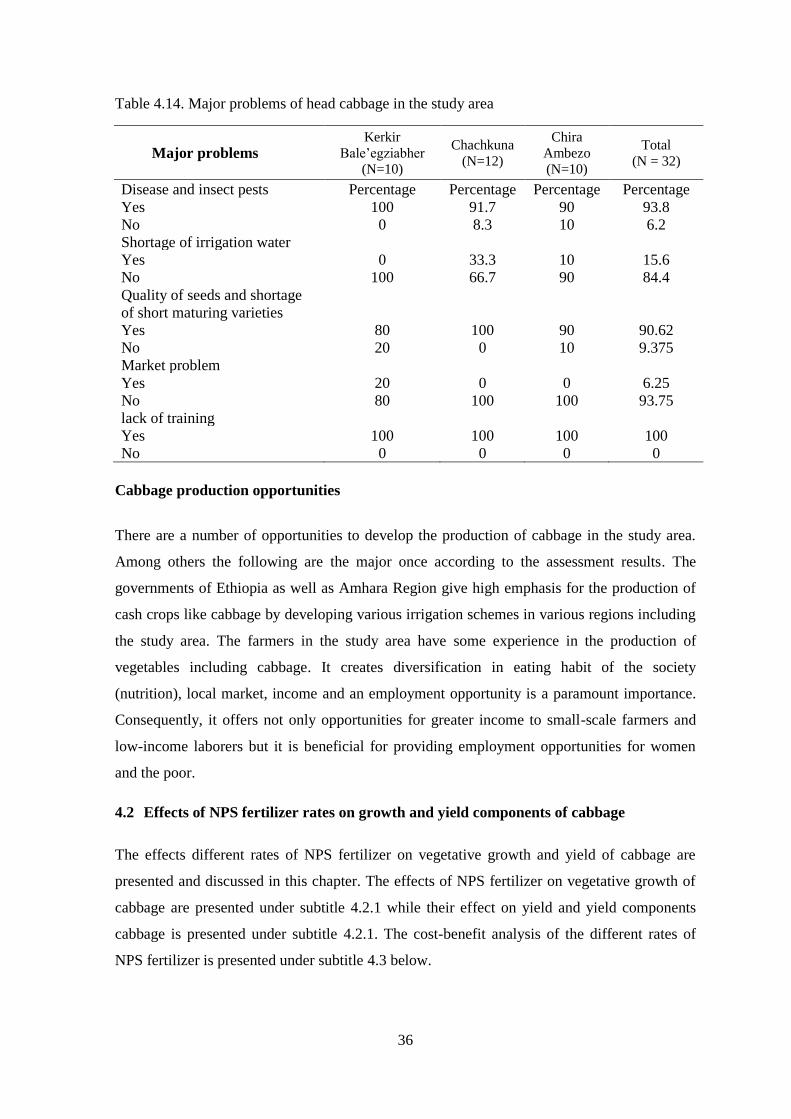
36
Table 4.14. Major problems of head cabbage in the study area
Major problems Kerkir
Bale’egziabher
(N=10)
Chachkuna
(N=12)
Chira
Ambezo
(N=10)
Total
(N = 32)
Disease and insect pests Percentage Percentage Percentage Percentage
Yes 100 91.7 90 93.8
No 0 8.3 10 6.2
Shortage of irrigation water
Yes 0 33.3 10 15.6
No 100 66.7 90 84.4
Quality of seeds and shortage
of short maturing varieties
Yes 80 100 90 90.62
No 20 0 10 9.375
Market problem
Yes 20 0 0 6.25
No 80 100 100 93.75
lack of training
Yes 100 100 100 100
No 0 0 0 0
Cabbage production opportunities
There are a number of opportunities to develop the production of cabbage in the study area.
Among others the following are the major once according to the assessment results. The
governments of Ethiopia as well as Amhara Region give high emphasis for the production of
cash crops like cabbage by developing various irrigation schemes in various regions including
the study area. The farmers in the study area have some experience in the production of
vegetables including cabbage. It creates diversification in eating habit of the society
(nutrition), local market, income and an employment opportunity is a paramount importance.
Consequently, it offers not only opportunities for greater income to small-scale farmers and
low-income laborers but it is beneficial for providing employment opportunities for women
and the poor.
4.2 Effects of NPS fertilizer rates on growth and yield components of cabbage
The effects different rates of NPS fertilizer on vegetative growth and yield of cabbage are
presented and discussed in this chapter. The effects of NPS fertilizer on vegetative growth of
cabbage are presented under subtitle 4.2.1 while their effect on yield and yield components
cabbage is presented under subtitle 4.2.1. The cost-benefit analysis of the different rates of
NPS fertilizer is presented under subtitle 4.3 below.

37
4.2.1 Growth parameters of head cabbage
Plant height
Plant height is one of important growth parameters of cabbage. It depends on several factors
like genetic makeup, nutrient availability, climate, soil and etc. The analysis variance revealed
that plant height was significantly (p < 0.05) affected by different levels of NPS fertilizer rate
(Appendix Table 2).
The tallest plant height (22.36 cm) was obtained from the treatment T11 received
102.5:115.0:21.18 kg ha-1 of N:P2O5:S whereas the shortest plant height was recorded in T1
(16.84 cm) which was not supplied with NPS fertilizer (Table 4.15).
The results of the study are in agreement with the findings of Hossain (1998), kacjan Marsic
and Osvald (2004) and Pramanik (2007) obtained the maximum plant height of cabbages with
increased nitrogen rates. Moreover in the research results of Moniruzzaman et al. (2006)
increased plant height was obtained from cabbage and broccoli plants treated with 240 kg N,
100 kg P and 80 kg K per hectare. Similarly, Thapa and Prasad (2011) obtained the maximum
plant height (32.57 cm) using the combined application of 120 kg nitrogen and 100 kg
phosphorus ha-1. Similarly, Akand et al. (2015) also obtained the maximum plant height
(36.82 cm) at 60 DAT by the application of 200 kg ha-1 of nitrogen. Hossain et al. (2011) also
obtained significantly maximum plant height (37.5 cm) of cabbage by the application of
nitrogen, phosphorous potassium and sulfur with the rates of 240 kg, 45 kg, 180 kg and 45 kg
per hectare, respectively.
Spread of plant
In head cabbage, a spread of plant indicates growth and development and is directly related to
yield. Successive increase in fertility level progressively increases the spread of plant. The
analysis of variance revealed that plant spread was significantly (P<0.01) influenced by the
different NPS fertilizer rates (Appendix Table 3).
The maximum plant spread (32.51cm) measured at 40 days after transplanting was found from
the treatments T11 (102.5:115:21.18 of N:P2O5:S kg ha-1) fertility level which was statistically
similar with T8 (31.73 cm) and minimum plant spread (18.66 cm) was observed from control
T1 (Table 4.15).
38
The result of this study is agreement with Prasad et al. (2009) reported the increasing levels of
nitrogen and phosphorus increased plant spread (3458.78 cm2). Similarly Rathore (2012)
observed significance difference in plant spread due to different source sulfur level at 40 days
after transplanting. According to Rathore (2012), the maximum spread of cabbage plants
(26.7cm) was recorded with the application of 60 kg ha-1 of sulfur which was similar with
plant spread obtained from application of 30 kg ha-1 of sulfur.
Number of leaves per plant
The analysis of variance revealed that there was significant in different (p < 0.01) effect of
NPS fertilizer rates on the number of cabbage leaves (Appendix Table 4). In cabbage, leaves
play an important role for photosynthesis and the number of leaves per plant is major in head
of Cabbage. Number of leaves per plant is an important parameter considering the highest
performance of Cabbage yield.
However, cabbage plants in T7, T2, T12, T11 and T9 produced relatively high number of
leaves per plant with the mean values of 13.8, 13.7, 13.6, 13.6 and 13.5, respectively (Table
4.15). Generally, treatments with high rates nitrogen in the study resulted relatively high
number of cabbage leaves which is in good agreement with the findings of Moniruzzaman et
al. (2006) who reported that the maximum number of leaves in broccoli was produced when
nitrogen was applied at higher rates. Similarly, Akand et al. (2015) and Shahbazi (2005)
reported that maximum number of leaves in cabbage (14.3) was obtained by application of
200 kg ha-1 of nitrogen and the minimum number of leaves (12.7) was recorded from
treatments where nitrogen was not applied. Similar results were also observed by Shahbazi
(2005). However, Gulser (2005) also reported significantly the highest (17) number of leaves
at the combined application of 200 kg N ha-1 and 15 t ha-1 FYM. Hence, the application of
nitrogen fertilizer stimulated vegetative growth by increasing the number of leaves. Similarly,
Karic et al. (2005) found non-significant increment of leaves in leek and spinach with
increasing of nitrogen fertilizer rates.

39
Table 4.15 Effects of NPS fertilizer rate on Plant height, Plant spread and number of
leaves per plant of head Cabbage at 40 DAT
Treatment
(N:P2O5:S kg ha-1)
PH (cm) SP (cm) NLP
T1 (0: 0: 0) 16.84c 18.660c 10.333d
T2 (82:92: 0) 20.433ba 25.433 b 11.80 dc
T3 (61.5:92:16.95) 19.157bc 26.507ba 12.1333bdc
T4 (61.5: 69: 12.71) 19.23b 28.020 ba 13.4667 bac
T5 (61.5:115:21.18) 19.650b 30.933 ba 12.7333 bc
T6 (82:69:12.71) 21.023 ba 31.793a 13.8333 bac
T7 (82:92:16.95) 20.70ba 28.140 ba 12.7333bc
T8 (82:115:21.18) 21.043ba 31.733a 13.4667 bac
T9 (102.5:69:12.71) 20.767ba 28.273ba 13.3667bac
T10 (102.5:92:16.95) 20.450ba 28.673 ba 14.033ba
T11 (102.5:115:21.18) 22.357a 32.507a 15.30 a
Mean 20.1500 28.24303 13.01818
SE ± 0.734319 1.795301 0.689348
LSD 5% 2.3626 6.2839 2.0612
CV 6.884139 13.06335 9.296395
Sign .difference * ** **
Values in each column of the same letter are not significantly affected at (alpha = 0.05) **=
highly Significance LSD = least significant difference; SE ± = standard error of the means
PH= Plant height, SP = Spread of plant and NLP= Number of leaves per plant
Days to 50% head initiation
The analysis of variance revealed that different levels of NPS had highly significant (P<0.01)
effect on 50% head initiation of cabbage (Appendix Table 5). Relatively early head initiation
was observed in T10 followed by T9 and T11 with the mean values of 53.0, 53.7 and 54.3
days after transplanting, respectively, where the values were statistically similar (p< 0.01)
when compared each other. On the other hand plants which were not supplied (T1) with NPS
fertilizer required relatively longer time to initiate head (71.7 days) (Table 4.16). Generally
plants supplied with high quantity of nitrogen, phosphorous and sulfur started to initiate head
relatively in short period of time. The results are in agreement with the findings of Hossain et
al. (2011) who reported that the earliest head initiation (53 days) was observed on cabbage
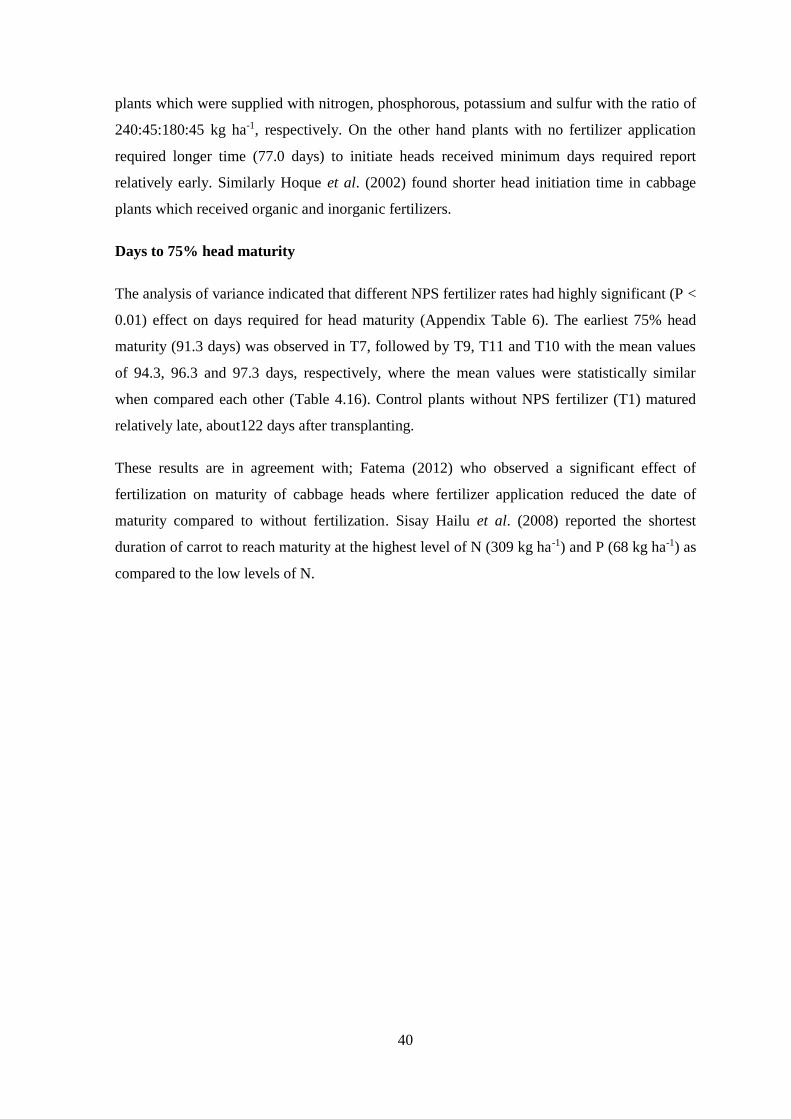
40
plants which were supplied with nitrogen, phosphorous, potassium and sulfur with the ratio of
240:45:180:45 kg ha-1, respectively. On the other hand plants with no fertilizer application
required longer time (77.0 days) to initiate heads received minimum days required report
relatively early. Similarly Hoque et al. (2002) found shorter head initiation time in cabbage
plants which received organic and inorganic fertilizers.
Days to 75% head maturity
The analysis of variance indicated that different NPS fertilizer rates had highly significant (P <
0.01) effect on days required for head maturity (Appendix Table 6). The earliest 75% head
maturity (91.3 days) was observed in T7, followed by T9, T11 and T10 with the mean values
of 94.3, 96.3 and 97.3 days, respectively, where the mean values were statistically similar
when compared each other (Table 4.16). Control plants without NPS fertilizer (T1) matured
relatively late, about122 days after transplanting.
These results are in agreement with; Fatema (2012) who observed a significant effect of
fertilization on maturity of cabbage heads where fertilizer application reduced the date of
maturity compared to without fertilization. Sisay Hailu et al. (2008) reported the shortest
duration of carrot to reach maturity at the highest level of N (309 kg ha-1) and P (68 kg ha-1) as
compared to the low levels of N.
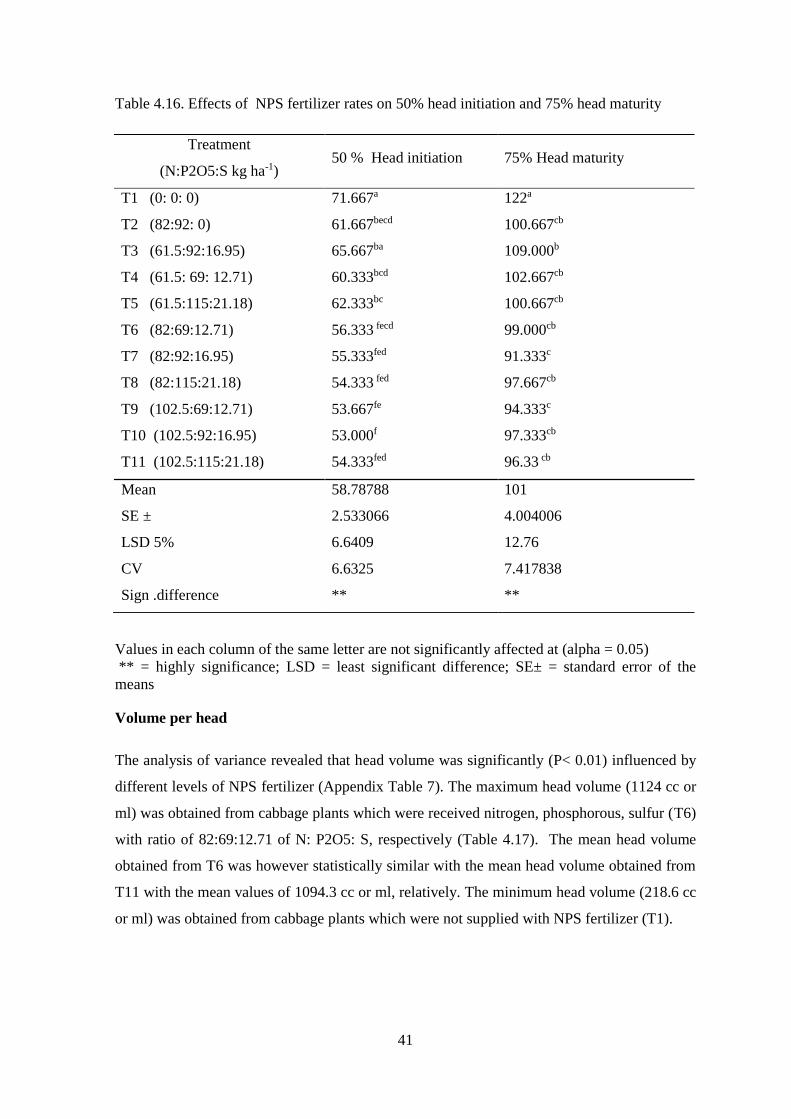
41
Table 4.16. Effects of NPS fertilizer rates on 50% head initiation and 75% head maturity
Values in each column of the same letter are not significantly affected at (alpha = 0.05)
** = highly significance; LSD = least significant difference; SE± = standard error of the
means
Volume per head
The analysis of variance revealed that head volume was significantly (P< 0.01) influenced by
different levels of NPS fertilizer (Appendix Table 7). The maximum head volume (1124 cc or
ml) was obtained from cabbage plants which were received nitrogen, phosphorous, sulfur (T6)
with ratio of 82:69:12.71 of N: P2O5: S, respectively (Table 4.17). The mean head volume
obtained from T6 was however statistically similar with the mean head volume obtained from
T11 with the mean values of 1094.3 cc or ml, relatively. The minimum head volume (218.6 cc
or ml) was obtained from cabbage plants which were not supplied with NPS fertilizer (T1).
Treatment
(N:P2O5:S kg ha-1) 50 % Head initiation 75% Head maturity
T1 (0: 0: 0) 71.667a 122a
T2 (82:92: 0) 61.667becd 100.667cb
T3 (61.5:92:16.95) 65.667ba 109.000b
T4 (61.5: 69: 12.71) 60.333bcd 102.667cb
T5 (61.5:115:21.18) 62.333bc 100.667cb
T6 (82:69:12.71) 56.333 fecd 99.000cb
T7 (82:92:16.95) 55.333fed 91.333c
T8 (82:115:21.18) 54.333 fed 97.667cb
T9 (102.5:69:12.71) 53.667fe 94.333c
T10 (102.5:92:16.95) 53.000f 97.333cb
T11 (102.5:115:21.18) 54.333fed 96.33 cb
Mean 58.78788 101
SE ± 2.533066 4.004006
LSD 5% 6.6409 12.76
CV 6.6325 7.417838
Sign .difference ** **
42
Head diameter
Head diameter is an important yield component of cabbage. The analysis of variance revealed
that head diameter was significantly (P< 0.01) influenced by different levels of NPS fertilizer
(Appendix Table 8). The maximum average head diameter (13.88 cm) was obtained in T11
who received 102.5:115:21.18 of N:P2O5:S kg ha-1. The average minimum head diameter
(6.99 cm) was recorded in control plants, without NPS fertilize (Table 4.17). The increase in
head diameter in this study is obviously associated with the increase in nitrogen, phosphorous
as well as sulfur which is in agreement with the findings of Hossain et al. (2011) who reported
the maximum average head diameter (17.2 cm) was found with the application of
240:45:180:45 kg ha-1 of N, P, K and S. The minimum head diameter (8.0 cm) was recorded
from control plants, without fertilizer application. Similarly, Din et al., (2007) reported
significant high head diameter was obtained from NPK fertilizer with the level of 120-90-60
kg ha-1.Similarly, Thapa and Prasad (2011) obtained the maximum head diameter (48.98 cm)
by the application 100 kg nitrogen and 100 kg phosphorus ha-1. Moreover, Akand et al., (2015)
reported maximum head diameter (12.43 cm) was observed in nitrogen fertilizer with the rate
of 200 kg ha-1 and the minimum (10.73 cm) was observed in plants without nitrogen fertilizer.
Head weight
Weight of head is an important yield component of head cabbage. The analysis of variance
revealed that head weight of cabbage was significantly (P < 0.01) affected by different rates of
NPS fertilizer (Appendix Table 9). The highest average weight of head (1.08 kg) was obtained
from plants in T10 who received 102.5:92:16.95 N:P2O5:S kg ha-1, followed by the heads
obtained from T11 (1.077 kg) which were statistically similar compared with each other. The
lowest average head weight (0.23 kg) was recorded from control plants (Table 4.17). Similar
results are observed by Prasad et al. (2009) who reported that the combined application of 120
kg and 100 kg ha-1 of nitrogen and phosphorous, respectively, gave the maximum plant height
(32.6 cm), leaf area (972.43 cm2) and head weight (1.63 kg) of cabbages. The application of
NPK at the rate of 470:222:371 kg ha-1, respectively, increased different yield parameters of
cabbage in Poonch Valley.
The combined application of 120 kg nitrogen and 100 kg phosphorus ha-1 recorded maximum
plant height (32.57 cm), leaf area (972.43 cm) and total head weight (1.63 kg).
43
Table 4.17. Effects of NPS fertilizer rate on Diameter of Head, Volume of Head and Head
Weight
Treatment
(N:P2O5:S kg ha-1)
Head diameter
(cm)
Head volume
(cm)
Head weight
(kg)
T1 (0: 0: 0) 6.99c 218.6c 0.23333f
T2 (82:92: 0) 12.8133ba 918.3ba 0.88000bdc
T3 (61.5:92:16.95) 11.35 b 632.6b 0.67333e
T4 (61.5: 69: 12.71) 12.7033ba 945.1a 0.78667 de
T5 (61.5:115:21.18) 12.4ba 991.2a 0.84000 dec
T6 (82:69:12.71) 13.0633a 1124.0a 1.00667bac
T7 (82:92:16.95) 13.1333a 992.7a 0.93333bdac
T8 (82:115:21.18) 13.2533a 981.7a 0.95000bdac
T9 (102.5:69:12.71) 13.21a 982.0a 0.95333bdac
T10 (102.5:92:16.95) 13.02a 983.9 a 1.08000a
T11 (102.5:115:21.18) 13.8767 c 1094.3a 1.07667ba
Mean 12.34667 896.7494 0.855758
SE ± 0.545172 108.1667 0.059699
LSD 5% 1.5929 301.37 0.1994
CV 7.575127 19.73184 13.68001
Sign .difference ** ** **
Values in each column of the same letter are not significantly affected at (alpha = 0.05) **=
highly significance; LSD = least significant difference; SE± = Standard error of the means
Yield of cabbage
Cabbage plants supplied with 102.5:115:21.18 kg ha-1 of N:P2O5:S (T11) produced
significantly (p < 0.01) the highest marketable yield (42.78 t ha-1) (Appendix Table 10).
Plants in T10, T6 and T9 produced the second highest marketable yield of cabbage with the
mean values of 40.7, 36.35 and 35.85 t ha-1, respectively, which were statistically similar (p <
0.01) when compared each other, On the other hand, the lowest marketable yield (2.34 t ha-1)
was obtained in control plants (T1), where no NPS fertilizer was applied (Table 4.18).
Cabbage plants supplied with no NPS fertilizer was applied (T1) produced significantly (p <
0.01) the highest unmarketable yield (5.41 t ha-1) (Appendix Table 11). The highest
unmarketable yield of cabbage was obtained from plants in T1 (5.41 t ha-1) followed by T9
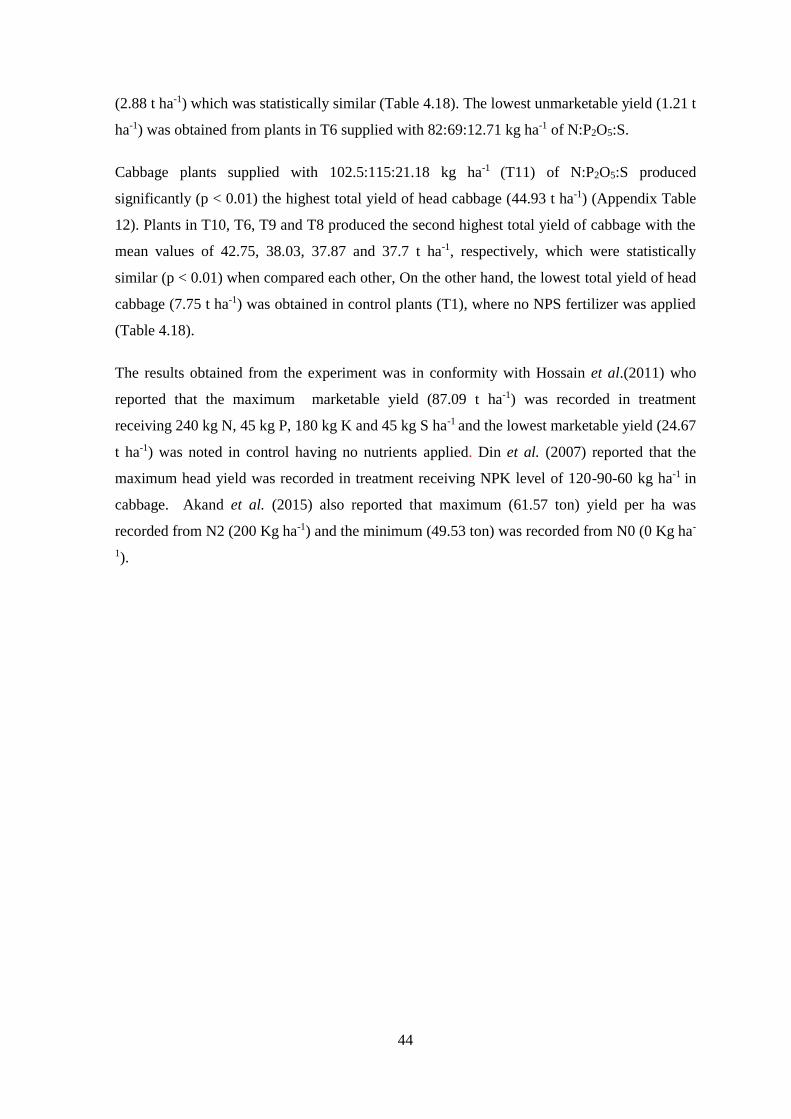
44
(2.88 t ha-1) which was statistically similar (Table 4.18). The lowest unmarketable yield (1.21 t
ha-1) was obtained from plants in T6 supplied with 82:69:12.71 kg ha-1 of N:P2O5:S.
Cabbage plants supplied with 102.5:115:21.18 kg ha-1 (T11) of N:P2O5:S produced
significantly (p < 0.01) the highest total yield of head cabbage (44.93 t ha-1) (Appendix Table
12). Plants in T10, T6, T9 and T8 produced the second highest total yield of cabbage with the
mean values of 42.75, 38.03, 37.87 and 37.7 t ha-1, respectively, which were statistically
similar (p < 0.01) when compared each other, On the other hand, the lowest total yield of head
cabbage (7.75 t ha-1) was obtained in control plants (T1), where no NPS fertilizer was applied
(Table 4.18).
The results obtained from the experiment was in conformity with Hossain et al.(2011) who
reported that the maximum marketable yield (87.09 t ha-1) was recorded in treatment
receiving 240 kg N, 45 kg P, 180 kg K and 45 kg S ha-1 and the lowest marketable yield (24.67
t ha-1) was noted in control having no nutrients applied. Din et al. (2007) reported that the
maximum head yield was recorded in treatment receiving NPK level of 120-90-60 kg ha-1 in
cabbage. Akand et al. (2015) also reported that maximum (61.57 ton) yield per ha was
recorded from N2 (200 Kg ha-1) and the minimum (49.53 ton) was recorded from N0 (0 Kg ha-
1).
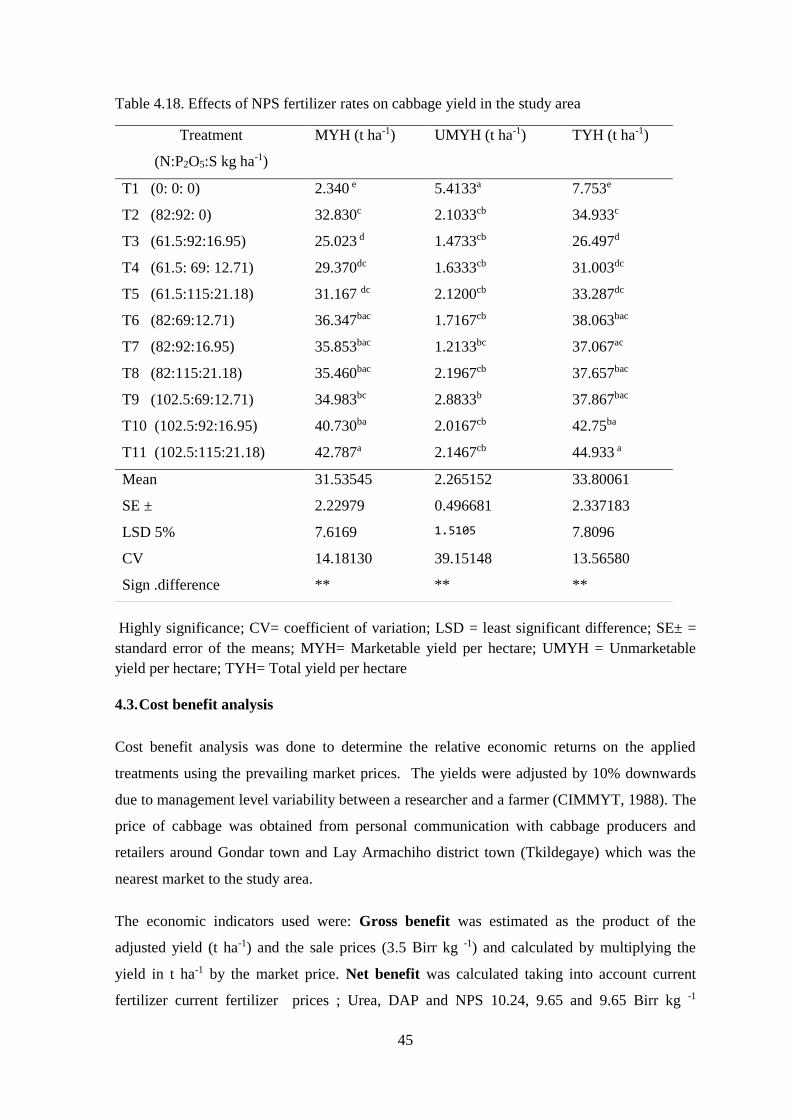
45
Table 4.18. Effects of NPS fertilizer rates on cabbage yield in the study area
Highly significance; CV= coefficient of variation; LSD = least significant difference; SE± =
standard error of the means; MYH= Marketable yield per hectare; UMYH = Unmarketable
yield per hectare; TYH= Total yield per hectare
4.3. Cost benefit analysis
Cost benefit analysis was done to determine the relative economic returns on the applied
treatments using the prevailing market prices. The yields were adjusted by 10% downwards
due to management level variability between a researcher and a farmer (CIMMYT, 1988). The
price of cabbage was obtained from personal communication with cabbage producers and
retailers around Gondar town and Lay Armachiho district town (Tkildegaye) which was the
nearest market to the study area.
The economic indicators used were: Gross benefit was estimated as the product of the
adjusted yield (t ha-1) and the sale prices (3.5 Birr kg -1) and calculated by multiplying the
yield in t ha-1 by the market price. Net benefit was calculated taking into account current
fertilizer current fertilizer prices ; Urea, DAP and NPS 10.24, 9.65 and 9.65 Birr kg -1
Treatment
(N:P2O5:S kg ha-1)
MYH (t ha-1) UMYH (t ha-1) TYH (t ha-1)
T1 (0: 0: 0) 2.340 e 5.4133a 7.753e
T2 (82:92: 0) 32.830c 2.1033cb 34.933c
T3 (61.5:92:16.95) 25.023 d 1.4733cb 26.497d
T4 (61.5: 69: 12.71) 29.370dc 1.6333cb 31.003dc
T5 (61.5:115:21.18) 31.167 dc 2.1200cb 33.287dc
T6 (82:69:12.71) 36.347bac 1.7167cb 38.063bac
T7 (82:92:16.95) 35.853bac 1.2133bc 37.067ac
T8 (82:115:21.18) 35.460bac 2.1967cb 37.657bac
T9 (102.5:69:12.71) 34.983bc 2.8833b 37.867bac
T10 (102.5:92:16.95) 40.730ba 2.0167cb 42.75ba
T11 (102.5:115:21.18) 42.787a 2.1467cb 44.933 a
Mean 31.53545 2.265152 33.80061
SE ± 2.22979 0.496681 2.337183
LSD 5% 7.6169 1.5105 7.8096
CV 14.18130 39.15148 13.56580
Sign .difference ** ** **

46
respectively, field price of cabbage was 3.50 Birr kg -1, cost of labor per day in the area is 45
Birr and the transportation cost for each 100 kg of fertilizer was 10 Birr. And also net benefit
was calculated by subtracting the total cost of production from the gross benefit. Marginal
analysis compares the net benefits with the total variable cost. The total variable cost was
determined for each treatment and was compared with the net benefit. Here also dominant
treatments were analyzed and arranged in terms of increasing variable costs. The
corresponding net benefits were also indicated. A treatment is dominant when it has a higher
cost but a lower net benefit than any preceding treatment. Finally, marginal rate of returns
were calculated (MRR), where the percentage change in benefit over change in total variable
cost in moving from a lower cost treatment to a higher one (Table 4.19). All the treatments
were arranged from the highest to the lowest in terms of profitability. This was achieved by
dividing the total variable cost by the net benefit multiplied by 100.
MRR (%) = x100
Only the adjusted marketable yields were considered for sale. The marketable yields, sales,
costs incurred due to use of the N:P2O5:S fertilizer, labor cost and the net benefit relative to the
benefits obtained from untreated control plots were calculated.
The marginal rate of returns, which determines the acceptability of any treatment showed that
treatments (T6) that received 82:69:12.71 kg ha-1 of N: P2O5: S gave the highest marginal rate
of return of 11156 % indicating that for every 1.00 birr invested for 82:69:12.71 kg ha-1 of
N:P2O5:S input and its application in the field, farmers can obtain an additional 111.56 Birr.
The second most promising result with marginal rate of returns 4748 % with net benefit of
124594.08 Birr ha-1 treatment that received 102.5:92:16.95 of kg ha-1 N: P2O5: S (Table 4.20).
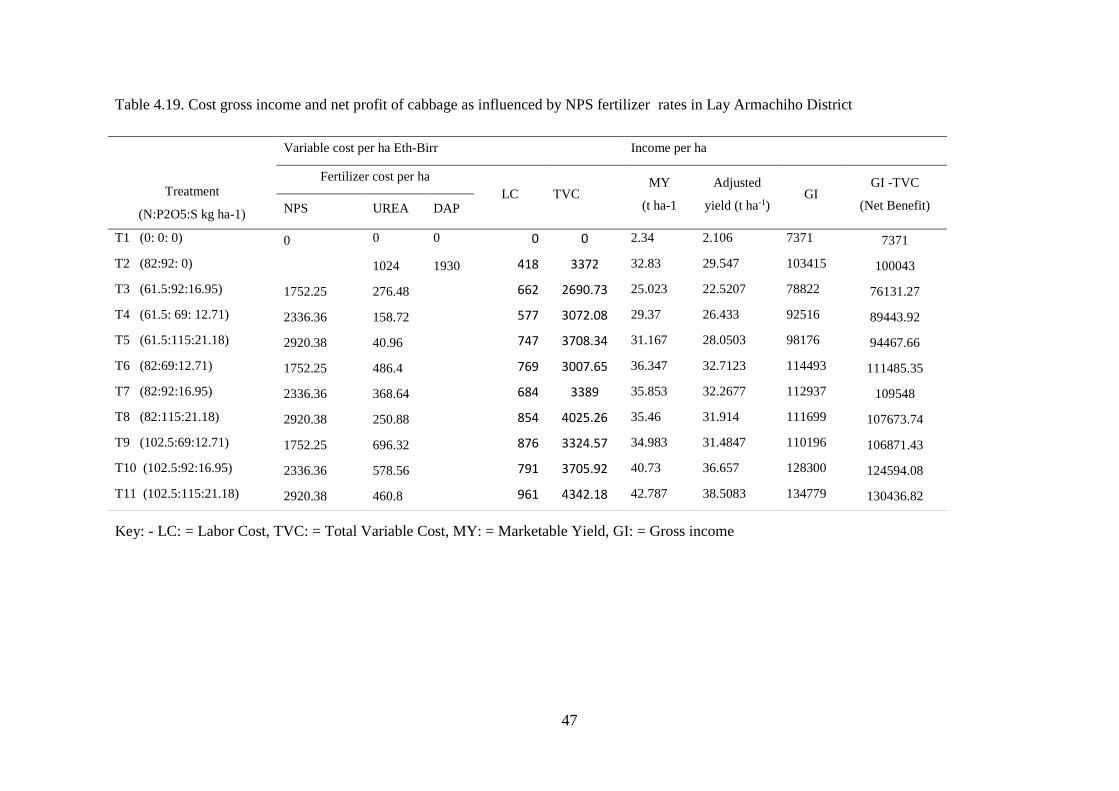
47
Table 4.19. Cost gross income and net profit of cabbage as influenced by NPS fertilizer rates in Lay Armachiho District
Key: - LC: = Labor Cost, TVC: = Total Variable Cost, MY: = Marketable Yield, GI: = Gross income
Treatment
(N:P2O5:S kg ha-1)
Variable cost per ha Eth-Birr Income per ha
Fertilizer cost per ha
LC TVC MY
(t ha-1
Adjusted
yield (t ha-1) GI
GI -TVC
(Net Benefit) NPS UREA DAP
T1 (0: 0: 0) 0 0 0 0 0 2.34 2.106 7371 7371
T2 (82:92: 0) 1024 1930 418 3372 32.83 29.547 103415 100043
T3 (61.5:92:16.95) 1752.25 276.48 662 2690.73 25.023 22.5207 78822 76131.27
T4 (61.5: 69: 12.71) 2336.36 158.72 577 3072.08 29.37 26.433 92516 89443.92
T5 (61.5:115:21.18) 2920.38 40.96 747 3708.34 31.167 28.0503 98176 94467.66
T6 (82:69:12.71) 1752.25 486.4 769 3007.65 36.347 32.7123 114493 111485.35
T7 (82:92:16.95) 2336.36 368.64 684 3389 35.853 32.2677 112937 109548
T8 (82:115:21.18) 2920.38 250.88 854 4025.26 35.46 31.914 111699 107673.74
T9 (102.5:69:12.71) 1752.25 696.32 876 3324.57 34.983 31.4847 110196 106871.43
T10 (102.5:92:16.95) 2336.36 578.56 791 3705.92 40.73 36.657 128300 124594.08
T11 (102.5:115:21.18) 2920.38 460.8 961 4342.18 42.787 38.5083 134779 130436.82
48
Table 4.20. Marginal rate of return (MRR) of NPS fertilizer rates in Lay Armachiho District
Treatment
(N:P2O5:S kg ha-1) TVC
GI -TVC
(Net Benefit) MRR % Rank
T1 (0: 0: 0) 0 7371
T3 (61.5:92:16.95) 2690.73 76131.27 2555.00 4
T6 (82:69:12.71) 3007.65 111485.35 11156.00 1
T10 (102.5:92:16.95) 3705.92 124594.08 4748.00 2
T11 (102.5:115:21.18) 4342.18 130436.82 7183.00 3
Key: - MRR = Marginal Rate of Returns, TVC: = Total Variable Cost
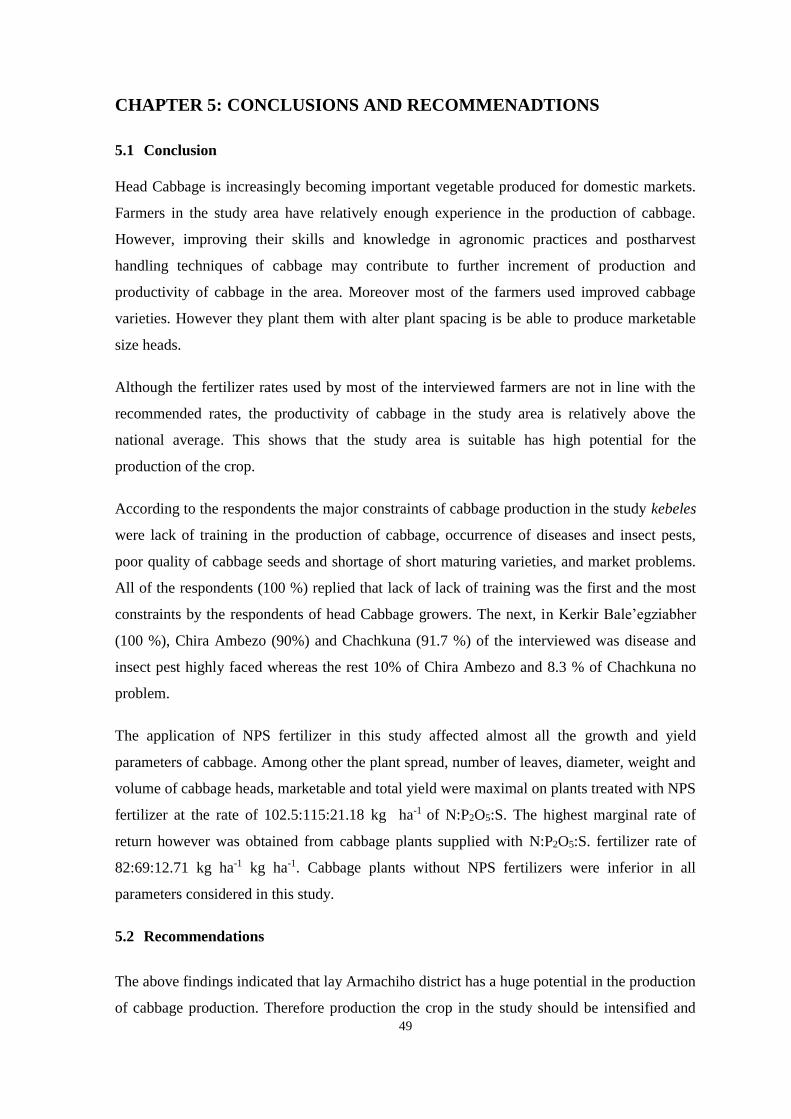
49
CHAPTER 5: CONCLUSIONS AND RECOMMENADTIONS
5.1 Conclusion
Head Cabbage is increasingly becoming important vegetable produced for domestic markets.
Farmers in the study area have relatively enough experience in the production of cabbage.
However, improving their skills and knowledge in agronomic practices and postharvest
handling techniques of cabbage may contribute to further increment of production and
productivity of cabbage in the area. Moreover most of the farmers used improved cabbage
varieties. However they plant them with alter plant spacing is be able to produce marketable
size heads.
Although the fertilizer rates used by most of the interviewed farmers are not in line with the
recommended rates, the productivity of cabbage in the study area is relatively above the
national average. This shows that the study area is suitable has high potential for the
production of the crop.
According to the respondents the major constraints of cabbage production in the study kebeles
were lack of training in the production of cabbage, occurrence of diseases and insect pests,
poor quality of cabbage seeds and shortage of short maturing varieties, and market problems.
All of the respondents (100 %) replied that lack of lack of training was the first and the most
constraints by the respondents of head Cabbage growers. The next, in Kerkir Bale’egziabher
(100 %), Chira Ambezo (90%) and Chachkuna (91.7 %) of the interviewed was disease and
insect pest highly faced whereas the rest 10% of Chira Ambezo and 8.3 % of Chachkuna no
problem.
The application of NPS fertilizer in this study affected almost all the growth and yield
parameters of cabbage. Among other the plant spread, number of leaves, diameter, weight and
volume of cabbage heads, marketable and total yield were maximal on plants treated with NPS
fertilizer at the rate of 102.5:115:21.18 kg ha-1 of N:P2O5:S. The highest marginal rate of
return however was obtained from cabbage plants supplied with N:P2O5:S. fertilizer rate of
82:69:12.71 kg ha-1 kg ha-1. Cabbage plants without NPS fertilizers were inferior in all
parameters considered in this study.
5.2 Recommendations
The above findings indicated that lay Armachiho district has a huge potential in the production
of cabbage production. Therefore production the crop in the study should be intensified and
50
diversified. However, cabbage producers in the area do not implement the recommended
agronomic practices such as fertilizer rates, plant spacing and required water quantity in the
production of cabbage which are necessary to increase the productivity of cabbage. Therefore
continuous training and extension services should be given by the respective stakeholders such
as Agricultural Offices, Universities and concerned Non-Governmental Organizations.
Moreover, the supply of inputs such as seeds of short maturing cabbage varieties and
pesticides should be improved. For this purpose it is necessary to support the private and
cooperative input suppliers and create a strong institutional linkage between input suppliers
and farmers.
Furthermore, the yield of cabbage at Lay Armachiho district can be increased by application
of N:P2O5:S fertilizer at the rate of 102: 115:21.18kg ha-1 whereas the highest marginal rate of
return however was obtained from cabbage plants supplied with NPS fertilizer rate of
82:69:12.71 kg ha-1 of N:P2O5:S. To develop forceful recommendation however, it is advised
to repeat the experiment on other kebeles of the district using different varieties of cabbage.
51
REFERENCES
Acedo AL Jr. 2010. Postharvest technology for leafy vegetables. AVRDC-ADB Postharvest
Projects RETA 6208/6376, AVRDC Publication No. 10-733, AVRDC - The World
Vegetable Center, Taiwan, 67pp.
Agricultural research council of South Africa (ARCoSA). 2013. Production guideline for
winter vegetables. Published by the agricultural research council (ARC) and vegetable
and ornamental plant institute (VOPI) private Bagx 293. Pretoria, South Africa Pp15
Akand H. E., Hasanuzzaman Md, Khairul Mazed M, Ashraful Md, Islam Pulok, Jannatul
Ferdous Moonmoon and Subrato Gope Partho. 2015. Influence of different dose of
nitrogen on the growth and yield of Cabbage (Brassica oleracea var. capitata l.)
International Journal of Multidisciplinary Research and Development 2(2): 11-14
Al-Said, F. A, Ashfaq, M., Al-Barhi, M., Hanjra, M. A. and Khan, I. A. 2012. Water
productivity of vegetables under modern irrigation methods in oman. Irrig. and Drain.,
61: 477–489. doi:10.1002/ird.1644
Amhara National Regional State Bureau of Agriculture (ANRSBoA). 2014. Irrigation crops
development package training manual (in Amharic) Bahir Dar, Ethiopia.
Amhara National Regional State Bureau of Finance and Economic Development. 2009.
Annual bullet (in Amharic). Bahir Dar, Ethiopia.
Amhara Regional Agricultural Research Institute (ARARI). 2005. Horticultural crops
production training manual (in Amharic) for Developmental Agents volume 3.
Amhara agricultural research institute. July, 2005 Bahir Dar, Ethiopia
Amsal Tarekegne, Tanner, D.G., Amanuel Gorfu, Tilahun Geleto and Zewdu Yilma. 1997a.
The effect of several crop management factors on bread wheat yields in the Ethiopian
highlands. African CropScience Journal 5: 161-174.
Anonymous. 1991. Effect of chemical fertilizer and organic manure on the yield of Cabbage.
Annual Report, BARI, Joydebpur, Gazipur. pp. 254-287.
Anonymous. 2011. Health Care. Accessed on http://www.health careclinic.org/vegetables
Ashworth. 2002. Seed to Seed: Seed Saving and Growing Techniques for Vegetable
Gardeners. New York: Seed Savers Exchange In, Pp: 54-68.
Ayuso M. A; Pascal J. A; Garcia C. and Hernandez T. 1996. Evaluation of urban wastes for
urban agricultural use. Soil science and plant nutrition 142:105-111.
Baligar V.c. and Bennett. O.L. 1986. Outlook on fertilizer use efficiency in the tropics.
Fertilizer Research 10:83-96.
Baloch A. W., Soomro A. M., Javed, M. A., Ahmed, M., Bughio, H. R., Bughio, M. S and
Mastoi, N. N. (2002). Optimum Plant Density for High Yield in Rice (Oryza sativa
L.). Asian Journal of Plant Sciences 1: 25-27.
52
Bangladesh Bureau of Statistics (BBS). 2009. Year Book of Agriculture. Statistics of
Bangladesh. Bangladesh Bureau of Statistics, Ministry or Planning Govt. of the
Peoples Republic of' Bangladesh, Dhaka.
Beecher C. 1994. Cancer preventive properties of varieties of Brassica oleracea: a review. Am
J. Clin. Nutr. 1994; 59 (suppl): 1166S – 70S 1994.
Belay A.; Classens, A. S.; Wehner, F. C. and De Beer, J. M. (2001). Influence of residual
manure on selected nutrient elements and microbial composition of soil under long
term crop rotation. South African Journal of Plant and Soil 18:1-6.
Berard L.S. 1990. Effects of nitrogen fertilization on stored Cabbage. Development of
physiological disorders on tolerant and susceptible cultivars
Bessembinder J., Leffelaar P., Dhindwal A. and Ponsioen T., 2005. Which crop and which
drop, and the scope for improvement of water productivity: Agricultural water
management, v. 73, no. 2, p. 113-130.
Bok I, Madisa M, Machacha D, Moamogwe M, More K. (Revised). 2006. Manual for
Vegetable Production in Botswana. Department of Agriculture Research, Gaborone,
Botswana. Pp57
Centro International de Mejoramiento de Maiz Y Trigo (CIMMYT). 1988. From Agronomic
Data to Farmer Recommendations: An Economics Training Manual. Completely
revised edition. Mexico. Pp 75
Chadha B. 2006. Hand Book of Horticulture. Fifth Reprint Indian Council of Agricultural
Research New Delhi published by kuldeep Sharma, New Delhi (Infdia).
Chatterjee R, Bandhopadhyay S. and Jana J. C. 2014. Organic Amendments Influencing
Growth, Head Yield and Nitrogen Use Efficiency in Cabbage (Brassica Oleracea Var.
Capitata L.) American International Journal of Research in Formal, Applied & Natural
Sciences
Chauhan O. 1986. Vegetable production in India. Ram Prasad and sons, India, 1986, Pp 131-
140.
Costa F. C. Hernadez G. C. and Polo A. (1991). Residuos organicos urbanicos in manejoy
utilizacion CSIC Munica p181.
Csizinszky AA. and Schuster DJ. 1985. Response of cabbage to insecticides schedule, plant
spacing, and fertilizer rate. Journal of American society for Horticultural Science 110,
888- 893
Dhemre J.K. And Desale S.B. 2009. Impact of front line demonstration on production
technology of cabbage var. Wonder ball in dhule district of Maharashtra. HIND
AGRICULTURAL RESEARCH AND TRAINING INSTITUTE Agriculture Update |
February & May 2010 | Vol. 5 | Issue 1 & 2| 243-244|
Din M., Qasim M. and alam M.. 2007. Effect of different levels of N, P and k on the growth
and yield of cabbage. J. Agril. Res. 45(2):171-176.
53
Dragland, S. 1976. Nitrogen requirement for Cabbage grown with a high soil moisture status.
Land Bruket, 27(3): 375-391. [Cited from Hort. Abst., 47 (3): 2551].
Edossa Etissa,Nigussie Dechassa, Tena Alamirew, Yibekal Alemayehu and Lemma
Desalegne. 2014. Irrigation Water Management Practices in Smallholder Vegetable
Crops Production: The Case of the Central Rift Valley of Ethiopia. Science,
Technology and Arts Research Journal. A Peer Reviewed Official International
Journal of Wollega University, Ethiopia
Egyir, S. Irene, Sarpong, D. B. and Obeng-Ofori, D. 2008. Final report on harvest and
postharvest baseline study. University of Ghana Legon, Ghana, Department of
Agricultural Economics and Agribusiness.
El-Shakweer M. H. A, El-Sayad E. A. and Ewees M. S. 1998. Soil and Plant analysis as a
guide for interpretation of the improvement efficiency of organic conditioners added to
different soils in Egypt. Communication in soil science and plant analysis 29:2067-
2088.
Ethiopian Central Statistical Agency (CSA). 2007/2008. The Federal Democratic Republic of
Ethiopia Central Statistical Agency Agricultural sample survey Volume I, report on
area and production of major crops, Addis Ababa, Ethiopia.
Ethiopian Central Statistical Agency (CSA). 2012/2013. The Federal Democratic Republic of
Ethiopia Central Statistical Agency Agricultural sample survey Volume I and V,
report on area and production of major crops, Addis Ababa, Ethiopia
Ethiopian Central Statistical Agency (CSA). 2013. Population Projection of Ethiopia for All
Regions at Wereda Level from 2014 – 2017. Federal Democratic Republic of Ethiopia
Central Statistical Agency. August 2013, Addis Ababa, Ethiopia.
Ethiopian Central Statistical Agency (CSA). 2013/2014. The Federal Democratic Republic of
Ethiopia Central Statistical Agency Agricultural sample survey Volume I and V,
report on area and production of major crops, Addis Ababa, Ethiopia.
Farooque A. M. and Mondal F. 1987. Effect of spacing and levels of nitrogen on growth and
yield of cabbage. Bangladesh Hort., 15(2):1-6.
Fatema T. Z. 2012. Effect of different levels of nitrogen, pinching and age of seedlings on
growth and yield of Cabbage. MSc Thesis, Bangladesh Agricultural University
Mymensingh, 39pp.
Fereres C., Gutierrez P., Del Estal, and Castanera P. 1988. Impact of the English grain aphid,
sitobion avenae (f.) (homoptera: Aphididae), on the yield of wheat plants subjected to
water deficits. Environmental Entomology, 17(3):596–602.
Food and Agricultural Statistics of the United Nations (FAO). 1992. Irrigation water
management training manual no 7 canals FAO, Rome ,October 1992 7- 12 pp
Food and Agricultural Statistics of the United Nations (FAO). 2009. Food and Agricultural
Organization Statistics Quarterly Bulletin of Statistics, 46, 160 -165.
Food and Agriculture Organization of the United Nations (FAO). 1988. Traditional food
plants. Food and Agricultural Organizations of the United Nations, Rome, Italy.

54
Food and Agriculture Organization of the United Nations (FAO). 2014. The Food and
Agriculture Organization database (FAOSTAT). http://faostat3.fao.org/home/E
Food and Agriculture Organization of the United Nations (FAO). 2000. Statistical database.
Food and Agricultural Organization of the United Nations, Rome, Italy.
Fuchs W.; Rauch, K and Wiche H. J. 1970. Effect of organic fertilizer and organo mineral
fertilizing on development and yield of cereals. Abrecht- Thaer arch 14: 359-366
Gashawbeza Ayalew and Ogol C. 2006. Occurrence of the Diamondback Moth (Plutella
xylostella L.) and it’s Parasitoids in Ethiopia: Influence of Geographical Region and
Agronomic Traits. J. of Appl. Entomol., P 343-347
Gay L. R. 1987. Educational Research: Competencies for Analysis and Application, 3rd ed.,
(Columbus, Ohio: Merrill Publishing Company, 1987), 101.
Gomez, K. A. and A. A. Gomez. 1984. Statistical Procedure for Agricultural Research (2nd
ed.), A Wiley Inter Science Publication, John Wiley and Sons, New York. 680p
Grubben G.J.H., Denton O.A, Messiaen C.M and Schippers R.R. 2004. Plant resource of
Tropical Africa and vegetables. PROTA foundation, Wageningen, Netherlands /
Backlmys Publishers, Leiden, Netherlands / CTA Wageningen, Netherlands. 668 pp.
Gulser F. 2005. Effect of ammonium sulphate and urea on NO3- and NO2- accumulation
nutrient contents and yield criteria in spinach. Scientia Horticulturae, 106, 330-340.
Hazelton P. and Murphy B. 2007. Interpreting soil test results: What do all the numbers
mean? 2nd Edition. CSIRO Publishing. 152pp.
Hemy C. 1984. Growing vegetables in South Africa. Macmillan, South Africa (Publishers)
(Pty) Ltd, Johannesburg, South Africa.
Hoque, M.O., A.M. Farooque, M.S. Hoque, M.A. Salam and M.H. Rahman. 2002. Effect of
combined use of manure and fertilizer on the yield of main and ratoon crop of
cabbage. Bangladesh J. Agril Res .27(4): 649- 655
Hossain ATZ. 1998. Effect of different planting time, spacing and nitrogen on growth and
yield of cabbage. Ann Agrill Res 1998; 14(2):1-4.
Hossain Md. Ashraful Haque, Abuyusuf M. Riad M.M. and Iqbal Hussain A.S.M. 2011.
Response of Cabbage to Different Levels of Fertilizer Application in Salna Silty Clay
Loam Soil. Bangladesh research publications journal. ISSN: 1998-2003, Volume: 6,
Issue: 2, Page: 155-166, November - December, 2011
Indian Horticulture Database (IHD). 2014. Indian Horticulture Database 2014. National
Horticulture Board, Ministry of Agriculture, Government of India 85, Institutional
Area, Sector-18, Gurgaon-122 015 INDIA
Ipimoroti R. R.; Daniel M. A. and Obatolu C. R. 2002. Effect of organic mineral fertilizer on
tea growth at Kusuku Mabila Plateau Nigeria. Moor Journal of Agric.Research 3: 180-
183.
55
Jensen B. 2004. The healing power of fruits and vegetables. Global paperback edition
published by global vision publishing house 19A/E, G.T.B. Enclave, Delhi-110093
(INDIA) Pp 189
kacjan Marsic, N.and J.Osvald. 2004. the effect of fertigation on yield and quality of four
white cabbage (Brassica Oleacea. capitata L.) cultivars Acta agriculture
slovenica.83(1): 23- 29.
Kahsay Berhe. 2013. Diagnosis and intervention plans for North Gonder zone, Amhara
Region. Livestock and irrigation value chains for Ethiopian smallholders
(Unpublished).
Kang B. T. and Juo A. S. R. 1980. Management of low activity clay soils in tropical Africa
for food crops production pp129-133 In: Terry ER, KA Oduro and S Caveness (eds.)
Tropical Roots crops. Research strategies for the 1980s.Ottawa, Ontario IDRC.
Karic, L., Vukasinovic, S. & Znidarcic, D. 2005. Response of leek (Allium porrum L.) to
different levels of nitrogen dose under agro-climatic conditions of Bosnia and
Herzegovina. Acta Agric. Slovenica, 85, 219-226
Khadir G.A, Marazat S.K. and Sadoun S.A. 1989. Effect of different levels of urea fertilizers
and plant spacing on growth and yield of Cabbage. Dirasat , 16(9): 88-105.
Khokhar N.S, Singh R.P. and Parshad M. 1970. Effect of different levels of nitrogen,
phosphorus, potassium and FYM on the yield of Cabbage. Indian J Agron., 15: 9-12.
(Cited from Hort. Abstr. 41(3): 6433, 1971).
Kopsell D A, Kopsell D E. and Lefsrud M G. 2004. Variation in lutein, ß-carotene and
chlorophyll concentrations among leafy Brassica oleracea cultigens and seasons.
Hort Science 39 (2): 361 – 4.
Locascio, S.J., Wiltbank, W.J., Gull, D.D. and Maynard, D.N. 1984. Fruit and vegetable
quality as affected by nitrogen nutrition, p. 617-26. In: R.D. Hauck (ed.). Nitrogen in
crop production. Amer. Soc. Agron., Madison, Wisconsin.
Malik N. M. 2009. Horticulture. Biotech Books Delhi, India– 110035 Pp 515
Manchalia, S., Murthy, K.N.C. and Patil, B.S. 2011. Crucial facts about health benefits of
popular cruciferous vegetables journal of functional foods 4: 94 –106
Mateljan, G. 2007. The world’s healthiest food. Nutrient in cabbage, shredded, boiled. George
Mateljan Foundation, Chicago.
Melkamu Alemayehu, Fentahun Tessafa, Solomon Bizuayehu, Belayneh Ayele. 2015. Amhara
region horticulture development strategy (ARHDS) (2015-2019). Prepared by
College of Agriculture and Environmental Sciences Bahir Dar University. Bahir Dar,
Ethiopia.
Mengel, K. and Kirkby E. A. 1996. Principles of Plant Nutrition. Panimo Publishing
Corporation, New Delhi, India.
56
Ministry of Agriculture Natural Resource Sector (MANRS). 2011. Guideline on Irrigation
Agronomy. Published by Natural Resources Management Directorate, Natural
Resource Sector and the Ministry of Agriculture, Addis Ababa, Ethiopia
Mloza-Banda H. 2006. Experiences with micro irrigation technologies and practices: Malawi.
Report written for IWMI. IWMI (International Water Management Institute), Pretoria,
South Africa.
Moamogwe M. 2005. Adaptation Trial of Introduced Cabbage Cultivars. ARP Training
Reports (1995-1997) AVRDC-AFRICA Regional Program, Arusha, Tanzania. Pp: 27-
29.
Molla Tefera. 2009. Determination of the Levels of Essential and Non - Essential Metals in
Commercially Available Ethiopian Red Pepper (capsicum annuum). MSc Thesis,
Addis Ababa University, Addis Ababa, Ethiopia.
Moniruzzaman M.S, Rahman M.M. and Islam M.R. 2006. Effects of NPK on growth and
yield of broccoli in southeast hilly areas of Bangladesh. Bangladesh journal of
agriculture. 31(1 & 2: 19-25.
Morrison JIL, Baker NR, Mullineaux PM, Davies WJ.2007. improving water use in crop
production. DOI:10.1098/rstb.2007.2175.
Murwira H. K. and Kirchman A. K. 1993. Carbon and nitrogen mineralization of cattle
manures subjected to different treatment in Zimbabwean and Swedish soils:In K
Mulongoy and K.R Merckr (editors)Soil organic matter dynamics and sustainability of
tropical agriculture pp189-198.
National Population and Housing Census of Ethiopia.2007
Norman, JC. 1992. Tropical vegetable crops. Arthur H. Stockwell Ltd, Ilfracombe, Great
Britain. Pp.52-77.
Obi M. E and Ebo P. O. 1995.The effect of different management practices n the soil physical
properties and maize production in severely degraded soil in /Southern Nigeria.
Biological resource technology 51: 117-123.
Osei M. K, Osei K, Braimah H, Mochiah M. B, Berchie J. N, Bolfrey-Arku G, Lamptey J. N.
L. 2013. Practices and constraints to cabbage production in urban and peri-urban
Ghana: Focus on Brong Ahafo and Ashanti Regions. Basic Research Journal of
Agricultural Science and Review ISSN 2315-6880 Vol. 2(1) CSIR-Crops Research
Institute, Box 3785, Kumasi, Ghana. Pp 05-14
Oyekale A.S. and Idjesa E. 2009. Adoption of improved maize seed and production efficiency
in River State, Nigeria. Acad. J. Plant Sci. 2:44- 50.
Panda S.C. 2008. Agronomy, Agribios (India), Chopasni, Jodhpur: 160-169.
Peck N.H. 1981. Cabbage plant responses to nitrogen fertilization. Agron. J. 73:679-684.
Pierce L.C. 2007. Vegetables: Characteristics, Production and Marketing. John Wely and
Sons, Incorporation Toronto, Canada, 15: 176- 223.
57
Pramanik S. 2007. Effect of nitrogen and phosphorus on the growth and yield of cabbage. MS
Thesis. Dept of Hort. SAU, Dhaka, 2007, 21-42.
Pramanik S. Effect of nitrogen and phosphorus on the growth and yield of cabbage. MS
Thesis. Dept of Hort. SAU, Dhaka, 2007, 21-42.
Prabagar B.S. and Srinivas K. 1990. Effect of spacing and fertilizer on head yield of cabbage.
Progress of Horticulture, 22 (1-4):112-116.
Prasad P. H, Bhunia P, Naik A. and Thapa U. 2009. Response of nitrogen and phosphorus
levels on the growth and yield of Chinese cabbage (Brassica campestris L. var.
pekinensis) in the gangetic plains of West Bengal. Journal of Crop and Weed, 5(2): 75-
77
Preece, J.E. and Read, P.E. 2005. The biology of horticulture: An introductory textbook. 2nd
Edition. John Wiley and Sons, Inc. Hoboken, New Jersey.
Radov A.S. and Turkmenbaen B.A. 1973. Fertilizing head Cabbage in the flood plain of the
ural. river. Khimiya v Schl'skom Khozyaistve 11(11):. (Cited from Hort. Abstr..,
44(8): 5622, 1974). Pp 13-15
Rail N. and Yadav D.S. 2005. Advanced in Vegetable Production. Indian Council of
Agricultural Research New Delhi, India Pp
Rankov V. and Belichki I. 1980. The, biological removal of nutrients by a crop of early head
Cabbage receiving mineral fertilizers. Resteniev dni Nauki, 26(2): 73-82. (Cited from
Hort. Abstr. 60 (5): 3344).
Rankov V. and Belichki I. 1980. The, biological removal of nutrients by a crop of early head
cabbage receiving mineral fertilizers.
Rathore M. 2012. Effect of sulfur and zinc on growth, yield and quality of Cabbage (Brassica
oleracea var. capitata L.) under varying moisture regimes. MSc Thesis, Swami
keshwanand Rajasthan Agricultural University, Bikaner 47pp
Romain, H. R. 2001. Crop Production in Tropical Africa. Published by Ministry of Foreign
Affairs. External trade and International co-operation. Brussels, Belgium. Pp 424-430
Salunkhe D.K., Desai B.B. & Bhat N.R. 1987. Vegetable and flower seed production.
Agricole Publishing Academy, New Delhi.
Samec D, Piljac-Zegarac J and Bogovi M. 2011. Antioxidant potency of white (Brassica
oleracea L. var. capitata) and Chinese (Brassica rapa L. var. pekinensis (Lour.))
cabbage: The influence of development stage, cultivar choice and seed selection. Sci
Hort, 128, 78-83.
Sammis T.W. and Wu I.P. 1989. Deficit irrigation effects on head cabbage production.
Agricultural Water Management, 16: 229-239.
Sammis T.W., Kratky B.A. and Wu I.P. 1988. Effects of limited irrigation on lettuce and
Chinese cabbage production. Irrigation Science, 9: 187- 98.
58
Sanchez, P.A. 1976. Properties and management of soils in the tropics. John Wiley and Sons,
New York. pp 618.
Sarker M.Y, Azad A.K, Hasan M.k, Nasreen A, Naher Q. and Baset M.A. 2002. Effect of
plant spacing and source of nutrients on the growth and yield of head Cabbage.
Pakistan journal of biological sciences 5(6): 636 – 639
Sarker N.I. and Mannaf M.A. 1996. Effect of fertilizers alone and in combination with cow
dung on the growth and yield of potato. Bangladesh J. Agri. Sci., 21(1): 275-282.
Schlegel R.H.J. 2010. Dictionary of plant breeding (second edition).CRC Press Taylor and
Francis Group Boca Raton London New York Pp571
Seleshi Bekele, Awulachew, Lemperiere P. and Taffa Tulu. 2009. Training material on
agricultural water management. Module 3. IWMI (International Water Management
Institute), Addis Ababa, Ethiopia, ILRI (International Livestock Research Institute),
Nairobi, Kenya and Adama University, Adama, Ethiopia. 34pp.
Shahbazi M. 2005. Effects of different nitrogen levels on the yield and nitrate accumulation in
the four of lettuce cultivars. Msc Thesis, Department of Horticulture, Science and
Research Branch, Islamic Azad university, Tehran Iran, 99 pp (in Farsi).
Silva A. A. Jr. 1986. Mineral and organic fertilizing in cabbage. Commercial quality and the
occurrence of Xanthomonas campestries cv. Campestris. Hort. Bras., 4(2): 10- 12.
Singh B K, Sharma S.R. and Singh B. 2009. Heterosis for mineral elements in single cross-
hybrids of cabbage (Brassica oleracea var. capitata L). Scientia Horticulturae 122(1):
32–6.
Singh N., Shubhadeep Roy, Pradip K, Chaurasia, S.N.S., Gupta, S. and Singh, B. 2015.
Improved Production Technologies in Vegetable Crops. IIVR Training Manual No. 59.
ICAR-Indian Institute of Vegetable Research, Varanasi, India, Pp 268.
Singh R.V. and Naik L.B. 1988. Response of Cabbage to plant spacing. Nitrogen and
phosphorus levels. Indian Journal Hort. 45(34): 325-328.
Sisay Hailu, Tilahun Seyoum and Nigussie Dechassa. 2008. Effect of Combined Application
of Organic P and Inorganic N Fertilizers on Yield of Carrot. African Journal of
Biotechnology, 7(1):27-34.
Stepanović M.V., Bjelič, V.V. and Dragičević V.D. 2000. Effect of crop density on
morphological characteristics and yield of cabbage. Acta Hort., 533: 205–207.
Subedi, K.D., B.L. Ma and A.G. Xue. 2007. Planting date and nitrogen effects on grain yield
and protein content of spring wheat. Crop Sci., 47: 36-44
Tadesse Amera and Asferachew Abate. 2008. An assessment of the pesticide use, practice and
hazards in the Ethiopian rift valley. Africa Stockpiles program annex 6.
Tekalign Mamo, Haque, I. and Aduayi, E.A. 1991. Soil, plant, water, fertilizer, animal manure
and compost analysis manual. Plant science division working document No 13,
59
International Livestock Research Center for Africa (ILCA), Addis Ababa, Ethiopia.
P220.
Tesdeke Abate and Gashawbeza Ayalew. 1994. Progressin vegetable management research:
1985-1992. pp. 187-193. In:E. Hearth and Lemma, D. (eds.). Proceedings of the
Second National Horticultural Workshop, Addis Ababa, Ethiopia, 1-3 December 1992,
IAR/FAO.
Thapa U. and Prasad P. H. 2011. Response of nitrogen and phosphorus levels on the growth
and yield of Chinese cabbage [Brassica rapa (L.) var. Perkinensis] Crop Res. 42 (1, 2
& 3) : 207-209 (2011). Printed in India
Thompson A.K. 1996. Postharvest treatments. In: Postharvest technology of fruit and
vegetables. Cambridge, Mass.: Blackwell Science Ltd. pp 95–128.
Tilahun Geleto, Tanner D. G, Tekalgn Mamo and Getnet Gebeyehu. 1996. Response of rain
fed bread and durum wheat to source, level and timing of nitrogen fertilizer at two
vertisol sites in Ethiopia. In: Tanner, D. G., T. Payne, and O. S. Abdalla (eds.).
Proceeding of Ninth Regional wheat Workshop for Eastern, Central and South Africa.
CIMMYT:Addis Ababa, Ethiopia 128 - 132.
Tindall H.D, Rice R.P. and Rice L. W. 1987. Fruit and vegetable production in Africa.
Macmillan publishers Printed in Hong Kong Pp 174-175
Tindall H.D. 1983. Vegetables in the Tropics. Macmillan Education Ltd. Basingstore,
Hampshire and London, Britain. pp 400-530.
Uddin, M. J., Islam, M. M. and Naher, M. N. A. 2009. Basic Agriculture, Part Ι. 74/4,
Upashahar, Rajshahi. 379 p.
Vleck F. and Polack J. 1964. Top dressing savoys and Cabbages with nitrogen. Bull Vyzk.
Ust Zelin, Ulomoul, 8: 175-83. (Cited from Hort. Abstr. 35(4): 7689).
Westerveld S.M, McDonald M.R. and McKeown A.W. 2003. Optimum Nitrogen Fertilization
of Summer Cabbage in Ontario Department of Plant Agriculture University of Guelph
Guelph, Ontario Canada
White J.M. and Forbes R.B. 1976. Effect of spacing and fertilizer rates on Cabbage yield and
head weight. Florida Agricultural Experiment stations journal series No 176 Proc. Fla.
State Hort. Soc. 89:118-120.
Yano M, Ito H, Hayami A. and Obama S. 1999. Effect of cultural practices on the quality of
vegetables. Sugar contents of cabbage and carrot. Bulletin of National Institution of
Vegetable and Tea Science, Pp: 53–67.
Purushottam, P. and Khatiwada K. 2000/2001. Plant spacing: A key husbandry practice for
rainy season cabbage production. Journal of Nepal Agriculture Research, 4-5: 4855
Zebarth, B.J., Freyman, S. and Kowalenko, C.G. 1991. Influence of nitrogen fertilization on
cabbage yield, head nitrogen content and extractable soil inorganic nitrogen at harvest.
Can. J. Plant Sci. 71:1275-1280.
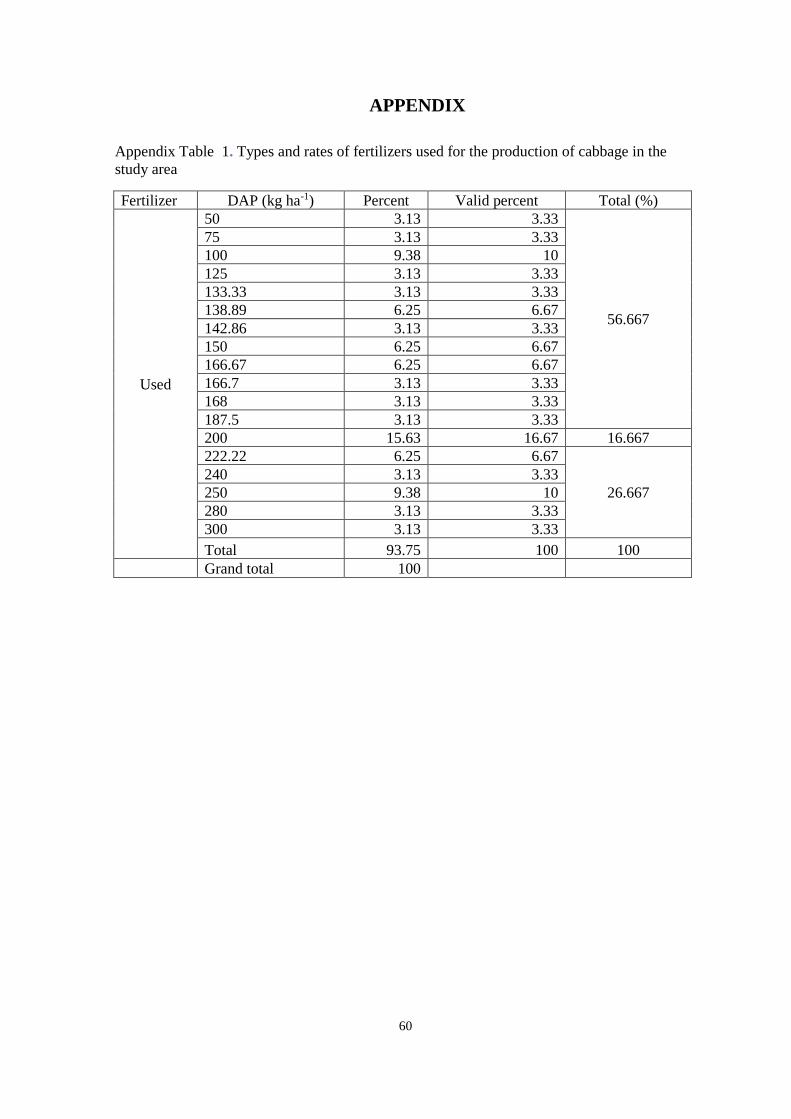
60
APPENDIX
Appendix Table 1. Types and rates of fertilizers used for the production of cabbage in the
study area
Fertilizer DAP (kg ha-1) Percent Valid percent Total (%)
Used
50 3.13 3.33
56.667
75 3.13 3.33
100 9.38 10
125 3.13 3.33
133.33 3.13 3.33
138.89 6.25 6.67
142.86 3.13 3.33
150 6.25 6.67
166.67 6.25 6.67
166.7 3.13 3.33
168 3.13 3.33
187.5 3.13 3.33
200 15.63 16.67 16.667
222.22 6.25 6.67
26.667
240 3.13 3.33
250 9.38 10
280 3.13 3.33
300 3.13 3.33
Total 93.75 100 100
Grand total 100
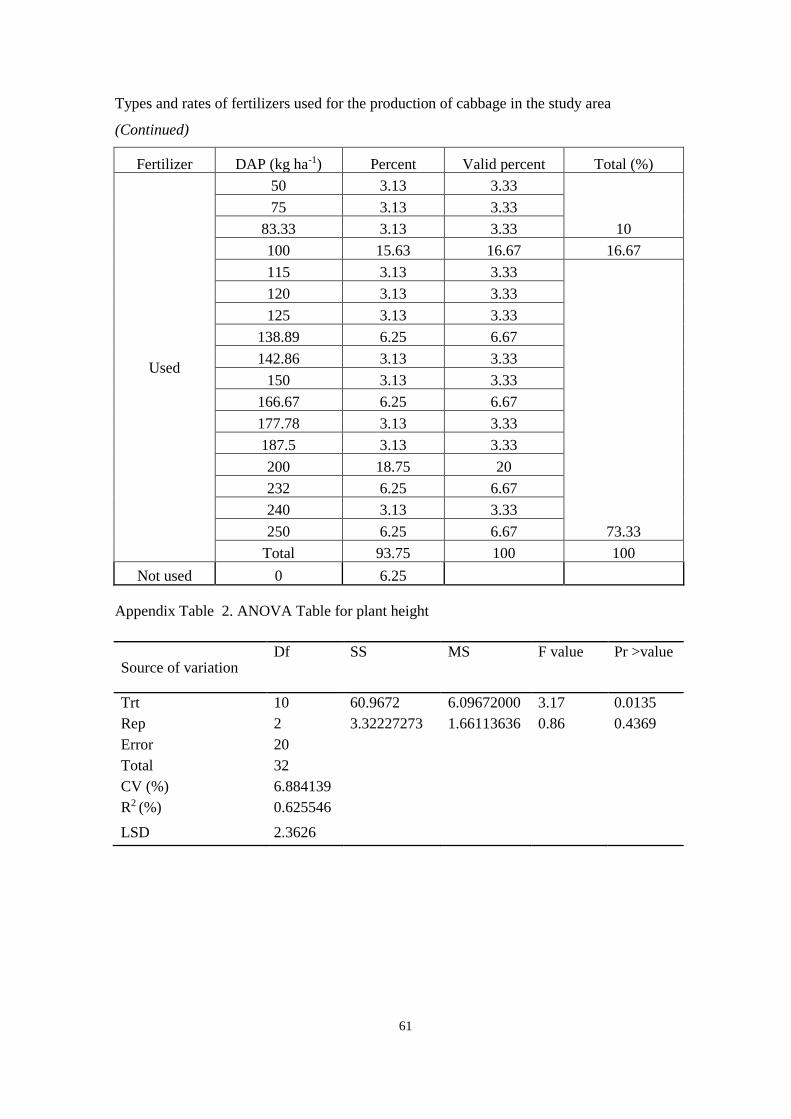
61
Types and rates of fertilizers used for the production of cabbage in the study area
(Continued)
Fertilizer DAP (kg ha-1) Percent Valid percent Total (%)
Used
50 3.13 3.33
10
75 3.13 3.33
83.33 3.13 3.33
100 15.63 16.67 16.67
115 3.13 3.33
73.33
120 3.13 3.33
125 3.13 3.33
138.89 6.25 6.67
142.86 3.13 3.33
150 3.13 3.33
166.67 6.25 6.67
177.78 3.13 3.33
187.5 3.13 3.33
200 18.75 20
232 6.25 6.67
240 3.13 3.33
250 6.25 6.67
Total 93.75 100 100
Not used 0 6.25
Appendix Table 2. ANOVA Table for plant height
Source of variation Df SS MS F value Pr >value
Trt 10 60.9672 6.09672000 3.17 0.0135
Rep 2 3.32227273 1.66113636 0.86 0.4369
Error 20
Total 32
CV (%) 6.884139
R2 (%) 0.625546
LSD 2.3626
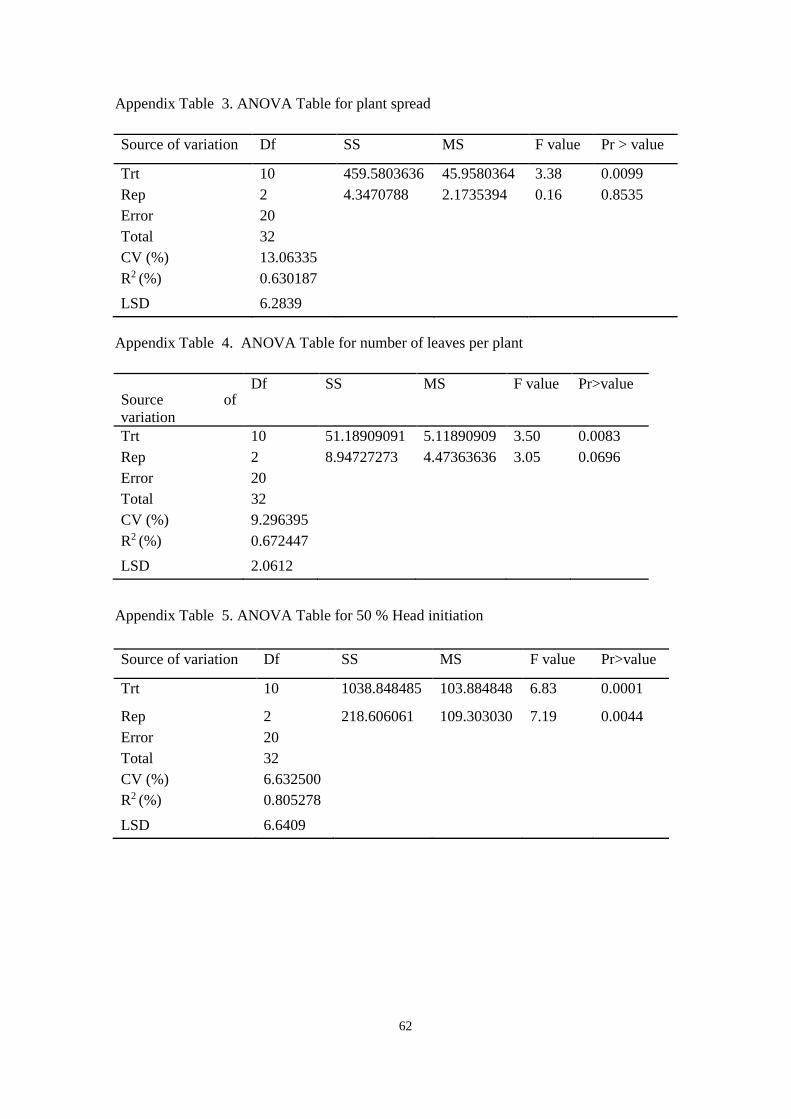
62
Appendix Table 3. ANOVA Table for plant spread
Source of variation Df SS MS F value Pr > value
Trt 10 459.5803636 45.9580364 3.38 0.0099
Rep 2 4.3470788 2.1735394 0.16 0.8535
Error 20
Total 32
CV (%) 13.06335
R2 (%) 0.630187
LSD 6.2839
Appendix Table 4. ANOVA Table for number of leaves per plant
Source of
variation
Df SS MS F value Pr>value
Trt 10 51.18909091 5.11890909 3.50 0.0083
Rep 2 8.94727273 4.47363636 3.05 0.0696
Error 20
Total 32
CV (%) 9.296395
R2 (%) 0.672447
LSD 2.0612
Appendix Table 5. ANOVA Table for 50 % Head initiation
Source of variation Df SS MS F value Pr>value
Trt 10 1038.848485 103.884848 6.83 0.0001
Rep 2 218.606061 109.303030 7.19 0.0044
Error 20
Total 32
CV (%) 6.632500
R2 (%) 0.805278
LSD 6.6409

63
Appendix Table 6. ANOVA Table for 75 % Head Maturity
Source of
variation
Df SS MS F value Pr>value
Trt 10 2088.666667 208.866667 3.72 0.0060
Rep 2 264.727273 132.363636 2.36 0.1204
Error 20
Total 32
CV (%) 7.417838
R2 (%) 0.677041
LSD 12.76
Appendix Table 7. ANOVA Table for Volume of Head
Source of variation Df SS MS F value Pr>value
Trt 10 1990064.715 199006.472 6.36 0.0002
Rep 2 270058.868 135029.434 4.31 0.0277
Error 20
Total 32
CV (%) 19.73184
R2 (%) 0.783048
LSD 301.37
Appendix Table 8. ANOVA Table for Diameter of Head
Source of
variation
Df SS MS F value Pr>value
Trt 10 106.5875333 10.6587533 12.19 <.0001
Rep 2 4.9355879 2.4677939 2.82 0.0833
Error 20
Total 32
CV (%) 7.575127
R2 (%) 0.864400
LSD 1.5929

64
Appendix Table 9. ANOVA Table for Weight of Head
Source of
variation
Df SS MS F value Pr>value
Trt 11 1.71773939 0.17177394 12.53 <.0001
Rep 2 0.04276970 0.02138485 1.56 0.2346
Error 22
Total 35
CV (%) 13.68001
R2 (%) 0.865283
LSD 0.1994
Appendix Table 10. ANOVA Table for Marketable Yield per Hectare
Source of
variation
Df SS MS F
value
Pr>value
Trt 10 3544.483618 354.448362 17.72 <.0001
Rep 2 45.163109 22.581555 1.13 0.3431
Error 20
Total 32
CV (%) 14.18130
R2 (%) 0.899740
LSD 7.6169
Appendix Table 11. ANOVA Table for Unmarketable Yield per Hectare
Source of
variation
Df SS MS F value Pr>value
Trt 10 38.56275758 3.85627576 4.90 0.0012
Rep 2 4.76375152 2.38187576 3.03 0.0710
Error 20
Total 32
CV (%) 39.15148
R2 (%) 0.733648
LSD 7.6169
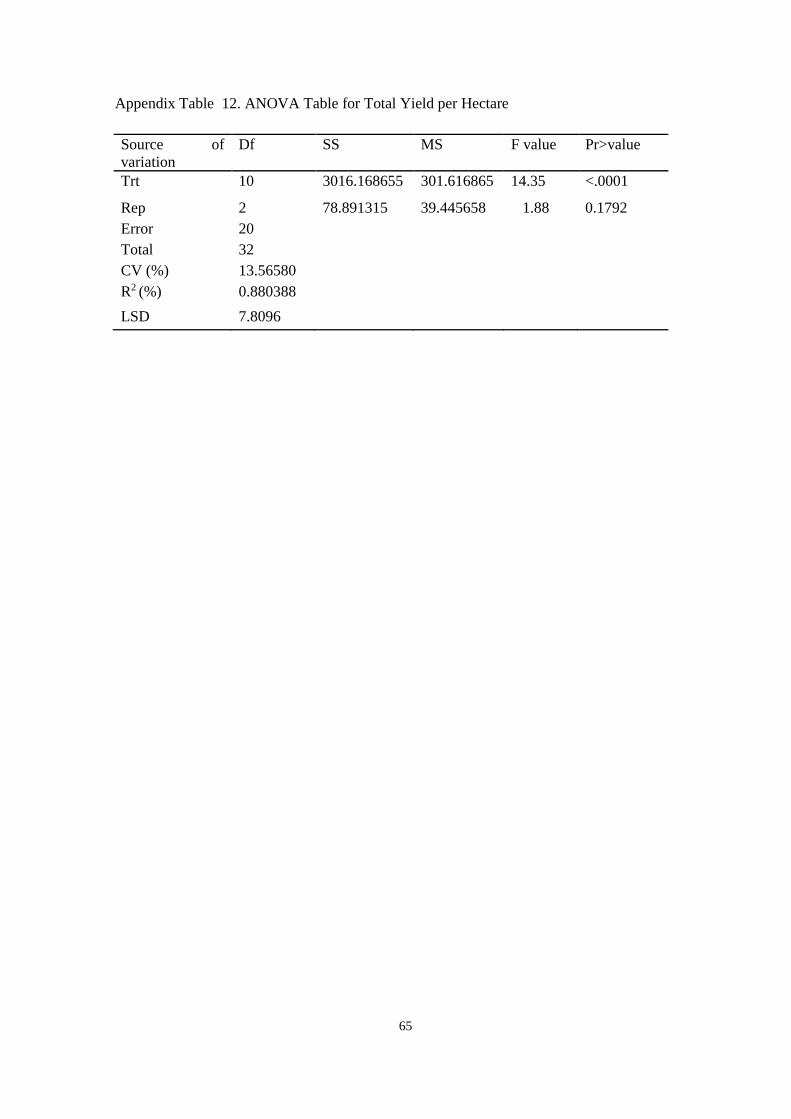
65
Appendix Table 12. ANOVA Table for Total Yield per Hectare
Source of
variation
Df SS MS F value Pr>value
Trt 10 3016.168655 301.616865 14.35 <.0001
Rep 2 78.891315 39.445658 1.88 0.1792
Error 20
Total 32
CV (%) 13.56580
R2 (%) 0.880388
LSD 7.8096
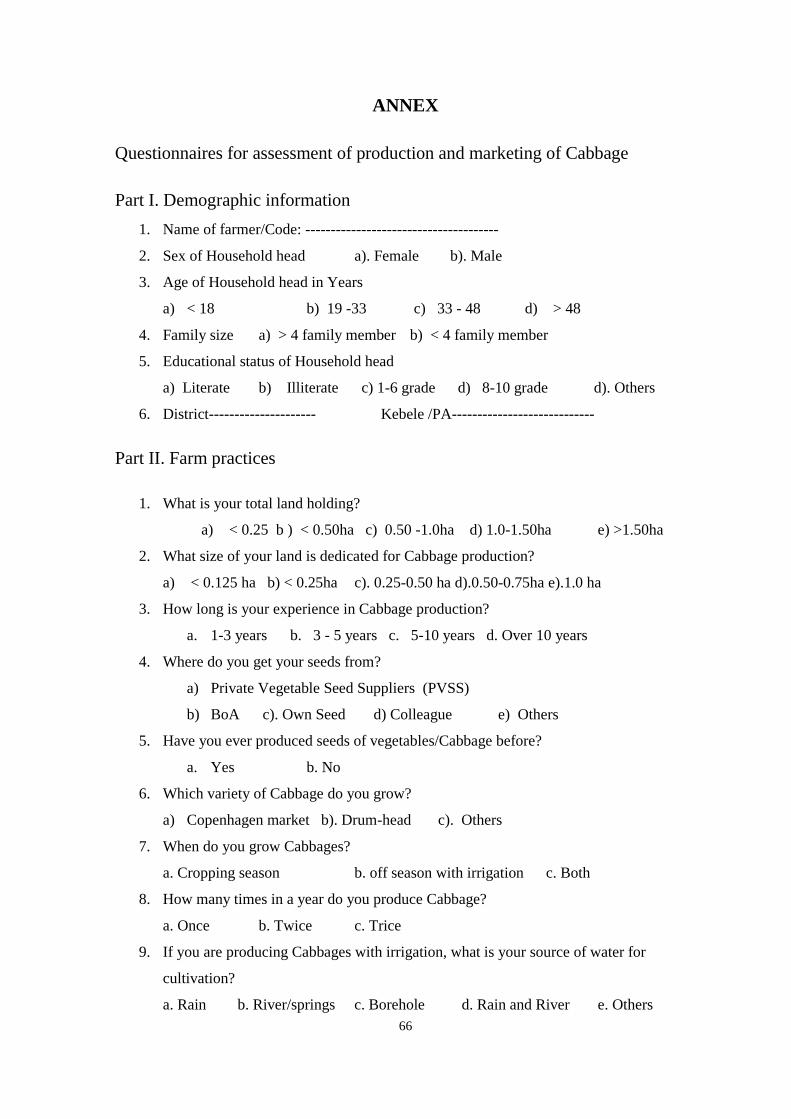
66
ANNEX
Questionnaires for assessment of production and marketing of Cabbage
Part I. Demographic information
1. Name of farmer/Code: --------------------------------------
2. Sex of Household head a). Female b). Male
3. Age of Household head in Years
a) < 18 b) 19 -33 c) 33 - 48 d) > 48
4. Family size a) > 4 family member b) < 4 family member
5. Educational status of Household head
a) Literate b) Illiterate c) 1-6 grade d) 8-10 grade d). Others
6. District--------------------- Kebele /PA----------------------------
Part II. Farm practices
1. What is your total land holding?
a) < 0.25 b ) < 0.50ha c) 0.50 -1.0ha d) 1.0-1.50ha e) >1.50ha
2. What size of your land is dedicated for Cabbage production?
a) < 0.125 ha b) < 0.25ha c). 0.25-0.50 ha d).0.50-0.75ha e).1.0 ha
3. How long is your experience in Cabbage production?
a. 1-3 years b. 3 - 5 years c. 5-10 years d. Over 10 years
4. Where do you get your seeds from?
a) Private Vegetable Seed Suppliers (PVSS)
b) BoA c). Own Seed d) Colleague e) Others
5. Have you ever produced seeds of vegetables/Cabbage before?
a. Yes b. No
6. Which variety of Cabbage do you grow?
a) Copenhagen market b). Drum-head c). Others
7. When do you grow Cabbages?
a. Cropping season b. off season with irrigation c. Both
8. How many times in a year do you produce Cabbage?
a. Once b. Twice c. Trice
9. If you are producing Cabbages with irrigation, what is your source of water for
cultivation?
a. Rain b. River/springs c. Borehole d. Rain and River e. Others

67
10. If you are using irrigation, which method do you use?
a. Watering can b. Furrow Irrigation c. Flooding d Others
11. How frequently do you irrigate your Cabbages?
a) Every day b) within 3 – 4 days b. Every week c. Every two weeks d.
Others
12. Which method of planting do you follow for Cabbage?
a. Direct sowing b. Transplanting c. Both
13. If you are transplanting seedlings, at what stage do you do it?
a) Two pair of leaves stage b) Three pair of leaves stage c) four pair leaves stage d)
Six pair of leaves stage. e) Others
14. How long do you wait for seedlings to transplant?
a) Three weeks b. four weeks c. five weeks d. six weeks e. Others
15. Do you transplant your Cabbage seedlings in rows?
a. Yes b. No
16. What spacing do you follow when raising seedling?
a) 60 cm x 40cm b) 60 cm x 50cm c) 50 cm x50 cm d) Others
17. What time in the day do you transplant seedlings?
a) Early morning b) noon time c) late evening d) Others
18. Please provide details on the types of fertilizers, method and rate of their application
Practice
Urea
(kg/ha)
DAP
(kg/ha)
Compost
(kg/ha)
How much do you apply?
When do you apply?
How do you apply?
Who does apply fertilizers?
19. Do you grow Cabbages on the same piece of land every year?
a. Yes b. No
20. What kinds of diseases did you observe on your Cabbages plants?
A) Cabbage Yellows (Fusarium oxysporium) B) Black Rot of Crucifers
(Xanthomonas campestris) C) Downy Mildew D) others….
21. What measures did you take?
---------------------------------------------------
22. Which insect pest are causing serious problem at nursery and field level?

68
a) Cut worm b) Thrips c) Wire Stem d) Aphids e) flea beetles f) Others
23. What measures did you take?
---------------------------------------------------
Part III. Harvest and postharvest operation
1. How long does Cabbage take to reach harvesting?
a. 3months b. 3 ½ months c. 4 months d. 5 Months d. > 5months
2. How do you know when your Cabbage is ready for harvesting?
a) Number of day’s
b) Compactness of head (Firm head)
c) Head Size
d) Color of the head
e) Compactness of the head and color of the head
3. What time of the day are you harvesting your Cabbages?
a. Early morning b. Mid Noon c. late evening d. Any time of the day e.
Others--
4. What is the average productivity (kg/ha) of head Cabbages in your area? ----
5. Whom do you sell your Cabbages to?
a. Consumers b. Hotels/restaurants c. Brokers d. Whole sellers e.
Retailers
6. If you have to sale you Cabbages, how far do you travel?
a. 1 hour b. 2hours c. 3 hours d. 4 hours e. Others
7. How do you take your Cabbage to the market?
a. On foot b. By Pack animals c. By Vehicle d Others
8. How do you store your Cabbage?
a. Boxes b. sacks c. Ground floor d. Basket e. Others
9. If there is no good price for your Cabbage, what do you do with them?
----------------------------------------------------------------------------------------
10. For how long can you store your Cabbage?
a) 1week b) 2 weeks c) 3weeks d) 1month e) Others
Part V. What are the general problems in the production of head cabbage?
a) Lack of training
b) Quality of seed and shortage of short
maturity varieties
c) Shortage of irrigation water
d) Disease and insect pests
e) Market problems
69
BIOGRAPHICAL SCKETCH
The author, Demoz Kidanie, was born in Gondar Town, North Gondar Zone of Amhara
National Regional state, Northern Ethiopia in November 19, 1981. He attended his elementary
school at the Tsadiku Yohannes and junior secondary school Atse Bekafa. He also attended
his high-school education at Ashewameda and Fasiledes Gondar senior secondary. After
passing the Ethiopian School Leaving Certificate Examination (ESLCE), he joined Jimma
University College of Agriculture and Veterinary Medicine graduated with Diploma in
General Agriculture and BSc in Horticulture in 2000 and 2007, respectively.
The author has served in Governmental Organization such as Tegede Armachiho and Merabe
Armachiho district more than ten years. He assigned to work as different market development
expert, extension team leader, root and vegetable expert, irrigation development team leader
and Horticultural expert. He also served in Non Governmental Organization in USAID
(FINTRAC CAMPANY) as oil seed and pulse crops extension agronomist in Tsehay union
multipurpose farmer cooperatives (Gondar town) for one and half years.
In April 2011, he joined North Gondar Zone Agriculture office as agronomist and now
working as a Horticultural expert. In 2014 he joined the school of graduate study at Bahir Dar
University Collage Agriculture and Environmental Sciences to pursue his M.Sc. degree in
horticulture. He is married and a father of two boys.
Copyright © 2022 FDOKUMEN