B-vitamins in Relation to Depression in Older Adults over 60 ...
27
1 B-vitamins in Relation to Depression in Older Adults over 60 Years of Age: The TUDA 1 Cohort Study 2 Katie Moore, PhD a , Catherine F. Hughes, PhD a , Leane Hoey, PhD a , Mary Ward, PhD a , 3 Conal Cunningham, MD b , Anne M. Molloy, PhD c , J.J. Strain, PhD a , Kevin McCarroll, 4 MD b , Miriam C. Casey, MD b , Fergal Tracey, MD d , Eamon Laird, PhD c , Maurice O’Kane, 5 MD e , Helene McNulty, PhD a 6 a Nutrition Innovation Centre for Food and Health (NICHE), School of Biomedical 7 Sciences, Ulster University, Coleraine, Northern Ireland, United Kingdom 8 b Mercers Institute for Research on Aging, St James's Hospital, Dublin 8, Ireland 9 c School of Medicine, Trinity College Dublin, Dublin b, Ireland 10 d Causeway Hospital, Northern Health and Social Care Trust, Coleraine, Northern 11 Ireland, United Kingdom 12 e Clinical Chemistry Laboratory, Altnagelvin Hospital, Western Health and Social Care 13 Trust, Londonderry, Northern Ireland, United Kingdom 14 Corresponding author: Helene McNulty, Nutrition Innovation Centre for Food and 15 Health (NICHE), School of Biomedical Sciences, Ulster University, Cromore Road, 16 Coleraine, Northern Ireland BT521SA. Email: [email protected] 17 Running title: B-vitamin Status and Depression in Aging 18 Key words: B-vitamins, folate, depression, anxiety, aging, food fortification 19 Funding sources: This work was supported by the Irish Department of Agriculture, 20 Food and the Marine and Health Research Board (under the Food Institutional 21 Research Measure, FIRM) and from the Northern Ireland Department for Employment 22 and Learning (under its Strengthening the All-Island Research Base initiative). 23 Word count: Abstract: 300; Brief Summary: 185; Main text: 3536; Reference count: 24 40; Table/Figures: 5 and 1 Supplemental Table. 25
-
Upload
khangminh22 -
Category
Documents
-
view
4 -
download
0
Transcript of B-vitamins in Relation to Depression in Older Adults over 60 ...
1
B-vitamins in Relation to Depression in Older Adults over 60 Years of Age: The TUDA 1
Cohort Study 2
Katie Moore, PhDa, Catherine F. Hughes, PhDa, Leane Hoey, PhDa, Mary Ward, PhDa, 3
Conal Cunningham, MDb, Anne M. Molloy, PhDc, J.J. Strain, PhDa, Kevin McCarroll, 4
MDb, Miriam C. Casey, MDb, Fergal Tracey, MDd, Eamon Laird, PhDc, Maurice O’Kane, 5
MDe, Helene McNulty, PhDa 6
aNutrition Innovation Centre for Food and Health (NICHE), School of Biomedical 7
Sciences, Ulster University, Coleraine, Northern Ireland, United Kingdom 8
bMercers Institute for Research on Aging, St James's Hospital, Dublin 8, Ireland 9
cSchool of Medicine, Trinity College Dublin, Dublin b, Ireland 10
dCauseway Hospital, Northern Health and Social Care Trust, Coleraine, Northern 11
Ireland, United Kingdom 12
eClinical Chemistry Laboratory, Altnagelvin Hospital, Western Health and Social Care 13
Trust, Londonderry, Northern Ireland, United Kingdom 14
Corresponding author: Helene McNulty, Nutrition Innovation Centre for Food and 15
Health (NICHE), School of Biomedical Sciences, Ulster University, Cromore Road, 16
Coleraine, Northern Ireland BT521SA. Email: [email protected] 17
Running title: B-vitamin Status and Depression in Aging 18
Key words: B-vitamins, folate, depression, anxiety, aging, food fortification 19
Funding sources: This work was supported by the Irish Department of Agriculture, 20
Food and the Marine and Health Research Board (under the Food Institutional 21
Research Measure, FIRM) and from the Northern Ireland Department for Employment 22
and Learning (under its Strengthening the All-Island Research Base initiative). 23
Word count: Abstract: 300; Brief Summary: 185; Main text: 3536; Reference count: 24
40; Table/Figures: 5 and 1 Supplemental Table. 25
2
Brief Summary: 26
This study draws on data from over 5000 European adults of 60+ years and shows 27
that better folate and related B-vitamin status may have a positive impact on mental 28
health in older adults. 29
30
Abstract 31
Objectives: Mental health disorders are major contributors to disease burden in older 32
people. Deficient status of folate and the metabolically related B-vitamins may be 33
implicated in these conditions. This study aimed to investigate folate, vitamin B12, 34
vitamin B6 and riboflavin in relation to depression and anxiety in aging and also 35
considered the role of fortified foods as a means of optimizing B-vitamin status and 36
potentially reducing the risk of these mental health disorders. 37
Design: The TUDA aging study was a cross-sectional cohort study. 38
Setting and Participants: Community-dwelling adults (n = 5186; ≥ 60 years) recruited 39
from two jurisdictions within the island of Ireland from 2008 to 2012. 40
Measures: Depression and anxiety were assessed using the Centre for 41
Epidemiological Studies Depression (CES-D) and the Hospital Anxiety and 42
Depression (HAD) scales, respectively. The following B-vitamin biomarkers were 43
measured: red blood cell folate, serum total vitamin B12, plasma pyridoxal-5-44
phosphate (PLP; vitamin B6) and erythrocyte glutathione reductase activation 45
coefficient (EGRac; riboflavin). 46
Results: Biomarker values in the lowest 20% of status for folate (Odds Ratio (OR) 47
1.79; 95% CI 1.23-2.61), vitamin B6 (OR 1.45; 1.01-2.06) or riboflavin (OR 1.56; 1.10-48
3
2.00), but not vitamin B12, were each associated with an increased risk of depression 49
(CES-D score ≥16). Correspondingly, B-vitamin fortified foods if consumed daily were 50
associated with a reduced risk depression (OR 0.54; 0.41-0.70). A deficient status of 51
vitamin B6 (OR 1.73; 1.07-2.81), but not other vitamins, was associated with increased 52
anxiety. 53
Conclusions/Implications: Better B-vitamin status may have a role in impacting 54
positively on mental health in older adults. Regular intake of fortified foods can provide 55
a means of optimizing B-vitamin status and thus could contribute to reducing 56
depression. If confirmed by a randomized trial, these results may have implications for 57
nutrition and mental health policy, and thus quality of life, in older people. 58
59
4
Introduction 60
Globally the population is aging and by 2050 the number of people aged ≥60 years is 61
predicted to reach 2.1 billion.1 Mental health disorders are a leading cause of disability 62
and ill health in older age,2 affecting an estimated 20% of adults ≥60 years worldwide.3 63
Given the considerable human and economic cost of mental health conditions and the 64
generally poor response rates to costly pharmacological treatments,4,5 there is much 65
interest in the potential roles of certain dietary components as modifiable risk factors 66
for depression. Folate and vitamin B12 have received particular attention in this 67
regard.6 These B-vitamins have interrelated roles within one-carbon metabolism, 68
where folate in the form of 5 methyltetrahydrofolate, and vitamin B12 in the form of 69
methylcobalamin, are required for the remethylation of homocysteine to methionine 70
which subsequently forms S-adenosylmethionine (SAM).7 SAM, in turn, is the 71
essential methyl donor required for the production of monoamine neurotransmitters, 72
phospholipids and nucleotides.8 73
Historically, clinical deficiencies of folate and vitamin B12 were associated with 74
a range of neuropsychiatric symptoms, including depression,9-11 raising the possibility 75
that optimizing relevant B-vitamin intake and status could be protective. Research to 76
date in this area has however focused predominantly on folate, and to a lesser extent 77
vitamin B1212 whereas related B-vitamins - vitamin B6 and riboflavin - also required 78
for one-carbon metabolism have received much less attention. The aim of this study 79
therefore was to investigate biomarker status of all relevant B-vitamins - folate, vitamin 80
B12, vitamin B6 and riboflavin - in relation to mental health in a well characterized 81
cohort of 5186 older adults born in Ireland. Furthermore, this study considered the role 82
of fortified foods as a means of optimizing B-vitamin status, and potentially reducing 83
the risk of depression and anxiety, in older adults. 84
5
Methods 85
Study design and participants 86
The study involved new analysis of data from the TUDA aging cohort study 87
(ClinicalTrials.gov Identifier: NCT02664584). As described in detail elsewhere,13 5,186 88
community-dwelling adults aged ≥60 years were recruited between 2008 and 2012 89
from two jurisdictions within the island of Ireland - Northern Ireland (United Kingdom, 90
UK) and the Republic of Ireland. The TUDA study initially aimed to investigate the role 91
of nutrition and lifestyle factors in the etiology of common age-related diseases, 92
namely, dementia, osteoporosis and cardiovascular disease. Participants were 93
recruited in both jurisdictions using standardized protocols by centrally trained staff, 94
either from general practice or hospital outpatient clinics, and deemed suitable if they 95
were born on the island of Ireland and were without a diagnosis of dementia. For the 96
current study, participants receiving vitamin B12 injections were excluded from the 97
analysis (Fig. 1). 98
Ethical approval was granted by the Office for Research Ethics Committees 99
Northern Ireland (ORECNI; reference 08/NI/RO3113), with corresponding approvals 100
from The Northern and Western Health and Social Care Trusts in Northern Ireland, 101
and the Research Ethics Committee of St James Hospital and The Adelaide and 102
Meath Hospital in Dublin. All participants provided written informed consent. 103
104
Neuropsychiatric assessment 105
During the participant appointment, depression was assessed using the Centre 106
for Epidemiological Studies Depression (CES-D) scale, which is a 20 item self-107
reported questionnaire, with a minimum score of 0 (no symptoms of depression) and 108
maximum score of 60 (significant symptoms of depression). A score of ≥16 was used 109
6
as a cut-off value suggestive of clinical depression.14 Anxiety was assessed using the 110
7 item Hospital Anxiety and Depression (HAD) scale, with a minimum score of 0 111
(suggestive of no symptoms of anxiety) and a maximum score of 21 (significant 112
anxiety). A score ≥11 was used as a cut-off value for probable anxiety.15 113
For the purpose of the current analysis, cognitive function was assessed using 114
the Folstein Mini-Mental State Examination (MMSE),16 a short, structured cognitive 115
test. The maximum score achievable is 30, with a score <25 indicating a possibility of 116
cognitive impairment and a score <20 indicating dementia. 117
118
Blood sampling and laboratory analysis 119
A non-fasting blood sample was obtained and analyzed on the day of sampling 120
for routine biomarkers of health in participating hospital laboratories. For research 121
biomarkers, all sample preparation and fractionation was carried out within 4 hours of 122
collection and fractions were stored at -70 °C (for up to five years) for batch analysis 123
at the end of the study. B-vitamins were analyzed centrally in laboratories in Dublin 124
(vitamin B12, folate, homocysteine) or Coleraine (vitamin B6, riboflavin) using 125
established methods. Red blood cell (RBC) folate and serum total vitamin B12 were 126
measured by microbiological assay using Lactobacillus casei and Lactobacillus 127
leichmanni, respectively.17,18 Plasma homocysteine was measured by fluorescence 128
polarization immunoassay.19 Vitamin B6 status (plasma pyridoxal-5-phosphate, PLP) 129
was analyzed by HPLC with fluorescence detection.20 Riboflavin status was measured 130
by erythrocyte glutathione reductase activation coefficient (EGRac), a functional assay 131
that measures the activity of glutathione reductase before and after in-vitro reactivation 132
with its prosthetic group flavin adenine dinucleotide (FAD), the active cofactor form of 133
riboflavin; results are reported as a ratio, a higher EGRac ratio indicates lower 134
7
riboflavin status.21 For each assay, quality controls were provided by the repeated 135
analysis of pooled samples covering a wide range of values. 136
137
Dietary assessment 138
Dietary information on habitual intake of specified foods (for the purpose of this 139
paper, B-vitamin fortified foods) was collected using a researcher-assisted food 140
frequency questionnaire (FFQ), previously validated for B-vitamin intake against B-141
vitamin biomarkers.22 Using a 7-item section for fortified foods (from a larger FFQ 142
used in the TUDA study), brand names of fortified food products were collected so that 143
up-to-date details on relevant nutrient profiles could be obtained. Using this approach, 144
participants were categorized according the number of portions of fortified food 145
consumed per week. A small number of participants (n = 110; 2.2%) could not be 146
classified as regards fortified food intake and/or supplement use and are not included 147
in this analysis. 148
149
General health, lifestyle and biophysical measures 150
Health and lifestyle information was gathered using a researcher-assisted, 151
questionnaire which included information on smoking, alcohol, medical history and use 152
of prescription drugs, including antidepressant medications. To facilitate the accuracy 153
of recorded drugs and vitamin supplements, participants were asked to bring these 154
items to their appointment for inspection by the researcher. Anthropometric 155
measurements were recorded (including weight, height, waist and hip) and blood 156
pressure measurements were taken in accordance with standard operating 157
procedures by trained researchers. The Timed Up-and-Go (TUG) test,23 the Physical 158
Self-Maintenance Scale (PSMS) and the Instrumental Activities of Daily Living (IADL) 159
8
scale were used to assess functional mobility and general ability of participants. Socio-160
economic status was measured as area-based deprivation by adopting a novel cross-161
jurisdictional appraoch, whereby geo-referenced address-based information was used 162
to map and link participants to official socioeconomic indicators of deprivation within 163
Northern Ireland (UK) and the Republic of Ireland, as previously described in detail.13 164
165
Statistical Analysis 166
All statistical analysis was performed using SPSS software (Statistical Package 167
for Social Sciences, Version 23.0, SPSS UK Ltd., Chersey, United Kingdom). Data 168
were checked for normality and log-transformed as appropriate. Analysis of 169
covariance with Bonferroni post hoc test was used for analysis of continuous data and 170
chi-squared tests were used for categorical variables. Relationships of demographic, 171
clinical and lifestyle factors with depression (CES-D score) and anxiety (HAD score) 172
were investigated using multiple linear regression analysis. The risk of depression 173
(CES-D score ≥16) and anxiety (HAD score ≥11) in relation B-vitamin biomarker status 174
was determined using logistic regression. For this purpose, B-vitamin biomarkers were 175
examined in quintiles ranging from the highest 20% (reference category) to lowest 176
20% of values, and the model was adjusted for relevant co-variates. The associations 177
of B-vitamin fortified food intake with risk of depression (CES-D score ≥16) and anxiety 178
(HADS score ≥11) were also determined using logistic regression, with adjustment for 179
relevant co-variates; the reference category was non-consumers, against which the 180
remaining categories (low, medium and high fortified food frequencies) were 181
compared. 182
183
Results 184
9
General characteristics 185
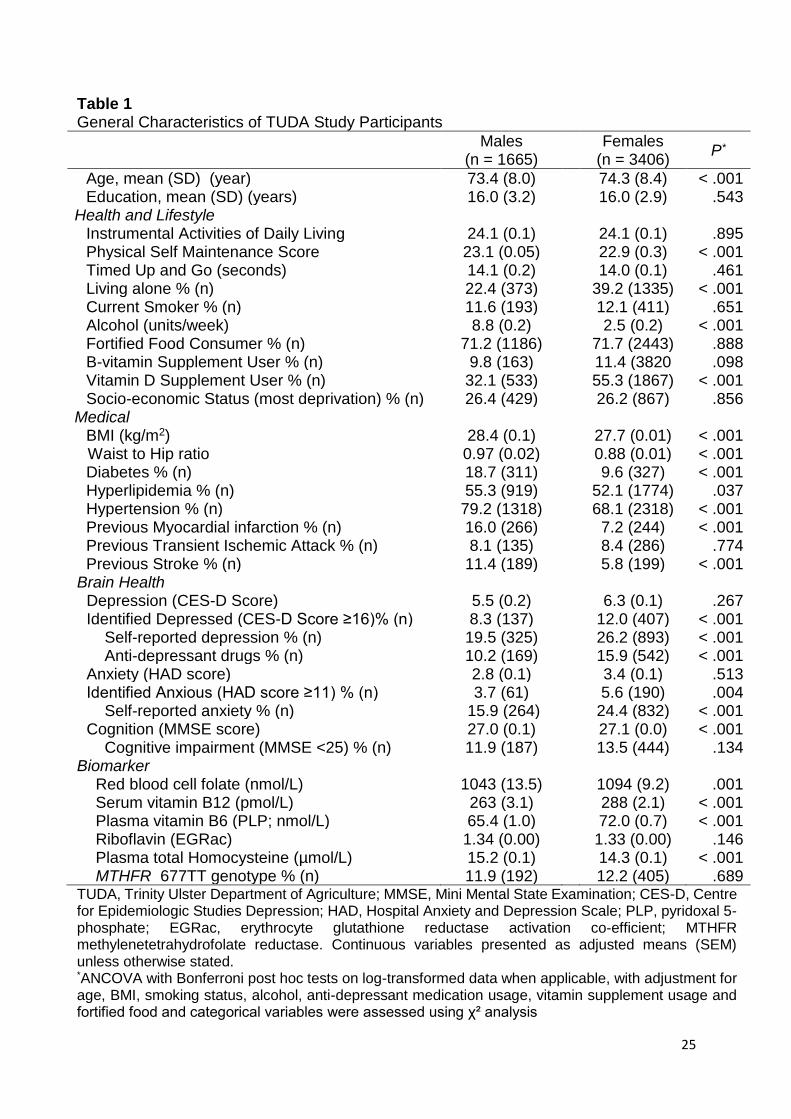
The general characteristics of the study population are described in Table 1. 186
Participants were predominantly female (67%), the majority were fortified food 187
consumers (72%) and 11% were B-vitamin supplement users. Overall, higher rates of 188
depression (CES-D score ≥16.0) and anxiety (HAD score ≥11.0) were recorded in 189
females compared to males; likewise, self-reported depression and anxiety were also 190
higher in females. B-vitamin biomarker status was generally lower, and homocysteine 191
concentrations higher, in men compared to women. Although mean B-vitamin 192
biomarker concentrations fell within normal reference ranges, some evidence of 193
deficiency (using accepted laboratory cut-offs) was identified for specific B-vitamin 194
biomarkers (data not shown): folate (RBC folate 2.3%); vitamin B12 (serum B12 195
11.6%); vitamin B6 (PLP 12.2%); riboflavin (EGRac 48.6%). 196
197
Relationships of demographic, clinical and lifestyle factors with depression and anxiety 198
The relationship of clinical and lifestyle factors with depression (CES-D score) 199
and anxiety (HAD score) was examined by linear regression (Supplemental Table 1). 200
The following factors were significantly associated with depression: female sex (β = 201
0.04, P = .008), socioeconomic status (β = 0.09, P <.001), physical frailty (β = 0.19, P 202
< .001), living alone (β = 0.08, P <.001), antidepressant usage (β = 0.21, P < .001), 203
previous ischemic attack (β = 0.04, P = .02) and smoking (β = 0.05, P =.001), whereas 204
age (β = - 0.10 P <.001) and education (β = - 0.06, P <.001) were negatively related 205
to depression. The following factors were identified as being positively associated with 206
anxiety: female sex (β = 0.08, P <.001), socioeconomic status (β = 0.08, P <.001), 207
hypertension (β = 0.04, P = .027) and anti-depressant usage (β = 0.18, P <.001), 208
10
whereas age (β = -0.138, P <.001), education (β = -0.10, P <.001) and BMI (β = -0.05, 209
P <.001) were inversely related to anxiety. 210
211
B-vitamin biomarker status in relation to depression and anxiety 212
The associations of B-vitamin biomarker status with risk of depression (CES-D 213
score ≥16) was examined after adjustment for the above co-variates and vitamin 214
supplement use (Fig. 2). Each B-vitamin was examined in quintiles of biomarker 215
status; the reference category was set at the highest 20% of values. Compared with 216
the reference category, the lowest quintile of folate (Odds Ratio (OR) 1.79; 95% CI 217
1.23-2.61, P = .002), vitamin B6 (OR 1.45; 1.01-2.06, P = .043) or riboflavin (OR 1.56; 218
1.10-2.00, P = .012) status was associated with increased risk of depression. No 219
significant relationship of serum total B12 was observed with depression (P = 0.577). 220
Similarly, the relationship of B-vitamins with anxiety was examined in quintiles of 221
biomarker status (data not shown). After adjustment for relevant co-variates (i.e. age, 222
gender, anti-depressant drug usage, education, BMI, socioeconomic status and 223
hypertension) and vitamin supplement use, only low/deficient status of B6 - but not 224
other B-vitamins - was associated with an increased risk of anxiety (OR 1.73; 1.07-225
2.81, P = .024). 226
227
B-vitamin intakes, biomarker status and risk of depression or anxiety 228
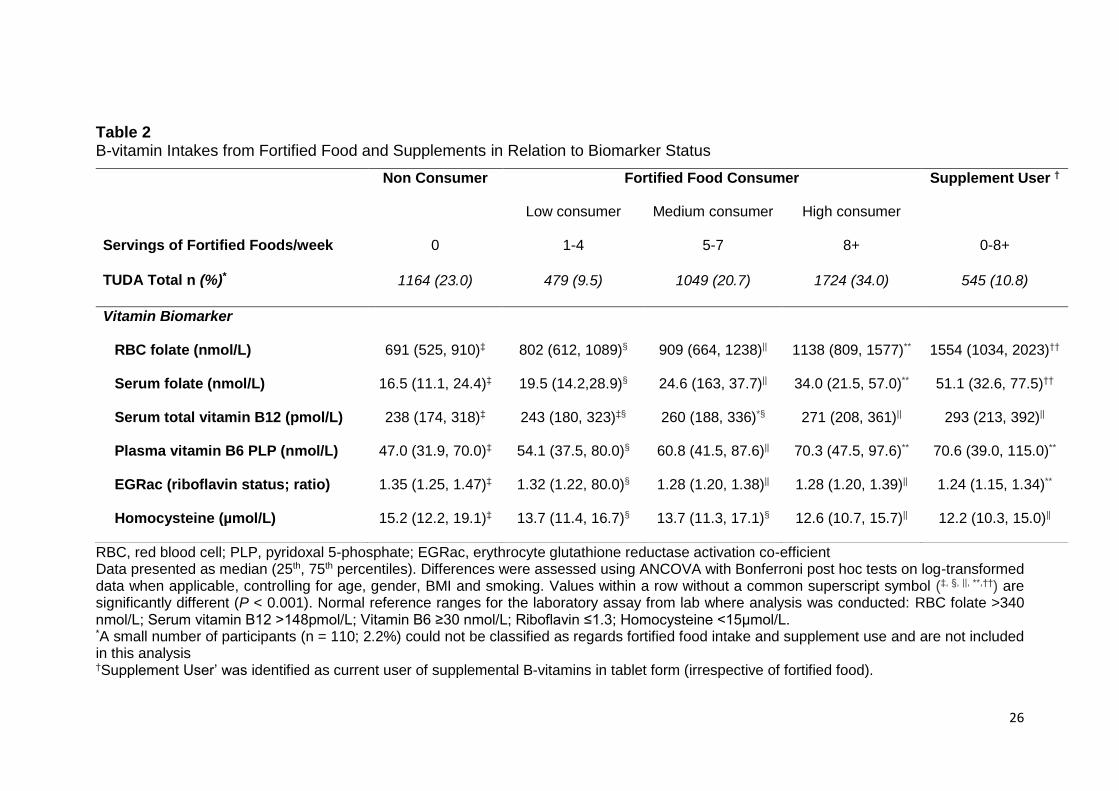
The influence of B-vitamin fortified food and supplement intake on B-vitamin 229
biomarker status was examined (Table 2). Participants were categorized by fortified 230
food intake (0, low, medium, high) and supplement usage; ‘non-consumers’ did not 231
consume fortified foods or supplements and hence depended on natural food sources 232
of B-vitamins only. As dietary intake of B-vitamin fortified foods increased, biomarker 233
11
status of each vitamin increased in a stepwise manner, with the highest B-vitamin 234
biomarker status being observed in those participants who consumed the highest 235
intakes of fortified foods (i.e. at least once daily) and in those taking B-vitamin 236
supplements. Supplement users were identified on the basis of their reported current 237
use of supplemental B vitamins in tablet form (irrespective of fortified food) and 238
accounted for 10.8% of overall TUDA sample. A small number of participants (n = 110; 239
2.2%) could not be classified as regards fortified food intake and supplement use and 240
thus were excluded from this part of the analysis. Fortified breakfast cereals (65%), 241
spreads (55 %) and drinks (20 %) were the most commonly consumed fortified foods 242
within this cohort (data not shown). 243
The risk of depression was examined in relation to B-vitamin fortified food intake 244
(Fig. 3); for this purpose, the reference category was ‘non-consumers’ i.e. no fortified 245
food or supplement usage. High fortified food intake (> 1 portion per day) was 246
associated with significantly lower depression (OR 0.54; 95% CI 0.41-0.70, P <.001). 247
After adjustment for relevant co-variates (i.e. age, gender, anti-depressant medication, 248
education, vitamin supplement usage, smoking status, physical frailty, living alone, 249
socioeconomic status and transient ischemic attack) and fortified food intake, B-250
vitamin supplement usage was not associated with risk of depression (OR 0.941; 0.68-251
1.30, P = .712). No significant relationship was identified between B-vitamin fortified 252
food intake (OR 0.97; 0.69-1.36, P = .861) or supplement usage (OR 0.99; 0.64-1.54, 253
P = .974) and anxiety. 254
255
Discussion 256
This study is the first large cross sectional study to investigate biomarker status 257
of all four B-vitamins involved in one-carbon metabolism in relation to depression and 258
12
anxiety in older adults. The findings suggest that low biomarker status of folate, vitamin 259
B6 or riboflavin, but not vitamin B12, were each independently associated with 260
increased depression. Correspondingly, consuming at least one portion per day of B-261
vitamin fortified food was associated with lower depression (by 50% relative to non-262
consumers). Only deficient status of vitamin B6 (but not the other B-vitamins) was 263
associated with higher risk of anxiety, and no significant relationship of fortified food 264
with anxiety was shown. 265
The current results estimated that having RBC folate concentrations in the 266
lowest 20% was associated with an increased risk of depression (by almost 80%), 267
adding to the considerable body of evidence linking low folate with depression. 268
Likewise, published meta-analyses of observational studies in adults reported that low 269
biomarker status of folate was associated with between 23%12 and 42%24 increased 270
risk of depression. The stronger relationship of folate with depression identified in the 271
current study compared with the aforementioned studies,12,24 may be explained to 272
some extent by the use of RBC folate. RBC folate is widely considered to be a better 273
index of long-term folate status, compared to plasma or serum folate as it parallels 274
liver concentrations (accounting for about 50% of total body folate) and is thus 275
considered to represent tissue folate stores, whereas serum folate is the earliest 276
indicator of folate exposure and reflects recent dietary intake.7,25 The evidence linking 277
folate with depression is however not entirely consistent. The Chicago Health and 278
Aging Study (CHAP) (n = 3503) and the Quebec longitudinal study on nutrition and 279
Aging (NuAge) (n = 1368) found no association of folate with depression; however 280
these observations were based on dietary intakes only with no corresponding folate 281
biomarker data.26,27 Furthermore, the studies were conducted in regions with 282
mandatory folic acid fortification policies, where more optimal folate status throughout 283
13
the population would make a relationship with depression less likely. The current study 284
found no association of vitamin B12 with depression, which is in line with the findings 285
from one large cohort study (n = 2,524) conducted in the USA,28 but at odds with other 286
research which reported inverse associations of vitamin B12 intake26,27 or 287
biomarkers29 with depression. The explanation for such discrepancy in the evidence 288
linking vitamin B12 with depression is unclear, but may possibly relate to differences 289
in B12 status among populations under investigation or methodological variation 290
among studies, including the use of different B12 biomarkers to measure status, 291
especially considering that no consensus exists as to the best biomarker for assessing 292
B12 status in the laboratory.30 293
Low status of vitamin B6 or riboflavin were each significantly associated with 294
depression. Likewise, previous studies have reported inverse associations of vitamin 295
B6 biomarkers with depression.31 In contrast to the other relevant B-vitamins, riboflavin 296
has received very little attention as regards its potential role in depression, with 297
previous evidence limited to one early study which reported that 27% of patients 298
admitted to a psychiatric inpatient unit had riboflavin deficiency,32 whilst a recent study 299
showed no significant relationship of dietary riboflavin intake with depression.33 The 300
finding that both vitamins show similar relationships with depression is perhaps 301
unsurprising. There is a well established metabolic dependency of vitamin B6 on 302
riboflavin, in that the generation in tissues (via pyridoxine 5’phosphate oxidase) of the 303
active B6 form, PLP, requires riboflavin in its co-factor form flavin mononucleotide 304
(FMN). This interrelationship in humans was previously confirmed by showing that 305
riboflavin supplementation of older adults not only improved riboflavin biomarker 306
status, but also enhanced vitamin B6 concentrations, suggesting that riboflavin may 307
be the more limiting nutrient.34 308
14
In the current study, low/deficient vitamin B6 status was associated with an 309
increased risk of anxiety, while no significant associations with anxiety were found for 310
any other B-vitamin biomarkers or fortified foods. The findings are generally in line with 311
those of the Hordaland Homocysteine Study (n = 5948) which also reported no 312
significant relationships of folate or vitamin B12 with anxiety in Norwegian adults.35 313
Few previous studies have investigated vitamin B6 in relation to anxiety and the 314
evidence is unclear, although one randomized trial in 60 patients observed short term 315
benefits in symptoms of anxiety in response to a supplement containing vitamin B6 316
(combined with vitamin B12 and folate) in patients suffering from depression,36 317
perhaps suggesting potential benefits of optimizing B6 status in this patient group. In 318
line with the conclusions of a recent meta-analysis, we observed a positive association 319
of anxiety with hypertension in the current study, the mechanism for which has been 320
previously reviewed but remains unclear.37 Further work would be required to 321
investigate whether vitamin B6 plays a role in this complex relationship. 322
The current results not only showed that low biomarker status of specific B-323
vitamins was associated with a higher risk of depression, but importantly suggested 324
(for the first time) the potential for fortified foods to contribute to reducing depression 325
in older age. Fortified foods are known to provide a highly bioavailable source of B-326
vitamins, particularly folate,7 and their contribution to optimal B-vitamin biomarker 327
status among adults (not taking B-vitamin supplements) has previously been 328
reported.22 The current results suggest that regular consumption of fortified foods, by 329
improving B-vitamin biomarkers, may provide a practical means of reducing the risk of 330
depression in older adults. Indeed the findings, showing a potential benefit of fortified 331
foods in relation to mental health, may contribute to the current risk-benefit debate 332
surrounding mandatory fortification with folic acid, and specifically the issue of whether 333
15
there are any benefits to older people from a folic acid fortification policy directed 334
primarily at preventing neural tube defects in women of reproductive age.38 335
The biological mechanism explaining these and previous results linking folate 336
and related B-vitamins with depression is not known, but invariably must relate to their 337
roles in one-carbon metabolism. In particular, these B-vitamins are required for 338
methylation reactions; lower status may thus reduce the methylation of 339
neurotransmitters.6 Furthermore, folate is required for monoamine synthesis and lower 340
concentrations of monoamine metabolites in cerebral spinal fluid have been found in 341
folate deficient patients suffering from depresssion.8 Additionally, the active form of 342
vitamin B6 (PLP) is the cofactor for aromatic L-amino acid decarboxylase in the 343
tryptophan serotonin pathway, thus deficient B6 status (and/or riboflavin required to 344
generate PLP in tissues)34 may lead to reduced concentrations of serotonin.39 345
This study had both strengths and limitations. Although the TUDA study is one 346
of the largest and most comprehensively characterized cohorts of its kind, its cross-347
sectional design means that the possibility of residual confounding and reverse 348
causality cannot be excluded. Also, the data have been derived from only two 349
jurisdictions within Europe, Ireland and the UK, therefore the results may not 350
necessarily be generalizable to other populations. Furthermore the CES-D scale used 351
in this study to assess depression, while widely considered to have an acceptable 352
screening accuracy in primary care settings, is not as robust as certain other 353
diagnostic instruments and this may have limited the interpretation of the findings to 354
some extent.40 However, this is the first human study to investigate the associations 355
of all relevant B-vitamin biomarkers (including riboflavin, rarely assessed in cohort 356
studies or nutritional surveys) with depression and anxiety in older adults, and thus 357
allowed an in-depth examination of the role of one-carbon metabolism in mental 358
16
health. Finally, this is the first study to have considered the potential role of fortified 359
foods as a practical means of reducing depression in older age. 360
361
Conclusions/Relevance 362
This study shows that lower biomarker status of folate or vitamin B6 or riboflavin 363
was associated with depression in older adults, while deficient status of vitamin B6 364
was associated with anxiety. Higher intakes of B-vitamin fortified foods (e.g. fortified 365
breakfast cereals) or B-vitamin supplement use resulted in the achievement of optimal 366
B-vitamin biomarker status, whereas fortified foods consumed daily were associated 367
with lower depression. Further work in the form of well-designed randomized 368
controlled trials, investigating relevant B-vitamins and in populations with sub-optimal 369
B-vitamin status, are needed to confirm these observational findings. If confirmed, 370
these results may have implications for dietary recommendations and health policy 371
involving low cost non-drug options to improve mental health and thus quality of life in 372
older adults. 373
374
Conflicts of Interest 375
The authors have no financial or personal conflicts of interest. 376
377
Acknowledgements 378
The TUDA study was supported by the Irish Department of Agriculture, Food 379
and the Marine and Health Research Board (under the Food Institutional Research 380
Measure, FIRM) and from the Northern Ireland Department for Employment and 381
Learning (under its Strengthening the All-Island Research Base initiative). 382

17
Sponsor's role: The funders of this research had no role in the design, methods, 383
subject recruitment, data collections, analysis and preparation of paper. 384
The authors are grateful to all TUDA participants. 385
386
18
References
1. United Nations Department of Economic and Social Affairs/Population Division.
World Population Prospects: The 2015 Revision, Key Findings and Advance Tables.
United Nations, 2015.
2. Andreas S, Schulz H, Volkert J, Dehoust M et al. Prevalence of mental disorders
in elderly people: the European MentDis_ICF65+ study. Br J Psychiatry
2016;210:125-131.
3. World Health Organisation. .Mental health and older adults.
http://www.who.int/mediacentre/factsheets/fs381/en/.Accessed on April 2016.
4. Almeida OP, Flicker L, Hankey GJ, Yeap BB et al. Depression, Frailty, and All-
Cause Mortality: A Cohort Study of Men Older than 75 Years. J Am Med Dir Assoc
2015;16:296-300.
5. Rush AJ, Trivedi MH, Wisniewski SR, Nierenberg AA et al. Acute and longer-term
outcomes in depressed outpatients requiring one or several treatment steps: a
STAR*D report. Am J Psychiatry 2006;163:1905-1917.
6. Moore K, Hughes CF, Ward M, Hoey L et al. Diet, nutrition and the ageing brain:
current evidence and new directions. Proc Nutr Soc 2018;1-12.
7. Bailey LB, Stover PJ, McNulty H, Fenech MF et al. Biomarkers of Nutrition for
Development-Folate Review. J Nutr 2015;145:1636-1680.
8. Bottiglieri T, Reynolds EH. Folate and Neurological Disease. In: LB Bailey, eds.
Folate in Health and Disease. 2nd Ed. Florida: CRC Press, 2005.
19
9. Carney MWP. Serum Folate Values In 423 Psychiatric Patients. Br Med J
1967;4:512-516.
10. Reynolds EH, Preece JM, Bailey J, Coppen A. Folate Deficiency in Depressive
Illness. Br J Psychiatry 1970;117:287.
11. Shorvon SD, Carney MWP, Chanarin I, Reynolds EH. The neuropsychiatry of
megaloblastic anaemia. Br Med J 1980;281:1036.
12. Petridou ET, Kousoulis AA, Michelakos T, Papathoma P et al. Folate and B12
serum levels in association with depression in the aged: a systematic review and
meta-analysis. Aging Ment Health 2016;20:965-973.
13. McCann A, McNulty H, Rigby J, Hughes CF et al. Impact of area-level
socioeconomic deprivation on the risk of cognitive dysfunction in older adults. J Am
Geriatr Soc 2018;66:1269-1275.
14. Radloff L, Locke B. The community mental health assessment survey and the
CES-D Scale. . In: M Weissman, Myers J, Ross C, eds. Community surveys of
psychiatric disorders. New Brunswick, NJ: Rutgers University Press, 1986.
15. Zigmond AS, Snaith RP. The hospital anxiety and depression scale. Acta
Psychiatr Scand 1983;67:361-370.
16. Folstein MF, Folstein SE, McHugh PR. "Mini-mental state". A practical method
for grading the cognitive state of patients for the clinician. J Psychiatr Res
1975;12:189-198.
20
17. Molloy AM, Scott JM. Microbiological assay for serum, plasma, and red cell folate
using cryopreserved, microtiter plate method. Methods Enzymol 1997;281:43-53.
18. Kelleher BP, Broin S. Microbiological Assay for Vitamin-B-12 Performed in 96-
Well Microtitre Plates. J Clin Pathol 1991;44:592-595.
19. Leino A. Fully automated measurement of total homocysteine in plasma and
serum on the Abbott IMx analyzer. Clin Chem 1999;45:569-571.
20. Bates CJ, Pentieva KD, Matthews N, Macdonald A. A simple, sensitive and
reproducible assay for pyridoxal 5'-phosphate and 4-pyridoxic acid in human plasma.
1999;280:101-111.
21. Powers HJ, Bates CJ, Prentice AM, Lamb WH et al. The relative effectiveness or
iron and iron with riboflavin in correcting a microcytic anaemia in men and children in
rural Gambia. 1983;37:413-425.
22. Hoey L, McNulty H, Askin N, Dunne A et al. Effect of a voluntary food fortification
policy on folate, related B vitamin status, and homocysteine in healthy adults. Am J
Clin Nutr 2007;86:1405-1413.
23. Podsiadlo D, Richardson S. The timed 'Up and Go': A test of basic functional
mobility for frail elderly persons. J Am Geriatr Soc 1991;39:142-148.
24. Gilbody S, Lightfoot T, Sheldon T. Is low folate a risk factor for depression? A
meta-analysis and exploration of heterogeneity. J Epidemiol Community Health
2007;61:631-637.
21
25. Duffy ME, Hoey L, Hughes CF, Strain JJ et al. Biomarker responses to folic acid
intervention in healthy adults: a meta-analysis of randomized controlled trials. Am J
Clin Nutr 2014;99:96-106.
26. Skarupski KA, Tangney C, Li H, Ouyang B et al. Longitudinal association of
vitamin B-6, folate, and vitamin B-12 with depressive symptoms among older adults
over time. Am J Clin Nutr 2010;92:330-335.
27. Gougeon L, Payette H, Morais JA, Gaudreau P et al. Intakes of folate, vitamin
B6and B12and risk of depression in community-dwelling older adults: the Quebec
Longitudinal Study on Nutrition and Aging. Eur J Clin Nutr 2016;70:380.
28. Beydoun MA, Shroff MR, Beydoun HA, Zonderman AB. Serum folate, vitamin B-
12, and homocysteine and their association with depressive symptoms among U.S.
Adults. Psychosom Med 2010;72:862-873.
29. Kim JM, Stewart R, Kim SW, Yang SJ et al. Predictive value of folate, vitamin B-
12 and homocysteine levels in late-life depression. Br J Psychiatry 2008;192:268-
274.
30. McNulty H, Hughes C. Assessing biomarker status of vitamin B12 in the
laboratory: no simple solution. Ann Clin Biochem 2017;55:188-189.
31. Merete C, Falcon LM, Tucker KL. Vitamin B6 is associated with depressive
symptomatology in Massachusetts elders. J Am Coll Nutr 2008;27:421-427.
32. Carney MW, Ravindran A, Rinsler MG, Williams DG. Thiamine, riboflavin and
pyridoxine deficiency in psychiatric in-patients. Br J Psychiatry 1982;141:271-272.
22
33. Murakami K, Mizoue T, Sasaki S, Ohta M et al. Dietary intake of folate, other B
vitamins, and omega-3 polyunsaturated fatty acids in relation to depressive
symptoms in Japanese adults. Nutrition 2008;24:140-147.
34. Madigan SM, Tracey F, McNulty H, Eaton-Evans J et al. Riboflavin and vitamin
B-6 intakes and status and biochemical response to riboflavin supplementation in
free-living elderly people. Am J Clin Nutr 1998;68:389-395.
35. Bjelland I, Tell GS, Vollset SE, Refsum H et al. Folate, vitamin B-12,
homocysteine, and the MTHFR 677C -> T polymorphism in anxiety and depression -
The Hordaland Homocysteine Study. Arch Gen Psychiatry 2003;60:618-626.
36. Lewis JE, Tiozzo E, Melillo AB, Leonard S et al. The Effect of Methylated Vitamin
B Complex on Depressive and Anxiety Symptoms and Quality of Life in Adults with
Depression. ISRN Psychiatry 2013;2013:621453.
37. Pan Y, Cai W, Cheng Q, Dong W et al. Association between anxiety and
hypertension: a systematic review and meta-analysis of epidemiological studies.
Neuropsychiatr Dis Treat 2015;11:1121-1130.
38. Mills J, Molloy AM, Reynolds E. Do the benefits of folic acid fortification outweigh
the risk of masking vitamin B12 deficiency? BMJ 2018;360:k1334-k1334.
39. Hensler J. Serotonin. In: Siegel GJ, Albers RW, Brady ST, Price DL, eds. Basic
Neurochemistry: Molecular, Cellular and Medical Aspects. 7th Ed. Canada: Elsevier
Academic Press, 2006.
23
40. Vilagut G, Forero CG, Barbaglia G, Alonso J. Screening for Depression in the
General Population with the Center for Epidemiologic Studies Depression (CES-D):
A Systematic Review with Meta-Analysis. PLoS One 2016;11:e0155431-e0155431.
24
List of Figure Captions
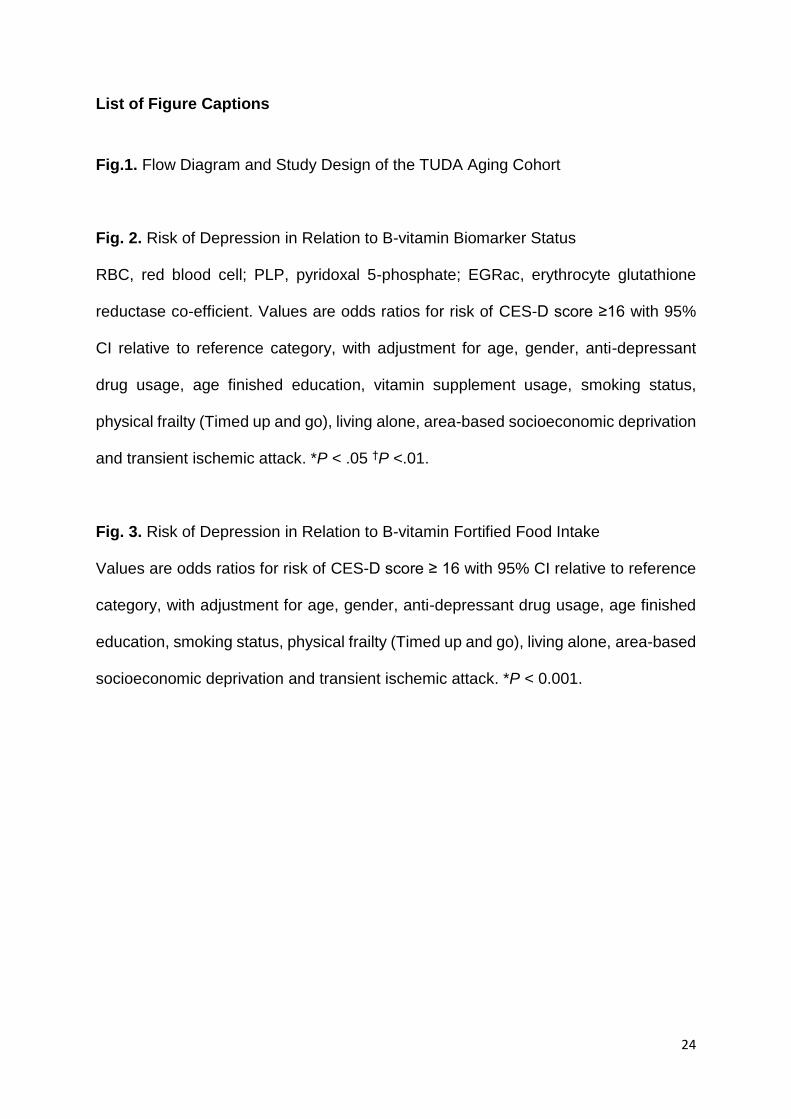
Fig.1. Flow Diagram and Study Design of the TUDA Aging Cohort
Fig. 2. Risk of Depression in Relation to B-vitamin Biomarker Status
RBC, red blood cell; PLP, pyridoxal 5-phosphate; EGRac, erythrocyte glutathione
reductase co-efficient. Values are odds ratios for risk of CES-D score ≥16 with 95%
CI relative to reference category, with adjustment for age, gender, anti-depressant
drug usage, age finished education, vitamin supplement usage, smoking status,
physical frailty (Timed up and go), living alone, area-based socioeconomic deprivation
and transient ischemic attack. *P < .05 †P <.01.
Fig. 3. Risk of Depression in Relation to B-vitamin Fortified Food Intake
Values are odds ratios for risk of CES-D score ≥ 16 with 95% CI relative to reference
category, with adjustment for age, gender, anti-depressant drug usage, age finished
education, smoking status, physical frailty (Timed up and go), living alone, area-based
socioeconomic deprivation and transient ischemic attack. *P < 0.001.
25
Table 1 General Characteristics of TUDA Study Participants
Males (n = 1665)
Females (n = 3406)
P*
Age, mean (SD) (year) 73.4 (8.0) 74.3 (8.4) < .001 Education, mean (SD) (years) 16.0 (3.2) 16.0 (2.9) .543
Health and Lifestyle Instrumental Activities of Daily Living 24.1 (0.1) 24.1 (0.1) .895 Physical Self Maintenance Score 23.1 (0.05) 22.9 (0.3) < .001 Timed Up and Go (seconds) 14.1 (0.2) 14.0 (0.1) .461 Living alone % (n) 22.4 (373) 39.2 (1335) < .001 Current Smoker % (n) 11.6 (193) 12.1 (411) .651 Alcohol (units/week) 8.8 (0.2) 2.5 (0.2) < .001 Fortified Food Consumer % (n) 71.2 (1186) 71.7 (2443) .888 B-vitamin Supplement User % (n) 9.8 (163) 11.4 (3820 .098 Vitamin D Supplement User % (n) 32.1 (533) 55.3 (1867) < .001 Socio-economic Status (most deprivation) % (n) 26.4 (429) 26.2 (867) .856
Medical BMI (kg/m2) 28.4 (0.1) 27.7 (0.01) < .001
Waist to Hip ratio 0.97 (0.02) 0.88 (0.01) < .001 Diabetes % (n) 18.7 (311) 9.6 (327) < .001 Hyperlipidemia % (n) 55.3 (919) 52.1 (1774) .037 Hypertension % (n) 79.2 (1318) 68.1 (2318) < .001 Previous Myocardial infarction % (n) 16.0 (266) 7.2 (244) < .001 Previous Transient Ischemic Attack % (n) 8.1 (135) 8.4 (286) .774 Previous Stroke % (n) 11.4 (189) 5.8 (199) < .001
Brain Health Depression (CES-D Score) 5.5 (0.2) 6.3 (0.1) .267 Identified Depressed (CES-D Score ≥16)% (n) 8.3 (137) 12.0 (407) < .001
Self-reported depression % (n) 19.5 (325) 26.2 (893) < .001 Anti-depressant drugs % (n) 10.2 (169) 15.9 (542) < .001
Anxiety (HAD score) 2.8 (0.1) 3.4 (0.1) .513 Identified Anxious (HAD score ≥11) % (n) 3.7 (61) 5.6 (190) .004
Self-reported anxiety % (n) 15.9 (264) 24.4 (832) < .001 Cognition (MMSE score) 27.0 (0.1) 27.1 (0.0) < .001
Cognitive impairment (MMSE <25) % (n) 11.9 (187) 13.5 (444) .134 Biomarker
Red blood cell folate (nmol/L) 1043 (13.5) 1094 (9.2) .001 Serum vitamin B12 (pmol/L) 263 (3.1) 288 (2.1) < .001 Plasma vitamin B6 (PLP; nmol/L) 65.4 (1.0) 72.0 (0.7) < .001 Riboflavin (EGRac) 1.34 (0.00) 1.33 (0.00) .146 Plasma total Homocysteine (µmol/L) 15.2 (0.1) 14.3 (0.1) < .001 MTHFR 677TT genotype % (n) 11.9 (192) 12.2 (405) .689
TUDA, Trinity Ulster Department of Agriculture; MMSE, Mini Mental State Examination; CES-D, Centre for Epidemiologic Studies Depression; HAD, Hospital Anxiety and Depression Scale; PLP, pyridoxal 5-phosphate; EGRac, erythrocyte glutathione reductase activation co-efficient; MTHFR methylenetetrahydrofolate reductase. Continuous variables presented as adjusted means (SEM) unless otherwise stated. *ANCOVA with Bonferroni post hoc tests on log-transformed data when applicable, with adjustment for age, BMI, smoking status, alcohol, anti-depressant medication usage, vitamin supplement usage and fortified food and categorical variables were assessed using χ² analysis
26
Table 2 B-vitamin Intakes from Fortified Food and Supplements in Relation to Biomarker Status
RBC, red blood cell; PLP, pyridoxal 5-phosphate; EGRac, erythrocyte glutathione reductase activation co-efficient Data presented as median (25th, 75th percentiles). Differences were assessed using ANCOVA with Bonferroni post hoc tests on log-transformed data when applicable, controlling for age, gender, BMI and smoking. Values within a row without a common superscript symbol (‡, §, ||, **,††) are significantly different (P < 0.001). Normal reference ranges for the laboratory assay from lab where analysis was conducted: RBC folate >340 nmol/L; Serum vitamin B12 >148pmol/L; Vitamin B6 ≥30 nmol/L; Riboflavin ≤1.3; Homocysteine <15µmol/L. *A small number of participants (n = 110; 2.2%) could not be classified as regards fortified food intake and supplement use and are not included in this analysis
†Supplement User’ was identified as current user of supplemental B-vitamins in tablet form (irrespective of fortified food).
Non Consumer Fortified Food Consumer Supplement User †
Low consumer Medium consumer High consumer
Servings of Fortified Foods/week 0 1-4 5-7 8+ 0-8+
TUDA Total n (%)* 1164 (23.0) 479 (9.5) 1049 (20.7) 1724 (34.0) 545 (10.8)
Vitamin Biomarker
RBC folate (nmol/L) 691 (525, 910)‡ 802 (612, 1089)§ 909 (664, 1238)|| 1138 (809, 1577)** 1554 (1034, 2023)††
Serum folate (nmol/L) 16.5 (11.1, 24.4)‡ 19.5 (14.2,28.9)§ 24.6 (163, 37.7)|| 34.0 (21.5, 57.0)** 51.1 (32.6, 77.5)††
Serum total vitamin B12 (pmol/L) 238 (174, 318)‡ 243 (180, 323)‡§ 260 (188, 336)*§ 271 (208, 361)|| 293 (213, 392)||
Plasma vitamin B6 PLP (nmol/L) 47.0 (31.9, 70.0)‡ 54.1 (37.5, 80.0)§ 60.8 (41.5, 87.6)|| 70.3 (47.5, 97.6)** 70.6 (39.0, 115.0)**
EGRac (riboflavin status; ratio) 1.35 (1.25, 1.47)‡ 1.32 (1.22, 80.0)§ 1.28 (1.20, 1.38)|| 1.28 (1.20, 1.39)|| 1.24 (1.15, 1.34)**
Homocysteine (µmol/L) 15.2 (12.2, 19.1)‡ 13.7 (11.4, 16.7)§ 13.7 (11.3, 17.1)§ 12.6 (10.7, 15.7)|| 12.2 (10.3, 15.0)||

27