Awan egov01 journal 20100717b
10
Architectural Model of Spatially Enabled E-Government in Indonesia Adhiawan Soegiharto 1 , Dana Indra Sensuse 2 1,2 Magister Teknologi Informasi, Fakultas Ilmu Komputer, Universitas Indonesia Gedung Pusat Ilmu Komputer Universitas Indonesia Jl. Salemba Raya No. 4, Jakarta Pusat, Indonesia [email protected] [email protected] Abstract— Data and spatial information has been recognised as an important element in decision making. The high cost of spatial data procurement can become an obstacle in accessing spatial information, so that the spatial data held by certain institutions cannot be shared by other institutions that may need it. To overcome this problem, national government has issued policies on the dissemination of spatial data. This policy appoints several agencies to act as nodes and node connectors of a National Spatial Data Network. However, within this policy there is no reference to the architecture that is required to build an e- government which can support the use of spatial data for decision making. To build such an architectural model, identification and observation is required in every relevant Indonesian institution designated as nodes and connecting node in the National Spatial Data Network. To establish current best practice, a critical observation and comparative review will be completed of e-government architecture models in other spatially enabled countries. The results of this identification and observation become the basis for the design of an appropriate architectural model. Architectural models thus formed can provide a reference for agencies in Indonesia. Such a reference is expected to facilitate institutions in building the information technology architecture that can enable them to efficiency and effectively make best use of spatial data. Keywords— e-government, e-government architecture, spatial information, data integration, core diagram I. BACKGROUND AND MOTIVATION E-government initiatives in Indonesia began in the early 2000s and confirmed by the issuance of Presidential Instruction (Inpres) No. 6 year 2001 on Telematics. This Presidential Directive states that government officials should use telematics technology to support good governance. The Initiative is expanding so that the government issued Presidential Instruction No. 3 year 2003 on e-government development policy. E-government development, in addition to improving the quality of service to the community, also improves the quality of data and information provided through the service. Data and information can be used as a basis for decision making, both by businesses, the public, or other government institutions. According to the survey results on Spatial Enablement of government in Australia by Geoscience Australia in 2007, ‘the use of spatial information will improve the quality of decision making, reduce administrative costs, improve the quality of the governmental activities, and improve opportunities for industrial development. However, this requires the availability of spatial data and its access that is well maintained to be used by most of spatially unaware people’ [46]. Government that provides extensive spatial information is referred as a spatially enabled government. From the initial literature study, the authors conclude that if spatial elements are embedded in e-government, then the awareness of the use and dissemination of spatial data and information is expected to start rising. This is due to the purpose and nature of e-government itself, which provides access information to the public in a simple and accessible form. This public awareness will lead to increased community interest in obtaining access to spatial information. The high public interest is expected to increase the awareness of government institutions in the larger benefits of wider spatial data and information dissemination and sharing. II. PROBLEM STATEMENT Government regulations on the establishment of the ministries (UU No. 39 year 2008) states that each function of governance may not be done by only a particular institution or ministry. Governance functions which are performed by several institutions led to the emergence of several programs which will use similar data and information. About 80 percent of them contain elements of spatial information [38]. Currently, in Indonesia, the use of spatial data and information, both by public and government institutions, is still very small. The expensive provision of spatial data is one of the main reasons. Currently, each sub-directorate, which launched a program almost always procure their own spatial data. Procurement of spatial data is usually a significant cost of financing the overall program. The high cost provision of spatial data causes each institution to store spatial data for
-
Upload
independent -
Category
Documents
-
view
0 -
download
0
Transcript of Awan egov01 journal 20100717b

Architectural Model of Spatially Enabled
E-Government in Indonesia Adhiawan Soegiharto1, Dana Indra Sensuse2
1,2Magister Teknologi Informasi, Fakultas Ilmu Komputer, Universitas Indonesia
Gedung Pusat Ilmu Komputer Universitas Indonesia
Jl. Salemba Raya No. 4,
Jakarta Pusat, Indonesia
Abstract— Data and spatial information has been recognised as
an important element in decision making. The high cost of spatial
data procurement can become an obstacle in accessing spatial
information, so that the spatial data held by certain institutions
cannot be shared by other institutions that may need it.
To overcome this problem, national government has issued
policies on the dissemination of spatial data. This policy appoints
several agencies to act as nodes and node connectors of a
National Spatial Data Network. However, within this policy there
is no reference to the architecture that is required to build an e-
government which can support the use of spatial data for
decision making. To build such an architectural model,
identification and observation is required in every relevant
Indonesian institution designated as nodes and connecting node
in the National Spatial Data Network. To establish current best
practice, a critical observation and comparative review will be
completed of e-government architecture models in other spatially
enabled countries.
The results of this identification and observation become the
basis for the design of an appropriate architectural model.
Architectural models thus formed can provide a reference for
agencies in Indonesia. Such a reference is expected to facilitate
institutions in building the information technology architecture
that can enable them to efficiency and effectively make best use
of spatial data.
Keywords— e-government, e-government architecture, spatial
information, data integration, core diagram
I. BACKGROUND AND MOTIVATION
E-government initiatives in Indonesia began in the early
2000s and confirmed by the issuance of Presidential
Instruction (Inpres) No. 6 year 2001 on Telematics. This
Presidential Directive states that government officials should
use telematics technology to support good governance. The
Initiative is expanding so that the government issued
Presidential Instruction No. 3 year 2003 on e-government
development policy.
E-government development, in addition to improving the
quality of service to the community, also improves the quality
of data and information provided through the service. Data
and information can be used as a basis for decision making,
both by businesses, the public, or other government
institutions.
According to the survey results on Spatial Enablement of
government in Australia by Geoscience Australia in 2007, ‘the
use of spatial information will improve the quality of decision
making, reduce administrative costs, improve the quality of
the governmental activities, and improve opportunities for
industrial development. However, this requires the availability
of spatial data and its access that is well maintained to be
used by most of spatially unaware people’ [46]. Government
that provides extensive spatial information is referred as a
spatially enabled government.
From the initial literature study, the authors conclude that if
spatial elements are embedded in e-government, then the
awareness of the use and dissemination of spatial data and
information is expected to start rising. This is due to the
purpose and nature of e-government itself, which provides
access information to the public in a simple and accessible
form.
This public awareness will lead to increased community
interest in obtaining access to spatial information. The high
public interest is expected to increase the awareness of
government institutions in the larger benefits of wider spatial
data and information dissemination and sharing.
II. PROBLEM STATEMENT
Government regulations on the establishment of the
ministries (UU No. 39 year 2008) states that each function of
governance may not be done by only a particular institution or
ministry. Governance functions which are performed by
several institutions led to the emergence of several programs
which will use similar data and information. About 80 percent
of them contain elements of spatial information [38].
Currently, in Indonesia, the use of spatial data and
information, both by public and government institutions, is
still very small. The expensive provision of spatial data is one
of the main reasons. Currently, each sub-directorate, which
launched a program almost always procure their own spatial
data. Procurement of spatial data is usually a significant cost
of financing the overall program. The high cost provision of
spatial data causes each institution to store spatial data for
their own. This causes the provision of the same spatial data at
different institutions. Multiple procurements cause higher
procurement costs for the same spatial data for the
government as a whole. Other impacts that occur are the lack
of awareness that spatial data use can become widespread, due
to the tendency of not sharing data.
Data sharing has been recognized to be the solution to the
expensive spatial data procurement. To facilitate the
dissemination of spatial data, the Government of Indonesia
has established the NSDI (National Spatial Data
Infrastructure/Infrastruktur Data Spasial Nasional – IDSN).
Spatial data infrastructures are the key to the formation of a
spatially enabled government [37]. This implementation is
followed by the release of Presidential Regulation (Perpres)
No. 85/2007 regarding the NDSN (National Spatial Data
Network/Jaringan Data Spasial Nasional – JDSN).
E-Government architectural models that support spatial
enablement assist institutions in building e-government
architecture which in turn means that institutions become
spatially enabled and, at the same time, take advantage of
spatial data infrastructure available. Because such reference
model architecture supports e-government usage does not
exist yet in Indonesia, the research question to be answered by
this thesis is "what is the architectural model for spatially
enabled e-government in Indonesia."
III. LITERATURE STUDY
Literature review conducted on the documents of
institutions establishment, the journals, articles, and reference
books on spatially enabled government, e-government, spatial
information, spatial data integration, current geospatial
technologies, enterprise architecture, and related studies that
have been done in the field of e-government.
In Indonesia, there are 4 types of institutions; the State
Supreme Agencies, Ministry, Ministerial Level of
Government Institutions and Non-Departmental Government
Institutions (Lembaga Pemerintah Non Departemen – LPND).
Of the four types of them, there are 2 types of institutions
designated to become the nodes and node connector in the
National Spatial Data Network (NDSN/JDSN), the ministry
and LPND.
These institutions were established to carry out the
functions of governance as in the regulation. Each of the
governance functions are described in detail in the Document
of e-Government Blue Print Design issued by the Ministry of
Communications and Informatics (Kemenkominfo).
Rajabifard states that a government or society is said to be
spatially enabled when spatial information has been widely
available for the community and spatial information are
widely used by consumers as the use of non-spatial
information. In developed countries, the use of spatial
information has now become a common part of the e-
government and broader government ICT strategy [46].
Müller estimates that about 80% of data in the process of
governance institutions is a spatial data or data that relate to
spatial data, so the establishment of spatial data infrastructure
becoming a very important part of the processes that exist in
e-government [38].
A. Interoperability
Interoperability is a crucial issue in the formation of this
spatially enabled government. One of the objectives of the
establishment of NSDI is to address this issue. Sukyadi has
constructed a model of e-Government interoperability [57],
but it has not considering the spatial dimension. Other
researches on spatial data interoperability were conducted by
Zhang et.al [69], Huang et.al [19], and Zheng et.al [70] on
web service interoperability model. These researches show a
positive result on implementation of Open Geospatial
Consortium (OGC) standards as interoperability model. From
the perspective of interoperability on spatially enabled e-
government, the research by Sukyadi (e-government) and
other four researches above are complementing each other.
The interoperability models from those five researches
became matters of literature study to form an integration
model in enterprise architecture of e-government.
B. Spatial Data Infrastructure
SDI (Spatial Data Infrastructure) is a collection of
technologies, policies and institutional arrangements that
facilitate access availability to spatial data [46]. Rajabifard
states that the spatial data infrastructure is the key to the
establishment of a spatially enabled government [47].
In Indonesia, the NSDI was formed as a consortium of
concerned institutions for spatial data. This consortium is
coordinated by Bakosurtanal as government institution that
serves as the coordinator of the survey and mapping. The
NSDI consists of 3 components: institutional, legislation, and
primary data. One of NSDI results is the emergence of Perpres
No. 85/2007 regarding the NSDN (National Spatial Data
Network).
C. National Spatial Data Network
To prevent the procurement of the same spatial data
collection, the Government of Indonesia (GoI) has issued
Perpres No. 85/2007 regarding the NSDN. This regulation
states that NDSN administered through an electronic media
(i.e. Internet) and serves as a means of exchange and
dissemination of spatial data.
This regulation specifies which parties are given the
responsibility as a Node and Node Connector of NDSN. Mesh
networks consist of government institutions, departmental and
non-departmental, provincial, and municipal/district. Network
Node Connector played by the Coordination Agency for
Surveys and Mapping (Bakosurtanal). The table below shows
the institutions included in NDSN.
TABLE I
AGENCIES IN NDSN
No. Government Sector Agency
1 Survey and
mapping
Bakosurtanal (Badan Koordinasi Survei
dan Pemetaan Nasional)
2 Land administration BPN (Badan Pertanahan Nasional)
3 Internal affairs Kemendagri (Kementerian Dalam
Negeri)
4 Transportation Kemenhub (Kementerian Perhubungan)
5 Communication and
informatics
Kemenkominfo (Kementerian
Komunikasi dan Informatika)
6 Public works Kementerian PU (Pekerjaan Umum)
No. Government Sector Agency
7 Culture and tourism Kemenbudpar (Kementerian
Kebudayaan dan Pariwisata)
8 Statistics BPS (Badan Pusat Statistik)
9 Energy and mineral
resources
Kementerian ESDM (Energi dan
Sumber Daya Mineral)
10 Forestry Kemenhut (Kementerian Kehutanan)
11 Agriculture Kementan (Kementerian Pertanian)
12 Marine and
fisheries
KKP (Kementerian Kelautan dan
Perikanan)
13 Meteorology and
geophysics
BMKG (Badan Meteorologi,
Klimatologi, dan Geofisika)
14 Space and
aeronautics
Lapan (Lembaga Antariksa dan
Penerbangan Nasional)
There are 44 types of spatial data, which is mentioned in
NDSN regulation, which must be produced by institutions that
have been designated as a nodes and node connector of the
NDSN. Spatial data production process will become the basis
for building spatial information model of each institution in
NDSN.
The NDSN regulation clearly states that NDSN must be
held through an electronic-based information network. This
assumes technologies that utilize the Internet as a medium of
exchange of spatial data. Reviews of this technology include
the standards of publication, representation, processing, and
production of spatial data.
Internet Map Server is one of the most common
technologies in use today which has implemented this
standard. For the processing and production of spatial data,
GIS desktop applications remain a top choice so far, because
this application provides much more complete spatial features
than the web-based mapping applications. Although it’s
desktop-based, the current applications of GIS has been able
to connect spatial database through the Internet with the same
communication standard used by web mapping.
To show a simple/generic form of a spatially enabled e-
government architecture, the authors adopt Ross core diagram
[40]. A core diagram provides main points in the enterprise
architecture to be a reference for the responsible management
in developing and utilizing this architecture [40]. The
management in this case is the Government of Indonesia. This
diagram is expected to facilitate the government in the overall
view of the architecture.
IV. FRAMEWORK AND METHODOLOGY
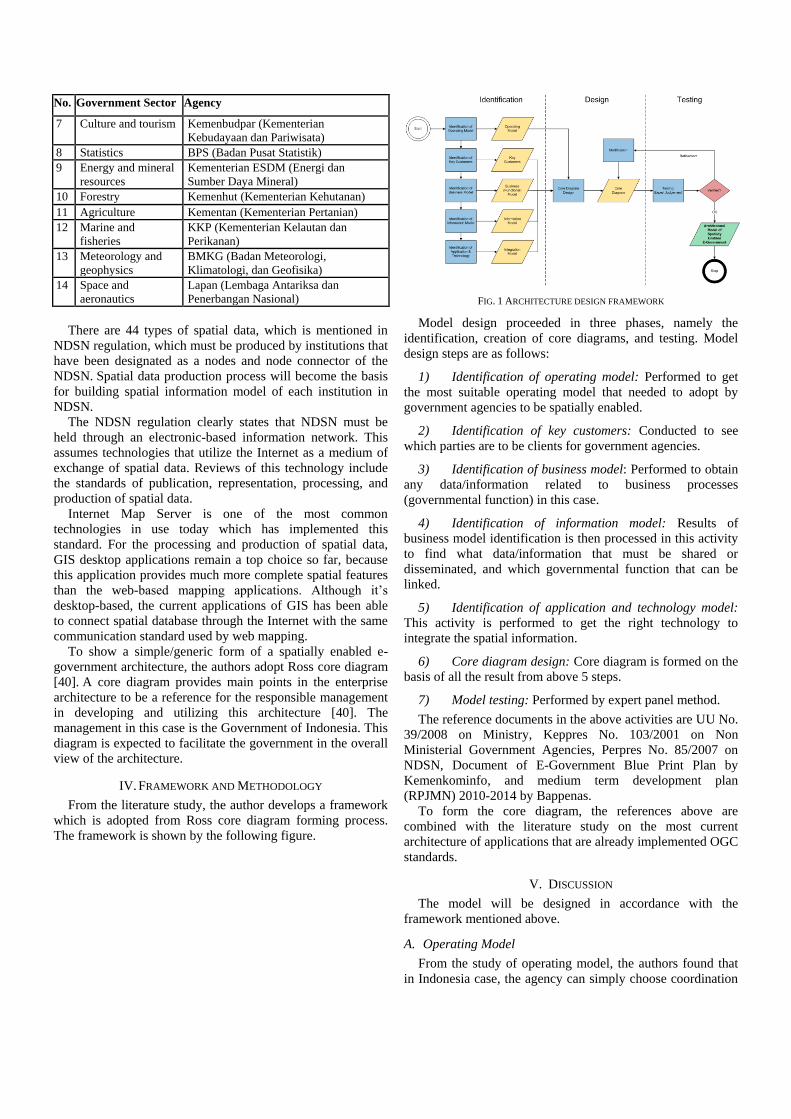
From the literature study, the author develops a framework
which is adopted from Ross core diagram forming process.
The framework is shown by the following figure.
FIG. 1 ARCHITECTURE DESIGN FRAMEWORK
Model design proceeded in three phases, namely the
identification, creation of core diagrams, and testing. Model
design steps are as follows:
1) Identification of operating model: Performed to get
the most suitable operating model that needed to adopt by
government agencies to be spatially enabled.
2) Identification of key customers: Conducted to see
which parties are to be clients for government agencies.
3) Identification of business model: Performed to obtain
any data/information related to business processes
(governmental function) in this case.
4) Identification of information model: Results of
business model identification is then processed in this activity
to find what data/information that must be shared or
disseminated, and which governmental function that can be
linked.
5) Identification of application and technology model:
This activity is performed to get the right technology to
integrate the spatial information.
6) Core diagram design: Core diagram is formed on the
basis of all the result from above 5 steps.
7) Model testing: Performed by expert panel method.
The reference documents in the above activities are UU No.
39/2008 on Ministry, Keppres No. 103/2001 on Non
Ministerial Government Agencies, Perpres No. 85/2007 on
NDSN, Document of E-Government Blue Print Plan by
Kemenkominfo, and medium term development plan
(RPJMN) 2010-2014 by Bappenas.
To form the core diagram, the references above are
combined with the literature study on the most current
architecture of applications that are already implemented OGC
standards.
V. DISCUSSION
The model will be designed in accordance with the
framework mentioned above.
A. Operating Model
From the study of operating model, the authors found that
in Indonesia case, the agency can simply choose coordination

operating model to prepare the spatial enablement. There are
three points to be considered:
a) Noting the influence of the data produced by
institutions with the interests of other institutions,
while maintaining its own business processes;
b) Following the data standardisation that has been
established by the NSDI; only spatial data related
that need to follow this standardisation;
c) IT architecture and/or infrastructure related decision
making are taken at institutional level.
Implementation and technology selection can be
decided by the units under it, as long as spatial data
related technologies are referring to NSDI.
B. Business Model
The business model in government case is indicated by its
services. Service model is formed by mapping the governance
functions (which exist in the governmental functional system
framework) with the institutions mentioned in NSDN.
The output of this analysis then summarised to a table, then
mapped to a matrix of institution vs. functional block as a
service model.
FIG. 2 SUMMARISED OF SERVICE MODEL MATRIX OF INSTITUTIONS IN NDSN
The shaded part in the matrix above shows:
a) Governance function that is performed by the agency
in its column above.
b) That governance function is coordinate by the agency
in its column above.
c) Other agencies that may perform the same function
have to refer to the procedure or standards set by the
agency in its column above.
The matrix above will be used in the mapping process
between service model and information model, which is
focused on function of national development. The
considerations to choose it are:
a) The function of institutional support and service is an
internal function of each institution. Therefore, no
inter-institutions relationship patterns are identified
in this function.
b) The function of politics and legislation and the
function of defence and security, from the scope of
this thesis (NDSN), are only performed by
Kemendagri.
c) There is no institution mentioned in the NDSN
regulation that is performed function of laws,
regulations, and legislations, and the function of
national monetary and fiscal.
d) Though performed by all institutions, the function of
information publication and government service is
not related to other institutions because the
information is only related to each institution itself.
Although focused on the function of National
Development, but on the core diagram to be constructed, the
seven governance function will be listed. Governance
functions 1, 4, and 5 will be listed on the first level only, while
the functions of governance 2, 3, 6, and 7 will be listed until
the first sub-levels.
C. Information Model
Identification information model is performed by map the
outputs with basic needs of spatial information in each of the
agency in NDSN. The result is then summarised to see the
overall relationship between the functional classifications of
spatial data with the institutions concerned. This summary is
shown in the matrix below.
FIG. 3 AGENCY IN NDSN OUTPUT AND SPATIAL INFORMATION NEEDS
Bakosurt
anal
BP
N
Kem
endagri
Kem
enhub
Kem
enkom
info
Kem
ente
rian P
U
Kem
enbudpar
BP
S
Kem
ente
rian E
SD
M
Kem
enhut
Kem
enta
n
KK
P
BM
G
LA
PA
N
6.1 Governance
6.2 Zoning
6.3 Social
6.4 Facilities & Infrastructures
7. Information Publication & Government Services
1. Institutional Support & Services
2. Politics & Legislation
3. Defense & Security
4. Laws, Regulations, & Legislation
5. Monetary & Fiscal
6.
National
Develo
pm
ent

D. Integration Model
Web-based technology is chosen as integration technology
with the use of Internet Map Service. Integration model
adopted from the model of application architecture, web-
mapping applications that have implemented OGC standards.
Models of spatial data integration for publication can be seen
in Fig. 4.
Production, processing, and management of spatial data
perform by using desktop GIS applications. For spatial data
management, web-mapping applications can be used, but
today, tools for production and processing spatial data in
desktop applications are still have much more complete
features than in web-mapping applications. Features of spatial
analysis on a desktop application are also more sophisticated
than web-mapping.
FIG. 4 INTEGRATION MODEL IN SPATIAL DATA PUBLICATION
In data integration, these desktop GIS applications use the
same communication standard with a web-mapping, which
uses OGC standards. Figure below shows the model of
integration of spatial data through desktop GIS applications.
FIG. 5 INTEGRATION MODEL IN SPATIAL DATA PRODUCTION
Through the database connection layer, GIS application
connects to al required spatial data, vector files, and raster
files. All spatial data that has been connected is processed,
analysed, and/or combined to produce a new spatial data.
Cleaning process at each connected spatial data topology must
be done before performing spatial analysis. RS applications or
extensions are used to perform data mining process in raster
files of satellite imageries or aerial photos. This process
results are vectors that can be processed or analysed further by
GIS application. The final output is then stored into a spatial
data warehouse. Spatial data stored in a data warehouse are
(has to be) already topologically clean. This would be very
useful for other institutions that will use this spatial data,
because it will reduce time of topology cleaning significantly.
Both integration models above are then combined to form
an overall integration model (Fig. 6). Agencies producing
spatial data will access spatial data required via database
connection. It is strongly recommended to use the Internet
channels with specific security levels that can only be
accessed by government agencies.
FIG. 6 INTEGRATION MODEL OF SPATIAL INFORMATION
E. Architectural Model of E-Government
In accordance with literature studies on Ross core diagram,
the analysis then mapped onto the core diagram forming
process. The mapping can be seen in the following table.
TABLE II
MAPPING OF ANALYSIS RESULTS WITH CORE DIAGRAM
Process Analysis Result
Shared customers Public, business, and other government
institutions.
Shared data All spatial data mentioned in NDSN
regulation.
Integrating
technologies
The use of Internet Map Service and GIS
applications which are already
implemented OGC standards.
Linked processes Governance function in governmental
functional framework.
From the analysis of each of the above process, the e-
government architecture formed as shown in the Fig. 7 below.

FIG. 7 E-GOVERNMENT CORE DIAGRAM
As shown in the core diagram, there are 2 main layers, the
interface layer, and system layer. Interface layer is the layer
that connects between the systems with potential data users (in
this case, the general public, businesses, and government
institutions). Interface layer is separated into two types to
differentiate its services, to the general public and business
community, and to government institutions. Layer consists of
database systems, spatial database, data processing
applications, and integration. XML, GML and SVG primarily
are the choice of technology for this integration.
F. Sample Implementation
The authors make an example of architecture
implementation if applied in Ministry of Public Works
(Kementerian PU). Kementerian PU produces six types of
spatial data using nine types of base spatial data in four
different agencies. This example is shown in the Fig. 8 below.
FIG. 8 SAMPLE IMPLEMENTATION IN KEMENTERIAN PU
The six types of spatial data in the spatial data warehouse
(1) are the result of analysis using GIS and/or RS (2). Analysis
is performed on base data/base map from other agencies (3)
which then overlaid with some spatial data (4) or additional
rasters (6). If necessary, the result then stored to a local
database (5) so then it can be analysed further before
generating the final spatial data which then stored to spatial
data warehouse (1). Data that has been stored in a data
warehouse can then be used by other institutions (8) to
produce the required spatial data.
Spatial data in a data warehouse are then published through
the IMS (7) for use by decision-makers (9) either within the
ministry itself, or in other agencies. Referring to the role of
Kementerian PU in the national development function, the
spatial data are used to make decisions related to the function
of 6.1 governance, 6.2 zoning, and 6.4 facilities and
infrastructure.
G. Proposed Solution
Proposed implementation of solutions on the institutions
integration model of spatial data are mapped in Fig. 9 as
follow.
FIG. 9 MAPPING OF PROPOSED SOLUTION
As seen on the proposed implementation above, there are
two important parts on the integration model. The first part (1)
is a production process which includes GIS (overlay, spatial
analysis, network analysis) and RS (georeferencing, image
classification, digitisation). This production process can
retrieve data from a local database (4) and the end result is
stored into a spatial data warehouse (3). The second part (2)
covers the process of publication; publication is only
performed on spatial data stored in spatial data warehouse (3).
FIG. 10 SAMPLE SOLUTION FOR SPATIAL DATA PRODUCTION
1) Sample solution for spatial data production: There
are three activities in the production process spatial data,
namely topology cleaning, image processing, and GIS
processing. An example of the proposed solution is shown in
Fig. 10.
Other solution examples for the production of spatial data
can be seen in Table III below. This table also contains some
proprietary solutions, apart from open source solutions.

TABLE III
SAMPLE SOLUTION FOR DATA SPATIAL PRODUCTION
Sample Solution Topology
Cleaning
Image
Processing
GIS
Processing
Open Source
GRASS GIS
grass.itc.it ■
OSSIM
www.ossim.org ■
Quantum GIS
www.qgis.org ■
Ilwis
www.ilwis.org ■ ■
Proprietary
ArcGIS
www.esri.com ■ ■ ■
Erdas Imagine
www.erdas.com ■
Idrisi
www.clarklabs.org ■ ■
Manifold
www.manifold.net ■ ■
GeoMedia
www.intergraph.com ■ ■ ■
2) Sample solution for spatial data publication: There
are three layers in the publication of spatial data, the server
layer, application layer, and web servers, as seen in Fig. 11.
FIG. 11 SAMPLE SOLUTION FOR SPATIAL DATA PUBLICATION
Other solution examples for the production of spatial data
can be seen in the following Table IV. This table also contains
some proprietary solutions, apart from open source solutions.
TABLE IV
SAMPLE SOLUTION FOR SPATIAL DATA PUBLICATION
Sample Solution Map
Server
Application/
Framework
Web
Server
Map
Viewer
Map
Catalog
Open Source
MapGuide Open Source
mapguide.osgeo.org ■ ■ ■
MapServer
mapserver.org ■ ■ ■
GeoServer
geoserver.org ■ ■ ■
OpenLayers
openlayers.org ■
CartoWeb
www.cartoweb.org ■ ■
Apache
httpd.apache.org ■
GeoNetwork
sourceforge.net/projec
ts/geonetwork/
■
Proprietary
ArcGIS Server
www.esri.com ■ ■ ■ ■
Manifold IMS
www.manifold.net/inf
o/ims.shtml
■ ■ ■
GeoMedia WebMap
www.intergraph.com ■ ■ ■ ■
IIS (Windows Server)
www.microsoft.com/se
rvers
■
3) Sample solution for database and data warehouse:
Currently, open source databases have not been able to use as
a data warehouse because, currently, the maximum data size
that is accommodated by open source solutions is 4
Gigabyte. Data warehouse, especially for storing spatial data,
should be able to accommodate larger data sizes, with no size
limit.
TABLE V
SAMPLE SOLUTION FOR DATABASE AND DATA WAREHOUSE
Sample Solution Spatial
Database
Spatial Data
Warehouse
Open Source
Postgres+PostGIS
www.postgresql.org
postgis.refractions.net
■
MySQL Spatial
www.mysql.com ■
Proprietary
Postgres Plus
www.enterprisedb.com ■ ■
Oracle Spatial
www.oracle.com ■ ■
Cubewerx CubeSTOR
www.cubewerx.com ■ ■
H. Implication of Architecture Implementation
There are several implications of the adoption of this
spatially enabled e-government architecture.

1) Management: To ensure the integration of spatial
data in the architectural model in this thesis, the government
should establish a policy to choose a georeference standard for
all agencies in Indonesia. On the other hand, the application of
spatial data warehouse means necessary enforcement of SOPs
from every production process in the use of spatial data and
data cleaning.
2) System: Open source applications for GIS and web
mapping is now approaching features of proprietary
applications, so the cost of purchasing and updating
applications can be suppressed. Because the integration of the
proposed architecture is built upon the network (Internet), then
the government needs to establish a special channel of data
communication between agencies. This data communication
lines can be a WAN or MAN. Implementation of spatial data
warehouse will minimise data inconsistency.
3) Academic perspective: From the academic side, the
implications of the adoption of e-government architecture
which spatially enabled in this thesis are:
Study on the implementation of this spatially enabled
architecture at agencies that have not been included in
NDSN.
Research on ICT governance for the implementation of
architecture that is spatially enabled.
Research on the communication security between
agencies in the implementation of this architecture.
Study on spatial data acquisition speed improvement for
decision making on the implementation of the
architecture.
Study on the improvement in term of speed and accuracy
of interventions for the decision based on the use of
spatial data.
VI. CONCLUSION AND SUGGESTION
A. Conclusion
1) Model of data spatial integration: Can be done by
implementing the OGC standards, whether for publication or
for the production and processing.
2) Open source applications: Already have a fairly
complete feature in the publication of spatial data, while for
the production, processing, and spatial data management, use
of open source applications still need to be combined with the
use of proprietary applications.
3) Result of expert panel: The proposed architectural
model has been considered to be a national benchmark or
reference for the development of spatially enabled e-
government.
B. Suggestion
a) The government should issue a policy to choose a
georeference standard for all agencies in Indonesia
that produce spatial data.
b) Each agency shall issue, enforce, and supervise the
implementation of the SOP on spatial data production
processes.
c) Government and the agencies producing spatial data
need to assess the utilization of open source
applications, both on the production and publication
processes.
d) Government should consider the establishment of the
government service provider to provide electronic
channels (Internet) for communication between
government agencies, to ensure the security and
speed of delivery and exchange of information,
especially spatial information.
e) Each agency needs to ensure the implementation of
spatial data warehouse concept, to maintain the
validity of data.
C. Further Research
Conduct further research or study on:
a) The implementation of this spatially enabled
architecture on other agencies that are not yet
designated as NSDN nodes;
b) The proper ICT governance for the implementation
of a spatially enabled architecture;
c) Security factor in communication channel (Internet)
between agencies to accommodate the integration in
this spatially enabled architecture;
d) The increase of speed in spatial data acquisition for
decision making on the implementation of the
architecture;
e) The speed and accuracy of intervention upon the
decision based on the use of spatial data.
VII. BIBLIOGRAPHY
[1] John W. Barnes and Richard J. Lisle, Basic Geological Mapping, 4th
ed. England: John Wiley & Sons Ltd, 2004.
[2] Karin Berkhoff and Sylvia Herrmann, "Modeling Land Use Change: A
GIS Based Modeling Framework to Support Integrated Land Use
Planning (NabanFrame)," in Advances in GIScience, Monika Sester,
Lars Bernard, and Volker Paelke, Eds.: Springer-Verlag Berlin
Heidelberg, 2009.
[3] Rick Bradford and Daniel Vincent, "Development of Temporal
Mapping Techniques to Support Urban Retrospectives Database," US
Geological Survey, 1998.
[4] Günay Çakir, Fatih Sivrikaya, Salih Terzioğlu, and Emin Zeki Başkent,
"Mapping Secondary Forest Succession with Geographic Information
Systems: A Case Study from Bulanıkdere, Kırklareli, Turkey," Turkish
Journal of Agriculture and Forestry, vol. 31, pp. 71-81, February 2007.
[5] Daniel M. Campbell, Local Government Handbook for GIS
Implementation Within the Commonwealth of Pennsylvania.:
Pennsylvania Mapping and Geographic Information Consortium
(PaMAGIC), 2002.
[6] Commonwealth Cultural Resources Group, Inc., "Minnesota Deep Test
Protocol Project," Minnesota Department of Transportation, Jackson,
2006.
[7] Leslie M. Cone, "Explaining the National Integrated Land System
(NILS)," U.S. Bureau of Land Management, 2008.
[8] Michele Crosetto and Paolo Pasquali, "DSM Generation and
Deformation Measurement from SAR Data," in Advances in
Photogrammetry, Remote Sensing and Spatial Information Sciences:
2008 ISPRS Congress Book, Zhilin Li, Jun Chen, and Emmanuel
Baltsavias, Eds. London: Taylor & Francis Group, 2008.
[9] Christopher Daly, E. H. Helmer, and Maya Quińones, "Mapping the
Climate of Puerto Rico, Vieques and Culebra," International Journal of
Climatology, vol. 23, pp. 1359-1381, August 2003.
[10] Rolf A. de By et al., Principles of Geographic Information Systems,
3rd ed., Rolf A. de By, Ed. Enschede, The Netherlands: The
International Institute for Geo-Information Science and Earth
Observation (ITC), 2004.

[11] Direktorat E-Government, Direktorat Jenderal Aplikasi Telematika,
Rancangan Blue Print E-Government. Jakarta, Indonesia: Kementerian
Komunikasi dan Informatika, 2006.
[12] R.J.J. Dost and C.M.M. Mannaerts, "Generation of Lake Bathymetry
Using Sonar, Satellite Imagery, and GIS," in ESRI Users Group
Conference, 2009.
[13] Ralph Dubayah, Robert Knox, Michelle Hofton, J. Bryan Blair, and
Jason Drake, "Land Surface Characterization Using Lidar Remote
Sensing," in Spatial Information for Land Use Management, Michael J.
Hill and Richard J. Aspinall, Eds., 2000.
[14] W. E. Featherstone, "On the Use of the Geoid in Geophysics: A Case
Study Over the North-West Shelf of Australia," Exploration
Geophysics, vol. 28, no. 1, pp. 52-57, 1997.
[15] FGDC, Geographic Information Framework Data Content Standard
Part 4: Geodetic Control.: Federal Geographic Data Committee
(FGDC), 2008.
[16] Witold Fraczek, "Mean Seal Level, GPS, and the Geoid," ArcUser, pp.
36-41, September 2003.
[17] Maria Grazia Fugini, "A Security Model and Architecture for
Multichannel E-Government Systems," in Second International
Conference on Availability, Reliability and Security, ARES, Vienna,
2007.
[18] Guangping He and Greg Orvets, "Capturing Road Network Data Using
Mobile Mapping Technology," International Archives of
Photogrammetry and Remote Sensing, vol. XXXIII, 2000.
[19] Fang Huang, Dingsheng Liu, Guoqing Li, and Jian Wang, "Preliminary
Study on the Application of OGC Interoperability Specifications in
Spatial Information Grid," in International Conference on New Trends
in Information and Service Science, NISS. , Beijing, 2009, pp. 515-
520.
[20] International Association of Assessing Officers, Standard on Manual
Cadastral Maps and Parcel Identifiers. Chicago: International
Association of Assessing Officers, 2004.
[21] Noritoshi Kamagata et al., "A New Method of Vegetation Mapping by
Object-based Classification Using High Resolution Satellite Data," in
International Conference on Object-based Image Analysis, Salzburg,
2006.
[22] A. J. Kenny, M. Desprez I. Cato, G. Fader, R. T. E. Schüttenhelm, and
J. Side, "An Overview of Seabed-mapping Technologies in the Context
of Marine Habitat Classification," ICES Journal of Marine Sciences,
vol. 60, pp. 411-418, 2003.
[23] Gottfried Konecny, Geoinformation: Remote Sensing, Photogrammetry
and Geographic Information Systems. New York: Taylor & Francis
Inc, 2003.
[24] Marwan Koudmani, "Applications of Remote Sensing to Hydrology
and Hydrogeology," in International Conference on Water Resources &
Arid Environment, Riyadh, 2004.
[25] Alphonce Kyessi and Victoria Mwakalinga, "GIS Application in
Coordinating Solid Waste Collection: The Case of Sinza
Neighbourhood in Kinondoni Municipality, Dar es Salaam City,
Tanzania," in International Federation of Surveyors (FIG) Working
Week, Eilat, 2009.
[26] Kamal Labbassi, Amina Tajdi, and Ahmed Er-raji, "Remote Sensing
and Geological Mapping for a Groundwater Recharge Model in the
Arid Area of Sebt Rbrykine: Doukkala, Western Morocco," in
Geoscience and Remote Sensing Symposium, Cape Town, 2009, pp.
112-115.
[27] Nag Yeon Lee, E-Government Applications.: United Nations Asian
and Pacific Training Centre for Information and Communication
Technology for Development, 2009.
[28] Hyejin Lee and Lee Hyunah, "Design and Implementation of
Integrated MapServer in Web Mapping Environments," in International
Geoscience and Remote Sensing Symposium, 2005, Seoul, 2005.
[29] Bambang Edhi Leksono, Yuliana Susilowati, Hendriatiningsih, and
Denisanto, "The Influence of Urban Accessibility in Determining
Average Indicated Land Values for the Region.," in FIG Congress
2010: Facing the Challenges – Building the Capacity, Sydney, 2010.
[30] Arika Ligman-Zielinska, Richard L. Church, and Piotr Jankowski,
"Spatial Optimization as a Generative Technique for Sustainable
Multiobjective Land Use Allocation," International Journal of
Geographical Information Science, vol. 22, no. 6, pp. 601-622, June
2008.
[31] Feng Ling, Qiu-wen Zhang, and Cheng Wang, "Comparison of SRTM
Data with other DEM sources in Hydrological Researches," in
International Symposium on Remote Sensing of Environment, St.
Petersburg, 2005.
[32] Lifan Li, Qing Yu, and Jiechen Wang, "Assistant Decision System of
E-Government Based on WebGIS," in International Symposium on
Information Engineering and Electronic Commerce, Ternopil, 2009.
[33] Xiaolin Lu, "A Unified E-Government Information Management
Platform Based on Web GIS Technology," in International Conference
on Computational Intelligence and Software Engineering, Wuhan,
2009, pp. 1-4.
[34] M.L. Manchanda, M. Kudrat, and A.K. Tiwari, "Soil Survey and
Mapping Using Remote Sensing," Tropical Ecology, vol. 43, pp. 61-
74, 2002.
[35] Yannis Manolopoulos, Apostolos N. Papadopoulos, and Michael Gr.
Vassilakopoulos, Spatial Databases: Technologies, Techniques, and
Trends.: Idea Group Publishing, 2005.
[36] MapServer Team University of Minnesota, MapServer
Documentation.: University of Minnesota, 2010.
[37] I. Masser, A. Rajabifard, and I.P. Williamson, "Spatially Enabling
Governments through SDI implementation," International Journal of
GIS, vol. 21, pp. 1-16, July 2007.
[38] Hartmut Müller, "Information Technology and Spatial Data
Infrastructure for E-Government," in FIG Workshop on eGovernance,
Knowledge Management and eLearning, Budapest, Hungary, 2006.
[39] Oil and Gas Management Branch, "Seismic Exploration," Yukon
Government, Whitehorse, Yukon Government Oil and Gas Best
Management Practices 2006.
[40] Open Geospatial Consortium. (2010, May) OGC Website. [Online].
http://www.opengeospatial.org
[41] Open GIS Consortium, OpenGIS Simple Features Specification for
SQL.: Open GIS Consortium, Inc., 1999.
[42] Gordon Petrie and Kenneth Smillie, "Airborne Digital Imaging Sensors
and Systems," in Advances in Photogrammetry, Remote Sensing and
Spatial Information Sciences: 2008 ISPRS Congress Book, Zhilin Li,
Jun Chen, and Emmanuel Baltsavias, Eds. London: Taylor & Francis
Group, 2008.
[43] Peter Poole, "Cultural Mapping and Indigenous Peoples," UNESCO,
2003.
[44] Presiden Republik Indonesia, Peraturan Presiden Republik Indonesia
No. 85/2007., 2007.
[45] Yu-kun Qiao, Shi-cheng Wang, Jin-sheng Zhang, Li-hua Chen, and Qi
Zhang, "Surface Spline Based Constructing Method for Geomagnetic
Reference Map," in IEEE International Conference on Information and
Automation, Zhuhai/Macau, 2009.
[46] Abbas Rajabifard, "SDI Design to Facilitate Spatially Enabled
Society," in ISPRS workshop on Geoinformation and Decision Support
Systems and 4th GIS Conference, Teheran, Iran, 2008.
[47] Abbas Rajabifard, "Spatially Enabled Government and Society: A
Scenario for the Future," International Seminar on Land Administration
Trends and Issues in Asia and The Pacific Region, August 2008.
[48] H.M. Rajesh, "Application of Remote Sensing and GIS in Mineral
Resource Mapping - An overview," Journal of Mineralogical and
Petrological Sciences, vol. 99, pp. 83-103, 2004.
[49] I. Prasada Rao, B. Kangadurai, P. K. Jain, and Neelam Jain,
"Information System for Rural Road Network Planning - a case study,"
in Map India Conference, 2003.
[50] J. K. Rawat, Alok Saxena, and Sudhanshu Gupta, "Remote Sensing
Satellite Based Forest Cover Mapping: Some Recent Developments,"
Indian Cartographer, 2003.
[51] T. J. Reerink, M. A. Kliphuis, and R. S. W. van de Wal, "Mapping
Technique of Climate Fields between GCM’s and Ice Models,"
Geoscientific Model Development, vol. 3, pp. 13-41, January 2010.
[52] Ravi Prakash Rivastava, Nimisha Vedanti, and V.P. Dimri, "Optimal
Design of a Gravity Survey Network and its Application to Delineate
the Jabera-Damoh Structure in the Vindhyan Basin, Central India,"
Pure and Applied Geophysics, vol. 164, pp. 2009-2022, October 2007.
[53] Jeanne W. Ross, Peter Weill, and David C. Robertson, Enterprise
Architecture as Strategy: Creating a Foundation for Business
Execution.: Harvard Business School Press, 2006.
[54] M. Sarpoulaki, A. Eslami Rad, and A. Saleknia, "E-Government
Concept and Spatial Information: A Case Study in Islamic Republic of
Iran," The International Archives of the Photogrammetry, Remote
Sensing and Spatial Information Sciences, vol. XXXVII, 2008.
[55] James Sinnott, Michael Lowry, Bill Cooter, Jennifer Lloyd, and Roger
Anzzolin, "EPA Drinking Water Mapping Application: Client Focus

and Architecture Design," in 23rd Annual ESRI International User
Conference, 2003.
[56] State of Montana. (2010) Montana Base Map Service Center. [Online].
http://giscoordination.mt.gov
[57] Didi Sukyadi, Model Interoperabilitas Sistem Informasi Layanan
Publik Studi Kasus: E-Government. Jakarta, Indonesia: Program Studi
Magister Teknologi Informasi Fakultas Ilmu Komputer Universitas
Indonesia, 2009.
[58] The Open Source Geospatial Foundation. (2010) MapServer History.
[Online]. http://trac.osgeo.org/mapserver/wiki/MapServerHistory
[59] Waldo Tobler, "Movement Mapping," Center for Spatially Integrated
Social Science, Santa Barbara, 2003.
[60] Yaw A. Twumasi, Andrew Manu, Tommy L. Coleman, Brian Schmid,
and A. Moustapha, "Use of Geo-Spatial Data for Sustainable
Management of Solid Waste in Niamey, Niger," Journal of Sustainable
Development in Africa, vol. VIII, no. 1, 2006.
[61] University of Melbourne, Department of Geomatics, Country Report
2003: Indonesia.: PCGIAP-Working Group 3 "Cadastre"; FIG-
Commission 7 "Cadastre and Land Management", 2003.
[62] J. Wallace, I. P. Williamson, A. Rajabifard, and R. Bennet, "Spatial
Information Opportunities for Government," Spatial Science, vol. 51,
2006.
[63] Shi-cheng Wang, Yu-kun Qiao, Jin-sheng Zhang, Li-hua Chen, and Qi
Zhang, "SVM Based Constructing Method for Geomagnetic Reference
Map," in Pacific-Asia Conference on Circuits,Communications and
System, Chengdu, 2009.
[64] Qihao Weng, Remote Sensing and GIS Integration: Theories, Methods,
and Applications.: The McGraw-Hill Companies, Inc., 2010.
[65] Clay G. Wescott, "E-Government in the Asia-Pacific Region," Asian
Development Bank, Working Papers January 2005.
[66] World Bank. (2002) The World Bank Group Web Site. [Online].
http://go.worldbank.org/M1JHE0Z280
[67] Albert K. W. Yeung and G. Brent Hall, Spatial Database Systems:
Design, Implementation, and Project Management.: Springer, 2007.
[68] Yun Zhang, "Pan-sharpening for Improved Information Extraction," in
Advances in Photogrammetry, Remote Sensing and Spatial Information
Sciences: 2008 ISPRS Congress Book, Zhilin Li, Jun Chen, and
Emmanuel Baltsavias, Eds. London: Taylor & Francis Group, 2008.
[69] Shuliang Zhang, Jiayan Gan, LiZhi Miao, Guonian Lv, and Jiazhu
Huang, "Study on GML Spatial Interoperability based on Web
Service," in 31st Annual International Computer Software and
Applications Conference, COMPSAC., Beijing, 2007, pp. 649-656.
[70] Wenfeng Zheng, Zhengtong Yin, and Xiaolu Li, "The Integration
Evaluation and Explanation System of Geo-information in OpenGIS
Environment," in International Conference on New Trends in
Information and Service Science, NISS., Beijing, 2009, pp. 515-520