
Available Energy in Cars' Exhaust System for IoT ... - MDPI
15
energies Article Available Energy in Cars’ Exhaust System for IoT Remote Exhaust Gas Sensor and Piezoelectric Harvesting Francesco Madaro 1, * , Iman Mehdipour 1 , Antonio Caricato 2 , Francesco Guido 1 , Francesco Rizzi 1 , Antonio Paolo Carlucci 2 and Massimo De Vittorio 1 1 Center for Biomolecular Nanotechnologies, Istituto Italiano di Tecnologia, 73010 Arnesano (LE), Italy; [email protected] (I.M.); [email protected] (F.G.); [email protected] (F.R.); [email protected] (M.D.V.) 2 Dipartimento di Ingegneria dell’ Innovazione, Università del Salento, 73100 Lecce, Italy; [email protected] (A.C.); [email protected] (A.P.C.) * Correspondence: [email protected]; Tel.: +39-377-435-4866 Received: 29 June 2020; Accepted: 11 August 2020; Published: 12 August 2020 Abstract: The exhaust system of the light-duty diesel engine has been evaluated as a potential environment for a mechanical energy recovery system for powering an IoT (Internet of Things) remote sensor. Temperature, pressure, gas speed, mass flow rate have been measured in order to characterize the exhaust gas. At any engine point explored, thermal energy is by far the most dominant portion of the exhaust energy, followed by the pressure energy and lastly kinetic energy is the smallest fraction of the exhaust energy. A piezoelectric flexible device has been tested as a possible candidate as an energy harvester converting the kinetic energy of the exhaust gas flow, with a promising amount of electrical energy generated in the order of microjoules for an urban or extra-urban circuit. Keywords: light-duty diesel engine; piezoelectric harvester; IoT remote sensor; aluminum nitride 1. Introduction European emissions standards [1,2] tighten limits on air pollutant emissions and require the best technology currently available for vehicle emission control. Many of these technologies require the on-board measurement of regulated pollutant emission levels in order to guarantee the maximum conversion efficiency. On the other hand, in Europe the New European Driving Cycle (NEDC) procedure has been proven nonrepresentative of real world vehicle operation, thus leading to a gap between officially reported emissions and the ones experienced during real world operation [3]. New procedures require the measurement of pollutant emission levels during real driving emission conditions and portable emission sensing devices have been reported and proven to be reliable ways of monitoring real driving emissions [4–6]. The above considerations both lead to a pressing need for portable gas monitoring systems. The exhaust gas monitoring system is a comprehensive system made of the gas sensors, data logger, data transceiver, and power system. In order to avoid issues related to replacing batteries powering the sensors and the transceiver, several ways have been reported to recover energy from the engine [6–16]. The scope would be to design a complete IoT system for sensing, logging and transmitting data from the exhaust gas [17] and ideally, the system should be self-powered using the energy available in the environment in which it operates. Piezoelectric transduction is a very promising mechanism to directly convert the kinetic energy of a fluid into available electrical energy and piezoelectric energy harvesting has been evaluated and Energies 2020, 13, 4169; doi:10.3390/en13164169 www.mdpi.com/journal/energies
-
Upload
khangminh22 -
Category
Documents
-
view
2 -
download
0
Transcript of Available Energy in Cars' Exhaust System for IoT ... - MDPI
energies
Article
Available Energy in Carsrsquo Exhaust System for IoTRemote Exhaust Gas Sensor andPiezoelectric Harvesting
Francesco Madaro 1 Iman Mehdipour 1 Antonio Caricato 2 Francesco Guido 1Francesco Rizzi 1 Antonio Paolo Carlucci 2 and Massimo De Vittorio 1
1 Center for Biomolecular Nanotechnologies Istituto Italiano di Tecnologia 73010 Arnesano (LE) Italyimanmehdipouriitit (IM) francescoguidoiitit (FG) francescorizziiitit (FR)massimodevittorioiitit (MDV)
2 Dipartimento di Ingegneria dellrsquo Innovazione Universitagrave del Salento 73100 Lecce Italyantoniocaricato1unisalentoit (AC) paolocarlucciunisalentoit (APC)
Correspondence francescomadaroiitit Tel +39-377-435-4866
Received 29 June 2020 Accepted 11 August 2020 Published 12 August 2020
Abstract The exhaust system of the light-duty diesel engine has been evaluated as a potentialenvironment for a mechanical energy recovery system for powering an IoT (Internet of Things) remotesensor Temperature pressure gas speed mass flow rate have been measured in order to characterizethe exhaust gas At any engine point explored thermal energy is by far the most dominant portion ofthe exhaust energy followed by the pressure energy and lastly kinetic energy is the smallest fractionof the exhaust energy A piezoelectric flexible device has been tested as a possible candidate as anenergy harvester converting the kinetic energy of the exhaust gas flow with a promising amount ofelectrical energy generated in the order of microjoules for an urban or extra-urban circuit
Keywords light-duty diesel engine piezoelectric harvester IoT remote sensor aluminum nitride
1 Introduction
European emissions standards [12] tighten limits on air pollutant emissions and require the besttechnology currently available for vehicle emission control Many of these technologies require theon-board measurement of regulated pollutant emission levels in order to guarantee the maximumconversion efficiency
On the other hand in Europe the New European Driving Cycle (NEDC) procedure has beenproven nonrepresentative of real world vehicle operation thus leading to a gap between officiallyreported emissions and the ones experienced during real world operation [3] New procedures requirethe measurement of pollutant emission levels during real driving emission conditions and portableemission sensing devices have been reported and proven to be reliable ways of monitoring real drivingemissions [4ndash6]
The above considerations both lead to a pressing need for portable gas monitoring systemsThe exhaust gas monitoring system is a comprehensive system made of the gas sensors data loggerdata transceiver and power system In order to avoid issues related to replacing batteries powering thesensors and the transceiver several ways have been reported to recover energy from the engine [6ndash16]The scope would be to design a complete IoT system for sensing logging and transmitting data fromthe exhaust gas [17] and ideally the system should be self-powered using the energy available in theenvironment in which it operates
Piezoelectric transduction is a very promising mechanism to directly convert the kinetic energy ofa fluid into available electrical energy and piezoelectric energy harvesting has been evaluated and
Energies 2020 13 4169 doi103390en13164169 wwwmdpicomjournalenergies
Energies 2020 13 4169 2 of 15
reviewed [1819] in several applications The vortex-induced vibration method is a common practiceused to harvest the kinetic energy of a fluid using piezoelectric transducers [20]
This work reports the comprehensive evaluation of the energy available and harvestable in exhaustgas in different forms such as thermal pressure and kinetic at different positions of the exhaustsystem and at different engine operating conditions (engine speed and torque) Physical properties ofthe gas such as temperature pressure gas speed have been measured in order to provide a completedescription of the environment in which the harvester and the IoT smart gas sensor would operate
The work also describes the preliminary results of the installation of a piezoelectric harvesterand simultaneous measurement of several parameters of the engine in real driving conditions andmeasurement of the electrical energy produced
Thoretical Model for Evaluating Exhaust Gas Energy
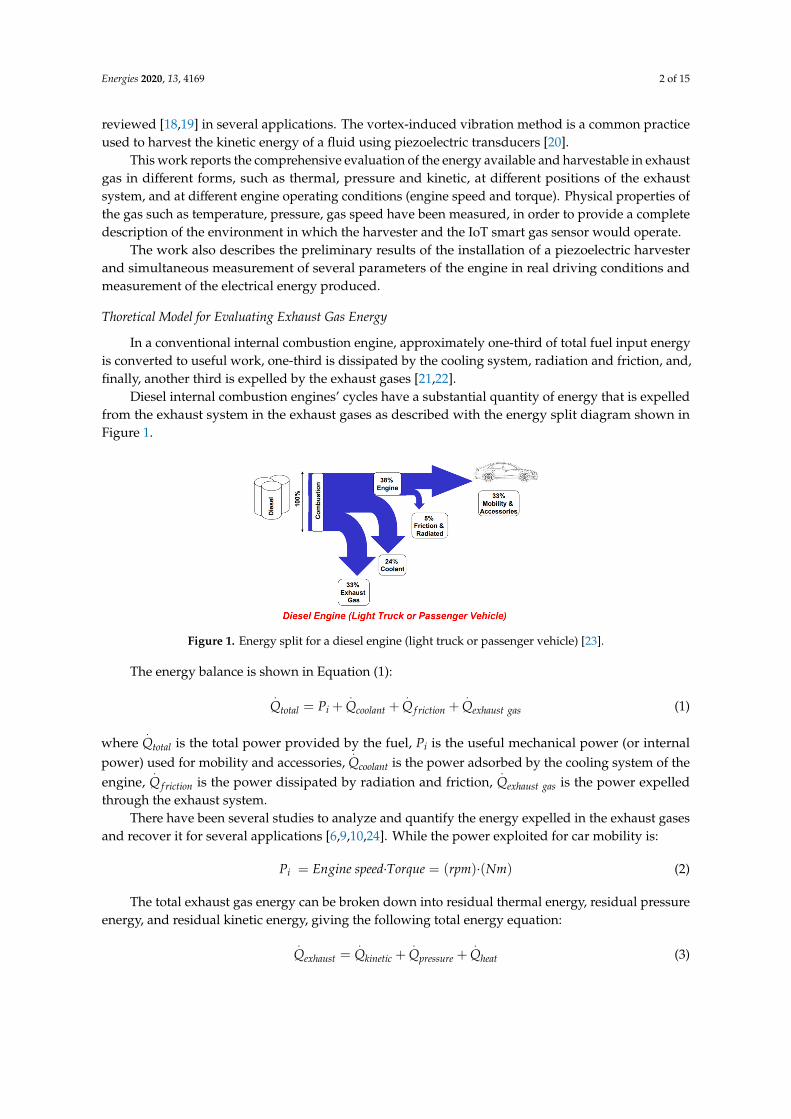
In a conventional internal combustion engine approximately one-third of total fuel input energyis converted to useful work one-third is dissipated by the cooling system radiation and friction andfinally another third is expelled by the exhaust gases [2122]
Diesel internal combustion enginesrsquo cycles have a substantial quantity of energy that is expelledfrom the exhaust system in the exhaust gases as described with the energy split diagram shown inFigure 1
Energies 2020 13 x FOR PEER REVIEW 2 of 15
reviewed [1819] in several applications The vortex-induced vibration method is a common practice used to harvest the kinetic energy of a fluid using piezoelectric transducers [20]
This work reports the comprehensive evaluation of the energy available and harvestable in exhaust gas in different forms such as thermal pressure and kinetic at different positions of the exhaust system and at different engine operating conditions (engine speed and torque) Physical properties of the gas such as temperature pressure gas speed have been measured in order to provide a complete description of the environment in which the harvester and the IoT smart gas sensor would operate
The work also describes the preliminary results of the installation of a piezoelectric harvester and simultaneous measurement of several parameters of the engine in real driving conditions and measurement of the electrical energy produced
11 Thoretical Model for Evaluating Exhaust Gas Energy
In a conventional internal combustion engine approximately one-third of total fuel input energy is converted to useful work one-third is dissipated by the cooling system radiation and friction and finally another third is expelled by the exhaust gases [2122]
Diesel internal combustion enginesrsquo cycles have a substantial quantity of energy that is expelled from the exhaust system in the exhaust gases as described with the energy split diagram shown in Figure 1
Figure 1 Energy split for a diesel engine (light truck or passenger vehicle) [23]
The energy balance is shown in Equation (1) = + + + (1)
where is the total power provided by the fuel is the useful mechanical power (or internal power) used for mobility and accessories is the power adsorbed by the cooling system of the engine is the power dissipated by radiation and friction is the power expelled through the exhaust system
There have been several studies to analyze and quantify the energy expelled in the exhaust gases and recover it for several applications [691024] While the power exploited for car mobility is
= ∙ = ( ) ∙ ( ) (2)
The total exhaust gas energy can be broken down into residual thermal energy residual pressure energy and residual kinetic energy giving the following total energy equation = + + (3)
In the equation is the total flow of exhaust gas energy Js is the flow of residual kinetic energy Js is the flow of residual pressure energy Js is the flow of residual thermal energy Js
The mass flow rate at the exhaust gas is equal to
Figure 1 Energy split for a diesel engine (light truck or passenger vehicle) [23]
The energy balance is shown in Equation (1)
Qtotal = Pi +
Qcoolant +
Q f riction +
Qexhaust gas (1)
where
Qtotal is the total power provided by the fuel Pi is the useful mechanical power (or internalpower) used for mobility and accessories
Qcoolant is the power adsorbed by the cooling system of the
engine
Q f riction is the power dissipated by radiation and friction
Qexhaust gas is the power expelledthrough the exhaust system
There have been several studies to analyze and quantify the energy expelled in the exhaust gasesand recover it for several applications [691024] While the power exploited for car mobility is
Pi = Engine speedmiddotTorque = (rpm)middot(Nm) (2)
The total exhaust gas energy can be broken down into residual thermal energy residual pressureenergy and residual kinetic energy giving the following total energy equation
Qexhaust =
Qkinetic +
Qpressure +
Qheat (3)
Energies 2020 13 4169 3 of 15
In the equation
Qexhaust is the total flow of exhaust gas energy Js
Qkinetic is the flow of residualkinetic energy Js
Qpressure is the flow of residual pressure energy Js
Qheat is the flow of residual
thermal energy JsThe mass flow rate at the exhaust gas is equal to
mexhaust =
mair +
m f uel (4)
In the equation above
mexhaust
mair and
m f uel are respectively the exhaust gas air and fuel massflow rates
The specific heat capacity of the exhaust gas is a function of temperature however we can considercp constant by assuming the behavior of the exhaust gas as perfect If the exhaust gas were assumed tobe real gas the use of a cp varying with temperature would give an error of 2ndash3 on the results ofthermal power which is acceptable given the accuracy of the experimental measurements
Therefore the flow of residual thermal energy can be solved with the following equation
Qheat =
mexhaust middot
int Texhaust
T0
cpdT sim
mexhaustmiddotcpmiddot∆T (5)
In the equation cp is the specific heat capacity of exhaust gas [25] in J(kgmiddotK) Tex is the temperatureof exhaust gas in K T0 is the environment temperature in K
The exhaust gas pressure energy can be calculated through the following equation [26]
Qpressure =
mexhaustmiddot
kkminus 1
middotRgmiddotTexmiddot
[1minus
p0
pex
kminus1k]
(6)
In the equation pex is the pressure of the exhaust gas p0 is the atmospheric pressure understandard conditions Pa Rg is the gas constant of the exhaust gas J(kgmiddotK) κ is the specific heat capacity
The equation for the residual kinetic energy is
Qkinetic =
12middotρexhaustmiddotAmiddotvexhaust
3 =12middot
mexhaustmiddotvexhaust
2 (7)
In the calculations of residual pressure energy and residual thermal energy the standardatmospheric conditions are considered
Any energy recovery system would need to operate in the harsh environment of the exhaust gassystem In order to design and maximize the efficiency of the harvester it is fundamental to knowthe temperature pressure and the speed of the exhaust gas as well as information about the level ofturbulence of the same gas The purpose of the experimental session is to characterize the differentparameters of the exhaust gas at different operating points of the engine ie at different loads torqueand rpm Several works have been published related to the recovery of exhaust energy through thermalor pressure conversion [69ndash111327] However kinetic energy can be potentially converted into usefulelectrical energy for powering IoT sensors for monitoring the gas properties such as concentrationof polluting species fuel not combusted or temperature A special emphasis has been given to thecalculation of the kinetic energy available in the exhaust gas with the goal in mind of converting itinto electric power by means of piezoelectric conversion A test of the conversion of kinetic energy ofexhaust gas into electrical energy has been attempted using a flexible piezoelectric harvester
2 Materials and Methods
21 Tests at the Engine Bench
The engine used for the measurements was an AUDI A4 year 2011 2000cc TDI diesel engine ofthe VAG group developed by Audi it is a four-cylinder in-line four-stroke compression ignition system
Energies 2020 13 4169 4 of 15
with four valves per cylinder ldquoturbochargedrdquo and equipped with a common rail (CR) injection systemThe engine delivers a maximum power of 105 kW (143 HP) at 4200 rpm and a maximum torque of320 Nm between 1750 and 2500 rpm (Figure 2)Energies 2020 13 x FOR PEER REVIEW 4 of 15
(a) (b)
(c) (d)
Figure 2 (a) Lab engine photo (b) torque and power curves of the engine (c) map of the engine and engine points explored circled (d) power curves of the engine the legend shows the percentage of load (gas pedal)
In addition to the use of the common rail injection system and the piezoelectric injectors which guarantee meticulous control of the quantity of fuel injected into the combustion chamber thereby decreasing the quantity of unburned fuel expelled at the exhaust other technologies such as electric EGR valve (exhaust gas recirculation) an EGR cooling system and a particulate filter equip the engine in order to lower polluting emissions
These characteristics make the engine perfectly suited to the study thanks to the optimization of combustion which limits the fluctuations of torque and power and thanks to the use of the turbocharger it allows for a range of air speeds in the intake and exhaust interesting for the analysis of the energy harvesting system
The power torque and specific consumption curves for different percentages of pedal were obtained during several tests carried out in the ldquoInternal Combustion Enginesrdquo laboratories of the University of Salento to better characterize the engine and define the most interesting test points for the study
The engine bench characterization and the implemented layout allowed for the experimental definition of the test engine points checking of all the parameters of the control unit and the percentage of the pedal and the ability to identify torque and power in urban suburban and freeway use
22 Test Cycles
The idea of defining the engine operating points was to define operating conditions characteristic of urban suburban and freeway routes under particular driving conditions which are listed in Table 1
Figure 2 (a) Lab engine photo (b) torque and power curves of the engine (c) map of the engine andengine points explored circled (d) power curves of the engine the legend shows the percentage ofload (gas pedal)
In addition to the use of the common rail injection system and the piezoelectric injectorswhich guarantee meticulous control of the quantity of fuel injected into the combustion chamberthereby decreasing the quantity of unburned fuel expelled at the exhaust other technologies such aselectric EGR valve (exhaust gas recirculation) an EGR cooling system and a particulate filter equip theengine in order to lower polluting emissions
These characteristics make the engine perfectly suited to the study thanks to the optimizationof combustion which limits the fluctuations of torque and power and thanks to the use of theturbocharger it allows for a range of air speeds in the intake and exhaust interesting for the analysis ofthe energy harvesting system
The power torque and specific consumption curves for different percentages of pedal wereobtained during several tests carried out in the ldquoInternal Combustion Enginesrdquo laboratories of theUniversity of Salento to better characterize the engine and define the most interesting test points forthe study
The engine bench characterization and the implemented layout allowed for the experimentaldefinition of the test engine points checking of all the parameters of the control unit and the percentageof the pedal and the ability to identify torque and power in urban suburban and freeway use
22 Test Cycles
The idea of defining the engine operating points was to define operating conditions characteristicof urban suburban and freeway routes under particular driving conditions which are listed in Table 1
Energies 2020 13 4169 5 of 15
Table 1 Engine points studied
Point 1 Point 2 Point 3 Point 4 Point 5 Point 6
RPM 1500 1500 2000 2000 3000 3000Torque 200 320 50 320 40 320
Equivalent gear 1 2 5 3 6 6
The points described in Table 1 were inserted within the torque curves of the engine to establishthe gas pedal percentages to be supplied to the engine in order to obtain the required torque and poweras an output
It should also be noted that points 3 and 5 are characterized by a low percentage of turbochargeroperation while points 2 4 and 6 represent the points of maximum torque that can be delivered by theengine at the given engine speed
23 Measurement Systems
The average gas speed was measured with a pitot tube [28] which included also a thermocouplefor measuring temperature and data logger Testo 480 [29] with a sampling rate of 1 samplesec
The exhaust tube was drilled to host the pitot tube (approximately 6 mm in diameter) which wasused to measure the total pressure and the dynamic pressure from which the logger calculated the gasspeed using Bernoullirsquos equation [30]
All parameters related to the engine were monitored and measured while driving on the road byusing a commercial OBD II (on-board-diagnostics) which is a device that is connected to the electroniccentral unit (ECU) of the car The OBD logger was inserted into the OBD port of the car and the datacollected were transferred via blue-tooth protocol to the mobile application
24 Exhaust Gas Positions
As indicated below the chosen measuring points were located along the exhaust line startingfrom downstream of the particulate filter up to the point of expulsion of the gases into the atmosphere
The exhaust system studied is shown in Figure 3 with the 5 positions at which the gas wasmeasured Position 1 rdquoEngine Exitrdquo was directly downstream of the particulate filter position 2ldquoResonatorrdquo was in the empty cylinder approximately 600 mm downstream of position 1 position 3ldquoBetween Resonator and Mufflerrdquo was approximately 300 mm downstream of the resonator finallypositions 4 and 5 were the two exits of the muffler
Energies 2020 13 x doi FOR PEER REVIEW wwwmdpicomjournalenergies
Table 1 Engine points studied 1 Point 1 Point 2 Point 3 Point 4 Point 5 Point 6
RPM 1500 1500 2000 2000 3000 3000 Torque 200 320 50 320 40 320
Equivalent gear 1 2 5 3 6 6
The points described in Table 1 were inserted within the torque curves of the engine to establish 2 the gas pedal percentages to be supplied to the engine in order to obtain the required torque and 3 power as an output 4
It should also be noted that points 3 and 5 are characterized by a low percentage of turbocharger 5 operation while points 2 4 and 6 represent the points of maximum torque that can be delivered by 6 the engine at the given engine speed 7
23 Measurement Systems 8 The average gas speed was measured with a pitot tube [28] which included also a thermocouple 9
for measuring temperature and data logger Testo 480 [29] with a sampling rate of 1 samplesec 10 The exhaust tube was drilled to host the pitot tube (approximately 6 mm in diameter) which 11
was used to measure the total pressure and the dynamic pressure from which the logger calculated 12 the gas speed using Bernoullirsquos equation [30] 13
All parameters related to the engine were monitored and measured while driving on the road 14 by using a commercial OBD II (on-board-diagnostics) which is a device that is connected to the 15 electronic central unit (ECU) of the car The OBD logger was inserted into the OBD port of the car 16 and the data collected were transferred via blue-tooth protocol to the mobile application 17
24 Exhaust Gas Positions 18 As indicated below the chosen measuring points were located along the exhaust line starting 19
from downstream of the particulate filter up to the point of expulsion of the gases into the 20 atmosphere 21
The exhaust system studied is shown in Figure 3 with the 5 positions at which the gas was 22 measured Position 1 rdquoEngine Exitrdquo was directly downstream of the particulate filter position 2 23 ldquoResonatorrdquo was in the empty cylinder approximately 600 mm downstream of position 1 position 3 24 ldquoBetween Resonator and Mufflerrdquo was approximately 300 mm downstream of the resonator finally 25 positions 4 and 5 were the two exits of the muffler 26
27
Figure 3 Exhaust system and characterized positions Each muffler tube has a diameter of 60 mm 28 and an area of 2800 mm2 29
Figure 3 Exhaust system and characterized positions Each muffler tube has a diameter of 60 mmand an area of 2800 mm2
Energies 2020 13 4169 6 of 15
25 Piezoelectric Conversion
According to the theory of flow around bluff bodies introduced by T von Karman [31] the Karmanvortex street was created to improve the vibrational energy of the exhaust gas The forces from sheddingvortices make the flexible piezoelectric harvester (Aluminum Nitride-based) device vibrate periodicallyThe electromechanical energy conversion is then completed based on the direct piezoelectric effectwhich is the process of formation of an electrical field within the material through the separation ofcharge due to applied strain Figure 4 shows the process of the energy conversion from kinetic toelectrical by the flexible piezoelectric harvester
Energies 2020 13 x FOR PEER REVIEW 2 of 15
25 Piezoelectric Conversion 30 According to the theory of flow around bluff bodies introduced by T von Karman [31] the 31
Karman vortex street was created to improve the vibrational energy of the exhaust gas The forces 32 from shedding vortices make the flexible piezoelectric harvester (Aluminum Nitride-based) device 33 vibrate periodically The electromechanical energy conversion is then completed based on the direct 34 piezoelectric effect which is the process of formation of an electrical field within the material through 35 the separation of charge due to applied strain Figure 4 shows the process of the energy conversion 36 from kinetic to electrical by the flexible piezoelectric harvester 37
The piezoelectric constitutive equations also known as ldquocoupled equationsrdquo are given below 38 [32] 39 = +
(8) = + (9) where S is the strain tensor sE is the matrix of compliance coefficient T is the stress tensor d is the 40 matrix of the piezoelectric strain constant D is the tensor of elecric displacement εT is the permittivity 41
42 Figure 4 Schematic representation of the energy conversion from kinetic to electrical by the 43 piezoelectric transducer 44
3 Results 45 The data of mass flow of fuel and air were taken from the electronic central unit of the engine 46
(ECU) relative to the different engine operating conditions and are listed in Table 2 47
Table 2 Measurements of gas flow at the exhaust relative to the different engine operating conditions 48 Engine operating point
Speed_torque Fuel gas flow Fuel mass flow1 Total mass flow
(rpm)_(Nm) (mgstroke) (gs) (gs) 1500_200 1500_320 2000_50 2000_320 3000_40 3000_320
388 550 114 572 119 551
37 43 22 68 63
100
382 458 22
649 63
1005 1 Fuel mass flow measured as mgstroke converted into gs by the formula mgstroke = 4rpm60 (mgs) 49
31 Detailed Results Relative to the Exhaust Gas for Each Exhaust Position 50 The exhaust gas was characterized at different positions of the exhaust system and gas pressure 51
gas speed and temperature were measured using the methods described in Materials and Methods 52 Detailed plots of the measured gas parameters are presented in Table A1 Table A2 Table A3 in 53 Appendix at the end of the document 54
Results of the measurements are summarized in Figure 5 55
Figure 4 Schematic representation of the energy conversion from kinetic to electrical by thepiezoelectric transducer
The piezoelectric constitutive equations also known as ldquocoupled equationsrdquo are given below [32]
S = sET + dE (8)
D = dT + εTE (9)
where S is the strain tensor sE is the matrix of compliance coefficient T is the stress tensor d is thematrix of the piezoelectric strain constant D is the tensor of elecric displacement εT is the permittivity
3 Results
The data of mass flow of fuel and air were taken from the electronic central unit of the engine(ECU) relative to the different engine operating conditions and are listed in Table 2
Table 2 Measurements of gas flow at the exhaust relative to the different engine operating conditions
Engine Operating PointSpeed_Torque Fuel Gas Flow Fuel Mass Flow 1 Total Mass Flow
(rpm)_(Nm) (mgstroke) (gs) (gs)
1500_200 388 37 3821500_320 550 43 4582000_50 114 22 22
2000_320 572 68 6493000_40 119 63 63
3000_320 551 100 10051 Fuel mass flow measured as mgstroke converted into gs by the formula mgstroke = 4rpm60 (mgs)
Detailed Results Relative to the Exhaust Gas for Each Exhaust Position
The exhaust gas was characterized at different positions of the exhaust system and gas pressuregas speed and temperature were measured using the methods described in Materials and MethodsDetailed plots of the measured gas parameters are presented in Table A1 Table A2 Table A3 inAppendix at the end of the document
Energies 2020 13 4169 7 of 15
Results of the measurements are summarized in Figure 5Energies 2020 13 x FOR PEER REVIEW 3 of 15
(a) (b)
(c) (d)
Figure 5 Summary of the exhaust gas properties at each exhaust line position (a) Gas speed measured 56 at each of the five positions of the exhaust system (b) absolute gas static pressure at each of the five 57 positions of the exhaust system (c) gas temperature at each of the five positions of the gas exhaust 58 system (d) description of the operating engine points studied 59
4 Discussion 60 Based on the data collected with the measurement of the fundamental gas properties several 61
calculations have been carried out using the equation presented in the introduction in order to 62 calculate the power of the exhaust gas A preliminary discussion on the measurement of the gas speed 63 is presented first 64
41 Validation of Gas Speed Measured by Pitot Tube 65 As described by Gonzales et al [33] there is a high frequency component to the pressure waves 66
of the exhaust gas therefore the exhaust gas flow is not steady or constant However for the purpose 67 of the present work where the measurement of the gas speed has been performed with a sampling 68 rate of 2 sampless we can consider the flow as quasi-static 69
The average gas speed measured by the pitot tube has been compared with values of gas speed 70 calculated by a mathematical model based on the measured mass flow of the gas speed at each engine 71 point and the density and temperature of the gas as shown in Table 3 The calculation of the average 72 gas speed starting from the measured mass flow rate has been performed using Equation (8) 73 volume flow rate = mass flow ratedensity
gas velocity = volume flow ratearea
(10)
Figure 5 Summary of the exhaust gas properties at each exhaust line position (a) Gas speed measuredat each of the five positions of the exhaust system (b) absolute gas static pressure at each of the fivepositions of the exhaust system (c) gas temperature at each of the five positions of the gas exhaustsystem (d) description of the operating engine points studied
4 Discussion
Based on the data collected with the measurement of the fundamental gas propertiesseveral calculations have been carried out using the equation presented in the introduction in order tocalculate the power of the exhaust gas A preliminary discussion on the measurement of the gas speedis presented first
41 Validation of Gas Speed Measured by Pitot Tube
As described by Gonzales et al [33] there is a high frequency component to the pressure waves ofthe exhaust gas therefore the exhaust gas flow is not steady or constant However for the purpose ofthe present work where the measurement of the gas speed has been performed with a sampling rateof 2 sampless we can consider the flow as quasi-static
The average gas speed measured by the pitot tube has been compared with values of gas speedcalculated by a mathematical model based on the measured mass flow of the gas speed at each enginepoint and the density and temperature of the gas as shown in Table 3 The calculation of the averagegas speed starting from the measured mass flow rate has been performed using Equation (8)
volume flow rate = mass flow ratedensity
gas velocity = volume flow ratearea
(10)
Energies 2020 13 4169 8 of 15
Table 3 Gas parameters at left muffler
Engine PointRpm_Torque
Total MassFlow Gas Density Volume Flow Cross Section Calculated
SpeedMeasured
Speed Error
(gs) (kgm3) (m3s) times 10minus3 (cm2) (ms) (ms)
1500_200 382 081 472 56 84 9 641500_320 458 079 580 56 104 11 592000_50 22 077 286 56 51 5 202000_320 694 075 925 56 165 16 333000_40 63 072 875 56 156 15 423000_320 1005 072 1396 56 249 23 84
As described in previous work [3435] the main component of the gas exhaust as it is in the air isN2 When considering the gas properties neglecting the combustion products the error is typically nothigher than 2 therefore we have used air density when needed for the gas exhaust
Given the relatively small discrepancy between measured and calculated values the measuredvalues of the gas speed can be considered reliable therefore they have been used for the calculation ofthe kinetic energy in the following sections
42 Estimation of Power at the Engine Exhaust for the Bench Engine
Three forms of energy at the exhaust were evaluated and the power was calculated usingEquations (5)ndash(7) for thermal pressure and kinetic power respectively The results showed that thermalpower was by far the most dominant form of power present in the exhaust gas followed by pressurepower and finally kinetic power was the smallest fraction
Figure 6andashc give a graphic summary of the power results Figure 6d shows the trend of the differentforms of power with the value of the torque fixed at 320 Nm while the engine speed (RPM) variablebetween 1500 rpm and 3000 rpm which is the most common range of engine speeds experienced inreal driving conditions Figure 6d represents the values on the Y-axis with a logarithmic scale showingthe kinetic power in the order of W which was a small fraction of the exhaust energy available in otherforms (thermal and pressure)
It is noteworthy that in position 2 (resonator) the pressure was approximately the same as the pressuremeasured in position 3 (between resonator and muffler) However the gas speed and consequentlythe kinetic energy associated with the gas was significantly higher in position 3 compared to position2 The reason for this behavior is currently unclear The exhaust system is a complex fluid dynamicenvironment in which several factors such as cross-section variation pressure wave propagation andreflection and heat exchange contribute to complex effects on the gas speed For example pressure wavepropagation leads to maxima and minima which could be further emphasized in positions closer to theresonator Further studies would be needed to clarify these aspects
Energies 2020 13 4169 9 of 15
Energies 2020 13 x doi FOR PEER REVIEW wwwmdpicomjournalenergies
(a) (b)
(c) (d)
Figure 6 Summary of power calculations at different engine points and at each of the five exhaust 101 locations (a) thermal power (b) pressure power and (c) kinetic power (d) thermal kinetic pressure 102 and internal power 103
43 Piezoelectric Conversion from the Exhaust Pipe under Real Driving Conditions 104 Real driving emission conditions were evaluated by carrying out measurements of the exhaust 105
gas while driving a car on the road The car tested was a Fiat Freemont 2000cc TDI therefore equipped 106 with an engine very similar to the one tested in the lab In addition to measuring pressure 107 temperature and gas speed of the exhaust gas a first test on the piezoelectric conversion was 108 performed in order to evaluate the efficiency of the energy conversion A flexible piezoelectric 109 transducer fabricated according to the process described by Guido et al [1934] was held inside the 110 exhaust pipe and the electrical signal generated by the piezoelectric transducer was recorded and 111 shown in the figure below 112
Figure 7 shows the parameters of the engine and the exhaust gas measured simultaneously 113 during the real driving conditions road test The temperature of the exhaust gas at the muffler grew 114 rapidly over 100 degC therefore the choice of the material of any harvester needs to consider this 115 constraint 116
The harvester used in this work was made of piezoelectric aluminum nitride on a flexible 117 substrate of polyimide (commercial Kapton) Theoretical models showed that harvester efficiency 118 could experience a drop with temperature due to thermal stresses [35] Noteworthy no creeps in the 119 aluminum nitride piezoelectric layer were observed with temperature suggesting the harvesting 120 device could withstand the temperature range measured The gas speed was generally below 10 ms 121 with a few spikes over 15minus20 ms 122
Figure 6 Summary of power calculations at different engine points and at each of the five exhaustlocations (a) thermal power (b) pressure power and (c) kinetic power (d) thermal kinetic pressureand internal power
43 Piezoelectric Conversion from the Exhaust Pipe under Real Driving Conditions
Real driving emission conditions were evaluated by carrying out measurements of the exhaustgas while driving a car on the road The car tested was a Fiat Freemont 2000cc TDI therefore equippedwith an engine very similar to the one tested in the lab In addition to measuring pressure temperatureand gas speed of the exhaust gas a first test on the piezoelectric conversion was performed in orderto evaluate the efficiency of the energy conversion A flexible piezoelectric transducer fabricatedaccording to the process described by Guido et al [1934] was held inside the exhaust pipe and theelectrical signal generated by the piezoelectric transducer was recorded and shown in the figure below
Figure 7 shows the parameters of the engine and the exhaust gas measured simultaneously duringthe real driving conditions road test The temperature of the exhaust gas at the muffler grew rapidlyover 100 C therefore the choice of the material of any harvester needs to consider this constraint
The harvester used in this work was made of piezoelectric aluminum nitride on a flexiblesubstrate of polyimide (commercial Kapton) Theoretical models showed that harvester efficiencycould experience a drop with temperature due to thermal stresses [35] Noteworthy no creeps inthe aluminum nitride piezoelectric layer were observed with temperature suggesting the harvestingdevice could withstand the temperature range measured The gas speed was generally below 10 mswith a few spikes over 15minus20 ms
Energies 2020 13 4169 10 of 15Energies 2020 13 x FOR PEER REVIEW 2 of 15
123
Figure 7 Recorded real driving conditions parameters 124
Figure 8a shows the bluff body and holder of the piezoelectric harvester made of a polyimide 125 substrate and 1 micron thick layer of piezoelectric AlN responsible for the electro-mechanical 126 conversion during the vortex-induced vibration No visible buildup of carbon on the harvester 127 potentially changing its mechanical response was observed even after repeated tests The deposition 128 of carbon cannot be excluded and further study will be conducted to determine its potential effect 129 Figure 8d shows the retrofit system including the harvester and the measurement setup of the exhaust 130 gas Figure 8c shows the voltage generated during the car drive of approximately 10 minutes in a mix 131 of urban and extra-urban settings The power calculated based on the voltage measured at the 132 piezoelectric device using a 1 Mohm probe is reported in Figure 8d There was a delay between the 133 spikes of RPM torque and engine load and the spikes of voltage generated that were not 134 synchronized with the peaks of the engine parameters Considering that the harvester is based on a 135 vortex-induced vibration mechanism it is possible that the piezoelectric conversion could be more 136 efficient during the transitions between operating conditions of the engine than in fixed regime 137 conditions These topics will be treated in following studies in order to optimize the design of the 138 harvester 139
Figure 7 Recorded real driving conditions parameters
Figure 8a shows the bluff body and holder of the piezoelectric harvester made of a polyimidesubstrate and 1 micron thick layer of piezoelectric AlN responsible for the electro-mechanicalconversion during the vortex-induced vibration No visible buildup of carbon on the harvesterpotentially changing its mechanical response was observed even after repeated tests The depositionof carbon cannot be excluded and further study will be conducted to determine its potential effectFigure 8d shows the retrofit system including the harvester and the measurement setup of the exhaustgas Figure 8c shows the voltage generated during the car drive of approximately 10 min in a mixof urban and extra-urban settings The power calculated based on the voltage measured at thepiezoelectric device using a 1 Mohm probe is reported in Figure 8d There was a delay between thespikes of RPM torque and engine load and the spikes of voltage generated that were not synchronizedwith the peaks of the engine parameters Considering that the harvester is based on a vortex-inducedvibration mechanism it is possible that the piezoelectric conversion could be more efficient during thetransitions between operating conditions of the engine than in fixed regime conditions These topicswill be treated in following studies in order to optimize the design of the harvester
Energies 2020 13 4169 11 of 15Energies 2020 13 x FOR PEER REVIEW 3 of 15
(a) (b)
(c) (d)
Figure 8 Summary of the real driving condition measurements (a) piezoelectric converter mounted 140 on the aluminum bluff body (b) extender of the exhaust pipe at the muffler for mounting the 141 piezoelectric harvester in retrofit (c) voltage of electrical signal generated by the piezoelectric flexible 142 transducer (d) instant power calculated from the voltage 143
Table 4 summarizes the electrical voltage power and energy generated by the piezoelectric 144 harvester during the 10 min ride on the road Although the harvester generated a few peaks of power 145 in the order of microW the average power was in the order of nW The simultaneous use of several 146 harvesters working in parallel could be pursued but in order to enhance the efficiency of the whole 147 system the set of harvesters needs to work in phase Recently the optimization of energy harvesters 148 networks through Artificial Intelligence have shown a valuable strategy to follow [36] 149
Table 4 Electrical energy voltage power 150 Voltage average Voltage max Energy Power average Power max
74 mV 65 V 21 microJ 33 nW 42 microW
44 Efficiency of Piezoelectric Harvester 151 The efficiency of the piezoelectric harvester was evaluated at several gas speeds The efficiency 152
curve was constructed by dividing the electrical power output by the available fluid power (kinetic 153 power) available in the cross-sectional area in which the harvester operated according to the 154 following equation 155 = (12 ∙ ∙ ∙ ) (11)
where is the efficiency P is the electrical power outout is the air density A is the cross sectional 156 area presented to the incoming stream and is the air velocity [37] Figure 9 shows the trend of the 157 efficiency of conversion of the piezoelectric harvester 158
Figure 8 Summary of the real driving condition measurements (a) piezoelectric converter mounted onthe aluminum bluff body (b) extender of the exhaust pipe at the muffler for mounting the piezoelectricharvester in retrofit (c) voltage of electrical signal generated by the piezoelectric flexible transducer(d) instant power calculated from the voltage
Table 4 summarizes the electrical voltage power and energy generated by the piezoelectricharvester during the 10 min ride on the road Although the harvester generated a few peaks of power inthe order of microW the average power was in the order of nW The simultaneous use of several harvestersworking in parallel could be pursued but in order to enhance the efficiency of the whole systemthe set of harvesters needs to work in phase Recently the optimization of energy harvesters networksthrough Artificial Intelligence have shown a valuable strategy to follow [36]
Table 4 Electrical energy voltage power
Voltage Average Voltage Max Energy Power Average Power Max
74 mV 65 V 21 microJ 33 nW 42 microW
44 Efficiency of Piezoelectric Harvester
The efficiency of the piezoelectric harvester was evaluated at several gas speeds The efficiencycurve was constructed by dividing the electrical power output by the available fluid power (kineticpower) available in the cross-sectional area in which the harvester operated according to thefollowing equation
η = P(1
2middotρmiddotAmiddotv3
)(11)
Energies 2020 13 4169 12 of 15
where η is the efficiency P is the electrical power outout ρ is the air density A is the cross sectionalarea presented to the incoming stream and v is the air velocity [37] Figure 9 shows the trend of theefficiency of conversion of the piezoelectric harvesterEnergies 2020 13 x FOR PEER REVIEW 4 of 15
159 Figure 9 Efficiency (logarithmic scale) of AlN-based piezoelectric harvester 160
It was noticeable that there was a decreasing trend of efficiency with increasing gas speed 161 probably due to a couple of factors von Karman vortex excitation losing efficacy on the piezoelectric 162 component and possible generation of opposite charge in different parts of the piezoelectric 163 component due to vibrational modes different from mode I Further studies are needed to explain 164 this trend 165
5 Conclusions 166 The gas at the exhaust of an internal combustion engine carries power that can be classified in 167
three portions thermal pressure and kinetic The thermal power is most dominant with values in 168 the order of kW while the pressure and the kinetic are of the order of watts at the exhaust muffler 169
Temperature rapidly exceeds 120 degC in most of the points of the exhaust system at several engine 170 points Therefore the use of piezoelectric harvesters has to be restricted to materials whose 171 piezoelectric properties can withstand those temperatures The piezoelectric conversion using high 172 temperature-resistant transducers (AlN on polyimide) has been demonstrated to be a good 173 candidate to be used as an energy harvester in a harsh environment in the exhaust system However 174 further studies are needed to study the influence of temperature (in the range of the exhaust gas 175 temperatures) in order to quantify its effect on the performance of the device as a whole 176
Appendix 177 Results of measurement of temperature pressure and gas speed of the exhaust gas are 178
summarized below in Table A1 Table A2 Table A3 179
Table A1 Results summary gas speed 180 Engine regime rpm
torque Engine exit Resonator Between resonatormuffler
Muffler right tube
Muffler left tube
Position 1 2 3 4 5 1500 rpm 30 Nm 12 ms 2 ms 13 ms 4 ms 9 ms 1500 rpm 320 Nm 17 ms 3 ms 17 ms 9 ms 11 ms 2000 rpm 50 Nm 7 ms 3 ms 9 ms 2 ms 5 ms 2000 rpm 320 Nm 26 ms 6 ms 25 ms 14 ms 16 ms 3000 rpm 40 Nm 23 ms 5 ms 30 ms 12 ms 15 ms 3000 rpm 320 Nm 37 ms 8 ms 41 ms 22 ms 23 ms
Table resembling Table A2 of the article by Nontharkan [26] 181
Table A2 Results summary temperature 182
Figure 9 Efficiency (logarithmic scale) of AlN-based piezoelectric harvester
It was noticeable that there was a decreasing trend of efficiency with increasing gas speed probablydue to a couple of factors von Karman vortex excitation losing efficacy on the piezoelectric componentand possible generation of opposite charge in different parts of the piezoelectric component due tovibrational modes different from mode I Further studies are needed to explain this trend
5 Conclusions
The gas at the exhaust of an internal combustion engine carries power that can be classified inthree portions thermal pressure and kinetic The thermal power is most dominant with values in theorder of kW while the pressure and the kinetic are of the order of watts at the exhaust muffler
Temperature rapidly exceeds 120 C in most of the points of the exhaust system at severalengine points Therefore the use of piezoelectric harvesters has to be restricted to materials whosepiezoelectric properties can withstand those temperatures The piezoelectric conversion using hightemperature-resistant transducers (AlN on polyimide) has been demonstrated to be a good candidateto be used as an energy harvester in a harsh environment in the exhaust system However furtherstudies are needed to study the influence of temperature (in the range of the exhaust gas temperatures)in order to quantify its effect on the performance of the device as a whole
Author Contributions Conceptualization methodology validation formal analysis investigation data curationwritingmdashoriginal draft preparation FM IM FG and AC writingmdashreview and editing FR supervisionMDV and APC All authors have read and agreed to the published version of the manuscript
Funding HORIZON 2020rdquo PON IampC 201ndash ldquoRecupero di Energia Meccanica da fluidi per internet delle cose esensori remoti (REM)rdquo n F05011101-03X32
Conflicts of Interest The authors declare no conflict of interest
Appendix A
Results of measurement of temperature pressure and gas speed of the exhaust gas are summarizedbelow in Table A1 Table A2 Table A3
Energies 2020 13 4169 13 of 15
Table A1 Results summary gas speed
Engine Regime Rpm Torque Engine Exit Resonator BetweenResonatorMuffler
MufflerRight Tube Muffler Left Tube
Position 1 2 3 4 5
1500 rpm 30 Nm 12 ms 2 ms 13 ms 4 ms 9 ms1500 rpm 320 Nm 17 ms 3 ms 17 ms 9 ms 11 ms2000 rpm 50 Nm 7 ms 3 ms 9 ms 2 ms 5 ms2000 rpm 320 Nm 26 ms 6 ms 25 ms 14 ms 16 ms3000 rpm 40 Nm 23 ms 5 ms 30 ms 12 ms 15 ms3000 rpm 320 Nm 37 ms 8 ms 41 ms 22 ms 23 ms
Table resembling Table A2 of the article by Nontharkan [26]
Table A2 Results summary temperature
Engine Regime Rpm Torque Engine Exit Resonator BetweenResonatorMuffler
MufflerRight Tube Muffler Left Tube
Position 1 2 3 4 5
1500 rpm 30 Nm 485 C 450 C 280 C 100 C 165 C1500 rpm 320 Nm 630 C 550 C 320 C 110 C 175 C2000 rpm 50 Nm 340 C 370 C 300 C 115 C 183 C2000 rpm 320 Nm 640 C 380 C 300 C 125 C 195 C3000 rpm 40 Nm 645 C 370 C 310 C 160 C 220 C3000 rpm 320 Nm 740 C 400 C 300 C 190 C 220 C
Table A3 Results Summary pressure (kPa)
Engine Regime Rpm Torque Engine Exit Resonator BetweenResonatorMuffler
MufflerRight Tube Muffler Left Tube
Position 1 2 3 4 5
1500 rpm 30 Nm 164 167 162 101 1011500 rpm 320 Nm 182 200 190 101 1012000 rpm 50 Nm 116 120 117 101 1012000 rpm 320 Nm 225 225 225 101 1013000 rpm 40 Nm 137 133 135 101 1013000 rpm 320 Nm 225 225 225 101 101
References
1 Hooftman N Messagie M Van Mierlo J Coosemans T A review of the European passenger carregulationsmdashReal driving emissions vs local air quality Renew Sustain Energy Rev 2018 86 1ndash21[CrossRef]
2 Williams M Minjares R A technical summary of Euro 6VI vehicle emission standards The InternationalCouncil on Clean Transportation Available online httpwwwindiaenvironmentportalorginfilesfile
ICCT_Euro6-VI_briefingpdf (accessed on 2 May 2020)3 Fontaras G Ciuffo B Zacharof N Tsiakmakis S Marotta A Pavlovic J Anagnostopoulos K
The difference between reported and real-world CO2 emissions How much improvement can be expectedby WLTP introduction Transp Res Procedia 2017 25 3933ndash3943 [CrossRef]
4 Varella R Giechaskiel B Sousa L Duarte G Weiss M Bonnel P Hummel R Steininger N Djoric VJovic J et al Comparison of Portable Emissions Measurement Systems (PEMS) with Laboratory GradeEquipment Appl Sci 2018 8 1633 [CrossRef]
5 Djoric V Jovic J Vukanovic S Collection and assessment of instantaneous vehicle emissions on streetnetwork In Proceedings of the Transport Research Arena (TRA) 5th Conference Transport Solutions fromResearch to Deployment European Commission Paris Italy 14ndash17 April 2014
6 Hossain SN Bari S Waste heat recovery from exhaust of a diesel generator set using organic fluidsProcedia Eng 2014 90 439ndash444 [CrossRef]
7 Hossain SN Bari S Additional power generation from waste energy of diesel engine using parallel flowshell and tube heat exchanger J Eng Gas Turbines Power 2014 136 100ndash104 [CrossRef]
Energies 2020 13 4169 14 of 15
8 Fern P Armas O Gil A Developing Computational Fluid Dynamics (CFD) Models to Evaluate AvailableEnergy in Exhaust Systems of Diesel Light-Duty Vehicles Appl Sci 2017 7 590 [CrossRef]
9 Jadhao JS Thombare DG Student PG Sangali D Review on Exhaust Gas Heat Recovery for IC engineInt J Eng Innov Technol (IJEIT) Vol 2013 2 93ndash100
10 Orido G Ngunjiri PG Njue DM Exhaust Gases Energy Recovered from Internal Combustion Engine forUseful Applications IOSR J Mech Civ Eng 2017 14 01ndash07 [CrossRef]
11 Guduru KK Power Generation by using Kinetic Energy of Exhaust Gases from an Internal CombustionEngine Int J Res Comput Technol 2019 7 1ndash5
12 Alshammari M Alshammari F Pesyridis A Electric boosting and energy recovery systems for enginedownsizing Energies 2019 12 4636 [CrossRef]
13 Ismail BI Automotive exhaust gas waste-heat recovery for green electrical power generation usingThermoelectric technology Recent Pat Electr Electron Eng 2012 5 185ndash197 [CrossRef]
14 Weiss M Bonnel P Hummel R Steininger N A Complementary Emissions Test for Light-Duty VehiclesAssessing the Technical Feasibility of Candidate Procedures Conclusions of the Real-Driving Emissions-Light-DutyVehicles (RDE-LDV) working group Publications Office of the European Union Brussels Belgium 2013[CrossRef]
15 Valencia G Fontalvo A Caacuterdenas Y Duarte J Isaza C Energy and exergy analysis of different exhaustwaste heat recovery systems for natural gas engine based on ORC Energies 2019 12 2378 [CrossRef]
16 Fu J Liu J Yang Y Yang H A Study on the Prospect of Engine Exhaust Gas Energy RecoveryIn Proceedings of the 2011 International Conference on Electric Information and Control Engineering WuhanChina 15ndash17 April 2011 IEEE Miami FL USA 2011 pp 1960ndash1963 [CrossRef]
17 Gomes JBA Rodrigues JJPC Rabecirclo RAL Kumar N Kozlov S IoT-enabled gas sensors Technologiesapplications and opportunities J Sens Actuator Netw 2019 8 57 [CrossRef]
18 Todaro MT Guido F Mastronardi V Desmaele D Epifani G Algieri L De Vittorio M PiezoelectricMEMS vibrational energy harvesters Advances and outlook Microelectron Eng 2017 183ndash184 23ndash36[CrossRef]
19 Guido F Qualtieri A Algieri L Lemma ED De Vittorio M Todaro MT AlN-based flexible piezoelectricskin for energy harvesting from human motion Microelectron Eng 2016 159 174ndash178 [CrossRef]
20 Lee YJ Qi Y Zhou G Lua KB Vortex-induced vibration wind energy harvesting by piezoelectric MEMSdevice in formation Sci Rep 2019 9 1ndash11 [CrossRef] [PubMed]
21 Boulahlib MS Boukebbab S Gaci F Kholai O Experimental study of energy balance for air-cooled didiesel engines operating in hot climates SAE Tech Pap 2009 [CrossRef]
22 Taymaz I An experimental study of energy balance in low heat rejection diesel engine Energy 2006 31364ndash371 [CrossRef]
23 Fairbanks JW The 60 Percent Efficient Diesel Engine Probable Possible or Just A Fantasy In Proceedingsof the 2005 Diesel Engine Emissions Reduction (DEER) Conference Presentations US Department of EnergyChicago Chicago IL USA 24 August 2005
24 Gopal KN Subbarao R Pandiyarajan V Velraj R Thermodynamic analysis of a diesel engine integratedwith a PCM based energy storage system Int J Thermodyn 2010 13 15ndash21 [CrossRef]
25 Kyle BG Chemical and Process Thermodynamics Englewood CliffsPrentice Hall Upper Saddle River NJUSA 1984
26 Dubois E Mercier A Design and Optimization of an Integrated Turbo-Generator and ThermoelectricGenerator for Vehicle Exhaust Electrical Energy Recovery Energy Recover 2009 1ndash329 [CrossRef]
27 Koshy AP Jose BK Johnson JE Krishnan KN Exhaust Gas Waste Heat Recovery and UtilizationSystem in ICEngine Int J Innov Res Sci Technol 2015 1 392ndash400
28 Testo Tubo di Pitot Diritto 360 mm Available online httpswwwtestocomit-ITtubo-di-pitot-diritto-360-mmp0635-2043 (accessed on 1 April 2020)
29 Testo 480 Data Logger Available online httpswwwtestocomen-UStesto-480p0563-4800 (accessed on 1April 2020)
30 Saleh JM Fluid Flow Handbook McGraw-Hill Professional New York NY USA 200231 Von Karman T Aerodynamics McGraw-Hill New York NY USA 1963 ISBN 978-0-486-43485-832 Townley A Vibrational Energy Harvesting Using Mems Piezoelectric Generators Available online https
sunfestseasupenneduwp-contentuploads201807TownleyAndrew09pdf (accessed on 7 June 2020)
Energies 2020 13 4169 15 of 15
33 Fonseca Gonzaacutelez N Casanova Kindelaacuten J Loacutepez Martiacutenez JM Methodology for instantaneous averageexhaust gas mass flow rate measurement Flow Meas Instrum 2016 49 52ndash62 [CrossRef]
34 Petroni S Rizzi F Guido F Cannavale A Donateo T Ingrosso F Mastronardi VM Cingolani RDe Vittorio M Flexible AlN flags for efficient wind energy harvesting at ultralow cut-in wind speed RSCAdv 2015 5 14047ndash14052 [CrossRef]
35 Arroyo E Jia Y Du S Chen ST Seshia AA Experimental and theoretical study of a piezoelectricvibration energy harvester under high temperature J Microelectromechanical Syst 2017 26 1216ndash1225[CrossRef]
36 Nabavi S Zhang L Design and Optimization of a Low-Resonant-Frequency Piezoelectric MEMS EnergyHarvester Based on Artificial Intelligence Proceedings 2018 2 930 [CrossRef]
37 Weinstein LA Cacan MR So PM Wright PK Vortex shedding induced energy harvesting frompiezoelectric materials in heating ventilation and air conditioning flows Smart Mater Struct 2012 21[CrossRef]
copy 2020 by the authors Licensee MDPI Basel Switzerland This article is an open accessarticle distributed under the terms and conditions of the Creative Commons Attribution(CC BY) license (httpcreativecommonsorglicensesby40)
- Introduction
- Materials and Methods
-
- Tests at the Engine Bench
- Test Cycles
- Measurement Systems
- Exhaust Gas Positions
- Piezoelectric Conversion
-
- Results
- Discussion
-
- Validation of Gas Speed Measured by Pitot Tube
- Estimation of Power at the Engine Exhaust for the Bench Engine
- Piezoelectric Conversion from the Exhaust Pipe under Real Driving Conditions
- Efficiency of Piezoelectric Harvester
-
- Conclusions
- References
-
Energies 2020 13 4169 2 of 15
reviewed [1819] in several applications The vortex-induced vibration method is a common practiceused to harvest the kinetic energy of a fluid using piezoelectric transducers [20]
This work reports the comprehensive evaluation of the energy available and harvestable in exhaustgas in different forms such as thermal pressure and kinetic at different positions of the exhaustsystem and at different engine operating conditions (engine speed and torque) Physical properties ofthe gas such as temperature pressure gas speed have been measured in order to provide a completedescription of the environment in which the harvester and the IoT smart gas sensor would operate
The work also describes the preliminary results of the installation of a piezoelectric harvesterand simultaneous measurement of several parameters of the engine in real driving conditions andmeasurement of the electrical energy produced
Thoretical Model for Evaluating Exhaust Gas Energy
In a conventional internal combustion engine approximately one-third of total fuel input energyis converted to useful work one-third is dissipated by the cooling system radiation and friction andfinally another third is expelled by the exhaust gases [2122]
Diesel internal combustion enginesrsquo cycles have a substantial quantity of energy that is expelledfrom the exhaust system in the exhaust gases as described with the energy split diagram shown inFigure 1
Energies 2020 13 x FOR PEER REVIEW 2 of 15
reviewed [1819] in several applications The vortex-induced vibration method is a common practice used to harvest the kinetic energy of a fluid using piezoelectric transducers [20]
This work reports the comprehensive evaluation of the energy available and harvestable in exhaust gas in different forms such as thermal pressure and kinetic at different positions of the exhaust system and at different engine operating conditions (engine speed and torque) Physical properties of the gas such as temperature pressure gas speed have been measured in order to provide a complete description of the environment in which the harvester and the IoT smart gas sensor would operate
The work also describes the preliminary results of the installation of a piezoelectric harvester and simultaneous measurement of several parameters of the engine in real driving conditions and measurement of the electrical energy produced
11 Thoretical Model for Evaluating Exhaust Gas Energy
In a conventional internal combustion engine approximately one-third of total fuel input energy is converted to useful work one-third is dissipated by the cooling system radiation and friction and finally another third is expelled by the exhaust gases [2122]
Diesel internal combustion enginesrsquo cycles have a substantial quantity of energy that is expelled from the exhaust system in the exhaust gases as described with the energy split diagram shown in Figure 1
Figure 1 Energy split for a diesel engine (light truck or passenger vehicle) [23]
The energy balance is shown in Equation (1) = + + + (1)
where is the total power provided by the fuel is the useful mechanical power (or internal power) used for mobility and accessories is the power adsorbed by the cooling system of the engine is the power dissipated by radiation and friction is the power expelled through the exhaust system
There have been several studies to analyze and quantify the energy expelled in the exhaust gases and recover it for several applications [691024] While the power exploited for car mobility is
= ∙ = ( ) ∙ ( ) (2)
The total exhaust gas energy can be broken down into residual thermal energy residual pressure energy and residual kinetic energy giving the following total energy equation = + + (3)
In the equation is the total flow of exhaust gas energy Js is the flow of residual kinetic energy Js is the flow of residual pressure energy Js is the flow of residual thermal energy Js
The mass flow rate at the exhaust gas is equal to
Figure 1 Energy split for a diesel engine (light truck or passenger vehicle) [23]
The energy balance is shown in Equation (1)
Qtotal = Pi +
Qcoolant +
Q f riction +
Qexhaust gas (1)
where
Qtotal is the total power provided by the fuel Pi is the useful mechanical power (or internalpower) used for mobility and accessories
Qcoolant is the power adsorbed by the cooling system of the
engine
Q f riction is the power dissipated by radiation and friction
Qexhaust gas is the power expelledthrough the exhaust system
There have been several studies to analyze and quantify the energy expelled in the exhaust gasesand recover it for several applications [691024] While the power exploited for car mobility is
Pi = Engine speedmiddotTorque = (rpm)middot(Nm) (2)
The total exhaust gas energy can be broken down into residual thermal energy residual pressureenergy and residual kinetic energy giving the following total energy equation
Qexhaust =
Qkinetic +
Qpressure +
Qheat (3)
Energies 2020 13 4169 3 of 15
In the equation
Qexhaust is the total flow of exhaust gas energy Js
Qkinetic is the flow of residualkinetic energy Js
Qpressure is the flow of residual pressure energy Js
Qheat is the flow of residual
thermal energy JsThe mass flow rate at the exhaust gas is equal to
mexhaust =
mair +
m f uel (4)
In the equation above
mexhaust
mair and
m f uel are respectively the exhaust gas air and fuel massflow rates
The specific heat capacity of the exhaust gas is a function of temperature however we can considercp constant by assuming the behavior of the exhaust gas as perfect If the exhaust gas were assumed tobe real gas the use of a cp varying with temperature would give an error of 2ndash3 on the results ofthermal power which is acceptable given the accuracy of the experimental measurements
Therefore the flow of residual thermal energy can be solved with the following equation
Qheat =
mexhaust middot
int Texhaust
T0
cpdT sim
mexhaustmiddotcpmiddot∆T (5)
In the equation cp is the specific heat capacity of exhaust gas [25] in J(kgmiddotK) Tex is the temperatureof exhaust gas in K T0 is the environment temperature in K
The exhaust gas pressure energy can be calculated through the following equation [26]
Qpressure =
mexhaustmiddot
kkminus 1
middotRgmiddotTexmiddot
[1minus
p0
pex
kminus1k]
(6)
In the equation pex is the pressure of the exhaust gas p0 is the atmospheric pressure understandard conditions Pa Rg is the gas constant of the exhaust gas J(kgmiddotK) κ is the specific heat capacity
The equation for the residual kinetic energy is
Qkinetic =
12middotρexhaustmiddotAmiddotvexhaust
3 =12middot
mexhaustmiddotvexhaust
2 (7)
In the calculations of residual pressure energy and residual thermal energy the standardatmospheric conditions are considered
Any energy recovery system would need to operate in the harsh environment of the exhaust gassystem In order to design and maximize the efficiency of the harvester it is fundamental to knowthe temperature pressure and the speed of the exhaust gas as well as information about the level ofturbulence of the same gas The purpose of the experimental session is to characterize the differentparameters of the exhaust gas at different operating points of the engine ie at different loads torqueand rpm Several works have been published related to the recovery of exhaust energy through thermalor pressure conversion [69ndash111327] However kinetic energy can be potentially converted into usefulelectrical energy for powering IoT sensors for monitoring the gas properties such as concentrationof polluting species fuel not combusted or temperature A special emphasis has been given to thecalculation of the kinetic energy available in the exhaust gas with the goal in mind of converting itinto electric power by means of piezoelectric conversion A test of the conversion of kinetic energy ofexhaust gas into electrical energy has been attempted using a flexible piezoelectric harvester
2 Materials and Methods
21 Tests at the Engine Bench
The engine used for the measurements was an AUDI A4 year 2011 2000cc TDI diesel engine ofthe VAG group developed by Audi it is a four-cylinder in-line four-stroke compression ignition system
Energies 2020 13 4169 4 of 15
with four valves per cylinder ldquoturbochargedrdquo and equipped with a common rail (CR) injection systemThe engine delivers a maximum power of 105 kW (143 HP) at 4200 rpm and a maximum torque of320 Nm between 1750 and 2500 rpm (Figure 2)Energies 2020 13 x FOR PEER REVIEW 4 of 15
(a) (b)
(c) (d)
Figure 2 (a) Lab engine photo (b) torque and power curves of the engine (c) map of the engine and engine points explored circled (d) power curves of the engine the legend shows the percentage of load (gas pedal)
In addition to the use of the common rail injection system and the piezoelectric injectors which guarantee meticulous control of the quantity of fuel injected into the combustion chamber thereby decreasing the quantity of unburned fuel expelled at the exhaust other technologies such as electric EGR valve (exhaust gas recirculation) an EGR cooling system and a particulate filter equip the engine in order to lower polluting emissions
These characteristics make the engine perfectly suited to the study thanks to the optimization of combustion which limits the fluctuations of torque and power and thanks to the use of the turbocharger it allows for a range of air speeds in the intake and exhaust interesting for the analysis of the energy harvesting system
The power torque and specific consumption curves for different percentages of pedal were obtained during several tests carried out in the ldquoInternal Combustion Enginesrdquo laboratories of the University of Salento to better characterize the engine and define the most interesting test points for the study
The engine bench characterization and the implemented layout allowed for the experimental definition of the test engine points checking of all the parameters of the control unit and the percentage of the pedal and the ability to identify torque and power in urban suburban and freeway use
22 Test Cycles
The idea of defining the engine operating points was to define operating conditions characteristic of urban suburban and freeway routes under particular driving conditions which are listed in Table 1
Figure 2 (a) Lab engine photo (b) torque and power curves of the engine (c) map of the engine andengine points explored circled (d) power curves of the engine the legend shows the percentage ofload (gas pedal)
In addition to the use of the common rail injection system and the piezoelectric injectorswhich guarantee meticulous control of the quantity of fuel injected into the combustion chamberthereby decreasing the quantity of unburned fuel expelled at the exhaust other technologies such aselectric EGR valve (exhaust gas recirculation) an EGR cooling system and a particulate filter equip theengine in order to lower polluting emissions
These characteristics make the engine perfectly suited to the study thanks to the optimizationof combustion which limits the fluctuations of torque and power and thanks to the use of theturbocharger it allows for a range of air speeds in the intake and exhaust interesting for the analysis ofthe energy harvesting system
The power torque and specific consumption curves for different percentages of pedal wereobtained during several tests carried out in the ldquoInternal Combustion Enginesrdquo laboratories of theUniversity of Salento to better characterize the engine and define the most interesting test points forthe study
The engine bench characterization and the implemented layout allowed for the experimentaldefinition of the test engine points checking of all the parameters of the control unit and the percentageof the pedal and the ability to identify torque and power in urban suburban and freeway use
22 Test Cycles
The idea of defining the engine operating points was to define operating conditions characteristicof urban suburban and freeway routes under particular driving conditions which are listed in Table 1
Energies 2020 13 4169 5 of 15
Table 1 Engine points studied
Point 1 Point 2 Point 3 Point 4 Point 5 Point 6
RPM 1500 1500 2000 2000 3000 3000Torque 200 320 50 320 40 320
Equivalent gear 1 2 5 3 6 6
The points described in Table 1 were inserted within the torque curves of the engine to establishthe gas pedal percentages to be supplied to the engine in order to obtain the required torque and poweras an output
It should also be noted that points 3 and 5 are characterized by a low percentage of turbochargeroperation while points 2 4 and 6 represent the points of maximum torque that can be delivered by theengine at the given engine speed
23 Measurement Systems
The average gas speed was measured with a pitot tube [28] which included also a thermocouplefor measuring temperature and data logger Testo 480 [29] with a sampling rate of 1 samplesec
The exhaust tube was drilled to host the pitot tube (approximately 6 mm in diameter) which wasused to measure the total pressure and the dynamic pressure from which the logger calculated the gasspeed using Bernoullirsquos equation [30]
All parameters related to the engine were monitored and measured while driving on the road byusing a commercial OBD II (on-board-diagnostics) which is a device that is connected to the electroniccentral unit (ECU) of the car The OBD logger was inserted into the OBD port of the car and the datacollected were transferred via blue-tooth protocol to the mobile application
24 Exhaust Gas Positions
As indicated below the chosen measuring points were located along the exhaust line startingfrom downstream of the particulate filter up to the point of expulsion of the gases into the atmosphere
The exhaust system studied is shown in Figure 3 with the 5 positions at which the gas wasmeasured Position 1 rdquoEngine Exitrdquo was directly downstream of the particulate filter position 2ldquoResonatorrdquo was in the empty cylinder approximately 600 mm downstream of position 1 position 3ldquoBetween Resonator and Mufflerrdquo was approximately 300 mm downstream of the resonator finallypositions 4 and 5 were the two exits of the muffler
Energies 2020 13 x doi FOR PEER REVIEW wwwmdpicomjournalenergies
Table 1 Engine points studied 1 Point 1 Point 2 Point 3 Point 4 Point 5 Point 6
RPM 1500 1500 2000 2000 3000 3000 Torque 200 320 50 320 40 320
Equivalent gear 1 2 5 3 6 6
The points described in Table 1 were inserted within the torque curves of the engine to establish 2 the gas pedal percentages to be supplied to the engine in order to obtain the required torque and 3 power as an output 4
It should also be noted that points 3 and 5 are characterized by a low percentage of turbocharger 5 operation while points 2 4 and 6 represent the points of maximum torque that can be delivered by 6 the engine at the given engine speed 7
23 Measurement Systems 8 The average gas speed was measured with a pitot tube [28] which included also a thermocouple 9
for measuring temperature and data logger Testo 480 [29] with a sampling rate of 1 samplesec 10 The exhaust tube was drilled to host the pitot tube (approximately 6 mm in diameter) which 11
was used to measure the total pressure and the dynamic pressure from which the logger calculated 12 the gas speed using Bernoullirsquos equation [30] 13
All parameters related to the engine were monitored and measured while driving on the road 14 by using a commercial OBD II (on-board-diagnostics) which is a device that is connected to the 15 electronic central unit (ECU) of the car The OBD logger was inserted into the OBD port of the car 16 and the data collected were transferred via blue-tooth protocol to the mobile application 17
24 Exhaust Gas Positions 18 As indicated below the chosen measuring points were located along the exhaust line starting 19
from downstream of the particulate filter up to the point of expulsion of the gases into the 20 atmosphere 21
The exhaust system studied is shown in Figure 3 with the 5 positions at which the gas was 22 measured Position 1 rdquoEngine Exitrdquo was directly downstream of the particulate filter position 2 23 ldquoResonatorrdquo was in the empty cylinder approximately 600 mm downstream of position 1 position 3 24 ldquoBetween Resonator and Mufflerrdquo was approximately 300 mm downstream of the resonator finally 25 positions 4 and 5 were the two exits of the muffler 26
27
Figure 3 Exhaust system and characterized positions Each muffler tube has a diameter of 60 mm 28 and an area of 2800 mm2 29
Figure 3 Exhaust system and characterized positions Each muffler tube has a diameter of 60 mmand an area of 2800 mm2
Energies 2020 13 4169 6 of 15
25 Piezoelectric Conversion
According to the theory of flow around bluff bodies introduced by T von Karman [31] the Karmanvortex street was created to improve the vibrational energy of the exhaust gas The forces from sheddingvortices make the flexible piezoelectric harvester (Aluminum Nitride-based) device vibrate periodicallyThe electromechanical energy conversion is then completed based on the direct piezoelectric effectwhich is the process of formation of an electrical field within the material through the separation ofcharge due to applied strain Figure 4 shows the process of the energy conversion from kinetic toelectrical by the flexible piezoelectric harvester
Energies 2020 13 x FOR PEER REVIEW 2 of 15
25 Piezoelectric Conversion 30 According to the theory of flow around bluff bodies introduced by T von Karman [31] the 31
Karman vortex street was created to improve the vibrational energy of the exhaust gas The forces 32 from shedding vortices make the flexible piezoelectric harvester (Aluminum Nitride-based) device 33 vibrate periodically The electromechanical energy conversion is then completed based on the direct 34 piezoelectric effect which is the process of formation of an electrical field within the material through 35 the separation of charge due to applied strain Figure 4 shows the process of the energy conversion 36 from kinetic to electrical by the flexible piezoelectric harvester 37
The piezoelectric constitutive equations also known as ldquocoupled equationsrdquo are given below 38 [32] 39 = +
(8) = + (9) where S is the strain tensor sE is the matrix of compliance coefficient T is the stress tensor d is the 40 matrix of the piezoelectric strain constant D is the tensor of elecric displacement εT is the permittivity 41
42 Figure 4 Schematic representation of the energy conversion from kinetic to electrical by the 43 piezoelectric transducer 44
3 Results 45 The data of mass flow of fuel and air were taken from the electronic central unit of the engine 46
(ECU) relative to the different engine operating conditions and are listed in Table 2 47
Table 2 Measurements of gas flow at the exhaust relative to the different engine operating conditions 48 Engine operating point
Speed_torque Fuel gas flow Fuel mass flow1 Total mass flow
(rpm)_(Nm) (mgstroke) (gs) (gs) 1500_200 1500_320 2000_50 2000_320 3000_40 3000_320
388 550 114 572 119 551
37 43 22 68 63
100
382 458 22
649 63
1005 1 Fuel mass flow measured as mgstroke converted into gs by the formula mgstroke = 4rpm60 (mgs) 49
31 Detailed Results Relative to the Exhaust Gas for Each Exhaust Position 50 The exhaust gas was characterized at different positions of the exhaust system and gas pressure 51
gas speed and temperature were measured using the methods described in Materials and Methods 52 Detailed plots of the measured gas parameters are presented in Table A1 Table A2 Table A3 in 53 Appendix at the end of the document 54
Results of the measurements are summarized in Figure 5 55
Figure 4 Schematic representation of the energy conversion from kinetic to electrical by thepiezoelectric transducer
The piezoelectric constitutive equations also known as ldquocoupled equationsrdquo are given below [32]
S = sET + dE (8)
D = dT + εTE (9)
where S is the strain tensor sE is the matrix of compliance coefficient T is the stress tensor d is thematrix of the piezoelectric strain constant D is the tensor of elecric displacement εT is the permittivity
3 Results
The data of mass flow of fuel and air were taken from the electronic central unit of the engine(ECU) relative to the different engine operating conditions and are listed in Table 2
Table 2 Measurements of gas flow at the exhaust relative to the different engine operating conditions
Engine Operating PointSpeed_Torque Fuel Gas Flow Fuel Mass Flow 1 Total Mass Flow
(rpm)_(Nm) (mgstroke) (gs) (gs)
1500_200 388 37 3821500_320 550 43 4582000_50 114 22 22
2000_320 572 68 6493000_40 119 63 63
3000_320 551 100 10051 Fuel mass flow measured as mgstroke converted into gs by the formula mgstroke = 4rpm60 (mgs)
Detailed Results Relative to the Exhaust Gas for Each Exhaust Position
The exhaust gas was characterized at different positions of the exhaust system and gas pressuregas speed and temperature were measured using the methods described in Materials and MethodsDetailed plots of the measured gas parameters are presented in Table A1 Table A2 Table A3 inAppendix at the end of the document
Energies 2020 13 4169 7 of 15
Results of the measurements are summarized in Figure 5Energies 2020 13 x FOR PEER REVIEW 3 of 15
(a) (b)
(c) (d)
Figure 5 Summary of the exhaust gas properties at each exhaust line position (a) Gas speed measured 56 at each of the five positions of the exhaust system (b) absolute gas static pressure at each of the five 57 positions of the exhaust system (c) gas temperature at each of the five positions of the gas exhaust 58 system (d) description of the operating engine points studied 59
4 Discussion 60 Based on the data collected with the measurement of the fundamental gas properties several 61
calculations have been carried out using the equation presented in the introduction in order to 62 calculate the power of the exhaust gas A preliminary discussion on the measurement of the gas speed 63 is presented first 64
41 Validation of Gas Speed Measured by Pitot Tube 65 As described by Gonzales et al [33] there is a high frequency component to the pressure waves 66
of the exhaust gas therefore the exhaust gas flow is not steady or constant However for the purpose 67 of the present work where the measurement of the gas speed has been performed with a sampling 68 rate of 2 sampless we can consider the flow as quasi-static 69
The average gas speed measured by the pitot tube has been compared with values of gas speed 70 calculated by a mathematical model based on the measured mass flow of the gas speed at each engine 71 point and the density and temperature of the gas as shown in Table 3 The calculation of the average 72 gas speed starting from the measured mass flow rate has been performed using Equation (8) 73 volume flow rate = mass flow ratedensity
gas velocity = volume flow ratearea
(10)
Figure 5 Summary of the exhaust gas properties at each exhaust line position (a) Gas speed measuredat each of the five positions of the exhaust system (b) absolute gas static pressure at each of the fivepositions of the exhaust system (c) gas temperature at each of the five positions of the gas exhaustsystem (d) description of the operating engine points studied
4 Discussion
Based on the data collected with the measurement of the fundamental gas propertiesseveral calculations have been carried out using the equation presented in the introduction in order tocalculate the power of the exhaust gas A preliminary discussion on the measurement of the gas speedis presented first
41 Validation of Gas Speed Measured by Pitot Tube
As described by Gonzales et al [33] there is a high frequency component to the pressure waves ofthe exhaust gas therefore the exhaust gas flow is not steady or constant However for the purpose ofthe present work where the measurement of the gas speed has been performed with a sampling rateof 2 sampless we can consider the flow as quasi-static
The average gas speed measured by the pitot tube has been compared with values of gas speedcalculated by a mathematical model based on the measured mass flow of the gas speed at each enginepoint and the density and temperature of the gas as shown in Table 3 The calculation of the averagegas speed starting from the measured mass flow rate has been performed using Equation (8)
volume flow rate = mass flow ratedensity
gas velocity = volume flow ratearea
(10)
Energies 2020 13 4169 8 of 15
Table 3 Gas parameters at left muffler
Engine PointRpm_Torque
Total MassFlow Gas Density Volume Flow Cross Section Calculated
SpeedMeasured
Speed Error
(gs) (kgm3) (m3s) times 10minus3 (cm2) (ms) (ms)
1500_200 382 081 472 56 84 9 641500_320 458 079 580 56 104 11 592000_50 22 077 286 56 51 5 202000_320 694 075 925 56 165 16 333000_40 63 072 875 56 156 15 423000_320 1005 072 1396 56 249 23 84
As described in previous work [3435] the main component of the gas exhaust as it is in the air isN2 When considering the gas properties neglecting the combustion products the error is typically nothigher than 2 therefore we have used air density when needed for the gas exhaust
Given the relatively small discrepancy between measured and calculated values the measuredvalues of the gas speed can be considered reliable therefore they have been used for the calculation ofthe kinetic energy in the following sections
42 Estimation of Power at the Engine Exhaust for the Bench Engine
Three forms of energy at the exhaust were evaluated and the power was calculated usingEquations (5)ndash(7) for thermal pressure and kinetic power respectively The results showed that thermalpower was by far the most dominant form of power present in the exhaust gas followed by pressurepower and finally kinetic power was the smallest fraction
Figure 6andashc give a graphic summary of the power results Figure 6d shows the trend of the differentforms of power with the value of the torque fixed at 320 Nm while the engine speed (RPM) variablebetween 1500 rpm and 3000 rpm which is the most common range of engine speeds experienced inreal driving conditions Figure 6d represents the values on the Y-axis with a logarithmic scale showingthe kinetic power in the order of W which was a small fraction of the exhaust energy available in otherforms (thermal and pressure)
It is noteworthy that in position 2 (resonator) the pressure was approximately the same as the pressuremeasured in position 3 (between resonator and muffler) However the gas speed and consequentlythe kinetic energy associated with the gas was significantly higher in position 3 compared to position2 The reason for this behavior is currently unclear The exhaust system is a complex fluid dynamicenvironment in which several factors such as cross-section variation pressure wave propagation andreflection and heat exchange contribute to complex effects on the gas speed For example pressure wavepropagation leads to maxima and minima which could be further emphasized in positions closer to theresonator Further studies would be needed to clarify these aspects
Energies 2020 13 4169 9 of 15
Energies 2020 13 x doi FOR PEER REVIEW wwwmdpicomjournalenergies
(a) (b)
(c) (d)
Figure 6 Summary of power calculations at different engine points and at each of the five exhaust 101 locations (a) thermal power (b) pressure power and (c) kinetic power (d) thermal kinetic pressure 102 and internal power 103
43 Piezoelectric Conversion from the Exhaust Pipe under Real Driving Conditions 104 Real driving emission conditions were evaluated by carrying out measurements of the exhaust 105
gas while driving a car on the road The car tested was a Fiat Freemont 2000cc TDI therefore equipped 106 with an engine very similar to the one tested in the lab In addition to measuring pressure 107 temperature and gas speed of the exhaust gas a first test on the piezoelectric conversion was 108 performed in order to evaluate the efficiency of the energy conversion A flexible piezoelectric 109 transducer fabricated according to the process described by Guido et al [1934] was held inside the 110 exhaust pipe and the electrical signal generated by the piezoelectric transducer was recorded and 111 shown in the figure below 112
Figure 7 shows the parameters of the engine and the exhaust gas measured simultaneously 113 during the real driving conditions road test The temperature of the exhaust gas at the muffler grew 114 rapidly over 100 degC therefore the choice of the material of any harvester needs to consider this 115 constraint 116
The harvester used in this work was made of piezoelectric aluminum nitride on a flexible 117 substrate of polyimide (commercial Kapton) Theoretical models showed that harvester efficiency 118 could experience a drop with temperature due to thermal stresses [35] Noteworthy no creeps in the 119 aluminum nitride piezoelectric layer were observed with temperature suggesting the harvesting 120 device could withstand the temperature range measured The gas speed was generally below 10 ms 121 with a few spikes over 15minus20 ms 122
Figure 6 Summary of power calculations at different engine points and at each of the five exhaustlocations (a) thermal power (b) pressure power and (c) kinetic power (d) thermal kinetic pressureand internal power
43 Piezoelectric Conversion from the Exhaust Pipe under Real Driving Conditions
Real driving emission conditions were evaluated by carrying out measurements of the exhaustgas while driving a car on the road The car tested was a Fiat Freemont 2000cc TDI therefore equippedwith an engine very similar to the one tested in the lab In addition to measuring pressure temperatureand gas speed of the exhaust gas a first test on the piezoelectric conversion was performed in orderto evaluate the efficiency of the energy conversion A flexible piezoelectric transducer fabricatedaccording to the process described by Guido et al [1934] was held inside the exhaust pipe and theelectrical signal generated by the piezoelectric transducer was recorded and shown in the figure below
Figure 7 shows the parameters of the engine and the exhaust gas measured simultaneously duringthe real driving conditions road test The temperature of the exhaust gas at the muffler grew rapidlyover 100 C therefore the choice of the material of any harvester needs to consider this constraint
The harvester used in this work was made of piezoelectric aluminum nitride on a flexiblesubstrate of polyimide (commercial Kapton) Theoretical models showed that harvester efficiencycould experience a drop with temperature due to thermal stresses [35] Noteworthy no creeps inthe aluminum nitride piezoelectric layer were observed with temperature suggesting the harvestingdevice could withstand the temperature range measured The gas speed was generally below 10 mswith a few spikes over 15minus20 ms
Energies 2020 13 4169 10 of 15Energies 2020 13 x FOR PEER REVIEW 2 of 15
123
Figure 7 Recorded real driving conditions parameters 124
Figure 8a shows the bluff body and holder of the piezoelectric harvester made of a polyimide 125 substrate and 1 micron thick layer of piezoelectric AlN responsible for the electro-mechanical 126 conversion during the vortex-induced vibration No visible buildup of carbon on the harvester 127 potentially changing its mechanical response was observed even after repeated tests The deposition 128 of carbon cannot be excluded and further study will be conducted to determine its potential effect 129 Figure 8d shows the retrofit system including the harvester and the measurement setup of the exhaust 130 gas Figure 8c shows the voltage generated during the car drive of approximately 10 minutes in a mix 131 of urban and extra-urban settings The power calculated based on the voltage measured at the 132 piezoelectric device using a 1 Mohm probe is reported in Figure 8d There was a delay between the 133 spikes of RPM torque and engine load and the spikes of voltage generated that were not 134 synchronized with the peaks of the engine parameters Considering that the harvester is based on a 135 vortex-induced vibration mechanism it is possible that the piezoelectric conversion could be more 136 efficient during the transitions between operating conditions of the engine than in fixed regime 137 conditions These topics will be treated in following studies in order to optimize the design of the 138 harvester 139
Figure 7 Recorded real driving conditions parameters
Figure 8a shows the bluff body and holder of the piezoelectric harvester made of a polyimidesubstrate and 1 micron thick layer of piezoelectric AlN responsible for the electro-mechanicalconversion during the vortex-induced vibration No visible buildup of carbon on the harvesterpotentially changing its mechanical response was observed even after repeated tests The depositionof carbon cannot be excluded and further study will be conducted to determine its potential effectFigure 8d shows the retrofit system including the harvester and the measurement setup of the exhaustgas Figure 8c shows the voltage generated during the car drive of approximately 10 min in a mixof urban and extra-urban settings The power calculated based on the voltage measured at thepiezoelectric device using a 1 Mohm probe is reported in Figure 8d There was a delay between thespikes of RPM torque and engine load and the spikes of voltage generated that were not synchronizedwith the peaks of the engine parameters Considering that the harvester is based on a vortex-inducedvibration mechanism it is possible that the piezoelectric conversion could be more efficient during thetransitions between operating conditions of the engine than in fixed regime conditions These topicswill be treated in following studies in order to optimize the design of the harvester
Energies 2020 13 4169 11 of 15Energies 2020 13 x FOR PEER REVIEW 3 of 15
(a) (b)
(c) (d)
Figure 8 Summary of the real driving condition measurements (a) piezoelectric converter mounted 140 on the aluminum bluff body (b) extender of the exhaust pipe at the muffler for mounting the 141 piezoelectric harvester in retrofit (c) voltage of electrical signal generated by the piezoelectric flexible 142 transducer (d) instant power calculated from the voltage 143
Table 4 summarizes the electrical voltage power and energy generated by the piezoelectric 144 harvester during the 10 min ride on the road Although the harvester generated a few peaks of power 145 in the order of microW the average power was in the order of nW The simultaneous use of several 146 harvesters working in parallel could be pursued but in order to enhance the efficiency of the whole 147 system the set of harvesters needs to work in phase Recently the optimization of energy harvesters 148 networks through Artificial Intelligence have shown a valuable strategy to follow [36] 149
Table 4 Electrical energy voltage power 150 Voltage average Voltage max Energy Power average Power max
74 mV 65 V 21 microJ 33 nW 42 microW
44 Efficiency of Piezoelectric Harvester 151 The efficiency of the piezoelectric harvester was evaluated at several gas speeds The efficiency 152
curve was constructed by dividing the electrical power output by the available fluid power (kinetic 153 power) available in the cross-sectional area in which the harvester operated according to the 154 following equation 155 = (12 ∙ ∙ ∙ ) (11)
where is the efficiency P is the electrical power outout is the air density A is the cross sectional 156 area presented to the incoming stream and is the air velocity [37] Figure 9 shows the trend of the 157 efficiency of conversion of the piezoelectric harvester 158
Figure 8 Summary of the real driving condition measurements (a) piezoelectric converter mounted onthe aluminum bluff body (b) extender of the exhaust pipe at the muffler for mounting the piezoelectricharvester in retrofit (c) voltage of electrical signal generated by the piezoelectric flexible transducer(d) instant power calculated from the voltage
Table 4 summarizes the electrical voltage power and energy generated by the piezoelectricharvester during the 10 min ride on the road Although the harvester generated a few peaks of power inthe order of microW the average power was in the order of nW The simultaneous use of several harvestersworking in parallel could be pursued but in order to enhance the efficiency of the whole systemthe set of harvesters needs to work in phase Recently the optimization of energy harvesters networksthrough Artificial Intelligence have shown a valuable strategy to follow [36]
Table 4 Electrical energy voltage power
Voltage Average Voltage Max Energy Power Average Power Max
74 mV 65 V 21 microJ 33 nW 42 microW
44 Efficiency of Piezoelectric Harvester
The efficiency of the piezoelectric harvester was evaluated at several gas speeds The efficiencycurve was constructed by dividing the electrical power output by the available fluid power (kineticpower) available in the cross-sectional area in which the harvester operated according to thefollowing equation
η = P(1
2middotρmiddotAmiddotv3
)(11)
Energies 2020 13 4169 12 of 15
where η is the efficiency P is the electrical power outout ρ is the air density A is the cross sectionalarea presented to the incoming stream and v is the air velocity [37] Figure 9 shows the trend of theefficiency of conversion of the piezoelectric harvesterEnergies 2020 13 x FOR PEER REVIEW 4 of 15
159 Figure 9 Efficiency (logarithmic scale) of AlN-based piezoelectric harvester 160
It was noticeable that there was a decreasing trend of efficiency with increasing gas speed 161 probably due to a couple of factors von Karman vortex excitation losing efficacy on the piezoelectric 162 component and possible generation of opposite charge in different parts of the piezoelectric 163 component due to vibrational modes different from mode I Further studies are needed to explain 164 this trend 165
5 Conclusions 166 The gas at the exhaust of an internal combustion engine carries power that can be classified in 167
three portions thermal pressure and kinetic The thermal power is most dominant with values in 168 the order of kW while the pressure and the kinetic are of the order of watts at the exhaust muffler 169
Temperature rapidly exceeds 120 degC in most of the points of the exhaust system at several engine 170 points Therefore the use of piezoelectric harvesters has to be restricted to materials whose 171 piezoelectric properties can withstand those temperatures The piezoelectric conversion using high 172 temperature-resistant transducers (AlN on polyimide) has been demonstrated to be a good 173 candidate to be used as an energy harvester in a harsh environment in the exhaust system However 174 further studies are needed to study the influence of temperature (in the range of the exhaust gas 175 temperatures) in order to quantify its effect on the performance of the device as a whole 176
Appendix 177 Results of measurement of temperature pressure and gas speed of the exhaust gas are 178
summarized below in Table A1 Table A2 Table A3 179
Table A1 Results summary gas speed 180 Engine regime rpm
torque Engine exit Resonator Between resonatormuffler
Muffler right tube
Muffler left tube
Position 1 2 3 4 5 1500 rpm 30 Nm 12 ms 2 ms 13 ms 4 ms 9 ms 1500 rpm 320 Nm 17 ms 3 ms 17 ms 9 ms 11 ms 2000 rpm 50 Nm 7 ms 3 ms 9 ms 2 ms 5 ms 2000 rpm 320 Nm 26 ms 6 ms 25 ms 14 ms 16 ms 3000 rpm 40 Nm 23 ms 5 ms 30 ms 12 ms 15 ms 3000 rpm 320 Nm 37 ms 8 ms 41 ms 22 ms 23 ms
Table resembling Table A2 of the article by Nontharkan [26] 181
Table A2 Results summary temperature 182
Figure 9 Efficiency (logarithmic scale) of AlN-based piezoelectric harvester
It was noticeable that there was a decreasing trend of efficiency with increasing gas speed probablydue to a couple of factors von Karman vortex excitation losing efficacy on the piezoelectric componentand possible generation of opposite charge in different parts of the piezoelectric component due tovibrational modes different from mode I Further studies are needed to explain this trend
5 Conclusions
The gas at the exhaust of an internal combustion engine carries power that can be classified inthree portions thermal pressure and kinetic The thermal power is most dominant with values in theorder of kW while the pressure and the kinetic are of the order of watts at the exhaust muffler
Temperature rapidly exceeds 120 C in most of the points of the exhaust system at severalengine points Therefore the use of piezoelectric harvesters has to be restricted to materials whosepiezoelectric properties can withstand those temperatures The piezoelectric conversion using hightemperature-resistant transducers (AlN on polyimide) has been demonstrated to be a good candidateto be used as an energy harvester in a harsh environment in the exhaust system However furtherstudies are needed to study the influence of temperature (in the range of the exhaust gas temperatures)in order to quantify its effect on the performance of the device as a whole
Author Contributions Conceptualization methodology validation formal analysis investigation data curationwritingmdashoriginal draft preparation FM IM FG and AC writingmdashreview and editing FR supervisionMDV and APC All authors have read and agreed to the published version of the manuscript
Funding HORIZON 2020rdquo PON IampC 201ndash ldquoRecupero di Energia Meccanica da fluidi per internet delle cose esensori remoti (REM)rdquo n F05011101-03X32
Conflicts of Interest The authors declare no conflict of interest
Appendix A
Results of measurement of temperature pressure and gas speed of the exhaust gas are summarizedbelow in Table A1 Table A2 Table A3
Energies 2020 13 4169 13 of 15
Table A1 Results summary gas speed
Engine Regime Rpm Torque Engine Exit Resonator BetweenResonatorMuffler
MufflerRight Tube Muffler Left Tube
Position 1 2 3 4 5
1500 rpm 30 Nm 12 ms 2 ms 13 ms 4 ms 9 ms1500 rpm 320 Nm 17 ms 3 ms 17 ms 9 ms 11 ms2000 rpm 50 Nm 7 ms 3 ms 9 ms 2 ms 5 ms2000 rpm 320 Nm 26 ms 6 ms 25 ms 14 ms 16 ms3000 rpm 40 Nm 23 ms 5 ms 30 ms 12 ms 15 ms3000 rpm 320 Nm 37 ms 8 ms 41 ms 22 ms 23 ms
Table resembling Table A2 of the article by Nontharkan [26]
Table A2 Results summary temperature
Engine Regime Rpm Torque Engine Exit Resonator BetweenResonatorMuffler
MufflerRight Tube Muffler Left Tube
Position 1 2 3 4 5
1500 rpm 30 Nm 485 C 450 C 280 C 100 C 165 C1500 rpm 320 Nm 630 C 550 C 320 C 110 C 175 C2000 rpm 50 Nm 340 C 370 C 300 C 115 C 183 C2000 rpm 320 Nm 640 C 380 C 300 C 125 C 195 C3000 rpm 40 Nm 645 C 370 C 310 C 160 C 220 C3000 rpm 320 Nm 740 C 400 C 300 C 190 C 220 C
Table A3 Results Summary pressure (kPa)
Engine Regime Rpm Torque Engine Exit Resonator BetweenResonatorMuffler
MufflerRight Tube Muffler Left Tube
Position 1 2 3 4 5
1500 rpm 30 Nm 164 167 162 101 1011500 rpm 320 Nm 182 200 190 101 1012000 rpm 50 Nm 116 120 117 101 1012000 rpm 320 Nm 225 225 225 101 1013000 rpm 40 Nm 137 133 135 101 1013000 rpm 320 Nm 225 225 225 101 101
References
1 Hooftman N Messagie M Van Mierlo J Coosemans T A review of the European passenger carregulationsmdashReal driving emissions vs local air quality Renew Sustain Energy Rev 2018 86 1ndash21[CrossRef]
2 Williams M Minjares R A technical summary of Euro 6VI vehicle emission standards The InternationalCouncil on Clean Transportation Available online httpwwwindiaenvironmentportalorginfilesfile
ICCT_Euro6-VI_briefingpdf (accessed on 2 May 2020)3 Fontaras G Ciuffo B Zacharof N Tsiakmakis S Marotta A Pavlovic J Anagnostopoulos K
The difference between reported and real-world CO2 emissions How much improvement can be expectedby WLTP introduction Transp Res Procedia 2017 25 3933ndash3943 [CrossRef]
4 Varella R Giechaskiel B Sousa L Duarte G Weiss M Bonnel P Hummel R Steininger N Djoric VJovic J et al Comparison of Portable Emissions Measurement Systems (PEMS) with Laboratory GradeEquipment Appl Sci 2018 8 1633 [CrossRef]
5 Djoric V Jovic J Vukanovic S Collection and assessment of instantaneous vehicle emissions on streetnetwork In Proceedings of the Transport Research Arena (TRA) 5th Conference Transport Solutions fromResearch to Deployment European Commission Paris Italy 14ndash17 April 2014
6 Hossain SN Bari S Waste heat recovery from exhaust of a diesel generator set using organic fluidsProcedia Eng 2014 90 439ndash444 [CrossRef]
7 Hossain SN Bari S Additional power generation from waste energy of diesel engine using parallel flowshell and tube heat exchanger J Eng Gas Turbines Power 2014 136 100ndash104 [CrossRef]
Energies 2020 13 4169 14 of 15
8 Fern P Armas O Gil A Developing Computational Fluid Dynamics (CFD) Models to Evaluate AvailableEnergy in Exhaust Systems of Diesel Light-Duty Vehicles Appl Sci 2017 7 590 [CrossRef]
9 Jadhao JS Thombare DG Student PG Sangali D Review on Exhaust Gas Heat Recovery for IC engineInt J Eng Innov Technol (IJEIT) Vol 2013 2 93ndash100
10 Orido G Ngunjiri PG Njue DM Exhaust Gases Energy Recovered from Internal Combustion Engine forUseful Applications IOSR J Mech Civ Eng 2017 14 01ndash07 [CrossRef]
11 Guduru KK Power Generation by using Kinetic Energy of Exhaust Gases from an Internal CombustionEngine Int J Res Comput Technol 2019 7 1ndash5
12 Alshammari M Alshammari F Pesyridis A Electric boosting and energy recovery systems for enginedownsizing Energies 2019 12 4636 [CrossRef]
13 Ismail BI Automotive exhaust gas waste-heat recovery for green electrical power generation usingThermoelectric technology Recent Pat Electr Electron Eng 2012 5 185ndash197 [CrossRef]
14 Weiss M Bonnel P Hummel R Steininger N A Complementary Emissions Test for Light-Duty VehiclesAssessing the Technical Feasibility of Candidate Procedures Conclusions of the Real-Driving Emissions-Light-DutyVehicles (RDE-LDV) working group Publications Office of the European Union Brussels Belgium 2013[CrossRef]
15 Valencia G Fontalvo A Caacuterdenas Y Duarte J Isaza C Energy and exergy analysis of different exhaustwaste heat recovery systems for natural gas engine based on ORC Energies 2019 12 2378 [CrossRef]
16 Fu J Liu J Yang Y Yang H A Study on the Prospect of Engine Exhaust Gas Energy RecoveryIn Proceedings of the 2011 International Conference on Electric Information and Control Engineering WuhanChina 15ndash17 April 2011 IEEE Miami FL USA 2011 pp 1960ndash1963 [CrossRef]
17 Gomes JBA Rodrigues JJPC Rabecirclo RAL Kumar N Kozlov S IoT-enabled gas sensors Technologiesapplications and opportunities J Sens Actuator Netw 2019 8 57 [CrossRef]
18 Todaro MT Guido F Mastronardi V Desmaele D Epifani G Algieri L De Vittorio M PiezoelectricMEMS vibrational energy harvesters Advances and outlook Microelectron Eng 2017 183ndash184 23ndash36[CrossRef]
19 Guido F Qualtieri A Algieri L Lemma ED De Vittorio M Todaro MT AlN-based flexible piezoelectricskin for energy harvesting from human motion Microelectron Eng 2016 159 174ndash178 [CrossRef]
20 Lee YJ Qi Y Zhou G Lua KB Vortex-induced vibration wind energy harvesting by piezoelectric MEMSdevice in formation Sci Rep 2019 9 1ndash11 [CrossRef] [PubMed]
21 Boulahlib MS Boukebbab S Gaci F Kholai O Experimental study of energy balance for air-cooled didiesel engines operating in hot climates SAE Tech Pap 2009 [CrossRef]
22 Taymaz I An experimental study of energy balance in low heat rejection diesel engine Energy 2006 31364ndash371 [CrossRef]
23 Fairbanks JW The 60 Percent Efficient Diesel Engine Probable Possible or Just A Fantasy In Proceedingsof the 2005 Diesel Engine Emissions Reduction (DEER) Conference Presentations US Department of EnergyChicago Chicago IL USA 24 August 2005
24 Gopal KN Subbarao R Pandiyarajan V Velraj R Thermodynamic analysis of a diesel engine integratedwith a PCM based energy storage system Int J Thermodyn 2010 13 15ndash21 [CrossRef]
25 Kyle BG Chemical and Process Thermodynamics Englewood CliffsPrentice Hall Upper Saddle River NJUSA 1984
26 Dubois E Mercier A Design and Optimization of an Integrated Turbo-Generator and ThermoelectricGenerator for Vehicle Exhaust Electrical Energy Recovery Energy Recover 2009 1ndash329 [CrossRef]
27 Koshy AP Jose BK Johnson JE Krishnan KN Exhaust Gas Waste Heat Recovery and UtilizationSystem in ICEngine Int J Innov Res Sci Technol 2015 1 392ndash400
28 Testo Tubo di Pitot Diritto 360 mm Available online httpswwwtestocomit-ITtubo-di-pitot-diritto-360-mmp0635-2043 (accessed on 1 April 2020)
29 Testo 480 Data Logger Available online httpswwwtestocomen-UStesto-480p0563-4800 (accessed on 1April 2020)
30 Saleh JM Fluid Flow Handbook McGraw-Hill Professional New York NY USA 200231 Von Karman T Aerodynamics McGraw-Hill New York NY USA 1963 ISBN 978-0-486-43485-832 Townley A Vibrational Energy Harvesting Using Mems Piezoelectric Generators Available online https
sunfestseasupenneduwp-contentuploads201807TownleyAndrew09pdf (accessed on 7 June 2020)
Energies 2020 13 4169 15 of 15
33 Fonseca Gonzaacutelez N Casanova Kindelaacuten J Loacutepez Martiacutenez JM Methodology for instantaneous averageexhaust gas mass flow rate measurement Flow Meas Instrum 2016 49 52ndash62 [CrossRef]
34 Petroni S Rizzi F Guido F Cannavale A Donateo T Ingrosso F Mastronardi VM Cingolani RDe Vittorio M Flexible AlN flags for efficient wind energy harvesting at ultralow cut-in wind speed RSCAdv 2015 5 14047ndash14052 [CrossRef]
35 Arroyo E Jia Y Du S Chen ST Seshia AA Experimental and theoretical study of a piezoelectricvibration energy harvester under high temperature J Microelectromechanical Syst 2017 26 1216ndash1225[CrossRef]
36 Nabavi S Zhang L Design and Optimization of a Low-Resonant-Frequency Piezoelectric MEMS EnergyHarvester Based on Artificial Intelligence Proceedings 2018 2 930 [CrossRef]
37 Weinstein LA Cacan MR So PM Wright PK Vortex shedding induced energy harvesting frompiezoelectric materials in heating ventilation and air conditioning flows Smart Mater Struct 2012 21[CrossRef]
copy 2020 by the authors Licensee MDPI Basel Switzerland This article is an open accessarticle distributed under the terms and conditions of the Creative Commons Attribution(CC BY) license (httpcreativecommonsorglicensesby40)
- Introduction
- Materials and Methods
-
- Tests at the Engine Bench
- Test Cycles
- Measurement Systems
- Exhaust Gas Positions
- Piezoelectric Conversion
-
- Results
- Discussion
-
- Validation of Gas Speed Measured by Pitot Tube
- Estimation of Power at the Engine Exhaust for the Bench Engine
- Piezoelectric Conversion from the Exhaust Pipe under Real Driving Conditions
- Efficiency of Piezoelectric Harvester
-
- Conclusions
- References
-
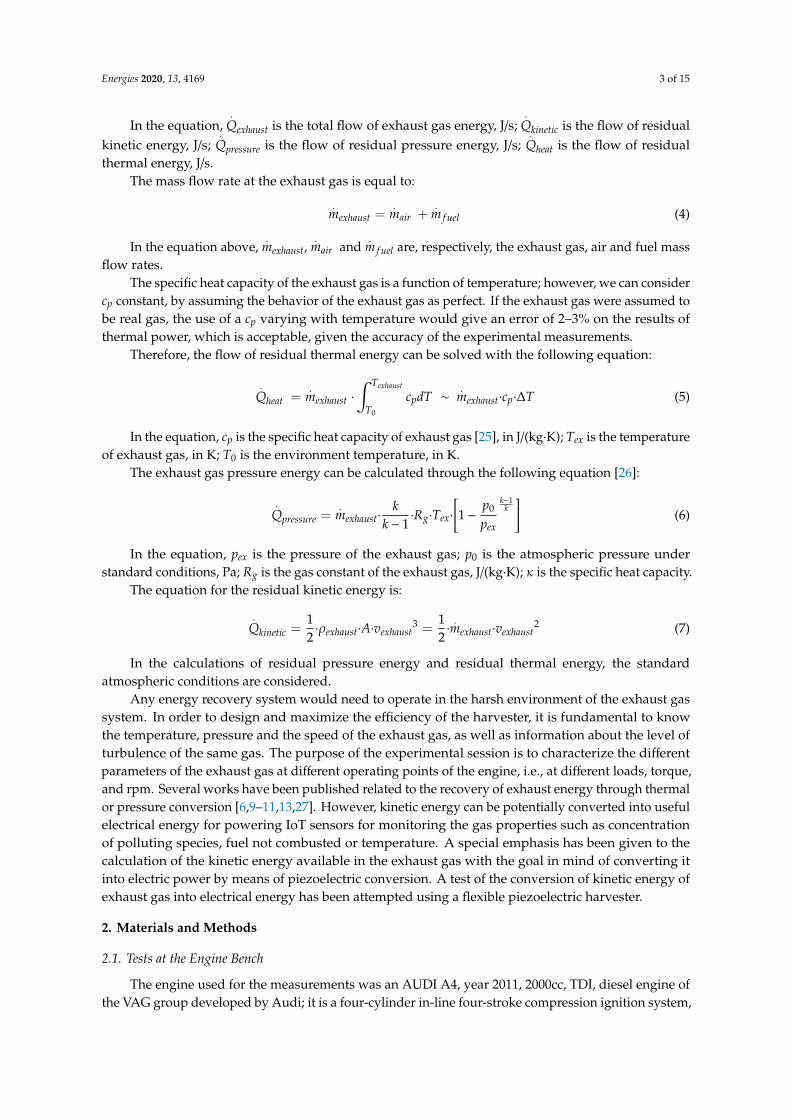
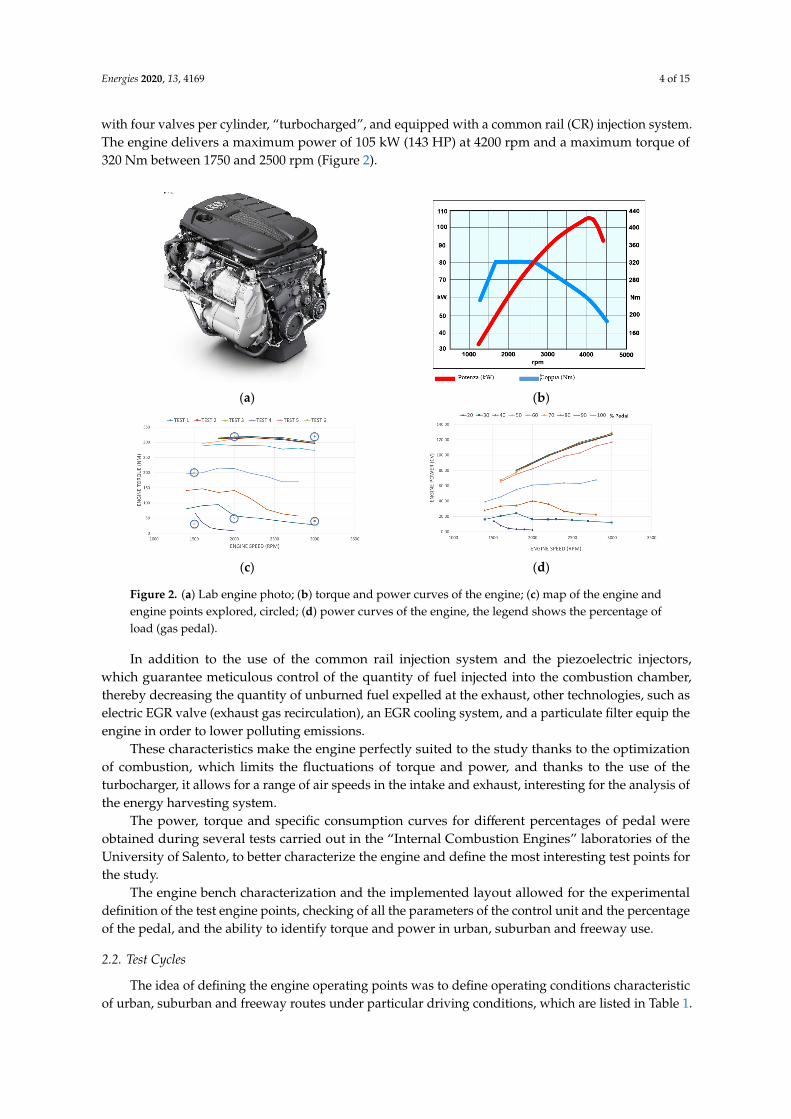
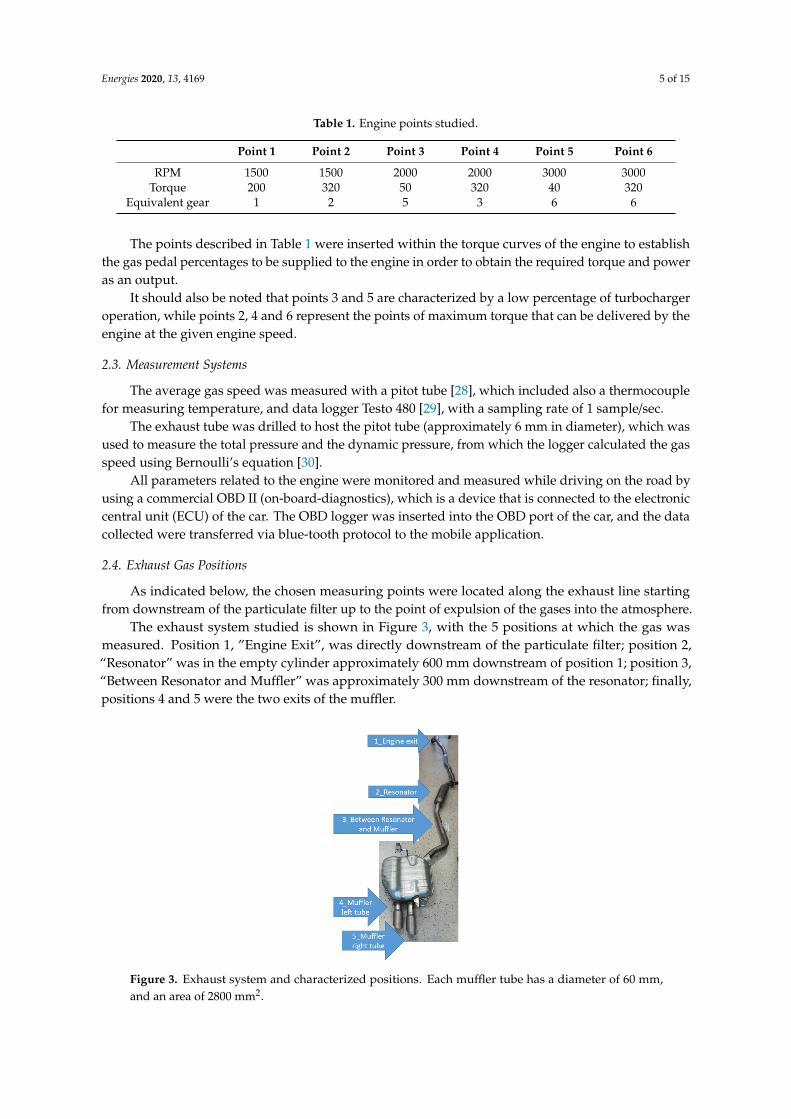
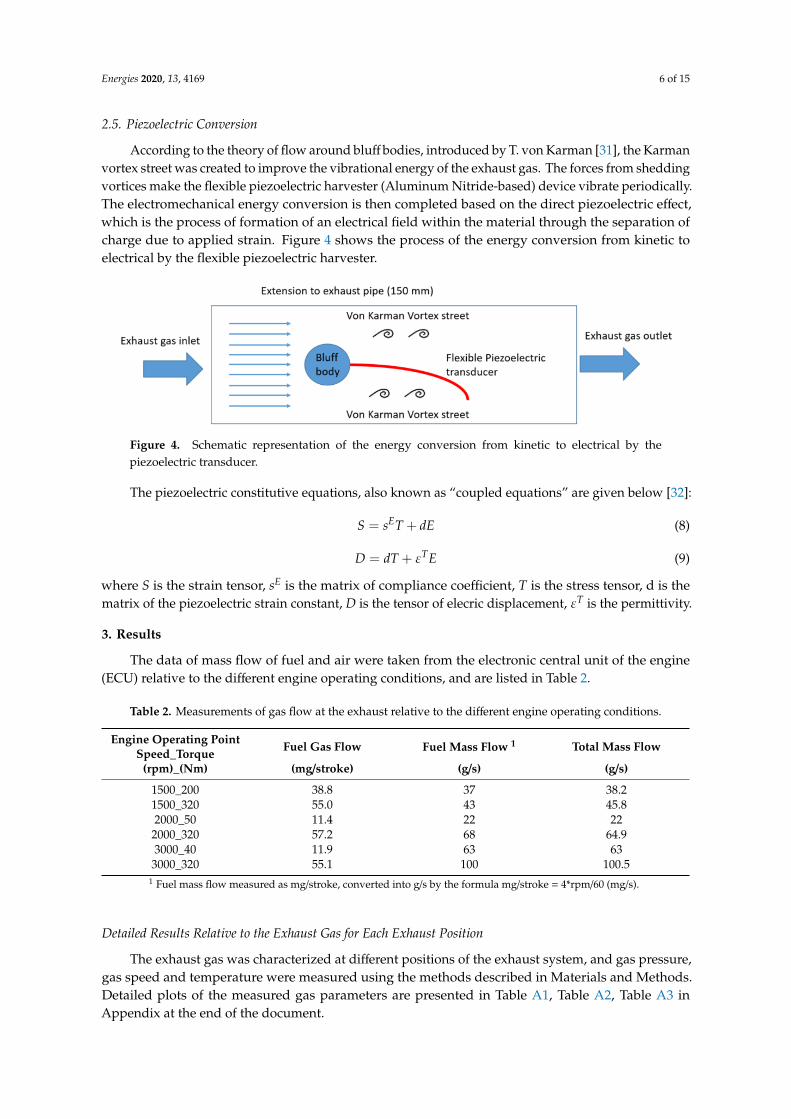
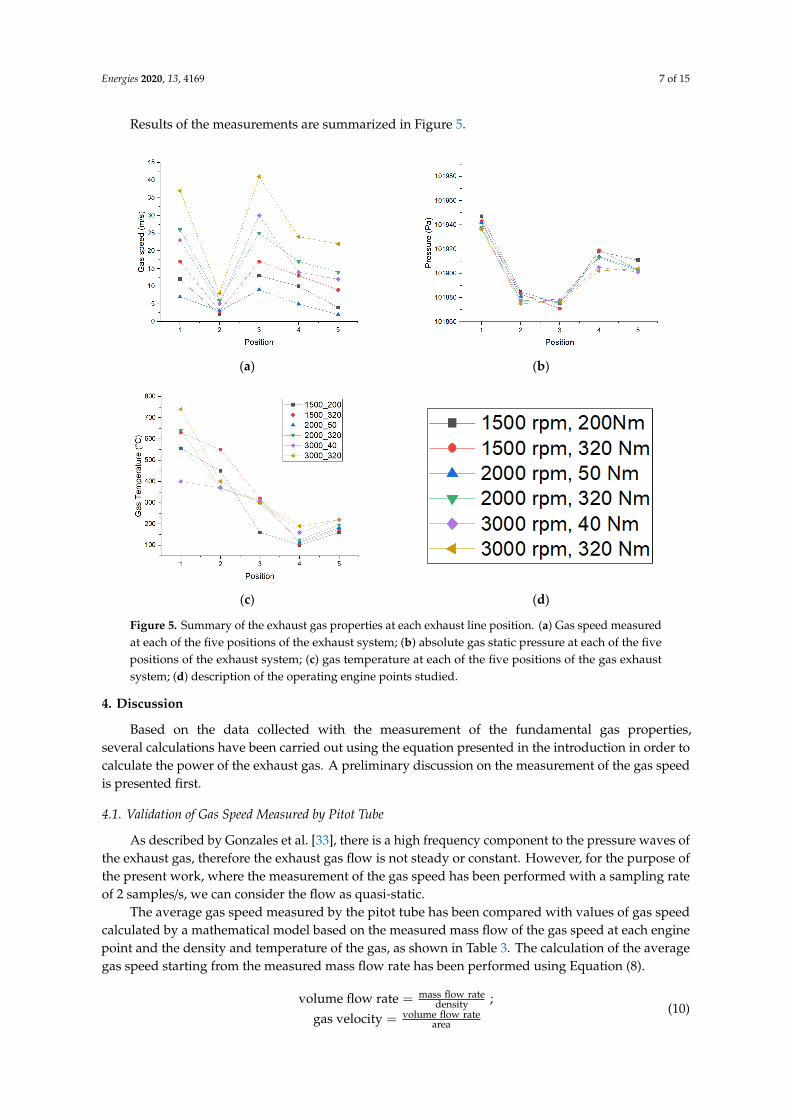
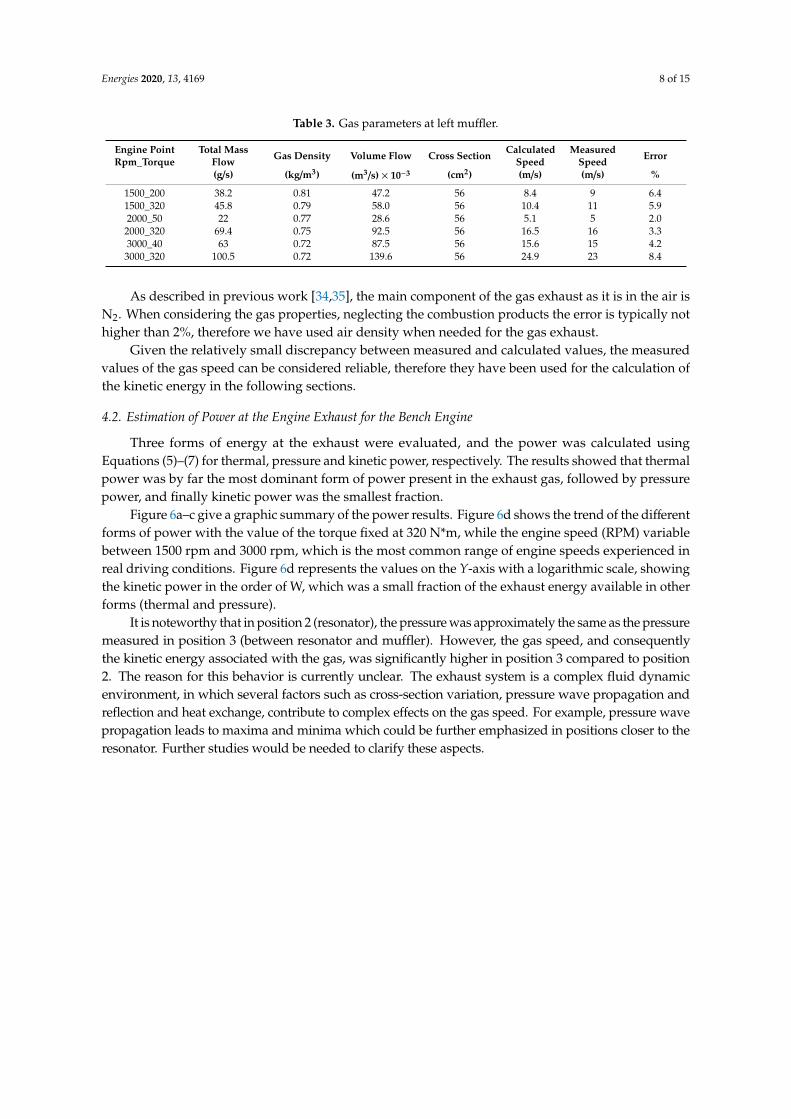
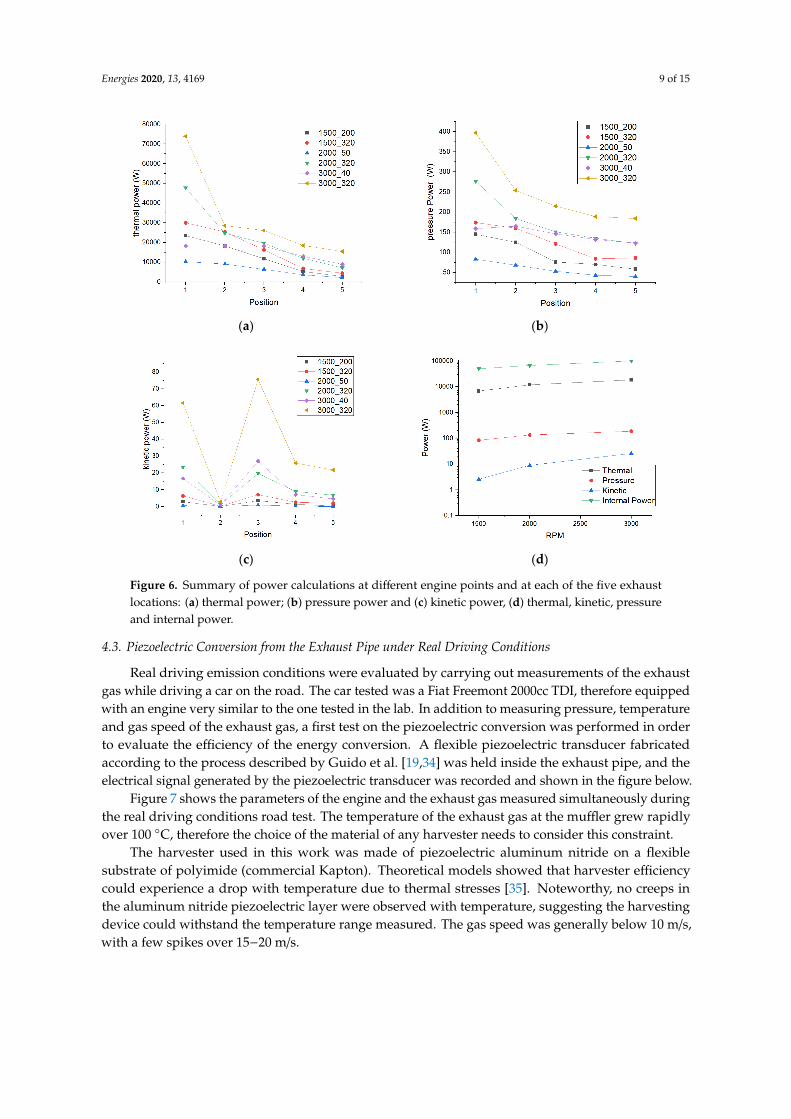
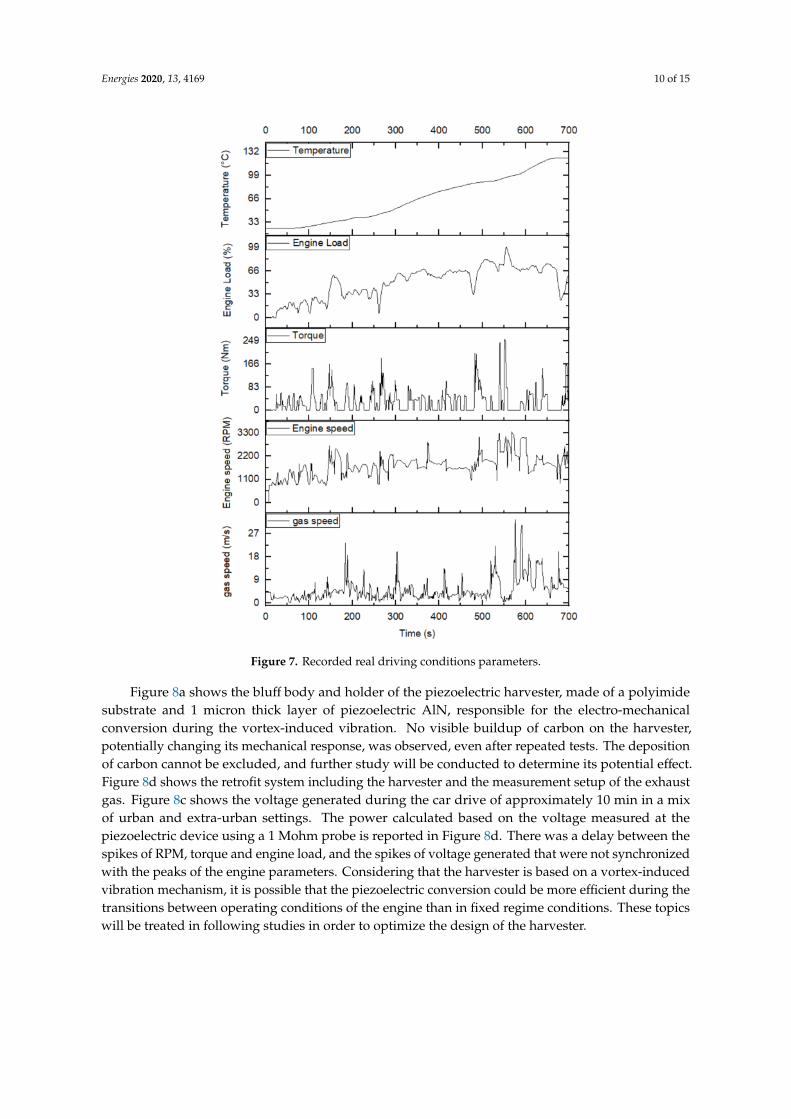
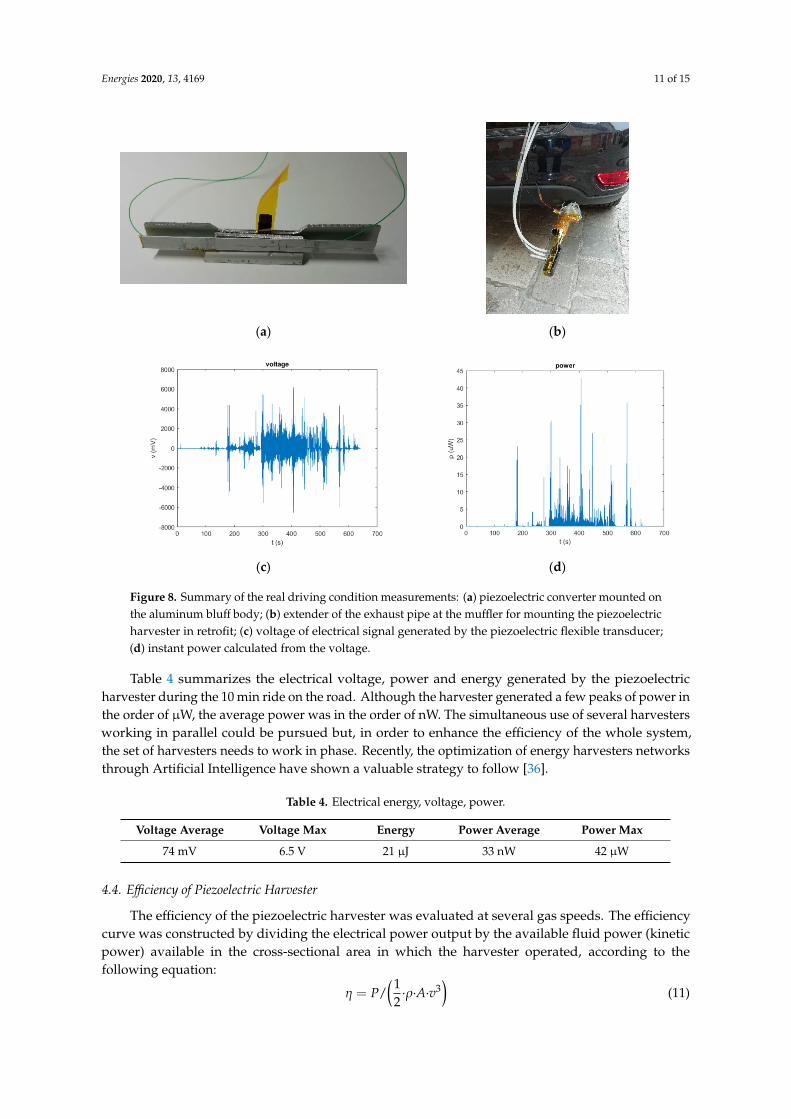
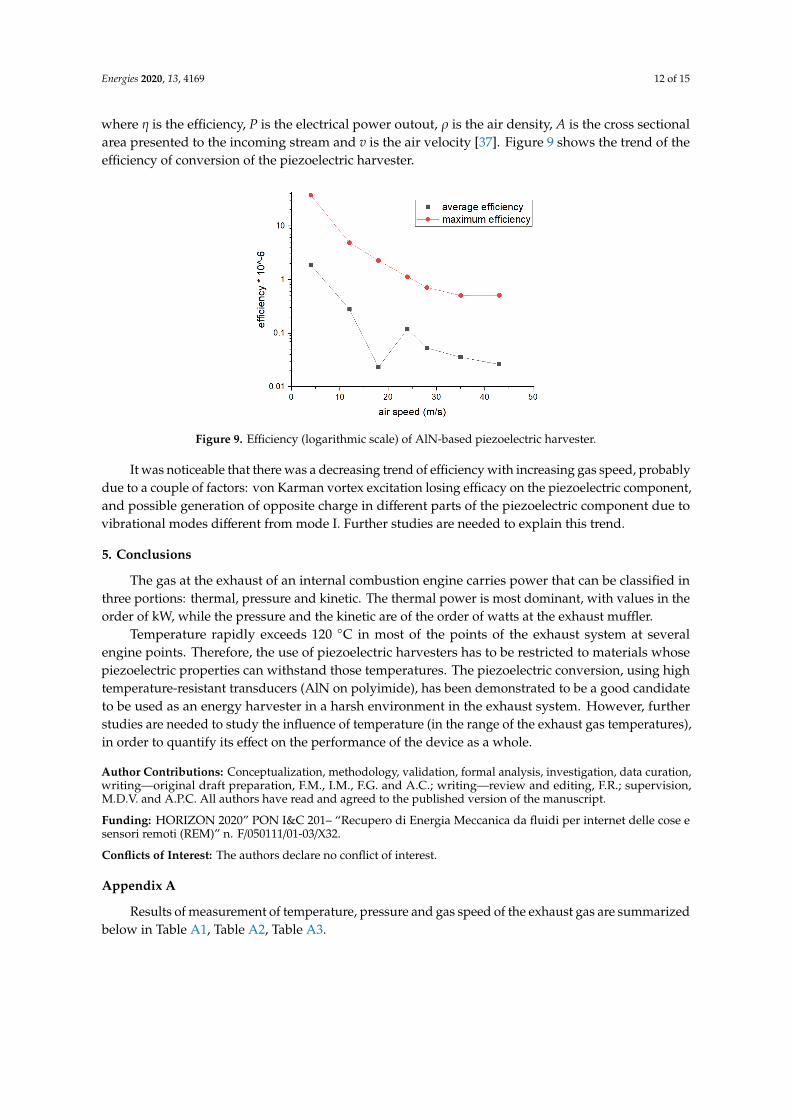
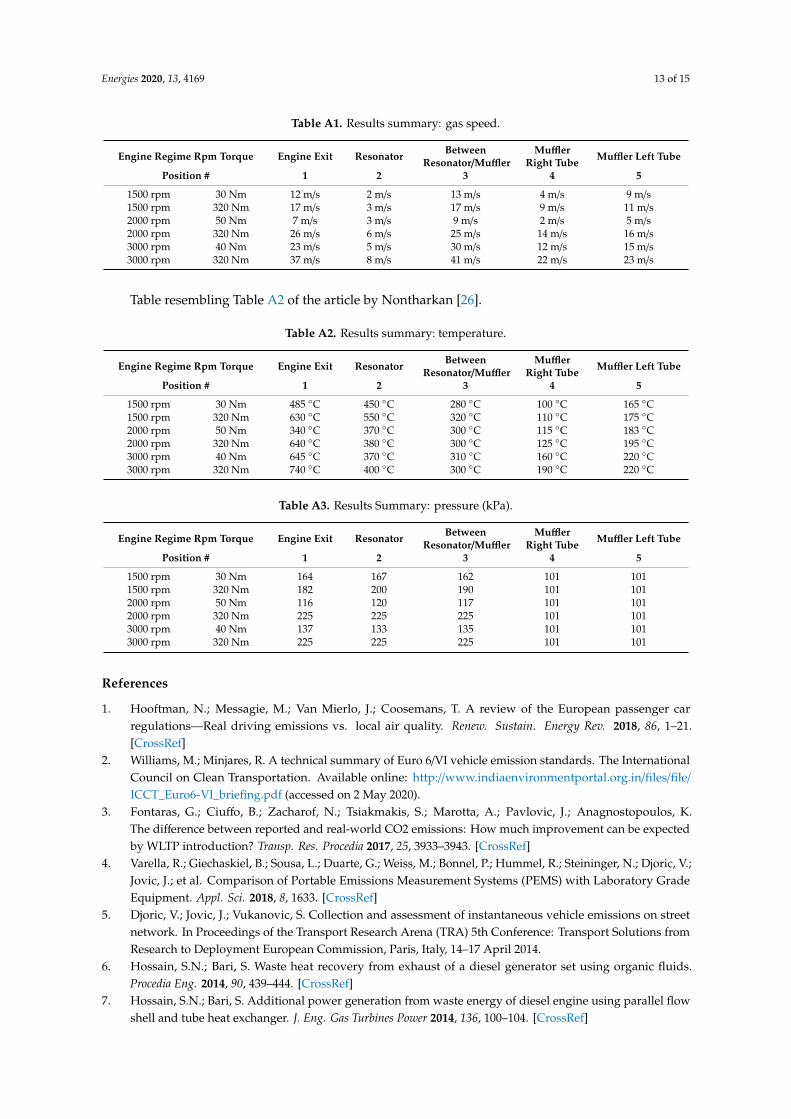
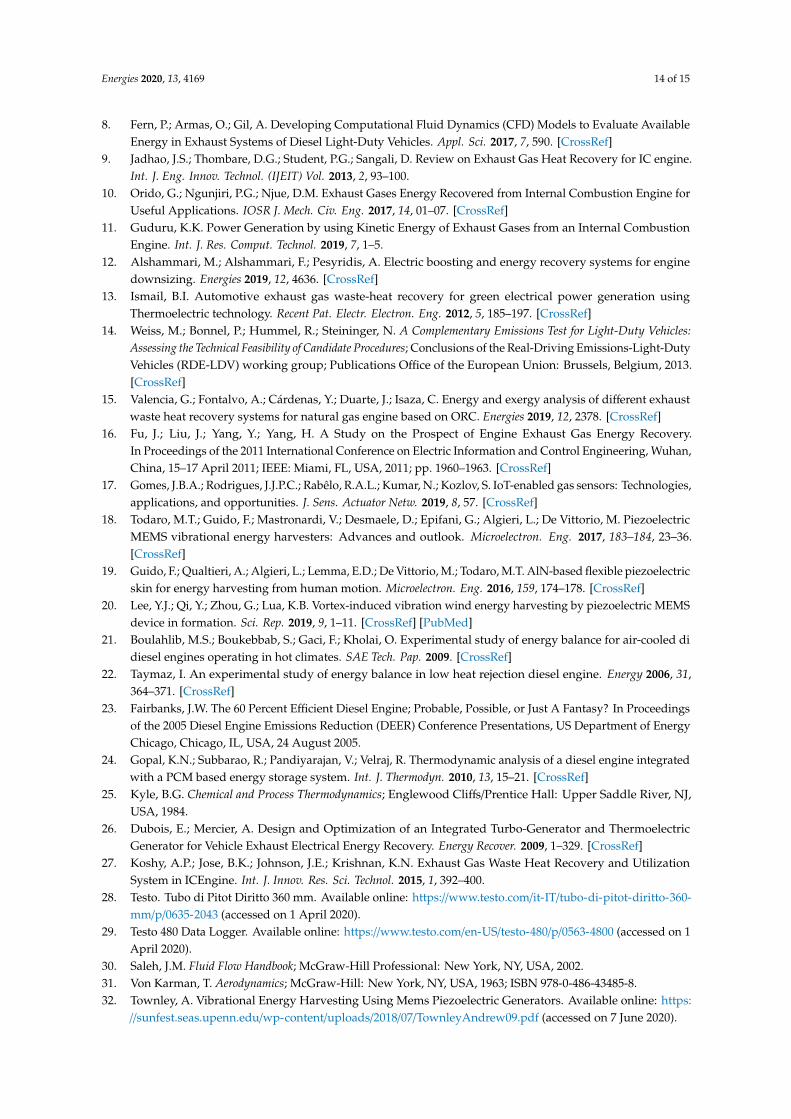