Automatic Extraction of Structures of Issues Based on Newspaper Articles
7
Automatic Extraction of Structures of Issues Based on Newspaper Articles Hirohide Haga Faculty of Science and Engineering, Doshisha University 1-3 Miyakotani, Tatara, Kyotanabe, 610-0321 Japan [email protected] ABSTRACT In this article, we propose the method to extract the structure of issues by using newspaper articles. The principal method used to extract the structure is ISM (Imperative Structural Modelling). ISM is widely used for structuring problems. However, using ISM often consumes much time and efforts. This is mainly because building the relation matrix, which is an essential element for building ISM diagram, needs time and cost. In this article, we focus on the automatic relation matrix generation algorithm. Firstly, keywords related to a issues are selected. Then the relation between two arbitrary keywords is examined. After examining the relations of all pairs of keywords, a relation matrix is generated from which a reachable matrix is calculated. By using this reachable matrix, an ISM diagram can be constructed. Then, the correlation ratio such as co-occurrence ratio of all words pair will be calculated and the average correlation ratio is determined. By comparing each correlation ratio and the average ratio, the strong and week correlation will be determined. After the determination of all pairs of correlation, relation matrix will be generated automatically. The proposed algorithm has been implemented as an Web application. KEYWORDS Structural Modelling, Relation Matrix, Co-occurrence frequency, Newspaper, Full Text Search, Web Application 1. INTRODUCTION This article proposes an web-based tool for constructing relation matrix of keywords based on the newspaper article. The proposed tool is applied to Imperative Structural Modelling (ISM), and is called “ISMWeb.” ISM is widely used for structuring items of complex structure. ISM is one of the most popular and promising methods for analysing and solving complex problems. But ISM has serious drawbacks: labour cost and time. In ISM, keywords related to the problem are selected firstly. Then the relation between two arbitrary keywords pairs is examined. When a relation exists between these two keywords, a non-zero value such as 1 is assigned to this relation. After examining the relations of all pairs of keywords, an n x n relation matrix is generated where n stands for the number of keywords. Then a reachable matrix is calculated from the relation matrix. By using the reachable matrix, the structure of the problem is constructed. In such ISM diagram generation, building a relation matrix requires much time and labour. After getting the relation matrix, a reachable matrix can be calculated algorithmically, and drawing the diagram can be supported by graph drawing software. Therefore, to use the ISM, improving the relation matrix's generation efficiency is essential. In this article, we propose an automatic generation method for the relation matrix and its web implementation. First, keywords are selected. Then a set of original materials such as newspaper articles is fully text scanned to extract articles that include at least one keyword, and the number of articles that include any two keywords is counted. Next the co-occurrence ratio is calculated, and all ratios are arranged in a matrix form. The average value of the co-occurrence ratio is calculated for each keyword, and the relation is evaluated based on comparisons of the average and co-occurrence ratios of each pair. It is assumed that if the co- occurrence ratio is larger than the average ratio, these two keywords have a relatively strong relation. Using the above criteria, the relation of any pair of two keywords is evaluated, and the result becomes a relation matrix from which an ISM diagram can automatically be generated. Since our ISBN: 978-0-9891305-2-3 ©2013 SDIWC 208
Transcript of Automatic Extraction of Structures of Issues Based on Newspaper Articles
Automatic Extraction of Structures of Issues Based on Newspaper Articles
Hirohide Haga Faculty of Science and Engineering, Doshisha University
1-3 Miyakotani, Tatara, Kyotanabe, 610-0321 Japan
[email protected] ABSTRACT In this article, we propose the method to extract the structure of issues by using newspaper articles. The principal method used to extract the structure is ISM (Imperative Structural Modelling). ISM is widely used for structuring problems. However, using ISM often consumes much time and efforts. This is mainly because building the relation matrix, which is an essential element for building ISM diagram, needs time and cost. In this article, we focus on the automatic relation matrix generation algorithm. Firstly, keywords related to a issues are selected. Then the relation between two arbitrary keywords is examined. After examining the relations of all pairs of keywords, a relation matrix is generated from which a reachable matrix is calculated. By using this reachable matrix, an ISM diagram can be constructed. Then, the correlation ratio such as co-occurrence ratio of all words pair will be calculated and the average correlation ratio is determined. By comparing each correlation ratio and the average ratio, the strong and week correlation will be determined. After the determination of all pairs of correlation, relation matrix will be generated automatically. The proposed algorithm has been implemented as an Web application. KEYWORDS Structural Modelling, Relation Matrix, Co-occurrence frequency, Newspaper, Full Text Search, Web Application 1. INTRODUCTION This article proposes an web-based tool for constructing relation matrix of keywords based on the newspaper article. The proposed tool is applied to Imperative Structural Modelling (ISM), and is called “ISMWeb.” ISM is widely used for structuring items of complex structure. ISM is one of the most popular and promising methods for
analysing and solving complex problems. But ISM has serious drawbacks: labour cost and time. In ISM, keywords related to the problem are selected firstly. Then the relation between two arbitrary keywords pairs is examined. When a relation exists between these two keywords, a non-zero value such as 1 is assigned to this relation. After examining the relations of all pairs of keywords, an n x n relation matrix is generated where n stands for the number of keywords. Then a reachable matrix is calculated from the relation matrix. By using the reachable matrix, the structure of the problem is constructed. In such ISM diagram generation, building a relation matrix requires much time and labour. After getting the relation matrix, a reachable matrix can be calculated algorithmically, and drawing the diagram can be supported by graph drawing software. Therefore, to use the ISM, improving the relation matrix's generation efficiency is essential. In this article, we propose an automatic generation method for the relation matrix and its web implementation. First, keywords are selected. Then a set of original materials such as newspaper articles is fully text scanned to extract articles that include at least one keyword, and the number of articles that include any two keywords is counted. Next the co-occurrence ratio is calculated, and all ratios are arranged in a matrix form. The average value of the co-occurrence ratio is calculated for each keyword, and the relation is evaluated based on comparisons of the average and co-occurrence ratios of each pair. It is assumed that if the co-occurrence ratio is larger than the average ratio, these two keywords have a relatively strong relation. Using the above criteria, the relation of any pair of two keywords is evaluated, and the result becomes a relation matrix from which an ISM diagram can automatically be generated. Since our
ISBN: 978-0-9891305-2-3 ©2013 SDIWC 208

proposed method is fully automatic, an ISM diagram is automatically generated from the original materials. The rest of the paper is organized as follows. In Section 2, a brief introduction and two ISM problems are described. Section 3 shows the details of the proposed algorithm. Example usage and evaluation of the proposed method are described in Section 4. Section 5 describes the proposed algorithm's implementation on the Web (ISMWeb). ISMWeb is a web application that provides identical, location-free service to users. 2 BRIEF DESCRIPTIONS OF ISM AND ITS PROBLEMS 2.1 What is ISM? Interpretive Structural Modelling (ISM), a well-known method for visualising the hierarchy structure of problems, was first introduced by Warfield [1] for modelling the relationship between many elements involved in a complex situation. In ISM, all elements are arranged in a hierarchal manor in a structure constructed from the dependency of two elements. ISM was first introduced to visualize the summarization of brainstorming. Now, it is widely used for the visualisation of the complex structure of problems in any field. In ISM, elements (usually represented as keywords) are extracted through brainstorming or other methods. Then the dependency between two elements is evaluated. After approving dependency, a non-zero value such as 1 is assigned to the relation. By arranging all elements in a matrix form, a relation matrix can be generated in which the topmost row and the leftmost column include all elements. 0 or 1 is assigned to all cells in accordance with the existence of dependency. After the identification of a relation matrix, a reachable matrix is calculated in the following manner: (1) Let A be a relation matrix. Then n x n unit
matrix I is added to A. Let P=A+I. (2) Then the production operation of matrices is
iterated until Pn+1=Pn is satisfied where Pn denotes the product of matrix P n-times.
(3) Then we can get reachable matrix R=Pn
A hierarchy diagram is drawn using reachable matrix R. This procedure means that once relation matrix A is determined, reachable matrix R can be calculated automatically. Therefore the most essential point concerning ISM usage is getting the relation matrix from the problem description. 2.2 Some Problems of Diagram Generation As mentioned in Section 2.1, after determining relation matrix A, reachable matrix R is generated algorithmically, and then the diagram is drawn automatically. To get the relation matrix, ISM users have to determine the relation between any pairs of two elements in the problem domain. However, the definition of dependency between two elements consumes much time and efforts. As the number of elements increases, the complexity of defining the dependency increases rapidly, and therefore, time and labour costs also increase rapidly. Furthermore, the objectivity of the relation matrix is another problem for identifying dependency. Since only a few users participate in identifying the dependency, its evaluation is heavily influenced by the participants. To resolve these problems, this article proposes an automatic generation method of a relation matrix. By using the proposed method, the time and cost of building the relation matrix will be resolved. Furthermore, objectivity also will be maintained. 3 AUTOMATIC GENERATION OF A RELATION MATRIX 3.1 Overview The automatic generation of a relation matrix is performed as follows: Step 1: First, some (usually at most three) essential keywords are selected and used for “pre-scanning” the materials to eliminate obviously inappropriate materials. Selecting essential keywords does not require so much time and efforts. Step 2: Analysers identify keywords that represent the problem.
ISBN: 978-0-9891305-2-3 ©2013 SDIWC 209

Step 3: Primary materials are fully text scanned, and materials that include at least one keyword are extracted from the material set. Step 4: Extracted materials are scanned again, and materials that include any pair of two keywords are extracted. Step 5: Based on the number of materials, the occurrence ratio of all keywords and all pairs of two keywords are calculated. Step 6: Based on the occurrence ratio, the relation of any two keywords is determined. Since the above steps are performed by computer after identifying the keywords (Step 2), objectivity is secured. Furthermore, the problem of time and labour cost is also resolved. Figure 1 is an overview of the proposed method. In the above steps, Step 6 is the key factor. The details of the method to determine the relation between two keywords will be described in the next section.
Figure 1. Overview of proposed system
3.2 Details of the automatic generation In this article, we assume that newspaper articles are used as primary materials. This is partly
because newspaper articles contain a wide range of topics from politics, economics, to science and technology. And many newspaper articles are now available in a digital form. Therefore, we use newspaper articles as primary materials. Let w1, w2,…, wn be the determined keywords of a certain problem. First, all newspaper articles are fully text scanned to eliminate obviously inappropriate articles by using the essential keywords set (Step 1). Participants determine keywords that represent the problem to be structured (Step 2). Next, find articles that include at least one keyword wi (Step 3). Let ni be the number of articles that include keywords wi. Then select other keywords wj and find articles that include both wi and wj (Step 4). After that, the number of articles that include both wi and wj are added and denoted as nij. The following co-occurrence ratio pij among two keywords is calculated:
pij = nij / (ni+nj-nij) (1) Next, all co-occurrence ratios are arranged, as shown in Table 1 (Step 5).
Table 1. Co-occurrence ratio table w1 w2 … wn average
w1 p11 p12 p1n pr1
w2 p21 p22 p2n pr2
… wn pn1 pn2 pnn pr
n average pc
1 pc2 pc
n The average ratio of each column and row is calculated. Let pi
c be the average ratio of column i and pj
r be the average ratio of row j. Then the dependency can be identified, as in the following criterion (Step 6): If pij> pi
c, then assume a strong relation between wi and wj. Therefore, the value of 1 will be assigned to cell (i, j). Otherwise, the value of cell (i, j) is 0. This is because word wj is more frequently used with word wi than other words w1,…, wi-1 and wi+1,…, wn. It means there is a relatively stronger relation between wi and wj than other words. Then we can get the 0/1 value matrix. But this matrix
ISBN: 978-0-9891305-2-3 ©2013 SDIWC 210

does not represent the dependency direction. To draw an ISM hierarchy diagram, we have to determine the dependency direction of any pair of keywords. Next we evaluate the dependency direction of wi and wj as follows: • If pij > pi
c and pji < pjr, then there is a
dependency where wi depends on wj, and we assign value 1 to cell (i, j) and {¥tt 0} to cell (j, i).
• If pij > pic and pji > pj
r, then dual dependency exists between wi and wj. Therefore, value 1 is assigned to cells (i, j) and (j, i).
This is because wi is used in the article where wj is used more than in the article where another word such as wk is used. On the other hand, wj uses other words more than wi. In the article, since wj refers to other words more than wi, word wj does not depend on wi. But it does depend on wj. Therefore, we consider wj a source and wi a destination of this relation. In other words, wj is a cause, and wj is a result of this relation. Using the above two criteria, we can get the relation matrix. After it is obtained, an ISM hierarchy diagram can automatically be drawn. Since this procedure only requires slight labour and time costs, we can apply it to a wide range of problem areas, including diplomatic, technical, and everyday life fields. In the next section, we describe one example of our experiment from a societal information development system. 4 IMPLEMENTATION ON THE WEB We developed a web-based automatic relation matrix generator. By building a web-based system, various users in many different fields can use our proposed method without installing specific software on their personal computers. This system is called “ISMWeb,” and its overall structure is shown in Figure 2.
Figure 2. Overall ISMWeb structure
All programs were developed by Java programming language. Java-based full text scanning software “Lucene” [4] and web server “Tomcat” [5] were used for implementing ISMWeb, which runs as Java-Server-Page (JSP). Figure 3 shows the top page of ISMWeb. Since we currently only have a Japanese version system, all the following screen shots are in Japanese.
Figure 3. Top page of ISM Web Users have to enter the following information to use ISMWeb: • Database: choosing a database (set of
newspaper articles) to use for searching articles
• Important keywords: used for pre-scanning • Keywords: used for drawing ISM diagrams By entering this information, a relation matrix will be automatically generated, as shown in Figure 4. Top table of Figure 4 is a co-occurrence frequency of any pairs of keywords, middle table is a relation matrix, and the bottom table is a reachable matrix. Then with graph drawing software, users can get the ISM structure. Figure 5 is an example of ISM diagram generated by the reachable matrix in Figure 5. From the input of keywords, no human
ISBN: 978-0-9891305-2-3 ©2013 SDIWC 211
activities are necessary. All processes are executed automatically.
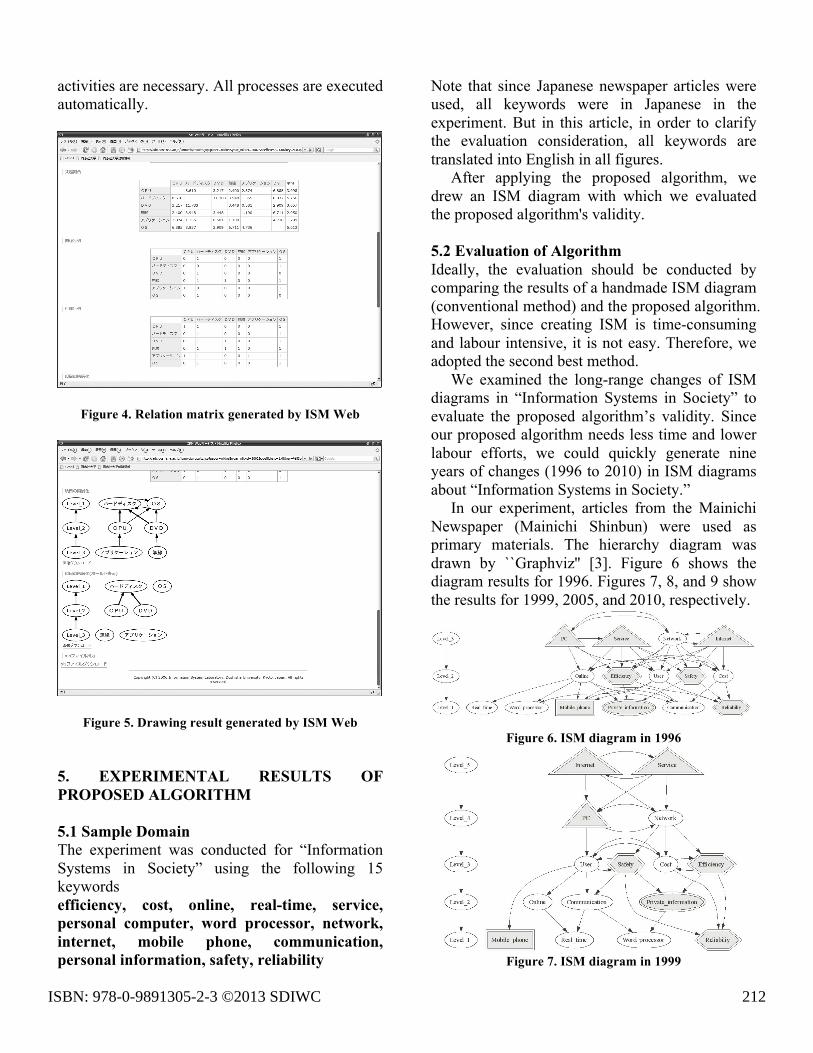
Figure 4. Relation matrix generated by ISM Web
Figure 5. Drawing result generated by ISM Web 5. EXPERIMENTAL RESULTS OF PROPOSED ALGORITHM 5.1 Sample Domain The experiment was conducted for “Information Systems in Society” using the following 15 keywords efficiency, cost, online, real-time, service, personal computer, word processor, network, internet, mobile phone, communication, personal information, safety, reliability
Note that since Japanese newspaper articles were used, all keywords were in Japanese in the experiment. But in this article, in order to clarify the evaluation consideration, all keywords are translated into English in all figures. After applying the proposed algorithm, we drew an ISM diagram with which we evaluated the proposed algorithm's validity. 5.2 Evaluation of Algorithm Ideally, the evaluation should be conducted by comparing the results of a handmade ISM diagram (conventional method) and the proposed algorithm. However, since creating ISM is time-consuming and labour intensive, it is not easy. Therefore, we adopted the second best method. We examined the long-range changes of ISM diagrams in “Information Systems in Society” to evaluate the proposed algorithm’s validity. Since our proposed algorithm needs less time and lower labour efforts, we could quickly generate nine years of changes (1996 to 2010) in ISM diagrams about “Information Systems in Society.” In our experiment, articles from the Mainichi Newspaper (Mainichi Shinbun) were used as primary materials. The hierarchy diagram was drawn by ``Graphviz'' [3]. Figure 6 shows the diagram results for 1996. Figures 7, 8, and 9 show the results for 1999, 2005, and 2010, respectively.
Figure 6. ISM diagram in 1996
Figure 7. ISM diagram in 1999
ISBN: 978-0-9891305-2-3 ©2013 SDIWC 212

Figure 8. ISM diagram in 2005
Figure 9. ISM diagram in 2010
From the changes in the diagrams, we can read the following trends: (a) In 1996, the problem was less structured, as
read from a diagram with shallow hierarchy where almost all keywords are connected to each other. The structure is not well defined. Any keyword is used with no strong relation with other keywords.
(b) By 1999, the problem had become more structured. The hierarchy has five levels, and clearer dependency can be seen between keywords. The number of links is fewer than in 1996.
(c) By 2005, keyword “private information,” represented as a double line oval in all figures, rose up the diagram hierarchy, indicating that the importance of “private information” had increased.
(d) The same trend can be seen for “mobile phone,” represented as a double line rectangle. In 1996, “mobile phone” was located at the bottom of the diagram. By 2010, however, it had moved to the hierarchy’s top. Mobile phones are one key component of Information Systems.
(e) Three keywords, “personal computer,” “internet,” and “service,” represented as
double line triangles, are shown in all diagrams. These three components are essential elements of “Information Systems.”
(f) Note the change of the locations of “efficiency,” “reliability,” and “safety,” represented by a double line hexagon. From 1996 to 1998, the location of “efficient” was higher than “reliability” and “safety.” But by 1999, “safety” had risen to the same level as “efficiency,” and from 2005, the location of “safety” surpassed “efficiency.” The location of “reliability” is also higher than previous years. In society the importance of Information System changed from efficiency to safety and reliability.
All trends read from the results of the long-range changes of ISM diagrams seem to match actual societal changes, reflecting the high reliability of our proposed automatic generation algorithm. Therefore, by using the chronological changes of ISM diagrams, we can select appropriate items. For example, the diagrams of Figures 6 to 9 indicate increases in the importance of security issues in the field of Information Systems. 6. RELATED WORKS The ISM method is widely used in various fields, especially for teaching material structuring, where its use is quite common. Sato [6,7] describes the concept and method of applying ISM to educational technology . Sakakibara [8] used ISM to analyse science activities in elementary school classrooms, and Tahira [9] applied ISM for evaluating usability. However none of these works mention the automatic generation of a relation matrix. They all explicitly or implicitly assumed a handmade relation matrix. There is no other work about the automatic generation of relation matrixes. Alternatives exist for measuring the degree of relation in two keywords. In this article, co-occurrence ratio was used. However, other measures include mutual information, Jacacard coefficient, Simpson coefficient, and TF-IDF value ([10], [11]). Matsuo proposed a measurement method for the degree of relation using various measures. They also pointed out that to measure the relation, the kind of relation such
ISBN: 978-0-9891305-2-3 ©2013 SDIWC 213

as co-authoring, collaborative research, friend, and so on must be considered for selecting the criterion of measurement [12]. Jin also stressed the importance of low co-occurrence relations [13]. When considering the relation of two entities belonging to different communities such as the scientific or artist communities, low co-occurrence sometimes plays a crucial role. Therefore, in such cases, other appropriate measures should be adopted. There is no versatile measure for all problem domains. Appropriate criterion should be used by reviewing the results. 7. CONCLUSION AND FUTURE WORKS In this article, we proposed an automatic generation algorithm for relation matrixes for ISM diagram drawings. ISM is used for the selection of up-to-date teaching items. Our proposed algorithm, which is based on the co-occurrence ratio of two keywords, was evaluated by the long-range changes of problem structure. The field of “Information Systems in Society” was selected for evaluation, and an ISM diagram was generated from newspaper articles. Nine years of ISM diagram changes seem to reflect the changes of the actual world, suggesting the proposed method's validity. The proposed algorithm was implemented on the Web. This system, named ISMWeb, provides location-free same ISM automatic generation service. In the proposed system, all keywords were selected by the participants. The selection of keyword sets sometimes greatly influences the results of the ISM diagram. Our next step will consider a more objective and a procedural method of selecting keywords. The effect of the criterions of the similarity definition is another future research topic. References [1] Warfield, J. N.: Binary matrices in system modeling, IEEE Trans. SMC, 3(5), pp.441-449 (1973) [2] Mainichi Shinbun, http://www.mainichi.co.jp/(2007): [3] Graphviz - Graph Visualization Software (Graphviz): http://www.graphviz.org/ (2007) [4] Lucene, Fulltext scanning engine “Lucene” http://lucene.apache.org/ [5] Tomcat, Apache Tomcat: http://tomcat.apache.org/
[6] Sato, T.: ISM Structural Learning Technology (in Japanese) (ISM kozou gakushuhou), Meiji Tosho Publishing Co. Ltd. (1987) [7] Sato, T.: Introduction of educational engineering (in Japanese) (Kyoiku Kougaku Nyumon), Corona Publishing Co.Ltd. (1989) [8] Sakakibara, Y., Hishida, K. Analysis using SOCSIA and ISM teaching objective structural chart analysis for Classroom activities of science subject in elementary school, Bulletin of Tokyo Gakugei University. Series IV, Mathematics and Natural Sciences, 45, 97-107 (1993) [9] Tahira, H. : Usability Problem Solving with Graph Theory - A case study in introducing Structure Modelling, Proceedings of Human Interface Symposium, pp.277-280 (2002) [10] Manning, C.D., Schuetze, H.: Foundations of statistical natural language processing, MIT Press, London (2002) [11] Rasumussen, E.: Clustering Algorithms, in Information Retrieval: Data Structures & Algorithms, Willam B. Frakes and Ricardo Baeza-Yates (Eds), Prentice Hall (1992) [12] Matsuo, Y. et al.: Social Network Extraction from the Web information (in Japanese), Journal of Japanese Society of Artificial Intelligence, 20(1), 46-56 (2005) [13] Jin, Y.: Extracting Artist Network from World Wide Web, Proceedings of The 20th Annual Conference of the Japanese Society for Artificial Intelligence, 3D4-3 (2006)
ISBN: 978-0-9891305-2-3 ©2013 SDIWC 214