
Attaining Success through Growth Hacking - Theseus
130
Attaining Success through Growth Hacking Case: MyChat – Social Chat App from MySQUAR LAHTI UNIVERSITY OF APPLIED SCIENCES Faculty of Business Studies Degree Programme in International Business Bachelor’s Thesis Autumn 2016 Khanh Gia Ha Minh Quan Le
-
Upload
khangminh22 -
Category
Documents
-
view
1 -
download
0
Transcript of Attaining Success through Growth Hacking - Theseus
Attaining Success through
Growth Hacking
Case: MyChat – Social Chat App from
MySQUAR
LAHTI UNIVERSITY OF APPLIED SCIENCES Faculty of Business Studies Degree Programme in International Business Bachelor’s Thesis Autumn 2016 Khanh Gia Ha Minh Quan Le
Lahti University of Applied Sciences Degree Programme in International Business
HA, KHANH GIA: Attaining Success through Growth Hacking
LE, MINH QUAN Case: MyChat – Social Chat App from MySQUAR
Bachelor’s Thesis in International Business, 117 pages, 5 pages of appendices
Autumn 2016
ABSTRACT
Over the past years, app industry has many times witnessed the incredible: app startups achieving unprecedented growth rate with little to no resources. The one held accountable for such success was growth hacking - a new practice that embraces both marketing and product development.
The case company, MySQUAR PTE LTD, is an international app startup dedicated for Myanmar. The company has developed and released many apps in the market, among which stands MyChat, its flagship social chat app. At the end of 2016, MYSQUAR is going to release a new version of MyChat, which is referred to as MyChat 2.0. The company therefore needs a plan that can secure the success of the launch while laying foundation for future growth.
The main objective of this thesis is to assist the case company in formulating a launch strategy for MyChat 2.0 by providing (1) insights into the theory of growth hacking, (2) examples of its practices, and (3) an implementation plan constructed based on the findings. For that, this thesis adopts a deductive research approach, employs a qualitative research method, and collects both primary and secondary data.
This thesis is divided into three main parts: theory, practice and implementation. First, the authors study theoretical basics of growth hacking as well as analysis tool. Second, the authors look into the practices that the historical cases have utilized to growth hack, and that are viable for the case company. Third, the authors analyze the app MyChat, and then incorporate earlier findings into the results to formulate an implementation plan which the company can undertake to launch MyChat 2.0.
Key words: app, future growth, growth hacking, launch strategy, launch success, Myanmar, MySQUAR, MyChat.
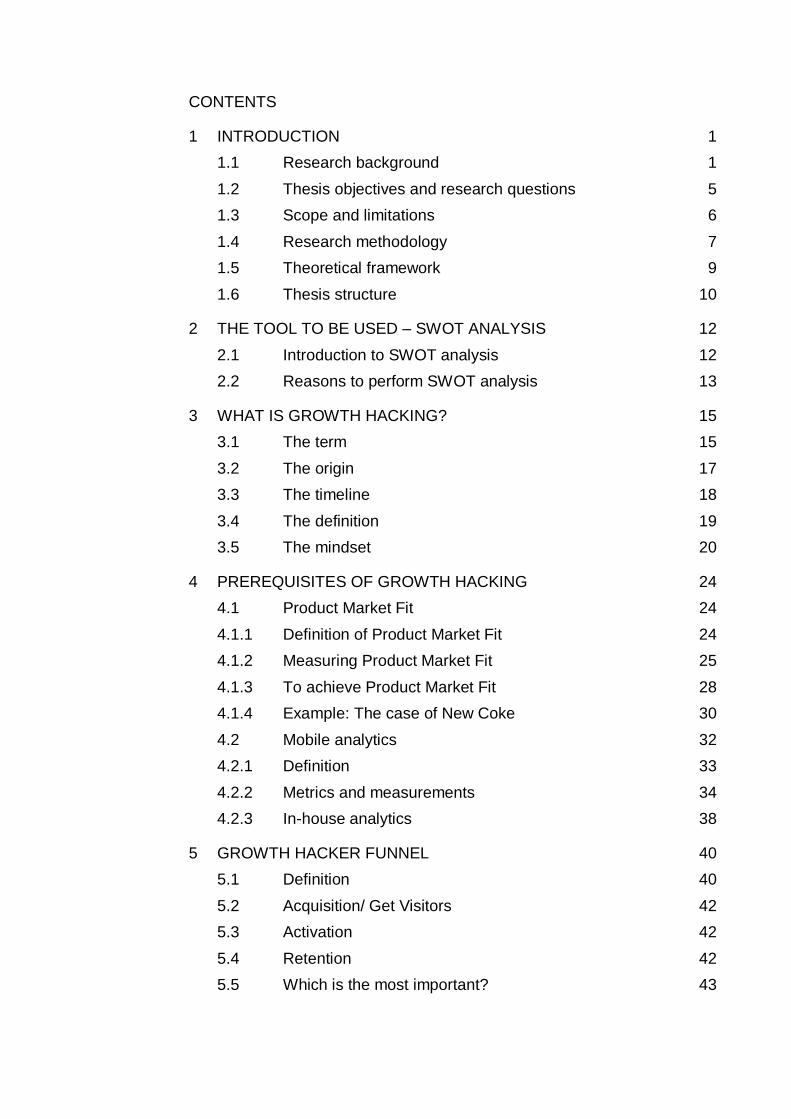
CONTENTS
1 INTRODUCTION 1
1.1 Research background 1
1.2 Thesis objectives and research questions 5
1.3 Scope and limitations 6
1.4 Research methodology 7
1.5 Theoretical framework 9
1.6 Thesis structure 10
2 THE TOOL TO BE USED – SWOT ANALYSIS 12
2.1 Introduction to SWOT analysis 12
2.2 Reasons to perform SWOT analysis 13
3 WHAT IS GROWTH HACKING? 15
3.1 The term 15
3.2 The origin 17
3.3 The timeline 18
3.4 The definition 19
3.5 The mindset 20
4 PREREQUISITES OF GROWTH HACKING 24
4.1 Product Market Fit 24
4.1.1 Definition of Product Market Fit 24
4.1.2 Measuring Product Market Fit 25
4.1.3 To achieve Product Market Fit 28
4.1.4 Example: The case of New Coke 30
4.2 Mobile analytics 32
4.2.1 Definition 33
4.2.2 Metrics and measurements 34
4.2.3 In-house analytics 38
5 GROWTH HACKER FUNNEL 40
5.1 Definition 40
5.2 Acquisition/ Get Visitors 42
5.3 Activation 42
5.4 Retention 42
5.5 Which is the most important? 43
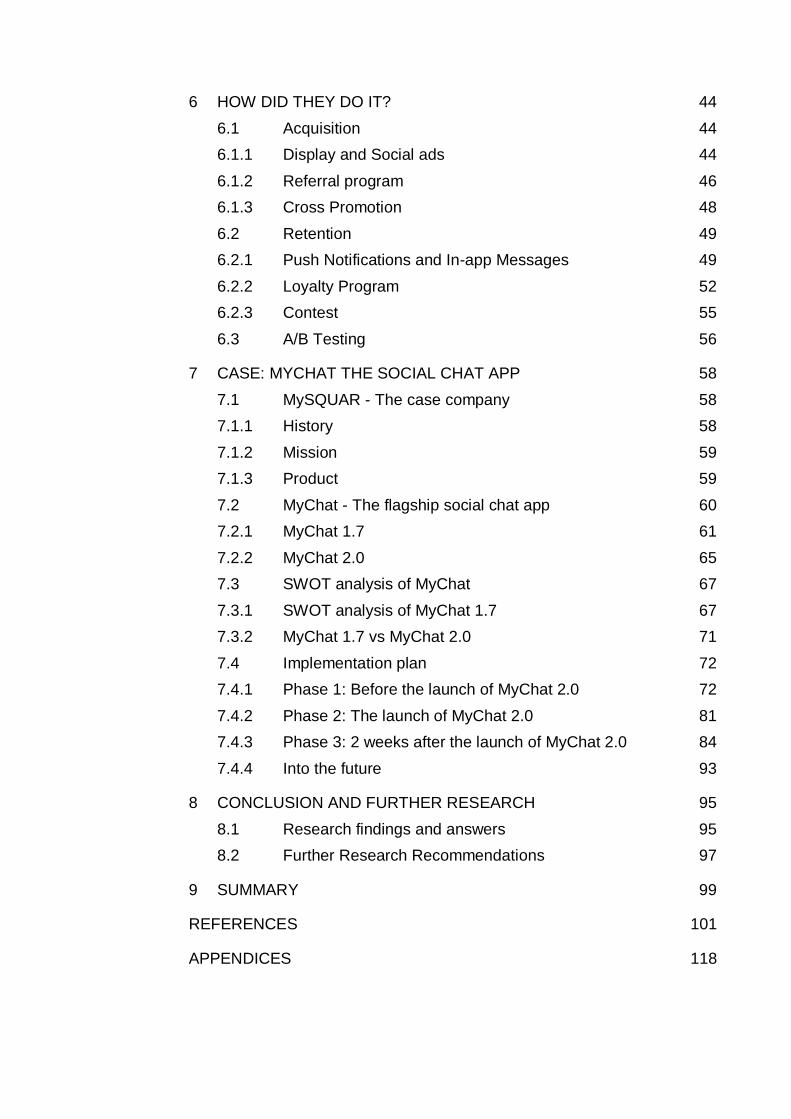
6 HOW DID THEY DO IT? 44
6.1 Acquisition 44
6.1.1 Display and Social ads 44
6.1.2 Referral program 46
6.1.3 Cross Promotion 48
6.2 Retention 49
6.2.1 Push Notifications and In-app Messages 49
6.2.2 Loyalty Program 52
6.2.3 Contest 55
6.3 A/B Testing 56
7 CASE: MYCHAT THE SOCIAL CHAT APP 58
7.1 MySQUAR - The case company 58
7.1.1 History 58
7.1.2 Mission 59
7.1.3 Product 59
7.2 MyChat - The flagship social chat app 60
7.2.1 MyChat 1.7 61
7.2.2 MyChat 2.0 65
7.3 SWOT analysis of MyChat 67
7.3.1 SWOT analysis of MyChat 1.7 67
7.3.2 MyChat 1.7 vs MyChat 2.0 71
7.4 Implementation plan 72
7.4.1 Phase 1: Before the launch of MyChat 2.0 72
7.4.2 Phase 2: The launch of MyChat 2.0 81
7.4.3 Phase 3: 2 weeks after the launch of MyChat 2.0 84
7.4.4 Into the future 93
8 CONCLUSION AND FURTHER RESEARCH 95
8.1 Research findings and answers 95
8.2 Further Research Recommendations 97
9 SUMMARY 99
REFERENCES 101
APPENDICES 118
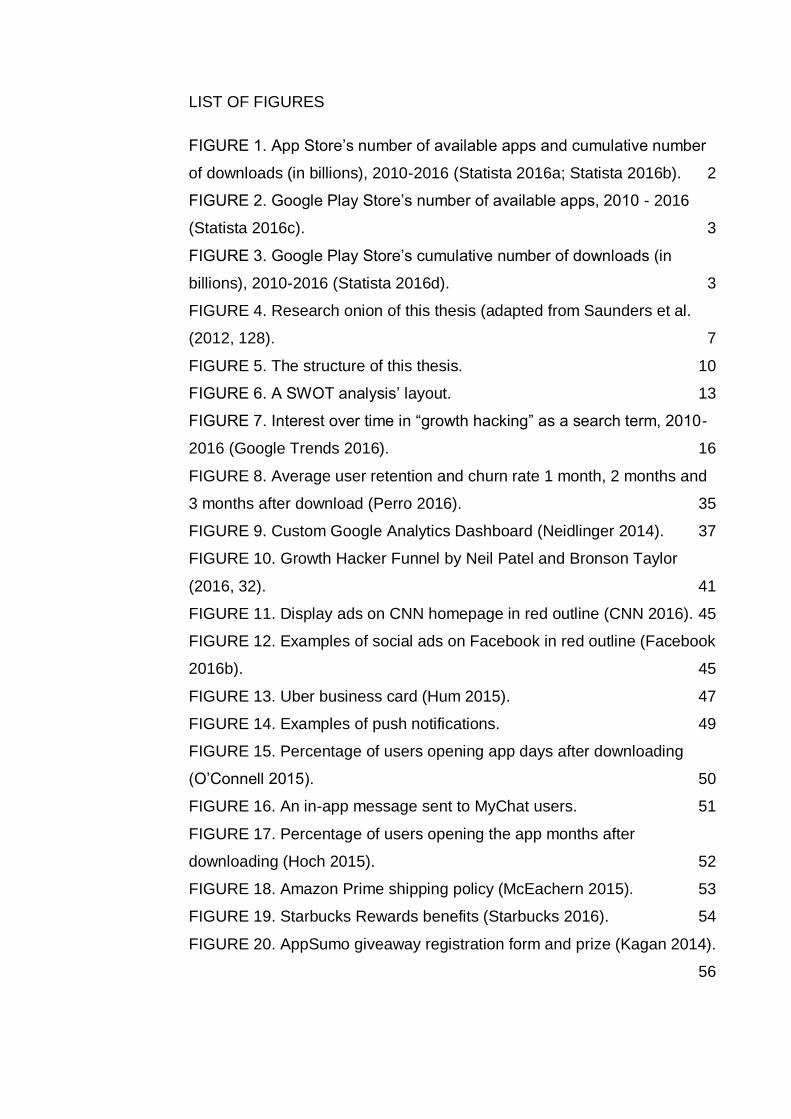
LIST OF FIGURES
FIGURE 1. App Store’s number of available apps and cumulative number
of downloads (in billions), 2010-2016 (Statista 2016a; Statista 2016b). 2
FIGURE 2. Google Play Store’s number of available apps, 2010 - 2016
(Statista 2016c). 3
FIGURE 3. Google Play Store’s cumulative number of downloads (in
billions), 2010-2016 (Statista 2016d). 3
FIGURE 4. Research onion of this thesis (adapted from Saunders et al.
(2012, 128). 7
FIGURE 5. The structure of this thesis. 10
FIGURE 6. A SWOT analysis’ layout. 13
FIGURE 7. Interest over time in “growth hacking” as a search term, 2010-
2016 (Google Trends 2016). 16
FIGURE 8. Average user retention and churn rate 1 month, 2 months and
3 months after download (Perro 2016). 35
FIGURE 9. Custom Google Analytics Dashboard (Neidlinger 2014). 37
FIGURE 10. Growth Hacker Funnel by Neil Patel and Bronson Taylor
(2016, 32). 41
FIGURE 11. Display ads on CNN homepage in red outline (CNN 2016). 45
FIGURE 12. Examples of social ads on Facebook in red outline (Facebook
2016b). 45
FIGURE 13. Uber business card (Hum 2015). 47
FIGURE 14. Examples of push notifications. 49
FIGURE 15. Percentage of users opening app days after downloading
(O’Connell 2015). 50
FIGURE 16. An in-app message sent to MyChat users. 51
FIGURE 17. Percentage of users opening the app months after
downloading (Hoch 2015). 52
FIGURE 18. Amazon Prime shipping policy (McEachern 2015). 53
FIGURE 19. Starbucks Rewards benefits (Starbucks 2016). 54
FIGURE 20. AppSumo giveaway registration form and prize (Kagan 2014).
56
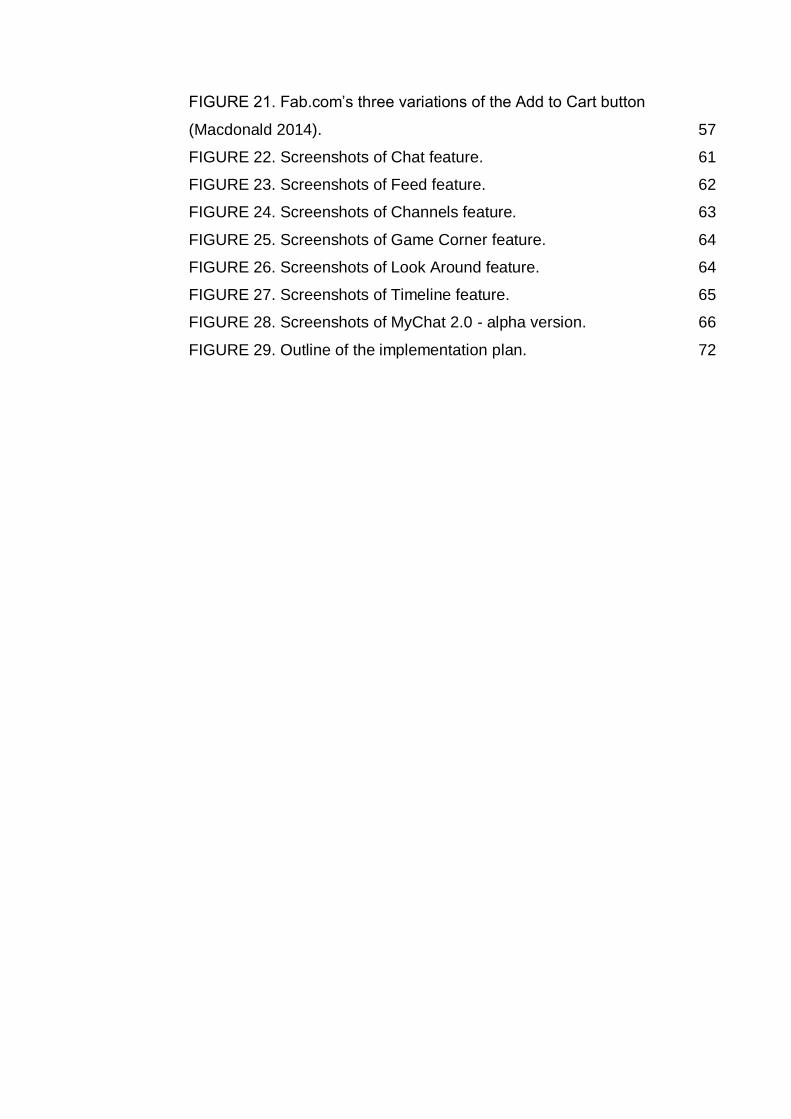
FIGURE 21. Fab.com’s three variations of the Add to Cart button
(Macdonald 2014). 57
FIGURE 22. Screenshots of Chat feature. 61
FIGURE 23. Screenshots of Feed feature. 62
FIGURE 24. Screenshots of Channels feature. 63
FIGURE 25. Screenshots of Game Corner feature. 64
FIGURE 26. Screenshots of Look Around feature. 64
FIGURE 27. Screenshots of Timeline feature. 65
FIGURE 28. Screenshots of MyChat 2.0 - alpha version. 66
FIGURE 29. Outline of the implementation plan. 72
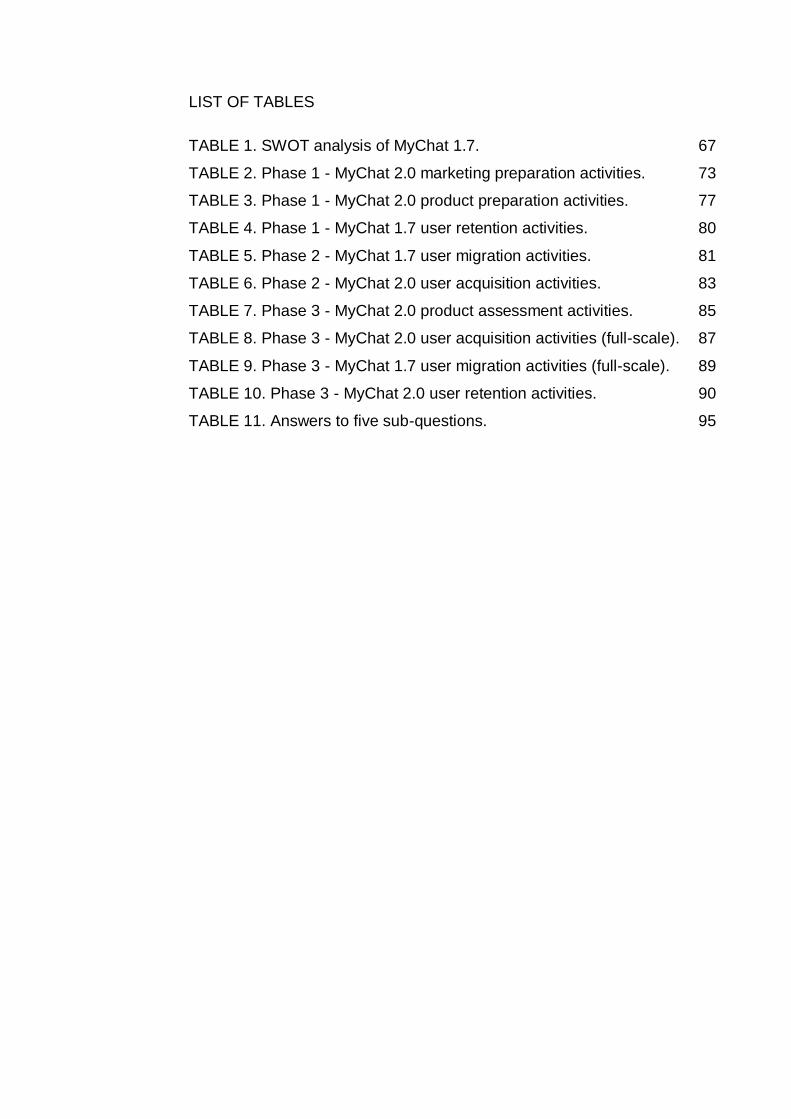
LIST OF TABLES
TABLE 1. SWOT analysis of MyChat 1.7. 67
TABLE 2. Phase 1 - MyChat 2.0 marketing preparation activities. 73
TABLE 3. Phase 1 - MyChat 2.0 product preparation activities. 77
TABLE 4. Phase 1 - MyChat 1.7 user retention activities. 80
TABLE 5. Phase 2 - MyChat 1.7 user migration activities. 81
TABLE 6. Phase 2 - MyChat 2.0 user acquisition activities. 83
TABLE 7. Phase 3 - MyChat 2.0 product assessment activities. 85
TABLE 8. Phase 3 - MyChat 2.0 user acquisition activities (full-scale). 87
TABLE 9. Phase 3 - MyChat 1.7 user migration activities (full-scale). 89
TABLE 10. Phase 3 - MyChat 2.0 user retention activities. 90
TABLE 11. Answers to five sub-questions. 95
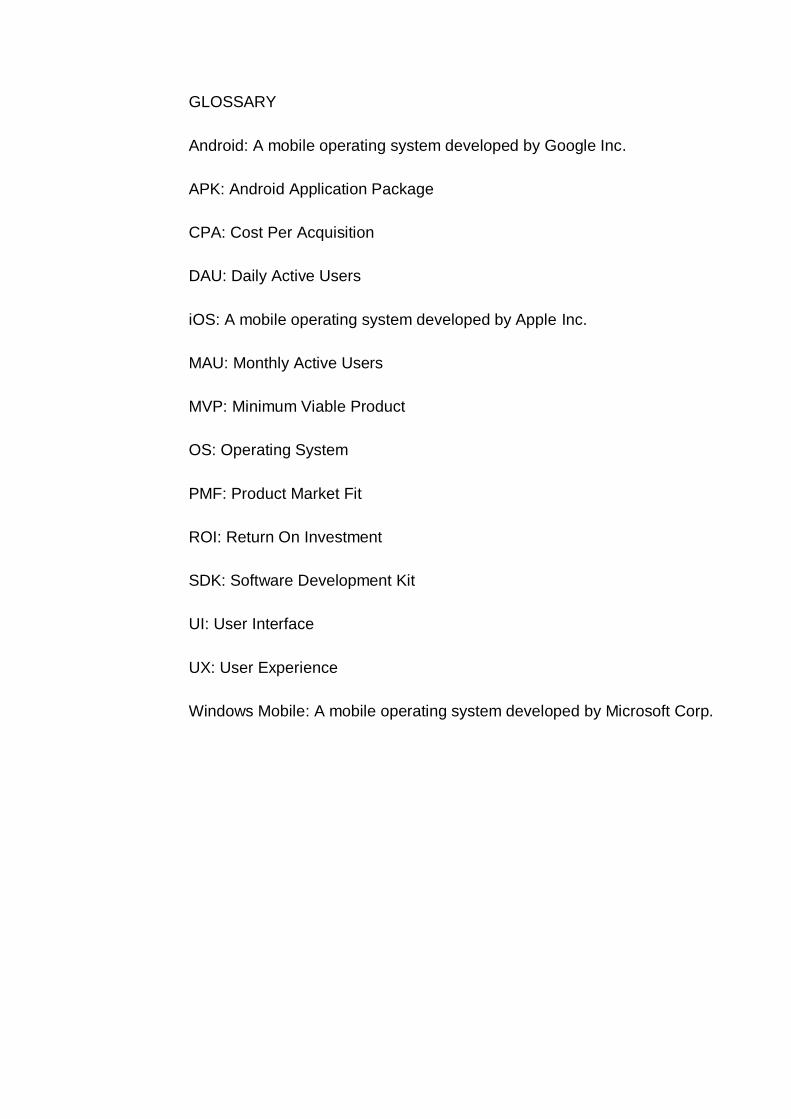
GLOSSARY
Android: A mobile operating system developed by Google Inc.
APK: Android Application Package
CPA: Cost Per Acquisition
DAU: Daily Active Users
iOS: A mobile operating system developed by Apple Inc.
MAU: Monthly Active Users
MVP: Minimum Viable Product
OS: Operating System
PMF: Product Market Fit
ROI: Return On Investment
SDK: Software Development Kit
UI: User Interface
UX: User Experience
Windows Mobile: A mobile operating system developed by Microsoft Corp.
1 INTRODUCTION
To give a thorough first look at the thesis, the following six fundamentals
are covered respectively in this chapter: research background, objectives
and research questions, scope and limitations, research methodology and
data collection, theoretical framework, and thesis structure. By the end of
this chapter, the readers can learn about not only the principles and
motivations behind this thesis, but also an outline map of where it is
heading.
1.1 Research background
In 1962, J.C.R. Licklider envisioned a “Galactic Network”, which he
described as a universally interconnected network of computers
(History.com 2010; Leiner, Cerf, Clark, Kahn, Kleinrock, Lynch, Postel,
Roberts & Wolff 2016). His concept at the time was one of the very first
bases of the Internet we have today. More than fifty years has passed, the
Internet is now considered a basic human right (United Nations Human
Rights Council 2016, 1-4), and is the backbone of countless technological
breakthroughs, provoking immense changes to our lives and our society
(Vîrjan 2013, 117-124; Pont 2013, 2). One major change the Internet
brought us is a brand new concept of product: intangible, untouchable,
“invisible bits and bytes”, and yet profitable. App, that is. (Patel & Taylor
2016, 7.)
App is an abbreviation for application. It is “a computer program or piece of
software designed for a particular purpose” (Cambridge Dictionary 2016).
Depending on the usage, an app can be built to run on a computer or a
mobile phone, or on any electronic devices; however, in modern use, the
word app is most associated with software applications that run particularly
on mobile phones or other mobile devices. (Karch 2016.)
Similar to the Internet, app too has gone a long way in a short time. Apple
launched its first App Store in July 2008 (Apple 2008), followed by Google
with its Android Market’s release for users in October 2008 (Chu 2008).
2
Android Market was the predecessor for today Google Play Store, which
was launched in March 2012 (Google 2016a). Ever since their releases,
these app markets have witnessed dramatic changes in the app industry.
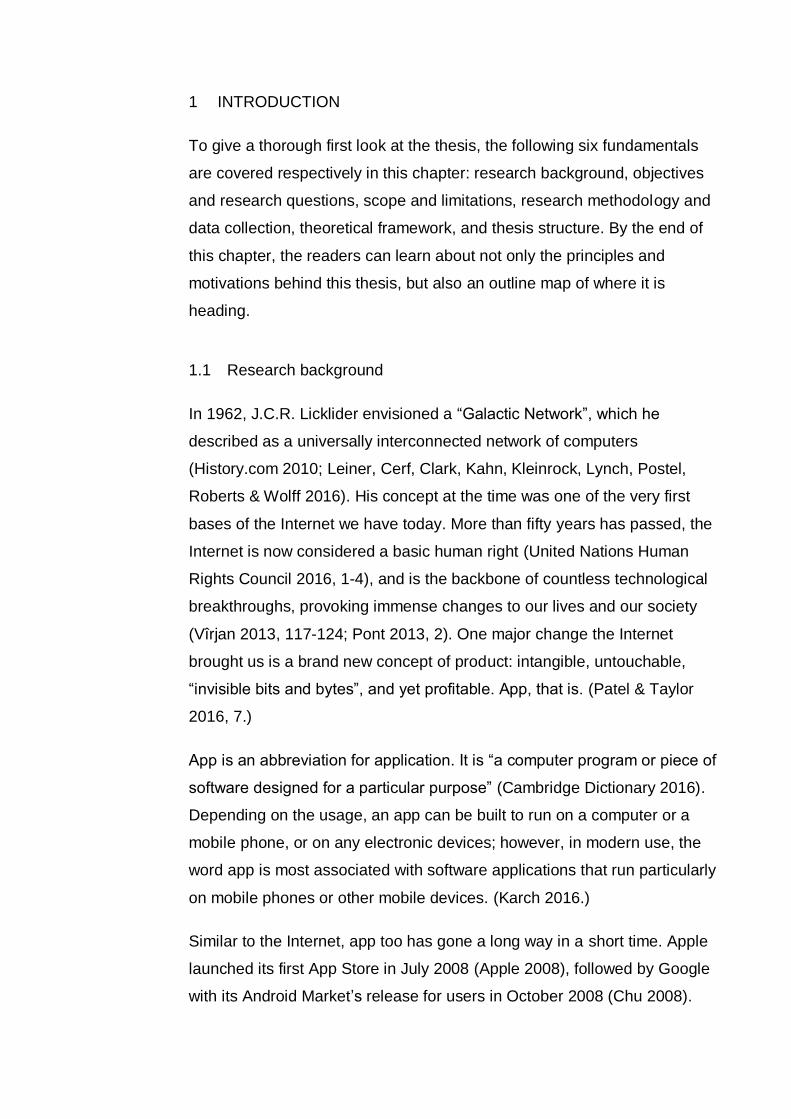
In the case of App Store, Figure 1 portrays its rapid development.
FIGURE 1. App Store’s number of available apps and cumulative number
of downloads (in billions), 2010-2016 (Statista 2016a; Statista 2016b).
From 2010 to 2016, App Store has enjoyed tremendous increases in the
total number of available apps as well as the total number of downloads.
In June 2010, there were 225,000 apps available for download on App
Store. In June 2016, the number was 2,000,000. The amount of apps
increased tenfold in just six years. Additionally, 130 billion apps had been
downloaded from App Store in June 2016, whereas the number was
merely 5 billion in June 2010. App Store’s figures were indeed remarkable;
however, Google Play Store’s were no less eye-popping. The upcoming
Figure 2 and Figure 3 illustrate how Google Play Store has witnessed its
numbers skyrocketing from 2010 to 2016.
June 2010 June 2012 June 2014 June 2016
Number of Apps 225000 650000 1200000 2000000
Cumulative Number ofDownloads (bil)
5 30 75 130
0
20
40
60
80
100
120
140
0
500000
1000000
1500000
2000000
2500000
3
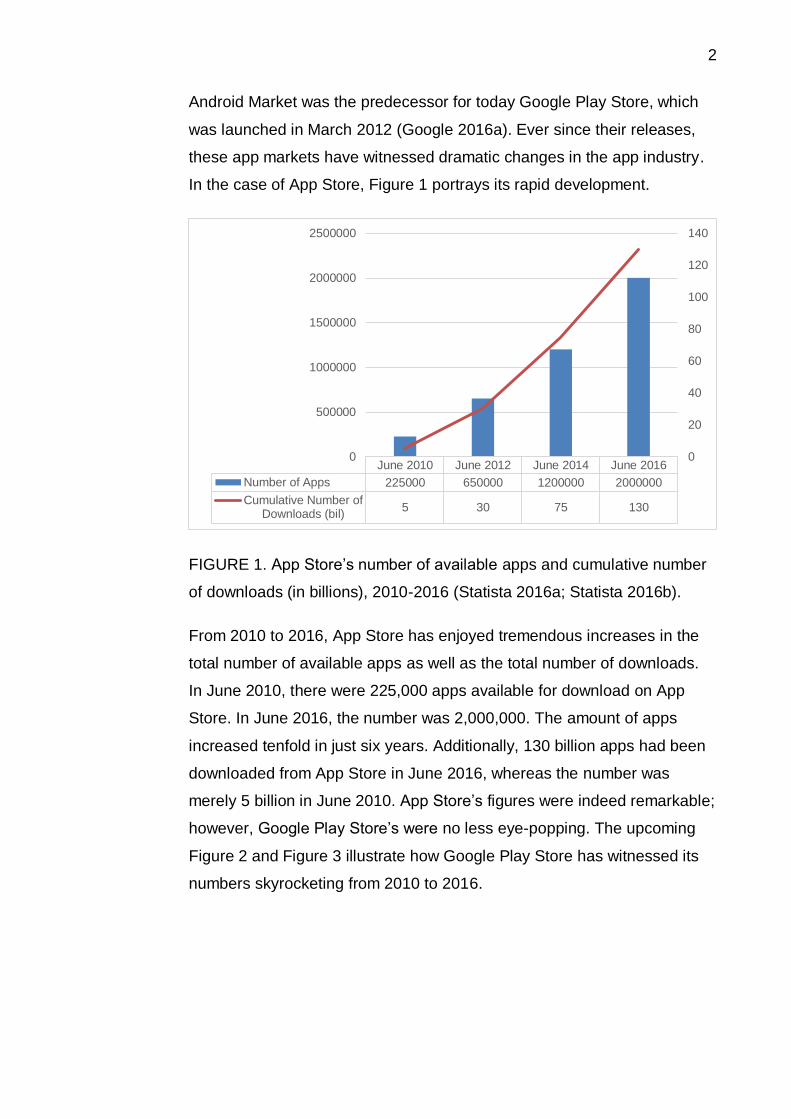
FIGURE 2. Google Play Store’s number of available apps, 2010 - 2016
(Statista 2016c).
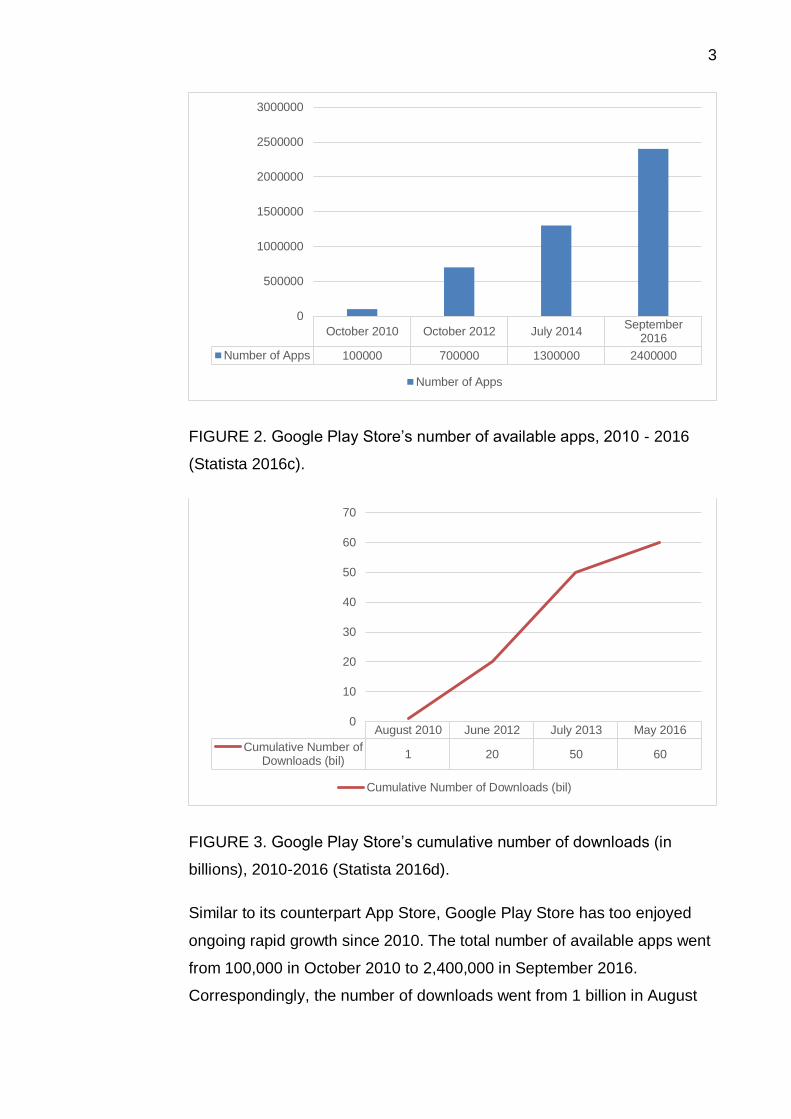
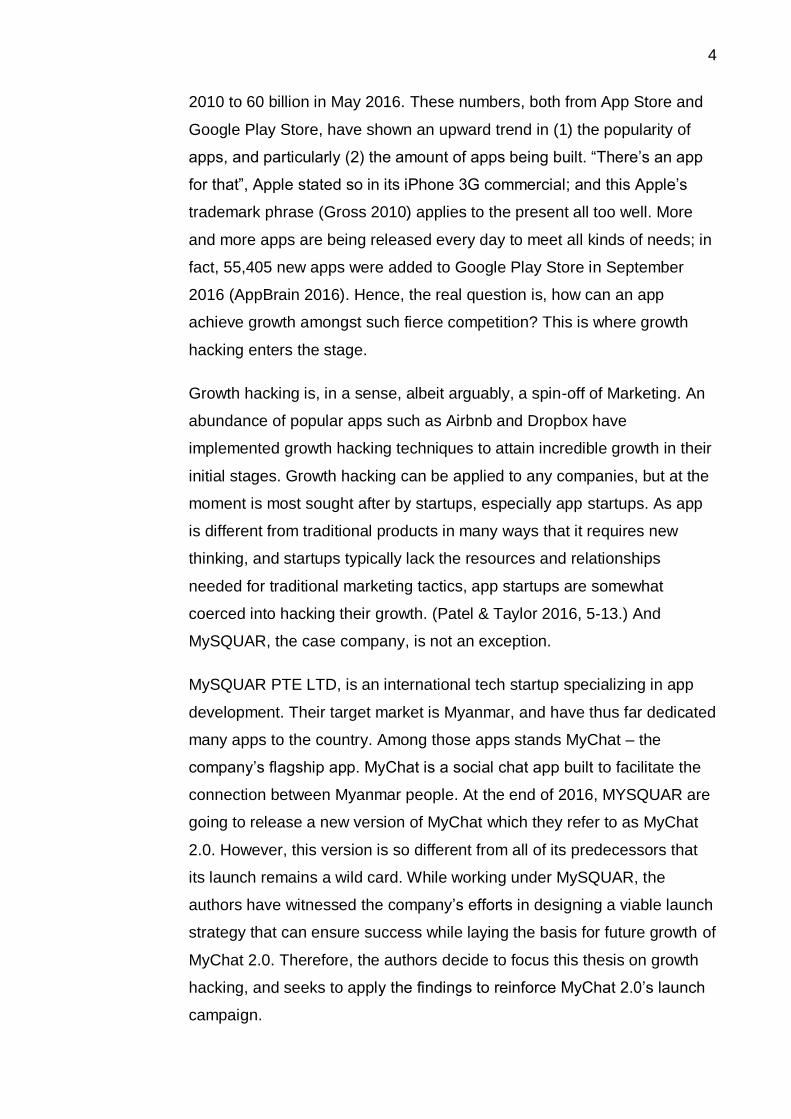
FIGURE 3. Google Play Store’s cumulative number of downloads (in
billions), 2010-2016 (Statista 2016d).
Similar to its counterpart App Store, Google Play Store has too enjoyed
ongoing rapid growth since 2010. The total number of available apps went
from 100,000 in October 2010 to 2,400,000 in September 2016.
Correspondingly, the number of downloads went from 1 billion in August
October 2010 October 2012 July 2014September
2016
Number of Apps 100000 700000 1300000 2400000
0
500000
1000000
1500000
2000000
2500000
3000000
Number of Apps
August 2010 June 2012 July 2013 May 2016
Cumulative Number ofDownloads (bil)
1 20 50 60
0
10
20
30
40
50
60
70
Cumulative Number of Downloads (bil)
4
2010 to 60 billion in May 2016. These numbers, both from App Store and
Google Play Store, have shown an upward trend in (1) the popularity of
apps, and particularly (2) the amount of apps being built. “There’s an app
for that”, Apple stated so in its iPhone 3G commercial; and this Apple’s
trademark phrase (Gross 2010) applies to the present all too well. More
and more apps are being released every day to meet all kinds of needs; in
fact, 55,405 new apps were added to Google Play Store in September
2016 (AppBrain 2016). Hence, the real question is, how can an app
achieve growth amongst such fierce competition? This is where growth
hacking enters the stage.
Growth hacking is, in a sense, albeit arguably, a spin-off of Marketing. An
abundance of popular apps such as Airbnb and Dropbox have
implemented growth hacking techniques to attain incredible growth in their
initial stages. Growth hacking can be applied to any companies, but at the
moment is most sought after by startups, especially app startups. As app
is different from traditional products in many ways that it requires new
thinking, and startups typically lack the resources and relationships
needed for traditional marketing tactics, app startups are somewhat
coerced into hacking their growth. (Patel & Taylor 2016, 5-13.) And
MySQUAR, the case company, is not an exception.
MySQUAR PTE LTD, is an international tech startup specializing in app
development. Their target market is Myanmar, and have thus far dedicated
many apps to the country. Among those apps stands MyChat – the
company’s flagship app. MyChat is a social chat app built to facilitate the
connection between Myanmar people. At the end of 2016, MYSQUAR are
going to release a new version of MyChat which they refer to as MyChat
2.0. However, this version is so different from all of its predecessors that
its launch remains a wild card. While working under MySQUAR, the
authors have witnessed the company’s efforts in designing a viable launch
strategy that can ensure success while laying the basis for future growth of
MyChat 2.0. Therefore, the authors decide to focus this thesis on growth
hacking, and seeks to apply the findings to reinforce MyChat 2.0’s launch
campaign.
5
1.2 Thesis objectives and research questions
The objective of this thesis is to assist the case company in formulating a
launch strategy for the new MyChat by providing (1) insights into the
theory of growth hacking, (2) examples of its practices, and (3) an
implementation plan constructed based on the findings. In addition to a
detailed examination of growth hacking literature, this thesis studies the
practices that the historical cases have implemented to growth hack, and
that are suitable for the case company. Then, based on the findings, this
thesis puts forward a sequence of actions aiming at securing the success
of MyChat 2.0’s launch, and at the same time laying the foundation for its
future growth. In order to fulfill this goal, a set of research questions is
thereby laid out.
Question is at the core of all knowledge development, and research
question is the starting point that provides basic direction and path for the
development of the research (Alvesson & Sandberg 2013, 10-11). Hence,
the role of formulating clear research questions at the start of the research
process is crucial and can never be overemphasized (Saunders, Lewis &
Thornhill 2012, 40). The authors devise the main research question of this
thesis as below:
How can MySQUAR incorporate growth hacking into its launch strategy for
MyChat 2.0 to secure success while laying the basis for its future growth?
Defining the main research question is, in a sense, “the identification of a
destination” before embarking on a journey (Kumar 2010, 44). The journey
is long, and thus subsidiary questions (or sub-questions) are formulated to,
by answering each of them back-to-back, help the authors arrive at the
answer to the main research question (Andrews 2003, 43). Here are the
sub-questions of this thesis:
Why is growth hacking decisive to app startups?
What factors are necessary for a successful implementation of
growth hacking?
6
Which stage of growth hacking is the most influential to attaining
growth?
Which user acquisition tactics did the historical cases employ to
attain growth?
Which user retention tactics did the historical cases employ to attain
growth?
1.3 Scope and limitations
The essence of this thesis is its focus on getting to a viable launch strategy
for MyChat 2.0. MyChat is a mobile app; therefore, the authors study the
theories, practices, and examples of growth hacking which befit, and relate
to mobile app, despite its vast influence in services and tangible products.
Additionally, the implementation plan the authors put forward in this thesis
concerns both the marketing and product departments of the case
company.
Next, before going through the in-depth study, the readers shall keep in
mind that there are limitations to this thesis. First and foremost, growth
hacking is a young field, and hence a serious shortage of academic
sources. Therefore, in addition to published books, this thesis also (and
mainly) gathers information from the field’s pioneers’ blog posts, podcasts,
e-articles, presentations, infographics, etc. These sources are neither
traditional nor academic, but they are just as credible. Second, as
mentioned previously, this thesis views growth hacking from the
perspective of mobile apps; hence, the data collected might not be
applicable to services and tangible products. Third, while reading, the
readers may notice that some arguments require numeric data to back
them up; however, such data are not presented due to their being
classified or the authors’ inability to retrieve them. Fourth, in the literature
review, the authors intentionally skim through many concepts and
practices in an attempt to keep this thesis concentrated. Fifth, even though
there exists an abundance of growth hacking tactics, the authors select
only a handful of tactics which they deem viable for the case company to
7
present in chapter 6. Sixth, MyChat 2.0 is the focal product of this thesis;
however, it is still in its development stage at the time of this thesis, and
hence the authors’ unavoidably limited knowledge of this version. Finally,
yet importantly, the implementation plan drawn from this thesis is meant
for the launch of MyChat 2.0, and thereby might be inapplicable to other
mobile apps.
1.4 Research methodology
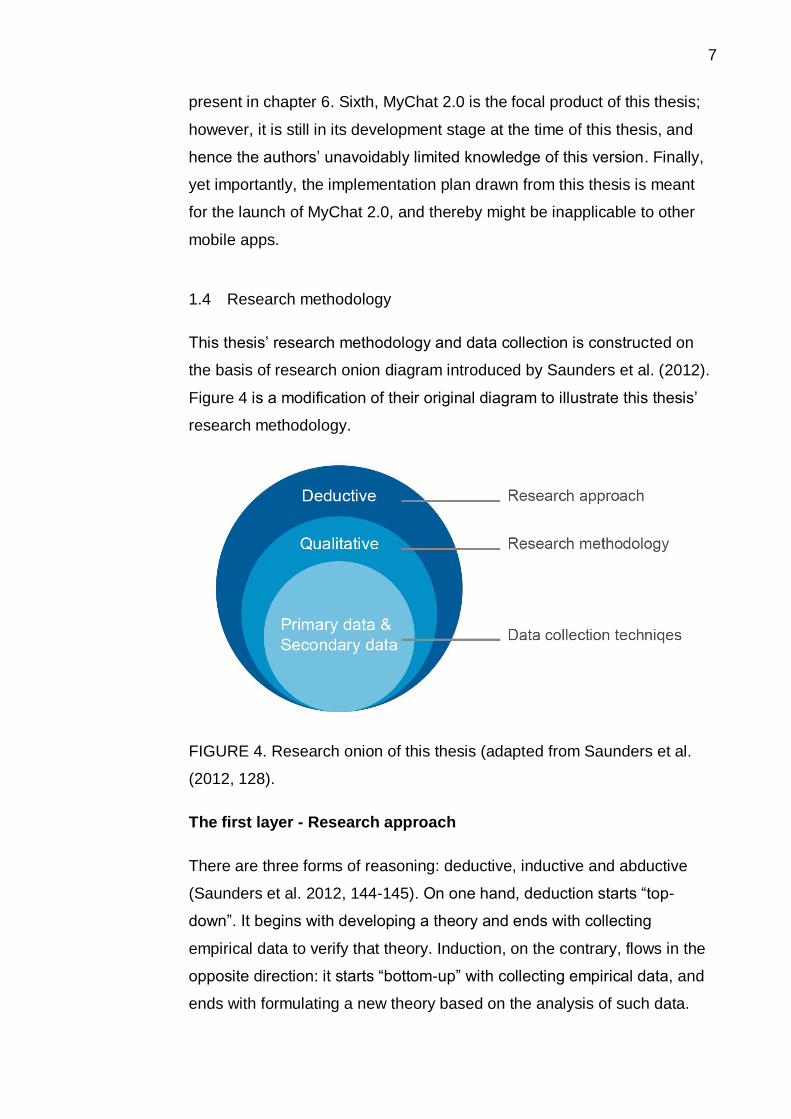
This thesis’ research methodology and data collection is constructed on
the basis of research onion diagram introduced by Saunders et al. (2012).
Figure 4 is a modification of their original diagram to illustrate this thesis’
research methodology.
FIGURE 4. Research onion of this thesis (adapted from Saunders et al.
(2012, 128).
The first layer - Research approach
There are three forms of reasoning: deductive, inductive and abductive
(Saunders et al. 2012, 144-145). On one hand, deduction starts “top-
down”. It begins with developing a theory and ends with collecting
empirical data to verify that theory. Induction, on the contrary, flows in the
opposite direction: it starts “bottom-up” with collecting empirical data, and
ends with formulating a new theory based on the analysis of such data.
8
(Myers 2013, 23.) Last but not least, according to Suddaby (2006)
abduction moves back and forth between theory and data. Abduction
begins with the observation of an abnormality; it then proceeds to work out
some plausible explanations of how such abnormality could have
occurred. (Saunders et al. 2012, 147.)
When it comes to selecting the right approach for a business research, a
myriad of factors should be taken into consideration: the emphasis of the
research, the nature of the research, time frame, risk assessment, and the
audience (Saunders et al. 2012, 148). For the case of this thesis, with all
those factors taken into account, deductive approach is adopted.
The second layer - Research methodology
Moving onto the next layer of the “research onion”, there are two most
prevalent basic research methodologies: quantitative and qualitative.
These two methods are distinctive from each other in many aspects,
particularly in the type of data they generate/use. To put it simply,
quantitative research is an empirical research that involves numeric data –
data in the form of numbers (or measurement) (Punch 2013, 3). On the
other hand, qualitative research is an empirical research that involves non-
numeric data (Punch 2013, 3) – data in the form of words, images, video
clips, etc. (Saunders et al. 2012, 161). Certainly there are more to these
two methodologies, and to differentiate them simply by the type of data
they use would be narrow (Saunders et al. 2012, 161) and unwise.
Nonetheless, such simplified differentiation befits the intent of the authors.
A research can implement either quantitative method or qualitative method
alone, or a combination of the both of them (Thomas 2003, 6-7). For the
case of this thesis, qualitative research methodology alone is adopted.
The third layer - Data collection
At the last layer of the “research onion” is data collection. Generally
speaking, there is an abundance of ways to categorize data (Allen &
Cervo 2015, 154); however, this thesis is specifically concerned with the
9
alternative that classifies data as either primary data or secondary data.
The terms “primary” and “secondary”, in this case, indicate the origins of
the data collected, and not their relative importance. (Stevens, Loudon,
Ruddick, Wrenn & Sherwood 2012, 90.)
Primary data are generated (Blaikie 2003, 18) or collected first-hand by the
researchers themselves for the particular research at hand (Stevens et al.
2012, 90), while secondary data have already been gathered by other
researchers for other purposes (Blaikie 2003, 18; Sarstedt & Mooi 2014,
48). For the case of this thesis, in order to fulfill the research objectives,
both primary and secondary data are assembled through an employment
of different data collection techniques. For the former, primary data are
collected from two sources: the authors’ unstructured interviews with the
case company’s product director and digital marketing manager, and first-
hand personal observations while working under the case company. For
the latter, secondary data are derived from books, articles, journals, blogs
and other credible electronic sources.
1.5 Theoretical framework
The purpose of this thesis is to assist the case company in devising a
launch strategy for the new version of MyChat. For that, the authors need
to perform a SWOT analysis of the app MyChat to assess its potential and
risk. As a result, this thesis starts with a brief introduction to the tool before
digging into the concept of growth hacking.
In order to implement growth hacking, the authors need to fully grasp what
this concept is about. Hence, this thesis dedicates chapter 3, 4, and 5 to
studying the theoretical basics of growth hacking. Throughout these
chapters, concepts such as Product Market Fit, Sean Ellis test, mobile
analytics, metrics and measurements, Neil Patel and Bronson Taylor’s
Growth Hacker Funnel, etc. will make their appearance.
Then, the authors move onto studying the tactics of growth hacking. These
tactics comprise display ads and social ads, referral program, cross
10
promotion, push notification and in-app message, loyalty program, contest,
and A/B testing, and are introduced in chapter 6.
At the end of this thesis is an implementation plan the authors suggest the
company undertake for the launch of the new version of MyChat. The plan
is drafted based on the above findings together with the results of
MyChat’s SWOT analysis.
1.6 Thesis structure
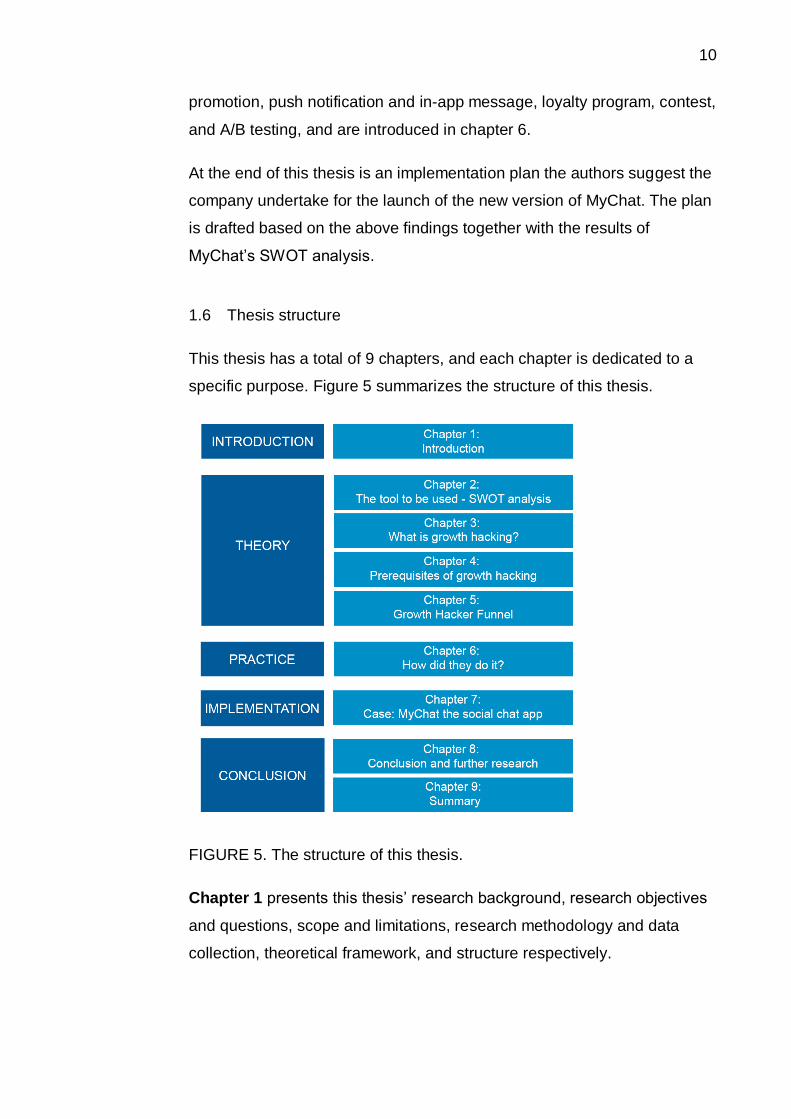
This thesis has a total of 9 chapters, and each chapter is dedicated to a
specific purpose. Figure 5 summarizes the structure of this thesis.
FIGURE 5. The structure of this thesis.
Chapter 1 presents this thesis’ research background, research objectives
and questions, scope and limitations, research methodology and data
collection, theoretical framework, and structure respectively.
11
Chapter 2 introduces SWOT analysis – the tool the authors utilize to
analyze the case product MyChat app.
Chapter 3, Chapter 4, and Chapter 5 cover the theoretical fundamentals
of growth hacking. Explanation of the term is provided in Chapter 3; a
checklist of prerequisites is compiled in Chapter 4; and finally, Growth
Hacker Funnel is presented in Chapter 5.
Chapter 6 studies growth hacking tactics that are via for the case
company while giving examples to illustrate (if applicable).
Chapter 7 entails introduction to the case company MySQUAR and the
app MyChat, a SWOT analysis of the app, and an implementation plan the
authors construct based on the accumulated findings.
Chapter 8 draws conclusion of this thesis, and puts forward suggestions
for further study.
Chapter 9 encapsulates the main findings of this thesis.
12
2 THE TOOL TO BE USED – SWOT ANALYSIS
As listed before, chapter 7 provides a comprehensive SWOT analysis of
the case product - MyChat app. Therefore, this chapter is dedicated to
equip the readers with the essentials of SWOT analysis.
2.1 Introduction to SWOT analysis
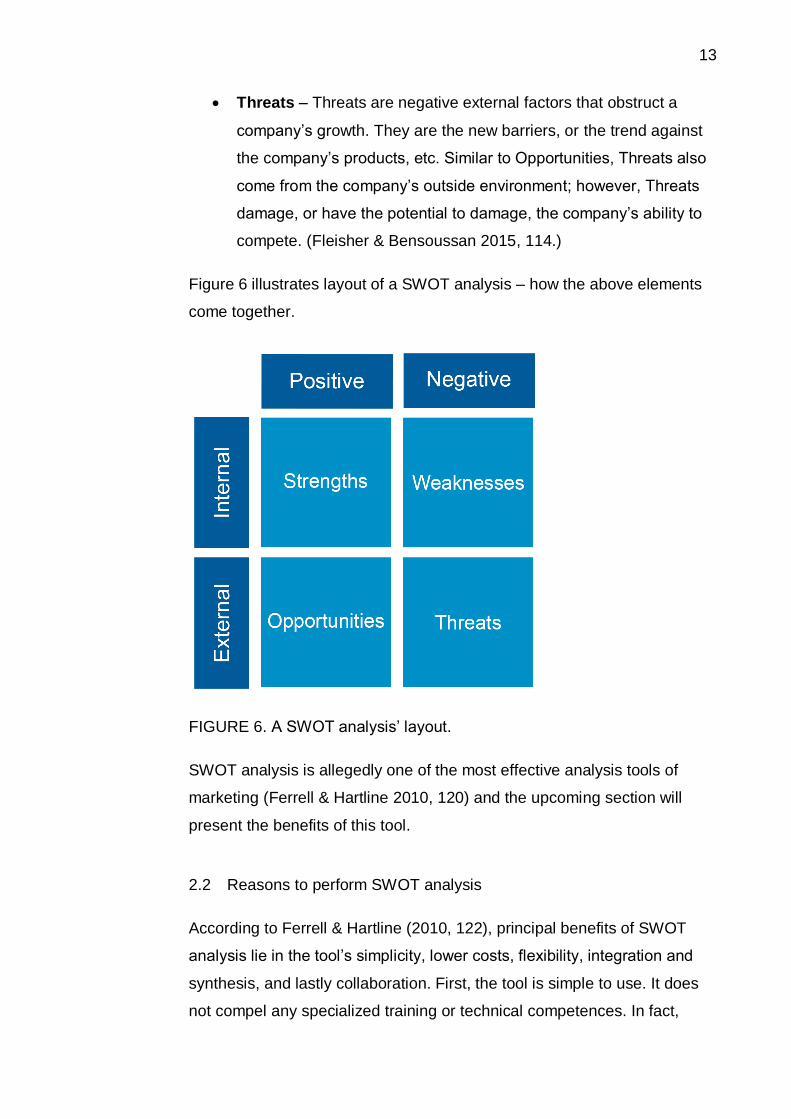
The S, W, O, T in SWOT analysis stands for Strengths, Weaknesses,
Opportunities and Threats respectively (Ferrell & Hartline 2010, 120;
Fleisher & Bensoussan 2015, 105). A SWOT analysis provides insights
into a company’s both internal and external environments, by assessing
that company’s:
Strengths – Strengths are positive internal factors that add to a
company’s competitiveness. Strengths are what the company is
good at doing. They are the resources and/or capabilities that the
company holds that are superior to competitors’. They are the
entities which the company can utilize effectively to reach its
performance goals. (Fleisher & Bensoussan 2015, 113.)
Weaknesses – Weaknesses are the polar opposite of Strengths;
they are the negative internal factors that diminish a company’s
competitiveness. Weaknesses are what the company is bad at
doing. They are the resources and/or capabilities that the company
holds that are inferior to competitors’. They are the limitations which
restrict the company from realizing its goals. (Fleisher &
Bensoussan 2015, 113.)
Opportunities – Opportunities are positive external factors that
favor a company’s growth. They are the changes in legislations
which support the company, or the trend which boosts the demand
for the company’s products, etc. Opportunities come from the
company’s outside environment; they give the company the chance
to reinforce its competitive position. (Fleisher & Bensoussan 2015,
114.)
13
Threats – Threats are negative external factors that obstruct a
company’s growth. They are the new barriers, or the trend against
the company’s products, etc. Similar to Opportunities, Threats also
come from the company’s outside environment; however, Threats
damage, or have the potential to damage, the company’s ability to
compete. (Fleisher & Bensoussan 2015, 114.)
Figure 6 illustrates layout of a SWOT analysis – how the above elements
come together.
FIGURE 6. A SWOT analysis’ layout.
SWOT analysis is allegedly one of the most effective analysis tools of
marketing (Ferrell & Hartline 2010, 120) and the upcoming section will
present the benefits of this tool.
2.2 Reasons to perform SWOT analysis
According to Ferrell & Hartline (2010, 122), principal benefits of SWOT
analysis lie in the tool’s simplicity, lower costs, flexibility, integration and
synthesis, and lastly collaboration. First, the tool is simple to use. It does
not compel any specialized training or technical competences. In fact,
14
analysts are only required to have comprehensive understanding of the
company and its industry. Second, as SWOT analysis involves neither
training nor specific skills, it helps to reduce strategic planning costs. Third,
to SWOT, extensive marketing information systems are more a good-to-
have than an utmost necessity. SWOT analysis can reinforce a company’s
strategic planning even in the absence of extensive marketing information
systems. Nonetheless, in the presence of such systems, repeated SWOT
analyses can be performed more efficiently and smoothly. Fourth, the tool
enables analysts to integrate and synthesize information from diverse
sources, regardless of its quantitative or qualitative nature. SWOT analysis
helps to organize both widely known information and recently discovered
information; it also works with a variety of information sources. To put it
simply, SWOT perceives information diversity as a strength rather than a
weakness. Finally, SWOT encourages cooperation and open information
exchange between different departments. Marketing analysts needs to
take into consideration what their counterparts do, what they know, etc. to
ensure the completeness of the analysis. By doing so, not only can they
solve problem, but they also prevent future disagreements between the
departments.
In short, as SWOT analysis assesses a company’s internal and external
factors simultaneously, it allows the analyst an overall look at the
company. This chapter has served its purpose of introducing SWOT
analysis to the reader; the next chapter will take the readers to growth
hacking - the core of this thesis.
15
3 WHAT IS GROWTH HACKING?
The purpose of this chapter is to answer the question what growth hacking
is. However, as mentioned previously, the concept of growth hacking is
relatively young. There exists a lack of official documents, and at the same
time an excess of arguments and contradictions between the pioneers of
the field. Consequently, the topic question cannot be approached directly,
but rather in a more roundabout manner. Instead of providing a full-fledged
definition (which is absent at the time of this thesis) straight away, this
chapter starts with a brief introduction to growth hacking, and then takes
the readers back to the past – what prompted the practice – and moves
on to reveal 2 momentous cases of growth hacking. After that, the readers
will again venture to the presence, where they will be provided with
analyses of definitions and traits of growth hacking. Finally, one last thing
to take note of is that, the information in this chapter is collected and later
on scrutinized from the perspective of app industry, and not any other
types of product.
3.1 The term
In 2010, Sean Ellis conceived the term “growth hacker” (Holiday 2013;
Patel & Taylor 2016, 5), which soon took off and became a new buzzword
among startups (Patel 2016) and marketers (Farr 2013). The term spread
like wildfire, leading to an upward trend in people’s googling “growth
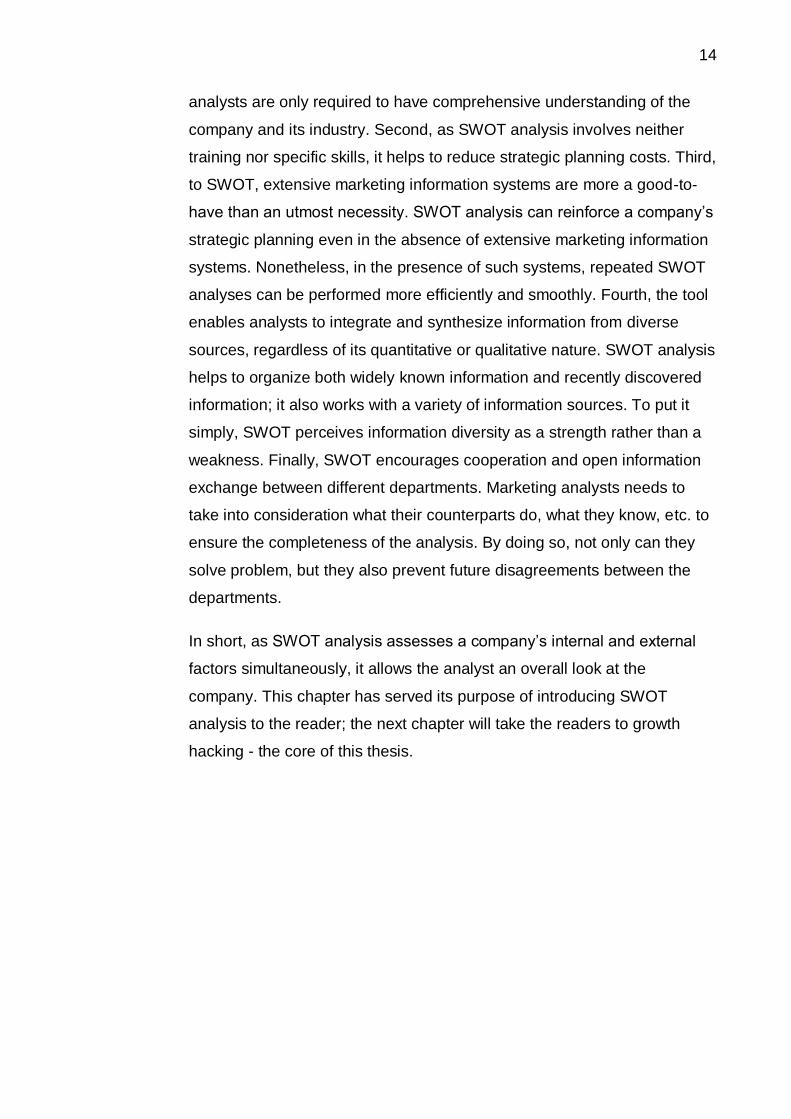
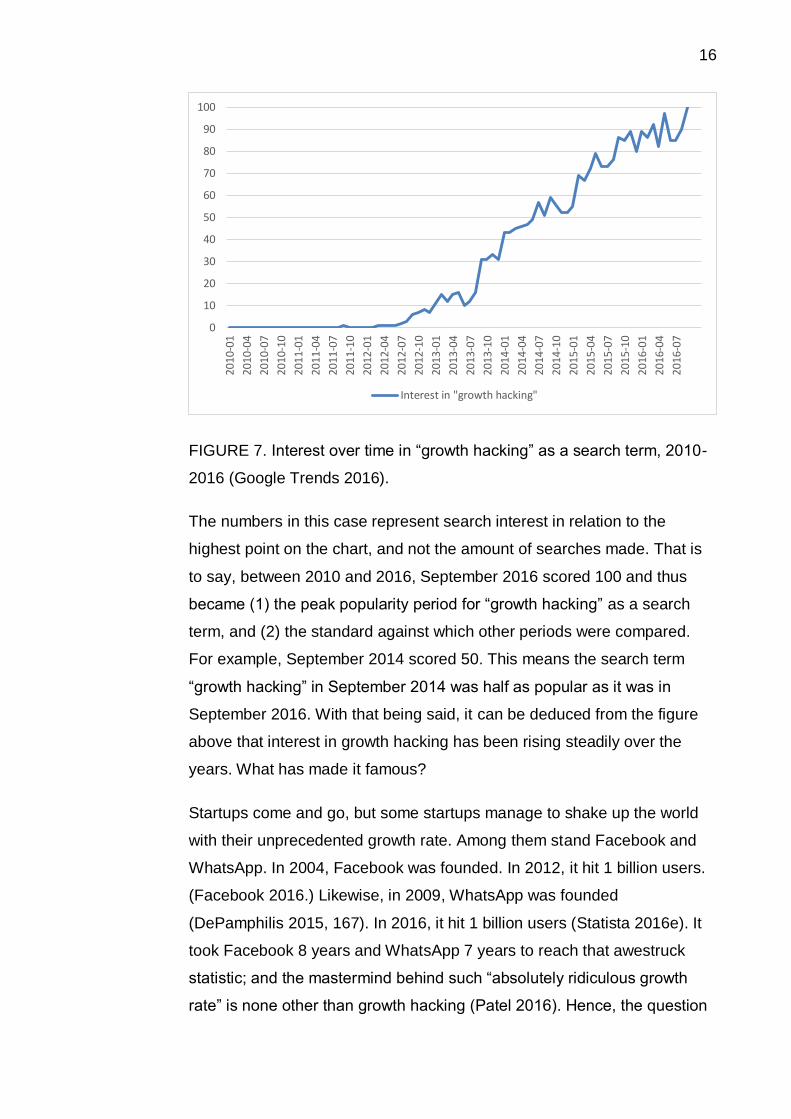
hacking”. This is can be seen in Figure 7 on the next page.
16
FIGURE 7. Interest over time in “growth hacking” as a search term, 2010-
2016 (Google Trends 2016).
The numbers in this case represent search interest in relation to the
highest point on the chart, and not the amount of searches made. That is
to say, between 2010 and 2016, September 2016 scored 100 and thus
became (1) the peak popularity period for “growth hacking” as a search
term, and (2) the standard against which other periods were compared.
For example, September 2014 scored 50. This means the search term
“growth hacking” in September 2014 was half as popular as it was in
September 2016. With that being said, it can be deduced from the figure
above that interest in growth hacking has been rising steadily over the
years. What has made it famous?
Startups come and go, but some startups manage to shake up the world
with their unprecedented growth rate. Among them stand Facebook and
WhatsApp. In 2004, Facebook was founded. In 2012, it hit 1 billion users.
(Facebook 2016.) Likewise, in 2009, WhatsApp was founded
(DePamphilis 2015, 167). In 2016, it hit 1 billion users (Statista 2016e). It
took Facebook 8 years and WhatsApp 7 years to reach that awestruck
statistic; and the mastermind behind such “absolutely ridiculous growth
rate” is none other than growth hacking (Patel 2016). Hence, the question
0
10
20
30
40
50
60
70
80
90
100
2010
-01
2010
-04
2010
-07
2010
-10
2011
-01
2011
-04
2011
-07
2011
-10
2012
-01
2012
-04
2012
-07
2012
-10
2013
-01
2013
-04
2013
-07
2013
-10
2014
-01
2014
-04
2014
-07
2014
-10
2015
-01
2015
-04
2015
-07
2015
-10
2016
-01
2016
-04
2016
-07
Interest in "growth hacking"
17
is, what is this growth hacking? Let’s start from the history – how the term
came into existence.
3.2 The origin
Growth is vital to business. Growth yields bigger returns, and forecasts
long-term success. Growth is more important than margin or cost
structure; an increase in revenue growth rates drives greater market-
capitalization gain than an improvement in margin does. In short, “growth
trumps all”. (Kutcher, Nottebohm & Sprague 2014.) Companies desire
growth, and this aspiration for growth is even more intense for the case of
startup. Growth decides the life and death for startup (Ginn 2012a). As
Graham (2012) put it, “[a] startup is a company designed to grow fast (…)
The only essential thing is growth. Everything else we associate with
startups follows from growth.” The pursuit of growth is what makes a
startup startup (Weinberg & Mares 2015). However, when entering the
game, startup is at a disadvantage. They are David surrounded by a forest
of Goliaths.
Well-established companies have been in the playground for a long time.
They have copious advantages which startups do not (Epstein, Widener &
Verbeeten 2016, 14). Their brand equity is well-entrenched (Wight 2016),
and they can afford to dominate the traditional channels (Ellis 2014).
Startups, on the other hand, lack resources (Christensen 2001, 31). They
are too disadvantaged to play by the rules of the old (Ellis 2014). They do
not have the budget (Akdeniz 2015), nor human (Panici 2016), nor
relationships needed for traditional marketing tactics to be effective (Patel
& Taylor 2016, 13). As a result, to break through the noise and make it to
their audience, startups need to do a lot more with a lot less; they need to
“hack”. Such conditions triggered the very first growth hacking
occurrences.
18
3.3 The timeline
The term “growth hacking” itself is only 6 years old, but the practice has a
history much longer than that. People had been growth hacking way
before it became growth hacking.
Flashback to 1996, Hotmail was allegedly one of the first companies to
growth hack (and succeeded). The founders, Sabeer Bhatia and Jack
Smith, and venture capitalist, Tim Draper, sat down to discuss how they
could spread the words about their web-based email product. To no
surprise, they first went over a list of industrial marketing options, including
billboard and radio advertising. However, such alternatives were instantly
rejected for they were too expensive to promote a free product. Then,
Draper came up with an idea: put “P.S: I love you. Get your free email at
Hotmail” at the bottom of every email. The founders initially resisted this
suggestion due to various reasons. However, after a few months, they
agreed to adopt it, but dropped the “P.S: I love you” part. A tagline “Get
your free email at Hotmail” was then inserted at the end of every outbound
email, turning every message sent by users into promotional pitch for the
company. The impact was compounding; growth was exponential. Hotmail
hit 1 million users after six months into the adoption. (Penenberg 2010.)
The solution appeared simple, and yet yielded astonishing result. It then
became one exemplary example of early-stage growth hacking.
Moving up the timeline, Airbnb is a more recent case. Airbnb is an online
community marketplace that allows people to list their spare rooms for
rent, and to book accommodations around the world. In its early stage,
Airbnb recognized that much of its growth came through craigslist
(craigslist is a website for people to post classified advertisements,
including housing rentals). Upon this realization, the engineers at Airbnb
built a “Post to craigslist” feature which enabled Airbnb users to easily
cross-post their listings to craigslist. (Weinberg & Mares 2015.) However,
the thing was, craigslist did not technically allow other sites, including
Airbnb, to post to theirs. Without access to craigslist’s codebase, it turned
out that the team at Airbnb reverse engineered craigslist to make the
19
cross-posting possible. (Patel & Taylor 2016, 10-12; Chen 2016a.) This
featured was soon shut down as craigslist fixed the “holes” (Patel & Taylor
2016, 12), but it managed to drive tens of thousands of craigslist users to
Airbnb website (Weinberg & Mares 2015). This tactic allegedly became
one of the best marketing move of the company (Holiday 2013).
Together with the origin, the above two examples provided an elementary
overall look at growth hacking. Now, it is time to move onto the details to
answer what growth hacking really is.
3.4 The definition
The thing is, there is no official definition of growth hacking (Dev 2016;
Zylka, Fuehres, Colladon & Gloor 2016, 151). A search for the term
“growth hacking” across technical dictionaries including Business
Dictionary, Investopedia, and Oxford Dictionary of Marketing returned no
result (as of 11th June 2016). Plenty of growth hackers and experts in the
field have attempted to define the term; however, as they share
differences in background and experience, their interpretation varies, and
even clashes. As Holiday (2013) put it, “[t]he term “growth hacker” has
many different meanings for different people”. Take a growth hacker’s
need for coding skill as an example. From Patel & Taylor’s viewpoint, a
growth hacker is not necessarily a programmer (2016, 14-15); however,
Chen (2016a) proposed otherwise. By describing growth hacker as “a
hybrid of marketer and coder”, and stressing that “coding and technical
chops are now an essential part of being a great marketer”, he inherently
set coding as an essential of growth hackers. And the list of discrepancies
goes on.
Nonetheless, after scrutinizing the variant definitions of growth hacking
with an eye toward app industry, Holiday’s interpretation (2013) emerges
as the most befitting ones. Albeit arguable, his variant provides a good
look at what growth hacker is to the app industry. Here it comes:
Growth hacker is someone who has thrown out the playbook of traditional marketing, and replaced it with only
20
what is testable, trackable, and scalable. Their tools are emails, pay-per-click ads, blogs, and platform APIs instead of commercials, publicity and money. While their marketing brethren chase vague notions like “branding” and “mind share”, growth hackers relentlessly pursue users and growth - and when they do it right, those users beget more users, who beget more users. They are the inventors, operators, and mechanics of their own self-sustaining and self-propagating growth machine that can take a start-up from nothing to something.
It is unavoidable that there shall be “holes” in, and disagreements with
Holiday’s interpretation, particularly with the growth hackers’ tools part.
However, when putting his variant next to the above examples of growth
hacking, a mindset starts to materialize. At this point, it appears that
digging deeper into defining growth hacking would lead to even more
contradictions and subsequently greater confusion. As a result, it would be
better to delve into the growth hacking mindset – what makes growth
hacking growth hacking. Hence the following part.
3.5 The mindset
Growth strategies cannot be simply duplicated from product to product
(Ginn 2016). The tools differ, but the mindset stays (Holiday 2013). Rather
than a set of tools, growth hacking is more a mindset (Holiday 2013; Ginn
2012b) which:
Revolves around growth – Growth hackers are abnormally fixated
on growth. They are obsessed (THE PLAID AGENCY 2016). Every
decision they make, every action they take is instructed by growth
and is endeavored with an eye toward growth (Patel & Taylor 2016,
7). Growth hacker is, in the end, “a person whose true north is
growth” (Ellis 2010).
Blends marketing with product development – Growth hackers
stand at the “intersection of marketing and product development”
(Bussgang & Benbarak 2016). For a long time, the circumstances
have been that coder builds, and marketer pushes; now, the
systems are colliding (Patel & Taylor 2016, 12), as marketing
21
features can be baked into the application experience (Smart 2016,
130-134; Cecchi 2016). For instance, in the case of Hotmail, a
promotional pitch was embedded into every email composed by
users. For another instance, if a phone contact is not on Viber, it is
possible to send that person an invitation to join Viber. That is to
say, product features can now be directly accountable for growth
(Patel & Taylor 2016, 13). To leverage this attribute, a mindset that
is both marketing- and product-driven at the same time is required.
The above example of Airbnb reflects this requirement. The Airbnb
integration with craigslist simply involved too many technical details
for a traditional marketer to conceive, much less to execute (Patel &
Taylor 2016, 10-12). Only an engineer assigned with acquiring
customers from craigslist could have done it (Chen 2016a).
Favors data – Growth hackers have a passion for (Out 2016), and
a reliance on data (Patel & Taylor 2016, 17). As growth hackers
associate themselves with only what is “testable, trackable, and
scalable” (Holiday 2013), or in other words, “measurable (...) and
calculable” (Out 2016), they need data. Data keep growth hackers
honest and away from assumption and vanity. Data assist them in
placing and shifting their focus, as well as enable repeating past
successes and predicting future trends. (Patel & Taylor 2016, 17-
18.) Certainly, there are more to how data benefit growth hackers.
Data are important to the extent that, without data and metrics,
growth hackers feel “naked” (Ginn 2012b; Patel & Taylor 2016, 17).
Embraces creativity – Creativity is a must-have for growth hackers
(Ellis 2010). First, business tends to flock to channels with which
they are familiar, or which they think they should use due to their
product or company (Weinberg & Mares 2015). However, more
than often, it is the uncommon (Ginn 2012c) and underutilized
(Weinberg & Mares 2015) channels that are the most likely to
deliver results. Hence, to drive growth, growth hackers need to go
beyond the predetermined tactics to unearth the right methods.
They need to think out of the box. Second, the right channels will
work wonders at first, but all channels have their own lifespan. Their
22
efficacy is bound to decay over time as the market becomes
saturated. (Weinberg & Mares 2015; Chen 2016b.) As a result,
growth hackers assiduously seek new channels and “reimagine the
existing channels” (Ginn 2012c). For that, they need to be
ingenious. “Paths to grow are not usually obvious and it takes
extreme creativity to find them”, as Patel & Taylor (2016, 9) put it.
Endorses curiosity – Curiosity kills the cat, but benefits the growth
hacker (Patel & Taylor 2016, 20-21). Growth hackers have an urge
to go beyond the surface. They have a long list of what-if and why
questions. They want to know why certain things work while others
do not. They continually run and tweak experiments to discover new
ways to push their metrics up. This constant curiosity and insatiable
hunger for knowledge enable them to have deep understanding of
product, user experience and user behavior. (Ginn 2012b.) Such
understanding is decisive for growth hackers, for they work closely
with both marketing and product development.
Lives on experiments – Growth hacking is not easy, it “only looks
simple once you’ve found out the things that work for your product”
(Patel & Taylor 2016, 22-23). There is not a set in stone process for
growth hacking and different situations and businesses require
different strategies. Sean Ellis (2016a) called growth hacking
“Experiment Driven Marketing”. Thus, failure is not avoidable and
most certainly inevitable. Not succeeding the first time but a
hundredth time is the characteristic of growth hacking; and it is a
process that requires running experiments, tracking and analyzing
the results and iterating the strategy. (Patel & Taylor 2016, 22-23.)
To sum up, “[g]rowth hacking was born out of startups”, just as Ellis (2014)
stated, and is all about growth. The tools vary, but a growth hacker needs
to be fixated on growth and growth alone, and is able to think from the
perspective of both marketing and product development at the same time.
Additionally, a growth hacker needs to be analytical, creative, curious, as
well as experiment-driven. Now that the basis of growth hacking has been
laid out, it is time to cover the prerequisites of growth hacking. What
23
factors are needed for growth hacking to take place? The following
chapter answers this question.
24
4 PREREQUISITES OF GROWTH HACKING
This chapter goes into details the conditions for growth hacking to
succeed. These prerequisites include Product Market Fit (PMF) and
analytics. While they do not absolutely guarantee success, they are
powerful and simple tools recommended by many entrepreneurs and
experts such as Eric Ries, Sean Ellis, and Steve Blank to help increase
the odds for startup.
4.1 Product Market Fit
PMF is simple as creating a product that the customers would want to buy
(Holiday 2013). Yet, it is a vital prerequisite of growth hacking, to the point
that Holiday (2013) stressed, “marketing as we know it is a waste of time
without PMF”. Ginn (2013) was of the same mind by stating that it was
impossible to “grow a broken product” in his email to Holiday (2013).
Having PMF is the foundation for successful business development at all
stages, especially for startup and small to medium enterprises (Holiday
2013). By achieving PMF, a business is making a product the market
needs, in turn boosting the number of returning users (Maurya 2010).
4.1.1 Definition of Product Market Fit
Andreessen (2007), co-founder of Netscape, in his series of blog post
titled “PMarca's Guide to Startups”, addressed the definition of PMF as
"being in a good market with a product that can satisfy that market".
Calling this the Rachleff’s Corollary of Startup (in honor of entrepreneur
Andy Rachleff), Andreessen went on further to emphasize the importance
of PMF in the context of a startup product: "The only thing that matters is
getting to product/market fit."
PMF assesses both the ability of the product to satisfy the market's need
and the ability of the market to sustain the business (Jorgenson 2015). On
one hand, achieving PMF requires the product to be evolved to be stable,
appealing and able to satisfy the customers. On the other hand, the
25
market has to be capable of providing enough room for the business to
grow scalably (Espinal 2013). Cooper & Vlaskovits (2010) based on this
definition to outline three criteria for PMF:
The customer is willing to pay for the product.
The cost of acquiring the customer is less than what they pay for the product.
There’s sufficient evidence indicating the market is large enough to support the business.
Additionally, Porter (2016) gave another angle at defining PMF as “when
people sell for you”. He argues that when customers understand the
product’s value, they continue relaying their positive experience to other
potential customers, thus become the business’s proxy salesperson; and
that is when PMF has been achieved. Even though Porter’s concept of
PMF is not strictly a definition of the term, a cause-consequence
relationship can be deducted: once PMF is achieved, the business
benefits as the product becomes self-marketed via its customers.
4.1.2 Measuring Product Market Fit
There have been a number of different approaches to defining whether a
business has achieved PMF. In his article, Andreessen (2007) wrote, "you
can always feel product/market fit when it's happening" and associated
success in achieving PMF with the growth in customer product usage and
production capability, as well as the increase in press coverage, revenue
and investment. Conversely, failure to achieve PMF can also be "felt" with
every metrics mentioned being stagnant or negative (Andreesseen 2007).
While other entrepreneurs or writers agree with this notion, it is purely
unreliable anecdote, and thereby should serve as no more than an
inspiration in achieving PMF (Chen 2016c).
Cummings (2013), American entrepreneur and Pardot's founder, provides
another angle with his five ways to identify PMF:
1. 10+ customers have signed on in a modest period of
26
time (e.g. 3 – 9 months) and they haven’t been friendlies (people you already knew, favors you called in, etc.)
2. At least five customers actively using the product with little / no product customization (e.g. the product is valuable and mature enough that heavy development work isn’t required for each new customer)
3. At least five customers have actively used the product for over a month without finding a bug (no matter how great the product is people always find issues with it, which is natural for this beginning stage)
4. At least five customers use the product in a similar way and achieve similar results (early on you find that customers use the product in ways you didn’t imagine, which is great, but the goal is to find consistent, repeatable patterns)
5. At least five customers exhibited a similar customer acquisition and onboarding process whereby they bought and went live with the product in a timeframe that was consistent with each other (e.g. had a two month sales cycle and took a week to get the product running)
The key difference between Cummings' definition and Andreessen's is his
focus on consistency in product performance and customer product usage
rather than growth. While Cummings provides specific numbers in all five
of his rules, he does not provide any further information regarding
empirical backing evidence or the scope and context of his study in which
these rules are applicable.
During his time at the startup consulting company 12in6, Sean Ellis
attempted at creating a different measurement method which would later
be known as the Sean Ellis Test. As part of the consulting process, he
conducted qualitative surveys between the client companies and their
customers, which reached the sample size of over one hundred client
companies. (Maurya 2010.) In order to deter data skew, Ellis (2016b)
recommended that the participating customers satisfy the following three
criteria:
They have experienced the core of [the business]'s product or service;
27
They have experienced [the business]'s product or service at least twice;
They have experienced [the business]'s product or service within the last two weeks.
Instead of complex metrics, Ellis' survey (2016b) consists of only one
customer-based question "How would you feel if you could no longer use
[product]?" with four possible answers. These answers represent the
importance and appeal of the client companies' products or services to
their customers which gradually decreases from top to bottom:
1. Very disappointed.
2. Somewhat disappointed.
3. Not disappointed (it really isn't that useful).
4. N/A - I no longer use [product].
For the purpose of defining the achievement of PMF, Ellis focused on the
percentage of "Very disappointed" answer (Law 2016). By choosing this
answer, the customers indicated that the client companies' products or
services were of high importance and appeal to them, which meant the
products or services satisfied the market's need and fulfill the definition of
PMF (Martin 2016). After compiling and comparing over one hundred
results, Ellis (2016b) found out that those client companies with over 40%
of their responses as "Very disappointed" without their products had a
great chance of building sustainable, scalable customer acquisition
growth, and sustaining their business. Conversely, those with under 40%
of their responses as "Very disappointed" struggled. He concluded that
having a benchmark score above 40% in this (Sean Ellis Test) test was
the indicator that the business was on course for creating a "must have"
product and achieving PMF.
However, the Sean Ellis Test is not without a number of drawbacks. The
40% benchmark score itself is a result of observation based on answers
that are subjected to honesty and customer’s change of mind. (Maurya
2010.) Furthermore, the test does not take into consideration numerous
variables of the nature of the product/service and the market in which the
28
business operates. Simply put, different businesses may require a
benchmark score of higher or lower than 40% to be able to achieve PMF.
Finally, the test itself is merely a verification tool of whether the business
has achieved PMF, rather than a means of helping the business to
achieve it (Maurya 2010). Thus, the Sean Ellis Test should be treated as
an indicator and not a definitive methodology.
After reviewing all three presented methods, the authors have come to the
conclusion that there has yet to be a quantifiable method to measure a
business's success in achieving PMF. This does not equate criticisms
toward any method and their creator, but merely an observation on the
difficulty in researching on the topic of growth hacking and PMF due to
being relatively new and qualitative fields (Law 2016). However, the
authors are still able to deduct from the mentioned opinions the major
signs of a business achieving PMF:
Visible growth (in customer product usage, production capacity,
investments and revenue);
Consistency (in customer acquisition, product usage and product
performance);
High product appeal to the market, indicated by a benchmark score
of over 40% on the Sean Ellis Test.
4.1.3 To achieve Product Market Fit
Achieving PMF is not always a discrete, big bang event. While there exist
businesses that hit it from the start, it is generally a lengthy and
incremental process. (Horowitz 2010.) Not only is it slow, but the process
is also iterative and requires continual effort. There may be various
processes and ways to achieve PMF for businesses depending on their
conditions, markets and products; however, many entrepreneurs and
consultants agree on the base idea of developing a Minimum Viable
Product (MVP) through cycles of building, testing and analyzing the results
(Blank 2010; Ries 2011; Holiday 2013).
29
MVP is originally defined by Ries (2011) as “version of a new product
which allows a team to collect the maximum amount of validated learning
about customers with the least effort”. In layman’s terms, MVP is a product
with the fewest number of features that the customers are willing to pay
for. These features depend much on the type of product and the business’
core customer segment. An example would be a messaging app that only
allows its users to add their acquaintances to a contact list and
communicate with them via text messages, lacking any features such as
emoticons, files sharing, video messaging, etc. Creating a MVP as a
starting point provides a wide array of benefits for startup comparing to
creating a final product that fits only the business’ vision (Holiday 2013).
By keeping the number of features as low as possible, a MVP requires
minimal amount of time and money to develop and maintain by ruling out
features that may be bloated, unnecessary, or potentially removed in the
future due to customer feedback. MVP does not equate a buggy or rushed
half-finished product. It is a product which fulfills only the most important
identified needs of the customers, and which is enough to justify charging
a cost. (Maurya 2010.)
Nonetheless, MVP is not only a product; it is a process that goes hand in
hand with product development and is done by incorporating testing and
learning to improve the original MVP (Olsen 2015). While the Sean Ellis
Test emerges as a simple tool to measure if PMF has been achieved, its
shortcomings are also apparent and should be noted. Thus, the
introduction of customer feedback into the Sean Ellis Test, including
question such as “how can [business] improve the product to better suit
your need?” or “how will you weigh the importance of this feature in
compare to [another feature]?” is necessary. While these questions may
fall into the confirmation bias fallacy or simply lack the insight into the true
performance of the product, they provide a direction to which MVP can
progress to improve itself and customer satisfaction, rather than only a
PMF verification that the Sean Ellis Test is. (Maurya 2010.) In addition to
qualitative measurements, quantitative methods such as analytics are
recommended in conjunction use to have an unbiased look at customer
30
behaviors. These analytics include user acquisition, retention, screen flow
and so on, and are further explained in details in the next section.
Based on the information gained by customer feedback and analytics, the
product can be improved further than the MVP prototype (Olsen 2015). As
stated, this is an iterative process and the MVP evolves into the final
product rather than it happening immediately. From one iteration to the
next, the feedback and analytics should provide positive data if the
business is heading the right way to achieve PMF.
4.1.4 Example: The case of New Coke
On 23rd April 1985, The Coca-Cola Company unveiled its first-ever
reformulation in the 99-year history of its most famous drink, Coca-Cola (or
simply Coke). What followed went down in history as one of the most
infamous marketing scheme, which spawned countless discussions,
articles and books surrounding the failure of the previously-thought
infallible company. (TIME 2016.)
Prior to the announcement, The Coca-Cola Company was in the midst of a
fierce marketing campaign from its longest rival PepsiCo. During the mid-
70s, PepsiCo’s consumer research discovered that in blind taste tests,
consumers preferred the taste of Pepsi over Coke. This led to a number of
television ads dubbed “Pepsi Challenge” in which soft drinkers would
expressed this preference for a cola which was later revealed to be Pepsi.
By 1977, Coke lost its leading position in food store market share to Pepsi.
(Schindler 1992, 22-27.)
This prompted a response from The Coca-Cola Company, which came in
form of an overhaul of its flagship soft drink. The new formula, called “New
Coke” is not only sweeter, but also came in a different can with red and
silver color. (The Coca-Cola Company 2012.) In its extensive market
research, the company spent over $4 million, interviewing over 200,000
consumers and the initial results were positive. During blind tests, New
Coke beat Pepsi by 6-8% and old Coke by 10%, even for the loyal old
31
Coke drinkers segment, this figure was 6%. In identified taste test, New
Coke beat old Coke by a landslide 61% to 39%. (Schindler 1992, 22-27.)
These results were reflected in the real market during the first phase of
New Coke rollout when a 900-respondent survey turned out to be positive.
However, gradually a public outcry broke out in the media as well as The
Coca-Cola Company’s customer support (The Coca-Cola Company 2012).
By July of the same year, a conducted survey showed that only 30% of the
interviewees preferred the taste of New Coke. This forced The Coca-Cola
Company to re-release the old Coke formula under the name “Classic
Coke”, though New Coke was also renamed to Coke and remained the
company’s flagship cola. Despite the promotion of the new formula, New
Coke’s market share continued to dwindle. By September, New Coke
made up only 30% in sales of both formulas and in 1986, Classic Coke
outsold New Coke eight to one. (Schindler 1992, 22-27.)
There have been explanations proposed for the failure of New Coke, some
went as far as claiming it was an ingenious marketing move to ignite
consumers’ loyalty with classic Coke, which has since been dismissed by
the company (The Coca-Cola Company 2012). According to Schindler
(1992, 22-27), explanations for this were the following:
The introduction of New Coke was overly brash. Had the change
been rolled out incrementally or quietly, the reaction could have
been less aggressive. PepsiCo had been known to modify the
formula of Pepsi without public knowledge during its history, and
hence much less strong public reaction. This could also had been
avoided by selling New Coke as an option; but
New Coke was forced. By discontinuing classic Coke, The Coca-
Cola Company effectively alienated part of their consumers. In fact,
during a 982 focus group survey of 2000 respondents, 10-12%
answered that they would be upset over this change. That means
one out of eight Coke drinkers would react negatively, potentially
causing a chain negative reaction;
32
Classic Coke is not a simple physical product. Being the first major
cola to achieve worldwide fame and had carried on for nearly a
century, classic Coke carried sentimental value beyond that of a
soft drink to its consumer. During the mentioned focus group
survey, the reaction to a hypothetical change for Pepsi was
sanguine while Coke’s was largely negative, which further
highlighted the attachment between Coke and its consumers;
Fundamental problems occurred in The Coca-Cola Company’s
market research or its interpretation. Most notably, a poorly
conducted questionnaire in the blind taste test might provide
insufficient feedback, which led to incorrect market reaction
forecast. Simply put, the question “which cola do you prefer out of
those that you taste?” would fail to provide the reaction from the
question “how would you feel if we are to replace the old flavor with
this new flavor?”.
The case of New Coke is a classic example of discord between product
hypothesis, testing and implementation. The Coca-Cola Company failed to
achieve PMF, creating a marketing debacle and hampering its consumer
growth. While The Coca-Cola Company survived the ordeal, it may not be
the same with every business, thus the importance of Product Market Fit
must be stressed.
4.2 Mobile analytics
Joorabchi, Mesbah & Kruchten (2016) call mobile analytics “a visualization
tool such as those hospital monitoring devices with heart rate, blood
pressure, etc., would help to gain a better understanding of an app’s
health and performance”, which highlights the importance of mobile
analytics in developing an app for the mobile market. In the case of growth
hacking, the data and metrics collected and provided by analytics are
invaluable and vital in monitoring the product’s performance as well as the
market’s reception to further plan the course of action to maximize growth.
33
4.2.1 Definition
The Digital Analytics Association (2016) defines digital analytics as the
collection of information in interactive channels such as online, mobile,
social, etc. to improve performance and predict the future. Digital analytics
provides insights into the performance of a business’ products/services as
well as reception, usage and behaviors of its market. Digital analytics can
be used as a tool to either improve the product to increase PMF, or assist
in creating marketing content/strategy to boost growth. (Harty & Aymer
2015.)
There are three major types of analytics, based on the way it is applied:
Descriptive analytics, which made up to 80% of business
analytics, aims to summarize what happened. Descriptive analytics
consists simple event counters and arithmetics based on aggregate
function. Data provided by descriptive analytics range from simple
page views, session length, number of likes or shares on Facebook
to slightly more advanced arithmetics operations such as average
comments, average unique visitors per day… (Wu 2013a.)
Predictive analytics processes historical data to forecast the
future. Predictive analytics uses the existing data to form a model
and from this model predict the data that have not occurred yet.
While it does not provide a definitive answer, predictive analytics
provides the likely outcome and more than one alternatives could
be forecasted as well. (Siegel 2013.)
Prescriptive analytics is one step above predictive analytics. The
information provided by prescriptive analytics does not only forecast
the future but also is actionable. That means a system capable of
prescriptive analytics is able to learn from the data and recommend
a course of action with rational reasons behind it. However, as
uncommon as predictive analytics is, prescriptive analytics is even
rare. (Harty & Aymer 2015.)
34
Mobile analytics is subset of digital analytics with its function being
collecting and reporting on in-app data regarding the operation of the app
and the behavior of its users (Wong, Haight & Leow 2015). Mobile
analytics vendors provide software development kits (SDK) for different
mobile platforms such as iOS, Android and Windows Mobile. These SDKs
contain software libraries that developers can incorporate into their apps to
track different metrics for use in mobile analytics. (Dykes 2013.) The
software libraries incorporated in the apps have the same level of privilege
as the apps themselves. That means if an app has permission to its users’
personal data, so does the library and analytics system. (Harty & Aymer
2015.) Lastly, mobile analytics is dependent on a reliable internet
connection that the software libraries can access since the data are
transferred via the internet connection. Depends on the method used, data
that are not transferred during a period of no internet connection may be
discarded or forwarded by the app, which leads to inaccuracy in analytics.
(Harty & Aymer 2015.)
4.2.2 Metrics and measurements
The following section lays in details different metrics an analytic system
may provide. It does not include every single metric possible but a notable
few. The metrics are separated into four groups based on their nature,
including user base, user profile, usage and behavior.
4.2.2.1 User base
These metrics provide insight visibility into the number of users interacting
with an app, whether they use the app frequently, have ceased to use the
app or have never used the app since downloading it.
Acquisition
Acquisition represents the number of users who download and install your
app from a certain location, through organic search, word-of-mouth, paid
campaigns or in-app referrals. This metric allows the business to see the
number of user downloads for their apps and the channels through which
35
the app is downloaded. CPA (Cost per Acquisition) and ROI (Return on
Investment) can be calculated using this metric and then used to assess
the efficiency of advertising platforms (if applicable) like social media,
email, in-app advertising, cross promotion... (Localytics 2016.) Acquisition
is also the first step in the Growth Hacker Funnel, which further
emphasizes the importance of obtaining accurate data.
Retention
The retention metric measures the number of users returning to use the
app after downloading it (AppDynamics 2016). Retention rate is calculated
by using the following formula:
Retention Rate = ((E-N)/S)*100
This formula, E represents the number of customer at the end of the
period, N the number of customers gained during the period and S the
number of customers at the beginning of the period. (Carpenter 2014.)
Conversely, churn rate is the percentage of users cease to use the app
during the period and is calculated by subtracting the retention rate from
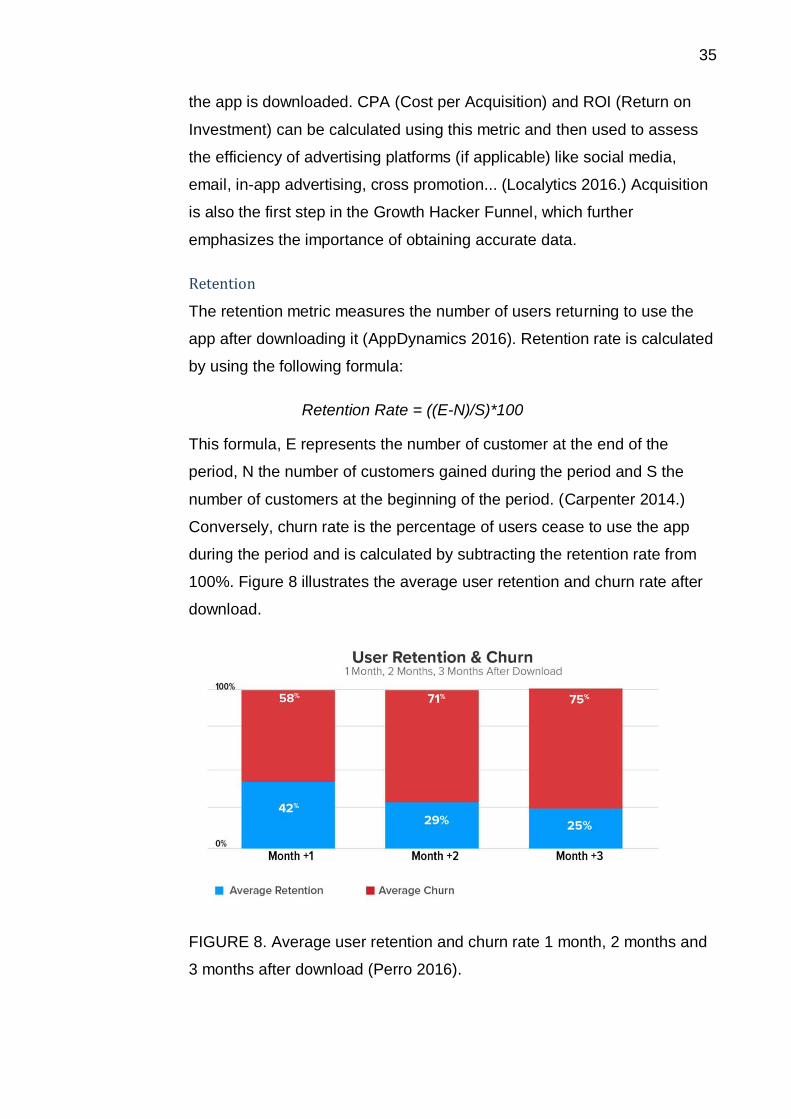
100%. Figure 8 illustrates the average user retention and churn rate after
download.
FIGURE 8. Average user retention and churn rate 1 month, 2 months and
3 months after download (Perro 2016).
36
The average across the board retention rate after 90 days is 25% as seen
in Figure 8. Specific numbers vary between different types of apps, which
is as high as 24% for Media & Entertainment and as low as 10% for
Gaming. (Perro 2016.) Knowing the industry as well as sector’s average
retention rate is important as it becomes the benchmark for the
performance of an app. In the following chapter focusing on the Growth
Hacker Funnel, the authors would further study and discuss about
retention as the second step in the funnel, its significance on growth
hacking and the strategies to increase retention rate.
Daily Active User/ Monthly Active User (DAU/ MAU)
DAU and MAU are straightforward data regarding the number of recurring
users of an app. DAU is calculated by the number of users open the app
during 24 hours, MAU is calculated in the same way but during 30 days.
By definition, DAU and MAU are only calculated by using the number of
unique users, not sessions. That means if within 24 hours, an app is open
100 times by 27 users, its DAU is 27. (Appdynamics 2016.) By monitoring
the trend of DAU/ MAU (increasing/ decreasing/ plateauing), businesses
can gain knowledge into the performance of their apps.
4.2.2.2 User profile
Understanding the business's core customers and its app’s user base is
vital to succeed in growth hacking. Popular analytics platforms such as
Google Analytics or Yahoo Flurry has been providing customer profile data
for their analytics services since their inception (Yahoo 2016; Google
2016b). These metrics continue to make their presence in the mobile app
analytics services that flourished during the smartphone boom.
Take Google Analytics as an example, a user profile is compiled from
various metrics including their demographics (age, gender), geographical
location, technological background (device, carrier, app, OS version) and
interests/affinity (Google 2016b). The data can also be sorted into subset,
visualized and compared to create a comprehensive overall as well as
detailed look. According to Google, this information can be obtained from
37
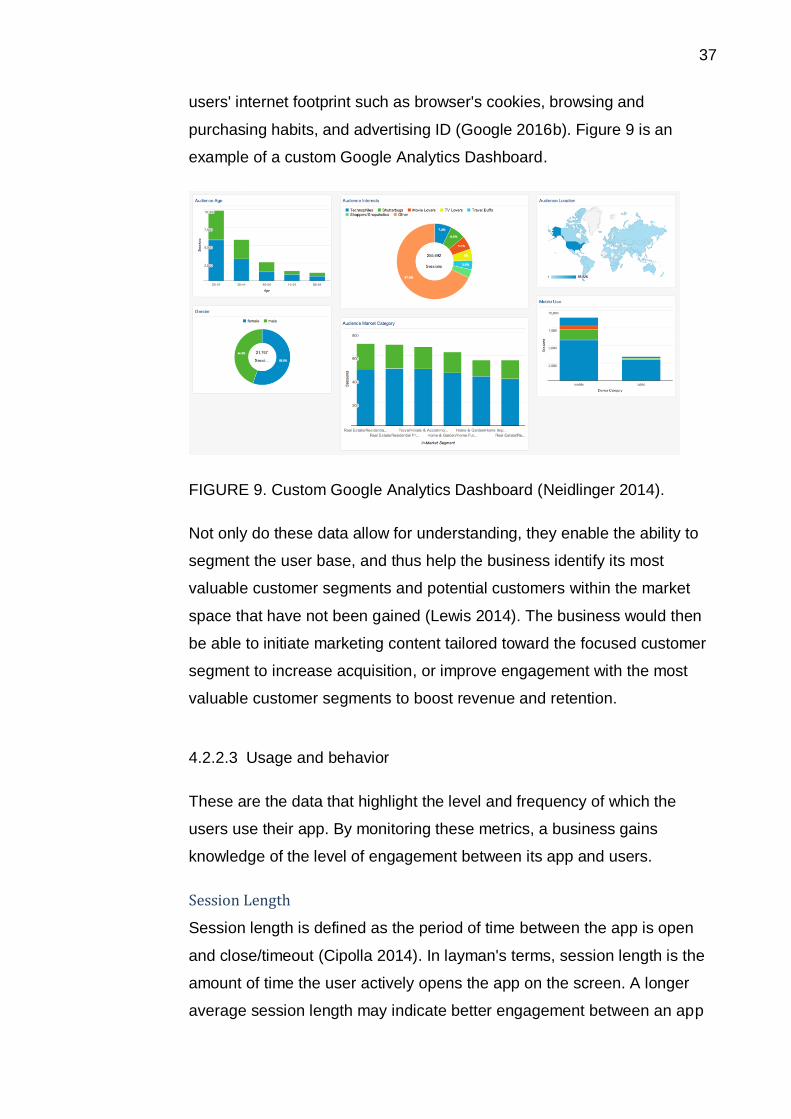
users' internet footprint such as browser's cookies, browsing and
purchasing habits, and advertising ID (Google 2016b). Figure 9 is an
example of a custom Google Analytics Dashboard.
FIGURE 9. Custom Google Analytics Dashboard (Neidlinger 2014).
Not only do these data allow for understanding, they enable the ability to
segment the user base, and thus help the business identify its most
valuable customer segments and potential customers within the market
space that have not been gained (Lewis 2014). The business would then
be able to initiate marketing content tailored toward the focused customer
segment to increase acquisition, or improve engagement with the most
valuable customer segments to boost revenue and retention.
4.2.2.3 Usage and behavior
These are the data that highlight the level and frequency of which the
users use their app. By monitoring these metrics, a business gains
knowledge of the level of engagement between its app and users.
Session Length
Session length is defined as the period of time between the app is open
and close/timeout (Cipolla 2014). In layman's terms, session length is the
amount of time the user actively opens the app on the screen. A longer
average session length may indicate better engagement between an app
38
and its users, but it is not always the case. Apps of certain nature such as
finding public transportation or emergency services would ideally require
its users a shorter amount of time to reach their goals (Cipolla 2014).
It is up to the business/developer to understand the goal of its app and
decide if their app should engage with its users as long as possible, or
finish its task within a reasonable amount of time. The session length
metric provides insight into whether the business/developer would need to
increase engagement or streamline the app experience (Localytics 2016).
Session Interval
Session interval is the period of time between a user's app sessions,
showing the frequency with which users use the app (Localytics 2016).
Much like session length, optimal session interval is dependent on the type
of app.
Screenflow/App Funnel
Screenflow is metrics tracking user interaction with an app, typically at
which screen users exit the app, how many times an app screen is visited,
what flow users take to get to a particular screen (e.g. Main Menu >
Options > Audio). Monitoring the screenflow metrics is an effective way to
identify the funnel users take to reach desired screen and any irregularity
within said funnel. (Localytics 2016.) This allows the developers to modify
an optimal app funnel to maximize user retention and revenue especially
in the case of in-app advertising, as well as streamline the screenflow to
improve user experience.
4.2.3 In-house analytics
When analytics are concerned, there is always a prevalent question, “In-
house analytics or third party analytics?” The authors believe having in-
house analytics and tracking system is superior to using a third party
service because of:
Specialized knowledge – A third party analytics service serves
more than one customer, possible within more than one industry,
39
thus is compelled to provide a broader array of tools to satisfy their
customer needs. This often equates a lack in deep insight into
metrics that a business may require. (Vawter 2014.) An in-house
analytics system offsets this problem by being built and owned by
the business itself, thus renders it customizable.
Agility – Much like above, a first party analytics system and
analysts do not have any priority than the business that they are
owned by, therefore increase the rate at which they respond
(Vawter 2014).
Accuracy – An in-house analytics and tracking system uses
primary data and without limitations imposed upon large data set
like third party analytics. For example, Google Analytics uses the
sampling method in reporting analytics by observing the trends of a
subset of data as the representative of the data set. This sampling
method is applied when a data set becomes too substantial or
reaches above the premium amount, which means analytics of a
large data set is not 100% accurate and is prone to errors. (Google
2016b.)
Cost – Generally, on an hourly basis the cost of in-house analytics
is lower than that of third party service (Vawter 2014). However, the
initial cost of building an analytics and tracking system may be
substantial, thus is more applicable in long term situations that
allows the total cost of third party service to amount over that of in-
house (Fogarty & Bell 2014).
40
5 GROWTH HACKER FUNNEL
This chapter contains the researched knowledge of the Growth Hacker
Funnel. While the term itself has only been used within the latest five
years, the definition dates back to 2007, created by Dave McClure under
the name Pirate Metrics.The funnel is vital to any growth hacker due to it
creating a streamlined process with distinct stages, their purposes and
goals to be used as a roadmap in the growth hacking pipeline.
5.1 Definition
Growth Hacker Funnel is a relatively new term coined by Neil Patel and
Bronson Taylor in their work “The Definitive Guide to Growth Hacking”.
However, their definition is a modified version of what was called the
Pirate Metrics, originally created by Dave McClure in 2007. (Patel & Taylor
2016, 31-32.) McClure’s original model includes five steps: Acquisition,
Activation, Retention, Referral, Revenue (AARRR), which are five metrics
representing five stages of customer behaviors from when they start
signing up for the product (Acquisition) to creating income for the business
(Revenue). The Pirate Metrics serves as a framework to help businesses
gain knowledge into their customers’ behaviors using analytics in order to
create and adjust their growth hacking strategies to maximize growth.
(Gooding 2014.)
The five original metrics of the Pirate Metrics are defined by McClure
(2007) as below:
Acquisition - where / what channels do users come from?
Activation - what % have a "happy" initial experience?
Retention - do they come back & re-visit over time?
Referral - do they like it enough to tell their friends?
Revenue - can you monetize any of this behavior?
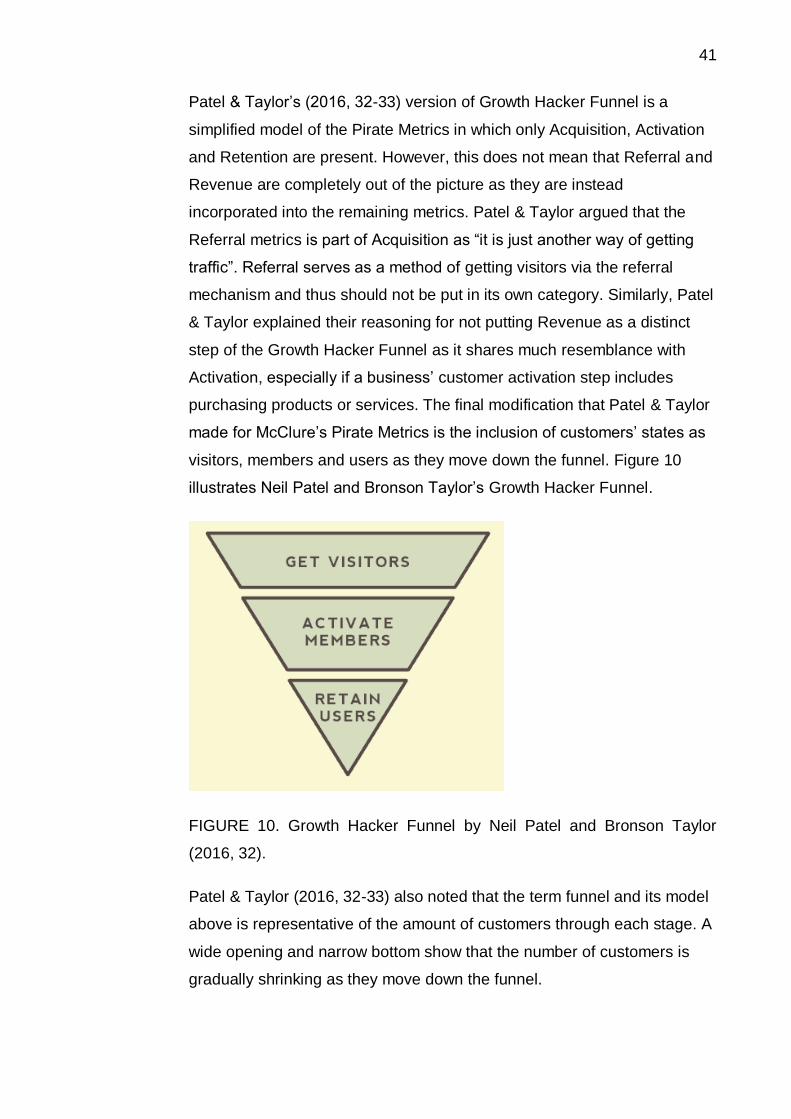
41
Patel & Taylor’s (2016, 32-33) version of Growth Hacker Funnel is a
simplified model of the Pirate Metrics in which only Acquisition, Activation
and Retention are present. However, this does not mean that Referral and
Revenue are completely out of the picture as they are instead
incorporated into the remaining metrics. Patel & Taylor argued that the
Referral metrics is part of Acquisition as “it is just another way of getting
traffic”. Referral serves as a method of getting visitors via the referral
mechanism and thus should not be put in its own category. Similarly, Patel
& Taylor explained their reasoning for not putting Revenue as a distinct
step of the Growth Hacker Funnel as it shares much resemblance with
Activation, especially if a business’ customer activation step includes
purchasing products or services. The final modification that Patel & Taylor
made for McClure’s Pirate Metrics is the inclusion of customers’ states as
visitors, members and users as they move down the funnel. Figure 10
illustrates Neil Patel and Bronson Taylor’s Growth Hacker Funnel.
FIGURE 10. Growth Hacker Funnel by Neil Patel and Bronson Taylor
(2016, 32).
Patel & Taylor (2016, 32-33) also noted that the term funnel and its model
above is representative of the amount of customers through each stage. A
wide opening and narrow bottom show that the number of customers is
gradually shrinking as they move down the funnel.
42
5.2 Acquisition/ Get Visitors
Acquisition refers to acquiring first time or lapsed customers (Gupta &
Zeithaml 2006, 718-739). Acquisition stage is the first point at which
customers come into contact with the business and users experience,
price, promotion… all come after the customers being acquired (Gooding
2014). There is a plethora of channels from which customers can be
acquired, namely: social networks, display ads, affiliate programs… It is
important that acquired customers are broken down into channels/leads
and properly tracked using analytics or tracking system. This helps the
business monitor the quality and performance of each channel/lead as
their customers move down the Growth Hacker Funnel and make informed
decision based on the return on investment of each channel/lead. (Teneva
2016a.)
5.3 Activation
The second stage of the Growth Hacker Funnel, activation, refers to the
first interaction between a business and its customers. These interactions
could be as simple as registering membership, subscribing to newsletter,
browsing the catalogue to more engaging such as downloading a free
resource or starting the checkout process. (Murry 2015.) While customers
performing these actions does not indicate that they are active or returning
customers, they are indicators that the products or services potentially
provide sufficient value to satisfy the customer needs. (Gooding 2014.) As
mentioned above, monitoring the activation metric also allows for the
quality assessment of acquisition channels/leads and is clearly indicative
of which channel/lead is worth investing (Teneva 2016b).
5.4 Retention
The last stage of Growth Hacker Funnel, retention, refers to having
activated customers returning to purchase or use the product/service
(Gooding 2014). As it is the bottom stage of the Growth Hacker Funnel,
the amount of users retained is the lowest compared to acquisition and
43
activation. Retention rates vary dependently on the industry and it could
be as low as 25% of acquired users in the case of mobile application
industry pertaining to Figure 8 (Perro 2016). A good set of strategies
aiming for maximizing is necessary not only for minimizing dead
acquisition leads/channels but also because of the high profitable impact
of each retained customer (Teneva 2016c).
5.5 Which is the most important?
Bronson Taylor (2013) put it “Retention trumps acquisition”, asserting that
the final stage of the Growth Hacker Funnel is the most important of all the
stages (Holiday 2013). Every new customer requires their own acquisition,
activation and the cost associated with the process while existing
customers require such process only once per customer. A business with
customers moving down the Growth Hacker Funnel as Acquisition >
Activation > Churn has the possibility of not breaking even after calculating
their acquisition costs. (Teneva 2016c.) In fact, the cost of acquiring a new
customer could amount to as high as 15 times the cost of retaining an
existing customer (Gillen 2005).
Not only is it cost-effective to putting more emphasis on retention, the
actual return on investment is also higher. The probability of selling to a
new customer is 5-20 % while the same figure for existing customers is
60-70% (Farris 2010). With every purchase that an existing customer
make, the cost of acquisition per purchase is driven down. An increase of
5% in customer retention rate yields a 25-95% increase in profit according
to Reichheld & Schefter (2000). Additionally, the probability of selling to a
new customer is 5-20 % while the same figure for existing customers is
60-70% (Farris 2010). All these data points out toward the conclusion that
retained customers are of utmost significance and thus the retention stage
of the Growth Hacker Funnel becomes the most important stage.
44
6 HOW DID THEY DO IT?
In this chapter the authors laid out various marketing strategies, methods
and tools that have been utilized in historical cases by different
businesses. These strategies are separated into two different groups
based on their focus on the Acquisition or Retention stage on the Growth
Hacker Funnel. To ensure the success of these strategies, A/B Testing is
also provided as a standalone marketing tool. It is important to note that
the strategies and tools mentioned are not strictly applicable to either
acquisition or retention only; with minor tweaking, they can be utilized to
achieve both purposes.
6.1 Acquisition
The customer acquisition strategies include Display and Social Ads,
Referral Program and Cross Promotion.
6.1.1 Display and Social ads
Display ads are banner ads that appear across thousands of website
spanning many types such as blog, forums, and media… on their
designated ads spaces. Advertisers can have their ads displayed on
websites by either directly buying it from the website owner or from
consolidated ads networks, namely Google’s Display Network, AOL’s
Advertising.com, AdBlade... Such ads networks span the majority of the
internet, offering different targeting methods for the advertisers’ desired
demographics and contents. Google Display Network itself has 4 billion
daily page views and 700 million monthly visitors, representing 80% of
total online audience. Display ads is one of the standard method of
customer acquisition for marketers. (Weinberg & Mares 2015.) An
example of display ads is shown in the upcoming Figure 11.
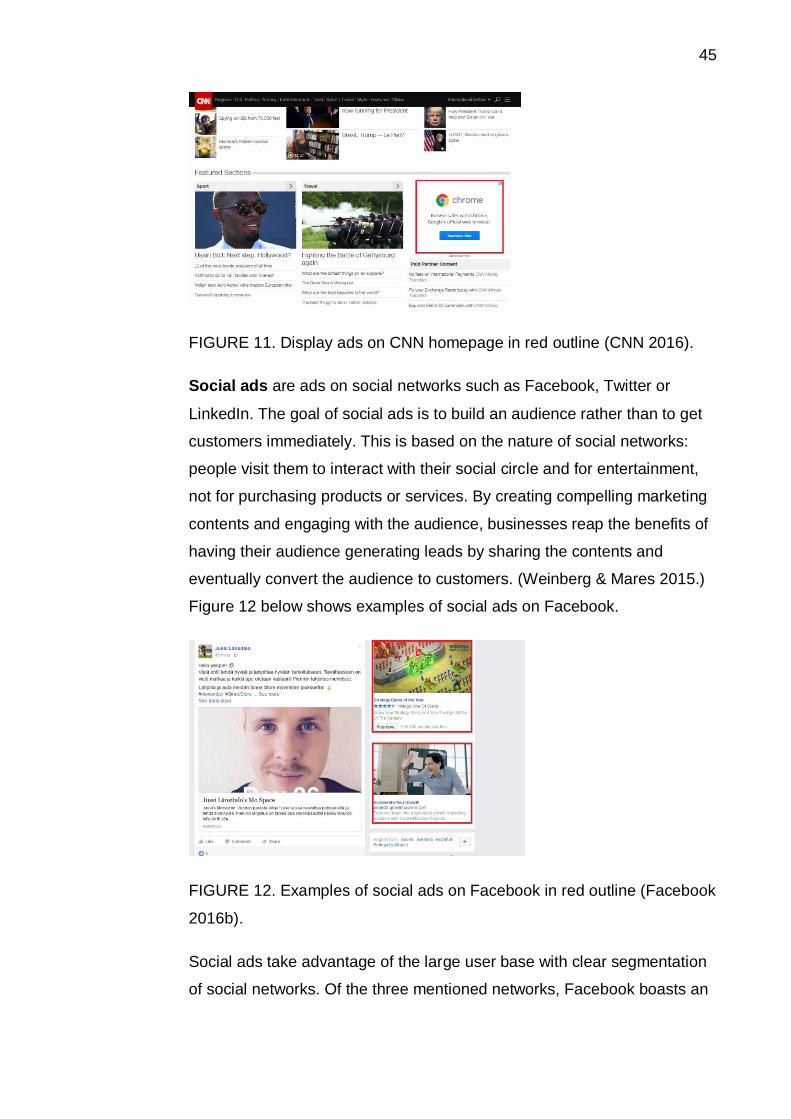
45
FIGURE 11. Display ads on CNN homepage in red outline (CNN 2016).
Social ads are ads on social networks such as Facebook, Twitter or
LinkedIn. The goal of social ads is to build an audience rather than to get
customers immediately. This is based on the nature of social networks:
people visit them to interact with their social circle and for entertainment,
not for purchasing products or services. By creating compelling marketing
contents and engaging with the audience, businesses reap the benefits of
having their audience generating leads by sharing the contents and
eventually convert the audience to customers. (Weinberg & Mares 2015.)
Figure 12 below shows examples of social ads on Facebook.
FIGURE 12. Examples of social ads on Facebook in red outline (Facebook
2016b).
Social ads take advantage of the large user base with clear segmentation
of social networks. Of the three mentioned networks, Facebook boasts an
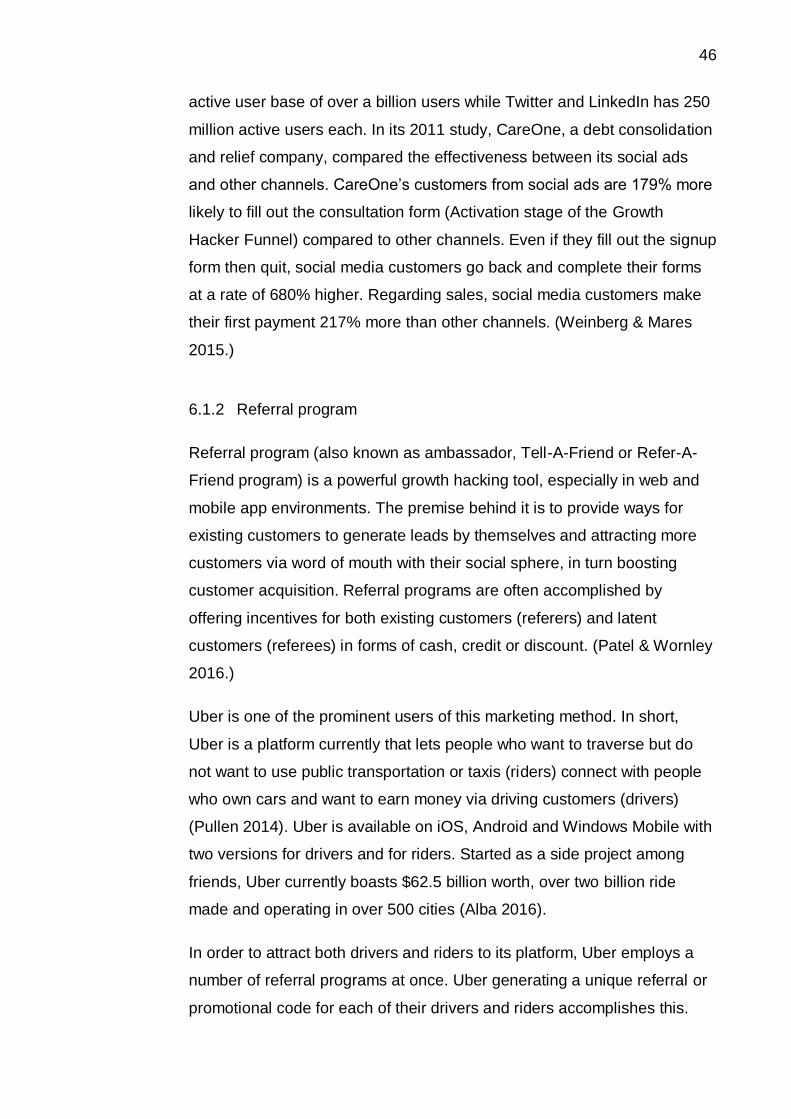
46
active user base of over a billion users while Twitter and LinkedIn has 250
million active users each. In its 2011 study, CareOne, a debt consolidation
and relief company, compared the effectiveness between its social ads
and other channels. CareOne’s customers from social ads are 179% more
likely to fill out the consultation form (Activation stage of the Growth
Hacker Funnel) compared to other channels. Even if they fill out the signup
form then quit, social media customers go back and complete their forms
at a rate of 680% higher. Regarding sales, social media customers make
their first payment 217% more than other channels. (Weinberg & Mares
2015.)
6.1.2 Referral program
Referral program (also known as ambassador, Tell-A-Friend or Refer-A-
Friend program) is a powerful growth hacking tool, especially in web and
mobile app environments. The premise behind it is to provide ways for
existing customers to generate leads by themselves and attracting more
customers via word of mouth with their social sphere, in turn boosting
customer acquisition. Referral programs are often accomplished by
offering incentives for both existing customers (referers) and latent
customers (referees) in forms of cash, credit or discount. (Patel & Wornley
2016.)
Uber is one of the prominent users of this marketing method. In short,
Uber is a platform currently that lets people who want to traverse but do
not want to use public transportation or taxis (riders) connect with people
who own cars and want to earn money via driving customers (drivers)
(Pullen 2014). Uber is available on iOS, Android and Windows Mobile with
two versions for drivers and for riders. Started as a side project among
friends, Uber currently boasts $62.5 billion worth, over two billion ride
made and operating in over 500 cities (Alba 2016).
In order to attract both drivers and riders to its platform, Uber employs a
number of referral programs at once. Uber generating a unique referral or
promotional code for each of their drivers and riders accomplishes this.
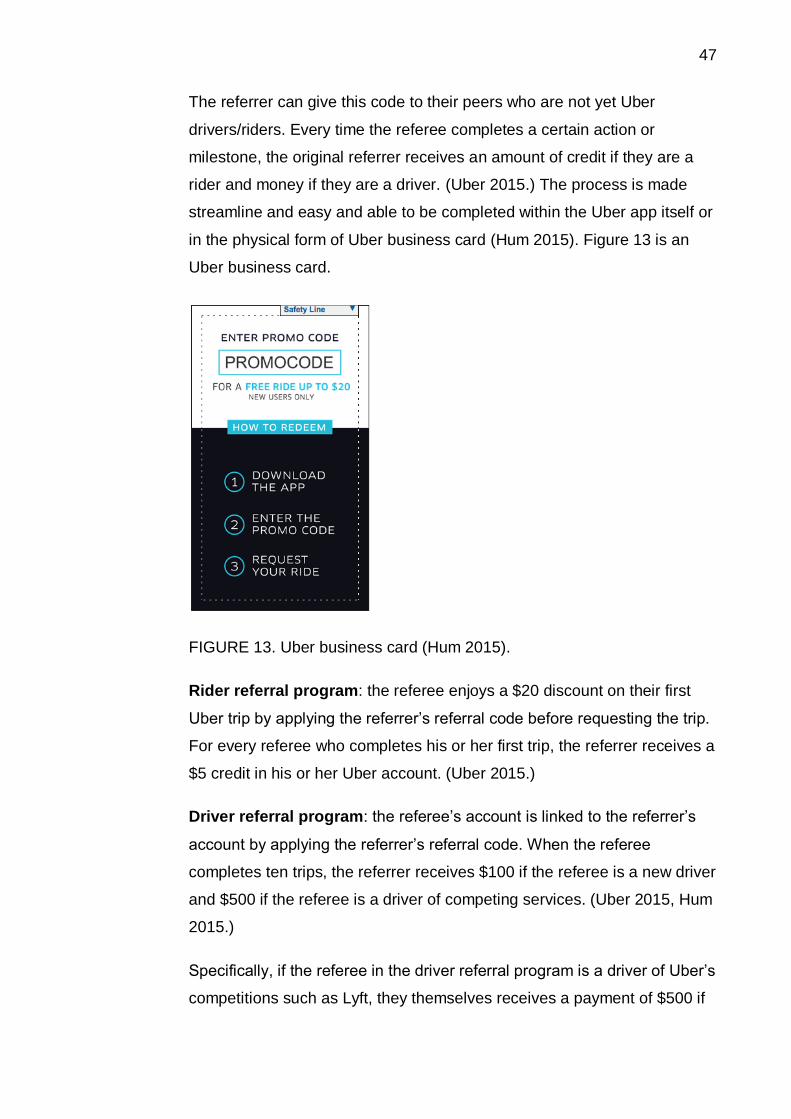
47
The referrer can give this code to their peers who are not yet Uber
drivers/riders. Every time the referee completes a certain action or
milestone, the original referrer receives an amount of credit if they are a
rider and money if they are a driver. (Uber 2015.) The process is made
streamline and easy and able to be completed within the Uber app itself or
in the physical form of Uber business card (Hum 2015). Figure 13 is an
Uber business card.
FIGURE 13. Uber business card (Hum 2015).
Rider referral program: the referee enjoys a $20 discount on their first
Uber trip by applying the referrer’s referral code before requesting the trip.
For every referee who completes his or her first trip, the referrer receives a
$5 credit in his or her Uber account. (Uber 2015.)
Driver referral program: the referee’s account is linked to the referrer’s
account by applying the referrer’s referral code. When the referee
completes ten trips, the referrer receives $100 if the referee is a new driver
and $500 if the referee is a driver of competing services. (Uber 2015, Hum
2015.)
Specifically, if the referee in the driver referral program is a driver of Uber’s
competitions such as Lyft, they themselves receives a payment of $500 if
48
they have a Lyft payment receipt as proof and complete 25 trips within 30
days (Rideshare Dashboard 2015). While the system is vulnerable to
exploits such as drivers working for both platforms, it encourages the
growth of Uber’s driver base and shows that Uber is confident enough that
their drivers’ service can attract drivers working for their competitors.
6.1.3 Cross Promotion
Cross Promotion is a marketing strategy that involves two or more
businesses working in partnership to promote their services or products. In
addition to the product or service they are currently use, customers are
marketed a relevant product or service coming from the partner business.
(Picard 2005.) Cross promotion could be done by creating incentives for
customers to experience the partner business’s products or services. It is
a great method to boost customer acquisition for all businesses (Patel &
Wormley 2016).
Foody is a website created for allowing people to find locations to eat. The
website allows restaurants/ cafes/ tearooms owners to list their locations,
menus and prices as well as discounts online for customers to find using
the website search engine and filter. Customers are provided ability to
leave ratings, reviews and comments about the businesses at which they
use the service. Foody is currently operating exclusively in Vietnam and
the company has developed a mobile app titled FOODY on both iOS and
Android platforms. (Foody 2016.)
During April 14th to July 31st, 2016, Foody and Uber Vietnam announced
partnership, which offered various perquisites for customers of both
platforms when using both services simultaneously. For the duration of the
promotion, mobile users of the FOODY app were able to launch and find
available Uber drivers from within the FOODY app after they had chosen a
location from it. By doing this, customers would receive a promotion code
that offered a 100,000 VND discount on their first trip. In addition, the
payment receipt from said trip also acted as a coupon of 10-20% discounts
at specific partner restaurants. (Uber Vietnam 2016.)
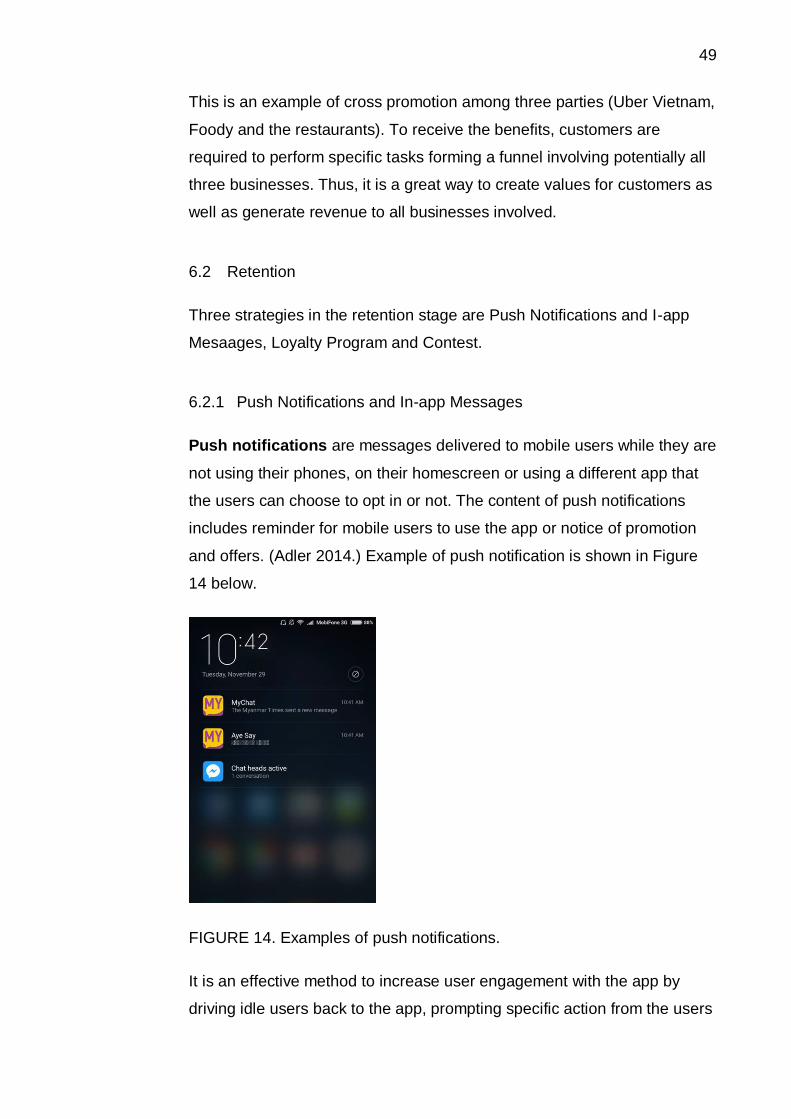
49
This is an example of cross promotion among three parties (Uber Vietnam,
Foody and the restaurants). To receive the benefits, customers are
required to perform specific tasks forming a funnel involving potentially all
three businesses. Thus, it is a great way to create values for customers as
well as generate revenue to all businesses involved.
6.2 Retention
Three strategies in the retention stage are Push Notifications and I-app
Mesaages, Loyalty Program and Contest.
6.2.1 Push Notifications and In-app Messages
Push notifications are messages delivered to mobile users while they are
not using their phones, on their homescreen or using a different app that
the users can choose to opt in or not. The content of push notifications
includes reminder for mobile users to use the app or notice of promotion
and offers. (Adler 2014.) Example of push notification is shown in Figure
14 below.
FIGURE 14. Examples of push notifications.
It is an effective method to increase user engagement with the app by
driving idle users back to the app, prompting specific action from the users
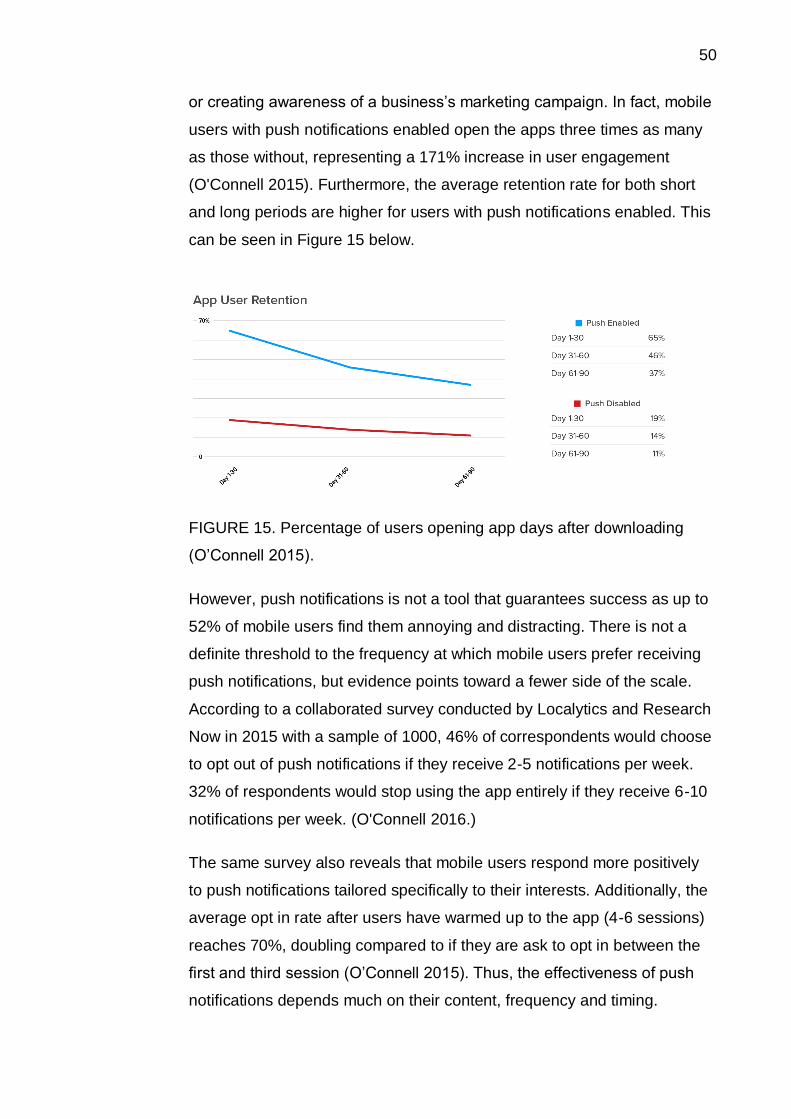
50
or creating awareness of a business’s marketing campaign. In fact, mobile
users with push notifications enabled open the apps three times as many
as those without, representing a 171% increase in user engagement
(O'Connell 2015). Furthermore, the average retention rate for both short
and long periods are higher for users with push notifications enabled. This
can be seen in Figure 15 below.
FIGURE 15. Percentage of users opening app days after downloading
(O’Connell 2015).
However, push notifications is not a tool that guarantees success as up to
52% of mobile users find them annoying and distracting. There is not a
definite threshold to the frequency at which mobile users prefer receiving
push notifications, but evidence points toward a fewer side of the scale.
According to a collaborated survey conducted by Localytics and Research
Now in 2015 with a sample of 1000, 46% of correspondents would choose
to opt out of push notifications if they receive 2-5 notifications per week.
32% of respondents would stop using the app entirely if they receive 6-10
notifications per week. (O'Connell 2016.)
The same survey also reveals that mobile users respond more positively
to push notifications tailored specifically to their interests. Additionally, the
average opt in rate after users have warmed up to the app (4-6 sessions)
reaches 70%, doubling compared to if they are ask to opt in between the
first and third session (O’Connell 2015). Thus, the effectiveness of push
notifications depends much on their content, frequency and timing.
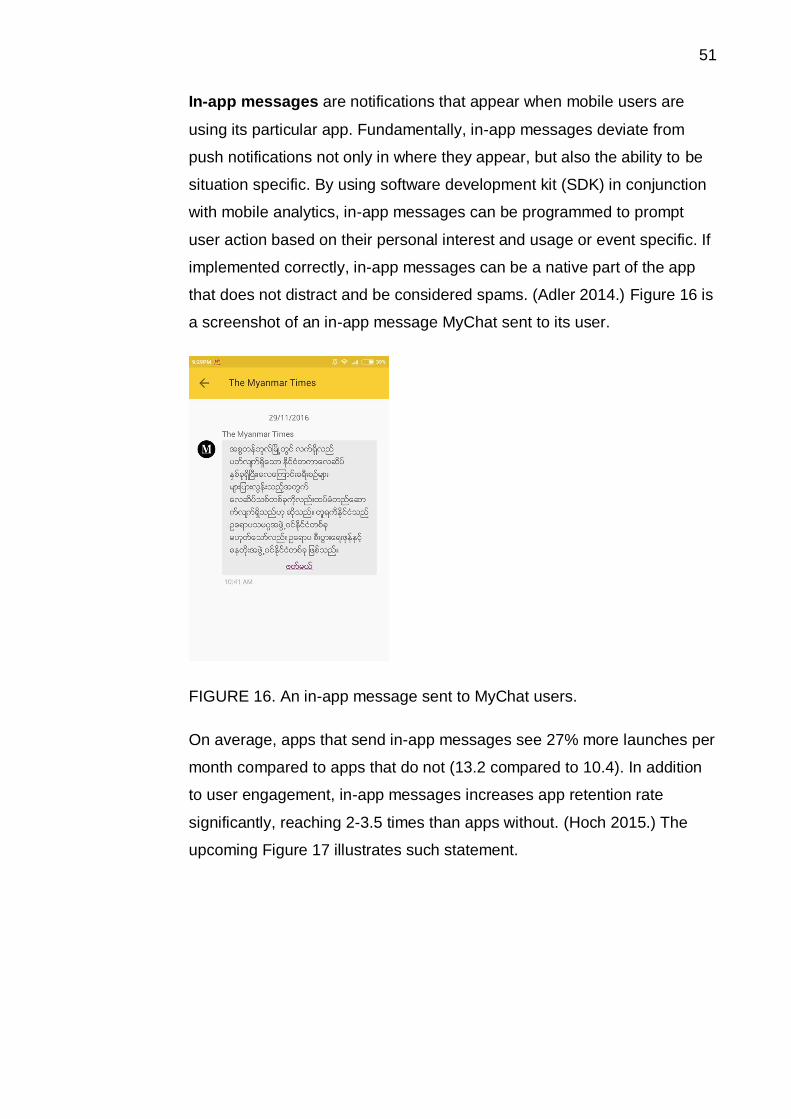
51
In-app messages are notifications that appear when mobile users are
using its particular app. Fundamentally, in-app messages deviate from
push notifications not only in where they appear, but also the ability to be
situation specific. By using software development kit (SDK) in conjunction
with mobile analytics, in-app messages can be programmed to prompt
user action based on their personal interest and usage or event specific. If
implemented correctly, in-app messages can be a native part of the app
that does not distract and be considered spams. (Adler 2014.) Figure 16 is
a screenshot of an in-app message MyChat sent to its user.
FIGURE 16. An in-app message sent to MyChat users.
On average, apps that send in-app messages see 27% more launches per
month compared to apps that do not (13.2 compared to 10.4). In addition
to user engagement, in-app messages increases app retention rate
significantly, reaching 2-3.5 times than apps without. (Hoch 2015.) The
upcoming Figure 17 illustrates such statement.
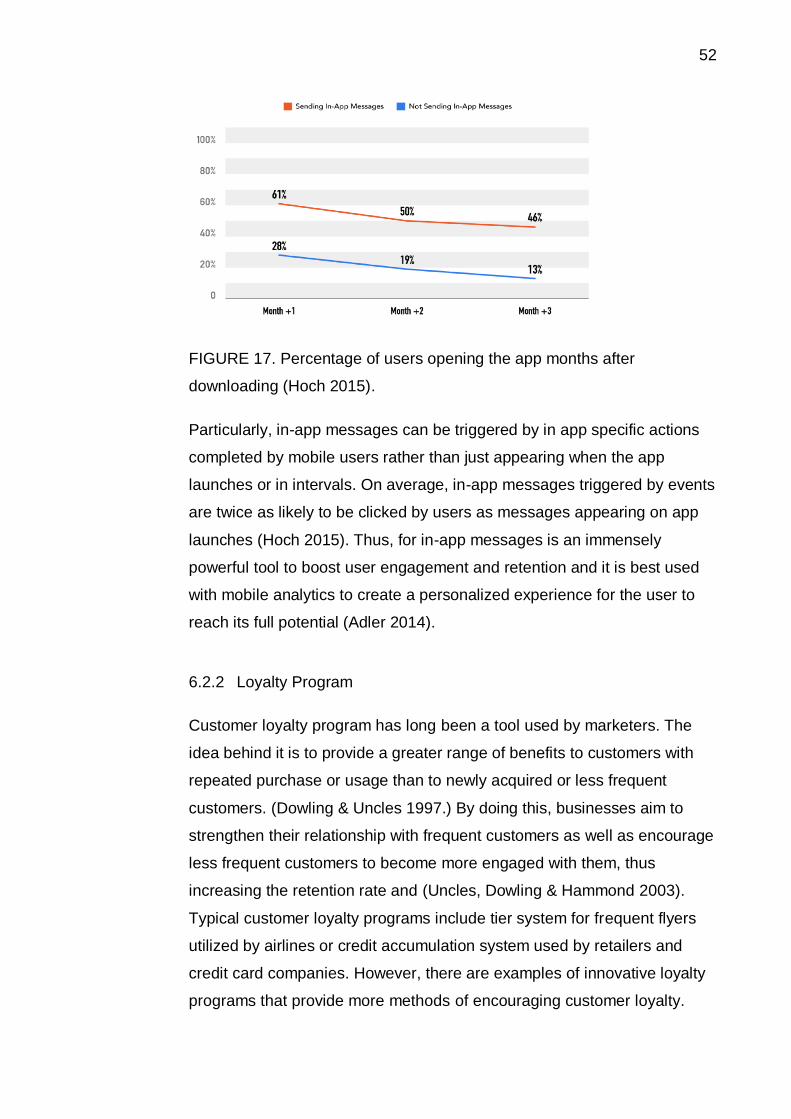
52
FIGURE 17. Percentage of users opening the app months after
downloading (Hoch 2015).
Particularly, in-app messages can be triggered by in app specific actions
completed by mobile users rather than just appearing when the app
launches or in intervals. On average, in-app messages triggered by events
are twice as likely to be clicked by users as messages appearing on app
launches (Hoch 2015). Thus, for in-app messages is an immensely
powerful tool to boost user engagement and retention and it is best used
with mobile analytics to create a personalized experience for the user to
reach its full potential (Adler 2014).
6.2.2 Loyalty Program
Customer loyalty program has long been a tool used by marketers. The
idea behind it is to provide a greater range of benefits to customers with
repeated purchase or usage than to newly acquired or less frequent
customers. (Dowling & Uncles 1997.) By doing this, businesses aim to
strengthen their relationship with frequent customers as well as encourage
less frequent customers to become more engaged with them, thus
increasing the retention rate and (Uncles, Dowling & Hammond 2003).
Typical customer loyalty programs include tier system for frequent flyers
utilized by airlines or credit accumulation system used by retailers and
credit card companies. However, there are examples of innovative loyalty
programs that provide more methods of encouraging customer loyalty.
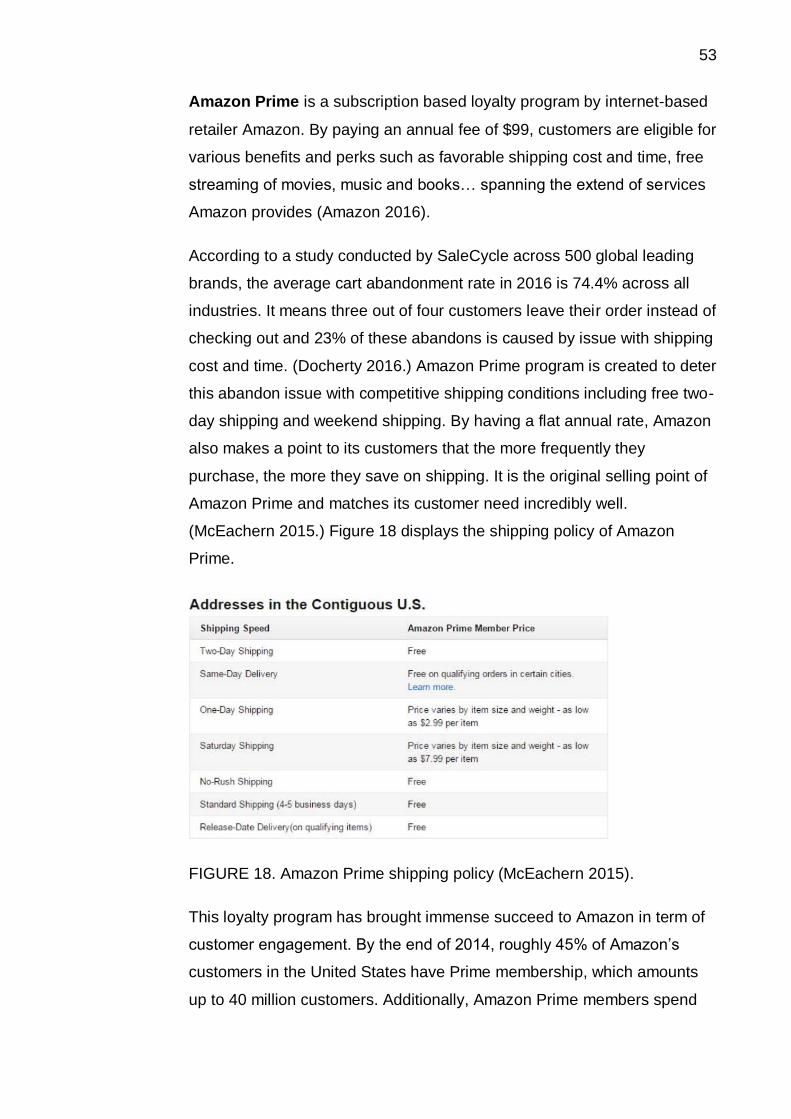
53
Amazon Prime is a subscription based loyalty program by internet-based
retailer Amazon. By paying an annual fee of $99, customers are eligible for
various benefits and perks such as favorable shipping cost and time, free
streaming of movies, music and books… spanning the extend of services
Amazon provides (Amazon 2016).
According to a study conducted by SaleCycle across 500 global leading
brands, the average cart abandonment rate in 2016 is 74.4% across all
industries. It means three out of four customers leave their order instead of
checking out and 23% of these abandons is caused by issue with shipping
cost and time. (Docherty 2016.) Amazon Prime program is created to deter
this abandon issue with competitive shipping conditions including free two-
day shipping and weekend shipping. By having a flat annual rate, Amazon
also makes a point to its customers that the more frequently they
purchase, the more they save on shipping. It is the original selling point of
Amazon Prime and matches its customer need incredibly well.
(McEachern 2015.) Figure 18 displays the shipping policy of Amazon
Prime.
FIGURE 18. Amazon Prime shipping policy (McEachern 2015).
This loyalty program has brought immense succeed to Amazon in term of
customer engagement. By the end of 2014, roughly 45% of Amazon’s
customers in the United States have Prime membership, which amounts
up to 40 million customers. Additionally, Amazon Prime members spend
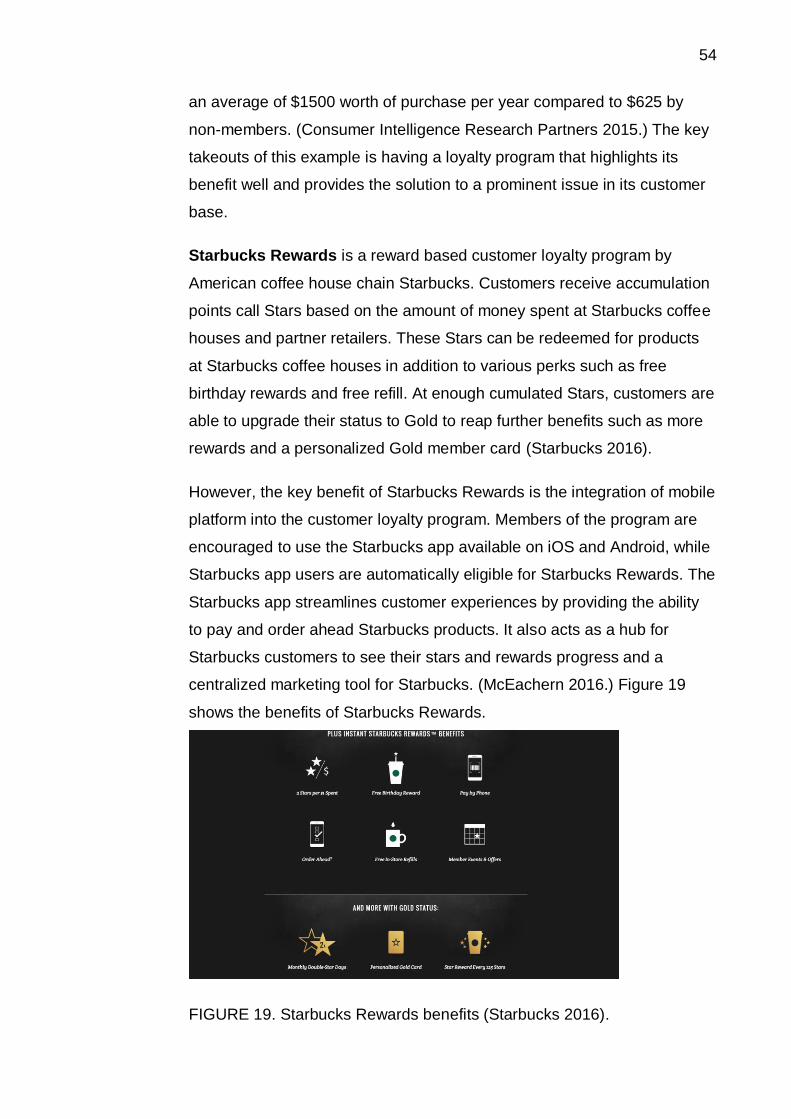
54
an average of $1500 worth of purchase per year compared to $625 by
non-members. (Consumer Intelligence Research Partners 2015.) The key
takeouts of this example is having a loyalty program that highlights its
benefit well and provides the solution to a prominent issue in its customer
base.
Starbucks Rewards is a reward based customer loyalty program by
American coffee house chain Starbucks. Customers receive accumulation
points call Stars based on the amount of money spent at Starbucks coffee
houses and partner retailers. These Stars can be redeemed for products
at Starbucks coffee houses in addition to various perks such as free
birthday rewards and free refill. At enough cumulated Stars, customers are
able to upgrade their status to Gold to reap further benefits such as more
rewards and a personalized Gold member card (Starbucks 2016).
However, the key benefit of Starbucks Rewards is the integration of mobile
platform into the customer loyalty program. Members of the program are
encouraged to use the Starbucks app available on iOS and Android, while
Starbucks app users are automatically eligible for Starbucks Rewards. The
Starbucks app streamlines customer experiences by providing the ability
to pay and order ahead Starbucks products. It also acts as a hub for
Starbucks customers to see their stars and rewards progress and a
centralized marketing tool for Starbucks. (McEachern 2016.) Figure 19
shows the benefits of Starbucks Rewards.
FIGURE 19. Starbucks Rewards benefits (Starbucks 2016).
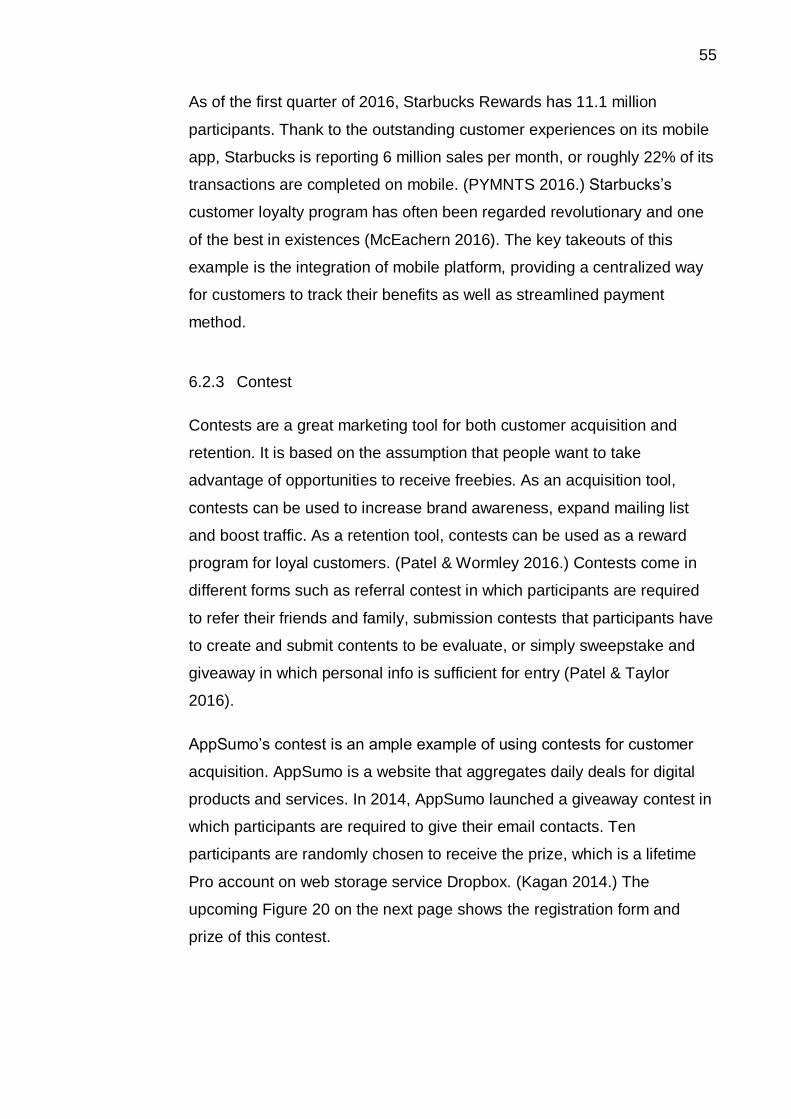
55
As of the first quarter of 2016, Starbucks Rewards has 11.1 million
participants. Thank to the outstanding customer experiences on its mobile
app, Starbucks is reporting 6 million sales per month, or roughly 22% of its
transactions are completed on mobile. (PYMNTS 2016.) Starbucks’s
customer loyalty program has often been regarded revolutionary and one
of the best in existences (McEachern 2016). The key takeouts of this
example is the integration of mobile platform, providing a centralized way
for customers to track their benefits as well as streamlined payment
method.
6.2.3 Contest
Contests are a great marketing tool for both customer acquisition and
retention. It is based on the assumption that people want to take
advantage of opportunities to receive freebies. As an acquisition tool,
contests can be used to increase brand awareness, expand mailing list
and boost traffic. As a retention tool, contests can be used as a reward
program for loyal customers. (Patel & Wormley 2016.) Contests come in
different forms such as referral contest in which participants are required
to refer their friends and family, submission contests that participants have
to create and submit contents to be evaluate, or simply sweepstake and
giveaway in which personal info is sufficient for entry (Patel & Taylor
2016).
AppSumo’s contest is an ample example of using contests for customer
acquisition. AppSumo is a website that aggregates daily deals for digital
products and services. In 2014, AppSumo launched a giveaway contest in
which participants are required to give their email contacts. Ten
participants are randomly chosen to receive the prize, which is a lifetime
Pro account on web storage service Dropbox. (Kagan 2014.) The
upcoming Figure 20 on the next page shows the registration form and
prize of this contest.
56
FIGURE 20. AppSumo giveaway registration form and prize (Kagan 2014).
The result was nothing less than stunning. Within the 11 days of the
contest, AppSumo received 482,044 visits from 398,896 unique visitors
compared to an average of 7,593 visits and 5,806 visitors in the same
timeframe before the contest. AppSumo’s founder Noah Kagan more than
double his Twitter followers, jumping from 13,460 to 32,427. By the end of
the contest, AppSumo got 364,104 email address registrations, even after
duplicated, cheating and invalid email addresses were eliminated, it was
left with 187,991 email addresses, representing a 3,418% leap in
AppSumo’s mailing list. (Flynn 2014.) By Kagan’s calculation, it normally
takes AppSumo $5 per email subscriber through online ads but the
contest brought in nearly 200,000 subscribers for a cost-effective $0.30
each (Kagan 2014).
6.3 A/B Testing
A/B Testing, also known as split testing, are controlled experiment in which
two variants (A and B) with minor variations between them are pitched
together to compare their performance. A/B tests are used to answer the
question “If a specific change is introduced, will it improve key metrics?”
(Kohavi & Longbotham 2010.) In the case of online A/B testing, website
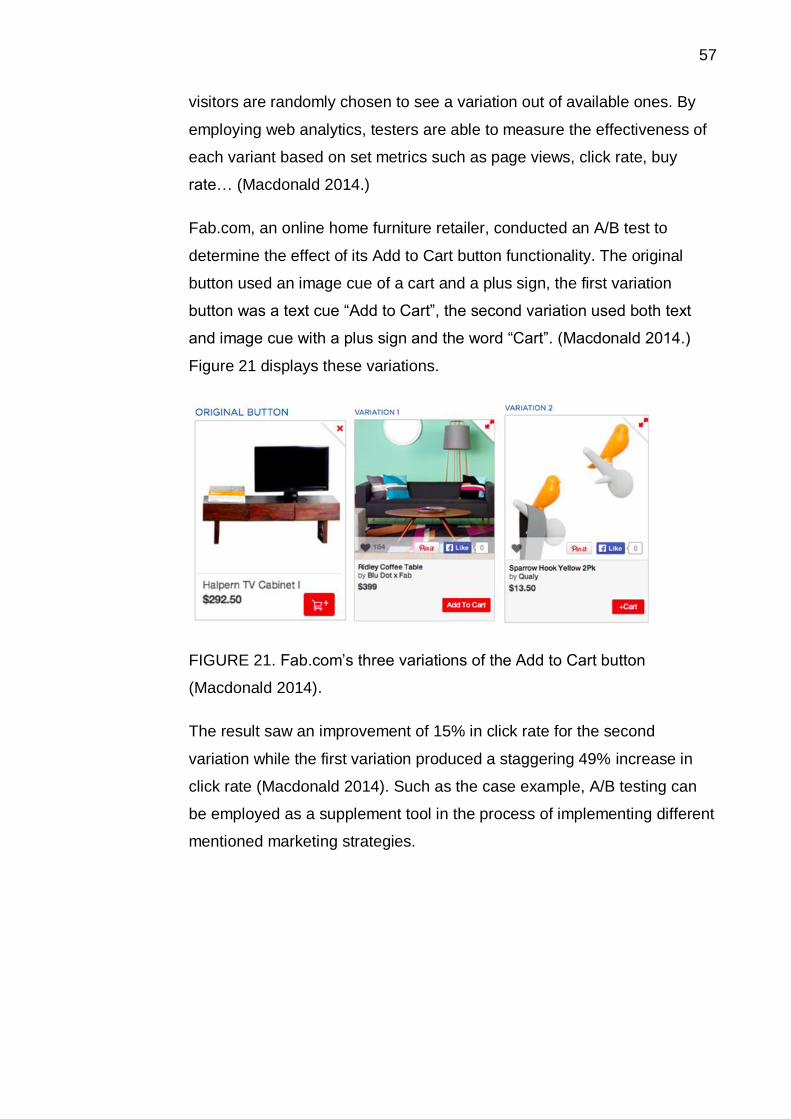
57
visitors are randomly chosen to see a variation out of available ones. By
employing web analytics, testers are able to measure the effectiveness of
each variant based on set metrics such as page views, click rate, buy
rate… (Macdonald 2014.)
Fab.com, an online home furniture retailer, conducted an A/B test to
determine the effect of its Add to Cart button functionality. The original
button used an image cue of a cart and a plus sign, the first variation
button was a text cue “Add to Cart”, the second variation used both text
and image cue with a plus sign and the word “Cart”. (Macdonald 2014.)
Figure 21 displays these variations.
FIGURE 21. Fab.com’s three variations of the Add to Cart button
(Macdonald 2014).
The result saw an improvement of 15% in click rate for the second
variation while the first variation produced a staggering 49% increase in
click rate (Macdonald 2014). Such as the case example, A/B testing can
be employed as a supplement tool in the process of implementing different
mentioned marketing strategies.
58
7 CASE: MYCHAT THE SOCIAL CHAT APP
The authors dedicate this chapter to answering the research question:
“How can MySQUAR incorporate growth hacking into its launch strategy
for MyChat 2.0 to secure success while laying the basis for its future
growth?”. The readers will first walk through a precise introduction to the
case company MySQUAR, and later on a more in-depth study of the app
MyChat and its 2.0 version. A comprehensive SWOT Analysis of MyChat
will also be presented at that stage. After that comes the implementation
plan the authors construct based on earlier findings. The plan is the
authors’ solutions to the launch challenge of MyChat 2.0.
7.1 MySQUAR - The case company
MySQUAR PTE LTD is a tech startup specializing in mobile apps. The
company target at Myanmar market only, and have been releasing many
apps exclusively in the market. MySQUAR hit 6 million registered users
across all of their apps and games this October 2016 (MySQUAR 2016a),
3 years after their foundation. The company have indeed enjoyed steady
growth rate.
At the moment, the company have three offices: one in Singapore, one in
Ho Chi Minh City, Vietnam, and one in Yangon, Myanmar. Development,
management, and marketing teams are based in Ho Chi Minh City office;
this is also where the authors were working.
7.1.1 History
The story of MySQUAR began in 2013. Having identified key opportunities
for internet products in Myanmar, the company launched operations in
June 2013 (MySQUAR 2016b). For years, their primary activity has
remained the same: to “design, develop and commercialise Myanmar-
focused internet-based mobile applications” (MySQUAR 2016a). Now, the
company’s product portfolio encompasses a wide range of apps, re-
affirming themselves as a “Myanmar-language social media, entertainment
59
and payments platform” (MySQUAR 2016a). The products of MySQUAR
may fit in different categories, but they all share one mutual purpose – to
fulfill the mission of MySQUAR.
7.1.2 Mission
As the company put it on their LinkedIn profile, “MySQUAR (...) [is] created
to enrich the lives of the Myanmar people through deep, accessible and
rich online experiences”. The company work to deliver the kind of
technology that can inspire creativity, deliver entertainment, and ultimately
facilitate better standards of living for the people of Myanmar. (MySQUAR
2016c.) To live up to that mission, MySQUAR have been continuously
developing apps and expanding their product portfolio.
7.1.3 Product
Ever since their establishment, MySQUAR have released many apps in
Myanmar market, especially in 2016. The year 2016 has witness a variety
of apps launching back-to-back, marking a prominent growth phase for the
company. At the moment of this thesis, MySQUAR’s range of product
consists of:
MyChat - mobile app (flagship)
MyFlip - mobile app
Lann Kyaung - mobile app
Destroyer King - mobile game
MyFish - mobile game
Hawk Hero - mobile game
Moreover, voice call and payment services will soon be released in the
fourth quarter of 2016, while M-commerce and social media intelligence
will be released beyond 2016 (MySQUAR 2016d, 6).
60
The product portfolio of MySQUAR is remarkable for a young tech startup.
However, this thesis will focus solely on MyChat - the company’s flagship
app. Here comes the introduction to MyChat.
7.2 MyChat - The flagship social chat app
In 2010, MyChat was beta-launched in Myanmar market as an Android
free mobile messaging app (Digital Market Asia 2014; San 2014). By beta-
launching, it means that at the time, MyChat was open only to a limited
number of users so they could try out the app before its official release to
general public (Oxford Learner’s Dictionaries 2016). MyChat’s key strength
at the time was its being tailored to Myanmar people: language, look,
emoticons, and sticker sets were all localized (San 2014). Such value is
still upheld by the current MyChat, and will continue to be. MyChat is built
for Myanmar, and is developed with an eye to Myanmar people.
The target audience of MyChat consists of 2 groups: the young adults
between the age of 16 and the age of 25, and the adults between the age
of 26 and the age of 35, with the former being the primary target.
Regardless of their age, the target audience of MyChat are urban
inhabitants living in Yangon and Mandalay. They own smartphones. They
are open to innovations, and are eager to improve their standards of living.
They are trend followers.
Years have passed, MyChat has evolved from an Android messaging app
into an Android social chat app. The first release of MyChat was all about
chatting, and that was literally the only thing people could do with MyChat.
However, the current MyChat is more concerned about the connection
between the people of Myanmar, and thus has offered more features to
emphasize and facilitate such connection. This justifies the app’s tagline
“Connecting Myanmar”.
Similar to other apps, new versions of MyChat have been released on a
regular basis; and each time that happened, the app underwent minor-to-
major technical changes. Yet, those changes will be little compared to
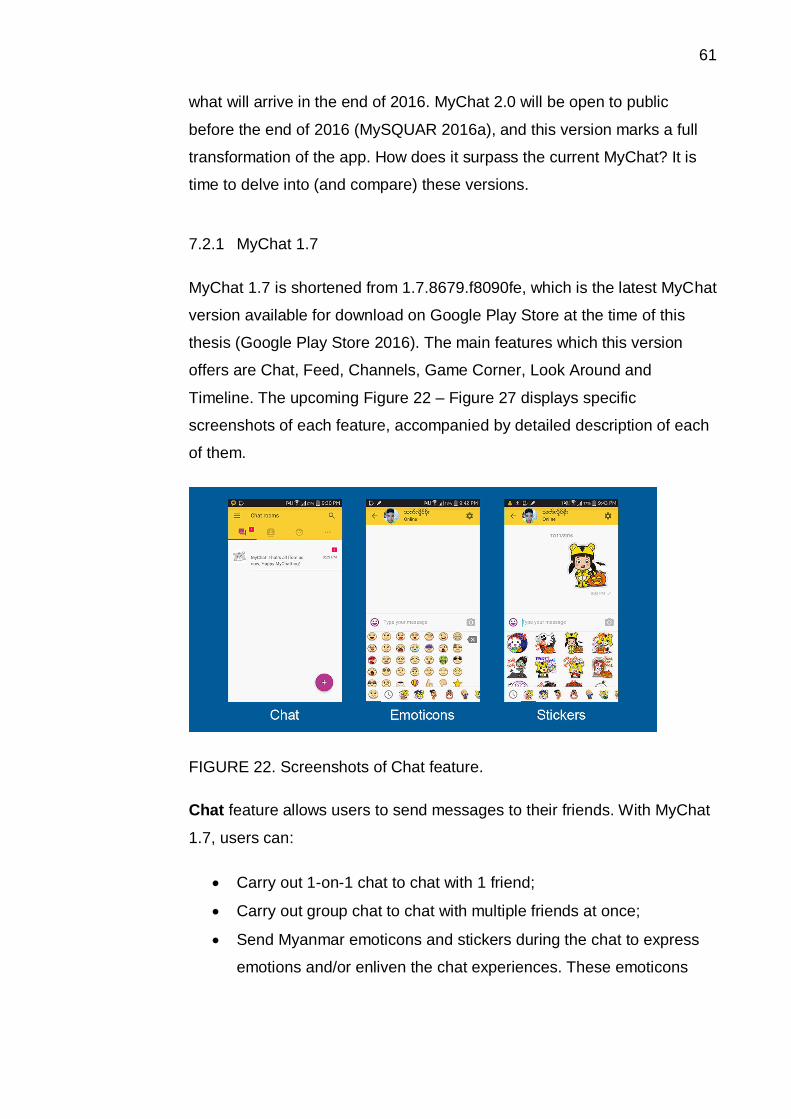
61
what will arrive in the end of 2016. MyChat 2.0 will be open to public
before the end of 2016 (MySQUAR 2016a), and this version marks a full
transformation of the app. How does it surpass the current MyChat? It is
time to delve into (and compare) these versions.
7.2.1 MyChat 1.7
MyChat 1.7 is shortened from 1.7.8679.f8090fe, which is the latest MyChat
version available for download on Google Play Store at the time of this
thesis (Google Play Store 2016). The main features which this version
offers are Chat, Feed, Channels, Game Corner, Look Around and
Timeline. The upcoming Figure 22 – Figure 27 displays specific
screenshots of each feature, accompanied by detailed description of each
of them.
FIGURE 22. Screenshots of Chat feature.
Chat feature allows users to send messages to their friends. With MyChat
1.7, users can:
Carry out 1-on-1 chat to chat with 1 friend;
Carry out group chat to chat with multiple friends at once;
Send Myanmar emoticons and stickers during the chat to express
emotions and/or enliven the chat experiences. These emoticons
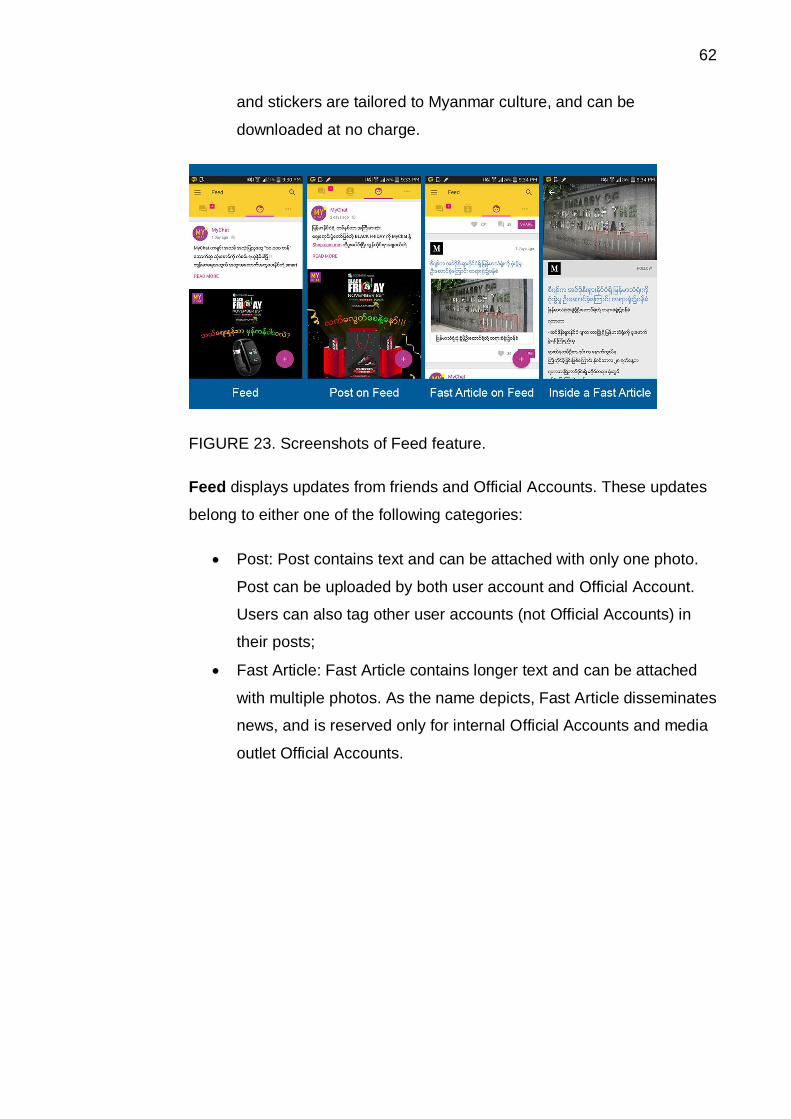
62
and stickers are tailored to Myanmar culture, and can be
downloaded at no charge.
FIGURE 23. Screenshots of Feed feature.
Feed displays updates from friends and Official Accounts. These updates
belong to either one of the following categories:
Post: Post contains text and can be attached with only one photo.
Post can be uploaded by both user account and Official Account.
Users can also tag other user accounts (not Official Accounts) in
their posts;
Fast Article: Fast Article contains longer text and can be attached
with multiple photos. As the name depicts, Fast Article disseminates
news, and is reserved only for internal Official Accounts and media
outlet Official Accounts.
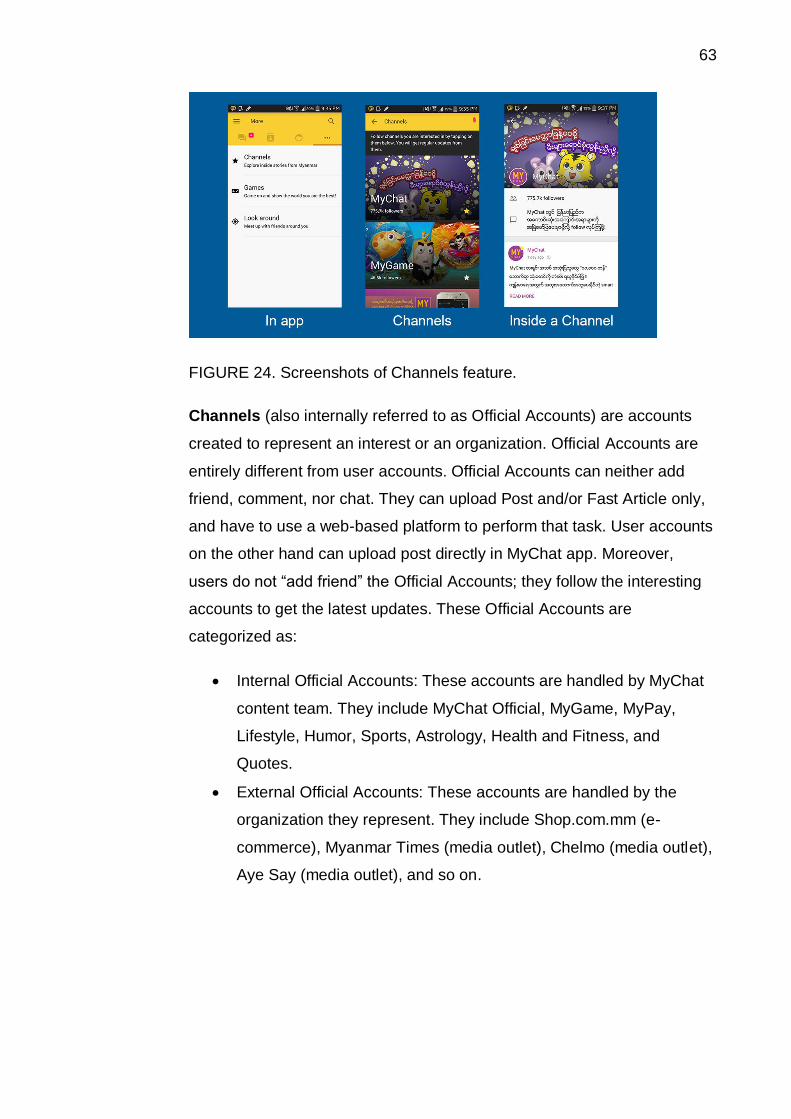
63
FIGURE 24. Screenshots of Channels feature.
Channels (also internally referred to as Official Accounts) are accounts
created to represent an interest or an organization. Official Accounts are
entirely different from user accounts. Official Accounts can neither add
friend, comment, nor chat. They can upload Post and/or Fast Article only,
and have to use a web-based platform to perform that task. User accounts
on the other hand can upload post directly in MyChat app. Moreover,
users do not “add friend” the Official Accounts; they follow the interesting
accounts to get the latest updates. These Official Accounts are
categorized as:
Internal Official Accounts: These accounts are handled by MyChat
content team. They include MyChat Official, MyGame, MyPay,
Lifestyle, Humor, Sports, Astrology, Health and Fitness, and
Quotes.
External Official Accounts: These accounts are handled by the
organization they represent. They include Shop.com.mm (e-
commerce), Myanmar Times (media outlet), Chelmo (media outlet),
Aye Say (media outlet), and so on.
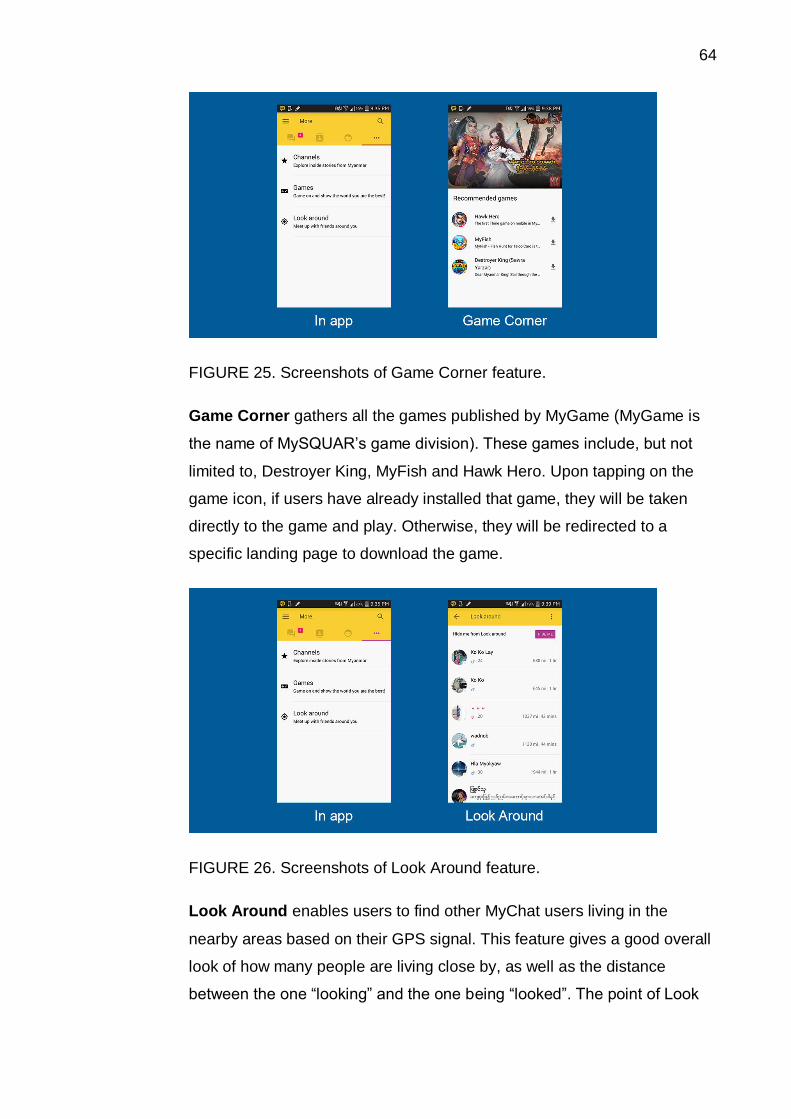
64
FIGURE 25. Screenshots of Game Corner feature.
Game Corner gathers all the games published by MyGame (MyGame is
the name of MySQUAR’s game division). These games include, but not
limited to, Destroyer King, MyFish and Hawk Hero. Upon tapping on the
game icon, if users have already installed that game, they will be taken
directly to the game and play. Otherwise, they will be redirected to a
specific landing page to download the game.
FIGURE 26. Screenshots of Look Around feature.
Look Around enables users to find other MyChat users living in the
nearby areas based on their GPS signal. This feature gives a good overall
look of how many people are living close by, as well as the distance
between the one “looking” and the one being “looked”. The point of Look
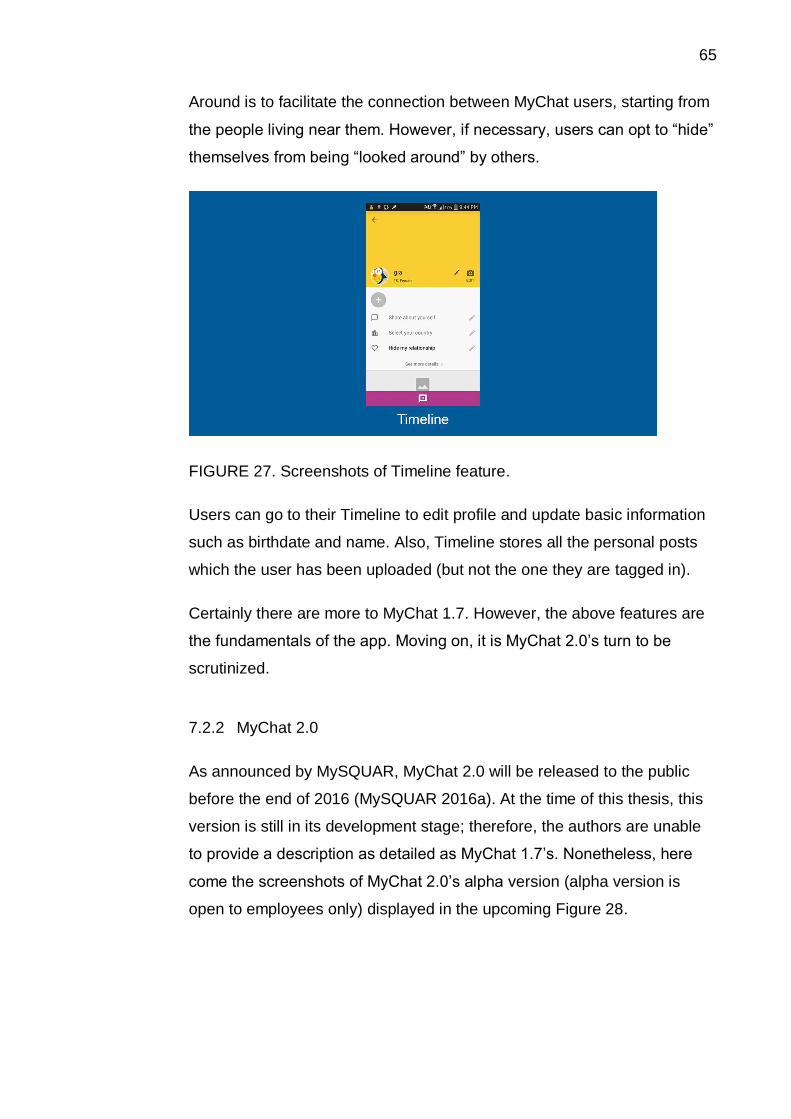
65
Around is to facilitate the connection between MyChat users, starting from
the people living near them. However, if necessary, users can opt to “hide”
themselves from being “looked around” by others.
FIGURE 27. Screenshots of Timeline feature.
Users can go to their Timeline to edit profile and update basic information
such as birthdate and name. Also, Timeline stores all the personal posts
which the user has been uploaded (but not the one they are tagged in).
Certainly there are more to MyChat 1.7. However, the above features are
the fundamentals of the app. Moving on, it is MyChat 2.0’s turn to be
scrutinized.
7.2.2 MyChat 2.0
As announced by MySQUAR, MyChat 2.0 will be released to the public
before the end of 2016 (MySQUAR 2016a). At the time of this thesis, this
version is still in its development stage; therefore, the authors are unable
to provide a description as detailed as MyChat 1.7’s. Nonetheless, here
come the screenshots of MyChat 2.0’s alpha version (alpha version is
open to employees only) displayed in the upcoming Figure 28.
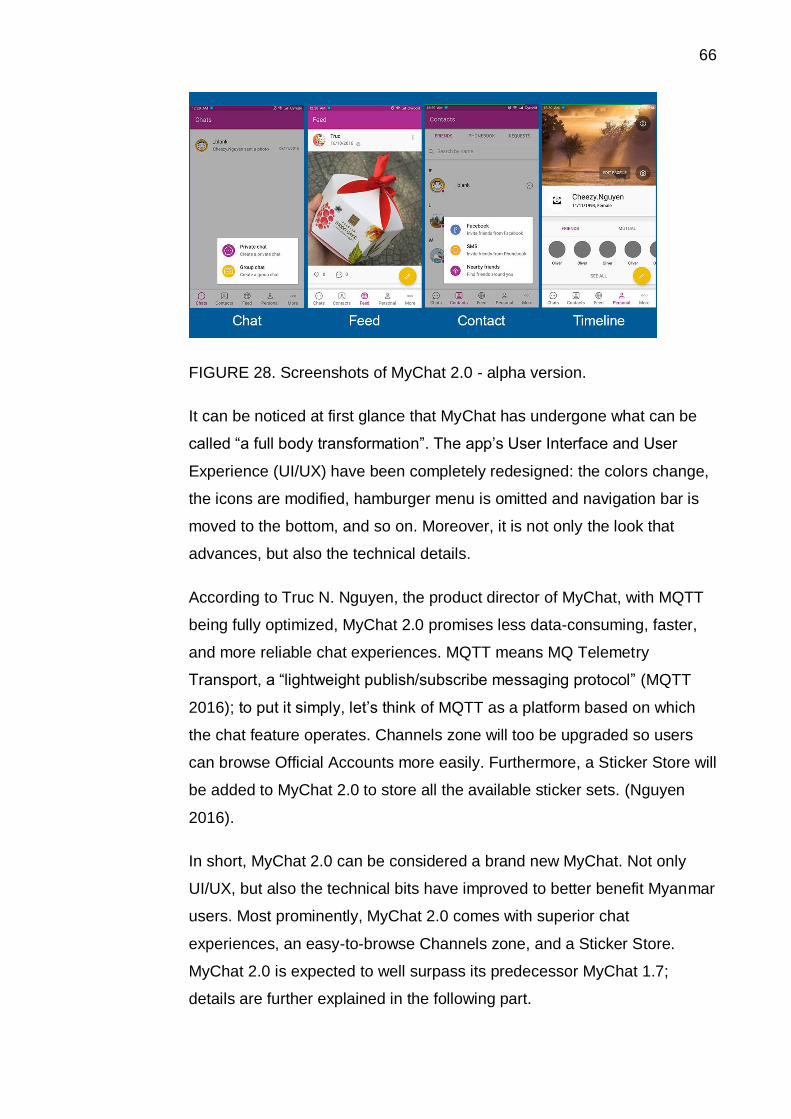
66
FIGURE 28. Screenshots of MyChat 2.0 - alpha version.
It can be noticed at first glance that MyChat has undergone what can be
called “a full body transformation”. The app’s User Interface and User
Experience (UI/UX) have been completely redesigned: the colors change,
the icons are modified, hamburger menu is omitted and navigation bar is
moved to the bottom, and so on. Moreover, it is not only the look that
advances, but also the technical details.
According to Truc N. Nguyen, the product director of MyChat, with MQTT
being fully optimized, MyChat 2.0 promises less data-consuming, faster,
and more reliable chat experiences. MQTT means MQ Telemetry
Transport, a “lightweight publish/subscribe messaging protocol” (MQTT
2016); to put it simply, let’s think of MQTT as a platform based on which
the chat feature operates. Channels zone will too be upgraded so users
can browse Official Accounts more easily. Furthermore, a Sticker Store will
be added to MyChat 2.0 to store all the available sticker sets. (Nguyen
2016).
In short, MyChat 2.0 can be considered a brand new MyChat. Not only
UI/UX, but also the technical bits have improved to better benefit Myanmar
users. Most prominently, MyChat 2.0 comes with superior chat
experiences, an easy-to-browse Channels zone, and a Sticker Store.
MyChat 2.0 is expected to well surpass its predecessor MyChat 1.7;
details are further explained in the following part.
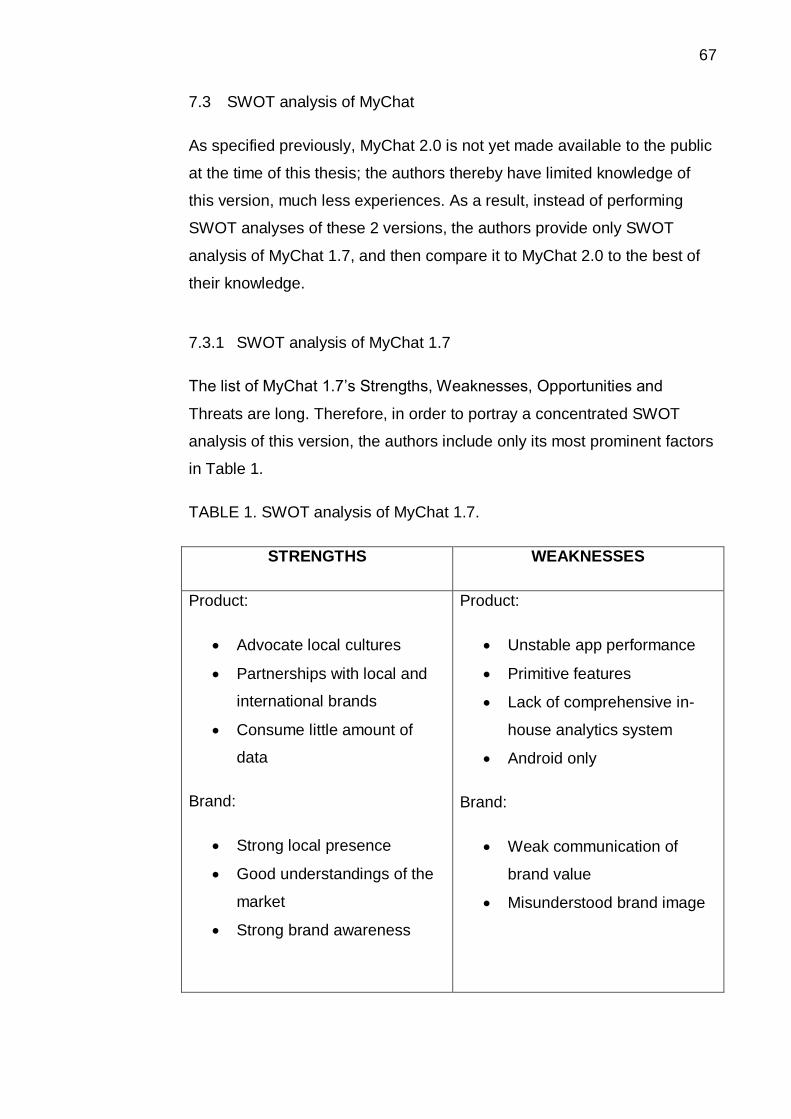
67
7.3 SWOT analysis of MyChat
As specified previously, MyChat 2.0 is not yet made available to the public
at the time of this thesis; the authors thereby have limited knowledge of
this version, much less experiences. As a result, instead of performing
SWOT analyses of these 2 versions, the authors provide only SWOT
analysis of MyChat 1.7, and then compare it to MyChat 2.0 to the best of
their knowledge.
7.3.1 SWOT analysis of MyChat 1.7
The list of MyChat 1.7’s Strengths, Weaknesses, Opportunities and
Threats are long. Therefore, in order to portray a concentrated SWOT
analysis of this version, the authors include only its most prominent factors
in Table 1.
TABLE 1. SWOT analysis of MyChat 1.7.
STRENGTHS WEAKNESSES
Product:
Advocate local cultures
Partnerships with local and
international brands
Consume little amount of
data
Brand:
Strong local presence
Good understandings of the
market
Strong brand awareness
Product:
Unstable app performance
Primitive features
Lack of comprehensive in-
house analytics system
Android only
Brand:
Weak communication of
brand value
Misunderstood brand image
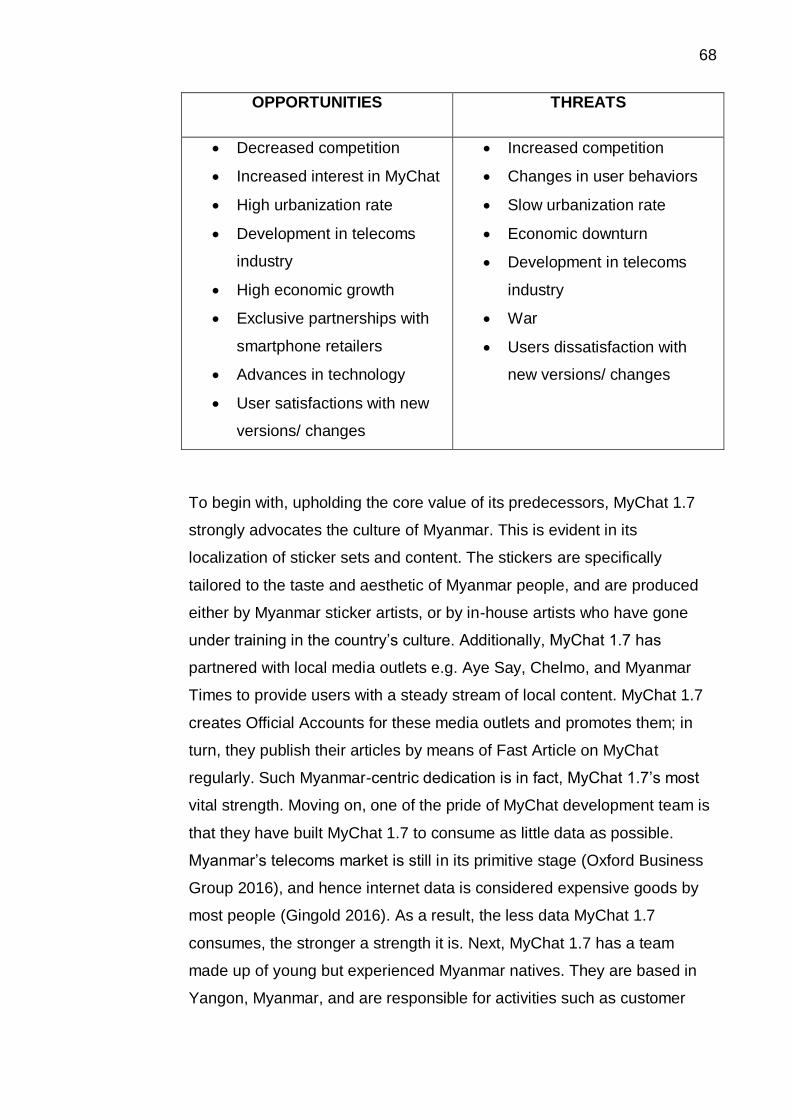
68
OPPORTUNITIES THREATS
Decreased competition
Increased interest in MyChat
High urbanization rate
Development in telecoms
industry
High economic growth
Exclusive partnerships with
smartphone retailers
Advances in technology
User satisfactions with new
versions/ changes
Increased competition
Changes in user behaviors
Slow urbanization rate
Economic downturn
Development in telecoms
industry
War
Users dissatisfaction with
new versions/ changes
To begin with, upholding the core value of its predecessors, MyChat 1.7
strongly advocates the culture of Myanmar. This is evident in its
localization of sticker sets and content. The stickers are specifically
tailored to the taste and aesthetic of Myanmar people, and are produced
either by Myanmar sticker artists, or by in-house artists who have gone
under training in the country’s culture. Additionally, MyChat 1.7 has
partnered with local media outlets e.g. Aye Say, Chelmo, and Myanmar
Times to provide users with a steady stream of local content. MyChat 1.7
creates Official Accounts for these media outlets and promotes them; in
turn, they publish their articles by means of Fast Article on MyChat
regularly. Such Myanmar-centric dedication is in fact, MyChat 1.7’s most
vital strength. Moving on, one of the pride of MyChat development team is
that they have built MyChat 1.7 to consume as little data as possible.
Myanmar’s telecoms market is still in its primitive stage (Oxford Business
Group 2016), and hence internet data is considered expensive goods by
most people (Gingold 2016). As a result, the less data MyChat 1.7
consumes, the stronger a strength it is. Next, MyChat 1.7 has a team
made up of young but experienced Myanmar natives. They are based in
Yangon, Myanmar, and are responsible for activities such as customer
69
support, marketing support, content editing, and business development.
Not only the team enhance MyChat 1.7’s local presence, but they also
provide excellent insights into, and deep understanding of, the market.
This in turn adds to MyChat 1.7’s advantage in knowledge. Also, even
though MyChat has not invested much in offline (traditional) marketing
activities, the name MyChat is well-known among Myanmar people.
MyChat 1.7 now enjoys the strong brand awareness its predecessors have
accumulated for the past 2 years.
Now come the weaknesses of MyChat 1.7. Technically speaking, while
competitors, e.g. Viber and Line, are seniors with years-long experience,
MyChat 1.7 is a toddler having a long list of things to catch up with. The
app’s performance is unstable, with frequent occurrences of crashes and
bugs. More importantly, its core features (including Chat, Feed, Look
Around, etc.) are still in their somewhat primitive stages. Saying primitive
is indeed making a mountain out of a molehill, but it emphasizes the fact
that these features, albeit having been constantly being developed, are
lacking. They need a multitude of tweaks and optimization to meet the
competition. Moreover, MyChat 1.7 is deficient in features dedicated for
marketing/growth hacking, particularly a comprehensive tracking system.
MyChat does have an in-house analytics system, but there exist many
limitations to it. Furthermore, being an Android-only app has its own
drawbacks, especially when Myanmar market is experiencing growth in
iPhone users. Concerning the brand name MyChat, as mentioned in the
strengths of MyChat 1.7, the name MyChat is well-known, and yet well-
misunderstood at the same time. Until recently, MyChat has not carried
out any proper brand communication; there was no guidelines for doing
so. Besides, even though MyChat is marketed as a social chat app to
connect the people of Myanmar, more than often it is seen as Myanmar’s
Tinder (an online dating app) by its users. People go to MyChat not to
simply make friends.
Coming up are the opportunities that the external environment can bring to
MyChat 1.7’s benefits. The list of opportunities is long, but here are the
main factors. First, if either the competition decreases with competitors
70
opting out of the market, or the interest in MyChat escalates, MyChat 1.7
has more chances to grow its market share. Second, for now, the majority
of Myanmar internet users is located in urban. They are the people that
can afford smart-phones and internet data, and are living in areas with
better telecoms infrastructure. As a result, a faster speed of urbanization,
especially if accompanied by progress in telecoms industry and growth in
income, will substantially increase the number of internet and smart-phone
users, and inherently potential MyChat 1.7 users. Fourth, in Myanmar, it is
common to go to smartphone retailers to have apps installed (because
downloading them would be costly). Hence, acquiring exclusive deals with
these retailers to have them recommend MyChat, or even pre-install
MyChat on their offer of phones, would profoundly affect MyChat 1.7’s
growth. Fifth, advances in technology can boost the development of the
app, and open the door to a more efficient and more competitive MyChat,
more happy users, and eventually more growth.
Onto the last part of SWOT analysis, here are the most important threats
to MyChat 1.7. Most of them are the contrary to opportunities, and thus
holds polar opposite effect on the app. For instance, with more
communication apps enter the market, the competition will rise and
MyChat’s market shares may plummet. Likewise, if users change
behaviors and switch to other kind of apps, such as Instagram or
Snapchat, for social connectivity, MyChat 1.7’s growth will be harmed.
Besides, a diminishing urbanization rate or an economic downturn can
hinder user base growth of MyChat 1.7. Progress in telecoms industry can
also become a threat to MyChat. With better internet speed and internet
data package, Myanmar people can gain access to a wider range of apps,
and this again intensifies the competition for MyChat. Finally, internal
conflict is still around in Myanmar, and war is still a possibility. War is
detrimental to MyChat’s operations in various ways.
71
7.3.2 MyChat 1.7 vs MyChat 2.0
MyChat 2.0 inherits the key strengths of MyChat 1.7, and is built on the
knowledge of its predecessor’s vital weaknesses. As an attempt to
improve the core Chat feature, MyChat 2.0’s development team has
implemented MQTT to enhance chatting experiences - less lags and less
missing messages. The team have also added or optimized other features
to make the experiences smoother and more enjoyable, as described
previously in the introduction of MyChat 2.0. They have too invested in
rebuilding the in-house analytics system, promising a more sophisticated,
more comprehensive, and more reliable tracking system. In addition,
marketing team has compiled official brand guidelines to tackle the issue
of ungoverned brand communication. The guidelines are inclusive; not
only do they provide directions for MyChat 2.0’s brand communication, but
also regulations for the components of its brand identity. Bringing in the
guidelines will enable consistency in communication, and ultimately
reinforce MyChat 2.0’s brand image.
Concerning the opportunities and threats the external environment poses
to MyChat 2.0, they are practically the same as what MyChat 1.7 is now
facing. Nonetheless, there is one element that is significantly more
decisive to MyChat 2.0 than it is to MyChat 1.7: users’ satisfaction with the
new version. MyChat turns over a new leaf with this 2.0 version; it is the
team’s result of a year-long learning and building, and is their stakes in
carving out a new era of MyChat. Hence, it is no exaggeration to state that
users’ satisfaction with 2.0 decides the life and death of the app. And in
this game, MyChat 2.0’s fresh UI/UX is a wild card. The current users of
MyChat are specifically affected by this change in UI/UX; they will either
love it, or hate it immensely. And the last thing MyChat ever needs is
users’ disapproval of 2.0. This leads to the next section: the authors’
recommendations to MySQUAR on heightening MyChat 2.0’s chances of
success.
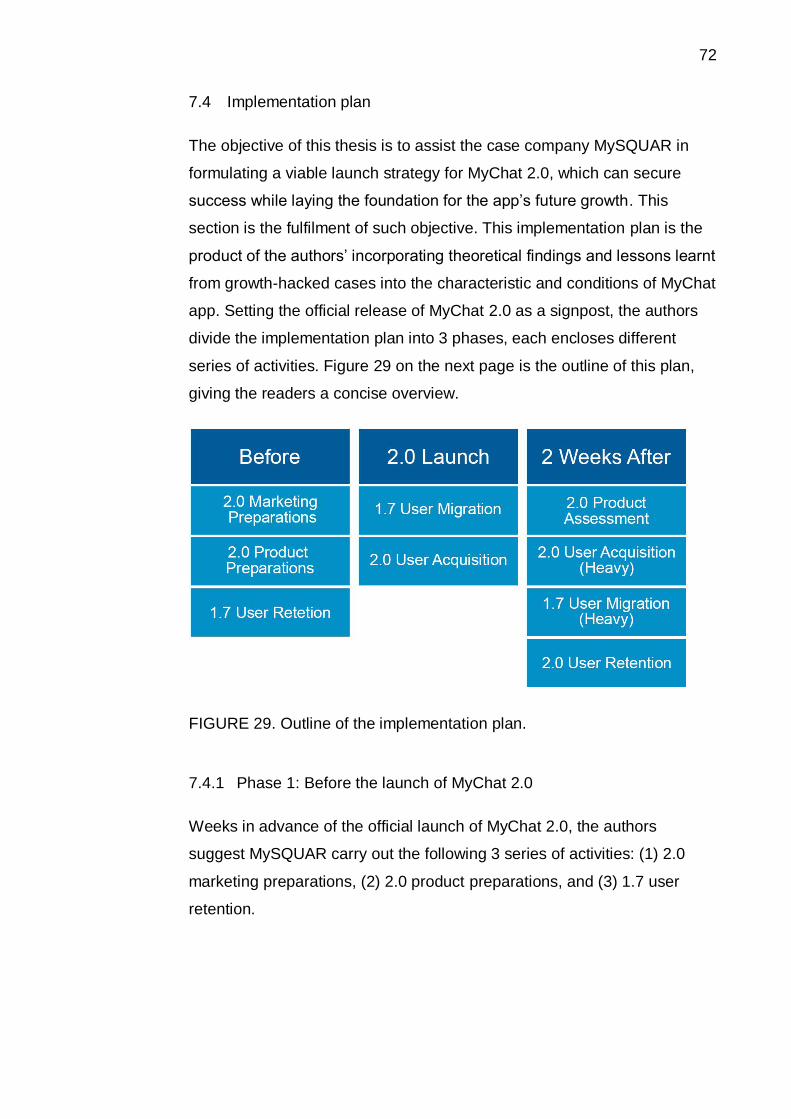
72
7.4 Implementation plan
The objective of this thesis is to assist the case company MySQUAR in
formulating a viable launch strategy for MyChat 2.0, which can secure
success while laying the foundation for the app’s future growth. This
section is the fulfilment of such objective. This implementation plan is the
product of the authors’ incorporating theoretical findings and lessons learnt
from growth-hacked cases into the characteristic and conditions of MyChat
app. Setting the official release of MyChat 2.0 as a signpost, the authors
divide the implementation plan into 3 phases, each encloses different
series of activities. Figure 29 on the next page is the outline of this plan,
giving the readers a concise overview.
FIGURE 29. Outline of the implementation plan.
7.4.1 Phase 1: Before the launch of MyChat 2.0
Weeks in advance of the official launch of MyChat 2.0, the authors
suggest MySQUAR carry out the following 3 series of activities: (1) 2.0
marketing preparations, (2) 2.0 product preparations, and (3) 1.7 user
retention.
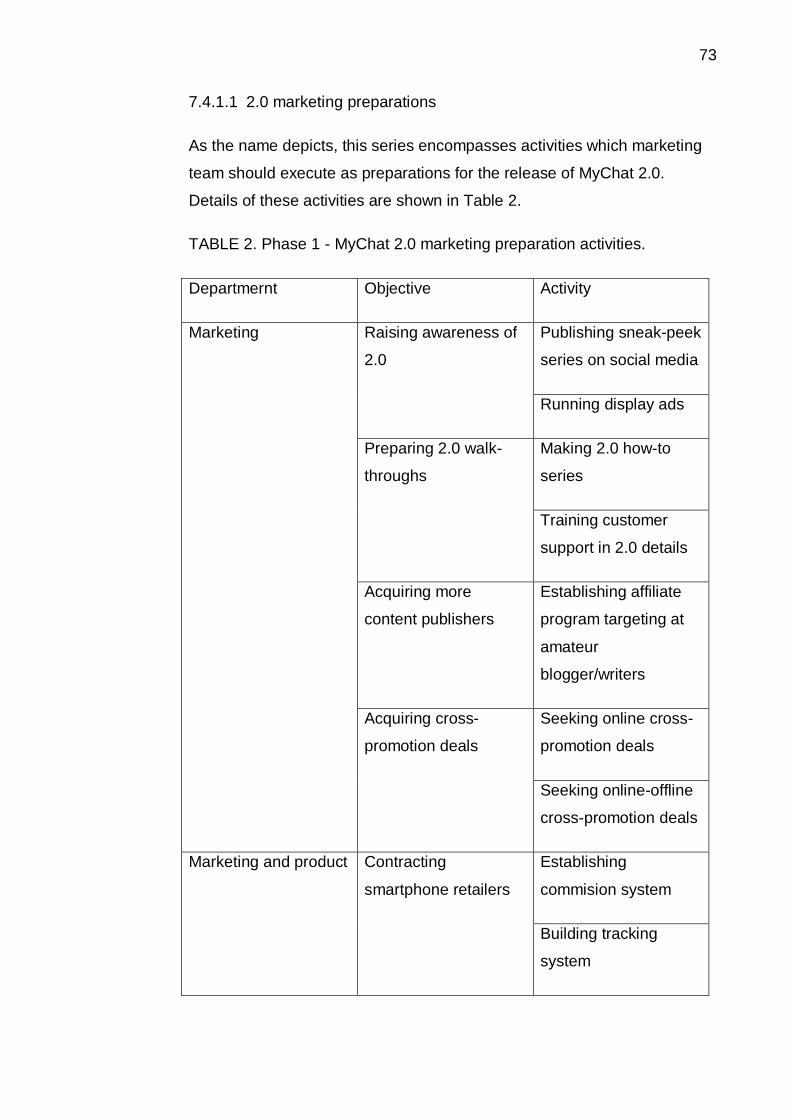
73
7.4.1.1 2.0 marketing preparations
As the name depicts, this series encompasses activities which marketing
team should execute as preparations for the release of MyChat 2.0.
Details of these activities are shown in Table 2.
TABLE 2. Phase 1 - MyChat 2.0 marketing preparation activities.
Departmernt Objective Activity
Marketing Raising awareness of
2.0
Publishing sneak-peek
series on social media
Running display ads
Preparing 2.0 walk-
throughs
Making 2.0 how-to
series
Training customer
support in 2.0 details
Acquiring more
content publishers
Establishing affiliate
program targeting at
amateur
blogger/writers
Acquiring cross-
promotion deals
Seeking online cross-
promotion deals
Seeking online-offline
cross-promotion deals
Marketing and product Contracting
smartphone retailers
Establishing
commision system
Building tracking
system
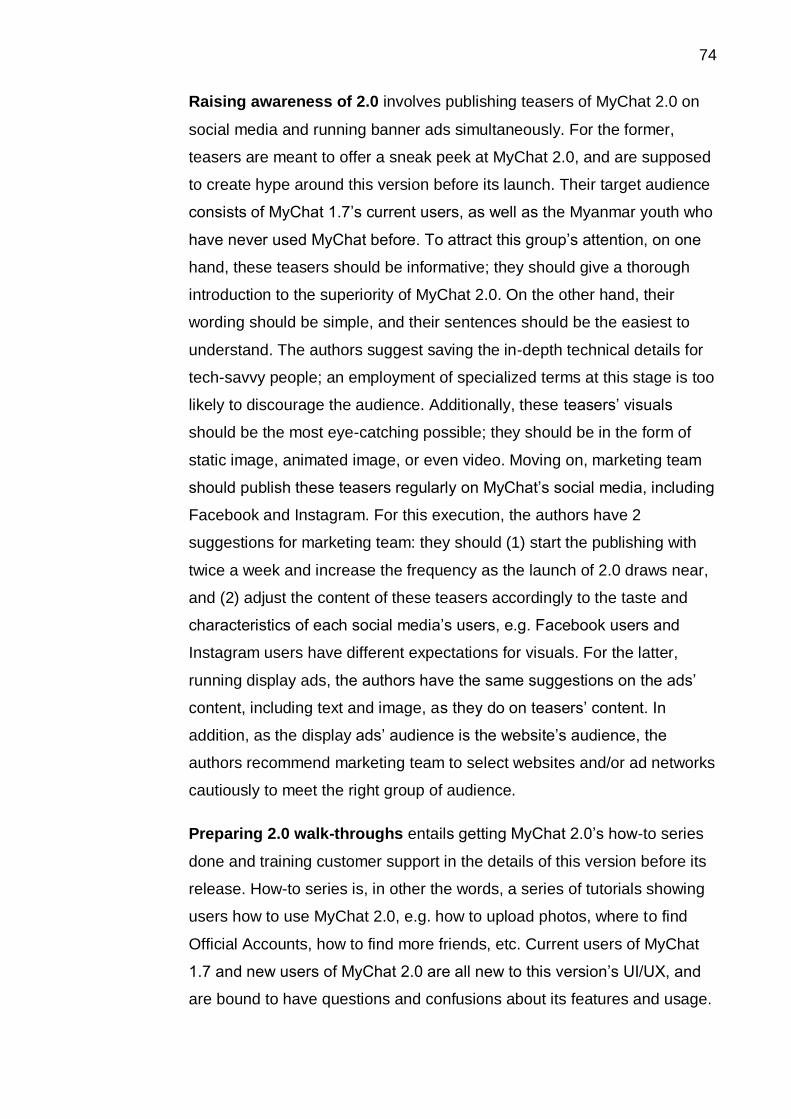
74
Raising awareness of 2.0 involves publishing teasers of MyChat 2.0 on
social media and running banner ads simultaneously. For the former,
teasers are meant to offer a sneak peek at MyChat 2.0, and are supposed
to create hype around this version before its launch. Their target audience
consists of MyChat 1.7’s current users, as well as the Myanmar youth who
have never used MyChat before. To attract this group’s attention, on one
hand, these teasers should be informative; they should give a thorough
introduction to the superiority of MyChat 2.0. On the other hand, their
wording should be simple, and their sentences should be the easiest to
understand. The authors suggest saving the in-depth technical details for
tech-savvy people; an employment of specialized terms at this stage is too
likely to discourage the audience. Additionally, these teasers’ visuals
should be the most eye-catching possible; they should be in the form of
static image, animated image, or even video. Moving on, marketing team
should publish these teasers regularly on MyChat’s social media, including
Facebook and Instagram. For this execution, the authors have 2
suggestions for marketing team: they should (1) start the publishing with
twice a week and increase the frequency as the launch of 2.0 draws near,
and (2) adjust the content of these teasers accordingly to the taste and
characteristics of each social media’s users, e.g. Facebook users and
Instagram users have different expectations for visuals. For the latter,
running display ads, the authors have the same suggestions on the ads’
content, including text and image, as they do on teasers’ content. In
addition, as the display ads’ audience is the website’s audience, the
authors recommend marketing team to select websites and/or ad networks
cautiously to meet the right group of audience.
Preparing 2.0 walk-throughs entails getting MyChat 2.0’s how-to series
done and training customer support in the details of this version before its
release. How-to series is, in other the words, a series of tutorials showing
users how to use MyChat 2.0, e.g. how to upload photos, where to find
Official Accounts, how to find more friends, etc. Current users of MyChat
1.7 and new users of MyChat 2.0 are all new to this version’s UI/UX, and
are bound to have questions and confusions about its features and usage.
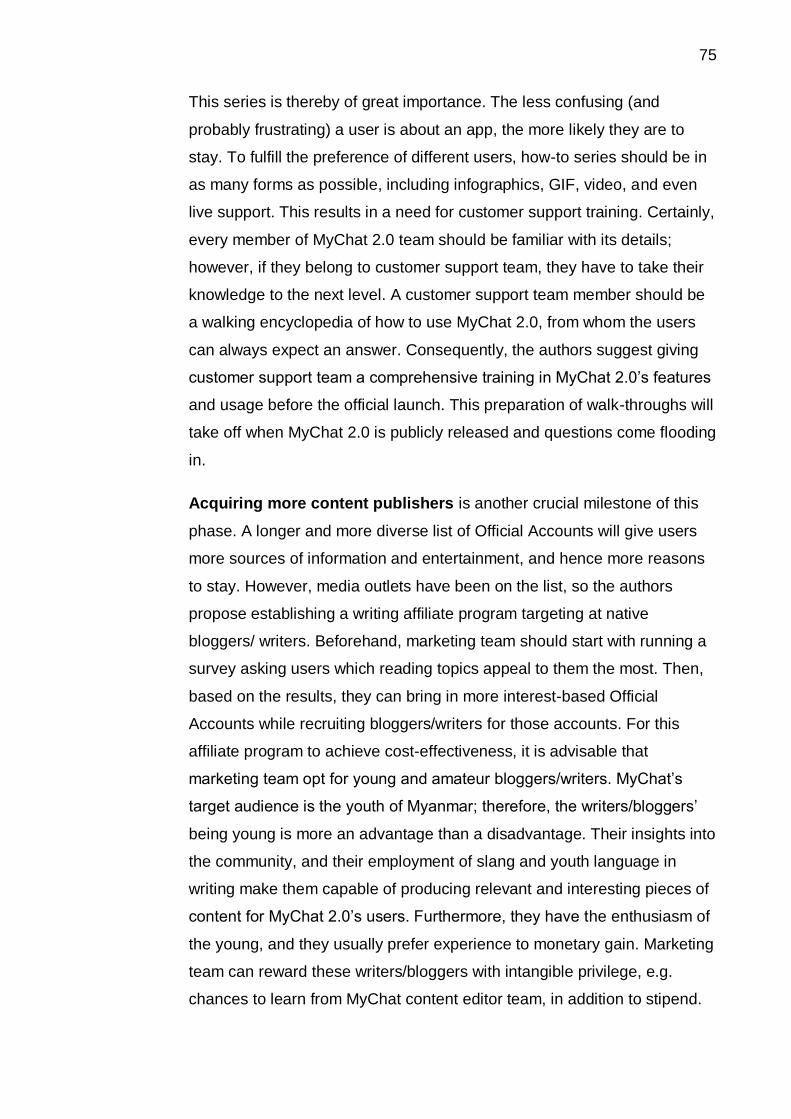
75
This series is thereby of great importance. The less confusing (and
probably frustrating) a user is about an app, the more likely they are to
stay. To fulfill the preference of different users, how-to series should be in
as many forms as possible, including infographics, GIF, video, and even
live support. This results in a need for customer support training. Certainly,
every member of MyChat 2.0 team should be familiar with its details;
however, if they belong to customer support team, they have to take their
knowledge to the next level. A customer support team member should be
a walking encyclopedia of how to use MyChat 2.0, from whom the users
can always expect an answer. Consequently, the authors suggest giving
customer support team a comprehensive training in MyChat 2.0’s features
and usage before the official launch. This preparation of walk-throughs will
take off when MyChat 2.0 is publicly released and questions come flooding
in.
Acquiring more content publishers is another crucial milestone of this
phase. A longer and more diverse list of Official Accounts will give users
more sources of information and entertainment, and hence more reasons
to stay. However, media outlets have been on the list, so the authors
propose establishing a writing affiliate program targeting at native
bloggers/ writers. Beforehand, marketing team should start with running a
survey asking users which reading topics appeal to them the most. Then,
based on the results, they can bring in more interest-based Official
Accounts while recruiting bloggers/writers for those accounts. For this
affiliate program to achieve cost-effectiveness, it is advisable that
marketing team opt for young and amateur bloggers/writers. MyChat’s
target audience is the youth of Myanmar; therefore, the writers/bloggers’
being young is more an advantage than a disadvantage. Their insights into
the community, and their employment of slang and youth language in
writing make them capable of producing relevant and interesting pieces of
content for MyChat 2.0’s users. Furthermore, they have the enthusiasm of
the young, and they usually prefer experience to monetary gain. Marketing
team can reward these writers/bloggers with intangible privilege, e.g.
chances to learn from MyChat content editor team, in addition to stipend.
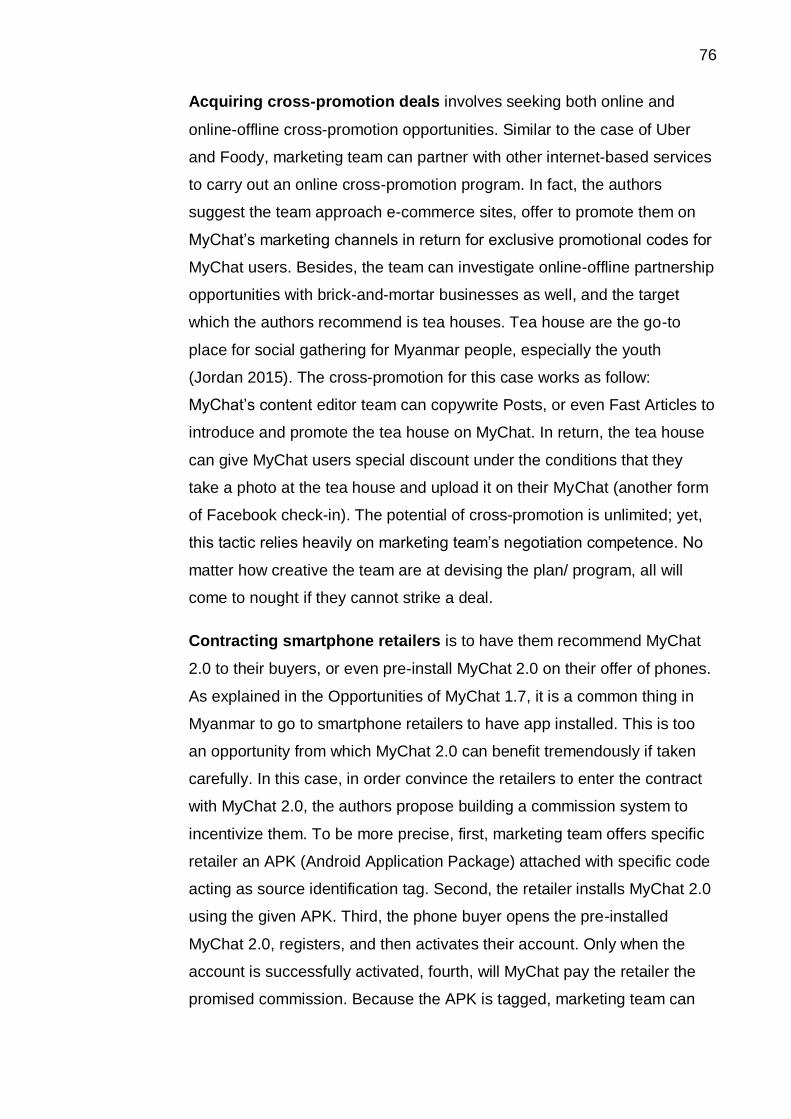
76
Acquiring cross-promotion deals involves seeking both online and
online-offline cross-promotion opportunities. Similar to the case of Uber
and Foody, marketing team can partner with other internet-based services
to carry out an online cross-promotion program. In fact, the authors
suggest the team approach e-commerce sites, offer to promote them on
MyChat’s marketing channels in return for exclusive promotional codes for
MyChat users. Besides, the team can investigate online-offline partnership
opportunities with brick-and-mortar businesses as well, and the target
which the authors recommend is tea houses. Tea house are the go-to
place for social gathering for Myanmar people, especially the youth
(Jordan 2015). The cross-promotion for this case works as follow:
MyChat’s content editor team can copywrite Posts, or even Fast Articles to
introduce and promote the tea house on MyChat. In return, the tea house
can give MyChat users special discount under the conditions that they
take a photo at the tea house and upload it on their MyChat (another form
of Facebook check-in). The potential of cross-promotion is unlimited; yet,
this tactic relies heavily on marketing team’s negotiation competence. No
matter how creative the team are at devising the plan/ program, all will
come to nought if they cannot strike a deal.
Contracting smartphone retailers is to have them recommend MyChat
2.0 to their buyers, or even pre-install MyChat 2.0 on their offer of phones.
As explained in the Opportunities of MyChat 1.7, it is a common thing in
Myanmar to go to smartphone retailers to have app installed. This is too
an opportunity from which MyChat 2.0 can benefit tremendously if taken
carefully. In this case, in order convince the retailers to enter the contract
with MyChat 2.0, the authors propose building a commission system to
incentivize them. To be more precise, first, marketing team offers specific
retailer an APK (Android Application Package) attached with specific code
acting as source identification tag. Second, the retailer installs MyChat 2.0
using the given APK. Third, the phone buyer opens the pre-installed
MyChat 2.0, registers, and then activates their account. Only when the
account is successfully activated, fourth, will MyChat pay the retailer the
promised commission. Because the APK is tagged, marketing team can
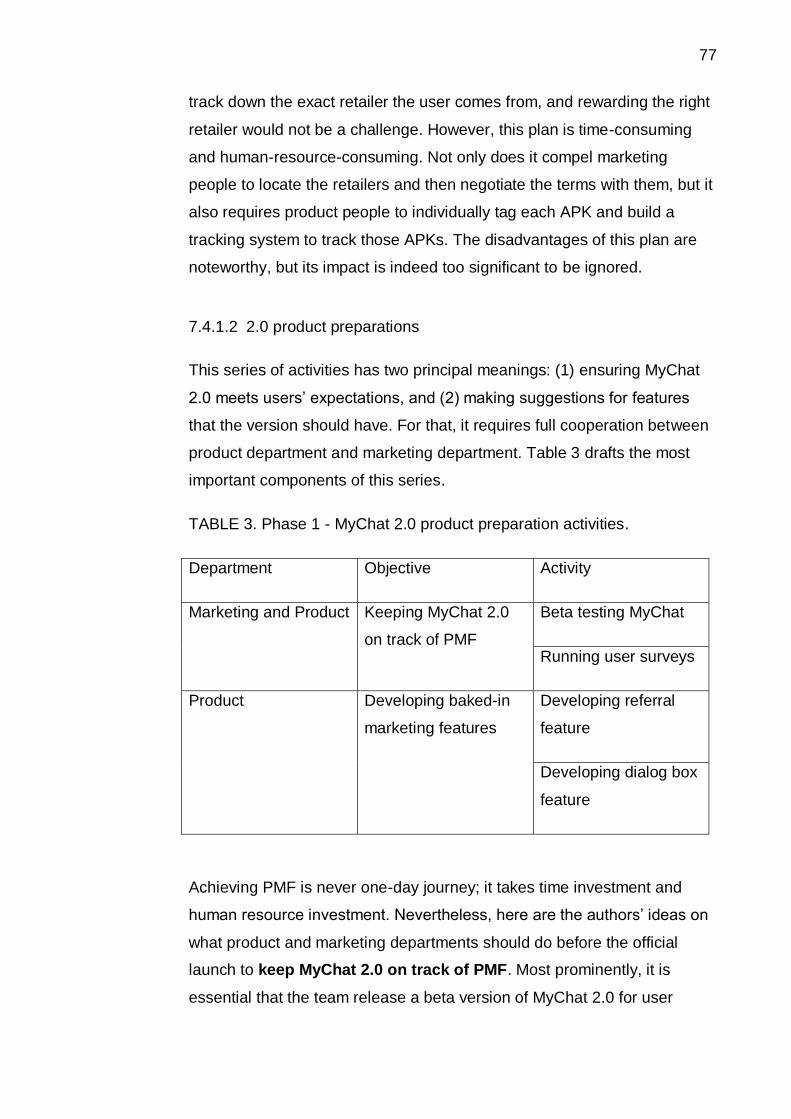
77
track down the exact retailer the user comes from, and rewarding the right
retailer would not be a challenge. However, this plan is time-consuming
and human-resource-consuming. Not only does it compel marketing
people to locate the retailers and then negotiate the terms with them, but it
also requires product people to individually tag each APK and build a
tracking system to track those APKs. The disadvantages of this plan are
noteworthy, but its impact is indeed too significant to be ignored.
7.4.1.2 2.0 product preparations
This series of activities has two principal meanings: (1) ensuring MyChat
2.0 meets users’ expectations, and (2) making suggestions for features
that the version should have. For that, it requires full cooperation between
product department and marketing department. Table 3 drafts the most
important components of this series.
TABLE 3. Phase 1 - MyChat 2.0 product preparation activities.
Department Objective Activity
Marketing and Product Keeping MyChat 2.0
on track of PMF
Beta testing MyChat
Running user surveys
Product Developing baked-in
marketing features
Developing referral
feature
Developing dialog box
feature
Achieving PMF is never one-day journey; it takes time investment and
human resource investment. Nevertheless, here are the authors’ ideas on
what product and marketing departments should do before the official
launch to keep MyChat 2.0 on track of PMF. Most prominently, it is
essential that the team release a beta version of MyChat 2.0 for user
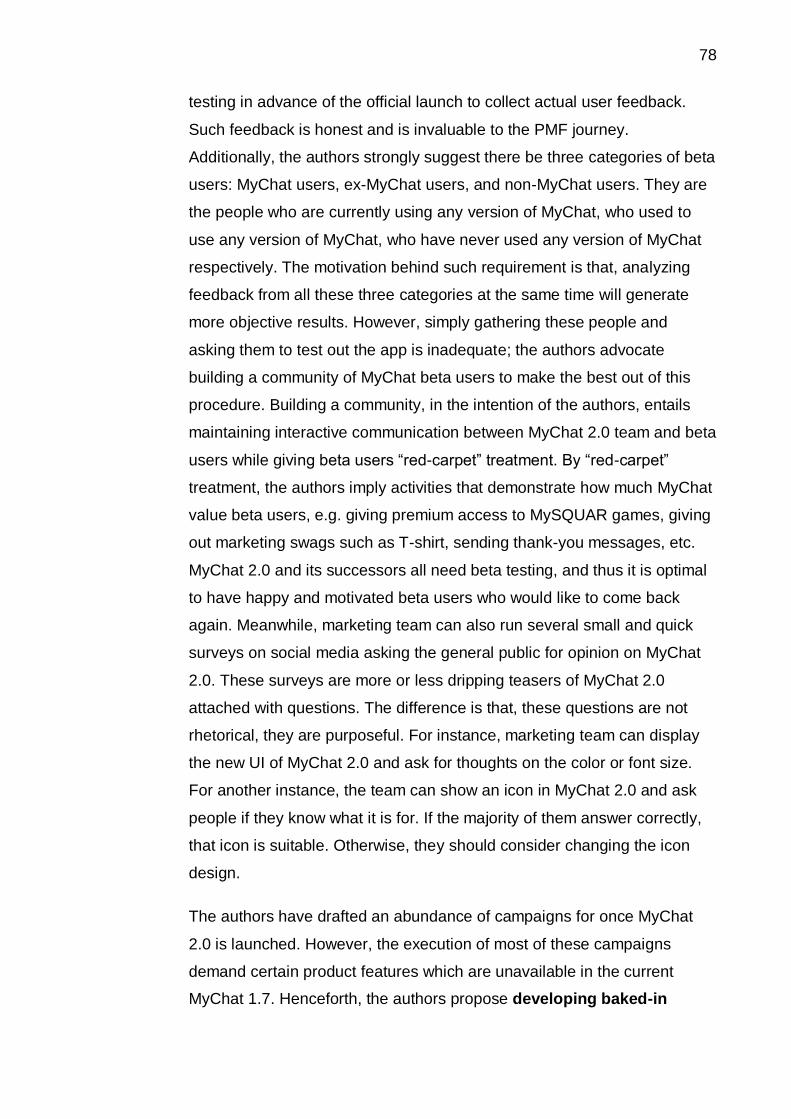
78
testing in advance of the official launch to collect actual user feedback.
Such feedback is honest and is invaluable to the PMF journey.
Additionally, the authors strongly suggest there be three categories of beta
users: MyChat users, ex-MyChat users, and non-MyChat users. They are
the people who are currently using any version of MyChat, who used to
use any version of MyChat, who have never used any version of MyChat
respectively. The motivation behind such requirement is that, analyzing
feedback from all these three categories at the same time will generate
more objective results. However, simply gathering these people and
asking them to test out the app is inadequate; the authors advocate
building a community of MyChat beta users to make the best out of this
procedure. Building a community, in the intention of the authors, entails
maintaining interactive communication between MyChat 2.0 team and beta
users while giving beta users “red-carpet” treatment. By “red-carpet”
treatment, the authors imply activities that demonstrate how much MyChat
value beta users, e.g. giving premium access to MySQUAR games, giving
out marketing swags such as T-shirt, sending thank-you messages, etc.
MyChat 2.0 and its successors all need beta testing, and thus it is optimal
to have happy and motivated beta users who would like to come back
again. Meanwhile, marketing team can also run several small and quick
surveys on social media asking the general public for opinion on MyChat
2.0. These surveys are more or less dripping teasers of MyChat 2.0
attached with questions. The difference is that, these questions are not
rhetorical, they are purposeful. For instance, marketing team can display
the new UI of MyChat 2.0 and ask for thoughts on the color or font size.
For another instance, the team can show an icon in MyChat 2.0 and ask
people if they know what it is for. If the majority of them answer correctly,
that icon is suitable. Otherwise, they should consider changing the icon
design.
The authors have drafted an abundance of campaigns for once MyChat
2.0 is launched. However, the execution of most of these campaigns
demand certain product features which are unavailable in the current
MyChat 1.7. Henceforth, the authors propose developing baked-in
79
marketing features during the pre-launch, to ensure the necessary
features are built in by the time MyChat 2.0 is released. These features
include referral and dialog box. First, the referral feature here is the same
in spirit as Uber referral program, i.e. to get users to do the acquisition;
however, it is not as sophisticated. The referral feature in the authors’ mind
is no more than an “Invite your friend” button with an underlying tracking
system. Each user is assigned with a specific code, and all invitations sent
from this button are attached with that specific code to act as source
identification tag. That is to say, everything that follows the invitations can
all be tracked and traced back to its root. For example, user A invites a
group of friends, and marketing can see in the analysis system that how
many of his invitations have been opened, clicked, and converted into
actual users. Second, dialog is, to put it simply, popup text message from
the app to user. If the message is sent when users are using the app,
dialog box will appear in the middle of their phone screens, but not taking
up the whole thing. Dialog provides a means of two-way communication
between app operator and users: it can include an action which the
receivers take in reply to the sender’s message. For example, the
message is “Are you sure you want to exit? Yes - No”, with “Yes” and “No”
being clickable options. The action in this case is for users to tap on either
one of the options. Once tapped, their answer will be recorded
automatically in MyChat system, and can be retrieved later. In other
words, the action prompted by a dialog has more meaning than just
confirmation.
7.4.1.3 1.7 user retention
In Table 4, activities of this series are drafted with aim to retain the users
of MyChat 1.7, which is still in operation at the moment of this thesis.
80
TABLE 4. Phase 1 - MyChat 1.7 user retention activities.
Department Objective Activity
Marketing Get MyChat 1.7 users
to stick with the app
Running contests
Sustaining (and
expanding) a steady
stream of content on
Feed
To retain the users of MyChat 1.7 is to give them the reasons to open
and use the app time after time. Because the above 2 series have already
called for big investment and commitment, for this series, the authors
suggest marketing team keep doing what they have been doing thus far to
retain users: running contests in MyChat and sustaining (and expanding) a
steady stream of content on Feed. Regarding the former, marketing team
can attempt themed contests or giveaway events. For instance, the
authors’ proposal is a New Year photo contest which takes place between
the end of the old year and the beginning of the new year. In order to join,
users have to upload photos of their family together to their MyChat
timeline, then proceed to get as many likes as possible from their circle of
MyChat friends. Users whose photos with the most likes will be rewarded
by MyChat. Nevertheless, it is important to take note that the sky is not the
limit in this case. Marketing team has to consult with product team on the
possibility of execution, e.g. whether it is possible track all the participants’
photos, or whether it is possible for the participants to share the photo’s
link to their friends directly, etc. Regarding the latter, the authors advise
marketing team to gradually increase the inputs of in-house content while
having the currently onboard media outlets do the same with their Fast
Articles. They should also incorporate knowledge of user behaviour into
this activity to achieve bigger impact. The team can look into users’ habits
and routines, e.g. at what time they are most online, which topics draw
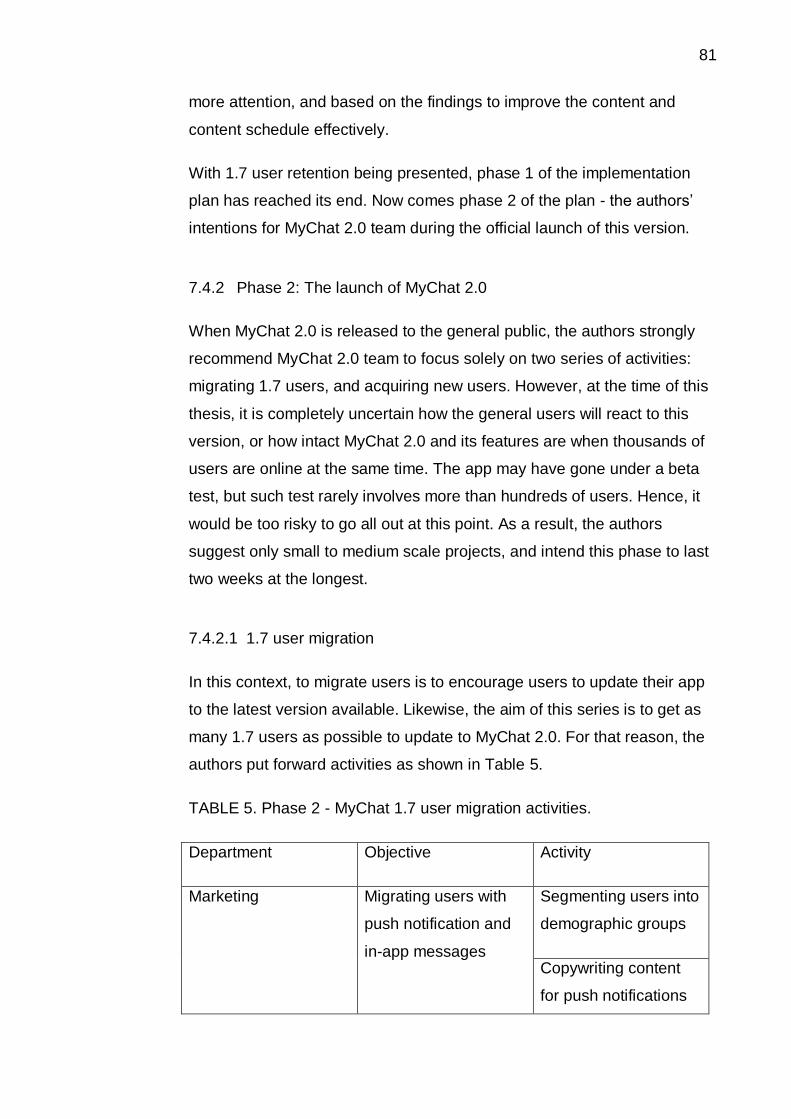
81
more attention, and based on the findings to improve the content and
content schedule effectively.
With 1.7 user retention being presented, phase 1 of the implementation
plan has reached its end. Now comes phase 2 of the plan - the authors’
intentions for MyChat 2.0 team during the official launch of this version.
7.4.2 Phase 2: The launch of MyChat 2.0
When MyChat 2.0 is released to the general public, the authors strongly
recommend MyChat 2.0 team to focus solely on two series of activities:
migrating 1.7 users, and acquiring new users. However, at the time of this
thesis, it is completely uncertain how the general users will react to this
version, or how intact MyChat 2.0 and its features are when thousands of
users are online at the same time. The app may have gone under a beta
test, but such test rarely involves more than hundreds of users. Hence, it
would be too risky to go all out at this point. As a result, the authors
suggest only small to medium scale projects, and intend this phase to last
two weeks at the longest.
7.4.2.1 1.7 user migration
In this context, to migrate users is to encourage users to update their app
to the latest version available. Likewise, the aim of this series is to get as
many 1.7 users as possible to update to MyChat 2.0. For that reason, the
authors put forward activities as shown in Table 5.
TABLE 5. Phase 2 - MyChat 1.7 user migration activities.
Department Objective Activity
Marketing Migrating users with
push notification and
in-app messages
Segmenting users into
demographic groups
Copywriting content
for push notifications
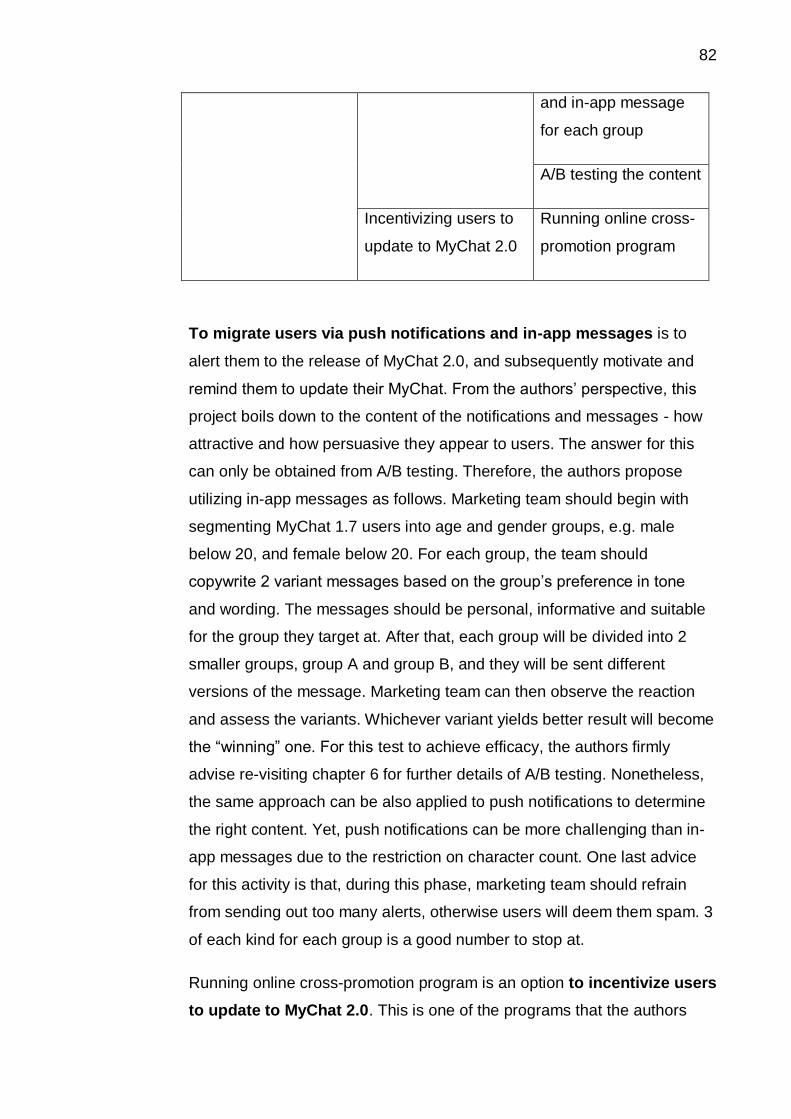
82
and in-app message
for each group
A/B testing the content
Incentivizing users to
update to MyChat 2.0
Running online cross-
promotion program
To migrate users via push notifications and in-app messages is to
alert them to the release of MyChat 2.0, and subsequently motivate and
remind them to update their MyChat. From the authors’ perspective, this
project boils down to the content of the notifications and messages - how
attractive and how persuasive they appear to users. The answer for this
can only be obtained from A/B testing. Therefore, the authors propose
utilizing in-app messages as follows. Marketing team should begin with
segmenting MyChat 1.7 users into age and gender groups, e.g. male
below 20, and female below 20. For each group, the team should
copywrite 2 variant messages based on the group’s preference in tone
and wording. The messages should be personal, informative and suitable
for the group they target at. After that, each group will be divided into 2
smaller groups, group A and group B, and they will be sent different
versions of the message. Marketing team can then observe the reaction
and assess the variants. Whichever variant yields better result will become
the “winning” one. For this test to achieve efficacy, the authors firmly
advise re-visiting chapter 6 for further details of A/B testing. Nonetheless,
the same approach can be also applied to push notifications to determine
the right content. Yet, push notifications can be more challenging than in-
app messages due to the restriction on character count. One last advice
for this activity is that, during this phase, marketing team should refrain
from sending out too many alerts, otherwise users will deem them spam. 3
of each kind for each group is a good number to stop at.
Running online cross-promotion program is an option to incentivize users
to update to MyChat 2.0. This is one of the programs that the authors
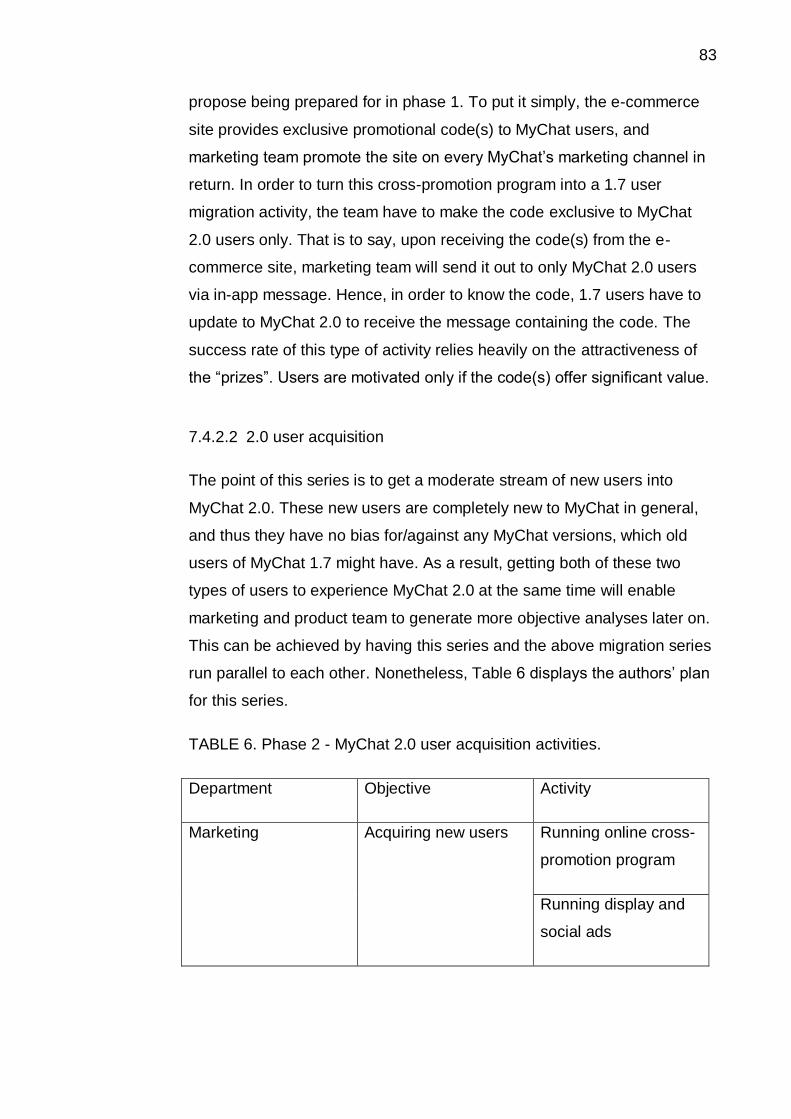
83
propose being prepared for in phase 1. To put it simply, the e-commerce
site provides exclusive promotional code(s) to MyChat users, and
marketing team promote the site on every MyChat’s marketing channel in
return. In order to turn this cross-promotion program into a 1.7 user
migration activity, the team have to make the code exclusive to MyChat
2.0 users only. That is to say, upon receiving the code(s) from the e-
commerce site, marketing team will send it out to only MyChat 2.0 users
via in-app message. Hence, in order to know the code, 1.7 users have to
update to MyChat 2.0 to receive the message containing the code. The
success rate of this type of activity relies heavily on the attractiveness of
the “prizes”. Users are motivated only if the code(s) offer significant value.
7.4.2.2 2.0 user acquisition
The point of this series is to get a moderate stream of new users into
MyChat 2.0. These new users are completely new to MyChat in general,
and thus they have no bias for/against any MyChat versions, which old
users of MyChat 1.7 might have. As a result, getting both of these two
types of users to experience MyChat 2.0 at the same time will enable
marketing and product team to generate more objective analyses later on.
This can be achieved by having this series and the above migration series
run parallel to each other. Nonetheless, Table 6 displays the authors’ plan
for this series.
TABLE 6. Phase 2 - MyChat 2.0 user acquisition activities.
Department Objective Activity
Marketing Acquiring new users Running online cross-
promotion program
Running display and
social ads
84
Acquiring new users at this phase entails running online cross-promotion
program together with running display and social ads. The online cross-
promotion program mentioned here and the online cross-promotion
program mentioned above in user migration is just one program. If carried
out appropriately, this program with e-commerce site can be both a user
migration tactic and a user acquisition tactic simultaneously. That is the
reason for the authors’ suggesting putting such program into practice at
this phase. It is killing two birds with one stone. The side of user migration
has been covered; now, it is the user acquisition’s turn. This side is as
simple as requesting the e-commerce site to put up banners, posters, etc.
about the promotion on their website and social media, or even send
messages to their phone list, to spread the words to their audience. As a
consequence, the audience who are not yet a MyChat user but want the
code will have to download MyChat and register. Marketing team ‘s
responsibility at that stage is to make sure that they download the right
MyChat 2.0, and that they receive the code they want. Another activity to
acquire new users is to run display and social ads. Similar to the teaser
activity and ads activity in phase 1, the authors (again) strongly emphasize
the importance of content. The copywriting should be ear-catching; the
graphic should be eye-catching; and the both of them should meet the
taste of the ads’ target audience. There is also the role of ads network,
too. There are many options available, and marketing team should
investigate beforehand to select only the network(s) whose audience
matches MyChat 2.0’s target audience.
As explained previously, all the activities at this phase should remain small
to medium scale. This is to enable both marketing team and product
development team to observe and collect necessary datas to move onto
the next phase: 2 weeks after the launch.
7.4.3 Phase 3: 2 weeks after the launch of MyChat 2.0
By the time the small to medium scale activities in phase 3 finish, it is time
to assess the performance of MyChat 2.0. Depending on the results, there
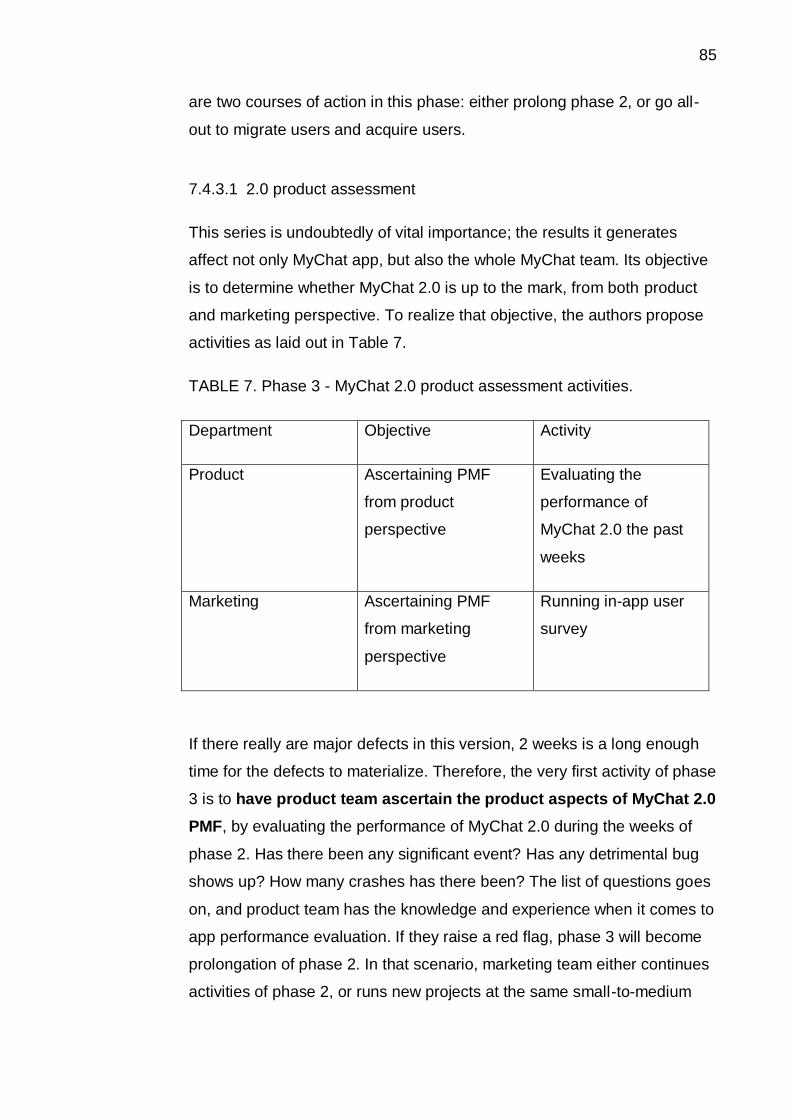
85
are two courses of action in this phase: either prolong phase 2, or go all-
out to migrate users and acquire users.
7.4.3.1 2.0 product assessment
This series is undoubtedly of vital importance; the results it generates
affect not only MyChat app, but also the whole MyChat team. Its objective
is to determine whether MyChat 2.0 is up to the mark, from both product
and marketing perspective. To realize that objective, the authors propose
activities as laid out in Table 7.
TABLE 7. Phase 3 - MyChat 2.0 product assessment activities.
Department Objective Activity
Product Ascertaining PMF
from product
perspective
Evaluating the
performance of
MyChat 2.0 the past
weeks
Marketing Ascertaining PMF
from marketing
perspective
Running in-app user
survey
If there really are major defects in this version, 2 weeks is a long enough
time for the defects to materialize. Therefore, the very first activity of phase
3 is to have product team ascertain the product aspects of MyChat 2.0
PMF, by evaluating the performance of MyChat 2.0 during the weeks of
phase 2. Has there been any significant event? Has any detrimental bug
shows up? How many crashes has there been? The list of questions goes
on, and product team has the knowledge and experience when it comes to
app performance evaluation. If they raise a red flag, phase 3 will become
prolongation of phase 2. In that scenario, marketing team either continues
activities of phase 2, or runs new projects at the same small-to-medium
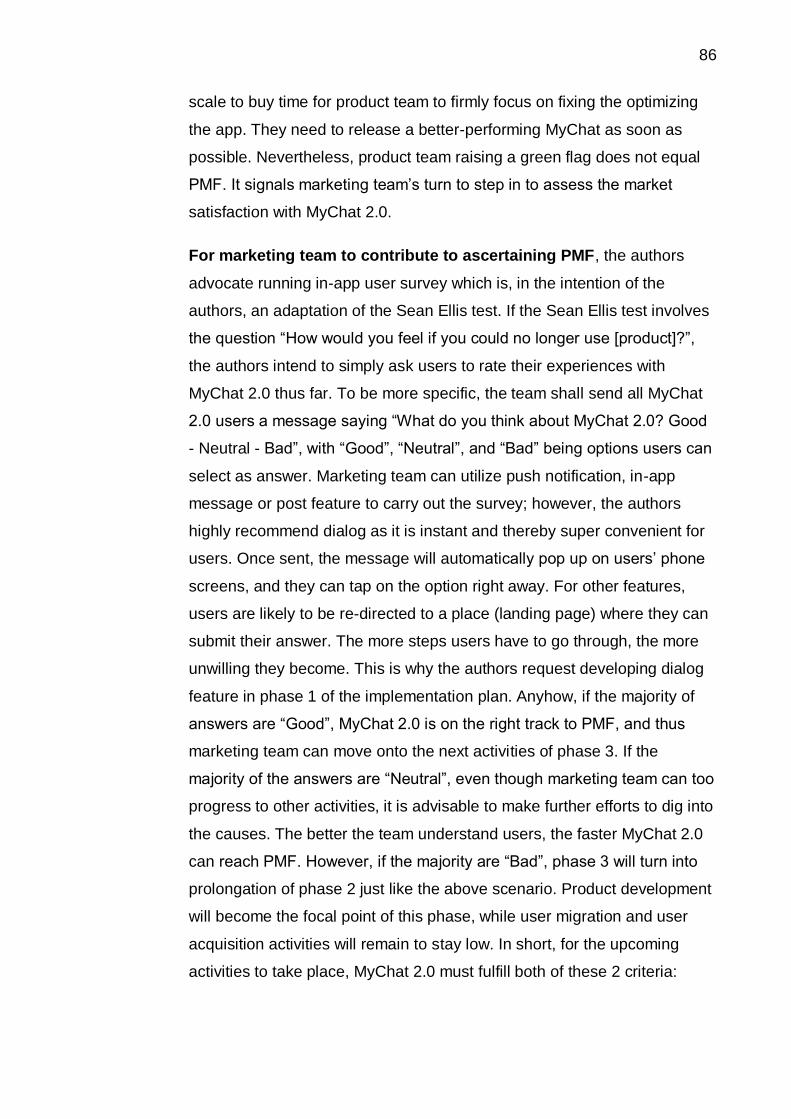
86
scale to buy time for product team to firmly focus on fixing the optimizing
the app. They need to release a better-performing MyChat as soon as
possible. Nevertheless, product team raising a green flag does not equal
PMF. It signals marketing team’s turn to step in to assess the market
satisfaction with MyChat 2.0.
For marketing team to contribute to ascertaining PMF, the authors
advocate running in-app user survey which is, in the intention of the
authors, an adaptation of the Sean Ellis test. If the Sean Ellis test involves
the question “How would you feel if you could no longer use [product]?”,
the authors intend to simply ask users to rate their experiences with
MyChat 2.0 thus far. To be more specific, the team shall send all MyChat
2.0 users a message saying “What do you think about MyChat 2.0? Good
- Neutral - Bad”, with “Good”, “Neutral”, and “Bad” being options users can
select as answer. Marketing team can utilize push notification, in-app
message or post feature to carry out the survey; however, the authors
highly recommend dialog as it is instant and thereby super convenient for
users. Once sent, the message will automatically pop up on users’ phone
screens, and they can tap on the option right away. For other features,
users are likely to be re-directed to a place (landing page) where they can
submit their answer. The more steps users have to go through, the more
unwilling they become. This is why the authors request developing dialog
feature in phase 1 of the implementation plan. Anyhow, if the majority of
answers are “Good”, MyChat 2.0 is on the right track to PMF, and thus
marketing team can move onto the next activities of phase 3. If the
majority of the answers are “Neutral”, even though marketing team can too
progress to other activities, it is advisable to make further efforts to dig into
the causes. The better the team understand users, the faster MyChat 2.0
can reach PMF. However, if the majority are “Bad”, phase 3 will turn into
prolongation of phase 2 just like the above scenario. Product development
will become the focal point of this phase, while user migration and user
acquisition activities will remain to stay low. In short, for the upcoming
activities to take place, MyChat 2.0 must fulfill both of these 2 criteria:
87
product team confirm the stability and performance of MyChat 2.0, and
users are (somewhat) satisfied with its performance.
7.4.3.2 2.0 user acquisition (heavy)
Once the app stability and user satisfaction are affirmed, it is time to go
full-scale with 2.0 user acquisition activities. Table 8 on the next page
summarizes the authors’ plan.
TABLE 8. Phase 3 - MyChat 2.0 user acquisition activities (full-scale).
Department Objective Activity
Marketing Acquire users online Running social and
display ads
Running referral
contest
Acquire users offline Running online-offline
cross-promotion with
tea house
Running retailer
commission program
The authors have selected two prevalent tactics for marketing team to
acquire users online during this phase, including contest and online ads.
First is the referral contest. This is where the previously-required referral
feature makes its appearance. The contest aims at getting MyChat 2.0
users to send as many invitations as possible to their friends, and the
users who have the most friends converted into MyChat 2.0 users will be
rewarded plentifully. For such contest to take place and succeed, (1) the
referral feature and its underlying tracking system need to be built in
MyChat 2.0 already by then, (2) product team must make sure the links
88
enclosed in the invitations lead to the download of MyChat 2.0 and not any
other versions, and (3) marketing team should make the prizes as valuable
as possible to stimulate users, e.g. offering five high-priced smartphones
instead of ten medium-priced ones. Next is running social ads and display
ads. At this phase, marketing team shall consider running video ads in
addition to static ads. Nonetheless, the advices for this activity are pretty
much the same as what the authors have given for the previous ads
activity; the tactic remains the same, but the content differs, and the
budget increases. Activities at this phase are at a much larger scale than
those at phase 2, and thus require much more significant budgets.
To acquire users offline is to reap what the marketing team sow during
the pre-launch of MyChat 2.0. The possibility of the upcoming activities
depends heavily on the preparations the team have accomplished in
phase 1. The authors have previously suggested establishing an online-
offline cross-promotion program with tea houses, as well as a commission
program with smartphone retailers. Now, it is time to kickstart them. For
the former, marketing team promote the tea houses on MyChat, and the
tea houses offer MyChat users special discount in return. The team shall
as well prepare materials, e.g. posters, leaflets, about this promotion for
the tea house to put up at their store and on their social media (if
applicable). The target audience of these materials are the customers who
are not yet a MyChat users; therefore, not only do they give information
about the promotion, but they also have to introduce MyChat 2.0 and
provide a link to download directly. Their mission is to inform, motivate and
make the download as convenient as possible. For the latter, by running
the commission program, marketing team give smartphone retailers the
incentive to recommend MyChat 2.0 to their customers, or even pre-install
MyChat 2.0 in their offer of phones. Every time their customers convert
into MyChat 2.0 users, the retailers gain monetary value. The authors
expect that such program will have great impact once it runs. However,
this tactic is a lot easier said than done, and that is why the authors
strongly advocate making the preparations (tagging the APKs and
negotiating with the retailers) in advance, particularly in phase 1.
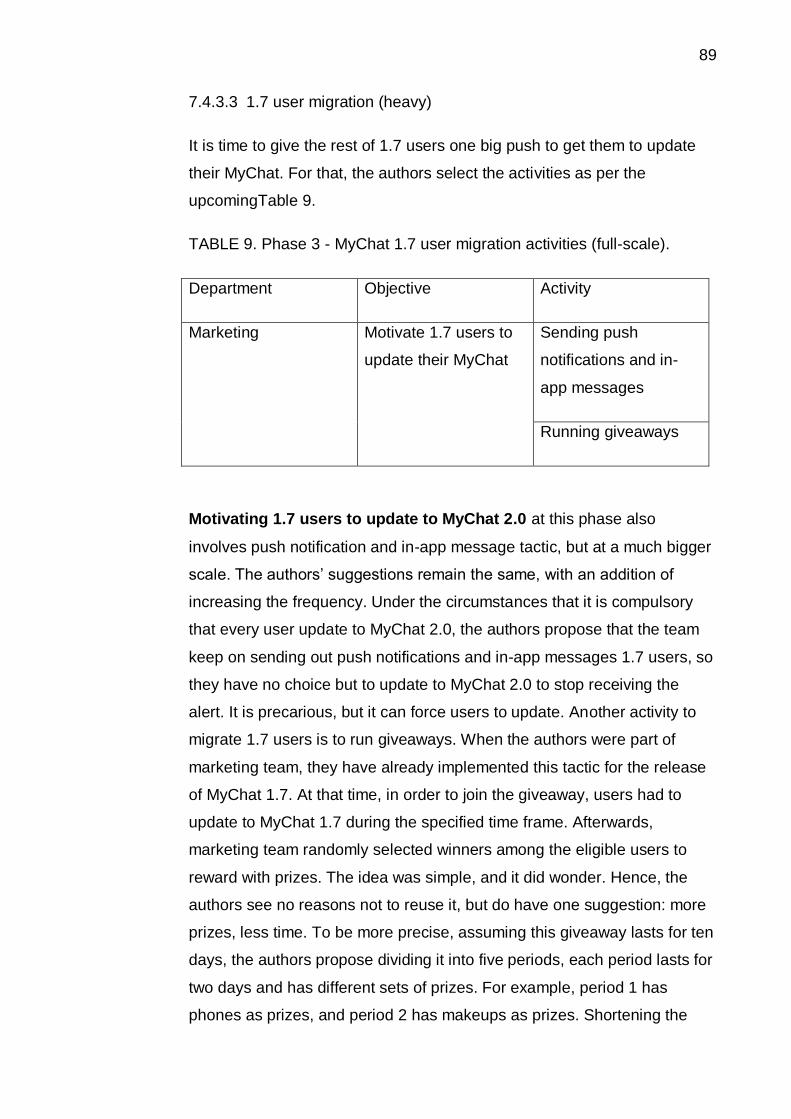
89
7.4.3.3 1.7 user migration (heavy)
It is time to give the rest of 1.7 users one big push to get them to update
their MyChat. For that, the authors select the activities as per the
upcomingTable 9.
TABLE 9. Phase 3 - MyChat 1.7 user migration activities (full-scale).
Department Objective Activity
Marketing Motivate 1.7 users to
update their MyChat
Sending push
notifications and in-
app messages
Running giveaways
Motivating 1.7 users to update to MyChat 2.0 at this phase also
involves push notification and in-app message tactic, but at a much bigger
scale. The authors’ suggestions remain the same, with an addition of
increasing the frequency. Under the circumstances that it is compulsory
that every user update to MyChat 2.0, the authors propose that the team
keep on sending out push notifications and in-app messages 1.7 users, so
they have no choice but to update to MyChat 2.0 to stop receiving the
alert. It is precarious, but it can force users to update. Another activity to
migrate 1.7 users is to run giveaways. When the authors were part of
marketing team, they have already implemented this tactic for the release
of MyChat 1.7. At that time, in order to join the giveaway, users had to
update to MyChat 1.7 during the specified time frame. Afterwards,
marketing team randomly selected winners among the eligible users to
reward with prizes. The idea was simple, and it did wonder. Hence, the
authors see no reasons not to reuse it, but do have one suggestion: more
prizes, less time. To be more precise, assuming this giveaway lasts for ten
days, the authors propose dividing it into five periods, each period lasts for
two days and has different sets of prizes. For example, period 1 has
phones as prizes, and period 2 has makeups as prizes. Shortening the
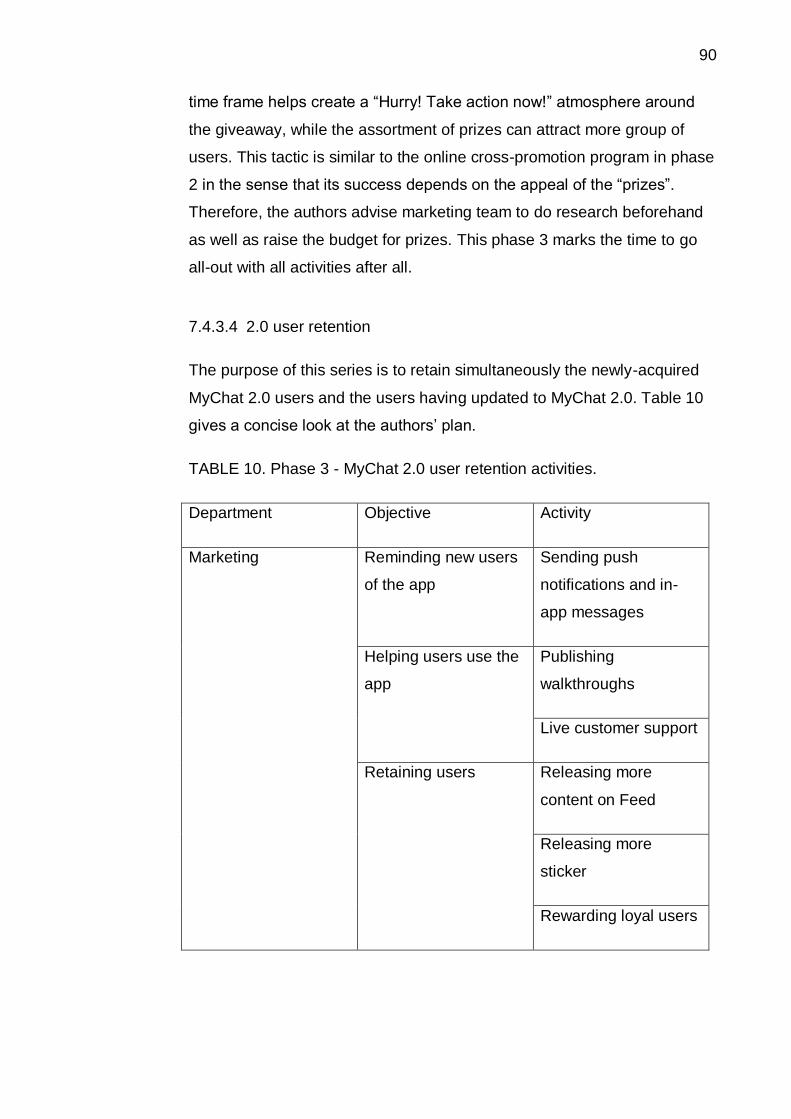
90
time frame helps create a “Hurry! Take action now!” atmosphere around
the giveaway, while the assortment of prizes can attract more group of
users. This tactic is similar to the online cross-promotion program in phase
2 in the sense that its success depends on the appeal of the “prizes”.
Therefore, the authors advise marketing team to do research beforehand
as well as raise the budget for prizes. This phase 3 marks the time to go
all-out with all activities after all.
7.4.3.4 2.0 user retention
The purpose of this series is to retain simultaneously the newly-acquired
MyChat 2.0 users and the users having updated to MyChat 2.0. Table 10
gives a concise look at the authors’ plan.
TABLE 10. Phase 3 - MyChat 2.0 user retention activities.
Department Objective Activity
Marketing Reminding new users
of the app
Sending push
notifications and in-
app messages
Helping users use the
app
Publishing
walkthroughs
Live customer support
Retaining users Releasing more
content on Feed
Releasing more
sticker
Rewarding loyal users
91
More than often people sign up for an app and then forget about its
existence. Hence, the first activity of this series is dedicated to reminding
those users of MyChat 2.0 before they completely churn; and push
notification and in-app message tactic appears as the most befitting
reminder tool. The target of this activity is new users who have not
reopened the app three days after the day they activated their accounts.
The content of the push notifications and in-app messages must intrigue
these users to reopen the app, e.g. they introduce the features of MyChat
2.0 along with its superiority, or they present the exclusive benefits
MyChat 2.0 users enjoy, etc. In order to determine which type of content,
and/or which style of copywriting will do the trick, the authors (again)
stress the implementation of A/B testing and the conduct of this activity
running parallel to each other. Additionally, the frequency of sending push
notifications and in-app messages to these users should stay moderate.
The authors recommend the schedule as follows, counting from the day
they activate their accounts:
On the 3rd day of their being inactive
On the 7th day of their being inactive
On the 10th day of their being inactive
On the 14th day of their being inactive
On the 21st day of their being inactive
In other words, if the users have been inactive for three days after
activating their accounts, send them push notification and/or in-app
message on the 3rd day. Upon receiving the alert, if they reopen the app,
stop sending them further reminder. If they still remain inactive, proceed to
send them another push notification and/or in-app message on the 7th
day, and so on.
Both newly- acquired users and old users having updated to MyChat 2.0
are bound to be unfamiliar with this version’s new UI/UX, and thus, the
next activities in this series is to help 2.0 users get used to the app, by
walkthroughs and live customer support. First, in phase 1, the authors
have proposed investing in creating walkthroughs for MyChat 2.0; now in
92
phase 3, it is time to publish them. Marketing team should publish these
walkthroughs regularly on MyChat Official Account as well as MyChat’s
social media; the aim is to inform and educate as many users as possible
after all. Likewise, this is also where the training for customer support team
in phase 1 takes off. It is expected that questions from users about
MyChat 2.0 come flooding in at this stage, and having proficient customer
support team will undoubtedly enable a more satisfactory service. These
two activities are indeed, should have been carried out since day one of
the official launch. However, the authors purposefully place them here in
phase 3 as an attempt to keep phase 2 concentrated on PMF while
emphasizing the scale of phase 3.
Finally, the last activity of this phase involves retaining MyChat 2.0 users
in general. For that, the authors recommend releasing more content on
Feed, more sticker sets for Chat, and rewarding loyal users. The release
of more content on Feed is, yet, another fruit of phase 1’s preparations. In
phase 1, the authors have proposed establishing a writing affiliate program
targeting at young and amateur writers/bloggers, and if such program is
running by the time of this phase, it will bring in a more diverse stream of
information and news for our users, keeping them entertained. In addition,
marketing team shall frequently release new sticker sets to make the Chat
feature more enjoyable and more exciting. Stickers are more powerful a
hook than they appear to be; people more than often choose to stick with
an (chat) app because of the app’s exclusive stickers. At last, by rewarding
loyal users, the authors mean sending MyChat 2.0 users personal
messages to thank them for having used the version for a long time, e.g.
twenty hours in total. The message can be short, but must be emotional,
e.g. “We are very happy to see that you are enjoying MyChat 2.0! Lots of
thanks from MyChat team”. In addition, the authors recommend sending
these messages via dialog, as it can make the messages (appear)
personal while ensuring that users will see them. Such activity is, in the
intentions of the authors, the premise of a much larger and much more
potential user loyalty program.
93
This concludes the authors’ implementation plan for the launch of MyChat
2.0. The plan consists of three main phases: before, during, and after the
official release of MyChat 2.0. All the activities are drafted with one aim in
sight: to ensure the release of MyChat 2.0 is a success. Nevertheless, the
authors do have suggestions for the further future of MyChat, which are
elaborated in the following section.
7.4.4 Into the future
To retain users and acquire new users, it is essential that product team
continuously develop new features for MyChat in addition to app/feature
optimization and performance improvement. For that, the authors strongly
suggest taking the referral program to the next level, and in fact, to Uber’s
level. Once the payment service and paid stickers are in place, it would be
greatly influential if MyChat 2.0 is equipped with a referral program similar
to the one Uber is employing. To be more specific, each MyChat user at
that time will be assigned with a specific code, and if they share their code
with other users, they all will be rewarded with monetary value. They can
later user the accumulated monetary value to buy paid stickers, or any
other services the future MyChat offers. This program has the potential to
strengthen not only user acquisition, but also user retention.
User loyalty program is another suggestion for further investment from the
authors. Similar to Starbucks’ customer loyalty program, MyChat should
reward users for the hours they spend on using the app, and the reward
increases with the amount of time spent. For example:
20 hours in MyChat: send them a personal thank-you message (as
described above);
50 hours in MyChat: reward them with an exclusive sticker set;
100 hours in MyChat: reward them with an exclusive promotional
code from any of MyChat’s long-term partners.
The important thing is that this loyalty program is not a one-shot activity. It
should run permanently and automatically. Users, regardless of when they

94
sign up, are entitled for its benefits. This program, as the authors firmly
believes, will give MyChat’s user retention one big push once it is put into
practice.
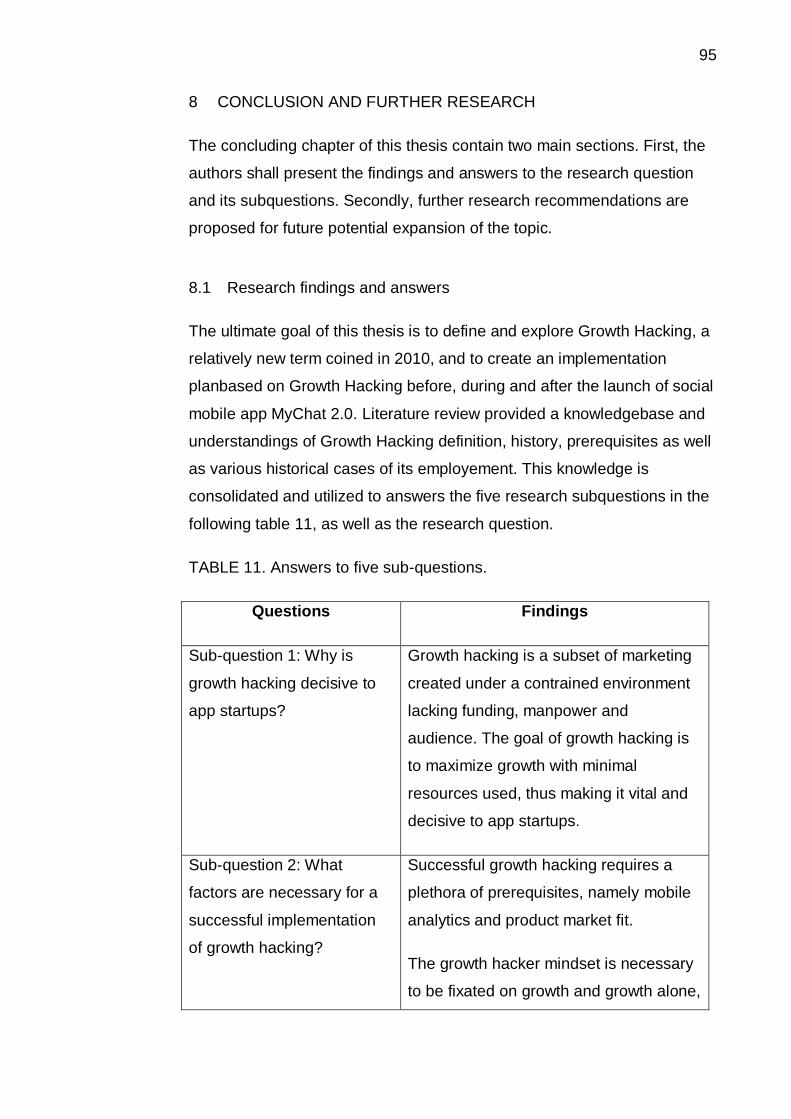
95
8 CONCLUSION AND FURTHER RESEARCH
The concluding chapter of this thesis contain two main sections. First, the
authors shall present the findings and answers to the research question
and its subquestions. Secondly, further research recommendations are
proposed for future potential expansion of the topic.
8.1 Research findings and answers
The ultimate goal of this thesis is to define and explore Growth Hacking, a
relatively new term coined in 2010, and to create an implementation
planbased on Growth Hacking before, during and after the launch of social
mobile app MyChat 2.0. Literature review provided a knowledgebase and
understandings of Growth Hacking definition, history, prerequisites as well
as various historical cases of its employement. This knowledge is
consolidated and utilized to answers the five research subquestions in the
following table 11, as well as the research question.
TABLE 11. Answers to five sub-questions.
Questions Findings
Sub-question 1: Why is
growth hacking decisive to
app startups?
Growth hacking is a subset of marketing
created under a contrained environment
lacking funding, manpower and
audience. The goal of growth hacking is
to maximize growth with minimal
resources used, thus making it vital and
decisive to app startups.
Sub-question 2: What
factors are necessary for a
successful implementation
of growth hacking?
Successful growth hacking requires a
plethora of prerequisites, namely mobile
analytics and product market fit.
The growth hacker mindset is necessary
to be fixated on growth and growth alone,
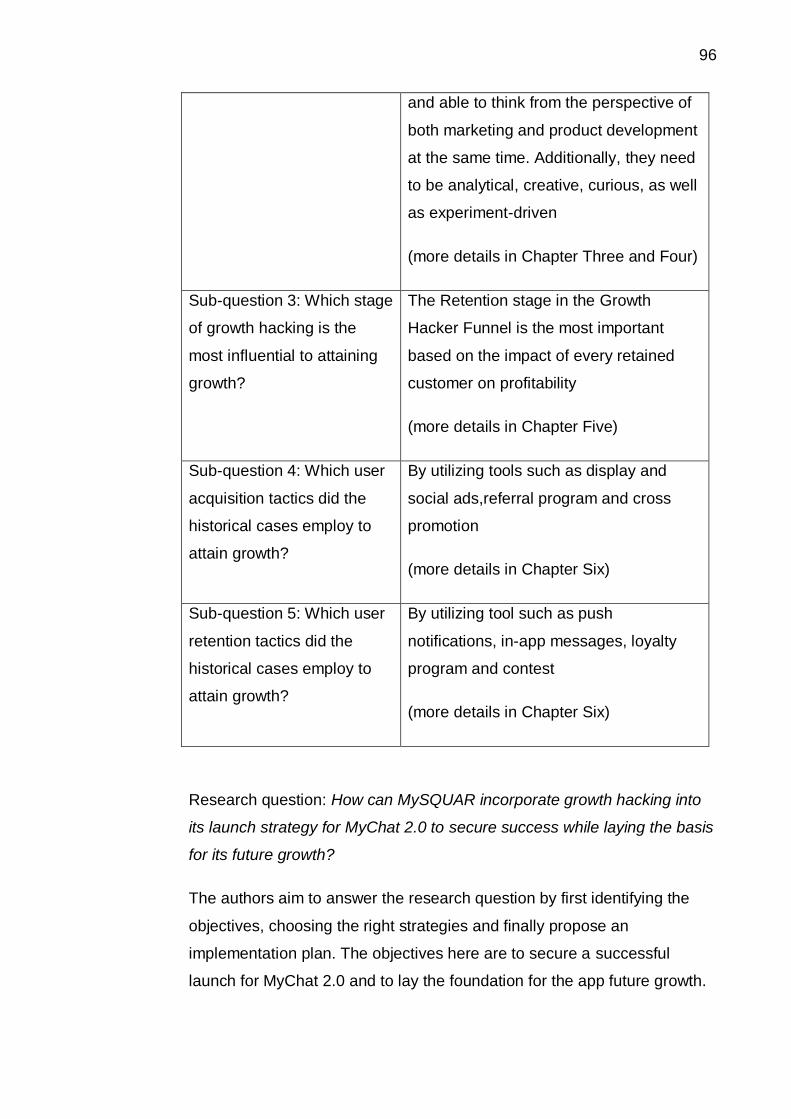
96
and able to think from the perspective of
both marketing and product development
at the same time. Additionally, they need
to be analytical, creative, curious, as well
as experiment-driven
(more details in Chapter Three and Four)
Sub-question 3: Which stage
of growth hacking is the
most influential to attaining
growth?
The Retention stage in the Growth
Hacker Funnel is the most important
based on the impact of every retained
customer on profitability
(more details in Chapter Five)
Sub-question 4: Which user
acquisition tactics did the
historical cases employ to
attain growth?
By utilizing tools such as display and
social ads,referral program and cross
promotion
(more details in Chapter Six)
Sub-question 5: Which user
retention tactics did the
historical cases employ to
attain growth?
By utilizing tool such as push
notifications, in-app messages, loyalty
program and contest
(more details in Chapter Six)
Research question: How can MySQUAR incorporate growth hacking into
its launch strategy for MyChat 2.0 to secure success while laying the basis
for its future growth?
The authors aim to answer the research question by first identifying the
objectives, choosing the right strategies and finally propose an
implementation plan. The objectives here are to secure a successful
launch for MyChat 2.0 and to lay the foundation for the app future growth.
97
The first objective, success, is tackled with a 3-phase implementation plan
including before MyChat 2.0 launch, during and after launch. The authors
introduce a set of activities specialized for each phase based on their
goals. In short, product market fit is prioritized before launch to ensure that
MyChat 2.0 as a product satisfy the technical and market requirements to
minimize the risk of customer dissatisfaction. A comprehensive activities
set immediately follow after with the ultimate goal is to maintain a high
acquisition and retention rate while keeping user churn rate low.
The second objective, growth basis, is tackled by a detailed guideline that
can be applied into MySQUAR’s roadmap in order to retain ongoing
benefits. This guideline includes four initiatives that can be implemented.
The first is a writing affiliate program in which MySQUAR partners with
blog writers to create content. The second is smartphone retailer
commission program in which MySQUAR provides smartphone retailer
with the APK of MyChat 2.0 and pays commission per customer install.
The third is a referral program in the vein of Uber referral program to turn
MyChat users into lead generation tools. Lastly, a user loyalty program
should be considered in order to maintain customer retention rate.
8.2 Further Research Recommendations
This study has but explored a fraction of Growth Hacking as it is and as it
will be. Growth Hacking is a definition that was created not more than
seven years prior to this study and the science itself is still continually
evolving. The authors recognized the limitation in qualitative materials
during the literature review segment of this study.
Further understanding of multiple growth channels and situation in which
they are applicable could supplement this study well. Growth channels
differ much from marketing online channels, of which the differences stem
from being in an online environment. A compilation of existing growth
channels, how they work and how to decide the best fit for different
busisnesses is recommended by the authors for future research.
98
Lastly, this study could be expanded with further research into the usage
of mobile analytics in Growth Hacking. Speciafically, establishing a causal
relationship between activities during different stages of the Growth
Hacker Funnel and the change in key metrics could provide insight into the
significance of analytics during Growth Hacking. Furthermore, this could
potentially create a definitive and quantitative measurement system for
each activities and stages of the Growth Hacker Funnel.
99
9 SUMMARY
For the last few year, the second boom of the Internet has brought about
various new aspects such as social media, e-commerce, internet startup,
mobile app… The business world has to evolve and adapt itself to utilize
these facets of the information era. Growth Hacking is a term born from
these conditions. While one can argue that growth hacking is a subset of
marketing, it employs the tools and strategies not available ten or twenty
years ago, guaranteeing a place of its own in the business world. The
case company, in the wake of the largest update to its social app MyChat,
is looking forward to incorporating growth hacking into its pipeline.
This study comprises of three sections: theoretical study, practices and
implementation plan.
The theoretical study is covered from Chapter 2 to Chapter 5. In Chapter
2, the authors outline the research tools that are used in this thesis, their
origin, definition and application. From Chapter 3 to Chapter 5, the authors
delve into an extended research of the main concept of this thesis: growth
hacking. The term’s definition and origin are laid out in Chapter 3, along
with a detailed history of growth hacking, spanning from the year of its
creation 2010 until this study, which is conducted in 2016. Chapter 4 is
dedicated to the two most important prerequisites of growth hacking which
are Product Market Fit and mobile analytics, both of which are relatively
recent as well. The final theoretical Chapter 5 carries the study of Neil
Patel and Bronson Taylor’s Growth Hacker Funnel and the analysis based
on the importance of each stage.
Consequently, the practices section consists of only one Chapter 6 in
which the authors study different historical case companies and the
strategies they employed to achieve growth. Many of these cases are
either within the last decade or ongoing, providing an update and timely
look at their execution and effectiveness.
Lastly, Chapter 7 contains the overview and relevant information of the
case company MySQUAR. A detailed implementation plan for its social
100
app MyChat 2.0 has been formulated and included. This implementation
plan spans before, immediately after and long term after launch of MyChat
2.0. The basis of this plan is upon the theoretical foundation previously
built in the prior chapters. The goal of this implementation plan is to ensure
MyChat 2.0 growth by focusing on customer acquisition, retention and
awareness of the app.
In conclusion, the theoretical study, practices and implementation plan are
consolidated into findings and answer for the main research question and
its sub-questions. Additionally, the authors are conscious that this study is
not fully representative of Growth Hacking as a science, hence further
research recommendations are included.
101
REFERENCES
Published Sources
Akdeniz, C. 2015. Why Startups Fail: Deadly Mistakes of Business Startup
Founders Explained.
Allen, M. & Cervo, D. 2015. Multi-Domain Master Data Management:
Advanced MDM and Data Governance in Practice. s.l.:Morgan Kaufmann.
Alvesson, M. & Sandberg, J. 2013. Constructing Research Questions:
Doing Interesting Research. s.l.:SAGE.
Andrews, R. 2003. Research Questions. s.l.:Bloomsbury Publishing.
Blaikie, N. 2003. Analyzing Quantitative Data: From Description to
Explanation. s.l.:SAGE.
Christensen, C. M. 2001. Assessing Your Organization's Innovation
Capabilities. Leader to Leader, Summer 2001(21), p. 31.
Consumer Intelligence Research Partners 2015. Amazon Prime Hits New
Highs, s.l.: Consumer Intelligence Research Partners.
Cooper, B. & Vlaskovits, P. 2010. The Entrepreneur's Guide to Customer
Development: A cheat sheet to The Four Steps to the Epiphany, s.l.:
CustDev.
DePamphilis, D. 2015. Mergers, Acquisitions, and Other Restructuring
Activities. 8th ed. s.l.:Academic Press.
Dowling, G. & Uncles, M., 1997. Do customer loyalty programs really
work?. MIT Sloan Management Review, 38(4), p. 71.
Epstein, M. J., Widener, S. K. & Verbeeten, F. 2016. Performance
Measurement and Management Control: Contemporary Issues.
s.l.:Emerald Group Publishing.
102
Farris, P. 2010. Marketing Metrics: The Definitive Guide to Measuring
Marketing Performance. Upper Saddle River: FT Press.
Ferrell, O. C. & Hartline, M. 2010. Marketing Strategy. 5th ed. s.l.:Cengage
Learning.
Fleisher, C. S. & Bensoussan, B. E. 2015. Business and Competitive
Analysis: Effective Application of New and Classic Methods. 2nd ed.
s.l.:FT Press.
Gillen, T. 2005. Winning New Business in Construction. Aldershot:
Ashgate.
Gupta, S. & Zeithaml, V. 2006. Customer Metrics and Their Impact on
Financial Performance. Marketing Science, 25(6), pp. 718-739.
Harty, J. & Aymer, A. 2015. The Mobile Analytics Playbook: A Practical
Guide to Better Testing, s.l.: Hewlett Packard Enterprise.
Kivi, A., 1873. Seittemän veljestä. Porvoo: WSOY.
Kohavi, R. & Longbotham, R. 2010. Online Controlled Experiments and
A/B Tests. In: C. Sammut & G. Webb, eds. Encyclopedia of Machine
Learning and Data Mining. s.l.:Springer.
Kumar, R. 2010. Research Methodology: A Step-by-Step Guide for
Beginners. 3rd ed. s.l.:SAGE.
Maurya, A. 2010. Running Lean: Iterate from Plan A to a Plan That Works,
s.l.: O'Reilly.
Myers, M. D. 2013. Qualitative Research in Business and Management.
s.l.:SAGE.
Nguyen, T. N. 2016. Product Director [Interview] (30 October 2016).
Olsen, D. 2015. The Lean Product Playbook: How to Innovate with
Minimum Viable Products and Rapid Customer Feedback, s.l.: John Wiley
& Sons.
103
Patel, S. & Wornley, R. 2016. 100 Day of Growth. s.l.:s.n.
Penenberg, A. 2010. Viral Loop: The Power of Pass-It-On, s.l.: Hachette
UK.
Picard, R. 2005. Media Product Portfolios: Issues in Management of
Multiple Products and Services. Mahwah: Lawrence Erlbaum.
Pont, S. 2013. Digital State: How the Internet is Changing Everything.
s.l.:Kogan Page Limited.
Punch, K. F. 2013. Introduction to Social Research: Quantitative and
Qualitative Approaches. 3rd ed. s.l.:SAGE.
Ries, E. 2011. The Lean Startup: How Today's Entrepreneurs Use
Continuous Innovation to Create Radically Successful Businesses, s.l.:
Crown Business.
Sarstedt, M. & Mooi, E. 2014. A Concise Guide to Market Research: The
Process, Data, and Methods Using IBM SPSS Statistics. 2nd ed.
s.l.:Springer.
Saunders, M., Lewis, P. & Thornhill, A. 2012. Research Methods for
Business Students. 6th ed. s.l.:Pearson.
Schindler, R. M., 1992. The real lesson of new Coke: The value of focus
groups for predicting the effects of social influence. Marketing Research,
4(4), pp. 22-27.
Siegel, E. 2013. Predictive Analytics: The Power to Predict Who Will Click,
Buy, Lie, or Die, s.l.: John Wiley & Sons .
Smart, R. 2016. The Agile Marketer: Turning Customer Experience Into
Your Competitive Advantage. s.l.:John Wiley & Sons.
Thomas, R. M. 2003. Blending Qualitative and Quantitative Research
Methods in Theses and Dissertations. s.l.:Corwin Press.
104
Uncles, M., Dowling, G. & Hammond, K. 2003. Customer Loyalty and
Customer Loyalty Programs. Journal of consumer marketing, 20(4), pp.
294-316.
Weinberg, G. & Mares, J. 2015. Traction: How Any Startup Can Achieve
Explosive Customer Growth, s.l.: Penguin UK.
Vîrjan, D. 2013. The internet is changing our world. Theoretical and
Applied Economics, Volume XX, pp. 117-124.
Stevens, R. E. et al. 2012. The Marketing Research Guide. 2nd ed.
s.l.:Routledge
Wong, J., Haight, C. & Leow, A. 2015. Market Guide for Mobile App
Analyticsx. s.l.:Gartner.
Zylka, M. P., Fuehres, H., Colladon, A. F. & Gloor, P. A. eds. 2016.
Designing Networks for Innovation and Improvisation: Proceedings of the
6th International COINs Conference. s.l., Springer.
Electronic Sources
Adler, B. 2014. Push Notifications vs. In-App Messaging: What's the
Difference for App Marketing? [accessed 26 November 2016]. Available
at: http://info.localytics.com/blog/push-messaging-vs-in-app-messaging-
whats-the-difference-for-app-marketing
Alba, D. 2016. Uber Hits 2 Billion Rides As Growth in China Soars—For
Now [accessed 26 November 2016]. Available at:
https://www.wired.com/2016/07/uber-hits-2-billion-rides-growth-china-
soars-now/
Amazon 2016. Amazon One Year Prime Membership [accessed 26
November 2016]. Available at: https://www.amazon.com/Amazon-Prime-
One-Year-Membership/dp/B00DBYBNEE
105
Andreessen, M. 2007. The Pmarca Guide to Startups Part 4: The only
thing that matters [accessed 11 November 2016]. Available at:
http://pmarchive.com/guide_to_startups_part4.html
AppBrain 2016. Number of Android applications [accessed 15 November
2016]. Available at: http://www.appbrain.com/stats/number-of-android-
apps
AppDynamics, n.d. 16 metrics to ensure mobile app success [accessed 12
November 2016]. Available at:
https://www.appdynamics.com/media/uploaded-files/1432066155/white-
paper-16-metrics-every-mobile-team-should-monitor.pdf
Apple 2008. iPhone App Store Downloads Top 10 Million in First Weekend
[accessed 01 November 2016]. Available at:
http://www.apple.com/pr/library/2008/07/14iPhone-App-Store-Downloads-
Top-10-Million-in-First-Weekend.html
Blank, S. 2010. Perfection By Subtraction – The Minimum Feature Set
[accessed 12 November 2016]. Available at:
https://steveblank.com/2010/03/04/perfection-by-subtraction-the-minimum-
feature-set/
Bussgang, J. & Benbarak, N. 2016. Every Company Needs a Growth
Manager [accessed 11 November 2016]. Available at:
https://hbr.org/2016/02/every-company-needs-a-growth-manager
Cambridge Dictionary, n.d. [accessed 01 November 2016]. Available at:
http://dictionary.cambridge.org/dictionary/english/app
Carpenter, R. 2014. How to Calculate Customer Retention [accessed 12
11 2015]. Available at: http://www.evergage.com/blog/how-calculate-
customer-retention/
Cecchi, T. 2016. When Marketing is ‘Baked Into’ the Product [accessed 11
November 2016]. Available at: https://medium.theuxblog.com/when-
marketing-is-baked-into-the-product-d880345ceed7#.ml2391b88
106
Chen, A., n.d. Growth Hacker is the new VP Marketing [accessed 11
November 2016]. Available at: http://andrewchen.co/how-to-be-a-growth-
hacker-an-airbnbcraigslist-case-study/
Chen, A., n.d. The Law of Shitty Clickthroughs [accessed 11 November
2016]. Available at: http://andrewchen.co/the-law-of-shitty-clickthroughs/
Chen, A., n.d. When has a consumer startup hit product/market fit?
[accessed 12 November 2016]. Available at: http://andrewchen.co/when-
has-a-consumer-startup-hit-productmarket-fit/
Chu, E. 2008. Android Market: Now available for users [accessed 01
November 2016]. Available at: http://android-
developers.blogspot.fi/2008/10/android-market-now-available-for-
users.html
Cipolla, H. 2014. Session Lengths as a Measure of App Engagement
[accessed 13 November 2016]. Available at:
http://info.localytics.com/blog/session-lengths-as-a-measure-of-app-
engagement
CNN 2016. Homepage [accessed 27 November 2016]. Available at:
http://edition.cnn.com/
Cummings, D. 2013. 5 Ways to Identify Product / Market Fit [accessed 12
November 2016]. Available at: https://davidcummings.org/2013/07/04/5-
ways-to-identify-product-market-fit/
Dev, R. 2016. Let’s define GROWTH HACKING for y’all [accessed 11
November 2016]. Available at: https://medium.com/@reachrishabh/lets-
define-growth-hacking-for-ya-ll-ccf1f570c74a#.iyh90yld7
Digital Analytics Association, n.d. Digital Analytics Association [accessed
12 November 2016]. Available at:
http://www.digitalanalyticsassociation.org/
107
Digital Market Asia 2014. MySQUAR’s MyChat for Myanmar [accessed 15
November 2016]. Available at:
http://www.digitalmarket.asia/2014/08/mysquars-mychat-for-myanmar/
Docherty, P. 2016. [Infographic] The Remarketing Report – Q3 2016
[accessed 26 November 2016]. Available at:
https://blog.salecycle.com/stats/infographic-remarketing-report-q3-2016/
Dykes, B. 2013. Web Analytics vs. Mobile Analytics: What’s the
Difference? [accessed 12 November 2016]. Available at:
http://www.analyticshero.com/2013/07/24/web-analytics-vs-mobile-
analytics-whats-the-difference/
Ellis, S. 2010. Find a Growth Hacker for Your Startup [accessed 11
November 2016]. Available at: http://www.startup-marketing.com/where-
are-all-the-growth-hackers/
Ellis, S. 2014. Growth Hacking is for Smart Marketers – Not Just Startups
[accessed 11 November 2016]. Available at: http://www.startup-
marketing.com/category/growth-hacking/
Ellis, S. 2016. Ask GH: What is your best three word description of growth
hacking? [accessed 14 November 2016]. Available at:
https://growthhackers.com/questions/ask-gh-what-is-your-best-three-word-
description-of-growth-hacking
Ellis, S., n.d. Using Survey.io [accessed 12 November 2016]. Available at:
http://www.startup-marketing.com/using-survey-io/
Espinal, C. E. 2013. The Product / Market Fit Cycle [accessed 11
November 2016]. Available at: http://thedrawingboard.me/2013/05/03/the-
product-market-fit-cycle/
Facebook 2016. Homepage [accessed 27 November 2016]. Available at:
https://www.facebook.com/
108
Facebook, n.d. Facebook [accessed 01 November 2016]. Available at:
https://www.facebook.com/facebook/about/
Farr, C. 2013. ‘Hyperdata,’ ‘growth hacker,’ & other awful buzzwords that
will rule in 2014 [accessed 01 November 2016]. Available at:
http://venturebeat.com/2013/12/25/hyperdata-growth-hacker-other-awful-
buzzwords-that-will-rule-in-2014/
Flynn, P. 2014. What I Learned From Growing My Email List 3,418%
(Nearly 200k) in Just 11 Days [accessed 27 November 2016]. Available at:
http://www.smartpassiveincome.com/what-i-learned-from-growing-my-
email-list-3418-nearly-200k-in-just-11-days/
Fogarty, D. & Bell, P. 2014. Should You Outsource Analytics? [accessed
12 November 2016]. Available at: http://sloanreview.mit.edu/article/should-
you-outsource-analytics-2/
Foody 2016. Introduction [accessed 26 November 2016]. Available at:
https://www.foody.vn/gioi-thieu
Gingold, N. 2016. Myanmar's connectivity catch-up [accessed 20
November 2016]. Available at:
http://frontiermyanmar.net/en/news/myanmars-connectivity-catch-up
Ginn, A. 2012. Build it and they won’t come: How and why growth hacking
came to be [accessed 11 November 2016]. Available at:
http://thenextweb.com/entrepreneur/2012/10/28/build-it-and-they-wont-
come-how-and-why-growth-hacking-came-to-be/
Ginn, A. 2012. Defining A Growth Hacker: 5 Ways Growth Hackers
Changed Marketing [accessed 11 November 2016]. Available at:
https://techcrunch.com/2012/09/07/defining-a-growth-hacker-5-ways-
growth-hackers-changed-marketing/
Ginn, A. 2012. Defining A Growth Hacker: Three Common Characteristics
[accessed 11 November 2016]. Available at:
109
https://techcrunch.com/2012/09/02/defining-a-growth-hacker-three-
common-characteristics/
Ginn, A., n.d. What is a growth hacker? [accessed 11 November 2016].
Available at: http://www.aginnt.com/growth-hacker
Gooding, L. 2014. Growth Hacking Like A Pirate, A Beginner’s Guide To
Pirate Metrics [accessed 19 November 2016]. Available at:
http://blog.trak.io/growth-hacking-like-a-pirate-a-beginners-guide-to-pirate-
metrics/
Google Play Store, n.d. MyChat - Chat in Myanmar [accessed 15
November 2016]. Available at:
https://play.google.com/store/apps/details?id=com.squar.mychat.release&
hl=en
Google Trends, n.d. Google Trends Explore "Growth Hacking" as a search
term [accessed 01 November 2016]. Available at:
https://www.google.com/trends/explore?date=2010-01-01%202016-11-
09&q=%22growth%20hacking%22
Google 2016. Where Analytics gets the data [accessed 14 November
2016]. Available at:
https://support.google.com/analytics/answer/2799357?hl=en#where
Google, n.d. Our history in depth [accessed 01 November 2016]. Available
at: https://www.google.com/about/company/history/#2008
Graham, P. 2012. Startup = Growth [accessed 11 November 2016].
Available at: http://www.paulgraham.com/growth.html
Gross, D. 2010. Apple trademarks 'There's an app for that' [accessed 01
November 2016]. Available at:
http://edition.cnn.com/2010/TECH/mobile/10/12/app.for.that/
110
History.com 2010. The Invention of the Internet [accessed 01 November
2016]. Available at: http://www.history.com/topics/inventions/invention-of-
the-internet
Hoch, D. 2015. In-App Messages Drive 3.5X Higher User Retention [New
Research] [accessed 26 November 2016]. Available at:
http://info.localytics.com/blog/in-app-messages-drive-higher-app-usage-
and-engagement-benchmarks
Horowitz, B. 2010. The Revenge of the Fat Gu [accessed 12 November
2016]. Available at: http://blog.pmarca.com/2010/03/20/the-revenge-of-
the-fat-guy/
Hum, S. 2015. Ride-sourcing Mobile App Referral Program Examples:
How Uber covered more than 50 countries in just 3 years [accessed 26
November 2016]. Available at: http://www.referralcandy.com/blog/ride-
sourcing-mobile-app-referral-program-examples-how-uber-covered-more-
than-50-countries-in-just-3-years/
Joorabchi, M. E., Mesbah, A. & Kruchten, P., n.d. Real Challenges in
Mobile App Development [accessed 12 November 2016]. Available at:
http://www.ece.ubc.ca/~amesbah/docs/mona-esem13.pdf
Jordan, A. 2015. In this Southeast Asian country, tea houses reign as the
go-to hangout [accessed 11 25 2016]. Available at:
http://mashable.com/2015/11/08/myanmar-tea-houses/#5od5WUDAOkqP
Jorgenson, E. 2015. Product/Market Fit: What it really means, How to
Measure it, and Where to find it [accessed 11 November 2016]. Available
at: https://medium.com/evergreen-business-weekly/product-market-fit-
what-it-really-means-how-to-measure-it-and-where-to-find-it-
70e746be907b#.ydzgvwcjx
Kagan, N. 2014. How we gained 200,000 new emails giving away some
Dropbox accounts [accessed 27 November 2016]. Available at:
http://www.appsumo.com/giveaways-early-special/
111
Karch, M. 2016. What Are Apps? - Definition and Examples [accessed 01
November 2016]. Available at: https://www.lifewire.com/what-are-apps-
1616114
Kutcher, E., Nottebohm, O. & Sprague, K. 2014. Grow fast or die slow
[accessed 11 November 2016]. Available at:
http://www.mckinsey.com/industries/high-tech/our-insights/grow-fast-or-
die-slow
Law, R. 2016. Pros and Cons of the Sean Ellis Product/Market Fit Test
[accessed 12 November 2016]. Available at:
https://www.cobloom.com/blog/how-to-use-the-sean-ellis-product/market-
fit-test#
Leiner, B. M. et al., n.d. Brief History of the Internet [accessed 01
November 2016]. Available at:
https://www.internetsociety.org/internet/what-internet/history-internet/brief-
history-internet
Lewis, A. 2014. Guide to Google Analytics Demographics Reports: Age,
Gender & Interests [accessed 12 November 2016]. Available at:
https://searchenginewatch.com/sew/how-to/2355504/guide-to-google-
analytics-demographics-reports-age-gender-interests
Localytics, n.d. The Beginner's Guide to App Analytics [accessed 14
November 2016]. Available at: http://info.localytics.com/hs-
fs/hub/367525/file-1246451878-
pdf/eBooks/The_Beginners_guide_to_app_marketing.pdf
Localytics, n.d. The Beginner's Guide to App Marketing [accessed 12
November 2016]. Available at: http://info.localytics.com/hs-
fs/hub/367525/file-1246451878-
pdf/eBooks/The_Beginners_guide_to_app_marketing.pdf
Macdonald, M. 2014. The Beginner's Guide to Simple A/B Testing
[accessed 26 November 2016]. Available at:
112
https://www.shopify.com/blog/12385217-the-beginners-guide-to-simple-a-
b-testing
Martin 2016. How to Assess Product Market Fit with the Sean Ellis Test
[accessed 12 November 2016]. Available at:
https://www.cleverism.com/product-market-fit-sean-ellis-test/
McClure, D. 2007. Startup Metrics for Pirates: AARRR! [accessed 18
November 2016]. Available at:
http://500hats.typepad.com/500blogs/2007/09/startup-metrics.html
McEachern, A. 2015. Loyalty Case Study: Amazon Prime [accessed 26
November 2016]. Available at:
https://www.sweettoothrewards.com/blog/loyalty-case-study-amazon-
prime/
McEachern, A. 2016. Loyalty Case Study: My Starbucks Rewards
[accessed 26 November 2016]. Available at:
https://www.sweettoothrewards.com/blog/loyalty-case-study-starbucks-
rewards/
MQTT, n.d. MQTT [accessed 20 November 2016]. Available at:
http://mqtt.org/
Murry 2015. AARRR Metrics For eCommerce Stores: The Holy Grail of
Growth [accessed 17 November 2016]. Available at:
https://www.metrilo.com/blog/aarrr-metrics-for-ecommerce/
MySQUAR 2016. MySQUAR Corporate Presentation (September 2016)
[accessed 15 November 2016]. Available at:
https://storage.googleapis.com/investors/MySQUAR%20Corporate%20Pre
sentation%20(September%202016).pdf
MySQUAR 2016. Registered user update [accessed 15 November 2016].
Available at: http://investors.mysquar.com/registered-user-update/
113
MySQUAR, n.d. Investor Website [accessed 15 November 2016].
Available at: http://investors.mysquar.com/
MySQUAR, n.d. MySQUAR's LinkedIn Profile [accessed 15 November
2016]. Available at: https://www.linkedin.com/company/squar-asia
O'Connell, C. 2015. 2015: The Year that Push Notifications Grew Up
[accessed 26 November 2016]. Available at:
http://info.localytics.com/blog/2015-the-year-that-push-notifications-grew-
up
O'Connell, C. 2016. The Inside View: How Consumers Really Feel About
Push Notifications [accessed 26 November 2016]. Available at:
http://info.localytics.com/blog/the-inside-view-how-consumers-really-feel-
about-push-notifications
Out, C. 2016. Growth Hacking vs. Traditional Marketing [accessed 11
November 2016]. Available at: https://rockboost.com/en-us/blog/growth-
hacking-vs-traditional-marketing
Oxford Business Group 2016. Myanmar’s telecoms industry to see new
entrant [accessed 11 20 2016]. Available at:
http://www.oxfordbusinessgroup.com/news/myanmar%E2%80%99s-
telecoms-industry-see-new-entrant
Oxford Learner’s Dictionaries, n.d. Definition of bete version [accessed 15
November 2016]. Available at:
http://www.oxfordlearnersdictionaries.com/definition/english/beta-
version?q=beta+version
Panici, J. 2016. What is the biggest marketing challenge faced by early
stage startups? [accessed 11 November 2016]. Available at:
https://www.quora.com/What-is-the-biggest-marketing-challenge-faced-by-
early-stage-startups
114
Patel, N., n.d. Growth Hacking Made Simple: A Step-by-Step Guide
[accessed 01 November 2016]. Available at: http://neilpatel.com/what-is-
growth-hacking/
Patel, N. & Taylor, B., n.d. The Definitive Guide to Growth Hacking
[accessed 11 November 2016]. Available at:
http://quicksprout.uberflip.com/i/174558-the-definitive-guide-to-growth-
hacking
Perro, J. 2016. Mobile Apps: What’s A Good Retention Rate? [accessed
13 November 2016]. Available at: http://info.localytics.com/blog/mobile-
apps-whats-a-good-retention-rate
PHKK 2010. Henkilöstöluettelo [accessed 30 November 2016]. Available
at: phkk.fi
Porter, J., n.d. Principles of Product Design [accessed 12 November
2016]. Available at: http://bokardo.com/principles-of-product-design/
Pullen, J. P. 2014. Everything You Need to Know About Uber [accessed
26 November 2016]. Available at: http://time.com/3556741/uber/
PYMNTS 2016. Starbucks Transactions Now 21 Percent On Mobile
[accessed 26 November 2016]. Available at:
http://www.pymnts.com/news/mobile-payments/2016/starbucks-
transactions-now-21-percent-on-mobile/
Reichheld, F. & Schefter, P. 2000. The Economics of E-Loyalty [accessed
18 November 2016]. Available at: http://hbswk.hbs.edu/archive/1590.html
Rideshare Dashboard 2015. Uber New $500 Referral Bonus In July 2015
for Lyft Drivers [accessed 26 November 2016]. Available at:
http://ridesharedashboard.com/2015/07/14/uber-new-500-referral-bonus-
in-july-2015-for-lyft-drivers/
San, M. S. 2014. MySQUAR Launches Free Mobile Messaging App for
Myanmar [accessed 15 November 2016]. Available at:
115
http://www.mmbiztoday.com/articles/mysquar-launches-free-mobile-
messaging-app-myanmar
Starbucks 2016. Rewards [accessed 26 November 2016]. Available at:
https://www.starbucks.ca/promo/rewards
Statista, n.d. Cumulative number of apps downloaded from the Apple App
Store from July 2008 to September 2016 (in billions) [accessed 01
November 2016]. Available at:
https://www.statista.com/statistics/263794/number-of-downloads-from-the-
apple-app-store/
Statista, n.d. Cumulative number of apps downloaded from the Google
Play as of May 2016 (in billions) [accessed 01 November 2016]. Available
at: https://www.statista.com/statistics/281106/number-of-android-app-
downloads-from-google-play/
Statista, n.d. Number of available applications in the Google Play Store
from December 2009 to September 2016 [accessed 01 November 2016].
Available at: https://www.statista.com/statistics/266210/number-of-
available-applications-in-the-google-play-store/
Statista, n.d. Number of available apps in the Apple App Store from July
2008 to June 2016 [accessed 01 November 2016]. Available at:
https://www.statista.com/statistics/263795/number-of-available-apps-in-
the-apple-app-store/
Statista, n.d. Number of monthly active WhatsApp users worldwide from
April 2013 to February 2016 (in millions) [accessed 11 November 2016].
Available at: https://www.statista.com/statistics/260819/number-of-
monthly-active-whatsapp-users/.
Teneva, D. 2016. Acquisition: AARRR Metrics Part 1 [accessed 18
November 2016]. Available at: https://www.metrilo.com/blog/acquisition-
aarrr-metrics-part-1/
116
Teneva, D. 2016. Activation: AARRR Funnel Part 2 [accessed 18
November 2016]. Available at: https://www.metrilo.com/blog/activation-
aarrr-funnel-part-2/
Teneva, D. 2016. Retention: AARRR Framework Part 3 [accessed 18
November 2016]. Available at: https://www.metrilo.com/blog/retention-
aarrr-framework/
The Coca-Cola Company 2012. The Real Story of New Coke [accessed
12 November 2016]. Available at: http://www.coca-
colacompany.com/stories/coke-lore-new-coke
THE PLAID AGENCY 2016. Be Obsessed With Growth Hacking
[accessed 11 November 2016]. Available at:
http://theplaidagency.com/blog/be-obsessed-with-growth-hacking/
TIME, n.d. Top 10 Bad Beverage Ideas [accessed 12 November 2016].
Available at:
http://content.time.com/time/specials/packages/article/0,28804,1913612_1
913610,00.htmlUber Vietnam 2016. Thứ Sáu đi ăn gì với Uber và Foody?
[accessed 26 November 2016]. Available at:
https://newsroom.uber.com/vietnam/thu6diangi/
Uber 2015. Earn Cash between Rides! [accessed 26 November 2016].
Available at: https://newsroom.uber.com/earn-cash-between-rides-2/
United Nations Human Rights Council 2016. The promotion, protection
and enjoyment of human rights on the Internet [accessed 01 November
2016]. Available at: https://documents-dds-
ny.un.org/doc/UNDOC/LTD/G16/131/89/PDF/G1613189.pdf?OpenElemen
t
Vawter, M. 2014. Analytics agencies vs. in-house: Which is best?
[accessed 14 November 2016]. Available at:
http://www.imediaconnection.com/articles/ported-articles/red-dot-
articles/2014/feb/analytics-agencies-vs-in-house-which-is-best/
Wight, M. 2016. Is Growth Hacking Just Marketing? Know The Difference
117
[accessed 11 November 2016]. Available at:
http://www.business2community.com/marketing/growth-hacking-just-
marketing-know-difference-01422349#cFkjKH5KSc8BXu1T.97
Wu, M. 2013. Big Data Reduction 1: Descriptive Analytics [accessed 12
November 2016]. Available at: https://community.lithium.com/t5/Science-
of-Social-blog/Big-Data-Reduction-1-Descriptive-Analytics/ba-p/77766
Wu, M. 2013. Big Data Reduction 3: From Descriptive to Prescriptive
[accessed 12 November 2016]. Available at:
https://community.lithium.com/t5/Science-of-Social-blog/Big-Data-
Reduction-3-From-Descriptive-to-Prescriptive/ba-p/81556
Yahoo, n.d. Flurry Analytics [accessed 14 November 2016]. Available at:
https://developer.yahoo.com/flurry/docs/analytics/
APPENDICES
APPENDIX 1. Interview with Truc N. Nguyen, product director of MyChat.
First and foremost, sincerely thank you, Ms Truc, for having agreed to this
interview.
Question 1: Has MyChat achieved product-market fit in Myanmar yet? If
yes, could you please elaborate more on this achievement?
In term of product performance, there are still lots of things for
improvement because the marketing always changes and users always
ask for new features and the best experiences. However, one thing we
have done well is providing a truly localized experience for Myanmar users
by
Dealing with font issue so we can cover all 3 most-used fonts in
Myanmar: Zawyi, Zawyi + Roboton, NotoSan Unicode so all text on
MyChat can be displayed clearly and correctly in every device.
Dealing with APK installation issue as 50% users of Myanmar do
not have Google Play in their Chinese device. So Myanmar users
without Google Play can still have a dedicate APK package for
installation.
Sticker localization: all sticker content and characters are localized
in Myanmar languages, daily emotion and activities. Stickers are all
designed by Myanmar artists
Content localization: all content published on MyChat feed are in
Myanmar and we also bring in Myanmar publishers to give users
healthy content to read.
Question 2: From a product perspective, what are MyChat app’s
strengths?
We are totally focusing on Myanmar market to create the best experiences
basing on Myanmar users’ demands. As we only are only operating in one
market so it is easy to adapt and change the product quickly based on
users’ expectation.
We also adapt new technology into the platform based on market
infrastructure. For example, we recently use MQTT technology for our chat
service. MQTT is a lightweight messaging protocol for small sensors and
mobile devices, optimized for high-latency or unreliable networks so it is
totally suitable for pre-emerging marketing like Myanmar where internet
connection is still low and unstable.
Question 3: From a product perspective, what are MyChat app’s
weaknesses?
MyChat is only a 2-year-old platform (we would launch version 2.0 by the
end of this year), in comparison, big players, such as Viber, Line,
Facebook, already have a very mature product with full features. So we
would need more time to complete core features as well as implement new
specifications dedicated for the marketing.
Also, as the market grows quickly so does our users base, even quicker
than our expectation. We were not well prepared for this situation
regarding the the application infrastructure and architecture, so the
application stability was not good for a long time. However, we have
restructured the architecture from June and the performance has been
better since then.
Question 4: Generally speaking, what are your thoughts on the current
MyChat app? Are you happy with its performance and its features?
MyChat needs to improve the performance of key features as well as be
competitive in specification servicing Myanmar users as MyChat won’t be
able to compete with other big guys who have entered and dominated the
chat messaging market for years. Localization would be the navigation for
product development so we are long way to go regarding specification
developments. In general, I’m happy with the performance after we have
reworked on the architecture and infrastructure of the application.
Question 5: As a product director, what is your strategy for the
development/ improvement of MyChat app? Please tell us about your
short-term and long-term goals.
My strategy regarding product development is based on Myanmar users‘
demand to prioritize the roadmap. I also need to balance between users’
requirement and business strategy. In short term, I want to focus on MQTT
optimization so we can bring the best chat experiences to users. In long
term, I hope to build up MyChat as an app-in-app platform so users can do
a bunch of things when they are on MyChat, order food, book a ride, play
a game or pay for their bill.
Question 6: There has been news about a brand new MyChat - a new
version that the team at MyChat has been working so diligently for. Could
you please tell us more about this breakthrough?
We plan to release the version 2 by the end of this year. This would be a
totally new MyChat which are
Applying our brand guideline, with new friendly UI and brand
identities.
MQTT is fully optimized so chat experiences would be super-fast,
stable and consume less data.
New Stickers Store so users can easily look for their favorite
characters designed by Myanmar artists.
New Channels zone so users can browse, read and follow up with
famous publishers in Myanmar.
Again, sincerely thank you for your time.
APPENDIX 2. Interview with Mr Dang H. Nguyen, digital marketing
manager of MyChat.
First and foremost, sincerely thank you, Mr Dang, for having agreed to this
interview.
Question 1: How is MyChat positioned in Myanmar?
MyChat is one of the leading mobile chat app in Myanmar which accounts
for 20% of Myanmar internet users.
Question 2: Has MyChat achieved product-market fit in Myanmar yet? If
yes, could you please elaborate more on this achievement?
MyChat has satisfied the demand of Myanmar market by offering the
dedicated content for Myanmar people including trendy news and
attractive sticker sets. Moreover, MyChat is improving routinely the UI and
UX for providing a better experience for Myanmar users.
Question 3: What is the current focus of the Marketing team at MyChat?
Is it acquisition, activation, retention or something else?
We will release the flagship version on December so retention is the
current focus of the Marketing team in order to maintain the Daily Active
Users as well as listen to user’s feedback.
Question 4: What method/ platform/ channel have you been implementing
to acquire users?
Facebook is the key channel for acquiring new users with a very
competitive CPI as well as gaining the viral effect in order to improving the
brand awareness and organic users.
Question 5: What method have you been using to retain users?
We are using push notifications and in-app messages to send segmented
messages to a suitable user list with the latest content which is generated
by internal channels and official publishers. Moreover, we are using
Facebook as a significant channel for engaging our current fans and
encouraging them back to MyChat.
Question 6: Tracking system is of utmost importance to an app. What are
your thoughts on the current tracking system of MyChat? (If possible,
please mention that the old tracking system is lacking in many areas)
The tracking system is absolutely important for every digital products. As a
mobile app, defining organic traffic is tough and we are also dealing with
the limitation of User Journey tracking. Myanmar users like to get the APK
file from official sources (our websites and social media) or from their
friends or at the mobile store rather than download from Google Play Store
so that the channel attribution is a challenge for us to define which one
gains the effectiveness on user acquisition and user retention.
Question 7: Will there be any investment to enhance the tracking system?
If yes, how is the new tracking system superior to the current one?
With the sophisticated user journey, we are trying to improve the tracking
system as well as reform the BI system in order to get a deep understand
of user behaviours.
Question 8: As a digital marketing manager, what are your future plans
for boosting the growth of MyChat app? Will your focus shift?
The V2 of MyChat is the result of 2-years learning and experimenting in
order to understand the local insights. We embrace every single pixel and
code line with a simple goal is to deliver a most powerful, hassle-free and
Myanmar-centric to every Myanmar people, especially Millennium who is
looking for a modern, fun and attractive chat app. As a Digital Marketing
Manager, there is nothing more delightful than the MyChat will be used by
40% of Myanmar internet users.
Again, sincerely thank you for your time.