PORT HACKING - Sutherland Shire Council
412
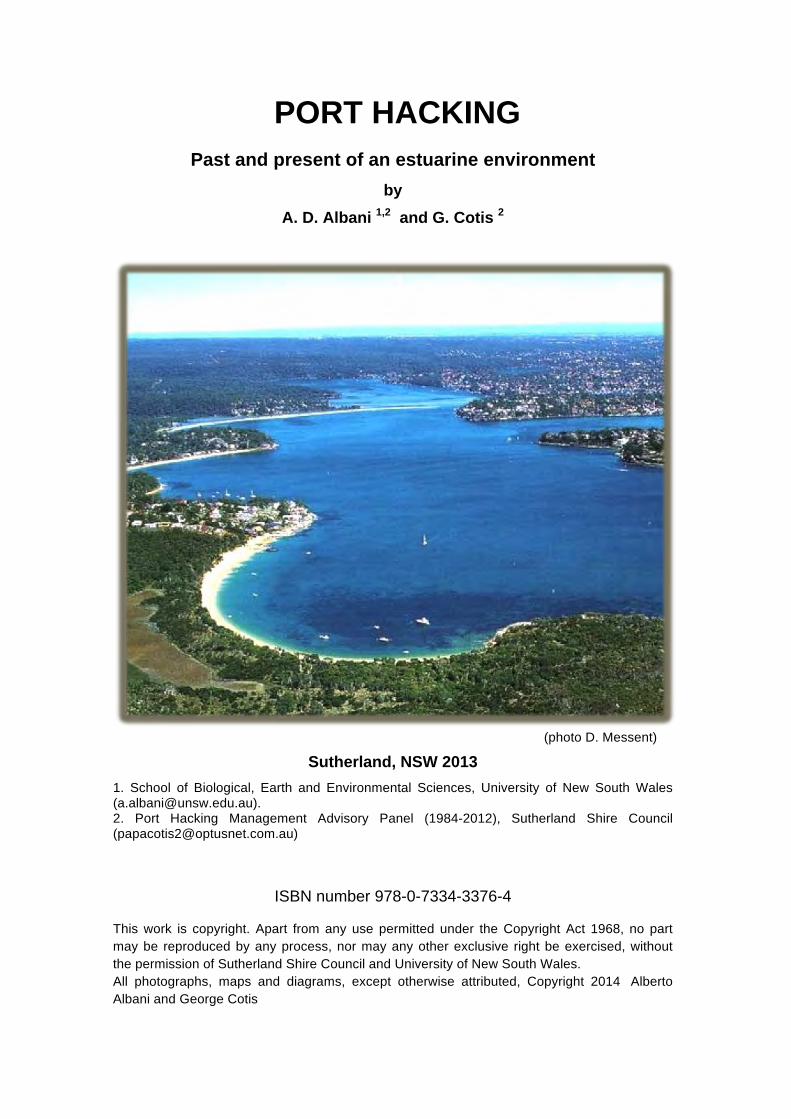
PORT HACKING Past and present of an estuarine environment by A. D. Albani 1,2 and G. Cotis 2 (photo D. Messent) Sutherland, NSW 2013 1. School of Biological, Earth and Environmental Sciences, University of New South Wales ([email protected]). 2. Port Hacking Management Advisory Panel (1984-2012), Sutherland Shire Council ([email protected]) ISBN number 978-0-7334-3376-4 This work is copyright. Apart from any use permitted under the Copyright Act 1968, no part may be reproduced by any process, nor may any other exclusive right be exercised, without the permission of Sutherland Shire Council and University of New South Wales. All photographs, maps and diagrams, except otherwise attributed, Copyright 2014 Alberto Albani and George Cotis
-
Upload
khangminh22 -
Category
Documents
-
view
2 -
download
0
Transcript of PORT HACKING - Sutherland Shire Council
PORT HACKING
Past and present of an estuarine environment by
A. D. Albani 1,2 and G. Cotis 2
(photo D. Messent)
Sutherland, NSW 2013 1. School of Biological, Earth and Environmental Sciences, University of New South Wales ([email protected]). 2. Port Hacking Management Advisory Panel (1984-2012), Sutherland Shire Council ([email protected])
ISBN number 978-0-7334-3376-4 This work is copyright. Apart from any use permitted under the Copyright Act 1968, no part may be reproduced by any process, nor may any other exclusive right be exercised, without the permission of Sutherland Shire Council and University of New South Wales. All photographs, maps and diagrams, except otherwise attributed, Copyright 2014 Alberto Albani and George Cotis
2
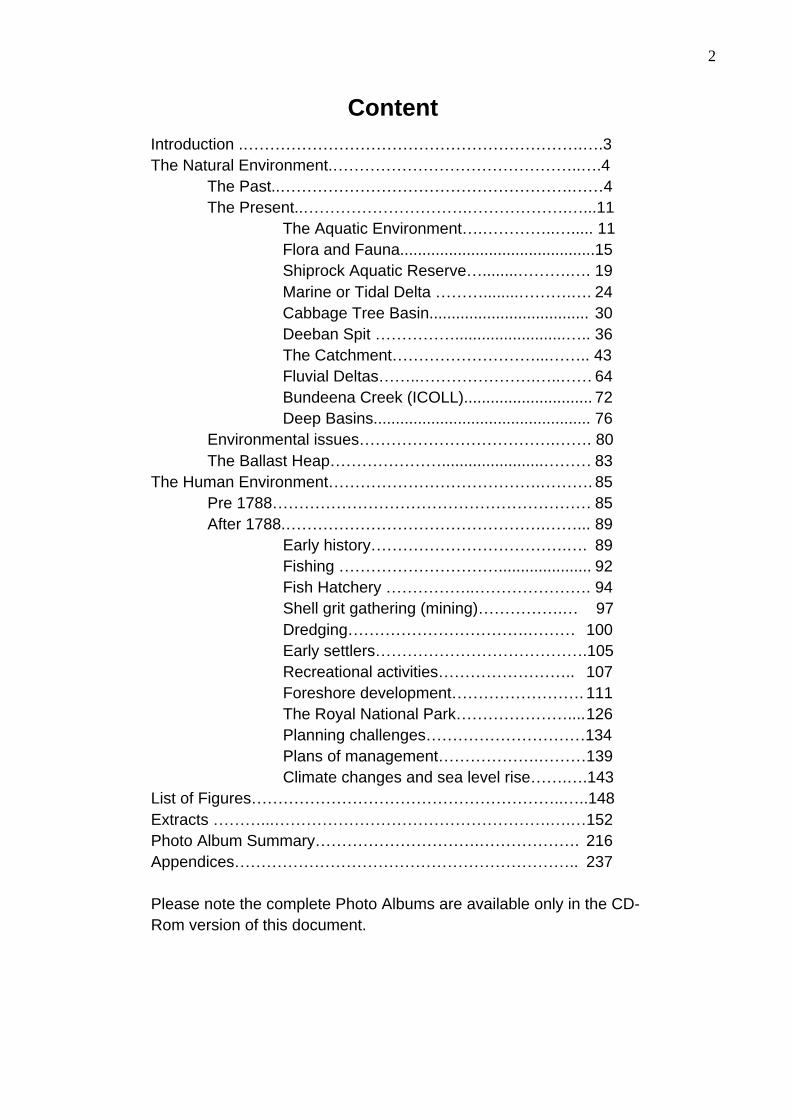
Content Introduction .……………………………………………………….….3 The Natural Environment.………………………………………..….4 The Past..……………………………………………….……4 The Present..………………………….……………….…...11 The Aquatic Environment….…………..…..... 11 Flora and Fauna............................................15 Shiprock Aquatic Reserve…........……….…. 19 Marine or Tidal Delta ………........……….…. 24 Cabbage Tree Basin.................................... 30 Deeban Spit …………….........................….. 36 The Catchment………………………...…….. 43 Fluvial Deltas……..………………….…..…… 64 Bundeena Creek (ICOLL)............................. 72 Deep Basins................................................. 76 Environmental issues……………………………….……. 80 The Ballast Heap………………….......................……… 83 The Human Environment………………………………….………. 85 Pre 1788…………………………………………………… 85 After 1788.………………………………………….……... 89 Early history……………………………….…. 89 Fishing …………………………..................... 92 Fish Hatchery ……………..…………………. 94 Shell grit gathering (mining)…………….… 97 Dredging…………………………….……… 100 Early settlers………………………………….105 Recreational activities…………………….. 107 Foreshore development……………………. 111 The Royal National Park………………….... 126 Planning challenges…………………………134 Plans of management……………….………139 Climate changes and sea level rise…….….143 List of Figures…………………………………………………..…..148 Extracts ………...…………………………………………….….…152 Photo Album Summary………………………….………………. 216 Appendices……………………………………………………….. 237 Please note the complete Photo Albums are available only in the CD-Rom version of this document.

3
Introduction
This paper has been prepared to complement the Port Hacking Plan of
Management and its updates. Its aim is to provide background information, and
to provide in abbreviated form an understanding of Port Hacking’s origins and
its dynamics. It contains Extracts from the Port Hacking Plan of Management
(Sutherland Shire, 1992), the Port Hacking Marine Delta, Management Options
(PWD, 86013), the Port Hacking Integrated Environmental Management Plan
(2007) and additional recent research material. We gratefully acknowledge the
support of Mr David Messent and Mr Les Bursill, Aboriginal Living Sites Survey
Team, for some of the photographs and Ms Mary Dallas, "Sutherland Shire
Council Aboriginal Cultural Heritage Study". We also express our thanks to the
editing assistance of Mrs. Sue Cotis.
Many published early works give a detailed account of events and the original
written words disclose the style and depth of thought and the interrelation with
the natural environment.
For that reason we offer a comprehensive series of Extracts of original
documents and narratives. To allow the flow of the discussion such Extracts
are presented at the end of this paper for easier consultation. The use of
bookmarks facilitates their use. Further there are three works that, because of
their relevance and magnitude, have been attached as Appendices.
Additional images of particular importance, to enhance description or to re-
enforce the text on a subject, are grouped as a separate file in Photo Album.
All figures are acknowledged; those without acknowledgement are by the
authors.
While the presentation has been divided into natural and human environments
some overlapping is unavoidable.

4
The Natural Environment - The Past Port Hacking lies on the southern fringe of Sydney, 30 kilometres from the city
proper (Fig. 1). Located between the unspoilt landscape of the Royal National
Park to the south and the surfing beaches of Cronulla to the north, Port
Hacking remains a relatively unspoilt waterway.
Figure 1 - Port Hacking (photo D. Messent)
Figure 2 - Climatic and sea level fluctuations during the last 1.8 million years.

5
During the last 1.8 million years, the Earth experienced a number of climatic
fluctuations (Fig. 2), with conditions similar to the present (warm) (Fig. 2 red)
alternating with periods characterised by glaciations (cold) (Ice Ages) (Fig. 2
blue). About 29% of the continental areas, mainly in the northern hemisphere,
was covered by ice that caused a drop in the sea level to a maximum of 120
metres below the present (Fig. 2). During the last 1.8 million years therefore
the sea level fluctuated several times between the present and 120 metres
below the present.
During the glaciation periods and the lower sea levels, large volumes of
sediments were eroded from the river valleys and transported to the sea.
During the warmer periods, as the ice melted, the sea rose to the present level
drowning the valleys; waves and tidal currents remobilized the sediments that
were then redeposited in the outer portion of the valleys.
During the low sea level conditions, the coastline of the metropolitan area of
Sydney, shown in figure 3 as bedrock contours below present sea level, was
several kilometres to the east and was characterized by numerous river
valleys. Many rivers can be recognised such as the Hawkesbury, Parramatta,
and Botany Rivers. The Hacking River was part of the Georges and Cooks
Rivers system that, flowing to the sea, cut a deep rocky valley on the inner
shelf to about 6-8 kilometres east of the present shores. They can be seen
converging in that process.
Other rivers are present mainly on the drowned inner shelf and largely covered
by sediments, although indications of their presence can be inferred from the
present day cliffs and beaches, and by the remnant terrestrial processes.
In figure 4 the ancient valleys of the Hacking and Georges Rivers, as they
appeared 20,000 years ago, are shown as bedrock contours in metres below
present sea level.

6
Figure 3 – The Sydney coastline, as it was 20,000 - 18,000 years ago.
100
10080
80 100
60402020
40
80
402060
60
20
40
20 40
80100
60
2040
60
100
100
100
80
80
80
80 100
100
100
100
100
80
80
10080
80
80
100
60
60
60
80
8060
60
6080
60
60
60
40
4020
20 40
20 40
2040
60
40
20
60
6060 10080
806040
40
40
40
20
20
20
100
100
100100
80
80
80
80
80
60
60
60
60
80
60
40
40
40
60
40
2020
20
20
20
20
20
20
100806040
40
8080
2020
20
4040
40
40
60
60 60
60
100
80
80
8060
80
80
80
100 100
100
10080
100
100
20
40
40
2040
60
100
20
9080
ThePeak
Bedrock
morphology
as contours
in metres
below
sea level
Hawkesbury River
Pitt Water
Narrabeen
Long Reef
Manly
Port Jackson
Bondi
(See bedrock map ofBotany Bay for details)
Botany Bay
Kurnell
Georges River
Malabar
Maroubra
Cogee
Bronte
Dover Heights
Vaucluse
Harbord
Dee Why
Mona Vale
Newport
BilgolaAvalon
Palm Beach
A.D. Albani et al. 2012
3 50 000 3 60 000 3 70 000
3 50 000 3 60 0003 40 000 3 70 000
6280
000
6270
000
6260
000
6250
000
6240
000
6230
000
3 40 0003 30 000
3 30 000
6280
000
6270
000
6260
000
6250
000
6240
000
6230
000
7
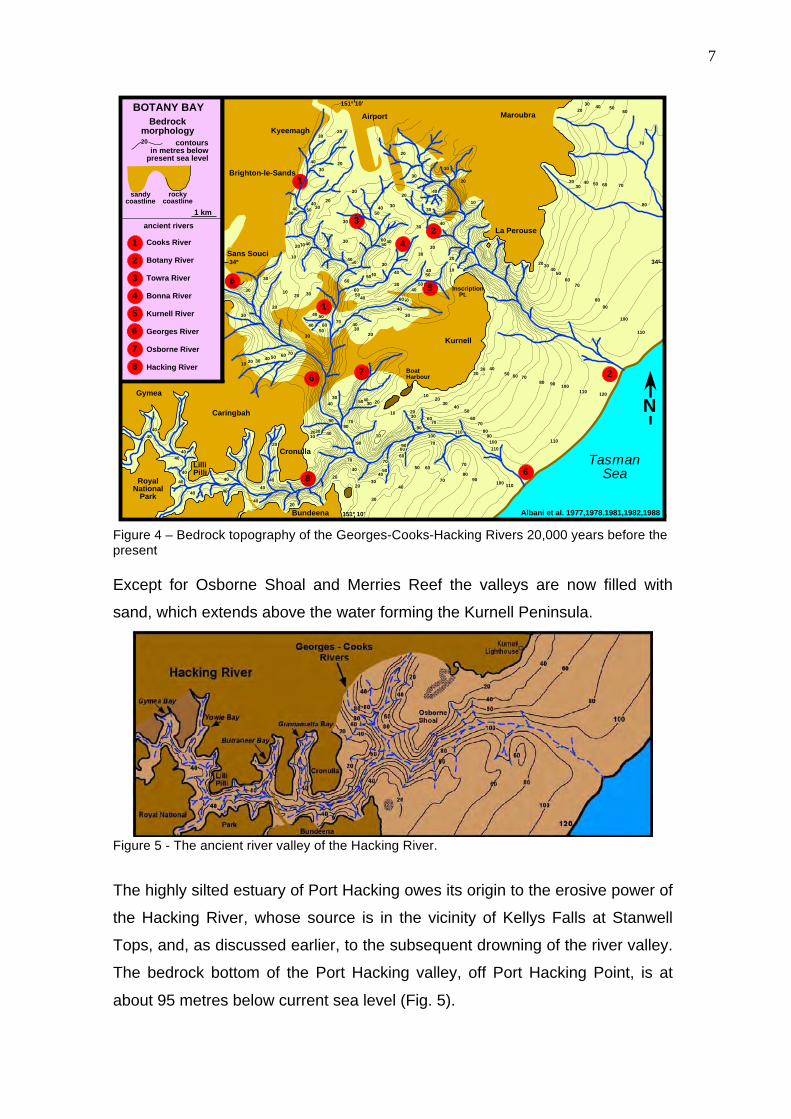
Figure 4 – Bedrock topography of the Georges-Cooks-Hacking Rivers 20,000 years before the present Except for Osborne Shoal and Merries Reef the valleys are now filled with
sand, which extends above the water forming the Kurnell Peninsula.
Figure 5 - The ancient river valley of the Hacking River.
The highly silted estuary of Port Hacking owes its origin to the erosive power of
the Hacking River, whose source is in the vicinity of Kellys Falls at Stanwell
Tops, and, as discussed earlier, to the subsequent drowning of the river valley.
The bedrock bottom of the Port Hacking valley, off Port Hacking Point, is at
about 95 metres below current sea level (Fig. 5).
5
1
3
42
1
6
6 7 2
68
110
100
9080
7060
5040
3020
1101009080
7060504030
20
120
110
110100
10090
90
80
80
70
70
7060
5040
3020
10
6050
40
30
3040
60
110
110
60
708090
10090
50
7070
90
90 7090
70
10
10
20
2030
2040
402010
30 40
4030 4050 30 20
4030
20
70
7060504030
4050
60
30
2010
20
30 3040
50
40
404040
40
5050
5040
60
30
30
3030
50
10
20
50
60
5040
303040
60
60
30 5040
40
20
20
30
103030
3040
4030
30
7010
50
20
2020
30
3040
30
30
5040
10
40
20
30
20
2030
40
2030
40
20
4040
40
4040
4040
40
40
4040
2030
40 50 60 70
80
70
60504030
20
20
Maroubra
Kyeemagh
La Perouse
InscriptionPt.
BoatHarbour
Sans Souci
CronullaLilliPilli
Caringbah
Gymea
Airport
Brighton-le-Sands
RoyalNational
Park
Bundeena
Kurnell
151º 10'
34º34º
151º 10'
BOTANY BAYBedrock
morphologycontours
in metres belowpresent sea level
20
rockycoastline
sandycoastline
1
2
3
4
5
7
8
46
ancient rivers
Cooks River
Botany River
Hacking River
Georges River
Towra River
Bonna River
Kurnell River
Osborne River
Albani et al. 1977,1978,1981,1982,1988
N
TasmanSea
1 km
8
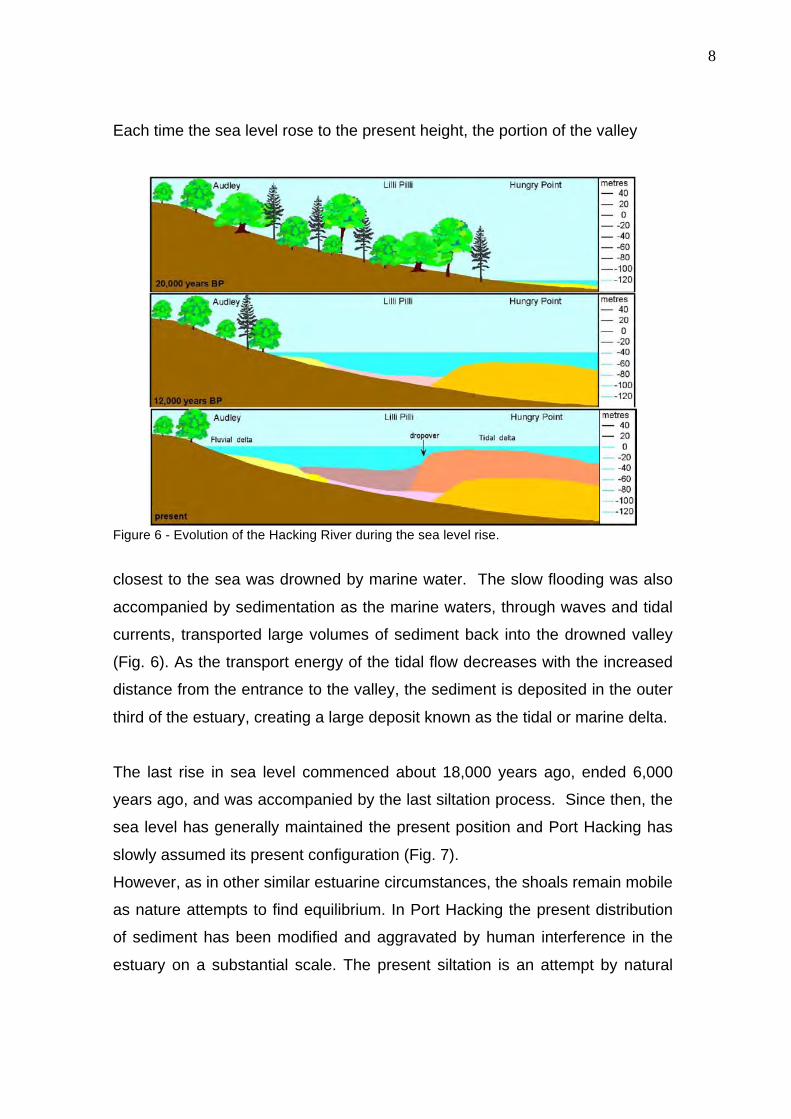
Each time the sea level rose to the present height, the portion of the valley
Figure 6 - Evolution of the Hacking River during the sea level rise.
closest to the sea was drowned by marine water. The slow flooding was also
accompanied by sedimentation as the marine waters, through waves and tidal
currents, transported large volumes of sediment back into the drowned valley
(Fig. 6). As the transport energy of the tidal flow decreases with the increased
distance from the entrance to the valley, the sediment is deposited in the outer
third of the estuary, creating a large deposit known as the tidal or marine delta.
The last rise in sea level commenced about 18,000 years ago, ended 6,000
years ago, and was accompanied by the last siltation process. Since then, the
sea level has generally maintained the present position and Port Hacking has
slowly assumed its present configuration (Fig. 7).
However, as in other similar estuarine circumstances, the shoals remain mobile
as nature attempts to find equilibrium. In Port Hacking the present distribution
of sediment has been modified and aggravated by human interference in the
estuary on a substantial scale. The present siltation is an attempt by natural

9
processes to achieve a near-equilibrium condition. This is discussed later in
this paper.
Figure 7 - Bathymetry map of Port Hacking
Figure 8 - Main sediment distribution in Port Hacking (redrawn from Port Hacking Plan of Management, Sutherland Shire, 1992).
Bass &FlindersPt
Port Hacking, N.S.W.
1 km
-1m
-10
waterdepth
North WestArm
GymeaBay
YowieBay
GannonsBay
Bu
rran
eer
Bay
DolansBay
Little TurriellBay
SouthWest Arm
Cab
bage
Tree
Bas
in
Middle GroundShoal
Burraneer
CronullaGu
nn
am
att
aB
ay
Lilli PilliPt
Ship Rock
BurraneerPt
HungryPt
Bate
Bay
JibbonPt
BundeenaBonnieVale
Maianbar
WillarongPt
YowiePt
Mansion Pt
PointDanger
Lig
hti
nin
gP
t
CostensPt
GogerleysPt
ROYAL
NATIONAL
PARK
DeebanSpit
Caringbah
MirandaGymea
N
Ballast Heap SalmonHaul Bay
TurriellPt
JibbonBeach
Fisherman’sBay
Yenabilli
RedJacksPt
Constables Pt
CabbageTree Pt
Warumbul
GraysPt
Bass &FlindersPt
Port Hacking, N.S.W.
1 km
North WestArm
GymeaBay
YowieBay
GannonsBay
Bu
rran
eer
Bay
DolansBay
Little TurriellBay
SouthWest Arm
Cab
bage
Tree
Bas
in
Middle GroundShoal
Burraneer
CronullaGu
nn
am
att
aB
ay
Lilli PilliPt
Ship Rock
BurraneerPt
HungryPt
Bate
Bay
JibbonPt
BundeenaBonnieVale
Maianbar
WillarongPt
YowiePt
Mansion Pt
PointDanger
Lig
hti
nin
gP
t
CostensPt
GogerleysPt
ROYAL
NATIONAL
PARK
DeebanSpit
Caringbah
MirandaGymea
N
Ballast Heap SalmonHaul Bay
TurriellPt
JibbonBeach
Fisherman’sBay
Yenabilli
RedJacksPt
Constables Pt
CabbageTree Pt
Warumbul
GraysPt
sediment
sand
muddy sand
mud
10
At the same time, however, surface runoff following rainfall continued to carry
fluvial sediments into the estuary creating fluvial or riverine deltas at the end of
the Hacking River and at the end of each sub-catchment (at the heads of
bays).
The areas between the tidal delta and the various fluvial deltas do not receive
large amounts of sediment, only some fine silt and clay (Fig. 8), and thus they
maintain much of the original depth. The deepest point in Port Hacking, 27
metres, is west of Lilli Pilli.
The Hacking River, with a length of 42 km from its most distant source (2 km
west of Stanwell Tops) to Port Hacking Point, drains an area largely occupied
by the Royal National Park to the south and the suburbs of the Sutherland
Shire to the north. Port Hacking proper is the estuary from the entrance to
Grays Point, at which point is the fluvial delta of the Hacking River.

11
The Natural Environment – The present
Aquatic Environment
The environmental conditions that control the water qualities, the ecological
distribution of plants and animals and the stability of the seabed are related to
the behaviour of the water masses. Tide and wave induced currents are the
main source of energy throughout an estuary.
The fluctuations of the water levels in response to tidal influence are referred to
as a series of tidal planes.
In Port Hacking the levels of the water do not show any considerable variation
from Hungry Point to Audley (Fig. 9).
In other words the same water level is experienced, although at different times,
throughout the Port. The physical configuration of the seabed and shorelines
does not constrict the flow.
Figure 9 – The tidal planes throughout the length of Port Hacking. ISLW is the level used in charts (redrawn from Port Hacking Marine Delta, Management Options, PWD, 86013).
Audley Gymea Bay Lilli PilliBurraneer
Bay HungryPoint
mean high water spring
mean high water
mean high water neaps
half tide level
mean low water neaps
mean low watermean low water spring
ISLW
chart datum
1.633 1.613 1.613 1.593 1.572
1.440
1.308
1.469
1.3441.368
1.4911.483
1.352
1.506
1.378
1.005
0.571
0.474
0.377
0.139
0.576
0.488
0.400
0.170
0.568
0.482
0.396
0.1660.146
0.376
0.475
0.574
0.100
0.552
0.442
0.331
0.100
11.8 6.0 3.9 1.4 0Km
heig
htab
ove
zero
onFo
rtD
enis
ontid
ega
uge
(m)
12
The Indian Spring Low Water (ISLW) is the level of reference used in all
soundings as it indicates the minimum possible depth of water. This level of
reference is directly related to the tidal variations and it may vary from locality
to locality even in the same body of water.
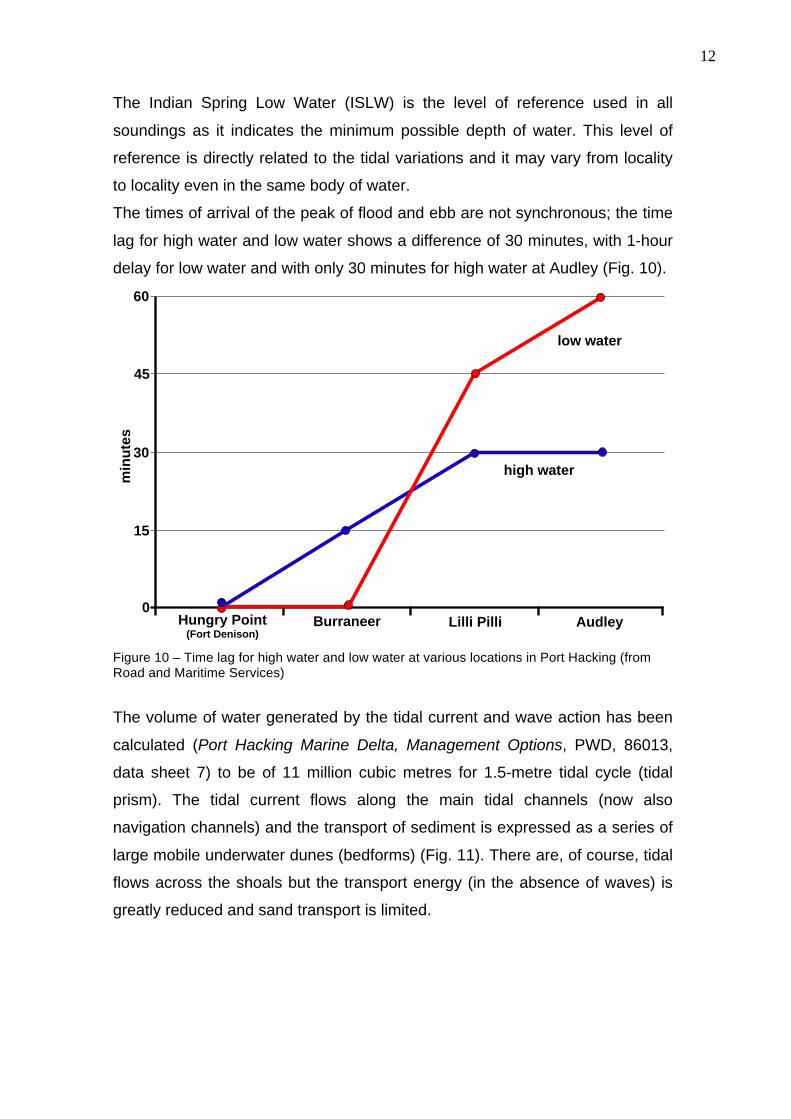
The times of arrival of the peak of flood and ebb are not synchronous; the time
lag for high water and low water shows a difference of 30 minutes, with 1-hour
delay for low water and with only 30 minutes for high water at Audley (Fig. 10).
Figure 10 – Time lag for high water and low water at various locations in Port Hacking (from Road and Maritime Services)
The volume of water generated by the tidal current and wave action has been
calculated (Port Hacking Marine Delta, Management Options, PWD, 86013,
data sheet 7) to be of 11 million cubic metres for 1.5-metre tidal cycle (tidal
prism). The tidal current flows along the main tidal channels (now also
navigation channels) and the transport of sediment is expressed as a series of
large mobile underwater dunes (bedforms) (Fig. 11). There are, of course, tidal
flows across the shoals but the transport energy (in the absence of waves) is
greatly reduced and sand transport is limited.
Hungry Point(Fort Denison)
Burraneer Lilli Pilli Audley0
15
30
45
60
min
utes
low water
high water

13
As the movement of sand takes place near the bed of the channel, the
monitoring of the bedforms provides an understanding of the magnitude and
direction of the sediment movement.
A number of these bedforms was monitored (Port Hacking Marine Delta,
Management Options, PWD, 86013) with the result that there is a net
movement of bottom sediment in the upstream direction (westward) (Fig. 12).
Figure 11 – Sand bodies (bedforms) clearly visible along the main tidal channels between Turriell Point and Lilli Pilli. Note the small delta at the end of the Fishermans Bay channel.
Figure 12 – Sediment movement based on bedform data. Note the net upstream sediment transport (flood) (redrawn from Port Hacking Marine Delta, Management Options, PWD, 86013).
Cronulla
Wave orthogonalDirection of wave travel
NBate Bay
Bundeena
Pole 0
Pole 1
2.0
1.5
1.0
0 0.05 0.15 0.25
sediment movement (m3 / m / 1/2 tide)
tidal
rang
e(m
)
flood
ebb

14
Waves are another component of the energy of the water masses; they stir the
sediment in a near suspension state making it available to tidal current
transport but also their direction of approach may create a longshore current.
The ocean swell enters Port Hacking from different approach directions that
are refracted so that they enter the Port within a narrow range of approaches
(within 5º) (Fig. 13).
Figure 13 – Refracted travel path of the waves approaching Port Hacking
Clear evidence of longshore transport is shown by the mobile sand bodies at
right angles to Deeban Spit (Fig. 14).
Figure 14 – Sand bodies at a right angle to Deeban Spit
Cronulla
Wave orthogonalDirection of wave travel
NBate Bay
Bundeena
Pole 0
Pole 1
2.0
1.5
1.0
0 0.05 0.15 0.25
sediment movement (m3 / m / 1/2 tide)
tidal
rang
e(m
)
flood
ebb

15
Flora and Fauna
Amongst the major elements of the aquatic environment of Port Hacking are
the three vegetative habitats important to the productivity of the estuary. These
habitats are characterised by seagrasses, mangroves and salt marshes (Fig.
15).
Figure 15 - The distribution of the major elements of the aquatic environment (Map reproduced with permission of NSW Department of Primary Industries from: Creese RG, Glasby TM, West G and Gallen C (2009) Mapping the habitats of NSW estuaries. Industry & Investment NSW Fisheries Final Report Series 113. Port Stephens, NSW, Australia. ISSN 1837-2112. 95pp)
The three different habitats are colonised by distinct floral and faunal
communities. However, they function similarly as areas of primary food
production where sunlight and nutrients are converted into organic material.
This material is then used in the estuarine food web. These habitats also
provide sheltered and stable areas for juvenile and adult estuarine species. A
wide range of organisms, from birds to fish to encrusting algae, benefits from
the food and shelter provided by these habitats.
Of the three vegetation types, seagrasses occupy the largest area within the
Port. A total of 87 hectares is covered by three species of seagrasses (Fig.
16).
P o r t H a c k i n g
Bundeena
Cronulla
Caringbah
Grays Point
GymeaBay
YowieBay
GannonsBay Burraneer
Bay
GunnamattaBay
Binnie Vale
Maianbar
Warumbul
Gymea
South West Arm
322000
322000
324000
324000
326000
326000
328000
328000
330000
330000
6226
000
6226
000
6228
000
6228
000
6230
000
6230
000
±LegendMacrophyte
PosidoniaPosidonia/Zostera
Posidonia/Zostera/HalophilaPosidonia/HalophilaZostera
HalophilaMangrove
Saltmarsh
Port Hacking, N.S.W.
0 10.5
Kilometers
16
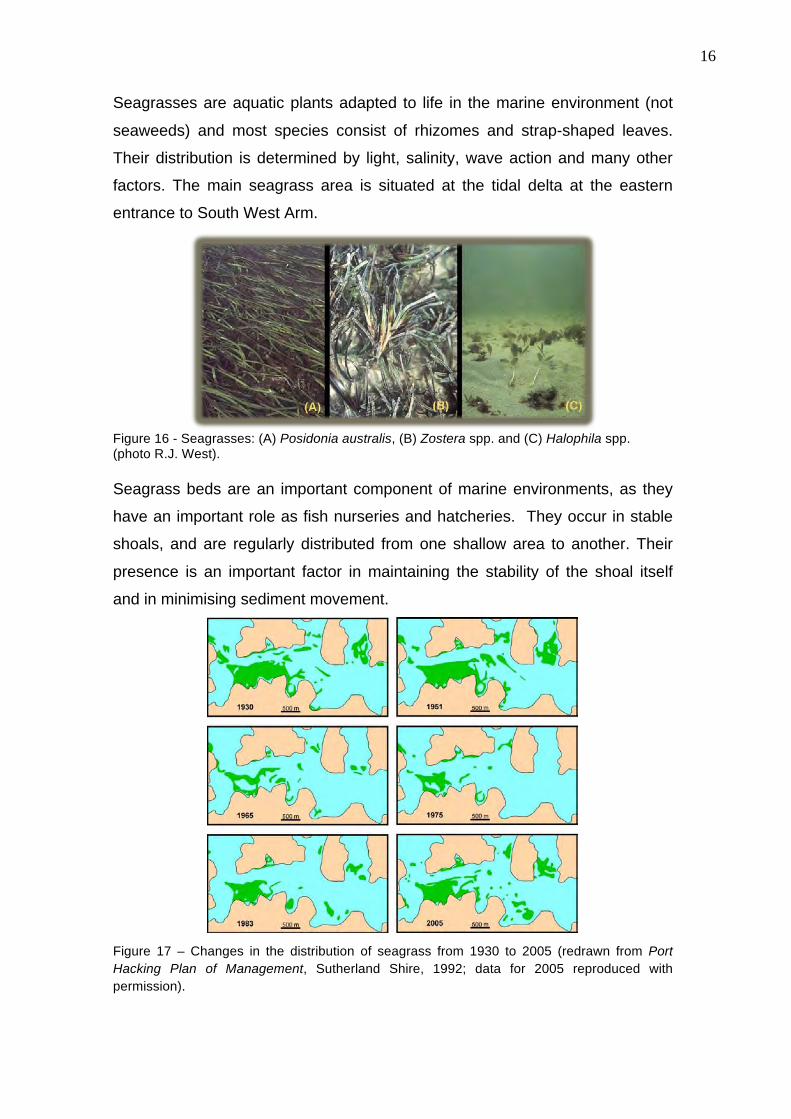
Seagrasses are aquatic plants adapted to life in the marine environment (not
seaweeds) and most species consist of rhizomes and strap-shaped leaves.
Their distribution is determined by light, salinity, wave action and many other
factors. The main seagrass area is situated at the tidal delta at the eastern
entrance to South West Arm.
Figure 16 - Seagrasses: (A) Posidonia australis, (B) Zostera spp. and (C) Halophila spp. (photo R.J. West). Seagrass beds are an important component of marine environments, as they
have an important role as fish nurseries and hatcheries. They occur in stable
shoals, and are regularly distributed from one shallow area to another. Their
presence is an important factor in maintaining the stability of the shoal itself
and in minimising sediment movement.
Figure 17 – Changes in the distribution of seagrass from 1930 to 2005 (redrawn from Port Hacking Plan of Management, Sutherland Shire, 1992; data for 2005 reproduced with permission).

17
Changes in the seagrass cover of the shoals of the tidal delta (Fig. 17), over
the period 1930 to 1983 indicate that the extensive seagrass beds that existed
in this area in 1930 and 1951 were progressively destroyed by shell grit mining
carried out from the late 1920’s up to the early 1960’s. Some regrowth of
seagrass beds has occurred since the shell grit mining ceased in 1973,
however its extent has not reached the pre-mining levels.
Two species of mangroves occupy a total of 33 hectares (Fig. 18), while salt
marsh only covers a total of 11 hectares and this is mainly in Cabbage Tree
Basin and South West Arm.
Figure 18 - Mangroves at North West Arm.
Other aquatic habitats are also important even though they do not provide the
same amounts of organic material. They include mud flats, rocky outcrops,
and open water.
Rocky outcrops in Port Hacking are an extension of the shoreline and provide
the hard substrate needed for attaching organisms. These occur in the
intertidal and sub-tidal zones of the rocky environments (Appendix 4) (Figs 19,
22). The organisms vary according to location, such as proximity to the sea,
but oysters are ubiquitous throughout the estuary.

18
Most importantly, these varying habitats are all highly interrelated making the
aquatic environment a single dynamic unit. This means that any change in one
habitat or area will have some effects elsewhere in the Port.
Figure 19 – Rocky outcrop with intertidal habitat, head of Gunnamatta Bay
Amateur recreational fishing and other water related activities are very popular
within Port Hacking. The Port is easily accessible and in close proximity to the
city of Sydney and to the large population catchment in Sydney’s southwest.
The waterway is almost solely reserved for recreational activities as the major
portion of the estuary (west of Hungry Point) has been closed to commercial
net fishing since 1902.
The conservation of the Port and its adjacent environment is an important issue
and efforts to address it began in 1879 with what is now the Royal National
Park. In 1967 the sea beds of Cabbage Tree Basin and South West Arm and
the Hacking River upstream of Grays Point were added to the Park for
protection. The Park's foreshores and waterways offer a wide range of
activities from simple exploration by individuals to study by educational and
scientific groups.

19
Shiprock Aquatic Reserve Shiprock, a deep submarine cliff (Fig. 20), is a unique feature in Port Hacking.
The site derives its name from a prominent ship-like rock off Little Turriell Point,
the west headland at the entrance to Burraneer Bay, nearly 3 kilometres from
Glaisher Point at the mouth of Port Hacking. The frontal lobe of the Deeban
Spit sits to its south. It is the submarine, or sub-tidal features that have earned
this site its protection as well its recreational and educational appeal. The site
was declared an aquatic reserve under the Fisheries and Oyster Farms Act in
March 1982.
Figure 20 – Shiprock. Localised strong currents and the cliff’s topography have maintained the site
free of the deposition of large quantities of sand, unlike other areas in the tidal
delta, leaving a relatively small but deep environment (Fig. 21) that is covered
by a rich growth of marine flora, invertebrates (Figs. 23 - 25) attracting large
numbers of fish, many species of which are not consistent with the rest of the
20
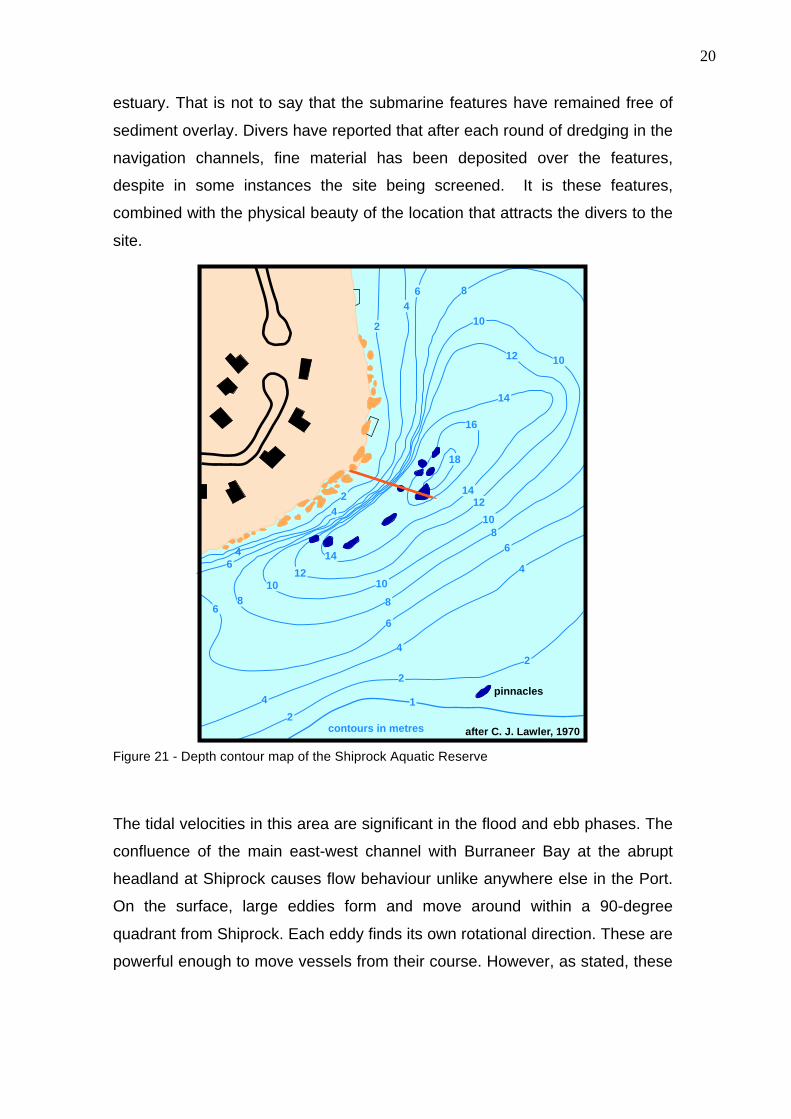
estuary. That is not to say that the submarine features have remained free of
sediment overlay. Divers have reported that after each round of dredging in the
navigation channels, fine material has been deposited over the features,
despite in some instances the site being screened. It is these features,
combined with the physical beauty of the location that attracts the divers to the
site.
Figure 21 - Depth contour map of the Shiprock Aquatic Reserve
The tidal velocities in this area are significant in the flood and ebb phases. The
confluence of the main east-west channel with Burraneer Bay at the abrupt
headland at Shiprock causes flow behaviour unlike anywhere else in the Port.
On the surface, large eddies form and move around within a 90-degree
quadrant from Shiprock. Each eddy finds its own rotational direction. These are
powerful enough to move vessels from their course. However, as stated, these
2
2
4
4
44
6
6
688
8
10 10
10
10
10
8
12
12
12
14
16
18
14
14
2
4
4
2
6
6
4
2
1
contours in metres
pinnacles
after C. J. Lawler, 1970

21
have been found to be superficial, and the currents below the surface (these
being critical to the existence of the submarine character) behave differently.
The bathymetry (sea-bed contours) (Fig. 21) shows the local peculiarities of the
site.
It is the coincidence of location, underwater topography and oceanic water flow
that has provided this estuarine microenvironment.
The site was extensively studied between the years of 1965 and 1970 by the
Underwater Research Group of New South Wales. That study appears in
Appendix 4 to this paper and provides an outstanding description of the
underwater landscape and biota.
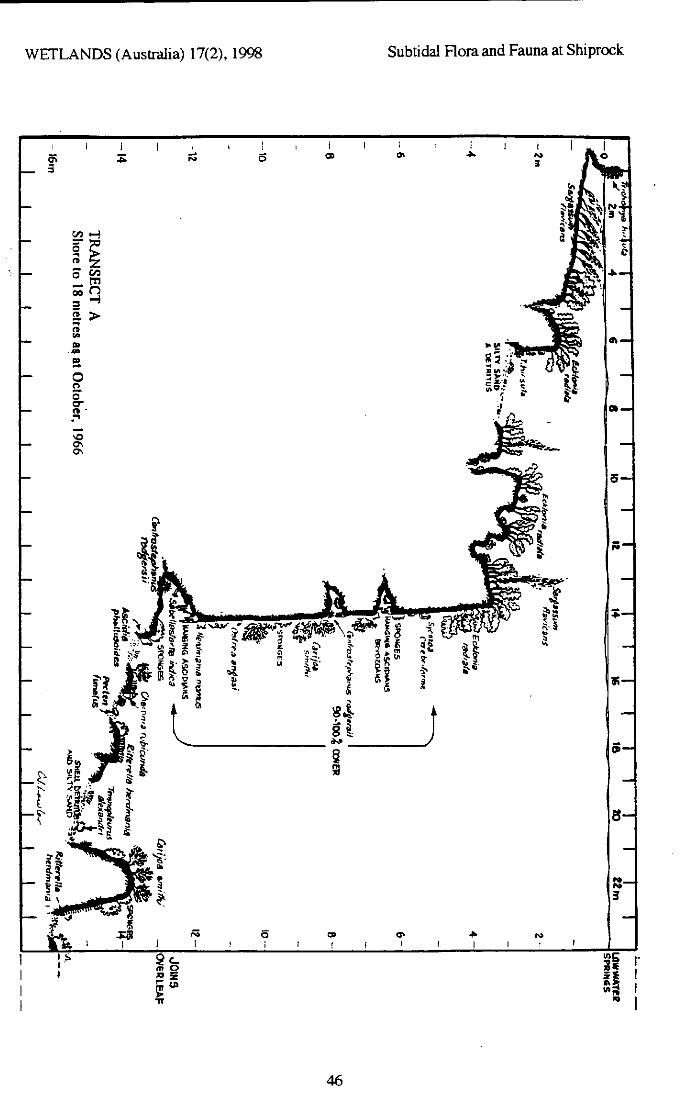
Figure 22 shows the subtidal profile, i.e. the topography of the wall and
seabed, together with the organisms that populate the wall.
Figure 22 – Idealised section showing the distribution of the most common elements of the biota (redrawn from original by C. Lawler, 1998).
Access to the water at the site was historically problematic even though a small
reserve provided an access easement. Its track was steep and largely unmade,
and when damp or wet made the trip down and up again, with the weight of
diving gear, a strenuous or hazardous exercise. The long-standing residents
adjacent to the easement made a bequest to the Council generous enough to
provide what is now a high quality dive access and community resource.
Sargassum flavicans (seaweed)
Eckloria radiata (seaweed)
ascidians
Carijoa smithi (coelenterate, alcyonaria, coral)
sponges
Ostrea angasi (mollusk, oysters)
Trichomya hirsuta (mollusk,mussels)
Sabellastarte indica (feather-duster worm)
Pecten fumatus (mollusk, scallops)
rock
sand
0
2
4
6
8
10
12
14
16
18
m
ThePinnacle

22
Figure 23 - Feather tube worm (Sabellastarte) (photo Daniel Wainwright)
Figure 24 – coral (Carijoa smithi) (photo Daniel Wainwright)
23
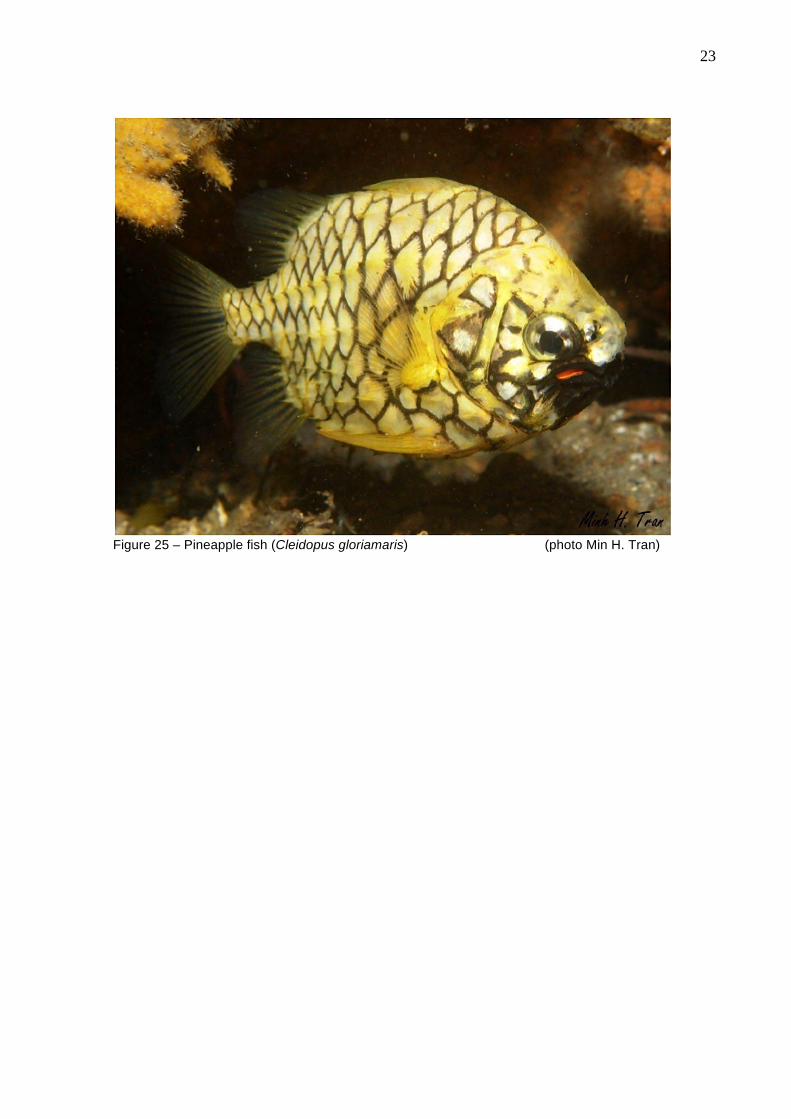
Figure 25 – Pineapple fish (Cleidopus gloriamaris) (photo Min H. Tran)

24
Marine or Tidal Delta
The marine delta occupies most of the area between the entrance and Lilli Pilli
Point (Figs. 26, 27).
Figure 26 - The tidal delta. Note the navigation channel and the large areas (dark right) of sea grasses. Note also the mobile sand forming the dropover area off Lilli Pilli and the sharp dropover at the entrance to South West Arm (bottom); sand bars are visible in the main navigation channel (photo Cronulla Beach YHA)
Figure 27 – The seabed configuration of the marine or tidal delta
It is composed of 160 million tonnes of fine-grained sand of marine origin with
local concentrations of shell fragments (Fig. 28).
25
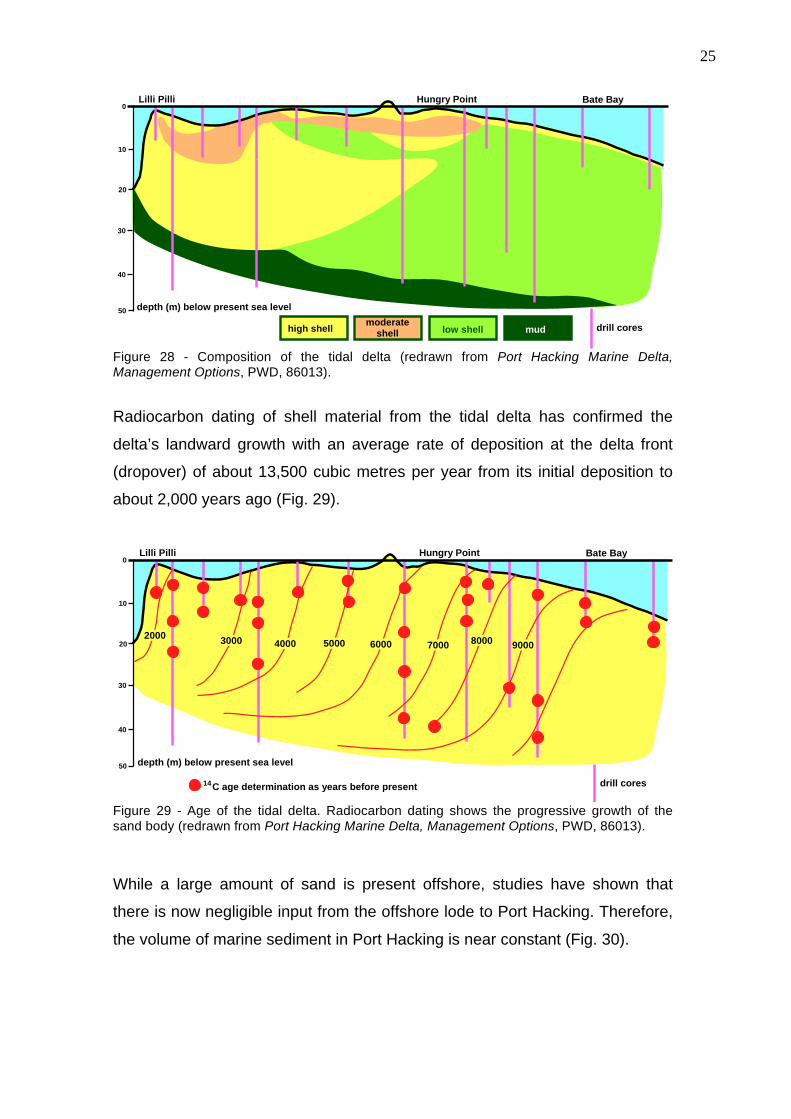
Figure 28 - Composition of the tidal delta (redrawn from Port Hacking Marine Delta, Management Options, PWD, 86013).
Radiocarbon dating of shell material from the tidal delta has confirmed the
delta’s landward growth with an average rate of deposition at the delta front
(dropover) of about 13,500 cubic metres per year from its initial deposition to
about 2,000 years ago (Fig. 29).
Figure 29 - Age of the tidal delta. Radiocarbon dating shows the progressive growth of the sand body (redrawn from Port Hacking Marine Delta, Management Options, PWD, 86013).
While a large amount of sand is present offshore, studies have shown that
there is now negligible input from the offshore lode to Port Hacking. Therefore,
the volume of marine sediment in Port Hacking is near constant (Fig. 30).
high shellmoderate
shell low shell mud
Lilli Pilli Hungry Point Bate Bay
depth (m) below present sea level
0
10
30
40
50
20
drill cores
Lilli Pilli Hungry Point Bate Bay
depth (m) below present sea level
0
10
30
40
50
20
drill coresC age determination as years before present14
90008000700060005000400030002000
26
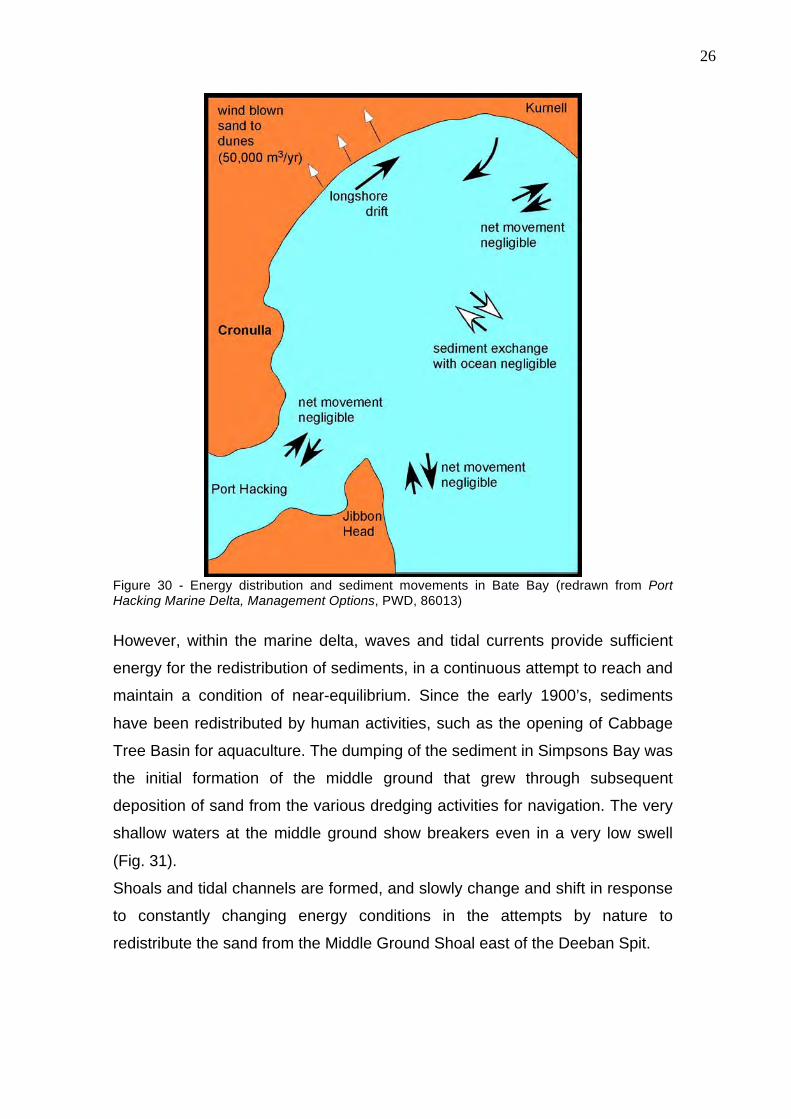
Figure 30 - Energy distribution and sediment movements in Bate Bay (redrawn from Port Hacking Marine Delta, Management Options, PWD, 86013)
However, within the marine delta, waves and tidal currents provide sufficient
energy for the redistribution of sediments, in a continuous attempt to reach and
maintain a condition of near-equilibrium. Since the early 1900’s, sediments
have been redistributed by human activities, such as the opening of Cabbage
Tree Basin for aquaculture. The dumping of the sediment in Simpsons Bay was
the initial formation of the middle ground that grew through subsequent
deposition of sand from the various dredging activities for navigation. The very
shallow waters at the middle ground show breakers even in a very low swell
(Fig. 31).
Shoals and tidal channels are formed, and slowly change and shift in response
to constantly changing energy conditions in the attempts by nature to
redistribute the sand from the Middle Ground Shoal east of the Deeban Spit.
27
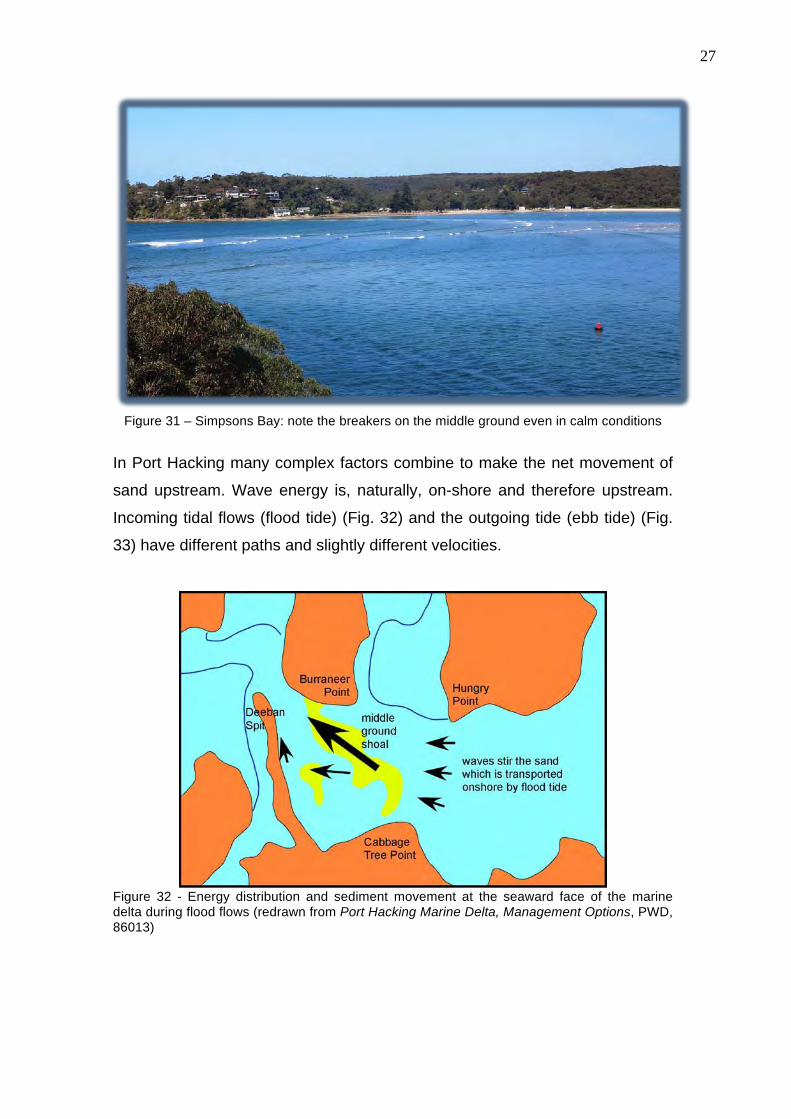
Figure 31 – Simpsons Bay: note the breakers on the middle ground even in calm conditions
In Port Hacking many complex factors combine to make the net movement of
sand upstream. Wave energy is, naturally, on-shore and therefore upstream.
Incoming tidal flows (flood tide) (Fig. 32) and the outgoing tide (ebb tide) (Fig.
33) have different paths and slightly different velocities.
Figure 32 - Energy distribution and sediment movement at the seaward face of the marine delta during flood flows (redrawn from Port Hacking Marine Delta, Management Options, PWD, 86013)

28
Figure 33 - Energy distribution and sediment movement at the seaward face of the marine delta during ebb flows (redrawn from Port Hacking Marine Delta, Management Options, PWD, 86013 As a result, more sediment is transported upstream by the flood tide than is
carried downstream by the ebb tide.
Consequently, the net result is that sand moves progressively upstream until it
is finally deposited at the upstream end of the marine delta, at the dropovers.
These dropovers occur at the eastern bays of Gunnamatta and Burraneer, at
Lilli Pilli and in South West Arm.
Clear evidence of this overall process is offered by the series of sand waves at
right angles to Deeban Spit (Figs. 35) and along the main tidal channel to Lilli
Pilli (Fig. 26).
Few areas protected from the waves and tidal currents by the configuration of
the ancient valley show limited sediment input and thus relatively deep-water
conditions such as Fishermans Bay (Fig. 34).
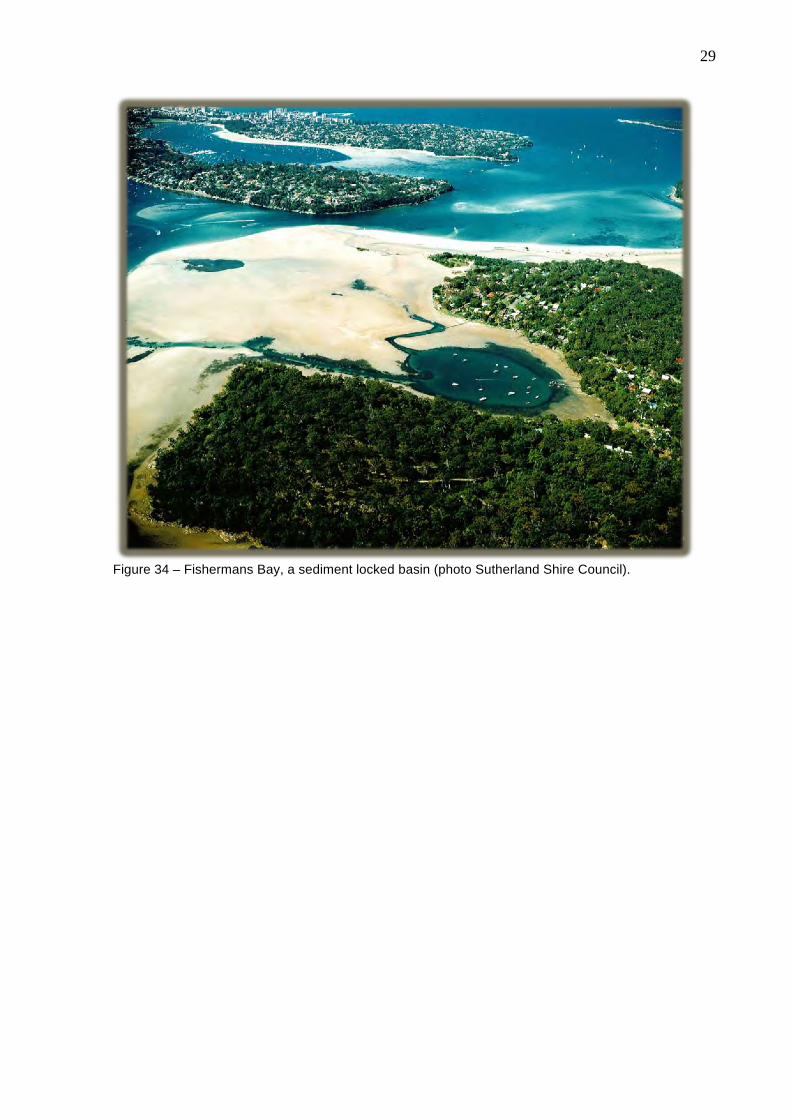
29
Figure 34 – Fishermans Bay, a sediment locked basin (photo Sutherland Shire Council).

30
Cabbage Tree Basin Cabbage Tree Basin is a small water body within the National Park on the
southern shore of Port Hacking and therefore is part of its overall catchment.
Although it may reach 6 metres in depth The Basin is surrounded by shallow
waters and sandy shoals that are exposed at low tide. A small tidal channel
brings clear marine waters from the Port and it allows the discharge of
floodwaters after heavy rainfall (Fig. 35).
Figure 35 – The Basin (left). Note the largely silted entrance. Note also the mobile sand bodies along the seaward edge of The Spit (photo Sutherland Shire Council).
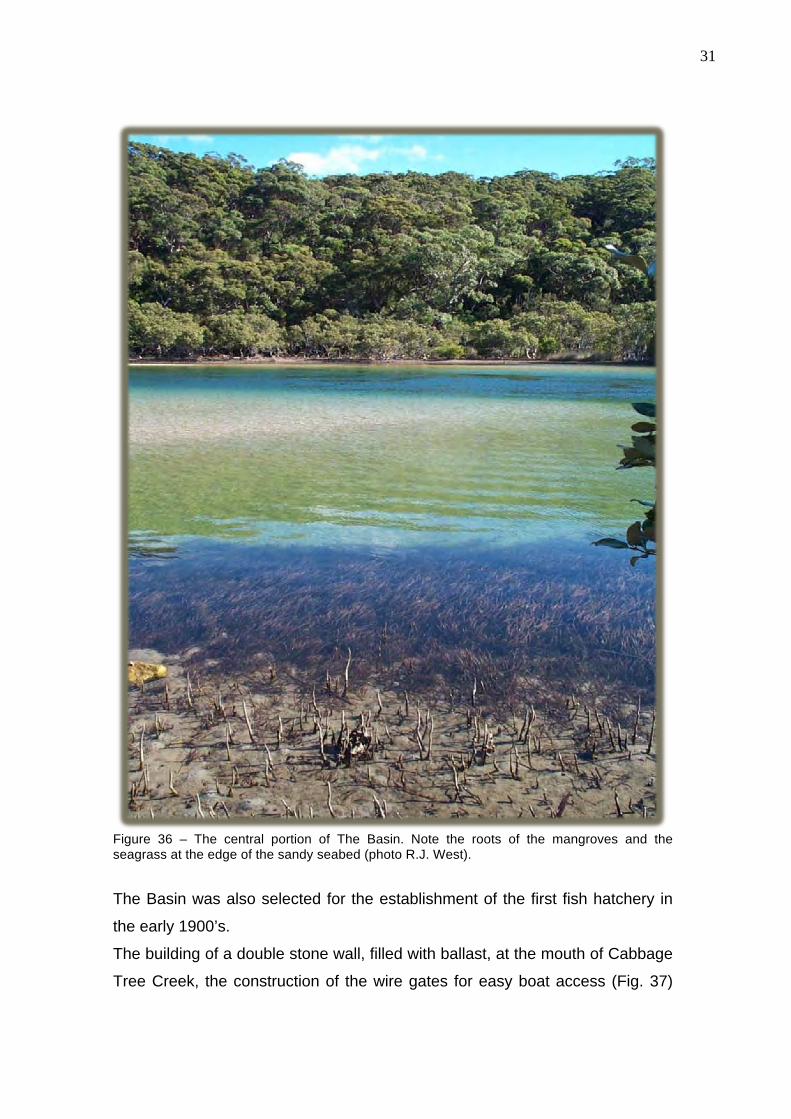
The Basin contains many important members of the estuarine wetlands
communities; it contains more than 90% of the saltmarsh areas of Port Hacking
and 37% of the mangrove area (Fig. 36) (Appendix 1).
One of the main features of The Basin catchment is the presence of peat soils
that act like a spongy reservoir of fresh water generating many springs. Even
during relatively dry periods, these freshwater springs remain a constant supply
of drinking water.
31
Figure 36 – The central portion of The Basin. Note the roots of the mangroves and the seagrass at the edge of the sandy seabed (photo R.J. West).
The Basin was also selected for the establishment of the first fish hatchery in
the early 1900’s.
The building of a double stone wall, filled with ballast, at the mouth of Cabbage
Tree Creek, the construction of the wire gates for easy boat access (Fig. 37)

32
and the dredging of the middle channel, have created irreversible changes
mainly in the distribution of the wetlands and sandy shoals.
Figure 37 – The wall and gates of The Hatchery in Cabbage Tree Basin (R.J. West)
Figure 38 – Simpsons Bay. Note the shallow sand banks in front of The Hatchery (R.J. West).
33
In 1901-1902 nearly 350,000 tonnes of sand were dredged from the side of
Simpsons Bay and dumped just in the centre of the bay (Fig. 38) that is one of
the most active zones of the estuary. Such initial dumping may have created
the first “middle ground shoal” that has grown by subsequent dumps of sand
from the various dredging for navigation channels.
In 1914 The Hatchery ceased operation and by the early 1920 the Middle
Ground Shoal was being moved by waves and flood tidal currents towards
Deeban Spit and westwards along the main navigation channels (Figs 39 –
43). Simpsons Bay was shoaling and the entrance to Cabbage Tree Basin
filled. Over the next twenty years the western movement of the middle ground
shoal continued.
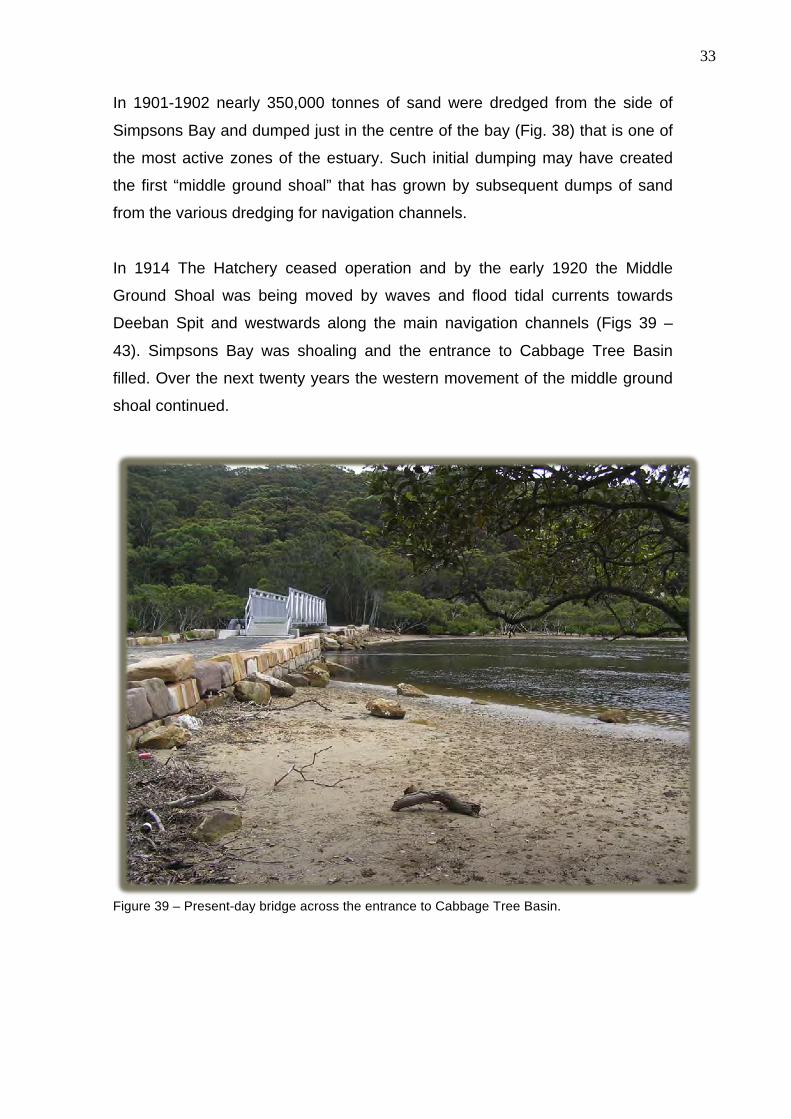
Figure 39 – Present-day bridge across the entrance to Cabbage Tree Basin.

34
Figure 40 – Entrance to Cabbage Tree Basin looking north towards Deeban Spit.
Figure 41 – Entrance to Cabbage Tree Basin looking south towards The Basin.

35
Figure 42 – Seagrass bed at the entrance channel
Figure 43 – Mangroves within The Basin
36
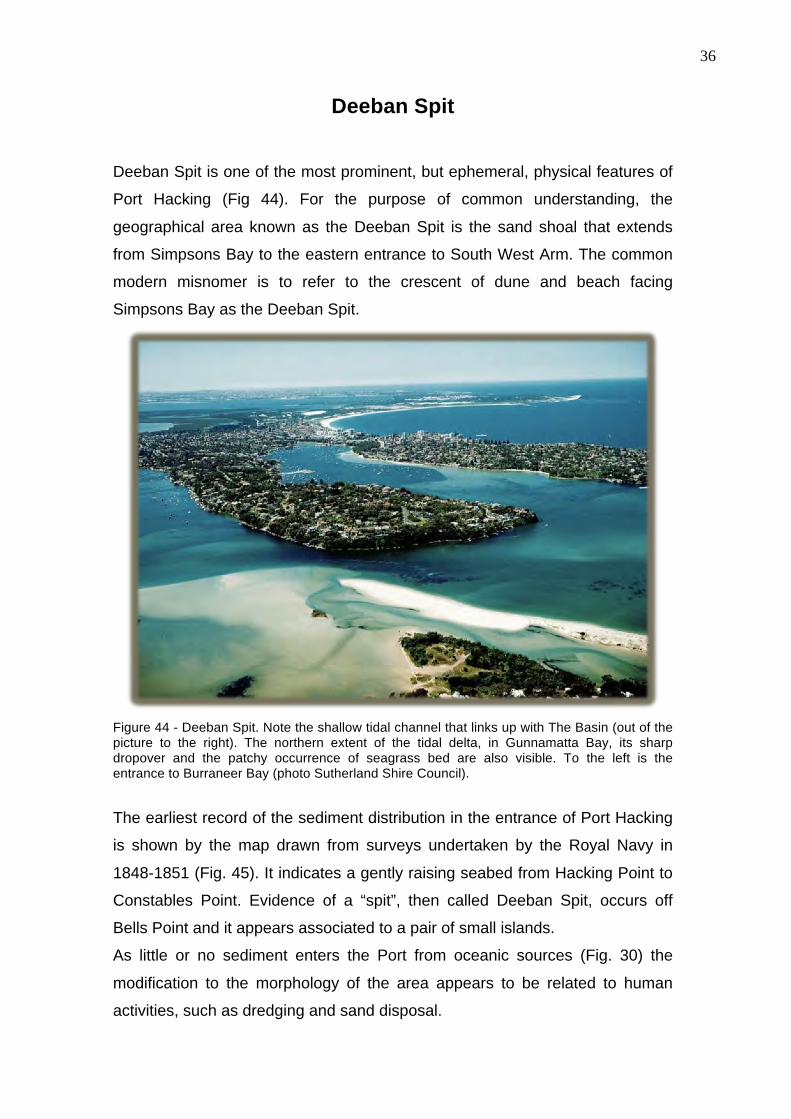
Deeban Spit Deeban Spit is one of the most prominent, but ephemeral, physical features of
Port Hacking (Fig 44). For the purpose of common understanding, the
geographical area known as the Deeban Spit is the sand shoal that extends
from Simpsons Bay to the eastern entrance to South West Arm. The common
modern misnomer is to refer to the crescent of dune and beach facing
Simpsons Bay as the Deeban Spit.
Figure 44 - Deeban Spit. Note the shallow tidal channel that links up with The Basin (out of the picture to the right). The northern extent of the tidal delta, in Gunnamatta Bay, its sharp dropover and the patchy occurrence of seagrass bed are also visible. To the left is the entrance to Burraneer Bay (photo Sutherland Shire Council).
The earliest record of the sediment distribution in the entrance of Port Hacking
is shown by the map drawn from surveys undertaken by the Royal Navy in
1848-1851 (Fig. 45). It indicates a gently raising seabed from Hacking Point to
Constables Point. Evidence of a “spit”, then called Deeban Spit, occurs off
Bells Point and it appears associated to a pair of small islands.
As little or no sediment enters the Port from oceanic sources (Fig. 30) the
modification to the morphology of the area appears to be related to human
activities, such as dredging and sand disposal.

37
Shell grit mining, while reworking the surface sand and destroying any
seagrass cover, cannot be associated with bulk transfer of sediment.
Figure 45 – Portion of the earliest map of Port Hacking (1848-1851 (part) (from Port Hacking Marine Delta, Management Options, PWD, 86013). Many significant pre-interference features are evident here, in particular the flow of entry to Cabbage Tree Basin, which begins at Cabbage Tree Point.
Maintenance dredging of navigation channels has been continual since 1890
but the earliest large activity linked to a dredging-disposal process has been
the creation of the Fish Hatchery with 350,000 tonnes of sand being dredged
and dumped in front of the opening to The Basin. Figure 38 clearly illustrates
the shallow water (shoal) conditions that have been created in Simpsons Bay,
the initial Middle Ground feature.
During the following years more sand from navigation maintenance dredging
was deposited in the same location and the sediment, under the action of
waves and tides, became mobile and was redistributed on the outer tidal delta
(Fig. 46).

38
Slowly an elongated body of sand developed, fed by the waves-tidal energies,
and by the early 1960s what we know now as Deeban Spit had taken shape.
Figure 46 - The changes in the distribution of sediments from 1930 (left) to 1999 (right) (from Port Hacking Marine Delta, Management Options, PWD, 86013). The need to exchange water between The Basin and the open sea created a
shallow tidal channel parallel to the rocky shore but separated from it.
Between its developed arc front at Simpsons Bay and westward to Fishermans
Bay its changes have been so dramatic that vegetated islands have come and
gone, and so too the infrastructure to facilitate access to the village of
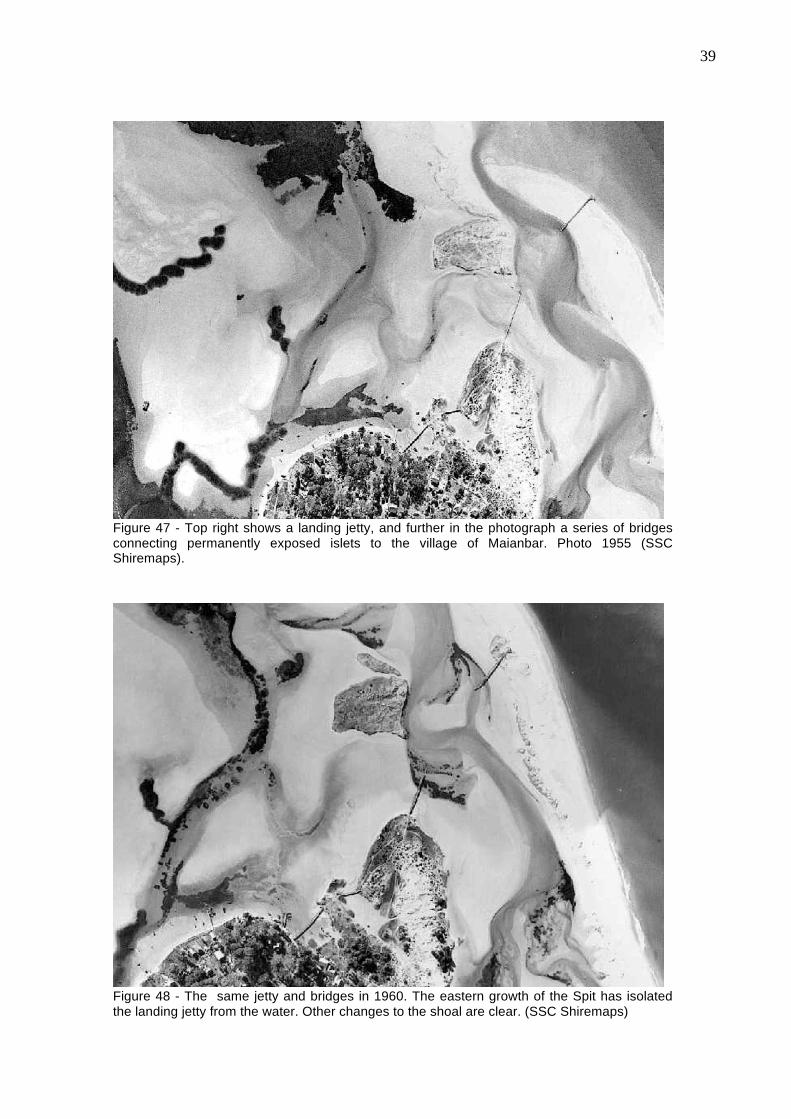
Maianbar. The aerial photograph of 1955 (Fig. 47) shows a landing jetty at the
Simpsons Bay face of The Spit.
It also shows a series of bridges connecting exposed islets to the shore at
Maianbar (Extract 15).
The aerial photograph of 1961 (Fig. 48) shows that the instability of The Spit
has rendered the seaward jetty redundant.
From 1965 to the present, Deeban Spit has consolidated its new shape and it
has been increased in height and in bulk by the dumping of dredged sand as
late as the mid 1990’s.
39
Figure 47 - Top right shows a landing jetty, and further in the photograph a series of bridges connecting permanently exposed islets to the village of Maianbar. Photo 1955 (SSC Shiremaps).
Figure 48 - The same jetty and bridges in 1960. The eastern growth of the Spit has isolated the landing jetty from the water. Other changes to the shoal are clear. (SSC Shiremaps)

40
The cycle of spoils dumping onto the Middle Ground Shoal, followed by the
movement of sand from the shoal to the Spit, has also been repeated.
The direction of approach of the waves along the seaward edge of Deeban Spit
creates a longshore drift towards the tip of the Spit as shown by the number of
mobile sand banks at right angles to the Spit (Fig. 35). The preferential inland
direction of sand transfer and movement is also shown by the shape of the spit,
curved towards the west along the main channel (Fig. 49).
Figure 49 - The westwards pointing edge of Deeban Spit. Note the channel leading to The Basin.
In recent years, however, the sand dredged from the navigation channels has
been used for the Cronulla Beach nourishment program and thus it has been
removed from the cycle.
41
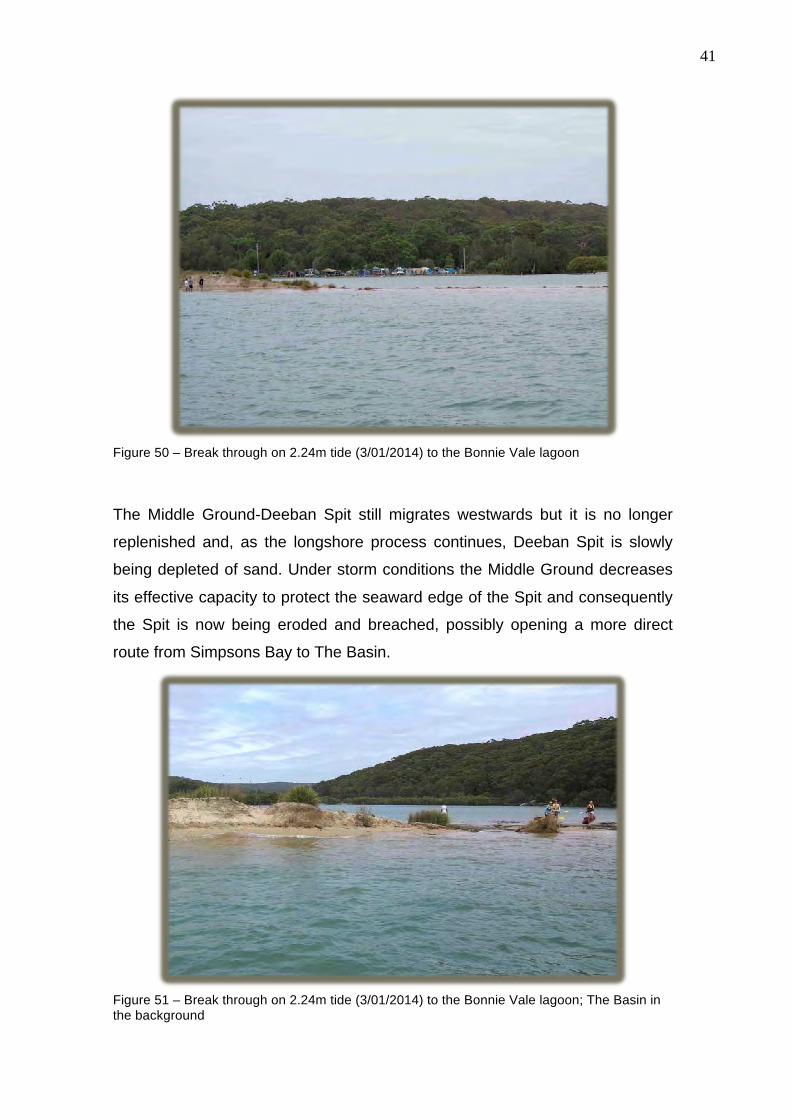
Figure 50 – Break through on 2.24m tide (3/01/2014) to the Bonnie Vale lagoon
The Middle Ground-Deeban Spit still migrates westwards but it is no longer
replenished and, as the longshore process continues, Deeban Spit is slowly
being depleted of sand. Under storm conditions the Middle Ground decreases
its effective capacity to protect the seaward edge of the Spit and consequently
the Spit is now being eroded and breached, possibly opening a more direct
route from Simpsons Bay to The Basin.
Figure 51 – Break through on 2.24m tide (3/01/2014) to the Bonnie Vale lagoon; The Basin in the background
42
Over recent years storms combined with moderate-only high tides have caused
breaching in a number of locations. However, now, spring tides without the
additional effect of any swell will overtop in the previously breached locations.
In other words, sea level on its own is now changing the morphology of the
dune top and in so doing is increasing the potential for a large portion to be
intertidal (Figs. 50, 51). If a direct route to The Basin is established from
Simpsons Bay, the flow of the tidal channel at the landside of Deeban Spit will
cease to be effective and therefore redundant. There is then a strong possibility
that the Spit will be replaced by coastal beaches against Constables Point
Reserve and the main body of the Deeban Spit. This may well replicate the
main elements of the morphology of the Spit before European intervention.
This tends to re-enforce the thesis that the marine delta of Port Hacking was in
a state of near equilibrium prior to the European interventions, and that, left
alone, the indications are that such equilibrium may again be established. In
this respect, the cessation of depositions in the dynamic zone (within the cycle)
combined with the removal of dredged spoils to the Cronulla beaches has been
an aid in that process.

43
The Catchment
The fresh water catchments of Port Hacking, however remote from the tidal
estuary, are an intrinsic and inseparable part of the nature and characteristics
of Port Hacking and therefore it is necessary to give coverage to them in this
document. Port Hacking’s fresh water catchment consists of three separate
and distinct entities: the Hacking River system, the South West Arm system,
and thirdly, the urban catchment of the tidal estuary and each is described
separately. The total area of Port Hacking and its catchment is approximately
173 km2.
In terms of administration or governance, the Hacking catchments fall within
Sutherland Shire in its northern parts, and Wollongong City in its southern
parts. The predominant area of the freshwater catchment falls within the Royal
National Park and the adjoining or associated Garrawarra State Conservation
Areas. In fact the combined catchments of the Hacking River and South West
Arm constitute a majority of the area of the Royal National Park. The urban
catchment is within the Sutherland Shire and drains into the estuary. The
catchments and the status and divisions of administration are shown in figure
52.
The inclusion of the Hacking River catchment in the Port Hacking estuary
management process was a decision taken in the earliest deliberative stages
of developing a management plan for the estuary. The most obvious physical
impact of the catchments is in the estuary’s fluvial deltas that preserve and
present much of the catchment’s pre-European history, and much of history of
European land practices. However, the NSW State Government initiated its
catchment management program throughout NSW in the 1980’s, through a
system of catchment management committees, and the Hacking River
Catchment Management Committee was appointed and worked on the whole-
of-catchment management challenges. Over time, the Hacking River lost its
specific identity in this process, being absorbed into larger regional programs.
44
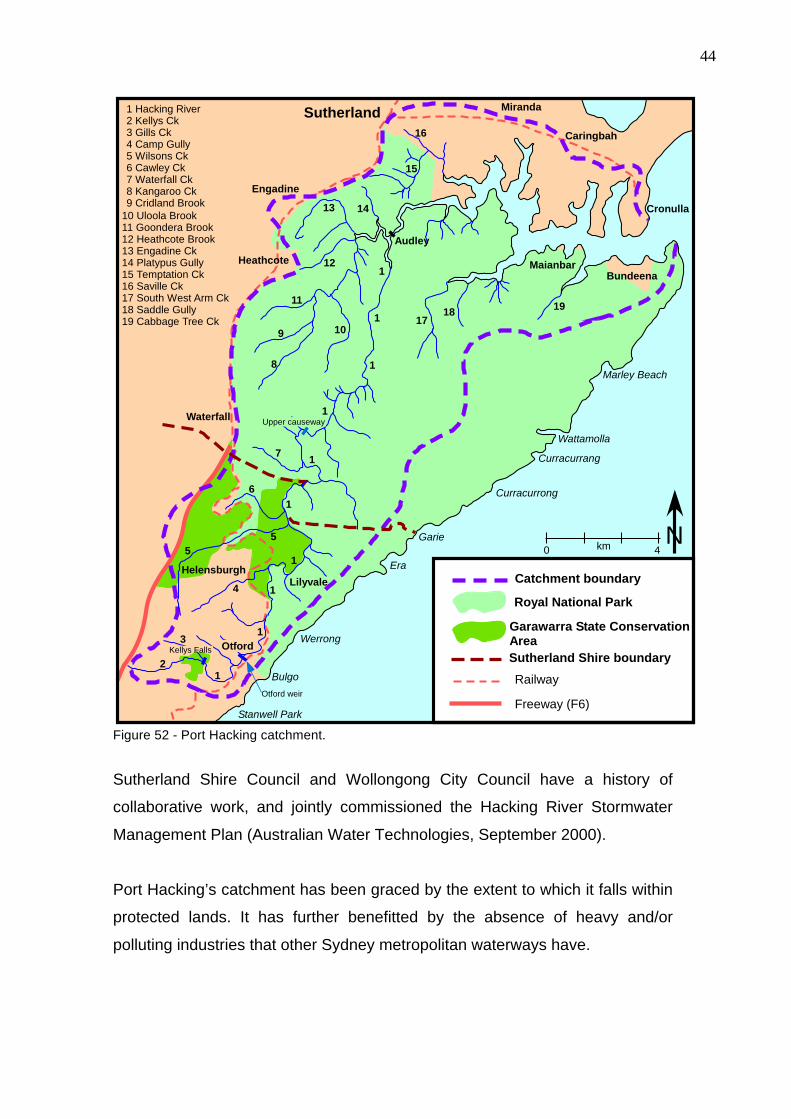
Figure 52 - Port Hacking catchment.
Sutherland Shire Council and Wollongong City Council have a history of
collaborative work, and jointly commissioned the Hacking River Stormwater
Management Plan (Australian Water Technologies, September 2000).
Port Hacking’s catchment has been graced by the extent to which it falls within
protected lands. It has further benefitted by the absence of heavy and/or
polluting industries that other Sydney metropolitan waterways have.
Marley Beach
Wattamolla
Garie
Werrong
Bulgo
Stanwell Park
Catchment boundary
Royal National Park
Sutherland Shire boundary
N
Railway
Freeway (F6)
0 4km
Curracurrang
Curracurrong
Era
Sutherland
Engadine
Heathcote
Waterfall
Helensburgh
Caringbah
Miranda
Cronulla
BundeenaMaianbar
Audley
1
1
1
1
1
1
1
12
3
4
5
5
6
7
8
9 10
11
12
13 14
15
16
1718
191
Lilyvale
Otford
Garawarra State ConservationArea
Kellys Falls
Otford weir
Upper causeway
1
1 Hacking River2 Kellys Ck3 Gills Ck4 Camp Gully5 Wilsons Ck6 Cawley Ck7 Waterfall Ck8 Kangaroo Ck9 Cridland Brook
10 Uloola Brook11 Goondera Brook12 Heathcote Brook13 Engadine Ck14 Platypus Gully15 Temptation Ck16 Saville Ck17 South West Arm Ck18 Saddle Gully19 Cabbage Tree Ck

45
The Hacking River Catchment The Hacking River and its tributaries are relatively small by comparison with
other coastal rivers. In terms of outright area and also for its variations and
complexity, the Hacking River catchment is the most significant of Port
Hacking’s fresh water input. The Hacking River is generally regarded as
starting at Kellys Falls, some 42 kms from the entrance to Port Hacking.
However, the principal feed waterway to the falls is Kellys Creek, a secondary
feed being Gills Creek, both being in southern Helensburgh and rising at
approximately the Princes Highway .
The catchment is defined in figure 52. It includes all the tributaries above
Audley, the principal being Kangaroo Creek that has a considerable catchment
of its own below Engadine prior to joining with the Hacking River at Audley.
The catchment drains predominately from the ancient high plateau rising south
of Sutherland, broken by extensive and deep river valleys. The tributary river
valleys drain predominantly from the western watershed progressively joining
the Hacking River in its flow from south to north where it terminates with its
fluvial delta at Grays Point.
Over time, all areas of the Hacking River catchment have been subjected to
extensive fire. In several cases these have been the result of some form or
another of human behaviour.
The general impression is that the Hacking River drains the Royal National
Park and must therefore be pristine. This is not entirely the case. The Hacking
River catchment has two distinct components, each being characterised by
land form and land use; the first being the upper catchment which starts at the
sources of Kellys and Gills Creeks, and the second being that part of the
catchment which falls within the Royal National Park.
Before detailing the separate components, an overall qualification is needed
about the water supply to the river and the nature of its flow. Rainfall can be
high (especially in the upper catchment) and the tributaries and river have
healthy flow. However, during dry periods flow can be reduced to a mere trickle
and the river reduced to a series of stagnant puddles. It is this that makes the
Hacking vulnerable and reduces its capacity for recovery and self-

46
rehabilitation. It is this fact that concentrates pollution inputs and creates critical
dangers to native wildlife.
The Upper Hacking. For the purposes of this paper, the area considered to be the upper Hacking
catchment is the area of the headwaters of the Hacking River and includes the
township of Helensburgh, the villages of Stanwell Tops and Otford and Lilyvale
below Helensburgh. This part of the catchment is a northern extension of the
Illawarra escarpment. The western extent is high, and is subject to episodic
high rainfall. The tributary waterways Kellys Creek, Gills Creek, Gardiners
Creek, Cedar Gully Creek, “Garbage Tip” Creek, Wilsons Creek, and Cawleys
Creek all feed to the Hacking River in the valley below. The National Falls are
below Waterfall on Waterfall Creek. The steep gradients combined with large
volumes of water, therefore high velocity, give the streams high erosive power.
The valleys are therefore steep-sided and gullied. Because of the steep-sided
valleys that carry significant water, the vegetation makes quick transitions from
typical sandstone woodland to riparian forest with rich and varied understories
in shaded and damp valley floors.
It is commonly stated that the Hacking River commences at Kellys Falls.
However, its true origins are in the streams of Kellys and Gills Creeks, which
although small are important upstream feeds to the falls by virtue of the nature
of their catchments. These waterways fall separately at what is generalised as
Kellys Falls but in reality Gill Creek falls to the Hacking River slightly to the
north of Kellys Creek (Fig. 53).
Part of the upper catchment is protected as the Garrawarra State Conservation
Area, although fragmented into separate components around Helensburgh and
Kellys Falls. Various land use zonings of private property and actual land use
activities may render the river vulnerable to adverse impacts.

47
Figure 53 – Kellys Fall. (Photo Tim Lloyd, Otford Farm)
The upper catchment has a long and continuing history of major works and
other activities which have, over time, had significant impacts on the river and
some continue to present on-going catchment management challenges:
Coal Mining. Coal was discovered at Camp Gully, now Helensburgh.
“In 1883 Cumberland Coal and Iron Mining Company took a ninety nine
year lease of 18,000 acres of Government land known as 'Camp Creek'.
Coal was found in 1884 on the site where the mine is located today. The
opening of the coal mine was responsible for the growth of the village of
Helensburgh. The Metropolitan Coal Company of Sydney took over the
mine in 1887 and opened in 1888 employing 45 men. This mine was
described as the most perfectly arranged mine in Australia because
miners were able to walk perfectly erect in contrast to most mines. It
was also possible to use horses rather than ponies in the unusually high
tunnels. (History of Helensburgh, 1978)” (Extract 24)
The mine is a significant physical, economic, social and environmental
presence in Helensburgh. It is located in an environmentally sensitive area, in

48
Figure 53a - Helensburgh mine in 1915 (hand painted photo, HDHS)
Figure 53b - Metropolitan colliery, 2007 (photo HDHS)
close proximity to protected land. Coal washing takes place on-site. There is a
rail siding from the Illawarra line, and coal is trucked from the site. In 2012, 2.1
million tons were produced.

49
Railway. The rail connection from Sydney involved major culvert cuttings,
tunnelling (the Otford tunnel is 1.5km in length and emerges at Stanwell Park)
and embankment building. From Lilyvale through the Otford valley the line runs
beside the Hacking River. Otford (formally Bulgo) originated as a railway town
and remained so until the end of the steam era.
"Otford was formerly known as Bulgo. Bulgo appears to have been first
marked on Robert Dixon's 'Map of the Colony of New South Wales' in
1842 and the name continued in use for some time. Construction of the
Illawarra line, north of Clifton, brought the appearance of a village here
in early 1885. Trains on the Illawarra line stopped here to take in water
and a small railway and sawmill centre developed at the mouth of the
Otford tunnel. The name of the village changed to Otford in May 1885.
Otford was probably named after the historic village of Otford in West
Kent, England, the name meaning 'otta's ford'." (Otford locality history on
www.wollongong.nsw.gov.au/library).
The original route and tunnelling to Stanwell Park through Bald Hill proved
problematic, and a new route with new tunnels had to be cut (Extract 25). A
consequence of the steam era on the Hacking River was the construction of a
ponding weir to supply water for locomotives. The weir remains.
The re-routing of the line between Otford and Stanwell Park has left a system
of disused tunnels, which were used for mushroom farming and have now
been assessed as having heritage value.
The urbanisation of Helensburgh. Apart from the land clearance and
disturbance, the township was supported by a garbage tip, and a night soil
disposal site which operated until the townships were sewered. Leachates from
these have been historically problematic and remain part of the threat from
urban expansion (Extract 26).

50
Logging. There was a history of substantial logging in the catchment area,
which although now ceased, has resulted in substantial modification to the
land coverage.
“The first mill within the Otford valley was established by Thomas James
and his three brothers in 1875 at the northern end of Otford. James
Forster also created a mill at the southern end of Otford 1899. The
sound of the sawmills echoed around the valley as men cut and
prepared timber for use in the local coal mines and for housing in the
area. (Adams, 1986? Fletcher & Rook, 1985)” Source; Wollongong City
Council Suburb Profiles 2013-07-24
Rural and semi-rural land activities. The upper catchment has an enduring
history of open-country activities: various forms of crop and animal farming,
animal keeping and use, quarrying and sand and soil supply, recreation
including horse forest trail rides. Horse riding is specifically prohibited in the
eastern Garrawarra State Conservation Area (east of the Princes Highway), as
it is in the Royal National Park.
Road Building. In addition to the construction of the Princes Highway, road
construction has followed the growing urbanisation and the other activities of
the area, and in more recent decades the F5 Freeway to Wollongong.
The upper catchment poses on-going challenges in itself and for the Hacking
River below it. Degradation of the riverine environments exists in eroded
banks, in some cases weed infestations, urban detritus and obvious dumping.
Although the area is principally sewered, there still remains a substantial
number of unsewered properties.
Large areas of private, freehold land around Helensburgh/Otford have been
proposed for urban development and on a number of occasions Wollongong
City Council has had before it land rezoning proposals. These have the
potential to exclude some land from development for a range of reasons, not
the least of which is the sensitivity of the catchment. However, the pressures
are considerable for substantial urban expansion.

51
The past impacts of land use and the potential impacts from urban expansion
have been documented and the report provided a detailed understanding of
the upper Hacking catchment in particular, but also of the Hacking River in the
context of the Royal National Park. This report is a major supporting document
for a move to have the Royal National Park World Heritage listed (Appendix 2).
This paper has relevance in the other non-urban catchment sections of the
Hacking River and in the section of this document dealing with the Royal
National Park.
Wollongong City Council has recognised the threats to the Hacking River
system in its list of considerations in rezoning.
The Lower Hacking This part of the catchment is within the Royal National Park with a few small
exceptions, these being the urban pockets of Heathcote East and part of
Helensburgh.
Figure 54 - View from Loftus Heights eastwards showing the Kangaroo Creek catchment
The Princes Highway approximates the watershed, and the Illawarra rail line
almost parallels that.
When looking across the park from east to west (or vice versa) the rugged
folds of valley after valley fade into the distance (Fig. 54).
52
This vista is typical of the topography and vegetation landscape of the western
portion of the catchment. In the eastern portions there is a mix of rocky
outcrops, flatter woodland and substantial areas of heath.
The gradients to the river proper, although lacking the greater elevations of the
upper Hacking, are nonetheless steep in many places.
This section of the catchment contains significant passive and active
recreational features of the Royal National Park, and the catchment is
interspersed with walking tracks. “The catchment of Kangaroo Creek is the
largest relatively undeveloped area in the Royal National Park” (Plan of
Management, Royal National Park and Garrawarra Sate Recreation Area,
2000). It is a large component of the freshwater drainage system into the
Hacking River above the Audley Weir.
In the still-young colony and even later to the World War II, and certainly after
proclamation as a national park, this section of the catchment was used for
timber extraction for a range of purposes, including those of the Trustees,
military training and encampments.
“In September-October 1899 ‘A’ Battery spent six weeks training in the
Park before embarking on the Warrigal in December for South Africa.
As the number of visitors to the Park increased the Trustees became
concerned about the use of live ammunition, so restricted the Military
manoeuvres to the Heathcote end of the Park with firing directed
towards the west over the Woronora River. This area was occupied by
the Military till 1914 when they transferred to Holsworthy. An extra 200
acres (81 ha) were added to the existing 225 acres (91 ha) used by the
Military at Loftus Heights in 1931. Military exercises of a more minor
nature continued in the Park until the early 1960s when requests started
to be rejected until 1967 they were refused outright.” Source: “History of
Royal National Park 1879-2013” by Judith Carrick, unpublished
The human impacts are contemporarily low and the entire catchment has the
protections and management in place to maintain its integrity from within.

53
However, it remains potentially vulnerable to non-National Park threats,
particularly from the upper catchment.
One creek, Temptation Creek, rises in the National Park at the intersection of
Farnell Avenue and the Princes Highway and becomes part of Port Hacking’s
urban drainage when it links up with Savilles Creek in Kirrawee.
South West Arm South West Arm is a major arm, or side embayment (tidal) of the marine
estuary of Port Hacking. Its fresh water source is South West Arm Creek that
rises some distance to the south at Colbee Knob (east of the township of
Waterfall) and flows northwards until a short distance below Winifred Falls (Fig.
55) where it forms its substantial fluvial delta, joined there by Saddle Gully
creek.
Figure 55 – Winifred Falls
The fluvial delta dropover is approximately 1.5 km from the marine delta. This
fresh water system has its own identity from the other Hacking systems
because: i) its entire catchment falls within the Royal National Park, ii) its
catchment has been relatively undisturbed, and iii) apart from the risk of spill
from a road incident appears not to be vulnerable to threats to water quality.

54
The watershed is bounded by the loop of Sir Bertram Stevens Drive, Wises
Trail, Bundeena Drive and Maianbar Road. The main tributary is Saddle Gully
Creek and with South West Arm Creek drop to their lower levels above their
fluvial deltas in waterfalls, Winifred Falls in South West Arm Creek and Anice
Falls in Saddle Gully. Saddle Gully Creek terminates in South West Arm’s
fluvial delta. These streams are small, and when seen from Sir Bertram
Stevens Drive, South West Arm Creek appears insignificant. However, it
appears to contribute significant freshwater in rain events.
The prevailing terrain and vegetation follows the trend of high and folding
topography in the west, flattening to plateau with rocky outcrops and shallow
ravines in its eastern part. The vegetation reflects the topography and location
that is dry woodland and heath on the flat, drier, shallow-earth plateau land,
with rapid transitions into forest in the valleys.
Severe fire damage has been as much a factor here as in the other Hacking
River catchments. While this catchment has never been excluded from human
impacts, these have not been in any way substantial compared with the other
Hacking catchments. This remains the most undisturbed and has the on-going
protection of National Park status.
Bushland Wildfires A phenomenon of the Port Hacking catchment has been wildfire. Wildfires have
long been part of the Australian bush. The incidence and magnitude of wildfires
are believed to have increased significantly in the period of European
settlement.
One of the hidden consequences of fires is the availability of soils to be eroded
before re-vegetation occurs. Rain after fires (and this can be heavy) loads the
creeks and the Hacking River with sediments that ordinarily would be
contained by vegetation. The abnormal sediment loads can occur for 12
months after a fire. The fires of 1994 (Figs. 56, 57) burnt from Heathcote to the
sea, burning to some degree approximately 90% of the Royal National Park
(Rural Fire Service of NSW). (The Park was closed for some time in the
interests of public safety, but also to minimise erosion).

55
Figure 56 – 1994 bushfire advancing along the ridge west of South West Arm. Smoke has obliterated South West Arm.
Figure 57 – Minutes only after figure 56; now racing along the ridge above Warumbul.
The impact of the Hacking River and South West Arm fresh water systems on
the estuary is not restricted to the enduring fluvial deltas or the input of
pollutants in the general sense, but can be visually apparent from time to time
in the discolouration of the estuary by suspended fine material transported to
the sea by large volume fresh water after protracted heavy rain. This
phenomenon can persist for some time, through many tidal cycles, before
clearing.
The Urban Catchment. Port Hacking’s urban catchment is in the main defined along an east-west line
in the north, generally defined by the Kingsway, and from north to south by the
high ridgelines separating each of Port Hacking’s north-south aligned bays.

56
There is a small urban component on the southern shore associated with the
villages of Bundeena and Maianbar.
Port Hacking’s freshwater catchment is in glaring contrast with those of the
non-urban catchments: it is totally urbanized, the waterways have, in a lot of
places lost their original nature, and past activities have been extensive not
only in changing the appearance and behaviours of the catchment but in the
extent and lasting impacts on the fluvial deltas within the estuary.
Port Hacking has a series of urban sub-catchments. These catchments are
defined (and almost obvious) by the ridgelines which surround Port Hacking’s
bays: North West Arm, Gymea Bay, Yowie Bay, Turriell Bay, Burraneer Bay,
Gunnamatta Bay, and Bundeena. The major waterways which feed these
catchments are: Savilles Creek, Dents Creek, Coonong Creek, Alcheringa
(Alkaringa) Gully, Yowie Gully, Kareena Creek and Bundeena Creek/Gully.
The urban catchment is marked by a contrast in the size of the waterways that
deliver surface water to the tidal estuary between the western and eastern
sections of the catchment. The catchment has its western extent in the Savilles
Creek system that rises at the Princes Highway at Sutherland/Loftus. The
Savilles Creek system is unique in the urban setting because of its relationship
with the Royal National Park, as the young or upstream part of the creek from
its source straddles the urban/National Park interface. Further, it is the only
urban waterway that is fed by waters from the National Park, Temptation
Creek, which rises at the intersection of the Princes Highway and Farnell
Avenue, and has its confluence with Savilles Creek at Kirrawee at this urban/
National Park interface.
The largest catchments occur west of Caringbah, and naturally result in the
largest freshwater-feed waterways to the estuary. In addition to the Savilles
and Kemp Creeks, these are, from west to east, the Coonong, Alkaringa and
Ewey Creek systems. In their service as urban stormwater systems, they
combine constructed waterways (in many places underground) with the natural
creek waterway. They all feature tributary systems of similar combination and
appearance. In the case of the Coonong and Alkaringa Creeks, they feature
57
significant gullies as they flow south to the estuary before reaching their fluvial
deltas. These gullies have significant remnant vegetation. Waterflows through
these gullies can be significant. The terminating fluvial deltas are Dents Creek-
North West Arm, Coonong Creek-Gymea Bay (at the baths); Alkaringa Creek-
Gymea Bay; Ewey Creek-Yowie Bay. The fluvial deltas are significant in
magnitude given the relatively small size of the catchments (Ewey Creek’s
catchment is 167 hectares). This western catchment of Port Hacking contains
small pockets of light industry, much of it associated with the automotive
industry.
In the eastern part (that is, east of Caringbah), the catchments are smaller and
the creeks feeding to the bays are shorter. Nonetheless the steep sides to the
bays result in high velocity discharges in heavy rain. Little Turriell Bay, Dolans
Bay and Burraneer Bay are all typified this way, and consequently have for
their size notable fluvial deltas. At Cronulla, the watershed almost bisects the
Cronulla peninsula with the water on the western side falling to Gunnamatta
Bay.
The storm watercourses and outlets into Port Hacking were all once streams
and creeks with virgin forest and woodland. Since European settlement the
catchments went through phases of clearing for timber and farming then to
urbanisation. Apart from the lack of control over sediment for decades, surface
run-off has been increased by the overwhelming replacement of vegetated
land with hard, impervious surfaces. Although many of the creeks have, of
necessity, been converted to concrete pipes or paved channels, disappearing
under roads or disappearing altogether under suburbs until emerging at the
tidal waterway, many retain at least some portion of their original character
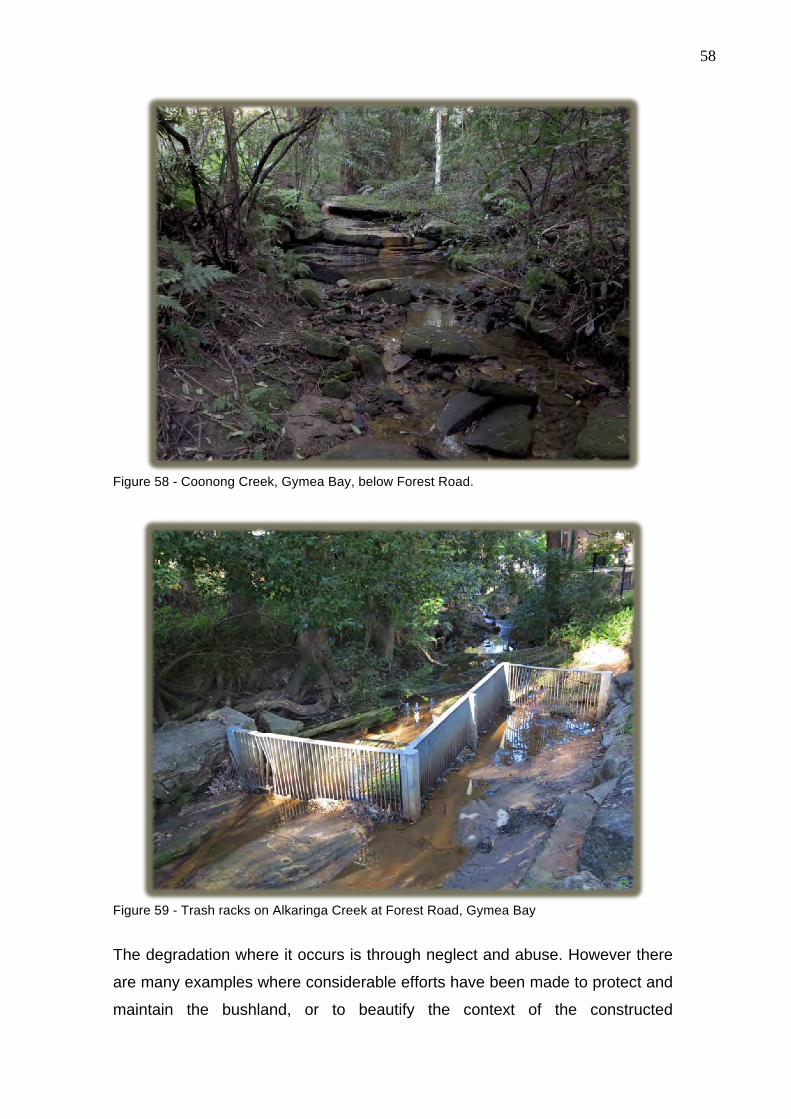
although with some level of degradation or urban adaptation. The best
examples are the creeks west of Caringbah. These contain some remnant
examples of the beauty of these streams, which, on account of their gradients,
have series of small cascades and stony basins. Where these occur they add
a charm and a quality to the surrounding built-form, and in some cases there is
a buffer of reserve parkland or bushland that adds to this attractiveness (Fig.
58).
58
Figure 58 - Coonong Creek, Gymea Bay, below Forest Road.
Figure 59 - Trash racks on Alkaringa Creek at Forest Road, Gymea Bay
The degradation where it occurs is through neglect and abuse. However there
are many examples where considerable efforts have been made to protect and
maintain the bushland, or to beautify the context of the constructed

59
watercourses. The adaptation of the creeks to an urban stormwater system
ranges from re-enforcement, bridging, and devices to protect the downstream
waterway. These devices are many and occur at points above the tidal
waterway, and some at the discharge point of the waterway itself (Fig. 59).
As development increased, the levels of material carried by these
watercourses became high, consisting not only of soils and clay, but also
gravel, road base and other materials associated with all facets of urban
development. This changes the magnitude and the physical and chemical
make up of the fluvial deltas at the heads of Port Hacking’s bays. (see “Fluvial
Deltas” in this document).
Another consequence of urbanisation has been the capitalization on the
opportunities provided by the creeks to route sewer mains. This network is
gravity based until it reaches sea level then is stage-pumped to the Cronulla
treatment works. To a large extent these are inconspicuous, but are designed
to allow overload release of the untreated sewage. Such releases have
occurred in some places from time to time and result in elevated and even
unsafe enterococci (e-coli) levels. Upgrades of sewerage systems in the
Sutherland Shire have significantly reduced the frequency of sewage overflows
in the area.
The small urban catchment of Bundeena drains to Port Hacking by Bundeena
Creek, which is only intermittently open to the estuary. Historically the creek
has been problematic because of the poor flow combined with urban inputs.
This has substantially eased with the connection of Bundeena (and Maianbar)
to the Cronulla sewerage system, and a plan of management put in place to
address the other impacts. Bundeena Creek is separately dealt with later in this
paper (See Bundeena Creek (ICOLL)).
Yowie Bay is a significant sub-estuary in terms of the urban catchment for
several reasons, and is therefore worthy as a “case study” for this paper. It is
significant because of the sum of the following:
1. The bay is fed by two separate major systems: Ewey Creek from the
northwest, and Kareena Creek from the north and northeast.

60
“Ewey Creek traverses the Shire flowing in an easterly direction for a
distance of 2.3 km from Manchester Road, Gymea, downstream to the
western head of Yowie Bay, draining a catchment of approximately 165
hectares. Ewey Creek is in a degraded condition, typical of the remaining
urban creeks in the Shire.
Land use within the Ewey Creek catchment has intensified over recent
years and in view of the increasing density of urban development, both
council and concerned members of the community agree that the
waterway’s remnant natural characteristics deserve recognition and
careful management for the future. This desire led to the development of
the Ewey Creek Management Plan, completed in March 1993 and
reviewed in 2006.
The objectives of the plan are to:
Transform a degraded creek system into a valuable passive open space
corridor,
Control drainage with a view to minimising erosion and flooding risks ,
Retain the natural appearance of the creek as far as practical,
Protect the viability of the creek as a natural system for vegetation and
wildlife conservation, and
Control water pollution and upgrade the aquatic environment to meet
Department of Environment, Climate Change and Water (DECCW)
standards.” (Report of Council staff to Councillors of Sutherland Shire Council. Minute
Number: 750; Council Meeting Date: 10/05/10)
Kareena Creek’s catchment is bounded in the north by the Kingsway,
west of the Sutherland Hospital, Caringbah, and to the northeast and east
at Caringbah and includes most of the western Caringbah shopping
centre. The stormwater feed from this precinct is sub-terranian and is only
visible as a creek after it emerges on the eastern side of Kareena Road,
and its Caringbah feed downstream of Curtis Avenue, Caringbah. This
joins Kareena Creek above President Avenue.
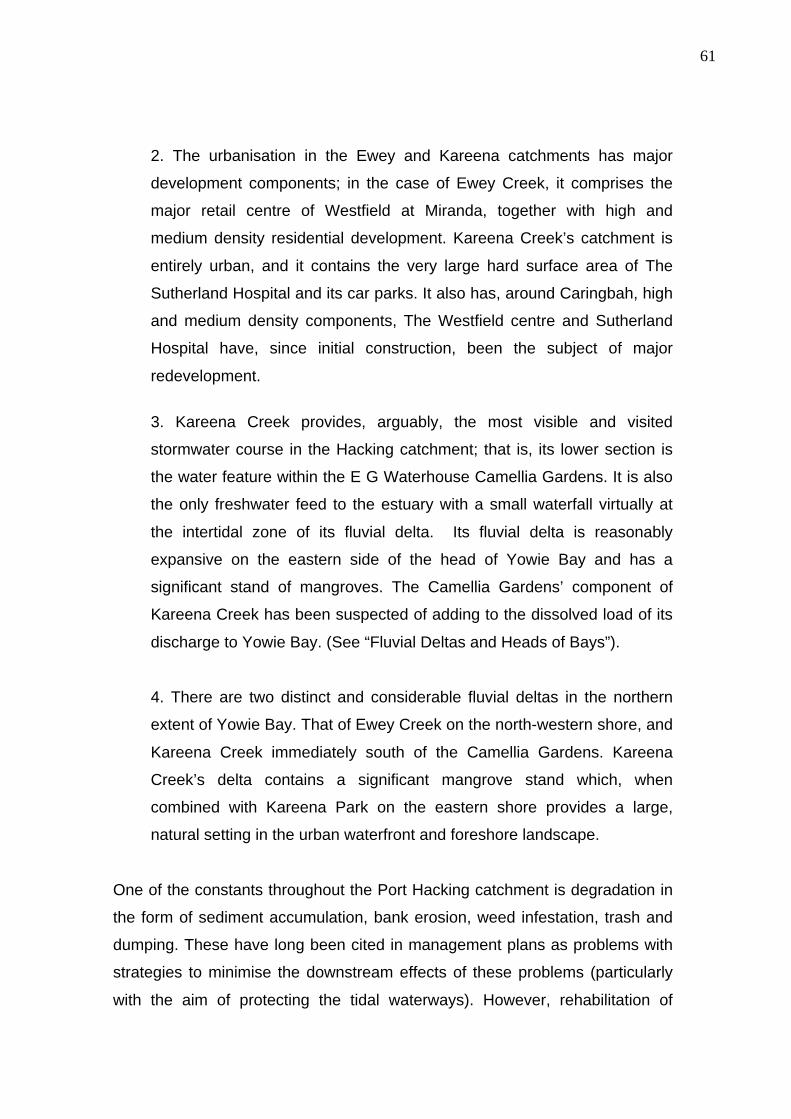
61
2. The urbanisation in the Ewey and Kareena catchments has major
development components; in the case of Ewey Creek, it comprises the
major retail centre of Westfield at Miranda, together with high and
medium density residential development. Kareena Creek’s catchment is
entirely urban, and it contains the very large hard surface area of The
Sutherland Hospital and its car parks. It also has, around Caringbah, high
and medium density components, The Westfield centre and Sutherland
Hospital have, since initial construction, been the subject of major
redevelopment.
3. Kareena Creek provides, arguably, the most visible and visited
stormwater course in the Hacking catchment; that is, its lower section is
the water feature within the E G Waterhouse Camellia Gardens. It is also
the only freshwater feed to the estuary with a small waterfall virtually at
the intertidal zone of its fluvial delta. Its fluvial delta is reasonably
expansive on the eastern side of the head of Yowie Bay and has a
significant stand of mangroves. The Camellia Gardens’ component of
Kareena Creek has been suspected of adding to the dissolved load of its
discharge to Yowie Bay. (See “Fluvial Deltas and Heads of Bays”).
4. There are two distinct and considerable fluvial deltas in the northern
extent of Yowie Bay. That of Ewey Creek on the north-western shore, and
Kareena Creek immediately south of the Camellia Gardens. Kareena
Creek’s delta contains a significant mangrove stand which, when
combined with Kareena Park on the eastern shore provides a large,
natural setting in the urban waterfront and foreshore landscape.
One of the constants throughout the Port Hacking catchment is degradation in
the form of sediment accumulation, bank erosion, weed infestation, trash and
dumping. These have long been cited in management plans as problems with
strategies to minimise the downstream effects of these problems (particularly
with the aim of protecting the tidal waterways). However, rehabilitation of
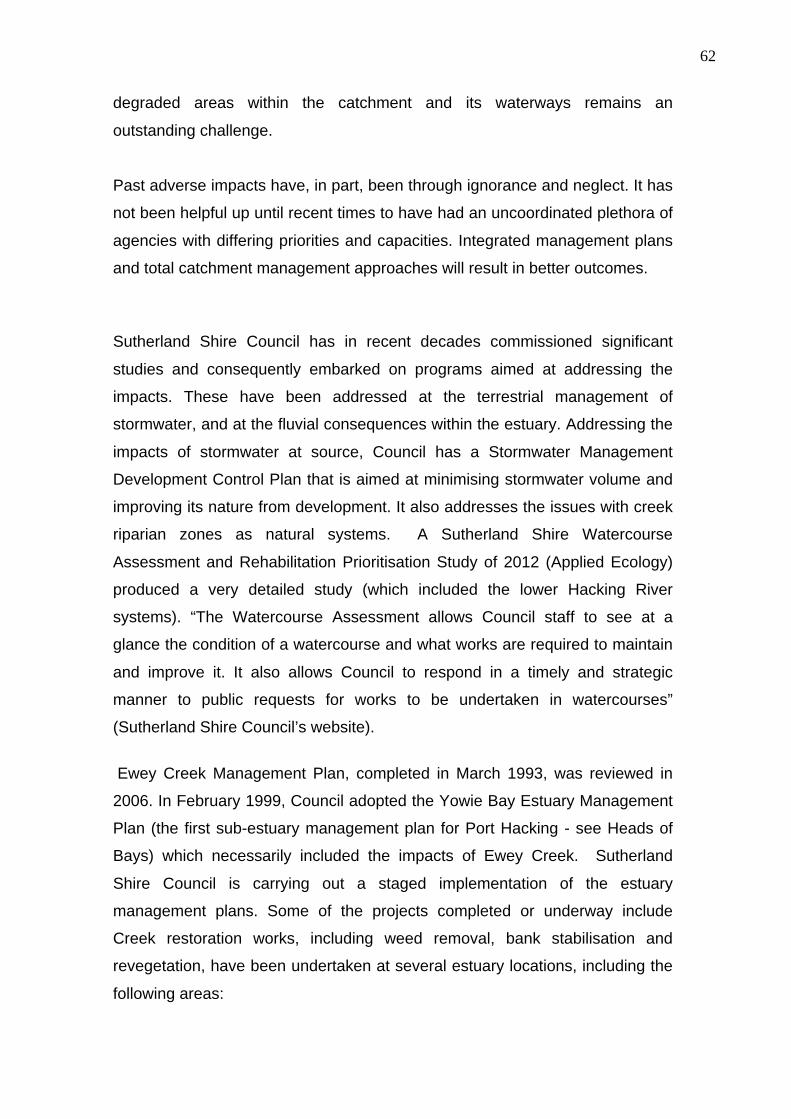
62
degraded areas within the catchment and its waterways remains an
outstanding challenge.
Past adverse impacts have, in part, been through ignorance and neglect. It has
not been helpful up until recent times to have had an uncoordinated plethora of
agencies with differing priorities and capacities. Integrated management plans
and total catchment management approaches will result in better outcomes.
Sutherland Shire Council has in recent decades commissioned significant
studies and consequently embarked on programs aimed at addressing the
impacts. These have been addressed at the terrestrial management of
stormwater, and at the fluvial consequences within the estuary. Addressing the
impacts of stormwater at source, Council has a Stormwater Management
Development Control Plan that is aimed at minimising stormwater volume and
improving its nature from development. It also addresses the issues with creek
riparian zones as natural systems. A Sutherland Shire Watercourse
Assessment and Rehabilitation Prioritisation Study of 2012 (Applied Ecology)
produced a very detailed study (which included the lower Hacking River
systems). “The Watercourse Assessment allows Council staff to see at a
glance the condition of a watercourse and what works are required to maintain
and improve it. It also allows Council to respond in a timely and strategic
manner to public requests for works to be undertaken in watercourses”
(Sutherland Shire Council’s website).
Ewey Creek Management Plan, completed in March 1993, was reviewed in
2006. In February 1999, Council adopted the Yowie Bay Estuary Management
Plan (the first sub-estuary management plan for Port Hacking - see Heads of
Bays) which necessarily included the impacts of Ewey Creek. Sutherland
Shire Council is carrying out a staged implementation of the estuary
management plans. Some of the projects completed or underway include
Creek restoration works, including weed removal, bank stabilisation and
revegetation, have been undertaken at several estuary locations, including the
following areas:

63
• Kareena Creek from Karimbla Road and Binalong Avenue to President
Avenue, Caringbah
• Wonga Road Reserve Creek, corner of Wonga Road and Attunga Road,
Yowie Bay
• Ewey Creek upstream of President Avenue, Caringbah
• Kiora Road Reserve, Yowie Bay
• Alkaringa Creek, Forest Road, Gymea
The council has installed more than 200 stormwater quality improvement
devices throughout the shire with more planned.

64
Fluvial Deltas
All of the fresh water systems described in the preceding “Catchments” topic
terminate in the estuary in a fluvial delta. This is the process of the deposition
of sediment as the river or creek’s energy is spent at is tidal interface. These
deltas vary in size depending on the erosive tendencies or vulnerability and
size of the catchment combined with the capacity of the stream to transport the
material. In the case of Port Hacking, whilst almost all of the streams terminate
in a delta, the major deltas are the Hacking River at Grays Point, and at the
heads of all bays in the estuary. As previously indicated the main part of the
Port Hacking catchment is associated with the Hacking River and within the
Royal National Park. Its sediment, fine sand, silt and mud, together with
vegetation debris is deposited along the course of the river in pools and as
sand banks. During small floods, much of this material is transported
downstream and deposited immediately upstream of the weir at Audley (Fig.
60).
Figure 60 – Audley Weir in flood (2/12/2010)
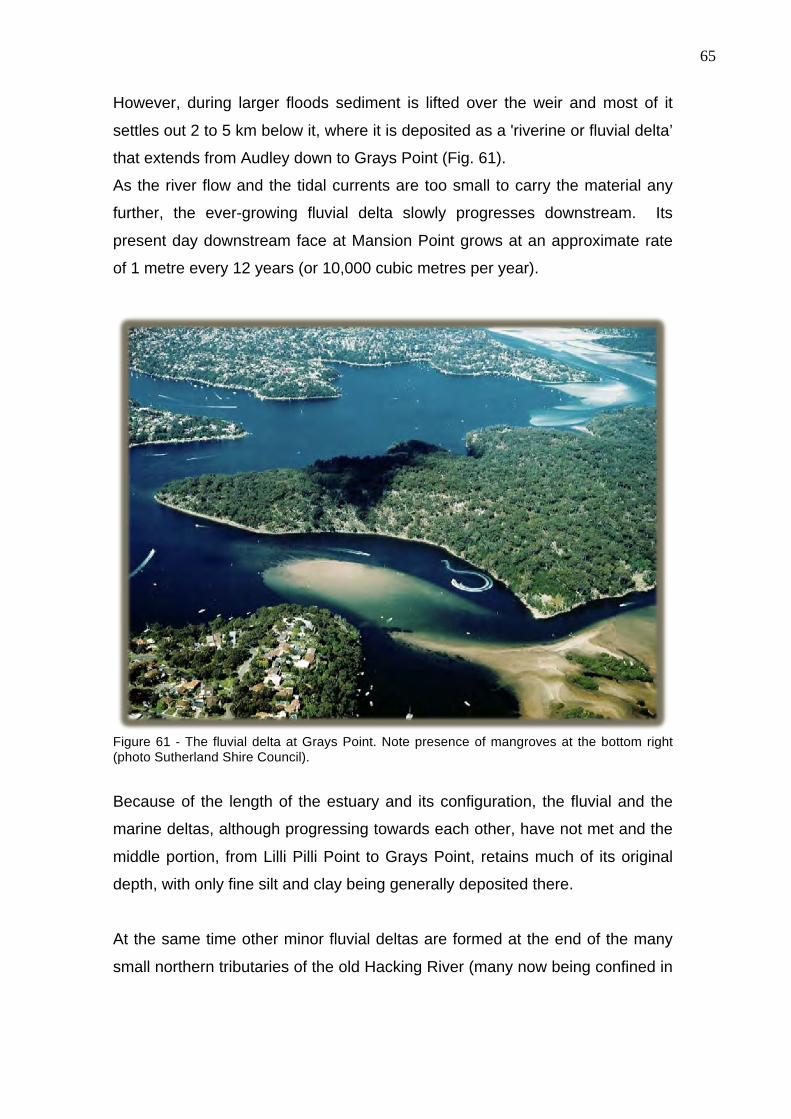
65
However, during larger floods sediment is lifted over the weir and most of it
settles out 2 to 5 km below it, where it is deposited as a 'riverine or fluvial delta’
that extends from Audley down to Grays Point (Fig. 61).
As the river flow and the tidal currents are too small to carry the material any
further, the ever-growing fluvial delta slowly progresses downstream. Its
present day downstream face at Mansion Point grows at an approximate rate
of 1 metre every 12 years (or 10,000 cubic metres per year).
Figure 61 - The fluvial delta at Grays Point. Note presence of mangroves at the bottom right (photo Sutherland Shire Council).
Because of the length of the estuary and its configuration, the fluvial and the
marine deltas, although progressing towards each other, have not met and the
middle portion, from Lilli Pilli Point to Grays Point, retains much of its original
depth, with only fine silt and clay being generally deposited there.
At the same time other minor fluvial deltas are formed at the end of the many
small northern tributaries of the old Hacking River (many now being confined in

66
drains). They carry small amounts of sand and mud which are deposited at the
heads of the bays into which the streams discharge.
The various deltas define themselves not only by magnitude, but also by the
quality of water inputs and sediment characteristics. These outcomes have
been determined in one respect by the degree of human disturbance and
behaviour in the catchment. In other words, there appear to be distinct
differences in the nature of the deltas of South West Arm Creek, or the Hacking
River, and, say, that of the head of Yowie or Gunnamatta Bays.
The rate of growth and the extent of these deltas depend on activities in, and
the conditions of each catchment, such as at Yowie Bay (Fig. 62), in North
West Arm (Fig. 63), Gymea Bay (Fig. 64) and South West Arm (Fig. 65).
Figure 62 - Yowie Bay. The fluvial deltas are visible at the bottom centre and right (photo Sutherland Shire Council). As development increased the levels of material carried by these watercourses
became high, consisting not only of soils and clays, but later also gravel, road
base, other materials associated with building, road and rail construction and
just about every other human activity. The magnitude and make-up of the
deltas changed with urbanisation and the results are now highly degraded

67
heads of the major bays of Port Hacking. North West Arm fluvial delta study
appears in Appendix 3.
Figure 63 - The fluvial delta present in North West Arm (photo Sutherland Shire Council).
Figure 64 – Small fluvial delta, head of Gymea Bay

68
Figure 65 – Fluvial Delta of South West Arm Creek.
In response to the perceptions of increasing sedimentation and its impacts on
the surrounding residential amenity, a study of the Ewey Creek delta and the
head of Yowie Bay was undertaken (“Yowie Bay Estuary Management Study
and Plan”, Patterson, Britton and Partners, 1999) This was the first sub-estuary
to be addressed by an estuary management study and plan. It has shown that
rehabilitation is difficult and consequently expensive.
This study introduced a finding that demonstrated clearly some of the problems
which are transferred from the catchment to the fluvial deltas:
“…..ecological assessment determined that the Camellia Gardens shoal
had a significantly lower biomass than the Ewey Creek shoal (approximately
50% lower)…….the reason could be associated with the poorer water quality
emanating from the Camellia Gardens Creek.” The study therefore was helpful
to emphasise the considerations of the geochemistry of the sediments as well
as the biota.
However, in this respect the head of Gunnammata Bay at Cronulla has been,
and remains, the most significant of the heads of Port Hacking’s bays for

69
several reasons: i) the extent of degradation has, over time been visually
significant; ii) the area has been substantially reclaimed and seawalled (Fig.
66); iii) it sits within the recreational and tourist hub of Port Hacking; iv) its
Figure 66 – Head of Gunnamatta Bay.
proximity to the sea, to the Cronulla’s restaurant quarter, to transport and v) the
concentration of the ferry and charter services. A large marina and boat
launching ramp are in, and contiguous with, the delta (Fig. 67).
Figure 67 – The marina at the head of Gunnamatta Bay

70
To date, significant pollution control measures have been introduced to
minimise sediment and gross pollutants, but the long history of degradation is
obvious and unresolved. The degraded condition of this delta adds to the speculation as to the means
and cost of remediation or whether the area (and other fluvial deltas, for that
matter) should further be reclaimed. The future of this area rests in the
finalisation of a master plan for this area.
During the course of European governance the number of authorities and
administrations had grown. Sutherland Council had responsibility for a large
part of the Hacking River catchment and the foreshore of Port Hacking. The
Department of Crown Lands would own the tidal area and below. The Maritime
Services Board (now the Roads and Maritime Authority) controlled boating and
navigation. The Public Works Department carried out the colony's and later the
State Government's works responsibilities. The National Park has its own laws
and administration. The State Government had control through other
departments for fisheries, highway, rail, water and sewerage, police and more.
The list of controlling authorities grew to about thirty in total and often with
overlapping areas of responsibility.
However, catchment management strategies, effected through modern
understanding giving rise to, among other things, what is now known as the
(Metropolitan) Catchment Management Authority have added a co-ordinated
approach which has been achieving focus on measures and outcomes where
catchment activities are concerned. Importantly, estuary management plans
have now been completed Under the NSW Estuary Management Policy, local
councils are responsible for preparing and implementing detailed management
plans for estuaries in their jurisdiction.
Sutherland Shire Council has developed the following estuary management
plans to cover estuaries in the Shire.

71
date study name
1999 Yowie Bay Estuary Management Study and Plan March 2004 Port Hacking Past and Present March 2004 Gunnamatta Bay Estuary Management Plan
May 2004 Gunnamatta Bay Contaminated Sediment Study 2008 Gymea Bay Estuary Management Plan 2008 Port Hacking Integrated Environmental
Management Plan (Bibliography)
2009 Bundeena Creek Management Plan
source: Sutherland Shire Council
Looking to the future, an important outcome of the Yowie Bay study was the
recognition to identify specific management activities and a program of
remedial works and measures that may be implemented by Sutherland Shire
Council. The obvious imperative is to address the many questions of
remediation dredging of the fluvial deltas. These are many, and involve the
questions relating to funding as well as the environmental and social priorities.

72
Bundeena Creek (ICOLL)
Bundeena Creek is a unique feature within Port Hacking. With its opening at
the eastern end of Hordern Beach (Figs 68-71), on the southern foreshore near
the entrance to Port Hacking, it is part of a system known as an intermittent
closing and opening lagoon (ICOLL). The creek winds from the beach front,
through a short urban environment, to a small lagoon and wetlands in the
village hinterland to its south. In typical character the creek and the lagoon are
shallow and in dry periods contain little water. By definition, the creek’s opening
at the beach is only intermittently open.
(The nature, function and importance of ICOLLs are simply and clearly
explained in the NSW Department of Primary Industry’s website at:
http://www.dpi.nsw.gov.au/fisheries/habitat/aquatic-habitats/wetland/coastal-
wetlands/management-of-coastal-lakes-and-lagoons-in-nsw)
The majority of the township, of some 2,700 people, drains into Bundeena
Creek. Bundeena village in the vicinity of the Creek is built on low, flat land
which is an infilled coastal lagoon behind the beach dunes (Kinhill, 1993). This
low area is surrounded by higher land that naturally drains to this
basin. Because of the intermittent nature of the creek combined with its central
drainage role for the village, for decades the Bundeena Creek had been the
source of concerns and complaints by the residents for a number of reasons,
principally: flood risk and potential damage caused by the build-up of sand at
the mouth, water quality, elevated nutrient concentrations in the creek and its
impacts; degradation of the riparian zone; impacts of storm water runoff,
erosion, weed infestation and feral animals.
The residents of Bundeena, perhaps through their sense of “isolation” have
long been organised through a progress association. This has provided the
means to prosecute community concerns, but historically has been also a
means of providing feedback to the community. The nature of an ICOLL was
not appreciated by the residents, and there were repeated representations for
the opening across the berm to be made permanent as the means of solving
the “problems”.
73
All of these problems have, over time, given rise to a number of detailed
studies, each producing a set of recommended outcomes. Consultants were
commissioned for flood management study (Kinhill, August, 1993) which also
addressed the potential for stormwater re-use. The major chronic problem
concerning water quality was that Bundeena was unsewered and, combined
with a high water table, meant that septic tank discharge seeped into the
Creek. This particular problem was overcome when the villages of Bundeena
and Maianbar were connected to the sewerage system in 2003, although there
was some time lag for the connection of some properties. The need for a
management plan was identified in the Port Hacking Estuary Management
Plan and in 2008 Sutherland Shire Council engaged Gutteridge, Hastings &
Davey, Pty Ltd (GHD) to develop a Management Plan for Bundeena Creek. In
each case, tangible outcomes were produced. Over time, management
strategies have been developed to address the above issues and improvement
in the natural functioning of the creek, at the same time allowing Bundeena
Creek to function as an ICOLL.
The fact that Bundeena Creek is an ICOLL, combined with the previously
described setting of the village, the village it is seen as having a heightened
risk of adverse impacts of sea level rise.

74
Figure 68 - Bundeena Creek (in its closed state) crossing the berm at Hordern Beach, Bundeena.
Figure 69 - Bridge across Bundeena Creek on the berm at Hordern Beach.

75
Figure 70 – Bundeena Creek in its closed state (photo SSC, Shiremaps)
Figure 71 - Bundeena Creek in its open state (photo SSC Shiremaps)

76
Deep Basins
Between the dropovers of the tidal delta and the fluvial deltas are deep basins
that can be 15 to 20 metres in depth. These are areas that over time have
received and are receiving the smallest amounts of sediment, primarily silt and
clay from the local catchments. This material is fine enough to be transported
beyond the fluvial delta and drop out where the transport velocity has
decreased.
The physical characteristics of the water in these deep basins may vary
depending upon the presence and strength of a vertical water exchange
between deep and surface water. This exchange is generally driven by the
shape and position of the various water bodies with respect to the tidal flow
and the prevailing winds. The deep basin in South West Arm with muddy
sediment has generally reducing conditions with a relatively low diversity of
benthic organisms. Conversely, the northern bays of Port Hacking show
abundant and diverse benthic life indicating a relatively well-mixed condition
within the water bodies.
These deep basins act as sinks where the various pollutants of the urban (in
the case of the northern bays) surface runoff may concentrate (Figs. 72, 73).
The concentrations of the different elements vary in the different basins and
reflect the different nature and sources of the sub-catchments. However the
various concentrations show a decrease from the point of entry in the Port,
represented by the fluvial delta, and the closest part of the tidal delta that has
generally concentrations comparable with the natural environment (Fig 74).
Within the various fluvial deltas the concentrations may reach values that
prevent sediment removal through dredging activities.
While the concentrations do not exceed the “HIGH” level determined by the
ANZECC guidelines, they often reach values greatly in excess of the “LOW”
boundary. These concentrations are also often present at depth of 1-2 metres
within the unconsolidated sediment as shown in some fluvial deltas.

77
Figure 72 - Distribution of the lead concentrations in the sediments of Gunnamatta Bay.

78
Figure 73 - Distribution of lead concentrations in the sediments of Yowie Bay

79
Figure 74 – Variation in the concentrations of various elements along the axis of Gunnamatta Bay. Note the higher concentrations at the fluvial delta (GB2) in comparison to the tidal delta (GB18) and the high values within the deep basin.

80
Environmental Issues In itself, the mobility of the sediments within the tidal delta is not an
environmental issue in the same way that pollutants, shore-based sediments
and recreational pressures may be.
However, the ferry service to Bundeena and some recreational boating
activities experience difficulties from time to time.
To alleviate these difficulties a number of dredging programs were carried out
since the turn of last century. At the same time a number of proposals have
been considered to achieve a more permanent solution to the navigation.
One of the basic considerations is the disposal of the dredged material. The
sediment was often disposed of within the active zone of the Port, such as the
Middle Ground Shoal east of Deeban Spit, from where it would be redistributed
by waves and tidal flows in the channels and thus eliminating any long-term
advantage gained by the dredging.
As part of the Hacking River Catchment Management Committee an initial
study of the quality of the sand in Bate Bay and in the tidal delta (Fig. 75) was
carried out.
Figure 75 - Sand quality in Bate Bay and in the outer tidal delta.

81
The strong similarity between the sand in Bate Bay and in the mobile portion of
the tidal delta suggested the suitability of the dredged sediment as source for
the nourishment and protection of the beaches along Bate Bay. The success in
beach nourishment (Figs. 76 - 79) confirms the suitability of the present
disposal.
Figure 76 - The dredge vessel in Port Hacking. (photo Sutherland Shire Council)
Figure 77 - Dredge fully loaded approaching the disposal site (photo Sutherland Shire Council).

82
Figure 78 - Unloading the sediment off Cronulla (photo Sutherland Shire Council)
Figure 79 - Dredge ready for another load. (photo Sutherland Shire Council) The section of the tidal delta further away from the seaward end may require a
different location for the deposition of the dredged material and the dropover
areas are generally suitable.
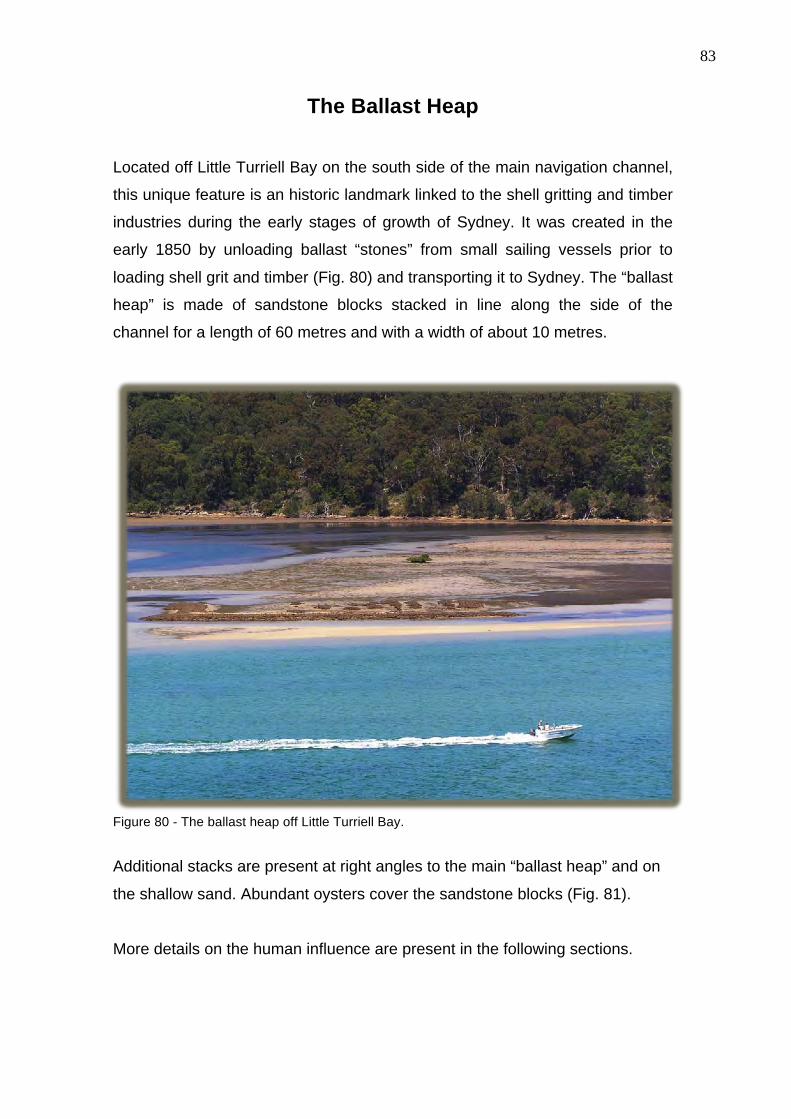
83
The Ballast Heap
Located off Little Turriell Bay on the south side of the main navigation channel,
this unique feature is an historic landmark linked to the shell gritting and timber
industries during the early stages of growth of Sydney. It was created in the
early 1850 by unloading ballast “stones” from small sailing vessels prior to
loading shell grit and timber (Fig. 80) and transporting it to Sydney. The “ballast
heap” is made of sandstone blocks stacked in line along the side of the
channel for a length of 60 metres and with a width of about 10 metres.
Figure 80 - The ballast heap off Little Turriell Bay.
Additional stacks are present at right angles to the main “ballast heap” and on
the shallow sand. Abundant oysters cover the sandstone blocks (Fig. 81).
More details on the human influence are present in the following sections.
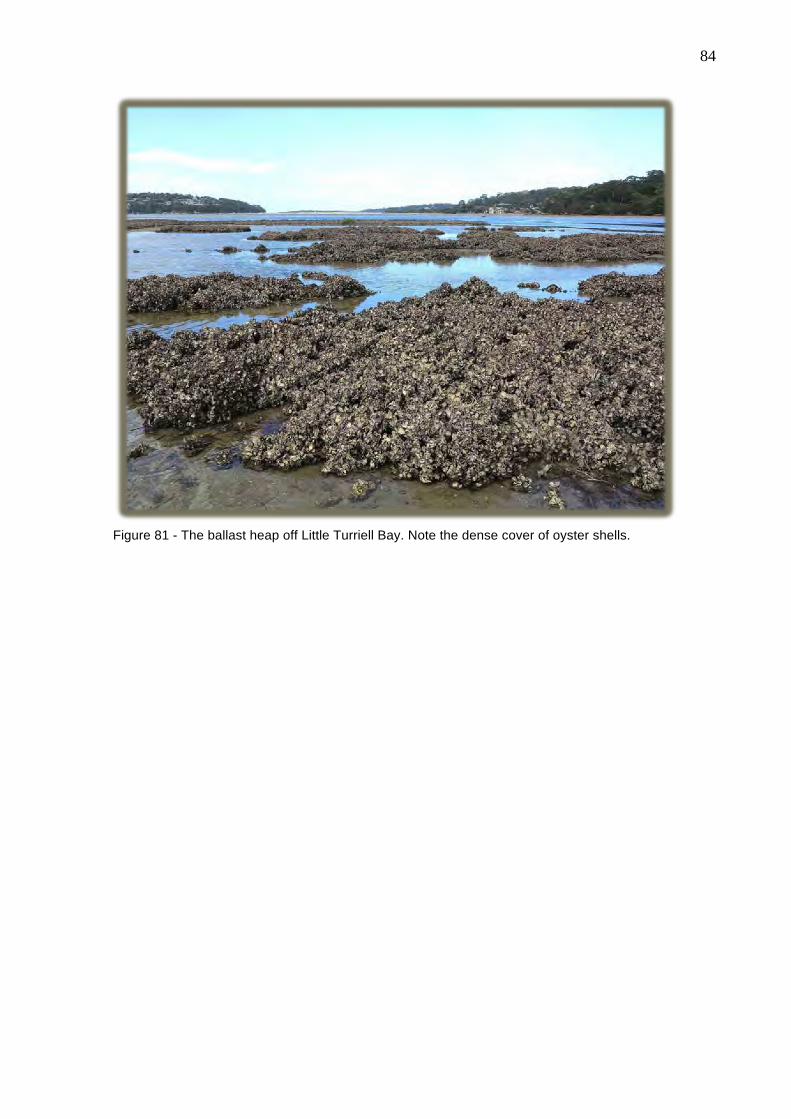
84
Figure 81 - The ballast heap off Little Turriell Bay. Note the dense cover of oyster shells.

85
The Human Environment This section is not intended as a comprehensive history of European activity on
and around Port Hacking. That is better left to the many creditable and detailed
published works. Rather, the intention here is to show the importance of
activities and the impacts that have set the nature of Port Hacking as it is
today. The comprehensive series of Extracts of the original documents and
narratives are presented in the Extracts.
Pre 1788 During the last great ice age, when sea levels fell, the landmass we call
Australia was joined by a land bridge to New Guinea, and so the original
peoples of this land walked their migration from the north, and by sea, from
what is now Indonesia.
Les Bursill, archaeologist and of Dharawal descent, tells the story in his work
“The Story of Djeebahn” (Extract 1). Anthropological and archaeological studies date human settlement at Port
Hacking for some 8,000 years. Human occupation of the continent has much
more ancient confirmations in so many other parts, and on the coast of NSW.
Aboriginal sites at Burrill Lake have been dated at 20,000 years. One can only
speculate that the evidence of much earlier occupation lies submerged in the
drowned valley and shores. However, such speculation was put to rest in 2005
when underwater researchers discovered in a bay of Port Hacking a
submerged archaeological site. This site was discovered under an overhang
which was a rock shelter and showed consistencies with terrestrial finds in that
area. Also, the soils of the area are not conducive to the preservation of (older)
relic material.
Bursill concludes from his research that the first group of travellers were not the
people who occupied the area of Sydney and found by Phillip in 1788 but that,
by then, the people were (and remained) the Dharawal speakers, a language

86
group of clans which by then occupied the Sydney and coastal regions to the
south coast of New South Wales (Extract 2)
The area we now refer to as Port Hacking was known to the Dharawal People
as Djeebahn, or Deeban.
Many engravings (Fig. 82), carvings, paintings (Fig. 83), tool-making sites and
midden sites remain as a source for this research, as does the midden record,
and of course the passing of the story by story, song and dance. Middens
reveal much of the Aboriginal life and history around Port Hacking (Extract 3).
Figure 82 - Rock carvings representing Yulungur and Marloo (photo Les Bursill, Aboriginal Living Sites Survey Team)
There is available through a number of sources, including Les Bursill, an
amazing catalogue of artefacts around Port Hacking. However, much has been
destroyed by development and vandalism.

87
Figure 83 – Hand paintings in rock shelters in the Cabbage Tree Basin catchment (photo R.J. West).
As with the various Aboriginal people around Australia, the Dreaming stories
were the way in which information was “archived” and passed on through the
generations. Animals feature in these stories because of the prominent place
they play in the stories of creation and of their lives - the successes and
failures, the reasons for things and so on, but for the coastal peoples, the Orca,
or Killer Whale, assumed dominance (Extract 4)
The Aboriginal history of this region is of importance to the European nation of
Australia because it is the site of the arrival (for settlement) of Europeans, and
the contacts between the first British arrivals in this area are perhaps the best
documented in the continent.
There has been a significant history of archaeological discovery and study in
and around Port Hacking. Many of the recognised sites have been degraded
through modern contact and development. Nonetheless, Port Hacking and its
catchment still contain much archaeological evidence of Aboriginal occupation
in middens, rock engravings, rock shelter and open campsites, tool making
grooves and other features.
88
The studies have revealed, for example, the particular importance of Warumbul
(in the Royal National Park) as a gathering place where the Law would be told,
and the surrounds contain clear indications of its importance in the passing
down of the “story” of the local people.
Understandably, the most easily identifiable archaeological relics occur in the
areas of the least European disturbance, in particular in what is now the Royal
National Park. There are well-recorded rock art, paintings, tool making and
burial sites. Some of these sites may be easily viewed.
However, despite the developed character of the northern foreshores, there
have been some recorded studies and events, as well as some remnant
material. Predictably, those areas that offer easy access to the waterway or
used as meeting areas or shelter have provided much of the historical record.
Development has erased much, but scientific studies were carried out, and
there have been disputes between landowners and authorities, and between
landowners, over protection and the right to develop on sites. Amateur
historian Frank Cridland believes in the presence of evidence of Aboriginal
habitation (Extract 5). That Port Hacking must have been a favourite camping
ground of the Aborigines is proved by the number of rock shelters, or, as they
are locally styled, ‘gunyahs’, along its shores. In 1918 the worst tragedy in
terms of human life in and around Port Hacking was reported due to the
collapse of one of these shelters (Extract 6).
The impact of the Aboriginal inhabitants was therefore totally unobtrusive.
From 1788, however, the human activities are of great impact.

89
After 1788
As the Royal National Park and the Hacking River Catchment are such a large
and significant part of “the whole” that is Port Hacking, in this context their
inclusion in this study is critical.
Early History Port Hacking owes that name to Henry Hacking (c. 1750-1831), first fleeter,
and Quartermaster on HMS "Sirius". European discovery is attributed to James
Aiken, a seaman on HMS "Supply". Aiken is reputed to have sighted the
estuary while seeking water for the First Fleet while anchored in Botany Bay.
The area accordingly was first known as Port Aiken.
When Bass, Flinders and the boy William Martin entered the Port on their first
voyage of coastal discovery in the "Tom Thumb", they took soundings of the
inlet. Those soundings remain on record and help today (along with a later
Royal Navy survey in 1851) to confirm hypotheses about the dynamics of the
estuary sands.
"April 1st, (1796) was employed in the examination of the Port...it is
something more than a mile wide in the entrance; but soon contracts to
half that space, and becomes shallow. Neither have the three arms into
which it afterwards branches out, any deep channel into them; although,
within the second branch, there are from 3 to 8 fathoms. Finding there
was no part accessible to a ship, beyond 2 miles from the entrance Port
Hacking was quit early in the morning of 2nd April." from “A Voyage to Terra
Australia” 1814 by Matthew Flinders.
Bass and Flinders on that voyage named the area Port Hacking after First
Fleet quartermaster Henry Hacking. Hacking had earlier indicated its
existence to the explorers but played no role in the exploration or any other
aspect of Port Hacking (Figs. 84, 85).

90
Figure 84 - Bass and Flinders Point at the northern entrance to Port Hacking
Figure 85 - Inscription on the memorial at Bass and Flinders Point
It is therefore confusing as to the name by which the area was popularly known
although it appears from many records that it was known as Port Aiken until
much later in the 19th Century when the name Port Hacking became used

91
exclusively.
The European settlement of Sydney very quickly spread to what is now Port
Hacking – the waterway, its northern and southern foreshores, and its
headwaters. It is from this time that people began to have a significant and
lasting impact on these three components.
Activities and their impacts arose in the first instance from the necessity to
service the colony and to developing settler livelihoods, and to recreation and
industry, and finally spreading urbanisation. In the course of this, the
environment in the fullest sense began to change forever, visually, functionally
and ecologically.
Nonetheless, the virgin forests offered a variety of useful and attractive timbers.
From very early days the areas logged included what was later to become
within the boundaries of the Royal National Park.
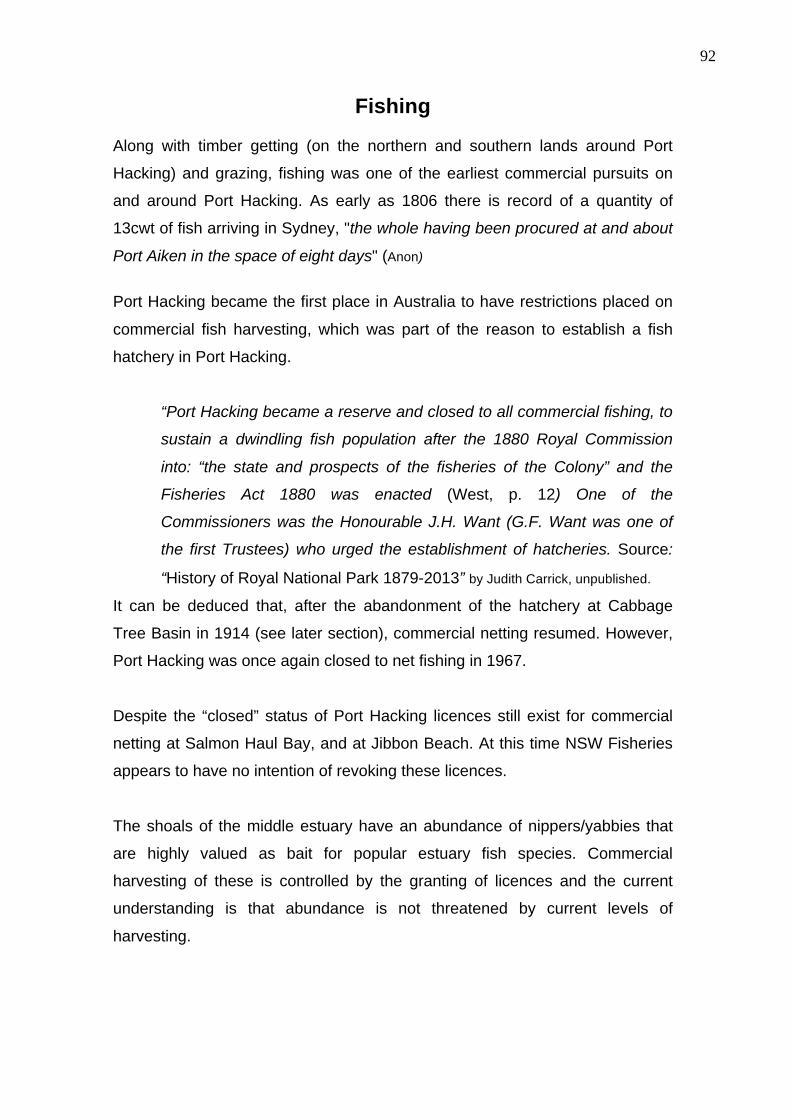
92
Fishing
Along with timber getting (on the northern and southern lands around Port
Hacking) and grazing, fishing was one of the earliest commercial pursuits on
and around Port Hacking. As early as 1806 there is record of a quantity of
13cwt of fish arriving in Sydney, "the whole having been procured at and about
Port Aiken in the space of eight days" (Anon)
Port Hacking became the first place in Australia to have restrictions placed on
commercial fish harvesting, which was part of the reason to establish a fish
hatchery in Port Hacking.
“Port Hacking became a reserve and closed to all commercial fishing, to
sustain a dwindling fish population after the 1880 Royal Commission
into: “the state and prospects of the fisheries of the Colony” and the
Fisheries Act 1880 was enacted (West, p. 12) One of the
Commissioners was the Honourable J.H. Want (G.F. Want was one of
the first Trustees) who urged the establishment of hatcheries. Source:
“History of Royal National Park 1879-2013” by Judith Carrick, unpublished.
It can be deduced that, after the abandonment of the hatchery at Cabbage
Tree Basin in 1914 (see later section), commercial netting resumed. However,
Port Hacking was once again closed to net fishing in 1967.
Despite the “closed” status of Port Hacking licences still exist for commercial
netting at Salmon Haul Bay, and at Jibbon Beach. At this time NSW Fisheries
appears to have no intention of revoking these licences.
The shoals of the middle estuary have an abundance of nippers/yabbies that
are highly valued as bait for popular estuary fish species. Commercial
harvesting of these is controlled by the granting of licences and the current
understanding is that abundance is not threatened by current levels of
harvesting.
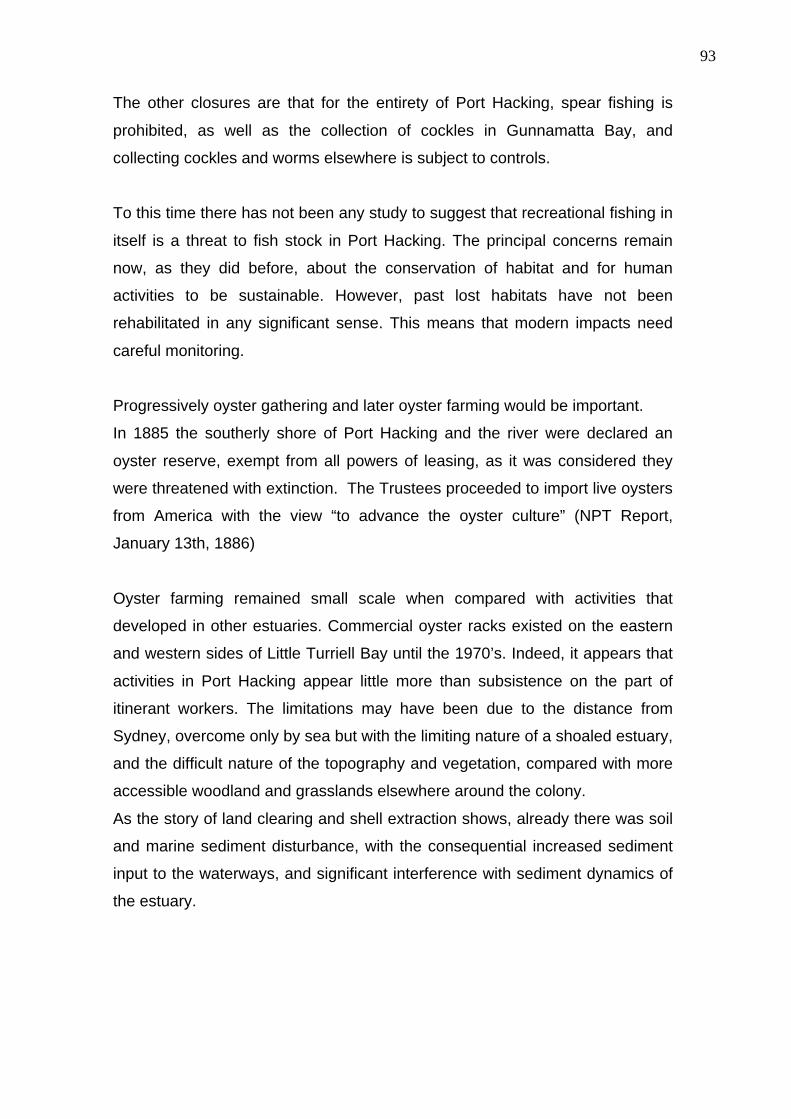
93
The other closures are that for the entirety of Port Hacking, spear fishing is
prohibited, as well as the collection of cockles in Gunnamatta Bay, and
collecting cockles and worms elsewhere is subject to controls.
To this time there has not been any study to suggest that recreational fishing in
itself is a threat to fish stock in Port Hacking. The principal concerns remain
now, as they did before, about the conservation of habitat and for human
activities to be sustainable. However, past lost habitats have not been
rehabilitated in any significant sense. This means that modern impacts need
careful monitoring.
Progressively oyster gathering and later oyster farming would be important.
In 1885 the southerly shore of Port Hacking and the river were declared an
oyster reserve, exempt from all powers of leasing, as it was considered they
were threatened with extinction. The Trustees proceeded to import live oysters
from America with the view “to advance the oyster culture” (NPT Report,
January 13th, 1886)
Oyster farming remained small scale when compared with activities that
developed in other estuaries. Commercial oyster racks existed on the eastern
and western sides of Little Turriell Bay until the 1970’s. Indeed, it appears that
activities in Port Hacking appear little more than subsistence on the part of
itinerant workers. The limitations may have been due to the distance from
Sydney, overcome only by sea but with the limiting nature of a shoaled estuary,
and the difficult nature of the topography and vegetation, compared with more
accessible woodland and grasslands elsewhere around the colony.
As the story of land clearing and shell extraction shows, already there was soil
and marine sediment disturbance, with the consequential increased sediment
input to the waterways, and significant interference with sediment dynamics of
the estuary.

94
Fish Hatchery
In the late part of the last century The Basin, the lagoon and surrounds
between Cabbage Tree Creek and Port Hacking proper, were chosen as a site
for a fish hatchery. The idea of a fish hatchery had earlier been pursued in Port
Hacking, but had failed partly because of the attempt to grow Northern
Hemisphere cold water species. It was the impacts of an outbreak of bubonic
plague in Sydney that gave impetus to the project in Port Hacking.
The Fish Hatchery, at Cabbage Tree Basin, had serious consequences for the
estuary, although the social and scientific consequences of the initiative were
more positive. That especially includes the environmental values of The Basin
itself. This was later to be made known in the detailed study of this area by
West and West (Appendix 1). This report provides elegant details of the history
of the Fish Hatchery, and more importantly gave recognition to the
conservation values of this place. In the case of Aboriginal records among
others, the area has a wide range of remnants, from middens to shelters and
other indications of the activities that took place at and around those sites
(Appendix 1).
The negative impacts arising from the construction of the hatchery relate in the
main to the large-scale sediment removal from Bonnie Vale and its deposition
on what is now known as the Middle Ground Shoal (350,000 tonnes = 170,000
m3). The magnitude and consequences on the sediment distribution will be
discussed later in this document. Importantly, this lode persists in being an
aggravation to navigation. To put the quantities of the spoil in the modern
context, each round of recent dredging of the navigation channels using the
current machinery has involved between 65,000 and 110,000 cubic metres.
The cost of this has climbed significantly and each round now well exceeds $1
million dollars (Extract 7).
The hatchery was transferred in 1907 from The Basin to the Fisheries
Research site at Hungry Point.
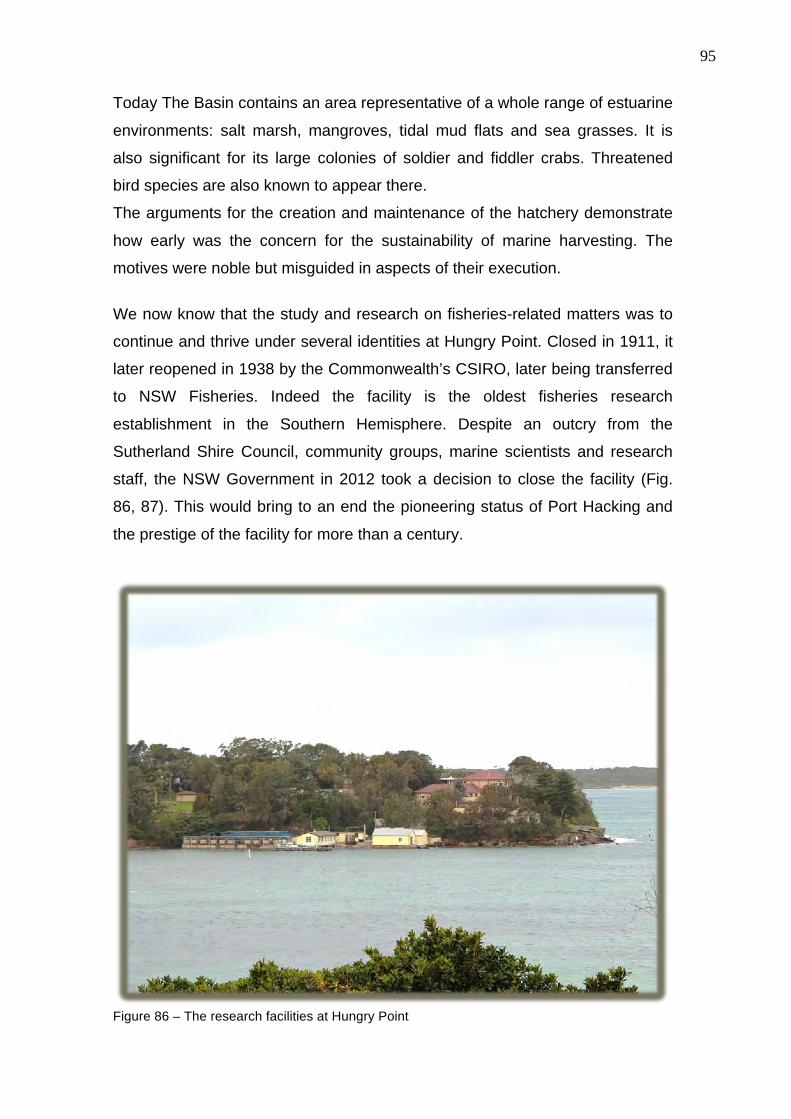
95
Today The Basin contains an area representative of a whole range of estuarine
environments: salt marsh, mangroves, tidal mud flats and sea grasses. It is
also significant for its large colonies of soldier and fiddler crabs. Threatened
bird species are also known to appear there.
The arguments for the creation and maintenance of the hatchery demonstrate
how early was the concern for the sustainability of marine harvesting. The
motives were noble but misguided in aspects of their execution.
We now know that the study and research on fisheries-related matters was to
continue and thrive under several identities at Hungry Point. Closed in 1911, it
later reopened in 1938 by the Commonwealth’s CSIRO, later being transferred
to NSW Fisheries. Indeed the facility is the oldest fisheries research
establishment in the Southern Hemisphere. Despite an outcry from the
Sutherland Shire Council, community groups, marine scientists and research
staff, the NSW Government in 2012 took a decision to close the facility (Fig.
86, 87). This would bring to an end the pioneering status of Port Hacking and
the prestige of the facility for more than a century.
Figure 86 – The research facilities at Hungry Point
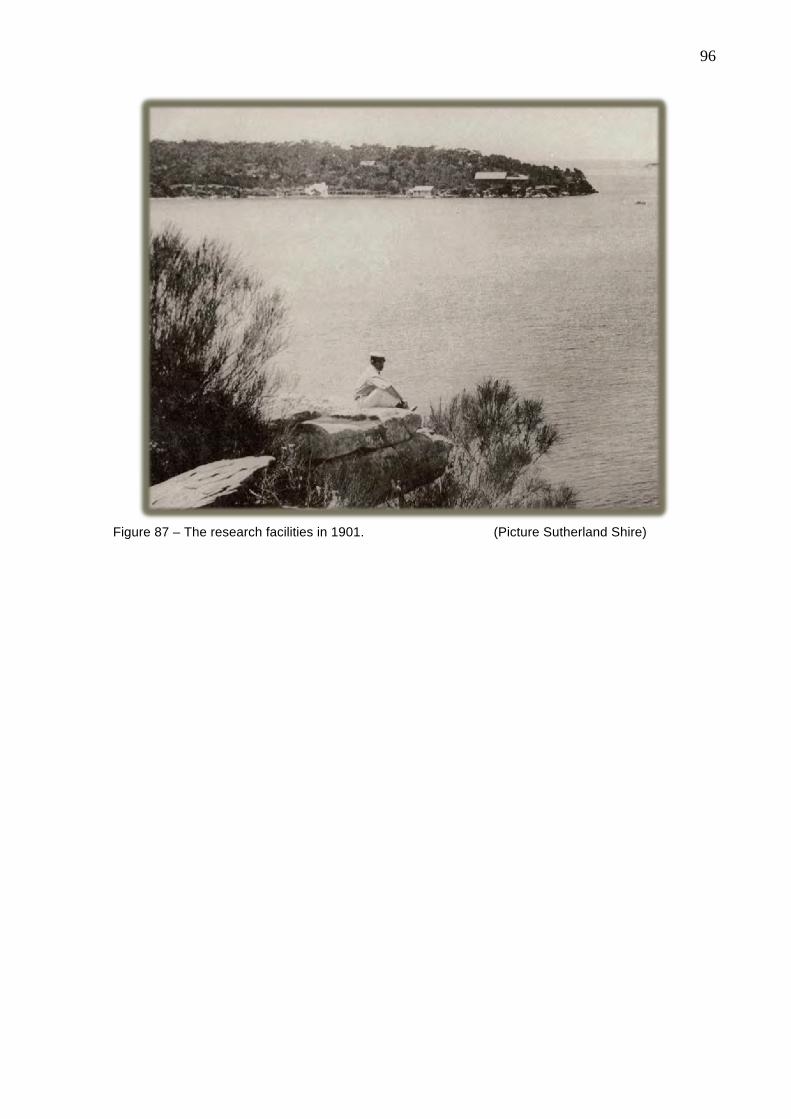
96
Figure 87 – The research facilities in 1901. (Picture Sutherland Shire)

97
Shell Grit Gathering (mining)
Also among the very early interests in the Port was shell gathering from the
waterway. The sands in some areas in Port Hacking have a very high shell
content and the colony needed lime for mortar for construction, and the shells
provided the base calcium carbonate. Much of the shell grit was taken by
visiting schooners, whose ballast contributed to the creation of the Ballast
Heap, to the Georges River and to Sydney Harbour. There are several modern
place names in around Sydney’s waterways that carry the record of lime kilning
associated with this early activity. However, there is evidence of kilning on the
shores of Port Hacking during the 19th Century, for example at Costens and at
Warumbul. There is also evidence to suggest that extraction took place in a
number of areas around Port Hacking.
Historian Frank Cridland wrote in the 1920’s that shell grit mining was “the
oldest continuing industry”. What Cridland was referring to was that, up until
then, it in the main subsistence or very small business extraction, with settlers
like Gogerly literally scratching out a business and that this type of Extraction
was in decline. In her “Thematic History of The Sutherland Shire” Pauline
Curby writes:
“Gradually the old industry fell into disfavour for a combination of
reasons. In 1916 the Council tried to have the removal of shell grit from
the waterfront banned and eventually the Department of lands restricted
the removal to ‘certain sections of the waterfront’. It is not certain if this
was done for environmental reasons…..”
Mining on a larger scale began in 1928. It appears that it was at this time that
dredges were employed to extract large quantities. In 1934 the industry
became highly controversial. By then the poultry industry was the driver of
supply, and was, by then, centred on the shoals at Maianbar: “Edwin
Hadlington, poultry expert, Department of Agriculture, said that grit from Port
Hacking was particularly suitable for poultry. The shell grit requirements of the

98
poultry industry in the counties of Cumberland and Northumberland were
between 5000 and 6000 tons annually” (Sydney Morning Herald, 3 October,
1934) However, although the industry persisted until about 1973, it wasn’t
always popular or accepted. The Sydney Morning Herald of 14 September,
1934, and later 3 October, 1934 reported on the objections of local business
(Extract 8) and indeed wider concerns about the impacts (Extract 9).
The shell grit was barged from the extraction site to Fernleigh Road in
Burraneer Bay where land based infrastructure had been installed (also
controversial). During the war years, Council’s objections to a new lease in Port
Hacking were overruled to support the poultry industry.
It is noteworthy for a number of reasons that shell grit gathering continued in
Port Hacking until as late as 1973. First, the displacement and dumping of the
sediment was a significant element in the redistribution of sediment and thus
aggravating the impediments to navigation. Second was the habitat
destruction. The destruction of seagrass was not only significant in its
magnitude, but has also been found to be permanent (Extract 10).
The main area of shell extraction on the shoals at Maianbar is clearly shown in
aerial photographs from 1955 (Figs. 88 – 90).
Figure 88 -The main area of shell extraction on the shoals at Maianbar. Photo 1955 (SSC Shiremaps)

99
Figure 89. Close-up of the dredge and trail of shell extraction in the 1955 photo (Fig. 88) (SSC Shiremaps)
Figure 90 - The shell extraction dredge. Note the booms extracting at the rear left, another redeposing to the right. The path of the dredge is clearly delineated (SSC Shiremaps).
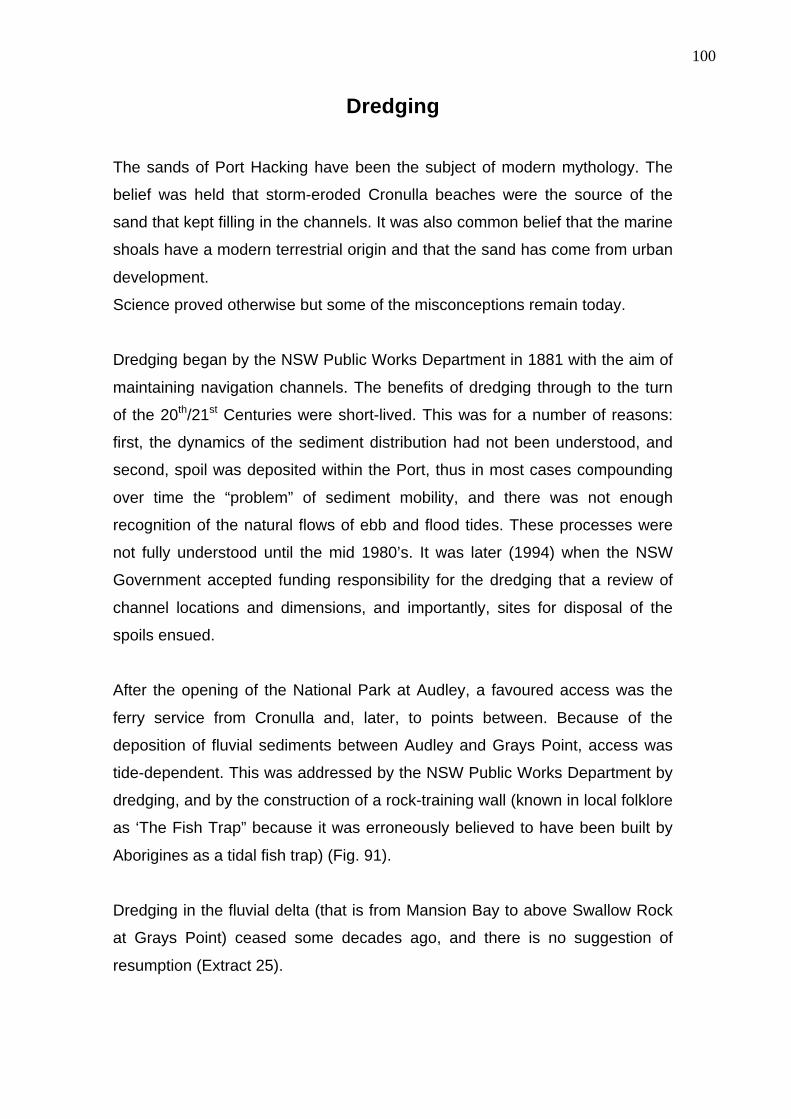
100
Dredging
The sands of Port Hacking have been the subject of modern mythology. The
belief was held that storm-eroded Cronulla beaches were the source of the
sand that kept filling in the channels. It was also common belief that the marine
shoals have a modern terrestrial origin and that the sand has come from urban
development.
Science proved otherwise but some of the misconceptions remain today.
Dredging began by the NSW Public Works Department in 1881 with the aim of maintaining navigation channels. The benefits of dredging through to the turn
of the 20th/21st Centuries were short-lived. This was for a number of reasons:
first, the dynamics of the sediment distribution had not been understood, and
second, spoil was deposited within the Port, thus in most cases compounding
over time the “problem” of sediment mobility, and there was not enough
recognition of the natural flows of ebb and flood tides. These processes were
not fully understood until the mid 1980’s. It was later (1994) when the NSW
Government accepted funding responsibility for the dredging that a review of
channel locations and dimensions, and importantly, sites for disposal of the
spoils ensued.
After the opening of the National Park at Audley, a favoured access was the
ferry service from Cronulla and, later, to points between. Because of the
deposition of fluvial sediments between Audley and Grays Point, access was
tide-dependent. This was addressed by the NSW Public Works Department by
dredging, and by the construction of a rock-training wall (known in local folklore
as ‘The Fish Trap” because it was erroneously believed to have been built by
Aborigines as a tidal fish trap) (Fig. 91).
Dredging in the fluvial delta (that is from Mansion Bay to above Swallow Rock
at Grays Point) ceased some decades ago, and there is no suggestion of
resumption (Extract 25).
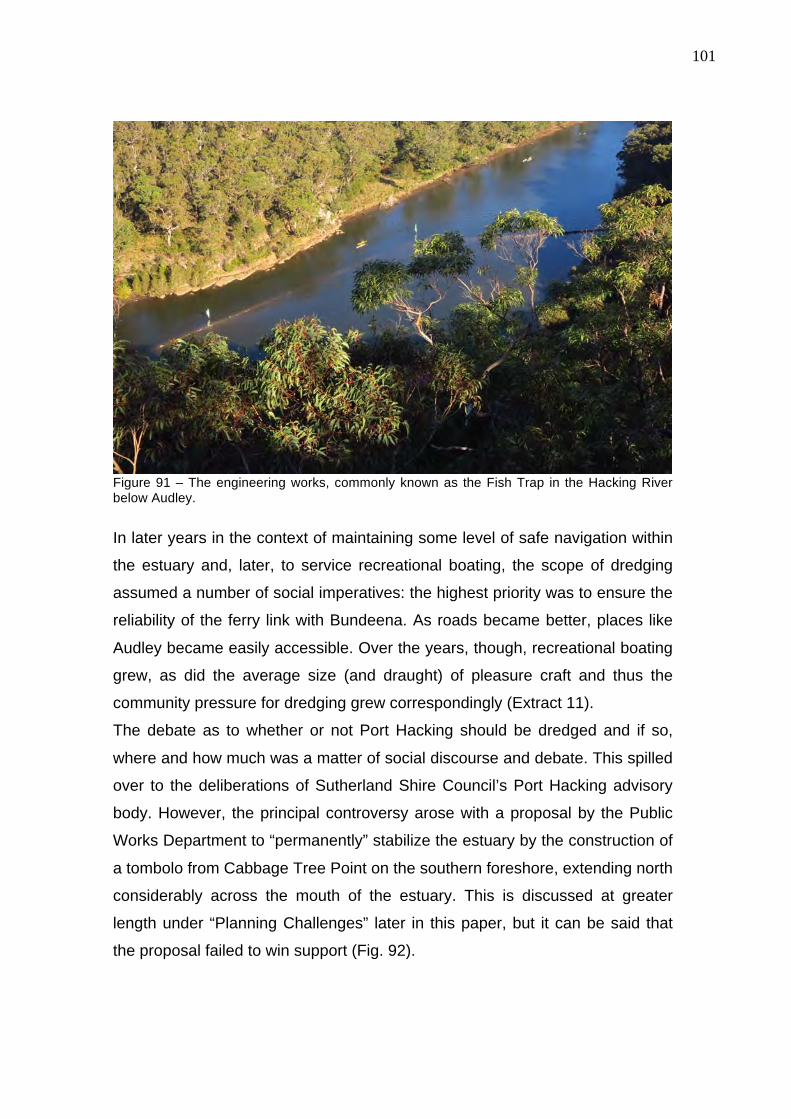
101
Figure 91 – The engineering works, commonly known as the Fish Trap in the Hacking River below Audley.
In later years in the context of maintaining some level of safe navigation within
the estuary and, later, to service recreational boating, the scope of dredging
assumed a number of social imperatives: the highest priority was to ensure the
reliability of the ferry link with Bundeena. As roads became better, places like
Audley became easily accessible. Over the years, though, recreational boating
grew, as did the average size (and draught) of pleasure craft and thus the
community pressure for dredging grew correspondingly (Extract 11).
The debate as to whether or not Port Hacking should be dredged and if so,
where and how much was a matter of social discourse and debate. This spilled
over to the deliberations of Sutherland Shire Council’s Port Hacking advisory
body. However, the principal controversy arose with a proposal by the Public
Works Department to “permanently” stabilize the estuary by the construction of
a tombolo from Cabbage Tree Point on the southern foreshore, extending north
considerably across the mouth of the estuary. This is discussed at greater
length under “Planning Challenges” later in this paper, but it can be said that
the proposal failed to win support (Fig. 92).
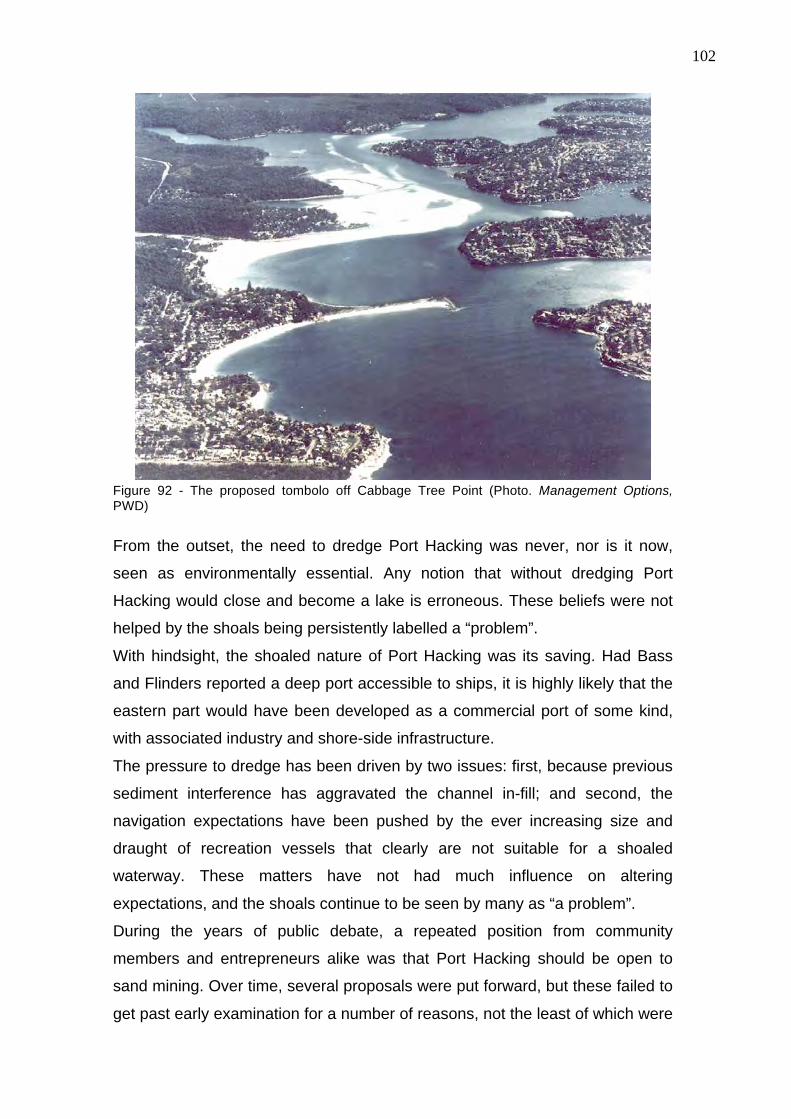
102
Figure 92 - The proposed tombolo off Cabbage Tree Point (Photo. Management Options, PWD)
From the outset, the need to dredge Port Hacking was never, nor is it now,
seen as environmentally essential. Any notion that without dredging Port
Hacking would close and become a lake is erroneous. These beliefs were not
helped by the shoals being persistently labelled a “problem”.
With hindsight, the shoaled nature of Port Hacking was its saving. Had Bass
and Flinders reported a deep port accessible to ships, it is highly likely that the
eastern part would have been developed as a commercial port of some kind,
with associated industry and shore-side infrastructure.
The pressure to dredge has been driven by two issues: first, because previous
sediment interference has aggravated the channel in-fill; and second, the
navigation expectations have been pushed by the ever increasing size and
draught of recreation vessels that clearly are not suitable for a shoaled
waterway. These matters have not had much influence on altering
expectations, and the shoals continue to be seen by many as “a problem”.
During the years of public debate, a repeated position from community
members and entrepreneurs alike was that Port Hacking should be open to
sand mining. Over time, several proposals were put forward, but these failed to
get past early examination for a number of reasons, not the least of which were

103
the marketability at a volume-related price, environmental limitations and social
disruption.
Through the years of consultative process, consensus was achieved on an on-
going navigation strategy. The State Government had agreed with Sutherland
Shire Council to accept funding responsibility for the dredging and a
Memorandum of Understanding was struck which set a framework within which
the work would be funded and executed.
“The Memorandum contained a package of environmental and
management elements, all forming a framework within which further
dredging was considered sustainable. All those who committed to this
package (environmental, boating, regulatory) acknowledged that
dredging in isolation was not a sustainable approach. Because
environmental protection and management aspects of that
Memorandum have not been implemented, future dredging is at risk.
PHPS have repeatedly highlighted this issue………..” Port Hacking
Protectorate, April, 1997
Given the storm damage to the Bate Bay beaches, and scientific assessment
that the sediment in Port Hacking is, in the most part (the eastern part of the
estuary), suitable for use as beach nourishment, and deposition sites off the
beaches were selected. This has been a welcome side benefit to the
maintenance of the channels within Port Hacking (Extract 30).
The estuarine sediments remain a social and political issue. When planning
first began in the 1980’s the shoals, which were exposed at low tides, were
seen as part of the “problem”. As places like Jibbon Beach, and later Deeban
Spit, have become overcrowded, the exposed shoals have become a valued
resource for recreation.
Although the dynamics of the marine estuary are now understood and the main
navigation channels are kept within accepted and agreed design parameters,
bigger boats mean a change in expectations. As of 2012, there is now some

104
question about the NSW Government’s commitment to fully fund the dredging
in future. The future of dredging for navigation (Fig. 93) now has a cloud of
uncertainty above it.
Further, noticeable and quickly occurring changes to the Middle Ground Shoal,
the Deeban Spit and the entrance creek to Cabbage Tree Basin give rise to the
need for further scientific survey of the changes and their causes. This is of no
surprise as the tidal delta has, for many decades, been in a state of flux and
will remain so. Any rise in sea level, combined with an increase in storm event
intensity, is likely to accentuate the changes and their rate.
Figure 93 – The 2011 proposed dredging to maintain the channels’ viability. (SSC map)
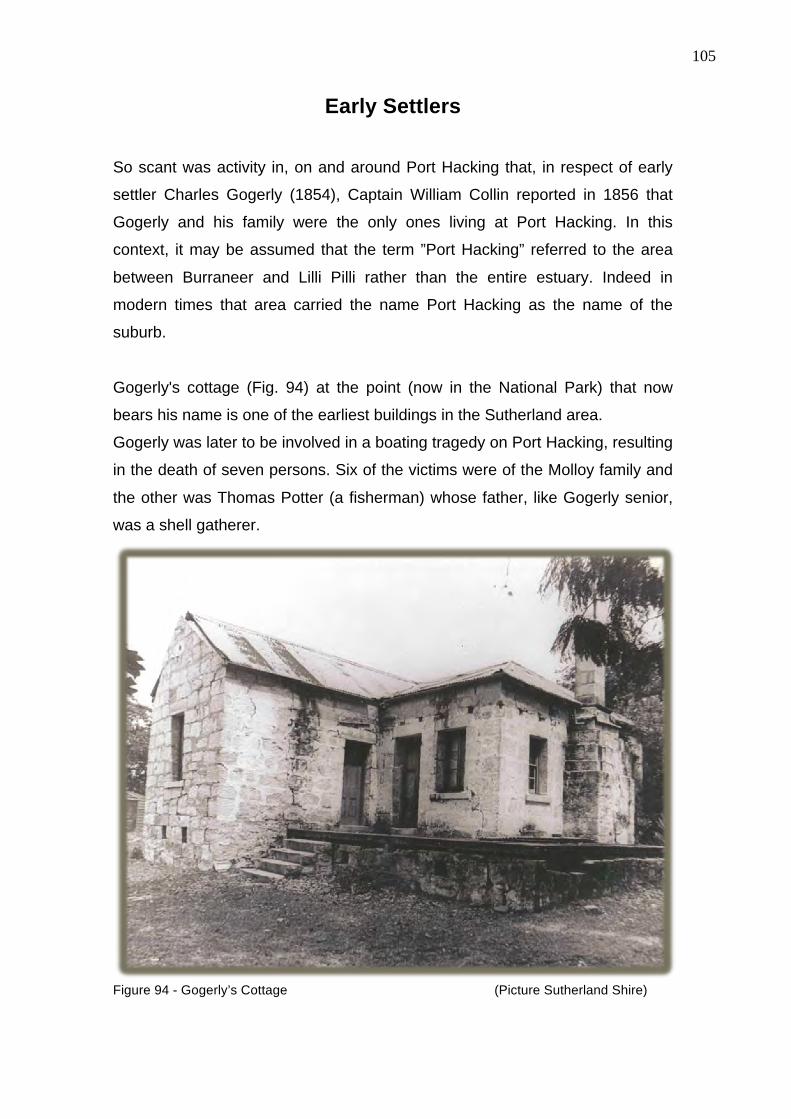
105
Early Settlers
So scant was activity in, on and around Port Hacking that, in respect of early
settler Charles Gogerly (1854), Captain William Collin reported in 1856 that
Gogerly and his family were the only ones living at Port Hacking. In this
context, it may be assumed that the term ”Port Hacking” referred to the area
between Burraneer and Lilli Pilli rather than the entire estuary. Indeed in
modern times that area carried the name Port Hacking as the name of the
suburb.
Gogerly's cottage (Fig. 94) at the point (now in the National Park) that now
bears his name is one of the earliest buildings in the Sutherland area.
Gogerly was later to be involved in a boating tragedy on Port Hacking, resulting
in the death of seven persons. Six of the victims were of the Molloy family and
the other was Thomas Potter (a fisherman) whose father, like Gogerly senior,
was a shell gatherer.
Figure 94 - Gogerly’s Cottage (Picture Sutherland Shire)

106
The tragedy is significant in the story of early European struggles on Port
Hacking not only for the heart-rending circumstances, but significant for the
descriptions of the livelihoods and life circumstances for these early strugglers.
The inquiry also noted that another early Port Hacking settler, a Mr Kosten
(now recorded as Costen), was in the vicinity with his ketch “Emu” and played
a part in the attending the scene and rescue (Extract 12).
Major acquirers of land around Port Hacking were Thomas Holt, John Connell,
Patrick and Dominic Dolan. Each of these was to be involved with significant
land clearing and later sub-division.
The more the settlers did around Port Hacking, the more the need arose for
things to happen. Land was cleared for animals, houses sprang up, tracks
were cut through, and eventually a railway. The line to Waterfall opened in
1886.
As stated in the beginning of this document, the intention is not to give a
comprehensive human history of Port Hacking but rather give an
understanding of how Port Hacking came to be as it is now. The activities of
the early settlers expanded into all the aspects of Port Hacking, as we now
know it – work, recreation, holiday and residential development, waterways
interventions and environmental management. This document has dealt with
the evolution of European activities on and around Port Hacking in a number of
preceding chapters, succeeding chapters and some of the Extracts give further
illustrations of the evolution of the early European days and the transition to the
present. In particular, the focus is on the impacts that have shaped the Port
Hacking of today.

107
Recreational Activities
What should not be undersold is just how early in the days of Port Hacking
recreation on and around the waterways became popular for locals and for
Sydneysiders alike. This was the case on the southern and the northern
foreshores, and over the extent of the estuary and the Hacking River. The
protected, shoaled and clean waters of Port Hacking and its bushland
surrounds were (and remain) conducive to almost every kind of recreational
pursuit. Indeed, recreation was to give rise to a range of positive as well as
negative impacts. We will see later how some early recreation needs were met
by the construction of a hotel at Bonnie Vale. By the latter part of the 19th
Century and early part of the 20th Century, recreation was to cause significant
changes on and around Port Hacking, not the least of which was the style of
the National Park at Audley. This resulted in the Hacking River being dammed,
and engineering works in the river just below to secure navigation access to
the pleasure grounds (Figs. 95, 96) (Extract 25).
Figure 95 – Recreational developments at Audley around 1920 (Source Museum Victoria, MM8745)
Many generations were to explore and exploit the features of the Port, and the
shacks and the formalising of camping at Bonnie Vale reflect the generations of
pursuit of these simple pleasures.

108
Figure 96 – Recreational developments at Audley around 1930 (Picture Sutherland Shire)
A number of formalised and commercial pleasure grounds grew (Yowie Bay, a
church camp at Grays Point, and of course the church camps at Warumbul)
(Figs. 97, 98).
Figure 97 – The church camps at Warumbul (Picture Sutherland Shire)

109
Figure 98 – Present day church camps at Warumbul
In the 20th Century, the casual and sporadic camping (generally accessed by
boat around the Port) became problematic because of bushland disturbance,
rubbish and fire risks and ultimately became discouraged and in places
prohibited.
The southern foreshore was progressively granted or purchased for a variety of
uses such as timber getting, boat repair and so on. The sandstone remnants of
settlement and activity remain in so many areas on the land and on the
waterfront, as does exotic vegetation. Most of this land was later, and
incrementally, to become part of what is now the Royal National Park.
The modern foreshore and waterfront contains many remnants/artifacts of
recreational constructions for boating, swimming and general access to the
water.
Grays Point received national headlines in 1927 when a young swimmer was
fatally mauled by a shark. This is the only recorded shark attack within Port

110
Hacking, although sightings have not been unusual. The victim was not a
“local” but had come to picnic and enjoy the wonderful ambience of Port
Hacking and the Hacking River. And thus it was from the beginning of the
European story - that recreation went side-by side with settlement. As
discussed earlier, there were many formal recreational developments around
Port Hacking, but from early days, people came from the more developed
colony (and later from Sydney’s sprawling suburbs) to enjoy this beauty and its
easy exploitation for play.

111
Foreshore Development
The village of Bundeena began life as the Yarmouth Estate, or Byrne's Bush
after an earlier grant of 400 acres to Owen Byrne was subdivided in 1886. At
Bonnie Vale William Simpson acquired 50 acres in 1863, and the house later
became Simpsons Hotel. Bundeena and the hotel were served by launch from
the northern side in 1915 for Bundeena from Gunnamatta, and 1916 for the
hotel from Tyreal (later Turriell) Point. At one point in the life of Simpsons
Hotel, the first school in the Sutherland Shire was held in a room. A substantial
wharf was built at Bonnie Vale to service the hotel (Fig. 99).
Figure 99 - The wharf at Bonnie Vale (Picture Sutherland Shire)
The story, which developed around Simpsons and Bonnie Vale, is worth telling
in some detail, because of its multi-facetted significance.
George Simpson was granted land at what is now known as Bonnie Vale in
1862 and was one of only two landholders at that time to actually settle on their
holdings.
With some controversy over land title and who precisely did what and where,

112
Simpson occupied land and built a substantial stone cottage (Conservation
Management Plan for Simpsons Hotel Precinct, Bonnie Vale, Royal National
Park 2001).
Ultimately, a hotel was established on the site (fig 100).
Figure 100 – Simpsons Hotel (Picture Sutherland Shire)
The access to the areas to the south from here was to play an important part in
the wider notion of a national park, that is a place of significant natural value,
rather than the European-style recreation area envisaged and created at
Audley as The National Park. In this way, nature-oriented recreationalists
played a key role in enshrining conservation values.
By the end of the 19th Century and in the early 20th Century there were
numerous residential subdivisions, and increasing recreational use of the
waterway (river and estuary) and of its northern and southern foreshores.
The Sutherland Shire was incorporated in 1906. At that time, the population of
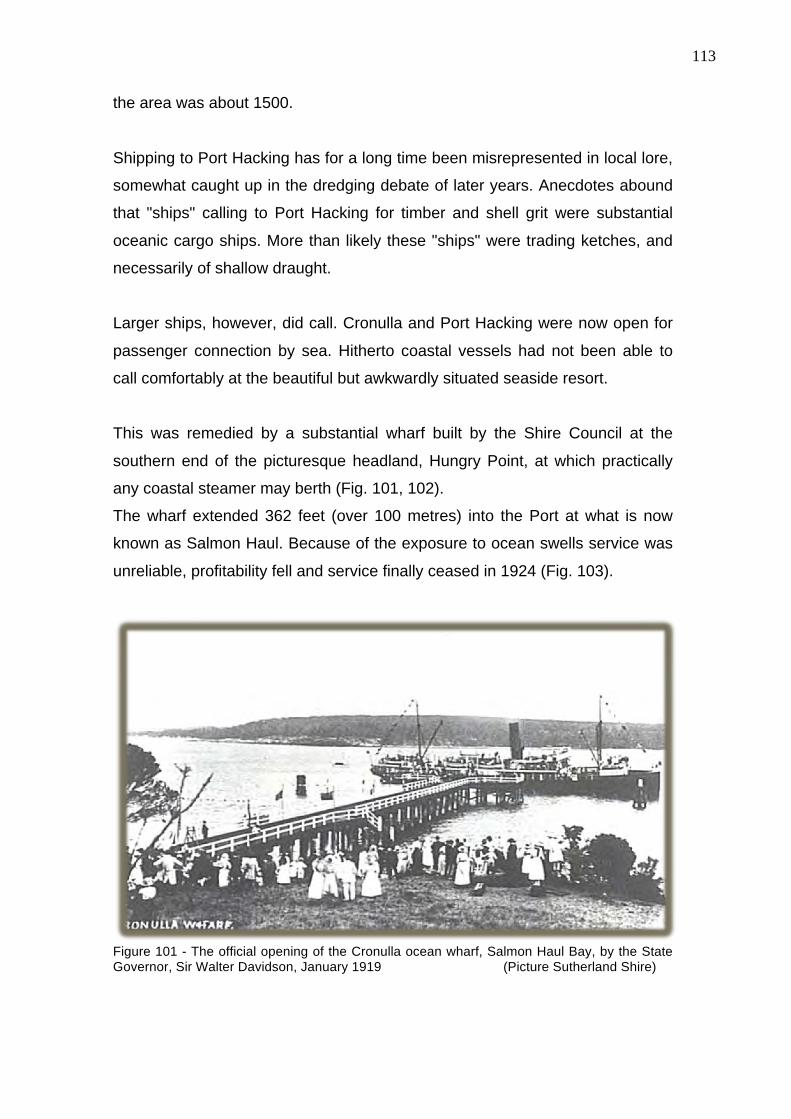
113
the area was about 1500.
Shipping to Port Hacking has for a long time been misrepresented in local lore,
somewhat caught up in the dredging debate of later years. Anecdotes abound
that "ships" calling to Port Hacking for timber and shell grit were substantial
oceanic cargo ships. More than likely these "ships" were trading ketches, and
necessarily of shallow draught.
Larger ships, however, did call. Cronulla and Port Hacking were now open for
passenger connection by sea. Hitherto coastal vessels had not been able to
call comfortably at the beautiful but awkwardly situated seaside resort.
This was remedied by a substantial wharf built by the Shire Council at the
southern end of the picturesque headland, Hungry Point, at which practically
any coastal steamer may berth (Fig. 101, 102).
The wharf extended 362 feet (over 100 metres) into the Port at what is now
known as Salmon Haul. Because of the exposure to ocean swells service was
unreliable, profitability fell and service finally ceased in 1924 (Fig. 103).
Figure 101 - The official opening of the Cronulla ocean wharf, Salmon Haul Bay, by the State Governor, Sir Walter Davidson, January 1919 (Picture Sutherland Shire)
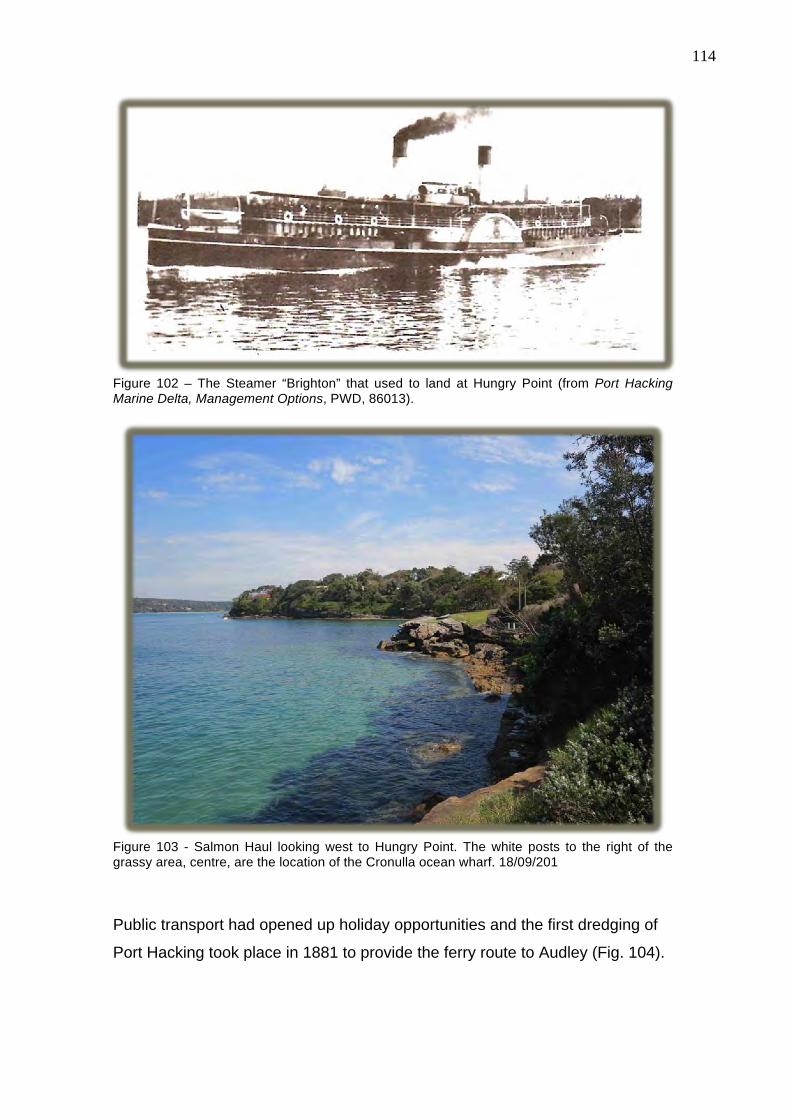
114
Figure 102 – The Steamer “Brighton” that used to land at Hungry Point (from Port Hacking Marine Delta, Management Options, PWD, 86013).
Figure 103 - Salmon Haul looking west to Hungry Point. The white posts to the right of the grassy area, centre, are the location of the Cronulla ocean wharf. 18/09/201
Public transport had opened up holiday opportunities and the first dredging of
Port Hacking took place in 1881 to provide the ferry route to Audley (Fig. 104).
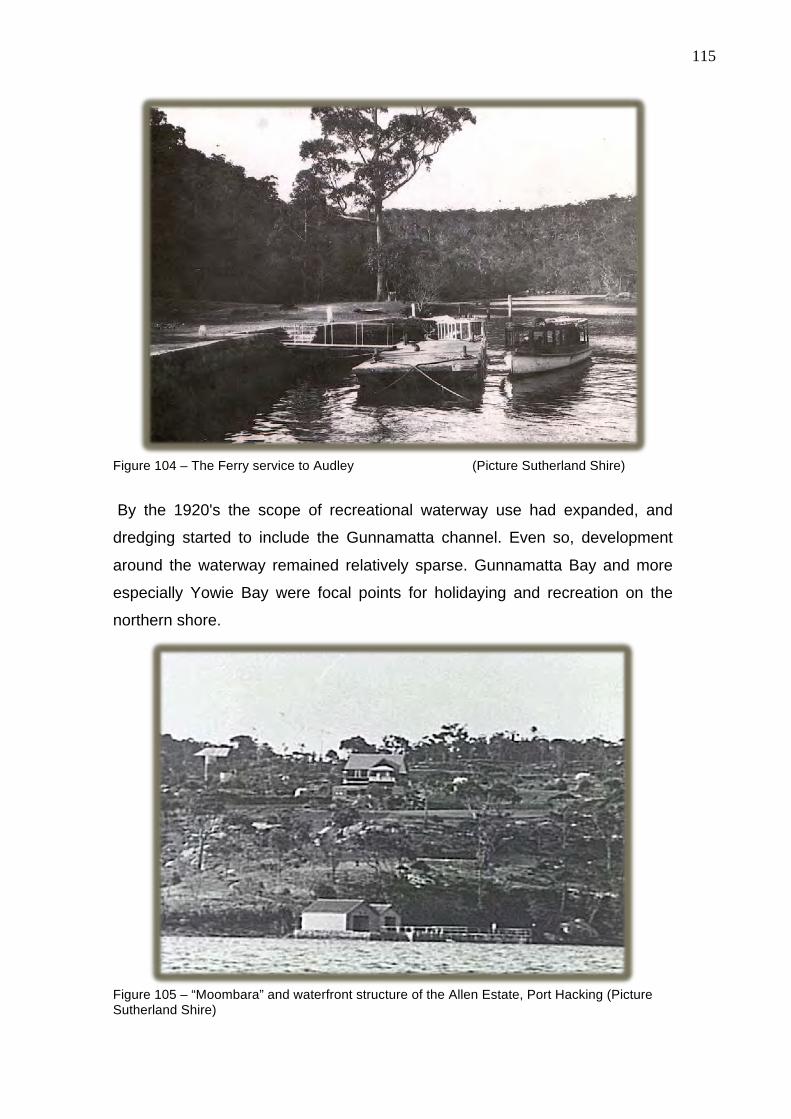
115
Figure 104 – The Ferry service to Audley (Picture Sutherland Shire)
By the 1920's the scope of recreational waterway use had expanded, and
dredging started to include the Gunnamatta channel. Even so, development
around the waterway remained relatively sparse. Gunnamatta Bay and more
especially Yowie Bay were focal points for holidaying and recreation on the
northern shore.
Figure 105 – “Moombara” and waterfront structure of the Allen Estate, Port Hacking (Picture Sutherland Shire)
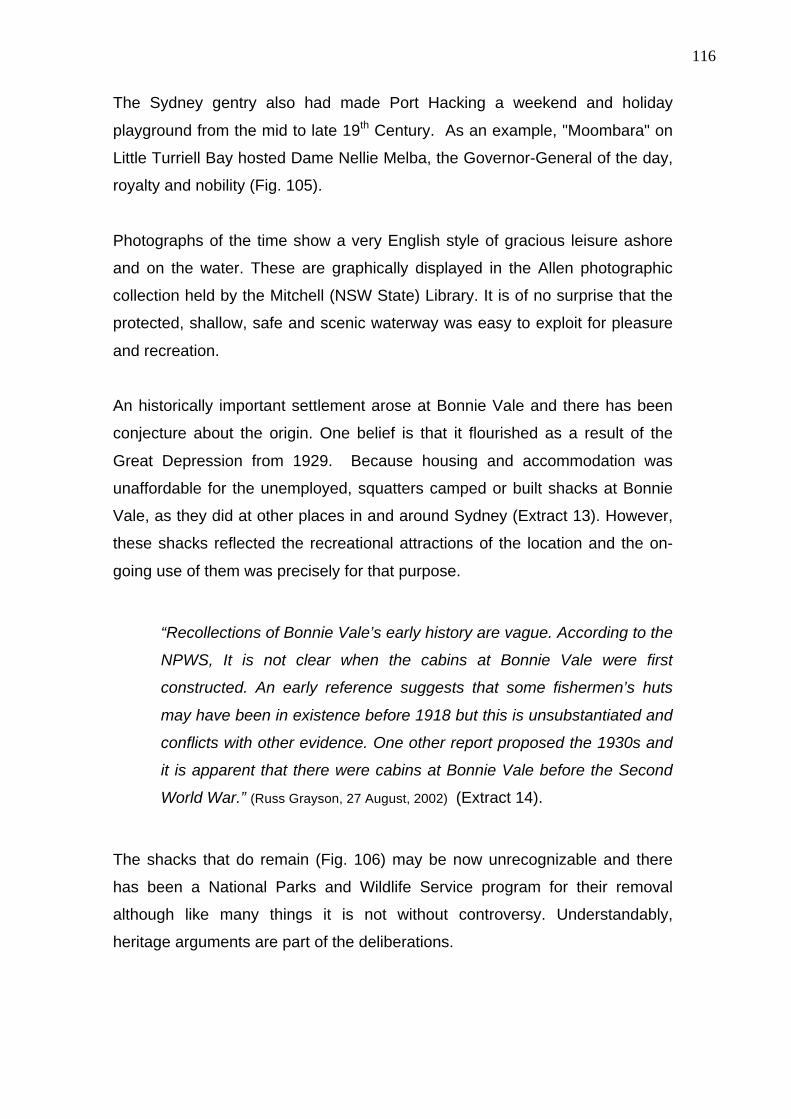
116
The Sydney gentry also had made Port Hacking a weekend and holiday
playground from the mid to late 19th Century. As an example, "Moombara" on
Little Turriell Bay hosted Dame Nellie Melba, the Governor-General of the day,
royalty and nobility (Fig. 105).
Photographs of the time show a very English style of gracious leisure ashore
and on the water. These are graphically displayed in the Allen photographic
collection held by the Mitchell (NSW State) Library. It is of no surprise that the
protected, shallow, safe and scenic waterway was easy to exploit for pleasure
and recreation.
An historically important settlement arose at Bonnie Vale and there has been
conjecture about the origin. One belief is that it flourished as a result of the
Great Depression from 1929. Because housing and accommodation was
unaffordable for the unemployed, squatters camped or built shacks at Bonnie
Vale, as they did at other places in and around Sydney (Extract 13). However,
these shacks reflected the recreational attractions of the location and the on-
going use of them was precisely for that purpose.
“Recollections of Bonnie Vale’s early history are vague. According to the
NPWS, It is not clear when the cabins at Bonnie Vale were first
constructed. An early reference suggests that some fishermen’s huts
may have been in existence before 1918 but this is unsubstantiated and
conflicts with other evidence. One other report proposed the 1930s and
it is apparent that there were cabins at Bonnie Vale before the Second
World War.” (Russ Grayson, 27 August, 2002) (Extract 14).
The shacks that do remain (Fig. 106) may be now unrecognizable and there
has been a National Parks and Wildlife Service program for their removal
although like many things it is not without controversy. Understandably,
heritage arguments are part of the deliberations.
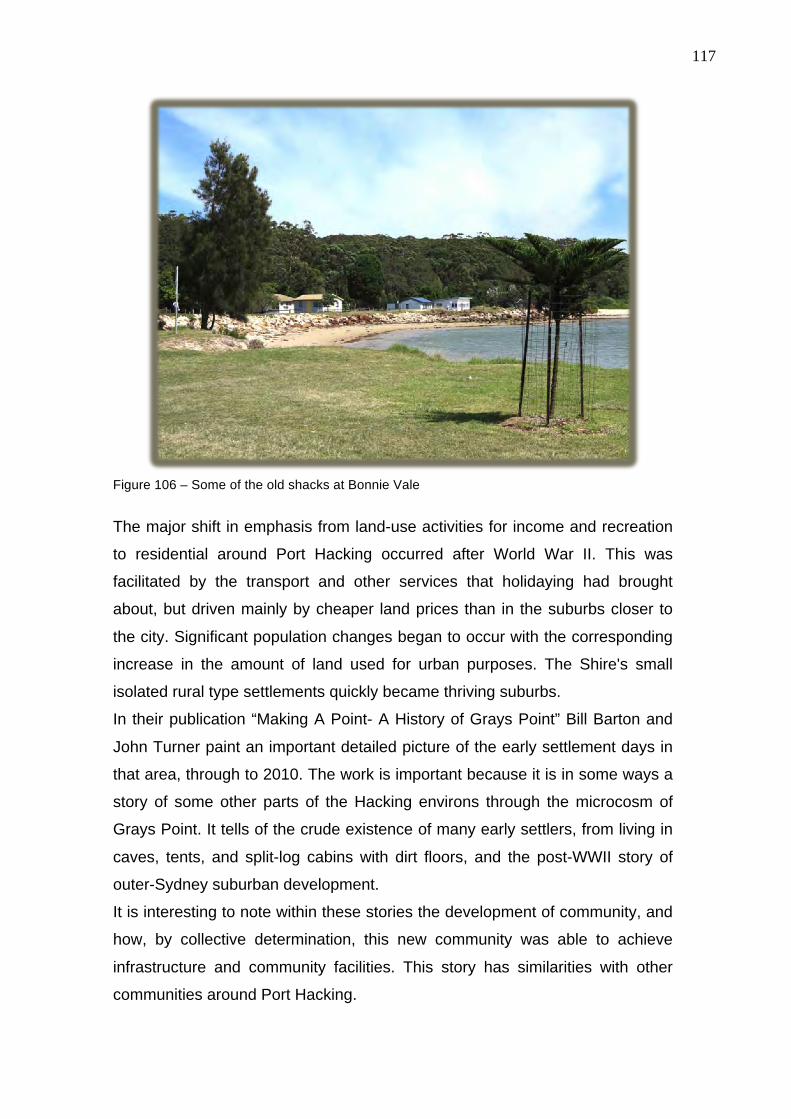
117
Figure 106 – Some of the old shacks at Bonnie Vale
The major shift in emphasis from land-use activities for income and recreation
to residential around Port Hacking occurred after World War II. This was
facilitated by the transport and other services that holidaying had brought
about, but driven mainly by cheaper land prices than in the suburbs closer to
the city. Significant population changes began to occur with the corresponding
increase in the amount of land used for urban purposes. The Shire's small
isolated rural type settlements quickly became thriving suburbs.
In their publication “Making A Point- A History of Grays Point” Bill Barton and
John Turner paint an important detailed picture of the early settlement days in
that area, through to 2010. The work is important because it is in some ways a
story of some other parts of the Hacking environs through the microcosm of
Grays Point. It tells of the crude existence of many early settlers, from living in
caves, tents, and split-log cabins with dirt floors, and the post-WWII story of
outer-Sydney suburban development. It is interesting to note within these stories the development of community, and
how, by collective determination, this new community was able to achieve
infrastructure and community facilities. This story has similarities with other
communities around Port Hacking.

118
Unlike the eastern foreshores of Port Hacking, where considerable land
clearing had taken place, Grays Point was adjacent to bushland, which will
forever remain so. Accordingly, the place of catchment streams feeding the
Hacking River is more prominent than in other places on the northern, urban
foreshore. In the modern setting, many of these streams have all but
disappeared as part of the stormwater infrastructure.
The Housing Commission resumed vacant land close to railway stations for its
developments, while thousands became “owner-builders”. One of the
limitations on the size of dwellings, other than the restrictions of income, so
much was the scarcity of building materials after the war that official limits were
placed on the size of dwellings, and materials rationed.
From the 1960s onwards, the waterfront and foreshore of Port Hacking
became the focus of expensive housing. However, the absence of technology
and the cost kept development to the more easily accessed and workable
sites, i.e. easy access from the street for construction as well as for the
residence, and reasonably workable terrain. The size of blocks remained large
enough to retain a sense of open space. This also meant the greater likelihood
of retained native, indigenous vegetation, although Australian gardens here, as
much as elsewhere, abounded in exotic plantings.
As time progressed, waterfront land became scarce, affluence had increased
and technology was becoming available for larger scale development on
difficult terrain. Steeper and more difficult sites were now exploited for
increasingly larger houses with the attending major modifications to the natural
landform through excavation.
The growing affluence also was driving the demolition of older buildings, to be
redeveloped on a much larger scale.
Moreover, the difficulty of some waterfront sites was met in many cases by
major construction and maintenance service from the water. Huge earthmoving
equipment, trucks, concrete agitators and cranes all being delivered to sites by
barge (Figs 107, 108).

119
Figure 107 – Barge loading at Wally’s Wharf, Dolans Bay
Figure 108 – Loaded barge in Burraneer Bay
This has not been without its costs. Vegetation losses have been significant
and measurable. The natural terrain has been significantly altered, and the
natural water’s edge has in too many places been replaced with seawall (Fig.
109).
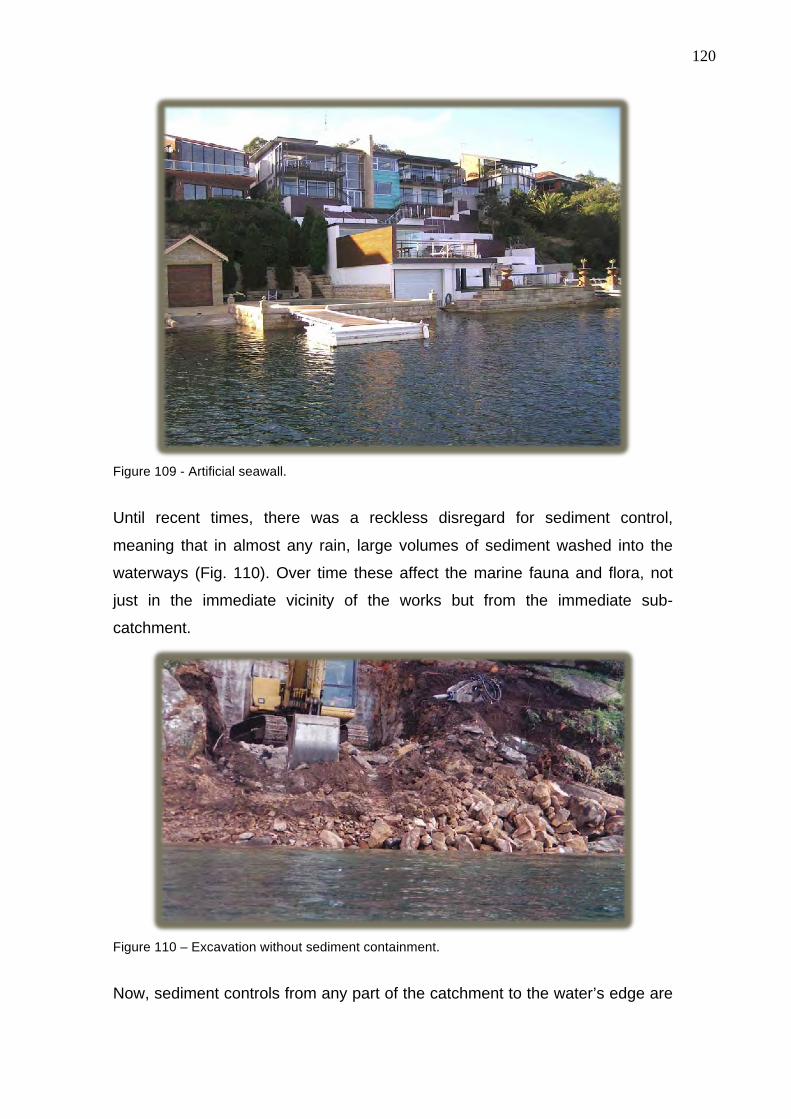
120
Figure 109 - Artificial seawall.
Until recent times, there was a reckless disregard for sediment control,
meaning that in almost any rain, large volumes of sediment washed into the
waterways (Fig. 110). Over time these affect the marine fauna and flora, not
just in the immediate vicinity of the works but from the immediate sub-
catchment.
Figure 110 – Excavation without sediment containment.
Now, sediment controls from any part of the catchment to the water’s edge are
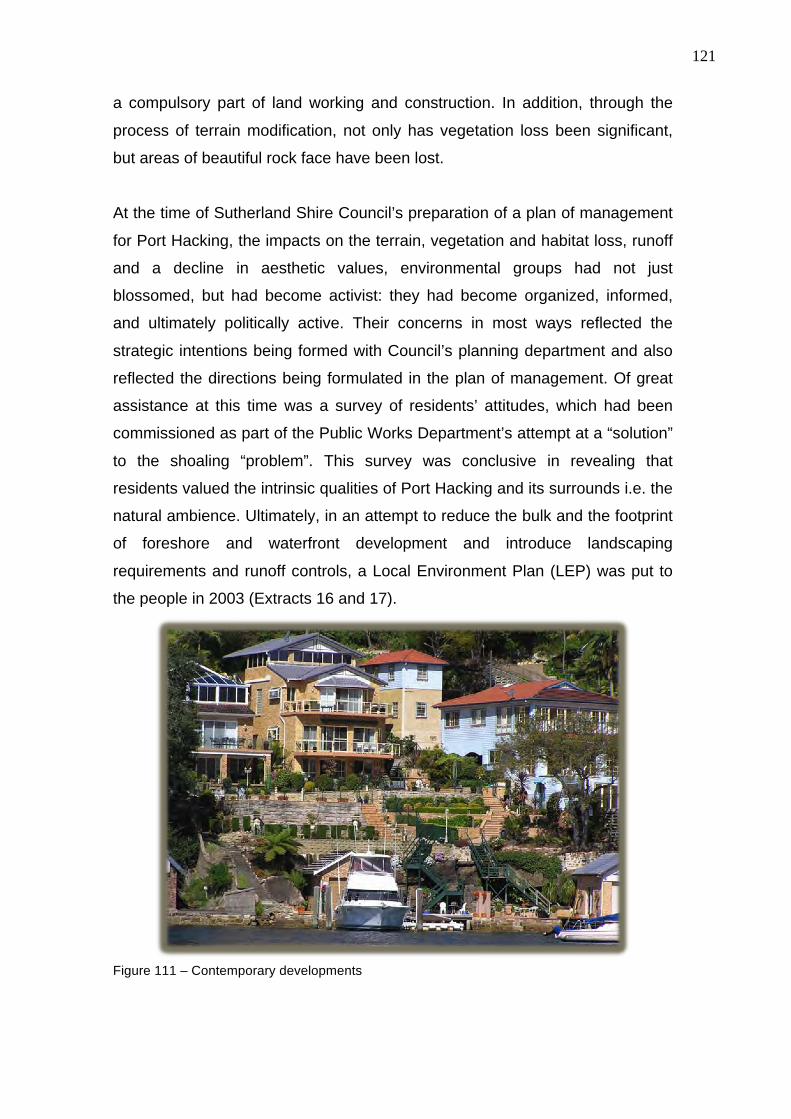
121
a compulsory part of land working and construction. In addition, through the
process of terrain modification, not only has vegetation loss been significant,
but areas of beautiful rock face have been lost.
At the time of Sutherland Shire Council’s preparation of a plan of management
for Port Hacking, the impacts on the terrain, vegetation and habitat loss, runoff
and a decline in aesthetic values, environmental groups had not just
blossomed, but had become activist: they had become organized, informed,
and ultimately politically active. Their concerns in most ways reflected the
strategic intentions being formed with Council’s planning department and also
reflected the directions being formulated in the plan of management. Of great
assistance at this time was a survey of residents’ attitudes, which had been
commissioned as part of the Public Works Department’s attempt at a “solution”
to the shoaling “problem”. This survey was conclusive in revealing that
residents valued the intrinsic qualities of Port Hacking and its surrounds i.e. the
natural ambience. Ultimately, in an attempt to reduce the bulk and the footprint
of foreshore and waterfront development and introduce landscaping
requirements and runoff controls, a Local Environment Plan (LEP) was put to
the people in 2003 (Extracts 16 and 17).
Figure 111 – Contemporary developments

122
Figure 112 – Contemporary development
However, the aesthetic values of Port Hacking’s urban surrounds have been
changed (Figs 111, 112). The size, style and nature of residential development
reflect an unprecedented affluence and is more imposing on the landscape
than ever. In many cases developments that do not meet local planning
intentions are due to decisions outside Council’s power.
Sydney was expanding everywhere during this time of development expansion
on Port Hacking’s foreshores. The major growth areas were in the west and
southwest of Sydney, especially in the Liverpool and Campbelltown region.
Population growth in that region became significant for Port Hacking because,
along with the Illawarra, Cronulla and Port Hacking were the most accessible
seaside and waterway recreational opportunities. Cronulla still remains the only
Sydney beach suburb served by rail. The southwestern region became part of
a now huge recreational user catchment for an attractive and diverse
recreational resource.
During this period the sand that had infilled Port Hacking over thousands of
years now took on an important new significance with Deeban Spit and the
shallows off Lilli Pilli being used as a recreational area (Fig. 113, 114).

123
Figure 113 – Recreational activities on Deeban Spit
Figure 114 – Recreational activities on the Lilli Pilli shallows
During the 1980s the users of larger watercraft were again becoming vocal and
political about the inconvenience caused by the shoals. This "inconvenience"
was for the deeper draught vessels having to wait for sufficient tide.

124
The social and political pressure had mounted much earlier with the formation
of Port Hacking’s first club for large powered craft, the (now) Royal Motor Yacht
Club. Two letters to the editor of the Sydney Morning Herald say it in the
colorful eloquence of the day (Extract 11).
Noteworthy is that the arguments proffered in the representations related
merely to boating pleasure and convenience. There was then no real attempt
to either understand and work with the nature of the estuary, nor was there any
consideration of the consequences of dredging. For example, whether or not
seagrass populations might be destroyed by the dredging or by the disposal of
the spoil, or whether the placement of the spoil may, over time have been a
waste of the dredging effort or a further aggravation to the channel in-filling.
These considerations came to the planning and management processes in the
late 1970’s and mid 1980’s.
Other significant conservation events in this era were the closure in 1902 of
Port Hacking to net fishing, and later the protection of some unique
environments. The Basin and South West Arm were given protection under the
powers of the National Park and Fisheries and added to the Park in 1967.
The temporary relief for boaters by dredging turned out to be a double-edged
sword as on many occasions the dredging spoil was deposited so that it soon
added to the sediment load being moved by nature around Port Hacking
adding to the instability of navigation channels (Figs 115, 116). Storm events
also caused quick changes to dredging outcomes and to the position and
depth of channels.

125
Figure 115 – Small dredge operation
Figure 116 – Localised disposal of dredged spoil

126
The Royal National Park
A landmark event was the dedication of the National Park in 1879. (The
"Royal" status was not granted until 1955.)
Robert Dixon surveyed the Hacking River in 1827, and later Lord Audley in
1864, after whom the area of “The Main National Park Camp” (later the picnic
grounds) at the confluence of the Hacking River and Kangaroo Creek was
named. The dedicated area of 18,000 acres included all remaining land on the
southern shores of Port Hacking. An enlightened move for its time, the wider
significance of this act would be realized and appreciated many years later.
The size of the Park is now approximately 15,100 hectares.
Figure 117 – The interface of the Royal National Park and the marine delta at Warumbul and South West Arm viewed from Lilli Pilli.
The Park includes the seabed of South West Arm, giving protection to that
waterway as well its foreshores (Fig. 117).
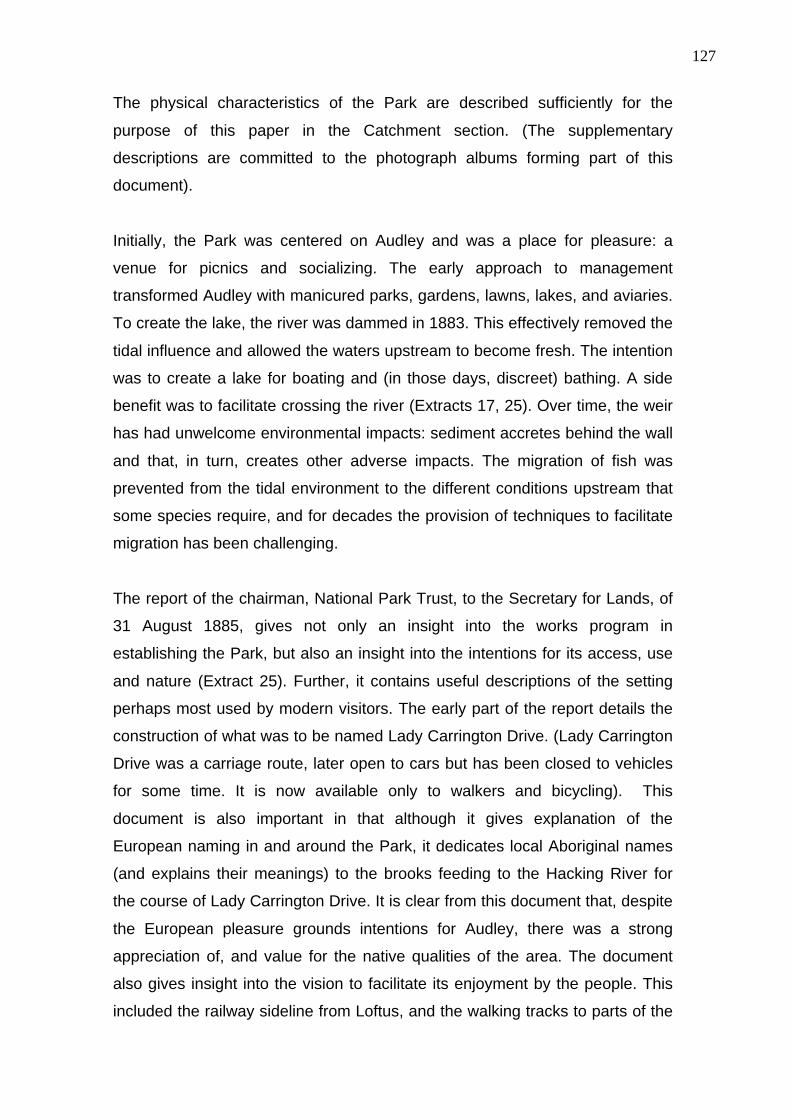
127
The physical characteristics of the Park are described sufficiently for the
purpose of this paper in the Catchment section. (The supplementary
descriptions are committed to the photograph albums forming part of this
document).
Initially, the Park was centered on Audley and was a place for pleasure: a
venue for picnics and socializing. The early approach to management
transformed Audley with manicured parks, gardens, lawns, lakes, and aviaries.
To create the lake, the river was dammed in 1883. This effectively removed the
tidal influence and allowed the waters upstream to become fresh. The intention
was to create a lake for boating and (in those days, discreet) bathing. A side
benefit was to facilitate crossing the river (Extracts 17, 25). Over time, the weir
has had unwelcome environmental impacts: sediment accretes behind the wall
and that, in turn, creates other adverse impacts. The migration of fish was
prevented from the tidal environment to the different conditions upstream that
some species require, and for decades the provision of techniques to facilitate
migration has been challenging.
The report of the chairman, National Park Trust, to the Secretary for Lands, of
31 August 1885, gives not only an insight into the works program in
establishing the Park, but also an insight into the intentions for its access, use
and nature (Extract 25). Further, it contains useful descriptions of the setting
perhaps most used by modern visitors. The early part of the report details the
construction of what was to be named Lady Carrington Drive. (Lady Carrington
Drive was a carriage route, later open to cars but has been closed to vehicles
for some time. It is now available only to walkers and bicycling). This
document is also important in that although it gives explanation of the
European naming in and around the Park, it dedicates local Aboriginal names
(and explains their meanings) to the brooks feeding to the Hacking River for
the course of Lady Carrington Drive. It is clear from this document that, despite
the European pleasure grounds intentions for Audley, there was a strong
appreciation of, and value for the native qualities of the area. The document
also gives insight into the vision to facilitate its enjoyment by the people. This
included the railway sideline from Loftus, and the walking tracks to parts of the

128
Hacking River from that terminus. For most people in the early days of the
Park, public transport was the only means of access. Audley grew to include a
large guesthouse and dance hall and the precinct quickly became a draw card
for recreation for the city dwellers.
The Audley Weir has been the road link between Bundeena and Maianbar and
the Princes Highway close to Sutherland and Engadine. The weir floods
frequently in heavy rain (Fig. 60). However, the weir at Audley was not the
only in-Park intervention with the Hacking River. In 1893 The Upper Crossing
was built to provide a crossing to access the Princes Highway at Waterfall.
Flooding at the Audley Weir often coincided with the Upper Crossing also being
impassable. To overcome this severe dislocation to access to the villages, an
elevated road bridge was built at the site of the Upper Crossing.
To complete the European setting of the Audley parklands/pleasure grounds,
deer were introduced. The deer were contained in an experimental farm but
escaped. The deer have been a serious management problem for the “modern”
Park, and for the residential areas adjacent to the Park and now, beyond.
Additionally, the Park then was afforded few measures of protection, and
extractive exploitation was allowed to continue (Extract 18, 25).
The early incursions south from Bonnie Vale by naturists and walkers helped
discover and promote the natural values of the region and interest groups such
as bushwalkers achieved significant early inclusions and later expansions to
the Park. This then became of greater importance in establishing a bushland
with multiple values such as recreation, conservation and preservation, which
now is the aesthetic contrast to the built form of the completely developed
northern foreshore, and the protection of about 90% of the Hacking River
catchment.
A persisting popular misconception is that the bushland of the Park is pristine,
punctuated only by the villages of Bundeena and Maianbar and the Church of
England camps and conference centres.

129
Figure 118 – Southern foreshore remnants of Gogerly’s activities
In fact it is far from pristine around the waterway. Along many parts of the
foreshores from Maianbar to Audley are the remnants of buildings and
waterfront structures and the legacy of introduced vegetation (Figs 118,119)
(Appendix 2) (Extract 29).
The size and configuration of the Park was not always the size and
configuration that it is now. It grew in increments, added to in stages. Tracts of
the foreshore were transferred from freehold title. The additions were not
always in a virgin or pristine state. Houses and foreshore structures dot most of
the southern shoreline, along with attendant non-indigenous plantings. Many
physical and vegetation remnants still exist.
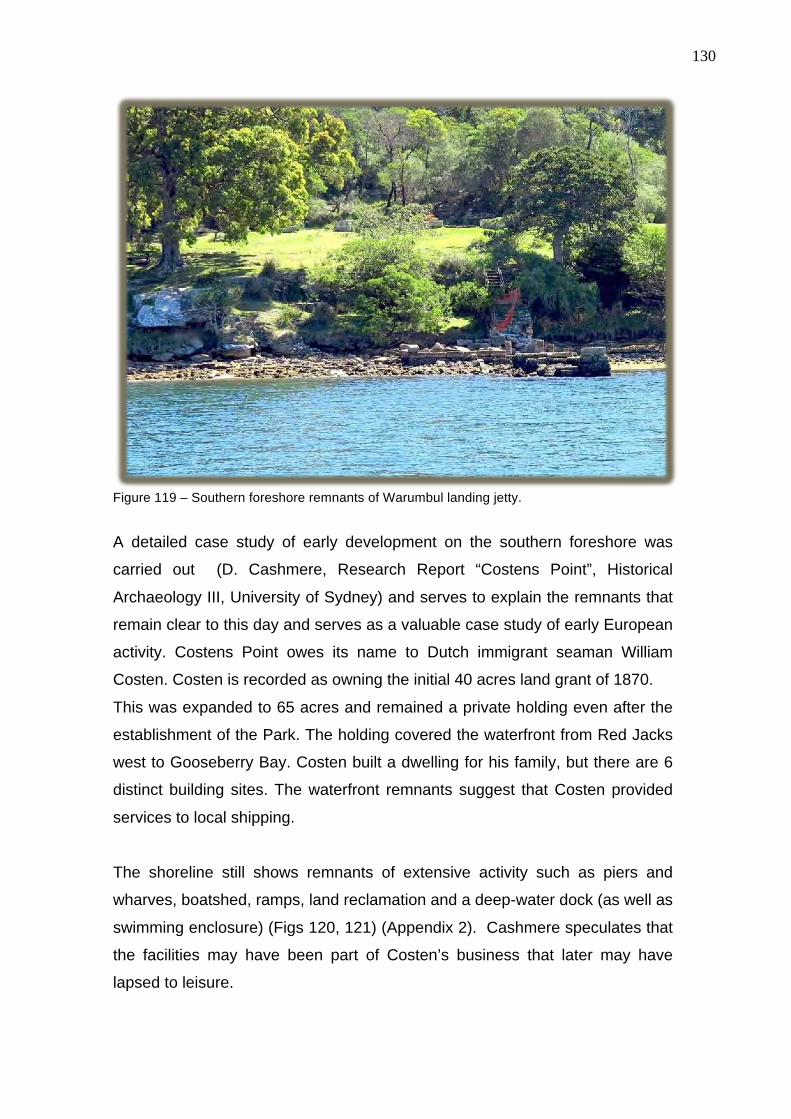
130
Figure 119 – Southern foreshore remnants of Warumbul landing jetty.
A detailed case study of early development on the southern foreshore was
carried out (D. Cashmere, Research Report “Costens Point”, Historical
Archaeology III, University of Sydney) and serves to explain the remnants that
remain clear to this day and serves as a valuable case study of early European
activity. Costens Point owes its name to Dutch immigrant seaman William
Costen. Costen is recorded as owning the initial 40 acres land grant of 1870.
This was expanded to 65 acres and remained a private holding even after the
establishment of the Park. The holding covered the waterfront from Red Jacks
west to Gooseberry Bay. Costen built a dwelling for his family, but there are 6
distinct building sites. The waterfront remnants suggest that Costen provided
services to local shipping.
The shoreline still shows remnants of extensive activity such as piers and
wharves, boatshed, ramps, land reclamation and a deep-water dock (as well as
swimming enclosure) (Figs 120, 121) (Appendix 2). Cashmere speculates that
the facilities may have been part of Costen’s business that later may have
lapsed to leisure.
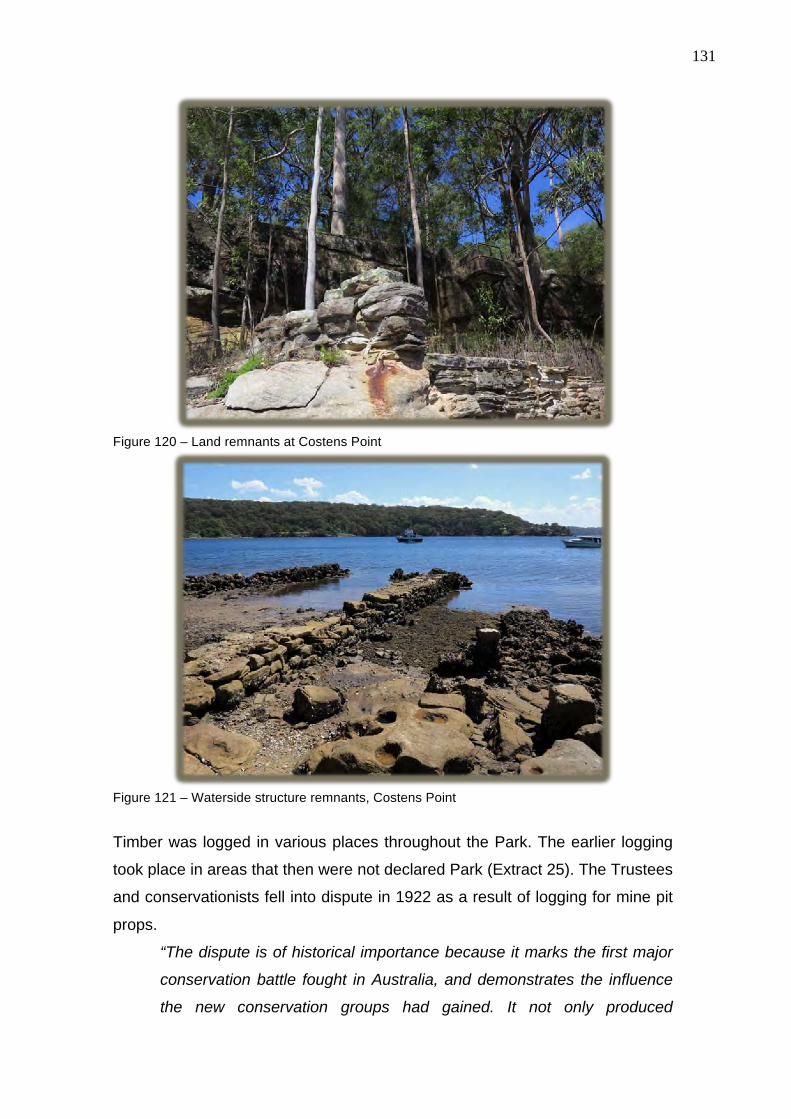
131
Figure 120 – Land remnants at Costens Point
Figure 121 – Waterside structure remnants, Costens Point
Timber was logged in various places throughout the Park. The earlier logging
took place in areas that then were not declared Park (Extract 25). The Trustees
and conservationists fell into dispute in 1922 as a result of logging for mine pit
props.
“The dispute is of historical importance because it marks the first major
conservation battle fought in Australia, and demonstrates the influence
the new conservation groups had gained. It not only produced

132
government intervention, but had the wider impact of altering
government attitudes towards nature generally.” (Slade,1985).
Later, during World War II, timber was extracted from dedicated sites in the
National Park. At the entry of Japan to WWII, all small craft on Port Hacking
were mustered and taken to Audley where they were stored ashore at Pool Flat
and Bus Stop Flat to render them unavailable to the possible invader (Extract
28).
The Park’s Port Hacking foreshores have remnants of formal boat access
facilities, a reminder that there was a level of ferried access to picnic grounds
on the shores. Old photographs show that this happened in a number of sites
in what is now National Park. “Formal” grounds remain around these sites.
Casual access for fishing and camping was always difficult by car, and as
boats and canoes became more popular, so did widespread informal use of the
Park’s foreshores for camping and picnicking. In the later part of the 20th
Century, waterskiing became popular, and with it came the shore side “base”.
These activities over time created management problems, in particular the
rubbish burden (which, in South West Arm became huge), and the fire risk
posed by campfires and negligence.
The Park’s interface with non-dedicated lands presents on-going management
challenges to ensure that threats to the integrity of its natural systems are
maintained. In particular, the urban interface has been the cause of, and
continues to pose the threat of feral animal incursions, exotic plants and
noxious weed spread (especial riparian infestations), motor trail bikes, dumping
and fire. The urban interface is with Kirrawee and Grays Point, the villages of
Bundeena and Maianbar, and in the upper catchment, Helensburgh, Stanwell
Tops and Otford.
Casual visitations to the Park have now reached 4 million per annum. Much of
this load is concentrated; the Audley precinct and Bonnie Vale are the most
used sites, however all sections of the Coast walk have high use, and
consequential wear and tear maintenance requirements. An important indirect

133
control mechanism on visitor impacts is the limited vehicular access to a large
part of the Park. There are three road entrances from Farnell Ave to Audley,
from Waterfall to Sir Bertram Stevens Drive, and from the south at Bald Hill
above Otford. These form part of a heavily used tourist drive, roads branch to
Warumbul, Maianbar, and Bundeena on Port Hacking, Wottamolla and Garie
Beach. These branch roads are used to access those particular destinations
and to access several popular picnic sites, walking tracks and secondary
destinations of Burning Palms and Era. Camping is controlled, bicycling
restricted to designated tracks and fire trails, and trail bikes and horse riding
are prohibited.
The dedication of the Park locked out development and thereby would forever
provide Port Hacking with its beautiful, natural southern foreshore. It is a vital
component in modern Port Hacking, providing the aesthetic contrast to the now
fully urbanized northern foreshore, complementing recreational and life-style
opportunities and, as exampled in the section dealing with the catchment,
ensuring the best opportunities for a high quality freshwater influence on the
estuary. Consequently, the fluvial deltas of the Park’s rivers provide the natural
environment suitable for the estuarine plant and fauna communities that are
critical to the health of the estuary.
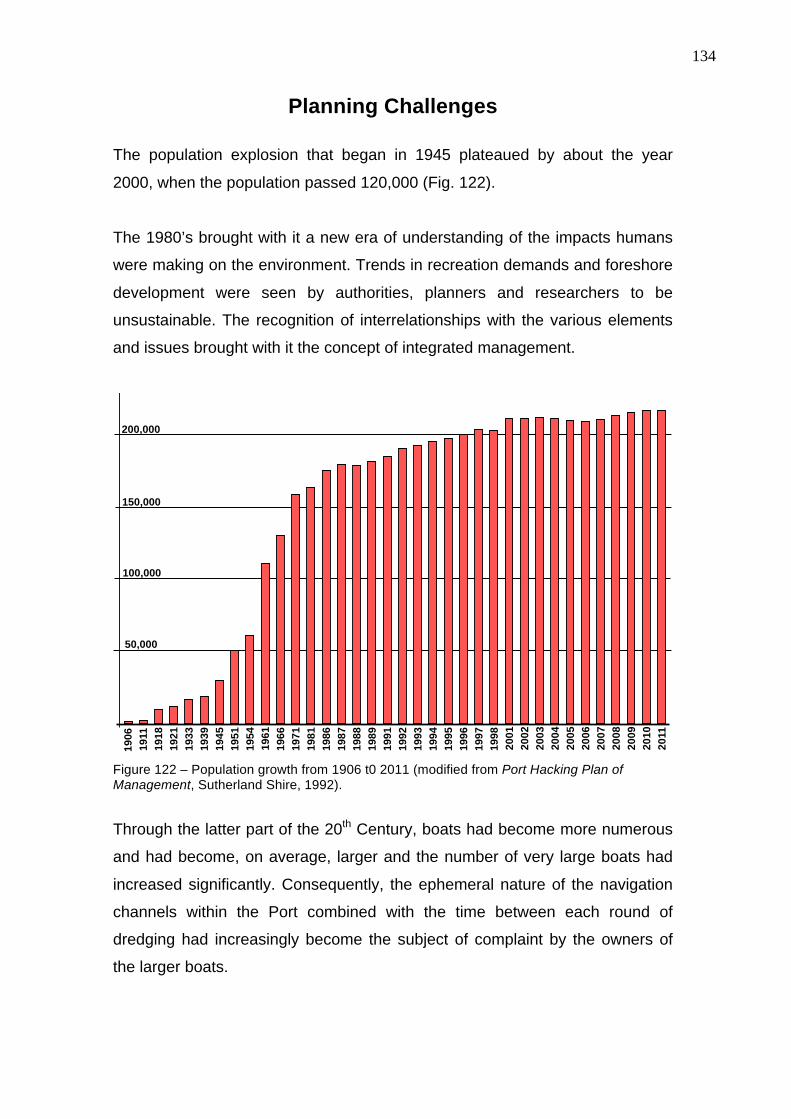
134
Planning Challenges
The population explosion that began in 1945 plateaued by about the year
2000, when the population passed 120,000 (Fig. 122).
The 1980’s brought with it a new era of understanding of the impacts humans
were making on the environment. Trends in recreation demands and foreshore
development were seen by authorities, planners and researchers to be
unsustainable. The recognition of interrelationships with the various elements
and issues brought with it the concept of integrated management.
Figure 122 – Population growth from 1906 t0 2011 (modified from Port Hacking Plan of Management, Sutherland Shire, 1992).
Through the latter part of the 20th Century, boats had become more numerous
and had become, on average, larger and the number of very large boats had
increased significantly. Consequently, the ephemeral nature of the navigation
channels within the Port combined with the time between each round of
dredging had increasingly become the subject of complaint by the owners of
the larger boats.
50,000
100,000
150,000
200,000
19
06
19
11
19
18
19
21
19
33
19
39
19
45
19
51
19
54
19
61
19
66
19
71
19
81
19
86
19
87
19
88
19
89
19
91
19
92
19
93
19
94
19
95
19
96
19
97
19
98
20
01
20
02
20
03
20
04
20
05
20
06
20
07
20
08
20
09
20
10
20
11
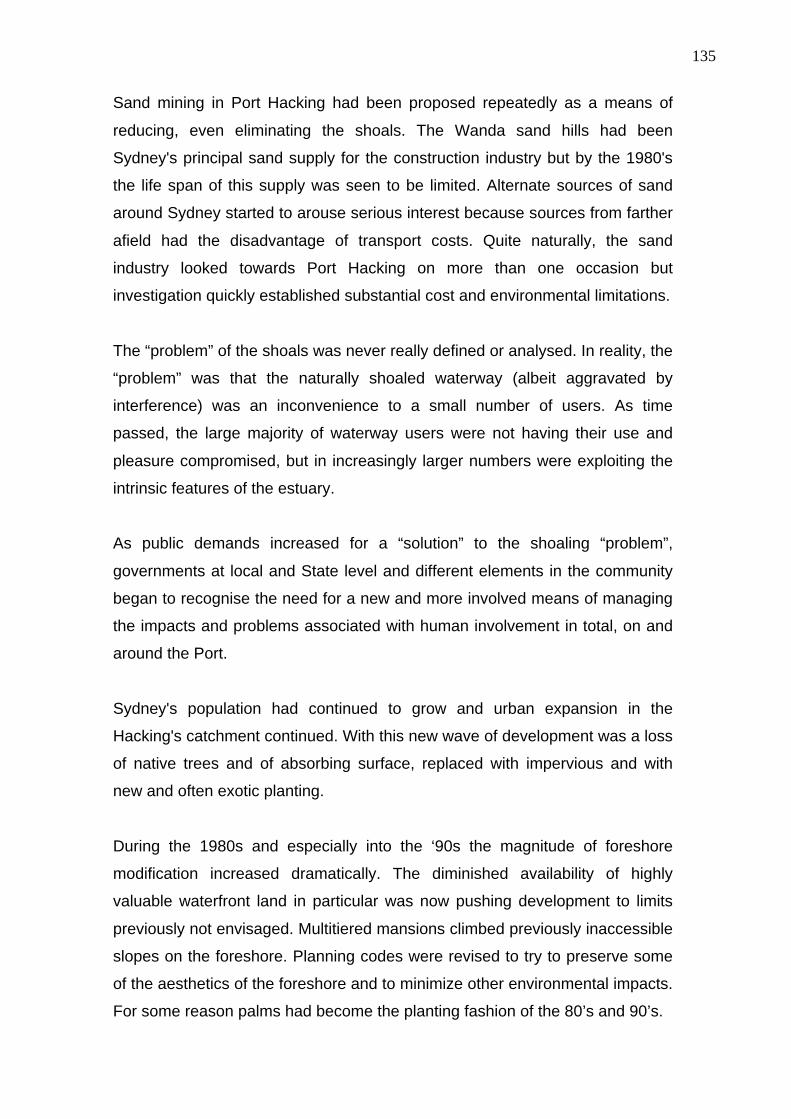
135
Sand mining in Port Hacking had been proposed repeatedly as a means of
reducing, even eliminating the shoals. The Wanda sand hills had been
Sydney's principal sand supply for the construction industry but by the 1980's
the life span of this supply was seen to be limited. Alternate sources of sand
around Sydney started to arouse serious interest because sources from farther
afield had the disadvantage of transport costs. Quite naturally, the sand
industry looked towards Port Hacking on more than one occasion but
investigation quickly established substantial cost and environmental limitations.
The “problem” of the shoals was never really defined or analysed. In reality, the
“problem” was that the naturally shoaled waterway (albeit aggravated by
interference) was an inconvenience to a small number of users. As time
passed, the large majority of waterway users were not having their use and
pleasure compromised, but in increasingly larger numbers were exploiting the
intrinsic features of the estuary.
As public demands increased for a “solution” to the shoaling “problem”,
governments at local and State level and different elements in the community
began to recognise the need for a new and more involved means of managing
the impacts and problems associated with human involvement in total, on and
around the Port.
Sydney's population had continued to grow and urban expansion in the
Hacking's catchment continued. With this new wave of development was a loss
of native trees and of absorbing surface, replaced with impervious and with
new and often exotic planting.
During the 1980s and especially into the ‘90s the magnitude of foreshore
modification increased dramatically. The diminished availability of highly
valuable waterfront land in particular was now pushing development to limits
previously not envisaged. Multitiered mansions climbed previously inaccessible
slopes on the foreshore. Planning codes were revised to try to preserve some
of the aesthetics of the foreshore and to minimize other environmental impacts.
For some reason palms had become the planting fashion of the 80’s and 90’s.

136
In 1984 Sutherland Shire Council began work with a project that was in most
respects unique. Council's target was to produce a plan of management for the
Hacking, the total catchment and the waterways. This project was novel
because of the joint involvement of community, local and state government and
because of the philosophy of bringing together all components of the waterway
under a broad planning umbrella. The concept of integrated management had
been established.
During the 1990s there was a proposal for major urban development at
Helensburgh, in the Hacking catchment, only to have it blocked by powerful
arguments and community resistance. The resistance was supported by the
Sutherland Shire Council on the basis of its location in the catchment and the
downstream risk to the Hacking system. The concept of “totality” leading to
integrated management had shown its value to Port Hacking (see The
Catchment discussion).
Environmental protection had begun early with a ban on commercial netting for
the most part of Port Hacking in 1902 and increased much later with certain
closures within the estuary, such as spear fishing and shellfish gathering. The
unique sea floor features and marine fauna and flora at Shiprock (Turriell Point)
were given protection by dedication of the area as an Aquatic Reserve in 1982.
Water quality became a serious management target. Urban pollution, poor
sewerage infrastructure and impacts from development add to the list.
Urbanisation had now been seen as having significant impacts on the
waterways; pesticides, domestic refuse, nutrients, silt, oils, rubber particles,
and heavy metals were all recognised as having serious potential in the
waterway and in tidal sediments in particular.
For the first time, environmental threats to Port Hacking were seen to exist
from offshore. There was a growing awareness in science of the transference
of marine organisms in the bilge water of ships. The opening of Port Botany as
Sydney's major commercial seaport resulted in ships anchoring in Bate Bay. A
137
more violent threat was to be realized when a large vessel was blown ashore
on Wanda Beach. Although eventually refloated without mishap, the incident
could well have devastated Port Hacking. For some, this was a serious
warning, but ships continued to anchor well within Bate Bay.
The pressures were all too obvious and started to shift social attitudes and
values.
Sandy shoals once considered a "problem" by some started to become a
recreational resource and in all probability their removal as once proposed
would now create resistance.
A consciousness was developing about the unsustainability of some practices,
and the style and magnitude of development brought into focus the aesthetic
and intrinsic values of the environs (Extract 20).
Community participation had been embraced in the 80's, but it took some
major events to trigger community activism. A proposal for major engineering
works for a "permanent solution" to the shoaling "problem", issues in the Royal
National Park, urban expansion proposals in the Hacking River headwaters,
high-rise construction in Cronulla, offshore sand mining proposals all in their
own way mobilised various sections of the community.
While the local boating community was pressing for dredging, there was also
the political pressure from the poor cost-effectiveness of the traditional
approach that is to regularly dredge the main navigation channels. A major
recurring problem was the disposal of the dredged spoils. The Public Works
Department's studies and deliberations in the early 1980s on the issues
associated with the shoals gained a huge boost by the adoption by the then
State Government of its Better Ports policy. This policy was aimed at port
improvements for commercial and recreational purposes.
Work by the Public Works Department on navigation in Port Hacking climaxed
in 1986 with the release of its Port Hacking Marine Delta Management Options
study. This paper put forward a series of options along with the costs, benefits
and negative impacts. Its preferred option was the construction of a tombolo
138
from Cabbage Tree Point north across the mouth of the Port (Fig. 92) (Extract
21).
Supporters were excited by the prospect of permanent navigation and deeper
water. Opponents were concerned about the aesthetics, adverse physical and
biological impacts, and the fear that the real but undeclared motive for the
works was to create a capacity for large marinas in Port Hacking.
An Environmental Impact Statement (EIS) carried out by the department did
nothing to ameliorate protest. If anything, the EIS presented material which,
combined with subsequent design amendments, further fuelled concerns about
adverse impacts on Port Hacking from the proposal.
In the end it was abandoned by the Public Works Department.
This matter produced a number of important outcomes: first, it had involved
technical studies which helped understand the natural processes and would be
useful for the future; second, it drew to the various authorities’ attention the
community’s values where Port Hacking is concerned; third, it accelerated the
focus on positive use of the dredged material: and finally, it mobilised citizens
into the formation of environmental interest groups. These groups grew quickly
in their understanding of issues and in their ability to prosecute their concerns.
With the 90’s came an age of environmental enlightenment, knowledge, and
understanding for the wider community. Television documentaries gave
graphic and explicit insights into the workings and wonders of the natural world.
Many of these presentations included warnings of all manner of environmental
pressures many of which were easily identifiable with the Port Hacking setting.
There was increasing public information from scientists and others about the
high probabilities of permanent human-caused changes to climate and the
consequences likely to arise from that.
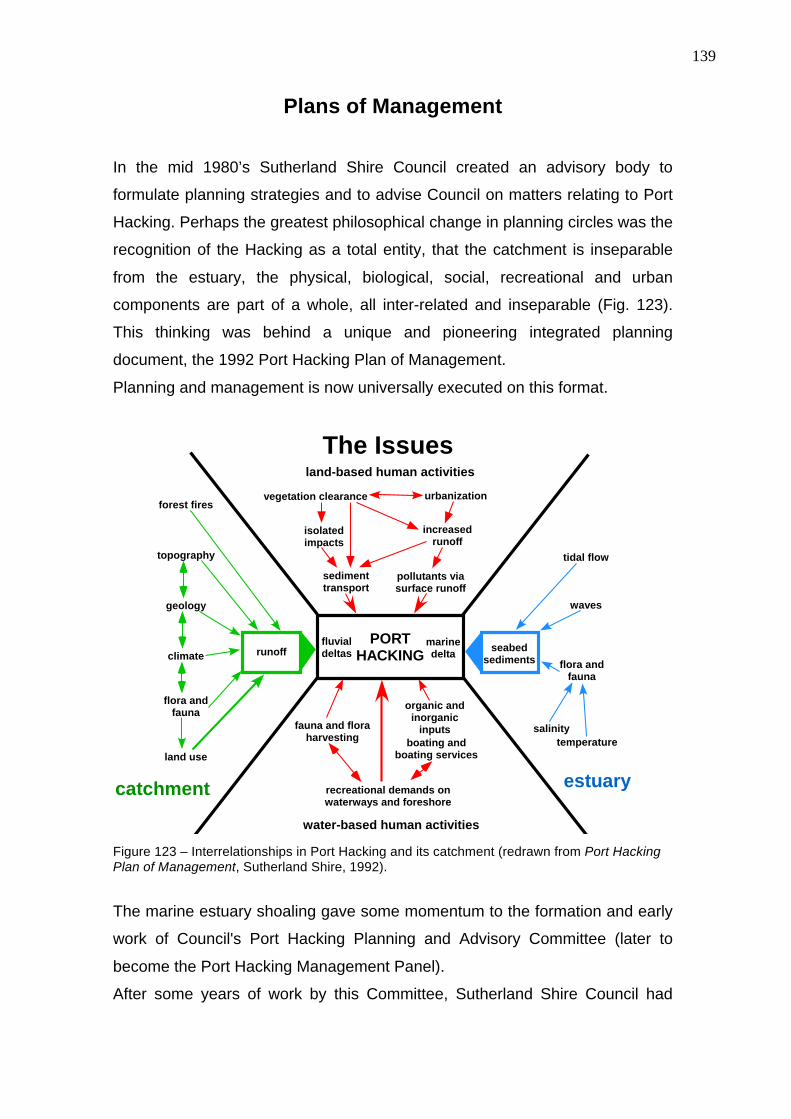
139
Plans of Management
In the mid 1980’s Sutherland Shire Council created an advisory body to
formulate planning strategies and to advise Council on matters relating to Port
Hacking. Perhaps the greatest philosophical change in planning circles was the
recognition of the Hacking as a total entity, that the catchment is inseparable
from the estuary, the physical, biological, social, recreational and urban
components are part of a whole, all inter-related and inseparable (Fig. 123).
This thinking was behind a unique and pioneering integrated planning
document, the 1992 Port Hacking Plan of Management.
Planning and management is now universally executed on this format.
Figure 123 – Interrelationships in Port Hacking and its catchment (redrawn from Port Hacking Plan of Management, Sutherland Shire, 1992).
The marine estuary shoaling gave some momentum to the formation and early
work of Council's Port Hacking Planning and Advisory Committee (later to
become the Port Hacking Management Panel).
After some years of work by this Committee, Sutherland Shire Council had
PORTHACKING
fluvialdeltas
marinedelta
vegetation clearance urbanization
isolatedimpacts
increasedrunoff
sedimenttransport
pollutants viasurface runoff
land-based human activities
The Issues
forest fires
topography
geology
climate
flora andfauna
land use
runoff seabedsediments
tidal flow
waves
temperature
salinity
flora andfauna
water-based human activities
fauna and floraharvesting
organic andinorganic
inputs
boating andboating services
recreational demands onwaterways and foreshore
estuarycatchment

140
produced a Plan of Management in the late 1980’s, which was formalised in
1992. This Plan was a trailblazer in the concept of integrated estuary
management (Fig. 124). Some important achievements came out of this Plan,
even if some of these did not occur within expected time objectives.
Figure 124 – Planning and management sequences (redrawn from Port Hacking Plan of Management, Sutherland Shire, 1992).
Local and Global events
- monitoring programs- review knowledge- review community aspirations- assess new developments and issues
Achieve legal statusunder planning laws
Assess submissions
Public exhibitioninvite comments frompublic authorities andcommunity
Prepare DRAFT Management Plan
Staticapproach
Multidisciplinaryand
Interdisciplinaryapproach
Integratedapproach
Dynamicapproach
Establish Planning Body- involved authorities- community representation
Identify Study Area- the geographic unitEssential concept: the TOTALITY ofthe UNIT and the interrelationshipsof its components
The StudyInformation gathering:- existing knowledge- fact finding- target surveys
Communityinput
The Issues- determine the aims- identify the issues- assess the issues against aims
and community expectations- define objectives
The Plan- short and long term planning- determine how objectives will be achieved- establish responsabilities of implementation- set time frame and priorities for achieving
objectives
FINALISE MANAGEMENT PLAN
Implement recommendations
conceptual path
primary path
secondary path

141
Urban consolidation became law in an attempt to contain Sydney’s sprawl. For
the Sutherland Shire this meant an explosion of medium density development
and the attending further increase in population. Older or smaller houses on
traditional “quarter acre” blocks became targets for this development.
In the wake of the tombolo proposal the then Minister for Public Works saw the
indefinite financial commitment involved with dredging as it was, and attempted
to shift the cost burden to Sutherland Council. The Council deftly opposed any
shift in responsibility, and the State Government terminated dredging.
In 1994 a Memorandum of Understanding (MoU) was struck which set the
strategy for on-going “maintenance” dredging. This was intended to bind all the
interests to a set of principles under which dredging would take place in the
future. One of its aims was to provide environmental safeguards and
sustainability. Another aim was to address some of the issues that give rise to
demand for deep-water navigation. A third objective was to achieve some
equity in the provision of public funds on and around the Port.
Importantly, the MoU became the legal basis by which any future dredging
would be funded by the State Government. This now is under serious
reconsideration, and there is likelihood that total funding guarantees will be
withdrawn. The consequences for maintaining the extent of dredging on the
marine delta will no doubt be re-assessed.
State and Federal Governments in this era had taken major environmental and
planning initiatives. The most significant of these, especially in terms of having
some impacts on public awareness and in some form of action, were: Total
Catchment Management, NSW Coastline Management Policy, Integrated
Environmental Management, the creation of the Coastal Council, Coastcare,
and State-driven storm water management funding. Total Catchment
Management resulted in a Southern Catchment Management Committee,
which focused, among other things, on important matters in the Hacking
system. It was vocal, and with the help of Sate funding was able to commission
professional studies. One such study provided a further insight into community
value (Extract 23).
142
Seagrasses, mangroves, saltmarshes have been given protection under law.
Polluting discharge from boats has had restrictions increased, and operating
guidelines for boat maintenance at slipways tightened.
The construction industry had tighter controls placed on it by prohibiting
concrete equipment washing down at building sites, and sediment containment
at street sites and at the waterfront.

143
Climate Change and Sea Level Rise
Warnings from the science community began some decades ago about the
consequences of climate change. One of the predicted consequences of
climate change is a rise in sea level. The magnitude of such a rise remains
open to debate (and this will be ongoing as studies continue to provide new
information and knowledge becomes more precise). However, there is
unanimity in mainstream science that a rise in sea level is happening.
“This sea-level rise is a response to increasing concentrations of
greenhouse gases in the atmosphere and the consequent changes in
the global climate. Sea-level rise contributes to coastal erosion and
inundation of low-lying coastal regions, particularly during extreme
sea level events. It also leads to saltwater intrusion into aquifers,
deltas and estuaries. These changes impact on coastal ecosystems,
water resources, and human settlements and activities. Regions at
most risk include heavily populated deltaic regions, small islands
(especially coral atolls), and sandy coasts backed by major coastal
developments.” (CSIRO, www.cmar.csiro.au/sealevel)
This has been accepted by many governments around the world, including all
tiers of Australian government. Successive NSW governments have had
policies which, with changes in government, have reflected shifting political
emphases. Sutherland Shire Council has promulgated information to the
community. (Extract 27).
A rise within the current predicted range (at the present centering at 80cm) will
have consequences for the Port Hacking, its ecology, and its foreshores. The
severest consequences of any rise have to be factored with the increased
severity of storm events and the consequential wave energy in the marine
delta, and storm-water flows in the freshwater catchments. In a general sense,
impacts of climate change and sea-level rise are potentially:
• increased storm damage to coastal infrastructure

144
• more rapid coastal erosion
• shoreline change including the possibility for total loss of protective natural
barriers
• saltwater intrusion into aquifers and surface waters
• rising water tables
• changes in tidal prism
• More frequent and extreme high water levels in coastal areas
• Increased risk to coastal infrastructure, as well as increased maintenance
and repair costs
• Loss of property due to erosion
• Loss of habitat and reduced biodiversity
• Saltwater intrusion into coastal aquifers
• Loss of cultural and historical sites
As far as Port Hacking is concerned it is fair to predict that over the next
decades, climate change may be responsible for a re-shaping of Port
Hacking’s marine delta in particular, and potentially its fluvial deltas. There are
now observable changes to the seaward face of Deeban Spit and to the
entrance to Cabbage Tree Basin. This cannot happen without significant re-
distribution of marine sediments and thus contributing to the re-shaping of the
marine delta, especially when combined with changes to the energy regime
associated with climate change. Consequently a redistribution of some
seagrasses and other estuarine flora is probable.
Inundation of low-lying foreshore, low-lying land and infrastructure are all
probabilities. Already, some of the inundation potential has been
estimated. The Sydney Coastal Councils Group (of which Sutherland Shire
Council is a member) has produced jointly with the CSIRO, as a service to
coastal councils a study “ Mapping and Responding to Coastal Inundation”
(www.sydneycoastalcouncils.com.au/Project/).
Less obvious but potentially serious is the stormwater system, which has its
outlets at sea level. Climate change is predicted to bring with it an increase in
the frequency and severity of storm and rain events. These, combined with
145
higher tides on a higher base sea level have a potential to heighten urban
flooding which should be differentiated from inundation just through elevated
sea levels.
“The ocean water level can vary significantly from that of the predicted tide
due to meteorological processes including storms, extreme winds and changes
in the mean sea level air pressure. As a liquid, the sea surface can be readily
deformed by wind and changes in atmospheric pressure.
Tide projections are based upon normal barometric pressure at mean sea
level (1013 hPa). The reduced barometric pressures associated with “low”
pressure weather systems which generate strong storm winds, also cause a
local rise in the ocean water surface (known as the “inverse barometer effect”).
Provided low pressures persist for a sufficient length of time, the increase in
water level amounts to approximately one centimetre for each hPa drop in
pressure below 1013 hPa. This phenomenon and its affect on elevating the
ocean water surface during a storm event is termed “barometric setup” and has
been measured in the order of 0.2 to 0.4m in NSW coastal waters (NSW Govt,
1990).
Extreme wind speeds not only generate local seas but, also tend to pile
water up against a shoreline in the direction of the wind. The component of
increasing water level attributable to wind action is termed “wind setup” and is
of the order of 0.1 to 0.2m (NSW Govt, 1990).
The vast majority of adverse weather systems which impact upon the
Sydney basin are “low” pressure systems bringing significant precipitation and
generating intense wind speeds. Under these circumstances, the super-
elevation of the ocean water surface due to the combined effects of
“barometric” and “wind setup” is termed “storm surge”..(From “Fort Denison –
Sea Level Rise Vulnerability Study 2008” prepared by the Coastal Unit,
Department of Environment and Climate Change, NSW)
The configuration of Port Hacking’s bays is north-south, and the storm-strength
winds prevail in the southern quadrant. In these cases, water can “pile up” on
the shoreline where many stormwater outlets are placed.
A simple model of the relationship of a stormwater outlet to the potential range
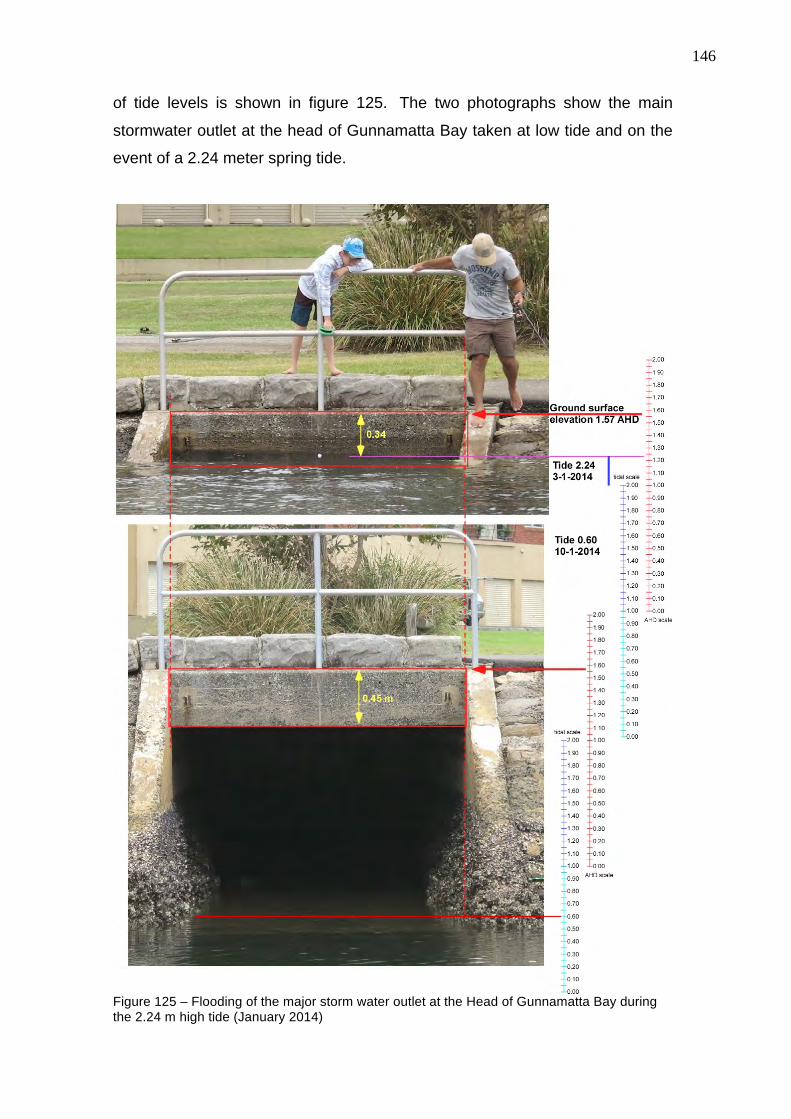
146
of tide levels is shown in figure 125. The two photographs show the main
stormwater outlet at the head of Gunnamatta Bay taken at low tide and on the
event of a 2.24 meter spring tide.
Figure 125 – Flooding of the major storm water outlet at the Head of Gunnamatta Bay during the 2.24 m high tide (January 2014)

147
A tidal range scale and elevation reference points have been superimposed to
give an appreciation of the impact of higher tides on the stormwater outfall
system.
Similar consideration can be applied to the predicted sea level rise. In figure
126 the tidal ranges due to sea level rises highlights the flooded conditions
experienced even with a small rise making the function of “stormwater outlet”
under considerable pressure and with potential outflows further upstream.
Figure 126 - Potential effect of the rising in sea level demonstrated at some stormwater outlets in Port Hacking
Big decisions lay ahead at all levels of government beyond policies for
containing carbon emissions. These include adaptation, retreat, assessing the
value of public resources including public foreshore, protection of public assets
and private property, and the redesign of infrastructure such as storm-water
and the sewerage system, and other vulnerable infrastructure. Many of the
critical policy decisions will be outside the power and financial capacities of
local government. Although significant time has been lost because of the social
immaturity in the overarching debate about the anthropogenic factors and real
potentials of climate change and sea level rise, peak bodies and governments
are now expending considerable energy on the assessment of consequences
and reactive strategies.

148
List of figures Figure 1 (page 4) - Port Hacking (photo D. Messent) Figure 2 (page 4) - Climatic and sea level fluctuations during the last 1.8 million years Figure 3 (page 6) - The Sydney coastline, as it was 20,000 -18,000 years ago Figure 4 (page 7) - Bedrock topography of the Georges-Cook-Hacking Rivers 20,000 years
before the present Figure 5 (page 7) - The ancient river valley of the Hacking River. Figure 6 (page 8) - Evolution of the Hacking River during the sea level rise. Figure 7 (page 9) - Bathymetry map of Port Hacking Figure 8 (page 9) - Main sediment distribution in Port Hacking (redrawn from Port Hacking
Plan of Management, Sutherland Shire, 1992). Figure 9 (page 11) -The tidal planes throughout the length of Port Hacking. ISLW is the level
used in charts (redrawn from Port Hacking Marine Delta, Management Options, PWD, 86013).
Figure 10 (page 12) - Time lag for high water and low water at various locations in Port Hacking (from Road and Maritime Services)
Figure 11 (page 13) - Sand bodies (bedforms) clearly visible along the main tidal channels between Turriell Point and Lilli Pilli. Note the small delta at the end of the Fishermans Bay channel.
Figure 12 (page 13) - Sediment movement based on bedform data. Note the net upstream sediment transport (redrawn from Port Hacking Marine Delta, Management Options, PWD, 86013).
Figure 13 (page 14) - Refracted travel path of the waves approaching Port Hacking Figure 14 (page 14) - Sand bodies at right angles to Deeban Spit Figure 15 (page 15) - The distribution of the major elements of the aquatic environment (Map
reproduced with permission of NSW Department of Primary Industries from: Creese RG et al. 2009
Figure 16 (page 16) - Seagrasses: (A) Posidonia australis, (B) Zostera spp. and (C) Halophila spp. (photo R.J. West).
Figure 17 (page 16) - Changes in the distribution of seagrass from 1930 to 2005 (redrawn from Port Hacking Plan of Management, Sutherland Shire, 1992; data for 2005 reproduced with permission).
Figure 18 (page 17) - Mangroves in North West Arm Figure 19 (page 18) - Rocky outcrop with intertidal habitat, Head of Gunnamatta Bay Figure 20 (page 19) - Shiprock. Figure 21 (page 20) - Depth contour map of the Shiprock Aquatic Reserve Figure 22 (page 21) – Idealised section showing the distribution of the most common elements of the biota (redrawn from original by C. Lawler, 1998). Figure 23 (page 22) - Feather tube worm (Sabellastarte) (photo Daniel Wainwright) Figure 24 (page 22) - coral (Carijoa smithi) (photo Daniel Wainwright) Figure 25 (page 23) – Pineapple fish (Cleidopus gloriamaris) (photo Minh H. Tran) Figure 26 (page 24) - The tidal delta. Note the navigation channel and the large areas (dark
right) of sea grasses. Note also the mobile sand forming the dropover area off Lilli Pilli and the sharp dropover at the entrance to South West Arm (bottom); sand bars are visible in the main navigation channel (photo Cronulla Beach YHA)
Figure 27 (page 24) -The seabed configuration of the marine or tidal delta. Figure 28 (page 25) - Composition of the tidal delta (redrawn from Port Hacking Marine Delta,
Management Options, PWD, 86013). Figure 29 (page 25) - Age of the tidal delta. Radiocarbon dating shows the progressive growth
of the sand body (redrawn from Port Hacking Marine Delta, Management Options, PWD, 86013).
Figure 30 (page 26) - Energy distribution and sediment movements in Bate Bay (redrawn from Port Hacking Marine Delta, Management Options, PWD, 86013)
149
Figure 31 (page 27) – Simpsons Bay: note the breakers on the middle ground even in calm conditions
Figure 32 (page 27) - Energy distribution and sediment movement at the seaward face of the marine delta during flood flows (redrawn from Port Hacking Marine Delta, Management Options, PWD, 86013)
Figure 33 (page 28) - Energy distribution and sediment movement at the seaward face of the marine delta during ebb flows (redrawn from Port Hacking Marine Delta, Management Options, PWD, 86013
Figure 34 (page 29) -Fishermans Bay, a sediment locked basin (photo Sutherland Shire Council).
Figure 35 (page 30) - The Basin (left). Note the largely silted entrance. Note also the mobile sand bodies along the seaward edge of the Spit (photo Sutherland Shire Council).
Figure 36 (page 31) -The central portion of The Basin. Note the roots of the mangroves and the seagrass at the edge of the sandy seabed (photo R.J. West).
Figure 37 (page 32) -The wall and gates of The Hatchery in Cabbage Tree Basin Figure 38 (page 32) - Simpsons Bay. Note the shallow sand banks in front of The Hatchery. Figure 39 (page 33) – Present-day bridge across the entrance to Cabbage Tree Basin. Figure 40 (page 34) - Entrance to Cabbage Tree Basin looking north towards Deeban Spit. Figure 41 (page 34) - Entrance to Cabbage Tree Basin looking south towards The Basin. Figure 42 (page 35) - Seagrass bed at the entrance channel Figure 43 (page 35) - Mangroves within The Basin Figure 44 (page 36) - Deeban Spit. Note the shallow tidal channel that links up with The Basin
(out of the picture to the right). The northern extent of the tidal delta, in Gunnamatta Bay, its sharp dropover and the patchy occurrence of seagrass bed are also visible. To the left is the entrance to Burraneer Bay (photo Sutherland Shire Council).
Figure 45 (page 37) - Portion of the earliest map of Port Hacking (1848-18510 (part) (from Port Hacking Marine Delta, Management Options, PWD, 86013). Many significant pre-interference features are evident here, in particular the flow of entry to Cabbage Tree Basin, which begins at Cabbage Tree Point
Figure 46 (page 38) - The changes in the distribution of sediments from 1930 (left) to 1999 (right) (from Port Hacking Marine Delta, Management Options, PWD, 86013).
Figure 47 (page 39) - Top right shows a landing jetty, and further in the photograph a series of bridges connecting permanently exposed islets to the village of Maianbar. Photo 1955. SSC Shire maps.
Figure 48 (page 39) - The same jetty and bridges in 1960. The eastern growth of the Spit has isolated the landing jetty from the water. Other changes to the shoal are clear. SSC Shire maps
Figure 49 (page 40) - The westwards pointing edge of Deeban Spit. Note the channel leading to The Basin.
Figure 50 (page 41) - Break through on 2.24m tide (3/01/2014) to the Bonnie Vale lagoon Figure 51 (page 41) - Break through on 2.24m tide (3/01/2014) to the Bonnie Vale lagoon; The Basin in the background
Figure 52 (page 44) - Port Hacking catchment. Figure 53 (page 47) – KellysFall (photo Tim Lloyd). Figure 53a (page 48) - Helensburgh mine in 1915 (hand painted photo, HDHS). Figure 53b (page 48) - Metropolitan colliery, 2007 (photo HDHS) Figure 54 (page 50) - View from Loftus Heights eastwards showing the Kangaroo Creek
catchment Figure 55 (page 52) - Winifred Falls Figure 56 (page 55) - 1994 bushfire advancing along the ridge west of South West Arm.
Smoke has obliterated South West Arm. Figure 57 (page 55) - minutes only after figure 56; now racing along the ridge above
Warumbul. Figure 58 (page 58) - Coonong Creek, Gymea Bay, below Forest Road.

150
Figure 59 (page 58) - Trash racks on Alkaringa Creek at Forest Road, Gymea Bay Figure 60 (page 64) - Audley Weir in flood (2/12/2010) Figure 61 (page 65) - The Fluvial Delta at Grays Point. Note presence of mangroves at the
bottom right (photo Sutherland Shire Council). Figure 62 (page 66) - Yowie Bay. The fluvial deltas are visible at the bottom centre and right
(photo Sutherland Shire Council). Figure 63 (page 67) - The fluvial delta present in North West Arm. Figure 64 (page 67) - Small fluvial delta off Gymea Bay. Figure 65 (page 68) - Fluvial Delta off South West Arm. Figure 66 (page 69) - Head of Gunnamatta Bay. Figure 67 (page 69) - The marina at the head of Gunnamatta Bay Figure 68 (page 74) - Bundeena Creek (in its closed state) crossing the berm at Horderns
Beach, Bundeena. Figure 69 (page 74) - Bridge across Bundeena Creek on the berm at Hordern Beach. Figure 70 (page 75) - Bundeena Creek in its closed state (photo SSC, Shiremap) Figure 71 (page 75) - Bundeena Creek in its open state (photo SSC Shiremap) Figure 72 (page 77) - Distribution of the lead concentrations in the sediments of Gunnamatta
Bay. Figure 73 (page 78) - Distribution of lead concentrations in the sediments of Yowie Bay Figure 74 (page 79) - Variation in the concentrations of various elements along the axis of
Gunnamatta Bay. Note the higher concentrations at the fluvial delta (GB2) in comparison to the tidal delta (GB18) and the high values within the deep basin.
Figure 75 (page 80) - Sand quality in Bate Bay and in the outer tidal delta. Figure 76 (page 81) - The dredge vessel off Cronulla. Figure 77 (page 81) - Dredge fully loaded approaching the disposal site. Figure 78 (page 82) - Unloading the sediment off Cronulla Figure 79 (page 82) - Dredge ready for another load. Figure 80 (page 83) - The ballast heap off Little Turriell Bay. Figure 81 (page 84) - The ballast heap off Little Turriell Bay. Note the dense cover of oysters
shells. Figure 82 (page 86) - Rock carvings representing Yulungur and Marloo (photo Les Bursill,
Aboriginal Living Sites Survey Team) Figure 83 (page 87) - Hand paintings in rock shelters in the Cabbage Tree Basin catchment
(photo R.J. West). Figure 84 (page 90) - Bass and Flinders Point at the northern entrance to Port Hacking Figure 85 (page 90) - Inscription on the memorial at Bass and Flinders Point. Figure 86 (page 95) - The research facilities at Hungry Point Figure 87 (page 96) - The research facilities in 1901 (Photo: Sutherland Shire Library) Figure 88 (page 98) -The main area of shell Extraction on the shoals at Maianbar. Photo 1955 Figure 89 (page 99) - Close-up of the dredge and trail of shell Extraction in the 1955 photo
(Fig. 88) Figure 90 (page 99) - The shell Extraction dredge . Note the booms Extracting at the rear left,
another redeposing to the right. The path of the dredge is clearly delineated. Figure 91 (page 101) - The engineering works, commonly known as the Fish Trap in the
Hacking River below Audley. Figure 92 (page 102) - The proposed tombolo off Cabbage Tree Point (Photo. Management
Options, PWD) Figure 93 (page 104) - The 2011 proposed dredging to maintain the channels’ viability. Figure 94 (page 105) - Gogerly’s Cottage (Photo: Sutherland Shire Library) Figure 95 (page 107) - Recreational developments at Audley around 1920 (Source Museum
Victoria, MM8745) Figure 96 (page 108) - Recreational developments at Audley around 1920 Figure 97 (page 108) - The church camps at Warumbul

151
Figure 98 (page 109) - Present day church camps at Warumbul Figure 99 (page 111) - The wharf at Bonnie Vale (Photo: Sutherland Shire Council) Figure 100 (page 112) - The Simpsons Hotel Figure 101 (page 113) - The official opening of the Cronulla ocean wharf, Salmon Haul Bay, by
the State Governor, Sir Walter Davidson, January 1919 (Sutherland Shire Council) Figure 102 (page 114) - The Brighton Steamer that used to land at Hungry Point (from Port
Hacking Marine Delta, Management Options, PWD, 86013). Figure 103 (page 114) - Salmon Haul looking west to Hungry Point. The grassy area, centre, is
the location of the Cronulla ocean wharf. 18/09/201 Figure 104 (page 115) - The Ferry service to Audley Figure 105 (page 115) – “Moombara” and waterfront structure of the Allen Estate, Port Hacking Figure 106 (page 117) – Some of the old shacks at Bonnie Vale Figure 107 (page 119) – Barge loading at Wally’s Wharf, Dolans Bay Figure 108 (page 119) – Loaded barge in Burraneer Bay Figure 109 (page 120) – Artificial seawall. Figure 110 (page 120) – Excavation without sediment containment Figure 111 (page 121) – Contemporary development. Figure 112 (page 122) – Contemporary development. Figure 113 (page 123) – Recreational activities on Deeban Spit Figure 114 (page 123) – Recreational activities on the Lilli Pilli shallows Figure 115 (page 125) – Small dredge operation Figure 116 (page 125) – Localised disposal of dredged spoil Figure 117 (page 126) - The interface of the Royal National Park and the marine delta at
Warumbul and South West Arm viewed from Lilli Pilli. Figure 118 (page 129) – Southern foreshores remnants of Gogerlye’s activities Figure 119 (page 130) – Southern foreshores remnants of Warumbul landing jetty. Figure 120 (page 131) – Land remnants at Costens Point Figure 121 (page 131) – Waterside structures remnants, Costens Point Figure 122 (page 134) – Population growth from 1906 t0 2011 (modified from Port Hacking
Plan of Management, Sutherland Shire, 1992). Figure 123 (page 139) – Interrelationships in Port Hacking and its catchment (redrawn from
Port Hacking Plan of Management, Sutherland Shire, 1992). Figure 124 (page 140) – Planning and management sequences (redrawn from Port Hacking
Plan of Management, Sutherland Shire, 1992). Figure 125 (page 146) – The flooding of the GTP outlet. Note the scales as term of reference. Figure 126 (page 147) - Potential effect of the rising in sea level demonstrated at the some
water outlet in Port Hacking
152
EXTRACTS Extract 1 - Aboriginal life around Port Hacking ……… p. 153
Extract 2 - The Dharawal people……………………… p. 154
Extract 3 – Middens………………………...…………. p. 154
Extract 4 - Aboriginal legend ……………………….. p. 156
Extract 5 - Aboriginal relics ……………………….….. p. 157
Extract 6 - Aboriginal tragedy………………………… p. 158
Extract 7- Fish hatchery ……………………………..… p. 159
Extract 8 - Shell dredging……………………………… p. 161
Extract 9 - Shell dredging …………………………….. p. 163
Extract 10 - Loss of seagrasses …………………..…. p. 164
Extract 11 - Dredging for navigation …………………. p. 165
Extract 12 - Boating tragedy…………………………… p. 167
Extract 13 – Bonnie Vale………………………………. p. 169
Extract 14 – Bonnie Vale cabins…………………..…. p. 170
Extract 15 - Maianbar and the Deeban Spit…………. p. 175
Extract 16 - Foreshore development……………….… p. 177
Extract 17 - Sutherland Shire draft LEP…………...… p. 184
Extract 18 - Royal National Park early history………. p. 186
Extract 19 - Royal National Park early history…….... p. 188
Extract 20 - Discovery of coal…………………………. p. 193
Extract 21 - Reflections of a Dolans Bay resident..…. p. 194
Extract 22 – Tombolo………………………………...… p. 198
Extract 23 - Residents' survey……………………..…. p. 199
Extract 24 - Discovery of coal…………………………. p. 202
Extract 25 - Construction of the southern railway…... p. 205
Extract 26 – Helensburgh………………………….….. p. 207
Extract 27 – Sea level rise………………………….…. p. 209
Extract 28 - Boats during World War II…………….... p. 211
Extract 29 - Wentworth's Cottage, Leg of Mutton Bay p. 212
Extract 30 - Cronulla beach nourishment…………….. p. 213
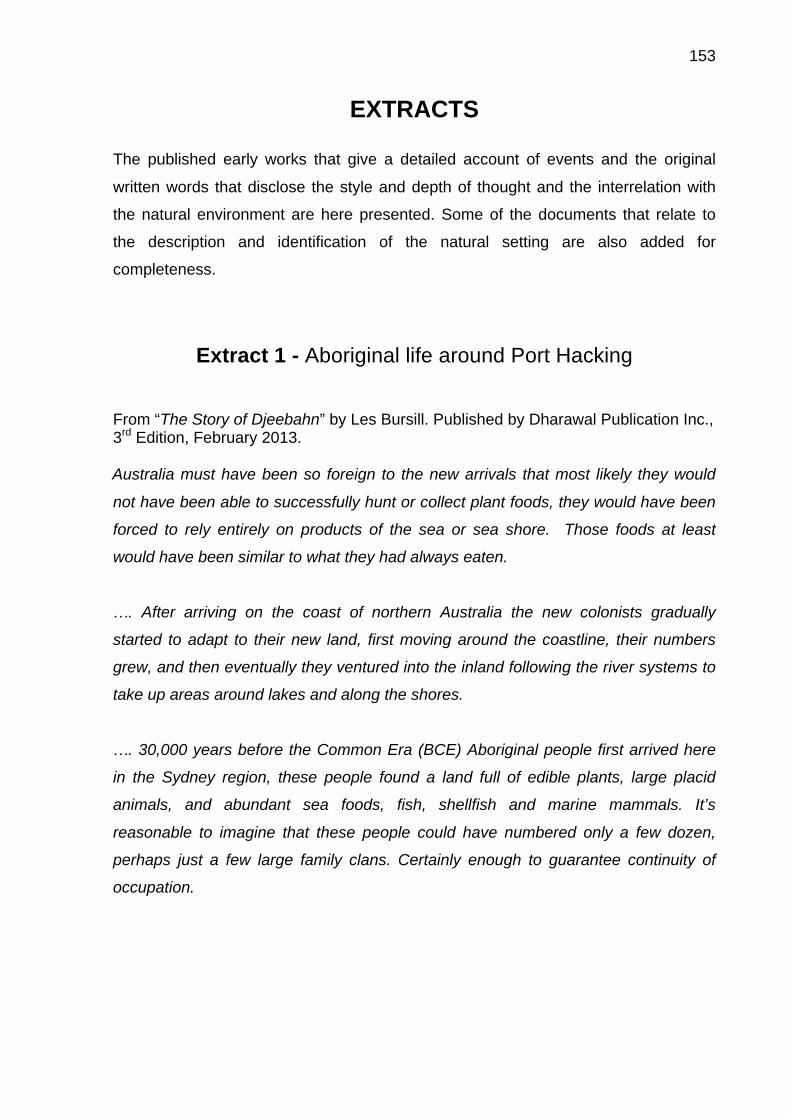
153
EXTRACTS
The published early works that give a detailed account of events and the original
written words that disclose the style and depth of thought and the interrelation with
the natural environment are here presented. Some of the documents that relate to
the description and identification of the natural setting are also added for
completeness.
Extract 1 - Aboriginal life around Port Hacking
From “The Story of Djeebahn” by Les Bursill. Published by Dharawal Publication Inc., 3rd Edition, February 2013. Australia must have been so foreign to the new arrivals that most likely they would
not have been able to successfully hunt or collect plant foods, they would have been
forced to rely entirely on products of the sea or sea shore. Those foods at least
would have been similar to what they had always eaten.
…. After arriving on the coast of northern Australia the new colonists gradually
started to adapt to their new land, first moving around the coastline, their numbers
grew, and then eventually they ventured into the inland following the river systems to
take up areas around lakes and along the shores.
…. 30,000 years before the Common Era (BCE) Aboriginal people first arrived here
in the Sydney region, these people found a land full of edible plants, large placid
animals, and abundant sea foods, fish, shellfish and marine mammals. It’s
reasonable to imagine that these people could have numbered only a few dozen,
perhaps just a few large family clans. Certainly enough to guarantee continuity of
occupation.
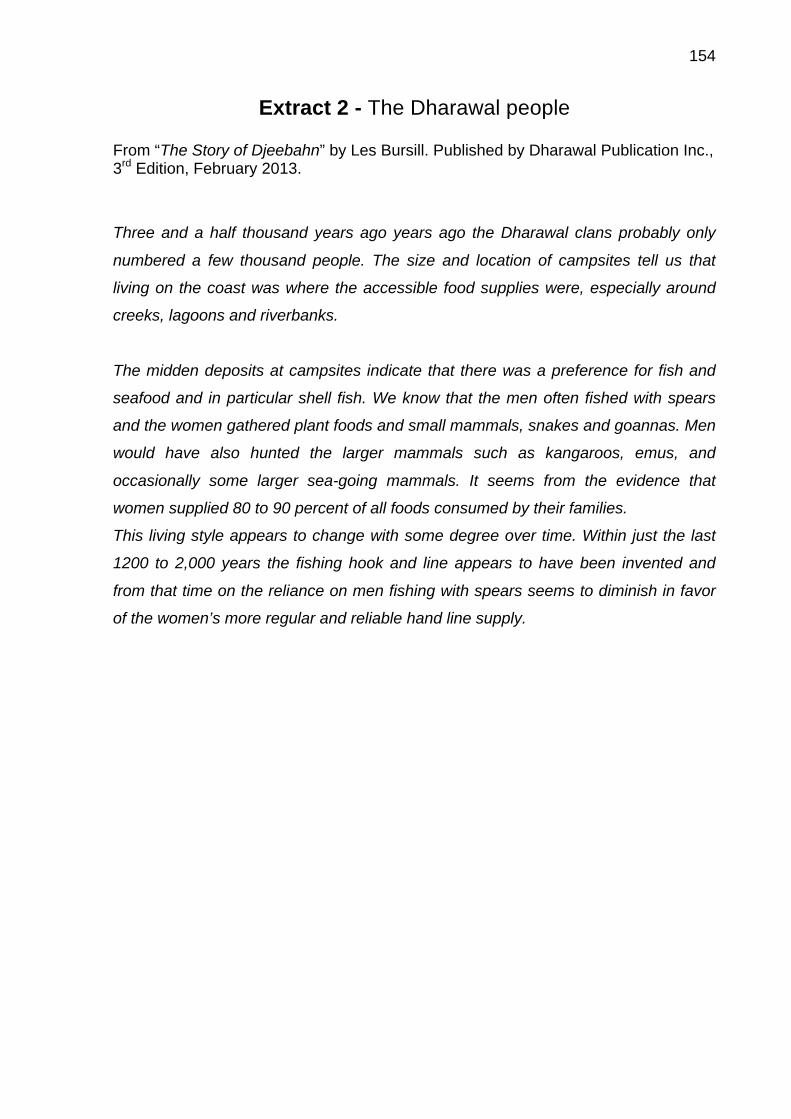
154
Extract 2 - The Dharawal people
From “The Story of Djeebahn” by Les Bursill. Published by Dharawal Publication Inc., 3rd Edition, February 2013.
Three and a half thousand years ago years ago the Dharawal clans probably only
numbered a few thousand people. The size and location of campsites tell us that
living on the coast was where the accessible food supplies were, especially around
creeks, lagoons and riverbanks.
The midden deposits at campsites indicate that there was a preference for fish and
seafood and in particular shell fish. We know that the men often fished with spears
and the women gathered plant foods and small mammals, snakes and goannas. Men
would have also hunted the larger mammals such as kangaroos, emus, and
occasionally some larger sea-going mammals. It seems from the evidence that
women supplied 80 to 90 percent of all foods consumed by their families.
This living style appears to change with some degree over time. Within just the last
1200 to 2,000 years the fishing hook and line appears to have been invented and
from that time on the reliance on men fishing with spears seems to diminish in favor
of the women’s more regular and reliable hand line supply.

155
Extract 3 - Middens
From “The Story of Djeebahn” by Les Bursill. Published by Dharawal Publication Inc., 3rd Edition, February 2013. The campsites of Aboriginal people are often referred to as “Kitchen Middens”, a
Swedish word meaning, “rubbish heap”. Middens are places where the cast offs from
eating shellfish and other food has accumulated over time. Middens are usually in the
best possible spot—a pleasant place, that’s easy to get to, where there are plenty of
shellfish. They are often fairly close to fresh water on a level, sheltered surface…
Today as we move around in the Djeeban we see only the remnant middens ……
Many ships’ captains and officers visiting Port Hacking in the 18th and 19th Centuries
remarked that the middens were so “large and bright white with shells that they
shone like stars at dusk”. ……
Middens may contain evidence of stone working and stone artifacts. Stone will often
have come from a very different area, showing that it was traded or transported.
Scientists occasionally find shell or bone artifacts, such as fishhooks or barbs, in the
upper layers of shell middens. There are also the occasional burials on midden sites.
No matter how we think of shell middens, it is important to remember that they
marked only the “summer” camping sites, for the clans of the Dharawal moved
around, not just in the immediate area of Sutherland.
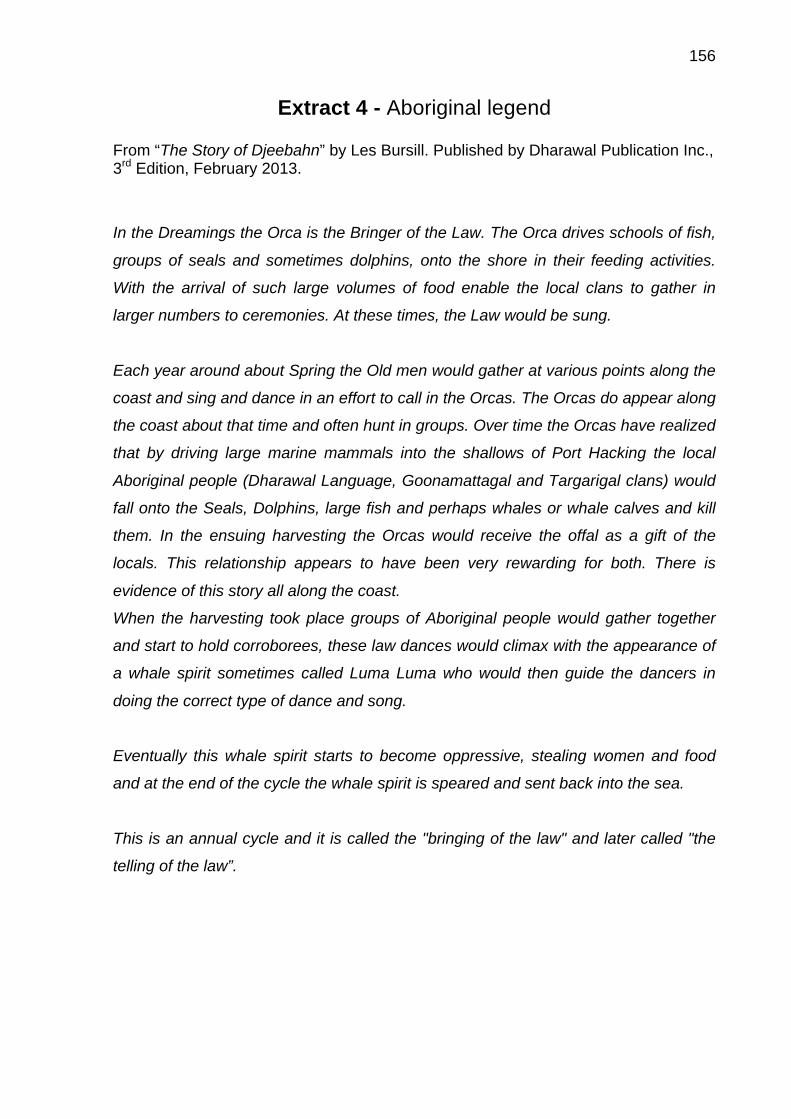
156
Extract 4 - Aboriginal legend
From “The Story of Djeebahn” by Les Bursill. Published by Dharawal Publication Inc., 3rd Edition, February 2013.
In the Dreamings the Orca is the Bringer of the Law. The Orca drives schools of fish,
groups of seals and sometimes dolphins, onto the shore in their feeding activities.
With the arrival of such large volumes of food enable the local clans to gather in
larger numbers to ceremonies. At these times, the Law would be sung.
Each year around about Spring the Old men would gather at various points along the
coast and sing and dance in an effort to call in the Orcas. The Orcas do appear along
the coast about that time and often hunt in groups. Over time the Orcas have realized
that by driving large marine mammals into the shallows of Port Hacking the local
Aboriginal people (Dharawal Language, Goonamattagal and Targarigal clans) would
fall onto the Seals, Dolphins, large fish and perhaps whales or whale calves and kill
them. In the ensuing harvesting the Orcas would receive the offal as a gift of the
locals. This relationship appears to have been very rewarding for both. There is
evidence of this story all along the coast.
When the harvesting took place groups of Aboriginal people would gather together
and start to hold corroborees, these law dances would climax with the appearance of
a whale spirit sometimes called Luma Luma who would then guide the dancers in
doing the correct type of dance and song.
Eventually this whale spirit starts to become oppressive, stealing women and food
and at the end of the cycle the whale spirit is speared and sent back into the sea.
This is an annual cycle and it is called the "bringing of the law" and later called "the
telling of the law”.

157
Extract 5 - Aboriginal relics
From “The Story of Port Hacking, Cronulla and the Sutherland Shire” by Frank Cridland. Book published by Angus and Robertson, 1924 No part of Port Hacking shows more evidence of continual aboriginal habitation….
They left behind some very fine rock carvings cut with remarkable fidelity and
proportion to life. … The flat rocks on the Gunnamatta side of the Point are
exceptionally rich in this respect. The Burraneer Bay side is, no doubt, still rich in
these treasures, for some of the private properties contain great mounds of half
decomposed shell and other debris…. The aboriginal history of the shire is retained
in the names of some of the neighboring places. These include Gymea, Burraneer,
and Gunnamatta.
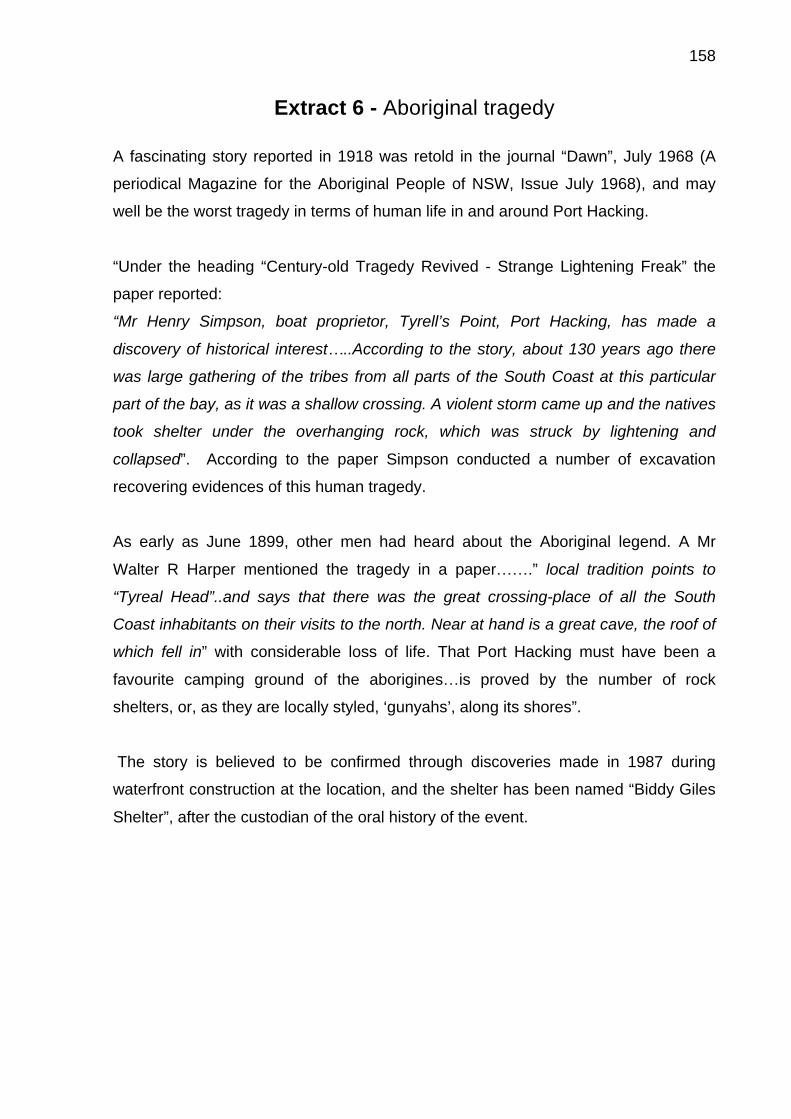
158
Extract 6 - Aboriginal tragedy
A fascinating story reported in 1918 was retold in the journal “Dawn”, July 1968 (A
periodical Magazine for the Aboriginal People of NSW, Issue July 1968), and may
well be the worst tragedy in terms of human life in and around Port Hacking.
“Under the heading “Century-old Tragedy Revived - Strange Lightening Freak” the
paper reported:
“Mr Henry Simpson, boat proprietor, Tyrell’s Point, Port Hacking, has made a
discovery of historical interest…..According to the story, about 130 years ago there
was large gathering of the tribes from all parts of the South Coast at this particular
part of the bay, as it was a shallow crossing. A violent storm came up and the natives
took shelter under the overhanging rock, which was struck by lightening and
collapsed”. According to the paper Simpson conducted a number of excavation
recovering evidences of this human tragedy.
As early as June 1899, other men had heard about the Aboriginal legend. A Mr
Walter R Harper mentioned the tragedy in a paper…….” local tradition points to
“Tyreal Head”..and says that there was the great crossing-place of all the South
Coast inhabitants on their visits to the north. Near at hand is a great cave, the roof of
which fell in” with considerable loss of life. That Port Hacking must have been a
favourite camping ground of the aborigines…is proved by the number of rock
shelters, or, as they are locally styled, ‘gunyahs’, along its shores”.
The story is believed to be confirmed through discoveries made in 1987 during
waterfront construction at the location, and the shelter has been named “Biddy Giles
Shelter”, after the custodian of the oral history of the event.
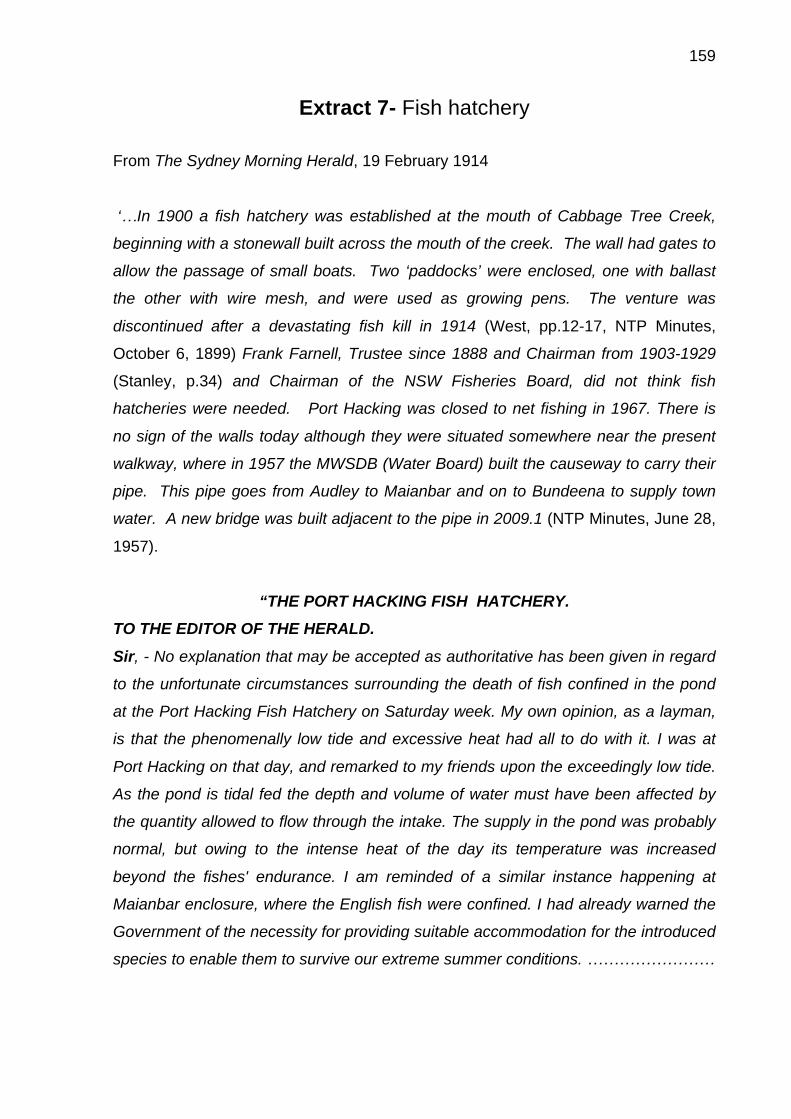
159
Extract 7- Fish hatchery
From The Sydney Morning Herald, 19 February 1914
‘…In 1900 a fish hatchery was established at the mouth of Cabbage Tree Creek,
beginning with a stonewall built across the mouth of the creek. The wall had gates to
allow the passage of small boats. Two ‘paddocks’ were enclosed, one with ballast
the other with wire mesh, and were used as growing pens. The venture was
discontinued after a devastating fish kill in 1914 (West, pp.12-17, NTP Minutes,
October 6, 1899) Frank Farnell, Trustee since 1888 and Chairman from 1903-1929
(Stanley, p.34) and Chairman of the NSW Fisheries Board, did not think fish
hatcheries were needed. Port Hacking was closed to net fishing in 1967. There is
no sign of the walls today although they were situated somewhere near the present
walkway, where in 1957 the MWSDB (Water Board) built the causeway to carry their
pipe. This pipe goes from Audley to Maianbar and on to Bundeena to supply town
water. A new bridge was built adjacent to the pipe in 2009.1 (NTP Minutes, June 28,
1957).
“THE PORT HACKING FISH HATCHERY. TO THE EDITOR OF THE HERALD. Sir, - No explanation that may be accepted as authoritative has been given in regard
to the unfortunate circumstances surrounding the death of fish confined in the pond
at the Port Hacking Fish Hatchery on Saturday week. My own opinion, as a layman,
is that the phenomenally low tide and excessive heat had all to do with it. I was at
Port Hacking on that day, and remarked to my friends upon the exceedingly low tide.
As the pond is tidal fed the depth and volume of water must have been affected by
the quantity allowed to flow through the intake. The supply in the pond was probably
normal, but owing to the intense heat of the day its temperature was increased
beyond the fishes' endurance. I am reminded of a similar instance happening at
Maianbar enclosure, where the English fish were confined. I had already warned the
Government of the necessity for providing suitable accommodation for the introduced
species to enable them to survive our extreme summer conditions. ……………………

160
Port Hacking Hatchery can be of no use as a means of ensuring a greater supply of
our indigenous marine species, for no more protection is afforded the fry hatched
there than the natural conditions of our waters afford,……..
I will be no advocate of the drastic action of abandoning the facilities the Gunnamatta
Marine Station provides for useful and valuable work, at the same time what has
puzzled me is the insatiable desire some people have for introducing into this country
species of marine fish, when we have a practically virgin field quite unexplored.
We cannot expect our rivers to retain full supplies when they are being patronized so
extensively by net fishermen and anglers, ……………..

161
Extract 8 - Shell dredging
From The Sydney Morning Herald, 21 March 1934
DREDGING FOR SEA SHELLS In Port Hacking River.The Cronulla District Chamber
of Commerce is opposing a scheme for dredging leases in the Port Hacking River for
shell grit and sea shells.Applications have been made by a company, under the
Mining Act, 1806. for permits to exploit the bed of Port Hacking at Burraneer Point
and Fisherman's Bay and also near Hungry Point.Objections to the applications are
also being lodged by the Sutherland Shire Council and the Department of Navigation.
However:
From The Sydney Morning Herald, 3 October 1934
SHELL-DREDGING LEASES.
Port Hacking Applications.
The Metropolitan Mining Warden (Mr. A. N. Graham) yesterday inquired into
applications for shell-dredging leases in Port Hacking River and Gunnamatta Bay.
The applicants were Marine Shell Products, Ltd., and Stafford and Hamilton, and the
applications were opposed by the National Park Trust, the Navigation Department,
the Public Works Department, the Sutherland Shire Council, and the Cronulla
Chamber of Commerce.
Mr. T. B. Watt, manager of Marine Shell Products, Ltd., said that the company, which
had operated in the area, which was the subject of the present applications since
1930, had expended £11,110 on buildings, plant, and equipment. When the original
leases were granted, special conditions giving wide powers of control to the
Navigation Department had been inserted, and the company had carefully complied
with those conditions. The company's operations had not endangered the navigability
of the channels.
Mr. W. F. Leighton Bailey, president of the National Park Trust, said that past shell
dredging operations had imperilled the navigation of deep-keeled craft in the river,
and had also had a serious effect on the feeding grounds of the fish. If the fishing
was destroyed by dredging, the livelihood of boatmen would be adversely affected.
162
Edwin Hadlington, poultry expert, Department of Agriculture, said that grit from Port
Hacking was particularly suitable for poultry. The shell grit requirements of the poultry
industry in the counties of Cumberland and Northumberland were between 5000 and
6000 tons annually. Any undue restriction of the sources of supply would harmfully
affect poultrymen.
Mr. T. L. Thompson, Sutherland shire engineer, said that, provided the river channel
was kept open and provision was made in the leases for the proper control of
dredging operations, the council did not offer opposition to Marine Shell Products,
Ltd.'s application. On the application of Stafford and Hamilton for a lease of an area
in Gunnamatta Bay, the council opposed dredging on the floor of the bay, as it feared
this would injure the present navigable channel used by ferry and launch traffic. The
council did not desire to see the present features of Gunyah Flat disturbed.
A series of special conditions was proposed by the Public Works Department for
incorporation in any lease granted under the application by Marine Shell Products,
Ltd. The department objected to Stafford and Hamilton's application.
Captain B. Palmer, of the Navigation Department, said the department objected to
the grant of a lease in Gunnamatta Bay, where dredging would cause danger of the
formation of blind channels by the action of the sea. At present the area applied for
was part of a natural bank to the main channel into Port Hacking. If disturbed, the
action of the sea swell would probably alter the formation of the flat and affect the
channel.
Mr. A. Campbell (Cronulla Chamber of Commerce) said that dredging in Gunnamatta
Bay would be detrimental to land values in the adjacent area.
A report will be made to the Minister of Mines by the Warden.

163
Extract 9 - Shell dredging
From The Sydney Morning Herald, 14 September 1934.
DREDGING FOR SEA SHELLS In Port Hacking River.
The Cronulla District Chamber of Commerce is opposing a scheme for dredging
leases in the Port Hacking River for shell grit and sea shells.
Applications have been made by a company, under the Mining Act, 1806, for permits
to exploit the bed of Port Hacking at Burraneer Point and Fisherman's Bay and also
near Hungry Point.
Objections to the applications are also being lodged by the Sutherland Shire Council
and the Department of Navigation
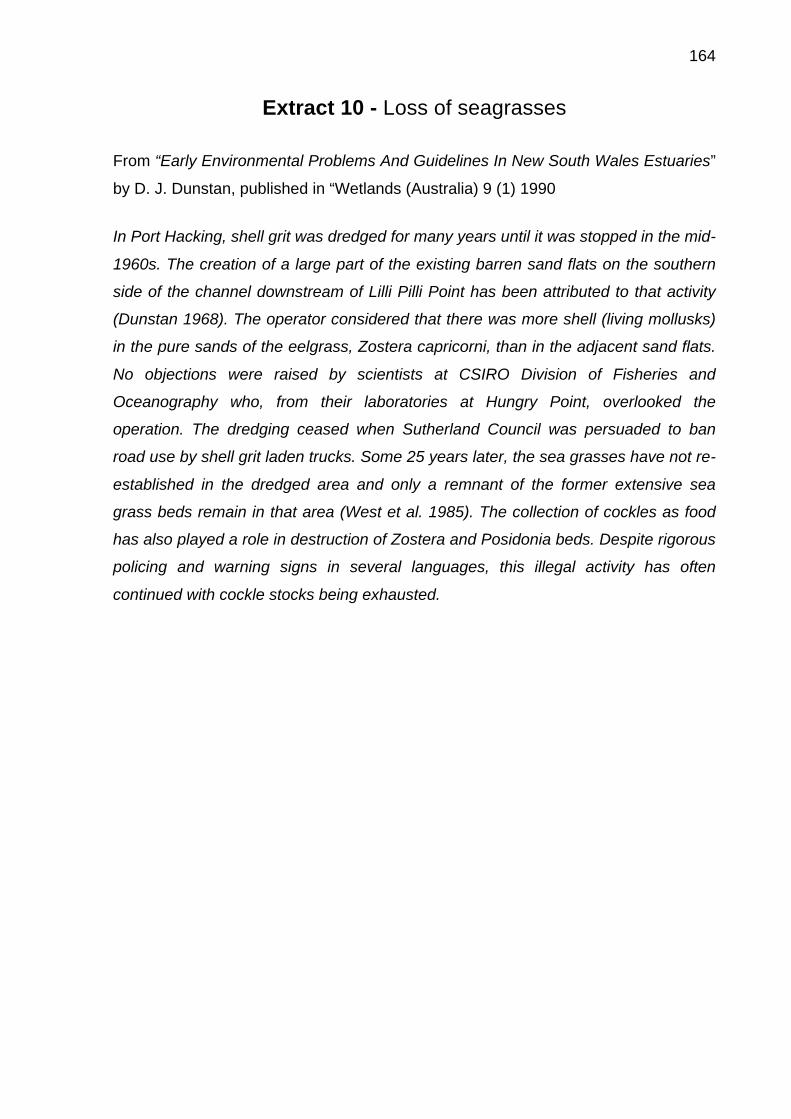
164
Extract 10 - Loss of seagrasses
From “Early Environmental Problems And Guidelines In New South Wales Estuaries”
by D. J. Dunstan, published in “Wetlands (Australia) 9 (1) 1990
In Port Hacking, shell grit was dredged for many years until it was stopped in the mid-
1960s. The creation of a large part of the existing barren sand flats on the southern
side of the channel downstream of Lilli Pilli Point has been attributed to that activity
(Dunstan 1968). The operator considered that there was more shell (living mollusks)
in the pure sands of the eelgrass, Zostera capricorni, than in the adjacent sand flats.
No objections were raised by scientists at CSIRO Division of Fisheries and
Oceanography who, from their laboratories at Hungry Point, overlooked the
operation. The dredging ceased when Sutherland Council was persuaded to ban
road use by shell grit laden trucks. Some 25 years later, the sea grasses have not re-
established in the dredged area and only a remnant of the former extensive sea
grass beds remain in that area (West et al. 1985). The collection of cockles as food
has also played a role in destruction of Zostera and Posidonia beds. Despite rigorous
policing and warning signs in several languages, this illegal activity has often
continued with cockle stocks being exhausted.

165
Extract 11 - Dredging for navigation
From The Sydney Morning Herald, 20 December 1933
DREDGING PORT HACKING.
TO THE EDITOR OF THE HERALD. I
Sir, -The attitude of your correspondent "Wake Up," in his letter with reference to the
above, is very hard to understand Is it 'an outrageous proposal' for a Deputation
representing the Sutherland Shire Council the National Park Trust the Royal Motor
Yacht Squadron of Sydney and others to ask the Minister for Public Works to di
dredge the silting up channel at the entrance to Port Hacking, and remove the
shoaled-up patches of the higher part of the river due to the disastrous and
unprecedented flood of last January' As Mr. Stuart Doyle very ably said on the day of
the deputation, at which I had the honor of attending "In Port Hacking we have the
most beautiful stretch of inland water on the coast of New South Wales and one that
has been sadly neglected by the Government " How your correspondent can deduce
the fact that "the tropical splendor of the river" will be lost by such dredging Is beyond
comprehension The beauties of the foreshores of the Port Hacking River can only be
fully appreciated by a trip on the river, and It is to enable thousands of intending
visitors to undertake that trip, that the Minister has been asked to sanction the
necessary dredging The writer has personally conducted very large numbers of
oversea and intercolonial tourists up and down this river, and the unanimous opinion
of all has been that nothing seen on their travels could surpass the beautiful natural
scenery of the Port Hacking River I know very little about the Tuggerah Lakes, but
"Wake Up" can rest assured that no necessary dredging that Is done at Port Hacking
will ever affect "the tropical splendor of the river," or turn Port Hacking into "a big,
dirty waterhole."
I am, etc.,
ROBERT RYALL. Cronulla,
166
From The Sydney Morning Herald, 23 April 1934
DREDGING PORT HACKING.
TO THE EDITOR OF THE HERALD
Sir, - The thanks of the travelling public, and such bodies as the Sutherland Shire
Council, the National Park Trust, the Royal Motor Yacht Club, the Cronulla Chamber
of Commerce, etc., are undoubtedly due to the Department of Public Works for at last
sending a dredge to Port Hacking to improve the silted up condition of the navigable
channels. Thanks are also due to the Herald for the continued publicity given to this
urgent matter. The hope freely expressed by all concerned, is that the dredge will be
allowed to complete the job, which she has already commenced. On Saturday 7th
instant on the occasion of the opening of a branch of the Royal Motor Yacht Club
Port Hacking was visited by a large fleet of Sydney’s largest and most palatial motor
yachts. The entrance to Port Hacking and the navigable channel up to Lilli Pilli (the
rendezvous for the visiting yacht squadron) were only safely negotiated at the top of
high water the motor vessels having to remain for 24 hours before the tide permitted
them to take their departure from Port Hacking. The arrival of the dredge has now
brought visions on the horizon of Port Hacking becoming the most popular of all our
beauty spots on the New South Wales coast.
I am. etc.,
ROBERT RYALL. Cronulla, April 19 (SMH, Monday 23 April, 1934)
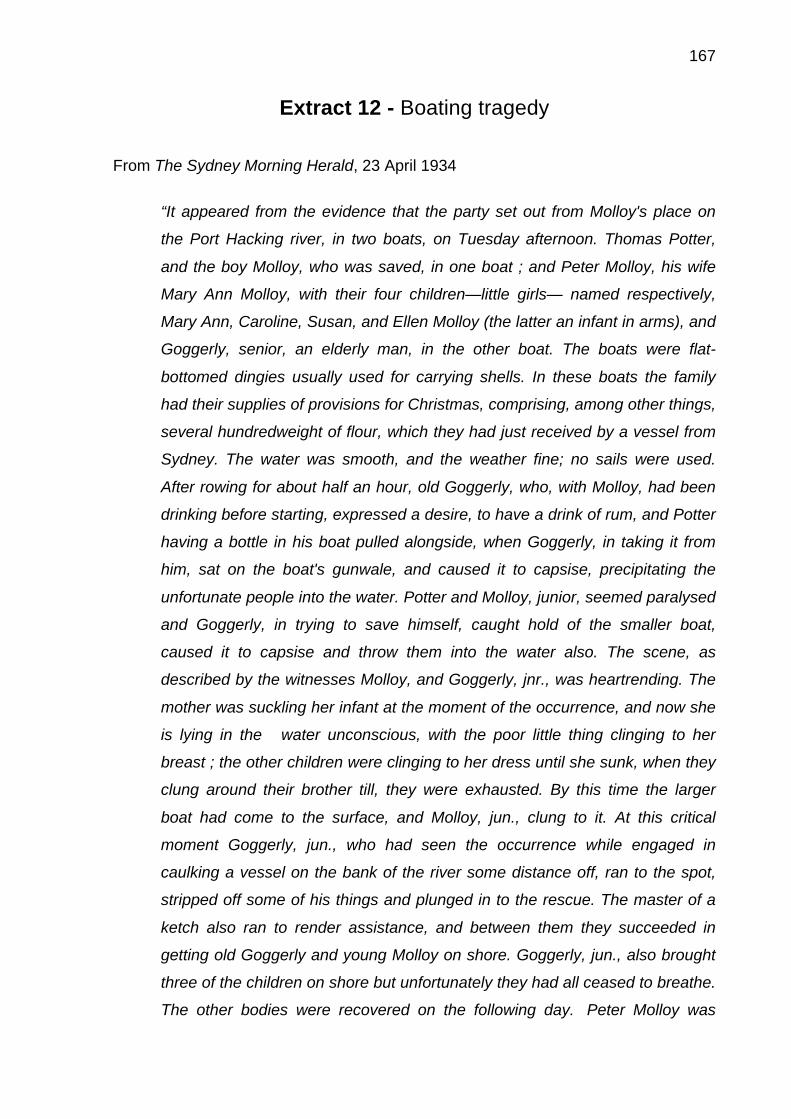
167
Extract 12 - Boating tragedy
From The Sydney Morning Herald, 23 April 1934
“It appeared from the evidence that the party set out from Molloy's place on
the Port Hacking river, in two boats, on Tuesday afternoon. Thomas Potter,
and the boy Molloy, who was saved, in one boat ; and Peter Molloy, his wife
Mary Ann Molloy, with their four children—little girls— named respectively,
Mary Ann, Caroline, Susan, and Ellen Molloy (the latter an infant in arms), and
Goggerly, senior, an elderly man, in the other boat. The boats were flat-
bottomed dingies usually used for carrying shells. In these boats the family
had their supplies of provisions for Christmas, comprising, among other things,
several hundredweight of flour, which they had just received by a vessel from
Sydney. The water was smooth, and the weather fine; no sails were used.
After rowing for about half an hour, old Goggerly, who, with Molloy, had been
drinking before starting, expressed a desire, to have a drink of rum, and Potter
having a bottle in his boat pulled alongside, when Goggerly, in taking it from
him, sat on the boat's gunwale, and caused it to capsise, precipitating the
unfortunate people into the water. Potter and Molloy, junior, seemed paralysed
and Goggerly, in trying to save himself, caught hold of the smaller boat,
caused it to capsise and throw them into the water also. The scene, as
described by the witnesses Molloy, and Goggerly, jnr., was heartrending. The
mother was suckling her infant at the moment of the occurrence, and now she
is lying in the water unconscious, with the poor little thing clinging to her
breast ; the other children were clinging to her dress until she sunk, when they
clung around their brother till, they were exhausted. By this time the larger
boat had come to the surface, and Molloy, jun., clung to it. At this critical
moment Goggerly, jun., who had seen the occurrence while engaged in
caulking a vessel on the bank of the river some distance off, ran to the spot,
stripped off some of his things and plunged in to the rescue. The master of a
ketch also ran to render assistance, and between them they succeeded in
getting old Goggerly and young Molloy on shore. Goggerly, jun., also brought
three of the children on shore but unfortunately they had all ceased to breathe.
The other bodies were recovered on the following day. Peter Molloy was

168
nearly sixty years of age, and obtained a livelihood by gathering the shells
used in making lime. Two members only of his family survive—the lad who
gave evidence, and a younger brother of about nine years, who was left at
home. Potter was a shell gatherer also, and has left a wife and seven
children.The jury returned a verdict stating that the seven deceased persons "
came by their deaths from suffocation by drowning ; and we consider the men
were under the in fluence of drink at the time, and caused the occurrence."
Portion of (SMH 23 December 1864)
The Coroner’s inquest into the tragedy found:
“The occurrence was caused by old Goggerly standing up in the boat and
falling suddenly on the gunwale. At that time he was "groggy," and had rum in
the boat. No person he thought would have drowned that day if he had been
sober.”
169
Extract 13 – Bonnie Vale
From “History of Royal National Park 1879-2013” by Judith Carrick, unpublished.
‘Mr. George Feldwick, licensee of Port Hacking Hotel (Simpson’s Hotel) during 1933-
1946, was so impressed by the beautiful bay he named it Bonnie Vale. Two of
William Simpson’s boats were named Blink Bonnie and Bonnie Bird, and George’s
house was named Bonnie Doon so it is possible the idea flowed on from that. In
1939 George asked the Trustees if the road to Bundeena could be improved, as it
was not in good repair. This road was originally built in 1922 (NPT Minutes, May 3rd,
1922, Philpott, p.38, NPT Minutes, October 25th, 1939). The heavy expenses of
rebuilding throughout the Park in the late 1930s left nothing for roads, which had
become neglected and inadequate. From 1938 the Department of Main Roads took
over the responsibility for the maintenance of the major roads (NPT Minutes,
February 9th, 1938). The Trustees maintained the minor roads and the Sutherland
Shire Council was responsible for the roads to Bundeena and Maianbar.
Being on the Hacking River and a short, pleasant ferry ride across the port from
Sydney, Bonnie Vale was always a popular fishing and holiday spot. William
Wentworth’s hut was the first of the fishing huts, which were erected in an higgledy-
piggledy fashion, probably as early as 1918 and continued to increase over the years
until 1947 when the Trustees purchased Simpson’s land. At that time there were 180
permanent camps (tents and cabins) there (NSW NPWS Huts Study 1994, p39) but
over the next 20 years the ramshackle cabins were removed and were replaced
under a specified design. The Bonnie Vale cabins differ from cabins in other areas as
they were developed on Park land under supervision of the Trustees and Sutherland
Shire, and as such, have particular cultural value as they are examples of the 1950s
weekender. Only eight cabins remain at Bonnie Vale and with plans to redevelop the
eastern end, even they may soon be gone.

170
Extract 14 – Bonnie Vale cabins
Reflections and observations, past and present, on a significant recreation site for
generations.
All that remains… ghosts of former times at Bonnie Vale by Russ Grayson, August
27, 2002.
A fibro shack typical in construction of those at Bonnie Vale.
AT FIRST, I thought the two women were just day trippers, people out to enjoy the
early Spring sunshine. They stood close together, looking at the fibro shack with its
galvanised iron roof that was still in good condition after all these years, and talked
quietly in the stop-and-start fashion of people comfortable with each other.
“There was a community hall over there where they held dances… and over there is
where we saw the ghost”, said one of the woman, pointing to an area of open space.
They moved towards where I stood, camera in hand, attaching a polarising filter to
my lens. It was the younger one who spoke, a woman of late-middle age with a quiet
voice. We acknowledged each other, made small talk about the warmth of the day,
then somehow the discussion got around to why we were there. I explained my
interest in the old huts. The woman explained that as a child she used to come on
holidays here with her family.
“We lived in Newtown then. Now we live in the western suburbs”, she said.

171
It was on one of those holidays that, one night all those years ago, she and the other
children saw the ghost that was rumored to haunt the settlement. Now, more than 70
years after the first holiday-makers came, it is the settlement itself which is becoming
a ghost of ts former self. Bonnie Vale, a monument to the way people lived and
enjoyed themselves in the middle years of the Twentieth Century, has been
progressively diminished by a National Parks and Wildlife service that has believed
that such artifacts have no place in our national parks. A pocket of Sydney’s social
history could disappear from the south bank of the Hacking River.
A modest settlement of ordinary people
The modest, fibro and galvanised iron huts that dot the flat land between the forested
hills and the beach at Bonnie Vale have been holiday home to generations of Sydney
families. They occupy a small corner of Royal National Park, Australia’s first and
most-visited park which separates Sydney’s sprawling southern suburbs from the
Illawarra region to the south. Continuing a 70-year old tradition, each January
Sydney families gather on the flats to erect their tents, to swim, fish and enjoy the
end-of-year break.
The densely-packed settlement of owner-built holiday buildings that was Bonnie Vale
pre-dates the incorporation of the area into the national park in 1947. By the 1950s,
the impromptu, unplanned settlement was a thriving village of modest, simple huts of
the kind one built by holidaymakers at other settlements at South Era, Bulgo, Little
Garie and Burning Palms, all now within Royal National Park. Like these other
settlements, Bonnie Vale evolved from a seasonal tent city.

172
Recollections of Bonnie Vale’s early history are vague. According to the NPWS, “It is
not clear when the cabins at Bonnie Vale were first constructed. An early reference
suggests that some fishermen’s huts may have been in existence before 1918 but
this is unsubstantiated and conflicts with other evidence. One other report proposed
the 1930s and it is apparent that there were cabins at Bonnie Vale before the Second
World War.”
Stephen Ward, once a resident of neighbouring Bundeena and publisher of Village
Voice, the local newspaper, wrote in The Bulletin that, ” …between the ’30s and the
’50s (Bonnie Vale) grew to about 500 permanent campsites and about 200 fibro
cabins. At first, the depression accounted for its popularity, as Syd Stephen wrote
that by the late-1970s most of the huts were occupied by pensioners who received a
rent concession from the NPWS.
At the turn of the Twentieth Century the land was privately owned by William
Simpson who built a hotel on the foreshore. Today, the NPWS ranger’s house stands
on the foundations of the hotel. According to Stephen, the hotel gained some
noteriety. “…by the ’30s the hotel’s location made it a haven for a section of Sydney’s
racing fraternity. It was known for after-hours drinking and all-night two-up and poker
games”.
As the settlement evolved, huts became more closely spaced and a community
centre was built. But by the late-1960s, the settlement had gone into decline. The
number of huts was reduced from a NPWS count of 171 in the 1960s, 123 in 1971,
59 in 1982, 31 in 1992 to about 20 cabins today. “At this rate they would all be
removed by 2000″, the NPWS erroneously predicted in its 1994 draft Cabins
Conservation Plan.

173
The decline in hut numbers was due not to bushfire, not to abandonment and decay,
not to any natural agency. It was due to the NPWS which, since 1967, has been
knocking them down.
Changing fashions
Within big institutions like national parks services, ideas change and notions about
the role and place of people in the bush vie for dominance. Notions are replaced as
new staff bring new ideas.
The belief that human works should be removed from at least some national parks,
for example, became popular in the 1970s as the idea of ‘wilderness’ as something
free from human impact gained ascendency. Later, people realised that humans,
both indigenous and European, had long been a factor in what are now national
parks and wilderness areas and their works represented a heritage, an example of
the human experience in those places. So it is that national parks today contain
historic sites.
Yet old notions linger into new times and it was this that the woman with whom I
spoke that warm saturday morning confronted as she acknowledged, sadly, that the
huts — a part of her own family’s history as much as they are a part of the wider
social history of the southern Sydney region — would go. I could tell from her voice
that she was unhappy about this, that something of value was to be taken from her
as much as from the rest of Sydney, that the past was to be obliterated.
Bonnie Vale reborn
When the huts go, Bonnie Vale will be redeveloped for camping. That the NPWS
would do this is understandable for, each January, there are more would-be campers
than there are campsites. Bonnie Vale has 40 campsites and between 15,000 and
20,000 visitor nights a year, according to the NPWS. The lucky ones are those pulled
out of the ranger’s hat in the ballot for a campsite.
But what of the people who continue to holiday in the remaining huts under an
agreement with the NPWS? Well, they are going to go, and to make sure that they do

174
they will be offered five-year, non-renewable leases. Pensioners whose only
residence is a Bonnie Vale hut will be offered a life tenancy. As the huts are
demolished as their leases expire, permanent buildings will be replaced by the
ephemeral campsites of seasonal visitors.
I left the two women to wander among the huts, to relive their memories of childhood
and family, to recall ghosts seen or unseen.
As I pointed my camera at those modest buildings still a part of the living memory of
many people I know that they were the visible part of an Australian experience fast
disappearing.
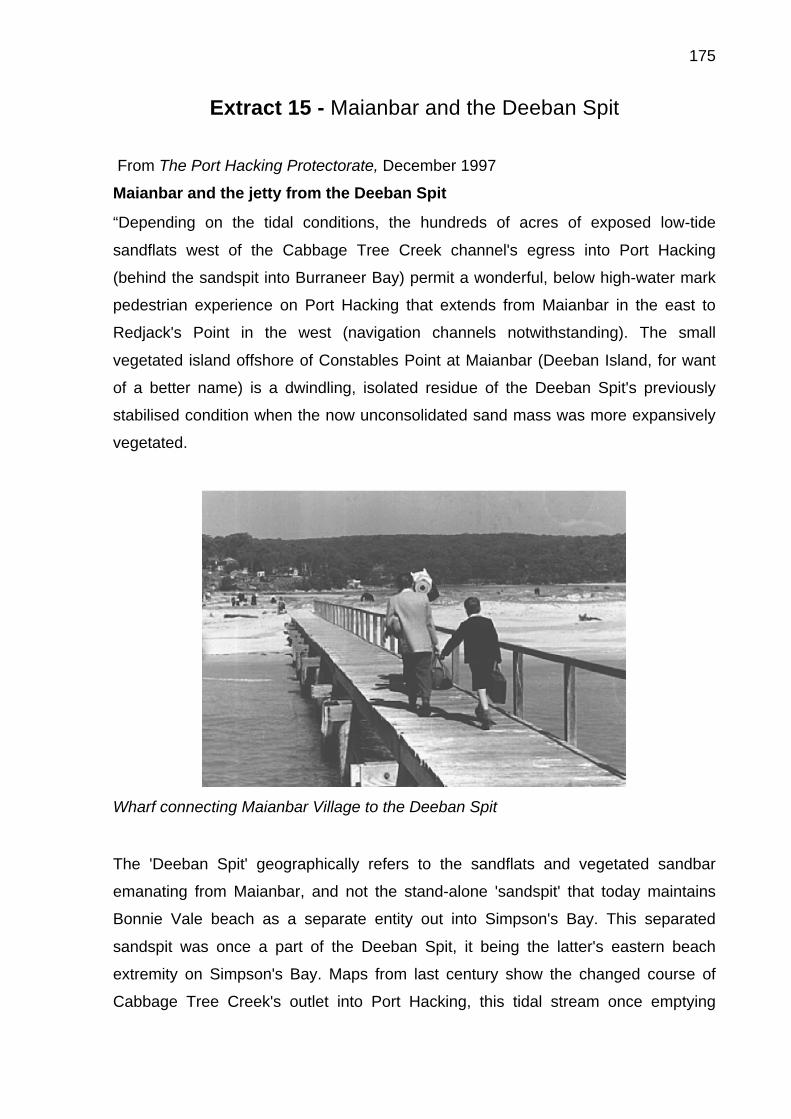
175
Extract 15 - Maianbar and the Deeban Spit
From The Port Hacking Protectorate, December 1997
Maianbar and the jetty from the Deeban Spit
“Depending on the tidal conditions, the hundreds of acres of exposed low-tide
sandflats west of the Cabbage Tree Creek channel's egress into Port Hacking
(behind the sandspit into Burraneer Bay) permit a wonderful, below high-water mark
pedestrian experience on Port Hacking that extends from Maianbar in the east to
Redjack's Point in the west (navigation channels notwithstanding). The small
vegetated island offshore of Constables Point at Maianbar (Deeban Island, for want
of a better name) is a dwindling, isolated residue of the Deeban Spit's previously
stabilised condition when the now unconsolidated sand mass was more expansively
vegetated.
Wharf connecting Maianbar Village to the Deeban Spit
The 'Deeban Spit' geographically refers to the sandflats and vegetated sandbar
emanating from Maianbar, and not the stand-alone 'sandspit' that today maintains
Bonnie Vale beach as a separate entity out into Simpson's Bay. This separated
sandspit was once a part of the Deeban Spit, it being the latter's eastern beach
extremity on Simpson's Bay. Maps from last century show the changed course of
Cabbage Tree Creek's outlet into Port Hacking, this tidal stream once emptying
176
directly into Simpson's Bay closer to the Simpson's Hotel site (now the NPWS
ranger'shouse).
Today's heaped-high sandspit severed from the Deeban shoal's sand mass, is the
long-established creation of spoil from dredging (for the construction of a
Government fish hatchery in Cabbage Tree Creek in 1900, and from shell-grit
mining), and the shifting egress of Cabbage Tree Creek following much reclamation
of its original wetland meanders where Bonnie Vale camping ground now is.”
177
Extract 16 - Foreshore development
Introduction.
As mentioned in the text, there had been a period of groundswell of community
activism (text page 113), driven by deferent issues and centred in different places.
There was a mobilization against the Public Works Department “Tombolo” proposal
which originated in the Bundeena community but spread. Residents of Cronulla were
concerned about high-rise development trends. Shire Watch grew out of concerns
about development including waterfront and foreshore development. This activism
resulted in a number of groups, Cronulla Development Watch and Shire Watch
winning places on Sutherland Shire Council. Their interests broadened over time,
and all aspects of waterways management- user impacts and conflicts, activity
sustainability and a plethora of planning and management issues were canvassed by
them. The SSEC became an umbrella organisation.
The following are extracts of the “Protectorate”, August 1995, with respect to the
impacts of foreshore development on Port Hacking. Although this newsletter was the
public voice of the Port Hacking Protection Society, it was published under the
banners of the Sutherland Shire Environment Centre (SSEC) and the Hacking River
Catchment.
These two extracts from the one issue give a useful insight into the issues of the day,
but give some insight into the level of sophistication that had evolved in grass-roots
community activism.
EDITORIAL (extract 1) Foreshore Development The major impact on the Port Hacking waterway over the last century has been
urban development. On the north shore of the Port, very little land remains in the
form of parks or bushland reserves. On the south shore, predominantly because of
the existence of the Royal National Park, only the communities of Bundeena and
Maianbar interrupt the bushland aspect.
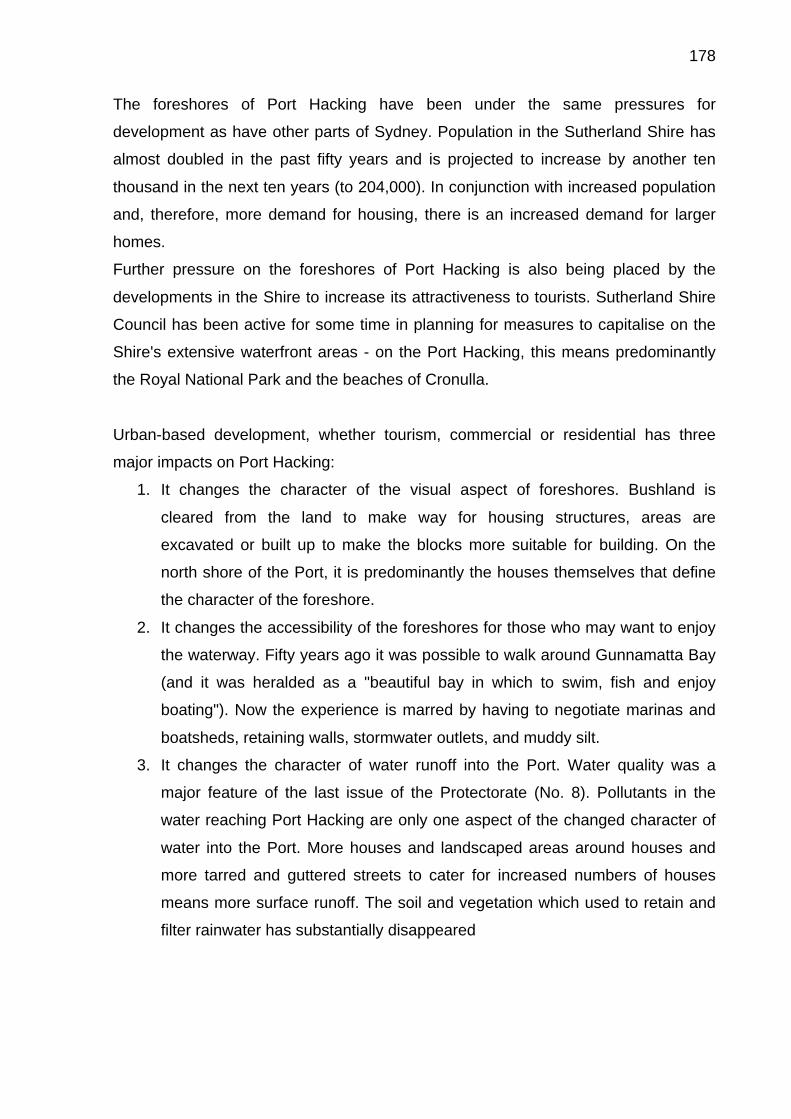
178
The foreshores of Port Hacking have been under the same pressures for
development as have other parts of Sydney. Population in the Sutherland Shire has
almost doubled in the past fifty years and is projected to increase by another ten
thousand in the next ten years (to 204,000). In conjunction with increased population
and, therefore, more demand for housing, there is an increased demand for larger
homes.
Further pressure on the foreshores of Port Hacking is also being placed by the
developments in the Shire to increase its attractiveness to tourists. Sutherland Shire
Council has been active for some time in planning for measures to capitalise on the
Shire's extensive waterfront areas - on the Port Hacking, this means predominantly
the Royal National Park and the beaches of Cronulla.
Urban-based development, whether tourism, commercial or residential has three
major impacts on Port Hacking:
1. It changes the character of the visual aspect of foreshores. Bushland is
cleared from the land to make way for housing structures, areas are
excavated or built up to make the blocks more suitable for building. On the
north shore of the Port, it is predominantly the houses themselves that define
the character of the foreshore.
2. It changes the accessibility of the foreshores for those who may want to enjoy
the waterway. Fifty years ago it was possible to walk around Gunnamatta Bay
(and it was heralded as a "beautiful bay in which to swim, fish and enjoy
boating"). Now the experience is marred by having to negotiate marinas and
boatsheds, retaining walls, stormwater outlets, and muddy silt.
3. It changes the character of water runoff into the Port. Water quality was a
major feature of the last issue of the Protectorate (No. 8). Pollutants in the
water reaching Port Hacking are only one aspect of the changed character of
water into the Port. More houses and landscaped areas around houses and
more tarred and guttered streets to cater for increased numbers of houses
means more surface runoff. The soil and vegetation which used to retain and
filter rainwater has substantially disappeared

179
Over the past ten years, the move to gain control over the negative impacts of urban-
based development has been gaining increased momentum. Significant among those
seeking to halt and prevent negative impacts has been the Sutherland Shire Council.
The Current Issues Council has significantly strengthened its Environmental Services Division. That
Division now provides a major input into resource allocation decisions. The past two
years have seen an integrated approach to water quality management. Studies have
been undertaken to check quality of urban runoff throughout the Shire (a summary of
that study for Port Hacking is included in this issue of the Protectorate). An active
program of community education has also begun with regular news briefs through
local papers and disbursement of information on water quality and sources of
pollution. Many drains and channels in the Shire now have signs or stencils on them
to tell people where and into which waterway fluids and litter entering the drain will
end up. In addition, pollutant traps are being installed in those areas identified as
stormwater sources of pollution. These traps range from gross pollutant traps (such
as that installed at Burraneer Bay Road capable of holding 50 tonnes (wet) of rubbish
and silt) to the one featured in this issue of the Protectorate, the CDS unit, to
construction of wetlands (such as the one in the RNP also featured in this issue).
Other Authorities, such as the Water Board (with its various Environmental Enquiries
and activities reported on in previous issues of the Protectorate, the EPA (including
the HRCMC) and CALM have also been active in working towards an infrastructure
which reduces the adverse impact of the built environment on the waterway itself.
While attention on water quality and infrastructure issues appears to be achieving
positive results, the same cannot be said of the management of the built environment
itself (houses). In 1990, Sutherland Shire Council called for submissions on the
revision of the Foreshore Development Code of Sutherland Shire. PHPS (along with
one other individual!) responded to this call. A summary of that submission is in this
issue. A modified Foreshore Development Code was reissued. But it would appear
that in the process of reviewing the code, Council also decided to amend its Local
Environment Plan with regard to permissive occupancies between the mean high-
water mark and the foreshore building line. Council, in its amendment, insisted that

180
before applications for development or extensions to foreshore homes would be
considered, unapproved structures between the mean high-water mark and the
foreshore building line must first be demolished.
This move by Council spawned the reaction of a number of foreshore owners who
formed themselves into the Sutherland Shire Waterfront Owners Association. This
group has waged a vigorous and active campaign to have this part of the LEP
removed or amended.
Sutherland Shire Council put forward a further draft Development Control Plan for
Waterfront Properties. However, the sticking point of this Control Plan was again the
requirement for the removal of existing illegal structures with many waterfront owners
believing that such a requirement was an infringement on their private property
rights. The effectiveness of the current Code was called into question in June this
year when its requirement for demolition was waived in a specific case (Leader
8/6/95).
“In the battle for individual rights of property owners and developers, the need
for appropriate development of the foreshore appears to be lost”
Development of a meaningful Foreshore Development Code for Port Hacking,
however, cannot be discussed without considering the wider community debate,
discussion, battle, over dual occupancy and medium density. Sutherland Shire
Council has fought a protracted battle with the former State Government over the
right of Council to ensure that development within the Shire preserved the character
of the Shire. In addition, two other groups have been vocal in this debate: The
Sutherland Shire Waterfront and Foreshore Owners Association (SSFOA) and the
Combined Residents/Precincts of Sutherland Shires (CROSS). SSFOA together with
the HIA, the MBA, Cronulla Sutherland Division Real Estate Institute of NSW and the
Practicing Architects of Sutherland Shire have objected that the LEP is unfair
(Leader, 14/3/95). CROSS, also representing residents throughout the Shire, claim
that the campaign waged by SSFOA is short-sighted and misleading.
In all this furore, which still continues though somewhat abated since the election of
the Labor Government with its ban on subdivision of dual occupancies, the need for
appropriate development of the foreshore appears to be lost. Keith Muir in this issue
of the Protectorate, makes a plea for consideration of the overall impact of decisions
and for the need to support those groups of hardworking volunteers who give up their

181
free time and energy to ensure that the silent environment (which we all like to enjoy)
is cared for. Architect A. D. Oosthuizen writes that low impact development which
caters to the needs and aspirations of home builders is possible, and house builders
should insist upon competent design of their homes.
Foreshore Development Code (extract 2)
PHPS Submission In July 1993 the Port Hacking Protection Society responded to a call for submissions
on the Foreshore Development Code by Sutherland Shire Council. That submission
to Council is in part reproduced below and is as relevant today to the debate over an
appropriate foreshore development code as it was two years ago.
Summary of PHPS Submission The existing code, whilst laudable as a starting point towards an integrated approach
to protecting the Port Hacking foreshores from insensitive or environmentally
destructive development, is no longer adequate in the light of the following:
• Increased user pressure upon the Port Hacking waterway, in particular the
desire of some boating users for access beyond that which is available from
the natural state of the Port; increasing tourist visits to Port Hacking and the
Royal National Park; and the development pressures attributable to increased
population and land values in the Shire.
• Water quality issues, including catchment water quality.
• Deterioration in the aesthetic values of the waterfront, with substantial areas of
Port Hacking being downgraded in visual quality as the result of an
accelerating trend towards:
o removal of native vegetation and its replacement by either construction,
paving and concrete, or inappropriate exotic vegetation such as palm
trees of a type not indigenous to this region;
o substantial excavation and geographic "restructuring" of waterfront
sites;
o replacement of rustic, low visual impact constructions with those made
of materials such as brick and glass with a high visual impact from both
land and waterway viewpoints;
182
o the construction of large scale, high rise developments which, whilst not
directly on the foreshores, have a significant impact upon the aesthetic
quality of the Port.
The Port Hacking Protection Society is sensitive to the difficulties faced by Council in
balancing the longer term environmental concerns with the more immediate
pressures of considering particular developments. Imposing additional restrictions will
give rise to conflict, often with individuals whose grievances will be apparently
legitimate. However, it is clear the amenity and environmental values of Port Hacking
are deteriorating under the immense pressures outlined above. The present code
(1993) may have ameliorated some of the worst effects of proposed development,
but it has not been sufficient to counteract the overall cumulative adverse effect of a
host of individual developments. We accept that reversing this negative trend will be
a difficult, if not impossible, task. We believe that unless Council aims at this with its
Foreshore Development Code, the Port Hacking will increasingly suffer downgrading
of its fundamental beauty, recreational and environmental value.
The economic importance of the Port's environment Unlike other areas where economic values and the environment are in conflict, Port
Hacking is an area where its economic value is intrinsically dependent upon the
maintenance of its environmental purity. Tourism, recreation, the access to the Royal
National Park, boating, and water sports (as well as the high value of real estate) all
depend upon preserving Port Hacking as a pristine waterway with high visual and
environmental quality.
The real danger to this economic resource is that by permitting a few to carry out
developments, which provide them with an immediate benefit, the Council and the
community will "destroy the goose that laid the golden egg". In the regime of ad hoc
development approvals, which has existed within Port Hacking for most of its history,
some damage has been done. But the real damage is only starting and it is against
that background that we propose a substantial re-appraisal of the Code.
Proposals for Improvement Our proposals fit into two basic categories:
1. A change to the overall approach of the Code to communicate a set of
preferences, values and aims to landowners and developers which state that

183
the objective of the code is to preserve the Port at its present level of
recreational amenity, visual appeal, and environmental standard and at every
opportunity to reduce the past adverse effects of foreshore development which
have adversely affected the unique and valuable natural characteristics of Port
Hacking, by approving only those new development which are appropriate to
this context. In addition, the code ought be rewritten so that not only the
aesthetic intent of the code is clear but the rules ought be understandable and
readily accessible to all would-be developers, not only those with specialist
training such as lawyers, engineers or architects.
2. Suggestions for improvements in the present (1993) code:
The code ought more positively promote designs with low visual impact
against a natural bush backdrop. The design rules ought take into
consideration: visual scale of construction, use of materials, minimisation of
bulky shapes, avoidance of expanses of reflective materials. The code ought
encompass any development that is visible from the waterway, even when
such construction is physically placed well back from the foreshore.
The code ought take cognisance of the fact that waterborne recreational
activities are often associated with land based facilities. The extent and nature
of on-shore infrastructure development is a partial determinant of the extent
and nature of pressures on the waterway. The Foreshore Development Code
ought address on-shore facilities as a partial means of controlling the growing
pressures upon the Port.
The Port Hacking Foreshore Development Code ought provide an absolute
protection against any further deterioration in the water quality of Port
Hacking, and ought set its goal as being the re-establishment of the pure
water quality of Port Hacking.
184
Extract 17 - Sutherland Shire draft LEP
The following is an extract from a submission by the Sutherland Shire Environment
Centre (SSEC) (authored by Dr Miriam Verbeek) on Sutherland Shire Council’s Draft
Local Environment Plan.
The SSEC was created out of a number of Sutherland Shire community groups that
were spawned in the period described in the text at page 113. This extract deals only
with that part of the submission that deals with foreshore development.
Waterfront development
The dLEP makes significant gains in attempting to address the many issues
confronting development (destruction) of the waterfront. There are, however, a
number of inherent problems in the dLEP proposals.
The major issues confronting the foreshore have not arisen because of a lack
of legal controls to limit development, but a lack of capacity or will to enforce
the controls. Simply providing yet another set of controls is unlikely to
overcome the problems.
The dLEP should clearly state the target that foreshore controls aim to
achieve. These targets should specify the degree of equity of access,
retention of native vegetation and natural foreshore structures, and increase in
scenic amenity of foreshores to be achieved within a particular time period.
Simply moving the building line and rezoning some areas will not achieve such
targets - nor are these clauses likely to achieve the objectives for the
foreshore stated in the dLEP. That is not to say that the initiatives in the dLEP
to impose stricter controls are not welcome. They must, however, be
accompanied by clear penalties and incentives to ensure that the objectives
(clarified in targets) for the foreshore are achieved.

185
We have worked closely with the Port Hacking Protection Society in examining
the requirements of foreshore development and support the recommendations
in its submission. In summary:
Recommendations: Rezoning of the foreshore be accompanied by
statements of time-bound targets and innovative means of achieving
compliance. These innovations should include incentives and penalties for
non-compliance. “
186
Extract 18 - Royal National Park early history
From The Sydney Morning Herald, 20 December, 1882
“Improvements At The National Park
During the past few months many important improvements have been carried out at
the National Park by the Trustees. The Hacking River has now been snagged as far
up as the Peach-trees, a point five miles above the camp, and the work is being
continued up to the limit of navigable water. Where the Wollongong-road turns off
from the Holt-Sutherland estate to the National Park camp, clearing has been
commenced and already a block of 100 acres, in close proximity to the Illawarra
railway line has been treated. It is intended to clear 300 or 400 acres, with a view of
holding the next volunteer encampment there, as there is an abundant supply of
fresh water close at hand, and the road is in good order. About 150 yards below the
junction of Kangaroo Creek with the Hacking River, a dam has been built. It was
completed about a month ago, and though owing to the small sum available for
expenditure upon it, it is comparatively a rough affair, being formed of a puddle clay
bank enclosed by piles, and protected on each side by sloping walls of loose stone, it
has worked with remarkable results. In the first placer the recent heavy floods had
no other effect on it than to wash out some of the clay packing in the boxes – which
is now nearly all replaced; and in the second, it is so thoroughly watertight, that the
water above it, which used to be salt or brackish six miles further up the Hacking
River and throughout the whole length of Kangaroo Creek, has become perfectly
fresh. This was discovered about 10 days ago; but on Monday one of our reporters
visited the dam, to verify the important statement sent in to us. In the lake let, just
above the dam, there were several deep holes; and if salt water were to be found
anywhere, it would be down in these. A punt was procured and poled to each of
these, and one of the Trustees of the park and our reporter lowered into them empty
bottles, weighted and corked. When they touched bottom a string attached to the
cork was pulled, and when the cessation of air-bubbles showed that the vessel was
full, it was hauled up and its contents tasted. In every instance they were found to be
perfectly fresh, and that this result should have been attained in a month cannot but

187
excite wonderment, and suggest the question why some other of our tidal rivers have
not long ago been freshened throughout a great part of their length. The Hacking
River dam has a by wash 12 feet wide, cut in solid rock on the western side, and it is
the intention of the trustees to stock the stream as soon as possible with trout and
salmon, both of which would certainly thrive there. A good road has been made from
the camp to the dam, and ultimately will be continued over it, and away until it joins
the coast road to Wollongong, so that travelers by this route will enjoy a drive highly
pleasant to anyone with an appreciation of lovely and varied scenery. The camp
itself has been improved and beautified by the formation of an orchard and garden on
the eastern flat. Everything thrives there, and grows and fructifies to an extent, which
speaks well for the fertility of the soil. The caretaker Henry Dunn has in charge some
cages of Californian quail, which are remarkably strong and healthy, and which are
soon to be turned loose to shift for themselves. If money for the work is available,
the trustees intend to fence the park and stock it with deer and any other animals,
which will increase its attraction for the general public.
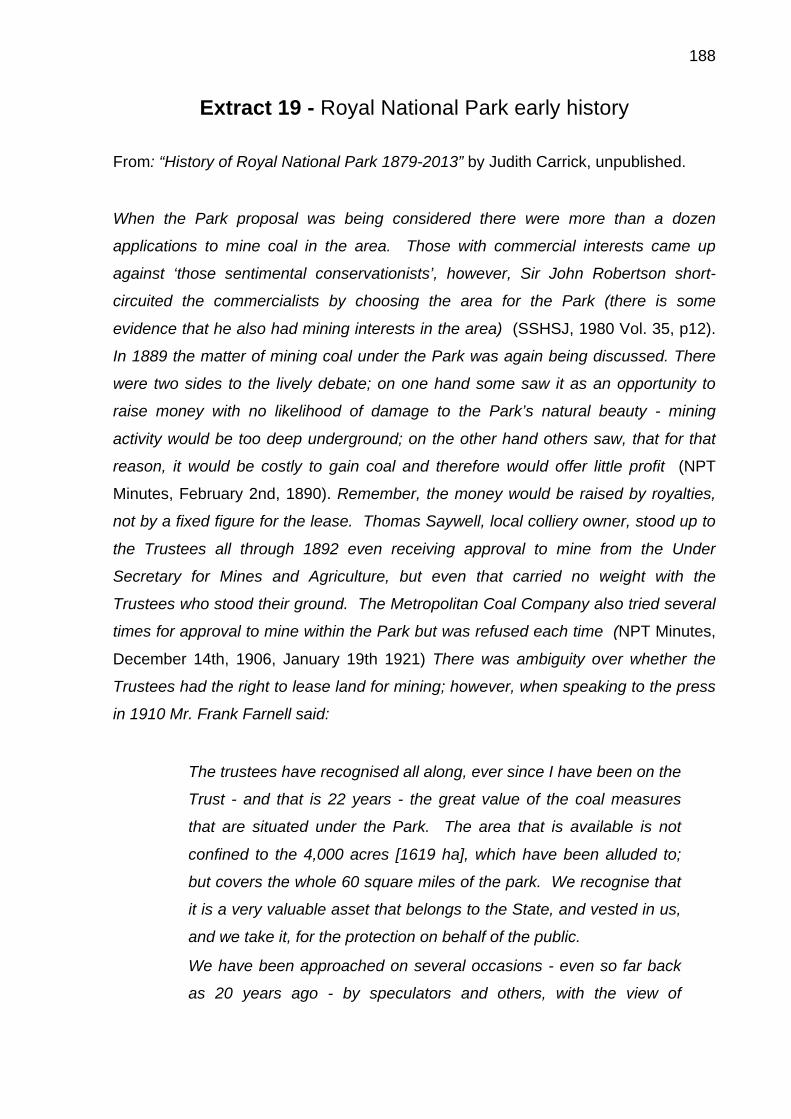
188
Extract 19 - Royal National Park early history
From: “History of Royal National Park 1879-2013” by Judith Carrick, unpublished.
When the Park proposal was being considered there were more than a dozen
applications to mine coal in the area. Those with commercial interests came up
against ‘those sentimental conservationists’, however, Sir John Robertson short-
circuited the commercialists by choosing the area for the Park (there is some
evidence that he also had mining interests in the area) (SSHSJ, 1980 Vol. 35, p12).
In 1889 the matter of mining coal under the Park was again being discussed. There
were two sides to the lively debate; on one hand some saw it as an opportunity to
raise money with no likelihood of damage to the Park’s natural beauty - mining
activity would be too deep underground; on the other hand others saw, that for that
reason, it would be costly to gain coal and therefore would offer little profit (NPT
Minutes, February 2nd, 1890). Remember, the money would be raised by royalties,
not by a fixed figure for the lease. Thomas Saywell, local colliery owner, stood up to
the Trustees all through 1892 even receiving approval to mine from the Under
Secretary for Mines and Agriculture, but even that carried no weight with the
Trustees who stood their ground. The Metropolitan Coal Company also tried several
times for approval to mine within the Park but was refused each time (NPT Minutes,
December 14th, 1906, January 19th 1921) There was ambiguity over whether the
Trustees had the right to lease land for mining; however, when speaking to the press
in 1910 Mr. Frank Farnell said:
The trustees have recognised all along, ever since I have been on the
Trust - and that is 22 years - the great value of the coal measures
that are situated under the Park. The area that is available is not
confined to the 4,000 acres [1619 ha], which have been alluded to;
but covers the whole 60 square miles of the park. We recognise that
it is a very valuable asset that belongs to the State, and vested in us,
and we take it, for the protection on behalf of the public.
We have been approached on several occasions - even so far back
as 20 years ago - by speculators and others, with the view of
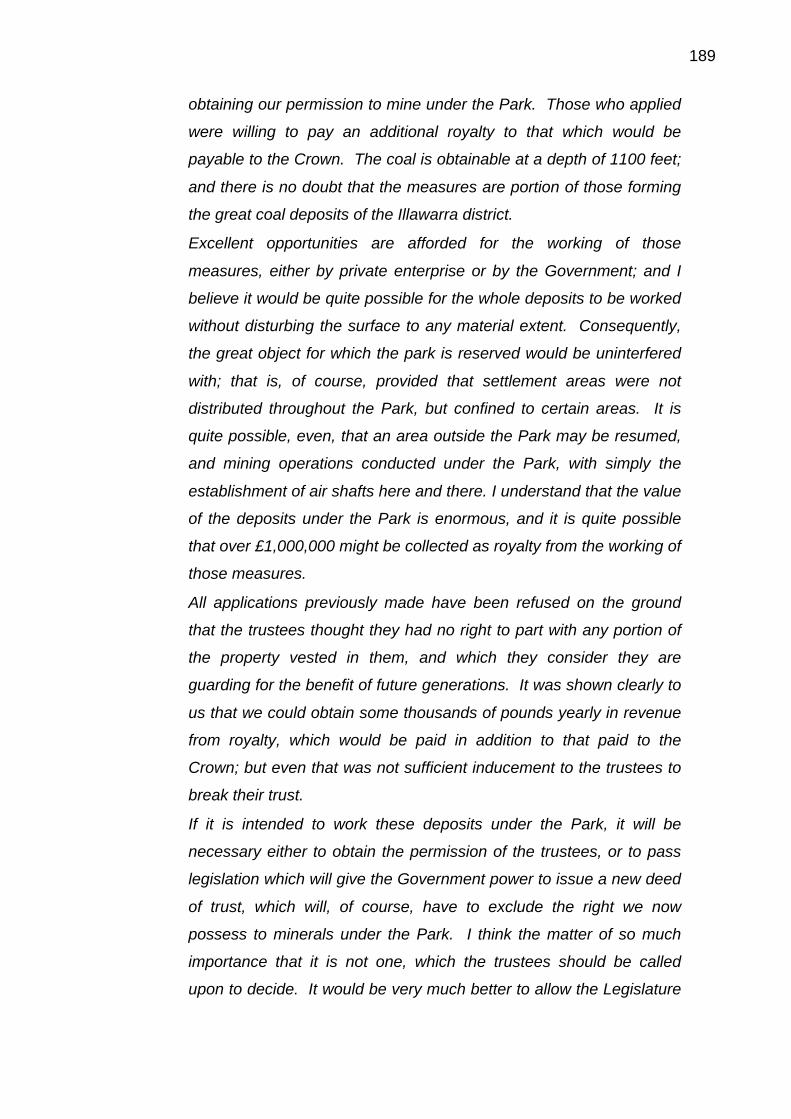
189
obtaining our permission to mine under the Park. Those who applied
were willing to pay an additional royalty to that which would be
payable to the Crown. The coal is obtainable at a depth of 1100 feet;
and there is no doubt that the measures are portion of those forming
the great coal deposits of the Illawarra district.
Excellent opportunities are afforded for the working of those
measures, either by private enterprise or by the Government; and I
believe it would be quite possible for the whole deposits to be worked
without disturbing the surface to any material extent. Consequently,
the great object for which the park is reserved would be uninterfered
with; that is, of course, provided that settlement areas were not
distributed throughout the Park, but confined to certain areas. It is
quite possible, even, that an area outside the Park may be resumed,
and mining operations conducted under the Park, with simply the
establishment of air shafts here and there. I understand that the value
of the deposits under the Park is enormous, and it is quite possible
that over £1,000,000 might be collected as royalty from the working of
those measures.
All applications previously made have been refused on the ground
that the trustees thought they had no right to part with any portion of
the property vested in them, and which they consider they are
guarding for the benefit of future generations. It was shown clearly to
us that we could obtain some thousands of pounds yearly in revenue
from royalty, which would be paid in addition to that paid to the
Crown; but even that was not sufficient inducement to the trustees to
break their trust.
If it is intended to work these deposits under the Park, it will be
necessary either to obtain the permission of the trustees, or to pass
legislation which will give the Government power to issue a new deed
of trust, which will, of course, have to exclude the right we now
possess to minerals under the Park. I think the matter of so much
importance that it is not one, which the trustees should be called
upon to decide. It would be very much better to allow the Legislature
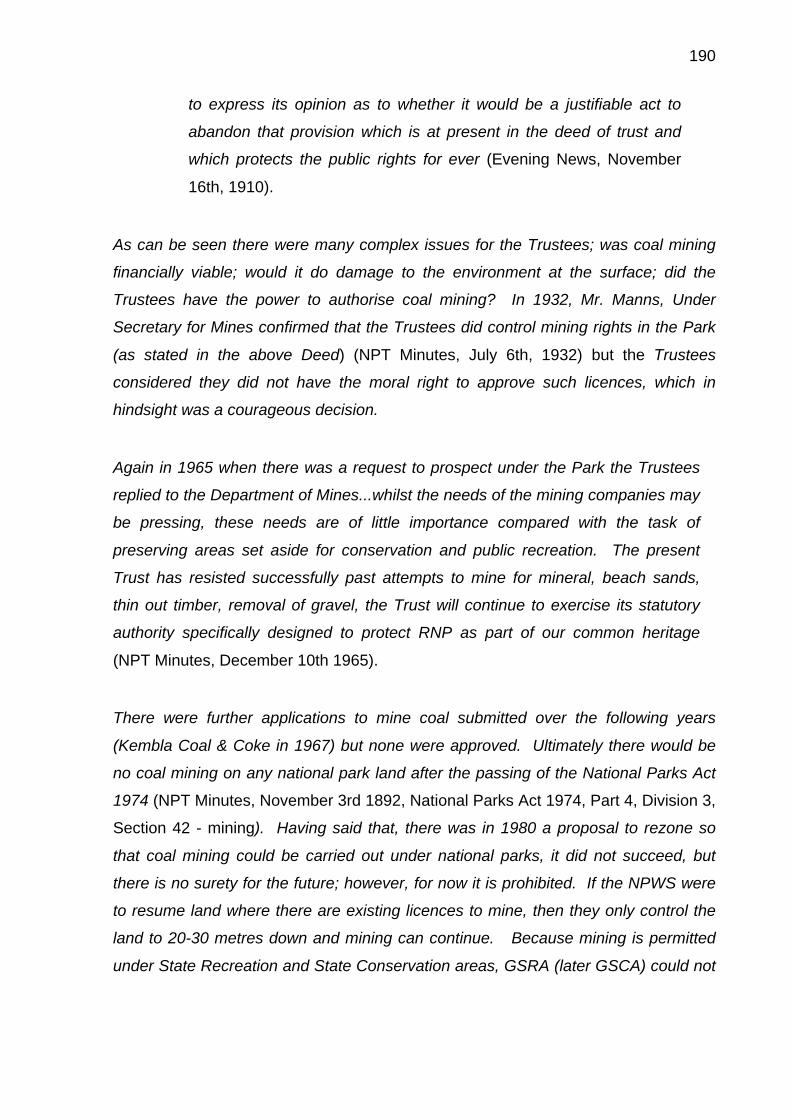
190
to express its opinion as to whether it would be a justifiable act to
abandon that provision which is at present in the deed of trust and
which protects the public rights for ever (Evening News, November
16th, 1910).
As can be seen there were many complex issues for the Trustees; was coal mining
financially viable; would it do damage to the environment at the surface; did the
Trustees have the power to authorise coal mining? In 1932, Mr. Manns, Under
Secretary for Mines confirmed that the Trustees did control mining rights in the Park
(as stated in the above Deed) (NPT Minutes, July 6th, 1932) but the Trustees
considered they did not have the moral right to approve such licences, which in
hindsight was a courageous decision.
Again in 1965 when there was a request to prospect under the Park the Trustees
replied to the Department of Mines...whilst the needs of the mining companies may
be pressing, these needs are of little importance compared with the task of
preserving areas set aside for conservation and public recreation. The present
Trust has resisted successfully past attempts to mine for mineral, beach sands,
thin out timber, removal of gravel, the Trust will continue to exercise its statutory
authority specifically designed to protect RNP as part of our common heritage
(NPT Minutes, December 10th 1965).
There were further applications to mine coal submitted over the following years
(Kembla Coal & Coke in 1967) but none were approved. Ultimately there would be
no coal mining on any national park land after the passing of the National Parks Act
1974 (NPT Minutes, November 3rd 1892, National Parks Act 1974, Part 4, Division 3,
Section 42 - mining). Having said that, there was in 1980 a proposal to rezone so
that coal mining could be carried out under national parks, it did not succeed, but
there is no surety for the future; however, for now it is prohibited. If the NPWS were
to resume land where there are existing licences to mine, then they only control the
land to 20-30 metres down and mining can continue. Because mining is permitted
under State Recreation and State Conservation areas, GSRA (later GSCA) could not

191
be dedicated as national park. That mining is permitted under Kelly’s Falls, recently
added to GSCA, it is a matter of concern to many.
In the 1870s there were also two leases of 640 acres (259 ha) each to a timber cutter
which were quietly withdrawn (Stanley, p4).
At first the Trustees operated all the facilities in the Park but as time went by they
issued licences, for a fee, for the running of the accommodation houses, boatsheds,
steam launch, bus service etc. but these did not raise sufficient income. The
following list shows other means of raising funds.
Many millions of bricks were made from clay taken from deposits within the Park near
Heathcote (Bottle Forest). 20 acres (8 ha) were marked out for Rowe & Smith who
were given licence, in 1885, to make bricks subject to a royalty of 1/6 per 1000 bricks
(NPT Minutes, January 5th, 1885).
The Trustees resisted giving licences for the removal of timber (except for their own
use) from the beginning; approving only a couple of minor permits in the early years.
It was not until 1920 that a five year licence was given to the Metropolitan Coal
Company to fell timber for their use as pit props (see Upper Causeway) (NPT
Minutes, September 22nd, 1920).
Gravel and ironstone were extracted for shire road making purposes. This was only
discontinued in the 1960s and large areas have been affected, e.g. southern end of
Lady Carrington Drive, on the plateau above Audley, near the cliffs at Curracurrang
and near Heathcote. The gravel pits at Lady Carrington Drive and Bundeena Road
were completely sealed off in1974. It is interesting to note that the beautiful
Hawkesbury sandstone landforms have been conserved, this is remarkable
considering the amount of sandstone used for building Sydney in the early years;
although a small area was quarried for use by the railways near Helensburgh (NPT
Minutes September 7th, 1893, March 8th, 1974).
Other activities were collecting of grass tree gum. Grass Tree gum was used for
making floor and stove polishes and exported to Europe for making lacquer.
192
Collecting shell grit for the making of lime and three tenders were given for the
grazing of cattle between Wattamolla and Jibbon (Goldstein, p167-168).
Consequently, the Park presents an altered environment today and past uses
certainly are not in line with present day philosophy of the Park management.

193
Extract 20 - Discovery of coal
From: “History of Royal National Park 1879-2013” by Judith Carrick, unpublished.
In August 1797 Dr. George Bass was sent back to confirm the extent of the coal
discovered. One month later he and the Acting Commissioner Williamson walked
from Sydney to the Cowpastures via the Nepean River and then across to the coast,
descending to the sea south of Wattamolla, where he and Flinders had sought refuge
in 1796. The Reverend W.B. Clarke, the geologist, was sent to the Illawarra in 1839
to inspect and report on the extent of coal. It was not until 1883 that the Cumberland
Coal and Iron Mining Company, under the guidance of Charles Harper began
prospecting for coal at Helensburgh, then Camp Creek. The Metropolitan Coal
Company took over the lease in 1886 (House, A., Helensburgh Colliery History, SMH
August 2nd, 1886). Although at first mining was deemed an advantage, one hundred
years on, it has proved to have environmental impacts.

194
Extract 21 - Reflections of a Dolans Bay resident
The following are the reflections of a Dolans Bay resident, inspired by development
but indicative of lifestyle and values of recent generations around Port Hacking.
Dolans Bay: Then and Now
by Ken Palmer, Dolan's Bay Port Hacking Protectorate, July 1999 (Newsletter of the Port Hacking Protection Society Inc) Dolan's Bay is one of the bays where residents are saying "enough it enough" when
it comes to the loss of natural condition. "Do we want all our bays to become boat
parking areas?" is being asked more often as the number of moorings increases
within the boundaries of the National Park, at Gunyah, Jibbon and in Dolan's Bay. To
the question "Is it acceptable to lose the natural state of the shoreline?" the
community has given a resounding 'no' in all surveys. Dolan's Bay and Yowie Bay
residents have become more direct in pressing to protect the natural beauty of their
areas, having seen the effects of not doing so.
The news is not all bad - residents are having some effect on limiting
195
overdevelopment, and there are some instances (such as one proposed in Dolan's
Bay) where developers have sought to create more natural space and tree cover, by
not developing sites to the maximum. But only with a full recognition of the natural
beauty of our bays, a community willing to stand up to defend this beauty, and
effective management can we be confident that the natural beauty we have the
privilege to enjoy will still be available to our children and grandchildren.
We asked a long-term resident of Dolan's Bay to reflect on the changes that have
taken place. Memories are always prone to error and there is a human tendency to
romanticise the past. I trust that some readers will correct the errors, and that most
will understand the latter tendency.
Our memories are mainly concerned with Dolan's Bay and that area of the southside
of Port Hacking extending westwards from the Deeban Spit to Costen's Point. My
wife's father bought a weekender in Dolan's Bay in 1947 when that area still had
vestiges of its "rural" background, vacant blocks by the score and patches of
blackberries in season. "Oriel" was one of only four boats in the Bay. The present
Dolan's Bay Marina was then Charley Alexander's Boatshed and Charley himself
was the next-door neighbour.
Part of our courtship was to row across to the Deeban Spit. But it was very different
from the today's scraggy spit. We recall it as being two pronged - the eastern prong
(in its scraggy state) - still exists. The western prong - separated from its mate by
Cabbage Tree Creek - stretched over towards Shiprock Point, existed above high
water and was well vegetated. Looking at the present configuration made us doubt
our memories but when we referred to the Second Edition of the "Tourist Map of the
Port Hacking District (undated), it seems to confirm our memories, as does the shape
of the present sand flats in that vicinity. Perhaps the vegetated "island" off Maianbar
is both a remnant and an indicator of the nature of this one grand prong of the
Deeban Spit.
To us, Turriel Point (on the tourist map) was always Shiprock Point. To its west was
the old red corrugated iron boatshed known as Simpson's and which we believed

196
had once been owned by Charley Alexander. Today only remnants of its eastward
sloping slipway can be seen.
Still evident through the 60's and 70's were the remains of the bridge and wharf
extending from Maianbar across Cabbage Tree Creek onto the eastern prong of
Deeban Spit - its actual landing, with bollards, half buried in the sand several metres
"inland" from the water's edge.
Travelling westwards across the flats of the southern shore one encountered, on the
flats between Fisherman's Bay and the main Channel, several deep holes and at
least two small sand islands - delightful playing places at low tide for our young
family.
West of the channel leading into Fisherman's Bay, the shell grit dredge worked. For
how long it had operated I don't know and I can't be sure when it ceased operations.
Certainly the extreme softness and "lack of body" of the sand in those flats were
attributed to its operations. For years afterwards an abandoned punt, presumably
from this finished industry, was a rotting memorial.
On Red Jack's Point were the complete sandstone walls of a building whose history
is unknown to me (Photo Album, I009). In my experience it was always roofless but
its sandstone construction and simple lines were very appealing. Further around the
point was a weekender cottage - very suburban looking and now gone. On Costen's
Point were a number of cottages - almost a village and including a tennis court,
swimming pools, slipways and elaborate landings. The remains of some of these
latter constructions still exist.
What more can I say of this small, beautiful section of the Port that was so central to
our lives and those of our growing family in these years? Compared to today, it was
undoubtedly quieter and cleaner. There were a lot of fish caught and we could scoop
prawns in Dolan's Bay. Perhaps the fish are there today - I don't know. But certainly
the Port is different. Superficially it still looks beautiful and a great playground for an
ever-growing population. It provides superlative views for a growing number of

197
houses. However the signs of a deteriorating environment are evident. Greater run-
off pollution, water often dirty, increasing amounts of rubbish. What knowledge have
we of deterioration of seagrasses and marine life?
Measured against its glories from the comparatively recent past the Port is at risk.
We cannot afford to take its beauties for granted.
The concern about overdevelopment of Dolan's Bay is not only about the former
Convent site. All of the foreshores, and the waterway itself, are under development
pressure. The real question is not whether any single proposal is good or bad, it is
whether the cumulative effects will create the type of place that the people who live
there want.

198
Extract 22 - Tombolo
From “Port Hacking Marine Delta Management Options” by the Public Works
Department, 1986.
A very different alternative would involve the creation of a tombolo, or sand
breakwater, projecting northwards off Cabbage Tree Point (Bundeena) projecting
northwards for some 500 metres. .........The tombolo would be created by
progressively dumping about 400,000 cubic metres of sand, the head of which would
be protected by rock…. approximately 10,000 tonnes of rock would be required....
.sand for the wall would be taken from the channels leading into and across the
mouth of Gunnamatta Bay, from the channel off Burraneer Point, and by the general
deepening of Simpsons Bay. In this way a 50 hectare area of sheltered water
between 3 and 5 metres deep would be created in Simpsons Bay.
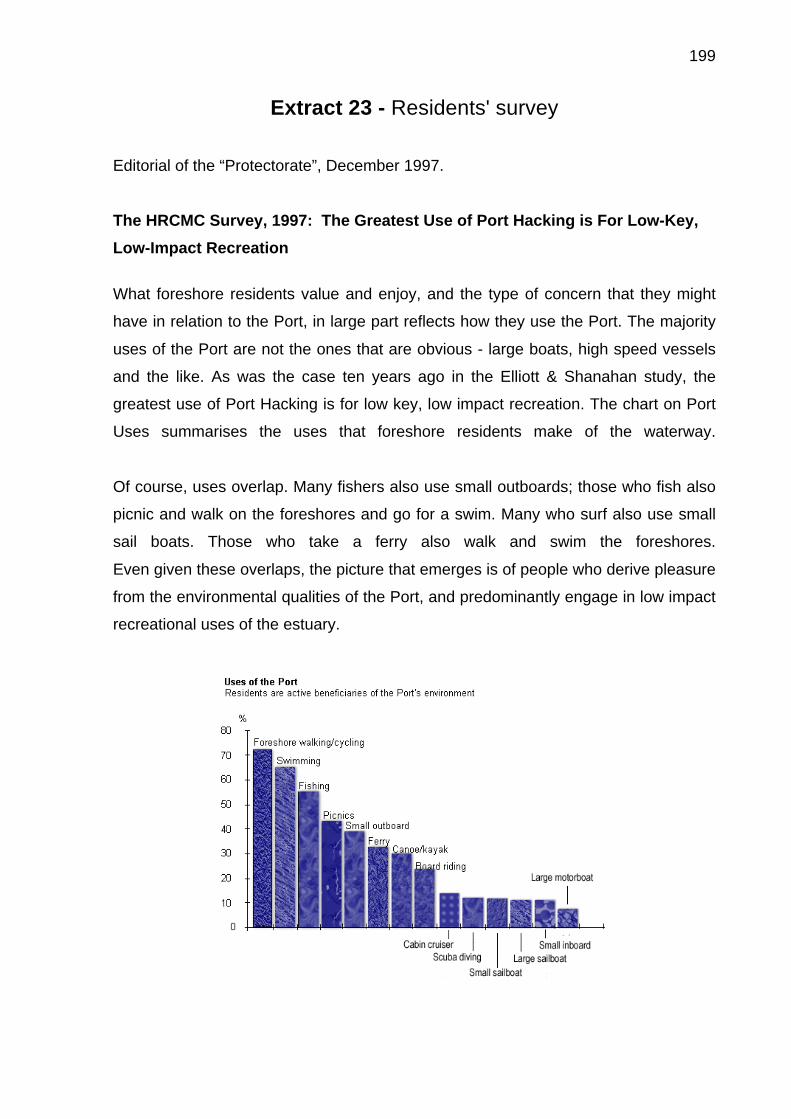
199
Extract 23 - Residents' survey
Editorial of the “Protectorate”, December 1997.
The HRCMC Survey, 1997: The Greatest Use of Port Hacking is For Low-Key, Low-Impact Recreation What foreshore residents value and enjoy, and the type of concern that they might
have in relation to the Port, in large part reflects how they use the Port. The majority
uses of the Port are not the ones that are obvious - large boats, high speed vessels
and the like. As was the case ten years ago in the Elliott & Shanahan study, the
greatest use of Port Hacking is for low key, low impact recreation. The chart on Port
Uses summarises the uses that foreshore residents make of the waterway.
Of course, uses overlap. Many fishers also use small outboards; those who fish also
picnic and walk on the foreshores and go for a swim. Many who surf also use small
sail boats. Those who take a ferry also walk and swim the foreshores.
Even given these overlaps, the picture that emerges is of people who derive pleasure
from the environmental qualities of the Port, and predominantly engage in low impact
recreational uses of the estuary.
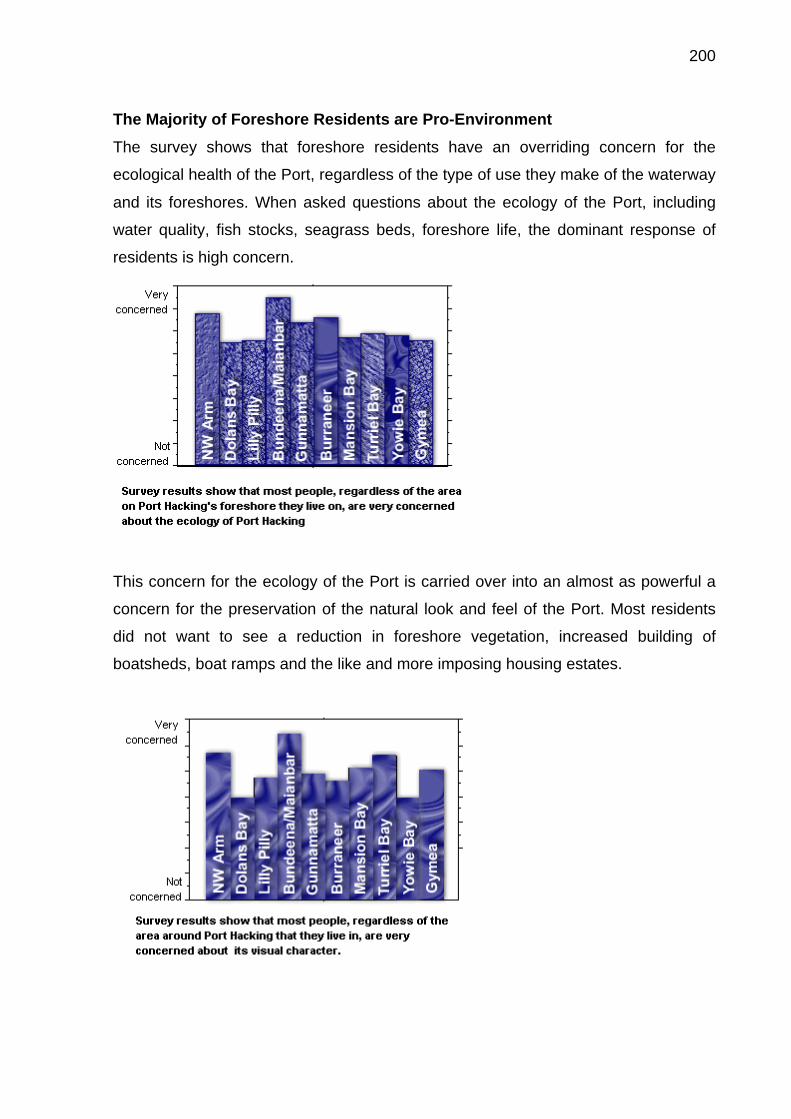
200
The Majority of Foreshore Residents are Pro-Environment The survey shows that foreshore residents have an overriding concern for the
ecological health of the Port, regardless of the type of use they make of the waterway
and its foreshores. When asked questions about the ecology of the Port, including
water quality, fish stocks, seagrass beds, foreshore life, the dominant response of
residents is high concern.
This concern for the ecology of the Port is carried over into an almost as powerful a
concern for the preservation of the natural look and feel of the Port. Most residents
did not want to see a reduction in foreshore vegetation, increased building of
boatsheds, boat ramps and the like and more imposing housing estates.
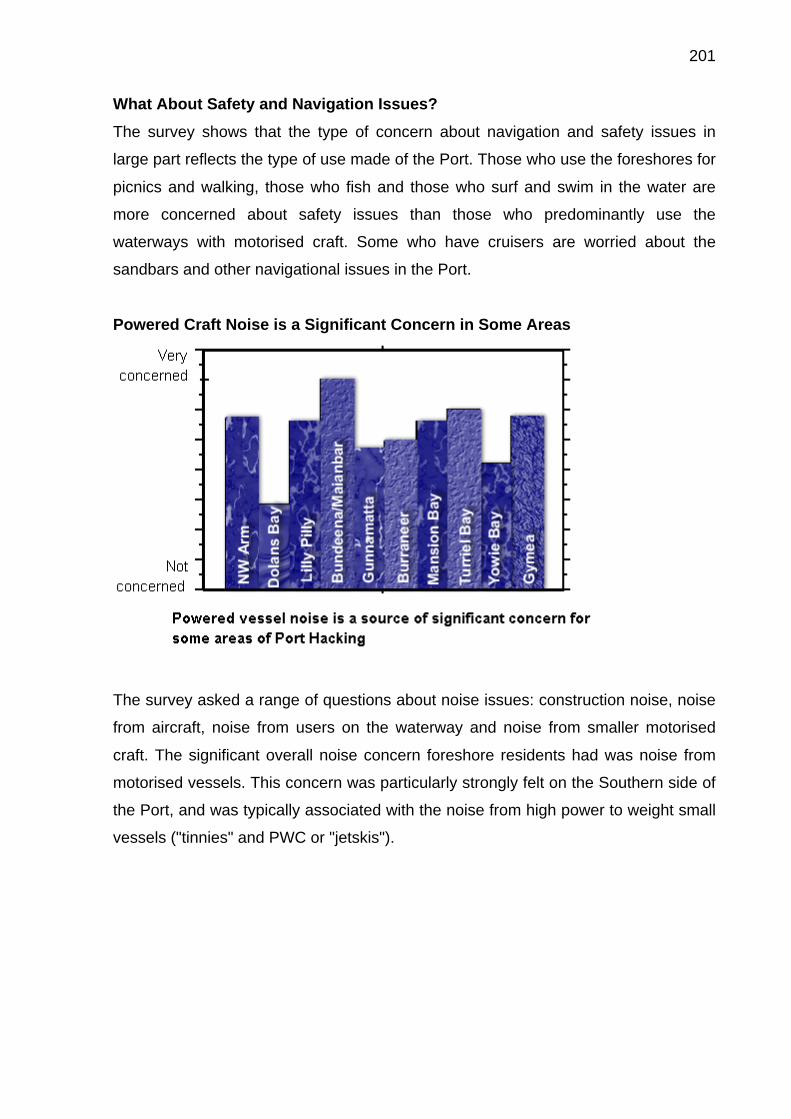
201
What About Safety and Navigation Issues? The survey shows that the type of concern about navigation and safety issues in
large part reflects the type of use made of the Port. Those who use the foreshores for
picnics and walking, those who fish and those who surf and swim in the water are
more concerned about safety issues than those who predominantly use the
waterways with motorised craft. Some who have cruisers are worried about the
sandbars and other navigational issues in the Port.
Powered Craft Noise is a Significant Concern in Some Areas
The survey asked a range of questions about noise issues: construction noise, noise
from aircraft, noise from users on the waterway and noise from smaller motorised
craft. The significant overall noise concern foreshore residents had was noise from
motorised vessels. This concern was particularly strongly felt on the Southern side of
the Port, and was typically associated with the noise from high power to weight small
vessels ("tinnies" and PWC or "jetskis").
202
Extract 24 - Discovery of coal From The Sydney Morning Herald, 1 December 1884
“IMPORTANT DISCOVERY OF COAL AT HEATHCOTE. A discovery of coal which,
if future development bears out the success anticipated from present indications, will
be of very great importance, has lately been made at Heathcote, a distance of 28
miles by railway and 32 miles by road from Sydney. Next July it will be two years
since Messrs, James Fletcher, M.L.A., and John Coghlan took up an area of 18,000
acres of land to prospect for coal and iron. The land is bounded on the Sydney side
by the National Park, and has a frontage of about 9 miles on the Illawarra rail- way
line, this line also passing through an additional dis tance of 3 miles, having the
property on both sides…………….. ……… .On the 20th of November, 1883, a
diamond drill and engine, with all necessary appliances, were transported, under the
superintendence of Mr. Coghlan, to the ground, where boring operations were at
once commenced. The bore was put down a distance of 720 feet 9 inches on the top
of a ridge overlooking a gully through which flows a stream known as Camp Creek,
emptying itself into Port Hacking, and is said to be a constant and abundant supply of
water for mining purposes…................. The bore having passed through a bed of soft
shale the earth caved in, and this impediment, together with the want of
success so far, determined the abandonment of the bore. ……… . Mr. Coghlan
voluntarily offered to put in a second bore, and it may fairly be said that it is in a great
measure owing to the energy and perseverance of this gentleman that the present
successful issue has been reached. The site selected for the second bore was at a
point about 300 feet lower in the strata upon the near bank of the creek, and about a
quarter of a mile distant in an easterly direction from the site of the first bore. It
was also immediately at the side of the railway line; a viaduct, when the line is
completed, spanning the gully. This bore was commenced on (the 19th July last, and
was sunk a depth of 847 feet, at which depth, on the 22nd instant, decided
indications of coal were come upon, and boring operations being continued, a seam
of coal was entered. ………………. Accordingly, on Friday morning a party of visitors
were driven to the company's property. The route was the main road to Tom Ugly's
Point, thence across George's River by punt, and then along the Illawarra-road for a
distance of about 18 miles till a track to the right hand was taken to Camp Creek.

203
………From George's River to Camp Creek the scenery is comparatively
uninteresting, consisting principally of rocky hills, covered with stunted shrub. Near
the river the tints of the spring foliage of the young forest trees, bunches of Christmas
roses, and occasional clumps of golden wattle in full bloom, brightened the
landscape. After passing through miles of country where gumtrees, gnarled and
twisted into strange outlines, coarse grass, and wiry ferns were the chief
characteristics, the road crossed the section of the railway line now being formed.
Several heavy excavations were seen and in the vicinity of Heathcote some
extensive tunnelling works were being carried on. The little clump of sheoaks, known
as Bottle Forest, with a bee farm by the roadside, was passed through, and then the
route lay through rugged sandstone hills. Here and there a railway camp, with its
tents and stores, its abundance of children, dogs, bottles, and debris, was passed
through. … .On either side were scrub-covered hills, with bald naked patches of
sandstone cropping out at intervals, and breaking the dull sage-green hue of the
foliage that clad the twisted branches of the stunted trees struggling upward from
between the rifts and openings of the rocks. The formation of the country was that
which is characteristically known as the Hawkesbury sandstone, and was capped in
places with concretionary iron ore of a poor quality, but which might possibly be
useful to mix with richer ores. Here and there were patches of iron ore five feet in
depth. The formation, in fact, was precisely similar to that of all the Illawarra district to
the south ; that is to say, the Hawkesbury formation overlying coal measures……...
Camp Creek Gully, in which the bore has been put down, may be described
roughly as a wedge-shaped excavation, made by the action of water in the country.
Its steep sides support a large quantity of straight, well, formed, sound timber, chiefly
black-butt, turpentine, and white gum, all of which will be of great value in working
a mine. The gully was, in fact, to the visitors, after the many miles of dull country
they had passed through, quite an oasis ; in its shaded, watered depth being fern
trees and foliage of many delicate hues of green…………………………………..
Previous to Saturday the seam of coal had been bored into a depth of 3 feet, and
shortly after midday it was announced that the bore had been sunk a further
distance of 3 feet 1 inch. It was then determined to lift the rods, and when this had
been done, amid much anticipation as to the result of the bore, the tube was emptied.
It was found that the bore was still in coal, making the thick- ness of the seam so far
6 feet 1 inch. The coal was dull, with occasional streaks of brighter bituminous

204
appearance, It was closely examined, but no sign of a band in the seam could be
detected in the core. So far as the core could be accepted as evidence of its quality,
it was a solid, compact seam. Mr. Wilkinson pronounced it to be "good, firm,
bituminous coal, resembling that of Coal Cliff and Bulli in every respect. It is without
bands so far as I have seen it. It would be good coal for household and steam
purposes, it being more a steam coal than a gas coal ; that is to say, it will be
superior for the one rather than for the other. "It will also be good for smelting
purposes."…………….. The company intend to have the shaft sunk and the
necessary works for the raising of coal completed by the time the railway is open to
Sydney. The shaft will be put down on the slope of the side of the gully, a distance of
about 75 feet above the present bore, so that a depth of about 922 feet will have to
be sunk to strike the seam. The site of the shaft will be on a level with the railway
line, to which sidings will be cut into the slope to junction with the line, at a point
between a tunnel some distance back and the viaduct over the creek. The distance
of the site of the shaft from the railway line is only about four chains, so that the cost
of construction will be comparatively trifling. Also, by the construction of 2½ miles of
railway line the company will be able to take the coal to a point at Botany Bay, where
it can be shipped ; or a less distance of line will enable them to ship it at Port
Hacking. At the present time the nearest coal-mine to Sydney is at Coal Cliff, which is
eight miles beyond the point where the recent discovery has been made. With these
advantages, and abundance of wood and water, the prospects of the company
certainly look very hopeful; and, should the bright anticipations raised be fully
realised, the advantage to Sydney and the addition to the wealth of our colony
generally will be far from inconsiderable……..Mr. Coghlan arrived in Sydney,
and stated that the bore had been sunk a further distance of 3 feet, and was still in
coal. This so far gives a depth of 9 feet 1 inch in coal, and still more to go through.
He brought with him a piece of the core, which showed a marked improvement in
the quality of the coal, it being much brighter in appearance and more bituminous in
nature. ………… . this apparently splendid seam of coal is undoubtedly it matter of
exceeding importance to the community, and will cause no little interest in mining and
commercial circles, it having been by many regarded as improbable that any
extensive coal deposit would be struck this side of Coal Cliff at a depth which would
render it possible to successfully work it.”

205
Extract 25 - Construction of the southern railway From Adams, 1986?. Bayley, 1989. Singleton, 1970. Wollongong City Council, on-line Library Service, “Suburb Profiles” 2013 ‘The announcement of the building of the railway line in 1881 was welcomed by the
people of the Illawarra as the demand for a safe transport route between Sydney and
the Illawarra had been constant. Other routes were by the sea in small craft where
the travellers were subject to sea sickness on unpredictable seas and weather
conditions. Or by the overland route via, Bulli pass which was so steep, fit and
healthy passengers were expected to walk the mountain pass then travel to
Campbelltown by coach, to complete the journey by rail. A reliable rail link would also
help transport coal to Sydney (Adams, 1986?). The line between Waterfall and
Clifton took the longest time and was expensive to build because of the construction
of seven tunnels and the rugged terrain of the area. This section of work delayed the
opening of the line to Illawarra by two years and used over 18 million bricks for the
construction. During the construction of the largest tunnel through Bald Hill, at the
southern end of Otford (1500 metres), teams had to work in continuous shifts to
complete it. (Adams, 1986?, Singleton, 1970).The first Steam Locomotive travelled
from Sydney carrying first and second class passengers for the official opening
celebrations in North Kiama on the 3rd October 1888………………………………..
……….However, travel through Otford tunnel became known as being very
unpleasant during the long steep climb back to Otford. There were no lights in the
carriages so the passengers had to sit in the dark and the thick smoke and soot
poured in through gaps and under the doors. Passengers in the third class section
had no windows or shelter against the choking soot as the train crawled at a snails
pace up through the hill. The enginemen suffered the most as they had to travel the
length of the tunnel crouching on the floor to avoid the heavy soot and smoke.
(Adams, 1986?. Bayley, 1989. Singleton, 1970).The tunnel's notoriety increased on a
busy day in October 1890 when a 12 car train stalled in the tunnel. Eventually the
engineman had to reverse the train to Stanwell Park and divide the train into halves
to be taken through the tunnel. The fear of the tunnel grew following reports of
accidents and engines' stalling more frequently. Finally the decision was made in
June 1917 to move the line and construct a new tunnel with an easier incline of 1:80

206
compared with the original tunnels' 1:40. This was completed in 1920 and is the
same line that is used to this day. (Adams, 1986?. Bayley, 1989. Singleton, 1970).”
207
Extract 26 - Helensburgh
From Wollongong City Council, on-line Library Service, “Suburb Profiles” 2013
Helensburgh began as a group of tents pitched in the heart of wild bush country in
the 1880's. Today it is a thriving centre with a growing population and a mixture of old
pioneer weatherboard homes and modern new homes built on the hillsides.
Unique flora and fauna found in this area include Cabbage tree palms, Gymea lily,
Yellow-top ash eucalyptus and Bush pea. Kelly's Falls has two waterfalls and an
abundance of rainforest flora which once covered this entire area.
Some of the native birds and animals found in the Helensburgh area are:
Sulphur-crested cockatoos; spotted owls; crimson rosella; kookaburra and the superb
lyrebird; long nose bandicoot; brush tail possums; swamp wallabies; bush rats and
feather tailed gliders.
“Helensburgh's closeness to the Royal National Park and the Garrawarra State
Recreation, both environmentally protected areas, means that any further
development must be carefully planned to ensure the survival of local native flora,
fauna and native wildlife corridors.
Future development of the Helensburgh area has been an important issue since the
1970's. In 1985 the State Government requested Wollongong City Council undertake
a Local Environment Study to investigate urban expansion and its effect on the local
environment. Also in 1985 there was a draft plan for the development of 2,200 lots in
the Camp Creek and Gills Creek area and a 40 hectare site for commercial
development on the town's outskirts. Council rejected the development plan after five
years of debating because it could not guarantee that the Royal National Park and
the Hacking river catchment area would not be polluted.(Illawarra Mercury 20 April,
1991).
Some of the problems associated with further development of the Helensburgh area
are:
Water suppy from the Woronora Dam
Waste disposal
Bushfire hazards
Introduction of exotic plants and domestic animals and the spread of diseases that
may affect native animals and plants

208
Contamination of Hacking River which flows through the National Park due to
sewerage waste, urban runoff, erosion from construction sites and also the scenic
value of certain areas around Helensburgh.
Spread of feral animals into National Park because of its proximity. (Helensburgh
Local Environmental Study Progress Report, 1986; The Helensburgh Plan: Draft,
1989; Future Development of Helensburgh, 1984) “

209
Extract 27 – Sea level rise
From (www.sutherlandshire.nsw.gov.au/Environment/Waterways/Sea_Level)
“Sea Level Rise Risk Assessment Sea Level Rise in NSW
Sea level rise is caused by a number of factors including rising temperatures,
changes to prevailing winds and weather systems, ocean currents, melting ice caps
and changes to the level of the land. Changes in sea levels can be both short term
and long term. Climatic events such as El Nino and La Ninia can influence sea levels
over periods of several years while changes resulting from Climate Change might
result in long term changes to sea levels. In its annual State of the Climate Report for
2012 the Bureau of Meteorology observed that in 2011 the global sea level was
210mm above the 1880 level.
In 2009 the State Government released sea level rise planning benchmarks based
on the assumption that climate change is, and will continue to influence the rate of
sea level rise. These benchmarks were based on the prediction that sea levels will
rise by 40cm by 2050 and 90cm by 2100. In September 2012 the State Government
announced that Councils were to be given the flexibility to select their own sea level
rise planning benchmarks taking into account regional factors. These changes have
been made as part of the Coastal Reforms announced by the State Government.
The NSW State Government asked the Chief Scientists to prepare a report into the
status of sea level rise and in particular the accuracy of State Government sea level
rise benchmarks. This report was released in April 2012. The report concluded that
the science underlying the estimates is adequate, but also acknowledged that there
is some uncertainty in the rate of change.
In due course Council will consider the changes announced by the State
Government, and this will include a review of information provided on section 149
Planning Certificates. In the interim Council will continue to follow the guidance
provided by the State Government……………. GHD Sea Level Rise study In 2008 Sutherland Shire Council engaged professional services company GHD Pty
210
Ltd to investigate the specific risks associated with sea level rise and flooding in the
Sutherland Shire region. Council requested that GHD produce a Risk Assessment
Report and associated mapping that will:
· Examine public and private assets at risk due to climate change induced sea level
rise.
· Evaluate and prioritise assets at risk by applying the Australia and New Zealand
AS/NZS 4360 Risk Management Standard.
· Determine the likely impacts of sea level rise on existing and planned public and
private assets.
· Determine the likely impacts of sea level rise, including adaptive capacity,
economic, environmental and social costs.
· Identify knowledge and information gaps relating to climate change.
· Identify any opportunities, such as integrated water cycle management, which may
result due to the impacts of climate change.
These assessments has been carried out using the latest scientific evidence from the
Intergovernmental Panel on Climate Change (IPCC), the Australian Government, the
NSW Government and Australia's leading climate science institutes. The assessment
also considers how regional factors in the Sutherland Shire influence the impact of
Sea Level Rise.”

211
Extract 28 - Boats during World War II
From The Sydney Morning Herald, 4 May 1942
BOAT-OWNERS AROUSED Protest to Canberra Concerned at the condition of small boats yielded up for security reasons, and at the
fact that valuable moorings cannot be serviced for lack of boats, hundreds of owners
of the Cronulla and Port Hacking district met yesterday at Cronulla and formed the
Port Hacking Boat Owners' Association.
It is expected that similar organisations will be formed at all other coastal centres.
First official act of the new body will be to send the following telegram to-day to the
Prime Minister. Mr Curtin.—"Large meeting Port Hacking boat owners Cronulla
yesterday expressed utter disgust at the manner in which boats are being taken from
people without giving a certificate of ownership and the manner in which boats are
dumped on the river bank at National Park and neglected. Request you give matter
immediate attention to prevent further damage to valuable private property. Also
draw your attention to absence of insurance against damage. Urgent."
It was stated at the meeting that, because no boats were available to inspect mooring
ropes and replace these when necessary, moorings which cost anything from £ 5 to
£50. were likely to become a total loss. Replacement of chains was difficult and
expensive.
Councillor D. P. Burrell was elected president of the association, with Councillor R. N.
Dallimore and Mr. B. J. Hasson as vice-presidents, and Miss Willis as secretary.

212
Extract 29 - Wentworth's Cottage, Leg of Mutton Bay
From The Sydney Morning Herald, 15 March 1941
LEG OF MUTTON BAY. Wentworth's Cottage. By M. L. Waddington.
How many are there, I wonder, who have been to Leg of Mutton Bay? How many
have even heard of it?
You will find it in the National Park, about four miles from Audley. It is, in fact, part of
the winding Port Hacking River.
The delightful country surrounding this unfamiliar bay is typical Australian bushland,
with an abundance of gum trees, wattle, bottle-brush, grass trees, boronia, flannel
flowers, and many other specimens of Australian flora, which, flowering in the spring,
combine to produce a riotous display of colour.
The boulder-strewn hills rising steeply from the water are thickly covered with ferns,
native shrubs, and cultivated plants "gone wild," while Moreton Bay fig trees fringe
the several excellent picnic sites, which command magnificent views of the blue-
green water, and the flotillas of pleasure and passenger launches and yachts which
frequent the water at week-ends.
And there is something, too, of historical interest at Leg of Mutton Bay, for one of the
picnic spots, connected to a stone wharf by steps hewn from solid stone, bears the
cornerstone of a cottage once occupied by William Charles Wentworth, statesman-
explorer. He owned land which took in a greater part or the territory surrounding the
bay. This was later resumed by the National Park Trust and incorporated in the
reserve.

213
Extract 30 - Cronulla beach nourishment
From “Beach Sand Nourishment Scoping Study” prepared for Sydney Coastal
Councils Group Inc. by AECOM Australia, 18 February 2010
3.2.5 Bate Bay
Large storms in 1974 caused extensive damage to the beaches and dune system of
Bate Bay, 20km south east of Sydney. Following the storm damage, comprehensive
coastal process studies and monitoring programmes were implemented from which a
management plan was developed. The emphasis of the management plan was to
develop a ‘soft’ management strategy aimed at establishing a well vegetated fore-
dune throughout as much of the embayment as possible. Four significant
nourishment projects have been undertaken on the Bate Bay beaches.
From 1977 to 1978, 120,000m3 of sand obtained from the dunes behind Wanda was
placed on Cronulla Beach.
The placed sand quickly moved offshore and was redistributed along the active
beach profile to the north (PBP 2006). At the same time, dune stabilisation
commenced by vegetating the dunes of Wanda, North Cronulla and what would
become Greenhills. Dune stabilisation works continued until 1989. In addition, a
340m long ‘Seabee’ seawall was constructed in 1985/86 at South Cronulla to protect
threatened assets.
Between 1998 and 1999 approximately 60,000m3 of material dredged during
navigation channel maintenance within Port Hacking was placed in the near-shore
zone between North Cronulla and Elouera Beaches by a trailer suction hopper
dredge. The material was placed in water depths of 4-8m around 200m offshore
(PBP 2006). An additional 10,000m3 of sand was placed on the subaerial profile at
Cronulla Beach.
Between 2002 and 2003, 90,000m3 of sand from maintenance dredging in Port
Hacking was placed in the nearshorzone between South Cronulla and Elouera. The
material was placed over a nominated area of 170m by700m approximately 200m
offshore. Finally, in 2007, 140,000m3 of sand from maintenance dredging in Port

214
Hacking was placed in the near-shore zone between South Cronulla and Elouera.
The Bate Bay foreshore is now stable with some 5km of vegetated fore-dunes having
been successfully established. In the hind-dune dune region, transgressive dunes
stretching some 1.7km along the foreshores have also been stabilised. Gordon
(1992) indicated that despite the occurrence of several major storms the net
shoreline and fore-dune movement since the implementation of the management
plan has shown an accretion trend.

216
PHOTO ALBUM (in the CD-Rom)
This document has given an understanding of the physical and human evolution of
Port Hacking and its catchment. It is accompanied by a separate Photo Album
containing photographs that have been selected to give the reader a visual
understanding of the physical setting and give pictorial insight to many of the specific
points raised in the document. It is felt also that the aesthetics of the Hacking system
should be presented for their own sake, as these are the qualities that not only attract
people to live and recreate there, but also cause many to strive to protect the intrinsic
values and the health and well-being of the area.
The photographs are presented in the following groupings that largely represent the
sequence in which they are presented in the narrative. Each group is introduced with
a brief narrative, here reproduced; where possible or appropriate, a location map is
included.
A - Cabbage Tree Basin………………………………. p. 217
B – Marine/Tidal delta and Deeban Spit…………….. p. 218
C - Hacking River above Audley …………………..... p. 222
D - Audley precinct ……………………………….…… p. 224
E - Hacking River below Audley and its delta…..….. p. 225
F - South West Arm…………………………………… p. 227
G - Urban Catchment…………………………………. p. 228
H - Fluvial deltas at the heads of bays …………….. p. 230
I - Remnants of early European activity ……………. p. 232
J – Bundeena Creek ICOLL ………………………….. p. 234
K – Shiprock Aquatic Reserve ……………………….. p. 235
L – Postcards…………………………………………… p. 236
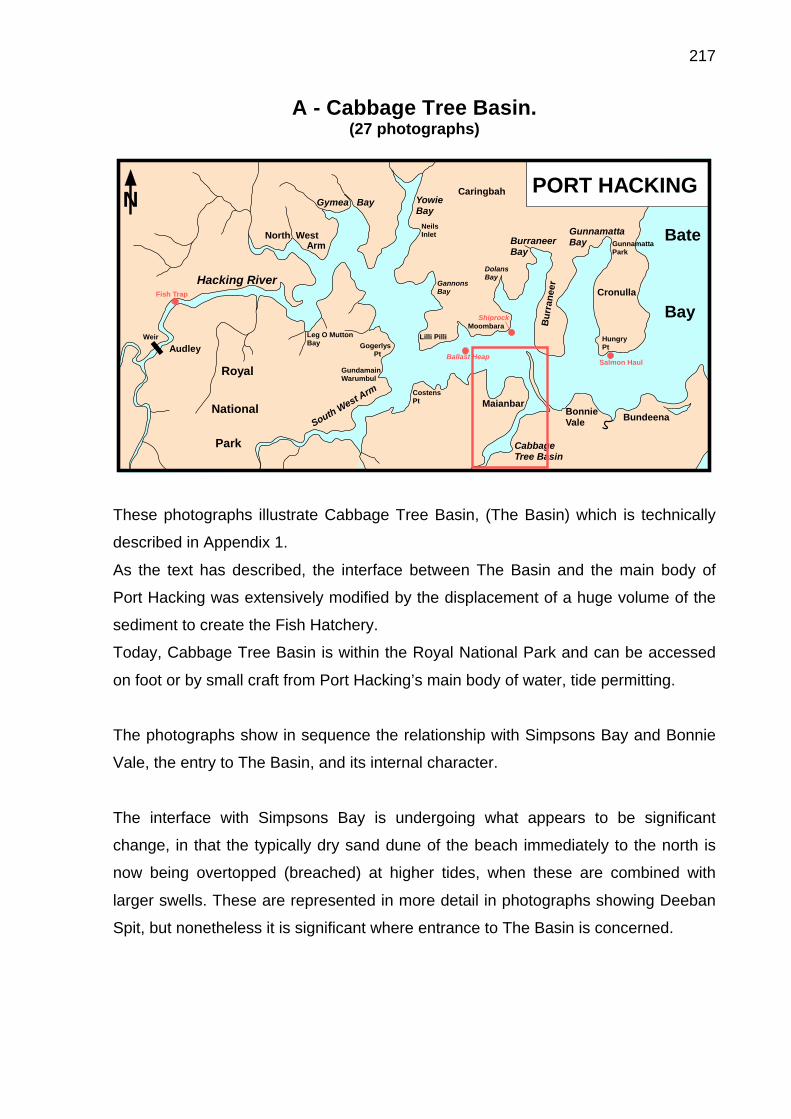
217
A - Cabbage Tree Basin. (27 photographs)
These photographs illustrate Cabbage Tree Basin, (The Basin) which is technically
described in Appendix 1.
As the text has described, the interface between The Basin and the main body of
Port Hacking was extensively modified by the displacement of a huge volume of the
sediment to create the Fish Hatchery.
Today, Cabbage Tree Basin is within the Royal National Park and can be accessed
on foot or by small craft from Port Hacking’s main body of water, tide permitting.
The photographs show in sequence the relationship with Simpsons Bay and Bonnie
Vale, the entry to The Basin, and its internal character.
The interface with Simpsons Bay is undergoing what appears to be significant
change, in that the typically dry sand dune of the beach immediately to the north is
now being overtopped (breached) at higher tides, when these are combined with
larger swells. These are represented in more detail in photographs showing Deeban
Spit, but nonetheless it is significant where entrance to The Basin is concerned.
Hacking River
North WestArm
BundeenaBonnieVale
CabbageTree Basin
Maianbar
CostensPt
SouthWest Arm
Royal
National
Park
Audley
Weir
Cronulla
GunnamattaBayBurraneer
Bay
DolansBay
HungryPt
GannonsBay
Bu
rran
eer
CaringbahYowieBay
Gymea Bay
Lilli Pilli
GogerlysPt
N
Bate
Bay
PORT HACKING
Leg O MuttonBay
GundamainWarumbul
GunnamattaPark
Moombara
Shiprock
Ballast Heap
Fish Trap
NeilsInlet
Salmon Haul

218
B – The Marine/Tidal delta and Deeban Spit. (56 photographs)
The text has described the marine delta’s origin, its nature and its location within Port
Hacking - it is the body of marine sediment (together with live and remnant shell and
other organisms) that occupies the frontal and central part of the estuary with its
long-term history of general upstream migration. It especially includes the Middle
Ground Shoal, notwithstanding that body’s history associated with the construction of
the fish hatchery at Bonnie Vale.
Photographs of the Middle Ground Shoal show its physical context, but give some
idea the wave energy (albeit in calm conditions). These photographs also help to
explain why the sediment of the Shoal is mobile as described. The elevated
photographs have been taken from Rutherford Reserve on the Burraneer Headland.
These photographs are also helpful in introducing the frontal face of the Deeban Spit.
As the text of the document explains, 'Deeban Spit' refers geographically to the sand
flats and vegetated sandbar emanating from Bonnie Vale and north of the eastern
part of the village of Maianbar and not just the arc of beach and dune sweeping
around Simpsons Bay from Bonnie Vale towards Turriell Point. This separated sand
spit was once an integral part of Deeban Spit, it being the latter's eastern beach
extremity on Simpsons Bay.
Hacking River
North WestArm
BundeenaBonnieVale
CabbageTree Basin
Maianbar
CostensPt
SouthWest Arm
Royal
National
Park
Audley
Weir
Cronulla
GunnamattaBayBurraneer
Bay
DolansBay
HungryPt
GannonsBay
Bu
rran
eer
CaringbahYowieBay
Gymea Bay
Lilli Pilli
GogerlysPt
N
Bate
Bay
PORT HACKING
Leg O MuttonBay
GundamainWarumbul
GunnamattaPark
Moombara
Shiprock
Ballast Heap
Fish Trap
NeilsInlet
Salmon Haul

219
Deeban Spit represents the greatest single mass of the tidally-exposed marine delta.
On exposure at low tide, its mass can be seen from the beach arcing from Bonnie
Vale to the north towards Burraneer Bay, to as far westward almost to Costens Point.
The eastern mass is in large part sand only, and it is only west from the Ballast Heap
can a significant area of the remnant seagrasses be seen. The aerial photographs
show this clearly.
The photographs in this Group depict the contemporary morphology of the entire
Deeban Spit and some activities that take place there. They show the Spit’s
significant expanse. However, the tidal range makes this large body a highly
ephemeral physical feature of Port Hacking and, as the photographs show clearly,
the only portion clearly visible at high tide is the arc of beach at its east. At low tide,
the great exposed mass reveals itself as significant in another respect- that is the
plethora of birdlife that proliferates at the seagrasses for the feed which is revealed.
This is unique in the main body of the estuary.
Several small mangrove islands stand in conspicuous isolation on the flats off north
of Red Jacks and are somewhat of an oddity in their environment (B030 – B032).
The trees have remained in this configuration for decades, although have had to
survive their secondary role as jetski slalom markers.
As mentioned in the main text, the dunes on the arc of beach were artificially
constructed and were “topped up” with spoil from dredging for navigation.
Several of the photographs show the overtopping of the beach in many places with
the waves spilling to the channel behind. The pictures also show the likely re-opening
of a shorter and direct channel into Cabbage Tree Basin at Bonnie Vale. The more
recent photos show the remaining “dry” dune dwindling in height and length reduced
by overtopping, and new breached sites. These recent breaches and overtopping
occurred after a series of 2 metre tides combined with moderate swell.
These recent events are significant in their own right because of the cause and effect
involved. The cause of the new effect of higher tides may, as speculation, be in part
due to the reduction in the mass of the Middle Ground Shoal and therefore reducing
the energy absorption by that sand lode. It cannot be ignored that the energy now
extant on the seaward face of the Spit appears more significant since the last round
220
of navigation dredging in the nearby main channels.
More significantly, the current observations and photographic recording are helping
to give some indication of the likely behavior and consequences when associated
with the predicted sea level rise, as what it is now a spring or king tides will at some
time in the near future be normal high tide. The energy input to be superimposed on
the tide is the moderate to large swell, and at the more extreme end, storm events. It
may well be that the morphology of the entire area, perhaps including the Middle
Ground Shoal, is now undergoing a significant transformation.
The Ballast Heap, a significant historical and physically obvious feature occurs in this
tidal mass. The photos give a clear idea of the mass and orientation of this feature.
Aerial Photographs. The sequence of aerial photographs in the latter part of this
series shows the consequences over years of the commercial-scale shell grit
extraction. If one uses fixed reference points with the sequences, the areas dredged
and the depositions of the time from 1955 to 1970 can be clearly seen and
importantly, so too can the retreat of the seagrasses that continued beyond 1970. To
assist in interpretation, three fixed points of reference are Constables and Yennabilli
Points, and the Ballast Heap. The photographs also show clearly the absence of any
significant seagrass regeneration since dredging ceased.
In addition to the seagrasses, other points of interest in the photographs when seen
in sequence are:
-The shell grit dredge at work (see main text);
-The changing morphology of the total visible spit, especially when compared with
the photographs in the text;
-The variations in tidal supply stream to Cabbage Tree Basin;
-The tidal drainage of the main sand body;
-Changes over time to the exposed vegetation, including that at Constables Point at
Maianbar;
-A structure north of Fishermans Bay and east of Yennabilli which first appears in the
aerial photograph of 1955, and does not appear intact after 1961 (see close-ups).
There is a view that the structure is a disused barge previously used as a base

221
for shell grit dredging;
-The parallel lines within a wider shaded area in 1970, which in later photographs
correspond with a navigation channel to Fishermans Bay. This is a channel
initially dredged by the shell grit operator to access Fishermans Bay.
-The disappearance of the bridges/boardwalks emanating from Maianbar to the then
exposed sand islets, including the isolation and subsequent decay of the ferry
wharf at the Simpsons Bay face of the Spit.
-The aerial photographs have also given a lead to investigate a structure in the
vicinity south of the Ballast Heap near a shell grit dredge site. In the 1961 aerial
photo there is a barge alongside the shell grit dredge in the vicinity. In the 1970
photograph a structure of the precise dimensions remains in the location. By the
1978 photograph it appears merely as a dark outline in the sand. Investigation of
the site has revealed the remnants of the barge.

222
C - Hacking River Above Audley (44 photographs)
This group of photographs covers the principal catchment area of The Hacking River
that rises not far above Kellys Falls at Stanwell Tops. They reflect the mixed nature
of the upper Hacking River and some of its principal tributaries around Helensburgh.
They describe, among other things, the ephemeral nature of the Hacking River from
its source to the weir at Audley. The pictures illustrate the river in small sections from
Kellys Falls and Otford in a period some weeks after rain. The crossings at Otford
(floodway/causeway and a little further downstream, the weir and causeway) and the
weir at the Upper Crossing below Waterfall all flood after substantial rain. This
caused the construction at the Upper Crossing of the Joan Holland Bridge as an all-
weather crossing servicing villages to the north and south. Nonetheless, the water of
Marley Beach
Wattamolla
Garie
Werrong
Bulgo
Stanwell Park
Catchment boundary
Royal National Park
Sutherland Shire boundary
N
Railway
Freeway (F6)
0 4km
Curracurrang
Curracurrong
Era
Sutherland
Engadine
Heathcote
Waterfall
Helensburgh
Caringbah
Miranda
Cronulla
BundeenaMaianbar
Audley
1
1
1
1
1
1
1
12
3
4
5
5
6
7
8
9 10
11
12
13 14
15
16
1718
191
Lilyvale
Otford
Garawarra State ConservationArea
Kellys Falls
Otford weir
Upper causeway
1
1 Hacking River2 Kellys Ck3 Gills Ck4 Camp Gully5 Wilsons Ck6 Cawley Ck7 Waterfall Ck8 Kangaroo Ck9 Cridland Brook
10 Uloola Brook11 Goondera Brook12 Heathcote Brook13 Engadine Ck14 Platypus Gully15 Temptation Ck16 Saville Ck17 South West Arm Ck18 Saddle Gully19 Cabbage Tree Ck
223
the Hacking River is shallow and the pictures help to give some understanding of
how, in dry periods, the river can be reduced to a series of puddles, with miniscule
flow. For all of the adverse impacts over time, the pictures show the beauty that adds
significantly to the Royal National Park and attracts passive and active
recreationalists the year round. When combined with the photographs of the Audley
precinct give an illustration of the reason for the popularity of Lady Carrington Drive,
which runs beside the river from Audley to the upper gates shown in this series of
photographs.
Special comment is needed on the red colouration in the photographs at and above
Kellys Falls. The colour of the rock under the water and the stalactites at the falls are
due to deposition of iron compounds mainly goethite FeO(OH). They can be formed
in various natural environments, from freshwater to marine systems, from aquifers to
thermal hot springs and are very common in mining-impacted streams and rivers.
Goethite, for its red-brown colour, is known since prehistoric times as a pigment. It is
precipitated directly from oxygenated iron-saturated solutions, or it is formed by iron-
oxidising bacteria as a result of a metabolic activity.
Siderite (FeCO3) is the dominant iron mineral in the Hawkesbury Sandstone,
consisting of average between 5 to 7% of the rock mass and, in this occurrence, may
be the primary source of iron.
The observation of local iron was reported in the ‘Sydney Morning Herald’ account.
The result is a spectacular effect at the falls above the main drop. Traces of colour
can be found in some of the photos of the river at Otford (Extract 24).
Note that laterite, formed in similar way, has been extracted in the headwaters region
for use, among other things, in decorative gardens.
“………The formation of the country was that which is characteristically known as the
Hawkesbury sandstone, and was capped in places with concretionary iron ore of a
poor quality, but which might possibly be useful to mix with richer ores. Here and
there were patches of iron ore five feet in depth. The formation, in fact, was precisely
similar to that of all the Illawarra district to the south;” (Extract 24)

224
D – AUDLEY Precinct (63 photographs)
This group of photographs is aimed at giving some understanding of the evolution of
the intentions of the founders, as described in the text and the Extracts, to the
modern era.
The photographs display some of the many beautiful and important natural features
and, importantly, the scope and use of the artificially created “pleasure grounds”.
The pictures show the fabric of human intervention, the old stonework, the exotic
vegetation, the visitor facilities and passive and active recreation. They also show
that the beautiful natural features remain as the intrisic substance to this precinct.
Hacking River
North WestArm
BundeenaBonnieVale
CabbageTree Basin
Maianbar
CostensPt
SouthWest Arm
Royal
National
Park
Audley
Weir
Cronulla
GunnamattaBayBurraneer
Bay
DolansBay
HungryPt
GannonsBay
Bu
rran
eer
CaringbahYowieBay
Gymea Bay
Lilli Pilli
GogerlysPt
N
Bate
Bay
PORT HACKING
Leg O MuttonBay
GundamainWarumbul
GunnamattaPark
Moombara
Shiprock
Ballast Heap
Fish Trap
NeilsInlet
Salmon Haul
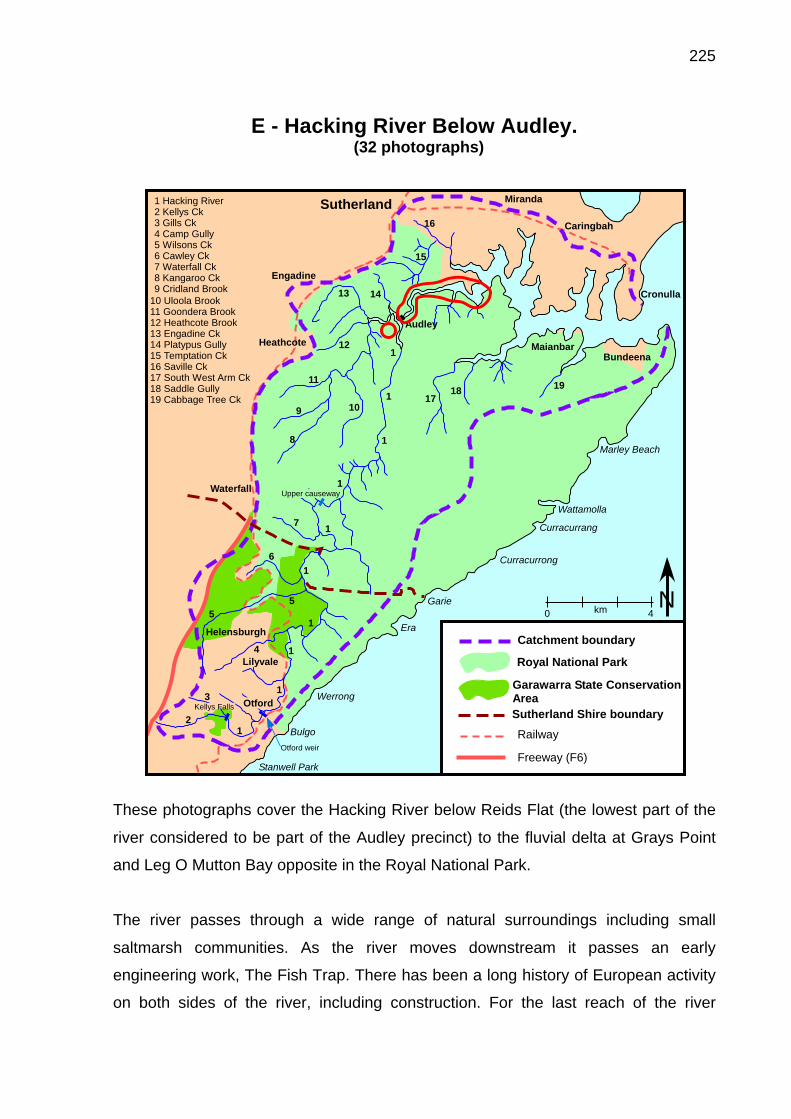
225
E - Hacking River Below Audley.
(32 photographs)
These photographs cover the Hacking River below Reids Flat (the lowest part of the
river considered to be part of the Audley precinct) to the fluvial delta at Grays Point
and Leg O Mutton Bay opposite in the Royal National Park.
The river passes through a wide range of natural surroundings including small
saltmarsh communities. As the river moves downstream it passes an early
engineering work, The Fish Trap. There has been a long history of European activity
on both sides of the river, including construction. For the last reach of the river
Marley Beach
Wattamolla
Garie
Werrong
Bulgo
Stanwell Park
Catchment boundary
Royal National Park
Sutherland Shire boundary
N
Railway
Freeway (F6)
0 4km
Curracurrang
Curracurrong
Era
Sutherland
Engadine
Heathcote
Waterfall
Helensburgh
Caringbah
Miranda
Cronulla
BundeenaMaianbar
Audley
1
1
1
1
1
1
1
12
3
4
5
5
6
7
8
9 10
11
12
13 14
15
16
1718
191
Lilyvale
Otford
Garawarra State ConservationArea
Kellys Falls
Otford weir
Upper causeway
1
1 Hacking River2 Kellys Ck3 Gills Ck4 Camp Gully5 Wilsons Ck6 Cawley Ck7 Waterfall Ck8 Kangaroo Ck9 Cridland Brook
10 Uloola Brook11 Goondera Brook12 Heathcote Brook13 Engadine Ck14 Platypus Gully15 Temptation Ck16 Saville Ck17 South West Arm Ck18 Saddle Gully19 Cabbage Tree Ck
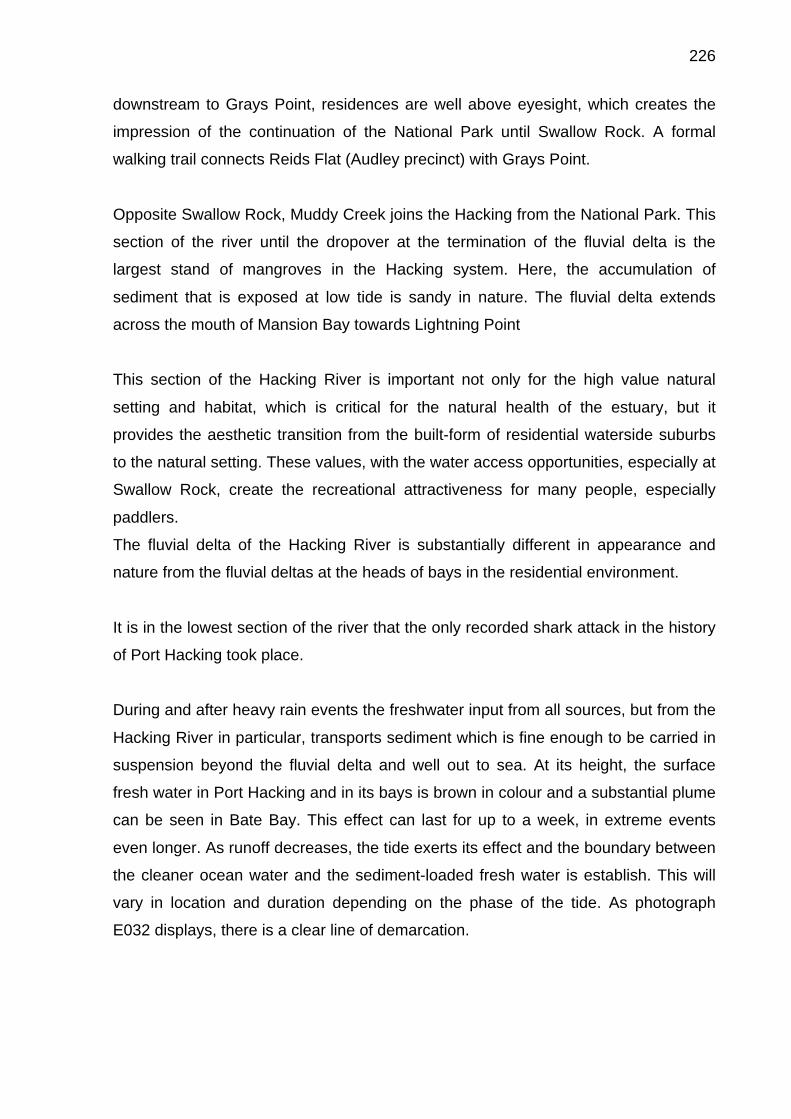
226
downstream to Grays Point, residences are well above eyesight, which creates the
impression of the continuation of the National Park until Swallow Rock. A formal
walking trail connects Reids Flat (Audley precinct) with Grays Point.
Opposite Swallow Rock, Muddy Creek joins the Hacking from the National Park. This
section of the river until the dropover at the termination of the fluvial delta is the
largest stand of mangroves in the Hacking system. Here, the accumulation of
sediment that is exposed at low tide is sandy in nature. The fluvial delta extends
across the mouth of Mansion Bay towards Lightning Point
This section of the Hacking River is important not only for the high value natural
setting and habitat, which is critical for the natural health of the estuary, but it
provides the aesthetic transition from the built-form of residential waterside suburbs
to the natural setting. These values, with the water access opportunities, especially at
Swallow Rock, create the recreational attractiveness for many people, especially
paddlers.
The fluvial delta of the Hacking River is substantially different in appearance and
nature from the fluvial deltas at the heads of bays in the residential environment.
It is in the lowest section of the river that the only recorded shark attack in the history
of Port Hacking took place.
During and after heavy rain events the freshwater input from all sources, but from the
Hacking River in particular, transports sediment which is fine enough to be carried in
suspension beyond the fluvial delta and well out to sea. At its height, the surface
fresh water in Port Hacking and in its bays is brown in colour and a substantial plume
can be seen in Bate Bay. This effect can last for up to a week, in extreme events
even longer. As runoff decreases, the tide exerts its effect and the boundary between
the cleaner ocean water and the sediment-loaded fresh water is establish. This will
vary in location and duration depending on the phase of the tide. As photograph
E032 displays, there is a clear line of demarcation.

227
F - South West Arm
(30 photographs)
South West Arm is a unique system in the framework of Port Hacking. Its catchment
is totally within the Royal National Park and it terminates in the tidal estuary, again
within the National Park, with its own substantial fluvial delta.
These photographs help to describe the landscape, the natural values and the
beauty of the system. They illustrate also the contrast between high and low tide, the
evidence in the exposed fluvial sands of abundant intertidal fauna, and the variations
in the estuarine flora. The navigable section of South West Arm is a popular boating
and canoeing site and can fluctuate between deserted tranquility and boat-massing
at holiday times.
Marley Beach
Wattamolla
Garie
Werrong
Bulgo
Stanwell Park
Catchment boundary
Royal National Park
Sutherland Shire boundary
N
Railway
Freeway (F6)
0 4km
Curracurrang
Curracurrong
Era
Sutherland
Engadine
Heathcote
Waterfall
Helensburgh
Caringbah
Miranda
Cronulla
BundeenaMaianbar
Audley
1
1
1
1
1
1
1
12
3
4
5
5
6
7
8
9 10
11
12
13 14
15
16
1718
191
Lilyvale
Otford
Garawarra State ConservationArea
Kellys Falls
Otford weir
Upper causeway
1
1 Hacking River2 Kellys Ck3 Gills Ck4 Camp Gully5 Wilsons Ck6 Cawley Ck7 Waterfall Ck8 Kangaroo Ck9 Cridland Brook
10 Uloola Brook11 Goondera Brook12 Heathcote Brook13 Engadine Ck14 Platypus Gully15 Temptation Ck16 Saville Ck17 South West Arm Ck18 Saddle Gully19 Cabbage Tree Ck

228
G - The Urban Catchment (61 photographs)
It is superfluous to illustrate the vast area of urban landscape that makes up the
surface area of the catchment. Instead, the photographs illustrate the watershed in
several places, and the various means by which water that falls in the Sutherland
Shire’s Port Hacking urban catchment makes its way to the tidal estuary. The urban
catchment is predominantly hard surface resulting in greater runoff volumes per
hectare than that of bushland. The photographs demonstrate the contrast between
remnant “natural” waterways, and engineered conduits, and illustrate some of the
devices by which terrestrial debris is screened from the waterways.
Marley Beach
Wattamolla
Garie
Werrong
Bulgo
Stanwell Park
Catchment boundary
Royal National Park
Sutherland Shire boundary
N
Railway
Freeway (F6)
0 4km
Curracurrang
Curracurrong
Era
Sutherland
Engadine
Heathcote
Waterfall
Helensburgh
Caringbah
Miranda
Cronulla
BundeenaMaianbar
Audley
1
1
1
1
1
1
1
12
3
4
5
5
6
7
8
9 10
11
12
13 14
15
16
1718
191
Lilyvale
Otford
Garawarra State ConservationArea
Kellys Falls
Otford weir
Upper causeway
1
1 Hacking River2 Kellys Ck3 Gills Ck4 Camp Gully5 Wilsons Ck6 Cawley Ck7 Waterfall Ck8 Kangaroo Ck9 Cridland Brook
10 Uloola Brook11 Goondera Brook12 Heathcote Brook13 Engadine Ck14 Platypus Gully15 Temptation Ck16 Saville Ck17 South West Arm Ck18 Saddle Gully19 Cabbage Tree Ck
229
As mentioned in the main text, the urban catchment is highly varied, with terrain
becoming higher towards the west, with longer and steeper watercourses and there
is greater accommodation of natural settings for the watercourses. The joining of
Savilles Creek with Dents Creek results in a substantial lower watercourse feeding to
its delta in North West Arm. Savilles Creek is substantial in its own right, being fed by
Temptation Creek out of the north-western extremity of the Royal National Park and
joining Savilles at the National Park boundary at Kirrawee. The contrasts between
these systems and those further east are stark. In particular, the photographs show
the Ewey and Kareena Creek urban catchment developments at Miranda
and Caringbah. Unique in the passage of the Shire’s fresh watercourses to the
estuary is Kareena Creek that passes through the highly valued and visited E G
Waterhouse Camellia Gardens.
The photos also illustrate various technologies as part of the water quality
management regime, and the way in which these appear in their urban settings.
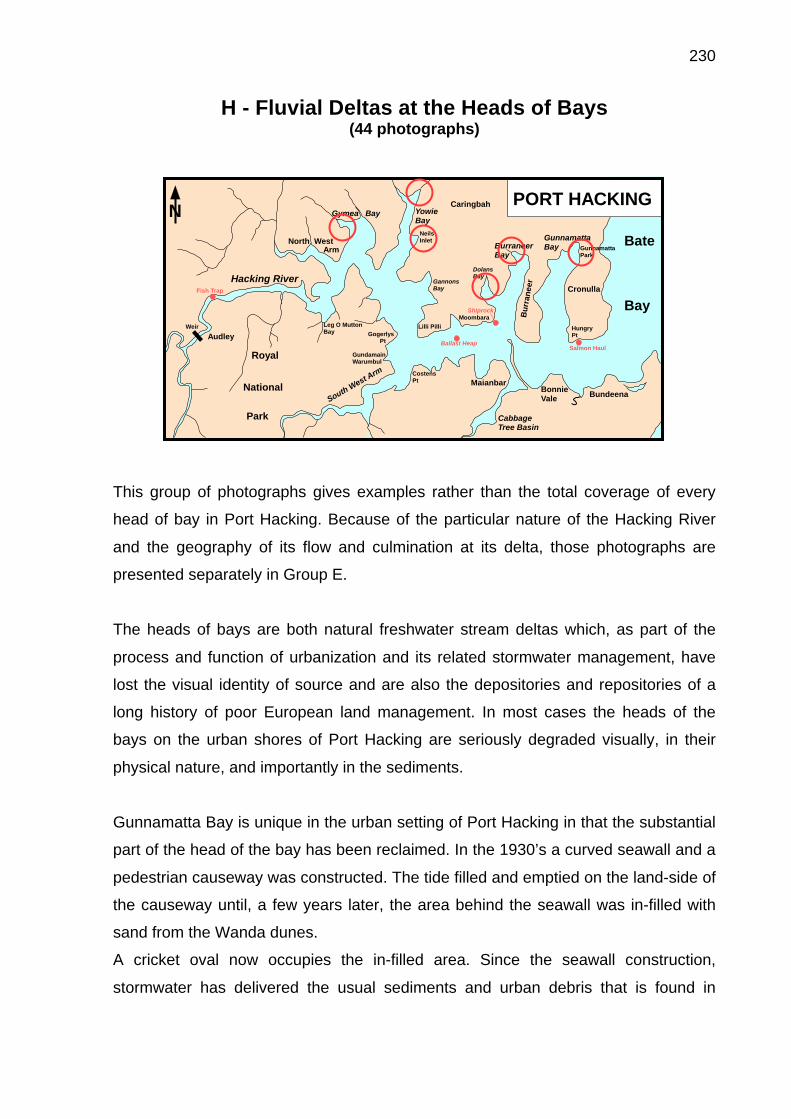
230
H - Fluvial Deltas at the Heads of Bays (44 photographs)
This group of photographs gives examples rather than the total coverage of every
head of bay in Port Hacking. Because of the particular nature of the Hacking River
and the geography of its flow and culmination at its delta, those photographs are
presented separately in Group E.
The heads of bays are both natural freshwater stream deltas which, as part of the
process and function of urbanization and its related stormwater management, have
lost the visual identity of source and are also the depositories and repositories of a
long history of poor European land management. In most cases the heads of the
bays on the urban shores of Port Hacking are seriously degraded visually, in their
physical nature, and importantly in the sediments.
Gunnamatta Bay is unique in the urban setting of Port Hacking in that the substantial
part of the head of the bay has been reclaimed. In the 1930’s a curved seawall and a
pedestrian causeway was constructed. The tide filled and emptied on the land-side of
the causeway until, a few years later, the area behind the seawall was in-filled with
sand from the Wanda dunes.
A cricket oval now occupies the in-filled area. Since the seawall construction,
stormwater has delivered the usual sediments and urban debris that is found in
Hacking River
North WestArm
BundeenaBonnieVale
CabbageTree Basin
Maianbar
CostensPt
SouthWest Arm
Royal
National
Park
Audley
Weir
Cronulla
GunnamattaBayBurraneer
Bay
DolansBay
HungryPt
GannonsBay
Bu
rran
eer
CaringbahYowieBay
Gymea Bay
Lilli Pilli
GogerlysPt
N
Bate
Bay
PORT HACKING
Leg O MuttonBay
GundamainWarumbul
GunnamattaPark
Moombara
Shiprock
Ballast Heap
Fish Trap
NeilsInlet
Salmon Haul

231
almost all heads of bays. However, in the case of Gunnamatta Bay, the photographs
show modern gross pollutant stormwater management infrastructure.
As well as stormwater depositing waterborne urban sediments and debris, some of
the photos show signs of dumping.
Yowie Bay is exampled at its head rather than at Ewey Creek because of the setting
of the (Kareena Creek and Matson Crescent) deltas with the E G Waterhouse
Camellia Gardens and Kareena Park.
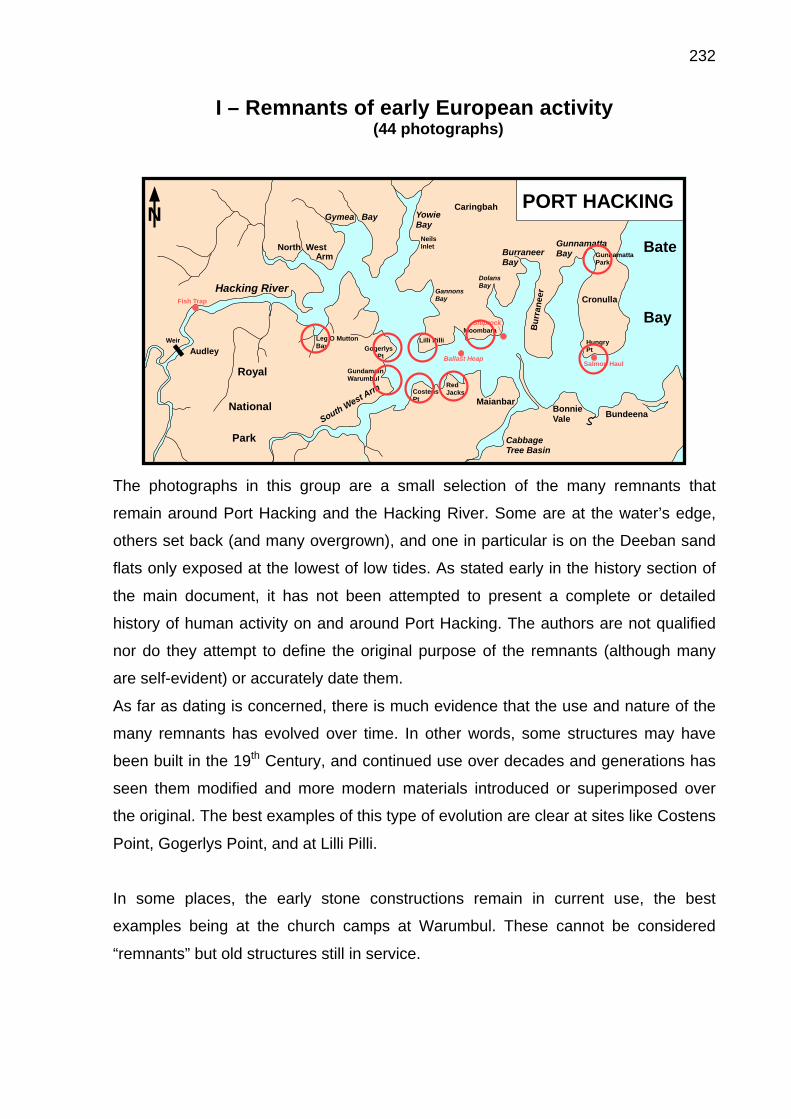
232
I – Remnants of early European activity (44 photographs)
The photographs in this group are a small selection of the many remnants that
remain around Port Hacking and the Hacking River. Some are at the water’s edge,
others set back (and many overgrown), and one in particular is on the Deeban sand
flats only exposed at the lowest of low tides. As stated early in the history section of
the main document, it has not been attempted to present a complete or detailed
history of human activity on and around Port Hacking. The authors are not qualified
nor do they attempt to define the original purpose of the remnants (although many
are self-evident) or accurately date them.
As far as dating is concerned, there is much evidence that the use and nature of the
many remnants has evolved over time. In other words, some structures may have
been built in the 19th Century, and continued use over decades and generations has
seen them modified and more modern materials introduced or superimposed over
the original. The best examples of this type of evolution are clear at sites like Costens
Point, Gogerlys Point, and at Lilli Pilli.
In some places, the early stone constructions remain in current use, the best
examples being at the church camps at Warumbul. These cannot be considered
“remnants” but old structures still in service.
Hacking River
North WestArm
BundeenaBonnieVale
CabbageTree Basin
Maianbar
CostensPt
SouthWest Arm
Royal
National
Park
Audley
Weir
Cronulla
GunnamattaBayBurraneer
Bay
DolansBay
HungryPt
GannonsBay
Bu
rran
eer
CaringbahYowieBay
Gymea Bay
Lilli Pilli
GogerlysPt
N
Bate
Bay
PORT HACKING
Leg O MuttonBay
GundamainWarumbul
GunnamattaPark
Moombara
Shiprock
Ballast Heap
Fish Trap
NeilsInlet
Salmon Haul
RedJacks

233
Some indication of the scope of European activity in what is now National Park can
be drawn from the scope of these remnants around Port Hacking’s southern
foreshores. Moreover, much use can be made of mid-20th Century aerial
photographs to determine the scope of activity and the use to which the original
structures were attached. In the case of the remnants at Red Jacks and Costens,
there has been an historical progression from Costens grant at Red Jacks in 1858 of
25 acres (10Ha) that he sold and subsequently granted a further 40 acres (16Ha) at
what is now Costens Point.
A photograph of the historic house “Moombara” is included in this album for several
reasons: first it helps to give meaning to the contemporary setting of the remnants
associated with current usage, and, second, it gives some indication of the landscape
and waterway at the time of sparse settlement dominated by a grand house and
waterway leisure lifestyle. The photograph is from the Allen Family photographic
albums held by the NSW State Library.
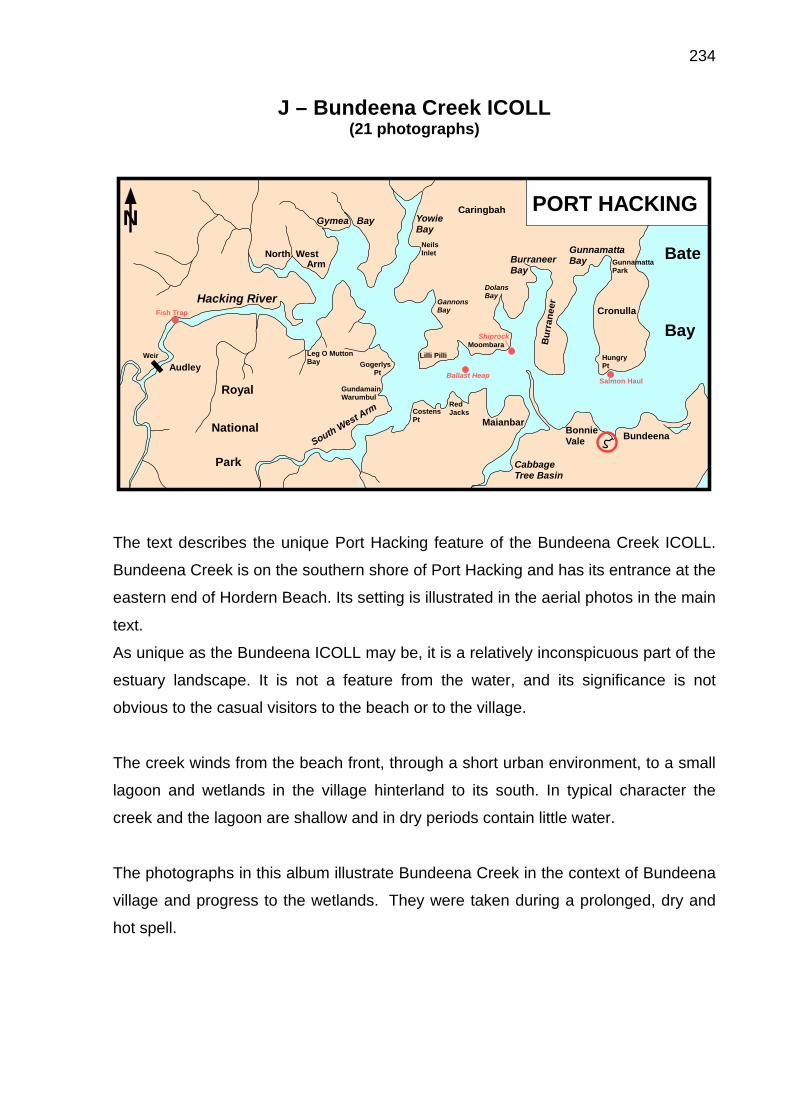
234
J – Bundeena Creek ICOLL (21 photographs)
The text describes the unique Port Hacking feature of the Bundeena Creek ICOLL.
Bundeena Creek is on the southern shore of Port Hacking and has its entrance at the
eastern end of Hordern Beach. Its setting is illustrated in the aerial photos in the main
text. As unique as the Bundeena ICOLL may be, it is a relatively inconspicuous part of the
estuary landscape. It is not a feature from the water, and its significance is not
obvious to the casual visitors to the beach or to the village.
The creek winds from the beach front, through a short urban environment, to a small
lagoon and wetlands in the village hinterland to its south. In typical character the
creek and the lagoon are shallow and in dry periods contain little water.
The photographs in this album illustrate Bundeena Creek in the context of Bundeena
village and progress to the wetlands. They were taken during a prolonged, dry and
hot spell.
Hacking River
North WestArm
BundeenaBonnieVale
CabbageTree Basin
Maianbar
CostensPt
SouthWest Arm
Royal
National
Park
Audley
Weir
Cronulla
GunnamattaBayBurraneer
Bay
DolansBay
HungryPt
GannonsBay
Bu
rran
eer
CaringbahYowieBay
Gymea Bay
Lilli Pilli
GogerlysPt
N
Bate
Bay
PORT HACKING
Leg O MuttonBay
GundamainWarumbul
GunnamattaPark
Moombara
Shiprock
Ballast Heap
Fish Trap
NeilsInlet
Salmon Haul
RedJacks
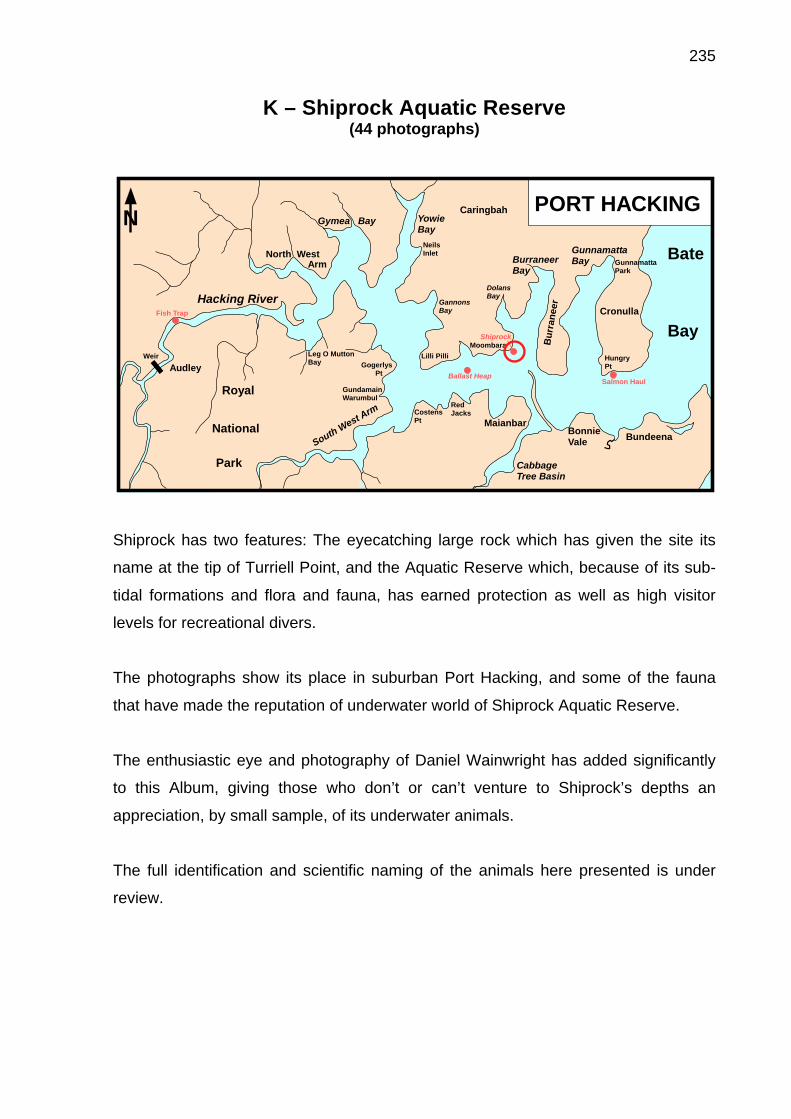
235
K – Shiprock Aquatic Reserve (44 photographs)
Shiprock has two features: The eyecatching large rock which has given the site its
name at the tip of Turriell Point, and the Aquatic Reserve which, because of its sub-
tidal formations and flora and fauna, has earned protection as well as high visitor
levels for recreational divers.
The photographs show its place in suburban Port Hacking, and some of the fauna
that have made the reputation of underwater world of Shiprock Aquatic Reserve.
The enthusiastic eye and photography of Daniel Wainwright has added significantly
to this Album, giving those who don’t or can’t venture to Shiprock’s depths an
appreciation, by small sample, of its underwater animals.
The full identification and scientific naming of the animals here presented is under
review.
Hacking River
North WestArm
BundeenaBonnieVale
CabbageTree Basin
Maianbar
CostensPt
SouthWest Arm
Royal
National
Park
Audley
Weir
Cronulla
GunnamattaBayBurraneer
Bay
DolansBay
HungryPt
GannonsBay
Bu
rran
eer
CaringbahYowieBay
Gymea Bay
Lilli Pilli
GogerlysPt
N
Bate
Bay
PORT HACKING
Leg O MuttonBay
GundamainWarumbul
GunnamattaPark
Moombara
Shiprock
Ballast Heap
Fish Trap
NeilsInlet
Salmon Haul
RedJacks

236
L – Postcards Port Hacking from the sea to the Hacking River source
(131 photographs)
These photographs give an overview of the estuary from the sea (Bate Bay and the
Tasman Sea) to the source of the Hacking River. They present the dramatic contrast
between the southern and northern foreshore, and also between some development
and land uses with others. In many respects the contrasts between one bay and
another are obvious. The photographs illustrate the estuary’s transition from a wide
and open outer part, to the shoaled main body and then to the narrower (river) upper
parts.
Some of the prominent features and landmarks, as well as some of the lifestyle and
uses that the waterway facilitates are featured, as are some glimpses of history.
Many can be related to the main text and its supporting Photo Albums. The ferries
“Curranulla” and “Tom Thumb” pop up in different locations in the collection to
highlight their omnipresent, essential and colourful presence on Port Hacking and the
Hacking River.
The natural beauty of this place is present throughout this collection.
237
Appendices
Appendix 1
Cabbage Tree Basin: Natural values and options for management - RJ
and JM West, 2000
Appendix 2
Impact of Helensburgh, Otford and Stanwell Tops on their surrounding
natural environment, report to DEP 1984 - B. Crombie, 2012
Appendix 3
Environmental Assessment of North West Arm, Port Hacking NSW -
A.D. Albani, D. Edwards and N. Turner, 2013
Appendix 4
The subtidal flora and fauna at Shiprock, Port Hacking, New South
Wales, during 1965-1970 – C.J. Lawler. Wetlands (Australia), 17(2),
1998
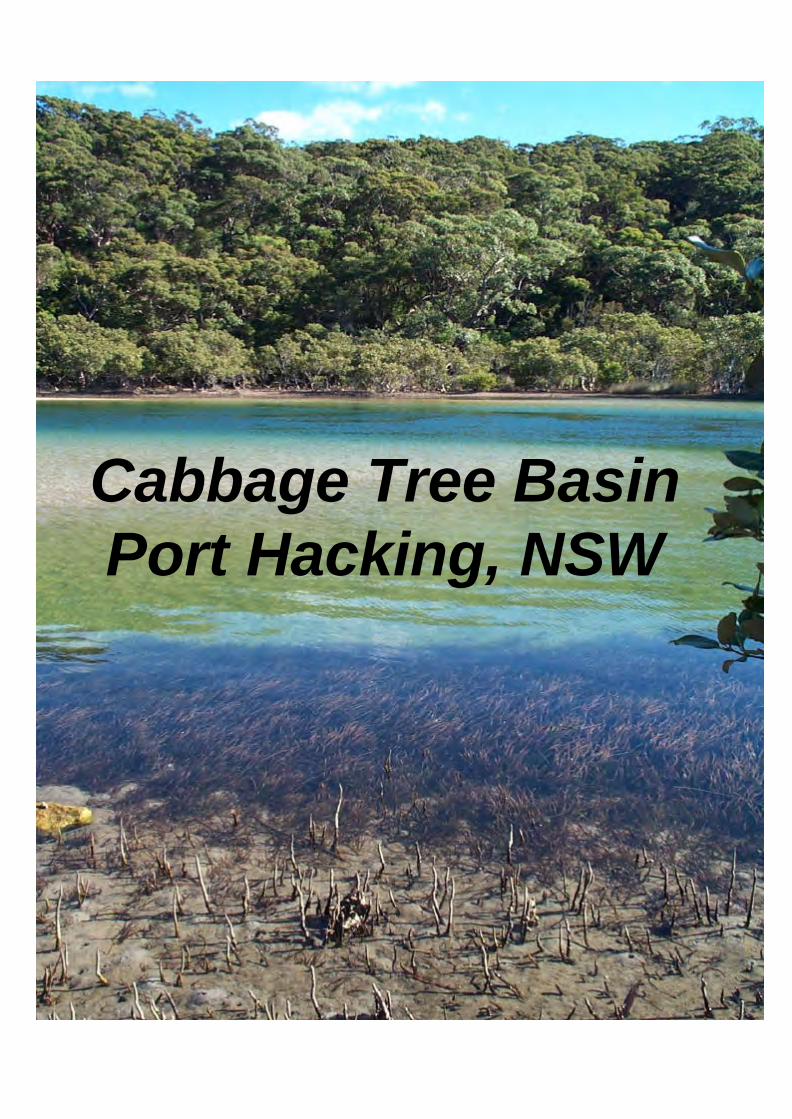
1
Cabbage Tree Basin
Port Hacking, NSW
2
Cabbage Tree
Basin:
Natural values and options for management
Prepared by RJ & JM West for: Hacking Catchment Management Committee (New South Wales, Australia)
December 2000

3
CONTENTS EXECUTIVE SUMMARY……...………………………………………………………………4 SECTION 1: INTRODUCTION ................................................................................................. 5
SECTION 2: HISTORICAL SIGNIFICANCE ......................................................................... 8
INTRODUCTION ............................................................................................................................ 8 ABORIGINAL OCCUPATION ........................................................................................................... 8 THE FISH HATCHERY ................................................................................................................. 12
SECTION 3: ESTUARINE RESOURCES .............................................................................. 18
INTRODUCTION .......................................................................................................................... 18 ESTUARINE FLORA ..................................................................................................................... 18
Basin Algae ........................................................................................................................... 18 Basin Seagrasses................................................................................................................... 24 Basin Mangroves................................................................................................................... 30 Basin Saltmarshes................................................................................................................. 38
ESTUARINE FAUNA .................................................................................................................... 42 Estuarine Invertebrates......................................................................................................... 42 Basin Fishes .......................................................................................................................... 46
SECTION 4: CONCLUSIONS & RECOMMENDATIONS.................................................. 52
INTRODUCTION .......................................................................................................................... 52 MANAGEMENT RESPONSIBILITIES .............................................................................................. 52 HERITAGE VALUES ..................................................................................................................... 54
Aboriginal heritage ............................................................................................................... 54 Fish hatchery......................................................................................................................... 55
NATURAL VALUES ...................................................................................................................... 56 GENERAL................................................................................................................................... 57
SECTION 5: REFERENCES CITED ....................................................................................... 59
SECTION 6: ABSTRACTED LITERATURE REVIEW....................................................... 61
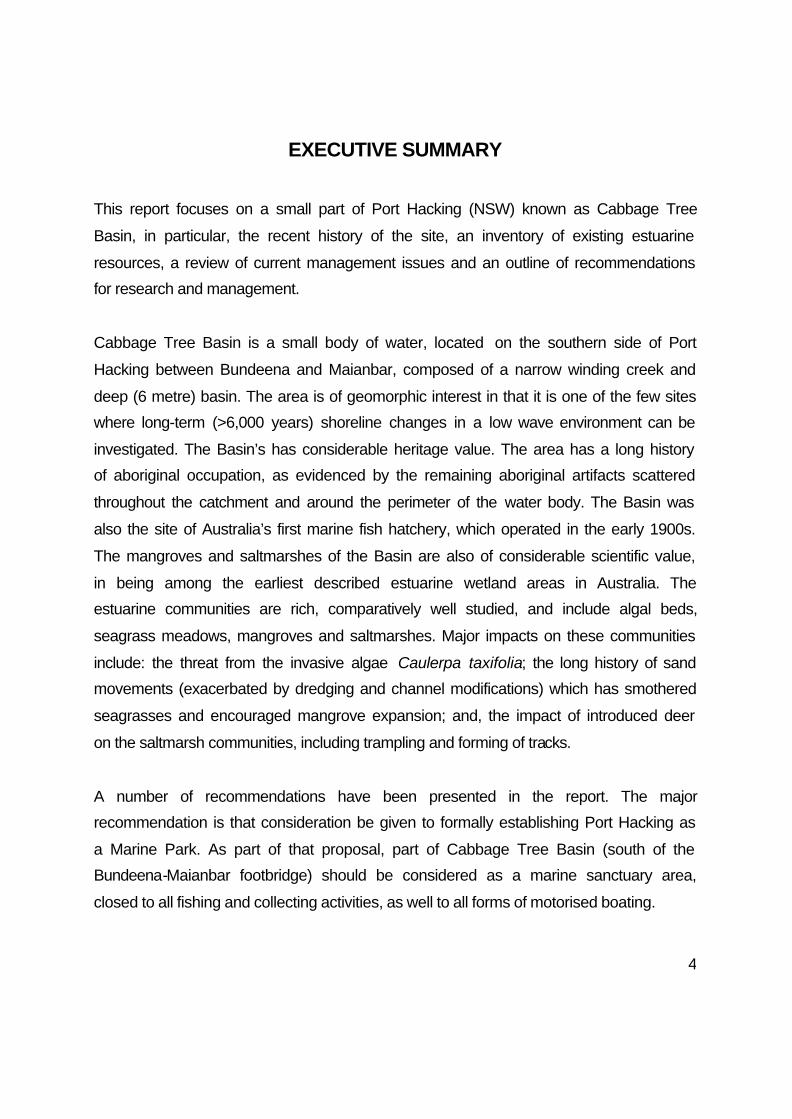
4
EXECUTIVE SUMMARY
This report focuses on a small part of Port Hacking (NSW) known as Cabbage Tree
Basin, in particular, the recent history of the site, an inventory of existing estuarine
resources, a review of current management issues and an outline of recommendations for research and management.
Cabbage Tree Basin is a small body of water, located on the southern side of Port
Hacking between Bundeena and Maianbar, composed of a narrow winding creek and
deep (6 metre) basin. The area is of geomorphic interest in that it is one of the few sites where long-term (>6,000 years) shoreline changes in a low wave environment can be
investigated. The Basin’s has considerable heritage value. The area has a long history of aboriginal occupation, as evidenced by the remaining aboriginal artifacts scattered
throughout the catchment and around the perimeter of the water body. The Basin was
also the site of Australia’s first marine fish hatchery, which operated in the early 1900s.
The mangroves and saltmarshes of the Basin are also of considerable scientific value,
in being among the earliest described estuarine wetland areas in Australia. The estuarine communities are rich, comparatively well studied, and include algal beds,
seagrass meadows, mangroves and saltmarshes. Major impacts on these communities
include: the threat from the invasive algae Caulerpa taxifolia; the long history of sand movements (exacerbated by dredging and channel modifications) which has smothered
seagrasses and encouraged mangrove expansion; and, the impact of introduced deer
on the saltmarsh communities, including trampling and forming of tracks.
A number of recommendations have been presented in the report. The major recommendation is that consideration be given to formally establishing Port Hacking as
a Marine Park. As part of that proposal, part of Cabbage Tree Basin (south of the Bundeena-Maianbar footbridge) should be considered as a marine sanctuary area,
closed to all fishing and collecting activities, as well to all forms of motorised boating.

5
SECTION 1: INTRODUCTION
Cabbage Tree Basin is a small water body nestled wi thin the Royal National Park, between the townships of Bundeena and Maianbar on the southern shoreline of Port
Hacking, NSW (see Figure 1-1). As such, it is part of the larger Hacking River
Catchment. As its name implies, the Basin is a relatively deep body of water (6 metres), but is surrounded by shallow waters and sandy shoals that are exposed at low tides. A
narrow creek winds through these sand shoals, bringing clear marine waters from the
Port and allowing the passage of floodwaters after heavy rainfall.
The catchment and shoreline of Cabbage Tree Basin have a collection of interesting aboriginal artefacts. While the gunyas, rock carvings, hand paintings, middens and tools
have only recently been documented in any detail, even early European settlers recognised the area as an important site containing the evidence of a long indigenous
occupation.
To the casual observer or bushwalker, the clear waters of the Basin, the narrow winding
creek, the wetlands, and the abundant fish and birdlife, provide an impression of a pristine and relatively stable environment. However, this is not the case.
Cabbage Tree Basin has undergone dramatic and perhaps irreversible change over the
past century, and particularly over the past 50 years. These changes have had a major
impact on the natural resources of the site, particularly the wetlands. These changes to
the nature of the wetlands have had flow-on effects, altering the dominant species and
the boundaries of the plant and animal communities.

6
Figure 1-1: Cabbage Tree Basin is situated on the southern shoreline of Port Hacking, New South Wales.
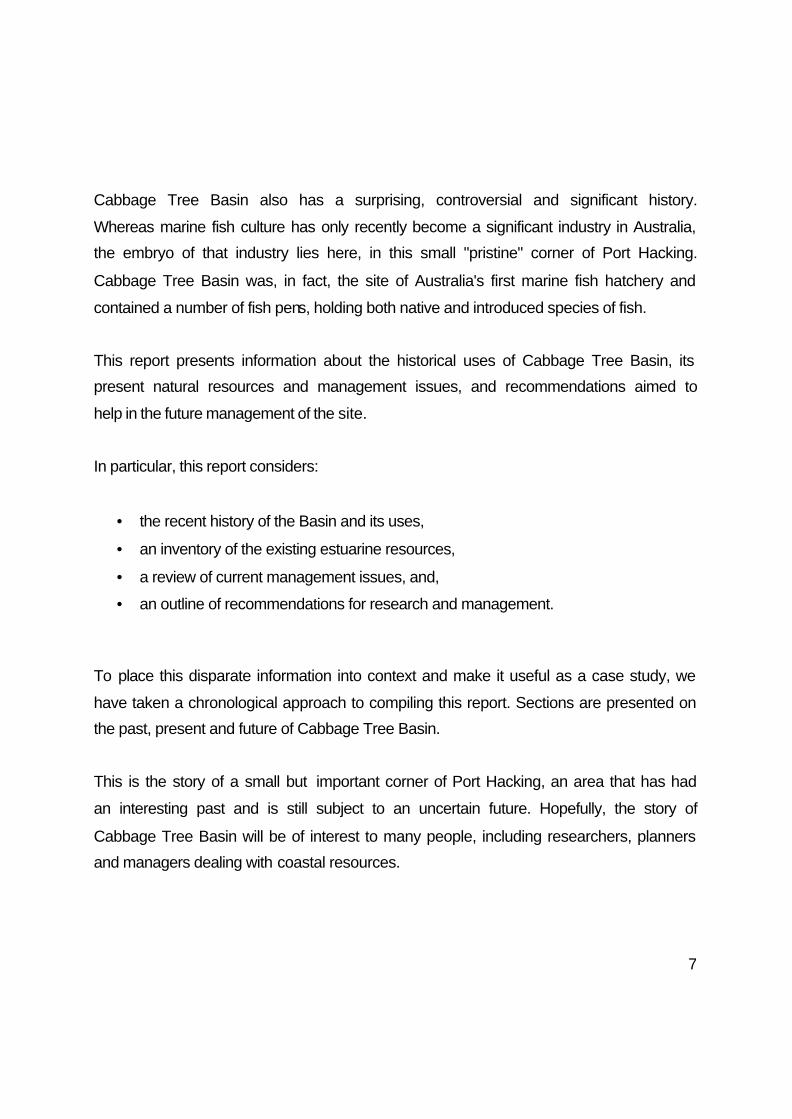
7
Cabbage Tree Basin also has a surprising, controversial and significant history.
Whereas marine fish culture has only recently become a significant industry in Australia, the embryo of that industry lies here, in this small "pristine" corner of Port Hacking.
Cabbage Tree Basin was, in fact, the site of Australia's first marine fish hatchery and
contained a number of fish pens, holding both native and introduced species of fish.
This report presents information about the historical uses of Cabbage Tree Basin, its present natural resources and management issues, and recommendations aimed to
help in the future management of the site.
In particular, this report considers:
• the recent history of the Basin and its uses,
• an inventory of the existing estuarine resources,
• a review of current management issues, and,
• an outline of recommendations for research and management.
To place this disparate information into context and make it useful as a case study, we
have taken a chronological approach to compiling this report. Sections are presented on the past, present and future of Cabbage Tree Basin.
This is the story of a small but important corner of Port Hacking, an area that has had
an interesting past and is still subject to an uncertain future. Hopefully, the story of
Cabbage Tree Basin will be of interest to many people, including researchers, planners and managers dealing with coastal resources.

8
SECTION 2: HISTORICAL SIGNIFICANCE
Introduction
Cabbage Tree Basin and Creek have special historical significance, particularly as an
area of interest to marine and coastal scientists. This stems from the fact that Port Hacking was probably the first estuary in Australia to receive some status as a marine
“reserve”. As a direct result of the declaration of the Royal National Park, the waters of
Port Hacking were closed to commercial fishing in the late 19th Century. The Basin also has special significance as the site of Australia’s first fish hatchery.
In common with much of the catchment of Port Hacking, the Basin and surrounding
lands are also rich in aboriginal artefacts.
Aboriginal occupation
The catchment and foreshores of Cabbage Tree Creek and Basin are rich with the
evidence of past Aboriginal occupation, despite a century of interference and neglect. Cridland (1924) and Curby (1998) have described the early European contact with
Dharawal people in the Sutherland – Cronulla Region but, overall, there is little
information available about the Dharawal in this region.
It is generally thought that the Dharawal were present in the area at least up to the
1840’s and possibly up to the 1870’s. There were few permanent residents in the Shire
prior to the 1850’s, although there were many visitors. In the mid-19th century, shell grit
was in high demand as a source of lime for building in the Sydney district. As a result, mud and rock oysters were collected in large numbers from local waterways, including
Port Hacking, and aboriginal midden sites in the region were scavenged. The shells were returned to Sydney by barge for crushing.
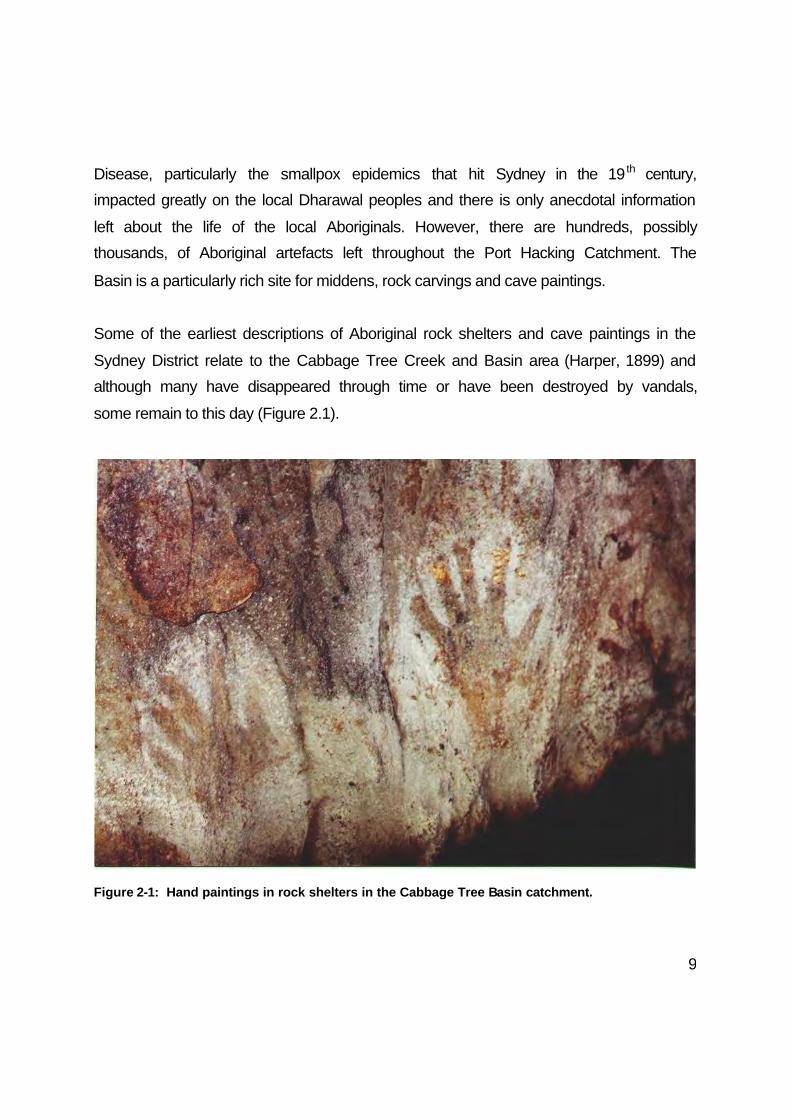
9
Disease, particularly the smallpox epidemics that hit Sydney in the 19 th century, impacted greatly on the local Dharawal peoples and there is only anecdotal information
left about the life of the local Aboriginals. However, there are hundreds, possibly thousands, of Aboriginal artefacts left throughout the Port Hacking Catchment. The
Basin is a particularly rich site for middens, rock carvings and cave paintings.
Some of the earliest descriptions of Aboriginal rock shelters and cave paintings in the
Sydney District relate to the Cabbage Tree Creek and Basin area (Harper, 1899) and although many have disappeared through time or have been destroyed by vandals,
some remain to this day (Figure 2.1).
Figure 2-1: Hand paintings in rock shelters in the Cabbage Tree Basin catchment.

10
While cave paintings are now relatively rare, spear-sharpening grooves (Figure 2-2) are
common along the upper sections of Cabbage Tree Creek and on some of the smaller creeks entering the Basin (Figure 2-2). Shell middens can also be found around most of
the Basin’s perimeter (Figure 2-3).
Figure 2-2: Spear-sharpening grooves in rocks along Cabbage Tree Basin
Creek, Port Hacking.
Figure 2-3: A midden located on the shoreline of the Basin.
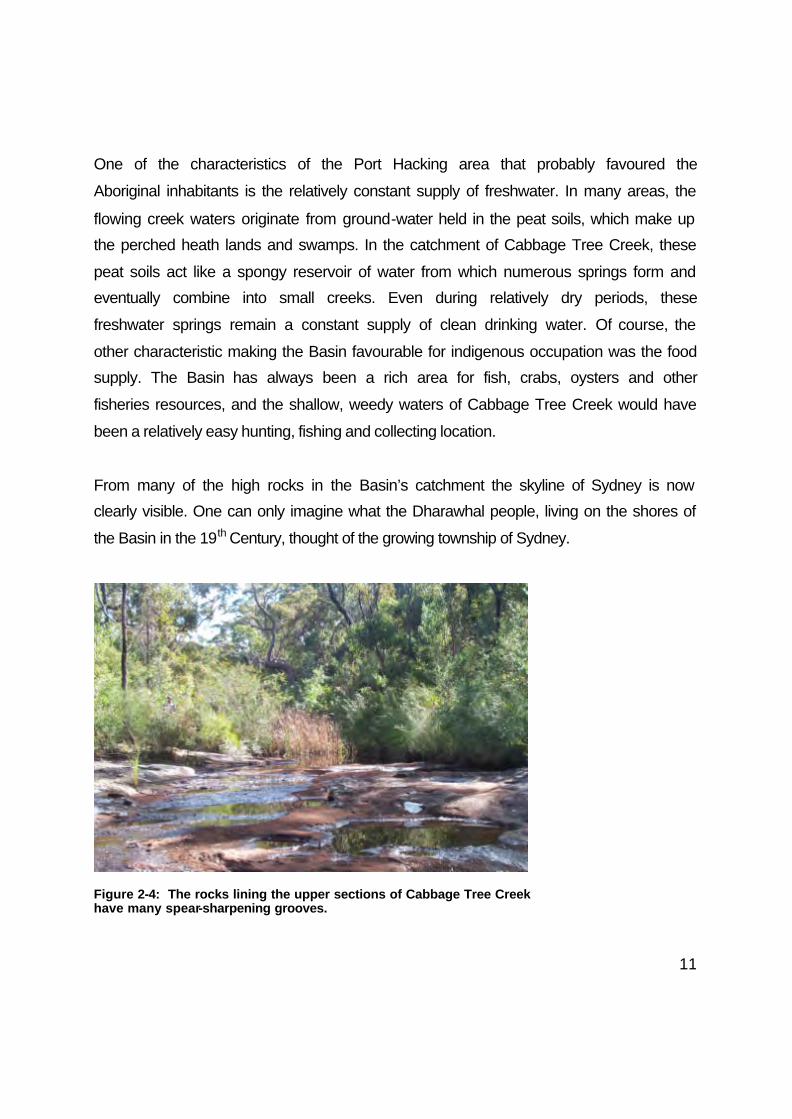
11
One of the characteristics of the Port Hacking area that probably favoured the
Aboriginal inhabitants is the relatively constant supply of freshwater. In many areas, the
flowing creek waters originate from ground-water held in the peat soils, which make up the perched heath lands and swamps. In the catchment of Cabbage Tree Creek, these
peat soils act like a spongy reservoir of water from which numerous springs form and eventually combine into small creeks. Even during relatively dry periods, these
freshwater springs remain a constant supply of clean drinking water. Of course, the
other characteristic making the Basin favourable for indigenous occupation was the food supply. The Basin has always been a rich area for fish, crabs, oysters and other
fisheries resources, and the shallow, weedy waters of Cabbage Tree Creek would have
been a relatively easy hunting, fishing and collecting location.
From many of the high rocks in the Basin’s catchment the skyline of Sydney is now clearly visible. One can only imagine what the Dharawhal people, living on the shores of
the Basin in the 19th Century, thought of the growing township of Sydney.
Figure 2-4: The rocks lining the upper sections of Cabbage Tree Creek have many spear-sharpening grooves.

12
The Fish Hatchery
Port Hacking is an important fisheries habitat and has always been a popular place to
fish. However, the links between fishing and Port Hacking are much deeper and stronger than many might suspect. Not only is Port Hacking the first area in Australia to
be permanently reserved and closed to commercial fishing, but it is also the site of Australia’s first marine fish hatchery. The history of these links begins with a Royal
Commission into fishing and fisheries held in 1880 and often involved political and
scientific controversy.
In the late 1800’s, the Colony of NSW had reached an interesting stage of development. There was great interest in the natural sciences and a number of public societies and
scientific journals had evolved. The fish of the Colony had been described by a number
of early authors and angling was already a popular recreational activity.
The Australian public has always had a particular interest in fish and fisheries, perhaps
a result of the nature of those who emigrated from the harbours and coastal areas of
England. Initially there were few laws and controls on fishing activities, but in 1880 there
was sufficient public and government concern about the lack of control over fishing and the poor state of the fish stocks, that a Royal Commission was held into fisheries.
The 1880 Royal Commission was held in Sydney and had the aim of investigating “the
actual state and prospects of the fisheries of the Colony” (Anon 1880). One of the major
findings of the Commission was that fishing activities needed to be controlled much better by the government. As a result, a new fisheries act was drafted to replace earlier
legislation.
Interestingly, the objective of this proposed legislation was to stop commercial fishing in
all the waters of the Colony and to only allow a resumption of fishing in particular areas after it had been shown to be sustainable. As you might expect, there was much

13
argument about this proposed legislation and it proved to be so unpopular with sections
of the public that it was changed dramatically before being enacted in 1881. In fact, when enacted, the new legislation allowed fishing in all waters of the Colony, unless
fishing could be shown to be unsustainable.
The 1881 Fisheries Act also allowed the government to establish a Board of
Commissioners to assist in the management and development of fisheries. As a result, five “Commissioners of Fisheries” were appointed in 1882. Several of these new
Commissioners were not happy with the state of the fisheries and considered that large areas should have been reserved and closed to fishing, to ensure the survival of the fish
populations.
Some of the Commissioners were so concerned about the poor state of the fish
supplies in the Colony that they investigated other methods of enhancing the fisheries. For example, one Commissioner, the Honorable J.H. Want, considered that the
Fisheries Commission:
“should make some efforts to save the total disappearance of the finny tribe (that is,
fish) … but as the establishment of close(d) fisheries was not only difficult and unpopular, I thought we might try if something could be done to create an artificial
supply by fish-breeding in salt water as well as fresh” (Want, 1900).
In the early 1880’s, Want had travelled through England and America and came to the
conclusion that the best method of improving the NSW marine fisheries was to establish an artificial supply of fish. Acclimatisation of various European animals to the Australian
conditions had become very popular, and animals such as deer, foxes and rabbits had
been introduced. The Royal National Park was one of the sites where such
introductions were often trialled (NPWS 2000). As a result, plans were well underway to
introduce European fish such as trout and salmon, and to establish fish hatcheries, as a replacement for the depleted stocks of freshwater fishes in inland rivers and streams.

14
Since there was little detailed knowledge about the breeding of marine fish in NSW, Want and others decided on a plan to bring some species of European marine fish to
Australia. As a first step, funding was obtained to build a fish hatchery and grow-out ponds and Cabbage Tree Basin, which was described at the time as a “miniature
harbour”, was selected as the ideal site.
Construction of the hatchery began in early 1900 with the building of a double stonewall,
in-filled with ballast, across the mouth of Cabbage Tree Creek. In the middle of the channel, which was dredged for better boat access, two large wire gates were
constructed. These allowed exchange of water, but restricted movement of fish into the
Basin. The gates were arranged between two large wooden posts and could be raised and lowered with ropes and pulleys, to allow the passage of small boats. It is now
difficult to determine the exact site of the stonewall and gates, but it is apparent that the present footbridge is not part of that structure (Figures 2-5, 2-6). Two large “marine
paddocks” were constructed on the western side of Cabbage Tree Creek in about one
metre of water. One enclosure was made of ballast stones (110 ft x 70 ft) and one of wire mesh (80 ft x 40 ft). These paddocks were used as growing pens and, over the
years of operation, were stocked with a wide range of fish species.
By 1901, the hatchery reportedly contained snapper, black bream, garfish, whiting,
Tasmanian trumpeter, herrings, lobsters and oysters, and, produced millions of fry. One of the major functions of the hatchery was the study of the local fish species, particularly
life history of the fish species and various characteristics, such as length, weight and age. At about this time, 2,000 rainbow trout were also released into the freshwater
reaches of Cabbage Tree Creek.

15
Figure 2-5: View over Simpson’s Bay showing the stone walls and double gates of the fish hatchery (circa. 1910). Note the position of the entrance to Cabbage Tree Creek (and the lack of mangroves north of the gates).
Figure 2-6: View to “Simpson’s Hotel” showing the operating fish hatchery (circa 1910).

16
The hatchery operated in Cabbage Tree Basin between about 1900 and 1914, holding
or capturing fish and fish eggs, and releasing newly hatched fish to the adjoining waters of Port Hacking. For example, the “Annual Report of the Commissioners of Fisheries” in
1909 reported that,
“the following numbers of fish were hatched at, and liberated from, the hatchery:
1,250,000 sand whiting
250,000 black bream 4,500,000 southern flounder
300,000 trevally
3,000 river garfish”
Figure 2-7: View looking into the Basin from the fish hatchery gates (circa. 1900).
17
In 1911, the fish hatchery was expanded and a building constructed on Hungary Point
(Cronulla) to assist in the breeding of fish. The grow-out and holding pens continued to operate in Cabbage Tree Basin until February 1914, when a catastrophe struck:
“Last week the whole of the fishes in the State hatcheries at National Park died. Not a
single one escaped. Even the hardy crayfish fell victim to the mysterious epidemic. The
Chief Inspector of Fisheries is likewise in the dark, but believes that the slaughter has been the result of a combination of circumstances … poor tides … excessive heat …
muggy conditions …”. Sydney Morning Herald (16th February 1914).
The sudden death of all the penned fish sparked a debate about the whole operation of
the fish hatchery that eventually led to its closure. There was obviously much disagreement between the few politicians who supported the hatchery, and the fisheries
department who thought it was a poor use of their limited resources. For example, consider the point of view of Mr Frank Farnell:
"I never believed in the hatcheries at all. There never was any necessity for them. There are 550 varieties of fishes on our coast, and 250 of them are edible. What is the use of
trying to provide a few more, when Nature has so lavishly endowed our waters … I may say that the idea of introducing new species into our marine waters originated from
people not associated with the Fisheries Department. The Fisheries Board was not
asked for advice. The only consultation was in connection with paying the bill for £1,560. The scheme was worked by political influence and it resulted as all political
canker-worm schemes deserve to end." Mr Frank Farnell, Chairman of the NSW Fisheries Board & Trustee of the Royal National Park (20th February 1914).

18
SECTION 3: ESTUARINE RESOURCES
Introduction
Cabbage Tree Basin has special geomorphic interest, as one of the few sites that
demonstrate shoreline changes, over the past 6,000 years, in a low wave environment (NPWS 2000). It is also of special interest for its natural resource values.
Even after a century of change, Cabbage Tree Basin still represents one of the most significant estuarine habitats within the Port Hacking estuary. It is also an important site
within the context of the Sydney and South Coast Region. According to the mapping of estuarine habitats in Port Hacking by NSW Fisheries (Williams and Meehan, 2000), the
Basin contains about 94% of the saltmarsh areas of Port Hacking, 37% of the mangrove
area and 1% of the seagrass area. The present estuarine flora and fauna of Cabbage Tree Basin are described in greater detail below. These descriptions come both from
existing literature, from field work carried out during 2000, and from an examination of the range of historical and current aerial photography.
Estuarine Flora
Cabbage Tree Basin contains many important aquatic floral communities, particularly
estuarine wetland plants. The main species discussed in this report are the estuarine
macrophytes, namely the algal communities, seagrasses, mangroves and saltmarshes.
Basin Algae
Algae are relatively simple non-flowering plants that generally do not have well structured roots, stems and leaves. Macro-algae (or large algae) normally require a
solid substrata for attachment, such as rock, although a few species will also grow in

19
unconsolidated sand. Unfortunately there are no useful taxonomic keys or
comprehensive identification guides available for the New South Wales algae and identification, especially to species level, is often difficult or impossible.
Figure 3-1: Rocks associated with the Maianbar-Bundeena footbridge and water supply pipe, constructed in 1958, provides the hard substrate necessary for algae communities to develop.
A number of macro-algae species are present in the Basin but species composition
varies markedly between seasons and years. A few species form more or less permanent communities and these will be discussed in more detail.
Probably the most obvious community of macro-algae in the Cabbage Tree Basin area
is that attached to the concrete boulders and rocks that make up the foundations of the
Bundeena-Maianbar footbridge (Figure 3-1). On this relatively new structure, completed

20
in 1958 (Guest and Miller, 1958), a small temperate reef community has developed,
with many of the algae present being species typical of the local rock platforms. The dominant algae at this site are:
• large brown algae, such as Sargussum sp., Ecklonia sp. and Cystophora sp.,
• short turf species, such as iridescent reds like Laurencia sp.,
• encrusting species of coralline algae, and,
• free-floating species, such as Ulva (Figure 3-5), Chaetomorpha and
Enteromorpha spp.
The strong current and clear waters at this site have allowed the development of a
healthy algal community and this in turn has led to colonisation of a number of
specialised reef fish (discussed below). Other rocks and boulders around the basin also
support algal communities, although they are generally not as diverse or luxurious as the footbridge site.
Figure 3-2: Large brown algae, such as Sargussum sp. are common on the rocks of the Maianbar-Bundeena footbridge.

21
Mangrove forests also act as a substrate on which algae can attach and this is
particularly true for areas where large numbers of pneumatophores protrude from the sand and mud bars. Increases in some of the mangrove areas over the past 50 years
(see below), have resulted in an increase in the area available for algal colonisation.
Laursen and King (2000) have described in some detail the type of algal communities
found on mangrove pneumatophores at Woolooware Bay (Botany Bay), and similar algal communities are associated with the Cabbage Tree Basin mangrove community.
This association consists of several species of Bostrychia and Caloglossa, the exact composition of which changes with season and exposure. Another significant algal
community associated with the mangroves in Cabbage Tree Basin is a distinct sub-
species of Hormosira banksii (Figure 3-3), which is similar to the Hormosira found in rock pools (commonly called Neptune's necklace), but has slightly different morphology.
This species has been described for locations around Botany Bay, but is also found at one main site in Cabbage Tree Basin.
Figure 3-3: Hormosira banksii attached to rocks. The species is also found free floating amongst the pneumatophores of grey mangrove forests.

22
Small rocks, branches and shells found along Cabbage Tree Creek also have a number of the algae species mentioned above, although much reduced in numbers of species
and extent of community. Large, often solitary, specimens of Codium (Figure 3-4). are also found attached to branches and rocks in this location.
Within the past few months, the macro-algae Caulerpa taxifolia has been reported in sections of Port Hacking, such as Fishermans Bay (Maianbar), in many cases out-
competing the local seagrass beds. This is an invasive algal species that is causing enormous damage to seagrass beds throughout the Mediterranean.
As it is now established across a significant area of Port Hacking, Caulerpa taxifolia is now likely to spread quickly throughout the rest of Port Hacking and possible invade
other local estuaries. This alga has probably been introduced to Port Hacking from locals cleaning out aquariums along the water's edge. It has the potential to cause
considerable changes to the flora and fauna of Port Hacking, displacing seagrass beds
and, in turn, affecting the distribution and abundance of local fish species. The distribution of this species needs to be monitored carefully over the next few years to
assess the need for any remedial action.
During the present surveys of Cabbage Tree Creek (September 2000), only one
specimen of Caulerpa taxifolia was found floating in the sand channel leading to the Basin. This large clump of Caulerpa was washing in and out on the tide, near a channel
which links Cabbage Tree Creek and Fishermans Bay. It is probably only a matter of time before Caulerpa taxifolia invades the Basin.

23
Figure 3-4: Codium fragile attached to some of the large sticks and rocks in
Cabbage Tree Basin.
Figure 3-5: Ulva sp. is one of the free floating alga sometimes
occurring in association with the seagrass beds.

24
Basin Seagrasses
Seagrasses (Figure 3-6) are an important component of regional estuarine vegetation
communities as they provide critical habitat for many local species of fish, crustaceans and other fauna. They are among the most diverse communities in estuaries, having a
wide range of plant and animal species, including many of commercial importance. Local economically important fish species, such as sea mullet (Mugil cephalus),
yellowfin bream (Acanthopagrus australis) and luderick (Girella tricuspidata), all use
seagrass beds as nursery and feeding habitats. As well, a large number of non-commercial fish species inhabit seagrass beds. Some of the families of fish with species
that spend much of their life history in these habitats are the leatherjackets, pipefishes, gobies and gudgeons. Information on fish species in the Basin is presented below.
Figure 3-6: Unlike algae (or seaweed), seagrasses are higher plants with well developed leaves, roots and flowers. The flowers are pollinated underwater.

25
During this study, four species of seagrass have been identified from Cabbage Tree Basin. Zostera capricorni (hereafter called Zostera) is the most common seagrass in the
area, lining the sandy entrance delta and the Basin's circumference. Zostera (Figure 3-
7) is widely distributed within most NSW estuaries and is found in a range of salinity conditions, from seawater (35 parts per thousand, ppt) to brackish conditions (5-10 ppt).
This species spreads relatively quickly from vegetative drift material, generally
occupying suitable areas within a few years. It displays a wide variation of plant sizes,
and in Cabbage Tree Basin varies from plants with leaf dimensions about 1-2 mm wide and 1 cm in length, up to plants with leaves 5 mm wide and 30 cm in length. Sometimes
these different forms are incorrectly labelled as separate species.
Figure 3-7: Eelgrass (Zostera capricorni) is the main seagrass now found in the Basin. It has thin leaves (<5 mm) and can range in leaf lengths from a few centimeters to 50 cm.

26
The two Halophila species found in Cabbage Tree Basin, Halophila ovalis (Figure 3-8)
and Halophila decipiens, have not been studied in any detail within NSW waters. However, they are known to be fast spreading seasonal species that grow quickly from
seed or vegetative shoots. These species generally occupy greatest areas in spring and summer and die back during the Autumn and Winter. Halophila ovalis is the most
widespread and occupies the shallow sandy shoals. Halophila decipiens generally
occurs seasonally in deeper waters.
Figure 3-8: Paddleweed (Halophila ovalis) is a small plant with rounded leaves about the same size as clover.
Posidonia australis (hereafter Posidonia) presently occupies only a limited number of sites within the Basin, mainly on the drop-off of the sandy delta into the basin proper.
There is good evidence that Posidonia had a much wider distribution, which has been
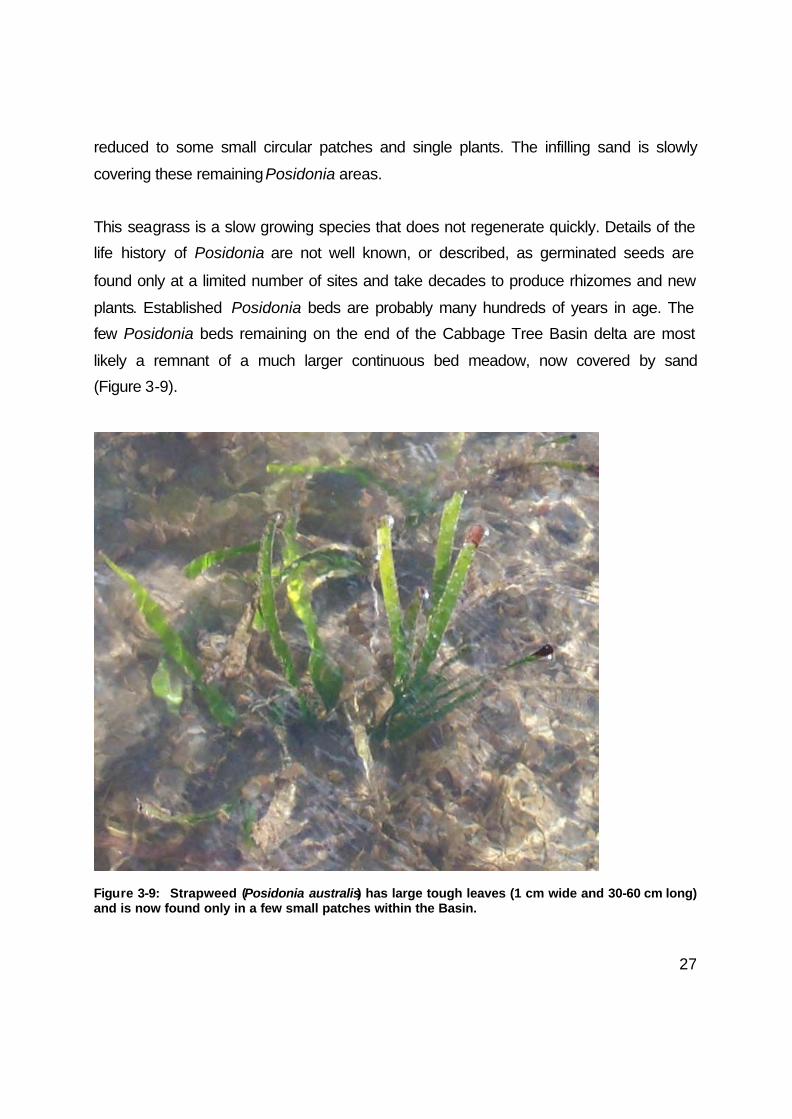
27
reduced to some small circular patches and single plants. The infilling sand is slowly
covering these remaining Posidonia areas.
This seagrass is a slow growing species that does not regenerate quickly. Details of the life history of Posidonia are not well known, or described, as germinated seeds are
found only at a limited number of sites and take decades to produce rhizomes and new
plants. Established Posidonia beds are probably many hundreds of years in age. The few Posidonia beds remaining on the end of the Cabbage Tree Basin delta are most
likely a remnant of a much larger continuous bed meadow, now covered by sand (Figure 3-9).
Figure 3-9: Strapweed (Posidonia australis) has large tough leaves (1 cm wide and 30-60 cm long) and is now found only in a few small patches within the Basin.
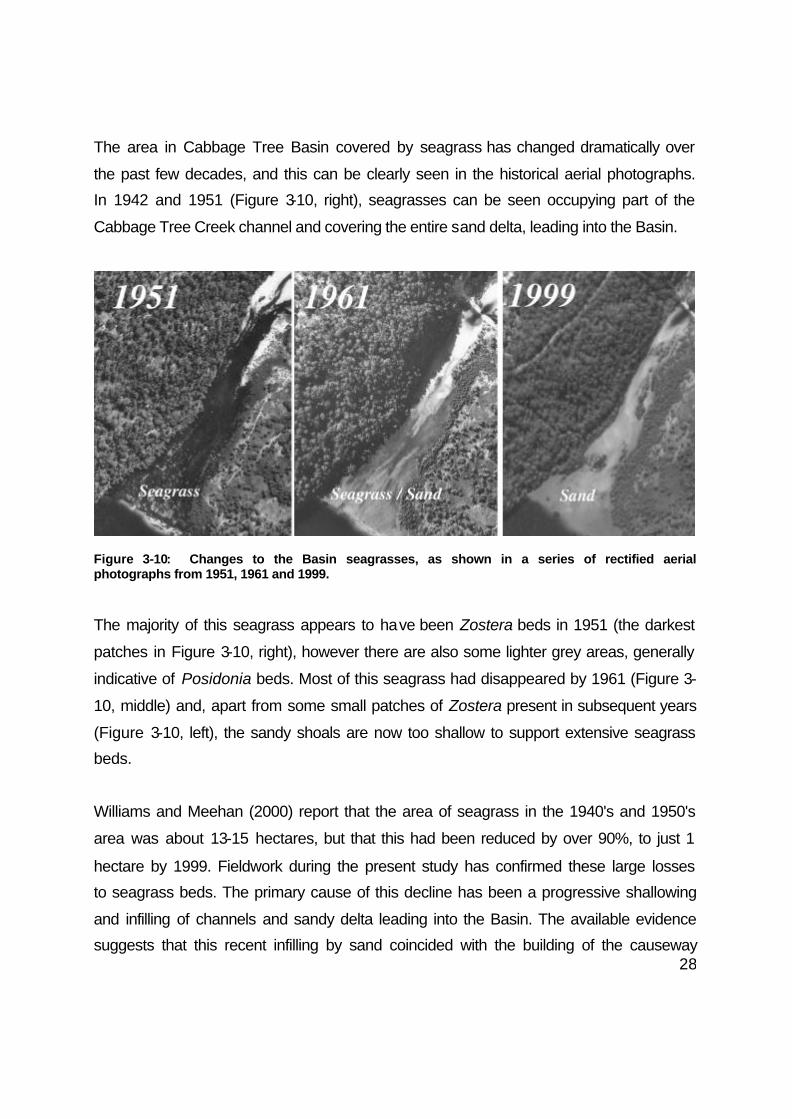
28
The area in Cabbage Tree Basin covered by seagrass has changed dramatically over
the past few decades, and this can be clearly seen in the historical aerial photographs. In 1942 and 1951 (Figure 3-10, right), seagrasses can be seen occupying part of the
Cabbage Tree Creek channel and covering the entire sand delta, leading into the Basin.
Figure 3-10: Changes to the Basin seagrasses, as shown in a series of rectified aerial photographs from 1951, 1961 and 1999.
The majority of this seagrass appears to have been Zostera beds in 1951 (the darkest
patches in Figure 3-10, right), however there are also some lighter grey areas, generally
indicative of Posidonia beds. Most of this seagrass had disappeared by 1961 (Figure 3-
10, middle) and, apart from some small patches of Zostera present in subsequent years
(Figure 3-10, left), the sandy shoals are now too shallow to support extensive seagrass beds.
Williams and Meehan (2000) report that the area of seagrass in the 1940's and 1950's
area was about 13-15 hectares, but that this had been reduced by over 90%, to just 1
hectare by 1999. Fieldwork during the present study has confirmed these large losses to seagrass beds. The primary cause of this decline has been a progressive shallowing
and infilling of channels and sandy delta leading into the Basin. The available evidence suggests that this recent infilling by sand coincided with the building of the causeway
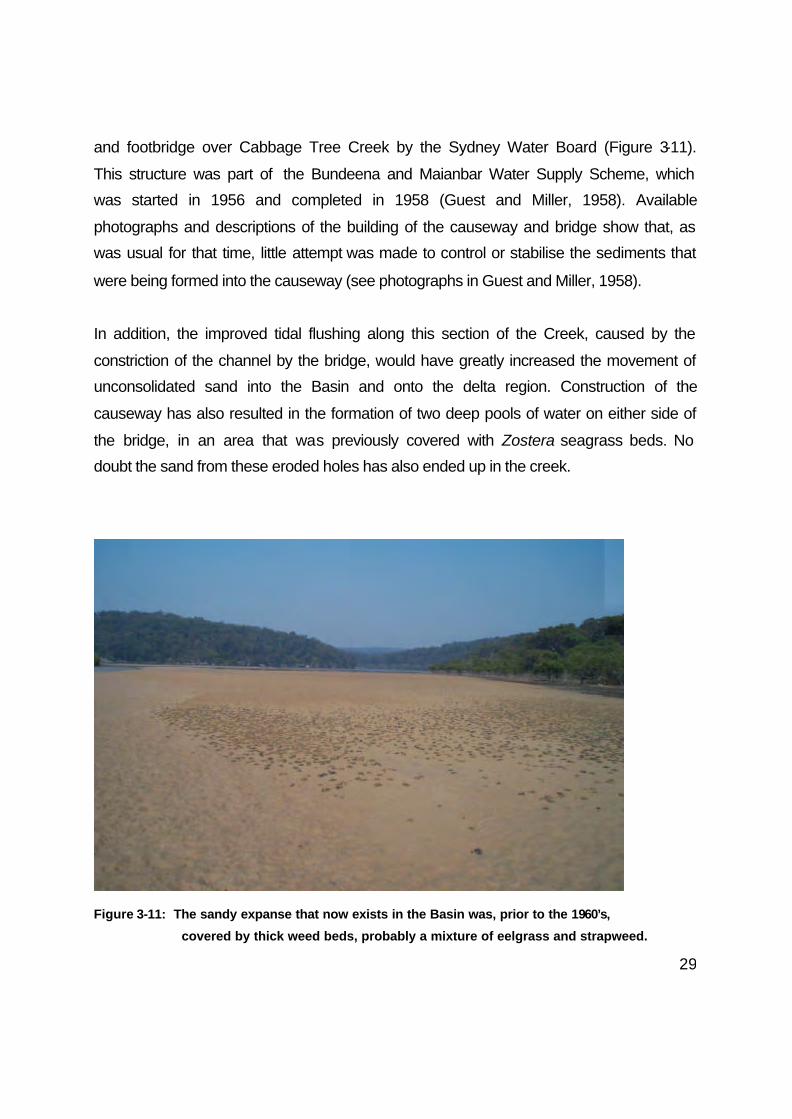
29
and footbridge over Cabbage Tree Creek by the Sydney Water Board (Figure 3-11).
This structure was part of the Bundeena and Maianbar Water Supply Scheme, which was started in 1956 and completed in 1958 (Guest and Miller, 1958). Available
photographs and descriptions of the building of the causeway and bridge show that, as was usual for that time, little attempt was made to control or stabilise the sediments that
were being formed into the causeway (see photographs in Guest and Miller, 1958).
In addition, the improved tidal flushing along this section of the Creek, caused by the
constriction of the channel by the bridge, would have greatly increased the movement of unconsolidated sand into the Basin and onto the delta region. Construction of the
causeway has also resulted in the formation of two deep pools of water on either side of
the bridge, in an area that was previously covered with Zostera seagrass beds. No doubt the sand from these eroded holes has also ended up in the creek.
Figure 3-11: The sandy expanse that now exists in the Basin was, prior to the 1960’s,
covered by thick weed beds, probably a mixture of eelgrass and strapweed.
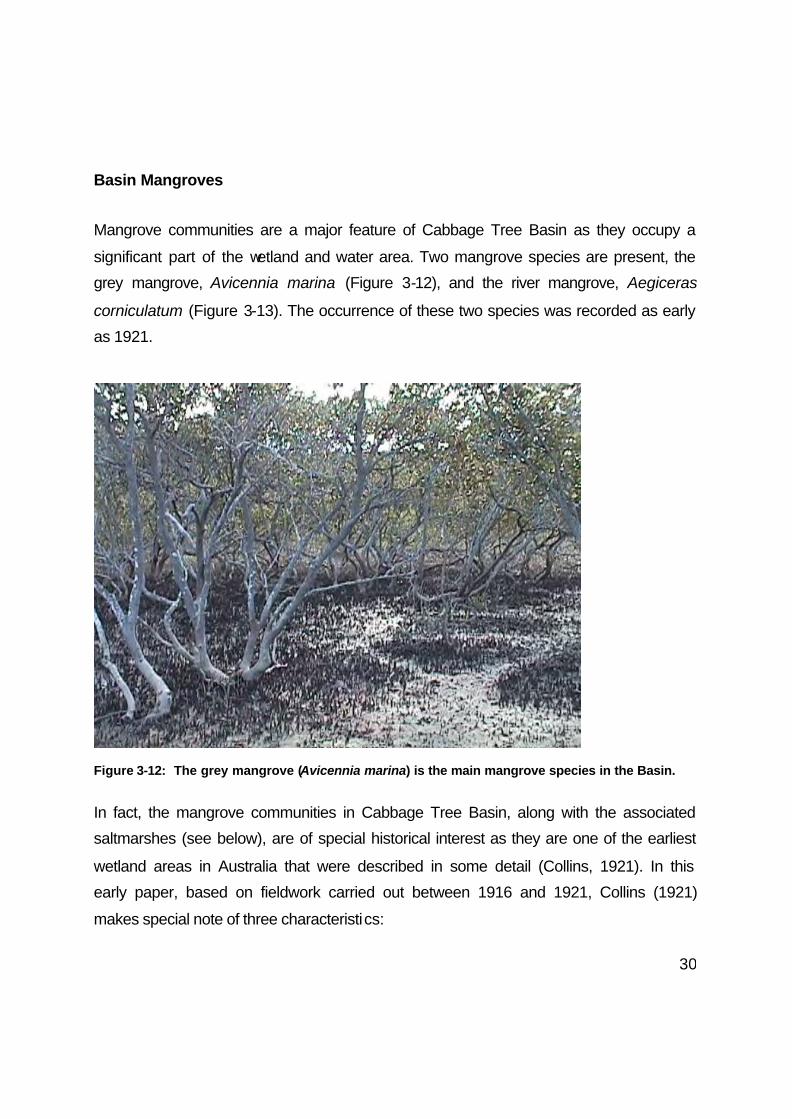
30
Basin Mangroves
Mangrove communities are a major feature of Cabbage Tree Basin as they occupy a
significant part of the wetland and water area. Two mangrove species are present, the grey mangrove, Avicennia marina (Figure 3-12), and the river mangrove, Aegiceras
corniculatum (Figure 3-13). The occurrence of these two species was recorded as early as 1921.
Figure 3-12: The grey mangrove (Avicennia marina) is the main mangrove species in the Basin.
In fact, the mangrove communities in Cabbage Tree Basin, along with the associated saltmarshes (see below), are of special historical interest as they are one of the earliest
wetland areas in Australia that were described in some detail (Collins, 1921). In this early paper, based on fieldwork carried out between 1916 and 1921, Collins (1921)
makes special note of three characteristics:
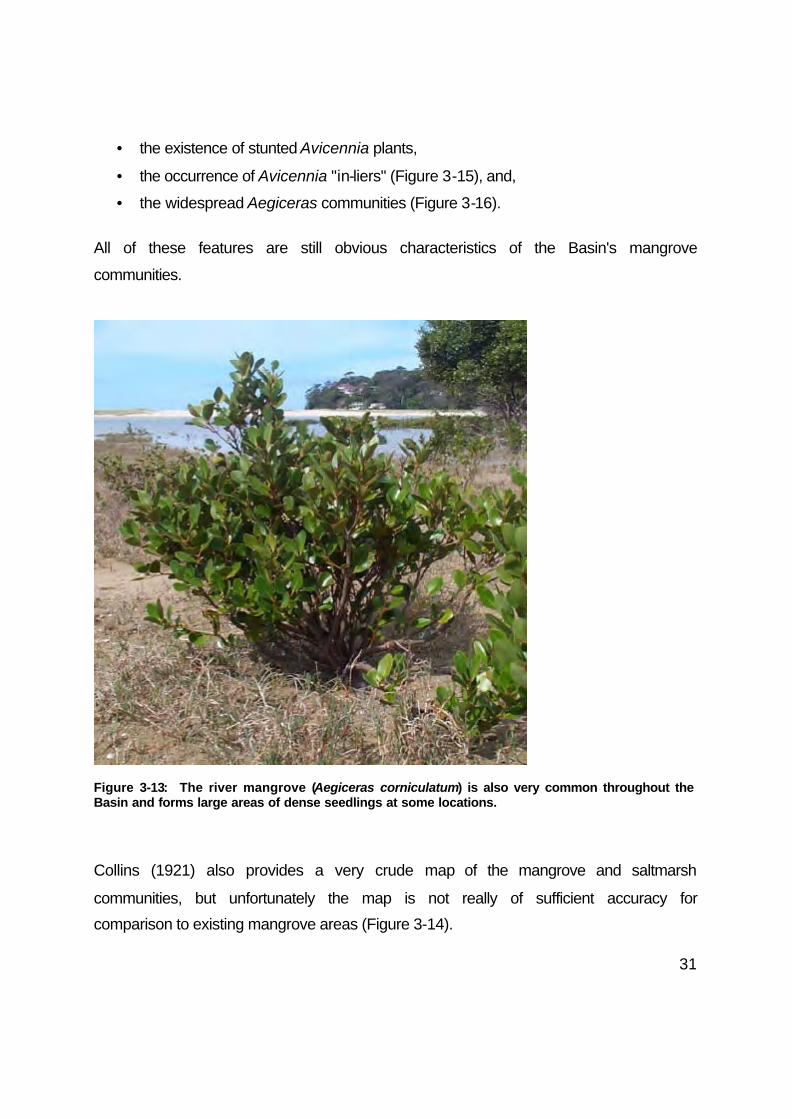
31
• the existence of stunted Avicennia plants,
• the occurrence of Avicennia "in-liers" (Figure 3-15), and,
• the widespread Aegiceras communities (Figure 3-16).
All of these features are still obvious characteristics of the Basin's mangrove
communities.
Figure 3-13: The river mangrove (Aegiceras corniculatum) is also very common throughout the Basin and forms large areas of dense seedlings at some locations.
Collins (1921) also provides a very crude map of the mangrove and saltmarsh
communities, but unfortunately the map is not really of sufficient accuracy for comparison to existing mangrove areas (Figure 3-14).

32
Figure 3-14: Map of the Cabbage Tree Basin estuarine wetlands compiled in about 1916. Note that there are obvious errors in this map, although it is useful for general information it contains (from Collins, 1921).
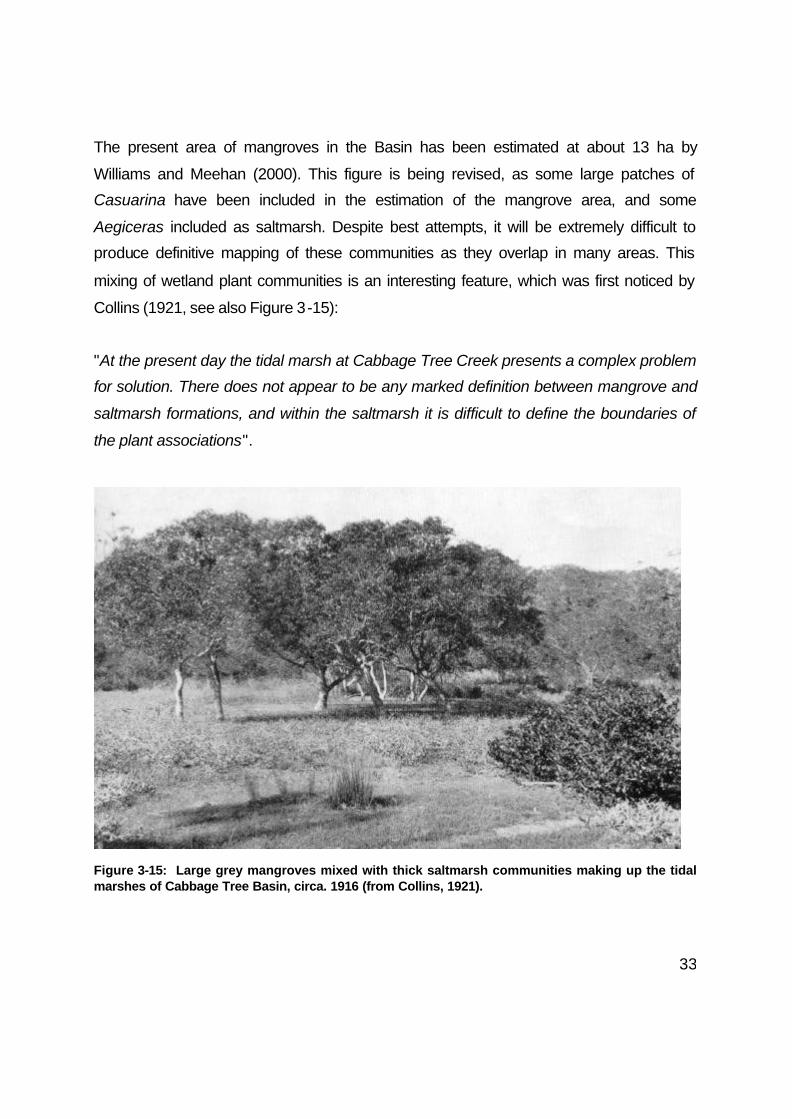
33
The present area of mangroves in the Basin has been estimated at about 13 ha by
Williams and Meehan (2000). This figure is being revised, as some large patches of Casuarina have been included in the estimation of the mangrove area, and some
Aegiceras included as saltmarsh. Despite best attempts, it will be extremely difficult to produce definitive mapping of these communities as they overlap in many areas. This
mixing of wetland plant communities is an interesting feature, which was first noticed by
Collins (1921, see also Figure 3-15):
"At the present day the tidal marsh at Cabbage Tree Creek presents a complex problem for solution. There does not appear to be any marked definition between mangrove and
saltmarsh formations, and within the saltmarsh it is difficult to define the boundaries of
the plant associations".
Figure 3-15: Large grey mangroves mixed with thick saltmarsh communities making up the tidal
marshes of Cabbage Tree Basin, circa. 1916 (from Collins, 1921).
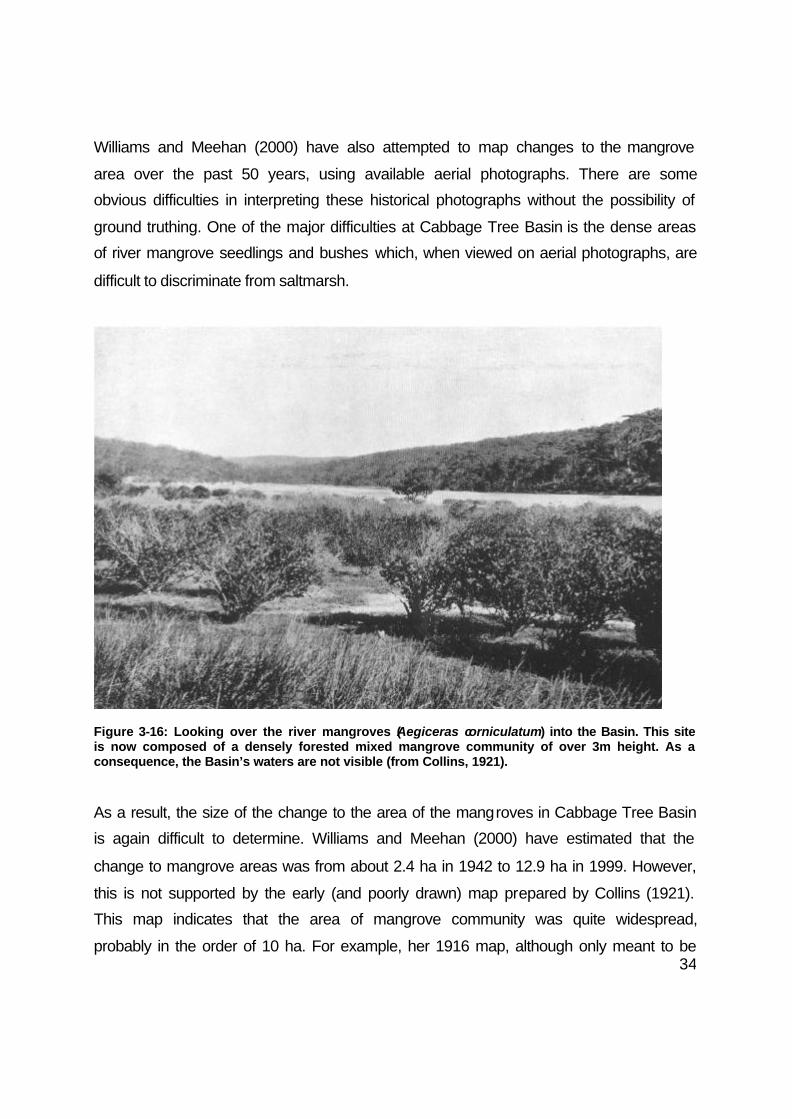
34
Williams and Meehan (2000) have also attempted to map changes to the mangrove
area over the past 50 years, using available aerial photographs. There are some obvious difficulties in interpreting these historical photographs without the possibility of
ground truthing. One of the major difficulties at Cabbage Tree Basin is the dense areas of river mangrove seedlings and bushes which, when viewed on aerial photographs, are
difficult to discriminate from saltmarsh.
Figure 3-16: Looking over the river mangroves (Aegiceras corniculatum) into the Basin. This site is now composed of a densely forested mixed mangrove community of over 3m height. As a consequence, the Basin’s waters are not visible (from Collins, 1921).
As a result, the size of the change to the area of the mangroves in Cabbage Tree Basin is again difficult to determine. Williams and Meehan (2000) have estimated that the
change to mangrove areas was from about 2.4 ha in 1942 to 12.9 ha in 1999. However,
this is not supported by the early (and poorly drawn) map prepared by Collins (1921). This map indicates that the area of mangrove community was quite widespread,
probably in the order of 10 ha. For example, her 1916 map, although only meant to be
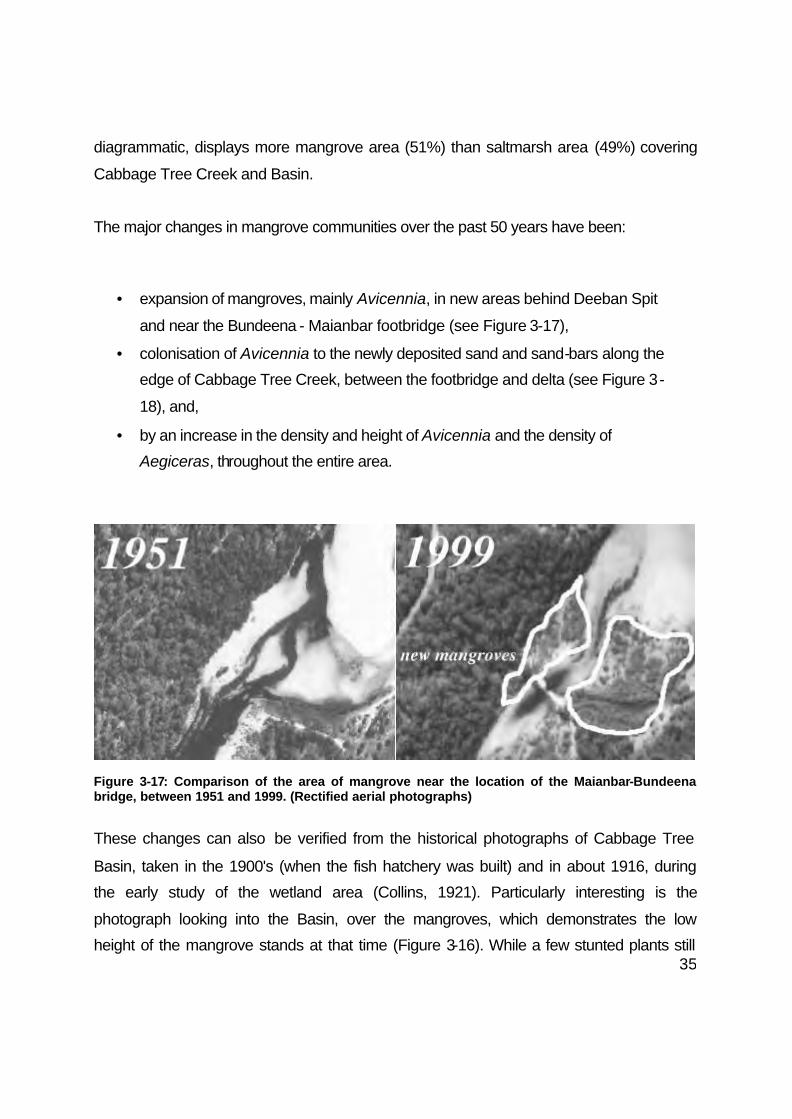
35
diagrammatic, displays more mangrove area (51%) than saltmarsh area (49%) covering
Cabbage Tree Creek and Basin.
The major changes in mangrove communities over the past 50 years have been:
• expansion of mangroves, mainly Avicennia, in new areas behind Deeban Spit
and near the Bundeena - Maianbar footbridge (see Figure 3-17),
• colonisation of Avicennia to the newly deposited sand and sand-bars along the edge of Cabbage Tree Creek, between the footbridge and delta (see Figure 3-
18), and,
• by an increase in the density and height of Avicennia and the density of Aegiceras, throughout the entire area.
Figure 3-17: Comparison of the area of mangrove near the location of the Maianbar-Bundeena bridge, between 1951 and 1999. (Rectified aerial photographs)
These changes can also be verified from the historical photographs of Cabbage Tree
Basin, taken in the 1900's (when the fish hatchery was built) and in about 1916, during the early study of the wetland area (Collins, 1921). Particularly interesting is the
photograph looking into the Basin, over the mangroves, which demonstrates the low height of the mangrove stands at that time (Figure 3-16). While a few stunted plants still

36
occur throughout the site, the vast majority of mangroves in Cabbage Tree Basin are
now full grown specimens. This probably indicates a change in some of the environmental factors controlling Avicennia growth, such as higher nutrient levels or
changed soil conditions. Densities of both Avicennia and Aegiceras have both appeared to increase since the early surveys.
Figure 3-18: Expansion of the mangrove communities between 1951 and 1999 lining Cabbage
Tree Creek, as shown by rectified aerial photographs.
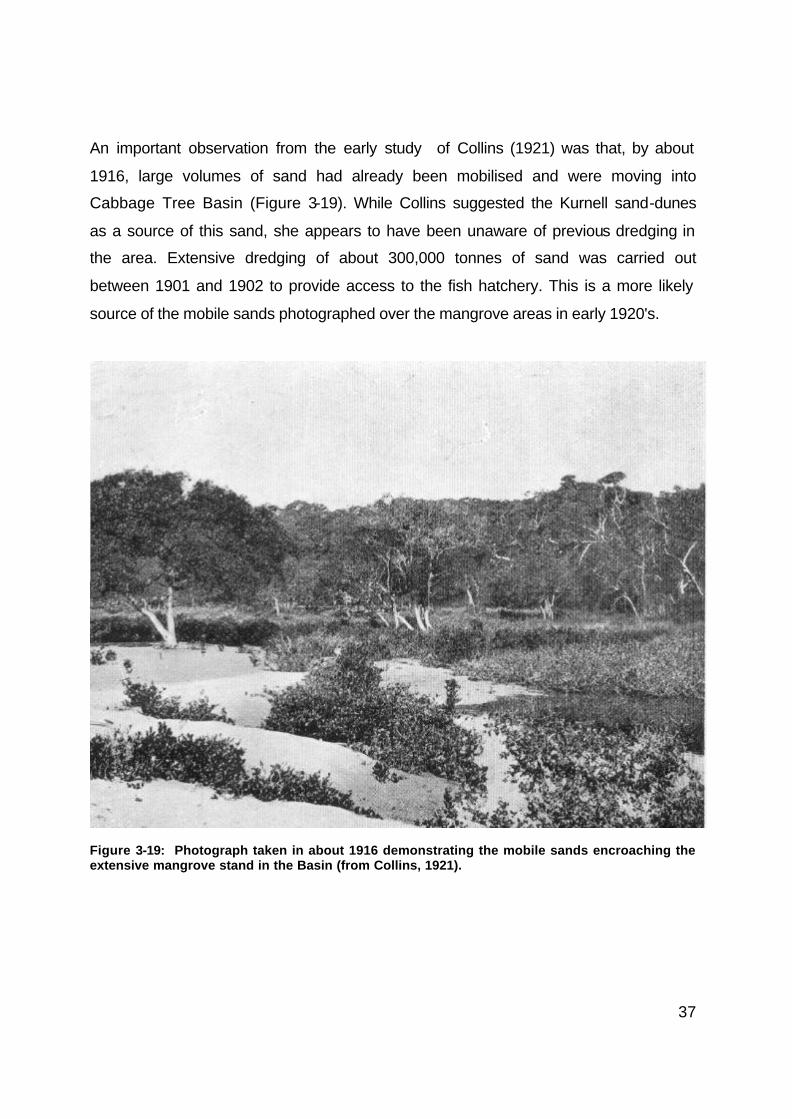
37
An important observation from the early study of Collins (1921) was that, by about
1916, large volumes of sand had already been mobilised and were moving into
Cabbage Tree Basin (Figure 3-19). While Collins suggested the Kurnell sand-dunes
as a source of this sand, she appears to have been unaware of previous dredging in
the area. Extensive dredging of about 300,000 tonnes of sand was carried out
between 1901 and 1902 to provide access to the fish hatchery. This is a more likely
source of the mobile sands photographed over the mangrove areas in early 1920's.
Figure 3-19: Photograph taken in about 1916 demonstrating the mobile sands encroaching the extensive mangrove stand in the Basin (from Collins, 1921).

38
Basin Saltmarshes
The community composition of saltmarsh plants within Cabbage Tree Basin appears
to have changed little since the description by Collins (1921), who notes that the
saltmarsh is different from others in the area, in only having a limited number of
species. She records the plants as:
Salicornia australis (now named Sarcocornia quinquiflora, see Figure 3-20)
Sporobulus virginicus (see Figure 3-21)
Samolus repens (see Figure 3-22)
Sueda australis (few isolated plants)
Spegularia rubra (few isolated plants)
Juncus maritimus (see Figure 3-23)
Casuarina glauca
Figure 3-20: Salt wort (Salicornia australis) is widespread through the Basin saltmarshes, but has been damaged in
many areas by trampling and deer grazing.

39
This is essentially the same species composition that is found in this saltmarsh
community at the present time. Apart from the changes along the fringes of the
saltmarshes, due to colonisation by mangroves (see above), the distribution of
saltmarsh plants also appears to be similar to that in 1921. Communities dominated
by Salicornia (Figure 3-20), Sporobolus (Figure 3-21) and Samolus repens (Figure 3-
22) are still widespread in the area, with Juncus communities at both the landward
fringe and at sites within the mangrove stands proper (see Figure 3-23).
Figure 3-21: The grass in this photograph is salt couch (Sporobolus virginicus).
Apart from the mapping of the area by West et al. (1985), very little detailed study
was carried out on Cabbage Tree Basin until about 1989. At that time, productivuty of
some of the saltmarsh communities in Cabbage Tree Basin were investigated by
Clarke (1994). He found that the Juncus communities had significantly lower biomass
than similar communities elsewhere, which he attributed to differences in salinity,
nutrients, or disturbance by feral deer.
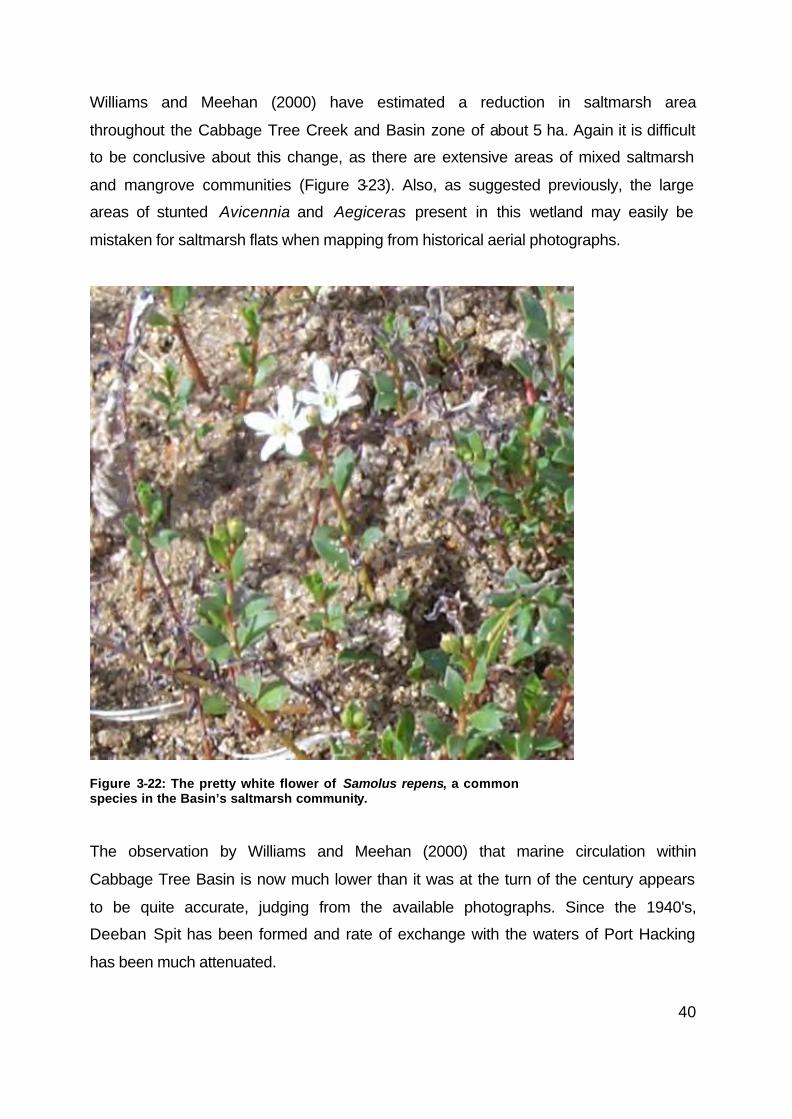
40
Williams and Meehan (2000) have estimated a reduction in saltmarsh area
throughout the Cabbage Tree Creek and Basin zone of about 5 ha. Again it is difficult
to be conclusive about this change, as there are extensive areas of mixed saltmarsh
and mangrove communities (Figure 3-23). Also, as suggested previously, the large
areas of stunted Avicennia and Aegiceras present in this wetland may easily be
mistaken for saltmarsh flats when mapping from historical aerial photographs.
Figure 3-22: The pretty white flower of Samolus repens, a common species in the Basin’s saltmarsh community.
The observation by Williams and Meehan (2000) that marine circulation within
Cabbage Tree Basin is now much lower than it was at the turn of the century appears
to be quite accurate, judging from the available photographs. Since the 1940's,
Deeban Spit has been formed and rate of exchange with the waters of Port Hacking
has been much attenuated.

41
The saltmarsh communities in Cabbage Tree Basin are presently in very poor
condition and possible remedial actions will be discussed later in this report. Among
the most damaging impacts on the saltmarshes are the effects of the introduced deer.
The deer are responsible for the large number of trails throughout the marsh and
have caused considerable damage in many areas, through grazing, trampling and
digging.
Figure 3-23: Mixed saltmarsh, including Juncus rushes, adjoining mangrove trees (June, 2000). This is a similar view to Figure 3-16.

42
Estuarine Fauna
Cabbage Tree Basin is an important site for many bird species covered by
international treaties (NPWS 2000). It also has a rich aquatic fauna and is among the
most species rich sites within Port Hacking.
The diverse community of fish, particularly juvenile fish, was mentioned as one of the
reasons Cabbage Tree Basin was selected for the fish hatchery (see previous). In this
section, some of the dominant fauna species in the estuarine areas of the Basin are
discussed. Here is a brief explanation of some of the terms used to describe these
communities (see Allaby 1994, for more detail):
• benthic fauna - those animals that live attached to or on the bottom sediments
or on objects on the bottom, definitions vary, but can include:
o epifauna - animals living on the surface of the sea floor, or attached to
other benthic organisms (such as seagrass),
o infauna - animals living in the mud, such as burrowing worms
o meiofauna - microscopic animals living on or near the sediments
o macrofauna - larger animals living on or near the sediments
• littoral fauna - animals along the shoreline down to the limit of the rooted
vegetation
• pelagic - animals (& plants) that occupy the open waters or oceans
For convenience, the section is divided into a discussion of aquatic invertebrates and
fishes in the estuarine environment of the Basin.
Estuarine Invertebrates
Animals that have no backbone, such as crabs, prawns, octopus and snails, are
classified as invertebrates. Among the most obvious invertebrates in the Basin are
the bait nippers, cockles, sea snails and crabs (Figure 3-24), some of which are

43
illustrated and discussed below. There are likely to be hundreds, if not thousands, of
species of invertebrates within the Basin and no definitive list exists and is likely to be
collected for many years. In any case, species composition varies greatly between
seasons, between years and between sites.
Figure 3-24: The small green crab, Parasesarma erythodactyla, is common among the saltmarsh and mangroves of the Basin.
As part of their larger 1980's study of Port Hacking (see Cuff and Tomczak 1983),
CSIRO scientists used Cabbage Tree Basin as an example of an area of low
pollution. As a result, information is available on some of the benthic communities in
the Basin, particularly the macrobenthic invertebrates (Rainer 1981, Rainer and
Fitzhardinge 1981). As the name indicates, macrobenthic invertebrates are large
molluscs, annelid worms and crustaceans, associated with the sediments, and are
very important as food items of fish and birds.
Rainer and Fitzhardinge (1981) sampled benthic fauna in several habitats in the
Basin over a 18 month period in 1977-78. In general, species composition was similar
to other sites around the southeastern Australian coast, although the dominant

44
species were distinct between habitat types. A total of 163 species of benthic fauna
were collected. Photographs of some the more common species of invertebrates
have been included in this report (see Figures 3-24, 3-25 and 3-26).
Rainer and Fitzhardinge (1981) and Rainer (1981) found lowest biomass and diversity
in the central deep basin sites and highest diversity and biomass in the Zostera
seagrass areas. There were 59 species of polychaetes, 47 species of molluscs, 27
species of crustaceans and 30 species from other taxonomical groups. The seagrass
sites, one in Zostera and one in Posidonia, had by far the highest number of species
and highest abundances compared to sand and mud sites. These authors considered
that the central basin sites had limited species diversity due partly to the periodic de-
oxygenation of the deeper waters.
Figure 3-25: A brightly coloured ascidian attached to a mangrove pneumatophore.

45
Figure 3-26: Bait nippers, Trypaea australiensis are harvested throughout the Basin.
Rainer and Fitzhardinge (1981) and Rainer (1981) both attempt to correlate the
species diversity of benthic fauna with the "environmental harshness" of the various
habitat types they sampled. For example, they considered that "the sandflat and
Posidonia sites should thus be least subject to environmental extremes" and, on that
basis, concluded that "there is no simple relationship between environmental
harshness and values of H' (diversity) and J' (eveness of species)" (Rainer and
Fitzhardinge 1981). Unfortunately, these authors were not aware of the large-scale
environmental changes that were obviously taking place during this period, such as
the losses to seagrass beds (see above). In retrospect, none of these sites could
really be considered to have been stable during the time that they were being
sampled.
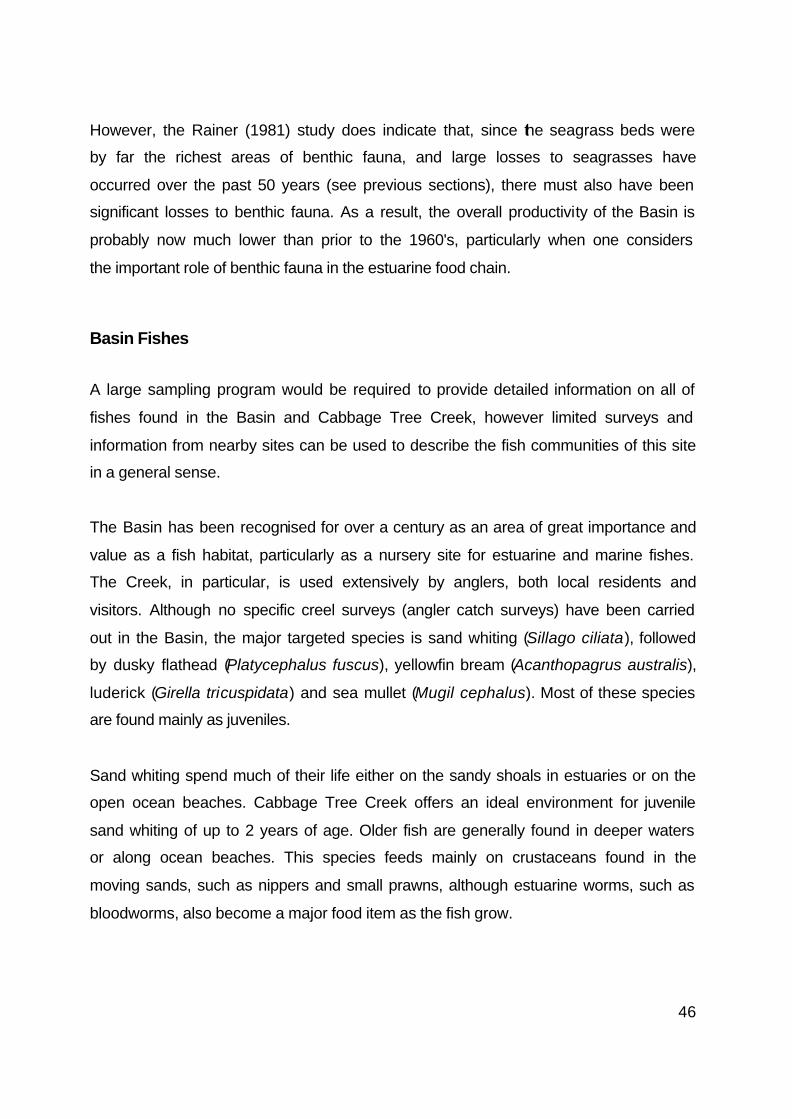
46
However, the Rainer (1981) study does indicate that, since the seagrass beds were
by far the richest areas of benthic fauna, and large losses to seagrasses have
occurred over the past 50 years (see previous sections), there must also have been
significant losses to benthic fauna. As a result, the overall productivity of the Basin is
probably now much lower than prior to the 1960's, particularly when one considers
the important role of benthic fauna in the estuarine food chain.
Basin Fishes
A large sampling program would be required to provide detailed information on all of
fishes found in the Basin and Cabbage Tree Creek, however limited surveys and
information from nearby sites can be used to describe the fish communities of this site
in a general sense.
The Basin has been recognised for over a century as an area of great importance and
value as a fish habitat, particularly as a nursery site for estuarine and marine fishes.
The Creek, in particular, is used extensively by anglers, both local residents and
visitors. Although no specific creel surveys (angler catch surveys) have been carried
out in the Basin, the major targeted species is sand whiting (Sillago ciliata), followed
by dusky flathead (Platycephalus fuscus), yellowfin bream (Acanthopagrus australis),
luderick (Girella tricuspidata) and sea mullet (Mugil cephalus). Most of these species
are found mainly as juveniles.
Sand whiting spend much of their life either on the sandy shoals in estuaries or on the
open ocean beaches. Cabbage Tree Creek offers an ideal environment for juvenile
sand whiting of up to 2 years of age. Older fish are generally found in deeper waters
or along ocean beaches. This species feeds mainly on crustaceans found in the
moving sands, such as nippers and small prawns, although estuarine worms, such as
bloodworms, also become a major food item as the fish grow.

47
Figure 3-27: Several species of leatherjacket are common in seagrass habitats (eg. Toothbrush leatherjacket, Penicipelta vittiger).
Large mixed schools of yellowfin bream and luderick are common in Cabbage Tree
Basin and can often been seen when snorkelling in the vicinity of the Bundeena -
Maianbar footbridge. Both species spawn near the mouth of estuaries and their larvae
settle into the shallow seagrass, algae and mangrove habitats. Juveniles feed in
these areas for up to about 3-6 months in age.
At about 10-12 cm, bream (Figure 3-28) and luderick (Figure 3-29) tend to move to
deeper waters and visit the seagrass and mangrove sites mainly when feeding.
During the winter in particular, sub-adults (15-20 cm) and adults (about >20 cm) will
form large schools and prepare for a spawning migration. These schools can often be
seen in the deep waters of the Basin and about the Bundeena - Maianbar footbridge,
waiting for appropriate conditions to move out of the Creek.

48
Figure 3-28: Juvenile yellowfin bream (Acanthopagrus australis) are common in the Basin.
There are at least two species of flathead found in Cabbage Tree Basin and Creek,
dusky flathead and sand flathead. Dusky flathead is predominantly an estuarine
species which can spend its entire life history in coastal rivers and estuaries. Sand
flathead are an inshore species that is generally less common in estuaries. Both
species are present as juveniles and adults, and tend to use these sites as feeding
areas. They are ambush feeders and find camouflage in the sand and mud, between
seagrass patches and in mangrove creeks and channels.
Finally, another common fish in estuarine habitats is sea mullet, which are particularly
abundant as juveniles. This is another fish species that recruits to shallow water
habitats, such as seagrass beds and mangroves creeks. Adult sea mullet, about 5 to
7 years in age, form dense spawning aggregations, prior to moving to the ocean and
travelling north along the NSW beaches to spawn.
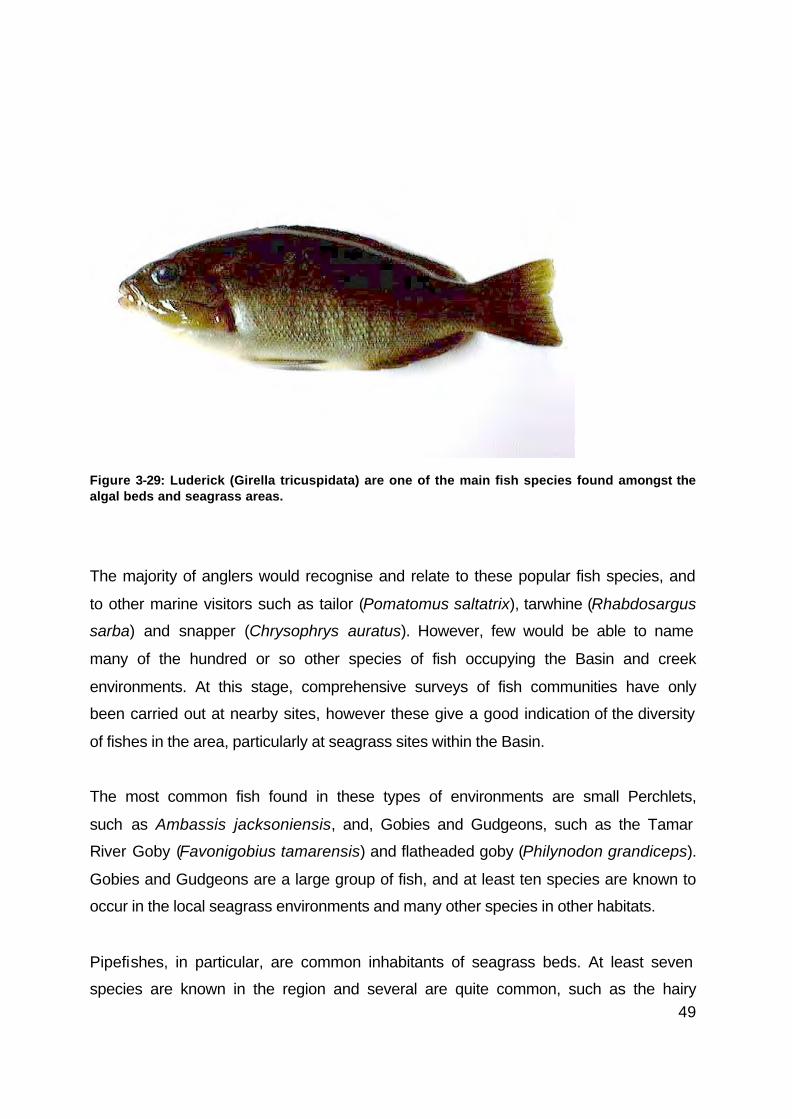
49
Figure 3-29: Luderick (Girella tricuspidata) are one of the main fish species found amongst the
algal beds and seagrass areas.
The majority of anglers would recognise and relate to these popular fish species, and
to other marine visitors such as tailor (Pomatomus saltatrix), tarwhine (Rhabdosargus
sarba) and snapper (Chrysophrys auratus). However, few would be able to name
many of the hundred or so other species of fish occupying the Basin and creek
environments. At this stage, comprehensive surveys of fish communities have only
been carried out at nearby sites, however these give a good indication of the diversity
of fishes in the area, particularly at seagrass sites within the Basin.
The most common fish found in these types of environments are small Perchlets,
such as Ambassis jacksoniensis, and, Gobies and Gudgeons, such as the Tamar
River Goby (Favonigobius tamarensis) and flatheaded goby (Philynodon grandiceps).
Gobies and Gudgeons are a large group of fish, and at least ten species are known to
occur in the local seagrass environments and many other species in other habitats.
Pipefishes, in particular, are common inhabitants of seagrass beds. At least seven
species are known in the region and several are quite common, such as the hairy
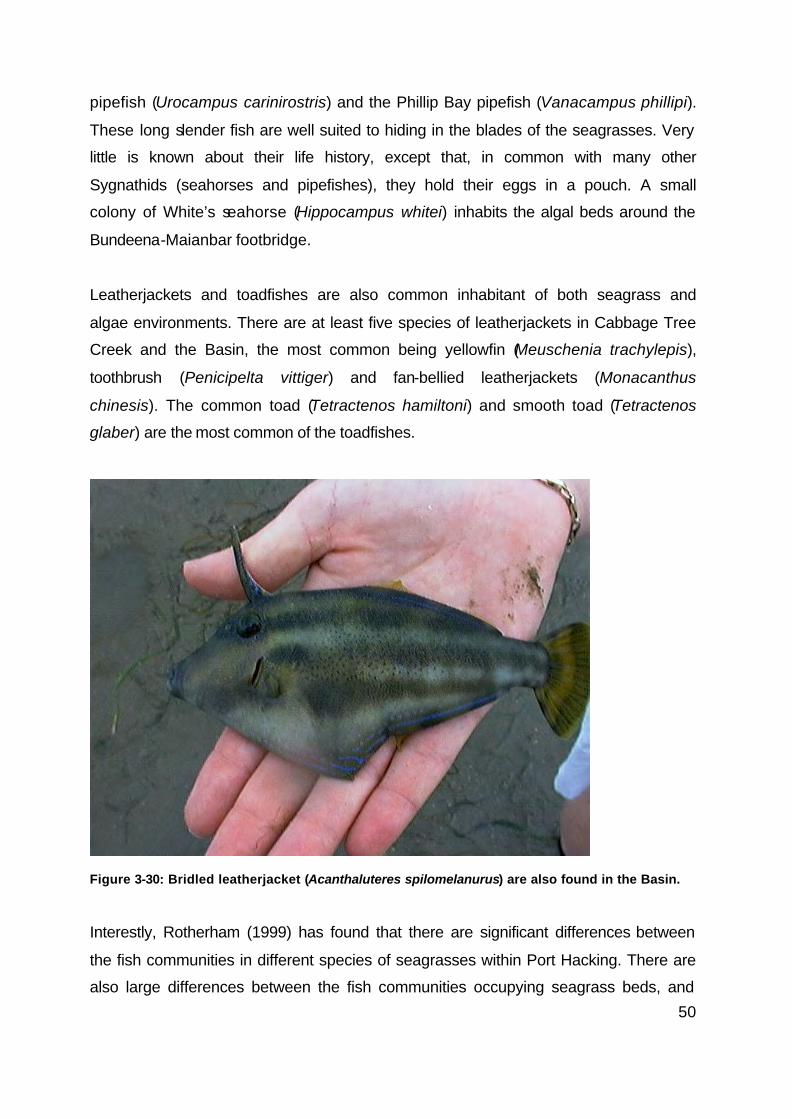
50
pipefish (Urocampus carinirostris) and the Phillip Bay pipefish (Vanacampus phillipi).
These long slender fish are well suited to hiding in the blades of the seagrasses. Very
little is known about their life history, except that, in common with many other
Sygnathids (seahorses and pipefishes), they hold their eggs in a pouch. A small
colony of White’s seahorse (Hippocampus whitei) inhabits the algal beds around the
Bundeena-Maianbar footbridge.
Leatherjackets and toadfishes are also common inhabitant of both seagrass and
algae environments. There are at least five species of leatherjackets in Cabbage Tree
Creek and the Basin, the most common being yellowfin (Meuschenia trachylepis),
toothbrush (Penicipelta vittiger) and fan-bellied leatherjackets (Monacanthus
chinesis). The common toad (Tetractenos hamiltoni) and smooth toad (Tetractenos
glaber) are the most common of the toadfishes.
Figure 3-30: Bridled leatherjacket (Acanthaluteres spilomelanurus) are also found in the Basin.
Interestly, Rotherham (1999) has found that there are significant differences between
the fish communities in different species of seagrasses within Port Hacking. There are
also large differences between the fish communities occupying seagrass beds, and

51
those on sandy shoals, in algae habitats, in rocky reef sites and in deepwater
locations, such as the central Basin.
There is no doubt that changes to the balance of habitats over the past 50 years, as
described in the previous sections, would have had a major impact on the types of
fish communities now found in Cabbage Tree Creek and Basin. The area is now
dominated by sandy shoals and narrow creeks, favouring open water fish, such as
sand whiting and flathead. Fifty years ago, the area was dominated by shallow
seagrass beds (see previous sections) and would have been a very significant fish
nursery area, particularly for species such as yellowfin bream, luderick, sea mullet
(and other mullets), tarwhine, perchlets, gobies, pipefishes, possibly snapper and
others.
In terms of the present fishing activities, these are mainly limited to recreational
angling, and the vast majority of catches are of juveniles of the popular angling
species. This is well known from surveys throughout NSW and at least one carried
out in Port Hacking. Port Hacking has been closed to commercial fishing since 1880.
Figure 3-31: Recreational fishing is a common activity in the Basin and creek.

52
SECTION 4: CONCLUSIONS & RECOMMENDATIONS
Introduction
Information has been presented in this report on the recent history of the Basin and
an inventory of its estuarine resources. This information has been gathered to help in
the consideration of some of the possible options for the management of Cabbage
Tree Basin and the associated waterway.
Coastal and estuary management has always been a difficult issue for all
governments, as they involve the management of a large number of natural resources
and of many forms of catchment development, such as agricultural, residential and
industrial. Usually many different arms of government, often with poor co-ordination
and direction, manage each of the environmental issues separately.
The principle that resources, such as water, should be managed on a whole-of-
catchment basis was adopted by the NSW Government over the last decade, and is
known as Total Catchment Management (TCM). This has developed further in recent
years, in that it is now generally considered that the management of natural
resources, such as fisheries, water, coastal lands, and so on, should not only be on a
total catchment basis, but should also be integrated. This principle is called Integrated
Catchment Management (ICM).
Many governments, including the NSW Government, have developed systems to help
create an integrated approach. This is usually achieved through a co-ordinating body
with some overall responsibilities or, at least, an advisory function to government.
Management Responsibilities
The management of the environment of Cabbage Tree Basin and Creek is the role of
the NSW Government, acting through a number of agencies. For example, the

53
following paragraphs list several of these agencies and some of their responsibilities,
as they relate to the Basin.
NSW National Parks and Wildlife Service (NPWS). The NPWS, through the
management of the Royal National Park (RNP), has responsibility for the
management of much of the catchment the Basin and the majority of flora and fauna,
as well as the heritage and archaeological values. NPWS has responsibility for “the
management of the beds” of Cabbage Tree Basin, including “any structures attached
to them” (NPWS 2000).
NSW Fisheries (NSWF). The NSWF has responsibility for the management of the
aquatic fauna, other than mammals and birds, and the marine vegetation, including
mangroves. While NPWS owns much of the saltmarsh and mangrove areas, NSWF
has several regulations affecting their management.
NSW Waterways Authority. The Waterways Authority controls boating activities
(including boat discharges) and moorings in Port Hacking, including the Cabbage
Tree Basin and Creek.
NSW Department of Land and Water Conservation (NSW DLWC). DLWC owns
any Crown Land associated with the Basin, which probably includes some of the sea-
floor and any exposed sand bars. They also have responsibility over dredging and
reclamation activities, and any foreshore improvement works.
NSW Environmental Protection Authority (NSW EPA). The EPA have general
responsibility for water pollution issues associated with the Basin and the Creek.
Sydney Water. Sydney Water constructed the Bundeena-Maianbar footbridge and
manage the water pipes and future sewerage pipes that transverse the catchment.
Sutherland Shire Council (SSC). SSC is responsible for environmental planning and
management of some areas within the catchment of the Basin, particularly the
residential and road areas in sections of Maianbar.

54
To facilitate an integration of management responsibilities in coastal catchments, the
NSW Government has developed a NSW Coastal Policy, established the NSW
Coastal Council and set up a system of Catchment Management Committees (CMCs)
and Estuary Management Committees (EMCs). These committees were originally
set up for major catchments, and for many sub-catchments, throughout NSW.
However, this structure proved difficult to service and left many small water bodies
outside the management system. To solve these problems, a new catchment
management structure was created in December 1999, which included the
establishment of a system of Catchment Management Boards with larger areas of
responsibility.
The Basin, Cabbage Tree Creek and Port Hacking in general, are now within the
jurisdiction of the Southern Sydney Catchment Management Board.
The catchment of Cabbage Tree Basin and Creek is predominantly within the Royal
National Park and is managed within an established management plan (NPWS 2000).
This report deals with management issues that are mainly outside the scope of that
plan and that, in some cases, would require a co-operative approach of several
agencies and governments to resolve. The management issues discussed relate to
the estuarine wetlands, to the fish and fisheries, and to boating access.
Heritage values
Aboriginal heritage
As reported previously, there are a number of interesting sites containing Aboriginal
artefacts throughout the Basin catchment and some of these, particularly the artwork,
are of international significance. However, surprisingly little is known about the
Dharawal people’s occupation of this region and no systematic survey or research
into Aboriginal sites in the Royal National Park has ever been undertaken (NPWS
2000).

55
NPWS maintains an Aboriginal Sites Register and has responsibility for the protection
and preservation of sites, and manages the Aboriginal heritage in close consultation
with local Aboriginal people.
The RNP Management Plan (NPWS 2000) lists the protection, research and
promotion of Aboriginal history and culture as a high priority. Several important sites
within the Basin’s catchment require some immediate attention in terms of removing
existing rubbish, graffiti and evidence of past vandalism. Some consideration should
also be given to possible avenues to promote knowledge about this particular site,
given the high usage by visitors and relatively easy access.
It is recommended that the management of the Aboriginal heritage of the Basin
environment be given a high priority within the context of actions contained in
the RNP’s Plan of Management.
Fish hatchery
The history of the fish hatchery in the Basin precinct represents an interesting facet to
the overall heritage values of the RNP and to the history of NSW fisheries and fishing
industries. Unfortunately, at this stage, there appears to be no remains of buildings,
objects or artefacts that have survived or been preserved. The history of the hatchery
and grow out pens in the Basin, which operated between about 1900 and 1914, is not
well documented and is confused with the history of the hatchery built in Gunnamatta
Bay in 1911. Cabbage Tree Basin and Port Hacking are also of historical interest as
possibly the first area closed permanently to commercial fishing activities, such as
netting and trawling.
It is recommended:
• That the NPWS consider listing of the precinct of the Basin on the
Historic Places Register, in that it was the first marine fish hatchery and
56
marine field research station in Australia, in that the estuarine wetlands
have historical scientific values and in being part of the first area
reserved from commercial fishing.
• That further research and a review of the records and documentation
held by several agencies, such as NPWS, NSWF and DLWC be
undertaken to allow a proper assessment of the historical significance of
the Basin precinct.
Natural values
Major management issues affecting the natural values of Cabbage Tree Basin
include:
• Introduction of the invasive alga, Caulerpa taxifolia.
• Options for rehabilitation due to:
o Extensive losses to seagrass beds,
o Changes to mangrove communities,
o Damage to saltmarsh communities (particularly from the deer).
Eradication of Caulerpa taxifolia in the Basin can only be achieved as part of a larger
plan to control the species in Port Hacking as a whole. Every effort should be made to
achieve eradication, if it is possible. Once established, Caulerpa taxifolia has the
potential to completely replace the seagrass beds in Port Hacking and have flow-on
effects to the fish that rely on these habitats.
It is recommended that research and management activities aimed at
eradicating Caulerpa taxifolia from Port Hacking, and/or reducing the species’
impact, be strongly supported by all government agencies.
Rehabilitation of the Cabbage Tree Basin estuarine wetlands was suggested as a
possible action by Williams and Meehan (2000), mainly in respect to the large losses

57
to seagrass beds that have been recorded. However, these losses are now thought to
be due a large influx of sand since the late 1950’s, which has also been responsible
for the expansion of mangrove areas.
Actions to remedy the loss of seagrass and increase in mangroves may be possible
but would be extremely difficult. It remains very important to protect existing areas
and encourage natural recovery. The main damaging activity that requires some
control is the open access allowed to motorized watercraft in the Basin. The shallow
sand shoals, the remaining seagrass beds and the poor access under the existing
footbridge make the channel leading to the Basin rarely suitable for these type of
watercraft.
It is recommended:
• That remedial and management work is carried out to reduce the damage
to the Basin saltmarshes by:
o Establishing a single marked track for access across the saltmarsh
with accompanying interpretive signage
o Continuing to control and eradicate the deer, particularly the large
herd that is destroying these important wetlands
• That, in order to protect the remnant seagrass beds in Cabbage Tree
Basin and encourage recovery, access by motorised water craft be
restricted to areas north of the Bundeena-Maianbar footbridge.
General
Port Hacking has been closed to commercial fishing since the 1880’s and represents
what is essentially the first marine or estuarine area reserved in Australia. The Port
also contains the Shiprock Marine Reserve, an area of just over 300 ha, where fish
and marine vegetation have been protected. For at least the past decade, several
58
proposals for a marine park covering the shore of the RNP have been suggested
(e.g., see Schoer 1993), but have involved large unpopular fishing closures.
Unfortunately, the existing long standing commercial fishing closure is not recognised
as a marine reserve, even though it offers an equivalent degree of protection as is
offered to many established marine reserves and parks. The Basin, south of the
footbridge, is subject to relatively light recreational fishing activities, is wholly within
the RNP and has a unique blend of heritage, scientific and natural values.
It is recommended that consideration be given to formally establishing Port
Hacking as a Marine Park.
As part of that proposal, part of Cabbage Tree Basin (south of the Bundeena-
Maianbar footbridge) should be considered as a marine sanctuary area, closed
to all fishing and collecting activities, as well as to motorised forms of boating.
Port Hacking is well recognised for its beauty and natural values, and Cabbage Tree
Basin and Creek represents a special area within the Port. Careful management will
be required to assist in the protection and rehabilitation of Cabbage Tree Basin, and it
is hoped that the preparation of this Report will highlight some of the issues that might
need to be addressed by Government and community groups.

59
SECTION 5: REFERENCES CITED
Allaby, M. 1994. The concise oxford dictionary of ecology. Oxford University Press,
Oxford, Great Britain.
Clarke, P.J. and Jacoby, C.A. 1994. Biomass and above-ground productivity of salt-
marsh plants in south-eastern Australia. Australian Journal of Marine and Freshwater
Research, 45: 1521-1528.
Collins, M.I. 1921. On the mangrove and saltmarsh vegetation near Sydney, New
South Wales, with special reference to Cabbage Tree Creek, Port Hacking.
Proceedings of the Linnean Society of NSW, XX: 376-392.
Cridland, F. 1924. The story of Port Hacking, Cronulla and Sutherland Shire. Angus
and Robertson, Sydney (New Edition printed in 1959). 198 pp.
Cuff, W.R. and Tomczak Jr, M. 1983. Synthesis and modelling of intermittent
estuaries. A case study from planning to evaluation. Lecture Notes 3. Berlin, Springer
Verlag.
Harper, W.R. 1899. Results of an exploration of aboriginal rock shelters at Port
Hacking. Proceedings of the Linnean Society, XXIV, 322-332.
NPWS. 2000. Royal National Park, Heathcote National Park and Garawarr State
Recreation Area, Plan of Management. NSW National Parks and Wildlife Service,
Sydney, Australia.
PWD (1986). Port Hacking marine delta management options. PWD Report 86013,
Sydney, Australia.
Rainier, S. 1981. Temporal patterns in the structure of macrobenthic communities of
an Australian estuary. Estuarine and Coastal Shelf Science, 13: 597-620.
60
Rainer, S.F. And Fitzhardinge, R.C. 1981. Benthic communities in an estuary with
periodic deoxygenation. Australian Journal of Marine and Freshwater Research, 32:
227-243.
Schoer, G. Fighting for marine conservation, how one NPA branch is doing it.
National Parks Journal, December 1993. NSW National Parks and Wildlife Service,
Sydney.
West, R.J., Thorogood, C.A., Walford, T.R. and Williams, R.J. 1985. An estuarine
inventory of New South Wales, Australia. Fisheries Bulletin 2, Department of
Agriculture and Fisheries, NSW.
Williams, R.J. And Meehan, A.J. 2000. A history of change to the estuarine
macrophytes of Port Hacking. NSW Fisheries (Australia). NSW Fisheries Final Report
Series No. 25.

61
SECTION 6: ABSTRACTED LITERATURE REVIEW
Albani, A. D., P. C. Rickwood, et al. (1983). Geological aspects of the Port Hacking Estuary. Synthesis and Modelling of Intermittent Estuaries. A Case Study from Planning to Evaluation. W. R. Cuff and M. Tomczak, , Jr.: 17-26. The geology of Port Hacking, a small estuary on Australia's east coast, is reviewed and results of a survey based on continuous seismic profiling for the determination of the depth of bedrock are reported. This depth is between 40 and 60 m below the present bottom of the highly silted estuary. An estimate is derived for the amount of construction sand that could be dredged from Port Hacking. Allen, K. R. (1983). Introduction to the Port Hacking Estuary Project. Synthesis and Modelling of Intermittent Estuaries. A Case Study from Planning to Evaluation. W. R. Cuff and M. Tomczak, , Jr.: 1-6. Estuaries are exposed to a variety of human activities and are susceptible to stress resulting from these activities. In subtropical areas, many estuaries are affected by freshwater inflow only occasionally and often quite irregularly. The Port Hacking Estuary in south-east Australia falls into this category. It was studied by the CSIRO Division of Fisheries and Oceanography during 1973-78. Anon (1985). “Gregory's Sydney waterways guide.” Universal Press, Sydney. Provides descriptions, photographs and area maps of Sydney waterways. Outlines the hazards of boating in some waters around Sydney together with details about places of historic and scenic significance. The safety section of this book will assist readers to gain a sound understanding of the regulations prescribed by the Maritime Services Board and the NSW Water Police. The information given covers the following areas: the Hawkesbury system, Pittwater, Brisbane Waters, Broken Bay to Cowan Creek, Sydney Harbour, Lane Cove, North Harbour, Middle Harbour, Botany Bay, Cooks River, Georges River and Port Hacking. This book is intended for boating enthusiasts, aiming at encouraging them to enjoy the waterways and reducing the risks of boating accidents. Anon (1989). “Major study into stormwater pollution.” Aquarian 04(51): 7. A major study of stormwater pollution to determine its contribution to the problem of beach pollution will be conducted by the New South Wales, Water Board. It will begin with mapping of all stormwater drainage and catchment areas which discharge into the ocean between Port Hacking and Palm Beach NSW. Atkinson, G. (1984). “Erosion damage following bushfires.” Journal of soil conservation, New South Wales 40(1): 4-9. A case of study was made of the Royal National Park south of Sydney when wildfire in a bushland catchment was followed by heavy rains. Some of the consequences within 10 weeks of the fire were erosion of topsoil to 48 tonnes/ha, removal of soil nutrients released in soluble form during the fire, removal of seed released by plants in response to the fire, changes in species composition of the bush, severe erosion of fire trails and walking tracks, flooding of homes and services as a result of higher runoff rates in the catchments, blockage of urban drainage systems by ash debris and extensive sedimentation downstream in Port Hacking (A). Australian, M. (1994). “Post impact monitoring study in subtidal areas dredged for the third runway in Botany Bay: interim report.”. The recovery status of benthic infauna in areas of Botany Bay dredged for runway construction was monitored on both sandy and muddy sites. Reference sites in Port Hacking and Pittwater were also monitored. The sampling methodology is outlined. While some changes in fauna may be seasonal, impacted sites show lower abundances of organisms than the reference sites in the first samples. It is not possible to assess recovery from the data at this stage. (JD)
62
Batley, G. E. and D. Gardner (1978). “A study of copper, lead and cadmium speciation in some estuarine and coastal marine waters.”. The potential of a heavy metal speciation scheme to reflect differences in metal distributions within a water mass was evaluated in a study of soluble copper, lead and cadmium speciation in water samples from five stations in the Port Hacking Estuary (Australia) and one coastal Pacific Ocean station. The observed metal distributions were found to be consistent with the other measured physical and chemical properties of the sampled waters. In all samples, the percentages of metals associated with colloidal matter were high, amounting to 40-60% of total copper, 45-70% of total lead and 15-35% of total cadmium. The scheme was used to follow changes in metal speciation under different sample storage conditions. Storage at 4-degree-C in polythene containers was shown to prevent losses or changes in speciation of the metals studied. Battaglene, S. C. and R. B. Talbot (1994). “Hormone induction and larval rearing of mulloway, Argyrosomus hololepidotus (Pisces: Sciaenidae).” Aquaculture 126(1-2): 73-81. Pond-held mulloway (Argyrosomus hololepidotus) from Port Hacking, New South Wales, were induced to spawn by injecting human chorionic gonadotropin (hCG) at 1000 IU/kg for females and 250 IU/kg for males. Two pairs of fish were stripped, and fertilised eggs were incubated at 23.5 plus or minus 1 degree C. Fecundity was high with an estimated 900,000 and 1,042,000 eggs collected from each female. At hatch, larvae averaged 2.25 plus or minus 0.09 mm TL (mean plus or minus s.d.) with a yolk sac of 0.88 plus or minus 0.08 mm and an oil globule of 0.27 plus or minus 0.03 mm. Feeding and initial swim bladder inflation started between day 3 and 4 after hatch. Metamorphosis started when larvae reached 12 mm at 23 days of age, and was complete by day 34 when larvae were 15-26 mm. Larvae with functional swim bladders (> 70% by day 11) grew faster than those without swim bladders. Cannibalism of smaller fish, many without swim bladders (4.2 plus or minus 0.06 mm), occurred from day 18. Fish were offered live food to day 68, supplemented with finely chopped pilchards and pellets from day 38. From day 106 to day 180 fish were feeding solely on pellets. Juveniles grew to mean weight of 21.0 plus or minus 0.7 g and a mean length of 121.5 plus or minus 1.3 mm in 180 days. These results indicate that A. hololepidotus has potential for hatchery production. Beer, T. (1983). “Australian estuaries and estuarine modelling.” Search 14(5-6): 136-140. Various classifications of estuaries are discussed and then, by reference to model studies of Australian estuaries, the state of the art of estuarine modelling is evaluated. Studies discussed are the Westernport Bay and Gippsland Lakes studies in Victoria, the Blackwood River and Peel Inlet studies in Western Australia and the Port Hacking study in New South Wales. The solution of Young (1978), which involved the recursive updating of the model as new data becomes available, together with Young's revised methodology for the modelling of environmental systems, is endorsed as the solution to the problem of data collecting vs modelling. Bell, J. D., N. Quartararo, et al. (1991). “Growth of snapper, Pagrus auratus , from south-eastern Australia in captivity.” N.Z. J. Mar. Freshwat. Res. 25(2): 117-121. This study aimed to determine whether the relatively slow growth of wild Pagrus auratus in south-eastern Australia can be increased in captivity to a rate acceptable for aquaculture. Juvenile snapper from Port Hacking, New South Wales (34 degree 47'S) were reared at ambient water temperatures. The fish were fed on a dry, sinking pellet with 42% protein. At the start of the trial in April 1989, the snapper had a mean fork length (FL) of 121 plus or minus 11 mm SD, an average weight of 50 g, and an estimated age of 8 months. After 12.5 months their mean FL was 249 plus or minus 15 mm and their mean weight was 403 plus or minus 70 g. Data indicate that, like the reproductively isolated population in Japan, growth of Pagrus auratus from Australasia can be rapid enough for aquaculture, and that there is potential to increase growth rate further. Britton, G. W., B. M. Druery, et al. (1985). “Flow measurement and data acquisition, Port Hacking, NSW, Australia.” International Association for Hydraulic Research Congress, 21st. A system of high resolution, dynamic water level recorders and current meters has been deployed to study the hydrodynamic and sedimentary processes of the shallow marine delta of Port Hacking. Real time, on- site, data analysis techniques are discussed to show how data storage demands can be limited but flexibility maintained by retaining significant blocks of raw data for off site detailed analysis. Discussion of the data concentrates on nonlinear wave features and the fi t of vocoidal nonlinear wave theory (A).

63
Britton, G. W., B. M. Druery, et al. (1985). Flow measurement and data acquisition, Port Hacking, N.S.W., Australia. Preprinted Proceedings: 21st Congress, International Association for Hydraulic Research, Melbourne, 19 23 August 1985. Volume 5. Theme D: Flow Measurement and Data Acquisition.: 101-110. High resolution dynamic water level recorders and current meters have been installed to assist investigations into the hydrodynamic and sedimentary processes of Port Hacking. Real time data analysis is used to limit on-site data storage demands but maintain flexibility for off-site detail analysis. Water depths are shallow and tidal currents strong, and non-linear wave effects are a feature of the data. Non-linear wave theories fit some aspects of the data but further refinement is necessary. Britton, G. W. and J. M. Floyd (1985). “Data acquisition system at Port Hacking, NSW and interpretation of data for storms of June and July 1984.”. A system of high resolution, dynamic water level recorders and current meters has been deployed to assist in a study of the hydrodynamic and sedimentary processes of the shallow marine delta in Port Hacking, NSW. The on-site, real time, data analysis techniques are discussed to demonstrate the manner in which data storage demands have been reduced but flexibility maintained by retention of selected blocks of new data for more rigorous off-site analysis. A preliminary interpretation of the data associated with storms experienced in June and July 1984 is presented, in particular the degree of wave penetration into Port Hacking, storm surge levels and the magnitude of beach erosion. Bulleid, N. C. (1983). The nutrient cycle of an intermittently stratified estuary. Synthesis and Modelling of Intermittent Estuaries. A Case Study from Planning to Evaluation. W. R. Cuff and M. Tomczak, , Jr.: 55-75. The influence of stratification on the oxygen regime and nutrient concentrations was examined over four years in South West Arm, Port Hacking, N.S.W. affected by occasional heavy freshwater run-off. The rate of detrital input to the sediment was measured using sedimentation tubes, and oxygen flux across the sediment-water interface was estimated from the oxygen consumption of intact sediment cores. Following the onset of stratification, oxygen concentration in the bottom water decreased, and the concentrations of nitrate, phosphate, silicate and ammonium all increased. The major source of these nutrients was planktonic detritus recently settled from the water column, although over short periods terrestrial material (following torrential rain) and the sediment nutrient pool (during anoxic conditions) were also important. The rate of nitrogen remineralization at the sediment surface, on a mean annual basis, was found to be 40% of that required by phytoplankton, which demonstrates the important link between benthic recycling and the productivity of the water column. Burchmore, J. J., D. A. Pollard, et al. (1984). “Community structure and trophic relationships of the fish fauna of an estuarine Posidonia australis seagrass habitat in Port Hacking, New South Wales.” Aquatic botany 18(03043770): 71-87. The fish community present in an area of sea grass meadow dominated by Posidonia australis Hook f. was quantitatively sampled during 2 springs and 2 autumns by enclosure and poisoning with rotenone. Thirty-nine species were collected and these were classified into permanent residents (50% of total numbers), temporary residents (30%) and transients (20%). Approximately 30% of the total number of fish collected belonged to species of some economic importance. Species diversity indices were calculated and compared between seasons, but no obvious differences were found. Shannon's H1 (heterogeneity index) ranged from 2.11 to 2.56, Gleason's d (richness index) ranged from 8.08 to 5.05, and scaled H (evenness index) ranged from 0.59 to 0.74. Agglomerative polythetic classification of the average diets of all species collected indicated 7 basic feeding groups within the community. Many species preferred crustaceans as food and several species consumed sea grass. Upper water column dwellers were mainly microcrustacean feeders, canopy dwellers fed primarily on crustaceans, sea grass and algae. Benthic dwellers consumed mainly crustaceans and polychaetes (A).
64
Burchmore, J. J., D. A. Pollard, et al. (1985). “Community structure and trophic relationships of the fish fauna of an estuarine Posidonia australis seagrass habitat in Port Hacking, New South Wales.”. The fish community present in a seagrass meadow dominated by Posidonia australis was quantitatively sampled and the results detailed in this report. Thirty-nine species were collected and classified into permanent residents, temporary residents and transients. Around 30% belonged to species of economic importance. No obvious differences were found in species diversity indices between seasons. An analysis of stomach contents revealed seven basic feeding groups. Many species preferred crustaceans and several consumed seagrass. (Au, JC) Clarke, P. J. and C. A. Jacoby (1994). “Biomass and above ground productivity of saltmarsh plants in south eastern Australia.” Australian journal of marine and freshwater research 45(8): 1521-1528. The above ground biomass of three dominant salt marsh vascular plants, Juncus kraussii, Sarcocornia quinqueflora and Sporobolus virginicus, was measured to assess both spatial and temporal variation and to provide baseline data. Additionally the culm dynamics of the rush J. kraussii were measured so that above ground productivity could be estimated. No distinct seasonal patterns were detected in above ground biomass in J. kraussii and culms are replaced annually, so standing crop approximated annual above ground productivity. Above ground biomass of the decumbent perennial grass S. quinqueflora and the procumbent perennial chenopod S. virginicus showed no consistent spatial or temporal trends (A). Coleby, D. (1987). “Tracing sand movements in Port Hacking.” Nuclear spectrum 3(1): 16-17. Nearly 3 decades of Australian Atomic Energy Commission radioisotope tracing of sands in the marine environment has provided valuable information about how fast sand moves, in what directions, how far and in what quantities. The latest of these tracking studies has assisted in defining the management options for Port Hacking NSW. Port Hacking, a major recreational feature of Sutherland Shire, consists of river and marine sands and the sands have placed severe constraints on the use of the Port as well as curtailing the ferry service. Cuff, W. R. (1983). An evaluation of the Port Hacking Estuary Project from the viewpoint of applied science. Synthesis and Modelling of Intermittent Estuaries. A Case Study from Planning to Evaluation. W. R. Cuff and M. Tomczak, , Jr.: 273-292. The Port Hacking Estuary Project, a model-guided study of the flow of carbon through a small Australian estuary, is reviewed from the viewpoint of applied science. The Project did not reach its goal of constructing a predictive dynamic model of carbon flow in the South Wales Arm of Port Hacking and key ambiguities in project design and execution that inhibited progress are identified. It is suggested that the model structure chosen to be compatible with time and manpower constraints did not allow sufficient mechanistic contribution to attract the support of the experimental participants. It is suggested that more emphasis is made on the data that has been collected from the specific ecosystem: in particular, periodic syntheses of the available data set not supplemented by data of unknown reliability. Cuff, W. R. (1983). An evaluation of the dynamic information for South West Arm, Port Hacking. Synthesis and Modelling of Intermittent Estuaries. A Case Study from Planning to Evaluation. W. R. Cuff and M. Tomczak, , Jr.: 233-258. Chemical and biological studies were conducted to obtain data for incorporation into a dynamic model of the flow of carbon through South West Arm. This paper represents an attempt to synthesize that dynamic information: the functions and parameters were based on studies in South West Arm, rather than on the literature. This attempt to study an incomplete set of data of the sort required to make a dynamic model of the flow of carbon (or other chemical species) through the environment is novel, or at least such an attempt has not yet been reported in the literature. The study shows that synthesis of dynamic information can be usefully done, using a procedure analogous to that used in synthesizing an incomplete set of static information in a budget. The value of such a synthesis is that it organizes currently available information, and hence should make a useful contribution to further planning for research or ecosystem management.
65
Cuff, W. R., R. E. Sinclair, et al. (1983). A carbon budget for South West Arm, Port Hacking. Synthesis and Modelling of Intermittent Estuaries. A Case Study from Planning to Evaluation.: 193-232. A multidisciplinary study of the structure and dynamics of a small ( similar to 78 ha) Australian marine embayment (South West Arm of Port Hacking, New South Wales) was conducted during 1973-1978. Compatible data were obtained by studying processes in terms of the flow of carbon. The carbon budget developed in this paper represents an attempt at a synthesis of that information. The chemical and biological species contained in each of 10 compartments are described; as data allows, the average carbon mass within each compartment and the average flow rates between the compartments, with variances, are estimated. This information is used to piece together the distribution of carbon among the compartments and to ascertain the major flow paths of carbon into, within, and out of South West Arm. Cuff, W. R. and M. Tomczak, Jr. (1983). Synthesis and modelling of intermittent estuaries. A case study from planning to evaluation. Lect. Notes Coast. Estuar. Stud. The book reports on the findings of the Port Hacking Estuary Project Abstracts of the 17 chapters are cited individually in this issue of ASFA. Druery, B. M. and M. G. Geary (1985). “The measurement of sediment transport in NSW estuaries.”. The paper discusses methods used by the Public Works Department to assess the tidal transport of medium grained sand in the estuaries of NSW. Methods vary from qualitative to quantitative and comprise; sedimentology, coring and radiometric dating, delta front progradation, photogrammetry, bedforms and radioisotope tracing. These methods are discussed within the context of a major study of sedimentary processes in Port Hacking. The relative merits of each are examined from the viewpoint of cost, limitations and effectiveness. Dunstan, D. J. (1990). “Some early environmental problems and guidelines in New South Wales estuaries.”. In the 1960s and 70s developments in estuaries in New South Wales were largely uncontrolled, and this resulted in many conflicts and ultimately in new legislation. Estuary management needs to strike a balance between mangrove beds and other uses. This article suggests that controlled dredging may be useful in restoring tide patterns and water quality and that selective pruning of mangroves may be appropriate. (Au, JD) Ecology Lab Pty, L. and C. Federal Airports (1993). “A draft quantitative study of the impact of construction of a third runway at Mascot on Posidonia seagrasses in Botany Bay: Towra Point.”. The results of a survey of the seagrass beds off Towra Point are presented. Posidonia, Zostera and Halophila species were identified. Data were collected on the percentage cover, shoot density, leaves per shoot, leaf length, leaf width and epiphyte biomass. Two other sites at Port Hacking and Pittwater were also sampled. While generally similar to the reference sites, the Towra Point seagrass beds are more fragmented, with more Zostera. This study provides baseline data to enable the seagrass beds to be monitored following construction of the runway. (JD) Giles, M. S. (1983). Primary production of benthic micro-organisms in South West Arm, Port Hacking, New South Wales. Synthesis and Modelling of Intermittent Estuaries. A Case Study from Planning to Evaluation. W. R. Cuff and M. Tomczak, , Jr.: 147-166. Net photosynthetic incorporation of dissolved inorganic carbon into the micro-organisms of shallow benthic areas of South West Arm, Port Hacking, New South Wales was measured in situ and in the laboratory. Methods for calculating productivity from continuously recorded light readings using mathematical models based on laboratory studies were evaluated. Three sediment types were investigated and shown to have incorporation rates which varied between 130 and 310 mg of carbon per square metre per day. High levels of carbon uptake by incubations done in the dark and the concentration of dissolved inorganic carbon in sediment interstitial waters were also investigated.
66
Godfrey, J. S. (1983). Tidal flushing and vertical diffusion in South West Arm, Port Hacking. Synthesis and Modelling of Intermittent Estuaries. A Case Study from Planning to Evaluation. W. R. Cuff and M. Tomczak, , Jr.: 27-54. South West Arm (SWA), a small Australian estuary, is hydrodynamically a small fjord with highly intermittent river discharge; tidal inflow sinks into it in a thin turbulent sheet. An existing water quality model is adapted to the situation in SWA. Application to the response of SWA to a rainstorm results in energy conversion efficients of 0.025 - 0.05. Application to spring warm-up in SWA needed slightly lower conversion efficiencies - around 0.025 - to get satisfactory results; but these efficiencies are in any case uncertain to within a factor of 3, due to lack of knowledge of the kinetic energy of the inflow. Order-of-magnitude estimates for dissolved oxygen show that (a) during spring warm-up, DO concentration at the bottom of SWA is principally a balance between eddy diffusion and biological consumption; and (b) estimates of the rate of diffusion through 13 m depth, using diffusivities calculated from observed temperature structure, agree well with measured consumption rates. Oxygen response to a rainstorm is modelled reasonably well. Gray, C. A. (1991). “Temporal variability in the demography of the palaemonid prawn Macrobrachium intermedium in two seagrasses.” Mar. Ecol. Prog. Ser. 75(2-3): 227-237. Spatial and temporal variations in the demography of the palaemonid prawn Macrobrachium intermedium were investigated in Port Hacking, New South Wales, Australia. Populations in 2 adjacent seagrass meadows, Zostera capricorni and Posidonia australis , were sampled monthly over 3 yr (1976 to 1978) using a small beam trawl. For most population variables there were no consistent differences between meadows and both meadows showed similarly variable temporal changes. Neither meadow consistently supported large populations nor recruited more juveniles. In 1976 abundance was greater in Zostera than Posidonia , the opposite occurred in 1977, whilst there was no difference in 1978. Seasonal and annual changes in abundances were basically similar in both populations and repeated in all 3 yr. Abundances peaked between spring and autumn and were smallest in winter. In both meadows, abundances were greater in 1976 and 1978 than in 1977. Gray, C. A., N. M. Otway, et al. (1992). “Distribution and abundance of marine fish larvae in relation to effluent plumes from sewage outfalls and depth of water.” Mar. Biol. 113(4): 549-559. Fish larvae were sampled in and below three separate sewage plumes associated with the cliff-face (shoreline) outfalls at North Head, Bondi and Malabar, and at three control (non-plume) sites located > 8 km away from the sewage outfalls, at Long Reef, Port Hacking and Marley Beach, in nearshore waters off Sydney, south-eastern Australia. Samples were collected at the surface and at 20 m depth during three periods: December 1989, April/May 1990 and August/September 1990. In December 1989, a greater number of taxa were caught at both depths at the plume sites compared to the control sites, but this did not occur during the other two sampling periods. Similarly, in April/May 1990, greater numbers of the clupeid Hyperlophus vittatus but fewer anthiines were caught at both depths near the outfalls (plume sites). Myctophids were more numerous in surface samples, but not at 20 m, at the plume sites in both April/May and August/September 1990, whereas in April/May 1990, labrids and anguilliformes were less abundant at 20 m at the plume sites compared to the control sites. Griffiths, F. B. (1983). Zooplankton community structure and succession in South West Arm, Port Hacking. Synthesis and Modelling of Intermittent Estuaries. A Case Study from Planning to Evaluation. W. R. Cuff and M. Tomczak, , Jr.: 91-107. A one-year study of zooplankton and its community structure in South West Arm, Port Hacking was carried out between Jun. 1975 and Jul. 1976. Multivariable classification yielded two groups (marine and estuarine) consistent enough to be considered communities. The marine community had significantly smaller biomass and fewer individuals per sample but significantly higher species richness, diversity and equitability than the estuarine community. A large proportion of these differences is due to variations in the abundance of the Oithona species group (Copepoda, Cyclopodia). These differences in community structure are attributed to the effects of different environmental structure caused by salinity stratification. The marine community had a more complex structure in a simpler, unstratified environment, while the estuarine community was structurally simple in a more complex environment. Seasonal succession occurred in the marine community, and was responsible for the change in speices composition leading to the estuarine community. Seasonal succession was suppressed during the estuarine period.

67
Hair, C. A. and J. D. Bell (1992). “Effects of enhancing pontoons on abundance of fish: Initial experiments in estuaries.” Bull. Mar. Sci. 51(1): 30-36. We investigated whether it was possible to increase abundances of fish associated with pontoons by increasing the available shelter. The physical complexity of the undersides of pontoons was enhanced by adding 7 m super(2) units made up of artificial seagrass leaves. Abundances of fish from these pontoons were compared with those from normal pontoons. The total number of fish, number of species and number of recently settled fish were significantly higher on enhanced pontoons than on unenhanced pontoons during December, but not October. The number of recently settled fish on pontoons was low compared to simultaneous settlement of fish in nearby natural habitat. Possible reasons for this were the position of pontoons in the water column, their movement in relation to tides and currents, and shading. Harper, W. R. (1899). “Results of an exploration of Aboriginal rockshelters at Port Hacking.”. Three rock shelters at Port Hacking are described, two containing hand impressions and the third, human remains. Methods and pigments used in the impressions are discussed. The skeletal remains found in the third cave are identified as those of an adult male and four children. Bone implements and midden material on the floor of the cave are also described. (LT) Hawes, P. M. (1995). “Trace metals in mangrove sediments of the Sydney region.” Australian journal of ecology 20(4): 578. Bioavailable concentrations of trace metals in mangrove sediments are examined for sites in four urbanized estuaries of the Sydney NSW region: Port Hacking, Botany Bay, Port Jackson and Broken Bay. Mangrove areas provide optimum conditions for accumulation of metal contaminants and high concentrations of trace metals have been reported. This can have implications for the management of mangrove areas as they have the potential to act both as a sink and as a source for contamination. Sediments were analyzed for copper, zinc, lead, cadmium, iron, manganese, nickel and chromium. Weak, acid soluble metal content of surface sediments was found to be highly variable. Examination of correlations between metals and sediment characteristics revealed significant relationships between most metals. Principal component analysis of metals determined that two factors account for 71.5% of the variance. Percentage mud is found to be a potentially important controlling factor. Concentrations of copper, lead, zinc and chromium were shown to be indicative of persistent contamination at some sites, most notable those within Port Jackson NSW (A). Hiatt, L. R. (1966). “Mystery at Port Hacking.”. The remains of an Aboriginal woman who either died on a kitchen midden or was placed on it after death have been found at Port Hacking. This paper presents a theory on the manner of her death. Methods of disposing of corpses throughout the continent are outlined with examples from the Gidjingali of Arnhem Land, the Walbiri in central Australia and the Yerklamining of South Australia. Higgins, H. W. and D. J. Mackey (1987). “Role of Ecklonia radiata (C. Ag.) J. Agardh in determining trace metal availability in coastal waters. 1. Total trace metals.” Aust. J. Mar. Freshwat. Res. 38(3): 307-315. No seasonal variations were found in the concentrations of Zn, Cd, Cu, K, Ca, Mg and Na in the kelp E. radiata collected from the marine-dominated Port Hacking estuary on the east coast of Australia. Concentrations of Fe and Mn were about 60% higher in late summer. The relative distributions of all metals between different kelp tissues, however, showed no seasonal variation. Concentration factors (dry weight basis) for trace metals ranged from 2600 for Cu to 68,000 for Fe. With high biomasses common in macroalgal ecosystems, a large proportion of the non-sediment-bound trace metals can be associated with the macroalgae, which therefore act as substantial buffers for these elements.

68
Hirst, A. and E. T. Linacre (1978). “Associations between coastal sea-surface temperatures, onshore winds, and rainfalls in the Sydney area.”. It has been shown (Priestly 1964) that monthly fluctuations of sea surface temperature (SST) at Port Hacking near Sydney were correlated with the rainfall at Observatory Hill on Sydney Harbour. The authors consider here, firstly the degree to which the association of SST with local rainfall persists inland and, secondly, the extent to which the association is caused by the simultaneous determination of both SST and rainfall by the direction of the prevailing winds. It appears that SST and onshore winds control the rainfall separately. A high incidence of onshore winds would enhance both orographic rainfall in the coastal hills and also convective rainfall, by bringing in moist air. It is concluded that the association between coastal SST and the rainfall is less at 52 km inland than for places nearer the sea. The rainfall depends on the SST and on the prevailing wind direction, separately. Hobbs, L. (1991). “Coastal water quality monitoring: Sydney ocean outfalls 1989-1991: interim report.” New South Wales, Water Board, Sydney NSW 08(1). This report is a summary of the water quality data collected by the New South Wales Water Board and State Pollution Control Commission, as part of the environmental monitoring program for the deep ocean outfalls. Water quality studies were undertaken at 10 sites from Long Reef to Port Hacking to establish baseline data for comparison following the commissioning of the outfalls. Hurrell, G. L., B. M. Druery, et al. (1986). Public participation in waterway development. 1. Australasian Port, Harbour and Offshore Engineering Conference.: 255-262. The Public Works Department N.S.W. has completed a comprehensive investigation of the estuarine processes at Port Hacking. As part of this investigation a range of waterway management options were devised which addressed shoaling and waterway access problems and impinged upon many social and community issues. The paper discusses the methods used to determine public attitudes towards future management of the waterway and the role of the public in developing in developing an optimum solution to the problems of the waterway. The importance of using communication skills to develop effective public participation is highlighted. Hurrell, G. L., B. M. Druery, et al. (1986). “Public participation in waterway development.”. The Public Works Department NSW has completed a comprehensive investigation of the estuarine processes at Port Hacking. As part of this investigation a range of waterway management options were devised which addressed shoaling and waterway access problems and impinged upon many social and community issues. The paper discusses the methods used to determine public attitude towards future management of the waterway and the role of the public in developing an optimum solution to the problems of the waterway. The importance of using communication skills to develop effective public participation is highlighted. Hutchings, P. and A. Murray (1984). Taxonomy of polychaetes from the Hawkesbury River and the southern estuaries of New South Wales, Australia. Rec. Aust. Mus. The polychaete fauna of the Hawkesbury River and some other estuarine areas in central and southern New South Wales is described. The majority of material comes from Marimbula, Jervis Bay, Port Hacking, Botany Bay, Hawkesbury River, Port Stephens and Broughton Island; often from seagrass habitats. The material from the Hawkesbury River has been collected over several years and detailed habitat and occurrence data are available. Huzzey, L. M. (1982). “The dynamics of a bathymetrically arrested estuarine front.” Estuarine, coastal and shelf science 15(5): 537-552. The mixing and circulation associated with a bathymetrically arrested estuarine front was studied using hydrographic and current data. A quasi-steady front, exhibiting strongly convergent surface flows, is formed along the steeply sloping inner margins of the flood tide delta during each semidiurnal tide cycle. This front separates the brackish ambient water within a deep estuarine basin from the incoming oceanic tidal water. A vertically integrated horizontal momentum equation was derived for flow in the upper layer and an estimate made as to the value of the associated entrainment coefficient.

69
Huzzey, L. M. (1982). “The dynamics of a topographically arrested estuarine front: Port Hacking NSW.” MSc Thesis, University of Sydney, Sydney 86(57). The mixing and circulation associated with a density front in Port Hacking estuary NSW is studied using hydrographic and current data. It is shown that a quasi-steady front, exhibiting strongly convergent surface flows, is formed along the inner margins of the flood tide delta during each semi-diurnal tide cycle. This front separates the ambient water within the Port Hacking Basin from the incoming higher density tidal water. Beneath the surface there is an inclined frontal interface where static stability is very low and vertical mixing intense. It is found that the position of the front is dependent on the depth and the difference in density between the two masses. Investigations are also made as to the amount of associated entrainment mixing across the frontal interface (A). Inglis, G. J. and M. P. Lincoln Smith (1998). “Synchronous flowering of estuarine seagrass meadows.” Aquatic botany 60(1): 37-48. A hierarchical sampling scheme was used to describe variation in the timing and intensity of flowering of multiple meadows of two species of seagrasses, Posidonia australis and Zostera capricorni. Flowers of P. australis were found only in August 1993, when they were present in all nine of the meadows examined, coinciding with unseasonably cool autumnal water temperatures. Reproductive shoots of Z. capricorni were also recorded in each of the nine meadows surveyed, but the timing and magnitude of peak abundance varied widely among estuaries and exhibited considerable patchiness within individual meadows. The results suggest that the timing and intensity of flowering of Z. capricorni and P. australis are affected by processes that operate over at least three spatial scales. Initiation of flower production appears to be triggered by regional changes in environmental conditions, such as water temperature or photoperiod, whereas the abundance of flowers varied significantly among estuaries and may be influenced more by meso-scale processes within estuaries and by local conditions within each meadow (A). Jayewardene, I. F. W., K. D. C. Haradasa, et al. (1993). “Analysis of wave groupiness.”. Wave groupiness is an important factor in the design of coastal structures. The motion of moored structures, resonance within harbours, stability and overtopping of breakwaters and revetments are influenced by wave groups. In this paper a 'groupiness factor' was computed based on the 'smoothed instantaneous wave energy history' of a wave record. The variation in groupiness of a single storm event was analysed for a storm that was recorded from 30-31 March 1993. Although no significant change in groupiness was measured as the storm progressed along the coastline it was found that the groupiness factor increased by as much as three times at the shallow water recording station of Port Hacking when compared to Sydney deepwater measurements. It was also found that Pierson Moskowitz spectra generated in a wave flume increased in groupiness as waves travelled into shallow water. Johnson, B. D., A. D. Albani, et al. (1977). “The bedrock topography of the Botany Basin, New South Wales.”. The bedrock topography of the Botany Basin has been determined from seismic-sparker records made in Botany Bay and Bate Bay, and from seismic-refraction and gravity measurements on the Kurnell Peninsula. Supplementary information has been obtained from boreholes both on land and in the sea. The Cooks and Georges Rivers formerly constituted the main drainage of the Basin and flowed generally southeastwards (beneath the present Kurnell Peninsula) and joined the Port Hacking River east of Cronulla. The depth of the bedrock channel of the former Georges River is 75-80 m b.s.l. at Taren Point, 90-95 m beneath the Kurnell Peninsula and 110-115 m at its junction with the Port Hacking River channel. The bedrock channel of the former Cooks River is about 30 m b.s.l. at Kyeemagh, its present entrance to Botany Bay, and it joined the Georges River at a location now 90 m b.s.l. beneath the Kurnell Peninsula. A second drainage system existed in the north and east of Botany Bay and generated the present mouth beneath which the bedrock is now 110 m b.s.l. This channel followed a southeasterly course parallel to the present northern shore of Botany Bay and was separated from that of the 'Cooks and Georges Rivers' by a bedrock ridge which extended from beneath Sydney Airport to the northern extremity of the Kurnell Peninsula. Over much of its length this divide had a depth of about 30 m b.s.l. The formation of the Kurnell Peninsula tombolo led to the diversion of the 'Cooks/Georges River' through the mouth of Botany Bay and subsequently led to the development of the bay. This change in the drainage system occurred when the sea was less than 30 m below the present sea level.
70
Kennelly, P. and B. Cole (1997). “Your creek your future: a science ecology resource for teachers of students in stages 4 and 5.” Hawkesbury Nepean Catchment Management Trust, Windsor NSW, 1997?, ISBN 1875994254(40). Intended as a teachers' guide to direct educational activities and investigations of ecosystems, the package focuses on issues relating to sustainable management of the South Creek catchment in New South Wales. It details a range of practical activities which wi ll promote knowledge and understanding of the biodiversity of the region and stimulate the development of attitudes and values which will contribute to maintaining or improving the quality of ecosystems in the region (A). Kirkman, H., I. H. Cook, et al. (1982). “Biomass and Growth of Zostera capricorni Aschers. in Port Hacking, N.S.W., Australia.” Aquat. Bot. 12(1): 57-67. The biomass and net porductivity of the leaves of Z. capricorni were measured in an estuary near Sydney, New South Wales, at various times during the period 1976-1979. The mean standing crop biomass of leaves was 55 g dry wt. m super(-2), while mean relative growth rate aranged from 0.014 g g super(-1) day super(-1) in winter to 0.028 g g super(-1) day super(-1) over the summer months. Productivity was estimated by a leaf marking method, and showed a closer relationships to water temperature than to solar radiation. Data on leaf length composition indicate that new leaf production continues throughout the year. Kirkman, H. and D. D. Reid (1979). “A study of the role of the seagrass Posidonia australis- in the carbon budget of an estuary.”. The budget and fate of organic carbon from the leaves of the seagrass P. australis- were studied in a small sunken river valley in Port Hacking, New South Wales. Standing stock and leaf growth were measured over 12-month periods. Estimated average relative leaf growth was 2.3 mgC/g dry wt./day. Estimated losses totalled 2.6 mgC/g dry wt./day of which 48% was in the form of dissolved organic carbon, while grazing by herbivores (3%), leaves floating off (12%) and sinking leaves (37%) accounted for the remainder of the carbonaceous material lost from the seagrass leaves. Lawler, C. J. (1998). “The subtidal flora and fauna at Shiprock, Port Hacking, New South Wales during 1965-1970.”. Generally bays and inlets in New South Wales river estuaries have a rather restricted attached flora and fauna. However, the area at Little Turriell Point or Shiprock in Port Hacking is an exception; there the combination of a deep submarine cliff, strong currents and unpolluted water have resulted in an extremely rich growth of sedentary marine invertebrates with a resulting large population of fishes. This paper records the result of investigations of the area made over five years. A large percentage of the fishes of the area are monocathids. There are several genera represented with the most common species occurring being the Fanbellied Leatherjacket Monocanthus chinensis. (Au, AM) Lincoln Smith, M. P. and R. A. Mann (1989). “Bioaccumulation in nearshore marine organisms, I: organochlorine compounds and trace metals in rocky reef animals near the Malabar ocean outfall.” New South Wales, State Pollution Control Commission, Sydney 03(0730552888). Fish and invertebrates were collected from reefs near Malabar outfall and at 2 control sites, Port Hacking and Terrigal, in May 1987. The species sought were common inhabitants of shallow rocky reefs and are believed to reside permanently, at least as adults, over a relatively small area of the reef. Evidence of organochlorine accumulation was found at Malabar and Port Hacking only. At Malabar, heptachlor epoxide, BHC and dieldrin occurred in concentrations above NHMRC recommended limits for human consumption. Levels of most trace metals in muscle tissue at the 3 study sites were below NHMRC recommended limits.

71
Mackey, D. J. and R. Szymczak (1988). “Seasonal variations in the copper complexing capacity of Port Hacking.” Australian journal of marine and freshwater research 39(2): 125-132. The copper complexing capacity (CuCC) of waters at the entrance to Port Hacking NSW estuary was monitored daily in 1984. From May to August, CuCC values averaged 5nm, with occasional high values attributable to terrestrial runoff following heavy rainstorms. In mid October, CuCC values up to 56nm were attributable to a phytoplankton bloom that resulted from intrusion of nutrient rich slope waters onto the continental shelf. The CuCC of Port Hacking is dominated by processes originating outside the estuary. Port Hacking cannot therefore be a significant source of organic ligands to coastal waters (A). McCleod, K. and G. F. Birch (1995). “Understanding urban and industrial impact by comparing two major NSW estuaries.” Newcastle Symposium: Advances in the Study of the Sydney Basin 29th. Geochemical surveys of bottom sediments in Sydney's four major estuaries (Parramatta River/Port Jackson, Port Hacking, Georges River/ Botany Bay and Hawkesbury River), as well as the Hunter River estuary have been conducted in a program aimed to better understand the nature of urban and industrial impacts on Sydney estuaries. A heavy metals inventory was generated and is now available for compilation into a regional contaminant framework for the central New South Wales area. It can also be interrogated to provide information regarding potential sources and to possible 'fingerprint' different geochemical environments. This paper describes the sampling methods and the results of the geochemical analysis. On the basis of the results, a comparison is made between the various localities and concludes that zinc (Zn) and lead (Pb) point source contributions to the Georges River/Botany Bay and Port Hacking River estuaries are markedly different, but that for copper (Cu) differences are not so great. The data also show Prospect Creek to be characterized by relatively minimal enrichment for Cu and Pb compared to the other Georges River/Botany Bay point sources, whereas Cooks River is typified by significant enrichment in Zn and Pb compared to other point sources in the estuary. McNeill, S. E., D. G. Worthington, et al. (1992). “Consistently outstanding recruitment of five species of fish to a seagrass bed in Botany Bay, NSW.” Australian journal of ecology 17(4): 359-365. Variability in abundance of fish associated with beds of the seagrass Zostera capricorni was documented at 16 sites in four estuaries in New South Wales. One site, Pilot Harbour, a small constructed harbour in Botany Bay, had significantly greater abundances of recruits of five species of economically important fish during all three recruitment seasons. Abundances between June and March each year were up to 73 times greater than abundances at the other 15 sites. However, at other times during the year there was no significant difference between this site and the others (A). Megaw, J. V. S. (1966). “The excavation of an Aboriginal rock-shelter on Gymea Bay, Port Hacking NSW: with an analysis of the stone industry by RVS Wright.”. An account is given of the excavation of an Aboriginal rock shelter at Gymea Bay. Findings in the stratified midden deposits included human skeletons among the mollusc shells and fish bones. Few implements were found, but where they were present stone flakes or ground implements predominated. Smoke stains on the shelter roof indicate the original size of the midden. Distribution of artefacts suggests an economy relying on a seasonal, changing diet. Appended are reports on the skeletal remains and identification of molluscs and charcoals. The chronology of the stone implement industry of the region is analysed. (BW) Megaw, J. V. S. e. (1974). “The recent archaeology of the Sydney district: excavations 1964-1967.”. Descriptions are provided of excavations of rock shelters at Wattamolla Cove and Curracurrang Cove in Royal National Park and at Yowie Bay and Gymea Bay in Port Hacking. Findings in midden layers are detailed and compared, the evidence from types of bone and stone implements and faunal remains confirming ethnographic evidence of total local environmental exploitation and trade in raw materials in a diverse economy. (BW)
72
Mullins, T. L. (1984). “Selective separation and determination of dissolved chromium species in natural waters by atomic absorption spectrometry.” Analytica chimica acta 165(103). Describes a simplified procedure to assess the contribution of bound species of chromium by use of a single initial separation by coprecipitation from which both chromium (III) and chromium (VI) concentrations are determined independently. The organic contribution is then calculated by difference from a determination of the total dissolved concentration. This method was used to analyze water samples from Port Hacking, Georges River, Drummoyne Bay, Botany Bay, Cooks River and Parramatta River. The relatively high chromium concentrations found reflect in part the use of most of the waterways as industrial carriers. In most areas, chromium (IV) concentration is much higher than other species, except in Port Hacking where lower concentrations of chromium occur, reflecting the primary use of the bay as a recreational area devoted particularly to the use of power and sail boats. Nielsen, A. (1994). “Sediment transport on the Inner Continental Shelf, Sydney, Australia.”. Sediments on the seafloor can be agitated and transported under the actions of waves and currents. For projects on the Inner Continental Shelf a considerable body of field data has been collected, analytical studies have been carried out and the application of theoretical and laboratory studies to field data have enabled an informed assessment rate of sand transport. The studies indicated little nett transport but, within the 60m isobath, various sand transport mechanisms result in reworking of surficial sediments to depths of decimetres and, over time frames of millenia, reworking of the seabed surface may occur to depths of several metres. Otway, N. M., C. A. Gray, et al. (1996). “Assessing the impacts of deepwater sewage outfalls on spatially- and temporally-variable marine communities.” Mar Environ Res 41(1): 45-71. Until recently, Sydney's domestic and industrial sewage was discharged to the Tasman Sea through outfalls at the cliff-face at North Head, Bondi and Malabar, NSW, Australia. To overcome the resulting pollution of nearby beaches, three deepwater outfalls were constructed and effluent is now discharged from the seabed in 60-80 m of water some 2-4km offshore. An environmental monitoring programme was set up to assess the impacts of the new deepwater outfalls. This study describes the underlying philosophy and sampling designs of this monitoring programme. In doing so, it provides an overview of the pre-commissioning phase studies of the ichthyoplanktonic, demersal fish and soft-bottom communities. The abundances of the organisms comprising the three communities fluctuated in space and time. The sampling highlighted marked differences in the depth-distributions of larval fish. Trawling and longlining further reinforced technique-dependent selectivity and overcame problems of environmental heterogeneity which are often manifest when sampling fish populations. Power analyses using data for six families of polychaetes demonstrate the concerns over Type II errors in environmental impact assessment, and this paper suggests ways of addressing this issue. Finally, an experimental design is discussed that incorporates estimates of spatial and temporal variation, thus allowing better (unconfounded) assessments of the impacts of sewage-disposal on marine biological communities. Parker, R. R. (1983). Some ecological effects of rainfall on the protoplankton of South West Arm. Synthesis and Modelling of Intermittent Estuaries. A Case Study from Planning to Evaluation. W. R. Cuff and M. Tomczak, , Jr.: 135-146. Changes in ecological parameters affecting protoplankton in South West Arm of Port Hacking (Sydney region, Australia) were followed over a 94 day period during which several major rainstorms occurred. The precipitation pattern resulted in the formation of a double pycnocline and virtual isolation of the bottom water. A monospecific bloom of Ceratium furca developed in close association with the lower pycnocline. This population may have been utilizing the eutrophic water immediately below for a nutrient supply and the euphotic water above for energy. An unidentified green pigment accumulated in the deep basin anaerobic periods. Toward the end of the 94 day period South West Arm returned to the normal marine condition with a completely mixed water column and with about the same amount and diversity of standing stock of protoplankton as at the beginning. Parker, R. R., D. J. Rochford, et al. (1983). History and organization of the Port Hacking Estuary Project. Synthesis and Modelling of Intermittent Estuaries. A Case Study from Planning to Evaluation. W. R. Cuff and M. Tomczak, , Jr.: 7-16. The history of research into Port Hacking before the Port Hacking Estuary Project of 1973-1978 is summarized. The different steps of the organization of the Project are then described: project initiation, problem definition and refinement, staffing, facilities, field work. A list of publications resulting from the Project is appended.

73
Porter, M. F. and G. L. Hurrell (1988). “Port Hacking Tombolo: management of social and environmental issues.”. The Public Works Department is proposing to construct a tombolo (sand pit) in port Hacking to overcome chronic shoaling problems. The proposal has been developed after intensive technical investigation and wide community consultation. The strategy for community consultation adopted at the outset had to be revised during the course of the project to counter intense opposition from self interest groups who engaged in a campaign of premeditated misinformation. As a result of experience with this project, the effectiveness of lengthy consultation with the community is questioned. Rainer, S. (1981). “Temporal Patterns in the Structure of Macrobenthic Communities of an Australian Estuary.” Estuar. Coast. Shelf Sci. 13(6): 597-620. The benthic fauna of a small estuary was examined to test hypotheses about community structure and environmental stress (foreign, or natural but excessive, perturbations in the environment). Quantitative samples were collected at approximately 2-month intervals over 18 months from Cabbage Tree Basin, Port Hacking, New South Wales. The species composition of the intertidal and shallow-water sites was more stable than that of the deeper sites, due to the presence of short-lived opportunistic species at the deeper sites after periods of deoxygenation. The stable community structure and species composition at the intertidal and shallow-water sites indicated that greater environmental harshness does not necessarily imply less faunal stability. It is suggested that the ecotone point in a stressed community may be characterized by diversity values that are in agreement with neutral model predictions. The statistical properties of the measures of diversity and evenness were not important for their interpretation. Biomass-based measures indicated patterns that were often different from frequency-based measures. Rainer, S. F. (1982). “Trophic structure and production in the macrobenthos of a temperate Australian estuary.” Estuarine, coastal and shelf science 15(4): 423-441. The soft-bottom fauna of Gunnamatta Bay, Port Hacking NSW, was sampled to estimate the abundance, trophic structure, and net production of the macrobenthos. The samples were classified into groups from spatially distinct strata, the groups differing in species abundance and diversity and in the identity of the dominant species. Production estimated for carnivores was higher than could be supported by the noncarnivore populations, suggesting that some of the species considered to be carnivores have additional feeding modes. Rainer, S. F. and R. C. Fitzhardinge (1981). “Benthic Communities in an Estuary with Periodic Deoxygenation.” Aust. J. Mar. Freshwater Res. 32(2): 227-243. The relationship between spatial patterns in the physical environment and patterns in community and trophic structure in the benthic fauna was investigated in an estuary with periodic deoxygenation of the near bottom water. Six sites were sampled between intertidal mangroves and an 8 m deep basin of Port Hacking, NSW. A total of 163 species was collected, ranging from 11 to 94 at each site. Both frequency and biomass were least in the central basin and highest in a bed of the seagrass Zostera capricorni Aschers. The distribution of common species was limited by fluctuations in dissolved oxygen levels, but not obviously so by sediment differences or short-term fluctuations in water temperature or salinity. Frequency-based diversity and evenness values were similar to those from other estuarine areas. Biomass-based values were lower at most sites than frequency-based values. Patterns of diversity and evenness could not be simply interpeted as indicators of environmental harshness in the community.

74
Roubal, F. R., N. Quartararo, et al. (1996). “Spatial and temporal variation in populations and community of ectoparasites on young snapper, Pagrus auratus (Bloch & Schneider) (Sparidae), from the wild and captivity at Port Hacking, Sydney, Australia.” Mar. Freshwat. Res. 47(4): 585-593. Snapper in both the estuary (0+, 1+ age classes) and from offshore reefs (1+, 2+, 3+ age classes) at Port Hacking, NSW, were infested with the monogeneans Lamellodiscus pagrosomi, Anoplodiscus cirrusspiralis and Bivagina pagrosomi and the copepods Unicolax chrysophryenus, Pseudoeucanthus australiensis, Hatschekia pagrosomi, Clavellopsis sargi and Lernanthropus atrox; offshore snapper also had the monogenean Choricotyle australiensis and the copepods Caligus spp. and Lepeophtheirus sekii. Most species had a higher prevalence, but not intensity, on offshore fish. Season was not a significant factor for most infrapopulations. Species richness, number of parasites and diversity were greater on offshore fish and differed among estuary samples but not offshore samples. Estuary infracommunities were dominated by L. pagrosomi (mainly 1+) and B. pagrosomi (mainly 0+); C. sargi and L. atrox dominated when richness was low. Offshore infracommunities were dominated by H. pagrosomi except in winter when L. pagrosomi was dominant, possibly owing to movement of estuary fish to offshore reefs. Captivity in experimental cages in the estuary resulted in transient increases in A. cirrusspiralis, B. pagrosomi and Benedenia sekii. Lamellodiscus pagrosomi increasingly dominated all samples and infracommunities. Neither condition factor nor stocking density had a significant influence on infestation. Scanes, P. R. and A. C. Roach (1999). “Determining natural 'background' concentrations of trace metals in oysters from New South Wales, Australia.” Environmental pollution 105(3): 437-446. Using bivalves to indicate the spatial and temporal distribution of bioavailable metals is now standard practice but natural variations in metal concentrations resulting from geological factors often confound the interpretation of patterns. A method using clustering and principal component analyses to determine background concentrations of metals in the oyster (Saccostrea commercialis) sampled from twenty estuaries in New South Wales is described. It is suggested that concentrations of trace metals in oysters can be used to identify areas where increased concentrations of bioavailable metals pose potential ecological threats (A). Scott, B. D. (1978). “Nutrient cycling and primary production in Port Hacking, NSW”. The changes in the concentrations of nitrate, phosphate and silicate in a marine-dominated estuarine basin are described and related to the changes in the physical properties of the water and the primary production. The consumption of oxygen and nutrient regeneration in the lower water column were directly related to density differences in the lower water column, and to the primary production. The regeneration of nutrients was related to the consumption of oxygen, with seasonal differences in the regeneration of nitrate and silicate. Increased rates of nutrient regeneration during salinity stratification afterheavy rain were attributed to increased sedimentation rates. Scott, B. D. (1978). “Phytoplankton distribution and light attenuation in Port Hacking estuary.”. The distribution of phytoplankton in a marine dominated estuary is described in terms of in vivo chlorophyll fluorescence, phytoplankton photosynthesis rates at constant irradiance, and the attenuation of solar irradiance by the water column. The phytoplankton distribution was consistent with the physiography and water circulation in the estuary. A method is described for estimating the proportions of suspended sediments, introduced with runoff from the land, which are removed from the estuary by tidal exchange or by sinking. Estimates of the proportions of phytoplankton and detritus in the water column are derived from the relationship of chlorophyll concentration to the extinction coefficient. Scott, B. D. (1979). “Seasonal variations of phytoplankton production in an estuary in relation to coastal water movements.”. Primary production and phytoplankton biomass in Port Hacking, an estuary 24 km south of Sydney, were measured at 2-4 day intervals for 1 yr. Measurements of solar irradiance and light attenuation by the water column were also obtained. Nutrient concentrations were measured both in the estuary and in the coastal waters adjacent to Port Hacking. The short-term variations of phytoplankton biomass were found to be due to both estuarine hydrological events resulting in the release of regenerated nutrients, and to coastal hydrological events, where slope water intrusions enriched the coastal waters and were introduced into the estuarine basins by tidal exchange. The annual variation of primary production in Port Hacking was related to the annual variation of solar irradiance. A minor part of the annual variation appeared to be due to temperature, but the nature of this relationship was uncertain.

75
Scott, B. D. (1983). Phytoplankton distribution and production in Port Hacking Estuary, and an empirical model for estimating daily primary production. Synthesis and Modelling of Intermittent Estuaries. A Case Study from Planning to Evaluation. W. R. Cuff and M. Tomczak, , Jr.: 77-89. The variations of phytoplankton biomass with both time and space are described for Port Hacking, New South Wales, a marine dominated estuary. Frequent short-term increases in phytoplankton biomass and production were caused by estuarine hydrological events resulting in the release of regenerated nutrients, and by coastal hydrological events where slope-water intrusions enriched the coastal waters and were introduced into the estuary by tides. These frequent changes prevented any prediction of primary production. A simple empirical model was devised to estimate daily primary production by phytoplankton from measurements of phytoplankton biomass, total daily solar irradiance, and light attenuation by the water column. Sinclair, R. E., W. R. Cuff, et al. (1983). Ecosystem modeling of South West Arm, Port Hacking. Synthesis and Modelling of Intermittent Estuaries. A Case Study from Planning to Evaluation. W. R. Cuff and M. Tomczak, , Jr.: 259-271. A major aim of the Port Hacking Estuary Project was to produce an ecosystem model of a small marine embayment (South West Arm) in the Estuary. This paper describes the modelling efforts of the Project and puts them in perspective. St Clair, C. and W. King (1993). “Bundeena/Maianbar community consultation programme: a case study.” Australian Water and Wastewater Association, Federal Convention, 15th: 1289-1293. The importance of involving the community in decisions which may impact on their living standards and general wellbeing has become more widely recognized by public and private organizations. A range of mechanisms, selected according to the nature and scope of the project and the characteristics of the community affected, can be used. These mechanisms include community advisory committees, working parties, open houses, public meetings, presentations, newsletters and surveys. The New South Wales Water Board embarked on a community consultation program with the people of Bundeena and Maianbar to improve the wastewater management in unsewered areas with a view to improved public health and the environment. A number of community consultation mechanisms were combined in order to maximize the effectiveness of the consultation program. Stark, J. S. (1998). “Heavy metal pollution and macrobenthic assemblages in soft sediments in two Sydney estuaries, Australia.” Marine and freshwater research 49(6): 533-540. The influence of heavy metals (copper, lead and zinc) associated with urban runoff, on assemblages of macrofauna in intertidal soft sediments was studied in two estuaries in the Sydney NSW region. The patterns of distribution and abundance of fauna and assemblages was found to vary significantly at several spatial scales, within bays in an estuary and between bays from different estuaries. Significant differences were found in concentrations of heavy metals in sediments, but there was very little difference among bays in other environmental variables: grain-size characteristics and organic matter content of sediments. Bays polluted by heavy metals had significantly different assemblages to unpolluted bays, were generally less diverse and were generally characterized by greater abundance of capitellids, spionids, nereids and bivalves. Unpolluted bays had greater abundance of crustaceans and several polychaete families and were generally more diverse. There was a significant correlation between patterns of assemblages and concentrations of heavy metals, but not with other environmental variables (A).

76
Stark, J. S. (1998). “Cornish family records Fred Midgley: Sutherland Shire local history collection Heavy metal pollution and macrobenthic assemblages in soft sediments in two Sydney estuaries.”. The influence of heavy metals (copper, lead and zinc) associated with urban runoff on assemblages of macrofauna in intertidal soft sediments was studied in two estuaries in the Sydney region. The patterns of distribution and abundance of fauna and assemblages was found to vary significantly at several spatial scales, within bays in an estuary and between bays from different estuaries. Bays polluted by heavy metals had significantly different assemblages to unpolluted bays, were generally less diverse and were characterised by a greater abundance of capitellids, spionids, nereids and bivalves. Unpolluted bays had greater abundance of crustaceans and several polychaete families, including paraonids and nephtyids and were generally more diverse. (Au, AM) Suthers, I. and D. Rissik (1992). “Do large rivers influence the abundance and diversity of estuarine larval fish?” Newsl. Aust. Soc. Fish Biol. 22(2): 54-55. As the East Australian Current is low in nutrients, the main source of new nutrients along the NSW coast is either from sporadic upwelling or rivers. I hypothesised that estuaries with large rivers, and hence high nutrients would support a greater abundance of plankton and larval fish. Ichthyoplankton was compared between six estuaries that exhibited either high or low riverine inputs in the winter of 1991; Batemans Bay, Shoalhaven River, Jervis Bay, Port Hacking, Port Stephens and Wallis Lake. Each estuary was sampled at two sites on the ebb tide. An epibenthic sled sampled 80% of larval fish (total = 5,565), and slightly more taxa (total taxa = 25) than in the sub-surface ring net tow. Samples were dominated by the Clupeidae and Gobiidae. There was large within estuary variation. Significantly less larval fish occurred in estuaries of high riverine input, due in part to recent heavy rains. The effects of currents and season will be discussed. Szymczak, R. and T. D. Waite (1988). “Generation and decay of hydrogen peroxide in estuarine waters.” Australian journal of marine and freshwater research 39(3): 289-299. Aspects of the generation and decay of hydrogen peroxide in the Port Hacking River estuary NSW, were investigated. Peroxide concentrations in surface waters in the early morning are relatively uniform over the estuary and typically less than 35nm, whereas concentrations in mid- afternoon in excess of 100nm have been observed. Variation of peroxide concentration with depth in the deep basins of Port Hacking is dependent on the extent of structure within the water column, with little mixing of surface-generated peroxide into poorly illuminated bottom waters under stratified conditions. Laboratory studies confirmed that light induces hydrogen peroxide production. Filtration of samples had little effect on generation of hydrogen peroxide, but dramatically reduced rate of decay of photogenerated hydrogen peroxide (A). Tafe, D. J. and F. B. Griffiths (1983). Seasonal abundance, geographical distribution and feeding types of the copepod species dominant in Port Hacking, New South Wales. Synthesis and Modelling of Intermittent Estuaries. A Case Study from Planning to Evaluation. W. R. Cuff and M. Tomczak, , Jr.: 109-113. Zooplankton samples were collected over a one-year period by net haul and light trap at four locations in Port Hacking Estuary. Copepods accounted for approximately three quarters of the total zooplankton numbers taken on a yearly basis and 94% of this fraction was composed of 11 copepod species. The seasonal abundance and geographical distribution of these 11 species were recorded and their gut and faecal pellet contents examined. Acartia tranteri , Bestiola similis , Gladioferens pectinatus , Oithona brevicornis , O. plumifera , O. simplex , Paracalanus crassirostris , P. indicus and Temora turbinata were classified as herbivores, Acartia bispinosa and Tortanus barbatus as omnivores.

77
Tomczak, M., Jr. (1983). Some conclusions from the Port Hacking Estuary Project. Synthesis and Modelling of Intermittent Estuaries. A Case Study from Planning to Evaluation. W. R. Cuff and M. Tomczak, , Jr.: 293-302. The Port Hacking experiment, an interdisciplinary five-year study of an east Australian estuary guided by a model of carbon flow, is reviewed as an application of systems analysis to marine ecology. It is argued that the experiment was of the basic research type, irrespective of statements by participants at the start of the project. It is observed that the numerical model suffered from insufficient input data, a situation which is shown to be common with models of the basic research type. A discussion of some general characteristics features of research programs with strong mathematical input leads to a recommendation to weaken the link between numerical model and field program and let both disciplines develop along their own lines, with weak interaction through a joint project. Tranter, D. J. and G. Kennedy (1983). Size-specific respiration rate of Port Hacking zooplankton. Synthesis and Modelling of Intermittent Estuaries. A Case Study from Planning to Evaluation. W. R. Cuff and M. Tomczak, , Jr.: 167-176. The respiration rates of natural zooplankton assemblages from Port Hacking, measured 4 - 5 h after capture, at 18 - 22 degree C, are described by the equation R' = 0.857 W super(-0.306) ( mu g-atom O sub(2)/mg dry weight/h) where W is dry body weight and R' is the respiration rate per unit body weight. These weight-specific respiration rates are higher than those recorded by other workers for larger zooplankton, 24 h after capture. The difference may be due to the small size of present experimental animals (0.8 - 29 mu g) or to the fact that active, rather than basal, metabolic rates were measured. Vail, L. L. and R. E. Wass (1981). “Experimental Studies on the Settlement and Growth of Bryozoa in the Natural Environment.” Aust. J. Mar. Freshwater Res. 32(4): 639-656. A rack of six panels of roughened black Perspex was placed in Port Hacking, Sydney, for a period of 34 weeks. Some panels were screened and the rack was examined each week for accumulation of Bryozoa. Some colonies were allowed to grow for the complete study period: some panels were scraped free of all organisms each week; some were scraped free of all organisms except Bryozoa: and some panels which had been screened were returned to the environment unscreened. Sizes of colonies were noted and are presented in tabular form. There is a marked variation in the growth of Bryozoa. Environmental variables such as rainfall, salinity and temperature were monitored at stations close to the panel site and are discussed in relation to bryozoan growth. Vaudrey, D. J., F. B. Griffiths, et al. (1983). Data base for the Port Hacking Estuary Project: Parameters, monitoring procedure, and management system. Synthesis and Modelling of Intermittent Estuaries. A Case Study from Planning to Evaluation. W. R. Cuff and M. Tomczak, , Jr.: 177-192. The data base which resulted from two of the major monitoring activities of the Port Hacking Estuary Project is described and discussed: monitoring stations, variables, sampling schedules, field/laboratory analytical procedures, and management system. Vesk, M. and S. W. Jeffrey (1987). “Ultrastructure and pigments of two strains of the picoplanktonic alga Pelagococcus subviridis (Chrysophyceae).” J. Phycol. 23(2): 322-336. The organelle ultrastructure and photosynthetic pigments of a new isolate of the picoplanktonic alga Pelagococcus subviridis Norris from the East Australian Current was compared with the North Pacific Ocean type species. No differences in the ultrastructure of the two isolates were observed. Mitosis was studied in detail in the Australian strain, and showed two unusual features: the de novo appearance of centrioles prior to mitosis, and the formation of a small, extra-nuclear spindle. While the pigment composition suggests affinities with certain newly examined prymnesiophytes, organelle ultrastructure indicates Pelagococcus to be a member of the Chrysophyceae. Mitosis is, however, atypical of both Prymnesiophyceae and Chrysophyceae, and if this picoplanktonic alga is to be retained in the Chrysophyceae it must be seen as a most unusual member.

78
Wadley, V. A. (1980). “Spatial and temporal heterogeneity in the epibenthic fauna of estuarine sand and seagrass beds.” MSc Thesis, University of Sydney 99(87). The three habitats sampled were sand, and the seagrasses Zostera capricorni Aschers. and Posidonia australis Hook. f. in the Port Hacking estuary NSW. Samples were taken each month from Feb 1976 for 18 months. Temporal heterogeneity in the data, although significant, was small compared with spatial heterogeneity. Differences in the fauna with the month and season of sampling showed strong interaction with the type of habitat. Patterns in temporal heterogeneity were not related to changes in the abiotic factors of depth, salinity or rainfall but showed some correspondence with changes in temperature. Samples taken before and after floods did not differ significantly, indicating relatively stable communities, despite the unpredictable environment. Warringah Shire, C. (1986). “The role of local government in estuarine management: proceedings of the seminar (26 Sept 1986: Dee Why NSW).”. The aim of the seminar was to identify action to achieve acceptable environmental quality. The report contains papers delivered on the commonality of problems, where the responsibility lies, and opportunities for change. Specific cases dealt with were Lake Illawarra, Port Hacking and Tuggerah Lakes. The establishment of an Association of Councils on Estuaries was recommended with its aims and objectives to be circulated for discussion among participating councils. (OH) Wass, R. E. and L. L. Vail (1978). “Encrusting Bryozoa exhibit linear growth.”. This study incorporates theoretical considerations and experimental examination of growth rate in Bryozoa. Test panels were immersed in water of 4 m depth off Port Hacking and measured at weekly intervals for the growth increment of encrusting bryozoans. Data from six colonies of Valdemunitella valdemunita (a first record from Australian waters) confirm that A-SUP-O-.-5- against time is linear, where A = colony area; thus, linear growth is exhibited. Details of zooidal division will be dealt with in a subsequent paper. Wiebe, W. J. and D. F. Smith (1977). “Direct measurement of dissolved organic carbon release by phytoplankton and incorporation by microheterotrophs.”. It is now possible to divide particulate primary production into algal and heterotrophic components without physical separation. This depends on two innovations, the introduction of isotope in the form of labelled dissolved product(s) of primary production and the employment of a data analysis specifically designed for tracer kinetic incorporation experiments. The -SUP-14-C technique described by Steemann Nielsen (1952) is inapplicable in the analyses of certain classes of systems and kinetic tracer incorporation experiments must be employed instead. It is shown that measurement of PDOC production rate requires such kinetic tracer analyses. Measrements made in the laboratory on water taken from 2 m depth in South West Arm of the Port Hacking estuary showed that: (1) the steady-state rate of PDOC production was 0-.-10 to 0-.-13 mg C.m-SUP--3-.h-SUP--1-; (2) the rate of PDOC incorporation into microheterotroph particulate organic carbon was 0-.-10 to 0-.-12 mg C.m-SUP--3-.h-SUP--1-; (3) the rate at which PDOC was respired to CO-SUB-2- was 0-.-001 to 0-.-003 mg C.m-SUP--3-.h-SUP--1-. (4) the PDOC makes up only about 0-.-1% of the total dissolved organic carbon. The size class of particles associated with PDOC production differed from the size class responsible for uptake of PDOC. More than 50% of the PDOC production was associated with particles having a nominal diameter range of 20 to 63 -mu-m, while this fraction was responsible for <10% of the incorporation.

79
Worthington, D. G., S. E. McNeill, et al. (1995). “Large scale variation in abundance of five common species of decapod sampled from seagrass in New South Wales.” Australian journal of ecology 20(4): 515-525. Decapods associated with two species of seagrass (Zostera capricorni and Posidonia australis) were sampled at sites within four New South Wales estuaries over a three year period. Batemans Bay, Botany Bay and Port Hacking NSW and Jervis Bay ACT were included in the study. Two species of decapod were abundant in Z. capricorni and four species were abundant in P. australis. Abundance of these six species fluctuated greatly among sites and through time. Some seasonal patterns in abundance were evident and appeared to be caused by recruitment and subsequent mortality or migration of individuals. Similarly, there were some consistent spatial patterns in abundance of most species. In particular, some sites supported consistently more juveniles during the same period of separate years. Within Jervis Bay, P. australis was also sampled in shallow and deep water. Three species were abundant but showed no consistent differences between the two depths. Abundances of these species did fluctuate greatly among the sites within Jervis Bay and through time (A).

1
Impact of Helensburgh, Otford and Stanwell Tops on their surrounding natural environment, report to DEP 1984 BY BOB CROMBIE, ON NOVEMBER 28TH, 2012
IMPACT OF HELENSBURGH, OTFORD AND
STANWELL TOPS ON THEIR SURROUNDING
NATURAL ENVIRONMENT_________________
(NPWS report to the Department of Environment and Planning for their study and comparison of urban development proposals for Helensburgh and West Menai. This digital copy was prepared on 24th February 2011 by Bob Crombie from a photocopy of the original copy of the report.)
The Study Area
The study area includes Otford, Stanwell Tops, Blue gum Forest, Helensburgh West, Helensburgh, Lilyvale, Garrawarra Hospital and the lands surrounding these developments north to Waterfall and McKell Avenue including parts of Royal National Park
Water Catchment
The study area is almost wholly contained within the Catchment area of the Hacking River. A small area on the western edge drains into the MWSDB Woronora Water Catchment Area. Major tributaries receiving runoff from the developed lands include:
a) The Hacking River itself
b) Gill’s Creek
c) Gardiner’s Gully
d) Camp Gully Creek
e) Garbage Tip Creek (drains the garbage tip and sanitary depot)
f) Wilson’s Creek
g) Cawley’s Creek
All of these creeks drain into the Hacking River which then flows north through Royal National Park and out into Port Hacking.
Resume of Royal National Park
Royal National Park is part of a statewide and national system of parks and reserves set aside to conserve outstanding scenery or natural features in an area.
These parks and reserves also:
• Conserve viable populations of wildlife of an area • Conserve representative samples of a complete range of the state’s natural environments • Protect and preserve Aboriginal sites and objects • Protect and preserve areas that are the sites of buildings, objects, monuments or events of
national significance • Provide for the promotion of public awareness, understanding and appreciation of
wildlife, National Parks and culture conservation, and the importance of these to the overall quality of people’s environment.
2
• Provide for regulated appropriate use and enjoyment by the public consistent with the nature conservation objectives for the area.
Royal national Park for itself conserves:
• Representative samples of Hawkesbury Sandstone landforms, geology and soils • Representative samples of Narrabeen series landforms, geology and soils • Some samples of Wianamatta series landforms, geology and soils • Representative samples of Hawkesbury sandstone vegetal alliances and their associated
animal life including
• A very complex mosaic of floristic assemblages on a scale from large to small with the assemblages frequently intergrading.
This is a reflection of the very varied assemblage of sol factors (depth, structure, nutrition), drainage patterns, climatic patterns, salt spray accession, plateau dissection, altitude, aspect, fire histories and geographic location (on a biogeographic ecotone between a northern warm temperate biota and a southern cool temperate biota respectively).
Communities include a variety of heathlands, woodlands, open forests and closed forests.
• An excellent sample of the vegetation of the area now covered by the metropolis of Sydney
• An excellent sample of mallee heathland.
• Representative samples of Narrabeen series rock vegetal alliances and their associated animal life.
Communities include a variety of woodlands, open forests and closed forests.
The open forests are rich in arboreal mammals and contain excellent stands of very tall trees.
The closed forests (rainforests) are very rich floristically and are a very varied assemblage with considerable intergradation at the sub-alliance and alliance level. They are part of a spectrum of rainforests along the Illawarra Escarpment and Hacking River along many environmental gradients producing a very complex and diverse array of forests of great scientific and ecological significance.
They represent the northern most limit and lowest altitude of these forests and they overlap between a northern warm temperate biota and a southern cool temperate biota. This unique geographical and biological location produces many unique and important features in the rainforest in this area.
• A very rich variety of endangered plants and animals • A biologically outstanding, very varied and complex array of wildlife (described above)
important ecologically, scientifically and educationally and for appropriate recreation. • Lands recognized as having truly national significance as a series of recreational
complexes in a natural or national park setting, in particular the Hacking River, creeks, inlets and coastal foreshores are of immense value for recreation. Very large numbers of people use the park.
• The Hacking River as a wild river. • Aboriginal sites and relics of the Dharawal tribe • Important historic and cultural relics and traditions • A large tract of natural land exceedingly well placed in close proximity to and separating
the large population centres of Sydney and Wollongong. This provides unique and very

3
important scientific, recreational, educational and cultural opportunities for many people.
• The first national park in Australia and the second in the world.
Historical Perspectives and implications
Royal National Park was dedicated as the National Park in 1879 as the first national park in Australia and the second in the world. The park reserved a large, unalienated tract of natural land rich in natural resources and natural features very suitable for the preservation of nature “to show perpetually what Australian vegetation is capable of,” “as a place for recreation and enjoyment” and as “lungs for Sydney” to purify its air and provide a place of healthful retreat for Sydneysiders.
At this time, the National park was part of a vast tract of land continuous with the Illawarra Escarpment and coastal lowlands to the south, with the Water Board and Army lands to the south and west and with vast tracts of natural and crown land to the north west.
This continuity ensured the safety and survival of the wildlife in the park.
Ijn 1934, the Garrawarra range was secured as a reserve for public recreation. This was added to the park in 1967.
Between 1970 and 1973 the National parks and Wildlife Service investigated lands around Helensburgh and Otford and recommended acquisition and addition of these lands to Royal National Park. The area recommended included the lands east of Helensburgh encompassing Herbert’s Creek, Gardiner’s Creek, Cedar Creek, Stuart’s Gully and the lands north of Camp Gully Creek.
The process of acquisition was begun for these lands, however, an unfortunate clerical error resulting from promotion and transfer of the staff member handling these matters, resulted in this process being sent into files and consequently no further action was taken. The error was not discovered until 1982. Until this time, the management of the South Metropolitan District of the National Parks and Wildlife Service had been resting easy on this matter in the false belief that much pf the land was secured for the Service and only awaiting release from t he objections raised by mining interests before it would be acquired and added to the park. The falsity of these beliefs and the error from which they resulted was not discovered until 1982.
Over the years since its inception, and increasingly more so recently, considerable change in land use of the lands neighbouring Royal National Park has occurred. There has been an increasing number of urban, industrial and rural developments many of which have had a significant effect upon the park and its use.
Many established land uses in the areas neighbouring the park require study and control as it is now recognized that they have had slow and steady accumulative impacts which have only recently become apparent. Further study will undoubtedly reveal the true extent of this problem
Since 1975, State, Regional, and Local Government planning requirements have changed considerably. The Environmental Planning and Assessment Act, 1979, has made it mandatory for the Service to fully appraise the potential impacts caused by its own projects. The Service will continue to appraise potential environmental impacts of proposals initiated by other authorities and persons which impinge upon the Service’s responsibilities.
Royal National Park has a Plan of Management which was adopted b y the Minister in 1975. However, many important management issues that were not foreseen in 1975 now need specific planning and many others require more detailed provisions than the 1975 Plan contained.
The appearance of these new issues has necessitated a review of the 1975 Plan and the concomitant preparation of a new (draft) Plan of Management. This process of review of the Plan of Management will be an important task of the park managers and it will be done at intervals of

4
from 5 to 10 years. The review of the 1975 Plan and preparation of the new (draft) Plan is going on now.
LAND-USE CHANGES IN THE STUDY AREA
(a) Historic and established changes
1. Firewood cutting and logging of all lands in the Hacking River valley and tributary valley south of Bola Creek with emphasis upon tall open forests and rainforests.
2. Firewood cutting and logging of all lands along the Woronora Ridge from Waterfall to Sutherland.
3. Establishment of Javan rusa deer populations over entire study area. 4. Considerable alterations to all aspects of the fire regime over most of the area. 5. Fires burning rainforests and tall open forests following the aftermath of logging. 6. Introduction of exotic plants particularly lantana and Crofton weed. 7. Introduction of exotic animals particularly dogs, cats and foxes. 8. Diseases affecting many marsupials in early 1900’s and dramatically reducing population
levels of many species. 9. Construction of Prince’s Highway.
10. Construction of the Illawarra Railway Line.
11. Urban and rural development of Otford, Stanwell Tops, Helensburgh, Waterfall, Heathcote, Engadine, Loftus and Sutherland.
12. Sydney urban rail link to Otford established.
13. Coal mining at Helensburgh established.
14. Coal waste disposal in Camp Gully Creek.
15. Helensburgh Garbage Tip and Sanitary Depot established.
16. Garrawarra Hospital established.
17. Strip mining for laterite on Woronora Ridge.
18. Sand and stone mining.
19. Mushroom mining.
20. Minor industrial development of Helensburgh, Heathcote, Engadine and Loftus.
21. Road and track construction throughout the area.
22. Establishment of flora reserve on Camp Gully Creek.
(b) Recent Land-use changes
1. Upgrading and widening of the Prince’s Highway. 2. Increase in traffic on the Prince’s Highway. 3. Construction of F5 Freeway from Waterfall t o Wollongong. 4. Upgrading, widening and electrification of the Illawarra Railway line with increased rail
traffic. 5. Further urban and rural development. 6. Connection of sewer to Helensburgh from Waterfall (imminent). 7. Increase in the number of service easements and constructions. 8. Establishment of horse-riding activities around Helensburgh and Otford. 9. Establishment of Kelly’s Falls Reserve.
10. Increased trail-bike and 4WD vehicle activity on roads and tracks around Helensburgh.

5
11. Small acre farm development between Helensburgh and Otford.
12. Classification of the Waters of the Hacking River and its tributaries as Class “P”, Protected Waters, (Clean Waters Act).
13. Mapping of Protected Lands Around Helensburgh (Soil).
14. Establishment of large horse-riding companies with many horse-riding trips carried out through the bushland and illegally in Royal National Park.
(c) Proposed Land-use Changes
a) Increase in the size of the urban area of Helensburgh with a projected four-fold increase in the population.
b) Further ‘rural’ development around Helensburgh.
c) Upgrading of the water supply to the Helensburgh area.
d) Increased industrial development of Helensburgh.
e) Large scale urban developments of the Helensburgh area.
f) Development of Stuart’s Gully as a coal waste dump of alternatively the Garrawarra Hospital gravel pits.
g) Development of Helensburgh as the terminal station on the Sydney Urban Rail Illawarra Line (imminent).
h) Increased recreational demand on Royal National Park.
IMPACT OF LAND-USE CHANGES ON ROYAL NATIONAL PARK
The impact of the land-use changes surrounding Royal National Park has been considerably degrading to the natural environment and the environmental amenity of large areas of the Park. Some changes have had a directly obvious effect upon the Park, for example, the SRA electrification activities on the Illawarra Railway Line have contributed large loads of sediment to the Hacking River and its tributaries and caused great turbidity for often weeks at a time.
These sediment beds have been ‘fertilised’ by nutrients from many sources (Garrawarra Hospital, Otford mushroom farms, Helensburgh Garbage Tip/Sanitary Depot) and grown massive weed infestations.
However, the impacts of some of the changes are not immediately obvious and impose long term threats to many environmental values.
ISOLATION OF ROYAL NATIONAL PARK
Royal National Park is becoming increasingly isolated from surrounding natural lands with which it previously had a connection of bush.
Urban development, railway constructions and upgrading highway and freeway construction, increased traffic on the transport services, rural and semi-rural development with their tree clearance, construction of many roads and trails, construction of cleared service easements, and many other developments act as impermeable barriers to wildlife movement and have already isolated Royal National Park from their surrounding lands except for a few corridors of varying degrees of quality which are available for the movement of Wildlife to and from the Park.
Royal National Park is approximately 15000 hectares in area and is a goodly sized reserve of natural land. However, a look at Map I (attached) will show that this 15ooo hectares is not a continuous conservation unit but is rather divided broadly into four major conservation units these being (a) a primarily woodland/low open forest unit, (b) a primarily heathland/low open

6
woodland unit, (c) a tall open forest/rainforest unit, and (d) a unit of vegetation influenced greatly by its littoral exposure, respectively with their associated animal life.
Consequently, the effective conservation size of Royal National Park is largely dependant upon the size of these units rather than on the 15000 hectares as a whole.
The area of each of these compartments is such that it is entirely feasible for any one or more units to be catastrophically affected by fire, disease, drought, insect attack, or other circumstance or combination of circumstances with disastrous results for the wildlife in them.
Many catastrophes are of natural occurrence and historically natural environments recover from catastrophe by recolonisation from small unaffected refuges if present and by migration of species back into the affected area from adjacent unaffected lands.
However, Royal National Park is being increasingly deprived of this natural environmental safeguard as a result of its increasing isolation by developments around its perimeter.
Units A and B have recently suffered catastrophic burning, which over a number of years has affected up to three quarters of their area.
Unit C is the area under most threat as it is the smallest unit. It presently is continuous with forests outside Royal National Park east of Helensburgh, but these forests are proposed for urban and rural development and for mining purposes. The Service is presently investigating these lands as a matter of urgency for acquisition and addition to Royal National Park.
The integrity of Unit C has also been seriously compromised by logging and the intrusion of deer affecting recovery.
Therefore, throughout these lands today the area occupied by many natural habitats, and the distributional areas of many species, are undergoing two types of change. First, the total area occupied by natural habitats and by species adversely affected by Man is shrinking at the expense of human-made habitats and by species benefited by people. Second, formally continuous natural habitats and distributional ranges of human-intolerant species are being fragmented into disjunctive pieces. These processes have important consequences for the future of natural habitats and human-intolerant species.
The implications are: (1) the ultimate number of species that the area will save is likely to be an increasing function of the reserve’s area or conservation units’ areas, and their integrity.(2) the rate at which species go extinct in the area is likely to be a decreasing function of the reserve’s area or conservation units’ areas, and their integrity. (3) The relation between reserved habitat area and probability of a species’ survival is characteristically different for each species. (4) Explicit suggestions can be made for the optimal design of human intrusions to minimize the impact of these intrusions upon habitats and species.
The effective population number must also be taken into account and this is the minimum population size to which a species can fall if it is going to recover and recolonise an area, and that will retain the original genetic diversity of the species or a large fraction of it, in perpetuity and provide the genetic means for continued evolution. It must take into account natural and human-induced fluctuations, and be large enough to withstand the vicissitudes of fire, drought, disease, increased predation (dog, cat, fox, insect, etc,), etc or a combination of these. It is the lowest number that a population can fall to under these circumstances if the species is to survive.
Many species in Royal National Park have already suffered local extinction. Grey kangaroo, wallaroo, potaroo, eastern quoll, tiger quoll, koala, rock wallaby, platypus and brown phascogale are some examples.
Many other species are threatened with local extinction. For example, pademelons, red-necked wallaby, pygmy possum, squirrel glider, greater glider, yellow-bellied glider, mountain possum, coucal pheasant, emu wren, broad-headed snake, white beech, ceratin jewel beetles and some orchids.

7
Many of the aforementioned locally extinct and threatened species are largely dependant upon the tall open forests and rainforests of conservation unit C for their existence.
There is reserved in Royal National Park, insufficient area of tall open forest and rainforest to maintain effective population numbers of many species particularly the large mammals. Over 50% of the rainforest and tall open forest in the Hacking River Catchment is outside Royal National Park and subject to the threat of land clearance and various developments. If the integrity of these habitats and their continuity with Royal National Park were lost it can be reasonably predicted that many species dependant on these habitats in Royal national Park would be threatened with local extinction and this includes the plants as well as the animals.
Despite the very serious nature of this threat to unit C the same argument and logic applies also to the other units A, B and D and consequently the same threat.
To safeguard the natural values of Royal National Park, wildlife corridors must be established between it and the neighbouring natural land units to mitigate against the fragmentation of land into smaller natural units and to allow for movement of species between the land units as a safeguard against the effects of catastrophe and, just as important but more insidious, the effects of slow accumulative impacts.
Royal National Park requires some form of recognized, and preferably reserved, continuity with the MWSDB Catchment lands to the west and south west to safeguard units A and B and with the lands east of Helensburgh and the Illawarra Escarpment to safeguard units C and D. (See map 3 – wildlife movement corridors around Helensburgh).
As much as possible, the Service should seek to acquire these lands or seek their protection by special zoning.
WATER POLLUTION
The Hacking River is the major river system in Royal National Park. It and its tributaries receive drainage from many urban and rural developments around the perimeter of Royal National Park and upstream of the Park. Much of the upper catchment of the river is outside of the Park.
The waters of the Hacking River and its tributaries are classified Class “P” Protected Waters according to the Clean Waters Act.
In a great many ways the creeks and Hacking River permeates the aesthetic qualities and leisure and recreational potential of the Park. They provide the drinking water for many of the animals in the Park. They are frequently bounded by communities very sensitive to environmental disturbance such as rainforests and tall open forests.
The river and streams are highly variable in flow and for long periods of the year may be stagnant or slowly flowing.
Accessibility to the Hacking River is good and swimming in its waters is, or rather was until recently, a popular activity. Boating in the backed up waters of Audley Weir is a very popular leisure activity.
The Hacking River is being forced to receive wastes in increasing quantities from many land use changes within its catchment and these wastes are having a considerable detrimental effect upon water quality for animal drinking, human contact, leisure and recreational use, and aesthetic appreciation. The river has very little assimilative capacity to absorb these wastes and they are released into it without any concern about the possible effects of these wastes on the environment. These waters have seriously disrupted the Park management systems and involved them in time and money consuming control activities.
Large volumes of liquid wastes are an inevitable consequence of human settlement. The proper disposal of these wastes is a complex and costly exercise. If the upper catchment of the Hacking River is allowed to be developed further for rural and urban purposes, an increasingly large, up to massive discharge of liquids bearing wastes to the water environment must occur. There can be
8
no possible expectation that wastes can be eliminated or that accidents, negligence or criminal acts will not occur, and that environmental damage will be avoided. The river and its tributaries must be degraded more as a consequence throwing and enormous on-going burden of cost (in weed control, river cleaning, wildlife management, etc.) onto the State and resulting in the degradation of a valuable community resource.
The present state of affairs has been allowed to develop without any say ion the matter from those who suffer the most, the general public and the Royal National Park managers. It is only over the last two year and a half years that the voice of these people has been raised and considered on these issues.
If “Helensburgh” develops further, who is going to determine an “acceptable” degree of water quality and ensure that it is gained by proper planning, construction and control and who is going to share the associated costs of these necessary protective measures? This calculus is a basic but very difficult part of the process which should underlie all policy decisions upon developments in the area.
The Hacking River and certain tributaries can expect massive increases in volume of rainwater and associated waste discharge directed there from all sealed and street surfaces by gutters and street drains and from house and other roofs by pipes and man-made stormwater drains. Although in proportion to the water volume the quantity of waste matter may be small, it can and does have major detrimental impacts on the quality and amenity of the receiving water bodies out of all proportion to the relative quantity of this waste matter and this impact is generally accumulative. Little is known about these flows and even less action is taken in modern Sydney developments with few exceptions to control them. By their nature – being derived from rainfall across an area – they are extremely difficult to manage, Acquiring a special waste load through the scouring of man-made wastes from developed surfaces, the volume and directions of flow depend on the basic factors of city layout design road and building materials and human activities: they tie massive liquid waste flow intimately into town planning and development. No such control is planned in any of the new developments prepared for action now and likely to increase the population of Helensburgh fourfold and expand the developed urban area. Their lack of control will only vitiate other expensive management and control provisions.
It is to be expected, too, that urban development in the upper catchment area will also enhance stormwater intrusions of sewer mains with added disruption of the management system and rising incidence of sewer overflows.
The variability of the rainfall has another important bearing on sewer overflows. The rainfall over the upper catchment is highly variable and it suffers from frequent brief periods of relatively heavy rain on a small number of days. These heavy rain periods will almost certainly contribute to regular overflowing of the sewers.
It is interesting to note that when the sewer line from Helensburgh to Waterfall was constructed, the National Parks and Wildlife Service was given no say in the planning of the route of the line and the location of servicing points and sewer overflows, yet it was and will continue to be the Service which has and will bear the brunt of managing the problems associated with this lack of liaison and poor planning.
Sewer overflows particularly have been very poorly located with respect to environmental values and will significantly degrade the environment downslope of their location. Some have been located on natural ridge tops far from any natural watercourse to dilute and carry away the waste. It is expected that within a very short time these overflows will become weed ridden swamps.
The combined impact of the urban runoff and sewer overflows will be the constant accumulative degradation of the receiving waters affecting amenity, human and animal health and many natural values.
It is generally forgotten that many animals must drink the water in these creeks and animals are just as prone to the effects of toxins and pathogens as people. We can certainly expect animal

9
populations which drink these waters to suffer periodic episodes of death and debility or enteric illness in proportion to the amount of waste entering the waters.
The chances of cataclysmic accidents occurring must also increase and these have been disastrous to animals downstream. All platypi and water rats Hydronomys chrysogaster were killed in Wilson’s Creek and the Hacking River in the mid 1970s as a result of a sulphuric acid spill on the Prince’s Highway in the headwaters of Wilson’s Creek. Since then, no platypi have been seen anywhere in the Hacking River catchment area. What impact this acid spill had on other life forms is not documented or known.
In March of 1983 the National Parks and Wildlife Service was in the process of preparing a declaration concerning the possible health hazard to people from the waters of the Hacking River if they came into contact with or drank these waters. Fortunately, record rains and floods in the catchment area flushed the river out and lessened this threat. The major contributing factors to the problem were at the time, raw sewage and garbage tip leachate from Helensburgh Tip and Sanitary Depot and raw sewage from Garrawarra Hospital where in both instances, treatment processes had broken down and large quantities of raw liquid waste were released in the nearby creeks. It took over 18 months for the Helensburgh Sanitary Depot problems to be repaired despite great pressure from the National parks and Wildlife Service and the garbage tip leachate problems are still being “worked on”. The SPCC has been negotiating with the Health Department fro three years to repair the sewage treatment plant at Garrawarra Hospital and the National Parks and Wildlife Service is still waiting for a progress report on these negotiations.
These aforementioned polluting problems have had considerably detrimental and permanent impact upon the Hacking. Their impact was greatly exacerbated by other phenomena affecting the river at the same time, these being a record drought where the Hacking River stopped flowing on three occasions with, at these times, the only liquid entering the river being the wastes from the Helensburgh Tip and Sanitary Depot, Garrawarra Hospital Sanitary Depot Waste Water Treatment Plant, Metropolitan Colliery Waste Water Treatment Plant and Otford Valley Mushroom Farm. At the same time, the SRA Illawarra Railway Line electrification activities and the MWS&DB Helensburgh to Waterfall sewer works were contributing massive sediment loads to the creeks and river which silted up dramatically in places. In both of these instances the National parks and Wildlife Service had to battle for lengthy periods to gain control of these problems and eventually the SRA and the MWSDB had to employ Soil Conservation officers to prepare erosion control plans and direct restoration and control works.
However, the Hacking River ad many of its tributaries have been irreparably damaged as a result of this coincidental set of circumstances. Photographs of the Hacking River at Red Cedar Flat in Royal National Park in 1979 show a flowing clear stream over rapids and a mix of coal wash and sand banks. People were happily swimming in the river. The banks were open and clear. Photographs of the same location in 1981/82 show the whole river bed to be a weed choked swamp with o water channel at all and the banks covered with a profuse growth of weeds. The bed of the river was stinking, putrid mud.
A monitor of the weeds since then has shown them to be spreading downstream at a rate of 4 kilometres per year. The inevitability is that they will infect the whole length of the Hacking River and even the shores of the Hacking Inlet. These infestations will then become foci for the weeds to spread into the bushland surrounding. Coincidently, the Hacking River traverses the Park through the natural communities least able to resist this threat, the tall open forests and rainforests.
The coal waste dump in Camp Gully Creek for Metropolitan Colliery has regularly polluted the Hacking River with sediments and suspended particles. Black and grey sediments are spread the whole length of the river to Gray’s Point from its confluence with Camp Gully Creek. Many minor collapses of the coal dump walls have occurred blackening the bed and waters of the river for days on end. In the early 1970s a major collapse of one wall occurred and 10,000 cu m of coal waste was dumped into Camp Gully Creek to find its way into the Hacking River. The old walls of the dump have still to be stabilized properly and the Metropolitan Colliery is preparing plans for this now. However, in time, the coal dump must continue to erode and suffer periodic slumps of

10
varying proportion. The walls are so steep that this will occur purely as a result of natural processes.
Recently, Metropolitan Colliery has constructed a 3½ million dollar waste treatment plant to treat all waters from their works (toilets, showers, cleaning yards, store depots, trucks, etc.). These have been a regular source of pollution. The treatment plant has reduced this pollution considerably but it has not removed nutrients from the waste.
Metropolitan Colliery has proposed the development of Stuart’s Gully south of Camp Gully Creek as the next site for a coal waste dump. Again, in the long term, such a dump must inevitably contribute back coal waste to the Hacking River.
This proposed dump is located in a most critical position in the middle of the wildlife corridor between Royal National Park and the forests east of Helensburgh and the Illawarra Escarpment. The use of this gully would seriously disrupt the potential for movement of species to and fro in this area and significantly contribute to the isolation of Royal National Park.
One can reasonably [predict that a result of further urban development of the upper catchment will be increased frequency and intensity of flooding downstream with their concomitant effects. The Audley Weir would be blocked on more occasions.
OTHER IMPACTS
Another direct impact would result from increased predation upon wildlife from a large number of domestic dogs and cats living around the Park. Domestic dogs regulary hunt in Royal National Park either singularly, in small groups, or even in packs. They travel large distances on these forays. Many dogs from Sutherland have been caught at Garie Beach and Era. They chase everything that moves and have even, although rarely, menaced people in the Park. Although not studied, I believe their hunting forays have made a significant contribution to the reduction in population numbers of many large mammals.
Domestic cats also make hunting forays in the Park from surrounding suburbs and may travel up to 6 kilometres into the Park in a night and return. Pygmy possums, classified as Endangered Fauna, are a prey species of the cat and many specimens have been deposited for show on floors and doorsteps around Heathcote put there by the household cat. Birds particularly are preyed upon.
Traffic through he Park would be expected to increase and an increased number of animal road kills would be expected as a result. Road kills are a significant cause of death in many animal populations in the Park. For example, in May 1982, 15 swamp wallabies, 7 possums, 3 bandicoots, 3 cats, 3 foxes, 35 birds (including lyre birds, kookaburras, owls, and wattlebirds), 4 snakes, 5 blue tongues, 1 wombat, 5 deer, 3 rats and 7 lizards were reported as killed on roads in the Park and this record is no where near a complete record for that month. The proportions would be different for each month as the different animals begin their various movements.
An increase in population around Helensburgh would lead to an increased visitation to the Park for recreation and place great demand on the recreation facilities which are frequently stretched to their full capacity now. Also these demands would be placed on a part of the park which is least designed for and has the least capacity for recreation and where recreational disruption to the natural environment would have the most impact – the tall open forest and rainforests of the Hacking River along Lady Wakehurst Drive, the route along which most of these new park users would enter the park.
Logging of the tall open forests and rainforest in and around Royal National Park has had a major impact upon these habitats. The rainforests in particular have been hard hit and their recovery has been seriously hindered by the incursions of fire, which have occurred more frequently and been able to enter the forests opened up by the logging. Deer particularly have hindered the recovery of these forests for a long time by grazing off the regenerating shoots, seedlings and saplings and considerably slowing down regeneration. The logging removed nearly all the big trees. A lot of clearance of ‘old and useless’ trees was done during this logging. Unfortunately it is

11
these ‘old and useless trees’ which are most important for animals by providing the essential nesting and shelter hollows. Logging has consequently greatly reduced the carrying capacity of these forests for many animals (including birds) dependant upon hollows. It takes a forest a very long time to grow and mature enough for hollows to develop and the carrying capacity to increase again. The number of hollows in an area is in many cases the limiting factor for the population size of many species.
Dumping of rubbish and garden refuse in the Park can be expected to increase. The dumping of garden refuse is a particularly detrimental activity the full implications of which area poorly appreciated by the public. The spread of weeds and disease as a result can be very difficult and costly to control. The Park is regularly used for the disposal of garden refuse by some people. The impact of this sort of activity can be out of all proportion to the amount of waste deposited.
_________________________________________________
CONCLUSION
The further development of the Helensburgh area for rural, urban and industrial purposes would have a considerable detrimental impact upon conservation values in the area and upon Royal National Park.
To safeguard the natural values of Royal National Park, wildlife corridors must be established between it and the neighbouring natural lands units to mitigate against the fragmentation of the land into small natural units and to allow for movement of species between the land units to counter the effects of catastrophe and slow accumulative deleterious impacts.
Royal National Park requires some form of recognized and preferably reserved naturally vegetated continuity with the MWS&DB catchment lands to the west and sout west and with the lands east of Helensburgh, and the Illawarra Escarpment.
As much as possible the Service should seek to acquire these lands of seek their protection by special zoning.
The Service should be involved in all land-use planning design and policy formation within the catchment of the Hacking River.
R Crombie
Senior Ranger
South Metropolitan District
30th March 1984
Map 1: Hacking River Catchment
Map 2: Urban development areas acceptable to the Service (interim planning) – no urban development areas.
Map 3: Distribution of major vegetation =units in Royal National Park and southern wildlife corridors.
Map 4: Wildlife corridors connecting Royal National Park with Heathcote National Park, Woronora River Water Catchment Area and the Illawarra Escarpment.
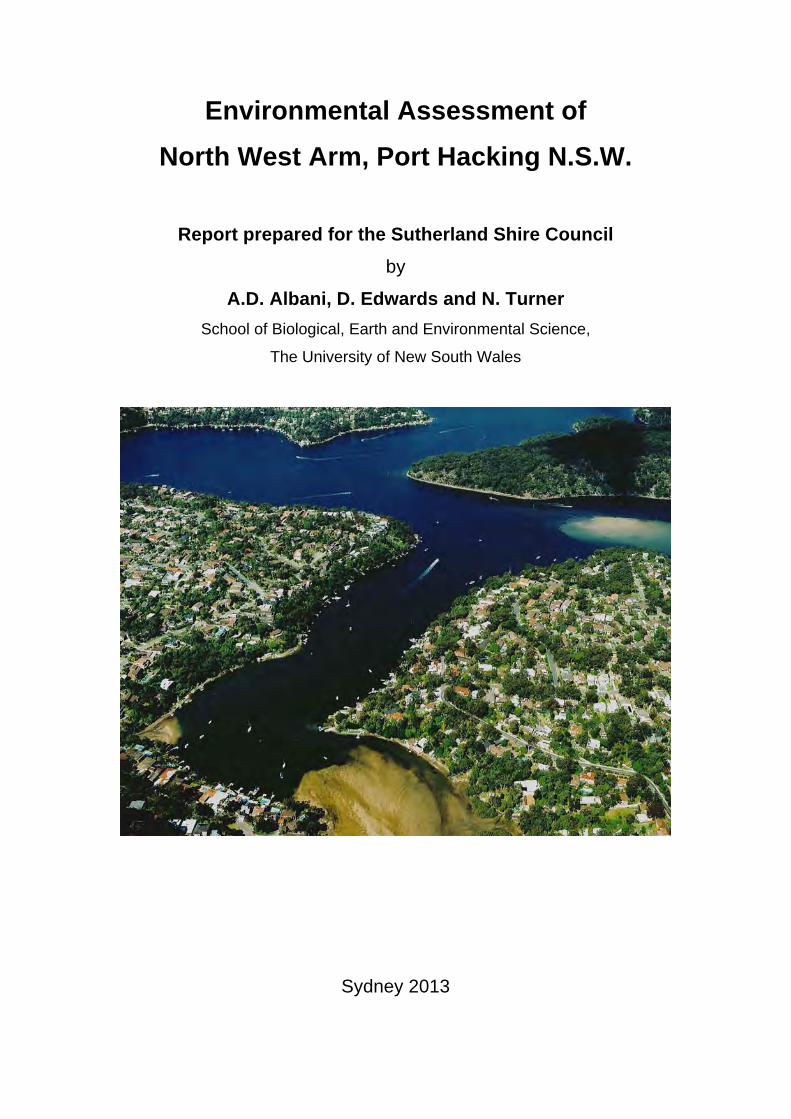
Environmental Assessment of North West Arm, Port Hacking N.S.W.
Report prepared for the Sutherland Shire Council
by
A.D. Albani, D. Edwards and N. Turner School of Biological, Earth and Environmental Science,
The University of New South Wales
Sydney 2013

2
Content 1 – Introduction p. 3 2 - Study Area p. 5 3 – Past and present day delta morphology p. 9 a. Topographic Survey p. 9 b. Analysis of Historical Photos and Information p. 11 c. Air photo interpretation p. 14
d. Comparison of Air Photos with Modern Survey p. 19
4 - Cores p. 22 a. Sampling and methods p. 22 b. Sediments (lithologies) p. 25 b. Sediments (grain size) p. 32 5 – Geochemistry p. 39 a. Arsenic p. 43 b. Copper p. 44 c. Lead p. 45 d. Zinc p. 46 e. Chromium p. 46 f. Antimony p. 47 6 - Foraminifera p. 50 a. Calcioferrite formation p. 55 7 – Conclusions p. 61 8 – Acknowledgments p. 63 9 – References p. 64 10 – List of Figures and Tables p. 67 11 - Appendices p. 69 1. Aerial photographs p. 69 2 – Cores p. 87 3 – Sediments p. 112 4 – Geochemistry p. 156 5 – Foraminifera p. 159

3
1. Introduction
Since European settlement, most fluvial and estuarine systems in the Sydney
region have been modified or degraded in some way. The hydrological
regime and sedimentology of streams and estuaries has been altered as a
result of human induced changes to channels and catchments including
vegetation removal, urbanisation and industrial development. This in turn has
led to significant changes to the morphology of streams and increased rates
of sedimentation in estuaries. In addition, urban and industrial discharge has
adversely impacted sediment and water quality in estuaries (Birch, et al.,
1996; Albani et al. 2011). Remediation of these sites can prove to be costly
and difficult without adequate knowledge of the sediment sources and degree
of contamination (Suh et al., 2004).
Unlike many other waterways around Sydney, Port Hacking has preserved a
large proportion of its natural environment despite the pressures of increasing
urban and industrial development. This is due, in part, to the presence of the
Royal National Park on the southern and western flank of the estuary and also
because the catchment of the estuary has been dominated by urban rather
than industrial land uses. Generally speaking, the Port Hacking estuary has
experienced less human impact than heavily disturbed nearby estuaries such
as Botany Bay or Port Jackson. Nonetheless Sutherland Shire Council (2012)
has identified increased sedimentation rates and contamination of sediments,
particularly by heavy metals, as important environmental threats to the
estuary that need to be addressed.
The Port Hacking estuary contains numerous inlets and bays where
sediments are transported from surrounding catchments by relatively small
streams and deposited as deltas of various sizes and styles. The overall
morphology of these deltas is controlled by a variety of factors including the
quantity and calibre of sediment supply, the hydrologic regime of the
surrounding catchment and the accommodation space for the sediment in the

4
central basin. The capacity for sediment reworking by tidal and wave action is
also important.
Previous research on the sedimentation rates and sediment quality in some of
these bays and deltas (eg Whitehill 1996; Mares 2003; Albani and Cotis,
2008) has revealed that each sub-catchment has its own unique history and
degree of human modification. The development of appropriate management
plans therefore needs to accommodate the particular environmental record for
each location as well as adopt broader management goals and priorities This
approach is echoed in the Port Hacking Integrated Environmental
Management Plan 2007 - 2012 (Sutherland Council) which identifies the need
for better understanding of when sediments were added to the system and an
indication of the contaminant levels.
Some bays on the northern side of Port Hacking, such as North West Arm,
were previously considered to be less modified by human development of the
surrounding catchment (1997 Port Hacking Ranking) and therefore ranked
low in terms of requiring remediation and management works. However
recent concerns over sedimentation in North West Arm (Walshe, 2003; Barton
and Turner 2011) have seen local residents push for direct remedial action
such as dredging of the delta. The successful implementation of such
strategies or the consideration of viable alternatives requires a better
understanding of the past and present sedimentary history of North West Arm.
This aim of this study is to explain the recent evolution and sedimentology of
the North West Arm delta. Little is known about the rates of sedimentation on
the delta or the degree to which the sediments are contaminated. The study
will therefore provide input to local and estuary wide management plans and
also point the way forward for future research.

5
2. Study Area North West Arm is located adjacent to Gymea Bay and is the most north-
western branch of the Port Hacking estuary. It is surrounded by the suburbs
of Kirrawee, Gymea and Grays Point. The North West Arm catchment is
approximately 10 km² (Fig. 1) and is largely drained by three streams:
Temptation Ck, Savilles Ck and Dents Ck which occupy narrow v-shaped
valleys.
Figure 1 - Topographic map of the North West Arm catchment. The catchment is approximately 50% residential area and 50% National Park.
The geology of the North West Arm catchment is mostly comprised of medium
to coarse grained quartz sandstones with minor shale and laminated lenses
from the Triassic aged Hawkesbury Sandstone and Narrabeen Group. The
sandstone has been eroded to form a deeply incised plateau, classified as
part of the Woronora plateau geomorphic unit (Hazelton and Tille, 1990).
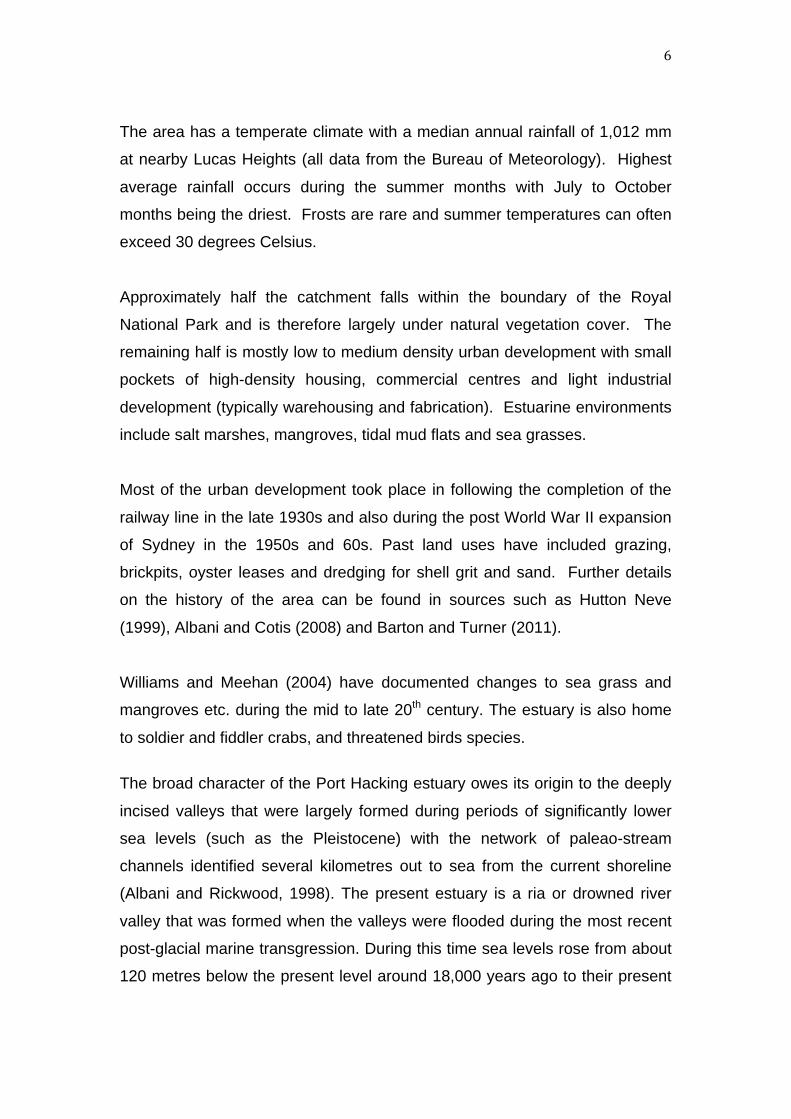
6
The area has a temperate climate with a median annual rainfall of 1,012 mm
at nearby Lucas Heights (all data from the Bureau of Meteorology). Highest
average rainfall occurs during the summer months with July to October
months being the driest. Frosts are rare and summer temperatures can often
exceed 30 degrees Celsius.
Approximately half the catchment falls within the boundary of the Royal
National Park and is therefore largely under natural vegetation cover. The
remaining half is mostly low to medium density urban development with small
pockets of high-density housing, commercial centres and light industrial
development (typically warehousing and fabrication). Estuarine environments
include salt marshes, mangroves, tidal mud flats and sea grasses.
Most of the urban development took place in following the completion of the
railway line in the late 1930s and also during the post World War II expansion
of Sydney in the 1950s and 60s. Past land uses have included grazing,
brickpits, oyster leases and dredging for shell grit and sand. Further details
on the history of the area can be found in sources such as Hutton Neve
(1999), Albani and Cotis (2008) and Barton and Turner (2011).
Williams and Meehan (2004) have documented changes to sea grass and
mangroves etc. during the mid to late 20th century. The estuary is also home
to soldier and fiddler crabs, and threatened birds species.
The broad character of the Port Hacking estuary owes its origin to the deeply
incised valleys that were largely formed during periods of significantly lower
sea levels (such as the Pleistocene) with the network of paleao-stream
channels identified several kilometres out to sea from the current shoreline
(Albani and Rickwood, 1998). The present estuary is a ria or drowned river
valley that was formed when the valleys were flooded during the most recent
post-glacial marine transgression. During this time sea levels rose from about
120 metres below the present level around 18,000 years ago to their present
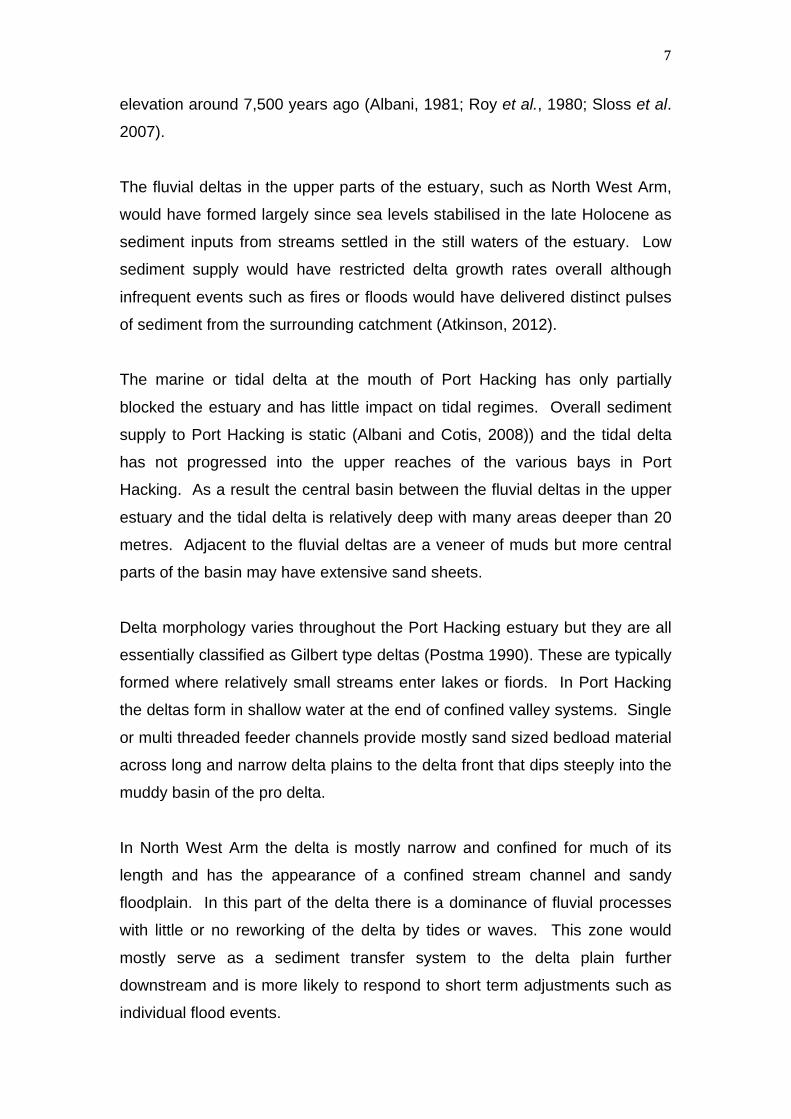
7
elevation around 7,500 years ago (Albani, 1981; Roy et al., 1980; Sloss et al.
2007).
The fluvial deltas in the upper parts of the estuary, such as North West Arm,
would have formed largely since sea levels stabilised in the late Holocene as
sediment inputs from streams settled in the still waters of the estuary. Low
sediment supply would have restricted delta growth rates overall although
infrequent events such as fires or floods would have delivered distinct pulses
of sediment from the surrounding catchment (Atkinson, 2012).
The marine or tidal delta at the mouth of Port Hacking has only partially
blocked the estuary and has little impact on tidal regimes. Overall sediment
supply to Port Hacking is static (Albani and Cotis, 2008)) and the tidal delta
has not progressed into the upper reaches of the various bays in Port
Hacking. As a result the central basin between the fluvial deltas in the upper
estuary and the tidal delta is relatively deep with many areas deeper than 20
metres. Adjacent to the fluvial deltas are a veneer of muds but more central
parts of the basin may have extensive sand sheets.
Delta morphology varies throughout the Port Hacking estuary but they are all
essentially classified as Gilbert type deltas (Postma 1990). These are typically
formed where relatively small streams enter lakes or fiords. In Port Hacking
the deltas form in shallow water at the end of confined valley systems. Single
or multi threaded feeder channels provide mostly sand sized bedload material
across long and narrow delta plains to the delta front that dips steeply into the
muddy basin of the pro delta.
In North West Arm the delta is mostly narrow and confined for much of its
length and has the appearance of a confined stream channel and sandy
floodplain. In this part of the delta there is a dominance of fluvial processes
with little or no reworking of the delta by tides or waves. This zone would
mostly serve as a sediment transfer system to the delta plain further
downstream and is more likely to respond to short term adjustments such as
individual flood events.

8
The final 300 metres of the delta plain occupy a wider and more open section
of the valley where flow expansion leads to reductions in unit stream power.
In this zone the delta is prograding and long term sediment storage is filling
the available accommodation space. It is this broader downstream reach of
the delta that was the focus of our research (Fig. 2).
Figure 2 – North West Arm fluvial delta exposed at low tide.
9
3. Past and Present Day Delta Morphology
An assessment of changes in the delta morphology over time was made using
three key sources:
i. completion of a detailed topographic survey of delta surface;
ii. comparison of historical photos and other information; and
iii. an analysis of vertical air photographs over time;
iv. comparison of Air Photos with Modern Survey
a. Topographic Survey
A detailed topographic survey of the present delta morphology was completed
during low tide on 1st August 2012 using a Sokkia Set 550 total station and
standard reflector targets (Fig. 3). A total of 138 data points were surveyed
covering all of the studied section of the delta to the edge of the steeply
dipping delta front. The location of sediment cores and other features were
also included as part of the survey. The survey points were referenced to
local benchmarks with co-ordinates determined using a Garmin eTrex30 GPS
and comparison to values on geo-referenced images obtained from Near
Map. Elevations were converted to AHD levels using tidal data from the
National Tidal Facility and Manly Hydraulics Lab.
The deep water zone of North West Arm seaward of the delta was surveyed
using a depth sounder from a small boat and a Garmin eTrex30 GPS on 12th
September 2012. Tidal information from the National Tidal Facility was used
to tie in this survey with the total station data.
This data was used to construct a detailed contour map of the delta using
Surfer v8.0 (Golden Software Inc., 2002) which has been overlaid on the 14th
August 2012 air photo image as shown in Figure 4.

10
Figure 3 - Surveying the North West Arm fluvial delta.
Figure 4 - Contour map of the North West Arm fluvial delta plotted on the terrain image. (Image Source: Sutherland Shire Council, 2012)

11
The studied section of the present delta is approximately 300 long and 180
metres wide at its widest section with an overall area of about 55 000m2. The
delta is confined by the sandstone bedrock of the valley walls and is less
than150 metres wide at the upstream study limit and along the delta front.
The central part of the delta surface is dominated by a large longitudinal bar
that separates the main northern freshwater channel from a deeper tidal inlet
on the southern margin of the delta. At low tide the freshwater channel has
clearly defined banks but is less than half a metre deep. Relief across the
delta is generally less than 0.8 m that is in stark contrast to the steeply dipping
delta front into Gymea Bay where maximum depths are over six metres.
The northern side of the delta is comprised of two main sediment bodies; a
landward component attached to a bedrock shelf and a wedge of material on
the north-eastern margin of the main delta front. The combination of this
sediment wedge, the freshwater outlet channel, the central bar and the
southern tidal channel yields an irregular shaped delta front. Smaller
freshwater outlets from natural and artificial sources (such as stormwater
drains) have created scour pools and secondary delta features along the
southern margin and in the southern tidal channel.
The studied section of delta was mostly unvegetated but thick stands of
mangroves occupied both sides of the valley upstream. Mangroves were also
present along the southern delta margin. Deeper sections of the uneven delta
front were covered in sea grasses.
b. Analysis of Historical Photos and Information Historical photos are useful sources of information on landscape changes and
can be valuable supplements to oral and written histories of change in natural
systems (McLoughlin, 2000; Pickard 2002). The two main sources of
historical photos used in the present study were the recently published book

12
on the history of Grays Point (Barton and Turner 2011) and the Conyard
family photo collection.
In many cases the historical photos could only dated as precisely as the
nearest year or decade, which limits their value for interpretation of changes
to the delta system or catchment. Despite this they provide an important
chronology of changes to North West Arm.
The earliest photo available was taken in1917. It clearly shows the
downstream section of the delta investigated in the present study. The
freshwater outlet channel is well defined and therefore the photo must have
been taken at low tide. Without a precise date and time we cannot determine
how low the tide was and compare the delta area exposed to the present day
morphology. However, it is clear that the delta was already well established
100 years ago.
Figure 5 – The fluvial delta in the study area in 1917 (Conyard family)

13
Many of the photos show activities such as boating and sailing in the area of
the delta during the 1930s - 1950s. Again, without precise dates and times
we cannot determine the tide level in the photos.
We also do not know the draught of the various vessels in the photos but
despite this it is clear that various types of boating activities were popular in
the delta area and that this would be difficult today except on the highest
portion of the tidal cycle.
The photos and historical accounts also make mention of large swimming
holes that were present in the confined section of the delta as exemplified by
the following quotes extracted from Barton and Turner (2011):
Several swimming places were very popular with locals and visitors to North West Arm
in the 1920s.
There was the main Swimming Hole, which was then very deep and located at the
lower portion of the road just down from today’s childcare centre on North West Arm
Road. This became a very popular picnic and swimming spot ......... in 1922 when the
bridge opened.
Next hole downstream was Bungers Rock. It was a favoured diving spot and, as with
the other pools, people used to swing off tree ropes into the deep, crystal-clear water.
About 50 metres further along was a long, narrow channel called The Drain. It was
deep and about 12 feet (four metres) wide...................The North West Arm swimming
hole was still used into the 1950s, but gradually yielded to siltation and pollution.
It is clear from the historical evidence that the delta had existed well before
the era of urbanisation in the mid 20th century and was probably therefore a
natural feature of the landscape. However, the historical records also indicate
that the delta has been altered by increased sedimentation in recent times.

14
c. Air Photo Interpretation Comparison of historical aerial photographs was used to identify changes in
the morphology and size of the North West Arm fluvial delta and also assess
transformation of the surrounding catchment such as the spread of urban
development.
A total of forty one air photos from 1930 until the present day were obtained
from Sutherland Shire Council, Near Map and NSW LPI. . Only photos of
high quality that clearly displayed the delta morphology were selected for
analysis and comparison. Preference was also given to photos that depicted
the delta at low tide. For some time periods there was only a small selection
of photos available and these were used in the analysis regardless of their
quality. Precise georectification of the photos was not required as our
concern was with changes in the overall size and morphology of the delta
over time rather than determining the exact location of features.
A selection of the air photos used in the analysis are included in Appendix 1.
The earliest available air photo was taken on the 28th February 1930. Tidal
records indicate the photo was taken between mid and low tide and therefore
most of the delta was covered in water. Despite this, the outline of the delta is
clearly visible and it is starkly obvious that there is little difference between the
gross overall size and morphology of the delta in this photo and that seen in
subsequent photos including the latest available photograph taken on 14th
August 2012. Despite this lack of gross change over time there have been
significant changes in the delta as noted below.
Throughout the photographic record there has been an increase in the delta
length along the delta front by approximately 10 metres. This growth occurred
initially in the NE section of the delta front during the 1960s that was followed
by growth on the southern front during the 1970s.

15
Movement and migration of the freshwater outlet channel has been one of the
most distinctive and obvious changes during the 82 year period covered by
the air photos. The main changes are summarized as follows:
• Between 1930 and 1961, the main freshwater outflow channel was
located on southern margin of the central bar. Any channels through
the central or northern sections of the delta were poorly defined.
• The 1966 photo revealed a dramatic change in the freshwater outflow
channel with a large central channel running approximately halfway
down the length of the delta before splitting into a number of smaller
braided distributaries. Smaller overflow channels can also be seen
crossing the bar into the southern tidal channel.
• From 1970 through to the 1994 the outflow channel bifurcated
upstream of the study area and the delta was cut by a main northern
and southern channel. In 1994 there was once again a series of braid
channels and splay features on the leading edge of the delta.
• From 1994 to 2005, extensive sedimentation on the central and
southern part of the delta was coincidental with migration of the
southern channel northwards and merging with the northern channel.
By 2006 the southern freshwater channel exists as a relict feature only.
• From 2006 to the present the outflow channel has remained on the
northern side of the delta. The upstream section of the southern tidal
channel experienced increased sedimentation during this time.
The air photo record also reveals changes in the vegetation cover of the delta.
There has been an approximate increase of 8,500 m² in mangrove cover of
the studied section of the delta from 1930 to 2012 that is in general
agreement with other studies of increased recent mangrove colonisation in
Port Hacking (Williams and Meehan, 2005). This increase in mangrove cover
suggests a reduction in mean water depth and increase in suitable habitat
over the area being colonized but may also simply indicate a recovery of the
mangroves following extensive harvesting and clearing the early 20th century.
There has also been an increase in sea grass cover on then delta front which

16
again may also indicate a reduction in water depth or be a response to
reduced sediment transport and greater stability in this zone in recent years.
The air photos clearly depict the transformation of the catchment of the North
West Arm from a semi-rural landscape to a highly urbanised residential area
over the past 82 years. The earliest aerial photograph from 1930 depicts the
early stages of urban development but the area remained well vegetated. It is
evident the catchment was becoming more urbanized throughout the 1960s
and 1970s with increases in housing and road density and reductions in the
amount of vegetation cover. The urban development was largely complete by
the start of the 1980s although some further subdivision of blocks and the
rebuilding and renovation of houses has occurred since then and continues to
the present day.
A critical event in the recent transformation of the delta was the extraction of
more than 9,000 cubic metres of sand by a small suction dredge (Fig. 6). This
event is captured by the February 1966 air photo as shown in figure 7. The
dredging operations took place during 1966 and 1967 in the confined
upstream section of the delta in the vicinity of the swimming holes noted in
various historical accounts. As shown in Figure 6 the method of extraction
resulted in a significant reworking of the upper part of the sediment body and
the discharge during the process would have create well-sorted clean
sediments.
The dredge operated within a pool and whether the dredge was exploiting a
pre-existing hole (such as the previously mentioned swimming holes) or a
new hole cannot be ascertained from the air photos. Notably the 1970 photo
of the same section of the delta (Fig. 8) shows two holes. Again it cannot be
ascertained whether these holes were the yet to be infilled dredge ponds or
scars from floods. Neither of the holes were visible in the 1978 air photos.
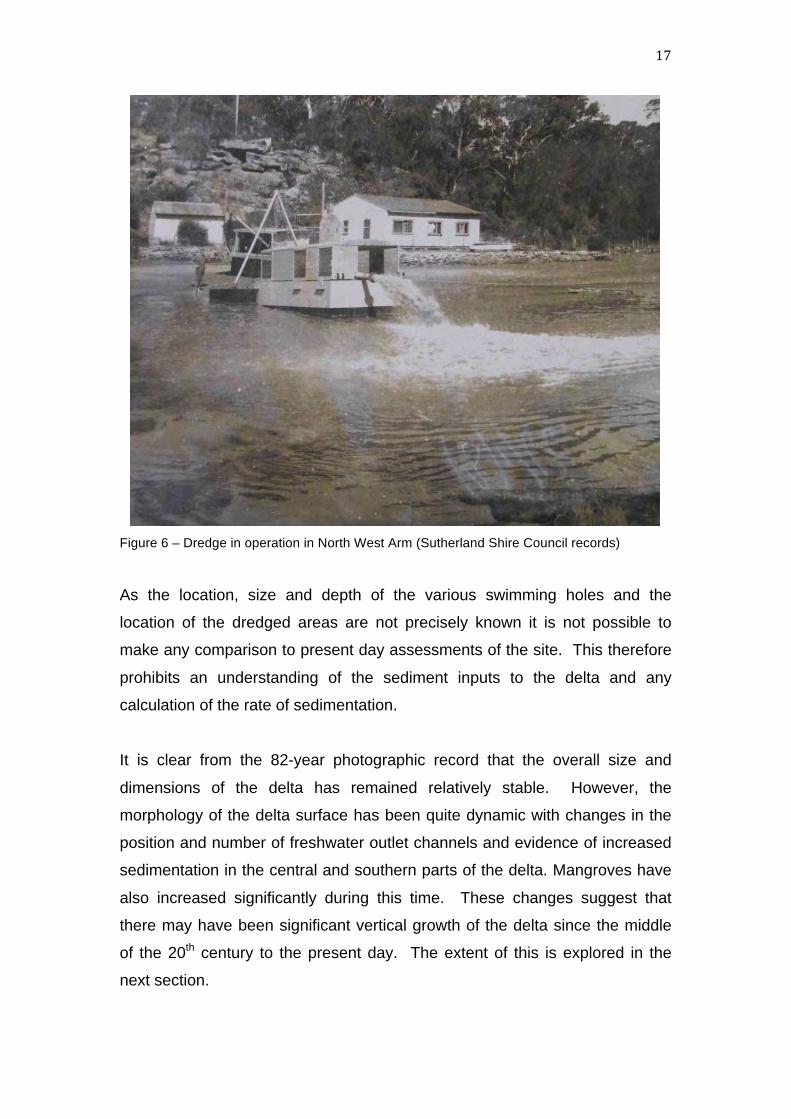
17
Figure 6 – Dredge in operation in North West Arm (Sutherland Shire Council records)
As the location, size and depth of the various swimming holes and the
location of the dredged areas are not precisely known it is not possible to
make any comparison to present day assessments of the site. This therefore
prohibits an understanding of the sediment inputs to the delta and any
calculation of the rate of sedimentation.
It is clear from the 82-year photographic record that the overall size and
dimensions of the delta has remained relatively stable. However, the
morphology of the delta surface has been quite dynamic with changes in the
position and number of freshwater outlet channels and evidence of increased
sedimentation in the central and southern parts of the delta. Mangroves have
also increased significantly during this time. These changes suggest that
there may have been significant vertical growth of the delta since the middle
of the 20th century to the present day. The extent of this is explored in the
next section.

18
B
A
Figure 7
A. Section of 1966 photo showingupstream dredge pool.
B. Enlargement of photo showingdredge on edge of pool as indicatedby the arrow

19
Figure 8 - Extract from the 1970 Air Photo showing Upstream Section of Delta showing holes (indicated by arrows)
d. Comparison of Air Photos with Modern Survey
To ascertain the extent of any vertical aggradation the area of the delta
surface exposed at various low tide levels was compared between the
historical photos and the digital elevation model derived from the survey
completed in August 2012. The date and times at which the photos were
taken were used to determine the tide height based on data obtained from the
National Tidal Facility. Tide levels for the gauge at Fort Dennison were
adjusted to Australian Height Datum (AHD) by subtracting 0.925m (Mehl,
2012).

20
As shown in Table 1 the historical air photos used were from February 1930,
June 1961, February 1966, October 2003 and January 2007. Comparison of
the area of delta exposed between the historical air photos and the present
survey reveals dramatic increases in delta sedimentation have occurred. For
example, both the February 1930 photo and the October 2003 photo were
taken at a 0.8 m low tide. According to the 2012 survey 5,000 m2 of the delta
was exposed at this tide level but none of the delta was exposed in 1930 and
only 3,000m2 in 2003. Similarly, in the June 1961 photo, none of the delta
was exposed but according to the topographic survey a similar tide level in
2012 would reveal approximately 30,000m2 of the delta surface.
Overall, the comparisons shown in Table 1 indicate a greater area of delta
exposed in later photos and also in the 2012 survey. Whilst this clearly shows
that the delta has accumulated material over time, it is not possible to make
volume calculations based on data available. This would require elevation
data that cannot be determined from the old photos.
Notably the 1930 and 1961 air photos revealed the most dramatic differences
in the area of the delta exposed compared to the 2012 survey. Changes from
1966 onward were less significant. These trends make sense in terms of the
degree of housing and road construction in the catchment as previously
outlined.
Overall the analysis of various photographic records indicates that the broad
overall morphology of the channel has changed little from 1917 to the present
day. Nonetheless there have been changes in the extent of delta
sedimentation as revealed from the amount of delta exposed at low tide. In
addition there have been important changes to the morphology of the
channels crossing the delta and also significant modification of the upstream
part of the delta due to human activities such as dredging.
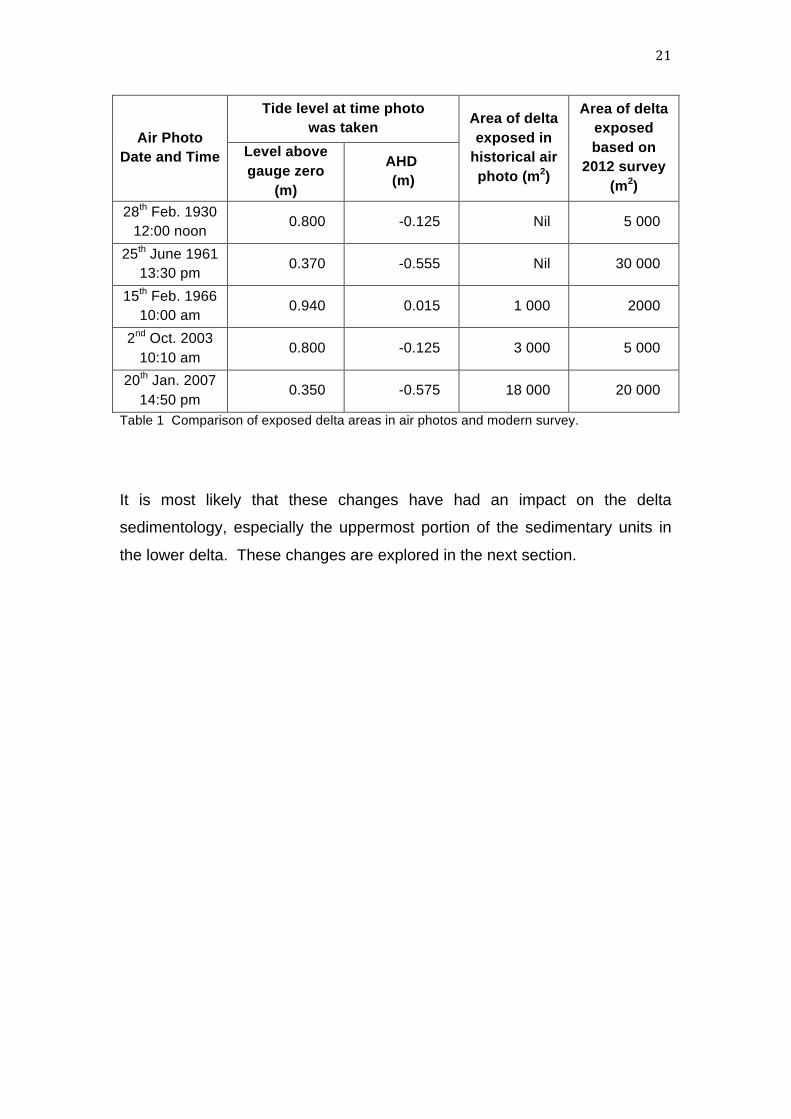
21
Air Photo Date and Time
Tide level at time photo was taken Area of delta
exposed in historical air photo (m2)
Area of delta exposed based on
2012 survey (m2)
Level above gauge zero
(m)
AHD (m)
28th Feb. 1930 12:00 noon
0.800 -0.125 Nil 5 000
25th June 1961 13:30 pm
0.370 -0.555 Nil 30 000
15th Feb. 1966 10:00 am
0.940 0.015 1 000 2000
2nd Oct. 2003 10:10 am
0.800 -0.125 3 000 5 000
20th Jan. 2007 14:50 pm
0.350 -0.575 18 000 20 000
Table 1 Comparison of exposed delta areas in air photos and modern survey.
It is most likely that these changes have had an impact on the delta
sedimentology, especially the uppermost portion of the sedimentary units in
the lower delta. These changes are explored in the next section.

22
4. Cores a. Sampling and methods Five sediment cores (D, E, F, G, L) were extracted from locations along the
central delta bar that were expected to best depict the overall stratigraphy and
sedimentology of the delta (Fig. 9 and Table 2). An additional three cores (H,
J, K) were obtained from closer to the southern margin of the delta to assess
the lateral variability of the sediments. Areas that had localised impacts, such
as recent bank rehabilitation, construction sites and areas of storm water
discharge, were specifically avoided as the sediment in these areas would not
be representative of the majority of the delta sediments (Albani, et al., 2011).
Figure 9 - Location of samples on the North West Arm fluvial delta. (Image Source: Sutherland Shire Council, 2012)
The cores were all extracted at low tide by manually inserting five metre
lengths of pre-cleaned 65 mm diameter PVC pressure pipe into the sediment
(Fig. 10). The pipes were driven in until refusal or to depths of approximately
four metres. The process of inserting the cores results in compaction of the
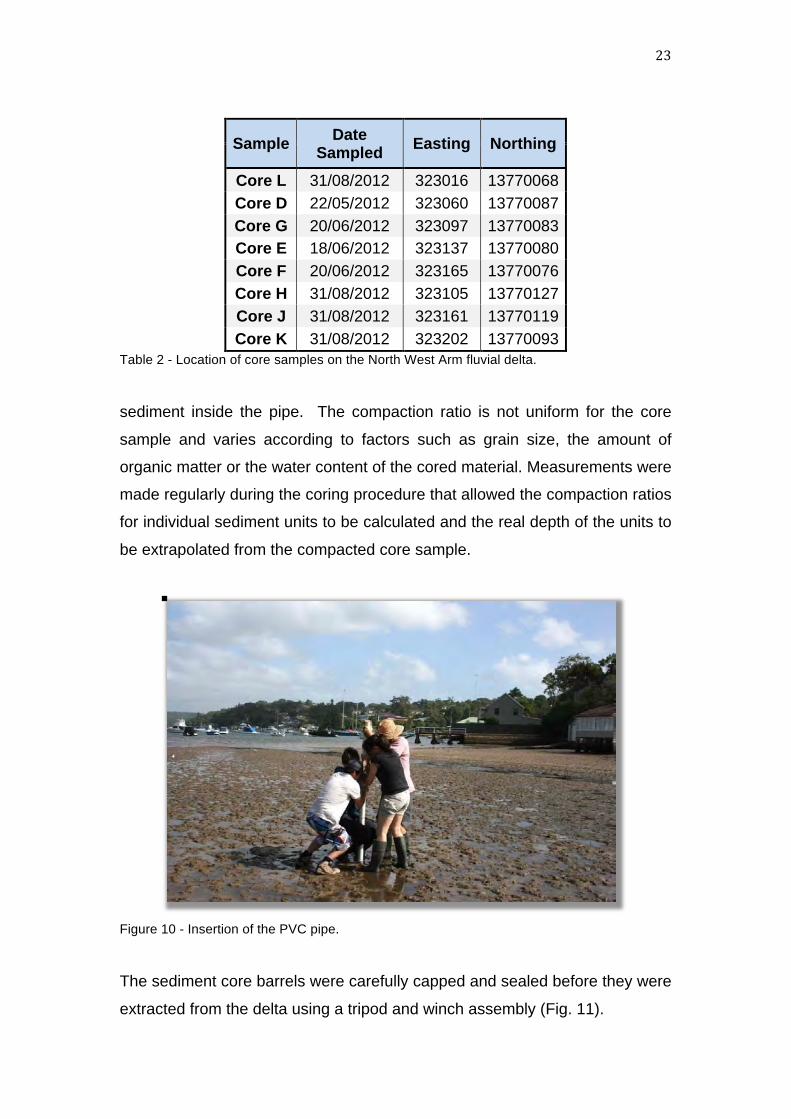
23
Sample Date Sampled Easting Northing
Core L 31/08/2012 323016 13770068 Core D 22/05/2012 323060 13770087 Core G 20/06/2012 323097 13770083 Core E 18/06/2012 323137 13770080 Core F 20/06/2012 323165 13770076 Core H 31/08/2012 323105 13770127 Core J 31/08/2012 323161 13770119 Core K 31/08/2012 323202 13770093
Table 2 - Location of core samples on the North West Arm fluvial delta.
sediment inside the pipe. The compaction ratio is not uniform for the core
sample and varies according to factors such as grain size, the amount of
organic matter or the water content of the cored material. Measurements were
made regularly during the coring procedure that allowed the compaction ratios
for individual sediment units to be calculated and the real depth of the units to
be extrapolated from the compacted core sample.
Figure 10 - Insertion of the PVC pipe.
The sediment core barrels were carefully capped and sealed before they were
extracted from the delta using a tripod and winch assembly (Fig. 11).
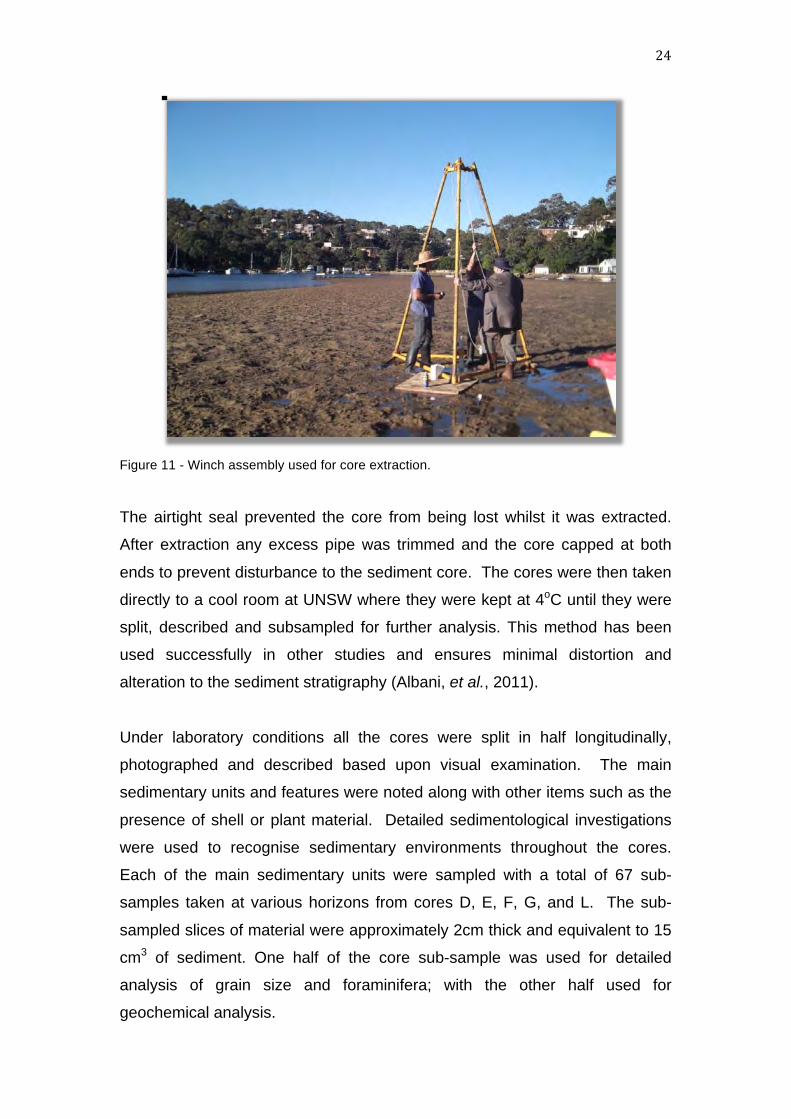
24
Figure 11 - Winch assembly used for core extraction.
The airtight seal prevented the core from being lost whilst it was extracted.
After extraction any excess pipe was trimmed and the core capped at both
ends to prevent disturbance to the sediment core. The cores were then taken
directly to a cool room at UNSW where they were kept at 4oC until they were
split, described and subsampled for further analysis. This method has been
used successfully in other studies and ensures minimal distortion and
alteration to the sediment stratigraphy (Albani, et al., 2011).
Under laboratory conditions all the cores were split in half longitudinally,
photographed and described based upon visual examination. The main
sedimentary units and features were noted along with other items such as the
presence of shell or plant material. Detailed sedimentological investigations
were used to recognise sedimentary environments throughout the cores.
Each of the main sedimentary units were sampled with a total of 67 sub-
samples taken at various horizons from cores D, E, F, G, and L. The sub-
sampled slices of material were approximately 2cm thick and equivalent to 15
cm3 of sediment. One half of the core sub-sample was used for detailed
analysis of grain size and foraminifera; with the other half used for
geochemical analysis.

25
Figure 12 - Location of surface samples from the deep water region of North West Arm.
Table 3 - Location of samples from deep water of the North West Arm fluvial delta.
b. Sediments (lithologies) A complete record of the cores is presented in Appendix 2 and the sediment
analyses and graphic representations are contained in Appendix 3.
The photographic images of the cores contain additional information including:
• a description of the sedimentary units;
• rates of compaction of the core sample within the barrel;
• details of samples selected from various sedimentary units for further
analysis;
Sample Depth (m)
Date Sampled
Time Sampled Easting Northing
NWA 1 3.30 4/09/2012 10.58 am 323265 13769989 NWA 2 6.30 4/09/2012 11.15 am 323332 13769881 NWA 3 11.80 4/09/2012 11.29 am 323430 13770011 NWA 4 12.90 4/09/2012 11.41 am 323595 13770114 NWA 5 14.20 4/09/2012 11.53 am 323746 13770259

26
• results of sediment analysis such as primary modal grain size, organic
matter content organics and membership of cluster groups; and,.
• the colour and codes for the sedimentary units and cluster
membership classes adopted for the various results diagrams and
tables (Fig. 13).
Figure 13 - Lithological units used in this study
lithological unit and description% compaction
1
2
3
4
5
6
19
19
12
11
19
12
15 7
8
9
10
11
12
19
9
4
15
8
clean sand
clean sand with shell grit
shells
sand with shells
fine grey sand with some organic bands
clean sand with shells and organics (different from 8)
medium grey sand with some shells and organics
clean sand
grey sand with shell and organics
organic matt with sand bands and plant remains
sand with some organic bands
sand with scattered organics
Lithologies
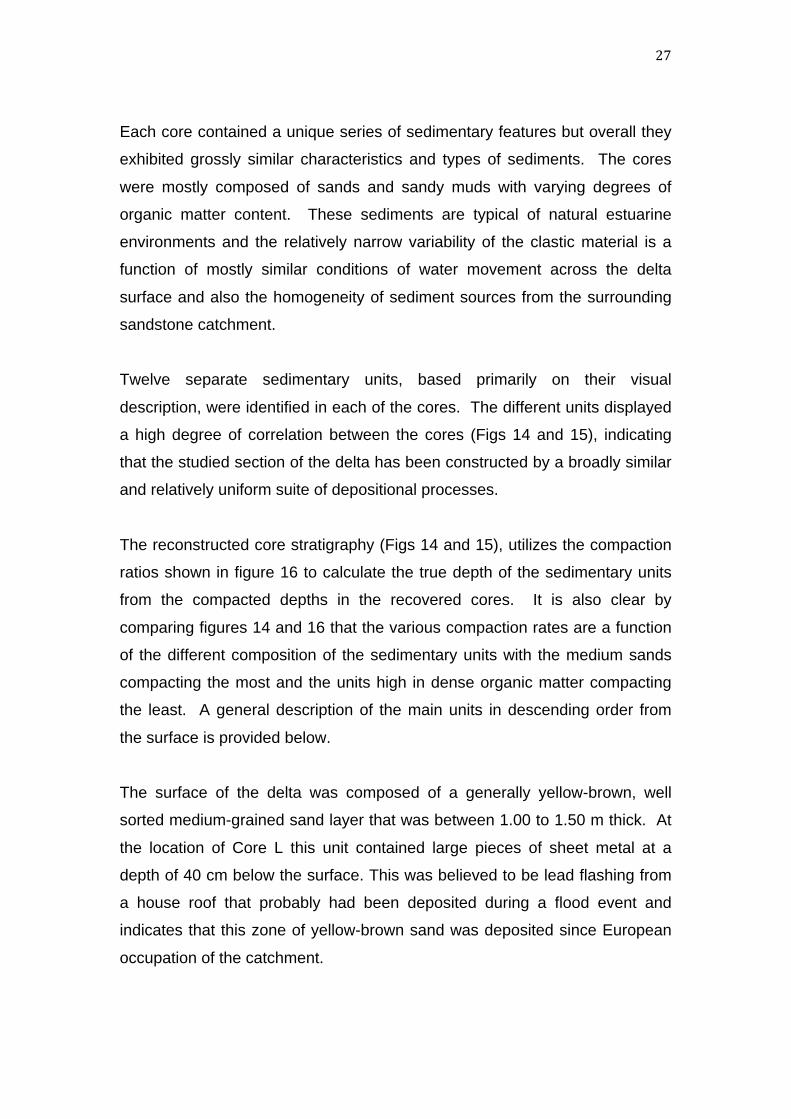
27
Each core contained a unique series of sedimentary features but overall they
exhibited grossly similar characteristics and types of sediments. The cores
were mostly composed of sands and sandy muds with varying degrees of
organic matter content. These sediments are typical of natural estuarine
environments and the relatively narrow variability of the clastic material is a
function of mostly similar conditions of water movement across the delta
surface and also the homogeneity of sediment sources from the surrounding
sandstone catchment.
Twelve separate sedimentary units, based primarily on their visual
description, were identified in each of the cores. The different units displayed
a high degree of correlation between the cores (Figs 14 and 15), indicating
that the studied section of the delta has been constructed by a broadly similar
and relatively uniform suite of depositional processes.
The reconstructed core stratigraphy (Figs 14 and 15), utilizes the compaction
ratios shown in figure 16 to calculate the true depth of the sedimentary units
from the compacted depths in the recovered cores. It is also clear by
comparing figures 14 and 16 that the various compaction rates are a function
of the different composition of the sedimentary units with the medium sands
compacting the most and the units high in dense organic matter compacting
the least. A general description of the main units in descending order from
the surface is provided below.
The surface of the delta was composed of a generally yellow-brown, well
sorted medium-grained sand layer that was between 1.00 to 1.50 m thick. At
the location of Core L this unit contained large pieces of sheet metal at a
depth of 40 cm below the surface. This was believed to be lead flashing from
a house roof that probably had been deposited during a flood event and
indicates that this zone of yellow-brown sand was deposited since European
occupation of the catchment.

28
Figure 14 – Distribution of the lithological units in each core.

29
Figure 15 – Correlation of lithologies along the fluvial delta
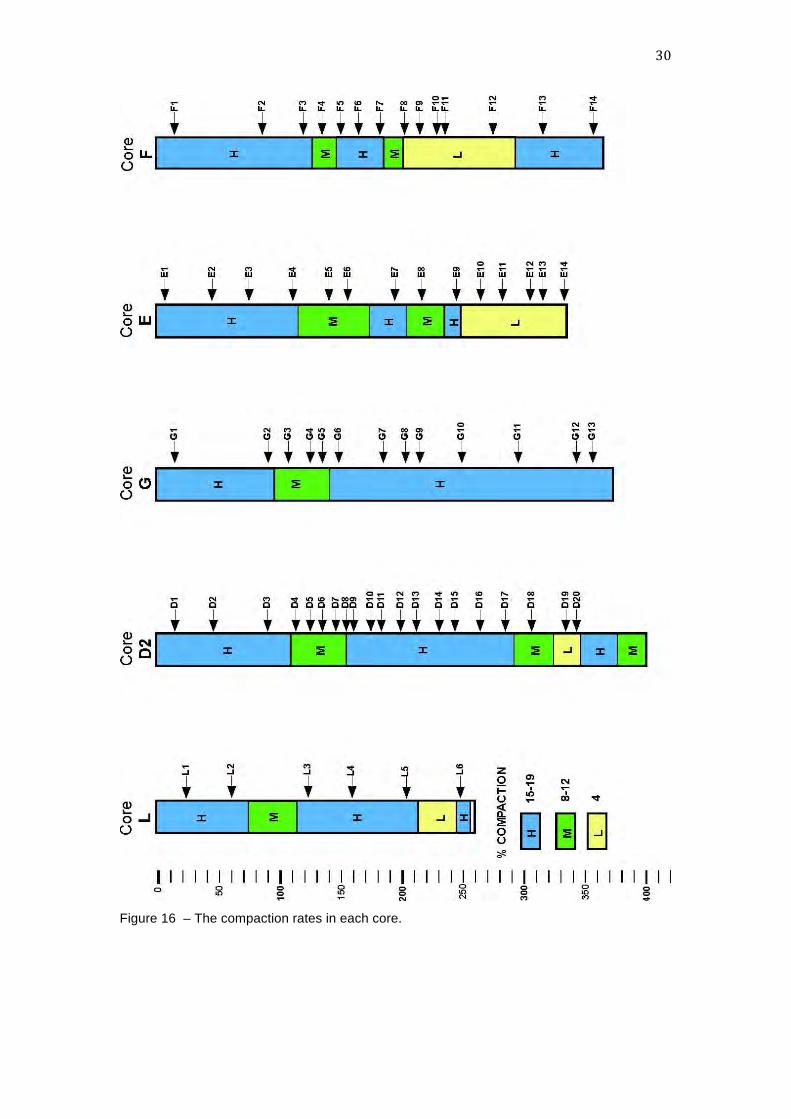
30
Figure 16 – The compaction rates in each core.

31
This top sandy layer was particularly homogeneous and it did not contain
shells or shell grit. It was similar in thickness, depth and character to the
surface sediment obtained in cores by the authors at other sites in Port
Hacking (eg Yowie Bay, near the Camellia Gardens) and has been attributed
at those sites as being material resulting from shell grit extraction during the
middle of the twentieth century. Notably, we could not find any air photo or
historical evidence for shell grit extraction in North West Arm. As discussed
previously, we found evidence for substantial volumes of sand extraction in
the 1960s and it is thought that this sediment unit is related to that event.
A well developed and continuous layer of shells (Unit 3) that varied in
thickness from 20 to 60 cm was common to all cores. This shell layer
occurred at depths of between 75 and 165 cm with the depth of occurrence
generally increasing towards the delta front. The types of shells included
Anadata trapezia, a bivalve, and Velacumantis australis, a gastropod. These
species typically live in the surface 10 cm of estuarine sediment. Oysters were
also identified in this layer in Cores F and G. We can speculate that this
ubiquitous layer represented a previous delta surface that has since been
covered over by more recent deposits.
Below the shell layer there were a number of units composed mainly of
coarse sand with variable amount of shells and organic matter. Within many
of these units we observed several bands of organic rich material that were
dipping at an angle of approximately 30° and are believed to be indicative of
the foreset beds of the prograding delta. Swirls of organic matter are also
present at different depth suggesting possible reworking. Core E is the only
core that contains a distinct layer of charcoal. In all other cores, charcoal
appears mixed in with the organic matter, particularly in the lower half of the
core where organic content is high.
The lowermost unit identified was a very homogenous layer of dark fine-
grained mud. This unit was only observed in the base of core D2 that was the
deepest of the cores. However, based on the similar stratigraphy of core D to

32
cores E and J, it is possible that this unit of darker mud could also potentially
exist in the bottom of the sedimentary sequence at these locations
c. Sediments (grain size).
The erosion, transport and deposition of sediments in fluvial and estuarine
systems is mostly controlled by the volume and energy of flowing water. The
particle sizes of the unconsolidated sediment generally reflect the relative
strength of flow and available energy present. The grain size of a sediment
body is a function of energy regimes of the transporting water masses and its
degree of sorting describes the persistence of this energy condition (Albani, et
al., 2011).
Detailed particle size analysis was performed using a combination of sieving
at ¼ phi intervals for the sand fraction, and laser granulometry using a
Malvern Mastersizer for the mud fraction. Grain size statistics on the
combined data were calculated using the Folk and Ward (1957) graphical
methods and these are shown in Appendix 3 . The sediments from the studied
section of the delta were dominated by sand sized material (92.1%), which is
to be expected from a catchment comprised of Hawkesbury Sandstone. The
remaining fraction consists of an average of 7.5% mud.
Many studies only compare the sediment units and characteristics based on
the on the summarised particle size parameters. The methodology adopted in
this study to evaluating the grain size data is based on rigorous statistical
analysis that utilises the totality of the data rather than just the summary
statistics. This has been found (Albani, 1974, 1981) to provide a greater
insight to the differences between the various sedimentary units and to obtain
a more comprehensive understanding of the sedimentary environment.

33
Figure 17 – Dendrogram based on the cluster analysis of the total sediment data set
The totality of the data set (2,664 data points) was statistically classified using
Q-mode cluster analysis with the Euclidean Coefficient using SPSS V19
statistical software. This yields a similarity matrix and this is displayed as a
D16
G09G11
G08G10D17G07
D19G13
E09E01F01
G01
L02L03L01
E02
D06E13D01L05L04
F04
G03F07D14D02
D03F02E06F05F06G02
G05
E04
E05D04F03
G04D05E07
D13
F11F10
G06D18
G12D15
E08E03F13F12D10
D11D08F08
D12
D20E12L06
F09F14D09
E11D07
NWA2
E10NWA1
NWA3NWA4
NWA5E14
5 10 15 20 25
A CLUSTER A
CLUSTER B
CLUSTER C
CLUSTER D
CLUSTER E
B
C
D
E
Dendrogram of clasticsediments based on theEuclidean coefficient ofcorrelation.
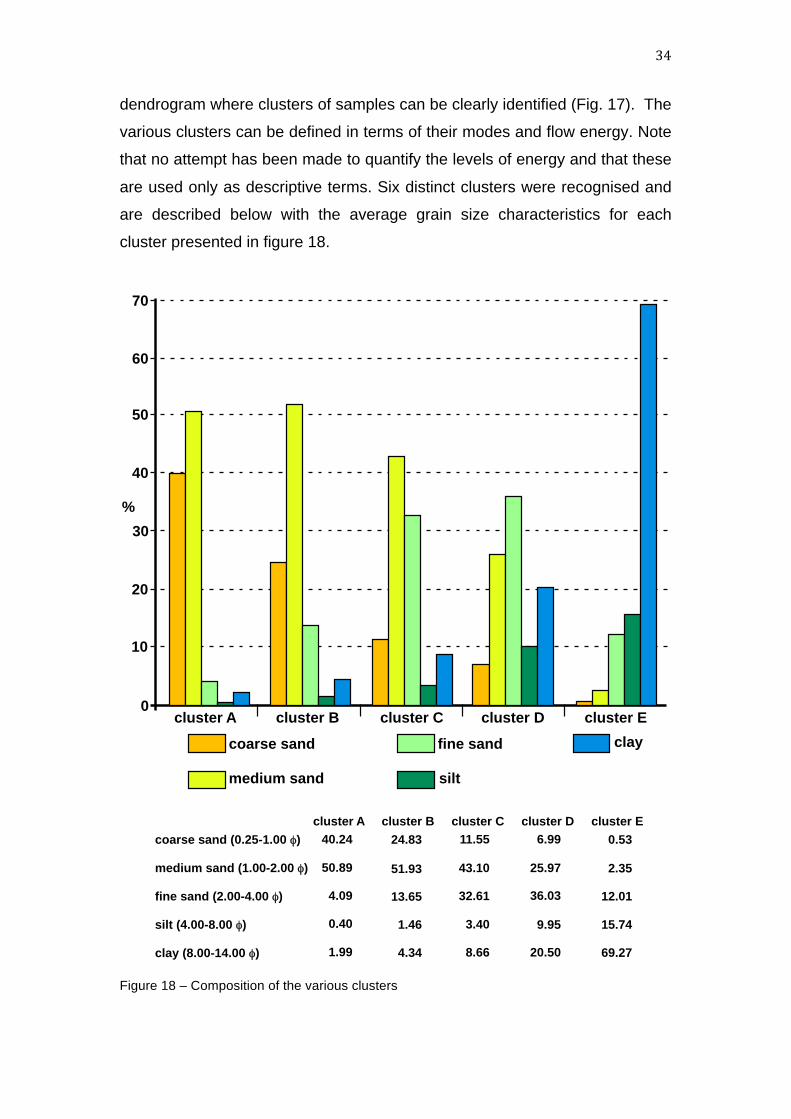
34
dendrogram where clusters of samples can be clearly identified (Fig. 17). The
various clusters can be defined in terms of their modes and flow energy. Note
that no attempt has been made to quantify the levels of energy and that these
are used only as descriptive terms. Six distinct clusters were recognised and
are described below with the average grain size characteristics for each
cluster presented in figure 18.
Figure 18 – Composition of the various clusters
coarse sand
medium sand
fine sand
silt
claycluster A cluster B cluster C cluster D cluster E
0
10
20
30%
40
50
60
70
coarse sand (0.25-1.00 φ)
medium sand (1.00-2.00 φ)
fine sand (2.00-4.00 φ)
silt (4.00-8.00 φ)
clay (8.00-14.00 φ)
40.24
50.89
4.09
0.40
1.99
24.83
51.93
13.65
1.46
4.34
11.55
43.10
32.61
3.40
8.66
6.99
25.97
36.03
9.95
20.50
0.53
2.35
12.01
15.74
69.27
cluster A cluster B cluster C cluster D cluster E

35
Their occurrences in the cores are shown in figures 19 and 20.
Cluster A – It consist of a relatively small number of samples (7, 9.7%) with
50% of the sample made up with the main grain size particle (1.5 phi) typical
of the fluvial delta. However it is associated with the highest content (40%) of
coarser sand. This indicates either a local flooding event of brief duration and
of limited distribution or a short lived lateral migration of the tidal channel.
Cluster B - contains the greatest number of samples and represents the
typical sediment of the fluvial delta. The most common particle size is the 1.5
phi (medium sand) but it is associated with a lower content of coarse sand
(24.8%). A component of fine sand (13.6%) and a small amount of clay (4.3%)
indicate a reduced energy of transport.
Cluster C incorporates more of the finer components of the delta sediments
with less coarse sand (11.5%) than Cluster A and an increase of fine sand
(32.6%) and also of clay (8.7%). While it generally occurs at the base of the
cores, it is also present in limited horizons in cores D and F and is generally
found in association with Cluster D.
Cluster D consists of the finest component of the active delta with fine sand
predominating (36%) followed by medium sand (26%) and clay (20%). It may
represent very low energy conditions with very limited clastic sediment
transport and deposition of suspended clay. These conditions may occur
when the active in tidal pools located well away from the active freshwater
channel. Samples obtained from the upper slope of the delta front were also
included in this cluster and these would have had sediment contributions not
only from the main freshwater channel (sample NWA1) but also from the
smaller tributaries that enter on the southern side of the delta and flow out
through the southern tidal channel (sample NWA2).
Cluster E is dominated by clay sized material and it typical of the deep part of
the estuary in front of the delta. Only very small amounts of coarser material
can be transported this far from the delta. Occasional deposition of silt (16%)
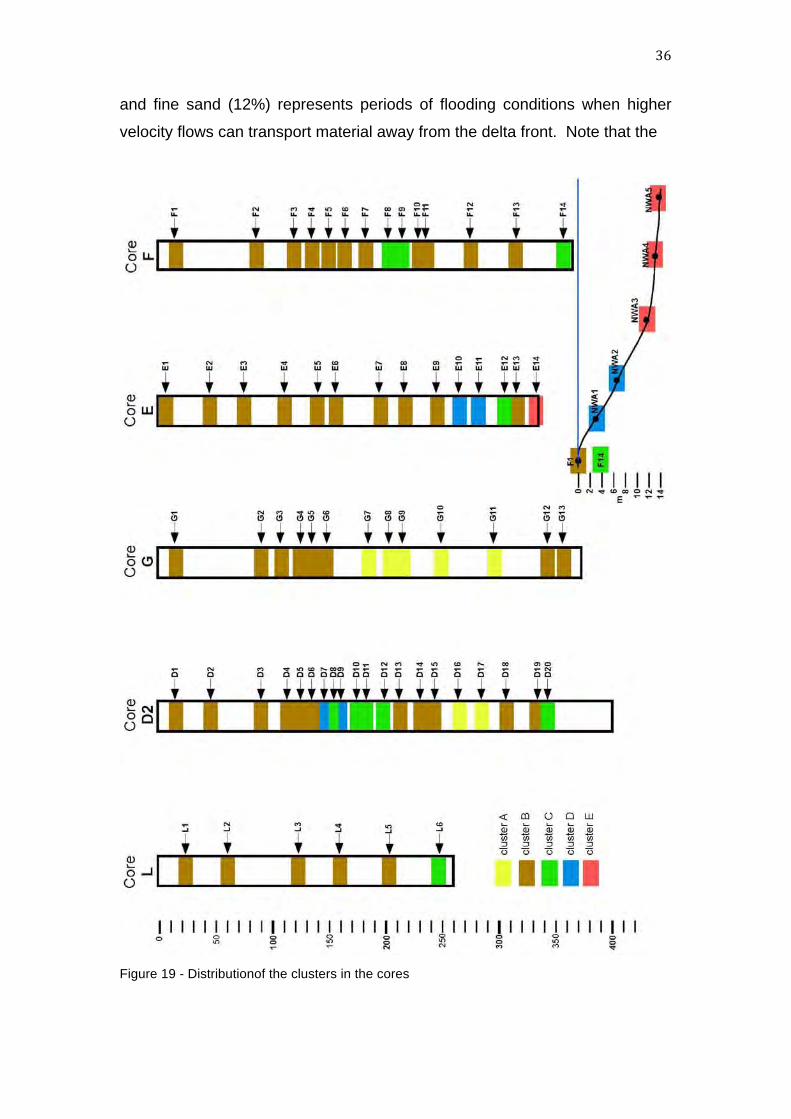
36
and fine sand (12%) represents periods of flooding conditions when higher
velocity flows can transport material away from the delta front. Note that the
Figure 19 - Distributionof the clusters in the cores

37
deepest sample in Core E was also included in this cluster indicating it was
also formed in quiet , deep water conditions.
Figure 20 – Sediment correlation along the section

38
Overall the shape of the dendrogram depicts a high level of similarity within
the sediment characteristics. In addition the large number of samples within
Cluster B (45 samples ~ 63.5%) indicates the uniform nature of the material
found in fluvial delta. The main variability is due to variable content of charcoal
and vegetation debris related to energy fluctuations and reworking of the light
material.

39
5. Geochemistry
X-ray fluorescence (XRF) spectrometry was used to analyse the chemical
composition of the sixty one sediment samples taken from cores D, E, F and
G. A standard set of 11 major elements (SiO2, TiO2, Al2O3, Fe2O3, MnO, MgO,
CaO, Na2O, K2O, P2O5, SO3) and 20 trace elements (Pb, Sr, Rb, Y, Zr, Cu,
Zn, Ni, Ga, U, Sn, As, Sb, Mo, Cd, Cr, V, Nb, Th, Ce) were investigated.
Many of these elements, such as the heavy metals, are suspected to be toxic
to life forms and are likely to be introduced into the area by man. The choice
of the elements tested was largely guided by the experience with a similar set
of samples from Broken Bay, New South Wales, (Rickwood et al., 1983) and
from the Adriatic Sea and the Lagoon of Venice (Albani et al., 1989; Albani et
al., 1995).
While most of the determinations are carried out on a selected portion of the
sediment, mainly the fine fraction, the technique here adopted examines the
totality of the sample including the interstitial water present in the sediment at
the time of the collection. This approach allows for an understanding of the
amounts of the heavy metals, which may be affected by the sampling
process.
In many geochemical investigations studies, the analysis is often only
performed on just the fine fraction of the sediment sample (typically the
muds). The technique adopted in the present study examines the totality of
the sediment sample including the interstitial water present in the sediment at
the time of the collection. This approach provides a better understanding of
the entire sediment body and behaviour of the various chemical components
such as the heavy metals, which may be affected controlled by a variety of
factors including the sampling process itself.
The complete analytical results are present in Appendix 4. All concentrations
for the various elements at the sample depth are plotted along with the
sample compaction values in figure 21 for the major elements and figures 22-
28 for the trace elements. The consideration of the sediment compaction rate
is critical for interpreting the geochemical results because of the role it plays in
controlling the level of migration of the interstitial water. A greater compaction

40
rate for a sample indicates a less dense packing arrangement of the sediment
particles in the delta (prior to the core sampling) and therefore a greater
capacity of the interstitial water to migrate under pressure. Alternatively. low
compaction rates may, in effect, act as a barrier to such movement.
Among the major elements studied, three have been selected for further
discussion: CaO, Al₂O₃ and Fe₂O₃.
Generally (Fig. 21) the high concentrations of CaO are linked with the high
number of shells as in Core D, with the main peak occurs in D12. This trend is
also evident in the other cores where the main peaks occur generally with
shell layers. E6 showed the greatest peak with levels of CaO at 7.69%.
Although calcium is also associated with the construction industry, as CaO is
found in cement and gypsum, due to the strong correlation between the main
peaks and the stratigraphy, the main source of CaO in the North West Arm
fluvial delta is most likely derived from the concentration of shells.
Peak levels for Al₂O₃ occurred at a depth between 1.0-2.0 m, as did the
relatively high levels for Fe₂O₃. This coincided with the high levels of CaO.
The maximum peaks for Al₂O₃ and Fe₂O₃ at each core occurred at the same
points, with Al₂O₃ levels reaching 3.43% (D7), 2.55% (G6), 3.80% (E7) and
3.60% (F4), and iron levels returning as 1.77% (D7), 1.35% (G6), 2.07% (E7)
and 2.42% (F4).
Due to its resistance to corrosion, non-toxicity, high strength and low density,
Al₂O₃ has a wide variety of uses, however the high values in each of the
cores appear to be present around the medium compaction rate (M, 8-12%).
This appears to suggest a link between these concentrations and the capacity
of percolation of the interstitial water during the compression inherent with the
coring processes. The low values at the upper section of each core, in the
area of high compressibility, tend to confirm the migration downward of the
interstitial water.

41
Figure 21 – Concentration of CaO, Al2O3 and Fe2O3

42
Peak levels for Al2O3 occurred at a depth between 1.0-2.0 m, as did the
relatively high levels for Fe2O3. This coincided with the high levels of CaO.
The maximum peaks for Al2O3 and Fe2O3 at each core occurred at the same
points, with Al2O3 levels reaching 3.43% (D7), 2.55% (G6), 3.80% (E7) and
3.60% (F4), and iron levels returning as 1.77% (D7), 1.35% (G6), 2.07% (E7)
and 2.42% (F4).
Due to its resistance to corrosion, non-toxicity, high strength and low density,
Al2O3 has a wide variety of uses, however the high values in each of the cores
appear to be present around the medium compaction rate (M, 8-12%). This
appears to suggest a link between these concentrations and the capacity of
percolation of the interstitial water during the compression inherent with the
coring processes. The low values at the upper section of each core, in the
area of high compressibility, tend to confirm the migration downward of the
interstitial water.
Of the eighteen trace elements tested, most showed elevated concentrations
that probably represent changes in the source catchment following European
settlement. The focus in this section will be on six elements most commonly
linked to contamination from urban and industrial sources: arsenic (As),
copper (Cu), lead (Pb), zinc (Zn), chromium (Cr) and antimony (Sb) (Birch and
Taylor, 1999; Birch, et al., 2001; McReady, et al., 2006).
The results are presented according to sediment quality guidelines that have
been established for Australia (ANZECC, 2000). The graphical
representations in are colour coded for low, medium and high range values
according to the ANZECC guidelines. The concentration values are in ppm
(mg/kg) and once again the results are plotted in conjunction with the
compression ratio data which reveals a similar relationship to the major
elements indicating the important role of interstitial water movement in the
cores.
With the exception of antimony, the selected elements all generally have the
highest or highly elevated concentrations in the sediments of the deep section

43
of the delta front or in the bottom sediments lying in front of the delta. These
deep water sites act as the ultimate sink for contaminants such as heavy
metals.
a. Arsenic (As) (Fig. 22) Arsenic has a wide variety of uses, particularly industrial applications,
including anti-fouling paint and fireworks, and is also used in insecticides,
herbicides (for railway and power poles), fungicides and algaecides (Leonard,
1989). Arsenic derived from the catchment would be transported to the delta
through waste and stormwater discharges. Only one sample (F4) shows a
concentration value above the ANZECC midrange at 51 ppm. The other
values ranged from 3 to 23 ppm, within the ANZECC low to midrange
guideline. The higher arsenic values correlate with the compaction values
within each core. It is most likely that the sediment units with a lower
compaction rate have acted as a barrier to the flow of interstitial water and
thus resulted in a localised increase in concentrations within the core sample.
Figure 22 – Distribution of the concentration of Arsenic
H
M
H
M
L
H
M
H
M
H
H
M
M
H
H
L
H
M
H
M
L
H
H 15-19
M 8-12
L 4
% COMPACTION
2.9
8.2
39.1
70.0
ppm
minimum
AZECC midrange
AZECC low
AZECC HighArsenic (As)
LOW
HIGH
ANZECC boundaries
8.2
70
D1
D2
D3
D4D5D6D7D8D9
D10D11
D12D13
D14D15
D16
D17
D18
D19D20
F1
G2
G3
G4G5
G6
G7
G8G9
G10
G11
G12
G13
G1
E2
E3
E4
E5
E6
E7
E8
E9
E10
E11
E12E13
E14
E1
F2
F3
F4
F5
F6
F7
F8F9
F10F11
F12
F13
F14
0
50
100
150
200
300
250
350
400
Core D2 Core G Core E Core F
02468
101214
m
NWA1
NWA2
NWA3NWA4 NWA5
F1

44
b. Copper (Cu) (Fig. 23) Copper has wide number of human uses including construction, motor
vehicles and boating activities. It would have entered the delta sediments via
discharge from stormwater, and directly from the boats on the estuary. Since
the banning of tributylin-based antifouling paints, they have been replaced by
paints with a higher copper content (Albani, 2005) and this may contribute to
the increasing copper levels in more recently deposited sediments. Copper
values were fairly low towards the bottom of the cores but increased closer to
the surface. One point stands out in D2, however, which showed the highest
value of 10 ppm. This upper layer of sediment was clearly deposited since
European settlement with Core L just upstream containing large pieces of
metal flashing at a similar depth.
As in all other elements, the highest concentrations are found in the
sediments of the deep section of the estuary that acts as a sink.
Figure 23 – Distribution of the concentration of Copper
H
M
H
M
L
H
M
H
M
H
H
M
M
H
H
L
H
M
H
M
L
H
H 15-19
M 8-12
L 4
% COMPACTION
LOW
HIGH
ANZECC boundaries
34
270
minimum
median
midrangeppm
4.0
5.8
8.1
maximum10.3Copper (Cu)
D1
D2
D3
D4D5D6D7D8D9
D10D11
D12D13
D14D15
D16
D17
D18
D19D20
F1
G2
G3
G4G5
G6
G7
G8G9
G10
G11
G12
G13
G1
E2
E3
E4
E5
E6
E7
E8
E9
E10
E11
E12E13
E14
E1
F2
F3
F4
F5
F6
F7
F8F9
F10F11
F12
F13
F14
0
50
100
150
200
300
250
350
400
Core D2 Core G Core E Core F
02468
101214
m
NWA1
NWA2
NWA3NWA4 NWA5
F1

45
c. Lead (Pb) (Fig. 24) Lead is derived from many sources which end up into the catchment including
lead-based paints used on boats, vehicle exhausts, lead-acid batteries,
ballast, waste dumps, sewage overflows and industrial discharge (Albani,
2005). Medium to high levels of lead were evident towards the top of the
cores. These elevated levels of lead were found at greater depths in the cores
nearer the prograding delta front suggesting that lead was being brought in
with the most recent sediments accumulating as well as with the migration of
interstitial water. Several peak levels occurred in samples D2 (22 ppm), E2
(16 ppm) and E3 (19 ppm). The layer of metal remains identified at a depth of
0.4 m in Core L, which was only 50m upstream from Core D, may have
contributed to these high values. Points D2, E2 and E3 were located at depths
of 0.5 m, 0.44 m and 0.66 m respectively and were directly downstream from
the contaminated material at Core L. It is therefore likely that the elevated
levels in lead and copper may have been associated with occurrence of the
metal remains.
Figure 24 – Distribution of the concentration of Lead
H
M
H
M
L
H
M
H
M
H
H
M
M
H
H
L
H
M
H
M
L
H
H 15-19
M 8-12
L 4
% COMPACTION
LOW
HIGH
ANZECC boundaries
46.7
218.0
minimum
median
midrange
maximum
ppm
1.0
6.0
14.1
22.2Lead (Pb)
D1
D2
D3
D4D5D6D7D8D9
D10D11
D12D13
D14D15
D16
D17
D18
D19D20
F1
G2
G3
G4G5
G6
G7
G8G9
G10
G11
G12
G13
G1
E2
E3
E4
E5
E6
E7
E8
E9
E10
E11
E12E13
E14
E1
F2
F3
F4
F5
F6
F7
F8F9
F10F11
F12
F13
F14
0
50
100
150
200
300
250
350
400
Core D2 Core G Core E Core F
02468
101214
m
NWA1
NWA2
NWA3NWA4 NWA5
F1
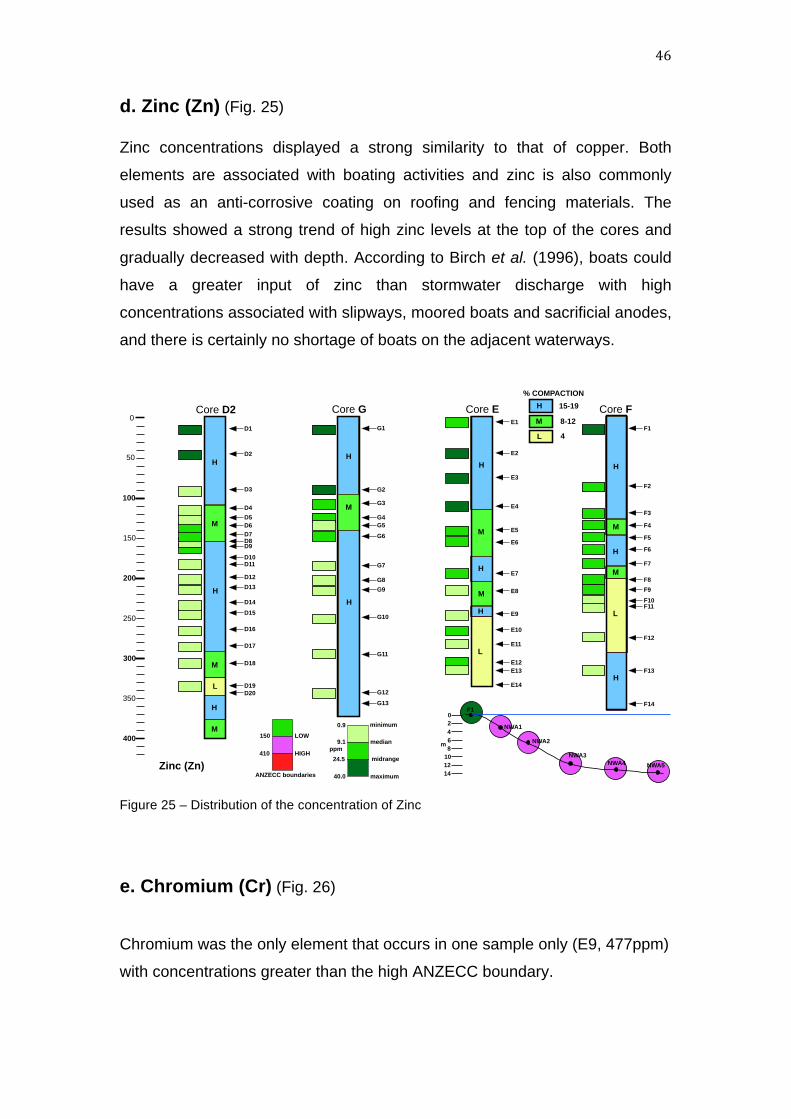
46
d. Zinc (Zn) (Fig. 25) Zinc concentrations displayed a strong similarity to that of copper. Both
elements are associated with boating activities and zinc is also commonly
used as an anti-corrosive coating on roofing and fencing materials. The
results showed a strong trend of high zinc levels at the top of the cores and
gradually decreased with depth. According to Birch et al. (1996), boats could
have a greater input of zinc than stormwater discharge with high
concentrations associated with slipways, moored boats and sacrificial anodes,
and there is certainly no shortage of boats on the adjacent waterways.
Figure 25 – Distribution of the concentration of Zinc
e. Chromium (Cr) (Fig. 26)
Chromium was the only element that occurs in one sample only (E9, 477ppm)
with concentrations greater than the high ANZECC boundary.
H
M
H
M
L
H
M
H
M
H
H
M
M
H
H
L
H
M
H
M
L
H
H 15-19
M 8-12
L 4
% COMPACTION
LOW
HIGH
ANZECC boundaries
150
410
minimum
median
midrange
maximum
ppm
0.9
9.1
24.5
40.0Zinc (Zn)
D1
D2
D3
D4D5D6D7D8D9
D10D11
D12D13
D14D15
D16
D17
D18
D19D20
F1
G2
G3
G4G5
G6
G7
G8G9
G10
G11
G12
G13
G1
E2
E3
E4
E5
E6
E7
E8
E9
E10
E11
E12E13
E14
E1
F2
F3
F4
F5
F6
F7
F8F9
F10F11
F12
F13
F14
0
50
100
150
200
300
250
350
400
Core D2 Core G Core E Core F
02468
101214
m
NWA1
NWA2
NWA3NWA4 NWA5
F1

47
It should be noted, however, that this concentration, together with the value of
340ppm present at F11, corresponds to the lowest compaction rate levels and
thus these occurrences may be partially due to downward water migration
during the sampling phase.
The source of both chromium and antimony in North West Arm may be
identified in the upper reaches of the estuary within the urbanised sector.
Most of the chromium produced is used in the metal industry, in alloys and
steels (stainless steel), and in the galvanizing industry for chrome plating.
Loss to the environment during production is possible as dust, liquid or
aerosol. Other uses include as pigments, as a catalyst and in the tanning
industry from which chromium can escape into the environment via effluent.
Figure 26 – Distribution of the concentration of Zinc
f. Antimony (Sb) (Fig. 27)
Antimony and many of its components are toxic. It is used in a great variety of
industries from semiconductors to flame-retardant formulations. As an alloy it
H
M
H
M
L
H
M
H
M
H
H
M
M
H
H
L
H
M
H
M
L
H
H 15-19
M 8-12
L 4
% COMPACTION
LOW
HIGH
ANZECC boundaries
81
370
Chromium (Cr)
12.9
81.0
225.5
370.0
ppm
minimum
AZECC midrange
AZECC low
AZECC High
D1
D2
D3
D4D5D6D7D8D9
D10D11
D12D13
D14D15
D16
D17
D18
D19D20
F1
G2
G3
G4G5
G6
G7
G8G9
G10
G11
G12
G13
G1
E2
E3
E4
E5
E6
E7
E8
E9
E10
E11
E12E13
E14
E1
F2
F3
F4
F5
F6
F7
F8F9
F10F11
F12
F13
F14
0
50
100
150
200
300
250
350
400
Core D2 Core G Core E Core F
02468
101214
m
NWA1
NWA2
NWA3NWA4 NWA5
F1

48
increases the hardness of lead and, as such, is used for storage batteries.
Other uses include ceramic enamels, paints and pottery. The trends in
concentrations of antimony were similar to that of the other elements. In cores
E and F the highest concentrations once again correlated with the lowest
compaction rates suggesting they are related to the movement of interstitial;
water in the cores. An investigation of the different present and past industries
within the urban catchment may shed some light on the source of the
antimony.
Figure 27 – Distribution of the concentration of Antimony
It should be emphasised that the concentration of copper, lead and zinc in the
delta sediments were all below the Low limit set by the ANZEEC protocols.
This is in contrast to the concentrations found in the deep water sediments
which were all within the Low to High range. This spatial pattern is to be
expected as the deep water zone acts as the final sink for most pollutants and
contaminants. This pattern is not so clear for antimony, arsenic and chromium
that exhibit isolated high values throughout the cores. It is possible that these
peak values may be related to the movement of interstitial water during the
coring process. Moreover, it is apparent that despite these isolated high
H
M
H
M
L
H
M
H
M
H
H
M
M
H
H
L
H
M
H
M
L
H
H 15-19
M 8-12
L 4
% COMPACTION
LOW
HIGH
ANZECC boundaries
2
25
Antimony (Sb)
1.5
2.0
13.5
25.0
ppm
minimum
AZECC midrange
AZECC low
AZECC High
D1
D2
D3
D4D5D6D7D8D9
D10D11
D12D13
D14D15
D16
D17
D18
D19D20
F1
G2
G3
G4G5
G6
G7
G8G9
G10
G11
G12
G13
G1
E2
E3
E4
E5
E6
E7
E8
E9
E10
E11
E12E13
E14
E1
F2
F3
F4
F5
F6
F7
F8F9
F10F11
F12
F13
F14
0
50
100
150
200
300
250
350
400
Core D2 Core G Core E Core F
02468
101214
m
NWA1
NWA2
NWA3NWA4 NWA5
F1

49
values, the vast bulk of the delta sediments have very low concentrations of
these elements as depicted in figure 28.
Figure 28 – Summary of the concentrations of Arsenic, Antimony and Chromium
In summary, the results of the geochemical analysis of the sediment cores
suggest that the overall level of contamination of the delta sediments is
relatively low although there is a trend for with increasing levels of
contaminants towards the surface. Urbanisation appears to be a significant
contributor to the presence of heavy metals within the catchment.
10
20
30
40
50
60
70
80
0ANZEEC
8.20
70.0
ppm
36
1
Cores
14
Arsenic
5
F4
10
20
30
0
ppm
2.0
25.0
20
1
25
Antimony
15
5
25
6
4
ANZEEC Cores
E11
D7, D14,E10, F9
100
200
300
400
50
150
0
ppm
81
370
46
1
7
ChromiumANZEEC Cores
250
3501 F11
E9
1 concentration levels andnumber of samples within it

50
6. Foraminifera
Most of the shells present throughout the cores consist of gastropods of the
genus Pyrazus and Velacumantis and by the bivalve Anadara and some
oysters. The great majority of these shells show varying degree of reworking
and thus they are not reliable for age determination. One of the groups that
does not survive any shallow water reworking is that of foraminifera which
makes these species very useful for environmental assessment as well as for
absolute age determination.
Foraminifera are unicellular organisms that live predominantly in marine
environments, but also occur in brackish environments; their size range
ranging from 0.1 to 2 mm. Foraminifera secrete a shell, known as a test,
made of calcium carbonate. At the death of the organism (9-12 months life
span) the test becomes part of the bottom sediment and thus its presence is
recorded. The importance of foraminifera is associated with their usefulness
as stratigraphical index fossils in sedimentary rocks (Albani, et al., 2001) and
in environmental studies. Benthic foraminifera are extremely sensitive to
variations in the physical-chemical characteristics of their environment such
as salinity, temperature, food availability and water depth and levels of
pollutants. The abundance of individuals (population) in relation to the variety
of species (assemblage) present in a sample can give an indication of the
slightest changes in environmental conditions. Their short life spans are also
an indicator of water quality (Serandrei, et al., 2004), which can aid in the
reconstruction of past environmental changes.
The same samples used for the particle size analysis were used to study the
benthic foraminifera. All the individuals extracted were identified and counted
under the microscope and expressed as a percentage of the total population
present in each sample.
Only 22 of the 67 samples taken from the North West Arm sediment cores
contained benthic foraminifera with a total assemblage of 20 species (Table
4). The complete data set is available in Appendix 5.

51
The number of species in each sample ranged from 18 to 1-3 species only,
indicating a general and constant brackish to fresh water conditions. Out of
the 22 samples only eight showed a relatively high diversity and ten showed a
number of individuals greater than 100. Nevertheless, on the whole,
foraminiferal numbers were far smaller than elsewhere in Port Hacking due to
the inner location of North West Arm.
Table 4 – Benthic foraminifera present in North West Arm
In the samples where foraminifera were present, it was indicative that the
conditions at the time were possibly periods of dominating stable brackish
conditions. However, the general lack of foraminifera throughout the delta
suggests accumulation of sediment dominated by freshwater and terrigenous
inputs. This is in general agreement with model of delta growth proposed from
the air photo analysis whereby the delta has been largely formed by migration
of the freshwater channel(s) and that the reworking of sediments by tides or
wave action is very limited.
species1 Tritaxis conica (Parker and Jones)2 Ammobaculites exiguus Cushman and Bronnimann3 Trochammina inflata (Montagu)4 Miliammina fusca (Brady)5 Haplophragmoides australensis Albani6 Eggerella australis Collins7 Ammonia aoteana (Finlay)8 Rotalinoides inflata (Millet)9 Elphidim advenum limbatum (Chapman)
10 Elphidium advenum advenum (Cushman)11 Elphidium lene Cushman and McCulloch12 Elphdium sp13 Guttulina austriaca d'Orbigny14 Quinqueloculina seminula (Linne)15 Quinqueloculna oblonga (Montagu)16 Reussella spinulosa (Reuss)17 Brizalina striatula (Cushman)18 Bulimina marginata d'Orbigny19 Lagena sriata strumosa Reuss20 Spiroculina antillarum d'Orbigny

52
A Pearson multivariate cluster analysis was performed on this data set to
compare and cluster according to levels of similarity in species abundance
and then presented graphically using a dendrogram to illustrate the
similarities. All the analyses were completed using SPSS v.21
The foraminiferal fauna shows a number of clusters (biotopes) that suggest
different environmental conditions that have been identified as ranging from
brackish with a marine character to freshwater conditions (Fig. 29).
Figure 29 – Dendrogram of the foraminiferal fauna with their environmental character and composition. Note the samples labelled N2-N5 are the NWA2-NWA5 of previous figures.
The distribution of the foraminifera thoughout the cores strongly indicate the
predominance of freshwater within the fluvial delta with isolated occurrences
of brackish-marine conditions (Figs. 30 and 31).
The number of foraminiferal individuals and the excellent preservation of their
shell in the few brackish-marine horizons made these samples suitable for
D14
F4
D16
D17
D4
D20
D15
F7
D13
N2
N4
D2
D3
F1
G2
N5
N3
D11
D1
D9
D10
D8
Brackish to fresh water
Estuarine
marine
brackish
Environment Foraminiferal species
Tritaxis conica (1.7%)
Trochammina inflata
Eggerella australis
Ammonia aoteana (43.4%)
Elphidium limbatum (45.4%)
Elphidium lene (7.8%)
Tritaxis conica (15.5%)
Trochammina inflata (6.3%)
Eggerella australis (5.9%)
Ammonia aoteana (61.4%)
Elphidium limbatum (13.1%)
Elphidium lene (20.9%)
Average percentage of main species
Trochammina inflata (100%)
Dendrogram based on the
Pearson coefficient
Fresh water no foraminifera present
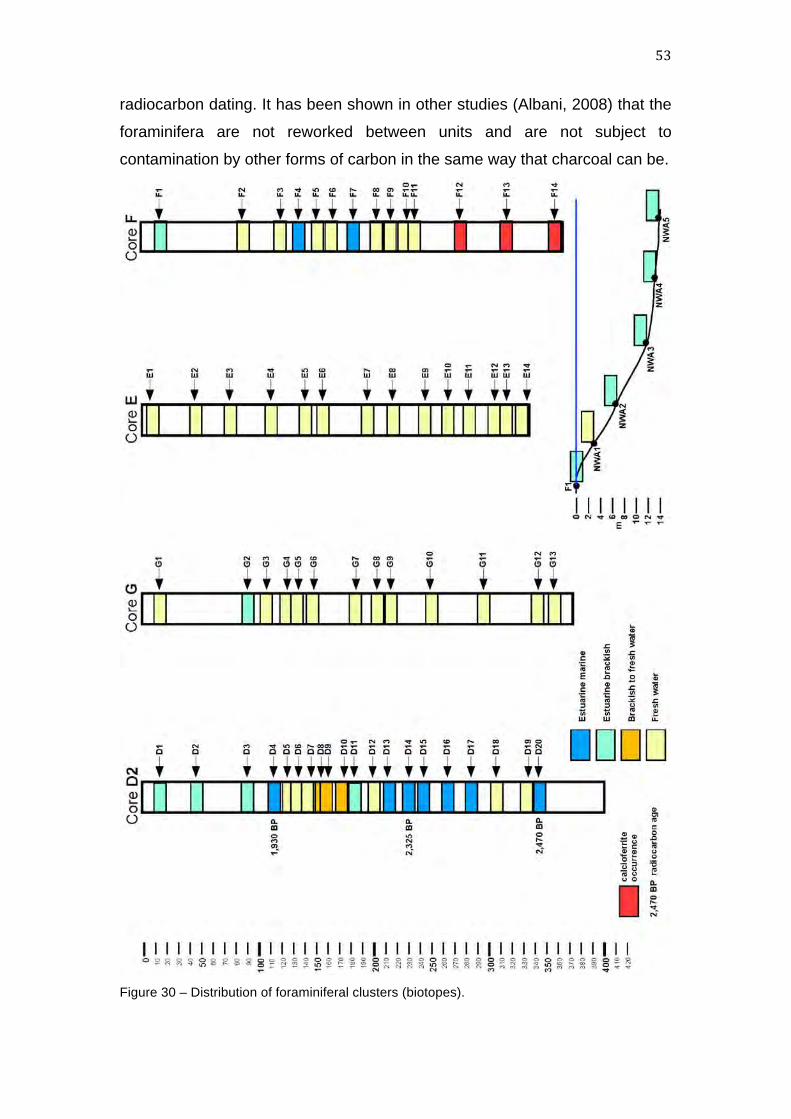
53
radiocarbon dating. It has been shown in other studies (Albani, 2008) that the
foraminifera are not reworked between units and are not subject to
contamination by other forms of carbon in the same way that charcoal can be.
Figure 30 – Distribution of foraminiferal clusters (biotopes).

54
Figure 31 – Correlation of the sedimentary environments as from the cores based on the foraminiferal fauna.

55
Selected samples of foraminifera within key sedimentary units were sent to
ANSTO for radiocarbon dating. The dates are shown in figure 30.
The radiocarbon dates reveal that most of the delta sediments are more than
1,900 years old. The radiocarbon dates are in correct stratigraphic order and
this indicates that there has been no reworking of the sediments containing
the foraminifera.
From the range of dates we can calculate that the delta accumulated
approximately 2.5 metres of sediment in the period from 2,470 to 1,930 BP.
Study Site Holocene
Sedimentation Rate (mm/yr)
Reference
Lake Macquarie ~ 1.0 Olmos and Birch, 2008
Lake Illawarra 1.2 - 2.0 Sloss, et al., 2011
Sydney Harbour 0.8 McLoughlin, 2000
Tuggerah Lake ~ 1.4 King and Hodgson, 1995 Table 5 - Sedimentation rates from southeastern Australian estuaries (adapted from Roger and Saintilan, 2012).
This is equivalent to sedimentation rate of just over 4mm per year. This rate
appears higher than results published for nearby locations (See Table 5) but
can be justified because our data was for the actively prograding delta at the
end a very steep catchment whereas the other sites were all within central
basins where rates would be lower.
The sedimentation rate since 1,930 BP cannot be calculated due to a lack of
data and also because it is clear that the samples in this section of the cores
have been reworked. Further research is therefore required to be able to
provide an estimate of post-European sedimentation rates.
a. Calcioferrite Formation The two deepest samples of Core F (F13 and F14) contained a reddish
colouring that coated the outside surface layer of calcium carbonate material.
The samples were examined under a scanning electron microscope at UNSW
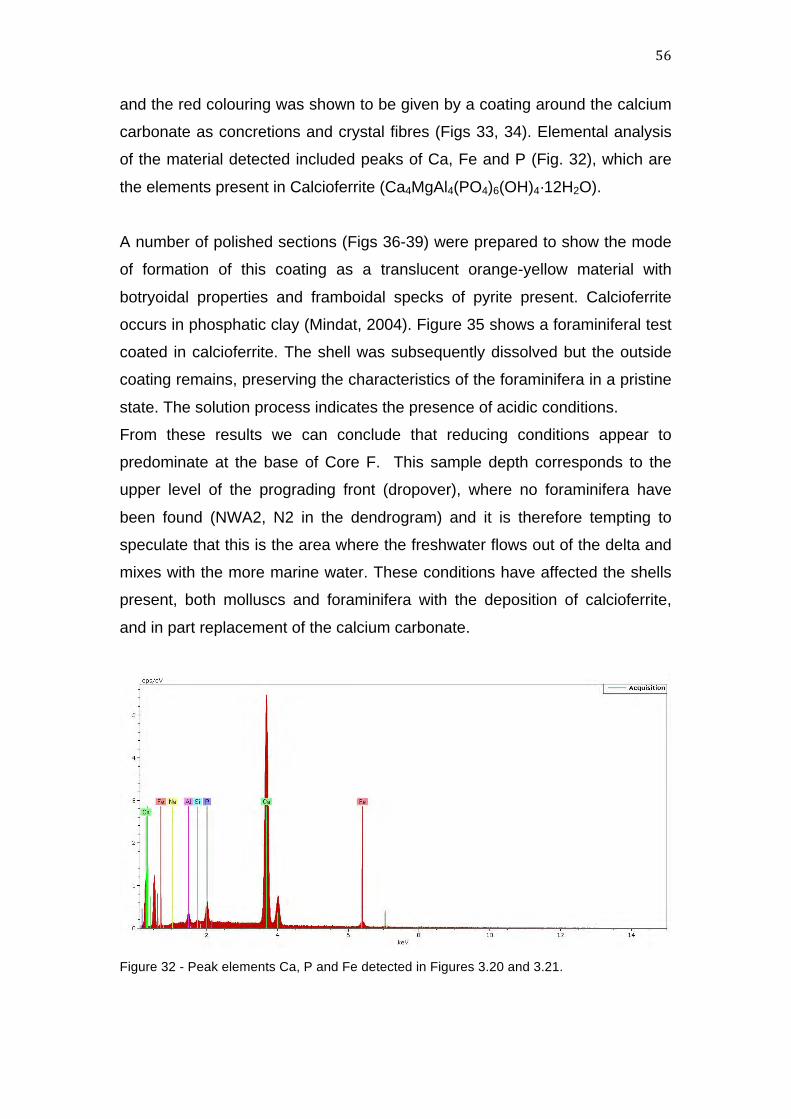
56
and the red colouring was shown to be given by a coating around the calcium
carbonate as concretions and crystal fibres (Figs 33, 34). Elemental analysis
of the material detected included peaks of Ca, Fe and P (Fig. 32), which are
the elements present in Calcioferrite (Ca4MgAl4(PO4)6(OH)4·12H2O).
A number of polished sections (Figs 36-39) were prepared to show the mode
of formation of this coating as a translucent orange-yellow material with
botryoidal properties and framboidal specks of pyrite present. Calcioferrite
occurs in phosphatic clay (Mindat, 2004). Figure 35 shows a foraminiferal test
coated in calcioferrite. The shell was subsequently dissolved but the outside
coating remains, preserving the characteristics of the foraminifera in a pristine
state. The solution process indicates the presence of acidic conditions.
From these results we can conclude that reducing conditions appear to
predominate at the base of Core F. This sample depth corresponds to the
upper level of the prograding front (dropover), where no foraminifera have
been found (NWA2, N2 in the dendrogram) and it is therefore tempting to
speculate that this is the area where the freshwater flows out of the delta and
mixes with the more marine water. These conditions have affected the shells
present, both molluscs and foraminifera with the deposition of calcioferrite,
and in part replacement of the calcium carbonate.
Figure 32 - Peak elements Ca, P and Fe detected in Figures 3.20 and 3.21.
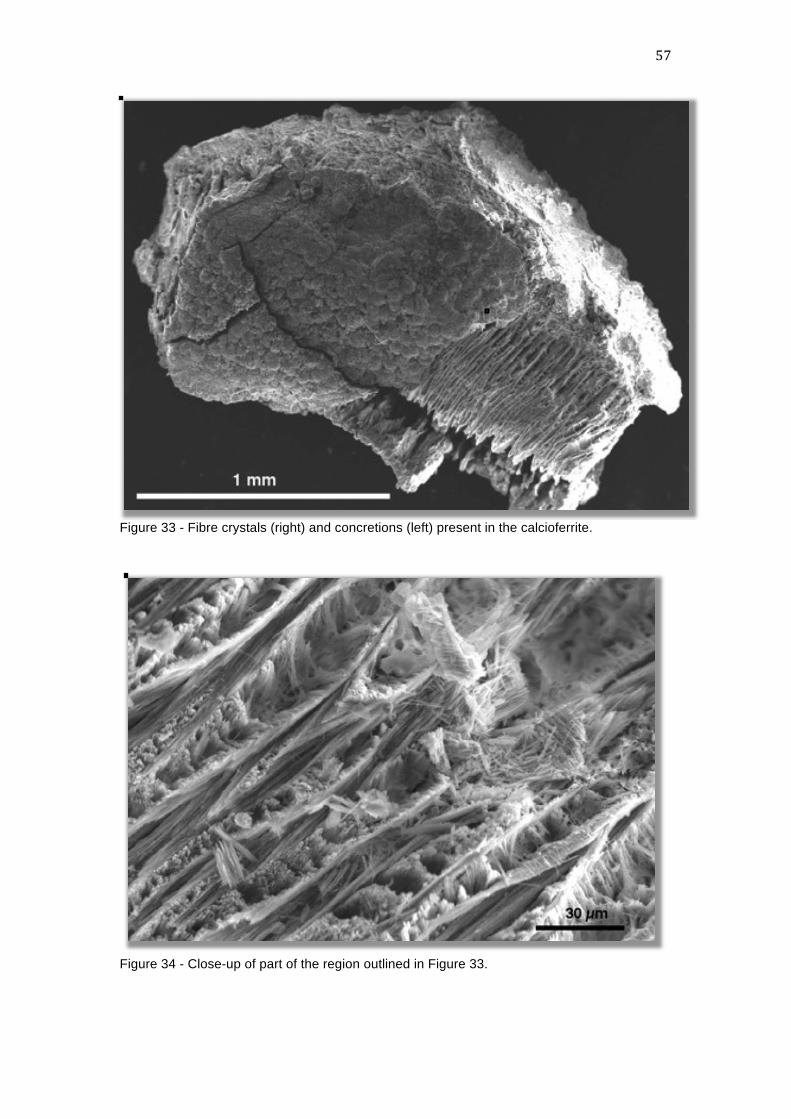
57
Figure 33 - Fibre crystals (right) and concretions (left) present in the calcioferrite.
Figure 34 - Close-up of part of the region outlined in Figure 33.
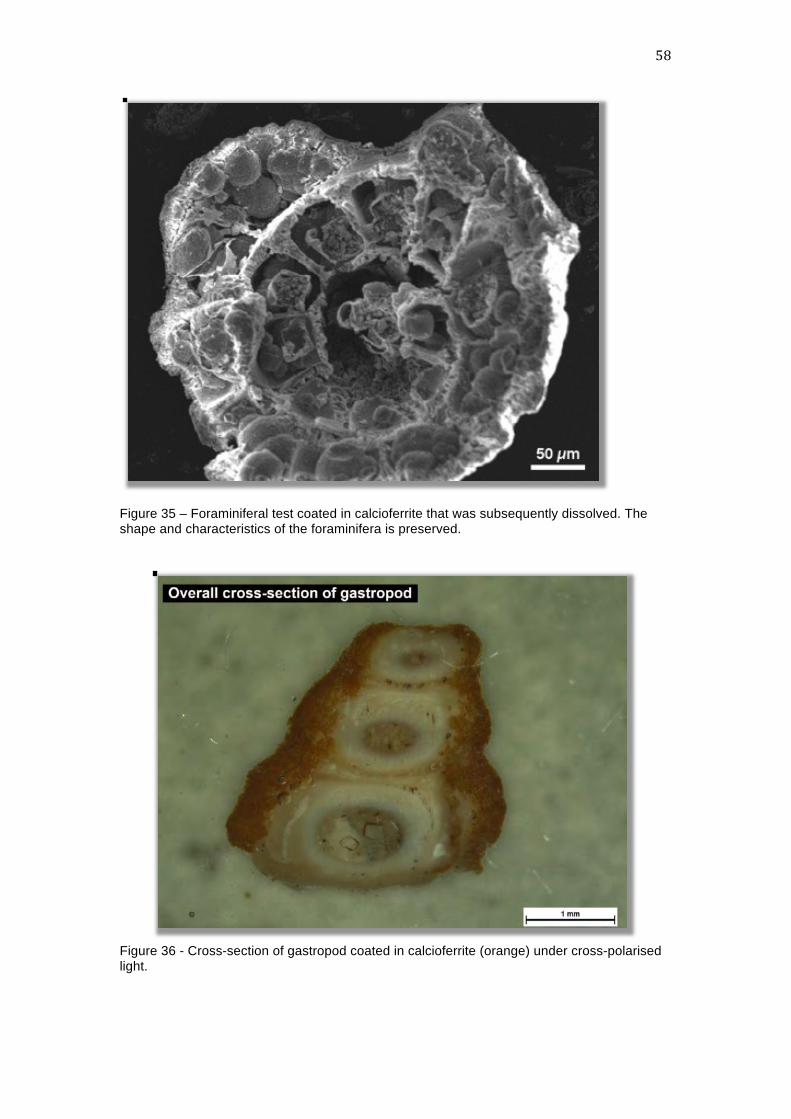
58
Figure 35 – Foraminiferal test coated in calcioferrite that was subsequently dissolved. The shape and characteristics of the foraminifera is preserved.
Figure 36 - Cross-section of gastropod coated in calcioferrite (orange) under cross-polarised light.

59
Figure 37 - Cross-section of gastropod coated in calcioferrite under plane polarised light. It is
evident that the calcioferrite is only a surface coating.
Figure 38 - Botryoidal nature of thin outer crust under cross-polarised light.

60
Figure 39 - Close-up of botryiodal material under cross-polarised light.
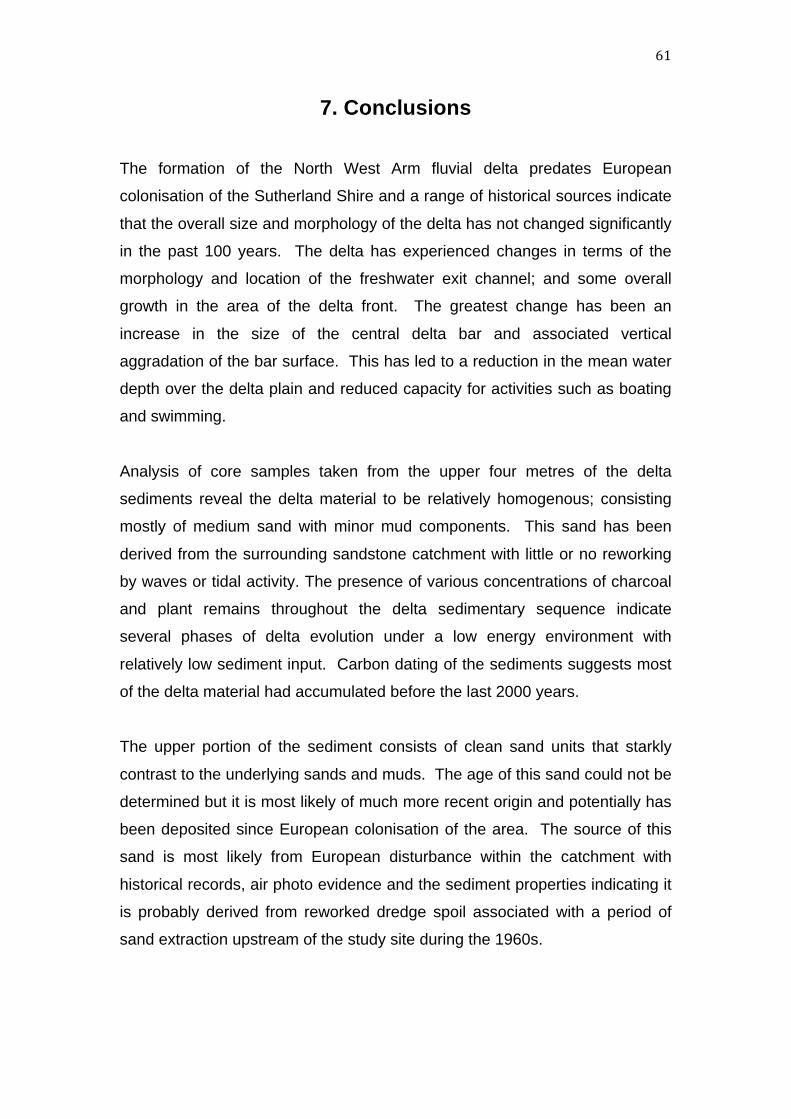
61
7. Conclusions
The formation of the North West Arm fluvial delta predates European
colonisation of the Sutherland Shire and a range of historical sources indicate
that the overall size and morphology of the delta has not changed significantly
in the past 100 years. The delta has experienced changes in terms of the
morphology and location of the freshwater exit channel; and some overall
growth in the area of the delta front. The greatest change has been an
increase in the size of the central delta bar and associated vertical
aggradation of the bar surface. This has led to a reduction in the mean water
depth over the delta plain and reduced capacity for activities such as boating
and swimming.
Analysis of core samples taken from the upper four metres of the delta
sediments reveal the delta material to be relatively homogenous; consisting
mostly of medium sand with minor mud components. This sand has been
derived from the surrounding sandstone catchment with little or no reworking
by waves or tidal activity. The presence of various concentrations of charcoal
and plant remains throughout the delta sedimentary sequence indicate
several phases of delta evolution under a low energy environment with
relatively low sediment input. Carbon dating of the sediments suggests most
of the delta material had accumulated before the last 2000 years.
The upper portion of the sediment consists of clean sand units that starkly
contrast to the underlying sands and muds. The age of this sand could not be
determined but it is most likely of much more recent origin and potentially has
been deposited since European colonisation of the area. The source of this
sand is most likely from European disturbance within the catchment with
historical records, air photo evidence and the sediment properties indicating it
is probably derived from reworked dredge spoil associated with a period of
sand extraction upstream of the study site during the 1960s.

62
The sand extraction is believed to have removed more than 9,000 cubic
metres of material from a section of the delta that had previously been
characterised by the presence of several swimming holes. These swimming
holes no longer exist and it is possible that they have been filled sediments
mobilised as part of the urbanisation of the catchment during the 1960s.
Once these holes were filled then any additional sediment would have been
deposited in the prograding section of the delta and the main delta bar that
formed part of this study. Quantifying sedimentation rates or establishing a
chronology of recent sedimentary units was not possible based upon the data
available.
The geochemical analysis of the sediment cores suggest that the overall level
of contamination is relatively low. This is especially so not only in comparison
to contaminated sites such as Port Jackson or Botany Bay but also compared
to other sites in Port Hacking such as Ewey Creek. The more recently
deposited parts of the delta indicate that urbanisation appears to be a
significant contributor to the presence of heavy metals within the catchment.
The predominant “freshwater” character of the environmental conditions also
suggest that occasional inputs from the catchment greatly exceed any tidal
and marine effects.
Overall we conclude that the morphology and sedimentology of the lower
portion of the North West Arm fluvial delta have been altered due to urban
development of the surrounding catchment in the past 50 years. Increased
sediment yield from the catchment has resulted in aggradation and
progradation of the delta of mostly sandy material. Only small volumes of
relatively fine material in suspension reach the prodelta. Direct modification of
the upstream reaches of the delta (eg dredging) have also played a role if
changing the sedimentary environment of the delta but we cannot say to what
extent. Although contamination of the sediments is relatively low, it has
nevertheless increased since European settlement.
63
Despite recently adopted management strategies to control the rate of
sediment accumulation in the delta, local resident’s concerns over
sedimentation appear to be well founded. It is also likely that the low energy
environment of the delta is not going to result in significant reworking of the
sediments in the short term. Therefore even the most ardent attempts to
control the sediment influx from the catchment will not deliver the desired
outcome of greater water depths across the delta surface. It would appear
that this might only be achieved via direct action such as dredging the delta.
Dredging has numerous potential environmental impacts, such as mobilisation
of heavy metals that may contaminate sediments and local ecosystems;
although the present concentrations of heavy metals do not prevent such
remedial activity. Additionally disposal of dredge spoils may be a problem as it
is likely that local heavy metal contamination will increase due to agitation of
the settled contaminants in the sediment. There is also a concern that
dredging will have a more immediate effect on local ecosystems and will
negatively impact the aesthetics of the area. Dredging, however, is only a
temporary solution, unless there is a sustained effort to prevent sediment
inputs from the catchment, as sediment will continue to accumulate in
different parts of the delta. Baseline data as provided in this report will assist
in assessing rates of change in the future.
8. Acknowledgments
The authors gratefully acknowledge the Conroy family for their support and in
particular the late Donald P. Conyard for the permission to use the waterfront
facilities for the field work. Dr. Mike Hotchkis (ANSTO) assistance is also
gratefully acknowledged.

64
9. References
Albani, A. D. (1974). Sedimentary Environments in Broken Bay, NSW, Australia. Journal of the Geological Society of Australia , 21, 277-288.
Albani, A. D. (1981). Sedimentary Environments and Pleistocene Chronology of the Botany Basin, NSW, Australia. Geo-Marine Letters , 1, 163-167.
Albani, A. D. (2005). Cooks River Survey. Sydney: University of New South Wales, School of Biological, Earth and Environmental Sciences.
Albani, A. D., & Cotis, G. (2008). Port Hacking: Past and Present of an Estuarine Environment. Sutherland: Sutherland Shire Council.
Albani, A. D., Edwards, D., & Hyde, M. (2011). Cooks River Survey: Part II - Cores. Sydney: School of Biological, Earth and Environmental Sciences, University of New South Wales.
Albani, A. D., Hayward, B. W., & Grenfell, H. R. (2001). Taxomorph: Foraminifera from the Southwest Pacific. An Interactive Catalogue for the Natural Sciences .
Albani, A. D., & Rickwood, P. C. (1998). The Botany Basin: Its Bedrock Topography and Recent Geological History. In G. H. McNally, & J. Jancowski (Eds.), Collected Case Studies in Engineering Geology, Hydrogeology and Environmental Geology (pp. 190-196). Springwood, NSW: Engineering Geology Specialist Group of the Geological Society of Australia.
Albani, A.D., Rickwood, P.C., Favero, V. and Serandrei Barbero, R. (1989) The geochemistry of marine sediments off the Lagoon of Venice. Bulletin of Marine Pollution, 20 (9): 438-442
Albani, A.D., Rickwood, P.C., Favero, V. and Serandrei Barbero, R. (1995) The geochemistry of recent sediments in the Lagoon of Venice: environmental implications. Istituto Veneto di Scienze, Lettere ed Arti, Atti, 153: 235-321.
Atkinson, G. (2012). Soil Erosion Following Wildfire in Royal National Park, New South Wales. Proceedings of the Linnean Society of New South Wales , 134, B25-B38.
Barton, B. and Turner, J, (2011). Making a point – a history of Grays Point, Grays Point Progress Association
Birch, G. F., Evenden, D., & Teutsch, M. E. (1996). Dominance of Point Source in Heavy Metal Distributions in Sediments of a Major Sydney Estuary (Australia). Environmental Geology , 28, 69-174.
Birch, G. F., & Taylor, S. E. (1999). Source of Heavy Metals in Sediments of the Port Jackson Estuary, Australia. Science of the Total Environment , 277, 123-138.
Birch, G. F., Taylor, S. E., & Matthai, C. (2001). Small-Scale Spatial and Temporal Variance in the Concentration of Heavy Metals in Aquatic Sediments: A Review and Some New Concepts. Environmental Pollution, 113, 357-372.
Folk, R. L., & Ward, W. C. (1957). Brazos River Bar: A Study in the Significance of Grain Size Parameters. Journal of Sedimentary Petrology , 27, 3-26.

65
Hazelton, P. A., & Tille, P. J. (1990). Soil Landscapes of the Wollongong-Port Hacking 1:100,000 Sheet Map and Report. Sydney: Soil Conservation Service of NSW.
Hutton Neve, M. (1999). A brief history of Sutherland Shire, Sutherland Shire Historical Society and Sutherland Shire Council, Sutherland NSW.
Mares, T. (2003). An Environmental Assessment of Gunnamatta Bay, Port Hacking, NSW. BSc (Hons) Thesis. School of B.E.E.S, University of NSW (unpublished); 151 pp.
McReady, S. S., Birch, G. F., & Long, E. R. (2006). Metallic and Organic Contaminants in Sediments of Sydney Harbour, Australia and Vicinity: A Chemical Dataset for Evaluating Sediment Quality Guidelines. Environment International , 32, 455-456.
McLoughlin, L. C. (2000). Estuarine Wetlands Distribution along the Parramatta River, Sydney, 1788–1940: Implications for Planning and Conservation. Cunninghamia , 6 (3), 579-610.
Mehl, P. (ed) (2012). Impacts of Climate Change on Urban Stormwater Infrastructure in Metropolitan Sydney. Report prepared by J. WYNDHAM PRINCE for the Sydney Metropolitan Catchment Management Authority Parramatta NSW
Mindat. (1993-2012). Calcioferrite. Retrieved September 26, 2012, from The Mineral and Locality Database: http://www.mindat.org/min-832.html
Pickard, J. (2002) Assessing vegetation change over a century using repeat photography. Australian Journal of Botany, 50: 409-414.
Postma, G. (1990) 'Depositional architecture and facies of river and fan deltas: A synthesis', in Colella, A., and Prior, D.B., eds., Coarse-grained deltas: International Association of Sedimentologists Special Publication 10, p. 13–27.
Rickwood, P.C., Albani, A.D., and Chorley, G.I. (1983). The relationship between sediment composition and the distribution of benthic foraminifera in Broken Bay, New South Wales, Australia.pp 135-147. In: The Significance of Trace Elements in Solving Petrogenetic Problems and Controversies. Theophrastus Publ., Athens, 917 pp.
Rogers, K., & Saintilan, N. (2012). Options for Assessing Sedimentation Rates in Dee Why Lagoon: Scoping Study. Sydney: Pacific Wetland
Roy, P. S., Thom, B. G., & Wright, L. D. (1980). Holocene Sequences on an Embayed High-Energy Coast: An Evolutionary Model. Sedimentary Geology , 26, 1-19.
Serandrei Barbero, R, Albani, A.D., Donnici, S. and Rizzetto, F. (2004). Foraminifera as proxy record of marginal environments: the age of the sediments of the Lagoon of Venice. In Campostrini, P.(Ed) – Scientific Research and Safeguarding of Venice. CORILA, Venezia
Sloss C.R., Murray-Wallace C.V. and Jones B.G. (2007). Holocene sea-level change on the southeast coast of Australia: a review. The Holocene 17: 999
Suh,J-Y, Birch, G.F., Hughes, K., AND Matthai, C. (2004). Spatial distribution and source of heavy metals in reclaimed lands of Homebush Bay: the venue of the 2000 Olympic Games, Sydney, New South Wales. Australian Journal of Earth Sciences 51, 53–66

66
Walshe, B. (2003). Shire Life: Neglect of Port Hacking is a Disgrace! Its North West Arm Shows the Problems, Offers Solutions. Sutherland: Sutherland Shire Environment Centre.
Whitehill, B. W. (1996). The Impact of Urbanisation on Ewey Creek, Port Hacking, New South Wales. Sydney: University of New South Wales.
Williams, R. J., & Meehan, A. J. (2005). Focusing Management Needs at the Sub-Catchment Level Via Assessments of Change in the Cover of Estuarine Vegetation, Port Hacking, NSW, Australia. Wetlands Ecology and Management , 12 (5), 499-518.

67
10. List of Figures and Tables Figure 1 - Topographic map of the North West Arm catchment. The catchment is approximately 50% residential area and 50% National Park. Figure 2 – North West Arm fluvial delta exposed at low tide. Figure 3 - Surveying the North West Arm fluvial delta. Figure 4 - Contour map of the North West Arm fluvial delta plotted on the terrain image. (Image Source: Sutherland Shire Council, 2012) Figure 5 – The fluvial delta in the study area in 1917 (Conroy family) Figure 6 – Dredge in operation in North West Arm (Sutherland Shire Council records) Figure 7 – A. Section of 1966 photo showing upstream dredge pool; B. Enlargement of photo showing dredge on edge of pool as indicated by the arrow. Figure 8 - Extract from the 1970 Air Photo showing Upstream Section of Delta showing holes (indicated by arrows) Figure 9 - Location of samples on the North West Arm fluvial delta. (Image Source: Sutherland Shire Council, 2012) Figure 10 - Insertion of the PVC pipe. Figure 11 - Winch assembly used for core extraction. Figure 12 - Location of surface samples from the deep water region of North West Arm. Figure 13 - Lithological units used in this study Figure 14 – Distribution of the lithological units in each core. Figure 15 – Correlation of lithologies along the fluvial delta Figure 16 – The compaction rates in each core. Figure 17 - Dendrogram based on the cluster analysis of the total sediment data set Figure 18 – Composition of the various clusters Figure 19 - Distributionof the clusters in the cores Figure 20 – Sediment correlation along the section Figure 21 – Concentration of CaO, Al2O3 and Fe2O3 Figure 22 – Distribution of the concentration of Arsenic Figure 23 – Distribution of the concentration of Copper Figure 24 – Distribution of the concentration of Lead Figure 25 – Distribution of the concentration of Zinc Figure 26 – Distribution of the concentration of Zinc Figure 27 – Distribution of the concentration of Antimony Figure 28 – Summary of the concentrations of Arsenic, Antimony and Chromium Figure 29 – Dendrogram of the foraminiferal fauna with their environmental character and composition. Note the samples labelled N2-N5 are the NWA2-NWA5 of previous figures. Figure 30 – Distribution of foraminiferal clusters (biotopes). Figure 31 – Correlation of the sedimentary environments as from the cores based on the foraminiferal fauna. Figure 32 - Peak elements Ca, P and Fe detected in Figures 3.20 and 3.21. Figure 33 - Fibre crystals (right) and concretions (left) present in the calcioferrite. Figure 34 - Close-up of part of the region outlined in Figure 33. Figure 35 – Foraminiferal test coated in calcioferrite that was subsequently dissolved. The shape and characteristics of the foraminifera is preserved. Figure 36 - Cross-section of gastropod coated in calcioferrite under cross-polarised light. Figure 37 - Cross-section of gastropod coated in calcioferrite under plane polarised light. It is evident that the calcioferrite is only a surface coating. Figure 38 - Botryoidal nature of thin outer crust under cross-polarised light. Figure 39 - Close-up of botryiodal material under cross-polarised light.

68
Table 1 Comparison of exposed delta areas in air photos and modern survey. Table 2 - Location of core samples on the North West Arm fluvial delta. Table 3 - Location of samples from deep water of the North West Arm fluvial delta. Table 4 – Benthic foraminifera present in North West Arm Table 5 - Sedimentation rates from southeastern Australian estuaries (adapted from Roger and Saintilan, 2012).