At the rhythm of language: Brain bases of language-related frequency perception in children
10
At the rhythm of language: Brain bases of language-related frequency perception in children Ioulia Kovelman a, b, ⁎, Kira Mascho a , Louisa Millott b , Alyssa Mastic a , Bianca Moiseff a , Mark H.Shalinsky b a Department of Psychology, University of Michigan, 530 Church Street, East Hall, Ann Arbor, MI 48109, USA b Center for Human Growth and Development, University of Michigan, 300 North Ingalls, Ann Arbor, MI 48109-0477, USA abstract article info Article history: Received 5 July 2011 Revised 21 December 2011 Accepted 22 December 2011 Available online 2 January 2012 Keywords: Language Language acquisition Reading acquisition Dyslexia Brain development Near infrared imaging What neural mechanisms underlie language and reading acquisition? Slow rhythmic modulations in the linguis- tic stream (below 8 Hz) mark syllable and word boundaries in the continuous linguistic stream, potentially help- ing children master the words and structures of their language. Converging evidence across language and reading research suggests that children's sensitivity to these slow rhythmic modulations is important for language and reading acquisition. In infancy, children produce rhythmically alternating syllables, or babbles, at a slow frequency of ~1.5 Hz or 660 ms (Petitto et al., 2001). In early grades, children's sensitivity to slow rhyth- mic modulations correlates with their reading ability (Goswami, 2011). We used functional Near Infrared (fNIRS) imaging to investigate the brain bases of “language rhythm” in beginning readers (ages 6–9). Right hemisphere showed an overall greater activation toward the slow rhythmic stimuli, and left hemisphere showed greater activation toward 1.5 Hz, relative to faster and slower frequencies. The findings suggest that while right hemi- sphere might have an overall better ability to process rhythmic sensitivity, left hemisphere might have a select sensitivity to a preferred range of slow rhythmic modulations—a range that might be particularly salient to brain mechanisms responsible for cross-modal language processing and reading acquisition. Published by Elsevier Inc. Introduction One of the greatest challenges in understanding the neural bases of language is determining what neural mechanisms support language acquisition in early life, and what neural mechanisms support a child's transition from language to literacy. Evidence suggests that children's sensitivity toward slow rhythmic modulations inherent in the linguistic stream facilitates language acquisition in infancy and the transition from language in speech to language in print dur- ing the early years of reading acquisition (Goswami, 2011; Petitto, 2005). Within the linguistic stream these slow rhythmic modula- tions are thought to be perceived as beats occurring at Delta–Theta frequencies of 1–8 Hz (Fowler et al., 1986; Jusczyk et al., 1999), and infants' sensitivity to these rhythmic patterns may help them identify syllable and word boundaries in the continuous linguistic stream (c.f., Petitto, 2005). Children with language and reading difficulties have deficits in perceiving these slow rhythmic modulations, suggesting the importance of this perceptual ability for language as well as reading acquisition (Goswami, 2011). It is further hypothesized that upon hear- ing language, parts of the brain that participate in language perception and production synchronize with the temporal and rhythmic properties of the speech stream; thus facilitating language proces- sing and language acquisition (Poeppel et al., 2008; Telkemeyer et al., 2009). Here we investigate the brain bases of young readers' sensitivity to slow rhythmic modulations because this sensitivity may underlie the brain's ability to acquire language, as well as the ability to transition from language in speech to language in print. Slow rhythmic modulations in early language production At the beginning of language acquisition, babbling is an infant's very first universal milestone in language production. At about 5 months, infants begin to produce rhythmically-alternating, meaningless sylla- bles. The milestone is considered “universal” as it emerges in babies exposed to any spoken or any sign language; regardless of the child's hearing status, infants exposed to a sign language will babble with their hands (“manual babbling”: Petitto et al., 2001; Petitto and Marentette, 1991). Cross-linguistic evidence also suggests some differ- ences in babbling structure. For instance, Korean and English infants show different language-specific vowel structure in their babbles (Lee et al., 2010). Sign-exposed children will produce rhythmically- alternating meaningless combinations of hand-shapes and hand move- ments that are commensurate with the syllabic structure of their sign language (Petitto, 2005; Petitto and Marentette, 1991; Petitto et al., 2001). This first manifestation of rhythmic linguistic production is thought to be under the control of the language hemisphere, as an NeuroImage 60 (2012) 673–682 ⁎ Corresponding author. E-mail addresses: [email protected] (I. Kovelman), [email protected] (K. Mascho), [email protected] (L. Millott), [email protected] (A. Mastic), [email protected] (B. Moiseff), [email protected] (M. H.Shalinsky). 1053-8119/$ – see front matter. Published by Elsevier Inc. doi:10.1016/j.neuroimage.2011.12.066 Contents lists available at SciVerse ScienceDirect NeuroImage journal homepage: www.elsevier.com/locate/ynimg
Transcript of At the rhythm of language: Brain bases of language-related frequency perception in children

NeuroImage 60 (2012) 673–682
Contents lists available at SciVerse ScienceDirect
NeuroImage
j ourna l homepage: www.e lsev ie r .com/ locate /yn img
At the rhythm of language: Brain bases of language-related frequency perceptionin children
Ioulia Kovelman a,b,⁎, Kira Mascho a, Louisa Millott b, Alyssa Mastic a, Bianca Moiseff a, Mark H.Shalinsky b
a Department of Psychology, University of Michigan, 530 Church Street, East Hall, Ann Arbor, MI 48109, USAb Center for Human Growth and Development, University of Michigan, 300 North Ingalls, Ann Arbor, MI 48109-0477, USA
⁎ Corresponding author.E-mail addresses: [email protected] (I. Kovelma
(K. Mascho), [email protected] (L. Millott), [email protected]@gmail.com (B. Moiseff), mark.shalinsky@
1053-8119/$ – see front matter. Published by Elsevier Idoi:10.1016/j.neuroimage.2011.12.066
a b s t r a c t
a r t i c l e i n f oArticle history:Received 5 July 2011Revised 21 December 2011Accepted 22 December 2011Available online 2 January 2012
Keywords:LanguageLanguage acquisitionReading acquisitionDyslexiaBrain developmentNear infrared imaging
What neuralmechanisms underlie language and reading acquisition? Slow rhythmicmodulations in the linguis-tic stream (below 8 Hz)mark syllable andword boundaries in the continuous linguistic stream, potentially help-ing children master the words and structures of their language. Converging evidence across language andreading research suggests that children's sensitivity to these slow rhythmic modulations is important forlanguage and reading acquisition. In infancy, children produce rhythmically alternating syllables, or babbles, ata slow frequency of ~1.5 Hz or 660 ms (Petitto et al., 2001). In early grades, children's sensitivity to slow rhyth-micmodulations correlateswith their reading ability (Goswami, 2011).Weused functional Near Infrared (fNIRS)imaging to investigate the brain bases of “language rhythm” in beginning readers (ages 6–9). Right hemisphereshowed an overall greater activation toward the slow rhythmic stimuli, and left hemisphere showed greateractivation toward 1.5 Hz, relative to faster and slower frequencies. The findings suggest that while right hemi-sphere might have an overall better ability to process rhythmic sensitivity, left hemisphere might have a selectsensitivity to a preferred range of slow rhythmic modulations—a range that might be particularly salient tobrain mechanisms responsible for cross-modal language processing and reading acquisition.
Published by Elsevier Inc.
Introduction
One of the greatest challenges in understanding the neural basesof language is determining what neural mechanisms support languageacquisition in early life, and what neural mechanisms support achild's transition from language to literacy. Evidence suggests thatchildren's sensitivity toward slow rhythmic modulations inherentin the linguistic stream facilitates language acquisition in infancyand the transition from language in speech to language in print dur-ing the early years of reading acquisition (Goswami, 2011; Petitto,2005). Within the linguistic stream these slow rhythmic modula-tions are thought to be perceived as beats occurring at Delta–Thetafrequencies of 1–8 Hz (Fowler et al., 1986; Jusczyk et al., 1999), andinfants' sensitivity to these rhythmic patterns may help them identifysyllable and word boundaries in the continuous linguistic stream (c.f.,Petitto, 2005). Children with language and reading difficulties havedeficits in perceiving these slow rhythmic modulations, suggesting theimportance of this perceptual ability for language as well as readingacquisition (Goswami, 2011). It is further hypothesized that upon hear-ing language, parts of the brain that participate in language perceptionand production synchronize with the temporal and rhythmic
n), [email protected] (A. Mastic),gmail.com (M. H.Shalinsky).
nc.
properties of the speech stream; thus facilitating language proces-sing and language acquisition (Poeppel et al., 2008; Telkemeyer et al.,2009). Here we investigate the brain bases of young readers' sensitivityto slow rhythmic modulations because this sensitivity may underliethe brain's ability to acquire language, as well as the ability to transitionfrom language in speech to language in print.
Slow rhythmic modulations in early language production
At the beginning of language acquisition, babbling is an infant's veryfirst universal milestone in language production. At about 5 months,infants begin to produce rhythmically-alternating, meaningless sylla-bles. The milestone is considered “universal” as it emerges in babiesexposed to any spoken or any sign language; regardless of the child'shearing status, infants exposed to a sign language will babble withtheir hands (“manual babbling”: Petitto et al., 2001; Petitto andMarentette, 1991). Cross-linguistic evidence also suggests some differ-ences in babbling structure. For instance, Korean and English infantsshow different language-specific vowel structure in their babbles (Leeet al., 2010). Sign-exposed children will produce rhythmically-alternating meaningless combinations of hand-shapes and handmove-ments that are commensurate with the syllabic structure of their signlanguage (Petitto, 2005; Petitto and Marentette, 1991; Petitto et al.,2001). This first manifestation of rhythmic linguistic production isthought to be under the control of the language hemisphere, as an
674 I. Kovelman et al. / NeuroImage 60 (2012) 673–682
infant's mouth aperture during vocal babbling has been found to begreater on the right than on the left (Holowka and Petitto, 2002).
Research into the temporal structure of vocal babbling revealedthat syllabic units within infants' babbling are about 330 ms in length,and are produced at a slow rhythmic rate of about 3 Hz (i.e. ~ 3 sylla-bles per second; Dolata et al., 2008). While syllable duration in signlanguages is roughly commensurate to spoken languages (Wilburand Nolen, 1986), hand-motion analyses of infants' manual babblingrevealed that this repetitive and rhythmic hand activity occurs at aslow frequency of about 1–2 Hz (Petitto et al., 2001). The hand mo-tions during manual babbling are roughly commensurate with infants'jaw movements during vocal babbling, which also occur at a slow fre-quency of about 1.8 Hz (Steeve et al., 2008). Temporal and mouthasymmetry evidence on infants' first linguistic production milestone,babbling, has led researchers to suggest that the neural mechanismsthat support infants' acquisition of language might be selectivelysensitive to cross-modal slow rhythmic properties of language andlocated in left hemisphere regions known to support language acrossvisual and auditory modalities (Petitto, 2005; Petitto et al., 2000).
Language rhythm: Language-specific and language-common rhythms
Prior to the onset of babbling, infants demonstrate a high sensitivityto the rhythmic structure of language. This rhythmicity of languageis thought to have both language-specific and language-common prop-erties (Byers-Heinlein et al., 2010; Fowler et al., 1986; Hoequist, 1983;Jusczyk et al., 1999; Nazzi & Ramus, 2003). Language-specific prosodiccontours: All natural human languages fall on a continuum of acousticparameters that define the language's rhythmic prosodic contour(Ramus andMehler, 1999). The continuum is roughly based on the pro-portion of vowels and consonant clusters within a phrase, aswell as theduration of these units in a language (Ramus and Mehler, 1999). Pro-sodic contour varies across languages. Listeners can easily tell apartsentences that “sound” Chinese, Russian, or English. Neonates are capa-ble of making a similar distinction. This ability to distinguish prosodiccontour of different languages is thought to be critical in helpingbilingual infants avoid confusion between their two languages fromthe very onset of language acquisition (Byers-Heinlein et al., 2010;Gervain and Mehler, 2010; May et al., 2011).
Language-common perceptual centers
All languages have syllables, and all syllables are thought to havea perceptual onset (termed as perceptual or “P-center”), which arethought to coincide with the articulatory onset of the vowel (Fowleret al., 1986; Hoequist and Smith, 1986). Adult speakers of languagesthat come from different points along the prosodic continuum dem-onstrate a similar temporal/rhythmic pattern when producing indi-vidual syllables of varying structure (same inter-syllabus interval(ISI) across languages, but varied ISI for longer/shorter syllables).Similarly, participants can accurately keep pace while tapping to syl-lables of different structures, with the beat roughly coinciding withthe syllable's vowel-onset, irrespective of the syllable's vowel andconsonant cluster duration (for a review see Hoequist and Smith,1986). This beat is thought to be language-universal—aiding infants'speech segmentation during language acquisition (Fowler et al.,1986), and young children's ability to identify syllables and rimesduring pre-reading tasks (Goswami et al., 2011).
Slow rhythmic modulations in early reading acquisition
At the beginning of reading acquisition, children must learn torelate spoken language to print through explicit phonological aware-ness, which is the realization that spoken words are composed of dis-crete sounds and syllables that can be mapped onto letters and otherorthographic characters (Ziegler and Goswami, 2005). Children's
sensitivity to larger phonological units of language, such as syllablesand rimes, is the first milestone in phonological awareness abilities.While infants' babbling, or production of suprasegmental units, isthe first universal milestone in language production, children's pho-nological awareness of the suprasegmental units of language is thefirst precursor to reading acquisition: phonological awareness hasfrequently been found to precede and predict success in learning toread in alphabetic as well as non-alphabetic languages (Ziegler andGoswami, 2005).
A deficit in phonological awareness is thought to be the most com-mon etiology of dyslexia, a life-long learning difficulty that affects 5–17% of children (Shaywitz and Shaywitz, 2005). Moreover, phonolog-ical and reading deficits are also common in children with specificlanguage impairment (SLI), a language acquisition difficulty thataffects about 5% of the population (Gathercole, 2006). Research hasnow shown that in English as well as other languages, children's sen-sitivity to slow rhythmic modulations correlates with their phonolog-ical and reading abilities and is impaired in both dyslexia and SLI(Corriveau and Goswami, 2009; Goswami, 2011; Goswami et al.,2002, 2011; Thomson and Goswami, 2008). Research on slow rhyth-mic sensitivity frequently uses finger-tapping tasks during whichreading-age children and adults tap to slow “tappable” frequencies inthe range of about 1–4 Hz (Corriveau and Goswami, 2009; Thomsonand Goswami, 2008). Difficulties in tapping along with the slowfrequencies found in individuals with dyslexia and SLI have beenthought to relate to their difficulty with speech segmentation, phono-logical awareness, and overall phonological and reading development(c.f., Goswami, 2011).
Brain bases of slow rhythmic modulations and language perception
Neuroimaging research suggests that upon hearing language, theneural networks of the adult brain enter a coordinated communica-tion between the different frequency modulations of the linguisticstream and the endogenous rhythmic oscillations of the neural activ-ity. In particular, neuronal firing rates are known to oscillate at differ-ent frequency bands, including Delta (1–3 Hz), Theta (4–8 Hz), andGamma (30–80 Hz). Slower frequencies correspond to syllabic andword boundaries (Delta–Theta), and faster frequencies correspondto individual phonemes (phonemes are the smallest sound units oflanguage, such as English sounds /b/ or /d/). Upon hearing language,in several parts of the brain the person's endogenous Delta–Thetaand Gamma neural oscillations align with the temporal propertiesof the speech stream (Giraud et al., 2007; Luo and Poeppel, 2007,Luo et al., 2010; Morillon et al., 2010). Left lateralization of Delta–Theta indigenous oscillation in response to language becomes partic-ularly pronounced during cross-modal language exposure (i.e. whenparticipants both hear the speakers and see their facial movementsduring speech; Morillon et al., 2010). Researchers interpret thesefindings as consistent with infants' successful cross-modal phonolog-ical development in spoken and sign language modalities (Morillonet al., 2010).
A series of neuroimaging studies investigated infants' neural re-sponse to temporally-modulated auditory information inherent inthe speech stream (c.f. Obrig et al., 2010). Newborns (Telkemeyer etal., 2009), 3- and 6-month old infants (Telkemeyer et al., 2011), andadults (Boemio et al., 2005) listened to auditory stimuli with rapid(~phonetic) and slow (~syllabic) temporal modulations. Imaging re-sults revealed that during the slow condition, newborns had greaterright than left activation in temporal and temporoparietal regions.Three month-olds had greater left than right activation in these re-gions, while 6-month olds and adults had greater right than left acti-vation. All infants showed a relatively balanced bilateral responseduring the fast condition. The results are interpreted as suggestingthat despite the contradictory results for the 3-month-olds, thereis a developmentally stable right-hemisphere preference for slow
675I. Kovelman et al. / NeuroImage 60 (2012) 673–682
temporal modulations of the speech stream, and an overall bilateralresponse to rapid temporal transitions (Telkemeyer et al., 2011).Such interpretation is consistent with the hypothesis that speech isprocessed at two time scales corresponding to phonetic versus supra-segmental language units, with an inherent hemispheric asymmetryfor the two streams: bilateral for rapid temporal and right for slowtemporal (Poeppel et al., 2008). Yet, the findings are inconsistentwith other imaging studies showing an early left-ward asymmetryfor suprasegmental and rhythmic properties of language (Homae etal., 2006; Pena et al., 2003; Saito et al., 2009; Wartenburger et al.,2007), warranting further inquiry into this issue. Finally, to the bestof our knowledge, no imaging study has directly investigated thebrain bases of slow rhythmic sensitivity in elementary school chil-dren, the age during which children's ability for segmentation andphonological analyses actively changes in response to reading acqui-sition demands (Castles and Coltheart, 2004).
Brain bases of phonological and rhythmic processing
What might be the neural base of slow rhythmic processing that iscritical for language and literacy? On the one hand, theories of slowrhythmic auditory perception suggest that the right hemisphere isthe key locus of the brain's sensitivity to Delta–Theta frequencies(Boemio et al., 2005). On the other hand, multimodal functionalMagnetic Resonance (fMRI)/Evoked Response Potential (ERP) neuro-imaging studies have shown that when exposed to an audiovisualspeech stream, adults show the greatest synchronization of neuraland linguistic temporal signals in the left hemisphere (Morillon etal., 2010). Similarly, studies of language and literacy acquisitionhave shown that left hemisphere regions (especially left posteriortemporal, parietal and inferior frontal regions) are critical for phono-logical analyses and reading; researchers also consistently findbilateral differences in how children with dyslexia process language(c.f., Kovelman et al., in press-a,b, 2011). The question we ask here,is what is the nature of children's sensitivity to slow rhythmic modu-lations within the brain regions important for phonological awarenessprocessing.
Behavioral studies that suggested the connection between languageand reading acquisition and slow rhythmic sensitivity used finger-tapping tasks, during which participants listened to blocks of beeps(essentially a metronome) and were asked to tap in time withthese beeps (c.f., Goswami, 2011). While slow frequency modula-tions are thought to go up to 8 Hz, children can only comfortablytap to frequencies of up to about 3–4 Hz, thus limiting the range ofstudied frequencies (Corriveau and Goswami, 2009; Thomson andGoswami, 2008). Participants with SLI and dyslexia showed difficultykeeping pace with these “tappable” slow frequencies relative to con-trol groups, and children's performance on these tapping tasks hasbeen found to correlate with their language and reading abilities(Corriveau and Goswami, 2009; Thomson and Goswami, 2008).What brain mechanisms might support a child's ability to processthese “tappable” slow frequencies? In the present study we used aRhythm task during which young readers (ages 6–9) listened to blocksof beeps at the slow frequency rates of 0.5, 1.5 and 3.0 Hz, while wemeasured their brain activity with fNIRS. We also used a Languagetask to identify brain regions critical to language and phonological pro-cessing, so that we could investigate the brain's response to slowfrequencies in regions that process rhythm as well as brain regionsthat process language.
In order to identify language-related brain regions that might besensitive to slow rhythmic modulations, we targeted two types oflanguage processing: phonological awareness and verbal short-termmemory. Phonological awareness frequently precedes and predictsreading acquisition. Neuroimaging studies of phonological awarenesstypically use rhyming tasks because rhyme detection is one of theearliest phonological awareness tasks that children master, because
it is a suprasegmental analyses task (syllables or parts of syllablesmust be identified, rather than individual phonemes), and becauserhyming is an effective predictor of reading success for young chil-dren (Bradley and Bryant, 1978; Ziegler and Goswami, 2005). ERPstudies of phonological awareness report that children as young as7 years old show a “rhyming effect,” or a greater N400/N450 responsefor non-rhymes as compared to rhymes (Coch et al., 2011; Grossi, etal., 2001). In rhyming tasks, this negative-going wave at ~400/450 ms after the stimulus onset is thought to reflect phonological an-alyses, as well as an integration of lexico-semantic and phonologicalinformation (Coch et al., 2011; Desroches et al., 2008). Childrenwith dyslexia have been found to show an attenuated “rhymingeffect,” as compared to typical readers (Ackerman et al., 1994). Ana-tomically, bilateral temporal and parietal regions are thought to gen-erate this N400/N450 response (Khateb et al., 2007), highlightingthe importance of both hemispheres in suprasegmental phonologicalanalyses.
fMRI studies of phonological awareness in English have consis-tently shown that typically developing children show activation in in-ferior frontal, temporal, parietal, and occipito-temporal regions, andthat children with dyslexia frequently show reduced activation isthese regions (Cao et al., 2006; Hoeft et al., 2007). fMRI studies of dys-lexia also frequently show greater right than left activation in rightparietal, temporal and frontal regions in children and adults withdyslexia relative to age- and ability-matched controls (Corina et al.,2001; Kovelman et al., in press-a,b Pugh et al., 2000; Shaywitz andShaywitz, 2005). Theories of a slow temporal processing deficit indyslexia suggest that this right hemisphere hyperactivation is a re-flection of impaired (possibly more effortful) slow rhythmic proces-sing (Goswami et al., 2002, 2011).
Verbal short-term memory (STM) ability, or the ability to remem-ber verbal information over a brief period of time, is also thought tobe critical to both language and literacy development (Gathercole,2006). A verbal or phonological short-termmemory deficit is thoughtto be one of the most common deficits in SLI, and may possibly beat the etiology of the disorder (Gathercole, 2006). This deficit isfrequently revealed with word, pseudoword, and number repetitiontasks (e.g., digit span and pseudoword repetition tasks; Gathercole,2006). Adult brain imaging studies, including our own work onword and pseudoword repetition and matching, suggest that similarregions are engaged in phonological awareness and verbal STM,including left inferior frontal and bilateral posterior temporal andparietal regions (Perrachione et al., 2009; Strand et al., 2008). Thissuggests that a combined use of rhyme and word-match tasks mayhelp us identify bilateral brain regions critical to linguistic, phonolog-ical, and slow rhythmic processing that are critical for language.
The study investigated the brain bases of slow rhythmic sensitivityand its potential relationship to the brain bases of language and liter-acy. Using fNIRS imaging we studied young readers (ages 6–9), whocompleted a Rhythm task with 0.5–3.0 Hz slow frequencies and aLanguage task with rhyme and word-match conditions. First weseparately identified brain regions that showed significant activationduring the Rhythm task and during the Language task. We then ana-lyzed the brain activation in response to 0.5, 1.5 and 3.0 Hz frequen-cies across the two hemispheres in each of the active regions. Wehypothesized that while the right hemisphere might indeed be a gen-eral perceptual processor of slow rhythmic auditory information(possibly yielding an overall greater right than left hemisphere acti-vation), the left hemisphere might also show sensitivity to slowrhythmic modulations (and yield different activation for the threedifferent frequencies), especially within the posterior temporal andparietal regions known to support phonological processing and cross-modal integration. Children and adults with SLI and dyslexia have pre-viously shown to have significant deficits at tapping in rhythmwith theslow frequencies chosen for this study. Here we investigated brainactivation in response to these slow frequencies and aimed to improve
676 I. Kovelman et al. / NeuroImage 60 (2012) 673–682
our understanding of how slow rhythmic sensitivity relates to languageand reading acquisition.
Material and methods
Participants
Fifteen children participated in the study (4 girls and 11 boys;mean age 7, range 6–9, see Table 1). All children were right-handedand native speakers of English without any history of language, liter-acy, hearing or any known neurological difficulties. Fourteen childrencompleted the Language task, ten children completed the Rhythmtask, and nine children completed both tasks. The treatment of allparticipants and all experimental procedures were in full compliancewith the ethical guidelines of the Institutional Review Boards of theUniversity of Michigan Medical School.
Behavioral measures
Participants completed standardizedmeasures of cognitive, language,and reading abilities, including the Kaufman Brief Intelligence Test(Kaufman and Kaufman, 1990), the Comprehensive Test of Phono-logical Processing (Elision and Blending Words; (Wagner et al.,1999)), and the Woodcock Reading Mastery Tests — Revised/Norma-tive Update (Letter and Word ID; (Woodcock, 1998)). Parents alsocompleted a questionnaire detailing their child's language, reading,cognitive and motor development, as well as any family history oflearning difficulties. All children had age- and grade-appropriate read-ing, language and IQ abilities (Table 1).
Imaging tasks
Language task. During fNIRS imaging, participants completed a Languagetask, which was based on two phonological processes frequently used tostudy and diagnose dyslexia and SLI: a phonological awareness Rhymetask and a verbal short-term memory Word-Match task. In the Rhymecondition participants listened to a pair of real words, segmented thewords' phonological forms into their constituent parts, identified the end-ings, and decided if the endingswere identical or not (e.g., “cat” and “bat”rhyme; “cup” and “pan” do not). In theMatch task participants listenedto a pair of realwords and decided if the twoword-formswere identicalor not (e.g., “dog” and “dog” are identical; “rat” and “pan” are not). Forboth tasks, children heard pairs of words and made a yes/no decisionabout the pairs. There were equal numbers of “yes” and “no” answersfor both the rhyme and match tasks, with the number of “yes” and“no” answers randomized across blocks.
The experiment began with a 33 s lead-in-time during which thebaseline physiological measure of the participants' hemodynamic re-sponse was collected. There were six 24 s blocks of Rhyme and six24 s blocks of Match (four trials per block, 6 s per trial). The orderof the blocks was randomized. Each Rhyme and Match block was
Table 1Participant information.
Participant information Mean±SD
N 15Age (years) 7.3±.96Behavioral measuresKBIT verbal IQ standard score 113.2±9.3KBIT non-verbal IQ standard score 115±8.1CTOPP phonological 111.7±19.7Awareness compositea standard scoreWoodcock word ID standard score 105.8±7.5Phonological task accuracy (% correct) 96.1±7.5
Note. All participants fell within normal range for language abilities and IQ.a Composite of elision and blending words.
preceded with a 2 s instruction. Each condition was also color-coded(a black fixation cross with an orange background for the Rhymetask and a purple background for the Match task). There was an18 s Rest period (white cross on black background) between the ex-perimental blocks. Word stimuli. All stimuli were real monosyllabicwords matched within and across conditions (see Kovelman et al.,in press-b for more details on the task).
Rhythm perception imaging task
During fNIRS imaging, participants listened to a brief beep (13 ms)played at one of the three frequencies: 0.5 Hz, 1.5 Hz and 3.0 Hz. Theexperiment began with a 33 s lead-in-time during which the baselinephysiological measure of the participants' hemodynamic responsewas collected. Participants heard four 20 s long blocks of each fre-quency condition. There was an 18 s rest period between each blockand a black screen with a fixation image was presented during thetask and the rest blocks.
Experimental procedure
All participants were asked to complete several experimentaltasks, including Rhythm, Phonology, as well as tasks unrelated tothis experiment (which could have included experiments on “Theoryof Mind,” “Food Preference,” and “Selective Attention/Inhibition”).The order of experiments was randomized, and therefore children'spatterns of attrition (mostly due to fatigue and increasing motionartifacts) varied. As a result, only 9 participants successfully complet-ed both Rhythm and Language tasks, while a total of 15 participantssuccessfully completed at least one of the two experimental tasks.
fNIRS imaging apparatus
To record the hemodynamic response, we used a Hitachi ETG-4000with 44 channels, acquiring data at 10 Hz (Fig. 1; see Kovelman et al.,2009 for detailed apparatus description, imaging procedure, and ana-tomical coregistration). The parents of participants signed consentforms and the participants signed assent forms. Participants were thenintroduced to the fNIRS system, 10–20 measurements were taken,probes were placed and photos of each probe position were taken.Participants received brief training for each task immediately prior tothe corresponding task. All stimuli in this experiment were presentedusing MATLAB (MathWorks), Psychtoolbox Version 3 (developed byMario Kleiner and colleagues), presented with an iMac “Core 2 Duo”3.06 (2009 model) with a 27-inch screen, and auditory stimuli wereplayed via the built-in Mac stereo speakers.
fNIRS data analyses
After the recording session, data were exported and analyzed usingMATLAB-based software developed by Drs. Mark Shalinsky and Laura-Ann Petitto (we thank Dr. Laura Ann Petitto for making this softwareavailable to us, for details see Kovelman et al., 2009). Raw time coursedata for each participant was plotted inMATLAB and visually examinedfor artifacts such as motion spikes; time periods where signal changeoccurred over a period of time that was too fast to be physiological(3 s or less) were removed from further analyses. A total of 19 childrenwere tested; 4 were excluded due to data quality (equipment failure,overall signal quality, or excessive motion). Careful examination ofeach subject's data (all conditions, all channels) revealed great het-erogeneity in the exact time of hemodynamic response rise per sub-ject, yet practically all subjects showed a rise and sustained positiveactivation by midblock, therefore mean oxy-hemoglobin valueswere calculated from the second part of the experimental blocks(all channels, all conditions, all subjects). All group-level analyseswere conducted with mean oxy-hemoglobin values, which were
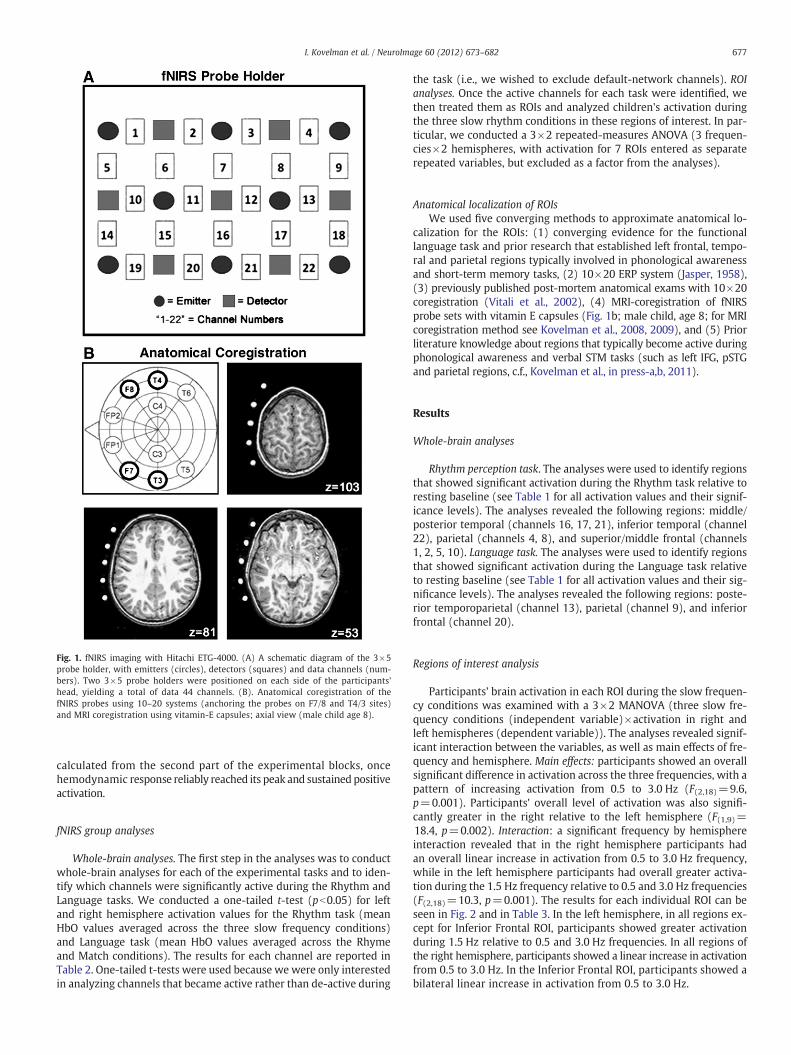
Fig. 1. fNIRS imaging with Hitachi ETG-4000. (A) A schematic diagram of the 3×5probe holder, with emitters (circles), detectors (squares) and data channels (num-bers). Two 3×5 probe holders were positioned on each side of the participants'head, yielding a total of data 44 channels. (B). Anatomical coregistration of thefNIRS probes using 10–20 systems (anchoring the probes on F7/8 and T4/3 sites)and MRI coregistration using vitamin-E capsules; axial view (male child age 8).
677I. Kovelman et al. / NeuroImage 60 (2012) 673–682
calculated from the second part of the experimental blocks, oncehemodynamic response reliably reached its peak and sustained positiveactivation.
fNIRS group analyses
Whole-brain analyses. The first step in the analyses was to conductwhole-brain analyses for each of the experimental tasks and to iden-tify which channels were significantly active during the Rhythm andLanguage tasks. We conducted a one-tailed t-test (pb0.05) for leftand right hemisphere activation values for the Rhythm task (meanHbO values averaged across the three slow frequency conditions)and Language task (mean HbO values averaged across the Rhymeand Match conditions). The results for each channel are reported inTable 2. One-tailed t-tests were used because we were only interestedin analyzing channels that became active rather than de-active during
the task (i.e., we wished to exclude default-network channels). ROIanalyses. Once the active channels for each task were identified, wethen treated them as ROIs and analyzed children's activation duringthe three slow rhythm conditions in these regions of interest. In par-ticular, we conducted a 3×2 repeated-measures ANOVA (3 frequen-cies×2 hemispheres, with activation for 7 ROIs entered as separaterepeated variables, but excluded as a factor from the analyses).
Anatomical localization of ROIsWe used five converging methods to approximate anatomical lo-
calization for the ROIs: (1) converging evidence for the functionallanguage task and prior research that established left frontal, tempo-ral and parietal regions typically involved in phonological awarenessand short-term memory tasks, (2) 10×20 ERP system (Jasper, 1958),(3) previously published post-mortem anatomical exams with 10×20coregistration (Vitali et al., 2002), (4) MRI-coregistration of fNIRSprobe sets with vitamin E capsules (Fig. 1b; male child, age 8; for MRIcoregistration method see Kovelman et al., 2008, 2009), and (5) Priorliterature knowledge about regions that typically become active duringphonological awareness and verbal STM tasks (such as left IFG, pSTGand parietal regions, c.f., Kovelman et al., in press-a,b, 2011).
Results
Whole-brain analyses
Rhythm perception task. The analyses were used to identify regionsthat showed significant activation during the Rhythm task relative toresting baseline (see Table 1 for all activation values and their signif-icance levels). The analyses revealed the following regions: middle/posterior temporal (channels 16, 17, 21), inferior temporal (channel22), parietal (channels 4, 8), and superior/middle frontal (channels1, 2, 5, 10). Language task. The analyses were used to identify regionsthat showed significant activation during the Language task relativeto resting baseline (see Table 1 for all activation values and their sig-nificance levels). The analyses revealed the following regions: poste-rior temporoparietal (channel 13), parietal (channel 9), and inferiorfrontal (channel 20).
Regions of interest analysis
Participants' brain activation in each ROI during the slow frequen-cy conditions was examined with a 3×2 MANOVA (three slow fre-quency conditions (independent variable)×activation in right andleft hemispheres (dependent variable)). The analyses revealed signif-icant interaction between the variables, as well as main effects of fre-quency and hemisphere. Main effects: participants showed an overallsignificant difference in activation across the three frequencies, with apattern of increasing activation from 0.5 to 3.0 Hz (F(2,18)=9.6,p=0.001). Participants' overall level of activation was also signifi-cantly greater in the right relative to the left hemisphere (F(1,9)=18.4, p=0.002). Interaction: a significant frequency by hemisphereinteraction revealed that in the right hemisphere participants hadan overall linear increase in activation from 0.5 to 3.0 Hz frequency,while in the left hemisphere participants had overall greater activa-tion during the 1.5 Hz frequency relative to 0.5 and 3.0 Hz frequencies(F(2,18)=10.3, p=0.001). The results for each individual ROI can beseen in Fig. 2 and in Table 3. In the left hemisphere, in all regions ex-cept for Inferior Frontal ROI, participants showed greater activationduring 1.5 Hz relative to 0.5 and 3.0 Hz frequencies. In all regions ofthe right hemisphere, participants showed a linear increase in activationfrom 0.5 to 3.0 Hz. In the Inferior Frontal ROI, participants showed abilateral linear increase in activation from 0.5 to 3.0 Hz.
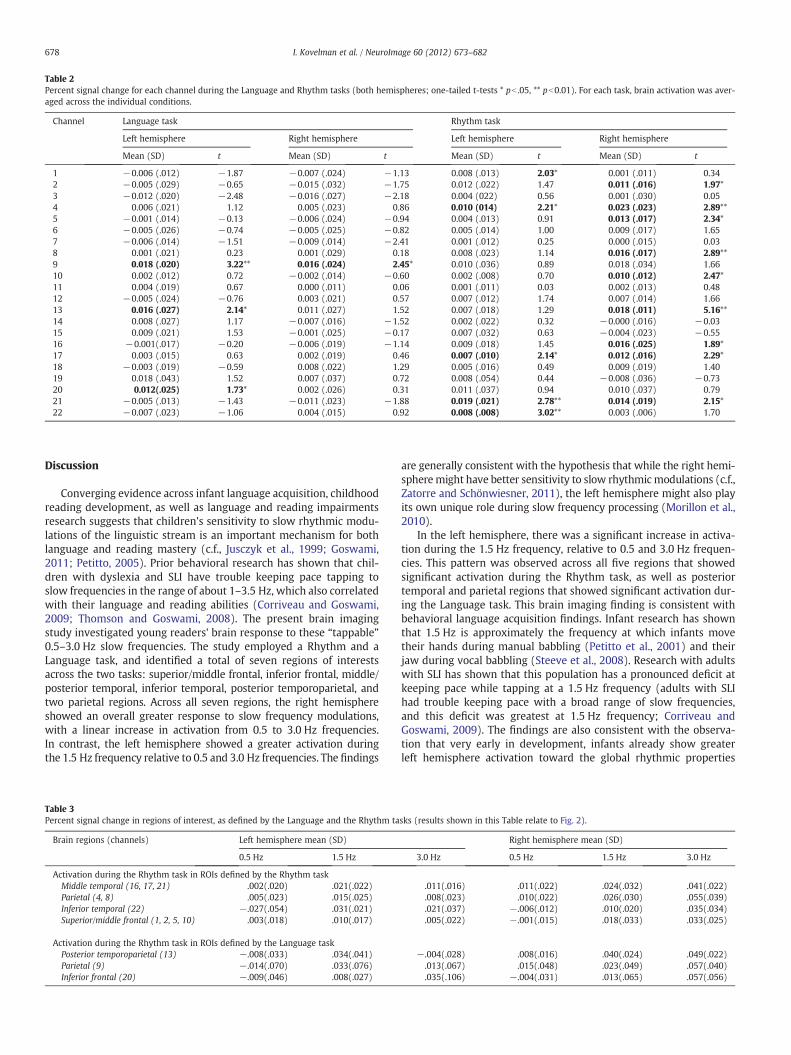
Table 2Percent signal change for each channel during the Language and Rhythm tasks (both hemispheres; one-tailed t-tests * pb .05, ** pb0.01). For each task, brain activation was aver-aged across the individual conditions.
Channel Language task Rhythm task
Left hemisphere Right hemisphere Left hemisphere Right hemisphere
Mean (SD) t Mean (SD) t Mean (SD) t Mean (SD) t
1 −0.006 (.012) −1.87 −0.007 (.024) −1.13 0.008 (.013) 2.03* 0.001 (.011) 0.342 −0.005 (.029) −0.65 −0.015 (.032) −1.75 0.012 (.022) 1.47 0.011 (.016) 1.97*3 −0.012 (.020) −2.48 −0.016 (.027) −2.18 0.004 (022) 0.56 0.001 (.030) 0.054 0.006 (.021) 1.12 0.005 (.023) 0.86 0.010 (014) 2.21* 0.023 (.023) 2.89**5 −0.001 (.014) −0.13 −0.006 (.024) −0.94 0.004 (.013) 0.91 0.013 (.017) 2.34*6 −0.005 (.026) −0.74 −0.005 (.025) −0.82 0.005 (.014) 1.00 0.009 (.017) 1.657 −0.006 (.014) −1.51 −0.009 (.014) −2.41 0.001 (.012) 0.25 0.000 (.015) 0.038 0.001 (.021) 0.23 0.001 (.029) 0.18 0.008 (.023) 1.14 0.016 (.017) 2.89**9 0.018 (.020) 3.22** 0.016 (.024) 2.45* 0.010 (.036) 0.89 0.018 (.034) 1.6610 0.002 (.012) 0.72 −0.002 (.014) −0.60 0.002 (.008) 0.70 0.010 (.012) 2.47*11 0.004 (.019) 0.67 0.000 (.011) 0.06 0.001 (.011) 0.03 0.002 (.013) 0.4812 −0.005 (.024) −0.76 0.003 (.021) 0.57 0.007 (.012) 1.74 0.007 (.014) 1.6613 0.016 (.027) 2.14* 0.011 (.027) 1.52 0.007 (.018) 1.29 0.018 (.011) 5.16**14 0.008 (.027) 1.17 −0.007 (.016) −1.52 0.002 (.022) 0.32 −0.000 (.016) −0.0315 0.009 (.021) 1.53 −0.001 (.025) −0.17 0.007 (.032) 0.63 −0.004 (.023) −0.5516 −0.001(.017) −0.20 −0.006 (.019) −1.14 0.009 (.018) 1.45 0.016 (.025) 1.89*17 0.003 (.015) 0.63 0.002 (.019) 0.46 0.007 (.010) 2.14* 0.012 (.016) 2.29*18 −0.003 (.019) −0.59 0.008 (.022) 1.29 0.005 (.016) 0.49 0.009 (.019) 1.4019 0.018 (.043) 1.52 0.007 (.037) 0.72 0.008 (.054) 0.44 −0.008 (.036) −0.7320 0.012(.025) 1.73* 0.002 (.026) 0.31 0.011 (.037) 0.94 0.010 (.037) 0.7921 −0.005 (.013) −1.43 −0.011 (.023) −1.88 0.019 (.021) 2.78** 0.014 (.019) 2.15*22 −0.007 (.023) −1.06 0.004 (.015) 0.92 0.008 (.008) 3.02** 0.003 (.006) 1.70
678 I. Kovelman et al. / NeuroImage 60 (2012) 673–682
Discussion
Converging evidence across infant language acquisition, childhoodreading development, as well as language and reading impairmentsresearch suggests that children's sensitivity to slow rhythmic modu-lations of the linguistic stream is an important mechanism for bothlanguage and reading mastery (c.f., Jusczyk et al., 1999; Goswami,2011; Petitto, 2005). Prior behavioral research has shown that chil-dren with dyslexia and SLI have trouble keeping pace tapping toslow frequencies in the range of about 1–3.5 Hz, which also correlatedwith their language and reading abilities (Corriveau and Goswami,2009; Thomson and Goswami, 2008). The present brain imagingstudy investigated young readers' brain response to these “tappable”0.5–3.0 Hz slow frequencies. The study employed a Rhythm and aLanguage task, and identified a total of seven regions of interestsacross the two tasks: superior/middle frontal, inferior frontal, middle/posterior temporal, inferior temporal, posterior temporoparietal, andtwo parietal regions. Across all seven regions, the right hemisphereshowed an overall greater response to slow frequency modulations,with a linear increase in activation from 0.5 to 3.0 Hz frequencies.In contrast, the left hemisphere showed a greater activation duringthe 1.5 Hz frequency relative to 0.5 and 3.0 Hz frequencies. The findings
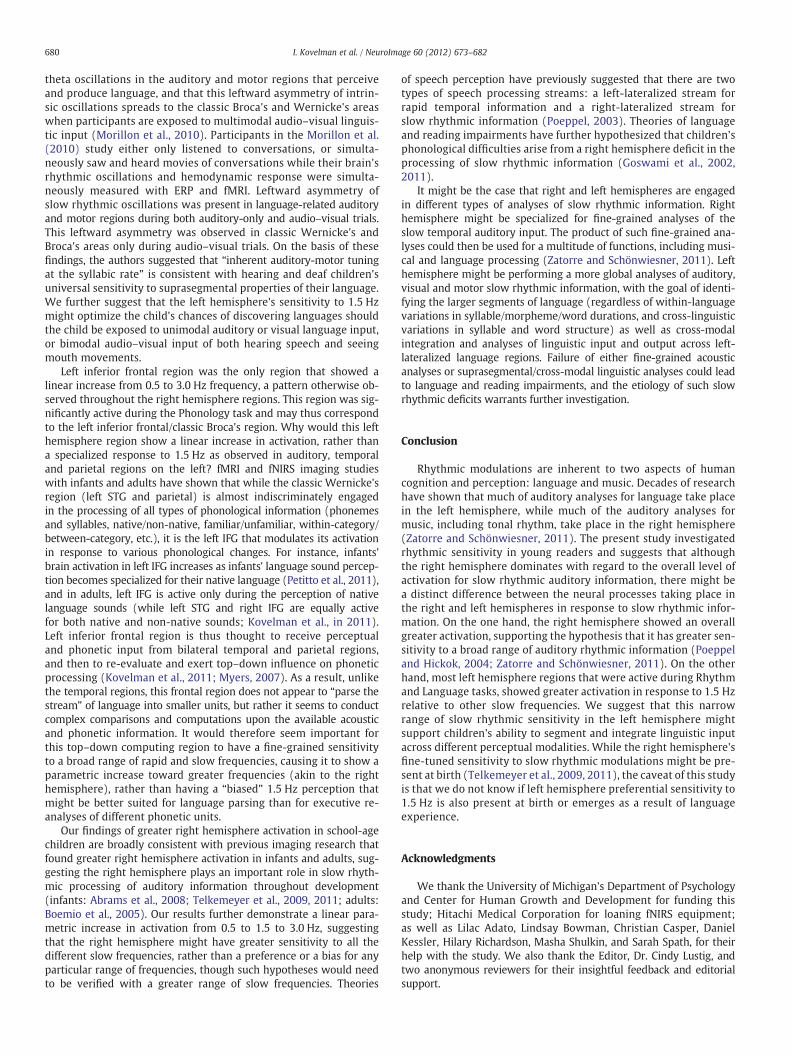
Table 3Percent signal change in regions of interest, as defined by the Language and the Rhythm ta
Brain regions (channels) Left hemisphere mean (SD)
0.5 Hz 1.5 Hz
Activation during the Rhythm task in ROIs defined by the Rhythm taskMiddle temporal (16, 17, 21) .002(.020) .021(.022)Parietal (4, 8) .005(.023) .015(.025)Inferior temporal (22) −.027(.054) .031(.021)Superior/middle frontal (1, 2, 5, 10) .003(.018) .010(.017)
Activation during the Rhythm task in ROIs defined by the Language taskPosterior temporoparietal (13) −.008(.033) .034(.041)Parietal (9) −.014(.070) .033(.076)Inferior frontal (20) −.009(.046) .008(.027)
are generally consistent with the hypothesis that while the right hemi-spheremight have better sensitivity to slow rhythmicmodulations (c.f.,Zatorre and Schönwiesner, 2011), the left hemisphere might also playits own unique role during slow frequency processing (Morillon et al.,2010).
In the left hemisphere, there was a significant increase in activa-tion during the 1.5 Hz frequency, relative to 0.5 and 3.0 Hz frequen-cies. This pattern was observed across all five regions that showedsignificant activation during the Rhythm task, as well as posteriortemporal and parietal regions that showed significant activation dur-ing the Language task. This brain imaging finding is consistent withbehavioral language acquisition findings. Infant research has shownthat 1.5 Hz is approximately the frequency at which infants movetheir hands during manual babbling (Petitto et al., 2001) and theirjaw during vocal babbling (Steeve et al., 2008). Research with adultswith SLI has shown that this population has a pronounced deficit atkeeping pace while tapping at a 1.5 Hz frequency (adults with SLIhad trouble keeping pace with a broad range of slow frequencies,and this deficit was greatest at 1.5 Hz frequency; Corriveau andGoswami, 2009). The findings are also consistent with the observa-tion that very early in development, infants already show greaterleft hemisphere activation toward the global rhythmic properties
sks (results shown in this Table relate to Fig. 2).
Right hemisphere mean (SD)
3.0 Hz 0.5 Hz 1.5 Hz 3.0 Hz
.011(.016) .011(.022) .024(.032) .041(.022)
.008(.023) .010(.022) .026(.030) .055(.039)
.021(.037) −.006(.012) .010(.020) .035(.034)
.005(.022) −.001(.015) .018(.033) .033(.025)
−.004(.028) .008(.016) .040(.024) .049(.022).013(.067) .015(.048) .023(.049) .057(.040).035(.106) −.004(.031) .013(.065) .057(.056)
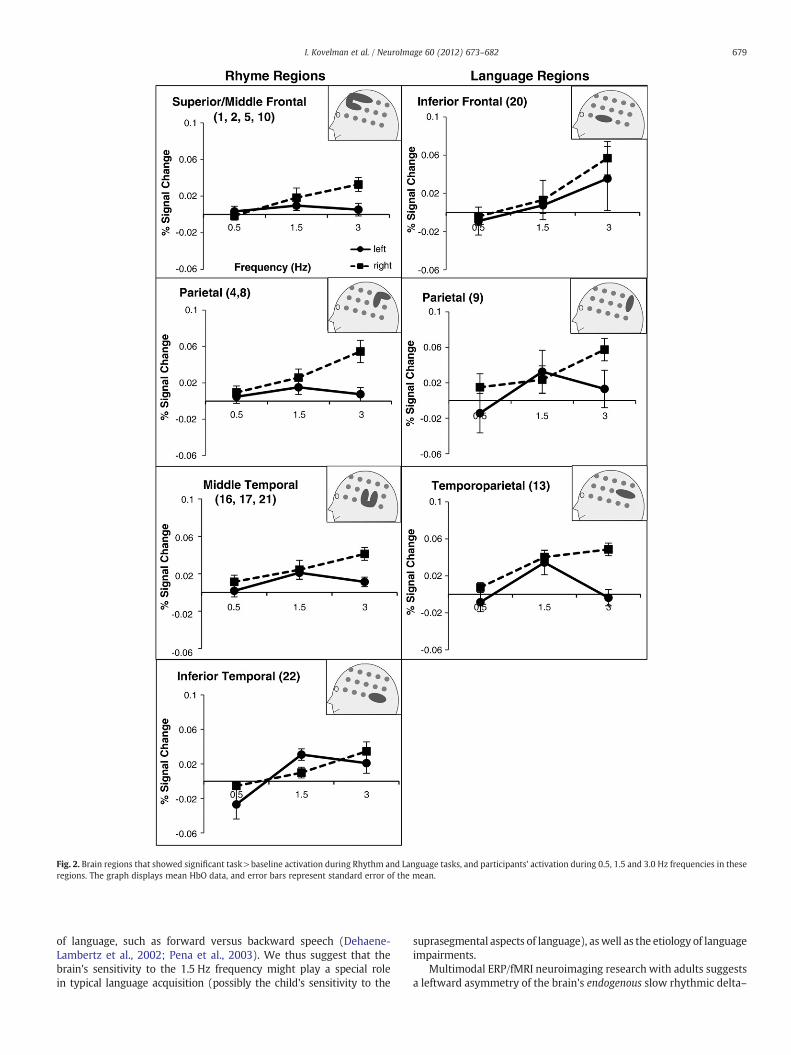
Fig. 2. Brain regions that showed significant task>baseline activation during Rhythm and Language tasks, and participants' activation during 0.5, 1.5 and 3.0 Hz frequencies in theseregions. The graph displays mean HbO data, and error bars represent standard error of the mean.
679I. Kovelman et al. / NeuroImage 60 (2012) 673–682
of language, such as forward versus backward speech (Dehaene-Lambertz et al., 2002; Pena et al., 2003). We thus suggest that thebrain's sensitivity to the 1.5 Hz frequency might play a special rolein typical language acquisition (possibly the child's sensitivity to the
suprasegmental aspects of language), aswell as the etiology of languageimpairments.
Multimodal ERP/fMRI neuroimaging research with adults suggestsa leftward asymmetry of the brain's endogenous slow rhythmic delta–
680 I. Kovelman et al. / NeuroImage 60 (2012) 673–682
theta oscillations in the auditory and motor regions that perceiveand produce language, and that this leftward asymmetry of intrin-sic oscillations spreads to the classic Broca's and Wernicke's areaswhen participants are exposed to multimodal audio–visual linguis-tic input (Morillon et al., 2010). Participants in the Morillon et al.(2010) study either only listened to conversations, or simulta-neously saw and heard movies of conversations while their brain'srhythmic oscillations and hemodynamic response were simulta-neously measured with ERP and fMRI. Leftward asymmetry ofslow rhythmic oscillations was present in language-related auditoryand motor regions during both auditory-only and audio–visual trials.This leftward asymmetry was observed in classic Wernicke's andBroca's areas only during audio–visual trials. On the basis of thesefindings, the authors suggested that “inherent auditory-motor tuningat the syllabic rate” is consistent with hearing and deaf children'suniversal sensitivity to suprasegmental properties of their language.We further suggest that the left hemisphere's sensitivity to 1.5 Hzmight optimize the child's chances of discovering languages shouldthe child be exposed to unimodal auditory or visual language input,or bimodal audio–visual input of both hearing speech and seeingmouth movements.
Left inferior frontal region was the only region that showed alinear increase from 0.5 to 3.0 Hz frequency, a pattern otherwise ob-served throughout the right hemisphere regions. This region was sig-nificantly active during the Phonology task and may thus correspondto the left inferior frontal/classic Broca's region. Why would this lefthemisphere region show a linear increase in activation, rather thana specialized response to 1.5 Hz as observed in auditory, temporaland parietal regions on the left? fMRI and fNIRS imaging studieswith infants and adults have shown that while the classic Wernicke'sregion (left STG and parietal) is almost indiscriminately engagedin the processing of all types of phonological information (phonemesand syllables, native/non-native, familiar/unfamiliar, within-category/between-category, etc.), it is the left IFG that modulates its activationin response to various phonological changes. For instance, infants'brain activation in left IFG increases as infants' language sound percep-tion becomes specialized for their native language (Petitto et al., 2011),and in adults, left IFG is active only during the perception of nativelanguage sounds (while left STG and right IFG are equally activefor both native and non-native sounds; Kovelman et al., in 2011).Left inferior frontal region is thus thought to receive perceptualand phonetic input from bilateral temporal and parietal regions,and then to re-evaluate and exert top–down influence on phoneticprocessing (Kovelman et al., 2011; Myers, 2007). As a result, unlikethe temporal regions, this frontal region does not appear to “parse thestream” of language into smaller units, but rather it seems to conductcomplex comparisons and computations upon the available acousticand phonetic information. It would therefore seem important forthis top–down computing region to have a fine-grained sensitivityto a broad range of rapid and slow frequencies, causing it to show aparametric increase toward greater frequencies (akin to the righthemisphere), rather than having a “biased” 1.5 Hz perception thatmight be better suited for language parsing than for executive re-analyses of different phonetic units.
Our findings of greater right hemisphere activation in school-agechildren are broadly consistent with previous imaging research thatfound greater right hemisphere activation in infants and adults, sug-gesting the right hemisphere plays an important role in slow rhyth-mic processing of auditory information throughout development(infants: Abrams et al., 2008; Telkemeyer et al., 2009, 2011; adults:Boemio et al., 2005). Our results further demonstrate a linear para-metric increase in activation from 0.5 to 1.5 to 3.0 Hz, suggestingthat the right hemisphere might have greater sensitivity to all thedifferent slow frequencies, rather than a preference or a bias for anyparticular range of frequencies, though such hypotheses would needto be verified with a greater range of slow frequencies. Theories
of speech perception have previously suggested that there are twotypes of speech processing streams: a left-lateralized stream forrapid temporal information and a right-lateralized stream forslow rhythmic information (Poeppel, 2003). Theories of languageand reading impairments have further hypothesized that children'sphonological difficulties arise from a right hemisphere deficit in theprocessing of slow rhythmic information (Goswami et al., 2002,2011).
It might be the case that right and left hemispheres are engagedin different types of analyses of slow rhythmic information. Righthemisphere might be specialized for fine-grained analyses of theslow temporal auditory input. The product of such fine-grained ana-lyses could then be used for a multitude of functions, including musi-cal and language processing (Zatorre and Schönwiesner, 2011). Lefthemisphere might be performing a more global analyses of auditory,visual and motor slow rhythmic information, with the goal of identi-fying the larger segments of language (regardless of within-languagevariations in syllable/morpheme/word durations, and cross-linguisticvariations in syllable and word structure) as well as cross-modalintegration and analyses of linguistic input and output across left-lateralized language regions. Failure of either fine-grained acousticanalyses or suprasegmental/cross-modal linguistic analyses could leadto language and reading impairments, and the etiology of such slowrhythmic deficits warrants further investigation.
Conclusion
Rhythmic modulations are inherent to two aspects of humancognition and perception: language and music. Decades of researchhave shown that much of auditory analyses for language take placein the left hemisphere, while much of the auditory analyses formusic, including tonal rhythm, take place in the right hemisphere(Zatorre and Schönwiesner, 2011). The present study investigatedrhythmic sensitivity in young readers and suggests that althoughthe right hemisphere dominates with regard to the overall level ofactivation for slow rhythmic auditory information, there might bea distinct difference between the neural processes taking place inthe right and left hemispheres in response to slow rhythmic infor-mation. On the one hand, the right hemisphere showed an overallgreater activation, supporting the hypothesis that it has greater sen-sitivity to a broad range of auditory rhythmic information (Poeppeland Hickok, 2004; Zatorre and Schönwiesner, 2011). On the otherhand, most left hemisphere regions that were active during Rhythmand Language tasks, showed greater activation in response to 1.5 Hzrelative to other slow frequencies. We suggest that this narrowrange of slow rhythmic sensitivity in the left hemisphere mightsupport children's ability to segment and integrate linguistic inputacross different perceptual modalities. While the right hemisphere'sfine-tuned sensitivity to slow rhythmic modulations might be pre-sent at birth (Telkemeyer et al., 2009, 2011), the caveat of this studyis that we do not know if left hemisphere preferential sensitivity to1.5 Hz is also present at birth or emerges as a result of languageexperience.
Acknowledgments
We thank the University of Michigan's Department of Psychologyand Center for Human Growth and Development for funding thisstudy; Hitachi Medical Corporation for loaning fNIRS equipment;as well as Lilac Adato, Lindsay Bowman, Christian Casper, DanielKessler, Hilary Richardson, Masha Shulkin, and Sarah Spath, for theirhelp with the study. We also thank the Editor, Dr. Cindy Lustig, andtwo anonymous reviewers for their insightful feedback and editorialsupport.
681I. Kovelman et al. / NeuroImage 60 (2012) 673–682
References
Abrams, D.A., Nicol, T., Zecker, S., Kraus, N., 2008. Right-hemisphere auditory cortex isdominant for coding syllable patterns in speech. J. Neurosci. 28, 3958–3965.
Ackerman, P.T., Dykman, R.A., Oglesby, D.M., 1994. Visual event-related potentials of dyslexicchildren to rhyming and nonrhyming stimuli. J. Clin. Exp. Neuropsychol. 16, 138–154.
Boemio, A., Fromm, S., Braun, A., Poeppel, D., 2005. Hierarchical and asymmetric tem-poral sensitivity in human auditory cortices. Nat. Neurosci. 8, 389–395.
Bradley, L., Bryant, P.E., 1978. Difficulties in auditory organization as a possible cause ofreading backwardness. Nature 271, 746–747.
Byers-Heinlein, K., Burns, T.C., Werker, J.F., 2010. The roots of bilingualism in newborns.Psychol. Sci. 21 (3), 343–348.
Cao, F., Bitan, T., Chou, T.L., Burman, D.D., Booth, J.R., 2006. Deficient orthographic andphonological representations in children with dyslexia revealed by brain activationpatterns. J. Child Psychol. Psychiatry 47, 1041–1050.
Castles, A., Coltheart, M., 2004. Is there a causal link from phonological awareness tosuccess in learning to read? Cognition 91 (1), 77–111.
Coch, D., Mitra, P., George, E., Berger, N., 2011. Letters rhyme: electrophysiologicalevidence from children and adults. Dev. Neuropsychol. 36, 302–318.
Corina, D.P., Richards, T.L., Serafini, S., Richards, A.L., Steury, K., Abbott, R.D., Echelard,D.R., Maravilla, K.R., Berninger, V.W., 2001. fMRI auditory language differences be-tween dyslexic and able reading children. NeuroReport 12, 1195–1201.
Corriveau, K.H., Goswami, U., 2009. Rhythmic motor entrainment in children withspeech and language impairments: tapping to the beat. Cortex 45, 119–130.
Dehaene-Lambertz, G., Dehaene, S., Hertz-Pannier, L., 2002. Functional neuroimagingof speech perception in infants. Science 298, 2013–2015.
Desroches, A.S., Newman, R.L., Joanisse, M.F., 2008. Investigating the time course ofspoken word recognition: electrophysiological evidence for the influences of pho-nological similarity. J. Cogn. Neurosci. 21, 1893–1906.
Dolata, J.K., Davis, B.L., Macneilage, P.F., 2008. Characteristics of the rhythmic organiza-tion of vocal babbling: implications for an amodal linguistic rhythm. Infant Behav.Dev. 31, 422–431.
Fowler, C.A., Smith, M.R., Tassinary, L.G., 1986. Perception of syllable timing by prebab-bling infants. J. Acoust. Soc. Am. 79, 814–825.
Gathercole, S.E., 2006. Nonword repetition and word learning: the nature of the rela-tionship. Appl. Psycholinguist. 27, 513–543.
Gervain, J., Mehler, J., 2010. Speech perception and language acquisition in the firstyear of life. Annu. Rev. Psychol. 61, 191–218.
Giraud, A.L., Kleinschmidt, A., Poeppel, D., Lund, T.E., Frackowiak, R.S., Laufs, H., 2007.Endogenous cortical rhythms determine cerebral specialization for speech percep-tion and production. Neuron 56, 1127–1134.
Goswami, U., 2011. A temporal sampling framework for developmental dyslexia.Trends Cogn. Sci. 15, 3–10.
Goswami, U., Thomson, J., Richardson, U., Stainthorp, R., Hughes, D., Rosen, S., Scott, S.,2002. Amplitude envelope onsets and developmental dyslexia: a new hypothesis.Proc. Natl. Acad. Sci. U. S. A. 99, 10911–10916.
Goswami, U., Wang, H.L., Cruz, A., Fosker, T., Mead, N., Huss, M., 2011. Language-universalsensory deficits in developmental dyslexia: English, Spanish, and Chinese. J. Cogn.Neurosci. 23, 325–337.
Grossi, G., Coch, D., Coffey-Corina, S., Holcomb, P.J., Neville, H.J., 2001. Phonologicalprocessing in visual rhyming: a developmental ERP study. J. Cogn. Neurosci. 13,610–625.
Hoeft, F., Meyler, A., Hernandez, A., Juel, C., Taylor-Hill, H., Martindale, J.L., McMillon,G., Kolchugina, G., Black, J.M., Faizi, A., Deutsch, G.K., Siok, W.T., Reiss, A.L.,Whitfield-Gabrieli, S., Gabrieli, J.D., 2007. Functional and morphometric braindissociation between dyslexia and reading ability. Proc. Natl. Acad. Sci. U. S. A.104, 4234–4239.
Hoequist Jr., C.E., 1983. The perceptual center and rhythm categories. Lang. Speech 26(Pt 4), 367–376.
Hoequist Jr., C.E., Smith, M.R., 1986. Using P centers to assess the coherence of syllables.J. Acoust. Soc. Am. 80, S126.
Holowka, S., Petitto, L.A., 2002. Left hemisphere cerebral specialization for babies whilebabbling. Science 297, 1515.
Homae, F., Watanabe, H., Nakano, T., Asakawa, K., Taga, G., 2006. The right hemisphereof sleeping infant perceives sentential prosody. Neurosci. Res. 54, 276–280.
Jasper, H.H., 1958. The ten-twenty electrode placement system of the InternationalFederation. Electroencephalogr. Clin. Neurophysiol. 10 371–275.
Jusczyk, P.W., Houston, D.M., Newsome, M., 1999. The beginnings of word segmenta-tion in English-learning infants. Cogn. Psychol. 39, 159–207.
Kaufman, A., Kaufman, N., 1990. Kaufman Brief Intelligence Test.Khateb, A., Pegna, A.J., Landis, T., Michel, C.M., Brunet, D., Seghier, M.L., Annoni, J.M.,
2007. Rhyme processing in the brain: an ERP mapping study. Int. J. Psychophysiol.63, 240–250.
Kovelman, I., Shalinsky, M.H., Berens, M.S., Petitto, L.A., 2008. Shining new light on thebrain's “bilingual signature”: a functional near infrared spectroscopy investigationof semantic processing. NeuroImage 39, 1457–1471.
Kovelman, I., Shalinsky, M.H., White, K.S., Schmitt, S.N., Berens, M.S., Paymer, N., Petitto,L.A., 2009. Dual language use in sign-speech bimodal bilinguals: fNIRS brain-imaging evidence. Brain Lang. 109, 112–123.
Kovelman, I., Christodoulou, J.A., Gabrieli, J.D.E., In press-a. Dyslexia: The neural basesof reading impairments. In: Faust, M. (Ed.), Advances in the Neural Substrates ofLanguage: Toward a synthesis of basic science and Clinical Research. BlackwellWiley, Hoboken, NJ.
Kovelman, I., Norton, E.S., Christodoulou, J.A., Gaab, N., Lieberman, D.A., Triantafyllou,C., Wolf, M., Whitfield-Gabrieli, S., Gabrieli, J.D.E., In press -b. Dyslexia. Brain
Basis of Phonological Awareness for Spoken Language in Children and Its Disrup-tion in Dyslexia. Cereb Cortex.
Kovelman, I., Yip, J.C., Beck, E.L., 2011. Cortical systems that process language, as revealedby non-native speech sound perception. NeuroReport. 22, 947–950.
Lee, S.A., Davis, B., MacNeilage, P., 2010. Universal production patterns and ambientlanguage influences in babbling: a cross-linguistic study of Korean- and English-learning infants. J Child Lang 37, 293–318.
Luo, H., Poeppel, D., 2007. Phase patterns of neuronal responses reliably discriminatespeech in human auditory cortex. Neuron 54, 1001–1010.
Luo, H., Liu, Z., Poeppel, D., 2010. Auditory cortex tracks both auditory and visualstimulus dynamics using low-frequency neuronal phase modulation. PLoS Biol.8, e1000445.
May, L., Byers-Heinlein, K., Gervain, J., Werker, J.F., 2011. Language and the newbornbrain: does prenatal language experience shape the neonate neural response tospeech? Front. Psychol. 2, 222.
Morillon, B., Lehongre, K., Frackowiak, R.S.J., Ducorps, A., Kleinschmidt, A., Poeppel, D.,Giraud, A.L., 2010. Neurophysiological origin of human brain asymmetry for speechand language. Proc. Natl. Acad. Sci. U. S. A. 107, 18688–18693.
Myers, E.B., 2007. Dissociable effects of phonetic competition and category typicalityin a phonetic categorization task: an fMRI investigation. Neuropsychologia 45,1463–1473.
Nazzi, T., Ramus, F., 2003. Perception and acquisition of linguistic rhythm by infants.Speech Commun. 41, 233–243.
Obrig, H., Rossi, S., Telkemeyer, S., Wartenburger, I., 2010. From acoustic segmenta-tion to language processing: evidence from optical imaging. Front Neuroener-getics 2.
Pena, M., Maki, A., Kovacic, D., Dehaene-Lambertz, G., Koizumi, H., Bouquet, F., Mehler,J., 2003. Sounds and silence: an optical topography study of language recognitionat birth. Proc. Natl. Acad. Sci. U. S. A. 100, 11702–11705.
Perrachione, T.K., Kovelman, I., Ostrovskaya, I., Lymberis, J., O'Loughlin, P., Norton, E.S.,Ghosh, S.S., Gabrieli, J.D.E., 2009. Temporal and prefrontal cortical contributions tophonological working memory for words and pseudowords. 39th Annual Meetingof the Society for Neuroscience, Chicago, IL, USA.
Petitto, L.A., 2005. How the brain begets language: on the neural tissue underlyinghuman language acquisition. In: McGilvray, J. (Ed.), The Cambridge Companionto Chomsky. Cambridge University Press, Cambridge, UK, pp. 84–101.
Petitto, L.A., Marentette, P.F., 1991. Babbling in the manual mode: evidence for theontogeny of language. Science 251, 1493–1496.
Petitto, L.A., Zatorre, R.J., Gauna, K., Nikelski, E.J., Dostie, D., Evans, A.C., 2000. Speech-like cerebral activity in profoundly deaf people processing signed languages: impli-cations for the neural basis of human language. Proc. Natl. Acad. Sci. U. S. A. 97,13961–13966.
Petitto, L.A., Holowka, S., Sergio, L.E., Ostry, D., 2001. Language rhythms in baby handmovements. Nature 413, 35–36.
Petitto, L.A., Berens, M.S., Kovelman, I., Dubins, M.H., Jasinska, K., Shalinsky, M.,2011. The “Perceptual Wedge Hypothesis” as the basis for bilingual babies'phonetic processing advantage: new insights from fNIRS brain imaging. BrainLang.
Poeppel, D., 2003. The analysis of speech in different temporal integration windows:cerebral lateralization as ‘asymmetric sampling in time’. Speech Commun. 41,245–255.
Poeppel, D., Hickok, G., 2004. Towards a new functional anatomy of language. Cogni-tion 92, 1–12.
Poeppel, D., Idsardi, W.J., van Wassenhove, V., 2008. Speech perception at the inter-face of neurobiology and linguistics. Philos. Trans. R. Soc. Lond. B Biol. Sci. 363,1071–1086.
Pugh, K.R., Mencl, W.E., Jenner, A.R., Katz, L., Frost, S.J., Lee, J.R., Shaywitz, S.E., Shaywitz,B.A., 2000. Functional neuroimaging studies of reading and reading disability(developmental dyslexia). Ment. Retard. Dev. Disabil. Res. Rev. 6, 207–213.
Ramus, F., Mehler, J., 1999. Language identification with suprasegmental cues: a studybased on speech resynthesis. J. Acoust. Soc. Am. 105, 512–521.
Saito, Y., Fukuhara, R., Aoyama, S., Toshima, T., 2009. Frontal brain activation in prema-ture infants' response to auditory stimuli in neonatal intensive care unit. EarlyHum. Dev. 85, 471–474.
Shaywitz, S.E., Shaywitz, B.A., 2005. Dyslexia (specific reading disability). Biol. Psychiatry57, 1301–1309.
Steeve, R.W., Moore, C.A., Green, J.R., Reilly, K.J., Ruark McMurtrey, J., 2008. Babbling,chewing, and sucking: oromandibular coordination at 9 months. J. Speech Lang.Hear. Res. 51, 1390–1404.
Strand, F., Forssberg, H., Klingberg, T., Norrelgen, F., 2008. Phonological working memorywith auditory presentation of pseudo-words— an event related fMRI Study. Brain Res.1212, 48–54.
Telkemeyer, S., Rossi, S., Koch, S.P., Nierhaus, T., Steinbrink, J., Poeppel, D., Obrig, H.,Wartenburger, I., 2009. Sensitivity of newborn auditory cortex to the temporalstructure of sounds. J. Neurosci. 29, 14726–14733.
Telkemeyer, S., Rossi, S., Nierhaus, T., Steinbrink, J., Obrig, H., Wartenburger, I., 2011.Acoustic processing of temporally modulated sounds in infants: evidence from acombined near-infrared spectroscopy and EEG study. Front. Psychol. 1, 62.
Thomson, J.M., Goswami, U., 2008. Rhythmic processing in children with developmen-tal dyslexia: auditory and motor rhythms link to reading and spelling. J. Physiol.Paris 102, 120–129.
Vitali, P., Avanzini, G., Caposio, L., Fallica, E., Grigoletti, L., Maccagnano, E., Rigoldi, B.,Rodriguez, G., Villani, F., 2002. Cortical location of 10–20 system electrodes on nor-malized cortical MRI surfaces. Int. J. Bioelectromagn. 4, 147–148.
Wagner, R., Torgesen, J., Rashotte, C., 1999. Comprehensive Test of Phonological Pro-cessing. Pro-Ed, Austin, TX.

682 I. Kovelman et al. / NeuroImage 60 (2012) 673–682
Wartenburger, I., Steinbrink, J., Telkemeyer, S., Friedrich, M., Friederici, A.D., Obrig, H.,2007. The processing of prosody: evidence of interhemispheric specialization atthe age of four. NeuroImage 34, 416–425.
Wilbur, R.B., Nolen, S.B., 1986. The duration of syllables in American sign language.Lang. Speech 29 (Pt 3), 263–280.
Woodcock, R., 1998. Woodcock Reading Master Tests Revised/Normative Update.American Guidance Service Inc, Circle Pines, MN.
Zatorre, R.J., Schönwiesner, M., 2011. Cortical Speech and Music ProcessesRevealed by Functional Neuroimaging. In: Winer, J.A., Schreiner, C.E. (Eds.),The Auditory Cortex. Springer Science + Business Media, LLC. Philadelphia,PA.
Ziegler, J.C., Goswami, U., 2005. Reading acquisition, developmental dyslexia, andskilled reading across languages: a psycholinguistic grain size theory. Psychol.Bull. 131, 3–29.