
Assigning People to Jobs at Ajax Auto: A Case that Applies the Linear Assignment Algorithm to a...
12
Journal of Human Resource Education Vol. 1, No. 1, Summer 2007, 58-69 58 Assigning People to Jobs at Ajax Auto: A Case that Applies the Linear Assignment Algorithm to a Common HR Problem William L. Tullar University of North Carolina - Greensboro Richard A. Ehrhardt University of North Carolina - Greensboro ABSTRACT This paper presents a case that has been successfully used more than 30 times to teach the application of the linear assignment algorithm to the human resource problem of assigning people to jobs. The case has generally been used in human resource courses in an MBA program but has occasionally been successfully used with small classes of very good undergraduates. We offer a brief summary of some of the recent literature on assigning people to jobs, the text of the case, an explanation of how to formulate and solve the problem using Excel, and teaching notes explaining how to get the most out of the case discussion and/or case write-ups. INTRODUCTION While human resource courses at colleges and universities do not often emphasize management science, most HR professors would acknowledge that there are some management science applications in human resources. This paper focuses on a case to teach the linear assignment algorithm, optimizing assignment to task based on ratings in a cross training program. We argue that it is important that MBA students see the application of management science methods applied to human resource problems because there is a considerable amount of work that has been done in this area. Those who are going to be managing human resource functions would do well to be aware of the potential contributions of management science to the problem of assigning people to tasks, positions, or jobs. Human resource professionals and academics may not be familiar with the management science literature focused on the assignment problem. It is beyond the scope of this paper to provide a full literature review. We will offer only a few recent studies in this area to reinforce our point that this is a problem that management scientists, both practitioners and academics, have worked on extensively.
Transcript of Assigning People to Jobs at Ajax Auto: A Case that Applies the Linear Assignment Algorithm to a...

Journal of Human Resource Education Vol. 1, No. 1, Summer 2007, 58-69 58
Assigning People to Jobs at Ajax Auto: A Case that Applies the
Linear Assignment Algorithm to a Common HR Problem
William L. Tullar
University of North Carolina - Greensboro
Richard A. Ehrhardt
University of North Carolina - Greensboro
ABSTRACT
This paper presents a case that has been successfully used more than 30 times to teach the
application of the linear assignment algorithm to the human resource problem of assigning
people to jobs. The case has generally been used in human resource courses in an MBA
program but has occasionally been successfully used with small classes of very good
undergraduates. We offer a brief summary of some of the recent literature on assigning people
to jobs, the text of the case, an explanation of how to formulate and solve the problem using
Excel, and teaching notes explaining how to get the most out of the case discussion and/or case
write-ups.
INTRODUCTION
While human resource courses at colleges and universities do not often emphasize
management science, most HR professors would acknowledge that there are some management
science applications in human resources. This paper focuses on a case to teach the linear
assignment algorithm, optimizing assignment to task based on ratings in a cross training
program. We argue that it is important that MBA students see the application of management
science methods applied to human resource problems because there is a considerable amount of
work that has been done in this area. Those who are going to be managing human resource
functions would do well to be aware of the potential contributions of management science to the
problem of assigning people to tasks, positions, or jobs.
Human resource professionals and academics may not be familiar with the management science
literature focused on the assignment problem. It is beyond the scope of this paper to provide a
full literature review. We will offer only a few recent studies in this area to reinforce our point
that this is a problem that management scientists, both practitioners and academics, have worked
on extensively.

Journal of Human Resource Education Vol. 1, No. 1, Summer 2007, 58-69 59
RECENT MANAGEMENT SCIENCE STUDIES
Most recently, work by Srour, Haas, and Morton (2006) focuses on a problem common to
the construction industry in the United States and other parts of the world -- namely, shortages
workers with the appropriate construction skills. They further note that there are no human
resource management strategies for staffing construction workers at project, corporate, regional,
or industry levels. Their work “presents a framework to optimize the investment in, and make the
best use of, the available workforce with the intent to reduce project costs and improve schedule
performance (Srour, Haas, & Morton, 2006; p. 1158)”.
Amacost and James (2005) report on a linear programming assignment model for U.S.
Air Force Academy graduates. Their algorithm allows measuring and balancing cadets' class
standing, Air Force career field requirements, and cadets' career field preferences in order to
assign each cadet to a career field in the Air Force. Their computational experiments show the
superiority of their method over previous classification approaches. Their method yields more
than a 10% increase in the number of cadets assigned to their top career field choice and almost a
100% reduction in the number of cadets not receiving any of their career field choices. The
outcome of using such a model would likely be a cadre of Air Force Academy graduates who
will be much more satisfied with their field assignments than previous classes.
Holder (2005) proposes a model designed to aid in optimizing the process of assigning
sailors to jobs. This procedure attempts to achieve an increased level of sailor satisfaction by
providing a list of possible jobs from which a sailor may choose. His work demonstrates that the
optimal partition from an interior-point algorithm is particularly useful when designing the job
lists. Once again, here is an article focused on assigning people to jobs in some optimal sense.
We could easily adduce ten more examples of management science work on the optimal
assignment of people to jobs. However, articles such as these are rarely cited in human resource
textbooks and even more rarely included in course work. The Ajax Auto Case presented below
is brief, can be done in Excel, takes a fairly short amount of time for students to complete, and
provides them with an experience that will allow them to connect their coursework in
management science and human resource management.
The objectives of the Ajax Automobile Case are to teach techniques of assigning people
to jobs, critical reasoning, effective written communication, clear communication of quantitative
analysis, and spreadsheet skills using Excel and Solver.
---------------------------------------------------------------------------------------------------------------------
THE AJAX AUTO COMPANY CASE
To combat rising labor costs in Germany and to get around certain import duties, BMW,
among other car makers, imports unassembled automobiles into Mexico. In Puebla, as well as
other cities around the country, they assemble the cars and sell them in the Mexican market. In
order to make this strategy work, it is vital to produce high quality automobiles -- and the finish

Journal of Human Resource Education Vol. 1, No. 1, Summer 2007, 58-69 60
of the automobiles contributes considerably to consumer perceptions of quality. Hence, it is
important to assign workers to those tasks for which they are best suited in order to produce a
high quality product. This is especially true in Mexico where highly skilled workers are
sometimes quite hard to find.
Juan Gonzalez De La Borda is the plant manager of the plant in Mexico that assembles
BMW models imported from Germany. His plant in Puebla is a model of efficiency and
effectiveness. As a result of recent Business Process Reengineering training, he has workers
who have been cross-trained in all the main tasks of the plant. Moreover, he has the training
ratings of each worker in each task. These ratings are prepared by the training supervisor on the
last day of each training program. The ratings are shown in Table 1.
Table 1
Ratings of the Workers in the Cross-Training Program
Sheet Metal
Finishing
Tires, Brakes, Steering
Engine and
Trans.
Windshield and
Windows
Trunk and
Bumpers Electrical Harness
Seats and
Carpeting
Coachwork and
Headliner
Lights and
Wipers Quality Coord.
Ceron 6 9 4 6 7 4 5 4 8 7
Gonzales 3 5 2 4 8 4 4 5 6 6
Laborde 8 10 5 5 9 7 5 7 8 8
Muñoz 6 7 4 5 6 6 7 7 5 8
Ortiz 4 5 5 4 9 4 2 4 7 5
Penazola 6 9 4 8 5 5 5 6 7 8
Pisano 7 4 5 5 5 9 4 2 4 7
Ramirez 6 2 5 10 4 4 4 7 8 6
Sanchez 5 2 3 4 7 3 4 7 6 5
Villareal 4 6 5 6 8 4 3 7 9 8
The extensive cross-training done at this plant means that any worker can be assigned to
any of these ten jobs. However, such an assignment is often less than optimal. As you can see,

Journal of Human Resource Education Vol. 1, No. 1, Summer 2007, 58-69 61
workers are simply better at some jobs than others. Juan has called you in to use your extensive
knowledge of management science to calculate the ideal assignment of workers to jobs1.
Using your knowledge of “solver” in Excel, set up and solve this problem. In the Ideal
Assignment Form below, indicate which worker should be assigned to which job. Show all your
work.
Ideal Assignment
1. Sheet metal: ________________
2. Tires, brakes, steering: ________________
3. Engine and transmission: ________________
4. Windshield and windows: ________________
5. Trunk and bumpers: ________________
6. Electrical harness: ________________
7. Seats and carpeting: ________________
8. Coachwork and headliner: ________________
9. Lights and wipers: ________________
10. Quality coordination: ________________
---------------------------------------------------------------------------------------------------------------------
THE QUANTITATIVE MODEL
It is useful to think of decision making situations in terms of the ABCs of Optimization
(Savage, 1993), which is a convenient way to organize all the relevant information. The ABCs
stand for the questions: (1) What is “Adjustable?” (2) What is “Best?” and (3) What
“Constrains” us? The Adjustable quantities are the decision variables, quantities whose best
values are to be chosen. These define the essence of the choice to be made, a list of numbers to
be determined. Specifying what is Best defines the objective of the decision, i.e., a way to
measure how good each possible decision is. The objective in business applications is usually
either to maximize the profit or to minimize the cost resulting from the decision. The analyst
defines an objective function, which is a formula that computes the value of the objective for any
set of values of the decision variables. Finally, the Constraints describe all aspects of the decision
making environment that limit the decision in some way, such as resource availability.
Constraints are defined as relationships among the decision variables that must be satisfied if the
1 In order to make this problem readily soluble for people with limited management science backgrounds, this
assignment problem is a simplification of the actual problem.
Journal of Human Resource Education Vol. 1, No. 1, Summer 2007, 58-69 62
decision is to be a feasible one. These relationships may be expressed as equations or
inequalities.
Once the decision making situation has been formulated into the ABCs of Optimization,
the resulting mathematical model can be solved to find the values of the decision variables that
give the best value of the objective function among all decisions that satisfy the constraints.
There are many software packages available to solve problems of this form, including the Solver
tool of Microsoft Excel.
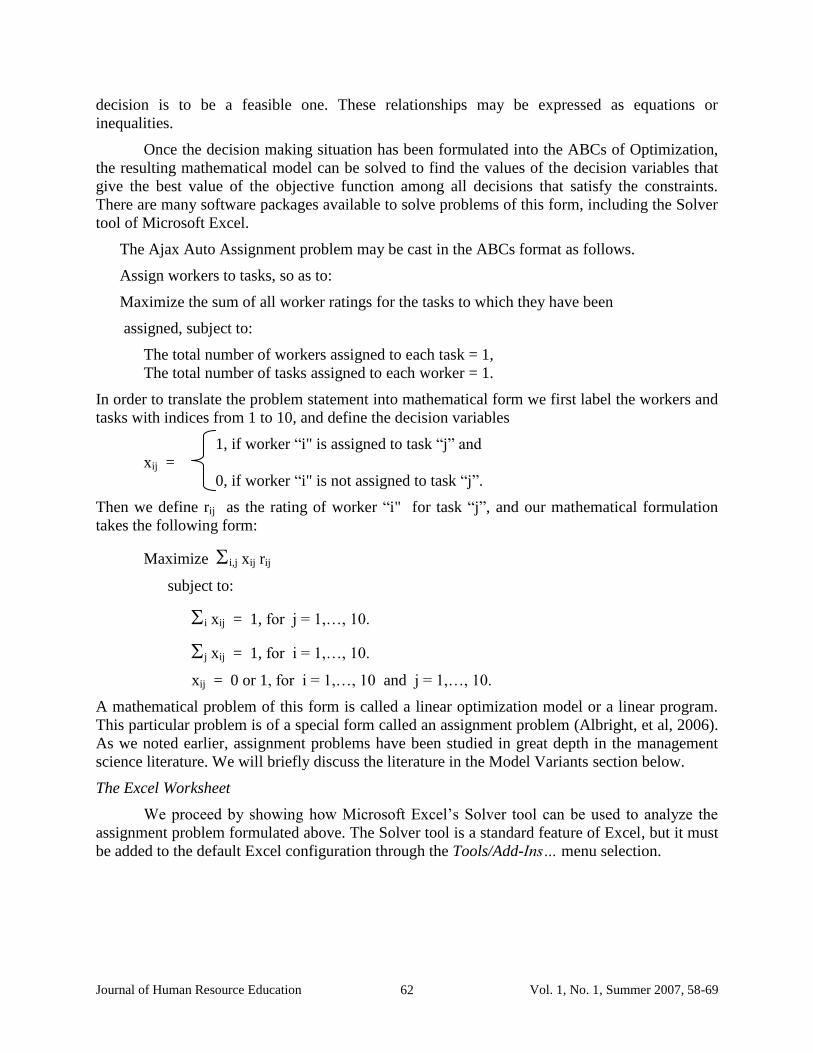
The Ajax Auto Assignment problem may be cast in the ABCs format as follows.
Assign workers to tasks, so as to:
Maximize the sum of all worker ratings for the tasks to which they have been
assigned, subject to:
The total number of workers assigned to each task = 1,
The total number of tasks assigned to each worker = 1.
In order to translate the problem statement into mathematical form we first label the workers and
tasks with indices from 1 to 10, and define the decision variables
1, if worker “i" is assigned to task “j” and
xij =
0, if worker “i" is not assigned to task “j”.
Then we define rij as the rating of worker “i" for task “j”, and our mathematical formulation
takes the following form:
Maximize i,j xij rij
subject to:
i xij = 1, for j = 1,…, 10.
j xij = 1, for i = 1,…, 10.
xij = 0 or 1, for i = 1,…, 10 and j = 1,…, 10.
A mathematical problem of this form is called a linear optimization model or a linear program.
This particular problem is of a special form called an assignment problem (Albright, et al, 2006).
As we noted earlier, assignment problems have been studied in great depth in the management
science literature. We will briefly discuss the literature in the Model Variants section below.
The Excel Worksheet
We proceed by showing how Microsoft Excel’s Solver tool can be used to analyze the
assignment problem formulated above. The Solver tool is a standard feature of Excel, but it must
be added to the default Excel configuration through the Tools/Add-Ins… menu selection.

Journal of Human Resource Education Vol. 1, No. 1, Summer 2007, 58-69 63
To begin with, we must have our assignment model formulated in a proper spreadsheet
layout. This means that the worksheet must have:
1. a cell for each decision variable
2. a cell with a formula that calculates the objective function
3. a cell with a formula that calculates the left-hand side of each constraint, and
4. a cell with the numerical value of each constraint’s right-hand side.
Our assignment model does not require the fourth element, because the right-hand side of each
constraint is 1. We will never want to change this value, so we will enter it directly into the
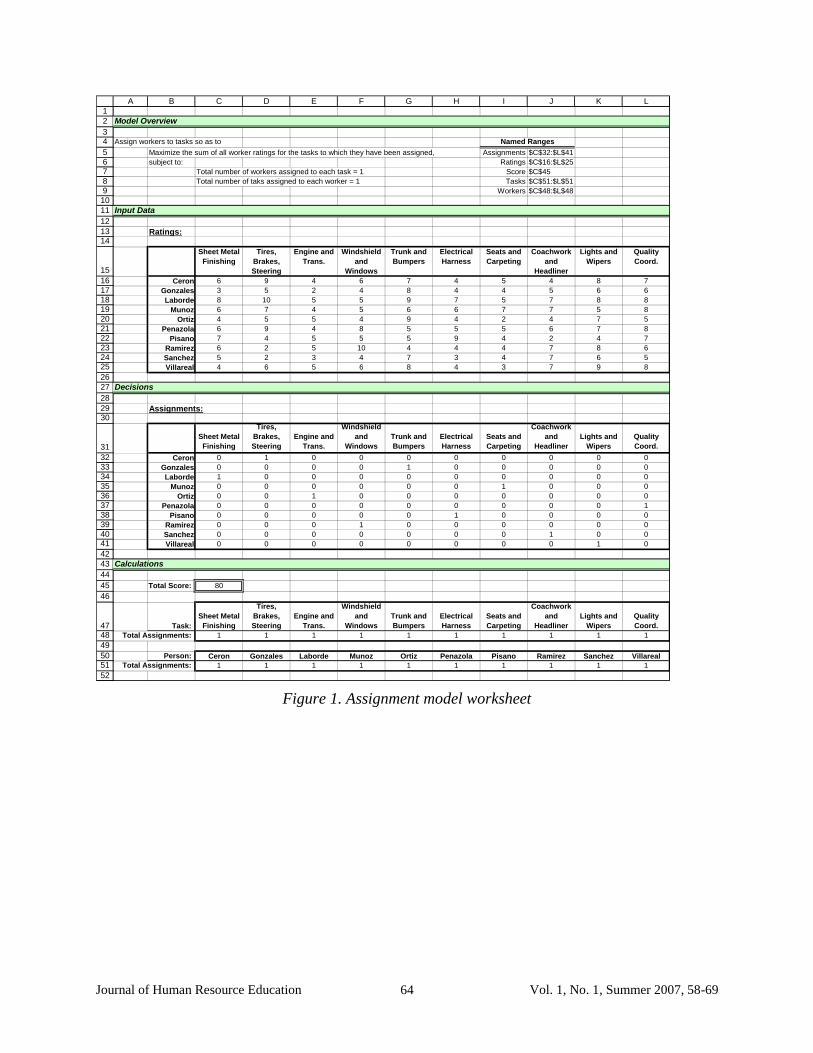
Solver tool. The worksheet pictured in Figure 1 is designed to implement the assignment model
for the Ajax Auto Assignment problem. Notice several features of the worksheet design.
The worksheet is clearly divided into four separate sections, each reserved for a different
aspect of the model: a model overview, input data cells, decision variable cells and calculations.
The organization accomplishes a number of goals. First, by providing an overview and
separating the cells into clearly labeled sections, the worksheet is easily understood by users
other than the worksheet designer. Second, by listing input data only in the designated cells and
never entering them directly into formulas, the model parameters are clear and are easily
changed when desired. Calculation cells contain no numbers, only cell references. Third, by
assigning names to the most important ranges of cells, formulas are easily entered and
understood. The named ranges are Ratings (the 10 by 10 table of worker-task ratings in the Input
Data section), Assignments (the 10 by 10 table of decision cells), Score (the calculated objective
value), Tasks (the row of 10 cells displaying the calculated number of tasks assigned to each
worker) and Workers (the row of 10 cells displaying the calculated number of workers assigned
to each task).
To see how to create names for cells or ranges of cells, refer to Figure 2, where the upper-
left corner of the Excel window is displayed. Rows 2 through 42 are hidden, and cell C45 has
been selected. The name “Score” is assigned to cell C45 by clicking in the Name Box (below the
left end of the Toolbar) and entering the name. To name a range of cells follow the same
procedure after first selecting the range of interest. More options for creating and managing
named ranges are available by selecting Name under the Insert menu.
The cell contents are easily described. The input data cells are the ratings of each worker
for each task. The decision cells must all be either 0 or 1 for a feasible decision, but the problem
can be solved with any numbers in these cells initially. There are only three types of calculations.
The formula in the Total Score cell (named Score, Figure 2) is =SUMPRODUCT (Assignments,
Ratings). The Sumproduct function operates on cell ranges of equal dimensions, computes the
products of cells in equivalent range positions, and adds all the products together. It is a very
useful function that easily performs 100 multiplications and 99 additions for us here.
Journal of Human Resource Education Vol. 1, No. 1, Summer 2007, 58-69 64
1
2
34
5678910
11
12
1314
15
16171819202122232425
26
27
28
2930
31
32333435363738394041
42
43
44
45
46
4748
49
5051
52
A B C D E F G H I J K L
Model Overview
Assign workers to tasks so as to
Maximize the sum of all worker ratings for the tasks to which they have been assigned, Assignments $C$32:$L$41
subject to: Ratings $C$16:$L$25
Total number of workers assigned to each task = 1 Score $C$45
Total number of taks assigned to each worker = 1 Tasks $C$51:$L$51
Workers $C$48:$L$48
Input Data
Ratings:
Sheet Metal
Finishing
Tires,
Brakes,
Steering
Engine and
Trans.
Windshield
and
Windows
Trunk and
Bumpers
Electrical
Harness
Seats and
Carpeting
Coachwork
and
Headliner
Lights and
Wipers
Quality
Coord.
Ceron 6 9 4 6 7 4 5 4 8 7
Gonzales 3 5 2 4 8 4 4 5 6 6
Laborde 8 10 5 5 9 7 5 7 8 8
Munoz 6 7 4 5 6 6 7 7 5 8
Ortiz 4 5 5 4 9 4 2 4 7 5
Penazola 6 9 4 8 5 5 5 6 7 8
Pisano 7 4 5 5 5 9 4 2 4 7
Ramirez 6 2 5 10 4 4 4 7 8 6
Sanchez 5 2 3 4 7 3 4 7 6 5
Villareal 4 6 5 6 8 4 3 7 9 8
Decisions
Assignments:
Sheet Metal
Finishing
Tires,
Brakes,
Steering
Engine and
Trans.
Windshield
and
Windows
Trunk and
Bumpers
Electrical
Harness
Seats and
Carpeting
Coachwork
and
Headliner
Lights and
Wipers
Quality
Coord.
Ceron 0 1 0 0 0 0 0 0 0 0
Gonzales 0 0 0 0 1 0 0 0 0 0
Laborde 1 0 0 0 0 0 0 0 0 0
Munoz 0 0 0 0 0 0 1 0 0 0
Ortiz 0 0 1 0 0 0 0 0 0 0
Penazola 0 0 0 0 0 0 0 0 0 1
Pisano 0 0 0 0 0 1 0 0 0 0
Ramirez 0 0 0 1 0 0 0 0 0 0
Sanchez 0 0 0 0 0 0 0 1 0 0
Villareal 0 0 0 0 0 0 0 0 1 0
Calculations
Total Score: 80
Task:
Sheet Metal
Finishing
Tires,
Brakes,
Steering
Engine and
Trans.
Windshield
and
Windows
Trunk and
Bumpers
Electrical
Harness
Seats and
Carpeting
Coachwork
and
Headliner
Lights and
Wipers
Quality
Coord.
Total Assignments: 1 1 1 1 1 1 1 1 1 1
Person: Ceron Gonzales Laborde Munoz Ortiz Penazola Pisano Ramirez Sanchez Villareal
Total Assignments: 1 1 1 1 1 1 1 1 1 1
Named Ranges
Figure 1. Assignment model worksheet

Journal of Human Resource Education Vol. 1, No. 1, Summer 2007, 58-69 65
Figure 2. Cell C45’s name and contents.
Three rows below the Total Score calculation is a row of 10 cells named Workers. Each of these
cells is the sum of one column of the Assignments range, and displays the number of workers
assigned to the task for that column. Three rows further down is a row of 10 cells named Tasks.
Each of these cells is the sum of one row of the Assignments range, and displays the number of
tasks assigned to the worker for that row.
Optimization
To get access to the Solver tool, we click on Solver under the Tools menu. A dialog window like
the one pictured below in Figure 3 appears. This picture already includes the proper entries for
our problem.
Figure 3. The Solver Parameters dialog window.

Journal of Human Resource Education Vol. 1, No. 1, Summer 2007, 58-69 66
Notice that the address of the cell with the objective function formula has been entered in
the Set Target Cell box, the Max radio button has been clicked, and the range of cells containing
the decision variable values has been entered in the By Changing Cells box. This entry may be
made either by keying the range name into the box or by pointing and clicking on the cells of the
worksheet itself. To enter the constraint information, we first click in the Subject to the
Constraints box, and then click Add. A dialog window like the one pictured below in Figure 4
will appear. Notice that the address of the cells containing the left-hand sides of the Tasks
constraints have been entered in the Cell Reference box, the = option has been selected, and the
number 1 has been entered in the Constraint box. This will require each of the 10 cells in the
Tasks range to be constrained to the value 1. Both sets of constraints were entered in this way.
Other kinds of constraints can be specified when formulating different optimization models by
selecting any of the options available in the central box: = , >= , <= , int (for integer), or bin
(for binary).
Figure 4. The Add Constraint dialog window.
After entering a constraint in the Add Constraint dialog window, we click on OK. This will
return us to the original Solver Parameters dialog window.
To encode the 0/1 restrictions on the decision variables, we could use the constraint
specification procedure described above, entering the Assignments range in the Cell Reference
box and selecting the bin option instead of = in the central box. It turns out, however, that
assignment models are guaranteed to return 0/1 optimal solutions without such an explicit
constraint. If we merely require nonnegative decision variables the solution algorithm operates
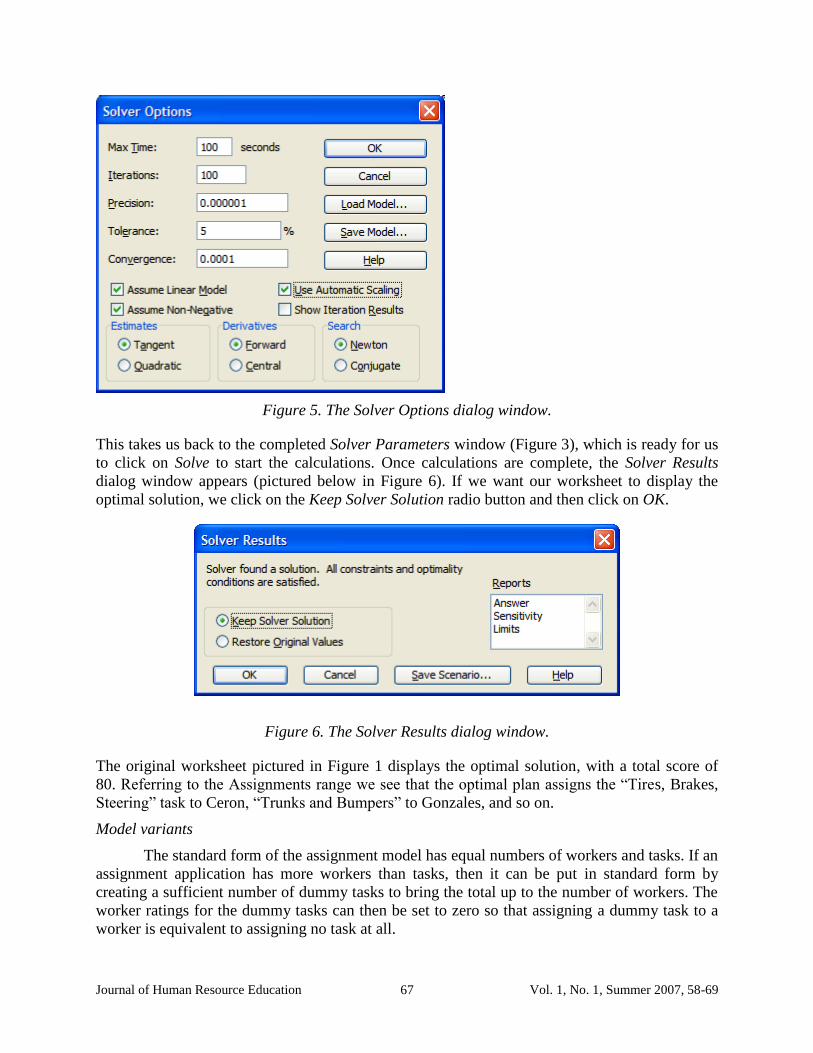
more efficiently, and we can accomplish this through the Options dialog window. We click on
the Options button (Figure 3), which makes another dialog window (pictured below in Figure 5)
appear. We select Assume Linear Model and Assume Non-Negative, and then click on OK.
Journal of Human Resource Education Vol. 1, No. 1, Summer 2007, 58-69 67
Figure 5. The Solver Options dialog window.
This takes us back to the completed Solver Parameters window (Figure 3), which is ready for us
to click on Solve to start the calculations. Once calculations are complete, the Solver Results
dialog window appears (pictured below in Figure 6). If we want our worksheet to display the
optimal solution, we click on the Keep Solver Solution radio button and then click on OK.
Figure 6. The Solver Results dialog window.
The original worksheet pictured in Figure 1 displays the optimal solution, with a total score of
80. Referring to the Assignments range we see that the optimal plan assigns the “Tires, Brakes,
Steering” task to Ceron, “Trunks and Bumpers” to Gonzales, and so on.
Model variants
The standard form of the assignment model has equal numbers of workers and tasks. If an
assignment application has more workers than tasks, then it can be put in standard form by
creating a sufficient number of dummy tasks to bring the total up to the number of workers. The
worker ratings for the dummy tasks can then be set to zero so that assigning a dummy task to a
worker is equivalent to assigning no task at all.

Journal of Human Resource Education Vol. 1, No. 1, Summer 2007, 58-69 68
Another possible model variant occurs if there is any task for which it is not permissible
or desirable to assign a worker with a rating less than some minimum value. If this is the case,
then any rating less than that amount can be revised to a very negative value, so that it could not
be optimal to assign that worker to that task.
Finally, it might be important to consider assignments that are made repeatedly over time.
In this case, it might be desirable to vary each worker’s assignments so as to reduce the negative
effects of boredom. It is possible to modify the assignment model to take this effect into account,
but the result is a very complicated algorithm that is beyond the scope of this paper (Bhadury &
Radovilsky, 2006).
TEACHING NOTE
First, we have found that this case lends itself well to both discussion and a written case
analysis. In the class discussion after students have done the Excel work, it is useful to remind
them what is being optimized. The measurements of performance are training ratings from a
cross-training program. They are NOT performance ratings. It is likely that training ratings are
correlated to performance, but they are certainly not identical to them. The students also need to
examine the question of when the optimal assignment might not be optimal. That is, what are
other variables that might make this assignment less than optimal in a real life setting?
Second, students need to reason from the optimal to the possible. They also need to
imagine how to do this over time so that optimal solutions are produced many times. It is also
helpful to discuss what other measures of performance might be better than the training ratings
and what optimality might mean for such measures. Beyond this, the instructor should ask the
students to imagine what circumstances might make optimal assignment critical to organizational
success. In this discussion, the example of the military could be used. The military services take
thousands of people in each year and must match them as effectively as possible with military
jobs. To the extent that they are able to do this, they are able to deploy their human resources to
the fullest.
Third, we have found that requiring students to write an analysis of the results of the
optimization is helpful in confirming their understanding of the linear assignment algorithm.
Writing up the case makes them describe precisely what they have done, what the quantitative
results were, and what the results mean. One of the problems that most business students have is
that they tend to believe that numbers speak for themselves. Describing the tables of results of
this case is useful to reinforce the point that students must explain the numbers that they report.
Fourth, the students’ spreadsheet skills using Excel and Solver are reinforced. The case
presents an opportunity for the instructor to reintroduce Solver and to reinforce the use of it that
students learned in their quantitative methods course. Oftentimes students learn skills in their
quantitative methods courses that are not reinforced in subsequent coursework. This case offers
an opportunity for reinforcement in the context of a course that students often view as purely
qualitative.
Regardless of whether the instructor processes the case verbally, requires a written case
analysis, or does both, Ajax Auto teaches valuable lessons about human resources and the
application of quantitative methods to human resource problems.
_______________

Journal of Human Resource Education Vol. 1, No. 1, Summer 2007, 58-69 69
William L. Tullar is professor of management in the Bryan School of Business and Economics
at The University of North Carolina at Greensboro. He has been visiting professor at IRIMS in
Moscow, USSR, FH Worms in Worms, Germany, and IMI in Chisinau, Moldova. His current
research interests include knowledge management, human resource metrics, and employee
selection. Contact at [email protected].
Richard Ehrhardt is professor of information systems and operations management in the Bryan
School of Business and Economics at The University of North Carolina at Greensboro. He holds
a Ph.D. in administrative sciences from Yale University and teaches MBA courses in statistics
and management science. Contact at [email protected].
REFERENCES
Albright, S. C., Winston, W. L., & Zappe, C. J. (2006). Data analysis and decision making with
Microsoft Excel, Thomson South-Western.
Armacost, A., & Lowe, J. (2005). Decision support for the career field selection process at the
U.S. Air Force Academy. European Journal of Operational Research, 160 (3), 839-850.
Bhadury, J., & Radovilsky, Z. (2006). Job rotation in a multi-period assignment problem.
International Journal of Production Research, 44 (20), 4431-4444.
Holder, A. (2005). Navy personnel planning and the optimal partition. Operations Research, 53
(1), 77-89.
Savage, S. (1993). Fast QM: Fundamental analytical spreadsheet tools for quantitative
management. New York: McGraw-Hill.
Srour, I., Haas, C., & Morton, D. (2006). Linear programming approach to optimize strategic
investment in the construction industry. Journal of Construction Engineering &
Management, 132 (11), 1158-1166.
Journal of Human Resources Education
An online refereed journal sponsored by
Sorrell College of Business
Troy, Alabama 36082
E-mail: [email protected]