1 Title page How can 1 + 1 = 3? β2-Adrenergic and glucocorticoid ...
Upload
khangminh22Category
view
0download
0
ASSESSMENT REPORT TITLE PAGE AND SUMMARY TITLE OF REPORT: 2015 Geological and Geochemical Assessment Report on the More Creek Property TOTAL COST: AUTHOR(S): Henderson, Sarah L. SIGNATURE(S): NOTICE OF WORK PERMIT NUMBER(S)/DATE(S): STATEMENT OF WORK EVENT NUMBER(S)/DATE(S ): 5594082 YEAR OF WORK: 2015
PROPERTY NAME: More Creek
CLAIM NAME(S) (on which work was done): 508124, 508337, 408606 COMMODITIES SOUGHT: Copper, Gold MINERAL INVENTORY MINFILE NUMBER(S),IF KNOWN: MINING DIVISION: Liard NTS / BCGS: 104G01, 104G02, 104B16 LATITUDE: _____57_____° ___00_______’ __________" LONGITUDE: _____130_____° _____27_____’ __________" (at centre of work) UTM Zone: EASTING: NORTHING: OWNER(S): Galore Creek Mining Corporation MAILING ADDRESS: Suite 3300, 550 Burrard Street Vancouver, BC V6B 0B3 OPERATOR(S) [who paid for the work]: Galore Creek Mining Corporation MAILING ADDRESS: Suite 3300, 550 Burrard Street, Vancouver, BC, V6B 0B3 REPORT KEYWORDS (lithology, age, stratigraphy, structure, alteration, mineralization, size and attitude. (Do not use abbreviations or codes) Stikine, Stuhini Group, volcanics, Bowser Lake Group, Hazelton Group, Downpour Creek, VHMS, Paleozoic, Jurassic, Late Triassic, Eocene, rhyolite, basalt, gabbro, obsidian, sediments, Willow Ridge Complex, pyrite, More Creek, Galore Creek, Forrest Kerr fault, sinistral, Eskay Creek Rift REFERENCES TO PREVIOUS ASSESSMENT WORK AND ASSESSMENT REPORT NUMBERS: 1990 Assessment report on geological mapping, prospecting, rock, soil and stream sampling on the Burr 1-4 claim group (AR #20593) 1991 Geological, Geochemical, Geophysical Report on the Devil Property (AR #21087) 1991 Geophysical Assessment Report on the Devil 3, and More 1 and 2 claims (AR #21348) 2005 Seismic Refraction Assessment Report on the More Creek Property (AR #28423) 2006 Geotechnical Drilling Assessment Report on the More Creek Property (AR #28791) 2007 Geotechnical drilling, Geochemical Sampling, and Geological Mapping Assessment Report on the More Creek Property (AR #29749) 2014 Geological and Geochemical Assessment Report on the More Creek Property (AR #35253)

Page 2 of 2
TYPE OF WORK IN
EXTENT OF WORK
ON WHICH CLAIMS
PROJECT COSTS
THIS REPORT (in metric units) APPORTIONED (incl. support)
GEOLOGICAL (scale, area)
Ground, mapping
5Km road cut mapping 508124, 508337
408606 45,856
Photo interpretation
GEOPHYSICAL (line-kilometres)
Ground
Magnetic
Electromagnetic
Induced Polarization
Radiometric
Seismic
Other
Airborne
GEOCHEMICAL (number of samples analysed for …)
Soil
Silt
Rock
Other
6 lithogeochem 508124, 508337
408606 886
DRILLING (total metres, number of holes, size, storage location)
Core
Non-core
RELATED TECHNICAL
Sampling / Assaying
Petrographic
4 samples 508124, 508337
1009
Mineralographic
Metallurgic
PROSPECTING (scale/area)
PREPATORY / PHYSICAL
Line/grid (km)
Topo/Photogrammetric (scale, area)
Legal Surveys (scale, area)
Road, local access (km)/trail
Trench (number/metres)
Underground development (metres)
Other
Report Prep
408606, 508124, 508337
5,180
TOTAL COST
52,931

Galore Creek Mining Corporation Suite 3300, 550 Burrard Street Vancouver, BC V6C 0B3 Tel +1 (604) 699-4572
2015 GEOLOGICAL AND GEOCHEMICAL ASSESSMENT REPORT
ON THE MORE CREEK PROPERTY
Event Number: 5594082 Claims Worked On: 408606, 508124 and 508337
Located in the Galore Creek Area
Liard Mining Division British Columbia, Canada
NTS Map Sheet 104G01, 104G02 and 104B16
BCGS Map Sheet 104G.007, 008, 009 and 019 and 104B.099 57o 00’ North Latitude
130o 27’ West Longitude
Owned & Operated by
Galore Creek Mining Corporation Suite 3300, 550 Burrard Street
Vancouver, B.C. V6C 0B3
Prepared by Sarah Henderson, B.Sc.
Galore Creek Mining Corporation Suite 3300, 550 Burrard Street
Vancouver, B.C. V6C 0B3
May, 2016

2015 Geological and Geochemical Assessment Report on the More Creek Property May, 2016
Page 2
TABLE OF CONTENTS
Page
1.0 INTRODUCTION ..................................................................................................................... 4
2.0 LOCATION, ACCESS & PHYSIOGRAPHY .................................................................................... 6
3.0 EXPLORATION HISTORY .......................................................................................................... 7
4.0 LAND TENURE AND CLAIM STATUS ......................................................................................... 9
5.0 2015 SUMMARY OF WORK ................................................................................................... 12
6.0 GEOLOGY ............................................................................................................................ 14
6.1 REGIONAL GEOLOGY ......................................................................................................... 14
6.2 PROPERTY GEOLOGY ......................................................................................................... 14
7.0 GEOCHEMICAL MAPPING & SAMPLING PROGRAM ............................................................... 19
7.1 INTRODUCTION ................................................................................................................. 19
7.2 SAMPLING ......................................................................................................................... 19
7.2.1 Lithogeochemical Sampling Results ........................................................ 22
7.2.2 Geochronology Sampling Results ........................................................... 24
7.2.3 Petrographic Work .......................................................................................... 25
7.3 GEOLOGICAL MAPPING .................................................................................................... 27
8.0 DISCUSSION AND CONCLUSIONS…………………………………………………………………………………………..29

2015 Geological and Geochemical Assessment Report on the More Creek Property May, 2016
Page 3
LIST OF FIGURES
Figure 1: General Location Map 5
Figure 2: More Creek Property Claim Map 10
Figure 3: 2015 More Creek Field Stations 11
Figure 4: More Creek Property Geology 17
Figure 5: 2015 More Creek Sample Locations 21
Figure 6: Classification of 2015 Lithogeochemical Samples 23
Figure 7: Thin Section Photograph of Sample 2015SA0882 26
LIST OF TABLES
Table 1: More Creek Property Mineral Claims 9 Table 2: 2015 More Creek Claims Sample Types and Locations 20
Table 3: Lithogeochemical Sample Descriptions 22
Table 4: Geochron Sample Description 24
APPENDICES
APPENDIX I References
APPENDIX II Statement of Expenditures
APPENDIX III Statement of Qualification
APPENDIX IV Assay Certificates (Attached Digitally)
APPENDIX V Analytical Procedures (Attached Digitally)
APPENDIX VI Petrographic Report (Attached Digitally)
APPENDIX VII Geological Maps

2015 Geological and Geochemical Assessment Report on the More Creek Property May, 2016
Page 4
1.0 INTRODUCTION
The More Creek property is located in northwestern British Columbia, 115 kilometres north of
the port town of Stewart. The Stewart-Cassiar Highway passes through the easternmost claims
in the group. The property consists of 14 mineral claims totalling 6,305.44 hectares owned by
the Galore Creek Mining Corporation, a jointly controlled operating company established to
direct the operation of the Galore Creek Project. Teck Resources Ltd. and NOVAGOLD
Resources Inc. each hold a 50% interest in this partnership created to build the Galore Creek
copper-gold mine. The 2015 field program on the More Creek property was completed under
the direction and effort of the Galore Creek Mining Corporation.
The Galore Creek access road route passes through most claims in the property. The road
begins approximately 15 kilometres north of the Bob Quinn Airstrip on the Stewart-Cassiar
Highway and will, upon completion, provide access to the Galore Creek alkalic porphyry deposit
125 kilometres to the west. Staging for the Galore Creek project was carried out from Sus
camp, located just off the Stewart-Cassiar Highway; however this camp has been
decommissioned, and staging for the main Galore valley camp is currently carried out from
Chi’yone Camp, located at kilometre 36 along the Galore Creek access road route. Both of these
road construction camps are within the More Creek property boundary.
This report documents the geological mapping and sampling program completed between
August 21, 2015 and September 4, 2015 on the More Creek property. The work on the More
Creek claims was conducted on mineral claims 508124, 508337, and 408606.

2015 Geological and Geochemical Assessment Report on the More Creek Property May, 2016
Page 5
Figure 1: General Location Map

2015 Geological and Geochemical Assessment Report on the More Creek Property May, 2016
Page 6
2.0 LOCATION, ACCESS & PHYSIOGRAPHY
The More Creek property is located in northwestern British Columbia, approximately 115
kilometres north of the tidewater port of Stewart, British Columbia (Figure 1). The Stewart-
Cassiar Highway (Highway 37) runs along the eastern edge of the claim group, with the Bob
Quinn Airstrip located immediately south of the eastern claims. The Galore Creek access road
route runs through the centre of the claims in the property. The road route is on the east side
of the upper Iskut River, and the north side of More Creek, crossing the Iskut River at the
confluence with More Creek (Figure 2). The property is located within the Liard Mining Division
at 57° 00’ North Latitude and 130° 27’ West Longitude.
The 2015 field program was based out of the Schaft Creek camp owned and operated by Teck
Resources Ltd., located northwest of the More Creek claim group. During the 2015 field
season, the Schaft Creek camp was accessed by Hawk Air flights to the Dease Lake Airstrip from
Vancouver via Smithers or Terrace. Helicopter travel between Dease Lake, the Schaft Creek
camp, and the More Creek claims was operated by Lakelse Air Helicopters.
The Galore Creek access road begins approximately 15 kilometres north of the Bob Quinn
Airstrip on the Stewart-Cassiar Highway. The Sus Camp, which is now decommissioned, was a
further 3 kilometre drive west on the access road. A branch road leads from the old Sus Camp
to a main staging area that has been used for the Galore Creek project, 2 kilometres to the
southeast. Staging is now carried out from Chi’yone Camp at km 36 on the Galore Creek access
road route.
The property straddles the eastern margin of the Coast Mountains. The western claims follow
the More Creek river valley, which has steep, rugged valley walls. The claim physiography
mainly encompasses the valley floor with minor sections of cliff bands along the river. The
eastern claims in the property lie within the broad glacial valley of the upper Iskut River, and
are characterized by much more gentle topography than the western claims. Elevations in the
property range from 400 metres along the Iskut River, to 1050m along the western valley walls.
Relief varies from moderate to extreme. The claims are below the tree line which lies at 1100
metres, and host forests of balsam fir, sitka spruce, alder, willow, devils club and cedar.

2015 Geological and Geochemical Assessment Report on the More Creek Property May, 2016
Page 7
3.0 EXPLORATION HISTORY
In 1990 Noranda Exploration Ltd. ran an extensive program on land currently making up much
of the western portion of the current More Creek property. Noranda’s 1990 program focused
south of the current More Creek claims but also included the Devil claims, covered by portion
of tenure 508338. The Devil claims were acquired by option from Santa Marina Gold Ltd. Prior
to 1990 there had been no work on the Devil property. In 1990 a program of airborne
geophysics, geological mapping and reconnaissance geochemistry was completed. The airborne
geophysical program consisted of electro-magnetic and magnetic surveys. The geochemistry
program included soil, silt, rock and pan sampling.
Reconnaissance sampling identified a large area of anomalous copper, manganese, vanadium
and zinc on the south side of More Creek, in the southeast portion of the claims. Although this
anomaly is outside the current claim boundaries, the favorable host lithology, felsic rocks of the
Downpour Creek facies are present in the current boundary. Grid sampling on the north side of
More Creek identified a multi-element anomaly in the northwest corner of the claims (Baerg et
al, 1991). Airborne magnetic data indicated that there is a major lithological break along More
Creek, with higher magnetic relief on the north side, suggesting the possibility of a higher
volcanic component (Baerg, 1991).
Also in 1990, Stow Resources Ltd. conducted a reconnaissance exploration program on the Burr
Property. The Burr Property is presently covered by tenure 508124 and the east half of tenure
508337. The program consisted of rock, soil and stream sampling as well as geological mapping
and prospecting (Bobyn, 1990).
During 2004 and 2005, NovaGold Canada Inc. acquired mineral claims 408606, 508124, 508337,
508338, 514542, 514545, 514548, and 514551. In 2005, NovaGold hired Frontier Geosciences
Inc. to conduct a seismic refraction survey at several proposed creek and river crossings along
the Galore Creek access road route. The purpose of the survey was to determine the
thicknesses and extent of overburden layering, and the depth and configuration of competent
bedrock surface. The work was carried out as a segment of the evaluation of the Galore Creek
access road route (Craig, 2006).
Field work on the More Creek property during the 2006 field season consisted of digital
mapping and geotechnical drilling programs. The drilling was performed along the Galore
Creek access road route at the Iskut River crossing on mineral claim 508124, and the Muskwie
Creek crossing on mineral claim 508338. Digital mapping, consisting of lidar and digital

2015 Geological and Geochemical Assessment Report on the More Creek Property May, 2016
Page 8
photography, was conducted on mineral claims 408606, 508124, 508337, 508338, 521935,
521936 (Petsel and Wu, 2007).
In August 2007 NovaGold Resources Ltd. and Teck Cominco Ltd. (now Teck Resources Ltd.)
established the Galore Creek Mining Corporation to develop the Galore Creek project. On
October 15, 2007 the More Creek property claims held by NovaGold Canada Inc. were
transferred to the Galore Creek Mining Corporation.
In 2007 NovaGold Canada Inc. operated a field program consisting of geotechnical drilling,
geochemical sampling and geological mapping. Geotechnical drilling was performed to develop
water wells for Sus Camp, located at kilometre 3 on the Galore Creek access road. The program
commenced on November 21, 2006 and ended on May 11, 2007. Acid Rock Drainage (ARD) and
geochemical sampling, conducted between June 2nd, 2007 and October 10th, 2007, consisted
of 168 samples collected from drill cuttings and blasted rock produced during road
construction. Sampling was conducted for exploration purposes, as well as to identify rock
which future road construction spoils could potentially generate acid drainage. Mapping
focused on the Galore Creek access road route between kilometre 32 and kilometer 37 (Petsel
et al. 2008).
In 2014 Galore Creek Mining Corporation completed a small field program consisting of
geological mapping and geochemical sampling on newly exposed rock outcrop along the Galore
Creek access road route, focusing between kilometre 19 and kilometre 24. Twelve rock outcrop
samples were collected in support of the mapping project; seven ICP samples, four
petrographic samples, and one lithogeochemistry sample. Mapping and sampling was
completed to identify and characterize rock types encountered, and to test for anomalous base
and precious metals.

2015 Geological and Geochemical Assessment Report on the More Creek Property May, 2016
Page 9
4.0 LAND TENURE AND CLAIM STATUS
The More Creek property consists of 14 mineral claims totalling 6,305.44 hectares. The claims
are listed in Table 1 and displayed on a claim map in Figure 2. This report covers work
completed on the More Creek property between August 21, 2015 and September 4, 2015.
The 2015 field work conducted on the More Creek claims includes geological mapping, and
eleven (11) rock samples taken for lithogeochemical, geochronological, and petrographic
analysis within mineral claims 408606, 508337 and 508124 (Figures 5), and applied to all More
Creek property claims held by the Galore Creek Mining Corporation. Under Event Number
5594082, assessment work was applied to the claims listed below in Table 1, which will be
advanced to May, 2017, subject to government approval of this report.
Table 1. More Creek Property Mineral Claims
Owner: Galore Creek Mining Corporation - Client No. 211373
Tenure No. Claim Name Owner Tenure Type Issue Date
Good To Date
Area (ha)
408606 VIA 17 211373 (100%) Mineral Claim 2004/mar/06 2017/may/27 500
508124 CV 1 211373 (100%) Mineral Claim 2005/mar/07 2017/may/27 440.17
508337 CV 2 211373 (100%) Mineral Claim 2005/mar/07 2017/may/27 985.4798
508338 CV 3 211373 (100%) Mineral Claim 2005/mar/07 2017/may/27 1354.832
514542 THOMAS 1 211373 (100%) Mineral Claim 2005/jun/15 2017/may/27 421.877
514545 THOMAS 2 211373 (100%) Mineral Claim 2005/jun/15 2017/may/27 422.043
514548 THOMAS 3 211373 (100%) Mineral Claim 2005/jun/15 2017/may/27 421.895
514551 THOMAS 4 211373 (100%) Mineral Claim 2005/jun/15 2017/may/27 369.29
515244 ISKUT 1 211373 (100%) Mineral Claim 2005/jun/24 2017/may/27 422.16
521931 BQ 1 211373 (100%) Mineral Claim 2005/nov/04 2017/may/27 422.299
522111 BQ 13 211373 (100%) Mineral Claim 2005/nov/07 2017/may/27 70.397
545723 Thomas 5 211373 (100%) Mineral Claim 2006/nov/22 2017/may/27 87.8953
545725 CV 4 211373 (100%) Mineral Claim 2006/nov/22 2017/may/27 175.9993
566898 Thomas 6 211373 (100%) Mineral Claim 2007/sep/28 2017/may/27 211.1012
14 Mineral Claims Hectares 6,305.44
*Note: Indicated Good-To dates are subject to BC Ministry of Energy and Mines.

.
0 2.75 5.5 km.
Legend
This map is a user generated static output from an Internet mapping site and is for generalreference only. Data layers that appear on this map may or may not be accurate, current, orotherwise reliable. THIS MAP IS NOT TO BE USED FOR NAVIGATION.
Notes: March 7, 2016
Scale: 1:150,000Map center: 57°4' N, 130°29' W

!.
!.
!.
!.
!.!.!.
!.
!.
!.
!.
!.
!.
!.
!.
!.
!.
!.
!.
!.!.!.!.!.
!.
!.
!.
!.
!.
!.
!.
508337
508124
566898
muJs
Eqp
Eqp
uTb1
uTsd1
uTsd1
uTsn
uTsd1
uTsd1
uTb1
uTb1
uTc1
uTb1
uTc1
uTc1
uTr
uTc1
Qal
888
887886
885
884883
882 881879 877
876
875 873
913
912
911910
871
870868
867 866863
862
861860
414000.000000
414000.000000
415000.000000
415000.000000
416000.000000
416000.000000
417000.000000
417000.000000
6322
000.0
0000
0
6322
000.0
0000
0
6323
000.0
0000
0
6323
000.0
0000
0
6324
000.0
0000
0
6324
000.0
0000
0
6325
000.0
0000
0
6325
000.0
0000
0
Figure 3. 2015 More Creek Field Stations0 250 500 750 1,000125
Meters
Geology from Alldrick, D.J., Nelson, J.L., and Barresi, T. (2005): Geology of the Volcano Creek-More Creek Area, British Columbia; BC Ministry of Energy, Mines, and Petroleum Resources,Open File Map 2005-5, 1:50,000 scale. Geology Shapefiles courtesy of D.J. Alldrick
NAD 1983, UTM Zone 9, Scale 1:25,000, Compiled by: S. Henderson, March 29, 2016
!. 2015 More Creek Field Stations
BQ-More Creek Claims
Rivers- Floodplains- Lakes
Glaciers and Icefields
Highway 37
Galore Creek Access Road
100m Contours±
More Creek
Isku
t Riv
er
!.
408606
508338
545725
uTb1
uTs1
lmJDCQal
890
402000.000000
402000.000000
403000.000000
403000.000000
6325
000.0
0000
0
6325
000.0
0000
0
6326
000.0
0000
0
6326
000.0
0000
0
6327
000.0
0000
0
6327
000.0
0000
0

2015 Geological and Geochemical Assessment Report
on the More Creek Property
March, 2016
Page 12
5.0 2015 SUMMARY OF WORK
The Galore Creek Mining Corporation (GCMC) 2015 geological mapping and geochemical
sampling program included eleven (11) rock samples taken for geochemical analysis: 6
lithogeochemistry samples, 4 petrography samples, and one geochronology (age dating)
sample. Sampling and mapping occurred between August 21, 2015 to September 4, 2015,
within the boundaries of mineral claims 408606, 508337 and 508124, at a cost of $52,931.00.
This report discusses the work completed during that period. Details of the reported
assessment work expenditures can be found in Appendix II.
On March 7, 2016, under Event Number 5594082, $75,542.04 ($52,931.00 of assessment work
and $22,611.04 of PAC credits) was applied to the More Creek claims in Table 1, with the claim
expiry dates advancing to May 27, 2017 upon government approval of this assessment report.
The field program primarily focused on continued mapping and sampling of newly exposed
outcrop along the GCMC access road route, picking up from where mapping and sampling were
completed in GCMC’s 2014 program, and continuing east. An emphasis was placed on
adequately sampling the rhyolite unit suspected to be of Jurassic age encountered during the
2014 field program. A Jurassic age to the rhyolite would indicate potential for an Eskay Creek
rift type stratigraphy in the area. Determining the geological age of this rhyolite unit, due to the
economic potential associated with a Jurassic age, and identifying other areas with
mineralization potential was the main focus of GCMC’s 2015 field program.
Kilometres 14 to 19 along the access road were mapped and sampled in an effort to age date
and geologically characterize the lithological units encountered, and to explore for mineral
potential in the exposed road cuts. The west corner of the claim group was also briefly
prospected and sampled for any significant mineral showings. Development of the access road
route by GCMC has exposed new outcropping and allowed for ease of access for mapping and
sampling. Lithogeochemical, geochronology, and petrographic samples were collected to aid in
geological characterization of rock units encountered, interpretation of mapping, and to test for
anomalous base and precious metal values.
The majority of samples were collected from road cuts within the claims, with one sample
collected in the western part of the claim group in outcrop north of the access road (claim
408606). Six lithogeochemistry samples were collected: four from the felsic volcanic unit, one
from gabbroic intrusive unit, and one from volcanic outcrop in claim 408606, with sample
selection favouring the lowest alteration and weathering intensity. Four petrographic samples

2015 Geological and Geochemical Assessment Report
on the More Creek Property
March, 2016
Page 13
were collected from volcanic units between km 19 and 17, to aid in the characterization of rock
type and to check for deformation not visible in hand sample. A geochronology sample was
collected between km 19 and 17 to in an effort to determine the absolute age of the rhyolite
unit encountered during GCMC’s 2014 and 2015 field programs.
Samples were bagged in poly sample bags, zap strapped, and flown to Schaft Creek camp,
where they were stored in a secure location till shipment. The lithogeochemical samples were
shipped to ALS Minerals Laboratories in North Vancouver for sample preparation and analysis.
Standard, Blank, and duplicate samples were inserted into the lithogeochemical sample batch
by ALS Minerals. The petrographic samples were shipped to Vancouver Petrographics Ltd. in
Langley B.C, for thin section preparation, and then prepared sections were shipped to Blue
Metal Resources Inc. in Revelstoke BC, for thin section analysis. The geochronology sample was
shipped to the GCMC office in Vancouver, BC where the sample was cleaned, and then shipped
to Boise State University in Boise, Idaho for Uranium-Lead (U-Pb) dating of zircons.
Helicopter support for the project was provided by Lakelse Air Ltd., of Terrace, BC. The
following helicopter was supplied under charter arrangement or sublease: one Eurocopter
(Astar) AS350B2.

2015 Geological and Geochemical Assessment Report
on the More Creek Property
March, 2016
Page 14
6.0 GEOLOGY
6.1 Regional Geology
The following regional geology of the More Creek area is paraphrased from Logan (2000):
The More Creek area is located along the western margin of the Intermontane
Belt, adjacent to the high-relief mountains of the Coast Belt. The area is mainly
underlain by rocks of the Stikine terrane, which is composed of well stratified
Middle Paleozoic to Mesozoic sedimentary rocks, and volcanic and comagmatic
plutonic rocks of probable island arc affinity. The Paleozoic Stikine assemblage,
the Late Triassic Stuhini Group and the Early Jurassic Hazelton Group are
overlapped by the Middle Jurassic to Early Tertiary successor-basin sediments of
the Bowser Lake and Sustut Groups, Late Cretaceous to Tertiary continental
volcanic rocks of the Sloko Group, and Late Tertiary to Recent bimodal shield
volcanism of the Edziza and Spectrum ranges.
At least 7 discrete plutonic episodes can be recognized in the region: Late
Devonian, Early Mississippian, Middle (?) to Late Triassic, Late Triassic to Early
Jurassic, late Early Jurassic, Middle Jurassic and Eocene. In northwestern British
Columbia, the Late Triassic to Early Jurassic Copper Mountain Plutonic Suite
consists of numerous small alkaline and associated ultramafic bodies that occupy
a north-northwest-trending belt along the east side of the Coast Range. They lie
within the Stikine terrane and include the Bronson, Zippa Mountain and Galore
Creek intrusions.
6.2 Property Geology
The property geology is dominated by the Triassic Stuhini, Early to Middle Jurassic Hazelton,
and Middle to Upper Jurassic Bowser Lake Groups (Figure 5). The eastern claims in the claim
group lie within the Bowser Basin. The margin of the basin lies just to the west of the upper
Iskut River. West of the Iskut River, outcrop is dominated by sediments and volcanogenic rocks
of the Stuhini and Hazelton Groups. The regional scale N-S trending Forrest Kerr fault lies just 2
kilometres west of the claim group, and marks the boundary between the Paleozoic Stikine
assemblage in the West and Mesozoic rocks to the East. The Triassic Pass fault runs north-
south through the western portion of the claim group, separating rocks of the Hazelton group
to the west from the Stuhini group to the east (Alldrick et al., 2005).

2015 Geological and Geochemical Assessment Report
on the More Creek Property
March, 2016
Page 15
In the claim area the Late Triassic Stuhini group is represented by volcanic sandstone with
lesser mudstone and conglomerate, limestone, vesicular mafic volcanic fragmental, black flow-
banded pyritic rhyolite, and massive aphyric dacite (Alldrick et al., 2005). The geochemistry of
the Stuhini Group volcanic rock has a strong arc signature. The Stuhini Group has been inferred
to represent a Carnian to Norian age arc that built upon the basement Paleozoic Stikine
Assemblage (Logan et al., 2000).
The Early Jurassic Lower Hazelton group is represented in the claims by a fault bounded unit of
massive andesite to dacite flows, with lesser maroon-weathering volcanic conglomerate and
breccia of Sinemurian to Toarcian age (Alldrick et al., 2005).
The Eskay Rift resulted from an extensional regime in the Early to Middle Jurassic. Orientations
of dykes and feeder zones suggest east-west extension of the north-south trending regional
scale structure. The extensional regime of the Toarcian to Bathonian age gave way to sinistral
displacement imposed on the pre-existing rift weakness in the Middle to Late Jurassic (Alldrick
et al., 2005). Sinistral displacement on the Forrest Kerr fault has been dated to 172 to 167 Ma
by Uranium-Lead dating of syn and post kinematic plutons. It has an east-side-down throw of
greater than 2 kilometres, and a post mid Jurassic sinistral displacement of greater than 2.5
kilometres. This displacement has resulted in the Stikine Assemblage outcropping to the west
of the fault, with the Hazelton and Stuhini Groups exposed on the east side of the fault (Alldrick
et al., 2005).
The Middle to Late Jurassic Bowser Lake Group overlaps the older volcanic sequences. It is
made up of turbiditic shale, siltstone, greywacke, fine to medium grained sandstone and rare
conglomerate. The contact with the underlying Upper Hazelton Group is gradational (Alldrick
et al., 2005). South of More Creek the rocks of the Stuhini Group are thrust over, and in
sinistral fault contact with the Bowser Lake Group. Intrusives of the Early Jurassic Texas Creek
and the Middle Jurassic Three Sisters Plutonic Suite are found just west of the claims, along the
Forrest Kerr fault (Alldrick et al., 2005). Eocene rhyolite is exposed along the faulted contact
immediately north and south of More Creek.
A rhyolite unit is exposed along the faulted contact between the Triassic Stuhini and Bowser
Lake Groups, immediately north and south of More Creek. The age of this rhyolite is
inconclusive with mapping by Alldrick (2005) suggesting an Eocene age, while earlier mapping
by Read et al. (1990) believing the unit to represent felsic volcanism of the early Jurassic. Work

2015 Geological and Geochemical Assessment Report
on the More Creek Property
March, 2016
Page 16
completed in this area by Stow Resources (Bobyn, 1990) supported Read’s interpretation of an
early Jurassic age.

FF
F
FFF
DM
DM
CslDM
muJs
Eqp
Eqp
lJv
lJcg
lJsl
lJv
lJv
lJf
lJcg
lJf
lJcg
lJv
lJr
lJv
lJv
lJf
lJv
LTsy
LD-EMg
LD-EMg
MJd
MJd
MJdMJd
MJd
MJd
MJd
MJd
MJd
MJd
MJd
MJd
MJd
MJd
EJmz
EJmz
EJmz
EJmz
EJmz
EJmz
uT
uTd1
uTsd1
uTb1
uTb1
uTsn
uTsn
uTs1
uTsn
uTsn
uTsn
uTsd1
uTs1
uTr
uTsv1
uTsv1
uTsl
uTsd1
uTsn
uTsn
uTb1uTsn
uTsd1
muTsluTb1
uTds
uTb1uTr
uTruTi1
uTc1uTs1
uTr
uTsd1
uTsl
uTsd1
uTc1
uTs1
uTc1
uTc1
uTr
uTc2
uTsn
uTb4
uTr
uTc1
uTb4
uTs1
uTb1
uTsv1
uTc1uTr
uTs2
uTb1
uTvcg1
uTc1
uTs1
uTsd1
uTr
uTc1uTc2
uTc2
uTb1
uTb1
uTs1
uTc1
uTsd1
uTc1
uTc1
uTc1
uTc1
uTc1
uTc1
uTc1uTc1
uTc1
uTc1uTc1
uTb1
lmJDC
lmJDCr
lmJDCsl
lmJDCb
lmJSPcg
lmJSP
lmJDCb
lmJDCb
lmJDCr
lmJDCrlmJDCrlmJDCr
Qal
QalQal
Qal
Qal
lmJr
lmJr
uTsd
uTsn
uTsd
lmJr
uTiuTd
uTsd
2500
3000
2000
3500
1500
4000
4500
5000
5500
6000
65007000
6000
3500
2500
5500
3000
6500
4500
6500
6500
2000
5500 3500
2000
5500
6000
6000
2000
6500
5500
2500
2000
3000
6500
3000
5000
2000
4000
3500
6500
2000
6000
6500
3500
3000
6500
5500
5000
5000
6500
4000
4000
2500
5500
6500
2000
4500
65004000
6000
4500
5500
2000
6500
398000.000000
398000.000000
400000.000000
400000.000000
402000.000000
402000.000000
404000.000000
404000.000000
406000.000000
406000.000000
408000.000000
408000.000000
410000.000000
410000.000000
412000.000000
412000.000000
414000.000000
414000.000000
416000.000000
416000.000000
418000.000000
418000.000000
420000.000000
420000.000000
422000.000000
422000.000000
6318
000.0
0000
0
6318
000.0
0000
0
6320
000.0
0000
0
6320
000.0
0000
0
6322
000.0
0000
0
6322
000.0
0000
0
6324
000.0
0000
0
6324
000.0
0000
0
6326
000.0
0000
0
6326
000.0
0000
0
6328
000.0
0000
0
6328
000.0
0000
0
6330
000.0
0000
0
6330
000.0
0000
0
6332
000.0
0000
0
6332
000.0
0000
0
Figure 4. More Creek Property Geology
0 1,250 2,500 3,750 5,000625Meters
Geology from Alldrick, D.J., Nelson, J.L., and Barresi, T. (2005): Geology of the Volcano Creek-More Creek Area, British Columbia; BC Ministry of Energy, Mines, and Petroleum Resources,Open File Map 2005-5, 1:50,000 scale. Geology Shapefiles courtesy of D.J. Alldrick
NAD 1983, UTM Zone 9, Scale 1:100,000, Compiled by: S. HendersonMarch 24, 2016, Geology legend on following page
BQ-More Creek Claims
Lakes
Rivers- Floodplains
Glaciers and Icefields
Galore Creek Access Road
Highway 37
Contour - 500ft ±
More Creek
Isku
t Riv
er
HWY 37

2015 Geological Geochemical Assessment Report
on the More Creek Property
May, 2016
Page 18
4

2015 Geological and Geochemical Assessment Report
on the More Creek Property
May, 2016
Page 19
7.0 GEOCHEMICAL MAPPING & SAMPLING PROGRAM
7.1 Introduction
The 2015 More Creek claims geochemical sampling and mapping program was carried out
between August 21, 2015 and September 4, 2015, and focused on characterization of rock
types and identification of mineral showings in exposed road cuts within claim blocks 508124
and 508337. An emphasis was placed on adequately sampling the felsic volcanic unit (rhyolite
to rhyo-dacite) encountered during the 2014 and 2015 field programs that was suspected to be
of Jurassic age. Additionally, cliffs north of the access road in the westernmost claim of the
group (408606) were briefly prospected and sampled to test for anomalous base and precious
metal values. Eleven (11) rock outcrop samples were collected in support of the mapping
program; 6 lithogeochemical samples, four petrographic samples, and one geochronology (age
dating) sample. Sample locations are shown on Figure 5.
Rock samples were collected during geological mapping by geologists Alicia Carpenter and
Sarah Henderson. Petrographic and lithogeochemistry samples were collected in order to
better define observed rock types, and compare sample results to regional mapping. The
geochronology sample was taken in an effort to determine an absolute geological age for the
rhyolite unit that was mapped during GCMC’s 2014 and 2015 field seasons.
7.2 Sampling
Sampling occurred during the 2015 field program for the purposes of lithogeochemical,
geochronological, and petrographic analysis. At each lithogeochemistry sample location, 3 kg of
rock were chipped from outcrop using a rock hammer. The samples were chosen as
representative samples from the outcrop, with the majority of the lithogeochemical samples
being taken from the felsic volcanic package outcropping between kilometres 17 and 19. Effort
was made to ensure that the least-weathered, least-altered material was collected. About 2kg
of rock were taken at each petrographic sample location, with a focus on choosing samples that
best represented textures throughout the outcrop. Petrographic samples were taken from
outcrop for description of textures and minerals present that were not visible in hand
specimen. At the geochron sample location, about 5 kg of rock were chipped off the outcrop.
The geochronological sample was taken at the location of a 2014 lithogeochemical sample
(station 843 from GCMC’s 2014 field program).

2015 Geological and Geochemical Assessment Report
on the More Creek Property
May, 2016
Page 20
All samples were given field descriptions of lithology, alteration, and mineralization (where
present). Samples were bagged in poly sample bags, zap strapped, and flown to Schaft Creek
camp, where they were stored in a secure location until shipment.
Lithogeochemical samples were shipped to ALS Minerals Laboratories, in North Vancouver, for
preparation and analysis. Lithogeochem sample preparation consisted of typical drying,
crushing, splitting, and pulverizing (ALS code PREP-31). Samples were then analyzed using a
complete characterization package (CCP-PKG01) and XRF spectrometry (ME-XRF26) to quantify
the major, trace, and rare earth elements, and base metals and gold present. A description of
ALS analytical methods and QA/QC procedures can be found in Appendix V.
The petrographic samples were shipped to Vancouver Petrographics Ltd. in Langley B.C, where
unpolished thin sections were prepared, and then prepared sections were shipped to Blue
Metal Resources Inc. in Revelstoke BC, for thin section analysis. The geochronology sample was
shipped to the GCMC office in Vancouver, BC where the sample was cleaned, and then shipped
to Boise State University in Boise, Idaho for Uranium-Lead (U-Pb) radiometric dating of zircons.
Sample locations are shown on Figure 5. Table 3 below describes 2015 rock sample locations,
and sample type(s) at each location. Eastings and Northings for samples were recorded in the
field using a handheld GPS with 3 to 8 metres accuracy.
Table 2: 2015 More Creek Claims Sample Types and Locations
Field Station Sample Number
Sample type UTM* Easting UTM* Northing
862 2015SA862b Litho + Petrographic 416698 6322234
867 2015SA867 Litho 416588 6321934
869 2015SA869 Litho 416141 6321852
910 2015SA910 Petrographic +
Geochron 415165 6322634
882 2015SA882 Litho + Petrographic 415864 6322130
887 2015SA887 Litho + Petrographic 414938 6323093
890 2015SA890 Litho 402792 6326392
*UTM Nad 83 Zone 9

#0
XWXW
[_
#0
#0
2015SA0867: Litho, 6 ppm Cu, 2015SA0869: Litho, 20 ppm Cu,
2015SA0910: Geochron + Petrographic, ,
2015SA0882: Litho + Petrographic, 2 ppm Cu, 2015SA0862b: Litho + Petrographic, 4 ppm Cu,
2015SA0887: Litho + Petrographic, 63 ppm Cu, 0.001 ppm Au508337
508124
566898
414000.000000
414000.000000
415000.000000
415000.000000
416000.000000
416000.000000
417000.000000
417000.000000
418000.000000
418000.000000
6322
000.0
0000
0
6322
000.0
0000
0
6323
000.0
0000
0
6323
000.0
0000
0
6324
000.0
0000
0
6324
000.0
0000
0
6325
000.0
0000
0
6325
000.0
0000
0
Figure 5. 2015 More Creek Sample Locations0 210 420 630 840105
Meters
NAD 1983, UTM Zone 9, Scale 1:25,000, Compiled by: S. Henderson, March 30, 2016
2015 Sample Type[_ Geochron + Petrographic
XW Litho
#0 Litho + Petrographic
BQ-More Creek Claims
Rivers- Floodplains- Lakes
Highway 37
Galore Creek Access Road
100m Contours ±
More Creek
Isku
t Riv
er
XW2015SA0890: Litho, 116 ppm Cu, 0.003 ppm Au
408606
508338
545725
402000.000000
402000.000000
403000.000000
403000.000000
6325
000.0
0000
0
6325
000.0
0000
0
6326
000.0
0000
0
6326
000.0
0000
0

2015 Geological and Geochemical Assessment Report
on the More Creek Property
May, 2016
Page 22
7.2.1 Lithogeochemical Sampling Results
Six lithogeochemistry samples were collected during the 2015 field program. Table 3 below
describes the samples collected along with their copper and gold assay values. The assay
certificate from ALS Laboratories can be found in Appendix IV.
Table 3: Lithogeochemical Sample Descriptions
Field
Station
Sample No Sample type Description Cu
(ppm)
Au
(ppm)
862 2015SA862b Lithogeochem
+ Petrographic
East end of Outcrop 2. Finely bedded volcanic-
sedimentary, looks same as last outcrop, but a
gradational change with an increase in sedimentary
beds (up to ~30% of outcrop). Numerous faults
cross-cutting outcrop. Coarser beds within outcrop,
appearing pebble conglomerate-like, and typically
located adjacent to faults. Sample taken from a
finer-grained section with visible quartz crystals.
4 <0.001
867 2015SA867 Lithogeochem Outcrop 3, north side of rd, west end of outcrop.
Volcanics with minor beds @ 352/20.
6 <0.001
869 2015SA869 Lithogeochem New unit within O/C 4. Intrusive? Gabbro. ~5-10%,
2-3mm lathy white phenos, annd some 1-3mm,
0.5%, calcite replaced, white subhedral phenos
(feldspar). 1%, medium-grained disseminated py +/-
cpy. Carbonate veins. Sample taken for thin section.
20 <0.001
882 2015SA882 Lithogeochem
+ Petrographic
New outcrop. North side of road, east side of new
outcrop. Volcanic unit: Green-grey, fine-grained
matrix, with ~10% lathy chl altered hbl phenos or
flattened clasts, 2-4mm, but up to 2cm.
Clasts/phenos are aligned at 015/88. Hornblende (?)
phyric flow, or welded lapilli tuff? Rare large clasts
within matrix, (up to 5cm) - possibly volcanic
bombs/ejecta?
2 <0.001
887 2015SA887 Lithogeochem
+ Petrographic
Crystal (possibly lithic) tuff with local bedding. Beds
at 337/86. Sample taken for litho and thin section.
63 0.001
890 2015SA890 Lithogeochem Outcrop north of Chi'yone camp in forest north of
access road. Mafic volcanic - crystal rich tuff. Mafic
crystals and plagioclase crystals observed. Hematite
and chlorite altered. No sulphides observed.
Bedding observed within outcrop @ 184/70.
116 0.003

2015 Geological and Geochemical Assessment Report
on the More Creek Property
May, 2016
Page 23
Copper and gold results above the analytical detection limit are plotted on Figure 5 for each
sample. Sample 2015SA890, taken from the claim 408606, returned the only anomalous Cu and
Au values at 116 ppm and 0.003ppm, respectively. This sample was taken from a volcanic
outcropping (interpreted to belong to the Stuhini Group) that plots as basaltic in composition
on the volcanic rock classification diagram below (Figure 6). The sample was chlorite and
hematite altered, and no sulphides were observed; however due to the anomalous copper and
gold values, further exploration, mapping, and sampling of outcrop within this claim is
warranted.
Figure 6: Classification of 2015 Lithogeochemical Samples
None of the samples taken from the eastern section of the mapping area returned anomalous
base or precious metal values. The majority of these samples plot as rhyolitic in composition,
and no sulphides were observed within the samples collected.
Sample 2015SA887 plots as a trachy-andesite on Figure 6, suggesting it does not belong to the
large rhyolite unit that samples 2015SA862b, 2015SA867, and 2015SA882 were collected from,

2015 Geological and Geochemical Assessment Report
on the More Creek Property
May, 2016
Page 24
and is likely a localized outcrop of an andesite unit further west that was encountered during
the 2014 program.
A gabbro unit, that is intercalated within the felsic volcanics (mapped at field station 869), plots
as a basaltic-andesite on Figure 6 above, thus is classified as a gabbroic-diorite intrusive
volcanic based on mineralogical composition.
7.2.2 Geochronology Sampling Results
One sample (2015SA910) was taken for uranium-lead (U/Pb) age dating of zircons, from the
large felsic volcanic unit (rhyolite to rhyo-dacite) exposed between kilometres 17 and 19 on the
access road. During GCMC’s 2014 field season a lithogeochemical sample was collected from
the rhyolite unit, and in 2015 the geochronology sample was collected from the same location.
A description and location of sample 2015SA910 are found in Table 5 below.
Table 4: Geochron Sample Description WPT UTM*_E UTM*_N Description Sample Type Sample #
910 415165 6322634
Volcanic rhyo-dacite. Fine-grained to aphanitic,
light grey felsic volcanic. Same location (WPT
843) where lithogeochem sample was taken in
2014. Sample taken for age dating – suspected
Hazelton Group Jurassic, or Eocene?
Geochron 2015SA910
*UTM Nad 83 Zone 9
There has been some uncertainty in regards to the age of the unit; Alldrick et al. (2005) mapped
the unit as a quartz-phyric rhyolite of Eocene age, while Read (1990) interpreted the unit as a
felsic volcanic of the Early Jurassic. The rhyolite was also the focus of a geochemical sampling
program run in 1990 by Stow resources in the Burr claim group (Bobyn, 1990).
Results from the 2014 lithogeochemical sample were compared to whole rock analyses
collected by the BC Geological Survey (BCGS) in 2005. Comparison of REE values showed a
similar signature to the rhyolites of the rift-related Willow Ridge Complex of the Upper
Hazelton Group (Carpenter, 2014). Although this was not conclusive evidence, it supported an
interpretation of an early Jurassic age for the unit, which would have allowed for an Eskay
Creek rift type stratigraphy and favourable host rock for a VHMS deposit.
The 2014 sample results showed sufficient zirconium content (264 ppm) for zircon to form
within the rhyolite, making it a good candidate for U/Pb radiometric dating; thus the

2015 Geological and Geochemical Assessment Report
on the More Creek Property
May, 2016
Page 25
geochronology sample was collected from the same location as the 2014 lithogeochem sample.
Unfortunately however, no zircons were found in the sample that was collected in 2015 and
sent to Boise State University for age dating; therefore it was not possible to obtain an absolute
age for the rhyolite package located between kilometres 19 and 17 on the Galore Creek access
road.
Geological observation, and petrographic analysis of the felsic volcanics, discussed in the
following two sections, however, allows for the placement of the rhyolite as younger than
Jurassic in age, and likely not belonging to the Hazelton Group volcanics.
7.2.3 Petrographic Work
Four samples were collected for petrographic analysis to support geological mapping and
interpretation completed during the field program. Locations of these samples can be viewed
in Figure 4. Hand samples of representative rock types were shipped to Vancouver
Petrographics in Langley, B.C., where unpolished thin sections were prepared, then samples
were shipped to Blue Metal Resources, in Revelstoke, BC where petrographic descriptions were
completed. Petrographic descriptions excerpted from Febbo’s (2015) report are below:
Sample 2015SA862b (Rhyolite flow): Rock is fine-grained, flow banded, quartz
microporphyritic rhyolite flow with a groundmass of interlocking quartz-K-feldspar-
plagioclase. Disseminated leucoxene and anatase disseminated throughout groundmass
and secondary chlorite and hematite. Rock sample is a rhyolite based on modal
mineralogy of quartz, K-feldspar and plagioclase. The fine grain size, even distribution of
grains, irregular shape of phenocrysts and interlocking textures of grains are consistent
with an interpretation of a coherent rhyolite flow.
Sample 2015SA882 (Welded pumiceous rhyolite lapilli tuff): Rock is green-grey,
pumiceous, welded rhyolite lapilli tuff with eutaxitic foliation and leucoxene
disseminations; matrix of felsic glass and grains of feldspar replaced to chlorite-sericite.
The rock sample interpreted to have formed from explosive magmatic processes as a
felsic pyroclastic deposit. The abundance of bubble-wall glass shards in the matrix, wispy
pumice fragments, and absence of accretionary lapilli favour a magmatic as opposed to
phreatomagmatic eruptive process (McPhie et al., 2005). Internal grains of quartz in
glass shards are interpreted to be a result of quench crystallization.

2015 Geological and Geochemical Assessment Report
on the More Creek Property
May, 2016
Page 26
Figure 7: Thin Section Photograph of Sample 2015SA0882
Microphotograph of sample 2015SA882. Glass shard in: a) cross polarized light using the gypsum plate (first order
retardation) and b) plane polarized light. The shard preserves the bubble-wall and is composed of blocky to fibrous
quartz (qz) grains. Chlorite (chl) lines the bubble-wall and is disseminated in matrix. Image from Febbo (2015).
Sample 2015SA887 (Feldspar-quartz rhyodacite flow breccia): Rock is white-grey, fine-
grained, chlorite amygdaloidal, glassy, feldspar-quartz-phyric rhyolite flow breccia.
Clasts are poorly formed, mm-scale and are cemented by feldspar-quartz and calcite.
Secondary calcite and chlorite replace feldspar cut by a 2 mm wide ankerite-leucoxene
vein. Porphyritic textures, volcanic glass and amygdules all indicate a supracrustal
depositional setting. Fragmental porphyritic regions that are infilled by quartz-chlorite
are interpreted to represent flow brecciation.
Sample 2015SA910 (Rhyolite porphyry): Rock is fine-grained, flow-banded feldspar-
quartz porphyry flow or hypabyssal intrusion overprinted by chlorite and calcite
alteration that is cut by a calcite-leucoxene veinlet. Interlocking textures of quartz,
plagioclase and K-feldspar and even size and distribution of phenocrysts are consistent
with an interpretation of a coherent lava or intrusion.
Results of thin section analysis show little to no deformation within the samples taken between
kilometres 17 and 19 on the access road. Samples taken from these locales are all described by
Febbo (2015) as some variation of a felsic volcanic (rhyolite to rhyo-dacite), which is consistent

2015 Geological and Geochemical Assessment Report
on the More Creek Property
May, 2016
Page 27
with the rhyolitic quartz-feldspar porphyry (Eqp) unit mapped by Alldrick et al. (2005). Also, no
zircons were observed or reported in thin section descriptions of the 2015 samples collected
from the rhyolite unit; thus conclusive age dating by measuring U/Pb radioactive decay in
zircons may prove to be difficult.
The full petrographic report by Blue Metal Resources can be viewed in Appendix VI.
7.3 Geological Mapping
Mapping efforts in 2015 occurred between kilometres 19 and 14 on the Galore Creek access
road route within claims 508337 and 508124. Various volcanic and sedimentary rock types
were encountered in outcrop and subcrop along the road. Claim 408606 was briefly prospected
north of the access road, but was not mapped.
Mapping along road cuts primarily focused on detailed descriptions and geological
characterization of the outcrop encountered between kilometres 17 and 19 on the Galore
Creek access road. The majority of the outcrops were identified or suspected as rhyolitic in
composition, with a gabbroic-diorite unit mapped in a few locations intercalated with the
rhyolite with faulted contacts. The rhyolites in this area have been interpreted as Eocene in age
by Alldrick et al. (2005), although no field stops were made in the rhyolite unit during that
particular mapping program, and as Early Jurassic by Read (1990). The REE signature from a
2014 lithogeochem sample collected by GCMC from the rhyolite matches Early Jurassic rocks of
the Willow Ridge Complex (Barresi & Dostal, 2005) which led to the interpretation that the
More Creek rhyolite may be Jurassic in age (Carpenter, 2014).
There is limited outcrop exposed by the road cuts between kilometer 17 and the west bank of
the Iskut River. From the east bank of the Iskut River (kilometer 15) to approximately kilometer
13, sediments of the Bowser Lake Group were encountered and mapped within claim 508337.
The Bowser Group sediments encountered ranged from mudstone to chert-rich pebble
conglomerate, in mm to metre scale beds. Field station 912 to the west of the access road, was
an area of chert pebble conglomerate subcrop. No samples were collected from the outcrop or
subcrop between kilometres 13 and 15.
At each mapping location, texture, alteration, and mineralization present within the outcrop
was recorded. Effort was made to interpret rock type; however textures in hand samples were
not always conclusive. Petrographic and lithogeochemical samples were taken to aid in the
interpretation of mapping. The absence of deformation textures in outcrop was noted, and this

2015 Geological and Geochemical Assessment Report
on the More Creek Property
May, 2016
Page 28
was verified in thin section samples. Little to no sulphides were observed at the mapping field
stations in 2015; however when present, sulphides were typically located adjacent to faulting.
Although this was not observed at any of the field stations in 2015, it is important to note that
during GCMC’s 2014 More Creek mapping program, at field station 886 (425171E, 6322644N),
black glass (obsidian) bubbles were observed within fractures at a rhyolite outcrop. This
observation has become important in limiting the age of the rhyolite unit, as U/Pb age dating
was not possible from the sample collected in 2015. The outcrop containing obsidian was
described in 2014 as follows (Henderson & Carpenter, 2014 field notes):
South side of road. Rhyolite with sulphides (probably just pyrite) seen on fracture
coatings. Mm scale black obsidian shards and bubbles occurring with sulphides
throughout outcrop. Qtz veins throughout. Sample taken of rhyolite with sulphides for
ICP assay (SA20140886).
As obsidian eventually devitrifies or hydrates, no obsidian older than Cretaceous age has ever
been identified (Miller, 2016). Although no obsidian was encountered within the felsic volcanic
outcrops mapped in 2015 between kilometres 17 and 19, these rhyolites are believed to be part
of the same volcanic package as the mapped rhyolite outcrop in 2014 at station 886. Through
this observation, the rhyolitic volcanic package located in the mapping area between the
Stuhini Group volcanics to the west, and the Bowser Lake sediments to the east, is interpreted
to be younger than Jurassic in age.
The gabbroic-diorite unit encountered during the 2015 field program, intercalated with the
rhyolitic volcanics with faulted contacts, is thus also interpreted to be younger than Jurassic in
age, and possibly younger than the rhyolite in relative age.
When compared to Alldrick et al.’s (2005) regional geology map, sample 2015SA887 falls within
the inferred boundary of a mafic volcanic tuff (uTb1) of the Stuhini Group. However, due to its
composition (trachy-andesite), and the textural observations provided in thin section analysis
by Febbo (2015), sample 2015SA887 has been interpreted to belong to localized outcrop of an
andesitic flow breccia, possibly unit ‘uTi1’ of the Stuhini Group volcanics. Unit uTi1 was also
encountered further west, during the 2014 More Creek mapping program.
A geological map detailing the interpretation from the 2015 More Creek geological mapping
program is presented in Appendix VII.

2015 Geological and Geochemical Assessment Report
on the More Creek Property
May, 2016
Page 29
8.0 DISCUSSION AND CONCLUSIONS
During the 2015 field season, geological mapping and sampling were conducted between
kilometres 14 and 19 of the Galore Creek access road. A total of eleven (11) rock samples,
including six lithogeochemical, four petrographic, and one geochronology sample were
collected on the More Creek claims.
The main objectives of the geochemical sampling and geological mapping program were to
assess outcrops, which were exposed during the building of the Galore Creek access road, for
their economic potential and geological significance. In addition, the westernmost claim in the
group (408606) was briefly prospected for anomalous base and precious metal values.
Previously an early Jurassic age was suspected for rhyolites in the eastern portion of the map
area, which would have indicated potential for VHMS deposits in the area. Past work by Stow
Resources (Bobyn, 1990), and work completed in 2014 and 2015 by GCMC in the area of these
rhyolites has not found any significant anomalous base or precious metal values within the
claim boundaries.
Slightly anomalous copper and gold values were returned from a sample collected in the
westernmost claim (408606) in outcropping north of the access road. This sample was taken
from a basaltic volcanic outcrop (interpreted to belong to the Stuhini Group). No sulphides
were observed at the sample location; however the area was not thoroughly explored and
mapped, and due to the anomalous copper and gold values returned from the sample, further
exploration within this claim is warranted.
Results of mapping and petrographic work noting the absence of deformation textures within
the rhyolite unit of controversial age, and the presence of localized obsidian leads to the
conclusion that the rhyolite unit exposed on the access route between kilometres 19 and 17 is
not of Jurassic age (Hazelton Group). The author of this report is in agreement with the 2005
mapping interpretation by Alldrick et al. that the rhyolite unit is probably of Eocene age. With
this geochronological interpretation there is no longer potential for an Eskay Creek type VHMS
deposit associated with this unit. However, since an absolute age date was not obtained due to
the absence of zircons in the geochron sample collected, 2015 lithogeochem sample results
should be examined for zirconium content, and if possible more sample material should be
collected from various locations within the rhyolite and sent for U/Pb age dating.
Recommendations for future work include continued exploration within the westernmost claim
(408606), mapping rock types and testing for anomalous base and precious metal values.

2015 Geological and Geochemical Assessment Report
on the More Creek Property
May, 2016
Page 30
Additionally, if conclusive age dating is desired for the rhyolite unit encountered during the
2014 and 2015 field programs, it is recommended that samples are collected from various
locations within the rhyolite for the purpose of U/Pb radiometric dating – in particular near the
origin of samples 2015SA862b, 2015SA867, and 2015SA882 which show elevated zirconium
content.

2015 Geological and Geochemical Assessment Report
on the More Creek Property
May, 2016
APPENDIX I
REFERENCES

2015 Geological and Geochemical Assessment Report
on the More Creek Property
May, 2016
References
Alldrick, D.J., Nelson, J.L., and Barresi, T. (2005). Geology and Mineral Occurrences of the Upper Iskut
River Area: Tracking the Eskay Rift through Northern British Columbia (Telegraph Creek NTS 104G/1,2; Iskut River NTS 104 B/9, 10, 15, 16), Geological Fieldwork 2004, British Columbia Geological Survey, Paper 2005-1.
Alldrick, D.J., Nelson, J.L., and Barresi, T. (2005). Geology of the Volcano Creek – More Creek Area, British Columbia; BC Ministry of Energy, Mines, and Petroleum Resources, Open File Map 2005-5, 1:50,000 scale.. Baerg, R. (1991). Geophysical Assessment Report on the Devil 3, and More 1 and 2 claims, for Noranda
Exploration Company Ltd., May 1991. AR #21348. Baerg, R., Bradish, L., and Wong, T. (1991). Geological, Geochemical, Geophysical Report on the Devil
Property (Devil 1-4 claims), for Noranda Exploration Company Ltd., January 1991. AR #21087. Barresi, T. and Dostal, J. (2005). Geochemistry and Petrography of Upper Hazelton Group Volcanics: VHMS- Favourable Stratigraphy in the Iskut River and Telegraph Creek Map Areas, Northwestern British Columbia, Geological Fieldwork 2004, British Columbia Geological Survey, Paper 2005-1 Bobyn, M. (1990). Assessment report on geological mapping, prospecting, rock, soil and stream sampling on the Burr 1-4 claim group, for Stow Resources Ltd., December 1990. AR #20593. Carpenter, A. (2014). 2014 Geological and Geochemical Assessment Report on the More Creek Property, for
Galore Creek Mining Corporation. December, 2014. AR #35253. Craig, C.P. (2006). 2005 Seismic Refraction Assessment Report on the More Creek Property, for NovaGold
Canada Inc., June 2006. AR #28423.
Febbo, G. (2015) Petrographic Report for Galore Creek. Internal Report prepared by Blue Metal Resources, Inc.
Grill E., and Savell, M. (1991). Geological, Geochemical & Geophysical Report on the Wad 1 & 2, Sinter
1 & 2, Bill 2 Mineral Claims, More Creek Property, for Noranda Exploration Company Ltd. April 1991. AR #21311.
Logan, J.M., Drobe, J.R. and McClelland, W.C. (2000). Geology of the Forrest Kerr – Mess Creek Area, Northwestern British Columbia (104B/10, 15 & 104G/2 & 7W). British Columbia Ministry of Energy and Mines, Bulletin 104, 164 pages. Mann, R.K., and Gale, D.F.G., (2004). 2003 Assessment Report on the RDN 1-18 and MOR 1-16, 18
Claims, for Rimfire Minerals Corporation and Barrick Gold Inc., March 2004. AR #27376. Miller, J. (2016). http://volcano.oregonstate.edu/obsidian. Department of Geosciences. Oregon State University.
Payne, J. (2014) Petrographic Report for Galore Creek. Internal Report prepared by Vancouver Petrographics Ltd.
Petsel, S.A., and Wu, S.W.M. (2007). 2006 Geotechnical Drilling Assessment Report on the More Creek Property,
For NovaGold Resources, January 2007. AR #28791
Petsel, S.A., Jutras, G., and Williams M. (2008). 2007 Geotechnical drilling, Geochemical sampling, and Geological Mapping Assessment Report on the More Creek Property, February 2008. AR #29749

2015 Geological and Geochemical Assessment Report
on the More Creek Property
May, 2016
APPENDIX II
STATEMENT OF EXPENDITURES

2015 Geological and Geochemical Assessment Report
on the More Creek Property
May, 2016
Statement of Expenditures
More Creek Geological Mapping and Geochemical Sampling program Period of Field Work: August 21, 2015 to September 4, 2015 Work Performed on Claims: 508124, 508337 and 408606
Indirect Sampling Costs: Helicopter Support – Lakelse Air Helicopters Ltd. Astar 350B2 ($1150/hr) – 18.1 hours $21,943
Helicopter Fuel (1567L @ $1.47/litre average) $1,705 Transportation – Airfare: Vancouver-Terrace-Dease Lake Roundtrip, two people: $2,708
Camp Support Costs: Food, safety, and maintenance crews
Camp accommodation rate pp/per day: $235 (3 crew @ 5 days, 2 crew @ 6 days) $6,345 Sample Assaying and Freight Costs: 6 lithogeochem @ ALS Minerals Labs $716 4 petrographic @ Vancouver Petrographics Ltd & Blue Metal Resources Inc $840 Shipping (Bandstra) $338 Geochemical Sampling and Report Preparation Costs: Geologists Alicia Carpenter and Sarah Henderson (August 21 to September 4, 2015) $13,156 Report preparation (GCMC) $5,180
Subtotal: $52,931 TOTAL WORK AVAILABLE FOR ASSESSMENT CREDIT: $52,931 FUNDS DEBITED FROM PAC (211373) $22,611.04 Total Assessment Work Applied to Mineral Claims: $75,542.04
Event Number: 5594082

2015 Geological and Geochemical Assessment Report
on the More Creek Property
May, 2016
APPENDIX III
STATEMENT OF QUALIFICATION


2015 Geological and Geochemical Assessment Report
on the More Creek Property
May, 2016
APPENDIX IV
ASSAY CERTIFICATES
(Attached Digitally)

ALS CODE DESCRIPTION
WEI- 21 Received Sample Weight
LOG- 22 Sample login - Rcd w/o BarCode
CRU- 31 Fine crushing - 70% <2mm
CRU- QC Crushing QC Test
SPL- 21 Split sample - riffle splitter
PUL- 31 Pulverize split to 85% <75 um
ALS CODE DESCRIPTION INSTRUMENT
ME- XRF26 XRFWhole Rock By Fusion/XRF
OA- GRA05x WST- SEQLOI for XRF
ME- MS42 ICP- MSUp to 34 elements by ICP- MS
S- IR08 LECOTotal Sulphur (Leco)
C- IR07 LECOTotal Carbon (Leco)
ME- MS81 ICP- MSLithium Borate Fusion ICP- MS
ME- 4ACD81 ICP- AESBase Metals by 4- acid dig.
Au- ICP21 ICP- AESAu 30g FA ICP- AES Finish
This report is for 6 Rock samples submitted to our lab in Vancouver, BC, Canada on15- SEP- 2015.
Project: Galore Creek
P.O. No.: 13053
The following have access to data associated with this certificate:SARAH HENDERSON
To:
To:ALS Canada Ltd.
2103 Dollarton HwyNorth Vancouver BC V7H 0A7Phone: + 1 (604) 984 0221 Fax: + 1 (604) 984 0218
www.alsglobal.com
This is the Final Report and supersedes any preliminary report with this certificate number. Results apply to samples assubmitted. All pages of this report have been checked and approved for release.
Colin Ramshaw, Vancouver Laboratory Manager***** See Appendix Page for comments regarding this certificate *****

ALS Canada Ltd.
2103 Dollarton HwyNorth Vancouver BC V7H 0A7Phone: + 1 (604) 984 0221 Fax: + 1 (604) 984 0218
www.alsglobal.com
To:
Project: Galore Creek
WEI- 21 Au- ICP21 ME- XRF26 ME- XRF26 ME- XRF26 ME- XRF26 ME- XRF26 ME- XRF26 ME- XRF26 ME- XRF26 ME- XRF26 ME- XRF26 ME- XRF26 ME- XRF26 ME- XRF26
Recvd Wt. Au Al2O3 BaO CaO Cr2O3 Fe2O3 K2O MgO MnO Na2O P2O5 SiO2 SrO TiO2
kg ppm % % % % % % % % % % % % %
0.02 0.001 0.01 0.01 0.01 0.01 0.01 0.01 0.01 0.01 0.01 0.01 0.01 0.01 0.01
2015SA862b 2.16 <0.001 14.46 0.15 0.25 0.01 3.81 2.58 1.01 0.04 5.60 0.05 70.31 0.01 0.37
2015SA867 1.48 <0.001 13.16 0.20 0.18 0.01 3.17 3.24 0.66 0.04 4.88 0.04 72.34 0.01 0.31
2015SA869 2.22 <0.001 14.29 0.07 5.54 0.01 10.24 1.18 6.42 0.18 3.68 0.23 53.30 0.03 1.07
2015SA882 2.76 <0.001 14.17 0.22 0.25 <0.01 4.36 6.05 1.38 0.06 1.67 0.03 69.17 0.02 0.33
2015SA887 3.02 0.001 15.73 0.15 6.11 0.01 5.65 4.59 2.18 0.17 5.28 0.43 51.36 0.03 0.67
2015SA890 1.28 0.003 13.99 0.30 14.00 0.01 8.12 1.96 3.44 0.36 3.72 0.38 40.21 0.13 0.48
***** See Appendix Page for comments regarding this certificate *****

ALS Canada Ltd.
2103 Dollarton HwyNorth Vancouver BC V7H 0A7Phone: + 1 (604) 984 0221 Fax: + 1 (604) 984 0218
www.alsglobal.com
To:
Project: Galore Creek
OA- GRA05x ME- XRF26 ME- MS81 ME- MS81 ME- MS81 ME- MS81 ME- MS81 ME- MS81 ME- MS81 ME- MS81 ME- MS81 ME- MS81 ME- MS81 ME- MS81 ME- MS81
LOI 1000 Total Ba Ce Cr Cs Dy Er Eu Ga Gd Ge Hf Ho La
% % ppm ppm ppm ppm ppm ppm ppm ppm ppm ppm ppm ppm ppm
0.01 0.01 0.5 0.5 10 0.01 0.05 0.03 0.03 0.1 0.05 5 0.2 0.01 0.5
2015SA862b 0.84 99.62 1255 58.5 10 0.26 8.84 5.33 2.27 20.0 9.42 <5 10.1 1.87 28.7
2015SA867 0.75 99.83 1695 53.2 30 0.29 9.27 6.45 1.37 17.5 7.72 <5 9.3 2.07 26.9
2015SA869 2.92 99.41 549 18.1 40 1.20 4.61 2.95 1.07 15.1 4.05 <5 2.2 1.05 8.8
2015SA882 1.84 99.62 1935 65.8 <10 2.07 13.60 9.99 1.61 26.9 10.60 <5 10.8 3.25 33.3
2015SA887 6.61 99.28 1250 61.8 40 0.33 3.43 1.97 1.45 21.2 4.79 <5 4.7 0.71 35.5
2015SA890 12.90 100.35 2700 9.9 20 2.59 2.23 1.21 0.53 14.2 2.01 <5 0.9 0.49 6.0
***** See Appendix Page for comments regarding this certificate *****

ALS Canada Ltd.
2103 Dollarton HwyNorth Vancouver BC V7H 0A7Phone: + 1 (604) 984 0221 Fax: + 1 (604) 984 0218
www.alsglobal.com
To:
Project: Galore Creek
ME- MS81 ME- MS81 ME- MS81 ME- MS81 ME- MS81 ME- MS81 ME- MS81 ME- MS81 ME- MS81 ME- MS81 ME- MS81 ME- MS81 ME- MS81 ME- MS81 ME- MS81
Lu Nb Nd Pr Rb Sm Sn Sr Ta Tb Th Tm U V W
ppm ppm ppm ppm ppm ppm ppm ppm ppm ppm ppm ppm ppm ppm ppm
0.01 0.2 0.1 0.03 0.2 0.03 1 0.1 0.1 0.01 0.05 0.01 0.05 5 1
2015SA862b 0.88 18.8 31.5 7.96 29.6 9.34 3 89.0 1.0 1.58 9.16 0.80 2.98 6 1
2015SA867 1.13 16.9 29.6 7.25 41.9 6.95 2 49.5 0.8 1.41 8.25 1.05 3.75 5 1
2015SA869 0.44 5.5 11.0 2.40 22.5 3.06 1 278 0.2 0.68 1.90 0.47 1.13 278 1
2015SA882 1.76 18.3 34.5 8.30 166.0 8.43 4 146.0 0.9 1.98 9.42 1.58 4.85 <5 1
2015SA887 0.26 42.6 25.7 6.93 87.9 5.00 1 266 1.9 0.61 5.71 0.28 2.68 154 1
2015SA890 0.22 3.8 5.4 1.17 41.7 1.56 1 1190 0.1 0.34 1.06 0.21 0.69 269 4
***** See Appendix Page for comments regarding this certificate *****

ALS Canada Ltd.
2103 Dollarton HwyNorth Vancouver BC V7H 0A7Phone: + 1 (604) 984 0221 Fax: + 1 (604) 984 0218
www.alsglobal.com
To:
Project: Galore Creek
ME- MS81 ME- MS81 ME- MS81 ME- 4ACD81 ME- 4ACD81 ME- 4ACD81 ME- 4ACD81 ME- 4ACD81 ME- 4ACD81 ME- 4ACD81 ME- 4ACD81 ME- 4ACD81 ME- 4ACD81 ME- MS42 ME- MS42
Y Yb Zr Ag Cd Co Cu Li Mo Ni Pb Sc Zn As Bi
ppm ppm ppm ppm ppm ppm ppm ppm ppm ppm ppm ppm ppm ppm ppm
0.5 0.03 2 0.5 0.5 1 1 10 1 1 2 1 2 0.1 0.01
2015SA862b 50.6 5.53 377 <0.5 <0.5 1 4 20 4 2 6 6 69 1.1 0.07
2015SA867 54.7 7.66 352 <0.5 <0.5 2 6 10 2 6 11 5 68 2.7 0.06
2015SA869 25.9 3.19 85 <0.5 0.5 31 20 20 1 16 <2 31 78 0.2 0.01
2015SA882 81.6 11.35 382 <0.5 <0.5 1 2 20 <1 <1 7 6 129 0.4 0.07
2015SA887 18.3 1.70 196 <0.5 <0.5 14 63 10 <1 19 14 10 72 2.1 0.06
2015SA890 12.7 1.45 28 <0.5 <0.5 17 116 40 <1 10 2 25 76 1.7 0.01
***** See Appendix Page for comments regarding this certificate *****

ALS Canada Ltd.
2103 Dollarton HwyNorth Vancouver BC V7H 0A7Phone: + 1 (604) 984 0221 Fax: + 1 (604) 984 0218
www.alsglobal.com
To:
Project: Galore Creek
ME- MS42 ME- MS42 ME- MS42 ME- MS42 ME- MS42 ME- MS42 ME- MS42 ME- MS42 S- IR08 C- IR07
Hg In Re Sb Sc Se Te Tl S C
ppm ppm ppm ppm ppm ppm ppm ppm % %
0.005 0.005 0.001 0.05 0.1 0.2 0.01 0.02 0.01 0.01
2015SA862b 0.024 0.089 <0.001 0.35 2.2 0.4 <0.01 0.03 0.03 0.03
2015SA867 0.035 0.074 <0.001 1.18 1.6 0.5 <0.01 0.06 0.27 0.04
2015SA869 0.006 0.029 0.001 <0.05 8.1 0.8 <0.01 0.04 0.06 0.07
2015SA882 0.026 0.062 <0.001 0.27 1.3 0.5 <0.01 0.08 0.02 0.05
2015SA887 0.053 0.044 <0.001 0.12 10.5 0.5 0.02 0.07 0.10 1.55
2015SA890 0.202 0.034 <0.001 <0.05 17.3 0.7 0.02 0.04 0.09 2.97
***** See Appendix Page for comments regarding this certificate *****

ALS Canada Ltd.
2103 Dollarton HwyNorth Vancouver BC V7H 0A7Phone: + 1 (604) 984 0221 Fax: + 1 (604) 984 0218
www.alsglobal.com
To:
Project: Galore Creek
Processed at ALS Vancouver located at 2103 Dollarton Hwy, North Vancouver, BC, Canada.
Au- ICP21Applies to Method: C- IR07 CRU- 31 CRU- QC
LOG- 22 ME- 4ACD81 ME- MS42 ME- MS81
ME- XRF26 OA- GRA05x PUL- 31 S- IR08
SPL- 21 WEI- 21

2015 Geological and Geochemical Assessment Report
on the More Creek Property
May, 2016
APPENDIX V
ANALYTICAL PROCEDURES
(Attached Digitally)

Lab Accreditation & QA Overview (rev05.00) Revision: 05.00 December 7, 2010 Page 1 of 9


ISO 9001

CRU-31
PUL-31


PDetectionLimit
cPc ( ) 100%
%Precision as a Function of Detection Limit
0.00%
20.00%
40.00%
60.00%
80.00%
100.00%
120.00%
1 2 5 10 20 50 100 200 500 1000 2000 5000 10000
Concentration (ppm)
% P
rec
isio
n
1 ppm DL
2 ppm DL
10 ppm DL


Fire AssAy Procedure
Au-icP21 and Au-icP22Fire AssAy Fusion icP-Aes Finish
Revision 01.01 | AUG 18, 2005 www.AlsGlobAl.com
sAmPle decomPositionFire Assay Fusion (FA-FUsPG1 & FA-FUsPG2)
AnAlyticAl methodInductively Coupled Plasma – Atomic Emission Spectrometry (ICP-AES)
A prepared sample is fused with a mixture of lead oxide, sodium carbonate, borax, silica and other reagents as required, inquarted with 6 mg of gold-free silver and then cupelled to yield a precious metal bead.
The bead is digested in 0.5 ml dilute nitric acid in the microwave oven. 0.5 ml concentrated hydrochloric acid is then added and the bead is further digested in the microwave at a lower power setting. The digested solution is cooled, diluted to a total volume of 4 ml with de-mineralized water, and analyzed by inductively coupled plasma atomic emission spectrometry against matrix-matched standards.
method code element symbol units sAmPle
Weight (g)loWer limit
uPPer limit
deFAult overlimit method
Au-icP21 Gold Au ppm 30 0.001 10 Au-AA25
Au-icP22 Gold Au ppm 50 0.001 10 Au-AA26

January 10th
, 2014
Geochemical Package
Revision 04.00
Geochemical Package – CCP-PKG01
Complete Characterization
By combining a number of methods into one cost effective package, a complete characterization is
obtained. This package combines the whole rock package ME-ICP06 plus carbon and sulfur by
combustion furnace (ME-IR08) to quantify the major elements in a sample. Trace elements including
the full rare earth element suite are reported from three digestions with either ICP-AES or ICP-MS
finish: A lithium borate fusion for the resistive and rare earth elements (ME-MS81), a four acid
digestion for the basemetals (ME-4ACD81) and an aqua regia digestion for the volatile gold related
trace elements (ME-MS42).
The nature of Lithophile elements and the matrices in which they occur require stronger dissolution
procedures. The most accurate results will therefore be obtained using fusion as the dissolution
procedure.
Whole Rock Geochemistry – ME-ICP06 and OA-GRA05
Analysis of major oxides by ICP-AES
ME-ICP06
Sample Decomposition:
Lithium Metaborate/Lithium Tetraborate (LiBO2
/Li2
B4O7
) Fusion* (FUS LI01)
Analytical Method:
Inductively Coupled Plasma - Atomic Emission Spectroscopy (ICP-AES)
A prepared sample (0.200 g) is added to lithium metaborate/lithium tetraborate flux, mixed well and
fused in a furnace at 1025°C. The resulting melt is then cooled and dissolved in an acid mixture
containing nitric, hydrochloric and hydrofluoric acids. This solution is then analyzed by ICP-AES.
Results are corrected for spectral inter-element interferences and reported.
Element Symbol Units Lower Limit Upper Limit
Silica SiO2
% 0.01 100
Aluminum Al2
O3
% 0.01 100
Iron Fe2
O3
% 0.01 100
Calcium CaO % 0.01 100

January 10th
, 2014
Geochemical Package
Revision 04.00
Element Symbol Units Lower Limit Upper Limit
Magnesium MgO % 0.01 100
Sodium Na2
O % 0.01 100
Potassium K2
O % 0.01 100
Chromium Cr2
O3
% 0.01 100
Titanium TiO2
% 0.01 100
Manganese MnO % 0.01 100
Phosphorus P2
O5
% 0.01 100
Strontium SrO % 0.01 100
Barium BaO % 0.01 100
OA-GRA05
Loss on Ignition
Sample Decomposition:
Thermal decomposition Furnace (OA-GRA05)
Analytical Method:
Gravimetric
If required, the total oxide content is determined from the ICP analyte concentrations and loss on
Ignition (L.O.I.) values. A prepared sample (1.0 g) is placed in an oven at 1000°C for one hour,
cooled and then weighed. The percent loss on ignition is calculated from the difference in weight.
Method Code Element Symbol Units Lower
Limit
Upper
Limit
OA-GRA05 Loss on
Ignition LOI % 0.01 100

January 10th
, 2014
Geochemical Package
Revision 04.00
Total Carbon – Method Code C-IR07
Sample Decomposition:
LECO Furnace
Analytical Method:
Infrared Spectroscopy
The sample is combusted in a LECO induction furnace. The generated CO2 is quantitatively detected
by infrared spectrometry and reported as percent carbon.
Method Code Element Symbol Units Lower Limit
Upper Limit
C-IR07 Carbon C % 0.01 50
Specialty Assay Procedure – Total Sulphur S-IR08
Sample Decomposition:
Various
Analytical Method:
Leco sulphur analyzer, Gravimetric
The sample is analyzed for Total Sulphur using a Leco sulphur analyzer. Sulphur dioxide released
from the sample is measured by an IR detection system and the Total Sulphur result is provided.
Method Code Element Symbol Units Lower
Limit
Upper
Limit
S-IR08 Sulphur S % 0.01 50

January 10th
, 2014
Geochemical Package
Revision 04.00
ME-MS81
Lithogeochemistry
Sample Decomposition:
Lithium Borate (LiBO2
/Li2
B4
O7
) Fusion (FUS-LI01)*
Analytical Method:
Inductively Coupled Plasma - Mass Spectroscopy (ICP - MS)
A prepared sample (0.100 g) is added to lithium metaborate/lithium tetraborate flux, mixed well and
fused in a furnace at 1025°C. The resulting melt is then cooled and dissolved in an acid mixture
containing nitric, hydrochloric and hydrofluoric acids. This solution is then analyzed by inductively
coupled plasma - mass spectrometry.
Element Symbol Unit Lower Limit Upper Limit
Barium Ba ppm 0.5 10000
Cerium Ce ppm 0.5 10000
Chromium Cr ppm 10 10000
Cesium Cs ppm 0.01 10000
Dysprosium Dy ppm 0.05 1000
Erbium Er ppm 0.03 1000
Europium Eu ppm 0.03 1000
Gallium Ga ppm 0.1 1000
Gadolinium Gd ppm 0.05 1000
Hafnium Hf ppm 0.2 10000
Holmium Ho ppm 0.01 1000
Lanthanum La ppm 0.5 10000
Lutetium Lu ppm 0.01 1000
Niobium Nb ppm 0.2 2500
Neodymium Nd ppm 0.1 10000

January 10th
, 2014
Geochemical Package
Revision 04.00
Element Symbol Unit Lower Limit Upper Limit
Praseodymium Pr ppm 0.03 1000
Rubidium Rb ppm 0.2 10000
Samarium Sm ppm 0.03 1000
Tin Sn ppm 1 10000
Strontium Sr ppm 0.1 10000
Tantalum Ta ppm 0.1 2500
Terbium Tb ppm 0.01 1000
Thorium Th ppm 0.05 1000
Thallium Tl ppm 0.5 1000
Thullium Tm ppm 0.01 1000
Uranium U ppm 0.05 1000
Vanadium V ppm 5 10000
Tungsten W ppm 1 10000
Yttrium Y ppm 0.5 10000
Ytterbium Yb ppm 0.03 1000
Zirconium Zr ppm 2 10000
*Note: Minerals that may not recover fully using the lithium borate fusion include zircon, some
metal oxides, some rare-earth phosphates and some sulphides. Basemetals also do not fully recover
using this method.

January 10th
, 2014
Geochemical Package
Revision 04.00
ME-4ACD81 Addition of Basemetals
Sample Decomposition:
4-Acid (GEO-4ACID)
Analytical Method:
Inductively Coupled Plasma – Atomic Emission Spectroscopy (ICP-AES
A prepared sample (0.25 g) is digested with perchloric, nitric, hydrofluoric and hydrochloric acids.
The residue is topped up with dilute hydrochloric acid and the resulting solution is analyzed by
inductively coupled plasma-atomic emission spectrometry. Results are corrected for spectral inter-
element interferences.
Element Symbol Units Lower Limit Upper Limit
Silver Ag ppm 0.5 100
Cadmium Cd ppm 0.5 1000
Cobalt Co ppm 1 10000
Copper Cu ppm 1 10000
Lithium Li ppm 10 10000
Molybdenum Mo ppm 1 10000
Nickel Ni ppm 1 10000
Lead Pb ppm 2 10000
Zinc Zn ppm 2 10000

January 10th
, 2014
Geochemical Package
Revision 04.00
Geochemical Procedure – ME-MS42
Single Element Trace Level Methods Using ICP-MS
Sample Decomposition:
Aqua Regia Digestion (GEO-AR01)
Analytical Method:
Inductively Coupled Plasma - Mass Spectrometry (ICP-MS)
A prepared sample (0.50 g) is digested with aqua regia for 45 minutes. After cooling, the resulting
solution is diluted to 12.5 mL with de-ionized water, mixed and analyzed by inductively coupled
plasma-mass spectrometry. The analytical results are corrected for inter element spectral
interferences.
Element Symbol Units Lower
Limit
Upper
Limit
Arsenic As ppm 0.1 250
Bismuth Bi ppm 0.01 250
Mercury Hg ppm 0.005 250
Antimony Sb ppm 0.05 250
Selenium Se ppm 0.2 250
Tellurium Te ppm 0.01 250

Lab Accreditation & QA Overview (rev08.00) Revision: 07.00
Issuing Authority: Erin Miller August 6, 2014 Page 1 of 10
R I G H T S O L U T I O N S | R I G H T P A R T N E R
QUALITY ASSURANCE OVERVIEW
Laboratory Accreditation and Certification
ISO/IEC 17025 The North American analytical laboratories are accredited by the Standards Council of Canada (SCC) for specific tests listed in the Scopes of Accreditation to ISO/IEC 17025, the General Requirements for the Competence of Testing and Calibration Laboratories, and the PALCAN Handbook (CAN-P-1570). Accreditation to this ISO standard involves detailed, on-site audits to evaluate our quality
management system and verify the technical competence of our methods and personnel.
This technical verification includes the requirement for successful participation in inter-
laboratory proficiency testing programs and full method validation.
ALS has taken the additional step to list all sample preparation laboratories in North America
as part of the Scopes of Accreditation for our analytical laboratories. By doing this ALS
acknowledges that sample preparation is performed at locations that are monitored
regularly for quality control practices.
The scope of accreditation for ALS Geochemistry Vancouver includes the following methods:
Au-AA: Determination of Au by Lead Collection Fire Assay and AAS Au/Ag-GRA: Determination of Au and Ag by Lead Collection Fire Assay and
Gravimetric Finish PGM-ICP: Determination of Au, Pt and Pd by Lead Collection Fire Assay and ICP-AES ME-ICP41: Multi-Element (Ag, Al, As, B, Ba, Be, Bi, Ca, Cd, Co, Cr, Cu, Fe, Ga, Hg, K,
La, Mg, Mn, Mo, Na, Ni, P, Pb, S, Sb, Sc, Sr, Ti, Tl, U, V, W, Zn) Determination by Aqua Regia Digestion and ICP-AES

Lab Accreditation & QA Overview (rev08.00) Revision: 08.00
Issuing Authority: Laura Glaubach October 23, 2015
Page 2 of 10
ME-MS41: Multi-Element (Ag, Al, As, B, Ba, Be, Bi, Ca, Cd, Ce, Co, Cr, Cs, Cu, Fe, Ga, Ge, Hf, Hg, In, K, La, Li, Mg, Mn, Mo, Na, Nb, Ni, P, Pb, Rb, Re, S, Sb, Sc, Se, Sn, Sr, Ta, Te, Th, Ti, Tl, U, V, W, Y, Zn, Zr) Determination by Aqua Regia Digestion and ICP-AES and ICP-MS
ME-ICP61: Multi-Element (Ag, Al, As, Ba, Be, Bi, Ca, Cd, Co, Cr, Cu, Fe, Ga, K, La, Li, Mg, Mn, Mo, Na, Nb, Ni, P, Pb, Rb, S, Sb, Sc, Se, Si, Sn, Sr, Ta, Te, Ti, Tl, U, V W, Y, Zn and Zr) Determination by 4-Acid Digestion and ICP-AES
ME-MS61: Multi-Element (Ag, Al, As, Ba, Be, Bi, Ca, Cd, Ce, Co, Cr, Cs, Cu, Fe, Ga, Ge, Hf, In, K, La, Li, Mg, Mn, Mo, Na, Nb, Ni, P, Pb, Rb, Re, S, Sb, Sc, Se, Si, Sn, Sr, Ta, Te, Th, Ti, Tl, U, V, W, Y, Zn, Zr) Determination by 4-Acid Digestion and ICP-AES and ICP-MS
ME-ICP81: Al, Co, CU, Fe, Mg, Mn, Ni, Pb, S and Zn by Sodium Peroxide Fusion and ICP-AES
OG46: Ag, Cu, Mo, Pb, and Zn – Determination of Ores and High Grade Material Using ICP-AES Following an Aqua Regia Digestion
OG62: Ag, Cu, Mo, Pb and Zn – Determination of Ores and High Grade Material Using ICP-AES Following a Four-Acid Digestion
AA45: Ag, Cu, Pb and Zn – Determination of Base Meals Using AAS Following an Aqua Regia Digestion
AA46: Ag, Cu, Pb, Zn and Mo – Determination of Ores and High Grade materials Using AAS Following an Aqua Regia Digestion
AA61: Ag, Co, Cu, Ni, Pb and Zn – Determination of Base Metals Using AAS Following a Four-Acid Digestion
AA62: Ag, Co, CU, Mo, Ni, Pb and Zn – Determination of Ores and High Grade Materials Using AAS Following a Four-Acid Digestion
ME-ICP06: SiO2, Al2O3, Fe2O3, CaO, MgO, Na2O, K2O, Cr2O3, TiO2, MnO, P2O5, SrO, BaO, Total - Determination of Major Oxides by Lithium Metaborate/Lithium Tetraborate Fusion and ICP-AES
OA-GRA05: LOI – Loss on Ignition ME-MS81: Ba, Ce, Cr, Cs, Dy, Er, Eu, Ga, Gd, Hf, Ho, La, Lu, Nb, Nd, Pr, Rb, Sm, Sn, Sr,
Ta, Tb, Th, Tl, Tm, U, V, W, Y, Yb, Zr – Determination of Rare Earth Elements by Lithium Borate Fusion and ICP-MS
ME-ICP41a: Multi-Element (Ag, Al, As, B, Ba, Be, Bi, Ca, Cd, Ce, Co, Cr, Cu, Fe, Ga, Hf, Hg, K, La, Li, Mg, Mn, Mo, Na, Nb, Ni, P, Pb, Rb, S, Sb, Sc, Se, Si, Sn, Sr, Ta, Te, Th, Ti, Tl, U, V, W, Y, Zn) – Determination of Low Grade Ores by Aqua Regia Digestion and ICP-AES
ME-ICP61a: Multi-Element (Ag, Al, As, Ba, Be, Bi, Ca, Cd, Ce, Co, Cr, Cu, Fe, Ga, Hf, K, La, Li, Mg, Mn, Mo, Na, Nb, Ni, P, Pb, Rb, S, Sb, Sc, Se, Sn, Sr, Ta, Te, Th, Ti, Tl, U, V, W, Y, Zn, Zr – Determination of Low Grade Ores by Four-Acid Digestion and ICP-AES
ME-XRF06: SiO2, Al2O3, Fe2O3, CaO, MgO, Na2O, K2O, Cr2O3, TiO2, MnO, P2O5, SrO, BaO, Total – Determination of Major Oxides by Lithium Metaborate/Lithium Tetraborate Fusion and XRF
OA-GRA06: LOI – Loss on Ignition ME-XRF26: SiO2, Al2O3, Fe2O3, CaO, MgO, Na2O, K2O, Cr2O3, TiO2, MnO, P2O5, SrO,
BaO, Total – Determination of Major Oxides by Lithium Metaborate/Lithium Tetraborate Fusion and XRF
OA-GRA05x: LOI – Loss on Ignition S-IR08: S – Determination of Total S by Leco Furnace and Infrared Spectroscopy C-IR07: C - Determination of Total C by Leco Furnace and Infrared Spectroscopy OA-VOL08: Fizz Rating, NP, MPA, NNP, Ratio (NP:MPA) – Acid Base Accounting

Lab Accreditation & QA Overview (rev08.00) Revision: 08.00
Issuing Authority: Laura Glaubach October 23, 2015
Page 3 of 10
The scope of accreditation for ALS Geochemistry Reno includes the following methods:
Au-AA: Determination of Au by Lead Collection Fire Assay and AAS Au/Ag-GRA: Determination of Au by Lead Collection Fire Assay and Gravimetric
Finish The scope of accreditation for ALS Geochemistry Val d’Or includes the following methods:
Au-AA: Determination of Au by Lead Collection Fire Assay and AAS Au-GRA: Determination Au by Lead Collection Fire Assay and Gravimetric Finish
Aside from laboratory accreditation, ALS Geochemistry has been a leader in participating in, and sponsoring, the assayer certification program in British Columbia. Many of our analysts have completed this demanding program that includes extensive theoretical and practical examinations. Upon successful completion of these examinations, they are awarded the title of Registered Assayer.
Quality Assurance Program
The quality assurance program is an integral part of all day-to-day activities at ALS Geochemistry and involves all levels of staff. Responsibilities are formally assigned for all aspects of the quality assurance program. As part of the program, checks are made to monitor quality at both sample preparation and analytical stages.
Quality Assurance Program Overview
Sample Preparation Quality Control
Quality Specifications Fineness of crushing and pulverizing checked and monitored according to method specifications. Sample Preparation Duplicates Inserted every 50 samples. Split taken from coarse crushed material.
Analytical Quality Control
Blanks, reference materials and pulp duplicates are inserted into every analytical run. Frequency details can be found on page 6.
Sample Preparation Quality Specifications Standard specifications for sample preparation are clearly defined and monitored. The specifications for our most common methods are as follows:
Crushing (CRU-31) > 70% of the crushed sample passes through a 2 mm screen
Ringing (PUL-31)

Lab Accreditation & QA Overview (rev08.00) Revision: 08.00
Issuing Authority: Laura Glaubach October 23, 2015
Page 4 of 10
> 85% of the ring pulverized sample passes through a 75 micron screen (Tyler 200 mesh)
Samples Received as Pulps >85% of the sample passes through a 75 micron screen (Tyler 200 mesh)
These characteristics are measured and results reported to verify the quality of sample preparation. Our standard operating procedures require that samples at every preparation station are tested regularly throughout each shift. Measurement of sample preparation quality allows the identification of equipment, operators and processes that are not operating within specifications. QC results from all global sample preparation laboratories are captured by the LIM System and the QA Department compiles a monthly review report for senior management on the performance of each laboratory from this data.

Lab Accreditation & QA Overview (rev08.00) Revision: 08.00
Issuing Authority: Laura Glaubach October 23, 2015
Page 5 of 10
Other Sample Preparation Specifications Sample preparation is a vital part of any analysis protocol. Many projects require sample preparation to other specifications, for instance >90% of the crushed sample to pass through a 2 mm screen. These procedures can easily be accommodated and the Prep QC monitoring system is essential in ensuring the required specifications are routinely met.
Sample Preparation Duplicates In addition to routine screen tests, sample preparation quality is monitored at ALS Geochemistry through the insertion of sample preparation duplicates. For every 50 samples prepared, an additional split is taken from the coarse crushed material to create a pulverizing duplicate. The additional split is processed and analyzed in a similar manner to the other samples in the submission. The precision of the preparation duplicate results is highly dependent on the individual sample mineralogy, analytes of interest and procedures selected for sample preparation. Therefore the data is most relevant at the client /project level. All preparation duplicate data is automatically captured, sorted and retained in the QC Database and available on Webtrieve™ for client review. The data is also available on the QC Data Certificates.

Lab Accreditation & QA Overview (rev08.00) Revision: 08.00
Issuing Authority: Laura Glaubach October 23, 2015
Page 6 of 10

Lab Accreditation & QA Overview (rev08.00) Revision: 08.00
Issuing Authority: Laura Glaubach October 23, 2015
Page 7 of 10
Analytical Quality Control – Reference Materials, Blanks & Duplicates The LIMS inserts quality control samples (reference materials, blanks and duplicates) on each analytical run, based on the rack sizes associated with the method. The rack size is the number of sample including QC samples included in a batch. The blank is inserted at the beginning, standards are inserted at random intervals, and duplicates are analysed at the end of the batch. Quality control samples are inserted based on the following rack sizes specific to the method:
Rack Size Methods Quality Control Sample Allocation
20 Specialty methods including specific gravity, bulk density, and acid insolubility
2 standards, 1 duplicate, 1 blank
28 Specialty fire assay, assay-grade, umpire and concentrate methods
1 standard, 1 duplicate, 1 blank
39 XRF methods 2 standards, 1 duplicate, 1 blank
40 Regular AAS, ICP-AES and ICP-MS methods
2 standards, 1 duplicate, 1 blank
84 Regular fire assay methods 2 standards, 3 duplicates, 1 blank
Laboratory staff analyse quality control samples at least at the frequency specified above. If necessary, they may include additional quality control samples above the minimum specifications.
All data gathered for quality control samples – blanks, duplicates and reference materials – are automatically captured, sorted and retained in the QC Database.
Quality Control Limits and Evaluation Quality Control Limits for reference materials and duplicate analyses are established according to the precision and accuracy requirements of the particular method. Data outside control limits are identified and investigated and require corrective actions to be taken. Quality control data is scrutinised at a number of levels. Each analyst is responsible for ensuring the data submitted is within control specifications. In addition, there are a number of other checks.
Certificate Approval If any data for reference materials, duplicates, or blanks falls beyond the control limits established, it is automatically flagged red by the computer system for serious failures, and yellow for borderline results. The Department Manager(s) conducting the final review of the Certificate is thus made aware that a problem may exist with the data set.

Lab Accreditation & QA Overview (rev08.00) Revision: 08.00
Issuing Authority: Laura Glaubach October 23, 2015
Page 8 of 10
Precision Specifications and Definitions Most geochemical procedures are specified to have a precision of 10%, and assay procedures 5%. The precision of Au analyses is dominated by the sampling precision. Precision can be expressed as a function of concentration:
PDetectionLimit
cPc ( ) 100%
where Pc - the precision at concentration c c - concentration of the element P - the “Precision Factor” of the element. This is the precision of the
method at very high concentrations, i.e. 0.05 for 5%.
(M. Thompson, 1988. Variation of precision with concentration in an analytical system. Analyst, 113:
1579-1587.)
As an example, precision as a function of concentration (10% precision) is plotted for three different detection limits. The impact of detection limit on precision of results for low-level determinations can be dramatic.
%Precision as a Function of Detection Limit
0.00%
20.00%
40.00%
60.00%
80.00%
100.00%
120.00%
1 2 5 10 20 50 100 200 500 1000 2000 5000 10000
Concentration (ppm)
% P
rec
isio
n
1 ppm DL
2 ppm DL
10 ppm DL

Lab Accreditation & QA Overview (rev08.00) Revision: 08.00
Issuing Authority: Laura Glaubach October 23, 2015
Page 9 of 10
Evaluation of Trends Control charts for frequently used method codes are generated and evaluated by laboratory staff on a regular basis. The control charts are evaluated to ensure internal specifications for precision and accuracy are met. The data is also reviewed for any long-term trends and drifts.

Lab Accreditation & QA Overview (rev08.00) Revision: 08.00
Issuing Authority: Laura Glaubach October 23, 2015
Page 10 of 10
External Proficiency Tests Proficiency testing provides an independent assessment of laboratory performance by an outside agency. Test materials are regularly distributed to the participants and results are processed by a central agency. The results are usually converted to a Z-Score to rate the laboratory’s result against the consensus value from all participating labs. All ALS Geochemistry analytical facilities in North America participate in proficiency tests for the analytical procedures routinely done at each laboratory. ALS Geochemistry has participated for many years in proficiency tests organized by organizations such as Canadian Certified Reference Materials Projects, and Geostats as well as a number of independent studies organized by consultants for specific clients. We have participated also participated in several certification studies for new certified reference materials by CANMET and Rocklabs. Feedback from these studies is invaluable in ensuring our continuing accuracy and validation of methods.
Quality Assurance Meetings A review of quality assurance issues is held regularly at Technical and Quality Assurance Meetings. The meetings cover such topics as:
Results of internal round robin exchanges, external proficiency tests and performance evaluation samples
Monitoring of control charts for reference materials Review of quality system failures Incidents raised by clients Results of internal quality audits Other quality assurance issues
The Quality Assurance Department and senior laboratory management participate in these meetings.

February 2014 REVISION 4.0
Geochemcial Procedure
R I G H T S O L U T I O N S | R I G H T P A R T N E R
ME-XRF26 – Silicate / Whole Rock by Fusion / XRF
Sample Decomposition: Lithium Borate Fusion (WEI-GRA12b)
Analytical Method: X-Ray Fluorescence Spectroscopy (XRF)
A prepared sample (0.66 g) is fused with a 12:22 lithium tetraborate – lithium metaborate flux which also includes
an oxidizing agent (Lithium Nitrate), and then poured into a platinum mold. The resultant disk is in turn analyzed
by XRF spectrometry.
The XRF analysis is determined in conjunction with a loss-on-ignition at 1000°C. The resulting data from both
determinations are combined to produce a “total”.
Analyte Symbol Units Lower Limit Upper Limit
Aluminum Al2
O3
% 0.01 100
Barium BaO % 0.01 66
Calcium CaO % 0.01 60
Chromium Cr2
O3
% 0.01 10
Iron Fe2
O3
% 0.01 100
Potassium K2
O % 0.01 15
Magnesium MgO % 0.01 50
Manganese MnO % 0.01 39
Sodium Na2
O % 0.01 10
Phosphorus P2
O5
% 0.01 46
Sulphur SO3
% 0.01 34
Silicon SiO2
% 0.01 100
Titanium TiO2
% 0.01 30

Revision 03.03
March 29, 2012
Sample Preparation Package
PREP-31
Standard Sample Preparation: Dry, Crush, Split and Pulverize
Sample preparation is the most critical step in the entire laboratory operation. The purpose of
preparation is to produce a homogeneous analytical sub-sample that is fully representative of the
material submitted to the laboratory.
The sample is logged in the tracking system, weighed, dried and finely crushed to better than 70 %
passing a 2 mm (Tyler 9 mesh, US Std. No.10) screen. A split of up to 250 g is taken and pulverized
to better than 85 % passing a 75 micron (Tyler 200 mesh, US Std. No. 200) screen. This method is
appropriate for rock chip or drill samples.
Method Code Description
LOG-22 Sample is logged in tracking system and a bar code label is
attached.
CRU-31 Fine crushing of rock chip and drill samples to better than
70 % of the sample passing 2 mm.
SPL-21 Split sample using riffle splitter.
PUL-31 A sample split of up to 250 g is pulverized to better than
85 % of the sample passing 75 microns.

Revision 03.03
March 29, 2012
Sample Preparation Package
Flow Chart -
Sample Preparation Package – PREP-31
Standard Sample Preparation: Dry, Crush, Split and Pulverize
LOG-22
Affix Bar Code and Log Sample in LIMS
CRU-31
Fine crushing of rock chip and drill samples
to better than 70 % < 2 mm
Receive
Sample
WEI-21
Record received sample weight
SPL-21
Split sample using riffle
splitter
Keep
RejectReject
The sample reject is
saved or dumped
pending client
instructions. Prolonged
storage (> 45 days) of
rejects will be charged
to the client.
Is sample
dry?
YES
Dry Sample
NO If samples air-dry
overnight, no charge to
client. If samples are
excessively wet, the
sample should be dried
to a maximum of
120°C. (DRY-21)
QC testing of
pulverizing efficiency is
conducted on random
samples (PUL-QC).
Retain
pulp for
analysis
Lab splits are required
when analyses must
be performed at a
location different than
where samples
received.
PUL-31
Up to 250 g sample split is pulverized to
better than 85 % < 75 microns
QC testing of crushing
efficiency is conducted
on random samples
(CRU-QC).

ALS CODE DESCRIPTION
WEI- 21 Received Sample Weight
LOG- 22 Sample login - Rcd w/o BarCode
CRU- 31 Fine crushing - 70% <2mm
CRU- QC Crushing QC Test
SPL- 21 Split sample - riffle splitter
PUL- 31 Pulverize split to 85% <75 um
ALS CODE DESCRIPTION INSTRUMENT
ME- XRF26 XRFWhole Rock By Fusion/XRF
OA- GRA05x WST- SEQLOI for XRF
ME- MS42 ICP- MSUp to 34 elements by ICP- MS
S- IR08 LECOTotal Sulphur (Leco)
C- IR07 LECOTotal Carbon (Leco)
ME- MS81 ICP- MSLithium Borate Fusion ICP- MS
ME- 4ACD81 ICP- AESBase Metals by 4- acid dig.
Au- ICP21 ICP- AESAu 30g FA ICP- AES Finish
This report is for 6 Rock samples submitted to our lab in Vancouver, BC, Canada on15- SEP- 2015.
Project: Galore Creek
P.O. No.: 13053
The following have access to data associated with this certificate:SARAH HENDERSON
To:
To:ALS Canada Ltd.
2103 Dollarton HwyNorth Vancouver BC V7H 0A7Phone: + 1 (604) 984 0221 Fax: + 1 (604) 984 0218
www.alsglobal.com
This is the Final Report and supersedes any preliminary report with this certificate number. Results apply to samples assubmitted. All pages of this report have been checked and approved for release.
Colin Ramshaw, Vancouver Laboratory Manager***** See Appendix Page for comments regarding this certificate *****

ALS Canada Ltd.
2103 Dollarton HwyNorth Vancouver BC V7H 0A7Phone: + 1 (604) 984 0221 Fax: + 1 (604) 984 0218
www.alsglobal.com
To:
Project: Galore Creek
Au- ICP21 ME- XRF26 ME- XRF26 ME- XRF26 ME- XRF26 ME- XRF26 ME- XRF26 ME- XRF26 ME- XRF26 ME- XRF26 ME- XRF26 ME- XRF26 ME- XRF26 ME- XRF26 OA- GRA05x
Au Al2O3 BaO CaO Cr2O3 Fe2O3 K2O MgO MnO Na2O P2O5 SiO2 SrO TiO2 LOI 1000
ppm % % % % % % % % % % % % % %
0.001 0.01 0.01 0.01 0.01 0.01 0.01 0.01 0.01 0.01 0.01 0.01 0.01 0.01 0.01
AMIS0304
Target Range - Lower Bound
Upper Bound
BP- 13 0.361
Target Range - Lower Bound 0.336
Upper Bound 0.380
CDN- PGMS20 1.185
Target Range - Lower Bound
Upper Bound
DS- 1
Target Range - Lower Bound
Upper Bound
DS- 1
Target Range - Lower Bound
Upper Bound
G307- 7 8.01
Target Range - Lower Bound 7.40
Upper Bound 8.34
GBM908- 10
Target Range - Lower Bound
Upper Bound
GBM908- 5
Target Range - Lower Bound
Upper Bound
GLG307- 4 0.050
Target Range - Lower Bound 0.048
Upper Bound 0.056
GS310- 10
Target Range - Lower Bound
Upper Bound
GS310- 10
Target Range - Lower Bound
Upper Bound
***** See Appendix Page for comments regarding this certificate *****

ALS Canada Ltd.
2103 Dollarton HwyNorth Vancouver BC V7H 0A7Phone: + 1 (604) 984 0221 Fax: + 1 (604) 984 0218
www.alsglobal.com
To:
Project: Galore Creek
ME- XRF26 ME- MS81 ME- MS81 ME- MS81 ME- MS81 ME- MS81 ME- MS81 ME- MS81 ME- MS81 ME- MS81 ME- MS81 ME- MS81 ME- MS81 ME- MS81 ME- MS81
Total Ba Ce Cr Cs Dy Er Eu Ga Gd Ge Hf Ho La Lu
% ppm ppm ppm ppm ppm ppm ppm ppm ppm ppm ppm ppm ppm ppm
0.01 0.5 0.5 10 0.01 0.05 0.03 0.03 0.1 0.05 5 0.2 0.01 0.5 0.01
AMIS0304 2600 8350 90 0.48 132.0 33.4 146.0 58.3 352 9 28.3 18.20 3580 1.95
Target Range - Lower Bound 2340 7280 70 0.34 119.0 30.6 135.0 47.8 309 <5 25.0 16.20 3250 1.83
Upper Bound 2860 8900 120 0.43 145.5 37.4 165.0 58.7 377 18 31.0 19.80 3970 2.26
BP- 13
Target Range - Lower Bound
Upper Bound
CDN- PGMS20
Target Range - Lower Bound
Upper Bound
DS- 1
Target Range - Lower Bound
Upper Bound
DS- 1
Target Range - Lower Bound
Upper Bound
G307- 7
Target Range - Lower Bound
Upper Bound
GBM908- 10
Target Range - Lower Bound
Upper Bound
GBM908- 5
Target Range - Lower Bound
Upper Bound
GLG307- 4
Target Range - Lower Bound
Upper Bound
GS310- 10
Target Range - Lower Bound
Upper Bound
GS310- 10
Target Range - Lower Bound
Upper Bound
***** See Appendix Page for comments regarding this certificate *****

ALS Canada Ltd.
2103 Dollarton HwyNorth Vancouver BC V7H 0A7Phone: + 1 (604) 984 0221 Fax: + 1 (604) 984 0218
www.alsglobal.com
To:
Project: Galore Creek
ME- MS81 ME- MS81 ME- MS81 ME- MS81 ME- MS81 ME- MS81 ME- MS81 ME- MS81 ME- MS81 ME- MS81 ME- MS81 ME- MS81 ME- MS81 ME- MS81 ME- MS81
Nb Nd Pr Rb Sm Sn Sr Ta Tb Th Tm U V W Y
ppm ppm ppm ppm ppm ppm ppm ppm ppm ppm ppm ppm ppm ppm ppm
0.2 0.1 0.03 0.2 0.03 1 0.1 0.1 0.01 0.05 0.01 0.05 5 1 0.5
AMIS0304 >2500 3990 >1000 10.6 585 24 3530 11.6 33.9 460 3.41 25.9 367 5 392
Target Range - Lower Bound 4670 3610 925 9.3 543 22 3060 11.1 30.8 406 3.14 21.6 331 3 369
Upper Bound >2500 4410 >1000 11.8 664 29 3740 13.8 37.7 496 3.86 26.5 415 7 452
BP- 13
Target Range - Lower Bound
Upper Bound
CDN- PGMS20
Target Range - Lower Bound
Upper Bound
DS- 1
Target Range - Lower Bound
Upper Bound
DS- 1
Target Range - Lower Bound
Upper Bound
G307- 7
Target Range - Lower Bound
Upper Bound
GBM908- 10
Target Range - Lower Bound
Upper Bound
GBM908- 5
Target Range - Lower Bound
Upper Bound
GLG307- 4
Target Range - Lower Bound
Upper Bound
GS310- 10
Target Range - Lower Bound
Upper Bound
GS310- 10
Target Range - Lower Bound
Upper Bound
***** See Appendix Page for comments regarding this certificate *****

ALS Canada Ltd.
2103 Dollarton HwyNorth Vancouver BC V7H 0A7Phone: + 1 (604) 984 0221 Fax: + 1 (604) 984 0218
www.alsglobal.com
To:
Project: Galore Creek
ME- MS81 ME- MS81 ME- 4ACD81 ME- 4ACD81 ME- 4ACD81 ME- 4ACD81 ME- 4ACD81 ME- 4ACD81 ME- 4ACD81 ME- 4ACD81 ME- 4ACD81 ME- 4ACD81 ME- MS42 ME- MS42 ME- MS42
Yb Zr Ag Cd Co Cu Li Mo Ni Pb Sc Zn As Bi Hg
ppm ppm ppm ppm ppm ppm ppm ppm ppm ppm ppm ppm ppm ppm ppm
0.03 2 0.5 0.5 1 1 10 1 1 2 1 2 0.1 0.01 0.005
AMIS0304 17.35 1170
Target Range - Lower Bound 15.25 1005
Upper Bound 18.75 1230
BP- 13
Target Range - Lower Bound
Upper Bound
CDN- PGMS20
Target Range - Lower Bound
Upper Bound
DS- 1
Target Range - Lower Bound
Upper Bound
DS- 1
Target Range - Lower Bound
Upper Bound
G307- 7
Target Range - Lower Bound
Upper Bound
GBM908- 10 3.0 1.8 26 3650 10 56 2250 2070 18 1060
Target Range - Lower Bound 1.9 0.6 22 3370 <10 57 2030 1860 14 939
Upper Bound 4.2 2.8 30 3890 30 71 2490 2280 20 1155
GBM908- 5 6.0 0.64 0.032
Target Range - Lower Bound 5.7 0.78 0.017
Upper Bound 7.1 0.98 0.043
GLG307- 4
Target Range - Lower Bound
Upper Bound
GS310- 10
Target Range - Lower Bound
Upper Bound
GS310- 10
Target Range - Lower Bound
Upper Bound
***** See Appendix Page for comments regarding this certificate *****

ALS Canada Ltd.
2103 Dollarton HwyNorth Vancouver BC V7H 0A7Phone: + 1 (604) 984 0221 Fax: + 1 (604) 984 0218
www.alsglobal.com
To:
Project: Galore Creek
ME- MS42 ME- MS42 ME- MS42 ME- MS42 ME- MS42 ME- MS42 ME- MS42 S- IR08 C- IR07
In Re Sb Sc Se Te Tl S C
ppm ppm ppm ppm ppm ppm ppm % %
0.005 0.001 0.05 0.1 0.2 0.01 0.02 0.01 0.01
AMIS0304
Target Range - Lower Bound
Upper Bound
BP- 13
Target Range - Lower Bound
Upper Bound
CDN- PGMS20
Target Range - Lower Bound
Upper Bound
DS- 1 3.09
Target Range - Lower Bound 3.01
Upper Bound 3.25
DS- 1 2.58
Target Range - Lower Bound 2.51
Upper Bound 2.71
G307- 7
Target Range - Lower Bound
Upper Bound
GBM908- 10
Target Range - Lower Bound
Upper Bound
GBM908- 5 0.013 <0.001 0.14 1.5 1.3 0.05 0.36
Target Range - Lower Bound <0.005 <0.001 <0.05 1.3 0.5 0.03 0.31
Upper Bound 0.026 0.003 0.25 1.9 1.4 0.07 0.47
GLG307- 4
Target Range - Lower Bound
Upper Bound
GS310- 10 1.05
Target Range - Lower Bound 1.03
Upper Bound 1.13
GS310- 10 0.27
Target Range - Lower Bound 0.25
Upper Bound 0.29
***** See Appendix Page for comments regarding this certificate *****

ALS Canada Ltd.
2103 Dollarton HwyNorth Vancouver BC V7H 0A7Phone: + 1 (604) 984 0221 Fax: + 1 (604) 984 0218
www.alsglobal.com
To:
Project: Galore Creek
Au- ICP21 ME- XRF26 ME- XRF26 ME- XRF26 ME- XRF26 ME- XRF26 ME- XRF26 ME- XRF26 ME- XRF26 ME- XRF26 ME- XRF26 ME- XRF26 ME- XRF26 ME- XRF26 OA- GRA05x
Au Al2O3 BaO CaO Cr2O3 Fe2O3 K2O MgO MnO Na2O P2O5 SiO2 SrO TiO2 LOI 1000
ppm % % % % % % % % % % % % % %
0.001 0.01 0.01 0.01 0.01 0.01 0.01 0.01 0.01 0.01 0.01 0.01 0.01 0.01 0.01
MRGeo08
Target Range - Lower Bound
Upper Bound
OREAS- 104
Target Range - Lower Bound
Upper Bound
OREAS- 904 0.045
Target Range - Lower Bound 0.041
Upper Bound 0.049
OxJ111 2.16
Target Range - Lower Bound 2.04
Upper Bound 2.30
PD1 0.540
Target Range - Lower Bound 0.508
Upper Bound 0.576
PK2 4.97
Target Range - Lower Bound 4.50
Upper Bound 5.07
SARM- 43 47.65
Target Range - Lower Bound 45.67
Upper Bound 50.49
SARM- 45 26.38 0.10 0.78 0.04 12.60 3.08 3.46 0.10 0.84 0.08 49.62 0.01 1.82
Target Range - Lower Bound 25.48 0.07 0.72 <0.01 12.17 3.02 3.22 0.07 0.77 0.05 48.43 <0.01 1.71
Upper Bound 26.96 0.13 0.84 0.06 13.03 3.34 3.56 0.13 0.91 0.11 50.81 0.03 1.93
SCH- 1 2.63
Target Range - Lower Bound 2.56
Upper Bound 2.85
SY- 4 20.67 0.05 8.02 <0.01 6.23 1.66 0.55 0.11 7.25 0.12 49.85 0.14 0.29
Target Range - Lower Bound 20.07 <0.01 7.74 <0.01 5.95 1.56 0.49 0.08 6.81 0.10 48.70 0.11 0.25
Upper Bound 21.31 0.06 8.36 0.02 6.47 1.76 0.59 0.13 7.39 0.16 51.10 0.17 0.32
***** See Appendix Page for comments regarding this certificate *****

ALS Canada Ltd.
2103 Dollarton HwyNorth Vancouver BC V7H 0A7Phone: + 1 (604) 984 0221 Fax: + 1 (604) 984 0218
www.alsglobal.com
To:
Project: Galore Creek
ME- XRF26 ME- MS81 ME- MS81 ME- MS81 ME- MS81 ME- MS81 ME- MS81 ME- MS81 ME- MS81 ME- MS81 ME- MS81 ME- MS81 ME- MS81 ME- MS81 ME- MS81
Total Ba Ce Cr Cs Dy Er Eu Ga Gd Ge Hf Ho La Lu
% ppm ppm ppm ppm ppm ppm ppm ppm ppm ppm ppm ppm ppm ppm
0.01 0.5 0.5 10 0.01 0.05 0.03 0.03 0.1 0.05 5 0.2 0.01 0.5 0.01
MRGeo08
Target Range - Lower Bound
Upper Bound
OREAS- 104 1265 94.4 40 3.55 6.82 3.71 1.21 23.8 8.69 <5 6.6 1.35 45.4 0.47
Target Range - Lower Bound 1160 91.3 30 3.37 6.35 3.48 1.13 22.8 8.41 <5 6.1 1.21 43.4 0.42
Upper Bound 1415 112.5 80 4.15 7.87 4.32 1.45 28.1 10.40 12 7.9 1.51 54.2 0.54
OREAS- 904
Target Range - Lower Bound
Upper Bound
OxJ111
Target Range - Lower Bound
Upper Bound
PD1
Target Range - Lower Bound
Upper Bound
PK2
Target Range - Lower Bound
Upper Bound
SARM- 43
Target Range - Lower Bound
Upper Bound
SARM- 45 100.25
Target Range - Lower Bound 97.99
Upper Bound 102.00
SCH- 1
Target Range - Lower Bound
Upper Bound
SY- 4 99.64
Target Range - Lower Bound 97.31
Upper Bound 101.30
***** See Appendix Page for comments regarding this certificate *****

ALS Canada Ltd.
2103 Dollarton HwyNorth Vancouver BC V7H 0A7Phone: + 1 (604) 984 0221 Fax: + 1 (604) 984 0218
www.alsglobal.com
To:
Project: Galore Creek
ME- MS81 ME- MS81 ME- MS81 ME- MS81 ME- MS81 ME- MS81 ME- MS81 ME- MS81 ME- MS81 ME- MS81 ME- MS81 ME- MS81 ME- MS81 ME- MS81 ME- MS81
Nb Nd Pr Rb Sm Sn Sr Ta Tb Th Tm U V W Y
ppm ppm ppm ppm ppm ppm ppm ppm ppm ppm ppm ppm ppm ppm ppm
0.2 0.1 0.03 0.2 0.03 1 0.1 0.1 0.01 0.05 0.01 0.05 5 1 0.5
MRGeo08
Target Range - Lower Bound
Upper Bound
OREAS- 104 26.5 47.0 11.70 117.0 10.45 7 106.0 2.6 1.25 153.0 0.53 125.5 18 3 35.0
Target Range - Lower Bound 26.3 44.5 11.50 112.5 9.42 6 102.5 2.5 1.24 137.0 0.50 113.5 6 <1 33.2
Upper Bound 32.6 54.6 14.10 137.5 11.60 11 125.5 3.3 1.54 167.5 0.64 138.5 27 5 41.6
OREAS- 904
Target Range - Lower Bound
Upper Bound
OxJ111
Target Range - Lower Bound
Upper Bound
PD1
Target Range - Lower Bound
Upper Bound
PK2
Target Range - Lower Bound
Upper Bound
SARM- 43
Target Range - Lower Bound
Upper Bound
SARM- 45
Target Range - Lower Bound
Upper Bound
SCH- 1
Target Range - Lower Bound
Upper Bound
SY- 4
Target Range - Lower Bound
Upper Bound
***** See Appendix Page for comments regarding this certificate *****

ALS Canada Ltd.
2103 Dollarton HwyNorth Vancouver BC V7H 0A7Phone: + 1 (604) 984 0221 Fax: + 1 (604) 984 0218
www.alsglobal.com
To:
Project: Galore Creek
ME- MS81 ME- MS81 ME- 4ACD81 ME- 4ACD81 ME- 4ACD81 ME- 4ACD81 ME- 4ACD81 ME- 4ACD81 ME- 4ACD81 ME- 4ACD81 ME- 4ACD81 ME- 4ACD81 ME- MS42 ME- MS42 ME- MS42
Yb Zr Ag Cd Co Cu Li Mo Ni Pb Sc Zn As Bi Hg
ppm ppm ppm ppm ppm ppm ppm ppm ppm ppm ppm ppm ppm ppm ppm
0.03 2 0.5 0.5 1 1 10 1 1 2 1 2 0.1 0.01 0.005
MRGeo08 4.5 2.2 20 637 30 15 714 1100 12 807
Target Range - Lower Bound 3.2 1.2 17 586 <10 12 621 969 10 722
Upper Bound 5.7 3.4 23 676 60 18 761 1190 15 886
OREAS- 104 3.26 225
Target Range - Lower Bound 3.06 215
Upper Bound 3.80 267
OREAS- 904
Target Range - Lower Bound
Upper Bound
OxJ111
Target Range - Lower Bound
Upper Bound
PD1
Target Range - Lower Bound
Upper Bound
PK2
Target Range - Lower Bound
Upper Bound
SARM- 43
Target Range - Lower Bound
Upper Bound
SARM- 45
Target Range - Lower Bound
Upper Bound
SCH- 1
Target Range - Lower Bound
Upper Bound
SY- 4
Target Range - Lower Bound
Upper Bound
***** See Appendix Page for comments regarding this certificate *****

ALS Canada Ltd.
2103 Dollarton HwyNorth Vancouver BC V7H 0A7Phone: + 1 (604) 984 0221 Fax: + 1 (604) 984 0218
www.alsglobal.com
To:
Project: Galore Creek
ME- MS42 ME- MS42 ME- MS42 ME- MS42 ME- MS42 ME- MS42 ME- MS42 S- IR08 C- IR07
In Re Sb Sc Se Te Tl S C
ppm ppm ppm ppm ppm ppm ppm % %
0.005 0.001 0.05 0.1 0.2 0.01 0.02 0.01 0.01
MRGeo08
Target Range - Lower Bound
Upper Bound
OREAS- 104
Target Range - Lower Bound
Upper Bound
OREAS- 904
Target Range - Lower Bound
Upper Bound
OxJ111
Target Range - Lower Bound
Upper Bound
PD1
Target Range - Lower Bound
Upper Bound
PK2
Target Range - Lower Bound
Upper Bound
SARM- 43
Target Range - Lower Bound
Upper Bound
SARM- 45
Target Range - Lower Bound
Upper Bound
SCH- 1
Target Range - Lower Bound
Upper Bound
SY- 4
Target Range - Lower Bound
Upper Bound
***** See Appendix Page for comments regarding this certificate *****

ALS Canada Ltd.
2103 Dollarton HwyNorth Vancouver BC V7H 0A7Phone: + 1 (604) 984 0221 Fax: + 1 (604) 984 0218
www.alsglobal.com
To:
Project: Galore Creek
Au- ICP21 ME- XRF26 ME- XRF26 ME- XRF26 ME- XRF26 ME- XRF26 ME- XRF26 ME- XRF26 ME- XRF26 ME- XRF26 ME- XRF26 ME- XRF26 ME- XRF26 ME- XRF26 OA- GRA05x
Au Al2O3 BaO CaO Cr2O3 Fe2O3 K2O MgO MnO Na2O P2O5 SiO2 SrO TiO2 LOI 1000
ppm % % % % % % % % % % % % % %
0.001 0.01 0.01 0.01 0.01 0.01 0.01 0.01 0.01 0.01 0.01 0.01 0.01 0.01 0.01
BLANK <0.001
BLANK <0.001
Target Range - Lower Bound <0.001
Upper Bound 0.002
BLANK
Target Range - Lower Bound
Upper Bound
BLANK
Target Range - Lower Bound
Upper Bound
BLANK
Target Range - Lower Bound
Upper Bound
BLANK
Target Range - Lower Bound
Upper Bound
BLANK <0.01 0.01 <0.01 0.01 <0.01 <0.01 <0.01 <0.01 <0.01 <0.01 99.71 <0.01 0.01
Target Range - Lower Bound <0.01 <0.01 <0.01 <0.01 <0.01 <0.01 <0.01 <0.01 <0.01 <0.01 <0.01 <0.01 <0.01
Upper Bound 0.02 0.02 0.02 0.02 0.02 0.02 0.02 0.02 0.02 0.02 0.02 0.02 0.02
BLANK 0.01
Target Range - Lower Bound <0.01
Upper Bound 0.02
BLANK
Target Range - Lower Bound
Upper Bound
ORIGINAL
DUP
Target Range - Lower Bound
Upper Bound
***** See Appendix Page for comments regarding this certificate *****

ALS Canada Ltd.
2103 Dollarton HwyNorth Vancouver BC V7H 0A7Phone: + 1 (604) 984 0221 Fax: + 1 (604) 984 0218
www.alsglobal.com
To:
Project: Galore Creek
ME- XRF26 ME- MS81 ME- MS81 ME- MS81 ME- MS81 ME- MS81 ME- MS81 ME- MS81 ME- MS81 ME- MS81 ME- MS81 ME- MS81 ME- MS81 ME- MS81 ME- MS81
Total Ba Ce Cr Cs Dy Er Eu Ga Gd Ge Hf Ho La Lu
% ppm ppm ppm ppm ppm ppm ppm ppm ppm ppm ppm ppm ppm ppm
0.01 0.5 0.5 10 0.01 0.05 0.03 0.03 0.1 0.05 5 0.2 0.01 0.5 0.01
BLANK
BLANK
Target Range - Lower Bound
Upper Bound
BLANK
Target Range - Lower Bound
Upper Bound
BLANK
Target Range - Lower Bound
Upper Bound
BLANK
Target Range - Lower Bound
Upper Bound
BLANK 0.8 <0.5 <10 <0.01 <0.05 <0.03 <0.03 <0.1 <0.05 <5 <0.2 <0.01 <0.5 <0.01
Target Range - Lower Bound <0.5 <0.5 <10 <0.01 <0.05 <0.03 <0.03 <0.1 <0.05 <0.2 <0.01 <0.5 <0.01
Upper Bound 1.0 1.0 20 0.02 0.10 0.06 0.06 0.2 0.10 0.4 0.02 1.0 0.02
BLANK 99.77
Target Range - Lower Bound <0.01
Upper Bound 0.02
BLANK
Target Range - Lower Bound
Upper Bound
BLANK
Target Range - Lower Bound
Upper Bound
ORIGINAL 9.2 2.5 20 56.1 0.64 0.23 <0.03 45.2 0.50 <5 2.3 0.09 1.1 0.06
DUP 8.7 2.3 20 55.1 0.54 0.25 <0.03 45.6 0.53 <5 2.2 0.08 1.1 0.06
Target Range - Lower Bound 8.0 1.8 <10 52.8 0.51 0.20 <0.03 43.0 0.44 <5 1.9 0.07 <0.5 0.05
Upper Bound 9.9 3.0 30 58.4 0.67 0.28 0.06 47.8 0.59 10 2.6 0.10 1.7 0.07
***** See Appendix Page for comments regarding this certificate *****

ALS Canada Ltd.
2103 Dollarton HwyNorth Vancouver BC V7H 0A7Phone: + 1 (604) 984 0221 Fax: + 1 (604) 984 0218
www.alsglobal.com
To:
Project: Galore Creek
ME- MS81 ME- MS81 ME- MS81 ME- MS81 ME- MS81 ME- MS81 ME- MS81 ME- MS81 ME- MS81 ME- MS81 ME- MS81 ME- MS81 ME- MS81 ME- MS81 ME- MS81
Nb Nd Pr Rb Sm Sn Sr Ta Tb Th Tm U V W Y
ppm ppm ppm ppm ppm ppm ppm ppm ppm ppm ppm ppm ppm ppm ppm
0.2 0.1 0.03 0.2 0.03 1 0.1 0.1 0.01 0.05 0.01 0.05 5 1 0.5
BLANK
BLANK
Target Range - Lower Bound
Upper Bound
BLANK
Target Range - Lower Bound
Upper Bound
BLANK
Target Range - Lower Bound
Upper Bound
BLANK
Target Range - Lower Bound
Upper Bound
BLANK <0.2 <0.1 <0.03 <0.2 <0.03 <1 0.1 <0.1 <0.01 <0.05 <0.01 <0.05 <5 1 <0.5
Target Range - Lower Bound <0.2 <0.1 <0.03 <0.2 <0.03 <1 <0.1 <0.1 <0.01 <0.05 <0.01 <0.05 <5 <1 <0.5
Upper Bound 0.4 0.2 0.06 0.4 0.06 2 0.2 0.2 0.02 0.10 0.02 0.10 10 2 1.0
BLANK
Target Range - Lower Bound
Upper Bound
BLANK
Target Range - Lower Bound
Upper Bound
BLANK
Target Range - Lower Bound
Upper Bound
ORIGINAL 72.5 1.1 0.34 458 0.42 339 21.4 43.1 0.14 4.17 0.05 11.60 <5 7 3.2
DUP 71.6 1.1 0.32 453 0.49 394 20.8 42.4 0.11 4.21 0.04 10.45 <5 8 3.1
Target Range - Lower Bound 68.2 0.9 0.28 433 0.40 347 19.9 40.5 0.11 3.93 0.03 10.40 <5 6 2.5
Upper Bound 75.9 1.3 0.38 478 0.51 386 22.3 45.0 0.14 4.45 0.06 11.65 10 9 3.8
***** See Appendix Page for comments regarding this certificate *****

ALS Canada Ltd.
2103 Dollarton HwyNorth Vancouver BC V7H 0A7Phone: + 1 (604) 984 0221 Fax: + 1 (604) 984 0218
www.alsglobal.com
To:
Project: Galore Creek
ME- MS81 ME- MS81 ME- 4ACD81 ME- 4ACD81 ME- 4ACD81 ME- 4ACD81 ME- 4ACD81 ME- 4ACD81 ME- 4ACD81 ME- 4ACD81 ME- 4ACD81 ME- 4ACD81 ME- MS42 ME- MS42 ME- MS42
Yb Zr Ag Cd Co Cu Li Mo Ni Pb Sc Zn As Bi Hg
ppm ppm ppm ppm ppm ppm ppm ppm ppm ppm ppm ppm ppm ppm ppm
0.03 2 0.5 0.5 1 1 10 1 1 2 1 2 0.1 0.01 0.005
BLANK
BLANK
Target Range - Lower Bound
Upper Bound
BLANK
Target Range - Lower Bound
Upper Bound
BLANK <0.5 <0.5 <1 <1 <10 1 <1 <2 <1 <2
Target Range - Lower Bound <0.5 <0.5 <1 <1 <1 <1 <2 <2
Upper Bound 1.0 1.0 2 2 2 2 4 4
BLANK 0.1 <0.01 <0.005
Target Range - Lower Bound <0.1 <0.01 <0.005
Upper Bound 0.2 0.02 0.010
BLANK <0.03 4
Target Range - Lower Bound <0.03 <2
Upper Bound 0.06 4
BLANK
Target Range - Lower Bound
Upper Bound
BLANK
Target Range - Lower Bound
Upper Bound
BLANK
Target Range - Lower Bound
Upper Bound
ORIGINAL 0.46 25
DUP 0.55 23
Target Range - Lower Bound 0.45 21
Upper Bound 0.56 27
***** See Appendix Page for comments regarding this certificate *****

ALS Canada Ltd.
2103 Dollarton HwyNorth Vancouver BC V7H 0A7Phone: + 1 (604) 984 0221 Fax: + 1 (604) 984 0218
www.alsglobal.com
To:
Project: Galore Creek
ME- MS42 ME- MS42 ME- MS42 ME- MS42 ME- MS42 ME- MS42 ME- MS42 S- IR08 C- IR07
In Re Sb Sc Se Te Tl S C
ppm ppm ppm ppm ppm ppm ppm % %
0.005 0.001 0.05 0.1 0.2 0.01 0.02 0.01 0.01
BLANK
BLANK
Target Range - Lower Bound
Upper Bound
BLANK <0.01
Target Range - Lower Bound <0.01
Upper Bound 0.02
BLANK
Target Range - Lower Bound
Upper Bound
BLANK <0.005 <0.001 <0.05 <0.1 <0.2 <0.01 <0.02
Target Range - Lower Bound <0.005 <0.001 <0.05 <0.1 <0.2 <0.01 <0.02
Upper Bound 0.010 0.002 0.10 0.2 0.4 0.02 0.04
BLANK
Target Range - Lower Bound
Upper Bound
BLANK
Target Range - Lower Bound
Upper Bound
BLANK
Target Range - Lower Bound
Upper Bound
BLANK <0.01
Target Range - Lower Bound <0.01
Upper Bound 0.02
ORIGINAL
DUP
Target Range - Lower Bound
Upper Bound
***** See Appendix Page for comments regarding this certificate *****

ALS Canada Ltd.
2103 Dollarton HwyNorth Vancouver BC V7H 0A7Phone: + 1 (604) 984 0221 Fax: + 1 (604) 984 0218
www.alsglobal.com
To:
Project: Galore Creek
Au- ICP21 ME- XRF26 ME- XRF26 ME- XRF26 ME- XRF26 ME- XRF26 ME- XRF26 ME- XRF26 ME- XRF26 ME- XRF26 ME- XRF26 ME- XRF26 ME- XRF26 ME- XRF26 OA- GRA05x
Au Al2O3 BaO CaO Cr2O3 Fe2O3 K2O MgO MnO Na2O P2O5 SiO2 SrO TiO2 LOI 1000
ppm % % % % % % % % % % % % % %
0.001 0.01 0.01 0.01 0.01 0.01 0.01 0.01 0.01 0.01 0.01 0.01 0.01 0.01 0.01
ORIGINAL
DUP
Target Range - Lower Bound
Upper Bound
ORIGINAL 0.031
DUP 0.035
Target Range - Lower Bound 0.030
Upper Bound 0.036
ORIGINAL 0.014
DUP 0.014
Target Range - Lower Bound 0.012
Upper Bound 0.016
ORIGINAL 5.40 0.02 2.87 0.01 28.54 0.79 2.45 0.07 0.47 0.14 57.32 0.01 0.22 0.99
DUP 5.32 0.02 2.85 0.01 28.19 0.78 2.43 0.07 0.47 0.14 56.74 0.01 0.21 0.95
Target Range - Lower Bound 5.27 <0.01 2.81 <0.01 27.93 0.76 2.39 0.06 0.45 0.13 56.16 <0.01 0.20 0.94
Upper Bound 5.45 0.03 2.91 0.02 28.80 0.81 2.49 0.08 0.49 0.15 57.90 0.02 0.23 1.00
ORIGINAL 0.414
DUP 0.420
Target Range - Lower Bound 0.395
Upper Bound 0.439
2015SA887
DUP
Target Range - Lower Bound
Upper Bound
2015SA853b
DUP
Target Range - Lower Bound
Upper Bound
ORIGINAL 0.002
DUP 0.003
Target Range - Lower Bound <0.001
Upper Bound 0.004
***** See Appendix Page for comments regarding this certificate *****

ALS Canada Ltd.
2103 Dollarton HwyNorth Vancouver BC V7H 0A7Phone: + 1 (604) 984 0221 Fax: + 1 (604) 984 0218
www.alsglobal.com
To:
Project: Galore Creek
ME- XRF26 ME- MS81 ME- MS81 ME- MS81 ME- MS81 ME- MS81 ME- MS81 ME- MS81 ME- MS81 ME- MS81 ME- MS81 ME- MS81 ME- MS81 ME- MS81 ME- MS81
Total Ba Ce Cr Cs Dy Er Eu Ga Gd Ge Hf Ho La Lu
% ppm ppm ppm ppm ppm ppm ppm ppm ppm ppm ppm ppm ppm ppm
0.01 0.5 0.5 10 0.01 0.05 0.03 0.03 0.1 0.05 5 0.2 0.01 0.5 0.01
ORIGINAL
DUP
Target Range - Lower Bound
Upper Bound
ORIGINAL
DUP
Target Range - Lower Bound
Upper Bound
ORIGINAL
DUP
Target Range - Lower Bound
Upper Bound
ORIGINAL 101.55
DUP 100.40
Target Range - Lower Bound 99.96
Upper Bound 102.00
ORIGINAL
DUP
Target Range - Lower Bound
Upper Bound
2015SA887
DUP
Target Range - Lower Bound
Upper Bound
2015SA853b
DUP
Target Range - Lower Bound
Upper Bound
ORIGINAL
DUP
Target Range - Lower Bound
Upper Bound
***** See Appendix Page for comments regarding this certificate *****

ALS Canada Ltd.
2103 Dollarton HwyNorth Vancouver BC V7H 0A7Phone: + 1 (604) 984 0221 Fax: + 1 (604) 984 0218
www.alsglobal.com
To:
Project: Galore Creek
ME- MS81 ME- MS81 ME- MS81 ME- MS81 ME- MS81 ME- MS81 ME- MS81 ME- MS81 ME- MS81 ME- MS81 ME- MS81 ME- MS81 ME- MS81 ME- MS81 ME- MS81
Nb Nd Pr Rb Sm Sn Sr Ta Tb Th Tm U V W Y
ppm ppm ppm ppm ppm ppm ppm ppm ppm ppm ppm ppm ppm ppm ppm
0.2 0.1 0.03 0.2 0.03 1 0.1 0.1 0.01 0.05 0.01 0.05 5 1 0.5
ORIGINAL
DUP
Target Range - Lower Bound
Upper Bound
ORIGINAL
DUP
Target Range - Lower Bound
Upper Bound
ORIGINAL
DUP
Target Range - Lower Bound
Upper Bound
ORIGINAL
DUP
Target Range - Lower Bound
Upper Bound
ORIGINAL
DUP
Target Range - Lower Bound
Upper Bound
2015SA887
DUP
Target Range - Lower Bound
Upper Bound
2015SA853b
DUP
Target Range - Lower Bound
Upper Bound
ORIGINAL
DUP
Target Range - Lower Bound
Upper Bound
***** See Appendix Page for comments regarding this certificate *****
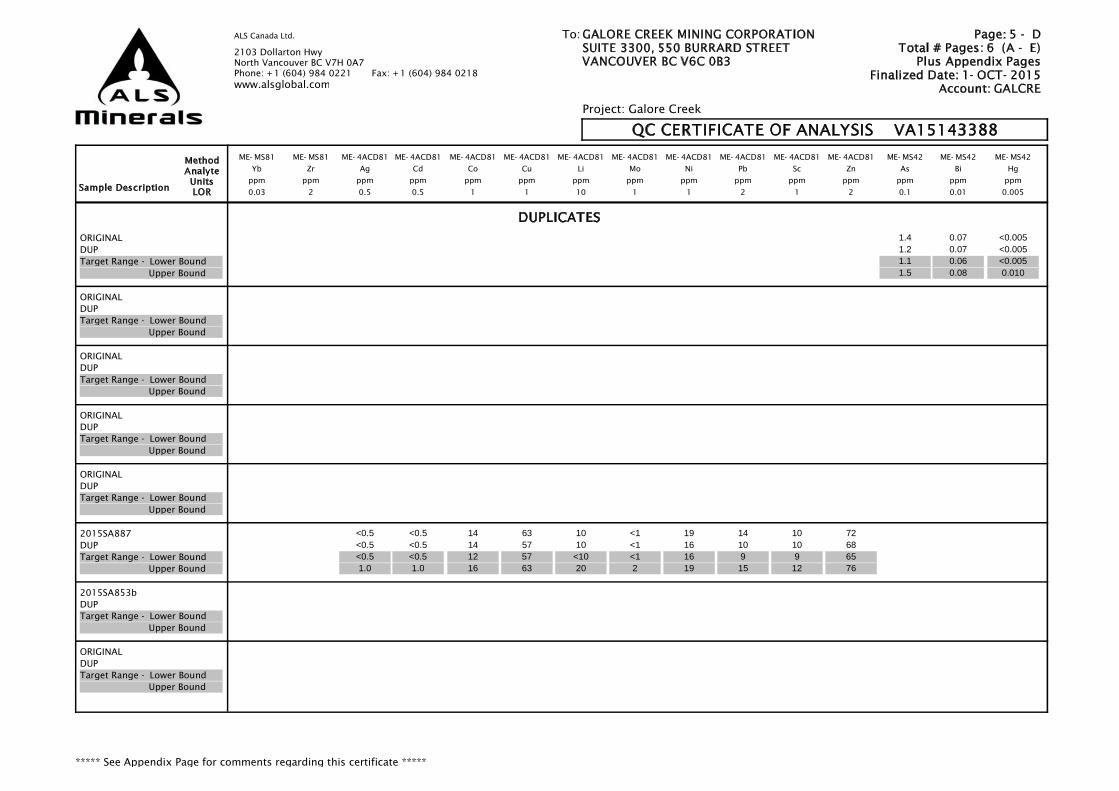
ALS Canada Ltd.
2103 Dollarton HwyNorth Vancouver BC V7H 0A7Phone: + 1 (604) 984 0221 Fax: + 1 (604) 984 0218
www.alsglobal.com
To:
Project: Galore Creek
ME- MS81 ME- MS81 ME- 4ACD81 ME- 4ACD81 ME- 4ACD81 ME- 4ACD81 ME- 4ACD81 ME- 4ACD81 ME- 4ACD81 ME- 4ACD81 ME- 4ACD81 ME- 4ACD81 ME- MS42 ME- MS42 ME- MS42
Yb Zr Ag Cd Co Cu Li Mo Ni Pb Sc Zn As Bi Hg
ppm ppm ppm ppm ppm ppm ppm ppm ppm ppm ppm ppm ppm ppm ppm
0.03 2 0.5 0.5 1 1 10 1 1 2 1 2 0.1 0.01 0.005
ORIGINAL 1.4 0.07 <0.005
DUP 1.2 0.07 <0.005
Target Range - Lower Bound 1.1 0.06 <0.005
Upper Bound 1.5 0.08 0.010
ORIGINAL
DUP
Target Range - Lower Bound
Upper Bound
ORIGINAL
DUP
Target Range - Lower Bound
Upper Bound
ORIGINAL
DUP
Target Range - Lower Bound
Upper Bound
ORIGINAL
DUP
Target Range - Lower Bound
Upper Bound
2015SA887 <0.5 <0.5 14 63 10 <1 19 14 10 72
DUP <0.5 <0.5 14 57 10 <1 16 10 10 68
Target Range - Lower Bound <0.5 <0.5 12 57 <10 <1 16 9 9 65
Upper Bound 1.0 1.0 16 63 20 2 19 15 12 76
2015SA853b
DUP
Target Range - Lower Bound
Upper Bound
ORIGINAL
DUP
Target Range - Lower Bound
Upper Bound
***** See Appendix Page for comments regarding this certificate *****

ALS Canada Ltd.
2103 Dollarton HwyNorth Vancouver BC V7H 0A7Phone: + 1 (604) 984 0221 Fax: + 1 (604) 984 0218
www.alsglobal.com
To:
Project: Galore Creek
ME- MS42 ME- MS42 ME- MS42 ME- MS42 ME- MS42 ME- MS42 ME- MS42 S- IR08 C- IR07
In Re Sb Sc Se Te Tl S C
ppm ppm ppm ppm ppm ppm ppm % %
0.005 0.001 0.05 0.1 0.2 0.01 0.02 0.01 0.01
ORIGINAL 0.014 <0.001 0.94 1.9 1.2 0.01 0.02
DUP 0.013 <0.001 0.89 2.0 1.3 0.01 0.02
Target Range - Lower Bound 0.008 <0.001 0.80 1.8 1.0 <0.01 <0.02
Upper Bound 0.019 0.002 1.03 2.1 1.5 0.02 0.04
ORIGINAL
DUP
Target Range - Lower Bound
Upper Bound
ORIGINAL
DUP
Target Range - Lower Bound
Upper Bound
ORIGINAL
DUP
Target Range - Lower Bound
Upper Bound
ORIGINAL
DUP
Target Range - Lower Bound
Upper Bound
2015SA887
DUP
Target Range - Lower Bound
Upper Bound
2015SA853b 0.09 1.86
DUP 0.10 1.87
Target Range - Lower Bound 0.08 1.81
Upper Bound 0.11 1.92
ORIGINAL
DUP
Target Range - Lower Bound
Upper Bound
***** See Appendix Page for comments regarding this certificate *****

ALS Canada Ltd.
2103 Dollarton HwyNorth Vancouver BC V7H 0A7Phone: + 1 (604) 984 0221 Fax: + 1 (604) 984 0218
www.alsglobal.com
To:
Project: Galore Creek
Au- ICP21 ME- XRF26 ME- XRF26 ME- XRF26 ME- XRF26 ME- XRF26 ME- XRF26 ME- XRF26 ME- XRF26 ME- XRF26 ME- XRF26 ME- XRF26 ME- XRF26 ME- XRF26 OA- GRA05x
Au Al2O3 BaO CaO Cr2O3 Fe2O3 K2O MgO MnO Na2O P2O5 SiO2 SrO TiO2 LOI 1000
ppm % % % % % % % % % % % % % %
0.001 0.01 0.01 0.01 0.01 0.01 0.01 0.01 0.01 0.01 0.01 0.01 0.01 0.01 0.01
ORIGINAL 0.001
DUP <0.001
Target Range - Lower Bound <0.001
Upper Bound 0.002
ORIGINAL 0.001
DUP 0.002
Target Range - Lower Bound <0.001
Upper Bound 0.002
***** See Appendix Page for comments regarding this certificate *****

ALS Canada Ltd.
2103 Dollarton HwyNorth Vancouver BC V7H 0A7Phone: + 1 (604) 984 0221 Fax: + 1 (604) 984 0218
www.alsglobal.com
To:
Project: Galore Creek
ME- XRF26 ME- MS81 ME- MS81 ME- MS81 ME- MS81 ME- MS81 ME- MS81 ME- MS81 ME- MS81 ME- MS81 ME- MS81 ME- MS81 ME- MS81 ME- MS81 ME- MS81
Total Ba Ce Cr Cs Dy Er Eu Ga Gd Ge Hf Ho La Lu
% ppm ppm ppm ppm ppm ppm ppm ppm ppm ppm ppm ppm ppm ppm
0.01 0.5 0.5 10 0.01 0.05 0.03 0.03 0.1 0.05 5 0.2 0.01 0.5 0.01
ORIGINAL
DUP
Target Range - Lower Bound
Upper Bound
ORIGINAL
DUP
Target Range - Lower Bound
Upper Bound
***** See Appendix Page for comments regarding this certificate *****

ALS Canada Ltd.
2103 Dollarton HwyNorth Vancouver BC V7H 0A7Phone: + 1 (604) 984 0221 Fax: + 1 (604) 984 0218
www.alsglobal.com
To:
Project: Galore Creek
ME- MS81 ME- MS81 ME- MS81 ME- MS81 ME- MS81 ME- MS81 ME- MS81 ME- MS81 ME- MS81 ME- MS81 ME- MS81 ME- MS81 ME- MS81 ME- MS81 ME- MS81
Nb Nd Pr Rb Sm Sn Sr Ta Tb Th Tm U V W Y
ppm ppm ppm ppm ppm ppm ppm ppm ppm ppm ppm ppm ppm ppm ppm
0.2 0.1 0.03 0.2 0.03 1 0.1 0.1 0.01 0.05 0.01 0.05 5 1 0.5
ORIGINAL
DUP
Target Range - Lower Bound
Upper Bound
ORIGINAL
DUP
Target Range - Lower Bound
Upper Bound
***** See Appendix Page for comments regarding this certificate *****

ALS Canada Ltd.
2103 Dollarton HwyNorth Vancouver BC V7H 0A7Phone: + 1 (604) 984 0221 Fax: + 1 (604) 984 0218
www.alsglobal.com
To:
Project: Galore Creek
ME- MS81 ME- MS81 ME- 4ACD81 ME- 4ACD81 ME- 4ACD81 ME- 4ACD81 ME- 4ACD81 ME- 4ACD81 ME- 4ACD81 ME- 4ACD81 ME- 4ACD81 ME- 4ACD81 ME- MS42 ME- MS42 ME- MS42
Yb Zr Ag Cd Co Cu Li Mo Ni Pb Sc Zn As Bi Hg
ppm ppm ppm ppm ppm ppm ppm ppm ppm ppm ppm ppm ppm ppm ppm
0.03 2 0.5 0.5 1 1 10 1 1 2 1 2 0.1 0.01 0.005
ORIGINAL
DUP
Target Range - Lower Bound
Upper Bound
ORIGINAL
DUP
Target Range - Lower Bound
Upper Bound
***** See Appendix Page for comments regarding this certificate *****

ALS Canada Ltd.
2103 Dollarton HwyNorth Vancouver BC V7H 0A7Phone: + 1 (604) 984 0221 Fax: + 1 (604) 984 0218
www.alsglobal.com
To:
Project: Galore Creek
ME- MS42 ME- MS42 ME- MS42 ME- MS42 ME- MS42 ME- MS42 ME- MS42 S- IR08 C- IR07
In Re Sb Sc Se Te Tl S C
ppm ppm ppm ppm ppm ppm ppm % %
0.005 0.001 0.05 0.1 0.2 0.01 0.02 0.01 0.01
ORIGINAL
DUP
Target Range - Lower Bound
Upper Bound
ORIGINAL
DUP
Target Range - Lower Bound
Upper Bound
***** See Appendix Page for comments regarding this certificate *****

ALS Canada Ltd.
2103 Dollarton HwyNorth Vancouver BC V7H 0A7Phone: + 1 (604) 984 0221 Fax: + 1 (604) 984 0218
www.alsglobal.com
To:
Project: Galore Creek
Processed at ALS Vancouver located at 2103 Dollarton Hwy, North Vancouver, BC, Canada.
Au- ICP21Applies to Method: C- IR07 CRU- 31 CRU- QC
LOG- 22 ME- 4ACD81 ME- MS42 ME- MS81
ME- XRF26 OA- GRA05x PUL- 31 S- IR08
SPL- 21 WEI- 21

2015 Geological and Geochemical Assessment Report
on the More Creek Property
May, 2016
APPENDIX VI
PETROGRAPHIC REPORT
(Attached Digitally)

Sarah Henderson,
Galore Creek Mining Corp.,
3300-550 Burrard Street,
Vancouver BC, V6C0B3
E-mail: [email protected]
Tel: 604-699-4738 December, 2015
Samples: 20155A862b, 20155A882, 20155A887, 20155A910
Summary: rocks are rhyolite and rhyodacite in composition and interpreted to be part of the Ootsa Lake
Group (Eocene) not Stuhini Group (Upper Triassic) as previously mapped.
Sample 20155A862b: Rock is fine-grained, flow banded, quartz microporphyritic rhyolite flow
with a groundmass of interlocking quartz-K-feldspar-plagioclase. Disseminated leucoxene and
anatase disseminated throughout groundmass and secondary chlorite and hematite.
Sample 20155A882: Rock is green-grey, pumiceous, welded rhyolite lapilli tuff with eutaxitic
foliation and leucoxene disseminations; matrix of felsic glass and grains of feldspar replaced to
chlorite-sericite.
Sample 20155A887: Rock is white-grey fine-grained, chlorite amygdaloidal, glassy, feldspar-
quartz-phyric rhyolite flow breccia. Clasts are poorly formed, mm-scale and are cemented by
feldspar-quartz and calcite. Secondary calcite and chlorite replace feldspar cut by a 2 mm wide
ankerite-leucoxene vein.
Sample 20155A910: Rock is fine-grained, flow-banded feldspar-quartz porphyry flow or
hypabyssal intrusion overprinted by chlorite and calcite alteration that ia cut by a calcite-
leucoxene veinlet.
Gayle E. Febbo
E-mail: [email protected]
Tel: 250-837-1606

Figure 1. Photographs of blocks of petrographic samples. Abbreviations: S0-primary foliation, leu-
leucoxene, py-pyrite and cb-carbonate.

Figure 2. Petrographic scans of thin sections. Locations of microphotographs indicated by figure numbers
3-10.

Sample Quartz Plag K-feldspar Leucoxene Anatase Chlorite Hematite Ankerite Sericite Pyrite Calcite
20155A862b 35%, 1-
200 µm
10%,
10-50
µm
50%, 1-20
µm
2%, < 5-30
µm
2%, <5
µm
1%, 5-10
µm
Tr, < 20
µm
20155A882 55%, 5-
50 µm
9%, 5-
40 µm
22%, 5-50
µm
2%, 1-10
µm
10%, 5-10
µm
2%, 5-
10 µm
20155A887 63%,
100-500
µm
15%, 50
µm
10%, <50
µm
1%, 0.5-1.5
mm
Tr, < 10
µm
7%, < 10
µm.
Tr, < 5
µm
1%, 1-20
µm
Tr,
100-
600
µm
2%, 10-
100 µm
20155A910 28%,
<400
µm
15%,
50-500
µm
50%, 20-
100 µm
1%, 10 µm 5%, 5-30
µm
1%, 5
µm
Table 1. Summary of mineral abundance and average diameter estimates of petrographic samples.

Sample 20155A862b: Rhyolite flow
Description: Rock is fine-grained, flow banded, quartz microporphyritic rhyolite flow with a groundmass
of interlocking quartz-K-feldspar-plagioclase. Leucoxene and anatase disseminated throughout
groundmass and secondary chlorite and hematite.
Primary Minerals:
50% K-feldspar: colourless, amorphous, cloudy aggregates about quartz grains, range in size 1-20
µm in diameter, grain boundaries are interlocking with quartz.
35% Quartz: colorless, microporphyritic (50-200 µm diameter; Fig. 3) grains are subequant to
irregular and anhedral with 1st order birefringence. Cloudy grains due to fluid inclusions. In
groundmass grains are 1-10 µm in diameter and are amorphous-irregular and interlocking with K-
feldspar grains.
10% Plagioclase: 10-50 µm subhedral colourless laths, 1:4 aspect ratios, 1st order birefringence,
some with polysynthetic twins.
2% Anatase: pleochroic, green-purple, high relief, < 5 µm amorphous aggregates of grains in
groundmass (Fig. 4).
2% Leucoxene: 5-30 µm opaque grains disseminated in groundmass, pale white grey internal
reflections (Figs. 3,4).
Secondary Minerals:
1% Chlorite: pale green pleochroic, amorphous, 5-10 µm grains with anatase, replacements after
feldspar.
Tr Hematite: red-brown pleochroic < 20 µm grains in groundmass near leucoxene.
Interpretation: Rock sample is a rhyolite based on modal mineralogy of quartz, K-feldspar and
plagioclase. The fine grain size, even distribution of grains, irregular shape of phenocrysts and
interlocking textures of grains are consistent with an interpretation of a coherent rhyolite flow.

Figure 3. Photomicrograph of sample 20155A862b. Quartz (Qz) microphenocrysts measure 50-
200 µm and are irregular in shape; groundmass consists of <10 µm quartz and K-feldspar (Qz-
Kf); opaque leucoxene (Leu) dissemination adjacent to quartz; cross polarized light.
Figure 4. Photomicrographo of sample 20155A862b. Grains of anatase (An) are < 5 µm,
pleochoric green-purple; opaque 30 µm leucoxene (Leu) grains disseminated in groundmass, plane
polarized light.

Sample 20155A882: Welded pumiceous rhyolite lapilli tuff
Description: Green-grey, pumiceous, welded rhyolite lapilli tuff with eutaxitic foliation and leucoxene
disseminations; matrix of felsic glass and grains of feldspar replaced chlorite-sericite.
17% Clasts (lapilli):
12% Pumice fragments (fiamme): ~1 mm long, green fragments with aspect ratios of 1:10-20,
replaced to chlorite-sericite with lattice-preferred orientation, 5-10 µm quartz phenocrysts in
pumice clasts ( ~20% abundance in clast).
5% Lapilli fragments: lenticular-irregular, 200-500 µm long, quartz microporphyritic (10-100
µm), groundmass in clast is replaced to green-brown pleochroic chlorite.
83% Matrix (ash):
45% Glass: Cuspate silicic shards, some preserve bubble-walls, most 5-50 µm diameter,
colourless with internal blocky to fibrous quartz grains.
38% Grains: quartz, feldspar and secondary replacements to sericite and chlorite.
Primary Minerals:
55 % Quartz: colourless, cloudy, 5-50 µm subequant grains in matrix, some grains contain
undulose extinction, quenched grains in glass, and fine phenocrysts in fiamme.
22% K-feldspar: colourless grains measure 5-50 µm in matrix.
9% Plagioclase: colourless grains 5-40 µm in matrix, replacements to chlorite-sericite.
2% Leucoxene: 1-10 µm opaque grains with white-grey internal reflections disseminated in
matrix and fiamme.
Secondary Minerals:
10% Chlorite: 1-10 µm secondary replacement of fiamme, replacements of feldspar grains in
matrix.
2% Sericite: secondary, 5-10 µm grains in matrix with chlorite, replacements of feldspar.
Interpretation: The rock sample interpreted to have formed from explosive magmatic processes as a felsic
pyroclastic deposit. The abundance of bubble-wall glass shards in the matrix, wispy pumice fragments,
and absence of accretionary lapilli favour a magmatic as opposed to phreatomagmatic eruptive process
(McPhie et al., 2005). Internal grains of quartz in glass shards are interpreted to be a result of quench
crystallization.

Figure 5. Microphotograph of sample 20155A882. Glass shard in: a) cross polarized light using the
gypsum plate (first order retardation) and b) plane polarized light. The shard preserves the bubble-wall
and is composed of blocky to fibrous quartz (qz) grains. Chlorite (chl) lines the bubble-wall and is
disseminated in matrix.
Figure 6. Microphotograph of sample 20155A882. Two flattened pumice fragments (fiamme) replaced to
chlorite and sericite (chl-ser) in a matrix of dense glass shards and grains replaced to chlorite (chl), plane
polarized light.

Sample 20155A887: Feldspar-quartz rhyodacite flow breccia
Description: White-grey fine-grained, chlorite amygdaloidal, glassy, feldspar-quartz-phyric rhyodacite
flow breccia. Clasts are poorly formed, mm-scale and are cemented by feldspar-quartz and calcite.
Secondary calcite and chlorite replace feldspar cut by a 2 mm wide ankerite-leucoxene vein.
Primary Minerals:
63% Quartz: equant, phenocrysts measure 100-500 µm (~15% of rock; Fig. 7), hexagonal cross
sections, local fragmentation of porphyritic rock is cemented by < 10 µm diameter grains
intergrown quartz and calcite (Fig. 7).
15% Plagioclase: phenocrysts measure up to 500 µm, laths have polysynthetic twins, 1:4 aspect
ratios (~7% of rock) and 50 µm grains in groundmass (Fig. 8).
10% K-feldspar: amorphous grains in margins to quartz phenocrysts distributed in groundmass,
grains < 50 µm.
2% Calcite: colourless grains, extreme birefringence, grains cement clasts, 10-100 µm grains.
1% Leucoxene: opaque aggregates with white-grey internal reflections in margins to vein
measure 0.5-1.5 mm.
Tr Anatase: pleochoric green-purple, high relief, < 10 µm amorphous grains, 2nd
order
birefringence, intergrown with quartz in cement between porphyritic fragments.
Tr Pyrite: anhedral disseminations in groundmass, yellow internal reflections, 100-600 µm
diameter grains.
Secondary Minerals:
7% Chlorite: pleochroic green amorphous replacements of feldspar grains, infilling of vesicles
(amygdules), < 10 µm diameter grains(Fig. 7).
2% Ankerite: cloudy carbonate vein (2 mm) with hematite dusting, intergrown with leucoxene, 1-
20 µm diameter grains.
Tr Hematite: reddish-brown pleochroic to opaque aggregates in ankerite vein, amorphous, < 5 µm
diameter grains (Fig. 7).
Interpretation: Porphyritic textures, volcanic glass and amygdules all indicate a supracrustal depositional
setting. Fragmental porphyritic regions that are infilled by quartz-chlorite are interpreted to represent flow
brecciation.

Figure 7. Photomicrograph of sample 20155A887. Fragment of glass-bearing, chlorite (chl)
amygdaloidal, quartz-phyric (qz) porphyry cemented by quartz and anatase (an); secondary hematite
(hem), plane polarized light.
Figure 8. Grain of plagioclase (plag) with polysynthetic twins in finer quartz (qz) groundmass intergrown
with anatase (an), cross polarized light, sample 20155A887

Sample 20155A910: Rhyolite porphyry
Description: Fine-grained, flow-banded feldspar-quartz porphyry flow or hypabyssal intrusion
overprinted by chlorite and calcite alteration and cut by a calcite-leucoxene veinlet.
Primary Minerals:
50% K-feldspar: 20-100 µm diameter grains in the groundmass, grain boundaries are interlocking
with quartz, grains are subhedral (Fig. 9) with 1st order birefringence.
28% Quartz: subequant, irregular phenocrysts measure up to 400 µm, smaller irregular grains
with 1st order birefringence intergrown with feldspar in the groundmass (Fig. 9).
15% Plagioclase: phenocrysts 300-500 µm euhedral grains, secondary calcite alteration of
plagioclase phenocrysts, in groundmass plagioclase grains are subhedral laths that measure 50-
100 µm along the c-axis. Some glomerocrysts (Fig. 10) of plagioclase contain numerous
intergrown grains.
1% Leucoxene: opaque disseminations in the groundmass average 10 µm in diameter, white-
silver internal reflections.
Secondary Minerals:
5% Chlorite: pleochroic pale green, 2nd
order birefringence, amorphous to fibrous, secondary 5-30
µm diameter grains in groundmass.
1% Calcite: 5 µm colourless grains replace plagioclase, intergrowths with leuxocene in vein,
Type I calcite twins, extreme birefringence.
Interpretation: Interlocking textures of quartz, plagioclase and K-feldspar and even size and distribution
of phenocrysts are consistent with an interpretation of a coherent lava or intrusion.

Figure 9. Photomicrograph of sample 20155A910. Phenocryst of plagioclase (plag) in a groundmass of
quartz (qz), plagioclase and K-feldspar (kf). Vein of calcite (cal) and leucoxene (leu) overprint the
porphyry and relate to calcite alteration of the plagioclase phenocryst, cross polarized light.
Figure 10. Photomicrograph of sample 20155A910. Plagioclase phenocryst (plag; left) replaced to calcite
(cal) and plagioclase glomerocryst, cross polarized light.

Comparison with Payne’s (2014) samples:
Four samples from Payne’s (2014) report were collected from areas mapped as Stuhini Group (Upper
Triassic). These rocks are identified as andesite lapilli tuff, metamorphosed hypabyssal monzodiorite,
hypabyssal andesite, and an intermediate tuff (Payne, 2014). In contrast, the samples in this study are
significantly more felsic in composition ranging from rhyolite to rhyodacite (Fig. 11).
The samples of Stuhini Group are observed to have dynamically recrystallized plagioclase (Payne, 2014),
deformation by calcite twinning (this study) and dynamically recrystallized quartz (this study). Type II
tabular thick twins in calcite (sample 5A20140861) are indicative of deformation temperatures in the
range of 200-300°C (Passchier and Trouw, 2005; Fig. 12a). Deformation textures in quartz include
undulose extinction, deformation lamellae, sutured grain boundaries, bulging recrystallization (Fig 12b)
and dynamically recrystallized grains (Fig 12c). The temperature of deformation of quartz is bracketed
similarly between 200-300°C (Passchier and Trouw, 2005). Payne (2014) documented partly
recrystallized plagioclase grains in sample SA20140861; this recrystallization requires temperatures
above 400°C (Passchier and Trouw, 2005). In contrast, the samples of rhyolite and rhyodacite do not
preserve evidence for deformation of calcite, quartz or plagioclase. Hence, the rhyolite-rhyodacite
samples have undergone lower temperatures of deformation (< 125°C) as compared to the intermediate
composition rocks of Payne’s (2014) report (200-400°C).
Figure 11. Compositions of samples based on modal abundance of quartz (Q), alkali feldspar (A), and
plagioclase feldspar (P) are rhyolite to rhyodacite.

Figure 11. Photomicrographs of 2014 samples: a) sample 5A20140861 contains thick Type II twins in
calcite that measure 5-10 µm; b) sample 5A20140877 contains quartz grains with highly sutured grain
boundaries and local bulging recrystallization (blg); and quartz in sample 5A20140861 hosts several
smaller dynamically recrystallized grains that do not have fluid inclusions.
Discussion:
This petrographic research aims to determine if the volcanic rocks are part of the Stuhini Group strata
(Upper Triassic age; pre-accretion) as previously mapped or are part of the Ootsa Lake Group (Eocene
age; post-accretion). Eocene and younger aged deformation events regionally include low temperature,
brittle, strike-slip dextral faults such as the Brucejack fault to the south (Febbo, 2015). As Upper Triassic
strata have undergone several deformation events regionally (e.g. Early Jurassic, Febbo, 2015; mid-
Cretaceous; Evenchick, 2007), it is reasonable to assume that the difference in deformation temperature
estimates between the felsic and intermediate rocks relates to a difference in age. This difference in
deformation temperature estimates between the 2014 and 2015 samples is consistent with an Eocene age
interpretation for samples of this study.

References
Evanchick, C.A., McMechan, M.E., McNicoll, V.J., Carr, S.D., 2007. A synthesis of the Jurassic-
Cretaceous tectonic evolution of the central and southeastern Canadian Cordillera: exploring the links
across the orogeny. In: Sears, J.W., Harms, T.A., and Evanchick, C.A., eds., Whence the mountains?
Inquiries into the evolution of orogenic systems: a volume in honour of Raymond A Price, Geological
Society of America, Special Paper 433, pp. 117-145.
Febbo, G.E., 2015. Structural evolution of the Mitchell Au-Cu-Ag-Mo porphyry deposit, northwestern
British Columbia. Unpublished M.Sc thesis, the University of British Columbia, 329 p.
McPhie, J., Doyle, M., Allen, R., 2005. Volcanic textures: a guide to the interpretation of textures in
volcanic rocks. Centre of Excellence in Ore Deposits, University of Tasmania, 198 p.
Passcheir, C.W. and Trouw, R.A.J., 2005. Microtectonics. In: Springer, textbook, 2nd
ed., 366 p.
Payne, J. G., 2014. More Creek Petrographic Report, Vancouver Petrographics. Internal report for Galore
Creek Mining Corporation, 11 p.

2015 Geological and Geochemical Assessment Report
on the More Creek Property
May, 2016
APPENDIX VII
GEOLOGICAL MAPS

!.
!.
!.
!.
!.!.!.
!.
!.
!.
!.
!.
!.
!.
!.
!.
!.
!.
!.
!.!.!.!.!.
!.
!.
!.
!.
!.
!.
508124
508337
muJsEqp
uTb1
uTb1
uTsd1
uTsd1
887886
885
884883882
881880
879877
876
875873
913
912
911910
871
870869
868
867866 865
864
863
862
861860
415000.000000
415000.000000
416000.000000
416000.000000
417000.000000
417000.000000
6322
000.0
0000
0
6322
000.0
0000
0
6323
000.0
0000
0
6323
000.0
0000
0
Appendix VII. 2015 More Creek Claims Geological Mapping
± NAD 1983, UTM Zone 9,Compiled by: S. Henderson, April 15, 2016
!. 2015 More Creek Field StationsGalore Creek Access RoadRivers- Floodplains- LakesBQ-More Creek Claims100m ContoursHighway 37
More Creek
Isku
t Riv
er
!.
!.
!.913
912
911
417400.000000
417400.000000
6321
800.0
0000
0
6321
800.0
0000
0
6322
000.0
0000
0
6322
000.0
0000
0
6322
200.0
0000
0
6322
200.0
0000
0
6322
400.0
0000
0
6322
400.0
0000
0
6322
600.0
0000
0
6322
600.0
0000
0
508338
508337
408606
508124
521931
515244
514545
514548 514542
514551
545725 547093
566898
545723
522111
0 250 500 750 1,000125Meters
0 50 100 150 20025Meters
!.
!.
!.
!.
!.
!.
!.
!.
!.
!.
875
873
867
866
865864
863
862
861
860
416600.000000
416600.000000
416800.000000
416800.000000
6322
000.0
0000
0
6322
000.0
0000
0
6322
200.0
0000
0
6322
200.0
0000
0
6322
400.0
0000
0
6322
400.0
0000
0
!.
!.
!.
!.
!.
!.
!.
!.
!.
!.
!.
!.
!.
!.
885
884
883
882
881880
879
878877
876
871
870
869
868
415600.000000
415600.000000
415800.000000
415800.000000
416000.000000
416000.000000
416200.000000
416200.000000
416400.000000
416400.000000
6321
800.0
0000
0
6321
800.0
0000
0
6322
000.0
0000
0
6322
000.0
0000
0
6322
200.0
0000
0
6322
200.0
0000
0
!.
!.
887
886
414800.000000
414800.000000
415000.000000
415000.000000
6323
000.0
0000
0
6323
000.0
0000
0
0 50 100 150 20025Meters
0 50 100 150 20025Meters
0 50 100 150 20025Meters
Contact-defined
Contact-assumed
Contact-assumed-2015
Fault-strike-slip-approximate
EqpRhyolite; dikes, sills, and stocks;white, quartz-phyric to aphanitic
Gabbro Gabbroic-diorite (age uncertain)
muJsSiltstone, sandstone, mudstone,rare chert pebble conglomerate uTsd1
Sandstone. Dominantly volcanic sandstone withlesser mudstone and conglomerate with angularto rounded pebble to cobble sized clasts
uTi1Andesite; flows and breccias, massive to bedded volcanic conglomerate
CenzoicIntrusive Rocks
Upper TriassicStuhini Group
Middle to Upper JurassicBowser Lake Group
1:20,000 1:5,000 1:5,000
1:5,000 1:5,000
Copyright © 2022 FDOKUMEN