Assessment of wheat cultivars for drought tolerance via osmotic stress imposed at early seedling...
13
Assessment of wheat cultivars for drought tolerance via osmotic stress imposed at early seedling growth stages 1234567 89A64BC7D F72B4 65C 9766 C4 1 1 7733 34 1 D C 1 1BB7BB73 C73 596342B 2 D29C3 367257 4 B345 B327BB 4B7D 3 726 B77D64 23C B37B 926 1245963926 *7B725C + , --., 146A67 3 C33/5739227D459-, !3 4B D4BA67 3 2772 3 3C7 9A64BC72"B 72B4 4 9 437D 3 5437 2 3C7 2 89A64BC7D 72B4 3/ C33/#2559234BB9$C%&+' 89A64BC72/ 42753237 1245963926 !234 89#A :C27 166 9393B 4 731;* 27 237537D A !376675396 82723 *4C3B 6 4569D4 524C3 6 24C3 D !8* 4B 27347D A 3C7 52732B 2 3C72 524C3 C6D72B <72B D 5D434B 2 9B7 3C4B 37246 27 D747D 4 3C7 =D ;B72 127773 27D45957392 CentAUR 7326 125C47 3 3C7 ;472B43 *7D4 *7D4"B 27B725C 9393B 647
Transcript of Assessment of wheat cultivars for drought tolerance via osmotic stress imposed at early seedling...

Assessment of wheat cultivars for drought tolerance via osmotic stress imposed at early seedling growth stages
�������
�A��BC�DEF��B���
�����C�E��E���E�������E���E�C�������E��E���E��������E���E������E��E��E��DE�C�����E��E��E� !" #E�BB�BB$���E�%E�C���E����&��BE%��ED��'C�E���������E&��E�B$����EB���BBE�$(�B�DE��E����)EB��D���'E'����CEB��'�B�E������E�%E�'��������E*�B����C�E+!E�,#�E((�E --.,"!�EE�&����A��E��EC��(/00����������D��'�����0 -1,20
3�E�BE�D&�B�A��E��E��%��E��E�C�E(A��BC��4BE&��B���E�%E)�E�����DE��E����E%��$E�C�E�����E�A��BC�DE&��B���E��/EC��(/00����5�����$�(�0�����BB6 !� #�(C(7(8+19
�A��BC��/E�����������E�%E�'��������E3�%��$������E��5�A�E:�C���E
���E��(�BE��E�����;*E���E(�������DEA)E3����������E���(���)E*�'C�BE����E����D��'E��()��'C�E����E��()��'C�E��DE3�*E�BE�������DEA)E�C�E�������BE��E��C��E��()��'C�EC��D��B�E<��$BE��DE���D�����BE%��EB�E�%E�C�BE$�������E���ED�%���DE��E�C�E=�DE;B��E�'���$����
�������D��'�����0������
CentAUR
�������E���C�&�E��E�C�E;��&��B��)E�%E*��D��'
*��D��'4BE��B����CE��(�BE������

Assessment of wheat cultivars for drought tolerance
J. Agric. Res., 2012, 50(3)
299
ASSESSMENT OF WHEAT CULTIVARS FOR DROUGHT TOLERANCE VIA OSMOTIC STRESS IMPOSED AT EARLY
SEEDLING GROWTH STAGES
Muhammad Jurial Baloch*, Jim Dunwell**, Abdul Aziz Khakwani***, Mike Dennet**, Wajid Ali Jatoi and Siraj Ahmed Channa*
ABSTRACT A study was conducted in the Department of Plant Breeding and Genetics, Sindh Agriculture University, Tandojam, Pakistan during the year 2009. Sixteen spring wheat cultivars (Triticum aestivum L.) were screened under osmotic stress with three treatments i.e. control-no PEG (polyethylene glycol), 15 percent and 25 percent PEG-6000 solution. The analysis of variance indicated significant differences among treatments for all seedling traits except seed germination percentage. Varieties also differed significantly in germination percentage, coleoptile length, shoot root length, shoot weight, root/shoot ratio and seed vigour index. However, shoot and root weights were non-significant. Significant interactions revealed that cultivars responded variably to osmotic stress treatments; hence provided better opportunity to select drought tolerant cultivars at seedling growth stages. The relative decrease over averages due to osmotic stress was 0.8 percent in seed germination, 53 percent in coleoptile length 62.9 percent in shoot length, 74.4 percent in root length, 50.6 percent in shoot weight, 45.1 percent in root weight, 30.2 percent in root/shoot ratio and 68.5 percent in seed vigour index. However, relative decrease of individual variety for various seedling traits could be more meaningful which indicated that cultivar TD-1 showed no reduction in coleoptile length, while minimum decline was noted in Anmol. For shoot length, cultivar Sarsabz expressed minimum reduction followed by Anmol. However, cultivars Anmol, Moomal, Inqalab-91, and Pavan gave almost equally lower reductions for root length suggesting their higher stress tolerance. In other words, cultivars Anmol, Moomal, Inqalab-91, Sarsabz, TD-1, ZA-77 and Pavan had relatively longer coleoptiles, shoots and roots, and were regarded as drought tolerant. Correlation coefficients among seedlings traits were significant and positive for all traits except germination percentage which had no significant correlation with any of other trait. The results indicated that increase in one trait may cause simultaneous increase in other traits; hence selection for any of these seedling attributes will lead to develop drought tolerant wheat cultivars. KEYWORDS: Triticum aestivum; cultivars; seedlings; osmotic pressure;
stress; Pakistan.
*Department of Plant Breeding and Genetics, Sindh Agriculture University, Tandojam, **School of Biological Sciences, University of Reading, U.K. ***Wheat Research Institute, Dera Ismail Khan, KPK, Pakistan.

M. J. Baloch et al.
J. Agric. Res., 2012, 50(3)
300
INTRODUCTION Development of stress tolerant varieties has been a major objective of many breeding programmes. However, success has been limited by inadequate screening techniques, and lack of genotypes that illustrate apparent differences in response to well-defined environmental stresses. Yield has been the foremost criteria for such programmes and is very complex trait in terms of number of genes controlling it. This trait is also largely influenced by the environmental factors that cause selection for such traits less effective. Another problem is that due to major environmental factors, the heritability of yield and its components is also very low (7). Drought related traits can, however, effectively be measured in off-season or in controlled laboratory conditions in early generations, which could be a cost effective and still potenial approach. Seedling emergence is one of the most sensitive growth stages that are susceptible to water-deficit. Therefore, seed germination, seedling vigour and coleoptiles’s length are prerequisites for successful stand establishment of crop plants. Rauf et al. (10) observed that in semiarid regions, low moisture is limiting factor during germination, hence, the rate and degree of seedling establishment are extremely important in determining both yield and time of maturity The availability of soil moisture has a major effect on germination and subsequent emergence. Besides reduction in total germination, relatively low soil moisture causes delay in seed emergence also. Germination percentage and seedling growth have been reported to decrease at low moisture levels as noted by Ashraf and Abu-Shakra (1). Dilday et al. (5) have demonstrated the importance of coleoptile length (protective sheath that covers the shoot during emergence) in achieving optimum stand establishment particularly when seed is planted deep to reach moisture in dry soils. It appears that there is dire need to improve the genetic tolerance of crops at seedling stages so as to save the resources in field trials and rather do the extensive screening at early stages of crop growth and development. Selection for drought tolerance at early stage of seedlings is most commonly carried out by using chemical desiccators like polyethylene glycol (PEG-6000) medium. Lagerwerff et al. (6) indicated that PEG can be used to modify the osmotic potential of nutrient solution culture and thus induce plant water-deficit in a relatively controlled manner yet appropriate to experimental protocols (8, 13). Rauf et al. (10) evaluated 16 spring wheat genotypes at four levels of PEG-6000 and noted significant reduction in germination percentage, germination rate index, shoot length, root length, fresh and dry weights of shoot, fresh and dry weights of root, and root/shoot ratio in all

Assessment of wheat cultivars for drought tolerance
J. Agric. Res., 2012, 50(3)
301
treatments of PEG except control, yet the greatest decrease in these traits occurred with 33 percent PEG concentration. Sayar et al. (12) observed that PEG at 25 percent concentration decreased the germination by 9 percent in sensitive varieties while at 30 percent PEG, only few seeds from drought tolerant varieties germinated. Bayoumi et al. (2) evaluated nine Triticum aestivum L. cultivars by using PEG with 0, 15 and 25 percent. PEG considerably reduced the shoot, root biomass and coleoptile length in susceptible genotypes, while less reduction was noted in drought tolerant genotypes.
Morgan et al. (9) stated that drought avoidance due to a profound root system enhances the ability of a plant to capture water from deeper layers of soils and is a fundamental adaptation mechanism to drought. So root system characteristics are of fundamental importance for soil exploration and below-ground resource acquisition, and are strongly related to plant adaptation to sub-optimal conditions such as drought stress. In a comprehensive review of traits likely to improve yield in water-limited environments, Ludlow and Muchow (7) placed the rooting depth and density higher in their list of priorities of drought-adaptive attributes to be exploited in crop improvement programmes. Previous studies also suggest that root-to-shoot ratio increases under water-stress conditions to facilitate water absorption which is related to abscisic acid (ABA) content of roots and shoots.
The present study was aimed to find-out a rapid and straightforward technique for screening wheat genotypes for drought tolerance at early seedling growth stages by using PEG-6000 and also quantify the associations between drought related seedling traits.
MATERIALS AND METHODS
This study was conducted in a growth room of the Department of Plant Breeding and Genetics, Sindh Agriculture University, Tandojam, Pakistan during 2009. The experiment was laid-out in split-plots arranged in randomized complete blocks with three replications where osmotic stresses were considered as main plots and varieties as sub-plots. Sixteen spring wheat genotypes viz. Anmol, Inqalab-91, Moomal, TJ-83, Sarsabz, Khirman, SKD-1, TD-1, Kiran, Abadgar, Marvi, Mehran, Bhitai, ZA-77, Pavan and Imdad were studied to see the effect of osmotic stress imposed by using polyethylene glycol (PEG) 6000. Solutions were prepared according to weight by volume i.e. T1 (control with distilled water), T2 (15% PEG solution) and T3 (25% PEG solution). It means while preparing 15 percent PEG, 150g of PEG was dissolved with a stirrer in 1000ml of distilled water. Similarly for making 25 percent PEG, 250g of PEG was dissolved in 1000ml of distilled water. The

M. J. Baloch et al.
J. Agric. Res., 2012, 50(3)
302
temperature in growth room was kept at 25 ± 20C with 60 percent relative humidity. Thirty seeds were placed in Whatman No.1 filter paper in Petri dishes measuring 90mm. After placing the seeds in Petri dishes, measured volume of 10ml PEG solution or distilled water was taken by Eppendorf pipette and poured into Petri dishes. Thereafter, every day, 5ml of distilled water was added in 15 and 25 percent PEG treatments whereas same amount of distilled water was added to control Petri dishes so as to keep them moist and maintain the evaporation losses. The seeds were considered germinated when radicle (coleorhizae) measured at least 5mm while the germination percentage and other measurements were recorded after 10 days of treatment. None of the seeds germinated in 25 percent PEG solutions, hence this treatment was discarded from the experiment. The data were recorded on 15 seedlings of each variety. The observations were taken on germination percentage, coleoptile length (cm), shoot length (cm), root length (cm), fresh weight of shoot (g), fresh weight of root (g), root/shoot ratio and seed vigour index (calculated by multiplying the sum of root and shoot lengths with germination percentage). The data collected were statistically analyzed by using Genstat 11th Edition software to workout the significant differences among genotypes as affected by PEG osmotic stress. Least significant difference test was applied at 5 percent probability level to compare the mean differences. Pearson’s simple correlation coefficient between different traits at seedling stage was also computed with Genstat 11th Edition.
RESULTS AND DISCUSSION
Analysis of variance revealed significant treatment effect on all traits except germination and root/shoot ratio which were declared non-significant (Table 1). With regard to varietal differences and treatment x varietal interaction,
Table 1. Mean squares of various spring wheat seedling traits affected by PEG-6000 treatments.
Traits Treatment (T) Error (a) Variety (V) V x T Error (b)
1df 2df 15df 15df 60df Germination% 14.00ns 81.37 60.92** 48.82** 22.65 Coleoptile length 59.588** 0.0669 0.1767** 0.1532** 0.0557 Shoot length 1960.234** 2.255 3.255** 3.165** 0.799 Root length 2111.876** 21.207 13.814** 15.469** 4.283 Shoot weight 0.390** 0.00129 0.0006NS 0.0005NS 0.0005 Root weight 0.13261** 0.0006 0.0028NS 0.0035NS 0.0031 Root/shoot ratio 2.0723** 0.2051 0.1078** 0.0427NS 0.0098 Seed vigour index 73250739.0** 190754.0 116685.0NS 155015.0NS 104552.0
**Significant at 1% probability level, NS = Non-significant.

Assessment of wheat cultivars for drought tolerance
J. Agric. Res., 2012, 50(3)
303
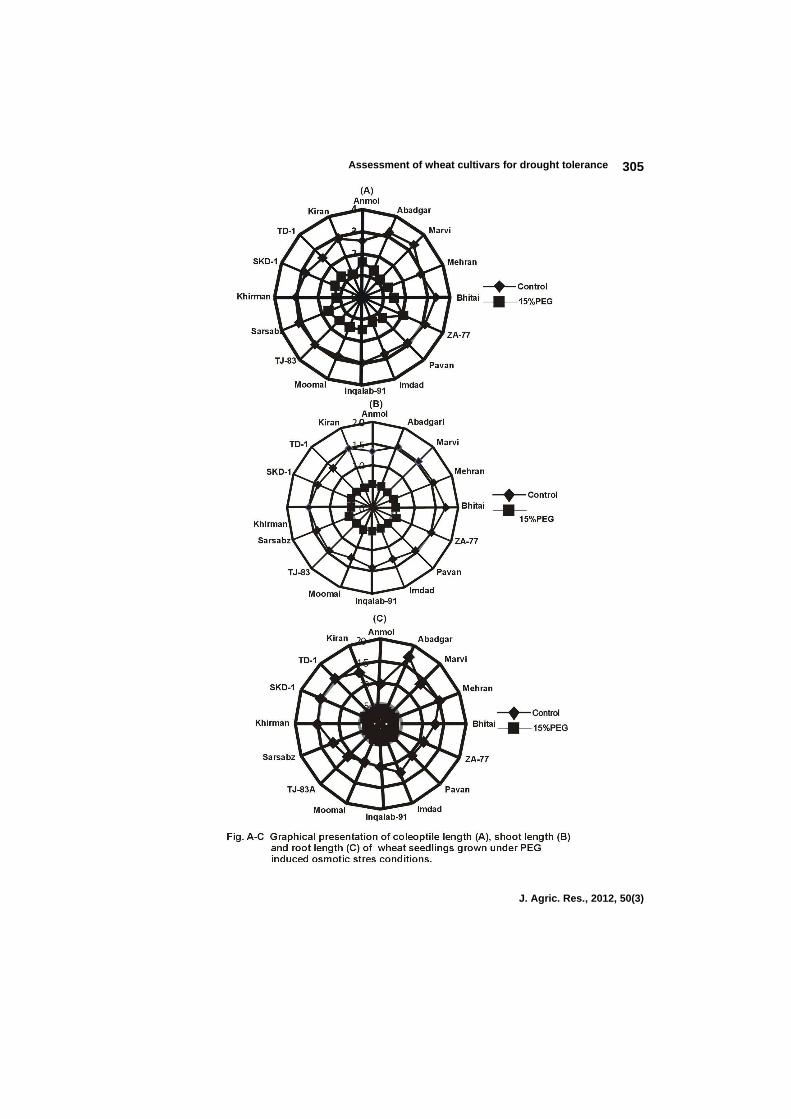
significant differences existed for germination percentage, coleoptile length, shoot length, root length, while root/shoot ratio was significant for varieties but not for interaction. Dhanda et al. (4), Rauf et al. (10), and Bamouni et al. (2) also noted significant effect of PEG treatment on wheat seedling traits, significant varietal and differential response of varieties to PEG treatment. Varying response of genotypes to PEG treatment is very important for plant breeders as drought tolerant genotypes could be screened and tagged at seedling stage before extensive and expensive field tests are conducted. The expression of mean performance of all seedling traits was higher in control than in osmotic stress (15% PEG) treatment (Table 2 Fig. A-G). Similarly, ranges in mean values of control treatment were greater and more variable than PEG induced stress conditions. This is probably due to significant depression in traits due to PEG-desiccation. The relative decrease (RD) over averages was 0.8 percent in seed germination 53 percent in coleoptile length, 62 percent in shoot length, 74.4 percent in, root length, 50.6 percent in shoot weight, 45.1 percent in root weight, 30.2 percent in root/shoot ratio and 68.5 percent in seed vigour index (Table 2). The results further showed that maximum decrease occurred in root length and minimum in germination percentage. However, data of individual variety in osmotic stress, indicated no decrease in seed germination in more than half of varieties (Table 3). Therefore, seed germination cannot be used as a criterion for osmotic stress tolerance because it could not obviously discriminate among the varieties. This has also been shown by non-significant mean square differences among the varieties (Table 1). These results are in consonance with those of Sayar et al. (12) who concluded that seed germination under stress conditions could not distinguish among varieties. So it can be regarded as an inappropriate test for drought tolerance screening. Similar to present results, Roza et al. (11) noted significant decrease in radicle and plumule length and dry matter. Longer coleoptile length helps seedlings to emerge from the soil even at low soil moistures levels, hence can play an important role in the establishment of plant stand. Variety TD-1 did not show any decrease under osmotic stress being less affected, nonetheless minimum decrease (38.1%) was also observed in Anmol but maximum in Marvi (66.5%). Shoot length showed substantial vulnerability to osmotic stress (Fig.B), because all varieties exhibited considerable decrease in shoot length due to PEG desiccation. However, minimum decrease (57.5%) was noted in Sarsabz being drought tolerant and maximum decrease (68.4%) was observed in Bhitai showing higher susceptibility to osmotic stress. The development of root system in water deficit conditions appears to be a very viable criterion to select for water stress because it takes the moisture from lower layers of soil and also

M. J. Baloch et al.
J. Agric. Res., 2012, 50(3)
304
Table 2. Average values of various spring wheat seedling traits under Polyethylene glycol-6000 treatments.
Variety SG (%) CL.
(cm) SL
(cm) RL (cm) SW (g) RW (g) R/S ratio SVI
T1 = control no PEG application Anmol 96.7 2.58 13.04 9.49 0.251 0.159 0.721 2178
Inqalab-91 91.1 3.01 14.00 10.23 0.246 0.135 0.719 2215
Moomal 93.3 2.89 12.82 9.53 0.218 0.130 0.723 2068
TJ-83 94.4 3.06 14.23 10.98 0.239 0.144 0.755 2378
Sarsabz 100.0 3.12 13.93 12.12 0.253 0.158 0.874 2606
Khirman 96.7 3.04 14.83 14.70 0.231 0.171 0.987 2845
SKD-1 87.8 2.82 13.74 15.20 0.277 0.194 1.109 2546
TD-1 96.7 2.56 13.10 14.94 0.264 0.218 1.144 2711
Kiran 94.4 2.90 14.88 13.17 0.276 0.134 0.885 2650
Abadgar 95.6 3.22 15.34 17.00 0.271 0.183 1.107 3090
Marvi 95.6 3.40 15.26 13.44 0.245 0.168 0.869 2726
Mehran 96.7 2.88 15.48 14.83 0.232 0.165 0.956 2925
Bhitai 94.4 3.39 17.11 12.72 0.262 0.194 0.742 2816
ZA-77 93.3 3.14 15.00 10.84 0.273 0.171 0.709 2416
Pavan 94.4 2.91 14.33 10.28 0.239 0.152 0.719 2322
Imdad-05 93.3 2.78 12.89 12.28 0.271 0.174 0.934 2325
Range 91.1-100 2.9-3.4 12.9-17.1 9.5-17.0 0.22-.77 0.13-.73 0.71-1.14 2068-3090
Average 94.7 2.98 14.38 12.61 0.253 0.166 0.872 2551
LSD var. (5%) 5.5 0.27 1.32 3.19 NS NS 0.188 NS
T2 = 15% PEG-6000 Anmol 90.0 1.60 5.50 3.41 0.134 0.080 0.619 805
Inqalab-91 95.6 1.48 5.43 3.72 0.124 0.084 0.685 884
Moomal 87.8 1.48 5.40 3.39 0.126 0.087 0.627 767
TJ-83 98.9 1.44 5.33 3.10 0.121 0.083 0.581 834
Sarsabz 98.9 1.66 5.92 3.21 0.129 0.079 0.561 903
Khirman 93.3 1.20 5.03 3.02 0.122 0.082 0.600 754
SKD-1 91.1 1.36 5.29 3.78 0.122 0.084 0.715 821
TD-1 86.7 2.56 5.21 3.24 0.121 0.085 0.622 727
Kiran 95.6 1.14 5.00 3.01 0.118 0.074 0.604 763
Abadgar 97.8 1.36 5.29 2.89 0.130 0.091 0.545 801
Marvi 96.7 1.14 5.00 3.19 0.123 0.085 0.643 791
Mehran 97.8 1.27 5.26 3.10 0.127 0.073 0.587 818
Bhitai 80.0 1.47 5.40 2.84 0.123 0.077 0.537 660
ZA-77 96.7 2.02 6.11 3.20 0.134 0.087 0.529 900
Pavan 97.8 1.32 5.18 3.84 0.123 0.036 0.742 883
Imdad 97.8 1.19 5.06 2.77 0.128 0.074 0.545 764
Range 80-89.9 1.4-2.6 5-6.1 2.8-3.7 0.12-0.13 0.04-0.09 0.53-0.74 727-903
Average 93.9 1.40 5.34 3.23 0.125 0.091 0.690 804
RD (%) 0.8 53.0 62.9 74.4 50.6 45.1 30.2 68.5
LSD V. (5%) 5.5 0.27 1.32 3.19 NS NS 0.188 NS
LSD T (5%) NS 0.23 1.32 4.05 NS NS NS 383
LSD VxT(5%) 8.5 0.39 1.19 4.81 NS NS 0.428 NS
Assessment of wheat cultivars for drought tolerance
J. Agric. Res., 2012, 50(3)
305

M. J. Baloch et al.
J. Agric. Res., 2012, 50(3)
306

Assessment of wheat cultivars for drought tolerance
J. Agric. Res., 2012, 50(3)
307
Table 3. Relative decrease (%) in individual variety with 15% PEG treatment (T2) against control
(T1) for various wheat seedlings traits.
Varieties Treat- ment
SG (%)
CL (cm)
SL (cm)
RL (cm)
SW (g)
RW (g) R/S ratio
SVI
Anmol T1 96.7 2.58 13.04 9.49 0.251 0.158 0.721 2178 T2 90.0 1.60 5.50 3.41 0.134 0.080 0.619 805 RD (%) 6.9 38.1 57.8 64.1 46.6 49.4 14.1 63.0
Inqalab- 91
T1 91.1 3.01 14.00 10.23 0.246 0.135 0.719 2215 T2 95.6 1.48 5.43 3.72 0.124 0.084 0.685 884 RD (%) ND 50.8 61.2 63.6 49.6 37.8 4.73 60.1
Moomal T1 93.3 2.89 12.82 9.53 0.218 0.130 0.723 2068 T2 87.8 1.48 5.40 3.39 0.126 0.087 0.627 767 RD (%) 5.9 48.8 57.9 64.4 42.2 33.1 13.3 62.9
TJ-83 T1 94.4 3.06 14.23 10.98 0.239 0.143 0.755 2378 T2 98.9 1.44 5.33 3.10 0.121 0.083 0.581 834 RD (%) ND 52.9 62.5 71.8 49.4 42.1 23.0 64.9
Sarsabz T1 100.0 3.12 13.93 12.12 0.253 0.158 0.874 2606 T2 98.9 1.66 5.92 3.21 0.129 0.079 0.561 903 RD (%) 1.1 46.8 57.5 73.5 49.0 50.0 39.9 65.3
Khirman T1 96.7 3.04 14.83 14.70 0.231 0.171 0.987 2845 T2 93.3 1.20 5.03 3.02 0.122 0.082 0.600 754 RD (%) 3.5 60.5 66.1 79.5 47.2 52.0 39.2 73.8
SKD-1 T1 87.8 2.82 13.74 15.20 0.277 0.194 1.109 2546 T2 91.1 1.36 5.29 3.78 0.122 0.084 0.715 821 RD(%) ND 51.8 61.5 75.1 56.1 56.7 35.5 67.8
TD-1 T1 96.7 2.56 13.10 14.94 0.264 0.218 1.144 2711 T2 86.7 2.56 5.21 3.24 0.121 0.085 0.622 727 RD (%) 10.3 ND 60.3 78.3 54.2 61.0 45.6 73.2
Kiran-95 T1 94.4 2.90 14.88 13.17 0.276 0.134 0.885 2650 T2 95.6 1.14 5.00 3.01 0.118 0.074 0.604 763 RD (%) ND 60.7 66.4 77.1 57.2 44.8 31.8 71.2
Abadgar T1 95.6 3.22 15.34 17.00 0.271 0.183 1.107 3090 T2 97.8 1.36 5.29 2.89 0.130 0.091 0.545 801 RD (%) ND 57.8 65.5 83.0 52.0 66.7 50.8 74.1
Table 3 contd….

M. J. Baloch et al.
J. Agric. Res., 2012, 50(3)
308
Marvi T1 95.6 3.40 15.26 13.44 0.245 0.168 0.869 2726 T2 96.7 1.14 5.00 3.19 0.123 0.085 0.643 791 RD (%) ND 66.5 67.2 76.3 49.8 49.4 26.0 71.1
Mehran T1 96.7 2.88 15.48 14.83 0.232 0.165 0.956 2925 T2 97.8 1.27 5.26 3.10 0.127 0.073 0.587 818 RD (%) ND 55.9 66.0 79.1 45.3 55.8 38.6 72.0
Bhitai T1 94.4 3.39 17.11 12.72 0.262 0.194 0.742 2816 T2 80.0 1.47 5.40 2.84 0.123 0.077 0.537 660 RD (%) 15.3 56.6 68.4 77.7 53.1 60.3 27.6 76.6
ZA-77 T1 93.3 3.14 15.00 10.84 0.273 0.171 0.709 2416 T2 96.7 2.02 6.11 3.20 0.134 0.087 0.529 900 RD (%) ND 35.7 59.3 70.5 50.9 49.1 25.4 62.7
Pavan T1 94.4 2.91 14.33 10.28 0.239 0.152 0.719 2322 T2 97.8 1.32 5.18 3.84 0.123 0.036 0.742 883 RD (%) ND 54.6 63.9 62.6 48.5 76.3 ND 62.1
Imdad T1 93.3 2.78 12.89 12.28 0.271 0.174 0.934 2325 T2 97.8 1.19 5.06 2.77 0.128 0.074 0.545 764 RD (%) ND 57.2 60.7 77.4 52.8 57.5 41.6 67.1
ND= No decrease, SG= Seed germination, CL = Coleoptile length, SL= Shoot length, RL= Root length, SW= Shoot weight, RW = Root weight, R/S = Root-shoot ratio, SVI = Shoot vigour index. obviously suffers more than any other seedling trait. Dhanda et al. (3) reported that continued growth of roots in dry soil is particularly important to avoid drought. As compared to shoot, root length demonstrated a high percentage decrease due to osmotic stress. The variety Pavan presented minimum reduction in root length (62.6%) while maximum reduction was registered by Abadgar (83.0%). In case of shoot weight Moomal showed minimum reduction (42.2%) against maximum in Kiran-95 (57.23). About root weight, Moomal proved as more tolerant while Pavan was less. Regards to root/shoot ratio, no decrease occurred in Pavan whereas the highest reduction (50.8%) was noted in Abadgar being most vulnerable to osmotic stress. Considerable declines were noted for seed vigour index in all varieties ranging from 60.1 (Inqalab-91) to 76.6 percent (Bhitai). Similar to present findings, Bayoumi et al. (2) and Rauf et al. (10) also noted significant reductions in all seedling traits by osmotic stress, yet some of the varieties gave little decline, and were regarded as drought tolerant. Correlations among seedling traits Correlations are important statistical parameters for selection and crop improvement. The correlation values (Table 4) indicated that seed germination percentage was not affected by PEG and also did not show correlation with any other seedling trait. Coleoptile length expressed significantly positive correlation with shoot length (r=0.95), root length (r=0.81), shoot weight (r=0.90), root weight (r=0.57), root/shoot ratio (r=0.45) and seed vigour index (r=0.90). These results indicated that increase in

Assessment of wheat cultivars for drought tolerance
J. Agric. Res., 2012, 50(3)
309
Table 4. Correlation coefficients (r) among various seedling traits of spring wheat genotypes treated with polyethylene glycol (PEG-6000).
Seedling traits
Coleoptile length
Shoot length
Root length
Shoot weight
Root weight
Root/ shoot ratio
Seed vigour index
Germination percentage
0.05ns 0.06NS -0.006 0.04NS 0.04NS -0.09NS 0.10NS
Coleoptile length 1 0.95** 0.81** 0.90** 0.57** 0.45** 0.90** Shoot length 1 0.89** 0.95** 0.59** 0.55** 0.97** Root length 1 0.89** 0.64** 0.84** 0.97** Shoot weight 1 0.62** 0.59** 0.94** Root weight 1 0.51** 0.63** Root/shoot ratio 1 0.71**
**Significant at 1% probability level, NS = Non-significant
coleoptile length caused a simultaneous increase in other traits. Similarly, shoot length showed significant and positive correlations with root length (r=0.89), shoot weight (r=0.95), root weight (r=0.59), root/shoot ratio (r=0.55) and seed vigour index (r=0.97). Likewise root length, shoot weight, root weight and seed vigour index manifested significant and positive correlations with other seedling traits further suggesting that increase in any one seedling attribute correspondingly increased the other traits. It means if one reliable attribute is picked in osmotic stress and used as a selection criterion that will lead to improve other seedling traits for drought conditions and better varieties could be selected to cope with stress environments. Several other workers (2, 4, 10) also noted positive correlations among wheat seedling traits under osmotic or water stress conditions.
CONCLUSION
In this study osmotic stress caused significant effect on all the seedling traits. However, the effect on individual variety was more meaningful which indicated that cultivar TD-1 showed no reduction in coleoptile length while minimum reduction was recorded in Anmol. Similarly, Sarsabz and Anmol expressed minimum reductions in shoot and root length suggesting their higher stress tolerance, so these seedling traits may be used as good indicators for drought tolerance. Correlations among seedling traits were significant and positive except germination percentage which suggested that increase in one seedling trait could cause simultaneous increase in another trait; hence may lead to screen and develop drought tolerant wheat cultivars.
REFERENCES 1. Ashraf, C.M. and S. Abu-Shakra. 1978. Wheat seed germination under
low temperature and moisture stress. Agron. J. 70: 135-139.

M. J. Baloch et al.
J. Agric. Res., 2012, 50(3)
310
2. Bayoumi, T.Y., H.E. Manal and E.M. Metwali. 2008. Application of physiological and biochemical indices as a screening technique for drought tolerance in wheat genotypes. African J. Biotechnol. 7: 2341-2352.
3. Dhanda, S.S., R.K. Behl and L. Elbassam. 1995. Breeding wheat genotypes for water deficit environments. Landbanforschung Volkenrode. 45: 159-167.
4. Dhanda, S.S., G.S. Sethi and R.K. Behl. 2004. Indices of drought tolerance in wheat genotypes at early stages of plant growth. J. Agron. Crop Sci. 190: 6-12.
5. Dilday, R.H., M.A. Mgonja,, S.A. Amonsilpam, F.C. Collins and B.R. Wells. 1990. Plant height vs. mesocotyl and coleoptile elongation in rice: Linkage or pleiotropism? Crop Sci. 30: 815-818.
6. Lagerwerff, J.V., G. Ogata and H.E. Eagle. 1961. Control of osmotic pressure of culture solutions with polyethylene glycol. Science. 133: 1486.
7. Ludlow, M.M. and R.C. Muchow. 1990. A critical evaluation of traits for improving crop yields in water limited environments. Adv. Agron. 43: 107-153.
8. Money, N.P. 1989. Osmotic pressure of aqueous polyethylene glycols. Relationship between molecular weight and vapor pressure deficit. Plant Physiol. 91: 766-769.
9. Morgan, J.M., R.A. Hare and R. J. Fletcher. 1986. Genetic variation in osmo-regulation in bread and drum wheat and its relationship to grain yield in a range of field environments. Aust. J. Agric. Res. 37: 449-457.
10. Rauf, M., M. Munir, M. Ul-Hassan, M. Ahmed and M. Afzal. 2007. Performance of wheat genotypes under osmotic stress at germination and early seedling growth stage. Afr. J. Biotechnol. 8: 971-975.
11. Roza, G. M., K.Shahzad Jamaati-e-Somarin and R. Zabihi-e-Mahmoodabad. 2010. Effects of polyethylene glycol and NaCl stress on two cultivars of wheat (Triticum durum) at germination and early seedling stages. American-Eurasian J. Agric. & Environ. Sci. 9: 86-90.
12. Sayar, R., H. Khemira, A. Kameli and M. Mosbahi. 2008. Physiological tests as predictive appreciation for drought tolerance in durum wheat (Triticum durum Desf.). Agron. Res. 6: 79-90.
13. Zhu, J.K., P.M. Hasegawa, and R.A. Bressan. 1997. Molecular aspects of osmotic stress in plants. Crit. Rev. Plant Sci. 16: 253-277.