The Influence of Attractiveness and Expertise on Celebrity ...

Facebook 4 Urban Facelift
Assessment of Urban Attractiveness of Torre Annunziata - Facebook 4 Urban Facelifts Mariarosaria Angrisano¹, Paolo Franco Biancamano², Amalia Cancelliere³, Antonia Gravagnuolo4 1 Ph.D University of Naples “Federico II”, Via Toledo 402, 80132, Naples; [email protected] (F.L.)
2 Ph.D University of Naples “Federico II”, Via Toledo 402, 80132, Naples; [email protected] (F.L.)
3 Ph.D University of Naples “Federico II”, Via Toledo 402, 80132, Naples; [email protected] (F.L.)
4 Ph.D University of Naples “Federico II”, Via Toledo 402, 80132, Naples; [email protected] (F.L.)
Received: / Accepted: /Published:
Abstract: This research aims to assess the change in the attractivenessof urban waterfronts depending on specific actions, in order to enhance the regeneration, growth, development and promotion of transformation areas in port cities. The main purpose of the research is to develop a tool for the assessment of impacts generated by the variation of "spatial quality" of places on the attractiveness of port cities. This article focuses on the city of Torre Annunziata and in particular on its industrial port area and waterfront. The research method is based on a participative process able to build a shared long-term strategy for the enhancement of visual quality of port areas, based on the evaluation of perceived urban quality of Torre Annunziata waterfront. A number of semi structured, in-depth interviews has been proposed to various stakeholder to assess the general perception of the area in terms ofattractiveness. The results offer an alternative tool to evaluate different “scenarios” for the future of cities development that can support decision makers, businessmen, citizen and various stakeholder taking the most effective decisions towards a sustainable development of port cities.

1. Introduction
Local resources play a fundamental role in the global competition between territories. Globalization processes and the growth of differences - poverty, social exclusion - show the importance of local values for the stability of positive impacts of socio economic and cultural development ofplaces. Cities are “engines” of global development based on local values. Sustainable development of cities is encouraged by several international conventions and programs (Lille Action Program 2000, Bristol Convention 2005, Leipzig Charter on Sustainable European Cities 2007) towards the promotion of the city as active subject, able to use material and human, internal and outside resources, to lead development to environmental, cultural, social and economic sustainability.
A focus on the future of sustainable cities is contained in the “Joint European Support for Sustainable Investments in City Areas”, a recent funding initiative of European Union to use structural Funds in urban areaswith the aim of leading public and private investments into high quality urban development.
Cities – not Nations - are the bricks of global economy. To assess the dynamic of economic growth, the research should consider the urban economy as fundamental (Jacobs 2009). Cities have been described as inhuman and unnatural agglomerates, infected with diseases such as crime, epidemics, violence and the exorbitant cost of living.
Crime, traffic, pollution, social segregation are the evils that afflict cities even today, but why people continue to move to the city? According to the prediction of the "World Urbanization Prospect" of the United Nations, the percentage of people living in urban areas will continue to

increase in the coming decades. This is because the city is also perceived as an opportunity rather than a source of problems. Cities must face today quantitative and qualitative challenges, they should become more intelligent, attractive, sustainable and inclusive, designed to improve thequality of life of citizen.
But what are cities? “Dynamic territorial supplements and cognitive multipliers of the global circuits of knowledge; unique/rare from the geographical and social point of view” (Carta 1996). “Relational hubs able to combine internal “stable” cognitive resources – meanings, symbols, identities, knowledge, personalities, self-organization, etc.) and “mobile”cognitive resources from outside (Dematteis 2006). Cities are places in which material and immaterial components coexist, determining the presence of two interrelated parts: the “visible” city and the “livable”, experienced city. Thus, the nature of urban environment is multifaceted andcomplex and the evaluation of its global attractiveness, wealth and competitiveness becomes a very difficult task.
This research assumes that the city is the result of two components: the "invisible city", which is familiar to every resident in every age even though the forms and urban typologies are almost endless, and the "livable city", which cannot be seen, but it is as real as the visible. Revised indicators are thus necessary to assess the attractiveness and competitiveness of cities. Quantitative analysis of different aspects of the city of Torre Annunziata has been processed in this research besides the investigation of the perceived visual features in order to assess the importance of intangible values that cannot be understood though conventional statistical analysis. The urban “milieu”, the city atmosphere are fundamental components of the uniqueness and quality of cities. Researchers (Bonaiuto, Bonnes, Nenci 2011) argue the need to assess the quality of the city through the use of quality / quantity indicators through methods and techniques that are able to incorporate the results of participatory and dialogical processes and that go beyond the use of existing information technologies that are based only on the hierarchy of data (Saaty 1991).
2. Conceptual framework
2.1 Background

Urban regeneration seeks ways to improve disadvantaged places and the livesof people who live and work there. The task of achieving urban regenerationin towns and cities cannot be carried out with public funds alone: privatecapital is necessary. Studies demonstrate that real-estate and developersoccupy a pivotal position in the identification and creation of developmentopportunities thereby facilitating the flow of long-term investment finance[JRF Joseph Rowntree Foundation Report, 1998]. In order to attract privatecapitals and reduce the investment risk it is necessary to assess thelocalization preferences of residents and stakeholders in certaindistricts. Localization preferences can encourage private investment inrun-down areas, if suitably co-located in complementary social policies andpublic funding initiatives.
Main research issues are:
- to explore whether and how visual features are important for theattractiveness of waterfront districts;
- to process a participative and transparent tool for the development of ashared long-term strategy aiming to enhance the attractiveness ofwaterfronts for private investments at the same time managing the conflictdue to different priorities between public and private sectors.
2.2 The role of waterfronts as elements of attractiveness in urban competition
Port cities can be “hotspots” for creative and sustainable urbandevelopment [Ravetz, Fusco Girard, Bornstein 2012]. Ports have always beenplaced within the flows of, among other things, people, ideas and goods[Hein 2011]. Port areas inside the cities are places of “identity” beforebeing location for trades and productions [Schubert 2011], for this reasonthey need regeneration strategies able to make them attractive forresidents, tourists and developers. The economic trends of the 60s-70s inItaly based on industrial development led port cities to use large portareas as industrial districts, thanks to their attractive location and easyaccess to marine transport routes. After this period, post-industrial portareas and waterfronts have been abandoned and show nowadays the signs ofenvironmental exploitation [Fusco Girard 2011]. Since the 80s theredevelopment of urban waterfronts in Europe has been a primary issue ofterritorial planning. The process of de-industrialization and relocation ofproduction facilities influenced local economies. On the other side, thanksto the charming presence of the sea and to the opportunity of have accessto facilities and amenities, the coastline is becoming the place whereenvironmental and social values, as well as economic values related torental growth and real estate market, are growing and multiplying.
Many significant urban transformation in recent years have been realized inwaterfront districts. Barcelona and Genoa recovered the seaside in theearly 90s, while Seville and Lisbon implemented the respective Expos,Bilbao and London started regeneration processes in waterfront districts.
According to the several examples of port cities regeneration, two startingsituations of waterfront conditions can be distinguished (Censis, 2009):
1. one, that is typical of Northern Europe, related to industrialareas/ports abandoned or underutilized, often very large, and placedon the periphery of the city center;
2. that, more Mediterranean, of ports and industrial sites inside ornext to the city center, smaller and often highly integrated with thehistoric city.
Starting from case studies and from the results of international research in the field of attractiveness of cities for investments and talents, and its relation with the quality of urban environment, the waterfront of TorreAnnunziata has been investigated as object of this research. The waterfrontarea has been chosen as engine of urban development and element of economicand cultural attractiveness for the entire city.
The processing of the future vision for the regeneration of the waterfrontin Torre Annunziata followed different "steps":
Step 1. Analysis of the city, S.W.O.T. Analysis and selection of thedistrict;
Step 2. Processing of the evaluation survey: choice of thestakeholders; definition of the aspects to analyse; choice ofpictures; definition of criteria (questions);
Step 3. Processing the evaluation table necessary to prioritize theaspects and choose the most effective actions to improve waterfrontconditions;
Step 4. Processing FIVE interconnected “URBAN IMAGES” for TorreAnnunziata 2050: ENTREPRENEURIAL CITY; CITY OF IDENTITY; LIVABLECITY; CONNECTED CITY; CULTURAL AND CREATIVE CITY.
Step 5. Processing the Urban Faces and the MATRIX TABLE ofFaces/Images.
3. The port city of Torre Annunziata. Socioeconomic, cultural and environmental features

3.1 The Gulf of Naples: cultural aspects
The ancient port cities located in the Gulf of Naples have always beenplaces rich in history and culture [Colletta, 2010]. Since VIII century b.C. they were populated by Greek colonies and after this period Romans builtin these territory various military and commercial ports as well asbeautiful villas.
The southern area of Vesuvio mountain includes the coast between theancient rivers Sebeto and Sarno. Twelve municipalities are included in thisarea covering about 1333 sq. km: Boscoreale, Boscotrecase, Castellammare diStabia, Pompei, Portici, Ercolano, San Giorgio a Cremano, Sant’AntonioAbate, Torre Annunziata, Torre del Greco, Santa Maria la Carità andTrecase. These cities, that define the Gulf of Naples waterfront, pourtoday in conditions of total abandonment, mostly due to the disposal ofindustries during the 90s. From that period the coast developeduncontrolled, without a specific urban design.
3.2 The city of Torre Annunziata
The city of Torre Annunziata covers an area of about 7.33 square km and 6km of waterfront, it is situated in the centre of the Gulf of Naples andsurrounded by the cities of Torre del Greco, Trecase, Boscotrecase,Boscoreale, Pompei and Castellammare di Stabia. The industrial district issituated in the eastern part of the city, it covers about 200 hectares and2.5 km of beaches and is populated by more than 3000 inhabitants.
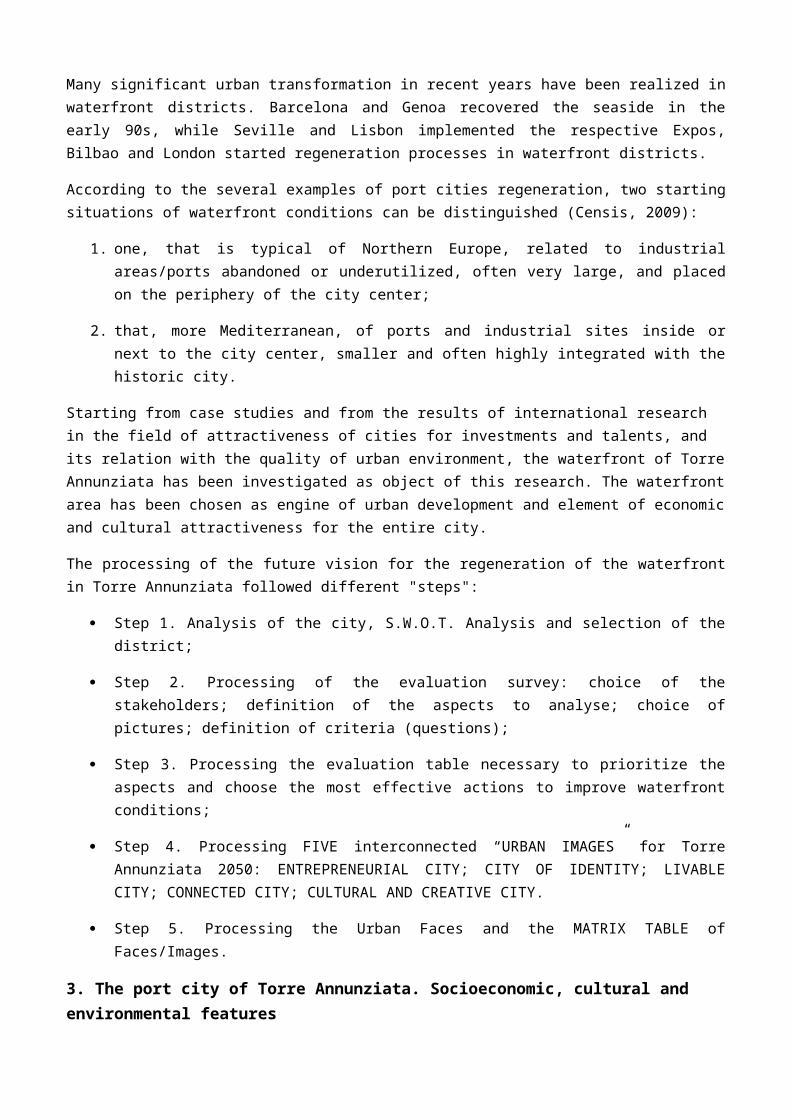
According to the classification of Italian municipalities for populationsize, the city of Torre Annunziata is classified as a medium-large urbancentre (range 20 thousand - 50 thousand inhabitants). The populationdensity highlights the phenomenon of a high concentration of populationtypical of the Vesuvian area (see Table 1). The city covers an area ofabout 7.33 square km and 6 km of waterfront, the industrial districtlocated on the waterfront covers about 200 hectares and 2.5 km of beachesand is populated by more than 3000 inhabitants. During the last decades thecity faced a slow decline, shown by the decreasing trend in residentpopulation (see Figure 1).
Figure 1. Demographics trend of the resident population in the municipality of Torre Annunziata
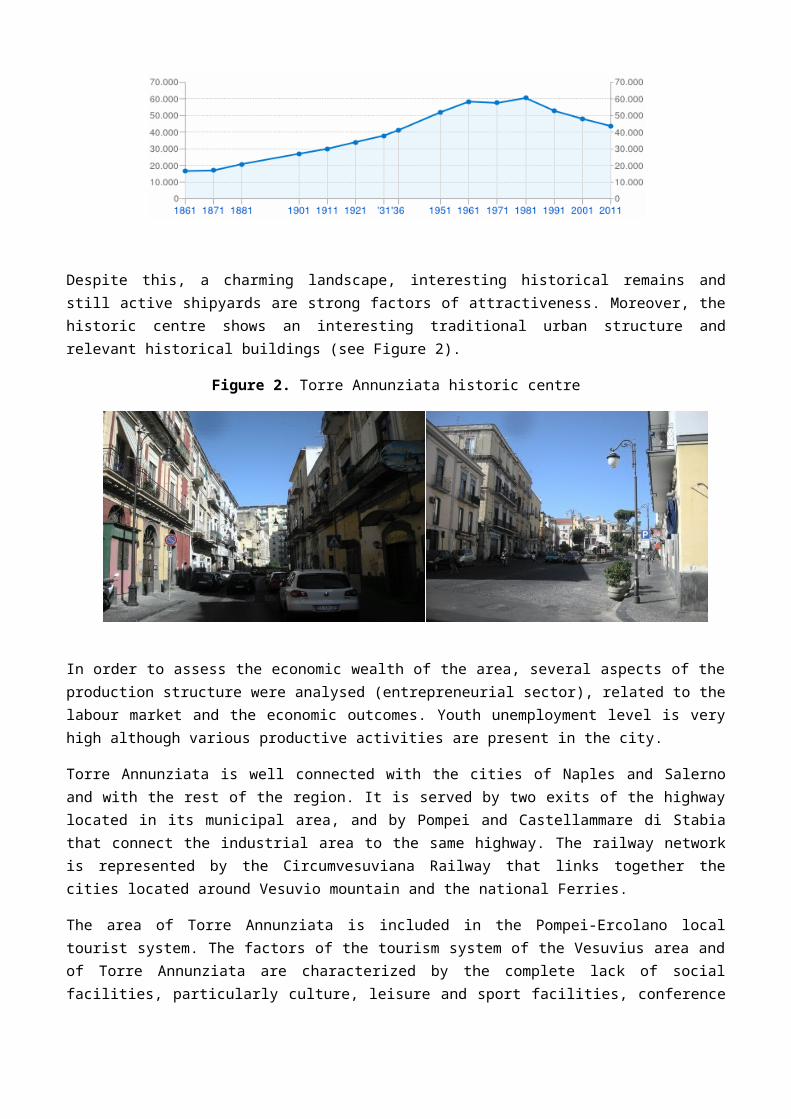
Despite this, a charming landscape, interesting historical remains andstill active shipyards are strong factors of attractiveness. Moreover, thehistoric centre shows an interesting traditional urban structure andrelevant historical buildings (see Figure 2).
Figure 2. Torre Annunziata historic centre
In order to assess the economic wealth of the area, several aspects of theproduction structure were analysed (entrepreneurial sector), related to thelabour market and the economic outcomes. Youth unemployment level is veryhigh although various productive activities are present in the city.
Torre Annunziata is well connected with the cities of Naples and Salernoand with the rest of the region. It is served by two exits of the highwaylocated in its municipal area, and by Pompei and Castellammare di Stabiathat connect the industrial area to the same highway. The railway networkis represented by the Circumvesuviana Railway that links together thecities located around Vesuvio mountain and the national Ferries.
The area of Torre Annunziata is included in the Pompei-Ercolano localtourist system. The factors of the tourism system of the Vesuvius area andof Torre Annunziata are characterized by the complete lack of socialfacilities, particularly culture, leisure and sport facilities, conference
halls or every other space of sociality that can both attract and retainthe touristic flows and improve the quality of life of residents.
3.3 Port system and waterfront visual features
The Port of Torre Annunziata is one of the most important seaports inCampania region, the fourth largest one after those of Naples, Salerno andCastellammare di Stabia and the third one for handlings after Naples andSalerno. It has numerous storage spaces and buildings including silos forthe storage of grain, that were reached by trains loading productsdirectly. It was served by the station of Torre Annunziata Marittima, todayclosed, which was connected directly to the railroad.
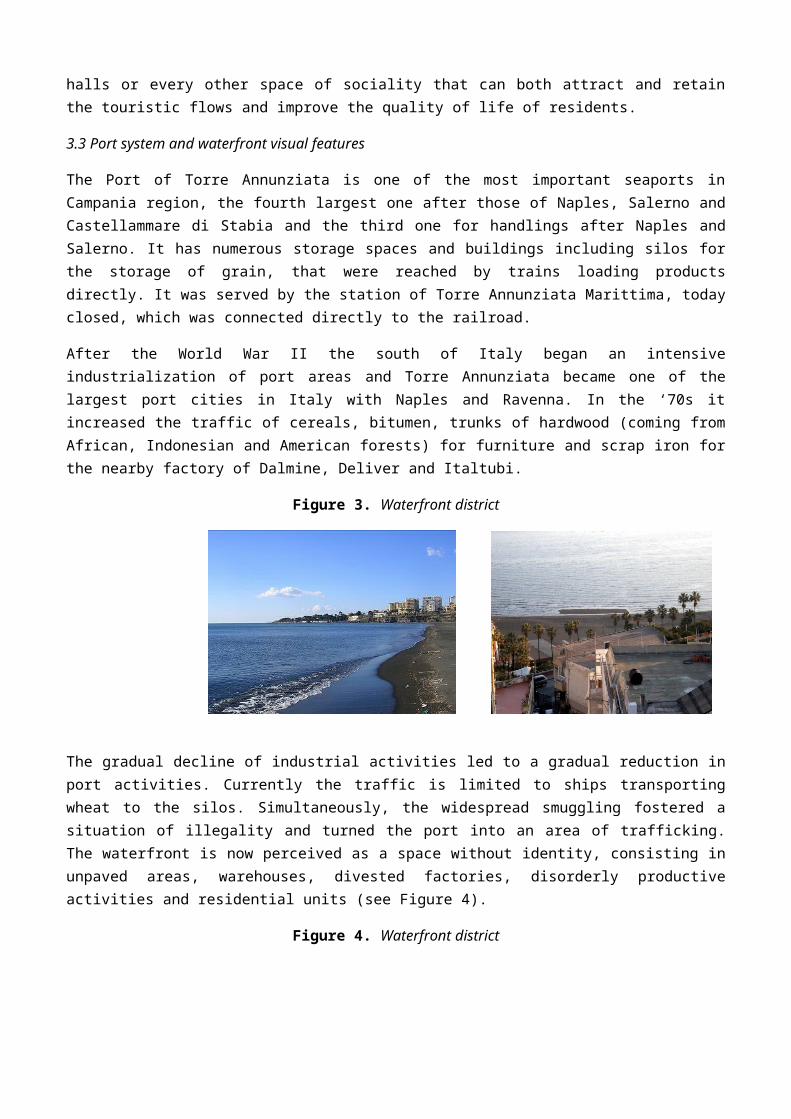
After the World War II the south of Italy began an intensiveindustrialization of port areas and Torre Annunziata became one of thelargest port cities in Italy with Naples and Ravenna. In the ‘70s itincreased the traffic of cereals, bitumen, trunks of hardwood (coming fromAfrican, Indonesian and American forests) for furniture and scrap iron forthe nearby factory of Dalmine, Deliver and Italtubi.
Figure 3. Waterfront district
The gradual decline of industrial activities led to a gradual reduction inport activities. Currently the traffic is limited to ships transportingwheat to the silos. Simultaneously, the widespread smuggling fostered asituation of illegality and turned the port into an area of trafficking.The waterfront is now perceived as a space without identity, consisting inunpaved areas, warehouses, divested factories, disorderly productiveactivities and residential units (see Figure 4).
Figure 4. Waterfront district
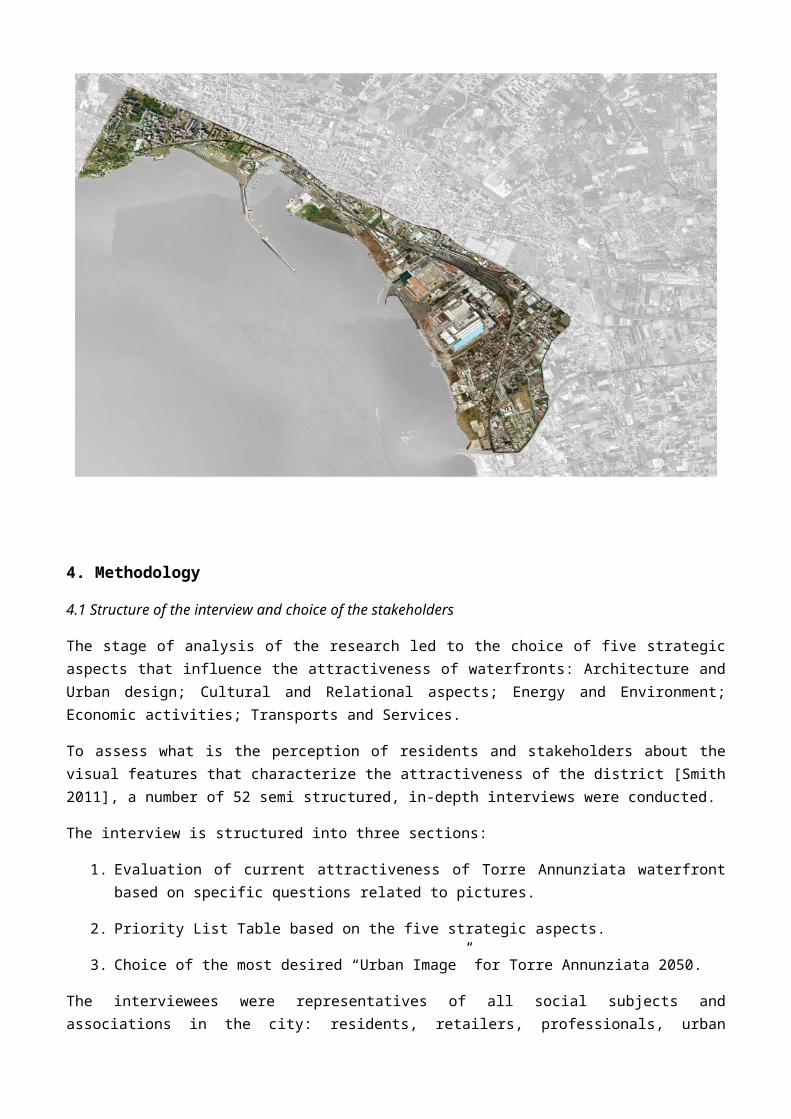
4. Methodology
4.1 Structure of the interview and choice of the stakeholders
The stage of analysis of the research led to the choice of five strategicaspects that influence the attractiveness of waterfronts: Architecture andUrban design; Cultural and Relational aspects; Energy and Environment;Economic activities; Transports and Services.
To assess what is the perception of residents and stakeholders about thevisual features that characterize the attractiveness of the district [Smith2011], a number of 52 semi structured, in-depth interviews were conducted.
The interview is structured into three sections:
1. Evaluation of current attractiveness of Torre Annunziata waterfrontbased on specific questions related to pictures.
2. Priority List Table based on the five strategic aspects.
3. Choice of the most desired “Urban Image” for Torre Annunziata 2050.
The interviewees were representatives of all social subjects andassociations in the city: residents, retailers, professionals, urban

planners, entrepreneurs, public officials and policy-makers. They wereasked to rate the present visual features of each aspect through picturesand specific questions and then range the five aspects in a priority list.The involvement of various stakeholders allows to process a “cognitive map[…], a kind of geographic map of the thought in which subjective knowledge,individual indicators and experiences are clarified and related trough aparticular set of relations” (Fusco Girard, Nijkamp 2003).
The choice of priorities is a fundamental step [Saaty 1991] to assess whichshould be the most significant goals for funding and public policies inorder to attract private investors and secure a guaranteed minimum returnof property income to developers.
The interview concludes with five “visions” proposed for the waterfront ofTorre Annunziata 2050, each one connected to one of the analyzed aspects ofthe district.
4.2 Rating Scale
A simple "Likert scale" has been chosen for the survey in order to achievea rating scale that could be easy to understand by the interviewee,defining an easy and short list of items that contains a fairly largenumber of selectable numbers in order to give stability to the scale. TheLikert scale appears to be the simplest among the well-known scalingtechniques such as Thurstone, Guttman, Differential Thermometer andsemantic feelings.
This technique consists mainly in developing a number of statements(technically defined item) that express a positive and negative attitudewith respect to a specific object. The sum of these judgments will tend todraw in a reasonably precise attitude of the subject towards the object.Each question is related to the choice of preset numbers - a scale ofsufficient / insufficient, generally 5 or 7 mode. The respondents are askedto indicate their degree of agreement or disagreement with the statementsof the survey. This method is applicable both for one-dimensional type ofattributes than multidimensional questions.
The scale used for the survey had five items from 1 to 5 (1 = very poor, 2= very poor, 3 = fair, 4 = good, 5 = excellent).
We take as criteria:
one-dimensionality of the attitudes under investigation: thedifferent statements used must refer to the same concept, i.e.

items / questions should detect the same property and then measurethe same thing.
It is assumed that the distance between "very poor" and "poor" is thesame as the one that exists between "good" and "excellent."
The advantage of this choice is that of making response categoriesintuitive and clear. Furthermore the Likert scale provides a minimum ofarticulation of the interviewee choice, despite closed form of responsessuch as yes/no choice.
4.3 Analyzed aspects
Architecture and Urban design
This aspect refers to the visual features of the urban waterfront. Publicspaces are areas in which everybody can walk, stay, relax, go shopping, gocycling, meet. They should be safe, clean and well lighted. They should fitthe human scale and give identity to the place. The waterfront is the partof the city that is directly connected with the sea. It should includefacilities and services. It should be vital, beautiful and give the city asense of freedom.
Cultural and Relational
This aspect refers to the cultural life of the district. Festivals,celebrations and other cultural events represent an opportunity forcitizens to share feelings, traditions and all kind of activity with otherpeople living or visiting the district. A cultural district should offerdifferent facilities in order to allow people enjoying concerts, going outfor sports and gathering traditional celebrations. People should feel safewalking around the district and trust other visitors. Associations shouldcooperate with Institutions and Residents to build trust and participation.
Energy and Environment
This aspect refers to the use of renewable energies and to clean air, waterand soil. An attractive district should take care of the environment andavoid pollution, separating wastes and using renewable energies, recyclingmaterials and water. Buildings should be energy‐efficient and urban greenshould create a comfortable microclimate.
Economic Activities
This aspect refers to the vitality of tourism, trade and entrepreneurialclimate. A vital district should revalue traditional productions and create

the opportunities to developing them towards innovation and creativity.Shipbuilding could attract investors and create employment. The districtshould offer a lot of shops and markets with a large variety of goods.Welcome and tourist activities should be well organized and people who cometo the port should find all goods they need, fresh foods and allinformation about the territory.
Transports and Services
This aspect refers to transports and accessibility of the district and to the services offered to citizens. An accessible district should be reached and visited through private and public transport; it should offer an efficient, green and not expensive public transport system (bus, tram, trains, boats, car sharing) and a network of bike/pedestrian routes. Wealth, education and administrative services and offices should be easily reached through public transport and pedestrian/bike routes, their public buildings should be clean and well-kept.
4.4 Priority list
In the first step of the interview stakeholders were asked to rate theperformances of the district through the analysis of the above aspects.Specific questions related to significant pictures of the district wereproposed to interviewees for each aspect. After this step, a priority listtable was proposed to the interviewees to prioritize the fields ofinterventions for a future urban development strategy.
Table 6. Priority list table
ANALYZED ASPECTS
PRIORITY from 1 (max.priority) to 5(min. priority)
PRIORITY – Components
Please choose one component for eachanalyzed aspect
SUGGESTIONS,DRAWINGS, IDEAS …
ARCHITECTURE ANDURBAN DESIGN
Identity/Public spaces Urban designPedestrian Green areas Waterfront
CULTURAL ANDRELATIONAL
Enjoyment and Cultural events Sport facilities Enjoyment and cultural facilities Perception about safety Social cohesion
Renewable energies

ENERGY ANDENVIRONMENT
Pollution
Buldings energy efficiency
Waste recycling
ECONOMIC ACTIVITIES
Traditional/Innovative productionsVitality of trade climate Vitality of entrepreneurial climate Welcome and Tourism Wellness and SPAVitality of waterfront activities
TRANSPORTS ANDSERVICES
Wealth and Education Administrative services University and Apprenticeship Transports Big infrastructures (Port)
4.5 Urban Images of Torre Annunziata 2050
Five urban images 2050 were proposed to the stakeholders to improve thecity attractiveness. The images, or “visions”, of the city have beenprocessed considering the urban trends in European cities development[Nijkamp, Kourtit 2012] and the five factors of attractiveness ofwaterfront regeneration.
City of Identity (Architecture and Urban design)
The image refers to a city that valorizes his material and immaterialcultural heritage, connecting the waterfront area with a renovated historiccentre and connecting the archaeological site of Oplontis to the port andthe waterfront, making streets and public spaces clean and safe andpromoting their image in the touristic circuits.
Special transport systems are improved connecting the roman remains withother internationally well‐known archaeological sites such as Pompeii,Ercolano and the Vesuvian Villas nearby the city. The traditionalproductions, such as “pasta”, are also internationally promoted throughfestivals and special events combining it with local wines of Vesuvius andother gastronomic specialties. The waterfront is connected to the city andoffers a lot of entertainments on the characteristic black volcanic sand ofthe beaches.
Creative and Cultural city (Cultural and Relational aspect)
This image refers to a city where the waterfront district offers a lot ofcultural activities and facilities (concert hall, cinema, exhibition areas)and traditional events are enhanced.

New water sport facilities are built on the waterfront and there are lotsof public spaces of relation and green areas with sport facilities. Streetsand squares are well-kept and well lighted, a lot of differententertainments are located near the port and the whole area is perceived asvital during night and day. The waterfront is the place where people meetat every time, it offers spaces to study and work and becomes attractivethanks to its creative atmosphere.
Liveable city (Energy and Environment)
This image refers to a clean, safe and green city, where the beautifullandscape and the investments in the green economy attract workers andresidents.
People living in the city can go everywhere on feet or using the new bikepaths, students and young people can choose between several entertainmentsand a lot of green areas where to go in for sports or just to relax. Wasteand water are recycled and the streets are always clean, public and privatebuildings use renewable energy sources, such as all new buildings on thewaterfront. Historic buildings are restored improving their energyefficiency and opening them as public spaces of relation.
Entrepreneurial city (Economic activities)
The image of an entrepreneurial city is connected to a vitalentrepreneurial climate, a city that produces innovation and gains accessto the markets outside Europe thanks to its high quality products (e.g.shipbuilding) and high professionalization of workers and managers.
An entrepreneurial city gives young people the possibility to enter theglobal market thanks to its commercial and touristic port, it offers a lotof services for young entrepreneurs who want to realize their projects andoffers a high level of education in the fields of economics, engineeringand marine design. This is a city where the local institutions offer a lowlevel of bureaucracy, gain access to several funding initiatives, and keepa legal and democratic entrepreneurial climate where everyone has the sameopportunities to realize his projects.
Connected city (Transports and Services)
The image of a connected city refers to the development of advancedtransportation infrastructures, starting from the existing port andrailways and developing smart logistic systems and accessible communicationsystems through which the city becomes the main trade hub of the wholeterritory. The city can develop as a node of commercial transfers,
capturing the flows of trading goods in the Mediterranean Sea, andconnecting them with Europe through fast railways.
This is a city where the administrative services are efficient and welllocated and the pedestrian/bike accessibility to the several offices isimproved. Innovative information technologies are developed in order tomake the administrative interactions easy and fast. This image refers tothe innovation in all the administrative services and the city becomes theclue of this type of services for other cities in the territory.
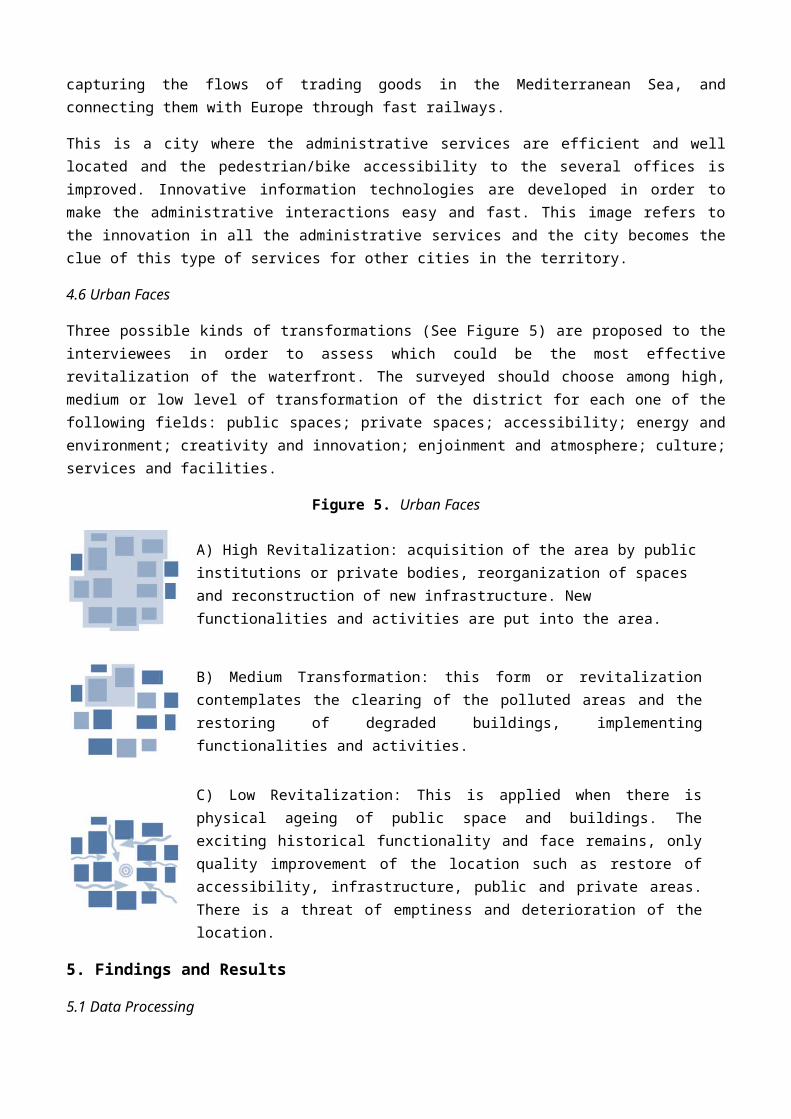
4.6 Urban Faces
Three possible kinds of transformations (See Figure 5) are proposed to theinterviewees in order to assess which could be the most effectiverevitalization of the waterfront. The surveyed should choose among high,medium or low level of transformation of the district for each one of thefollowing fields: public spaces; private spaces; accessibility; energy andenvironment; creativity and innovation; enjoinment and atmosphere; culture;services and facilities.
Figure 5. Urban Faces
A) High Revitalization: acquisition of the area by publicinstitutions or private bodies, reorganization of spaces and reconstruction of new infrastructure. New functionalities and activities are put into the area.
B) Medium Transformation: this form or revitalizationcontemplates the clearing of the polluted areas and therestoring of degraded buildings, implementingfunctionalities and activities.
C) Low Revitalization: This is applied when there isphysical ageing of public space and buildings. Theexciting historical functionality and face remains, onlyquality improvement of the location such as restore ofaccessibility, infrastructure, public and private areas.There is a threat of emptiness and deterioration of thelocation.
5. Findings and Results
5.1 Data Processing

The high amount of collected data made it possible to create a largedatabase of stakeholders perceptions about the waterfront. In total 52interviews were conducted. Some of them were administered directly (19interviews), while others were compiled independently by respondents (theremaining 33). An initial analysis of the average values of the two samplesinterviews ruled out a possible influence of the responses from the sampleinterviewed individually. In fact, the average values of the two maincategories are aligned and do not represent significant deviations.
The interview provided different data types for each section. Inparticular, Section 1 of the interview provided data related to theassessment of perception of visual quality for each analysed aspect. Theperception of visual features of the district is investigated throughsignificant pictures associated to specific questions (See Figure 6). Theseare the most important data related to the perception of the presentsituation, they represent the starting point to measure the change betweencurrent and potential attractiveness of analysed places.
Figure 6. Visual structure of the interview
Assessment of the potential attractiveness of the district as perceived bystakeholders and storytelling are also contained in the first part of theinterview.
Section 2 of the interview provided data related to the selection ofpriorities, and Section 3 is related to “Urban Images” 2050 and “UrbanFaces”. Interviewees were asked to choose the most desired “Urban Image”2050 and relate the choice with the most effective urban transformation -“Urban Face”.
Specific evaluation techniques have been chosen related to different datatypes collected from each section of the interview. The sample respondentswere divided into three categories of stakeholders: public sector,represented by policy-makers; private sector, represented by entrepreneursand investors; third sector, represented by civil and professionalassociations. In general each category of respondents is fairly homogeneousand it is an important and significant sample.
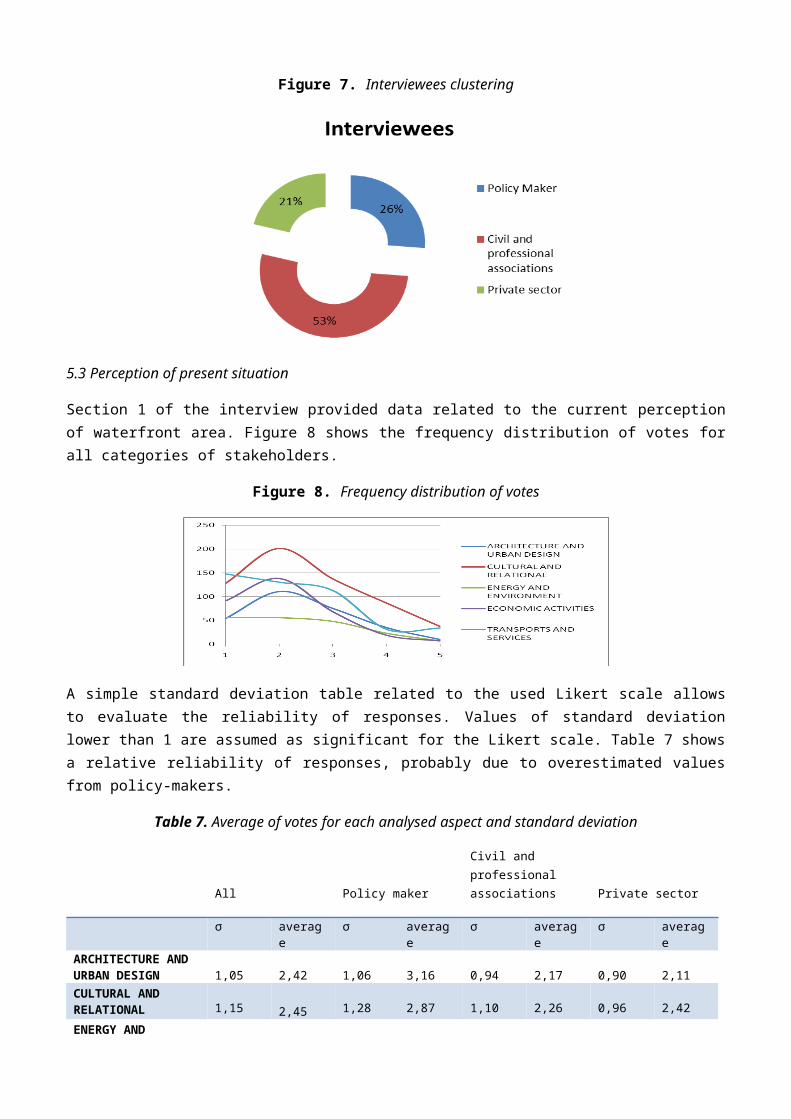
Figure 7. Interviewees clustering
5.3 Perception of present situation
Section 1 of the interview provided data related to the current perceptionof waterfront area. Figure 8 shows the frequency distribution of votes forall categories of stakeholders.
Figure 8. Frequency distribution of votes
A simple standard deviation table related to the used Likert scale allowsto evaluate the reliability of responses. Values of standard deviationlower than 1 are assumed as significant for the Likert scale. Table 7 showsa relative reliability of responses, probably due to overestimated valuesfrom policy-makers.
Table 7. Average of votes for each analysed aspect and standard deviation
All Policy maker
Civil and professional associations Private sector
σ average
σ average
σ average
σ average
ARCHITECTURE AND URBAN DESIGN
1,05
2,42
1,06
3,16
0,94
2,17
0,90
2,11
CULTURAL AND RELATIONAL
1,15
2,45
1,28
2,87
1,10
2,26
0,96
2,42
ENERGY AND

ENVIRONMENT 1,13 2,39 1,16 2,90 1,06 2,07 0,96 2,56 ECONOMIC ACTIVITIES
0,95
2,11
0,99
2,44
0,87
1,96
0,92
2,21
TRANSPORTS AND SERVICES
1,20
2,17
1,48
2,54
1,10
2,00
0,91
2,11
The following are "spider diagram" obtained from average total votes of allinterviewees (See Figure 9). In the first aspect (Architectural and Urbandesign) the average votes are lower than 3, that corresponds to a“sufficient” value, it follows that the architectural aspect is stronglyaffected and degraded. The perception of citizens denounces the lack ofequipment.
Figure 9(b) highlights problems related to energy and environment aspects in the waterfront area. The average votes stressed the perception of environmental quality as very low, however recent establishment of waste recycling by the local government allowed an average value for this sub-aspect that is near to the middle value.
The aspect of economic activities characterizes more than others thedistrict. The presence of shipyards and “pasta” factories on the waterfronthas strongly influenced the development of Torre Annunziata, although theseactivities are today facing a slow decline. The vitality of economicactivities are perceived very negatively by the citizens. Thermal Spa isperceived as the only vital activity of the district.
Figure 9(e) related to services is perceived as rather positive. The majorinfrastructure (port) is valued negatively for the lack of any kind offacilities and amenities. Transports and Apprenticeship services are ratedas negative.
Figure 9. Perceived present situation of waterfront district in Torre Annunziata

a. b.
c. d.
e.
As expected, each category of stakeholders shows a different perception ofcurrent situation, although average rates are almost homogeneous for allinterviewees. Figure 10 shows that policy-makers rated each aspect as morepositive than other stakeholders.

Figure 10. Average of votes about perception of current situation
5.4 Perception of potential attractiveness
Data about the perception of potential attractiveness highlighted the largegap between the current situation and the potentiality (See Figure 11). Itis possible to note that the average ratings of perceived potentialattractiveness does not change a lot for different categories ofstakeholders. It can be argued that the potential attractiveness of thedistrict is almost equally perceived by all respondents.
Figure 11. Visualization of the gap between potential (red) and current (blue) attractiveness of thedistrict
The figure shows the gaps between the current situation and potentialattractiveness. The largest gap is related to ecological-environmentalaspect.
5.5 Choice of priorities and “Urban Image”

Data collected in Section 2 of the interview have been processed throughthe Logit model for evaluation and analysis of statistic data. This modelallows to identify which factors are essential for qualitative choices ofinterviewees, in this case represented by the choice of priorities. Theanalytic model (See Figure 12) relates each choice (Y) with differentvariables (x), and allows to calculate specific values related to eachvariable.
Figure 12. Logit analytic model for the evaluation of priorities
The research assumes each analyzed aspect as dependent variable (Y),defining five independent variables (xn) as represented in Table 8.
Table 8. Dependent and independent variables
Variable Name Type Values
Y Dependent variable CHOSEN PRIORITY Dummy 0 = ARCHITECTURE AND URBAN DESIGN1 = CULTURAL AND RELATIONAL2 = ENERGYAND ENVIRONMENT3 = ECONOMIC ACTIVITIES 4 = TRANSPORTSAND SERVICES
x1 Independent variable STAKEHOLDERS Dummy 0 = Policy Maker 1 = Civil and professional associations3 = Entrepreneurs
x2 Independent variable AGE Dummy 0 = 20-40 1 = 40-65
x3 Independent variable GENDER Dummy 0 = Female 1 = Male
x4 Independent variable RESIDENT/NON-RESIDENT Dummy 0 = Yes 1 = No
x5 Independent variable AVERAGE RATES Numeric Numeric
The same model can be applied to the choice of the most desired “UrbanImage” for Torre Annunziata 2050. Independent variables resulted fromdifferent clustering of interviewees (See Table 9).
Table 9. Percentage of interviewees divided into groups
StakeholdersPolicy Maker 26 %Civil and professional associations
53 %
Age20-40 37 %40-65 63 %

Entrepreneurs 21 %
GenderFemale 32 %Male 68 %
Resident/Non-ResidentYes 74 %No 26 %
The second part of the interview focused on the direct choice of prioritiesfor operative actions in the district. Results not always confirmed thedata of the first part of the interview (See Figure 13). From theassessment of the aspects we would expect that the priorities chosen by thecitizens were those affecting environmental quality. Rather surprisingly,citizens tackled as a priority for future investments the economic sector.
Figure 13. Priority list evaluation scheme
The last part of the survey focused on the choice of the most desiredfuture “image” of the city 2050 (See Figure 14).
Figure 14. Choice of the most desired Urban Image
Finally, interviewees filled in the matrix of faces/images in whichthey indicated the most effective urban transformation (Urban Face)in order to reach each vision.

Figure 15. Choice of the most effective transformation
5.7 Story Telling
It is important to show ideas and suggestions collected through openquestions of the survey, which support the evaluation process assessingissues and challenges of the city.
The underdevelopment of the waterfront district is perceived as due to:
• the presence of organized criminality that controls very large areasof the territory
• diffused corruption that slows the processing and execution ofcorrect policies for the city
• lack of urban planning and illegal disorderly buildings thatinfluence the negative perception of visual features of thewaterfront district
• lack of amenities in the port area
• physical barriers between the city and the sea, i.e. railway roads,also due to the presence of shipyards on the waterfront
5.8 General results
Data evaluation through specific evaluation methods highlighted thedifferent perception of urban attractiveness of Torre Annunziata waterfrontdepending on the characteristics of sample interviewees. Significantvariables that influence the choice of stakeholders emerged from theresearch, although the number of interviews is relatively low. The sampleof 52 interviews proved to be fairly significant and highlighted thefollowing results:
poor environmental quality (present situation)
need of improvement of quality of life (potential)
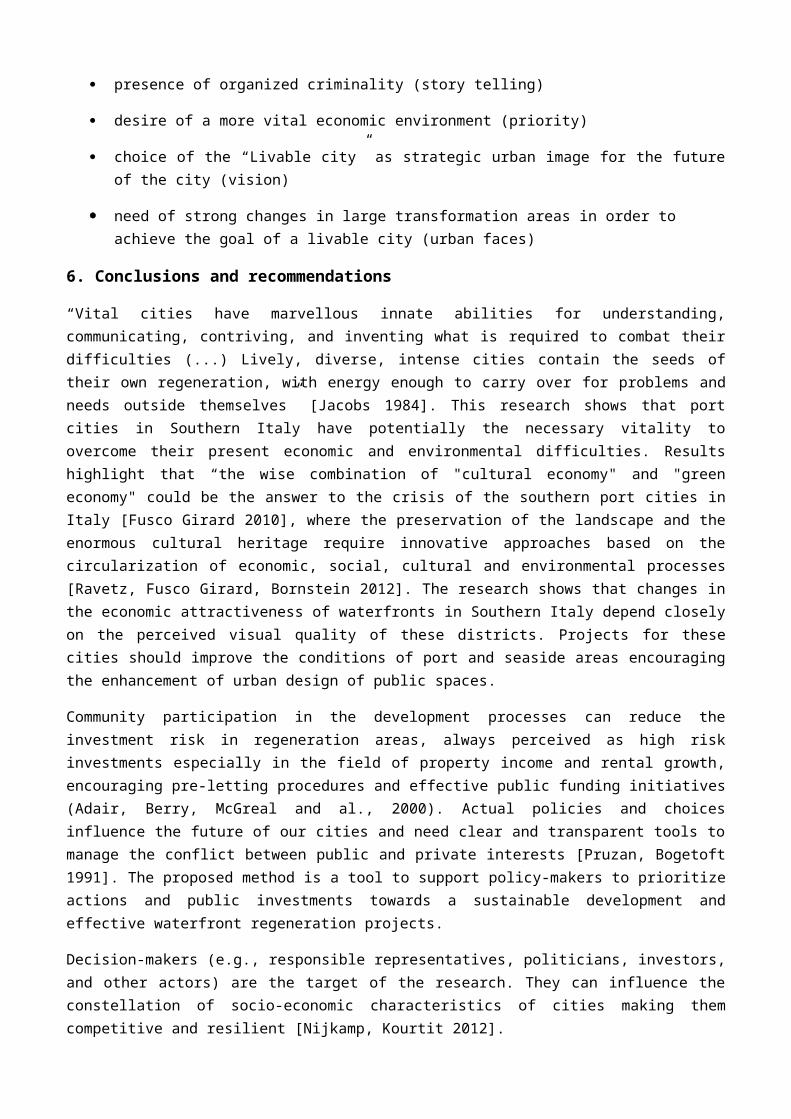
presence of organized criminality (story telling)
desire of a more vital economic environment (priority)
choice of the “Livable city” as strategic urban image for the futureof the city (vision)
need of strong changes in large transformation areas in order to achieve the goal of a livable city (urban faces)
6. Conclusions and recommendations
“Vital cities have marvellous innate abilities for understanding,communicating, contriving, and inventing what is required to combat theirdifficulties (...) Lively, diverse, intense cities contain the seeds oftheir own regeneration, with energy enough to carry over for problems andneeds outside themselves” [Jacobs 1984]. This research shows that portcities in Southern Italy have potentially the necessary vitality toovercome their present economic and environmental difficulties. Resultshighlight that “the wise combination of "cultural economy" and "greeneconomy" could be the answer to the crisis of the southern port cities inItaly [Fusco Girard 2010], where the preservation of the landscape and theenormous cultural heritage require innovative approaches based on thecircularization of economic, social, cultural and environmental processes[Ravetz, Fusco Girard, Bornstein 2012]. The research shows that changes inthe economic attractiveness of waterfronts in Southern Italy depend closelyon the perceived visual quality of these districts. Projects for thesecities should improve the conditions of port and seaside areas encouragingthe enhancement of urban design of public spaces.
Community participation in the development processes can reduce theinvestment risk in regeneration areas, always perceived as high riskinvestments especially in the field of property income and rental growth,encouraging pre-letting procedures and effective public funding initiatives(Adair, Berry, McGreal and al., 2000). Actual policies and choicesinfluence the future of our cities and need clear and transparent tools tomanage the conflict between public and private interests [Pruzan, Bogetoft1991]. The proposed method is a tool to support policy-makers to prioritizeactions and public investments towards a sustainable development andeffective waterfront regeneration projects.
Decision-makers (e.g., responsible representatives, politicians, investors,and other actors) are the target of the research. They can influence theconstellation of socio-economic characteristics of cities making themcompetitive and resilient [Nijkamp, Kourtit 2012].

Results show the reliability of this methodology to support decisions aboutthe enhancement of city attractiveness through different outputs:
- Design of a shared “urban image” for the development of Torre Annunziata waterfront, processed by the community in an active way in order to involvecitizen in the planning activities of their city;
- Definition of an organic framework of problems that can be useful to identify possible solutions through participative and transparent tools;
- Identification of priorities towards shared community goals;
This research confirms the importance of “evaluation methods opened toparticipatory procedures” [Fusco Girard Nijkamp 2003]. The “comparison” ofdifferent simulations of district regeneration, obtained throughappropriate IT tools, allows stakeholders to understand the variation of“quality” contained in each scenario and guides them in the choice of themost desired urban “image”. The results of this research can supportdecision makers and policy makers towards the identification of a sharedand viable “vision” for the future of the city. The value of the proposedmethod stays in the capability to involve all categories of residents:civil associations, investors, professionals, retailers, policy makers. Theregeneration of trust resources is a key issue for the current westernsocieties [Fukuyama 1995]. Urban research can help to make urban choicesmore transparent [Storper, Manville 2006]. The aim is to lead citizens toan active participation in the strategic choices of their hometown,allowing them to be part of the planning processes in their own districts,collecting their ideas, feelings, wishes. This allows to elaborate a“conceptual map” which expresses the expectations of the community and tofinally fulfil the desired “vision” for the waterfront and the entire city.
“Economists have argued that individuals choose locations that maximizetheir economic position and broad utility. Sociologists have found thatsocial networks and social interactions shape our satisfaction with ourcommunities. Research, across various social science fields, finds thatbeauty has a significant effect on various economic and social outcomes”.According to the sociologist John Urry, contemporary cities are objects of“visual consumption”, or rather aesthetic fruition (Urry, 1995). Thus,planning urban transformations means to invest in the production of placesthat are suited for visual consumption, or rather to enhance the aestheticfruition of the city. The perceived aesthetic beauty of places has asignificant influence on the localization choices of various economic andsocial actors. It is “one of the most significant factors alongside

economic security, good schools, and the perceived capacity for socialinteraction” [Florida, Mellander, Stolarick 2008].
References

Adair, A.; Berry, J.; Mc Greal, S.; Poon, J.; Hutchison, N.; Watkins, C.; Gibb, K. Benchmarking Urban Regeneration. RICS Foundation: London, 2000.
Bonaiuto, M.; Bonnes M.; Nenci A.M.; Carrus, G. Urban Diversities - Environmental andSocial Issues. Hogrefe Publishing: 2011.
Carta, M. Pianificazione territoriale e urbanistica. Dalla Conoscenza alla Partecipazione. Laboratorio di Pianificazione Territoriale Medina, 1996.
CENSIS, Recupero dei waterfront e sviluppo territoriale. Opportunità per Pozzuoli. Pozzuoli, 2009.
Colletta, T. Tra storia e recupero. Le città portuali nell'età di Filippo II. L'età del confronto e la riqualificazione dei fronti a mare storici. In Storia dell’Urbanistica. Campania., 1st ed.; Edizioni Kappa: Roma, Italy, 2010; Volume 9.
Dematteis, G.; Indovina, F.; Magnaghi, A.; Piroddi, E.; Scandura, E.; Secchi, B., I futuri delle città. Tesi a confronto. Franco Angeli: Milano, 2006.
Florida, R. Mellander, C., Stolarick, K. Beautiful Places: The Role of Perceived AestheticBeauty in Community Satisfaction. Working Paper Series, Martin Prosperity Research Institute, Toronto, Ontario: 2008 REF. 2009-MPIWP-008.
Fukuyama, F. Trust: the Social Virtues and the Creation of Prosperity. Free Press: New York,1995.
Fusco Girard, L. Sustainability, creativity, resilience: toward new development strategies of port areas through evaluation processes. International Journal of Sustainable Development 2010, Volume 13, Number 1-2/2010, 161-184.
Fusco Girard, L.; Nijkamp, P. Le valutazioni per lo sviluppo sostenibile della città e del territorio, 3rd ed.; Franco Angeli: Milano, Italy, 2003.
Fusco Girard, L; Nijkamp, P; Baycan, T. Sustainable City and Creativity. Promoting Creative Urban Initiatives. Ashgate: 2011.
Fusco Girard; Per uno sviluppo umano sostenibile nel Mezzogiorno: come gestire la transizione verso una nuova base economica urbana?, In Il Nord e il Sud dell’Italia a 150 anni dall’Unità, Quaderno Speciale; Svimez: 2011, 759-779.
Hein, C. Port Cities: Dynamic Landscapes and Global Networks. Routledge: 2011.
Hennicke, P. Sganciare il Benessere dal PIL - Verso un nuovo tipo di progresso tecnologico, in BDC, Bollettino del Dipartimento di Conservazione dei Beni Architettonici edAmbientali, Director Fusco Girard, L., vol. 4/2003
Jacobs, J. Cities and the wealth of Nations. Random House: New York, NY,1984.

Jacobs, M. The Green Economy. Pluto Press: London, 1991.
JRF Foundation; Attracting private finance into urban regeneration. RICS Books: London, 1998. Available online: http://www.jrf.org.uk/sites/files/jrf/hr558.pdf
Nijkamp, P. Sustainability of Urban System. Aldershot: Avebury, 1990.
Nijkamp, P.; Kourtit K. NDSM: Facebook 4 Urban Facelift. Department of Spatial Economics: Amsterdam, 2012.
Nijkamp, P.; Kourtit, K. Suzuki, S. Exceptional Places: The Rat Race Between World Cities.Department of Spatial Economics: Amsterdam, 2012.
Pruzan, P. Bogetoft, P. Planning with multiple criteria. North Holland: Amsterdam, 1991.
Ravetz, J.; Fusco Girard, L.; Bornstein, L. “A research and policy development agenda: fostering creative, equitable, and sustainable port cities”. In Bollettino del Dipartimento di Conservazione dei Beni Architettonici ed Ambientali, vol. 12, 1/2012. Università degli Studi di Napoli Federico II: Napoli, 2012.
Saaty, T.L. The Logic of Priorities. RWS Publications: Pittsburg, 1991.
Schubert, D. Seaport Cities. In Port Cities: Dynamic Landscapes and Global Networks, Hein, C.; Routledge: 2011.
Smith, J.A. The Influence of District Visual Quality on Location Decisions of Creative Entrepreneurs. JAPA, 2011, DOI: 10.1080/01944363.2011.567924. Available online: http://dx.doi.org/10.1080/01944363.2011.567924 (accessed on 13 April 2011).
Storper, M., Manville, M. Behaviour, preferences and cities: Urban theory and urban resurgence. Urban Studies: 2006, 1247-1274.
Urry, J. Consuming Places. Routledge: New York, 1995.
Websites
http://www.eib.org/attachments/documents/jessica_evaluation_focused ...
http://ec.europa.eu/regional_policy/thefunds/instruments/jessica_it ...
http://www.creativemetropoles.eu/
http://www.creative-growth.eu/
http://www.daretobedigital.com/

http://ec.europa.eu/europeaid/evaluation/methodology/methods/mth_ccr_en.htm
http://www. Agenda 21 culture.net
http://ec.europa.eu/environment/urban/pdf/eci_final_report.pdf
© 2012 by the authors;
Copyright © 2022 FDOKUMEN