ASSESSMENT OF THE ECOLOGICAL RISKS ASSOCIATED WITH IRRIGATION IN THE GOULBURN BROKEN CATCHMENT Phase...
35
ASSESSMENT OF THE ECOLOGICAL RISKS ASSOCIATED WITH IRRIGATION IN THE GOULBURN BROKEN CATCHMENT Phase 1 – Identification of risks and development of conceptual models April 2001 Peter Cottingham Ron Beckett Peter Breen Pat Feehan Mike Grace Barry Hart Cooperative Research Centre for Freshwater Ecology University of Canberra, ACT
Transcript of ASSESSMENT OF THE ECOLOGICAL RISKS ASSOCIATED WITH IRRIGATION IN THE GOULBURN BROKEN CATCHMENT Phase...

ASSESSMENT OF THE ECOLOGICALRISKS ASSOCIATED WITH IRRIGATION
IN THE GOULBURN BROKENCATCHMENT
Phase 1 – Identification of risks and development of conceptual models
April 2001
Peter Cottingham
Ron Beckett
Peter Breen
Pat Feehan
Mike Grace
Barry Hart
Cooperative Research Centre for Freshwater Ecology
University of Canberra, ACT

AAASSSSSSEEESSSSSSMMMEEENNNTTT OOOFFF TTTHHHEEEEEECCCOOOLLLOOOGGGIIICCCAAALLL RRRIIISSSKKKSSS
AAASSSSSSOOOCCCIIIAAATTTEEEDDD WWWIIITTTHHH IIIRRRRRRIIIGGGAAATTTIIIOOONNNIIINNN TTTHHHEEE GGGUUOOULBBBUUURRRNNN BBBRRROOOKKKEEENNN
CCCAAATTTCCCHHHMMMEEENNNTTT
Phase 1 – Identification of risks and development of conceptual models
April 2001
Peter Cottingham Ron Beckett Peter Breen Pat Feehan Mike Grace Barry Hart
Cooperative Research Centre for Freshwater Ecology University of Canberra, ACT

The Cooperative Research Centre for Freshwater Ecology is a national research centre specialising in river and wetland ecology. The CRC for Freshwater Ecology provides the ecological knowledge needed to help manage the rivers in a sustainable way. It was established in 1993 under the Australian Government’s Cooperative Research Centre Program. In the CRC, university, government and industry partners work together to understand river systems.
The Cooperative Research Centre for Freshwater Ecology is a collaborative venture between: • ACTEW Corporation • CSIRO Land and Water • Department of Land and Water Conservation, NSW • Department of Natural Resources, Queensland • Department of Natural Resources and Environment, Victoria • Environment ACT • Environment Protection Authority, NSW • Environment Protection Authority, Victoria • Goulburn-Murray Rural Water Authority • Griffith University • La Trobe University • Lower Murray Water • Melbourne Water • Monash University • Murray-Darling Basin Commission • Sunraysia Rural Water Authority • Sydney Catchment Authority • University of Canberra
Cooperative Research Centre for Freshwater Ecology
All rights reserved. This publication is copyright and may not be resold or reproduced in any manner (except parts thereof for bona fide study purposes in accordance with the Copyright Act) without prior consent of the Publisher.
Ph: 02 6201 5168 Fax: 02 6201 5038 Email: [email protected] http://freshwater.canberra.edu.au
Printed in April 2001
ISBN 1 876810 72 6
This project was undertaken with the assistance of the National Program for Irrigation research and Development (NPIRD). This assistance is gratefully acknowledged.
The project was managed by Mr Pat Feehan, Manager Natural Resources, Goulburn-Murray Water, Tatura (e-mail [email protected]).
Contents
1 ABSTRACT ....................................................................................................... 1
2 INTRODUCTION .............................................................................................. 2
2.1 PURPOSE AND OBJECTIVES ........................................................................................2
3 GENERAL APPROACH....................................................................................... 3
3.1 STAKEHOLDER WORKSHOP ........................................................................................3 3.2 WHAT IS ERA? ......................................................................................................3 3.3 PROJECT BOUNDARIES..............................................................................................3
4 PRIORITY ECOLOGICAL CONSEQUENCES ....................................................... 5
4.1 CONCEPTUAL MODELS..............................................................................................5 4.1.1 Issue 1 – Blue-green algae............................................................................6 4.1.2 Issue 2 - Fish kills.........................................................................................8 4.1.3 Issue 3 - Pest plants and animals.................................................................14 4.1.4 Degradation of floodplain vegetation............................................................16
5 RANKING OF RISK......................................................................................... 18
6 KNOWLEDGE GAPS........................................................................................ 20
6.1 KNOWLEDGE GAPS ................................................................................................20 6.1.1 Algal blooms ..............................................................................................20 6.1.2 Fish kills ....................................................................................................20 6.1.3 Pest plants and animals ..............................................................................21 6.1.4 Floodplain and wetland vegetation ...............................................................21
7 CONCLUSIONS............................................................................................... 22
8 REFERENCES ................................................................................................. 23
APPENDIX 1 ………………………………………………...…………………………………… 24 APPENDIX 2 ………………………………………………...…………………………………… 28
Acknowledgments The input of local stakeholders who attended the workshop at Tatura on 22 September 2000 (Appendix 2) was greatly appreciated.

Ecological Associated with Irrigation Systems in the Goulburn-Broken Catchment
1
1 ABSTRACT
The National Program for Irrigation Research and Development (NPIRD) established a research project to develop and test a generic framework for assessing the ecological risks associated with irrigation systems. The framework development and partial testing will be informed by case studies in three irrigation systems, the Goulburn-Broken (Victoria), the Ord (Western Australia) and the Fitzroy (Queensland).
Each case study is to be implemented in three phases:
1. Problem formulation phase - identify likely ecological risks associated with irrigation systems and what is known about these risks;
2. Investigation phase - undertake specific studies to gather specific information required to complete the detailed ERA in phase 3;
3. Detailed ecological risk assessment.
This report provides the findings of Phase 1 for the Goulburn Broken irrigation area and seeks to identify likely ecological risks associated with irrigation systems in the Goulburn Broken catchment.
A list, and brief description, of likely ecological consequences of development in the catchment on which irrigation is likely to have a significant impact was developed at a workshop with relevant catchment stakeholders. Priority risks, or ecological consequences, identified included increased occurrence of blue-green algae (eutrophication); reduced native fish abundance and diversity (fish kills); spread of aquatic pest plants and animals; loss/decrease in structure and function of terrestrial/floodplain vegetation communities.
Conceptual models for each of these ecological consequences have been developed. A qualitative ranking of these consequences was undertaken based on its importance in the catchment, the impact of irrigation, the probability of the consequence occurring and the scientific knowledge of the consequence. The ranking can be undertaken quantitatively when better data is assembled.
Finally, knowledge gaps for each consequence have been identified. These knowledge gaps can be addressed in Phase 2 of the project.
Ecological Associated with Irrigation Systems in the Goulburn-Broken Catchment 2
2 INTRODUCTION
The National Program for Irrigation Research and Development (NPIRD) has established a research project to develop and test a generic framework for assessing the ecological risks associated with irrigation systems. The framework development and partial testing will be informed by case studies in three irrigation systems, the Goulburn-Broken (Victoria), the Ord (Western Australia) and the Fitzroy (Queensland).
Each case study is to be implemented in three phases:
1. Problem formulation phase - identify likely ecological risks associated with irrigation systems and what is known about these risks;
2. Investigation phase - undertake specific studies to gather specific information required to complete the detailed ERA in phase 3;
3. Detailed ecological risk assessment.
This report provides the finding of Phase 1 for the Goulburn-Broken irrigation area.
2.1 Purpose and Objectives
The purpose of this project is, as part of the larger NPIRD project, to identify likely ecological risks associated with irrigation systems in the Goulburn Broken catchment. Specifically, the objectives are to:
• Develop a list and brief description of up to six ecological consequences of development in the catchment on which irrigation is likely to have a significant impact. The process of identifying ecological consequences is to be done in consultation with relevant catchment stakeholders.
• Develop conceptual models for each of the ecological consequences listed. The models may be overlapping and have common stressors. The conceptual models will include relevant data where possible (e.g. some quantification/scaling/trigger levels for the stressors).
• Complete an ecological effects matrix table to help establish priorities for each ecological consequence.
• Briefly justify the rankings in the ecological effects matrix table and review current and past activities in the catchment to address the effects or issues.
The project will address the ecological consequences of irrigation systems in the Goulburn Broken catchment. These consequences may not necessarily be directly associated with irrigation areas. They may, for example, be a consequence of water transfers from the upper catchment or of downstream impacts of discharges of salt and nutrients from an irrigation area.

Ecological Associated with Irrigation Systems in the Goulburn-Broken Catchment
3
3 GENERAL APPROACH
3.1 Stakeholder Workshop
A workshop of stakeholders from the Goulburn-Broken irrigation area was held on the 11 September 2000. The workshop was useful for developing a common understanding of what was meant by ERA, the spatial and temporal boundaries at which ERA should be applied in the Goulburn-Broken, and priority ecological consequences for which conceptual models would be developed. The minutes of the workshop and a list of attendees is given in Appendix 2.
3.2 What is ERA?
Ecological Risk Assessment (ERA) is a process for determining the level of risk posed by stressors to the health or survival of ecosystems. ERA seeks to account for the variability and complexity of natural ecosystems and provides a method for assessing the ecological consequences of stressors. There are three components associated with ecological risk:
1. The probability or likelihood of an adverse effect occurring; 2. The consequences if that event occurred; and 3. The timeframe over which risk is considered.
Thus the model adopted for ecological risk assessment in this project is:
Risk = consequence x likelihood
This is an extension of the traditional Risk = Hazard x Exposure model for contaminants.
Undertaking ERA poses many challenges, including:
• The potentially large number of target species (multiple species); • The large number of possible stressors (multiple stressors); • Defining the boundaries (spatial and temporal) of the system; • Obtaining accurate data or information on causal linkages; and • Defining what is an ‘acceptable’ risk;
One common failing of many ERAs is that they fail to explicitly state the assumptions made during the risk assessment process. This lack of transparency prevents any cross-checking or validation of the assessment in the light of new evidence/information or to verify the conclusions. In this work, the explicit statement of assumptions and a clear delineation of the methodology should largely redress this significant deficiency in contemporary ERAs.
3.3 Project boundaries
Defining the spatial and temporal boundaries of the project is an important first step, especially for developing the conceptual models upon which the ERA will be based. While stressors have their own bounds and variability, an assessment of the effects of stressors associated with the irrigation area is still required. When developing conceptual models, irrigation effects were considered at Local (e.g. subcatchment), Catchment (e.g. Goulburn – Broken basin) and downstream (e.g. Adelaide) scales. Temporal scales included short-term effects (seasonal), medium term effects (5-10 years) and long term effects (30-50 years). The spatial boundaries to be considered were identified at the stakeholder workshop to include upstream (above Eildon), downstream (Murray River) and local (irrigation areas in the Goulburn and Broken catchments). Upstream areas were

Ecological Associated with Irrigation Systems in the Goulburn-Broken Catchment 4
important as diversions for irrigation occur there and events such as fuel and pesticide spills affect stream health.
The project considered both the changes to the catchment that result from irrigation and also catchment changes that impact on irrigation, as appropriate. While it is important to account for direct impacts resulting from activities or processes that occur in irrigation areas, it may also be important to consider outside factors that impact on ecological conditions in irrigation areas, and subsequently affect the downstream environment (e.g. dryland salinity impacts on irrigation water and drainage quality; upstream salinity can affect the sustainability of irrigated enterprises and damage infrastructure).
The steps involved to identify priority ecological consequences and subsequent information needs was agreed and outlined in Figure 1.
The Big Picture For Each Ecological Consequence
Prepare conceptualmodel of the system
Define notional temporal & spatial boundaries
Define project objectives
Identify ecological consequences or effects
Identify ecological consequences or effects
Identify major stressorsIdentify major stressors
Identify the available datafor each model
Prepare conceptual modelfor each ecological effect
Identify what additional dataare needed and how to obtainIdentify what additional data
are needed and how to obtain
Figure 1: General approach used to identify priorities for investigation.

Ecological Associated with Irrigation Systems in the Goulburn-Broken Catchment
5
4 PRIORITY ECOLOGICAL CONSEQUENCES
The workshop identified a number of ecological consequences to be avoided, including:
• Terrestrial and riparian vegetation damage and loss;
• Biodiversity loss; • Increased presence of alien species or pests; • Increased groundwater salinity; • Increased algal bloom frequency and
intensity; • Increased sedimentation and erosion; • Smothering of stream communities by
sediments; • Death of biota due to anoxia;
• Reduced aquatic plant productivity; • Reduced native fish abundance and
diversity; • Reduced health of stream biota; • Reduced reproductive success of biota; • Decreased water quality; and • Loss of floods and interruption of
geomorphological processes.
It was recognised that the community may want to include public health (potable water) and agricultural risks to the above list, and that we must be clear to differentiate between ecological risk assessment and the treatment of other risks.
A preliminary list of risks to be considered was prepared, including:
• Increased occurrence of blue-green algae; • Reduced native fish abundance and diversity (fish kills); • Reduced invertebrate abundance and diversity; • Reduced aquatic plant abundance and diversity; • Loss/decrease in agricultural production; • Reduced beneficial uses of water (potable/irrigation); • Loss/decrease in structure and function of terrestrial/floodplain communities; • Spread of aquatic pest plants and animals; • Spread of terrestrial pest plants and animals.
Priority was assigned to:
• Increased occurrence of blue-green algae (eutrophication); • Reduced native fish abundance and diversity (fish kills); • Spread of aquatic pest plants and animals; • Loss/decrease in structure and function of terrestrial/floodplain vegetation communities.
4.1 Conceptual Models
Conceptual models have been developed that may be applied at the scales of interest for managers in the Goulburn-Broken region (local, catchment, regional). It became apparent when developing these conceptual models and expanding them to inform the ERA process, that clear management objectives were required for each issue being addressed. For example, when dealing with the issue of fish kills, is this to include only native fish species or are pest species such as carp also included? Clear statements on management objectives are essential so that the appropriate risk factors can be considered and the ERA process informs future management decision making.

Ecological Associated with Irrigation Systems in the Goulburn-Broken Catchment 6
4.1.1 Issue 1 – Blue-green algae Achieving a reduction in the frequency and severity of blue-green algal blooms in the waters of the Goulburn Broken basin has been the concern of natural resource managers and the local community for many years (GBWQWG 1997). A simple conceptual model for the formation of algal blooms in waterways in the region is shown in Figure 2. Here an algal bloom is considered to require three main factors (drivers):
• Adequate concentrations of nutrients; • Adequate light for photosynthesis; and • Low flow conditions that will allow the BG algal populations to achieve bloom numbers
before they are washed out.
Information on the risks of an algal bloom forming is likely to be used in two main ways:
• To identify sites across the Goulburn-Broken that have the highest risk of a bloom occurring (catchment, regional scale); and
• To assess the risk of a bloom developing at any one site (local scale).
Increased frequency of blue-green algal bloomsIncreased frequency of blue-green algal blooms
NutrientsNutrients
Model
LightLight Flowhydrodynamics
Flowhydrodynamics
Conceptual ModelConceptual ModelConceptual ModelConceptual Model
Figure 2. Conceptual model for blue-green algae growth
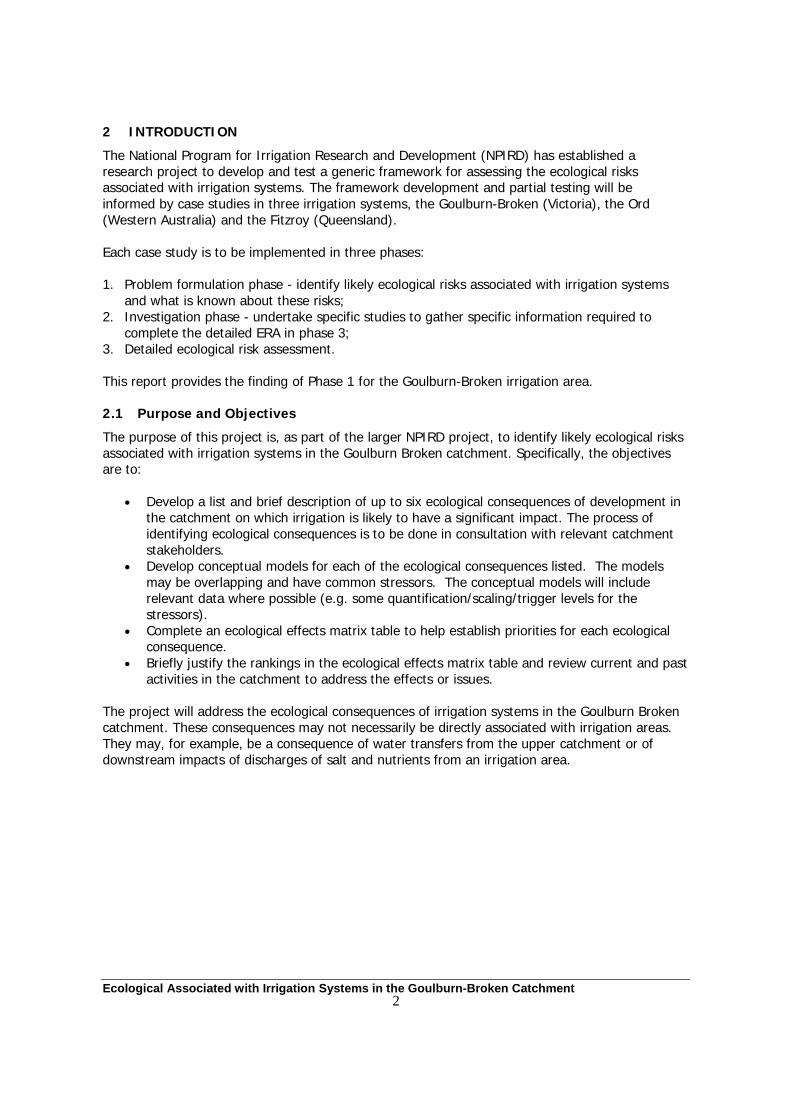
A simple decision tree for assessing the risk that a blue-green algal bloom will occur is shown in Figure 3. Here if the nutrient concentration measured by TP is >50 µg/L, and there is sufficient light (assumed to occur if the turbidity is <30 NTU) and the flow conditions are right (Hart et al.1998), then there is a high risk that an algal bloom will occur. This decision tree method is semi-quantitative, in that while quantitative trigger values are provided for TP, turbidity and flow, the combination of these drivers is still qualitative.
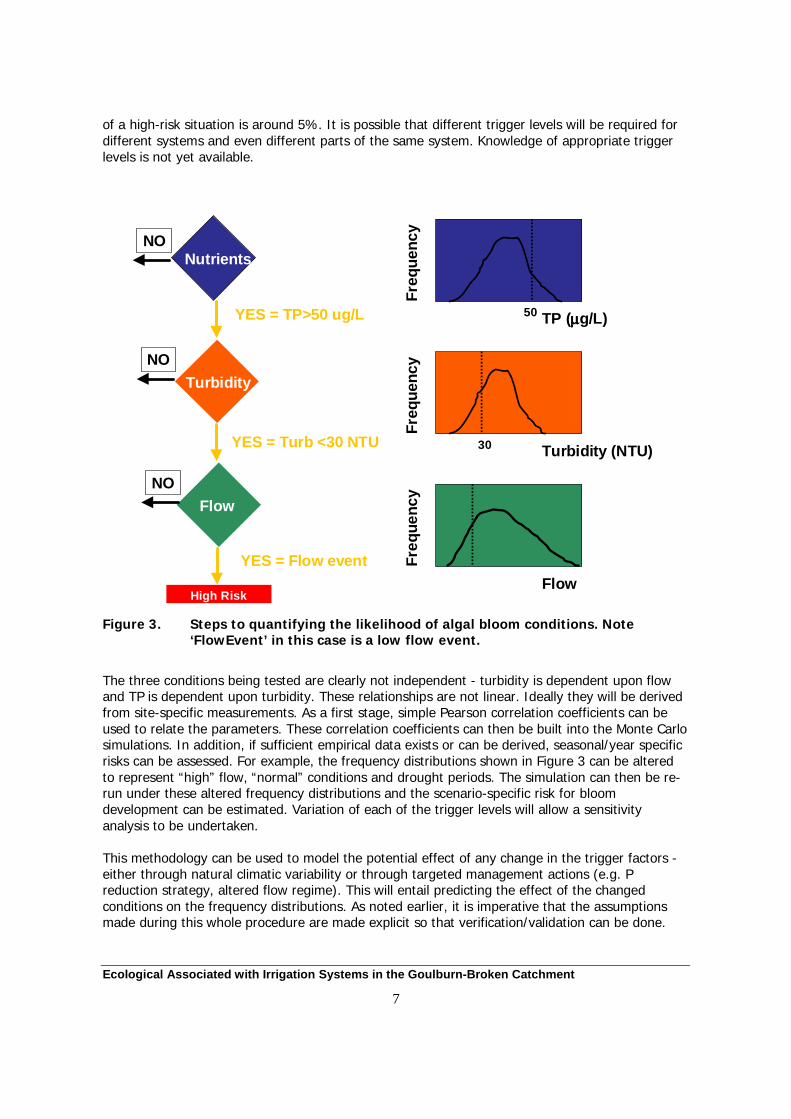
We are working to make the decision tree more quantitative by using the known data distributions for each of the three drivers (these we have obtained from 20 years of data records for the Goulburn River). Monte Carlo simulation will then be used to select randomly a value from each of the three distributions, asking the question ‘is the value above or below the trigger value’ (Yes/No?) in each case. After computing this exercise several thousand times, a distribution will be obtained that provides a more quantitative estimate of the high-risk situation (Yes, Yes, Yes for the trigger values for each driver – See Figure 4). Potential knowledge gaps are the trigger levels that are used to define whether a risk exists or not. For the case shown in Figure 4, the probability
Ecological Associated with Irrigation Systems in the Goulburn-Broken Catchment
7
of a high-risk situation is around 5%. It is possible that different trigger levels will be required for different systems and even different parts of the same system. Knowledge of appropriate trigger levels is not yet available.
TP (µµµµg/L)
Freq
uenc
y
50
Turbidity (NTU)
Freq
uenc
y
30
Flow
Freq
uenc
y
High Risk
Nutrients
YES = TP>50 ug/L
NO
YES = Turb <30 NTU
TurbidityNO
Flow
YES = Flow event
NO
Figure 3. Steps to quantifying the likelihood of algal bloom conditions. Note ‘FlowEvent’ in this case is a low flow event.
The three conditions being tested are clearly not independent - turbidity is dependent upon flow and TP is dependent upon turbidity. These relationships are not linear. Ideally they will be derived from site-specific measurements. As a first stage, simple Pearson correlation coefficients can be used to relate the parameters. These correlation coefficients can then be built into the Monte Carlo simulations. In addition, if sufficient empirical data exists or can be derived, seasonal/year specific risks can be assessed. For example, the frequency distributions shown in Figure 3 can be altered to represent “high” flow, “normal” conditions and drought periods. The simulation can then be re-run under these altered frequency distributions and the scenario-specific risk for bloom development can be estimated. Variation of each of the trigger levels will allow a sensitivity analysis to be undertaken.
This methodology can be used to model the potential effect of any change in the trigger factors - either through natural climatic variability or through targeted management actions (e.g. P reduction strategy, altered flow regime). This will entail predicting the effect of the changed conditions on the frequency distributions. As noted earlier, it is imperative that the assumptions made during this whole procedure are made explicit so that verification/validation can be done.
Ecological Associated with Irrigation Systems in the Goulburn-Broken Catchment 8
Another major purpose in clearly specifying the whole methodology, including all the assumptions made, is that it demystifies the “black box” approach of risk characterisation. It facilitates discussion at both stakeholder and ‘expert’ level, especially the questioning of the assumptions - i.e. “Is this reasonable? “Does it fit in with your experience/expectations?” This stage is almost never done in contemporary ERAs.
Figure 4. Example of the frequency of exceeding the trigger values for the 3 drivers of algal blooms.
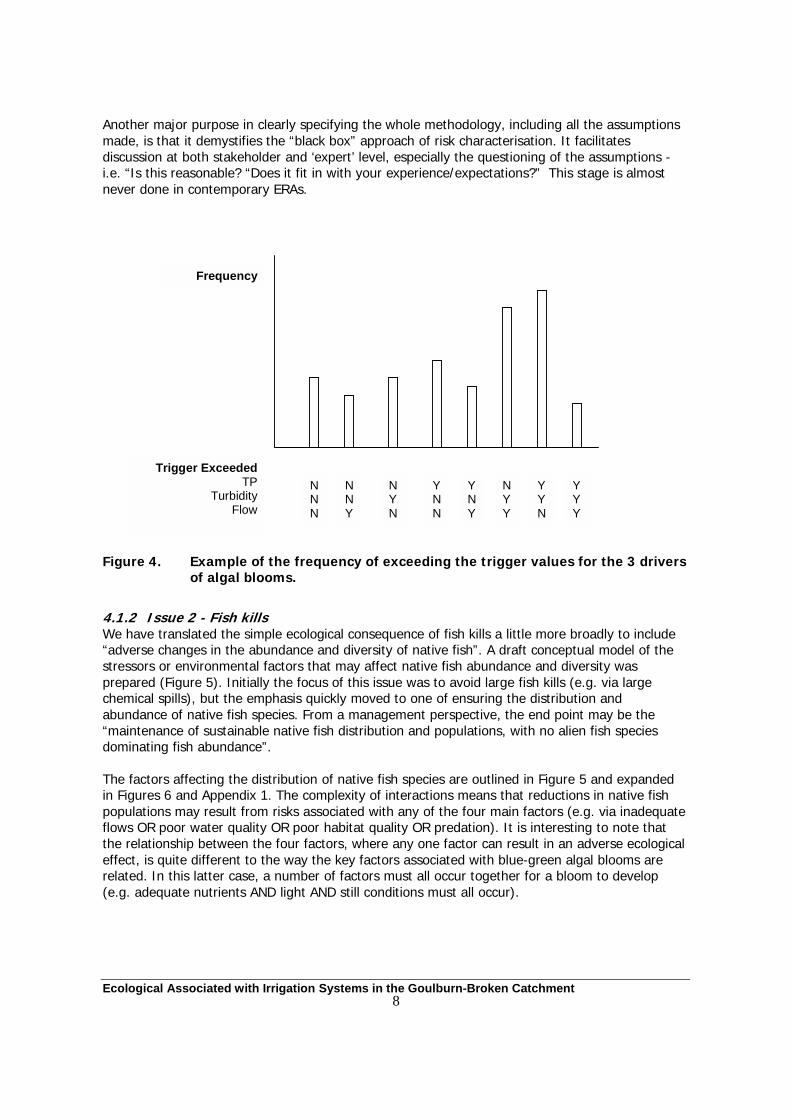
4.1.2 Issue 2 - Fish kills We have translated the simple ecological consequence of fish kills a little more broadly to include “adverse changes in the abundance and diversity of native fish”. A draft conceptual model of the stressors or environmental factors that may affect native fish abundance and diversity was prepared (Figure 5). Initially the focus of this issue was to avoid large fish kills (e.g. via large chemical spills), but the emphasis quickly moved to one of ensuring the distribution and abundance of native fish species. From a management perspective, the end point may be the “maintenance of sustainable native fish distribution and populations, with no alien fish species dominating fish abundance”.
The factors affecting the distribution of native fish species are outlined in Figure 5 and expanded in Figures 6 and Appendix 1. The complexity of interactions means that reductions in native fish populations may result from risks associated with any of the four main factors (e.g. via inadequate flows OR poor water quality OR poor habitat quality OR predation). It is interesting to note that the relationship between the four factors, where any one factor can result in an adverse ecological effect, is quite different to the way the key factors associated with blue-green algal blooms are related. In this latter case, a number of factors must all occur together for a bloom to develop (e.g. adequate nutrients AND light AND still conditions must all occur).
NNN
Trigger Exceeded TP
Turbidity Flow
NNY
NYN
YNN
YNY
NYY
YYN
YYY
Frequency

Ecological Associated with Irrigation Systems in the Goulburn-Broken Catchment
9
Figure 5. Simple conceptual model of factors affecting native fish populations (expanded further in Figure 6 and Appendix 1 for clarity).
Reduced Native Fish Abundance and Diversity
A. Water Quality
C. Habitat B. Flow
D. Biological Interactions

Ecol
ogic
al R
isk
Ass
ocia
ted
with
Irrig
atio
n Sy
stem
s in
the
Gou
lbur
n B
roke
n ca
tchm
ent.
10
-
Figu
re 6
: ER
A f
ram
ewor
k fo
r as
sess
ing
the
risk
of
redu
ced
nat
ive
fish
abu
nda
nce
and
dive
rsit
y
Hyd
rolo
gy
Phys
ical
/Str
uctu
ral
Bar
riers
H
abita
t W
ater
Qua
lity
Is th
ere
wat
er
harv
estin
g?
Patte
rn o
f H
ydro
logi
c re
gim
e in
tact
?
Sea
sona
lity
Pre
dict
abili
ty
Low
Flo
ws
Hig
h Fl
ows
Ris
k Fa
ctor
1
Ris
k Fa
ctor
2
Ris
k Fa
ctor
3
Ris
k Fa
ctor
4
Yes
Do
barr
iers
to
fish
pass
age
exis
t?
Has
hab
itat
been
cha
nged
?H
as w
q be
en
chan
ged?
See
next
pag
e
Se
e ne
xt p
age
Dam
s
W
eirs
C
ulve
rts
C
hann
el
G
eom
orph
olog
y
Ris
k Fa
ctor
1
Ris
k Fa
ctor
2R
isk
Fact
or 3
Ris
k Fa
ctor
4
No
No
No
No
Yes
Yes
No

.
Ecol
ogic
al R
isk
Ass
ocia
ted
with
Irrig
atio
n Sy
stem
s in
the
Gou
lbur
n B
roke
n ca
tchm
ent.
11
Figu
re 6
(Con
tinue
d)
No
Has
hab
itat
been
cha
nged
? H
as W
Q b
een
chan
ged?
Lo
w R
isk
Fl
oodp
lain
F
lood
plai
n
R
ipar
ian
In
stre
am
H
abita
t
Con
nect
ion
V
eget
atio
n
Hab
itat
Ris
k
Fact
or 1
R
isk
Fact
or 3
R
isk
Fa
ctor
4
Terr
estri
al v
eg
Wet
land
veg
R
efug
ia
Sal
inity
Tem
pera
ture
Turb
idity
/SS
DO
/BO
D To
xica
nts
(agr
o-ch
em, m
inin
g w
aste
set
c.)
No
Yes
Yes
Pred
atio
n
Mor
talit
y
Com
petit
ion
Ris
k
Fact
or 2
R
isk
Fa
ctor
1R
isk
Fa
ctor
2R
isk
Fact
or 3
Ris
k
Fact
or 4
R
isk
Fa
ctor
5
Hav
e bi
olog
ical
in
tera
ctio
ns
chan
ged?
No
Yes
Ris
k
Fact
or 1
Ris
k
Fact
or 2
Ris
k Fa
ctor
3
Hab
itat
Wat
er Q
ualit
y B
iolo
gica
l Int
erac
tions

Ecological Risk Associated with Irrigation Systems in the Goulburn Broken catchment. 12
-
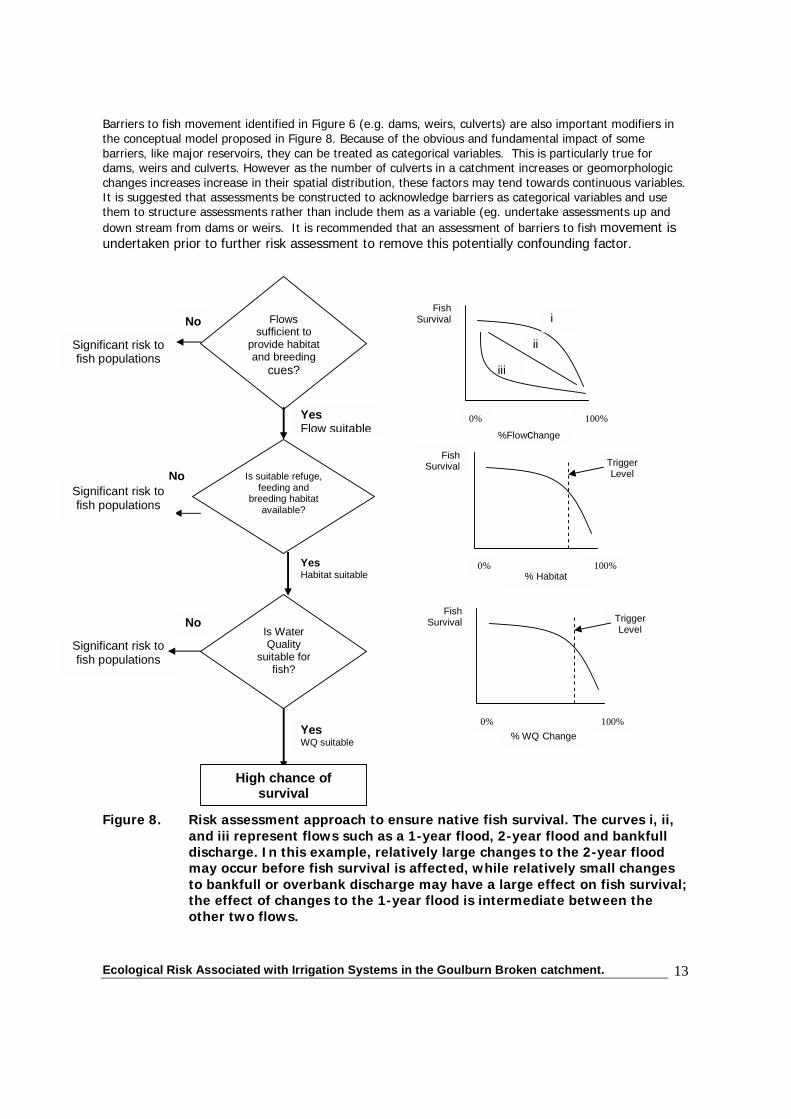
An alternative approach is to consider the factors required to ensure fish survival, rather than fish kills. Fish survival will be ensured if there is sufficient flow (e.g. to provide habitat, cues for breeding etc.) AND access to physical habitat AND good water quality. The challenge then is to define the relationship between fish survival and key drivers in a way that can be informed by ERA. For example, how does fish breeding vary with changes to the flow regime, and what is/are the flow trigger level beyond which fish survival is compromised? A key factor to be considered is the definition of ‘fish survival’; for example does this mean maintenance of abundance or species richness, or both? The choice of the end point will alter the assessment.
Figure 7. Potential relationship between (a) fish survival and habitat, and (b) fish survival and water quality
There is limited knowledge available to quantify the relationship between survival and changes to habitat and water quality for each of the many native fish species that occur across the Goulburn Broken. This lack of knowledge is considered in more detail in Chapter 6.
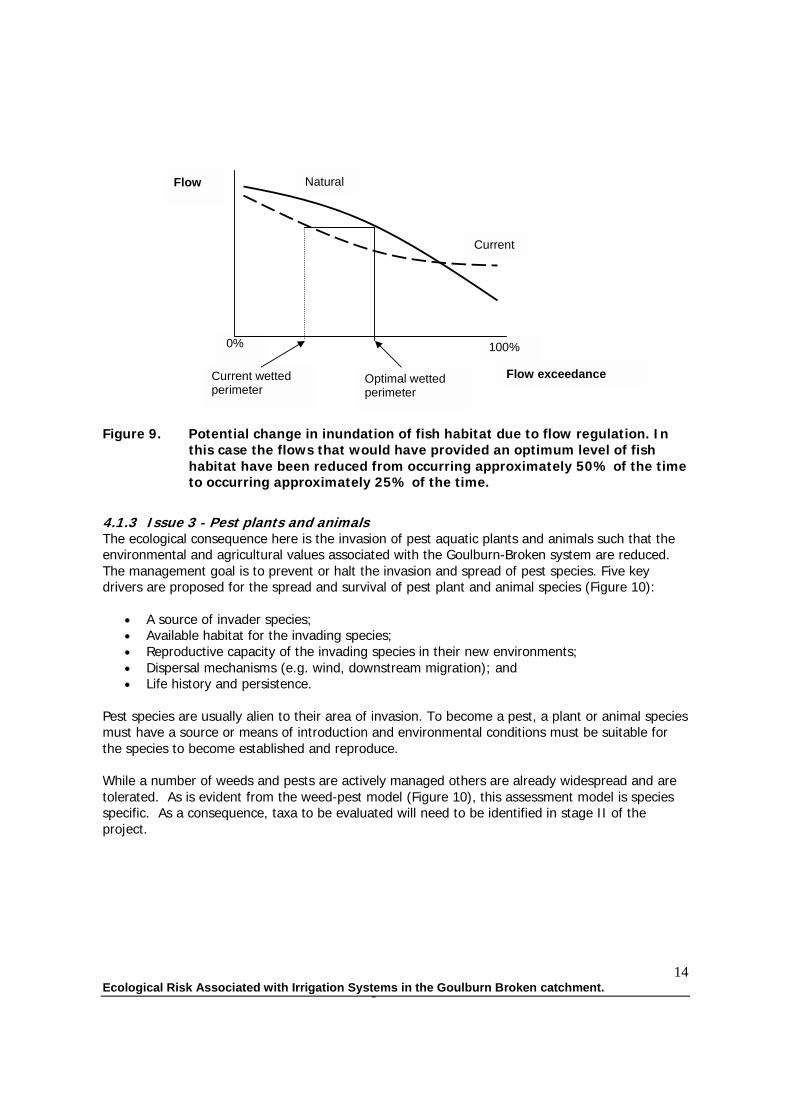
Surrogate measures will be required to relate flow, habitat and water quality in a manner that can be quantified for inclusion in a risk assessment (Figure 8), similar to that proposed for algal blooms (see Figures 3 and 4). For example, risk assessment may be based on the wetted perimeter that is optimal for Murray cod, or some other flagship fish species (Figure 9). Surrogates for water quality may be based on parameters such as temperature, dissolved oxygen and pesticide concentration (USEPA 1998). A key task will be to relate the changes to the drivers (e.g. changes to the flow regime since flow regulation commenced) to the life history of target fish species.
TriggerLevel
Fish Survival TriggerLevel
(a)
(b)
Change in Habitat
Low High
Change in WQ
Low High
Fish Survival
Low
High
Low
High
Ecological Risk Associated with Irrigation Systems in the Goulburn Broken catchment. 13
Barriers to fish movement identified in Figure 6 (e.g. dams, weirs, culverts) are also important modifiers in the conceptual model proposed in Figure 8. Because of the obvious and fundamental impact of some barriers, like major reservoirs, they can be treated as categorical variables. This is particularly true for dams, weirs and culverts. However as the number of culverts in a catchment increases or geomorphologic changes increases increase in their spatial distribution, these factors may tend towards continuous variables. It is suggested that assessments be constructed to acknowledge barriers as categorical variables and use them to structure assessments rather than include them as a variable (eg. undertake assessments up and down stream from dams or weirs. It is recommended that an assessment of barriers to fish movement is undertaken prior to further risk assessment to remove this potentially confounding factor.
Figure 8. Risk assessment approach to ensure native fish survival. The curves i, ii, and iii represent flows such as a 1-year flood, 2-year flood and bankfull discharge. In this example, relatively large changes to the 2-year flood may occur before fish survival is affected, while relatively small changes to bankfull or overbank discharge may have a large effect on fish survival; the effect of changes to the 1-year flood is intermediate between the other two flows.
iii
ii
Is Water Quality
suitable for fish?
Is suitable refuge, feeding and
breeding habitat available?
Flowssufficient to
provide habitat and breeding
cues?
Fish Survival Trigger
Level
0% 100% % WQ Change
Fish Survival Trigger
Level
0% 100% % HabitatCh
Fish Survival
0% 100%
%Flowchange
i
High chance of survival
No
No
No
Significant risk to fish populations
Significant risk to fish populations
Significant risk to fish populations
YesFlow suitable
YesHabitat suitable
YesWQ suitable
Ecological Risk Associated with Irrigation Systems in the Goulburn Broken catchment. 14
-
Figure 9. Potential change in inundation of fish habitat due to flow regulation. In this case the flows that would have provided an optimum level of fish habitat have been reduced from occurring approximately 50% of the time to occurring approximately 25% of the time.
4.1.3 Issue 3 - Pest plants and animals The ecological consequence here is the invasion of pest aquatic plants and animals such that the environmental and agricultural values associated with the Goulburn-Broken system are reduced. The management goal is to prevent or halt the invasion and spread of pest species. Five key drivers are proposed for the spread and survival of pest plant and animal species (Figure 10):
• A source of invader species; • Available habitat for the invading species; • Reproductive capacity of the invading species in their new environments; • Dispersal mechanisms (e.g. wind, downstream migration); and • Life history and persistence.
Pest species are usually alien to their area of invasion. To become a pest, a plant or animal species must have a source or means of introduction and environmental conditions must be suitable for the species to become established and reproduce.
While a number of weeds and pests are actively managed others are already widespread and are tolerated. As is evident from the weed-pest model (Figure 10), this assessment model is speciesspecific. As a consequence, taxa to be evaluated will need to be identified in stage II of the project.
Natural
Current
Flow
Optimal wetted perimeter
Current wetted perimeter
Flow exceedance
0% 100%

Ecol
ogic
al R
isk
Ass
ocia
ted
with
Irrig
atio
n Sy
stem
s in
the
Gou
lbur
n B
roke
n ca
tchm
ent.
15
Is th
ere
apo
tent
ial
dono
rpo
pula
tion
No
risk
Is th
ere
suita
ble
habi
tat
avai
labl
efo
rco
loni
zers
Wha
t is t
here
prod
uctiv
eca
paci
ty o
fth
e co
loni
zer
No
No
No
Is th
ere
likel
ihoo
d th
atph
ysic
al d
istu
rban
ceco
uld
crea
te s
uita
ble
habi
tat/s
pace
for
inva
sion
Low
ris
k
Yes
Yes
Yes
Low
Hig
h
Dis
pers
alpo
tent
ial
Low
Low
Hig
h
Hig
h
Life
His
tory
Driv
ers:
Pote
ntia
l sou
rce/
curr
ent d
istri
butio
nH
abita
t ava
ilabi
lity
Rep
rodu
ctiv
e ca
paci
ty/d
ispe
rsal
pot
entia
lLi
fe h
isto
ry/p
ersi
sten
ce in
the
envi
ronm
ent
Ephe
mer
al/
shor
t liv
ed
Pere
nnia
l/lo
ng li
ved
Ephe
mer
al/
shor
t liv
ed
Ephe
mer
al/
shor
t liv
ed
Ephe
mer
al/
shor
t liv
ed
Pere
nnia
l/lo
ng li
ved
Pere
nnia
l/lo
ng li
ved
Pere
nnia
l/lo
ng li
ved
Low
: spa
rse,
loca
l,te
mpo
rary
,
Low
-med
ium
: spa
rse,
loca
l,pe
rman
ent
Med
ium
: den
se, l
ocal
,te
mpo
rary
Med
ium
: spa
rse,
wid
espr
ead,
tem
pora
ry
Hig
h: d
ense
, wid
espr
ead,
tem
pora
ry
Med
ium
-hig
h: d
ense
, loc
al,
perm
anen
t
Ver
y hi
gh: d
ense
,w
ides
prea
d, p
erm
anen
t
Med
ium
-hig
h: sp
arse
,w
ides
prea
d, p
erm
anen
t
Ris
k - O
ccur
renc
e pa
ttern
NPI
RD
Mod
el -
Spre
ad o
f Aqu
atic
Pes
t and
Wee
ds
Figu
re 1
0.
Fact
ors
lead
ing
to t
he
grow
th a
nd
surv
ival
of
pest
spe
cies
Ecological Risk Associated with Irrigation Systems in the Goulburn Broken Catchment. 16
4.1.4 Degradation of floodplain vegetation The consequence to be avoided is the degradation of floodplain vegetation (e.g. wetland vegetation) that is an important component of biodiversity in the landscape and plays an important role in riverine ecosystem function (e.g. a source of productivity, refuge for aquatic species etc.). The management goal will be to protect and enhance floodplain vegetation, so that the abundant vegetation communities are predominantly native species.
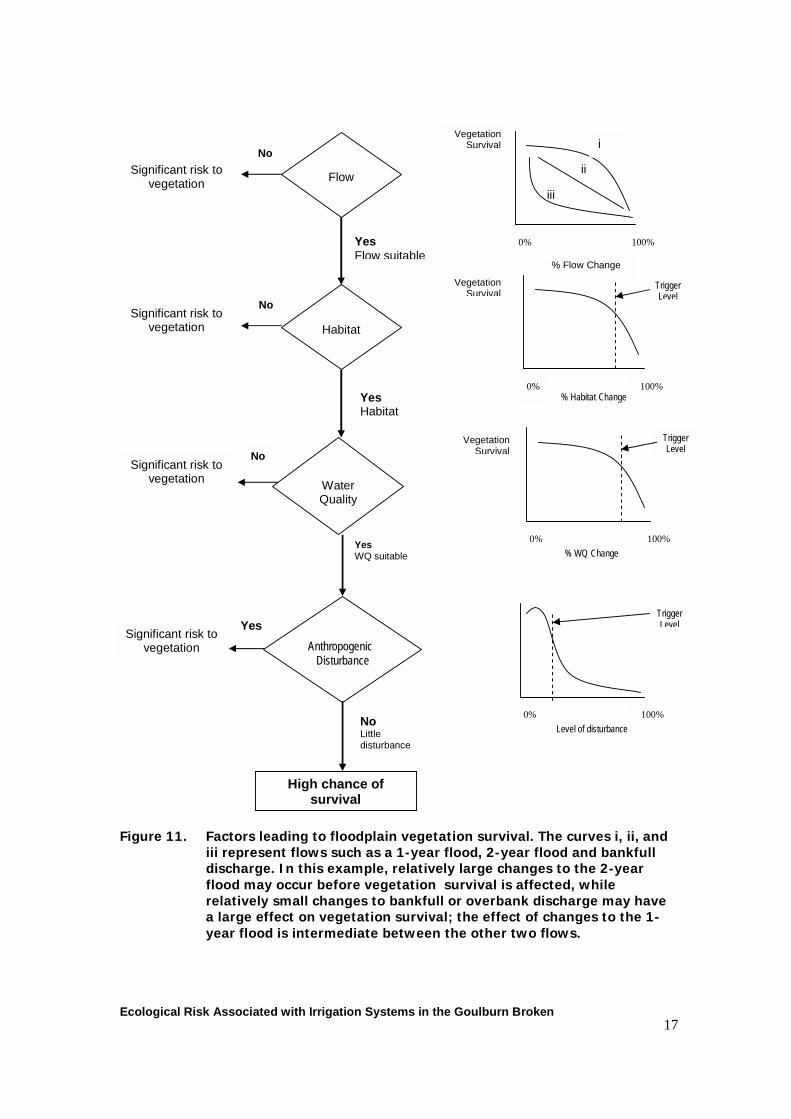
The conceptual model proposed here is similar to that adopted for native fish survival. Rather than trying to quantify the complex relationship of factors that may kill floodplain vegetation, we believe it best to turn this around so that the factors required to ensure the survival of floodplain vegetation are highlighted. The survival of floodplain vegetation will require drivers such as a suitable hydrology regime AND available habitat (defined by the hydraulic regime) AND good water quality AND protection from anthropogenic disturbance, such as land clearance and livestock access (Figure 11). Key drivers are:
• Changes to the frequency and duration of vegetation inundation (e.g. for the flows that flood important wetland and floodplain areas);
• Hydraulic regime that will define habitat for plant species; • Good water quality, free of pesticides; • Protection from activities such as land clearance and agricultural activities, and
livestock.
Quantification of the relationships between the key drivers and the response of vegetation communities is likely to face the same difficulties as that described for fish survival (e.g. identifying trigger levels for drivers beyond which the survival of floodplain vegetation is compromised).
Ecological Risk Associated with Irrigation Systems in the Goulburn Broken17
Figure 11. Factors leading to floodplain vegetation survival. The curves i, ii, and iii represent flows such as a 1-year flood, 2-year flood and bankfull discharge. In this example, relatively large changes to the 2-year flood may occur before vegetation survival is affected, while relatively small changes to bankfull or overbank discharge may have a large effect on vegetation survival; the effect of changes to the 1-year flood is intermediate between the other two flows.
iii
ii
Water Quality
Habitat
Flow
TriggerLevel
0% 100% % WQ Change
TriggerLevel
0% 100% % Habitat Change
Vegetation Survival
0% 100%
% Flow Change
i
High chance of survival
No
No
No
Significant risk to vegetation
Significant risk to vegetation
Significant risk to vegetation
YesFlow suitable
YesHabitat
YesWQ suitable
Vegetation Survival
Vegetation Survival
Anthropogenic Disturbance
YesSignificant risk to
vegetation
NoLittle disturbance
TriggerLevel
0% 100% Level of disturbance
Ecological Risk Associated with Irrigation Systems in the Goulburn Broken Catchment. 18
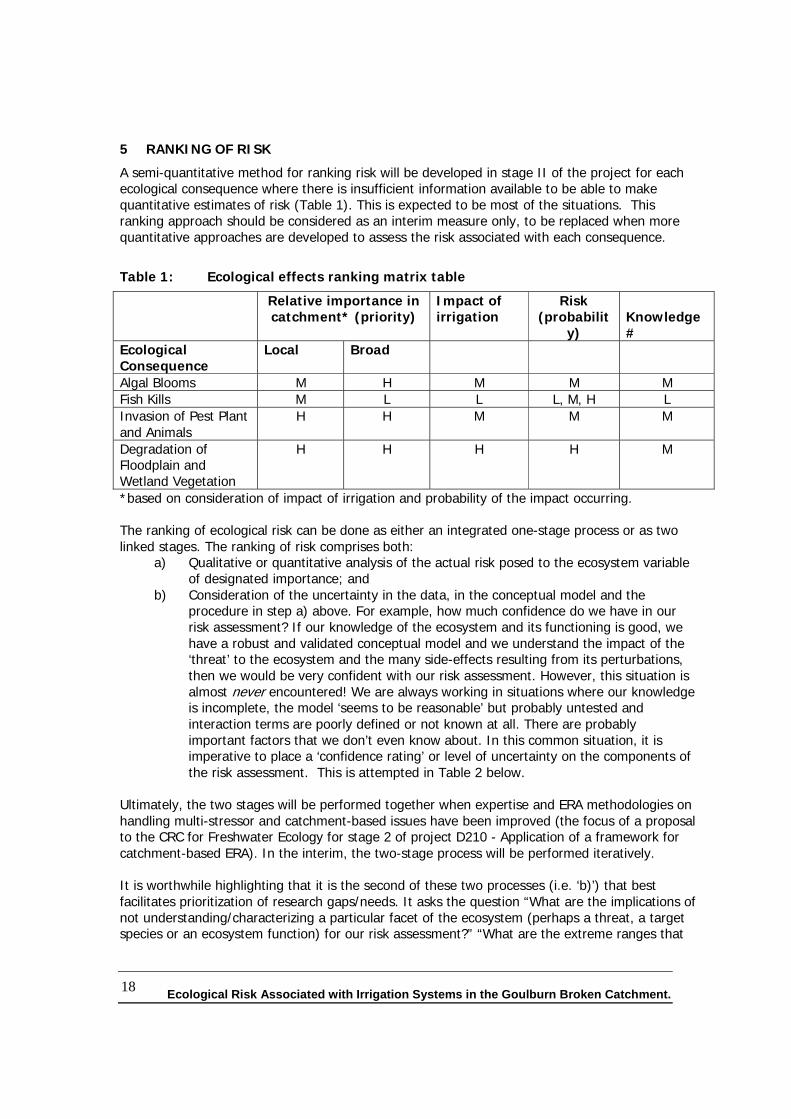
5 RANKING OF RISK
A semi-quantitative method for ranking risk will be developed in stage II of the project for each ecological consequence where there is insufficient information available to be able to make quantitative estimates of risk (Table 1). This is expected to be most of the situations. This ranking approach should be considered as an interim measure only, to be replaced when more quantitative approaches are developed to assess the risk associated with each consequence.
Table 1: Ecological effects ranking matrix table
Relative importance in catchment* (priority)
Impact of irrigation
Risk (probabilit
y) Knowledge#
Ecological Consequence
Local Broad
Algal Blooms M H M M M Fish Kills M L L L, M, H L Invasion of Pest Plant and Animals
H H M M M
Degradation of Floodplain and Wetland Vegetation
H H H H M
*based on consideration of impact of irrigation and probability of the impact occurring.
The ranking of ecological risk can be done as either an integrated one-stage process or as two linked stages. The ranking of risk comprises both:
a) Qualitative or quantitative analysis of the actual risk posed to the ecosystem variable of designated importance; and
b) Consideration of the uncertainty in the data, in the conceptual model and the procedure in step a) above. For example, how much confidence do we have in our risk assessment? If our knowledge of the ecosystem and its functioning is good, we have a robust and validated conceptual model and we understand the impact of the ‘threat’ to the ecosystem and the many side-effects resulting from its perturbations, then we would be very confident with our risk assessment. However, this situation is almost never encountered! We are always working in situations where our knowledge is incomplete, the model ‘seems to be reasonable’ but probably untested and interaction terms are poorly defined or not known at all. There are probably important factors that we don’t even know about. In this common situation, it is imperative to place a ‘confidence rating’ or level of uncertainty on the components of the risk assessment. This is attempted in Table 2 below.
Ultimately, the two stages will be performed together when expertise and ERA methodologies on handling multi-stressor and catchment-based issues have been improved (the focus of a proposal to the CRC for Freshwater Ecology for stage 2 of project D210 - Application of a framework for catchment-based ERA). In the interim, the two-stage process will be performed iteratively.
It is worthwhile highlighting that it is the second of these two processes (i.e. ‘b)’) that best facilitates prioritization of research gaps/needs. It asks the question “What are the implications of not understanding/characterizing a particular facet of the ecosystem (perhaps a threat, a target species or an ecosystem function) for our risk assessment?” “What are the extreme ranges that

Ecological Risk Associated with Irrigation Systems in the Goulburn Broken19
this facet could take and what are the risks at either end of the spectrum? If there is a huge range, with important consequences for the ecosystem and its effective management, then further insight into this facet needs to be flagged as critically important.
Table 2: Semi-quantitative ranking of risk associated with an ecological consequence
Ecological Risk Low (1) Medium (2) High (3)
High (3) 3 6 9 Medium (2) 2 4 6
Unc
erta
inty
in
Ec
olog
ical
Ri
sk
Low (1) 1 2 3
Quantifying the risk of algal blooms is possible with existing information and associated uncertainties can be narrowed with additional information (discussed in chapter 6). However, there are a large number of species or communities that may form the basis for assessing the risk associated with the remaining ecological consequences of fish kills (e.g. Murray cod, Trout cod, Golden perch), pest plant and animal invasions (e.g. carp, redfin perch, Gambusia, arrow weed, alligator weed), and the degradation of floodplain and wetland vegetation (e.g. from individual species to entire communities). The selection of appropriate species or communities for further consideration is best undertaken in consultation with local stakeholders, who have a good knowledge of the species the community wishes to protect (in the case of fish kills and protection of floodplain vegetation) or guard against (in terms of pest species).

Ecological Risk Associated with Irrigation Systems in the Goulburn Broken Catchment. 20
6 KNOWLEDGE GAPS
6.1 Knowledge Gaps
A considerable amount of investigation and data collection on eutrophication and algal bloom management has been compiled for the waters of the Goulburn Broken Basin (GBWQWG 1999). However, there are many knowledge gaps related to the other issues considered in this study, mainly related to the life history of key species or communities and their interaction with the key ecological drivers of flow, habitat and water quality. The complexity of interaction between species or communities and key ecological drivers means that filling many of these knowledge gaps will require a considerable investment over many years. It is also important that studies undertaken to inform the ERA process consider the role of the irrigation system as a potential modifier of ecological processes.
6.1.1 Algal blooms Assessing the risk of algal blooms will be informed by:
• Investigation of better trigger values for nutrients and turbidity for different water bodies (e.g. shallow lakes, deep lakes, wetlands) (Cottingham et al. 2000)
• Clarification of the relationship between turbidity and light penetration in order to use turbidity as a surrogate for light availability for algal growth. There may be scope for defining the empirical relationship (based on particle size) in terms of dominant catchment geology or site specific information will be required;
• Validation of the algae ‘growth event’ flows of >6 days duration of flows less than the 25 percentile;
• The trial of a modified process model (Harper 2000) that includes the possible release of nutrients from the sediments of waterbodies; and
• Monte Carlo simulation with several data sets containing nutrient, turbidity and flow data to validate the predictions in situations where we have Chl-a or algae count data (e.g. from GMW Major Storages Operational Monitoring Program).
6.1.2 Fish kills Assessing the risk of fish kills (alternatively, maintaining the survival of native fish species) will be informed by:
• A review of barriers to fish movement in the Goulburn Broken and Murray Rivers as this is a modifier to be checked before using the approach outlined previously. This is currently being undertaken by the Goulburn Broken Catchment Management Authority and the Department of Natural Resources and Environment.
• A workshop of key stakeholders to identify the keystone or flagship native fish species that will form the basis of future risk assessment, and to identify flow and habitat requirements or associated knowledge gaps. Although the fate of a keystone species provides a focus for management actions, we should recognise the inherent problem in using a particular keystone or charismatic species - we simply tend to manage the system for the benefit of this species, perhaps to the detriment of the entire ecosystem.
• A project that will quantify the relationship between fish survival and change to flow and habitat availability, and the level of change (trigger levels) beyond which fish survival is compromised. The prediction of flows necessary to ensure fish breeding or migration is also a problem encountered when developing environmental flow recommendations.
Ecological Risk Associated with Irrigation Systems in the Goulburn Broken21
• A small project in which to relate fish survival to percentage change in habitat (e.g. wetted perimeter or some other measure), and also identify the change in habitat availability since regulation.
• A review of the literature to identify water quality-survival relationship for key fish species (e.g. temperature versus survival, DO versus survival, pesticides versus survival). Data and information is likely to exist for this exercise, but is likely to be spread across the scientific literature and a number of government agencies (e.g. DNRE, NSW Fisheries).
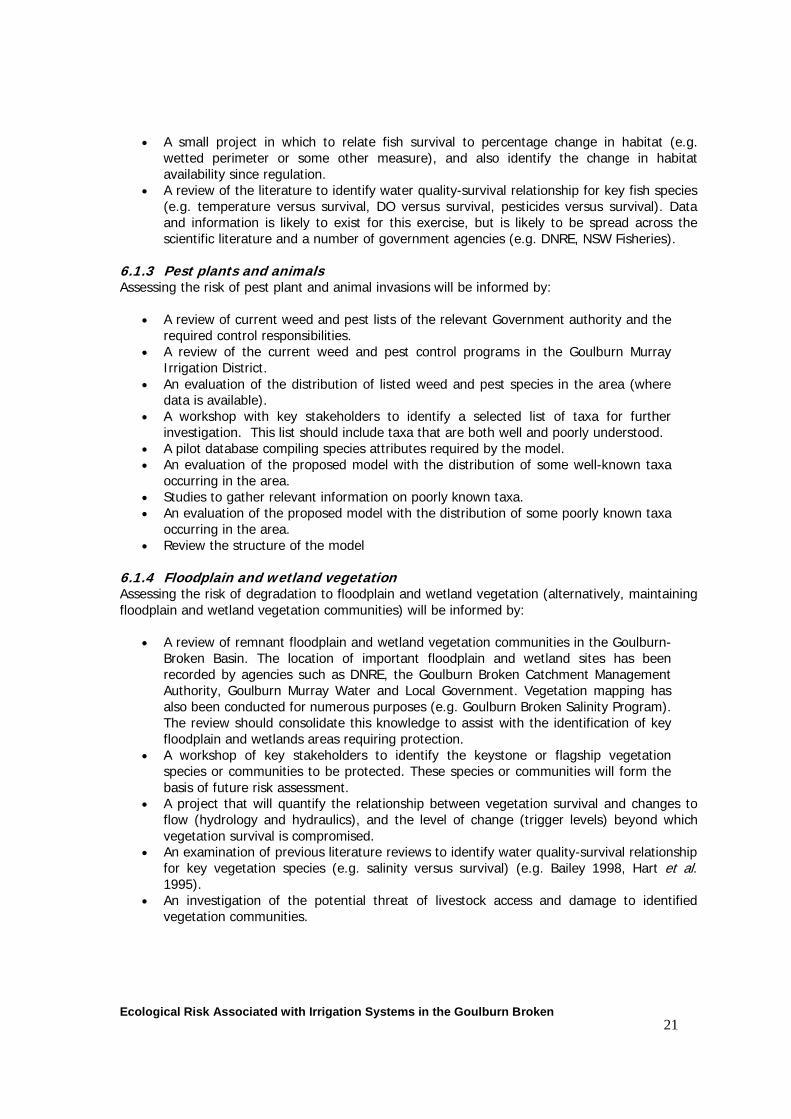
6.1.3 Pest plants and animals Assessing the risk of pest plant and animal invasions will be informed by:
• A review of current weed and pest lists of the relevant Government authority and the required control responsibilities.
• A review of the current weed and pest control programs in the Goulburn Murray Irrigation District.
• An evaluation of the distribution of listed weed and pest species in the area (where data is available).
• A workshop with key stakeholders to identify a selected list of taxa for further investigation. This list should include taxa that are both well and poorly understood.
• A pilot database compiling species attributes required by the model. • An evaluation of the proposed model with the distribution of some well-known taxa
occurring in the area. • Studies to gather relevant information on poorly known taxa. • An evaluation of the proposed model with the distribution of some poorly known taxa
occurring in the area. • Review the structure of the model
6.1.4 Floodplain and wetland vegetation Assessing the risk of degradation to floodplain and wetland vegetation (alternatively, maintaining floodplain and wetland vegetation communities) will be informed by:
• A review of remnant floodplain and wetland vegetation communities in the Goulburn- Broken Basin. The location of important floodplain and wetland sites has been recorded by agencies such as DNRE, the Goulburn Broken Catchment Management Authority, Goulburn Murray Water and Local Government. Vegetation mapping has also been conducted for numerous purposes (e.g. Goulburn Broken Salinity Program). The review should consolidate this knowledge to assist with the identification of key floodplain and wetlands areas requiring protection.
• A workshop of key stakeholders to identify the keystone or flagship vegetation species or communities to be protected. These species or communities will form the basis of future risk assessment.
• A project that will quantify the relationship between vegetation survival and changes to flow (hydrology and hydraulics), and the level of change (trigger levels) beyond which vegetation survival is compromised.
• An examination of previous literature reviews to identify water quality-survival relationship for key vegetation species (e.g. salinity versus survival) (e.g. Bailey 1998, Hart et al.1995).
• An investigation of the potential threat of livestock access and damage to identified vegetation communities.
Ecological Risk Associated with Irrigation Systems in the Goulburn Broken Catchment. 22
7 CONCLUSIONS
Key resource management issues in the Goulburn-Broken irrigation area requiring ecological risk assessment were identified as:
• Increased occurrence of blue-green algae (eutrophication); • Reduced native fish abundance and diversity (fish kills); • The spread of aquatic pest plants and animals; and • A loss/decrease in structure and function of floodplain or wetland vegetation
communities.
Conceptual models have been developed for each issue. Some issues were initially considered in terms of protecting against degradation (e.g. fish kills, damage to floodplain and wetland vegetation). However, the complexity of factors that may act on species or communities at any one time meant that is was conceptually easier to consider these issues in terms of species survival, where a number of conditions must be met to ensure that species or communities were maintained.
Further expansion of the risk ranking tables and review of current and past activities associated with the risks is premature at this stage. More consultation with local stakeholders and relevant experts is required to properly identify the aquatic species or communities that require attention, given the complexity of biological interactions and environmental factors that have to be considered. Ways to address this issue were outlined in Chapter 6.

Ecological Risk Associated with Irrigation Systems in the Goulburn Broken23
8 REFERENCES
Bailey, P. (1998). Effects of increased salinity on riverine and wetland biota. Land and Water Resources Research and Development Corporation, Canberra, ACT.
Cottingham, P., Hart, B.T., Adams, H., Doolan, J., Feehan, P., Grace, M., Grayson, R., Hamilton, D., Harper, M., Hibbert, B., Lawrence, I., Oliver, R., Robinson, D., Vollebergh, P. and Whittington, J. (2000). Quantifying nutrient – algae relationships in freshwater systems. Technical Report 8/2000, CRC for Freshwater Ecology, Canberra.
Goulburn Broken Water Quality Working Group (1997). Goulburn Broken Catchment Water Quality Strategy. A component of the Goulburn Broken Regional Catchment Strategy.
Harper, M.P. (2000). SNAPP: A sorption-based model of phosphorus and nitrogen dynamics in freshwater sediments. Paper submitted to Environmental Science and Technology.
Hart B.T., Breen P. and Cullen P. (1998) Ecological risk assessment for irrigation drainage discharges. Proceedings from the Multi Objective Surface Drainage Design Workshop. Drainage Program Technical Report No. 7, Moama, March 11-13, pp 8-24.
Hart, B.T., Bailey, P., Edwards, R. and James K. (1991). A review of the salt sensitivity of the Australian freshwater biota. Hydrobiologia, 210 (1-2), p105-144.
USEPA (1998). Guidelines for ecological risk assessment. US Environmental Protection Agency, Washington, DC.

Ecological Risk Associated with Irrigation Systems in the Goulburn Broken Catchment. 24
APPENDIX 1 DRAFT INTERACTIONS RELATED TO FISH DISTRIBUTION AND ABUNDANCE

Ecol
ogic
al R
isk
Ass
ocia
ted
with
Irrig
atio
n Sy
stem
s in
the
Gou
lbur
n B
roke
n C
atch
men
t. 25
Figu
re A
1.
W
ater
qu
alit
y fa
ctor
s af
fect
ing
nat
ive
fish
pop
ula
tion
s (D
RA
FT)
Red
uced
Nat
ive
Fish
A
bund
ance
and
Div
ersit
y
DO
Hig
h B
OD
Org
anic
M
atte
r
Stra
tific
atio
nTe
mpe
ratu
re
Turb
idity
C. H
abita
t
B. F
low
Salin
ity
Res
pira
tion
Hig
h A
lgae
Bi
omas
sN
utri
ents
NH
3/pH
Tox
ican
ts
Sour
ces o
f Org
anic
M
atte
r
Floo
dpla
in
Indu
stri
al
Fish
Far
ms
Dec
ayin
g ve
geta
tion
Sept
ic,
Sew
age
Irri
gatio
n D
rain
s

CR
C fo
r Fre
shw
ater
Eco
logy
26Fi
gure
A2
Flow
fac
tors
aff
ecti
ng
nat
ive
fish
pop
ula
tion
s (D
RA
FT)
Red
uced
Nat
ive
Fish
A
bund
ance
and
Div
ersit
y
Stra
tific
atio
n
B. F
low
Hyd
rolo
gyV
olum
e, P
atte
rn,
Tem
pera
ture
C. H
abita
t A
. Wat
er Q
ualit
y

Ecol
ogic
al R
isk
Ass
ocia
ted
with
Irrig
atio
n Sy
stem
s in
the
Gou
lbur
n B
roke
n C
atch
men
t. 27
Figu
re A
3 H
abit
at f
acto
rs a
ffec
tin
g n
ativ
e fi
sh p
opul
atio
ns
Red
uced
Nat
ive
Fish
A
bund
ance
and
Div
ersit
y
Terr
estri
al
Veg
etat
ion
B. H
ydro
logy
Fl
ow, P
atte
rn
Hab
itat
Phys
ical
Bar
riers
e.
g. d
ams
Instr
eam
Hab
itat
Floo
dpla
in
Inve
rtebr
ates
Food
Org
anic
Car
bon
Com
petit
ion,
Pr
edat
ion,
M
orta
lity
etc.
Ripa
rian
Veg
etat
ion
Mig
ratio
n
A. W
ater
Q
ualit
y
Ecological Risk Associated with Irrigation Systems in the Goulburn Broken Catchment. 28
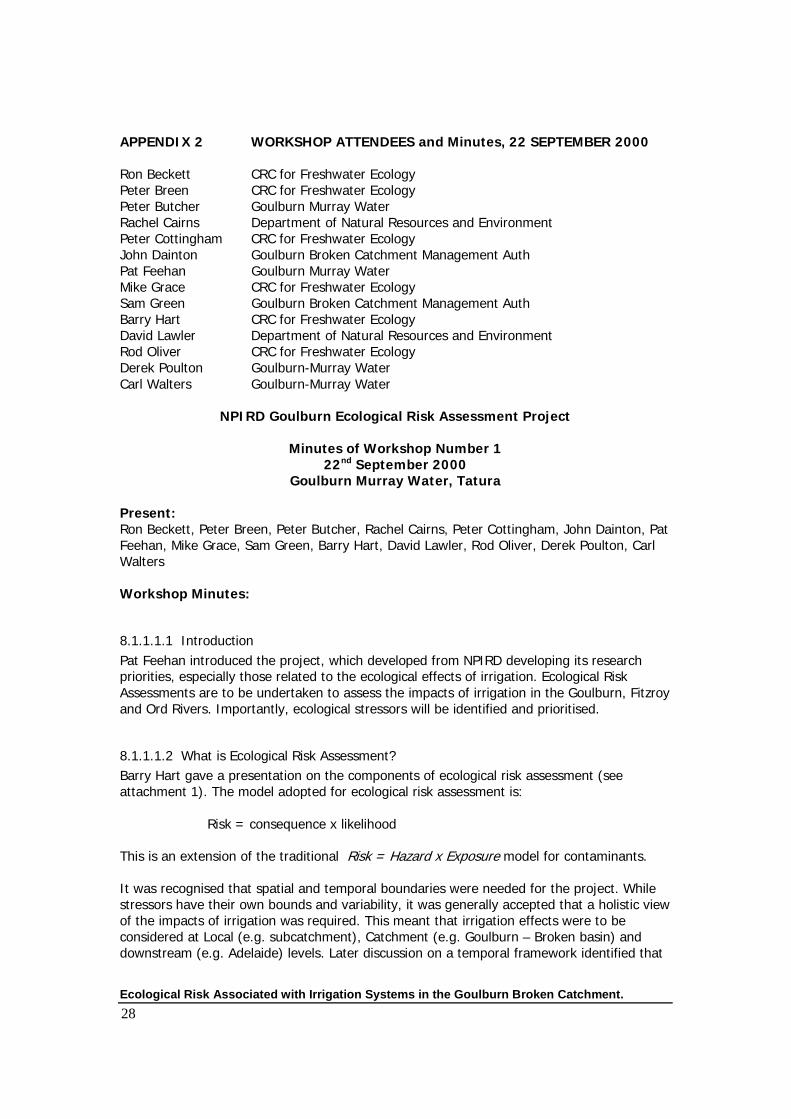
APPENDIX 2 WORKSHOP ATTENDEES and Minutes, 22 SEPTEMBER 2000
Ron Beckett CRC for Freshwater Ecology Peter Breen CRC for Freshwater Ecology Peter Butcher Goulburn Murray Water Rachel Cairns Department of Natural Resources and Environment Peter Cottingham CRC for Freshwater Ecology John Dainton Goulburn Broken Catchment Management Auth Pat Feehan Goulburn Murray Water Mike Grace CRC for Freshwater Ecology Sam Green Goulburn Broken Catchment Management Auth Barry Hart CRC for Freshwater Ecology David Lawler Department of Natural Resources and Environment Rod Oliver CRC for Freshwater Ecology Derek Poulton Goulburn-Murray Water Carl Walters Goulburn-Murray Water
NPIRD Goulburn Ecological Risk Assessment Project
Minutes of Workshop Number 1 22nd September 2000
Goulburn Murray Water, Tatura
Present: Ron Beckett, Peter Breen, Peter Butcher, Rachel Cairns, Peter Cottingham, John Dainton, Pat Feehan, Mike Grace, Sam Green, Barry Hart, David Lawler, Rod Oliver, Derek Poulton, Carl Walters
Workshop Minutes:
8.1.1.1.1 Introduction Pat Feehan introduced the project, which developed from NPIRD developing its research priorities, especially those related to the ecological effects of irrigation. Ecological Risk Assessments are to be undertaken to assess the impacts of irrigation in the Goulburn, Fitzroy and Ord Rivers. Importantly, ecological stressors will be identified and prioritised.
8.1.1.1.2 What is Ecological Risk Assessment? Barry Hart gave a presentation on the components of ecological risk assessment (see attachment 1). The model adopted for ecological risk assessment is:
Risk = consequence x likelihood
This is an extension of the traditional Risk = Hazard x Exposure model for contaminants.
It was recognised that spatial and temporal boundaries were needed for the project. While stressors have their own bounds and variability, it was generally accepted that a holistic view of the impacts of irrigation was required. This meant that irrigation effects were to be considered at Local (e.g. subcatchment), Catchment (e.g. Goulburn – Broken basin) and downstream (e.g. Adelaide) levels. Later discussion on a temporal framework identified that
Ecological Risk Associated with Irrigation Systems in the Goulburn Broken Catchment. 29
short-term effects (seasonal), medium term effects (5-10 years) and long term effects (30-50 years) should be considered.
Derek Poulton suggested that the project should consider both the changes to the catchment that result from irrigation and also catchment changes that impact on irrigation. While the initial response was that we should focus solely on the impacts caused by irrigation, subsequent discussion recognised that factors that impact on irrigation can in turn affect the downstream environment (e.g. dryland salinity impacts on irrigation water and drainage quality; upstream salinity can affect the sustainability of irrigated enterprises and damage infrastructure).
There was discussion on the precision and accuracy of information required for ERA. Peter Butcher raised the question of how we identify the level of accuracy we require. While we want our data to be as accurate as possible, the complexity of interactions possible in ecological systems suggests that there will be some level of subjectivity involved as we will have to use the best available data and opinions. Additional information will be collected in the second phase of the project. High quality data would be sought for high-risk areas (this will also help direct NPIRD investments). Ecological modelling, especially non-linear and multiple effect models, may be considered to supply data for ERA in the absence of other quantitative data.
There was further discussion on the spatial boundaries of the project. It was agreed that upstream (above Eildon), downstream (Murray River) and local (irrigation areas in the Goulburn and Broken catchments) would be considered. Upstream areas were important as diversions for irrigation occur there and events such as fuel and pesticide spills affect stream health.
John Dainton and Peter Butcher suggested that as biodiversity issues will be important that the terrestrial effects of irrigation should also be considered (e.g. diverters on crown frontage introducing flora etc.). Rod Oliver suggested that as most effects had already occurred, emerging risks would be more useful to consider.
All present were asked to identify ecological consequences that might be considered. These are summarised below:
• Terrestrial and riparian vegetation damage and loss
• Biodiversity loss • Increased presence of alien species or pests • Increased groundwater salinity • Increased algal bloom frequency and
intensity • Increased sedimentation and erosion • Smothering of stream communities by
sediments • Death of biota due to anoxia
• Reduced aquatic plant productivity • Reduced native fish abundance and diversity • Reduced health of stream biota • Reduced reproductive success of biota • Decreased water quality • Loss of floods and interruption of
geomorphological processes
Ecological Risk Associated with Irrigation Systems in the Goulburn Broken Catchment. 30
It was recognised that the public may want to include public health (potable water) and agricultural risks to the above list, and that we must be clear to differentiate between ecological risk assessment and impact assessment.
A preliminary list of risks to be considered was prepared, including: • Increased occurrence of blue-green algae; • Reduced native fish abundance and diversity; • Reduced invertebrate abundance and diversity; • Reduced aquatic plant abundance and diversity; • Loss/decrease in agricultural production; • Reduced beneficial uses of water (potable/irrigation); • Loss/decrease in structure and function of terrestrial/floodplain communities; • Spread of aquatic pest plants and animals; • Spread of terrestrial pest plants and animals.
Priority was assigned to: • Increased occurrence of blue-green algae; • Reduced native fish abundance and diversity; • Loss/decrease in structure and function of terrestrial/floodplain communities; • Spread of aquatic pest plants and animals.
A draft conceptual model of the factors that may affect native fish abundance and diversity was prepared (Figure 1, 1A, 1B, 1C – not attached but reproduced in this report). Similar models will be prepared for the other priority issues. The links between components in the conceptual models will be quantified where possible. In addition, knowledge gaps will be identified and prioritised for stage 2 of the project. The focus will be on risks with a high rating.