Assessment of the Contraceptive Market in India - USAID
96
Assessment of the Contraceptive Market in India May 1997 Ruth R. Berg Anton Schneider Neeraj Kak Victoria Baird
-
Upload
khangminh22 -
Category
Documents
-
view
1 -
download
0
Transcript of Assessment of the Contraceptive Market in India - USAID

Assessment of the Contraceptive Market in India
May 1997
Ruth R. BergAnton Schneider
Neeraj KakVictoria Baird

ii
CONTENTS
Acknowledgments .................................................................................................................. iiiExecutive Summary ............................................................................................................... iv
I. OVERVIEW ........................................................................................................................1
II. MARKET SIZE: PAST, PRESENT, AND FUTURE .................................................... 2
III. BARRIERS TO GREATER TEMPORARY METHOD USE .................................... 38
IV. MEDIA ASSESSMENT ..................................................................................................80
REFERENCES .......................................................................................................................86

iii
ACKNOWLEDGMENTS
The authors gratefully acknowledge the valuable comments on earlier drafts of this report fromWilliam Goldman (USAID/India), Sheena Chhabra (USAID/India), and Lucia Tabor(USAID/India). Special appreciation also goes to John Stover (The Futures Group International)and Fred Arnold (Macro International) for their thoughtful comments and suggestions regardingSection II and Section III. David McGuire (The Futures Group International) and S.S. Modkar(The Futures Group International) provided key sources of information needed to complete thisreport. Their assistance and support is gratefully acknowledged.

iv
EXECUTIVE SUMMARY
I. Overview
The main purpose of this report is to summarize currently available information with respect to 1)the size of the market for temporary contraceptive methods, 2) potential barriers to the increaseduse of temporary contraceptive methods, and 3) mass media capabilities. The principal audiencefor this report comprises private sector contraceptive manufacturers, selected advertisingagencies, the Program for the Advancement of Commercial Technology-Child and ReproductiveHealth (PACT-CRH), and the Industrial Credit and Investment Corporation of India (ICICI). Thereport is intended to serve as a background document in a collaborative effort to expand privatesector sales of high quality, affordable, modern temporary contraceptive methods and to increaseknowledge and use of modern temporary methods.
II. Market Size: Past, Present, and Future
While sterilizations have dominated the Indian contraceptive market to date, recent trends in theuse of temporary contraceptive methods coupled with the stated preferences of potential futurecontraceptive users suggest that there is substantial potential for the market for temporarymethods to expand:
• Contraceptive use has grown from 10% in 1978 to approximately 41% today
• Thirty one percent of women not currently using a contraceptive method who intend to use in
the future plan to use temporary methods, compared to 14% who use temporary methods
today
• A conservative scenario of future demand based on current patterns of contraceptive use
projects the size of the market for modern temporary methods to grow from 9 million users in
1992-3 to 29 million users by 2011
• A more ambitious scenario based on the intentions of potential future contraceptive users
projects the size of the market for modern temporary methods to grow to 40 million users by
2011
Most of the growth in the demand for pills and condoms will occur in the private sector(commercial and social marketing combined). Currently, about 80 percent of condom users and68 percent of pill users purchase their method from private sector providers. The share of privatesector purchases that are commercial is 34% for pills and 45% for condoms. Non-users whointend to use a temporary contraceptive method in the future strongly favor the pill, especially inrural areas. An expansion of commercial distribution coupled with a strong communicationscampaign would further expand the commercial market for both pills and condoms.
v
In the case of IUDs, 37.4 percent of IUD users receive their method from the private commercialsector, and 62.6 percent receive their method from the public sector. If current trends in method-specific prevalence continue, the number of IUD users can be expected to double between 1992-93 and 2011. On the other hand, if current non-users who intend to use in the future usemethods according to their stated preferences, the number of IUD users can be expected to triplebetween 1992-93 and 2011.
Little is currently known about the demand for injectables. However results from the 1992-93National Family Health Survey (NFHS) and other research indicate that there is a modest level ofawareness and interest in using this product. If even half of the number of women who said in theNFHS that they intend to use injectables actually do purchase them, the number of private sectorinjectable users would be expected to approximate 1 million women by 2011. A well-designedcommunications campaign combined with active distribution would further increase demand forthis method.
III. Potential Barriers to Greater Temporary Method Use: Assessment and MarketingImplications
Whether the growth trajectory for the temporary method market follows a more conservative or amore ambitious course will depend partly on the extent to which key stakeholders address existingbarriers to temporary method use. Potential barriers to increased use by method type are asfollows:
Condoms
• Low levels of knowledge and awareness (rural women only)
• Lack of widespread availability coupled with a high level of awareness among men that
condoms are not readily available
• Embarrassment with respect to purchase
• Policies (advertising restrictions, tax, and government subsidy)
Pills
• Lack of awareness (rural sector only)
• Lack of availability beyond pharmaceuticals
• Incorrect consumer knowledge regarding use (which contributes to psychological barriers to
use)
• Perceptions of negative side effects among non-users and providers
• Policies (advertising restrictions, tax, and government subsidy)
vi
IUDs
• Lack of awareness (rural sector only)
• Fear of the method
• Incorrect consumer knowledge regarding use
• High price in private sector
• Limited cadre of trained private sector providers
• Policies (advertising restrictions and tax)
Injectables
• Lack of awareness
• Myths
• High price
• Lack of perceived and actual availability
• Policies (opposition among key influentials, advertising restrictions, government approval for
public sector distribution and tax, distribution limited to physicians)
The marketing implications associated with the barriers outlined above are as follows:
Condoms
• Expand distribution beyond chemist shops, especially in rural areas
• Reduce embarrassment surrounding purchase by using social marketing approaches that have
been successful in other countries (e.g., the promotion of condoms with other routinely
purchased items such as razor blades)
• Develop advertising campaign designed to attract new users
• Work with government officials to remove advertising restrictions and taxes
Pills
• Develop well focused communications campaign that addresses myths and rumors and
emphasizes the safety, convenience and effectiveness of pills for family planning
• Address incorrect knowledge with respect to correct use through communication campaigns
and low literacy inserts
• Greatly expand distribution outside of pharmaceutical networks

vii
IUDs
•
• Develop well focused communications campaign that addresses the most common concerns
about IUDs as well as raise awareness
• Lower price of device and insertion
• Eliminate excise taxes on packaging
• Collaborate with other projects and donor agencies to address the lack of sufficiently trained
private sector service providers
• Work with government officials to remove advertising restrictions
Injectables
• Develop a strong advertising campaign that will educate consumers about the convenience,
safety and effectiveness of injectables
• Address concerns of key influentials (e.g., feminist groups) through a well planned media and
PR campaign to promote correct information and dispel myths and rumors
• Train providers so that they may provide proper screening and counseling
• Negotiate best consumer price
• Eliminate excise taxes on packaging
• Work with government officials to remove advertising and distribution restrictions
IV. Media Assessment
The Indian marketplace offers unique challenges for any marketing activity. Its size and complexitycoupled with the enormous growth of private sector economic activities in recent years have resulted infierce and growing competition among consumer products. As a consequence, family planningmessages must aggressively compete for consumer “mindshare”. If the market for family planningproducts and services is to grow and flourish, development and placement of media messages must besophisticated, memorable, and well-targeted.
Key potential barriers to greater temporary method use in India include lack of awareness, incorrectknowledge, and myths and rumors. These are all issues that a mass media campaign is particularly wellsuited to address. The target for the PACT-CRH project is to achieve extensive distribution(penetration of the market). To develop an effective distribution strategy, it is important to be asspecific as possible with respect to distribution targets and with respect to how efficiently themedia can support those targets:
• 85% of urban India and 49% of rural India can be reached through some form of mass media

viii
• Television is the medium with the greatest reach in both rural and urban sectors (32% and
74% respectively), regardless of town or village size
• While television is key to the development of an effective communications campaign, radio has two
important advantages: 1) relatively low cost and 2) its ability to broadcast programming and
commercials in local languages and dialects
• The importance of radio as a secondary medium is greatest in rural areas

I. OVERVIEW
PURPOSE
The main purpose of this report is to summarize currently available information with respect to 1)the size of the market for temporary contraceptive methods, 2) potential barriers to the increaseduse of temporary contraceptive methods, and 3) the relative strengths and weaknesses of differentmass media for the purpose of developing an effective communication campaign. The report isintended to serve as a background document for members of the Program for the Advancement ofCommercial Technology-Child and Reproductive Health (PACT-CRH), the Industrial Credit andInvestment Corporation of India (ICICI), private sector contraceptive manufacturers, and selectedadvertising agencies. With the exception of the projections presented in Section II, all of theinformation provided in this report is from previously published research.
BACKGROUND
The PACT-CRH Program is managed by ICICI and funded by USAID, with technical assistancefrom The Futures Group International (FUTURES). The objectives of the PACT-CRH Programare to 1) expand access to quality contraceptives, reproductive health and child health productsand services through the private sector; 2) broaden the range of quality temporary family planningmethods; and 3) promote the commercialization of technologies related to health, AIDSprevention, child survival and contraception.
In the effort to meet these objectives, the PACT-CRH Program, ICICI, private sectorcontraceptive manufacturers/distributors and FUTURES will collaborate in a project specificallydesigned to 1) expand sales of high quality, affordable, modern temporary contraceptive methodsbeyond the existing distribution networks and 2) increase knowledge and use of moderntemporary methods. This report is meant to support this effort by providing a common referencefor information on the size of the market for temporary methods, the potential barriers to greateruse of temporary methods, and mass media capabilities.
ORGANIZATION OF THIS REPORT
This report is organized as follows: Section II provides an overview of past trends and currentestimates of the size of the market for contraceptives and an analysis of the potential demand fortemporary methods in the future. Section III reviews available data to assess four types ofpotential barriers to the use of temporary methods: 1) knowledge and awareness; 2) attitudes andperceptions; 3) access (i.e, availability and price); and 4) policy. Section IV assesses the relativestrengths and weaknesses of different mass media in terms of cost and ability to reach the consumer.

2
II. MARKET SIZE: PAST, PRESENT AND FUTURE
Clinic-based contraceptive services in India were introduced in the early 1950s, making India’sofficial family planning program the world’s first. After modest beginnings, the proportion ofcouples in India aged 15-49 who practiced some form of contraception increased dramaticallyfrom approximately 10 percent in 1970-71 to an estimated 40.6 percent in 1992-93 (Ministry ofHealth and Family Welfare 1993; National Family Health Survey 1992-93). While sterilizationshave dominated the Indian contraceptive market to date, recent trends in the use of temporarycontraceptive methods coupled with the stated preferences of potential future users suggest thatthere is substantial potential for the market for temporary methods to expand. This sectionprovides an overview of past trends and current estimates of the size of the market forcontraceptives and an analysis of the potential demand for temporary methods in the future.
CURRENT ESTIMATES AND PAST TRENDS
The size of the contraceptive market can be estimated either from information about contraceptiveuse as reported by individual users or from information about contraceptive distribution asreported by manufacturers and/or service providers. Each approach has its strengths andweaknesses. Data on contraceptive use provide estimates of the number of people who actuallyuse a given product. Distribution data, on the other hand, provide information about the numberof products that are distributed, but not necessarily purchased or used. In general, data oncontraceptive use and data on distribution should yield similar estimates of market size. There areat least three important factors, however, that can lead to discrepancies between the two types ofestimates.
First, in most countries data on contraceptive use refer only to use for family planning purposesamong couples in union, while distribution data generally refer to products distributed for allpurposes (i.e., disease prevention as well as pregnancy prevention) and to all types of individuals(i.e., single as well as married). Therefore, in countries where there is a relatively high level ofsexual activity outside of marital union and/or a relatively high level of use for non-contraceptivepurposes, data on contraceptive use will tend to under-estimate market size. In India, as in mostcountries, the level of sexual activity outside of union and the level of use of contraceptiveproducts for non-contraceptive reasons is unknown. It is generally believed, however, that theneed for condoms to prevent the spread of AIDS and STDs in India is growing (UNFPA 1995;World Bank 1996). Therefore data on reported use of condoms for contraceptive purposes islikely to underestimate the size of the total market for condoms in India.
A second source of discrepancy between market size estimates based on reported use and thosebased on distribution figures is wastage. If a relatively large number of contraceptive products aredistributed but not actually used, distribution data will tend to over-estimate market size. Thistype of discrepancy is particularly a risk when a relatively large share of the distribution goes tothe public, or “free”, sector since consumers are presumably less likely to actually use productsthat they receive for free than products for which they themselves pay. Currently, 63 percent of

3
the distribution of pills and 71 percent of the distribution of condoms is to the public (free) sector(Ministry of Health and Family Welfare 1997).
A third source of discrepancy is misreporting. Under-reporting of self-reported use is a risk whenthere are either social norms or legal sanctions against the use of particular methods. Forexample, in many contexts use of condoms is associated with prostitution and/or disease and, as aresult, users may be reluctant to report their use of this product. Misreporting may also occur inservice statistics. For example, in countries, such as India until very recently, where serviceproviders are expected to meet distribution targets, there is a risk of over-reporting the number ofcontraceptive services provided.
Market Size Estimates Based on Use
The 1992-93 National Family Health Survey (NFHS) provides an estimate of contraceptive use inIndia for 1992-93, the most recent year for which self-reported information on contraceptive useis available (International Institute for Population Sciences 1995). The NFHS estimates that in1992-93, contraceptive prevalence was 40.7 percent. The distribution of contraceptive users bymethod type (i.e., the “method mix”) is shown in Figure 1. The figure indicates that the share ofall method use that can be attributed to temporary methods (i.e., IUDs, pills, condoms andtraditional methods) in 1992-93 is estimated at 24.1 percent of all married women of reproductiveage. The share of all methods that can be attributed to modern temporary methods (i.e., IUDs,pills and condoms) is 13.5 percent.
Figure 1. Method Mix, NFHS 1992-93
Source: International Institute for Population Sciences 1995
ll
Ster.
IUDPill Cond.Trad
75.9%
4.7%2.9% 5.9%
10.6%
The 1992-93 NFHS data also provide estimates of contraceptive method use by self-reportedsource of supply. Figure 2 shows that, while the public sector is responsible for the majority of

4
female sterilizations and IUD insertions, the private sector (commercial and social marketingcombined) dominates the provision of condoms and pills.1,2
Figure 2. Public and Private Sector Share of Market byMethod Type: NFHS 1992-93
Condoms Pills
IUDs Female Sterilizations
llPublic20%
Private80%
Public63%
Private37%
Public87%
Private13%
Public32%
Private68%
Source: International Institute for Population Sciences 1995
Information about contraceptive use by source of supply in combination with information aboutmethod mix can be used to derive estimates of market size (i.e., the number of users and unitsales) by method and by market sector. The total number of estimated users of contraception forthe purpose of pregnancy prevention is estimated at 68.5 million couples.3 If we distribute thesewomen according to the types of methods that they use and by their reported source of supply,we obtain the total number of estimated users by method and source of supply. This informationis summarized in Table 1.
1 Note that information about source of supply for injections is based on fewer than 50 cases in the NFHS and istherefore not provided here.2 Note that we assigned women who named “other” as a source for pills and condoms to private and public sectorcategories in proportions consistent with the distribution of women who reported public or private sources. Alsonote that we assigned all women who named “shop” as a source for pills or condoms to the private sector.3 We derive this figure by multiplying the total estimated number of women of reproductive age in 1993 (217million) by the total estimated proportion in union in 1993 (.775) and by the total estimated proportion usingcontraception in 1993 (.407). The number of women of reproductive age is taken from United Nations (1995)projections (interpolated); the proportion of women of reproductive age in union is taken from the 1992-93 NFHS;and the proportion of women of reproductive age who use contraception is taken from the 1992-93 NFHS.
5
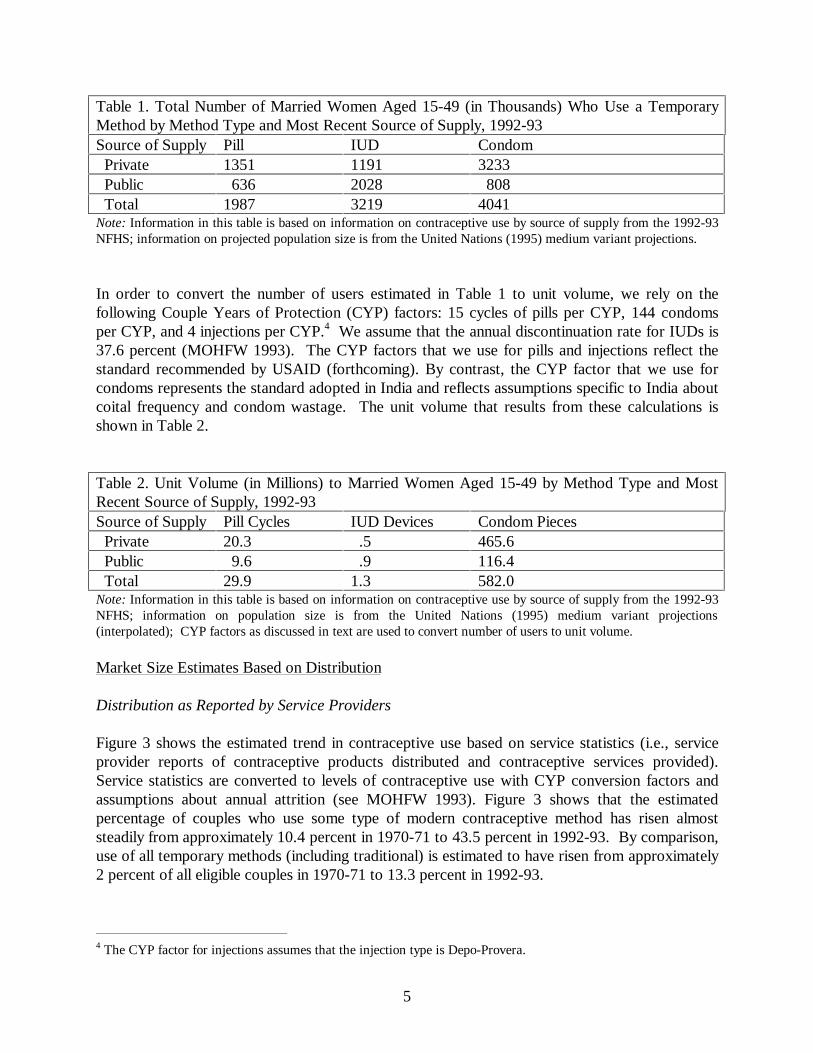
Table 1. Total Number of Married Women Aged 15-49 (in Thousands) Who Use a TemporaryMethod by Method Type and Most Recent Source of Supply, 1992-93Source of Supply Pill IUD Condom Private 1351 1191 3233 Public 636 2028 808 Total 1987 3219 4041Note: Information in this table is based on information on contraceptive use by source of supply from the 1992-93NFHS; information on projected population size is from the United Nations (1995) medium variant projections.
In order to convert the number of users estimated in Table 1 to unit volume, we rely on thefollowing Couple Years of Protection (CYP) factors: 15 cycles of pills per CYP, 144 condomsper CYP, and 4 injections per CYP.4 We assume that the annual discontinuation rate for IUDs is37.6 percent (MOHFW 1993). The CYP factors that we use for pills and injections reflect thestandard recommended by USAID (forthcoming). By contrast, the CYP factor that we use forcondoms represents the standard adopted in India and reflects assumptions specific to India aboutcoital frequency and condom wastage. The unit volume that results from these calculations isshown in Table 2.
Table 2. Unit Volume (in Millions) to Married Women Aged 15-49 by Method Type and MostRecent Source of Supply, 1992-93Source of Supply Pill Cycles IUD Devices Condom Pieces Private 20.3 .5 465.6 Public 9.6 .9 116.4 Total 29.9 1.3 582.0Note: Information in this table is based on information on contraceptive use by source of supply from the 1992-93NFHS; information on population size is from the United Nations (1995) medium variant projections(interpolated); CYP factors as discussed in text are used to convert number of users to unit volume.
Market Size Estimates Based on Distribution
Distribution as Reported by Service Providers
Figure 3 shows the estimated trend in contraceptive use based on service statistics (i.e., serviceprovider reports of contraceptive products distributed and contraceptive services provided).Service statistics are converted to levels of contraceptive use with CYP conversion factors andassumptions about annual attrition (see MOHFW 1993). Figure 3 shows that the estimatedpercentage of couples who use some type of modern contraceptive method has risen almoststeadily from approximately 10.4 percent in 1970-71 to 43.5 percent in 1992-93. By comparison,use of all temporary methods (including traditional) is estimated to have risen from approximately2 percent of all eligible couples in 1970-71 to 13.3 percent in 1992-93.
4 The CYP factor for injections assumes that the injection type is Depo-Provera.

6
Figure 3. Contraceptive Use as Estimated fromService Statistics: 1970-71 to 1992-93
05
1015202530354045
71 72 73 74 75 76 77 78 79 80 81 82 83 84 85 86 87 88 89 90 91 92 93
Est
imat
ed %
Wh
o U
se a
Met
ho
d
All Methods Modern Temporary Methods
Source: MOHFW 1993
It should be noted that the contraceptive prevalence rate estimated from service statistics (43.5percent) is higher that the NFHS contraceptive prevalence rate (40.7 percent) for the same period.Since the percentage of couples sterilized is virtually identical in the service statistics estimate andthe NFHS estimate (30.3 percent and 30.9 percent respectively), the discrepancy in prevalencerates appears to be due to a discrepancy in the estimates of temporary method use. For example,service statistics estimate that a total of 6.3 percent of couples use the IUD compared to theNFHS estimate of 1.9 percent for the same period. Some analysts have speculated that thisdiscrepancy is due to the fact that some family welfare workers inflate the service statisticsbecause of their desire to achieve government targets.5 According to this line of reasoning, servicestatistics for temporary methods are inflated rather than service statistics for sterilizations becausesterilization figures are relatively difficult to alter without detection.
Figure 4 shows the share of all method use that can be attributed to temporary method usebetween 1970-71 and 1992-93 as estimated from service statistics. The figure shows thattemporary method use as a percentage of all method use fell from 23 percent in 1970-71 to a lowof 10.7 percent in 1978-79 and has been climbing almost steadily since to an unprecedented highof 31.3 percent in 1990-91. This trend suggests a slow but near continuous rise in the demand fortemporary methods in India over the past decade.
5 Note that the recent removal of family planning targets should reduce the potential for type of bias in futureservice statistics.

7
Figure 4. Share of All Method Use Attributed toTemporary Methods as Estimated from Service
Statistics: 1970-71 to 1992-93
0
5
10
15
20
25
30
35
71 72 73 74 75 76 77 78 79 80 81 82 83 84 85 86 87 88 89 90 91 92 93
Per
cen
tag
e S
har
e
Source: MOHFW 1993
Distribution as Reported by Contraceptive Manufacturers
Data that pertain to the number of units of pills and condoms distributed by manufacturers towholesalers by sector (commercial, social marketing, and public) are reported on a regular basisto the Government of India (GOI). This information is summarized in Tables 3 and 4 for theyears 1987-88 through 1995-96 (MOHFW 1997).
Consistent with the trend in reported temporary method use (Figure 3), the data show that thetotal distribution of both pills and condoms has been increasing over the last decade. The trend indistribution within different sectors, however, varies. The distribution of free (public sector) pillsand condoms, commercial condoms, and socially marketed (CSMP) pills has been increasingalmost continuously over the past decade. By contrast, the distribution of commercial pills hasremained nearly constant, and the distribution of CSMP condoms has declined.
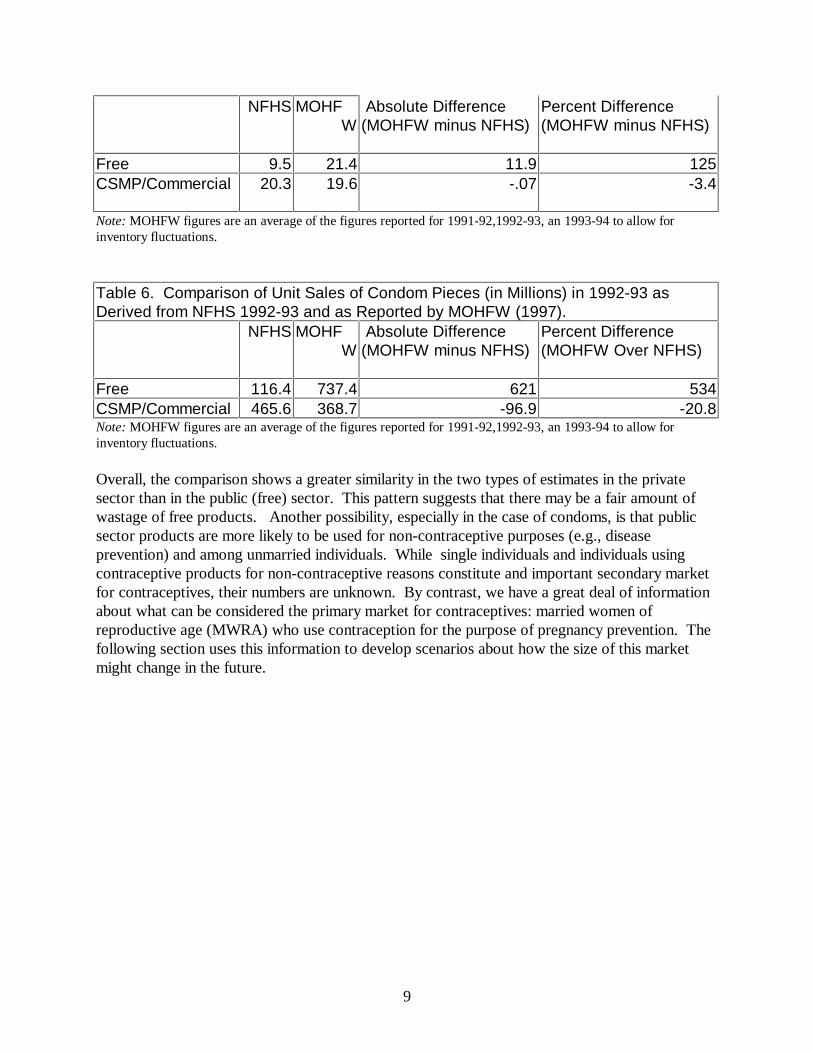
Tables 5 and 6 compare unit volume figures for pills and condoms in 1992-93 as derived from the1992-93 NFHS data on contraceptive use and from the MOHFW (1997) data on distribution.The comparison of pills in Table 5 shows that the MOHFW estimate of unit volume in the public(free) sector is more than double the volume derived from reported use. By contrast, theMOHFW estimate of unit volume in the private sector is nearly the same as the NFHS estimate

8
based on use. The comparison of condom volume estimates in Table 6 shows a similar pattern.The MOHFW estimate of condom volume in the public sector is substantially higher than theNFHS estimate (over 6 times as large). By contrast, the MOHFW estimate of condom volumein the private sector is 20 percent lower than the NFHS estimate. Note that one possible sourcefor the discrepancy in the estimates of condom use in the private sector may be the CYP factorthat we use to convert number of users to condom volume. As mentioned earlier, we haveadopted the standard conversion factor for India: 144. If we were to adopt the standard asrecommended by USAID (Stover et al. 1997), which is 120, the MOHFW estimate would only be5 percent lower than the NFHS estimate. The CYP conversion factor for condoms, however,would not explain the discrepancy in the estimates of condom use in the public sector. In fact, ifwe were to use the USAID recommended factor, this discrepancy would widen.
Table 3: Pill Distribution Figures (Millions of Cycles), 1987-95Volume Percentage
Free CSMP Comm Total Free CSMP Comm Total1987-88 0.0 0.7 8.91988-89 17.0 2.9 9.2 29.2 58.5 9.8 31.7 100.01989-90 24.0 4.6 9.5 38.1 63.1 12.0 24.9 100.01990-91 20.1 5.8 9.3 35.2 57.1 16.6 26.4 100.01991-92 20.1 8.9 9.6 38.7 52.1 23.1 24.8 100.01992-93 14.4 7.9 9.0 31.3 45.9 25.3 28.8 100.01993-94 29.9 13.9 9.5 53.2 56.1 26.1 17.8 100.01994-95 26.0 12.5 10.4 48.9 53.2 25.6 21.3 100.01995-96 41.0 14.7 9.3 64.9 63.1 22.6 14.3 100.0Source: Ministry of Health and Family Welfare 1997.
Table 4: Condom Distribution Figures (Millions of Pieces), 1987-95Volume Percentage
Free CSMP Comm Total Free CSMP Comm Total1987-88 477.6 265.3 72.6 815.5 58.6 32.5 8.9 1001988-89 589.2 236.6 67.3 893.1 66.0 26.5 7.5 1001989-90 657.5 297.0 65.7 1020.1 64.5 29.1 6.4 1001990-91 677.8 320.4 63.3 1061.4 63.9 30.2 6.0 1001991-92 662.4 241.1 93.8 997.3 66.4 24.2 9.4 1001992-93 679.0 278.7 117.8 1075.4 63.1 25.9 11.0 1001993-94 871.0 219.2 155.5 1245.7 69.9 17.6 12.5 1001994-95 916.0 146.0 154.9 1216.9 75.3 12.0 12.7 1001995-96 874.1 163.4 199.3 1236.8 70.7 13.2 16.1 100Source: Ministry of Health and Family Welfare 1997
Table 5. Comparison of Unit Sales of Pill Cycles (in Millions) in 1992-93 as Derivedfrom NFHS 1992-93 and as Reported by MOHFW (1997).
9
NFHS MOHFW
Absolute Difference(MOHFW minus NFHS)
Percent Difference(MOHFW minus NFHS)
Free 9.5 21.4 11.9 125CSMP/Commercial 20.3 19.6 -.07 -3.4
Note: MOHFW figures are an average of the figures reported for 1991-92,1992-93, an 1993-94 to allow forinventory fluctuations.
Table 6. Comparison of Unit Sales of Condom Pieces (in Millions) in 1992-93 asDerived from NFHS 1992-93 and as Reported by MOHFW (1997).
NFHS MOHFW
Absolute Difference(MOHFW minus NFHS)
Percent Difference(MOHFW Over NFHS)
Free 116.4 737.4 621 534CSMP/Commercial 465.6 368.7 -96.9 -20.8Note: MOHFW figures are an average of the figures reported for 1991-92,1992-93, an 1993-94 to allow forinventory fluctuations.
Overall, the comparison shows a greater similarity in the two types of estimates in the privatesector than in the public (free) sector. This pattern suggests that there may be a fair amount ofwastage of free products. Another possibility, especially in the case of condoms, is that publicsector products are more likely to be used for non-contraceptive purposes (e.g., diseaseprevention) and among unmarried individuals. While single individuals and individuals usingcontraceptive products for non-contraceptive reasons constitute and important secondary marketfor contraceptives, their numbers are unknown. By contrast, we have a great deal of informationabout what can be considered the primary market for contraceptives: married women ofreproductive age (MWRA) who use contraception for the purpose of pregnancy prevention. Thefollowing section uses this information to develop scenarios about how the size of this marketmight change in the future.

10
PROJECTED MARKET SIZE: 1992-93 to 2011
Projections are useful not only to gain a better understanding of possible future market size, butalso for specific planning purposes. A projection can motivate manufacturers to increaseproduction capacity or to target specific consumer groups for future sales. It is important torecognize, however, that projections are not predictions or forecasts; rather they are mathematicalmodels of what will happen if demographic and consumer behavior variables follow certainspecified patterns. The more key stakeholders are able to shape demographic and consumerbehavior to conform to those patterns, the more closely current market projections will matchfuture market realities.
The first step in projecting future market size (i.e., contraceptive users and unit sales) is to select abase year for which information about actual market size and actual consumer behavior isavailable. As the previous section discussed, the most recent year for which we have detailedinformation about contraceptive use patterns in India at the national level is 1992-93, from theNFHS. Thus, 1992-93 serves as the base year for all of the projections in this section. To projectthe size of the market for contraceptives beyond 1992-93, we must make specific assumptionsabout three key determinants of future market growth: 1) future population growth, 2) futurecontraceptive use, and 3) future commercial sector market share (commercial sector projectionsonly). These assumptions should be within the upper and lower bounds of real possibility. Weturn now to a detailed discussion of the assumptions that underlie the contraceptive marketprojections in this report for all-India, rural India and urban India.
Projection Assumptions and Scenarios
Future Population Growth: As discussed in the previous section, the primary market for moderntemporary contraceptive products is married women of reproductive age. All projections in thissection assume that the number of women in this age group will increase according to the mediumvariant population projections for all-India, rural India and urban India published by the UnitedNations (1995a,b).6 The same assumption underlies the recent contraceptive commodityprojections for all-India produced by Mauldin, Ahmed and Brandt (1995).7
Future Contraceptive Use: In order to project the number of future contraceptive users in theprimary market, we need to make assumptions not only about population growth, but also aboutthe prevalence of marriage and contraceptive use. The NFHS estimates that the percentage ofwomen of reproductive who were married in 1992-93 is 77.4 percent for all-India, 37.1 for ruralIndia and 51.1 for urban India. We assume that marriage prevalence will slowly decline over timeas the average age of marriage in India rises (see Tables 7, 8, and 9). The rate of decline that weassume for all-India is comparable to the rate of decline assumed by Mauldin, Ahmed, and Brandt(1995).
6 These United Nations projections assume that India will reach replacement level fertility by 2010-2020. Thebaseline data for these projections are taken from the 1991 India census and the 1989 Indian Sample RegistrationSystem (United Nations 1995).7 Mauldin, Ahmed and Brandt have not yet officially published their projections.

11
Information about the level of contraceptive use in combination with information about thenumber of MWRA allows us to produce projections of the number of MWRA who usecontraception (i.e., the total number of contraceptive users in the primary market). According tothe NFHS 1992-93, 37.1 percent of rural MWRA, 51.0 percent of urban MWRA, and 40.7percent of all MWRA in India use some type of contraception. We assume that contraceptiveprevalence will rise in rural and urban India by .81 and 1.2 percentage points respectively eachyear between 1993 and 2011. This assumption results in an average annual increase incontraceptive prevalence for all-India of 1.0 percentage points. This average rate of increase isconsistent with both the United Nations medium variant fertility assumptions and the Governmentof India’s (GOI) current goal to reach replacement fertility by 2011-2016. It is also the same rateof increase assumed by Mauldin, Ahmed and Brandt (1995).
Source: Number of Women Aged 15-49 from United Nations (1995b) medium variant projections (intermediatefigures are interpolated), Percent Married in 1993 from NFHS, Percent Using a Method in 1993 from NFHS.
Tables 7, 8, and 9 present the projected figures for 1) the number of women of reproductive age,2) percent married, 3) percent using contraception, and 4) the total number of contraceptive usersin the primary market for rural India, urban India and all-India respectively. The results of theseprojections suggest that the total number of contraceptive users in the primary market in 2011 willbe 70% higher in rural areas, 150 percent higher in urban areas and 95% higher in all-India thanthe number of contraceptive users in 1993.
Table 7: Number of Women Aged 15-49, Marriage Prevalence among Women Aged 15-49 Married,Percentage of MWRA who Use a Contraceptive Method, and Number of MWRA who Use aContraceptive Method: Rural India, 1993-2011.Year Number of
Women 15-49(Thousands)
Percent Married Percent Using aMethod
Number of Users(Thousands)
1993199419951996199719981999200020012002200320042005200620072008200920102011
156,942 159,692 162,419 165,398 168,340 171,242 174,107 176,934 179,412 181,841 184,222 186,555 188,840 190,546 192,195 193,786 195,320 196,796 197,605
80.0079.8479.6879.5279.3679.2079.0478.8878.7278.5678.4078.2478.0877.9277.7677.6077.4477.2877.12
37.1037.9138.7239.5340.3441.1541.9642.7743.5844.3945.2046.0146.8247.6348.4449.2550.0650.8751.68
46,580 48,335 50,110 51,992 53,892 55,809 57,743 59,692 61,549 63,413 65,283 67,157 69,034 70,718 72,394 74,061 75,719 77,365 78,757

12
Table 8: Number of Women Aged 15-49, Marriage Prevalence among Women Aged 15-49, Percentage of MWRAwho Use a Contraceptive Method, and Number of MWRA who Use a Contraceptive Method: Urban India, 1993-2011.Year Number of Women 15-49
(Thousands)Percent Married Percent Using a
MethodNumber of Users(Thousands)
1993199419951996199719981999200020012002200320042005200620072008200920102011
60,474 62,334 64,217 66,561 68,942 71,362 73,821 76,317 79,088 81,907 84,774 87,690 90,654 93,915 97,234 100,610 104,044 107,535 111,225
70.9070.7470.5870.4270.2670.1069.9469.7869.6269.4669.3069.1468.9868.8268.6668.5068.3468.1868.02
51.1052.3053.5054.7055.9057.1058.3059.5060.7061.9063.1064.3065.5066.7067.9069.1070.3071.5072.70
21,910 23,062 24,249 25,639 27,077 28,564 30,100 31,686 33,422 35,217 37,070 38,984 40,959 43,110 45,330 47,622 49,986 52,422 55,002
Source: Number of Women Aged 15-49 from United Nations (1995b) medium variant projections (intermediatefigures are interpolated), Percent Married in 1993 from NFHS, Percent Using a Method in 1993 from NFHS.
Table 9: Number of Women Aged 15-49, Marriage Prevalence among Women Aged 15-49 Married (MWRA),Percentage of MWRA who Use a Contraceptive Method, and Number of MWRA who Use a Contraceptive Method:All India, 1993-2011.Year Number of Women 15-49
(Thousands)Percent Married Percent Using a
MethodNumber of Users(Thousands)
1993199419951996199719981999200020012002200320042005200620072008200920102011
217,416 222,026 226,636 231,959 237,282 242,605 247,928 253,251 258,500 263,748 268,997 274,245 279,494 284,461 289,429 294,396 299,364 304,331 308,831
77.4077.2877.1076.9176.7276.5276.3376.1475.9475.7375.5375.3375.1374.9274.7074.4974.2874.0673.84
40.7041.6142.5543.5244.4845.4546.4247.3948.3849.3850.3851.3852.3853.4154.4555.4956.5357.5858.65
68,490 71,396 74,358 77,631 80,969 84,374 87,843 91,378 94,971 98,630 102,353 106,141 109,994 113,828 117,724 121,683 125,704 129,787 133,758
Source: Number of Women Aged 15-49 from United Nations (1995a) medium variant projections (intermediatefigures are interpolated), Percent Married in 1993 from NFHS , Percent Using a Method in 1993 from 1993 NFHS.

13
Method Mix Scenarios
In order to make separate method-specific projections, we need to make assumptions not onlyabout contraceptive use in general, but about the future use of specific methods. According to theNFHS, modern temporary methods make up 13.5 percent of the “method mix” for all-India, 9 %of the method mix for rural India, and 22.8 percent of the method mix in urban India. Figure 5shows the breakdown by method. Scenarios about how this method mix might change allow us tomake projections that establish upper and lower bounds of future contraceptive use and sales. Inthis report we present two projection scenarios. The only difference between the two scenarios isthe size of the contribution of temporary methods to the total method mix. All assumptionsoutlined above hold for both scenarios.
The first projection scenario, Method Mix Scenario 1, assumes that the 1992-93 method mix forboth rural India and urban India will remain constant from 1992-93 to 2011. Given recent effortsto promote birth spacing (as opposed to limiting) in India and an increased trend towardtemporary method use, we consider this scenario to be conservative. Nevertheless, we believethat the scenario provides a lower bound of real possibility in a period when fundamental changesin approaches to family planning policy (e.g., the introduction of the target-free approach) aretaking place.
Method Mix Scenario 2 incorporates the method preferences of women who were not using anymethod in 1992-93 but who said that they intended to use a method in the future.8 As Figure 6illustrates, the “preferred method mix” of women who are likely to be future users more stronglyfavors temporary methods than the 1992-93 method mix. Specifically, the share of the preferredmethod mix that is attributable to temporary methods is 31 percent for all three sectors (all-India,rural India, and urban India).9 Method Mix Scenario 2 assumes that the 1992-93 method mix willremain constant until the end of 1996 and then shift increasingly towards modern temporarymethods so that by 2011 all new users will use according to the preferred method mix.10
Finally, in order to convert the number of users projected in the three scenarios to projectedquantities of temporary methods required for effective use (i.e. unit volume), we rely on the sameCouple Years of Protection (CYP) factors discussed earlier in this section: 15 cycles of pills per 8 Previous studies have found that intention to use contraception strongly predicts actual future use (Westoff 1996).Thus, we assume that women who stated that they intend to use in the future will make up the bulk of new users inthe near future.9 Note that there is some concern among analysts of the NFHS data that some of the preference for injectionsreported in the NFHS may actually reflect preference for an IUD. This concern stems from the fact that the Hindiword for injection (sui) is the same as the word for IUD insertion. The extent to which NFHS interviewersadequately probed to distinguish the two interpretations of the word while conducting the questionnaire isuncertain. Due to this concern, we reduce the proportion of the preferred method mix attributable to injections tohalf the reported size in the NFHS and assign the remaining half to IUDs for Method Mix Scenario 2. Thus,Method Mix Scenario 2 assumes that 1.05 percent (as opposed to 2.1 percent) of women who intend to use amethod in the future intend to use injectables and 6.95 percent (as opposed to 5.90 percent) of women who intendto use a method in the future intend to use IUDs.10 Contraceptive users in 1996 are assumed to continue to use their method until they either discontinue of “ageout” of the reproductive age group. While this is a simplifying assumption, it is not unreasonable for the majorityof women since 75.9 percent are assumed to rely on sterilization as their method.

14
CYP, 144 condoms per CYP, and 4 injections per CYP. Again, we assume that the annualdiscontinuation rate for the IUD is 37.6 percent (MOHFW 1993).
75%
5%3% 11%6%
Figure 5. Method Mix Scenario 1: 1992-93Method Mix Remains Constant from 1993 to 2011
82%
3% 2% 10%3%
All-India
Rural India Urban India
66%
8%
4%11% 11%
CondTrad
Pill
IUD
Ster
TradCond
PillIUD
Ster
Ster
IUD Pill TradCond
60%
7%
19%
3%4%6%
1%
Figure 6. Method Mix Scenario 2: 1992-93Method Mix Shifts to “Preferred Method Mix” by 2011
60%
6%
21%
3%3%6%
1%
All-India
Rural India Urban India
59%
10%
13%3% 7%
7%1%
CondTrad
Pill
IUD
Ster
Trad Cond
Pill
IUDSter
SterIUD
Pill
Trad Cond
OtherInjectable
OtherInjectable
Other
Injectable

15
Future Commercial Sector Share:
As Figure 2 showed earlier, the private sector share (commercial and social marketing combined)of the pill and condom markets for all-India is approximately 68 percent and 80 percentrespectively. Within the all-India private sector, the commercial share is 34 percent for pills and45 percent for condoms (ORG 1997).11 In rural India, the private sector share of the pill andcondom markets is approximately 57 percent and 63 percent respectively. The commercial shareof the rural private sector market for pills is 19 percent, and the commercial share of the ruralprivate sector market for condoms is 36 percent (ORG 1997). Finally, in urban India, the privatesector comprises about 82 percent of the total pill market and about 90 percent of the totalcondom market. The commercial share of the urban pill market is 48 percent and the commercialshare of the urban condom market is 52 percent (ORG 1997)
We expect that the concerted efforts of private sector stakeholders will lead to an expansion ofboth the commercial sector and the private sector as a whole. Thus, in addition to the two methodmix scenarios outlined above, this report provides two illustrative scenarios of the futurecommercial share of the pill and condoms markets. The first, Source Mix Scenario A, assumesthat the commercial share of the private sector pill and condom markets and the private sectorshare of the total market remain constant at 1992-93 levels for both rural India and urban India.The second, Source Mix Scenario B, assumes that 1) the private sector grows to 90 percent ofthe total urban pill market and 65 percent of the total rural pill market by 2011; 2) the commercialshare of the private pill market grows to 58 percent in the urban sector and 25 percent in the ruralsector; 3) the private sector of the total condom market grows to 95 percent in urban India and 70percent in rural India; 4) the commercial share of the total private condom market increase to 62percent in urban India and to 46 percent in rural India.
We assume that the commercial sector performs 100 percent of all private sector IUDs and 100percent of all private sector injections. Therefore, we do not provide separate commercial sectorprojections for these methods within the commercial sector (refer to the projections for thesemethods within the total private sector).
Projection Results
The market size (contraceptive users and unit sales) projections in this report are made using theTarget-Cost Model, a projection model developed by the Futures Group International under theOPTIONS project of the U.S. Agency for International Development.12 The model is based onthe proximate determinants of fertility framework and allows for the projection of a host of family 11 Note that these data refer to the period January - December 1996. Data from the MOHFW (1997) show higherfigures for the commercial share of the private sector over the period 1995-1996. Specifically, the MOHFW (1997)reports that the commercial share of the private pill market for all-India is 39% and that the commercial share ofthe private sector condom market for all-India is 55%. The discrepancy between MOHFW (1997) and ORG (1997)figures may be due to the following factors: 1) MOHFW figures reflect what has been sold to the retailer whileORG figures reflect what has been sold to the consumer and 2) the timeframes for the two sets of figures areoverlapping but not the same (i.e., MOHFW figures include 1995 volume while ORG figures do not).12 The model was adapted for the purposes of this report to allow the method mix of new users to vary from themethod mix of continuing users as is required by Method Mix Scenario 3.

16
planning and reproductive health variables including number of contraceptive users by method,number of commodities by sector, fertility levels, number of new acceptors, etc. Below,projections of number of users and unit sales are presented in three sections: 1) the total market(public, commercial and social marketing combined); 2) the total private sector (commercial andsocial marketing sectors combined); and 3) the commercial sector. Within each of these sections,projections are presented separately for the all-India, rural India and urban India. It is importantto keep in mind that these projections refer to married women of reproductive age who usecontraceptive methods for pregnancy prevention. They do not refer either to single individuals orto individuals who use contraceptives for non-contraceptive purposes. Therefore these projectionsare best interpreted as projections of the primary market, rather than the total market forcontraceptives.

17
Market Projections: Total Market(Combined Public, Commercial and CSM)

18
I. All-India
IA. Number of Users
Table 1. Method Mix Scenario 1, Projected Number of Contraceptive Users by Method, Total Market, All-India,1993-2011 (Numbers in Thousands)Year Total Users Sterili-
zationPill Inject-
ableIUD Condom Any
TraditionalOther
1993199419951996199719981999200020012002200320042005200620072008200920102011
68,49071,39674,35877,63180,96984,37487,84391,37894,97198,630102,353106,141109,994113,828117,724121,683125,704129,787133,758
46,24848,18450,15652,32554,53656,78859,08161,41463,77166,16768,60371,07873,59276,07278,58981,14183,72986,35288,880
1,929
2,013
2,100
2,196
2,295
2,396
2,500
2,605
2,714
2,825
2,938
3,054
3,172
3,292
3,415
3,539
3,667
3,796
3,925
0000000000000000000
3,2243,3713,5213,6903,8634,0414,2234,4104,6054,8045,0095,2185,4325,6535,8796,1116,3486,5906,834
4,0354,2244,4184,6394,8655,0985,3375,5825,8416,1076,3806,6606,9477,2487,5577,8738,1978,5298,869
7,249 7,559 7,876 8,226 8,584 8,949 9,321 9,701 10,088 10,483 10,885 11,294 11,711 12,128 12,552 12,983 13,422 13,867 14,303
5,8056,0456,2886,5546,8267,1017,3827,6677,9538,2438,5378,8369,1399,4349,73310,03610,34210,65210,947
Table 2. Method Mix Scenario 2, Projected Number of Contraceptive Users by Method, Total Market, All-India,1993-2011 (Numbers in Thousands)Year Total Users Sterili-
zationPill Inject-
ableIUD Condom Any
TraditionalOther
1993 68,490 46,248 1,929 0 3,224 4,035 7,249 5,805
19
199419951996199719981999200020012002200320042005200620072008200920102011
71,39674,35877,63180,96984,37487,84391,37894,97198,630102,353106,141109,994113,828117,724121,683125,704129,787133,758
48,18450,15652,32554,35256,34758,31660,26262,16664,04665,90067,72669,52571,23772,92174,57576,20077,79479,255
2,013 2,100 2,196 2,633 3,204 3,900 4,713 5,650 6,710 7,893 9,201 10,637 12,186 13,862 15,667 17,604 19,673 21,836
002354941411962603324125005977028169391,0711,210
3,371 3,521 3,690 3,920 4,177 4,459 4,764 5,099 5,459 5,844 6,254 6,691 7,156 7,647 8,166 8,713 9,288 9,885
4,2244,4184,6394,8234,9975,1635,3215,4765,6235,7615,8906,0086,1196,2186,3056,3796,4406,483
7,5597,8768,2268,4078,5288,5928,6038,5588,4588,3018,0857,8117,4727,0716,6086,0805,4874,822
6,045 6,288 6,554 6,811 7,067 7,321 7,575 7,825 8,074 8,323 8,572 8,821 9,062 9,303 9,546 9,789 10,033 10,267
IB. Quantities of Commodities (Sales Volume)
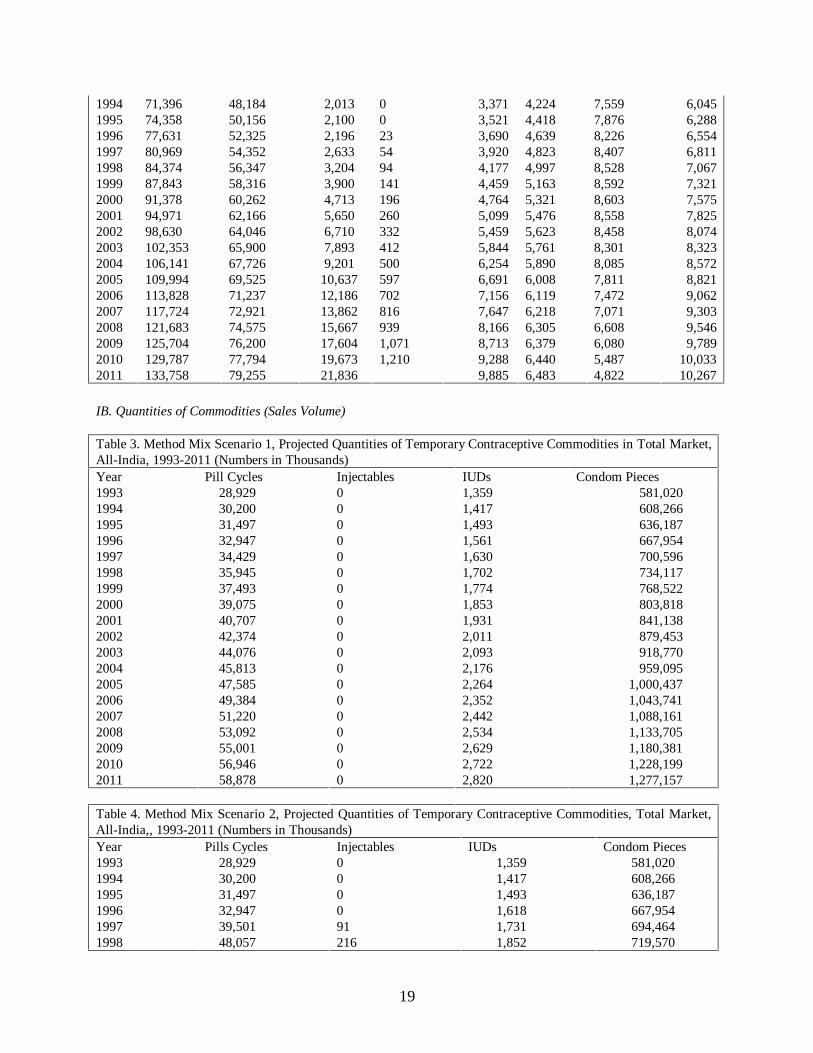
Table 3. Method Mix Scenario 1, Projected Quantities of Temporary Contraceptive Commodities in Total Market,All-India, 1993-2011 (Numbers in Thousands)Year Pill Cycles Injectables IUDs Condom Pieces1993199419951996199719981999200020012002200320042005200620072008200920102011
28,929 30,200 31,497 32,947 34,429 35,945 37,493 39,075 40,707 42,374 44,076 45,813 47,585 49,384 51,220 53,092 55,001 56,946 58,878
0000000000000000000
1,3591,4171,4931,5611,6301,7021,7741,8531,9312,0112,0932,1762,2642,3522,4422,5342,6292,7222,820
581,020 608,266 636,187 667,954 700,596 734,117 768,522 803,818 841,138 879,453 918,770 959,095 1,000,437 1,043,741 1,088,161 1,133,705 1,180,381 1,228,199 1,277,157
Table 4. Method Mix Scenario 2, Projected Quantities of Temporary Contraceptive Commodities, Total Market,All-India,, 1993-2011 (Numbers in Thousands)Year Pills Cycles Injectables IUDs Condom Pieces199319941995199619971998
28,929 30,200 31,497 32,947 39,501 48,057
000091216
1,359 1,417 1,493 1,618 1,731 1,852
581,020 608,266 636,187 667,954 694,464 719,570

20
1999200020012002200320042005200620072008200920102011
58,497 70,688 84,752 100,645 118,390 138,017 159,557 182,785 207,927 235,010 264,059 295,098 327,536
3755647861,0401,3271,6472,0012,3872,8083,2643,7554,2834,841
1,982 2,126 2,277 2,437 2,608 2,789 2,980 3,182 3,394 3,617 3,851 4,089 4,342
743,433 766,174 788,576 809,739 829,605 848,105 865,165 881,107 895,392 907,927 918,622 927,384 933,600

21
II. RURAL INDIA
II.A. Number of Users
Table 5. Method Mix Scenario 1, Projected Number of Contraceptive Users by Method, Total Market, Rural India,1993-2011 (Numbers in Thousands)Year Total Users Sterili-
zationPill Inject-
ableIUD Condom Any
Traditional
Other
1993199419951996199719981999200020012002200320042005200620072008200920102011
46,580 48,335 50,110 51,992 53,892 55,809 57,743 59,692 61,549 63,413 65,283 67,157 69,034 70,718 72,394 74,061 75,719 77,365 78,757
33,212 34,463 35,728 37,070 38,425 39,792 41,171 42,560 43,885 45,214 46,546 47,883 49,222 50,422 51,617 52,806 53,987 55,161 56,154
1,118 1,160 1,203 1,248 1,293 1,339 1,386 1,433 1,477 1,522 1,567 1,612 1,657 1,697 1,737 1,777 1,817 1,857 1,890
0000000000000000000
1,537 1,595 1,654 1,716 1,778 1,842 1,906 1,970 2,031 2,093 2,154 2,216 2,278 2,334 2,389 2,444 2,499 2,553 2,599
1,537 1,595 1,654 1,716 1,778 1,842 1,906 1,970 2,031 2,093 2,154 2,216 2,278 2,334 2,389 2,444 2,499 2,553 2,599
4,751 4,930 5,111 5,303 5,497 5,693 5,890 6,089 6,278 6,468 6,659 6,850 7,042 7,213 7,384 7,554 7,723 7,891 8,033
4,425 4,592 4,760 4,939 5,120 5,302 5,486 5,671 5,847 6,024 6,202 6,380 6,558 6,718 6,877 7,036 7,193 7,350 7,482
Table 6. Method Mix Scenario 2, Projected Number of Contraceptive Users by Method, Total Market, Rural India,1993-2011 (Numbers in Thousands)Year Total Users Sterili-
zationPill Inject-
ableIUD Condom Any
TraditionalOther
1993199419951996199719981999200020012002200320042005200620072008200920102011
46,580 48,335 50,110 51,992 53,892 55,809 57,743 59,692 61,549 63,413 65,283 67,157 69,034 70,718 72,394 74,061 75,719 77,365 78,757
33,212 34,463 35,728 37,070 38,257 39,389 40,471 41,506 42,417 43,273 44,074 44,818 45,505 46,008 46,448 46,825 47,136 47,381 47,417
1,118 1,160 1,203 1,248 1,542 1,934 2,419 2,989 3,644 4,386 5,216 6,134 7,142 8,211 9,365 10,604 11,929 13,339 14,784
0 0 0 0 14 34 59 89 124 164 209 259 315 374 438 506 580 659 740
1,537 1,595 1,654 1,716 1,813 1,925 2,049 2,187 2,333 2,492 2,663 2,846 3,042 3,241 3,452 3,674 3,908 4,153 4,396
1,537 1,595 1,654 1,716 1,780 1,845 1,911 1,978 2,043 2,108 2,174 2,241 2,308 2,369 2,431 2,492 2,554 2,616 2,669
4,751 4,930 5,111 5,303 5,398 5,455 5,478 5,468 5,414 5,326 5,203 5,046 4,854 4,615 4,341 4,033 3,690 3,311 2,890
4,425 4,592 4,760 4,939 5,089 5,227 5,356 5,475 5,575 5,664 5,743 5,812 5,869 5,900 5,919 5,926 5,922 5,907 5,861

22
II.B Quantities of Commodities (Sales Volume)
Table 7. Method Mix Scenario 1, Projected Quantities of Temporary Contraceptive Commodities, Total Market,Rural India, 1993-2011 (Numbers in Thousands)Year Pills Injectables IUDs Condoms1993199419951996199719981999200020012002200320042005200620072008200920102011
16,769 17,400 18,039 18,717 19,401 20,091 20,787 21,489 22,158 22,829 23,502 24,176 24,852 25,459 26,062 26,662 27,259 27,851 28,352
0000000000000000000
636 658 684 708 732 756 781 802 825 849 872 895 912 933 953 974 994 1,006 1,018
221,350 229,686 238,121 247,065 256,095 265,206 274,395 283,657 292,482 301,339 310,223 319,128 328,051 336,052 344,017 351,939 359,815 367,638 374,252
Table 8. Method Mix Scenario 2, Projected Quantities of Temporary Contraceptive Commodities, Total Market,Rural India, 1993-2011 (Numbers in Thousands)Year Pills Injectables IUDs Condoms1993199419951996199719981999200020012002200320042005200620072008200920102011
16,769 17,400 18,039 18,717 23,127 29,009 36,281 44,832 54,657 65,788 78,234 92,009 107,125 123,165 140,477 159,064 178,930 200,078 221,754
0 0 0 0 57 136 237 357 497 657 837 1,038 1,259 1,495 1,751 2,026 2,321 2,635 2,959
636 658 684 742 793 849 908 969 1,036 1,108 1,185 1,266 1,343 1,429 1,520 1,615 1,715 1,804 1,898
221,350 229,686 238,121 247,065 256,290 265,674 275,208 284,881 294,187 303,593 313,094 322,687 332,367 341,178 350,019 358,885 367,771 376,673 384,398

23
III. URBAN INDIA
III.A Number of Users
Table 9. Method Mix Scenario 1, Projected Number of Contraceptive Users by Method, Total Market, Urban India,1993-2011 (Numbers in Thousands)Year Total Users Sterili-
zationPill Inject-
ableIUD Condom Any
Traditional
Other
1993199419951996199719981999200020012002200320042005200620072008200920102011
21,910 23,062 24,249 25,639 27,077 28,564 30,100 31,686 33,422 35,217 37,070 38,984 40,959 43,110 45,330 47,622 49,986 52,422 55,002
13,036 13,722 14,428 15,255 16,111 16,996 17,910 18,853 19,886 20,954 22,057 23,196 24,371 25,650 26,972 28,335 29,742 31,191 32,726
811 853 897 949 1,002 1,057 1,114 1,172 1,237 1,303 1,372 1,442 1,515 1,595 1,677 1,762 1,849 1,940 2,035
0000000000000000000
1,687 1,776 1,867 1,974 2,085 2,199 2,318 2,440 2,573 2,712 2,854 3,002 3,154 3,319 3,490 3,667 3,849 4,037 4,235
2,498 2,629 2,764 2,923 3,087 3,256 3,431 3,612 3,810 4,015 4,226 4,444 4,669 4,915 5,168 5,429 5,698 5,976 6,270
2,498 2,629 2,764 2,923 3,087 3,256 3,431 3,612 3,810 4,015 4,226 4,444 4,669 4,915 5,168 5,429 5,698 5,976 6,270
1,380 1,453 1,528 1,615 1,706 1,800 1,896 1,996 2,106 2,219 2,335 2,456 2,580 2,716 2,856 3,000 3,149 3,303 3,465
Table 10. Method Mix Scenario 2, Projected Number of Contraceptive Users by Method, Total Market, UrbanIndia, 1993-2011 (Numbers in Thousands)Year Total Users Sterili-
zationPill Inject-
ableIUD Condom Any
TraditionalOther
19931994199519961997199819992000200120022003200420052006200720082009
21,910 23,062 24,249 25,639 27,077 28,564 30,100 31,686 33,422 35,217 37,070 38,984 40,959 43,110 45,330 47,622 49,986
13,036 13,722 14,428 15,255 16,095 16,958 17,845 18,756 19,750 20,773 21,826 22,908 24,020 25,229 26,472 27,751 29,064
811 853 897 949 1,092 1,270 1,481 1,724 2,006 2,324 2,677 3,067 3,495 3,975 4,497 5,063 5,675
0 0 0 0 8 20 34 52 72 96 122 152 186 223 264 309 359
1,687 1,776 1,867 1,974 2,107 2,253 2,410 2,578 2,766 2,967 3,181 3,408 3,649 3,914 4,195 4,492 4,805
2,498 2,629 2,764 2,923 3,043 3,152 3,252 3,342 3,433 3,515 3,587 3,649 3,700 3,750 3,787 3,813 3,825
2,498 2,629 2,764 2,923 3,008 3,070 3,110 3,130 3,137 3,121 3,084 3,023 2,937 2,832 2,701 2,541 2,351
1,380 1,453 1,528 1,615 1,724 1,842 1,969 2,105 2,258 2,421 2,594 2,778 2,972 3,187 3,414 3,654 3,906

24
20102011
52,422 55,002
30,413 31,837
6,335 7,052
412 470
5,135 5,489
3,824 3,814
2,130 1,880
4,172 4,458
III.B. Quantities of Commodities (Sales Volume)
Table 11. Method Mix Scenario 1, Projected Quantities of Temporary Contraceptive Commodities, Total Market,Urban India, 1993-2011 (Numbers in Thousands)Year Pills Injectables IUDs Condoms1993199419951996199719981999200020012002200320042005200620072008200920102011
12,160 12,799 13,458 14,230 15,028 15,853 16,706 17,586 18,549 19,545 20,574 21,636 22,732 23,926 25,158 26,430 27,742 29,094 30,526
0000000000000000000
723 759 809 853 898 945 994 1,051 1,106 1,162 1,221 1,281 1,351 1,419 1,489 1,561 1,635 1,716 1,802
359,671 378,580 398,066 420,890 444,501 468,911 494,127 520,161 548,656 578,114 608,547 639,967 672,385 707,689 744,145 781,766 820,567 860,561 902,905
Table 12. Method Mix Scenario 2, Projected Quantities of Temporary Contraceptive Commodities, Total Market,Urban India, 1993-2011 (Numbers in Thousands)Year Pills Injectables IUDs Condoms1993199419951996199719981999200020012002200320042005200620072008200920102011
12,160 12,799 13,458 14,230 16,374 19,048 22,217 25,856 30,095 34,857 40,156 46,008 52,432 59,619 67,450 75,946 85,128 95,020 105,782
0 0 0 0 34 80 138 207 289 383 490 609 742 892 1,057 1,238 1,435 1,648 1,881
723 759 809 875 938 1,004 1,074 1,157 1,241 1,329 1,423 1,522 1,637 1,753 1,874 2,002 2,137 2,285 2,444
359,671 378,580 398,066 420,890 438,174 453,896 468,225 481,293 494,389 506,147 516,512 525,418 532,797 539,929 545,373 549,042 550,851 550,711 549,202

25
Market Projections: Private Sector(Combined Commercial and CSM)

26
I. ALL-INDIA
I.A. Number of Users
Table 1. Method Mix Scenario 1, Projected Number of Contraceptive Users by Method, Private Sector, All-India,1993-2011 (Numbers in Thousands)Year Pills Injectables IUDs Condoms1993199419951996199719981999200020012002200320042005200620072008200920102011
1,310 1,369 1,430 1,498 1,568 1,640 1,713 1,789 1,867 1,947 2,030 2,114 2,200 2,289 2,379 2,472 2,567 2,664 2,762
0000000000000000000
1,160 1,216 1,273 1,338 1,405 1,474 1,544 1,617 1,694 1,774 1,856 1,940 2,026 2,117 2,210 2,306 2,405 2,506 2,610
3,6153,7853,9584,1564,3594,5684,7825,0025,2345,4725,7175,9686,2256,4946,7717,0547,3457,6427,947
Table 2. Method Mix Scenario 2, Projected Number of Contraceptive Users by Method, Private Sector, All-India,1993-2011 (Numbers in Thousands)Year Pills Injectables IUDs Condoms1993199419951996199719981999200020012002200320042005200620072008200920102011
1,310 1,369 1,430 1,498 1,785 2,157 2,610 3,137 3,746 4,434 5,202 6,051 6,983 7,992 9,086 10,264 11,530 12,883 14,304
0000174170106147195249309375448526612704803908
1,160 1,216 1,273 1,338 1,423 1,518 1,622 1,734 1,857 1,989 2,131 2,281 2,441 2,614 2,796 2,989 3,192 3,405 3,629
3,615 3,785 3,958 4,156 4,321 4,477 4,626 4,767 4,907 5,038 5,162 5,277 5,383 5,482 5,571 5,649 5,716 5,770 5,809

27
I.B. Quantities of Commodities (Sales Volume)
Table 3. Method Mix Scenario 1, Projected Quantities of Temporary Contraceptive Commodities, Private Sector,All-India, 1993-2011 (Numbers in Thousands)Year Pill Cycles Injectables IUD Condom Pieces1993199419951996199719981999200020012002200320042005200620072008200920102011
19,650 20,539 21,449 22,473 23,524 24,600 25,702 26,829 28,007 29,212 30,446 31,708 32,999 34,330 35,691 37,083 38,506 39,959 41,425
0000000000000000000
1,3591,4171,4931,5611,6301,7021,7741,8531,9312,0112,0932,1762,2642,3522,4422,5342,6292,7222,820
581,020608,266636,187667,954700,596734,117768,522803,818841,138879,453918,770959,0951,000,4371,043,7411,088,1611,133,7051,180,3811,228,1991,277,157
Table 4. Method Mix Scenario 2, Projected Quantities of Temporary Contraceptive Commodities, Private Sector,All-India, 1993-2011 (Numbers in Thousands)Year Pill Cycles Injectable IUD Condom Pieces1993199419951996199719981999200020012002200320042005200620072008200920102011
19,650 20,539 21,449 22,473 26,774 32,357 39,146 47,058 56,196 66,515 78,033 90,770 104,748 119,887 136,286 153,965 172,946 193,246 214,567
0 0 0 0 68 162 281 423 589 780 995 1,235 1,501 1,790 2,106 2,448 2,816 3,212 3,630
492 514 544 589 630 674 722 775 831 889 952 1,018 1,090 1,165 1,244 1,327 1,414 1,505 1,602
520,594 545,006 570,023 598,487 622,240 644,734 666,116 686,492 706,564 725,526 743,326 759,902 775,187 789,472 802,271 813,503 823,085 830,936 836,505

28
II. RURAL INDIA
II.A. Number of Users
Table 5. Method Mix Scenario 1, Projected Number of Contraceptive Users by Method, Private Sector, RuralIndia, 1993-2011 (Numbers in Thousands)Year Pills Injectables IUDs Condoms1993199419951996199719981999200020012002200320042005200620072008200920102011
643 667 692 717 744 770 797 824 849 875 901 927 953 976 999 1,022 1,045 1,068 1,087
0000000000000000000
369 383 397 412 427 442 457 473 487 502 517 532 547 560 573 587 600 613 624
1,377 1,429 1,482 1,537 1,593 1,650 1,707 1,765 1,820 1,875 1,930 1,986 2,041 2,091 2,141 2,190 2,239 2,288 2,329
Table 6. Method Mix Scenario 2, Projected Number of Contraceptive Users by Method, Private Sector, RuralIndia, 1993-2011 (Numbers in Thousands)Year Pills Injectables IUDs Condoms1993199419951996199719981999200020012002200320042005200620072008200920102011
643 667 692 717 887 1,112 1,391 1,719 2,095 2,522 2,999 3,527 4,106 4,721 5,385 6,097 6,859 7,670 8,501
0 0 0 0 11 26 44 67 93 123 157 195 236 280 328 380 435 494 555
369 383 397 412 435 462 492 525 560 598 639 683 730 778 828 882 938 997 1,055
1,377 1,429 1,482 1,537 1,595 1,653 1,712 1,773 1,830 1,889 1,948 2,008 2,068 2,123 2,178 2,233 2,288 2,344 2,392
29
II.B Quantities of Commodities (Sales Volume)
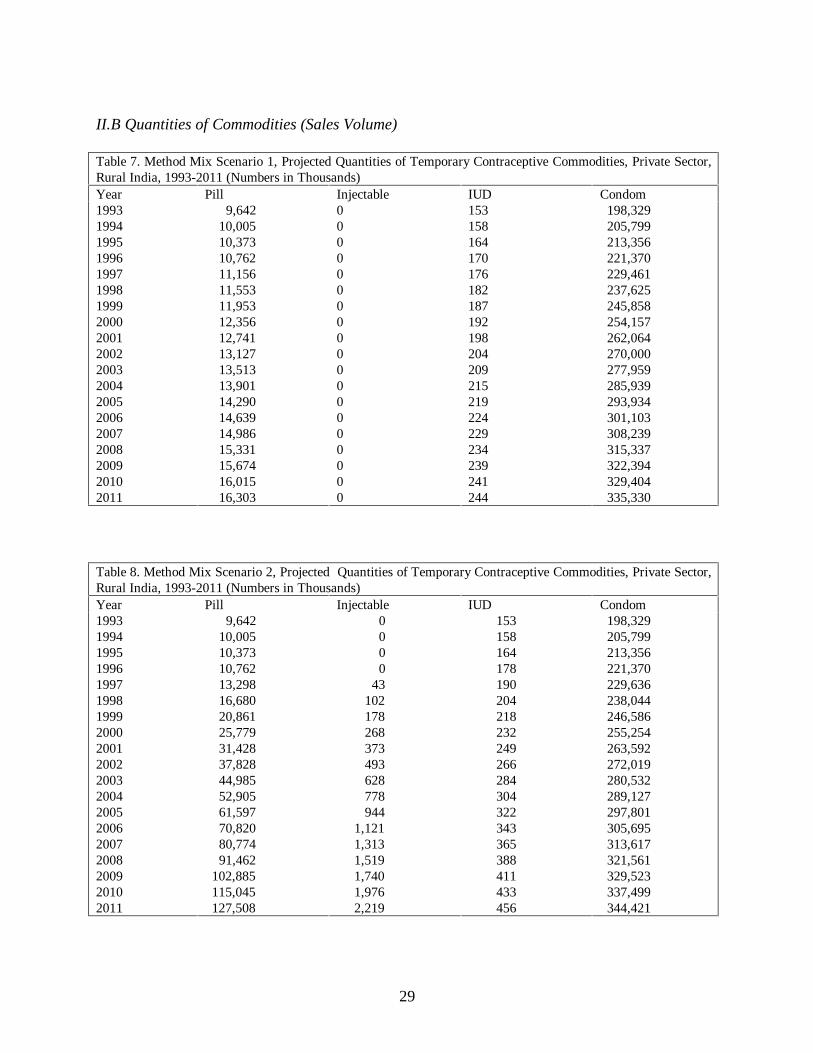
Table 7. Method Mix Scenario 1, Projected Quantities of Temporary Contraceptive Commodities, Private Sector,Rural India, 1993-2011 (Numbers in Thousands)Year Pill Injectable IUD Condom1993199419951996199719981999200020012002200320042005200620072008200920102011
9,642 10,005 10,373 10,762 11,156 11,553 11,953 12,356 12,741 13,127 13,513 13,901 14,290 14,639 14,986 15,331 15,674 16,015 16,303
0000000000000000000
153158164170176182187192198204209215219224229234239241244
198,329 205,799 213,356 221,370 229,461 237,625 245,858 254,157 262,064 270,000 277,959 285,939 293,934 301,103 308,239 315,337 322,394 329,404 335,330
Table 8. Method Mix Scenario 2, Projected Quantities of Temporary Contraceptive Commodities, Private Sector,Rural India, 1993-2011 (Numbers in Thousands)Year Pill Injectable IUD Condom1993199419951996199719981999200020012002200320042005200620072008200920102011
9,642 10,005 10,373 10,762 13,298 16,680 20,861 25,779 31,428 37,828 44,985 52,905 61,597 70,820 80,774 91,462 102,885 115,045 127,508
0 0 0 0 43 102 178 268 373 493 628 778 944 1,121 1,313 1,519 1,740 1,976 2,219
153 158 164 178 190 204 218 232 249 266 284 304 322 343 365 388 411 433 456
198,329 205,799 213,356 221,370 229,636 238,044 246,586 255,254 263,592 272,019 280,532 289,127 297,801 305,695 313,617 321,561 329,523 337,499 344,421
30
III. URBAN INDIA
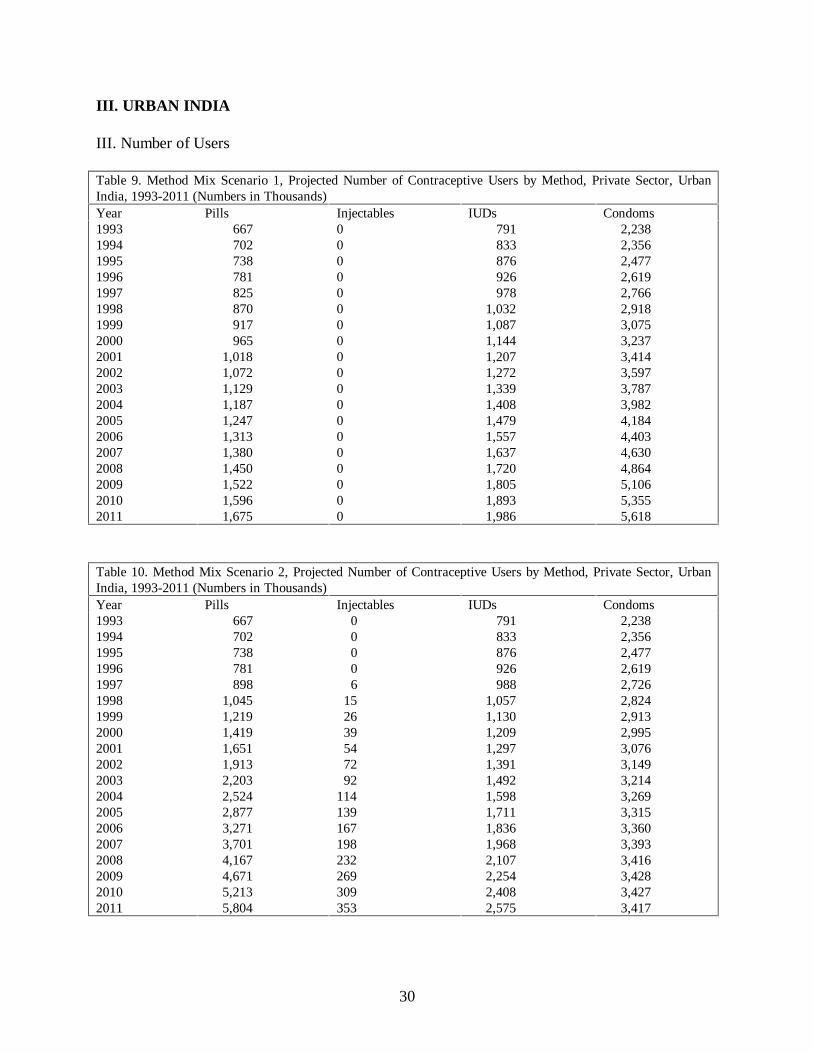
III. Number of Users
Table 9. Method Mix Scenario 1, Projected Number of Contraceptive Users by Method, Private Sector, UrbanIndia, 1993-2011 (Numbers in Thousands)Year Pills Injectables IUDs Condoms1993199419951996199719981999200020012002200320042005200620072008200920102011
667 702 738 781 825 870 917 965 1,018 1,072 1,129 1,187 1,247 1,313 1,380 1,450 1,522 1,596 1,675
0000000000000000000
791 833 876 926 978 1,032 1,087 1,144 1,207 1,272 1,339 1,408 1,479 1,557 1,637 1,720 1,805 1,893 1,986
2,238 2,356 2,477 2,619 2,766 2,918 3,075 3,237 3,414 3,597 3,787 3,982 4,184 4,403 4,630 4,864 5,106 5,355 5,618
Table 10. Method Mix Scenario 2, Projected Number of Contraceptive Users by Method, Private Sector, UrbanIndia, 1993-2011 (Numbers in Thousands)Year Pills Injectables IUDs Condoms1993199419951996199719981999200020012002200320042005200620072008200920102011
667 702 738 781 898 1,045 1,219 1,419 1,651 1,913 2,203 2,524 2,877 3,271 3,701 4,167 4,671 5,213 5,804
0 0 0 0 6 15 26 39 54 72 92114139167198232269309353
791 833 876 926 988 1,057 1,130 1,209 1,297 1,391 1,492 1,598 1,711 1,836 1,968 2,107 2,254 2,408 2,575
2,238 2,356 2,477 2,619 2,726 2,824 2,913 2,995 3,076 3,149 3,214 3,269 3,315 3,360 3,393 3,416 3,428 3,427 3,417

31
III.B. Quantities of Commodities (Sales Volume)
Table 11. Method Mix Scenario 1, Projected Quantities of Temporary Contraceptive Commodities, Private Sector,Urban India, 1993-2011 (Numbers in Thousands)Year Pill Injectable IUD Condom1993199419951996199719981999200020012002200320042005200620072008200920102011
10,008 10,534 11,076 11,711 12,368 13,047 13,749 14,473 15,266 16,086 16,932 17,807 18,709 19,691 20,705 21,752 22,832 23,945 25,123
0000000000000000000
339 356 379 400 421 443 466 493 519 545 572 601 634 666 698 732 767 805 845
322,265 339,208 356,667 377,117 398,273 420,144 442,738 466,064 491,596 517,991 545,258 573,410 602,457 634,089 666,754 700,462 735,228 771,063 809,003
Table 12. Method Mix Scenario 2, Projected Quantities of Temporary Contraceptive, Private Sector, Urban India,1993-2011 (Numbers in Thousands)Year Pill Injectable IUD Condom1993199419951996199719981999200020012002200320042005200620072008200920102011
10,008 10,534 11,076 11,711 13,476 15,676 18,284 21,279 24,769 28,688 33,049 37,865 43,151 49,067 55,512 62,504 70,061 78,201 87,058
0 0 0 0 25 60 103 155 216 287 367 457 557 669 793 928 1,076 1,236 1,411
339 356 379 411 440 471 504 543 582 624 667 714 768 822 879 939 1,002 1,072 1,146
322,265 339,208 356,667 377,117 392,604 406,691 419,530 431,238 442,972 453,508 462,794 470,775 477,386 483,777 488,654 491,942 493,562 493,437 492,085

32
Market Projections: Commercial Sector

33
I. ALL INDIA
I.A. Number of Users
Table 1. Method Mix Scenario 1, Projected Number of Contraceptive Users by Method, Commercial Sector, All-India, 1993-2011 (Numbers in Thousands)
Source Mix Scenario A Source Mix Scenario BYear Pills Condoms Pills Condoms1993199419951996199719981999200020012002200320042005200620072008200920102011
442 463 485 511 537 563 591 619 650 681 713 746 780 815 852 890 929 969 1,011
1,5191,5931,6701,7581,8491,9432,0402,1392,2462,3562,4692,5852,7052,8332,9643,0993,2383,3813,529
442 463 485 511 534 557 580 603 626 649 672 695 718 741 764 787 810 833 1,369
1,5191,5931,6701,7581,9432,1282,3132,4972,6822,8673,0523,2373,4213,6063,7913,9764,1604,3454,530
Table 2. Method Mix Scenario 2, Projected Number of Contraceptive Users by Method, Commercial Sector, All-India, 1993-2011 (Numbers in Thousands)
Source Mix Scenario A Source Mix Scenario BYear Pills Condoms Pills Condoms1993199419951996199719981999200020012002200320042005200620072008200920102011
442 463 485 511 599 712 848 1,005 1,188 1,394 1,623 1,877 2,155 2,460 2,791 3,149 3,535 3,948 4,388
1,519 1,593 1,670 1,758 1,829 1,895 1,957 2,014 2,072 2,125 2,173 2,217 2,256 2,293 2,325 2,351 2,371 2,384 2,391
442 463 485 511 813 1,115 1,418 1,720 2,023 2,325 2,628 2,930 3,232 3,535 3,837 4,140 4,442 4,744 6,084
1,519 1,593 1,670 1,758 1,848 1,938 2,028 2,118 2,208 2,297 2,387 2,477 2,567 2,657 2,747 2,836 2,926 3,016 3,106

34
I.B. Quantities of Commodities (Sales Volume)
Table 3. Method Mix Scenario 1, Projected Quantities of Pills and Condoms, Commercial Sector, All-India, 1993-2011 (Numbers in Thousands)
Source Mix Scenario A Source Mix Scenario BYear Pills Condoms Pills Condoms1993199419951996199719981999200020012002200320042005200620072008200920102011
6,6286,9507,2807,6598,0498,4518,8649,2899,74310,21110,69111,18511,69312,23112,78513,35413,93914,54015,161
218,667 229,423 240,471 253,202 266,322 279,836 293,746 308,057 323,426 339,255 355,547 372,308 389,543 407,926 426,842 446,296 466,294 486,842 508,221
6,6286,9507,2807,6598,0058,3518,6979,0429,3889,73410,08010,42610,77211,11811,46411,80912,15512,50120,542
218,667 229,423 240,471 253,202 279,810 306,418 333,026 359,633 386,241 412,849 439,457 466,065 492,673 519,281 545,889 572,497 599,105 625,712 652,320
Table 4. Method Mix Scenario 2, Projected Quantities of Pills and Condoms, Commercial Sector, All-India, 1993-2011 (Numbers in Thousands)
Source Mix Scenario Source Mix Scenario BYear Pills Condoms Pills Condoms1993199419951996199719981999200020012002200320042005200620072008200920102011
6,6286,9507,2807,6598,98410,67712,71715,08117,82020,90624,34828,15132,32536,90341,87247,24253,02259,22165,822
218,667 229,423 240,471 253,202 263,393 272,886 281,759 290,069 298,311 305,946 312,948 319,286 324,925 330,254 334,795 338,509 341,353 343,285 344,310
6,6286,9507,2807,65912,19516,73121,26825,80430,34034,87639,41343,94948,48553,02157,55862,09466,63071,16691,253
218,667 229,423 240,471 253,202 266,139 279,076 292,013 304,950 317,887 330,824 343,761 356,697 369,634 382,571 395,508 408,445 421,382 434,319 447,256

35
II. RURAL INDIA
II.A. Number of Users
Table 5. Method Mix Scenario 1, Projected Number of Contraceptive Users by Method, Commercial Sector, RuralIndia, 1993-2011 (Numbers in Thousands)
Source Mix Scenario A Source Mix Scenario BYear Pills Condoms Pills Condoms1993199419951996199719981999200020012002200320042005200620072008200920102011
120 125 129 134 139 144 149 154 159 164 169 173 178 183 187 191 195 200 203
345358371385399413428442456470483497511524536548561573583
120 125 129 134 146 157 169 180 192 203 215 226 238 250 261 273 284 296 307
345358371385415445475506536566596626656686716747777807837
Table 6. Method Mix Scenario 2, Projected Number of Contraceptive Users by Method, Commercial Sector, RuralIndia, 1993-2011 (Numbers in Thousands)
Source Mix Scenario A Source Mix Scenario BYear Pills Condoms Pills Condoms1993199419951996199719981999200020012002200320042005200620072008200920102011
120 125 129 134 166 208 260 321 392 472 561 660 768 883 1,007 1,141 1,283 1,435 1,590
345 358 371 385 399 414 429 444 458 473 488 503 518 532 545 559 573 587 599
120 125 129 134 285 437 588 739 890 1,041 1,193 1,344 1,495 1,646 1,798 1,949 2,100 2,251 2,402
345 358 371 385 417 448 480 512 543 575 606 638 670 701 733 765 796 828 860
36
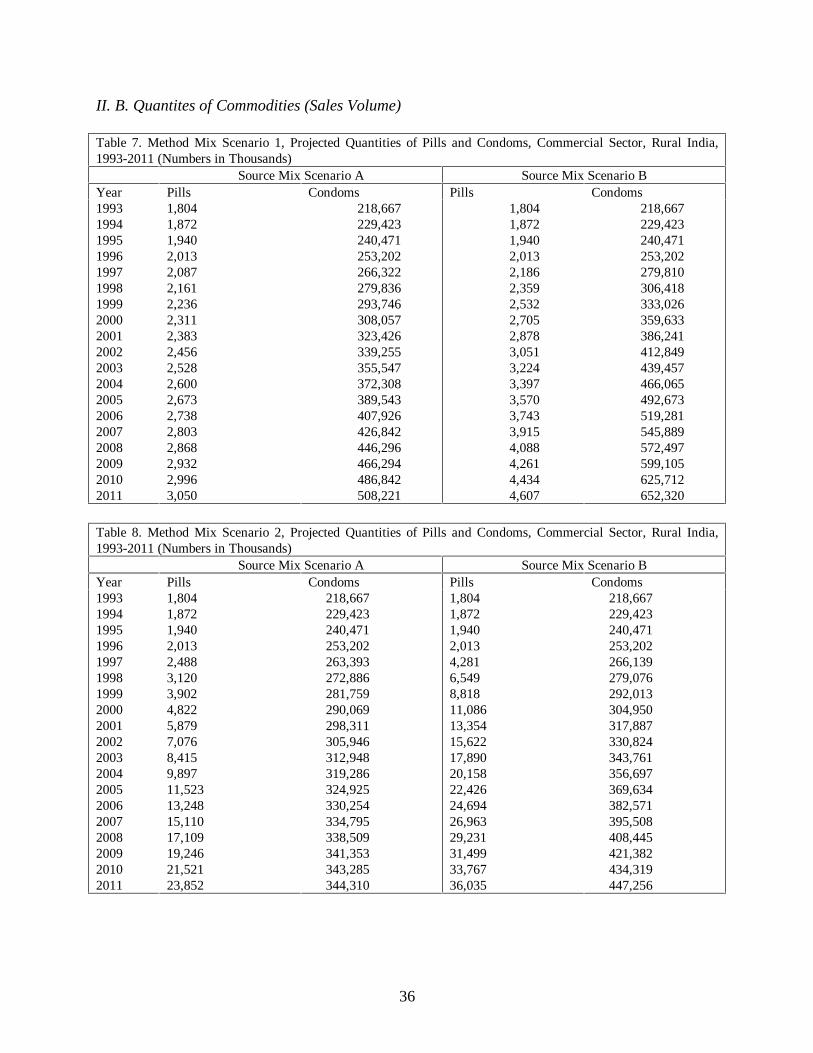
II. B. Quantites of Commodities (Sales Volume)
Table 7. Method Mix Scenario 1, Projected Quantities of Pills and Condoms, Commercial Sector, Rural India,1993-2011 (Numbers in Thousands)
Source Mix Scenario A Source Mix Scenario BYear Pills Condoms Pills Condoms1993199419951996199719981999200020012002200320042005200620072008200920102011
1,8041,8721,9402,0132,0872,1612,2362,3112,3832,4562,5282,6002,6732,7382,8032,8682,9322,9963,050
218,667 229,423 240,471 253,202 266,322 279,836 293,746 308,057 323,426 339,255 355,547 372,308 389,543 407,926 426,842 446,296 466,294 486,842 508,221
1,804 1,872 1,940 2,013 2,186 2,359 2,532 2,705 2,878 3,051 3,224 3,397 3,570 3,743 3,915 4,088 4,261 4,434 4,607
218,667 229,423 240,471 253,202 279,810 306,418 333,026 359,633 386,241 412,849 439,457 466,065 492,673 519,281 545,889 572,497 599,105 625,712 652,320
Table 8. Method Mix Scenario 2, Projected Quantities of Pills and Condoms, Commercial Sector, Rural India,1993-2011 (Numbers in Thousands)
Source Mix Scenario A Source Mix Scenario BYear Pills Condoms Pills Condoms1993199419951996199719981999200020012002200320042005200620072008200920102011
1,8041,8721,9402,0132,4883,1203,9024,8225,8797,0768,4159,89711,52313,24815,11017,10919,24621,52123,852
218,667 229,423 240,471 253,202 263,393 272,886 281,759 290,069 298,311 305,946 312,948 319,286 324,925 330,254 334,795 338,509 341,353 343,285 344,310
1,8041,8721,9402,0134,2816,5498,81811,08613,35415,62217,89020,15822,42624,69426,96329,23131,49933,76736,035
218,667 229,423 240,471 253,202 266,139 279,076 292,013 304,950 317,887 330,824 343,761 356,697 369,634 382,571 395,508 408,445 421,382 434,319 447,256
37
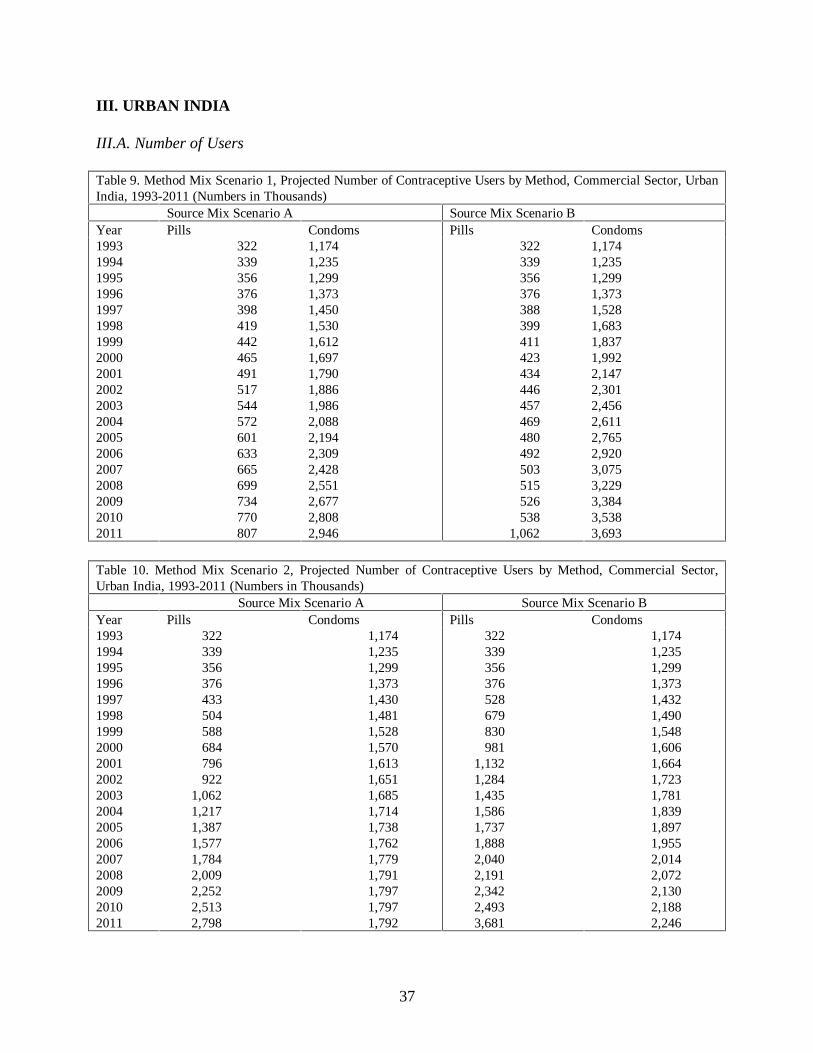
III. URBAN INDIA
III.A. Number of Users
Table 9. Method Mix Scenario 1, Projected Number of Contraceptive Users by Method, Commercial Sector, UrbanIndia, 1993-2011 (Numbers in Thousands)
Source Mix Scenario A Source Mix Scenario BYear Pills Condoms Pills Condoms1993199419951996199719981999200020012002200320042005200620072008200920102011
322 339 356 376 398 419 442 465 491 517 544 572 601 633 665 699 734 770 807
1,1741,2351,2991,3731,4501,5301,6121,6971,7901,8861,9862,0882,1942,3092,4282,5512,6772,8082,946
322 339 356 376 388 399 411 423 434 446 457 469 480 492 503 515 526 538 1,062
1,1741,2351,2991,3731,5281,6831,8371,9922,1472,3012,4562,6112,7652,9203,0753,2293,3843,5383,693
Table 10. Method Mix Scenario 2, Projected Number of Contraceptive Users by Method, Commercial Sector,Urban India, 1993-2011 (Numbers in Thousands)
Source Mix Scenario A Source Mix Scenario BYear Pills Condoms Pills Condoms1993199419951996199719981999200020012002200320042005200620072008200920102011
322 339 356 376 433 504 588 684 796 922 1,062 1,217 1,387 1,577 1,784 2,009 2,252 2,513 2,798
1,174 1,235 1,299 1,373 1,430 1,481 1,528 1,570 1,613 1,651 1,685 1,714 1,738 1,762 1,779 1,791 1,797 1,797 1,792
322 339 356 376 528 679 830 981 1,132 1,284 1,435 1,586 1,737 1,888 2,040 2,191 2,342 2,493 3,681
1,174 1,235 1,299 1,373 1,432 1,490 1,548 1,606 1,664 1,723 1,781 1,839 1,897 1,955 2,014 2,072 2,130 2,188 2,246

38
III.B. Quantities of Commodities (Sales Volume)
Table 11. Method Mix Scenario 1, Projected Quantities of Pills and Condoms, Commercial Sector, Urban India,1993-2011 (Numbers in Thousands)
Source Mix Scenario A Source Mix Scenario BYear Pills Condoms Pills Condoms1993199419951996199719981999200020012002200320042005200620072008200920102011
4,825 5,078 5,340 5,646 5,963 6,290 6,628 6,977 7,360 7,755 8,163 8,585 9,019 9,493 9,982 10,486 11,007 11,544 12,112
168,992 177,877 187,032 197,756 208,850 220,319 232,167 244,399 257,788 271,629 285,928 300,690 315,922 332,510 349,638 367,315 385,545 404,337 424,232
4,8255,0785,3405,6465,8195,9926,1656,3386,5106,6836,8567,0297,2027,3757,5487,7217,8948,06715,935
168,992 177,877 187,032 197,756 220,026 242,297 264,567 286,837 309,108 331,378 353,648 375,919 398,189 420,459 442,730 465,000 487,270 509,541 531,811
Table 12. Method Mix Scenario 2, Projected Quantities of Pills and Condoms, Commercial Sector, Urban India,1993-2011 (Numbers in Thousands)
Source Mix Scenario A Source Mix Scenario BYear Pills Condoms Pills Condoms1993199419951996199719981999200020012002200320042005200620072008200920102011
4,825 5,078 5,340 5,646 6,497 7,557 8,815 10,258 11,941 13,830 15,933 18,254 20,803 23,655 26,762 30,133 33,776 37,700 41,970
168,992 177,877 187,032 197,756 205,877 213,264 219,997 226,137 232,290 237,814 242,684 246,869 250,336 253,687 256,245 257,969 258,819 258,753 258,044
4,8255,0785,3405,6467,91410,18212,45014,71816,98619,25521,52323,79126,05928,32730,59532,86335,13137,39955,218
168,992 177,877 187,032 197,756 206,138 214,519 222,901 231,282 239,664 248,046 256,427 264,809 273,190 281,572 289,954 298,335 306,717 315,098 323,480
39
III. BARRIERS TO GREATER TEMPORARY METHOD USE IN URBAN AND RURALAREAS: ASSESSMENT AND MARKETING IMPLICATIONS
The extent to which temporary methods make up a greater share of the contraceptive market inthe future (as outlined in scenarios 2 and 3 in the previous section) will depend partly on theextent to which key stakeholders address existing barriers to temporary method use. This sectionreviews available data to assess four types of potential barriers to the use of temporary methods inurban and rural areas: 1) knowledge and awareness; 2) attitudes and perceptions; 3) access (i.e.,availability and price); and 4) policy. The section provides a separate assessment for condoms,pills, IUDs, and injectables. For each method, data are presented separately for urban and ruralareas. Each assessment begins with an overview of current use, then moves to an analysis of thefour types of potential barriers to expanded use, and closes with a summary of findings andmarketing implications.
Since the subject of this report is the national market for temporary methods in India, the analysisrelies whenever possible on data from the National Family Health Survey 1992-93 (NFHS)13, themost recent and comprehensive source of information about contraceptive use at the national levelin India. However many issues of special interest to marketers and manufacturers, such aspurchasing behavior and attitudes towards particular contraceptive brands, are not available fromthe NFHS. In these instances, we rely on surveys and other sources of information at the sub-national level. While this information cannot provide a full picture of the national situation, it isnevertheless likely to provide insights that are relevant to the development of a national marketingstrategy. These key additional data sources are: 1) Family Planning in Uttar Pradesh: A Reviewof Secondary Research Focused on Contraceptive Social Marketing by Social and Rural ResearchInstitute (1994); 2) The 1993 Condom Use Survey14 conducted by Operations Research Group(ORG) and Family Health International (FHI); 3) the 1996 Contraceptive Use Survey conductedby Marketing and Research Group (MARG)15; 4) 20 focus group discussions moderated by Socialand Rural Research Institute (SRI)16; 5) the 1996 Opportunities and Barriers to ContraceptivesUptake in Orissa through Social Marketing report by AIMS Research (1996)17; and 6) Results ofthe Price Elasticity Study18 of the Masti Condoms by Marketing Business Associates.
13 The data from the 1992-93 NFHS pertain to ever-married and currently married women of reproductive age andare representative of all-India.14 Surveyed a representative sample of currently married men in three northern states: Haryana, Rajasthan, andUttar Pradesh. These three states cover approximately 25 percent of the Indian population.15 Random sample survey of currently married men (1251) and women (1333) in five districts in Uttar Pradesh: 1)Basti; 2) Deoria; 3) Agra; 4) Muradabad; and 5) Kanpur. These districts are characterized by relatively highcontraceptive prevalence levels and are not representative of all Uttar Pradesh or the country on the whole.16 Separate discussions were held with men aged 25-40 years and women aged 16-25 years in 1994.17 The survey covered both consumers (men and women) and health providers (doctors and ANMs).18 1,895 respondents were interviewed in Delhi, Lucknow, Jaipur, and Muzzafar Nagar.

40
ASSESSMENT BY METHOD TYPE
A. Condoms: Rural Sector
1. Current Condom Use
According to the 1992-93 NFHS, 4.6 percent of currently married women in rural India have everused condoms (Table 1). The data also show that only about one-fourth of eligible couples whohave ever used condoms to avoid pregnancy currently use them.
Table 1. Percentage of Currently Married Women of Reproductive Age(MWRA) Who Have Ever Used Condoms, Rural India, 1992-93 NFHS.
RuralCurrently Use 1.2%Ever Used 4.6%% of Ever Users Who Currently Use 26.1%
The private sector (medical and shops) is source of supply for condoms for a significant numberof contracepting women in rural areas.19 More than a quarter of rural condom users obtaincondoms from a public sector provider (Figure 1).
Figure 1: Source of Supply for Women of Reproductive Age Who Use Condoms in Rural Areas, 1992-93 NFHS
Husband24%
Shops27%
Priv. Medical18%
Public27% Other
4%
19 Note that in the previous section (“Market Size: Past, Present, and Future”), the definition of the private sector inthe case of condoms included shops, and “other” sources were distributed according to the distribution of womenwho reported their source as public or private.
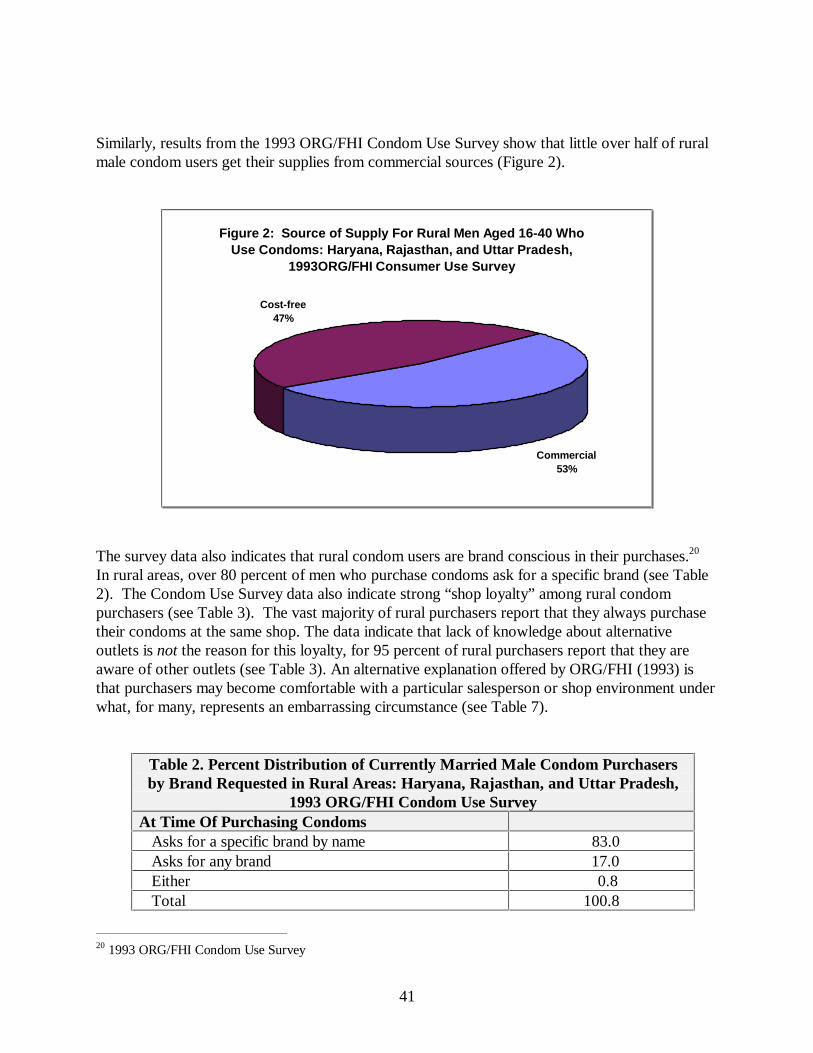
41
Similarly, results from the 1993 ORG/FHI Condom Use Survey show that little over half of ruralmale condom users get their supplies from commercial sources (Figure 2).
Figure 2: Source of Supply For Rural Men Aged 16-40 Who Use Condoms: Haryana, Rajasthan, and Uttar Pradesh,
1993ORG/FHI Consumer Use Survey
Commercial53%
Cost-free47%
The survey data also indicates that rural condom users are brand conscious in their purchases.20
In rural areas, over 80 percent of men who purchase condoms ask for a specific brand (see Table2). The Condom Use Survey data also indicate strong “shop loyalty” among rural condompurchasers (see Table 3). The vast majority of rural purchasers report that they always purchasetheir condoms at the same shop. The data indicate that lack of knowledge about alternativeoutlets is not the reason for this loyalty, for 95 percent of rural purchasers report that they areaware of other outlets (see Table 3). An alternative explanation offered by ORG/FHI (1993) isthat purchasers may become comfortable with a particular salesperson or shop environment underwhat, for many, represents an embarrassing circumstance (see Table 7).
Table 2. Percent Distribution of Currently Married Male Condom Purchasersby Brand Requested in Rural Areas: Haryana, Rajasthan, and Uttar Pradesh,
1993 ORG/FHI Condom Use SurveyAt Time Of Purchasing Condoms Asks for a specific brand by name 83.0 Asks for any brand 17.0 Either 0.8 Total 100.8
20 1993 ORG/FHI Condom Use Survey

42
Table 3. Percent Distribution of Currently Married Male Condom Purchasersby Place of Purchase, Outlet Awareness in Rural Areas: Haryana, Rajasthan,
and Uttar Pradesh, 1993 ORG/FHI Condom Use Survey Where Usually Buy?
Always the same shop 88 Different shop 12 Total 100 Aware of Other Outlets?
Yes 95 No 5 Total 100
Table 4 shows trends in market share by brand for rural India as reported in a study by ORG/FHI(1993). The data show that over time Nirodh has lost market share, although it still maintains thehighest share of the market. Nirodh’s loss in market share in rural areas appears to be dueprimarily to a rise in sales of Nirodh Deluxe. The sales of Masti condoms also have increasedsignificantly. In 1988, approximately 3 million pieces were sold in urban and rural areas, whichincreased to 35 million pieces in 1995.21
Table 4. Trends in Market Share (% Distribution of Sales) of Leading CondomBrands in Rural Areas: Selected Years
Brand 1984 1986 1988 1990Nirodh 96 80 62 55Nirodh Deluxe 1 15 28 33Kohinoor 2 3 7 6All Other 1 2 3 6Total 100 100 100 100
Source: ORG/FHI 1993.
2. Knowledge and Awareness as a Potential Barrier
The NFHS measures two types of contraceptive knowledge: 1) spontaneous knowledge (i.e., therespondent mentions the method as a way to avoid pregnancy without prompting from theinterviewer), and 2) prompted knowledge (i.e., the respondent recognizes the method as a way toavoid pregnancy only after it is mentioned by the interviewer). Table 5 presents the NFHS resultson knowledge about condoms among currently married women in rural India. About half of thewomen interviewed had heard of condoms. Thus, to the extent that condoms are marketed towomen, raising awareness is a priority in the rural sector.
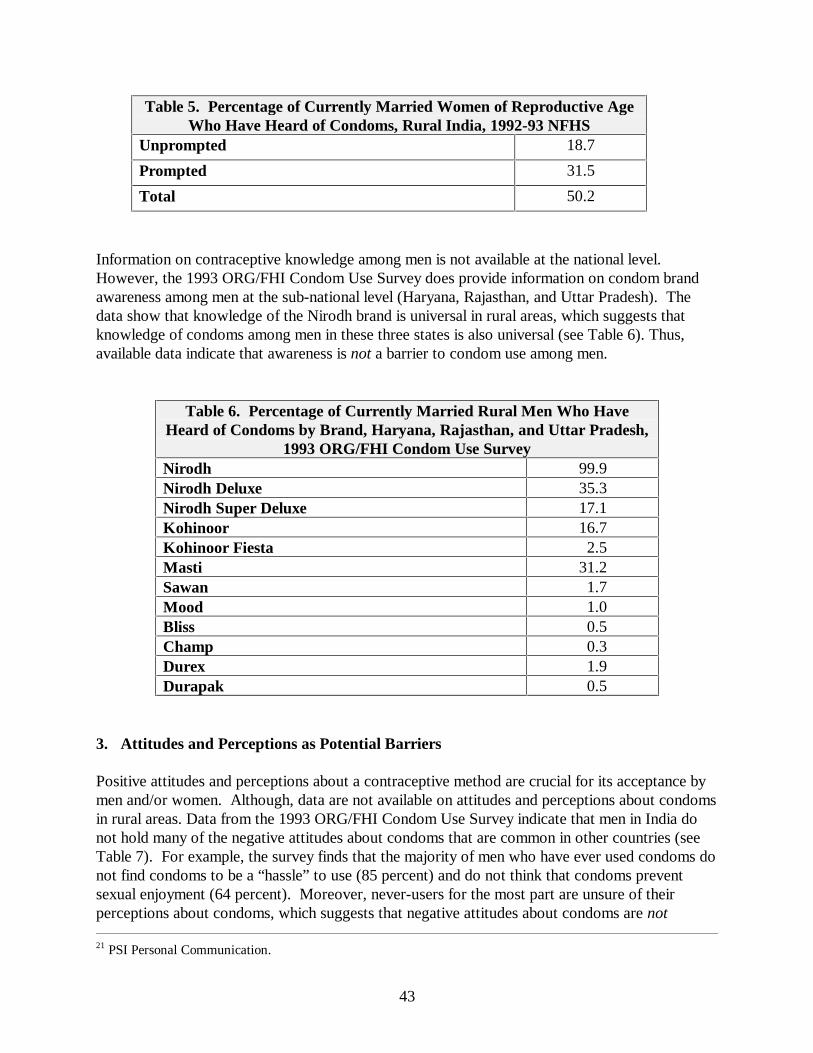
43
Table 5. Percentage of Currently Married Women of Reproductive AgeWho Have Heard of Condoms, Rural India, 1992-93 NFHS
Unprompted 18.7
Prompted 31.5
Total 50.2
Information on contraceptive knowledge among men is not available at the national level.However, the 1993 ORG/FHI Condom Use Survey does provide information on condom brandawareness among men at the sub-national level (Haryana, Rajasthan, and Uttar Pradesh). Thedata show that knowledge of the Nirodh brand is universal in rural areas, which suggests thatknowledge of condoms among men in these three states is also universal (see Table 6). Thus,available data indicate that awareness is not a barrier to condom use among men.
Table 6. Percentage of Currently Married Rural Men Who HaveHeard of Condoms by Brand, Haryana, Rajasthan, and Uttar Pradesh,
1993 ORG/FHI Condom Use SurveyNirodh 99.9Nirodh Deluxe 35.3Nirodh Super Deluxe 17.1Kohinoor 16.7Kohinoor Fiesta 2.5Masti 31.2Sawan 1.7Mood 1.0Bliss 0.5Champ 0.3Durex 1.9Durapak 0.5
3. Attitudes and Perceptions as Potential Barriers Positive attitudes and perceptions about a contraceptive method are crucial for its acceptance bymen and/or women. Although, data are not available on attitudes and perceptions about condomsin rural areas. Data from the 1993 ORG/FHI Condom Use Survey indicate that men in India donot hold many of the negative attitudes about condoms that are common in other countries (seeTable 7). For example, the survey finds that the majority of men who have ever used condoms donot find condoms to be a “hassle” to use (85 percent) and do not think that condoms preventsexual enjoyment (64 percent). Moreover, never-users for the most part are unsure of theirperceptions about condoms, which suggests that negative attitudes about condoms are not 21 PSI Personal Communication.

44
responsible for their non-use of this method. The lack of fully-formed attitudes about condomsamong non-users represents a tremendous opportunity to create positive images of condoms,which is much easier than changing existing opinions.
The data in Table 7 indicate that among the perceptions explored in the 1993 ORG/FHI CondomUse Survey, at least three may represent important barriers to greater use of this method: 1) thewidespread perception that condoms are not regularly available; 2) the commonly held view thatcondoms are difficult to hide from children; and 3) the perception that condoms are embarrassingto buy.
Table 7. Perception of Condoms Among Ever Users and Never Users(Percent Distribution), Haryana, Rajasthan, and Uttar Pradesh, 1993
ORG/FHI Condom Use Survey User Status
Perception Current or Past Users
Never Users
Hassle to use
Agree 13.9 5.5
Disagree 85.1 8.7
Not sure 1.0 85.8
Does not prevent sexual enjoyment
Agree 64.3 6.9
Disagree 32.3 7.2
Not sure 3.4 85.9
Liked by Women Also
Agree 73 10
Disagree 16 8
Not sure 11 83
Embarrassing to buy
Agree 43.1 52.3
Disagree 56.1 29.1
Not sure 0.8 18.6
All Brands are similar
Agree 18 9
Disagree 52 19
Not sure 30 72

45
Table 7 Continued. Perception of Condoms Among Ever Users and NeverUsers (Percent Distribution), Haryana, Rajasthan, and Uttar Pradesh, 1993
ORG/FHI Condom Use Survey User Status
Perception Current or
Past Users
Never Users
Difficult to discard after use
Agree 15 13
Disagree 85 12
Not sure - 74
Embarrassing to see TV ad
Agree 39.3 30.9
Disagree 42.5 22.2
Not sure 18.1 46.3
Not Regularly Available
Agree 95 71
Disagree 4 7
Not sure 1 22
Not a Reliable Method
Agree 9 6
Disagree 90 64
Not sure 1 30
Difficult to Hide Away from Children
Agree 59 50
Disagree 41 16
Not sure - 34
Note: Disaggregated data for urban/rural not available.
The data in Tables 8 and 9 summarize perceptions of condom quality by brand among malecondom users in the rural areas of Haryana, Rajasthan, and Uttar Pradesh. The data indicate thatperceived effectiveness is a concern among users, especially users of lower priced and freelydistributed brands. The 1993 ORG/FHI Contraceptive Use Survey finds that about one-third ofrural users of the cost-free Nirodh brand inquired about effectiveness. This was less of a concernfor purchasers of commercial brands (fewer than 10 percent asked about effectiveness). The samesurvey finds that men are less likely to agree that the lowest priced condom brands (i.e., Nirodh

46
brands) are free of defects than they are to agree that higher priced condom brands are free ofdefects (see Table 9).
Table 8. Percentage of Male Condom Purchasers in Rural Areas WhoAsked Provider About the Effectiveness of Condoms in Preventing
Pregnancy (% Distribution): Haryana, Rajasthan, and Uttar Pradesh, 1993ORG/FHI Condom Use Survey
Cost-free Supply Users Commercial Source Users Asked 35 9 Did Not Ask 65 91 Total 100 100
Table 9. Percentage of Male Condom Users Who Agree that Condom is Free of Defectsby Brand: Haryana, Rajasthan, and Uttar Pradesh, 1993 ORG/FHI Condom Use Survey
Nirodh (free) Nirodh Nirodh Deluxe
Kohinoor Masti Other
% Agree BrandFree of Defects
35.1 33.3 62.1 71.4 72.4 73.7
Note: Disaggregated data for urban/rural not available. Retailer opinions of brand quality also suggest an association between price and perceptions ofquality. Table 10 shows that the percentage of retailers who rate the quality of the highest pricedbrands (e.g., Kohinoor Fiesta and Bliss) as “good” is higher than the percentage of retailers whorate the quality of lowest priced brands (e.g., Nirodh, Nirodh Deluxe and Sawan) as good. Anexception to this pattern is the socially marketed Sawan brand in the rural sector. Sawan is moreexpensive than either Nirodh Deluxe or Nirodh Super Deluxe (ORG 1996), yet the percentage ofretailers in rural areas who rate its quality as good is lower than the percentage who rate the lessexpensive Nirodh brands as good.
Table 10. Perceptions of Quality as Reported by Retailers BRAND Percent Rating “Good”
Kohinoor Fiesta 100.0 Bliss 100.0 Kohinoor 98.0 Imported 89.0 Masti 99.0 Sawan 63.6 Nirodh Deluxe 82.8 Super Deluxe Nirodh 92.8 Nirodh 71.8
Note: Disaggregated data for urban/rural not available.

47
4. Availability as a Potential Barrier
Existing data on condom availability show a lack of penetration in rural commercial markets:
• In the three states surveyed by ORG/FHI (1993), only 19 percent of retail outlets carrycondoms
• In these same three states, ORG/FHI (1993) found that the rank order of rural retail outletscarrying condoms is: chemists (86.7 percent); general stores (60.9 percent); grocers (16.6percent); and others (6.4 percent).
• While chemist shops represent the principal retail outlet for condoms, they only account for3.3 percent of potential rural outlets (ORG-Core)
• The Condom Use Survey conducted by ORG/FHI shows that 95 percent of users and 71percent of non-users state that condoms are not regularly available (see Table 7).
The especially low level of penetration in the rural sector suggests that one reason that rural menare less likely than urban men to obtain condoms from the commercial sector is the relative lack ofavailability.
5. Price as a Potential Barrier
According to the September 1996 ORG retail audit in Uttar Pradesh, commercially availablecondoms range in price from .30 Rs. to 2.67 Rs. per condom. The Available data do not allow usto discern the extent to which price is a barrier to use among non-users.22 However data from the1993 ORG/FHI survey suggest that price does segment the market among users. Table 11 showsthat for the most part, those with lowest education and income levels use the least expensivebrands (free Nirodh and Nirodh); those with intermediate levels of income and education use anintermediate priced condom (Nirodh Deluxe); and those with the highest level of income andeducation use the most expensive brands (Kohinoor). Users of Masti represent an exception tothis pattern. Masti is more expensive than Nirodh Deluxe but appears to appeal to men with asimilar level of income and educational attainment. This suggests that the Masti brand has beensuccessful at marketing to consumers who would otherwise be likely to use a lower priced brand.
22 According to the 1995 MARG UP Survey, most users (93%) and non-users (83%) believe that the condoms arein expensive. The Masti Condom Price Elasticity study also showed a minimal effect on market shares due to aprice change.

48
Table 11. Socioeconomic Characteristics of Condom Users by Leading BrandsCurrently Purchased/Used: Haryana, Rajasthan, and Uttar Pradesh, 1993 ORG/FHI
Condom Use Survey.Characteristic Nirodh
(free)Nirodh Nirodh
DeluxeKohinoor Masti Other Any
Education (mean yrs) 7.3 6.5 8.7 11.0 9.9 10.5 8.4
Family Income (medianmonthly in Rs.)
1,000 908 1,144 1,212 1,124 1,226 1,025
Note: Disaggregated data for urban/rural not available.
While price may be somewhat of a deterrent to greater use of higher priced condoms, thefollowing information suggests that many users are nevertheless willing and able to pay more.
• During the past year (between 9/95 and 9/96) the commercial share of the condom marketmore than doubled while socially marketed brands experienced a decline in market share dueto a decline in government procurements (see Table 13). This shift in market share suggeststhat many consumers of lower priced brands switched to higher priced brands when the lowerpriced brands became unavailable. If this supposition is correct, it suggests an ability andwillingness to pay for higher priced brands among many who use lower priced brands.
• Data from the 1993 ORG/FHI Condom Use Survey (see Table 12) suggest that a majority ofmen would continue with the same brand rather than switch to a less expensive brand (samplelimited to Haryana, Rajasthan, and Uttar Pradesh) if condom prices were to increase by 50paisa (a 70% increase over the prevailing average retail price at that time).
Table 12: Willingness to Buy if Price Increased By 50 Paisa, in Rural
Areas of Haryana, Rajasthan, and Uttar Pradesh, 1993 ORG/FHICondom Use Survey
Amount (Rs) Current CondomUsers (%)
Would continue buying 83.8
Would discontinue/switch to cheaper brand 10.5
Uncertain 5.7

49
TABLE 13: MARKET SHARE: CONDOMS
Market Share
September’95 September’96
Sector Vol. / Val. Vol. / ValContraceptive Social MarketingNirodh (MOH&FW) (MRP Rs.1.50-2 for 5’s) 46.1 18.0 20.1 6.9
Bliss (PSS) (MRP Rs.6.00 for 4’s) 0.2 0.3 1.0 2.3
Sawan (PSS) (MRP Rs.4.00 for 4’s) 1.6 1.3 4.7 2.4
Masti (PSI) (MRP Rs.5.00 for 4’s) 27.2 27.4 9.0 5.7
Tamanna & Dream (RBD) (MRP Rs.4-6 for 4’s) 2.6 3.5 13.8 15.8
Total of CSMP 77.7 50.5 48.6 33.1
Private Sector Brands
London Rubber Company(Price of all brands range between Rs.6-7 for 3’s) 14.2 27.3 28.0 33.9
Hindustan Latex Limited
(Price of all brands range between Rs.4-5 for 3’s) 0.8 1.6 3.3 4.3
Polar Latex Limited
(Price of all brands range between Rs.4-5 for 3’s) 0.5 0.3 1.9 3.1
J. K. Chemicals Limited
(Mid-priced brand: Midnight Cowboy MRP Rs.5.00 for 3’s) 0.2 0.4 0.6 0.7
(High priced brand: Kamasutra MRP Rs. 8.00 for 3’s) 2.5 8.2 5.9 12.7
(JKCL’s other brands) 0.4 1.0 4.3 5.5
J.K. Chemicals Limited’s Market 3.1 9.6 10.8 18.9
Total of Private Sector 18.6 38.8 44.0 60.0
Imported 6.7 10.7 7.4 6.9
*Note: MRP is acronym for Maximum Retail Price
Source: ORG U.P. Retail Audit - September 1995/September 1996
6. Policy Environment The following policy constraints affect the promotion and price structure of condoms:
• Advertising of contraceptives, under a recent government ruling, is currently restricted to after23:30. This regulation may soon be rescinded, though the timing is uncertain.
• The government currently levies a 10% excise tax on packaging.

50
• Social marketing and government distribution of condoms is highly subsidized. Thegovernment procures condom commodities from manufacturers and re-sells them tomarketing organizations below the original procurement price (ORG/FHI 1993). Themarketing companies package, distribute and promote the products under various brandnames. Ideally, the customer benefits from this tremendous subsidy. In reality, however, thegovernment is, in effect, the largest consumer and many manufacturers are reluctant to financemarketing and distribution directly to the consumer as it is a lower volume, less lucrativebusiness than the current arrangement. The current system also leaves room for considerableproduct “leakage”, so that not all of the product procured by the government actually ends upon the retail shelves or the consumer’s hands. This “leakage” has been estimated to as high as60% (FHI/ORG, 1993).
7. Summary of Potential Barriers and Non-barriers This section has identified the following as potential barriers to expanded condom use in ruralareas of India:
• Knowledge and awareness among women• Perceptions of availability• Actual availability• Embarrassment with respect to purchase• Policies (advertising restrictions, tax, and government subsidy)
Available data do not allow an assessment of price a potential barrier to the increased use ofcondoms in as a category. Although price does appear to segment those who use condoms bysocio-economic level, many users appear to be willing and able to pay more. Thus, price does notappear to be a strong barrier among users to the use of higher priced brands.
The analysis finds that the following do not appear to be barriers to increased condom use:
• Knowledge and awareness (men only)• Male attitudes towards condoms• Perceptions of quality
8. Marketing Implications
• Develop advertising campaigns designed to raise awareness among women in rural areas• Expand distribution beyond chemist shops, especially in rural areas• Reduce embarrassment surrounding purchase by using social marketing approaches that have
been successful in other countries (e.g., the promotion of condoms with other routinelypurchased items such as razor blades).

51
• Work with government officials to remove advertising restrictions and taxes

52
B. Condoms: Urban Sector
1. Current Condom Use
A larger proportion of currently married women of reproductive age in urban areas have everused condoms compared to women in the rural areas. The data show that about 41 percent ofeligible couples who have ever used condoms to avoid pregnancy currently use them (see Table14).23
Table 14. Percentage of Currently Married Women of Reproductive Age(MWRA) Who Have Ever Used Condoms, Urban India, 1992-93 NFHS.
Currently Use 5.8%Ever Used 14.3%% of Ever Users Who Currently Use 40.6%
The private sector (medical and shops) is the major source of condoms for contracepting womenin urban areas (see Figure 3).24 A survey among men also reports that predominant sources ofcondoms in urban areas are commercial outlets (see Figure 4).25
Figure 3: Source of Supply for Women of Reproductive Age Who Use Condoms in Urban Areas, 1992-93 NFHS
Husband20%
Shops46%
Private Medical22%
Public8% Other
4%
23 1992-93 NFHS24 1992-93 NFHS25 1993 FHI/ORG Condom Use Survey
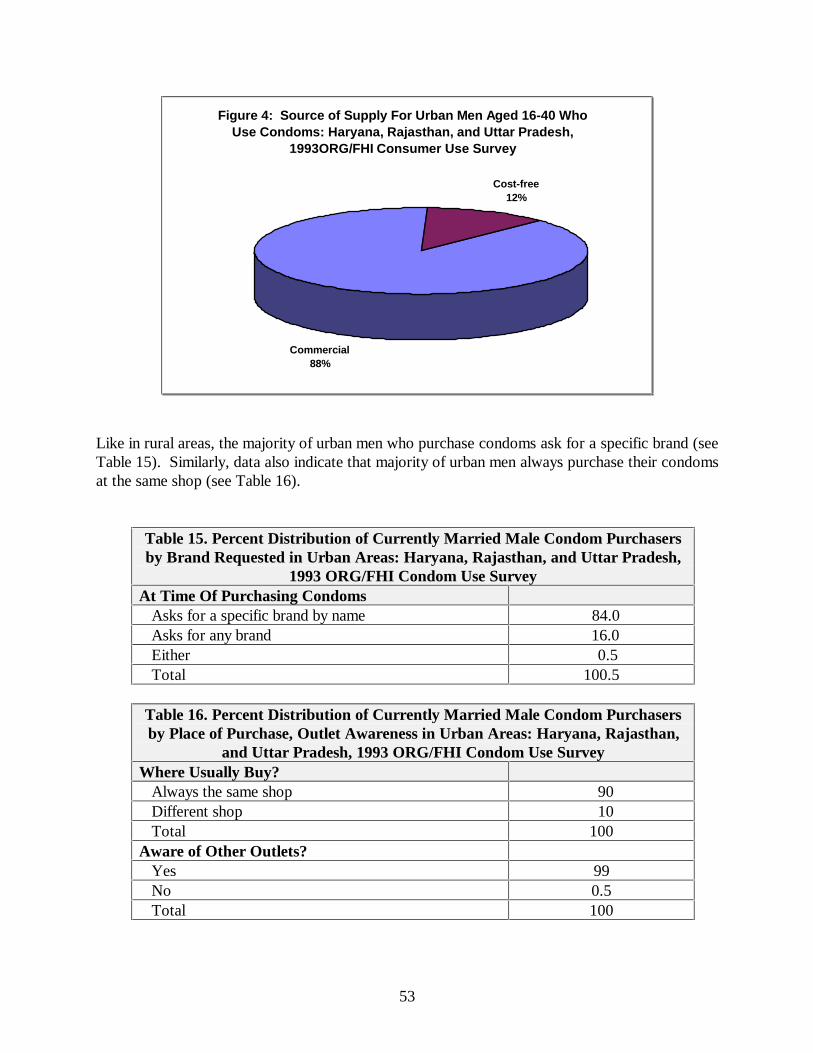
53
Figure 4: Source of Supply For Urban Men Aged 16-40 Who Use Condoms: Haryana, Rajasthan, and Uttar Pradesh,
1993ORG/FHI Consumer Use Survey
Commercial88%
Cost-free12%
Like in rural areas, the majority of urban men who purchase condoms ask for a specific brand (seeTable 15). Similarly, data also indicate that majority of urban men always purchase their condomsat the same shop (see Table 16).
Table 15. Percent Distribution of Currently Married Male Condom Purchasersby Brand Requested in Urban Areas: Haryana, Rajasthan, and Uttar Pradesh,
1993 ORG/FHI Condom Use SurveyAt Time Of Purchasing Condoms Asks for a specific brand by name 84.0 Asks for any brand 16.0 Either 0.5 Total 100.5
Table 16. Percent Distribution of Currently Married Male Condom Purchasersby Place of Purchase, Outlet Awareness in Urban Areas: Haryana, Rajasthan,
and Uttar Pradesh, 1993 ORG/FHI Condom Use Survey Where Usually Buy?
Always the same shop 90 Different shop 10 Total 100 Aware of Other Outlets?
Yes 99 No 0.5 Total 100

54
As in rural areas, the market share of Nirodh condoms has declines in urban areas too (see Table17). Market shares of socially marketed brands in addition to Nirodh Deluxe have seen stronggains.
Table 17. Trends in Market Share (% Distribution of Sales) of LeadingCondom Brands in Urban Areas: Selected Years
Brand 1984 1986 1988 1990Nirodh 59 43 28 16Nirodh Deluxe 3 29 35 36Kohinoor 20 15 16 21All Other 18 13 21 27Total 100 100 100 100
2. Knowledge and Awareness as a potential barrier
Unlike in the rural areas, the knowledge about condoms among currently married women in urbanIndia is high. About eighty percent of the women interviewed had heard of condoms (Table 18).
Table 18. Percentage of Currently Married Women of Reproductive AgeWho Have Heard of Condoms, Urban India, 1992-93 NFHS
Unprompted 48.7
Prompted 31.5
Total 80.2
As in the rural areas, knowledge of the Nirodh brand is universal in urban areas, which suggeststhat knowledge of condoms among men is also universal (see Table 19). Thus, available dataindicate that awareness is not a barrier to condom use among men.

55
Table 19. Percentage of Currently Married Urban Men Who HaveHeard of Condoms by Brand, Haryana, Rajasthan, and Uttar Pradesh,
1993 ORG/FHI Condom Use Survey
Nirodh 100.0Nirodh Deluxe 76.9Nirodh Super Deluxe 47.4Kohinoor 55.9Kohinoor Fiesta 15.6Masti 73.6Sawan 7.7Mood 8.1Bliss 3.2Champ 2.9Durex 11.4Durapak 3.9
3. Attitudes and Perceptions as Potential Barriers As was true in the rural analysis, the results from the urban analysis also suggest at least threeimportant barriers to greater use of condoms in urban areas: 1) the widespread perception thatcondoms are not regularly available; 2) the commonly held view that condoms are difficult to hidefrom children; and 3) the perception that condoms are embarrassing to buy (see Table 7). The data from urban areas of Haryana, Rajasthan, and Uttar Pradesh suggest that perceivedeffectiveness is a concern among users, especially users of lower priced and freely distributedbrands (Table 20). As was the case in the rural areas, a larger proportion of the urban usersinquired about the effectiveness of free condoms in preventing pregnancy.
Table 20. Percentage of Male Condom Purchasers in Urban Areas WhoAsked Provider About the Effectiveness of Condoms in Preventing
Pregnancy (% Distribution): Haryana, Rajasthan, and Uttar Pradesh, 1993ORG/FHI Condom Use Survey
Cost-free Supply Users Commercial Source Users Asked 24 5 Did Not Ask 76 95 Total 100 100

56
As presented earlier in the rural analysis, the percentage of retailers who rate the quality of thehighest priced brands (e.g., Kohinoor Fiesta and Bliss) as “good” is higher than the percentage ofretailers who rate the quality of lowest priced brands (e.g., Nirodh, Nirodh Deluxe and Sawan) asgood (see Table 10).26
4. Availability as a Potential Barrier
As in the rural sector, existing data on condom availability show a limited penetration in urbancommercial markets:
• In the three states reviewed by ORG/FHI (1993), only 41 percent of retail outlets carrycondoms
• In the same three states, ORG/FHI (1993) found that the rank order of urban retail outletscarrying condoms is: chemists (93.9 percent); general stores (72.8 percent); grocers (32.1percent); and others (24 percent).
• While chemist shops represent the principal retail outlet for condoms, they only account for6.3 percent of potential urban outlets (ORG-Core)
• The Condom Use Survey conducted by ORG/FHI shows that 95 percent of users and 71percent of non-users state that condoms are not regularly available (see Table 7).
5. Price as a Potential Barrier As was true in the rural analysis, the price may be somewhat of a deterrent to greater use ofhigher priced condoms in urban areas. However, the data indicate that many users arenevertheless willing and able to pay more (see Tables 13 and 21).
Table 21: Willingness to Buy if Price Increased By 50 Paisa, in Urban Areas
of Haryana, Rajasthan, and Uttar Pradesh, 1993 ORG/FHI Condom Use
Survey
Amount (Rs) Current Condom Users (%)
Would continue buying 82.2
Would discontinue/switch to cheaper brand 11.4
Uncertain 6.4
6. Policy Environment
26 Urban-rural breakdown not available.

57
The policy constraints affecting the promotion and price structure of condoms are similar in bothurban and rural areas. These include: restricted hours for advertising on electronic media; 10percent excise tax on packaging; and competition with highly subsidized socially marketed andfree condoms. 7. Summary of Potential Barriers and Non-barriers
The major barriers to expanded condom use in urban areas include:
• Perceptions of availability• Actual availability• Embarrassment with respect to purchase• Policies (advertising restrictions, tax, and government subsidy)
The analysis finds that the following do not appear to be barriers to increased condom use:
• Knowledge and awareness (men only)• Male attitudes towards condoms• Perceptions of quality
8. Marketing Implications
• Develop advertising campaigns designed to raise awareness among women in urban areas• Expand distribution beyond chemist shops• Reduce embarrassment surrounding purchase by using social marketing approaches that have
been successful in other countries (e.g., the promotion of condoms with other routinelypurchased items such as razor blades).
• Work with government officials to remove advertising restrictions and taxes
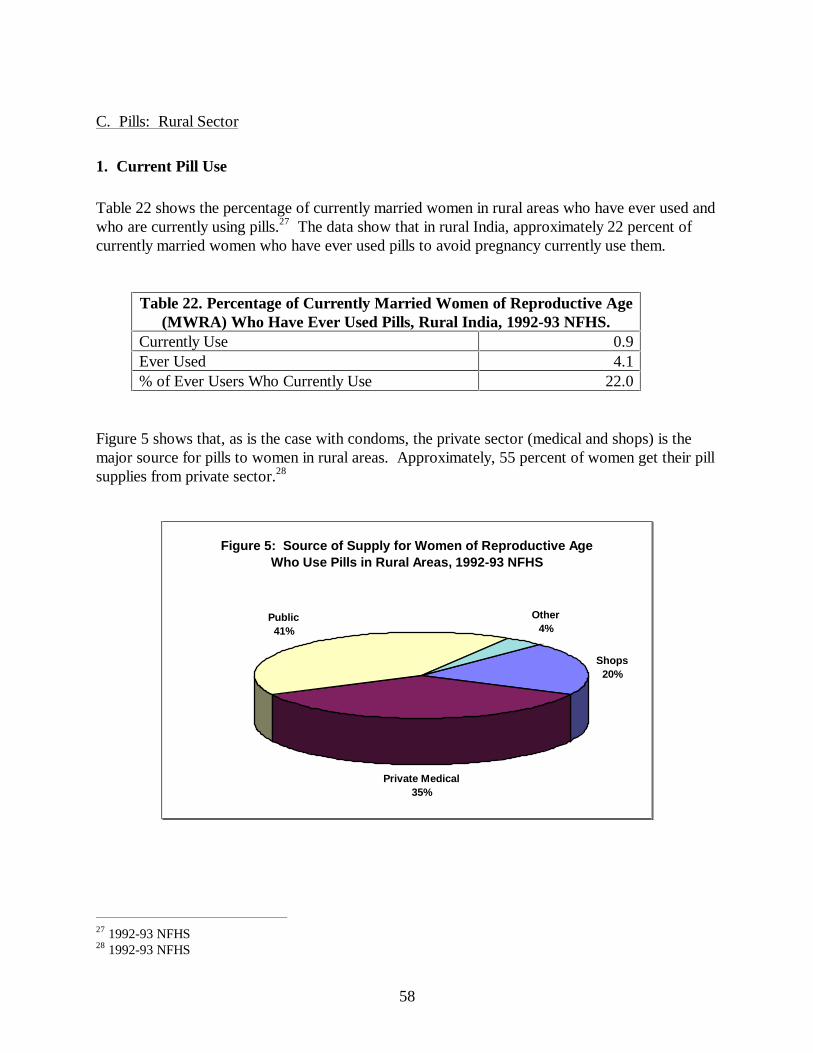
58
C. Pills: Rural Sector
1. Current Pill Use
Table 22 shows the percentage of currently married women in rural areas who have ever used andwho are currently using pills.27 The data show that in rural India, approximately 22 percent ofcurrently married women who have ever used pills to avoid pregnancy currently use them.
Table 22. Percentage of Currently Married Women of Reproductive Age(MWRA) Who Have Ever Used Pills, Rural India, 1992-93 NFHS.
Currently Use 0.9Ever Used 4.1% of Ever Users Who Currently Use 22.0
Figure 5 shows that, as is the case with condoms, the private sector (medical and shops) is themajor source for pills to women in rural areas. Approximately, 55 percent of women get their pillsupplies from private sector.28
Figure 5: Source of Supply for Women of Reproductive Age Who Use Pills in Rural Areas, 1992-93 NFHS
Shops20%
Private Medical35%
Public41%
Other4%
27 1992-93 NFHS28 1992-93 NFHS

59
2. Knowledge and Awareness as a Potential Barrier
In rural areas, only fifty-nine percent of the married women of reproductive age were aware ofpills as a method to prevent pregnancy (see Table 23). Thus, in the rural sector, lack ofawareness may be a barrier to the increased use of pills.
Table 23. Percentage of Currently Married Women of ReproductiveAge Who Have Heard of Pills by Residence, Rural India, 1992-93 NFHSUnprompted 25.7
Prompted 33.7
Total 59.4
Knowledge of correct use and misconceptions of health consequences are also a problem amongconsumers. In a review of family planning in Uttar Pradesh (Khan and Patel 1993), only about athird of eligible couples had correct knowledge of pill use. A significant number of women havemisconceptions and/or concerns with the use of pills (1988/89 Third All-India Survey). Theseinclude: unable to work hard (20%); menstrual problems (15%); causes headaches (29%); causesnausea (26%); causes chronic health problems (24%).
3. Attitudes and Perceptions as Potential Barriers
Data from the 1992-93 NFHS indicate that the majority of women (rural and urban combined)who use the pill in India do not perceive side effects (80 percent). Although the NFHS does notprovide perceptions of side effects among non-users, the 1996 MARG Contraceptive Use Surveyof women in five districts in Uttar Pradesh does. Like the NFHS, the MARG survey finds that themajority (75 percent) of pill users do not perceive any explicit hazards of the pill (see Table 24).By contrast, nearly 40 percent of non-users associate the pill with negative side effects. Thefinding that non-users are more likely to associate negative side effects with the pill suggests thatthese perceptions may serve as a barrier to use.29 It should be noted that at least some of thenegative perceptions among non-users are likely to be based on previous experience with pills.
29 Note that focus group discussion moderated by SRI (1995) suggest that women perceive Mala - D and Mala - N(the least expensive brands) as having the most side effects.

60
Table 24. Percent Distribution of Currently Married Women by PerceivedHazards of Pill Use, 5 Districts in Uttar Pradesh, 1996 MARG Contraceptive
Use SurveyPerceived Hazard Users Non-Users Total
Headache/Sickness 20 27 26Weight Gain 4 11 10Not Effective Against Pregnancy 0 3 3Nothing/Can’t Say 76 59 61Total 100 100 100
Note: Disaggregated data for urban/rural not available.
A 1992 survey of physicians in Uttar Pradesh conducted by SRI indicates that many healthproviders also harbor negative perceptions of pill side effects. Over one-fourth of physiciansinterviewed did not advise their patients to take oral contraceptives, with “too many side effects”(53 percent) most often given as the reason for not advising pill use. In addition, 18 percent ofthe physicians interviewed doubted the efficacy of pills, and 8 percent acknowledged that theywere generally unfamiliar with pills, so could not properly advise patients about their use. Arecent survey conducted in Orissa shows similar concerns and biases among providers aboutpills.30
4. Availability Currently available data do not provide information on the availability of pills in the market place.
5. Price as a Potential Barrier
Table 25 shows the price range for pills in Uttar Pradesh according to the ORG retail audit.Currently available data do not provide information on income by user status, willingness to pay,urban/rural residence, or other indicators that might help determine whether price is a barrier touse. The 1996 MARG Contraceptive Use Survey did, however, ask currently married womenwhether they agree that pills are inexpensive. The majority of both users and non-users agreedthat pills were inexpensive (84% and 71%, respectively). However, it is unclear as to whetherrespondents were referring to a particular brand (e.g., Mala - N or Mala - D) or to the whole pillcategory.
After conducting focus group discussions in Uttar Pradesh on the subject of pills, SRI (1995)concluded the following:
30 Opportunities and barriers to contraceptive uptake in Orissa through social marketing. AIMS 1996.

61
On the subject of pills, opinions were divided. Some women felt that pillsshould be available at low cost while others believed that cost was not animportant factor, so far as the quality was good and the pill did not causeany adverse effects (SRI 1995).
SRI (1995) provides the following excerpts from the discussions as examples of the mixedsentiments towards price:
“We will not think of the price if the benefit is more”
“In my opinion its price is important because we have to continue taking it for along periods - till the time we don not want the (next) child. Its price should besuch that we can afford it. It should not be very costly”
Table 25. MARKET SHARE
Oral Contraceptives*
Market Share
Sept’95 Sept’96
Vol. / Val. Vol. / Val.
Contraceptive Social Marketing
MALA-D (MOH&FW) (MRP Rs. 2.00 for a pack of 28 tabs) 51.8 11.1 40.9 7.6
MOTI (RBD) (MRP Rs. 6.00 for a pack of 28 tabs) 0.8 0.5 0.9 0.5
PEARL (PSI) (MRP Rs. 5.00 for a pack of 28 tabs) 5.8 3.1 7.3 3.4
ECROZ (PSS) (MRP Rs. 6.00 for a pack of 28 tabs) 1.0 0.7 3.4 1.8
Total 59.4 15.4 52.5 13.3
Private Sector
German Remedies Ltd. (MRP RANGING FROM RS.22.00 TO 26.49) 11.7 29.4 10.1 21.9
Wyeth Labs. Limited (MRP ranging from Rs.18.50 to 23.40) 23.4 41.0 30.5 46.3
Infar India Limited (MRP ranging from Rs.14.40 to 25.00) 1.0 2.4 1.2 3.4
Total 36.1 72.8 41.8 71.6Non Steroidal Contraceptives(MRP ranging from Rs.12 to 26.44) 4.5 11.8 5.7 15.1 *Note: MRP is acronym for Maximum Retail Price Source: ORG U.P. Retail Audit - September 1995/September 1996

62
The most compelling evidence available that consumers are somewhat flexible on the issue ofprice when it comes to actual purchases of the pill comes from the ORG retail audit. As was thecase with condoms, the availability of the government’s socially marketed brand, Mala - D,declined as government procurements declined during 1995. Between September 1995 andSeptember 1996, Mala - D’s market share declined by 21 percent. Over this same period, theshare of the commercial market for pill increased by a little over 15 percent. This suggests thatmany Mala - D users may have switched to more expensive commercial pill brands as Mala - Dbecame less available. If this is correct, it suggests a willingness and ability to pay higher pricesfor the pill among at least some users of the least expensive brands. 6. Policy Environment A number of policy level constraints affect the promotion, production and retail price of hormonalcontraceptives in both rural and urban areas. These include:
• Broadcast advertising is restricted to after 23:30H.• The government imposes a 65% import duty on hormones and 10% excise tax on packaging.• As with condoms, social marketing and government distribution of pills is highly subsidized.
This has the effect of “crowding out” the private sector.
7. Summary of Potential Barriers and Non-barriers
Based on available information, the following are potential barriers to expanded pill use in ruralareas:
• Awareness• Incorrect consumer knowledge regarding pill use• Perceptions of negative side effects among non-users and providers• Policies (advertising restrictions, tax, and government subsidy) Available data do not allow an assessment of availability or price as potential barriers to theincreased use of pills as a category. However, data from Uttar Pradesh do show that the majorityof women interviewed believe that pills are readily available. With respect to price, retail audits inUttar Pradesh suggest that among users, price may not be a strong barrier to the use of moreexpensive brands. 8. Marketing Implications
• Develop advertising campaigns designed to raise awareness among rural women• Develop well focused method-specific advertising campaign that emphasizes the safety,
convenience and effectiveness of pills for family planning• Address incorrect knowledge with respect to correct use through low literacy inserts

63
• Address negative perceptions of side effects through training of doctors and retailers.• Work with government officials to remove advertising restrictions and taxes

64
D. Pills: Urban Sector
1. Current Pill Use
In the urban areas of India, approximately 22 percent of currently married women, who have everused pills to avoid pregnancy, are currently using them (Table 26).31 There are twice morewomen in urban areas compared to rural areas who have ever used as well as are currently usingpills for avoiding pregnancy.
Table 26. Percentage of Currently Married Women of Reproductive Age(MWRA) Who Have Ever Used Pills, Urban India, 1992-93 NFHS.
Currently Use 1.9Ever Used 8.7% of Ever Users Who Currently Use 21.8
A larger number of urban women compared to rural women get their oral contraceptive suppliesfrom the private sector (chemists and other shops). Approximately, 80 percent of women gettheir pill supplies from private sector (Figure 6).
Figure 6: Source of Supply for Women of Reproductive Age Who Use Pills in Urban Areas, 1992-93 NFHS
Shops30%
Private Medical50%
Public17% Other
3%
31 1992-93 NFHS

65
2. Knowledge and Awareness as a potential barrier
Unlike the rural areas, the awareness of pills as a method to prevent pregnancy is high in the urbanareas (Table 27). However, knowledge of correct use and misconceptions about the use of pillsare similar in both urban and rural areas.
Table 27. Percentage of Currently Married Women of ReproductiveAge Who Have Heard of Pills in Urban India, 1992-93 NFHS
Unprompted 56.1
Prompted 29.4
Total 85.5
3. Attitudes and Perceptions as Potential Barriers
As discussed earlier, the majority of current pill users do not perceive side effects with its use.However, a large proportion of non-users of pills perceives negative side effects with the use oforal contraceptives. The data also show that a significant proportion of providers are biasedagainst pills, and as a result do not advise pill use to their clients. Both provider biases andnegative perceptions among current non-users serve as a barrier to the expanded use of pills inboth urban and rural areas. 4. Availability as a Potential Barrier Currently available data do not provide information on the availability of pills in the market place.
5. Price as a Potential Barrier
As discussed earlier in the rural sector analysis, the data show that there is a willingness andability to pay higher prices for the pill among at least some users of the least expensive brands. 6. Policy Environment As is true for the rural areas, similar policy level constraints affect the expansion of use of oralcontraceptives in the urban areas. These include: restricted hours for advertising on electronicmedia; 65 percent import duty on hormones and 10 percent excise tax on packaging; and“crowding out” of private sector due to the availability of subsidized socially marketed and freeoral contraceptives.

66
7. Summary of Potential Barriers and Non-barriers
Based on available information, the analysis finds that the following are potential barriers toexpanded pill use in urban areas:
• Incorrect consumer knowledge regarding pill use• Perceptions of negative side effects among non-users and providers• Policies (advertising restrictions, tax, and government subsidy) 8. Marketing Implications
• Develop well focused method-specific advertising campaign that emphasizes the safety,convenience and effectiveness of pills for family planning
• Address incorrect knowledge with respect to correct use through low literacy inserts• Address negative perceptions of side effects through training of doctors and retailers.• Work with government officials to remove advertising restrictions and taxes

67
E. IUDs: Rural Sector
1. Current IUD32 Use
In the rural areas, only a small proportion of currently married women have ever used IUDs foravoiding pregnancy (see Table 28). Approximately 37 percent of currently married women whohave ever used IUDs to avoid pregnancy currently use them. The majority of rural womenobtain their IUDs from the public sector institutions (see Figure 7).
Table 28. Percentage of Currently Married Women of Reproductive Age(MWRA) Who Have Ever Used IUDs, Rural India, 1992-93 NFHS.
Currently Use 1.2Ever Used 3.2% of Ever Users Who Currently Use 37.5
Figure 7: Source of Supply for Women of Reproductive Age Who Use IUDs in Rural Areas, 1992-93 NFHS
Private Medical24%
Public75%
Other1%
32 Currently, the IUD market in India is dominated by the CuT-200. Although the CuT-380 is also manufacturedin India, this product serves primarily an export market demand.
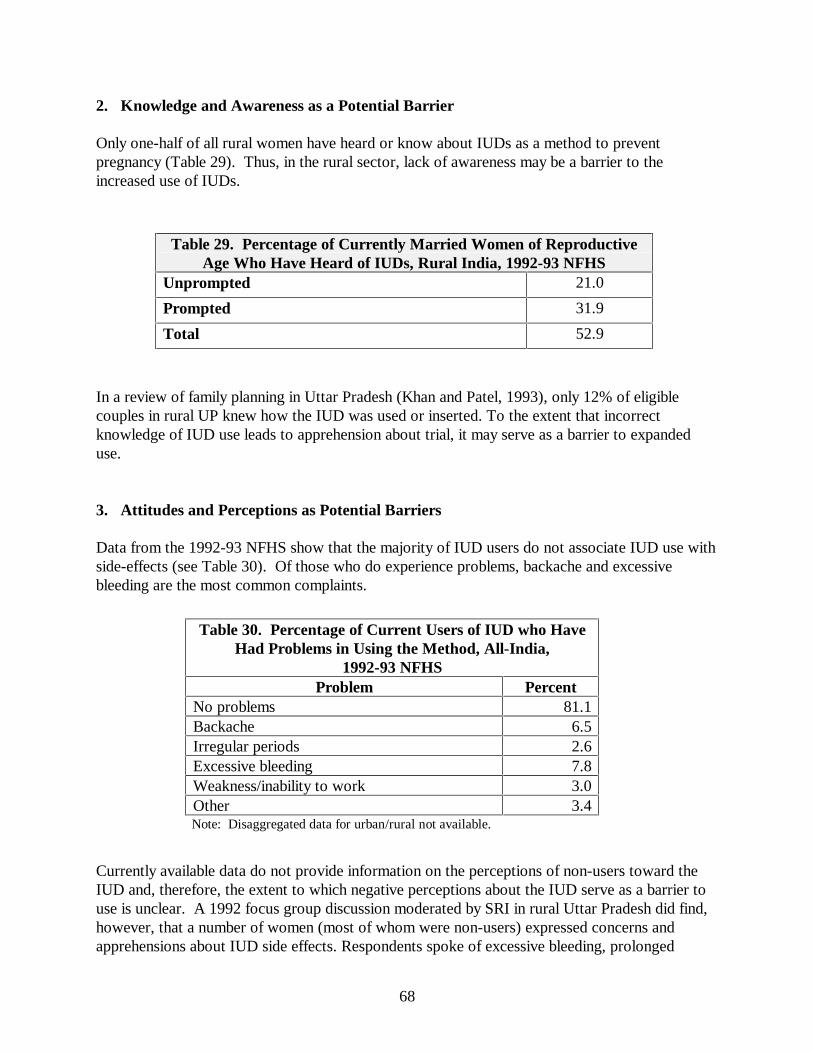
68
2. Knowledge and Awareness as a Potential Barrier
Only one-half of all rural women have heard or know about IUDs as a method to preventpregnancy (Table 29). Thus, in the rural sector, lack of awareness may be a barrier to theincreased use of IUDs.
Table 29. Percentage of Currently Married Women of ReproductiveAge Who Have Heard of IUDs, Rural India, 1992-93 NFHS
Unprompted 21.0
Prompted 31.9
Total 52.9
In a review of family planning in Uttar Pradesh (Khan and Patel, 1993), only 12% of eligiblecouples in rural UP knew how the IUD was used or inserted. To the extent that incorrectknowledge of IUD use leads to apprehension about trial, it may serve as a barrier to expandeduse.
3. Attitudes and Perceptions as Potential Barriers
Data from the 1992-93 NFHS show that the majority of IUD users do not associate IUD use withside-effects (see Table 30). Of those who do experience problems, backache and excessivebleeding are the most common complaints.
Table 30. Percentage of Current Users of IUD who HaveHad Problems in Using the Method, All-India,
1992-93 NFHSProblem Percent
No problems 81.1Backache 6.5Irregular periods 2.6Excessive bleeding 7.8Weakness/inability to work 3.0Other 3.4Note: Disaggregated data for urban/rural not available.
Currently available data do not provide information on the perceptions of non-users toward theIUD and, therefore, the extent to which negative perceptions about the IUD serve as a barrier touse is unclear. A 1992 focus group discussion moderated by SRI in rural Uttar Pradesh did find,however, that a number of women (most of whom were non-users) expressed concerns andapprehensions about IUD side effects. Respondents spoke of excessive bleeding, prolonged

69
bleeding, backache, stomachache, and also expressed concerns about the possible displacement ofthe device within the body. Though most admitted that these apprehensions were based onhearsay rather than personal experience, they nevertheless helped to form consumer perceptionsof the product.
Some of the comments expressed by these participants are the following:
• Someone in my mother’s village … got the Copper-T put which caused a lot of bleeding.• Copper-T causes bleeding. I am afraid to use it.• I have heard of Copper-T, but I have also heard it causes bleeding• Some say it suits them; others gain weight.• It is a question of determination. If you are determined, then everything is okay.• Someone got a Copper-T fitted. In spite of that, she conceived.• My sister-in-law had it, but at present she is in the hospital due to this. The Copper-T got
displaced and then it moved to the uterus and it started hurting her in the uterus. After that,she had a child, but that (Copper-T) did not come out even at the time of delivery.
Provider bias is a major concern in expanding the use of IUDs in both rural and urban areas. Arecent survey conducted in Orissa shows that providers have misconceptions about IUDs.33 Forexample, a number of providers associate a host of menstruation-related disorders with use ofIUDs. These include heavy bleeding, white discharge, uterine disorders, gynecological problems,backaches, PID, tumor, cancer, etc. Chronic vaginal infection leading to impairment of fertility isalso linked to IUD use by some gynecologists.
4. Availability as a Potential Barrier Currently available data do not provide information on the availability of IUDs in the market or onperceptions of availability.
5. Price as a Potential Barrier Currently Multiload Cu 250, marketed by Infar (Organon) Pvt. Ltd., is only available throughchemist shops at Rs.204.70. In addition to the high cost for the product, a woman not wanting togo to the public sector for insertion would have to pay a high priced OB/GYN to insert the IUD(approximately Rs.300). The insertion charges and medical examination fee varies from Rs.150to Rs.300. This price structure suggests that, at least in the private sector, price represents abarrier to increased use of the IUD.
33 Opportunities and barriers to contraceptive uptake in Orissa through social marketing. AIMS 1996.

70
6. Policy Environment There are at least two policy level constraints that effect the promotion and price structure ofIUDs:
• Advertising is restricted to after 23:30H.• 10% excise tax on packaging
7. Summary of Potential Barriers and Non-barriers Based on available information the analysis finds that the following are potential barriers toexpanded IUD use:
• Awareness and incorrect consumer knowledge regarding IUD use• Price (private sector)• Policies (advertising restrictions and tax)
Available data do not allow an assessment of availability or perceptions of IUDs as a potentialbarrier to the increased use of IUDs as a category. However, information from focus groupdiscussions suggest that concerns and fears about the use of this method exist among women andtherefore may serve as a barrier to use. 8. Marketing Implications
• Develop advertising campaigns to raise awareness among women in rural areas• Develop well focused method-specific advertising campaign that addresses the most
common concerns about IUDs• Lower price through negotiations with manufacturers and providers (for insertion) and
elimination of excise taxes on packaging• Work with government officials to remove advertising restrictions

71
F. IUDs: Urban Sector
1. Current IUD Use
Unlike the rural women, more currently married urban women have ever used or are currentlyusing this method of contraception. Approximately 37 percent of currently married women whohave ever used IUDs to avoid pregnancy currently use them (Table 31). In the urban areascompared to the rural areas, a higher proportion of IUD users get their IUDs from privateproviders. Approximately, 46 percent of urban IUD users have received their method fromprivate providers (Figure 8).
Table 31. Percentage of Currently Married Women of ReproductiveAge (MWRA) Who Have Ever Used IUDs, Urban India, 1992-93
NFHS.Currently Use 1.9Ever Used 5.1% of Ever Users Who Currently Use 37.3
Figure 8: Source of Supply for Women of Reproductive Age Who Use IUDs in Urban Areas, 1992-93 NFHS
Priv. Medical46%
Public52%
Other2%
2. Knowledge and Awareness as a potential barrier
Again awareness about IUDs is high among the urban women compared to the rural women.Approximately 83 percent of the urban women know about the IUDs (Table 32).

72
Table 32. Percentage of Currently Married Women of ReproductiveAge Who Have Heard of IUDs, Urban India, 1992-93 NFHSUnprompted 50.2
Prompted 32.8
Total 83.1
In the urban areas, only one-third of married women know how the IUD is used or inserted.34
Although, this knowledge is higher compared to the rural areas, it still poses a major barrier toexpansion of IUD use.
3. Attitudes and Perceptions as Potential Barriers
As discussed in the rural sector, the majority of current IUD users do not associate IUD use withside-effects.35 However, some data36 suggest that the non-users of IUD have concerns andapprehensions about the side effects of this method. 4. Availability as a Potential Barrier Currently available data do not provide information on the availability of IUDs in the market or onperceptions of availability.
5. Price as a Potential Barrier As discussed in the rural sector analysis, price represents a barrier to increased use of the IUD inthe private sector. 6. Policy Environment
The two major policy level constraints include: advertising after 23:30H; and 10 percent excisetax on packaging.
34 Khan and Patel, 199335 1992-93 NFHS36 SRI focus group discussions in UP held in 1993
73
7. Summary of Potential Barriers and Non-barriers Based on available information the analysis finds that the following are potential barriers toexpanded IUD use:
• Price (private sector)• Concerns about side-effects among non-users• Policies (advertising restrictions and tax)
8. Marketing Implications
• Develop well focused method-specific advertising campaign that addresses the mostcommon concerns about IUDs
• Lower price through negotiations with manufacturers and providers (for insertion) andelimination of excise taxes on packaging
• Work with government officials to remove advertising restrictions
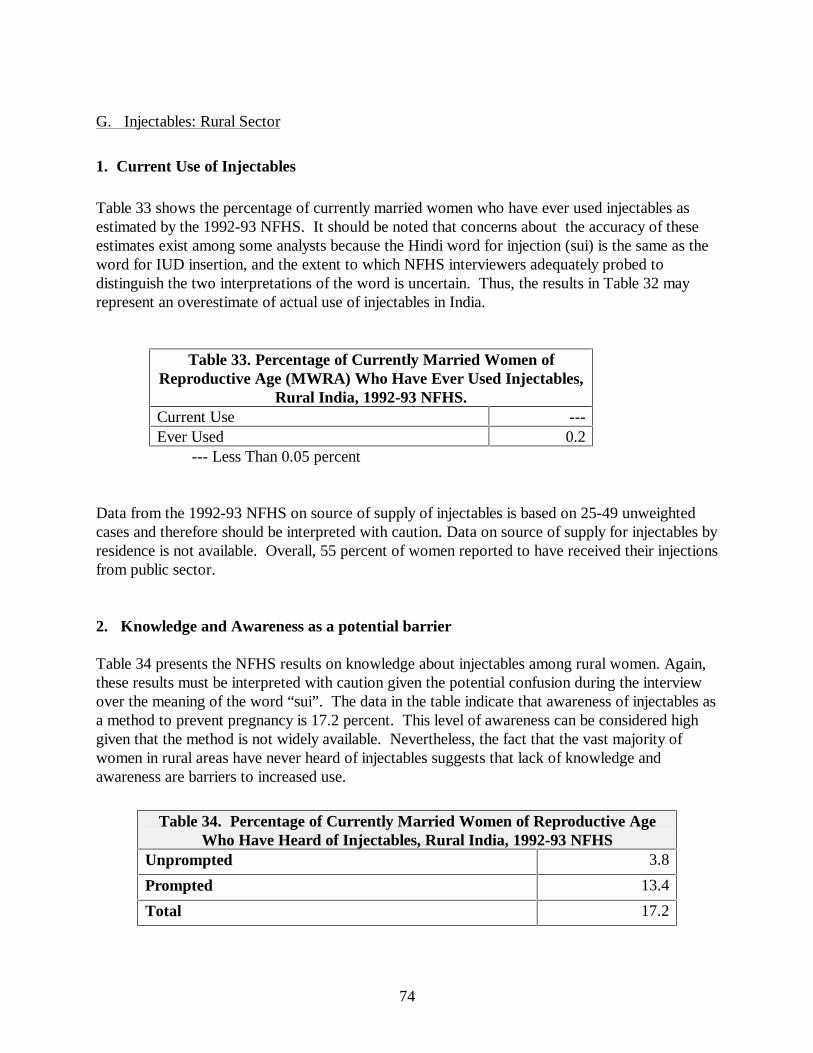
74
G. Injectables: Rural Sector
1. Current Use of Injectables
Table 33 shows the percentage of currently married women who have ever used injectables asestimated by the 1992-93 NFHS. It should be noted that concerns about the accuracy of theseestimates exist among some analysts because the Hindi word for injection (sui) is the same as theword for IUD insertion, and the extent to which NFHS interviewers adequately probed todistinguish the two interpretations of the word is uncertain. Thus, the results in Table 32 mayrepresent an overestimate of actual use of injectables in India.
Table 33. Percentage of Currently Married Women ofReproductive Age (MWRA) Who Have Ever Used Injectables,
Rural India, 1992-93 NFHS.Current Use ---Ever Used 0.2
--- Less Than 0.05 percent
Data from the 1992-93 NFHS on source of supply of injectables is based on 25-49 unweightedcases and therefore should be interpreted with caution. Data on source of supply for injectables byresidence is not available. Overall, 55 percent of women reported to have received their injectionsfrom public sector.
2. Knowledge and Awareness as a potential barrier
Table 34 presents the NFHS results on knowledge about injectables among rural women. Again,these results must be interpreted with caution given the potential confusion during the interviewover the meaning of the word “sui”. The data in the table indicate that awareness of injectables asa method to prevent pregnancy is 17.2 percent. This level of awareness can be considered highgiven that the method is not widely available. Nevertheless, the fact that the vast majority ofwomen in rural areas have never heard of injectables suggests that lack of knowledge andawareness are barriers to increased use.
Table 34. Percentage of Currently Married Women of Reproductive AgeWho Have Heard of Injectables, Rural India, 1992-93 NFHS
Unprompted 3.8
Prompted 13.4
Total 17.2

75
Available data from 20 focus group discussions conducted by SRI (1995) in Uttar Pradeshsuggests that incorrect knowledge of injectables is prevalent among men and women. SRI reportsthat “the popular notion was that the injectable provided five years of protection frompregnancy”.
3. Attitudes and Perceptions as Potential Barriers
Representative data on attitudes and perceptions of injectables are non-existent. However, focusgroup discussions conducted by SRI (1995) provide information on some of the concerns thatwomen and men have about this method in Uttar Pradesh. SRI reports that in 15 out of the 20group discussions held, “injectable contraceptives found mention”. With respect to perceptionsabout side effects they report the following:
Adverse side effects of injectables were mentioned in only two (out of 20)discussions. The urban men in Oudh (Gonda) believed that the use ofinjectables could cause weight gain, while the rural women in Rohelkhand(Barielly) believed that injectables are not suitable for everyone. They alsobelieved that injectables were harmful because the injectable stops themenstrual cycle, and they were of the opinion that hindering a naturalprocess would be detrimental to the health of the woman (SRI 1995)..
With respect to perceptions about availability, SRI reports that
In two (out of twenty) group discussions,...it was mentioned that injectableswere not yet available in their area. A few respondents believed thatinjectables were available in bigger cities such as Lucknow, Jaipur and NewDelhi. Interestingly, in one of the discussion in urban Bhojpur (Varanasi), aman mentioned that one or two women in his area had gone to some healthservice providers to receive injectable contraceptives, but when heapproached the private doctors in his area, he was told that these were notavailable. The respondent believed that the doctors were deliberatelywithholding information about the injectable as they wanted people to havechildren since otherwise their income would be adversely affected.
4. Availability as a Potential Barrier Currently available data do not provide information on the availability of injectables in the market,however it is generally understood that the injectable is not yet widely available. Thus, availabilitypresents a barrier to increased use of this method. 5. Price as a Potential Barrier

76
Current price is likely to serve as a barrier to increased use of this method. Currently Noristeratsells for Rs.140 MRP and Depo-Provera is available for Rs.150. This price does not include theprice of the injection service which ranges from Rs.50 - Rs.150.
6. Policy Environment
There are several policy level constraints that effect the availability, promotion and price structureof injectables:
• Strong opposition by some feminist groups to the method. Some women’s groupshave opposed the method in India due to concerns about side effects and the followingmisconceptions about the method: 1) the injectable is not widely used in developedcountries; 2) it has carcinogenic effects; 3) it has a long term impact on fertility; 4)proper screening and counseling cannot be done within the Indian context andinfrastructure
• Advertising restricted to after 23:30H.• The Government of India has not approved the method for public sector distribution• 10% excise tax on packaging
7. Summary of Potential Barriers and Non-barriers
Based on available information the analysis finds that the following are potential barriers toexpanded use of injectables:
• Awareness• Price• Availability• Policies (opposition among key influentials, advertising restrictions, government
approval for public sector distribution and tax) Available data do not allow an assessment of perceptions of injections as a potential barrier to theincreased use of injectables as a category. However, information from focus group discussionssuggest that some concerns about side effects about this method exist and will need to beaddressed in order for the method to appeal to potential users.
8. Marketing Implications
• Develop a strong advertising campaign that will educate consumers about the convenience,safety and effectiveness of injectables
• Address concerns of key influentials (e.g., feminist groups) through a well planned media andPR campaign to promote correct information and dispel myths and rumors

77
• Train providers so that they may provide proper screening and counseling.• Lower price through negotiations with manufacturers and elimination of excise taxes on
packaging• Work with government officials to remove advertising and distribution restrictions
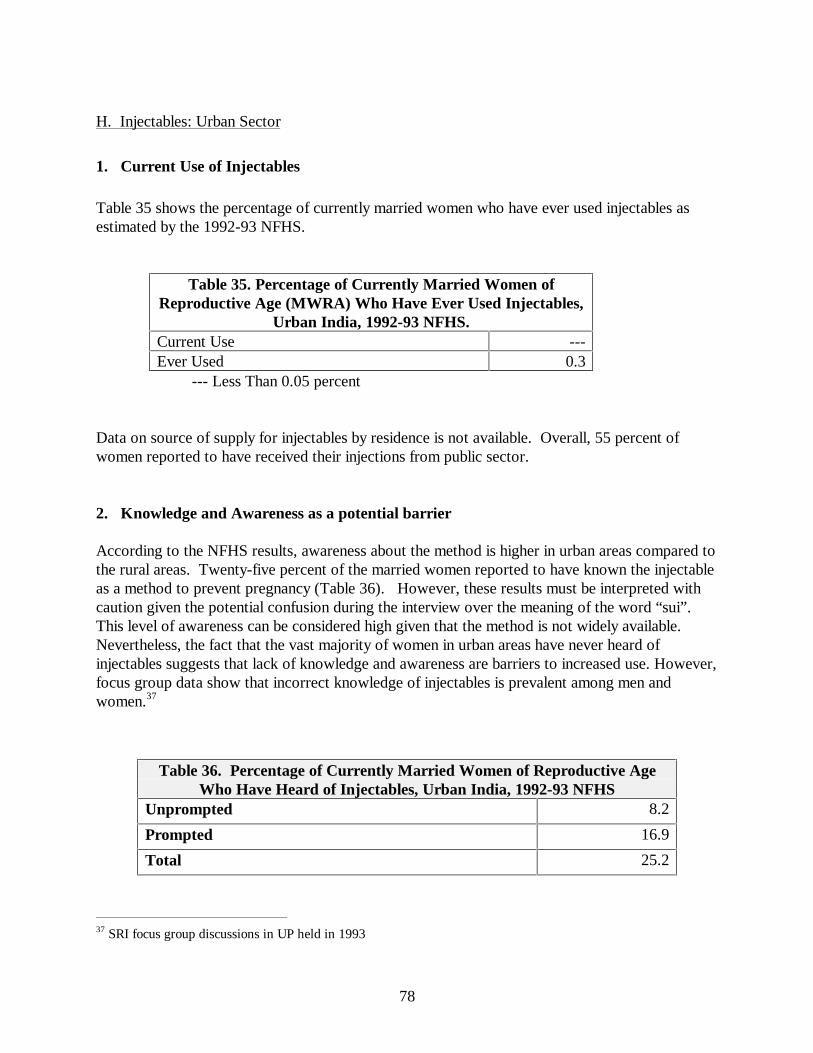
78
H. Injectables: Urban Sector
1. Current Use of Injectables
Table 35 shows the percentage of currently married women who have ever used injectables asestimated by the 1992-93 NFHS.
Table 35. Percentage of Currently Married Women ofReproductive Age (MWRA) Who Have Ever Used Injectables,
Urban India, 1992-93 NFHS.Current Use ---Ever Used 0.3
--- Less Than 0.05 percent
Data on source of supply for injectables by residence is not available. Overall, 55 percent ofwomen reported to have received their injections from public sector.
2. Knowledge and Awareness as a potential barrier
According to the NFHS results, awareness about the method is higher in urban areas compared tothe rural areas. Twenty-five percent of the married women reported to have known the injectableas a method to prevent pregnancy (Table 36). However, these results must be interpreted withcaution given the potential confusion during the interview over the meaning of the word “sui”.This level of awareness can be considered high given that the method is not widely available.Nevertheless, the fact that the vast majority of women in urban areas have never heard ofinjectables suggests that lack of knowledge and awareness are barriers to increased use. However,focus group data show that incorrect knowledge of injectables is prevalent among men andwomen.37
Table 36. Percentage of Currently Married Women of Reproductive AgeWho Have Heard of Injectables, Urban India, 1992-93 NFHS
Unprompted 8.2
Prompted 16.9
Total 25.2
37 SRI focus group discussions in UP held in 1993

79
3. Attitudes and Perceptions as Potential Barriers
As discussed earlier in the rural sector analysis, representative data on these subjects is notavailable. 4. Availability as a Potential Barrier
As is the case with the rural sector, available data do not provide information on the availability ofinjectables in the urban market. However, it is generally understood that the injectable is not yetwidely available. Thus, availability presents a barrier to increased use of this method. 5. Price as a Potential Barrier Current price is likely to serve as a barrier to increased use of this method. 6. Policy Environment
There are several policy level constraints that effect the availability, promotion and price structureof injectables. These include: strong opposition by some feminist groups to the method;advertising restrictions; GOI policy of not providing this method in public sector outlets; andexcise tax.
7. Summary of Potential Barriers and Non-barriers
Based on available information the analysis finds that the following are potential barriers toexpanded use of injectables:
• Awareness• Price• Availability• Policies (opposition among key influentials, advertising restrictions, government
approval for public sector distribution and tax) 8. Marketing Implications
The marketing implications are similar for both the urban and rural areas and include:• Develop a strong advertising campaign that will educate consumers about the convenience,
safety and effectiveness of injectables

80
• Address concerns of key influentials (e.g., feminist groups) through a well planned media andPR campaign to promote correct information and dispel myths and rumors
• Train providers so that they may provide proper screening and counseling.• Lower price through negotiations with manufacturers and elimination of excise taxes on
packaging• Work with government officials to remove advertising and distribution restrictions
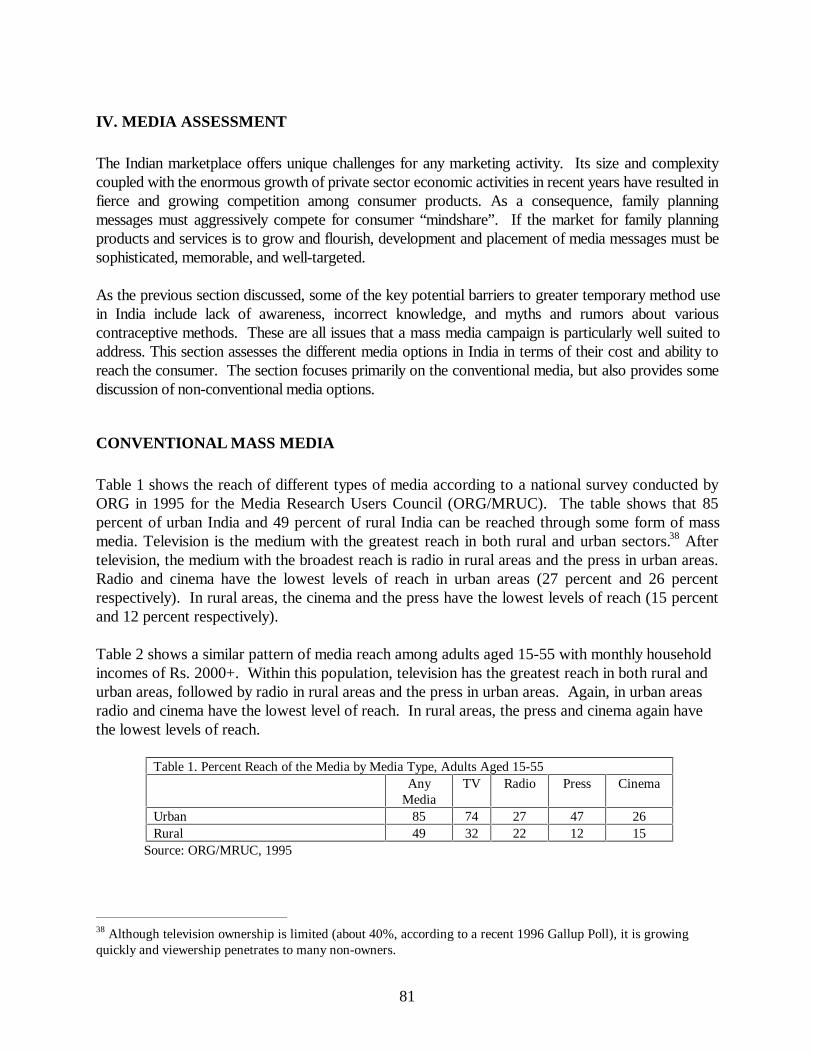
81
IV. MEDIA ASSESSMENT
The Indian marketplace offers unique challenges for any marketing activity. Its size and complexitycoupled with the enormous growth of private sector economic activities in recent years have resulted infierce and growing competition among consumer products. As a consequence, family planningmessages must aggressively compete for consumer “mindshare”. If the market for family planningproducts and services is to grow and flourish, development and placement of media messages must besophisticated, memorable, and well-targeted.
As the previous section discussed, some of the key potential barriers to greater temporary method usein India include lack of awareness, incorrect knowledge, and myths and rumors about variouscontraceptive methods. These are all issues that a mass media campaign is particularly well suited toaddress. This section assesses the different media options in India in terms of their cost and ability toreach the consumer. The section focuses primarily on the conventional media, but also provides somediscussion of non-conventional media options.
CONVENTIONAL MASS MEDIA
Table 1 shows the reach of different types of media according to a national survey conducted byORG in 1995 for the Media Research Users Council (ORG/MRUC). The table shows that 85percent of urban India and 49 percent of rural India can be reached through some form of massmedia. Television is the medium with the greatest reach in both rural and urban sectors.38 Aftertelevision, the medium with the broadest reach is radio in rural areas and the press in urban areas.Radio and cinema have the lowest levels of reach in urban areas (27 percent and 26 percentrespectively). In rural areas, the cinema and the press have the lowest levels of reach (15 percentand 12 percent respectively).
Table 2 shows a similar pattern of media reach among adults aged 15-55 with monthly householdincomes of Rs. 2000+. Within this population, television has the greatest reach in both rural andurban areas, followed by radio in rural areas and the press in urban areas. Again, in urban areasradio and cinema have the lowest level of reach. In rural areas, the press and cinema again havethe lowest levels of reach.
Table 1. Percent Reach of the Media by Media Type, Adults Aged 15-55Any
MediaTV Radio Press Cinema
Urban 85 74 27 47 26Rural 49 32 22 12 15
Source: ORG/MRUC, 1995
38 Although television ownership is limited (about 40%, according to a recent 1996 Gallup Poll), it is growingquickly and viewership penetrates to many non-owners.

82
Table 2. Percent Reach of Media by Type of Media, Adults Aged 15-55 with MonthlyHousehold Incomes of Rs. 2,000+ by Residence
AnyMedia
TV Radio Press Cinema
Urban 94 87 28 63 25Rural 74 58 31 26 17
Source: ORG/MRUC, 1995
Table 3 shows the reach of the media by type and town-size within the urban and rural sectors.39 Thedata in this table show the same media reach pattern within rural and urban towns of different sizes aswithin the rural and urban categories as a whole. Specifically, television maintains the broadest reachof any medium regardless of town size in rural and urban areas. Within urban towns of all sizes, thepress has the second broadest reach. Within rural towns of all sizes, radio has the second broadestreach. Radio and cinema consistently have the lowest reach in urban towns, while the press and thecinema consistently have the lowest reach in rural towns. With the exception of the cinema and radioin urban areas, the reach of all types of media declines as the size of the town decreases.
Table 3. Percent and Number (in Millions) of Persons Reached by Media by Type of Media and Town Size,Adults Aged 15-55Media Urban Rural
UrbanTotal
10Lakh+
5-10Lakhs
1-5Lakhs
50,000-1Lakh
<50,000 RuralTotal
> =5,000
1,000-4,999
<1,000
Press % #
47.9104
56.0n.a.
51.9n.a.
48.0n.a.
44.010
36.419
12.679
23.1n.a.
12.1n.a.
6.4n.a.
T.V. % #
74.1161
84.7n.a
78.7n.a.
74.9n.a.
69.716
58.530
31.5197
37.2n.a.
33.0n.a.
24.4n.a.
Radio % #
25.455
29.3n.a.
22.3n.a.
24.6n.a.
22.05
23.612
20.6129
27.6n.a.
20.2n.a.
17.3n.a.
Cinema % #
23.351
22.7n.a.
21.9n.a.
25.7n.a.
26.66
21.111
12.780
20.5n.a.
12.7n.a.
7.1n.a.
Source: ORG/MRUC, 1995
Table 4 shows the average duration of exposure to television, radio and the press in minutes forall-India by day of the week according to the ORG/MRUC survey. On average, television yieldsthe highest level of daily exposure, followed by radio, and then the press. Television viewersspend about an hour and a half per weekday, on average, watching television. By contrast, thosewho listen to the radio spend, on average, a little over an hour per day listening to the radio andthose who read the press do so for about half an hour, on average, per weekday. This research,conducted by National Rural Studies Council (1995), is corroborated by research conducted byORG/MRUC (1995).
Consistent with the information above on reach and exposure, television also receives the highestrating from condom retailers in terms of perceived effectiveness for condom advertising (seeTable 5). Nevertheless, the importance that condom retailers assign to television relative to other
39 The urban-rural distinction for towns with fewer than 50,000 inhabitants but greater than 5,000 inhabitants isnot specified by ORG/MRUC.

83
media does vary across rural and urban sectors. Far more urban retailers rank television as themost important medium (47.6 percent) than any other medium. By contrast while 28.9 percentof rural condom retailers rank television as the most important medium, nearly as many ruralretailers (27.6 percent) cited radio as the most effective medium. This finding is consistent withthe finding in Table 1 that in rural areas, radio is a relatively close second to television in terms ofits reach.
Table 4. Average Exposure to Media In Minutes Per Day, Adults Aged 15 Years and Above.MEDIUM AVERAGE
EXPOSURE PERDAY
(In minutes)
DAY BASE
Television14794
Sun/Holiday
Weekday
All TV Viewers
Radio 68 Daily All RadioListeners
Press4337
Sun/Holiday
Weekday
All PressReaders
Source: National Rural Studies Council (1995).
Table 5. Percentage of Condom Retailers Who Rank Medium as Most Effective for AdvertisingCondoms: Haryana, Rajasthan and Uttar Pradesh, 1993.*
Total Urban RuralTV 37.2 47.6 28.9Posters 23.6 20.0 26.4Radio 19.3 8.8 27.6Hoarding 8.9 5.7 11.5POP Materials 6.2 9.3 3.8Press 4.0 6.9 1.8Neon Signs 0.8 1.7 0.0
Source: Condom Retailer Survey, ORG/FHI 1993. * Among retailers stocking condoms
Taken together, the data indicate that the use of television will be key to the development of acommunications campaign for temporary methods in both rural and urban settings. The data alsohighlight radio as an important secondary medium in rural areas. Below, we present more detailedinformation on these two media types with respect to the reach of specific channels and cost.
Television Channels
The national broadcaster, Doordarshan, through its national network channel (DDI), broadcastterrestrially, reaches 86 percent of the target audience (see Table 6). It’s Metro Channel (DD2), whichcovers 45 towns terrestrially, reaches 33 percent of the target audience, which is concentrated in themetros and large towns. Cable and Satellite, again concentrated in metros and large towns, has a reachof 28 percent. Note that since there are over 30 cable and satellite options, cable and satellite reach isquite fragmented.
Table 6. Percent Reach of Television Channels

84
Doordarshan (National Channel) 86%Doordarshan (Metro Channel) 33%Cable and Satellite 28%Source: 1995, ORG / Media Research Users Council (MRUC)
Reach of Radio Channels
Radio reach is almost exclusively provided by the national broadcaster All India Radio (AIR).There is insignificant listenership of external broadcasts, such as the BBC and the VOA. Thecommercial service of AIR, Vividh Bharti, is broadcast from slightly over 90 locations across thecountry in metro and other large towns with high accent on entertainment, and enjoys a 20percent reach (see Table 7). The primary channel uses nearly 100 transmitters spread across thecountry with high rural coverage, and programming is geared more towards information andeducation than entertainment. Listenership of English programs is very low and confined tometro areas, particularly the FM channel which is currently in 5 metropolitan areas. A strongadvantage of radio as a secondary medium is its ability to broadcast programming andcommercials in local languages and dialects.
Table 7. Percent Reach of Radio ChannelsVividh Bharti (Commercial Channel) 20Primary Channel 16FM 2
Source: 1995, ORG / Media Research Users Council (MRUC)
Rates
Mass media in India is expensive in absolute terms, but perhaps not so expensive when thebreadth of its reach is taken into account. A national television buy costs approximately $15,000per 30-second spot. A modest annual budget for television (one spot per week) will thus costapproximately $780,000. A stronger media schedule (approximately two spots per week) willcost over $1,500,000.
Radio is much less expensive per spot, but to achieve national reach, time on approximately 200stations will have to be bought. In addition, given the nature of radio as a non-intrusive medium,a very heavy schedule of spots is needed to achieve impact. A very general rule of thumb is to runsix to seven radio ads in order to equal one television ad. Buying time on all 139 of the VividhBharti and Primary Channel stations (one 30-second spot) will cost almost Rs. 90,000 –approximately Rs. 650 per station per spot. A national radio buy, including about 200 stations,and averaging about 2 spots per day will cost at least $400,000. Note that because the cost ofproducing radio commercials is relatively low, it can be used as an effective and relativelyinexpensive medium to tailor language-specific messages to specific regional target audiences.

85
NON-CONVENTIONAL MEDIA
Despite conventional media’s high reach, much of this is concentrated in urban areas. In ruralareas, approximately 50 percent of the population is not exposed to any conventional mass media.For this reason, many national advertisers who wish to reach rural audiences have used non-conventional approaches. One of the most popular is the Cinema Van, or “Video on Wheels”.
There are two syndicated systems, Video on Wheels (VOW) and Rural Communications andMarketing (RCM) which accepts advertising. While this is an excellent medium for reachingremote rural areas, there is not an adequate system for controlling and monitoringimplementation. Corporations have been using these media for many years but many largecorporations (e.g., Unilever) use their own video van system, which guarantees control andmonitoring. Cinema Vans, Video on Wheels or Frontier Extension Vans cover 5 to six villages ina working day, reaching the site of Haat (Weekly Market) by the afternoon. In the Haat itperforms two functions; communication through audio visual programs and a setting up a boothwhich displays and makes the advertised products readily available. While covering each village itruns audio visual programs for communication and through interpersonal efforts of its operatingstaff which sells the products to the interested outlets of the village.
DISTRIBUTION AND COMMUNICATION OBJECTIVES
The target for the PACT-CRH project is to achieve extensive distribution (penetration of themarket). To develop an effective distribution strategy, it is important to be as specific as possiblewith respect to distribution targets and with respect to how efficiently television and radio cansupport those targets. Distribution and media coverage objectives are proposed as follows:
Distribution objectives:
Phase 1 - To reach Class 1 towns (100,000 and above) and Class 2 towns (50,000-100,000)Phase 2 - To reach Class 3 towns (20,000-50,000)Phase 3 - To reach Class 4 towns (10,000-20,000)Phase 4 - To reach Class 5 towns (5,000-10,000)
Table 8. Percent Reach of Television by Town Size (Based on Reach Presented in Table 3):
Phase 1 Phase 2 Phase 3 Phase 4Class 1 Towns 84.7%Class 2 Towns 69.7%Class 3 Towns 58.5%Class 4 Towns 58.5%Class 5 Towns 58.5%

86
MEDIA SURVEYS
Key sources of information that will provide good guidance on media matters are the following:
• IMRB conducted a National Readership Survey (NRS) in 1995 (next survey will be in 2000)
• IMRB conducts TRP television ratings weekly. These ratings show viewership ofshows/programs and can be broken down by major metro and mini metro areas as well as bytarget audience
• MRUC, composed of ad agencies and market research organizations, conducted an IndiaReadership Service (IRS) in 1995 (next survey will be in 2000)
The National Council of Applied Economic Research (NCAER) conducted a major study in 1995
which gives broad demographic information as well as specific consumer information such as
television ownership and penetration of product use by audience.

87
REFERENCES
International Institute for Population Sciences. 1995. National Family Health Survey. Bombay: IPPS.
Khan, M.E. and Bella C. Patel. 1993. Review of Family Planning in Uttar Pradesh: A synthesis Paper. India: The Population Council.
Marketing and Research Group Pvt. Ltd. (MARG). 1996a. Project Buss: Report for Study on Contraceptives in U.P., India. New Delhi: Marg.
Mauldin, Parker, Javid Ahmed, and Jesse Brandt. 1995. Contraceptive Requirements and Logistics management Needs in India. New Delhi: UNFPA/Unpublished.
Measham, Anthony R. and Richard A. Heaver. 1996. India’s Family Welfare Program: Moving to a Reproductive and Child Health Approach. Washington, D.C.: The World Bank.
Measham, Anthony R. and Richard A. Heaver. 1996. Supplement to India’s Family Welfare Program: Moving to a Reproductive and Child Health Approach. Washington, D.C.: The World Bank.
Ministry of Health and Family Welfare (Mishra, S. B. and Narasimhan, Shri R. L.). 1993. Year Book 1992-1993. New Delhi: Ministry of Health and Family Welfare.
Ministry of Health and Family Welfare 1997. Information taken from the following Table provided to SOMARC by the MOHFW: All India Figures for Free, Contraceptive Social Marketing Programme (Including PSI) and Commercial Distribution of Condoms and Oral Contraceptive Pills.
Operations Research Group (ORG) and Family Health International (FHI). 1993. Social Marketing of Condoms in India. New Delhi: ORG.
Samara, Renee, Bates Buckner, and Amy Ong Tsui. 1996. Understanding How Family Planning Programs Work: Findings from Five Years of Evaluation Research. Washington, D.C.: USAID.
Social and Rural Research Institute (SRI). 1995. Contraceptive Methods in Uttar Pradesh: An Exploratory Study of Consumer Attitudes and Behavior. New Delhi: SRI.

88
Stover, John, Jane T. Bertrand, Susan Smith, Naomi Rutenberg, and Kimberly Meyer-Ramirez. 1996. The EVALUATION Project: Empirically Based Conversion Factors for Calculating Couple-Years of Protection. Chapel Hill, NC: Carolina Population Center.
United Nations: Department for Economic and Social Information and Policy Analysis. 1995a. World Population Prospects: The 1994 Revision. New York: United Nations.
United Nations: Department for Economic and Social Information and Policy Analysis. 1995b. World Urbanization Population Prospects: The 1994 Revision. New York: UnitedNations.