Assessment of genetic structure among eastern North Pacific gray whales on their feeding grounds
21
MARINE MAMMAL SCIENCE, **(*): ***–*** (*** 2014) © 2014 Society for Marine Mammalogy DOI: 10.1111/mms.12129 Assessment of genetic structure among eastern North Pacific gray whales on their feeding grounds AIM EE R. LANG, 1 Marine Mammal & Turtle Division, Southwest Fisheries Science Center, National Marine Fisheries Service, National Oceanic and Atmospheric Administration, La Jolla, California 92037, U.S.A. and Ocean Associates Incorporated, 4007 North Abingdon Street, Arlington, Virginia 22207, U.S.A.; JOHN CALAMBOKIDIS, Cascadia Research Collec- tive, Olympia, Washington 98501, U.S.A.; JONATHAN SCORDINO, Marine Mammal Pro- gram, Makah Fisheries Management, Makah Tribe, Neah Bay, Washington 98357, U.S.A.; VICTORIA L. PEASE, Marine Mammal & Turtle Division, Southwest Fisheries Science Center, National Marine Fisheries Service, National Oceanic and Atmospheric Administration, La Jolla, California 92037, U.S.A.; AMBER KLIMEK, Cascadia Research Collective, Olympia, Washington 98501, U.S.A.; VLADIMIR N. BURKANOV, National Marine Mammal Labora- tory, Alaska Fisheries Science Center, National Marine Fisheries Service, National Oceano- graphic and Atmospheric Administration, Seattle, Washington 98115, U.S.A. and Kamchatka Branch of the Pacific Geographical Institute, Russian Academy of Sciences, Petro- pavlovsk-Kamchatsky, Kamchatka 683000, Russia; PAT GEARIN, Kamchatka Branch of the Pacific Geographical Institute, Russian Academy of Sciences, Petropavlovsk-Kamchatsky, Kamchatka 683000, Russia; DENNIS I. LITOVKA, Marine Mammal Laboratory, Chukotka Branch of FGUP-TINRO, Anadyr, Chukotka 689000, Russia; KELLY M. ROBERTSON, Mar- ine Mammal & Turtle Division, Southwest Fisheries Science Center, National Marine Fisheries Service, National Oceanic and Atmospheric Administration, La Jolla, California 92037, U.S.A.; BRUCE R. MATE, Marine Mammal Institute, Oregon State University, Hatfield Mar- ine Science Center, Newport, Oregon 97365, U.S.A.; JEFF K. JACOBSEN, Humboldt State University, Department of Biological Sciences, Arcata, California, U.S.A.; BARBARA L. TAYLOR, Marine Mammal & Turtle Division, Southwest Fisheries Science Center, National Marine Fisheries Service, National Oceanic and Atmospheric Administration, La Jolla, Califor- nia 92037, U.S.A. Abstract Although most eastern North Pacific (ENP) gray whales feed in the Bering, Beau- fort, and Chukchi Seas during summer and fall, a small number of individuals, referred to as the Pacific Coast Feeding Group (PCFG), show intra- and interseasonal fidelity to feeding areas from northern California through southeastern Alaska. We used both mitochondrial DNA (mtDNA) and 12 microsatellite markers to assess whether stock structure exists among feeding grounds used by ENP gray whales. Significant mtDNA differentiation was found when samples representing the PCFG (n = 71) were compared with samples (n = 103) collected from animals feeding fur- ther north (F ST = 0.012,P = 0.0045). No significant nuclear differences were 1 Corresponding author (e-mail: [email protected]). 1
Transcript of Assessment of genetic structure among eastern North Pacific gray whales on their feeding grounds
MARINE MAMMAL SCIENCE, **(*): ***–*** (*** 2014)© 2014 Society for Marine MammalogyDOI: 10.1111/mms.12129
Assessment of genetic structure among eastern NorthPacific gray whales on their feeding grounds
AIM�EE R. LANG,1 Marine Mammal & Turtle Division, Southwest Fisheries Science Center,
National Marine Fisheries Service, National Oceanic and Atmospheric Administration, La
Jolla, California 92037, U.S.A. and Ocean Associates Incorporated, 4007 North Abingdon
Street, Arlington, Virginia 22207, U.S.A.; JOHN CALAMBOKIDIS, Cascadia Research Collec-
tive, Olympia, Washington 98501, U.S.A.; JONATHAN SCORDINO, Marine Mammal Pro-
gram, Makah Fisheries Management, Makah Tribe, Neah Bay, Washington 98357, U.S.A.;
VICTORIA L. PEASE, Marine Mammal & Turtle Division, Southwest Fisheries Science Center,
National Marine Fisheries Service, National Oceanic and Atmospheric Administration, La
Jolla, California 92037, U.S.A.; AMBER KLIMEK, Cascadia Research Collective, Olympia,
Washington 98501, U.S.A.; VLADIMIR N. BURKANOV, National Marine Mammal Labora-
tory, Alaska Fisheries Science Center, National Marine Fisheries Service, National Oceano-
graphic and Atmospheric Administration, Seattle, Washington 98115, U.S.A. and
Kamchatka Branch of the Pacific Geographical Institute, Russian Academy of Sciences, Petro-
pavlovsk-Kamchatsky, Kamchatka 683000, Russia; PAT GEARIN, Kamchatka Branch of the
Pacific Geographical Institute, Russian Academy of Sciences, Petropavlovsk-Kamchatsky,
Kamchatka 683000, Russia; DENNIS I. LITOVKA, Marine Mammal Laboratory, Chukotka
Branch of FGUP-TINRO, Anadyr, Chukotka 689000, Russia;KELLY M. ROBERTSON, Mar-
ine Mammal & Turtle Division, Southwest Fisheries Science Center, National Marine Fisheries
Service, National Oceanic and Atmospheric Administration, La Jolla, California 92037,
U.S.A.; BRUCE R. MATE, Marine Mammal Institute, Oregon State University, Hatfield Mar-
ine Science Center, Newport, Oregon 97365, U.S.A.; JEFF K. JACOBSEN, Humboldt State
University, Department of Biological Sciences, Arcata, California, U.S.A.; BARBARA L.TAYLOR, Marine Mammal & Turtle Division, Southwest Fisheries Science Center, National
Marine Fisheries Service, National Oceanic and Atmospheric Administration, La Jolla, Califor-
nia 92037, U.S.A.
Abstract
Although most eastern North Pacific (ENP) gray whales feed in the Bering, Beau-fort, and Chukchi Seas during summer and fall, a small number of individuals,referred to as the Pacific Coast Feeding Group (PCFG), show intra- and interseasonalfidelity to feeding areas from northern California through southeastern Alaska. Weused both mitochondrial DNA (mtDNA) and 12 microsatellite markers to assesswhether stock structure exists among feeding grounds used by ENP gray whales.Significant mtDNA differentiation was found when samples representing the PCFG(n = 71) were compared with samples (n = 103) collected from animals feeding fur-ther north (FST = 0.012, P = 0.0045). No significant nuclear differences were
1Corresponding author (e-mail: [email protected]).
1
detected. These results indicate that matrilineal fidelity plays a role in creating struc-ture among feeding grounds but suggests that individuals from different feedingareas may interbreed. Haplotype diversities were similar between strata (hPCFG =0.945, hNorthern = 0.952), which, in combination with the low level of mtDNA dif-ferentiation identified, suggested that some immigration into the PCFG could beoccurring. These results are important in evaluating the management of ENP graywhales, especially in light of the Makah Tribe’s proposal to resume whaling in anarea of the Washington coast utilized by both PCFG and migrating whales.
Key words: Eschrichtius robustus, gray whale, population structure, mitochondrialDNA, microsatellites, demographic independence.
A single stock of gray whales (Eschrichtius robustus) is currently recognized in U.S.waters (Carretta et al. 2013). This stock, which is referred to as the eastern NorthPacific (ENP) stock, is estimated to contain approximately 19,000 individuals (Laakeet al. 2009). Most of these whales feed in the Bering, Beaufort, and Chukchi Seas dur-ing summer and fall and then migrate south along the coast of North America tooverwinter in the lagoons and coastal waters of Baja Mexico. However, a small num-ber of individuals feed in more southern waters from northern California throughsoutheastern Alaska during summer and fall (Gilmore 1960; Pike 1962; Hatler andDarling 1974; Darling 1984; Calambokidis et al. 2002, 2012). Photo-identificationresearch, which commenced in the early 1970s and continues to date, has identified asubset of whales that have returned to this southern feeding ground in multiple yearsand account for the majority of sightings in the area during summer and fall months(Hatler and Darling 1974; Darling 1984; Calambokidis et al. 2002, 2012). Thesewhales are referred to as the Pacific Coast Feeding Group (PCFG; IWC 2011a).Recent estimates of annual abundance suggest that the PCFG includes approximately200 animals (Calambokidis et al. 2012). Although PCFG whales account for themajority of sightings on this southern feeding ground during summer and fall, thearea is also used by whales that are encountered in the region following the migration(e.g., after 1 June) but are seen in only one year (Calambokidis et al. 2012). Theseindividuals are generally seen for shorter time periods and in a more limited area thanare PCFG whales, and they may represent stragglers from the larger group of animalsthat migrate through the southern feeding ground on their way to feeding areas fur-ther north (Calambokidis et al. 2012).The PCFG includes some animals that were first identified as calves with their
mothers on the southern feeding ground and that have returned to feed in the area insubsequent years (Calambokidis et al. 2012). This pattern of behavior, which is oftencalled matrilineal fidelity, likely results from calves learning the location of suitablefeeding/calving grounds from their mothers. Matrilineal fidelity to feeding and/orcalving areas has been documented in other baleen whales (e.g., Gulf of Maine hump-back whales, Clapham and Mayo 1987; southern right whales, Valenzuela et al.2009). Understanding patterns of matrilineal fidelity may be important in shapingmanagement decisions, as it is thought that the lack of recovery or repopulation ofbaleen whales in some areas heavily impacted by commercial whaling is related to theloss of knowledge of where suitable habitat is located (Clapham et al. 2008).Concern for PCFG whales has arisen in part from recent interest in the resumption
of whaling by the Makah Tribe in northwest Washington, an area used by virtuallyall migrating whales as well as by foraging whales considered part of the PCFG. Thecurrent proposal by the Makah Tribe includes time/area restrictions designed to
2 MARINE MAMMAL SCIENCE, VOL. **, NO. **, 2014
reduce the probability of killing a PCFG whale by focusing hunt effort on the muchlarger group of whales migrating to/from feeding areas further north. However,PCFG whales are present during the migratory season, and it is impossible to ensurethat no PCFG whales would be killed. The Makah Tribe also proposes to comparephotographs of any whales harvested in the hunt to a photo-identification catalog ofknown PCFG whales and to suspend the hunt if needed to prevent the number ofPCFG whales harvested from exceeding the annual allowable bycatch level for thatyear (IWC 2011b).Evaluating whether any kills would, over time, have the potential to deplete the
PCFG requires an understanding of how individuals are recruited into the group.If recruitment into the area is exclusively internal, such that use of the area is dri-ven by calves learning the location of feeding grounds from their mothers, then aPCFG individual that is removed would not be replaced by immigration. However,if recruitment is largely external, then it is possible that any takes from the PCFGcould be offset by immigration into the PCFG by whales that in previous years fedin northern areas. As aforementioned, some PCFG individuals were first identifiedas calves on the feeding ground and have returned to the area to feed in subsequentyears. However, the origin of other individuals is unknown, and “new” (previouslyunidentified) noncalf whales are identified each year, some of which have returnedto the southern feeding ground in subsequent years (Calambokidis et al. 2012).Although these whales may be individuals who were “missed” as calves (e.g., notidentified as a calf or not photographed that season), they could also representwhales that previously fed further north but now demonstrate fidelity to the PCFGrange.Genetic studies have provided some insight into mechanisms of recruitment into
the PCFG. Initial work utilizing a simulation-based approach indicated that if thePCFG originated from a single recent colonization event in the past 40–100 yr, withno external recruitment into the group, detectable mtDNA genetic differentiationwould be generated (Ramakrishnan and Taylor 2001). Subsequent empirical analysis,however, failed to detect such a signal when comparing 16 samples collected fromPCFG whales using Clayoquot Sound, British Columbia, with samples (n = 41) col-lected from individuals presumed to feed in more northern areas (Steeves et al. 2001).More recently, Frasier et al. (2011) used mtDNA to compare samples collected from40 individuals considered part of the PCFG with published data generated from 105samples collected from ENP gray whales, most of which stranded along the migra-tory route (LeDuc et al. 2002). All haplotypes identified among the PCFG sampleswere also found in the larger ENP sample set, and haplotype diversity found in thePCFG (h = 0.93) was lower than, but similar to, that found among the samples repre-senting the larger ENP population (h = 0.95). However, significant differences inestimates of long-term effective size and mtDNA haplotype frequencies were identi-fied between the two groups. These results suggest that matrilineally directed fidelityplays a role in use of this area, and the authors concluded that the PCFG should berecognized as a distinct management unit (Frasier et al. 2011).One limitation of previous genetic studies on the PCFG is that they utilized sam-
ples primarily collected from gray whales that stranded while on the ENP migratoryroute as representative of the larger ENP population in their comparisons. Althoughthe likelihood that any of these stranded animals were part of the PCFG is low giventhe large size of the ENP gray whale population, this possibility could not be ruledout based on the location where most of the ENP samples were collected. Moreimportantly, the limited number of samples available from the feeding ground(s)
LANG ET AL.: ENP GRAYWHALE STOCK STRUCTURE 3
north of the Aleutians precluded previous studies from making a direct comparisonbetween animals utilizing different feeding grounds.At the end of the feeding season, PCFG whales are thought to join the southbound
migration to Mexican waters and have therefore been presumed to interbreed withthe larger ENP population (Calambokidis et al. 2002, 2012). Earlier genetic studiesof the PCFG relied exclusively on mtDNA, however, and the assumption that PCFGwhales interbreed with gray whales feeding in other areas was not assessed. Concep-tion in gray whales is thought to occur primarily during a 3 wk period between lateNovember and early December (27 November to 13 December), although if no con-ception occurs during this first period, a second estrus may occur about 40 d laterwhen whales are on or near their wintering grounds (Rice and Wolman 1971). Rughet al. (2001) estimated that the median (peak) sighting date for the southboundmigration is 12 December for Unimak Pass, Alaska, suggesting that many graywhales would be north of the PCFG seasonal range during the first mating periodand raising the possibility that some segregation in breeding could occur with respectto feeding ground origin.Here we contribute to the understanding of stock structure of gray whales by (1)
comparing samples collected from gray whales feeding north of the Aleutians withsamples collected from PCFG whales to directly address whether structure existsamong feeding grounds used by ENP gray whales, and (2) using nuclear markers (n =12 microsatellites) to test the assumption that PCFG whales interbreed with whalesfrom other feeding grounds. We also increased the number of samples collected fromPCFG whales and, for those samples linked to photographed individuals, were ableto further refine our representation of the PCFG by incorporating sighting historiesof known individuals in the comparisons. Although other scenarios are possible, herewe test the following three hypotheses:(1) No population structure (e.g., panmixia) is present among feeding grounds used
by ENP gray whales; individuals move between feeding areas and exhibit randommating. This hypothesis would be supported by a finding of no nuclear or mitochon-drial differentiation between samples from PCFG whales and those collected fromanimals feeding further north.(2) Utilization of feeding areas is influenced by internal recruitment, with calves
following their mothers to feeding grounds and returning in subsequent years. Mat-ing is random with respect to feeding ground affiliation. This hypothesis would besupported by a finding of significant differences in mtDNA haplotype frequencieswhen comparing samples from PCFG whales with those collected from animals feed-ing further north, but no significant differences in microsatellite allele frequenciesbetween these groups.(3) Utilization of feeding areas is influenced by matrilineal fidelity and mating is
not random with respect to feeding ground affiliation. This hypothesis would be sup-ported by a finding of significant differences in both mtDNA haplotype and micro-satellite allele frequencies.
Methods
Samples
The initial sample set consisted of 277 samples collected between 1994 and 2010,with collection locations ranging from northern California to Barrow, Alaska and
4 MARINE MAMMAL SCIENCE, VOL. **, NO. **, 2014
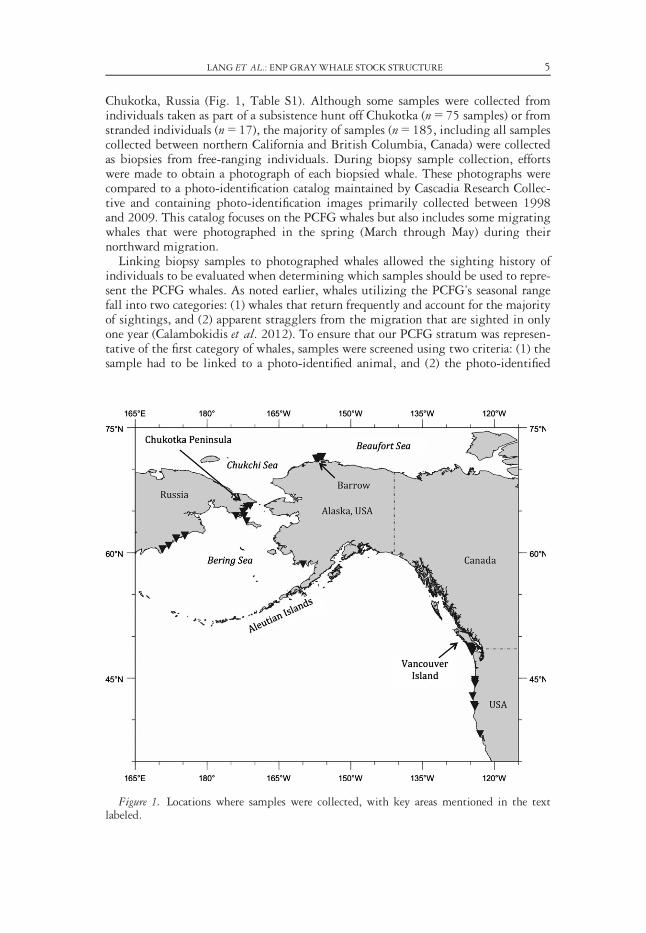
Chukotka, Russia (Fig. 1, Table S1). Although some samples were collected fromindividuals taken as part of a subsistence hunt off Chukotka (n = 75 samples) or fromstranded individuals (n = 17), the majority of samples (n = 185, including all samplescollected between northern California and British Columbia, Canada) were collectedas biopsies from free-ranging individuals. During biopsy sample collection, effortswere made to obtain a photograph of each biopsied whale. These photographs werecompared to a photo-identification catalog maintained by Cascadia Research Collec-tive and containing photo-identification images primarily collected between 1998and 2009. This catalog focuses on the PCFG whales but also includes some migratingwhales that were photographed in the spring (March through May) during theirnorthward migration.Linking biopsy samples to photographed whales allowed the sighting history of
individuals to be evaluated when determining which samples should be used to repre-sent the PCFG whales. As noted earlier, whales utilizing the PCFG’s seasonal rangefall into two categories: (1) whales that return frequently and account for the majorityof sightings, and (2) apparent stragglers from the migration that are sighted in onlyone year (Calambokidis et al. 2012). To ensure that our PCFG stratum was represen-tative of the first category of whales, samples were screened using two criteria: (1) thesample had to be linked to a photo-identified animal, and (2) the photo-identified
Figure 1. Locations where samples were collected, with key areas mentioned in the textlabeled.
LANG ET AL.: ENP GRAYWHALE STOCK STRUCTURE 5
animal to which the sample was linked had to have been sighted in two or more yearswithin the defined season (1 June to 30 November) and area (between 41ºN and52ºN, in concordance with the boundaries used by the International Whaling Com-mission’s Scientific Committee, IWC 2012) representative of PCFG whales. Samplescollected on the southern feeding ground but not meeting these criteria (n = 36) wereremoved prior to data analysis, leaving 113 samples collected from whales consideredto represent the PCFG in the sample set.Samples collected from gray whales on the northern feeding area were stratified in
two ways. First, all samples collected from whales that were north of the AleutianIsland chain between June and November were included in a “North” stratum (n =128). This stratification assumes that whales use the northern feeding area in a rela-tively uniform manner, such that sampling location within this area does not matter.However, little is known about whether gray whales exhibit fidelity to smallerregions within the northern feeding area. If multiple feeding aggregations exist northof the Aleutians, then sampling location within that larger area is important.Although the original design of the study was to have a stratum representing Chuk-otka, Russia, and a stratum representing Barrow, Alaska, the sample size for the latter(n = 14 individuals) was insufficient to characterize genetic frequencies from that area.As such, we were unable to directly address hypotheses about whether additionalstructure exists north of the Aleutian Islands. However, we did include a comparisonof the PCFG stratum to the Chukotka stratum (n = 75 samples) to avoid includingunrecognized heterogeneity in our representation of animals feeding in the north.
Laboratory Processing
DNA extraction, PCR amplification and sequencing—Genomic DNA was extractedfrom samples using either sodium chloride protein precipitation (Miller et al. 1988)or silica-based filter purification (Qiaxtractor DX reagents, Qiagen, Valencia, CA) fol-lowing the manufacturers’ instructions. Extractions were performed on a JANUSautomated work station (Perkin-Elmer, Waltham, MA). MtDNA sequences for eightof these samples had been generated previously for another study (LeDuc et al. 2002);however, to provide consistent quality control, these samples were resequenced forour analyses. The 50 end of the hyper-variable mtDNA control region was amplifiedfrom extracted genomic DNA, using the polymerase chain reaction (PCR) and theprimers used in the LeDuc et al. (2002) study (H00034, Rosel et al. 1994; L15812,Chivers et al. 2005). DNA was amplified using a 25 lL reaction of ~100 ng DNA,19 PCR buffer (50 mM KCl, 10 mM Tris-HCl, pH 8.3, and 1.5 mM MgCl2), 0.6mM dNTPs, 0.3 lM primers, and 0.25 units of Taq DNA polymerase (New EnglandBioLabs, Inc.). The PCR cycling profile consisted of 90°C for 2 min, followed by 35cycles of 94°C for 50 s, an annealing temperature of 60°C for 50 s, and 72°C for 1min, then a final extension of 72°C for 5 min. Sequencing of amplified products fol-lowed standard techniques (Saiki et al. 1988, Palumbi et al. 1991), and both strandsof the amplified DNA product were sequenced independently on an Applied Biosys-tems, Inc. (ABI) model 3730 sequencer. If a sample was identified as having amtDNA haplotype that was not found among any of the other samples, mtDNAamplification and sequencing were replicated to confirm the haplotype identity. Allsequences were aligned using Sequencher v4.8 (Gene Codes Corp. 2000), resulting infinal sequences that were 523 base pairs long.Nuclear DNA processing—Twelve microsatellite loci isolated from other cetacean
species were used to genotype the samples (see Table S2): EV14, EV37, and EV94
6 MARINE MAMMAL SCIENCE, VOL. **, NO. **, 2014
(Valsecchi and Amos 1996); Gata028, Gata098, Gata417, and Gt023 (Palsbøll et al.1997); RW31 and RW48 (Waldick et al. 1999); and SW10, SW13, and SW19(Richard et al. 1996). For all reverse primers except those amplifying Gata098 andEV37 (which failed to amplify with modified primers), the primer sequence wasmodified from the original design by placing the sequence GTTTCTT on the 50 endto facilitate complete adenylation and thus more consistent scoring (Brownstein et al.1996). Forward primers were fluorescently labeled. Extracted DNA was amplifiedusing a 25 lL reaction of ~100 ng of DNA, 19 PCR buffer (50 mM KCl, 10 mMTris-HCl, pH 8.3, and 1.5 mM MgCl2), 0.6 mM dNTPs, 0.3 lM primers, and 0.5units of Taq DNA polymerase (New England BioLabs, Inc.). The PCR cycling profileincluded 90°C for 2.5 min, followed by 35 cycles of 94°C for 45 s, 1 min at the opti-mal annealing temperature (see Table S2), and 72°C for 1.5 min, then a final exten-sion of 72°C for 5 min. Only one locus was amplified per reaction, and each PCRproduct was assessed electrophoretically on a 2% agarose gel for size and qualitybefore loading onto an ABI 3730 Genetic Analyzer. ABI GeneMapper software (ver-sion 4.0) was used along with an internal size standard (GeneScan-500 ROX, ABI) todetermine allele fragment size. Two positive control samples were included on eachplate to ensure consistent sizing between runs.Sex determination—Samples were genetically sexed by amplification and Real-Time
PCR (MX3000p, Stratagene Inc.) of the zinc finger (ZFX and ZFY) genes. Samplesfrom one male and one female for which sex had been determined via examination ofa stranded animal were included as positive controls in all amplifications. Sex wasdetermined by the amplification pattern: males had two products and females hadone (Morin et al. 2005).
Analysis
Data review—Quality control and sample tracking procedures, as detailed in Morinet al. (2010), were implemented during data generation. A randomly chosen set ofsamples, representing 13% of all samples processed, was sequenced, sexed, and geno-typed a second time, and these records were reviewed for consistency. For the micro-satellite data, replicate and original genotypes were compared, and a per-allele errorrate was calculated by determining the number of discrepant allele calls divided bythe total number of allele calls compared across all loci. In addition, all microsatellitegenotypes were scored independently by two experienced genotypers. The allele callsfrom each genotyper were compared, and calls that did not match were reviewedjointly by both genotypers. Inconsistencies that could not be resolved upon reviewwere treated as missing data.After genotyping of samples was complete for eight of the twelve loci (EV14,
EV94, Gata028, Gata417, Gt023, RW31, SW13, and SW19), the program GENE-CAP (Wilberg and Dreher 2004) was used to calculate the probability that tworandomly chosen individuals would share the same multilocus genotype under boththe assumption of Hardy-Weinberg equilibrium (PIDHW, Paetkau and Strobeck1994) and under the more conservative assumption that full siblings may be presentwithin the data set (PIDSIB, Waits et al. 2001). Samples with identical genotypes,indicating that they may have been collected from the same animal, were flagged forfurther review. These sample pairs were checked to see if they also shared the samemtDNA haplotype and sex, and, when possible, photo-identification records wereused to confirm the genetic match. For all samples that shared identical mtDNAhaplotypes, sexes, and nuclear genotypes at the eight loci, one sample from each pair
LANG ET AL.: ENP GRAYWHALE STOCK STRUCTURE 7
was removed and then the remaining samples were genotyped at the additional fourloci prior to further analysis.After genotyping at all 12 microsatellite loci was complete, the data set was
reviewed to identify samples that were missing data for ≥25% of the markers; thesesamples were considered to be of poor quality and were removed prior to furtheranalysis. The program MSTOOLS (Park 2001) was used to identify any additionalsamples whose genotypes matched at eight or more loci (using the full 12 microsatel-lite data set) and thus might represent duplicate samples that were not detected inthe earlier analysis. Deviations from Hardy-Weinberg equilibrium (HWE) wereassessed for each locus using Genepop (version 4.0.11, Rousset 2008). Both the prob-ability test (Guo and Thompson 1992) and the test for heterozygote deficiency (Rous-set and Raymond 1995) were conducted using the program defaults for the Markovchain parameters (10,000 dememorization steps, 20 batches, 5,000 iterations/batch).Genepop was also used to test for linkage disequilibrium (LD) for each pair of loci.All tests were run for the combined data set as well as for each stratum. The false dis-covery rate (FDR) adjustment (Benjamini and Hochberg 1995) was used to controlfor multiple testing when the results of the HWE and LD analyses were assessed.Genetic diversity—For the mtDNA data, nucleotide (p) and haplotype (h) diversities
(Nei 1987) were calculated using Arlequin 3.1 (Excoffier et al. 2005). To look forphylogeographic patterns among the mtDNA data, the software package Network4.5.1.0 (available at http://www.fluxus-engineering.com/sharenet.htm) was used togenerate a median-joining network of haplotypes using the algorithm of Bandeltet al. (1999). For the microsatellite data, the number of alleles per locus and observedand expected heterozygosities (Nei and Roychoudhury 1974) were calculated usingcustom code (eiaGenetics2) written in the statistical programming language R (RCore Development Team 2009).Genetic structure—Pairwise estimates of genetic divergence were calculated using
both FST (Weir and Cockerham 1984) and the AMOVA ФST (Excoffier et al. 1992)for the mtDNA data using Arlequin v3.1 (Excoffier et al. 2005). For the ФST pair-wise distance calculations, the program jModelTest v2.1.4 (Guindon and Gascuel2003, Posada 2008, Darriba et al. 2012) was used to select the best nucleotide substi-tution model based on the Akaike Information Criterion (AIC). Statistical signifi-cance was assessed using 10,000 permutations. Fisher’s exact test (Raymond andRousset 1995) was also used to test for mtDNA differentiation between strata usingArlequin 3.1 (Excoffier et al. 2005); 10,000 replications were used to test for signifi-cance. For the microsatellite data, FST (Weir and Cockerham 1984), F0ST (Hedrick2005, Meirmans 2006), and a v2 test were used to assess genetic differentiation usingcustom R-code (eiaGenetics). Statistical significance was determined from 5,000permutations of each data set.
Results
Data Review
Fourteen samples (including 11 samples collected from stranded whales) did notproduce useable mtDNA sequence data and also failed to amplify at >4 microsatellite
2Available on request from E. Archer at [email protected].
8 MARINE MAMMAL SCIENCE, VOL. **, NO. **, 2014
loci; these samples (identified as “poor quality” samples) were removed from all sub-sequent analyses and data review (Table S1, S3).Based on the genotypes of the remaining samples (n = 227) at the initial eight
loci, the probability of two individuals possessing the same multilocus genotype was9.08 9 10–9 for unrelated individuals (PIDHW) and was 6.97 9 10–4 for full siblings(PIDSIB), indicating that the microsatellite loci were adequate for identifying uniqueindividuals. These samples were screened for duplicates (i.e., samples considered to befrom the same animal) after genotyping of the first eight loci was complete. Fiftysamples had microsatellite genotypes that were identical to at least one other samplein the data set. In all cases, the mtDNA haplotypes and sexes of each pair alsomatched. Forty-two of the duplicate samples were identified in the PCFG stratum;74% of these (n = 31) were confirmed to be the same animal using photo-identifica-tion records. All 50 duplicate samples were removed from further analysis. No move-ments of animals between regions representing different strata were identified basedon genetic matches (i.e., all samples sharing identical genetic profiles were part of thesame stratum). The number of unique individuals (n = 177) remaining after removalof duplicates is shown in Table S3.The proportion of missing genotypes at each locus was ≤2% for all loci (Table S2).
Using the samples randomly selected for replication, a per-allele error rate of 0.11%was detected for the full microsatellite data set. After controlling for the FDR, no locidemonstrated significant deviations from HWE for either the probability test or thetest for heterozygote deficiency. One pair of loci (EV94-SW19) showed significantlinkage disequilibrium (LD) in the Chukotka and the North strata, while three pairsof loci (EV14-Gt023, EV94-RW48, and EV94-Gata098) demonstrated significantLD in the PCFG stratum. All loci were retained in subsequent analyses.Further review of the microsatellite data set did not identify any samples that were
identical for ≥7 loci. Two samples amplified at ≤8 loci and were removed from themicrosatellite analyses, leaving a total of 175 unique individuals for the microsatelliteanalyses. These samples did produce useable mtDNA sequence data and were thusretained in that data set.No discrepancies were identified when the replicated and original mtDNA haplo-
type sequences were compared. The mtDNA haplotype could not be resolved forthree of the 177 individuals, and these individuals were removed from the mtDNAdata set but retained in the microsatellite data set. Sex was determined for all of the177 individuals.
Genetic Diversity
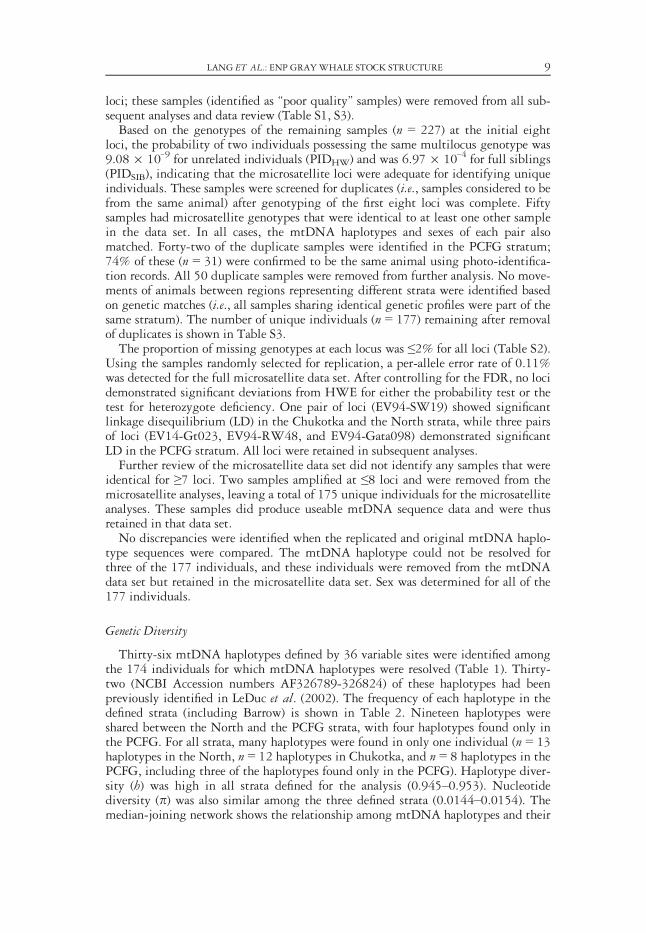
Thirty-six mtDNA haplotypes defined by 36 variable sites were identified amongthe 174 individuals for which mtDNA haplotypes were resolved (Table 1). Thirty-two (NCBI Accession numbers AF326789-326824) of these haplotypes had beenpreviously identified in LeDuc et al. (2002). The frequency of each haplotype in thedefined strata (including Barrow) is shown in Table 2. Nineteen haplotypes wereshared between the North and the PCFG strata, with four haplotypes found only inthe PCFG. For all strata, many haplotypes were found in only one individual (n = 13haplotypes in the North, n = 12 haplotypes in Chukotka, and n = 8 haplotypes in thePCFG, including three of the haplotypes found only in the PCFG). Haplotype diver-sity (h) was high in all strata defined for the analysis (0.945–0.953). Nucleotidediversity (p) was also similar among the three defined strata (0.0144–0.0154). Themedian-joining network shows the relationship among mtDNA haplotypes and their
LANG ET AL.: ENP GRAYWHALE STOCK STRUCTURE 9
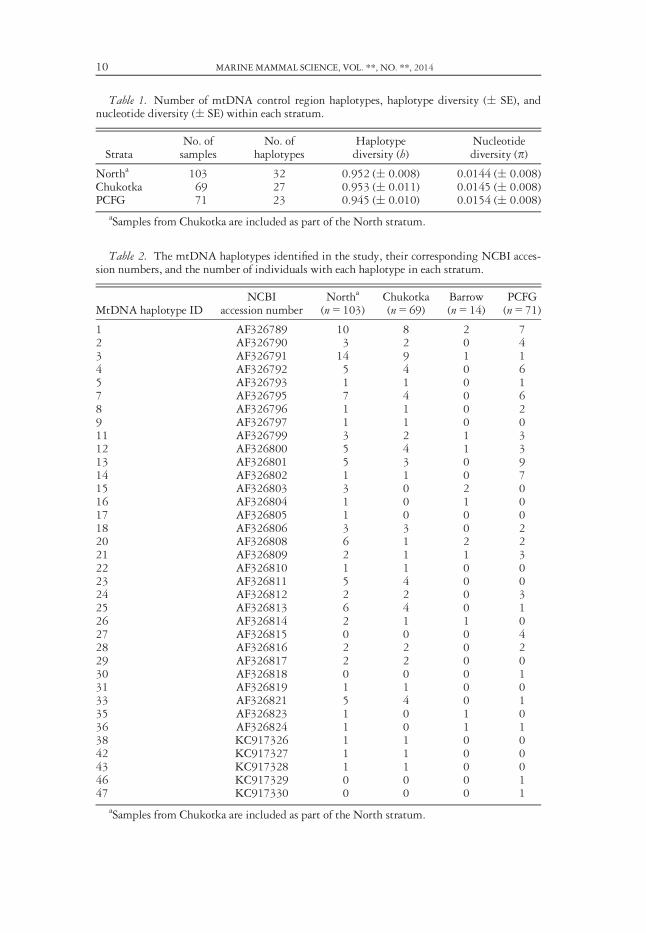
Table 1. Number of mtDNA control region haplotypes, haplotype diversity (� SE), andnucleotide diversity (� SE) within each stratum.
StrataNo. ofsamples
No. ofhaplotypes
Haplotypediversity (h)
Nucleotidediversity (p)
Northa 103 32 0.952 (� 0.008) 0.0144 (� 0.008)Chukotka 69 27 0.953 (� 0.011) 0.0145 (� 0.008)PCFG 71 23 0.945 (� 0.010) 0.0154 (� 0.008)
aSamples from Chukotka are included as part of the North stratum.
Table 2. The mtDNA haplotypes identified in the study, their corresponding NCBI acces-sion numbers, and the number of individuals with each haplotype in each stratum.
MtDNA haplotype IDNCBI
accession numberNortha
(n = 103)Chukotka(n = 69)
Barrow(n = 14)
PCFG(n = 71)
1 AF326789 10 8 2 72 AF326790 3 2 0 43 AF326791 14 9 1 14 AF326792 5 4 0 65 AF326793 1 1 0 17 AF326795 7 4 0 68 AF326796 1 1 0 29 AF326797 1 1 0 011 AF326799 3 2 1 312 AF326800 5 4 1 313 AF326801 5 3 0 914 AF326802 1 1 0 715 AF326803 3 0 2 016 AF326804 1 0 1 017 AF326805 1 0 0 018 AF326806 3 3 0 220 AF326808 6 1 2 221 AF326809 2 1 1 322 AF326810 1 1 0 023 AF326811 5 4 0 024 AF326812 2 2 0 325 AF326813 6 4 0 126 AF326814 2 1 1 027 AF326815 0 0 0 428 AF326816 2 2 0 229 AF326817 2 2 0 030 AF326818 0 0 0 131 AF326819 1 1 0 033 AF326821 5 4 0 135 AF326823 1 0 1 036 AF326824 1 0 1 138 KC917326 1 1 0 042 KC917327 1 1 0 043 KC917328 1 1 0 046 KC917329 0 0 0 147 KC917330 0 0 0 1
aSamples from Chukotka are included as part of the North stratum.
10 MARINE MAMMAL SCIENCE, VOL. **, NO. **, 2014
frequency in each stratum (Fig. 2). MtDNA haplotypes from both Chukotka and thePCFG are dispersed throughout the network, and no phylogeographic pattern wasapparent.A summary of nuclear diversity for each microsatellite locus is shown in Table S2.
Measures of nuclear diversity for each stratum after averaging across loci are shown inTable 3. As in the comparisons of mtDNA haplotype and nucleotide diversity,nuclear diversity was similar across all strata. Nine alleles were found only amongwhales that were part of the North stratum (six of these were from Chukotka), andthree alleles were identified only among PCFG whales.
Figure 2. Median-joining network showing relationships among the mtDNA haplotypes.The numbers next to the nodes correspond to the haplotype IDs listed in Table 4. The size ofthe nodes is proportional to the frequencies of the haplotypes, and each node is shaded to indi-cate the fraction of individuals with that haplotype from each strata. The small black diamonds(unlabeled) indicate haplotypes that were inferred by the program but were not found amongour samples. The length of lines connecting nodes is proportional to the inferred number ofmutations separating haplotypes; for all haplotypes separated by more than one mutation, hashmarks are used to represent the number of mutational events.
Table 3. Estimates of the number of alleles, observed heterozygosity (Ho), and expectedheterozygosity (He) averaged across loci within each stratum for the microsatellite data. Thegenotypes of two samples that were used in the mtDNA analysis were removed because theyamplified for ≤8 loci.
Strata No. of samples Mean number of alleles Mean Ho Mean He
Northa 105 8.75 0.72 0.73Chukotka 70 8.33 0.73 0.73PCFG 70 8.00 0.74 0.73
aSamples from Chukotka are included as part of the North stratum.
LANG ET AL.: ENP GRAYWHALE STOCK STRUCTURE 11
Sex Ratio
All strata were comprised of more females than males, with ratios of 1.4 femalesper male in each stratum (Table S3). This female bias is similar to that (1.47 femalesper male) described in Frasier et al. (2011). Although the female bias was not signifi-cantly different from the expected 1:1 ratio in any of the strata, when all sampleswere combined the female bias was significantly different from parity (v2 = 5.43,P < 0.05).
Genetic Structure
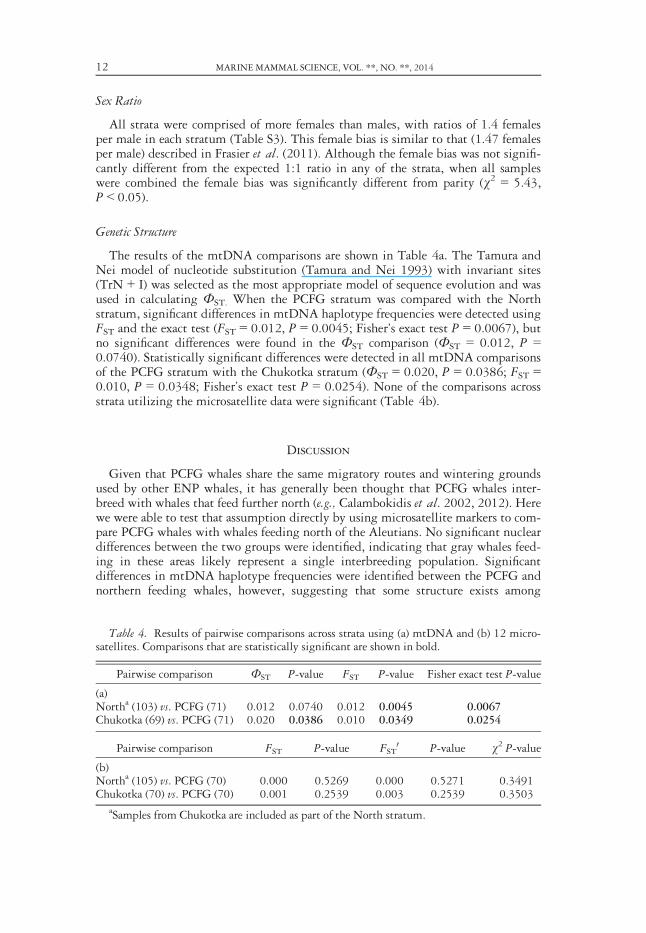
The results of the mtDNA comparisons are shown in Table 4a. The Tamura andNei model of nucleotide substitution (Tamura and Nei 1993) with invariant sites(TrN + I) was selected as the most appropriate model of sequence evolution and wasused in calculating ФST. When the PCFG stratum was compared with the Northstratum, significant differences in mtDNA haplotype frequencies were detected usingFST and the exact test (FST = 0.012, P = 0.0045; Fisher’s exact test P = 0.0067), butno significant differences were found in the ФST comparison (ФST = 0.012, P =0.0740). Statistically significant differences were detected in all mtDNA comparisonsof the PCFG stratum with the Chukotka stratum (ФST = 0.020, P = 0.0386; FST =0.010, P = 0.0348; Fisher’s exact test P = 0.0254). None of the comparisons acrossstrata utilizing the microsatellite data were significant (Table 4b).
Discussion
Given that PCFG whales share the same migratory routes and wintering groundsused by other ENP whales, it has generally been thought that PCFG whales inter-breed with whales that feed further north (e.g., Calambokidis et al. 2002, 2012). Herewe were able to test that assumption directly by using microsatellite markers to com-pare PCFG whales with whales feeding north of the Aleutians. No significant nucleardifferences between the two groups were identified, indicating that gray whales feed-ing in these areas likely represent a single interbreeding population. Significantdifferences in mtDNA haplotype frequencies were identified between the PCFG andnorthern feeding whales, however, suggesting that some structure exists among
Table 4. Results of pairwise comparisons across strata using (a) mtDNA and (b) 12 micro-satellites. Comparisons that are statistically significant are shown in bold.
Pairwise comparison ФST P-value FST P-value Fisher exact test P-value
(a)Northa (103) vs. PCFG (71) 0.012 0.0740 0.012 0.0045 0.0067Chukotka (69) vs. PCFG (71) 0.020 0.0386 0.010 0.0349 0.0254
Pairwise comparison FST P-value FST0 P-value v2 P-value
(b)Northa (105) vs. PCFG (70) 0.000 0.5269 0.000 0.5271 0.3491Chukotka (70) vs. PCFG (70) 0.001 0.2539 0.003 0.2539 0.3503
aSamples from Chukotka are included as part of the North stratum.
12 MARINE MAMMAL SCIENCE, VOL. **, NO. **, 2014
feeding grounds used by ENP gray whales. Within the PCFG, this finding is concor-dant with photo-identification records that indicate that many animals first identifiedas calves return to the PCFG feeding area in subsequent years (Calambokidis et al.2012). When combined, these findings are consistent with the second proposedhypothesis, and suggest that while mating is random with respect to feeding groundaffiliation, utilization of feeding areas is influenced by internal recruitment.The results of our mtDNA comparisons are similar to those presented in Frasier
et al. (2011), who also found evidence of maternally driven structure when comparingsamples from whales that were considered to represent the PCFG with a sample setcomprised primarily of animals that stranded along the migratory route in the ENP.All of the samples utilized in the Frasier et al. (2011) study to represent the PCFGwere collected from whales in Clayoquot Sound, which is located off the central westcoast of Vancouver Island, British Columbia. In contrast, 89% of the samples repre-senting the PCFG in this study were collected from animals in the waters off north-ern California, Oregon, and Washington, with only 12 samples (11%) collected offsouthern Vancouver Island. While the majority of PCFG whales photographed offsouthern Vancouver Island (52%) and northern Washington (60%) have also beensighted off western Vancouver Island, interchange between more distant areas (e.g.,comparison of northern California and western Vancouver Island) has been docu-mented less frequently (Calambokidis et al. 2012). In addition, while some whalesare known to move throughout the range of the PCFG, sightings of other whales areconcentrated within subareas (Calambokidis et al. 2012), suggesting that individualgray whales may not use the range of the PCFG randomly. Thus while there is likelyoverlap among the individuals sampled in Frasier et al. (2011) and the current study,neither represents random sampling across the range of the PCFG. In the future, thecollection of additional samples from whales in the northern portion of the PCFGrange and/or integration of our sample set with that utilized by Frasier et al. (2011)would provide more evenly distributed sample coverage throughout the range of thePCFG and could provide insight into whether additional substructuring within thePCFG exists.Despite the fact that the estimated abundance of the PCFG is roughly 1% of that
of the ENP population as a whole, the haplotype diversity identified in the PCFG issimilar to that found among strata representing the larger ENP population. Thishigh haplotype diversity seems inconsistent with what might be expected if thePCFG was founded by a small number of individuals and has remained isolated (e.g.,all recruitment into the group is internal) for many generations. Under such a sce-nario, the mtDNA haplotypes carried by founders that were males or nonreproducingfemales would be lost over time, while haplotypes found in successfully reproducingfemales and their returning offspring would build to higher frequencies, resulting inreduced haplotype diversity in the group. However, the mtDNA haplotype diversityfound within the PCFG, as well as the significant but relatively low level of mtDNAdifferences identified between the PCFG and northern feeding whales, could suggestthat colonization of the PCFG range occurred relatively recently. Under this scenario,strong mtDNA differences between PCFG whales and individuals feeding furthernorth may have had insufficient time to develop, and the number and distribution ofhaplotypes in the PCFG would not have been strongly affected by genetic drift. Littleis known about the history and origin of the PCFG. Gray whales have been recordedfeeding in the southern portion of the PCFG range as early as 1926, when a singlegray whale, which was reported to have been feeding with four other whales, wastaken by the Trinidad whaling station off the entrance to the Crescent City Harbor
LANG ET AL.: ENP GRAYWHALE STOCK STRUCTURE 13
in July (Howell and Huey 1930). Additional sightings of whales within the PCFGrange during summer and fall were reported in the 1940s, 50s, and 60s (Gilmore1960, Pike and MacKaskie 1969, Rice and Wolman 1971). The repeated return ofindividual whales to the area was first documented starting in the 1970s (Hatlerand Darling 1974, Darling 1984). This time period marked the beginning ofphoto-identification studies for gray whales, and thus it is unknown if fidelity to thePCFG area occurred prior to this time or if the sightings recorded earlier were of ani-mals that only visited the area during a single feeding season.It is unclear what oceanographic conditions would have been present during the
last century that would have precipitated use of the PCFG feeding area. Pyenson andLindberg (2011) reconstructed the carrying capacity of gray whales over the past120,000 yr by quantifying what feeding habitats would have been available duringthat time. They hypothesized that gray whales survived glacial fluctuations duringthe Pleistocene by employing generalist filter-feeding strategies that allowed them totake advantage of alternative food sources and feeding areas, similar to foraging strat-egies and areas used by PCFG whales today (e.g., Darling et al. 1998, Dunham andDuffus 2001). More recently, access to the Bering Sea feeding areas would have beenlimited by heavy ice during parts of the “Little Ice Age” (ca. 1450–1850). Even if thePCFG seasonal range was colonized prior to the start of commercial whaling, thisgroup of animals may have been greatly depleted or eliminated prior to the end ofcommercial whaling. Thus, it is plausible that the PCFG range may have been colo-nized multiple times in the past as a response to environmental changes and/or todepletion due to whaling.The low level of mtDNA differentiation and high diversity are also consistent with
a scenario in which matrilineal fidelity plays a role in determining use of the PCFGarea but in which external recruitment also occurs. Given that the migratory routefor whales traveling to the northern feeding ground(s) passes through the PCFGrange, such recruitment could take place if migrating whales encounter a productivesource of food within the PCFG range, remain in the area for the remainder of theseason, and return in subsequent years (Calambokidis et al. 2002, 2012). Externalrecruitment would slow the accumulation of genetic differences between PCFGwhales and individuals feeding further north. Also, external recruits (at least initially)would likely carry haplotypes not previously identified among PCFG individuals,increasing the number and diversity of haplotypes found as well as the proportion ofhaplotypes currently shared between the PCFG and the animals feeding north of theAleutians. Examination of the photo-identification data provides some informationrelevant to evaluating whether external recruitment into the PCFG could be occur-ring. Although photo-identification studies of the PCFG started in the early 1970s(Hatler and Darling 1977, Darling 1984), consistent efforts covering a larger portionof the PCFG seasonal range did not begin until 1998 (Calambokidis et al. 2012).Between 1998 and 2010, “new” (i.e., previously unidentified) noncalf whales contin-ued to be identified in the PCFG area each year, and many of these whales returned tothe area in subsequent years (mean = 11 whales per year, 2002–2009, northern Cali-fornia to northern British Columbia; Calambokidis et al. 2012). It is unknown whatproportion of these new whales could be immigrants into the group (e.g., externalrecruits) and what proportion may be animals that were internally recruited but werenot identified as calves during their first year (e.g., “missed calves”). Although thenumber of calves identified on the PCFG range each year is low (mean = 3 calves peryear, range 0–9, 2002–2009, northern California to northern British Columbia),calves may wean from their mothers as early as June or July, making them difficult to
14 MARINE MAMMAL SCIENCE, VOL. **, NO. **, 2014
identify as calves (vs. yearlings or young animals) and leading to underestimates ofthe number of calves present (Calambokidis et al. 2012). Indices of gray whale calfproduction based on estimates of the number of northbound calves past Piedras Blan-cas, California, are highly variable and averaged 4.3% (calf estimate/total populationestimate, range 1.55%–6.8%) between 1994 and 2000 (Perryman et al. 2002). Theseestimates are likely high relative to the total number of gray whale calves that survivethe full migration, as mortality of calves due to killer whale predation is known tooccur in areas north of Piedras Blancas, including Monterey Bay, California (see sum-maries in Jefferson et al. 1991, Ford and Reeves 2008), an area that both PCFG andENP whales traverse while migrating. While it is unknown how these estimatesrelate to calf production among PCFG whales, applying these indices to a group of200 animals would result in a mean of 9 calves per year (range 3–13 calves per year).In addition, comparison of nine whales photographed off Barrow, Alaska in 2006
and 2010 with the photo-identification catalog of animals identified within thePCFG range resulted in two matches (Calambokidis et al. 2012). One of these ani-mals was photographed off Vancouver Island during March on a single occasion andthus may have been migrating through the area and would not be considered part ofthe PCFG. The second animal, however, had previously been sighted in multipleyears during summer/fall in the PCFG area. While the significance of this match isdifficult to interpret given the limited photo-identification data available from Bar-row, it does indicate that at least this one individual has utilized more than one feed-ing ground during its lifespan.Based on the genetic results presented here, it is not possible to determine the
extent of immigration into the PCFG that could occur while still allowing mtDNAdifferences to be detected. While dispersal can be indirectly estimated from FST val-ues (Wright 1931), the assumptions (e.g., equal population sizes, equilibrium) of theunderlying model are unlikely to be valid in wild populations (Whitlock and McCau-ley 1999). In addition, if the PCFG was isolated from the rest of the ENP populationin the past, then the underlying level of genetic divergence would be related to thelength of time the two groups had been separated and their effective sizes (Nei andChakravarti 1977). As the underlying level of genetic divergence increases, theamount of recent immigration that could occur without obscuring the signal ofmtDNA differentiation also increases. This highlights the fact that there are multiplescenarios (e.g., colonization histories, number of founders, and immigration rates) thatcould lead to the pattern of mtDNA differentiation seen in the comparisons of thePCFG and the ENP samples. Given the information that is currently available, weare not able to discriminate among these possibilities.A remaining question is whether additional structure exists within the northern
feeding area. If there is no structure on the feeding grounds north of the Aleutians,then the northern strata (both “North” and “Chukotka”) could be considered repre-sentative of the genetic diversity of whales feeding throughout the northern feedingarea and the mtDNA differences observed here would be driven by fidelity of individ-uals to the PCFG seasonal range. However, if structuring is present among northernfeeding areas, then the differences demonstrated here may be influenced by fidelityof individuals in either or both areas (PCFG and Chukotka). While the results ofphoto-identification studies of the PCFG are consistent with the occurrence of someinternal recruitment, the collection of additional samples from northern feeding areaswould be valuable in further elucidating the mechanisms creating the observed differ-ences and in evaluating whether structuring is present among whales utilizing thenorthern feeding grounds.
LANG ET AL.: ENP GRAYWHALE STOCK STRUCTURE 15
Implications for Management
Understanding recruitment into the PCFG is relevant to management under theMarine Mammal Protection Act (MMPA). The goal of the MMPA is to maintainpopulation stocks as functioning elements of their ecosystem. The National MarineFisheries Service (2005) considers stocks to be demographically independent units,such that the population dynamics of the affected group is more a consequence ofbirths and deaths within the group (internal dynamics) rather than of immigration oremigration (external dynamics). This definition is similar to that described for man-agement units by Palsbøll et al. (2007) and for a population under the ecological par-adigm by Waples and Gaggiotti (2006).Traditionally, the most commonly used approach to evaluate demographic inde-
pendence using genetic data has been null hypothesis testing, in which significantdivergence of allele frequencies between groups is considered evidence supporting thedelineation of separate management units (Moritz 1994). This approach assumes thatif the migration rate is large enough to lead to demographic dependence, then geneticcomparisons will not be able to reject the null hypothesis. Under this criterion, ourfindings support recognition of the PCFG of gray whales as demographically inde-pendent based on the significant differences in mtDNA between the PCFG andwhales feeding further north.Critical to our understanding of whether two groups are demographically indepen-
dent, however, is the rate of dispersal between them. As noted in Waples and Gag-giotti (2006), there is no general framework for determining at what dispersal ratepopulations become demographically correlated, although it has been suggested thatdemographic correlation occurs when the proportion of immigrants in a group isgreater than 10% (Hastings 1993). However, simulations have shown that, at least incases where multiple microsatellite loci are used, it may be possible to reject pan-mixia even when dispersal rates are higher than this level (Palsbøll et al. 2006, Wa-ples and Gaggiotti 2006). These results suggest that while genetic comparisons likethose conducted here can provide insight into demographic connectivity, they shouldbe interpreted carefully and integrated with other available information on thedemography of the groups being considered (Lowe and Allendorf 2010).When the significant mtDNA differences identified between the PCFG and the
northern feeding strata are put into context with the other available evidence, ques-tions arise about the balance between internal recruitment and external immigration.The significant mtDNA differences, as well as the observations of animals first identi-fied as calves returning to the PCFG (Calambokidis et al. 2012), indicate that inter-nal recruitment into the group occurs. However, the low level of mtDNA differencesidentified, the similarity in haplotype diversities between the PCFG and other groupsthought to represent the larger ENP population, and the continued identification of“new” whales each year (Calambokidis et al. 2012) suggest that external immigrationinto the group may also be taking place. While other explanations (e.g., recent coloni-zation and a high rate of “missed” calves) exist that could be consistent with demo-graphic independence of the PCFG, discriminating between these explanations is notcurrently possible.Although uncertainty remains, our results indicate that it is plausible that the
PCFG represents a demographically independent group and suggest that cautionshould be used when evaluating the potential impacts of the proposed Makah harveston this group of animals. Continued monitoring of the PCFG, including thecollection of additional photographs and genetic samples, is warranted. Future work
16 MARINE MAMMAL SCIENCE, VOL. **, NO. **, 2014
should focus on estimating dispersal rates and levels of internal recruitment in thePCFG. The lack of differentiation in nuclear markers identified in our study limitsthe use of some approaches (e.g., assignment tests) commonly used to estimate dis-persal. However, with the collection of additional samples from PCFG whales, a par-entage-based approach, similar to that used by Peery et al. (2008), may be valuable indocumenting internal recruitment into the group and thus in assessing the demo-graphic independence of the PCFG.
Acknowledgments
This work was supported by the Southwest Fisheries Science Center, National Marine Fish-eries Service, National Oceanic and Atmospheric Administration; the Northwest RegionalOffice, National Marine Fisheries Service, National Oceanic and Atmospheric Administration;and by a Species Recovery Grant to Tribes. Samples utilized in this project were collectedunder MMPA permit #14097 granted to the Southwest Fisheries Science Center, permit#14366 granted to the National Marine Mammal Laboratory, permit #540-1811 granted toJohn Calambokidis of Cascadia Research Collective, permit # 369-1757 granted to Bruce Mateof Oregon State University, and permit #38 granted by the Russian agency Rosprirodnadzorto the Kamchatka Branch of the Pacific Geographical Institute of Russian Academy of Scienceson 6 April 2010. Samples collected in Russian waters were imported under CITES permit#1OUS77422319, held by the Southwest Fisheries Science Center. We thank Robin Aberna-thy, Billy Adams, Russ Andrews, Eric Archer, Amanda Bowman, Nicky Beaulieu, ValentinaBurkanov, Douglas Coleman, Dominick DeBari, Louella Dolar, Graeme Ellis, John Ford, GaryFriedrichsen, J. Craig George, Brian Gisborne, Dawn Goley, Merrill Gosho, Ernie Grimes, JeffHarris, Jason Herreman, Barb Lagerquist, Rikki Manuel, Jeremiah Minich, Michael Murner,Carrie Newell, Sean Oliver, Nate Pamplin, Joe Scordino, Gaby Serra-Valente, Mikhail Shle-mov, Tatiana Shulezhko, Debbie Steele, Rod Towell, Andrey Tretyakov, Paul Wade, and GinaYlitalo for their assistance with sample collection, sample contribution, or data generation andanalysis. John Bickham, Bob Brownell, Donna Darm, Karen Martien, Bill Perrin, PatriciaRosel, Steve Stone, Dave Weller, and three anonymous reviewers provided helpful commentsfor improving the manuscript. Some of the work presented here was conducted as part of aNational Research Council Postdoctoral Fellowship.
Literature Cited
Bandelt, H.-J., P. Forster and A. R€ohl. 1999. Median-joining networks for inferringintraspecific phylogenies. Molecular Biology and Evolution 16:37–48.
Benjamini, Y., and Y. Hochberg. 1995. Controlling the false discovery rate: A practical andpowerful approach to multiple testing. Journal of the Royal Statistical Society Series B57:289–300.
Brownstein, M. J., J. D. Carpten and J. R. Smith. 1996. Modulation of nontemplatednucleotide addition by Taq DNA polymerase: Primer modifications that facilitategenotyping. Biotechniques 20:1004–1010.
Calambokidis, J., J. D. Darling, V. Deecke, et al. 2002. Abundance, range and movements of afeeding aggregation of gray whales (Eschrichtius robustus) from California to southeasternAlaska in 1998. Journal of Cetacean Research and Management 4:267–276.
Calambokidis, J., J. L. Laake and A. Klimek. 2012. Updated analysis of abundance andpopulation structure of seasonal gray whales in the Pacific Northwest, 1998–2010. PaperSC/M12/AWMP2 presented to the International Whaling Commission ScientificCommittee. Available at http://www.iwcoffice.co.uk/_documents/sci_com/workshops/AWMP3/SC_M12_AWMP2-Rev.pdf.
LANG ET AL.: ENP GRAYWHALE STOCK STRUCTURE 17
Carretta, J. V., E. Oleson and D. W. Weller, et al. 2013. U. S. Pacific marine mammal stockassessment: 2012. U. S. Department of Commerce, NOAA Technical Memorandum,NMFS-SWFSC-504. 55 pp.
Chivers, S. J., R. G. LeDuc, K. M. Robertson, N. B. Barros and A. E. Dizon. 2005. Geneticvariation of Kogia spp., with preliminary evidence for two species of Kogia sima. MarineMammal Science 21:619–634.
Clapham, P. J., and C. A. Mayo. 1987. Reproduction and recruitment of individuallyidentified humpback whales, Megaptera novaeangliae, observed in Massachusetts Bay,1979–1985. Canadian Journal of Zoology 65:2853–2863.
Clapham, P. J., A. Aguilar and L. T. Hatch. 2008. Determining spatial and temporal scalesfor management: Lessons from whaling. Marine Mammal Science 24:183–201.
Darling, J. D. 1984. Gray whales (Eschrichtius robustus) off Vancouver Island, BritishColumbia. Pages 267–287 inM. L. Jones, S. L. Swartz and S. Leatherwood, eds. The graywhale. Academic Press Inc., Orlando, FL.
Darling, J. D., K. E. Keogh and T. E. Steeves. 1998. Gray whale (Eschrichtius robustus) habitatutilization and prey species off Vancouver Island, BC. Marine Mammal Science 14:692–720.
Darriba, D., G. L. Taboada, R. Doalla and D. Posada. 2012. jModelTest 2: More models, newheuristics and parallel computing. Nature Methods 9:772–772.
Dunham, J. S., and D. A. Duffus. 2001. Foraging patterns of gray whales in central ClayoquotSound, British Columbia, Canada. Marine Ecology Progress Series 223:299–310.
Excoffier, L., P. E. Smouse and J. M. Quattro. 1992. Analysis of molecular variance inferredfrom metric distances among DNA haplotypes: Application to human mtDNArestriction data. Genetics 131:479–491.
Excoffier, L., G. Larval and S. Schneider. 2005. Arlequin ver. 3.0: An integrated softwarepackage for population genetic data analysis. Evolutionary Bioinformatics Online 1:47–50.
Ford, J. K. B., and R. R. Reeves. 2008. Fight or flight: Antipredator strategies of baleenwhales. Mammal Review 38:50–86.
Frasier, T. R., S. M. Koroscil, B. N. White and J. D. Darling. 2011. Assessment of populationsubstructure in relation to summer feeding ground use in the eastern North Pacific graywhale. Endangered Species Research 14:39–48.
Gilmore, R. M. 1960. A census of the California gray whale. U.S. Fish and Wildlife ServiceSpecial Scientific Report 342:1–30.
Guindon, S., and O. Gascuel. 2003. A simple, fast and accurate algorithm to estimate largephylogenies by maximum likelihood. Systematic Biology 52:696–704.
Guo, S. W., and E. A. Thompson. 1992. Performing the exact test of Hardy-Weinbergproportion for multiple alleles. Biometrics 48:361–372.
Hastings, A. 1993. Complex interactions between dispersal and dynamics: Lessons fromcoupled logistic equations. Ecology 74:1362–1372.
Hatler, D. F., and J. D. Darling. 1974. Recent observations of the gray whale Eschrichtiusrobustus in British Columbia. The Canadian Field-Naturalist 88:449–460.
Hedrick, P. 2005. A standardized genetic differentiation measure. Evolution 59:1633–1638.Howell, A. B., and L. M. Huey. 1930. Food of the gray and other whales. Journal of
Mammalogy 11:321–322.IWC (International Whaling Commission). 2011a. Report of the Scientific Committee,
Annex E: Report of the Standing Working Group on the Aboriginal WhalingManagement Plan. Journal of Cetacean Research and Management (Supplement) 12.
IWC (International Whaling Commission). 2011b. Annex D of the Report of the 2011AWMP workshop with a focus on eastern gray whales. SC/63/Report 2 presented to theInternational Whaling Commission Scientific Committee. Available at http://iwc.int/sc63docs.
IWC (International Whaling Commission). 2012. Report of the Scientific Committee.Journal of Cetacean Research and Management (Supplement) 13.
18 MARINE MAMMAL SCIENCE, VOL. **, NO. **, 2014
Jefferson, T. A., P. J. Stacey and R. W. Baird. 1991. A review of killer whale interactions withother marine mammals: Predation to co-existence. Mammal Review 21:151–180.
Laake, J., A. Punt, R. Hobbs, M. Ferguson, D. Rugh and J. Breiwick. 2009. Re-analysis ofgray whale southbound migration surveys 1967-2006. U.S. Department of Commerce,NOAA Technical Memorandum, NMFS-AFSC-203. 55 pp.
LeDuc, R. G., D. W. Weller, J. Hyde, et al. 2002. Genetic differences between western andeastern gray whales (Eschrichtius robustus). Journal of Cetacean Research and Management4:1–5.
Lowe, W. H., and F. W. Allendorf. 2010. What can genetics tell us about populationconnectivity? Molecular Ecology 19:3038–3051.
Meirmans, P. G. 2006. Using the AMOVA framework to estimate a standardized geneticdifferentiation measure. Evolution 60:2399–2402.
Miller, S. A., D. D. Dykes and H. F. Polesky. 1988. A simple salting out protocol forextracting DNA from human nucleated cells. Nucleic Acid Research 16:1215.
Morin, P. A., A. Nestler, N. T. Rubio-Cisneros, K. M. Robertson and S. L. Mesnick. 2005.Interfamilial characterization of a region of the ZFX and ZFY genes facilitates sexdetermination in cetaceans and other mammals. Molecular Ecology 14:3275–3286.
Morin, P. A., K. K. Martien, F. I. Archer, F. Cipriano, D. Steel, J. Jackson and B. L. Taylor.2010. Applied conservation genetics and the need for quality control and reporting ofgenetic data used in fisheries and wildlife management. Journal of Heredity 101:1–10.
Moritz, C. 1994. Defining ‘Evolutionarily Significant Units’ for conservation. Trends inEcology and Evolution 9:373–375.
Nei, M. 1987. Molecular evolutionary genetics. Columbia University Press, New York, NY.Nei, M., and A. Chakravarti. 1977. Drift variances of FST and GST statistics obtained from a
finite number of isolated populations. Theoretical population biology 11:307–325.Nei, M., and A. K. Roychoudhury. 1974. Sampling variances of heterozygosity and genetic
distance. Genetics 76:379–390.National Marine Fisheries Service. 2005. Revisions to guidelines for assessing marine mammal
stocks. 24 pp. Available at http://www.nmfs.noaa.gov/pr/pdfs/sars/gamms2005.pdf.Paetkau, D., and C. Strobeck. 1994. Microsatellite analysis of genetic variation in black bear
populations. Molecular Ecology 3:489–495.Palsbøll, P. J., M. Berube, A. H. Larsen and H. Jorgensen. 1997. Primers for the amplification
of tri and tetramer microsatellite loci in baleen whales. Molecular Ecology 6:893–895.Palsbøll, P. J., M. Berube and F. W. Allendorf. 2007. Identification of management units
using population genetic data. Trends in Ecology and Evolution 22:11–16.Palumbi, S. R., A. P. Martin, S. Romero, W. O. Mcmillan, L. Stice and G. Grawboski. 1991.
The simple fool’s guide to PCR version 2.0. University of Hawaii, Honolulu, HI.Park, S. D. E. 2001. Trypanotolerance in West African cattle and the population genetic
effects of selection. Ph.D. thesis, University of Dublin, Dublin, Ireland.Peery, M. Z., S. R. Beissinger, R. F. House, M. Berube, L. A. Hall, A. Sellas and P. J. Palsbøll.
2008. Characterizing source-sink dynamics with genetic parentage assignments. Ecology89:2746–2759.
Perryman, W. L., M. A. Donahue, P. C. Perkins and S. B. Reilly. 2002. Gray whale calfproduction 1994–2000: Are observed fluctuations related to changes in seasonal icecover? Marine Mammal Science 18:121–144.
Pike, G. C. 1962. Migration and feeding of the gray whale (Eschrichtius gibbosus). Journal of theFisheries Research Board of Canada 19:815–838.
Pike, G. C., and I. B. McCaskie. 1969. Marine mammals of British Columbia. Bulletin of theFisheries Research Board Canada 171:1–54.
Posada, D. 2008. jModelTest: Phylogenetic model averaging. Molecular Biology andEvolution 25:1253–1256.
Pyenson, N. D., and D. R. Lindberg. 2011. What happened to gray whales during thePleistocene? The ecological impact of sea-level change on benthic feeding areas in theNorth Pacific Ocean. PLOS One 6:e21295.
LANG ET AL.: ENP GRAYWHALE STOCK STRUCTURE 19
R Development Core Team. 2009. R: A language and environment for statistical computing.R Foundation for Statistical Computing, Vienna, Austria.
Ramakrishnan, U., and B. L. Taylor. 2001. Can gray whale management units be assessedusing mitochondrial DNA? Journal of Cetacean Research and Management 3:13–18.
Raymond, M., and F. Rousset. 1995. An exact test for population differentiation. Evolution49:1280–1283.
Rice, D. W., and A. A. Wolman. 1971. The life history and ecology of the gray whale(Eschrichtius robustus). The American Society of Mammalogists, Special Publication No.3.
Richard, K. R., H. Whitehead and J. M. Wright. 1996. Polymorphic microsatellites fromsperm whales and their use in the genetic identification of individuals from naturallysloughed pieces of skin. Molecular Ecology 5:313–315.
Rosel, P. E., A. E. Dizon and J. E. Heyning. 1994. Genetic analysis of sympatric morphotypesof common dolphins (genus Delphinus). Marine Biology 119:159–167.
Rousset, F. 2008. Genepop’007: A complete reimplementation of the Genepop software forWindows and Linux. Molecular Ecology Resources 8:103–106.
Rousset, F., and M. Raymond. 1995. Testing heterozygote excess and deficiency. Genetics140:1413–1419.
Rugh, D. J., K. E. W. Sheldon and A. Shulman-Janiger. 2001. Timing of the gray whalesouthbound migration. Journal of Cetacean Research and Management 3:31–39.
Saiki, R. K., D. H. Gelfand, S. Stoffle, et al. 1988. Primer-directed amplification of DNA witha thermostable DNA polymerase. Science 239:487–491.
Steeves, T. E., J. D. Darling, P. E. Rosel, C. M. Schaeff and R. C. Fleischer. 2001. Preliminaryanalysis of mitochondrial DNA variation in a southern feeding group of eastern NorthPacific gray whales. Conservation Genetics 2:379–384.
Tamura, K., and M. Nei. 1993. Estimation of the number of nucleotide substitutions in thecontrol region of mitochondrial-DNA in humans and chimpanzees. Molecular Biologyand Evolution 10:512–526.
Valenzuela, L. O., M. Sironi, V. J. Rowntree and J. Seger. 2009. Isotopic and genetic evidencefor culturally inherited site fidelity to feeding grounds in southern right whales(Eubalaena australis). Molecular Ecology 18:782–791.
Valsecchi, E., and W. Amos. 1996. Microsatellite markers for the study of cetaceanpopulations. Molecular Ecology 5:151–156.
Waits, L. P., G. Luikart and P. Taberlet. 2001. Estimating the probability of identity amonggenotypes in natural populations: Cautions and guidelines. Molecular Ecology 10:249–256.
Waldick, R. C., M. W. Brown and B. N. White. 1999. Characterization and isolation ofmicrosatellite loci from the endangered North Atlantic right whale. Molecular Ecology8:1763–1765.
Waples, R. S., and O. E. Gaggiotti. 2006. What is a population? An empirical evaluation ofsome genetic methods for identifying the number of gene pools and their degree ofconnectivity. Molecular Ecology 15:1419–1439.
Weir, B. S., and C. C. Cockerham. 1984. Estimating F-statistics for the analysis of populationstructure. Evolution 38:1358–1370.
Whitlock, M. C., and D. E. McCauley. 1999. Indirect measures of gene flow and migration:FST not equal 1/(4Nm + 1). Heredity 82:117–125.
Wilberg, M. J., and B. P. Dreher. 2004. GENECAP: A program for analysis of multilocusgenotype data for non-invasive sampling and capture-recapture population estimation.Molecular Ecology Notes 4:783–785.
Wright, S. 1931. Evolution in Mendelian populations. Genetics 16:97–159.
Received: 24 April 2013Accepted: 31 January 2014
20 MARINE MAMMAL SCIENCE, VOL. **, NO. **, 2014
Supporting Information
The following supporting information is available for this article online at http://onlinelibrary.wiley.com/doi/10.1111/mms.12129/suppinfo.Table S1. Samples used in the study, including the SWFSC accession number,
GeneticID, collection method (B = biopsy, H = harvest, S = stranding), date of col-lection, location of collection, strata, and whether the sample was retained in the finalanalysis. Samples were removed because they were considered duplicates (code 1), dueto poor quality (code 2), or because they could not be assigned to a stratum (code 3,which includes whales that were sampled in the PCFG range but did not meet thecriteria for being included in the PCFG stratum). GeneticID represents a uniqueidentifier for individuals, such that samples that were considered to be from the sameindividual were assigned the same GeneticID. The strata specified include: North,CHK (Chukotka), PCFG, and South. Samples considered part of the CHK stratumwere also included in the North stratum in the analyses. The South stratum includessamples collected from whales within the PCFG seasonal range but which did notmeet the criteria for being classified as PCFG whales (see text for further explana-tion).
Table S2. Characteristics of the microsatellite loci used in the study, including thespecies for which primers were initially designed, the size of repeats, the annealingtemperature used in the study (Ta), the reference listing primer sequences, the num-ber of alleles per locus, the proportion of missing genotypes, the expected heterozy-gosity (He), the observed heterozygosity (Ho), and the results of the test forheterozygote deficiency (HWE; Rousset and Raymond 1995).
Table S3. The total number of samples in each stratum, the number of samplesremoved from the study due to poor quality (see criteria described in text), the num-ber of duplicate samples removed, and the number of individuals remaining in eachstratum for each analysis. Duplicate samples (i.e., samples from the same individual)were identified based on genotyping of eight microsatellite loci. Samples collected onthe southern feeding ground but not considered to represent the PCFG (n = 36) arenot included in the table.
LANG ET AL.: ENP GRAYWHALE STOCK STRUCTURE 21