ASSESSING THE SCIENTIFIC INQUIRY PRACTICES OF ...
349
ASSESSING THE SCIENTIFIC INQUIRY PRACTICES OF TEACHERS AND INVESTIGATING THEIR RELATIONSHIP WITH STUDENT LEARNING Dennis L. Danipog MA Chemistry Education AB-BSE Chemistry ORCID iD: https://orcid.org/0000-0002-7939-2312 A thesis submitted in total fulfillment of the requirements for the degree of Doctor of Philosophy December 2018 Melbourne Graduate School of Education The University of Melbourne
-
Upload
khangminh22 -
Category
Documents
-
view
1 -
download
0
Transcript of ASSESSING THE SCIENTIFIC INQUIRY PRACTICES OF ...

ASSESSING THE SCIENTIFIC INQUIRY PRACTICES OF TEACHERS
AND INVESTIGATING THEIR RELATIONSHIP WITH
STUDENT LEARNING
Dennis L. Danipog
MA Chemistry Education AB-BSE Chemistry
ORCID iD: https://orcid.org/0000-0002-7939-2312
A thesis submitted in total fulfillment of the requirements for the degree of
Doctor of Philosophy
December 2018
Melbourne Graduate School of Education
The University of Melbourne

II
Abstract
This study explored the nature of classroom instruction of teachers in the
Philippines, particularly their enactment of specific inquiry-based teaching practices as
they implemented the newly designed Grade 7 chemistry curriculum, and how each
specific practice related to student learning outcomes. Specifically, it examined whether
teachers’ inquiry practices of engaging in questioning, designing and conducting
investigations, collecting data, analyzing data, developing explanations, and
communicating information were related to students’ chemistry achievement. Data were
collected from chemistry tests (pretest and posttest) of 495 Grade 7 students, 57 lesson
observations in 12 classes, and questionnaire responses of ten chemistry teachers. Test
data were analyzed using Rasch (1960) modeling. The relationship between each
practice of scientific inquiry and chemistry achievement was determined using
multilevel modeling with Bayesian estimation. Observations revealed that teachers
enacted the six practices of scientific inquiry in varying degrees in their classrooms.
They seemed to be more comfortable to enact the practices of engaging in questioning
and communicating information than the practices of designing and conducting
investigations, collecting data, analyzing data, and developing explanations in chemistry
teaching. Teacher-centered inquiry instruction was more evident than student-centered
inquiry instruction, which suggests that inquiry in most chemistry classrooms was
structured. The study found that out of six scientific inquiry practices, only engaging in
questioning showed a significant positive relationship with students’ chemistry
achievement. The findings have direct implications for education administrators in
designing professional development programs, as well as science curriculum
development, the teaching of science through inquiry, and future research.

III
Declaration
This is to certify that:
§ the thesis comprises only my original work towards the PhD;
§ due acknowledgement has been made in the text to all other material used; and
§ the thesis is less than 100,000 words in length, exclusive of tables, maps,
bibliographies and appendices.
DENNIS L. DANIPOG

IV
Preface
The chemistry tests (pretest and posttest) used in this study were developed
collaboratively by the researchers of the Assessment, Curriculum and Technology
Research Centre in Manila and the Assessment Research Centre in Melbourne. The
researcher for this study was a member of the Assessment Research Centre test
development team. He was responsible for the development of items on scientific
inquiry, which were designed to match the proposed framework for developing
indicators for inquiry-based teaching.
Dr Masa Pavlovic, Dr Zhonghua Zhang, and Dr Susan-Marie Harding from the
Assessment Research Centre at the University of Melbourne performed the Rasch
analysis of the chemistry tests to determine its psychometric properties. The results of
this analysis were included in this study (see pages 219-225). The researcher for this
study was responsible for interpreting the results of the Rasch analysis and writing up
the findings in Chapter 6.
The Scientific Inquiry Teaching Observation Instrument (SITOI) was developed
by the researcher for this study with the assistance of Dr Susan-Marie Harding and
Professor Esther Care from the Assessment Research Centre and Dr Marlene Ferido
from the University of the Philippines. Dr Susan-Marie Harding and Dr Zhonghua
Zhang guided the analysis procedure for the SITOI.
V
Acknowledgements
I would like to express my sincere thanks and gratitude to:
Associate Professor Suzanne Rice, Dr Zhonghua Zhang, Dr Kerry Woods, Dr
Masa Pavlovic, Dr Susan-Marie Harding, Dr Cuc Nguyen, and Professor Esther Care
for their expertise and critical advice.
Pam Robertson, Dr Marlene Ferido, Dr Rebekah Luo, Pik Yen Lim, Shuntaro
Izuka, Lingfen Zhang, Farhan Azim, and Joel Ballesteros for their valued collegiality
and assistance.
The Assessment Research Centre, Assessment, Curriculum and Technology
Research Centre, and the University of the Philippines for their support.
The Australia Awards Scholarship for the generous financial assistance.
My family for the love and encouragement.
My God for His unconditional love and abundant blessings. All glory and honor
to Him.

VI
Table of Contents
ABSTRACT ................................................................................................................... II DECLARATION .......................................................................................................... III PREFACE ..................................................................................................................... IV ACKNOWLEDGEMENTS .......................................................................................... V TABLE OF CONTENTS ............................................................................................. VI LIST OF TABLES ......................................................................................................... X LIST OF FIGURES ...................................................................................................... XI CHAPTER 1: INTRODUCTION ................................................................................ 1
WHAT IS SCIENTIFIC INQUIRY? ...................................................................................... 4 Constructivism and scientific inquiry ....................................................................... 6
WHAT ARE THE CHALLENGES FACING SCIENTIFIC INQUIRY TEACHING IN THE CLASSROOM? .............................................................................................................. 11 WHAT IS THE NEW BASIC EDUCATION SYSTEM IN THE PHILIPPINES? .......................... 18 RESEARCH QUESTIONS ................................................................................................ 22 SIGNIFICANCE OF THE STUDY ...................................................................................... 23 SCOPE OF THE STUDY .................................................................................................. 24 STRUCTURE OF THIS DISSERTATION ............................................................................ 25
CHAPTER 2: TRACING THE HISTORY OF SCIENTIFIC INQUIRY IN CLASSROOMS ............................................................................................................ 28
HISTORICAL PERSPECTIVES ON SCIENTIFIC INQUIRY IN INTERNATIONAL CLASSROOMS .................................................................................................................................... 28
Scientific inquiry in the 19th century ...................................................................... 29 Scientific inquiry in the 20th century ...................................................................... 31 Scientific inquiry in the period of science curriculum reform movement .............. 35 Scientific inquiry in contemporary times ............................................................... 36
HISTORICAL PERSPECTIVES ON SCIENTIFIC INQUIRY IN PHILIPPINE CLASSROOMS ...... 42 How was scientific inquiry incorporated into pre-tertiary science education in the Philippines? ............................................................................................................ 42 A brief background on K to 12 education reform in the Philippines ..................... 43 How is inquiry incorporated into the K to 12 education reform in the Philippines? ................................................................................................................................ 45
CHAPTER SUMMARY .................................................................................................... 47 CHAPTER 3: REVIEWING WHAT RESEARCH SAYS ABOUT SCIENTIFIC INQUIRY AND HOW IT IS ASSESSED IN CLASSROOMS ................................ 49
HOW IS SCIENTIFIC INQUIRY CHARACTERIZED IN THE RESEARCH LITERATURE? ........ 49 WHAT ARE THE MODELS OF SCIENTIFIC INQUIRY AND THE EVIDENCE OF USING THESE IN CLASSROOM RESEARCH? ........................................................................................ 54
Inquiry in science instructional models .................................................................. 55 Inquiry in science curriculum documents ............................................................... 60 Summary of the foregoing scientific inquiry models identified through research . 65
A REVIEW OF RESEARCH ON SCIENTIFIC INQUIRY IN THE CLASSROOM ....................... 66 How is inquiry implemented in contemporary science classrooms? ...................... 68

VII
What is the evidence that scientific inquiry practices improve student learning? .. 72 MEASURING SCIENTIFIC INQUIRY APPROACHES TO INSTRUCTION ............................... 78
What instruments are available to measure scientific inquiry instruction in science classrooms? ............................................................................................................. 79 What assessments are available to measure students’ learning of science concepts and learning of and about inquiry? ......................................................................... 93 The Rasch model .................................................................................................. 106
CHAPTER SUMMARY .................................................................................................. 110 CHAPTER 4: METHODOLOGY AND SAMPLE ................................................ 113
ASSESSING TEACHERS’ SCIENTIFIC INQUIRY INSTRUCTION ....................................... 113 Development of research instrument .................................................................... 113
The Scientific Inquiry Teaching Observation Instrument (SITOI) .................. 113 Teacher questionnaire ....................................................................................... 123
Ethics .................................................................................................................... 123 Sample recruitment ............................................................................................... 124 Classroom observations ........................................................................................ 125 Teacher questionnaire administration ................................................................... 128 Data analysis procedure ........................................................................................ 129
MEASURING STUDENTS’ LEARNING IN CHEMISTRY ................................................... 137 Development of research instrument .................................................................... 137
The ACTRC chemistry tests ............................................................................. 137 Data collection procedure ..................................................................................... 147
Chemistry tests administrations ........................................................................ 148 Data analysis procedure ........................................................................................ 150
CHAPTER SUMMARY .................................................................................................. 158 CHAPTER 5: ASSESSING TEACHERS’ INQUIRY INSTRUCTION IN CHEMISTRY CLASSROOMS ................................................................................. 160
CHARACTERISTICS OF TEACHERS AND THEIR CLASSROOM SETTINGS ........................ 160 Teacher A ............................................................................................................. 161 Teacher B .............................................................................................................. 163 Teacher C .............................................................................................................. 164 Teacher D ............................................................................................................. 165 Teacher E .............................................................................................................. 166 Teacher F .............................................................................................................. 167 Teacher G ............................................................................................................. 168 Teacher H ............................................................................................................. 169 Teacher I ............................................................................................................... 170 Teacher J ............................................................................................................... 172
COMPONENTS OF SCIENTIFIC INQUIRY ENACTED BY TEACHERS IN CHEMISTRY TEACHING ................................................................................................................. 173
Teacher F: Teacher with most enacted practices related to inquiry ..................... 177 Teacher J: Teacher with fewest enacted practices related to inquiry ................... 180 Teachers B and I: How did they implement inquiry in their two chemistry ........ 182 classes? Did they apply the same teaching approach in their two classes? .......... 182
SPECIFIC CLASSROOM PRACTICES RELATED TO EACH COMPONENT OF INQUIRY ENACTED BY TEACHERS ............................................................................................ 186
Component 1: Engaging in questioning ............................................................... 187

VIII
Component 2: Designing and conducting investigations ..................................... 191 Component 3: Collecting data .............................................................................. 195 Component 4: Analyzing data .............................................................................. 199 Component 5: Developing explanations ............................................................... 203 Component 6: Communicating information ......................................................... 207
CHARACTERIZATION OF INQUIRY IN CHEMISTRY CLASSROOMS ................................ 211 Teacher-centered inquiry practices ....................................................................... 213 Student-centered inquiry practices ....................................................................... 214
CHAPTER SUMMARY .................................................................................................. 216 CHAPTER 6: INVESTIGATING THE RELATIONSHIP BETWEEN TEACHERS’ INQUIRY PRACTICES AND STUDENTS’ LEARNING IN CHEMISTRY .............................................................................................................. 219
RESULTS OF THE RASCH ANALYSIS OF THE ACTRC CHEMISTRY TESTS ................... 219 RESULTS OF THE STUDENT CHEMISTRY TESTS .......................................................... 225 RESULTS OF THE MULTILEVEL MODELING ................................................................ 230
Descriptive statistics of the variables ................................................................... 230 Correlations of the variables ................................................................................. 231
Correlations between predictor variable and student learning in chemistry .... 231 Correlations between predictor variables ......................................................... 233
Two-level unconditional model: No predictor variable ....................................... 234 Two-level model with predictor variables: Pretest score (level 1 predictor) and scientific inquiry practices (level 2 predictors) .................................................... 236 Multivariate multilevel model .............................................................................. 238
Engaging in questioning and student posttest score ......................................... 239 Designing and conducting investigations, collecting data, analyzing data, developing explanations, and communicating information and student posttest score .................................................................................................................. 240
CHAPTER SUMMARY .................................................................................................. 244 CHAPTER 7: CONCLUSIONS AND IMPLICATIONS ....................................... 246
A REVIEW OF THE RESEARCH QUESTIONS OF THE STUDY ......................................... 246 KEY FINDINGS AND CONCLUSIONS ............................................................................ 247
Towards an understanding of teachers’ implementation of inquiry in the challenging teaching and learning environments ................................................. 248 Towards an understanding of the relationship between the specific practices of scientific inquiry implemented by teachers and student learning ......................... 259 Towards a fine-grained assessment of inquiry-based instruction in the science classroom .............................................................................................................. 266
IMPLICATIONS OF THE STUDY .................................................................................... 267 Implications for education administrators ............................................................ 267 Implications for science curriculum development ................................................ 269 Implications for inquiry-based science teaching .................................................. 270 Implications for future research ............................................................................ 271
LIMITATIONS OF THE STUDY ...................................................................................... 272 REFERENCES ........................................................................................................... 274 APPENDICES ............................................................................................................. 317
APPENDIX A .............................................................................................................. 317
IX
Scientific Inquiry Teaching Observation Instrument (SITOI) Version 1 ............. 317 APPENDIX B .............................................................................................................. 319
Scientific Inquiry Teaching Observation Instrument (SITOI) Version 2 ............. 319 APPENDIX C .............................................................................................................. 321
Scientific Inquiry Teaching Observation Instrument (SITOI) Version 3 ............. 321 APPENDIX D .............................................................................................................. 323
Final Version of the Scientific Inquiry Teaching Observation Instrument (SITOI) .............................................................................................................................. 323
APPENDIX E ............................................................................................................... 325 Teacher Questionnaire .......................................................................................... 325
APPENDIX F ............................................................................................................... 327 Consent Forms and Plain Language Statements ................................................... 327
APPENDIX G .............................................................................................................. 335 Sample Coded Lesson Observation Notes ............................................................ 335

X
List of Tables
Table 1. Characteristics of Sample Schools ................................................................. 124 Table 2. Number of Lesson Observations per Class .................................................... 127 Table 3. Junior High School Science Curriculum Focus by Quarter Across Grades ... 140 Table 4. Content of Administered Pretest .................................................................... 145 Table 5. Content of Administered Posttest ................................................................... 147 Table 6. Details of Sample Students ............................................................................. 148 Table 7. Set-up for Chemistry Tests Administrations .................................................. 149 Table 8. Background Characteristics of Teachers ........................................................ 161 Table 9. Chemistry Pretest Item Statistics .................................................................... 220 Table 10. Chemistry Posttest Item Statistics ................................................................ 221 Table 11. Item and Person Separation Reliabilities for the ACTRC Chemistry Tests . 222 Table 12. Mean Pretest, Posttest, and Gain Scores per Class ....................................... 226 Table 13. Adjusted Mean Gain Score per Class ........................................................... 228 Table 14. Difference in Mean Gain Score Between Classes ........................................ 230 Table 15. Descriptive Statistics of the Outcome, Student-Level, and Teacher-Level
Variables ............................................................................................................... 231 Table 16. Correlations Between Predictor Variable and Student Chemistry Posttest
Score ..................................................................................................................... 232 Table 17. Results of Correlation Analyses Between Predictor Variables .................... 233 Table 18. Unconditional Model of Students' Chemistry Learning ............................... 235 Table 19. Relationship Between Teachers' Scientific Inquiry Practices and Students'
Learning in Chemistry .......................................................................................... 237 Table 20. Chemistry Posttest Item 1 Statistics ............................................................. 242 Table 21. Chemistry Posttest Item 2 Statistics ............................................................. 242 Table 22. Chemistry Posttest Item 3 Statistics ............................................................. 243 Table 23. Variance in Chemistry Posttest Score Explained by Student Covariate and
Teachers' Scientific Inquiry Practices .................................................................. 244

XI
List of Figures
Figure 1. The ACTRC chemistry tests structure. ......................................................... 139 Figure 2. Chemistry tests administration scheme. ........................................................ 149 Figure 3. Mean scores of inquiry component with standard error bars per observation.
.............................................................................................................................. 174 Figure 4. Inquiry practices enacted by each teacher per observation. .......................... 175 Figure 5. Engaging in questioning practices. ............................................................... 188 Figure 6. Designing and conducting investigations practices. ..................................... 192 Figure 7. Collecting data practices. .............................................................................. 197 Figure 8. Analyzing data practices. .............................................................................. 201 Figure 9. Developing explanations practices. ............................................................... 203 Figure 10. Communicating information practices. ....................................................... 208 Figure 11. Amount of inquiry practices versus who initiated the inquiry in the
classroom. ............................................................................................................. 211 Figure 12. Variable map of student and item distribution for the pretest. .................... 223 Figure 13. Variable map of student and item distribution for the posttest. .................. 224 Figure 14. Relationship between pretest and gain scores. ............................................ 227 Figure 15. Adjusted mean gain score with standard error bars per class. .................... 229
1
Chapter 1: Introduction
Any education that focuses predominantly on the detailed products of
scientific labor—the facts of science—without developing an
understanding of how those facts were established or that ignores the
many important applications of science in the world misrepresents
science and marginalizes the importance of engineering. (National
Research Council, 2012, p. 42)
This statement from the National Research Council (NRC) in the United States
through its 2012 Framework for K-12 Science Education suggested that placing too
much emphasis on knowledge of science content and leaving behind its applications and
the understanding of how this knowledge is generated and accepted, that is, scientific
inquiry itself, misrepresents science education. As implied in this statement, scientific
inquiry is one of the important elements of science education. Inquiry as an approach to
teaching in science education has been a focus of interest for many years. For example,
most conversations about reform-based science teaching include the word inquiry (Abd-
El-Khalick et al., 2004; Anderson, 2002; Crawford, 2014; Kim, Tan, & Talaue, 2013;
Schneider, Krajcik, & Blumenfeld, 2005). Further, curriculum reform movements in K
to 12 science education since the time of Dewey (1910b) emphasize the importance of
instruction that supports students’ adoption of and engagement in scientific inquiry
practices (Abd-El-Khalick et al., 2004; Barrow, 2006; Hackling, Goodrum, & Rennie,
2001; Kennedy, 2013; Kim et al., 2013; NRC, 2012; Ramnarain, 2014; Wu & Hsieh,
2006). Aside from the United States, the aforementioned curriculum reform movements
have been observed in other countries including Australia, Ireland, Singapore, South
Africa, and Taiwan. These reform movements suggest that the pedagogical approaches

2
that teach students about and through inquiry play a significant role in science teaching
and learning. From Dewey’s (1910b) work on science as a method or process of inquiry
and on student-centered approaches to education to the present interest in an inquiry-
based science teaching (Bevins & Price, 2016; Minner, Levy, & Century, 2010;
Rundgren, 2017; Tuan, Chin, Tsai, & Cheng, 2005), inquiry has been increasingly
adopted by many countries as one of the salient features in K to 12 science curriculum
reforms (Abd-El-Khalick et al., 2004; Australian Curriculum and Assessment Reporting
Authority [ACARA], 2014; Heinz et al., 2017; Kennedy, 2013; Kim et al., 2013;
Ramnarain, 2014; Samuel & Ogunkola, 2013; Wilson, Taylor, Kowalski, & Carlson,
2010; Wu & Hsieh, 2006). This is because scientific inquiry has been considered to
have the potential to improve scientific literacy in classrooms (Flick & Lederman,
2004), which has been described as the ultimate goal of science education (Lederman,
2004).
Many studies have reported that students’ greater achievement in science can be
achieved through the use of inquiry-based teaching approach (e.g., Jiang & McComas,
2015; Minner et al., 2010; Mupira & Ramnarain, 2018; Wilson et al., 2010; Wu &
Hsieh, 2006). However, there is a lack of detailed investigation of the practices of
inquiry employed by teachers in the classroom, which may help students acquire greater
achievement in science. Specifically, the relationship between specific practices of
inquiry and student learning in science is not extensively investigated. According to
Minner and DeLisi (2012), researchers placed a very little emphasis on investigating
which specific practices of an inquiry-based teaching can lead to students’ greater
achievement. The paucity of research focused on specific inquiry practices of teachers
in classrooms and the relationship of these specific practices to learning is also related

3
to the lack of an observational instrument specifically designed to assess the specific
inquiry practices implemented by teachers in the classroom. For this reason, a need for
an observational tool that could directly assess inquiry instruction by looking at the
granular view of scientific inquiry practices of teachers was identified in this study. This
would allow a fine-grained investigation of the impact of specific inquiry practices on
student learning in science. This study allows the identification of which practices of
inquiry teaching have most potential to improve student learning since scientific inquiry
has been increasingly used as a teaching approach and as one of the essential features of
curriculum documents in pre-tertiary science education worldwide.
Furthermore, literature shows that most classroom research on inquiry-based
teaching and learning in pre-tertiary science education have been conducted in
developed countries (e.g., Crawford, 2012; Fitzgerald, Danaia, & McKinnon, 2017;
Kim et al., 2013). Implementation of inquiry-based teaching in less developed countries
may be more challenging than in developed countries. For instance, there has been
relatively little research on the degree to which teachers can implement inquiry in
schools with challenging teaching and learning environments (e.g., schools with lack of
teaching resources and facilities, classrooms with large number of students) such as
most public schools in the Philippines, and schools in many other less developed
countries. Can teachers effectively implement the practices of scientific inquiry (which
the developed countries are using in their classrooms) in the classroom of less
developed countries? What is the nature of teachers’ enactment of inquiry teaching in
less developed countries? These questions indicate the need for an empirical research on
how inquiry-based teaching is translated to developing countries, and how it positively
impacts student learning in these contexts. For this reason, this study was conducted to
4
describe how classroom teachers in a less developed country, the Philippines,
implemented scientific inquiry as a teaching approach in challenging teaching and
learning environments, and how it affected student learning outcomes. But, what is
scientific inquiry? Does it mean the same thing to everyone? Does it mean the same
thing in varied contexts?
What is Scientific Inquiry?
Scientific inquiry is defined in different ways depending on the context in which
the term is used. In the scientific context, inquiry refers to “the diverse ways in which
scientists study the natural world and propose explanations based on evidence derived
from their work” (NRC, 1996, p. 23). According to Anderson (2007), the work of
scientists, the nature of their investigations, and the abilities and understandings
necessary to perform their work are at the heart of this definition of scientific inquiry.
In the educational context, scientific inquiry can be viewed as either a means or
an end. Scientific inquiry as a means refers to teaching approaches used to help students
develop inquiry skills and improve their understanding of science (Abd-El-Khalick et
al., 2004). As a teaching approach, it should capture the essence of scientific
investigation and the development of knowledge about the natural world (Bybee, 2004).
Moreover, in combining the historical views of Dewey (1910b) and Schwab (1962)
with modern views of current science education researchers (Bybee et al., 2006;
Magnusson, Palincsar, & Templin, 2004; Osborne, Simon, Christodoulou, Howell-
Richardson, & Richardson, 2013; Schwarz & Gwekwerere, 2007; Tytler, 2007),
scientific inquiry as a teaching approach involves engaging students in using critical
thinking skills, which includes asking questions, designing and carrying out

5
investigations, interpreting data as evidence, creating arguments, building models, and
communicating findings in the pursuit of deepening their understanding by using logic
and evidence about the natural world (Achieve Inc., 2013; Crawford, 2014; NRC,
2012). Scientific inquiry as an end refers to student learning outcomes. These outcomes
can be viewed as (1) students’ ability to do scientific inquiry and (2) students’
knowledge about science (Abd-El-Khalick et al., 2004; Capps, Crawford, & Constas,
2012; Flick & Lederman, 2004).
In 2012, the Department of Education (DepEd) in the Philippines included
scientific inquiry in the newly designed K to 12 science curriculum as one of the
domains of learning science. This enhanced science curriculum was described as
inquiry-based and student-centered (DepEd, 2016). It was designed around three
domains of learning science:
• understanding and applying scientific knowledge in the local setting as
well as global context whenever possible
• performing scientific processes and skills
• developing and demonstrating scientific disposition and values
The acquisition of these domains, as explained in the curriculum, was facilitated
using different approaches including an inquiry-based approach (DepEd, 2016). In the
K to 12 science curriculum guide, scientific inquiry was defined as the teaching and
learning of inquiry processes and skills (methods of scientific investigation),
emphasizing the use of evidence in constructing explanations (DepEd, 2016). Science
content and science processes were intertwined in the K to 12 curriculum. As argued by
DepEd, without the content, students will have difficulty utilizing science process skills

6
since these processes are best learned in context. The science curriculum was organized
around situations and problems that challenge and arouse students’ curiosity. Inquiry-
based activities were included to develop students’ interest and allow them to become
active learners .Furthermore, the concepts and skills in the curriculum were presented
with increasing levels of complexity from one grade level to another in a spiral
progression, with the intention of paving the way to a deeper understanding of core
concepts. In this spiral progression approach, the scope and sequence of the content of
the curriculum are developed such that concepts and skills are revisited at each grade
level with increasing depth. As more facts and principles on each topic are encountered,
learning of knowledge, skills, values, and attitudes increases in depth and breadth,
creating a metaphorical spiral (Southeast Asian Ministers of Education Organization-
Regional Center for Education Innovation and Technology [SEAMEO-INNOTECH],
2012).
The aforementioned meanings of scientific inquiry, as means and ends, are
distinct from each other although they also have many connections. Underlying these
conceptions of scientific inquiry is a constructivist approach to teaching, which focuses
on engaging students physically and cognitively in the act of learning as active
constructors of their own knowledge, rather than relying exclusively on transmission by
a knowledgeable other (i.e., the teacher).
Constructivism and scientific inquiry
Constructivism in education offers an explanation on how knowledge is
constructed by students for their learning (Henson 2003; Unal & Akpinar, 2006).
Specifically, it suggests that students learn from direct experiences and interaction with
7
their environment, and through actively negotiating and combining newly presented
information with their prior knowledge to form new understandings (Lew, 2010;
Savasci & Berlin, 2012). The development of constructivism in education has been
based on the ideas of respected thinkers, primarily, Dewey (1859-1952), Piaget (1896-
1980), and Vygotsky (1896-1934).
Dewey was a prominent figure during the progressive educational reform
movement in the United States (McCaughan, 2013). In this movement, learning was
described as a self-construction process through experiences (Dewey, 1938). Dewey
proposed that students are active agents who interact with their environments as part of
the learning process (McCaughan, 2013). He argued that students should learn by doing
(Henson, 2003; Platz & Arellano, 2011). He suggested that students should study
problems that are related to their experiences and within their intellectual capability so
that they are active learners in their search for answers (Dewey, 1938).
Thus, Dewey (1938) explicitly articulated the value of learning through the use
of real-life experiences. In science teaching, this is evident particularly when students
are given the opportunity to learn actively using first-hand experiences in scientific
activities or research. As such, students can freely connect abstract science to its
practical meanings in real-life problems and situations that are familiar to them. Here,
the student is actively involved, and the teacher has a role as facilitator and guide. As
Henson (2003) pointed out, Dewey’s approach to instruction marked the shift from
teacher-centered to student-centered instruction in the classroom, at least in theory
although not necessarily in practice.
The genetic epistemology of Piaget underpins the growth of constructivism in
education (Burnett, 2010; Dykstra, 2012). Within the framework of his extensive and

8
seminal body of research, Piaget (1954) placed emphasis on constructing knowledge
through cognitive processes of analyzing and interpreting. Piaget noted that children’s
learning happens through processes of assimilating and accommodating information
they receive through their experiences (Piaget, 1954). From this view, in order for
students to construct new knowledge, classroom teachers should provide students with
learning experiences that allow them to acquire information and integrate it with their
understandings. There are opportunities to observe this approach in science classrooms,
specifically when students are collecting information or data that they need for their
science activities. They then analyze and interpret this new information in accordance
with their understanding and existing scientific knowledge. As with Dewey’s approach
to instruction, an approach based on Piaget’s understanding of the way that children
build knowledge can be described as student-centered constructivism, where students
construct knowledge for themselves (Gordon, 2009).
Furthermore, Piaget’s view on construction of knowledge can be juxtaposed
with Kuhn’s view on the development of scientific knowledge. Kuhn’s ideas are well
known and have been definitive of contemporary views on scientific knowledge
development. Kuhn (1996) developed an explanation of the development of scientific
knowledge in his publication The Structure of Scientific Revolutions. He argued that
development of scientific knowledge is not uniform but has alternating normal and
revolutionary phases. In the normal phase, the development of scientific knowledge is
“continuous insofar as there is accumulation of puzzles solved” (Tsou, 2006, p. 211). In
this manner, Piaget’s view is the same with Kuhn’s. On the other hand, in the
revolutionary phase, the development of scientific knowledge is discontinuous and non-
cumulative. This may look different from Piaget’s idea that portrayed a more

9
continuous view of knowledge development resulting from integrative processes of
assimilation and accommodation. According to Piaget and Garcia (1989), development
of new knowledge is not independent from previous knowledge; it is only a
reorganization or an addition to existing knowledge.
Without negating views of learning that prioritized real-life experiences or those
that stressed learning through internal cognitive processes, Vygotsky (1978) placed
emphasis on learning through social interaction with the environment (Jaramillo, 1996).
Vygotsky (1978) argued that knowledge is developed in the context of personal
experiences in collaboration with others. He believed that learning is initially social in
nature and then psychological or cognitive (Gordon, 2009). Based on this perspective,
students learn from active engagement with the teacher and/or more advanced peers
through socially organized learning activities in the classroom. This concept is referred
to as learning within a zone of proximal development (Henson, 2003). This can be
illustrated in a situation where the concepts in a lesson are too difficult for a student to
learn alone. Working in isolation, the student may not be able to interpret the
information or experience provided by the lesson. However, if the concepts are within
the students’ zone of proximal development, then they can be grasped through working
with more advanced peers (Gordon, 2009). This can be observed in science classes
where students work in teams for their investigative project. Students sometimes
collaborate with teachers or researchers to better understand the scientific nature of their
project. This situation could allow students to engage in scientific thinking with
knowledgeable others, which supported Vygotsky’s claim that over time students can
progress from spontaneous thinking to scientific thinking (Alozie, Moye, & Krakcik,
2010).
10
The aforementioned schools of thought emphasized the importance of learning
experiences in constructing knowledge, and became the roots of a constructivist
approach to pedagogy. Based on the ideas of the prominent thinkers summarized above,
it is clear that their position on knowledge construction is that knowledge is not
transmitted directly from teacher to student, but is actively built up by the student. With
this, the argument that human beings are active agents constructing knowledge by
themselves has been a driving force for educators to believe that instructional activities
should encourage students to construct knowledge through their own participation
(Zhang, 2016). This constructivist view plays an important role in science teaching and
learning and has become a dominant teaching paradigm in theories of education (Taber,
2010, 2011; Ültanir, 2012; Zhang, 2016).
Constructivism entered science education through focusing on students’ ideas
and understandings (Kelly, 2013). Constructivists contend that students learn science by
authentically engaging in the activities associated with being a scientist (Orgill &
Thomas, 2007). They suggested that students must be given opportunities to engage in
activities and reflect on those activities, rather than sitting passively in the classroom, in
order to become scientifically literate individuals (Haney, Lumpe, & Czerniak, 2003).
These constructivist views of learning became a theoretical foundation for
promoting scientific inquiry in science classrooms beginning in the early 1960s, and
have become a major and officially endorsed approach in U.S. schools (Taber, 2010,
2011; Zhang, 2016). Because of this, a range of instructional models that engaged
students in inquiry-based, hands-on experiences, and that allowed them to construct
their understanding, have emerged (Taber, 2010; 2011; Zhang, 2016). These
instructional models (e.g., 5E model [Bybee et al., 2006], Guided Inquiry model

11
[Magnusson et al., 2004]) had common features in that they provided students with
questions or problems and required them to collect data and look for patterns, answers,
and solutions. This approach has come to be identified as inquiry-based instruction
(Jadrich & Bruxvoort, 2011). Inquiry-based instructional models are aligned with the
ideas of the prominent thinkers mentioned above, and allow students to perform
scientific practices, provide them with authentic issues that are meaningful to them, and
teach them the science concepts and skills that they will need to become productive and
scientifically literate citizens.
This view of science teaching has long been advocated (Capps & Crawford,
2013; Crawford, 2014; Zhang, 2016). In the early 1960s, Schwab and Brandwein (1962)
argued for a need to adopt inquiry-based science teaching in schools. They asserted that
inquiry-based science teaching is valuable as it provides learners with opportunities to
experience the scientific processes and allows them to construct scientific knowledge
through their own explorations. Schwab also encouraged science teachers to use the
laboratory to assist students in their study of science concepts. He recommended that
science be taught in an inquiry format. Since then, multiple versions of an inquiry-based
teaching approach with slight differences have been developed (Taber, 2011; NRC,
2000; Zhang, 2016). Details on the historical background of scientific inquiry as a
teaching approach, the aspects of scientific inquiry, and the models of inquiry-based
teaching are discussed in Chapters 2 and 3.
What are the Challenges Facing Scientific Inquiry Teaching in the Classroom?
Today, scientific inquiry in the classroom is advocated by science education
reform movements in different parts of the world (Abd-El-Khalick et al., 2004; Heinz et
12
al., 2017; Mumba, Chabalengula, & Hunter, 2007; Xie, Talin, & Sharif, 2014) and yet is
surprisingly rare (Cheung, 2011; Crawford, 2014). Studies conducted in the United
States, Korea, and Canada have shown that many teachers do not typically use scientific
inquiry in their classrooms (Capps & Crawford, 2013; Kim & Tan, 2011; Trautmann,
MaKinster, & Avery, 2004). In fact, research says that neither teachers nor students
typically hold informed views of scientific inquiry (Lederman & Lederman, 2004;
Lederman et al., 2014; Schwartz et al., 2002). As a result, most teachers have difficulty
creating classroom environments that foster students’ scientific inquiry skills (Capps &
Crawford, 2013; Fitzgerald et al., 2017; Kang & Keinonen, 2016; Lederman et al.,
2014; Lederman & Lederman, 2004; Minstrell & van Zee, 2000; Saad & BouJaoude,
2012). They tend to teach science as a collection of facts, principles, and concepts
without explicitly instructing students in the processes by which scientific knowledge is
generated and accepted. According to Crawford (2014), classroom observations
revealed that in today’s science classes many teachers are still delivering concepts and
principles primarily through lecture mode, and their students are often passively
listening and taking notes. Moreover, Crawford reported that if a lesson involves a
laboratory experience, students are usually required to run through the procedures, step
by step, in order to verify an already known result. In such cases, the laboratory lesson
may resemble the kind of tightly structured, traditional science teaching practice found
in many classrooms of the last century. According to Wallace and Kang (2004), if
teachers’ understanding of scientific inquiry approaches is not clear, they may inhibit
students from being involved in inquiry activities that include questioning, designing
and carrying out investigations, interpreting data, and developing explanations for the
phenomena.

13
It is clear from the findings of aforementioned international studies that
scientific inquiry teaching is not readily implemented by teachers in many science
classrooms around the globe. Why is this the case? What are the reasons for rare
implementation of this science teaching approach in the classroom, despite its advocacy
by science education reform movements worldwide and the importance placed on it by
curriculum designers? Researchers have identified the following factors pertaining to
the reluctance of teachers to use scientific inquiry teaching in classrooms: (1) lack of
informed views about scientific inquiry and inquiry-based teaching; (2) lack of
confidence and competence in using inquiry-based approaches; (3) lack of time for
preparation and implementation; (4) inadequate professional development programs; (5)
importance of preparation for examinations; and (6) student learning abilities (Capps &
Crawford, 2013; Davis, 2003; Fitzgerald et al., 2017; Garet, Porter, Desimone, Birman,
& Yoon, 2001; Kang & Keinonen, 2016; Lederman et al., 2014; Marshall, Smart, &
Alston, 2016; Ramnarain, 2016; Saad & BouJaoude, 2012; Trautmann et al., 2004;
Wang, Wu, Wu, & Tseng, 2014). Saad and BouJaoude (2012), for instance, argued that
the culturally-based beliefs of the importance of preparation for examinations, and the
importance of efficiency in covering the curriculum, had a powerful influence on
impeding inquiry practices in the classroom. According to them, teachers may develop a
goal of teaching facts or information to cover the content of the curriculum for students
to pass examinations and get good grades, which could de-emphasize the importance of
having positive attitudes toward inquiry. Ramnarain (2016) investigated the factors
influencing the implementation of inquiry-based teaching in high schools in an
underdeveloped urban area in South Africa and highlighted that a lack of professional
science knowledge (e.g., content knowledge, pedagogical content knowledge, curricular

14
knowledge) contributed toward teachers’ uncertainty in inquiry-based teaching. Davis
(2003) and Kang and Keinonen (2016) argued that class size and school resources could
affect teachers’ inquiry practices in classrooms. Furthermore, Fitzgerald et al. (2017)
explored teachers’ perspectives on the factors that prevented them from implementing
inquiry-based teaching and learning approaches in Australian secondary school science
classes. One important barrier that they identified was the lack of good models and
definitions for inquiry-based teaching. They found that, although teachers were familiar
with the term inquiry-based teaching, they were not sure about what it would involve in
the reality of their own classrooms.
The barriers that teachers describe as impeding the enactment of scientific
inquiry teaching in classrooms point to a lack of congruence between curriculum design
and the classroom practices of teachers. Researchers have argued that, when an
envisioned curriculum clashes with the reality of schools and classroom teaching, and
the associated social, political, economic, and cultural aspects of a community, it is
often transformed into incommensurate curriculum and then translated into incongruent
enactments or classroom practices (Abd-El-Khalick et al., 2004; Anderson, 2002). This
inconguency has long been recognized and is a widely noted phenomenon within the
educational literature (e.g., Abd-El-Khalick et al., 2004; Elmore, 1996; Fitzgerald et al.,
2017; Ramnarain, 2016; Smith & Southerland, 2007).
The scenario described above can also be observed in many science classrooms
in the Philippines (Science Education Institute-Department of Science and Technology
& University of the Philippines National Institute for Science and Mathematics
Education Development [SEI-DOST & UP NISMED], 2011a). Bernardo, Limjap,
Prudente, and Roleda (2008) examined the perceptions of 7,885 elementary and high

15
school Filipino students about their science classes. They reported important
dimensions of the science classrooms in the Philippines from the eyes of the students.
One of these dimensions is that students perceived their science teachers’ instructional
practices as oriented towards helping them learn but these practices did not involve
sufficient inquiry-oriented activities and did not provide sufficient support or
encouragement for self-directed learning (Bernardo et al., 2008). The perceptions of the
students are related to the findings of researchers at the Assessment, Curriculum and
Technology Research Centre (ACTRC) in Manila. In 2014, ACTRC conducted a
scoping study into the teaching of science inquiry skills of 22 Grade 8 science teachers
across 11 schools in the Philippines. Multiple classroom observations were conducted in
Grade 8 science classes and the participating teachers used a new science curriculum,
one of the important features of which was the learning of scientific processes and skills
in addition to learning of content. The ACTRC researchers found that teachers delivered
some science inquiry skills while other skills included in the curriculum were seldom
seen in classrooms (ACTRC, 2014).
Furthermore, in the study conducted by Gutierez (2015), which involved 30
elementary science teachers in the Philippines who participated in a professional
development program, she reported that most teachers placed too much emphasis on the
content as specified in the curriculum; they set the scale of students’ knowledge
acquisition by the quantity of the concepts that were introduced, rather than on the depth
of understanding. She also reported that, even though the intention of teachers was to
employ more inquiry-based practices in their classes, they still used the traditional
didactic method due to the volume of topics they are expected to teach. This is related to
the findings of de Mesa and de Guzman (2006) when they established a portrait of

16
Filipino teachers’ classroom practices. They reported that a majority of classroom
activities were teacher-directed and teacher-controlled. Gutierez (2015) identified
additional challenges that the teachers encountered in implementing inquiry-based
teaching. These were (1) lack of support, training, and availability of inquiry-based
materials; and (2) the perceived difficulty and time-consuming nature of inquiry-based
approaches.
The SEI-DOST and UP NISMED (2011a), through their publication Framework
for Philippine Science Teacher Education, reported that there was evidence that the
transmission approach to teaching may be contributing to the lack of interest in science
that is observed among elementary and high school students across the Philippines.
They identified the predominance of teacher-centered classrooms and teaching practices
in many Philippine secondary schools as one of the reasons for a low percentage of
Filipino students venturing into science-related careers in tertiary education (Science
Education Institute-Department of Science and Technology [SEI-DOST], 2009).
According to SEI-DOST and UP NISMED (2011a), many teachers turned to lecturing,
instead of providing students with engaging and challenging activities that enabled them
to develop creative ideas and solve problems, due to lack of content and pedagogical
skills suitable for science teaching. They reported that many teachers teaching science
subjects in schools were non-science majors. This implied that there was a shortage of
qualified science teachers in the country. They also reported that the lack of qualified
science teachers in many schools led to the practice of assigning teachers to teach
science subjects despite their limited background.
In the Philippines, various professional development programs such as teacher
training, seminar-workshops, short-term courses, and lesson study, have been designed

17
to assist elementary and secondary school teachers in their teaching of science
(Gutierez, 2015; SEI-DOST & UP NISMED, 2011a). In fact, a large number of Filipino
teachers have been highly motivated to participate in regional and national professional
development opportunities and have collaborated enthusiastically with science
education specialists and university-based researchers to improve their own science
teaching and learning (Gutierez, 2015; SEAMEO-INNOTECH, 2015). Although
significant gains have been made through continuing professional development for
teachers (Lotter, Harwood, & Bonner, 2007; NRC, 2000), there is still an uncertainty
about how inquiry is implemented in science classrooms in the Philippines (Garcia &
Tan, 2004; SEI-DOST & UP NISMED, 2011a). According to Gutierez (2015), teachers
often find it difficult to sustain their practice after short-term professional development
related to inquiry-based teaching. Filipino researchers who conducted research on
curriculum implementation in schools (e.g., Lim & Prudente, 2013; Sanosa, 2013)
reported that the focus of instruction towards test preparation in schools, the
insufficiency of resources and school facilities, the limited time to finish the intended
scope of the lesson, the lack of understanding about an inquiry-based curriculum
framework, and the lack of skills in delivering the teaching plan were the factors that
affected teachers in implementing the curriculum the way it was intended to be
implemented in the classroom. The aforementioned situation in the Philippines
demonstrated that the curriculum design was either incompletely followed, or translated
differently, by teachers in classroom teaching. This mismatch between curriculum
design and curriculum delivery was also observed in international classrooms, as
discussed earlier. However, in the Philippines, expectations of a shift in science
teaching to include inquiry-based practices was further complicated by the demands on

18
schools and teachers that they adapt to a large-scale overhaul of education. This is
discussed in the next section.
What is the New Basic Education System in the Philippines?
Five years before the current study was initiated, efforts had been directed
towards the improvement of classroom teaching and learning at the basic education
level in the Philippines. From 1945 to 2010, basic education in the Philippines covered
Grades 1-10 only. In 2011, the Department of Education initiated a basic education
reform, which is known as the K to 12 Program. This program covered Kindergarten
and 12 years of basic education: six years of Primary or Elementary education, four
years of Junior High School, and two years of Senior High School. The rationale for
this reform was to provide sufficient time for mastery of concepts and skills, develop
lifelong learners, and prepare graduates for tertiary education, middle-level skills
development, employment, and entrepreneurship (DepEd, 2013b; SEAMEO-
INNOTECH, 2015). Details on the features of the K to 12 Program in the Philippines
are discussed in Chapter 2.
As part of the K to 12 program, a new science curriculum was developed and
implemented in schools across the country (Montebon, 2014). Through this new
curriculum, science education aimed to develop scientific literacy among students and
enable them to make judgments and decisions on the applications of scientific
knowledge that may have significant impact in everyday life (DepEd, 2013a). The new
curriculum was designed according to the three domains of learning science: (1)
understanding and applying scientific knowledge in local setting as well as global
context, (2) performing scientific processes and skills, and (3) developing and

19
demonstrating scientific disposition and values. These domains could be seen in major
international science assessment frameworks of the time. For instance, in the
Programme for International Student Assessment (PISA) framework for the 2015
scientific literacy assessment, these three domains were anchored to its four basic
components: context (i.e., personal, local/national and global issues that demand some
understanding of science and technology); knowledge (i.e., understanding of the major
facts, concepts, and theories that form the basis of scientific knowledge); competencies
(i.e., evaluate and design scientific inquiry, using scientific evidence, explaining
phenomena scientifically); and attitudes (i.e., interest in science and technology, support
for scientific inquiry, awareness of environmental issues) (Organisation for Economic
Co-operation and Development [OECD], 2017). In the PISA 2006 science assessment
framework, it was observed that each item involved the predominant use of the
competencies (Bybee, McCrae, & Laurie, 2009).
The domains of learning science in the new curriculum could also be seen in the
science assessment framework for the Trends in International Mathematics and Science
Study (TIMSS) 2015 except for the attitude domain. This assessment framework placed
an emphasis on two domains: content domain (specifying the subject matter to be
assessed), and cognitive domain (specifying the thinking processes to be assessed)
(Jones, Wheeler, & Centurino, 2013). In addition, science processes and skills were also
included in the TIMSS 2015 science framework, which must be assessed in the context
of the content domain and draw upon the range of thinking processes specified in the
cognitive domain (Jones et al., 2013).
What made the new science curriculum distinct from the previous science
curriculum in the Philippines was that it was designed to be student-centered and

20
inquiry-based, emphasizing the teaching and learning of inquiry skills (DepEd, 2013a).
The organization of the science curriculum had also changed in that concepts and skills
were revisited at each grade level with increasing depth, creating a ‘spiral’ progression,
as described above. Implementation of this new science curriculum began in Grade 3
and Grade 7 (1st year Junior High School) in school year 2012-2013 and it was
progressively introduced in other grade levels. At the time of writing, it was
implemented in Grades 3 to 6, 7 to 10, and 11 to 12.
This major educational reform in the Philippines (SEAMEO-INNOTECH, 2015)
took many years to implement in full, from implementation of Kindergarten in 2011 to
implementation of Grade 12 Senior High School in 2018. The first cohort of students to
progress through the full K to 12 Program were expected to graduate in the year 2024.
During this period of major educational reform, the link between the intended,
implemented, and achieved curricula could be expected to be particularly tenuous
(Hume & Coll, 2010; Sherin & Drake, 2009). Research findings have shown that, in
science and mathematics, there is significant difference between the intended and
implemented curricula at both elementary and secondary level (Levitt, 2001; Phaeton &
Stears, 2017; Smith & Southerland, 2007). The intended curriculum is determined by an
organization and usually consists of goals and expectations set by curriculum policy
makers and curriculum developers along with textbooks, official syllabi, or curriculum
standards set by a particular organization (Kuiper, Folmer, & Ottevanger, 2013, Phaeton
& Stears, 2017; van den Akker, 2003). For the K to 12 science program in the
Philippines, the formal documents used in classrooms were the Curriculum Guide,
Teachers’ Guide, and the Learners’ Modules. According to Williams, Ferido, and
Metila (2013), the degree to which the intended curriculum is clear and specific, in the

21
context of its goals and values, has direct implications for its interpretation by teachers
and text writers, and therefore particularly for its chance of success.
The implemented curriculum refers to the educational processes happening in
the classroom. It is usually described in terms of the learning opportunities offered to
students and depends on curricula, educational standards, assessment, teaching and
learning resources available, and other implemented structural arrangements of
schooling (Mereku & Mereku, 2015). In this study, this curriculum is described in terms
of the ways in which scientific inquiry practices are being implemented by teachers, and
any relevant classroom contextual factors (e.g., class size). This will vary across classes
and schools. The degree to which this curriculum will vary beyond the reasonable
individual differences in teaching style will have immediate implications for the
opportunities for students to learn (Williams et al., 2013).
The achieved curriculum refers to student learning outcomes after receiving
instruction (Thijs & van den Akker, 2009; van den Akker, 2003, 2010). It is usually
described in terms of the main capabilities or other specific qualities that students are
expected to demonstrate as a result of successful learning (Mereku & Mereku, 2015).
The alignment of the intended, implemented, and achieved curricula is important
as it determines the kind of result the teaching and learning process yields (Phaeton &
Stears, 2017). According to Squires (2012), curriculum alignment has been found to
have a positive effect on student achievement. At some point, it can be observed that
what is articulated in the curriculum documents and what happens during instruction
may be quite dissimilar (Phaeton & Stears, 2017). This may result in a gap between the
intended and implemented curricula (Sethole, 2004), which is usually observed during
periods of major reform (Hume & Coll, 2010; Sherin & Drake, 2009). There is an

22
argument therefore, with the recent science curriculum reform in the Philippines, for
examining its alignment to practices in schools.
Research Questions
Although many empirical pieces of evidence have suggested that inquiry-based
instruction can lead to greater student achievement in science (Fogleman, McNeill, &
Krajcik, 2011; Jiang & McComas, 2015; Minner et al., 2010; Mupira & Ramnarain,
2018; Sadeh & Zion, 2009; Tuan et al., 2005; Wilson et al., 2010; Wu & Hsieh, 2006),
only a few studies have been conducted to investigate the specific scientific inquiry
practices that teachers enact in classrooms (Dudu & Vhurumuku, 2012; Poon, Lee, Tan,
& Lim, 2012; Secker, 2002), and which of these practices are related to greater
achievement in science. This is also related to the lack of available observational
instruments that can directly assess the specific inquiry practices of classroom teachers.
Moreover, there has been relatively little research focused on how scientific inquiry as a
teaching approach, which is advocated by most developed countries, is translated to less
developed countries, and how it positively affects student learning in these contexts.
The present study addressed these issues.
This study investigated the enactment of specific inquiry practices of teachers in
a less developed country, the Philippines, as they implemented the new inquiry-based
science curriculum, specifically the Grade 7 chemistry curriculum, and examined how
each of these specific inquiry practices are related to student learning outcomes.
Specifically, this research addressed the following questions:

23
1. How have teachers implemented inquiry teaching in junior high school
chemistry classrooms in the Philippines? Which specific practices of
teachers in junior high school chemistry classrooms exhibited components
of scientific inquiry? To what extent are these practices translated to
Philippine junior high school chemistry classrooms observed in this study?
2. What is the relationship between the practices of scientific inquiry
implemented by teachers (engaging in questioning, designing and
conducting investigations, collecting data, analyzing data, developing
explanations, and communicating information) and students’ learning in
chemistry?
Significance of the Study
Scientific inquiry as a teaching approach at the basic education level has been
advocated internationally to improve student learning in science. It has been
increasingly used by many countries as one of the essential components of pre-tertiary
science education. However, there has been little research to identify which specific
practices of scientific inquiry of teachers could lead to better learning of students in
science. This study addressed this issue by identifying the degree to which specific
inquiry-based teaching practices of teachers could help students improve their learning
in chemistry. Furthermore, much of the research to date on scientific inquiry teaching
has been conducted in developed countries, in which teachers have access to relatively
high levels of resourcing (e.g., Crawford, 2007; Fitzgerald et al., 2017; Kennedy, 2013;
Kim et al., 2013). There is little that explores how teachers work to implement inquiry-
based teaching practices in developing countries where school and teacher resources

24
may be much more limited, and implementation of inquiry-based teaching practices
more problematic. This study provided a platform to understand how teachers enact
inquiry-based reform documents in challenging teaching and learning environments
such as most science classrooms in the Philippines, and may provide insights for others
working in and with school systems in developing countries. Finally, the study also
contributed to our knowledge through the development of a validated and multifaceted
observational instrument for measuring teachers’ scientific inquiry practices in the
classroom.
Scope of the Study
This study was limited to investigating Grade 7 science teachers’ specific
instructional practices on engaging in questioning, designing and conducting
investigations, collecting data, analyzing data, developing explanations, and
communicating information, and their students’ achievement in chemistry (inquiry
skills and content knowledge) in Philippine classrooms. The new science curriculum in
the Philippines was initiated with Grade 7 junior high school implementation. With this,
students entering Grade 7 junior high school went through the previous basic education
curriculum, where the spiral progression of concepts and scientific inquiry in science
were not clearly articulated. In Philippine basic education, a school year was divided
into four different quarters of schooling period. For Grade 7 Science, students studied
chemistry in the first quarter, biology in the second quarter, physics in the third quarter,
and earth and space in the fourth quarter. So, in Grade 7 junior high school, students
took chemistry as their first unit of science study. These conditions provided the
opportunity for a baseline measurement of student understanding and skills that was

25
unhindered by knowledge of the subject acquired in other units of the science
curriculum. It provided an opportunity to establish a starting point to determine student
progress in chemistry. In addition, based on the K to 12 science curriculum guide in the
Philippines, only in Grade 7 chemistry was scientific inquiry explicitly listed as a
conceptual topic to be covered by teachers. Students in this grade level began to do
guided and semi-guided investigations in chemistry, emphasizing fair test
experimentation (DepEd, 2016). Lazonder and Harmsen (2016) summarized findings of
studies on scientific reasoning conducted by different researchers (e.g., Koerber,
Sodian, Thoermer, & Nett, 2005; Piekny, Gruber, & Maehler, 2014; Piekny & Maehler,
2013; Varma, 2014) and they reported that learners from the age five onward possessed
a basic ability to generate hypotheses, design and conduct experiments, and evaluate
evidence, and therefore seem ready for inquiry-based learning. With the aforementioned
points, Grade 7 junior high school and the chemistry component of the Grade 7
curriculum were considered to be the focus of this study.
All teacher- and student-participants were drawn from four public secondary
schools in the National Capital Region (NCR) since these schools could give the biggest
sample size. The study was conducted during the first quarter (from June to August) of
school year 2015-2016 because it was during this period that scientific inquiry was one
of the conceptual topics in the Grade 7 chemistry curriculum.
Structure of this Dissertation
There are seven chapters in this dissertation. This chapter has outlined different
challenges of implementing inquiry-based teaching in science classrooms at the
international and local (Philippines) contexts to clearly define the problem to be

26
investigated. Chapter 2 presents the historical background of scientific inquiry as a
teaching approach in international and Philippine classrooms to clarify its various
meanings, and to show the early and current justifications for the use of inquiry as an
approach to teaching science at the basic education level. It also presents a brief
explanation on how inquiry is situated in the Philippines’ K to 12 science curriculum.
Chapter 3 presents and synthesizes the research literature on scientific inquiry in science
classrooms. It also discusses the assessment methods for inquiry-based teaching and
learning in science. The important aspects of scientific inquiry and the features of
different inquiry-based instructional models are presented in order to achieve a
comprehensive theoretical understanding of an inquiry-based teaching approach. A
critical review of the existing observational instruments that have been developed to
assess inquiry-based instruction in the classroom is also presented. This review, with
examination of different inquiry-based instructional models, paves the way to inform
the key elements of inquiry-based teaching to be built into the measurement instruments
developed and used in the current study. The chapter also discusses a body of research
on how inquiry is used by teachers and how it is likely to affect student outcomes.
Descriptions of the chemistry test to measure student outcomes are also presented.
Chapter 4 discusses the research methods of the study. It includes an explanation
of the process of developing the observation instrument for assessing inquiry-based
teaching and of developing the chemistry test for measuring student outcomes. The
process of analyzing tests (pretest and posttest) using Rasch (1960) modeling and the
process of determining the relationship between variables through multilevel modeling
are also discussed. Chapter 5 presents the results of multiple classroom observations of
instructional practices of teachers that are related to scientific inquiry. Together with the

27
literature review on inquiry-based teaching, a discussion of observation findings, and
specifically the amount and type of inquiry-based teaching practices implemented in
chemistry classrooms as well as the degree of initiation of these practices, is included to
establish an understanding of the nature of inquiry-based instruction of teachers under
the newly reformed curriculum.
The results of Rasch (1960) analyses of the ACTRC chemistry tests and of the
student tests and the results of the multilevel analysis of the relationship between
teaching practices and learning outcomes are presented in Chapter 6. The results of
chemistry tests are presented to document the progress of each class in chemistry.
Multilevel models are established in this chapter to determine the relationship between
teachers’ specific inquiry practices and students’ learning in chemistry. The established
relationships are then discussed in conjunction with the results of the analysis of
selected posttest items and observed teachers’ inquiry practices. Finally, Chapter 7
presents the discussion of the research findings with conclusions about the policy,
curriculum development, and science teaching, the future research implications of the
findings, and the limitations of the study.
28
Chapter 2: Tracing the History of Scientific Inquiry in Classrooms
This chapter is divided into two parts. The first part traces the history of
scientific inquiry as a teaching approach in international classrooms. It presents the
nature of inquiry in basic science education from the nineteenth century to the present
time. The second part traces the history of scientific inquiry as a teaching approach in
Philippine classrooms. It discusses how inquiry was incorporated into Philippine basic
science education and how it was highlighted in the new science curriculum (DepEd,
2016).
Historical Perspectives on Scientific Inquiry in International Classrooms
Scientific inquiry has been part of the educational landscape at least since the
middle of the 19th century (Bybee & DeBoer, 1994; DeBoer, 2001, 2004). In fact,
education literature for over the past 100 years clearly showed that scientific inquiry in
classrooms is not a new idea (Anderson, 2002; Crawford, 2014; Lederman, 2004). As a
teaching approach, scientific inquiry mirrors the processes that scientists use to study
the natural world by emphasizing student questioning, investigation, and problem
solving. It uses the general processes of science as its teaching methodology. The
following sections discuss the historical bases of scientific inquiry, and present a
number of arguments that have been made over the years to justify its use as a teaching
approach in the science classrooms around the globe. With this background information,
it is easy to make sense of the reasons why scientific inquiry continues to be advocated
as a science teaching approach.

29
Scientific inquiry in the 19th century
During the 19th century, science was introduced into the school curriculum as an
inductive, laboratory-based study (DeBoer, 2004). As such, scientific inquiry was
advocated for classroom teaching by means of laboratory and investigations. Three
notable persons supported this movement. They were Thomas Huxley (1825-1895),
Herbert Spencer (1820-1903), and Charles Eliot (1834-1926). A prominent British
biologist and a key advocate for science, Thomas Huxley, emphasized the importance
of science in the school curriculum. Huxley (1899) pointed out:
The great peculiarity of scientific training, that in virtue of which it cannot be replaced
by any other discipline whatsoever, is this bringing of the mind directly into contact
with fact, and practicing the intellect in the complete form of induction; that is to say in
drawing conclusions from particular facts made known by immediate observation of
nature. In teaching him botany, he must handle the plants and dissect the flowers for
himself; in teaching him physics and chemistry, you must not be solicitous to fill him
with information, but you must be careful that what he learns he knows of his own
knowledge, and especially, tell him that it is his duty to doubt until he is compelled, by
the absolute authority of nature, to believe that which is written in books. (pp. 126-127)
Huxley’s view on how science should be taught became the justification for the
emerging science laboratory. The idea of laboratory instruction and teaching science as
a process of investigation was supported by another prominent 19th century British
scientist, Herbert Spencer. In the book published by Spencer in 1864, where his essay
entitled What Knowledge is of Most Worth can be found, he emphasized that the
laboratory should provide the opportunity for students to develop a clear conception of
natural phenomena, something that could not be accomplished through book learning

30
alone, and to practice drawing conclusions from observations, which he called
judgment. Spencer argued that the generalizations that were discovered by students
through their own inquiries would be remembered longer and the process of inquiry
would make the students independent from the authority of the teacher. The
implications of Spencer’s argument were that teaching science through inquiry led
students to make their own investigations and to draw their own inferences. It also
implied that students should perhaps be told as little as possible, but rather be induced to
discover as much as possible.
Spencer’s (1864) argument for incorporating scientific inquiry in classrooms
received support from Charles Eliot’s (1898) view of science teaching. Eliot was an
American chemist and president of Harvard University from 1869 to 1895. He
emphasized that students’ direct and independent contact with the objects and
phenomena of nature that could be accomplished in the laboratory would provide a clear
and unbiased view of the world, which could not be achieved through book study alone.
Further, he pointed out that learning how to conduct independent investigations would
free students from the authority of both the text and the teacher. Based on all the
aforementioned, it can be argued that the purpose of advocating inquiry-based teaching
into the classroom by means of the laboratory in the 19th century was to develop
students’ inductive reasoning skills and their ability to acquire knowledge
independently.
Although, in the 19th century, secondary schools were in the early stage of
development and attended only by the privileged in preparation for college (Chiapetta,
2008), studying science in the classroom started to be promoted by scientists from
Europe and the United States (DeBoer, 2004). Science became part of the school

31
curriculum because of its perceived ability to develop the intellect in ways that were
different (e.g., observing the natural world and drawing conclusions from this
observation) from what was usually done in schools. From this point, it can be argued
that the inclusion of science into the curriculum may be seen as a way for individual
personal development to produce educated people to meet the demands for a skilled
workforce. Since science was highlighted for its ability to develop intellect, it can also
be argued that studying science in the 19th century focused on familiarity with the facts
and principles of science. Moreover, scientists advocated the laboratory and student
investigation as a means of introducing scientific inquiry in science classrooms in order
to develop inductive reasoning skills, which was something that the other school
subjects could not do. This was another justification for studying science during that
time. The idea of introducing scientific inquiry in the classrooms through the laboratory
was to give students the opportunity to develop their own way of seeking knowledge for
personal development.
Scientific inquiry in the 20th century
During the first half of the 20th century, there was a continuing interest in
teaching students the scientific way of thinking in the context of problems and projects
that were interesting to them and that had social relevance (DeBoer, 2004). The topic of
discussion was the appropriate use of laboratory as to whether it should be used to
strengthen concepts, to verify scientific principles, to teach laboratory techniques, or to
provide a place for students to engage in genuine investigations (DeBoer, 2004). In the
end, most science educators during that time decided to use the laboratory as a place

32
where students could work on problems of interest to them that had social, as well as
scientific, relevance and importance.
In addition, emphasis was also given to the importance of student-centered
approaches to education, which was credited in large part to the influence of Dewey
(1938). The student-centered approach is based on the philosophy that students learn
best from experiences that are engaging, meaningful, challenging, and relevant. In this
approach, the ‘sense-making’ rests with students, and the teacher acts as a facilitator to
support the learning as students engage in scientific practices (Granger et al., 2012).
Crawford (2014) traced the history of scientific inquiry in classrooms in the United
States, reiterating Dewey’s (1910b) point that if science is taught only as a well-
established body of facts, an opportunity to engage students in learning how to think
scientifically will be missed. According to Dewey (1910b):
Science is more than a body of knowledge to be learned, there is a process or method to
learn as well (p. 14). Science teaching has suffered because science has been so
frequently presented just as so much ready-made knowledge, so much subject-matter of
fact and law, rather than as the effective method of inquiry into any subject-matter (p.
124).
Dewey’s (1910b) statement implied that teachers might have taught science with
an emphasis on facts and not enough emphasis on how to think about the way science
works. Consequently, Dewey recommended the inclusion of scientific inquiry in
classrooms. In his publication entitled How We Think (1910a), Dewey presented
students’ behaviors that relate to scientific inquiry. These behaviors were (1) defining
the problem, (2) noting conditions associated with the problem, (3) formulating an
hypothesis for solving the problem, (4) elaborating the value of various solutions, and
(5) testing the ideas to see which provide the best solution for the problem. These

33
behaviors show that in scientific inquiry, students may have the autonomy to establish
and control their own learning for the construction of new knowledge. Thus, in this
period, scientific inquiry was seen as a way to foster independent learners of science
who are able to apply the processes of inquiry in solving problems of personal and
social concern.
Many significant events in the early 20th century (e.g., World War 1, the
influenza pandemic, the Great Depression) brought about political and social pressures
that shaped the goals of public education (Chiapetta, 2008). With this, education leaned
towards a pragmatic approach in order to find solutions to the pressing problems that
the rapidly changing world had faced—issues related to public health, urbanization,
immigration, and other socially-based problems. This implies that school education
during the first half of the 20th century was directed towards more practical work for
students because this approach could have the potential to address issues having
importance in society. From these societal changes, it can be argued that they influenced
science teaching in basic education. That is why science was usually taught in schools
by stressing its practical aspect so that students could take their place as productive
members of society (Chiapetta, 2008; DeBoer, 2004). Thus, in this period, social
relevance began to take precedence over the goal of individual personal development. It
is also important to note that the composition of secondary school education changed
over time, with the extension of secondary education to a much larger proportion of the
youth population. Because of this, a larger population can be seen at least in the lower
years of secondary education in the 20th century than in the 19th century when secondary
education was attended only by a privileged individual.
34
In this changing approach to education, scientific inquiry teaching was now seen
as a way to develop the abilities needed to solve specific problems having social
significance rather than as a way to ‘discipline the mind’ through inductive reasoning
(DeBoer, 2004). During the first half of the 20th century, it was emphasized that
students should be encouraged to apply an inquiry-style of solving problems of social
concern. Dewey (1910a) argued that students should be inquirers regarding the nature of
their physical and social environments and active participants in the construction of
society. The process of science and the term inquiry began to popularized (Chiapetta,
2008). From these ideal views on science teaching, students may receive the
opportunities to acquire skills and dispositions to formulate questions for inquiry that
were significant and meaningful to them.
Despite the emphasis given to inquiry in science education, this teaching
approach was not equally adopted in basic education during this period (Bull, Gilbert,
Barwick, Hipkins, & Baker, 2010). Knowledge-centered approaches, in which the
primary focus was to replicate the structures of the discipline, were mostly observed in
secondary school classrooms while student-centered approaches, which were oriented
around the student’s needs, predominated in primary school classrooms (Bull et al.,
2010). According to Bull et al. (2010), many science teachers expressed strong
resistance when curriculum reformers designed the secondary school science curriculum
as more inclusive, relevant, or student-centered. Some teachers argued that science is a
body of objective facts that cannot be diluted by teaching approaches designed to meet
the needs of learners (Bull et al., 2010). This suggests that Dewey’s (1910a) ideal
approach to teaching science was not widely or readily implemented in secondary
school classrooms. This may be due to teachers’ earlier teaching beliefs and conceptions

35
or teachers’ lack of knowledge and skills to implement the intended approach. This
situation implies that a mismatch between curriculum design and classroom practice can
be observed during that the first half of the 20th century.
Scientific inquiry in the period of science curriculum reform movement
With the purpose of improving science education, a curriculum reform
movement began, particularly in the United States, in the 1950s and lasted throughout
the 1970s (Yager, 2000). Leaders of this movement believed that science should be
taught in classrooms as it is practiced by scientists in order to give it the most
authenticity possible. Curriculum reforms suggested that fundamental ideas of science
should be taught to students through investigations that mirrored the way scientists
themselves generated new knowledge (DeBoer, 2004). This meant that authentic
scientific inquiry, research that scientists actually carry out (Chinn & Malhotra, 2002),
would become the model for classroom teaching and learning. In looking at the major
difference between this period’s version of inquiry teaching and the earlier versions, this
version was linked even more closely to authentic scientific inquiry in order to make it
as intellectually rigorous as possible. Theorists argued that learning science is learning it
in the way that scientists understood it, including both the content and the modes of
inquiry that were used (DeBoer, 2004; Schwab, 1962). Whether it is learned through the
laboratory or through a textbook, the conclusions of science and the evidence that
supported those conclusions would go hand-in-hand.
The individual most often associated with the reform movement’s notion of
scientific inquiry was Joseph Schwab (1909-1988). According to Schwab (1962),
scientific content and processes were intimately connected and inseparable. Because of

36
this, content should be taught in relation to the methods that generated new knowledge.
However, it is important to note that Schwab’s main interest was not in preparing
students to be inquirers into the nature of the physical world but to have the fullest and
most complete understanding of science as possible, both its content and its methods.
He argued that in this way, students could develop a firm foundation for further study of
science if they were to become scientists, or they would simply be sympathetic to the
scientific enterprise if they did not carve out science careers.
Although Schwab (1962) and other educational leaders of the time (e.g., Herron,
1971; Hurd, 1958; Rutherford, 1964) recognized the usefulness of direct teaching in
scientific discovery, they believed that it was more important to have students conduct
their own investigations because they believed this promoted deeper intellectual
engagement with the content and more meaningful understanding of the nature of
scientific processes.
Scientific inquiry in contemporary times
Scientific inquiry in classrooms became more visible in the publications of the
United States policy documents for K to 12 science education in the late 1980s and
early 1990s (Crawford, 2014). For example, Science for All Americans (American
Association for the Advancement of Science [AAAS], 1989) is a document that
recommended science teaching be consistent with the nature of scientific inquiry. This
document emphasized that “students need to get acquainted with the things around
them—including devices, organisms, materials, shapes, and numbers—and to observe
them, collect them, handle them, describe them, become puzzled by them, ask questions
about them, argue about them, and then try to find answers to their questions” (AAAS,

37
1989, p. 201). After this publication, the National Science Education Standards (NRC,
1996) was published which made clear that scientific inquiry was the preferred method
of teaching science in the United States. This is an all-encompassing document that
includes a wide range of content and process goals. In this document and the follow-up
volume, Inquiry and the National Science Education Standards (NRC, 2000), scientific
inquiry is described as “a set of interrelated processes by which students pose questions
about the natural world and investigate phenomena; in doing so, students acquire
knowledge and develop a right understanding of concepts, principles, models, and
theories” (NRC, 1996, p. 214). Finally, the most recent iteration of scientific inquiry in
classrooms in the United States occurs in the new Framework for K-12 Science
Education (NRC, 2012) and the Next Generation Science Standards (NGSS) (Achieve,
Inc., 2013). In the new Framework, science learning is structured around three
dimensions: (1) the disciplinary core ideas, (2) the scientific and engineering practices,
and (3) the key crosscutting concepts (Pellegrino, Wilson, Koenig, & Beatty, 2014). The
second dimension highlights the scientific practices commonly used by scientists but,
this time, engineering practices were included in the Framework to help students
appreciate that “engineering in scientific investigation requires not only skill but also
knowledge specific to each practice” (NRC, 2012, p. 30). The NGSS described specific
goals for science learning in the form of performance expectations, statements about
what students should know and be able to do at each grade level, and thus what should
be tested at each grade level. Each performance expectation incorporates the three
dimensions. Both documents emphasized that science and engineering education should
support the integration of these three dimensions that are needed by students to be able
to engage in scientific inquiry and engineering design.

38
It is notable that all the aforementioned documents argued for the importance of
scientific inquiry in classrooms in giving an accurate portrayal of scientific
investigation, in contributing to one’s personal intellectual development, and in offering
a way of thinking that would be used in the solution of everyday problems. But perhaps
the primary justification for using scientific inquiry, particularly in the NRC’s
publications, is the argument that it is a more effective teaching strategy, more
engaging, and that students learn more from inquiry-based approaches to teaching
(DeBoer, 2004). However, it is important to recognize that there appears to be no single
way to think about what scientific inquiry is and no single argument that justifies its
use. It is a multifaceted approach to teaching that can be used to accomplish different
purposes for different reasons. Although the K to 12 science education reform
documents in the United States highlighted the importance of inquiry, and referred to
inquiry as a central teaching strategy, researchers in the United States (e.g., Capps &
Crawford, 2013; Crawford, 2007; Minstrell & van Zee, 2000) claimed that few teachers
actually used inquiry to teach science in the classroom. According to them teachers
usually have limited views of inquiry-based instruction, which are reflected in their
classroom teaching practice.
During this time, inquiry became prominent in curricula for basic science
education in other parts of the world and most countries emulated the United States
reform documents on inquiry science education (Abd-El-Khalick et al., 2004). In
Europe, inquiry-based teaching and learning are part of science instruction, curricula,
and teacher professional development programs (Heinz et al., 2017). Features of
inquiry, like dialogues, discussion, and collaborative working are frequently
recommended in the European educational policy documents (Heinz et al., 2017).

39
According to Ropohl, Ronnebeck, Bernholt, & Koller (2013), several European Union
(EU)-funded projects (e.g., Science-Teacher Education Advanced Methods [S-TEAM],
Strategies for Assessment of Inquiry Learning in Science [SAILS], Promoting Inquiry
in Mathematics and Science Education [PRIMAS], Professional Reflection-Oriented
Focus on Inquiry-based Learning and Education through Science [PROFILES]) have
been initiated in the field of inquiry-based science education since 2008. Most of these
projects focused on the professional development of teachers in implementing inquiry
in their classrooms, promotion of widespread use of inquiry in teaching and learning of
science and mathematics, and development of inquiry-based resources and materials
(Ropohl et al., 2013).
While scientific inquiry is the main focus of the European basic science
education policy, there is a lack of knowledge about the conditions that influence its
implementation (Heinz et al., 2017). European researchers (e.g., Heinz et al., 2017;
Ropohl et al., 2013) attributed this to the considerable variation that exists between the
educational systems in each EU country, which has resulted in implementation of
inquiry-based teaching and learning in varying degrees in each country’s science
education program.
The South African basic education system also advocated scientific inquiry in
the teaching and learning of science (Ramnarain, 2016). The school science curriculum
advocated inquiry, which encouraged learners to “explore objects, situations and events
in their immediate environment, to collect data and record information, and draw
conclusions accurately” (Department of Education, 2002, p.34). This was also
emphasized in the new Curriculum and Assessment Policy Statement (CAPS) document
which stated that physical sciences is a subject that “promotes knowledge and skills in

40
scientific inquiry and problem solving; the construction and application of scientific and
technological knowledge; an understanding of the nature of science and its
relationships” (Department of Basic Education, 2011, p.8). According to Ramnarain
(2016), the implementation of inquiry teaching and learning in the diverse South
African educational landscape is inextricably context-dependent, and such
implementation interacts in significant ways with national educational policy, science
teachers’ background, professional development, school culture, governance, and
resources, among a number of other factors.
In Australia, the curriculum for pre-tertiary science education contains two
strands, namely the nature and influence of science and science inquiry skills,
particularly on skills essential for working scientifically (ACARA, 2014). The skills,
knowledge, and information associated with scientific inquiry were embedded in the
scope and sequence of general capabilities in Science, History, Geography, Economics
and Business, Civics and Citizenship, Critical and Creative Thinking (CCT), and
Information and Communication Technology (ICT) (Lupton, 2014). This clearly shows
that inquiry was given emphasis in the Australian primary and secondary education
systems. With this, Australian teachers and schools were mandated to incorporate
inquiry at some level into their regular classroom practice (Fitzgerald et al., 2017).
However, implementing this approach in a typical science classroom was challenging
for Australian teachers due to the influence of extrinsic (e.g., time) and intrinsic (e.g.,
views on inquiry-based teaching) factors (Fitzgerald et al., 2017).
Asian countries such as China (Ministry of Education of the People ́s Republic
of China [MEPRC], 2001), Korea (Ministry of Education [MOE], 2007), Singapore
(Ministry of Education [MOE], 2007), and Taiwan (Ministry of Education [ME], 1999)

41
have included scientific inquiry as one of the important features of the school science
curriculum. They all have a common goal of developing students’ inquiry and research
abilities. For example, in Korea, the MOE initiated the revision of the science
curriculum by adding mandatory open inquiry practice for at least six hours per year
from Grade 3 to Grade 10 (MOE, 2007). The revised science curriculum has been
implemented in primary and secondary schools since 2010 (Park & Lee, 2011). The
purpose of revision was for the students to conduct inquiry, from planning of
experiments to reporting of results, and to collaborate with other students in school
(MOE, 2007). Korean researchers (e.g., Kim, Yoon, Lee, & Cho, 2010; Park & Lee,
2011) have explored the implementation of the science curriculum in classrooms. They
found that, contrary to the Government’s expectation, teachers were mainly responsible
for determining the research topics of students, and students often conducted inquiry
alone as an out-of-school assignment. According to the researchers, these findings were
attributed to some factors like insufficient time, tight curricula, large class sizes, and
low confidence in teaching and practicing of inquiry (Kim et al., 2010).
The Philippines is a new addition to the list of Asian countries giving
importance to scientific inquiry in basic science education. In 2012, the Philippine
Department of Education initiated a science curriculum reform where scientific inquiry
was included as one of the salient features of the curriculum (DepEd, 2013b). The
present research explored the implementation of this inquiry-based science curriculum
in Philippine classrooms and this is described in more detail below.
42
Historical Perspectives on Scientific Inquiry in Philippine Classrooms
How was scientific inquiry incorporated into pre-tertiary science education
in the Philippines?
In the Philippines, the upsurge of research, curriculum development, and teacher
training in science for pre-tertiary education began in the 1960s and continued into the
1970s (UP NISMED & Foundation for the Promotion of Science and Mathematics
Education and Research [FPSMER], 2001). Since its early years, the University of the
Philippines Science Education Center (UP SEC), now known as the University of the
Philippines National Institute for Science and Mathematics Education Development
(UP NISMED), had developed science textbooks, laboratory manuals, and teachers’
guides with an emphasis on inquiry learning. Development of these materials was made
possible because of the establishment of UP SEC with curriculum development as its
primary mandate. This reform promoted active involvement of the students in doing
activities in the classroom with an emphasis on the relationship of concepts and
processes to develop content knowledge and science process skills. Key indicators of
desirable habits, scientific disposition, science process skills, and values along with the
cognitive objectives were also included in each teaching unit (UP NISMED &
FPSMER, 2001).
The developed materials required a new teacher orientation in science teaching.
Because of this, teachers went through in-service training programs such as workshops,
seminars on teaching strategies, equipment improvisation, and assessment procedures.
For many years, starting in 1993, teacher-training programs in the Philippines zeroed in
on the use of practical work approaches to teaching and learning (SEI-DOST & UP
NISMED, 2011a). This approach requires science teachers to use hands-on activities to

43
stimulate students’ curiosity and imagination. During this period, in-service training
programs had successfully exposed many teachers to new student-centered materials
and approaches. However, teachers’ and school administrators’ commitment to sustain
the programs was criticized as inadequate (UP NISMED & FPSMER, 2001). After
applying the ideas learned in the training, many teachers went back to the same lecture-
oriented method of the past (UP NISMED & FPSMER, 2001). In 2012, the Philippine
Department of Education and its stakeholder allies responded to the urgent and critical
need to improve the quality of basic education through the K to 12 education reforms.
A brief background on K to 12 education reform in the Philippines
As described in Chapter 1, the K to 12 program in the Philippines covers
Kindergarten and 12 years of school education (six years of primary education, four
years of junior high school, and two years of senior high school) to provide sufficient
time for mastery of concepts and skills and to develop lifelong learners. This program
was first implemented in Kindergarten in the school year (SY) 2011-2012. The
enhanced curriculum for Grade 1 and Grade 7 (1st year junior high school) was rolled
out in SY 2012-2013, and progressively introduced in other grade levels in succeeding
school years. Meanwhile, Grade 11 was introduced in SY 2016-2017 and Grade 12 was
introduced in SY 2017-2018. In this scheme, the first batch of high school students to
go through K to 12 will graduate in March 2018. The K to 12 curriculum framework
aims to foster a holistically developed Filipino with 21st century skills so that Filipino
graduates will be prepared for higher education, middle-level skills, employment, and
entrepreneurship (SEAMEO-INNOTECH, 2015). Compared with the previous ten-year
basic education system, which was congested and outdated in terms of desired

44
competencies and content (SEAMEO-INNOTECH, 2015), the K to 12 curriculum was
enriched to make it more relevant and responsive to students’ needs (DepEd, 2013b).
The Philippine Education for All 2015 Review Report (SEAMEO-INNOTECH,
2015) outlined the following features of K to 12 curriculum reforms which aim to
address the shortcomings of the previous curriculum. It can be summarized as follows:
1. The K to 12 curriculum aims to be decongested. The new curriculum focuses
on understanding for mastery and has removed unnecessarily repeated
competencies.
2. The K to 12 curriculum aims to be seamless. This ensures smooth transition
between grade levels and continuum of competencies through spiral
progression where learning of knowledge, skills, values, and attitudes
increases in depth and breadth. There is also continuity of competencies and
standards from elementary to secondary level through a unified curriculum
framework. The unified standards and competencies ensure integration of
what learners learn across grade levels and across learning areas for more
meaningful learning.
3. The K to 12 curriculum aims to be relevant and responsive as it focuses on
the Filipino learner. It is developmentally appropriate (age-appropriate) and
focuses on succeeding in the 21st century. Moreover, the curriculum
responds to the needs of the community. For example, an agricultural town
may offer agricultural elective courses; a coastal area, fishery elective
courses; and an urban area, industrial arts. Learning will be systematically
matched with labor market requirements.

45
4. The K to 12 curriculum aims to be learner-centered. It focuses on the
optimum development of the Filipino learners.
5. The K to 12 curriculum aims to be enriched. It uses integrative, inquiry-
based and constructive approaches to develop the competencies of the
learners (SEAMEO-INNOTECH, 2015).
How is inquiry incorporated into the K to 12 education reform in the
Philippines?
The new K to 12 science curriculum in the Philippines now includes statements
outlining the progression of inquiry skills and expectations of the rate at which students
will develop these skills (Ferido, Robertson, Care, & Bustos, 2015). The curriculum
emphasizes the understanding and application of scientific knowledge, learning
scientific inquiry skills, and developing and demonstrating scientific disposition and
beliefs (DepEd, 2016). In 2014, a group of researchers from the ACTRC, a partnership
between the University of Melbourne and the University of the Philippines, conducted a
scoping study into the teaching of scientific inquiry skills using the new K to 12
curriculum—Delivery of Science Inquiry Skills in K to 12 Curriculum (ACTRC, 2014).
They found that scientific inquiry skills such as observing, classifying, measuring,
inferring, and hypothesizing were represented at some point in the key stage standards
of the new K to 12 curriculum guide (K-3, Grade 4-6, 7-10 and 11-12) but these skills
were less well represented in all grade level standards (K, Grade 1, Grade 2, etc.) and
sparsely represented in some parts of the learning competencies for the different science
units at the grade levels (e.g., Living Things and their Environment, Grade 8). However,
scientific inquiry skills are clearly represented in the newly developed Learners’

46
Modules and Teachers’ Guides, although some skills appear repeatedly in those texts,
while others are not mentioned. These new elements of the curriculum address some of
the recommendations resulting from a comparison of the Philippines curriculum with
other Southeast Asian countries (Care & Griffin, 2011).
In addition, the organization of the science curriculum has also changed so that
concepts and inquiry skills are now revisited at each grade level with increasing depth
(spiral progression approach). This approach is a significant change in the new
curriculum as previously science was taught by discipline (discipline-based) per grade
level in secondary schools. For example, in Grade 8, students studied biology for the
whole school year, in Grade 9, students took chemistry, and physics was taught at Grade
10. The intention of this change is to better equip school leavers to make a contribution
as “scientifically, technologically, and environmentally literate and productive members
of society” (DepEd, 2016, p. 2). The new curriculum has been accompanied by changes
to the recommended assessment practices to support the assessment of students’ skills
(DepEd, 2012).
The concept of scientific inquiry in classrooms is not new to Filipino teachers. It
had been already mentioned in various science curriculum documents (e.g., DepEd,
2002a, 2002b; SEI-DOST & UP NISMED, 2011b). Professional development for
teachers is widely conducted to properly orient and present the benefits of inquiry-based
teaching (Gutierez, 2015; SEI-DOST & UP NISMED, 2011a). However, it appears
there may still be exists a big gap in the effective implementation of scientific inquiry in
the classroom (Gutierez, 2015; Montebon, 2014; SEI-DOST & UP NISMED, 2011a).

47
Chapter Summary
Researchers have different views about inquiry teaching in the science
classroom. Thus, in this chapter, tracing the history of scientific inquiry has been laid
out and synthesized to clarify the various meanings that this teaching approach has had
and to review the arguments used to justify its use in classrooms. The historical
perspectives on scientific inquiry in classrooms revealed four aspects—students doing
inquiry-based practice, students learning science concepts through inquiry, students
learning the nature of scientists’ inquiry-based practice, and teachers teaching science
through inquiry. The justification for using scientific inquiry as a teaching approach in
classrooms has changed according to the educational philosophy of its supporters (e.g.,
Dewey, 1910b; Schwab, 1962). Despite the early arguments presented to justify its use
in classrooms (e.g., Spencer, 1864; Dewey, 1910b; Schwab, 1962), history showed that
scientific inquiry remained an essential component of science education throughout the
years (Chiapetta, 2008; DeBoer, 2004). Understanding the variety of ways that
scientific inquiry can be used and the range of meanings it can have should aid
educators in moving toward effective pedagogies that deepen students’ engagement
with scientific ideas and processes, thus motivating them and giving them a better sense
of what science involves. Enacting inquiry-based curricula in classrooms designed by
organizations was challenging for teachers, as shown in the analysis of the historical
background of inquiry (Capps & Crawford, 2013; Fitzgerald et al., 2017; Ramnarain,
2016; UP NISMED & FPSMER, 2001). It is evident that sometimes the intended
inquiry-based curriculum was not implemented in classrooms (Bull et al., 2010; Heinz
et al., 2017; Kim et al., 2010).

48
With a renewed focus on teachers enacting inquiry-based pedagogy, there is a
need for research to track the progress of scientific inquiry teaching and learning in
classrooms (Crawford, 2014). This is to address the lack of detailed investigation of the
specific practices of inquiry employed by teachers in the classroom and of how each of
these practices is related to science learning. This renewed focus on inquiry was given
emphasis in the K to 12 education reform in the Philippines (SEAMEO-INNOTECH,
2015), specifically in the new science curriculum (DepEd, 2016; Ferido et al., 2015). It
can be noted that inquiry had gained recognition in Philippine science education in
1970s (UP NISMED & FPSMER, 2001). The present study explored inquiry-based
teaching and learning in Philippine classrooms under the K to 12 education reform. This
aimed to address the lack of empirical research on specific practices of inquiry-based
teaching employed by science teachers in developing countries. This study provided an
image of how teachers in a developing country, like the Philippines, used inquiry as a
teaching approach in the presence of particular challenges in the teaching and learning
environments. This could inform educators on the diversity of inquiry-based teaching
implementation particularly those who are working in the same education environment
in other developing countries. The aspects that have been mainly addressed in this study
were the specific inquiry teaching practices of teachers while using the new science
curriculum, teachers’ participation in the professional development on using the new
curriculum conducted by the Department of Education in the Philippines, and student
learning in science in relation to specific inquiry teaching practices of teachers. As
inquiry becomes the central focus of teaching and science classroom research, many
researchers have identified the characteristics of scientific inquiry that are relevant for
basic science education. More details about this are discussed in Chapter 3.

49
Chapter 3: Reviewing What Research Says About Scientific Inquiry and How it is
Assessed in Classrooms
This chapter is divided into two parts. The first part reviews the research
literature on scientific inquiry in pre-tertiary science education. It presents research-
based information on general characteristics of scientific inquiry that are useful in basic
education, on inquiry teaching models and how they were used in classroom research,
on teachers’ implementation of inquiry teaching in the classroom, and on student
learning through inquiry. Since this study involves observation of inquiry teaching
practices of teachers and measurement of student learning outcomes, the second part
reviews the methods used to assess inquiry teaching and learning in the science
classroom. It discusses tools such as observation protocols, teacher questionnaires, and
science tests that were used to assess teachers’ inquiry teaching and students’ learning
in science. In addition, it discusses a Rasch (1960) modeling approach to measurement,
which is argued to be beneficial for determining student learning outcomes.
How is Scientific Inquiry Characterized in the Research Literature?
Researchers and educators have identified general characteristics of scientific
inquiry that are particularly relevant to pre-tertiary science education. Crawford (2007)
conducted a study that examined the knowledge, beliefs, and efforts of five prospective
teachers to enact scientific inquiry in high school classrooms. In her study, Crawford
presented seven characteristics of scientific inquiry, which were based on the NRC’s
(1996, 2000) science education reform documents in the United States, the National
Science Education Standards and the Inquiry and the National Science Education

50
Standards. She used these characteristics as a framework for data analysis in inquiry
teaching research. Below are the characteristics of scientific inquiry identified by
Crawford (2007, p. 618):
1. Scientific inquiry involves asking and answering a question and comparing the
answer with what scientists already know about the world.
2. Data analyses are directed by questions of interest, involve representation of
data in meaningful ways, and involve the development of patterns and
explanations that are logically consistent.
3. Investigations have multiple purposes and use multiple methods.
4. Scientists formulate and test their explanations by examining evidence, and they
suggest alternative explanations.
5. Scientists often work in teams with different individuals contributing different
ideas.
6. Creativity is found in all aspects of scientific work.
7. Scientists make the results of their investigations public.
It can be inferred from these characteristics that scientific inquiry has the following
components: scientific questions, investigations, data, explanations based on evidence,
collective works in science, and dissemination of scientific results. Some of these
components can be observed in science classrooms as strategies of teachers to teach
science (e.g., questioning), or as activities of students to do science (e.g., performing
investigations). With this, it can be argued that in school science education, scientific
inquiry components can be used as a teaching approach, which may allow students to
experience how to do the processes of science. Based on this argument, it is therefore
51
important for classroom teachers to be informed of the characteristics of scientific
inquiry so that they can guide their students in doing inquiry.
Reform documents in K to 12 science education that focus on scientific
inquiry—Benchmarks for Science Literacy (AAAS, 1993), National Science Education
Standards (NRC, 1996), Inquiry and the National Science Education Standards (NRC,
2000), and Scientific Research in Education (NRC, 2002) along with science educators
(e.g., Chinn & Malhotra, 2002; Flick & Lederman, 2004; Minstrell & van Zee, 2000;
Osborne, Collins, Ratcliffe, Millar, & Duschl, 2003; Windschitl, 2004), and researchers
who have explored scientists in practice (e.g., Dunbar, 2001; Knorr-Cetina, 1999) have
provided key descriptions about the nature of scientific inquiry that became the
framework for identifying the general characteristics of scientific inquiry developed by
Schwartz, Lederman, and Lederman (2008). This group of researchers identified the
common aspects of scientific inquiry from the aforementioned framework which led
them to develop descriptions about scientific inquiry that are relevant and important for
basic science education. They called these descriptions the Aspects of the Nature of
Scientific Inquiry. According to Schwartz et al. (2008), these aspects are not new and
they were consistent with the description of scientific inquiry suggested by Schwab in
1962. As discussed in the earlier section of this dissertation, Schwab was recognized as
the individual most often associated with the curriculum reform movement’s notion of
scientific inquiry (DeBoer, 2004). The general aspects of the nature of scientific inquiry
developed by Schwartz et al. (2008) are presented below.
1. Scientific question guide investigations
2. Multiple methods of scientific investigations
3. Multiple purposes of scientific investigations

52
4. Justification of scientific knowledge
5. Recognition and handling of anomalous data
6. Distinctions between data and evidence
7. Community of practice
These aspects of scientific inquiry were used as indicators in the questionnaire
developed by Schwartz et al. (2008) in order to assess students’ views of scientific
inquiry. Based on these aspects, scientific inquiry involves scientific questions, different
kinds and purposes of investigations, scientific explanations based on evidence,
difference between data and evidence, and communication and peer review. It can be
noticed that most of these components of inquiry are also identified in the previously
discussed characteristics of inquiry. It can be argued that in school science education it
is important to explicitly discuss with students what is meant by each of these
components so that they know not only how to do the process but also the reasons or
justifications for doing it.
In Chapter 2, it was mentioned that the most recent iteration of scientific inquiry
in K to 12 classrooms in the United States was presented in the new document
Framework for K-12 Science Education (NRC, 2012). With this, a group of researchers
led by Lederman et al. (2014) referred to this document to revise and update the aspects
of the nature of scientific inquiry developed by Schwartz et al. in 2008. This time, they
came up with eight aspects of scientific inquiry which are educationally and
developmentally appropriate for K to 12 students. The following outlines the aspects of
scientific inquiry developed by Lederman et al. (2014, p. 68).
1. Scientific investigations all begin with a question but do not necessarily test
a hypothesis.

53
2. There is no single set and sequence of steps followed in all scientific
investigations (i.e., there is no single scientific method).
3. Inquiry procedures are guided by the question asked.
4. All scientists performing the same procedures may not get the same
conclusions.
5. Inquiry procedures can influence the conclusions.
6. Research conclusions must be consistent with the collected data.
7. Scientific data are not the same as scientific evidence.
8. Explanations are developed from a combination of collected data and what is
already known.
Lederman et al. (2014) used these aspects of scientific inquiry as a framework for the
development of the Views About Scientific Inquiry questionnaire. According to
Lederman et al. (2014), these eight aspects represent the necessary knowledge about
scientific inquiry that the students need to acquire, in addition to learning how to
perform the processes of scientific inquiry. It can be argued that these aspects of
scientific inquiry are also important for teachers to learn, especially if they are using
inquiry as a teaching approach in science, in order for them to implement this approach
appropriately.
The foregoing different sets of aspects of scientific inquiry were examined to
identify the common characteristics of inquiry that the researchers considered relevant
to school science education. Based on literature, the researchers who developed these
aspects have extensively explored inquiry in the science classrooms. It is important to
note that these sets of aspects of scientific inquiry were not completely addressed in the
present study. Although these researchers and educators offered different sets of
54
characteristics of scientific inquiry, they all have exhibited commonalities in the
following characteristics. These common characteristics were derived after examining
the aforementioned aspects of scientific inquiry.
1. Scientific inquiry involves asking questions.
2. Different methods of investigation can be designed in scientific inquiry.
3. Scientific inquiry involves data and evidence, which are distinct from each
other.
4. Explanations are generated from doing scientific inquiry based on evidence.
5. Results are presented to the community by means of communicating
information.
These five general characteristics of scientific inquiry were given emphasis and
significance in the development of the following instructional models available in the
literature, which can be used in classrooms to teach science through inquiry. These
characteristics were juxtaposed with teaching practices of teachers to characterize the
nature of their inquiry-based teaching in classrooms.
What are the Models of Scientific Inquiry and the Evidence of Using these in
Classroom Research?
In teaching science in K to 12 classrooms, teachers may use a number of
instructional models which range from teacher-centered to those that are student-
centered (Treagust & Tsui, 2014). These instructional models, which are also called
learning cycles (Atkin & Karplus, 1962), teaching sequences (Driver & Oldham 1986),
heuristics (Magnusson et al., 2004), or pedagogical frameworks (Poon et al., 2012),

55
offer broad guidance on the steps that a teacher might use to plan and deliver a lesson.
In science teaching, some instructional models were designed to promote inquiry
teaching and learning in the classroom (Marshall, Horton, & Smart, 2009). In addition,
most K to 12 science curriculum documents around the globe include scientific inquiry
as one of their essential features. With the emphasis given to inquiry in science
teaching, models of scientific inquiry, as outlined below, have been used in different
countries (e.g., Iran, Kenya, Singapore, Taiwan, Turkey, and the United States) to help
teachers deliver inquiry-based approaches in the classroom. It is acknowledged that
every model used to promote scientific inquiry in classrooms has its own merits, but the
review of scientific inquiry models in this study was limited to those that are designed
for science education at the primary and secondary school settings, have reference to a
constructivist or socio-constructivist focus, and are more directly focused on students’
learning in an inquiry science environment. A review of the essential components of
scientific inquiry as a teaching approach and a summary of each model of scientific
inquiry as shown in instructional models and science curriculum documents used in
science education at the primary and secondary schools are presented below. Details on
how the models of scientific inquiry applied in classroom research are also discussed.
Inquiry in science instructional models
Models used as framework for developing materials for inquiry teaching
The BSCS 5E model. This research-based instructional model is a theoretically
driven framework used in the development of new curriculum materials for use in
science teaching, and in teachers’ professional development programs (Bybee et al.,
2006). Aside from the United States, this model was used in other countries (e.g., Iran,

56
Kenya, Singapore, Taiwan, and Turkey) to teach science in schools (Fazelian, Ebrahim,
& Soraghi, 2010; Lin et al., 2014; Opara & Waswa, 2013; Poon et al., 2012; Sen &
Oskay, 2017). It consists of five phases—the 5 Es—engage, explore, explain, elaborate,
and evaluate (Biological Sciences Curriculum Study [BSCS] & International Business
Machines [IBM], 1989; Bybee, 2004). Each phase has a specific function and
contributes to the teacher’s coherent instruction and to the learners’ formulation of a
better understanding of scientific and technological knowledge, attitudes, and skills
(Bybee et al., 2006). Researchers have carried out extensive efficacy studies of
curricular materials based on the 5E model and have shown evidence of increased
mastery of subject matter compared with other modes of instruction such as typical
laboratory experiences (Bybee et al., 2006; Poon et al., 2012). Each phase of the 5E
model can be summarized as follows:
1. Engagement—engage students in the concept, process, or skill to be
explored
2. Exploration—students actively explore their environment or manipulate
materials
3. Explanation—students pay attention to a particular aspect of their
engagement and exploration experiences and teachers provide opportunities
for them to verbalize their conceptual understanding, or demonstrate their
skills or knowledge
4. Elaboration—extend students’ conceptual understanding and practice skills
or behavior to develop deeper and broader understanding, more information,
and adequate skills
5. Evaluation—assess students’ understanding and abilities

57
In the publication entitled The BSCS 5E Instructional Model Creating Teachable
Moments, Bybee (2015) emphasized that the BSCS 5E instructional model provides
classroom teachers with an approach to teaching that changes the emphasis within
lessons and provides a sequence that increases the probability of teachable moments.
According to Bybee, teachable moments occur in classrooms when students were totally
engaged because of phenomena, events, or situations that brought forth a need to know
and increased motivation to learning. These moments can be created in classrooms
through the BSCS 5E model. Although the BSCS 5E model and scientific inquiry are
not exactly the same, the BSCS 5E is an instructional model that is based on
constructivism which offers strong guidance and support for a teaching approach that
promotes inquiry among students. It can be argued that each phase of this model
provides experiences and strategies for students to construct their own learning within
the context of experiences consistent with scientific inquiry.
The EIMA model. This research-based instructional model is a framework used
for developing inquiry-based lesson materials and scientific models in science teaching
(Poon et al., 2012; Schwarz & Gwekwerere 2007). It consists of four phases: engage,
investigate, model, and apply (EIMA). In this model, scientific modeling is given
greater emphasis to give students the opportunity to create and refine explanations for
the phenomena they investigate. Based on a small-scale study of 24 pre-service
teachers, this model was found to be effective in helping them learn how to design
lesson materials around model-based scientific inquiry (Schwarz & Gwekwerere 2007).
The pre-service teachers also taught the lesson plans that they designed in their field
placements with the use of the EIMA model. After using this in classrooms, most pre-
service teachers (two thirds of the class) changed their teaching orientations from

58
traditional didactic approaches to reform-based approaches such as inquiry. With this,
Schwarz and Gwekwerere (2007) argued that using the EIMA model could enable pre-
service teachers to socially construct, synthesize, and apply their knowledge for
enacting reform-based teaching approaches such as inquiry. Below is a description of
each phase:
1. Engage—engage students’ prior knowledge and interest in a topic
2. Investigate—collect and analyze data to generate patterns or rules
3. Model—use data to create models that provide coherent explanations for the
observations
4. Apply—test and apply models in novel situations
The guided-inquiry model. This model consists of five phases—engage, prepare
to investigate, investigate, prepare to report, and report (Magnusson & Palincsar, 1995;
Magnusson et al., 2004) which can be summarized as follows:
1. Engage—engage students in questioning
2. Prepare to investigate—involve students in preparing questions, materials,
methods, design, and test of explanation
3. Investigate—students derive knowledge claims about the physical world and
their community
4. Prepare to report—students are asked to determine claims and evidence
5. Report—students are asked to share the results of their investigative activity
to the community
In Indonesia, the guided-inquiry model was used as a framework for developing
science learning materials for teachers to use in inquiry-based teaching (Putra, Widodo,
& Jatmiko, 2016). After implementing this material with pre-service teachers in a one-

59
semester period, researchers found that there was an improvement in the science literacy
skills of prospective teachers. In the United States, this model was used in teaching
students with learning disabilities and has shown positive outcomes in students’
engagement and learning of science (Palincsar, Collins, Marano, & Magnusson, 2000).
Similar positive results were observed in science achievement, attitude, and process
skills of mainstream primary and middle school students in Turkey and Greece when
their teachers used the guided-inquiry instruction approach (Koksal & Berberoglu,
2014; Vlassi & Karaliota, 2013).
Based on the phases of this instructional model, it is arguable that it is aligned
with socio-cognitive perspective of learning in which knowledge can be developed
through the practices of a community (Magnusson et al., 2004). The two instructional
models previously discussed seemed to align more with cognitive constructivist
perspective of learning. But all of them support inquiry teaching and inquiry learning in
the science classroom.
A model that emphasized authentic inquiry in science teaching
The 3D inquiry model. This recent model of scientific inquiry depends on three
dimensions (3D)—conceptual, procedural, and personal. Bevins and Price (2016)
argued that some existing models reduce the essence of inquiry by focusing more on a
sequence of tasks driven by a mechanistic approach which, according to them, is
unhelpful in the context of authentic inquiry. Because of this, they proposed the 3D
inquiry model, and they argued that using this model could avoid algorithmic and
passive learning, a consideration that is essential for inquiry teaching in the science
classroom as it reflects more closely authentic science than other inquiry models. They

60
also claimed that this model could promote student motivation and has the potential for
encouraging student autonomy. Bevins and Price (2016) argued that the 3D model in
total is novel and they proposed to use an action research approach to develop this
model with classroom teachers and students. The three interrelated dimensions can be
summarized as follows:
1. Conceptual dimension—this demonstrates scientists’ thinking about
phenomena and can generate questions and suggestions for inquiry. This
dimension includes theories of science to explain phenomena and verifiable
facts about a particular situation.
2. Procedural dimension—this ensures evidence is generated reliably,
interpreted with reference to the underlying ideas and the observed data and
communicated appropriately. Other procedures that make up this dimension
are identifying and controlling variables, careful experimentation, hypothesis
generation, and data analysis.
3. Personal dimension—this provides the willingness to create and manage an
authentic inquiry. This is the dimension that elevates the algorithmic
procedures of Dimension 2 into a dynamic, active process that has the
potential to generate new knowledge.
Inquiry in science curriculum documents
Essential features of scientific inquiry
The NRC (2000) through its publication entitled Inquiry and the National
Science Education Standards outlines the five features of inquiry in science classrooms.
These features have been used extensively in science education research as a framework

61
for discussing inquiry-based instruction in classrooms (Capps, Crawford, & Constas,
2012; Crawford, 2012; Kang, Orgill, & Crippen, 2008; Kim et al., 2013; Yang,
Soprano, & McAllister, 2012). For instance, Kang et al. (2008) investigated teachers’
conceptions of inquiry in terms of the characteristics of inquiry activities used in their
classrooms. These characteristics identified by the teachers were juxtaposed to the five
essential features of inquiry in order to characterize their conceptions of classroom
inquiry. Crawford (2012) also used the five essential features of inquiry to describe how
classroom teachers engage their Grade 5 students in doing authentic science. She then
investigated the impact of their inquiry instruction on student learning of science
concepts, principles, and nature of science. She found that when students were engaged
in authentic science through performing the essential features of inquiry, students
acquired better understanding of concepts and nature of science. Moreover, Yang et al.
(2012) conducted an analysis of inquiry components in the science curriculum of
Taiwan using the five essential features of inquiry. They determined the variations of
inquiry involved in the science activities included in the curriculum. The summary of
each feature is presented below:
1. Engages in scientific-oriented questions—involve students in a
scientifically-oriented question
2. Collects evidence—give priority to evidence in responding to the question
3. Formulates explanations from evidence—use evidence to develop an
explanation
4. Connects explanations with knowledge—examine sources of scientific
knowledge and form the links to explanations

62
5. Communicates and justifies explanations—form reasonable and logical
argument to communicate explanations
Elements of inquiry-based education (IBE)
In one of the European Union (EU) funded research projects in science
education called the European Science and Technology in Action Building Links with
Industry, Schools, and Home (ESTABLISH), science curricula for basic education in
eleven participating EU countries were analyzed, and fundamental abilities of students
in Inquiry-Based Education (IBE) were outlined based on the nine elements of IBE
proposed by Linn, Davis, and Bell (2004) as indicated below.
1. Diagnosing problems—identify the core of the problems and use prior
knowledge to be able to form working hypothesis
2. Critiquing experiments—formulate arguments, state outcomes in a
comparative way, and suggest further developments
3. Distinguishing alternatives—identify key elements of the problem and
express alternatives in suitable form
4. Planning investigations—students set a time frame, steps involved, resources
required, and training in use of any equipment
5. Testing hypothesis—test hypothesis which follows from observations, facts
previously gathered, or preliminary theories
6. Searching for information—define what to search using the right resources
and identify sources of information relating to intervening variables
7. Constructing models—construct models that can be checked, proved,
disproved, adapted, and improved

63
8. Debating with peers—discuss and regard different interpretations of
experimental results and work collaboratively
9. Forming coherent arguments—students form arguments and conclusion
based on evidence
Based on curriculum analysis, most of these elements were explicitly stated in
the national curricula of the eleven European countries (Cyprus, Czech Republic,
Germany, Estonia, Ireland, Italy, Malta, Netherlands, Poland, Slovakia, and Sweden)
which participated in the ESTABLISH project (McLoughlin, 2011).
Scientific practices for K to 12 classrooms
In the new Framework for K-12 Science Education of the United States, NRC
(2012) outlined the following eight scientific practices that are essential elements for K
to 12 science curriculum. These practices are derived from those that scientists and
engineers actually engage in as part of their work, which can be summarized as follows:
1. Asking questions—ask questions about the natural and human-built worlds;
distinguish a scientific question from a non-scientific one
2. Developing and using models—construct drawings or diagrams as
representations of events or systems; represent and explain phenomena with
multiple types of models
3. Planning and carrying out investigations—plan experimental or field-
research procedures, identify relevant independent and dependent variables,
and when appropriate, the need for controls
4. Analyzing and interpreting data—analyze data systematically, either to look
for salient patterns or to test whether data are consistent with an initial

64
hypothesis; use spreadsheets, databases, tables, charts, graphs, mathematics
to collate, summarize, and display data
5. Using mathematics and computational thinking—recognize dimensional
quantities and use appropriate units in scientific applications of mathematical
formulas and graphs; express relationships and quantities in appropriate
mathematical forms
6. Constructing explanations—construct own explanations of phenomena using
knowledge of accepted scientific theory and linking to models and evidence
7. Engaging in argument from evidence—construct a scientific argument
showing how data support a claim
8. Obtaining, evaluating, and communicating information—use tables,
diagrams, and graphs as well as mathematical expressions, to communicate
their understanding or to ask questions about a system under study
This framework is embedded in the Next Generation Science Standards (NGSS)
in the United States where these eight scientific inquiry practices are clearly presented
and articulated (National Academies, 2013). The NGSS reflects the framework by
focusing on a small set of core ideas, emphasizing deep understanding and application
of content, and building a coherent progression of concepts over the course of students’
K-12 science education (National Academies, 2013). As of November 2017, nineteen
states and the District of Columbia have adopted the NGSS and are currently working to
implement this in districts and schools (National Science Teachers Association, 2017).
Science leaders across the United States have embraced the vision of the framework,
whether or not their states are planning to adopt NGSS (Penuel, Harris, & Debarger,
2015).

65
Summary of the foregoing scientific inquiry models identified through
research
Researchers have different views about teaching science in K to 12 classrooms.
However, the emphasis placed on scientific inquiry appears to be an essential theme of
K to 12 science education documents. After examining all the aforementioned models
of scientific inquiry as shown in instructional models and science curriculum
documents, it can be argued that they provide:
1. A clear scientific orientation of inquiry teaching and learning activities in
classrooms.
2. Several defining characteristics of inquiry in the science classrooms.
3. A systematic approach to science instruction.
4. A wider perspective of scientific inquiry and teaching strategies.
Based on the above models, it is evident that there is no single and fixed method of
inquiry teaching in the science classroom. However, it can be argued that most of the
key features of inquiry models as shown in the instructional models and curriculum
documents suggest commonalities in the following six major components of inquiry
teaching in the classroom (Fogleman et al., 2011; Minner et al., 2010; Wilson et al.,
2010):
1. Engaging in questioning
2. Designing and conducting investigations
3. Collecting and organizing data
4. Analyzing and interpreting data
5. Developing explanations and conclusion
6. Communicating information
66
The aforementioned scientific inquiry models have been developed based on
research (e.g., Bransford, Brown, & Cocking, 1999; Johnson, Johnson, & Holubec,
1986; Karplus & Their, 1967; Linn et al., 2004; Magnusson, Krajcik, & Borko, 1999;
NRC, 2000; Schwab, 1962; Shulman, 1987) or some may have expanded on previous
instructional models, which can be used in classroom teaching. However, it can be
argued that the responsibility rests with classroom teachers to evaluate alternative
instructional models and employ the most appropriate approaches in their specific
classrooms. As discussed earlier, these inquiry models have been used in many
classrooms worldwide but this does not mean that teachers applied the model in the
same way in their own science teaching. Irrespective of how the models of scientific
inquiry have been conceptualized in the past 50 years or so, and features of inquiry have
changed during this period, research (e.g., Abd-El-Khalick et al., 2004; Anderson, 2002;
Phaeton & Stears, 2017) has consistently indicated that what is enacted in classrooms is
mostly incommensurate with visions of inquiry put forth in reform documents. This
means that a mismatch between the intended and implemented curricula tends to occur
in schools (Sethole, 2004).
A Review of Research on Scientific Inquiry in the Classroom
In reviewing related studies on inquiry in the science classroom, three lines of
research emerged. The first line of research, which comprised most of the studies (e.g.,
Crawford, 2000, 2012; James Long & Bae, 2018; Kang et al., 2008; Keys & Kennedy,
1999; Lotter, Harwood, & Bonner, 2007; Park Rogers & Abell, 2008), focused on
implementation of inquiry in science classrooms and students’ and teachers’ views or
perceptions of a scientific inquiry teaching approach. The studies belonging to this

67
group are mainly exploratory and descriptive and could not give a decisive answer
about the effectiveness of the approach. Next, a second line of research described
specific elements of scientific inquiry as a teaching approach (Bybee et al., 2006;
Magnusson et al., 2004; Poon et al., 2012; Schwarz & Gwekwerere, 2007; van Rens,
Pilot, & van der Schee, 2010). In this group of studies, improving or revising the
existing inquiry instructional model is the central focus by scrutinizing their constituent
elements. In this case, the effectiveness of the method should be considered in light of
the specific element under investigation, not in terms of the method as a whole. Lastly,
the third line of research examines the effectiveness of an inquiry-based teaching
approach as a whole to science learning (Areepattamannil, 2012; Fogleman et al., 2011;
Jiang & McComas, 2015; Koksal & Berberoglu, 2014; Lavonen & Laaksonen, 2009;
McNeil, 2009; Minner et al., 2010; Wallace & Kang, 2004; Wilson et al., 2010). It is
very common to see from the studies belonging to this group that a comparative
approach is used, for example, by differentiating a student-centered format from a
teacher-centered one, or by investigating changes before and after a curriculum shift or
teaching intervention. The effectiveness of the approach is usually measured in terms of
knowledge, skills, competencies, or affective variables.
The next sections present related studies that specifically focus on the first line
(implementation of inquiry in classroom) and third line (effectiveness of inquiry to
learning) of research since this project focuses on investigating teachers’
implementation of scientific inquiry practices in the Philippine classrooms and its
impact on student learning. Furthermore, knowledge and skills are the focus of this
review since these are often considered most revealing in terms of effectiveness.

68
How is inquiry implemented in contemporary science classrooms?
Research shows that the quality of science education in schools is greatly
influenced by the quality of teaching practice of teachers (Hattie, 2003; UP NISMED,
DOST, & DepEd, 2010). Various science education reform movements have recognized
the role of teachers as a major factor in student learning (DepEd, 2013b; Duschl,
Schweingruber, & Shouse, 2007; Kang et al., 2008; NRC, 1996, 2012). For students to
understand inquiry and use it to learn science, their teachers need to be well-versed in
scientific inquiry (NRC, 2000). For this reason, investigating how teachers implement
scientific inquiry teaching practices and determining the extent to which these practices
are implemented in classrooms are important research foci.
Based on the characteristics and models of scientific inquiry, it can be argued
that an inquiry-based teaching approach is a complex and sophisticated way of teaching
science that requires the teacher to have a firm understanding of the processes of
scientific inquiry. Several studies indicate that teachers are able to use scientific inquiry
in their classrooms in various ways despite the implementation challenges associated
with this teaching approach (Capps & Crawford, 2013; Kang et al., 2008; van Driel,
Beijaard, & Verloop, 2001; Wagh, Cook-Whitt, & Wilensky, 2017). Keys and Kennedy
(1999) used the case study method and participant-observer techniques to examine the
teaching practices of an elementary school teacher with 11 years of experience. Data
were collected through field notes during lessons, informal interviews, and transcripts
of three formal interviews. Four main themes emerged: (1) the teacher planned
instruction to explore questions that arose in context naturally from science activities,
(2) the teacher helped students take responsibility for hands-on work, (3) the teacher
supported students in constructing explanations and concepts from data, and (4) the

69
teacher provided opportunities for students to apply scientific knowledge. The
researchers also identified major challenges for the teacher in carrying out scientific
inquiry practices in the classroom such as lack of time, the challenge of turning
questions back onto students, and difficulty in teaching mandated concepts through
inquiry.
In another study, Crawford (2000) documented and examined the beliefs and
practices of an experienced rural public high school science teacher to determine how
the teacher created an inquiry-based classroom environment. The researcher collected
data for more than a year. The report focused on 20 students in an ecology class. Data
were collected through teacher interviews, notes of informal conversations, videotapes
of classroom and field trips, interviews with eight randomly selected students, student
products, and an end-of-year anonymous student questionnaire. Six key characteristics
emerged: (1) situating instruction in authentic problems, (2) grappling with data, (3)
collaboration of students and teacher, (4) connecting students with the community, (5)
the teacher modeling behaviors of a scientist, and (6) fostering students in taking
ownership of their own learning. In addition, Crawford found that the teacher exhibited
ten roles when implementing scientific inquiry in the classroom. These roles were
motivator, diagnostician, guide, innovator, experimenter, researcher, modeler, mentor,
collaborator, and learner.
Crawford’s finding is different from Anderson’s (2002) argument that teachers
typically employ a universal stepwise procedure, the scientific method, in implementing
scientific inquiry in their classrooms. Researchers have pointed out that this method of
implementation can fail to capture the creative and imaginative nature of the scientific
endeavor (Abd-El-Khalick & BouJaoude, 1997; Akerson, Abd-El-Khalick, &

70
Lederman, 2000; Lederman, 1992). In one study, teachers provided students with a
problem to solve by themselves (Lotter et al., 2007). This study confirmed the claims of
Crawford (2012) and Lederman et al. (2014) that scientific inquiry is typically
implemented in classrooms by letting students perform simple hands-on science
activities. According to the researchers, the aforementioned implementation illustrated a
narrow and incomplete image of real scientific investigation in the classroom
(Magnusson et al., 1999; van Rens et al., 2010; Wellington, 2000).
In the research conducted by Kang et al. (2008), the NRC’s five essential
features of inquiry, which have been discussed previously, were used to characterize
teachers’ implementation of scientific inquiry in classrooms. Researchers found that
participating teachers used only three of the five essential features of inquiry detailed in
the standards documents (NRC, 1996, 2000) when expressing their ideas of classroom
inquiry. They also found that there are teachers who place more emphasis on some
features of inquiry than others. For example, teachers more frequently implemented the
features of giving priority to evidence, and formulating explanations based on evidence
in teaching science, than that of engaging in scientifically oriented questions. Teachers
rarely implemented the features of evaluating explanations in connection with scientific
knowledge and communicating explanations.
In the Philippines, a scoping study into the teaching of inquiry skills under the
new K to 12 science curriculum was conducted by ACTRC in 2014. To evaluate the
degree to which the new emphasis on inquiry skills was being adopted, researchers
compared the intended curriculum (what is to be taught) with the implemented
curriculum (what is being taught). To ascertain the implemented curriculum, classroom
observations were conducted for 22 Grade 8 science teachers across 11 schools,

71
resulting in a total of 204 one-hour observations. These revealed that some scientific
inquiry skills were frequently referred to by teachers. For example, students were
regularly asked ‘how’ and ‘why’ questions, which focus on scientific inquiry, in
addition to ‘what’ questions, which focus on content knowledge. Teachers also asked
students to record observations and measurements and to connect explanations with
existing scientific knowledge. In addition to having classroom observations, ACTRC
researchers also examined teachers’ lesson plans and conducted interviews with the
teachers and the eleven science department heads. These measures revealed that the
teachers understood scientific inquiry as a method that requires students to engage in
hands-on tasks, gather evidence, formulate explanations, and draw conclusions.
However, some scientific inquiry skills, such as the use of scientific instruments, the
tabulation of results, and the testing of variables were seldom seen in classrooms.
Although the ACTRC researchers examined the teaching of scientific inquiry in science
classrooms, the relationship of teacher implementation of specific inquiry-based
practices to student learning was not investigated. Minner and DeLisi (2012) reported
that researchers often placed very little emphasis on investigating which specific
practices of scientific inquiry can lead to students’ greater achievement in science. With
this, it can be argued that there is a dearth of research focusing on the relationship
between the specific practices of inquiry employed by teachers in classrooms and
students’ learning in science. The present study aims to address this issue.
In summary, these different studies have pointed to various ways teachers are
carrying out scientific inquiry practices in their classrooms in different contexts.
However, it is important to investigate the actual practices of teachers in their
classrooms over several lessons and even over multiple years to understand the

72
complexities involved when a teacher strives to implement scientific inquiry in light of
reform-based curriculum and national mandates. This study aims to further explore the
explicit classroom practices enacted by teachers in the Philippines that are related to the
following components of scientific inquiry: (1) engaging in questioning, (2) designing
and conducting investigations, (3) collecting data, (4) analyzing data, (5) developing
explanations, and (6) communicating information. These six components were derived
from the synthesis drawn from literature on the different models and aspects of
scientific inquiry previously discussed (e.g., Bybee et al., 2006; Lederman et al., 2014;
Linn et al., 2004; Magnusson et al., 2004; NRC, 2000, 2012; Schwarz & Gwekwerere
2007). In addition, this research also seeks to explore the impact of teachers’ scientific
inquiry practices on students’ science learning.
What is the evidence that scientific inquiry practices improve student
learning?
The role of a teacher in the classroom has been established as a major factor in
student learning (Beese & Liang, 2010; Duschl et al., 2007; Granger et al., 2012; Hattie,
2003; O’Dwyer, Wang, & Shields, 2015; NRC, 1996). Many reform documents in K to
12 science education (e.g., Achieve, Inc., 2013; NRC, 2000, 2012) reported results of
studies (Duschl & Grandy, 2008; Schmidt, McKnight, & Raizen, 1997) indicating that
teacher practices such as presenting science only as a body of facts, using primarily
lecture modes, stressing vocabulary-driven drill-practice, and using only teacher-
centered versus student-centered approaches, are less effective in supporting student
learning. Surveys of students in science reveal that they were more inspired by teachers
who engaged them in tasks that enabled them to inquire and solve problems (Bernardo
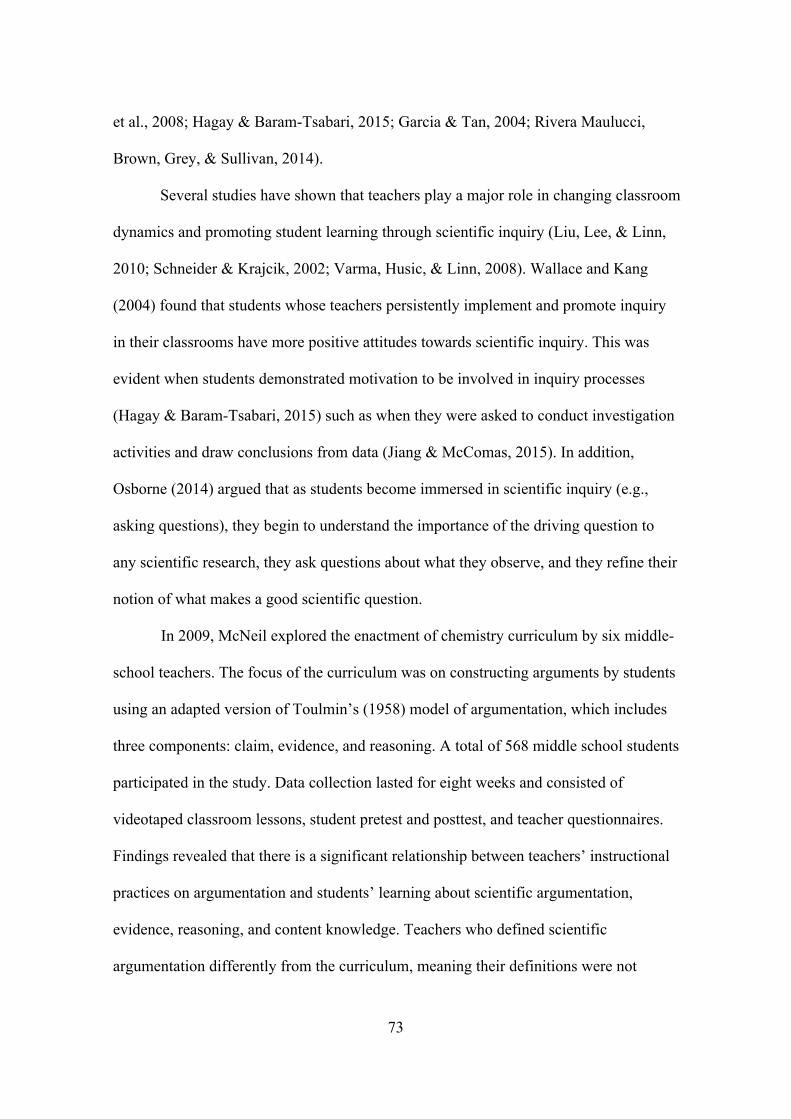
73
et al., 2008; Hagay & Baram-Tsabari, 2015; Garcia & Tan, 2004; Rivera Maulucci,
Brown, Grey, & Sullivan, 2014).
Several studies have shown that teachers play a major role in changing classroom
dynamics and promoting student learning through scientific inquiry (Liu, Lee, & Linn,
2010; Schneider & Krajcik, 2002; Varma, Husic, & Linn, 2008). Wallace and Kang
(2004) found that students whose teachers persistently implement and promote inquiry
in their classrooms have more positive attitudes towards scientific inquiry. This was
evident when students demonstrated motivation to be involved in inquiry processes
(Hagay & Baram-Tsabari, 2015) such as when they were asked to conduct investigation
activities and draw conclusions from data (Jiang & McComas, 2015). In addition,
Osborne (2014) argued that as students become immersed in scientific inquiry (e.g.,
asking questions), they begin to understand the importance of the driving question to
any scientific research, they ask questions about what they observe, and they refine their
notion of what makes a good scientific question.
In 2009, McNeil explored the enactment of chemistry curriculum by six middle-
school teachers. The focus of the curriculum was on constructing arguments by students
using an adapted version of Toulmin’s (1958) model of argumentation, which includes
three components: claim, evidence, and reasoning. A total of 568 middle school students
participated in the study. Data collection lasted for eight weeks and consisted of
videotaped classroom lessons, student pretest and posttest, and teacher questionnaires.
Findings revealed that there is a significant relationship between teachers’ instructional
practices on argumentation and students’ learning about scientific argumentation,
evidence, reasoning, and content knowledge. Teachers who defined scientific
argumentation differently from the curriculum, meaning their definitions were not
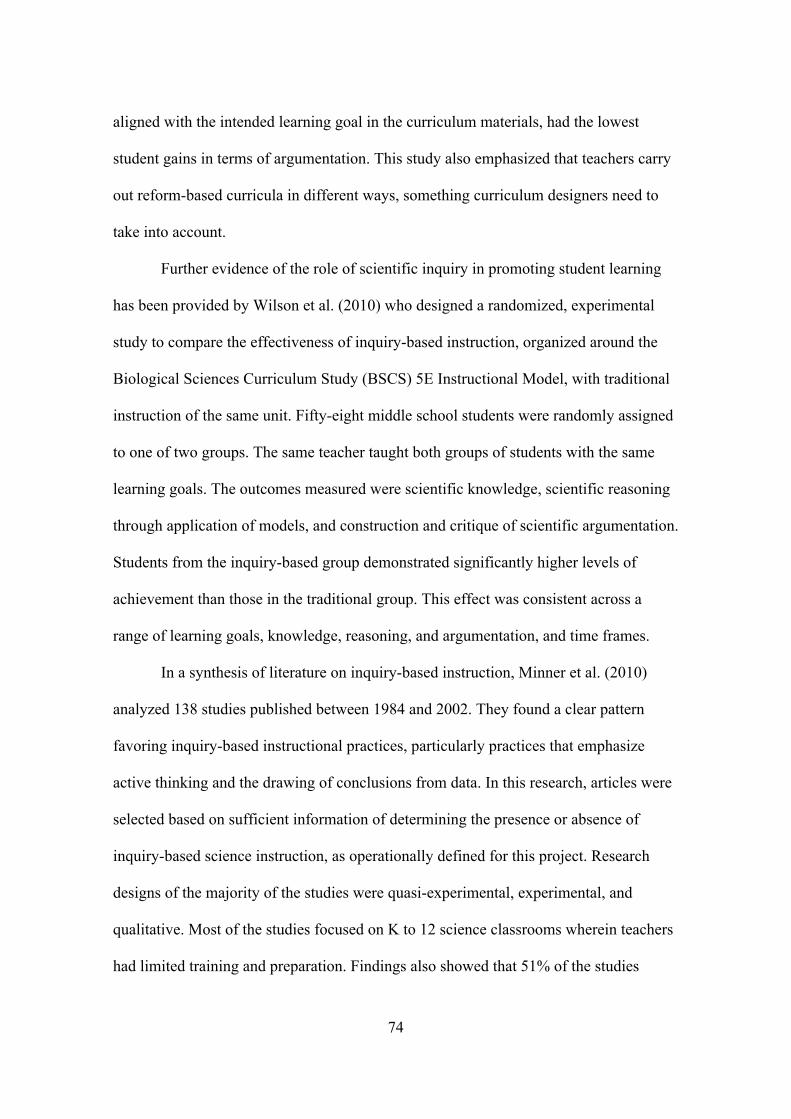
74
aligned with the intended learning goal in the curriculum materials, had the lowest
student gains in terms of argumentation. This study also emphasized that teachers carry
out reform-based curricula in different ways, something curriculum designers need to
take into account.
Further evidence of the role of scientific inquiry in promoting student learning
has been provided by Wilson et al. (2010) who designed a randomized, experimental
study to compare the effectiveness of inquiry-based instruction, organized around the
Biological Sciences Curriculum Study (BSCS) 5E Instructional Model, with traditional
instruction of the same unit. Fifty-eight middle school students were randomly assigned
to one of two groups. The same teacher taught both groups of students with the same
learning goals. The outcomes measured were scientific knowledge, scientific reasoning
through application of models, and construction and critique of scientific argumentation.
Students from the inquiry-based group demonstrated significantly higher levels of
achievement than those in the traditional group. This effect was consistent across a
range of learning goals, knowledge, reasoning, and argumentation, and time frames.
In a synthesis of literature on inquiry-based instruction, Minner et al. (2010)
analyzed 138 studies published between 1984 and 2002. They found a clear pattern
favoring inquiry-based instructional practices, particularly practices that emphasize
active thinking and the drawing of conclusions from data. In this research, articles were
selected based on sufficient information of determining the presence or absence of
inquiry-based science instruction, as operationally defined for this project. Research
designs of the majority of the studies were quasi-experimental, experimental, and
qualitative. Most of the studies focused on K to 12 science classrooms wherein teachers
had limited training and preparation. Findings also showed that 51% of the studies

75
indicated positive effects of inquiry-based instruction on content learning and retention,
33% of the studies showed mixed impacts, 14% showed no impact, and 2% showed
negative impact. Researchers noted that, although the evidence is not completely
positive, those students who engaged in instruction within an investigation cycle, which
has an emphasis on student active thinking or responsibility for learning, exhibited
enhanced content learning.
Furthermore, Fogleman et al. (2011) examined 19 middle school teachers on
how they implemented an inquiry-based science curriculum. In this study, researchers
aimed to determine the influence of a teacher’s curricular adaptations on student
learning by using hierarchical linear modeling. Data were collected through curriculum
surveys, videotape observations, and pretest and posttests from 1,234 students.
Researchers found that teacher experience and the amount of student initiation of
investigation activities during instruction were the variables that significantly predicted
student learning. Findings showed that teachers who had previously taught the inquiry-
based science curriculum had greater student learning gains. Students who completed
investigations had greater learning gains when compared to students whose teachers
used only demonstrations or carried out the inquiry on their own. The study implied that
it takes time for teachers to effectively implement innovative science curriculum and
that it is important that students actively engage in inquiry investigations.
The aforementioned studies presented positive impacts of inquiry-based teaching
on classroom learning. However, there were also studies that reported the opposite of
these results. For example, in the United States, Pine et al. (2006) compared the science
learning of fifth grade students who used hands-on inquiry-based curricula with the
performance of fifth grade students who used traditional textbooks. The sample students

76
were from 41 classrooms in nine school districts. The researchers explored students’
understanding of scientific phenomena and their performance in conducting inquiry
experiments, specifically their abilities in planning experiments, making observations,
collecting and analyzing data, and making inferences. The results of multilevel modeling
showed that hands-on inquiry-based curricula did not outperform traditional textbooks
in improving students’ science learning. In Finland, Lavonen and Laaksonen (2009)
examined the science learning of Finnish students using the Programme for International
Student Assessment (PISA) 2006 scientific literacy assessment data. The results of
regression analysis revealed that the most negative predictor for PISA science
performance of students was the frequency of science inquiry activities in class. Further,
in Qatar, Areepattamannil (2012) investigated the effects of inquiry-based instruction on
students’ science achievement. There were 5,120 students involved in this study from 85
schools. Consistent with other studies, hierarchical linear modeling showed that science
teaching and learning using scientific inquiry such as hands-on activities had
“substantial negative effects” on students’ science achievement (p. 134).
Some researchers clearly expressed their concerns with scientific inquiry in
classrooms and explicitly questioned this approach to science teaching. For example, in
the research of Klahr and Nigam (2004) on examining students’ ability to design
scientific investigations, they compared students’ performance under two conditions:
direct instruction and student-centered discovery approach. They found that direct
instruction (teacher-directed) was more effective in facilitating student learning,
particularly in learning scientific investigation skills, than student-centered discovery
approaches to instruction. They claimed that their findings challenged the long-standing
assumptions of the superiority of a student-centered inquiry-based approach to science

77
learning. In another article, Kirschner, Sweller, and Clark (2006) contrasted minimally
guided instructional approaches (e.g., inquiry-based teaching, problem-based learning)
with approaches that provide direct instructional guidance in the context of their
knowledge of human cognitive architecture, expert-novice differences, and cognitive
load. They argued that minimally guided instructional approaches are ineffective and
inefficient. Specifically, they argued that inquiry-based teaching places huge burdens on
students’ cognitive capacity by requiring them find solutions to a problem;
consequently, there are insufficient cognitive resources for new learning to occur.
It is clear from these studies that there is inconsistency in the results concerning
the impact of scientific inquiry on student learning. It is also clear that there is a very
little research that investigated the impact of different elements of scientific inquiry
teaching to learning. This is because there is a lack of fine-grained examination of
teachers’ practices of scientific inquiry in classrooms as evident from most studies
mentioned above. This suggests that further investigation is needed to track scientific
inquiry teaching of teachers in classrooms in order to provide an evidenced-based
documentation of specific teaching practices related to scientific inquiry. It is also
important to examine the impact of each specific inquiry teaching practice in order to
find other evidence, which may provide a clear interpretation of the effect of scientific
inquiry on science learning. In the Philippines, scientific inquiry teaching was
emphasized as one of the important features of the new science curriculum for pre-
tertiary education. The impact of this new curriculum emphasis on student learning is
not yet known. The present study addresses this issue by identifying the specific inquiry-
based teaching practices that the teachers used in classrooms and then examining the
impact of each of these practices to student learning in chemistry. This provided an

78
understanding of teachers’ enactment of specific inquiry teaching practices in
challenging classrooms of a developing country and how it affects student learning. This
may inform others who work in school education particularly in developing countries.
Measuring Scientific Inquiry Approaches to Instruction
Assessment of scientific inquiry in science classrooms offers rich possibilities,
both in terms of inquiry skills and competencies and inquiry teaching approaches.
Assessment has a strong impact on what is taught and how it is taught (Harlen, 2007).
With this, it is important that assessments and standards coverage are addressed in the
instructional process. This reflects alignment of assessment to the curriculum (Squires,
2012). But it is important to note that implementing a curriculum is not a smooth
process as it may not occur as intended, which reflects loopholes that create a gap
between the expectations of curriculum designers and what really takes place within the
classroom (Phaeton & Stears, 2017; Thijs & van den Akker, 2009). The relationship
between curriculum, learning, and assessment goals, respectively, is thus not only
crucial when analyzing and evaluating the effectiveness of inquiry-based approaches
(Furtak, Seidel, Iverson, & Briggs, 2012) but also with respect to the success and
sustainability of innovative approaches in education (Wilson & Sloane, 2000). The
pedagogical approaches that teach about and through scientific investigation clearly
play a significant role in science teaching and learning. However, tools are needed in
order to conduct research documenting inquiry approaches to instruction and illustrating
the specific elements of science instruction that are potentially associated with student
learning outcomes. This section presents some of the tools that are used to assess
inquiry-based teaching and learning in the science classrooms.

79
What instruments are available to measure scientific inquiry instruction in
science classrooms?
For inquiry-based teaching
There are two types of measurement tools reported in the literature to determine
the degree of inquiry-based teaching in science classrooms (e.g., Heinz, Lipowsky,
Groschner, & Seidel, 2012; Ropohl et al., 2013). These tools are (1) teacher self-report
questionnaires and (2) observation protocols.
Teacher self-report questionnaires
Teacher self-report questionnaires are used to measure the implementation of
inquiry teaching in classrooms by asking teachers to indicate how often the inquiry
practices occur in their instruction or how much time they spend on enacting scientific
inquiry activities in their classrooms. Teacher self-report questionnaires are usually
presented in the form of Likert-type scale instruments. The following are some
examples of teacher questionnaires used to assess inquiry-based teaching in science
classrooms:
The Teaching Science as Inquiry (TSI) (Smolleck, Zembal-Saul, & Yoder, 2006)
was developed to measure pre-service teachers’ self-efficacy in regard to the teaching of
science as inquiry. It uses 69 Likert-type items to measure pre-service teachers’
personal self-efficacy and outcome expectancy. The researchers used the five essential
features of classroom inquiry through the Inquiry and the National Science Education
Standards (NRC, 2000) as a basis for developing items for the questionnaire. The TSI is
used by asking pre-service teachers to rate themselves in performing these example
types of items in order to capture their inquiry teaching in the classroom: (a) providing
opportunities for students to discuss the experiments in which they participated, (b)

80
allowing students to devise their own problems to investigate, and (c) engaging students
in a learning environment that allows diversity of problems and methods. It can be
noted that this questionnaire focuses more on teacher self-reported efficacy on teaching
science as inquiry than on explicit practices of inquiry-based teaching.
A number of research studies have used this questionnaire to explore teachers’
self-efficacy in inquiry-based science teaching (e.g., Saglam & Sahin, 2017; Smolleck
& Yoder; 2008; Southerland et al., 2016; Walker, Spencer, Claiborne-Payton, &
Whiteman, 2017). In a study conducted by Smolleck and Yoder (2008), the TSI was
used to measure the self-efficacy in inquiry-based teaching and learning of pre-service
elementary teachers in the United States who were enrolled in five sections of a science
methods course. Researchers reported that the TSI measured an increase in self-efficacy
scores from pretest to posttest. They attributed this increase to pre-service teachers’
experiences within the inquiry-based science methods course. Based on the result of this
study, they argued that the TSI demonstrated content and construct validity with high
internal reliability when used with pre-service elementary science teachers. Aside from
pre-service teachers, the TSI was also used for investigating the self-efficacy of in-
service teachers. For instance, in Turkey, this questionnaire was used to investigate the
effect of inquiry-based professional development activities on self-efficacy of in-service
teachers in inquiry-based science teaching (Saglam & Sahin, 2017). Researchers
reported that there was a significant development in teachers’ self-efficacy in inquiry
teaching.
The Inquiry Science Implementation Scale (ISIS) (Brandon, Young, Pottenger, &
Taum, 2009) was developed to assess teachers’ implementation of experimental
activities for students in the classroom. It consists of 22 Likert-type items with a 5-point
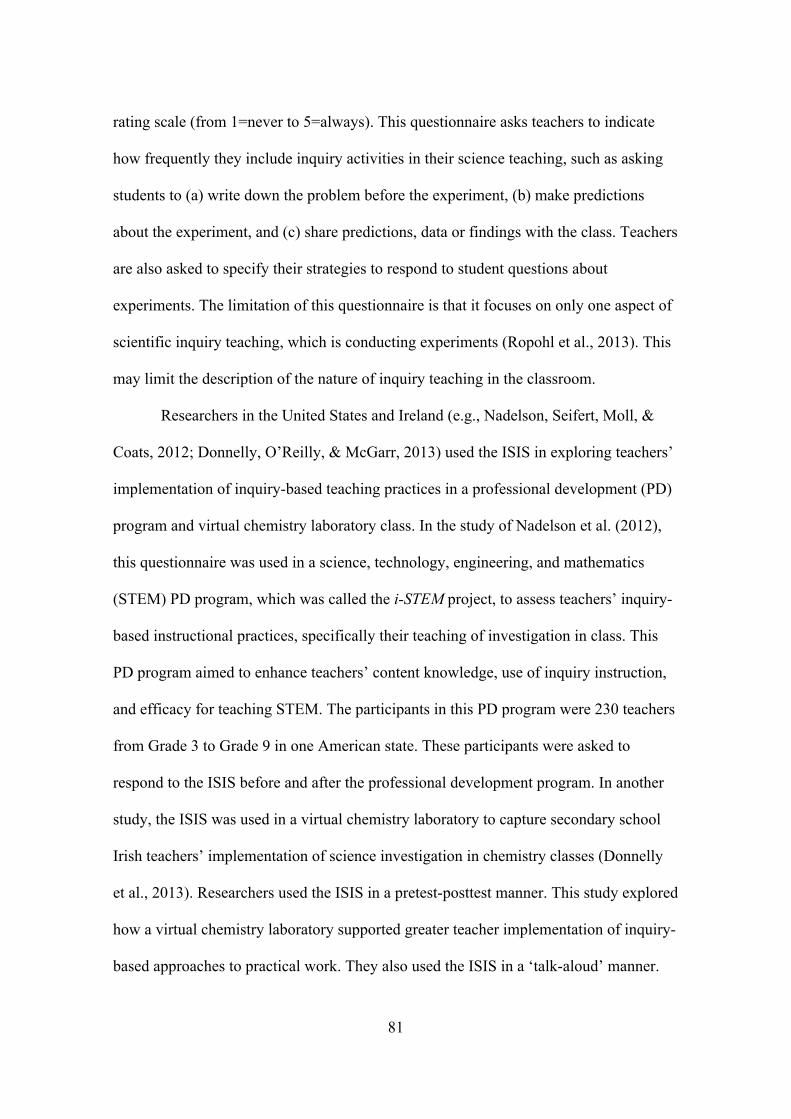
81
rating scale (from 1=never to 5=always). This questionnaire asks teachers to indicate
how frequently they include inquiry activities in their science teaching, such as asking
students to (a) write down the problem before the experiment, (b) make predictions
about the experiment, and (c) share predictions, data or findings with the class. Teachers
are also asked to specify their strategies to respond to student questions about
experiments. The limitation of this questionnaire is that it focuses on only one aspect of
scientific inquiry teaching, which is conducting experiments (Ropohl et al., 2013). This
may limit the description of the nature of inquiry teaching in the classroom.
Researchers in the United States and Ireland (e.g., Nadelson, Seifert, Moll, &
Coats, 2012; Donnelly, O’Reilly, & McGarr, 2013) used the ISIS in exploring teachers’
implementation of inquiry-based teaching practices in a professional development (PD)
program and virtual chemistry laboratory class. In the study of Nadelson et al. (2012),
this questionnaire was used in a science, technology, engineering, and mathematics
(STEM) PD program, which was called the i-STEM project, to assess teachers’ inquiry-
based instructional practices, specifically their teaching of investigation in class. This
PD program aimed to enhance teachers’ content knowledge, use of inquiry instruction,
and efficacy for teaching STEM. The participants in this PD program were 230 teachers
from Grade 3 to Grade 9 in one American state. These participants were asked to
respond to the ISIS before and after the professional development program. In another
study, the ISIS was used in a virtual chemistry laboratory to capture secondary school
Irish teachers’ implementation of science investigation in chemistry classes (Donnelly
et al., 2013). Researchers used the ISIS in a pretest-posttest manner. This study explored
how a virtual chemistry laboratory supported greater teacher implementation of inquiry-
based approaches to practical work. They also used the ISIS in a ‘talk-aloud’ manner.
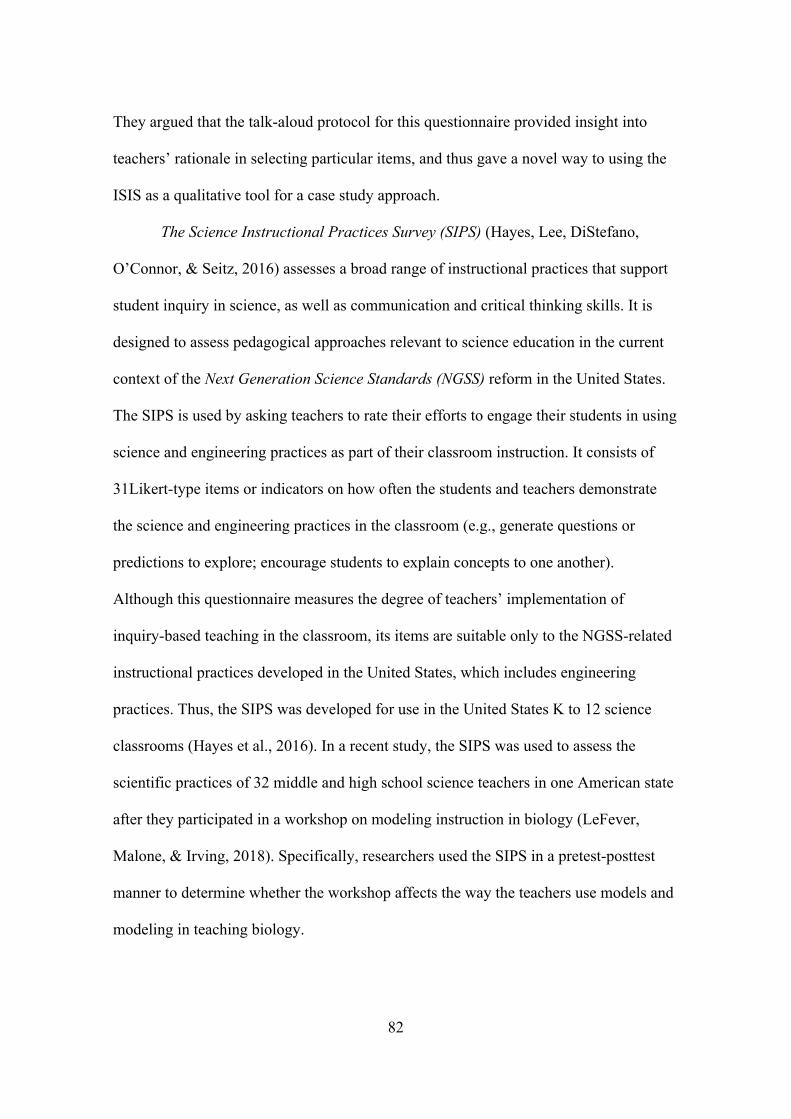
82
They argued that the talk-aloud protocol for this questionnaire provided insight into
teachers’ rationale in selecting particular items, and thus gave a novel way to using the
ISIS as a qualitative tool for a case study approach.
The Science Instructional Practices Survey (SIPS) (Hayes, Lee, DiStefano,
O’Connor, & Seitz, 2016) assesses a broad range of instructional practices that support
student inquiry in science, as well as communication and critical thinking skills. It is
designed to assess pedagogical approaches relevant to science education in the current
context of the Next Generation Science Standards (NGSS) reform in the United States.
The SIPS is used by asking teachers to rate their efforts to engage their students in using
science and engineering practices as part of their classroom instruction. It consists of
31Likert-type items or indicators on how often the students and teachers demonstrate
the science and engineering practices in the classroom (e.g., generate questions or
predictions to explore; encourage students to explain concepts to one another).
Although this questionnaire measures the degree of teachers’ implementation of
inquiry-based teaching in the classroom, its items are suitable only to the NGSS-related
instructional practices developed in the United States, which includes engineering
practices. Thus, the SIPS was developed for use in the United States K to 12 science
classrooms (Hayes et al., 2016). In a recent study, the SIPS was used to assess the
scientific practices of 32 middle and high school science teachers in one American state
after they participated in a workshop on modeling instruction in biology (LeFever,
Malone, & Irving, 2018). Specifically, researchers used the SIPS in a pretest-posttest
manner to determine whether the workshop affects the way the teachers use models and
modeling in teaching biology.

83
It is clear that the aforementioned teacher self-report questionnaires could offer
useful information to describe the nature of inquiry-based science instruction in the
classroom. However, any teacher self-report questionnaire (e.g., Likert-type scales) that
captures classroom practices has inherent issues of reliability and validity (Goe, Bell, &
Little, 2008). Goe et al. (2008) reported that self-report responses are susceptible to the
impact of social desirability, which is “the tendency on the part of individuals to present
themselves in a favorable light” (Moorman & Podsakoff, 1992 p.132). They reported
that this phenomenon would include both the conscious misrepresentation of teaching
practices to “look good” as well as unintentional misreporting due to a teacher’s
perception that he or she is correctly implementing a practice when in fact it is not being
implemented with fidelity. This phenomenon also includes insufficient reporting of the
details on important aspects of classroom teaching, as sometimes teachers may choose
not to reveal all their teaching style. With this, Goe et al. (2008) argued that potential
bias may lead to both overreporting and underreporting of practices, making the data
difficult to interpret. In addition, ratings can be influenced by the degree of teachers’
understanding about the construct being studied. This means that teachers may adjust
their understanding of the extent of inquiry teaching as they come to understand the
nature of inquiry advocated by a particular science curriculum. Due to the noted
limitations of teacher self-report questionnaires, this study considered another way of
assessing teachers’ instructional practices, which is observation of classroom instruction
through the use of an observation instrument. The present study explored various
observation protocols as presented below, which is beneficial in the development of an
observation instrument.

84
Observation protocols
In order to determine whether inquiry-based instruction occurs in the classroom
and to provide teachers with a tool that could support them in inquiry-based teaching, an
effective and valid observation protocol to measure the quantity and quality of this
teaching approach is necessary. The use of classroom observation instruments can
provide a more detailed description of teachers’ instructional practices than other
methods of evaluating teachers’ instruction (e.g., student report about teachers’
instruction, teacher self-report) (Halpin & Kieffer, 2015). This means that observation
instruments can provide a strong basis for supporting formative feedback to teachers. In
addition, observation instruments can facilitate research about the association between
instructional practices and student learning outcomes (e.g., academic performance)
(Halpin & Kieffer, 2015), which is the focus of the present study. For this reason, an
observation instrument was considered for use in this study to document the nature of
teachers’ inquiry instructional practices. Many classroom observation instruments have
tick-off sheets in which the observers are asked to mark each occurrence of a specific
practice within a predefined time frame. Other observation instruments have rating
sheets where teachers’ practices are rated on different point scales. The following are
some of the most common observation instruments used for assessing teachers’ inquiry-
based instruction in science classrooms:
The Inside the Classroom Observation and Analytic Protocol (Horizon
Research, 2000) was designed to assess the quality of lessons observed in K to 12
science and mathematics classrooms. Specifically, it assesses four aspects of
science/mathematics lesson instruction: (1) design of the lesson, (2) implementation of
the lesson, (3) science/mathematics content, and (4) classroom culture. In this

85
instrument, the items or indicators for each of these aspects are based on standards of
quality instruction in science and mathematics as outlined in K to 12 curriculum reform
documents in the United States—the National Science Education Standards (NRC,
1996), the Curriculum and Evaluation Standards for School Mathematics (National
Council of Teachers of Mathematics [NCTM], 1989), the Professional Teaching
Standards for School Mathematics (NCTM, 1991), and the Assessment Standards for
School Mathematics (NCTM, 1995). With this, this instrument allows classroom
observers to make judgments about how well the teachers’ instruction aligned with
these curriculum standards. Responses for the individual items or indicators are given
on a five-point scale (1=Not at all, 5=To a great extent). Although this observation
instrument could provide a solid and broad view of teachers’ instructional practices in
science and mathematics, it does not offer a thorough and granular understanding of
scientific inquiry teaching practices in science classrooms. This is because it mainly
focuses on general strategies in teaching science and mathematics, thus lacking in
specific teaching indicators on methods of science investigation. This was supported by
Marshall, Smart, and Horton (2009) when they reviewed this observation instrument.
They reported that this instrument does not provide a rigorous understanding of inquiry
teaching practices in the classroom.
The Reformed Teaching Observation Protocol (RTOP) (Sawada et al., 2002)
was developed by the Evaluation Facilitation Group (EFG) of the Arizona Collaborative
for Excellence in the Preparation of Teachers (ACEPT). The RTOP is specifically
designed for assessing ‘reformed teaching’ in science and mathematics classrooms. It
provides quantitative information on the degree of achieving reform in science and
mathematics teaching. Items in the RTOP were drawn from a pool of existing items

86
derived from different sources: (1) research studies in science and mathematics
standards conducted from 1989 to 2000, (2) existing observation instruments, and (3)
works of ACEPT staff and EFG. The RTOP is composed of 25 items grouped into three
categories: Lesson Design and Implementation, Content, and Classroom Culture. These
items are brief and specific statements about these three categories. Each statement in
an item has a rating scale from 0 (not occurred=the item never occurred in the lesson) to
4 (very descriptive=the item is very descriptive of the lesson). The lesson design and
implementation group included five items about the ACEPT definition of the structure
and nature of reformed teaching. The content group has ten items, which subdivide into
two parts. The first is propositional knowledge, which assesses the quality of the lesson
content (e.g., the lesson promoted strongly coherent conceptual understanding), and the
second is procedural knowledge, which captures the ACEPT understanding of the
inquiry process (e.g., students made predictions, estimations and/or hypothesis and
devised means for testing them). Lastly, the classroom culture group consists of ten
items focusing on the climate of reformed classroom (e.g., communicative interaction
between student and teacher). The reliability of the entire instrument is 0.97 and for the
subgroups, the reliability ranges from 0.80 to 0.93 (Sawada et al., 2002). This
observation instrument draws on major curriculum standards in the United States
developed by the NCTM, NRC, and AAAS.
Although the RTOP provides teachers and researchers with a clear method of
assessing a constructivist approach to teaching, it lacks a fine-grained way of assessing
instructional practices of teachers that are related to scientific inquiry in the classroom.
The instrument includes very few items or indicators on scientific inquiry teaching
practices. A fine-grained way of assessing inquiry-based teaching practices (e.g., adding

87
teaching indicators on specific classroom practices related to scientific inquiry in the
instrument) could offer recommendations for teachers particularly on the examples of
inquiry practices that can be used in their classrooms. This could be beneficial for them
as they improve their implementation of inquiry-based instruction. Moreover, the focus
of this observation instrument was assessment of the macro view of science and
mathematics teaching, which meant that its method was directed towards assessing
general strategies used in reformed classroom teaching.
The Science Teacher Inquiry Rubric (STIR) (Bodzin & Beerer, 2003) provides a
brief protocol that is aligned with the definition of scientific inquiry in classrooms set
forth by the National Science Education Standards (NSES) for K to 12 science (NRC,
1996) in the United States. This instrument translated each of the five essential features
of classroom inquiry, as presented in the text Inquiry and the National Science
Education Standards (NRC, 2000), into indicators or statements that portray inquiry
teaching practices and that capture the essence of each feature. Thus, it consists of a
rubric with different statements about inquiry teaching activities for each feature of
inquiry. The NRC’s five essential features of classroom inquiry provide important
characteristics of inquiry-based science instruction. In this instrument, the statements in
each feature vary based on the amount of teacher direction or the amount of student
initiation in doing inquiry activities. Although this observation instrument can be used
to monitor teachers’ inquiry-based instruction, it does not provide insight into the
specific teaching practices related to different elements of scientific inquiry (e.g.,
designing investigation) that teachers must implement in the classroom. This
observation instrument was designed only to determine whether the NSES were
achieved during instruction.

88
The Electronic Quality of Inquiry Protocol (EQUIP) (Marshall et al., 2009)
provides a protocol to guide teachers in increasing the quantity and quality of inquiry-
based instruction in the classroom. The development of this instrument was informed by
several existing observation protocols (e.g., Horizon Research, 2000; Sampson, 2004;
Sawada et al., 2000). The EQUIP was not developed for all classroom situations. It
mainly focuses on assessing the factors that affect the quality of inquiry-based
instruction and not on other teaching methods implemented in the classroom. There are
four specific factors that this instrument aimed to assess. These are Instruction,
Discourse, Assessment, and Curriculum. Each of these factors is associated with
different indicators. The total number of indicators included in this instrument is 19.
The EQUIP has a rubric created for each indicator. The rubric was used to distinguish
various levels of inquiry-based instructional proficiency of teachers for a specific
lesson: Pre-inquiry (Level 1), Developing Inquiry (Level 2), Proficient Inquiry (Level
3), and Exemplary Inquiry (Level 4). This rubric was also used as a benchmark to
challenge teachers to reflect about how to improve their implementation of inquiry
teaching in the classroom. In terms of statistical evidence, this instrument was supported
by validity checks and confirmatory analysis with high internal consistency (alpha
value=0.880-0.889) and solid interrater agreement (r2=0.856) (Marshall et al., 2009).
With this information about the EQUIP, it is clear that using this instrument in
the classroom to assess inquiry-based instruction could encourage teachers to strive to
increase the quantity and quality of their inquiry teaching since this instrument includes
several factors that support inquiry-based teaching and learning. However, due to its
focus on assessing these factors, this instrument lacks information on classroom
practices related to the processes of science, which is scientific inquiry itself. Most of

89
the elements of scientific inquiry were not included in the rubric. This is problematic
especially when assessing classroom instruction involving scientific investigations.
The Inquiry into Science Instruction Observation Protocol (ISIOP) (Minner &
DeLisi, 2012) was created to determine the extent of teachers’ implementation of
quality science teaching in classrooms, including science instruction that incorporates
scientific practices and habits of mind. Specifically, it is designed to comprehensively
document the nature of teachers’ implementation of scientific instruction. The teacher-
enacted curricula are the priority to capture by the ISIOP, which means that it focuses
on teachers’ own practices in classroom teaching rather than what reform documents
claim they should be doing. Recall that in Chapter 1, researchers reported that a
mismatch between the intended and implemented curricula was usually observed in the
classroom particularly in the period of major changes (Hume & Coll, 2010; Sethole,
2004; Sherin & Drake, 2009). The ISIOP may provide a way to monitor the degree of
implementation of the intended curriculum by teachers in the classroom. The conceptual
framework for the development of the ISIOP was based on the 2012 Framework for K-
12 Science Education (NRC, 2012) in the United States, which emphasized the
importance of instruction that supports students’ adoption of and engagement in
scientific practices. The development of items for the ISIOP and its content validity
were based on an extensive literature review of the nature of scientific inquiry through
the research project entitled Has Inquiry Made a Difference? A Synthesis of Research
on the Impact of Inquiry (Minner & DeLisi, 2012; Minner et al., 2010). One of the
unique aspects of the ISIOP, which was not noted in previously reviewed observation
instruments, is the inclusion of more items or teaching indicators on specific scientific
practices drawn exclusively from the science education literature. This aspect of the

90
ISIOP is crucial particularly in capturing the nature of scientific inquiry teaching of
teachers in classrooms. In addition, it is based on a comprehensive framework of
teachers’ practices, which are different from those that present in other observation
instruments, such as focusing on general classroom practices or on student practices.
Aside from the scientific investigation teaching indicators, the ISIOP has also included
teaching indicators on verbal practices and classroom instructional leadership practices.
It has a checklist and a rating scale that reflect a comprehensive view of classroom
practice that is standards-based and inquiry-oriented. It also includes teaching indicators
that have been either theorized or demonstrated to be associated with student learning.
This observation instrument can offer a granular way of assessing inquiry-based
practices of teachers in teaching science. However, evidence of the reliability and
precision of this instrument has not been firmly established (Minner & DeLisi, 2012).
One of the objectives of this study is to examine the classroom practices of
science teachers in the Philippines, and particularly those practices that are related to
scientific inquiry. This aspect of the study is needed in order to characterize the nature
of inquiry-based instruction in the classroom as teachers implement the newly designed
Grade 7 chemistry curriculum. Although curriculum alignment is not the direct focus of
the present study, exploring teachers’ practices under the new curriculum reform may
provide additional information on the degree of match between teachers’ science
instruction and the new curriculum emphasis, which is the teaching and learning of
scientific inquiry in addition to the acquisition of content or scientific knowledge
(DepEd, 2016). With this, meaningful assessment is needed through the use of a valid
instrument that focuses directly on measuring the implementation of specific inquiry-
based instructional practices of teachers that can facilitate inquiry-based learning in

91
science. For this study, a granular view of teaching practices related to the six elements
of scientific inquiry—engaging in questioning, designing and conducting investigations,
collecting data, analyzing data, developing explanations, and communicating
information—is crucial to thoroughly capture the nature of inquiry-based instruction of
teachers.
It is acknowledged that the information about the aforementioned observation
instruments has significant value for conducting classroom research on inquiry teaching
in science. The literature reported that these instruments have provided leadership in the
area of science instruction observation (Banilower, 2005; Heath, Lakshmanan,
Perlmutter, & Davis, 2010; Marshall et al., 2009; Smith, Jones, Gilbert, & Wieman,
2013). However, it can be argued that the contents of most of these instruments are
geared towards describing the broader strategies of teaching science which are not
sufficient for capturing the specific inquiry practices of teachers in classrooms. This
may affect researchers in conducting a detailed examination of teachers’ inquiry
teaching practices. Although these observation instruments could offer some
information about the nature of classroom inquiry, they possess the following
limitations, which could affect the characterization of specific inquiry teaching practices
of teachers:
1. There is lack of specific teaching indicators or items related to the
aforementioned six elements of scientific inquiry.
2. The elements of scientific inquiry are not explicitly specified in the instrument.
3. Most of these instruments are focusing on assessing broader instructional
strategies in science as well as other aspects of teaching and learning process
(e.g., assessment strategies).

92
4. Most of these instruments are not directly focusing on the teacher (except for the
ISIOP).
5. Since scientific inquiry in the classroom became more visible in the United
States K to 12 science reform documents (e.g., AAAS, 1989; NRC, 1996, 2000),
which were emulated by most countries (Abd-El-Khalick et al., 2004), these
instruments were developed in the context of United States K to 12 science
education.
For this reason, the present study created an observation instrument with direct
focus on assessing scientific inquiry teaching in the classroom. The development of an
observational tool that is directly aligned with science inquiry and contains specific
teaching indicators is indeed important since there is a lack of instrument specifically
designed to assess the specific inquiry practices of teachers. The observational
instruments developed by science education researchers were mostly assessing general
science teaching strategies and not focusing on granular view of inquiry practices of
teachers. With this, the Scientific Inquiry Teaching Observation Instrument (SITOI) was
developed for this study.
The Scientific Inquiry Teaching Observation Instrument (SITOI)
This observational tool was designed to measure teachers’ implementation of
specific classroom practices that are related to the elements of scientific inquiry. The
SITOI offers a granular view of inquiry-based teaching practices of teachers in the
classroom. It is composed of thirty-one items on specific inquiry practices, grouped into
the six major components of scientific inquiry—engaging in questioning, designing and
conducting investigations, collecting data, analyzing data, developing explanations, and

93
communicating information. These components were derived from the synthesis of
literature on models and aspects of scientific inquiry as previously discussed in the
summary of the scientific inquiry models section. The items in the SITOI were ranging
from teacher-centered to student-centered practices. More details on the development
process for this observation instrument are presented in Chapter 4.
What assessments are available to measure students’ learning of science
concepts and learning of and about inquiry?
For inquiry-based learning
As students’ inquiry-based learning has been recognized as an important
instructional objective and overarching goal in the United States K to 12 science
education (NRC, 1996, 2000), various standardized and convergent assessments have
been developed to assess this type of learning (Lederman et al., 2014). In this study, an
instrument that assesses students’ learning of concepts and inquiry processes and skills
is needed to measure inquiry-based learning in chemistry. In the past decades, both
quantitative and qualitative assessments have been developed and used in conducting
research related to science learning. These assessments were usually multiple-choice
tests or Likert-type questionnaires written from the perspectives of experts (Liang et al.,
2006). Multiple-choice tests have been commonly used for evaluating large samples of
students (Boone & Scantlebury, 2006). Some examples of assessments that measure
students’ inquiry-based learning were Views About Scientific Inquiry (Lederman et al.,
2014), Science Process Skills Inventory (Bourdeau & Arnold, 2009), and Science
Inquiry Literacy Test (Wenning, 2007). In addition, international assessment programs
such as the Trends in International Mathematics and Science Study (TIMSS) and the
94
Programme for International Student Assessment (PISA) issued by international
organizations (e.g., Organisation for Economic Co-operation and Development
[OECD], International Association for the Evaluation of Educational Achievement
[IEA]) have offered ways to assess students’ inquiry-based science learning.
The TIMSS is a well-established international assessment of science and
mathematics in grades four and eight (Mullis, 2017). The IEA has been conducting
international assessments of science and mathematics through TIMSS for nearly 20
years (Mullis, 2017). TIMSS began in 1995 and has been conducted every four years
since. According to Mullis (2017), about 60 countries use TIMSS trend data to monitor
the effectiveness of their educational systems in a global context. Martin, Mullis, and
Froy (2017) reported that TIMSS is designed to provide countries with information
about their students’ science and mathematics achievement that can be used to inform
evidence-based decisions for improving educational policy and practice. This is evident
in various studies around the globe (e.g., Bray & Kobakhidze, 2014; Carnoy,
Khavenson, & Ivanova, 2015; Nilsen, 2015; Topcu, Erbilgin, & Arikan, 2016). As
science and mathematics assessments, TIMSS is a valuable resource for monitoring
educational effectiveness because science, technology, engineering, and mathematics
(STEM) are key curriculum areas (Mullis, 2017).
The TIMSS science assessment in Grades four and eight is organized around
two dimensions: (1) content dimension, which specifies the subject matter to be
assessed, and (2) cognitive dimension, which specifies the thinking processes to be
assessed (Centurino & Jones, 2017). The content domains differ for Grade four (life
science, physical science, and earth science) and Grade eight (biology, chemistry,
physics, and earth science), which reflects the nature and difficulty of the science taught

95
at each grade. In Grade four, life science has more emphasis than its counterpart,
biology, in Grade eight. Chemistry and physics are assessed in Grade eight as separate
content domains and received more emphasis than in Grade four, where they are
assessed as one content domain (physical science). The content domains in each grade
include several major topic areas, and each topic area includes one or more topics. Each
topic has specific objectives that represent the students’ expected knowledge, abilities,
and skills assessed within each topic. TIMSS science assessments also include three
cognitive domains (knowing, applying, and reasoning) that are similar in both grades,
which encompassed the range of cognitive processes involved in learning science
concepts, and then applying these concepts and reasoning with them (Centurino &
Jones, 2017).
In addition to the content and cognitive domains, TIMSS science also assesses
inquiry practices, which include skills from daily life and school studies that students
use in a systematic way to conduct scientific inquiry and investigation and that are
fundamental to all science disciplines (Centurino & Jones, 2017). According to Mullis,
Martin, Goh, and Cotter (2016), inquiry has increasingly been given emphasis in many
countries’ current science curricula, standards, and frameworks, and so this is an
important component of TIMSS science assessments. In the upcoming TIMSS 2019
science assessments, five scientific inquiry practices are included: (1) asking questions
based on observations, (2) generating evidence, (3) working with data, (4) answering
the research question, and (5) making an argument from evidence (Centurino & Jones,
2017). Centurino and Jones (2017) argued that scientific inquiry practice is strongly
connected to the area of science under study and, therefore cannot be assessed in
isolation. They suggested that these practices are assessed in the context of science

96
content domains and by drawing upon the range of thinking processes specified in the
cognitive domains.
Further, the student responses to the items in each TIMSS assessment are
aggregated and converted to the TIMSS science and mathematics scale metrics at each
grade level to provide an overall picture of the assessment results for each country
(Martin et al., 2017). The TIMSS achievement scales provided established metrics
which countries can use to compare students’ progress in science and mathematics from
assessment to assessment in Grades four and eight. All results from TIMSS assessments
have been reported on the same scale metrics, making it possible to measure growth or
decline in countries’ achievement distributions from assessment to assessment (Martin
et al., 2017).
One of the important features of TIMSS science assessments that could be
beneficial for the present study, specifically in assessing student learning, is that
scientific inquiry is assessed together with science content. This feature is important for
this study particularly in developing chemistry test items on inquiry skills in the context
of chemistry content. Although TIMSS is a well-established science and mathematics
assessment, there were some issues reported by Wang (2011) from his in-depth analysis
on TIMSS assessment items such as (1) items with scientific and mathematical flaws,
(2) items with uneven difficulty levels, and (3) uncertainty of guessing embedded in
TIMSS.
The PISA is an international survey which occurs every three years to evaluate
education systems worldwide by testing the skills and knowledge of 15-year-old
students (OECD, 2018). The survey program was established by OECD in 1997 and
represents a commitment by the OECD member countries to monitor the outcomes of

97
their education systems in terms of student achievement, within a common international
framework (Bybee et al., 2009). Specifically, PISA focuses on assessing three major
domains—science, mathematics, and reading—with information about students’ home
background and their views of learning and learning environments (Bybee et al., 2009).
The results of PISA have been mainly used by researchers to examine educational
policies (e.g., Araujo, Saltelli, & Schnepf, 2017; Breakspear, 2012; Froese-Germain,
2010; Rautalin & Alasuutari, 2009). Since the first PISA survey in 2000, the number of
participating countries has continually increased from 28 OECD countries and four non-
OECD partner countries (Bybee et al., 2009) to 72 countries and economies in 2015
(OECD, 2018). This increase in number of participating countries may demonstrate
confidence in PISA as an important assessment program.
According to Bybee et al. (2009), PISA science has placed more emphasis on
assessing students in terms of the important knowledge and skills they will need in their
adult life and less in terms of mastering school curricula. This aspect differentiates
PISA from TIMSS. In PISA science, scientific literacy has been emphasized as the
major domain for assessment (OECD, 2017). Scientific literacy is defined in the PISA
assessment framework by the three competencies: (1) to explain phenomena
scientifically, (2) to evaluate and design scientific inquiry, and (3) to interpret data and
evidence scientifically (OECD, 2017). PISA science assesses the extent to which 15-
year-olds are capable of displaying these three competencies appropriately within a
range of personal, local/national, and global contexts (OECD, 2017). For PISA, these
competencies are only tested using the knowledge already acquired by 15-year-old
students. In addition to competencies, PISA science includes other aspects to assess
scientific literacy: context (personal, local/national, and global issues that demand some

98
understanding of science and technology), scientific knowledge (content, procedural,
and epistemic), and attitude towards science (interest in, attention to, and response to
science and technology) (OECD, 2017). Bybee et al. (2009) reported that PISA items
are arranged in units—groups of independently scored items (questions) based on a
common stimulus. All the three competencies and the three forms of scientific
knowledge were included in PISA test units and, in most cases, each test unit assessed
multiple competencies and knowledge categories (OECD, 2017). However, individual
test items only assessed one form of knowledge and one competency. PISA used three
classes of items to assess competencies and scientific knowledge: simple multiple
choice, complex multiple choice, and constructed-response items.
Bybee et al. (2009) reported that PISA science results were reported using a
combined scientific literacy scale, which has a mean score of 500 points among the
OECD countries with a standard deviation of 100 points. In addition to reporting the
results on a combined scale, the OECD also reported results using proficiency levels
representing a comprehensive range of scientific literacy. Level 1 indicates students at
the lowest or least proficient level, and level 6 indicates students at the highest or most
proficient level. According to Turner (2009), based on their scores, students were
assigned to the highest proficiency level for which they would be expected to answer
correctly a majority of assessment items spread across levels of difficulty.
One of the major strengths of the PISA science assessment is its emphasis on
assessing scientific competencies in relevant life situations, which represents a novel
approach to scientific literacy assessment (Bybee et al., 2009). The knowledge and
skills assessed in PISA are considered prerequisites to efficient learning in adulthood
and for full participation in society (Bussiere, Knighton, & Pennock, 2007; Bybee et al.,

99
2009). However, these features of PISA science assessment are not aligned with
features of chemistry assessments needed to assess student learning in the present study.
The focus of assessments for this study is on assessing content and skills that are
specified in the new Grade 7 chemistry curriculum in the Philippines, which is
something that is not in line with the focus of PISA science assessment.
The Views About Scientific Inquiry (VASI) questionnaire was developed by
Lederman et al. (2014) to measure students’ understanding about the nature of scientific
inquiry, which according to them is an integral component of scientific literacy. This
group of researchers argued that conducting scientific inquiry and knowledge about
scientific inquiry are both important, but knowledge about scientific inquiry is not
typically assessed in the classroom. They claimed that various science education reform
documents such as in the United States (e.g., NRC, 1996, 2000, 2012) have placed
importance on developing students’ understanding about scientific inquiry, but
assessment measures for this were not readily available for use by teachers in the
classroom. With this, Lederman et al. (2014) created the VASI questionnaire.
The VASI questionnaire was designed to assess students’ understanding of the
following eight aspects of scientific inquiry as suggested by Lederman et al. (2014, p.
68): (1) scientific investigations all begin with a question and do not necessarily test a
hypothesis, (2) there is no single set or sequence of steps followed in all investigations,
(3) inquiry procedures are guided by the question asked, (4) all scientists performing the
same procedures may not get the same results, (5) inquiry procedures can influence
results, (6) research conclusions must be consistent with the data collected, (7) scientific
data are not the same as scientific evidence, and (8) explanations are developed from a
combination of collected data and what is already known. According to Lederman et al.

100
(2014), these aspects of scientific inquiry were based on previous research (e.g.,
Schwab, 1962; Flick & Lederman, 2004; Osborne et al., 2003) and educationally
appropriate for middle and high school students.
The VASI is composed of seven open-ended response questions, which ask
students to give more than simple declarative answers by providing examples to further
elaborate their understanding about the eight aspects of scientific inquiry. A table of
specifications that links each question to various aspects of scientific inquiry is provided
for scoring. In evaluating student responses, views about scientific inquiry are
categorized as informed, mixed, naïve, or unclear. The validity and interrater reliability
for this questionnaire were established with agreement on over 90% of the questions
scored (Lederman et al., 2014). The VASI questionnaire was used in countries other
than the United States to assess students’ knowledge about scientific inquiry (e.g.,
Gaigher, Lederman, & Lederman, 2014; Hakanen & Lavonen, 2017; Yang, Park, Shin,
& Lim, 2017). In Finland, for instance, the VASI questionnaire was used to explore the
views of 149 grade seven students’ in the aspects of scientific inquiry (Hakanen &
Lavonen, 2017). Researchers reported that, based on the results of VASI questionnaire,
the sample students did not possess informed understanding of the nature of scientific
inquiry but they emphasized that these students have informed understanding on the
aspect “scientific data are not the same as scientific evidence”. Moreover, the VASI was
also used to examine the views of 282 Korean grade eight students about scientific
inquiry (Yang et al., 2017). Based on VASI, researchers reported that students
understand scientific inquiry in everyday contexts; however, students did not have
informed understanding of the terms data, evidence, and experiment, which is in
contrast with the case of Finnish students.

101
To assess student chemistry learning in this study, assessments need to focus on
assessing knowledge on chemistry content and skills in doing scientific inquiry as
specified in the enhanced science curriculum. It is clear that the VASI questionnaire
provided detailed information about the aspects of scientific inquiry that are important
for middle and high school students to learn in science classroom; however, its primary
focus is on assessing students’ knowledge about the nature of scientific inquiry, which
is something different from the skills of doing scientific inquiry.
The Science Process Skills Inventory (SPSI) was developed by Bourdeau and
Arnold (2009) to measure the development of science inquiry skills of middle school
students in the United States. It is an 11-item scale that mirrors the steps of the science
inquiry process. Based on SPSI (Bourdeau & Arnold, 2009), these steps of inquiry
process include forming and asking scientific questions, designing scientific procedures,
collecting and recording data, analyzing results, using models to describe results, and
creating scientific presentations. The SPSI was used by asking students to respond to
each item using a 4-point Likert scale (1=never, 2=sometimes, 3=usually, 4=always)
indicating how often they practice each of the items when doing science. According to
Bourdeau and Arnold (2009), the recommended scoring for this instrument is the
calculation of the composite science process skills score, which can be obtained by
summing the individual ratings for each item. The range for the composite score is 11-
44. Principal component analysis (PCA) was used to assess the latent structure of the
SPSI pretest and posttest scales, which indicated consistency with a single factor
solution for the scale. In terms of internal-consistency reliability, Cronbach alpha
coefficients for pretest and posttest range from 0.84 to 0.94 (Arnold, Bourdeau, & Nott,
2013).

102
Few studies reported the use of the SPSI in exploring students’ learning of
scientific inquiry skills (e.g., Arnold et al., 2013; Soomro, Qaisrani, & Uqaili, 2011).
One study was conducted in Pakistan wherein the researchers used the SPSI to measure
the ability of 40 grade ten students in using science process skills in physics (Soomro et
al., 2011). They investigated whether students’ development of process skills was more
favorable in a learning environment that used the 5E teaching model than in a learning
environment that used traditional teaching methods. They used SPSI in a pretest-
posttest control group research design. Based on the results of SPSI, they reported that
the 5E teaching model was more effective in improving students’ attitudes towards
science process skills in physics than traditional teaching methods.
It seems that the SPSI is not a widely used assessment for inquiry-based
learning. But the advantage of using the SPSI is that it may provide a clear profile of
student development of inquiry skills since it assessed a variety of specific scientific
inquiry practices of students in the classroom. This is evident in the composition of its
items, which represent the important steps of a complete inquiry process (Arnold et al.,
2013). Despite this strength of the SPSI, it could not offer ways to assess students’
learning of science content since its main focus is on the process of science only.
The Scientific Inquiry Literacy Test (ScInqLiT) was developed by Wenning
(2007) as a diagnostic multiple choice test relevant for scientific inquiry. Wenning
(2007) claimed that this test was not designed to “authentically assess student abilities
to conduct scientific inquiry” (p. 24). It was designed to offer measures of students’
development of scientific inquiry knowledge, which is ideal for the pretesting and
posttesting of the development of such knowledge (Hanauer, Hatfull, & Jacobs-Sera,
2009). In order to define clearly what is to be measured in the test, Wenning (2007)

103
developed a framework that operationally defines scientific inquiry at a level
appropriate to the understanding of high school students. This framework contains
proposed stages of scientific inquiry process, which were reviewed by physics teaching
majors, scientists, and educators. The following are the stages of scientific inquiry
suggested by Wenning (2007): (1) identify a problem to be investigated, (2) formulate a
hypothesis or model using induction from logic and evidence, (3) generate a prediction
from the hypothesis or model using deduction, (4) design experimental procedures to
test the prediction, (5) conduct a scientific experiment, observation or simulation to test
the hypothesis or model, (6) collect meaningful data, organize, and analyze data
accurately and precisely, (7) apply numerical and statistical methods to reach
conclusions, (8) explain unexpected results, and (9) use available technology to report,
display, and defend results. The initial 40 multiple choice test items were developed
based on these stages of inquiry process. These items were analyzed to determine item
difficulty and discrimination. After a series of pilot testing, five items were deleted and
leaving the final version of the test with 35 items.
Although the ScInqLiT was specifically designed to assess secondary school
students’ knowledge of scientific inquiry processes (e.g., Greene, O’Hair, Pedersen,
Nanny, & O’Hair, n.d.; Wenning, 2007), this test was also used to assess prospective
science teachers’ inquiry literacy (e.g., Kusnadi, Rustaman, Redjeki, & Aryantha,
2017). Researchers in Indonesia used the ScInqLiT to assess the development of
scientific inquiry literacy of prospective biology teachers after participating in an
inquiry-based laboratory project in Microbiology (Kusnadi et al., 2017). Specifically,
they assessed the research and laboratory skills and the attitudes toward science of
prospective teachers.
104
According to Wenning (2007), ScInqLiT is best used as a research instrument
for identifying weaknesses in student understanding of scientific inquiry processes,
improving science instructional practice, and determining program effectiveness in
relation to teaching scientific inquiry skills. In addition, ScInqLiT could determine the
level of students’ procedural knowledge on scientific inquiry, which may inform the
assessment of inquiry learning in this study. The only limitation of this test is the
absence of items that specifically assess science content knowledge, which is vital in the
assessment of scientific learning.
A review of all these approaches to assessment presents four aspects that are
important to consider when assessing inquiry-based science learning. These are
scientific content, scientific process, scientific inquiry skills, and attitude towards
science. Based on this review, scientific inquiry in the classroom seems to be a
multifaceted activity that requires knowledge and skills to solve a problem. For this
reason, the assessment of inquiry-based science learning may require the following: (1)
knowledge of scientific concepts and facts, or the content/substantive knowledge
(Hanauer et al., 2009; OECD, 2017); (2) knowledge of procedural aspects of how to do
scientific inquiry, or the procedural knowledge (Hanauer et al., 2009; OECD, 2017); (3)
skills on science processes (e.g., problem solving, conceptualizing results, and
developing explanation) (OECD, 2017); and (4) attitude towards science (OECD,
2017).
From all the assessments mentioned above, only the PISA science assessment
has been observed to include all the aforementioned aspects. Most assessments
canvassed were designed to focus on one aspect of scientific learning—either assessing
content or assessing process skills. The OECD (2017) and a number of science

105
education researchers (e.g., Norris & Philips, 2003; Ødegaard, Haug, Mork, & Sørvik,
2014; Lederman, Lederman, & Antink, 2013) emphasized that learning the content of
science alongside learning about the practices or processes of science or scientific
inquiry is an integral component of scientific literacy. This information is beneficial to
inform the present study on investigating the relationship of scientific inquiry practices
and student learning.
In this study, the chemistry test needed to address the content and inquiry skills
as specified in the new science curriculum in the Philippines. Although the instruments
reviewed above have their own strengths, they did not meet the requirement of
assessing the learning of chemistry content alongside learning of inquiry skills as
specified in the new curriculum. Thus, this study utilized the ACTRC chemistry tests
developed specifically for Grade 7 students in the Philippines, as these were specifically
designed to both match the curriculum being taught (content) and measure specific
inquiry skills.
The ACTRC Chemistry Tests
A key focus of this study is to consider how the teaching of scientific inquiry
skills impacts on student learning growth. To do this, a measure of student learning
needed to be identified. In order to assess students’ learning outcomes, the chemistry
tests developed by ACTRC were used in this study. This is because the tests were
developed based on the new science curriculum in the Philippines. The design of the
tests was aligned with the content and structure of the new science curriculum and
specifically the chemistry component for Grade 7. The key concepts and skills used in
test development were derived from the chemistry component of the curriculum. This is
106
beneficial for the present study since it explored Grade 7 students’ learning (content and
inquiry skills) in chemistry under the new curriculum reform. The ACTRC chemistry
tests also include items on scientific inquiry that are aligned with six different elements
of inquiry as discussed in the previous section of this chapter—engaging in questioning,
designing and conducting investigations, collecting data, analyzing data, developing
explanations, and communicating information. As a member of the test development
team, the author of this thesis mainly contributed to the development of items on
scientific inquiry for the ACTRC chemistry tests. These items were designed in
accordance with the framework for the development of assessment indicators for
inquiry-based teaching of teachers in chemistry, proposed by the author for this study.
This proposed framework will be presented in Chapter 4. The items on scientific inquiry
are additional to the items on content, which are based on the Grade 7 chemistry
component of the new science curriculum. Furthermore, the ACTRC chemistry tests
and scales were designed to measure student gain or growth within and across year
levels. The test alignment to the curriculum was reviewed and checked by the
appropriate experts and the scaling process utilized Rasch analysis. The curriculum
alignment and associated interval scales are characteristics of the ACTRC chemistry
tests which are beneficial for this study, particularly in measuring students’ learning in
chemistry across different time points. Details on test development process are
discussed in Chapter 4.
The Rasch model
The use of Rasch (1960) modeling has been considered by many to be one of the
best approaches for measurement (Boone, Townsend, & Staver, 2010; Liu, 2010;

107
Sondergeld & Johnson, 2014). Today, many researchers have used Rasch modeling in
both developing tests and obtaining student ability and item difficulty estimates (e.g.,
Areepattamannil & Khine, 2017; Boone & Scantlebury, 2006; Karim, Shah, Din,
Ahmad, & Lubis, 2014; Phillipson & Tse, 2007). This is because the Rasch model can
address some measurement issues that the Classical Test Theory (CTT), which was ever
prevalent in measurement history, fails to deal with.
CTT is a measurement framework that focuses on models at the test-score level
that link test scores to true scores rather than item scores to true scores (Hambleton &
Jones, 1993). Although the major focus of CTT is on test-level information, item
statistics such as item difficulty and item discrimination are also important for the CTT
model (Fan, 1998). According to Fan (1998), CTT is not using a complex theoretical
model to relate a person’s ability to success on a particular item. Instead, CTT
collectively considers a pool of persons and empirically examines their success rate on
an item. However, CTT has two major limitations. First, the person statistics (i.e.,
observed score) are test dependent. Second, the item statistics (i.e., item difficulty and
item discrimination) are person dependent. MacDonald and Paunonen (2002) reported
that similar statistical interdependencies exist between the observed scores and the item
discrimination indices of CTT. These limitations of CTT pose some difficulties in its
application to some measurement situations (e.g., test equating) (Fan, 1998). The
aforementioned dependencies could limit the utility of the person and item statistics in
practical test development work and in test equating which could complicate any
measurement analysis (e.g., measurement of growth) (Hambleton & Jones, 1993).
In the Rasch model, the probability of a person’ successful response in an item is
expressed mathematically as follows (Wright & Stone, 1979):

108
𝑃 𝑋!" = 1 𝛽!; δ! =exp(𝛽! − δ!)
1 + exp(𝛽! − δ!)
In this equation, 𝑋!" indicates the success or failure of person 𝑣 on the item 𝑖. When
𝑋!" = 1, it means success (or a correct response) on the item, and if 𝑋!" = 0 this means
failure (or an incorrect response) on the item. 𝛽! is a person-parameter, representing the
ability level of person 𝑣 on the latent variable scale, and δ! is the difficulty of the item
which is on the same measurement scale as 𝛽!.
Through this equation, the Rasch model explained that a student whose ability is
equal to the item difficulty has 50% chance of answering the item correctly. If an item’s
difficulty is lower than a student’s ability then the student has greater than 50% chance
of answering the item correctly. If an item’s difficulty is higher than a student’s ability
then the student has less than 50% chance of answering the item correctly. Further, the
above equation representing the Rasch model defines a unit called “logits” for student
ability and item difficulty estimates (Wright, 1977).
Assessment data analysis using the Rasch (1960) modeling approach provides
researchers with many techniques to evaluate assessment reliability and validity. It
provides a deeper understanding of the instrument’s strengths and weaknesses than the
CTT’s approach to measurement. In this study, the Rasch (1960) modeling approach
was employed to analyze chemistry assessments of Grade 7 students. The Rasch (1960)
model has wide application due to its property of invariance. The Rasch model property
of parameter invariance is essential for measuring growth or comparing measures
obtained from different student samples or measurement conditions. The degree to
which parameter invariance is achieved is the degree to which it is possible to make

109
valid inferences about student growth (Pavlovic, 2017). Furthermore, for parameter
invariance to hold, it is necessary to have the development of interval scales since the
item parameter estimates are not dependent on persons who took the test items, and the
person ability estimates are not dependent on the administered test items. Therefore, in
contrast with CTT, the key benefit in using the Rasch model in this study is its property
of parameter invariance and the consequent student ability estimates to compare results
obtained by two different chemistry tests. In addition, the Rasch model was used
because it has tight standards for the data to be analyzed. It is not designed to fit the
data, but instead is derived to define measurement (Wright, 1992). Therefore, it is an
ideal model that addresses the requirements of scientific measurement (Boone, Staver,
& Yale 2014). Moreover, Rasch modeling was also preferred for the present study
particularly due to its capacity to create ways of measuring gain or growth to determine
student learning outcomes, and to equate the two chemistry tests to compare results.
The other possible measurement models such as Item Response Theory (IRT)
[e.g., two-parameter logistic (2PL) and three-parameter logistic (3PL) models
(Birnbaum, 1968)] have weaker standards for the data to be analyzed, which means that
items are not rejected since the model adjusts to adapt to the contours of the data
(Wright, 1992). The Rasch model and Item Response Theory (IRT) are often conflated.
Some researchers associate the Rasch model with the family of IRT models (e.g., 2PL,
3PL), and they argue that it should be considered as a one-parameter logistic (1PL) IRT
model (Boone & Scantlebury, 2006). Although the mathematics of the Rasch model
may look like the one-parameter IRT model for dichotomously scored test items,
according to Boone et al. (2014), there is a core philosophical difference between the
Rasch model and IRT models. The Rasch model is not altered to fit a data set. This

110
makes the Rasch model the only model that meets the requirements of objective
measurement set forth by Thurstone (1928). On the other hand, IRT models are data-
centered. They are altered (more parameters are added) to fit a data set. Due to this
difference, it is misleading to classify the Rasch model as an IRT model. High-quality
measurement should not depend on the sample being measured, and the Rasch model is
sample independent. For these reasons, the Rasch model was used in this study to
analyze the student test data.
Chapter Summary
Several studies have suggested that scientific inquiry as a teaching approach can
meet a variety of educational goals (Anderson, 2002; Crawford, 2012, 2014; Hagay &
Baram-Tsabari, 2015; Heinz et al., 2017; Minner et al., 2010; Osborne, 2014). For
example, inquiry-based instruction has been posited as more effective than traditional
approaches in teaching a variety of specific science concepts (Duschl & Grandy, 2008;
Wilson et al., 2010). In addition, empirical evidence suggests that inquiry-based
approaches may be effective in promoting positive attitudes toward learning science
(Hagay & Baram-Tsabari, 2015; Rivera et al., 2014; Wallace & Kang, 2004). These
pieces of evidence indicate that using scientific inquiry in classrooms may have a
positive impact on student learning and attitudes toward life-long science learning.
However, other research is not as positive. Some researchers explicitly question
the effectiveness of inquiry as a teaching approach in classrooms (e.g., Kirschner et al.,
2006; Klahr & Nigam, 2004). There are also studies that report negative impacts of
inquiry-based teaching on student learning in science (e.g., Areepattamannil, 2012;
Lavonen & Laaksonen, 2009; Pine et al., 2006). These observed inconsistencies of the

111
results strongly suggest the need for further research to identify the impact of scientific
inquiry on students’ learning progress in science.
Furthermore, the overwhelming majority of research on scientific inquiry and its
relationship with students learning to date has been conducted in developed countries.
Teachers and students in these countries typically have access to resources (such as
physical resources and teacher support) that are not readily available in less developed
countries. Further, teaching practice in developed countries takes place under conditions
that may facilitate the use and effectiveness of scientific inquiry practices (such as
smaller class size). It is not yet known whether and how teaching through scientific
inquiry translates to less developed countries and if it is able to positively impact on
student learning in these contexts.
In addition, there is a lack of understanding about which aspects of scientific
inquiry practices, if any, are related to student learning growth. This study set out to
specify precisely specific scientific inquiry teacher behaviors, and investigate their
relationship with learning growth. To meet these research objectives, an observational
tool (the SITOI) was created that captured and classified a range of scientific inquiry
teacher practices. This allowed a more fine-grained examination of the relationship
between practices and student learning growth.
Furthermore, the review of different assessments designed to measure student
outcomes (e.g., Bourdeau & Arnold, 2009; Mullis, 2017; OECD, 2017; Wenning, 2007)
revealed that most assessments were designed to assess only one aspect of science
learning—either content or inquiry skills. With this, the present study used the ACTRC
chemistry tests that assess both the content and inquiry skills as specified in the new

112
curriculum. The Rasch (1960) model was used to derive measures of gain or growth.
The use of the Rasch model enabled comparison of students’ ability at two time points.

113
Chapter 4: Methodology and Sample
This chapter presents the participants, research instrument development, data
collection procedure, and data analysis procedure for assessing teachers’ inquiry
instruction and for measuring students’ learning in chemistry. A brief summary of the
methods is found at the end of the chapter.
Assessing Teachers’ Scientific Inquiry Instruction
Development of research instrument
The Scientific Inquiry Teaching Observation Instrument (SITOI)
To meet the study’s research objectives, there was a need for an observational
tool that could directly assess inquiry instruction by looking at the granular view of
scientific inquiry practices of teachers. For this reason, the Scientific Inquiry Teaching
Observation Instrument (SITOI) was developed by the author to cater for this need. The
SITOI was designed to measure teachers’ implementation of specific inquiry-based
instructional practices in science classrooms.
The SITOI development stage
The following stages were employed to develop the SITOI. Descriptions of each
of the development processes are presented below.
1. Establishment of the SITOI framework. In the first process of the SITOI
development, an assessment framework that is aligned with scientific inquiry was
created. The establishment of the framework involved two primary steps. First, the
construct was defined by reviewing relevant literature on the use of scientific inquiry in

114
the classroom and examining science curricula (especially the new Grade 7 chemistry
curriculum in the Philippines) to see the nature of inquiry-based lessons and the
associated inquiry skills included in the curriculum. Second, existing and established
observation protocols for science teaching at junior secondary level were examined,
particularly those that assess inquiry-based classroom teaching in order to build on
previous work in the field.
In the first step, the nature of scientific inquiry as a teaching approach in science
was explored to identify the general characteristics of scientific inquiry that are useful in
chemistry classrooms. The characteristics were derived from inquiry-based science
curriculum reform documents in the United States and Europe (e.g., Benchmarks for
Science Literacy [AAAS, 1993]; Inquiry and the National Science Education Standards
[NRC, 2000]; ESTABLISH project [McLoughlin, 2011]; Framework in K-12 Science
Education [NRC, 2012]) and some characteristics were provided by science education
researchers who worked on the use of scientific inquiry in teaching (e.g., Crawford,
2007; Lederman et al., 2014; Minstrell & van Zee, 2000). Aside from these documents,
the Philippine Grade 7 chemistry curriculum was closely examined to determine how
scientific inquiry is articulated in the new curriculum materials (e.g., Science
Curriculum Guide [DepEd, 2016], Teachers’ Guide, Learners’ Module). This also
offered descriptions and characteristics of scientific inquiry. In addition, the features of
inquiry-based teaching were identified through exploring different inquiry-based
instructional models developed by various researchers (e.g., 5E instructional model;
EIMA model; guided-inquiry model) in order to determine the components of scientific
inquiry suitable for basic education. The models suggest that scientific inquiry is a

115
broad array of approaches with varied teaching components that usually has questions
to be answered or problems to be solved.
In the second step, established observation protocols for science teaching (e.g.,
Reformed Teaching Observation Protocol [Sawada et al., 2002]; Science Teacher
Inquiry Rubric [Bodzin & Beerer, 2003]; Electronic Quality of Inquiry Protocol
[Marshall et al., 2009]; Inquiry into Science Instruction Observation Protocol [Minner
& DeLisi, 2012]) were examined to determine the components as well as the specific
indicators commonly used as contents of observational instruments to describe inquiry-
based teaching in the science classroom. Although the observational instruments
examined in this study (see Chapter 3) did not address all of the needs of the SITOI
development, they did provide ideas about the component elements of inquiry-based
science teaching.
The emphasis given on scientific inquiry appears to be a universal theme of K to
12 science education documents. However, it is clear that there is no single and fixed
method of inquiry teaching in the science classroom. Most of the characteristics of
scientific inquiry and key features of the different models of inquiry instruction suggest
these commonalities as exemplified in the following six major components of scientific
inquiry (Fogleman et al., 2011; Minner et al., 2010; Wilson et al., 2010). These six
components are the major practices of scientific inquiry and were used as a framework
to develop specific items or indicators of inquiry teaching practices listed in the SITOI.
1. Engaging in questioning (Q)
2. Designing and conducting investigations (DI)
3. Collecting data (CD)
4. Analyzing data (AD)

116
5. Developing explanations (DE)
6. Communicating information (CI)
It is important to note that the many facets of scientific inquiry reviewed from
the instructional models, inquiry science curricula, and observation protocols were not
all included in this study. These facets were examined to identify the common aspects
of inquiry that the researchers considered most relevant to school science education.
Although the models, curricula, and observation protocols reviewed in this study
offered different features of inquiry, they all have exhibited commonalities in the
aforementioned six components of inquiry relevant to school science education.
2. Development of items for the SITOI Version 1. After establishing this
framework, a preliminary version of the SITOI was created using the six components to
assess inquiry-based instruction of teachers. To devise items representative of each of
the six components, Version 1 of the SITOI was initially developed. This version of the
SITOI was composed of 36 items or statements on inquiry practices in classrooms
grouped into the six components of inquiry to capture the nature of inquiry instruction
of chemistry teachers. This preliminary set of items was developed and patterned
according to the items on inquiry teaching practices of the established and research-
based inquiry observation instruments reviewed in this study. The items ranged from
teacher-centered to student-centered inquiry practices.
3. Content validity of the SITOI Version 1. Two educational experts (one
Professor and one Research Fellow) of the Assessment Research Centre (ARC) at the
Melbourne Graduate School of Education reviewed the content of the SITOI Version 1.
Both of them had extensive experience in educational assessment. One of the experts

117
had scientific background with secondary school science classroom experience.
Independent preliminary feedback from each expert was gathered and used as a means
to revise the items. Their feedback suggested grammatical revisions and content
clarifications. To address their feedback, revisions of 36 preliminary items were done to
make them more clear and more specific. Items were added in some components of
inquiry to represent thoroughly the practices of scientific inquiry in classrooms.
Unnecessary repeated items in the list were deleted. Rewording or rephrasing the
statements was done for clarity and comprehension. One of the suggestions was to
rephrase all the statements and begin each statement with the word ‘Teacher’ to
emphasize that the SITOI was designed to assess teachers’ inquiry teaching practices.
For example, ‘Teacher prompts students to formulate and ask their own questions’.
Further, items in each component were reviewed again to make sure that they
appropriately represent a particular component of inquiry. With these actions, items of
the SITOI Version 1 were revised which resulted in the development of the SITOI
Version 2. A copy of SITOI Version 1 can be found in Appendix A.
4. Pilot test of the SITOI Version 2. The SITOI Version 2 with 29 items was
piloted in one Year 7 science class and one Year 8 science class in a public secondary
school in Victoria, Australia. Two researchers (the author and a research staff member
of the ARC) conducted paired observations in each science class using the SITOI
Version 2 to clarify the items on inquiry practices listed in the instrument and to
identify if the behaviors described by items were observable in the classroom. The pilot
test also provided an opportunity to assess the usability of the SITOI in the classroom.
A check mark was put next to an item every time it was observed in the classroom.
Notes were also taken during the observations. The SITOI Version 2 was piloted in

118
Australia since the Australian basic education system has been implementing an
inquiry-based science curriculum for a number of years (ACARA, 2017). Therefore, at
least theoretically, science teachers should be exhibiting a variety of inquiry-based
teaching practices in classrooms. Further, the K to 12 science curriculum in Australia
and the new K to 12 science curriculum in the Philippines are both student-centered and
inquiry-based, emphasizing the teaching and learning of inquiry.
5. Revision of items of the SITOI Version 2. After pilot testing of the SITOI
Version 2 in Australia, post-observation reflections and discussion meetings were
conducted by the two researchers to compare their observation data gathered using the
instrument, consolidate ideas, analyze observation notes, and confirm which items in
each component of inquiry listed in the SITOI Version 2 were enacted by teachers and
identify which items need improvement. Based on individual observational data
gathered using the SITOI, it was found that the two researchers had observed almost the
same items on inquiry practices of teachers enacted in classrooms. However, there was
a little difference in the total number of check marks put in some of the items observed.
With this, some items were refined based on the observed teacher practices
implemented in the inquiry-based science classrooms. Additional check boxes in each
item were also provided. It was found that some items on inquiry practices could be
combined with others that were similar and that, in order to fully capture scientific
inquiry practices, it was necessary to refine, revise, and add specific items based on the
observed practices enacted by teachers in the classroom. With these actions, items of the
SITOI Version 2 were revised which resulted in the development of the SITOI Version
3. A copy of SITOI Version 2 can be found in Appendix B.

119
6. Content validity of the SITOI Version 3. A science education specialist from
the University of the Philippines National Institute for Science and Mathematics
Education Development was asked to review the content of the SITOI Version 3 with
31 items. She holds a PhD in Chemistry Education and has extensive experience in
secondary school chemistry classroom research in the Philippines. Her feedback in the
SITOI Version 3 mainly focused on content clarification. In particular, she suggested
that the items in each component of inquiry should be more specific to ensure it could
be used effectively with Grade 7 chemistry teachers in the Philippines, one part of the
target sample population. For example, she suggested that an example of complex data
as specified in this item ‘Teacher asks students to analyze complex data’ be provided.
This is because complex data may not be part of the Grade 7 chemistry curriculum in
the Philippines. Her feedback provided the basis for item refinement, which resulted in
the final version of the SITOI. A copy of SITOI Version 3 can be found in Appendix C.
7. Finalization of the SITOI. The final version of the SITOI used in
observations was composed of 31 items on specific classroom practices, grouped into
the six major components of scientific inquiry. All items listed in the SITOI were
finalized and verified if they appropriately represented the intended scientific inquiry
components. Revisions (grammatical and content) from the previous process were made
for clarity and comprehension of the items. The items in each component of inquiry
were arranged from teacher-centered to student-centered to determine the degree of
initiation of inquiry practices in the classroom. The implication is that the more
responsibility students have for posing and responding to questions, designing and
conducting investigations, and extracting and communicating their learning, the more

120
open the inquiry. The more responsibility the teacher takes, the more guided or
structured the inquiry (NRC, 2000).
The SITOI items
After a series of revisions made in the foregoing process, the resulting
instrument includes the following 31 items of specific practices, which were developed
according to the six major components of scientific inquiry framework. As mentioned
above, the process of developing these items includes the examination and content
validation by relevant experts such as chemistry education specialist, scientist, and
education assessment specialist. These items were refined based on their critical
comments and suggestions.
Component I: Engaging in questioning (Q)
1. Teacher asks students a question about facts previously presented that requires
short, specific answer.
2. Teacher asks students a question about facts NOT previously presented which
elicit students’ own ideas.
3. Teacher asks students a question that requires them to justify a situation or
phenomenon.
4. Teacher prompts students to formulate and ask their own questions.
Component II: Designing and conducting investigations (DI)
1. Teacher demonstrates how to do the activity/experiment.
2. Teacher provides specific procedures to follow for students to do the
activity/experiment.

121
3. Teacher identifies the treatment and control variables for the
activity/experiment.
4. Teacher guides students while conducting the activity/experiment.
5. Teacher asks students to identify the treatment and control variables for the
activity/experiment.
6. Teacher asks students to design their own procedures for the
activity/experiment with assistance of teacher.
7. Teacher asks students to design their own procedures for the
activity/experiment.
8. Teacher asks students to formulate their own objectives for the
activity/experiment.
Component III: Collecting data (CD)
1. Teacher provides data for students.
2. Teacher asks students to make descriptive observations and/or collect data
from teacher demonstration.
3. Teacher asks students to make descriptive observations and/or collect data
from activity/experiments that students perform.
4. Teacher asks students to make measurements using scientific tools and
equipment.
5. Teacher asks students to explore phenomena and collect data outside the
classroom.
Component IV: Analyzing data (AD)
1. Teacher provides analysis/solution for students.
2. Teacher tells students direction on how data/problem is to be analyzed/solved.

122
3. Teacher asks students to analyze/solve simple data/problems.
4. Teacher asks students to analyze complex data/problems (e.g., secondary data
from existing scientific databases).
5. Teacher prompts students to assess the reliability and/or validity of
data/results.
Component V: Developing explanations (DE)
1. Teacher gives the explanation without giving students opportunity to explain
results.
2. Teacher gives the explanation but students are given opportunities to
explain and no one can make an explanation.
3. Teacher gives students pieces of evidence/information/clue they need and
then asks students to form their own explanation/conclusion/generalization
from results.
4. Teacher asks students to form their own explanations/conclusion from results.
Component VI: Communicating information (CI)
1. Teacher asks students to write information using the prescribed format.
2. Teacher asks students to devise and use their own format of writing
information.
3. Teacher asks students to describe, illustrate diagram/chart/picture, or
graph/table.
4. Teacher asks students to report on data or results of an individual or group
activity to the whole class.
5. Teacher asks students to report on data or results of an individual or group
activity with teacher-student interaction.

123
The final version of the SITOI is located in Appendix D. The SITOI was used in
the classroom from the start of the instruction period until the end of the instruction
period. Every time a teacher enacted the practice listed in the SITOI, a tick was placed
in a box provided in the instrument. Hence, the teaching implementation of a specific
practice could be recorded as many times as occurred. If a practice was not applicable to
the lesson taught by the teacher, ‘NA’ (not applicable) was noted next to a particular
item.
Teacher questionnaire
A short teacher questionnaire was developed to determine the background
characteristics of the sample teachers and their classroom contexts. It consisted of two
parts. The first part consisted of eight questions about teacher background information
such as education, gender, years of teaching experience, attendance at professional
development programs on the new science curriculum, and access to new curriculum
materials. The second part consisted of nine questions about the nature of the chemistry
classes they taught. Information on class size, student attendance, availability of
resource materials in class (e.g., science equipment, glassware, curriculum materials),
workspace to conduct experiments, and storage room for science materials was
collected. Both parts of the questionnaire included checklists and open-ended questions.
A copy of the teacher questionnaire used in this study is located in Appendix E.
Ethics
This study was given ethics approval from the University of Melbourne Human
Research Ethics Committee. The implementation of this study was also approved by the

124
Department of Education (DepEd) in the Philippines. The ethics documents for this
study (e.g., consent forms, plain language statements) can be found in Appendix F. The
plain language statements provided background information to the study, the research
focus, and how the participant was going to be involved. Contact information for the
ethics committee at the University of Melbourne was provided on this form.
Sample recruitment
Teacher participants
The data for this study were collected from four public mainstream secondary
schools from the National Capital Region (NCR) of the Philippines. These schools were
situated in densely populated cities in NCR. They were located quite far apart in three
different cities—Quezon City, Pasig City, and Makati City. The schools’ average class
size is 41. NCR was selected because of its relatively large population and consequent
role as education provider for a relatively large number of students with elementary and
secondary education. More characteristics of sample schools are outlined in Table 1
below.
Table 1. Characteristics of Sample Schools
School School Type School Location
Total Student Population
No. of Sample
Teachers
No. of Sample Classes
1 Regular, coeducational
Small urban area
7,755 2 3
2 Regular, coeducational
Small urban area
7,499 3 3
3 Regular, coeducational
Large urban area
12,348 2 3
4 Regular, coeducational
Large urban area
6,912 3 3
Notes. Regular school is a public school using the regular science curriculum. Student population was recorded during the school year 2015-2016.

125
Invitations to schools to participate in this study were mailed out through the
ACTRC, which is based in Manila. The school principals were invited to participate
upon permission from the DepEd by sending a letter from ACTRC, following formal
approval for the research by the DepEd. Consenting principals provided names and
contact details of Grade 7 chemistry teachers that enabled the ACTRC to send
invitations to participate in the research to relevant staff. The schools where the teachers
consented to participate were included in the research.
Based on this procedure, ten Grade 7 chemistry teachers (three males and seven
females) from four of the largest public secondary schools in NCR participated in this
study. The maximum years of science teaching experience of these teachers was twenty-
one and the minimum was four. Of the 10 teachers, nine were science majors and eight
participated in the national training for the implementation of the new science
curriculum conducted by DepEd. Some of them obtained postgraduate degree in
education (e.g., MA Educ). More details on teacher characteristics are presented in
Chapter 5.
Classroom observations
A series of classroom observations was conducted to identify teachers’ inquiry
practices in chemistry. Observation of classes provided opportunities to identify specific
teaching practices employed by teachers that were related to the six major components
of scientific inquiry. The lesson observations were conducted in twelve Grade 7
chemistry classes in four public secondary schools in NCR. Most of the Grade 7
chemistry classes observed in this study were crowded with students. The highest
number of students in a class was 57 and the lowest was 39. Some students were

126
grouped into homogeneous classes while other students were included in heterogeneous
classes. Generally, homogeneous classes in the Philippines are composed mainly of
students with similar ability. In contrast, heterogeneous classes are composed of
students with a wide range of ability levels, most of whom were not as academically
able as students in homogeneous classes. Student attendance in most classes was
generally good. Science laboratory room and materials were available in some classes
only. More details about each chemistry class observed are presented in Chapter 5.
Inquiry-based lessons in chemistry (Solutions, Substances and Mixtures,
Elements and Compounds, Acids and Bases, and Metals and Nonmetals) taught by
teachers were included in the new Grade 7 chemistry curriculum for the first quarter of
the school year. A total of 10 chemistry teachers were observed in different classroom
contexts in order to gather a wide variety of teaching practices related to inquiry while
implementing the inquiry-based curriculum. This would give a more detailed and
evidence-based documentation of the nature of inquiry teaching in Philippine
classrooms. There were two teachers who were observed teaching two different
chemistry classes and the remaining eight teachers were observed teaching one
chemistry class. Ten chemistry classes were observed for five one-hour lessons, one
class was observed for four one-hour lessons, and one remaining class was observed for
three one-hour lessons. This variation in the number of observations was a result of
class suspensions due to inclement weather conditions affecting the two classes with
fewer than five observations. The number of lesson observations per class is presented
in Table 2 below.

127
Table 2. Number of Lesson Observations per Class
Teacher Number of Classes
Number of Observations
Duration (Hour)
A 1 5 5 B 2 5 per class 5 C 1 5 5 D 1 5 5 E 1 5 5 F 1 5 5 G 1 5 5 H 1 5 5 I 2 5 in 1st class 5
3 in 2nd class 3 J 1 4 4
All classroom observations were done by the author. However, another person
was invited to observe all classes once each week. The rationale for doing this was for
validation of what was observed in the classroom using the SITOI, and to ensure that
there was no occurrence of bias. The invited observer was a Lecturer at the University
of the Philippines who used to teach chemistry to undergraduate students. He also had
experience in secondary school chemistry classroom. In order to familiarize the invited
observer about the use of the SITOI, the author gave an orientation on its essential
features and on how to use the instrument in the classroom.
The SITOI checklist was used in all lesson observations. In addition to using the
SITOI, notes of what exactly happened during instruction were written by both
observers in all lesson observations. This method produced detailed observation notes in
each class, which provide thorough descriptions of the inquiry practices enacted by
teachers. This also captured the specific classroom cases or scenarios that showed
teachers’ enactment of inquiry practices. Note-taking during instruction was done to
ensure that the data gathered from the observation using the SITOI were backed up with
specific evidence and thus became solid. This would make the observation data as

128
precise as possible. The total number of observations made was 57, over a period of six
weeks. In Chapter 1, it was mentioned that only in Grade 7 chemistry was scientific
inquiry explicitly listed as a conceptual topic to be covered by teachers. Grade 7
students studied chemistry in the first quarter of the school year with six weeks of
instruction. With this in mind, the implementation of classroom observations for this
study was fitted within this period of instruction. Generally, five one-hour lesson
observations were done per class to examine teachers’ implementation of inquiry-based
chemistry curriculum in the classrooms. In this duration of observation, teachers taught
different inquiry-based lessons in chemistry. The multiple classroom observations per
teacher provided the observers with more opportunities to capture the different facets of
teachers’ inquiry-based teaching practices, which helped generated sufficient
observational data.
After the observation, a debriefing session was conducted every week to
compare and discuss the observational data gathered using the SITOI. If discrepancies
were observed, these were discussed to determine the source of disagreement. Based on
individual observational data gathered, it was found that the author and the invited
observer had observed (ticked) almost all the same items on inquiry practices enacted
by teachers listed in the checklist.
Teacher questionnaire administration
The questionnaires were administered to teachers in order to collect data on their
experience in teaching science in secondary school classrooms, on their attendance in
training for the new science curriculum, on their confidence to teach the new science
curriculum, on their access to new curriculum materials, on their educational
background, and on their chemistry classroom settings such as the number of students in

129
a class and the availability of science facilities and resources. Questionnaires were given
to teachers after the lesson observations and then collected by the author as soon as they
finished answering. All ten teachers answered the questionnaire efficiently.
Data analysis procedure
Validity of the SITOI
Validity is an important property of test scores. It is the “degree to which
evidence and theory support the interpretations of test scores for proposed uses of test”
(AERA, APA, and NCME, 2014, p. 11). In other words, validity tells us whether the
scores are measuring the right things for a particular use of the test or instrument. For a
newly developed test, it is important to examine whether the test items really measure
the latent construct that they are supposed to measure because this determines the
appropriateness of the proposed inferences derived from test scores or other instrument
indicators. Given the complexity of validity, it is always recommended multiple
different types of validity indices be applied in test development practices (Messick,
1990). These widely applied types of validity include content validity, criterion-related
validity (predictive and/or concurrent), and construct validity (Messick, 1990; Reeves &
Marbach-Ad, 2016), etc. To examine the relevance and representativeness of the
content of the instrument in relation to the content of the behavioral or performance
domain about which inferences are to be drawn, the exploration of content validity for
the SITOI was prioritized in this study. The behavioral domain is the latent construct
(scientific inquiry), which is the target domain in this study.
As discussed in Chapter 3, the contents of most observation instruments for
science teaching are geared towards describing broader strategies, and are not sufficient

130
for capturing the specific inquiry practices of teachers in classrooms. They lack specific
teaching indicators or items related to scientific inquiry. Since there is a lack of
observation instruments containing items with specific inquiry practices, this study
explored the development of SITOI that focuses directly on assessing the
implementation of specific inquiry-based teaching practices of teachers. Because of this,
developing appropriate contents for the SITOI, particularly the relevant items
representing components of scientific inquiry, was important in the early formation of
the instrument. For this reason, examining the content validity of the newly developed
SITOI was a priority. Thus, this study concentrated on exploring the content validity of
the instrument given that this involves the specification of the target domain (scientific
inquiry) and development of items that reflect this domain specification (Kane, 2006),
which was crucial in the SITOI developmental stage process. Compared to other types
of validity such as criterion validity and construct validity, content validity mainly
focuses on evaluating how well the content of the instrument represents or samples the
target domain about which inferences are to be drawn or predictions made (Messick,
1990). This is demonstrated in the suggestion of other researchers (e.g., Goe, Bell, &
Little, 2008) that when assessing the validity of classroom observation instruments for
teacher evaluation, it is essential to examine how well its content exemplifies teachers’
implementation of standard of practice that are deemed important for the target grade
level, subject, and teaching context. Although there is concern about the objectivity of
content validity (e.g., construct validity and criterion validity are more objective than
content validity), this can be addressed through the making of judgments by content
experts who are not involved in the instrument development process (Kane, 2006),
which is what was undertaken for the present study.

131
As described in The SITOI development stage, the content validity of the SITOI
was established using the judgment of content experts who were not associated with the
SITOI development process, using the resultant independent feedback to provide
evidence supporting claims of validity. If the expert endorses an item based on
relevance and representativeness of the content, it can be considered to have construct
validity. If the expert rejects an item, it can be discarded or rewritten. This method
aligns with the claim of Messick (1990) that in practice, content validity evidence is
usually established through consensual professional judgments about the content
relevance of items (presumably construct-valid) to the domain of interest and judgments
about the representativeness of content of the instrument that covers the target domain.
This method for establishing content validity has also been employed by other
researchers who have developed observation instruments for classroom teaching (e.g.,
Pearl et al., 2018; Smolleck et al., 2006). According to Messick (1990), this process of
validating an instrument provides “judgmental evidence in support of the domain
relevance and representativeness of the content of the instrument” (p. 11). This
description of content validity was crucial in the developmental stage of the SITOI. In
validating the content of the SITOI, the experts verified that the all items included in
this instrument appropriately represented the target domain, which is the scientific
inquiry. The experts recommended these items, which showed relevance to the intended
components of scientific inquiry.
Construct validity and criterion validity were not examined in this study because
establishing these types of validity for empirical research normally requires a relatively
large sample size in order to generate robust findings. The present study explored the
development of a new observational tool (SITOI) involving four selected schools in

132
Manila that had access to training on the implementation of the new inquiry-based
science curriculum conducted by the Department of Education. For this reason, the
study involved a sample size that was not large enough to conduct robust data analyses
for establishing construct validity and criterion validity of the SITOI. Moreover, in
establishing the validity of the assessments, convergent validity can be examined
particularly when using different measures of construct to develop robust evidence of
relationships and effects (Carlson & Herdman, 2012). However, there is a lack of
alternative measures for the same construct with the same features like that of the
SITOI, that is containing items or indicators on specific practices of scientific inquiry in
classrooms, which hinders the examination of convergent validity of the SITOI.
Inter-rater reliability
Inter-rater reliability refers to the degree of variation in results between different
raters evaluating the same performance; ideally the variation should be very small
(Pantzare, 2015). In this study, paired observations were conducted to explore variations
of observational results between two observers. A debriefing session between observers
was conducted after class observations to check, compare, and discuss the observational
data gathered using the SITOI. If discrepancies were observed, these were discussed to
determine the source of disagreement in order to achieve consensus on the use of the
SITOI. Based on individual observational data gathered, observers had observed almost
all the same items on inquiry practices enacted by teachers listed in the SITOI. This
initial method of examining inter-rater reliability was based on the process employed by
a group of researchers who designed and validated the Electronic Quality of Inquiry

133
Protocol (EQUIP), an instrument for assessing inquiry-based instruction (Marshall,
Smart, & Horton, 2009).
The researcher of this study conducted all the observations to maintain the
consistency of interpreting and using of observation protocol in all chemistry classes.
The invited observer conducted classroom observations once each week to validate
what was observed and to avoid the occurrence of bias. In this case, the invited observer
conducted fewer number observations than the researcher, which resulted in fewer
number of common observations conducted by both observers (i.e., only 10
observations). Because of this very small number of common observations, it was not
possible to conduct robust statistical analysis on inter-rater reliability of the SITOI.
Classroom observation data analysis
To determine the components of scientific inquiry enacted by teachers in
chemistry classrooms, the mean score (average number) of the implementation of each
component was calculated for each lesson observed. The mean score was derived from
the total frequency of implementation of each component divided by the total number of
lesson observations per class. This provided an average implementation number for
each inquiry component per lesson observation in each class. The total frequency of
implementation of each of the six components was determined by counting the number
of ticks recorded in the SITOI.
To determine the specific practices enacted by teachers under each inquiry
component, the mean score (average number) of the implementation of each specific
practice under each component was calculated. This provided an average
implementation number for each specific practice (under each inquiry component) per
134
lesson observation in each class. Some examples of specific practices enacted by
teachers under the inquiry components were prompting students to formulate and ask
their own questions (engaging in questioning), asking students to make measurements
using tools and equipment (collecting data), and prompting students to form their own
explanation based on evidence (developing explanations). The idea of calculating the
mean score (average number) of teachers’ implementation of each scientific inquiry
practice in chemistry was derived from the study of O’Dwyer et al. (2015) where they
examined Grade 8 teachers’ use of instructional practices that support students’
conceptual understanding in mathematics. They identified six instructional practices
implemented by teachers and presented these numerically and graphically.
Furthermore, to determine the degree of initiation of inquiry practices for each
chemistry class, the frequency of teacher implementation of teacher-centered and
student-centered practices under each inquiry component was identified (e.g., Capps &
Crawford, 2013) by counting the number of ticks recorded from all observations. A
numerical score of 1 to 5 was assigned to specific practices under each inquiry
component (listed in the SITOI) to describe the degree of initiation in the classroom; 1
being the most teacher-centered and 5 being the most student-centered (e.g., Capps &
Crawford, 2013). It is important to note that the specific practices under each inquiry
component included in the SITOI were listed from the most teacher-centered (top) to
the most student-centered (bottom). For example, the inquiry component collecting data
has five individual practices as listed in the SITOI. A score of 1 was assigned to the first
practice (top) as this is the most teacher-centered. Then, a score of 2 was assigned to the
second practice, 3 to the third, 4 to the fourth, and 5 to the last practice (bottom) as this
is the most student-centered. The identified frequency of teacher implementation (the

135
recorded number of ticks from all lesson observations for each class) for specific
practices (teacher-centered and student-centered) under each inquiry component was
multiplied in the assigned scores to get the total score for inquiry initiation of each class
(e.g., Capps & Crawford, 2013).
To ascertain the mean score in inquiry initiation for each class, the total score for
inquiry initiation was divided by the number of observations. In this study, there is no
specified or assigned upper limit number of scientific inquiry practices implemented by
teachers. Every time the teacher was observed to enact an inquiry practice in the
classroom, it was recorded immediately in the SITOI and observation notes. Thus, each
implementation of a specific practice under each inquiry component can be recorded as
many times as occurred.
In addition to using the SITOI, observers wrote down notes from each lesson
observation in all classes. These observational notes were gathered and analyzed. The
collected notes were organized and encoded as soon as the observation was finished to
ensure these notes were as accurate as possible. Observation notes mainly consisted of
verbatim teacher-student dialogues which showed the following teacher verbal practices
that support inquiry environment: (1) gauging or expanding students’ thinking or
knowledge through asking various types of questions, (2) providing feedback to
students through responding to students’ thinking, and (3) prompting thinking or
reducing complexity by letting students form explanations or giving them new ways to
consider concepts. Students’ verbatim questions were also captured in the observation
notes. Other information included in the notes were identification numbers of schools,
teachers, and classes, date of observation, number of students present during
observation, lesson topic, start and end time of observation, and observation number.

136
Observation notes gathered for each lesson were analyzed by identifying
teaching practices that aligned with the specific practices under each component of
inquiry. A combination of letters and number codes was used for assigning the
identified teaching practices. For example, the four practices of engaging in questioning
listed in the SITOI were coded as Q1 (most teacher-centered, top), Q2, Q3, and Q4
(most student-centered, bottom). These codes were used to identify questioning
practices captured from the observation notes that were matched with the engaging in
questioning practices listed in the SITOI. This coding procedure was followed to
analyze the specific teaching practices in other components of scientific inquiry as well.
After analyzing the entire set of observation notes, the frequency of implementation of
practices was determined by counting the coded practices in each component of
scientific inquiry. Furthermore, the continuum of classroom inquiry proposed by
Brown, Abell, Abdulkadir, and Schmidt (2006) was used to characterize the nature of
inquiry instruction of teachers (e.g., teacher-centered or student-centered inquiry) in
chemistry classrooms. An example of coded lesson observation notes can be found in
Appendix G.
Teacher questionnaire data analysis
The responses of teachers in the questionnaire were categorized into
characteristics of teachers and characteristics of their chemistry classes. These
characteristics were uncovered from the analysis of the questionnaire. For instance,
teachers who had access to science reform documents and who attended training for the
new science curriculum were identified. Classes that had access to a science laboratory,
equipment, and new curriculum materials were also identified from the questionnaire.

137
Measuring Students’ Learning in Chemistry
Development of research instrument
The ACTRC chemistry tests
The ACTRC chemistry tests were designed specifically for Grade 7 junior high
school students in the Philippines. The tests were composed of both scientific inquiry
and content knowledge items. The pretest composed of 48 items; 29 items for content
knowledge and 19 items for scientific inquiry. The posttest had 58 items; 35 items for
content knowledge and 23 items for scientific inquiry. A more specific breakdown of
test items is presented in the next section.
One key objective of the present study is to investigate the relationship between
students’ learning in chemistry and teachers’ scientific inquiry instructional practices.
With this, the chemistry tests for Grade 7 students developed through collaboration
between the ACTRC and the ARC teams were used in this study to assess student
learning in chemistry. In this study, student learning in chemistry refers to the
acquisition of both content knowledge and scientific inquiry skills. This is in line with
the PISA 2015 Science Framework in that it emphasizes that scientific literacy requires
both content knowledge in science and knowledge of the practices associated with
scientific inquiry (OECD, 2017). The implementation of the spiral science curriculum
for basic education in the Philippines aimed to develop scientific literacy among
students such that they are able to make judgments and decision on the applications of
scientific knowledge that may have significant impact in everyday life (DepEd, 2016).
Thus, this study used tests consisting of items on chemistry content and items on
scientific inquiry skills.

138
The tests assessed students’ knowledge of chemistry concepts and scientific
inquiry skills developed through the Grade 7 chemistry curriculum. Specifically, the
tests assessed students’ development in the underlying construct of chemistry concepts.
In order to assess this, a baseline assessment of what is explicitly taught within the
Grade 7 chemistry curriculum and any precursor knowledge or skills that would help a
student learn the concepts was necessary. Thus, the pretest assessed some concepts that
were outlined from the previous elementary science curriculum of Grades 3 to 6.
Similarly, the posttest assessed concepts that were explicitly stated in the Grade 7
chemistry curriculum as well as precursor ideas for chemistry concepts in subsequent
grade levels (Grades 8-10). The pretest and posttest were linked by sets of common test
items. The use of common items enables the comparison of student acquisition of skills
and knowledge on the same scale. In addition to chemistry concepts, scientific inquiry
skills specified in the Grade 7 chemistry curriculum were also assessed by both tests.
Figure 1 below shows the structure of the chemistry test.

139
Figure 1. The ACTRC chemistry tests structure.
Source. Ferido, M., Robertson, P., Pavlovic, M., & Care, E. (2016). Progress of students through the science curriculum: Focus on chemistry. Stage 2 Pre-Grade 8 report. Assessment, Curriculum and Technology Research Centre. Melbourne and Manila.
The ACTRC chemistry tests development process
The following outlines the process undertaken by the test development teams
from the ACTRC and the ARC to construct the chemistry tests.
1. Analysis of the new Grade 7 chemistry curriculum. The test development
teams analyzed collaboratively the new Grade 7 chemistry curriculum to identify key
conceptual themes and key scientific inquiry skills. The focus of this study is the
Mat
ter D
omai
n
1 Properties of Matter
1.1 Physical states of matter
1.2 Properties of substances and mixtures
1.3 Properties of elements and compounds
2 Structure of Matter
2.1 Atomic structure
2.2 Molecular structure
3 Changes in Matter
3.1 Physical and chemical changes
3.2 Chemical reactions
4 Inquiry Skills 4.1 Chemistry-related inquiry skills
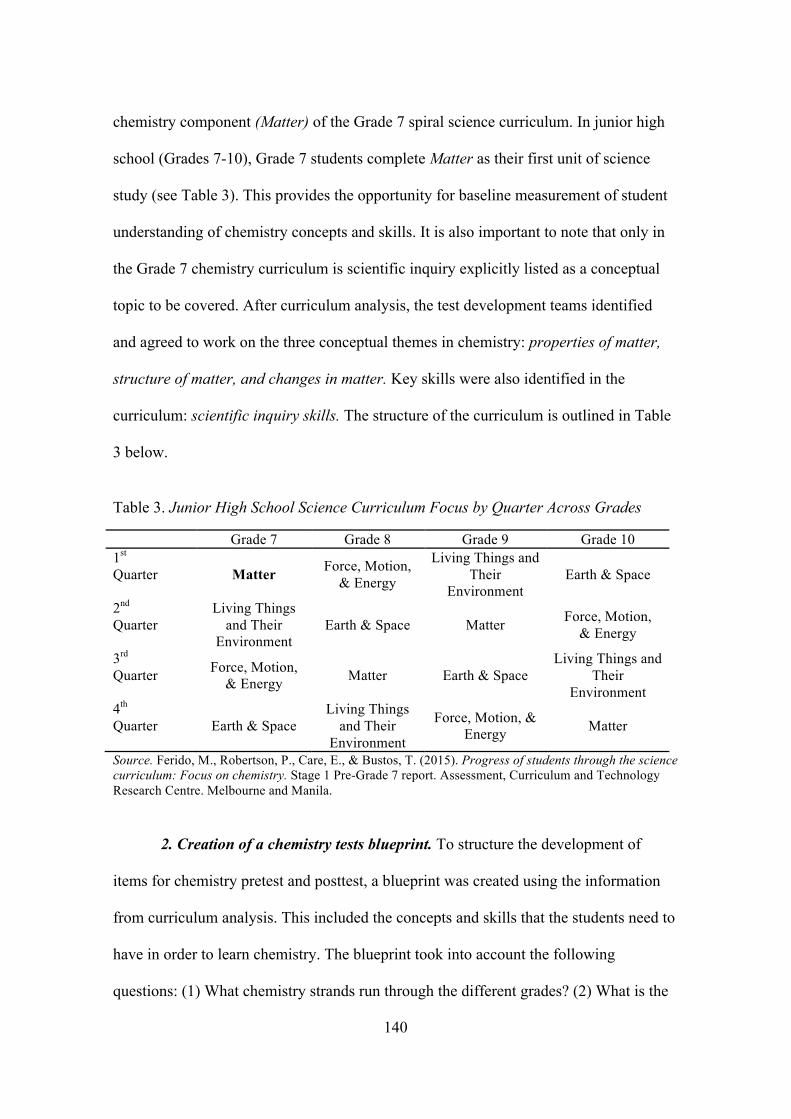
140
chemistry component (Matter) of the Grade 7 spiral science curriculum. In junior high
school (Grades 7-10), Grade 7 students complete Matter as their first unit of science
study (see Table 3). This provides the opportunity for baseline measurement of student
understanding of chemistry concepts and skills. It is also important to note that only in
the Grade 7 chemistry curriculum is scientific inquiry explicitly listed as a conceptual
topic to be covered. After curriculum analysis, the test development teams identified
and agreed to work on the three conceptual themes in chemistry: properties of matter,
structure of matter, and changes in matter. Key skills were also identified in the
curriculum: scientific inquiry skills. The structure of the curriculum is outlined in Table
3 below.
Table 3. Junior High School Science Curriculum Focus by Quarter Across Grades
Grade 7 Grade 8 Grade 9 Grade 10 1st Quarter Matter Force, Motion,
& Energy
Living Things and Their
Environment Earth & Space
2nd Quarter
Living Things and Their
Environment Earth & Space Matter Force, Motion,
& Energy
3rd Quarter Force, Motion,
& Energy Matter Earth & Space Living Things and
Their Environment
4th Quarter Earth & Space
Living Things and Their
Environment
Force, Motion, & Energy Matter
Source. Ferido, M., Robertson, P., Care, E., & Bustos, T. (2015). Progress of students through the science curriculum: Focus on chemistry. Stage 1 Pre-Grade 7 report. Assessment, Curriculum and Technology Research Centre. Melbourne and Manila.
2. Creation of a chemistry tests blueprint. To structure the development of
items for chemistry pretest and posttest, a blueprint was created using the information
from curriculum analysis. This included the concepts and skills that the students need to
have in order to learn chemistry. The blueprint took into account the following
questions: (1) What chemistry strands run through the different grades? (2) What is the

141
most communicative terminology to use for these strands? (3) Which strands appear
only at one/some grades? and (4) What is the relative importance of the
categories/strands at each grade level? (Ferido et al., 2015).
To articulate the skills integral to each grade level of the curriculum, specific
behaviors that a student could demonstrate were identified. Behaviors that could be
demonstrated in a pen and paper test were written for each statement. Where the same
behaviors appear at multiple grade levels, these were noted at each relevant level. The
blueprint for the chemistry pretest included the prerequisite concepts and skills
considered necessary for students to engage in the Grade 7 chemistry curriculum. These
prerequisites were determined from an analysis of Grades 3-6 science curricula. It
should be noted that some of the prerequisite concepts and skills were not explicitly
stated within these curricula. However, the prerequisites were included in the test
blueprint as they were seen as prerequisites for the successful undertaking of the Grade
7 chemistry curriculum. The prerequisite chemistry strands included in the blueprint
were states of matter, substances and mixtures, elements and compounds, atomic
structure, molecular structure, physical and chemical changes, and chemistry-related
inquiry skills. Although the concept that matter consists of elements, atoms, and
subatomic particles is not a strict prerequisite for Grade 7 chemistry, this idea was
included since students coming into Grade 7 with an understanding of this concept
would benefit. The blueprint for chemistry posttest includes the prerequisite concepts
and skills considered necessary for students to engage in the Grade 8 chemistry
curriculum. This blueprint was derived from the combination of the prerequisite
concepts and skills determined by the test development and curriculum expert teams
(same chemistry strands as mentioned above) and additional prerequisites added after

142
the analysis of the chemistry pretest. The blueprint for pretest and posttest indicated the
capabilities (what should students to be capable of) for the concepts of properties of
matter, structure of matter, and changes in matter as well as for scientific inquiry skills.
3. Construction of chemistry tests items. To inform the construction of test
items, a workshop on item writing and item review was conducted by the test
development teams, focusing on guidelines for writing test items, appropriate
terminology, and on multiple choice item development guidelines. Sample test items
were provided to the item writers. The items were constructed to cover a range of
difficulties. For example, items that assess chemistry content covered topics such as
identifying the properties of mixtures as well as distinguishing the methods of
separating components of mixtures. Items that assess scientific inquiry skills covered
topics from simple measurement and classification tasks to controlling of variables and
interpretation of multivariate data. The constructed items in the pretest and posttest were
not exactly the same but they assessed the same construct. With this, common items
were selected by a psychometrician to link the pretest and posttest and generate the data
from which can be inferred a progression of skills. This method allows for an estimate
of student ability to be made independent of the test set or tasks undertaken.
4. Paneling of chemistry tests items. A series of meetings was conducted in
Melbourne and Manila by the ARC and the ACTRC teams to panel the constructed
chemistry test items. Once each item was written and the skill identified, it underwent a
paneling process to review the content of the items and their face validity. Each item
was paneled twice by team members in each geographical location. This process drew
on the expertise of all team members and ensured items adhered to guidelines for best

143
practice in objective item writing and contained language and concepts that were
appropriate in the Philippines. During the paneling sessions, members of the test
development teams were able to discuss important points such as (1) the knowledge and
skills required to answer the item correctly, (2) the difficulty of the item, and (3) the
quality of the item. The necessity of general consensus on item to be retained or
removed from the test was always observed by the test developer during the paneling
sessions.
5. Pilot testing of chemistry tests items. After a series of paneling sessions, 72
chemistry test items for the pretest were pilot tested in a special summer school in NCR.
One hundred and ninety-seven Grade 7 students took the pretest for pilot testing. This
convenience sample of students was thought to be of approximately similar ability to
those beginning junior high school students. The pretest pilot was conducted in May
2015. The purpose of the pilot test was to evaluate the performance of each item and to
obtain item characteristics in order to develop a psychometrically sound test. In other
words, this process was for test development purposes.
6. Item calibration. Test data were calibrated using the Rasch one parameter
simple logistic model (Rasch, 1960), through ConQuest version 2.0 generalized item
response modeling software (Wu, Adams, & Wilson, 2007). In calibrating the items, the
whole test was analyzed in the software to determine its psychometric properties. After
the analysis, the results were examined, including checking the fit indices (Weighted
Mean Square) to find out which items fit the Rasch model, checking the observed item
characteristic curve, which should be close to theoretical one, and checking the item
discrimination and difficulty indices. Based on these results, the test development team

144
discussed which items should be revised or deleted. Items that did not fit the model
were deleted from the test, and the reasons for item deletion were presented in the
meeting. After item deletion, the whole test with a new set of items was analyzed using
the same software. After analysis, the calibrated items were found to fit the model,
showing that they measured the same construct and that the spread of the items was
appropriate for the student sample. Test items were examined based on item fit indices
and item difficulty estimates, which were determined from the analysis. In addition, the
expected a posteriori/plausible value (EAP/PV) item separation and the weighted
maximum likelihood estimation (WLE) person separation reliabilities were also
identified in the calibration process, and were acceptable for both tests.
7. Finalization of the tests. The output of the item analysis was used to finalize
the tests. The final number of chemistry test items in the administered pretest and
posttest is shown below. The items on scientific inquiry skills on both tests aligned with
the following six components of scientific inquiry: engaging in questioning, designing
and conducting investigations, collecting data, analyzing data, developing explanations,
and communicating information. For the pretest, a total of 48 items was chosen for test
administration after pilot analysis. There were 29 items on content knowledge and 19
items on scientific inquiry. For the posttest, a total of 58 items was chosen for test
administration. There were 35 items on content knowledge and 23 items on scientific
inquiry. The content of the administered pretest with samples of key concepts and skills
tested is shown in Table 4 and the content of the administered posttest is shown in Table
5.
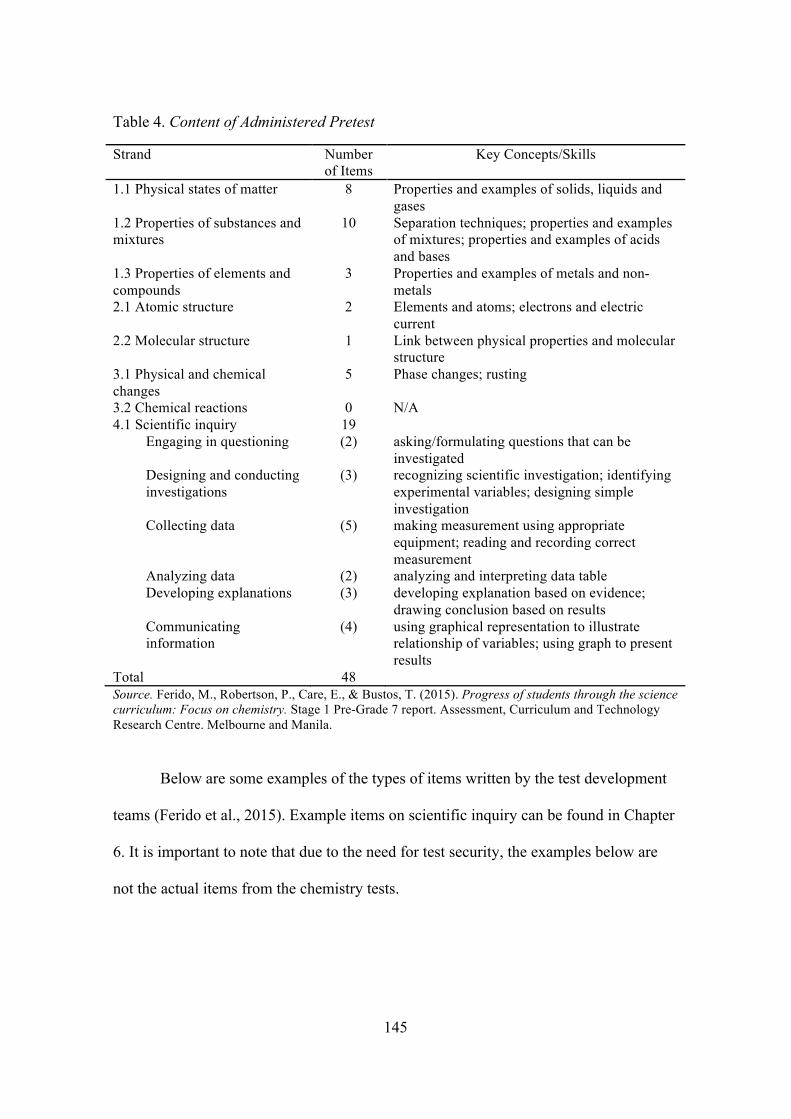
145
Table 4. Content of Administered Pretest
Strand Number of Items
Key Concepts/Skills
1.1 Physical states of matter 8 Properties and examples of solids, liquids and gases
1.2 Properties of substances and mixtures
10 Separation techniques; properties and examples of mixtures; properties and examples of acids and bases
1.3 Properties of elements and compounds
3 Properties and examples of metals and non-metals
2.1 Atomic structure 2 Elements and atoms; electrons and electric current
2.2 Molecular structure 1 Link between physical properties and molecular structure
3.1 Physical and chemical changes
5 Phase changes; rusting
3.2 Chemical reactions 0 N/A 4.1 Scientific inquiry Engaging in questioning Designing and conducting investigations Collecting data Analyzing data Developing explanations Communicating information
19 (2)
(3)
(5)
(2) (3)
(4)
asking/formulating questions that can be investigated recognizing scientific investigation; identifying experimental variables; designing simple investigation making measurement using appropriate equipment; reading and recording correct measurement analyzing and interpreting data table developing explanation based on evidence; drawing conclusion based on results using graphical representation to illustrate relationship of variables; using graph to present results
Total 48 Source. Ferido, M., Robertson, P., Care, E., & Bustos, T. (2015). Progress of students through the science curriculum: Focus on chemistry. Stage 1 Pre-Grade 7 report. Assessment, Curriculum and Technology Research Centre. Melbourne and Manila.
Below are some examples of the types of items written by the test development
teams (Ferido et al., 2015). Example items on scientific inquiry can be found in Chapter
6. It is important to note that due to the need for test security, the examples below are
not the actual items from the chemistry tests.

146
Strand: Physical states of matter. This item requires students to apply their knowledge
about the states of matter. Understanding the differences between solids, liquids, and
gases will assist them when they come to learn about Solutions in Grade 7.
Which of the following is a gas?
A. steam B. soup C. chalk D. flowers
Strand: Properties of elements and compounds. This item uses the context of separation
of mixtures (taught in Grade 6) to get students to apply their knowledge about metals.
They need to recognize that iron is a metal and that magnets attract many metals, then
connect these ideas and apply them to the given context. Connecting ideas about metals
and their properties will assist them when learning the more detailed properties of
metals and non-metals, such as malleability, ductility, and conductivity in Grade 7.
Charles suspects that there are iron filings in a powder sample given to him. To confirm this, he suspended the powder sample in water and stirred it. Which step will help him confirm the presence of iron filings?
A. Allow iron filings to float B. Allow iron filings to settle at the bottom of the beaker C. Use magnet to attract iron filings D. Use magnet to attract other particulates

147
Table 5. Content of Administered Posttest
Strand Number of Items
Key Concepts/Skills
1.1 Physical states of matter 4 Properties and examples of solids, liquids and gases
1.2 Properties of substances and mixtures
16 Separation techniques; properties and examples of mixtures; properties of substances with different pH values, terminology of solutions
1.3 Properties of elements and compounds
7 Properties and examples of metals and non-metals; macroscopic properties of elements and compounds; graphic representations of compounds
2.1 Atomic structure 1 Chemical symbols 2.2 Molecular structure 3 Particulate nature of matter 3.1 Physical and chemical changes
4 Phase changes; rusting
3.2 Chemical reactions 0 N/A 4.1 Scientific inquiry Engaging in questioning Designing and conducting investigations Collecting data Analyzing data Developing explanations Communicating information
23 (2)
(7)
(5)
(1) (3)
(5)
asking/formulating questions that can be investigated recognizing scientific investigation; identifying experimental variables; using appropriate procedure/method for experiment making correct measurement using appropriate equipment; reading scales; using appropriate method for correct measurement analyzing and interpreting data table developing explanation based on evidence; drawing conclusion based on results using graphical representation to illustrate relationship of variables; using graph to present results; interpreting graph of two variables
Total 58 Source. Ferido, M., Robertson, P., Pavlovic, M., & Care, E. (2016). Progress of students through the science curriculum: Focus on chemistry. Stage 2 Pre-Grade 8 report. Assessment, Curriculum and Technology Research Centre. Melbourne and Manila.
Data collection procedure
Student participants
To measure chemistry learning, pretest and posttest data were collected from
four hundred and ninety-five (495) Grade 7 students in twelve classes from four sample
schools. The sample students from these schools consisted of more females than males.

148
The specific numbers are provided in Table 6 below. The students were taught by ten
chemistry teachers participating in this study. Some of the students belong to
homogeneous classes while others belong to heterogeneous classes. These students
obtained their elementary education from different schools. Because of this, students
may have had different learning experiences in science. They belong to a cohort that
was exposed to the previous elementary science curriculum (before K to 12 reform)
where scientific inquiry was not effectively communicated and a spiral progression of
concepts and skills was not emphasized. Students in Grade 7 chemistry classes were
chosen because only in this grade level’s chemistry curriculum is scientific inquiry
explicitly listed as a conceptual topic to be covered.
Table 6. Details of Sample Students
School Student Age Range (Year)
No. of Female Students
No. of Male Students
Gender Not Specified
Total
1 11–14 91 64 0 155 2 11–14 58 54 3 115 3 11–14 67 51 0 118 4 11–14 62 44 1 107
Chemistry tests administrations
The pretest was administered to Grade 7 students from 25th to 26th of June 2015
at the start of first quarter of school year 2015-2016 prior to chemistry instruction. After
six weeks of instruction, the posttest was administered at the conclusion of the first
quarter of the same school year. The posttest was administered from 12th to13th of
August 2015 to the same Grade 7 students who previously took the pretest. The total
number of students who took both the pretest and posttest was 495 and this constituted
the sample for the analyses. Figure 2 below shows the tests administration scheme.

149
Figure 2. Chemistry tests administration scheme.
In each day of test administration, Grade 7 students from three classes in two
schools were given the test. Each test was administered in every class for one hour.
Each student was given a test booklet, a scannable answer sheet, and a pencil in both
pretest and posttest. Test administrators (the researcher and a proctor) were present
during test administrations. Before each test started, the researcher briefly discussed the
test protocol to the students. The purpose of administering the test was also explained
clearly to the students. Table 7 shows the set-up for administering the test in schools.
Table 7. Set-up for Chemistry Tests Administrations
Pretest School Number of Classes 25 June 2015 School 1
School 2 3 3
26 June 2015 School 3 School 4
3 3
Posttest School Number of Classes 12 August 2015 School 1
School 2 3 3
13 August 2015 School 3 School 4
3 3
Administration of chemistry
pretest June 2015
Administration of chemistry
posttest August 2015
Six weeks of instruction

150
Data analysis procedure
Student ability estimates
Student ability estimates were obtained from the pretest and posttest using the
Rasch one parameter simple logistic model (Rasch, 1960). The administered pretest had
48 items and assessed some concepts that were outlined from the previous Grades 3 to 6
science curricula. The administered posttest had 58 items and assessed concepts
specified in the Grade 7 chemistry curriculum as well as precursor ideas for chemistry
concepts in subsequent grade levels. The person-separation reliability of pretest and
posttest were 0.86 and 0.71 respectively. It is important to note that these indices are
comparable to alpha reliability and are well within the acceptable range.
Common items equating
Although the majority of the items in the pretest and posttest were different, both
tests measured the same constructs, student learning of chemistry concepts and
scientific inquiry skills. To measure these constructs, both tests were developed in such
a way that common items were included in them. There were 12 common items
included in both pretest and posttest. The common items were used to equate the
posttest to the scale established by the pretest, which enables the comparison of student
results obtained by the tests.
Equating is a process of putting the two tests on the same scale for comparison
(Wu, Hak, & Tsung-Hau, 2016). It enables matching the scores on different tests and
interpreting them on the same scale. This enables all the items in an item pool, and the
students who took them, to be described with the same units of measurement. With this,
student performances can then be interpreted in the same levels on a construct,
regardless of the subset of items or different tests they took. This is the goal of test

151
equating, and the use of the Rasch model is what makes it possible (Griffin, 1999). In
this study, tests were equated using an approach in which both pretest and posttest
responses were merged and analyzed together. This procedure resulted in one file of
students’ data on chemistry tests. In this study, all students who took the tests and all
pretest and posttest items, including the 12 common items, were combined. After
merging the tests, the whole set of tests was run for analysis in ConQuest software using
Rasch modeling. This analysis provided the ability estimates or the Weighted-
Likelihood Estimates (WLE) of students’ ability in the pretest and posttest.
Determining students’ gain score in chemistry
For a better interpretation, the WLE score of students in the tests were
standardized using a mean of 50 and a standard deviation (SD) of 10. For posttest WLE
score, the pretest mean of 50 and SD of 10 were used to obtain the standardized posttest
WLE score. Thereafter, the gain score (estimate of ability) of each student in chemistry
was determined by taking the difference between standardized posttest WLE score and
standardized pretest WLE score. There were 495 students who have both pretest and
posttest WLE scores and they constituted the study sample for analysis. The obtained
student gain score in chemistry was used in the next analysis—Multilevel Modeling.
Multilevel modeling of the relationship between students’ learning in
chemistry and teachers’ scientific inquiry practices
To address the second research question, the relationship between students’
learning in chemistry and teachers’ scientific inquiry practices was examined using
multilevel modeling. Multilevel models for each of the six practices of scientific inquiry
(engaging in questioning, designing and conducting investigations, collecting data,

152
analyzing data, developing explanations, and communicating information) were
generated via Mplus 7.4 version software (Muthén & Muthén, 2016) using Bayesian
estimation. The process of multilevel modeling was chosen for this study to ensure that
the statistical dependence among students within classes was accounted for by the
complex residual structure thereby producing correct estimates of the standard errors
associated with the regression coefficients (O’Dwyer et al., 2015; Raudenbush & Bryk,
2002). One major advantage of multilevel modeling is that it is possible to
simultaneously relate outcome variables to predictors at the individual and group levels
(Goldstein, 2011; Raudenbush & Bryk, 2002; Snijders & Bosker, 2012). In this study,
Bayesian estimation was used due to its suitability for a small number of groups, which
is the case of the present study. Several researchers have argued that Bayesian
estimation offers a promising approach for estimating multilevel models, particularly
when sample sizes are small and the estimation of variance components is crucial
(Gelman & Hill, 2007; Hamaker & Klugkist, 2011; Jackman, 2009; Swaminathan &
Rogers, 2008; Zitzmann, Ludtke, & Robitzsch, 2015). Recently, Zitzmann et al. (2015)
conducted a simulation study that compares the Bayesian estimation approach with the
Maximum Likelihood estimation approach using Mplus software. They found that
Bayesian estimation gives more accurate estimates of the group-level effect under
problematic conditions (i.e., small number of groups, predictor variable with small
intraclass correlation coefficient [ICC]) than the Maximum Likelihood estimation.
In this study, students’ chemistry learning (represented by posttest score) was
regressed on teachers’ scientific inquiry practices along with the student covariate
(pretest score). In the first step, an unconditional (or null) two-level regression model
was established. This model consists only of the outcome variable (student posttest

153
score in chemistry) and without independent variables. It gives information on
partitioning the total variability in student posttest score into within-class and between-
class variance components. These unconditional variance components were used to
estimate the degree of statistical dependence (nesting) among students within classes, as
indicated by the intraclass correlation coefficient (ICC) and served as a comparison for
subsequent models that included teachers’ scientific inquiry practices as well as the
student covariate (pretest score). The ICC is the proportion of variation in the student
posttest score in chemistry that is due to differences between classes. The equation for
the unconditional model in this study is as follows:
chemistry posttest score = ß0j + rij and ß0j = γ00 + u0j
In the second step, the within-class (level 1) model was created to explore
whether the student covariate (pretest score) is associated with students’ chemistry
learning. It gives information on how much of the total unexplained individual level
variance for student chemistry posttest score is explained by student covariate. The
equation for the level-1 model is as follows:
chemistry posttest score = ß0j + ß1j (pretest score)+ rij
In the level 1 model, ß0j is the chemistry posttest score when all other variables are
constant. The effect of pretest on students’ chemistry posttest score is represented by
ß1j. The rij is a random student effect. The level-1 predictor variable was entered into the
model centered at the grand mean. Centering level 1 predictors appropriately is vital to
the interpretation of intercept and slope parameters in multilevel models (Enders &
Tofighi, 2007).
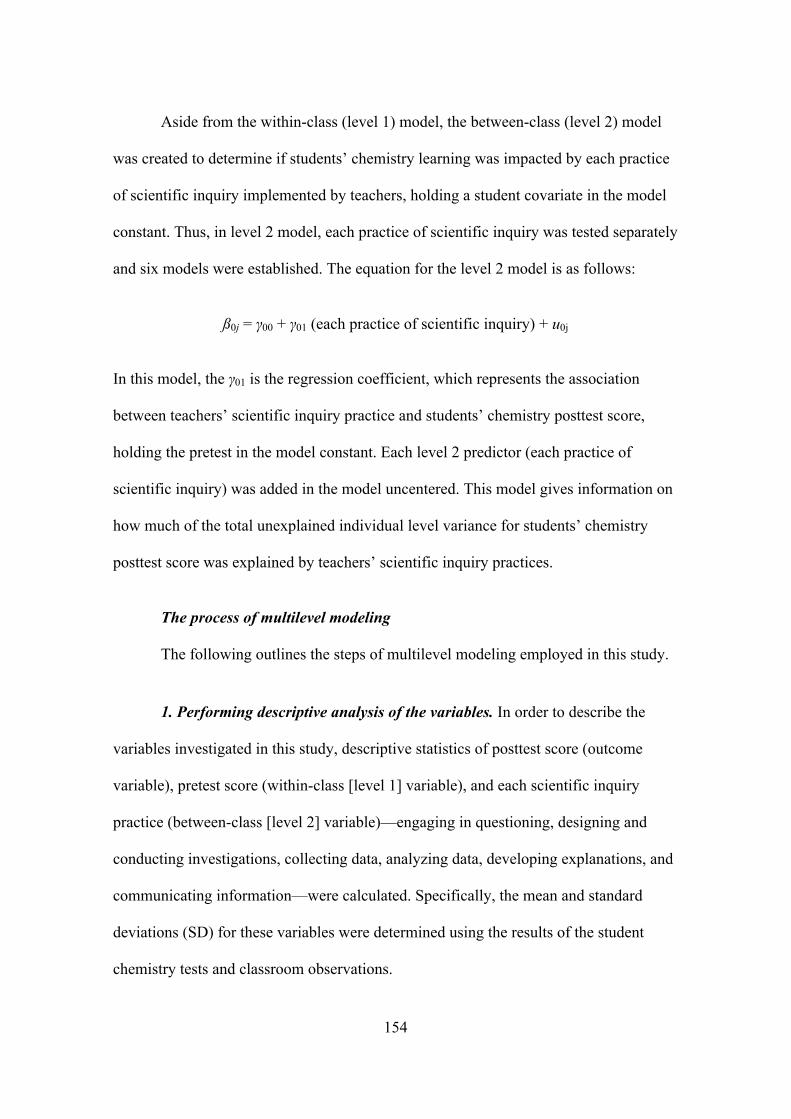
154
Aside from the within-class (level 1) model, the between-class (level 2) model
was created to determine if students’ chemistry learning was impacted by each practice
of scientific inquiry implemented by teachers, holding a student covariate in the model
constant. Thus, in level 2 model, each practice of scientific inquiry was tested separately
and six models were established. The equation for the level 2 model is as follows:
ß0j = γ00 + γ01 (each practice of scientific inquiry) + u0j
In this model, the γ01 is the regression coefficient, which represents the association
between teachers’ scientific inquiry practice and students’ chemistry posttest score,
holding the pretest in the model constant. Each level 2 predictor (each practice of
scientific inquiry) was added in the model uncentered. This model gives information on
how much of the total unexplained individual level variance for students’ chemistry
posttest score was explained by teachers’ scientific inquiry practices.
The process of multilevel modeling
The following outlines the steps of multilevel modeling employed in this study.
1. Performing descriptive analysis of the variables. In order to describe the
variables investigated in this study, descriptive statistics of posttest score (outcome
variable), pretest score (within-class [level 1] variable), and each scientific inquiry
practice (between-class [level 2] variable)—engaging in questioning, designing and
conducting investigations, collecting data, analyzing data, developing explanations, and
communicating information—were calculated. Specifically, the mean and standard
deviations (SD) for these variables were determined using the results of the student
chemistry tests and classroom observations.
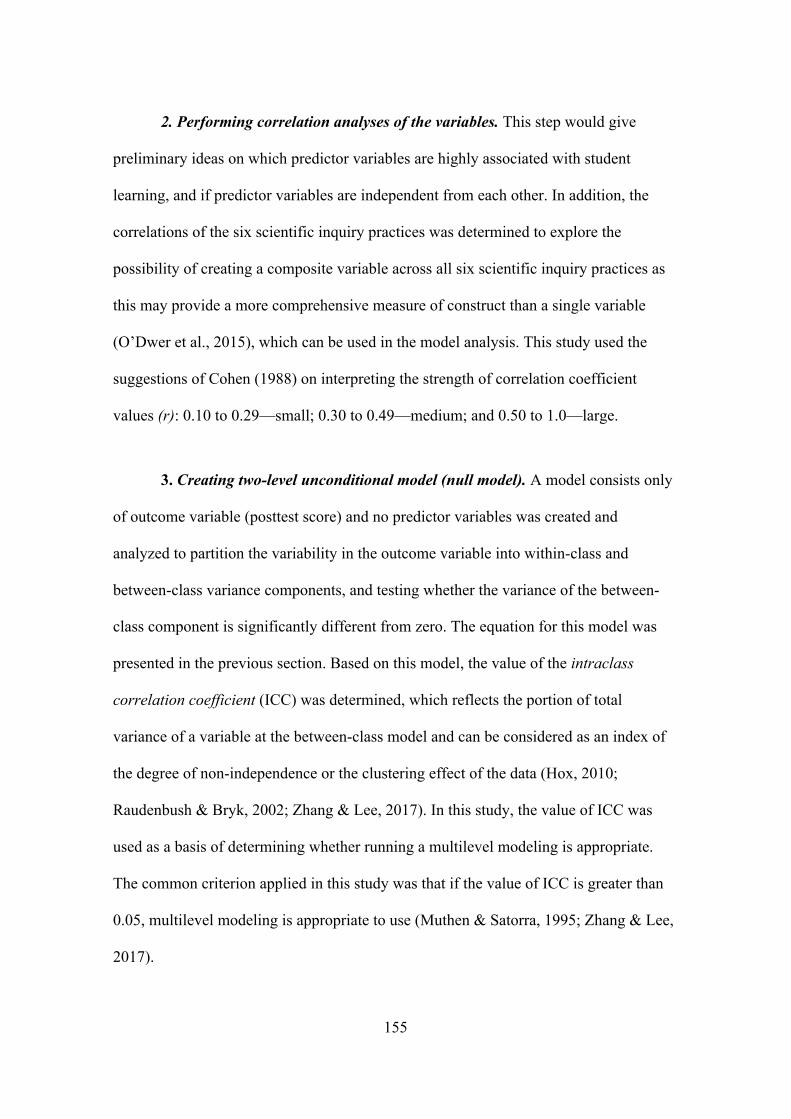
155
2. Performing correlation analyses of the variables. This step would give
preliminary ideas on which predictor variables are highly associated with student
learning, and if predictor variables are independent from each other. In addition, the
correlations of the six scientific inquiry practices was determined to explore the
possibility of creating a composite variable across all six scientific inquiry practices as
this may provide a more comprehensive measure of construct than a single variable
(O’Dwer et al., 2015), which can be used in the model analysis. This study used the
suggestions of Cohen (1988) on interpreting the strength of correlation coefficient
values (r): 0.10 to 0.29—small; 0.30 to 0.49—medium; and 0.50 to 1.0—large.
3. Creating two-level unconditional model (null model). A model consists only
of outcome variable (posttest score) and no predictor variables was created and
analyzed to partition the variability in the outcome variable into within-class and
between-class variance components, and testing whether the variance of the between-
class component is significantly different from zero. The equation for this model was
presented in the previous section. Based on this model, the value of the intraclass
correlation coefficient (ICC) was determined, which reflects the portion of total
variance of a variable at the between-class model and can be considered as an index of
the degree of non-independence or the clustering effect of the data (Hox, 2010;
Raudenbush & Bryk, 2002; Zhang & Lee, 2017). In this study, the value of ICC was
used as a basis of determining whether running a multilevel modeling is appropriate.
The common criterion applied in this study was that if the value of ICC is greater than
0.05, multilevel modeling is appropriate to use (Muthen & Satorra, 1995; Zhang & Lee,
2017).

156
4. Creating two-level model with predictors. This study used the pretest score as
the only predictor variable at the within-class model. The within-class model was
created to determine the total unexplained variance for posttest score explained by the
level 1 predictor, which was the pretest score. The equation for this model was
presented in the previous section. For the between-class model, each of the six scientific
inquiry practices of teachers was used as a predictor variable. The between-class model
was created to determine the total unexplained variance for posttest score explained by
each scientific inquiry practice of teachers (level 2 predictor), holding a pretest constant.
The equation for level 2 model was also discussed in the previous section. Each of the
six scientific inquiry practices was analyzed separately, thus six level 2 models were
created. The established two-level model with predictors were then analyzed.
5. Creating multivariate multilevel model. Since the two-level model with
predictors was created and analyzed in step 4, the results of this analysis were reviewed
before running the multivariate multilevel analysis to determine whether the predictor
variables in the within-class and between-class show statistically significant relationship
with the outcome variable. This information could be useful in identifying the variables
to be included in the multivariate analysis. It can be noted that the variables that are
significant have contributions to the explanation of the variance in the outcome variable
(posttest score).
If all predictor variables in the models specified in step 4 are significant, all
variables can be included in the multivariate analysis, where the level 1 predictor
(pretest score) and all level 2 predictors (six scientific inquiry practices) were put in a
single two-level model with posttest score as outcome variable. The equations for this
multivariate multilevel model are illustrated below:

157
Level 1: chemistry posttest score = ß0j + ß1j (pretest score)+ rij
Level 2: ß0j = γ00 + γ01 (engaging in questioning) + γ02 (designing and conducting investigations) + γ03 (collecting data) + γ04 (analyzing data) + γ05 (developing explanations) + γ06 (communicating information) + u0j
The description for the level 1 model is the same as discussed in the previous section.
However, the level 2 model here is different from what was discussed previously. In
this new level 2 model, student chemistry posttest score (ß0j) was predicted by the linear
combination of the six scientific inquiry practices of teachers. The γ01through γ06 are the
regression coefficients, which represents the association between each practice of
scientific inquiry and chemistry posttest score, holding the pretest in the model constant.
Here, each level 2 predictor (each scientific inquiry practice) was added in the model
uncentered.
On the one hand, it is also important to note that if the analysis described in step
4 would give a result that show some predictor variables in the within-class and
between-class models are not statistically significant, these predictor variables may be
removed from the multivariate analysis (e.g., Nguyen & Griffin, 2010). This is because
these variables do not contribute to explain the variability in students’ learning in
chemistry (posttest score). In this study, any predictor variables that were found
statistically insignificant in the analysis described in step 4 were removed from the
multivariate analysis.

158
Chapter Summary
A series of lesson observations in twelve chemistry classes was conducted to
explore the inquiry practices of teachers observed in the Philippines. Using the
observational checklist (the SITOI) developed by the author, a total of 57 one-hour
observations (alongside with observational notes) assessed the nature of inquiry
teaching practices of teachers as they implemented the new Grade 7 chemistry
curriculum. The SITOI was composed of 31 items grouped into the six components of
scientific inquiry: engaging in questioning, designing and conducting investigations,
collecting data, analyzing data, developing explanations, and communicating
information. All observations were performed by the author during the first quarter of
the school year (six weeks) in which the chemistry component of the curriculum was
studied by the students. A teacher questionnaire was also used to gather information on
the characteristics of teachers and of their chemistry classes. To determine the nature of
inquiry implemented in classrooms, the observational data were analyzed by calculating
the average number of implementations of each inquiry component per lesson
observation. This was calculated from the total frequency of implementation of each
inquiry component divided by the total number of lesson observations per class. The
frequency of implementation of each of the six components of inquiry was determined
by counting the number of ticks recorded in the SITOI. The degree of initiation of
inquiry (teacher-centered or student-centered) was also determined using the SITOI.
Observational notes were coded to identify the inquiry practices listed in the SITOI.
To measure the learning of 495 Grade 7 students in chemistry, the ACTRC
chemistry tests (pretest and posttest) were used in this study. The tests were
administered before and after chemistry instruction. The ACTRC chemistry tests were

159
designed in accordance with the Philippine Grade 7 chemistry curriculum, and
developed and scored based on the Rasch (1960) model, to measure the growth of
students in chemistry. In this study, Rasch modeling was used to calibrate chemistry test
data to produced students’ ability estimates. Since the pretest and posttest in chemistry
contained different items, test equating (common items equating) in Rasch analysis was
employed, which was an effective means to enable matching the scores on these tests
and interpreting them on the same scale. This calibration provided the Weighted
Likelihod Estimate (WLE) of ability scores of students (growth score). Multilevel
analysis (two-level with Bayesian estimation) was used to analyze the relationship
between teacher practices and student learning since it takes into account the statistical
dependence among students within classes. Bayesian estimation offers the present study
a promising approach for estimating multilevel models with small number of groups.

160
Chapter 5: Assessing Teachers’ Inquiry Instruction in Chemistry
Classrooms
This chapter reports on the results of the classroom observation analysis. It is
divided into five parts. The first part presents the background characteristics of teachers
as participants and their classroom contexts. The second part presents the amount (mean
implementation number) of each component of scientific inquiry enacted by teachers.
The third part identifies and focuses on the specific classroom practices enacted by
teachers related to each component of scientific inquiry. The fourth part presents the
characteristics of the nature of inquiry instruction of teachers through comparing the
amount of inquiry practices enacted by teachers with the degree of initiation in the
classroom—teacher-centered or student-centered inquiry instruction. Finally, part five
presents the summary of the chapter.
Characteristics of Teachers and their Classroom Settings
Before describing the details of teachers’ implementation of inquiry-based
teaching in chemistry classrooms, this part presents the background characteristics of
teachers and the descriptions of their classes, to show the scenario of each chemistry
classroom observed at the time this study was conducted.
The background characteristics of teachers involved in this study, gathered by
teacher questionnaires are shown in Table 8. The responses were consolidated
according to teacher characteristics and information on the nature of their classes. The
mean of science teaching experience of teachers was 12.1 years (minimum=4 years;
maximum=21 years).

161
Table 8. Background Characteristics of Teachers
Teacher Gender Major Science Teaching
Experience (Years)
Number of
Students
Participated in National Training for New Science Curriculum
Availability of Science Laboratory
Access to Basic
Laboratory Apparatus
Availability of New
Teachers’ Guide
A M General Science
15 41 Yes Yes Yes Yes
B F General Science
21 55 (c1) 39 (c2)
Yes Yes Yes Yes
C F Biology-Chemistry
16 40 Yes Yes Yes Yes
D M Physical Science
4 41 Yes Yes Yes Yes
E F Chemistry 19 40 Yes Yes Yes No F F General
Science 11 43 Yes No Yes Yes
G F Chemistry 9 52 Yes No Yes Yes H F General
Science 5 52 Yes No Yes Yes
I F History 13 57 (c1) 54 (c2)
No No Yes Yes
J M General Science
8 55 No No Yes Yes
Notes. M is male and F is female. c1 is class 1 and c2 is class 2.
Teacher A
At the time of the study, Teacher A taught five Grade 7 chemistry classes in a
large public secondary school (School 3) with a total student population of 12,348. He
held a bachelor’s degree in secondary education and a master’s degree in general
science education. He had 15 years’ experience in science teaching at basic education
level. Before the implementation of the new K to 12 education in the Philippines, he
was teaching chemistry at third year high school (Grade 9) and physics at fourth year
high school (Grade 10) in the same secondary school. When the K to 12 curriculum was
implemented, he reported that he was confident to teach the content of the new science
curriculum.
Teacher A was observed teaching chemistry in one of his Grade 7 classes. This
class was composed of 41 students with a wide range of ability levels. His classroom
was located on the second floor of five-story building. It was small, one-half of the size
162
of a regular classroom. Ideally, a regular classroom in public schools in the Philippines
can accommodate a maximum of 40 students. So, his classroom could accommodate a
maximum of 20 students only. The classroom was well-lit but hot inside because the
two ceiling fans in the room were not enough for the class. There was not enough space
inside the classroom for the teacher and students to move conveniently. The classroom
was crowded with students, seated in chairs with no space in between. Despite these
challenging conditions, Teacher A seemed to be patient in teaching chemistry and
interacting with his students.
It was observed that the new inquiry-based science curriculum documents such
as the Teachers’ Guide and the Learners’ Module developed by the Philippine
Department of Education were available in his class. Students used the Learners’
Module most of the time and each of them had a copy of this document. Teacher A had
a copy of the Teachers’ Guide but he used this irregularly in delivering the lesson.
During the period of class observation, Teacher A mostly used non-experimental
activities to teach chemistry lessons. Non-experimental activities were mostly hands-on
activities that had no testing of variables and hypotheses like games, demonstration
activities, etc. He did not use the available laboratory even if there was a laboratory-
based activity in the lesson. The chemistry laboratory in the school was small. Inside the
laboratory, there were some scientific apparatus, storage cabinets, sinks, working tables,
and chairs. Teacher A allowed his students to work along the corridor outside the
classroom. In this case, there were no working tables or chairs in the corridor. Students
worked in teams and each team formed a circle, sat down on the floor, and worked on
their activity. Teacher A provided each team with a plastic tray containing science

163
materials for them to use. He brought some basic apparatus like beakers and test tubes
into the classroom only when needed. Most students in this class were cooperative.
Teacher B
Teacher B taught chemistry in the same school as Teacher A. She had four
Grade 7 chemistry classes. Two of her classes were involved in this study (see class
details below). Teacher B had an undergraduate degree in secondary education. She was
an experienced teacher with 21 years in science teaching. She taught third year high
school chemistry (Grade 9) before the K to 12 education reform. She reported that her
confidence in teaching the new science curriculum would depend on the topic. During
the observation period, Teacher B used non-experimental activities in both classes.
Teacher B’s class 1
Class 1 was a large class with 55 students of similar ability. This class was the
‘star class’ (high-achieving class) for Grade 7 in her school. For this class, she taught
chemistry in a regular classroom. Her classroom was well-lit and well-ventilated.
However, there was not enough space inside the classroom for the students. The
Teachers’ Guide and Learners’ Module were available in Teacher B’s class. All
students had copies of the Learners’ Module but they seldom used them in the
classroom. Teacher B was not observed using the Teachers’ Guide in this class. She
used the chemistry laboratory to teach a non-experimental activity in one lesson. She
brought her students into the laboratory to work on the activity. The students worked in
teams, and each team had a working table. She let her students used some equipment
and materials inside the laboratory. In other chemistry activities, Teacher B allowed
students to work inside the classroom and in the corridor. Students worked in teams in a

164
circular formation; some teams sat down on the floor while others were seated at their
chairs.
Teacher B’s class 2
Class 2 was composed of 39 students with a wide range of ability levels. These
students stayed in a small classroom (the same size as Teacher A’s classroom) located
also on the second floor. This classroom was well-lit but had no air-conditioning. Due
to lack of space, the classroom was very crowded. Most students used the Learners’
Module. Teacher B was not observed using the Teachers’ Guide. In this class, Teacher
B also used the laboratory to deliver the lesson using a non-experimental activity. She
allowed her students to work in the laboratory and most of them appeared enthusiastic.
The students worked in teams and each team had a working table. The students used the
equipment and materials inside the laboratory. Teacher B also allowed her students to
work in the corridor outside the classroom for other chemistry activities. Students sat
down on the floor and worked in teams in a circular formation.
Teacher C
Teacher C taught chemistry in another large public secondary school (School 4)
with student population of 6,912 at the time of the study. She had three Grade 7
chemistry classes. She held a bachelor’s degree in secondary education, and at the time
this study was conducted, she was working on her doctoral degree in education. Teacher
C was an experienced chemistry teacher who had been teaching for 16 years. She was
teaching chemistry in third year high school (Grade 9) before the implementation of K
to 12 curriculum. She reported that she had the confidence to deliver the content of the
new science curriculum.

165
Teacher C was observed teaching chemistry in one of her Grade 7 classes. This
class was one of the high-achieving classes in Grade 7 in her school. She had 40
students with similar ability. Teacher C was the person in charge of taking care of the
chemistry laboratory. She always used the laboratory in every teaching session. She
used experimental and non-experimental activities to deliver the lesson. The chemistry
laboratory in the school was small. There were working tables, stools, storage cabinets,
and laboratory apparatus available for student use. However, there was little space
inside the laboratory, thus students worked very closely together. Students worked in
teams on chemistry activities. During the observation period, it was noticed that
Teacher C always reminded her students to practice discipline and orderliness inside the
laboratory. All students had the Learners’ Module and they used this document in every
session. Teacher C sometimes used the Teachers’ Guide in her class.
Teacher D
During the time of the study, Teacher D was in the early stage of his teaching
career. He was the youngest among the teacher-participants, with four years of teaching.
He had an undergraduate degree in secondary education. Teacher D worked at the same
school as Teacher C. He used to teach chemistry in third year high school (Grade 9) and
physics in fourth year high school (Grade 10) before the curriculum reform. He reported
that he was confident to teach the content of the new science curriculum.
Teacher D taught chemistry in a Grade 7 class that consisted of 41 students with
a wide range of ability levels. In the whole period of observation, it was noticed that
student attendance in this class was low. Teacher D’s classroom was spacious for
students to work on chemistry activities, however the classroom had no air-

166
conditioning. Each student had a copy of the Learners’ Module and they used it in every
lesson. Teacher D had a copy of the Teachers’ Guide but he was not observed using this
in the classroom. Teacher D taught chemistry without using the laboratory. During the
observation period, he mostly used non-experimental chemistry activities to teach the
lessons. In one lesson observation, there was a laboratory-based activity, but he allowed
the students to work inside the classroom using their modules. Students in this class
were not observed using the laboratory apparatus or equipment.
Teacher E
Teacher E was an experienced chemistry teacher, with 19 years of teaching. She
was teaching chemistry in third year high school (Grade 9) before the curriculum
reform. Teacher E’s content knowledge and chemistry laboratory experience were
strong, as she had an undergraduate degree in chemistry. She also obtained a certificate
in teaching chemistry and physics. She worked at the same school as Teachers C and D.
When the reform was implemented, she reported that she was confident to teach the
content of the new science curriculum. During the observation period, she used
experimental activities to teach the lesson in every class. At the time of the study,
Teacher E had four Grade 7 chemistry classes.
One Grade 7 chemistry class of Teacher E was observed for this study. This
class had 40 students with a wide range of ability levels. Teacher E used the biology
laboratory as her classroom. The biology laboratory was bigger than the chemistry
laboratory with four large working tables with stools. The room was well-lit and well-
ventilated. Inside the laboratory, there were scientific apparatus and equipment, storage
cabinets with science materials, sinks, and science teaching models. Students used the

167
necessary apparatus and materials for their chemistry activities. All students had copies
of the Learners’ Module and they used them in most of the lessons. However, Teacher E
had no copy of the Teachers’ Guide thus she was not observed using this in any
sessions. Students worked in teams on the activities. There were two teams working on
one big table. Each team had laboratory apparatus and materials to use in the activity. It
was observed that most students in this class were enthusiastic in performing the
activities.
Teacher F
Teacher F was teaching Grade 7 chemistry in another large public secondary
school (School 2) with a total student population of 7,499. She held a bachelor’s degree
in secondary education. She had three Grade 7 chemistry classes. Teacher F had a long
experience in teaching Grade 7 science since she had been teaching first year high
school (Grade 7) students for some years before the science curriculum reform. When
the new curriculum was implemented, Teacher F reported that she was confident in
delivering the new science curriculum but this would depend on the topic.
In this study, Teacher F was observed teaching chemistry to a high-achieving
Grade 7 class. This class had 43 students with similar ability. She had a copy of the
Teachers’ Guide. She delivered the chemistry lessons based on the sequence of topics
specified in the Teachers’ Guide. Students sometimes used the Learners’ Module
through sharing since not all students had a copy. Teacher F taught chemistry in a
regular classroom that was well-lit and well-ventilated. She used experimental and non-
experimental activities to teach the lesson. There was no science laboratory in the
school. The space inside the classroom was not large enough for students to perform
168
chemistry activities. Thus, some students worked inside the classroom while others
worked in the corridor outside the classroom. There was no working table available for
students; most of them sat down on the floor while performing their activities. The
school had some basic laboratory apparatus (e.g., beakers, graduated cylinders)
available for student use. Storage cabinets for these and other science materials were not
available inside the classroom. Teacher F brought the apparatus from the faculty office
to the classroom whenever materials were needed in the lesson. In some cases, materials
needed for chemistry activities were provided by Teacher F and her students from
resources in their homes. It was observed that each team of students with six to seven
members had one plastic storage bin where they put their own materials for chemistry
activities. Most students in this class were cooperative.
Teacher G
Teacher G taught chemistry in Grade 7 at the same school as Teacher F. She had
five chemistry classes. She taught chemistry in third year high school (Grade 9) before
the implementation of the new curriculum. She had an undergraduate degree in
secondary education. She reported that her confidence in teaching the new science
curriculum depended on the nature of the topic.
Teacher G’s Grade 7 chemistry class had 52 students with a wide range of
ability levels. Like Teacher F, she had a copy of the Teachers’ Guide. In the delivery of
the lesson, she followed the sequence of chemistry topics as specified in the Teachers’
Guide. Most of the time, students shared the Learners’ Module since not all students
had a copy. Teacher G’s chemistry classroom was well-lit but had no air-conditioning.
She taught chemistry with experimental and non-experimental activities. Since Teacher

169
G’s school had no science laboratory, students performed chemistry activities inside the
classroom. Students worked in teams with seven to eight members. Due to the lack of
space in the classroom, Teacher G allowed some teams to perform activities in the
corridor while other teams stayed inside the classroom. There were no available storage
cabinet and working tables for students. However, basic science materials (e.g., beakers,
graduated cylinders) were available for student use. Teacher G brought the materials
into the classroom when needed. Some materials for chemistry activities were provided
by Teacher G. In this class, students had no storage bin for their science materials.
Teacher H
Teacher H was in early stage of her teaching career at the time of the study,
having been teaching for five years. She taught general science in first year high school
(Grade 7) before the K to 12 curriculum reform. When the new science curriculum was
implemented, she taught Grade 7 chemistry at the same school as Teachers F and G.
She had a total of four Grade 7 chemistry classes. Teacher H reported that her
confidence in teaching the content of the new curriculum would depend on the topic.
She had a bachelor’s degree in secondary education.
In this study, Teacher H’s Grade 7 chemistry class was composed of 52 students
with a wide range of ability levels. These students sometimes used the Learners’
Module and few of them had copies of this material. Teacher H had a copy of the
Teachers’ Guide. Like Teachers F and G, she also followed the sequence of topics as
specified in the Teachers’ Guide when she delivered lessons in her class. She used
experimental and non-experimental activities in the class. Students performed these
activities in the classroom since the school had no science laboratory. The classroom

170
was small, thus some students worked in the corridor outside the classroom. There were
no working tables inside or outside the classroom, so most students sat down on the
floor while performing the activities. Students worked in teams with ten to eleven
members. Some basic laboratory apparatus and science materials were available,
however there was no storage cabinet to keep these resources. They were brought by
Teacher H into the classroom when needed. Teacher H provided each team of students
with a big cardboard box for storing materials for chemistry activities.
Teacher I
Teacher I taught chemistry in another public secondary school (School 1) with a
student population of 7,755 at the time of the study. She had an undergraduate degree in
secondary education with a major in a non-science subject. She had long experience in
teaching Grade 7 science since she taught this level before the curriculum reform.
Teacher I had three Grade 7 chemistry classes, two of which were involved in this study
as described below. She reported that her confidence in teaching the new science
curriculum would depend on the topic. During the time of class observation, Teacher I
used experimental and non-experimental chemistry activities in the lessons.
Teacher I’s class 1
This class was one of the high-achieving classes in Grade 7. It was a large class
with 57 students with similar ability. Due to lack of space, Teacher I’s classroom was
very crowded. A little space was provided inside the classroom for Teacher I’s table.
The classroom was clean and well-lit but there was no air-conditioning. In this class, the
Learners’ Module was used by students in most teaching sessions. However, each team
of students with ten to eleven members had only one copy of the Learners’ Module,

171
which necessitated sharing. The leader in each team was responsible for taking care of
the Learners’ Module. At the end of the session, students needed to return the module to
the teacher. Teacher I had a copy of the Teachers’ Guide but she used this irregularly.
The school had no science laboratory. Whenever Teacher I used hands-on
activities to teach the lesson, she allowed students to work inside and outside the
classroom. Some teams worked in the corridor outside the classroom. Since there were
no working tables, students in each team sat down on the floor in circular formation
while doing their activities. Storage cabinets for science materials were not available in
the classroom, so each team had a plastic storage bin where they put their materials for
chemistry activities. The team leader was in-charge of keeping the plastic storage bin
safe. Some basic laboratory apparatus (e.g., beakers, test tubes) were available in this
class and the students used these for activities. If the apparatus needed for an activity
was not available in the school, it was observed in this class that Teacher I provided
improvised laboratory apparatus for the students.
Teacher I’s class 2
Class 2 was also a high-achieving class in Grade 7. It was also a large class with
54 students of similar ability. These students stayed in a clean and well-lit classroom.
However, the classroom was small for 54 students (like the room for class 1) and there
was lack of space for everyone to move and work conveniently. The room had no air-
conditioning. In this class, there was also a lack of copies of the Learners’ Module, and
each team of ten to eleven students shared one copy of the Learners’ Module. It was
observed that students used the module in every session. After the session, Teacher I
collected the Learners’ Module from each team. Teacher I used non-experimental
activities to teach the lessons with this class. She allowed student teamwork to carry out
172
these activities. Due to lack of space inside the classroom, some teams worked in the
corridor outside the room. There were no working tables available for students, so the
members in each team sat down on the floor in a circular formation while doing their
activities. Each team had a plastic storage bin to keep their materials for chemistry
activities since storage cabinets were not available in school. The team leader was in-
charge of taking care of the plastic storage bin.
Teacher J
Teacher J was teaching at the same school as Teacher I. Before the
implementation of K to 12 curriculum, Teacher J taught general science in first year
high school (Grade 7). When the new science curriculum was implemented, he taught
Grade 7 chemistry. He had four Grade 7 chemistry classes. Teacher J reported that he
was confident to teach the content of the new curriculum, but this would depend on the
topic. He had a bachelor’s degree in secondary education.
In this study, Teacher J’s class had 55 students with a wide range of ability
levels. This large class was accommodated in a small classroom. The classroom was
clean and well-lit but had no air-conditioning. In this class, each student had a copy of
the Learners’ Module, however they rarely used it during the sessions observed. The
students needed to return the module to Teacher J after use. Teacher J had a copy of the
Teachers’ Guide, but he was not observed using it. Teacher J rarely used chemistry
activities in the sessions observed. He only once gave students a non-experimental
activity. Since there was no science laboratory, the students worked in teams inside and
outside the classroom. Like in the classes of Teacher I, students sat down on the floor
while working on their activity. Each team had one plastic storage bin with science

173
materials for the activity. In this class, students were not observed using laboratory
apparatus.
Components of Scientific Inquiry Enacted by Teachers in Chemistry Teaching
Based on 57 lesson observations, the six components of scientific inquiry
(engaging in questioning [Q], designing and conducting investigations [DI], collecting
data [CD], analyzing data [AD], developing explanations [DE], and communicating
information [CI]) were employed to some extent by teachers in their chemistry
instruction. Comparing across the six components of inquiry enacted by teachers (refer
to Figure 3), a large portion of chemistry instruction was comprised of engaging in
questioning practices (39%). Out of 12 chemistry classes, this pattern was observed in
11 classes. Generally, teachers were accustomed to using questioning as this was a more
familiar and common classroom practice compared to other components of scientific
inquiry (e.g., designing and conducting investigations, collecting data). Engaging in
questioning practices may be more suitable for their classrooms, given the context, as
this could be an easier and more convenient way of delivering the content rather than
setting up chemistry activities each time. Further, teachers’ questioning practices may
foster students’ higher order thinking skills even with a lack of chemistry activities,
especially considering science facilities and resources were not always available.
Different teaching practices related to engaging in questioning, from teacher-centered to
student-centered, were observed from all the teachers who implemented questioning in
chemistry classrooms. More details on specific questioning practices of teachers are
identified in the next part of this chapter. The mean number of implementation for each

174
of the six components of scientific inquiry per observation is illustrated in Figure 3
below.
Figure 3. Mean scores of inquiry component with standard error bars per observation.
The smallest portion of chemistry instruction was comprised of analyzing data
practices (8%). In this study, analyzing data practices were usually observed whenever
there was experimentation. Despite the experimental activities present in the new Grade
7 chemistry curriculum, some teachers chose to use non-experimental activities in
chemistry teaching. This situation may give teachers less opportunity to provide
students with the chance to analyze data in chemistry classrooms. The other components
of scientific inquiry incorporated into chemistry instruction less often than questioning
0
2
4
6
8
10
12 M
ean
Scor
e pe
r O
bser
vatio
n
Inquiry Component
Mean

175
were: designing and conducting investigations (12%), collecting data (10%), developing
explanations (13%), and communicating information (18%).
Furthermore, analysis of the observations revealed that some teachers
incorporated particular components of scientific inquiry into their chemistry instruction
more frequently than others. The amount (mean implementation number) of scientific
inquiry component enacted by teachers in their classrooms is shown in Figure 4. It is
important to note that teachers taught the same inquiry-based lessons in chemistry as
outlined in the Grade 7 chemistry curriculum documents. These inquiry-based lessons
were Solutions, Substances and Mixtures, Elements and Compounds, Acids and Bases,
and Metals and Nonmetals.
Figure 4. Inquiry practices enacted by each teacher per observation.
As evident in Figure 4, each teacher incorporated all of the six components of
scientific inquiry into their teaching of Grade 7 chemistry using the new science
0.00 5.00 10.00 15.00 20.00 25.00
A B1 B2 C D E F G H I1 I2 J
Amount of Inquiry Practices per Observation
Cla
ss
Engaging in questioning (Q)
Designing and conducting investigations (DI)
Collecting data (CD)
Analyzing data (AD)
Developing explanations (DE)
Communicating information (CI)

176
curriculum. Each teacher tended to enact more practices related to engaging in
questioning and communicating information than practices related to analyzing data,
collecting data, designing and conducting investigations, and developing explanations.
Generally, the practices of analyzing data, collecting data, designing and conducting
investigations were observed in teaching with experimental activities, which could be
challenging practices for most teachers to incorporate due to extrinsic factors such as
large class sizes and the availability of science facilities (e.g., access to a laboratory)
and resources. In looking at individual teachers’ enactment of inquiry component per
observation, Teacher F had the largest number of practices related to inquiry
implemented in the classroom. Despite the challenging conditions of school resources
and facilities, Teacher F still managed to implement inquiry-based practices in
chemistry instruction. Conversely, Teacher J had the smallest number of practices
related to inquiry enacted in the classroom. It is also interesting to determine the
practices enacted by teachers with two chemistry classes (class 1 and class 2) each such
as Teachers B and I. It can be noticed in Figure 4 that some components of inquiry were
given more emphasis by Teachers B and I in one class than in the other class.
Below are the details of their implementation of scientific inquiry components
supported with actual classroom scenarios captured during observations. These were
presented to understand: (1) how Teacher F implemented more inquiry practices in her
classroom, (2) why Teacher J implemented less inquiry in his classroom, and (3) what
was the nature of inquiry teaching in two chemistry classes of Teachers B and I—did
they implement the same approach to inquiry teaching in their two classes and did they
give the same emphasis on using inquiry to both of their classes? It is important to note
that in all observations, the researcher moved from one place to another in the

177
classroom and in the corridor (if there was a student activity), which was beside the
classroom, to observe closely what the teachers and the students were doing and to
capture efficiently the inquiry practices occurred during the instruction. The researcher
made sure that this process of observation did not cause any class disruptions or delays
in the instructional activities.
Teacher F: Teacher with most enacted practices related to inquiry
Comparing across teachers, Teacher F had the highest mean score (M=21.60,
SD=9.15) in implementing practices related to inquiry per chemistry lesson observation.
Based on a series of observations, Teacher F usually taught chemistry lessons using
different components of scientific inquiry, which could give her more opportunities to
implement inquiry practices in the classroom. Some of the inquiry components that she
used were evident in the following teaching scenarios as observed in her classroom. It is
important to note that the words of students and teachers in the scenarios were quoted
verbatim so may include grammatical errors.
Scenario 1
To teach and help students distinguish the type of Solutions, Teacher F showed
two setups: (1) To a beaker that contained water, she added a small amount of sugar, then she stirred the contents; (2) To a beaker that contained water, she added a large amount of sugar, then she stirred the contents. She asked the students to observe. Then, she asked the students the question, “What will happen to the sugar?” The students answered, “The sugar dissolves easily in setup 1.” Teacher F asked, “Why?” The students answered, “Because the water has a greater amount than sugar which helps the sugar to dissolve easily.” Then the teacher asked more questions, “What do you call this solution in setup 1?” “Which solution is unsaturated? Saturated?” “Why did you say so?” (Teacher F, Lesson Observation 1, 29-06-2015)
In this scenario, Teacher F engaged her students in the lesson cognitively
through asking questions about the demonstration. It was evident in the scenario that
178
while doing the demonstration, Teacher F asked a question that elicited students’ own
ideas about the topic. After the demonstration, she asked the students again but this time
she asked a question that required them to justify their answers. These practices of
Teacher F were relevant to the engaging in questioning component of inquiry. In
addition, the approach of Teacher F in this scenario could also give her the opportunity
to implement inquiry practices related to developing explanations.
Scenario 2
Teacher F discussed the features of the periodic table of elements and the important information that students can get from it. She also discussed the guidelines of writing the correct symbol of the elements as shown in the periodic table. After discussing the guidelines, she conducted a short game that required students to form a word by combining the symbol of the elements. For example, the symbol for Cobalt is Co and the symbol for Neon is Ne. Combining the symbols of these two elements, the word “CoNe” is formed. This game required students to be familiar with the elements and their correct symbols. After the game, the teacher asked the students to explain their work. She also asked them to explain the uses and importance of the elements, “What is the use of oxygen?” “What is the importance of iron?” (Teacher F, Lesson Observation 4, 23-07-2015)
In the second scenario, Teacher F used a non-experimental activity to teach the
concepts related to the periodic table of elements. In this activity, she let her students
analyze or solve problems when she asked them to form a word from the given list of
elements by combining the correct symbols of the elements. This practice was related to
the inquiry component of analyzing data. The activity also allowed Teacher F to
implement practices that encouraged students to develop their own explanations when
she asked them to explain the use and importance of the elements after they performed
the activity. This practice was related to developing explanations.
Scenario 3
Teacher F provided students with an experiment about factors affecting solubility. Before the students performed the experiment, she discussed first some

179
safety reminders to consider in performing the experiment. She instructed the students what to do in the activity by discussing the procedures. After conducting the experiment, the whole class discussed the results. The teacher asked one group of students to report the data collected from the experiment. The students explained the procedures and results of the task assigned to them. Two students reported in front of the class. After presentation, the teacher asked the students, “Why do you think it is dissolved?” team 1 answered, “The water and vinegar attracted [to] each other.” “Based on your results, what is the factor that affects solubility, team 1?” The students answered, “The nature of solute and solvent.” (Teacher F, Lesson Observation 1, 29-06-2015)
In the third scenario, Teacher F used experimentation to engage students in
conducting investigation on the factors that affect the solubility of a substance. She
asked the students to perform an investigation in teams. After conducting the
experiment, Teacher F asked the students to communicate the results of the
investigation through a group presentation in class. It was observed that it was not just a
one-way communication of results. It was a presentation with interactions between
teacher and students. This was evident when Teacher F asked the students a series of
questions and then the students responded to the questions being asked. This gave
Teacher F an opportunity to use practices that allowed students to work out an
explanation about what they have discovered from their experiment. In this scenario,
Teacher F enacted practices related to conducting investigation, communicating
information, and developing explanations.
Despite the challenges in the teaching environment, Teacher F still managed to
use available opportunities to implement inquiry-based teaching practices as much as
possible. As shown in Figure 4, Teacher F enacted more of engaging in questioning
practices and less of analyzing data practices. Analysis of lesson observations revealed
that Teacher F always used chemistry activities (experimental and non-experimental) to
teach the content of the lesson. Due to the large class size, students performed these

180
activities in teams. Teacher F was observed to use more non-experimental activities
than experimental activities. This is likely due to the non-availability of space for
conducting science experiment in her school and the lack of science equipment and
materials. Because of this situation, Teacher F implemented inquiry practices suitable
for her school and classroom contexts using non-experimental activities.
The use of non-experimental activities provided Teacher F with the
opportunities to implement inquiry practices that do not necessarily require science
facilities and equipment. Most of these practices were related to engaging in
questioning. She frequently used questioning practices to deliver the content in the
activity and to engage students cognitively in the lesson. Further, since using non-
experimental activities usually consumed shorter teaching time (as in the case of
Teacher F) than using experimental activities, Teacher F was observed to use the
available time to implement other inquiry teaching practices after students performed
non-experimental activities. These practices were related to communicating information
and developing explanations. These findings from Teacher F’s class suggest that it is
important to consider the context of teaching and learning environment in implementing
inquiry-based teaching as this may provide the key for teachers to implement a variety
of inquiry practices in classrooms.
Teacher J: Teacher with fewest enacted practices related to inquiry
On the one hand, Teacher J had the lowest mean score (M=7.75, SD=1.71) in
implementing inquiry practices per chemistry lesson observation. It was observed that
in his class, there were available opportunities to implement inquiry practices in the

181
classroom. However, he did not use these opportunities fully in class. This situation is
illustrated in the following scenario of Teacher J’s class:
Teacher J’s chemistry class was observed for four one-hour lessons. In three of
the lessons, he used the first thirty minutes in doing teaching activities such as checking of test papers, assignments, and student portfolios. Teacher J asked the students to check their own papers while he announced the correct answers in front of the class. Students had folders where they compiled their own test papers, quizzes, assignments, and activity sheets. (Teacher J, Lesson Observations 2-4, 13, 29, 31-07-2015)
This scenario shows that the available time of Teacher J to teach chemistry as
inquiry was compromised due to his application of other teaching activities other than
inquiry. Although Teacher J did use inquiry-based teaching, he seemed to prioritize
more the implementation of other teaching activities than the implementation of inquiry
teaching practices. Specifically, the activity that he implemented was asking students to
mark their own test papers, past quizzes, and assignments while he announced the
correct answers in front of the class. In this approach, students were just listening to
Teacher J without interaction. This consumed most of his teaching time.
Teacher J was observed using a non-experimental activity only once to teach a
lesson. Students performed this activity in teams. During this session the teacher was
observed implementing inquiry practices related to conducting investigations and
communicating information. However, this approach was not sustained in his class as
noticed during the period of observation. He delivered Grade 7 chemistry lessons
without incorporating activities in most of his teaching sessions. He focused more on
lecturing in front of the class to deliver the content of the lesson. In this approach,
Teacher J enacted some inquiry practices related to engaging in questioning. However,
this approach did not offer him wide opportunities to use other components of scientific
inquiry, which resulted in less implementation of inquiry practices in teaching

182
chemistry. However, there are reasons that could explain this situation. Teacher J had a
large class size (55 students), and a lecturing mode of instruction could be a convenient
way for him to teach the lesson in his big group of students. Further, the challenges of
Teacher J’s school environment (e.g., lack of science resources, unavailable space for
conducting science activities) were another factor that may reduce his capacity to
include chemistry activities in teaching most of the lessons. This may have caused him
to implement less inquiry-based teaching practices. Based on these explanations, it is
arguable that Teacher J used other approaches to teaching chemistry, which may be
convenient for his own classroom settings. However, this may inhibit him from enacting
varied inquiry practices. Findings from Teacher J’s class suggest incongruency between
the new curriculum emphasis, which is inquiry-based teaching, and classroom practices
due to some extrinsic factors.
Teachers B and I: How did they implement inquiry in their two chemistry
classes? Did they apply the same teaching approach in their two classes?
Two of the teachers in this study taught two chemistry classes each. Figure 4
shows the amount of inquiry practices enacted by Teachers B and I in their two classes.
There was no big variation in the amount of enacted inquiry practices in both classes of
Teacher B. In fact, the amount of practices related to conducting investigations,
analyzing data, and communicating information enacted by Teacher B was the same in
both classes. However, observations revealed that Teacher B gave more emphasis on
implementing other components of inquiry in class 2 than class 1. One inquiry
component was collecting data. This is because demonstration activities employed by
Teacher B were more visible in class 2 than class 1. Teacher B used demonstrations in

183
class 2 to explicitly show the difference between pure substance and mixture as
presented in the scenario below. Through this strategy, Teacher B had the opportunity to
engage students in demonstrations that required them to make and write descriptive
observations, which is a specific practice of collecting data. Consider the scenario
below:
Teacher B demonstrated mixture in class 2 by adding salt into a test tube containing water, and then she shook it. She asked the students to describe what they observed. She also asked them if salt could be separated from water. After this, Teacher B demonstrated substance by mixing iron filings and sulfur into the test tube, and then she heated it. She asked the students to describe what they observed and if sulfur and iron filings could be separated. (Teacher B, Lesson Observation 1 [class 2], 30-06-2015)
In class 1, Teacher B used other approaches to teach the lesson. She used
traditional lecture to deliver the concepts of pure substance and mixture. Teacher B was
delivering the lecture in front of the class using chalkboard and the students were
listening to her. Teacher B’s class 1 was a high-achieving class and composed of 55
students with similar ability. With this, it may be easier for Teacher B to facilitate the
lesson in a large class with academically good students using lecture mode of teaching
than setting up demonstration activities. However, the lecturing approach may not offer
him opportunities to use practices related to collecting data. Conversely, class 2 had
smaller number of students than class 1. It was composed of 39 students with a wide
range of ability levels. Most of these students were not as good as students in class 1.
Because of this, Teacher B explicitly discussed the lesson through demonstration so that
students may easily understand the concepts.
When it comes to Teacher I’s inquiry teaching, lesson observations revealed
that there was a variation in the amount of scientific inquiry practices enacted in her two
classes. The mean score of inquiry implementation per lesson observation for class 1
184
(M=17.00; SD=9.67) was greater than class 2 (M=11.67; SD=7.64). This shows that
Teacher I enacted more inquiry practices in class 1 than class 2. The variation was
evident particularly in the enactment of practices related to communicating information,
analyzing data, and engaging in questioning.
For communicating information, Teacher I enacted more practices in class 1
than class 2 as previously shown in Figure 4. This finding was explained by her
application of different approach in teaching the same lesson in class 1 and class 2.
Specifically, the lesson was about “Acids and Bases”. In class 1, Teacher I used a
chemistry activity entitled “How Can You Tell if a Mixture is Acidic or Basic?” to
deliver the concepts of acids and bases. This activity was performed by her students in
teams. In this activity, each team was asked to determine if the given household
materials were acidic or basic using an eggplant indicator. While doing the activity,
Teacher I asked each team to write the results in the data table (communicating
information). After the activity, she asked each team to report their results in class
through presentations (communicating information). Specifically, she asked them to
present the acidic or basic nature of the household materials using the color scheme for
eggplant indicator. After reporting, Teacher I discussed the concepts on acids and bases
using the results of the activity. The practices related to communicating information
enacted in this class were not observed in class 2.
Teacher I used another approach to teach acids and bases in class 2. She
discussed the importance of knowing about the acidity and basicity of some substances
through traditional lecture. She used a visual material showing a pH scale, posted on the
chalkboard, to determine the acidity and basicity of sample substances. There was no
hands-on activity for the students. After the lecture, Teacher I gave a short quiz for the
185
students. This approach of teaching in class 2 may not provide opportunities for Teacher
I to employ practices related to communicating information. As a result, Teacher I
enacted less communicating information in class 2 than class 1. It was observed that
during this time, Teacher I was not on track in class 2 in terms of teaching the required
chemistry lessons for the first marking period. Thus, class 2 was behind class 1 in terms
of the number of lessons taught during that period. In this case, Teacher B used
lecturing approach in class 2 because this may be the fastest way to teach the lesson so
that class 2 could move on to the remaining lessons. It may be important for Teacher I
to teach the required lessons as specified in the new curriculum in both classes since this
could have an impact on student assessment.
When it comes to analyzing data, Teacher I’s practices were more visible in
class 2 than class 1. This variation was specifically evident in the lesson that involves
activities about the “Concentration of Solutions” wherein Teacher I asked the students
to analyze the concentrations of solid solution quantitatively. Observations revealed that
in class 2, students were more engaged with Teacher I’s practices on analyzing and
solving problems about the concentration of solutions than students in class 1. The
reason for this is that there was a difference in the strategy that the teacher used to teach
this lesson. In class 2, Teacher I taught the lesson by letting students perform the
activity in the classroom. She asked the students to analyze the existing data needed for
determining the exact ratio of solute to solvent in a solid solution, which specifies the
concentration of a solution. Then, she asked the students to solve the problem related to
concentration of solid solution below. After this, Teacher I asked them to explain how
they analyze and solve the problem. Consider the following problem:

186
A one peso coin has a mass of 5.5 grams. How many grams of copper are in a one peso coin containing 75% copper by mass? In class 1, Teacher I asked the students to solve this problem at home. Then in
the next session, the first teaching activity that she performed was to discuss how to
analyze and solve the problem. She discussed the solution for this problem in front of
the class by writing on the chalkboard the complete steps of solving the problem.
Students were listening to Teacher I and checking their own work based on the solution
written on the board. Then, she asked the students if they got the correct solution and if
they understood the process. Because of this approach, where Teacher I provided the
solution to the problem outright, there were some practices in class 2 that were not
implemented in class 1. This approach may limit her to employ other teaching practices
related to problem solving and analysis.
These findings show that the reason why Teachers B and I enacted more inquiry
in one class and less inquiry in another class was that they used different teaching
approach to deliver the same lesson in both classes. It seemed that they consider their
own classroom contexts and their efficiency in covering the content of the new
curriculum when using a particular teaching approach in chemistry.
Specific Classroom Practices Related to Each Component of Inquiry Enacted by
Teachers
To provide an evidence-based documentation of specific teacher behaviors in
using the major practices of scientific inquiry as a teaching approach in developing
country, this part presents the specific classroom practices of teachers for each
component of scientific inquiry. It includes and describes selected teaching scenarios

187
from the chemistry classroom of individual teachers to show how the specific practices
in each component of inquiry were employed in their own teaching. This will provide a
granular view of teachers’ instruction to better understand their enactment of inquiry
teaching. Some specific practices under each component of inquiry listed in the SITOI
were implemented by the teachers in chemistry teaching during observed lessons.
Furthermore, information on which class implemented the most or the least of specific
practices in a particular component of inquiry will be described as this may be useful
and relevant for understanding the relationship between scientific inquiry and learning,
which is discussed in the later chapters of this thesis.
Component 1: Engaging in questioning
Generally, the results show that throughout the 57 lesson observations all
teachers used an engaging in questioning practice that specifically asked questions
about facts that were not previously presented, which elicited students’ own ideas and
required short specific answers. This type of engaging in questioning practice was the
most dominant in the classes observed. It comprised 58% of the total engaging in
questioning practices. Teachers also asked questions that required students to give a
justification for a phenomenon. These comprised 33% of the total engaging in
questioning practices. The least used practice related to engaging in questioning was
prompting students to ask or formulate their own questions (9%). Figure 5 below shows
the mean implementation number of implementing engaging in questioning practices by
individual teachers per lesson observation.

188
Figure 5. Engaging in questioning practices.
Comparing across teachers, Teacher F had the highest mean number of engaging
in questioning practices (M=9.20). Based on observations, Teacher F frequently asked
her students a question that elicited their own ideas, requiring short specific answers.
She enacted this engaging in questioning practice the most compared with other
teachers. Consider the scenario below:
To introduce the new lesson which was the properties of metals and non-metals, Teacher F showed pictures of coins, plastic bottles, and electrical wires to the students. Then, she asked the students, “What do you think are the properties of these materials?” One student answered, “Coins are hard.” Afterwards, Teacher F provided some properties of materials and asked the students to identify if these properties were for metals or non-metals. One property that has been mentioned was high melting point. Teacher F asked the students, “What does it mean by high melting point?” One student answered, “It needs a very high temperature to melt.” (Teacher F, Lesson Observation 5, 27-06-2015)
0.00 2.00 4.00 6.00 8.00 10.00
A B1 B2
C D E F G H I1 I2 J
Mean per lesson observation
Cla
ss
Asking questions that elicit own ideas and require short answer
Asking questions that require reasoning or justification
Prompting students to ask questions
189
In this scenario, Teacher F asked questions to probe the background knowledge of the
students about the properties of metals and non-metals. She also asked the students
about their ideas on a specific terminology that is commonly used in science (melting
point). This specific practice was also observed in the class of Teacher H as follows:
Teacher H started to discuss the new lesson, Solutions. She asked the students this question, “Class, what do you mean by miscible?” Then she asked another question, “What do you mean by immiscible?” (Teacher H, Lesson Observation 1, 29-06-2015) In this case, to start a new lesson about Solutions, Teacher H asked questions that
elicited students’ own ideas about the meaning of scientific terminologies used to
describe Solutions such as miscible and immiscible.
The questions asked by Teacher F encouraged students to give short specific
answers. However, she rarely prompted her students to develop and ask their own
questions about the phenomena. This situation was also observed in other chemistry
classes. Teacher J was not observed prompting students to ask their own questions at all
even when there were opportunities to implement this engaging in questioning practice
in the lessons. Focusing only on this practice, prompting students to develop and ask
their own questions, Teacher I enacted this practice the most compared with other
teachers. Specifically, Teacher I used this practice more frequently in class 2 than in
class 1. This is because in class 2, she implemented more student engagement activities
that required individual analysis of the Concentrations of Solutions than in class 1.
Because of this, she encouraged her students to ask questions for analysis. Next to
Teacher I, Teacher B and Teacher H also prompt students to ask questions frequently.
Consider the following scenario from Teacher B’s class 1:

190
After the students performed the activity on metals and non-metals, Teacher B started to process the results. First, she asked the students to share different properties of metals that they discovered from the activity. Then, properties like malleability, conductivity, and luster were discussed. Next, she asked questions about properties of non-metals. Some students answered “Non-metals cannot conduct electricity” while others said “They are dull”. Before proceeding to detailed discussions, Teacher B asked the students, “Do you have any questions?” “What is your question in the activity?” Teacher B called students for questions. One student asked, “Are there non-metals that conduct electricity?” Another student asked, “Why diamonds are made of Carbon but they are solid?” (Teacher B, Lesson Observation 2, 16-07-2015)
It is evident from this scenario that students were given opportunity to think and
ask their own questions. Teacher B was observed to be patient in soliciting questions
from students and giving them time to formulate questions about their activity on metals
and non-metals. This was evident when Teacher B engaged students in questions that
asked them to formulate questions twice, which goes like this, “Do you have any
questions?... (wait time)” “What is your question in the activity?” When she asked the
first question, no students responded. In this case she gave a wait time after asking a
question for students to think and raise their own questions. Then, she asked the second
question that encouraged students again to formulate questions. After this, two students
formulated and asked their own questions about the activity. This type of practice may
be important in science instruction where teachers are aiming to foster higher-cognitive
level learning in their students. Waiting more than a second for a student answer to a
teacher question is one well-known practice that has been shown to have a significant
positive effect on student learning (Osborne et al., 2013). However, compared to the
high mean scores of teachers for implementing the other two engaging in questioning
practices, this practice had low mean scores. This implies that even if teachers have
opportunities to use an inquiry-based curriculum to teach chemistry most of them who
were observed were not prioritizing this type of engaging in questioning practice where

191
students’ questioning ability is considered fundamental to develop critical reasoning,
and to the process of scientific inquiry. A practice of engaging in questioning that was
not observed during teachers’ instruction was asking students a question about facts
previously presented. This may imply that the teachers observed in this study did not
prioritize the use of teacher-centered questions that could lead to a simple recall of facts.
Component 2: Designing and conducting investigations
In designing and conducting investigations, there were four major practices
enacted by teachers in chemistry classrooms. Comparing across these four investigation
practices, the most enacted practice was providing specific procedures for students to
follow to conduct an investigation activity. This practice comprised 63% of the total
practices related to investigation. This practice was observed in all chemistry
classrooms where teachers provided students with an activity sheet that listed the
procedures or posted a diagram that outlined the specific procedures. Figure 6 outlines
the frequency of investigation practices, and shows that most teachers implemented this
practice (red bar) more than other investigation practices in their chemistry classrooms.
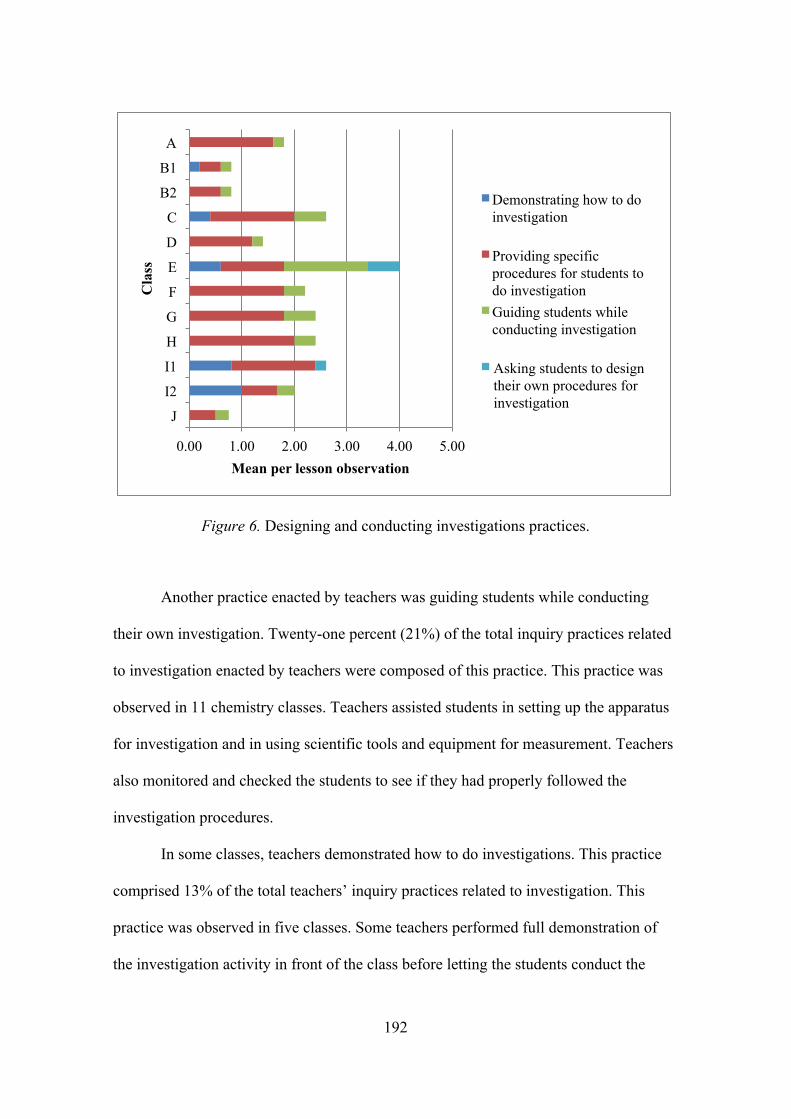
192
Figure 6. Designing and conducting investigations practices.
Another practice enacted by teachers was guiding students while conducting
their own investigation. Twenty-one percent (21%) of the total inquiry practices related
to investigation enacted by teachers were composed of this practice. This practice was
observed in 11 chemistry classes. Teachers assisted students in setting up the apparatus
for investigation and in using scientific tools and equipment for measurement. Teachers
also monitored and checked the students to see if they had properly followed the
investigation procedures.
In some classes, teachers demonstrated how to do investigations. This practice
comprised 13% of the total teachers’ inquiry practices related to investigation. This
practice was observed in five classes. Some teachers performed full demonstration of
the investigation activity in front of the class before letting the students conduct the
0.00 1.00 2.00 3.00 4.00 5.00
A
B1
B2
C
D
E
F
G
H
I1
I2
J
Mean per lesson observation
Cla
ss
Demonstrating how to do investigation
Providing specific procedures for students to do investigation Guiding students while conducting investigation
Asking students to design their own procedures for investigation
193
activity. Students were asked to carefully watch each step of the teacher in
demonstrating how the investigation should be done. Furthermore, observations
revealed that the least enacted practice of teachers related to investigation was asking
students to design their own procedures for investigation (3%). Only two teachers
enacted this practice (see Figure 6).
Requiring students to “evaluate the design, practices, and conduct of scientific
enquiry” (Osborne, 2014, p. 589) is one of the PISA’s three key competencies of the
scientifically literate individual (OECD, 2012). According to Osborne (2014), this
competency is best developed by engaging students in the practice of designing
empirical investigations to test hypotheses. However, from the four major investigation
practices observed in classrooms, this practice was the least implemented by teachers. It
was noted that whenever there was an experiment, most teachers had “recipe-type”
procedures for the students to follow. It was very rare to observe teachers letting
students design their own procedures for an experiment. It may be that the year level
observed influences the findings here. Designing experiments with the scarce science
resources available in Philippine schools may be a challenging task for Grade 7
students, so most teachers assisted them or created the experimental procedure for
students. This could also be due to the challenges of teaching environment (e.g.,
unavailable space for conducting experiments), which may deter most teachers from
employing this type of investigative practice.
Teacher E was one of the two teachers who encouraged students to design their
own investigation, which is evident in the following scenario:

194
Teacher E gave each group of students a sample mixture for them to separate. The mixtures were salt solution; oil and water; sulfur and iron filings; starch and water; and ink. Teacher E instructed the students, “Given the sample mixture and materials on each table, set up the materials and think of ways or procedures in which you can separate the components of a mixture. Discuss within your group the method that you will use. Answer the questions and present your results.” (Teacher E, Lesson Observation 2, 14-07-2015) In this scenario, Teacher E used an investigative activity about Separating
Components of a Mixture to allow students to explore different separation techniques
such as distillation, filtration, and decantation. She gave her students the freedom to
choose the necessary materials that they needed in designing their own methods to
separate the components of a mixture. Observations showed that Teacher E had the
highest mean score in implementing inquiry practices related to investigation per
chemistry lesson observation (M=4.00). Based on observations, Teacher E enacted all
the aforementioned investigation practices in her chemistry class. Since she had an
undergraduate degree in chemistry, her knowledge and experience in conducting
scientific research may have helped her to implement these investigation practices in the
classroom. She frequently used the practice of guiding students while conducting
investigations. She was observed using chemistry activities in all lessons that she
taught. These activities were (1) preparation of solutions, (2) separating components of
mixtures, (3) electrolysis of water, (4) identifying acidic and basic substances, and (5)
determining the pH of substances. These activities were included in and suggested by
the new chemistry curriculum for Grade 7. This strategy provided her with opportunities
to enact varied practices related to designing and conducting investigations in the
classroom. The following is another scenario from Teacher E’s class where three
investigation practices were exhibited:

195
Teacher E asked the students to perform an experiment on expressing concentration of a solution quantitatively by preparing a 70% alcohol. Before doing the experiment, Teacher E reviewed different laboratory apparatus placed on the table by asking, “Which is graduated cylinder? Which is Erlenmeyer flask?” After this, she asked the students, “How do you prepare a 70% alcohol?” She provided a list of steps on preparing 70% alcohol (practice 1). A demonstration of the experiment was shown by Teacher E before students performed it. She demonstrated how to measure and read the volume of a liquid using graduated cylinder (practice 2). Students were divided into five groups. Each group was asked to measure the volume of an alcohol using graduated cylinder. While students work, Teacher E moved around and instructed each group to measure the volume of alcohol and water (practice 3). The teacher also checked if each group prepared the right concentration of an alcohol. (Teacher E, Lesson Observation 1, 02-07-2015)
Throughout the lesson observations, no teachers were observed explicitly
teaching the concept of fair testing in investigation activities with experimental
variables (e.g., dependent and independent variables). Teachers were not observed
identifying the treatment and control variables for the activity. Although scientific
inquiry skills such as testing variables were indicated in the Grade 7 chemistry
curriculum documents, teachers in this study were not observed teaching this in class
discussions. In the same way, teachers were not observed asking students to identify the
treatment and control variables for experimental activities. The other practice that was
not observed in classrooms was asking students to formulate their own objectives for
the activity.
Component 3: Collecting data
Generally, inquiry practices related to collecting data were rarely implemented
by teachers. Based on observations, only 10% of the total inquiry practices implemented
by teachers were related to collecting data. From this small percentage, there were four
major practices related to collecting data enacted by teachers. The first was the most
implemented practice of teachers, which was asking students to collect data from an

196
individual or a group activity. This practice comprised 50% of the total collecting data
practices implemented by teachers. Teachers asked students to collect data through
making descriptive observations from chemistry activity the students performed in the
classroom. The second practice was asking students to collect data from teacher
demonstrations. This comprised 34% of the total collecting data practices. Teachers
asked students to collect data through making descriptive observations from a simple
demonstration related to the lesson conducted by the teacher. These first two collecting
data practices were observed in ten classes. The third inquiry practice of teachers related
to collecting data was asking students to make measurements using scientific tools and
equipment. Fifteen percent (15%) of the total collecting data practices enacted by
teachers was composed of this practice. Generally, this practice was observed whenever
students conducted experimental activities. These collecting data practices of teachers
also involved students in organizing data through recording into the activity sheets that
the teachers provided for them, or through writing into their notebooks. Finally, the
fourth practice of teachers was providing data for students (1%). This practice was
observed only in one class when the teacher asked the students to perform an activity on
What are the Properties of Solutions. The teacher posted a visual material on the
chalkboard that showed a data table containing different properties of solutions to
present to the class the correct data needed for the activity. Figure 7 shows the specific
classroom practices related to collecting data enacted by teachers.
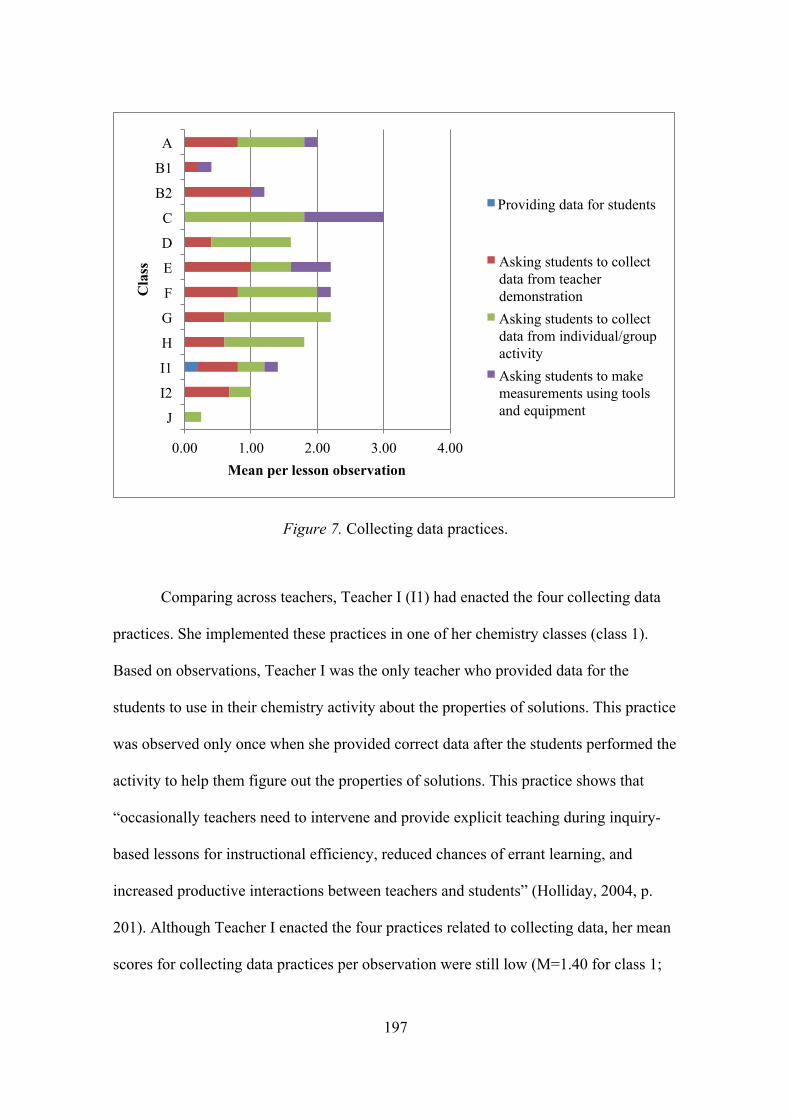
197
Figure 7. Collecting data practices.
Comparing across teachers, Teacher I (I1) had enacted the four collecting data
practices. She implemented these practices in one of her chemistry classes (class 1).
Based on observations, Teacher I was the only teacher who provided data for the
students to use in their chemistry activity about the properties of solutions. This practice
was observed only once when she provided correct data after the students performed the
activity to help them figure out the properties of solutions. This practice shows that
“occasionally teachers need to intervene and provide explicit teaching during inquiry-
based lessons for instructional efficiency, reduced chances of errant learning, and
increased productive interactions between teachers and students” (Holliday, 2004, p.
201). Although Teacher I enacted the four practices related to collecting data, her mean
scores for collecting data practices per observation were still low (M=1.40 for class 1;
0.00 1.00 2.00 3.00 4.00
A
B1
B2
C
D
E
F
G
H
I1
I2
J
Mean per lesson observation
Cla
ss
Providing data for students
Asking students to collect data from teacher demonstration Asking students to collect data from individual/group activity Asking students to make measurements using tools and equipment

198
M=1.00 for class 2). This means that collecting data was not extensively used in her
classrooms. The lack of school resources may have affected Teacher I’s capacity to
implement this component of inquiry in the classroom.
In contrast with Teacher I, Teacher C had the highest mean score in
implementing collecting data practices in chemistry classroom per lesson observation
(M=3.00). Teacher C had relatively extensive science facilities and resources which
may help her to implement collecting data practices. Based on observations, Teacher C
implemented two practices related to collecting data: (1) asking students to collect data
through making descriptive observations from the students’ investigation activity; and
(2) asking students to make measurements using scientific tools and equipment.
Observations revealed that Teacher C used experimental activities where she frequently
required students to make observations and measurements. These activities were related
to factors affecting solubility, properties of solutions, and using acid-base indicators in
determining acidic and basic substances. The following is a scenario from Teacher C’s
class, which shows her implementation of a practice related to collecting data.
Specifically, Teacher C asked students to collect data from an individual activity
through making descriptive observations.
Teacher C gave students an activity about determining the acidity or basicity of
some common household items using indicators. She provided an activity sheet for each student. Common household items like vinegar, shampoo, baking soda, etc., were also provided. She explained each procedure, for example how to use the litmus paper. The teacher asked the students to observe and describe what they observed by recording in their activity sheet. She distributed litmus paper to each group of students and asked them to observe the changes in color of litmus paper. She asked the students what were their observations when the indicator reacted to the sample substances. (Teacher C, Lesson Observation 5, 03-08-2015)

199
Moreover, Teachers E, F, and G had the same amount of collecting data practices
implemented in classrooms. However, Teacher E enacted varied practices related to
collecting data compared to Teachers F and G. This is because experimental activities
for students were more visible in Teacher E’s class than the classes of Teachers F and
G, which gave Teacher E more opportunities to employ collecting data practices. On the
one hand, Teacher J implemented only one specific practice related to collecting data.
Recall that Teacher J had the fewest enacted practices related to inquiry, which may be
attributed to a different approach that he used to deliver the lessons. This may inhibit
him from enacting inquiry including practices related to collecting data. The teachers in
this study were not observed using investigation activities that require students to
explore and collect data outside. For this reason, the practice of asking students to
explore phenomena and collect data outside was not seen in chemistry classrooms.
Component 4: Analyzing data
This component of scientific inquiry occurred least in teachers’ chemistry
instruction. Teachers’ practices related to analyzing data comprised only 8% of the total
inquiry practices in chemistry instruction. There were four practices related to analyzing
data implemented by teachers in the classroom. First, the most frequently implemented
practice was asking students to do the analysis. This practice comprised 69% of the total
implemented practices related to analyzing data. Teachers encouraged students to create
their own data analysis procedure and way of solving problems. Generally, teachers
asked students to analyze data gathered from investigation activities they conducted in
the classroom. Teachers also asked students to analyze quantitative problems (e.g.,
expressing concentration of solutions quantitatively) in chemistry and provide necessary
200
solutions to the problem. Second, teachers provided students with specific direction for
analysis, which comprised 20% of the total implemented practices on analyzing data.
Before the students analyzed or solved the problem, some teachers explicitly discussed
the procedures for solving quantitative problems and for analyzing experimental data
for students to follow. Third, some teachers provided a prepared analysis and solution
for the students (6% on analyzing data practices). A small portion of Teacher I’s
chemistry instruction was composed of this practice. This practice was only observed in
Teacher I’s classes. Last, teachers prompted students to assess the reliability or validity
of data resulting from investigation activities (5%). This practice was observed in two
chemistry classes only. The practice of analyzing data that was not observed in
classrooms was asking students to analyze complex data. Teachers did not teach
chemistry lessons involving analysis of complicated data for investigations.
Comparing across teachers, Teacher I had the highest mean score in the
implementation of inquiry practices related to analyzing data (M=3.67). This was
evident in class 2 (I2) (see Figure 8), where a large portion of chemistry instruction was
composed of practices that asked students to analyze and solve problems. This practice
was mostly observed when Teacher I discussed the lesson on the Concentration of
Solutions that required students to describe quantitatively the exact ratio of solute to
solvent, which specifies the concentration of a solution. The mean implementation
number of analyzing data practices per lesson observed is presented in Figure 8.

201
Figure 8. Analyzing data practices.
Teacher I provided the students in class 2 with problems on expressing the
concentration of solutions. She asked the students to analyze and solve the problem
below:
How [much is the] many volume of isopropyl alcohol in a 60 mL bottle of alcohol?
In this scenario, she encouraged students to devise their own procedure for analyzing
and solving this problem. She asked the students to write the complete solution for the
problem in their notebooks. Afterwards, she called one student to explain the analysis
procedure to the class. The problem above was also given to students in class 1
however, Teacher I used a different approach to deliver this lesson. In class 1, Teacher I
provided the solution to the problem for the students, which limits her to employ other
0.00 1.00 2.00 3.00 4.00
A
B1
B2
C
D
E
F
G
H
I1
I2
J
Mean per lesson observation
Cla
ss
Providing prepared analysis/solution for students
Providing students specific direction for analysis
Asking students to do the analysis
Prompting students to assess the reliability and validity of data/results
202
inquiry practices related to problem solving and analysis. Thus, Teacher I enacted more
practices related to problem and data analysis in class 2 than in class 1.
In another teaching scenario below, an inquiry practice related to analyzing data
was implemented in a different chemistry topic taught in the classroom.
Teacher A prepared a blank periodic table. Hypothetical elements like Xy, G,
Ab, Z, A, X and their properties were also given. He then asked students to analyze the properties of these elements and to identify their location in the periodic table based on their properties. (Teacher A, Lesson Observation 4, 24-07-2015)
In this scenario, Teacher A encouraged students to perform data analysis on their own.
She provided the data (properties of hypothetical elements) that they analyzed in order
to determine the correct location of the elements in the blank periodic table.
In very rare cases, Teachers B and H prompted students to assess the reliability
or validity of the data they developed from investigation activities. This practice was
observed after the students conducted their experiment and the teacher started to process
the results. Consider the following scenario from Teacher H’s class, which shows this
practice:
After the students performed an experiment on distinguishing substances and
mixtures in terms of how temperature changes during boiling, Teacher H asked them to report their temperature readings for distilled water and seawater after 30 seconds (s), 60 s, 90 s, 120 s and 150 s. Student data were presented on the board. Then the teacher asked, “What does the data mean? Are the data based on temperature readings correct? Based on data, what can you say about the boiling temperature of distilled water and seawater?” (Teacher H, Lesson Observation 3, 24-07-2015)
In this scenario, Teacher H provided students with the opportunities to examine the data
(temperature readings) that they collected by reflecting on the method they used in
doing the experiment (e.g., recording temperature in 30 second time interval). She asked
each team of students to describe how they measured the temperature. She also asked
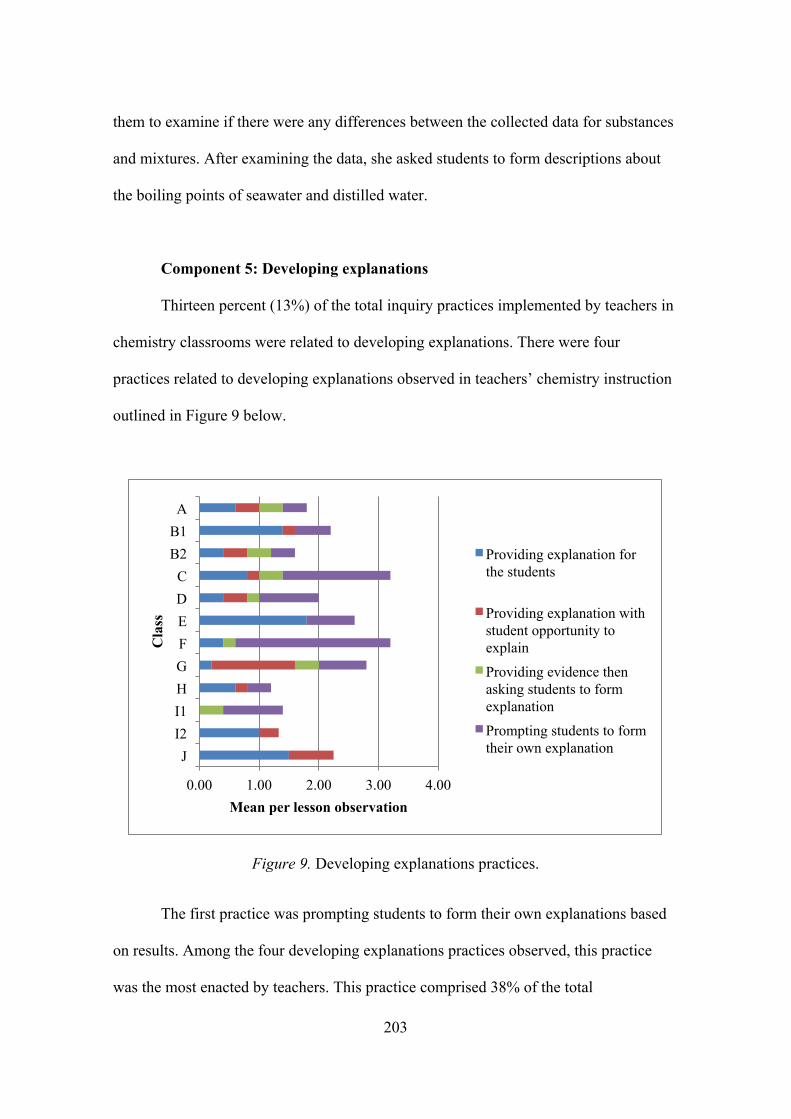
203
them to examine if there were any differences between the collected data for substances
and mixtures. After examining the data, she asked students to form descriptions about
the boiling points of seawater and distilled water.
Component 5: Developing explanations
Thirteen percent (13%) of the total inquiry practices implemented by teachers in
chemistry classrooms were related to developing explanations. There were four
practices related to developing explanations observed in teachers’ chemistry instruction
outlined in Figure 9 below.
Figure 9. Developing explanations practices.
The first practice was prompting students to form their own explanations based
on results. Among the four developing explanations practices observed, this practice
was the most enacted by teachers. This practice comprised 38% of the total
0.00 1.00 2.00 3.00 4.00
A B1 B2 C D E F G H I1 I2 J
Mean per lesson observation
Cla
ss
Providing explanation for the students
Providing explanation with student opportunity to explain
Providing evidence then asking students to form explanation
Prompting students to form their own explanation

204
implemented practices related to developing explanations. This was implemented in ten
classes, and Teacher F’s class had the highest mean score for implementing this practice
per lesson observation (M = 2.60). Generally, this practice was implemented by
teachers after the students conducted an experiment like the one shown in the following
scenario from Teacher F’s class. In this scenario, Teacher F discussed a lesson on
Factors Affecting How Fast a Solid Solute Dissolves.
Teacher F gave students an experiment about the factors affecting solubility.
After conducting the experiment, the whole class discussed the results. Teacher F asked one team of students to report on the data collected from investigating the effects of hot water and cold water on dissolving salt and sugar. The students explained the procedure of their investigation. Two students were reporting the results in front of class. After presentation, Teacher F asked students, “Why do you think salt dissolved faster than sugar in hot water?” Students from team 1 answered, “The water and salt attracted with each other.” “Based on your results, what is the factor that affect[s] solubility, team 1?” The students answered, “[The] Nature of [the] solute.” (Teacher F, Lesson Observation 1, 29-06-2015)
In this lesson, Teacher F divided the students into five teams with six to seven
members to investigate the factors that affect how fast a solid solute dissolves in a given
volume of water. Each team was assigned to investigate one factor only. The students
investigated factors such as stirring, particle size, temperature, nature of solute, and
pressure. In the scenario above, students investigated the effect of the nature of solute
on solubility. It was observed that Teacher F gave students the opportunity to formulate
their own explanations based on results of their work. Teacher F asked students to
provide an account of why something happens based on their results. It was observed in
this class that students could readily give their own explanations to Teacher F.
Observations also revealed that students from other classes had difficulty in
giving explanations or formulating conclusion from results. According to Treagust and
Tsui (2014), this is very common in science teaching when students have difficulties

205
identifying explanations that involve cause-effect relationships in phenomena.
However, in a situation like this, Teacher G used evidence of the occurrence of
phenomena to scaffold students in giving explanations. This strategy is shown in the
next scenario from Teacher G’s class where she used a familiar example to help
students understand the possible factors that affect solubility.
Teacher G asked team 2 to explain the procedure and results of the experiment
assigned to them. One student from team 2 read the procedure and showed the results in front of class. After presenting the results, Teacher G asked team 2, “What is the factor that affects solubility? From your results, what is the relationship of temperature and rate of solubility?” It was observed that students were having difficulty in giving answers to teacher. In this situation, Teacher G gave an example that could help students figure out the relationship between temperature and rate of solubility. The teacher said, “By using hot water the solubility is faster while using cold water the solubility is slower.” [Note: This is not always the case for all solutes.] After giving this information, the teacher asked the original question again to let students form their own explanations. (Teacher G, Lesson Observation 1, 29-06-2015)
The second practice that was part of the developing explanations component was
providing evidence for students to develop their own explanations, which comprised 9%
of the total implemented developing explanations practices. For example, Teacher G
also asked students to perform an experimental activity on Factors Affecting How Fast
a Solid Solute Dissolves. Unlike in Teacher F’s class where students could readily
explain their results, the students in Teacher G’s class could not provide an explanation,
thus she gave an example that described solubility in hot and cold systems to help
students form an explanation. This situation is related to the report of some researchers
(e.g., Gilbert & Treagust, 2009; Treagust & Tsui, 2014) that in today’s science
classrooms, teachers are using examples, models, simulations, actions, and gestures to
show evidence for scientific phenomena in order to deliver better explanations, and to
help students understand the science behind these phenomena.

206
The third practice of teachers observed in chemistry instruction was providing
explanations for students without giving them the opportunity to explain results. These
comprised 36% of the total developing explanations component. Most teachers
explicitly discussed the results of investigation activities and connected these to the
main concepts of the lesson. This practice was also frequently observed during
chemistry instruction. This practice was implemented in eleven classes, and Teacher E’s
class had the highest mean score for implementing this practice per lesson observation.
Finally, the fourth practice was providing explanations with student opportunity to
explain results. During discussion or processing the results of investigation activity,
some teachers encouraged students to make explanations about a particular topic or
about the activity they performed. However, there were times that students could not
provide explanations. Since no one could form an explanation, the teacher provided the
explanation to them (17%). This practice was implemented in nine classes.
Comparing across teachers, Teachers C (M=3.20) and F (M=3.20) had the
highest mean scores in implementing inquiry practices related to developing
explanations per lesson observation. Observations revealed that they frequently engaged
their students to make explanations about the results of their chemistry activities. The
results also revealed that inquiry practices related to developing explanations
implemented in two chemistry classes (I1 and I2) of Teacher I were different. In class 1,
Teacher I enacted developing explanation practices such as providing evidence then
asking students to form an explanation, and prompting students to form their own
explanations. In class 2, she enacted different practices such as providing explanations
for students, and providing explanation with student opportunity to explain. This
difference in developing explanations practices of Teacher I in class 1 and class 2 may

207
be a result of the different approach of teaching that she used in both classes. Teacher I
used approaches in class 1 that were more inquiry in nature than class 2 to deliver the
same lessons, which could give her opportunities to engage students in making their
own explanations. In class 2, she employed a traditional lecture mode of teaching,
which may encourage her to explain everything for students.
Component 6: Communicating information
Practices related to communicating information comprised 18% of the total
inquiry practices implemented by teachers in chemistry instruction. Five practices
related to communicating information were observed during instruction and the most
frequent practice was asking students to report the results of their experiment or activity
to the whole class. This practice comprised 46% of the total communicating information
practices implemented by teachers in classrooms. It was enacted the most by Teacher H
and implemented in ten classes. Figure 10 shows the communicating information
practices implemented by teachers.

208
Figure 10. Communicating information practices.
The aforementioned practice was typically observed when chemistry activities
(experimental or non-experimental) were given to students to work on. A typical
implementation of this practice was observed in the class of Teacher E when she
discussed the lesson on Separating Components of a Mixture. Consider the following
teaching scenario from Teacher E’s class:
After the students performed an experiment on separating components of a
mixture, Teacher E asked team 1 to present the results of their work in class. Two members of team 1 discussed the evaporation method in separating the components of the salt solution. After this, the teacher explained why evaporation was used and the process involved during evaporation. Next, Teacher E asked team 2 to present their results. Two members of team 2 explained the method called flotation, and then the teacher mentioned another method called scooping. She discussed this by using the sample mixture of oil and water. She also mentioned the difference between the density of oil and water. After team 2, team 3 was called to present their work. Two members
0 1 2 3 4 5 6
A
B1
B2
C
D
E
F
G
H
I1
I2
J
Mean per lesson observation
Cla
ss
Asking students to write information with prescribed format
Asking students to devise their own format of writing information
Asking students to make and describe graph, diagram, and table
Asking students to report results of experiment or activity to whole class
Asking students to report results of experiment or activity to whole class with interaction

209
discussed what they did in paper chromatography. (Teacher E, Lesson Observation 2, 14-07-2015)
In this scenario, Teacher E gave students with opportunities to communicate the results
of their work through oral presentations in class. However, it was noted that during
students’ presentations, more useful classroom dialogues (e.g., student-teacher and
student-questioning dialogues) were not manifested. Based on observations, students in
this class were just reading visuals with results posted on the chalkboard in front of their
classmates with a short elaboration. After students presented their results, Teacher E
immediately continued to discuss results and introduced science concepts involved in
the activity without probing or giving them opportunity to ask questions, make
comments or suggestions. This scenario was observed in other classes as well.
Unfortunately, this type of teacher practice may not encourage deep classroom
conversations, particularly with respect to reflecting scientific discourse.
However, there were a few classes that encouraged a simple interaction between
students and teachers during presentations. Some teachers asked students to report
results of experiment or activity to whole class with interaction. This is another
communicating information practice implemented by teachers in classrooms. Fifteen
percent (15%) of the total practices related to communicating information were
composed of this practice. This practice was observed in seven classes and mostly
implemented in the class of Teacher F like the one shown in the following scenario:
After performing the experiment on factors affecting how fast a solid solute
dissolves, Teacher F asked each team to report their results in front of the class. She called team 1 to present their results on investigating the effect of the nature of solute and solvent on solubility of a substance. Two students were reporting in the class. After reporting, Teacher F asked the students, “What is the factor that affects solubility, team 1” The students answered, “The Nature of [the] solute and [the] solvent” Then, Teacher F asked a follow-up question, “Why [did] is the substance dissolve?” The students

210
answered, “Because water and vinegar [are] attracted [to] with each other.” (Teacher F, Lesson Observation 1, 29-06-2015)
It is important that the process of communicating shown in the aforementioned
practices should be accomplished effectively through a dialogic way of communication,
which may promote scientific discourse in the classroom. However, it can be noticed
that the captured student-teacher dialogues presented in some scenarios is limited. It
could be patterned to the initiation (teacher asks a question), response (student responds
with an answer), and evaluation (teacher evaluates student response) (IRE) model,
which according to Skamp (2018) does not encourage “student-negotiated meaning
making” (p. 53). In addition to these practices, other practices related to communicating
information enacted by teachers were asking students to write information using the
prescribed format (21%), asking students to make and use their own format of writing
information (3%), and asking students to make and describe diagram, graph, or table
(15%).
Comparing across teachers, Teacher H had the highest mean score in
implementing practices related to communicating information (M=5.60). She frequently
asked her students to present the results of activity (experimental or non-experimental)
in the class. The presentation was usually done by each team of students. After the
students communicated their results, the next practice of Teacher H was to process the
results reported by each team and connect the results to the lesson being discussed.
Observations also revealed that Teachers D, F, and G enacted varied communicating
information practices in their classrooms. Recall also that Teacher I enacted more
communicating information practices in class 1 than class 2 due to differences in the
teaching approaches that she used in each of these classes.

211
Characterization of Inquiry in Chemistry Classrooms
In this study, to characterize inquiry in chemistry classrooms, mean scores for
the degree of initiation of inquiry (teacher-centered or student-centered) in each class
and mean scores for the amount of inquiry practices implemented in each class were
plotted in the graph as shown in Figure 11 below.
Figure 11. Amount of inquiry practices versus who initiated the inquiry in the classroom.
The calculated mean scores for the degree of initiation of inquiry by each
teacher ranged from zero to 105 and plotted in the x-axis of the graph. The mean scores
were calculated by dividing the total score for inquiry initiation in each class by the
number of observations. The total score for inquiry initiation was calculated by
multiplying the number of implementation for each practice to the scores ranging from
1 (for most teacher-centered practice) to 5 (for most student-centered practice) (Capps
A B1
B2
C
D
E
F G
H I1
I2
J
0.00
5.00
10.00
15.00
20.00
25.00
0.00 20.00 40.00 60.00 80.00 100.00
Am
ount
of I
nqui
ry p
ract
ices
(mea
n sc
ore)
Le
ss
M
ore
Teacher-centered Degree of Initiation (mean score) Student-centered
Teacher
212
& Crawford, 2013). The calculated mean scores for the amount of inquiry implemented
by each teacher ranged from zero to 25 and were plotted against the y-axis of the graph.
The mean scores were calculated by dividing the total frequency of implementation of
each inquiry component by the total number of lesson observations per class.
The graph of the degree of inquiry initiation versus the amount of inquiry
practices shown in Figure 11 created a modified version of the inquiry continuum,
which was based on the continuum of classroom inquiry proposed by Brown et al.
(2006). Using this continuum, teachers’ inquiry-based instruction in chemistry
classrooms were characterized based on their location on the continuum. Teachers could
be located in the upper quadrant (more inquiry) or lower quadrant (less inquiry). They
could also be located at the right side (student-centered) or left side (teacher-centered).
Teachers’ location in the continuum was based on their mean scores in the degree of
inquiry initiation and amount of inquiry practices. The higher the mean score in the
degree of inquiry initiation, the more student-centered the inquiry was in the classroom.
The higher the mean score in the amount of inquiry, the more inquiry was implemented
in the classroom. In this study, all teachers observed scored less than 52, which suggests
that inquiry practices observed in the classrooms were largely teacher-centered. The
highest mean score was 51(Teacher F) and the lowest mean score was 12 (Teacher J).
It is important to note that the focus of this study is not on investigating the relationship
between the amount of inquiry or the degree of inquiry initiation in classrooms and
student learning. This study investigated which specific practice or component of
inquiry implemented in classrooms is related to learning, which is discussed later in the
thesis. Details of teacher-centered and student-centered inquiry practices enacted by
teachers are discussed below.
213
Teacher-centered inquiry practices
As noted, teacher-centered scientific inquiry was more evident in the chemistry
classes observed in this study than student-centered scientific inquiry. In examining the
chemistry lessons that the teachers taught, hands-on or group activity-based lessons
(usually non-experimental activities) were characterized as having more teacher-
centered scientific inquiry. Usually, most parts of these lessons were teacher-driven and
highly structured. Thus, these lessons provided little opportunity for student autonomy.
The most common teacher-centered inquiry practices that occurred were: teachers
provided specific procedures to follow in the activity (designing and conducting
investigations), teachers demonstrated how to do the activity (designing and conducting
investigations), teachers asked questions about facts not previously presented which
elicited students’ own ideas (engaging in questioning), teachers assisted students while
performing the activity (designing and conducting investigations), and teachers gave the
explanation without giving students the opportunity to explain the results (developing
explanations). Below are some teaching scenarios captured from classroom
observations that illustrated teacher-centered inquiry practices:
Providing specific procedures for group activity
Teacher G presented an activity on separating the components of mixtures.
Before commencing the activity, she divided the students into three teams. She assigned each team a specific activity to perform. Team 1 performed activity A (separating a mixture of rice powder and sulfur), team 2 performed activity B (separating a mixture of oil and water), and team 3 performed activity C (separating a mixture of salt and water). Teacher G provided each team with a set of procedures that they needed to follow and then explained the procedure to each team. She moved around each group station and guided the students in performing the procedure of the activity. (Teacher G, Lesson Observation 3, 15-07-2015)

214
Demonstrating how to perform the activity As part of the activity on Electrolysis of Water, Teacher I1 demonstrated the
procedure in front of the class for the students. She demonstrated how to use the improvised electrolysis apparatus. She showed how to fill each “electrolysis syringe” with five percent (5%) sodium hydroxide solution. She also showed how to collect gases using a syringe from the apparatus. While Teacher I1 was demonstrating the procedure and explaining what to do in the activity, students were gathered in front to observe the demonstration. Based on demonstration, Teacher I1 asked students, “What happens to the water?” After the demonstration, she repeated the explanation of the procedures for the activity. (Teacher I1, Lesson Observation 4, 21-07-2015) Making explanations for students
Teacher C presented an activity on distinguishing substances and mixtures based
on how temperature changes during boiling. In this activity, distilled water was used as a sample substance and seawater was used as a sample mixture. Each team performed boiling of distilled water first, then followed by boiling of seawater. After performing the activity, Teacher C asked the students, “What can you say about the boiling temperature of distilled water and seawater?” After asking this question, she immediately explained the results of the experiment using the data of each team. She explained first the boiling of distilled water followed by the boiling of seawater. Then, she asked again a follow-up question, “What do you mean by distilled water?” After this, she immediately told the class that 100 degrees Celsius is the boiling point of distilled water. (Teacher C, Lesson Observation 3, 24-07-2015)
Student-centered inquiry practices
Chemistry lessons with investigative or experimental components like collecting
data, analyzing data, and communicating results of investigation that provided students
with at least some autonomy or intellectual ownership could be classified as mostly
student-directed. The most common specific inquiry practices that occurred in these
lessons were: the teacher asked students to collect data through making descriptive
observations from the activity or experiment (individual or group) the students
performed in the class (collecting data), teacher asked students to analyze data and/or
solve problems (analyzing data), and teacher asked students to report out data or results
of an individual or group experiment to the whole class (communicating information).

215
The following are some teaching scenarios captured from classroom observations that
illustrated student-centered inquiry practices:
Collecting data through observations
Teacher C presented an activity on determining the acidity or basicity of some
substances and mixtures using indicators. She asked students to use common household materials like vinegar, shampoo, and baking soda as sample substances and mixtures. Students used an acid-base indicator (litmus paper) to identify which of these materials are acids and bases. Students observed the reaction of the litmus paper with the common household materials. Specifically, they observed the changes in color of litmus paper once it reacted to household materials. The descriptive data that they collected were recorded in their data table. (Teacher C, Lesson Observation 5, 03-08-2015)
Analyzing and solving problems
After the students prepared the solution of 70% alcohol, Teacher E engaged them in quantitative methods for expressing the concentration of solutions. In doing so, she provided students with problems on expressing the correct concentration of solutions. Each team of students devised their own procedure for analyzing and solving problems. They wrote the complete solution for the problem in their notebooks. Afterwards, Teacher E called each team to explain their analysis procedure in the class. (Teacher E, Lesson Observation 1, 02-07-2015) Reporting out data or investigation results
After the students performed an experiment on factors affecting how fast a solid
solute dissolves, Teacher F asked each team to report their results in front of the class. Team 1 reported the results of investigation on the effect of nature of solute and solvent part on solubility of a substance. After reporting, Teacher F asked the students, “What is the factor that affects solubility, team 1.” The students answered, “The nature of [the] solute and [the] solvent” Then, Teacher F asked a follow-up question, “Why [did] is the substance dissolve?” The students answered, “Because water and vinegar [are] attracted [to] each other.” After this, other teams also reported their data and results in the class. (Teacher F, Lesson Observation 1, 29-06-2015)
In Figure 11, most teachers plotted in the upper left quadrant and few teachers
plotted in the lower left quadrant. Teachers in the upper left quadrant were found to
demonstrate multiple practices related to the six components of scientific inquiry.
However, there was not much evidence of inquiry-based instruction in the two

216
chemistry classes in the lower left quadrant. The lack of inquiry in these two classes
does not necessarily mean that the teachers did not teach chemistry as inquiry at all but
inquiry practices were less frequent. It can be noted that in most classes observed,
students were involved in inquiry that was guided by teachers. Overall, the evidence
collected from classroom observations suggest that most teachers demonstrated the
potential to teach chemistry as inquiry.
Chapter Summary
The findings from this chapter suggest that teachers tended to enact more
inquiry teaching practices related to engaging in questioning and communicating
information than the practices of analyzing data, collecting data, designing and
conducting investigations, and developing explanations. Because of the challenges in
the teaching and learning environments (e.g., lack of science laboratories, lack of
resources, large class sizes) encountered by most teachers, proper implementation of
inquiry-based teaching approaches may be challenging for them. As a result, inquiry
practices, particularly teaching experimentation that involved fair testing, were not
typically implemented by the teachers in their chemistry instruction. However, some
teachers used improvised teaching materials and equipment to implement inquiry in
their classrooms. Other teachers chose to use different approaches (e.g., traditional
lecture) other than inquiry to deliver the lesson, which could be suitable to their own
classroom contexts.
The six components of scientific inquiry were enacted by teachers in varying
degrees in their classrooms. The variation in inquiry practices was not surprising given
the different backgrounds of the teachers and different classroom contexts. Of the 10

217
teachers who demonstrated different inquiry instructional practices, there was no single
factor that could account for this. One might expect that chemistry classes in a school
with more facilities and equipment (e.g., working space for experiments, storage for
science materials, laboratory apparatus) would be able to demonstrate more inquiry in
the classroom, yet six of the 12 classes belong to schools with no available science
facilities and equipment and in some of these there was a greater use of inquiry
practices than in better-equipped schools. In fact, the class that demonstrated the highest
amount of inquiry in the classroom (Teacher F) was from a school with no science
laboratory to conduct experiments. This would suggest that teachers may remain the
central factor influencing creation of an inquiry-based classroom, and that a highly
capable teacher may be able to implement inquiry-based practices in spite of a lack of
facilities. Even where carefully designed and specified curriculum materials are
provided, teachers may play the key role in determining how the inquiry-based
instructional materials are enacted. However, this is not to suggest that the degree of
implementation of inquiry practices is immutable. In this study, most teachers who had
greater implementation of inquiry in classrooms had participated in a week-long
intensive inquiry-based national training program conducted by DepEd and UP
NISMED, which suggests that appropriate professional learning can have an impact on
the degree to which practices are implemented in classrooms. Although all teachers in
this study showed the potential to implement inquiry practices in the classroom, teacher-
centered scientific inquiry instruction was more evident than student-centered scientific
inquiry instruction, which suggests that inquiry in most chemistry classrooms was
structured.

218
However, the findings from the study also suggest that the capacity of most
teachers to implement inquiry-based teaching practices may be seriously constrained by
the available resources; while highly capable teachers may be able to implement science
inquiry practices in situations where there are limited or no laboratory access and
learning resources, the majority of teachers may struggle to do this. This further
suggests that there may be limits to translating pedagogies such as inquiry practices that
have largely been developed in first-world countries, into countries where high levels of
resourcing and facilities cannot be taken for granted.

219
Chapter 6: Investigating the Relationship Between Teachers’ Inquiry
Practices and Students’ Learning in Chemistry
This chapter is divided into three parts. The first part presents the results of the
Rasch analysis of the ACTRC chemistry tests (pretest and posttest). The second part
presents the results of the student chemistry tests. The third part presents the results of
the multilevel analysis of the relationship between the specific practices of scientific
inquiry implemented by teachers and students’ learning in chemistry. The multilevel
analysis is presented in two-level unconditional model, two-level model with predictor
variables, and multivariate multilevel model.
Results of the Rasch Analysis of the ACTRC Chemistry Tests
The summaries of item statistics for the pretest and posttest are presented in
Table 9 and Table 10, respectively. Test items were examined for item difficulty (item
delta) and item fit (weighted mean squared [MNSQ] fit). The item fit indices for all
items of the ACTRC chemistry pretest and posttest were within the acceptable range of
0.8-1.2 logits (Wright & Linacre, 1994). Based on the ACTRC’s Science Curriculum
Project Report for Stages 1 and 2, the items for both tests were found to fit the model,
showing that they measure the same construct. (Ferido et al., 2015; Ferido et al., 2016).

220
Table 9. Chemistry Pretest Item Statistics
Item Item Difficulty (Item Delta)
Error Item Fit (Weighted MNSQ)
1 -1.87 0.14 0.89 2 -0.82 0.10 0.86 3 -0.95 0.11 0.96 4 -1.74 0.13 0.88 5 0.01 0.09 1.02 6 -2.49 0.17 0.97 7 0.08 0.09 1.00 8 -0.59 0.10 1.00 9 -1.93 0.14 0.93 10 0.44 0.09 1.03 11 1.68 0.10 1.15 12 0.49 0.09 0.94 13 -0.96 0.11 0.94 14 1.29 0.10 1.06 15 -0.16 0.09 1.02 16 -0.04 0.09 0.91 17 1.46 0.10 1.14 18 -1.73 0.13 1.07 19 0.28 0.09 1.09 20 -0.13 0.09 0.89 21 -0.50 0.10 0.96 22 0.48 0.09 0.98 23 -0.36 0.10 0.90 24 0.97 0.09 0.98 25 -0.59 0.10 0.97 26 1.03 0.09 1.00 27 -0.33 0.10 0.84 28 -0.09 0.09 1.12 29 -0.08 0.09 0.99 30 0.48 0.09 1.05 31 0.94 0.09 1.08 32 -0.41 0.10 0.82 33 1.17 0.10 1.11 34 -0.34 0.10 1.06 35 1.44 0.10 1.09 36 0.18 0.09 0.98 37 -1.83 0.14 0.85 38 0.10 0.09 1.10 39 -0.55 0.10 1.11 40 -0.65 0.10 0.92 41 2.61 0.13 1.20 42 0.58 0.09 1.09 43 0.43 0.09 0.90

221
44 0.85 0.09 0.97 45 1.71 0.11 1.10 46 0.51 0.09 1.00 47 -0.01 0.09 0.94 48 -0.07 0.09 1.04
Table 10. Chemistry Posttest Item Statistics
Item Item Difficulty (Item Delta)
Error Item Fit (Weighted MNSQ)
1 -0.10 0.09 1.00 2 -0.23 0.09 1.02 3 0.25 0.10 1.00 4 1.35 0.13 0.95 5 -1.39 0.09 0.98 6 0.02 0.09 1.03 7 0.71 0.11 1.04 8 1.40 0.13 1.01 9 -1.12 0.09 1.03 10 -1.22 0.09 0.90 11 -1.75 0.10 0.94 12 0.62 0.11 1.04 13 -0.04 0.09 0.96 14 -0.45 0.09 0.99 15 -0.12 0.09 0.98 16 0.35 0.10 1.00 17 0.84 0.11 1.04 18 -0.06 0.09 1.03 19 -0.15 0.09 1.00 20 -0.06 0.09 0.99 21 -1.03 0.09 0.90 22 -0.28 0.09 1.00 23 -1.05 0.09 1.01 24 0.12 0.10 0.97 25 -0.52 0.09 1.04 26 -1.20 0.09 0.91 27 -1.62 0.10 0.94 28 0.16 0.10 1.02 29 1.08 0.12 1.00 30 -0.47 0.09 0.90 31 -0.53 0.09 1.06 32 1.46 0.14 1.01 33 0.81 0.11 1.00 34 -0.93 0.09 0.98 35 0.03 0.09 0.99

222
36 1.55 0.14 1.05 37 -1.32 0.09 0.96 38 0.15 0.10 0.98 39 0.46 0.10 1.06 40 -1.19 0.09 0.93 41 0.64 0.11 1.05 42 0.47 0.10 1.02 43 -0.67 0.09 0.93 44 0.21 0.10 0.94 45 0.53 0.10 1.01 46 0.14 0.10 1.07 47 -0.08 0.09 1.00 48 0.45 0.10 1.02 49 0.47 0.10 1.04 50 0.87 0.11 1.06 51 0.86 0.11 1.05 52 0.58 0.10 0.99 53 0.48 0.10 1.05 54 -0.51 0.09 1.05 55 0.47 0.10 0.98 56 -0.23 0.09 1.01 57 1.06 0.12 1.06 58 -0.28 0.09 1.04
The expected a posteriori/plausible value (EAP/PV) item separation and the
weighted maximum likelihood estimation (WLE) person separation reliabilities were
acceptable for both tests as shown in Table 11. Values greater than 0.70 are considered
acceptable (Grigg & Manderson, 2016; Yang, He, & Liu, 2017). This means that the
tests performed well in having items with different levels of difficulty to discriminate
between students with different levels, providing support for the reliability of the two
tests.
Table 11. Item and Person Separation Reliabilities for the ACTRC Chemistry Tests
ACTRC Chemistry Tests EAP/PV Item Separation Reliability
WLE Person Separation Reliability
Pretest 0.863 0.857 Posttest 0.713 0.705
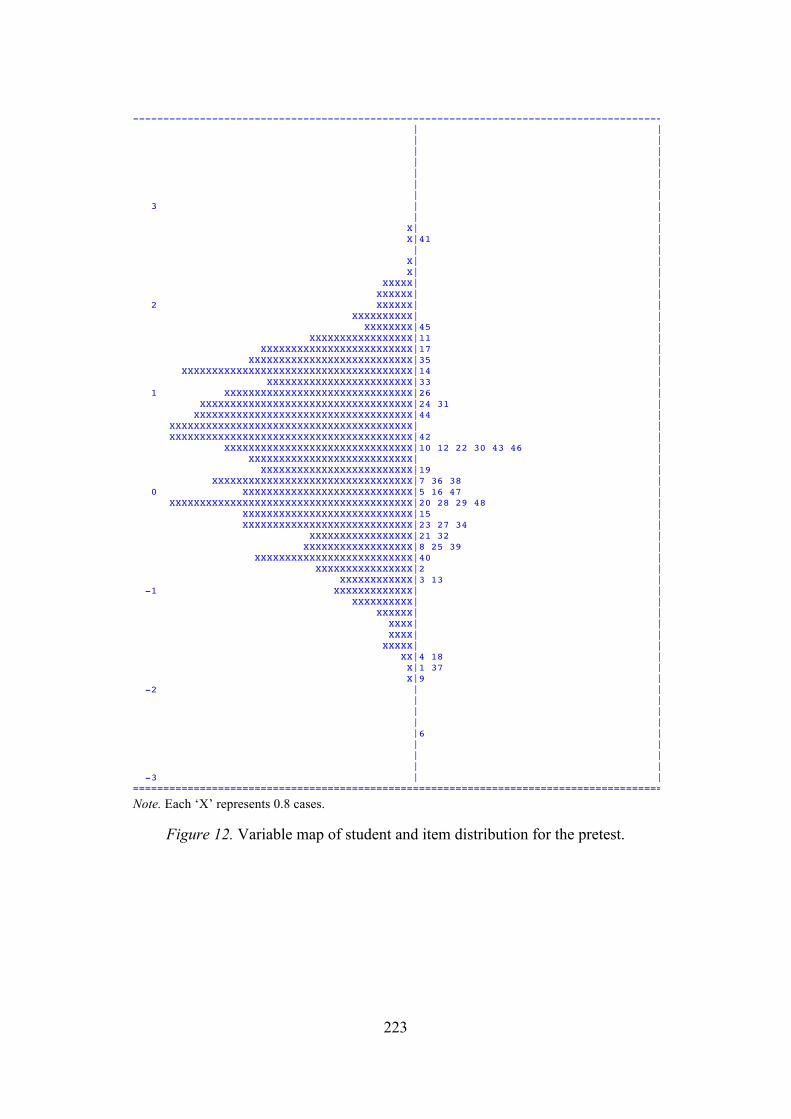
223
Note. Each ‘X’ represents 0.8 cases.
Figure 12. Variable map of student and item distribution for the pretest.
| | -3 | |=======================================================================================
| | | | | | |6 | | | | |
XXXX| | XXXXX| | XX|4 18 | X|1 37 | X|9 | -2 | |
XXXXXXXXXXXXXXXX|2 | XXXXXXXXXXXX|3 13 | -1 XXXXXXXXXXXXX| | XXXXXXXXXX| | XXXXXX| | XXXX| |
XXXXXXXXXXXXXXXXXXXXXXXXXXXXXXXXXXXXXXXX|20 28 29 48 | XXXXXXXXXXXXXXXXXXXXXXXXXXXX|15 | XXXXXXXXXXXXXXXXXXXXXXXXXXXX|23 27 34 | XXXXXXXXXXXXXXXXX|21 32 | XXXXXXXXXXXXXXXXXX|8 25 39 | XXXXXXXXXXXXXXXXXXXXXXXXXX|40 |
XXXXXXXXXXXXXXXXXXXXXXXXXXXXXXXXXXXXXXXX|42 | XXXXXXXXXXXXXXXXXXXXXXXXXXXXXXX|10 12 22 30 43 46 | XXXXXXXXXXXXXXXXXXXXXXXXXXX| | XXXXXXXXXXXXXXXXXXXXXXXXX|19 | XXXXXXXXXXXXXXXXXXXXXXXXXXXXXXXXX|7 36 38 | 0 XXXXXXXXXXXXXXXXXXXXXXXXXXXX|5 16 47 |
XXXXXXXXXXXXXXXXXXXXXXXXXXXXXXXXXXXXXX|14 | XXXXXXXXXXXXXXXXXXXXXXXX|33 | 1 XXXXXXXXXXXXXXXXXXXXXXXXXXXXXXX|26 | XXXXXXXXXXXXXXXXXXXXXXXXXXXXXXXXXXX|24 31 | XXXXXXXXXXXXXXXXXXXXXXXXXXXXXXXXXXXX|44 | XXXXXXXXXXXXXXXXXXXXXXXXXXXXXXXXXXXXXXXX| |
2 XXXXXX| | XXXXXXXXXX| | XXXXXXXX|45 | XXXXXXXXXXXXXXXXX|11 | XXXXXXXXXXXXXXXXXXXXXXXXX|17 | XXXXXXXXXXXXXXXXXXXXXXXXXXX|35 |
X|41 | | | X| | X| | XXXXX| | XXXXXX| |
| | | | | | 3 | | | | X| |
--------------------------------------------------------------------------------------- | | | | | | | |

224
Note. Each ‘X’ represents 0.8 cases.
Figure 13. Variable map of student and item distribution for the posttest.
Variable map or wright map can provide visual information about how the items and
persons are distributed along the latent continuum. Given that the Rasch model places
item difficulties and person abilities on the same scale, the distribution of item
difficulties can then be compared against the distribution of the person abilities, which
--------------------------------------------------------------------------------------- |4 8 32 36 | | | |29 57 | 1 | | | | |50 | |17 33 51 | | | X|7 | XX|12 41 | X|52 | X|45 | XXXXX|39 42 48 49 53 55 | XX| | XXXXXX|16 | XXXXXXX|3 | XXXXXXX|44 | XXXXXXXXXXXXX|24 28 38 46 | XXXXXXXXX| | 0 XXXXXXXXXXXXXXXX|6 35 | XXXXXXXXXXXXXXXXXX|13 18 20 | XXXXXXXXXXXXXXXXXXXXXXXX|1 15 47 | XXXXXXXXXXXXXXXXXXXXXXXXXXXXX|19 | XXXXXXXXXXXXXXXXXXXXXXXXX|2 56 | XXXXXXXXXXXXXXXXXXXX|22 58 | XXXXXXXXXXXXXXXXXXXXXXXXXXXX| | XXXXXXXXXXXXXXXXXXXXXXXXXXXXX|14 | XXXXXXXXXXXXXXXXXXXXXXXXXXXXXXX|30 54 | XXXXXXXXXXXXXXXXXXXXXXXXXXXXXXXXXXXXXXXX|25 31 | XXXXXXXXXXXXXXXXXXXXXXXXXXXXX| | XXXXXXXXXXXXXXXXXXXXXXXXXXXXXX|43 | XXXXXXXXXXXXXXXXXXXXXXXXXXXXXXXXX| | XXXXXXXXXXXXXXXXXXXXXXXXXXXXXXXXXXXXXX| | XXXXXXXXXXXXXXXXXXXXXXXXXXXXXXXXXXXXXX| | XXXXXXXXXXXXXXXXXXXXXXXXXXXXXXXXXXXXXXXX|34 | -1 XXXXXXXXXXXXXXXXXXXXXXXXXX| | XXXXXXXXXXXXXXXXXXXXXXXXXXXXXXXXXXXX|21 23 | XXXXXXXXXXXXXXXXXX|9 | XXXXXXXXXXXXXXXXXX|26 40 | XXXXXXXXXXXXXXXXXXXXX|10 | XXXXXXXXXXXXXXXX|37 | XXXXXXXXXX|5 | XXXXXXXXXX| | XXXXXX| | XXXXX| | XXX|27 | XXX| | XXX|11 | X| | X| | | | -2 X| | | | | | | | | | | | | | | | | |=======================================================================================

225
provides us how well the students at various levels of the latent ability could be
assessed. The variable maps for the pretest and posttest are shown in Figure 12 and
Figure 13, respectively. The distribution of students is shown on the left side with
students represented by ‘X’. The items are shown on the right side and each item is
shown as a number according to the test order. For the pretest, the logit scale extends
from -3 to 3 logits. The most difficult item on the pretest is shown to be Item 41, and
the easiest is shown to be Item 6. Generally, the items in the pretest widely spread along
the latent continuum, ensuring that there are available items with different difficulty
levels to measure the students who are located at different positions at the latent
continuum. For the posttest, the logit scale extends from -2 to 1 logits. The most
difficult items on the posttest are shown to be Items 4, 8, 32, and 36, and the easiest is
shown to be Item 11. Although the items in the posttest appear to be a little hard for the
students, there are still relatively enough available items along the latent continuum to
measure the students widely located at different position at the latent continuum. In
summary, all the results of the psychometric analyses provide initial support for the
construct validity of the two chemistry tests.
Results of the Student Chemistry Tests
The results of the student chemistry tests are shown in Table 12. Specifically,
the mean score of each class in the pretest and posttest, and the mean gain score in
chemistry are presented in the table. The associated standard deviations (SD) are also
shown.

226
Table 12. Mean Pretest, Posttest, and Gain Scores per Class
School Teacher Na Pretestb SD Posttestb SD Gainc SD 3 A 35 42.70 7.71 48.32 6.28 5.62 5.66
B c1 53 59.42 5.49 58.24 5.66 -1.17 5.56 c2 30 44.78 6.81 49.18 5.85 4.40 4.96
4 C 38 55.35 6.34 54.44 5.40 -0.91 4.85 D 32 41.83 8.35 48.19 4.69 6.35 7.59 E 37 47.58 7.78 49.02 5.61 1.44 5.38
2 F 40 57.29 7.49 59.64 5.40 2.35 6.03 G 42 38.55 4.91 45.35 4.49 6.80 4.65 H 33 39.79 7.32 48.42 4.85 8.63 5.31
1 I c1 54 56.34 6.64 55.50 5.70 -0.84 4.74 c2 49 55.50 7.77 54.24 5.57 -1.25 5.60
J 52 54.57 5.14 53.09 4.26 -1.47 4.97 Note. c1 is class 1 and c2 is class 2. aNumber of students. bStandardized score where mean=50 and standard deviation=10. cDifference between posttest and pretest scores.
The pretest scores in Table 12 suggest that there is a variation in student abilities
in chemistry at the start of Grade 7. These students obtained their elementary education
from different schools. They had different elementary school background and may have
had different learning experiences in the science classroom.
Figure 14 below shows the relationship between the pretest and gain scores in
chemistry.

227
Figure 14. Relationship between pretest and gain scores.
Figure 14 shows that there is a strong negative relationship between the pretest score
and gain score (r = 0.53). This indicates that students with low pretest scores had high
gain scores in chemistry while students with high pretest scores had low gain scores in
chemistry. It can be inferred from this result that students with high pretest scores may
have encountered, to some extent, the lessons specified in the new Grade 7 chemistry
curriculum prior to entering junior high school. They may have already learned some
concepts being taught by the teacher, and so there was no further capacity for them to
demonstrate learning growth. Thus, students with high mean pretest scores seemed to
have low or negative gain scores. This may also signify the presence of test ceiling
effect, which may limit the interpretation of students’ progress in chemistry. The ceiling
effect is “a measurement limitation that occurs when the highest possible score or close
to the highest score on a test is reached, thereby decreasing the likelihood that the

228
testing instrument has accurately measured the intended domain” (Taylor, 2012, p. 133).
It can be inferred that students with high pretest scores may have needed an enriched
chemistry curriculum, which could contribute for further learning. By contrast, the
Grade 7 chemistry lessons may have been new for students with low pretest scores, and
when they encountered these lessons in class there may have been space for them to
accommodate new conceptual learning. Thus, their gain scores were relatively high.
Since there was a strong relationship between students’ pretest scores (prior
abilities) and gain scores, further analysis was conducted by controlling the influence of
pretest score using the one-way analysis of covariance (ANCOVA) to obtain the
adjusted mean gain score in chemistry of each class as shown in Table 13.
Table 13. Adjusted Mean Gain Score per Class
Teacher Adjusted Gain Score A 1.613 B c1 3.376 c2 1.459 C 1.558 D 1.904 E -.072 F 5.815 G .672 H 3.134 I c1 2.131 c2 1.290 J .591
Note. c1 is class 1 and c2 is class 2.
After controlling for the influence of pretest on gain score, Table 13 shows that
Teacher F’s class obtained the highest mean gain score in chemistry while Teacher J’s
class had the lowest mean gain score. The students of Teacher E did not demonstrate
progress. The adjusted mean gain score with standard error bars are plotted in Figure 15
from the class with highest mean gain to the class with lowest mean gain.

229
Figure 15. Adjusted mean gain score with standard error bars per class.
The difference between the mean gain score of Teacher F’s class and the mean
gain score of all other classes was significant. The mean difference between Teacher
B’s class 1 and the classes of Teachers C, I (class 2), G, J and E was also significant. To
further explore for other differences in adjusted mean gain score between classes, a post
hoc test for one-way ANCOVA was employed in the analysis. Table 14 presents the
mean difference of adjusted gain score between classes with significance values. The
gray-shaded part of the table implies that the mean difference in the chemistry gain
score between two classes was significant at 0.05 level.
F B1 H I1 D A C B2 I2 G J E
-2
-1
0
1
2
3
4
5
6
7 A
djus
ted
Mea
n G
ain
Scor
e
Class

230
Table 14. Difference in Mean Gain Score Between Classes
Class F B1 H I1 D A C B2 I2 G J E F
B1 2.439a (0.006)b
H 2.682 (0.015)
0.242 (0.823)
I1 3.684 (0.000)
1.245 (0.127)
1.003 (0.334)
D 3.911 (0.000)
1.471 (0.166)
1.229 (0.238)
0.226 (0.824)
A 4.202 (0.000)
1.763 (0.086)
1.521 (0.137)
0.518 (0.600)
0.292 (0.776)
C 4.257 (0.000)
1.818 (0.043)
1.576 (0.148)
0.573 (0.519)
0.347 (0.747)
0.055 (0.958)
B2 4.356 (0.000)
1.917 (0.066)
1.675 (0.117)
0.672 (0.505)
0.446 (0.677)
0.154 (0.883)
0.099 (0.926)
I2 4.526 (0.000)
2.086 (0.013)
1.844 (0.077)
0.841 (0.310)
0.615 (0.550)
0.323 (0.745)
0.268 (0.767)
0.169 (0.868)
G 5.143 (0.000)
2.704 (0.010)
2.462 (0.012)
1.459 (0.144)
1.233 (0.213)
0.941 (0.330)
0.886 (0.399)
0.787 (0.439)
0.618 (0.538)
J 5.224 (0.000)
2.785 (0.001)
2.542 (0.013)
1.540 (0.060)
1.313 (0.193)
1.022 (0.295)
0.967 (0.280)
0.868 (0.386)
0.698 (0.403)
0.081 (0.934)
E 5.887 (0.000)
3.448 (0.000)
3.205 (0.002)
2.202 (0.018)
1.976 (0.054)
1.684 (0.092)
1.630 (0.101)
1.530 (0.139)
1.361 (0.148)
0.743 (0.448)
0.663 (0.473)
aMean difference of adjusted gain scores between two classes. bSignificance values at 0.05 level.
Due to the strong relationship between the pretest and gain scores, the pretest
score was controlled as a student covariate in the multilevel modeling of the relationship
between teachers’ scientific inquiry practices and students’ learning in chemistry as
presented in the next section. This is to account for student-to-student differences in
prior abilities that were unrelated to teacher instructional practices.
Results of the Multilevel Modeling
Descriptive statistics of the variables
The descriptive statistics (mean [M] and standard deviation [SD]) of the
outcome, within-class, and between-class variables are presented in Table 15. The mean
posttest score of students in chemistry was relatively higher than the mean pretest score.

231
The specific inquiry practice that implemented the most was engaging in questioning
and the practice that implemented the least was analyzing data.
Table 15. Descriptive Statistics of the Outcome, Student-Level, and Teacher-Level Variables
Variable M SD Outcome variable Chemistry posttest
52.49a
6.82
Student-level variable Chemistry pretest
50.53a
9.93
Teacher-level variable Scientific inquiry practices Engaging in questioning 6.42 4.05 Designing and conducting investigations 2.00 1.53 Collecting data 1.65 1.78 Analyzing data 1.25 1.96 Developing explanations 2.16 1.85 Communicating information 2.98 2.54
Note. The mean for each scientific inquiry practice is the mean number of implementation per lesson observation. aStandardized score where mean=50 and standard deviation=10.
Correlations of the variables
Correlations between predictor variable and student learning in chemistry
Initially, an exploration of which among the predictor variables involved in this
study have high associations with student learning in chemistry (posttest score) was
conducted through a series of correlation analyses. The results of correlation analyses
between predictor variable and outcome variable are shown in Table 16.

232
Table 16. Correlations Between Predictor Variable and Student Chemistry Posttest Score
Variable Student Chemistry Posttest Score
Student-level variable Pretest score 0.767a Teacher-level variables Engaging in questioning 0.098b Designing and conducting investigations –0.132a Collecting data –0.192a Analyzing data 0.217a Developing explanations 0.092b Communicating information –0.232a
aCoefficients are statistically significant at p < 0.01. bCoefficients are statistically significant at p < 0.05.
Based on Cohen’s (1988) suggestions on interpreting the strength of the value of
correlation coefficients (r) (discussed in Chapter 4), it can be noticed that the pretest
score of students was highly associated with their learning in chemistry (posttest score).
This means that student prior abilities may have influenced their learning; thus it is
important to control the pretest in the analysis of the relationship between student
learning and teacher practices. The correlations between teacher-level variables (each
scientific inquiry practice) and student learning in chemistry were relatively small;
ranging from r=0.09 to r=0.23.
Since the literature (discussed in earlier chapters) suggested that scientific
inquiry practices as a teaching approach could possibly lead to greater student
achievement in science (e.g., Fogleman et al., 2011; Minner et al., 2010; Wilson et al.,
2010), it is important to further investigates on the degree to which specific practice of
scientific inquiry teaching approach could help students improve their achievement.
With this, it is important to consider the six specific practices of scientific inquiry as
factors for student learning in chemistry despite their small coefficient values resulting
from this initial correlation analyses.
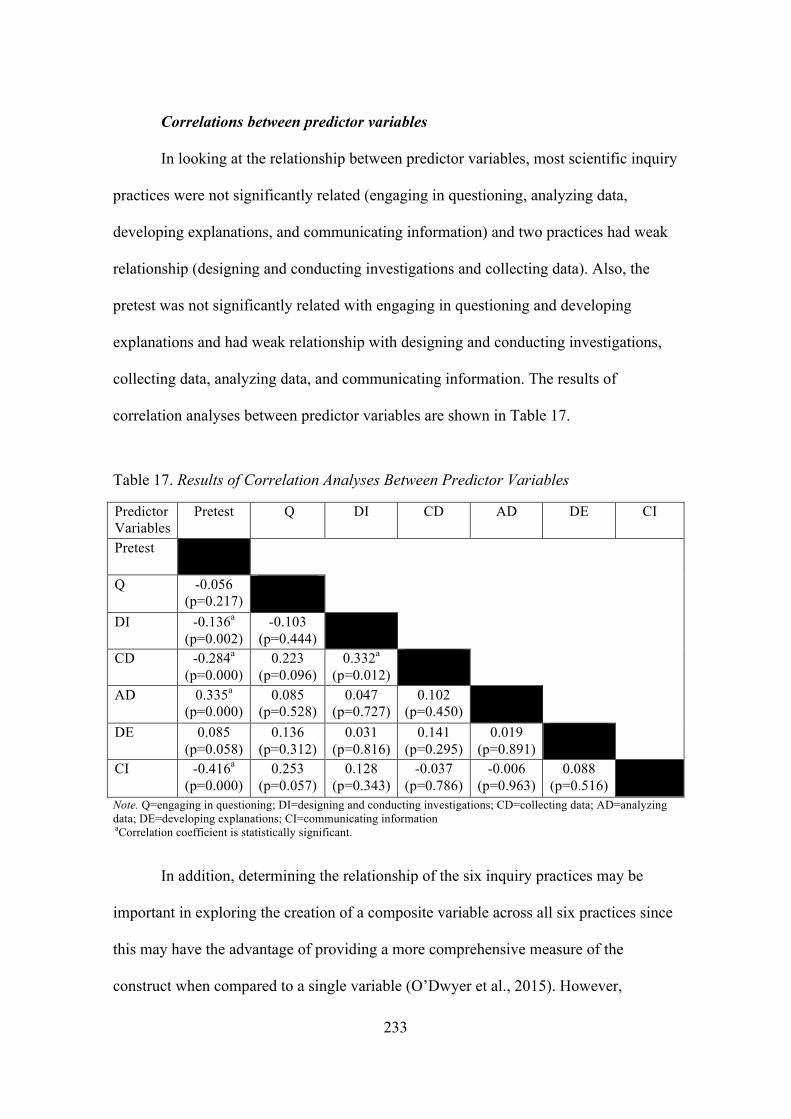
233
Correlations between predictor variables
In looking at the relationship between predictor variables, most scientific inquiry
practices were not significantly related (engaging in questioning, analyzing data,
developing explanations, and communicating information) and two practices had weak
relationship (designing and conducting investigations and collecting data). Also, the
pretest was not significantly related with engaging in questioning and developing
explanations and had weak relationship with designing and conducting investigations,
collecting data, analyzing data, and communicating information. The results of
correlation analyses between predictor variables are shown in Table 17.
Table 17. Results of Correlation Analyses Between Predictor Variables
Predictor Variables
Pretest Q DI CD
AD
DE CI
Pretest
Q -0.056 (p=0.217)
DI -0.136a (p=0.002)
-0.103 (p=0.444)
CD
-0.284a (p=0.000)
0.223 (p=0.096)
0.332a
(p=0.012)
AD
0.335a (p=0.000)
0.085 (p=0.528)
0.047 (p=0.727)
0.102 (p=0.450)
DE 0.085 (p=0.058)
0.136 (p=0.312)
0.031 (p=0.816)
0.141 (p=0.295)
0.019 (p=0.891)
CI -0.416a (p=0.000)
0.253 (p=0.057)
0.128 (p=0.343)
-0.037 (p=0.786)
-0.006 (p=0.963)
0.088 (p=0.516)
Note. Q=engaging in questioning; DI=designing and conducting investigations; CD=collecting data; AD=analyzing data; DE=developing explanations; CI=communicating information aCorrelation coefficient is statistically significant.
In addition, determining the relationship of the six inquiry practices may be
important in exploring the creation of a composite variable across all six practices since
this may have the advantage of providing a more comprehensive measure of the
construct when compared to a single variable (O’Dwyer et al., 2015). However,

234
correlation analyses failed to indicate a relationship between most scientific inquiry
practices. This may suggests that a composite variable could not be created, and the six
practices of inquiry were used individually to represent teachers’ specific practices
related to inquiry-based teaching.
Two-level unconditional model: No predictor variable
A multilevel analysis was conducted using the Mplus 7.4 version software
(Muthén & Muthén, 2016). The analysis began with a two-level unconditional
regression model, which consisted only of the outcome variable (posttest score in
chemistry) and no independent variable. This model provides the results of partitioning
the outcome variable into within-class and between-class components, and testing
whether the variance of the between-class component is significantly different from
zero. The unconditional model can be used to determine whether there are statistically
significant differences in student learning across 12 classes. From these measures, the
intraclass correlation coefficient (ICC) was obtained, which is the proportion of
variation in the student posttest score in chemistry that is due to differences between
classes. As discussed in Chapter 4, the equation for the two-level unconditional model
is as follows:
chemistry posttest score = ß0j + rij (level 1) and ß0j = γ00 + u0j (level 2)
In this equation, ß0j is the random intercept at level 1, rij is the residual score at level 1,
γ00 is the grand mean/intercept for random intercept coefficient at level 2, and u0j is the
residual score for the random intercept at level 2.
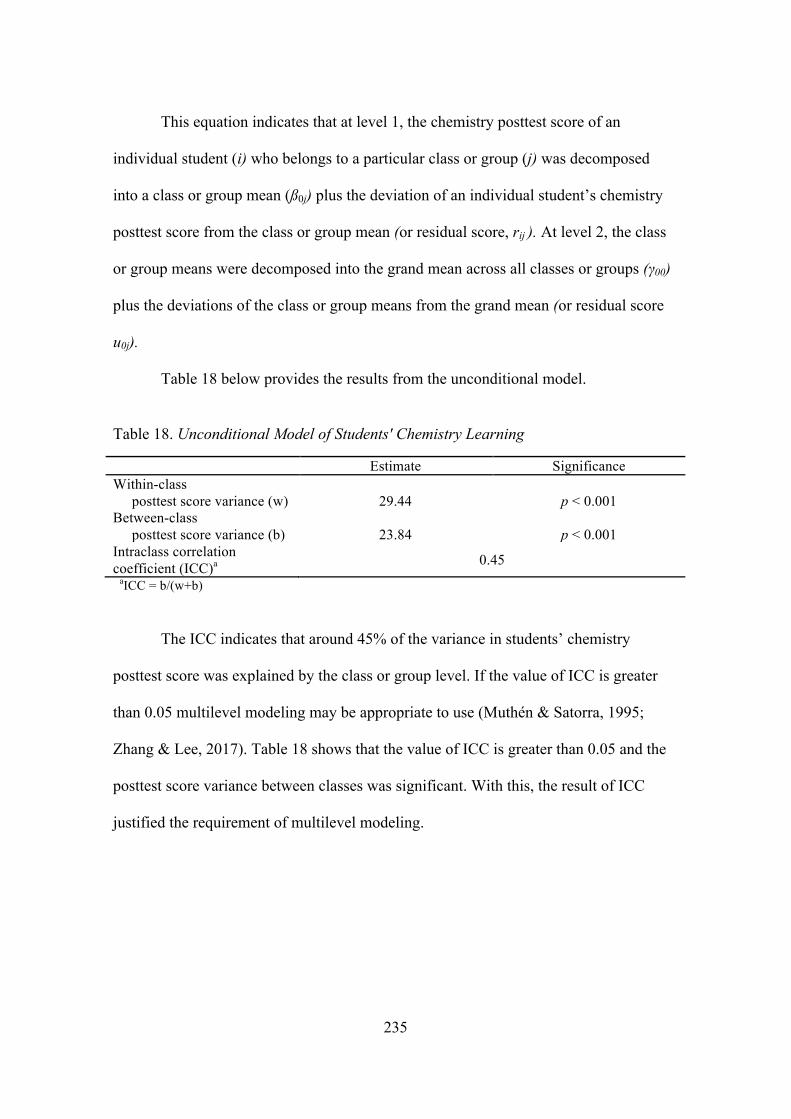
235
This equation indicates that at level 1, the chemistry posttest score of an
individual student (i) who belongs to a particular class or group (j) was decomposed
into a class or group mean (ß0j) plus the deviation of an individual student’s chemistry
posttest score from the class or group mean (or residual score, rij ). At level 2, the class
or group means were decomposed into the grand mean across all classes or groups (γ00)
plus the deviations of the class or group means from the grand mean (or residual score
u0j).
Table 18 below provides the results from the unconditional model.
Table 18. Unconditional Model of Students' Chemistry Learning
Estimate Significance Within-class
posttest score variance (w)
29.44
p < 0.001 Between-class
posttest score variance (b) 23.84 p < 0.001 Intraclass correlation coefficient (ICC)a 0.45
aICC = b/(w+b)
The ICC indicates that around 45% of the variance in students’ chemistry
posttest score was explained by the class or group level. If the value of ICC is greater
than 0.05 multilevel modeling may be appropriate to use (Muthén & Satorra, 1995;
Zhang & Lee, 2017). Table 18 shows that the value of ICC is greater than 0.05 and the
posttest score variance between classes was significant. With this, the result of ICC
justified the requirement of multilevel modeling.

236
Two-level model with predictor variables: Pretest score (level 1 predictor)
and scientific inquiry practices (level 2 predictors)
The within-class (level-1) model explored whether the student covariate (pretest
score) is associated with student chemistry learning. This model provided information
on how much of the total unexplained individual level variance for students’ chemistry
posttest score was explained by the student covariate. The equation for level 1 model is
as follows:
chemistry posttest score = ß0j + ß1j (pretest score)+ rij
In the level 1 model, ß0j is the chemistry posttest score when all other variables are
constant. The effect of pretest on students’ chemistry gain score is represented by the
regression coefficient ß1j. The rij is a random student effect. The level-1 predictor
variable (pretest score) was entered into the model centered at the grand mean.
The between-class (level-2) model determined if student learning in chemistry
was impacted by the practices of scientific inquiry implemented by teachers, holding a
student covariate in the model constant. It provided information on how much of the
total unexplained individual level variance for students’ posttest score was explained by
teachers’ scientific inquiry practices. In this model, each practice of scientific inquiry
enacted by teachers was tested separately. Thus, six level 2 models were created. The
equation for level 2 model is as follows:
ß0j = γ00 + γ01 (each practice of scientific inquiry) + u0j
In the level 2 model, γ01 is the regression coefficient, which represents the association
between each practice of scientific inquiry and students’ chemistry posttest score,

237
holding the pretest in the model constant. Each level 2 predictor (each scientific inquiry
practice) was added in the model uncentered.
In Table 19, the within-class and between-class models of students’ chemistry
learning and teachers’ scientific inquiry practices were presented. It shows the estimated
regression coefficients for each scientific inquiry practice of teachers (Models 1 through
6) for predicting students’ learning in chemistry. It also shows the estimated regression
coefficient for student covariate (pretest) since this is included in all models.
Table 19. Relationship Between Teachers' Scientific Inquiry Practices and Students' Learning in Chemistry
Model description Model 1
Model 2
Model 3
Model 4
Model 5
Model 6
Level 1 predictor (Student-level) Pretest
0.484 a 0.489 a 0.467 a 0.510 a 0.479 a 0.488 a
Level 2 predictors (Teacher-level) Scientific inquiry practices 1. Engaging in questioning (Q) 2. Designing and conducting investigations (DI) 3. Collecting data (CD) 4. Analyzing data (AD) 5. Developing explanations (DE) 6. Communicating information (CI)
0.551b (0.08)c
-0.336 (0.04)
-0.081 (0.01)
-0.033 (0.004)
0.102
(0.01)
0.359 (0.05)
aCoefficients are statistically significant at p < 0.001. bCoefficient is statistically significant at p < 0.05. cStandardized difference which is equal to the coefficient divided by the standard deviation of the outcome variable.
Patterns were observed in the estimated regression coefficients associated with
student covariate (pretest score) across the six models as shown in Table 19. The
coefficient values for the pretest were significantly associated with the posttest in

238
Models 1 through 6 (p < 0.001). In addition, all estimated regression coefficients
associated with pretest were positive; between 0.46 and 0.51. This means that students
who had high score in the pretest were predicted to have high score in the posttest as
expected. Due to significant association between pretest and posttest scores, student
covariate was controlled to see whether teachers’ scientific inquiry practices are
associated with students’ learning in chemistry.
Multivariate multilevel model
The results of analysis of the two-level model with predictor variables (Models
1-6) shown in Table 19 revealed that the pretest score was statistically significant and
positively related with the posttest score. This was observed in all models. In addition,
out of six scientific inquiry practices of teachers, only engaging in questioning was
statistically significant and positively related with the posttest score after controlling
for the pretest. This was observed in Model 1. These results suggested that the other
predictor variables, specifically other inquiry practices, that were not significant such
as designing and conducting investigations, collecting data, analyzing data, developing
explanations, and communicating information could not be included in the multivariate
analysis. Thus, in this study, these variables were removed from the multivariate
model. As a result, only one predictor variable (engaging in questioning) was left at
the level 2 model and the pretest score remained as predictor variable at the level 1
model. This resulting model was now exactly the same with Model 1, which was
already analyzed. Thus, in this case, performing a multivariate analysis was not
necessary since only one predictor variable was found significant at level 2 model.

239
Engaging in questioning and student posttest score Based on Table 19, engaging in questioning was the practice of scientific
inquiry of teachers that was significantly and positively associated with posttest score in
chemistry (coefficient=0.55, p < 0.05) after controlling for the student covariate
included in the model. Using the standard deviation (SD) of students’ posttest score in
the sample, the regression coefficients were transformed into predicted standardized
differences through dividing the coefficient by the standard deviation of the outcome
variable (posttest scores, SD = 6.83). For example, if an independent variable A is
associated with a regression coefficient x for predicting the outcome variable B, the
standardized regression coefficient is interpreted as the predicted standard deviation
change in B for a one unit increase in A, holding all else constant (O’Dwyer et al.,
2015). In this case, for every one point increase in teachers’ engaging in questioning
practice, for example, employing this practice more frequently from teaching some
lessons to teaching most lessons in chemistry, students’ chemistry scores were predicted
to increase by 0.08 standard deviations. Generally, teachers observed in this study used
this specific practice of scientific inquiry (engaging in questioning) the most in
chemistry classrooms. The specific practices of engaging in questioning implemented
by teachers were:
1. Teacher asked students a question about facts not previously presented which
elicited students’ own ideas (required short, specific answer).
2. Teacher asked students a question that required them to justify a situation or
phenomenon.
3. Teacher prompted students to formulate and ask their own questions.

240
A more detailed discussion of the relationship between the practice of engaging
in questioning and student learning in chemistry is presented in Chapter 7.
Designing and conducting investigations, collecting data, analyzing data,
developing explanations, and communicating information and student posttest score
Table 19 shows that the estimated regression coefficients associated with the
remaining five practices of scientific inquiry implemented by teachers (Models 2-6)
were not significant. Based on a series of observations, the practices of designing and
conducting investigations, collecting data, analyzing data, developing explanations, and
communicating information were implemented by teachers, however, most of these
practices had low mean implementation in classrooms. Specifically, the practices of
designing and conducting investigations, collecting data, analyzing data, and developing
explanations were not commonly observed in classrooms. It is possible that the
contextual conditions in Philippine classrooms limit the capacity of teachers to
implement these kinds of inquiry practices extensively. Teachers were not frequently
observed explicitly teaching the concepts or skills related to these practices of scientific
inquiry in their classes. This may have been reflected in the results of chemistry
posttest. For instance, examining the item characteristics for posttest items on designing
and conducting investigations showed that most students did not seem familiar with the
concepts or skills related to this inquiry practice. It seems likely that the low percentage
of students who selected the correct answer in these items indicates that the practice of
designing and conducting investigations implemented in classrooms was not explicitly
discussed by teachers with their students. It can be inferred from the following posttest
items that most students were not familiar with identifying the right variable for

241
investigation and selecting a suitable method for an experiment. Items 1 and 2 below
show the actual posttest items on designing and conducting investigations.
Results of Rasch (1960) analyses of posttest items 1 and 2, presented in the
shaded part of Tables 20 and 21, showed that the percentage of students who selected
the incorrect response for these items was high; 88% for item 1 and 80% for item 2.
Only 12% selected the correct response for item 1(B. time) and 20% for item 2 (A. mass
of food sample). These results may suggest that teachers implemented investigation
Item 1 Angelo tests the ability of different stoves to boil 2 liters of water in a pot. What is the dependent variable?
A. temperature of water B. time C. heat source D. pot
Item 2 Pablo wanted to compare the energy value of different foods. He burned different food samples for 10 minutes under a test tube containing a fixed amount of water as shown below. He used the increase in water temperature as a measure of the relative energy value. Which of the following variables must be kept the same, to ensure validity of results?
A. mass of food sample B. angle of test tube C. type of food tested D. final temperature of water

242
activities in chemistry without an explicit discussion of how a fair test with
experimental variables is conducted in scientific investigations.
Table 20. Chemistry Posttest Item 1 Statistics
Item 1
Cases for this item: 526 Item-Rest Cor.: 0.09 Item-Total Cor.: 0.14 Item Threshold(s): 2.12 Weighted MNSQ: 1.03 Item Delta(s): 2.12
Label Score Count % of tot Pt Bis t sig. p PV1Avg:1 PV1 SD:1
A 0 276 52.47 -0.14 -3.22 0.001 -0.080 0.630 B 1 65 12.36 0.09 2.12 0.034 0.210 0.620 C 0 140 26.62 0.09 2.03 0.043 0.130 0.550 D 0 45 8.56 0 0.01 0.990 0.010 0.640
Table 21. Chemistry Posttest Item 2 Statistics
Item 2
Cases for this item: 526 Item-Rest Cor.: 0.05 Item-Total Cor.: 0.11 Item Threshold(s): 1.55 Weighted MNSQ: 1.07 Item Delta(s): 1.55
Label Score Count % of tot Pt Bis t sig. p PV1Avg:1 PV1 SD:1
A 1 103 19.58 0.05 1.19 0.233 0.160 0.630 B 0 56 10.65 0.01 0.31 0.753 0.010 0.700 C 0 90 17.11 0.01 0.29 0.775 0.070 0.530 D 0 277 52.66 -0.06 -1.36 0.174 -0.040 0.620
In Tables 20 and 21, the heading Label shows the four response categories in the
posttest items. Under the heading Score, zero (0) was the score assigned for incorrect
response and one (1) was the score assigned for correct response. The Count shows the
number of students who responded with each of the response category. The % of total
shows the percentage of students who responded with each of the response categories.
Item 3 below shows another posttest item that asked students to choose a
suitable experimental method based on the objective of an investigation. Table 22
indicates that 75% of the students who took this item selected the incorrect response.

243
More detailed explanations about the relationship of these inquiry practices to student
chemistry learning are presented in the next chapter.
Table 22. Chemistry Posttest Item 3 Statistics
Item 3
Cases for this item: 526 Item-Rest Cor.: 0.04 Item-Total Cor.: 0.11 Item Threshold(s): 1.20 Weighted MNSQ: 1.09 Item Delta(s): 1.20
Label Score Count % of tot Pt Bis t sig. p PV1Avg:1 PV1 SD:1
A 0 76 14.45 -0.02 -0.37 0.715 -0.040 0.530 B 1 134 25.48 0.04 0.92 0.358 0.120 0.610 C 0 200 38.02 0.1 2.35 0.019 0.070 0.670 D 0 116 22.05 -0.15 -3.44 0.001 -0.130 0.580
Table 23 shows the percentage of variance explained (within and between
classes, and in total) by each practice of scientific inquiry and the student covariate. The
student covariate explained 38% of the total variance in scores. Despite being
significantly associated with chemistry posttest score, teacher implementation of the
practice of engaging in questioning (Model 1) in classrooms explained only a modest
percentage of the total variance in students’ gain score after controlling for the covariate
in the model (35%). This suggests that the inquiry practice of engaging in questioning
may have had only a small impact on student chemistry learning.
Item 3 Seawater is mainly sodium chloride (table salt) dissolved in water. If you wish to recover ONLY the salt, which of the following methods will you choose?
A. decantation B. distillation C. evaporation D. filtration

244
Table 23. Variance in Chemistry Posttest Score Explained by Student Covariate and Teachers' Scientific Inquiry Practices
Student Covariate-
only Model
(Pretest)
Model 1 Q
Model 2 DI
Model 3 CD
Model 4 AD
Model 5 DE
Model 6 CI
% Variance explained:
Within class
60.04% 59.76% 59.73% 58.81% 59.71% 59.39% 59.89%
Between class
11.06% 4.51% 12.37% 10.94% 9.42% 11.66% 6.31%
Totala 38.13% 35.04% 38.54% 37.39% 37.21% 38.03% 35.91% Note. Q=engaging in questioning; DI=designing and conducting investigations; CD=collecting data; AD=analyzing data; DE=developing explanations; CI=communicating information aThe total variance is the percentage of the sum of explained variance in within and between classes and the sum of variance available in within and between classes.
Chapter Summary
The student pretest score in chemistry had a strong negative relationship with
gain score. Because of this, the pretest was controlled using the one-way analysis of
covariance (ANCOVA) to determine the adjusted mean gain score in chemistry of each
class. After controlling the influence of pretest on gain score, Teacher F’s class obtained
the highest gain in chemistry while Teacher J’s class had the lowest gain score.
Using the Mplus 7.4 version software (Muthén & Muthén, 2016), multilevel
analysis was conducted to determine the relationship between each specific practice of
scientific inquiry of teachers and student learning in chemistry. The first model in the
analysis was the two-level unconditional regression model, which consists only of
posttest score and no predictors. This model gave an intraclass correlation coefficient
(ICC) of 0.45. This indicates that around 45% of the variance in students’ posttest score
was explained by class level. This value of ICC justified the requirement of multilevel
modeling that ICC should be greater than 0.05 (Muthén & Satorra, 1995; Zhang & Lee,
245
2017). In the second model, the pretest score was controlled in the multilevel modeling
of the relationship between teachers’ inquiry practices and students’ posttest score. Six
models were created because each specific practice of inquiry enacted by teachers was
tested separately. The third model, the multivariate multilevel model, was also
considered in the analysis.
The results of multilevel analysis showed that the specific practice of scientific
inquiry that was significantly and positively associated with posttest score
(coefficient=0.55, p < 0.05) after controlling for the pretest was engaging in
questioning. Conversely, the estimated regression coefficients associated with the
practices of designing and conducting investigations, collecting data, analyzing data,
developing explanations, and communicating information implemented by teachers
were not significant. The variables that were not significant were removed from the
multivariate multilevel model. As a result, only one significant variable remained at the
level 2 model. Because of this, performing multivariate analysis was not necessary.
246
Chapter 7: Conclusions and Implications
This chapter is divided into four parts. The first part reviews the research
questions for the study. The second part discusses the results and addresses the research
questions. The third part presents the implications of the study. The fourth part presents
the limitations of the study.
A Review of the Research Questions of the Study
Several studies have suggested that inquiry-based teaching can lead to greater
student achievement in science (Fogleman et al., 2011; Jiang & McComas, 2015;
Minner et al., 2010; Mupira & Ramnarain, 2018; Sadeh & Zion, 2009; Tuan et al.,
2005; Wilson et al., 2010; Wu & Hsieh, 2006). However, little emphasis had been
placed on investigating which specific practices of inquiry-based teaching can lead to
greater achievement (Minner & DeLisi, 2012). Because of this, a need for a fine-grained
research on the impact of specific inquiry practices to student learning in science was
identified in this study. This is important to identify which practices of inquiry teaching
has the potential to improve student learning since scientific inquiry has been
increasingly used as a teaching approach and as one of the essential features of
curriculum documents in pre-tertiary science education worldwide. Furthermore, the
overwhelming majority of research on scientific inquiry and its relationship with
student learning to date has been conducted in developed countries. It is not yet known
whether and how teaching through scientific inquiry, which is advocated by most
developed countries, translates to less developed countries and if it is able to positively
impact on student learning in these contexts.

247
With these reasons, this study was conducted to investigate the inquiry-based
teaching practices of sample teachers from a less developed country, the Philippines, as
they implemented the new Grade 7 chemistry curriculum and how these practices, as
promoted by the new curriculum, have impacted student learning in chemistry.
Specifically, this study addressed the following research questions:
1. How have teachers implemented inquiry teaching in Philippine junior high
school chemistry classrooms? Which specific practices of teachers in junior
high school chemistry classrooms exhibited components of scientific
inquiry? To what extent are these practices translated to Philippine junior
high school chemistry classrooms observed in this study?
2. What is the relationship between the practices of scientific inquiry
implemented by teachers (engaging in questioning, designing and
conducting investigations, collecting data, analyzing data, developing
explanations, and communicating information) and students’ learning in
chemistry?
Key Findings and Conclusions
This study has made several contributions to our knowledge in this field. It has
provided a critical understanding of teachers’ way of implementing scientific inquiry as
a teaching approach in the challenging teaching and learning environments. It has
provided an evidence-based documentation of specific practices of scientific inquiry
implemented by teachers in teaching chemistry in less developed country. This study
has also examined how the specific inquiry practices impacted on student learning, and
has shown the potential of a specific practice of scientific inquiry (engaging in

248
questioning) implemented by teachers to enhance student learning in chemistry. In
addition, this study has made a contribution to our knowledge through the rigorous
development of a validated instrument, the Scientific Inquiry Teaching Observation
Instrument (SITOI), for the observational measurement of specific scientific inquiry
teaching practices in the classroom that will contribute to further and more nuanced
research in the field. Detailed discussions are presented below.
Towards an understanding of teachers’ implementation of inquiry in the
challenging teaching and learning environments
Teachers may tend to prioritize certain practices of inquiry more than
others in chemistry teaching
In Chapter 3, a review of inquiry-based instructional models and inquiry-based
science curriculum documents showed that there is no fixed approach to inquiry
teaching; however, there were commonalities in the following six major components of
scientific inquiry that are likely useful in classroom teaching: engaging in questioning,
designing and conducting investigations, collecting data, analyzing data, developing
explanations, and communicating information. In this study, each teacher implemented
some of these components of inquiry more frequently than others in teaching Grade 7
chemistry. This finding supports the outcome of a study by Kang et al. (2008) who
reported that sample teachers in the U.S. placed more emphasis on some of the essential
features of classroom inquiry than others. Specifically, they reported that teachers
consistently implemented the features of giving priority to evidence, and formulating
explanations based on evidence in teaching science, than of engaging in scientifically
oriented questions. However, in the present study, teachers seemed to prioritize the

249
implementation of two components of scientific inquiry in chemistry teaching: engaging
in questioning and communicating information. Based on classroom observations
conducted in the sample schools in the National Capital Region of the Philippines, most
teachers used non-experimental activities which provided them with opportunities to
implement teaching practices related to engaging in questioning and communicating
information. Generally, teachers implemented these activities without requiring them to
use special facilities or many resources.
For engaging in questioning, the most frequently used practice of teachers was
asking questions that elicited students’ own ideas about the lesson, which may stimulate
and expand their thinking. This differs from the work of Keys and Kennedy (1999),
who found that contextual-based questions from science activities were usually
explored in class. However, the present study confirmed the findings of ACTRC (2014)
particularly on the questioning component of inquiry. When the researchers of ACTRC
investigated the delivery of scientific inquiry skills specified in the new Grade 8 science
curriculum in the Philippines, they found that classroom teachers frequently asked
questions about the content of the lesson, and to some extent, about the inquiry process
involved in the lesson, which was also observed in this study.
For communicating information, the most commonly used practice of teachers
was allowing students to report the results of chemistry activities through presentations
in class. Although students in this practice were actively involved in the planning and
delivery of presentation of results to the class, it was observed that an authoritative way
of communication seemed to be more strongly manifested in most chemistry classrooms
rather than a dialogic way of communication. According to Treagust and Tsui (2014), in
science teaching, it is important for a teacher to shift from authoritative to dialogic ways

250
of communication through discursive moves and turns of utterances like teachers’ or
students’ questions, answers, comments or suggestions. This is because using a dialogic
way of communication in the classroom is thought to help students become more
enthusiastically involved and to learn well (Mercer & Howe, 2012). Dialogic ways of
communication in science through scientific discourse can promote inquiry in the
classroom (Quigley, Marshall, Deaton, Cook, & Padilla, 2011). However, dialogic
communication was not commonly seen in the classrooms observed in this study. One
recommendation arising from this finding is that science teachers may need to be
explicitly trained to implement dialogic way of communication in inquiry teaching. It
can be important for them to be more open in practicing dialogues with students as part
of their inquiry teaching, which may promote learning.
Generally, teachers observed in this study seemed to give less priority to using
teaching practices related to designing and conducting investigations, collecting data,
analyzing data, and developing explanations. This is supported by the findings of
ACTRC (2014) that teaching practices related to these inquiry components such as the
use of scientific instruments, the tabulation of results, and the testing of variables, were
seldom seen in classrooms. It can be argued that the context of the teaching and learning
environment (e.g., class size, availability of facilities and resources) observed in this
study is a contributing factor for most teachers to decide to give less priority to these
inquiry practices. Detailed discussions of this can be found in the next section. In
looking from another perspective, a scientific culture may not be well-established yet in
pre-tertiary science education in the Philippines. Thus, the teachers observed in this
study may not be culturally attuned to these inquiry practices. In this case, traditional
practices in the science classroom may still exist, which according to Williams (1973)

251
can result in teaching traditions in schools that are difficult to change. He argued that
teaching traditions in the classroom are difficult to change, even if modifications are
made in curriculum documents. In this case, most of the aspects of the nature of
scientific inquiry for pre-tertiary science education suggested by Schwartz et al. (2008)
and Lederman et al. (2014) in Chapter 3 (e.g., scientific data are not the same as
scientific evidence; multiple methods of scientific investigation; inquiry procedures can
influence results) were not explicitly delivered in chemistry classrooms.
It is acknowledged that the implementation of inquiry-based teaching involved a
broad array of approaches and needed the support of facilities and resources, but it may
be important for teachers to consider implementing a broad range of scientific inquiry
processes so that students know how scientific knowledge is generated. If a teacher is
focusing only on implementing some practices of inquiry in classrooms, other important
aspects of scientific inquiry may be missed, and the necessary understanding about the
nature of scientific inquiry may not be achieved by the students.
Teachers may shift from inquiry to another teaching approach depending
on school and classroom contexts
In this study, teachers were observed using inquiry practices but at some point
their implementation was not sustained in their teaching. Teachers tended to shift to a
traditional teaching approach even if the lessons required an inquiry-based approach.
There are many reasons that could explain this situation. The SEI-DOST & UP
NISMED (2011a) reported that the lack of content and pedagogical skills suitable for
science teaching was the reason why many Filipino teachers turned to a traditional
teaching approach instead of using inquiry. However, this reason was not supported by
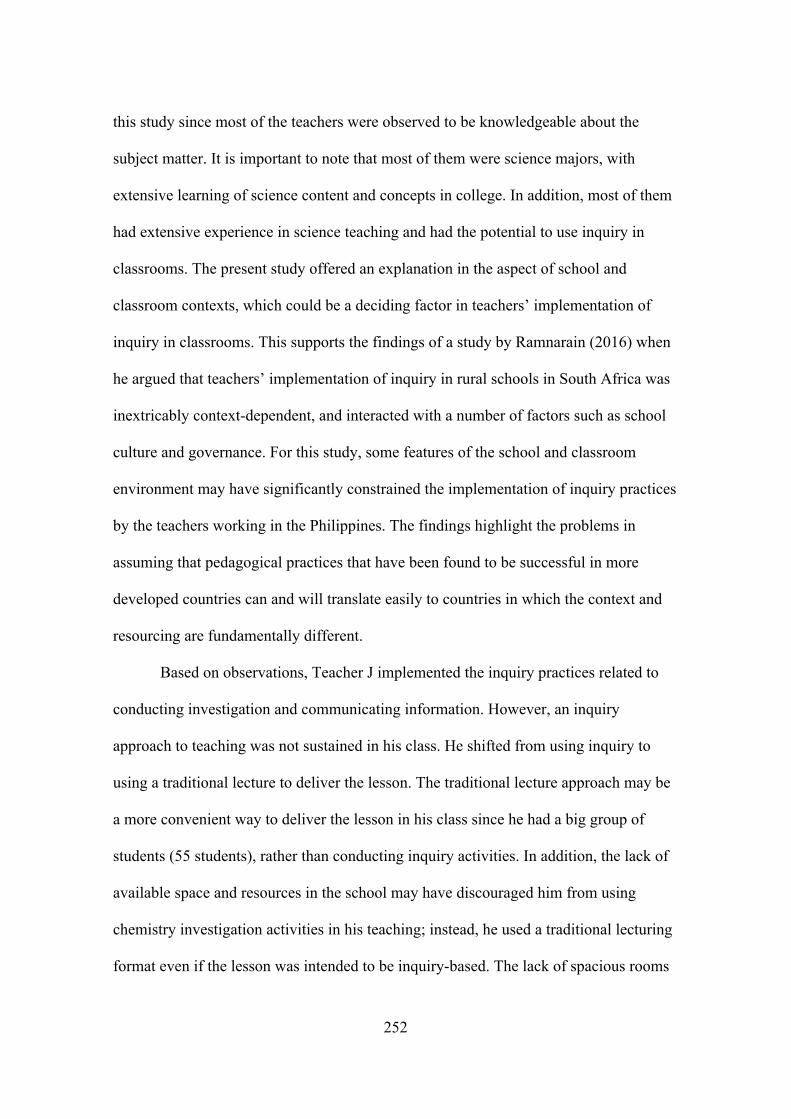
252
this study since most of the teachers were observed to be knowledgeable about the
subject matter. It is important to note that most of them were science majors, with
extensive learning of science content and concepts in college. In addition, most of them
had extensive experience in science teaching and had the potential to use inquiry in
classrooms. The present study offered an explanation in the aspect of school and
classroom contexts, which could be a deciding factor in teachers’ implementation of
inquiry in classrooms. This supports the findings of a study by Ramnarain (2016) when
he argued that teachers’ implementation of inquiry in rural schools in South Africa was
inextricably context-dependent, and interacted with a number of factors such as school
culture and governance. For this study, some features of the school and classroom
environment may have significantly constrained the implementation of inquiry practices
by the teachers working in the Philippines. The findings highlight the problems in
assuming that pedagogical practices that have been found to be successful in more
developed countries can and will translate easily to countries in which the context and
resourcing are fundamentally different.
Based on observations, Teacher J implemented the inquiry practices related to
conducting investigation and communicating information. However, an inquiry
approach to teaching was not sustained in his class. He shifted from using inquiry to
using a traditional lecture to deliver the lesson. The traditional lecture approach may be
a more convenient way to deliver the lesson in his class since he had a big group of
students (55 students), rather than conducting inquiry activities. In addition, the lack of
available space and resources in the school may have discouraged him from using
chemistry investigation activities in his teaching; instead, he used a traditional lecturing
format even if the lesson was intended to be inquiry-based. The lack of spacious rooms

253
for inquiry activities was also observed by the ACTRC researchers when they explored
the implementation of the new science curriculum in the Philippines (ACTRC, 2014).
Furthermore, the findings of other researchers (e.g., Davis, 2003; Kang & Keinonen,
2016; Kim et al., 2010) that class size and school resources could influence teachers’
use of inquiry practices in classrooms was supported by this study.
Aside from the class size, school facilities and resources, another factor that may
influence teachers’ implementation of inquiry practices could be the academic ability of
students in a class. Teacher B was observed teaching the same lesson in her two
chemistry classes. In class 2, she engaged students in collecting data practices through
demonstration activities. In class 1, she used a traditional lecture format. This raises the
question of why Teacher B used different approaches in delivering the same lesson in
two classes. Class 1 was the top Grade 7 class composed of students of similar ability.
In this case, a traditional lecture format may facilitate the lesson with academically able
students. By contrast, class 2 was composed of students with a wide range of ability
levels, most of whom were not as academically able as students in class 1. Teacher B
used demonstration in this class to explicitly discuss the lesson, which may support and
help students understand the lesson easily. This observation suggests that teachers may
take students’ learning ability into consideration when deciding whether to use inquiry
in the classroom, although there is a need for further research in this area. This finding
aligns with the work of Wang et al. (2014) who found that the learning abilities of
students was a factor that affected teachers’ implementation of inquiry instruction in
vocational schools in Taiwan.
Moreover, considerations of how to efficiently cover the content of the
curriculum could be another factor in the implementation of scientific inquiry practices

254
in classrooms. For example, Teacher I taught the same lesson in her two chemistry
classes. In class 1, she asked her students to perform a group activity which required
them to communicate results through presentations. In class 2, she discussed the activity
using traditional lecture without asking students for presentation of results. It was
observed that in class 2, Teacher I was not on track in teaching the lessons specified in
the curriculum and traditional lecture may be the faster way to cover the remaining
content of the curriculum. This finding confirmed Gutierez’s (2015) claim that,
although the new science curriculum is inquiry-based, teachers observed in the
Philippines tended to use traditional didactic approaches so as to deliver all mandated
content. According to Saad and BouJaoude (2012) the importance of efficiency in
covering the content of the curriculum had a powerful influence on impeding inquiry
practices of teachers in the classroom. This was observed in this study.
This study showed that the implementation of inquiry in classrooms could
depend on the features of school and classroom environment such as class size, student
learning abilities, covering curriculum content, and availability of facilities and
resources. It can be inferred that if these features were problematic they could become
barriers to implementing inquiry in classrooms, which may cause teachers to rely on
more traditional teaching approaches. This was evident in the cases of the
aforementioned teachers. This study showed that the school and classroom contexts
affect the capacity of teachers to implement reform-based teaching practices developed
in first-world countries (e.g., inquiry-based practices) to other settings. This suggests
that inquiry-based teaching practices are more challenging for teachers to translate
effectively in the classrooms of less developed countries where the contexts and
resources are not as good as in developed countries. Because of this, teachers in less

255
developed countries may shift from inquiry to traditional approach, or they may tend to
implement selected inquiry teaching practices that can fit in to their classroom contexts.
This study supported the report of Lim and Prudente (2013) and Sanosa (2013) that the
insufficiency of resources and school facilities was one of the factors that affected
Filipino teachers in implementing the curriculum the way it was intended to be
implemented in the classroom. This study also confirmed the claim of Hume and Coll
(2010) and Sherin and Drake (2009) that curriculum misalignment is usually observed
during periods of major reform, which is the case of Philippine basic education.
Teachers may implement inquiry in classrooms with scarce resources using
improvisation.
A review of studies on implementation of inquiry in pre-tertiary science
education presented in Chapter 1 reported that one of the barriers to implementing
inquiry in classrooms was the lack of resources and facilities (e.g., Davis, 2003; Kang &
Keinonen, 2016). This barrier was also observed in the present study. However, some
teachers observed in this study, specifically Teachers F and I, showed that to some
extent they could still manage to implement inquiry-based teaching practices in their
classrooms even if there was a scarcity of science teaching materials and facilities in
their schools. How did these teachers implement inquiry while facing the challenges of
limited school resources and facilities? This study uncovered a potential solution, which
may address this challenge and may support teachers in implementing inquiry in their
classrooms.
Improvisation of instructional materials. In this study, creative approaches by
some teachers in spite of limited resources allowed for the implementation of scientific

256
inquiry practices. Improvisation of scientific equipment using locally available
resources was observed in this study as a means to teach an inquiry-based lesson in
chemistry. Based on classroom observation, Teacher I constructed an improvised
electrolysis apparatus since the expensive chemistry laboratory equipment and
glassware, which are normally used to set up the standard electrolysis apparatus, were
not available in her school. Teacher I constructed the improvised electrolysis apparatus
using common materials like plastic bottles, plastic syringes, plastic straws, paper clips,
and dry cells. The improvised apparatus was used by Teacher I to deliver the lesson and
to engage her students in inquiry activities. She allowed her students to carry out an
experiment on electrolysis of water using this apparatus to investigate how water
decomposed into its elemental components. This scenario suggests a potential solution
for the lack of laboratory equipment in schools. Moreover, Teacher F used readily
available household materials as substitutes for imported chemicals and scientific
materials in teaching chemistry investigation. Based on observation, Teacher F and her
students brought locally available resources to use for chemistry activities since their
school had inadequate resources and no laboratory. For instance, she used salt, sugar,
and water to demonstrate the types of Solutions. Furthermore, since pH meters and
litmus paper were not available in school, Teacher I prepared an acid-base indicator
using eggplant for students to use in their investigation.
In the foregoing practices of improvisation, cheap locally available materials
were used to teach the concepts in chemistry through inquiry teaching. These practices
of improvisation are important particularly in schools with insufficient resources, which
may not have sufficient funds to provide for producing costly scientific materials and
equipment needed for inquiry-based science teaching. In a situation like this,
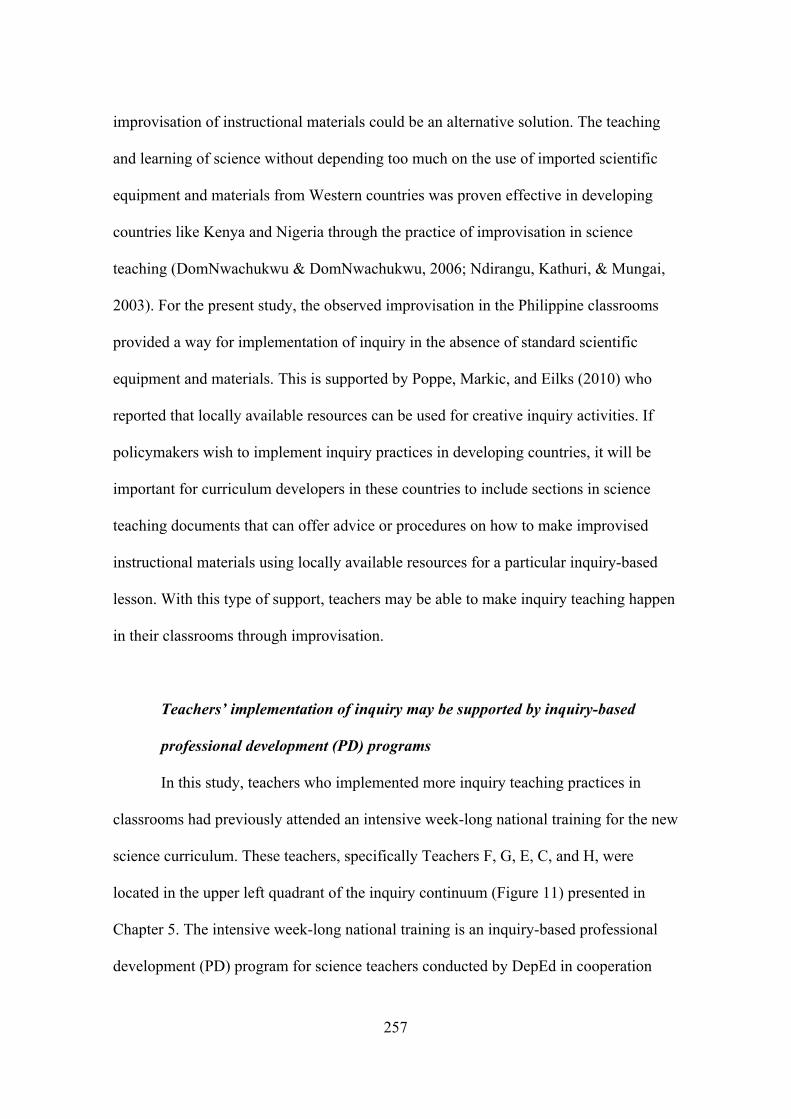
257
improvisation of instructional materials could be an alternative solution. The teaching
and learning of science without depending too much on the use of imported scientific
equipment and materials from Western countries was proven effective in developing
countries like Kenya and Nigeria through the practice of improvisation in science
teaching (DomNwachukwu & DomNwachukwu, 2006; Ndirangu, Kathuri, & Mungai,
2003). For the present study, the observed improvisation in the Philippine classrooms
provided a way for implementation of inquiry in the absence of standard scientific
equipment and materials. This is supported by Poppe, Markic, and Eilks (2010) who
reported that locally available resources can be used for creative inquiry activities. If
policymakers wish to implement inquiry practices in developing countries, it will be
important for curriculum developers in these countries to include sections in science
teaching documents that can offer advice or procedures on how to make improvised
instructional materials using locally available resources for a particular inquiry-based
lesson. With this type of support, teachers may be able to make inquiry teaching happen
in their classrooms through improvisation.
Teachers’ implementation of inquiry may be supported by inquiry-based
professional development (PD) programs
In this study, teachers who implemented more inquiry teaching practices in
classrooms had previously attended an intensive week-long national training for the new
science curriculum. These teachers, specifically Teachers F, G, E, C, and H, were
located in the upper left quadrant of the inquiry continuum (Figure 11) presented in
Chapter 5. The intensive week-long national training is an inquiry-based professional
development (PD) program for science teachers conducted by DepEd in cooperation

258
with UP NISMED, which focused on the implementation of the new inquiry-based
science curriculum for basic education in the Philippines. One of the salient features of
the inquiry-based PD was the emphasis on how to implement the new curriculum in
their classrooms using scientific inquiry. Teachers who attended the national training
program were introduced to inquiry-based classroom activities, inquiry-based teaching
approaches, and assessment procedures specifically designed for pre-tertiary science
education. By contrast, teachers with fewer inquiry teaching practices, located in the
lower left quadrant of inquiry continuum (e.g., Teacher J), did not attend the national
training program. This suggests that the intensive week-long national training program
conducted by DepEd may have helped those teachers in the upper left quadrant to
become familiar with the implementation of inquiry-based science curriculum. Based on
this finding, this study does not support the claims of other studies conducted in the
Philippines (e.g., Montebon, 2014; SEI-DOST & UP NISMED, 2011a) that an inquiry-
based PD program was deemed not effective in promoting the effective implementation
of inquiry-based teaching in classrooms. Research studies have proven that a relatively
short, yet intensive and well-designed PD program that models inquiry-based practices
and provides teachers with opportunities to experience scientific inquiry aligned with
school content objectives can effectively enhance teachers’ capacities to implement
inquiry in the classroom (Capps & Crawford, 2013; Kazempour, 2009).
According to Ramnarain (2014), if inquiry is to be implemented in the science
classroom, teachers will need to be adept at doing the processes of scientific inquiry so
that they can guide their students in performing inquiry in the classroom. In this case,
inquiry-based PD may be a promising approach to support teachers in carrying out
scientific inquiry. It can be important for inquiry-based PD, especially for teachers in
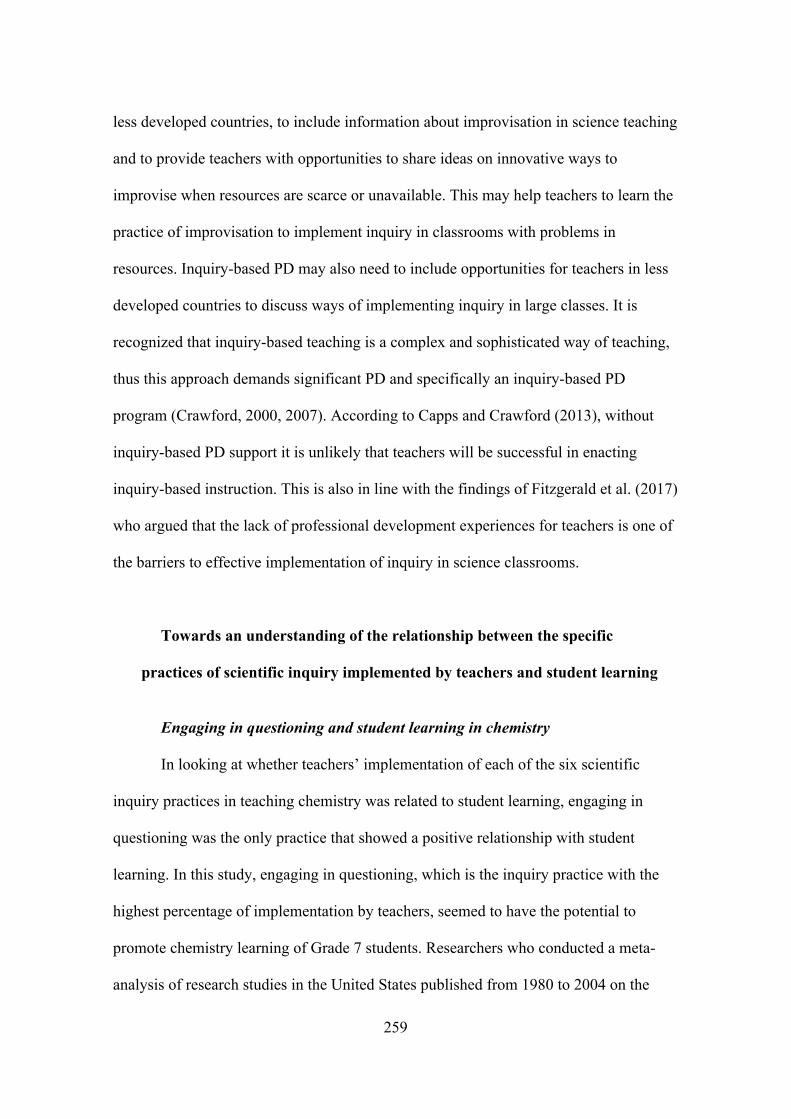
259
less developed countries, to include information about improvisation in science teaching
and to provide teachers with opportunities to share ideas on innovative ways to
improvise when resources are scarce or unavailable. This may help teachers to learn the
practice of improvisation to implement inquiry in classrooms with problems in
resources. Inquiry-based PD may also need to include opportunities for teachers in less
developed countries to discuss ways of implementing inquiry in large classes. It is
recognized that inquiry-based teaching is a complex and sophisticated way of teaching,
thus this approach demands significant PD and specifically an inquiry-based PD
program (Crawford, 2000, 2007). According to Capps and Crawford (2013), without
inquiry-based PD support it is unlikely that teachers will be successful in enacting
inquiry-based instruction. This is also in line with the findings of Fitzgerald et al. (2017)
who argued that the lack of professional development experiences for teachers is one of
the barriers to effective implementation of inquiry in science classrooms.
Towards an understanding of the relationship between the specific
practices of scientific inquiry implemented by teachers and student learning
Engaging in questioning and student learning in chemistry
In looking at whether teachers’ implementation of each of the six scientific
inquiry practices in teaching chemistry was related to student learning, engaging in
questioning was the only practice that showed a positive relationship with student
learning. In this study, engaging in questioning, which is the inquiry practice with the
highest percentage of implementation by teachers, seemed to have the potential to
promote chemistry learning of Grade 7 students. Researchers who conducted a meta-
analysis of research studies in the United States published from 1980 to 2004 on the

260
effect of specific science teaching strategies on student achievement reported that
teacher questioning strategies exhibited a significant positive influence on students’
achievement in science (Schroeder, Scott, Tolson, Huang, & Lee, 2007). They reported
that the effect size of teacher questioning strategies was 0.74, which was close to the
upper-effect size benchmark value of 0.84. Notably, Hattie (2003) also found that
teacher questioning was one of the stronger positive influences on student learning
when he rank-ordered average effect sizes of commonly studied influences on student
learning. In this study, the inquiry component engaging in questioning was interpreted
as the questioning practices of teachers that encourage students to verbalize their ideas,
expand their thinking, and ask scientific questions for investigations, which could be
teacher-centered or student-centered.
Teachers’ specific practices of engaging in questioning observed in the
classroom. The practices of engaging in questioning implemented by most
teachers were asking questions that elicited students’ own ideas and asking questions
that required students to make justifications. When teachers engaged their students in
these type of questioning practices in chemistry, they provided their students with the
opportunity to actively participate in thought-provoking tasks mediated by their
questioning practices, which may help enhance students’ conceptual understanding.
This was evident in Teacher F’s class where the students were frequently engaged in
these types of questioning practices and had the highest achievement in chemistry. Chin
(2006) argued that engaging students with teacher questioning that elicits, probes, and
extends students’ thinking in science could provide cognitive scaffolding for students
that guides them towards successively higher levels of learning. However, there was
also some teachers in this study who implemented engaging in questioning practices

261
that were fairly superficial initiation, response, evaluation questioning, rather than the
type of deeper questioning that builds conceptual knowledge.
In addition, some teachers observed in this study gave their students the
opportunity to think and ask their own questions in chemistry. This practice of engaging
in questioning could create a learning environment where the students could freely and
comfortably ask questions about the lessons. This learning environment may encourage
students to know more about chemistry, which may help them learn the subject. This
supported the research of Chin and Osborne (2008) on student questioning in secondary
school classrooms. They argued that students developing and asking their own questions
is “a first step towards filling their knowledge gaps and resolving puzzlements…to
articulate their current understanding of a topic, to make connections with other ideas,
and also to become aware of what they do or do not know” (p. 2). In addition, Osborne
(2014) argued that as students become immersed in scientific inquiry particularly asking
questions, they begin to understand the importance of the driving question to any
scientific research, they ask questions about what they observe, and they refine their
notion of what makes a good scientific question. The findings of the current study
support earlier research that claimed it was important that teachers should teach and
encourage students to develop and ask good questions in science.
Furthermore, Chin and Osborne (2008) argued in their literature review that
teachers can explicitly teach students questioning skills to improve their performance in
science-related tasks such as formulating research questions for projects and asking
higher-level questions. Encouraging students to formulate and ask good questions is a
crucial teacher practice (Treagust & Tsui, 2014), particularly in inquiry-based science
teaching. It could help students to better construct their own knowledge, develop their

262
interest and motivation, monitor their understanding, and argue (Chin & Osborne, 2010;
Treagust & Tsui, 2014). In this study, teachers engaging in questioning practices in
inquiry-based chemistry teaching encouraged students to verbalize their ideas, and
scaffold and expand their thinking, and guide students toward conceptual and skills
development by encouraging them to ask questions. According to Chin (2007), these
types of questioning practices were employed in classrooms “to coach students along
guided paths towards the construction of canonical scientific knowledge” (p. 837). Most
of these types of questioning practices were observed in classrooms of Teachers F, I
(class 1), and B (class 1) where their students achieved high gain scores in chemistry. It
can be inferred that these types of questioning practices may have helped these students
to build their knowledge in chemistry by enhancing their understanding of the concepts.
With this, the aforementioned argument of Chin (2007) is supported by the present
study.
Designing and conducting investigations, collecting data, analyzing data,
developing explanations, and communicating information and student
learning in chemistry
In this study, there was no significant relationship between each of these inquiry
practices of teachers: designing and conducting investigations, collecting data,
analyzing data, developing explanations, and communicating information, and learning
in chemistry of Grade 7 students. In looking at the results of other studies, Zuzovsky
(2013) reported similar findings, indicating that despite the advocacy for an inquiry-
oriented student-centered modes of instruction, such as planning and conducting
experiments, making observations, and working on experiments in small groups, the
regression coefficients of such practices were small and in most cases statistically

263
insignificant. She also found that the frequent implementation of practices in
experimentation such as designing or planning experiments, collecting data, and
analyzing data were negatively associated with learning outcomes in low-achieving
countries but positively associated with learning outcomes in high-achieving and
medium-achieving countries. The data for Zuzovsky’s study were obtained from the
TIMSS 2007 database, which provided the achievement scores in science. It is
important to note that the Philippines did not participate in the TIMSS 2007. In other
studies, practices such as planning experiments, making observations, collecting data,
analyzing data, and making inferences were also found to have no impact or negative
impact on student learning (e.g., Areepattamannil, 2012; Pine et al., 2006).
However, the relatively low frequency of these practices in this study may have
influenced the results. Although these practices were implemented in classrooms, most
of these practices, and particularly the practices of designing and conducting
investigations, collecting data, analyzing data, and developing explanations, were very
infrequently observed. Specifically, the explicit teaching of the skills related to these
inquiry practices was infrequently observed. For instance, teachers implemented the
practice of designing and conducting investigations in teaching chemistry; however,
they seemed not to give emphasis to teaching the use of variables in investigation. This
is more likely to be due to the lack of detailed information in the new Grade 7 chemistry
curriculum guide on how to teach the skills related to these inquiry practices in the
lessons outlined in the curriculum. This is in line with the findings of ACTRC (2014)
that the skills for these inquiry practices in the Philippines’ new science curriculum
guide were less well represented in the Grade Level Standards (K, Grade 1, Grade 2,
etc.) and sparsely represented in some parts of the learning competencies for the
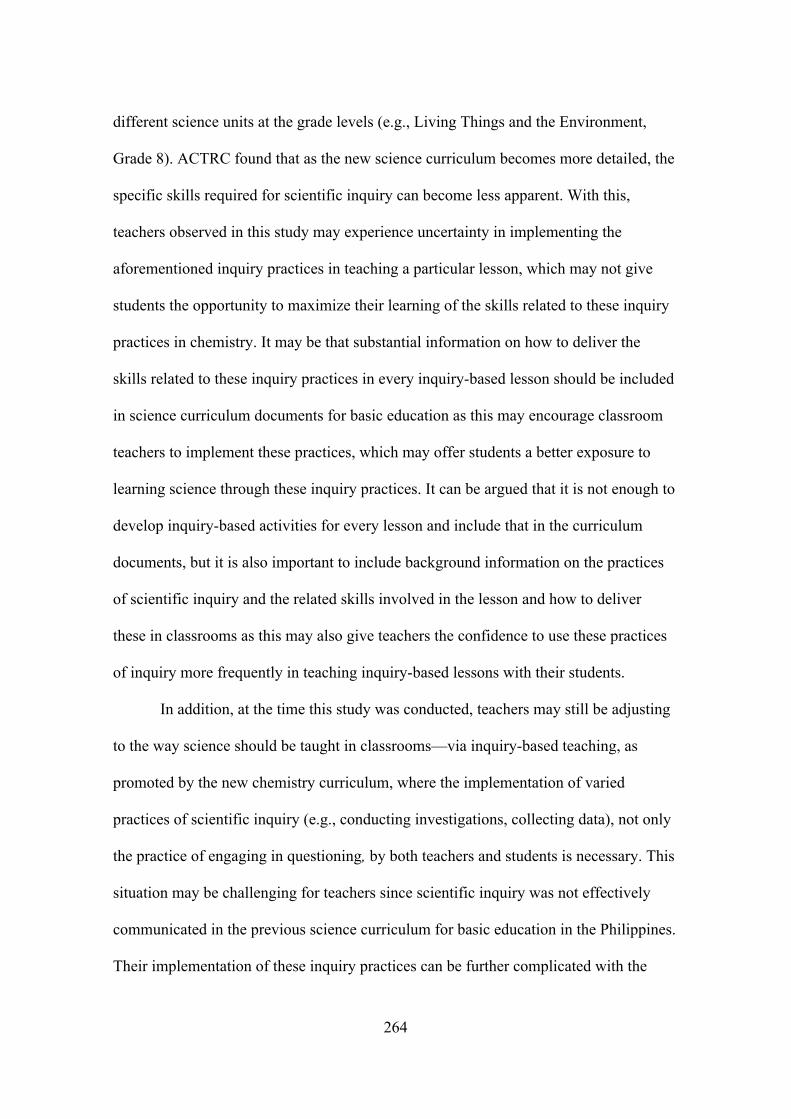
264
different science units at the grade levels (e.g., Living Things and the Environment,
Grade 8). ACTRC found that as the new science curriculum becomes more detailed, the
specific skills required for scientific inquiry can become less apparent. With this,
teachers observed in this study may experience uncertainty in implementing the
aforementioned inquiry practices in teaching a particular lesson, which may not give
students the opportunity to maximize their learning of the skills related to these inquiry
practices in chemistry. It may be that substantial information on how to deliver the
skills related to these inquiry practices in every inquiry-based lesson should be included
in science curriculum documents for basic education as this may encourage classroom
teachers to implement these practices, which may offer students a better exposure to
learning science through these inquiry practices. It can be argued that it is not enough to
develop inquiry-based activities for every lesson and include that in the curriculum
documents, but it is also important to include background information on the practices
of scientific inquiry and the related skills involved in the lesson and how to deliver
these in classrooms as this may also give teachers the confidence to use these practices
of inquiry more frequently in teaching inquiry-based lessons with their students.
In addition, at the time this study was conducted, teachers may still be adjusting
to the way science should be taught in classrooms—via inquiry-based teaching, as
promoted by the new chemistry curriculum, where the implementation of varied
practices of scientific inquiry (e.g., conducting investigations, collecting data), not only
the practice of engaging in questioning, by both teachers and students is necessary. This
situation may be challenging for teachers since scientific inquiry was not effectively
communicated in the previous science curriculum for basic education in the Philippines.
Their implementation of these inquiry practices can be further complicated with the

265
design of the new science curriculum. The new science curriculum in the Philippines
had shifted from a discipline-based approach where only one area of science was
studied by students per grade level (e.g., biology for Grade 8, chemistry for Grade 9) to
a spiral progression approach where the concepts and skills from four different areas of
science (chemistry, biology, physics, and earth and space) are taken by students with
increasing complexity per grade level. Because of this reform, science teachers at a
particular grade level in most schools are responsible to teach these four areas of
science using the new curriculum. This is another major adjustment for teachers in their
science teaching (ACTRC, 2014). Thus, effective implementation of an inquiry-based
approach in the classroom was coupled with many challenges facing teachers as
discussed in the earlier part of this chapter. With this, it can be inferred that most
students involved in this study may have not been properly or extensively exposed to
varied practices of scientific inquiry (e.g., designing and conducting investigations,
collecting data, analyzing data), which may cause students to miss relevant
understandings and skills related to these inquiry practices in chemistry. Based on this
finding, it is crucial for education administrators to provide robust support for teachers
to enact the practices of scientific inquiry in classrooms and the spiral curriculum
through creating a continuing PD program that mainly focuses on implementing varied
practices of scientific inquiry in science teaching and on discussing the spiral
curriculum. More details about inquiry-focused PD are discussed in the next part of this
chapter.
Although the practices of designing and conducting investigations, collecting
data, analyzing data, developing explanations, and communicating information had no
statistically significant influence on student learning, they may be helpful for improving

266
other student characteristics (e.g, attitude towards science, creativity in science).
However, this aspect needs further investigations. This study showed that there were
specific practices of scientific inquiry used in classroom teaching that had no impact on
Grade 7 students’ chemistry achievement. With this, the aforementioned arguments of
the studies mentioned earlier (e.g., Areepattamannil, 2012; Pine et al., 2006; Zuzovsky,
2013) are supported by the present study.
Towards a fine-grained assessment of inquiry-based instruction in the
science classroom
In this study, a validated observational instrument for assessing specific inquiry
teaching practices of teachers in the science classroom was created. This instrument is
the Scientific Inquiry Teaching Observation Instrument (SITOI). The SITOI is directly
aligned with the process of scientific inquiry as it contains specific teaching indicators,
ranging from teacher-centered to student-centered, related to the six practices of
scientific inquiry—engaging in questioning, designing and conducting investigations,
collecting data, analyzing data, developing explanations, and communicating
information. Since there is a lack of observational instrument specifically designed to
assess the specific inquiry practices of teachers, the development of the SITOI would be
beneficial for the science education community to capture the granular view of inquiry-
based instruction of teachers in the science classroom as evident in this study. This
allowed a more fine-grained examination of the relationship between specific practices
of inquiry and student learning in order to identify which specific inquiry practice has
significant impact on learning. As shown in this study, the SITOI also provided a more
detailed understanding of the nature of inquiry practices implemented in the classroom,

267
which may help educators and researchers to determine the quality of inquiry-based
instruction in the science classroom.
Implications of the Study
There are a number of implications flowing from this study, which will be
addressed under the following four headings: implications for education administrators,
implications for science curriculum development, implications for inquiry-based science
teaching, and implications for further research.
Implications for education administrators
Scientific inquiry as a teaching approach is advocated by science education
reform movements in different parts of the world (Abd-El-Khalick et al., 2004; Heinz et
al., 2017; Mumba et al., 2007; Xie et al., 2014). However, these reforms do not
guarantee teachers will teach new curriculum documents using scientific inquiry. This
study showed that most teachers who enacted scientific inquiry in chemistry classrooms
had previously attended an inquiry-based PD program. With this, a school-based
continuing PD program that is inquiry-focused and that can offer potential solutions to
the challenges of implementing inquiry reform documents (e.g., lack of resources and
facilities, large classes) may be a promising approach and needed to establish in order to
support teachers to enact the reform documents as intended. In this case, it may be
helpful to develop a framework for an inquiry-focused PD, which can guide schools and
teacher training institutions in conducting an inquiry-focused PD program to help
teachers implement inquiry in classrooms. It can be inferred from the findings of this

268
study that a framework for an inquiry-focused PD may include these two
characteristics:
1. Incorporating improvisation into PD programs for science teachers.
Allowing teachers to develop improvised science teaching materials or equipment may
not be usually seen in a PD program. However, in this study, some teachers used
improvised equipment and locally available materials as substitutes for scientific
equipment and glassware to implement inquiry teaching despite the lack of facilities and
resources. With this, improvisation in science teaching may be worth including in the
framework of inquiry-focused PD for teachers, as this could be a viable solution for the
problem of limited teaching resources and equipment in schools to make inquiry
teaching possible in the classroom. The inclusion of improvisation into the features of
inquiry-focused PD may help develop teachers’ improvisation skills, which is also
important to address the challenges of teaching resources especially in rural schools
where scientific equipment and materials are not always available.
2. Supporting teachers in performing and learning about scientific inquiry.
Allowing teachers to perform scientific experiments during the PD program may help
them become familiar with the entirety of scientific inquiry practices and train them in
proper teaching of these practices in the classroom. This may also help teachers to be
more confident in incorporating other practices of inquiry into their teaching of science.
In addition to performing scientific experiments, it is important for teachers to learn the
aspects of scientific inquiry (e.g. Lederman et al., 2014; Schwartz et al., 2008), and
these aspects should be discussed with them explicitly during the PD program so that
they will be able to know the fundamental understanding about inquiry. These aspects
are important since they may serve as a foundation to properly conducting scientific

269
inquiry. Thus, it is also important for teachers to explicitly discuss these aspects with
their students.
The inquiry-focused PD framework may be a crucial component in a pre-tertiary
science education community especially now that many schools are advocating inquiry-
based science curriculum. This type of PD framework can be developed in accordance
with school context and governance, and in collaboration with science education
specialists and practicing scientists to capture the essence of scientific inquiry for
science teaching. Thus, it is important for education officials or school administrators to
be active in providing robust support in developing this kind of PD framework and in
creating means to provide substantial resources for teachers to implement the reform
documents the way they are intended to be implemented.
Implications for science curriculum development
This study showed that the practice of engaging in questioning in inquiry
teaching had a positive relationship with student learning. It is acknowledged that in
inquiry teaching teachers need to know how to ask good questions effectively.
However, it can be argued that in inquiry teaching it is also important that teachers
know how to engage their students in scientific questioning as this may start to develop
students’ scientific thinking and may encourage them to do investigation or research,
which may lead to further learning. With this, it is important for curriculum designers to
explicitly incorporate into the inquiry-based science documents the possible approaches
of how teachers can effectively teach students questioning skills such as how to develop
researchable questions for investigations or how to ask good scientific questions. This
may help teachers to be more productive in employing the practice of soliciting

270
questions from their students and at the same time may help students to stimulate their
thinking and understanding about the lesson.
Furthermore, the entirety of scientific inquiry process may be important to
consider in implementing an inquiry-based science curriculum. This means that aside
from focusing on one or two inquiry practices in teaching, teachers may also need to
consider other practices of inquiry that are appropriate in their lessons. Although the
practices of designing and conducting investigations, collecting data, analyzing data,
developing explanations, and communicating information showed no statistically
significant influence on student achievement, they may have benefits to other student
characteristics. With this, student skills for each of these inquiry practices that are
appropriate to the grade level and the possible approaches to deliver these skills may
also need to be explicitly incorporated into the curriculum so that teachers understand
how they will implement these inquiry practices in classrooms. In addition, it may be
helpful to specify in the curriculum documents the available improvised materials or
equipment necessary to teach a particular lesson so that teachers will have an alternative
solution for implementing inquiry approach in case resources are not available.
Implications for inquiry-based science teaching
Inquiry-based science education is commonly associated with an implicit
approach to teaching. However, enacting inquiry-based science reform documents in the
classroom is not all about implicit teaching where most of the time teachers allow
students to discover all information on their own in order for them to learn. It also
involves explicit teaching where the teachers can openly discuss and explain to the
students the fundamental concepts in science that they need to build a foundation for

271
learning. It can be inferred from the findings of this study that it is important for
teachers to explicitly explain to the students not only the fundamental concepts in
chemistry but also the different aspects of scientific inquiry so that they understand the
essence of scientific investigation. Learning these aspects of scientific inquiry may help
students perform the process of science properly. Focusing too much on an implicit
approach to inquiry teaching may cause students to misinterpret or misunderstand the
concepts or process and thus may lead to errant learning or misconceptions. With this, it
is important for teachers to have a mixture of implicit and explicit approaches to
enacting inquiry-based science documents so that efficient teaching and productive
learning are more likely to occur.
Implications for future research
In this study, a number of scientific inquiry practices showed no significant
impact on student achievement. It may be that these practices may have beneficial
effects on other student characteristics. Because of this, further explorations on the
influence of scientific inquiry practices on other student characteristics such as
creativity, critical thinking skills, or scientific disposition are worthwhile to perform.
This may provide a broader understanding of how scientific inquiry practices can affect
a variety of student outcomes. This study reported that contexts and resources are
crucial factors in the implementation of inquiry teaching practices in chemistry
classrooms. It provided an evidence-based documentation of specific teacher behaviors
in using scientific inquiry as a teaching approach in challenging teaching and learning
environments. However, the relationship between classroom contexts and resources and
the capacity of teachers to implement inquiry teaching practices was not investigated.

272
Further research on this aspect may provide empirical evidence on the impact of
contexts and resources on teachers’ capacity to implement inquiry teaching practices,
which may address anecdotal accounts about this from science educators. In addition,
further work on the influence of contexts and resources on the effectiveness of inquiry
teaching practices in learning can be undertaken to see what specific features of
classroom context or what degree of resourcing are needed for inquiry to be effective in
learning.
Limitations of the Study
In this study, only one covariate (student pretest scores) was included in the
statistical model to analyze the relationship between teachers’ scientific inquiry
practices and students’ chemistry learning. However, other factors associated with
schools, teachers, and students (e.g., resources, socioeconomic status, home
background, teacher content knowledge, teacher pedagogical content knowledge,
college preparation in chemistry) may influence student learning. Future multilevel
analyses should include these as covariates to provide a clearer view of the impact of
teachers’ scientific inquiry practices on students’ chemistry learning.
This study also used a multilevel modeling approach with a small number of
groups or classes to analyze relationships. Replicating the study with a larger number of
classes would illuminate further the relationships between the teacher practices of
scientific inquiry and student learning, allow for more robust findings, and support
generalizability to a broader population.
The analyses of the inter-rater agreement statistics for the validation of items
included in the Scientific Inquiry Teaching Observation Instrument (SITOI) were not

273
conducted in this study. Because only two people were available to conduct
observations and the number of joint observations was small, it was not possible to
analyze the inter-rater agreement of a small group of observers to determine if the
developed items in the instrument were used by the observers with the same
interpretation or understanding of the items. Use of a larger number of observers
conducting the same number of observations in the future will be necessary to establish
the inter-rater agreement statistics of the SITOI.
Finally, the study was conducted in a developing country. It provides insights
into the impact of inquiry practices on student learning, but also demonstrates that
contextual factors such as lack of classroom space or appropriate laboratory resources
may hinder teachers’ implementation of inquiry practices in the science classroom.
Further research that utilizes the SITIO in developed countries with smaller classes
sizes and more extensive resources will support our understanding of whether the
findings also apply in these contexts.

274
References
Abd-El-Khalick, F., & BouJaoude, S. (1997). An exploratory study of the knowledge
base for science teaching. Journal of Research in Science Teaching, 34(7),
673-699.
Abd-El-Khalick, F., BouJaoude, S., Duschl, R., Lederman, N. G., Mamlok-Naaman,
R., Hofstein, A.,…Tuan, H.-L. (2004). Inquiry in science education:
International perspectives. Science Education, 88, 397-419.
Achieve, Inc. (2013). The next generation science standards. Retrieved from
http://www.nextgenscience.org
Akerson, V. L., Abd-El-Khalick, F., & Lederman, N. G. (2000). Influence of a
reflective explicit activity-based approach on elementary teachers’ conceptions
of nature of science. Journal of Research in Science Teaching, 37(4), 295- 317.
Alozie, N. M., Moje, E. B., & Krajcik, J. S. (2010). An analysis of the supports and
constraints for scientific discussion in high school project-based science.
Science Education, 94(3), 395-427
American Association for the Advancement of Science. (1989). Science for all
Americans. Washington, DC: AAAS.
American Association for the Advancement of Science. (1993). Benchmarks for science
literacy. New York: Oxford University Press.
American Educational Research Association, American Psychological Association,
and National Council on Measurement in Education. (2014). Standards for
educational and psychological testing. Washington, DC.
275
Anderson, R. D. (2002). Reforming science teaching: What research says about
inquiry. Journal of Science Teacher Education, 13(1), 1-12.
Anderson, R. D. (2007). Inquiry as an organizing theme for science curricula. In S. K.
Abell & N. G. Lederman (Eds.), Handbook of research on science education
(pp. 807-830). Mahwah, NJ: Lawrence Erlbaum Associates.
Araujo, L., Saltelli, A., & Schnepf, S. (2017). Do PISA data justify PISA-based
education policy? International Journal of Comparative Education and
Development, 19(1), 1-17.
Areepattamannil, S. (2012). Effects of inquiry-based science instruction on science
achievement and interest in science: Evidence from Qatar. The Journal of
Educational Research, 105(2), 134-146.
Areepattamannil, S., & Khine, M. S. (2017). Evaluating the psychometric properties of
the original grit scale using Rasch analysis in an Arab adolescent sample.
Journal of Psychoeducational Assessment, 1-7. doi:
10.1177/0734282917719976
Arnold, M. E., Bourdeau, V. D., & Nott, B. D. (2013). Measuring science inquiry skills
in youth development programs: The science process skills inventory.
Journal of Youth Development, 8(1), 1-11.
Assessment, Curriculum and Technology Research Centre. (2014). Study assesses
delivery of science inquiry skills in K to 12 curriculum. Retrieved from
https://actrc.org/2014/08/27/study-assesses-delivery-of-science-inquiry-
skills-in-k-to-12-curriculum/
Atkin, J., & Karplus, R. (1962). Discovery of invention? Science Teacher, 29(5), 45-
47.

276
Australian Curriculum and Assessment Reporting Authority. (2014).
Foundation to year 10 curriculum. Retrieved from
http://www.australiancurriculum.edu.au/
Banilower, E. R. (2005). A study of the predictive validity of the LSC classroom
observation protocol. Retrieved from http:// www.horizon-
research.com/reports/2005/COP_validity.phprl
Barrow, L. H. (2006). A brief history of inquiry: From Dewey to standards. Journal of
Science Teacher Education, 17, 265-278.
Beese, J., & Liang, X. (2010). Do resources matter? PISA science achievement
comparisons between students in the United States, Canada, and Finland.
Improving Schools, 13, 266-279.
Bernardo, A. B. I., Limjap, A. A., Prudente, M. S., & Roleda L. S. (2008). Students’
perceptions of science classes in the Philippines. Asia Pacific Education Review,
9(3), 285-295.
Bevins, S., & Price, G. (2016). Reconceptualising inquiry in science education,
International Journal of Science Education, 38(1), 17-29. doi:
10.1080/09500693.2015.1124300
Biological Sciences Curriculum Study & International Business Machines. (1989). New
designs for elementary science and health: A cooperative project between
Biological Sciences Curriculum Study (BSCS) and International Business
Machines (IBM). Dubuque, IA: Kendall/Hunt Publishing.
Birnbaum, A. (1968). Some latent trait models. In F. M. Lord & M. R. Novick, (Eds.),
Statistical theories of mental test scores. Reading, MA: Addison-Wesley.

277
Bodzin, A. M., & Beerer, K. M. (2003). Promoting inquiry-based science instruction:
The validation of the science teacher inquiry rubric (STIR). Journal of
Elementary Science Education, 15(2), 39-49.
Boone, W. J., & Scantlebury, K. (2006). The role of Rasch analysis when conducting
science education research utilizing multiple-choice tests. Science Education,
90, 253–269.
Boone, W. J., Staver, J. R., & Yale, M. S. (2014). Rasch analysis in the human sciences.
NY: Springer.
Boone, W. J., Townsend, J. S., & Starver, J. (2010). Using Rasch theory to guide the
practice of survey development and survey data analysis in science education
and to inform science reform efforts: An exemplar utilizing STEBI self-efficacy
data. Science Education, 95(2), 258-280.
Bourdeau, V. D., & Arnold, M. E. (2009). The science process skills inventory.
Corvallis, OR: 4-H Youth Development Education: Oregon State University.
Brandon, P. R., Young, D. B., Pottenger, F. M., & Taum, A. K. (2009). The inquiry
science implementation scale: Development and applications. International
Journal of Science and Mathematics Education, 7(6), 1135-1147.
Bransford, J. D., Brown, A. L., & Cocking, R. R. (Eds.). (1999). How people learn:
Brain, mind, experience, and school. Washington, DC, US: National Academy
Press.
Bray, M., & Kobakhidze, M. N. (2014). Measurement issues in research on shadow
education: Challenges and pitfalls encountered in TIMSS and PISA.
Comparative Education Review, 58(4), 590-620.

278
Breakspear, S. (2012). The policy impact of PISA: An exploration of the mormative
effects of international benchmarking in school system performance (Working
Papers, No. 71). OECD Publishing. Retrieved from
http://dx.doi.org/10.1787/5k9fdfqffr28-en
Brown, P. L., Abell, S. K., Abdulkadir, D., & Schmidt, F. L. (2006). College science
teachers’ views of classroom inquiry. Science Education, 90, 784-802.
Bull, A., Gilbert, J., Barwick, H., Hipkins, R., & Baker, R. (2010). Inspired by
science. A paper commissioned by the Royal Society of New Zealand and the
Prime Minister’s Chief Science Advisor.
Burnett, S. M. I. (2010). Substantiating constructivism from a brain-based perspective.
International Journal of Interdisciplinary Social Sciences, 5(4), 145-153.
Bussiere, P., Knighton, T., & Pennock, D. (2007). Measuring up: Canadian results of
the OECD PISA study. The performance of Canada’s youth in science,
reading and mathematics—2006 first results for Canadians aged 15. Canada:
Human Resource and Social Development Canada and Council of Ministers of
Education.
Bybee, R. W. (2004). Scientific inquiry and science teaching. In L. B. Flick & N. G.
Lederman (Eds.), Scientific inquiry and nature of science: Implications for
teaching, learning and teacher education (pp. 1-12). Dordrecht: Kluwer
Academic Publishers.
Bybee, R. (2015). The BSCS 5E instructional sequence: Creating teachable moments.
USA: NSTA.
Bybee, R., & DeBoer, G. (1994). Research on goals for the science curriculum. In D.
Gabel (Ed.), Handbook on research on teaching and learning (pp. 357-387).

279
New York: Macmillan.
Bybee, R., McCrae, B., & Laurie, R. (2009). PISA 2006: An assessment of scientific
literacy. Journal of Research in Science Teaching, 46(8), 865-883.
Bybee, R. W., Taylor, J. A., Gardner, A., Van Scotter, P., Powell, J., Westbrook, A.,
& Landes, N. (2006). The BSCS 5E instructional model: Origins, effectiveness,
and applications. Colorado, CO: BSCS.
Capps, D. K., & Crawford, B. A. (2013). Inquiry-based instruction and teaching about
nature of science: Are they happening? Journal of Science Teacher Education,
24, 497-526.
Capps, D. K., Crawford, B. A., & Constas, M. A. (2012). A review of empirical
literature on inquiry professional development: Alignment with best practices
and a critique of the findings. Journal of Science Teacher Education, 23, 291-
318.
Care, E., & Griffin, P. (2011). Curriculum comparison study for the Philippines basic
education sector. Melbourne: Assessment Research Centre, The University of
Melbourne.
Carlson, K. D., & Herdman, A. O. (2012). Understanding the impact of convergent
validity on research results. Organizational Research Methods, 15(1), 17-32.
Carnoy, M., Khavenson, T., & Ivanova, A. (2015). Using TIMSS and PISA results to
inform educational policy: A study of Russia and its neighbors. Compare: A
Journal of Comparative and International Education, 45(2), 248-271.
Centurino, V. A. S., & Jones, L. R. (2017). TIMSS 2019 science framework. In I. V.
S. Mullis & M. O. Martin (Eds.), TIMSS 2019 assessment frameworks (pp.
27-55). Retrieved from http://timssandpirls.bc.edu/timss2019/frameworks/

280
Cheung, D. (2011). Teacher beliefs about implementing guided-inquiry laboratory
experiments for secondary school chemistry. Journal of Chemical Education,
88(11), 1462-1468.
Chiapetta, E. L. (2008). Historical development of teaching science as inquiry. In J.
Luft, R. L. Bell, & J. Gess-Newsome (Eds.), Science as inquiry in the secondary
setting. Arlington, VA: NSTA Press.
Chin, C. (2006). Classroom interaction in science: Teacher questioning and feedback
to students’ responses. International Journal of Science Education, 28(11),
1315-1346.
Chin, C. (2007). Teacher questioning in science classrooms: Approaches that
stimulate productive thinking. Journal of Research in Science Teaching,
44(6), 815-843.
Chin, C., & Osborne, J. (2008). Students’ questions: A potential resource for teaching
and learning science. Studies in Science Education, 44(1), 1-39.
Chin C., & Osborne, J. (2010). Supporting argumentation through students’ questions:
Case studies in science classrooms. Journal of the Learning Sciences, 19(2),
230-284.
Chinn, C. A., & Malhotra, B. A. (2002). Epistemologically authentic inquiry in
schools: A theoretical framework for evaluating inquiry tasks. Science
Education, 86:175-218.
Cohen, J. W. (1988). Statistical power analysis for the behavioral sciences (2nd ed).
Hillsdale, NJ: Lawrence Erlbaum Associates.
Crawford, B. A. (2000). Embracing the essence of inquiry: New roles for science
teachers. Journal of Research in Science Teaching, 37, 916-937.

281
Crawford, B. A. (2007). Learning to teach science as inquiry in the rough and tumble
of practice. Journal of Research in Science Teaching, 44(4), 613-642.
Crawford, B. A. (2012). Moving the essence of inquiry into the classroom: Engaging
teachers and students in authentic science. In K. C. D. Tan & M. Kim (Eds.),
Issues and challenges in science education research: Moving forward (pp.
25-41). Springer.
Crawford, B. A. (2014). From inquiry to scientific practices in the science classroom.
In N. G. Lederman & S. K. Abell (Eds.), Handbook of research on science
education (pp. 515-541). New York, NY: Rouledge.
Davis, K. (2003). “Change is hard”: What science teachers are telling us about reform
and teacher learning of innovative practices. Science Education, 87(1), 3-30.
DeBoer, G. E. (2001). A history of ideas in science education: Implications for
practice. New York: Teachers College Press.
DeBoer, G. E. (2004). Historical perspectives on inquiry teaching in schools. In L. B.
Flick & N. G. Lederman (Eds.), Scientific inquiry and nature of science:
Implications for teaching, learning and teacher education (pp. 17-35).
Dordrecht: Kluwer Academic Publishers.
de Mesa, A. P., & de Guzman, A. B. (2006). Portrait of Filipino teachers’ classroom
practices: Traditional or constructivist? Educational Research for Policy and
Practice, 5(3), 235-253.
Department of Basic Education. (2011). Curriculum and assessment policy statement:
Grades 10–12 physical sciences. Pretoria: Government Printer.
Department of Education. (2002). Revised national curriculum statement for grades
R-9. Pretoria: Government Printer.
282
Department of Education. (2002a). Operations handbook in science (secondary). Pasig
City, Philippines: Department of Education.
Department of Education. (2002b). The 2002 basic education curriculum. Pasig City,
Philippines: Department of Education.
Department of Education. (2012). Guidelines on the assessment and rating of
learning outcomes under the K to 12 basic education curriculum. Pasig City,
Philippines: Department of Education.
Department of Education. (2013a). K to 12 curriculum guide: Science grade 3 to grade
10. Pasig City, Philippines: Department of Education.
Department of Education. (2013b). The K to 12 basic education program. Pasig City,
Philippines: Department of Education.
Department of Education. (2016). K to 12 curriculum guide: Science grade 3 to grade
10. Pasig City, Philippines: Department of Education.
Dewey, J. (1910a). How we think. Chicago: Henry Regnery Company.
Dewey, J. (1910b). Science as subject matter and as method. Science, 121-127.
Dewey, J. (1938). Experience and education. New York: Macmillan.
DomNwachukwu, N. S., & DomNwachukwu, C. S. (2006). The effectiveness of
substituting locally available materials in teaching chemistry in Nigeria: A
case for science education in developing countries. School Science and
Mathematics, 106(7), 296-305.
Donnelly, D., O’Reilly, J., & McGarr, O. (2013). Enhancing the student experiment
experience: Visible scientific inquiry through a virtual chemistry laboratory.
Research in Science Education, 43, 1571-1592.
Driver, R., & Oldham, V. (1986). A constructivist approach to curriculum development

283
in science. Studies in Science Education, 13, 105–122.
Dudu, W. T., & Vhurumuku, E. (2012). Teachers’ practices of inquiry when teaching
investigations: A case study. Journal of Science Teacher Education, 23(6),
579-600.
Dunbar, K. (2001). What scientific thinking reveals about the nature of cognition. In
K. Crowley, C. Shunn, & T. Okada (Eds.), Designing for science: Implications
from everyday classroom and professional settings. Mahwah, NJ: Lawrence
Erlbaum Associations, Inc.
Duschl, R.A., & Grandy, R.E. (2008). Teaching scientific inquiry: Recommendations
for research and implementation. Rotterdam, The Netherlands: Sense.
Duschl, R., Schweingruber, H., & Shouse, A. (2007). Taking science to school:
Learning and teaching science in grades K-8. Washington, DC: National
Academies Press.
Dykstra, D. (2012). New themes in physics teaching: A personal retrospective.
European Journal of Physics Education, 3(4).
Eliot, C. (1898). Educational reform. New York: Collier.
Elmore, R. (1996). Getting to scale with good educational practice. Harvard
Educational Review, 66(1), 1-27.
Enders, C. K., & Tofighi, D. (2007). Centering predictor variables in cross-sectional
multilevel models: A new look at an old issue. Psychological Methods, 12(2),
121-138.
Fan, X. (1998). Item response theory and classical test theory: An empirical
comparison of their item/person statistics. Educational and Psychological
Measurement, 58(3), 357-381.

284
Fazelian, P., Ebrahim, A. N., & Soraghi, S. (2010). The effect of 5E instructional
design model on learning and retention of sciences for middle class students.
Procedia Social and Behavioral Sciences, 5,140-143.
Ferido, M., Robertson, P., Care, E., & Bustos, T. (2015). Progress of students through
the science curriculum: Focus on chemistry. Stage 1 Pre-Grade 7 Report.
Assessment, Curriculum and Technology Research Centre. Melbourne and
Manila.
Ferido, M., Robertson, P., Pavlovic, M., & Care, E. (2016). Progress of students
through the science curriculum: Focus on chemistry. Stage 2 Pre-Grade 8
report. Assessment, Curriculum and Technology Research Centre. Melbourne
and Manila.
Fitzgerald, M., Danaia, L., & McKinnon, D. H. (2017). Barriers inhibiting inquiry-
based science teaching and potential solutions: Perceptions of positively
inclined early adopters. Research in Science Education. doi: 10.1007/s11165-
017-9623-5
Flick, L. B., & Lederman, N. G. (2004). Scientific inquiry and nature of science:
Implications for teaching, learning, and teacher education. Dordrecht: Kluwer
Academic Publishers.
Fogleman, J., McNeill, K. L., & Krajcik, J. (2011). Examining the effect of teachers’
adaptations of a middle school science-oriented curriculum on student
learning. Journal of Research in Science Teaching, 48(2), 149-169.
Froese-Germain, B. (2010). The OECD, PISA and the impacts on educational policy.
Canada: Canadian Teachers’ Federation.
285
Furtak, E. M., Seidel, T., Iverson, H., & Briggs, D. C. (2012). Experimental and
quasi-experimental studies of inquiry-based science teaching: A meta-
analysis. Review of Educational Research, 82(3), 300-329.
Gaigher, E., Lederman, N., & Lederman, J. (2014). Knowledge about inquiry: A study
in South African high schools. International Journal of Science Education,
36(18), 3125-3147.
Garcia, E. A., & Tan, M. C. (2004). Project RISE report: Rescue initiatives for
science education. Manila: Department of Science and Technology, Science
Education Institute.
Garet, M., Porter, A., Desimone, L., Birman, B., & Yoon, K. (2001). What makes
professional development effective? Results from a national sample of
teachers. American Educational Research Journal, 38(4), 915–945.
Gelman, A., & Hill, J. (2007). Data analysis using regression and
multilevel/hierarchical models. New York, NY: Cambridge University Press.
Gilbert, J. K., & Treagust, D. F. (Eds.). (2009). Multiple representations in chemical
education. Dordrecht: Springer.
Goe, L., Bell, C., & Little, O. (2008). Approaches to evaluating teacher effectiveness:
A research synthesis. Washington, DC: National Comprehensive Center for
Teacher Quality.
Goldstein, H. (2011). Multilevel statistical models (4th ed.). Chichester, UK: Wiley.
Gordon, M. (2009). Toward a pragmatic discourse of constructivism: Reflections on
lessons from practice. Educational Studies, 45(1), 39-58.
Granger, E. M., Bevis, T. H., Saka, Y., Southerland, S. A., Sampson, V., & Tate, R.
L. (2012). The efficacy of student-centered instruction in supporting science
286
learning. Science, 338, 105-108.
Greene, B., O’Hair, M. J., Pedersen, J., Nanny, M., & O’Hair, H. (n.d.). Teacher
quality and student success: Testing the K20 science professional development
model (K20 science) for science teachers. Retrieved from
https://arc.uchicago.edu/reese/projects/teacher-quality-and-student-success-
testing-k20-science-professional-development-mode
Griffin, P. (1999). Item response modelling: An introduction to the Rasch Model.
Melbourne: ARC Services.
Grigg, K., & Manderson, L. (2016). The Australian racism, acceptance, and cultural-‐‑
ethnocentrism scale (RACES): Item response theory findings. International
Journal for Equity in Health, 15(1), 49. https://doi.org/10.1186/s12939-‐‑016-‐‑
0338-‐‑4.
Gutierez, S. B. (2015). Collaborative professional learning through lesson study:
Identifying the challenges of inquiry-based teaching. Issues in Educational
Research, 25(2), 118-134.
Hackling, M., Goodrum, D., & Rennie, L. J. (2001). The state of science in Australian
secondary schools. Australian Science Teachers’ Journal, 47(4), 6-17.
Hagay, G., & Baram-Tsabari, A. (2015). A strategy for incorporating students’
interest into high-school science classroom. Journal of Research in Science
Teaching, 52(7), 949-978.
Hakanen, A. T., & Lavonen, J. (2017). 7th grade students’ views of the scientific
inquiry. LUMAT International Journal on Math, Science and Technology
Education, 5(1), 23-40.
Halpin, P. F., & Kieffer, M. J. (2015). Describing profiles of instructional practice: A

287
new approach to analyzing classroom observation data. Educational Researcher,
44(5), 263-277.
Hamaker, E. L., & Klugkist, I. (2011). Bayesian estimation of multilevel models. In J.
J. Hox & J. K. Roberts (Eds.), Handbook of advanced multilevel analysis (pp.
137–161). New York, NY: Routledge.
Hambleton, R. K., & Jones, R. W. (1993). Comparison of classical test theory and
item response theory and their applications to test development. Educational
Measurement: Issues and Practice, 38-47.
Hanauer, D. I., Hatfull, G. F., & Jacobs-Sera, D. (2009). Active assessment:
Assessing scientific inquiry. In J. E. Bell (Ed.), Mentoring in academia and
industry (p.31). NY: Springer.
Haney, J. J., Lumpe, A. T., & Czerniak, C. M. (2003). Constructivist beliefs about the
science classroom learning environment: Perspectives from teachers,
administrators, parents, community members, and students. School Science &
Mathematics, 108(8), 366-377.
Harlen, W. (2007). The quality of learning: Assessment alternatives for primary
education. Primary Review Research Survey. Cambridge: University of
Cambridge Faculty of Education.
Hattie, J.A. (2003, October). Teachers make a difference: What is the research
evidence? Background paper to invited address presented at the 2003 ACER
Research Conference, Carlton Crest Hotel, Melbourne, Australia, October 19-
21, 2003.
Hayes, K. N., Lee, C. S., DiStefano, R., O’Connor, D., & Seitz, J. C. (2016).
Measuring science instructional practice: A survey tool for the age of NGSS.

288
Journal of Science Teacher Education, 27, 137-164.
Heath, B., Lakshmanan, A., Perlmutter, A., & Davis, L. (2010). Measuring the impact
of professional development on science teaching: a review of survey,
observation and interview protocols. International Journal of Research &
Method in Education, 33(1), 3-20.
Heinz, J., Enghag, M., Stuchlikova, I., Cakmakci, G., Peleg, R., & Baram-Tsabari, A.
(2017). Impact of initiatives to implement science inquiry: A comparative study
of the Turkish, Israeli, Swedish, and Czech science education systems. Cultural
Studies of Science Education. doi: 10.1007/s11422-015-9704-6
Heinz, J., Lipowsky, F., Groschner, A., & Seidel, T. (2012). Indicators and
instruments in the context of inquiry-based science education. Munster:
Waxmann.
Henson, K. T. (2003). Foundations for learner-centered education: A knowledge base.
Education, 124(1), 5-16.
Herron, M. D. (1971). The nature of scientific inquiry. School Review, 79(2), 171.
Holliday, W. G. (2004). A balanced approach to science inquiry teaching. In L. B.
Flick & N. G. Lederman (Eds.), Scientific inquiry and nature of science:
Implications for teaching, learning and teacher education (pp. 201-217).
Dordrecht: Kluwer Academic Publishers.
Horizon Research. (2000). Inside the classroom observation and analytic protocol.
Retrieved from http://www.horizon-research.com/inside-the-classroom-
observation-and-analytic-protocol
Hox, J. J. (2010). Multilevel analysis. Techniques and applications. New York, NY:
Routledge.
289
Hume, A., & Coll, R. (2010). Authentic student inquiry: The mismatch between the
intended curriculum and the student-experienced curriculum, Research in
Science & Technological Education, (28)1, 43-62.
Hurd, P. (1958). Science literacy: Its meaning for American schools. Educational
Leadership, 16, 13-16.
Huxley, T. (1899). Science and education. New York: Appleton.
Jackman, S. (2009). Bayesian analysis for the social sciences. Chichester, UK: Wiley.
Jadrich, J., & Bruxvoort, C. (2011). Learning & teaching scientific inquiry: Research
and applications. Arlington, VA: National Science Teachers Association Press.
James Long, S. C., & Bae, Y. (2018). Action research: First-year primary school
science teachers’ conceptions on and enactment of science inquiry in
Singapore. Asia-Pacific Science Education, 4(2), 1-20.
Jaramillo, J. A. (1996). Vygotsky’s sociocultural theory and contributions to the
development of the constructivist curricula. Education, 117(1), 133.
Jiang, F., & McComas, W. F. (2015). The effects of inquiry teaching on student
science achievement and attitudes: Evidence from propensity score analysis of
PISA data. International Journal of Science Education, 37(3), 554-576.
Johnson, D. W., Johnson, R. T., & Holubec, E. J. (1986). Circles of learning:
Cooperation in the classroom. Edina, MN: Interaction Books.
Jones, L. R., Wheeler, G., & Centurino, V. A. S. (2013). TIMSS 2015 science
frameworks. Boston: TIMSS & PIRLS International Study Center.
Kane, M. (2006). Content-related validity evidence in test development. In S. M.
Downing, & T. M. Haladyna (Eds.), Handbook of test development (pp.131-
153). NJ: Lawrence Erlbaum Associates.

290
Kang, N. H., Orgill, M. K., & Crippen, K. J. (2008). Understanding teachers’
conceptions of classroom inquiry with a teaching scenario survey instrument.
Journal of Science Teacher Education, 19, 337-354.
Kang, J., & Keinonen, T. (2016). Examining factors affecting implementation of
inquiry-based learning in Finland and South Korea. Problems of Education in
the 21st Centruy, 74, 31-48.
Karim, A. A., Shah, P. M., Din, R., Ahmad, M., & Lubis, M. A. (2014). Developing
information skills test for Malaysian youth students using Rasch analysis.
International Education Studies, 7(13), 112-122.
Karplus, R., & Their, H. D. (1967). A new look at elementary school science. Science
Curriculum Improvement Study. Chicago: Rand McNally.
Kazempour, M. (2009). Impact of inquiry-based professional development on core
conceptions and teaching practices: A case study. Science Educator, 18(2), 56-
68.
Kelly, G. J. (2013). Inquiry teaching and learning: Philosophical considerations. In M.
R. Matthews (ed.), Handbook of historical and philosophical studies in
science education. Springer.
Kennedy, D. (2013). The role of investigations in promoting inquiry-based science
education in Ireland. Science Education International, 24(3), 282-305.
Keys, C. W., & Kennedy, V. (1999). Understanding inquiry science teaching in
context: A case study of an elementary teacher. Journal of Science Teacher
Education, 10, 315-333.
Kim, H., Yoon, H., Lee, K., & Cho, H. (2010). Secondary science teachers’
perception of ‘free inquiry’ of the 2007 revised science curriculum. Secondary
291
Education Research, 58(3), 213-235.
Kim, M., & Tan, A. L. (2011). Rethinking difficulties of teaching inquiry-based
practical work: Stories from elementary pre-service teachers. International
Journal of Science Education, 33(4), 465-486.
Kim, M., Tan, A. L., & Talaue, F. T. (2013). New vision and challenges in inquiry-
based curriculum change in Singapore. International Journal of Science
Education, 35(2), 289-311.
Kirschner, P. A., Sweller, J., & Clark, R. E. (2006). Why minimal guidance during
instruction does not work: An analysis of the failure of constructivist,
discovery, problem-based, experiential, and inquiry-based teaching.
Educational Psychologist, 41, 75-86.
Klahr, D., & Nigam, M. (2004). The equivalence of learning paths in early science
instruction effects of direct instruction and discovery learning. Psychological
Science, 15(10), 661–667.
Knorr-Cetina, K. (1999). Epistemic cultures: How the sciences make knowledge.
Cambridge: Harvard University Press.
Koerber, S., Sodian, B., Thoermer, C., & Nett, U. (2005). Scientific reasoning in
young children: Preschoolers’ ability to evaluate covariation evidence. Swiss
Journal of Psychology, 64, 141–152.
Koksal, E. A., & Berberoglu, G. (2014). The effect of guided-inquiry instruction on
6th grade Turkish students’ achievement, science process skills, and attitudes
toward science. International Journal of Science Education, 36(1), 66-78.
Kuhn, T. S. (1996). The structure of scientific revolutions (third edition). University
of Chicago Press: Chicago.

292
Kuiper, W., Folmer, E., & Ottevanger, W. (2013). Aligning science curriculum
renewal efforts and assessment practices. In D. Corrigan, R. Gunstone, & A.
Jones (Eds.), Valuing assessment in science education: Pedagogy, curriculum,
policy (pp. 101-118). Dordrecht: Springer.
Kusnadi, K., Rustaman, N. Y., Redjeki, S., & Aryantha, I. N. P. (2017). Enhancing
scientific inquiry literacy of prospective biology teachers through inquiry lab
project in Microbiology. Journal of Physics: Conference Series, 895, 1-8.
Lavonen, J., & Laaksonen, S. (2009). Context of teaching and learning school science
in Finland: Reflections on PISA 2006 results. Journal of Research in Science
Teaching, 46(8), 922–944.
Lazonder, A. W., & Harmsen, R. (2016). Meta-analysis of inquiry-based learning:
Effects of guidance. Review of Educational Research, 86(3), 681-718.
Lederman, N. G. (1992). Students’ and teachers’ conceptions of the nature of science:
A review of the research. Journal of Research in Science Teaching, 29(4), 331–
359.
Lederman, N. G. (2004). Syntax of nature of science within inquiry and science
instruction. In L. B. Flick & N. G. Lederman (Eds.), Scientific inquiry and
nature of science: Implications for teaching, learning and teacher education
(pp. 301-317). Dordrecht: Kluwer Academic Publishers.
Lederman, N. G., & Lederman, J. S. (2004) Project ICAN: A professional development
project to promote teachers’ and students’ knowledge of nature of science and
scientific inquiry. In proceedings of the 11th annual SAARMSTE conference.
Cape Town, South Africa.
Lederman, N. G., Lederman, J. S., & Antink, A. (2013). Nature of science and

293
scientific inquiry as contexts for the learning of science and achievement of
scientific literacy. International Journal of Education in Mathematics, Science
and Technology, 1(3), 138-147.
Lederman, J. S., Lederman, N. G., Bartos, S. A., Bartels, S. L., Meyer, A. A., &
Schwartz, R. S. (2014). Meaningful assessment of learners’ understandings
about scientific inquiry—The views about scientific inquiry (VASI)
questionnaire. Journal of Research in Science Teaching, 51(1), 65-83.
LeFever, M., Malone, K. L., & Irving, K. I. (2018). Effect of participation in
modeling instruction in biology yearlong professional development.
Levitt, K. (2001). An analysis of elementary teachers’ beliefs regarding the teaching
and learning of science. Science Education, 86, 1–22.
Lew, L. Y. (2010). The use of constructivist teaching practices by four new secondary
school science teachers: A comparison of new teachers and experienced
constructivist teachers. Science Educator, 19(2), 10-21.
Liang, L. L., Chen, S., Chen, X., Kaya, O. S., Adams, A. D., Macklin, M., Ebenezer,
J. (2006, April). Student understanding of science and scientific inquiry
(SUSSI): Revision and further validation of an assessment instrument. Paper
presented at the annual conference of the National Association for Research in
Science Teaching (NARST), San Francisco, CA.
Lim, B. F., & Prudente, M. S. (2013). Drawing curriculum reform implications from
in-service teachers’ lived experiences of the 2010 SEC. Paper presented at the
Research Congress 2013. De La Salle University, Manila.
Lin, J.-L., Cheng, M.-F., Chang, Y.-C., Li, H-W., Chang, J.-Y., & Lin, D.-M. (2014).
Learning activities that combine science magic activities with the 5E

294
instructional model to influence secondary-school students’ attitudes to
science. Eurasia Journal of Mathematics, Science & Technology Education,
10(5), 415-426.
Linn, M. C., Davis, E. A., & Bell, P. (Eds.). (2004). Internet environments for science
education. Mahwah: Lawrence Erlbaum Associates Publishers.
Liu, O. L., Lee, H-S., & Linn, M. C. (2010). An investigation of teacher impact on
student inquiry science performance using a hierarchical linear model. Journal
of Research in Science Teaching, 47(7), 807-819.
Liu, X. (2010). Using and developing measurement instruments in science education:
A Rasch modeling approach. Charlotte, NC: Information Age.
Lotter, C., Harwood, W. S., & Bonner, J. J. (2007). The influence of core teaching
conceptions on teachers’ use of inquiry teaching practices. Journal of
Research in Science Teaching, 44(9), 1318-1347.
Lupton, M. (2014). Inquiry skills in the Australian curriculum v6: A birds-eye view.
Access, 28, 8–29.
MacDonald, P., & Paunonen, S. V. (2002). A monte carlo comparison of item and
person statistics based on item response theory versus classical test theory.
Educational and Psychological Measurement, 62(6), 921-943.
Magnusson, S., Krajcik, J., & Borko, H. (1999). Nature, sources and development of
pedagogical knowledge for science teaching. In J. Gess-Newson, & N. G.
Lederman (Eds.), Examining pedagogical knowledge, 95–132, Dordrecht:
Kluwer Academic Press.
Magnusson, S. J., & Palincsar, A. S. (1995). Learning environments as a site of
science education reform: An illustration using interdisciplinary guided

295
inquiry. Theory in Practice, 34(1), 43-50.
Magnusson, S. J., Palincsar, A. S., & Templin, M. (2004). Community, culture, and
conversation in inquiry-based science instruction. In L. B. Flick & N. G.
Lederman (Eds.), Scientific inquiry and nature of science: Implications for
teaching, learning and teacher education (pp. 131-155). Dordrecht: Kluwer
Academic Publishers.
Marshall, J. C., Horton, B., & Smart, J. (2009). 4E x 2 instructional model: Uniting
three learning constructs to improve praxis in science and mathematics
classrooms. Journal of Science Teacher Education, 20, 501-516.
Marshall, J. C., Smart, J. B., & Alston, D. M. (2016). Inquiry-based instruction: A
possible solution to improving student learning of both science concepts and
scientific practices. International Journal of Science and Mathematics
Education. doi:10.1007/s10763-016-9718-x
Marshall, J. C., Smart, J., & Horton, R. M. (2009). The design and validation of
EQUIP: An instrument to assess inquiry-based instruction. International
Journal of Science and Mathematics Education, 8, 299-321.
Martin, M. O., Mullis, I. V. S., & Froy, P. (2017). TIMSS 2019 assessment design.
In I. V. S. Mullis & M. O. Martin (Eds.), TIMSS 2019 assessment
frameworks (pp. 79-91). Retrieved from
http://timssandpirls.bc.edu/timss2019/frameworks/
McCaughan, K. (2013). Barrows' integration of cognitive and clinical psychology in
PBL tutor guidelines. Interdisciplinary Journal of Problem-Based Learning,
7(1), 10-23.
McLoughlin, E. (2011). Guide for developing ESTABLISH teaching and learning units.

296
DCU
McNeil, K. (2009). Teachers’ use of curriculum to support students in writing
scientific arguments to explain phenomena. Science Education, 93(2), 233-
268.
Mercer, N., & Howe, C. (2012). Explaining the dialogic processes of teaching and
learning: The value and potential of sociocultural theory. Learning, Culture
and Social Interaction, 1, 12-21.
Mereku, D. K., & Mereku, C. W. K. (2015). Congruence between the intended,
implemented, and attended ICT curricula in Sub-Saharan Africa. Canadian
Journal of Science, Mathematics and Technology Education, 15(1), 1-14.
Messick, S. (August, 1990). Validity of test interpretation and use. Research reports.
NJ: Educational Testing Service.
Ministry of Education. (1999). Curriculum outline for “Nature science and
living technology.” Taipei: Ministry of Education. (In Taiwanese)
Ministry of Education. (2007). Primary science syllabus. Singapore: Ministry of
Education.
Ministry of Education. (2007). Science Education Curriculum. Korea:
Ministry of Education.
Ministry of Education of the People ́s Republic of China. (2001). Compulsory
education curriculum experiment scheme. (In Chinese) Retrieved from
http://www.moe.gov.cn/publicfiles/business/htmlfiles/moe/s7054/201403/x
xgk_166076.html.
Minner, D., & DeLisi, J. (2012). Inquiring into science instruction observation
protocol (ISIOP). Education Development Center.

297
Minner, D. D., Levy, A. J., & Century, J. (2010). Inquiry-based science instruction-
What is it and does it matter? Results from a research synthesis years 1984-
2002. Journal of Research in Science Teaching, 47(4), 474-496.
Minstrell, J., & van Zee, E. H. (2000). Inquiring into inquiry learning and teaching in
science. Washington, DC: American Association for the Advancement of
Science.
Moorman, R. H., & Podsakoff, P. M. (1992). A meta-analytic review and empirical
test of the potential confounding effects of social desirability response sets in
organizational behaviour research. Journal of Occupational and
Organizational Psychology, 65(2), 131–149.
Montebon, D. R. (2014). K-12 science program in the Philippines: student perception
on its implementation. International Journal of Education and Research,
2(12).
Mullis, I. V. S. (2017). Introduction. In I. V. S. Mullis & M. O. Martin (Eds.), TIMSS
2019 assessment frameworks (pp. 1-10). Retrieved from
http://timssandpirls.bc.edu/timss2019/frameworks/
Mullis, I.V.S., Martin, M.O., Goh, S., & Cotter, K. (Eds.). (2016). TIMSS 2015
encyclopedia: Education policy and curriculum in mathematics and science.
Retrieved from http://timssandpirls.bc.edu/timss2015/encyclopedia/
Mumba, F., Chabalengula, V. M., & Hunter, W. (2007). Inquiry levels and skills in
Zambian high school chemistry syllabus, textbooks and practical
examinations. Journal of Baltic Science Education, 6(2), 50-57.
Mupira, P., & Ramnarain, U. (2018). The effect of inquiry-based learning on the
achievement goal-orientation of grade 10 physical sciences learners at
298
township schools in South Africa. Journal of Research in Science Teaching.
doi: 10.1002/tea.21440.
Muthén, L. K., & Muthén, B. O. (2016). Mplus user’s guide. Seventh Edition. Los
Angeles, CA: Muthén & Muthén.
Muthen, B. O., & Satorra, A. (1995). Complex ample data in structural equation
modeling. In P. V. Marsden (Ed.), Socio-logical methodology (pp. 267–316).
Washington, DC: American Sociological Association.
Nadelson, L. S., Seifert, A., Moll, A. J., & Coats, B. (2012). i-STEM summer
institute: An integrated approach to teacher professional development in
STEM. Journal of STEM Education, 13(2), 69-83.
National Academies. (2013 April 10). National Research Council framework leads to
development of next generation science standards. Retrieved from
Academieshttp://www8.nationalacademies.org/onpinews/newsitem.aspx?
Record ID=05102013
National Council of Teachers of Mathematics. (1989). Curriculum and
evaluation standards for school mathematics. Reston, VA: NCTM.
National Council of Teachers of Mathematics. (1991). Professional
standards for teaching mathematics. Reston, VA: NCTM.
National Council of Teachers of Mathematics. (1995). Assessment standards for
school mathematics. Reston, VA: NCTM.
National Research Council. (1996). National science education standards.
Washington, DC: The National Academy Press.
National Research Council. (2000). Inquiry and the national science education
standards: A guide for teaching and learning. Washington, DC: The National

299
Academy Press.
National Research Council. (2002). Scientific research in education. Committee on
Scientific Principles for Education Research. Shavelson, R. J. & Towne, L.,
(Eds.). Center for Education. Division of Behavioral and Social Sciences and
Education. Washington, DC: National Academy Press.
National Research Council. (2012). A framework for K-12 science education:
Practices, crosscutting concepts, and core ideas. Washington, DC: The
National Academy Press.
National Science Teachers Association. (2017 November). About the next generation
science standards. Retrieved from http://ngss.nsta.org/About.aspx
Ndirangu, M., Kathuri, N. J., & Mungai, C. (2003). Improvisation as a strategy for
providing science teaching resources: An experience from Kenya. International
Journal of Educational Development, 23, 75-84.
Nguyen, C., & Griffin, P. (2010). Factors influencing student achievement in Vietnam.
Procedia Social and Behavioral Sciences, 2, 1871-1877.
Nilsen, T. (2015). Trends in physics competence: Using TIMSS for in-depth studies
to characterize Norwegian students’ physics competence and factors
influencing and explaining changes in this competence. Nordina: Nordic
Studies in Science Education, 11(3), 315.
Norris, S. P., & Phillips, L. M. (2003). How literacy in its fundamental sense is
central to scientific literacy. Science Education, 87(2), 224–240.
Ødegaard, M., Haug, B., Mork, S. M., & Sørvik, G. O. (2014). Challenges and
support when teaching science through an integrated inquiry and literacy
300
approach. International Journal of Science Education, 36(18), 2997-3020.
doi:10.1080/09500693.2014.942719
O’Dwyer, L. M., Wang, Y., & Shields, K. A. (2015). Teaching for conceptual
understanding: A cross-national comparison of the relationship between
teachers’ instructional practices and student achievement in mathematics.
Large-scale Assessments in Education, 3(1), 1-30.
Opara, F., & Waswa, P. (2013). Enhancing students’ achievement in chemistry
through the Piagetian model: The learning cycle. International Journal for
Cross-Disciplinary Subjects in Education, 4(4), 1270-1278.
Organisation for Economic Co-operation and Development. (2012). The PISA 2015
assessment framework: Key competencies in reading, mathematics and
science. Retrieved from
www.oecd.org/pisa/pisaproducts/pisa2015draftframeworks.htm
Organisation for Economic Co-operation and Development. (2017). PISA 2015 science
framework in PISA 2015 assessment and analytic framework: Science, reading,
mathematic, financial literacy and collaborative problem solving. Paris: OECD
Publishing.
Organisation for Economic and Co-operation and Development. (2018). What is PISA?
Retrieved from http://www.oecd.org/pisa/aboutpisa/
Orgill, M., & Thomas, M. (2007). Analogies and the 5E model. Science Teacher,
74(1), 40-45.
Osborne, J. (2014). Scientific practices and inquiry in the science classroom. In N. G.
Lederman & S. K. Abell (Eds.), Handbook of research on science education
(pp. 579-599). New York, NY: Rouledge.
301
Osborne, J., Collins, S., Ratcliffe, M., Millar, R., & Duschl, R. (2003). What “ideas-
about-science” should be taught in school science? A Delphi study of the
expert community. Journal of Research in Science Teaching, 40(7), 692-720.
Osborne, J., Simon, S., Christodoulou, A., Howell-Richardson, C., & Richardson, K.
(2013). Learning to argue: A study of four schools and their attempt to
develop the use of argumentation as a common instructional practice and its
impact on students. Journal of Research in Science Teaching, 50(3), 315-347.
Palincsar, A. S., Collins, K. M., Marano, N. L., & Magnusson, S. J. (2000).
Investigating the engagement and learning of students with learning
disabilities in guided inquiry science teaching. Language, Speech, and
Hearing Services, 31, 240-251.
Pantzare, A. L. (2015). Interrater reliability in large-scale assessments—Can teachers
score national tests reliably without external controls? Practical Assessment,
Research & Evaluation, 20(9), 1-14.
Park, J., & Lee, K. (2011). Actual conditions of free inquiry implementation and the
perceptions of teachers and students in middle school science. Journal of
Research in Curriculum & Instruction, 15(3), 603-632.
Park Rogers, M. A., & Abell, S. K. (2008). The design, enactment, and experience of
inquiry-based instruction in undergraduate science education: A case study.
Science Education, 92, 591-607.
Pavlovic, M. (2017). Impact of item parameter drift on student ability estimates and the
implications for teacher ability to target instruction (Unpublished doctoral
dissertation). The University of Melbourne, Australia.
Pearl, C. E., Vasquez, E., Marino, M. T., Wienke, W., Donehower, C., Gourwitz, J.,...

302
Duerr, S. R. (2018). Establishing content validity of the quality indicators for
classrooms serving students with autism spectrum disorders instrument. Teacher
Education and Special Education, 41(1), 58-69.
Pellegrino, J. W., Wilson, M., Koenig, J. A., & Beatty, A. S. (Eds).
(2014). Developing assessments for the next generation science
standards. Report of the Committee on Developing Assessments of Science
Proficiency in K-12. Washington DC: National Academies Press.
Penuel, W. R., Harris, C. J., & DeBarger, H. A. (2015). Implementing the next
generation science standards. Phi Delta Kappan, 96(6), 45-49.
Phaeton, M. J., & Stears, M. (2017). Exploring the alignment of the intended and
implemented curriculum through teachers’ interpretation: A case study of A-
level biology practical work. EURASIA Journal of Mathematics, Science and
Technology Education, 13(3), 723-740.
Phillipson, S. N., & Tse, A. K. (2007). Discovering patterns of achievement in Hong
Kong students: An application of the Rasch measurement model. High Ability
Studies, 18(2), 173-190.
Piaget, J. (1954). The construction of reality in the child (M. Cook, Trans.). New
York: Basic Books.
Piaget, J., & Garcia, R. (1989). Psychogenesis and the history of science (H. Feider,
Trans.). New York: Columbia University Press. (Original work published 1983.)
Piekny, J., Gruber, D., & Maehler, C. (2014). The development of experimentation
and evidence evaluation skills at preschool age. International Journal of
Science Education, 36, 334–354.
Piekny, J., & Maehler, C. (2013). Scientific reasoning in early and middle childhood:

303
The development of domain-general evidence evaluation, experimentation,
and hypothesis generation skills. British Journal of Developmental Psychology,
31, 153–179.
Pine, J., Aschbacher, P., Roth, E., Jones, M., McPhee, C., Martin, C.,…Foley, B.
(2006). Fifth graders’ science inquiry abilities: A comparative study of
students in hands-on and textbook curricula. Journal of Research in Science
Teaching, 43(5), 467–484.
Platz, D., & Arellano, J. (2011). "Time tested early childhood theories and practices."
Education, 132(1).
Poon, C. L., Lee, Y. J., Tan, A. L., & Lim, S. (2012). Knowing inquiry as practice and
theory: Developing a pedagogical framework with elementary school teachers.
Research in Science Education, 42, 303-327.
Poppe, N., Markic, S., & Eilks, I. (2010). Low cost experimental techniques for
science education: A guide for science teachers. Bremen: University of
Bremen.
Putra, M. I. S., Widodo, W., & Jatmiko, B. (2016). The development of guided
inquiry science learning materials to improve science literacy skill of
prospective MI teachers. Jurnal Pendidikan IPA Indonesia, 83-93.
Quigley, C., Marshall, J. C., Deaton, C. C. M., Cook, M. P., & Padilla, M. (2011).
Challenges to inquiry teaching and suggestions for how to meet them. Science
Educator, 20(1), 55-61.
Ramnarain, U. D. (2014). Teachers’ perceptions of inquiry-based learning in urban,
suburban, township and rural high schools: The context-specificity of science

304
curriculum implementation in South Africa. Teaching and Teacher Education,
38, 65-75.
Ramnarain, U. D. (2016). Understanding the influence of intrinsic and extrinsic
factors on inquiry-based science education at township schools in South
Africa. Journal of Research in Science Teaching, 53(4), 598-619.
Rasch, G. (1960). Probabilistic models for some intelligence and attainment tests.
Danish Institute for Educational Research, Copenhagen.
Raudenbush, S. W., & Bryk, A. S. (2002). Hierarchical linear models: Applications
and data analysis methods (2nd ed.). Thousand Oaks, CA: Sage.
Rautalin, M., & Alasuutari, P. (2009). The uses of the national PISA results by
Finnish officials in central government. Journal of Education Policy, 24(5),
539-556.
Reeves, T. D., & Marbach-Ad, G. (2016). Contemporary test validity in theory and
practice: A primer for discipline-based education researchers. CBE—Life Sciences
Education, 15, 1-9.
Rivera Maulucci, M. S., Brown, B. A., Grey, S. T., & Sullivan, S. (2014). Urban
middle school students’ reflections on authentic science inquiry. Journal of
Research in Science Teaching, 51(9), 1119-1149.
Ropohl, M., Ronnebeck, S., Bernholt, S., & Koller, O. (2013). A definition of inquiry-
based STM education and tools for measuring the degree of IBE (Report No.
D 2.5). Retrieved from: http://www.assistme.ku.dk
Rundgren, C.-J. (2017). Implementation of inquiry-based science education in
different countries: Some reflections. Cultural Studies of Science Education.
doi: 10.1007/s11422-016-9787-8

305
Rutherford, F. J. (1964). The role of inquiry in science teaching. Journal of Research
in Science Teaching, 2(2), 80-84.
Saad, R., & BouJaoude, S. (2012). The relationship between teachers’ knowledge and
beliefs about science and inquiry and their classroom practices. Eurasia
Journal of Mathematics, Science & Technology Education, 8(2), 113-128.
Sadeh, I., & Zion, M. (2009). The development of dynamic inquiry performances
within an open inquiry setting: A comparison to guided inquiry setting.
Journal of Research in Science Teaching, 46(10), 1137-1160.
Saglam, M. K., & Sahin, M. (2017). Inquiry-based professional development
practices for science teachers. Journal of Turkish Science Education, 14(4),
66-76.
Sampson, V. (2004). The science management observation protocol. The Science
Teacher, 71(10), 30-33.
Samuel, D. F., & Ogunkola, B. J. (2013). St. Lucian elementary school teachers’
applicability beliefs and beliefs about science teaching and learning:
Relevance to their level of inquiry-based instructional practices in science.
International Education Studies, 6(7), 48-65.
Sanosa, M. E. (2013). Implementation of K to 12 curriculum program among grade 7
science teachers in Eastern Visayas. Journal of Society & Technology, 3, 37-
44.
Savasci, F., & Berlin, D. (2012). Science teacher beliefs and classroom practice
related to constructivism in different school settings. Journal of Science
Teacher Education, 23(1), 65-86.
306
Sawada, D., Piburn, M., Falconer, K., Turley, J., Benford, R., & Bloom, I. (2000).
Reformed teaching observation protocol (RTOP) (Technical Report No. IN00-
01): Arizona State University. Document Number.
Sawada, D., Piburn, M. D., Judson, E., Turley, J., Falconer, K., Benford, R., &
Bloom, I. (2002). Measuring reform practices in science and mathematics
classrooms: The reformed teaching observation protocol. School Science and
Mathematics, 102(6), 245-253.
Schmidt, W. H., McKnight, C. C., & Raizen, S. (1997). A splintered vision: An
investigation of U.S. science and mathematics education. U.S. National
Research Center for the Third International Mathematics and Science Study.
Boston, MA: Kluwer Academic.
Schneider, R. M., & Krajcik, J. (2002). Supporting science teacher learning: The role
of educative curriculum materials. Journal of Science Teacher Education,
13(3), 221–245.
Schneider, R. M., Krajcik, J., & Blumenfeld, P. (2005). Enacting reform-based
science materials: The range of teacher enactments in reform classrooms.
Journal of Research in Science Teaching, 42(3), 283-312.
Schroeder, C., Scott, T., Tolson, H., Huang, T.-Y., & Lee, Y.-H. (2007). A meta-
analysis of national research: Effects of teaching strategies on student
achievement in science in the United States. Journal of Research in Science
Teaching, 44(10), 1136-1160.
Schwab, J. J. (1962). The teaching of science as enquiry. In J. Schwab & P.
Brandwein (Eds.), The teaching of science (pp. 1-103). Cambridge, MA:
Harvard University Press.

307
Schwab, J. J., & Brandwein, P. F. (1962). The teaching of science. Cambridge, MA:
Harvard University Press.
Schwartz, R. S., Lederman, N., Khishfe, R., Lederman, J. S., Matthews, L., & Liu, S.,
(2002). Explicit-reflective instructional attention to nature of science and
scientific inquiry: Impact on student learning. In paper presented at the 2002
annual international conference of the association for the education of
teachers in science. Charlotte, NC.
Schwartz, R. S., Lederman, N., & Lederman, J., (2008). An instrument to assess views
of scientific inquiry: The VOSI questionnaire. In paper presented at the
international conference of the National Association for Research in Science
Teaching (NARST). Baltimore,MD.
Schwarz, C. V., & Gwekwerere, Y. N. (2007). Using a guided inquiry and modeling
instructional framework (EIMA) to support pre-service K-8 science teaching.
Science Education, 91, 158–186.
Science Education Institute-Department of Science and Technology. (2009). SEI annual
report 2009. Taguig City, Philippines: SEI.
Science Education Institute-Department of Science and Technology & University of
the Philippines National Institute for Science and Mathematics Education
Development. (2011a). Framework for Philippine science teacher education.
Manila: DOST.
Science Education Institute-Department of Science and Technology & University of
the Philippines National Institute for Science and Mathematics Education
Development. (2011b). Science framework for Philippine basic education.
Manila: DOST.

308
Secker, C. V. (2002). Effects of inquiry-based teacher practices on science excellence
and equity. The Journal of Educational Research, 95(3), 151-160.
Sen, S., & Oskay, O. O. (2017). The effects of 5E inquiry learning activities on
achievement and attitude toward chemistry. Journal of Education and
Learning, 6(1), 1-9.
Sethole, G. (2004). Meaningful context or dead mock reality: Which form will the
everyday take? Pythagoras, 59, 18–25.
Sherin, M. G., & Drake, C. (2009). Curriculum strategy framework: Investigating
patterns in teachers’ use of a reform-based elementary mathematics
curriculum. Journal of Curriculum Studies, 41(4), 467-500.
Shulman, L. S. (1987). Knowledge and teaching: Foundations of the new reform.
Harvard Educational Review, 57, 1– 22.
Skamp, K. (2018). Constructivist views of learning and teaching science. In Skamp, K.
& Preston, C. (Eds.). Teaching primary science constructively (pp.28-66).
Melbourne: Cengage.
Smith, M. K., Jones, F. H. M., Gilbert, S. L., & Wieman, C. E. (2013). The classroom
observation protocol for undergraduate STEM (COPUS): A new instrument to
characterize university STEM classroom practices. CBE-Life Sciences
Education, 12, 618-627.
Smith, L., & Southerland, S. (2007). Reforming practice or modifying reforms?
Elementary teachers’ response to the tools of reform. Journal of Research in
Science Teaching, 44(3), 396–423.
Smolleck, L. A., & Yoder, E. P. (2008). Further development and validation of the
teaching science as inquiry (TSI) instrument. School Science and

309
Mathematics, 108(7), 291-297.
Smolleck, L. D., Zembal-Saul, C., & Yoder, E. P. (2006). The development and
validation of an instrument to measure preservice teachers’ self-efficacy in
regard to the teaching of science as inquiry. Journal of Science Teacher
Education, 17, 137-163.
Snijders, T. A. B., & Bosker, R. J. (2012). Multilevel analysis: An introduction to basic
and advanced multilevel modeling (2nd ed.). Los Angeles, CA: Sage
Publications.
Soomro, A. Q., Qaisrani, M. N., & Uqaili, M. A. (2011). Measuring students’attitudes
towards learning physics: Experimental research. Australian Journal of Basic
and Applied Sciences, 5(11), 2282-2288.
Sondergeld, T. A., & Johnson, C. C. (2014). Using Rasch measurement for the
development and use of affective assessments in science education research.
Science Education, 98, 581-613.
Southeast Asian Ministers of Education Organization-Regional Center for Education
Innovation and Technology. (2012). K to 12 toolkit: Resource guide for teacher
educators, school administrators, and teachers. Quezon City: SEAMEO-
INNOTECH.
Southeast Asian Ministers of Education Organization-Regional Center for Education
Innovation and Technology. (2015). Philippine education for all 2015 review
report. Quezon City: SEAMEO-INNOTECH.
Southerland, S. A., Granger, E. M., Hughes, R., Enderle, P., Ke, F., Roseler,
K.,…Tekkumru-Kisa, M. (2016). Essential aspects of science teacher

310
professional development: Making research participation instructionally
effective. AERA Open, 2(1), 1-16.
Spencer, H. (1864). Education: Intellectual, moral, and physical. New York:
Appleton.
Squires, D. (2012). Curriculum alignment research suggests that alignment can
improve student achievement. The Clearing House: A Journal of Educational
Strategies, Issues and Ideas, 85(4), 129-135.
Swaminathan, H., & Rogers, H. J. (2008). Estimation procedures for hierarchical
linear models. In A. A. O’Connell & D. B. McCoach (Eds.), Multilevel
modeling of educational data (pp. 469–519). Charlotte, NC: Information Age.
Taber, K. S. (2010). Paying lip-service to research?: The adoption of a constructivist
perspective to inform science teaching in the English curriculum context. The
Curriculum Journal, 21(1), 25–45.
Taber, K. S. (2011). Inquiry teaching, constructivist instruction and effective
pedagogy. Teacher Development, 15(2), 257-264.
Taylor, T. H. (2012). Ceiling effect. In N. J. Salkind (Ed.), Encyclopedia of research
design (pp. 133-134). Thousand Oaks: SAGE Publications, Inc.
Thijs, A., & van den Akker, J. (Eds.). (2009). Curriculum in development. Enschede,
Netherlands: SLO– Netherlands Institute for Curriculum Development.
Thurstone, L. L. (1928). Attitudes can be measured. American Journal of Sociology, 33,
529–554.
Topcu, M. S., Erbilgin, E., & Arikan, S. (2016). Factors predicting Turkish and
Korean students’ science and mathematics achievement in TIMSS 2011.
Eurasia Journal of Mathematics, Science and Technology Education, 12(7),

311
1711-1737.
Toulmin, S. (1958). The uses of argument. Cambridge, England: Cambridge
University Press.
Trautmann, N., MaKinster, J., & Avery, L. (2004). What makes inquiry so hard? (and
why is it worth it?). Proceedings of the National Association for Research in
Science Teaching (NARST) 2004 Annual Meeting. Vancouver, BC, Canada.
Treagust, D. F., & Tsui, C. Y. (2014). General instructional methods and strategies. In
N. G. Lederman & S. K. Abell (Eds.), Handbook of research on science
education, Volume 2 (pp. 303-320). New York: Rouledge.
Tsou, J. Y. (2006). Genetic epistemology and Piaget’s philosophy of science. Theory
and Psychology, 16(2), 203-224.
Tuan, H.-L., Chin, C.-H., Tsai, C.-C., & Cheng, S.-F. (2005). Investigating the
effectiveness of inquiry instruction on the motivation of different learning styles
students. International Journal of Science and Mathematics Education, 3, 541-
566.
Turner, R. (2009). PISA: An introduction and overview. In R. Bybee & B. McCrae
(Eds.), PISA science 2006. Implications for science teachers and teaching.
Arlington, VA: NSTA Press.
Tytler, R. (2007). Re-imagining science education: Engaging students in science for
Australia’s future. Australian Education Review. Victoria: ACER.
Ültanir, E. (2012). An epistemological glance at the constructivist approach:
Constructivist learning in Dewey, Piaget, and Montessori. International
Journal of Instruction, 5(2), 195- 212.
Unal, G., & Akpinar, E. (2006). To what extent science teachers are constructivist in

312
their classrooms? Journal of Baltic Science Education, 10, 40-50.
UP NISMED, DOST, & DepEd. (2010). Raising the bar for science teacher: Proposed
framework for science teacher education with standards of performance.
Manila: DOST.
UP NISMED & Foundation for the Promotion of Science and Mathematics Education
and Research. (2001). One hundred years of science and mathematics education
in the Philippines. Quezon City: UP NISMED.
van den Akker, J. (2003). The science curriculum: Between ideals and outcomes. In B.
J. Fraser & K. G. Tobin (Eds.), International handbook of science education
(pp. 421–449). Dordrecht: Kluwer Academic Publishers.
van den Akker, J. (2010). Curriculum perspectives: An introduction. In J. van den
Akker, W. Kuiper, & U. Hameyer (Eds.), Curriculum landscapes and trends
(pp. 1–10). London: Kluwer Academic.
van Driel, J. H., Beijaard, D., & Verloop, N. (2001). Professional development and
reform in science education: The role of teachers’ practical knowledge.
Journal of Research in Science Teaching, 38, 137-158.
van Rens, L., Pilot, A., & van der Schee. (2010). A framework for teaching scientific
inquiry in upper secondary school chemistry. Journal of Research in Science
Teaching, 47(7), 788-806.
Varma, K. (2014). Supporting scientific experimentation and reasoning in young ele-
mentary school students. Journal of Science Education and Technology, 23,
381– 397.
Varma, K., Husic, F., & Linn, M. C. (2008). Targeted support for using technology-
enhanced science inquiry modules. Journal of Science Education and
313
Technology, 17(4), 341–356.
Vlassi, M., & Karaliota, A. (2013). The comparison between guided inquiry and
traditional teaching method: A case study for the teaching of the structure of
matter to 8th grade Greek students. Procedia – Social and Behavioral
Sciences, 93, 494-497.
Vygotsky, L. (1978). Mind in society: The development of higher psychological
processes. Cambridge, MA: Harvard.
Wagh, A., Cook-Whitt, K., & Wilensky, U. (2017). Bridging inquiry-based science
and constructionism: Exploring the alignment between students tinkering with
code of computational models and goals of inquiry. Journal of Research in
Science Teaching, 54(5), 615-641.
Walker, T. M., Spencer, T., Claiborne-Payton, S., & Whiteman, L. (2017). Putting
theory into practice: An examination of preservice teachers’ beliefs about
teaching science. International Journal for Cross-Disciplinary Subjects in
Education, 8(3), 3151-3159.
Wallace, C. S., & Kang, N. H. (2004). An investigation of experienced secondary
science teachers’ beliefs about inquiry: An examination of competing belief
sets. Journal of Research in Science Teaching, 41(9), 936-960.
Wang, J. (2011). Re-examining test item issues in the TIMSS mathematics and
science assessments. School Science and Mathematics, 111(7), 334-344.
Wang, P.-H., Wu, P.-L., Wu, H.-J., & Tseng, S.-F. (2014). Qualitative research on the
implementation of inquiry-based instruction. Journal of Modern Education
Review, 4(2), 112-118.
Wellington, J. (2000). Teaching and learning secondary science. London: Routledge.

314
Wenning, C. J. (2007). Assessing inquiry skills as a component of scientific literacy.
Journal of Physics Teacher Education Online, 4(2), 21-24.
Williams, R. (1973). Base and superstructure in marxist cultural theory. New Left
Review, 82, 3–16.
Williams, A., Ferido, M., & Metila, R. (2013). Position paper on curriculum:
Executive summary. Manila: ACTRC.
Wilson, M., & Sloane, K. (2000). From principles to practice: An embedded
assessment system. Applied Measurement in Education, 13(2), 181-208.
Wilson, C. D., Taylor, J. A., Kowalski, S. M., & Carlson, J. (2010). The relative
effects and equity of inquiry-based and commonplace science teaching on
students’ knowledge, reasoning, and argumentation. Journal of Research in
Science Teaching, 47(3), 276-301.
Windschitl, M. (2004). Folk theories of “inquiry:” How preservice teachers reproduce
the discourse and practices of a theoretical scientific method. Journal of
Research in Science Teaching, 41(5), 481-512.
Wright, B. D. (1992). IRT in the 1990s: Which models work best? Rasch Measurement
Transactions, 6 (1), 196–200.
Wright, B. D. (1977). Solving measurement problems with the Rasch model. Journal
of Educational Measurement, 14(2), 97-116.
Wright, B. D., & Linacre, J. M. (1994). Reasonable mean-square fit values. Rasch
Measurement Transactions, 8 (3), 370.
Wright, B. D., & Stone, M. H. (1979). Best test design Rasch measurement. Chicago:
MESA Press.
Wu, M. L., Adams, R. J., & Wilson, M. R. (2007). ACER ConQuest version 2.0:

315
Generalized item response modelling software. Camberwell: ACER Press.
Wu, M. L., Hak, P. T., & Tsung-Hau, J. (2016). Educational measurement for applied
researchers. Singapore: Springer.
Wu, H.-K., & Hsieh, C.-E. (2006). Developing sixth graders’ inquiry skills to
construct explanations in inquiry-based learning environment. International
Journal of Science Education, 28(11), 1289-1313.
Xie, M., Talin, R., & Sharif, S. (2014). The relationship between teachers’
knowledge, attitude and belief with the implementation of inquiry-based
learning in Zhengzhou, China. International Journal of Learning, Teaching
and Educational Research, 8(1), 149-161.
Yager, R. (2000). The history and future of science education reform. The Clearing
House, 74(1), 51-54.
Yang, I.-H., Park, S.-W., Shin, J.-Y., & Lim, S.-M. (2017). Exploring Korean middle
school students’ view about scientific inquiry. EURASIA Journal of
Mathematics, Science and Technology Education, 13(7), 3935-3958.
Yang, L.-L., Soprano, K., & McAllister, M. (2012). What are elementary and middle
school students expected to learn about the sun and moon in Taiwan and the
US? Science Education International, 23(3), 241-267.
Yang, Y., He, P., & Liu, X. (2017). Validation of an instrument for measuring students’
understanding of interdisciplinary science in grades 4-‐‑8 over multiple semesters:
A Rasch measurement study. International Journal of Sciences and
Mathematics Education, 16(4), 639–654.
Zhang, L. (2016). Is inquiry-based science teaching worth the effort? Some thoughts
worth considering. Science & Education, 25, 897-915.
316
Zhang, Z., & Lee, J. C.-K. (2017): Students' behavioral and emotional participation
in academic activities in the mathematics classroom: A multilevel confirmatory
factor analysis. The Journal of Experimental Education. doi:
10.1080/00220973.2017.1335684
Zitzmann, S., Ludtke, O., & Robitzsch, A. (2015). A Bayesian approach to more stable
estimates of group-level effects in contextual studies. Multivariate Behavioral
Research, 50(6), 688-705.
Zuzovsky, R. (2013). What works where? The relationship between instructional
variables and schools’ mean scores in mathematics and science in low-,
medium-, and high-achieving countries. Large-scale Assessments in
Education, 1(2), 1-19.

317
Appendices
Appendix A
Scientific Inquiry Teaching Observation Instrument (SITOI) Version 1
Teacher ID: Class ID: Observer: Date: Start time: End time: Elements of
Science Inquiry
Classroom Practices Frequency of Implementation
Engaging in Questioning
Students are asked to formulate their own investigation questions
Students are asked to formulate hypotheses as part of an investigation
Teacher helps students figure out what will make a good investigation question (e.g. testable, empirical)
Teacher engages students in questioning that leads to explanation, justification, and reasoning
Teacher engages students in questioning that did not lead to discussion
Teacher explicitly tells the students the questions or hypotheses they will investigate
Designing and Conducting Investigations
Students are asked to design procedures to investigate research questions, including choosing appropriate variables, techniques, and tools to gather, record, and analyze data
Students are asked to identify treatment and control variables
Teacher helps students design investigations through discussing with them the role of variables and controls and guidelines to design and conduct investigations
Teacher provides the variables to investigate Teacher provides/explicitly tells specific procedure to follow in the investigation
Collecting Data Students are asked to make accurate measurements
using scientific tools and instruments
Students are asked to use physical models or simulations, and manipulate representations of phenomena to collect data
Students are asked to collect data or explore phenomena outside
Students are prompted to make descriptive observations from the activity
Students are prompted to collect, manipulate, download, or access data from existing scientific databases
Students are asked to devise and use their own organizational scheme for recording data
Teacher asks students to record data on worksheets,

318
notebooks, learner modules, workbook with a format prescribed by the teacher Teacher provides data for students
Analyzing Data Students are asked to use mathematics (e.g. graphs) to
transform, represent, or interpret data
Students are asked to use physical models or simulations, and manipulate representations of phenomena to assist with the analysis and interpretation of data
Students are prompted to assess the reliability and/or validity of the knowledge generated in an investigation by critiquing methodological flaws and how well procedures were followed
Teacher demonstrates actual phenomena using models to help students analyze and interpret data
Teacher explicitly tells students specific direction on how data is to be analyzed
Teacher provides data analysis for students Developing Explanations
Students are prompted to build logical arguments about the cause-and-effect relationships between variables
Students are asked to examine evidence to develop explanation independently
Students are asked to evaluate and revise their explanations in light of alternative explanations posed by the teacher, other students’ investigations, or other sources of existing scientific knowledge
Teacher explicitly states specific pieces of evidence and then help students develop explanations
Teacher explicitly states specific connections to alternative explanations
Teacher explicitly tells the students what to conclude from an investigation
Communicating Information
Students are asked to present their experimental designs including hypothesis, variables.
Students are asked to share investigation results and their own thinking and interpretations about the meaning of those results
Students plan presentation, specify content and layout to be used to communicate and justify information
Teacher prompts students to respond to each other and encouraging student to student dialogue
Teacher explicitly tells the result of an activity without giving the students an opportunity to report their own results
OBSERVATION NOTES:

319
Appendix B
Scientific Inquiry Teaching Observation Instrument (SITOI) Version 2
Teacher ID: Class ID: No. of students: Observer: Start time: End time: Date:
Elements of Science Inquiry
Classroom Practices
Frequency of Implementation
Engaging in Questioning
Teacher asks students a question about facts previously presented (requires short, specific answer)
Teacher asks students a question about facts NOT previously presented which elicit students’ own ideas (requires short, specific answer)
Teacher asks students a question that requires them to explain, reason, or justify a situation or phenomenon
Teacher prompts students to formulate and ask their own questions Teacher prompts students to ask their own substantive questions relevant to teacher’s discussion
Designing and Conducting Investigations
Teacher provides students specific procedure to follow in the activity Teacher identifies the treatment and control variables of an activity Teacher asks students to identify the treatment and control variables of an activity
Teacher asks students to design their own procedures for an activity with teacher assisting by discussing role of variables, controls and design of activity
Teacher asks students to design their own procedures for an activity with limited help
Teacher asks students to formulate their own objectives/questions for an activity
Collecting Data
Teacher provides data for students Teacher prompts students to make descriptive observations from teacher demonstration
Teacher prompts students to make descriptive observations from activity
Teacher asks students to make measurements using scientific tools and equipment
Teacher asks students to collect data or explore phenomena outside Analyzing Data
Teacher provides data analysis for students Teacher tells students specific direction on how data is to be analysed with the aid of models or sample situation
Teacher asks students to analyze simple data Teacher asks students to analyze complex data Teacher prompts students to assess the reliability and/or validity of the results of investigation by critiquing methodological flaws or how well procedures were followed

320
Developing Explanations
Teacher gives students the explanation without giving them opportunity to explain
Teacher gives students pieces of evidence/information/clue they need to make their own explanation
Teacher asks students to form their own explanation or conclusion from results
Communicating Information
Teacher asks students to write information or data on activity sheets, notebooks, learner modules with a format prescribed by the teacher
Teacher asks students to devise and use their own format of writing information or data with limited help
Teacher asks students to describe illustration, diagram, or graph Teacher asks students to report out data or results of an individual or group activity to whole class
Teacher asks students to report out data or results of an individual or group activity with teacher-student interaction
OBSERVATION NOTES:
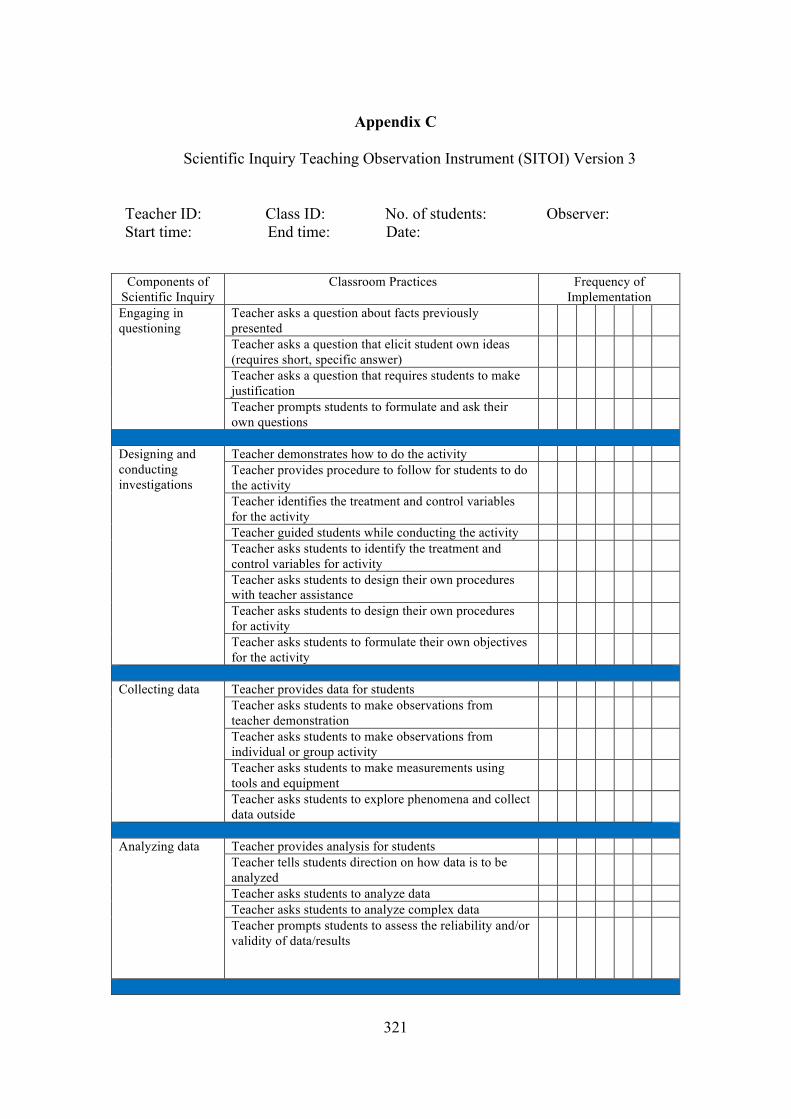
321
Appendix C
Scientific Inquiry Teaching Observation Instrument (SITOI) Version 3
Teacher ID: Class ID: No. of students: Observer: Start time: End time: Date:
Components of Scientific Inquiry
Classroom Practices
Frequency of Implementation
Engaging in questioning
Teacher asks a question about facts previously presented
Teacher asks a question that elicit student own ideas (requires short, specific answer)
Teacher asks a question that requires students to make justification
Teacher prompts students to formulate and ask their own questions
Designing and conducting investigations
Teacher demonstrates how to do the activity Teacher provides procedure to follow for students to do the activity
Teacher identifies the treatment and control variables for the activity
Teacher guided students while conducting the activity Teacher asks students to identify the treatment and control variables for activity
Teacher asks students to design their own procedures with teacher assistance
Teacher asks students to design their own procedures for activity
Teacher asks students to formulate their own objectives for the activity
Collecting data Teacher provides data for students
Teacher asks students to make observations from teacher demonstration
Teacher asks students to make observations from individual or group activity
Teacher asks students to make measurements using tools and equipment
Teacher asks students to explore phenomena and collect data outside
Analyzing data Teacher provides analysis for students
Teacher tells students direction on how data is to be analyzed
Teacher asks students to analyze data Teacher asks students to analyze complex data Teacher prompts students to assess the reliability and/or validity of data/results

322
OBSERVATION NOTES:
Developing explanations
Teacher gives the explanation without giving students opportunity to explain results
Teacher gives the explanation with giving students opportunity to explain but no one can make an explanation.
Teacher gives pieces of evidence they need then asks students to form their own explanations
Teacher prompts students to form their own explanations/conclusions from results
Communicating Information
Teacher asks students to write information using the prescribed format
Teacher asks students to make and use their own format of writing information
Teacher asks students to make and describe diagram, graph or table
Teacher asks students to report out results of activity to whole class
Teacher asks students to report out results of activity with teacher-student interaction
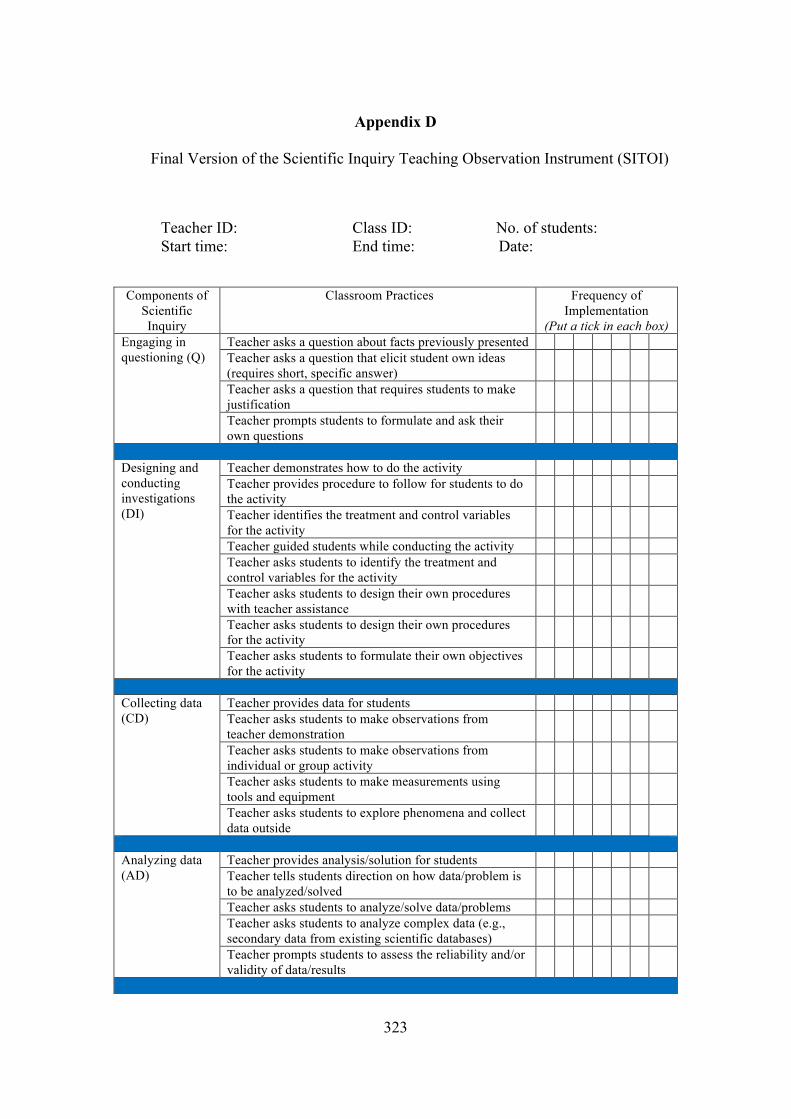
323
Appendix D
Final Version of the Scientific Inquiry Teaching Observation Instrument (SITOI)
Teacher ID: Class ID: No. of students: Start time: End time: Date:
Components of Scientific Inquiry
Classroom Practices
Frequency of Implementation
(Put a tick in each box) Engaging in questioning (Q)
Teacher asks a question about facts previously presented Teacher asks a question that elicit student own ideas (requires short, specific answer)
Teacher asks a question that requires students to make justification
Teacher prompts students to formulate and ask their own questions
Designing and conducting investigations (DI)
Teacher demonstrates how to do the activity Teacher provides procedure to follow for students to do the activity
Teacher identifies the treatment and control variables for the activity
Teacher guided students while conducting the activity Teacher asks students to identify the treatment and control variables for the activity
Teacher asks students to design their own procedures with teacher assistance
Teacher asks students to design their own procedures for the activity
Teacher asks students to formulate their own objectives for the activity
Collecting data (CD)
Teacher provides data for students Teacher asks students to make observations from teacher demonstration
Teacher asks students to make observations from individual or group activity
Teacher asks students to make measurements using tools and equipment
Teacher asks students to explore phenomena and collect data outside
Analyzing data (AD)
Teacher provides analysis/solution for students Teacher tells students direction on how data/problem is to be analyzed/solved
Teacher asks students to analyze/solve data/problems Teacher asks students to analyze complex data (e.g., secondary data from existing scientific databases)
Teacher prompts students to assess the reliability and/or validity of data/results

324
OBSERVATION NOTES:
Developing explanations (DE)
Teacher gives the explanation without giving students opportunity to explain results
Teacher gives the explanation with giving students opportunity to explain but no one can make an explanation.
Teacher gives pieces of evidence they need then asks students to form their own explanations
Teacher prompts students to form their own explanations/conclusions from results
Communicating Information (CI)
Teacher asks students to write information using the prescribed format
Teacher asks students to make and use their own format of writing information
Teacher asks students to make and describe diagram, graph, or table
Teacher asks students to report out results of activity to whole class
Teacher asks students to report out results of activity with teacher-student interaction

325
Appendix E
Teacher Questionnaire
School ID___ Teacher ID __ Class ID___ Region_____(administrator to fill) Teacher Information
1. Gender: * Male * Female
2. How many years have you been teaching high school science?___________
3. Before the K to 12 curriculum, which science subject/s were you teaching? * Biology * Chemistry * Physics * Earth Science * General Science * Other 4. What was your undergraduate degree?__________________Major in__________
5. Did you attend the national training for K to 12 Science? * Yes * No If yes
for grade________
6. Did you attend any regional training for K to 12 Science? * Yes * No If yes for grade________
7. Do you have a copy of the Grade 7 Science Teacher’s Guide? * Yes * No * Photocopy
8. How confident are you in teaching the content from the new science curriculum? * Not very confident * Confident * Depends on the topic Class Information 1. How many students are enrolled in this class?____________
2. How many students usually attend this class?____________
3. Which section/s are you teaching?_______
4. For this class are you teaching… * The usual curriculum * A modified or
enriched curriculum (regular classes) (for special science class)
5. Are you using the Learner’s Material to teach this class? * Not at all * Sometimes * Most of the time * All of the time

326
6. Does each student in this class have a copy of the Learner’s Material? * Yes * No * Photocopy
7. Do you have an appropriate workspace to conduct experiments in this class? * Yes * No * Some-what 8. Do you have the required equipment (e.g. microscope, platform balance) and
glassware, graduated cylinders, thermometers, to conduct experiments in this class? * Yes * No * Some-what 9. Do you have a place to store experimental/science materials? * Yes * No
* Some-what

327
Appendix F
Consent Forms and Plain Language Statements
Plain Language Statement for Teachers
I would like to invite your school to participate in a research project entitled Exploring Teachers’ Science Inquiry Practices and Students’ Inquiry Skills. I am undertaking this project as part of my PhD in Education at the Melbourne Graduate School of Education in the University of Melbourne, Australia. This project is a part of the Assessment, Curriculum and Technology Research Centre (ACTRC), a Partnership between the University of the Philippines and the University of Melbourne, supported by Australian Aid. My principal supervisor for this project is Associate Professor Esther Care. What are the aims of the study? The research project aims to explore the nature of classroom instruction related to science inquiry of teachers as they implement the new K to 12 science curriculum. It will provide an evidence-based documentation of inquiry-based teaching practices enacted by teachers in science classrooms, specifically in Philippine classrooms. It also provides information on the extent to which these practices are implemented in classrooms and the relationship between the implementation of these practices and the attainment of science inquiry skills.
What will you be asked to do? If you consent to the research you will be asked to allow researchers to:
• Observe you teaching approximately 6–8 science lessons. The observations will be carried out across two different groups of students (sections) during the 1st quarter of the 2015-2016 school year. You will not be asked to do anything other than what you would normally do in the class. There is no audiotape or videotape involve in observations.
• Collect and analyse teaching materials, including teacher-generated materials, lesson plans, logs or teacher notes, for the 1st quarter.
• Collect and analyse copies of tests and de-identified student results for the students observed which you provide. You will be responsible for removing identification from the student results by replacing student names with codes to ensure confidentiality.
Your decision regarding your participation in the research will not in any way affect your work or the educational experiences of your students and you are free to withdraw from the research at any time.

328
How will confidentiality be protected? No student, teacher, or school will be identified as part of this research. The researchers will use procedures in which any documents (classroom observations or materials collected) are identified only by use of codes. Teachers will be asked to remove all forms of identification from the student data prior to handing it to researchers. Those who will subsequently handle the data will do so using only codes. Schools and participants will not be named in any report as a result of this research. The information gathered will not be shared with anybody outside the research team (for example your Department Head or Principal) in any manner which would allow you to be identified.
If you decide to withdraw from the study at any time, or to withdraw unprocessed information that has been collected, you are free to do so. All information will be treated with utmost confidence subject to any legal limitations. It will be kept in secure files at the Assessment, Curriculum and Technology Research Centre of the UP College of Education, subject to guidelines for the management of research data and records and destroyed five years after publication of findings.
How will you receive feedback? You will be given a copy of the summary of findings on completion of the research. Results of the study will be presented in academic journals and at academic conferences and workshops for science teachers. This project has the clearance of The University of Melbourne’s Human Research Ethics Committee (HREC project number: 1443218.1). Should you have any concerns about the conduct of the research, contact the Executive Officer, Human Research Ethics, the University of Melbourne, on +61 3 8344 2073 (phone) or +61 3 9347 6739 (fax).
If you have any further questions about the project, please do not hesitate to contact the chief investigator of the study.
Yours sincerely, Mr Dennis Danipog PhD Candidate Melbourne Graduate School of Education The University of Melbourne [email protected] Ph: +61 3 8344 0967 Assessment Curriculum and Technology Research Centre College of Education University of the Philippines Diliman Quezon City 1101 Philippines T: +63 2 926 3996 W: www.actrc.org
A Partnership between the University of Melbourne and the University of the Philippines, supported by Australian Aid HREC Project No: 1443218; Date: 29 April 2015; Version: Teacher v2

329
Plain Language Statement for Principals
I would like to invite your school to participate in a research project entitled Exploring Teachers’ Science Inquiry Practices and Students’ Inquiry Skills. I am undertaking this project as part of my PhD in Education at the Melbourne Graduate School of Education in the University of Melbourne, Australia. This project is a part of the Assessment, Curriculum and Technology Research Centre (ACTRC), a partnership between the University of the Philippines and the University of Melbourne, supported by Australian Aid. My principal supervisor for this project is Associate Professor Esther Care. What are the aims of the study? The research project aims to explore the nature of classroom instruction related to science inquiry of teachers as they implement the new K to 12 science curriculum. It will provide an evidence-based documentation of inquiry-based teaching practices enacted by teachers in science classrooms, specifically in Philippine classrooms. It also provides information on the extent to which these practices are implemented in classrooms and the relationship between the implementation of these practices and the attainment of science inquiry skills. What will you and your school be asked to do? If you consent to the research being carried out in your school, you will be asked to:
• Provide researchers with the names of science teachers so they can be invited to participate. Each teacher will have the right to decline to participate in the research.
You also consent to allow researchers to: • Observe science classes of two teachers. Each teacher participating will be
observed for approximately 6-8 lessons across two different classes of students within the 1st quarter of the 2015-2016 school year.
• Collect and analyse teaching materials, including teacher-generated materials, lesson plans, logs or teacher notes, for the 1st quarter.
• Collect and analyse copies of tests and de-identified student results for the students observed which you provide. You will be responsible for removing identification from the student results by replacing student names with codes to ensure confidentiality.
Your decision regarding your school’s participation in the research will not in any way affect the work of your staff or the educational experiences of your students and you are free to withdraw your school from the research at any time.
330
How will confidentiality be protected? No student, teacher, or school will be identified as part of this research. The researchers will use procedures in which any documents (classroom observations or materials collected) are identified only by use of codes. Teachers will be asked to remove all forms of identification from the student data prior to handing it to researchers. Those who will subsequently handle the data will do so using only codes. Schools and participants will not be named in any report as a result of this research. The information gathered will not be shared with anybody outside the research team in any manner which would allow any member of your school to be identified.
If you decide to withdraw from the study at any time, or to withdraw unprocessed information that has been collected, you are free to do so. All information will be treated with utmost confidence subject to any legal limitations. It will be kept in secure files at the Assessment, Curriculum and Technology Research Centre of the UP College of Education, subject to guidelines for the management of research data and records and destroyed five years after publication of findings.
How will you receive feedback? You will be given a copy of the summary of findings on completion of the research. Results of the study will be presented in academic journals and at academic conferences and workshops for science teachers.
This project has the clearance of The University of Melbourne’s Human Research Ethics Committee (HREC project number: 1443218). Should you have any concerns about the conduct of the research, contact the Executive Officer, Human Research Ethics, the University of Melbourne, on +61 3 8344 2073 (phone) or +61 3 9347 6739 (fax). If you have any further questions about the project, please do not hesitate to contact the chief investigators of the study.
Yours sincerely, Mr Dennis Danipog PhD Candidate Melbourne Graduate School of Education The University of Melbourne [email protected] Ph: +61 3 8344 0967 Assessment Curriculum and Technology Research Centre College of Education University of the Philippines Diliman Quezon City 1101 Philippines T: +63 2 926 3996 W: www.actrc.org
A Partnership between the University of Melbourne and the University of the Philippines, supported by Australian Aid HREC Project No: 1443218; Date: 29 April 2015; Version: Principal v2

331
Consent Form for Teachers
Exploring Teachers’ Science Inquiry Practices and Students’ Inquiry Skills Name of Teacher: ........................................................................................................ School name: ................................................................................................................ Name of Investigator: Mr Dennis Danipog 1. I consent to the participation in the above research study, the particulars of which – including details of procedures – have been explained to me in the Plain Language Statement and I have been given a copy of that explanation to keep. 2. I authorize the investigators in the above study to implement the procedures referred to under (1) above (observing classroom instruction, collecting and analyzing teaching materials and copies of tests). 3. I acknowledge that: (a) the possible uses of the information arising from the study have been explained to me to my satisfaction; (b) I have been informed that my participation in this research is voluntary, and that I am free to withdraw from the study at any time and to withdraw any unprocessed information that has been supplied; (c) the study is for the purpose of research and development only; (d) once signed and returned, a copy of this consent form will be retained by the principal researcher; and (e) I have been informed that the confidentiality of the information provided by myself will be safeguarded, subject to any legal requirements (subpoena, freedom of information, mandated reporting), and in the following ways:

332
• no names or personal details of individual participants or schools will be revealed in any report of the study, and any contextual details that might reveal their identity will be removed;
• data will be stored in secure files at the Assessment Curriculum and Technology Research Centre of the UP College of Education for the management of research data and records, and destroyed five years after publication of findings.
Teacher’s Signature: ........................................................ Date: ....................................
Assessment Curriculum and Technology Research Centre College of Education University of the Philippines Diliman Quezon City 1101 Philippines T: +63 2 926 3996 W: www.actrc.org
A Partnership between the University of Melbourne and the University of the Philippines, supported by Australian Aid HREC Project No: 1443218; Date: 29 April 2015; Version: Teacher v2

333
Consent Form for Principals
Exploring Teachers’ Science Inquiry Practices and Students’ Inquiry Skills Name of School Principal: ........................................................................................... School name: ................................................................................................................ Name of Investigator: Mr Dennis Danipog 1. I consent to the participation of my school in the above research study, the particulars of which – including details of procedures – have been explained to me in the Plain Language Statement and I have been given a copy of that explanation to keep. 2. I authorize the investigators in the above study to implement the procedures referred to under (1) above (observing classroom instruction, collecting and analyzing teaching materials and copies of tests). 3. I acknowledge that: (a) the possible uses of the information arising from the study have been explained to me to my satisfaction; (b) I have been informed that my school’s participation and the participation of my teachers in this research is voluntary, and that I am free to withdraw my school from the study at any time and to withdraw any unprocessed information that has been supplied; (c) the study is for the purpose of research and development only; (d) once signed and returned, a copy of this consent form will be retained by the principal researcher; and (e) I have been informed that the confidentiality of the information provided by myself and teachers at my school will be safeguarded, subject to any legal requirements (subpoena, freedom of information, mandated reporting), and in the following ways:

334
• no names or personal details of individual participants or schools will be revealed in any report of the study, and any contextual details that might reveal their identity will be removed;
• data will be stored in secure files at the Assessment, Curriculum and Technology Research Centre of the UP College of Education for the management of research data and records, and destroyed five years after publication of findings.
Principal’s Signature: ............................................................... Date: .........................
Assessment Curriculum and Technology Research Centre College of Education University of the Philippines Diliman Quezon City 1101 Philippines T: +63 2 926 3996 W: www.actrc.org
A Partnership between the University of Melbourne and the University of the Philippines, supported by Australian Aid HREC Project No: 1443218; Date: 29 April 2015; Version: Principal v2
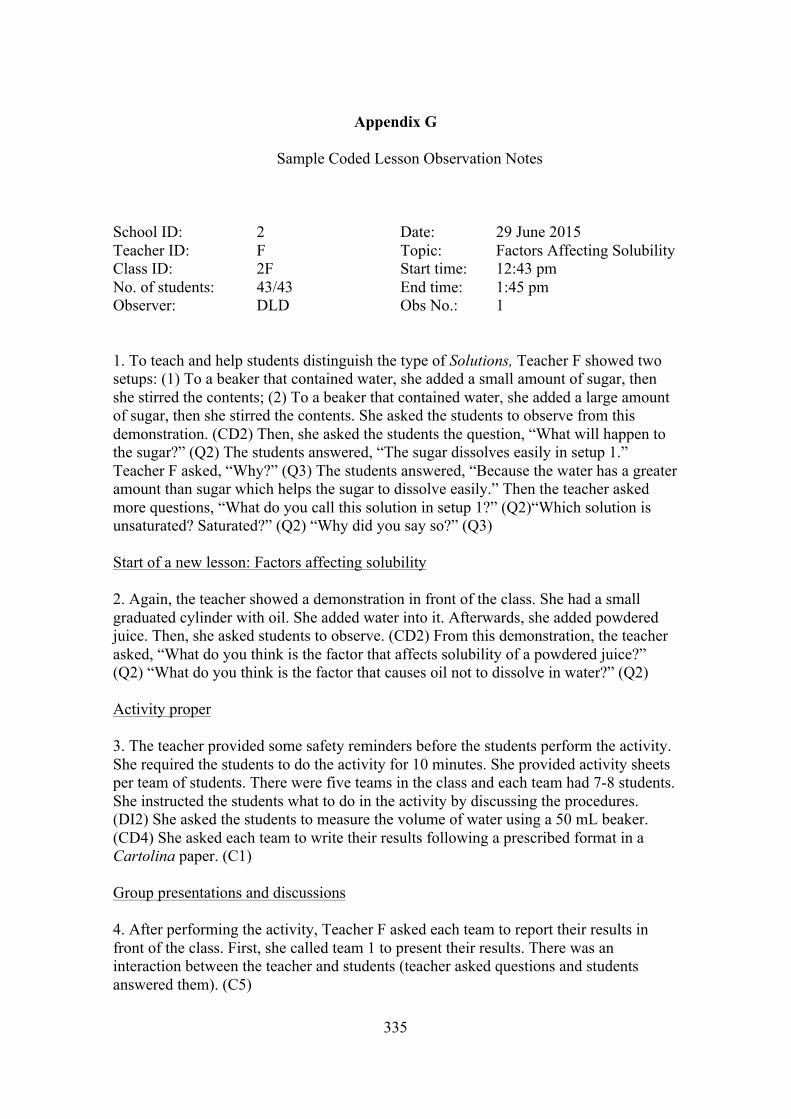
335
Appendix G
Sample Coded Lesson Observation Notes
School ID: 2 Date: 29 June 2015 Teacher ID: F Topic: Factors Affecting Solubility Class ID: 2F Start time: 12:43 pm No. of students: 43/43 End time: 1:45 pm Observer: DLD Obs No.: 1 1. To teach and help students distinguish the type of Solutions, Teacher F showed two setups: (1) To a beaker that contained water, she added a small amount of sugar, then she stirred the contents; (2) To a beaker that contained water, she added a large amount of sugar, then she stirred the contents. She asked the students to observe from this demonstration. (CD2) Then, she asked the students the question, “What will happen to the sugar?” (Q2) The students answered, “The sugar dissolves easily in setup 1.” Teacher F asked, “Why?” (Q3) The students answered, “Because the water has a greater amount than sugar which helps the sugar to dissolve easily.” Then the teacher asked more questions, “What do you call this solution in setup 1?” (Q2)“Which solution is unsaturated? Saturated?” (Q2) “Why did you say so?” (Q3) Start of a new lesson: Factors affecting solubility 2. Again, the teacher showed a demonstration in front of the class. She had a small graduated cylinder with oil. She added water into it. Afterwards, she added powdered juice. Then, she asked students to observe. (CD2) From this demonstration, the teacher asked, “What do you think is the factor that affects solubility of a powdered juice?” (Q2) “What do you think is the factor that causes oil not to dissolve in water?” (Q2) Activity proper 3. The teacher provided some safety reminders before the students perform the activity. She required the students to do the activity for 10 minutes. She provided activity sheets per team of students. There were five teams in the class and each team had 7-8 students. She instructed the students what to do in the activity by discussing the procedures. (DI2) She asked the students to measure the volume of water using a 50 mL beaker. (CD4) She asked each team to write their results following a prescribed format in a Cartolina paper. (C1) Group presentations and discussions 4. After performing the activity, Teacher F asked each team to report their results in front of the class. First, she called team 1 to present their results. There was an interaction between the teacher and students (teacher asked questions and students answered them). (C5)

336
5. Team 1 explained the procedure and results of the nature of solute and solvent part of the activity. Two students reported in front of the class. After presentation, the teacher asked the students, “Why do you think it is dissolved?” (DE4) team 1 answered, “The water and vinegar attracted [to] each other.” “Based on your results, what is the factor that affects solubility, team 1?” (DE4) The students answered, “The nature of solute and solvent.” 6. After this the teacher explained what is meant by “like dissolves like” and the polarity of a substance. Then, the teacher asked, “What do you think are the substances that can dissolve in water?” (Q2) 7. The teacher asked team 2 to explain the procedure and results of the temperature part of the activity. There was also an interaction between the teacher and students. (C5) In this case, one student read the procedure and showed the results in front of the class. After the presentation, Teacher F asked team 2, “Based on your observation, what do you is the factor that affects solubility?” (DE4) “From your results, what is the relationship of temperature to the rate of solubility?” (DE4) 8. But when the students cannot answer this question, the teacher gave an example that shows the relationship between temperature and rate of solubility, and then she repeated to ask the same question, “By using hot water the solubility is faster while using cold water the solubility is slower.” (DE3) “What is the relationship of temperature to the rate of solubility?” 9. The teacher asked team 3 to explain the procedure and results of the pressure part of the activity. There was an interaction between the teacher and students. (C5) Here, one student read the procedure and showed the results in front of the class. After the presentation, the teacher asked team 3, “Based on your results, what is the relationship between pressure and the rate of solubility?” (DE4) 10. Next, the teacher asked team 4 to explain the procedure and results of the particle size part of the activity (with interaction between the teacher and students). (C5) One student read the procedure and showed the results in front of the class. After the presentation, the teacher asked team 4, “Based on your results, what is the relationship of particle size to the rate of solubility?” (DE4) 11. Finally, Teacher F asked team 5 to explain the procedure and results of the agitation/stirring part of the activity (with interaction between the teacher and students). (C5) Also, one student read the procedure and showed the results in front of the class. Then, she asked, “From your results, can you explain the factor that affects solubility here? (DE4) Applications and closing 12. To apply the concepts in other areas of science, (e.g., Biology) the teacher asked these questions to the whole class, “Why many fishes cannot survive in warm water?” (Q3) “Why major ocean fisheries of the world are located in colder regions?” (Q3)

337
13. After discussing the results of the activity, the teacher asked the whole class: Do you have any questions in mind about our lesson? “Please raise your questions, if any” (Q4) 14. Then, teacher F gave the students a homework, “Find the formula of percent by mass and volume.”
***End***

Minerva Access is the Institutional Repository of The University of Melbourne
Author/s:
Danipog, Dennis
Title:
Assessing the scientific inquiry practices of teachers and investigating their relationship with
student learning
Date:
2018
Persistent Link:
http://hdl.handle.net/11343/224242
File Description:
Final PhD thesis
Terms and Conditions:
Terms and Conditions: Copyright in works deposited in Minerva Access is retained by the
copyright owner. The work may not be altered without permission from the copyright owner.
Readers may only download, print and save electronic copies of whole works for their own
personal non-commercial use. Any use that exceeds these limits requires permission from
the copyright owner. Attribution is essential when quoting or paraphrasing from these works.