Assessing students’ skills at writing in response to texts
37
Assessing Students' Skills at Writing Analytically in Response to Texts Author(s): Richard Correnti, Lindsay Clare Matsumura, Laura Hamilton, and Elaine Wang Source: The Elementary School Journal, Vol. 114, No. 2 (December 2013), pp. 142-177 Published by: The University of Chicago Press Stable URL: http://www.jstor.org/stable/10.1086/671936 . Accessed: 15/01/2014 12:40 Your use of the JSTOR archive indicates your acceptance of the Terms & Conditions of Use, available at . http://www.jstor.org/page/info/about/policies/terms.jsp . JSTOR is a not-for-profit service that helps scholars, researchers, and students discover, use, and build upon a wide range of content in a trusted digital archive. We use information technology and tools to increase productivity and facilitate new forms of scholarship. For more information about JSTOR, please contact [email protected]. . The University of Chicago Press is collaborating with JSTOR to digitize, preserve and extend access to The Elementary School Journal. http://www.jstor.org This content downloaded from 150.212.81.22 on Wed, 15 Jan 2014 12:40:19 PM All use subject to JSTOR Terms and Conditions
Transcript of Assessing students’ skills at writing in response to texts

Assessing Students' Skills at Writing Analytically in Response to TextsAuthor(s): Richard Correnti, Lindsay Clare Matsumura, Laura Hamilton, and Elaine WangSource: The Elementary School Journal, Vol. 114, No. 2 (December 2013), pp. 142-177Published by: The University of Chicago PressStable URL: http://www.jstor.org/stable/10.1086/671936 .
Accessed: 15/01/2014 12:40
Your use of the JSTOR archive indicates your acceptance of the Terms & Conditions of Use, available at .http://www.jstor.org/page/info/about/policies/terms.jsp
.JSTOR is a not-for-profit service that helps scholars, researchers, and students discover, use, and build upon a wide range ofcontent in a trusted digital archive. We use information technology and tools to increase productivity and facilitate new formsof scholarship. For more information about JSTOR, please contact [email protected].
.
The University of Chicago Press is collaborating with JSTOR to digitize, preserve and extend access to TheElementary School Journal.
http://www.jstor.org
This content downloaded from 150.212.81.22 on Wed, 15 Jan 2014 12:40:19 PMAll use subject to JSTOR Terms and Conditions

ASSESSING STUDENTS’ SKILLS AT
WRITING ANALYTICALLY IN
RESPONSE TO TEXTS
Richard CorrentiLindsay Clare Matsumura
Laura Hamilton
Elaine Wang
Despite the importance of writing analytically in re-sponse to texts, there are few assessments measuring stu-dents’ mastery of this skill. This manuscript describesthe development of a response-to-text assessment (RTA)intended for use in research. In a subsequent validityinvestigation we examined whether the RTA distin-guished among classrooms in students’ ability to writeanalytically in response to text and whether measures ofteaching predicted this variation. We demonstrate thatthe RTA was correlated with the state standardized as-sessment, but did not overlap with this accountabilitytest completely and, additionally, that more variationbetween classrooms existed on the RTA. Students’ op-portunities for reasoning and extended writing in theclassroom were significantly associated with RTA scores.The findings suggest that the RTA can be a valuable toolfor conducting research on students’ attainment of ana-lytic writing skills and for understanding how teachingrelates to student achievement on these skills.
AN A L Y T I C writing in response to text—that is, the ability to interpret andevaluate texts, construct logical arguments based on substantive claims,and marshal appropriate evidence in support of these claims—is funda-mental to academic success (Common Core State Standards Initiative,
2010; National Commission on Writing, 2003). Students who lack or only partiallymaster the ability to analyze texts often struggle in the secondary grades and/or are
, © 2013 by The University of Chicago. All rights reserved. 0013-5984/2013/11402-0001 $10.00
This content downloaded from 150.212.81.22 on Wed, 15 Jan 2014 12:40:19 PMAll use subject to JSTOR Terms and Conditions

likely to find college-level coursework too difficult to complete (Allensworth, Cor-rea, & Ponisciak, 2008). Despite the importance of writing analytically in response totexts, little systematic information about students’ progress toward attaining thisskill is available to most schools and districts. Instead, the most readily availableinformation about students’ literacy skills is generally obtained from large-scale stateachievement tests and other standardized tests that typically represent reading com-prehension and writing as separate skills. Reading comprehension is usually mea-sured through a series of multiple-choice questions and brief constructed responsesbased on texts that are not explicitly connected to the academic content to whichstudents are exposed in the school curriculum. Hirsch and Pondiscio (2010) refer tothese as “content-free” assessments, and they note that such assessments fail to rec-ognize that comprehension of text is inherently content laden. Writing, meanwhile,is often excluded from large-scale testing programs. When included, writing typi-cally involves having students respond to an open-ended prompt that is not con-nected to a rich text (Jeffery, 2009). Despite the fact that the bulk of challengingacademic work in many content areas lies at the intersection of reading comprehen-sion and writing, few large-scale assessments integrate these two domains in thecontext of rich textual material.
In this article, we describe our research focused on developing an assessment thatfills this gap; that is, one that measures students’ ability to write analytically in re-sponse to text. Our approach to assessment sampled from the target domains of readingcomprehension and writing to create an assessment that required students to reasonabout the text and then write an extended response, but did not require students to readthe text independently. While noting this critical distinction between our assessment andsimilar response-to-literature formats requiring students to first read the text indepen-dently, we refer to this as a response-to-text assessment (RTA) because students wereexpected to analyze the content of the text in their written responses.
Measures such as the RTA could potentially serve many purposes. For example,measuring students’ ability to write analytically, incorporating content from a text ortexts could draw attention to this academic skill and thereby encourage educators toemphasize it. In addition, assessments that provide teachers information about stu-dents’ attainment of analytic text-based writing skills could potentially help teachersevaluate their own instructional approach and encourage them to engage in teachingpractices to develop those skills in students. Our particular goal in developing theRTA, however, is to create a measure that can be used to further educational research.It is this purpose that we address in this study.
Much has been written about the potential for “higher-order” teaching to influ-ence students’ learning outcomes (see, e.g., Abrami et al., 2008, and Nickerson, 1989,for reviews of this work). Teaching of complex skills is thought to enhance students’ability to achieve on measures of rote learning as well as assessments meant to dem-onstrate reasoning or high cognitive demand skills such as critical thinking (e.g.,Abrami et al., 2008). While it is generally accepted that higher-order instructionvaries between classrooms (Knapp, 1995; Raudenbush, Rowan, & Cheong, 1993),there is a corresponding lack of assessments that demonstrate the effects of theseinstructional differences on student learning. Yet, assessments that gauge the extentto which students are capable of more complex reasoning are important for under-standing whether complex learning is being achieved in all classrooms (Resnick,1987, 2010) and whether certain approaches to teaching are associated with that
�
This content downloaded from 150.212.81.22 on Wed, 15 Jan 2014 12:40:19 PMAll use subject to JSTOR Terms and Conditions

learning (Bereiter & Scardamalia, 1987). This information is critical to building aknowledge base of the teaching profession that can inform professional educationand guide the development of more effective instructional interventions and policies(Hiebert, Gallimore, & Stigler, 2002).
We were especially motivated to create a response-to-text assessment in the con-text of the current policy environment in which states are adopting the CommonCore State Standards (CCSSI, 2010). A key feature of the Common Core State Stan-dards is the emphasis on students’ engagement with complex texts and, beginning inthe upper elementary grades, ability to draw inferences from a given text and useevidence to support their assertions (CCSSI, 2010). Our hunch is that assessmentsmeasuring students’ ability to write analytically in response to a text more so thangeneral tests of achievement will be more sensitive to natural variation in instruction.A similar argument was made in at least one prominent policy study, where theoutcome—a nontraditional student assessment—was sensitive to covariates distin-guishing between different professional development experiences (Cohen & Hill,2001).
While two consortia are currently developing the state-level assessments linked tothe CCSS, we believe that additional measures that are not part of the state’s account-ability system will be needed in research. We anticipate that instructional interven-tions will increasingly focus on developing teachers’ ability to teach students to re-spond analytically to texts in writing; correspondingly, measures of student learningaligned with these instructional processes will be needed. Lack of alignment betweenintervention goals and assessed student learning outcomes is a persistent problem ineducation research (e.g., Berends, Bodilly, & Kirby, 2002; Correnti & Rowan, 2007;Stebbins, St. Pierre, Proper, Anderson, & Cerva, 1977). Effects of interventions aimedat increasing teachers’ ability to teach complex academic skills may not be demon-strated when students’ learning outcomes are assessed on tests that measure lower-level skills. When assessments are not well aligned with interventions, it is impossibleto know if the interventions did not show desired effects because they were notsuccessful, or because the intended outcomes were not adequately measured (Caro,1971; Raudenbush, 2007). In the following section, we elaborate on why a focus onoverlap between what is taught and what is tested is so important for identifying linksbetween teaching and learning.
Properties of Overlap and Specificity
Numerous researchers have demonstrated that the alignment of assessments withthe object of study has ramifications for the ability to find effects of interventions orprofessional development (PD) programs. A special case of alignment arises whenresearchers attempt to study teaching effects on student learning. Here, researchershave demonstrated how overlap between students’ opportunities to learn and thetested content has an influence on research findings (Barr & Dreeben, 1983; Berliner,1981; D’Agostino, Welsh, & Corson, 2007; Ruiz-Primo, Shavelson, Hamilton, &Klein, 2002). Assessments can be biased if the overlap between different curriculaand assessments varies (Leinhardt & Seewald, 1981).
Overlap was a central motivation for cross-national studies such as the ThirdInternational Mathematics and Science Study (TIMSS; see, e.g., Schmidt et al., 2001),but the value of the concept would also seem to extend to classroom-level studies of
�
This content downloaded from 150.212.81.22 on Wed, 15 Jan 2014 12:40:19 PMAll use subject to JSTOR Terms and Conditions

teaching. That is, careful alignment between teaching and measures of learning ismore likely to provide a “fairer” test for finding associations between the two, sinceresearchers can avoid the specification error inherited when trying to associate (spe-cific) measures of teaching with more general measures of student learning. More-over, students are likely to perform better when they have had repeated exposure toboth the content and the format of the assessment, since what is taught and what istested both represent sampled domains (Cooley & Leinhardt, 1980).
On this latter point, the specificity1 or distinctiveness of the assessed domain is alsolikely to have bearing on the likelihood of finding an association. By narrowingassessments to specific (and potentially infrequently measured) skills, researchersshould be more likely to identify teaching-learning associations, provided the mea-sures of teaching have good overlap with the assessments. These specific associationsare important to begin to identify since they are the bedrock of a professional knowl-edge base of teaching. It is especially instructive to think of these specific associationsin relation to the accountability test, since they may highlight where learning thatextends beyond the skills generally tested in large-scale assessments is occurring inclassrooms.
These twin properties of overlap and specificity help motivate our validity inves-tigation. Our assessment contains dimensions of both specificity and overlap. On theRTA we have tried to assess student ability to respond analytically to a text in anextended written response, a skill that is complex but also fairly distinct when com-pared with the broad range of literacy skills typically measured on large-scale assess-ments. Furthermore, it is possible to imagine measures of teaching with good overlapto the assessment, since these measures of teaching are also infrequently capturedand since students’ skills in analytic writing are not likely to develop without practice(i.e., without regular exposure to extended writing and text analysis opportunities intheir literacy instruction). In the context of a unified view of validity (Kane, 2006;Messick, 1994), we therefore hypothesize that due to our focus on reasoning andwriting we are well positioned to find theoretically relevant associations between ourspecific measures of teaching and learning. This evidence will inform our under-standing of the construct validity of inferences made from the RTA.
Claims
This article examines the validity of the RTA for the purpose of documenting studentlearning in research contexts. An investigation of validity typically involves the col-lection of a wide range of evidence that provides a scientific basis for a specific scoreinterpretation (American Educational Research Association, American Psychologi-cal Association, & National Council on Measurement in Education, 1999; Kane,2006). Most assessments are designed to serve specific purposes, and each purposeinvolves an interpretation of scores that should be subjected to a validity investiga-tion. As described earlier, our primary purpose in developing the RTA was to createa measure that can be used in studies that require evidence about students’ ability towrite meaningfully in response to the content of a text and about the instructionalprocesses that promote that ability. To be useful for research, this measure wouldneed to provide information about differences in students’ writing skills across class-rooms and be sensitive to the effects of instructional practices that are intended toenhance attainment of these skills. Therefore, we investigate the following claims
�
This content downloaded from 150.212.81.22 on Wed, 15 Jan 2014 12:40:19 PMAll use subject to JSTOR Terms and Conditions

with our data: (1) the RTA distinguished among classrooms in students’ ability towrite in response to text after adjusting for student demographic differences andprior achievement; (2) the RTA is more aligned to teaching practices requiring stu-dent reasoning and extended writing than typical forms of assessment (i.e., standard-ized state tests). The RTA, therefore, is positioned to demonstrate that differencesbetween classrooms in teaching reasoning and extended writing result in differencesin student learning outcomes. In the sections that follow, we examine results fromstudent performance on the two assessments—the Maryland School Assessment(MSA) and the RTA—that we used to investigate these claims.
Development of the Response-to-Text Assessment (RTA)
The development of the RTA was guided by three central principles. First, we wantedthe assessment to build on an authentic text and support students to reason about thetext and cite supporting evidence. Second, given that the emphasis was on measure-ment of students’ skills at reasoning and writing, we designed our administrationprocedure to eliminate other potential sources of measurement error for assessingthose skills. Third, we sought to make our assessment relevant within the currentresearch context. Thus, we sought to align the RTA with the Common Core StateStandards (CCSSI, 2010) because as schools and districts respond to state adoption ofthe standards, they are likely to drive choices regarding curriculum and instruction.
We had three criteria for choosing the texts on which the assessment was based.First, we wanted the text to be authentic (the kind of text students might encounterin their own classroom) but brief. Brevity was important because in addition tohaving the text read to them, we wanted students to have time to reason about thetext and also write an extended response. Second, the text content had to support thedevelopment of an open-ended prompt that would invite multiple interpretationsand for which students could provide textual evidence to support their assertions(Beck & McKeown, 2001). Finally, in keeping with the spirit of the Common CoreState Standards, we wanted the text to be grade-level appropriate but also challeng-ing. The latter criterion is the most problematic to satisfy given the difficulty ofanticipating the reading levels of the students we intended to assess. Nevertheless,post-hoc analysis of the lexile level of each text convinced us that our text selectionstruck a middle ground between our pilot teachers’ concerns over readability of thetext and the ideals of the Common Core State Standards stating that texts shouldchallenge readers.2
In an attempt to minimize measurement error from unwanted sources, we madeseveral decisions to standardize the administration of the RTA. Since our assessmentwas designed to detect differences among students in their ability to respond inwriting to a text, we did not want reading fluency to confound the measurement ofstudents’ written responses. Therefore, we decided to have the teacher read the textwhile the students followed along with their own copy of the text. After this initialreading, students could refer back to the text at any time. We also sought to minimizethe role that vocabulary knowledge played in the measurement of student writingability; therefore, we used call-out boxes to define several vocabulary words (e.g.,hasty, deranged, and irrigation).
Finally, based on research showing the important role of text discussions forsupporting students’ comprehension (Murphy, Wilkinson, Soter, Hennessey, & Al-
�
This content downloaded from 150.212.81.22 on Wed, 15 Jan 2014 12:40:19 PMAll use subject to JSTOR Terms and Conditions

exander, 2009; Nystrand, 2006), we identified points in the texts at which teacherswould stop to ask standardized questions. Drawing on Questioning the Author (Beck& McKeown, 2006), we developed these standardized questions to aid students’literal comprehension of the text as it was being read. Our protocol (much like astandard interview protocol) included initial questions along with expected studentresponses and standardized follow-up questions if students did not respond as ex-pected. These questions were designed to give all students access to a literal under-standing of important story elements so they all had the potential to address theprompt. These decisions were motivated by our desire to measure how studentsanalyzed the content of the text beyond a literal understanding and then communi-cated their analysis in writing.
Previous Study of the RTA
We have engaged in a cycle of iterative improvements to the RTA (Diamond &Powell, 2011). In each attempt we have reconsidered our prompts as well as ouradministration and scoring procedures based on feedback received from literacyexperts, teachers, and pilot studies. Our initial pilot of the RTA was conducted in 30classrooms in western Pennsylvania. We administered prompts from four differenttexts (two were fiction and two were nonfiction) in a fully crossed design where eachprompt was randomly assigned to equal numbers of grade 4 and 5 classrooms.
Three findings from the pilot informed our current work. First, for 12 of theclassrooms we had scores for the same students on the Pennsylvania System ofSchool Assessments (PSSA) reading test and the RTA. We found more variancebetween classrooms on the RTA (18%) compared to the PSSA (12%) after adjustingfor background characteristics. Second, using a teacher survey, we found that varia-tion in teachers’ self-reports of the extent to which they had students integrate writ-ing with their comprehension instruction3 was associated with student performanceon the RTA. The effect size for this covariate was .35, indicating that one unit higheron this item (which was on a five-point scale) resulted in higher classroom averageRTA scores of a little more than one-third of a standard deviation. Third, in a hier-archical linear model adjusting for factors such as prompt difficulty and studentcharacteristics, students in grade 5 scored higher than fourth graders by about .4standard deviations on the assessments. This confirmed that scores increased withdevelopmental age and/or school experiences, suggesting the RTA measures weresensitive enough to capture gross differences in ability resulting from maturationand exposure to the grade 5 curriculum. Based on this early pilot, we selected two ofthe four prompts for further revision— one fictional to be administered to fourthgraders and one nonfictional to be administered to fifth and sixth graders. Thisiteration of the RTA forms the basis for our current study.
Current Version of the RTA
The grade 4 form of the current version of the RTA is based on a short story byJames Marshall titled “Rats on the Roof.” The story involves a pair of dogs who havea rat problem and enlist a snobbish cat to help them. The cat solves the problem but,ironically, not in the way the dogs intended. The prompt asks students, “Is theTomcat someone you would want to help you with a problem? Why or why not? Use
�
This content downloaded from 150.212.81.22 on Wed, 15 Jan 2014 12:40:19 PMAll use subject to JSTOR Terms and Conditions

at least 3 to 4 examples from the text to explain your answer.” We based the grade 5form on a feature article from Time for Kids about a United Nations–supported effortto eradicate poverty in a rural village in Kenya through the Millennium Villagesproject. The prompt asks students, “Why do you think the author thinks it’s impor-tant for kids in the United States to learn about what life was like in Kenya before andafter the Millennium Villages project? Make sure to include at least 3 examples ofwhat life in Kenya was like before the Millennium Villages project and what life is likenow.” Each of these prompts was intended to direct students toward formulating anorganized piece of writing that insightfully analyzed an aspect of the given text.Furthermore, the prompts were designed to encourage students to elaborate upontheir responses and to integrate multiple instances of appropriate textual evidence.In short, we sought to create a task that embodied the principles of a “thinkingcurriculum” (Resnick & Klopfer, 1989) and of “thoughtful literacy” (Brown, 1991).
We developed multiple rating categories to evaluate not only students’ thinkingabout the text, but their skill at marshaling evidence in support of their claims as wellas other criteria associated with effective analytic writing. Our goal for creating mul-tiple rating categories was to provide detailed information about students’ analyticwriting skills, as well as facilitate the investigation of hypotheses related to howinstructional behaviors might influence different aspects of students’ writing. Theprocess included iterative revisions to the rubric itself (see App. A). In constructingthe scoring criteria, we also sought to ensure that the language and expectationsreflected those of the Common Core State Standards.4 Over iterative sessions, afour-person group calibrated against the rubric to ensure uniform understandingand application of the criteria. Interrater reliability is reported below.
Each of the five criteria was rated on a four-point scale (1 � low to 4 � excellent).Analysis assessed students’ ability to demonstrate a clear understanding of the pur-pose of the literary work and to make valid and perceptive conclusions that inform aninsightful response to the prompt. Evidence captured the degree to which studentsselect and use details, including direct quotations from the text to support their keyidea. Organization assessed the degree to which students’ responses exhibit a strongsense of beginning, middle, and end, and demonstrate logical flow between sentencesand ideas. The Style criterion awarded points for varied sentence lengths and com-plex syntactical structures, multiple uses of tier 2 vocabulary (e.g., words like instruc-tions, fortunate, miserable, appreciate), and correct application of sophisticated con-nectives (e.g., however, meanwhile). Finally, students’ scores on Mechanics/Usage/Grammar/Spelling (MUGS) reflected their ability to adhere to grade-appropriatestandard writing conventions.
Interrater reliability was calculated on about 20% of the sample. A graduate stu-dent rater (with prior experience scoring essays on rubrics) coded all 426 pieces ofstudent writing. To calculate interrater reliability, the study’s project manager coded86 pieces of student writing randomly chosen from the larger sample, including 45responses to the “Rats on the Roof” prompt and 41 responses to the “MillenniumVillages” prompt. We examined a crosstab of the two raters. It showed that the exactmatch between raters was 79%, with only two instances of raters differing by morethan one. A Cohen’s kappa was also calculated, which reports the exact match agree-ment adjusted for the distribution of scores across categories. Cohen’s kappa (.672,�2 � 603.94, df � 9) and the Pearson correlation (r � .828) both indicate moderatelyhigh agreement between raters overall.
�
This content downloaded from 150.212.81.22 on Wed, 15 Jan 2014 12:40:19 PMAll use subject to JSTOR Terms and Conditions

We further examined interrater agreement by each of the five rating criteria and foreach of the two prompts. Results from the five criteria showed that exact agreementranged from a low of 70% (Evidence) to a high of 88% (Style). Cohen’s kappa values forthe five criteria from lowest to highest were Evidence (.55), Analysis (.62), MUGS (.68),Organization (.69), and Style (.81). While agreement rates varied, even the lowest cate-gory (Evidence) had a Pearson’s correlation of .80 between raters and only a single in-stance of raters being off by more than one. Agreement rates for exact matches for “Ratson the Roof” (77%) and “Millennium Villages” (78%), respectively, were quite similar.5
Current Study Data
Sample
The data used to investigate our claims were collected in 18 classrooms from a singleurban district in Maryland. Data on students were collected in the spring, includingmeasures of learning on two different assessments. First, we examined the reading por-tion of the Maryland School Assessment (MSA), which is the state standardized test thatall students from grades 3–8 must take. It was administered over 2 days in March, withabout 90 minutes of testing time each day. The test consisted of 33 multiple-choice ques-tions on vocabulary, word study, and reading comprehension, and four brief constructedresponses (BCR). A sample BCR prompt asks the following: “Explain how the settingaffects the actions of the characters in this story. In your response, use details from thestory that support your explanation” (Maryland State Department of Education[MSDE], 2012). Students must respond to each prompt within the eight lines provided.Accommodations for students with individualized education plans or 504 plans can beprovided upon application to and approval from the Department of Education. LimitedEnglish proficient (LEP) students who have been enrolled for more than 1 year must alsotake the MSA. Again, accommodations may be approved. In all cases, students com-pleted the assessment individually and independently of any teacher input. In terms ofscoring, the BCR is given a rating of 0–3, depending on the extent to which the responseaddresses the “demands of the question” and “uses test-relevant information to showunderstanding” (MSDE, 2012). The overall test score consisted of three subscales: Gen-eral Reading (15 multiple-choice items), Literary Reading and Information Reading (ninemultiple-choice and two BCRs each). The test publisher created scale scores for the testoverall and for each subscale.
The RTA was administered in one 60-minute session by teachers during the last weekof May. Teachers in eight grade 4 classrooms administered the prompt based on thefictional text “Rats on the Roof” and nine grade 5 teachers and one grade 6 teacheradministered the prompt based on the “Millennium Villages” informational text. Allstudents present on testing day in the participating classes took the RTA; no makeup forabsent students was available. Students received the testing accommodations they nor-mally receive through regular instruction. Teachers were directed to spend the first 15minutes reading the text aloud while students followed along. Teachers were also asked toread predefined vocabulary and stop at designated points to ask and engage students indiscussions of standardized prompts. Expected student responses and follow-up ques-tions were provided to help guide student comprehension. At the end, teachers read thewriting prompt with students and allowed them 45 minutes to respond on the two pagesof lined paper provided. Students were encouraged to brainstorm and plan as needed.
�
This content downloaded from 150.212.81.22 on Wed, 15 Jan 2014 12:40:19 PMAll use subject to JSTOR Terms and Conditions

Information on student demographic characteristics, including prior year achieve-ment on the MSA in both reading and math, was collected from the district for all 426students who took the RTA. The demographic characteristics of students in our samplewere roughly representative of the larger district. About 56% of the students received free(45%) or reduced (11%) price lunch, 11% had an individualized education plan (IEP), andstudents were absent, on average, about 7.5 days per year. Students in our sample werepredominantly minority, indicating the following group affiliations: Black (80%), His-panic (12%), Native American (11%), Asian (5%), and White (3%). In our predictionmodels we adjusted for these student background characteristics.
These 426 students were nested in 18 classrooms. Seventy-eight percent of the teachersin the sample had already received their Master’s (61%) or Ph.D. (17%) degree. Addition-ally, 18% had advanced professional certification. Teachers’ years of teaching experienceranged from 2 to 38, with an average of 17. The teachers in each of the 18 classrooms alsoparticipated in our larger data-collection efforts. These efforts included an annual survey,daily literacy logs (30 daily surveys over the course of the year in the fall, winter, andspring), and six response-to-literature assignments (three each in winter and spring).Sixteen of the 18 teachers had complete data across the survey, logs, and assignments. Theremaining two teachers had log and assignment data, but did not complete the annualsurvey. Rather than use listwise deletion to remove cases without complete data on in-struction, we opted for a strategy of multiple imputation. Following procedures outlinedin Peugh and Enders (2004), we imputed five data sets for the teacher survey measuresused in our analyses under the assumption that data were missing at random.6 To ac-complish this, a two-level multiple imputation was conducted in MPlus6.12 (Muthén &Muthén, 2010) using the regression command.
Instructional Scales
Using the five imputed data sets, we created two instructional scales from items onthe survey, logs, and assignments— one measure examined students’ opportunitiesfor reasoning and extended writing while the second utilized teachers’ self-reports oftheir reading comprehension instruction. Both of these instructional factors wereused in prediction models on the RTA and MSA.
Student reasoning and extended writing factor. Six covariates were combined tocreate a composite factor measuring students’ opportunities for reasoning and extendedwriting. This covariate was hypothesized to be well aligned to the RTA because it mea-sures the opportunity structure for students to develop analytical, text-based writingskills by sampling from four target domains: time devoted to writing, activities analyzingand/or synthesizing text(s) in the context of discussing or doing writing, opportunitiesfor elaborated communication, and exposure to writing tasks of a high cognitive de-mand. These student experiences provide opportunities for students to practice skillsaligned in content and format with the skills presumably measured by the RTA. Covar-iates measuring this opportunity structure are described in Table 1 and are further elab-orated in Correnti, Matsumura, Hamilton, and Wang (2012).
The variables contributing to this composite include (1) the frequency teachersreported integrating writing into their text discussions, (2) a writing scale from ameasurement model of log data, (3) a ratio of high-cognitive-demand items to allother items from the measurement model of log data (primarily measuring integra-tion of comprehension and writing as reciprocal processes), (4) the cognitive de-
�
This content downloaded from 150.212.81.22 on Wed, 15 Jan 2014 12:40:19 PMAll use subject to JSTOR Terms and Conditions

Table 1. Items Contributing to Measure of Students’ Opportunities for Reasoning and ExtendedWriting a
Measures Description Range Mean SD
Surveys:Frequency ofreasoning/writingintegrated in textdiscussions
This covariate is a factor of 4 survey responsesto an item stem asking the following: “Beloware a set of items pertaining to classroom textdiscussions. Considering constraints on yourteaching please indicate the frequencystudents engage in each element in your textdiscussions.” Items were answered on thefollowing scale: never, rarely, sometimes,often, and almost always. Four items formeda single factor explaining 63% of the variancein the items, and included, (1) studentsidentify the author’s purpose, (2) studentsdiscuss elements of the writer’s craft, (3)students make connections between ideas/literary elements within or across texts, and(4) students analyze and evaluate each other’sassertions.
2.5–5 3.20 .75
Logs: b
Writing Scale of writing items (pre-writing, writingpractice, literary techniques, revise, edit,share, teacher comment on writing, teacher-directed writing instruction, integratecomprehension, write connected paragraphs)across all logs contributed and weighted bytime. This scale represents the exposurestudents had to writing across the year.
�1.47–2.24 0 1
Integration ofcomprehensionwith writing
Scale of 8 items (analyze/evaluate incomprehension, focus on writing same day asfocus on comprehension, integrate writingwith comprehension, provide extendedanswers in comprehension, literarytechniques, integrate reading comprehensionwith writing, substantive revisions, wrotemultiple paragraphs) contrasted with all otherlog items across all logs contributed andweighted by time. This scale represents a ratioof the frequency teachers decided to integratecomprehension and writing instructionrelative to all other content.
�1.46–1.74 0 1
Assignments:Enacted cognitivedemand rating
This dimension is assessed on a 4-point scale(1 � poor, 4 � excellent) and focuses on thedegree to which an assignment supportsstudents to apply higher-level, analyticthinking skills (as opposed to recalling oridentifying basic information from a text) anduse appropriate evidence and details from atext to support their assertions. Interraterexact agreement of 90%.
1.33–2.83 2.08 .39
This content downloaded from 150.212.81.22 on Wed, 15 Jan 2014 12:40:19 PMAll use subject to JSTOR Terms and Conditions

mand rating of the challenging assignment tasks we collected, (5) the proportion ofchallenging assignments that went beyond either worksheets or brief constructedresponses of a paragraph or less, and (6) the average number of words students wrotein response to their assignments.7 The single composite formed from the six covar-iates and described in Table 1 was normally distributed.
Comprehension factor. Three covariates from self-report measures on the surveyand logs were used to create this composite. These covariates are further described inTable 2. The first covariate from the survey is calculated from the product of teacher-reported time spent in comprehension and teacher-reported time spent inferring theauthor’s meaning or citing evidence from text to support assertions when doingcomprehension text discussions. The second covariate from the survey representsthe frequency with which students participated in routine text discussion activities,such as recounting or sequencing events in a story. The third covariate was developedfrom the logs and utilized a measurement model to form a scale of comprehensionsimilar to the scale reported in Rowan, Camburn, and Correnti (2004). The singlecomposite formed from these three covariates was normally distributed.
Analytic Methods
Our data analyses were constructed to seek evidence related to our earlier claims. Thefirst claim sought to understand the extent to which the RTA distinguished amongclassrooms on students’ ability to write in response to texts. Implicit in the claim isthat the RTA distinguishes among classrooms such that we might draw valid infer-
Table 1. (Continued)
Measures Description Range Mean SD
Percent ofteacher-createdassignments
Percent of challenging assignments that wentbeyond brief constructed responses(restricting students to respond within a box)or curriculum-generated worksheets. Despiteexplicit instructions that read, “Please select aRESPONSE TO LITERATURE assignmentyou consider to be CHALLENGING for yourstudents. This may include (but is not limitedto): a summary of a text, an evaluation of abook, an analysis of a character, an essaycomparing and contrasting texts,” a majorityof assignments received were directly fromthe district curricula.
0–100 32 .34
Average length ofwritten response
The average number of words students wrotein response to challenging assignments,averaged across 6 assignments with 4 studentsper assignment (2 demonstrating high ability,2 demonstrating average ability).
38–230 112.42 59.75
aData reduction was accomplished through factor analysis using SPSS 19.0 specifying principal axis factoring and an
oblique rotation. A single factor was obtained explaining just over 60% of the variance in the six items. Examination of the scree plot
indicated a single factor was preferred.b
The frequency of days teachers reported using each of 28 dichotomous items in comprehension (10 items), writing (9 items),
and word analysis (9 items) was reported in Correnti et al. (2012). These dichotomous items were nested within days, and days were
nested in teachers to construct scales from a measurement model (e.g., see Raudenbush et al., 1991). The models weighted each occa-
sion by the number of minutes teachers reported teaching that day. From these measurement models we obtained an empirical Bayes
residual from instructional scales estimated simultaneously including writing and integration of comprehension with writing.
�
This content downloaded from 150.212.81.22 on Wed, 15 Jan 2014 12:40:19 PMAll use subject to JSTOR Terms and Conditions

Table 2. Items Contributing to Measure of Students’ Opportunities for Comprehension a
Measures Description Range Mean SD
Surveys:Time spent intext discussionsinferring andciting evidence
This covariate was calculated from teachers’ self-report of two separate time estimates. First,teachers were asked, “Consider the total amount oftime students spent on language arts in a typicalweek. What proportion of their time was spent onthe following? (Proportion of time should total100%).” Teachers reported the proportion of timethey spent in each of four options including (1)reading text and improving reading skills, (2)writing, (3) assessing students’ understanding/comprehension through multiple choice, fill-in-the-blank, or practice for the MSA, and (4) textdiscussion activities. We were interested in thelatter since it is our most direct measure of teachingcomprehension of the text.
.013–.078 .045 .018
Second, teachers were asked, “Consider the totalamount of time students spent in text discussions.What proportion of time was spent on thefollowing? (Proportion of time should total100%).” Teachers reported the proportion of timethey spent in each of four options including (1)respond briefly to literal and factual questionsabout the text, (2) identify main idea or discusssequence of events in the story, (3) infer author’smeaning by making connections within andbetween texts, and (4) build on each other’s ideasciting evidence from text to support theirassertions. We were interested in the latter twocategories indicating a focus on inferences andusing supporting evidence. This covariate was aproduct of time spent in text discussions and timein text discussion inferring or using supportingevidence.
Frequency ofroutinecomprehensionactivities
This covariate is a factor of 3 survey responses to anitem stem asking the following: “Below are a set ofitems pertaining to classroom text discussions.Considering constraints on your teaching pleaseindicate the frequency students engage in eachelement in your text discussions.” Items wereanswered on the following scale: never, rarely,sometimes, often, almost always. Three itemsformed a single factor explaining 57% of thevariance in the items and included (1) studentsprovide brief answers to comprehension questions,(2) students recount factual events in a story, and(3) students sequence events in a story.
3–5 3.95 .56
This content downloaded from 150.212.81.22 on Wed, 15 Jan 2014 12:40:19 PMAll use subject to JSTOR Terms and Conditions

ences from the rank order of classrooms based on students’ average performance onthe RTA. We sought evidence that performance on the RTA correlated with otherknown measures of student ability. Therefore, we compared and contrasted thescores for students on the two measures of student ability—the MSA and the RTA.Bivariate correlations between the average RTA score (mean score on the five dimen-sions) and the overall scale score on the MSA reading were .59 at the student level and.68 at the classroom level. Table 3 displays correlations among each dimension of theRTA with the MSA scale score; they range from .34 to .51 at the student level.
All of these correlations are statistically significant and connote a positive associ-ation between the MSA and RTA. Interestingly, rating categories based on the stu-dent response to the text (i.e., analysis and evidence) had lower correlations with theMSA than did more generic aspects of students’ writing (i.e., organization, style, andMUGS). While all the associations were significant, the moderate correlations alsosuggest that the abilities measured by the two assessments do not overlap completely.
We explored the factor structure of the subscores of our two assessments. For theRTA the subscores included the scores for the five criteria on the rubric, and for the
Table 2. (Continued)
Measures Description Range Mean SD
Logs: b
Comprehension Scale of comprehension items (activate priorknowledge, answer literal comprehensionquestions, examine story structure,analyze/synthesize, provide brief answers, studentsdiscuss text, provide extended answers, teacher-directed instruction, integrate writing into readingcomprehension) across all logs contributed andweighted by time. This scale represents theexposure students had to comprehension across theyear.
�1.73–2.21 0 1
aData reduction was accomplished through factor analysis using SPSS 19.0 specifying principal axis factoring and an oblique
rotation. A single factor was obtained explaining about 58% of the variance in the three covariates. Examination of the scree plot indi-
cated a single factor was preferred.b
The frequency of days teachers reported using each of the 10 dichotomous items in comprehension was reported in Correnti et
al. (2012). These dichotomous items were nested within days, and days were nested in teachers to construct scales from a measure-
ment model (e.g., see Raudenbush et al., 1991). The models weighted each occasion by the number of minutes teachers reported
teaching that day. From these measurement models we obtained an empirical Bayes residual from instructional scales estimated si-
multaneously including comprehension along with the aforementioned writing and integration of comprehension with writing scales.
Table 3. Bivariate Correlations a between RTA and MSA
MSAReading Analysis Evidence Organization Style MUGS
RTA(Avg.)
MSA reading – .34 .41 .51 .51 .51 .59Analysis .32 – .34 .51 .53 .41 .67Evidence .47 .56 – .60 .50 .45 .73Organization .69 .57 .85 – .63 .57 .83Style .72 .77 .67 .81 – .68 .87MUGS .76 .60 .68 .82 .88 – .80RTA (avg.) .68 .77 .86 .93 .94 .91 –
aUpper diagonal represents student-level correlations; lower diagonal represents classroom-level correlations.
�
This content downloaded from 150.212.81.22 on Wed, 15 Jan 2014 12:40:19 PMAll use subject to JSTOR Terms and Conditions

MSA the subscores included the three scales previously defined. We ran a confirma-tory factor analysis (CFA) using the software package MPlus6.12, assuming that thetwo tests measured different aspects of students’ learning. Using all eight subscales,the model could not be identified because of the distribution of student scores on theMSA general subscale. We reran the analysis using all five subscales of the RTA andjust two MSA subscales. This decision was made both because the general subscalehad a poor distribution and because the general subscale featured multiple-choiceitems that did not directly relate to students’ production of writing; in contrast, thetwo retained subscales contained multiple-choice comprehension items and briefconstructed responses to literary and informational text passages, respectively. Wecompared the results obtained from both a one- and two-factor solution. The single-factor solution fit statistics (�2 � 138.42, df � 14, p � .000; RMSEA � .144; CFI �.897; SPMR � .055) fail to demonstrate a good model fit even with modifications(�2 � 99.17, df � 12, p � .000; RMSEA � .128; CFI � .928; SPMR � .047). Thetwo-factor solution (�2 � 50.67, df �13, p � .000; RMSEA � .082; CFI � .969;SPMR � .028) demonstrates better model fit, which improves with modifications(�2 � 16.06, df � 11, p � .139; RMSEA � .033; CFI � .996; SPMR � .017). Thus, eventhough both assessments purport to measure aspects of writing, our analyses dem-onstrate better model fit when each test is considered separately.
The results from the CFA carried several implications for our analyses. First, wewere interested in exploring univariate hierarchical prediction models with the MSAand RTA considered separately. These allowed us to compare and contrast the RTAand MSA as outcomes in separate models. Here we were interested in comparingboth the variance components as well as effects of our instructional covariates. Sec-ond, we were also interested in additional analyses, particularly given the fact that theRTA is unlikely to take precedence over the accountability test that districts arerequired to administer. We conducted two separate multivariate analyses in order tounderstand how both tests combined could provide additional information aboveand beyond the univariate analysis of the accountability test alone.
The first multilevel multivariate model built off of the results from the CFA. Here,we examined the five subscales of the RTA and the two writing subscales of the MSA(informational and literary, hereafter labeled MSAinf�lit). The multilevel multivariatemodel allowed us to examine each as a separate test while accounting for the covari-ance between the two measures (Raudenbush, Rowan, & Kang, 1991; Snijders &Bosker, 1999; Thum, 1997). The psychometric phase of this model provided infor-mation about the correlation between the two tests after attenuating the scales formeasurement error. Furthermore, these multivariate models allowed us to moreaccurately represent the reality of complex phenomena (Thum, 1997) by providing ameans for comparing and contrasting effects of covariates across multiple outcomes(Hauck & Street, 2006; Hoffman & Rovine, 2007). For example, we examined stu-dents’ opportunities for reasoning and extended writing as a predictor of each test. Inparticular we were interested to see if our measure of student reasoning and extendedwriting would allow us to demonstrate a teaching effect on the district’s accountabil-ity test when examining just the two subscales incorporating elements of writing.
The second multilevel multivariate model examined an overall achievement scoreacross the seven subscales of the RTA and MSAinf�lit while also examining the con-trast between students’ performance on the RTA relative to performance on theMSAinf�lit. The purpose of this analysis was twofold. First, we wanted to examine a
�
This content downloaded from 150.212.81.22 on Wed, 15 Jan 2014 12:40:19 PMAll use subject to JSTOR Terms and Conditions

general measure of writing and comprehension (including components of readingcomprehension on the MSAinf�lit and listening comprehension on the RTA). Second,simultaneously, in the same model we wanted to examine whether our measure ofstudents’ opportunities for reasoning and extended writing was more potent forstudents’ performance on one type of written assessment versus the other. In partic-ular, we wanted to examine whether the RTA was more sensitive than the stateaccountability test to teaching that was theoretically aligned with skills needed to dowell on the RTA.
Univariate Analyses Predicting Student Learning
Using HLM7.0, we first examined each outcome separately in a two-level covari-ate adjusted model. The general form of this model is:
Level 1 �students�: (achieve) ij � �0j � �pj * �Api� � e0j,Q
(1.1)
Level 2 �teachers�: �0j � �p0 � ��pqXqj � r0j,q � 1
(1.2)
where (achieve)ij is the achievement of student i in teacher j’s classroom; �0j is theaverage achievement across all students; (Api) is a set of (p) student-level covariatesfor student i; �pj is the effect of each (p) student-level covariate on achievement; �p0
is the average achievement across all classrooms; Xqj is a set of teacher and classroomcovariates; �pq is the effect of teacher and classroom covariates on achievement, andwhere e0j and r0j are independent normal residual errors.
Instructional covariates in univariate analyses. We examined whether covariatesderived from the instructional data have logical relationships with different measuresof student learning. Since much prior research has demonstrated the importance ofcurricular alignment with the assessment (D’Agostino et al., 2007; Ruiz-Primo et al.,2002), we attempted to test for the presence of alignment between measures of teach-ing (the enacted curriculum) and measures of learning. Here we examined students’opportunities for comprehension and students’ opportunities for reasoning and ex-tended writing as covariates predicting student learning on the MSA and RTA. Itemson the MSA are a mix of multiple-choice comprehension questions, brief con-structed responses (in response to a short passage), and other items such as vocab-ulary; hence we expected that students with greater opportunities for comprehen-sion would score higher on the MSA because we thought the total scale scorereflected general comprehension skills. In contrast, we expected that students withgreater opportunities for reasoning and extended writing would perform better onthe RTA than students with fewer opportunities to develop these skills. To test thesehypotheses, we compared and contrasted results from univariate models on the MSAand RTA, respectively.
Multivariate Multilevel Analyses Predicting Student Learning
One reason for examining the multivariate models is that we know student per-formance is related on our two tests—the state test (MSA) and the response-to-textassessment (RTA). We examined a three-level hierarchical linear model using HLM7.0 (Raudenbush & Bryk, 2002). At level 1, this is a measurement model that describes
�
This content downloaded from 150.212.81.22 on Wed, 15 Jan 2014 12:40:19 PMAll use subject to JSTOR Terms and Conditions

the subscores contributing to each achievement scale and examines the measure-ment error variation in the true-score estimation of the achievement scales. Levels 2(student level) and 3 (classroom level) of this analysis then are essentially a multivar-iate two-level model for the latent scale scores of achievement. These models arefurther described in Appendix B. Analyses of the variance components and psycho-metric data from the measurement model help evaluate whether the scales createdfrom RTA and MSA subscores reliably distinguish between students and classroomson each scale.
Instructional covariates in multivariate analyses. To follow-up on findings ofour univariate analyses, we first included opportunities for reasoning and extendedwriting in a multilevel multivariate model as a classroom level predictor of the RTA(�105)1 and MSAinf�lit (�205)1. In a second multivariate multilevel model, we examinedwhether the same measure of instruction predicted overall achievement on the RTAand MSAinf�lit together (�105)2 and the effect of students’ opportunities for reasoningand extended writing on the contrast between performance on the RTA versusMSAinf�lit (�205)2.
Results
We examined a series of prediction models to investigate our initial claims. Theseclaims were essentially twofold. First, the RTA will distinguish among classrooms instudents’ ability to write analytically in response to a text. Second, performance onthe RTA is aligned in logical ways with measures of the enacted curriculum, specif-ically measures of students’ opportunities to both think critically about texts in dis-cussions and in class activities, and to produce extended writing. The first claim ispartially addressed by understanding whether there is sufficient variance betweenclassrooms to detect relationships. At the same time, both of the claims utilize infor-mation from prediction models to gauge the extent to which we can infer that theobserved variance is indicative of students’ analytic writing skills.
Student Performance on the RTA
We begin by describing students’ performance on the RTA to provide an overallpicture of what the ratings reveal about students’ response-to-text writing skills, aswell as to provide information about the ratings that could be useful for interpretingour quantitative results. As shown in Figure 1, the RTA ratings showed substantialvariation in student responses across the five dimensions (i.e., criterion). The modalresponse for each dimension was 2, indicating room for improvement across stu-dents in general in the quality of their responses; however, means and distributionsfor the individual rating scales varied considerably. Analysis was the most highlyskewed of the five scales and had the only mean below 2 (M � 1.88). Only 21% of thestudents scored a 3 or a 4, indicating that their responses showed evidence that theyunderstood the purpose of the text and could synthesize ideas in the text. Thesestudents made a clear inference and articulated it in the form of a valid and insightfulclaim in direct response to the prompt. The majority of students, in contrast, dem-onstrated a very limited understanding of the text and had a great deal of difficultyinferring meaning from the text. Students may, for example, merely summarize thetext or restate an obvious or given conclusion from the selection. Such responses may
�
This content downloaded from 150.212.81.22 on Wed, 15 Jan 2014 12:40:19 PMAll use subject to JSTOR Terms and Conditions

also include partial or unclear claims that are not explicitly articulated. Evidence,Organization, and Style all had a slight skew toward the lower end of the distributionand a similar mean; otherwise, they were fairly normally distributed. Students thatscored 3 or 4 on Evidence provided a sufficient number of pieces of evidence and theevidence selected was of concrete, specific events or utterances in the text. Further-more, the evidence was relevant and significant to the claim being argued. The typicalresponse, with a score of 2, however, indicated that students used limited pieces ofevidence that were often unclearly related to the argument or only referred generallyto parts of the text. While our scale rewarded students for constructing multipleparagraphs, having clear topic and concluding sentences, and demonstrating logicalflow between sentences and paragraphs, we found that the majority of students gavea single-paragraph response. Students tended to provide some version of a topicsentence that attempted to address the prompt; however, the writing tended to endabruptly, without a conclusion. The body of the paragraph may be underdeveloped(some responses consisted of only one or two sentences total) or contain ideas that,while on topic, are not organized coherently. Finally, students typically used ex-pected word choices, simple sentence structures, and basic connectives instead ofmore advanced academic language. A typical response also featured persistent gram-matical and mechanical errors, such as run-on sentences or fragments.
Annotated sample student responses are included in Appendix C. In the interestof brevity, in order to address both prompts and to show each scale value of the rubric(1– 4), we have provided two pieces of writing for each prompt. Furthermore, in theinterest of space, we have selected responses that earned the same score on all fivecriteria; this is a rare phenomenon in our sample. The four pieces provide a samplingof the quality of student writing to help interpret and understand our quantitativefindings. They demonstrate some obvious qualitative differences across students’reasoning and writing. For one, the sample responses demonstrate some of the waysstudents’ strategies for answering our prompt went awry. For example, most stu-dents had a heavy reliance on the text itself and thus had trouble generalizing from
Figure 1. Distribution of student scores on five scoring criteria of the RTA rubric.
�
This content downloaded from 150.212.81.22 on Wed, 15 Jan 2014 12:40:19 PMAll use subject to JSTOR Terms and Conditions

the text to take an analytic stance. The samples also demonstrate what it looked likewhen students used incomplete evidence (which was also a frequent occurrence), asin the focus in sample C on the before condition of Sauri to the exclusion of the aftercondition. Finally, in addition to demonstrating the variance in students’ perfor-mances, the annotated pieces of student writing provide the reader with a sense ofhow our raters applied the rubrics provided in Appendix A.
Comparing and Contrasting Univariate Hierarchical Models on the MSA andRTA
Variance components analysis. Tables 4 and 5 display the results for the randomeffects for each of the univariate models. We focus our immediate attention on thenull model containing no covariates and the model with only background charac-teristics of students and teachers (located in the first two columns of each table). Forboth outcomes, background characteristics explain a large proportion of the vari-ance at both the student (51% reduction in variance for the MSA and 32% for theRTA8) and teacher (68% reduction in variance for the MSA and 38% for the RTA)levels. It is important to note one difference: the background characteristics ex-plained more variance in student performance on the MSA at both levels than thebackground characteristics did on the RTA. Even for the MSA, however, the chi-square statistics of variance remaining between classrooms reveal significant differ-ences in classroom performance after adjusting for student and teacher characteris-
Table 4. Univariate Hierarchical Linear Models of Maryland School Assessment (MSA)
Coefficient (SE)
NullModel
BackgroundCharacteristics
ComprehensionFactor
ExtendedWriting Factor
Teacher-level fixed effects:Intercept �.04 (.13) �.01 (.08) �.02 (.08) �.01 (.08)Grade .25 (.14) .24 (.14) .23 (.14)Ph.D. .25 (.46) .18 (.55) .24 (.49)Advanced certification �.21 (.26) �.24 (.28) �.22 (.27)Years experience �.01 (.01) �.01 (.01) �.01 (.01)Instruction .05 (.12) .08 (.10)
Student-level fixed effects:Absences �.01 ** (.01) �.01 ** (.01) �.01 ** (.01)Hispanic .20 (.17) .19 (.17) .19 (.17)Black �.04 (.19) �.03 (.19) �.03 (.19)Native American �.19 (.23) �.18 (.23) �.18 (.23)Asian .22 (.23) .22 (.23) .22 (.23)Free lunch �.10 (.08) �.10 (.08) �.10 (.08)Reduced-price lunch �.09 (.10) �.09 (.10) �.09 (.10)Individualized education plan .14 (.11) .14 (.11) .14 (.11)Prior reading achievement .56 *** (.05) .56 *** (.05) .56 *** (.05)Prior math achievement .23 ***(.05) .23 *** (.05) .23 *** (.05)
Random effects:Between-classroom variance (��0) .28 .09 .09 .09�2 (df) 175.76 (17) 82.48 (13) 79.17 (12) 77.02 (12)Between-student variance (�2) .72 .35 .35 .35
** p � .01.*** p � .001.
�
This content downloaded from 150.212.81.22 on Wed, 15 Jan 2014 12:40:19 PMAll use subject to JSTOR Terms and Conditions

tics (�2 � 82.43, df � 13, p � .001). Likewise, the RTA also revealed significantdifferences in variance remaining between classrooms (�2 � 123.59, df � 13, p � .001)after adjusting for background. Finally, while both outcomes had significantbetween-classroom variance after adjusting for background, the proportion of vari-ance between classrooms was lower for the MSA (ICC � .21) than it was for the RTA(ICC � .29).9
Effects of covariates. Some covariates in Tables 4 and 5 demonstrate consistenteffects across the MSA and RTA. Background characteristics, for example, often hadsimilar effects in both models. Prior achievement in both reading and math werehighly significant on both outcomes. It bears noting that the magnitude of the effectfor prior math achievement was about the same as the magnitude for prior readingachievement on the RTA, which was not the case for the MSA, where reading had alarger effect. Free lunch seems to have a fairly consistent effect across the models, butis statistically significant on the RTA (p � .041) but not on the MSA (p � .190).
A few differences also emerge for the covariates. Grade predicts higher scores onthe MSA, which is logical since the MSA is equated across grades, whereas no gradedifferences were seen on the RTA where it was not possible to equate scores acrossgrades. Second, students with an IEP scored similarly to their peers on the MSA buthad lower performance on the RTA. No test accommodations were provided on theRTA, whereas test accommodations were available for the MSA. Finally, studentabsences predicted lower performance on the MSA but not the RTA. On balance, thepattern of results demonstrated that the RTA was sensibly related to student back-
Table 5. Univariate Hierarchical Linear Models of Response-to-Text Assessments (RTA)
Coefficient (SE)
NullModel
BackgroundCharacteristics
ComprehensionFactor
ExtendedWriting Factor
Teacher-level fixed effects:Intercept .00 (.13) .05 (.11) .05 (.11) .05 (.09)Grade �.05 (.19) �.07 (.18) �.13 (.16)Ph.D. .03 (.55) �.14 (.63) .02 (.50)Advanced certification .35 (.29) .29 (.30) .33 (.24)Years experience .00 (.02) .00 (.02) �.01 (.01)Instruction .18 (.14) .30 * (.11)
Student-level fixed effects:Absences .00 (.01) .00 (.01) .00 (.01)Hispanic .09 (.20) .09 (.20) .08 (.20)Black .13 (.22) .13 (.22) .14 (.22)Native American �.08 (.26) �.07 (.26) �.08 (.26)Asian .35 (.26) .36 (.26) .35 (.26)Free lunch �.17 * (.09) �.16 * (.09) �.17 * (.09)Reduced-price lunch �.18 (.12) �.17 (.12) �.17 (.12)Individualized educational plan �.28 * (.12) �.28 * (.12) �.29 * (.12)Prior reading achievement .33 *** (.06) .33 *** (.06) .32 *** (.05)Prior math achievement .27 *** (.06) .27 *** (.06) .26 *** (.06)
Random effects:Between-classroom variance (��0) .31 .19 .18 .11�2 (df) 217.66 (17) 123.59 (13) 110.16 (12) 68.85 (12)Between-student variance (�2) .68 .46 .46 .46
* p � .05.*** p � .001.
�
This content downloaded from 150.212.81.22 on Wed, 15 Jan 2014 12:40:19 PMAll use subject to JSTOR Terms and Conditions

ground characteristics that we would expect it to have an association with (e.g., priorachievement, free lunch status, and special needs) but not to others we would notexpect it to have an association with (e.g., grade). Finally, no teacher-level back-ground characteristics that were included as proxies for knowledge and experiencewere significant for either outcome.
Instructional covariates. The pattern of results for the instructional covariatesprovides another point of comparison for the performance of students on each test.In the right-hand column of Tables 4 and 5 we display the effects of students’ oppor-tunities for comprehension and for student reasoning and extended writing, eachincluded in separate models.
The RTA was sensitive to instructional effects in the ways we predicted, but nei-ther the factor measuring students’ opportunities for comprehension nor for rea-soning and extended writing was a significant predictor of student performance onthe MSA. Moreover, in the MSA models the addition of either instructional covariateresulted in no further reduction in between-classroom variance beyond student andclassroom background factors. Thus, while the coefficients of all instructional effectswere positive for both outcomes, only the RTA was sensitive to instructional effects,and only then to one of the two instructional factors—students’ opportunities forreasoning and extended writing (ES � .40).
Instructional factors explained a portion of the variance remaining between class-rooms on the RTA after adjusting for student background. Students’ opportunitiesfor comprehension, despite being nonsignificant, explained about 6% of the remain-ing between-classroom variance after student background characteristics were ac-counted for.10 Subsequently, the model examining students’ opportunities for rea-soning and extended writing as a covariate explained about 42% of the remainingbetween-classroom variance.
Comparing and Contrasting Results from Multilevel Multivariate HierarchicalModels
Psychometric findings. In the multilevel multivariate hierarchical linear model(HLM) we examined the relationship between MSAinf�lit (the combination of theMSA subscales on the informational and literary subsections containing both com-prehension multiple-choice items and students’ brief constructed responses) and theRTA. This model allows for a variance decomposition, treating �2 as measurementerror and decomposing the remaining “true score variance” into portions remainingbetween students within classrooms and between classrooms. These findings illus-trate the potential of the assessment to reliably distinguish between students on theMSAinf�lit (.62) and RTA (.78), respectively, and also between classrooms on the MSAinf�lit
(.87) and RTA (.90). These reliability estimates provide a measure of the internalconsistency of the scales relative to the measurement error. In each case, varianceexists to be explained by differences between both individuals and classrooms.Correlations were also obtained between the RTA and MSAinf�lit via this method.“True score” correlations between the ability scales at the student (r � .76) andteacher (r � .73) level were slightly higher in the measurement model than theywere in bivariate correlations reported in Table 3 (.59 and .68), which is naturalgiven that this model treats deviations from the average as residual measurementerror.
�
This content downloaded from 150.212.81.22 on Wed, 15 Jan 2014 12:40:19 PMAll use subject to JSTOR Terms and Conditions

Effects of opportunities for reasoning and extended writing. Findings for mul-tivariate model 1 in Table 6 resemble the findings from univariate analyses. Students’opportunities for reasoning and extended writing were predictive of performance onthe RTA after adjusting for student and classroom covariates (�105 � .244; ES � .46)but not significantly predictive of the MSAinf�lit (p � .681). One difference in themodels is that 77% of the variance in MSAinf�lit is accounted for by prior achievementon the MSA and student background, whereas student background accounts forabout 45% of the variance in RTA scores.11 Two additional findings merit brief con-sideration. First, no other teacher or classroom covariates were associated withachievement on either measure. Second, the addition of our measure of opportuni-ties for reasoning and extended writing explained about half of the variance in theRTA (50%) when compared to the model adjusting for student background charac-teristics alone.
Findings from multivariate model 2 confirm the notion that a focus on extendedwriting was associated with higher performance on combined achievement on theMSAinf�lit and RTA. Students’ opportunities for reasoning and extended writing wereassociated with higher overall achievement scores (�105 � .164; ES � .38). Addition-ally, opportunities for reasoning and extended writing were also predictive of thecontrast in performance on the RTA relative to the MSAinf�lit. Students with greateropportunities for reasoning and extended writing have relatively higher performanceon the RTA versus the MSAinf�lit (�205 � .401; ES � .46). Combined with findingsfrom multivariate model 1, we found that greater opportunities for reasoning andextended writing were associated with better performance overall, but in particularwith higher scores on the RTA relative to performance on the MSAinf�lit.
Discussion
The purpose of our study was to conduct a validity investigation of an assessment ofstudents’ analytic text-based writing skills. The motivation for creating this assess-ment (the RTA) was twofold. First, the majority of current assessments measurereading comprehension and writing as separate skills, which produces satisfyingpsychometrics but is not well aligned with the intent of the CCSS. Thus, in our viewcurrent assessments remain only modestly aligned with the particular writing skillsthat students need to succeed at higher levels of schooling. Second, we reasoned thatour assessment would be more sensitive to teaching that emphasizes text analysis andextended writing (i.e., higher-level literacy skills) than most readily available assess-ments. As such, our assessment would be useful in research focused on high-levelteaching-learning connections, as well as research investigating the effect of educa-tional reforms on teaching and students’ literacy skills. Overall, our findings providesupporting evidence that, for a small sample of classrooms at least, the RTA cansimultaneously measure students’ performance on a task that combines text analysis,use of evidence, and extended writing. Moreover, we were able to measure teachingpractice that was theoretically aligned with the development of students’ analyticaltext-based writing skill and such instruction was also associated with classroom per-formance on the RTA.
�
This content downloaded from 150.212.81.22 on Wed, 15 Jan 2014 12:40:19 PMAll use subject to JSTOR Terms and Conditions

Tab
le6.
Tes
tsof
Ass
ocia
tion
betw
een
the
RT
A,M
SAin
f�lit
,an
dO
ppor
tun
itie
sfo
rR
easo
nin
gan
dE
xten
ded
Wri
tin
g
Mu
ltiv
aria
teM
odel
1M
ult
ivar
iate
Mod
el2
RT
A( �
105)
1
MSA
inf�
lit
(�20
5)1
RT
A�
MSA
inf�
lit
(�10
5)2
Con
tras
tR
TA
/MSA
inf�
lit
(�20
5)2
Coe
ff.
SEC
oeff
.SE
Coe
ff.
SEC
oeff
.SE
Tea
cher
-lev
elfi
xed
effe
cts:
Inte
rcep
t.0
24.0
56�
.031
.056
.004
.051
.104
.092
Gra
de�
.094
.107
.162
.102
.002
.096
�.4
81**
.162
Ph
.D.
.080
.344
.152
.367
.107
.337
�.1
35.4
03A
dvan
ced
prof
essi
onal
cert
ifica
tion
.261
.159
�.1
41.2
06.1
10.1
59.7
53*
.308
Yea
rsex
peri
ence
�.0
08.0
10�
.005
.009
�.0
07.0
09�
.006
.014
OT
Lre
ason
/wri
te.2
45**
*.0
69.0
30.0
72.1
64*
.064
.401
**.1
16St
ude
nt-
leve
lfixe
def
fect
s:H
ispa
nic
.023
.140
.289
.157
.123
.116
�.4
97.3
46B
lack
.116
.162
.044
.175
.089
.135
.135
.381
Nat
ive
Am
eric
an�
.036
.182
�.1
82.2
06�
.091
.154
.273
.441
Asi
an.2
13.1
93.2
15.2
08.2
14.1
60�
.003
.459
Free
lun
ch�
.127
*.0
62�
.084
.069
�.1
11*
.053
�.0
80.1
48R
edu
ced
lun
ch�
.030
.091
.123
.102
.028
.077
�.2
87.2
17In
divi
dual
ized
edu
cati
onal
plan
�.2
27*
.088
.165
.102
�.0
80.0
74�
.733
***
.221
Rea
din
gpr
ior
.256
***
.040
.476
***
.046
.339
***
.034
�.4
11**
*.1
00M
ath
prio
r.1
90**
*.0
43.2
17**
*.0
48.2
00**
*.0
36�
.050
.104
Abs
ence
s�
.004
.004
�.0
15**
.005
�.0
08*
.003
.021
*.0
10R
ando
mef
fect
s:N
ull
Pre
d.N
ull
Pre
d.N
ull
Pre
d.N
ull
Pre
d.B
etw
een
-cla
ssro
omva
rian
cer 1
0�
.176
r 10�
.044
r 20�
.186
r 20�
.041
r 10�
.156
r 10�
.038
r 20�
.350
r 20�
.079
Bet
wee
n-s
tude
nt
vari
ance
e 1�
.324
e 1�
.179
e 2�
.382
e 2�
.186
e 1�
.305
e 1�
.117
e 2�
.614
e 2�
.427
Bet
wee
n-i
tem
vari
ance
(�2 )
.47
.47
*p
�.0
5.**
p�
.01.
***
p�
.001
.
This content downloaded from 150.212.81.22 on Wed, 15 Jan 2014 12:40:19 PMAll use subject to JSTOR Terms and Conditions

Qualities of Student Scores on the RTA
A key finding from our study is that students’ analytic text-based writing skillswere weak overall. Relatively few students were able to generate a clear inferencefrom the text, or use appropriate evidence from the text to support their claims.Students’ writing also showed weaknesses with respect to their use of the vocabularyand more sophisticated sentence structures that characterize an academic voice(Crosson, Matsumura, Correnti, & Arlotta-Guerrero, 2012). Results are not surpris-ing given the generally poor state of writing instruction in our country, as well asresearch showing that relatively few students are prepared to do the kinds of writingthat are required for success at higher levels of schooling and in the workplace(American Diploma Project, 2004; Applebee & Langer, 2009). Our results also sug-gest that students will likely have a great deal of difficulty meeting the writing stan-dards set out in the CCSS that emphasize formulating and supporting text-basedarguments. Substantive changes in classroom practice, and professional learningopportunities for teachers, will be needed.
For each of our five criteria (analysis, evidence, organization, style, and MUGS)we demonstrated moderate to high agreement rates based on Cohen’s kappa be-tween two trained raters. Notably, these rates were highest for the more objectivecategories (rating aspects of students’ writing quality) and lower for more subjectivecategories (rating students’ analysis of text and use of supporting evidence). Inter-estingly, we found that students rarely scored the same on all five of our rubriccriteria.12 Correlations among the dimensions indicated that scores on the dimen-sions varied within students, suggesting that multiple criteria were necessary forcapturing differences among students in analytic writing skills. Understanding howand why students differ in their analytic text-based writing, as well as rater reliabilityamong dimensions, are important topics for further study.
Supporting the first claim of our validity investigation, our results provide evi-dence that the RTA ratings were sensitive to variation between both students andclassrooms. We compared and contrasted student scores on the RTA and MSA forour sample of 426 students nested in 18 classrooms. Both tests demonstrated reliablebetween-student and between-classroom variance in our fully unconditional andconditional HLM models. Furthermore, the test scores were correlated at the studentand classroom levels, although the strength of association was not so great that thetests seemed to duplicate one another. The moderate correlation is not surprisinggiven that the MSA does ask students to write brief constructed responses and there-fore measures student writing in addition to other skills such as reading comprehen-sion, vocabulary, and word study. Indeed, correlations between the overall MSAscale score and each dimension of the RTA demonstrate that the correlation betweenMSA and RTA dimensions was highest where more generic aspects of student writingwere rated (i.e., organization, style, and MUGS) and lower where reasoning and useof supporting evidence were rated (i.e., analysis and evidence).
One possible explanation for this finding is that the dimensions of the RTA withless overlap with the MSA capture aspects of student learning that are difficult toevaluate and not often included in formal assessments. If this were the case, out-comes on the RTA could serve to inform both research and policy. Another possibleexplanation is that the low correlations are due to greater measurement error result-ing from greater subjectivity of the rating judgments required for those dimensions
�
This content downloaded from 150.212.81.22 on Wed, 15 Jan 2014 12:40:19 PMAll use subject to JSTOR Terms and Conditions
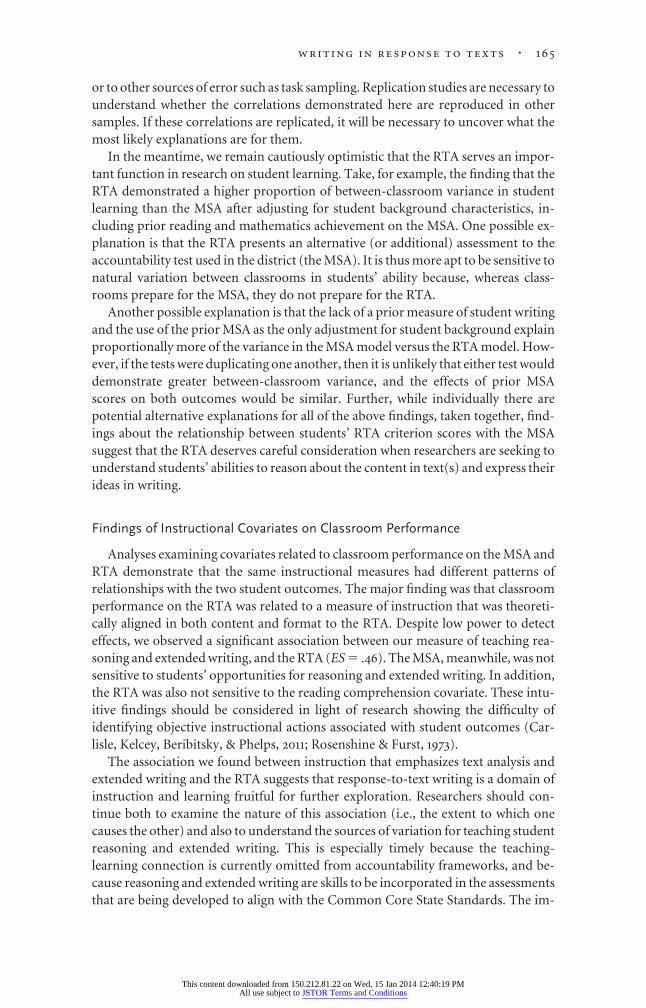
or to other sources of error such as task sampling. Replication studies are necessary tounderstand whether the correlations demonstrated here are reproduced in othersamples. If these correlations are replicated, it will be necessary to uncover what themost likely explanations are for them.
In the meantime, we remain cautiously optimistic that the RTA serves an impor-tant function in research on student learning. Take, for example, the finding that theRTA demonstrated a higher proportion of between-classroom variance in studentlearning than the MSA after adjusting for student background characteristics, in-cluding prior reading and mathematics achievement on the MSA. One possible ex-planation is that the RTA presents an alternative (or additional) assessment to theaccountability test used in the district (the MSA). It is thus more apt to be sensitive tonatural variation between classrooms in students’ ability because, whereas class-rooms prepare for the MSA, they do not prepare for the RTA.
Another possible explanation is that the lack of a prior measure of student writingand the use of the prior MSA as the only adjustment for student background explainproportionally more of the variance in the MSA model versus the RTA model. How-ever, if the tests were duplicating one another, then it is unlikely that either test woulddemonstrate greater between-classroom variance, and the effects of prior MSAscores on both outcomes would be similar. Further, while individually there arepotential alternative explanations for all of the above findings, taken together, find-ings about the relationship between students’ RTA criterion scores with the MSAsuggest that the RTA deserves careful consideration when researchers are seeking tounderstand students’ abilities to reason about the content in text(s) and express theirideas in writing.
Findings of Instructional Covariates on Classroom Performance
Analyses examining covariates related to classroom performance on the MSA andRTA demonstrate that the same instructional measures had different patterns ofrelationships with the two student outcomes. The major finding was that classroomperformance on the RTA was related to a measure of instruction that was theoreti-cally aligned in both content and format to the RTA. Despite low power to detecteffects, we observed a significant association between our measure of teaching rea-soning and extended writing, and the RTA (ES � .46). The MSA, meanwhile, was notsensitive to students’ opportunities for reasoning and extended writing. In addition,the RTA was also not sensitive to the reading comprehension covariate. These intu-itive findings should be considered in light of research showing the difficulty ofidentifying objective instructional actions associated with student outcomes (Car-lisle, Kelcey, Beribitsky, & Phelps, 2011; Rosenshine & Furst, 1973).
The association we found between instruction that emphasizes text analysis andextended writing and the RTA suggests that response-to-text writing is a domain ofinstruction and learning fruitful for further exploration. Researchers should con-tinue both to examine the nature of this association (i.e., the extent to which onecauses the other) and also to understand the sources of variation for teaching studentreasoning and extended writing. This is especially timely because the teaching-learning connection is currently omitted from accountability frameworks, and be-cause reasoning and extended writing are skills to be incorporated in the assessmentsthat are being developed to align with the Common Core State Standards. The im-
�
This content downloaded from 150.212.81.22 on Wed, 15 Jan 2014 12:40:19 PMAll use subject to JSTOR Terms and Conditions

portance of generating analytic writing in response to text is likely to gain in impor-tance if the CCSS remain in place. Students’ abilities to reason and write extendedresponses are essential skills for college and career readiness.
More generally, the research findings further demonstrate the importance of at-tending to principles of specificity and overlap when exploring teaching-learningassociations. The findings suggest that alternative assessments have the potential toreveal relationships between teaching and learning that are not obtainable throughcurrent accountability assessments. Thus, the sampled domain of student reasoning/extended writing is important because other alternative assessments sampling froma target domain different from the accountability test may be able to demonstratefurther unique teaching-learning associations. Therefore, it is important to be delib-erate in our choice of student learning outcomes as these will condition the teachingeffects that are available for researchers to uncover.
A final contribution of this work is in demonstrating the importance of simplyhaving multiple student learning outcomes. We have demonstrated one way multi-ple student outcomes can be used in both univariate and multivariate predictionmodels. In multivariate models we demonstrated how our measure of students’opportunities for reasoning and extended writing predicted a general outcome ofstudent learning combining portions of the MSA (MSAinf�lit) with the RTA, and howit also predicted the contrast in classroom performance on the RTA relative to class-room performance on the MSAinf�lit. These analyses demonstrate how researchersand districts could use assessments in addition to those required for accountabilitypurposes to learn how natural variation in measures of teaching are associated withbetter classroom performance. In turn, such knowledge could be useful to research-ers, individual practitioners, and interventionists thinking about school improve-ment.
Limitations and Directions for Future Research
Our approach to assessment on the RTA was to measure students’ ability to ex-press in writing how they reasoned about a text and provided evidence to supporttheir assertions. As such, it included no explicit measurement of students’ reading flu-ency or their reading comprehension. We made intentional choices (e.g., having theteacher read the text aloud and ask questions) to emulate authentic classroom instructionand to hone in on the constructs we were most interested in measuring—the combina-tion of reasoning and writing. Other researchers may choose to have students read thetext themselves, or perhaps choose not to provide conversational supports for literalcomprehension of the text and thus sample more completely from the target domain toassess not only reasoning and writing but also reading fluency and reading comprehen-sion.
While we have noted the differences between the RTA and MSA in our researchfindings, further study of differences between the RTA and other state standardizedassessments is warranted. One limitation of the work presented here is the differencein test administrations and, in particular, the timing of each assessment. Thus, whilethe RTA seems more sensitive to our instructional measures, a contributing factormay have been that the RTA was administered 2 months after the MSA. Thus, stu-dents could demonstrate an additional 2 months of accumulated learning opportu-nities on the RTA. Researchers should seek to understand how such timing could
�
This content downloaded from 150.212.81.22 on Wed, 15 Jan 2014 12:40:19 PMAll use subject to JSTOR Terms and Conditions

affect the extent to which standardized tests are sensitive to measures of teachingbecause it has implications for research findings when exploring teaching-learningassociations. It also has potential implications for practitioners as such tests arecurrently used as a component of teaching evaluation systems being put in place inmany schools (Baker et al., 2010).
Conclusion
We chose to examine students’ ability to reason about a text and then create anextended analytic written response because we see this as an important skill thatshould merit greater emphasis in the language arts curricula, even as early as grade 4.In our research we identified an association between teaching reasoning and ex-tended writing and our response-to-text assessment. We think this is an area ripe forfuture study and, furthermore, our findings suggest the importance of identifyingstudent learning outcome(s) aligned with specific elements of “effective teaching.”Through our analytic methods we demonstrated one method of examining bothunivariate and multivariate prediction models, which highlighted the utility of hav-ing multiple student learning outcomes. Careful consideration of student outcomesis critical going forward because the process of identifying teaching-learning associ-ations forms the basis for building a teaching knowledge base that can guide profes-sional learning and inform both policies and instructional interventions.
�
This content downloaded from 150.212.81.22 on Wed, 15 Jan 2014 12:40:19 PMAll use subject to JSTOR Terms and Conditions

App
endi
xA
Tab
leA
1.R
TA
Scor
ing
Ru
bric
(wit
hD
ecis
ion
Ru
les)
An
alys
isE
vide
nce
Org
aniz
atio
nSt
yle
Mec
han
ics/
Usa
ge/G
ram
mar
/Spe
llin
g
4•
Dem
onst
rate
sa
clea
run
ders
tand
ing
ofth
e(p
urpo
seof
the)
liter
ary
wor
k•E
xhib
its
orig
inal
insi
ghta
nddr
aws
mea
ning
fulc
oncl
usio
nsor
dem
onst
rate
sso
phis
tica
ted
and
succ
inct
synt
hesi
sof
idea
s•I
nfer
ence
/ins
ight
iscl
earl
y,ex
plic
itly
arti
cula
ted
•Inf
eren
ceis
elab
orat
edup
on,n
otju
stst
ated
ina
sent
ence
ora
few
wor
dsin
the
begi
nnin
g•A
ddre
sses
the
prom
pt
•Se
lect
sde
taile
d,pr
ecis
e,an
dsi
gnifi
can
tev
iden
cefr
omth
ete
xt•
Dem
onst
rate
sin
tegr
alu
seof
sele
cted
deta
ilsfr
omth
ete
xtto
supp
ort
and
exte
nd
key
idea
•Fo
cuse
son
the
mai
nid
ea•
Dem
onst
rate
slo
gica
lan
dse
amle
ssfl
owfr
omse
nte
nce
tose
nte
nce
and
idea
toid
ea•
Has
ast
ron
gse
nse
ofbe
gin
nin
g,m
iddl
e,an
den
d•
Beg
inn
ing
and
end
mu
stre
late
clos
ely
tosa
me
key
idea
•M
ust
feat
ure
mu
ltip
leap
prop
riat
epa
ragr
aph
s
•Fe
atu
res
vari
edse
nte
nce
len
gth
san
dst
ruct
ure
s,in
clu
din
gco
mpl
exst
ruct
ure
s•
Use
sti
er2
voca
bula
rym
ult
iple
tim
es•
Use
sso
phis
tica
ted
con
nec
tive
sa
mu
ltip
leti
mes
corr
ectl
y•
Feat
ure
sa
nu
mbe
rof
soph
isti
cate
dor
orig
inal
phra
ses
•Fe
atu
res
erro
rsth
atdo
not
detr
act
from
com
mu
nic
atio
nof
idea
s•
Feat
ure
sve
ryfe
wm
inor
erro
rsor
afe
w“s
oph
isti
cate
d”er
rors
3•
Dem
onst
rate
sad
equ
ate
un
ders
tan
din
gof
the
(pu
rpos
eof
the)
liter
ary
wor
k•
Mak
esm
ult
iple
valid
and
insi
ghtf
ul
infe
ren
ces
orde
mon
stra
tes
syn
thes
isof
idea
s•
Infe
ren
ce/i
nsi
ght
iscl
earl
y,ex
plic
itly
arti
cula
ted,
not
requ
irin
gin
terp
reta
tion
byre
ader
•A
ddre
sses
the
prom
pt
•Se
lect
sap
prop
riat
ean
dco
ncr
ete,
spec
ific
evid
ence
from
the
text
•D
emon
stra
tes
use
ofse
lect
edde
tails
from
the
text
tosu
ppor
tke
yid
ea
•A
dher
esto
the
mai
nid
ea•
Dem
onst
rate
slo
gica
lflow
from
sen
ten
ceto
sen
ten
cean
did
eato
idea
•H
asa
clea
rse
nse
ofbe
gin
nin
g,m
iddl
e,an
den
d•
Mak
esa
clea
rat
tem
ptat
pres
enti
ng
ake
yid
eain
begi
nn
ing
and
end,
but
may
bew
eak
inth
atth
eydo
not
rela
tecl
osel
y,an
dm
aybe
mis
sin
ga
begi
nn
ing
oren
d,bu
tor
gan
izat
ion
isst
ron
got
her
wis
e(e
.g.,
mu
ltip
lepa
ragr
aph
s,w
ell-
deve
lope
dm
iddl
e,et
c.)
•Fe
atu
res
vari
edse
nte
nce
stru
ctu
re•
Use
sti
er2
voca
bula
rya
few
tim
es•
Use
sso
phis
tica
ted
con
nec
tive
sa
few
tim
es•
Feat
ure
sso
me
soph
isti
cate
dor
orig
inal
phra
ses
•Fe
atu
res
erro
rsth
atde
trac
tso
mew
hat
from
com
mu
nic
atio
nof
idea
s•
Feat
ure
soc
casi
onal
min
orer
rors
Con
tinu
ed
This content downloaded from 150.212.81.22 on Wed, 15 Jan 2014 12:40:19 PMAll use subject to JSTOR Terms and Conditions

Tab
leA
1.(C
onti
nued
)
An
alys
isE
vide
nce
Org
aniz
atio
nSt
yle
Mec
han
ics/
Usa
ge/G
ram
mar
/Spe
llin
g
2•
Dem
onst
rate
sa
limit
edu
nde
rsta
ndi
ng
ofth
e(p
urp
ose
ofth
e)lit
erar
yw
ork
•M
akes
cred
ible
but
obvi
ous
and
basi
cin
fere
nce
s,w
hic
hm
ayco
nta
inm
inor
erro
rs•
Infe
ren
ceof
ten
base
don
one
sen
ten
ceor
even
just
afe
ww
ords
•A
ddre
sses
the
prom
pt
•Se
lect
sso
me
appr
opri
ate
but
gen
eral
evid
ence
from
the
text
;may
con
tain
afa
ctu
aler
ror
orom
issi
on•
Evi
den
cepr
ovid
edm
aybe
list-
like
ina
sen
ten
ceor
so,
not
expa
nde
du
pon
•D
emon
stra
tes
limit
edde
velo
pmen
tor
use
ofse
lect
edev
iden
ce
•H
asse
riou
sor
gan
izat
ion
alpr
oble
ms
•H
asso
me
un
even
flow
orso
me
un
clea
rpa
ssag
es•
Has
limit
edse
nse
ofbe
gin
nin
g,m
iddl
e,an
den
d•
Mis
sin
ga
begi
nn
ing
oren
d,an
dm
iddl
eex
ists
but
may
besh
ort
onde
velo
pmen
t
•U
ses
mec
han
ical
,alm
ost
robo
tic
(e.g
.,“c
hai
nin
g”)
sen
ten
ceco
nst
ruct
ion
s•
Feat
ure
sdu
llan
dre
peti
tive
wor
dch
oice
•U
ses
sim
ple
con
nec
tive
sco
rrec
tly
•Fe
atu
res
erro
rsth
atin
terf
ere
wit
hco
mm
un
icat
ion
ofid
eas/
impe
decl
ear
un
ders
tan
din
gof
mea
nin
g•
Feat
ure
sse
vera
lmaj
oror
sim
plis
tic
erro
rs;n
um
ber
ofer
rors
may
bedi
spro
port
ion
ate
toam
oun
tof
text
1•
Dem
onst
rate
slit
tle
un
ders
tan
din
gof
the
(pu
rpos
eof
the)
liter
ary
wor
k•
Mak
esm
any
inva
lid,i
rrel
evan
t,in
accu
rate
,or
inad
equ
ate
infe
ren
ces
•Su
bsti
tute
ssu
mm
ary
for
infe
ren
ceor
fails
toad
dres
sth
epr
ompt
alto
geth
er
•Se
lect
sin
appr
opri
ate
orlit
tle
evid
ence
from
the
text
;m
ayh
ave
seri
ous
fact
ual
erro
rsan
dom
issi
ons
•D
emon
stra
tes
littl
eor
no
deve
lopm
ent
oru
seof
sele
cted
evid
ence
•M
ayco
nsi
stm
ain
lyof
sen
ten
ces
copi
edfr
omth
ete
xtor
may
sum
mar
ize
enti
rete
xtin
stea
dof
loca
tin
gev
iden
ce
•H
aslit
tle
orn
oor
der
•M
ayfe
atu
rea
ram
blin
gco
llect
ion
ofth
ough
tsor
list-
like
idea
sw
ith
littl
eor
no
flow
•H
aslit
tle
orn
ose
nse
ofbe
gin
nin
g,m
iddl
e,an
den
d
•Fe
atu
res
inco
mpl
ete
sen
ten
ces;
may
only
con
sist
ofa
stri
ng
ofw
ords
con
veyi
ng
littl
eor
no
info
rmat
ion
•C
onta
ins
con
fusi
ng
orin
accu
rate
wor
dch
oice
•U
ses
sim
ple
con
nec
tive
sin
corr
ectl
yor
no
con
nec
tive
s•
Feat
ure
sm
inim
al(o
rigi
nal
)w
riti
ng
(1–2
sen
ten
ces)
,too
littl
eto
adeq
uat
ely
asse
ss
•Fe
atu
res
erro
rsth
atse
riou
sly
inte
rfer
ew
ith
com
mu
nic
atio
nof
idea
s/im
pede
un
ders
tan
din
gof
mea
nin
g•
Freq
uen
tly
feat
ure
sm
ajor
and
sim
plis
tic
erro
rs;n
um
ber
ofer
rors
may
bedi
spro
port
ion
ate
toam
oun
tof
text
•Fe
atu
res
min
imal
(ori
gin
al)
wri
tin
g(1
–2se
nte
nce
s),t
oolit
tle
toad
equ
atel
yas
sess
aA
ddit
ive
(e.g
.,“a
ddit
ion
ally
”an
d“a
lso”
),ca
usa
l(“b
ecau
se”
and
“sin
ce”)
,adv
ersa
tive
(“al
thou
gh,”
“non
eth
eles
s”),
tem
pora
l(fi
rst,
seco
nd
orfi
rst,
then
,fin
ally
).
This content downloaded from 150.212.81.22 on Wed, 15 Jan 2014 12:40:19 PMAll use subject to JSTOR Terms and Conditions

Appendix B
Multivariate Multilevel Model 1Before running the models, student subscores were standardized to have a mean of zero andstandard deviation of one. In addition, we first ran a null model to examine whether the scalevariances were equivalent so that the writing and MSA scales could be easily contrasted (see,e.g., Raudenbush, Rowan, & Kang, 1991). The psychometric phase of these models also al-lowed us to calculate between-student and between-teacher reliabilities in addition to exam-ining which covariates predict higher scores when considering each scale simultaneously asindependent outcomes. The level 1 model is described below:
achievemij � �1ij � �RTAmij� � �2ij � ��MSAinf�lit�mij� � mij, (2.1)
where achievemij is the achievement subscore for scale m for student i in classroom j;RTAmij is a dummy indicator demarcating the five subscores (or scoring criteria) of thewriting rubric; �1ij is the average writing achievement for student i in classroom j;(MSAinf�lit)mij is a dummy indicator demarcating the informational and literary subscalesof the MSA; �2ij is the average MSAinf�lit achievement for student i in classroom j; and mij
is the measurement error for dimension m for student i in classroom j. The level 2(student-level) model is written as follows:
�1ij � �10j � �1pj � �Api� � e1ij
�2ij � �20j � �2pj � �Api� � e2ij,
(2.2)
where �10j is the average RTA achievement for students in classroom j; Api is a set of (p)covariates for student i; �1pj is the effect of student-level covariates on RTA achievement;e1ij is residual error normally distributed with mean of 0 and standard deviation of unity;�20j is the average MSAinf�lit achievement for students in classroom j; Api is a set of (p)covariates for student i; �2pj is the effect of student-level covariates on MSAinf�lit achieve-ment; and e2ij is residual error normally distributed with mean of 0 and standard devia-tion of unity. The level 3 (teacher-level) model is written as
�10j � �100 � �q�1
4
�1pq Xq � �105�OTL for reasoning and writing j� � r10j
�20j � �200 � �q�1
4
�2pq Xq � �205�OTL for reasoning and writing j� � r20j,
(2.3)
where �100 is the average RTA achievement across all classrooms; Xq is a set of (q) teacherand classroom characteristics; �1pq is the effect of teacher and classroom characteristics onRTA achievement; �105 is the effect of students’ opportunities for reasoning and writingon the RTA; r10j is residual error normally distributed with a mean of 0 and a standarddeviation of unity; �200 is the average MSA achievement across all classrooms; Xq is a setof (q) teacher and classroom characteristics; �2pq is the effect of teacher and classroomcharacteristics on RTA achievement; �205 is the effect of students’ opportunities for rea-soning and writing on the MSAinf�lit; and r20j is residual error normally distributed with amean of 0 and a standard deviation of unity.
Multivariate Multilevel Model 2A similar analysis examined a second multivariate model. This model (see eqq. 3.1through 3.3 below) takes a similar form to the previous multilevel multivariate modelwith the exception that the scales no longer represent each test separately.
�
This content downloaded from 150.212.81.22 on Wed, 15 Jan 2014 12:40:19 PMAll use subject to JSTOR Terms and Conditions

achievemij � �1ij � ��MSAinf � lit � RTA�mij� � �2ij � �contrastmij� � mij, (3.1)
�1ij � �10j � �1pj � �Api� � e1ij
�2ij � �20j � �2pj � �Api� � e2ij,
(3.2)
�10j � �100 � �q�1
4
�1pqXq � �105�OTL for reasoning and writing j� � r10j,
�20j � �200 � �q�1
4
�2pqXq � �205�OTL for reasoning and writing j� � r20j.
(3.3)
Instead, the first scale considers achievement on the MSAinf�lit and RTA together((MSAinf�lit � RTA)mij). All seven achievement subscores of achievement are dummycoded 1 for this scale and thus �1ij is the average achievement across both MSAinf�lit andRTA for student i in classroom j. The second scale (contrastmij ) considers the contrast ofthe two, that is, RTA performance relative to MSAinf�lit performance. Here, contrastmij isan indicator variable coded 1/nm for each of the five subscores of the RTA and �1/nm foreach of the two subscales of the MSA, where nm equals the number of subscores in eachscale and thus �2ij is the contrast between performance on the RTA versus the MSAinf�lit
for student i in classroom j. For students with an equal relative ranking on each test thisratio will be one; for students whose relative performance on the RTA is better than theirrelative ranking on the MSAinf�lit this ratio will be positive. For the contrast scale we areseeking to examine whether students’ performance on the RTA relative to the MSAinf�lit
varies systematically between classrooms and whether we can predict this variation.
Appendix C
Annotated Sample Student Assessments
Sample A (rated 1 on all criteria)“Rats on the Roof” prompt
Yes because is he was lock ebery over and He sead They’ve got RATS in here! Somebodydo something! Call 911! Ooh! Ugh! That haw he isaverd. They wrote a letter like theys Towhom I May Concern owng to the excessively noisy disruption of our daytime sleepingschedule. We find ourselves no longer able to remain in residence. We are leavingsigned by the Rats on the Roof. that naw he is querd them and cate was to exited.
Sample A received a score of 1 on all criteria in response to the “Rats on the Roof” prompt. Thestudent fails to address the prompt by evaluating characteristics of the Tomcat that wouldmake him helpful in a situation. The student lapses into copying straight from the text ratherthan offering his/her own argument and explanation. Although the text is used, however, it isnot in service of any coherent claim. In terms of organization, style, and mechanics, thewriting is highly disjointed, heavily copied, and seriously flawed.
Sample B (rated 3 on all criteria)“Rats on the Roof” prompt
�
This content downloaded from 150.212.81.22 on Wed, 15 Jan 2014 12:40:19 PMAll use subject to JSTOR Terms and Conditions

I would not like the tomcat to help me with any proublems because the tomcat will
just want to live in your home. The tomcat will just want to live in your home. The
tomcat will charge you 10 dollars a week. He is not good at his job for example the
rat problem he just got scared of the rats and was going crazy breaking things, and
screaming. Another reason I don’t want the tomcat helping me with a problem
because even thow the tomcat got the rats out ther house he broke a lot of stuff in
it that will take a long time to replace.
Sample B scored a 3 on all criteria. The student addressed the prompt directly, giving a
clear opinion with several supporting reasons. The student also recognized the essential
point of the story, that the tomcat did in fact chase the rats away. He/she does not
automatically assume the “problem” the cat would be brought in to solve is rats on the
roof (which is characteristic of lower-scoring responses); however, he/she does not go
beyond the concrete details of the cat given in the story. The student does not infer further
about the characteristics of the cat nor offer precise adjectives to describe the cat. The
student uses a few good vocabulary words (“charge,” “replace”) and commits minimal
errors in spelling and usage.
Sample C (rated 2 on all criteria)
“Millennium Villages” prompt
I think the author think it’s for kids in the United States learn about how life is in
Kenya I think kids in the United States learn something because life is in Kenya. I
think kids in the United States learn something because life in Kenya was very hard
because they did not have doctors, no medicine, and now water and electricity. One
detail is from the story Kenya is there was 20,000 kids that died because they got bit
and there was no medicine. Another detail could be is in Kenya that they had to
send the kids to get water and wood so they won’t be thirsty. Proverty is poor,
having little or no money and that there were people that was like that, they didn’t
have no food, no water, and no wood to stay warm. There were some people who
couldn’t afford to get there child into school, so they had to work and get wood and
water to survive and other kids could afford to get into a school, they had to wait.
Farmers did not have irrigation and fertilizer for there crops. Bed nets are used in
every sleeping site in Sauri. The progress is encouraging to supporters to the Mil-
lennium Villages project. There are many solutions to the problem that keeps
people improverished. Women in Kenya still sit on the ground to sell bananas.
Irigation is process by which water is ditrubuted to crops.
Sample C, in response to “Millennium Villages” prompt, received a score of 2 on all
criteria. Despite the length of this piece of writing, the content is thin. The response
offers the basic observation that “life in Kenya was very hard.” In terms of evidence,
the student provided more than three pieces demonstrating understanding of life in
Sauri before the Millennium Villages project; however, no evidence is provided of
how life in Kenya has improved. The organization of the writing reflects a limited
sense of beginning, middle, and end. It opens with a series of false-start sentences.
The ending is abrupt and, in fact, features sentences copied straight from the text.
The middle contains ideas that do not flow. For example, the definition of poverty is
�
This content downloaded from 150.212.81.22 on Wed, 15 Jan 2014 12:40:19 PMAll use subject to JSTOR Terms and Conditions

inserted in the middle of the paragraph. As such, there are serious organizational
problems. Stylistically, the writing is composed of sentences that are basic in struc-
ture and repetitive (e.g., “One detail is . . . . Another detail could be . . . .” Very few
connectives are used to join ideas or create flow, and no tier 2 vocabulary is used.
Finally, the response is characterized by frequent grammatical errors and awkward-
ness that impede readers from clearly understanding the writer’s meaning (e.g., “One
detail is from the story Kenya is there was . . . .”).
Sample D (rated 4 on all criteria)
“Millennium Villages” prompt
Kids in the United States should know about Kenya and the Millenium Project so
that they can think twice before throwing a temper tantrum when they don’t get a
toy or candy. A day in Sauri can change their lives.
Sauri, Kenya is home to millions of people who struggle to survive each year. Kids
in America don’t know how hard it is to battle disease-ridden mosquitoes each
night, or trying to find food, or earning enough money to attend school. Every day,
20,000 kids die from Malaria because they can’t afford a $5 bednet. Malaria is a
disease spread by mosquitoes at night that causes children to die quickly, and adults
get very sick.
Malaria is very preventable and treatable. But the people of Sauri can’t get the
medical attention they need because there are no doctors, medicine, or running
water. 3 children share a bed and 2 adults share one. There just isn’t enough space
for the millions of patients coming in everyday who can’t afford health-care.
Students cannot attend the only school in their area, The Bar Sauri Primary School,
because their parents can’t afford school fees. The students who do go to school
have to work hard with the short supply of textbooks all day without lunch. Stu-
dents can’t even eat!
All of this stuff happened 5 years ago, before the Millenium Villages Project. Now,
the hospital has enough medicine to treat common diseases and running water.
Bed nets are used in every sleeping site in Sauri to prevent Malaria. School now
serves a midday meal and they have enough supplies for every student. Keeping
people impoverished is possible.
So the next time you want to cry over spilled milk, whine over not having a toy, or
throw a temper tantrum over not getting candy, think about the people of Sauri
who, for just too long, couldn’t even afford a $5 bed net or a good pair of clothes.
Don’t ever think the world revolves around you, because it doesn’t, and millions of
kids would give anything to trade places with you.
Sample D, in response to “Millennium Villages” prompt, received a score of 4 on all
criteria. The student articulated a plausible reason for why the author may have written
the article for kids in the United States and maintains this focus throughout with precise
examples from the text. The multiparagraph response is logically organized, with a clear
beginning and end that cohere. There are also instances of strong vocabulary and phrases
(“disease-ridden,” “short supply,” “throw a temper tantrum,” “revolve”). Although the
writing contains some colloquial language (“stuff”), a misused word (“impoverished”),
and spelling errors (“Millenium”), such weaknesses are seldom and minor.
�
This content downloaded from 150.212.81.22 on Wed, 15 Jan 2014 12:40:19 PMAll use subject to JSTOR Terms and Conditions

Notes
The research reported here was funded through grants from the W. T. Grant Foundation and theSpencer Foundation. The opinions expressed in this article are those of the authors, not the spon-sors. The authors remain responsible for any errors in the work.
1. Additionally, specificity has been a distinguishing characteristic for demonstrating effects inmeta-analyses of research on professional development (Kennedy, 1999) and in examining instruc-tional interventions (Crandall, Eiseman, & Louis, 1986).
2. Translating lexile measures into “grade-appropriate” designations can, at best, producerough approximations. In our pilot work, we heard anecdotally from many teachers and literacycoordinators that most of the texts we had chosen were too difficult for most students. The lexileanalyzer we used in our post-hoc analysis (obtained from the Lexile Framework for Readingwebsite) suggests that our grade 4 literary text is on par with what students currently read at themiddle of the year in grade 4, but below the reading level for suggested CCSS texts. However, the textfor grade 5 and 6 students is on par with what students in grades 5–8 currently read and also on par withsuggested CCSS texts for grades 5 and 6 (see http://lexile.com/about-lexile/grade-equivalent/grade-equivalent-chart/).
3. The responses were normally distributed, with 2 teachers indicating this occurred monthly, 4teachers reporting 2 or 3 times a month, 15 reporting it occurred weekly, 6 reporting it happening2 or 3 times a week, and 2 indicating integration of writing occurring daily.
4. Our scoring criteria parallel standards in the Writing and Language strands. For example, theAcademic Language descriptor aligns with the Common Core standard requiring students to“acquire and use accurately grade appropriate general academic and domain-specific words andphrases” (CCSSI, 2010, p. 29).
5. Cohen’s kappa (.66 and .68) was also similar for the two prompts demonstrating no differ-ences in agreement between the prompts.
6. A limited set of covariates was imputed due to the sparseness of the covariance matrix withonly 18 cases.
7. We use this as a proxy for the expectations teachers hold for student work. While the amountof writing students produce may be theoretically related to their ability to write, we found noempirical evidence for this. Instead, the average number of words is highly related to the percentageof assignments that do not draw directly from worksheets or brief constructed responses, suggest-ing it is a proxy for teachers’ normative expectations.
8. Proportion reduction in variance was calculated using the following formula: (��0null ���0background)/��0null.
9. Intraclass correlation was calculated using the following formula: ��0background/(��0background ��2
background).10. The percent variance explained was calculated using the following formula: (��0background �
��0instruction)/��0background.11. However, even after removing the adjustment for prior achievement, the covariate for rea-
soning and extended writing still did not reach a level of statistical significance (p � .114).12. The samples of student writing in Appendix B are thus the exception rather than the rule
since they were specifically chosen to be benchmark assessments because students’ scores did notvary on the five criteria.
References
Abrami, P., Bernard, R., Borokhovski, E., Wade, A., Surkes, M., Tamim, R., & Zhang, D. (2008).Instructional interventions affecting critical thinking skills and dispositions: A stage 1 meta-analysis. Review of Educational Research, 78, 1102–1134.
Allensworth, E., Correa, M., & Ponisciak, S. (2008). From high-school to the future: ACT prepara-tion—too much, too late. Chicago: Consortium on Chicago School Research.
American Diploma Project. (2004). Ready or not? Creating a high school diploma that counts. Wash-ington, DC: Achieve.
�
This content downloaded from 150.212.81.22 on Wed, 15 Jan 2014 12:40:19 PMAll use subject to JSTOR Terms and Conditions

American Educational Research Association, American Psychological Association, & National Council onMeasurement in Education. (1999). Standards for educational and psychological testing. Washington, DC:American Psychological Association.
Applebee, A. N., & Langer, J. A. (2009). What is happening in the teaching of writing? EnglishJournal, 98(5), 18 –28.
Baker, E. L., Barton, P. E., Darling-Hammond, L., Haertel, E., Ladd, H. F., Linn, R. L., . . . Shepard,L. (2010). Problems with the use of student test scores to evaluate teachers. Washington, DC:Economic Policy Institute.
Barr, R., & Dreeben, R. (1983). How schools work. Chicago: University of Chicago Press.Beck, I. L., & McKeown, M. G. (2001). Text talk: Capturing the benefits of read-aloud experiences
for young children. The Reading Teacher, 55, 10 –20.Beck, I. L., & McKeown, M. G. (2006). Improving comprehension with questioning the author: A fresh
and expanded view of a powerful approach. New York: Scholastic.Bereiter, C., & Scardamalia, M. (1987). An attainable version of high literacy: Approaches to reach-
ing higher-order skills in reading and writing. Curriculum Inquiry, 17(1), 9 –30.Berends, M., Bodilly, S., & Kirby, S. (Eds.). (2002). Facing the challenges of whole school reform: New
American schools after a decade. Santa Monica, CA: RAND.Berliner, D. C. (1981). Academic learning time and reading achievement. In J. T. Guthrie (Ed.),
Comprehension and teaching: Research reviews (pp. 203–226). Newark, DE: International Read-ing Association.
Brown, R. G. (1991). Schools of thought: How the politics of literacy shape thinking in the classroom.San Francisco: Jossey-Bass.
Caro, F. (1971). Issues in the evaluation of social programs. Review of Educational Research, 41(2),87–114.
Carlisle, J., Kelcey, B., Beribitsky, D., & Phelps, G. (2011). Embracing the complexity of instruction:A study of the effects of teachers’ instruction on students’ reading comprehension. ScientificStudies of Reading, 15(5), 409 – 439.
Cohen, D., & Hill, H. (2001). Learning policy: When state education reform works. New Haven, CT:Yale University Press.
Common Core State Standards Initiative (CCSSI). (2010). Common Core State Standards for Eng-lish Language Arts & Literacy in History/Social Studies, Science, and Technical Subjects. Retrievedfrom http://www.corestandards.org/assets/CCSSI_ELA%20Standards.pdf
Cooley, W. W., & Leinhardt, G. (1980). The instructional dimensions study. Educational Evaluationand Policy Analysis, 2, 7–25.
Correnti, R., Matsumura, L. C., Hamilton, L. H., & Wang, E. (2012). Combining multiple measuresof students’ opportunities to develop analytic text-based writing. Educational Assessment,17(2–3, special issue on measuring instruction), 132–161.
Correnti, R., & Rowan, B. (2007). Opening up the black box: Literacy instruction in schools par-ticipating in three comprehensive school reform programs. American Educational ResearchJournal, 44, 298 –338.
Crandall, D., Eiseman, J., & Louis, K. (1986). Strategic planning issues that bear on the success ofschool improvement efforts. Educational Administration Quarterly, 22(3), 21–53.
Crosson,A.C.,Matsumura,L.C.,Correnti,R.,&Arlotta-Guerrero,A.(2012).Thequalityofwritingtasksandstudents’ use of academic language in Spanish. Elementary School Journal, 112, 469–496.
D’Agostino, J. V., Welsh, M. S., & Corson, N. M. (2007). Instructional sensitivity of a state’sstandards-based assessment. Educational Assessment, 12, 1–22.
Diamond, K. E., & Powell, D. R. (2011). An iterative process to the development of a professionaldevelopment intervention for Head Start teachers. Journal of Early Intervention, 33(1), 75–93.doi:10.1177/1053815111400416
Hauck, K., & Street, A. (2006). Performance assessment in the context of multiple objectives: Amultivariate multilevel analysis. Journal of Health Economics, 25, 1029 –1048.
Hiebert, J., Gallimore, R., & Stigler, J. W. (2002). A knowledge base for the teaching profession:What would it look like and how can we get one? Educational Researcher, 31(5), 3–15.
Hirsch, E. D., & Pondiscio, R. (2010). There’s no such thing as a reading test. The American Prospect.Retrieved from http://prospect.org/article/theres-no-such-thing-reading-test
�
This content downloaded from 150.212.81.22 on Wed, 15 Jan 2014 12:40:19 PMAll use subject to JSTOR Terms and Conditions

Hoffman, L., & Rovine, M. (2007). Multilevel models for the experimental psychologist: Founda-tions and illustrative examples. Behavior Research Methods, 39, 101–117.
Jeffery, J. V. (2009). Constructs of writing proficiency in U.S. state and national writing assess-ments: Exploring variability. Assessing Writing, 14, 3–24.
Kane, M. T. (2006). Validation. In R. Brennan (Ed.), Educational measurement (4th ed., pp. 17– 64).Westport, CT: American Council on Education/Praeger.
Kennedy, M. (1999). Form and substance in mathematics and science professional development.National Institute for Science Education Brief, 3(2), 1–7.
Knapp, M., & Associates. (1995). Teaching for meaning in high poverty classrooms. New York: Teach-ers College Press.
Leinhardt, G., & Seewald, A. M. (1981). Overlap: What’s tested, what’s taught? Journal of Educa-tional Measurement, 18(2), 85–96.
Maryland State Department of Education. (2012). 2010 MSA Reading technical report. Retrievedfrom http://www.marylandpublicschools.org/MSDE/divisions/planningresultstest/2010�MSA�Reading�Technical�Report.htm
Messick, S. (1994). The interplay of evidence and consequences in the validation of performanceassessments. Educational Researcher, 23(2), 13–23.
Murphy, P. K., Wilkinson, I. A. G., Soter, A. O., Hennessey, M. N., & Alexander, J. F. (2009).Examining the effects of classroom discussion on students’ comprehension of text: A meta-analysis. Journal of Educational Psychology, 101(3), 740 –764.
Muthén, L., & Muthén, B. (2010). MPlus statistical analysis with latent variables: User’s guide. LosAngeles: Muthén & Muthén.
National Commission on Writing. (2003). The neglected “R”: The need for a writing revolution. NewYork: College Board.
Nickerson, R. (1989). On improving thinking through instruction. Review of Research in Education,15, 3–57.
Nystrand, M. (2006). Research on the role of classroom discourse as it affects reading comprehen-sion. Research in the Teaching of English, 40, 392– 412.
Peugh, J. L., & Enders, C. K. (2004). Missing data in educational research: A review of reportingpractices and suggestions for improvement. Review of Educational Research, 4, 525–556.
Raudenbush, S. (2007). Designing field trials of educational innovations. In B. Schneider & S. K.McDonald (Eds.), Scale-up in education: Issues in practice. New York: Rowman and Littlefield.
Raudenbush, S. W., & Bryk, A. (2002). Hierarchical linear models: Applications and data analysismethods. Thousand Oaks, CA: Sage.
Raudenbush, S., Rowan, B., & Cheong, Y. (1993). Higher order instructional goals in secondaryschools: Class, teacher and school influences. American Educational Research Journal, 30, 523–553.
Raudenbush, S., Rowan, B., & Kang, S. J. (1991). A multilevel, multivariate model for studyingschool climate with estimation via the EM algorithm and application to U.S. high-school data.Journal of Educational and Behavioral Statistics, 16, 295–330.
Resnick, L. B. (1987). Education and learning to think. Washington, DC: National Academy Press.Resnick, L. B. (2010). Nested learning systems for the thinking curriculum. Educational Researcher,
39, 183–197.Resnick, L. B., & Klopfer, L. E. (Eds.). (1989). Toward the thinking curriculum: Current cognitive
research. Alexandria, VA: Association for Supervision and Curriculum Development.Rosenshine, B., & Furst, N. (1973). The use of direct observation to study teaching. In R. M. W.
Travers (Ed.), Second handbook of research on teaching (pp. 122–183). Chicago: Rand McNally.Rowan, B., Camburn, E., & Correnti, R. (2004). Using teacher logs to measure the enacted curriculum: A
study of literacy teaching in third-grade classrooms. Elementary School Journal, 105, 75–102.Ruiz-Primo, A., Shavelson, R., Hamilton, L. S., & Klein, S. P. (2002). On the evaluation of systemic
science education reform: Searching for instructional sensitivity. Journal for Research in ScienceTeaching, 39, 369 –393.
Schmidt, W., McKnight, C., Houang, R., Wang, H., Wiley, D., Cogan, L., & Wolfe, L. (2001). Whyschools matter: A cross-national comparison of curriculum and learning. San Francisco: Jossey-Bass.
�
This content downloaded from 150.212.81.22 on Wed, 15 Jan 2014 12:40:19 PMAll use subject to JSTOR Terms and Conditions

Snijders, T., & Bosker, R. (1999). Multilevel analysis: An introduction to basic and advanced multi-level modeling. Thousand Oaks, CA: Sage.
Stebbins, L., St. Pierre, R., Proper, E., Anderson, R., & Cerva, T. (1977). Education as experimentation: Aplanned variation model: Vol. IV-A. An evaluation of follow-through. Cambridge, MA: ABT.
Thum, Y. M. (1997). Hierarchical linear models for multivariate outcomes. Journal of Educationaland Behavioral Statistics, 22, 77–108.
�
This content downloaded from 150.212.81.22 on Wed, 15 Jan 2014 12:40:19 PMAll use subject to JSTOR Terms and Conditions