Assessing Civic Competence Against The Normative ...
269
University of Pennsylvania University of Pennsylvania ScholarlyCommons ScholarlyCommons Publicly Accessible Penn Dissertations 2017 Assessing Civic Competence Against The Normative Benchmark Assessing Civic Competence Against The Normative Benchmark Of Considered Opinions Of Considered Opinions Jin Woo Kim University of Pennsylvania, [email protected] Follow this and additional works at: https://repository.upenn.edu/edissertations Part of the Communication Commons Recommended Citation Recommended Citation Kim, Jin Woo, "Assessing Civic Competence Against The Normative Benchmark Of Considered Opinions" (2017). Publicly Accessible Penn Dissertations. 2392. https://repository.upenn.edu/edissertations/2392 This paper is posted at ScholarlyCommons. https://repository.upenn.edu/edissertations/2392 For more information, please contact [email protected].
-
Upload
khangminh22 -
Category
Documents
-
view
1 -
download
0
Transcript of Assessing Civic Competence Against The Normative ...

University of Pennsylvania University of Pennsylvania
ScholarlyCommons ScholarlyCommons
Publicly Accessible Penn Dissertations
2017
Assessing Civic Competence Against The Normative Benchmark Assessing Civic Competence Against The Normative Benchmark
Of Considered Opinions Of Considered Opinions
Jin Woo Kim University of Pennsylvania, [email protected]
Follow this and additional works at: https://repository.upenn.edu/edissertations
Part of the Communication Commons
Recommended Citation Recommended Citation Kim, Jin Woo, "Assessing Civic Competence Against The Normative Benchmark Of Considered Opinions" (2017). Publicly Accessible Penn Dissertations. 2392. https://repository.upenn.edu/edissertations/2392
This paper is posted at ScholarlyCommons. https://repository.upenn.edu/edissertations/2392 For more information, please contact [email protected].

Assessing Civic Competence Against The Normative Benchmark Of Considered Assessing Civic Competence Against The Normative Benchmark Of Considered Opinions Opinions
Abstract Abstract There is widespread skepticism about civic competence. Some question if citizens are informed enough to make considered decisions. Others doubt citizens’ ability to rationally evaluate relevant evidence and update their opinions even when they have necessary information. The purpose of my dissertation is to critically evaluate this literature and its claims against a clearly defined normative benchmark of considered opinion.
In the first half of the dissertation, I revisit the benchmark of informed citizenship, arguing that seemingly knowledgeable citizens, as traditionally defined, may fail to consider a balanced range of arguments due to partisan biases. Accordingly, I draw a distinction between two dimensions of political knowledge; information—the classic definition and measurement; and what I call consideration—awareness of balanced sets of arguments. I empirically establish the discriminant validity of consideration as a separate and distinct dimension of political knowledge, and show that information and consideration have different consequences on policy opinions—a finding that calls for a better conceptualization of what it means to be well informed.
The importance of having political information ultimately hinges on a critical assumption that people are capable of using it effectively. In the second half, I test this assumption against even grimmer doubts over civic competence—namely that citizens lack the ability to think critically or that their conscious or unconscious desire to defend preordained political positions easily trumps the motivation to be accurate. I present three experiments that challenge these claims, in favor of a Bayesian model of information processing. Across the experiments, I find that people update their beliefs and attitudes in light of presented arguments. People did not mindlessly accept whatever arguments they encounter, nor did they categorically reject uncongenial arguments. Instead, they accounted for the (un)certainty of evidence as they form their posterior opinions, even when it disconfirms their prior opinions.
Taken together, the empirical evidence presented in this dissertation suggests that citizens’ failure to act as competent decision makers is more likely due to the lack of necessary and balanced information, rather than their own unwillingness or inability to use such information.
Degree Type Degree Type Dissertation
Degree Name Degree Name Doctor of Philosophy (PhD)
Graduate Group Graduate Group Communication
First Advisor First Advisor Michael X. Delli Carpini
Keywords Keywords Bayesian Belief Updating, Civic Competence, Considered Opinions, Deliberation, Motivated Reasoning, Political Knowledge

Subject Categories Subject Categories Communication
This dissertation is available at ScholarlyCommons: https://repository.upenn.edu/edissertations/2392

ASSESSING CIVIC COMPETENCE AGAINST THE NORMATIVE BENCHMARK
OF CONSIDERED OPINIONS
Jin Woo Kim
A DISSERTATION
in
Communication
Presented to the Faculties of the University of Pennsylvania
in
Partial Fulfillment of the Requirements for the
Degree of Doctor of Philosophy
2017
Supervisor of Dissertation
__________________________________
Michael X. Delli Carpini, Ph.D.
Professor of Communication and Walter H. Annenberg Dean of the Annenberg School
for Communication
Graduate Group Chairperson
__________________________________
Joseph Turow, Ph.D.
Robert Lewis Shayon Professor of Communication
Dissertation Committee:
Joseph N. Cappella, Ph.D., Gerald R. Miller Professor of Communication
Devra C. Moehler, Ph.D., Assistant Professor of Communication
Diana C. Mutz, Ph.D., Samuel A. Stouffer Professor of Political Science and
Communication, Director, Institute for the Study of Citizens and Politics

ASSESSING CIVIC COMPETENCE AGAINST THE NORMATIVE BENCHMARK
OF CONSIDERED OPINIONS
COPYRIGHT
2017
Jin Woo Kim

iii
To my mom,
Young Soon Cho (조영순)

iv
ACKNOWLEDGEMENT
I began my dissertation with an idea that may sound a little inconsistent with my
advisor Michael Delli Carpini’s famous work on political knowledge. My point was that
the more you know about something, the less willing you become to consider the
possibility that you’re wrong. And that can lead you to make a bad decision. Michael,
who has studied this topic for decades, should have struck this idea down, according to
my “theory.” Fortunately for me, but not so fortunately for my “theory,” he wasn’t like
that at all. He listened carefully to what I had to say, accepting my arguments when I
made sense, and pushing me to be clearer when I didn't make much sense. And that’s
how my little challenge became my dissertation. I thank him for his guidance, patience,
encouragement and enthusiasm for my research.
I am imbedded to my dissertation committee. Much of my dissertation would not
have been possible without Joe Cappella, who generously shared the Health Dialogue
Data with me. He offered valuable criticism and encouragement on my earlier papers that
ended up in this dissertation after many rounds of revisions. Devra Moehler and Diana
Mutz provided insightful comments that allowed me to see more clearly the implications
of my work.
I owe much to my friends at Annenberg. Jenny Eun-Ja Her, Hyun Suk Kim,
Felicity Duncan, Minji Kim, Chloe Kyung Lee, and Sun-ha Hong kept me in good spirits
over countless dinners and drinks. Eunji Kim has collaborated with me on several
projects. Her enthusiasm and commitment have kept our projects moving forward.

v
Throughout my life, I have had the tremendous support of my loving family. My
sister Yuri Kim has tolerated my weird sense of humor. My farther Wan Soo Kim has
tolerated my political views. Still, Yuri laughs at my silly jokes, and my farther values
my opinions. Our difference is never a match for the love and respect we have for one
another.
The final stages of graduate life can be very stressful for anyone. But I have been
able to relish the past few years because of my wife, partner and best friend Yunjoung
Park. When I am having one of the better days, she gets as excited as I am. When I am
not having one of those days, she would say “괜찮을 거야 (it’s going to be fine)” and
somehow make me believe her. Her ability to do so is a source of wonder. I especially
thank her for Gina, our beautiful daughter, who makes cameo appearances in the
dissertation.
But more than anyone else, I thank my mother Young Soon Cho, who passed
away a few months after I had finished my second year at Annenberg. She didn’t get as
much education as I did, but I will always count what I learned from her as the most
valuable lessons. I learned to love knowledge. I learned to believe in myself. And I
learned about God’s love. These lessons got me through many challenges I have faced at
Annenberg and elsewhere.
For this and much more, I dedicate this dissertation to my mom.

vi
ABSTRACT
ASSESSING CIVIC COMPETENCE AGAINST THE NORMATIVE BENCHMARK
OF CONSIDERED OPINIONS
Jin Woo Kim
Michael X. Delli Carpini
There is widespread skepticism about civic competence. Some question if citizens
are informed enough to make considered decisions. Others doubt citizens’ ability to
rationally evaluate relevant evidence and update their opinions even when they have
necessary information. The purpose of my dissertation is to critically evaluate this
literature and its claims against a clearly defined normative benchmark of considered
opinion.
In the first half of the dissertation, I revisit the benchmark of informed citizenship,
arguing that seemingly knowledgeable citizens, as traditionally defined, may fail to
consider a balanced range of arguments due to partisan biases. Accordingly, I draw a
distinction between two dimensions of political knowledge; information—the classic
definition and measurement; and what I call consideration—awareness of balanced sets
of arguments. I empirically establish the discriminant validity of consideration as a
separate and distinct dimension of political knowledge, and show that information and

vii
consideration have different consequences on policy opinions—a finding that calls for a
better conceptualization of what it means to be well informed.
The importance of having political information ultimately hinges on a critical
assumption that people are capable of using it effectively. In the second half, I test this
assumption against even grimmer doubts over civic competence—namely that citizens
lack the ability to think critically or that their conscious or unconscious desire to defend
preordained political positions easily trumps the motivation to be accurate. I present three
experiments that challenge these claims, in favor of a Bayesian model of information
processing. Across the experiments, I find that people update their beliefs and attitudes in
light of presented arguments. People did not mindlessly accept whatever arguments they
encounter, nor did they categorically reject uncongenial arguments. Instead, they
accounted for the (un)certainty of evidence as they form their posterior opinions, even
when it disconfirms their prior opinions.
Taken together, the empirical evidence presented in this dissertation suggests that
citizens’ failure to act as competent decision makers is more likely due to the lack of
necessary and balanced information, rather than their own unwillingness or inability to
use such information.

viii
TABLE OF CONTENTS
ACKNOWLEDGEMENT ............................................................................................... iv
ABSTRACT ...................................................................................................................... vi
TABLE OF CONTENTS .............................................................................................. viii
LIST OF TABLES ........................................................................................................... ix
LIST OF FIGURES .......................................................................................................... x
Chapter 1 Introduction .................................................................................................. 1
1.1 Forming a Considered Opinion .............................................................................. 4
1.2 Preview of Chapters to Follow .............................................................................. 8
Chapter 2 Revisiting Political Knowledge ................................................................. 12
2.1 Balanced Consideration as a Hallmark of Political Knowledge .......................... 15
2.2 Estimating Considered Opinions ......................................................................... 18
2.3 Data and Methods ................................................................................................ 23
2.4 Distinguishing Information and Consideration .................................................... 29
2.5 Informed Opinions versus Considered Opinions ................................................. 36
2.6 Summary .............................................................................................................. 44
Chapter 3 The Force of the Better Evidence ............................................................. 46
3.1 The Uncritical Public Hypothesis ........................................................................ 48
3.2 The Motivated Public Hypothesis ........................................................................ 52
3.3 A (Restrictive) Bayesian Learning Model ........................................................... 57
3.4 Experiment 1: A Pilot Test .................................................................................. 61
3.5 Experiment 2: The Affordable Care Act .............................................................. 67
3.6 Observational Replication of the ACA Experiment ............................................ 86
3.7 Experiment 3: The Economy ............................................................................... 89
3.8 Summary .............................................................................................................. 97
Chapter 4 General Discussion ..................................................................................... 99
4.1 Main Findings and Their Implications for the Literature .................................. 101
4.2 Implications for Democratic Politics ................................................................. 115
Appendix ........................................................................................................................ 122
Appendix A The Health Dialogue Data (Chapter 2)................................................. 122
Appendix B Experiment 1 (Chapter 3) ..................................................................... 146
Appendix C Experiment 2 (Chapter 3) ..................................................................... 159
Appendix D Experiment 3 (Chapter 3) ..................................................................... 199
Bibliography .................................................................................................................. 239

ix
LIST OF TABLES
Table 1: The Health Dialogue Project .............................................................................. 24
Table 2: Gap between Pros and Cons by PID ................................................................... 32
Table 3: Associations between Information and Consideration by PID ........................... 35
Table 4: Support for Universal Health Insurance by Political Information ...................... 36
Table 5: Support for Universal Health Insurance by Consideration ................................. 37
Table 6: Conditional Probabilities Pooled by the Type of Given Evidence ..................... 66
Table 7: Measurement of Beliefs and Attitudes about the ACA ...................................... 72
Table 8: Treatment Effects on ACA Opinions (Experiment 2) ........................................ 75
Table 9: Heterogeneous Treatment Effects by 14 Individual Traits (Experiment 2) ........ 84
Table 10: Measurement of Retrospective and Prospective Economic Evaluations .......... 93
Table 11: Treatment Effects on Economic Evaluations (Experiment 3) .......................... 95
Table 12: Heterogeneous Treatment Effects by 11 Individual Traits (Experiment 3) ...... 96
Table 13: Long-run Effects on Economic Evaluations (Experiment 3)............................ 97

x
LIST OF FIGURES
Figure 1: Political Learning with and without Partisan Bias ............................................ 16
Figure 2: Observed Relationship Between Information and Consideration ..................... 30
Figure 3: Comparing Information Effects versus Consideration Effects .......................... 41
Figure 4: Conditional Probabilities Given Evidence ........................................................ 64
Figure 5: Adjusted Means across Experimental Conditions ............................................. 77
Figure 6: Likelihood Ratios Corresponding to the Average Treatment Effects ............... 80
Figure 7: Perceived Argument Strength by Argument Type and Prior Attitudes ............. 81
Figure 8: Long-Run Effects on ACA Opinions (Experiment 2) ....................................... 86
Figure 9: Effects of Exposure to the Coverage of 2017 ACA Premium Increases ........... 88
Figure 10: Charts in the Strong (Left) vs. Weak (Right) Conditions ................................ 90

1
Chapter 1 Introduction
He who knows only his own side of the case knows little of that.
—John Stuart Mill, On Liberty
An essential part of navigating everyday life is making decisions based on
information at hand. At least for important decisions, people gather and synthesize some
information. The key word here is “some.” Many things are unknowable within the limits
of human capability. And even for readily available—i.e., “Googleable”—information,
learning everything there is to know is impossible for all but the most trivial topics. Thus,
we humans have to live with the choices we make with imperfect knowledge. It is the
source of constant regret when new information makes it clear that we had made a bad
decision. Even when this does not happen, uncertainty usually remains as to whether we
made the right call.
Given this human condition, what decision-making strategy would at least
increase the chance of making a good decision? The starting point of this dissertation is
the normative assumption that giving due considerations to both pros and cons of a
decision is an imperative element of sound decision making, even if the fact remains that
an individual can cover only so much information. I call an opinion formed in this way a

2
“considered opinion” and use it as the benchmark against which to assess civic
competence. Outside politics, at least, this point seems noncontroversial. That is why
cancer patients undergoing chemotherapies receive explanations about the side effects as
well as the intended treatment effects. That is also why an institutional review board
requires researchers to specify the potential benefits and harms of conducting a particular
study. Weighing pros and cons is a basic, although not perfect, guard against making a
blatantly bad and avoidable choice.
The normative case for my argument can be somewhat more ambiguous in
politics, due to the subjectivity involved in declaring a political decision “good,” the
prevalence of false information and conspiracy theories that presumably do not deserve
close attention, and so on. But few would argue that taking account of diverse aspects of
a potential political decision leads to more undesirable than desirable outcomes, as a
matter of general principle. The importance of considering conflicting ideas is also a
basic ingredient of most democratic theories. In one of the most memorable defenses of
free speech, John Stuart Mill (1869) argued that even seemingly faulty claims are worthy
of a fair hearing, because they ultimately provide the opportunity to perceive the truth
more clearly.1 In more recent years, deliberative theorists have similarly argued that
cross-cutting political conversation is central to the democratic citizenship (Benhabib
1996; Fishkin 1995; Gastil 2008; Guttmann and Thompson 1996; Habermas 1989).2
1 Mill’s argument would lose its ground, however, if people tend to ignore
counterevidence to defend their prior beliefs, as the motivated reasoning hypothesis
contends (Taber and Lodge 2006; Nyhan and Reifler 2010). Chapter 3 addresses this
concern directly. 2 For example, Habermas (1984, 25) holds that “[a]nyone participating in argument

3
There is also empirical evidence that an eclectic thinker who knows “many little things”
outperforms a dogmatic thinker who knows “one big thing,” as judged by the accuracy of
political predictions (Tetlock 2005; Tetlock and Gardner 2015).
But even if drawing on a diverse informational base can be conducive to forming
a better opinion in theory, it is entirely different matter as to how prevalent that exercise
is in citizens’ actual political decision-making processes. There is widespread skepticism
about civic competence, underscoring the seeming implausibility of the expectation that
the average citizen makes considered decisions about political matters. Some question if
citizens are informed enough to make considered decisions. Others doubt citizens’ ability
to rationally evaluate relevant evidence and update their opinions even when they have
necessary information. Raised in some of the seminal studies in political communication
and public opinion (e.g., Converse 1964; Berelson et al, 1954), these concerns have been
recurrent themes in the literatures on political knowledge (Delli Carpini and Keeter,
1996), public deliberation (Delli Carpini et al. 2004; Fishkin, 1991), and political
information processing models (Taber and Lodge 2006; Zaller, 1992).
The purpose of my dissertation is to critically evaluate this literature, and provide
empirical evidence that overcomes some of conceptual and/or methodological challenges
of prior research, allowing for a better understanding of whether people fail to act as
competent decision makers, and if so, in what way.
shows his rationality or lack of it by the manner in which he handles and responds to the
offering of reasons for or against claims. If he is ‘open to argument,’ he will either
acknowledge the force of these of reasons or seek to reply to them. … If he is ‘deaf to
argument,’ by contrast, he may either ignore contrary reasons or reply to them with
dogmatic assertions.”

4
1.1 Forming a Considered Opinion
Before getting into the specifics of my research, I begin by presenting a model
that specifies the process of forming a “considered opinion.” Throughout this dissertation,
I use a Bayesian model as a standard procedure of integrating one’s prior knowledge and
new information.3 Bayes’ theorem is an equation that calculates a conditional probability
of an event given another event, according to the law of probability. It is useful for
studies in public opinion formation because it can be applied to generate a
mathematically coherent prescription of how one should incorporate new evidence into
one’s prior belief. Under Bayes’ rule, the updated conclusion (posterior belief) is
supposed to be the precision-weighted average of the prior belief and new evidence. In
other words, one should update one’s belief such that one’s conclusion leans more
heavily toward new information to the extent that the evidence is clear and one’s prior
belief is uncertain.
For a more formal demonstration, consider the issue of the Affordable Care Act
(ACA), also known as “Obamacare.” Suppose that a Bayesian voter—let’s call her
Gina—will support the legislation to the extent that it is beneficial to her. Let θ be the
unobserved true net benefit for Gina.
3 Scholars disagree about whether certain patterns such as biased assimilation and attitude
polarization constitute a violation of Bayes Theorem (Bartels 2002; Bullock 2009; Gerber
and Green 1999; Taber and Lodge 2006; Taber et al. 2009; Tetlock 2005). This
disagreement arises because the properties of a Bayesian model vary depending on the
restriction on how people interpret information (i.e., likelihood functions). I address this
issue in detail in Chapter 3.

5
The net benefit θ can be expressed as the weighted average of various benefits
reduced to some common denominator (see Achen 1992; Downs 1957, 37; Gerber and
Green 1998). I define these benefits broadly; they may include values, self-interests,
public interests, altruistic motives, or even simple tastes (see Mansbridge 1983, 25-26).4
The true net benefit is what Mansbridge (1983, 25) refers to as “‘enlightened preferences’
among policy choices, ‘enlightened’ meaning the preferences that people would have if
their information were perfect, including the knowledge they would have in retrospect if
they had a chance to live out the consequences of each choice before actually making a
decision.” Clearly, this definition “can never be put into practice” because “[n]o one can
have perfect information.” The best Gina can do is to educate herself with available
information, though the quality of her opinion will be limited by the existing knowledge.
Now, let 𝜇0 be Gina’s initial estimate of θ Following previous studies using the
Bayesian framework (e.g., Bullock 2009; Gerber and Green 1999), I assume that this
variable is normally distributed: 𝑁 (𝜇0, 𝜎02), where the mean is Gina’s best guess, and the
variance is the uncertainty of the initial belief. Given she has not received any
information about the policy she would acknowledge that 𝜇0 may be far off the mark. So
𝜎02 is high.5
4 The net benefit of a policy will vary across individuals, to the extent that it has
differential effects for different people, and/or people use differential evaluative criteria
to judge the importance of these effects. 5 I follow Zaller’s (1996, 21) distinction between exposure and reception in that the latter
“involves actually ‘getting’ or taking in’ or ‘cognizing’ the given message.” Therefore,
when I say Gina received an argument, I mean that she was exposed to the argument and
she paid attention comprehending its key reasons and conclusion. Also note that I use
“consider” and “receive” interchangeably.

6
Gina becomes informed about the policy as she encounters new information that
suggests that the benefit (or harm) of the new policy is 𝑥1. I assume that 𝑥1 is normally
distributed: 𝑁 (𝜃, 𝜎12), where the variance 𝜎1
2 captures the precision of the new evidence
in information i. For example, if information 1 provides overwhelmingly clear evidence,
the variance 𝜎12 will be very small. Gina will update her belief by calculating a weighted
average of her prior belief 𝜇0 and information 𝑥1. Her posterior belief can be represented
by a normal distribution with mean 𝜇1 and variance 𝜌1, where
𝜇1 = 𝜇0 (𝜏0
𝜏0 + 𝜏1) + 𝑥1 (
𝜏1
𝜏0 + 𝜏1) (1.1a)
𝜌1 =1
𝜏0 + 𝜏1, (1.1b)
and where 𝜏0 = 1/𝜎02 and 𝜏1 = 1/𝜎1
2 are the precisions of the prior belief and the
argument, which determine the weights on the prior belief and the new message. If Gina
was initially unsure about the benefits of ACA (low 𝜏0), but then encounters new
information with extremely precise evidence (high 𝜏1), the new message will be heavily
weighted, virtually determining the mean of her updated beliefs 𝜇1. Given 𝜏1 > 0, the
precision of her belief becomes smaller (𝜌1 < 𝜌0).
Now suppose Gina repeats this process for a stream of information 1, 2 … , 𝑛,
where n is the number of arguments she receives, 𝑥𝑖 is a draw from a normal distribution
𝑁 (𝜃, 𝜎𝑖2), and 𝜎𝑖
2 is the (apparent) uncertainty of information 𝑖. The posterior belief

7
given n number of messages is distributed 𝑁 (𝜇𝑛, 𝜌𝑛), where 𝜇𝑛 and 𝜌𝑛 are the mean and
variance of the posterior distribution, and
𝜇𝑛 = 𝜌𝑛 (𝜇0𝜏0 + ∑ 𝑥𝑖𝜏𝑖
𝑛
𝑖=1
) , and (1.2a)
𝜌𝑛 = 1
𝜏0 + ⋯ 𝜏𝑛. (1.2b)
Again, the model implies that the posterior belief is the average of the initial
belief and the collection of information, weighted by precisions, and that Gina will
become even more certain about her belief after considering a range of new information
(𝜌𝑛 < 𝜌𝑛−1, when 𝜎𝑛2 is finite). Now let η be the posterior belief given all available
information, the best possible assessment of the true benefit. A “considered” opinion is a
“good” decision because it is more likely to be closer to η than a random initial guess and
an opinion of one “who knows only his own side of the case” (Mill 1869).6
One important strength of this model is that it parsimoniously expresses the
informational conditions under which Gina’s preference becomes a considered opinion.
First, n in Equations 1.2a and 1.2b should be greater than zero and 𝑥𝑖 should include both
6 This term will tend toward θ, as the quality and quantity of available information goes
into infinity. The correspondence between η and θ depends the quality of public discourse
which, practically speaking, is not the responsibility of the average citizen, but instead of
political elites and experts. This is clearly an important issue for democratic politics (e.g.,
Page and Shapiro 1992, Chap. 9), and although it is not my focus here, I do briefly return
to this issue in the concluding section.

8
positive and negative values. Second, Equations 1.2a and 1.2b should hold; in other
words, Gina should form her opinion by assessing the quality of information, and
assigning appropriate weights to her prior beliefs and new messages. These two
conditions have been the hallmarks of competent citizen decision making in the studies of
political communication, and public opinion, and will respectively be the foci of Chapters
2 and 3 of this dissertation.
1.2 Preview of Chapters to Follow
The general public appears too uninformed about most aspects of politics to be
able to form a “considered” opinion about a policy in question (Delli Carpini and Keeter
1996; for a recent review see Achen and Bartels 2016, Ch. 2). Concerns over low levels
of political knowledge, at least as traditionally conceptualized and measured, tell only
half the story, however. Even the knowledgeable might fail to serve as competent
decision makers, if information selection is generally biased toward their partisan
identity. To the extent that this concern holds true, the opinions of an “informed”
citizenry (e.g., Althaus 1998; Bartels 1996; Delli Carpini and Keeter 1996; Gilens 2001)
may differ from those of a “considered” citizenry. Chapter 2 examines this possibility. It
presents evidence drawn from the 2004-2005 Health Dialogue Project, underscoring the
potential tension between two dimensions of political knowledge; information—the
classic definition and measurement; and what I call consideration—awareness of
balanced sets of arguments.

9
Even if citizens have unbiased information, one might doubt their ability to use it
rationally, evaluating relevant evidence and updating their opinions as appropriate.
According to empirical research on persuasion and information processing (e.g., Bartels
2002; Kunda 1990; Lord et al., 1979; Taber and Lodge 2006; Zaller 1992; see Mutz
2008, 534) how people do—instead of should—respond to persuasive arguments appears
to be inconsistent with the democratic ideal. Some models suggest that people lack the
ability to think critically (Zaller 1992) or that their desire to defend preordained political
positions easily trumps the motivation to be accurate (Taber and Lodge 2006). Despite
such widespread skepticism, how close to the democratic ideal the average citizen might
reach if high quality and balanced information was given remains elusive because the
benchmark against which to judge the quality of political reasoning is often a moving
target (see Kuklinski and Quirk 2001). In Chapter 3, I present three survey experiments
that challenge the models assuming people’s internal failures of reason, in favor of a
Bayesian model of information processing.
Finally, Chapter 4 discusses the implications of the results for relevant literatures,
noting the limitations and caveats, and making suggestions for future research. This
chapter concludes by reflecting on the normative implications of the findings for
democracy.
Before moving on, let me acknowledge that the idealized the model of informed
citizen who knows “what the issues are, what their history is, what the relevant facts are,
what alternatives are proposed, what the party stands for, and what the likely
consequences are” (Berelson et al. 1954, 308) is not uniformly accepted. Some scholars

10
note that this characterization is not well reflective of classical democratic theorists
(Pateman 1970, Ch. 1) and the civic virtue of informed competence is a relatively new
invention that took shape in the Progressive Era in reaction to the enthusiastic party
politics of the Gilded Age (Schudson 1998).
Some scholars go further and question the usefulness of focusing on political
knowledge to assess citizen competence. For one, it is unrealistic to expect citizens stay
informed about political issues when information is costly and returns are often minimal
(Downs 1957). The portrait of the informed voter underlying the “folk theory of
democracy” is, it is argued, based on a fundamental misunderstanding of human nature
(Achen and Bartels 2016). Others have suggested that the scholarly attention to political
knowledge misses the points that voters can use information shortcuts to make rational
decisions (e.g., Lupia and McCubbins 1998), and that each individual voter’s errors
stemming from the lack of detailed knowledge cancel out when aggregated into public
opinions overall (Page and Shapiro 1992; but see Bartels [1996]; and Delli Carpini and
Keeter [1996]).
I do not dispute the general point that people have better things to do than
studying the minutiae of countless policy issues. Yet even the most skeptical observers of
public opinion, who do not see much value in ordinary citizens’ input into political
decision making, do recognize that there is an essential democratic function in giving
politicians “strong incentives to avoid doing what is widely despised” (Achen and Bartels
2016, 319; see also Zaller 1992, Ch.9). But this “modest victory for political
accountability” (Achen and Bartels 2016, 319) requires that citizens stay informed when

11
evidence of an elected official’s gross incompetence and/or corruption arises, and
rationally update their beliefs about the official. Thus, even the minimalist defense of
democracy appears to assume that citizens have some information about some political
issues. Again, the key word here is “some.” But how much is enough?
While not claiming to know the answer, I would argue (along with many other
scholars) that the range of such issues need not stop at politicians violating ethical norms,
but should also include some knowledge about policies that have the potential to
significantly affect the individual and collective lives of the public (e.g., healthcare) and
even the globe (e.g., climate change). Absent this, there would be little incentive for
political elites to refrain from making decisions that can, unwittingly or not, do a
disservice to their constituents’ essential interests.

12
Chapter 2 Revisiting Political Knowledge
For many, a key element of good decision making is political information (e.g.,
Bartels 1996; Converse 1964; Delli Carpini and Keeter 1996). In the running example
presented in Chapter 1, the importance of information is well reflected in the prediction
that Gina’s belief will be refined as n in Equations 2a and 2b increases. On the flipside, if
uninformed, Gina’s belief will mostly consist of random error, probably quite distant
from η. This prediction accounts for two important consequences of widespread political
ignorance (i.e., small n) that previous studies have identified. First, citizens’ political
opinions are usually incoherent and unstable, consisting of what Converse (1964) calls
nonattitudes—a characteristic that is more common among less informed citizens (Delli
Carpini and Keeter, 1996, 231-237). Second, voters hold policy positions that they would
not have supported if they knew more about the issues, leading to collective conclusions
that diverge from hypothetical “fully informed” public opinions (Althaus 1998; Bartels
1996; Delli Carpini and Keeter 1996, Ch. 6; Gilens 2001; but see Levendusky 2011 and
Pierce 2015 for critiques on this literature).
In practice, even highly knowledgeable citizens are not expected to be “fully
informed” in the strictest sense. As Berelson et al. (1954, 232) put it, “[v]oters cannot
have contact with the whole world of people and ideals; they must sample them.” So even
if Gina was extremely well informed, the range of relevant information she brings to bear
is likely a small subset sampled from the universe of all possible information of
relevance. Like survey sampling, representativeness is a critical benchmark here; a biased

13
sample, no matter how large, cannot form a valid estimate of the unknown parameter of
interest. But usually “the sampling is biased” (ibid, 232), and the most well known cause
of such bias is partisanship, which “raises a perceptual screen through which the
individual tends to see what is favorable to his orientation” (Campbell et al. 1960, 133).
Since Larzarsfeld, Berelson and Gaudet’s (1944, 89-90) seminal work, scholars have
raised the concern that citizens fail to consider balanced sets of competing arguments
because they selectively expose themselves and/or attend to information that is consistent
with their partisan identity (e.g., Bennett and Iyengar 2008; Iyengar and Hahn 2009;
Jamieson and Cappella 2008; Jerit and Barabas 2012; Sunstein 2001; Taber and Lodge
2006; see Hart et al. [2009] for a meta-analysis). And recent research indicates that well-
informed citizens are less likely to expose themselves to opposing political viewpoints
than others (Mutz 2006, 33; Taber and Lodge 2006).
Biased “sampling” of this kind (i.e., partisan selective exposure) can present a
serious challenge to making rational political decisions. Suppose Gina is a Democrat who
avoids uncongenial arguments, and thus the information Gina receives systematically
underrepresents information about the undesirable consequences of the ACA. In this
scenario, per Equation 1.2a, her estimate of 𝜃 is likely biased upward, possibly far off the
mark of her real interests.7
7 This is not to say there is no possibility that Gina “gets it right” without considering
both sides of the arguments. Indeed, it is quite likely that after taking up oppositional
information, Gina maintains her initial conclusion, if the new information turns out to be
much less certain and/or relevant to her than congenial information that she had
previously considered. My point, however, is that Gina cannot know if she “got it right”
unless she hears the other side. Without the complete knowledge of his evaluative criteria,
I (the researcher) cannot know if her decision is good either. While consideration of

14
An unbiased but relatively small sample of arguments can be more useful than a
large but biased sample. For instance, suppose that there are N number of voters, who
have identical interests and evaluative criteria as Gina, trying to determine whether the
ACA serves their best interests. Assume they are unbiased Bayesians, although they
consider just a few relevant arguments. For each individual, argument consideration
results in only a slight improvement (e.g., a few percentage points increase) over a 50-50
chance, because of individual errors stemming from their random initial guess, and
sampling variability in argument selection. But so long as these errors are random, they
will cancel out when aggregated. So the average of Ian-like voters’ opinions will quickly
approach η even when individuals draw on small amounts of information—more rapidly
so if the initial guess is given smaller weight than new information.
This idea may be reminiscent of Page and Shapiro (1992), who argue that
collective public opinions are “rational” despite individual ignorance and uncertainty. A
difficulty with this line of argument, however, is substantiating the assumption that
individual errors are randomly distributed (see Bartels 1996; Delli Carpini and Keeter
1996). While Page and Shapiro do acknowledge misleading and manipulative
information as one of the prominent threats to the validity of the random assumption,
their discussion is focused on the biases of available information and of those who
produce it—not those who consume it. Partisan bias on the part of the citizenry, however,
competing arguments is neither the necessary nor sufficient condition for “getting it
right,” but it raises the chance of better decision making (see Tetlock 2005).

15
also undermines a crucial condition under which aggregation can mitigate individuals’
lack of information.
2.1 Balanced Consideration as a Hallmark of Political Knowledge
My argument is in line with a central claim found in the scholarship on
deliberation; that the quality of democratic decisions depends on consideration of diverse
viewpoints (e.g., Fishkin, 1995; Gutmann and Thompson 1996; Mutz 2006, 7-10;
Sunstein 2001). At the same time, it points out an important limitation in the classic
conceptualization and measurement of political knowledge (and Equation 1.2a), which is
that they do not take partisan bias into account.8 In order to incorporate the possibility of
biased reception of information, I categorize the n cases of received arguments into two
groups: k cases of pro arguments (x > 0), and n – k cases of con arguments (x < 0), where
𝑛 ≥ 𝑘.9 I rewrite Equation 1.2a as
𝜇𝑛 = 𝜌𝑛 (𝜇0𝜏0 + ∑ 𝑥𝑖𝜏𝑖
𝑘
𝑖=1
+ ∑ 𝑥𝑖𝜏𝑖
𝑛
𝑖=𝑘+1
) . (2.1)
Assuming competing information flows in the public discourse are evenly
balanced (e.g., Zaller 1992, 187), the set of pro and con arguments Gina considers should
8 Delli Carpini and Keeter (1996, 10) define political knowledge as “the range of factual
information about politics that is stored in long-term memory.” 9 See Gerber and Green (1999, 195) for a similar formulation.

16
be roughly balanced (k ≈ 𝑛 − 𝑘).10 This requirement is violated, for example, when
Democrats systematically learn more pros than cons (k > n – k), while Republicans do the
opposite (k < n – k). The classic definition does not make this constraint explicit, leaving
open the possibility that seemingly knowledgeable citizens in fact know only one side of
the story.
Figure 1: Political Learning with and without Partisan Bias
For conceptual clarity, I draw a distinction between two dimensions of political
knowledge. One is information about politics and public affairs—the classic definition—
leading to what I call “informed opinion.” The other is consideration of the central
arguments in favor and against a political decision—leading to what I call “considered
10 This doesn’t imply everyone will converge to the middle because the weights
associated with each piece of information are assumed to vary across individuals.
Most Informed
Least Informed
Pro
Arg
um
en
ts
Con Arguments
Balanced LearningP
ro A
rgu
me
nts
Con Arguments
Imbalanced Learning
Strong Democrats
Moderate Democrats
Independents
Moderate Republicans
Strong Republicans

17
opinion.”11 Figure 1 visually demonstrates two hypothetical relationships between
information and consideration, with and without partisan bias in political learning;
coordinates in the first quadrant represent the number of pro (Y) and con (X) messages
one has received. In the left panel of Figure 1, partisans are equally likely to learn
evidence that supports the opposing party’s position as evidence congenial to their own
party. The right panel visualizes biased learning in its most extreme formulation where
strong partisans ignore unfavorable arguments altogether.
The first goal of this chapter is to examine how citizens actually match up against
these distinct possibilities, using an argument repertoire measure tapping people’s
awareness of pro and con arguments about a universal healthcare system (see Cappella et
al. 2002 for validity and reliability tests of this measurement). This is essentially a
discriminant validity test, establishing the (lack of) correspondence between information
and consideration, which may call for better conceptualization and measurement of
political knowledge.
11 Zaller (1992, 40) defines “consideration” as the “reason that might induce an individual
to decide a political issue one way or other,” which is formed when political arguments
are accepted. Unlike Zaller, however, my definition does not require acceptance of an
argument, only careful contemplation. This conceptual difference leads to different
operationalizations of consideration; unlike the survey item used in Zaller’s study to
measure considerations— “what idea came to mind as answering the question” — I draw
on the open-ended questionnaires that explicitly ask the respondents to mention
arguments for and against their own view, which enables me to capture the range of
reasons a respondent could offer (Cappella et al. 2002).

18
2.2 Estimating Considered Opinions
If reality resembles the left panel of Figure 1, the issue of improving public
opinions largely boils down to correcting for simple political ignorance. This is the
condition under which one can treat “informed opinion”— the opinion one would hold if
he/she was informed in the traditional sense—as the normative benchmark. Empirical
research on the effects of factual knowledge (or ignorance) on public opinion and vote
choice shares this assumption (e.g., Althaus 1998; Bartels 1996; Claassen and Highton
2006; Delli Carpini and Keeter 1996; Gilens 2001). These studies statistically impute a
counterfactual “fully informed” public by comparing each respondent’s actual preference
with an opinion that a “fully informed” individual sharing the same combination of
characteristics is predicted to hold. The gap between such hypothetical fully informed
preferences and the respondents’ observed preferences is taken to be evidence that
information, or the lack thereof, matters for public opinion.
On the other hand, if political learning is closer to the right panel, “informed
opinion” is likely to belie the benchmark. It is important to note that the methods that
statistically impute informed opinion are essentially changing the observed opinions of
lesser informed respondents to those held by well-informed individuals with similar
demographic and social characteristics. Therefore, the estimates of “informed opinion”
should reflect the characteristics of well-informed people, such as their political interest
(Delli Carpini and Keeter 1996), their news media use (Price and Zaller 1993), their
information processing strategies (Sniderman et al. 1991) and most importantly for my

19
purposes, the extent to which they consider conflicting perspectives (Mutz 2006; Taber
and Lodge 2006). To the extent that the citizen learning process is not evenhanded, it will
remain uncertain as to how much statistically simulated “fully informed” preferences
reflect the undesirable effects of partisan bias in information reception (see Pierce 2015).
In keeping with the conceptual distinction between the two facets of political
knowledge, I distinguish “considered opinion” from “informed opinion,” and define a
citizen as having the former if he/she has received a balanced set of competing arguments
offered by the oppositional sides. Using two empirical strategies, I estimate considered
opinions to gauge how balanced consideration affects public opinion. In doing so, I
impute “informed” opinions as well, following previous research (e.g., Bartels 1996;
Delli Carpini and Keeter 1996), to examine whether they converge to (or diverge from)
“considered opinions.”
The first strategy I use for observing considered opinions is statistical imputation
methods, similar to Bartels (1996) and Delli Carpini and Keeter (1996). In my case, I use
consideration instead of information to simulate what choice people would make if they
had considered a broad and balanced range of pros and cons. Specifically, I estimate the
effects of considering arguments for a universal healthcare system, and the effects of
considering arguments against. And based on the estimated parameters, I simulate a
“considered” public opinion by setting the numbers of pro and con arguments underlying
people’s opinion to be equally high for everyone and calculating the average of the
imputed opinions.

20
A key difference between this approach and previous models of “informed”
opinions is that it directly addresses the potential effects of imbalanced learning by fixing
argument awareness to be balanced—a defining property of a considered opinion. That
said, as with prior work (Bartels 1996), the imputation methods involve some strong
modeling assumptions, and thus the estimates may be susceptible to a variety of
specification errors. Perhaps the most prominent threat is an omitted variable bias (see
Levendusky 2011); those who have considered more (pro or con) arguments about the
healthcare issue may have idiosyncratic demographic and psychological traits, and these
characteristics, not consideration per se, may produce what is observed to be considered
opinions.
As a second empirical strategy, I draw on an experiment where individuals are
randomly assigned to participate in public deliberation—an intervention that is designed
to produce “refined” public opinion that “has been tested by the consideration of
competing arguments and information conscientiously offered by others who hold
contrasting views” (Fishkin 2009, 14; see also Barabas 2004; Cappella et al. 2002;
Fishkin 1995; Fishkin and Luskin 2005; Luskin et al. 2002; for a review see Delli
Carpini, Cook and Jacobs [2004]). Research based on experimentally induced
deliberation implements this conceptual framework (Barabas 2004; Cappella et al. 2002;
Fishkin 1995; Luskin et al. 2002) by creating carefully balanced argument pools, using
trained moderators, and encouraging participants to be open-minded. Although
participants still may not take opposing arguments seriously, it is safe to assume that
deliberation can surmount at least one likely cause of imbalanced considerations—

21
selective exposure—as diversity of viewpoints is a minimal requirement that
distinguishes it from other forms of political communication (Thompson 2008).
While statistical methods for imputing informed opinions and public deliberation
are sometimes seen as addressing the same underlying phenomenon of political ignorance
and its consequences (e.g., Althaus 1998, 547-548; see also Gilens 2001; Sturgis 2003),
according to my conceptualization, they emphasize different elements of political
decision making. Certain procedures in public deliberation are specifically designed to
combat such problems as biased selection of information, which may creep into the
estimates of “informed” opinion. Norms, such as equal exchange of diverse viewpoints
and careful consideration of competing arguments are theorized to be the defining
principles of successful deliberation (Benhabib 1996; Gastil 2008; Gutmanm and
Thompson 1996; Habermas 1989). To the degree that the difference between the two
research paradigms is substantial, “informed opinions” will not correspond to
“deliberative opinion.”
At the same time, the role of argument consideration in actual deliberative
forums is debatable (Mutz 2008; Sanders 1997; Price et al. 2006; Wojcieszak 2011).
Although deliberation by definition solves the selective exposure problem, it does not
necessarily guarantee balanced reception (see footnote 2); people may attend selectively
to congenial information. Or they may respond predominantly to superfluous information
(e.g., partisan cues) without really processing the content of the messages (Petty and
Cacioppo 1986; Zaller 1992). The difficulty comes from the fact that there are no
acceptable grounds for declaring a priori what “considered opinions” would look like

22
(see Kuklinsiki and Qurik 2001; Price and Neijens 1997), which makes the prediction of
opinion changes impossible in most cases. That said, there is evidence that formal
deliberation and exposure to disagreement in other contexts enhances the understanding
of opposing arguments (Cappella et al. 2002; Mutz 2006, 73; Price et al. 2006) and that
opinion shifts during deliberation are driven by consideration of well-justified arguments
(Westwood 2015).
One way to solve this dilemma may be to compare the results of the two
approaches (deliberation and statistical imputation), which bring different (normative and
methodological) assumptions to get at the same thing—collective opinions of a
hypothetically more deliberative citizenry. The two approaches will generate similar
results so long as both approaches successfully estimate considered public opinions. And
to that degree, each may provide complementary evidence to the other. The imputation
strategy can generate an expectation about how evenhanded argument consideration
during deliberation affects opinion changes ex ante, without making an assumption about
which collective opinion is “better” for the public. The experimental approach allows us
to observe actual opinion changes that arise when people are exposed to diverse
viewpoints, without modeling assumptions. Drawing on different methods can be seen as
a kind of a convergent validity test: If inconsistent, at least one of them has to be relying
on wrong assumptions. If consistent, one may have increased (though by no means
certain) confidence in the results.

23
2.3 Data and Methods
Data for my analyses comes from the 2004-2005 Healthcare Dialogue (HD)
Project, a multi-wave study that combined Internet surveys with online deliberation
experiments.12 Participants in the HD Project were drawn from a representative sample of
adult American citizens (aged 18 or older), maintained by Knowledge Networks (now
GfK ).13 Because of the software used for the online discussions, those without access to
a personal computer were excluded from the sample. Nevertheless, the characteristics of
the HD sample reasonably resembles the 2004 American National Election Study sample
and the 2004 Current Population Survey benchmark on key demographics and
partisanship (see Appendix A). At the screening survey, 3,429 respondents were invited
to take part in the study, and 2,193 completed the baseline survey. The final response rate
for the baseline survey was 33.5% (AAPOR RR3). Table 1 summarizes the timeline of
the major events of the Healthcare Dialogue Study with respect to the analyses I
conducted.
12 Data used in Chapter 2 of this dissertation comes from the Health Dialogue Project,
supported by grants to Vincent Price and Joseph N. Cappella from The National Science
Foundation (Grant EIA-0306801) and the Annenberg Public Policy Center at the
University of Pennsylvania. I thank everyone previously involved in the Health Dialogue
Project. They, not me, conducted surveys, experiments, and content analyses. 13 The project included a purposive sample of healthcare policy elites including policy
makers, experts and industry representatives (N = 314). Because the focus of this
research is policy preferences of the general public, I use only the population sample.

24
Table 1: The Health Dialogue Project Date Event Key Variables / Discussion Topics N
7/14 to 8/12 (2004) Baseline Survey Political Information
Argument Repertoire
Opinion: Nationalized Universal Healthcare (1)
Party Identification
Control Variables
2,193
9/17 to 9/23 Deliberation 1 The most pressing problem 376
11/30 to 12/6 Deliberation 2 Policy proposals for the selected problem 355
2/4 to 3/1 (2005) Post Survey Opinion: Nationalized Universal Healthcare (2) 1,340
Experimental Design
A subset of participants in the baseline survey (N = 1,844) was asked to
participate in subsequent pre- and post-discussion surveys. Among these individuals,
1,237 were randomly assigned to attend four rounds of online discussions that took place
between September 2004 and May 2005 in addition to the surveys. Those in the treatment
group were divided into 72 discussion groups. The first (September 2004) and second
(November 2004) discussions pertained to issues surrounding health insurance. In the
first discussion, participants deliberated about the most pressing problem related to health
insurance, and each group identified one problem as a top priority. Twenty seven groups
named the large number of Americans without insurance coverage, while 45 groups
named the increasing costs of health insurance. In the second round, participants
discussed the pros and cons of several policy proposals designed to address the specific
problem selected by the group in the first discussion. Each discussion was held for an
hour, facilitated by a moderator. Each deliberation participant made 18.6 (first round) and
20.2 (second round) statements on average at each event. Since I rely on open ended
questions tapping awareness of arguments for and against a “universal, federally funded

25
health insurance,” my analyses exclusively drew on the first two deliberation meetings
and the two waves of surveys conducted before the first and after the second deliberations
(see Table 1).14 Appendix A shows that the treatment and control groups are balanced on
pre-treatment covariates among those who responded to the baseline and post surveys,
minimizing concerns that uneven attrition between groups is responsible for the results
shown below.
Non-compliance.
Although substantial efforts were made to motivate participants to attend the
discussions by accommodating their schedules, sending reminders and offering incentives
(e.g., $15 in wave 2), among the 1,237 invitees, only about 30% were present in
deliberative meetings (376 in the first and 355 in the second). I take three estimation
strategies to deal with the non-compliance issue. First, I regress opinion change on
random assignment, estimating the Intent-to-Treat Effect (ITE). Albeit valid, ITE is a
smaller than average treatment effect (ATE) because many of those assigned to be treated
never receive the treatments. Second, I use a two-stage-least-square (2SLS) estimator
where random assignment is used as the instrument for attendance. This approach
recovers the ATE on the Treated (ATET). One must assume, however, that compliers and
non-compliers would be affected by the treatment in the same way in order to generalize
findings to the population. To estimate the ATE, I use simple Difference-in-Differences
(DD) estimators treating deliberation attendance as the independent variable, which can
14 The third and fourth discussions and surveys were concerned with prescription drugs.

26
be generalized to non-compliers. The downside is that this strategy is essentially
“observational”; since deliberation attendance is likely endogenous, it requires an
additional identifying assumption that the overtime opinion change would have been the
same for attendees and non-attendees in the absence of deliberation.
Measures
Support for universal health insurance. At the baseline survey, participants
indicated their views on “a universal, single-payer system of national health insurance
paid for by the federal government.” The same question was asked in the post survey,
which was fielded about two months after the round two deliberations. This variable was
coded on a scale from 0 (“oppose strongly”) to 1 (“favor strongly”), with the midpoint
representing “don’t know” responses.
Consideration of pro and con arguments. After being asked about one’s opinion
on universal health insurance, those who were favorable to the program were then asked
to offer all the reasons they have for being in favor of a universal, national health
insurance program. They were then asked to give reasons “other people” might have for
being opposed to the program. Similarly, participants who were opposed to a universal
health insurance program were asked to give rationales for their own and for others’
views. Those who did not take a position were asked to name the reasons why other
people might favor a universal health insurance, followed by a question asking about
reasons for being against it. Thus, all respondents were invited to offer both pro and con
arguments about a federally funded health insurance program, regardless of their opinion.

27
The number of pro and con arguments was counted by four independent coders,
using the coding procedure developed and implemented by Cappella et al. (2002).
Answers without evidence (e.g., “it makes sense”), restatement of opinion, repetition of
the same ideas, and the like were not counted. Evidence coupled with stated or implied
explanation as to why that evidence supports/opposes universal national health insurance
was counted as a reason (argument). A subsample of 50 responses was randomly drawn
and coded by all of the coders to test inter-coder reliability. Krippendorff’s alpha value
for reliability was .83 for pro reasons, and .85 for con reasons. Overall, people supplied
similar numbers of pro arguments (M = 2.30, SD = 2.69) and con arguments (M = 2.17,
SD = 2.74).15
Political information. The Healthcare Dialogue Project assessed general political
knowledge as well as specific healthcare issue knowledge in the baseline survey. General
knowledge was measured by an additive index of the number of correct answers to the
five questions recommended by Delli Carpini and Keeter (1996, 306). The seven
questions tapping healthcare issue knowledge included knowledge about provisions of
the Medicare bill signed by President Bush; which organization was responsible for
deciding whether drugs are ready for use; the political office held by Tommy Thompson;
the amount of Medicare’s fund; the Bush administration’s position on stem cell research;
15 Of course, I do not claim that there is a perfect correspondence between all the
arguments one had previously encountered, and the arguments one provided during the
survey. But it is not unreasonable to assume that those who were able to cite both pro and
con arguments in some details are more likely to have taken uncongenial arguments
seriously, than those who only cited arguments confirming their opinions (see Cappella et
al. 2002 for validity tests of this measure).

28
eligibility requirements for Medicare; and the percentage of Americans without health
insurance. I created an additive index of political information by counting the number of
correct responses to all 12 items (M = 7.20, SD = 2.47, α = .72).16
Party identification. Conventional survey questions (e.g., ANES) were used to
measure partisanship. Respondents were categorized into five (partisan) groups: Strong
Republicans (16.1%), Moderate Republicans (16.5%), Independents (34.5%), Moderate
Democrats (16.4%), and strong Democrats (16.5%).17
Control variables. Some of the statistical models to be reported below include a
range of covariates. They include age (Mean = 44.7), years of education (Mean = 14.2),
gender (Male = 46.6%), income (Median = $50,000), Black (8.4%), marital status
(Married = 64%), political interest, political participation, political discussion, attention
to news about healthcare issues, access to health insurance (insured = 87%), one’s own
health status (36.0% have a serious disease), and family health status (42.5% have a
family member with a serious disease). See Appendix A for more detailed information
about the measurement of the control variables. The appendices also provide survey
question wordings of the independent, dependent and control variables, and their
descriptive statistics. Unless noted otherwise, all variables are recoded to vary between 0
and 1.
16 The results reported below are robust to using general political knowledge items only
as well as using healthcare issue knowledge items only. 17 Those who indicated “something else” (N = 170) were categorized as independents.

29
2.4 Distinguishing Information and Consideration
A limitation in the classic notions of political knowledge and informed opinion, I
have argued, is that it ignores the possibility of biased sampling of incoming political
information. In this section, I examine this possibility empirically, using the distinction I
drew between two dimensions of political knowledge. If the partisan “perceptual screen”
affects the sampling of received information, citizens will fail to receive both sides of an
argument equally. And to the extent that some citizens are “better informed,” their
awareness of opposing arguments is likely to be slanted. If there is little partisan bias in
information selection, “well informed” partisans (according to the classic definition)
would have considered similar number of pro and con arguments, in which case
information and consideration would be essentially the same thing. In Figure 1 (above) I
presented two hypothetical scenarios, where such biased learning is completely absent
(left panel) or extremely strong (right panel).
In Figure 2, I match the actual data against the two hypothetical possibilities
outlined in Figure 1 (see Appendix A for specific numbers including number of
observations and standard errors).18 The solid lines plot the mean values of pro and con
arguments provided by each partisan group, with the four markers in each group
18 As a general principle, I start from simple (transparent) specifications, and then move
onto more complicated models, checking the robustness of findings. In these “simple”
models, I treat the key independent variables (e.g., PID and political information) as
categorical, and compare group means.

30
Figure 2: Observed Relationship Between Information and Consideration
Note. N = 2,193. The mean values of pro and con arguments are plotted by PID and
political information.
representing levels of political information.19 As can be seen, partisans tend to diverge
from the diagonal “benchmark” of balanced consideration, in the direction of the position
most closely associated with their partisan identity. People were more aware of the
arguments for their own side, and this pattern was largely driven by “knowledgeable”
citizens. Well-informed strong Republicans were especially likely to have ignored pro-
healthcare reform arguments, as they mention just about the same number of arguments
19 I use a quartile split to divide the respondents into four levels of political information,
with the following cutoffs: 42% or less, 50%, 67%, 83% correct answers, which roughly
correspond to the quartiles.
More Informed
Less Informed
0
1
2
3
4
5
0 1 2 3 4 5
Pro
Arg
um
en
ts
Con Arguments (Average)
Strong Democrats
Moderate Democrats
Independents
Moderate Republicans
Strong Republicans
Benchmark

31
for universal healthcare as their uninformed counterparts (1.86 vs 1.72), although they
were able to articulate far more con arguments than less informed ones. Similar, albeit
less pronounced, patterns can be found for moderate Republicans and strong Democrats.
Independents and moderate Democrats, on the other hand, appear to exhibit fairly well
balanced considerations on average.
Now, I provide a more formal examination of the tendencies highlighted in Figure
2: (1) partisan gaps in the awareness of pro and con arguments, and (2) the pattern where
partisan gaps are widest among the well informed. To do so, I fit a set of regression
models where the number of pros and cons are the dependent variable.20 First, consider
the following regression model:
𝐴𝑅𝑖,𝑗 = 𝛼 + 𝛽1𝑃𝑟𝑜𝑗 + 𝛾1𝑃𝐼𝐷𝑖 + 𝛾2𝑃𝑟𝑜𝑗×𝑃𝐼𝐷𝑖 + 𝛿𝑖 + 휀𝑖,𝑗 (2.2)
where the j subscript indexes arguments (pro or con), the i subscript indexes each
participant, 𝐴𝑅𝑖,𝑗 is the number of arguments, 𝑃𝑟𝑜𝑗 is a within-individual factor dummy
variable indicating argument position (pro =1; con=0), 𝑃𝐼𝐷𝑖 is a vector of dummy
variables for partisan identities where strong Republicans serve as the reference category,
𝛿𝑖 is individual-specific random effects and 휀𝑖,𝑗 is the stochastic error term.21 𝛼 is the
20 In these regression models, there are two observations of the dependent variable (pros
and cons) for each respondent. 21 Four dummy variables for PID were included in the model, with the base category
representing strong Republicans. I fit a Maximum Likelihood model to account for the
individual random effects.

32
average number of cons articulated by strong Republicans (the reference category), 𝛽1 is
the difference between the number of pros and cons (for strong Republicans), 𝛾1 is the
vectors of parameters for the PID dummies summarizing partisan differences in the
number of cons, and 𝛾2 is the interaction between PID and argument position indicating
the partisan differences in the gap between the number of pros and cons. If there is a
partisan bias in consideration of pro and con arguments, the difference between pros and
cons (i.e., the coefficient on 𝑃𝑟𝑜𝑗) will vary across partisan groups. This can be
demonstrated by fitting Equation 2.2 where the value of the coefficient on argument
position varies across PID, and comparing it against a reduced model restricting the
interactions (𝛾2 vector) to be zero. A likelihood-ratio test suggests that the model
including the interaction terms fits significantly better than the restrictive one (Chi2 (4) =
91.61, p < 0.001), providing strong evidence that the distributions of pros and cons that
underlie people’s opinion substantially differ by PID.
Table 2: Gap between Pros and Cons by PID (1) (2) (3) (4) (5)
Strong Rep Mod. Rep Independent. Mod. Dem Strong Dem
-1.077ab -0.13b 0.33a 0.53a 0.77 ab
(0.15) (0.15) (0.10) (0.15) (0.15)
Note. Entries are calculated by estimating Equation 2.2. Standard errors are in
parentheses. N = 4,340. a P < 0.1 where 𝐻0: 𝛽 = 0. b P < 0.1 where 𝐻0: 𝛽 = 0.33.
Table 2 reports the estimates of 𝛽1 + 𝛾2 (i.e., average gap between pros and cons
for each partisan group), which ranges from -1.08 to 0.77 in the expected direction (see
Appendix A for a full report on the estimates of Equation 2.2). How does each partisan

33
group measure up in terms of balanced awareness? One can think of two benchmarks
here; assuming that the information flows about the issue in public discourse were evenly
balanced, one may define unbiasedness as 𝑃𝑟𝑜 − 𝐶𝑜𝑛 = 0. By this standard, every group
appears to be biased beyond chance, except for moderate Republicans. But assuming that
Independents lack a partisan slant, the fact that they also named more pro arguments may
indicate the range of arguments brought to the citizenry overall is slightly slanted in favor
of universal healthcare. If this were the case, Independents could serve as a benchmark in
that they lack partisan bias. By this standard (𝑃𝑟𝑜 − 𝐶𝑜𝑛 = 0.33), all but moderate
Democrats significantly deviate from the benchmark. In either case, strong partisans
exhibit slanted distributions of considered reasons.
Next, to examine the correspondence between information and consideration I
estimate a regression that extends Equation 2.2 by including political information, and its
interactions with PID and argument position, which takes the form:
𝐴𝑅𝑖,𝑗 = 𝛼 + 𝛽1𝐼𝑛𝑓𝑜𝑖 + 𝛽2𝑃𝑟𝑜𝑗 + 𝛽3𝐼𝑛𝑓𝑜𝑖×𝑃𝑟𝑜𝑖 + 𝛾1𝑃𝐼𝐷𝑖 + 𝛾2𝐼𝑛𝑓𝑜𝑖×𝑃𝐼𝐷𝑖
+ 𝛾3𝑃𝑟𝑜𝑗×𝑃𝐼𝐷𝑖 + 𝛾4𝐼𝑛𝑓𝑜𝑖×𝑃𝑟𝑜𝑗×𝑃𝐼𝐷𝑖 + 𝛿𝑖 + 휀𝑖,𝑗 (2.3)
where 𝐼𝑛𝑓𝑜𝑖 is the political information of respondent i, 𝛼 is now the predicted number of
cons mentioned by the least informed strong Republicans (who served as the reference
category), 𝛼 + 𝛽2 is the predicted number of pros for strong Republicans with the lowest
political information score; 𝛼 + 𝛽1 is the fitted value of cons for “fully informed”
(𝐼𝑛𝑓𝑜𝑖 = 1) strong Republicans, and 𝛼 + 𝛽1 + 𝛽2 + 𝛽3 is their predicted number of pros,

34
𝛽1 is the difference between least informed and most informed strong Republicans in the
number of con arguments, and 𝛽1 + 𝛽3 is the difference in number of pros. The
difference (𝛽1 + 𝛽3 − 𝛽1 = 𝛽3) is the asymmetry in the association between information
and consideration of pros versus the association between information and consideration
of cons. It captures the extent to which the slope representing strong Republicans in
Figure 2 diverges from the diagonal benchmark, i.e., the extent to which information and
consideration do not correspond. Alternatively, one can interpret 𝛽3 as the extent to
which the pro versus con difference is strongly pronounced for well-informed strong
Republicans (𝛽2 + 𝛽3), compared to the less informed (𝛽2).
𝛾4 is the vector of coefficients on the triple interaction terms representing the
extent to which the asymmetric correlations differ by PID. If the relationship between
information and the range of considered reasons is unaffected by PID, a model that
restricts the triple interactions to zero should perform as well as a flexible model that
allows 𝛾4 to be non-zero. A likelihood-ratio test easily rejects this null hypothesis in favor
of the possibility that partisanship influences the differential correlations between
information and pro and con arguments (Chi2 (4) = 23.89, P < 0.001).
The estimates of Equation 2.3 are summarized in Table 3, which shows the
predicted difference in the number of pros between the least and most informed
respondents in each partisan group (𝛽1 + 𝛽3 + 𝛾2 + 𝛾4), as well as their predicted
difference in the number of cons (𝛽1 + 𝛾2). Also reported is 𝛽3 + 𝛾4 = (𝛽1 + 𝛽3 + 𝛾2 +
𝛾4) − (𝛽3 + 𝛾4), indicating the gap in these two correlations (see Appendix A for a full
report on the estimates of Equation 2.3). As with the previous model, there may be two

35
benchmarks. One may presuppose that “well informed” citizens should do better,
compared to less well informed ones, in articulating both pros and cons to the same
extent. In this the case, 𝛽1 + 𝛽3 + 𝛾2 + 𝛾4 should not be significantly different from 𝛽1 +
𝛾2. This “null” hypothesis (𝛽3 + 𝛾4 = 0) is tantamount to assuming that the slopes in
Figure 2 will parallel with the diagonal. As demonstrated in Table 3, Republicans,
especially strong ones, clearly fall short of this standard. The relationship between
information and consideration for strong Democrats appears to be slanted in the opposite
direction, although to a much lesser degree (𝛽3 + 𝛾4 = 0.99, p = 0.18). According to an
alternative standard provided by Independents (𝛽3 + 𝛾4 = −0.44), all but leaning
Democrats show asymmetric relationship between information and consideration.22
Table 3: Associations between Information and Consideration by PID (1) (2) (3) (4) (5)
Strong Rep Mod. Rep Independent. Mod. Dem Strong Dem
𝛽1 + 𝛽3 + 𝛾2 + 𝛾4 (Pros) 0.08 2.13 2.94 3.08 5.56
(0.88) (0.61) (0.43) (0.59) (0.70)
𝛽1 + 𝛾2 (Cons) 4.22 4.00 3.38 3.48 4.57
(0.88) (0.61) (0.43) (0.59) (0.70)
𝛽3 + 𝛾4 (Gap) -4.15ab -1.87ab -0.44 -0.41 0.99b
(0.98) (0.61) (0.48) (0.60) (0.74)
Note. Entries are calculated by estimating Equation 2.3. Standard errors are in
parentheses. N = 4,340. a P < 0.1 where 𝐻0: 𝛽3 = 0. b P < 0.1 where 𝐻0: 𝛽3 = −0.44.
22 The mismatch between information and consideration is particularly severe for
Republicans. Although I did not hypothesize it, this finding is in fact consistent with
studies showing that conservatives tend to avoid dissonance-arousing situations (Nam et
al., 2013), including exposure to counter-attitudinal information more than liberals
(Garrett and Stroud 2014; Mutz 2006, 33).

36
Taken together, the correspondence between being informed and being
considerate is far from perfect, and therefore there is little ground for treating these two
characteristics as the same. Thus even a well-informed public’s decisions may not
approximate the decisions that a well-considered public would make. I explore this
possibility in the following sections.
2.5 Informed Opinions versus Considered Opinions
Table 4: Support for Universal Health Insurance by Political Information
Note. N = 2,193. Standard errors in parentheses. *p < 0.1. The p values on each level are
for the mean comparisons against the baseline category (Very Low). The F statistic (with
3 degrees of freedom) tests the null hypothesis that the mean differences are jointly zero.
In this section I compare informed opinions and considered opinions. As
mentioned above, I use statistical simulation (and an experiment) to estimate them. But
before presenting the relatively complex models, I first outline how people’s opinions
differ across different levels of information and consideration using mean comparisons.
Table 4 compares the average support for universal healthcare of better informed and less
informed citizens using a quartile spilt. I find a significant (monotonic) negative
correlation between political information and the view that universal health insurance is a
Political Information Support
Very Low 0.64
(0.01)
Low 0.63 (0.01)
High 0.58*
(0.01) Very High 0.49*
(0.01)
F (3) 24.02*

37
good idea. The difference between the most informed and least informed citizens is quite
sizeable (mean difference = 0.16, p < 0.01), with the former being evenly divided and
the latter being generally supportive.
Table 5: Support for Universal Health Insurance by Consideration Consideration Support
Balanced 0.63* 0.70* 0.71*
(0.02) (0.03) (0.06)
Rest 0.59 0.59 0.59
(0.01) (0.01) (0.01)
Cutoff for Balanced Consideration 3 or more 5 or more 7 or more
Observations Passing Cutoff 358 105 35
Note. N = 2,187. Standard errors in parentheses. *p < 0.1. The p values are for the mean
differences between Balanced and Rest.
Does the same result arise when using consideration as the measure of political
knowledge? To examine this question, I compare the mean support for universal
healthcare of those who are fairly “well considered” against the rest of the respondents in
Table 5.23 I find that those who are well versed in both sides of arguments are more
supportive of universal healthcare than others, contrary to what was found for “well
informed” respondents. For example, the respondents who articulated five or more pros
and five or more cons were substantially more likely to approve the universal health
insurance policy than the rest (mean difference = 0.11, p < 0.01). Taken together, the
23 Given the uncertainty regarding how many arguments one should articulate to qualify
as exhibiting high levels of consideration, I use various cutoffs: from three pro and three
con arguments to seven pros and seven cons. Unsurprisingly, the number of respondents
categorized to have balanced consideration decreases rapidly as the definition of balanced
consideration becomes more restrictive (from about 16.3% to 1.6%).

38
mean comparisons reported in Tables 4 and 5 provide preliminary evidence that the
opinions held by “knowledgeable” citizens differ depending on how one defines and
measures political knowledge.
To be sure, the group means in Tables 4 and 5 are only crude measures of
“informed” and “considered” opinions.24 I next follow the imputation methods developed
by Delli Carpini and Keeter (1996) and Bartels (1996) to generate estimates of the
counterfactual collective opinions held by the “fully informed” public, and the “fully
considered” counterpart, while accounting for the most likely confounders and
heterogeneity in the effects of information and consideration (for similar approaches to
simulating other counterfactuals, see Kuklinski et al. 2000; Zhang 2010). First, I estimate
the effects of political information based on a regression model that takes the following
form:
𝑌𝑖 = 𝛽0 + 𝛽1𝐼𝑛𝑓𝑜𝑖 + 휀𝑖. (2.4)
where 𝑌𝑖 is support for a universal health insurance for individual i, 𝐼𝑛𝑓𝑜𝑖 is political
information, 𝛽0 is the average support among those who are lowest in political
information, and 𝛽1 is the effect of information.25 Given that people with different
political values or self-interests will (rationally) use different evaluative criteria, I allow
these parameters to vary across individual differences by adding a set of moderators to
Equation 2.4. To ensure that the results are not sensitive to the choice of individual
24 They do not account for likely confounding factors such as PID, and implicitly assume
that people will be equally affected by political information and considered arguments. 25 𝐼𝑛𝑓𝑜𝑖 is now a continuous variable ranging from 0 to 1.

39
factors, I try alternative specifications. In a more restrictive (but simple) variation of
Equation 2.4, I include only party identification and its interaction with political
information. A second specification includes demographic characteristics that are likely
to affect the evaluative criteria, in addition to party identification.26 Based on the
estimated parameters, I simulate an “informed” public opinion by setting 𝐼𝑛𝑓𝑜𝑖 to be the
highest possible value (100% correct) for everyone and calculating the average of
imputed 𝑌𝑖. Accordingly, the differences between the counterfactual and the observed
opinions constitute the anticipated opinion change upon each individual becoming “fully
informed.” And the mean of these differences is taken to be the “information effect.”
For considered opinions, I begin by measuring the effects of considering
arguments for a universal healthcare system, and the effects of considering arguments
against by fitting (an extended version of) the regression model:
𝑌𝑖 = 𝛽0 + 𝛽𝑝𝑘𝑖 + 𝛽𝑐(𝑛𝑖 − 𝑘𝑖) + 휀𝑖. (2.5)
where 𝛽𝑝 and 𝛽𝑐 are the effects of pro and con considerations, and 𝑘𝑖 and 𝑛𝑖 − 𝑘𝑖 are
again, the numbers of pros and cons underlying individual i’s opinion.27 As with
26 The demographic variables include a variety of stable characteristics pertinent to
healthcare policy preferences (see Appendix A, for the full list). They are similar to those
used in previous research (e.g., Althaus 1998), but also include several variables tapping
personal health status, and healthcare conditions (e.g., whether insured or not). In the
regression analysis, these variables and their interaction with political information are
added to Equation 2.4. 27 One can think of Equation 2.5 as a simplified version of Equation 2.1, which cannot be
estimated as it is. The simplification is that for individual i, all pro arguments are equally
effective, as are all con arguments.

40
Equation 2.4, I allow these effects to vary across individual differences using two
different specifications; one including PID only and the other adding demographic
factors.28 The key difference from “informed” opinion is that this time I set both 𝑘𝑖 and
𝑛𝑖 − 𝑘𝑖 to be equally high numbers for everyone, thereby forcing a balance in pros and
cons—a feature that is absent in the estimate of “informed” opinions.29
The results of these various models are presented in Figure 3.30 The circles and
triangles in the left half of the figure compare the imputed estimates of information
effects against consideration effects (with and without demographic moderators). Each
marker represents the point estimate of the difference between imputed informed or
considered public opinion and the baseline of actual public opinion. The bars report the
28 I also examined models that included interactions between pros and cons, allowing for
the possibility that the effect of one side of arguments depends on awareness of the other
side. The results were robust to this specification choice (See Appendix A). I report the
results from the simpler specification without the interaction term here. 29 Pro and con arguments had extremely skewed distributions; while the maximum values
were 42 and 48 respectively, for the most part respondents articulated five or less
arguments for each side (87.5% fall in this range for pros and 87.6% for cons). In fact,
only one respondent listed more than 15 pros and 15 cons (see also Figure A1 in
Appendix A). Given the sparseness of observations near the actual maximums, “fully
considered opinions” fixed at these values will be mere extrapolations. Consistent with
the mean comparison analyses (reported in Table 5), I employ more reasonable
definitions of “full consideration”—5 pros and 5 cons, and set the maximum of number
of arguments to be 5, by collapsing values greater than 6 into the maximum category.
Admittedly this is an arbitrary choice in that there is no theoretical ground to say
consideration of 5 reasons is enough, and 4 is not. Yet, the findings are generally robust
to alterative specifications using different cutoffs—3 or 7 arguments on both sides—and
using percentile values, which does not require (arbitrary) selection of cutoffs (See
Appendix A). 30 The confidence intervals and standard errors are calculated using bootstrapping. Each
set of analyses—i.e., regression and simulation—are replicated on 2000 bootstrap
samples drawn from the original sample with replacement. Thus the standard error and
confidence interval for fully informed preference are the standard deviation, and 5th and
95th quintiles of its values from the 2000 samples.

41
Figure 3: Comparing Information Effects versus Consideration Effects
Note. The dependent variable is support for universal health insurance. Information
Effects, denoted by the circle markers, represent the simulated estimates of public
opinion change that is anticipated when the public is fully informed. Imputed
Consideration Effects, denoted by the triangular markers, represent the simulated
estimates of public opinion change anticipated to occur when the public considers a “full”
range of competing arguments. Deliberation effects, denoted by the square markers,
represent the estimated effect of actual deliberation on opinion change. Vertical lines
represent 95% confidence intervals. See Appendix A for more information.
95% confidence intervals. As shown in the figure, imputed opinions significantly differ
from actual public opinion. More importantly, considered and informed public opinions
differ from actual opinion in the opposite direction. The estimated values suggest that
while informed public opinion is less favorable to a nationalized health insurance
program than actual collective opinion by 4.4 to 7.1 percentage points (both statistically
significant at p < .05), considered public opinion is more favorable. The size of the
“consideration effect” reported here varies somewhat—from 2.9 to 4.9 percentage
points—but these estimates are consistently positive, and the lower bounds of the 95%
-0.1
0
0.1
Inform(Imputed)(Mod: PID
Only)
Inform(Imputed)
(Mod: PID &More)
Consider(Imputed)(Mod: PID
Only)
Consider(Imputed)
(Mod: PID &More)
Consider(Deliberate)
(ITE)(Control:X)
Consider(Deliberate)
(ITE)(Control:O)
Consider(Deliberate)
(ATET)(Control:X)
Consider(Deliberate)
(ATET)(Control:O)
Consider(Deliberate)
(ATE)(Control:X)
Consider(Deliberate)
(ATE)(Control:O)

42
confidence intervals remain above zero with and without additional moderators in the
model.
In sum, this analysis suggests that the consideration effect on collective opinions
significantly diverges from the information effect, not only in magnitude, but also in
direction. This discrepancy seems to imply that the estimates of “fully informed” public
opinion (Althaus 1998; Bartels 1996; Delli Carpini and Keeter 1996) may reflect partisan
bias in awareness by leaving open the possibility that well informed citizens’ political
knowledge is generally imbalanced.
It is important note that the statistical imputation approach still requires some
strong modeling assumptions, particularly that there is no unobserved confounder. I now
turn to a randomized experiment on deliberation as a means to measure the causal effect
of consideration. If imputation and experimentation are both valid tools for identifying
more considered opinions, I should find that these estimates correspond to one another. I
fit the following regression model:
∆𝑌𝑖 = 𝛽0 + 𝛽1𝐷𝑒𝑙𝑖 + 휀𝑖 (2.6)
where ∆𝑌𝑖is change respondent i's support for universal healthcare system before and
after deliberations, 𝐷𝑒𝑙𝑖 indicates deliberation, and 𝛽1 is the causal effect of interest. As
mentioned above I use three different specification approaches—(1) ITT, (2) ATET, and
(3) ATE. The difference among the three is how deliberation is operationalized—(1)

43
assignment, (2) assignment as the instrument for attendance, and (3) attendance.31 I fit
each of the specifications with and without (pre-treatment) covariates, yielding a total of
6 estimates of deliberation effects (see Appendix A for full reports of these models
including the list of covariates). The rectangular markers in the right half of Figure 3
report 𝛽1 in Equation 2.6, across these specifications.
I first present the result of regressing opinion change on group assignment status
(without controls), which shows a treatment effect that is consistent with the imputed
estimates of consideration effect (𝛽1 = 0.031, p = 0.056). 32 The next model, shown in the
second rectangle, adds the lengthy list of control variables, but still produces a
remarkably similar figure (𝛽1=.030; p = 0.074). These two estimates capture the
“intention-to-treat” effect, which represents the impact of being assigned to a treatment
group, while ignoring the rate at which those in the treatment group actually receive it. To
calculate the ATET, I turn to 2SLS regression (the third and fourth triangles in Figure
3).33 I find that actual treatment (i.e., deliberative participation) increases support for
universal healthcare system by 7.8 to 8.2 percentage points for those would receive
treatment when assigned. Finally, comparing individuals on (endogenous) deliberation
attendance, I find the effect of deliberating about healthcare corresponds to 3.6
percentage points greater support for universal healthcare system, compared to non-
31 Attendance is coded as the following; 0 = none; 0.5= once; 1 = twice. 32 All test statistics are calculated using robust cluster standard error that accounts for
within-discussion-group correlations. I rescale the number of deliberations participated in
to range between 0 (none) and 1 (twice). See Appendix A for more information on the
models. 33 ATET is identical to the ITT effect divided by the average rates of deliberative
participation among the treatment group.

44
deliberators (p = 0.067). And holding fixed individual factors increases the size of the
point estimate (𝛽1=.046; p = 0.028), implying that omission of some potential
confounders, if anything, may have led to the underestimation of the deliberation effect.34
Taken as a whole, Figure 3 makes a very straightforward point: across various
specifications, deliberation moves public opinion in the direction predicted by my
simulation of “considered opinion,” which is at odds with “informed opinion.”
2.6 Summary
To summarize, this chapter underscores the discrepancy between two dimensions
of political knowledge—information and consideration—by providing the following
evidence. First, the range of considered argument is generally slanted in the direction of
partisan identities, and this tendency is far stronger among those who possess high levels
of factual information. Second, the statistical simulations of considered and informed
preferences indicate that they are not the same thing, significantly diverging on
preferences for government-sponsored health insurance. Third, on average, deliberative
intervention—an experimental method for producing considered opinions—pushed
public opinion in the same direction predicted by the imputation method.
It is important to note that whether these estimates of considered opinions are
normatively “better” than the baseline is still an open question. One may argue that
34 Note that the latest deliberation took place about two months before the measurement
of the post-test outcome variable (Table 1). Considering that communication effects in
general tend to disappear rather rapidly (e.g., Gerber et al. 2011), this result is impressive.

45
competent decision making requires more than the reception of a broad range of
messages. In particular, the Bayesian learning model dictates how citizens should revise
their opinions upon receiving a stream of information: the most certain evidence should
carry the greatest weight in opinion formation and revision. Importantly, the analyses
thus far have ignored the question of whether the quality of argument matters as citizens
form their policy opinions. Neither the certainty of arguments people had considered
prior to the surveys nor the certainty of the messages they received during deliberation
was measured. In the following chapter, I examine how people use received policy
information more directly by testing the effect of evidence strength.

46
Chapter 3 The Force of the Better Evidence
In terms of multi-step models of attitude change (McGuire 1969; Zaller 1992),
Chapter 2 focused (mostly) on the “reception” stage. It has been assumed that facilitating
more considered public opinions is largely a matter of solving the problems of ignorance
and partisan selective reception. But arguably the most damaging blow to citizen
competence comes from the notion that it does not even matter whether people have
substantive information about policy issues because they lack the ability to use
information rationally anyway. While it is the central assumption of deliberative
democracy that citizens are capable of forming meaningful opinions led by “the force of
the better argument” in the marketplace of ideas (Habermas 1984; Fishkin 1995; Mercier
and Landemore 2012), there has been little empirical evidence that directly supports it—
and plenty that calls it into question (for reviews of such evidence see Delli Carpini et al
2004; Mendelsberg 2002; Mutz 2008).
From a theoretical standpoint, there are two important reasons to think that it
does not matter whether citizens have detailed facts about the political issues of the day,
and the prospects of deliberative democracy are hopelessly untenable.
1. The Uncritical Public Hypothesis: People do not reason for themselves. They
defer readily to elite opinions (usually their party leaders’ positions), so much so
that they ignore substantive information about the merits of the policies at hand

47
(Broockman and Butler 2017; Cohen 2003; Lenz 2012; Rahn 1993; Zaller 1992;
see Bullock 2011 for a review).
2. The Motivated Public Hypothesis: People are motivated to defend their partisan
viewpoints. They vigorously discount uncongenial information when confronted,
even to the point of bolstering prior attitudes (Kunda 1990; Lord et al. 1979;
Taber and Lodge 2006; Nyhan and Reifler 2010).
But what empirical observation constitutes the evidence against the people can
pick and choose good argument in the marketplace of ideas? For example, if people
change their minds after hearing an argument, are they being “manipulated” or
“educated” (Mansbridge 2003)? If they don’t change their minds, are they exhibiting
healthy skepticism or irrationality? Teasing out these normative interpretations requires
defining ex ante the qualitative aspects of strong versus weak arguments that should (or
should not) make them persuasive—an approach that few studies on political persuasion
have taken. As such, I argue in the following section that prior evidence remains more
ambiguous about how critically and rationally citizens respond to new information
bearing on political issues than is often supposed. In this chapter, I fill this vacuum in the
literature by presenting three experiments examining whether people take account of
evidence strength, which permit more straightforward normative interpretation than
existing studies that draw on the general (and underspecified) concept of argument
strength.

48
Across the experiments drawing on highly contentious issues in American
politics—the Affordable Care Act, and the economic performance of the two major
parties— I find that people update their beliefs and attitudes in light of presented
arguments. According to the results, people do not mindlessly accept whatever arguments
they encounter, nor do they categorically reject uncongenial arguments. Instead, people
account for the (un)certainty of evidence as they form their posterior opinions, even when
it disconfirms their prior opinions. The patterns of belief and attitude changes imply that
people sensibly evaluate the diagnostic values of presented evidence in more or less the
same way across prior attitudes, partisan identity, and other individual traits. These
findings make a straightforward case for a Bayesian model of persuasion (specified
below), under which people revise their beliefs by calculating the probative values of new
information.
3.1 The Uncritical Public Hypothesis
Zaller’s (1992; 1996) RAS model provides a good starting point for the first
claim. His model aims to explain the nature and origins of mass opinion as a function of
elite discourse, and ideology while presuming no critical decision making on the part of
citizens. The patterns in public opinion depend on the two elite discourse variables—
relative balance between competing sides, and overall intensity of issue coverage—but
not on how citizens critically evaluate these messages. While he notes that better
informed citizens are more likely to resist incoming messages, even this is far from the

49
kind of critical reasoning that characterizes the democratic ideal in that these individuals
are not assumed to scrutinize the content of messages in doing so. As Zaller (1992, 45)
puts it, his “postulate makes no allowance for citizens to think, reason, or deliberate about
politics: If citizens are well informed, they react mechanically to political ideas on the
basis of external cues about their partisan implications, and if they are too poorly
informed to be aware of these cues, they tend to uncritically accept whatever ideas they
encounter.”
It is important to note that Zaller (1992, 3) does not provide a direct test of this
mechanical portrait of the populace. It is, rather, a simplifying assumption necessary for
“a unified theory of its major empirical regularities,” which after all proved useful. In his
famous analyses on Americans’ reactions to the Vietnam war, Zaller (1992; 1996) was
able to explain complicated shifts in mass opinion even though (or because) his model
did not take into account citizens’ ability to think for themselves. For instance, even in
the face of an extremely problematic situation in Vietnam in 1970, conservatives—
especially the informed ones—maintained their pro-war position, which, according to
Zaller (1996, 57-58), indicates that “independent thought among highly aware
conservatives—or, for that matter highly aware liberals—is entirely absent” (see also
Lenz 2012).
It is, however, difficult to know based on observational research (e.g., Lenz
2012; Zaller 1992) if citizens rely on party cues because they know little more than that,
or they instead do not reason using the substantive policy information they possess (see
Bullock 2011, 510-511). In fact, recent experimental studies that provide some detailed

50
facts about various political issues have documented information-based persuasion (e.g.,
Boudreau and MacKenzie 2014; Bullock 2011; Guess and Coppock 2015; Mérola and
Hitt 2016; but see also Broockman and Butler 2017). In particular, a series of
experiments by Chong, Druckman and their colleagues report that the strength of
arguments/frames drives policy opinions (e.g., Chong and Druckman 2007; 2010;
Druckman et al. 2013), even when participants are provided with party cues (Druckman
et al. 2013).35 In light of these findings, it may be tempting to draw the sanguine
conclusion that citizens are able to make competent decisions guided by the actual merits
of the arguments after all.
There is a major caveat though: the absence of a well-articulated definition of the
elements of strong arguments (see Chong and Druckman 2007, 652; Druckman et al.,
2013, 75). This is one of the longstanding difficulties in persuasion studies that has
hampered the systematic understanding of the relationship between specific message
variations and persuasion as well as the role of argument quality in persuasion in general
(Areni and Lutz 1988; O’keefe and Jackson 1995). As unsatisfactory as it might be,
argument quality has been defined in terms of perceived effectiveness, and
operationalized based on pretests identifying strong versus weak arguments (e.g., Chong
and Druckman 2007). The problem with this approach is that to derive a normative
implication from such a finding is to make the assumption that those who pretest the
arguments can (and do) evaluate them based on some normatively desirable standards
35 But the effect of argument strength disappears when participants are told that
Democratic and Republican politicians are polarized on the issue at hand (Druckman et
al. 2013).

51
(e.g., evidentiary certainty), which is the very thing one should to test in order to assess
the quality of political reasoning.
This issue is well understood and articulated by Chong and Druckman (2007,
652), who note: “strong frames that emerge from debate will reflect a political process in
which the persuasiveness of a claim depends on more than its validity or relation to
evidence. The elements of an argument that make it plausible or compelling seem to
reside as much in its source and the cultural values and symbols as in its causal logic.” To
the extent that these extraneous factors are not held constant in operationalization, it
opens up the possibility that the observed effect of argument strength is in fact
confounded with, for example, the effects of ideological differences across arguments.
Suppose, for example, that in an experiment, a “strong” argument that the ACA
will reduce the number of uninsured Americans was more persuasive than a “weak”
argument that the free market can handle various problems. A normatively pleasing
explanation may be that pre-testers successfully identified a better argument, which then
generated opinion change in the experiment. An alternative interpretation, however, is
that there is nothing inherently more valid about the pro-ACA argument, but that both
pre-testers and experiment participants favored it anyway, simply because it was more
consistent with their prior attitudes and values—a phenomenon called “biased
assimilation” (Lord et al., 1979), “prior attitude effect,” or “congruency bias” (Taber and
Lodge 2006) in the motivated reasoning literature.

52
3.2 The Motivated Public Hypothesis
In RAS, people rely on partisan cues simply because they are unable to think
critically (Zaller, 1992). According to the motivated reasoning theory, on the other hand,
they hold onto partisan viewpoints because they have motivations to do so. The
theoretical underpinnings of motivated reasoning are provided by Kunda (1990), who
notes that two general classes of motivations guide how people reason: (1) accuracy
goals, which lead people to consider a broad range of alternatives and carefully process
relevant information; and (2) directional goals, which is activated when people desire to
reach certain conclusions or defend their prior attitudes, usually leading to
disconfirmation of uncongenial information. While the reasoning strategies under the
accuracy motivations may be in much agreement with the democratic ideal (see
Druckman 2012), the defensive partisan motivations are assumed to be the general
default when it comes to political reasoning (Taber and Lodge 2006; 2012).
Classic evidence for the motivated reasoning hypothesis is found in the
experiment by Lord and his associates (1979), which documents that proponents of the
death penalty thought the studies showing pro-deterrent information were more
“convincing” and “well-done,” whereas opponents favored the studies demonstrating the
opposite, even though the quality of methodology was essentially the same (similar
findings are reported by Corner et al 2012; Lodge and Taber 2012; Miller et al. 1993;
Munro and Ditto 1997; Taber and Lodge 2006; Taber et al., 2009). And “biased

53
assimilation” of evidence is likely to lead to attitude polarization.36 “Such motivated
reasoning,” Taber et al. (2009, 138) argue, “is hard to square with normative standards
for belief updating, which require some independence of new evidence from priors.”
Unlike the Lord et al. (1979) study, the arguments used by Taber, Lodge and
colleagues are rhetorical points (recurrent pro and con frames in controversies on
affirmative action and gun control), rather than “hard” evidence regarding a particular
aspect of an issue. Albeit advantageous in external validity, this approach leaves open the
possibility that their findings simply reflect value differences instead of motivated biases
or irrationality. Indeed, for the findings of “prior attitude effect” or “polarization” to be
considered evidence of a bias or irrationality of any kind, one should rule out this
alternative explanation. As an example, suppose that Democrats care about reducing
disparities between rich and poor, and Republicans care about reducing the role of
government, and they are exposed to a pro-ACA argument that it can help those who
couldn’t afford a decent healthcare, and a con argument that the federal government will
impose more regulations under the ACA. It is not inconsistent with the democratic (or
Bayesian) standards when Democrats find the pro argument more convincing, whereas
Republicans favor the con. Nor is it problematic in any sense that they polarize after
receiving the two arguments. Their “fully informed” preferences of a public policy (per
Equation 2.1) can very well be divergent to the extent that Democrats and Republicans
use different evaluative criteria. So if they were in (some) agreement due to insufficient
36 Another component of motivated reasoning examined in Taber and Lodge (2006) is selective
exposure. This is not my focus here because I aim to examine how people use information after
exposure, not whether they receive it to begin with.

54
knowledge, it is expected that partisans who process the pro and con arguments in an
unbiased fashion move in the opposite directions.
Therefore, to the extent that values/frames are not held constant in research
design, the benchmark requiring evaluation and assimilation of new arguments to be
independent of priors are unduly restrictive. To uphold this requirement is to suggest
either that people with different prior attitudes and values should use the same evaluative
criteria, or that there are no value differences in the populace, both of which seem
untenable on normative as well as empirical grounds. In this regard, some of the most
widely cited evidence from the literature on motivated reasoning (e.g., Edwards and
Smith 1996; Taber and Lodge 2006; Taber et al., 2009) is not really a strong indictment
of the citizenry. It may as well be a testament to value diversity in the American public.
What about evidence that seems to rule out the possibility that apparent
“congruency biases” in argument assimilation simply reflect value differences? Most
notably, in the experiment by Lord et al. (1979), both sides of evidence presented to
participants address the same subtopic—deterrence effect—ensuring that the differential
evaluations of congenial versus uncongenial information is not driven by differences in
moral principles held by those who initially favor and oppose death penalty (for similar
results, see Houston and Fazio 1989; Munro and Ditto 1997; Schuette and Fazio 1995;
for a review of evidence from non-political issues see Kunda 1990). According to the
motivated reasoning literature, this evidence shows that “judgments about the validity,
reliability, relevance, and sometimes even the meaning proffered by evidence are biased”
(Lord et al. 1979, 2099).

55
But while the observed correlation between priors and evaluation of incoming
information would be a necessary condition for establishing people’s tendency to
selectively denigrate the diagnostic value of uncongenial information, it is not a sufficient
one. This is because people’s answers to the survey items probing the perceived
quality/strength of information (or arguments) can be causally posterior to their updated
conclusions. As an example consider a case of two unbiased Bayesians starting from
different priors. Gina thought there was an 80% chance that the ACA will successfully
“bend the cost curve.” Ian thought there was only a 10% chance. Assume that they both
received and understood the same piece of pro-ACA evidence, and also interpreted the
evidence in the same way; both thought the likelihood of observing that particular data
when the ACA actually controls cost is 2.25 times greater than when the opposite is true.
Following Bayes’ rule strictly, both revised their beliefs upward; Gina now thinks there is
a 90% chance, and Ian says 20%. However, when asked whether they found the evidence
“convincing,” they give conflicting responses, despite the fact that they are in full
agreement about the probative values of the evidence per se, because Ian, after all, was
not “convinced” (Gerber and Green 1999, 197-199).
Without making the implausible assumption that their responses to evidence
evaluation questionnaires—typically termed “convincing,” “persuasive,” “strong” and so
on—are strictly independent of the posteriors, the only condition under which Gina and
Hyoja will give the same answers to the survey items would be when they base their
conclusions entirely on the evidence and completely discard their prior knowledge.
Unless the evidence is indisputably clear, “openness” of this kind is an obvious violation

56
of Bayes’ Theorem. Arguably, this is even more problematic than biased assimilation,
because “[w]illingness to interpret new evidence in the light of past knowledge and
experience is essential for any organism to make sense of, and respond adaptively to its
environment” (Lord et al. 1979, 2107). This “bias” keeps people from being swayed by
highly implausible claims (e.g., conspiracy theories)—an exercise that is probably more
beneficial than harmful in general.
What is clearly not normative is to judge the plausibility of new information
based on one’s prior attitude and, as a result, push forward the very attitude that colored
the perception of new information (Gerber and Green 1999; Lord et al., 1979; Ross
2012). The evidence for polarization of this kind is mixed, however. While Lord et al.
(1979) found that participants strengthened their views after reading a set of mixed
evidence, it is important to note that they did not directly observe opinion change with
pre- and post-treatment measures, but instead relied on self-reported opinion change.
Subsequent research tapping actual (instead of self-assessed) opinion changes failed to
replicate Lord et al.’s (1979) findings on polarization (e.g., Guess and Coppock 2015;
Miller et al. 1993; Munro and Ditto 1997), although there are important exceptions (e.g.,
Nyhan and Reifler 2010). 37
37 Let me reiterate that unless values/frames of arguments are held constant, it does not
necessarily take defensive motivations for people with different political values to
polarize after receiving a balanced set of pro and con argument (e.g., Taber and Lodge
2006; Taber et al., 2009). In these studies, polarization per se is a poor indicator of
irrationality or partisan bias.

57
3.3 A (Restrictive) Bayesian Learning Model
In sum, the normative implications of the extant evidence on political
information processing are more ambiguous than is often assumed. This of course is not
to say that we have reason to believe that citizens meet any normative standard, but rather
that it is surprisingly difficult to draw any normative conclusion, the standard itself is a
moving target. In following section, I specify a restrictive Bayesian model that will be
used as a benchmark against which to judge the results of the experiments presented
below.
Suppose Gina, our Bayesian voter, receives an argument with some evidence
that the ACA will slow down cost growth. The model states:
𝑃(𝐻|𝐸) =𝑃(𝐸|𝐻) ∙ 𝑃(𝐻)
𝑃(𝐸) (3.1)
where H is a hypothesis about the Affordable Care Act (e.g., that the net benefit of the
law is greater than zero); E is evidence relevant to the hypothesis; 𝑃(𝐻) is Gina’s prior
probability that H is true, before observing E; 𝑃(𝐻|𝐸) is her posterior probability,
revised in light of E; and 𝑃(𝐸|𝐻)
𝑃(𝐸) is the likelihood function, representing her interpretation
of how the evidence bears on the hypothesis at hand. This term can be rewritten as:
𝑃(𝐸|𝐻)
𝑃(𝐸|𝐻) ∙ 𝑃(𝐻) + 𝑃(𝐸|~𝐻) ∙ 𝑃(~𝐻)

58
where 𝑃(𝐸|𝐻) is her belief about the likelihood of observing E when H was true, and
𝑃(𝐸|~𝐻) is the likelihood of observing E when the contrary was true.38 The ratio
between 𝑃(𝐸|𝐻) and 𝑃(𝐸|~𝐻)—the likelihood ratio—dictates in what direction, and
how much, Gina should update her belief about H after observing E. The likelihood ratio
of completely uninformative evidence will be 1, in which case, the posterior will be the
same as the prior. And the larger the difference the between the likelihoods, the more will
Gina’s posterior tend toward the evidence.
It is worth emphasizing that Bayes’ Theorem does not tell Gina how to construct
her likelihood function; it is up to her own judgments, which would reflect not only some
objective properties of E, but also her subjective evaluations of E. To be sure, if the
treatment of new evidence is left fully subjective (i.e., there is no constraints on the
acceptable treatment of new evidence) a Bayesian model becomes tautological because it
can account for any belief change (Taber et al. 2009). But then again, one should not
conflate subjectivity per se with bias. Although “[h]ow we determine the boundary line
between rational skepticism and irrational bias is a critical normative question, but one
that empirical research may not be able to address,” the fact remains that one somehow
should draw the line “to resolve the controversy over the rationality of motivated
reasoning” (Taber and Lodge 2006, 768). In order to make a Bayesian model falsifiable,
it is necessary to put constraints on likelihood functions based on the properties of E.
38 My discussion here focuses on a dichotomous parameter—the net effect of the ACA is
either positive (H) or negative (~H)—, this Bayesian framework can be extended to a
continuous parameter—the value of the net effect—using probability density functions.

59
In a recent study, Guess and Coppock (2015) address this dilemma by imposing
the restriction that the difference between the likelihoods, 𝑃(𝐸|𝐻) − 𝑃(𝐸|~𝐻), is
“correctly” signed, which does not allow people to have an extreme likelihood function
that would lead one to believe, for instance, that evidence of strong deterrent effects is
good news for the anti-death penalty position. I build on their research by introducing an
additional restriction that individuals’ likelihood functions are constrained not just by the
direction but also the strength of evidence. That is, Gina grasps the differences in the
diagnostic values of an event that is far more likely to occur when H is true than is not
(strong evidence), and an event that is slightly more likely to occur when H is true than is
not (weak evidence). More formally, it means Gina’s subjective likelihood ratios are
lined up such that 𝑃(𝐸𝑆𝑃|𝐻)
𝑃(𝐸𝑆𝑃|~𝐻)>
𝑃(𝐸𝑊𝑃|𝐻)
𝑃(𝐸𝑊𝑃|~𝐻), where 𝐸𝑆𝑃 and 𝐸𝑊𝑃 are strong and weak pro
evidence for H. Likewise, 𝑃(𝐸𝑆𝑐|~𝐻)
𝑃(𝐸𝑆𝑐|𝐻)>
𝑃(𝐸𝑊𝑐|~𝐻)
𝑃(𝐸𝑊𝑐|𝐻) where 𝐸𝑆𝐶 and 𝐸𝑊𝐶 are strong and weak
con evidence against H.
Imposing this restriction requires defining the objective elements of evidence that
would compel Gina toward the position it supports—i.e., what makes a piece of strong
evidence strong. I define these elements as the commonly held standards of statistical,
external, and construct validity, upon which social scientists readily draw to evaluate the
quality of research findings (e.g., Shadish et al. 2002). Accordingly, in the experiments
presented below, “strong” evidence describes, for instance, more sizeable effects of the
ACA on health care costs, based on more externally valid, and more relevant, data.
No one thinks that the average citizen is as skilled in making such assessments of
evidence as trained researchers (Niesbett and Ross 1980). But I would argue that people

60
routinely calculate the probative values of various kinds of information they encounter,
guided by common sense and logic, which allow them to notice the difference between
strong versus weak evidence. The theoretical expectation of the (restrictive) Bayesian
model specified here is that the following equation holds, regardless of prior attitudes:
𝑃(𝐻|𝐸𝑆𝐶) < 𝑃(𝐻|𝐸𝑊𝐶) < 𝑃(𝐻) < 𝑃(𝐻|𝐸𝑊𝑃) < 𝑃(𝐻|𝐸𝑆𝑃).
If, alternatively, people accept whatever arguments they encounter, without
accounting for the uncertainty of the evidence, one will find 𝑃(𝐻|𝐸𝑆𝐶) = 𝑃(𝐻|𝐸𝑊𝐶) <
𝑃(𝐻) < 𝑃(𝐻|𝐸𝑊𝑃) = 𝑃(𝐻|𝐸𝑆𝑃). If this holds true, political persuasion is possible, but
even to the point where politicians can get away with claiming whatever they want
citizens to believe. If people categorically reject counterevidence to defend their priors,
one will find P(𝐻|𝐸𝑆𝐶) = 𝑃(𝐻|𝐸𝑊𝐶) = 𝑃(𝐻) for proponents (or Democrats), and
P(𝐻) = 𝑃(𝐻|𝐸𝑊𝑃) = 𝑃(𝐻|𝐸𝑆𝑃) for opponents (or Republicans). If people backlash
against counterevidence, which is the most extreme form of motivated reasoning, one
will find P(𝐻|𝐸𝑆𝐶) > 𝑃(𝐻) and P(𝐻|𝐸𝑤𝐶) > 𝑃(𝐻) for supporters (or Democrats), and
P(𝐻|𝐸𝑆𝑃) < 𝑃(𝐻) and P(𝐻|𝐸𝑊𝑃) < 𝑃(𝐻) for opponents (or Republicans). If this holds
true, political persuasion would not be generally possible.
In what follows, I present three experiments that test these competing hypotheses.
To the extent that motivated reasoning overwhelms evidence-based opinion revision, “hot
button” issues should provide the hardest context under which to detect the effect of
evidence (Taber and Lodge 2006, 757). With that in mind, the experiments draw on two

61
of arguably the most contentious issues in American politics today—the Affordable Care
Act (Experiments 1 and 2), and the economic performance of the two major parties
(Experiment 3). The experiments examine how participants’ posterior beliefs and
attitudes vary in response to arguments coupled with varying degrees of evidence
certainty.
3.4 Experiment 1: A Pilot Test
The purpose of Experiment 1 was to pilot-test the materials—theoretical
explanations and factual evidence—that would then be used to construct the arguments
for Experiment 2. The dependent variable was people’s guesses about the ACA’s impact
on health care costs, conditional on a range of evidence that varies in position (good or
bad news for the ACA) and strength. These characteristics of presented evidence
constitute the key independent variables of Experiment 1. It thus represents a preliminary
test of how people would interpret the diagnostic values of various pieces of information,
and update their beliefs. The data were gathered from 246 participants recruited via
Amazon’s Mechanical Turk in March 2016. Each participant was paid $0.75.
Research Design
As noted earlier, it is important to hold “frames” constant to compare people’s
responses to political arguments against a normative standard. Among several economic
and social dimensions of the health care debate, I chose health care costs as the focus of

62
the Experiment 1 (and Experiment 2) because prior research shows it to be the most
prevalent frame in public discourse about this topic, and used in arguments made by both
sides (Druckman et al. 2012, 434). It also seemed plausible that both supporters and
opponents of the law would consider it an important evaluative criterion, unlike some of
the other considerations about the ACA (e.g., the government’s involvement in health
decisions).39 Throughout Experiments 1 and 2, “pro evidence” refers to the ones that
suggest the ACA is successfully “bending the cost curve”, and “con evidence” refers to
the ones that suggest the law makes health care even more expensive.
To maximize the realism of experimental stimuli, I draw on actual facts published
in research articles and reports (a full list of evidence and sources is offered in Appendix
B). I selected four “pairs” of pro evidence, and four “pairs” of con evidence, each pair
consisting of a strong version and a weak version. The strong versions are “quasi-
experimental” findings that describe (a) noticeable differences (b) at the national level (c)
in relevant statistical data. I created their weaker counterparts by manipulating some of
these dimensions—(a) smaller differences and/or (b) local level evidence, and/or (c)
arguably irrelevant statistics—as permitted by the information that I was able to find. I
also included six pieces of evidence—two strong and four weak (as judged by the same
criteria). In total, 22 pieces of evidence that vary in direction (11 pros and 11 cons) and
certainty (10 strong and 12 weak) were pre-tested. While I did not attempt to predict the
rank order of the likelihood ratios among all 22 pieces of information, I did expect that
39 This decision makes it easier to rule out value differences as a convincing explanation
for a partisan difference in treatment effects. But the tradeoff is that the lack of variation
in importance of the sub topic makes it difficult to detect its moderating effects.

63
evidence classified as strong ex ante would have higher likelihood ratios on average, in
people’s judgments. Testing this expectation was the point of Experiment 1.
The experiment was conducted as follows. After answering pre-treatment
questionnaires, participants read a message summarizing “health economists’ theory”
about the ACA’s impact on health care costs. Participants were randomly assigned to one
of two conditions. Half of the participants were told the ACA would slow down growth
in health care costs because Obamacare would solve the “adverse selection problem”
where those buying insurance were sicker than average (the pro condition). The other half
were told the ACA would accelerate cost growth because community rating would create
the adverse selection problem, where medical costs for healthy people would rise, leading
some of them to exit the insurance market (the con condition). Texts of the messages are
provided in Appendix B.
The dependent variable in this experiment is the conditional probability that the
ACA restrains (or drives up) health care costs, in light of each piece of evidence drawn
from the pool of information described above. Participants assigned a conditional
probability on a scale varying from “extremely low (5% chance)” to “extremely high
(95% chance),” given that a hypothetical new study found that “during the first two
quarters after the reform, premiums in the individual health insurance market increased
by 24.4% over what they would have been without Obamacare across all states.” This
task was repeated for the 22 facts in random order, making for a 2 (between-subject) by
22 (within-subject) factorial design.

64
Results
The mean difference between the two experimental groups represents the
conditional probability that the ACA controls cost growth given each piece of evidence
(scaled to vary between 0.05 to 0.95) minus the conditional probability the ACA drives
up costs given the same evidence. If a piece of information makes every respondent
believe that Obamacare will definitely bend the cost curve, the group difference given
this evidence would be 0.95-0.05=0.9. The main interest here is how this statistic varies
across the 22 pieces of evidence.
Figure 4: Conditional Probabilities Given Evidence
Note: OLS estimates. Horizontal lines are 95% confidence intervals. Standard errors are
clustered at the respondent level. “S” indicates “Strong.” “W” indicates “Weak.” “P”
indicates “Pro.” “C” indicates “Con.” Lower case letters in parentheses pair a piece of
strong evidence with its weaker version. For example, SP(a) and WP(a) are a pair.

65
Figure 4 reports the main results from regression models where conditional
probabilities were regressed on (1) experimental condition, (2) dummy variables
indicating each piece of evidence, and (3) the interactions between condition and the
dummies.40 To closely examine whether people interpret evidence differently across their
prior attitudes, I also present the model that draws on only opponents of the law (87
respondents) as well as the model drawing on only supporters (100 respondents). The
estimates are ordered on the vertical axis so that the evidence that drives conditional
probabilities to the pro-ACA direction the most is located on the top.
Several patterns stand out at a glance. First, the facts predetermined to be strong
pro evidence appear in the first five rows, and those predetermined to be strong con are
located at the bottom. This means that participants do take account of evidence strength,
and their interpretations are lined up as intended. Second, none of the evidence is
powerful enough to eliminate the gap between opponents and supporters. This indicates
people would reach different conclusions based on the same evidence. But more
importantly, there is a direct correspondence between how proponents’ conditional
probabilities vary across evidence, and how opponents’ vary. This means people starting
40 Across all experiments, I embedded a screener question right before the treatments take
place (Berinsky et al. 2014). In Experiment 1 participants were instructed to “ignore the
question and select the Drudge Report and none of the above as your two answers,"
before being asked to identify the news website they visit. 71.5% of participants correctly
marked the two options, whereas 15.5% marked only one of them—mostly failing to
notify the “none of the above” part of the instruction. I dropped the remaining 13%, who
would most likely add noise, and underweighted those who marked only one option
correctly by 0.5. The same approach was taken for Experiments 2 and 3 as well. The
results remain almost identical when low-attention participants are kept in the analyses
and given the same weight as high-attention participants. Also note that non U.S. citizens
were also excluded from all analyses.

66
from different priors are in good agreement with one another about the diagnostic values
(i.e., the likelihood ratios) of each piece of information. There is no clear indication that
they undervalue counterevidence. Overall, the results suggest that people match very
nicely to the restrictive Bayesian standards specified above.
Table 6: Conditional Probabilities Pooled by the Type of Given Evidence
(1) (2) (3) (4) (5) (6)
Subset All Opponent Supporter All Opponent Supporter
Strong Con -0.316 -0.563 -0.124 -0.327 -0.580 -0.127
(0.028) (0.034) (0.038) (0.029) (0.034) (0.039)
Weak Con -0.153 -0.404 0.058 -0.141 -0.396 0.081
(0.027) (0.035) (0.033) (0.027) (0.037) (0.033)
Weak Pro -0.047 -0.275 0.148 -0.024 -0.255 0.171
(0.025) (0.033) (0.032) (0.026) (0.036) (0.033)
Strong Pro 0.117 -0.103 0.313 0.139 -0.078 0.328
(0.029) (0.042) (0.038) (0.030) (0.045) (0.038)
F (3) 83.36* 50.42* 39.20* 81.96* 46.44* 38.38*
N (Evidence) 22 22 22 16 16 16
N (Respondent) 214 87 100 214 87 100
* p < 0.1 (two-tailed). OLS estimates with standard errors in parentheses. Entries are
marginal group differences, or the between the probability that the ACA controls cost
growth minus the probability that the ACA accelerates cost growth, by type of given
evidence. Standard errors are clustered at the respondent level.
In Table 6, I pool the results in Figure 4 by the four evidence types, and provide
F-statistics that test the null hypothesis that the differences in conditional probabilities do
not vary across the kind of given evidence.41 Column 1 draws on all participants, and
41 The estimates are based on OLS modes that regress the dependent variable on (1)
experimental condition, (2) three dummy variables indicating evidence type, and (3) the
interactions between condition and the dummies. The F-statistics test if the three
interaction terms are jointly zero—i.e., the group difference is constant across evidence
types.

67
Columns 2 and 3 subset the data by prior attitudes toward the ACA. As indicated by the
large F-values, the null hypothesis is easily rejected regardless of prior attitudes. Again,
while supporters and opponents never agree about the conditional probabilities, the
magnitudes of the within-subject differences across different types of evidence are very
similar (-0.103 + 0.563 = 0.460 for opponents; 0.313 + 0.124 = 0.447 for proponents).
I repeat similar analyses in Columns 4 to 6, but this time using the 8 pairs of
evidence that have a stronger/weaker counterpart (the ones with a lower case letter in
Figure 4). The results are virtually identical to the previous specification. To maximize
the comparability between the strong and weak arguments, only these 8 “pairs” of
evidence were used in Experiment 2.
3.5 Experiment 2: The Affordable Care Act
There are two important caveats to Experiment 1. First, participants did not
actually update their beliefs, unlike a typical experiment that tests the effects of a political
argument. Instead, they just indicated how they would assess the likelihood of the health
economists’ prediction being correct, “if and when” a hypothetical study presents a piece
of information as its finding. They might respond differently when the facts are presented
as actual findings from real data. In addition, there is an important distinction to make
between a belief about a specific consideration (cost) about the ACA, and overall
attitudes toward the law. As conventionally defined, the latter would be the weighted
average of multiple beliefs (Fishbein 1963). Even if strong counterevidence can change

68
people’s beliefs, it may ultimately fail to change attitudes, if people search their
memories to muster up reasons to draw the desired conclusion based on other beliefs
about the law (see Kunda 1990, 483). Experiment 2 addresses these concerns by having
participants read an argument coupled with the strong or weak evidence identified in
Experiment 1, and answer questions measuring beliefs and attitudes. The key dependent
variables are beliefs about the impacts of the ACA’s on health cost increases as well as
overall attitudes toward the law. The independent variable is exposure to one of four
arguments that differ in terms of position (pro versus con), and evidence strength.
Research Design
Experiment 2 was conducted in four waves. In the first wave, pre-treatment
covariates were measured, including the baseline values of the dependent variables, and
prior knowledge about the ACA.42 Survey responses were gathered from 2,029
participants recruited via Mechanical Turk in May 2016. Each participant was paid $0.35.
Following a week of “washout period,” 1,800 of the initial respondents were invited to
participate in the main experiment. Those who failed a screener question and non-U.S.
citizens were not invited. Among the invited respondents, 1,514 completed the second
wave. Initially, participants were paid $0.75 for Wave 2, though I increased the payment
amount to $1 and then to $1.5 to maximize the completion rate.
42 Some covariates were measured in the second wave. This decision was made based on
(1) whether answering the questions would plausibly affect how participants respond to
to the treatments, or (2) whether the treatments would plausibly affect the answers to the
questions.

69
Participants were randomly assigned to one of five conditions: strong con, weak
con, weak pro, strong pro, and placebo. Those assigned to one of the first four conditions
received an argument about the ACA’s impact on health costs, constructed from the
materials pre-tested in Experiment 1 (see Appendix C for the full texts of these
arguments). In these cases, the arguments began by stating “health experts have been
keeping close taps on how the law is changing America’s health care system.” In the con
conditions, the arguments went on to say “[D]espite some successes, Obamacare [the
ACA] is failing to address one of the most serious problems of America’s health care
system: the rising costs,” and then presented the health economists’ theoretical
explanation that was used in Experiment 1 as well. In the pro conditions, the messages
said “the ACA is successfully addressing the rising costs,” and then provided an
explanation. In all four cases, participants were told “now, there is mounting evidence
that that the health economists were right,” followed by four pieces of evidence pretested
in Experiment 1. In the strong pro condition, for example, participants were provided
with the following facts:
1. Confirming health economists’ key assumption about expanding the insurance
pool, an analysis by the Department of Health and Human Services indicates
that the uninsured rate for non-elderly adults has decreased by 43%, over the
two years after the reform.
2. According to a report by the Kaiser Family Foundation, the overall premium

70
for employer-sponsored health insurance rose by 3.8% each year since the
reform. By contrast, during the Bush years, premiums increased on average by
8.8 % each year.
3. According to the latest data released by the Centers for Medicaid and
Medicare Services, the annual growth in national out-of-pocket spending was
1.3% in 2014. Again this is lower than the annual growth rates under Bush
(5.6% on average).
4. Earlier this year, Kaiser Family Foundation released an analysis showing
premiums in the Obamacare Marketplaces decreased by 0.7% nationwide, after
accounting for tax credits. In comparison, the national individual health
insurance premium had increased by 10 to 12% per year before the reform,
according to an analysis by an MIT economist.
The arguments then concluded by emphasizing the importance of the “positive
[warning] signs.” Across these four conditions, the wordings were kept as close as
possible.43 In the placebo condition, participants read a message about the debt crisis in
Greece.44 The five messages were similar in length (between 416 to 462 words).
43 In each of the four treatment conditions, the law was referred to as “the Affordable
Care Act” (and then as “the ACA”) for half of participants, and as “Obamacare” for the
other half, by random assignments. I found no evidence that this wording choice altered
the treatment effects, so I pool them. 44 In Experiment 3, I added a control condition where participants did not read any

71
The second wave of Experiment 2 was conducted as follows. First, participants
answered general political knowledge questions,45 followed by a screener question.46. The
next step was the core part of this experiment. Participants were provided with one of the
five arguments to which they were randomly assigned, and asked to read the arguments
carefully.47 Then participants evaluated the strength of the argument and answered the
post-treatment measures of attitudes and belief about the law. Subsequently, participants
answered questions for potential moderators—e.g., need for cognition, demographic
characteristics, etc. Finally, they were asked to recall the contents of the argument.48
message to address the (unlikely) concern that the placebo had impacts on participants’
attitudes on American political issues. I found no evidence for this possibility. 45 General political knowledge questions were asked at the beginning as a “warm up”
exercise. I assumed that they are unlikely to have priming effects. 46 Similar to Experiment 1, participants were instructed to “ignore the question and select
the Drudge Report and the NPR website and none of the above as your three answers and
none of the above as your two answers," before being asked to identify the news website
they visit. 71.1% of participants correctly marked the two options, whereas 22.2%
marked only one or two of them—mostly failing to notify the “none of the above” part of
the instruction. I dropped the remaining 6.7%, who would most likely add noise, and
underweighted those who marked only one or two options correctly by 0.5. Appendix B
provides the results that treat low attention respondents in the same was high attention
respondents. The findings are virtually identical. 47 Participants were told that there would be recall questions toward the end of the survey.
The time that each participant spent on the message page was recorded. Its 99%-trimmed
mean was 143 seconds. The median was 113 seconds. Most participants (93.4 %) spent at
least 30 seconds reading the presented article. I did not drop those spent less time from
the analyses below, because doing so may compromise the comparability across
experimental conditions. 48 Two recall questions were used. The first one was choosing the factual evidence
included provided in the message one read. 78.9% of those in the treatment groups gave
correct answers. The second one was choosing the economic term that the argument used
to explain the health economists’ theory. 47.5% of the treated respondents correctly
identified “adverse selection,” 7.8% chose one of the incorrect answers, and the rest said
they were not sure.

72
Those who took part in the main experiment were invited to take two follow-up
surveys. Wave 3 was launched about 80 days after Wave 2 (between late July and early
August) in order to assess the longevity of the treatment effects. Wave 3 was completed
by 899 participants. In the wake of the widely-covered story of premium increases that
broke in late October, I re-contacted the participants to examine if (1) they received this
information, and if (2) they changed their beliefs as a result.49 According to my
classification, this story provides a piece of “strong con” evidence. The final survey was
completed by 850 participants.
Measurement
Table 7: Measurement of Beliefs and Attitudes about the ACA Belief in cost saving effect (Cronbach’s alpha = 0.83; scaled 0-1, with 1 indicating the pro-ACA side)
1. In terms of health care costs, the reform law is changing the American health care system... (for the better/worse)
2. The probability that the law slows down growth in health care costs over the next ten years is...(high/low)
3. The probability that the law accelerates growth in health care costs over the next ten years is... (high/low)
Attitudes toward ACA (Cronbach’s alpha = 0.96; scaled to 0-1, with 1 indicating the pro-ACA side)
1. Do you support or oppose the health care reform law passed in 2010?
2. Would you vote to repeal the health care reform law, if you were in Congress today?
3. The health care reform law is changing the American health care system... (for the better/worse)
4. The overall impacts of the health care reform law on the American people will be...(good/bad)
5. The overall impacts of the health care reform law on you and your family will be... (good/bad)
The key dependent variables are (1) belief in the ACA’s impact on health costs,
and (2) attitudes toward the ACA. Appendix C reports additional analyses focusing on
other dependent variables such as the intention to vote Democratic, support for President
49 The story broke on October 24th, 2016, and survey responses were collected between
October 26th and November 3rd (but mostly in the first three days).

73
Obama, and so on. All dependent variables were coded so that higher values indicate the
pro-ACA (and the Democratic) side. Table 7 lists the survey items used to measure
beliefs and attitudes. See Appendix C for survey wordings and more information about
measurements of other variables.
Results
The (immediate) treatment effects were estimated using the following regression
model:
𝑌𝑖 = 𝛽0 + 𝛽1𝑆𝐶𝑖 + 𝛽2𝑊𝐶𝑖 + 𝛽3𝑊𝑃𝑖 + 𝛽4𝑆𝑃𝑖 + 휀𝑖 (3.2)
where 𝑌𝑖 is the dependent variable, and 𝑆𝐶𝑖, 𝑊𝐶𝑖, 𝑊𝑃𝑖 , 𝑆𝑃𝑖 are dummy variables marking
the four treatment conditions to which participant i was assigned—e.g., SC indicates the
strong con condition—, 𝛽0 is the control group mean, and 𝛽1 to 𝛽4 are the treatment
parameters, and 휀𝑖 is an error term. To minimize error variance, and thus improve
statistical precisions, I estimate the model with a set of pre-treatment covariates that are
thought to be highly predictive of the dependent variables, including their lagged
values.50 Reported from here on out are all covariate-adjusted estimates. Participants
exhibiting low attention were underweighted.
50 When estimated without covariates, the point estimates are very similar, though
standard errors are larger. For the results without pre-treatment covariates and additional
robustness checks see Appendix C.

74
The expectation under the (restrictive) Bayesian model is 𝛽1 < 𝛽2 < 0 < 𝛽3 < 𝛽4
across priors. This model will be rejected if either of the skeptics’ hypotheses hold.
Specifically, one will have strong evidence against the Bayesian model in favor of the
uncritical public hypothesis when one finds 𝛽1 = 𝛽2 < 0 < 𝛽3 = 𝛽4. One will have
strong evidence for the motivated reasoning hypothesis if 𝛽1 = 𝛽2 = 0 for proponents (or
Democrats), and 𝛽3 = 𝛽4 = 0 for opponents (or Republicans).51 If there is a backfire
effect, one will find 𝛽1 > 0 and 𝛽2 > 0 for supporters (or Democrats), and 𝛽3 < 0 and
𝛽4 < 0 for opponents (or Republicans).
Table 8 reports Experiment 2’s main results (see Panel A). The first three columns
demonstrate the treatment effects on belief in the ACA’s cost saving effect. Column 1 for
all participants, and Columns 2 and 3 for opponents and supporters respectively. The
results are remarkably consistent with the Bayesian model. The average effect of the
strong con message is a 13.0 percentage point decrease. The weak con message’s effect is
-9.2 percentage points. The pro-ACA argument coupled with weak evidence increase
people’s belief in the ACA’s cost preserving effect by 8.4 percentage points, and the
strong pro evidence raises the effect to 12.6 percentage points. The estimate of 𝛽2 is
significantly higher than 𝛽1 (p < 0.01); 𝛽3 is significantly higher than 𝛽2 (p < 0.001); and
𝛽4 is significantly higher than 𝛽3 (p < 0.01). To put the sizes of these effects in context,
the gap between the strong con evidence condition and the strong pro evidence condition
51 I subset the data by prior attitudes toward the ACA in the analyses presented below.
Similar analyses subsetting the data by partisan identity is provided in Appendix C. I
reach the same general conclusion using this alternative specification.

75
(𝛽4 − 𝛽1 = 0.130 + 0.126 = 0.256) is comparable to the average difference between
Democrats and Republicans at the baseline (0.256).
Table 8: Treatment Effects on ACA Opinions (Experiment 2)
(1) (2) (3) (4) (5) (6)
DV Belief in Cost Saving Effect Attitudes toward ACA
Subset All Opponent Supporter All Opponent Supporter
Panel A
Strong Con (𝛽1) -0.130* -0.089* -0.156* -0.082* -0.030* -0.109*
(0.014) (0.024) (0.017) (0.011) (0.017) (0.015)
Weak Con (𝛽2) -0.092* -0.061* -0.105* -0.038* -0.029* -0.041*
(0.014) (0.025) (0.016) (0.010) (0.015) (0.013)
Weak Pro (𝛽3) 0.084* 0.088* 0.082* 0.035* 0.072* 0.013
(0.014) (0.024) (0.016) (0.010) (0.018) (0.012)
Strong Pro (𝛽4) 0.126* 0.137* 0.119* 0.060* 0.101* 0.032*
(0.014) (0.025) (0.017) (0.011) (0.019) (0.012)
AIC -1077 -301 -786 -1711 -586 -1119
Panel B
Linear Slope 0.275* 0.242* 0.295* 0.143* 0.147* 0.135*
(0.013) (0.023) (0.015) (0.011) (0.018) (0.013)
AIC -1073 -304 -783 -1715 -584 -1111
Covariates Yes Yes Yes Yes Yes Yes
N 1412 563 829 1412 563 829
* p < 0.1 (two-tailed). OLS estimates with robust standard errors in parentheses.
Covariates include the lagged values of the dependent variables, party ID, evaluations of
Obama (overall and healthcare), and vote choice. Low attention participants are
underweighted. The coefficients on the intercepts and the covariates are not shown. See
Appendix C.3 for the full reports.
In columns 2 and 3, I demonstrate that the treatment effects are fairly consistent
across prior attitudes. While the overall differences across experimental conditions are
somewhat larger for proponents, this heterogeneity is small considering the overall effect
sizes. Presumably, it reflects a floor effect for opponents, whose baseline belief in ACA’s
cost saving effect is lower (0.309) than proponents’ belief is high (0.584), as measured by

76
the control group’s means. Another noticeable difference is that con arguments produce
larger changes for proponents, and pro arguments produce larger changes for opponents,
again probably reflecting ceiling and floor effects. Importantly, to the extent there is
difference in the treatment effects, it is in the opposite direction of what should have
happened had people been motivated to eschew counterevidence. Indeed, the
heterogeneous treatment effects reduce the pre-existing belief gap.52
In Columns 4 to 6, I show that the treatments shifted people’s attitudes toward the
ACA (scaled 0-1, with 1 indicating most favorable attitudes) in a manner consistent with
the Bayesian model. In particular, the strong pro argument increases support for the law
by 6.0 percentage points on average, doing so by 10.1 points for opponents and by 3.0
percentage points for proponents. This means that the argument decreases the pre-
existing difference by 7.1 percentage points. The strong con argument also undercuts
support for the law by 8.0 percentage points on average, and by 10.9 points for
supporters. The effects on this dependent variable are not as large as the effects on belief
about costs. Conceiving an attitude as the summary of various beliefs (Fishbein 1963; see
also Zaller 1992), this is not surprising; health costs would be one of many things people
consider as they form their opinion about the law.
52 In Appendix C, I show that even those who exhibited strong attitudes toward the ACA
at the baseline survey are influenced in a similar way. They, too, adjusted their beliefs and
attitudes in response to counter arguments. I also show in the appendix that the treatment
effects are similar for those who supported different presidential candidates in the 2016
election cycle (e.g., Clinton versus Trump).

77
Figure 5: Adjusted Means across Experimental Conditions
Note: OLS estimates based on Table 8. Vertical lines are 95% confidence intervals.
Estimates are adjusted for pretreatment covariates including the lagged values of the
dependent variables, party ID, evaluations of Obama (overall and healthcare), and vote
choice. Low attention participants are underweighted. Unadjusted means are similar,
though confidence intervals wider.
Figure 5 summarizes the results by presenting the adjusted group means across
the experimental conditions. As can be seen at a glance, the treatments shifted people’s
beliefs and attitudes in a more or less linear fashion. This means that a single coefficient
of the “linear slope” may summarize the results more efficiently with greater statistical
power, though doing so involves restricting a change from each condition to the next

78
(e.g., strong con from weak con) to be the same across the spectrum. Panel B of Table 8
provides the estimates of these “slopes.”53 The overall treatment effects are estimated to
be between 24.2 to 29.5 percentage points on belief changes, and between 13.5 to 14.7
points on attitude changes.
By and large, the patterns shown above are consistent with what would happen
when people have similar ideas about the certainty of evidence—i.e., the likelihoods of
observing the “data” under the competing hypotheses about the ACA’s effects on health
care costs—regardless of their priors. This apparently goes against the general findings of
the motivated reasoning literature that people’s interpretation of new information is
colored by their prior attitudes. As I have argued, the previous findings of “biased
assimilation”—i.e., correlations between prior attitudes and argument evaluations—can
reflect the remaining disagreements between people starting from different priors, instead
of their tendency to discount counterevidence—i.e., biased likelihood functions. The fact
that people unfavorably evaluated arguments that challenged their prior attitudes in
ostensible perceived argument strength measures does not necessarily mean that people
refuse to recognize the “force” of counterevidence.
To make this point more precise, I calculated the likelihood ratios that correspond
to the average belief changes summarized in the left panel of Figure 5—i.e., “the force of
an argument, namely its general capacity of changing degrees of beliefs” (Hahn and
Oaksford 2007, 710). The likelihood ratio of a pro argument is: 𝐿𝑅𝑝𝑟𝑜 =𝑃 (𝐸𝑝𝑟𝑜|𝐻)
𝑃 (𝐸𝑝𝑟𝑜|~𝐻)=
53 Experimental conditions were coded as a continuous variable running from 0 (strong
con) to 0.25 (weak con), 0.5 (placebo), 0.75 (weak pro), and to 1 (strong pro).

79
𝑃 (𝐻|𝐸𝑝𝑟𝑜)
𝑃 (~𝐻|𝐸𝑝𝑟𝑜)∙
𝑃 (~𝐻)
𝑃 (𝐻), where H is the hypothesis that the ACA slows down cost growth, and
~H is the contrary hypothesis. The likelihood ratio of a con argument is: 𝐿𝑅𝑐𝑜𝑛 =
𝑃 (𝐸𝑐𝑜𝑛|~𝐻)
𝑃 (𝐸𝑐𝑜𝑛|𝐻)=
𝑃 (~𝐻|𝐸𝑐𝑜𝑛)
𝑃 (𝐻|𝐸𝑐𝑜𝑛)∙
𝑃 (𝐻)
𝑃 (~𝐻). Defining the average respondent’s prior as the control
group’s mean belief in H and her posterior given each argument as the treatment groups’
mean beliefs in H, the estimated value of the average respondent’s prior belief in H
would be 𝛽0̂ = 0.47 and posterior belief given the strong pro argument would be
𝛽0 + 𝛽4̂ = 0.60.54 The corresponding likelihood ratio is 𝐿𝑅𝑝𝑟𝑜 =
0.60
(1−0.60)∙
(1−0.47)
0.47≈
1.66; that is, a change from 0.47 and 0.60 is what would happen if one interprets that the
events described in the strong pro argument are 1.66 times more likely if H was true, than
if it was false (under Bayes’ theorem). This framework was used to calculate the
likelihood ratios of the four types of argument, as judged in the eyes of the average
opponent and supporter of the law. Figure 6 provides the point estimates and 95%
confidence intervals, obtained via bootstrapping.
The figure shows that the likelihood ratios—i.e., “the force of an argument” (see
Hahn and Oaksford 2007, 710)—differ significantly by argument type, but little by prior
attitudes. The results suggest that people assigned higher diagnostic values to the
arguments with stronger evidence (1.66 to 1.88) than weaker evidence (1.40 to 1.50). The
figure also suggests that the likelihood ratios assigned by the average opponent and
supporter are more or less the same across the four types of argument (all p >.10).55 If
54 I take these values as probability statements. That is, a respondent who scored 0.60 in
the belief scale is taken to have given a 60% chance that the ACA controls costs. 55 P-values are calculated via bootstrapping.

80
anything, the likelihood ratios associated with uncongenial arguments are higher than
congenial arguments.
Figure 6: Likelihood Ratios Corresponding to the Average Treatment Effects
Note. The estimates are calculated based on the group means shown in the left panel of
Figure 5. Vertical lines are 95% confidence intervals.
In contrast, people’s stated evaluations of arguments are correlated positively and
substantially with prior attitudes for both proponents and opponents, as shown in Figure
7.56 The discrepancy between Figures 6 and 7 underscores the need to differentiate
between people’s responses to the conventional measures of perceived argument strength
56 See Appendix C for more information about the measurement of perceived argument
strength, as well as the regression models, from which the figure is drawn.

81
and their actual interpretation of how probative the given evidence is—i.e., likelihood
functions. As long as people have similar likelihood functions, no matter how they
ostensibly evaluate the arguments, Bayes’ theorem predicts people’s beliefs will
eventually converge to the available evidence as the clarity and amount of (received)
information increases (see Tetlock 2005, 310 for an example of a formal demonstration
of the latter point).
Figure 7: Perceived Argument Strength by Argument Type and Prior Attitudes
Note: Based on regression estimates reported in Appendix C. Dots are marginal means,
adjusted for pretreatment covariates including lagged values of the dependent variables,
party ID, evaluations of Obama (overall and healthcare), and vote choice. Vertical lines
are 95% confidence intervals.

82
I have looked closely at the potential difference in treatment effects by prior
attitudes (and by party ID in Appendix C). Now I examine treatment effect heterogeneity
by other respondent characteristics. These factors include several direct and indirect
indicators of the importance of health care (costs), political knowledge, need for
cognition, and demographics. This exercise serves two purposes. From an empirical
standpoint, it allows me to examine the generalizability of the findings of the current
experiment that draws on a convenience sample from Mechanical Turk. Compared to the
general U.S population, MTurk respondents are known to be more Democratic and
liberal, more politically informed, high on need for cognition, less wealthy, younger,
more educated and so on (Berinsky et al. 2012). In the presence of substantial treatment
effect heterogeneity along these factors, one should be wary of the possibility that the
impacts of the arguments are overstated (or understated for that matter) here, due to the
peculiar sample attributes.
Exploring moderating effects can also have theoretical implications, because the
hypotheses discussed above can be extended to specify the boundary conditions under
which new information does (and does not) make an impact. For example, issues deemed
personally important can trigger defensive reactions, thereby attenuating the treatment
effects, according to the motivated reasoning hypothesis (see Leeper 2014). In contrast,
under the Bayesian framework, incoming information will be weighted more heavily
when it is personally relevant than when it is not, even if it is not consistent with one’s
prior beliefs.57 Since I have been examining the effects of four types of arguments on two
57 This is because people are expected to construct less discriminant likelihood functions

83
outcome variables, introducing 14 moderating variables means that there are 4×2×14 =
112 interaction terms to estimate and interpret. To reduce the complexity, I focus on the
differences in the “linear slopes” instead. I estimate 28 regression models that allow the
slopes to vary by each individual trait, by interacting it with experimental conditions
(operationalized as a continuous variable), and pre-treat covariates. Table 9 summarizes
the results.
As shown in Column 1, the treatment effects on the belief in ACA’s effect on cost
growth are highly consistent across a variety of individual factors. Some “significant”
differences do appear, but they are fairly small in substantive terms, and mostly fail to
survive the Holm correction for multiple (14) comparisons. Given this consistency, it
appears highly implausible that the treatment effects on beliefs would completely
disappear or even flip signs when examined with a different sample that is more
representative of the U.S. population.
Even if an argument creates similar changes in the beliefs about an objective
attribute of a policy—whether it raises health care costs—its impact on overall attitudes
can vary across individual differences in evaluative criteria. In the second column, I
report more noticeable interaction effects on attitudes toward the ACA. Six out of the 14
variables moderate the treatment effects at the p < 0.1 level, three of which remain
statistically significant even after correcting for multiple comparisons. Interestingly, I
(i.e., likelihood ratio close to 1) when the presented information is not relevant to their
concerns. For example, someone who does not care at all health care costs but cares
deeply about something else (e.g., the size of the federal government) is less likely to be
influenced by the arguments, even if the evidence is strong, compared to someone for
whom the rising costs are of greater concern.

84
Table 9: Heterogeneous Treatment Effects by 14 Individual Traits (Experiment 2) (1) (2)
Moderating Variables Beliefs Attitudes N
1 ACA Opponent 0.242* (0.023) 0.147* (0.018) 563
ACA Supporter 0.295* (0.015) 0.135* (0.014) 892
Difference in Treatment Effect 0.053* (0.028) -0.012 (0.023)
2 Republican 0.216* (0.025) 0.121* (0.020) 396
Democrat 0.300* (0.016) 0.148* (0.014) 842
Difference in Treatment Effect 0.084** (0.030) 0.027 (0.025)
3 Cost Importance < 1 0.280* (0.013) 0.136* (0.012) 1120
Cost Importance = 1 (Highest) 0.273* (0.036) 0.176* (0.027) 292
Difference in Treatment Effect -0.007 (0.038) 0.040 (0.030)
4 Healthcare Importance Low-mid 0.275* (0.018) 0.136* (0.015) 769
Healthcare Importance High 0.279* (0.019) 0.156* (0.017) 643
Difference in Treatment Effect 0.004 (0.026) 0.020 (0.022)
5 No Problems with Medical Bills 0.273* (0.017) 0.116* (0.015) 795
Had Problems with Medical Bills 0.272* (0.020) 0.177* (0.016) 617
Difference in Treatment Effect -0.001 (0.026) 0.061** (0.022)
6 Insured 0.289* (0.014) 0.143* (0.012) 1187
Uninsured 0.180* (0.037) 0.149* (0.033) 207
Difference in Treatment Effect -0.109* (0.040) 0.007 (0.035)
7 Middle or Upper Class 0.267* (0.017) 0.117* (0.014) 886
Working or Poor Class 0.291* (0.020) 0.182* (0.017) 621
Difference in Treatment Effect 0.024 (0.026) 0.065** (0.022)
8 Income ≥ $50,000 0.302* (0.018) 0.119* (0.015) 694
Income < $50,000 0.254* (0.018) 0.169* (0.016) 718
Difference in Treatment Effect -0.048* (0.026) 0.050* (0.022)
9 High Political Knowledge 0.274* (0.019) 0.105* (0.015) 664
Low Political Knowledge 0.275* (0.018) 0.175* (0.016) 748
Difference in Treatment Effect 0.002 (0.026) 0.070** (0.022)
10 High Need for Cognition 0.280* (0.019) 0.121* (0.015) 682
Low Need for Cognition 0.265* (0.017) 0.163* (0.016) 730
Difference in Treatment Effect -0.015 (0.026) 0.042* (0.022)
11 4 Year College or higher 0.293* (0.017) 0.120* (0.014) 751
2 Year College or lower 0.255* (0.020) 0.166* (0.017) 661
Difference in Treatment Effect -0.038 (0.026) 0.046* (0.022)
12 Age ≥ 35 0.267* (0.019) 0.133* (0.016) 604
Age < 35 0.279* (0.018) 0.148* (0.015) 808
Difference in Treatment Effect 0.012 (0.026) 0.015 (0.022)
13 Male 0.278* (0.018) 0.135* (0.015) 696
Female 0.274* (0.019) 0.153* (0.015) 716
Difference in Treatment Effect -0.005 (0.026) 0.018 (0.022)
14 White 0.271* (0.015) 0.141* (0.013) 1066
Non-White 0.287* (0.025) 0.153* (0.022) 346
Difference in Treatment Effect 0.016 (0.029) 0.013 (0.026)
Covariates Yes Yes
Moderator ×Covariates Yes Yes
* p < 0.1 (No correction). ** p <0.1 (Holm corrections for 14 comparisons; reported for
the interaction terms only). OLS estimates with robust standard errors in parentheses. The
set of covariates is the same as Table 8.

85
find that the effects are more pronounced for those who have had problems with medical
bills (by 6.1 percentage points), and those who identify themselves as the working/poor
class (by 6.5 points)—for whom, presumably, the rising costs would be of greater
importance. Personal relevance appears to lead people to give more relative weights to
incoming information than prior—a finding that is compatible with the Bayesian model,
but not with the motivated reasoning theory.58 Nevertheless, even these differences are
not big enough to make the treatment effects disappear for certain individuals. Across all
subsets of the sample, the treatment effects on attitudes are in the double digits, again
demonstrating a great deal of treatment effect homogeneity.
Longevity of Treatment Effects
Having documented immediate treatment effects, I now examine whether they
persist for an extended period of time. Figure 8 reports the overall treatment effects (i.e.,
linear slopes) as measured about 80 days Wave 3), and 160 days after the main
experiment (Wave 4). The effects did remain observable even a couple of months later,
but decayed in the long run. On average, the overall effects on beliefs about health costs
had diminished to about one-fourth of the original estimates (0.064/0.275) by the third
wave (though remaining statistically significant at p < 0.001), and to less than one-tenth
by the final survey (p = 0.301). As for attitudes toward the law, the treatment effects had
disappeared entirely by Wave 3 and remained so until Wave 4. Perhaps the eventual
58 As is often the case, a strong causal interpretation of the interaction effects is not
warranted, because they may reflect spurious correlations.

86
decay in the treatment effects is not surprising because, as shown in third panel of the
figure, most respondents in the treatment groups were (understandably) not able to recall
whether the message argued that Obamacare will increase/decrease healthcare costs in the
follow-ups.
Figure 8: Long-Run Effects on ACA Opinions (Experiment 2)
Note: Based on regression estimates reported in Table A21 in Appendix C. Dots are
overall treatment effects, adjusted for pretreatment covariates including baseline values of
the dependent variables, party ID, evaluations of Obama (overall and healthcare), and
vote choice. Vertical lines are 95% confidence intervals.

87
3.6 Observational Replication of the ACA Experiment
The main experiment is designed to measure the effects of new information in a
closely controlled setting. While it allows for a strong causal inference, it may be
questionable as to how far the findings can be generalized to how people update their
political opinions in light of new information in other contexts (see Shadish et al. 2002,
Chap. 3). First, people may have paid unusually high attention to the messages because
they were informed that recall questions would follow. Second, the estimates reported
above may be specific to the particular characteristics of the experimental stimuli; for
example, the effects might have been smaller, had the messages been less civil and/or
more partisan. Third, participants may have guessed the purpose of the experiment, and
tried to give responses that would confirm the hypothesis.
Wave 4 of the ACA study, which was fielded two days after news broke that
ACA premiums are increasing by 22% in 2017, provides an excellent opportunity to
addresses these concerns and strengthen the external validity of this research by shedding
light on how people respond to new information received in a non-artificial “real world”
setting. To do so, I asked participants if they heard or seen any news about health
insurance rates in 2017 over the past few days,59 and compared those who did and did not
receive the information. Admittedly, this particular analysis is not experimental, and thus
requires an identifying assumption. To identify the effect of the new information, I
59 56.5% responded yes, and most of them (98.1%) correctly indicated that the news reports
suggest premiums will increase next year.

88
regressed the dummy variable indicating whether one received the news, the lagged
dependent variables measured in the prior three waves, as well as other political variables
highly predictive of ACA beliefs and attitudes (e.g., PID).60 The identifying assumption
was that those who had the same opinions at prior waves would have had the same
opinions in the absence of exposure to the premium increase story (Angrist and Pischke
2009, 244). Consistent with this assumption, the exposed and unexposed groups did not
differ significantly in their attitudes and beliefs measured in Wave 3, conditional on
Wave 1 and Wave 2 covariates. Likewise, their Wave 2 opinions were statistically
indistinguishable, conditional on Wave 1 covariates.
Figure 9: Effects of Exposure to the Coverage of 2017 ACA Premium Increases
Note. Based on regression estimates reported in Table A22 in Appendix C. Dots are the
effects of exposure to the premium increase story. Vertical lines are 95% confidence
intervals. “Oppnnts” stands for “Opponents.” “Spprtrs” stands for “Supporters.” All
estimates are adjusted for pre-treatment covariates including lagged dependent variables.
60 Appendix B reports similar findings using a specification that controls only for lagged
dependent variable at Wave 3. It also reports consistent negative effects when the respondents are
subset by party ID instead of prior ACA attitudes.

89
As shown in Figure 9, receiving the news appears to have lowered people’s belief
in ACA’s cost saving effect by 3.6 percentage points, and overall support for the law by
2.4 points on average. Importantly, the results show that supporters of the law (and
Democrats) moved in the negative direction upon exposure to the unwelcoming
information, instead of ignoring it outright or backlashing. Again, this is consistent with
the findings of the main experiment, and not with the motivated reasoning hypothesis.
3.7 Experiment 3: The Economy
While the Affordable Care Act is obviously one of the most polarized political
issues of the day, one may point out that the law is only two years old. Few people know
about the provisions of the law in detail, and fewer still have a comprehensive knowledge
of the tangible changes that the law has introduced to the American health care system,
which might have attenuated the effects of motivated bias (Taber and Lodge 2006).
Experiment 3 replicates the main results of Experiment 2, focusing on another
contentious, but much older, issue in American politics—which party is strongest at
improving the nation’s economic performance.
Research Design
Unlike Experiment 2, all pre-treatment covariates were measured within the same
wave as the treatment. Twelve hundred (1200) respondents were recruited via
Mechanical Turk and completed the survey in April 2016. Each participant was paid

90
$1.25. Participants were randomly assigned to one of six conditions: strong income
evidence, weak income evidence, strong GDP evidence, weak GDP evidence, placebo,
and control.
Figure 10: Charts in the Strong (Left) vs. Weak (Right) Conditions
Note: Modified replications of Blinder and Watson (2016).
The evidence presented to the first experimental group (strong income growth
evidence) is a slightly modified replication of Bartels’ analysis (2008), which shows that
incomes grew generally faster under Democratic Presidents than Republican ones,
especially for the working class.61 To create its weaker counterpart (the second treatment
61 I also acknowledge that parts of the arguments used in the experiment are taken
directly from Bartels’ (2012) article, published on Salon.com.
0% 2% 4% 6%
Obama 2
Obama 1
G.W.Bush 2
G.W.Bush 1
Clinton 2
Clinton 1
G.W.H.Bush
Reagan 2
Reagan 1
Carter
Nixon-Ford
Nixon
Johnson
Kennedy-Johnson
Eisenhower 2
Eisenhower 1
Truman 2
Republican Avg
Democratic Avg
Strong GDP Growth Evidence
0% 2% 4% 6%
Obama 2
Obama 1
G.W.Bush 2
G.W.Bush 1
Clinton 2
Clinton 1
G.W.H.Bush
Reagan 2
Reagan 1
Carter
Nixon-Ford
Nixon
Johnson
Kennedy-Johnson
Eisenhower 2
Eisenhower 1
Truman 2
Republican Avg
Democratic Avg
Weak GDP Growth Evidence

91
group), I unfaithfully replicated Bartels’ (2008) findings, searching for a specification
that makes the partisan performance gaps appear much smaller, though not completely
absent. I took the same approach for the third and fourth treatment groups (strong and
weak GDP growth evidence groups), based on a study by Blinder and Watson (2016),
which shows that GDP grew much faster under Democratic Presidents than Republican
ones. Each argument contained a chart that summarizes mean differences. Figure 10
provides the examples from the third (strong GDP evidence) and fourth (weak GDP
evidence) conditions. Appendix C provides more information about these “replications.”
Those assigned to one of the first four conditions then received an argument about
the historic differences in economic performance under Democratic and Republican
Presidents since the 1950s. The first two focused on income growth, and the other two
focused on GDP growth. The arguments all claimed that Democratic Presidents
historically handled the economy better than Republican Presidents.62 All facts presented
in these conditions are generated based on my calculations, using the official data sources
cited in the messages; the U.S. Census Bureau in the first two and the National Bureau of
Economic Research in the other two.
By analyzing the income data and GDP data firsthand, I was able to calculate the
p-values, and incorporate that information in manipulating the uncertainty of the
evidence. For example, those assigned to the strong income evidence condition were told
“a regression analysis (a standard statistical technique) indicates that there is about a 1 in
1000 chance that a difference like this would pop up, simply because Democrats got
62 In other words, there was no pro-Republican argument in this experiment.

92
lucky, when there’s nothing inherently better about their policies.” Those in the
corresponding weak condition were told “there is less than a 3 in 7 chance.” In Bayesian
terms, these quantities represent the probabilities of observing the data under the null
hypothesis, or P (E|~H), which comprise the denominators of the likelihood ratios. All of
the four arguments concluded by suggesting that past performance provides important
information about the future as well. The placebo group read a message about debt crisis
in Greece, which also included a chart. The control group did not read any argument. The
full texts can be found in Appendix C.
Experiment 3 was conducted as follows. The experiment began with questions
measuring various pre-treatment covariates, including prior retrospective evaluations of
the two major parties, followed by a screener question. Then, those assigned to the
treatment and the placebo conditions were provided with one of the five messages. After
reading the messages, these participants were asked to evaluate the argument.63 Those in
the control group skipped these steps. Then all participants answered questions measuring
the dependent variable—their retrospective and prospective economic evaluations of the
major parties. Finally, they were asked to recall the contents of the argument.64
63 The time that each participant spent on the message page was recorded. Its 99%-
trimmed mean was 145 seconds. The median was 113 seconds. Most participants
(89.7 %) spent at least 30 seconds reading the presented article. I did not drop those spent
less time from the analyses below, because doing so might compromise the comparability
across experimental conditions. 64 Two recall questions were used. The first one asked respondents to choose the main
claim of the message. 78.7% of those in the treatment groups gave correct answers. The
second one involved choosing the chart they saw in the message. 80.8% of the treated
respondents correctly identified the chart included in each argument.

93
Measurement
Table 10: Measurement of Retrospective and Prospective Economic Evaluations Retrospective Beliefs (Cronbach’s alpha = 0.88; scaled 0-1, with 1 indicating the pro-Democratic side)
1. Which party has done a better job of handling the national economy
2. People like you have been better off under…
3. Which party has done a better job of handling income inequality
Prospective Beliefs (Cronbach’s alpha = 0.93; scaled to 0-1, with 1 indicating the pro-Democratic side)
1. Which party will do a better job of handling the national economy
2. Expect the national economy to get better, if a Democratic candidate wins
3. Expect the national economy to get better, if a Republican candidate wins
4. Between Democratic and Republican economic policies, which will generate faster economic growth
5. People like you will be better off financially under
6. Expect the total income of your household will go up or down, if a Democratic candidate wins
7. Expect the total income of your household will go up or down, if a Republican candidate wins
8. Between Democratic and Republican economic policies, which will make the your income grow faster
9. Which party will do a better job of handling income inequality
10. Expect income distribution to become more equal, or less equal than now, if a Democratic candidate wins
11. Expect income distribution to become more equal, or less equal than now, if a Republican candidate wins
12. Between Democratic and Republican economic policies, which will reduce income inequality more
The key dependent variables in Experiment 3 are retrospective and prospective
evaluations of the economic performance of the two major parties.65 Table 10 lists the 15
survey items that were used to measure economic evaluations along with reliability
statistics (for additional information about the measurements, see Appendix D).
Results
To simplify the analyses and presentation of the findings, I collapse the six
conditions into three: (1) strong income/GDP evidence, (2) weak income/GDP evidence,
65 See Appendix D for additional analyses examining the “carryover” treatment effects on
vote choice and so on.

94
and (3) control/placebo.66 As with Experiment 2, I also estimate the “linear slope” of
treatment effects by operationalizing the experiment conditions as a single continuous
variable representing a scale of evidence strength (0 = control/placebo, 0.5 = weak;
1=strong). In short, the treatment effects are estimated using the following regression
equations:
𝑌𝑖 = 𝛽0 + 𝛽1𝑊𝑒𝑎𝑘𝑖 + 𝛽2𝑆𝑡𝑟𝑜𝑛𝑔𝑖 + 휀𝑖 (3.3) and
𝑌𝑖 = 𝛾0 + 𝛾1𝐸𝑣𝑖𝑑𝑒𝑛𝑐𝑒𝑖 + 𝜖𝑖 (3.4).
Table 11 reports Experiment 3’s main results. Notably, the effects appear to be
much more modest than the belief changes observed in Experiment 2.67 But the central
expectations of the restrictive Bayesian model generally hold up. As shown in Columns 1
and 4, the arguments with strong evidence had significant, though incremental, effects on
both retrospective (5.5 percentage points) and prospective beliefs (3.4 percentage points)
66 In Appendix D, I report additional analyses estimating the effects of each of the four
treatment conditions. Appendix D also provides results based on alternative
operationalization of the dependent variables, by dividing them into three sub-elements:
sociotropic evaluations; pocketbook evaluations; income inequality evaluations. Although
it was not my primary concern, I examined whether the GDP arguments had more
pronounced effects on socio-tropic evaluations; and whether the income arguments on
evaluations of the handling of income inequality in the appendix. This indeed was the
case. 67 There are several possibilities as to why this was the case. The reason may be
something substantive—people had more certain prior beliefs about the economy; or
methodological—responses to pre-treatment questionnaires had stronger impacts because
they were measured within the same wave; or something artificial—the arguments were
not as well written as Experiment 2.

95
for the participants as a whole. Meanwhile, the effects of weak evidence were about half
the size of the strong one (3.7 and 1.7 percentage points). The estimates of 𝛽2 are
significantly higher than 𝛽1 for both retrospective (p = 0.07) and prospective evaluations
(p = 0.02). Columns 2 and 3 (and Columns 5 and 6) compare the treatment effects for
Republicans and Democrats. I do not find that Republicans ignored the uncongenial
arguments—in which case both 𝛽1 and 𝛽2 should have been zero—nor do I find that they
backlash—in which case both 𝛽1 and 𝛽2 should have taken on negative values. If
anything, the treatments had larger impacts on Republicans, though the difference
between strong versus weak arguments were pronounced only for Democrats.
Table 11: Treatment Effects on Economic Evaluations (Experiment 3) (1) (2) (3) (4) (5) (6)
DV Retrospective Beliefs Prospective Beliefs
Subset All Rep Dem All Rep Dem
Panel A
Weak 0.037* 0.070* 0.017 0.017* 0.040* 0.007
(0.010) (0.021) (0.012) (0.007) (0.014) (0.009)
Strong 0.055* 0.074* 0.037* 0.034* 0.033* 0.031*
(0.009) (0.018) (0.011) (0.007) (0.013) (0.009)
AIC -1449 -346 -919 -2065 -569 -1252
Panel B
Linear Slope 0.055* 0.077* 0.037* 0.034* 0.035* 0.031*
(0.009) (0.019) (0.011) (0.007) (0.013) (0.009)
AIC -1450 -344 -921 -2067 -567 -1253
Covariates Yes Yes Yes Yes Yes Yes
N 1100 319 654 1100 319 654
Note. * p < 0.1 (two-tailed). OLS estimates with robust standard errors in parentheses.
Covariates include party ID, favorite Presidential candidate (among Clinton, Sanders,
Trump, Cruz and Kasich), vote choice in 2012, evaluations of Obama (overall, economy
and inequality), pre-treatment retrospective evaluations of the two parties. The
coefficients on the intercepts and covariates are not shown. See Appendix D for the full
reports.

96
Table 12: Heterogeneous Treatment Effects by 11 Individual Traits (Experiment 3) (1) (2)
Model Moderating Variables Retrospective Prospective N
1 Republican 0.078* (0.018) 0.037* (0.013) 319
Democrat 0.038* (0.011) 0.032* (0.009) 654
Difference in Treatment Effect -0.040* (0.021) -0.005 (0.016)
2 Economy Importance Low 0.051* (0.014) 0.031* (0.012) 476
Economy Importance High 0.058* (0.012) 0.036* (0.009) 624
Difference in Treatment Effect 0.007 (0.019) 0.005 (0.015)
3 Equality Importance Low 0.057* (0.011) 0.031* (0.009) 646
Equality Importance High 0.052* (0.014) 0.039* (0.011) 458
Difference in Treatment Effect -0.005 (0.018) 0.008 (0.015)
4 Middle or Upper Class 0.045* (0.012) 0.024* (0.009) 465
Working or Poor Class 0.066* (0.014) 0.047* (0.012) 625
Difference in Treatment Effect 0.021 (0.018) 0.023 (0.015)
5 Income ≥ $50,000 0.045* (0.013) 0.030* (0.009) 562
Income < $50,000 0.062* (0.013) 0.037* (0.010) 538
Difference in Treatment Effect 0.017 (0.018) 0.007 (0.014)
6 High Knowledge 0.028* (0.011) 0.023* (0.009) 540
Low Knowledge 0.084* (0.014) 0.048* (0.011) 560
Difference in Treatment Effect 0.056** (0.018) 0.025* (0.014)
7 High Need for Cognition 0.039* (0.012) 0.036* (0.010) 540
Low Need for Cognition 0.075* (0.014) 0.036* (0.011) 560
Difference in Treatment Effect 0.038* (0.018) 0.000 (0.015)
8 4 Year College or higher 0.037* (0.012) 0.025* (0.009) 517
2 Year College or lower 0.075* (0.014) 0.042* (0.011) 583
Difference in Treatment Effect 0.038* (0.018) 0.017 (0.014)
9 Age ≥ 35 0.066* (0.012) 0.050* (0.010) 604
Age < 35 0.047* (0.013) 0.026* (0.010) 496
Difference in Treatment Effect -0.019 (0.018) -0.024* (0.014)
10 Male 0.061* (0.013) 0.046* (0.010) 542
Female 0.048* (0.013) 0.023* (0.010) 558
Difference in Treatment Effect -0.014 (0.018) -0.023 (0.014)
11 White 0.061* (0.010) 0.033* (0.008) 872
Non-White 0.034* (0.018) 0.039* (0.014) 228
Difference in Treatment Effect -0.027 (0.021) 0.006 (0.016)
Covariates Yes Yes
Moderator ×Covariates Yes Yes
* p < 0.1 (No correction). ** p <0.1 (Holm corrections for 14 comparisons; reported for
the interaction terms only). OLS estimates with robust standard errors in parentheses. The
set of covariates is the same as Table 11.

97
In Table 12, I explore whether the treatment effects interact with individual
characteristics. The treatment effects are fairly consistent across a variety of individual
factors. All but one interaction term fails to remain statistically significant, after
correcting for multiple comparisons. The treatment effects remain statistically significant
for all subsets of the sample. Overall, the key findings of Experiment 2 are replicated
fairly well.
Table 13: Long-run Effects on Economic Evaluations (Experiment 3) (1) (2) (3) (4) (5) (6)
DV Retrospective Beliefs Prospective Beliefs
Subset All Rep Dem All Rep Dem
Linear Slope 0.028* 0.033 0.023* 0.012 0.022 0.010
(0.011) (0.022) (0.014) (0.009) (0.018) (0.012)
AIC -1079 -265 -669 -1386 -361 -827
Covariates Yes Yes Yes Yes Yes Yes
N 837 251 492 837 251 492
Note. * p < 0.1 (two-tailed). OLS estimates with robust standard errors in parentheses.
Finally, Table 13 measure the treatment effects 1 or 2 weeks later. The estimated
effects on retrospective evaluations retained about 50% of immediate effects (p < 0.05),
whereas the effects on prospective evaluations were diminished to about 35% of the
original size (p = 0.170).
3.8 Summary
Despite widespread skepticism, it remains elusive as to whether people can
critically evaluate political information and revise opinions, because the benchmark itself

98
is often a moving target. In this chapter, I present three experiments that strongly support
a Bayesian model of information processing. Across the experiments, people updated
their beliefs and attitudes in light of the presented arguments. They did not mindlessly
accept whatever arguments they encounter, nor did they reject uncongenial arguments
outright. Instead, people account for the uncertainty of evidence as they form their
posterior opinions, regardless of the congeniality of the incoming information. To answer
the title question of this chapter, the quality of evidence matters.
An encouraging implication of these findings is that people will eventually be
able to know if a policy is in their interests, if they are exposed to a stream of
information. On a related note, and contrary to prior research rooted in the motivated
reasoning hypothesis (e.g., Nyhan and Reifler 2010), it also suggests that people will
move away from political misbeliefs—defined as those inconsistent with the best
available evidence—if sufficiently informed with facts where one side produces clearly
better evidence than the other. A big caveat to this counterfactual prediction, however, is
that most people do not consume much political information (Delli Carpini and Keeter
1996), and those who do follow politics more regularly tend to be more aware of
arguments that confirm their partisan viewpoints, as demonstrated in Chapter 2 (see also
Iyengar and Hahn 2009; Jerit and Barabas 2012; Taber and Lodge 2006).
The broad implications of this dissertation should, therefore, reflect and integrate
the findings of both Chapters 2 and 3—a task set out for the following chapter.

99
Chapter 4 General Discussion
In American politics, controversies surrounding policy proposals rarely come
down to a simple black and white choice. Almost every policy option entails trade-offs,
with legitimate rationales for supporting or opposing them. In this regard, democratic
decision making necessitates taking potential advantages and disadvantages into
consideration as one forms his or her opinion. Obviously, those who do not possess any
knowledge about politics are not likely to make political decisions in such a fashion.
They may not have any meaningful opinions at all (Converse 1964). A substantial body
of theory and research has argued that “informed citizens are demonstrably better
citizens, as judged by the standards of democratic theory and practice underpinning the
American system” (Delli Carpini and Keeter 1996, 272). Such citizens, it was found, are
more engaged, better able to translate their interests into opinions, more likely to support
democratic norms, and more likely to have stable opinions.
However, more recent research has counterbalanced this optimism, suggesting
that politically knowledgeable citizens are more likely to develop systematically biased
empirical beliefs; to align their opinions with their previously held values (Wells Reedy
Gastil and Lee 2009); to respond to partisan polarization among elites in ways consistent
with their own partisanship (Abramowitz 2010; Claassen and Highton 2009); and to
engage in even more biased information processing and be more likely to polarize as a
result (Taber and Lodge 2006). All of these tendencies seem to suggest that seemingly
well informed citizens fall short by the standard of having “considered opinions.” The

100
first half of the current research (Chapter 2) represents a long overdue attempt resolve
this discrepancy in the literature with a more nuanced conceptualization and measurement
of political knowledge.
But even assuming citizens are provided with diverse information, the question
remains as to whether they are capable of effectively using it, and thereby making
competent decisions. Dishearteningly, the bulk of empirical research has called this
assumption into question (see Achen and Bartels 2016, Chap. 2 for a recent review of this
literature). To the extent that citizens encounter political messages, they tend to
mechanically and even blindly rely on contextual cues and adopt elite positions instead of
thinking critically (Broockman and Butler 2017.; Cohen 2003; Lenz 2012; Rahn 1993;
Zaller 1992; 1996). And they tend to use a modicum of information they receive to
rationalize and strengthen their partisan viewpoints (Lodge and Taber 2013; Taber and
Lodge 2006).
But the case against evidence-based reasoning in a (hypothetically) informed
electorate is not settled. While the examples of political persuasion have been
documented in many experimental studies (see Druckman et al. 2013; Guess and
Coppock 2015 for recent examples), few studies manipulate arguments in such a way that
the observed persuasion can be considered clear evidence for (or against) citizens’ ability
to critically evaluate the quality of information. In addition, fully rational Bayesians may
appear to exhibit “biased assimilation”—the empirical bedrock of a second line of
skepticism (e.g., Taber and Lodge 2013)—under some plausible conditions such as that
people holding different values use differential evaluative criteria, and/or that their

101
responses to argument evaluation questionnaires are causally posterior to their
conclusions. The second half of the current research (Chapter 3) represents an attempt to
measure the extent to which evidence matters, directly pitting Bayesian rationality against
the skeptics’ hypotheses.
4.1 Main Findings and Their Implications for the Literature
There are several important findings reported in the previous chapters. In Chapter 2,
I showed that the range of considered argument is generally slanted in the direction of
partisan identities, and that this tendency is far stronger among those who possess high
levels of factual information. This raises important issues regarding the civic competence
of the knowledgeable, and even what one means by concepts such as “informed
opinions” or “political knowledge.” To be clear, nothing in these findings questions the
beneficial role of factual information for democratic decision making. It does suggest,
however, that the ways in which citizens receive and process political information do not
necessarily lead them to “fully consider” the merits and perils of the choices they make.
Given the skewed distribution of argument repertoires among the well informed, it is
not surprising that “informed” and “considered” opinions diverge on the support for a
universal healthcare program—the second takeaway of this dissertation. Taken together,
these findings call for a conceptual distinction between “informed” opinion (e.g., Althaus
1998; Gilens 2001), and “considered” opinion (e.g., Luskin et al. 2002), concepts which
have been used interchangeably in the literature (e.g., Fishkin 1995; Price and Neijens

102
1998). Citizens could have a large base of information about politics, and still hold ill-
considered opinions. On a related note, they help explain why “informed” citizens exhibit
arguably undesirable tendencies, such as holding incorrect beliefs aligned with their
partisan identity (Achen and Bartels 2006; see also Taber and Lodge 2006). My research
suggests that the limitations in conceptualization and measurement that have failed to
purge political knowledge of biased awareness may be the reason for some of the
apparent perils of “sophistication.”
But no matter how one defines adequate political knowledge, the importance of
being informed about politics ultimately depends on the assumption that people refine
their opinion in light of what they have learned. Some find this assumption unrealistic.
One concern is that people can easily be manipulated, often failing to account for the
strength of empirical evidence as they form their opinions. Another concern is that they
can be irrationally defensive about their partisan viewpoints often not budging an inch
even when faced with strong counterevidence. Neither was the case in the experiments
reported in Chapter 3. Instead, I found that people update their beliefs and attitudes in
response not only to the position of the argument, but also the (un)certainty of evidence.
Pro-ACA arguments shifted people’s mind in the expected direction, and more so when
the evidence was strong. Perhaps more important, I found no evidence of defensive
reaction to counter arguments, which is especially impressive considering that the
experiments drew on highly contentious issues in American politics. The patterns of
belief and attitude changes shown in the chapter imply that people evaluated the

103
diagnostic values of presented evidence in more or less the same way across prior
attitudes, partisan identity, and other individual traits.
These findings contribute to the long-standing controversy about citizens’ critical
ability to use information and complement recent research demonstrating the effects of
substantive information and arguments on policy opinions (e.g., Boudreau and
MacKenzie 2014; Bullock 2011; Chong and Druckman 2010; Druckman et al. 2013;
Guess and Coppock 2015; Mérola and Hitt 2016), by demonstrating particularly that
evidentiary (un)certainty puts constraints on belief and attitude updating. This is rare
evidence that people account for the differential probative values of strong versus weak
evidence when they update their opinions—even when the evidence challenges prior
opinions about highly contentious issues.
My findings are seemingly inconsistent with two important strands of prior research:
(1) partisan disagreements and misperceptions about factual matters at the macro-level
(e.g., Bartels 2002; Berinsky 2012a; 2012b; 2015; Flynn et al. 2017; Jerit and Barabas
2012; Kuklinski et al. 2000; but see Bullock et al. 2015; Prior et al. 2015); (2) and the
micro-level findings of motivated reasoning whereby people reject uncongenial
information when confronted, sometimes doubling down on their prior attitudes (e.g.,
Lord et al. 1979; Nyhan and Reifler 2010; Taber and Lodge 2006). I will now attempt to
reconcile my findings with the large body of evidence documenting partisan bias.
With respect partisan gaps in factual beliefs and misperceptions, the question is: how
can such differences persist if partisans indeed interpret information in more or less the
same way? A plausible explanation may be that people inevitably forget the specific

104
content of the new information over time, and as they do so, fall back on prior opinions
and party identification. While some previous studies found persuasion effects lasting at
least for a few weeks (e.g., Guess and Coppock 2015; but see Hill et al. 2013 and Gerber
et al. 2011 for examples showing more rapid decay), rarely do researchers attempt to
measure communication effects that last for several months, leaving open the possibility
that communication effects become minimal in a longer stretch of time. Indeed, the
treatment effects of new information found in Experiment 2 substantially decayed
(though partially surviving) 80 days into the post-treatment period, and almost entirely
disappeared in 160 days. Although hardly surprising, the long-run decay shown in my
experiments has an important implication: even if new evidence matters momentarily, at
the end of the day, public opinion would converge toward partisan viewpoints most of the
time. As such, the force of the better evidence is itself transitory, often failing to upset the
deeper partisan bedrock.
Of course, partisans may converge toward the best available evidence if partisans
continue to receive a stream of similar information doubling down on the same
conclusion repeatedly. But this scenario seems unlikely, given citizens’ lack of interest in
political issues and tendency to seek out information that confirms their pre-existing
attitudes to the extent that they consume political information at all (Bullock 2009)—a
point I return to below.
How then can my findings be squared with the motivated reasoning literature (e.g.,
Kunda 1990; Lord et al. 1979; Miller et al. 1993; Taber and Lodge 2006; Nyhan and
Reifler 2010; Nyhan et al. 2014)? First, it is worth re-emphasizing the point that people’s

105
response to ostensible argument evaluation items can differ across prior attitudes or
partisan leaning even when they are in full agreement about the diagnostic values of the
presented information. While such findings (conflicting evaluations about the same
information among partisans) have been taken to show that the likelihood function of
evidence is “biased” toward prior attitudes (e.g., Lord et al. 1979), they might also reflect
the fact that people starting from different priors fail to converge in the end because the
presented evidence is not clear enough (Gerber and Green 1999). Indeed, I would have
concluded that the participants in the ACA experiments also engaged in biased
assimilation, had I relied solely on how their stated evaluations of the arguments were
dependent on their priors—a misguided conclusion, given the parallel (and sometimes
convergent) belief updating patterns outlined throughout Chapter 3. This, of course, is not
to say motivated reasoning never occurs, but to question its predominance as the default
mode of political reasoning.
Importantly, there exists a considerably smaller but more convincing body of
evidence demonstrating “backfire” effects whereby people strengthen their prior opinions
in face of counterevidence (Nyhan and Reifler 2010; 2015; Nyhan et al. 2014). This is
more directly at odds the findings reported in Chapter 3 than other studies open to
alternative explanations (e.g., Lord et al. 1979; Taber and Lodge 2006). But the
prevalence of such backlash is also in dispute, as more recent studies found little to mixed
evidence (Bishin et al. 2016; Guess and Coppock 2015; Wood and Porter 2016). Taken as
a whole, there emerges an intriguing puzzle: under what conditions, does the force of
evidence trump the power of denial? I examine this question in terms of whether my

106
findings can be generalized to different contexts, different issues, and different features of
persuasive messages.
With respect to the context, the online experiments presented in Chapter 3 were
designed to isolate the effect of a single piece of argument. This “sterilized” setup is
admittedly less than ideal, as it resembles neither the usual information environments in
which citizens are situated nor the normative speech situation designed by deliberative
theorists. Democratic competition leads (or forces) citizens to have access to arguments
from competing sides (Chong and Druckman 2007), and I have argued that it is critical
that they do so in a balanced fashion to make considered decisions. One important
possibility is that the effects of multiple arguments become interactive, rather than
additive, such that the force of counterevidence arises only in the absence of a challenge,
and recedes into null in a competitive environment. However, the evidence for this
possibility is mixed in the previous literature.
On the one hand, studies on the inoculation theory (McGuire 1961) have found that
warning people about future persuasive attempts and preemptively discrediting the
argument helps people resist them (e.g., Pfau et al. 2001), even when the “preemption”
does not provide specific evidence against the forthcoming message (see Banas and Rains
2010 for a meta-analysis). In the “real-world” context, calling out the “mainstream”
media’s dishonesty and bias is one of the tactics used most frequently by conspiracy
theorists, commentators in partisan media and (some) politicians (see Jamieson and
Cappella 2008). Doing so may lead people to think that contradictory information simply
proves the other side is biased, and thus reinforce their prior opinions. Two well-known

107
cases of misbeliefs (about vaccines’ effect on autism and the presence of WMD in Iraq)
that “backfired” (Coppock 2016; Nyhan and Reifler 2010; 2015; Wood and Porter 2016)
were, perhaps, of this variety.
On the other hand, Chong and Druckman (2007, 651) found “competing frames tend
to stimulate individuals to deliberate on the merits of alternative interpretations” making
the effect of argument strength more pronounced. It is also worth noting that the
observational replication of the ACA experiment did show that people sensibly shifted
their opinions in the wake of the premium increase story that broke right toward the end
of the 2016 presidential campaign—arguably one of the most fiercely combative
moments in the modern history of American politics. A potentially fruitful avenue for
future research is to examine the effects of evidence in competitive environments where
participants receive both pro and con arguments, but one side offers clearly better
evidence. The understanding of voter rationality will be further sharpened by exploring
whether people start ignoring even strong counterevidence in favor of much more
dubious, or irrelevant evidence supporting congenial arguments, and if so, under what
conditions.
Secondly, the generalizability of the experiments presented in Chapter 3 should
depend on the extent to which the effects of evidence certainty are moderated by the
characteristics of the political issue in question. However, to the extent that there is
heterogeneity across issues, the evidence provided in Chapter 3 would be closer to the
lower bound. People are expected to have strong priors as well as the motivation to
defend the priors for polarized and salient issues such as the Affordable Care Act and the

108
economic performance of the parties—conditions that are likely to attenuate the treatment
effects of new information, according to the motivated reasoning hypothesis (Taber and
Lodge 2006). Indeed, the two issues were chosen precisely for this reason. And it seems
unlikely that new evidence would be less consequential when people update their beliefs
about non-partisan issues for which people possess even less baseline knowledge, and
less desire to maintain their pre-existing opinions.
That is not to deny the possibility that, for some issues, empirical evidence would
not matter much. Importantly, my experiments focused on “valence issues” for which the
end goals are relatively unambiguous. Most people want better and cheaper healthcare
that covers all. And no one would want to see slower income growth. The disagreement is
largely about the means—e.g., can the Affordable Care Act make health care less
expensive? One can at least imagine some piece of strong empirical evidence that can
provide a straightforward answer to questions like this. But when it comes to “position
issues” such as the pro-life/pro-choice controversy, the core disagreement between the
competing sides comes down to the normative question of what’s right and what’s wrong.
It is more difficult to fathom what “strong” evidence would create the kind of opinion
shifts observed in Chapter 3 for such value-laden issues. But at this point, we have moved
passed the scope of this dissertation. To the extent that people fail to build consensus
about moral issues after much deliberation, it would be extremely difficult (and perhaps
impossible) to tease out whether the remaining disagreement reflects motivated bias or
value differences.

109
Third, certain features of the treatment messages may have made them amenable to
finding support for the Bayesian model. The messages were probably outside the norm of
the usual political discourse than what people are accustomed to, in that statistical facts
were put in the forefront of the arguments instead of partisan talking points mixed with
emotional appeals and ad hominem attacks. One can imagine a different version of the
treatment messages that could have made people’s partisan identity more salient,
triggering more defensive motivated reasoning. Perhaps consistent with this possibility is
the finding that the effect of argument strength disappears when participants are told that
Democratic and Republican politicians are polarized on the issue at hand (Druckman et
al. 2013).
On the other hand, the partisan nature of the issues themselves (Obamacare and the
economic performance of the parties) must have been unambiguous to most participants,
and it is doubtful that making the messages more partisan would have made much
difference. Tellingly, in the ACA experiment, calling the law “Obamacare” versus “the
Affordable Care Act” in the treatment messages—the former presumably being the more
partisan label—made no discernable difference in how people responded to the messages.
Also, Coppock’s (2016) survey experiment shows that insulting language did not keep
people from rationally updating their opinions in light of new information. Taken
together, to the extent that the treatment messages were unique in their rather reserved
and analytical tone, prior research does not provide enough evidence to think that the
patterns of opinion updating would have been much different had the messages been
designed to instigate “hot cognition” (Redlawsk 2002; Taber and Lodge 2006).

110
To be sure, participants in the experiments did receive a wealth of statistical
evidence that is more detailed and probably better explained than they typically would
find in other contexts. Political persuasion in the “real world” is likely to be less dramatic
than what was reported above. But that was precisely the point of the three experiments
to begin with—examining how people behave in a counterfactual condition that gives
them a better chance to see evidence clearly and make up their minds. The fact that under
these conditions they do follow a rational belief updating model has important normative
implications about citizen competence and political environments, which I further
elaborate in my concluding remarks.
All in all, while there are issues with the external validity of the findings shown in
Chapter 3 vis-à-vis the motivated reasoning hypothesis, they could cut both ways. One
can think of a situation where people become more defensive about their priors, as well
as a situation where people give even more weight to new information. This means more
research is needed to establish the boundary conditions of evidence-based reasoning
versus motivated reasoning. Previous understanding has been that people would be
motivated to defend their opinions about polarized partisan issues. But this was simply
not the case in my experiments. Identifying what else is needed to trigger motivated
reasoning remains an important avenue for future research.
Finally, Chapters 2 and 3 provide evidence that has important implications for the
growing scholarship on public deliberation. While expanding the range of arguments and
counterarguments that people are exposed to is often offered as a central mechanism for
the positive benefits of deliberation on opinion formation (Fishkin 1995; 2009), this

111
proposition has remained unsubstantiated, largely because it requires strong and often
problematic normative assumptions to determine a priori what collective opinions are to
be held by the “considered” or “enlightened” public (see Kulinski and Quirk 2001; Price
and Neijens 1998). The approach taken in Chapter 2 helps to resolve this issue by
advancing hypotheses that do not depend on such normative assumptions. Additionally,
the supporting findings suggest that deliberation does lead to more “considered
preferences,” not only in the sense that the procedural requirements such as balanced
argument pools are met, but also in that the outcomes closely resemble the hypothetical
collective opinions that correct for the absence and imbalance of considerations.
Perhaps more importantly, Chapter 3 provides evidence for the central
assumption of deliberative democracy that citizens are capable of weighing different
ideas, and forming meaningful public opinion led by “the force of the better argument”
(Habermas 1984; Fishkin 1995; Mercier and Landemore 2012). Despite the importance
of this assumption for the theoretical framework, there has been little empirical evidence
that directly supports it—and plenty that calls it into question (Delli Carpini et al 2004;
Mendelsberg 2002; Mutz 2008). The key difficulty again is a normative one; that is, the
subjectivity involved in predetermining what is “the better argument” toward which
public opinion should converge after deliberation. I avoided making strong, and
potentially problematic normative assumptions, by focusing on evidence certainty, a sub-
element of the umbrella concept of argument strength stripped of the value-laden
components. My research, thereby, provides the empirical evidence to believe in “the
force of the better evidence” at least.

112
Overall, I believe that these findings represent an important step forward in the
long process of resolving the controversy around how to set the benchmark of civic
competence, and how people measure up. Nonetheless, it is only a step. There are several
important limitations that require future research.
First, the approach taken in Chapter 2 to revisit the classic definition and
measurement of political knowledge should not be considered the only way to go. While
prior research provides theoretical justification of using “argument repertoire” as a
measure of opinion quality, and for the empirical tests of its construct validity and
reliability (Cappella et al. 2002; see also Mutz 2006 for an application of similar
measures), I recognize that it has its limitations as an open-ended measure. For one, it can
be confounded with irrelevant factors such as one’s engagement with the survey itself.
On a more fundamental level, it may be a deficient proxy for accurate knowledge of
“inconvenient” facts, because accuracy was not a part of the coding scheme. Future
research should develop empirical strategies to measure being “well informed” in this
particular sense—accurate understanding of congenial and uncongenial information—and
examine its causes and effects.
Another limitation of this dissertation has to do with the fact that only two issues
(health care and the economy) were used across the studies. Particularly with respect to
the discrepancy between information and consideration outlined in Chapter 2, it is
important to keep in mind that one may reach a very different conclusion when looking at
an issue that is less divided than the health care issue in the United States. This is because
the discrepancy is assumed to arise when people fail to learn information that runs

113
counter to their partisan viewpoints. The match between the two dimensions of political
knowledge, therefore, can very well be issue-dependent. But at least when it comes to
“salient” issues of the day, the results may be more the rule than the exception because
many public debates are often fueled by vehement disagreements among partisans.
Nonetheless, more replications would be essential to better understand the potential
heterogeneity across various issues.
Moreover, the generalizability of findings from the Chapter 3 experiments can
also be questioned due to the characteristics of the samples drawn from MTurk. It is well
established from prior research (e.g., Berinsky et al. 2012) that MTurk respondents are
less representative of U.S. population compared to national probability samples, although
more so than in-person convenience samples. The estimates presented above, therefore,
are the sample average treatment effect (SATE), which may or may not be close to the
target estimates of the population average treatment effect (PATE). The correspondence
between the two depends on (1) the observed and unobserved differences between the
sample and the population, and (2) the treatment effect heterogeneity across such
differences.
However, it is important to note that while the PATEs can very well be smaller or
larger than the SATEs reported above, it is highly implausible that they approach zero, or
even flip signs. The condition under which the worst case scenarios come true would be
that some segments of population unrepresented in the sample have extremely deviant
likelihood functions, which lead them to update their belief downward substantially in

114
face of strong pro arguments, and upward substantially in face of strong con arguments.68
It is very difficult to imagine who these people might be. It is telling in that regard that
the moderating effects of various individual factors that were examined above turned out
to be mostly modest in size and statistically insignificant. In addition, recent studies have
found considerable similarity between the results from online convenience samples and
those from national samples (Berinsky et al. 2012; Coppock 2016; Krupnikov and Levine
2014; Mullinix et al 2015), somewhat allaying the concerns about the generalizability of
the results in Chapter 3. Even so, I recognize the possibility that some unobserved
features of the samples may have led me to overstate (or understate) the treatment effects,
and also the fact that it is not possible to quantify the uncertainty associated with this
potential issue. Only future research replicating the results with more representative
sample can put this concern to rest.
On a more fundamental level, one may argue that the treatments employed in the
previous chapters do not really resemble how people learn about policy issues on a daily
basis. People do not usually get together with those holding different viewpoints to refine
their opinions (Chapter 2). And the political messages they do consume are often
rhetorical points devoid of facts and substance (Chapter 3). What, then, do the findings
say about democratic politics?
68 Recall that some treatment effects were above 20 percentage points.

115
4.2 Implications for Democratic Politics
The overarching conclusion of this dissertation is that citizens usually don’t—but
can—form considered opinions about political issues. From a normative standpoint, the
discouraging side of my argument is that there is little guarantee that even “informed”
citizens—let alone less attentive citizens—would make well considered decisions. Of
course, my study showed that some had considered both sides of arguments carefully
enough to articulate the rationales for the competing perspectives in some detail. But the
fact that their opinions significantly differed from other citizens (including informed
ones), in conjunction with the imputed and experimental estimates of considered
opinions, ultimately suggests the public as a whole may be holding policy opinions that
they would not have held if they had a chance to go beyond their usual diet of political
information consumption, and consider more carefully the competing arguments.
Arguably the most damaging blow to the prospects of deliberative democracy
comes from the notion that it does not even matter whether people have balanced
substantive information about policy issues because they are too uncritical and/or too
biased to use it rationally anyway. But this skepticism, at least according to my argument
and evidence provided in Chapter 3, is misplaced and exaggerated. People do not simply
believe whatever they want to believe. Nor do they simply believe whatever politicians
want them to. Rather, given the chance people appear capable of accounting for evidence
and its (un)certainty, suggesting that public opinion would tend toward the best available
evidence as the amount and clarity of information that people receive increase. It offers

116
some reason to believe that public opinion reflects (or can reflect) rational thinking on the
part of the citizenry, at least for salient, widely covered, politically significant issues. This
claim runs against the tide of much scholarly and popular thinking, but I would argue that
it is consistent with some important observations from previous research on public
opinion and voter behavior, such as that an incumbent party’s reelection prospects
diminish dramatically in a failing economy (e.g., Kramer 1971; Hibbs 2000; Lewis-Beck
1988; but see Healy and Lenz 2014); or that partisan disagreement about economic
conditions recedes in face of indisputably clear signals (Parker-Stephen 2013; Stanig
2013). These studies and my research here seem to suggest that, everything else being
equal, citizens would give less credence to politicians’ claims when the evidence isn’t
simply there—a reason to be at least cautiously optimistic about the prospect of
democratic accountability. In short, the findings reported in Chapter 3 add (a hint of)
optimism to the literature on public opinion that has tilted toward documenting voter
irrationality (e.g., Bartels 2002; Campbell et al 1960; Berelson et al. 1954, Ch. 14; Taber
and Lodge 2006; Zaller 1992) over rationality (e.g., Fiorina 1980; Gerber and Green
1999; Key 1966; Page and Shapiro 1992).
To the extent that citizens fail to act as competent decision makers, it is more
likely so because they do not have the necessary (and necessary mix of) information
(Chapter 2), than because they are unable to use information even if they have it (Chapter
3). According to the findings, some of the more troubling tendencies observed in public
opinion research, such as partisan differences in factual beliefs (e.g., Bartels 2002) and
political misbeliefs (e.g., Berinsky 2015; Kuklinski et al. 2000), are likely to arise

117
because partisans infer these beliefs based on the talking points of their party leaders and
not much else (Achen and Bartels 2016, 280)—but not because partisans refuse to
recognize clear factual evidence that goes against their priors. There are two ways in
which people exhibit partisan biases, failing to give due considerations to oppositional
arguments: they may not receive them at all, or they may reject them outright upon
reception. This dissertation confirms the former possibility, but not the latter. It thus
underscores that improving the quality of public opinion, after all, comes down more to
solving the problems of ignorance and partisan bias at the “reception” stage—
encompassing both exposure to and comprehension of information—, than at the
“acceptance” stage.
I realize that it may seem that I am proposing even loftier goals than the
traditional model of informed citizenship—i.e., knowing “what the issues are, what their
history is, what the relevant facts are, what alternatives are proposed, what the party
stands for, and what the likely consequences are” (Berelson et al. 1954, 308)—by
introducing an additional requirement that the mix of information be balanced. No one
thinks that citizens have the time and energy to know every aspect of a political decision,
let alone politics in general. But, as Delli Carpini and Keeter (1996, 14) put it, “the value
of political information is … relative and collective.” The point is that all else being
equal, one’s opinion is more likely to be reflective of one’s interests when one takes
uncongenial information more seriously. Perhaps more importantly, the collective
opinions of a group of citizens with similar interests, and ultimately of the citizenry as a

118
whole are far more likely to be reflective of their collective interests when individuals
take uncongenial information more seriously.
Up to this point, I have focused almost exclusively on the civic competence of
the public. But the best citizens can do is to form opinions reflective of available
information; information which, for the most part, is supplied by political and media
elites. Things can go awry on “the supply side.” Elites can intentionally or unintentionally
“mislead” the public with biased, selective, and/or erroneous information and
interpretations (Page and Shapiro 1992, Chap. 9). They can present competing arguments
in ways that make it hard to take the other side seriously—for example, by yelling at each
other simultaneously, or denigrating each other’s motives or values. They can also avoid
communicating in ways that make clear the degree of certainty or uncertainty of their
evidence and the implicit assumptions underlying their claims, instead sticking to partisan
talking points. All these forms and styles of elite discourse—unfortunately and
increasingly standard fare in political communication—may make it difficult for citizens
to base their views on appropriate and appropriately balanced information, even if they
wanted to do so.
It is well beyond the purview of this dissertation to explicate the necessary
features of political environments that would help citizens make decisions that are
reflective of their individual and collective best interests in great detail. But these data
and findings point at least indirectly to the features of political environments that would
help citizens develop considered opinions. Specifically, the counterfactual situations
simulated in the experiments, where people talked about policy options with those with

119
whom they disagreed (Chapter 2), and evaluated the strength of available evidence based
on factual information (Chapter 3), provide good starting points. As such, I briefly
discuss the implications of my findings for those envisioning an information environment
that is more conducive to better political decision making than the status quo.
The research presented in this dissertation identified deficits in what people know
about political issues, but not in how people use information once they have it. The fact
that the key challenge to competent decision making is at the “reception” stage
underscores the importance of better civic education. And the challenge is not just that
people are generally underinformed, but also that even when they do learn, they tend to
learn particular sets of information that support their partisan opinions. This means that
people may miss the opportunity to see why their party’s policy position is not in their
best interests or in the larger public interest—even if they do follow politics and learn
about the issues. While formal and ongoing public deliberation per se would not be a
practical alternative for most citizens, there can be some (modest) changes to the
information environment that may increase the likelihood of citizens considering a wider
range of viewpoints.
One possible way would be for columns, op-eds, and the growing number of
partisan or ideological media outlets to regularly introduce its readers/viewers to the
“other side’s” perspectives; not, as is often currently the case, to counter-argue, criticize,
or make fun of these opposing viewpoints, but to give the audience the opportunity to
understand why they disagree. For example, the left leaning Guardian launched the
publication of a new weekly column called “Burst Your Bubble” that provides “five

120
conservative articles worth reading to expand your thinking each week” with some
background information about the author and the story to its (liberal) readers. According
to Wilson, the author of Burst Your Bubble, the column has become quite popular, and
perhaps other press or networks can learn from its success.
Another approach that the major social networking services such as Facebook
and Twitter can take may be to tweak their news feed algorithms, so that their users’
information feeds contain more cross-cutting viewpoints than they would otherwise.
While algorithmically ranked news feeds have been blamed for creating echo chambers
by selecting ideologically similar content to share with their users, they could just as
easily include dissimilar content to users’ information feeds in ways that parallel the
Guardian’s approach. In the meantime, citizens need not wait for the social media
services to rescue themselves from their echo chambers. New smartphone applications
(e.g., Read Across The Aisle) and browser extensions (e.g., Escape Your Bubble) have
been developed to help people monitor their “media diet” in terms of balance and receive
more cross-cutting content. Such services make it easier for citizens to check if they are
getting a healthy diet of quality information and well considered arguments. One can also
go to the Wall Street Journal’s “Blue Feed, Red Feed” site to see stories shared by liberal
and conservative Facebook users side by side.
Perhaps more importantly, the willingness to consider and understand
uncongenial arguments should be emphasized more emphatically as a hallmark of civic
virtue and responsibility. The fact that people have been developing new tools to burst
“filter bubbles” seems to suggest that the motivation to learn from the other side has been

121
growing lately—an encouraging development. But this change may be too modest to
counterbalance the tides of partisan fragmentation and affective polarization that have
swept political discourse and public opinion over the past decade (e.g., Iyengar et al.
2012). It should be communicated more forcefully—in public education, by the media,
and by public officials and other elites—that the more people fall deeply into their echo
chambers, the more difficult it becomes to build consensus around common ground, or to
understand if a political decision may ultimately backfire against one’s individual and
collective interests.
Much of scholarly work and conventional wisdom has focused on how the
deliberative, informed citizen model fails. Much less is known about how it works at all,
and less still about how to make it work better. I have sketched a few preliminary ways to
give people better opportunities to form considered opinions. The analyses presented in
this dissertation suggest that citizens are both willing and able to take advantage of such
an information environment, and to do so in ways conducive to the practice of democratic
politics.

122
Appendix
Appendix A The Health Dialogue Data (Chapter 2)
Appendix A.1. Sample Characteristics
Table A1. Health Dialogue Sample Characteristics Compared to ANES and CPS
Variables Health Dialogue
N = 2,193
2004 ANES
N = 1,211
2004 CPS
N = 226,672
Age (Average) 44.7 47.3 43.7
Female (%) 53.4 53.3 51.7
Bachelor’s Degree (%) 34.7 29.9 23.7
HH Income $ 50,000 or Higher (%) 52.5 48.0 52.3
Access to Health Insurance (%) 86.8 85.9 84.2
White (%) 78.7 72.7 81.7
Black (%) 8.3 15.0 11.7
Married (%) 64.2 51.6 53.2
Northeast (%) 18.9 18.0 19.0
Midwest (%) 22.2 25.9 22.6
South (%) 35.2 34.4 35.8
West (%) 23.4 21.7 22.6
Strong Democrat (%) 16.5 17.0 NA
Moderate Democrat (%) 16.4 15.0 NA
Independent (%) 34.5 39.0 NA
Moderate Republican (%) 16.4 12.9 NA
Strong Republican (%) 16.5 16.2 NA
Note. CPS results were derived from CPS Table Creator.2
This section compares characteristics of the Health Dialogue Project to 2004
American National Election Study (ANES) against the American adult population as
2 http://www.census.gov/cps/data/cpstablecreator.html

123
documented by the 2004 Current Population Survey (CPS) from the U.S. Census Bureau.
Overall, as shown in Table A3, the characteristics of HD sample were fairly similar to the
ANES sample, and the CPS benchmark. While those in the HD sample were somewhat
more educated, and more likely to be married than the ANES and CPS data, the HD
sample resembled the CPS benchmark more closely than the ANES sample on age,
income, and race (White).

124
Appendix A.2. Balance Check
In this section, I provide balance statistics. Treatment and control groups are
balanced on pre-treatment covariates among those responded to the baseline, and post
surveys, minimizing the concern that differential attrition introduced imbalances. As
shown in Table A4, the coefficients on each variable and the F-statistics are insignificant
(at p < 0.05) and the R-squares are very small. In addition, Table A4 shows that group
assignment did not significantly affect attrition, further mitigating the concern that
differential attrition is responsible for the results.

125
Table A2: Balance Check DV=
Assigned to
Deliberate
DV=
Assigned to
Deliberate
(If Completed
Post Survey)
DV=
Competed
Post Survey
Coef SE Coef SE Coef SE
Support for Universal Healthcare (0-1) 0.01 0.04 -0.04 0.05
Pro arguments (0-42) 0.01+ 0.00 0.01 0.01
Con arguments (0-48) 0.00 0.00 0.00 0.01
Political Information (0-1) 0.02 0.07 0.02 0.08
Party ID (0-1, 1=strong Dem) -0.04 0.04 -0.01 0.05
Age (0-1, 0 = 18, 1=94) 0.04 0.06 0.00 0.08
Years of Education (0-1) 0.04 0.06 0.06 0.08
Gender (1=male) 0.00 0.02 -0.02 0.03
Income (0.02-1, percentile) 0.00 0.04 0.03 0.05
Black (1=Black) 0.02 0.04 -0.02 0.05
Marital status (1=married) -0.01 0.02 -0.03 0.03
Political Interest (0-1) 0.11+ 0.06 0.08 0.08
Political participation (0-1) -0.02 0.06 -0.12 0.08
Political discussion (0-1) -0.08 0.05 0.02 0.07
Attention to political news (0-1) -0.09 0.06 -0.02 0.08
Attention to healthcare news (0-1) 0.06 0.06 0.02 0.07
Access to health insurance (1=insured) 0.01 0.04 0.00 0.04
Own serious disease (1=yes) -0.01 0.02 0.00 0.03
Family serious disease (1=yes) -0.03 0.02 -0.02 0.03
Healthcare satisfaction (0-1) -0.01 0.05 0.03 0.06
Assigned to deliberate 0.48 0.06 0.61 0.08 -0.01 0.02
Intercept 0.48* 0.06 0.61* 0.08 0.73* 0.02
Observations 2,080 1,276 1,844
R2 0.010 0.009 0.000
F 1.08 0.60 0.30
p 0.36 0.92 0.59
Note. OLS estimates with standard errors. + p < 0.1 * p < 0.05. Second model excludes
those who did not take post-treatment surveys. Third model excludes those uninvited (via
random assignment) to take the post survey. F tests fail to reject the null hypothesis that
the coefficients are jointly zero.

126
Appendix A.3. Measurement and Survey Items
This section provides information on the measurement of key variables and
covariates. Since the measurement of the key independent and dependent variables is
described in the main text, for these variables we simply provide the survey items here.
Some basic demographic variables used in our analyses were provided by
Knowledge Networks from the respondent profiles. These include age, education,
gender, income, race, and marital status. Age was rescaled to vary between 0 and 1.
Education was initially measured based on seven categories. We calculated years of
education by assigning the following numbers to each category: less than high school (8
years), some high school (10), high school graduate (12), some college (14), BA (16),
master’s degree (18), doctorate (21). I rescaled this to 0-1. (Household) Income was
measured on 19 categories, ranging from less than $5,000 to $175,000 or more. We took
the percentile values, with 1 representing the highest income level. Dummy variables
were created gender (male), race (i.e., Black), and marital status.
Political interest was measured by combining the two items, which were coded on
a 0-1 scale, with 1 indicating the highest interest level and averaged (Cronbach’s α=0.45).
Political participation. I counted the number of participatory activities that
respondents indicate that they engage in from the list of nine activities (Cronbach’s
α=0.72), which was then rescaled to 0-1.
Political discussion was measured based on two items, which was averaged and
rescaled to 0-1 (Cronbach’s α=0.64).

127
Attention to political was measured based on three items, which was averaged and
rescaled to 0-1, with 1 indicating “very closely” (Chronbach’s α=0.73).
Attention to news about healthcare issues was constructed from a single item,
which was scaled to 0-1, with 1 indicating “very closely.”
Access to health insurance was measured based on a single item, asking if the
respondent was covered by health insurance.
Own serious disease was measured by asking if the respondent had a serious
health condition. Those who noted “Yes” to both were coded 1, indicating having a
serious disease or chronic health condition, and 0 otherwise.
Family serious disease was measured by asking if “anyone living in the same
household” had one of the serious health condition. Those who noted “Yes” to both were
coded 1, indicating having a family member with serious disease or chronic health
condition, and 0 otherwise.
Survey Item Wordings
Support for universal health insurance.
Do you favor or oppose a universal, single-payer system of national health
insurance, paid for by the federal government (that is, a publicly financed, but
privately delivered heath care system)?
1) Favor strongly
2) Favor somewhat
3) Oppose somewhat
4) Oppose strongly
5) Don’t know
Consideration of pro and con arguments (argument repertoire)
(If favorable) What are the reasons you have for being in favor of a universal,
national health insurance program? (Please list all the reasons that come to mind)

128
What reasons do you think other people might have for being opposed to a
universal, national health insurance program? (Please list all the reasons that
come to mind)
(If unfavorable) What are the reasons you have for being opposed to a universal,
national health insurance program? (Please list all the reasons that come to mind)
What reasons do you think other people might have for being in favor of a
universal, national health insurance program? (Please list all the reasons that
come to mind)
(If don’t know) What are the reasons you think other people might have for being
in favor of a universal, national health insurance program? (Please list all the
reasons that come to mind)
What reasons do you think other people might have for being opposed to a
universal, national health insurance program? (Please list all the reasons that
come to mind)
Political information
Which one of the parties would you say is more conservative than the other at the
national level?
1) Democrats
2) Republicans
3) Don’t know
Do you happen to know what job or political office is currently held by Dick
Cheney?
1) U.S. Senator
2) U.S. Vice President
3) Energy Secretary
4) Don’t know
Which party has the most members in the United States House of
Representatives?
1) Democrats
2) Republicans
3) Don’t know
Who has the final responsibility to decide whether a law is Constitutional or not?
1) President
2) Congress
3) Supreme Court
4) Don’t know
How much of a majority is needed for the U.S. Senate and House to override a
presidential veto?
1) Simple majority (one more than half the votes)
2) Two-thirds majority
3) Three-fourths majority
4) Don’t know
Healthcare issue information

129
President Bush has signed a Medicare bill to help senior citizens with prescription
drugs. Which of the following is among the provisions of the new act offers a
prescription drug discount program for Medicare beneficiaries
1) Allows Medicare beneficiaries to buy prescription drugs from Canada
2) Permits the federal government to negotiate with drug companies to get
lower prices for those in Medicare
3) Don’t know
Which of the following has responsibility for deciding when drugs are ready for
use by the public?
1) FTC, Federal Trade Commission
2) FDA, Food and Drug Administration
3) APHA, American Public Health Association
4) Don’t know
Do you happen to know what job or political office is currently held by Tommy
Thompson?
1) State Governor
2) U.S. Surgeon General
3) U.S. Health and Human Services Secretary
4) Don’t know
Many experts say that Medicare’s main fund, the hospital insurance fund, will run
out of money if there are no changes in the way it works. According to
Medicare’s public trustees, when is the fund now expected to run out of money?
1) Within about 5 years
2) In the next 10 to 30 years
3) In the next 40 to 60 years
4) Later than 70 years from now
5) Don’t know
Which of the following best characterizes the Bush administration’s policy
concerning research on stem cells derived from human embryos?
1) Federal funds cannot be used to support any research on stem cells derived
from human embryos
2) Federal funds can be used to support any research on stem cells derived
from human embryos
3) Federal funds can be used to support research on stem cells, but only on a
limited number of cell lines derived from embryos before August 2001
4) Don’t know
The Medicare program provides health care coverage to the disabled and to older
Americans who paid enough in payroll taxes while they worked. Which of the
following best describes who is generally eligible for Medicare?
1) Age 55 or older, and earning less than $25,000 in income
2) Age 65 or older, and earning less than $25,000 in income
3) Age 65 or older, regardless of income
4) Age 70 or older, regardless of income
5) Don’t know

130
The percentage of Americans who do not have health care insurance is closest to
…
1) 5 percent
2) 15 percent
3) 33 percent
4) 50 percent
5) Don’t know
Party identification
Do you generally think of yourself as a …
1) Republican
2) Democrat
3) Independent
4) Something else
(If Republican) Do you consider yourself …
1) A strong Republican
2) Not a very strong Republican
(If Democrat) Do you consider yourself …
1) A strong Democrat
2) Not a very strong Democrat
Political interest
Generally speaking, how much do you care which party wins the 2004
presidential election?
1) A great deal
2) Somewhat
3) Not very much
4) Not at all
Some people seem to follow what is going on in government and public affairs
most of the time, whether there is an election or not. Others are not that
interested, or are interested in other things. How much would you say you follow
what is going on in government and public affairs?
1) Most of the time
2) Some of the time
3) Only now and then
4) Hardly at all
Political participation
In the last 12 months, have you personally done any of the following?
1) Contacted or written a public official about an issue that concerned you
2) Attended a public hearing or town meeting
3) Talked to anyone and tried to show them why they should vote for or
against a political candidate

131
4) Attended any political meetings, rallies, speeches, dinners or similar
events in support of a particular candidate
5) Done any other work for a candidate
6) Given money to a candidate
7) Worn a candidate’s campaign button, put a campaign sticker on your car
or placed a sign in your window or in front of your house 8) Contacted a newspaper or television station about an issue that concerned you
9) Tried to get another person to sign a petition
Political discussion
How many days in the past week did you discuss politics with your family or
friends?
How many days in the past week did you discuss politics with acquaintances or
people at work?
Attention to political news
How much attention did you pay to news stories about each of the following last
week?
National politics
Local news and events International affairs
1) very closely
2) fairly closely
3) not too closely
4) not at all
Attention to news about healthcare issues
How closely have you been following news about health care issues?
5) very closely
6) fairly closely
7) not too closely
8) not at all
Access to health insurance
Many Americans do not have health insurance. Are you now covered by any
form of health insurance, including any private insurance or a government
program such as Medicare or Medicaid?
1) Yes
2) No
Own serious disease
In the past 10 years, have you been told by a doctor or nurse that you have a
serious or chronic health condition or disease, such as any one of the following?

132
High blood pressure or high cholesterol
A heart condition or heart disease
A stroke
Emphysema or other chronic respiratory condition
Cancer or malignancy of any kind
Diabetes or high sugar levels
A liver or kidney condition
Serious chronic neck, back, or joint pain
Parkinson’s disease or other neurological disorder
Lasting depression or other mental health condition
Other serious or chronic health condition
1) Yes
2) No
Do you now have a serious or chronic health condition or disease?
1) Yes
2) No
Family serious disease
Does anyone else now living in your household have a serious or chronic health
condition or disease, such as any one of the following?
High blood pressure or high cholesterol
A heart condition or heart disease
A stroke
Emphysema or other chronic respiratory condition
Cancer or malignancy of any kind
Diabetes or high sugar levels
A liver or kidney condition
Serious chronic neck, back, or joint pain
Parkinson’s disease or other neurological disorder
Lasting depression or other mental health condition
Other serious or chronic health condition
1) Yes
2) No

133
Appendix A.4. Descriptive statistics
Table A3 reports descriptive statistics for our key variables and covariates. All
variables are scaled to 0-1, except for pro and con arguments. As mentioned in the main
text, pro and con arguments have skewed distribution. Table A2 shows frequencies and
Figure A1 plots distributions. Majority of respondents named less than three pro
arguments, and few named more than seven. Very similar patterns were found for con
arguments. The distributions of pros and cons look nearly identical.
Table A3: Descriptive statistics for key variables and covariates
Variables (range) Mean SD N
Support for Universal Healthcare (0-1) 0.59 0.33 2187
Pro arguments (0-42) 2.30 2.69 2193
Con arguments (0-48) 2.17 2.74 2193
Political Information (0-1) 0.59 0.21 2193
Party ID (0-1, 0=strong Rep, 1=strong Dem) 0.50 0.32 2170
Age (0-1, 0 = 18, 1=94) 0.35 0.20 2193
Years of Education (0-1) 0.47 0.20 2193
Gender (1=male) 0.47 0.50 2193
Income (0.02-1, percentile) 0.56 0.29 2193
Black (1=Black) 0.08 0.28 2182
Marital status (1=married) 0.64 0.48 2193
Political Interest (0-1) 0.79 0.23 2193
Political participation (0-1) 0.17 0.20 2192
Political discussion (0-1) 0.28 0.25 2188
Attention to political news (0-1) 0.62 0.22 2173
Attention to news about healthcare issues (0-1) 0.57 0.24 2186
Access to health insurance (1=insured) 0.87 0.34 2187
Own serious disease (1=yes) 0.36 0.48 2190
Family serious disease (1=yes) 0.42 0.49 2178
Healthcare satisfaction (0-1) 0.52 0.23 2164

134
Table A4: Frequencies of Pro and Con Arguments
Pro Con Total
0 16.8% 21.3% 12.9%
1 32.0% 30.9% 6.8%
2 19.7% 19.0% 18.3%
3-4 18.9% 16.5% 26.3%
5-6 6.4% 7.1% 15.0%
7 or more 6.1% 5.3% 16.5%
N = 2,193
Figure A1: Distributions of Pro and Con Arguments
Note: The maximum of pro arguments is 42. The maximum of con arguments is 48.
0
100
200
300
400
500
600
700
800
0 2 4 6 8 10 12 14 16 18 20 22 24 26 28 30 32 34 36 38 40 42 44 46 48
Nu
mb
er o
f O
bse
rvat
ion
s
Numer of Arguments
Pros Cons

135
Appendix A.5. Additional Information on Results in Chapter 2
This Appendix supplements the results reported in Chapter 2 by providing
additional information that was omitted in the main text.
Table A5 supplements Figure 2 in the main text. In addition to what was shown in
the figure, it describes specific group means, standard errors, and number of observations
in each group.
Table A6 reports the estimates of Equation 2.2 in the main text. The quantities in
Table 2 in the main text are derived from this model.
Table A7 reports the estimates of Equation 2.3 in the main text. The quantities in
Table 3 in the main text are derived from this model.
Tables A8 to A12 supplement Figure 3 in the main text.
Table A8 reports the the estimates of Equation 6 in the Main Text, which were
used to impute “fully informed” opinions. Four models are specified. All models allow
the effect of information to vary by party ID. Models 3 and 4 allow the effect of
information to vary by other demographic factors (e.g., access to health insurance), which
may affect evaluative criteria. Models (1) and (3) use the original political knowledge
index. Models 2 and 4 use the percentile values.
Table A9 reports the the estimates of Equation 7 in the Main Text, which were
used to impute “fully considered” opinions. A total of 16 models are specified. All
models allow the consideration of pros and cons to vary by party ID. In addition, Models
9 to 16 allow the effect of information to vary by other demographic factors (e.g., access

136
to health insurance), which may affect evaluative criteria. Also, Models 5 to 8, and 13 to
16 allow the effect of one side of argument to be heterogeneous by the awareness of the
other side. In Models 1, 5, 9, 13, the number of pro (or con) arguments larger than three
was recoded to three so that the maximum can be three, which was then divided by three.
In Models 2, 6, 10, 14 values greater than five were recoded (to five). In Models 3, 7, 11,
15 the collapsing cutoff was 7. In Models 4, 8, 12, 16, percentile values of pros and cons
were used without collapsing.
Table A10 reports four estimates of information effects, imputed in accordance
with the 4 models on in Table 8. Among these, the estimates from Models 1 and 3 were
shown in Figure 3, but the results are similar other specifications.
Table A11 reports 16 estimates of consideration effects, imputed in accordance
with the 16 models on in Table 9. Among these, the estimates from Models 2 and 10 were
shown in Figure 3, but the results are similar in other specifications.
Table 12 reports the estimates of Equation 8 in the Main Text, the experimental
approach to estimating consideration effects based on deliberations. Six models are
specified. Models 1 and 2 estimate the “intent-to-treat” effect by regressing opinion
change on random assignment. Models 3 and 4 estimate the average treatment effect on
the treated by using random assignment as instrument for attending deliberation
meetings. Models 5 and 6 estimates average treatment effect by regressing opinion
change on deliberation attendance. The identifying assumption for Models 5 and 6 are
that the potential change over time in the outcome variable for attendees and absentees
would have been without the treatment. We report the results with and without control

137
variables for each approach. Models 1, 3 and 5 do not make covariate adjustments.
Models 2,4 and 6 do. The results are robust.

138
Table A5: Pros and Cons by Political Information and Party Identification Total Strong Rep Moderate Rep
Pol Info Pro Con N Pro Con N Pro Con N
Low 1.51 1.07 586 1.72 1.53 39 1.51 1.43 81
(0.82) (0.06) (0.35) (0.36) (0.22) (0.23)
Lower 2.24 1.85 576 2.11 2.49 89 1.92 1.59 104
(0.09) (0.09) (0.20) (0.33) (0.19) (0.15)
Higher 2.65 2.74 613 1.98 3.26 112 2.42 2.65 100
(0.13) (0.14) (0.21) (0.41) (0.23) (0.25)
High 2.95 3.29 418 1.86 3.74 110 2.63 3.52 73
(0.14) (0.15) (0.13) (0.36) (0.35) (0.34)
Independent Moderate Dem Strong Dem
Pol Info Pro Con N Pro Con N Pro Con N
Low 1.44 0.94 165 1.44 0.94 165 1.44 0.94 165
(0.13) (0.08) (0.13) (0.08) (0.13) (0.08)
Lower 2.35 1.84 140 2.35 1.84 140 2.35 1.84 140
(0.21) (0.16) (0.21) (0.16) (0.21) (0.16)
Higher 2.79 2.65 165 2.79 2.65 165 2.79 2.65 165
(0.31) (0.20) (0.31) (0.20) (0.31) (0.20)
High 2.84 2.54 109 2.84 2.54 109 2.84 2.54 109
(0.22) (0.21) (0.22) (0.21) (0.22) (0.21)
Entries are average number of pro and con arguments listed by each partisan group across
different levels of political information, with standard errors in parentheses. Figure 2 in
the main text is generated based on these estimates.

139
Table A6. Partisan bias in consideration of pro versus con arguments
Coef. SE p
Pro -1.08 0.15 0.00
Moderate Republican -0.78 0.20 0.00
Independent -1.11 0.17 0.00
Moderate Democrat -1.19 0.20 0.00
Strong Democrat -0.90 0.20 0.00
Pro × Moderate Republican 0.95 0.22 0.00
Pro × Independent 1.41 0.19 0.00
Pro × Moderate Democrat 1.61 0.22 0.00
Pro × Strong Democrat 1.84 0.22 0.00
Constant 3.03 0.14 0.00
N = 4340 responses (i.e., 2,170 individuals). This regression model tests Equation 2.2 in
the main text. Estimates reported in Table 2 in the main text are derived from this model.
“Pro” is a within-individual factor indicating whether the response is the number of pros
(or cons). Dummies for PID were created and used, with the base category representing
Strong Republicans. Entries are maximum likelihood estimates. Individual-specific
random effects are accounted for.

140
Table A7. Political information and partisan bias in consideration of pro versus con
arguments
Coef. SE p
Information 4.23 0.78 0.00
Pro 1.77 0.61 0.00
Info × Pro -4.15 0.85 0.00
Moderate Republican -0.31 0.71 0.66
Independent -0.10 0.61 0.87
Moderate Democrat -0.16 0.67 0.81
Strong Democrat -0.82 0.71 0.25
Info × Moderate Republican -0.22 1.04 0.83
Info × Independent -0.84 0.88 0.34
Info × Moderate Democrat -0.74 1.02 0.47
Info × Strong Democrat 0.35 1.03 0.74
Pro × Moderate Republican -0.77 0.78 0.32
Pro × Independent -1.19 0.67 0.07
Pro × Moderate Democrat -1.03 0.73 0.16
Pro × Strong Democrat -1.61 0.77 0.04
Info × Pro × Moderate Republican 2.28 1.14 0.05
Info × Pro × Independent 3.71 0.97 0.00
Info × Pro × Moderate Democrat 3.74 1.12 0.00
Info × Pro × Strong Democrat 5.14 1.13 0.00
Constant 0.12 0.55 0.82
N = 4340 responses (i.e., 2,170 respondents). This regression model tests Equation 2.3 in
the main text. Estimates reported in Table 3 in the main text are derived from this model.
“Pro” is a within-individual factor indicating whether the response is the number of pros
(or cons). Dummies for PID were created and used, with the base category representing
Strong Republicans. Entries are maximum likelihood estimates. Individual-specific
random effects are accounted for.

141
Table A8: Regression models for imputation of informed opinions Model (1) Model (2) Model (3) Model (4)
Coef SE Coef SE Coef SE Coef SE
Intercept 0.84 0.04 0.68 0.03 0.70 0.09 0.64 0.06
Political Information -0.68 0.06 -0.50 0.04 -0.21 0.14 -0.15 0.11
PID -0.24 0.07 -0.01 0.05 -0.19 0.07 0.02 0.05
Information×PID 0.97 0.10 0.69 0.07 0.84 0.11 0.60 0.08
Age 0.14 0.11 0.10 0.08
Education 0.00 0.11 0.01 0.08
Male 0.02 0.04 0.01 0.03
Income 0.07 0.07 0.06 0.05
Black -0.08 0.07 -0.06 0.04
Married -0.06 0.04 -0.06 0.03
Insured 0.02 0.06 0.00 0.04
Satisfied -0.02 0.08 -0.09 0.06
Own Health 0.14 0.04 0.11 0.03
Family Health -0.03 0.04 -0.01 0.03
Information×Age -0.20 0.17 0.60 0.08
Information×Education 0.05 0.17 -0.14 0.12
Information×Male -0.04 0.06 0.05 0.12
Information×Income -0.09 0.12 -0.03 0.05
Information×Black 0.14 0.12 -0.08 0.09
Information×Married 0.05 0.07 0.13 0.09
Information×Insured -0.11 0.10 0.05 0.05
Information×Satisfied -0.32 0.13 -0.09 0.08
Information×Own Health -0.18 0.07 -0.24 0.10
Information×Family Health 0.09 0.06 -0.13 0.05
Information measure Original Percentile Original Percentile
N 2165 2165 2109 2109
Note. All variables were scaled to 0-1. All variables are scaled to 0-1. In Models 1 and 3,
the original political information score (% correct) was used. In Models 2 and 4,
percentile values of political information was used.

142
Table A9: Regression models for imputation of considered opinions Model (1) Model (2) Model (3) Model (4) Model (5) Model (6) Model (7) Model (8)
Coef SE Coef SE Coef SE Coef SE Coef SE Coef SE Coef SE Coef SE
Intercept 0.51 0.02 0.48 0.02 0.47 0.02 0.54 0.03 0.52 0.02 0.49 0.02 0.47 0.02 0.55 0.03
Pro 0.29 0.04 0.40 0.04 0.50 0.05 0.46 0.05 0.27 0.05 0.38 0.05 0.48 0.06 0.44 0.06
Con -0.45 0.03 -0.54 0.04 -0.61 0.04 -0.66 0.05 -0.47 0.04 -0.55 0.04 -0.62 0.05 -0.67 0.06
PID 0.11 0.04 0.18 0.03 0.22 0.03 0.07 0.04 0.11 0.04 0.18 0.03 0.22 0.03 0.07 0.04
Pro×PID -0.01 0.06 -0.09 0.07 -0.13 0.08 -0.08 0.08 0.00 0.06 -0.08 0.07 -0.12 0.08 -0.08 0.08
Con×PID 0.43 0.06 0.45 0.07 0.47 0.08 0.59 0.08 0.42 0.06 0.44 0.07 0.46 0.08 0.58 0.08
Pro×Con 0.03 0.05 0.04 0.06 0.04 0.07 0.03 0.08
Model (9) Model (10) Model (11) Model (12) Model (13) Model (14) Model (15) Model (16)
Coef SE Coef SE Coef SE Coef SE Coef SE Coef SE Coef SE Coef SE
(Intercept) 0.54 0.05 0.56 0.05 0.55 0.04 0.53 0.06 0.54 0.05 0.56 0.05 0.55 0.04 0.54 0.06
Pro 0.36 0.09 0.43 0.10 0.49 0.12 0.47 0.12 0.34 0.09 0.41 0.10 0.48 0.12 0.44 0.12
Con -0.26 0.09 -0.31 0.10 -0.31 0.12 -0.32 0.12 -0.29 0.09 -0.33 0.10 -0.33 0.12 -0.36 0.12
PID 0.11 0.07 0.04 0.06 0.02 0.05 0.08 0.05 0.12 0.07 0.05 0.06 0.03 0.05 0.08 0.05
Age -0.02 0.07 -0.01 0.06 0.00 0.05 0.11 0.08 -0.01 0.07 0.00 0.06 0.00 0.05 0.12 0.08
Education 0.03 0.02 0.01 0.02 -0.01 0.02 0.00 0.07 0.03 0.02 0.01 0.02 -0.01 0.02 0.02 0.08
Male 0.02 0.05 0.02 0.04 0.02 0.04 0.03 0.03 0.02 0.05 0.02 0.04 0.02 0.04 0.03 0.03
Income -0.03 0.04 -0.03 0.04 -0.04 0.04 0.03 0.05 -0.04 0.04 -0.04 0.04 -0.04 0.04 0.03 0.05
Black -0.03 0.03 -0.02 0.02 -0.03 0.02 -0.05 0.05 -0.03 0.03 -0.02 0.02 -0.03 0.02 -0.06 0.05
Married -0.02 0.04 -0.02 0.03 -0.02 0.03 -0.03 0.03 -0.02 0.04 -0.02 0.03 -0.02 0.03 -0.03 0.03
Insured -0.11 0.05 -0.15 0.05 -0.17 0.04 -0.01 0.04 -0.11 0.05 -0.15 0.05 -0.17 0.04 -0.01 0.04
Satisfied 0.04 0.03 0.04 0.02 0.04 0.02 -0.09 0.06 0.04 0.03 0.05 0.02 0.04 0.02 -0.09 0.06
Own Health -0.01 0.03 -0.01 0.02 0.00 0.02 0.05 0.03 -0.01 0.03 -0.01 0.02 0.00 0.02 0.05 0.03
Family Health 0.12 0.04 0.18 0.03 0.22 0.03 -0.02 0.03 0.12 0.04 0.18 0.03 0.22 0.03 -0.02 0.03
Pro×PID -0.01 0.07 -0.07 0.07 -0.10 0.08 -0.06 0.08 0.00 0.07 -0.06 0.07 -0.09 0.09 -0.05 0.08
Pro×Age -0.19 0.11 -0.22 0.12 -0.28 0.14 -0.26 0.14 -0.21 0.11 -0.23 0.12 -0.28 0.14 -0.28 0.14
Pro×Education -0.01 0.10 -0.09 0.11 -0.15 0.13 -0.03 0.13 -0.03 0.10 -0.12 0.12 -0.16 0.13 -0.06 0.13
Pro×Male -0.03 0.04 -0.01 0.04 0.02 0.05 -0.02 0.05 -0.03 0.04 -0.01 0.04 0.02 0.05 -0.02 0.05
Pro×Income 0.01 0.07 0.02 0.08 -0.01 0.10 0.03 0.10 0.02 0.07 0.03 0.08 -0.01 0.10 0.03 0.10
Pro×Black 0.01 0.07 0.01 0.08 0.02 0.09 -0.01 0.09 0.01 0.07 0.02 0.08 0.03 0.09 0.00 0.09
Pro×Married 0.01 0.04 0.01 0.05 0.02 0.06 0.02 0.06 0.01 0.04 0.01 0.05 0.02 0.06 0.02 0.06
Pro×Insured -0.02 0.06 0.03 0.07 0.11 0.07 0.00 0.08 -0.02 0.06 0.03 0.07 0.11 0.07 0.00 0.08
Pro×Satisfied 0.08 0.09 0.14 0.10 0.17 0.11 0.18 0.11 0.07 0.09 0.13 0.10 0.16 0.11 0.17 0.11
Pro×Own Health -0.01 0.04 0.00 0.05 -0.02 0.06 0.00 0.06 -0.01 0.04 0.00 0.05 -0.02 0.06 0.00 0.06
Pro×Family Health -0.06 0.04 -0.07 0.05 -0.07 0.05 -0.08 0.05 -0.06 0.04 -0.08 0.05 -0.07 0.05 -0.08 0.05
Con×PID 0.37 0.06 0.37 0.07 0.36 0.08 0.49 0.08 0.36 0.06 0.36 0.07 0.35 0.08 0.47 0.08
Con×Age -0.03 0.10 0.05 0.12 0.13 0.14 0.01 0.14 -0.03 0.10 0.05 0.12 0.13 0.14 0.00 0.14
Con×Education 0.03 0.10 0.09 0.11 0.12 0.13 0.02 0.13 0.02 0.10 0.09 0.11 0.11 0.13 0.00 0.13
Con×Male -0.04 0.04 -0.02 0.04 -0.02 0.05 -0.05 0.05 -0.03 0.04 -0.02 0.04 -0.02 0.05 -0.05 0.05
Con×Income -0.08 0.07 -0.09 0.08 -0.08 0.10 -0.10 0.10 -0.08 0.07 -0.09 0.08 -0.08 0.10 -0.10 0.10
Con×Black 0.07 0.08 0.08 0.10 0.11 0.12 0.12 0.10 0.08 0.08 0.08 0.10 0.11 0.12 0.13 0.10
Con×Married 0.01 0.04 -0.02 0.05 -0.03 0.06 -0.02 0.06 0.01 0.04 -0.02 0.05 -0.02 0.06 -0.01 0.06
Con×Insured 0.01 0.06 -0.07 0.07 -0.17 0.08 -0.03 0.08 0.01 0.06 -0.06 0.07 -0.17 0.08 -0.03 0.08
Con×Satisfied -0.28 0.09 -0.27 0.10 -0.27 0.11 -0.40 0.11 -0.28 0.09 -0.27 0.10 -0.27 0.11 -0.40 0.11
Con×Own Health -0.02 0.04 -0.06 0.05 -0.08 0.06 -0.05 0.06 -0.03 0.04 -0.06 0.05 -0.08 0.06 -0.05 0.06
Con×Family Health 0.11 0.04 0.15 0.05 0.15 0.05 0.16 0.05 0.11 0.04 0.15 0.05 0.15 0.05 0.15 0.05
Pro×Con 0.07 0.05 0.07 0.06 0.06 0.08 0.10 0.08
Cutoffs for Pro/Con 3 or more 5 or more 7 or more NA 3 or more 5 or more 7 or more NA
Consideration
measure
# of Arguments Percentile # of Arguments Percentile
Note. N = 2165 for Models 1 through 6. N = 2019 for Models 7 through 12. All variables,
including Pro and Con, are scaled to 0-1. In Models 1, 5, 9, 13, the number of pro (or
con) arguments larger than three was recoded to three so that the maximum can be three,
which was then divided by three. In Models 2, 6, 10, 14 values greater than five were
recoded (to five). In Models 3, 7, 11, 15 the collapsing cutoff was 7. In Models 4, 8, 12,
16, percentile values of pros and cons were used without collapsing.

143
Table A10: Estimates of Information Effects
Model (1) Model (1) Model (3) Model (4)
Point Estimate -0.071 -0.068 -0.044 -0.041
Standard Error 0.011 0.011 0.013 0.013
95% CI (Upper bound) -0.050 -0.045 -0.019 -0.017
90% CI (Upper bound) -0.053 -0.049 -0.023 -0.020
90% CI (Lower bound) -0.090 -0.086 -0.066 -0.063
95% CI (Lower bound) -0.093 -0.089 -0.070 -0.067
Moderators PID PID and demographics
Information measure Original Percentile Original Percentile
Note. Entries are the estimates of (imputed) informed opinion minus (observed) baseline.
Estimates in bold are reported in the main text. The confidence intervals and standard
errors are calculated using bootstrapping. Each set of analyses—i.e., regression and
imputation—are replicated on 2000 bootstrap samples drawn from the original sample
with replacement. Thus, the standard error and confidence interval for fully informed
preference are standard deviation, and 5th and 95th quintiles of its values from the 2000
samples. Models 1 and 3 are reported in Figure 3 in the main text.

144
Table A11: Estimates of Consideration Effects (1) (2) (3) (4) Moderators
Point Estimate 0.015 0.029 0.038 0.031 PID
Standard Error 0.009 0.014 0.019 0.012 PID
95% CI (Upper bound) 0.032 0.057 0.076 0.053 PID
90% CI (Upper bound) 0.030 0.053 0.059 0.050 PID
90% CI (Lower bound) 0.0001 0.006 0.008 0.011 PID
95% CI (Lower bound) -0.003 0.001 0.002 0.007 PID
(5) (6) (7) (8)
Point Estimate 0.020 0.040 0.053 0.038 PID and Demographics
Standard Error 0.013 0.023 0.033 0.021 PID and Demographics
95% CI (Upper bound) 0.044 0.085 0.117 0.081 PID and Demographics
90% CI (Upper bound) 0.041 0.077 0.106 0.073 PID and Demographics
90% CI (Lower bound) -0.001 0.004 -0.002 0.002 PID and Demographics
95% CI (Lower bound) -0.005 -0.004 -0.012 -0.004 PID and Demographics
(9) (10) (11) (12) Moderators
Point Estimate 0.027 0.049 0.070 0.048 PID
Standard Error 0.010 0.015 0.022 0.013 PID
95% CI (Upper bound) 0.047 0.079 0.112 0.073 PID
90% CI (Upper bound) 0.044 0.074 0.105 0.069 PID
90% CI (Lower bound) 0.016 0.025 0.036 0.027 PID
95% CI (Lower bound) 0.009 0.020 0.027 0.023 PID
(13) (14) (15) (16)
Point Estimate 0.038 0.068 0.091 0.068 PID and Demographics
Standard Error 0.013 0.025 0.034 0.023 PID and Demographics
95% CI (Upper bound) 0.065 0.118 0.160 0.112 PID and Demographics
90% CI (Upper bound) 0.061 0.110 0.148 0.107 PID and Demographics
90% CI (Lower bound) 0.016 0.026 0.035 0.069 PID and Demographics
95% CI (Lower bound) 0.012 0.020 0.025 0.025 PID and Demographics
Pro×Con Term Included Yes Yes Yes Yes
Cutoffs for collapsing 3 5 7 NA
Consideration measure # of arguments Percentile
Note. Entries are the estimates of (imputed) informed opinion minus (observed) baseline.
Estimates in bold are reported in the main text. The confidence intervals and standard
errors are calculated using bootstrapping. Each set of analyses—i.e., regression and
imputation—are replicated on 2000 bootstrap samples drawn from the original sample
with replacement. Thus, the standard error and confidence interval for fully informed
preference are standard deviation, and 5th and 95th quintiles of its values from the 2000
samples. Estimates in bold are reported in Figure 3 of the main text.

145
Table A12: Deliberation Effect on Support for Universal Healthcare System
Intend-to-treat effect Average treat. effect on
treated Average treat. effect
Assign. Assign. as IV for Attend. Attend.
Coef SE Coef SE Coef SE Coef SE Coef SE Coef SE
Deliberation 0.03+ 0.02 0.03+ 0.02 0.08+ 0.04 0.08+ 0.04 0.04+ 0.02 0.05* 0.02
Covariates
Pros -0.01 0.00 -0.01 0.00 -0.01 0.00
Cons 0.01 0.00 0.01 0.00 0.01 0.00
Info 0.00 0.05 -0.02 0.05 -0.01 0.05
PID -0.04 0.03 -0.04 0.03 -0.04 0.03
Age 0.01 0.04 0.01 0.04 0.01 0.04
Education 0.04 0.04 0.03 0.04 0.03 0.04
Male 0.02 0.02 0.03 0.02 0.02 0.02
Income -0.01 0.03 -0.01 0.03 -0.01 0.03
Black 0.03 0.03 0.03 0.03 0.03 0.03
Married 0.00 0.02 0.00 0.02 0.00 0.02
Pol. interest -0.02 0.04 -0.02 0.04 -0.02 0.04
Participation -0.10 0.05 -0.10 0.05 -0.10 0.05
Pol.
Discussion 0.07 0.04 0.08 0.04 0.08 0.04
pol. news 0.02 0.05 0.02 0.05 0.02 0.05
HC. news -0.05 0.04 -0.05 0.04 -0.05 0.04
Insured -0.01 0.03 -0.01 0.03 -0.01 0.03
Own disease -0.01 0.02 -0.01 0.02 -0.01 0.02
Family
disease 0.03 0.02 0.03 0.02 0.03 0.02
HC
satisfaction 0.06 0.04 0.06 0.04 0.06 0.04
Intercept -0.06 0.01 -0.06 0.05 -0.06 0.01 -0.04 0.05 -0.04 0.01 -0.04 0.05
N 1,325 1,266 1,325 1,266 1,325 1,266
Estimator OLS OLS 2SLS 2SLS OLS OLS
+ p <0.1 * p < 0.05. P-values are omitted for covariates.

146
Appendix B Experiment 1 (Chapter 3)
Appendix B.1. Message Wordings
Appendix B.1.1. Con Argument
Many health economists argue that Obamacare will accelerate growth in health care
costs. Here's why: Obamacare requires health insurance providers to offer health
insurance policies at the same price to all persons, regardless of their health conditions.
This regulation will almost certainly increase medical costs for healthy people and lead
some of them to exit the insurance market, causing costs to rise even more. It is
extremely important to have enough healthy people in the market to control the rising
health care prices, but Obamacare does just the opposite. Because of this “adverse
selection” problem, the health economists think that the law will make medical care even
more expensive than would have been the case otherwise, and we will see much faster
growth in health spending over the next ten years.

147
Appendix B.1.2. Pro Argument
Many health economists argue that Obamacare will slow down growth in health care
costs. Here's why: Obamacare provides several incentives for previously uninsured
healthy people to join the insurance pool. Before Obamacare, medical costs were so high
mainly because those buying insurance were sicker than average, which in turn led some
healthy people to exit the insurance market, causing costs to rise even more. It is
extremely important to have enough healthy people in the market to control the rising
health care prices, and Obamacare does just that. Since Obamacare solves this “adverse
selection” problem, the health economists think that the law will make medical care less
expensive than would have been the case otherwise, and we will see much slower growth
in health spending over the next ten years.

148
Appendix B.2 List of Evidence and Sources69
• In 2016, premiums in the Obamacare Marketplaces decrease by 0.7% nationwide,
whereas the national average premium in the individual health insurance market
had increased by 10 to 12% per year before the reform (Kaiser Family Foundation
2015).
• In 2016, premiums in the Obamacare Marketplace increase by 7.1% in Louisville,
Kentucky (Kaiser Family Foundation and HRET 2015), whereas the national
average premium in the individual health insurance market had increased by 10 to
12% per year before the reform (Gruber 2014).
• During the first two quarters after the reform, premiums in the individual health
insurance market increased by 24.4% than what they would have without
Obamacare across all states (Kowalski 2014).
• During the first two quarters after the reform, premiums in the individual health
insurance market increased by 1.4% than what they would have without
Obamacare in Maryland (Kowalski 2014).
• The latest annual growth in national out-of-pocket spending (1.3%) is lower than
the Bush years (5.6% on average) (Centers for Medicare and Medicaid Services
2015; my calculation).
• The latest annual growth in spending on cosmetic surgeries (8.5%) is lower than
the Bush years (9.8% on average) (American Society for Aesthetic Plastic
Surgery 2015; my calculation)
• The latest annual growth in national spending on health insurance (6.2%) is higher
than the year prior to the reform (3.0%) (Centers for Medicare and Medicaid
Services 2015; my calculation).
• The latest annual growth in spending on cosmetic surgeries (8.5%) is higher than
the year prior to the reform (7.5%) (American Society for Aesthetic Plastic
Surgery 2015; my calculation).
• The average deductible for employer-sponsored health insurance has increased by
22% over the two years after the reform (Kaiser Family Foundation and HRET
2015).
• The average premium for employer-sponsored health insurance has increased by
7.3% over the two years after the reform (Kaiser Family Foundation and HRET
2015).
• The uninsured rate for non-elderly adults (ages 18 to 64) has decreased by
43%, over the two years after the reform (Department of Health and Human
Services 2016).
• The uninsured rate for U.S. adults (ages 18 or older) has decreased by 1% over
the preceding year (Gallup 2016).
69 The sources shown here were not provided to the participants of Experiment 1.

149
• The latest annual growth in premiums for employer-sponsored health insurance
(3.8% on average) is lower than the Bush years (8.8% on average) (Kaiser Family
Foundation and HRET 2015).
• The latest annual growth in private sector spending on medical research (5.2% on
average) is lower than the Bush years (7.2% on average) (American Society for
Aesthetic Plastic Surgery 2015; my calculation).
• In 2016, premiums in the Obamacare Marketplaces increase by 10.1%,
nationwide and above 30% in some states (Kaiser Family Foundation 2015).
• In 2016, premiums in the Obamacare Marketplaces increase by 4.7%, in
Cheyenne, Wyoming (Kaiser Family Foundation 2015).
• Before the reform, the five U.S. states with similar regulations as Obamacare were
among the states with the highest insurance premiums (Rosenbaum and Gruber
2010).
• Premiums for individuals decreased by 10.5% in Massachusetts when it
implemented a health care reform similar to Obamacare, while premiums
increased by 12.8% in neighboring states at the same period of time (between
2004 and 2010) (Hackmann et al. 2015).
• In a recent national survey, 52% of Americans say they are not worried about not
being able to afford prescription drugs while 48% say they are worried (Kaiser
Family Foundation 2016).
• Before the reform, 64% of Americans were worried about having to pay more for
health care, and now 67% are worried (Kaiser Family Foundation 2016).
• Canada spends less on health care than the US.
• US national health spending accounted for 17.1% of GDP before the reform, and
17.5% after the reform (Centers for Medicare and Medicaid Services 2015; my
calculation).

150
Appendix B.3. Survey Wordings
Attitudes toward the ACA (pre-treat)
In general, do you support or oppose the health care reform law passed in 2010?
This law is called the Affordable Care Act, and sometimes referred to as
Obamacare.
1) Strongly support
2) Moderately support
3) Neither support nor oppose
4) Moderately oppose
5) Strongly oppose
Conditional Probabilities was measured by the following 22 questions and was scaled
0.05-0.95 where 0.95 indicates a 95% probability that the health economists’ theory turns
out to be right given the presented evidence. The questions were presented in the random
order.
Now let's assume that a group of independent researchers conduct a new study.
Its findings may or may not be useful in refining your long-term predictions,
depending on how you interpret the implications. Please indicate how you would
assess the probability that the health economists' prediction (Obamacare
accelerating [slowing down] cost growth) turns out to be right over the next ten
years, if and when the new study finds each of the followings.
If the new study finds the following...
In 2016, premiums in the Obamacare Marketplaces decrease by 0.7%
nationwide, the national average premium in the individual health
insurance market had increased by 10 to 12% per year before the
reform
I will say probability that the health economists’ theory (Obamacare accelerating
[slowing down] cost growth) turns out to be right over the next ten years is…
1) Extremely high (95% chance)
2) Fairly high (80% chance)
3) A little high (65% chance)
4) Neither high nor low (50/50)
5) A little low (35% chance)
6) Fairly low (20% chance)
7) Extremely low (5% chance)
If the new study finds the following...

151
In 2016, premiums in the Obamacare Marketplaces decrease by 0.7%
nationwide, the national average premium in the individual health
insurance market had increased by 10 to 12% per year before the
reform
I will say probability that the health economists’ theory (Obamacare accelerating
[slowing down] cost growth) turns out to be right over the next ten years
is… (same multiple choice options as above)
If the new study finds the following...
In 2016, premiums in the Obamacare Marketplace increase by 7.1% in
Louisville, Kentucky, whereas the national average premium in the
individual health insurance market had increased by 10 to 12% per year
before the reform
I will say probability that the health economists’ theory (Obamacare accelerating
cost growth) turns out to be right over the next ten years is… (same multiple
choice options as above)
If the new study finds the following...
During the first two quarters after the reform, premiums in the individual
health insurance market increased by 24.4% than what they would have
without Obamacare across all states
I will say probability that the health economists’ theory (Obamacare accelerating
[slowing down] cost growth) turns out to be right over the next ten years
is… (same multiple choice options as above)
If the new study finds the following...
During the first two quarters after the reform, premiums in the individual
health insurance market increased by 1.4% than what they would have
without Obamacare in Maryland
I will say probability that the health economists’ theory (Obamacare accelerating
[slowing down] cost growth) turns out to be right over the next ten years
is… (same multiple choice options as above)
If the new study finds the following...
The latest annual growth in national out-of-pocket spending (1.3%) is
lower than the Bush years (5.6% on average)
I will say probability that the health economists’ theory (Obamacare accelerating
[slowing down] cost growth) turns out to be right over the next ten years
is… (same multiple choice options as above)
If the new study finds the following...
The latest annual growth in spending on cosmetic surgeries (8.5%) is
lower than the Bush years (9.8% on average)

152
I will say probability that the health economists’ theory (Obamacare accelerating
[slowing down] cost growth) turns out to be right over the next ten years
is… (same multiple choice options as above)
If the new study finds the following...
The latest annual growth in national spending on health insurance
(6.2%) is higher than the year prior to the reform (3.0%).
I will say probability that the health economists’ theory (Obamacare accelerating
[slowing down] cost growth) turns out to be right over the next ten years
is… (same multiple choice options as above)
If the new study finds the following...
The latest annual growth in spending on cosmetic surgeries (8.5%) is
higher than the year prior to the reform (7.5%)
I will say probability that the health economists’ theory (Obamacare accelerating
[slowing down] cost growth) turns out to be right over the next ten years
is… (same multiple choice options as above)
If the new study finds the following...
The average deductible for employer-sponsored health insurance has
increased by 22% over the two years after the reform
I will say probability that the health economists’ theory (Obamacare accelerating
[slowing down] cost growth) turns out to be right over the next ten years
is… (same multiple choice options as above)
If the new study finds the following...
The average premium for employer-sponsored health insurance has
increased by 7.3% over the two years after the reform
I will say probability that the health economists’ theory (Obamacare accelerating
c[slowing down] ost growth) turns out to be right over the next ten years
is… (same multiple choice options as above)
If the new study finds the following...
The uninsured rate for non-elderly adults (ages 18 to 64) has decreased
by 43%, over the two years after the reform
I will say probability that the health economists’ theory (Obamacare accelerating
[slowing down] cost growth) turns out to be right over the next ten years
is… (same multiple choice options as above)
If the new study finds the following...
The uninsured rate for U.S. adults (ages 18 or older) has decreased by
1% over the preceding year

153
I will say probability that the health economists’ theory (Obamacare accelerating
[slowing down] cost growth) turns out to be right over the next ten years
is… (same multiple choice options as above)
If the new study finds the following...
The latest annual growth in premiums for employer-sponsored health
insurance (3.8% on average) is lower than the Bush years (8.8% on
average)
I will say probability that the health economists’ theory (Obamacare accelerating
[slowing down] cost growth) turns out to be right over the next ten years
is… (same multiple choice options as above)
If the new study finds the following...
The latest annual growth in private sector spending on medical research
(5.2% on average) is lower than the Bush years (7.2% on average)
I will say probability that the health economists’ theory (Obamacare accelerating
[slowing down] cost growth) turns out to be right over the next ten years
is… (same multiple choice options as above)
If the new study finds the following...
In 2016, premiums in the Obamacare Marketplaces increase by 10.1%,
nationwide and above 30% in some states
I will say probability that the health economists’ theory (Obamacare accelerating
[slowing down] cost growth) turns out to be right over the next ten years
is… (same multiple choice options as above)
If the new study finds the following...
In 2016, premiums in the Obamacare Marketplaces increase by 4.7%, in
Cheyenne, Wyoming
I will say probability that the health economists’ theory (Obamacare accelerating
[slowing down] cost growth) turns out to be right over the next ten years
is… (same multiple choice options as above)
If the new study finds the following...
Before the reform, the five U.S. states with similar regulations as
Obamacare were among the states with the highest insurance
premiums
I will say probability that the health economists’ theory (Obamacare accelerating
[slowing down] cost growth) turns out to be right over the next ten years
is… (same multiple choice options as above)
If the new study finds the following...
Premiums for individuals decreased by 10.5% in Massachusetts when it
implemented a health care reform similar to Obamacare, while

154
premiums increased by 12.8% in neighboring states at the same period
of time (between 2004 and 2010)
I will say probability that the health economists’ theory (Obamacare accelerating
[slowing down] cost growth) turns out to be right over the next ten years
is… (same multiple choice options as above)
If the new study finds the following...
In a recent national survey, 52% of Americans say they are not worried
about not being able to afford prescription drugs while 48% say they are
worried
I will say probability that the health economists’ theory (Obamacare accelerating
[slowing down] cost growth) turns out to be right over the next ten years
is… (same multiple choice options as above)
If the new study finds the following...
Before the reform, 64% of Americans were worried about having to pay
more for health care, and now 67% are worried
I will say probability that the health economists’ theory (Obamacare accelerating
[slowing down] cost growth) turns out to be right over the next ten years
is… (same multiple choice options as above)
If the new study finds the following...
Canada spends less on health care than the US
I will say probability that the health economists’ theory (Obamacare accelerating
[slowing down] cost growth) turns out to be right over the next ten years
is… (same multiple choice options as above)
If the new study finds the following...
US national health spending accounted for 17.1% of GDP before the
reform, and 17.5% after the reform
I will say probability that the health economists’ theory (Obamacare accelerating
[slowing down] cost growth) turns out to be right over the next ten years
is… (same multiple choice options as above)
Message Recall
Which of the followings is consistent with the message you read above? (If you
are not sure, you can mark that too)
1) Many health economists argue that Obamacare will accelerate growth
in health care costs
2) Many health economists argue that Obamacare will slow down
growth in health care costs
3) Not sure

155
Which of the following terms did the message use to explain the health
economists' theory? (If you are not sure, you can mark that too)
1) The free rider problem
2) Adverse selection
3) Risk aversion
4) Not sure
Screener (Those who failed this were underweighted)
When a big news story breaks people often go online to get up-to-the-minute
details on what is going on. We want to know which websites people trust to get
this information. We also want to know if people are paying attention to the
question. To show that you’ve read this much, please ignore the question
and select the Drudge Report and none of the above as your two answers.
1) New York Times website (1)
2) Huffington Post (2)
3) Washington Post website (3)
4) Cnn.com (4)
5) FoxNews.com (5)
6) MSNBC.com (6)
7) The Associated Press website (7)
8) Reuters website (8)
9) New York Post online (9)
10) The Drudge Report (10)
11) Google News (11)
12) ABC News website (12)
13) CBS News website (13)
14) NBC News website (14)
15) Yahoo! News (15)
16) NPR website (16)
17) USA Today website (17)
18) None of the above (18)

156
Appendix B.4. Additional Information on Results from Experiment 1
In Columns 1, 3, and 5 of Table A13, I report the regression models on which
Figure 4 is based. The dependent variable (conditional probability that the health
economists’ prediction turns out to be correct) was regressed on the position of the
presented argument (between-subject factor), the dummies for each piece of evidence (22
within-subject factors), and the interactions between the argument and evidence factors.70
Standard errors were clustered at the respondent level. The table shows the coefficients
on each of these terms. As noted in the main text, those who exhibited low attention by
failing the screener question (see Appendix B.3) were underweighted. Those who chose
only one of the two correct options were weighted by 0.5, and those who choose none of
the two were weighted by 0 (i.e., dropped).
Column 2, 4, and 6 of Table A13 repeats the same model, but this time without
underweighting the low-attention respondents. As can be seen, the results are very similar
across this specification choice.
70 The reference category for the evidence factor was “Premiums in ACA marketplaces
increase 10% nationwide (SC[h]).”

157
Table A13-1: Conditional Probabilities Given Evidence (1) (2) (3) (4) (5) (6)
Subset All Opponents Proponents
Pro Argument -0.368* -0.317* -0.646* -0.591* -0.133* -0.113* (0.035) (0.033) (0.038) (0.044) (0.050) (0.044)
SC(b): Individual premiums increased 24% after ACA nationwide -0.010 -0.012 -0.018 -0.009 0.026 0.013
(0.022) (0.021) (0.028) (0.030) (0.034) (0.030) SC(e): Employee deductibles have increased 20% 2 years into ACA -0.036* -0.036* -0.034 -0.018 -0.026 -0.046
(0.021) (0.021) (0.027) (0.028) (0.036) (0.033) SC(d): National health spending is higher than pre-ACA -0.043* -0.032* -0.063* -0.048* -0.023 -0.013
(0.019) (0.017) (0.024) (0.025) (0.032) (0.026) SC: States with ACA provisions had highest premiums before ACA -0.053* -0.044* -0.080* -0.078* -0.016 -0.005
(0.022) (0.020) (0.036) (0.032) (0.031) (0.027) WC(e): Employee premiums have increased 7% 2 years into ACA -0.056* -0.044* -0.063* -0.048* -0.046 -0.041
(0.018) (0.017) (0.019) (0.023) (0.034) (0.028) WC: 64% were worried health cost before ACA, now 67% are worried -0.105* -0.089* -0.146* -0.129* -0.058 -0.058
(0.024) (0.022) (0.026) (0.027) (0.042) (0.036) WC(h): Premiums in ACA marketplaces increase 5% in Cheyenne -0.140* -0.131* -0.143* -0.117* -0.138* -0.147*
(0.024) (0.023) (0.030) (0.033) (0.041) (0.038) WC: Share of health spending in GDP changed from 17.1 to 17.5 -0.154* -0.135* -0.137* -0.102* -0.168* -0.160*
(0.019) (0.021) (0.030) (0.034) (0.030) (0.034) WP(a): Premiums in ACA marketplaces increase 7% in Louisville -0.192* -0.162* -0.224* -0.192* -0.176* -0.145*
(0.025) (0.024) (0.034) (0.036) (0.040) (0.034) WC(b): Individual premiums increased 1.4% after ACA in Maryland -0.145* -0.125* -0.186* -0.147* -0.127* -0.122*
(0.022) (0.021) (0.032) (0.033) (0.038) (0.033) WP: 52% are not worried prescription drug cost -0.154* -0.130* -0.168* -0.132* -0.145* -0.132*
(0.023) (0.022) (0.035) (0.035) (0.037) (0.035) WP: Canada spends less on health care than the US -0.158* -0.145* -0.217* -0.192* -0.110* -0.119*
(0.025) (0.024) (0.028) (0.029) (0.046) (0.042)
WC (d): Cosmetic surgery spending growth is higher than pre ACA -0.179* -0.161* -0.224* -0.192* -0.150* -0.147*
(0.025) (0.024) (0.039) (0.039) (0.038) (0.035) WP(g): Research spending growth is lower than Bush years -0.203* -0.188* -0.251* -0.222* -0.175* -0.170*
(0.029) (0.026) (0.043) (0.041) (0.044) (0.039) WP(f): Uninsured rate dropped 1% past year -0.224* -0.204* -0.296* -0.252* -0.165* -0.160*
(0.027) (0.025) (0.041) (0.040) (0.039) (0.036) WP(c): Cosmetic surgery spending growth is lower than Bush years -0.227* -0.205* -0.277* -0.240* -0.171* -0.165*
(0.025) (0.024) (0.038) (0.037) (0.039) (0.035) SP Premiums went down in MA after health reform -0.202* -0.192* -0.242* -0.216* -0.190* -0.196*
(0.024) (0.023) (0.036) (0.036) (0.041) (0.036) SP(a): Premiums in ACA marketplaces decrease .7% nationwide -0.258* -0.230* -0.325* -0.288* -0.209* -0.188*
(0.028) (0.027) (0.045) (0.043) (0.042) (0.039) SP(f): Uninsured rate 43% has dropped since ACA -0.269* -0.225* -0.336* -0.285* -0.237* -0.198*
(0.028) (0.028) (0.046) (0.047) (0.042) (0.039) SP(c): Out of pocket spending growth is lower than Bush years -0.302* -0.257* -0.360* -0.309* -0.241* -0.201*
(0.028) (0.027) (0.045) (0.044) (0.038) (0.036) SP(g): Employee premium growth is lower than Bush years -0.335* -0.298* -0.432* -0.375* -0.257* -0.239*
(0.028) (0.027) (0.042) (0.044) (0.040) (0.036)
Low Attention Participants Underweighted Yes No Yes No Yes No

158
Table A13-2: Conditional Probabilities Given Evidence (Continued) (1) (2) (3) (4) (5) (6)
Subset All Opponents Proponents
Pro Argument × SC(b): Individual premiums increased 24% after ACA nationwide 0.019 0.004 0.091* 0.081* -0.072 -0.079* (0.031) (0.031) (0.047) (0.047) (0.046) (0.042)
Pro Argument × SC(e): Employee deductibles have increased 20% 2 years into ACA 0.054* 0.036 0.050 0.021 0.041 0.036 (0.030) (0.029) (0.040) (0.042) (0.048) (0.044)
Pro Argument × SC(d): National health spending is higher than pre-ACA 0.092* 0.057* 0.122* 0.096* 0.056 0.010 (0.027) (0.026) (0.038) (0.038) (0.043) (0.039)
Pro Argument × SC: States with ACA provisions had highest premiums before ACA 0.096* 0.079* 0.153* 0.163* 0.021 -0.007 (0.028) (0.027) (0.043) (0.041) (0.041) (0.039)
Pro Argument × WC(e): Employee premiums have increased 7% 2 years into ACA 0.110* 0.084* 0.105* 0.089* 0.111* 0.074* (0.027) (0.026) (0.034) (0.035) (0.047) (0.042)
Pro Argument × WC: 64% were worried health cost before ACA, now 67% are worried 0.164* 0.139* 0.217* 0.194* 0.102* 0.089* (0.031) (0.029) (0.038) (0.040) (0.053) (0.047)
Pro Argument × WC(h): Premiums in ACA marketplaces increase 5% in Cheyenne 0.214* 0.207* 0.236* 0.206* 0.189* 0.207* (0.031) (0.030) (0.039) (0.042) (0.052) (0.047)
Pro Argument × WC: Share of health spending in GDP changed from 17.1 to 17.5 0.235* 0.202* 0.232* 0.204* 0.237* 0.198* (0.027) (0.029) (0.037) (0.042) (0.044) (0.046)
Pro Argument × WP(a): Premiums in ACA marketplaces increase 7% in Louisville 0.267* 0.232* 0.313* 0.284* 0.253* 0.212* (0.033) (0.032) (0.044) (0.046) (0.052) (0.047)
Pro Argument × WC(b): Individual premiums increased 1.4% after ACA in Maryland 0.271* 0.236* 0.307* 0.266* 0.252* 0.224* (0.032) (0.031) (0.043) (0.045) (0.050) (0.046)
Pro Argument × WP: 52% are not worried prescription drug cost 0.272* 0.219* 0.298* 0.255* 0.267* 0.204* (0.033) (0.032) (0.046) (0.045) (0.054) (0.050)
Pro Argument × WP: Canada spends less on health care than the US 0.279* 0.248* 0.353* 0.332* 0.220* 0.193* (0.036) (0.036) (0.046) (0.050) (0.063) (0.059)
Pro Argument × WC (d): Cosmetic surgery spending growth is higher than pre ACA 0.296* 0.259* 0.350* 0.315* 0.254* 0.221*
(0.034) (0.032) (0.051) (0.050) (0.051) (0.047)
Pro Argument × WP(g): Research spending growth is lower than Bush years 0.350* 0.319* 0.405* 0.379* 0.312* 0.277* (0.037) (0.035) (0.055) (0.054) (0.055) (0.051)
Pro Argument × WP(f): Uninsured rate dropped 1% past year 0.360* 0.315* 0.423* 0.378* 0.297* 0.255* (0.036) (0.034) (0.051) (0.050) (0.053) (0.049)
Pro Argument × WP(c): Cosmetic surgery spending growth is lower than Bush years 0.394* 0.355* 0.438* 0.414* 0.339* 0.294* (0.036) (0.035) (0.050) (0.052) (0.057) (0.050)
Pro Argument × SP Premiums went down in MA after health reform 0.395* 0.360* 0.445* 0.417* 0.385* 0.351* (0.037) (0.034) (0.052) (0.052) (0.058) (0.050)
Pro Argument × SP(a): Premiums in ACA marketplaces decrease .7% nationwide 0.464* 0.412* 0.467* 0.445* 0.454* 0.371* (0.042) (0.039) (0.063) (0.062) (0.062) (0.056)
Pro Argument × SP(f): Uninsured rate 43% has dropped since ACA 0.468* 0.391* 0.545* 0.500* 0.440* 0.341* (0.042) (0.040) (0.062) (0.062) (0.064) (0.058)
Pro Argument × SP(c): Out of pocket spending growth is lower than Bush years 0.526* 0.448* 0.583* 0.541* 0.467* 0.363* (0.039) (0.038) (0.060) (0.058) (0.055) (0.053)
Pro Argument × SP(g): Employee premium growth is lower than Bush years 0.569* 0.499* 0.675* 0.627* 0.482* 0.401* (0.042) (0.040) (0.062) (0.062) (0.063) (0.055)
Intercept 0.704* 0.680* 0.838* 0.788* 0.582* 0.589*
(0.021) (0.021) (0.022) (0.031) (0.029) (0.028)
N 4708 5412 1914 2068 2200 2684
Low Attention Participants Underweighted Yes No Yes No Yes No
Note. OLS estimates. Standard errors in parentheses are clustered at the respondent level. The reference category for
the evidence factor is “Premiums in ACA marketplaces increase 10% nationwide (SC[h]).” “S” indicates “Strong.”
“W” indicates “Weak.” “P” indicates “Pro.” “C” indicates “Con.” Lower case letters in parentheses pair a piece of
strong evidence with its weaker version. For example, SP(a) and WP(a) are a pair.

159
Appendix C Experiment 2 (Chapter 3)
Appendix C.1. Message Wordings
Appendix C.1.1 Strong Con
A checkup for Obamacare reveals a warning sign
Since the passage of Obamacare, health experts have been keeping close taps on how the
law is changing America’s health care system.
What is the prognosis, almost three years into implementation? Despite some successes,
Obamacare is failing to address one of the most serious problems of America’s health
care system: the rising costs.
This isn't surprising to many health economists who had argued that Obamacare would
accelerate growth in health care costs from the beginning.
Here’s why: Obamacare requires health insurance providers to offer health insurance
policies at the same price to all persons, regardless of their health conditions. This
regulation would almost certainly increase medical costs for healthy people and lead
some of them to exit the insurance market, causing costs to rise even more.
It is extremely important to have enough healthy people in the market to control the rising
health care prices, but Obamacare does just the opposite.
Because of this “adverse selection” problem, the health economists have said that the law
would make medical care even more expensive than would have been the case otherwise,
and we would see much faster growth in health spending over the next ten years.
Now, there is mounting evidence that that the health economists were right.
1. Earlier this year, the Kaiser Family Foundation released an analysis showing
that premiums in Obamacare Marketplaces were rising by 10.1% on average
nationwide, and above 30% in some states.

160
2. A new study by a Yale economist finds that, during the first two quarters after
the reform, premiums in the individual health insurance market increased by
24.4% than what they would have without Obamacare across all states.
3. According to the 2015 annual health benefits survey by the Kaiser Family
Foundation, the average deductible for employer-sponsored health insurance has
increased by 22.0% over the two years after the reform.
4. The latest national health expenditure data released by the Centers for Medicaid
and Medicare Services shows that the annual growth in national spending
on health insurance was 6.2% in 2014. This was much higher than the annual
growth rate before the reform (3.0%).
So no matter how you look at the data, the evidence is clear. Obamacare is not
sustainable, and is likely to implode down the road if the current trend continues.
Then, what should be done? This question continues to frustrate many legislators and
experts. What is unhelpful, though, is the unwillingness to recognize the warning signs.

161
Appendix C.1.2 Weak Con
A checkup for Obamacare reveals a warning sign
Since the passage of Obamacare, health experts have been keeping close taps on how the
law is changing America’s health care system.
What is the prognosis, almost three years into implementation? Despite some successes,
Obamacare is failing to address one of the most serious problems of America’s health
care system: the rising costs.
This isn't surprising to many health economists who had argued that Obamacare would
accelerate growth in health care costs from the beginning.
Here’s why: Obamacare requires health insurance providers to offer health insurance
policies at the same price to all persons, regardless of their health conditions. This
regulation would almost certainly increase medical costs for healthy people and lead
some of them to exit the insurance market, causing costs to rise even more.
It is extremely important to have enough healthy people in the market to control the rising
health care prices, but Obamacare does just the opposite.
Because of this “adverse selection” problem, the health economists have said that the law
would make medical care even more expensive than would have been the case otherwise,
and we would see much faster growth in health spending over the next ten years.
Now, there is mounting evidence that that the health economists were right.
1. Earlier this year, the Kaiser Family Foundation released an analysis showing
that premiums in Obamacare Marketplaces were rising by 4.7% in Cheyenne,
Wyoming.
2. A new study by a Yale economist finds that, during the first two quarters after
the reform, premiums in the individual health insurance market increased by
1.4% than what they would have without Obamacare in Maryland.
3. According to the 2015 annual health benefits survey by the Kaiser Family
Foundation, the average premium for employer-sponsored health insurance has
increased by 7.3% over the two years after the reform.

162
4, The latest data released by the American Society for Aesthetic Plastic Surgery
shows that the annual growth in spending on cosmetic surgeries was 8.5% in
2015. This was higher than the annual growth rate before the reform (7.5%).
So no matter how you look at the data, the evidence is clear. Obamacare is not
sustainable, and is likely to implode down the road if the current trend continues.
Then, what should be done? This question continues to frustrate many legislators and
experts. What is unhelpful, though, is the unwillingness to recognize the clear warning
signs.

163
Appendix C.1.3. Strong Pro
A checkup for Obamacare reveals a positive prognosis
Since the passage of Obamacare, health experts have been keeping close taps on how the
law is changing America’s health care system.
What is the prognosis, almost three years into implementation? Despite some problems,
Obamacare is successfully addressing one of the most serious problems of America’s
health care system: the rising costs.
This isn’t surprising to many health economists who had argue that Obamacare would
slow down growth in health care costs from the beginning.
Here's why: Obamacare provides several incentives for previously uninsured healthy
people to join the insurance pool. Before the ACA, medical costs were so high mainly
because those buying insurance were sicker than average, which in turn led some healthy
people to exit the insurance market, causing costs to rise even more.
It is extremely important to have enough healthy people in the market to control the rising
health care prices, and Obamacare does just that.
Since Obamacare solves this “adverse selection” problem, the health economists have
said that the law would make medical care less expensive than would have been the case
otherwise, and we would see much slower growth in health spending over the next ten
years.
Now, there is mounting evidence that that the health economists were right.
1. Confirming the health economists’ key assumption about expanding the
insurance pool, an analysis by the Department of Health and Human Services
indicates that the uninsured rate for non-elderly adults has decreased by
43%, over the two years after the reform.
2. According to a report by the Kaiser Family Foundation, the overall premium
for employer-sponsored health insurance rose by 3.8% each year since the
reform. By contrast, during the Bush years, premiums increased on average by
8.8 % each year.
3. According to the latest data released by the Centers for Medicaid and Medicare
Services, the annual growth in national out-of-pocket spending was 1.3% in 2014.
Again this is lower than the annual growth rates under Bush (5.6% on average).

164
4. Earlier this year, Kaiser Family Foundation released an analysis showing
premiums in the Obamacare Marketplaces decreased by 0.7% nationwide, after
accounting for tax credits. In comparison, the national individual health insurance
premium had increased by 10 to 12% per year before the reform, according to an
analysis by an MIT economist.
So no matter how you look at the data, the evidence is clear. Obamacare is fixing the
problem that would have made the system far worse than it is now.
Of course, the law is not perfect by any means and there should be debates about how to
make more progresses. What is unhelpful, though, is the unwillingness to recognize the
positive signs.

165
Appendix C.1.4. Weak Pro
A checkup for Obamacare reveals a positive prognosis
Since the passage of Obamacare, health experts have been keeping close taps on how the
law is changing America’s health care system.
What is the prognosis, almost three years into implementation? Despite some problems,
Obamacare is successfully addressing one of the most serious problems of America’s
health care system: the rising costs.
This isn’t surprising to many health economists who had argue that Obamacare would
slow down growth in health care costs from the beginning.
Here's why: Obamacare provides several incentives for previously uninsured healthy
people to join the insurance pool. Before Obamacare, medical costs were so high mainly
because those buying insurance were sicker than average, which in turn led some healthy
people to exit the insurance market, causing costs to rise even more.
It is extremely important to have enough healthy people in the market to control the rising
health care prices, and Obamacare does just that.
Since Obamacare solves this “adverse selection” problem, the health economists think
that the law would make medical care less expensive than would have been the case
otherwise, and we would see much slower growth in health spending over the next ten
years.
Now, there is mounting evidence that that the health economists were right.
1. Confirming the health economists’ key assumption about expanding the
insurance pool, a recent Gallup poll indicates that the uninsured rate for U.S.
adults (ages 18 or older) has decreased by 1% point over 2015.
2. According to the data released by the Centers for Medicaid and Medicare
Services, private sector spending on medical research rose by 5.2% since the
reform. By contrast, during the Bush years, private sector spending on medical
research increased on average by 7.2% each year.
3. According to the 2015 survey by the American Society for Aesthetic Plastic
Surgery, the annual growth in spending on cosmetic surgeries was 8.5% in 2015.
Again this was lower than the annual growth rates under Bush (9.8% on average).

166
4. Earlier this year, the Kaiser Family Foundation released an analysis showing
premiums in the Obamacare Marketplaces increased by 7.1% in Louisville,
Kentucky. In comparison, the national individual health insurance premium had
increased by 10 to 12% per year before the reform, according to an analysis by an
MIT economist.
So no matter how you look at the data, the evidence is clear. The Obamacare is fixing the
problem that would have made the system far worse than it is now.
Of course, the law is not perfect by any means and there should be debates about how to
make more progresses. What is unhelpful, though, is the unwillingness to recognize the
positive signs.

167
Appendix C.1.5. Placebo
Germans Forget Postwar History Lesson on Debt Relief in Greece Crisis
It is not hard to notice hypocrisy in Germany’s insistence that Athens must agree to more
painful austerity before any sort of debt relief can be put on the table: The main creditor
demanding that Greeks be made to pay for past profligacy benefited not so long ago from
more lenient terms.
But beyond serving as a reminder of German hypocrisy, the history offers a more
important lesson: These sorts of things have been dealt with successfully before. The 20th
century offers a rich road map of policy failure and success addressing sovereign debt
crises.
The good news is that by now economists generally understand the contours of a
successful approach. “I’ve seen this movie so many times before,” said Carmen M.
Reinhart, a professor at the Kennedy School of Government at Harvard who is perhaps
the world’s foremost expert on sovereign debt crises. “It is very easy to get hung up on
the idiosyncrasies of each individual situation and miss the recurring pattern.”
The recurring, historical pattern? Major debt overhangs are only solved after deep write-
downs of the debt’s face value. The longer it takes for the debt to be cut, the bigger the
necessary write-down will turn out to be. Nobody should understand this better than the
Germans. It’s not just that they benefited from the deal in 1953, which underpinned
Germany’s postwar economic miracle.
Twenty years earlier, Germany defaulted on its debts from World War I, after undergoing
a bout of hyperinflation and economic depression that helped usher Hitler to power. It is a
general lesson about the nature of debt from the World War I defaults of more than a
dozen countries in the 1930s to the Brady write-downs of the early 1990s.
Both of these episodes were preceded by a decade or more of negotiations and
rescheduling plans that — not unlike Greece’s first bailout programs — extended the
maturity of debts and lowered their interest rate. But crises ended and economies
improved only after the debt was cut. A new study found sharp economic rebounds after
the 1934 defaults — which cut debtors’ foreign indebtedness by at least 43 percent, on
average — and the Brady plan, which sliced debtors’ burdens by an average of 36
percent.
The crisis exit in both episodes came only after deep face-value debt write-offs had been
implemented. Softer forms of debt relief, such as maturity extensions and interest rate
reductions, are not generally followed by higher economic growth or improved credit

168
ratings.
Yet Policy makers have yet to get this. It took a decade or more from the onset of the
Latin American debt crisis to the Brady deal. Brazil alone had six debt restructurings.
Similarly, the generalized defaults of 1934 followed more than a decade of failed half-
measures. Does Greece have to wait that long, too?

169
Appendix C.2. Measurement and Survey Wordings
Appendix C.2.1. Pre-treat Covariates (Control Variables)
Attitudes toward the ACA (Wave 1) was constructed by combining the five items, and
scaled to 0-1 where 1 indicates the strongest support (Cronbach’s alpha = 0.96).
In general, do you support or oppose the health care reform law passed in 2010?
This law is called the Affordable Care Act, and sometimes referred to as
Obamacare.
1) Support
2) Oppose
3) Neither support nor oppose
Is your support [opposition] strong or not so strong?
1) Strong
2) Not so strong
Do you lean toward supporting or opposing the health care reform
law, or do you not lean either way?
1) Supporting
2) Opposing
3) Do not lean either way
Would you vote to repeal the health care reform law, if you were in Congress
today?
1) Definitely yes
2) Probably yes
3) Might or might not
4) Probably not
5) Definitely not
6) Not sure
On the whole, the health care reform law is changing the American health care
system...
1) Definitely for the better
2) Probably for the better
3) Neither for the better nor worse
4) Probably for the worse
5) Definitely for the worse
In the long run, the overall impacts of the health care reform law on the
American people will be...

170
1) Definitely good
2) Probably good
3) Neither good nor bad
4) Probably bad
5) Definitely bad
In the long run, the overall impacts of the health care reform law on you and your
family will be...
1) Definitely good
2) Probably good
3) Neither good nor bad
4) Probably bad
5) Definitely bad
Belief that the ACA saves costs (Wave 1) was measured by combining the following three
items, and scaled to run from 0 to 1 where 1 indicates the strongest belief that the ACA
saves health care costs (Cronbach’s alpha = 0.77). “Not sure” responses were coded 0.5.
In terms of health care costs, the reform law is changing the American health care
system...
1) Definitely for the better
2) Probably for the better
3) Neither better nor worse
4) Probably for the worse
5) Definitely for the worse
6) Not sure
Based on what you have heard, the probability that the law slows down growth in
health care costs over the next ten years is...
1) Extremely high (95% chance)
2) Fairly high (80% chance)
3) A little high (65% chance)
4) Neither high nor low (50/50)
5) A little low (35% chance)
6) Fairly low (20% chance)
7) Extremely low (5% chance)
8) Not sure
Based on what you have heard, the probability that the law accelerates growth in
health care costs over the next ten years is...
1) Extremely high (95% chance)
2) Fairly high (80% chance)
3) A little high (65% chance)
4) Neither high nor low (50/50)

171
5) A little low (35% chance)
6) Fairly low (20% chance)
7) Extremely low (5% chance)
8) Not sure
Vote Choice 1 (Wave 1) was measured by the following questionnaire. When controlling
for this pre-treatment covariate, I estimated the fixed effects terms of each choice,
treating “The Democratic Party” as the reference category.
If you had to choose now, for which party would you vote in the 2016
Presidential Election?
1) The Democratic Party (whoever wins the nomination among the current
candidates)
2) The Republican Party (whoever wins the nomination among the current
candidates)
3) Either Party (depending on the primary results)
4) Neither Party
5) Will not vote
6) Not sure
Vote Choice 2 (Wave 1) was measured by the following questionnaire. When controlling
for this pre-treatment covariate, I estimated the fixed effects terms of each choice,
treating “Hillary Clinton” as the reference category.
If Hillary Clinton were the Democratic Party's candidate and Donald Trump were
the Republican Party's candidate, who would you vote for?
1) Hillary Clinton
2) Donald Trump
3) Someone else
4) Will not vote
5) Not sure
Party Identification (Wave 1) was measured by the following questionnaire, and scaled 0-
1 where 1 indicates “Strong Democrat”
Generally speaking, do you think of yourself as a Democrat, a Republican, an
Independent or something else?
1) Democrat
2) Republican
3) Independent
4) Other
Would you call yourself a strong Democrat or a not very strong
Democrat [Republican]?
1) Strong Democrat [Republican]

172
2) Not very strong Democrat [Republican]
Do you think of yourself as closer to the Democratic Party, the
Republican Party, or neither?
1) Closer to the Democratic Party
2) Closer to the Republican Party
3) Neither
Approval of Obama (Wave 1) was measured by the following questionnaire, and scaled 0-
1 where 1 indicates “strongly approve.”
Do you approve or disapprove of the way Barack Obama is handling his job as
President?
1) Strongly approve
2) Somewhat approve
3) Neither approve nor disapprove
4) Somewhat disapprove
5) Strongly disapprove
Approval of Obama’s Handling of Healthcare (Wave 1) was measured by the following
questionnaire, and scaled 0-1 where 1 indicates “strongly approve.”
Do you approve or disapprove of the way Barack Obama is handling health care?
1) Strongly approve
2) Somewhat approve
3) Neither approve nor disapprove
4) Somewhat disapprove
5) Strongly disapprove

173
Appendix C.2.2. Dependent Variables
Attitudes toward the ACA (wave 2) was measured in the same way as the pre-treatment
measurement (see above for survey wordings; Cronbach’s alpha = 0.96).
Belief that the ACA saves costs (wave 2) was measured in the same way as the pre-
treatment measurement (see above for survey wordings; Cronbach’s alpha = 0.83).
Vote Choice (wave 2) was measured the same survey item as the pre-treatment
measurement (see above the survey wordings). In the analyses presented below in this
appendix, “The Democratic Party” was coded 1, and other choices were coded 0.
Approval of Obama (Wave 2) was measured in the same way as the pre-treatment
measurement (see above for survey wording).
Approval of Obama’s Handling of Healthcare (Wave 2) was measured in the same way
as the pre-treatment measurement (see above for survey wording.
Perceived Argument Strength was measured using the following six items, and scaled to
vary between 0-1 where 1 indicates the highest score (Cronbach’s alpha = 0.94). Similar
questions were asked for the placebo group, although their responses were not included in
the analyses.
[Treatment Groups] Please indicate how much you agree or disagree with the
following statements about the argument about the 2010 health care reform law
called the Affordable Care Act, sometimes referred to as Obamacare.
The argument provided evidence that seems certain to me.
1) Strongly agree
2) Agree
3) Somewhat agree
4) Neither agree nor disagree
5) Somewhat disagree
6) Disagree
7) Strongly disagree
8) Not sure
The argument provided clear evidence (same multiple choices as above).
The argument provided strong evidence (same multiple choices as
above).

174
The argument provided a convincing reason for its position (same
multiple choices as above).
The argument provided an important reason for me to consider when I
form my opinion about the health care reform law (same multiple choices
as above).
The argument would help me form my opinion about the health care
reform law (same multiple choices as above).
[Placebo Group; not part of analysis] Please indicate how much you agree or
disagree with the following statements about the argument about Greece's debt
crisis.
The argument provided evidence that seems certain to me.
The argument provided clear evidence.
The argument provided strong evidence.
The argument provided a convincing reason for its position.
The argument would help me form my opinion about Greece's debt
crisis.
The argument put thoughts in my mind about supporting debt relief for
Greece.

175
Appendix C.2.3. Moderating Variables
Importance of Health care issue (Wave 1) was measured by the following questionnaire.
In the moderation analyses, “not at all” to “one of the five” were coded 0; and “one of the
two or three” and “single most important” was coded 1.
As compared to your feelings on other political issues, how important is health
care to you?
1) It is the single most important political issue to me
2) One of the two or three most important political issues
3) One of the five most important political issues
4) Not among the issues I consider important
5) Not at all important
Importance of Health care cost (Wave 1) was measured by the following questionnaire.
In the moderation analyses, “not at all” to “very important” were coded 0; and “single
most important” was coded 1.
Please rate the importance of each of the following considerations in evaluating
the health care reform law.
Its impacts on health care costs
1) Single most important
2) Very important
3) Moderately important
4) Slightly important
5) Not at all important
Political Knowledge was measured by counting the percentage of correct answers to the
following questionnaires (Cronbach’s alpha = 0.59). In the moderation analyses 0% to
67% were coded 0; and 68% to 100% were coded 1.
Please answer the following yes/no questions based on what you have heard
about the health care reform law. If you don't know the answer, you can mark
that too.
Did some people get their health care policies cancelled due to the new
regulations implemented by the law? (Wave 1)
1) Yes
2) No
3) Not sure
Has the number of uninsured Americans declined since the implementation of the
law? (Wave 1)

176
1) Yes
2) No
3) Not sure
Does the law require that if a U.S. citizen does NOT have health insurance, that
person will have to pay a fine on his or her federal income taxes? (Wave 1)
1) Yes
2) No
3) Not sure
Does the law allow health insurance companies to refuse to sell health insurance
to U.S. citizens who have a serious medical problem? (Wave 1)
1) Yes
2) No
3) Not sure
Which one of the parties would you say is more conservative than the other at the
national level? (If you don’t know the answer, you can mark that too) (Wave 1)
1) Democrats (1)
2) Republicans (2)
3) Not sure (3)
Do you happen to know what job or political office is currently held by John
Kerry? (If you don’t know the answer, you can mark that too) (Wave 2; before
treatment)
1) U.S. Senator (1)
2) U.S. Vice President (2)
3) U.S. State Secretary (3)
4) U.S Energy Secretary (4)
5) Not sure (5)
Do you happen to know what job or political office is currently held by Ernest
Moniz? (If you don’t know the answer, you can mark that too) (Wave 2; before
treatment)
1) U.S. Senator (1)
2) U.S. Vice President (2)
3) U.S. State Secretary (3)
4) U.S Energy Secretary (4)
5) Not sure (5)
Which party has the most members in the United States House of
Representatives? (If you don’t know the answer, you can mark that too) (Wave 2;
before treatment)
1) Democrats (1)

177
2) Republicans (2)
3) Not sure (3)
Who has the final responsibility to decide whether a law is Constitutional or
not? (If you don’t know the answer, you can mark that too) (Wave 2; before
treatment)
1) President (1)
2) Congress (2)
3) Supreme Court (3)
4) Not sure (4)
How much of a majority is needed for the U.S. Senate and House to override a
presidential veto? (If you don’t know the answer, you can mark that too) (Wave
2; before treatment)
1) Simple majority (one more than half the votes) (1)
2) Two-thirds majority (2)
3) Three-fourths majority (3)
4) Not sure (4)
Need for cognition (wave 2; after treatment) was measured by combining the following
items, and scaled 0-1 where 1 indicates highest score (0.86). In the moderation analyses 0
to 0.7 were coded 0; and 0.71 to 1 were coded 1.
Please indicate whether or not you agree with each of the following statements
about you or your beliefs. (Wave 2; after treatment)
1) Strongly agree
2) Somewhat agree
3) Neither agree nor disagree
4) Somewhat disagree
5) Strongly disagree
I prefer complex to simple problems (same multiple choices as above).
Thinking is NOT my idea of fun (same multiple choices as above).
I find satisfaction in deliberating hard and for long hours (same multiple choices
as above).
I like to have the responsibility of handling a situation that requires a lot of
thinking (same multiple choices as above).

178
Income (Wave 2; after treatment) was measured by the following question. In the
moderation analyses, “less than 30,000” to “49,999” were coded 0; and “50,000” or
higher were coded 1.
What is your combined annual household income?
1) Less than 30,000 (1)
2) 30,000 – 39,999 (2)
3) 40,000 – 49,999 (3)
4) 50,000 – 59,999 (4)
5) 60,000 – 69,999 (5)
6) 70,000 – 79,999 (6)
7) 80,000 – 89,999 (7)
8) 90,000 – 99,999 (8)
9) 100,000 or more (9)
Age (Wave 2; after treatment) was measured by the following question. In the moderation
analyses, 18 to 34 were coded 0; 35 or higher were coded 1. There was no respondent
under 18.
How old are you?
1) Under 18 (1)
2) 18-25 (2)
3) 26-34 (3)
4) 35-44 (4)
5) 45-54 (5)
6) 55-64 (6)
7) 65 or older (7)
Gender (Wave 2; after treatment) was measured by the following question.
What is your gender?
1) Male (1)
2) Female (2)
Race (Wave 2; after treatment) was measured by the following question. In the
moderation analyses, “White/Caucasian” was coded 0; other choices were coded 1.
What is your race?
1) White/Caucasian (1)
2) African American (2)
3) Hispanic (3)
4) Asian (4)
5) Native American (5)
6) Pacific Islander (6)

179
7) Multiracial (7)
8) Other (8)
Problems with medical bills (Wave 2; after treatment) was measured by the following
two questions. In the moderation analyses, those who indicated “Yes” to either question
were coded 1; those who indicated “No” to both were coded were coded 0. “Not sure”
was treated as “No.”
In the past 12 months, did you or another family member in your household have any
problems paying medical bills?
1) Yes (1)
2) No (2)
3) Not sure (3)
In the past 12 months, have you or someone else in your household ever put off or
postponed seeking health care you felt you needed but could not afford?
1) Yes (1)
2) No (2)
3) Not sure (3)
Insured (Wave 2; after treatment) was measured by the following question
Are you covered by any form of health insurance?
1) Yes (1)
2) No (2)

180
Appendix C.2.4. Message Recalls
Evidence Recall
Which of the followings is consistent with the message you read above? (If you
are not sure, you can mark that too)
1) Premiums in the ACA Marketplaces rose by 10.1% on average
nationwide in 2016.
2) Premiums in the ACA Marketplaces rose by 4.7% in Cheyenne,
Wyoming in 2016.
3) The uninsured rate has decreased by 43%, over the two years after the
reform.
4) The uninsured rate has decreased by 1% point over 2015.
5) In the 1930s, the German economy improved after debt relief
6) Not sure
Key Term Recall
Which of the following terms did the message use to explain the health
economists' theory? (If you are not sure, you can mark that too)
1) The free rider problem
2) Adverse selection
3) Risk aversion
4) I din't read anything about the health economist' theory
5) Not sure

181
Appendix C.2.5. Screeners
Wave 1 Attention Screener (Those who failed this question were not invited to Wave 2)
Recent research on decision making shows that choices are affected by context.
To help us understand how people make decisions, we are interested in
information about you. Specifically, we are interested in whether you actually
take the time to read the directions. To show that you have read the instructions,
please ignore the question below about how you are feeling and instead check
Interested, Bored and none of the above option as your three choices.
Please check all words that describe how you are currently feeling.
1) Excited
2) Distressed
3) Interested
4) Upset
5) Bored
6) Guilty
7) Scared
8) Hostile
9) Enthusiastic
10) None of the above
Citizenship (Wave 1; non-US citizens were not invited to Wave 2)
Are you a U.S. citizen? (Your answer will NOT affect HIT approval)
1) Yes
2) No
Wave 2 Attention Screener (Before Treatment; those who failed this question were
underweighted in the analyses)
When a big news story breaks people often go online to get up-to-the-minute
details on what is going on. We want to know which websites people trust to get
this information. We also want to know if people are paying attention to the
question. To show that you’ve read this much, please ignore the question
and select the Drudge Report and the NPR website and none of the above as your
three answers.
When there is a big news story, which is the one news website you visit first?
(Please only choose one)
1) New York Times website (1)

182
2) Huffington Post (2)
3) Washington Post website (3)
4) Cnn.com (4)
5) FoxNews.com (5)
6) MSNBC.com (6)
7) The Associated Press website (7)
8) Reuters website (8)
9) New York Post online (9)
10) The Drudge Report (10)
11) Google News (11)
12) ABC News website (12)
13) CBS News website (13)
14) NBC News website (14)
15) Yahoo! News (15)
16) NPR website (16)
17) USA Today website (17)
18) None of the above (18)

183
Appendix C.2.4. Exposure to the 2017 Premium Increase Story
Exposure to the Premium Increase Story (Wave 4) was measured by the following
questionnaire. In the moderation analyses, “No” and “Not Sure” was coded 0; “yes” was
coded 1.
The Obama administration released the prices for Obamacare health plans.
Over the past few days, have you seen or heard any news about the 2017
health insurance rates?
1) Yes
2) No
3) Not Sure
Follow-up Question
According to the news reports, the 2017 premiums for health plans under the
Affordable Care Act will…
1) Decrease
2) Stay about the same
3) Increase
4) I don’t remember the specifics

184
Appendix C.3. Additional Information, Robustness Checks, and Additional Analyses
This section provides additional information, and robustness checks and
additional analyses for the results from Experiment 2, reported in Chapter 2 of this
dissertation.
Tables A14 and A15 describes the full report on the regression models reported in
Panels A and B Table 8. in the main text. In Table A14, the dependent variables (belief
and attitudes) are regressed on the dummies for the experimental condition, for which the
control group serves as the reference, and pre-treatment covariates. Covariates include
prior attitudes toward ACA, prior belief about the ACA’s effect on health care costs,
approval of Obama’s performance as the President, approval of Obama’s handling of
health care, and dummies for vote choice. As noted in the main text, those who exhibited
low attention by failing the screener question (see Appendix C.2.5) were underweighted.
Those who chose one or two of the three correct options were weighted by 0.5, and those
who choose none of the two were weighted by 0 (i.e., dropped).
In Table A15, the experiment conditions were operationalized as a single
continuous variable representing a scale of evidence direction and strength (0 = strong
con; 0.25 = weak con; 0.5 = control; 0.75= weak pro 1=strong pro).
Tables A16 and A17 demonstrate that the results are robust across two important
model specification choices. In Table A16, the same analyses as those reported in Table
8. are repeated, but this time without underweighting those who failed to choose the tree
correct options in the screener question. In Table A17, I estimate the treatment effects

185
without controlling for the treatment covariates. As can be seen, the results are largely
similar to those reported in Table 8.
In Table A18, I report the regression models summarizing the treatment effects on
perceived argument strength. Figure 7 is based on these models. Perceived argument
strength scales were regressed on experimental conditions, and the same set of pre-
treatment covariates as prior analyses. Also, low-attention participants were
underweighted. Control group was excluded from this analysis.
Table A19 provides supplementary analyses examining the “carry-over” treatment
effects on additional outcome variables, other than the key dependent variables used in
the analyses reported in the main text. Specifically, I focus on vote choice in Coumns1 to
3, and overall support for Obama in Columns 4 to 6, and support for Obama’s handling of
healthcare in columns 7 to 9. All models included the same set of pre-treatment
covariates as prior analyses; and low-attention participants were underweighted. As the
table shows, the treatment effects on vote choice, and overall approval of Obama were
fairly small. The coefficients on each experimental condition were not statistically
significant, although correctly signed for the most part (see Columns 1 to 6 of Panel A).
While the effects of the experimental conditions as a whole, operationalized as a single
continuous variable, were significant for these dependent variables, the effects were
modest in size. This presumably reflects the fact that the Affordable Care Act as a
political issue accounts for only a part of people’s evaluations of the president, and their
voting decisions. In Columns 7 to 9, I report more sizable effects on approval of Obama’s
handling of health care, to which the contents of the arguments more relevant.

186
To address the concern that those with treatment effects may be weaker for those
with strong prior opinions, I repeat the main analyses this time using strong proponents
and opponents (Table A20-1). Strong proponents were defined as those scored 0.75 or
higher in the baseline measure of attitudes toward the ACA. Strong opponents are those
scored 0.25 or lower. As the table shows, I find no evidence that those with strong
opinions ignore or backlash against uncongenial arguments.
In Table A20-2, I show similar treatment effects across candidate support (during
the 2016 primary season), in contrast to the conventional wisdom that the supporters of a
certain presidential candidate tend to ignore uncongenial facts through motivated
reasoning (e.g., Ignatius 2016).
In Table A20-3, I show the treatment effects for each partisan group. Consistent
with the analyses presented in the main text (Table 8), I find that the treatments had
similar effects for both Republicans and Democrats, for both outcome variables.
Treatment effect heterogeneity was fairly small in comparison to the overall effect sizes.
And to the extent there is heterogeneity, people were influenced more by the arguments
that challenge their party’s positions.
In Table A21, I report the regression models summarizing the “long-run” effects
of the treatments measured 80 days (Wave 3) and 160 days (Wave 4) after the main
experiment. Figure 8 is based on these models. In these analyses, the experiment
conditions were operationalized as a single continuous variable representing a scale of
evidence direction and strength (0 = strong con; 0.25 = weak con; 0.5 = control; 0.75=
weak pro 1=strong pro). The estimates were adjusted for covariates include baseline

187
attitudes toward ACA, baseline belief about the ACA’s effect on health care costs,
approval of Obama’s performance as the President, approval of Obama’s handling of
health care, and dummies for vote choice. As noted in the main text, those who exhibited
low attention by failing the screener question (see Appendix C.2.5) were underweighted.
Low-attention participants were underweighted.
In Table A22, I report the estimated effect of the premium increase story. I
regressed beliefs and attitudes measured in Wave 4 on a dummy variable indicating
whether one received the news and the lagged dependent variables measured in the prior
three waves. In the upper panel, I show results unadjusted for other covariates. Reported
in the lower panel are estimates adjusted for other covariates including approval of
Obama’s performance as the President, approval of Obama’s handling of health care, and
dummies for vote choice. Receiving the news lowered people’s belief in ACA’s cost
saving effect and overall support for the law, across prior attitudes and party ID—a
finding that remains robust to the inclusion of additional controls.

188
Table A14: Full Reports on Panel A of Table 8 (Treatment Effects [Experiment 2])
Note. OLS estimates with robust standard errors in parentheses. Low attention
participants are underweighted. The reference categories for Vote Choice 1 and Vote
Choice 2 are respectively “the Democratic Party” and “Hilary Clinton.”
(1) (2) (3) (4) (5) (6)
DV Belief in Cost Saving Effect Attitudes toward ACA
Subset All Opponent Supporter All Opponent Supporter
Strong Con (𝛽1) -0.130* -0.089* -0.156* -0.082* -0.030* -0.109*
(0.014) (0.024) (0.017) (0.011) (0.017) (0.015)
Weak Con (𝛽2) -0.092* -0.061* -0.105* -0.038* -0.029* -0.041*
(0.014) (0.025) (0.016) (0.010) (0.015) (0.013)
Weak Pro (𝛽3) 0.084* 0.088* 0.082* 0.035* 0.072* 0.013
(0.014) (0.024) (0.016) (0.010) (0.018) (0.012)
Strong Pro (𝛽4) 0.126* 0.137* 0.119* 0.060* 0.101* 0.032*
(0.014) (0.025) (0.017) (0.011) (0.019) (0.012)
Prior Attitudes toward ACA 0.214* 0.236* 0.340* 0.689* 0.698* 0.735* (0.037) (0.086) (0.058) (0.033) (0.072) (0.051)
Prior Belief in Cost Saving Effects 0.418* 0.391* 0.421* 0.079* 0.075* 0.060*
(0.030) (0.049) (0.039) (0.024) (0.038) (0.030) Party ID 0.053* 0.016 0.066* 0.032 0.025 0.049*
(0.026) (0.042) (0.033) (0.022) (0.033) (0.029)
Obama Support 0.042 0.031 0.026 0.042 0.104* -0.041
(0.028) (0.044) (0.034) (0.027) (0.040) (0.033)
Obama Healthcare Support -0.027 0.075 -0.041 0.065* 0.058 0.092*
(0.035) (0.072) (0.038) (0.033) (0.063) (0.038) Vote Choice 1 (Republican) 0.017 -0.078* 0.066 -0.003 -0.010 -0.004
(0.027) (0.042) (0.042) (0.022) (0.035) (0.040)
Vote Choice 1 (Either Party) 0.036* -0.011 0.054* -0.003 -0.004 -0.004 (0.020) (0.035) (0.025) (0.015) (0.028) (0.020)
Vote Choice 1 (Someone else) -0.010 -0.091* 0.038 -0.004 -0.012 0.008
(0.022) (0.040) (0.025) (0.018) (0.032) (0.024) Vote Choice 1 (Will not vote) -0.007 -0.077 0.007 0.007 0.008 -0.009
(0.029) (0.048) (0.040) (0.029) (0.044) (0.042)
Vote Choice 1 (Not sure) 0.005 -0.077* 0.053* -0.001 -0.008 0.013 (0.026) (0.044) (0.032) (0.022) (0.034) (0.029)
Vote Choice 2 (Trump) -0.015 0.078* -0.072* -0.023 0.003 -0.049*
(0.021) (0.033) (0.027) (0.018) (0.029) (0.026) Vote Choice 2 (Someone else) -0.004 0.057* -0.019 -0.014 -0.007 -0.017
(0.015) (0.032) (0.017) (0.012) (0.028) (0.013) Vote Choice 2 (Will not vote) -0.020 0.072* -0.054* -0.036 -0.019 -0.044
(0.023) (0.042) (0.030) (0.025) (0.038) (0.036)
Vote Choice (Not sure) 0.013 0.064 0.006 0.007 0.031 -0.013 (0.027) (0.045) (0.034) (0.018) (0.036) (0.021)
Constant 0.120* 0.109* 0.036 0.074* 0.021 0.095*
(0.027) (0.046) (0.045) (0.021) (0.034) (0.038) N 1412 563 829 1412 563 829

189
Table A15: Full Reports on Panel B of Table 8 (Treatment Effects [Experiment 2])
Note. * p < 0.1 (two-tailed). OLS estimates with robust standard errors in parentheses.
Low attention participants are underweighted. The reference categories for Vote Choice 1
and Vote Choice 2 are respectively “the Democratic Party” and “Hilary Clinton.”
(1) (2) (3) (4) (5) (6)
DV Belief in Cost Saving Effect Attitudes toward ACA
Subset All Opponent Supporter All Opponent Supporter
Experimental Condition 0.275* 0.242* 0.295* 0.143* 0.147* 0.135*
(0.013) (0.023) (0.015) (0.011) (0.018) (0.013)
Prior Attitudes toward ACA 0.213* 0.242* 0.341* 0.687* 0.706* 0.731* (0.038) (0.086) (0.058) (0.033) (0.073) (0.051)
Prior Belief in Cost Saving Effects 0.418* 0.391* 0.415* 0.078* 0.073* 0.056*
(0.030) (0.049) (0.039) (0.024) (0.038) (0.030) Party ID 0.057* 0.014 0.072* 0.034 0.022 0.045
(0.026) (0.042) (0.033) (0.022) (0.033) (0.029)
Obama Support 0.039 0.028 0.024 0.041 0.101* -0.041 (0.028) (0.044) (0.034) (0.027) (0.040) (0.033)
Obama Healthcare Support -0.025 0.074 -0.038 0.066* 0.055 0.097*
(0.035) (0.072) (0.038) (0.033) (0.063) (0.037) Vote Choice 1 (Republican) 0.017 -0.079* 0.061 -0.003 -0.012 -0.010
(0.027) (0.042) (0.043) (0.022) (0.034) (0.040)
Vote Choice 1 (Either Party) 0.037* -0.012 0.056* -0.002 -0.007 -0.004
(0.020) (0.035) (0.025) (0.015) (0.028) (0.019)
Vote Choice 1 (Someone else) -0.007 -0.088* 0.041 -0.004 -0.010 0.005
(0.022) (0.040) (0.025) (0.018) (0.033) (0.024) Vote Choice 1 (Will not vote) -0.004 -0.078 0.012 0.008 0.005 -0.010
(0.029) (0.048) (0.040) (0.029) (0.043) (0.042)
Vote Choice 1 (Not sure) 0.005 -0.084* 0.056* -0.000 -0.018 0.014 (0.026) (0.045) (0.034) (0.021) (0.035) (0.030)
Vote Choice 2 (Trump) -0.015 0.079* -0.072* -0.023 0.004 -0.051*
(0.021) (0.033) (0.027) (0.018) (0.029) (0.027) Vote Choice 2 (Someone else) -0.004 0.058* -0.019 -0.014 -0.006 -0.018
(0.015) (0.032) (0.017) (0.012) (0.028) (0.014)
Vote Choice 2 (Will not vote) -0.021 0.075* -0.056* -0.037 -0.014 -0.046 (0.022) (0.042) (0.029) (0.025) (0.037) (0.036)
Vote Choice (Not sure) 0.012 0.064 0.002 0.007 0.031 -0.015
(0.027) (0.045) (0.034) (0.018) (0.037) (0.021) Constant -0.022 0.005 -0.126* -0.003 -0.028 0.012
(0.026) (0.046) (0.044) (0.020) (0.033) (0.037)
N 1412 563 829 1412 563 829

190
Table A16: Robustness Check on Table 8 (No Underweighting of Low-attention
Participants) (1) (2) (3) (4) (5) (6)
DV Belief in Cost Saving Effect Attitudes toward ACA
Subset All Opponents Supporters All Opponents Supporters
Panel A
Strong Con (𝛽1) -0.123* -0.083* -0.152* -0.085* -0.039* -0.111*
(0.013) (0.023) (0.016) (0.011) (0.017) (0.014)
Weak Con (𝛽2) -0.090* -0.061* -0.104* -0.044* -0.027* -0.053*
(0.013) (0.024) (0.015) (0.010) (0.015) (0.012)
Weak Pro (𝛽3) 0.084* 0.089* 0.082* 0.030* 0.066* 0.008
(0.013) (0.023) (0.015) (0.010) (0.018) (0.011)
Strong Pro (𝛽4) 0.128* 0.133* 0.123* 0.053* 0.088* 0.030*
(0.013) (0.023) (0.016) (0.010) (0.018) (0.011)
Panel B
Linear Slope 0.272* 0.233* 0.295* 0.140* 0.140* 0.137*
(0.012) (0.021) (0.015) (0.010) (0.017) (0.013)
Covariates Yes Yes Yes Yes Yes Yes
N 1514 602 890 1514 602 890
* p < 0.1 (two-tailed). OLS estimates with robust standard errors in parentheses.
Covariates include the lagged values of the dependent variables, party ID, evaluations of
Obama (overall and healthcare), and vote choice. Low attention participants are
underweighted.

191
Table A17: Robustness Check on Table 8 (No Covariates) (1) (2) (3) (4) (5) (6)
DV Belief in Cost Saving Effect Attitudes toward ACA
Subset All Opponents Supporters All Opponents Supporters
Panel A
Strong Con (𝛽1) -0.125* -0.111* -0.137* -0.072* -0.043* -0.097*
(0.020) (0.027) (0.021) (0.027) (0.024) (0.021)
Weak Con (𝛽2) -0.099* -0.110* -0.089* -0.042 -0.066* -0.031
(0.021) (0.029) (0.021) (0.029) (0.023) (0.020)
Weak Pro (𝛽3) 0.066* 0.055* 0.093* 0.011 0.040 0.022
(0.021) (0.029) (0.020) (0.027) (0.026) (0.017)
Strong Pro (𝛽4) 0.110* 0.109* 0.126* 0.035 0.079* 0.028
(0.021) (0.029) (0.020) (0.028) (0.028) (0.018)
Panel B
Linear Slope 0.254* 0.243* 0.284* 0.107* 0.141* 0.123*
(0.018) (0.026) (0.018) (0.024) (0.025) (0.018)
Covariates No No No No No No
N 1414 563 831 1414 563 831
* p < 0.1 (two-tailed). OLS estimates with robust standard errors in parentheses.
Covariates are not. Low attention participants are underweighted.

192
Table A18: Perceived Argument Strength by Experimental Condition and Prior Attitudes
(Experiment 2) (1) (2) (3)
Subset All Opponents Supporters
Weak Con -0.074* -0.052* -0.087*
(0.020) (0.026) (0.024)
Weak Pro -0.081* -0.340* 0.097*
(0.019) (0.026) (0.022)
Strong Pro -0.004 -0.273* 0.170*
(0.018) (0.026) (0.019)
Covariates Yes Yes Yes
N 1137 454 666
* p < 0.1 (two-tailed). Figure 7 in the main text is based on these results. OLS estimates
with robust standard errors in parentheses. The reference category is the Strong Con
condition. Entries report the mean differences between the reference category the other
conditions. Covariates include the lagged values of beliefs and attitudes about the ACA,
party ID, evaluations of Obama (overall and healthcare), and vote choice. Low attention
participants are not underweighted.

193
Table A19: Treatment Effects on Other Outcomes (Experiment 2) (1) (2) (3) (4) (5) (6) (7) (89) (9)
DV Vote Democratic Obama Approval Obama Healthcare Approval
Subset All Opponents Supporters All Opponents Supporters All Opponents Supporters
Panel A
Strong Con (𝛽1) -0.033 -0.031 -0.047 -0.010 -0.004 -0.015 -0.046* 0.005 -0.073*
(0.023) (0.031) (0.032) (0.011) (0.021) (0.013) (0.014) (0.021) (0.018)
Weak Con (𝛽2) -0.036 -0.018 -0.042 -0.008 -0.029 0.003 -0.028* -0.027 -0.029*
(0.024) (0.031) (0.033) (0.010) (0.018) (0.012) (0.012) (0.019) (0.016)
Weak Pro (𝛽3) 0.006 -0.022 0.014 0.011 0.010 0.011 0.059* 0.078* 0.045*
(0.023) (0.032) (0.030) (0.010) (0.017) (0.012) (0.013) (0.022) (0.015)
Strong Pro (𝛽4) 0.009 0.010 0.016 0.008 0.003 0.009 0.057* 0.054* 0.052*
(0.024) (0.033) (0.033) (0.012) (0.022) (0.013) (0.014) (0.023) (0.016)
Panel B
Linear Slope 0.050* 0.032 0.074* 0.022* 0.021 0.023* 0.117* 0.084* 0.131*
(0.022) (0.027) (0.031) (0.011) (0.020) (0.012) (0.013) (0.020) (0.016)
Covariates Yes Yes Yes Yes Yes Yes Yes Yes Yes
N 1514 602 890 1514 602 890 1514 602 890
* p < 0.1 (two-tailed). OLS estimates with robust standard errors in parentheses.
Covariates include the lagged values of the dependent variables, party ID, evaluations of
Obama (overall and healthcare), and vote choice. Low attention participants are not
underweighted.

194
Table A20-1: Treatment Effects for Strong Supporters and Strong Opponents of the ACA
(1) (2) (3) (4)
Subset Strong
Supporters
Strong
Opponents
Strong
Supporters
Strong
Opponents
Panel A
Strong Con (𝛽1) -0.088* -0.143* -0.013 -0.096*
(0.031) (0.020) (0.019) (0.017)
Weak Con (𝛽2) -0.052* -0.105* -0.008 -0.030*
(0.031) (0.021) (0.018) (0.013)
Weak Pro (𝛽3) 0.087* 0.082* 0.078* 0.003
(0.029) (0.019) (0.020) (0.012)
Strong Pro (𝛽4) 0.145* 0.120* 0.090* 0.017
(0.032) (0.020) (0.023) (0.014)
Panel B
Linear Slope 0.244* 0.286* 0.121* 0.105*
(0.028) (0.018) (0.022) (0.015)
Covariates No No No No
N 394 590 394 590
* p < 0.1 (two-tailed). OLS estimates with robust standard errors in parentheses.
Covariates are not included. Low attention participants are underweighted. Strong
proponents are defined as those scored 0.75 or higher in the baseline measure of attitudes
toward the ACA. Strong opponents scored 0.25 or lower.

195
Table A20-2: Treatment Effects by Favorite Candidates
(1) (2) (3) (4) (5) (6)
DV Belief in Cost Saving Effect Attitudes toward ACA
Candidate Clinton Sanders Trump Clinton Sanders Trump
Panel A
Strong Con (𝛽1) -0.139* -0.140* -0.115* -0.114* -0.099* -0.040
(0.037) (0.021) (0.044) (0.036) (0.017) (0.029)
Weak Con (𝛽2) -0.137* -0.088* -0.036 -0.035 -0.050* -0.017
(0.033) (0.022) (0.046) (0.028) (0.014) (0.030)
Weak Pro (𝛽3) 0.059* 0.099* 0.049 0.020 0.031* 0.050
(0.031) (0.020) (0.045) (0.022) (0.015) (0.034)
Strong Pro (𝛽4) 0.072* 0.145* 0.116* 0.027 0.062* 0.071*
(0.034) (0.021) (0.043) (0.025) (0.015) (0.042)
Panel B
Linear Slope 0.251* 0.303* 0.217* 0.133* 0.162* 0.117*
(0.034) (0.019) (0.039) (0.032) (0.017) (0.034)
Covariates Yes Yes Yes Yes Yes Yes
N 208 631 190 208 631 190
* p < 0.1 (two-tailed). OLS estimates with robust standard errors in parentheses.
Covariates include the lagged values of the dependent variables, party ID, evaluations of
Obama (overall and healthcare), and vote choice. Low attention participants are
underweighted. Support for the presidential candidate was measured at Wave 1.

196
Table A20-3: Treatment Effects by Partisan Identity (1) (2) (3) (4) (5) (6)
DV Belief in Cost Saving Effect Attitudes toward ACA
Subset All Republicans Democrats All Republicans Democrats
Panel A
Strong Con (𝛽1) -0.130* -0.098* -0.153* -0.082* -0.028 -0.110*
(0.014) (0.029) (0.017) (0.011) (0.018) (0.015)
Weak Con (𝛽2) -0.092* -0.029 -0.104* -0.038* -0.011 -0.046*
(0.014) (0.031) (0.017) (0.010) (0.019) (0.012)
Weak Pro (𝛽3) 0.084* 0.063* 0.090* 0.035* 0.062* 0.016
(0.014) (0.028) (0.016) (0.010) (0.021) (0.012)
Strong Pro (𝛽4) 0.126* 0.125* 0.122* 0.060* 0.086* 0.043*
(0.014) (0.029) (0.017) (0.011) (0.024) (0.012)
Panel B
Linear Slope 0.275* 0.216* 0.300* 0.143* 0.121* 0.148*
(0.013) (0.025) (0.016) (0.011) (0.020) (0.014)
Covariates Yes Yes Yes Yes Yes Yes
N 1412 396 842 1412 396 842
* p < 0.1 (two-tailed). OLS estimates with robust standard errors in parentheses.
Covariates include the lagged values of the dependent variables, party ID, evaluations of
Obama (overall and healthcare), and vote choice. Low attention participants are
underweighted.

197
Table A21: Long-Run Effects on Obamacare Opinions (Experiment 2) (1) (2) (3) (4) (5) (6)
DV Belief in Cost Saving Effect Attitudes toward ACA
Subset All Opponent Supporter All Opponent Supporter
Linear Slope (Wave 3) 0.064* 0.022 0.096* -0.002 -0.026 0.016
(0.016) (0.028) (0.019) (0.013) (0.022) (0.016)
Covariates Yes Yes Yes Yes Yes Yes
N 845 344 488 845 344 488
Linear Slope (Wave 4) 0.019 -0.004 0.038* 0.002 -0.031 0.022
(0.018) (0.031) (0.023) (0.015) (0.025) (0.019)
Covariates Yes Yes Yes Yes Yes Yes
N 808 332 461 808 332 461
Note. * p < 0.1 (two-tailed). OLS estimates with robust standard errors in parentheses.
Covariates include the lagged values of the dependent variables, party ID, evaluations of
Obama (overall and healthcare), and vote choice. Support for the presidential candidate
was measured at Wave 1.

198
Table A22-1: Effects of Exposure to the Coverage of 2017 ACA Premium Increases on
Beliefs (1) (2) (3) (4) (5)
DV Belief in Cost Saving Effect
Subset All Opponent Supporter Rep Dem
Exposure to Story -0.043* -0.061* -0.031* -0.036 -0.036*
(0.014) (0.023) (0.018) (0.028) (0.018)
Lagged DV (W3) Yes Yes Yes Yes Yes
Other Covariates No No No No No
Exposure to Story -0.036* -0.040* -0.038* -0.039 -0.041*
(0.014) (0.023) (0.018) (0.028) (0.018)
Lagged DV (W3) Yes Yes Yes Yes Yes
Other Covariates Yes Yes Yes Yes Yes
N 685 281 391 202 394
Note. * p < 0.1 (two-tailed). OLS estimates with robust standard errors in parentheses.
Covariates include the lagged values of the dependent variables measured Wave 1
through Wave 3, party ID, evaluations of Obama (overall and healthcare), and vote
choice. Support for the presidential candidate was measured at Wave 1.
Table A22-1: Effects of Exposure to the Coverage of 2017 ACA Premium Increases on
Attitudes (1) (2) (3) (4) (5)
DV Attitudes toward ACA
Subset All Opponent Supporter Rep Dem
Exposure to Story -0.037* -0.043* -0.033* -0.040* -0.029*
(0.011) (0.017) (0.014) (0.017) (0.015)
Lagged DV (W3) Yes Yes Yes Yes Yes
Other Covariates No No No No No
Exposure to Story -0.024* -0.010 -0.036* -0.039* -0.027*
(0.011) (0.018) (0.014) (0.018) (0.015)
Lagged DV (W3) Yes Yes Yes Yes Yes
Other Covariates Yes Yes Yes Yes Yes
N 685 391 281 202 394
Note. * p < 0.1 (two-tailed). OLS estimates with robust standard errors in parentheses.
Covariates include the lagged values of the dependent variables measured Wave 1
through Wave 3, party ID, evaluations of Obama (overall and healthcare), and vote
choice. Support for the presidential candidate was measured at Wave 1.

199
Appendix D Experiment 3 (Chapter 3)
Appendix D.1. Message Wordings
Appendix D.1.1. Income Strong
On income inequality, Republicans have a data problem
According to The Washington Post’s Philip Rucker and Dan Balz, “Economic mobility,
and the feeling of many Americans that they are being shut out from the nation’s
prosperity, will be a defining theme of the 2016 campaign.”
Republican presidential hopefuls have signaled their interest in addressing the issue of
stagnating working-class incomes. “[O]nly conservative principles can solve it by
removing the barriers to upward mobility,” as one conservative Super PAC puts.
How, exactly? Republicans offer the familiar recipe of smaller government, significant
tax cuts across the board and fewer regulations — a strategy that would help business,
boost growth, create jobs and ultimately boost working-class incomes.
Democrats, of course, have different solutions — more active government, higher taxes
on the rich, lower taxes on the poor, and higher minimum wages. They promise that these
policies will raise incomes for the working class, which will in turn create a larger
number of consumers and a more dynamic economy overall.
Voters called upon to bet on these promises often find themselves much in the
dark. Americans looking for skillful economic leadership from the White House would be
better served by considering the long-term economic performance of Democratic and
Republican presidents.
People readily grasp the diagnostic value of long-term performance in other walks of life.
A judge has ruled that poker is more skill than luck; though luck may beat skill in any
given hand, the better player is very likely to win in the long run. And on this front,
Republicans have a data problem.
Economists and political scientists have demonstrated that, since the 1950s, low-income
families have been much better off when a Democrat is president than when a Republican

200
is, in just about every aspect (faster income growth, lower unemployment, and so forth).
The chart below is a prime example. It shows average income growth under Democratic
presidents has been higher than Republican ones across the income spectrum, but
especially for families at the bottom 20%. The average incomes of these families have
grown more than 24 times as fast under Democratic presidents (2.512%) as they have
under Republican presidents (0.103%).
Annual income growth by income level under Democratic and Republican
presidents (1949-2014)
Source: Census Bureau Historical Income Tables
Some may be tempted to attribute all this to random luck. But the odds are very slim;
when a football team beats its “rival” team by wide margins, and do so again and again,
over an extended period time, it becomes harder and harder to think it’s just a
coincidence.
More formally, a regression analysis (a standard statistical technique) indicates that there
is about a 1 in 1000 chance that a difference this big would pop up simply because the
Democrats got lucky, when there’s nothing inherently better about their policies.
Of course, as investment advisers always say, “Past performance does not guarantee
future results.” Nevertheless, for low-income voters making a bet on their financial
future, the past performance of Democrats and Republicans in the White House provides
important evidence about how a Democratic or a Republican president would be likely to
play whatever cards they are dealt over the next four years.

201
Appendix D.1.2. Income Weak
On income inequality, Republicans have a data problem
According to The Washington Post’s Philip Rucker and Dan Balz, “Economic mobility,
and the feeling of many Americans that they are being shut out from the nation’s
prosperity, will be a defining theme of the 2016 campaign.”
Republican presidential hopefuls have signaled their interest in addressing the issue of
stagnating working-class incomes. “[O]nly conservative principles can solve it by
removing the barriers to upward mobility,” as one conservative Super PAC puts.
How, exactly? Republicans offer the familiar recipe of smaller government, significant
tax cuts across the board and fewer regulations — a strategy that would help business,
boost growth, create jobs and ultimately boost working-class incomes.
Democrats, of course, have different solutions — more active government, higher taxes
on the rich, lower taxes on the poor, and higher minimum wages. They promise that these
policies will raise incomes for the working class, which will in turn create a larger
number of consumers and a more dynamic economy overall.
Voters called upon to bet on these promises often find themselves much in the dark.
Americans looking for skillful economic leadership from the White House would be
better served by considering the long-term economic performance of Democratic and
Republican presidents.
People readily grasp the diagnostic value of long-term performance in other walks of life.
A judge has ruled that poker is more skill than luck; though luck may beat skill in any
given hand, the better player is very likely to win in the long run. And on this front,
Republicans have a data problem.
2
Economists and political scientists have demonstrated that, since the 1950s, l0w-income
families have been slightly better off when a Democrat is president than when a
Republican is.
The chart below is a prime example. It shows average income growth under Democratic
presidents has been higher than Republican ones across the income spectrum, but
especially for families at the bottom 20%. The average incomes of these families have
grown more than 1.2 times as fast under Democratic presidents (1.066%) as they have
under Republican presidents (0.895%).

202
Annual income growth by income level under Democratic and Republican
presidents (1953-2014)
Source: Census Bureau Historical Income Tables
Some may be tempted to attribute all this to random luck. But the odds are arguably slim.
When a football team beats its “rival” team more than half the time over an extended
period of time, it may no longer be a coincidence.
More formally, a regression analysis (a standard statistical technique) indicates that there
is less than a 3 in 7 chance that a difference like this would pop up simply because the
Democrats got lucky, when there’s nothing inherently better about their policies.
Of course, as investment advisers always say, “Past performance does not guarantee
future results.” Nevertheless, for low-income voters making a bet on their financial
future, the past performance of Democrats and Republicans in the White House provides
important evidence about how a Democratic or Republican president would be likely to
play whatever cards they are dealt over the next four years.
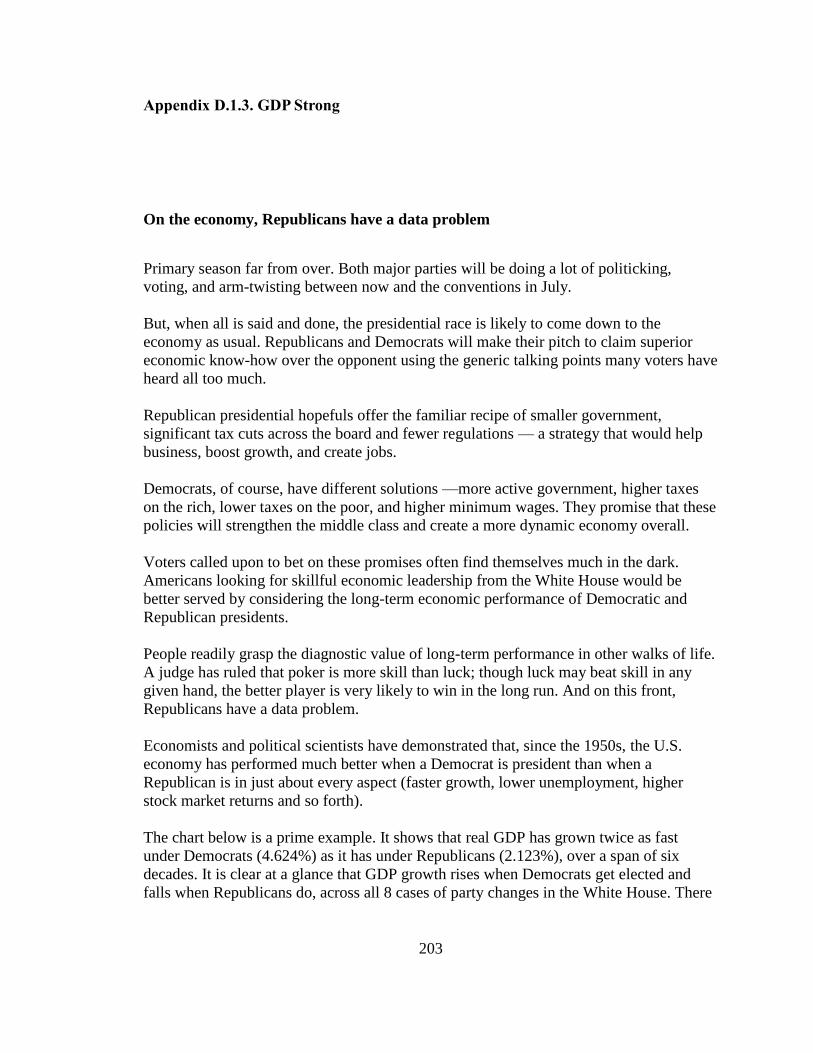
203
Appendix D.1.3. GDP Strong
On the economy, Republicans have a data problem
Primary season far from over. Both major parties will be doing a lot of politicking,
voting, and arm-twisting between now and the conventions in July.
But, when all is said and done, the presidential race is likely to come down to the
economy as usual. Republicans and Democrats will make their pitch to claim superior
economic know-how over the opponent using the generic talking points many voters have
heard all too much.
Republican presidential hopefuls offer the familiar recipe of smaller government,
significant tax cuts across the board and fewer regulations — a strategy that would help
business, boost growth, and create jobs.
Democrats, of course, have different solutions —more active government, higher taxes
on the rich, lower taxes on the poor, and higher minimum wages. They promise that these
policies will strengthen the middle class and create a more dynamic economy overall.
Voters called upon to bet on these promises often find themselves much in the dark.
Americans looking for skillful economic leadership from the White House would be
better served by considering the long-term economic performance of Democratic and
Republican presidents.
People readily grasp the diagnostic value of long-term performance in other walks of life.
A judge has ruled that poker is more skill than luck; though luck may beat skill in any
given hand, the better player is very likely to win in the long run. And on this front,
Republicans have a data problem.
Economists and political scientists have demonstrated that, since the 1950s, the U.S.
economy has performed much better when a Democrat is president than when a
Republican is in just about every aspect (faster growth, lower unemployment, higher
stock market returns and so forth).
The chart below is a prime example. It shows that real GDP has grown twice as fast
under Democrats (4.624%) as it has under Republicans (2.123%), over a span of six
decades. It is clear at a glance that GDP growth rises when Democrats get elected and
falls when Republicans do, across all 8 cases of party changes in the White House. There

204
are no exceptions.
Average annual growth by Democratic and Republican terms (1949-2015)
Source: National Bureau of Economic Research
Some may be tempted to attribute all this to random luck. But the odds are very slim; just
like winning 8 hands in a row in a one-on-one poker game is a very unlikely thing to
happen, unless the winning player has better skills.
More formally, a regression analysis (a standard statistical technique) indicates that there
is less than 1 in 1000 chance that a difference like this would pop up, simply because
Democrats got lucky, when there’s nothing inherently better about their policies.

205
Of course, as investment advisers always say, “Past performance does not guarantee
future results.” Nevertheless, for voters making a bet on America’s economic future, the
past performance of Democrats and Republicans in the White House provides important
evidence about how a Democratic or Republican president would be likely to play
whatever cards they are dealt over the next four years.

206
Appendix D.1.3. GDP Weak
On the economy, Republicans have a data problem
Primary season is far from over. Both major parties will be doing a lot of politicking,
voting, and arm-twisting between now and the conventions in July.
But, when all is said and done, the presidential race is likely to come down to the
economy as usual. Republicans and Democrats will make their pitch to claim superior
economic know-how over the opponent using the generic talking points many voters have
heard all too much.
Republican presidential hopefuls offer the familiar recipe of smaller government,
significant tax cuts across the board and fewer regulations — a strategy that would help
business, boost growth, and create jobs.
Democrats, of course, have different solutions —more active government, higher taxes
on the rich, lower taxes on the poor, and higher minimum wages. They promise that these
policies will strengthen the middle class and create a more dynamic economy overall.
Voters called upon to bet on these promises often find themselves much in the dark.
Americans looking for skillful economic leadership from the White House would be
better served by considering the long-term economic performance of Democratic and
Republican presidents.
People readily grasp the diagnostic value of long-term performance in other walks of life.
A judge has ruled that poker is more skill than luck; though luck may beat skill in any
given hand, the better player is very likely to win in the long run. And on this front,
Republicans have a data problem.
Economists and political scientists have demonstrated that, since the 1950s, the U.S.
economy has performed slightly better when a Democrat is president than when a
Republican is.
The chart below is a prime example. It shows that real GDP has grown 1.06 times as fast
under Democrats (3.233%) as it has under Republicans (3.043%), over a span of six
decades. It is may be noticeable at a glance that GDP growth usually rises when
Democrats get elected (with the exception of Carter) and falls when Republicans do (with
the exceptions of Nixon and Regan). Across all 8 cases of party changes in the White
House there are are only 3 exceptions.

207
Average annual GDP growth by Democratic and terms (1951-2015)
Source: National Bureau of Economic Research
Some may be tempted to attribute all this to random luck. But the odds are arguably slim;
just like winning 5 hands out of 8 in a one-on-one poker game could be an unlikely thing
to happen, unless the winning player has better skills.
More formally, a regression analysis (a standard statistical technique) indicates that there
is about 2 in 5 chance that a difference like this would pop up, simply because Democrats
got lucky, when there’s nothing inherently better about their policies.
Of course, as investment advisers always say, “Past performance does not guarantee
future results.” Nevertheless, for voters making a bet on America’s economic future, the
past performance of Democrats and Republicans in the White House provides important
evidence about how a Democratic or Republican president would be likely to play
whatever cards they are dealt over the next four years.

208
Appendix D.1.5. Placebo
Germans Forget Postwar History Lesson on Debt Relief in Greece Crisis
It is not hard to notice hypocrisy in Germany’s insistence that Athens must agree to more
painful austerity before any sort of debt relief can be put on the table: The main creditor
demanding that Greeks be made to pay for past profligacy benefited not so long ago from
more lenient terms.
But beyond serving as a reminder of German hypocrisy, the history offers a more
important lesson: These sorts of things have been dealt with successfully before. The 20th
century offers a rich road map of policy failure and success addressing sovereign debt
crises.
The good news is that by now economists generally understand the contours of a
successful approach. “I’ve seen this movie so many times before,” said Carmen M.
Reinhart, a professor at the Kennedy School of Government at Harvard who is perhaps
the world’s foremost expert on sovereign debt crises. “It is very easy to get hung up on
the idiosyncrasies of each individual situation and miss the recurring pattern.”
The recurring, historical pattern? Major debt overhangs are only solved after deep write-
downs of the debt’s face value. The longer it takes for the debt to be cut, the bigger the
necessary write-down will turn out to be. Nobody should understand this better than the
Germans. It’s not just that they benefited from the deal in 1953, which underpinned
Germany’s postwar economic miracle.
Twenty years earlier, Germany defaulted on its debts from World War I, after undergoing
a bout of hyperinflation and economic depression that helped usher Hitler to power. It is a
general lesson about the nature of debt from the World War I defaults of more than a
dozen countries in the 1930s to the Brady write-downs of the early 1990s.
Both of these episodes were preceded by a decade or more of negotiations and
rescheduling plans that — not unlike Greece’s first bailout programs — extended the
maturity of debts and lowered their interest rate. But crises ended and economies
improved only after the debt was cut. The chart below shows sharp economic rebounds
after the 1934 defaults — which cut debtors’ foreign indebtedness by at least 43 percent,
on average — and the Brady plan, which sliced debtors’ burdens by an average of 36
percent.

209
The crisis exit in both episodes came only after deep face-value debt write-offs had been
implemented. Softer forms of debt relief, such as maturity extensions and interest rate
reductions, are not generally followed by higher economic growth or improved credit
ratings.
Yet Policy makers have yet to get this. It took a decade or more from the onset of the
Latin American debt crisis to the Brady deal. Brazil alone had six debt restructurings.
Similarly, the generalized defaults of 1934 followed more than a decade of failed half-
measures. Does Greece have to wait that long, too?

210
Appendix D.2. Measurement and Survey Wordings
Appendix D.2.1. Pre-treatment Covariates (Control Variables)
Retrospective Evaluation (National Economy) was measured using the following
questionnaire, and was rescaled to 0-1, where 1 indicates “Definitely Democrats.”
Over the past few decades, which party do you think has done a better job of
handling the national economy?
1) Definitely Democrats
2) Probably Democrats
3) Not much difference between them
4) Probably Republicans
5) Definitely Republicans
6) Not sure
Retrospective Evaluation (Income Inequality) was measured using the following
questionnaire, and was rescaled to 0-1, where 1 indicates “Definitely Democrats.”
Over the past few decades, which party do you think has done a better job of
handling income inequality?
1) Definitely Democrats
2) Probably Democrats
3) Not much difference between them
4) Probably Republicans
5) Definitely Republicans
6) Not sure
Retrospective Evaluation (Pocketbook) was measured using the following questionnaire,
and was rescaled to 0-1, where 1 indicates “Definitely Democrats Presidents.”
Over the past few decades, people like you have been better off under...
1) Definitely Democratic Presidents
2) Probably Democratic Presidents
3) Not much difference between them
4) Probably Republican Presidents
5) Definitely Republican Presidents
6) Not sure

211
Party Identification was measured by the following questionnaire, and scaled 0-1 where 1
indicates “Strong Democrat”
Generally speaking, do you think of yourself as a Democrat, a Republican, an
Independent or something else?
1) Democrat
2) Republican
3) Independent
4) Other
Would you call yourself a strong Democrat or a not very strong
Democrat [Republican]?
1) Strong Democrat [Republican]
2) Not very strong Democrat [Republican]
Do you think of yourself as closer to the Democratic Party, the
Republican Party, or neither?
1) Closer to the Democratic Party
2) Closer to the Republican Party
3) Neither
Approval of Obama was measured by the following questionnaire, and scaled 0-1 where
1 indicates “strongly approve.”
Do you approve or disapprove of the way Barack Obama is handling his job as
President?
1) Strongly approve
2) Somewhat approve
3) Neither approve nor disapprove
4) Somewhat disapprove
5) Strongly disapprove
Approval of Obama’s Handling of Economy was measured by the following
questionnaire, and scaled 0-1 where 1 indicates “strongly approve.”
Do you approve or disapprove of the way Barack Obama is handling the national
economy?
1) Strongly approve
2) Somewhat approve
3) Neither approve nor disapprove
4) Somewhat disapprove
5) Strongly disapprove
Approval of Obama’s Handling of Inequality was measured by the following
questionnaire, and scaled 0-1 where 1 indicates “strongly approve.”

212
Do you approve or disapprove of the way Barack Obama is handling income
inequality?
1) Strongly approve
2) Somewhat approve
3) Neither approve nor disapprove
4) Somewhat disapprove
5) Strongly disapprove
Favorite Candidate was measured using the following question, and coded into five
categories (Clinton; Sanders; Trump; Cruz; Kasich; all else). When controlling for this
pre-treatment covariate, I estimated the fixed effects terms of each category, treating “all
else” as the reference category.
In the current election cycle, which presidential candidate do you support the
most?
1) Hilary Clinton
2) Bernie Sanders
3) Donald Trump
4) Ted Cruz
5) John Kasich
6) Someone else
7) None of them
8) Not sure
2012 Vote Choice was measured using the following question, and coded into three
categories (Romney; Obama; all else). When controlling for this pre-treatment covariate,
I estimated the fixed effects terms of each category, treating “all else” as the reference
category.
For which candidate did you vote in the 2012 Presidential Election?
1) Barack Obama
2) Mitt Romney
3) Someone else
4) Didn't vote
5) Not sure

213
Appendix D.2.2. Dependent Variables
Retrospective Evaluation was measured based on the following three items, and rescaled
to 0-1 where 1 indicates the pro-Democratic side.
Over the past few decades, which party do you think has done a better job of
handling the national economy?
1) Definitely Democrats
2) Probably Democrats
3) Not much difference between them
4) Probably Republicans
5) Definitely Republicans
6) Not sure
Over the past few decades, which party do you think has done a better job of
handling income inequality?
1) Definitely Democrats
2) Probably Democrats
3) Not much difference between them
4) Probably Republicans
5) Definitely Republicans
6) Not sure
Over the past few decades, people like you have been better off under...
1) Definitely Democratic Presidents
2) Probably Democratic Presidents
3) Not much difference between them
4) Probably Republican Presidents
5) Definitely Republican Presidents
6) Not sure
Retrospective Evaluation was measured based on the following twelve items, and
rescaled to 0-1 where 1 indicates the pro-Democratic side.
Which party do you think will do a better job of handling the national
economy over the next four years?
1) Definitely Democrats
2) Probably Democrats
3) Not much difference between them
4) Probably Republicans
5) Definitely Republicans
6) Not sure

214
Do you expect the national economy to get better, stay about the same, or get
worse than now, if a Democratic candidate wins the 2016 Presidential Election?
1) Definitely better
2) Probably better
3) About the same
4) Probably worse
5) Definitely worse
6) Not sure
Do you expect the national economy to get better, stay about the same, or get
worse than now, if a Republican candidate wins the 2016 Presidential Election?
1) Definitely better
2) Probably better
3) About the same
4) Probably worse
5) Definitely worse
6) Not sure
Between Democratic and Republican economic policies, which do you think will
generate faster economic growth?
1) Definitely Democratic
2) Probably Democratic
3) Not much difference between them
4) Probably Republican
5) Definitely Republican
6) Not sure
Which party do you think will do a better job of handling income inequality over
the next four years?
1) Definitely Democrats
2) Probably Democrats
3) Not much difference between them
4) Probably Republicans
5) Definitely Republicans
6) Not sure
Do you expect income distribution to become more equal, or less equal than now,
if a Democratic candidate wins the 2016 Presidential Election?
1) Definitely more equal
2) Probably more equal
3) About the same
4) Probably less equal
5) Definitely less equal
6) Not sure

215
Do you expect income distribution to become more equal, or less equal than now,
if a Republican candidate wins the 2016 Presidential Election?
1) Definitely more equal
2) Probably more equal
3) About the same
4) Probably less equal
5) Definitely less equal
6) Not sure
Between Democratic and Republican economic policies, which do you think
will reduce income inequality more?
1) Definitely Democratic
2) Probably Democratic
3) Not much difference between them
4) Probably Republican
5) Definitely Republican
6) Not sure
Thinking about the next President, people like you will be better off financially
under...
1) Definitely a Democrat
2) Probably a Democrat
3) Not much difference between them
4) Probably a Republican
5) Definitely a Republican
6) Not sure
Do you expect the total income of your household will go up or down, if a
Democratic candidate wins the presidential election?
1) Definitely up
2) Probably up
3) About the same
4) Probably down
5) Definitely down
6) Not sure
Do you expect the total income of your household will go up or down, if a
Republican candidate wins the presidential election?
1) Definitely up
2) Probably up
3) About the same
4) Probably down
5) Definitely down

216
6) Not sure
Between Democratic and Republican economic policies, which do you think will
make the total income of your household grow faster?
1) Definitely Democratic
2) Probably Democratic
3) Not much difference between them
4) Probably Republican
5) Definitely Republican
6) Not sure

217
Appendix D.2.3. Moderating Variables
Importance of the National Economy was measured by the following questionnaire. In the
moderation analyses, “not at all” to “one of the five” were coded 0; and “one of the two
or three” and “single most important” was coded 1.
As compared to your feelings on other political issues, how important is the
national economy to you?
1) It is the single most important political issue to me
2) One of the two or three most important political issues
3) One of the five most important political issues
4) Not among the issues I consider important
5) Not at all important
Importance of the Income Inequality was measured by the following questionnaire. In the
moderation analyses, “not at all” to “one of the five” were coded 0; and “one of the two
or three” and “single most important” was coded 1.
As compared to your feelings on other political issues, how important is income
inequality to you?
1) It is the single most important political issue to me
2) One of the two or three most important political issues
3) One of the five most important political issues
4) Not among the issues I consider important
5) Not at all important
Political Knowledge was measured by counting the percentage of correct answers to the
following questionnaires (Cronbach’s alpha = 0.67). In the moderation analyses 0% to
80% were coded 0; and 100% was coded 1.
Which one of the parties would you say is more conservative than the other at the
national level? (If you don’t know the answer, you can mark that too)
1) Democrats (1)
2) Republicans (2)
3) Not sure (3)
Do you happen to know what job or political office is currently held by John
Kerry? (If you don’t know the answer, you can mark that too)
1) U.S. Senator (1)
2) U.S. Vice President (2)
3) U.S. State Secretary (3)
4) U.S Energy Secretary (4)

218
5) Not sure (5)
Which party has the most members in the United States House of
Representatives? (If you don’t know the answer, you can mark that too)
1) Democrats (1)
2) Republicans (2)
3) Not sure (3)
Who has the final responsibility to decide whether a law is Constitutional or
not? (If you don’t know the answer, you can mark that too)
1) President (1)
2) Congress (2)
3) Supreme Court (3)
4) Not sure (4)
How much of a majority is needed for the U.S. Senate and House to override a
presidential veto? (If you don’t know the answer, you can mark that too)
1) Simple majority (one more than half the votes) (1)
2) Two-thirds majority (2)
3) Three-fourths majority (3)
4) Not sure (4)
Need for cognition (wave 2; after treatment) was measured by combining the following
items, and scaled 0-1 where 1 indicates highest score (0.86). In the moderation analyses 0
to 0.7 were coded 0; and 0.71 to 1 were coded 1.
Please indicate whether or not you agree with each of the following statements
about you or your beliefs. (Wave 2; after treatment)
1) Strongly agree
2) Somewhat agree
3) Neither agree nor disagree
4) Somewhat disagree
5) Strongly disagree
I prefer complex to simple problems (same multiple choices as above).
Thinking is NOT my idea of fun (same multiple choices as above).
I find satisfaction in deliberating hard and for long hours (same multiple choices
as above).
I like to have the responsibility of handling a situation that requires a lot of
thinking (same multiple choices as above).

219
Income (Wave 2; after treatment) was measured by the following question. In the
moderation analyses, “less than 30,000” to “49,999” were coded 0; and “50,000” or
higher were coded 1.
What is your combined annual household income?
1) Less than 30,000 (1)
2) 30,000 – 39,999 (2)
3) 40,000 – 49,999 (3)
4) 50,000 – 59,999 (4)
5) 60,000 – 69,999 (5)
6) 70,000 – 79,999 (6)
7) 80,000 – 89,999 (7)
8) 90,000 – 99,999 (8)
9) 100,000 or more (9)
Age (Wave 2; after treatment) was measured by the following question. In the moderation
analyses, 18 to 34 were coded 0; 35 or higher were coded 1. There was no respondent
under 18.
How old are you?
1) Under 18 (1)
2) 18-25 (2)
3) 26-34 (3)
4) 35-44 (4)
5) 45-54 (5)
6) 55-64 (6)
7) 65 or older (7)
Gender (Wave 2; after treatment) was measured by the following question.
What is your gender?
1) Male (1)
2) Female (2)
Race (Wave 2; after treatment) was measured by the following question. In the
moderation analyses, “White/Caucasian” was coded 0; other choices were coded 1.
What is your race?
1) White/Caucasian
2) African American
3) Hispanic
4) Asian
5) Native American

220
6) Pacific Islander
7) Multiracial
8) Other

221
Appendix D.2.4. Message Recalls
Argument Recall
Thinking about the message you read and evaluated above, which of the following
did it say?
1) Working class incomes have grown faster under Democrats than
Republicans.
2) GDP has grown faster under Democrats than Republicans.
3) In the 1930s, the German economy improved after debt relief.
4) I didn't read a message that says any of the above.
5) Not sure
Chart Recall
Which of the following charts did you see in the message above?
1)
2)

222
3)
4)
5) 6) I didn't see any of these charts.
7) Not sure

223
Appendix D.2.5. Screener
Attention Screener (Before Treatment). Those who exhibited low attention by failing this
screening test were underweighted. Those who chose one or two of the three correct
options were weighted by 0.5, and those who choose none of the two were weighted by 0
(i.e., dropped).
When a big news story breaks people often go online to get up-to-the-minute
details on what is going on. We want to know which websites people trust to get
this information. We also want to know if people are paying attention to the
question. To show that you’ve read this much, please ignore the question
and select the Drudge Report and the NPR website and none of the above as your
three answers.
When there is a big news story, which is the one news website you visit first?
(Please only choose one)
1) New York Times website (1)
2) Huffington Post (2)
3) Washington Post website (3)
4) Cnn.com (4)
5) FoxNews.com (5)
6) MSNBC.com (6)
7) The Associated Press website (7)
8) Reuters website (8)
9) New York Post online (9)
10) The Drudge Report (10)
11) Google News (11)
12) ABC News website (12)
13) CBS News website (13)
14) NBC News website (14)
15) Yahoo! News (15)
16) NPR website (16)
17) USA Today website (17)
18) None of the above (18)
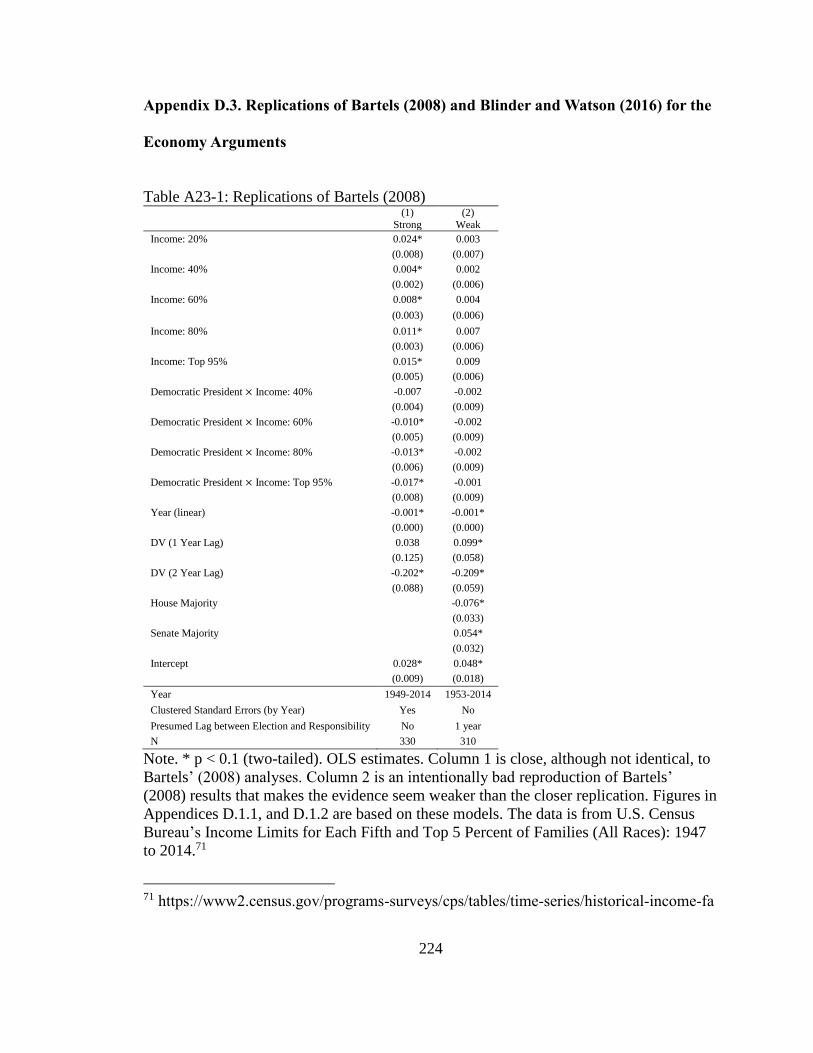
224
Appendix D.3. Replications of Bartels (2008) and Blinder and Watson (2016) for the
Economy Arguments
Table A23-1: Replications of Bartels (2008) (1)
Strong (2)
Weak
Income: 20% 0.024* 0.003 (0.008) (0.007)
Income: 40% 0.004* 0.002 (0.002) (0.006)
Income: 60% 0.008* 0.004
(0.003) (0.006)
Income: 80% 0.011* 0.007 (0.003) (0.006)
Income: Top 95% 0.015* 0.009 (0.005) (0.006)
Democratic President × Income: 40% -0.007 -0.002 (0.004) (0.009)
Democratic President × Income: 60% -0.010* -0.002 (0.005) (0.009)
Democratic President × Income: 80% -0.013* -0.002 (0.006) (0.009)
Democratic President × Income: Top 95% -0.017* -0.001 (0.008) (0.009)
Year (linear) -0.001* -0.001* (0.000) (0.000)
DV (1 Year Lag) 0.038 0.099* (0.125) (0.058)
DV (2 Year Lag) -0.202* -0.209* (0.088) (0.059)
House Majority -0.076* (0.033)
Senate Majority 0.054* (0.032)
Intercept 0.028* 0.048* (0.009) (0.018)
Year 1949-2014 1953-2014
Clustered Standard Errors (by Year) Yes No
Presumed Lag between Election and Responsibility No 1 year
N 330 310
Note. * p < 0.1 (two-tailed). OLS estimates. Column 1 is close, although not identical, to
Bartels’ (2008) analyses. Column 2 is an intentionally bad reproduction of Bartels’
(2008) results that makes the evidence seem weaker than the closer replication. Figures in
Appendices D.1.1, and D.1.2 are based on these models. The data is from U.S. Census
Bureau’s Income Limits for Each Fifth and Top 5 Percent of Families (All Races): 1947
to 2014.71
71 https://www2.census.gov/programs-surveys/cps/tables/time-series/historical-income-fa

225
Table A23-2: Replications of Blinder and Watson (2016)
Note. * p < 0.1 (two-tailed). OLS estimates. Column 1 is close, although not identical, to
Blinder and Watson’s (2016) analyses. Column 2 is an intentionally bad reproduction of
Blinder and Watson (2016) that makes the evidence seem weaker than the closer
replication. The bars representing Democratic and Republican averages in Figure 10 in
the main text (and the figures in Appendices D.1.3, and D.1.4) are based on these models.
The bars associated with each presidential term also use 3 months and 15 months as the
presumed lags between the election of a new president, and the time at which GDP
growth is attributed to the newly elected president’s responsibility. The data are from
U.S. Bureau of Economic Analysis’ Current-Dollar and "Real" Gross Domestic
Product.72
\
milies/f01ar.xls. 72 https://www.bea.gov/national/xls/gdplev.xls.
(1)
Strong
(2)
Weak
Democratic President 0.025* 0.002 (0.007) (0.007)
Year -0.004*
(0.002)
Year2 0.000*
(0.000)
Year3 -0.000*
(0.000)
DV (1 year lag) -0.194
(0.121)
DV (2 year lag) -0.243*
(0.117)
DV (2 ear lag) -0.183
(0.115)
Intercept 0.083* 0.030* (0.021) (0.004)
Presumed Lag between Election and Responsibility 3 Months 15 Months
N 65 64

226
Appendix D.4. Additional Information, Robustness Checks, and Additional Analyses
This section provides additional information, and robustness checks and
additional analyses for the results from Experiment 3, reported in Chapter 2 of this
dissertation.
Tables A24 and A25 describes the full report on the regression models reported in
Panels A and B Table 11. in the main text. In Table A24, the dependent variables
(retrospective and prospective economic evaluations) are regressed on the dummies for
the experimental condition, for which the control group serves as the reference, and pre-
treatment covariates. Covariates include prior retrospective evaluations, approval of
Obama’s performance as the President, approval of Obama’s handling of the economy,
approval of Obama’s handling of the income inequality, and dummies for vote choice and
favorite candidates. As noted in the main text, those who exhibited low attention by
failing the screener question (see Appendix D.2.4) were underweighted. Those who chose
one or two of the three correct options were weighted by 0.5, and those who choose none
of the two were weighted by 0 (i.e., dropped).
In Table A25, the experiment conditions were operationalized as a single
continuous variable representing a scale of evidence strength (0 = control; 0.5= weak 1=
pro).
Tables A26 and A27 demonstrate that the results are robust across two important
model specification choices. In Table A26, the same analyses as those reported in Table
11. are repeated, but this time without underweighting those who failed to choose the tree

227
correct options in the screener question. In Table A27, I estimate the treatment effects
without controlling for the treatment covariates. As can be seen, the results are largely
similar to those reported in Table 11.
Tables A28 and A29 provide supplementary analyses examining the “carry-over”
treatment effects on additional outcome variables, other than the key dependent variables
used in the analyses reported in the main text. Specifically, I focus on vote choice in
Table A28, and preferences for redistributive fiscal policies that are often associated with
the Democratic Party. All models included the same set of pre-treatment covariates as
prior analyses; and low-attention participants were underweighted.
As Table A28 shows, the treatment effects on vote choice are statistically
significant, and larger than those observed in the ACA experiment. The argument with
weak evidence increased the intention to vote for the Democratic Party by 5.9 percentage
points on average, and the argument with stronger evidence by 7.6 points. Interestingly, I
find no evidence that the arguments changed Republicans’ voting intentions, despite the
fact that their economic evaluations were affected by the arguments. Presumably, this
reflects the fact that convincing people to vote for the out-party is more difficult than
changing their beliefs about policies. As shown in Table A29, I find little evidence that
the treatments changed people’s opinions about redistributive policies. Apparently,
people did not attribute the Democratic edge in the economic performance to these policy
options.
In the main text (Table 11), I reported the findings based on my preferred
specification that collapsed experimental conditions into three categories. In Table A30, I

228
offer the estimates of the effects of each experimental condition by regression the
dependent variables on the four dummies indicating each argument type (Weak GDP
Evidence; Strong GDP Evidence; Weak Income Evidence; Strong Income Evidence), and
the same set of covariates as previous analyses. While the estimates are noisier than the
collapsed models, due the decrease in sample size in each category, they remain correctly
signed and statistically significant. Despite some exceptions, I also find that the
arguments with stronger evidence produced larger impacts than their weaker counterparts
by and large.
I focused on overall economic evaluations as the dependent variable in the main
text. Table A31 to A33 present an alternative specification that further categorizes
economic evaluations into sub-elements; socio-tropic (the national economy),
pocketbook, and income inequality. In each of these tables, Panel A presents the models
using the four dummies for each treatment condition, Panel B presents the models using
two (collapsed) dummies, and Panel C presents the models using a single continuous
variable. While there are some exceptions, the key findings—significant and positive
effects of arguments, especially those with stronger evidence—hold up here.
Interestingly, I find that the GDP arguments were more effective for socio-tropic
evaluations (Table A31), and the Income arguments were more effective for evaluations
of the handling of the income inequality issue (Table A33). This is consistent with what
should happen, when the arguments are assigned with more discriminating likelihood
functions for more pertinent outcome variables.

229
Table A24: Full Reports on Panel A of Table 11 (Treatment Effects on Economic
Evaluations) (1) (2) (3) (4) (5) (6)
DV Retrospective Evaluations Prospective Evaluations
Subset All Republicans Democrats All Republicans Democrats
Weak Evidence 0.037* 0.070* 0.017 0.017* 0.040* 0.007
(0.010) (0.021) (0.012) (0.007) (0.014) (0.009)
Strong Evidence 0.055* 0.074* 0.037* 0.034* 0.033* 0.031* (0.009) (0.018) (0.011) (0.007) (0.013) (0.009)
Party ID 0.110* 0.234* 0.061 0.117* 0.127* 0.153*
(0.035) (0.102) (0.043) (0.021) (0.062) (0.033) Favorite Candidate (Clinton) 0.013 -0.036 0.040* 0.028* -0.024 0.050*
(0.017) (0.058) (0.024) (0.012) (0.031) (0.016)
Favorite Candidate (Sanders) 0.037* 0.058 0.056* 0.040* 0.012 0.059* (0.015) (0.038) (0.022) (0.011) (0.028) (0.015)
Favorite Candidate (Trump) -0.043* -0.054* 0.010 -0.081* -0.103* -0.066*
(0.019) (0.027) (0.061) (0.014) (0.019) (0.038) Favorite Candidate (Cruz) -0.048* -0.055* -0.019 -0.018 -0.040* -0.012
(0.019) (0.026) (0.044) (0.014) (0.019) (0.026)
Favorite Candidate (Kasich) 0.005 -0.008 0.023 -0.001 -0.032 0.035 (0.022) (0.030) (0.042) (0.014) (0.019) (0.026)
2012 Vote Choice (Obama) 0.014 0.011 0.003 0.020* 0.023* 0.018
(0.014) (0.018) (0.055) (0.011) (0.013) (0.042) 2012 Vote Choice (Romney) 0.020 0.077* -0.010 0.014 0.012 0.014
(0.017) (0.035) (0.055) (0.012) (0.022) (0.042) Obama Approval -0.012 -0.089* 0.021 0.018 -0.024 0.035
(0.028) (0.051) (0.034) (0.023) (0.041) (0.027)
Obama Economy Approval 0.060* 0.093* 0.044 0.047* 0.069* 0.035
(0.025) (0.052) (0.033) (0.020) (0.035) (0.027) Obama Inequality Approval -0.025 -0.007 -0.033 -0.018 0.029 -0.044*
(0.017) (0.038) (0.021) (0.013) (0.026) (0.018)
Retrospective Evaluation (Economy) 0.169* 0.246* 0.133* 0.084* 0.095* 0.077* (0.027) (0.051) (0.034) (0.018) (0.035) (0.023)
Retrospective Evaluation (Inequality) 0.166* 0.139* 0.145* 0.113* 0.120* 0.088*
(0.024) (0.046) (0.032) (0.018) (0.030) (0.026) Retrospective Evaluation (Pocketbook) 0.262* 0.177* 0.315* 0.183* 0.172* 0.211*
(0.029) (0.048) (0.038) (0.021) (0.034) (0.028)
Constant 0.148* 0.134* 0.200* 0.244* 0.248* 0.211* (0.020) (0.034) (0.070) (0.014) (0.024) (0.050)
N 1100 319 654 1100 319 654
Note. * p < 0.1 (two-tailed). OLS estimates with robust standard errors in parentheses.
Low-attention participants are underweighted. All covariates were measured before
treatment. Reference categories for Favorite Candidate and 2012 Vote Choice are other
options.

230
Table A25: Full Reports on Panel B of Table 11 (Treatment Effects on Economic
Evaluations) (1) (2) (3) (4) (5) (6) DV Belief in Cost Saving Effect Attitudes toward ACA
Subset All Opponent Supporter All Opponent Supporter
Experimental Conditions (0-1) 0.055* 0.077* 0.037* 0.034* 0.035* 0.031*
(0.009) (0.019) (0.011) (0.007) (0.013) (0.009) Party ID 0.109* 0.222* 0.061 0.116* 0.118* 0.154*
(0.035) (0.102) (0.043) (0.021) (0.061) (0.033)
Favorite Candidate (Clinton) 0.015 -0.026 0.040* 0.028* -0.017 0.047* (0.017) (0.058) (0.024) (0.012) (0.031) (0.016)
Favorite Candidate (Sanders) 0.038* 0.070* 0.056* 0.040* 0.021 0.057*
(0.015) (0.039) (0.021) (0.010) (0.029) (0.015) Favorite Candidate (Trump) -0.042* -0.050* 0.010 -0.081* -0.100* -0.067*
(0.019) (0.027) (0.061) (0.014) (0.019) (0.038)
Favorite Candidate (Cruz) -0.048* -0.054* -0.019 -0.018 -0.039* -0.014 (0.019) (0.025) (0.044) (0.014) (0.019) (0.026)
Favorite Candidate (Kasich) 0.005 -0.004 0.023 -0.001 -0.029 0.036
(0.022) (0.030) (0.042) (0.014) (0.019) (0.026) 2012 Vote Choice (Obama) 0.014 0.012 0.003 0.020* 0.024* 0.020
(0.014) (0.018) (0.055) (0.010) (0.013) (0.041)
2012 Vote Choice (Romney) 0.020 0.075* -0.010 0.014 0.010 0.016 (0.017) (0.035) (0.054) (0.012) (0.022) (0.041)
Obama Approval -0.012 -0.084* 0.021 0.018 -0.021 0.034 (0.028) (0.050) (0.034) (0.023) (0.040) (0.027)
Obama Economy Approval 0.060* 0.088* 0.044 0.047* 0.066* 0.034
(0.025) (0.052) (0.033) (0.020) (0.035) (0.027) Obama Inequality Approval -0.026 -0.008 -0.033 -0.018 0.028 -0.044*
(0.017) (0.038) (0.021) (0.013) (0.026) (0.018)
Retrospective Evaluation (Economy) 0.168* 0.248* 0.133* 0.084* 0.096* 0.078*
(0.028) (0.052) (0.035) (0.018) (0.035) (0.023)
Retrospective Evaluation (Inequality) 0.166* 0.146* 0.145* 0.113* 0.125* 0.088*
(0.024) (0.044) (0.032) (0.018) (0.029) (0.026) Retrospective Evaluation (Pocketbook) 0.260* 0.173* 0.315* 0.183* 0.168* 0.213*
(0.029) (0.050) (0.038) (0.021) (0.035) (0.028)
Constant 0.151* 0.140* 0.199* 0.244* 0.252* 0.205* (0.020) (0.034) (0.068) (0.014) (0.024) (0.049)
N 1100 319 654 1100 319 654
Note. * p < 0.1 (two-tailed). OLS estimates with robust standard errors in parentheses.
Low-attention participants are underweighted. All covariates were measured before
treatment. Reference categories for Favorite Candidate and 2012 Vote Choice are other
options.

231
Table A26: Robustness Check on Table 11 (No Underweighting of Low-attention
Participants) (1) (2) (3) (4) (5) (6)
DV Retrospective Beliefs Prospective Beliefs
Subset All Rep Dem All Rep Dem
Panel A
Weak 0.030* 0.063* 0.010 0.016* 0.034* 0.006
(0.009) (0.019) (0.011) (0.007) (0.014) (0.008)
Strong 0.050* 0.065* 0.034* 0.033* 0.027* 0.033*
(0.008) (0.017) (0.010) (0.007) (0.012) (0.009)
Panel B
Linear Slope 0.050* 0.067* 0.034* 0.033* 0.029* 0.033*
(0.008) (0.017) (0.010) (0.007) (0.012) (0.009)
Covariates Yes Yes Yes Yes Yes Yes
Low Attention Participants Underweighted No No No No No No
N 1100 319 654 1100 319 654
Note. * p < 0.1 (two-tailed). OLS estimates with robust standard errors in parentheses.
Covariates include party ID, favorite Presidential candidate (among Clinton, Sanders,
Trump, Cruz and Kasich), vote choice in 2012, evaluations of Obama (overall, economy
and inequality), pre-treatment retrospective evaluations of the two parties. The
coefficients on the intercepts and covariates are not shown.

232
Table A27: Robustness Check on Table 11 (No Pre-treatment Covariates) (1) (2) (3) (4) (5) (6)
DV Retrospective Beliefs Prospective Beliefs
Subset All Rep Dem All Rep Dem
Panel A
Weak 0.022 0.065* -0.006 0.008 0.035* -0.011
(0.020) (0.028) (0.016) (0.015) (0.021) (0.013)
Strong 0.068* 0.058* 0.028* 0.046* 0.022 0.022*
(0.020) (0.027) (0.016) (0.016) (0.020) (0.013)
Panel B
Linear Slope 0.068* 0.061* 0.029* 0.045* 0.024 0.022*
(0.020) (0.027) (0.016) (0.016) (0.020) (0.013)
Covariates No No No No No No
Low Attention Participants Underweighted Yes Yes Yes Yes Yes Yes
N 1100 319 654 1100 319 654
Note. * p < 0.1 (two-tailed). OLS estimates with robust standard errors in parentheses.
Covariates are not included. Low-attention participants are underweighted. The
coefficients on the intercepts are not shown.

233
Table A28: “Carryover” Treatment Effects on Vote Choice (1) (2) (3) (4)
Subset All Republicans Independent Democrats
Panel A
Weak 0.059* 0.039 -0.089 0.097*
(0.023) (0.032) (0.071) (0.031)
Strong 0.076* 0.007 0.167* 0.081*
(0.023) (0.029) (0.079) (0.032)
Panel B
Linear Slope 0.077* 0.010 0.170* 0.080*
(0.023) (0.029) (0.080) (0.032)
Covariates Yes Yes Yes Yes
N 1100 319 127 654
Note. * p < 0.1 (two-tailed). OLS estimates with robust standard errors in parentheses.
Covariates include party ID, favorite Presidential candidate (among Clinton, Sanders,
Trump, Cruz and Kasich), vote choice in 2012, evaluations of Obama (overall, economy
and inequality), pre-treatment retrospective evaluations of the two parties. Low-attention
participants are underweighted. The coefficients on the intercepts and covariates are not
shown.

234
Table A29-1: “Carryover” Treatment Effects on Redistributive Policy Preferences (1) (1) (2) (3) (4) (5) (6)
DV Minimum Wage Rich Tax
Subset All Rep Dem All Rep Dem
Panel A
Weak -0.014 0.037 -0.020 0.003 0.029 -0.010
(0.019) (0.033) (0.023) (0.018) (0.036) (0.023)
Strong -0.030* -0.032 -0.017 0.038* 0.034 0.049*
(0.017) (0.033) (0.021) (0.018) (0.037) (0.022)
Panel B
Linear Slope -0.030* -0.028 -0.017 0.038* 0.035 0.049*
(0.017) (0.033) (0.021) (0.018) (0.037) (0.022)
Covariates Yes Yes Yes Yes Yes Yes
N 1075 311 644 1100 319 654
Table A29-2: “Carryover” Treatment Effects on Redistributive Policy Preferences (2) (1) (2) (3) (4) (5) (6)
DV Income Gap Government Responsibility
Subset
Panel A
Weak 0.004 -0.004 -0.003 0.000 0.051 -0.024
(0.017) (0.027) (0.023) (0.020) (0.040) (0.022)
Strong -0.012 -0.050* 0.004 -0.006 -0.003 -0.003
(0.016) (0.026) (0.023) (0.019) (0.041) (0.022)
Panel B
Linear Slope -0.012 -0.048* 0.004 -0.006 0.001 -0.002
(0.016) (0.026) (0.023) (0.019) (0.041) (0.022)
Covariates Yes Yes Yes Yes Yes Yes
N 1100 319 654 1100 319 654
Note. * p < 0.1 (two-tailed). OLS estimates with robust standard errors in parentheses.
Covariates include party ID, favorite Presidential candidate (among Clinton, Sanders,
Trump, Cruz and Kasich), vote choice in 2012, evaluations of Obama (overall, economy
and inequality), pre-treatment retrospective evaluations of the two parties. Low-attention
participants are underweighted. The coefficients on the intercepts and covariates are not
shown.

235
Table A30: The Effects on Economic Evaluations by Each Treatment Condition (1) (2) (3) (4) (5) (6)
DV Retrospective Beliefs Prospective Beliefs
Subset All Rep Dem All Rep Dem
Panel A
GDP Weak 0.070* 0.151* 0.031 0.035* 0.085* 0.018
(0.016) (0.032) (0.020) (0.011) (0.023) (0.013)
GDP Strong 0.093* 0.181* 0.033* 0.056* 0.070* 0.039*
(0.016) (0.035) (0.016) (0.012) (0.025) (0.014)
Income Weak 0.061* 0.087* 0.044* 0.028* 0.042* 0.022
(0.014) (0.032) (0.015) (0.011) (0.021) (0.014)
Income Strong 0.055* 0.097* 0.028 0.045* 0.052* 0.043*
(0.015) (0.030) (0.019) (0.011) (0.022) (0.014)
Covariates Yes Yes Yes Yes Yes Yes
N 1100 319 654 1100 319 654
Note. * p < 0.1 (two-tailed). OLS estimates with robust standard errors in parentheses.
Covariates include party ID, favorite Presidential candidate (among Clinton, Sanders,
Trump, Cruz and Kasich), vote choice in 2012, evaluations of Obama (overall, economy
and inequality), pre-treatment retrospective evaluations of the two parties. Low-attention
participants are underweighted. The coefficients on the intercepts and covariates are not
shown.

236
Table A31: The Effects on Sociotropic Evaluations (the National Economy) by Each
Treatment Condition (1) (2) (3) (4) (5) (6)
DV Retrospective Beliefs Prospective Beliefs
Subset All Rep Dem All Rep Dem
Panel A
GDP Weak 0.070* 0.151* 0.031 0.035* 0.085* 0.018
(0.016) (0.032) (0.020) (0.011) (0.023) (0.013)
GDP Strong 0.093* 0.181* 0.033* 0.056* 0.070* 0.039*
(0.016) (0.035) (0.016) (0.012) (0.025) (0.014)
Income Weak 0.061* 0.087* 0.044* 0.028* 0.042* 0.022
(0.014) (0.032) (0.015) (0.011) (0.021) (0.014)
Income Strong 0.055* 0.097* 0.028 0.045* 0.052* 0.043*
(0.015) (0.030) (0.019) (0.011) (0.022) (0.014)
Panel B
Weal 0.065* 0.116* 0.038* 0.031* 0.061* 0.020*
(0.012) (0.026) (0.015) (0.009) (0.018) (0.011)
Strong 0.074* 0.139* 0.030* 0.051* 0.061* 0.041*
(0.012) (0.026) (0.014) (0.009) (0.019) (0.012)
Panel C
Slope 0.074* 0.143* 0.030* 0.051* 0.063* 0.041*
(0.012) (0.026) (0.014) (0.009) (0.019) (0.011)
Covariates Yes Yes Yes Yes Yes Yes
N 1100 319 654 1100 319 654
Note. * p < 0.1 (two-tailed). OLS estimates with robust standard errors in parentheses.
Covariates include party ID, favorite Presidential candidate (among Clinton, Sanders,
Trump, Cruz and Kasich), vote choice in 2012, evaluations of Obama (overall, economy
and inequality), pre-treatment retrospective evaluations of the two parties. Low-attention
participants are underweighted. The coefficients on the intercepts and covariates are not
shown.

237
Table A32: The Effects on Pocketbook Evaluations by Each Treatment Condition (1) (2) (3) (4) (5) (6)
DV Retrospective Beliefs Prospective Beliefs
Subset All Rep Dem All Rep Dem
Panel A
GDP Weak 0.026 0.109* -0.010 0.023* 0.080* 0.006
(0.017) (0.031) (0.021) (0.012) (0.023) (0.015)
GDP Strong 0.034* 0.038 0.013 0.018 0.002 0.019
(0.015) (0.030) (0.018) (0.012) (0.025) (0.015)
Income Weak 0.020 0.039 0.008 -0.001 0.012 -0.007
(0.015) (0.033) (0.018) (0.012) (0.023) (0.016)
Income Strong 0.051* 0.061* 0.041* 0.029* 0.022 0.035*
(0.014) (0.031) (0.017) (0.012) (0.024) (0.015)
Panel B
Weal 0.023* 0.070* -0.001 0.011 0.042* -0.000
(0.013) (0.027) (0.015) (0.010) (0.018) (0.013)
Strong 0.042* 0.049* 0.027* 0.024* 0.011 0.027*
(0.012) (0.025) (0.014) (0.010) (0.019) (0.012)
Panel C
Slope 0.042* 0.053* 0.027* 0.024* 0.014 0.027*
(0.012) (0.025) (0.014) (0.010) (0.019) (0.012)
Covariates Yes Yes Yes Yes Yes Yes
N 1100 319 654 1100 319 654
Note. * p < 0.1 (two-tailed). OLS estimates with robust standard errors in parentheses.
Covariates include party ID, favorite Presidential candidate (among Clinton, Sanders,
Trump, Cruz and Kasich), vote choice in 2012, evaluations of Obama (overall, economy
and inequality), pre-treatment retrospective evaluations of the two parties. Low-attention
participants are underweighted. The coefficients on the intercepts and covariates are not
shown.

238
Table A33: The Effects on Performance on the Handling of Income Inequality by Each
Treatment Condition (1) (2) (3) (4) (5) (6)
DV Retrospective Beliefs Prospective Beliefs
Subset All Rep Dem All Rep Dem
Panel A
GDP Weak 0.017 0.028 0.017 0.006 0.033 -0.002
(0.017) (0.037) (0.022) (0.014) (0.032) (0.016)
GDP Strong 0.034* 0.012 0.040* 0.017 0.016 0.007
(0.016) (0.033) (0.019) (0.012) (0.028) (0.015)
Income Weak 0.028* 0.022 0.015 0.014 0.006 0.005
(0.016) (0.037) (0.019) (0.012) (0.026) (0.015)
Income Strong 0.064* 0.058 0.070* 0.040* 0.040 0.041*
(0.016) (0.036) (0.020) (0.012) (0.026) (0.015)
Panel B
Weal 0.022 0.025 0.016 0.010 0.018 0.001
(0.014) (0.031) (0.017) (0.010) (0.023) (0.013)
Strong 0.049* 0.035 0.055* 0.028* 0.027 0.025*
(0.013) (0.028) (0.016) (0.010) (0.021) (0.012)
Panel C
Slope 0.049* 0.035 0.055* 0.028* 0.028 0.025*
(0.013) (0.028) (0.016) (0.010) (0.021) (0.012)
Covariates Yes Yes Yes Yes Yes Yes
N 1100 319 654 1100 319 654
Note. * p < 0.1 (two-tailed). OLS estimates with robust standard errors in parentheses.
Covariates include party ID, favorite Presidential candidate (among Clinton, Sanders,
Trump, Cruz and Kasich), vote choice in 2012, evaluations of Obama (overall, economy
and inequality), pre-treatment retrospective evaluations of the two parties. Low-attention
participants are underweighted. The coefficients on the intercepts and covariates are not
shown.

239
Bibliography
Abramowitz, A. I. 2010. The Disappearing Center: Engaged Citizens, Polarization, and
American Democracy. New Haven: Yale University Press.
Achen, Christopher H. 1992. "Social Psychology, Demographic Variables, and Linear
Regression: Breaking the Iron Triangle in Voting Research." Political
Behavior 14 (3): 195-211.
Achen, Christopher H., and Larry M. Bartels. 2016. Democracy for Realists: Why
Elections Do Not Produce Responsive Government. Princeton: Princeton
University Press.
Althaus, Scott L. 1998. "Information Effects in Collective Preferences." American
Political Science Review 92 (3): 545-558.
American Society for Aesthetic Plastic Surgery. 2015. “Statistics.”
http://www.surgery.org/media/statistics.
Areni, Charles S., and Richard J. Lutz. 1988. "The Role of Argument Quality in the
Elaboration Likelihood Model." Advances in Consumer Research 15 (1): 197-
203.
Banas, John A., and Stephen A. Rains. 2010. “A Meta-Analysis of Research on
Inoculation Theory.” Communication Monographs 77 (3): 281-311.
Barabas, Jason. 2004. "How Deliberation Affects Policy Opinions." American Political
Science Review 98 (4): 687-701.

240
Bartels, Larry M. 1996. "Uninformed Votes: Information Effects in Presidential
Elections." American Journal of Political Science 40 (1): 194-230.
Bartels, Larry M. 2002. “Beyond the Running Tally: Partisan Bias in Political
Perceptions.” Political Behavior 24 (2): 117-50.
Bartels, Larry M. 2008. Unequal Democracy: The Political Economy of the New Gilded
Age. Princeton: Princeton University Press.
Bartels, Larry M. 2012. “Want a strong economy? Vote Democrat.” Salon.com,
November 2, 2012.
http://www.salon.com/2012/11/02/want_a_strong_economy_vote_democrat/.
Benhabib, Seyla. 1996. “Toward a Deliberative Model of Democratic Legitimacy.”
In Democracy and Difference: Contesting the Boundaries of the Political,
edited by Seyla Benhabib, 67-94. Princeton: Princeton University Press.
Bennett, W. Lance, and Shanto Iyengar. 2008. "A New Era of Minimal Effects? The
Changing Foundations of Political Communication." Journal of
Communication 58 (4): 707-731.
Berelson, Bernard R., Paul F. Lazarsfeld and William N. McPhee. 1954. Voting: A Study
of Opinion Formation in a Presidential Campaign. Chicago: University of
Chicago Press.
Berinsky, Adam J. 2012a. “The Birthers Are Back.” Last modified February 3, 2012,
https://today.yougov.com/news/2012/02/03/birthers-are-back/.
Berinsky, Adam J. 2012b. “The Birthers Are Still Back.” Last modified July 11, 2012,
https://today.yougov.com/news/2012/07/11/birthers-are-still-back/.

241
Berinsky, Adam J. "Rumors and Health Care Reform: Experiments in Political
Misinformation." British Journal of Political Science (47): 241-262.
Berinsky, Adam J., Gregory A. Huber, and Gabriel S. Lenz. 2012. "Evaluating Online
Labor Markets for Experimental Research: Amazon. com's Mechanical
Turk." Political Analysis 20 (3): 351-368.
Berinsky, Adam J., Michele F. Margolis, and Michael W. Sances. 2014. "Separating the
Shirkers from the Workers? Making Sure Respondents Pay Attention on Self‐
Administered Surveys." American Journal of Political Science 58 (3): 739-
753.
Bishin, Benjamin G., Thomas J. Hayes, Matthew B. Incantalupo, and Charles Anthony
Smith. "Opinion Backlash and Public Attitudes: Are Political Advances in
Gay Rights Counterproductive?" American Journal of Political Science 60
(3): 625-648.
Blinder, Alan S., and Mark W. Watson. 2016. "Presidents and the US Economy: An
Econometric Exploration." The American Economic Review 106 (4): 1015-
1045.
Boudreau, Cheryl, and Scott A. MacKenzie. 2014. "Informing the Electorate? How Party
Cues and Policy Information Affect Public Opinion about Initiatives."
American Journal of Political Science 58 (1): 48-62.
Broockman, David E., and Daniel M. Butler. 2017. "The Causal Effects of Elite Position‐
Taking on Voter Attitudes: Field Experiments with Elite Communication."
American Journal of Political Science 61 (1): 208-221.

242
Bullock, John G. 2009. "Partisan Bias and the Bayesian Ideal in the Study of Public
Opinion." The Journal of Politics 71 (3):1109-1124.
Bullock, John G. 2011. “Elite Influence on Public Opinion in an Informed Electorate.”
American Political Science Review 105 (3): 496–515.
Bullock, John G., Alan S. Gerber, Seth J. Hill, and Gregory A. Huber. "Partisan Bias in
Factual Beliefs about Politics." Quarterly Journal of Political Science 10 (4):
519-578.
Campbell, Angus, Philip E. Converse, Warren E. Miller, and Donald E. Stokes. 1960.
The American Voter. Chicago: University of Chicago Press
Cappella, Joseph N., Vincent Price, and Lilach Nir. 2002. "Argument Repertoire as a
Reliable and Valid Measure of Opinion Quality: Electronic Dialogue during
Campaign 2000." Political Communication 19 (1): 73-93.
Centers for Medicare and Medicaid Services. 2015. “The National Health Expenditure
Accounts.” https://www.cms.gov/Research-Statistics-Data-and-
Systems/Statistics-Trends-and-
Reports/NationalHealthExpendData/NationalHealthAccountsHistorical.html.
Claassen, Ryan L., and Benjamin Highton. 2006. "Does Policy Debate Reduce
Information Effects in Public Opinion? Analyzing the Evolution of Public
Opinion on Health Care." Journal of Politics 68 (2): 410-420.
Claassen, Ryan, and Benjamin Highton. 2009. "The ‘Choice Context’ and the Political
Significance of Political awareness." Political Research Quarterly 62: 538-
551.

243
Chong, Dennis, and James N. Druckman. 2007. “Framing Public Opinion in Competitive
Democracies.” American Political Science Review 101 (4): 637–55.
Chong, Dennis, and James N. Druckman. 2010. “Dynamic Public Opinion.” American
Political Science Review 104 (4): 663–80.
Cohen, Geoffrey L. 2003. "Party over Policy: The Dominating Impact of Group Influence
on Political Beliefs." Journal of Personality and Social Psychology 85 (5):
808-832.
Converse, Philip. E. 1964. “The Nature of Belief Systems in Mass Publics.” In Ideology
and Discontent, edited by David. E. Apter, 206-261. New York: Free Press.
Coppock, Alexander. 2016. “Positive, Small, Homogeneous, and Durable: Political
Persuasion in Response to Information.” PhD Diss., Columbia University.
Corner, Adam, Lorraine Whitmarsh, and Dimitrios Xenias. 2012. "Uncertainty,
Scepticism and Attitudes towards Climate Change: Biased Assimilation and
Attitude Polarisation." Climatic Change 114 (3): 463-478.
Delli Carpini, Michael X., and Scott Keeter. 1996. What Americans Know about Politics
and Why It Matters. New Haven: Yale University Press.
Delli Carpini, Michael X, Fay Lomax Cook, and Lawrence R. Jacobs. 2004. "Public
Deliberation, Discursive Participation, and Citizen Engagement: A Review of
the Empirical Literature." Annual Review of Political. Science 7 (4): 315-344.
Department of Health and Human Services. 2016. “Health Insurance and the Affordable
Care Act, 2010–2016.” Retrieved from
https://aspe.hhs.gov/sites/default/files/pdf/187551/ACA2010-2016.pdf

244
Downs, Anthony (1957). An Economic Theory of Democracy. New York: Harper and
Row.
Druckman, James N. 2012. "The Politics of Motivation." Critical Review 24 (2): 199-
216.
Druckman, James N., Jordan Fein and J. Leeper, Thomas. 2012. “A Source of Bias in
Public Opinion Stability." American Political Science Review 106 (2):430-
454.
Druckman, James N., Erik Peterson, and Rune Slothuus. 2013. "How Elite Partisan
Polarization Affects Public Opinion Formation." American Political Science
Review 107 (1): 57-79.
Edwards, Kari, and Edward E. Smith. 1996. "A Disconfirmation Bias in the Evaluation of
Arguments." Journal of Personality and Social Psychology 71 (1): 5-24.
Fiorina, Morris P. 1981. Retrospective Voting in American National Elections. New
Haven: Yale University Press.
Fishbein, Martin. 1963. "An Investigation of the Relationship between Beliefs about an
Object and the Attitude toward that Object." Human Relations 16 (3): 233-
239.
Fishkin, James S. 1991. Democracy and Deliberation: New Directions for Democratic
Reform. New Haven: Yale University Press.
Fishkin, James S. 1995. The Voice of the People: Public Opinion and Democracy. New
Haven: Yale University Press.

245
Fishkin, James. 2009. When the People Speak: Deliberative Democracy and Public
Consultation. New York: Oxford University Press.
Fishkin, James S., and Robert C. Luskin. 2005. "Experimenting with a Democratic Ideal:
Deliberative Polling and Public Opinion." Acta Politica 40 (3): 284-298.
Garrett, R. Kelly, and Natalie Jomini Stroud. 2014. "Partisan Paths to Exposure
Diversity: Differences in Pro‐and Counterattitudinal News
Consumption." Journal of Communication 64 (4): 680-701.
Gastil, John. 2008. Political Communication and Deliberation. Los Angeles: Sage.
Gerber, Alan S., James G. Gimpel, Donald P. Green, and Daron R. Shaw. "How Large
and Long-Lasting Are the Persuasive Effects of Televised Campaign Ads?
Results from a randomized field experiment." American Political Science
Review 105 (1): 135-150.
Gerber, Alan, and Donald P. Green. 1998. "Rational Learning and Partisan Attitudes."
American Journal of Political Science 42 (3): 794-818.
Gerber, Alan, and Donald Green. 1999. "Misperceptions about Perceptual bias." Annual
Review of Political Science 2 (1): 189-210.
Gilens, Martin. 2001. "Political Ignorance and Collective Policy Preferences." American
Political Science Review 95 (2): 379-396.
Guess, Andrew, and Alexander Coppock. 2015. "Back to Bayes: Confronting the
Evidence on Attitude Polarization." Unpublished Manuscript.
http://polisci.columbia.edu/files/polisci/u227/GuessCoppock_Back2BayesV3.
pdf.

246
Gruber, Jonathan J. 2014."Growth and Variability in Health Plan Premiums in the
Individual Insurance Market before the Affordable Care Act." Issue Brief
(Commonwealth Fund) 11: 1-12.
http://www.commonwealthfund.org/~/media/files/publications/issue-
brief/2014/jun/1750_gruber_growth_variability_hlt_plan_premiums_ib_v2.p
df
Gutmann, Amy, and Dennis Thompson. 1996. Democracy and Disagreement.
Cambridge, MA: Harvard University Press.
Habermas, Jürgen. 1984. The Theory of Communicative Action Volume One: Reason and
the Rationalization of Society. Boston: Beacon Press.
Habermas, Jürgen. 1989. The Structural Transformation of the Public Sphere: An Inquiry
into a Category of Bourgeois Society. Cambridge, MA: MIT press.
Hahn, Ulrike, and Mike Oaksford. 2007. "The Rationality of Informal Argumentation: A
Bayesian Approach to Reasoning Fallacies." Psychological Review 114 (3):
704-732.
Hart, William, Dolores Albarracín, Alice H. Eagly, Inge Brechan, Matthew J. Lindberg,
and Lisa Merrill. 2009. "Feeling Validated Versus Being Correct: A Meta-
Analysis of Selective Exposure to Information." Psychological Bulletin 135
(4): 555-588.
Healy, Andrew, and Gabriel S. Lenz. 2014. “Substituting the End for the Whole: Why
Voters Respond Primarily to the Election-Year Economy.” American Journal
of Political Science 58 (1): 31–47.

247
Hibbs Jr, Douglas A. 2000. "Bread and Peace Voting in US Presidential Elections."
Public Choice 104 (1-2): 149-180.
Hill, Seth J., James Lo, Lynn Vavreck, and John Zaller. "How Quickly We Forget: The
Duration of Persuasion Effects from Mass Communication." Political
Communication 30 (4): 521-547.
Houston, David A., and Russell H. Fazio. 1989. "Biased Processing as a Function of
Attitude Accessibility: Making Objective Judgments Subjectively." Social
Cognition 7 (1): 51-66.
Iyengar, Shanto, and Kyu S. Hahn. 2009. "Red Media, Blue Media: Evidence of
Ideological Selectivity in Media use." Journal of Communication 59 (1): 19-
39.
Iyengar, Shanto, Gaurav Sood, and Yphtach Lelkes. "Affect, Not Ideology: A Social
Identity Perspective on Polarization." Public Opinion Quarterly 76 (3): 405-
431.
Lazarsfeld, Paul F., Bernard Berelson and Hazel Gaudet. 1944. The People's Choice:
How the Voter Makes Up His Mind in a Presidential Campaign. New York:
Duell Sloan and Pearce.
Lupia, Arthur, and Mathew D. McCubbins. 1998. The Democratic Dilemma: Can
Citizens Learn What They Need to Know? New York: Cambridge University
Press

248
Jamieson, Kathleen Hall, and Joseph N. Cappella. 2008. Echo Chamber: Rush Limbaugh
and the Conservative Media Establishment. New York: Oxford University
Press.
Jerit, Jennifer, and Jason Barabas. 2012. "Partisan Perceptual Bias and the Information
Environment." Journal of Politics 74 (3): 672-684.
Key, Valdimer O. 1966. The Responsible Electorate. Cambridge, MA: Harvard
University Press.
Kramer, Gerald H. 1971. “Short-Term Fluctuations in U.S. Voting Behavior, 1896–
1964.” American Political Science Review 65 (1): 131–43.
Krupnikov, Yanna and Adam Seth Levine. 2014. “Cross-sample Comparisons and
External Validity.” Journal of Experimental Political Science 1 (1):59–80.
Kuklinski, James H., and Paul J. Quirk. 2001. "Conceptual Foundations of Citizen
Competence." Political Behavior 23 (3): 285-311.
Kuklinski, James H., Paul J. Quirk, Jennifer Jerit, David Schwieder, and Robert F. Rich.
2000. "Misinformation and the Currency of Democratic Citizenship." Journal
of Politics 62 (3): 790-816.
Kunda, Ziva. 1990. "The Case for Motivated Reasoning. Psychological Bulletin 108, (3):
480-498.
Leeper, Thomas J. 2014. "The Informational Basis for Mass Polarization." Public
Opinion Quarterly 78 (1): 27-46.
Lenz, Gabriel S. 2012. Follow the Leader? How Voters Respond to Politicians’
Performance and Policies. Chicago: University of Chicago Press.

249
Lewis-Beck, Michael S. 1988. “Economics and the American Voter: Past, Present,
Future.” Political Behavior 19 (1): 5–21.
Levendusky, Matthew S. 2011. "Rethinking the Role of Political Information." Public
Opinion Quarterly 75 (1): 42-64.
Lord, Charles G., Lee Ross, and Mark R. Lepper. 1979. "Biased Assimilation and
Attitude Polarization: The Effects of Prior Theories on Subsequently
Considered Evidence." Journal of Personality and Social Psychology 37 (11):
2098-2109.
Luskin, Robert C., James S. Fishkin, and Roger Jowell. 2002. "Considered Opinions:
Deliberative Polling in Britain." British Journal of Political Science 32 (3):
455-487.
Mansbridge, Jane. 1983. Beyond Adversary Democracy. Chicago: University of Chicago
Press.
Mansbridge, Jane. 2003. "Rethinking Representation." American Political Science
Review 97 (4): 515-528.
McGuire, William J. 1961. "The Effectiveness of Supportive and Refutational Defenses
in Immunizing and Restoring Beliefs against Persuasion." Sociometry 24 (2):
184-197.
McGuire, William J.1969. "The Nature of Attitudes and Attitude Change." The
Handbook of Social Psychology 3 (2):136-314.

250
Mendelberg, Tali. 2002. “The Deliberative Citizen.” In Political Decision Making,
Deliberation and Participation, edited by Michael X. Delli Carpini, Leonie
Huddy, and Robert Y. Shapiro, 151-193. New York: Elsevier Press.
Mérola, Vittorio, and Matthew P. Hitt. 2016, "Numeracy and the Persuasive Effect of
Policy Information and Party Cues." Public Opinion Quarterly 80 (2): 554-
562.
Mercier, Hugo, and Hélène Landemore. 2012. "Reasoning is for Arguing: Understanding
the Successes and Failures of Deliberation." Political Psychology 33 (2): 243-
258.
Mill, John Stuart. 1869. On Liberty. Longmans, Green, Reader, and Dyer.
Miller, Arthur G., John W. McHoskey, Cynthia M. Bane, and Timothy G. Dowd. 1993.
"The Attitude Polarization Phenomenon: Role of Response Measure, Attitude
Extremity, and Behavioral Consequences of Reported Attitude
Change." Journal of Personality and Social Psychology 64 (4): 561-574.
Mullinix, Kevin J., Thomas J. Leeper, James N. Druckman and Jeremy Freese. 2015.
“The Generalizability of Survey Experiments.” Journal of Experimental
Political Science 2:109-138.
Munro, Geoffrey D., and Peter H. Ditto. 1997. "Biased Assimilation, Attitude
Polarization, and Affect in Reactions to Stereotype-relevant Scientific
Information." Personality and Social Psychology Bulletin 23 (6): 636-653.
Mutz, Diana C. 2006. Hearing the Other Side: Deliberative versus Participatory
Democracy. New York: Cambridge University Press.

251
Mutz, Diana C. 2008. "Is Deliberative Democracy a Falsifiable Theory?" Annual Review
of Political Science 11: 521-538.
Nam, H. Hannah, John T. Jost, and Jay J. Van Bavel. 2013. “Not for All the Tea in
China!” Political Ideology and the Avoidance of Dissonance-Arousing
Situations." PloS One 8 (4): e59837.
Nisbett, Richard E., and Lee Ross. 1980. Human Inference: Strategies and Shortcomings
of Social Judgment. Englewood Cliffs, New Jersey: Prentice Hall.
Nyhan, Brendan and Jason Reifler. 2010. “When Corrections Fail: The Persistence of
Political Misperceptions.” Political Behavior 32(2):303–330.
Nyhan, Brendan, and Jason Reifler. 2015. "Does Correcting Myths about the Flu Vaccine
Work? An Experimental Evaluation of the Effects of Corrective Information."
Vaccine 33 (3): 459-464.
Nyhan, Brendan, Jason Reifler, Sean Richey, and Gary L. Freed. 2014. "Effective
Messages in Vaccine Promotion: A Randomized Trial." Pediatrics 133 (4):
e835-e842.
O’Keefe, Daniel J., and Sally Jackson. 1995. "Argument Quality and Persuasive Effects:
A Review of Current Approaches." In Argumentation and Values:
Proceedings of the Ninth SCA/AFA Conference on Argumentation, 88-92.
Speech Communication Association.
http://www.dokeefe.net/pub/okeefejackson95alta.pdf.

252
Page, Benjamin I., and Robert Y. Shapiro. 1992. The Rational Public: Fifty Years of
Trends in Americans' Policy Preferences. Chicago: University of Chicago
Press.
Parker-Stephen, Evan. 2013. "Tides of Disagreement: How Reality Facilitates (and
inhibits) Partisan Public Opinion." The Journal of Politics 75 (4): 1077-1088.
Pateman, Carole. 1970. Participation and Democratic Theory. New York: Cambridge
University Press.
Petty, Richard E., and John T. Cacioppo. 1986. “The Elaboration Likelihood Model of
Persuasion.” Advances in Experimental Social Psychology 19: 123–205.
Pfau, Michael, David Park, R. Lance Holbert, and Jaeho Cho. 2001. "The Effects of
Party-and PAC-Sponsored Issue Advertising and the Potential of Inoculation
to Combat its Impact on the Democratic Process." American Behavioral
Scientist 44 (12): 2379-2397.
Pierce, Douglas R. 2015. "Uninformed Votes? Reappraising Information Effects and
Presidential Preferences." Political Behavior 37(3): 537-565..
Price, Vincent, and Peter Neijens. 1997. "Opinion Quality in Public Opinion Research."
International Journal of Public Opinion Research 9 (4): 336-360.
Price, Vincent, and Peter Neijens. 1998. "Deliberative Polls: toward Improved Measures
of “Informed” Public Opinion?" International Journal of Public Opinion
Research 10 (2): 145-176.

253
Price, Vincent, Lilach Nir, and Joseph N. Cappella. 2006. "Normative and Informational
Influences in Online Political Discussions." Communication Theory 16 (1):
47-74.
Price, Vincent, and John Zaller. 1993. "Who Gets the News? Alternative Measures of
News Reception and Their Implications for Research." Public Opinion
Quarterly 57 (2): 133-164.
Prior, Marcus, Gaurav Sood, and Kabir Khanna (2015). "You Cannot be Serious: The
Impact of Accuracy Incentives on Partisan Bias in Reports of Economic
Perceptions." Quarterly Journal of Political Science: 10 (4): 489-518.
Rahn, Wendy M. "The Role of Partisan Stereotypes in Information Processing about
Political Candidates." American Journal of Political Science 37(2): 472-496.
Redlawsk, David P. 2002. "Hot Cognition or Cool consideration? Testing the Effects of
Motivated Reasoning on Political Decision Making." Journal of Politics 64
(4): 1021-1044.
Rosenbaum, Sara, and Jonathan J. Gruber. 2010. "Buying Health care, the Individual
Mandate, and the Constitution." New England Journal of Medicine 363 (5):
401-403.
Ross, Lee. 2012. "Reflections on Biased Assimilation and Belief Polarization." Critical
Review 24 (2): 233-245.
Sanders, Lynn M. 1997. "Against Deliberation." Political Theory 25 (3): 347-376.
Schudson, Michael. 1998. The Good Citizen: A History of American Civic Life.
Cambridge, MA: Harvard University Press.

254
Schuette, Robert A., and Russell H. Fazio. 1995. "Attitude Accessibility and Motivation
as Determinants of Biased Processing: A Test of the MODE Model."
Personality and Social Psychology Bulletin 21 (7): 704-704.
Shadish, William R., Thomas D. Cook, and Donald T. Campbell. 2002. Experimental and
Quasi-experimental Designs for Generalized Causal Inference. Boston:
Houghton, Mifflin and Company.
Sniderman, Paul M., Richard A. Brody and Phillip E. Tetlock. 1991. Reasoning and
Choice: Explorations in Political Psychology. New York: Cambridge
University Press.
Stanig, Piero. 2013. “Political Polarization in Retrospective Economic Evaluations during
Recessions and Recoveries.” Electoral Studies 32 (4): 729–45.
Sturgis, Patrick. 2003. "Knowledge and Collective Preferences: A Comparison of Two
Approaches to Estimating the Opinions of a Better Informed Public."
Sociological Methods and Research 31 (4): 453-485.
Sunstein, Cass. 2001. Republic. com. Princeton: Princeton University Press.
Taber, Charles S., Damon Cann, and Simona Kucsova. 2009. "The Motivated Processing
of Political Arguments." Political Behavior 31 (2): 137-155.
Taber, Charles S., and Milton Lodge. 2006. "Motivated Skepticism in the Evaluation of
Political Beliefs." American Journal of Political Science 50 (3): 755-769.
Tetlock, Philip. 2005. Expert Political Judgment: How Good is It? How can We Know?
Princeton: Princeton University Press.

255
Tetlock, Philip, and Dan Gardner. 2015. Superforecasting: The Art and Science of
Prediction. New York: Crown Publishers.
Thompson, Dennis F. 2008. "Deliberative Democratic Theory and Empirical Political
Science." Annual Review of Political Science 11: 497-520.
Wells, Chris, Justin Reedy, John Gastil, and Carolyn Lee. 2009. "Information Distortion
and Voting Choices: The Origins and Effects of Factual Beliefs in Initiative
Elections." Political Psychology 30 (6): 953-969.
Westwood, Sean J. 2015. "The Role of Persuasion in Deliberative Opinion Change."
Political Communication 32 (4): 509-528.
Wojcieszak, Magdalena. 2011. "Deliberation and Attitude Polarization." Journal of
Communication 61 (4): 596-617.
Wood, Thomas, and Ethan Porter. 2016. "The Elusive Backfire Effect: Mass Attitudes'
Steadfast Factual Adherence." Paper presented at the annual meeting for the
American Political Science Association, Philadelphia, Pennsylvania,
September 1-4. https://ssrn.com/abstract=2819073.
Zaller, John R. 1992. The Nature and Origins of Mass Opinion. New York: Cambridge
University Press.
Zaller, John. 1996. “The Myth of Massive Media Impact Revived: New Support for a
Discredited Idea.” In Political Persuasion and Attitude Change, edited by
Diana C. Mutz, Richard A. Brody and Paul M. Sniderman, 17-78. Ann Arbor:
The University of Michigan Press.

256
Zhang, Weiyu. 2010. "Simulating the Ideal eDeliberation: The Roles of Inclusion,
Equalization and Rationalization." Online Deliberation: 117-125.