Assesment of physicochemical quality of water from source to consumer level . A case study in...
74
SOKOINE UNIVERSITY OF AGRICULTURE FACULTY OF AGRICULTURE DEPARTMENT OF FOOD SCIENCE AND TECHNOLOGY SPECIAL PROJECT REPORT TITLE: ASSESMENT OF PHYSICOCHEMICAL QUALITY OF WATER FROM SOURCE TO CONSUMER LEVEL A CASE STUDY IN MOROGORO MUNICIPARITY NAME OF STUDENT: MTAKI REVOCATUS NAME OF SUPERVISOR: PROF. E.E. MAEDA REG. NO: FST/E/10/T/0096 SUBMITTED IN PARTIAL FULFILLMENT OF THE REQUIREMENT FOR AWARD OF A DEGREE IN FOODSCIENCE AND TECHNOLOGY OF THE SOKOINE UNIVERSITY OF AGRICULTURE. MOROGORO, TANZANIA.
Transcript of Assesment of physicochemical quality of water from source to consumer level . A case study in...

SOKOINE UNIVERSITY OF AGRICULTURE
FACULTY OF AGRICULTURE
DEPARTMENT OF FOOD SCIENCE AND TECHNOLOGY
SPECIAL PROJECT REPORT
TITLE: ASSESMENT OF PHYSICOCHEMICAL QUALITY OF WATER FROM
SOURCE TO CONSUMER LEVEL A CASE STUDY IN MOROGORO MUNICIPARITY
NAME OF STUDENT: MTAKI REVOCATUS
NAME OF SUPERVISOR: PROF. E.E. MAEDA
REG. NO: FST/E/10/T/0096
SUBMITTED IN PARTIAL FULFILLMENT OF THE REQUIREMENT FOR AWARD OF
A DEGREE IN FOODSCIENCE AND TECHNOLOGY OF THE SOKOINE UNIVERSITY
OF AGRICULTURE. MOROGORO, TANZANIA.

DATE: July, 2013
ii

ABSTRACT
Water quality physicochemical parameters in three water sources
namely, Mzinga River, Mindu Dam and Morogoro River (RDD) were
assessed. Three samples from each source were drawn, before
water treatment, after treatment and at the consumer level. pH,
Chloride, Calcium, conductivity total dissolved solids and the
degree of total hardness concentration were determined using
standard procedures (UNEP/WHO). World Health Organization
(WHO) and Tanzania Bureau Standards (TBS) acceptable limits
for drinking water were used as reference. The mean values
pH, total hardness, calcium, chloride, conductivity and TDS for
Mzinga river were 6.772, 22.667mg/l, 6.389mg/l, 8.199mg/,
61.211µs/cm and 32.757 respectively. The mean values pH, total
hardness, calcium, chloride, conductivity and TDS for Mindu dam
were pH 6.897, 44.22mg/l, 9.078mg/l, 10gm/l, 98.611µs/cm
59.156mg/l. respectively. The mean values pH, total hardness,
calcium, chloride, conductivity and TDS for RDD were 6.927,
22.111mg/l, 3.667mg/l, 8.656mg/l, 36.292µs/cm and 19.889mg/l
respectively. The measured values for all parameters were within
i

the WHO and TBS guidelines for drinking water. The results
showed that there was a significant different in mean values for
some physicochemical parameters between water source and status
at p< 0.05.The differences may be due to the effect of water
treatment. It is Concluded that the water sources and
water status analyzed were unpolluted based on the analyzed
water quality parameters. Therefore physicochemical parameter
values were within the range for water intended for domestic
use. It is recommended that drinking water sources for
domestic use should be protected from polluted sources.
DECLARATION
I, Mtaki Revocatus , do hereby declare to the Senate of Sokoine
University of Agriculture, that this special project is my
original work, and has not been submitted for a degree award in
any other university.
ii

Signature………………SUPERVISOR:
Date…………………….. Name……………………….Signature……………… Date……………………..
iii

COPYRIGHT
No part of this special project report may be produced, stored
in any retrieval system, or transmitted in hard copy or
electronic media or by any means without prior written
permission from author or the Sokoine University of Agriculture
in that behalf.
iv

ACKNOWLEDGEMENT
First of all I thank the Almighty God to enable me to complete
my studies in peace, health and successfully. I am very
grateful to my supervisor Prof E.E Maeda for taking the time and
trouble to read this report and made many helpful corrections. I
am also expressing my appreciation to my fellow students for
their ideas, cooperation and encouragement during my study. My
special thanks are due to the staff of the Department of Food
Science and Technology for their moral and material assistance
during the implementation of this study.
I would also like to extend my special thanks and profound
appreciation to the Higher Education Students Loan Board
financial support that facilitated my studies at Sokoine
University of Agriculture (SUA).
v

To my wife Tujenagwe, I thank her for her endless encouragement,
understanding, and support. Words on a page will never allow me
to express her importance to me. I would also like to thank to
my son Ladislaus,
Last but not least I would like extent my thanks to all members
of my class especially, Othiambo Marry J, Clement C Bundi and
Mwinuka Beda for their constant, encouragement and support.
TABLE OF CONTENTS
ABSTRACT......................................................i
DECLARATION..................................................ii
COPYRIGHT...................................................iii
ACKNOWLEDGEMENT..............................................iv
TABLE OF CONTENTS.............................................v
LIST O TABLES...............................................vii
LIST OF FIGURES............................................viii
LIST OF ACRONYMS..............................................x
CHAPTER ONE...................................................1
vi

INTRODUCTION..................................................1
CHAPTER TWO...................................................5
2.0 LITERATURE REVIEW.........................................5
2.1 Total hardness...........................................5
2.1.1.Calcium and Magnesium Hardness.......................6
2.1.2 Carbonate and non-carbonate hardness.................6
2.2 Chloride in water.........................................6
2.3 Calcium in water..........................................7
2.4 Water pH................................................7
2.5 Total Dissolved Solids (TDS)..............................8
2.6 Conductivity of water.....................................9
CHAPTER THREE................................................10
3.0 MATERIAL AND METHODS...................................10
3.1 Location of the stud.....................................10
3.2 Sample collection.......................................10
3.3. Experimental Design.....................................11
3.4 Analyses.................................................12
3.4.1. Measurement of water pH levels......................12
3.4.2 Measurement of Total hardness of water...............12
3.4.3. Analysis of calcium...............................12
3.4.4. Analysis of chloride...............................13
3.4.5. Conductivity.......................................13
3.4.6 Total Dissolved Solids..............................13
CHAPTER FOUR.................................................14
4. 0 RESULTS AND DISCUSSION..................................14
4.1 pH level.................................................14
4.2 Total Hardness...........................................16vii

4.3 Chloride concentration...................................17
4.4 Total dissolved solids (TDS)...........................18
4.5 Calcium..................................................20
4.6 Conductivity.............................................20
CHAPTER FIVE.................................................23
CONCLUSION AND RECOMMENDATION................................23
REFERENCES...................................................24
APPENDICES...................................................29
viii

LIST O TABLES
Table 1: Mean values of water source........................17
Table 2: Mean value of water status...........................17
Table 3: Separated mean values of physicochemical parameters
for water source samples...........................19
Table 4: Separated mean values of physicochemical parameters for
water status samples...................................19
Table 5: Mean values of water source and status interaction...22
Table 6: Separated mean values of physico-chemical parameters
for water source status interaction....................22
ix

LIST OF FIGURES
Figure 1: Physicochemical parameters in mgL-1 for mzinga river
...........................................................15
Figure 2: Physicochemical parameters in mgL-1 for mindu dam
...........................................................15
Figure 3: Physicochemical parameters in mgL-1 for RDD......21
Figure 4: Conductivity in µs/cm from water samples from
different water source....................................21
x

LIST OF PLATE
Plate 1: The Mindu Dam.......................................11
xi
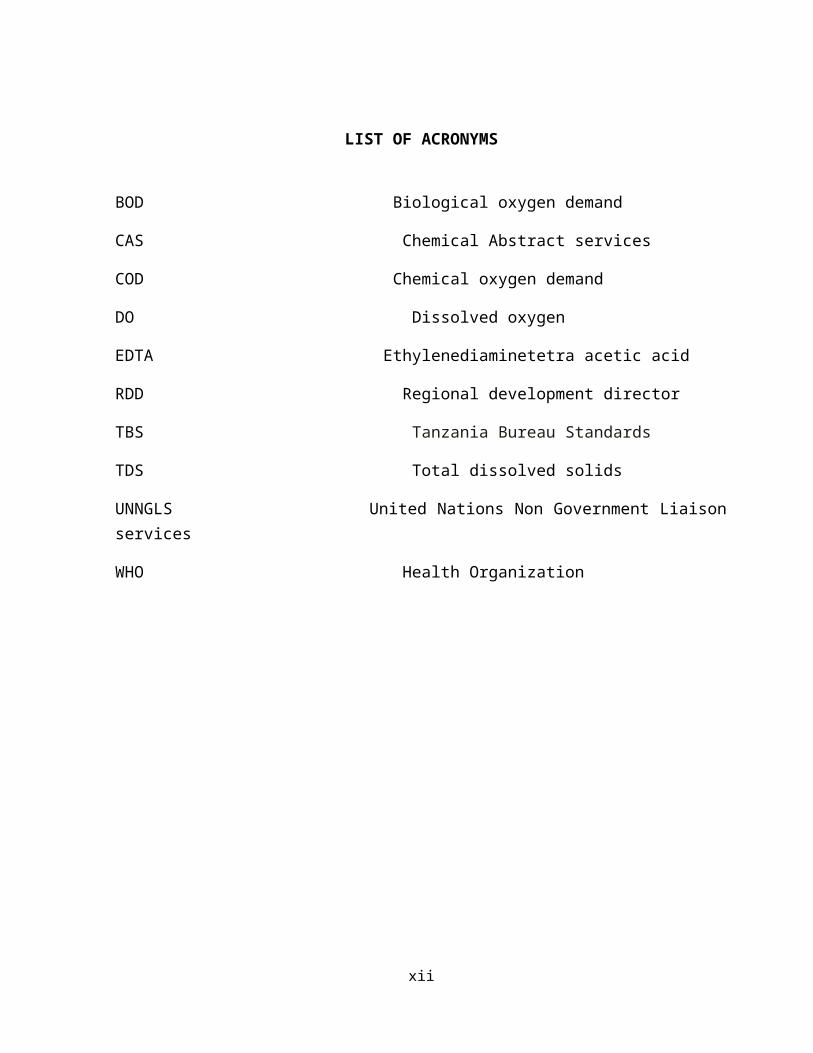
LIST OF ACRONYMS
BOD Biological oxygen demand
CAS Chemical Abstract services
COD Chemical oxygen demand
DO Dissolved oxygen
EDTA Ethylenediaminetetra acetic acid
RDD Regional development director
TBS Tanzania Bureau Standards
TDS Total dissolved solids
UNNGLS United Nations Non Government Liaisonservices
WHO Health Organization
xii

CHAPTER ONE
INTRODUCTION
Water is a universal solvent essential to man for various uses
such as drinking, cooking, industrial and agricultural
processes, waste disposal and human recreation (Adeniyi, 2004).
Of all renewable resources on the earth, water has a unique
place. It is essential for sustaining all forms of life and
economic development and for general well being. Though water is
important to life it is one of the most poorly managed resource
in the world (Fakayode, 2005).Water quality refers to all
attributes of water, which make it acceptable to the people.
Water quality is the measure of the condition of water relative
to the requirements of one or more biotic species and or to any
human need or purpose (FAO, 2003).Water is the most important
natural resource in the world since water plays a vital role in
development of the community. A reliable supply of water is
therefore an essential pre request for the establishment of
permanent community settlement (Shayo et al., 2007).
1

Due to high development of industry and agriculture sectors,
the water ecosystem has become perceptibly altered in several
aspects in recent years and as such they are exposed to all
local disturbances regardless of where they occur (Vencatesan,
2007). In view of its occurrence and distribution pattern, water
is not easily available to man in the desirable amount and
quality. It is estimated that 1.2 billion people around the
world lack access to safe water (UNNGLS, 2003). Over 2 billion
people of the world’s population have suffered from
diseases related to drinking polluted waters. More than
250 million new cases of waterborne diseases are reported
each year, resulting in more than 10 million deaths and
nearly 75% of these waterborne disease cases occur in
tropical areas (McFeters, 1990). The relationship between
water quality and health problems are complicated and
include both negative and positive effects (Tebbut, 1983).
The Bonn International Conference on Freshwater in 2001 revealed
that half of the people in Africa suffer from water-related
diseases.
2

According to Metcalf and Eddy (1991) water quality falls into
physical, biological and chemical parameters. Physical
parameters includes water turbidity, pH, temperature and thermal
stratification, suspended solids, light penetration,
transparency etc. Chemical parameters include nitrate,
phosphate, ammonia, dissolved oxygen, iron, and carbon dioxide
content. Biological parameters which includes phytoplankton,
microbial activity (BOD and COD), and micro invertebrates etc.
key physicochemical quality parameters namely pH, total
dissolved solids (TDS), conductivity, calcium, chloride, and
degree of total hardness was assessed in water at source up to
consumer level in the Morogoro Municipality.
Using contaminated water for drinking and processing food
products, results into inherent health problems. The increase in
population density within Morogoro municipalitycurrently at 24
persons per km2. (RC-Morogoro,2006). While the increase in
population density has increased demand for social services. The
natural resources including water has kept on declining at a
very high rate (Jouni, 2004). Water quality depletion due to
improper waste disposal domestic, agro-industrial wastes and3

environmental degradation consequential to deforestation of
river catchments for instance from Mzinga River (Yanda and
Munishi, 2007). Not only that but also due to the old age of
intake and distribution network pipe line for instance the
Momboro treatment plant is not working which can add chemical
contamination to the water (Moruwasa, 2012). According to
Mulengera et al, (2009) the major cause of water pollution in
Morogoro includes soil erosion land degradation in the Uluguru
Mountains as the result of tree cutting to meet increasing
firewood and charcoal demands, inappropriate agricultural
practices, and shortage of suitable land for cultivation.
Therefore the high soil erosion rates has caused serious land
degradation, increased sediment loads in streams and rivers,
leading to rapid siltation of water reservoirs (e.g. Mindu dam).
In this study, six physicochemical parameters were
analyzed, which are pH, total dissolved solids (TDS),
conductivity, calcium, chloride, and degree of total hardness.
The anticipated impacts are to provide effective maintenance
water quality through appropriate control measures and
continuous monitoring of its quality parameters. This will4

ensure that water is safe for domestic, industrial and
agricultural use
.
Water pollution are sufficiently to render the water
unacceptable for its usage hence there is an inherent health
implication in the consumption of contaminated or polluted water
which can lead to outbreak of many diseases and even death when
contaminated with organic or chemical pollutant (Bartran and
Balance, 1996). The possible health effects can be acute
(immediate) for example, nausea, lung irritation, skin rashes,
vomiting dizziness and even death (Stewart et al., 1989). Chronic
health effects occur long after repeated exposure to small
amount of chemicals example cancer, liver and kidney damage,
disorder of the nerve system, damage to the immune system and
birth defects have also been reported (Sandra and Herman, 1996).
To avoid any health hazard as the result of consumption of
contaminated water, physicochemical analysis of water is
unavoidable. Therefore in this study of assessment of
physicochemical parameters of water in Morogoro municipality
5

from its source to the consumer level is imminent. The results
that will be obtained will be compared to documented Tanzanian
standards for water quality and World health organization
standard (WHO), and will be used to provide useful information
about the quality of water in Morogoro Municipality. Also the
results from study will serve as baseline data for water
treatments to ensure that safe water is supplied to the consumer
and safeguard them from physicochemical water pollutants and
the associated health effects.
6

CHAPTER TWO
2.0 LITERATURE REVIEW
It has been reported that water is a common substance that
supports life on earth (Yoo and Boyd, 1994). Water is the major
component of living things whereby most of living things contain
great proportion. Water is important physiologically where it
plays an essential role in temperature control of organisms,
solvent in which gases, minerals, organic nutrients and
metabolic waste dissolves.Water quality describes the physical,
7

chemical and microbiological, properties of water that determine
its fitness for use (Boyd and Tucker, 1992) many of these
properties are controlled or influenced by substances which are
either dissolved or suspended in the water
2.1 Total hardness
Boyd (1990) define hardness as a characteristic of water
representing the total concentration of calcium and magnesium
expressed as their calcium carbonates equivalent when other
polyvalent metal ions are present in a significant level. They
are also determined and reported as hardness. The hardness of
water was originally defined in term of its ability to
precipitate soap. Calcium and Magnesium ions are the principal
causes, although, Iron, Aluminium, Manganese, Strontium, Zinc
and Hydrogen ions are capable of producing the same effect
(Stednick, 1991). Hardness does not affect the sanitary quality
but is of importance in domestic use such as laundry, boiler
water with high hardness value are referred to as hard while
those with low hardness value are soft (Horan, 1991). There are
two forms of water hardness as explained here under .
8

2.1.1.Calcium and Magnesium Hardness.
Calcium ion and Magnesium ions (Ca2+ and Mg2+) is identified by
the mineral involved. Hardness caused by Calcium is called
Calcium hardness due to Calcium Sulphate and that due to
Magnesium is called magnesium hardness. Therefore total hardness
= calcium hardness+ magnesium hardness (Hem, 1970).
2.1.2 Carbonate and non-carbonate hardness.
This is identified by both the bicarbonates (HCO3-) salts of
calcium ions (Ca2+) and by normal salts of calcium and magnesium
ions involved in causing water hardness. Carbonate hardness is
primarily caused by the bicarbonate of calcium and
magnesium .According Gallagher and Miller, (1996) calcium and
magnesium ions combine with carbonates and thereby contributing
carbonate hardness.
WHO, (2008) reported that, Public acceptability of the degree of
hardness of water may vary considerably from one community to
another, depending on local conditions. In particular, consumers
are likely to notice changes in hardness. The taste threshold
9

for the calcium ion is in the range of 100–300 mg/litre,
depending on the associated anion, and the taste threshold for
magnesium is probably lower than that for calcium. In some
instances, consumers tolerate water hardness in excess of 500
mg/litre.
2.2 Chloride in water
The chloride ion (Cl-) is the negatively charged chlorine atom
(Cl) (CAS No. 7782-atomic mass 35.45 g/mol) formed when the
chlorine atom picks up one electron. The chloride ion never
exists in free form in the environment (Nagpal et al., 2003). The
chloride ion commonly occurs as a salt. Some common chloride
salts include NaCl, KCl, MgCl2, and CaCl2 (used as a dust
suppressant on roads), AlCl3 (used in municipal drinking water
and waste water treatment facilities for removal of suspended
particles). Chloride containing compounds are highly soluble in
water (e.g. solubility of NaCl is 35.7g/100g water at 0oC),
hence they easily dissociate and tend to remain in their ionic
forms (e.g. Na+ and Cl-) (Mayer et al., 1999). High concentrations
of chloride ions can cause water to have an objectionable salty
10

taste and corrode hot-water plumbing systems. High-chloride
waters have a laxative effect to some people. Also an
intentional use chloride above the normal content in portable is
a remedy against suspected faecal pollution from human sewage,
animal manure or industrial wastes (Roxanne, and Tom 2012)
2.3 Calcium in water.
Calcium is the fifth most abundant natural element (CAS # 7440-
70-2).This element is presentin all natural waters (Dickson,
and Goyet, 1994). The most common source of calcium groundwater
is through the erosion of rocks such as limestone and dolomite,
as calcite and magnesite. Calcium may have beneficial effects
when ingested. It may block the absorption of heavy metals in
the body and is thought to increase bone mass and prevent
certain types of cancer (Nova Scotia Environment, 2008). Very
high concentrations of calcium may adversely affect the
absorption of other essential minerals from the gastrointestinal
tract (Marque et al., 2003).
11

2.4 Water pH
This parameter shows the quantity of hydrogen ions (H+) in the
water. The concentration of bases and acids in the water
determines its pH. Boyd (1990) proposed the scale for measuring
the degree of acidity is called the pH scale, which ranges from
1 to 14. A low pH is acidic and a high pH is basic; a pH of 7 is
neutral. Roxanne and Scherer (2012) reported that pH can be
affected by chemicals in the water; pH is an important indicator
of water that is changing chemically. Drinking water with a pH
between 6.5 and 8.5 generally is considered satisfactory. Acidic
waters are corrosive to plumbing and faucets, particularly if
the pH is below 6. Waters with a pH above 8.5 may have a bitter
or soda like taste (WHO, 2008) Water with a pH of 7 to 8.5
requires more chlorine for the destruction of pathogens (disease
organisms) than water that is slightly acidic (Scherer, 2012)
Although pH usually has no direct impact on consumers, it is one
of the most important operational water quality parameters.
Careful attention to pH control is necessary at all stages of
water treatment to ensure satisfactory water clari cation andfi
disinfection (WHO, 2008)
12

2.5 Total Dissolved Solids (TDS)
The total dissolved solid is a measure of the total amount of
all the materials that are dissolved in water. These materials,
both natural and anthropogenic (made by humans) are mainly
inorganic solids and a minor amount of organic material. Total
dissolved solids can vary greatly from a few milligrams per
litre to percent levels (tens of thousands of milligrams per
litre)depending on the type of water (Ben, 2004). Drinking Water
Standards recommend that the total dissolved solids
concentrations in drinking water not exceed 500 mg/L, based on
taste and aesthetics (Ashim, 1998). The total dissolved solids
givean indication of the degree of dissolved substances.
Dissolved oxygen (DO) is very crucial for survival of aquatic
organisms and it is also used to evaluate the degree of
freshness of a river (Fakayode 2005).
2.6 Conductivity of water
Mark (2006) defines conductivity as a measure of the ability of
water to pass an electrical current. Conductivity in water is
13

affected by the presence of inorganic dissolved solids such as
chloride, nitrate, sulfate, and phosphate anions (ions that
carry a negative charge) or sodium, magnesium, calcium, iron,
and aluminum cations (ions that carry a positive charge).
Conductivity is also affected by temperature: the warmer the
water, the higher the conductivity (Ben, 2004).Organic compounds
like oil, phenol, alcohol, and sugar do not conduct electrical
current very well and therefore have a low conductivity when in
water. Significant changes in conductivity can be an indicator
that a discharge or some other source of pollution has entered
the water (Apha, 1992).
14

CHAPTER THREE
3.0MATERIAL AND METHODS
3.1 Location of the stud
The study was conducted at Mindu dam, Regional development
director (RDD) ,Mzinga River and tap water from SUA, Morogoro
city centre and Kihonda.within Morogoro municipality. Mindu dam
is located at 6_ 50' S 37_ 35' E, 6 km west of Morogoro.
(Kayambazinthu, 1989). Access is from the main town of
Morogoro along Mikumi road. According to MORUWASA, (2012) Mindu
dam is the main of water supply in Morogoro Municipality; it
supplies about 70% of water to it residents in Morogoro
Municipality
15

3.2 Sample collection.
Water sample drawn at three different points at two different
surfaces, and at the entry point prior to treatment which were
labeled sample A, B and Crespectively from each water source.
Water sample from Kihonda, Sua and Morogoro city centre
collected from tap water, before sampling water allowed to
flowing out for 15 to 30 seconds. The collected samples were put
in a bucket with ice blocks so as to maintain its original state
as might be caused by temperature fluctuation. The chilled
samples were immediately taken to the Food science and
technology Laboratory (SUA) for determination of physicochemical
parameters.
16

3.3. Experimental Design.
The data was subjected to the Complete Randomized Design (CRD),
for each variable analysis of variance was done by using MSTAT C
program (Freed et al., 1990). Mean were separated by Duncan
Multiple Range test to test for significant difference at
p<0.05(Appendix…2)
Plate 1: The Mindu Dam
17

18

3.4 Analyses.
The analyses of water samples were conducted using standard
method (UNEP/WHO, 1996)
3.4.1. Measurement of water pH levels
The measurement of pH was done by using a table pH meter in
food laboratory at Sokoine University of Agriculture. The meter
was calibrated with standard buffer solutions of pH 4. The
electrode was removed from the buffer and rinsed with the sample
and after adjustment, the pH was recorded. The electrode was
rinsed with distilled water between successive measurements.
3.4.2 Measurement of Total hardness of water.
Total hardness was obtained by titrating a sample
solution with a 0.01 N of ethylenediaminetetraacetic acid
(EDTA) solution by using Eriochrome black T indicator, until
the color changes from purple to pure blue. Approximate 50
ml of water sample was accurately transferred into a
250 ml conical flask, and then 2 ml of buffer solution
were added, stirred and mixed with Eriochrome black T.
19

Indicator was added and mixed well until dissolved. After that
the mixture was titrated with 0.01 N, EDTA solution
until the color change from purple to pure blue.
Calculation. Total hardness (Mg/L as CaCo3 = (T-S) * C * 1000Volume of sample.
3.4.3. Analysis of calcium.
Calcium content was determined by titration method in which 50ml
of sample was pipetted to 250ml conical flask, 5ml 8N of sodium
hydroxide solution was added, a dash of 2-hydroxy-1-(2-hydroxy-
4-sulfo-1-naphthylazo-3-naphthoic acid (calcium indicator)
added and mixed the solution was titrated against EDTA 0 .01N
solution till the color change to blue.
Calcium hardness (mg/L) = Volume of EDTA*N* 50* 1000
Volume of
sample used
Calcium in water sample = calcium hardness in mg/L as CaCO3 *
molecular weight of Ca
Molecular weight of CaCO3
20

3.4.4. Analysis of chloride.
For analysis of chloride, 50ml sample was pipette into a 250ml
conical flask; 1ml K2Cro4 solution was added and mixed. The
solution titrated against silver nitrate solution till brownish
colors appear.
CL (mg/L) = volume of AgNO3 used *N*35.45* 1000
Volume of sample (50ml)
3.4.5. Conductivity
Conductivity was measured by conductivity meter (digimeter L21)
from soil science laboratory, recorded inmicro siemens per
centimeter (µs/cm).
3.4.6 Total Dissolved Solids
Total Dissolved Solids was measured by colorimeters.
21

CHAPTER FOUR
4.0 RESULTS AND DISCUSSION
4.1 pH level
The mean pH values from the three sources were within the
acceptable range of pH for drinking water quality as per TBS
(2007) and WHO (1996) standards which ranges from 6.5 - 8.5.
The mean pH for water from the Mindu dam, (Plate I), Morogoro
River (RDD). Mzinga River were 6.897/, 6.927 and 6.772
respectively. Statistically results show that the mean value pH
for Mzinga river was significant different at P >0.05.
According to Fakayode (2005) the closeness to neutral pH point
suggests the water regarded as neutral and unpolluted. Also The
mean pH values for status of the three water sources were within
the permissible limit for potable water according to TBS and
WHO, the mean pH for water before treatment, after treatment and
consumer level were 6.909, 6.848 and 6.839 respectively and were
not significantly different. (P< 0.05).
There was insignificance decrease pH level of the Mzinga water
after treatment. (Fig 1), There was also a slightdecrease of pH
22

level at the consumer level.The mean pH value for Mindu dam
waterdecreased from source to the consumer level (Fig 2).
Figure 1: Physicochemical parameters in mgL-1 for mzinga river
pH TH Ca+2 CL- TDS0
10
20
30
40
50
60
70
80
Before treatmentAfter treatmentconsumer level
Parameter
Mean
value
Figure 2: Physicochemical parameters in mgL-1 for mindu dam
23

pH TH Ca+2 CL- TDS0
10
20
30
40
50
60
Before treatmentafter treatmentconsumer level
Parameter
Mean
value
24

4.2 Total Hardness
The mean total hardness values of water sources and status were
within the WHO/TBS standards. The total hardness
concentration is not supposed to exceed 500 mgL-1 and 600
mgL-1 according to WHO standards and TBS standards
respectively , Mean total hardness value for Mzinga River,
Mindu dam and RDD were 22.667mgl-1, 44.222mgl-1 and 22.111mgl-1
respectively,(Table 1).The mean total hardness value for Mindu
dam was significantly different at P> 0.05. Also the mean value
for water status was within the recommended limit according to
TBS and WHO drinking water specifications. Mean total hardness
value of the three sources after treatment, and consumer’s
level were, 27mg/l and 24mg/l. respectively The mean value
before treatment was significant different at P>0.05. WHO
(1996), reported that water containing less than 60 mg of
calcium carbonate per liter generally being considered as soft.
Hardness levels above 500 mg/litter are generally considered to
be aesthetically unacceptable, although this level is tolerated
in some communities (Zoeteman, 1980).
25

In Fig 1 results showed that the concentration of total hardness
of water at source was high, after treatment there was a
decrease in the total hardness concentration, also level of
concentration at consumer level showed slightly decrease,
statistically there was no significant different at p<0.05.
Results shown in Fig 2 showed that total hardness at water
source was high, but after treatment the concentration
decreased slightly to consumer level. The mean values were
statistically insignificant following the analysis of variance.
But at RDD as shown in fig 9, total hardness concentration at
water source was low, after treatment there was an increase in
the concentration.
Table 1: Mean values of water source
PHYSICOCHEMICAL PARAMETERS
WATER SOURCEpH TOTAL.H
(mg/l)CALCIUM(mg/)
CHLORIDE(mg/l)
CONDUCTIVITY(µs/cm)
TDS(mg/l)
MZINGA 6.772 22.667 6.389 8.199 61.211 32.757MINDU 6.897 44.222 9.078 10 98.611 59.156RDD 6.927 22.111 3.667 8.656 36.292 19.889
26

4.3 Chloride concentration
The mean chloride valuesconcentration in the sample analyzed
were within the setlimits by TBS and WHO. The mean value of
water source showed no significant deferent, mean chloride
values for Mzinga river, Mindu dam and RDD were 8.199mg/l,
10mg/l and 8.656mg/l respectively (Table 1). Result showed on
significant different at P< 0.05. The chloride mean values for
water before treatment, after treatment and at the consumer
level were.9.943mg/l, 8.478mg/l and 8.433mg/l respectively,
(Table 2). Statistically result showed that there was no
significant different at P<0.05. Aremu et al., (2011) reported
that Chlorides are the most stable components in water
and its concentration is largely unaffected by most
natural physiochemical and biochemical processes.
Table 2: Mean value of water status
PHYSICOCHEMICAL PARAMETERS
STATUS pH TOTAL.H(mg/l)
CALCIUM(mg/l)
CHLORIDE(mg/l)
CONDUCTIVITY(µs/cm)
TDS(mg/l)
Before treatment 6.909 37.00 8.644 9.943 92.097
49.156
27

After treatment 6.848 27.667 5.378 8.478 54.65
32.667
Consumer level 6.839 24.333 5.111 8.433 49.368
29.797
4.4 Total dissolved solids (TDS)
The total dissolved solids (TDS) concentrationof all water
samples under study was within the recommended limits set by WHO
and TBS which is 1000 mg/L and 500mg/l respectively. The mean
TDS value for Mzinga river, Mindu dam and RDD were 32.757mg/l,
59.156mg/l and 19.889mg/l respectively .The mean value for Mindu
dam was significantly different at P <0.05 following a mean
difference separation by DMR – Test (Table 3). TDS mean values
for water status before treatment, after treatment and consumer
level were 49.156mg/l, 32.667mg/l and 29.797mg/l respectively.
The mean TDS value before treatment showed a significant
different at P< 0.05 (Table 3). It was observed that the TDS
concentration was decreasing subsequently from water source to
the consumer level as shown in Fig, 1, 2 and 3 of all water
sources.
WHO (1996) reported that, The palatability of water with a TDS
level of less than 600 mg/litre is generally considered to be
28
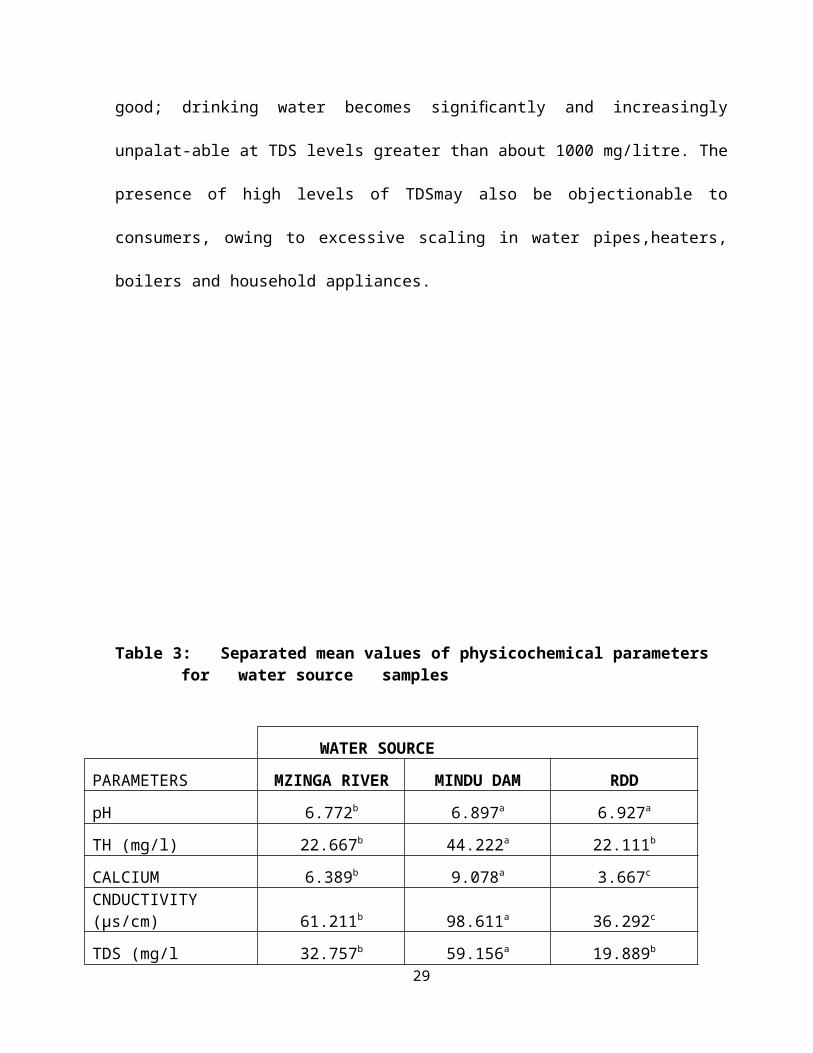
good; drinking water becomes signi cantly and increasinglyfi
unpalat-able at TDS levels greater than about 1000 mg/litre. The
presence of high levels of TDSmay also be objectionable to
consumers, owing to excessive scaling in water pipes,heaters,
boilers and household appliances.
Table 3: Separated mean values of physicochemical parameters for water source samples
29
WATER SOURCE
PARAMETERS MZINGA RIVER MINDU DAM RDD
pH 6.772b 6.897a 6.927a
TH (mg/l) 22.667b 44.222a 22.111b
CALCIUM 6.389b 9.078a 3.667c
CNDUCTIVITY (µs/cm) 61.211b 98.611a 36.292c
TDS (mg/l 32.757b 59.156a 19.889b

Mean superscripted by different lower case letter in the same row are significant different following a separation by Duncan multiple Range Test at P <0.05
Table 4: Separated mean values of physicochemical parameters forwater status samples
WATER STATUS
PARAMETERSBefore
TreatmentAfter
Treatment Consumer level
TH (mg/l) 37.00a 27.667b 24.333b
CALCIUM (mg/l) 8.644a 5.378b 5.111b
CONDUCTIVITY (µs/cm) 92.097a 54.650b 49.368b
TDS (mg/l) 49.156a 32.667b 29.979b
Mean superscripted by different lower caseletter in the same row are significant different following aseparation by Duncan multiple Range Test at P <0.05
4.5Calcium
Calcium, which is essential for nervous system and for
the formation of bones, is commonly present in all
water bodies where it usually comes from the leaching
of rocks (Agunwamba, 2000). Calcium concentration of all
water source and water status was within the recommended30

limits.The mean calcium values of water sourcesfor MzingaRiver,
Mindu dam and RDD were 6.389mg/l, 9.078mg/l and 3.667mg/l
respectively. Mindu dam has high calcium concentration compared
to Mzinga and RDD.The mean Calcium value for mzinga river showed
significantly differences at P<0.05, Standard concentration set
by TBS and WHO is 300mg/l. The mean calcium values for water
before treatment, after treatment and consumer level were
8.644mg/l, 5.378mg/l and 5.11mg/l, respectively Mean calcium
value of water status before treatment was high and significant
different at p<0.05.
4.6 Conductivity
The conductivity of all water samples werewithin the limits of
acceptable standards for drinking and domestic use, from source
to the consumer.Mean Conductivity valueS for Mzinga river Mindu
dam and RDD were 61.211(µs/cm), 98.611µs/cm 36.292µs/cm
respectively. Statistically result showed significantly
different at p < 0.05. Mean conductivityvalue for Mindu dam
showed high concentration .Mean conductivity values of water
status before treatment after treatmentand consumer were
31

92.0972 µs/cm 54.560 µs/cm and 49.368 µs/cm respectively.Mean
conductivity value for Mzinga river wassignificantly different
at p<0.05. Results shown in Fig .4 subsequentlydecreases in
conductivity from water source to the consumer level.
32

Figure 3:Physicochemical parameters in mgL-1 for RDD
pH TH Ca+2 CL- TDS0
5
10
15
20
25
30
Before treatment
after treatment
consumer level
parameters
Mean
value
RDD
Figure 4: Conductivity in µs/cm from water samples from different water source
MinduMzinga
Rdd
020406080
100120140
Before treatmentafter treatmentconsumer level
33

Table 5: Mean values of water source and status interaction
Physicochemical parametersWATERSOURCE STATUS
pHLevel
TH(mg/l)
CALCIUM
(mg/l)
CHLORIDE
(mg/l)
CONDUCTIVITY
(mg/l)
TDS(mg/l)
MZINGABefore
treatment6.757
37.333
10.600 9.16 103.000 52.000
Aftertreatment
6.763
15.667
4.400 7.40 42.500 23.933
Consumerlevel
6.797
15.000
4.167 8.03 38.1333 22.337
MINDU
Beforetreatment
7.19 53.667
11.767 11.30 130.433 71.800
Aftertreatment
6.747
41.333
8.033 10.40 86.067 54.733
Consumerlevel
6.753
37.667
7.433 8.30 79.333 50.933
RDD
Beforetreatment
6.278
20.000
3.567 9.367 42.857 23.667
Aftertreatment
7.033
26.000
3.700 7.63 35.383 19.330
Consumerlevel
6.967
20.333
3.733 8.967 30.637 16.667
Table 6: Separated mean values of physico-chemical parameters
for water sourcestatus interaction.
PHYSICOCHMEICAL PARAMETERS
WATERSOURCE STATUS
pH Level CONDUCTIVITY(µs/cm)
TDS(mg/l)
MZINGABefore
treatment6.757c 42.5c 23.93b
Aftertreatment
6.763c 38.13c 22.34b
Consumerlevel
6.797c 130.4a 71.8a
MINDU
Beforetreatment
7.19a 86.07b 54.73a
After 6.747c 79.33b 50.93a
34

treatmentConsumerlevel
6.753c 42.86c
23.67b
RDD
Beforetreatment
6.78c 35.38cd 19.33b
Aftertreatment
7.033b 30.64cd 16.67b
Consumerlevel
6.967b 8.71d 8.508b
Mean superscripted by different lower case letter in thesame Colum are significant different following a separationby Duncan multiple Range Test at P<0.05.
CHAPTER FIVE
CONCLUSION AND RECOMMENDATION
In conclusion, this work has presented the levels of
physicochemical parameters namely pH, conductivity, total
dissolved solids, total hardness, calcium, and chloride contents
in the waters source and status. The results for comparison
between the chemical parameters of water sources, status
and WHO/TBS acceptable levels have shown that all
physicochemical parameters Were within the permissible levels.
This shows that the water sources and status analyzed are
unpolluted in terms of chemical parameters. Based on the
water quality parameters analyzed in this study .Nevertheless
this does not rule out completely the need for the
appropriate treatment of these water sources for
portability and safe drinking.
35

Due to the deforestation of the river catchments, especially
Mzinga river. Morogoro municipality should mobilize people
living in and around the catchments areas to shift and forestate
the area respectively.To prevent Environmental degradation
around Mindu dam, farming within the catchments areas should be
controlled and human activities barred around reservoir such as
cultivation and carwashes.Morogoro municipality should consider
the provision of safe drinking water a priority. This is so
because safe drinking water is a basic need to human
development, health and well-being.
36

REFERENCES
1. Adeniyi, I.F. (2004). The Concept of Water Quality in: Ife
Environmentalist, Official Bulletin of Nigerian
Society for Environmental Management (NISEM) O.A.U.,
1(1): calcium and magnesium in drinking water; an
ecological study in elderly people Eur. J. Epidemiol.
18(4):, Aquaculture Auburn University. 305-309.
2. Agunwamba JC, ( 2000) Water Engineering Systems, Immaculate
Publications Limited, , pp 33-139
3. APHA. 1992. Standard methods for the examination of water and wastewater. 18th ed.
American Public Health Association, Washington, DC.
74pp.
4. Aremu, M. O., Olaofe, O., Ikokoh, P., P and Yakubu, M.
M. (2011) physicochemical characteristics of strem,
well and borehole water soures in Eggon,
Nasarawa State, Nigeria. Journal Chemical Society
Nigeria, 36 (1), 131-136.
37

5. Ashim, D.G, (1998), Ground water and the Environment, in water
Resources: Environmental Planning, Management and
Development Asit K.B (Ed). Tata: McGraw-Hill.
6. Bartran, J,. Balance, R. (1996). Water Quality Monitoring: A
practical guide to the design and implementation
of fresh water quality studies and monitoring
programs. E and F. N. Spoon, London. 22pp.
7. Ben,P. (2004) Conductivity of water . Stream Team Quarterly
Newsletter,vol 4; 4pp.
8. Boyd, C.E,. and Tucker, C.S,. (1992). Water Quality and Pond
Soil Analyses for Aquaculture. Alabama .Agricultural
Experiment Station, Auburn University, Alabama, 183
pp.
9. Boyd,C.E. (1990).Water Quality in Ponds for Aquaculture.
Birmingham Publishing Company 110pp
10. Dickson, A. G,. and Goyet, C. (1994). . Handbook of method
for the analysis of the various parameters of the
carbon dioxide system in sea water, version 2.
ORNL/CDIAC-74. http://en.wikipedia.org/wiki/Calcium#cite_note-2
38

11. Fakayode, S.O. (2005): Impact Assessment of Industrial
Effluent on Water Quality of the Receiving ALaro
River in Ibadan, Nigeria. Ajeam-Ragee Volume 10, 1-
13.
13. FAO. (2003) Prevention of Water Pollution by Agriculture
and Related Activities.
14. Freed, R., S.P Eisensmith, S .Goetz, D, Rercosky, V.N Smail
and P. Wolberg (1990). A microcomputer program for
the design , management and analysis of agronomic
research experiment ed Betsy Bricker.
15. Gallagher, L.M., and Miller, L.A. (1996). Clean water Handbook.
Government Institutes, Inc.
Rocknlle, Maryland, USA; 95pp.
16. Hem, J, D. (1970) Water Chemistry, US. Government Print off
Washington.
17. Horan, N.J. (1991) Biological water treatment systems;
Theory and operation.310p
http://stream-team.org/Parameters/conductb.html retrieved 14/12/2012.
39

18. Jouni, P. (2004) Livelihoods, Vulnerability and Adaptation
to Climate Change in the Morogoro Region, Tanzania,
CSERGE Working Paper. Pg 14
19.Kayambazinthu, D. (1989). Effects of selected forest types on
the water input, Mindu Forest Reserve, Morogoro.
M.Sc. thesis, 189 pp., mimeograph. Sokoine
University of Agriculture, Morogoro.
20. Mark, H. (2006) A Practical Guide to Conductivity
Measurement, MBH Engineering System.
21. Marque, S., Jacqmin G. H., Dartigues, J.F,. Commenges, D.
(2003) Cardiovascular mortality and calcium and
magnesium in drinking water; An ecological study in
elderly people.Eur.J.Epidemiol.18, 305-309.
22. Mayer, T., Snodgrass, W.J., and Morin, D. (1999). Spatial
Characterization of the Occurrence of Road Salts and
Their Environmental Concentrations as Chlorides in
Canadian Surface Waters and Benthic Sediments. Water
Quality Research Journal of Canada 34: 545-574
40

23. Metcalf, P., and Eddy,.M.B. (1991) Waste water engineering;
Treatment, disposal and Reuse, 3rd ED. McGrew .Hill,
New York. 130.
24. Morogoro Regional Commissioner Office (2006); Land, People
and Climate, Morogoro 6pp
25 Morogoro urban water supply and sewage system, (20012)
http://moruwasa.co.tz/home/index.php?
option=com_content&task=view&id=13&Itemid=9
26. Mulengera,M. K., Lulandala, L. L. L,. and Maliondo, S. M. S.
(2009.) Tanzania Journal of
ForestrandNature Conservation, Volume 79(1).
McFeters GA (1990). Drinking Water Microbiology, Springer Velag,
New York
27. Nagpal. N.K., Levy, D.A,. Macdonald, D.D. (2003). Ambient
Water Quality Guidelines for Chloride- Overview
Report. British Columbia. Water, Air and Climate
Change Branch. Pp6
http://www.env.gov.bc.ca/wat/wq/BCguidelines/chloride/chloride.html
.
41

28. Nova Scotia Environment (NSE), (2008). The drop on
water Calcium and
Magnesium.www.gov.ns.ca/.../water/docs/droponwaterFAQ_Calcium
Magnesium.pdf - 5k - 2009-06-26. pp 2
29. Roxanne, J,.and Scherer, T. ( 2012) Drinking Water Quality,
WQ-1341 U.S. Department of Agriculture.
30.Sandra, A. Z,. Herman, G.M.(1996) health effect of drinking
wacontamination, North Carolina HE, 393Pp.
31. Scherer,.T. (2012) Drinking Water Quality.
Testing and Interpreting Your
Results. North Dakota State
University. www.ndsu.edu/waterquality .
32. Shayo, N. B., Chove, B. E., Gidamis, A. B. and Ngoma, O. B.
(2007) "The quality of water in small community
supplies of kingolwira village, Morogora,
Tanzania". Tanzan Health Res. Bull. Jav.,vol 9.
33. Stednick, J. D (1991). Wildland water quality sampling and
analysis, United Kingdom, Academic pres Limited pg
145.
42

34. Stewart, J.C., Lemley, Ann T., H, Sharon I. and Weismiller,
R. A. (1989) Health Effects of Drinking Water
Contaminants. Cornell University and the University
of Maryland. Fact Sheet. 85-85pp
35.Tanzania Bureau of Standards (TBS) (1997).Finalized
Tanzania Standards: Specification for Drinking
Water-Part-1,TZS 574, Dar es Salaam
36. Tebbut TAY (1983). Principles of Water Quality,
University of Birmingham, Pergannon Press, UK.
37. United Nations Environment Programme and the World Health
Organization (UNEP/WHO) (1996) Water Quality
Monitoring - A Practical Guide to the Design and
Implementation of Freshwater Quality Studies and
Monitoring Programmes. Ed. Bartram J. and Balance R.
ISBN 0 419 22320 7 (Hbk) 0 419 21730 4 (Pbk)
38. United Nations Non Governmental Liaison Services (UNGLS)
(2003) .Third World Water Forum on water,
University of Leeds UK.
39. Vencatesan, J (2007). Protecting Wetlands. Curr. Sci. 93:
288-290.
43

40. World HealthOrganization (1996) Guidelines for Drinking-
Water Quality - Second Edition - Volume 2 - Health
Criteria and Other Supporting Information
41. World Health Organization (2008) Guidelines for drinking-
water quality [electronic resource]: incorporating
1st and 2nd addenda, Vol.1, Recommendations. – 3rd
ed.PG 215.
42. World Health Organization (1996). Guidelines for Drinking-
Water Quality, Health Criteria and Other
Supporting Informatio, Geneva: World Health
Organization, 2nd Ed. Vol.2.
43. Yanda, P. Z,. and. Munishi, P. K. T, (2007). Hydrologic and
land use/cover change analysis for the ruvu river
(uluguru) and sigi river (east usambara)
watersheds.pg 12.
44. Yoo, K.H and Boyd, C.E. (1994). Hydrology and water
supply for pond aquaculture. Chapman and Hall,
New York, USA, 483 pp.
45. Zoeteman B.C.J, (1980) .Sensory assessment of water
quality. Oxford, Pergamon Press.
44

APPENDICES
ANALYSIS OF VARIENCE OF PHYSICOCHEMICLA PARAMETERS OF
WATERFunction: FACTOR
Experiment Model Number 1:
Two Factor Completely Randomized Design
Data case no. 1 to 27.
Factorial ANOVA for the factors:
Replication (Var 3: REPLICATION) with values from 1 to 3
Factor A (Var 1: WATER SOURCE) with values from 1 to 3
Factor B (Var 2: STATUS) with values from 1 to 3
Variable 4: pH
45

Grand Mean = 6.865 Grand Sum = 185.360 Total Count = 27
T A B L E O F M E A N S
3 1 2 4 Total ------------------------------------------------------- * 1 * 6.772 60.950 * 2 * 6.897 62.070 * 3 * 6.927 62.340 ------------------------------------------------------- * * 1 6.909 62.180 * * 2 6.848 61.630 * * 3 6.839 61.550 ------------------------------------------------------- * 1 1 6.757 20.270 * 1 2 6.763 20.290 * 1 3 6.797 20.390 * 2 1 7.190 21.570 * 2 2 6.747 20.240 * 2 3 6.753 20.260 * 3 1 6.780 20.340 * 3 2 7.033 21.100 * 3 3 6.967 20.900 -------------------------------------------------------
A N A L Y S I S O F V A R I A N C E T A B L E
K Degrees of Sum of Mean FValue Source Freedom Squares Square Value Prob----------------------------------------------------------------------------- 2 Factor A 2 0.121 0.060 8.6594 0.0023 4 Factor B 2 0.026 0.013 1.8751 0.1821 6 AB 4 0.467 0.117 16.7619 0.0000
46

-7 Error 18 0.125 0.007----------------------------------------------------------------------------- Total 26 0.740-----------------------------------------------------------------------------
Coefficient of Variation: 1.22%
s_ for means group 2: 0.0278 Number of Observations: 9 y
s_ for means group 4: 0.0278 Number of Observations: 9 y
s_ for means group 6: 0.0482 Number of Observations: 3
Variable 5: TOTAL HARDNESS
Grand Mean = 29.667 Grand Sum = 801.000 Total Count = 27
T A B L E O F M E A N S
3 1 2 5 Total ------------------------------------------------------- * 1 * 22.667 204.000 * 2 * 44.222 398.000 * 3 * 22.111 199.000 ------------------------------------------------------- * * 1 37.000 333.000
47

* * 2 27.667 249.000 * * 3 24.333 219.000 ------------------------------------------------------- * 1 1 37.333 112.000 * 1 2 15.667 47.000 * 1 3 15.000 45.000 * 2 1 53.667 161.000 * 2 2 41.333 124.000 * 2 3 37.667 113.000 * 3 1 20.000 60.000 * 3 2 26.000 78.000 * 3 3 20.333 61.000 -------------------------------------------------------
A N A L Y S I S O F V A R I A N C E T A B L E
K Degrees of Sum of Mean FValue Source Freedom Squares Square Value Prob----------------------------------------------------------------------------- 2 Factor A 2 2861.556 1430.778 16.7451 0.0001 4 Factor B 2 776.000 388.000 4.5410 0.0253 6 AB 4 682.444 170.611 1.9967 0.1382 -7 Error 18 1538.000 85.444----------------------------------------------------------------------------- Total 26 5858.000-----------------------------------------------------------------------------
Coefficient of Variation: 31.16%
48

s_ for means group 2: 3.0812 Number of Observations: 9 y
s_ for means group 4: 3.0812 Number of Observations: 9 y
s_ for means group 6: 5.3368 Number of Observations: 3 y
Variable 7: CALCIUM
Grand Mean = 6.378 Grand Sum = 172.200 Total Count = 27
T A B L E O F M E A N S
3 1 2 7 Total ------------------------------------------------------- * 1 * 6.389 57.500 * 2 * 9.078 81.700 * 3 * 3.667 33.000 ------------------------------------------------------- * * 1 8.644 77.800 * * 2 5.378 48.400 * * 3 5.111 46.000 ------------------------------------------------------- * 1 1 10.600 31.800 * 1 2 4.400 13.200 * 1 3 4.167 12.500 * 2 1 11.767 35.300 * 2 2 8.033 24.100
49

* 2 3 7.433 22.300 * 3 1 3.567 10.700 * 3 2 3.700 11.100 * 3 3 3.733 11.200 -------------------------------------------------------
A N A L Y S I S O F V A R I A N C E T A B L E
K Degrees of Sum of Mean FValue Source Freedom Squares Square Value Prob----------------------------------------------------------------------------- 2 Factor A 2 131.762 65.881 16.7636 0.0001 4 Factor B 2 69.680 34.840 8.8651 0.0021 6 AB 4 43.324 10.831 2.7560 0.0600 -7 Error 18 70.740 3.930----------------------------------------------------------------------------- Total 26 315.507-----------------------------------------------------------------------------
Coefficient of Variation: 31.08%
s_ for means group 2: 0.6608 Number of Observations: 9 y
s_ for means group 4: 0.6608 Number of Observations: 9
50

y
s_ for means group 6: 1.1446 Number of Observations: 3 y
====================================================================
Variable 8: CONDUCTIVITY
Grand Mean = 65.371 Grand Sum = 1765.030 Total Count = 27
T A B L E O F M E A N S
3 1 2 8 Total ------------------------------------------------------- * 1 * 61.211 550.900 * 2 * 98.611 887.500 * 3 * 36.292 326.630 ------------------------------------------------------- * * 1 92.097 828.870 * * 2 54.650 491.850 * * 3 49.368 444.310 ------------------------------------------------------- * 1 1 103.000 309.000 * 1 2 42.500 127.500 * 1 3 38.133 114.400 * 2 1 130.433 391.300 * 2 2 86.067 258.200 * 2 3 79.333 238.000 * 3 1 42.857 128.570
51

* 3 2 35.383 106.150 * 3 3 30.637 91.910 -------------------------------------------------------
A N A L Y S I S O F V A R I A N C E T A B L E
K Degrees of Sum of Mean FValue Source Freedom Squares Square Value Prob----------------------------------------------------------------------------- 2 Factor A 2 17710.065 8855.032 38.9094 0.0000 4 Factor B 2 9767.738 4883.869 21.4600 0.0000 6 AB 4 2971.923 742.981 3.2647 0.0353 -7 Error 18 4096.450 227.581----------------------------------------------------------------------------- Total 26 34546.176-----------------------------------------------------------------------------
Coefficient of Variation: 23.08%
s_ for means group 2: 5.0286 Number of Observations: 9 y
s_ for means group 4: 5.0286 Number of Observations: 9 y
s_ for means group 6: 8.7098 Number of Observations: 3 y
52

53

Variable 9: TDS
Grand Mean = 37.267 Grand Sum = 1006.210 Total Count = 27
T A B L E O F M E A N S
3 1 2 9 Total ------------------------------------------------------- * 1 * 32.757 294.810 * 2 * 59.156 532.400 * 3 * 19.889 179.000 ------------------------------------------------------- * * 1 49.156 442.400 * * 2 32.667 294.000 * * 3 29.979 269.810 ------------------------------------------------------- * 1 1 52.000 156.000 * 1 2 23.933 71.800 * 1 3 22.337 67.010 * 2 1 71.800 215.400 * 2 2 54.733 164.200 * 2 3 50.933 152.800 * 3 1 23.667 71.000 * 3 2 19.333 58.000 * 3 3 16.667 50.000 -----------------------------------------------------
A N A L Y S I S O F V A R I A N C E T A B L E
K Degrees of Sum of Mean FValue SourceFreedom Squares Square Value Prob----------------------------------------------------------------------------- 2 Factor A 2 7213.057 3606.528 16.6095 0.0001
54

4 Factor B 2 1940.556 970.278 4.4685 0.0266 6 AB 4 545.662 136.415 0.6282 -7 Error 18 3908.460 217.137----------------------------------------------------------------------------- Total 26 13607.735-----------------------------------------------------------------------------
Coefficient of Variation: 39.54%
s_ for means group 2: 4.9119 Number of Observations: 9 y
s_ for means group 4: 4.9119 Number of Observations: 9 y
s_ for means group 6: 8.5076 Number of Observations: 3 y
Variable 4: CHLORIDE
Grand Mean = 8.951 Grand Sum = 241.690 Total Count = 27
T A B L E O F M E A N S
3 1 2 4 Total ------------------------------------------------------- * 1 * 8.199 73.790 * 2 * 10.000 90.000 * 3 * 8.656 77.900 ------------------------------------------------------- * * 1 9.943 89.490 * * 2 8.478 76.300
55

* * 3 8.433 75.900 ------------------------------------------------------- * 1 1 9.163 27.490 * 1 2 7.400 22.200 * 1 3 8.033 24.100 * 2 1 11.300 33.900 * 2 2 10.400 31.200 * 2 3 8.300 24.900 * 3 1 9.367 28.100 * 3 2 7.633 22.900 * 3 3 8.967 26.900 ------------------------------------------------------
A N A L Y S I S O F V A R I A N C E T A B L E
K Degrees of Sum of Mean FValue Source Freedom Squares Square Value Prob----------------------------------------------------------------------------- 2 Factor A 2 15.780 7.890 2.6962 0.0946 4 Factor B 2 13.290 6.645 2.2707 0.1320 6 AB 4 10.660 2.665 0.9107 -7 Error 18 52.675 2.926 ----------------------------------------------------------------------------- Total 26 92.405-----------------------------------------------------------------------------
Coefficient of Variation: 19.11%
s_ for means group 2: 0.5702 Number of Observations: 9 y
56

s_ for means group 4: 0.5702 Number of Observations: 9 y
s_ for means group 6: 0.9877 Number of Observations: 3
Duncan’s Multiple Range Test
Case Range: 28 - 30Variable 7: CALCIUMFunction: RANGE
Error Mean Square = 3.930 Error Degrees of Freedom = 18No. of observations to calculate a mean = 9
Duncan's Multiple Range TestLSD value = 1.963 s_ = 0.6608 at alpha = 0.050 x
Original Order Ranked Order
Mean 1 = 6.389 B Mean 2 = 9.078 A Mean 2 = 9.078 A Mean 1 = 6.389 B Mean 3 = 3.667 C Mean 3 = 3.667 C
Data File : MTAKI04Title : ANALYSIS OF PHYSICOCHEMICLA PARAMETERS OF WATER
Case Range: 33 - 35Variable 7: CALCIUMFunction: RANGE
57

Error Mean Square = 3.930 Error Degrees of Freedom = 18No. of observations to calculate a mean = 9
Duncan's Multiple Range TestLSD value = 1.963 s_ = 0.6608 at alpha = 0.050X
Original Order Ranked Order
Mean 1 = 8.644 A Mean 1 = 8.644 A Mean 2 = 5.378 B Mean 2 = 5.378 B Mean 3 = 5.111 B Mean 3 = 5.111 B
Case Range: 28 - 30Variable 8: CONDUCTIVITYFunction: RANGE
Error Mean Square = 227.6 Error Degrees of Freedom = 18No. of observations to calculate a mean = 9
Duncan's Multiple Range TestLSD value = 14.94 s_ = 5.029 at alpha = 0.050 x
Original Order Ranked Order
Mean 1 = 61.21 B Mean 2 = 98.61 A Mean 2 = 98.61 A Mean 1 = 61.21 B Mean 3 = 36.29 C Mean 3 = 36.29 C
Case Range: 33 - 35Variable 8 : CONDUCTIVITY
58

Function: RANGE
Error Mean Square = 228.0 Error Degrees of Freedom = 18No. of observations to calculate a mean = 9
Duncan's Multiple Range TestLSD value = 14.95 s_ = 5.033 at alpha = 0.050 x
Original Order Ranked Order
Mean 1 = 92.10 A Mean 1 = 92.10 A Mean 2 = 54.65 B Mean 2 = 54.65 B Mean 3 = 49.37 B Mean 3 = 49.37 B
Case Range: 28 - 30Variable 5: TOTAL HARDNESSFunction: RANGE
Error Mean Square = 85.44 Error Degrees of Freedom = 18No. of observations to calculate a mean = 9
Duncan's Multiple Range TestLSD value = 9.155 s_ = 3.081 at alpha = 0.050 x
Original Order Ranked Order
Mean 1 = 22.67 B Mean 2 = 44.22 A Mean 2 = 44.22 AMean 1 = 22.67 B Mean 3 = 22.11 B Mean 3 = 22.11 B
Case Range : 33 - 3559

Variable 5 : TOTAL HARDNESSFunction: RANGE
Error Mean Square = 85.44 Error Degrees of Freedom = 18No. of observations to calculate a mean = 9
Duncan's Multiple Range TestLSD value = 9.155 s_ = 3.081 at alpha = 0.050 x
Original Order Ranked Order
Mean 1 = 37.00 A Mean 1 = 37.00 A Mean 2 = 27.67 B Mean 2 = 27.67 B Mean 3 = 24.33 B Mean 3 = 24.33 B
60