Asia-Pacific -Hotels & Motels MarketLine Industry Profile Hotels & Motels in Asia-Pacific
Upload
khangminh22Category
view
0download
0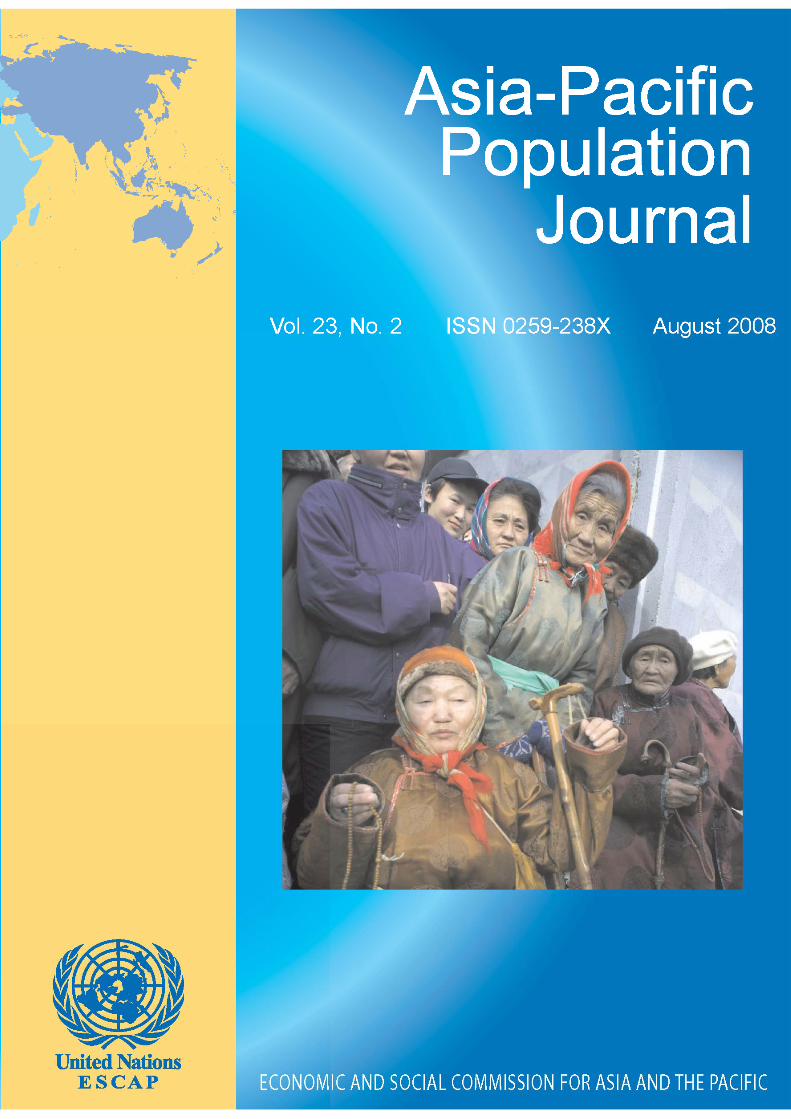
ASIA-PACIFIC POPULATION JOURNAL Vol. 23, No. 2, August 2008
The Asia-Pacific PopulationJournal is published three times a year in English by the UnitedNations Economic and SocialCommission for Asia and thePacific (ESCAP). Its publicationis made possible with financialsupport from ESCAP and theUnited Nations Population Fund(UNFPA), through projectnumber RAS5P203.
Produced by the SocialDevelopment Division of ESCAP,the Journal provides a mediumfor the international exchange ofknowledge, experience, ideas,technical information and dataon all aspects of the field ofpopulation, in order to helpdeveloping countries in theregion in improving theutilization of data andinformation for policy andprogramme purposes, amongothers.
The designations employedand the presentation of thematerial in this periodical do notimply the expression of anyopinion whatsoever on the part of the Secretariat of the UnitedNations concerning the legalstatus of any country, territory,city or area, or of its authorities,or concerning the delimitation ofits frontiers or boundaries.
The mention of firm namesand commercial products doesnot imply the endorsement of theUnited Nations.
ESCAP is not accountablefor the accuracy or authenticityof any quotations from sourcesidentified in this publication.Questions concerning quotedmaterials should be addressed tothe sources directly.
ST/ESCAP/2517
UNESCAP works towards reducing poverty and managing globalization
CONTENTSViewpoint
Are the Goals Set by the Millennium Declarationand the Programme of Action of the InternationalConference on Population and Developmentwithin Reach by 2015?
The risk now is that the benefits of development areincreasingly favouring the well-to-do, leading to deepeninginequality. Development is for everyone as the MillenniumDeclaration, makes very clear. The challenge now is toensure that no one is excluded.
By Mercedes B. Concepcion
3
Abstracts 10
Articles
Gender and Remittance Flows in Viet Namduring Economic Transformation
This article attempts to uncover some of the underlyingdifferences in remittance behaviours between men andwomen in Viet Nam. Some of the interesting results foundinclude a tendency for men to send remittances to other men,while women tend to send more to other women.
By Wade Donald Pfau and Giang Thanh Long
13
Spousal Abuse and Infant and Child Mortalityin India
It is clear from both bivariate and multivariate analyse thatphysical violence against mothers is associated positivelywith the increased risk of death of their children in bothinfancy and childhood.
By Abhishek Singh, Bidhubhusan Mahapatra andSubhra Dutta
33
Fertility Transition and Population Ageingin the Asian and Pacific Region
Considering the experience of low fertility countries, theGovernments of transitional and near-replacement fertilitycountries need to foresee the consequences of decliningfertility rates. A crucial agenda for the Governments istherefore to plan for an ageing society before fertility dropswell below the replacement level.
By Bhakta Gubhaju
55
Demographers’ Notebook
Dramatic Fertility Transition in Mongolia and itsDeterminants: the Demise of the Pronatalist State
It is projected to decline continously in Mongolia albeit at aslower rate, and TFR is expected to fall from 2.4 to 1.8children per woman during the period 2000-2025. Thisdecline will have a considerable impact on population growth,hence on the structure of the population.
By Altankhuyag Gereltuya
81
Full text of articles is available at:
www.unescap.org/appj.asp

COVER PHOTOGRAPH
A group of elderly women in Mongolia gather around the
photographer (Photo by Paul Ubl, courtesy of ESCAP Library).
Population ageing in Mongolia, an inescapable outcome of the
country’s dramatic fertility transition, is the focus of one of the articles
published in the present issue of the Asia-Pacific Population Journal. Be
sure to read it to have the rare chance to learn about the population trends in
this remote country.
In addition to the incisive Viewpoint article, other articles published
in this issue address a variety of topics in different geographical regions in
Asia and the Pacific.
ESCAP is the regional development arm of the United Nations and serves as the main
economic and social development centre for the United Nations in Asia and the Pacific.
Its mandate is to foster cooperation between its 53 members and 9 associate members.
ESCAP provides the strategic link between global and country-level programmes and
issues. It supports Governments of the region in consolidating regional positions and
advocates regional approaches to meeting the region’s unique socio-economic
challenges in a globalizing world. The ESCAP secretariat is located in Bangkok,
Thailand. Please visit the ESCAP website at www.unescap.org for further information.
The shade areas of the map indicate ESCAP members and associate members.

ASIA-PACIFIC POPULATION JOURNAL Vol. 23, No. 2, August 2008
The Asia-Pacific PopulationJournal is published three times a year in English by the UnitedNations Economic and SocialCommission for Asia and thePacific (ESCAP). Its publicationis made possible with financialsupport from ESCAP and theUnited Nations Population Fund(UNFPA), through projectnumber RAS5P203.
Produced by the SocialDevelopment Division of ESCAP,the Journal provides a mediumfor the international exchange ofknowledge, experience, ideas,technical information and dataon all aspects of the field ofpopulation, in order to helpdeveloping countries in theregion in improving theutilization of data andinformation for policy andprogramme purposes, amongothers.
The designations employedand the presentation of thematerial in this periodical do notimply the expression of anyopinion whatsoever on the part of the Secretariat of the UnitedNations concerning the legalstatus of any country, territory,city or area, or of its authorities,or concerning the delimitation ofits frontiers or boundaries.
The mention of firm namesand commercial products doesnot imply the endorsement of theUnited Nations.
ESCAP is not accountablefor the accuracy or authenticityof any quotations from sourcesidentified in this publication.Questions concerning quotedmaterials should be addressed tothe sources directly.
ST/ESCAP/2517
UNESCAP works towards reducing poverty and managing globalization
CONTENTSViewpoint
Are the Goals Set by the Millennium Declarationand the Programme of Action of the InternationalConference on Population and Developmentwithin Reach by 2015?
The risk now is that the benefits of development areincreasingly favouring the well-to-do, leading to deepeninginequality. Development is for everyone as the MillenniumDeclaration, makes very clear. The challenge now is toensure that no one is excluded.
By Mercedes B. Concepcion
3
Abstracts 10
Articles
Gender and Remittance Flows in Viet Namduring Economic Transformation
This article attempts to uncover some of the underlyingdifferences in remittance behaviours between men andwomen in Viet Nam. Some of the interesting results foundinclude a tendency for men to send remittances to other men,while women tend to send more to other women.
By Wade Donald Pfau and Giang Thanh Long
13
Spousal Abuse and Infant and Child Mortalityin India
It is clear from both bivariate and multivariate analyse thatphysical violence against mothers is associated positivelywith the increased risk of death of their children in bothinfancy and childhood.
By Abhishek Singh, Bidhubhusan Mahapatra andSubhra Dutta
33
Fertility Transition and Population Ageingin the Asian and Pacific Region
Considering the experience of low fertility countries, theGovernments of transitional and near-replacement fertilitycountries need to foresee the consequences of decliningfertility rates. A crucial agenda for the Governments istherefore to plan for an ageing society before fertility dropswell below the replacement level.
By Bhakta Gubhaju
55
Demographers’ Notebook
Dramatic Fertility Transition in Mongolia and itsDeterminants: the Demise of the Pronatalist State
It is projected to decline continously in Mongolia albeit at aslower rate, and TFR is expected to fall from 2.4 to 1.8children per woman during the period 2000-2025. Thisdecline will have a considerable impact on population growth,hence on the structure of the population.
By Altankhuyag Gereltuya
81
Full text of articles is available at:
www.unescap.org/appj.asp

Editorial Management
Editor-in-Chief: Keiko Osaki
Editor: Wanphen Sreshthaputra
Advisors: Bhakta Gubhaju, K.S. Seetharam,
Jerrold W. Huguet and Ghazy Mujahid
Editorial Advisory Board
BENCHA YODDUMNERN-ATTIG, Associate Professor,
Institute for Population and Social Research, Mahidol
University, Nakhon Pathom, Thailand
BHASSORN LIMANONDA, Director, College of
Population Studies, Chulalongkorn University, Bangkok
SUREEPORN PUNPUING, Director, Institute for
Population and Social Research, Mahidol University,
Nakhon Pathom, Thailand
G. GIRIDHAR, UNFPA Representative and Director, a.i.,
Asia Pacific Regional Office (APRO), Bangkok
GRACE CRUZ, Director, Population Institute, University
of the Philippines, Quezon City, Philippines
JOHN KNODEL, Professor, Population Studies Center,
University of Michigan, Ann Arbor, United States of
America
NIBHON DEBAVALYA, former Division Director, United
Nations Economic and Social Commission for Asia and the
Pacific, Bangkok
SHIREEN JEJEEBHOY, Senior Programme Associate,
Population Council, New Delhi
VIPAN PRACHUABMOH, Principal Investigator, Asian
MetaCentre, Singapore
WASIM ZAMAN, UNFPA Representative in Palestine

Are the Goals Set bythe Mil len nium Dec la ra tion
and the Programme of Actionof the In ter na tional Con fer ence on
Pop u la tion and De vel op mentwithin Reach by 2015?
The risk now is that the benefits of de velopment are increasinglyfa vour ing the well-to-do, leading to deepening in equality. As the
Mil len nium Dec la ra tion makes very clear, de vel op ment is for everyone.
The challenge now is to en sure that no one is excluded.
By Mercedes B. Concepcion*
It is now mid-2008, just seven years away from 2015, the target year for the
realization of the International Conference on Population and Development
(ICPD) Programme of Ac tion and the eight Millennium De velopment Goals.
Asia-Pacific Population Journal, August 2008 3
* University Professor Emeritus, College of Social Sciences and Philosophy, University of thePhilippines, e-mail: [email protected].
Viewpoint
The eight Goals that world leaders pledged to meet in order to solve global
challenges, range from halving extreme poverty to facing the problem of maternal
mortality and reversing the spread of HIV/AIDS by 2015. Owing to persistent
efforts of non-governmental organizations and other development partners, the
goal of universal access to reproductive health by 2015, agreed upon during ICPD
and reaffirmed at the Fifth Asian and Pacific Population Conference in December
2002, now forms a crucial part of the fifth Goal of improving maternal health.
While the Asian and Pacific region has been moving towards achieving the
Goals, progress has been uneven according to the most recent assessment
contained in the third Millenium Development Goals report for the region, entitled
A Future Within Reach 2008: Regional Partnerships for the Millennium
Development Goals in Asia and the Pacific (United Nations, 2008). The report
disclosed that, between 1990 and 2004, the number of people living in extreme
income poverty fell from 1 billion to 641 million in South-East Asia and China.
Concerning health, more children are now surviving beyond the age of 5. With
regard to education, millions more children are now going to school and a great
number of countries have attained nearly 100 per cent primary school enrolment
rates. The Asian and Pacific countries have also devised measures to achieve
greater equality both in schools and in the workplace.
The following paragraphs will zero in on the eradication of poverty and
hunger (Goal 1), the reduction of child mortality (Goal 4) and the improvement of
maternal health (Goal 5), citing examples from the Philippines and selected Asian
countries.
Goal 1: Eradicate extreme poverty and hunger
In just two years, between 2002 and 2004, the number of people living in
extreme poverty in the region fell by 82 million. Between 1990 and 2004, China
reduced its incidence of extreme poverty by 23 per cent, from 33 to 10 per cent,
thus surpassing the target set for the year 2015. Poverty rates have also diminished
sharply in Azerbaijan, Indonesia and Thailand.
However, the 2008 report revealed that, this year, one out of every two
people in the world subsisting on less than US $1 a day resides in the Asian and
Pacific region. Other areas of concern include distressing levels of infant and
maternal mortality, the increasing spread of HIV/AIDS and the low coverage of
water and sanitation.
In addition, women throughout the region continue to encounter
discrimination in their homes and communities, and many endure deplorable
4 Asia-Pacific Population Journal, Vol. 23, No. 2
working conditions. Another disquieting aspect of the region’s progress towards
meeting the Millenium Development Goals and the ICPD goals is the divergence
that persists within and between countries. Within countries, poor and vulnerable
groups, particularly those in rural and remote areas, are falling further behind. Such
countries as Bangladesh, the Lao People’s Democratic Republic, Nepal and Sri
Lanka slipped backward between the early 1990s and the early 2000s. The share of
the poorest quintile in national income or consumption, a measure of inequality,
remains less than 10 per cent (except in Japan) and appears to have declined in
several countries.
Today, with the price of fuel soaring past record levels, with inflation
reaching double-digit figures and headlines screaming of rice shortages, can we
expect the poor to be released from their bondage? Consider these facts: between
January and the first week of July 2008, the world price of Dubai Crude oil jumped
50 per cent; be tween Jan uary and mid-July 2008, petrol prices in the Philippines
surged 18 times; in July 2008 in Viet Nam, the oil price in creased 30 per cent, while
in Ma laysia it in creased by more than 40 per cent; the general in flation rate in the
Philippines reg istered a 11.4 per cent rise in June, with the inflation rate for food
items re corded at 17.4 per cent for the same month; and, in 2006, one in three
Fil i pi nos was poor, with some 11 million peo ple estimated to be subsisting on less
than US $1 day. With such a scenario, even middle-class work ers have had to
tighten their belts and learn to cope with less.
While there is no clear, universally accepted definition of hunger, the Food
and Agriculture Organization of the United Nations posits an average daily energy
requirement of 2,200 calories for adults undertaking light activity. Based on this
standard, about 545 million people in Asia and the Pacific are undernourished
(FAO, 2004), comprising almost two thirds of the world’s undernourished
population. Of this number, South Asia accounts for 300 million persons suffering
from hunger, including 233 million in India. Another 160 million live in East Asia,
with 119 million located in China. South-East Asia accounts for approximately 65
million undernourished people.
Although the Asian and Pacific region has witnessed an overall decrease in
the number and prevalence of undernourished persons, the average rate of
reduction has fallen short of what would be required to meet the first Goal of
halving the proportion of people who suffer from hunger by 2015. The highest
proportions of undernourished populations have been recorded in Tajikistan (61
per cent), the Democratic People’s Republic of Korea (35 per cent), Cambodia (33
per cent) and Bangladesh (30 per cent).
Asia-Pacific Population Journal, August 2008 5
The percentage of children under age 5 who are underweight is another vital
indicator of hunger. While the region has been making progress as far as this
indicator is concerned, it is considerably behind its target for 2015, with two out of
every seven children below age 5 being underweight. The region still accounts for
about two thirds of the world’s underweight children. In some countries, the
proportion is almost as high as one half.
Malnourished and underweight girls grow up to be undernourished mothers.
Receiving poor health care during pregnancy means such mothers are, in turn, at
risk of having underweight children. These forms of malnutrition may not
nec es sar ily be the con se quence of absolute shortages of food, but may be ow ing to
in ad e quate feed ing, es pe cially when chil dren are weaned.
It is clear, however, that hunger and malnutrition are not primarily due to
problems of food production. Nor are they simply the outcome of poverty. In fact, the
region has been more successful at producing food and reducing poverty than it has
been at diminishing hunger and child malnutrition. Some of the problems lie with the
way food is being used. One of the most important steps in the fight against extreme
poverty and hunger will be to increase the status of women. Such an improvement not
only fulfils women’s basic rights but also brings hope to other members of the
household, since women who have higher levels of education and who have greater
access to productive assets and resources will be in a better position to ensure that
their children are well fed. Countries will also need to improve essential social
infrastructure to relieve women of the burden of caregiving.
Goal 4: Reduce child mortality
Although child mortality has fallen to a record low throughout the world, it is
still a matter of great concern in the Asian and Pacific region, where some 4 million
children die every year before reaching the age of 5. The following countries
reported very high rates of under-5 mortality per 1,000 live births: Afghanistan
(257); Cambodia (143); Myanmar (105) and Turkmenistan (104). Infant mortality
followed a similar pattern.
Child mortality is closely associated with gender inequality. Discriminatory
practices prevailing in several countries have resulted in baby boys being preferred
over baby girls, neglecting the latter’s health and nutritional standards. Improving
levels of basic health and nutrition of women and increasing pregnant women’s
access to good health facilities will also lower the number of infant deaths.
And where are the infants? The most violated human right is that of a child to
reach his first birthday. The Asian Development Bank de clared: “The Philippines,
6 Asia-Pacific Population Journal, Vol. 23, No. 2

overall, is doing well on this and is on track to meet the (related) MDG goal by
2015”. Mean while, a worrisome gap be tween city and rural ar eas is emerging.
Goal 5: Improve maternal health
Regarding maternal health, the performance of countries in Asia and the
Pa cific has been deeply dis ap point ing. Some 250,000 women in the re gion die
each year dur ing child birth or from preg nancy-re lated com pli ca tions. The tar get is
to re duce the ma ter nal mor tal ity ra tio by three quar ters by the year 2015. In 1990,
Asia’s over all ma ter nal mor tal ity ra tio was 395 deaths per 100,000 live births. A
de cade later, the ra tio had only fallen to 300.
In the Philippines, 10 mothers die each day while giving birth. By contrast, the
figure is only 3 in Malaysia. The related Goal for the Philippines is to trim the
maternal mortality ratio to 52 for every 100,000 births by 2015, down from 209 in the
1990s. The country has slashed this ratio down to the current figure of 170.
Unfortunately, progress is far too slow. Skilled health personnel attend only 6 out of
every 10 births in the Philippines, while the number is close to 10 in Thailand. At this
rate, the maternal mortality ratio for Filipino mothers will dip only to 140 by 2015.
Although the situation varies from one country to the next, there are a number
of common problems, such as gender discrimination in accessing health services,
poor quality of services, a lack of emergency obstetric care, and a paucity of skilled
health personnel and community-level field workers.
Maternal mortality could fall by 75 per cent if all births were attended by
skilled health personnel with access to emergency obstetric care (Rightsbase,
2007). Another difficult issue is that many pregnant women are in poor health and
are malnourished, a frequent consequence of their low economic and social status.
This situation is especially dire for such vulnerable women as refugees, migrant
workers, minorities and women in conflict areas.
Certain countries have created obstacles in the progress towards ensuring
universal access to reproductive health, placing ideology above evidence and bias
above science. Well meaning but far less effective abstinence efforts are
supplanting comprehensive family planning and reproductive health strategies.
Moreover, the lack of accurate statistics has been hampering progress in
reducing maternal mortality. Only a few of the poorest countries have effective
systems for vital registration. Most data on maternal deaths come from household and
other surveys that have their own limitations. Hence, more efficient and effective
systems of data collection need to be implemented to correct this situation.
Asia-Pacific Population Journal, August 2008 7
In developed countries, the sex ratio at birth ranges from 103 to 107 males per
100 females. China’s sex ratio at birth is 120, while that of India is 108. In some
parts of the region, the birth of a boy is viewed as a gift from the gods while that of a
girl is of ten seen as a “curse”. Hence, some par ents re sort to se lec tive abor tion or in
some cases, in fan ti cide. With the de vel op ment of am nio cen te sis and ul tra sound
im ag ing tech nol o gies, par ents have been better able to choose the sex of their child.
A study con ducted in four coun tries in the re gion dubbed the sex-ra tio im bal ance
“gendercide” (UNFPA, 2007). Sub se quent gen der-based vi o lence or ne glect that
costs the lives of mil lions of women and girls also dis torts the sex ra tio at birth.
The ICPD Programme of Action and other international agreements, as well
as international organizations such as the United Nations Population Fund, the
International Planned Parenthood Federation and the United Nations Children’s
Fund that provide sup port for the im ple men ta tion of such agree ments, have been
the tar get of smear cam paigns that spew mis in for ma tion and con tinue to use the
abor tion is sue as a wedge to un der mine the real tar get: or ga nized fam ily plan ning,
re pro duc tive health programmes and equal ity for women.
The Philippines has emerged as one of the countries posing obstacles in the
progression towards ensuring universal access to reproductive health care. The
cur rent ad min is tra tion has placed ide ol ogy above ev i dence and bias above sci ence.
Well mean ing but far less ef fec tive ab sti nence ef forts sup plant com pre hen sive
fam ily plan ning and re pro duc tive health strat e gies. It is re gret ta ble that so many of
the peo ple talk ing about the sanc tity of life are, by their ac tions, ig no rant and
prej u diced, ef fec tively con demn ing women to die.
A sense of impotence among the needy can pose grave challenges for social
stability and economic well-being, compounded by weakness in governance,
problems in service delivery and persistent gender discrimination. During the
launch of the 2008 report in April, David Lockwood, Acting Head of the United
Nations Development Programme Regional Bureau for Asia and the Pacific,
emphasized that “raising standards of governance will assist countries in their
efforts to achieve ‘pro-poor’ growth”.
The 2008 report high lights the need for in ter na tional or ga ni za tions in the
re gion to co or di nate in a better fash ion their as sis tance to coun tries at tempt ing to
make the Mil len nium De vel op ment Goals a re al ity. At the launch of that same
re port, Noeleen Heyzer, Ex ec u tive Sec re tary of ESCAP, said: “It is es sen tial that
de vel op ment part ners con trib ute ac cord ing to their unique char ac ter is tics and
strengths, yet up hold the spirit, prin ci ple and prac tice of unit ing to ‘de liver as
one’”.
8 Asia-Pacific Population Journal, Vol. 23, No. 2

In most countries in Asia and the Pacific, the next generation is likely to be
less poor and better educated. However, the risk now is that the benefits of
development are increasingly favouring the well-to-do, leading to deepening
inequality. As the Millennium Declaration makes very clear, development is for
everyone.
The challenge now is to ensure that no one is excluded.
Reference
Food and Agriculture Organization (FAO (2004). The State of Food Insecurity in the World 2004,
Rome, FAO.
Rightsbase (2007). Maternal deaths catastrophic & avoidable: UN. Rightsbase Human Rights News
and Views, accessed on 27 April 2007 at http://blog
rightsbase.org/2007/04/27/maternal-deaths-catastrophic-avoidable-un/>.
United Nations Population Fund (UNFPA) (2007). Sex-ratio imbalance in Asia: trends, consequences
and policy responses. Conference on Reproductive and Sexual Health and Rights, 29-31
October 2007, Hyderabad, India.
United Nations (2008). A Future Within Reach 2008: Regional Partnerships for the Millennium
Development Goals in Asia and the Pacific (United Nations publication, Sales No.
E.08.II.F.15).
Asia-Pacific Population Journal, August 2008 9
Page
Gender and Remittance Flows in Viet Nam 13
during Economic Transformation
Since the 1990s, Viet Nam has been experiencing a dramatic growth in
remittance flows. This article uses the Viet Nam Living Standards Surveys of
1992-1993 and 1997-1998 to study the role of gender in both sending and
receiving remittance flows. Know ing about gen der dif fer ences will help to better
ex plain the im pact of re mit tances and to un der stand the na ture of gen der roles
dur ing a pe riod of rapid eco nomic trans for ma tion. There are im por tant
dis tinc tions be tween men and women, such as a greater sense of re spon si bil ity
among women for the intergenerational trans fers of re mit tances (par tic u larly
be tween par ents and chil dren), while men tend to take more re spon si bil ity for
intragenerational trans fers. In ad di tion, af ter con trol ling for other fac tors and
shar ing re mit tances be tween spouses who live to gether, ev i dence sug gests that
women have a greater like li hood of both send ing and re ceiv ing re mit tances.
Spousal Abuse and Infant and Child Mortality in India 33
Data from the National Family Health Survey, 1998-1999, India are used to
examine the association between domestic violence and the risk of infant and
10 Asia-Pacific Population Journal, Vol. 23, No. 2
Abstract

child mortality in India. The study explores the association of physical violence
against the nutritional status of women and children, the reporting of pregnancy
intendedness and the utilization of maternal and child health services. A significant
as so ci a tion is found be tween phys i cal vi o lence against moth ers and the risk of
death of their chil dren dur ing in fancy and child hood. This risk is 9 to 12 per cent
higher if the moth ers have been ex posed to phys i cal vi o lence, even af ter ad just ing
for other socio-eco nomic and de mo graphic vari ables. Bat tered moth ers are not
only less likely to uti lize ma ter nal and childcare ser vices but also more likely to
have poor nu tri tion. Do mes tic vi o lence is an im por tant pub lic health con cern and
should be taken se ri ously by policymakers and plan ners.
Fertility Transition and Population Ageing 55
in the Asian and Pacific Region
This paper provides a general overview of population ageing in the context
of fertility transition in Asia and the Pacific. Focusing on low-fertility countries, it
highlights the implications of low fertility for the ageing process. Indicators of
population ageing, such as changes in age structure, potential support ratio and the
feminization of the elderly population, are presented to provide a better
understanding of the overall situation.
As the region is home to over 60 per cent of the global population and has
been experiencing a rapid decline in fertility, the absolute size of the older
population is a cause for major concern. While the overall population growth rate
has been declining over time, the number of older persons is increasing at a faster
rate. In addition to the increase in the number of older persons, gen der dis par ity in
im prove ments in life ex pec tancy at birth is likely to re sult in a much higher
per cent age of fe males in the older age groups, par tic u larly in the age group 80
years and older.
It is therefore important for countries in the region to recognize the
significance of ageing problems and to start formulating policies for the elderly
given that it takes several decades for Government old-age pension schemes to
ma ture and to op er ate at full scale.
Asia-Pacific Population Journal, August 2008 11
Dramatic Fertility Transition in Mongolia and Its Determinants: 81
the Demise of the Pronatalist State
Mongolia followed a centrally planned economy up until 1989. Under
socialist rule, the country had a strong pronatalist population policy under which
those families having children were provided with generous benefits. The changes
made to these policies have had a considerable impact on fertility and family
formation in Mongolia.
Dramatic fertility declines occurred in Mongolia between the 1960s and the
end of the 1990s – mainly owing to changes in population policies and other social
dimensions. Although still not at a low level, the total fertility rate in Mongolia as a
whole has declined from about 8 children per woman to about 2.3 within a span of
38 years. Findings suggest that fertility transition is under way, and this transition
consists of the following periods: a) pre-transition (1960-1975); b) the onset of
transition (around 1975) and c) transition (1976-1998). The latter itself can be split
into two phases: the socialist and market periods.
If the decline in fertility persists in Mongolia, it will have a considerable
impact on population growth, hence on the country’s population structure. It is
likely that Mongolia may soon face population ageing and a decline in its
dependency ratio, which will have profound effects on many socio-economic
issues.
12 Asia-Pacific Population Journal, Vol. 23, No. 2

Gen der and Re mit tance Flowsin Viet Nam dur ing
Eco nomic Trans for ma tion
This article at tempts to un cover some of the un derlying dif ferences inremittance be haviours be tween men and women in Viet Nam.
Some of the in teresting results found in clude a ten dency for men to send remittances to other men, while
women tend to send more to other women.
By Wade Don ald Pfau and Giang Thanh Long*
Remittances are growing in importance in our globalizing world and,
consequently, they are receiving greater attention from researchers. At the
microeconomic level, researchers tend to use household surveys to examine why
people send remittances, how the characteristics of remittance recipients compare
to those of non-recipients, how remittances impact poverty and the income
Asia-Pacific Population Journal, August 2008 13
* Wade Donald Pfau, Associate Professor, National Graduate Institute for Policy Studies, e-mail:[email protected]; and Giang Thanh Long, Lecturer, National Economics University, e-mail:[email protected]
Articles

distribution, if remittances are spent for consumption or investment purposes, and
in order to access the role of remittances as an insurance mechanism. However, an
issue that has received less attention is the role of gender in remittance decisions,
from the perspective of both senders and receivers. In Viet Nam, the doi moi
economic reforms that began in 1986 have led to large-scale economic
transformation in the country, and gender has emerged as an important distinction
for understanding how economic growth benefits society and the various
subgroups of the population (Long and others, 2000). Viet Nam represents a case
of transition from the traditional patriarchal social structure of Confucianism, to a
structure of formal equality under socialism, and currently, with further changes
taking place, to a market economy. Using the Viet Nam Living Standards Surveys
(VLSSs) for 1992-1993 and 1997-1998, which include information about
remittance flows at the individual level, attempts are made to shed some light on
the role of gender in remittance decisions in Viet Nam during the period of rapid
economic transformation.
The authors of this article decided to focus their attention on this particular
issue for a number of reasons. First, the survey data allow for a thorough
examination of remittance flows at the individual level, whereas in many countries
such data can be obtained only at the household level. Second, Viet Nam is
undergoing a process of rapid economic change, and the two survey periods
provide insight into the impact of economic transformation on migration and
remittance flows. To understand those changes, it should be noted that, between
the survey years, the poverty rate fell from 57.6 per cent to 37.4 per cent.
Additionally, the real gross domestic product of Viet Nam grew by more than 8 per
cent for each year between 1992 and 1997 (IMF, 2008). The growth of new
industries and of the service sector reduced the importance of agriculture, leading
to many changes occurring in the lives of the Vietnamese people. Foreign
investment led to rural-urban migration and to the significant growth of both Ho
Chi Minh City and Hanoi within just a few years in the mid-1990s (Long and
others, 2000). Regarding older persons in Viet Nam, Giang and Pfau (2007)
document how traditional living arrangements are breaking down as more elderly
persons are living alone or in households with only other elderly persons, as this
age group is increasingly losing the support of their children. This trend may also
change the context of remittance flows.
Furthermore, the mid-1990s witnessed a change in the trend of migration
from Viet Nam, as political motives increasingly gave way to economic motives.
Much of the country’s international migration has been driven by non-economic
factors, at least before the early 1990s. Barbieri and others (1996) found that, of the
14 Asia-Pacific Population Journal, Vol. 23, No. 2

more than 1.2 million people who left Viet Nam between 1975 and 1993, 60 per
cent were illegal refugees and 40 per cent were part of the Orderly Departure
Programme set up by the Government of Viet Nam. Though it is not possible to
clearly distinguish political motives from economic ones, many of those ref ugees
were flee ing the Communist regime. Im migration data from the United States of
America, the des tination coun try for 62.1 per cent of Vietnamese emigrants
between 1975 and 1993, makes this clearer (Barbieri and oth ers, 1996).
Niedzwiecki and Duong (2004) compiled data from the United States Immigration
and Nat u ral iza tion Ser vice about Viet nam ese im mi gra tion to that coun try be tween
1971 and 2001, classifying immigrants as either ref ugees or non-ref ugees. For
refugees, the largest spike was in 1975 fol lowing the fall of Saigon, while an other
spike oc curred in the early 1980s as the communist Gov ernment strengthened its
position against po litical op ponents. While only a small number of non-refugee
migrants ar rived in the United States in the late 1980s and early 1990s, their
numbers soared and more than 40,000 arrived in both 1991 and 1992. As such,
between the two sur vey periods, one can wit ness how remittances may change as
economic migration becomes more important.
In addition, while international remittances have been growing steadily,
domestic remittances that took place between the two surveys were found to have
grown even more rapidly. Weighted by remittance value, the share of total
remittances from international sources fell from 71.7 per cent in 1992-1993 to 57.3
per cent in 1997-1998, whereas the share of remittances flowing from households
within the same province grew from 18.9 per cent to 25.8 per cent. By contrast,
remittances flowing between different provinces in Viet Nam grew from 9.4 to 17
per cent during the same period. For further information about the surge of internal
migration in the mid-1990s, see Long and others (2000).
It is clearly instructive to examine the nature of remittances in Viet Nam. In
this paper, remittances are examined especially from the perspective of gender.
The authors look at the flow of remittances between genders to answer such
questions as whether men are more likely than women to send or receive
remittances, and whether men tend to send those to other men or to women. The
analysis is then further extended by considering the gender flows for different
types of relationships – between senders and receivers � to answer such questions
as whether sons or daughters are more likely to send remittances to parents,
whether children tend to send those sums to their fathers or to their mothers, and
whether parents tend to send those to their sons or to their daughters, and so forth.
The next issue considered is that of remittance flows for married couples in order to
ascertain which member of the married couple tends to send and receive more
Asia-Pacific Population Journal, August 2008 15

remittances. This leads us to consider an alternative measure of remittance flows,
in which one assumes that any remittances sent or received by a married person
living with his/her spouse will be divided and shared equally with that person. This
reasonable assumption is found to have important implications for the subsequent
regression analysis, in which one seeks to determine the role of gender in sending
and receiving remittances at the individual level, after controlling for other
important characteristics, such as marital status, working status, migrant status,
region, urban/rural location, age, position in the income distribution and education.
Briefly, interesting patterns include the tendency of men to send remittances
to other men, and the tendency of women to send them to other women. This is the
case in ab solute terms for domestic re mittances, but is some what offset for
international re mittances, as men are more likely to send them to women.
Additionally, evidence sug gests that women tend to be more re sponsible for the
intergenerational trans mis sion of re mit tances (par tic u larly be tween par ents and
children), while men tend to take responsibility for such transfers within the same
generation. Also, for married cou ples who live to gether, this analysis found that
there is a tendency for the hus band to be more re sponsible for send ing and
receiving re mittances, whereas women are less likely to re ceive re mittances and
only slightly more likely to send remittances, if one assumes that spouses living
together share the remittance amount. Based on this same assumption, the
regression analysis shows that, when con trolling for other fac tors, women actually
have a higher probability than men to both send and receive remittances.
Literature review
This section reviews the literature available on the following three issues:
reasons remittances are sent; the role of gender in remittance-related decisions; and
general studies of remittances in Viet Nam. Theories about migration and
remittances can be divided into economic and non-economic motives. Massey and
others (1993) reviewed economic motives based on the neoclassical economic
theory that identifies the cause of migration as wage differentials, so that the net
flow of migrants is expected to be from low-wage areas to high-wage areas. More
recently, the new economics of migration have extended the analysis to the
household level, with migration being considered as a way to reduce risk by
diversifying income sources and providing insurance against local shocks when
market failures prevent even the availability of such schemes.
As for non-economic motives, remittances may be driven by altruism, in
which the sender does so out of a selfless desire to help recipients (Lucas and Stark,
1985). Also, as noted earlier, Viet Nam represents a special case, in which much of
16 Asia-Pacific Population Journal, Vol. 23, No. 2
the early international migration was driven by non-economic factors, which could
impact remittance decisions as well. Also, Curran and Saguy (2001) explained how
culture and social networks may influence the migration and remittance decisions
made by different genders, citing that, in Thailand, daughters are more likely to
send remittances than sons as a result of differing cultural expectations and family
power. As for Viet Nam, Long and others (2000) relate that parents do not show a
gender preference in the choice of living with adult unmarried children, but have a
clear preference to live with married sons over married daughters, implying that
married women tend to be expected to care for their in-laws. Sim ilarly, in studying
the remittances from migrants in Thailand, Osaki (2003) found statistically
significant ev idence that female migrants were more likely than males to send
remittances to their or igin household. Osaki explains this as possibly re sulting
from closer re la tion ships and ob li ga tions ex ist ing be tween fe males and their or i gin
households in Thailand compared with those between males and their origin
households.
Several studies on remittances in Viet Nam are available to researchers. For
instance, Le and Nguyen (1999) used the 1992-1993 VLSS to study domestic and
international remittance flows in and to and from Viet Nam. The authors found
that, af ter con trolling for other fac tors, fe male-headed house holds are more likely
to receive re mittances compared with male-headed house holds. A study that
discusses as pects of re mittances with regard to their role in sup porting the elderly
population is that of Knodel and oth ers (2000). An in teresting question posed in
that ar ticle is whether the elderly are disadvantaged by not hav ing a child of a
particular sex. Results are con flicting, though with re gard to the issue of material
support, they found weak evidence that el derly persons without sons in the north of
the country are less likely to re ceive sup port, and no ev idence in the south. Also of
rel e vance, Fried man and oth ers (2003) ex am ined gen der dif fer ences in the
well-being of the elderly in Viet Nam, in cluding in sup port for the elderly from
family members. They found that transfers between gen erations do not show much
variation be tween gen ders after con trolling for other fac tors such as marital status
and age. Fi nally, Barbieri (2006) found that elderly women (aged 60 and above)
are more likely than elderly men to receive remittances from their children.
Data
In this article, the authors use the 1992-1993 VLSS and 1997-1998 VLSS.1
These surveys were conducted by the General Statistics Office of Vietnam, along
with other international agencies, as a part of the Living Standards Measurement
Study of the World Bank. Detailed descriptions of these surveys can be found in
numerous research reports, such as those by the World Bank (2000 and 2001).
Asia-Pacific Population Journal, August 2008 17

Unless otherwise noted, the calculations are made using sample weights to make
the data representative of the entire Vietnamese population, in both urban and rural
areas and across different regions.
The surveys are organized by household, but they also include some
characteristics for each individual in the household, such as age; gender;
relationship to household head; marital, working and migrant status; salary; health
and education. The 1992-1993 VLSS includes 4,800 households with 24,068
individuals, whereas the 1997-1998 VLSS includes 6,002 households with 28,633
individuals. At the household level, those surveys provided extensive data on
sources of income, business and agricultural enterprises, detailed household
expenditures, the ownership of consumer durables, poverty incidence, poverty
alleviation programmes and housing conditions.
Remittances are defined in the surveys as the amount of money and monetary
value of in-kind benefits received by a household from people not living in the
household (family or friends), which do not require repayment. Reports on the
surveys provide information on specific de tails about each remittance a household
receives and sends. For remittances re ceived, the in formation in cludes which
member received it, the relationship of the re mittance sender with the receiver, and
the gender of the sender (only in the 1997-1998 VLSS). In ad dition, in formation is
provided on where the sender lives, in cluding the coun try if the re mittance came
from over seas, and whether the location is in an ur ban or ru ral area. The value of
the re mittances sent and re ceived is also provided. Based on details on both
remittances re ceived and re mittances sent by each household, it can be de termined
whether the household is a net receiver or sender, and the flow of remittances in
both directions can be examined.
Results
Characteristics of remittance flows in Viet Nam
Prior to the analysis of gender and remittances in Viet Nam, general
information about remittances for the country is presented. Evidence suggests that,
between 1992-1993 and 1997-1998, there was a small but increasingly significant
role for remittances in terms of the percentage of households sending and receiving
them. About 20.7 per cent of households (weighted by household size) received
remittances in 1992-1993, and this number increased to 22.7 per cent in
1997-1998. Most of those households received remittances from domestic
sources, while in both surveys, some 5.6 per cent of households received
remittances from a sender abroad. Meanwhile, in 1992-1993, 16.5 per cent of
18 Asia-Pacific Population Journal, Vol. 23, No. 2

households sent remittances to domestic residents. This number grew to 18.3 per
cent by 1997-1998. A mere 0.1 per cent of households sent remittances to family
members living abroad.
Table 1. Percentage of households that sent and received remittances
1992-1993 1997-1998
Households that received:
No remittances 79.3 77.3
Domestic remittances 16.1 17.8
International
remittances5.6 5.6
Households that sent:
No remittances 83.4 81.6
Domestic remittances 16.5 18.3
International
remittances 0.1 0.1
Households that sent
and/or received
No remittances 66.7 63.7
Only received 16.7 17.9
Only sent 12.5 13.6
Both received and sent 4.1 4.8
Source: Authors’ calculations are based on the Viet Nam Living Standards Surveys of 1992-1993
and 1997-1998.
Note: Columns in the top two sections of the table do not add up to 100 per cent because households
receiving or sending both domestic and international remittances are counted twice.
Remittance flows between genders
Remittance flows can be examined for only the 1997-1998 survey, since it is
the only one that identifies the gender of the person who sent the remittance to each
recipient. Overall, females received 54.9 per cent of the total remittance amounts
and sent 48.1 per cent of the remittances. Regarding the flow of remittances
between genders, at first glance it may seem as though there is no correlation as to
who sends to whom. However, a Pearson chi-square test does demonstrate a
statistically significant difference at the 0.1 per cent level: even though males send
Asia-Pacific Population Journal, August 2008 19
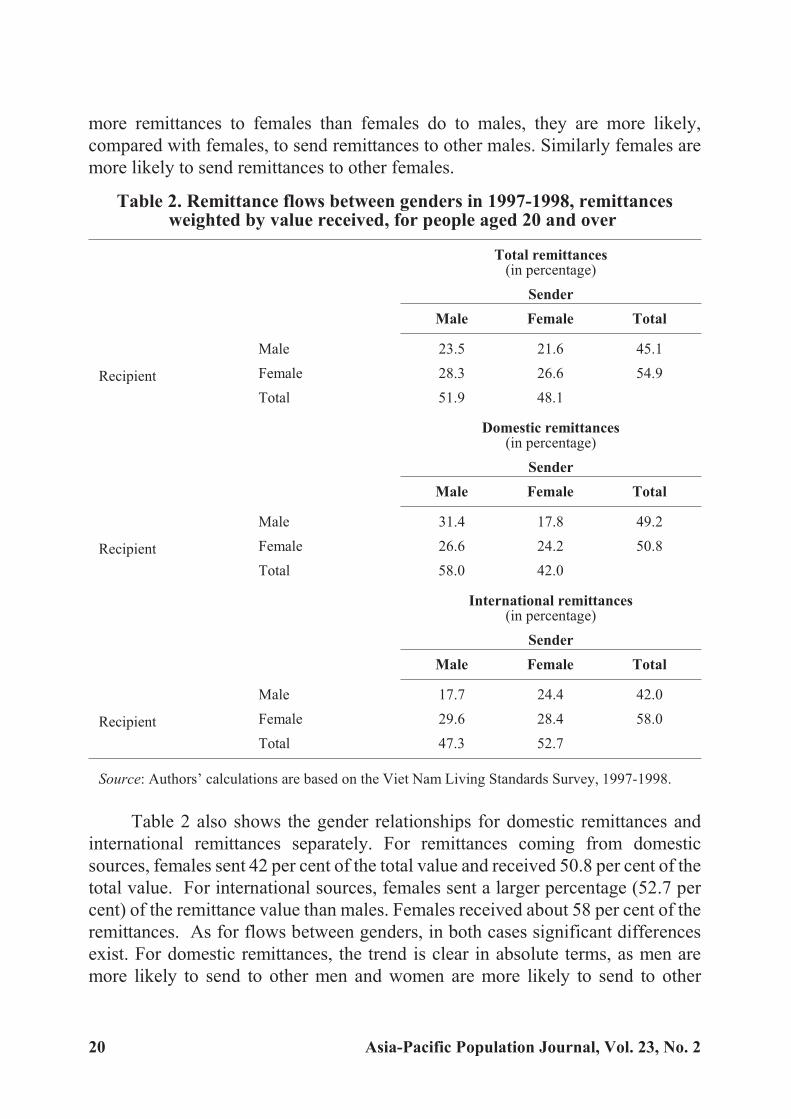
more remittances to females than females do to males, they are more likely,
compared with females, to send remittances to other males. Similarly females are
more likely to send remittances to other females.
Table 2. Remittance flows between genders in 1997-1998, remittancesweighted by value received, for people aged 20 and over
Total remittances(in percentage)
Sender
Male Female Total
Recipient
Male 23.5 21.6 45.1
Female 28.3 26.6 54.9
Total 51.9 48.1
Domestic remittances(in percentage)
Sender
Male Female Total
Recipient
Male 31.4 17.8 49.2
Female 26.6 24.2 50.8
Total 58.0 42.0
International remittances(in percentage)
Sender
Male Female Total
Recipient
Male 17.7 24.4 42.0
Female 29.6 28.4 58.0
Total 47.3 52.7
Source: Authors’ calculations are based on the Viet Nam Living Standards Survey, 1997-1998.
Table 2 also shows the gender relationships for domestic remittances and
international remittances separately. For remittances coming from domestic
sources, females sent 42 per cent of the total value and received 50.8 per cent of the
total value. For international sources, females sent a larger percentage (52.7 per
cent) of the remittance value than males. Females received about 58 per cent of the
remittances. As for flows between genders, in both cases significant differences
exist. For domestic remittances, the trend is clear in absolute terms, as men are
more likely to send to other men and women are more likely to send to other
20 Asia-Pacific Population Journal, Vol. 23, No. 2

women. However, the opposite emerges for international remittances. In this case,
men are relatively more likely to send to women, and women are relatively more
likely to send to men. This is an interesting result that the authors will explore
further, also by considering the relationships between senders and receivers.
Remittance flows by relationship status and gender
Tables 3 and 4 provide further details about the flow of remittances between
genders, categorized by the relationship of the receiver to the sender. This information
is given for people aged 20 and older in 1997-1998, and is shown separately for
domestic and international remittances. First, table 3 shows the proportion of total
remittances received by each relationship category, for eight different categories. For
domestic remittances, children/stepchildren receive the largest amount of remittances
(45.3 per cent of the value), followed by siblings, nieces and nephews (18.9 per cent),
and parents (17.7 per cent). Spouses, other relatives, non-relatives, grandchildren and
grandparents each receive less than 10 per cent. Meanwhile, for international
remittances, child recipients represent the largest category (36.9 per cent), though
siblings, nieces and nephews are a very close second (33.4 per cent). The category of
other relatives ranks third (12.2 per cent), whereas the shares flowing to parents or
spouses have both fallen to 5.7 per cent.
Table 3. Breakdown of remittances by relationship status of recipient,remittances weighted by value received in 1997-1998
for persons aged 20 and over
Domestic remittances International remittances
Proportion oftotal value
RankingProportion of
total valueRanking
Child, stepchild 45.3 1 36.9 1
Sibling, niece, nephew 18.9 2 33.4 2
Parent, mother-in-law,
father-in-law 17.7 3 5.7 4
Spouse 9.0 4 5.7 5
Other relative 4.5 5 12.2 3
Non-relative 3.6 6 2.0 7
Grandchild 0.5 7 4.2 6
Grandparent 0.5 8 0.0 8
Source: Authors’ calculations are based on the Viet Nam Living Standards Survey, 1997-1998.
Note: Relationship categories are in italics when there were less than 30 instances of that
relationship category, making it inappropriate to try to generalize further about the category.
Asia-Pacific Population Journal, August 2008 21

Table 4. Breakdown of remittances by relationship status and gender ofsender and receiver in 1997-1998, remittances weighted by value received
for people aged 20 and over
Relationship ofrecipient
Gender of
recipient
Domesticremittances
(percentage)
Internationalremittances
(percentage)
Gender of sender Gender of sender
Male Female Total Male Female Total
Child, stepchild Male 29.2 24.2 53.4 16.7 29.6 46.3
Female 21.8 24.8 46.6 23.6 30.1 53.7
Total 51.0 49.0 40.3 59.7
Sibling, niece, nephew Male 46.7 19.8 66.5 23.6 26.7 50.3
Female 19.0 14.5 33.5 27.4 22.4 49.7
Total 65.7 34.4 50.9 49.1
Parent, mother-in-law, Male 22.4 9.9 32.3 33.7 14.9 48.6
father-in-law Female 18.7 49.0 67.7 17.1 34.4 51.5
Total 41.1 58.9 50.7 49.3
Spouse Male 0.0 0.3 0.3
Female 99.7 0.0 99.7
Total 99.7 0.3
Other relative Male 51.6 15.1 66.7 6.8 14.4 21.2
Female 14.7 18.6 33.3 33.0 45.8 78.8
Total 66.3 33.7 39.8 60.2
Non-relative Male 78.5 3.5 82.0
Female 6.3 11.8 18.0
Total 84.7 15.3
Source: Authors’ calculations are based on the Viet Nam Living Standards Survey, 1997-1998.Note: The results for relationship categories with less than 30 instances of remittances have beenexcluded from the table.
Table 4 shows the gender breakdown by relationship category for domestic
and international recipients. First, for domestic remittances remitted to children,
46.6 per cent are received by females, and 49 per cent of these amounts are sent by
mothers. Those remittances are usually split almost equally between sons and
daughters, although fathers display a stronger tendency to send remittances to their
22 Asia-Pacific Population Journal, Vol. 23, No. 2
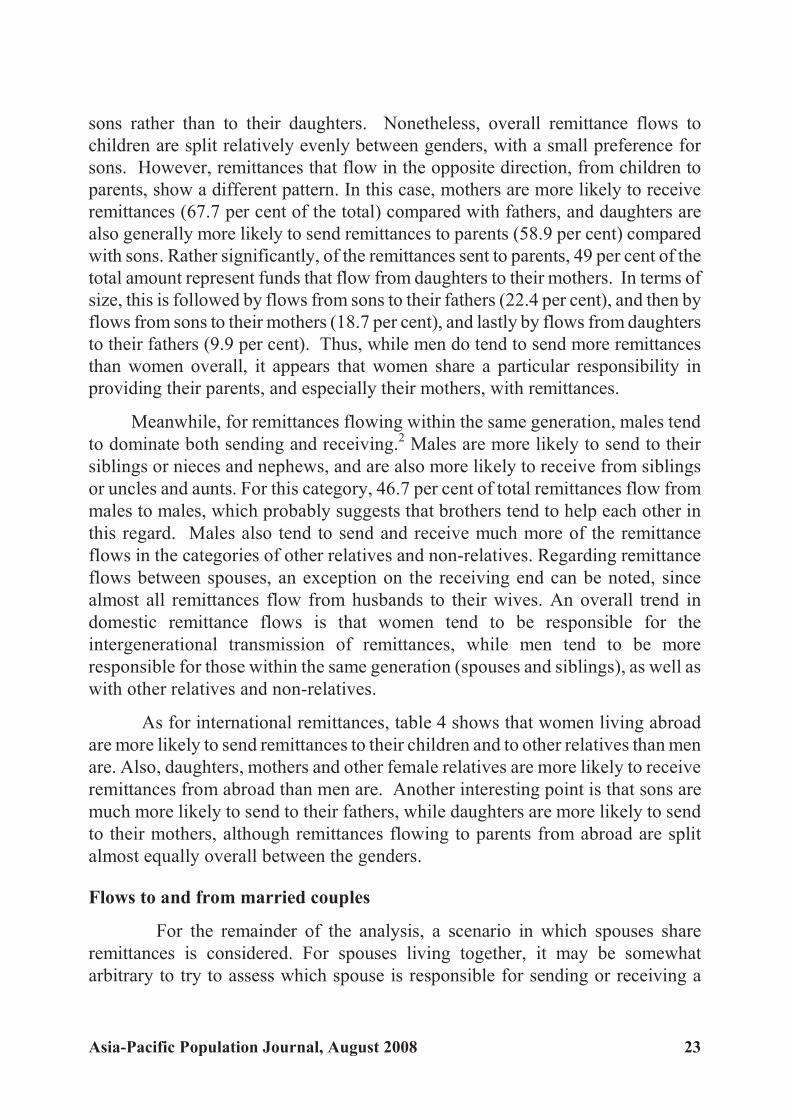
sons rather than to their daughters. Nonetheless, overall remittance flows to
children are split relatively evenly between genders, with a small preference for
sons. However, remittances that flow in the opposite direction, from children to
parents, show a different pattern. In this case, mothers are more likely to receive
remittances (67.7 per cent of the total) compared with fathers, and daughters are
also generally more likely to send remittances to parents (58.9 per cent) compared
with sons. Rather significantly, of the remittances sent to parents, 49 per cent of the
total amount represent funds that flow from daughters to their mothers. In terms of
size, this is followed by flows from sons to their fathers (22.4 per cent), and then by
flows from sons to their mothers (18.7 per cent), and lastly by flows from daughters
to their fathers (9.9 per cent). Thus, while men do tend to send more remittances
than women overall, it appears that women share a particular responsibility in
providing their parents, and especially their mothers, with remittances.
Meanwhile, for remittances flowing within the same generation, males tend
to dominate both sending and receiving.2 Males are more likely to send to their
siblings or nieces and nephews, and are also more likely to receive from siblings
or uncles and aunts. For this category, 46.7 per cent of total remittances flow from
males to males, which probably suggests that brothers tend to help each other in
this regard. Males also tend to send and receive much more of the remittance
flows in the categories of other relatives and non-relatives. Regarding remittance
flows between spouses, an exception on the receiving end can be noted, since
almost all remittances flow from husbands to their wives. An overall trend in
domestic remittance flows is that women tend to be responsible for the
intergenerational transmission of remittances, while men tend to be more
responsible for those within the same generation (spouses and siblings), as well as
with other relatives and non-relatives.
As for international remittances, table 4 shows that women living abroad
are more likely to send remittances to their children and to other relatives than men
are. Also, daughters, mothers and other female relatives are more likely to receive
remittances from abroad than men are. Another interesting point is that sons are
much more likely to send to their fathers, while daughters are more likely to send
to their mothers, although remittances flowing to parents from abroad are split
almost equally overall between the genders.
Flows to and from married couples
For the remainder of the analysis, a scenario in which spouses share
remittances is considered. For spouses living together, it may be somewhat
arbitrary to try to assess which spouse is responsible for sending or receiving a
Asia-Pacific Population Journal, August 2008 23
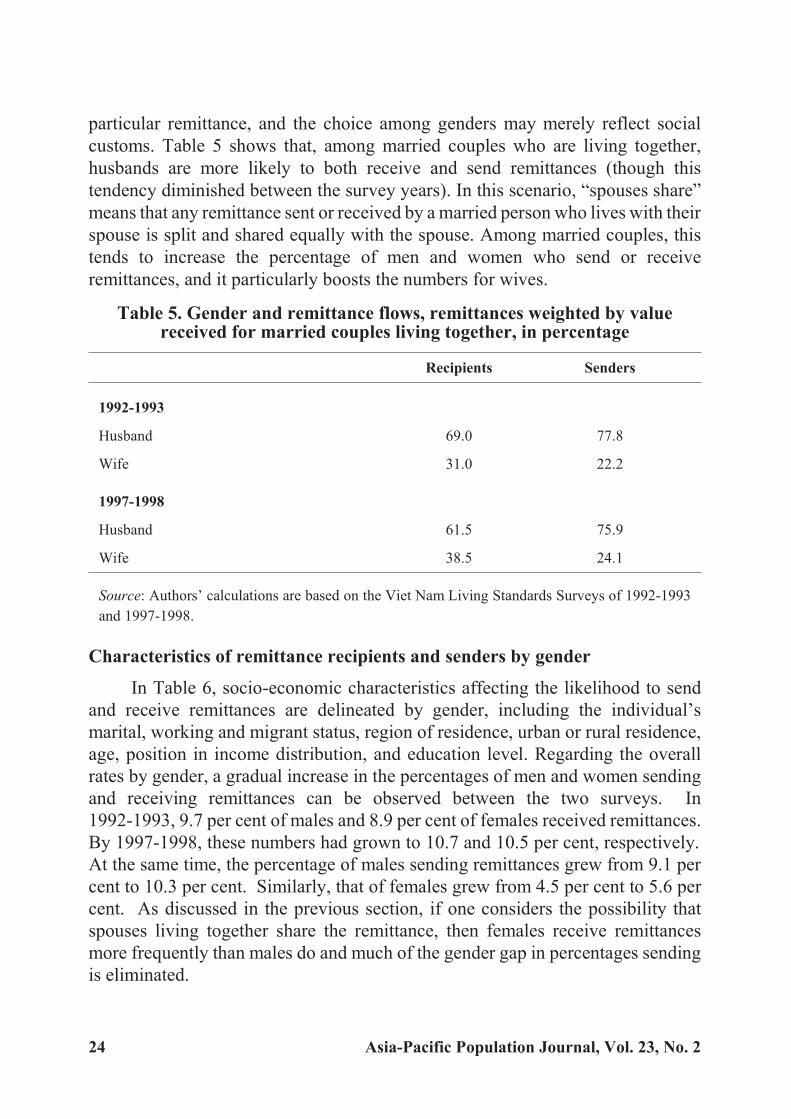
particular remittance, and the choice among genders may merely reflect social
customs. Table 5 shows that, among married couples who are living together,
husbands are more likely to both receive and send remittances (though this
tendency diminished between the survey years). In this scenario, “spouses share”
means that any remittance sent or received by a married person who lives with their
spouse is split and shared equally with the spouse. Among married couples, this
tends to increase the percentage of men and women who send or receive
remittances, and it particularly boosts the numbers for wives.
Table 5. Gender and remittance flows, remittances weighted by valuereceived for married couples living together, in percentage
Recipients Senders
1992-1993
Husband 69.0 77.8
Wife 31.0 22.2
1997-1998
Husband 61.5 75.9
Wife 38.5 24.1
Source: Authors’ calculations are based on the Viet Nam Living Standards Surveys of 1992-1993
and 1997-1998.
Characteristics of remittance recipients and senders by gender
In Table 6, socio-economic characteristics affecting the likelihood to send
and receive remittances are delineated by gender, including the individual’s
marital, working and migrant status, region of residence, urban or rural residence,
age, position in income distribution, and education level. Regarding the overall
rates by gender, a gradual increase in the percentages of men and women sending
and receiving remittances can be observed between the two surveys. In
1992-1993, 9.7 per cent of males and 8.9 per cent of females received remittances.
By 1997-1998, these numbers had grown to 10.7 and 10.5 per cent, respectively.
At the same time, the percentage of males sending remittances grew from 9.1 per
cent to 10.3 per cent. Similarly, that of females grew from 4.5 per cent to 5.6 per
cent. As discussed in the previous section, if one considers the possibility that
spouses living together share the remittance, then females receive remittances
more frequently than males do and much of the gender gap in percentages sending
is eliminated.
24 Asia-Pacific Population Journal, Vol. 23, No. 2

Table 6. Likelihood of receiving and sending remittances in Viet Nam by category and gender, of persons aged 20 and over, in percentage
1992-1993 1997-1998
Received Sent Received Sent
Males Females Males Females Males Females Males Females
Overall 9.7 8.9 9.1 4.5 10.7 10.5 10.3 5.6
Overall (spouses share) 13.8 15.6 12.0 11.5 14.9 17.7 13.7 13.2
Marital status of receiver/ sender
Married 11.1 7.7 11.2 4.7 12.6 8.4 13.1 6.5
Widowed 2.6 19.7 5.2 6.0 23.0 27.0 3.0 5.5
Otherwise not married 1.5 5.6 0.9 2.7 2.0 5.2 0.8 2.0
Married (spouses share) 16.2 17.3 14.8 14.7 18.0 19.0 17.6 17.8
Work status of recipient/sender
Not working 18.1 12.5 4.8 2.9 20.8 17.7 5.1 3.9
Working 8.6 8.2 9.7 4.8 8.6 8.3 11.4 6.0
Migrant status
Non-migrant 8.8 7.9 7.5 3.4 9.7 8.7 8.6 4.2
Migrant 12.9 11.6 14.3 7.3 13.8 14.9 15.5 9.0
Region
North 9.0 9.1 9.8 4.7 9.6 9.7 10.1 6.0
Central 11.8 8.4 9.3 4.0 13.4 10.9 13.4 5.3
South 9.4 9.1 8.5 4.6 10.2 10.9 8.5 5.3
Urban/ rural status
Rural 9.1 7.6 9.3 3.5 10.2 8.7 10.6 4.6
Urban 12.2 13.4 8.9 7.9 12.2 15.6 9.4 8.1
Age of recipient/ sender
20-29 4.0 5.1 3.5 1.7 1.9 2.8 1.2 1.9
30-39 8.0 7.2 10.3 5.6 8.2 8.4 11.6 7.1
40-49 8.7 10.1 15.8 6.6 8.9 10.1 16.8 8.5
50-59 13.3 10.4 14.7 7.7 12.9 13.0 18.3 8.4
60 -69 17.9 15.7 11.3 5.4 26.9 19.3 13.4 4.8
70-79 35.5 15.9 5.6 1.8 37.5 25.8 7.0 1.9
80 and older 25.5 19.4 1.8 1.0 36.8 19.1 3.5 2.2
Income distribution
1st quintile 8.0 6.5 3.8 1.1 7.8 6.4 6.1 1.9
2nd quintile 8.7 7.9 7.2 2.7 10.1 7.2 7.4 2.8
3rd quintile 8.6 8.2 9.4 3.4 9.3 9.5 10.1 5.7
4th quintile 11.2 9.5 11.3 5.3 12.7 13.2 13.0 6.5
5th quintile 12.1 12.3 13.7 9.6 14.7 18.0 16.5 12.7
.../
Asia-Pacific Population Journal, August 2008 25

Table 6. (Continued)
1992-1993 1997-1998
Received Sent Received Sent
Males Females Males Females Males Females Males Females
Education
No education 11.0 9.4 6.4 3.6 8.6 13.6 3.1 2.3
Primary education 9.3 6.5 9.6 5.1 13.7 10.4 6.7 4.4
Secondary education 8.9 9.3 10.0 5.0 9.4 9.1 12.2 7.3
University education 13.1 2.4 18.2 13.3 14.1 14.2 24.1 16.3
Source: Authors’ calculations are based on the Viet Nam Living Standards Surveys of 1992-1993 and
1997-1998.
In the marital status category, widowed women enjoy the highest likelihood
of receiving remittances. In 1992-1993, 19.7 per cent of widowed women
received remittances, and this number rose to 27 per cent in 1997-1998. The
percentage of widowed men receiving remittances also rose in 1997-1998, to 23
per cent from a much lower 2.6 per cent in 1992-1993. In addition, it is interesting
to note that married men are more likely to receive remittances than are married
women. They are also more likely to send remittances. However, this could be
misleading to some extent since, as explained earlier, husbands tend to be
responsible for remittance activities while sharing the proceeds or burden with
their wives. If one assumes that spouses living together share the remittance
values, then the gaps between genders are mostly closed, and married women are
actually slightly more likely to receive remittances on account of spouses not
living in the household.
Regarding the receiving of remittances, non-working people, migrants,
persons living in urban areas and persons in higher income brackets are more likely
to receive remittances than their counterparts. The trend is less clear, however, in
the lower income categories. Additionally, for these categories, men tend to
receive remittances more frequently than women, except for women living in
urban areas, who receive more frequently than male urban dwellers. The fact that
non-working men receive more remittances than non-working women could
reflect the idea that males who are not working may be more vulnerable than their
non-working female counterparts. Working people, migrants, rural males and
urban females, and those higher in the income distribution category tend to send
more remittances than their counterparts. Men tend to send more remittances than
women. Among migrants, it appears that both female and male migrants are more
likely to send and receive remittances than non-migrants. While male migrants are
26 Asia-Pacific Population Journal, Vol. 23, No. 2

more likely to send remittances than to receive them, female migrants are more
likely to receive them than to send them. It is also worth mentioning that,
throughout the three regions of Viet Nam, there do not seem to be any distinct
overall trends, apart from the fact that men in the central region appear more likely
to receive remittances than those living in the north or south of the country.
With regard to age and education, there is evidence of non-linear patterns.
First, the probability of receiving remittances increases gradually with age for
both men and women and this appears to be a tendency for all remittances flowing
from young to old generations. In 1992-1993, only 4 per cent of men and 5.1 per
cent of women aged 20 to 29 received remittances. These numbers increase, so
that about 35.5 per cent of men and 15.9 per cent of women aged 70 to 79 received
remittances. For ages 80 and above, the percentage of men declines to 25.5, while
that of women increases to 19.4. Older men are more likely to receive remittances
than are their female counterparts. These trends can also be observed in the VLSS
1997-1998. In this case, 1.9 per cent of men and 2.8 per cent of women aged 20 to
29 received remittances, while the percentages for both genders peaked between
the ages of 70 and 79, with 37.5 per cent of men and 25.8 per cent of women
receiving remittances. As for sending remittances, the age distribution follows a
more pronounced inverted-U shape for both genders, with the percentages for
those sending remittances reaching a peak between the ages of 40 and 59. Finally,
increasing education is associated with a higher probability of sending
remittances for both men and women, though the patterns for receiving
remittances are not as clear.
To summarize, evidence indicates that the percentage of males who
receive remittances is roughly similar to that of females, being only slightly
higher, while the percentage of males sending remittances is noticeably higher
than that of females. In addition, a number of trends emerge: widows tend to
receive more remittances; married people tend to send more; working people are
more likely to send but less likely to receive any; migrants are generally more
likely to send and receive remittances; there are more remittance transactions in
urban areas, but no clear pattern per region; and there are clear age patterns for
sending and receiving remittances. In addition, those who are higher in the
income distribution and are more educated are more likely to send remittances, yet
patterns are less clear for those receiving remittances.
Determinants of sending or receiving remittances
In the final part of the analysis, the authors seek to determine
whether gender plays an important role in the decision to send or receive
Asia-Pacific Population Journal, August 2008 27
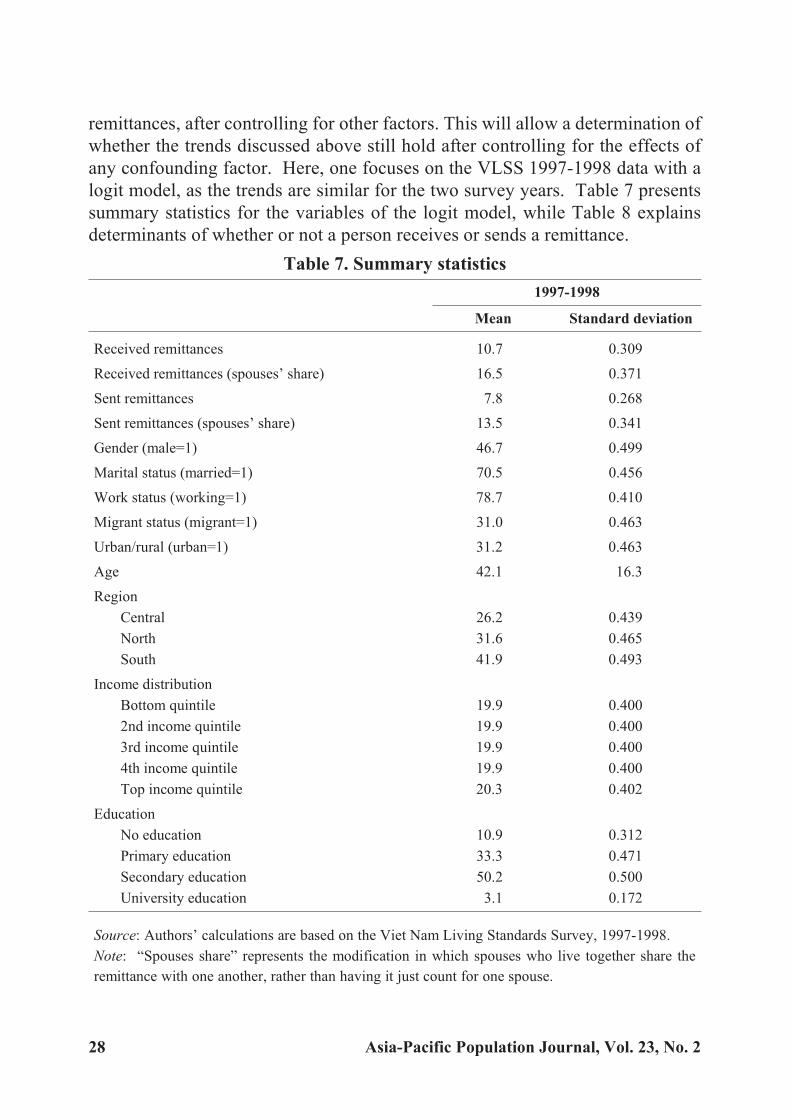
remittances, after controlling for other factors. This will allow a determination of
whether the trends discussed above still hold after controlling for the effects of
any confounding factor. Here, one focuses on the VLSS 1997-1998 data with a
logit model, as the trends are similar for the two survey years. Table 7 presents
summary statistics for the variables of the logit model, while Table 8 explains
determinants of whether or not a person receives or sends a remittance.
Table 7. Summary statistics
1997-1998
Mean Standard deviation
Received remittances 10.7 0.309
Received remittances (spouses’ share) 16.5 0.371
Sent remittances 7.8 0.268
Sent remittances (spouses’ share) 13.5 0.341
Gender (male=1) 46.7 0.499
Marital status (married=1) 70.5 0.456
Work status (working=1) 78.7 0.410
Migrant status (migrant=1) 31.0 0.463
Urban/rural (urban=1) 31.2 0.463
Age 42.1 16.3
Region
Central 26.2 0.439
North 31.6 0.465
South 41.9 0.493
Income distribution
Bottom quintile 19.9 0.400
2nd income quintile 19.9 0.400
3rd income quintile 19.9 0.400
4th income quintile 19.9 0.400
Top income quintile 20.3 0.402
Education
No education 10.9 0.312
Primary education 33.3 0.471
Secondary education 50.2 0.500
University education 3.1 0.172
Source: Authors’ calculations are based on the Viet Nam Living Standards Survey, 1997-1998.
Note: “Spouses share” represents the modification in which spouses who live together share the
remittance with one another, rather than having it just count for one spouse.
28 Asia-Pacific Population Journal, Vol. 23, No. 2
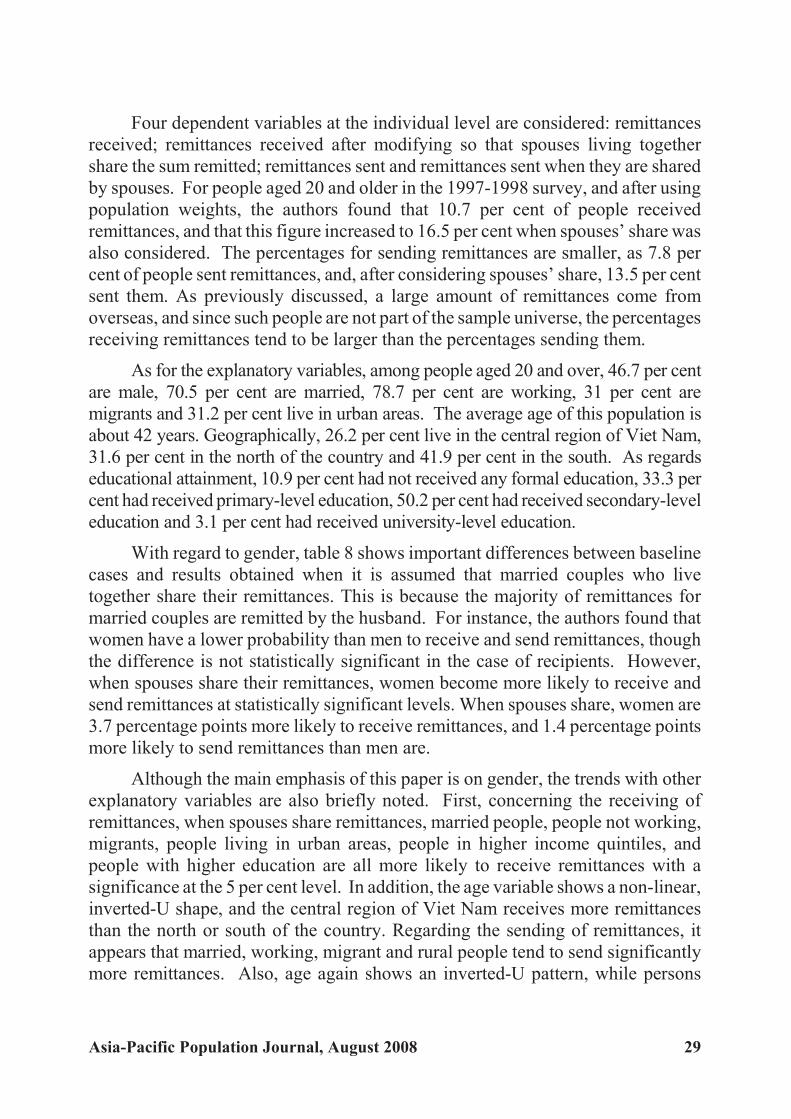
Four dependent variables at the individual level are considered: remittancesreceived; remittances received after modifying so that spouses living togethershare the sum remitted; remittances sent and remittances sent when they are sharedby spouses. For people aged 20 and older in the 1997-1998 survey, and after usingpopulation weights, the authors found that 10.7 per cent of people receivedremittances, and that this figure increased to 16.5 per cent when spouses’ share was also considered. The percentages for sending remittances are smaller, as 7.8 percent of people sent remittances, and, after considering spouses’ share, 13.5 per centsent them. As previously discussed, a large amount of remittances come fromoverseas, and since such people are not part of the sample universe, the percentagesreceiving remittances tend to be larger than the percentages sending them.
As for the explanatory variables, among people aged 20 and over, 46.7 per centare male, 70.5 per cent are married, 78.7 per cent are working, 31 per cent aremigrants and 31.2 per cent live in urban areas. The average age of this population isabout 42 years. Geographically, 26.2 per cent live in the central region of Viet Nam,31.6 per cent in the north of the country and 41.9 per cent in the south. As regardseducational attainment, 10.9 per cent had not received any formal education, 33.3 percent had received primary-level education, 50.2 per cent had received secondary-leveleducation and 3.1 per cent had received university-level education.
With regard to gender, table 8 shows important differences between baselinecases and results obtained when it is assumed that married couples who livetogether share their remittances. This is because the majority of remittances formarried couples are remitted by the husband. For instance, the authors found thatwomen have a lower probability than men to receive and send remittances, thoughthe difference is not statistically significant in the case of recipients. However,when spouses share their remittances, women become more likely to receive andsend remittances at statistically significant levels. When spouses share, women are3.7 percentage points more likely to receive remittances, and 1.4 percentage pointsmore likely to send remittances than men are.
Although the main emphasis of this paper is on gender, the trends with otherexplanatory variables are also briefly noted. First, concerning the receiving ofremittances, when spouses share remittances, married people, people not working,migrants, people living in urban areas, people in higher income quintiles, andpeople with higher education are all more likely to receive remittances with asignificance at the 5 per cent level. In addition, the age variable shows a non-linear,inverted-U shape, and the central region of Viet Nam receives more remittancesthan the north or south of the country. Regarding the sending of remittances, itappears that married, working, migrant and rural people tend to send significantlymore remittances. Also, age again shows an inverted-U pattern, while persons
Asia-Pacific Population Journal, August 2008 29

residing in the southern region send fewer remittances than those in the north orcentral regions. Persons in the higher end of the income distribution and thosehaving a higher level of education send more remittances as well.
Table 8. Logit model of remittance determinants in 1997-1998, for people aged 20 and over
Received
Received
(spouses’
share)
SentSent
(spouses’
share)
Probability for male 8.1 10.6 5.9 7.2
Probability for female 7.6 14.4 3.7 8.6
Difference -0.5 3.7 -2.2 1.4
Explanatory variables
Gender (male=1) 0.063 -0.318*** 0.495*** -0.190***
Marital status (married=1) -0.139* 0.749*** 0.609*** 1.548***
Work status (working=1) -0.393*** -0.359*** 0.487*** 0.406***
Migrant status (migrant=1) 0.075 0.099* 0.456*** 0.472***
Urban/rural (urban=1) 0.075 0.151** -0.706*** -0.723***
Age 0.079*** 0.067*** 0.107*** 0.100***
Age squared -0.001*** -0.000*** -0.002*** -0.002***
Region dummies (north is omitted)
Central 0.189** 0.219*** 0.079 0.102
South 0.016 0.008 -0.196* -0.283***
Income distribution (bottom quintile is omitted)
2nd income quintile 0.161 0.165* 0.194 0.219*
3rd income quintile 0.212* 0.171* 0.687*** 0.716***
4th income quintile 0.521*** 0.493*** 0.979*** 1.053***
Top income quintile 0.708*** 0.705*** 1.612*** 1.750***
Educational status (secondary education is omitted)
No education -0.569*** -0.527*** -0.933*** -0.696***
Primary education -0.294*** -0.230*** -0.542*** -0.403***
University education -0.132 -0.014 0.315* 0.277*
Constant -5.374*** -4.962*** -7.885*** -7.436***
N 16 005 16 005 16 005 16 005
pseudo-R2 0.111 0.122 0.143 0.171
Source: Authors’ calculations based on the Viet Nam Living Standards Survey 1997-1998.
Notes: Levels of significance: * < 0.05, ** < 0.01, ***<0.001; probabilities that males and femalesreceive or send remittances are calculated at the mean values of the other explanatory variables; “spouses’ share” represents the modification in which spouses who live together share the
remittance with one another.
30 Asia-Pacific Population Journal, Vol. 23, No. 2

Concluding remarks
This article attempts to uncover some of the underlying differences in
remittance behaviours between men and women in Viet Nam. Some of the
interesting results found include a tendency for men to send remittances to other
men, while women tend to send more to other women. This is the case in absolute
terms for domestic remittances, but is somewhat offset for international
remittances, as men are more likely to send to other women. In addition, the
authors found evidence suggesting that women tend to be more responsible for the
intergenerational transmission of remittances (particularly between parents and
children), while men tend to take responsibility for transfers within the same
generation. For married couples living together, a tendency could be identified for
the husband to be more responsible for sending and receiving remittances. The
authors also found that men are less likely to receive remittances and only slightly
more likely to send remittances than women are, if it can be assumed that spouses
living together share remittances. By using a logit regression analysis, the authors
found that, when controlling for other factors, women actually had a higher
probability than men to both send and receive remittances, if it can be assumed that
spouses share the remittances.
Endnotes
1. Household surveys are also available for 2002 and 2004, namely the Viet Nam Household Living
Standards Survey, but the information about remittances is much more limited in these surveys, which
indicate only the total amount of remittances received by each household, divided into domestic and
international remittances.
2. Most of the categories do not distinguish between generations; however, it is fair to assume that these
categories tend to be more representative of flows within the same generation. Nonetheless, it is a
generalization.
Asia-Pacific Population Journal, August 2008 31
Reference
Barbieri, Magali (2006). “Doi moi and the Elderly: Intergenerational Support under Strain of Reforms”,
paper presented at the Population Association of America 2006 Annual Meeting, Los
Angeles, United States, 30 March -1 April 2006.
Barbieri, Magali and others (1996). “Demographic trends in Vietnam”, Population: an English
Selection, vol. 8, pp. 209-234.
Curran, Sara R. and Abigail C. Saguy (2001). “Migration and cultural change: a role for gender and
social networks?”, Journal of International Women’s Studies, vol. 2, No. 3, pp. 54-77.
Friedman, Jed and others (2003). “Gender dimensions of support for elderly in Vietnam”, Research on
Aging, vol. 25, No. 6, pp. 587-630.
Giang, Thanh Long and Wade Donald Pfau (2007). “The elderly population in Vietnam during
economic transformation: an overview”, in Giang Thanh Long and Duong Kim Hong, eds.,
Social Issues under Economic Transformation and Integration in Vietnam, Volume 1
(Hanoi, Vietnam Development Forum), pp. 185-210.
International Monetary Fund (IMF) (2008). World Economic Outlook: Financial Stress, Downturns,
and Recoveries (Washington, D.C., IMF).
Knodel, John E. and others (2000). “Intergenerational exchanges in Vietnam: family size, sex
composition, and the location of children”, Population Studies Center Research Report No.
98-430, pp. 89-104.
Le, Minh Tam and Duc Vinh Nguyen (1999). “Remittances and the distribution of income”, in
Dominique Haughton and others, eds., Health and Wealth in Vietnam: an Analysis of
Household Living Standards (Singapore, Institute of Southeast Asian Studies), pp. 167-181.
Long, L. D. and others (2000). Changing Gender Relations in Vietnam’s Post Doi Moi Era, Policy
Research Report on Gender and Development Working Paper Series No. 14 (Washington
D.C., World Bank).
Lucas, Robert E. B. and Oded Stark (1985). “Motivations to remit: evidence from Botswana”, Journal
of Political Economy, vol. 93, No. 5, pp. 901-918.
Massey, Douglas S. and others (1993). “Theories of international migration: a review and appraisal”,
Population and Development Review, vol. 19, No. 3, pp. 431-466.
Niedzwiecki, Max and T. C. Duong (2004). Southeast Asian American Statistical Profile (Washington,
D.C., Southeast Asia Resource Action Center).
Osaki, Keiko (2003). “Migrant remittances in Thailand: economic necessity or social norm?”, Journal
of Population Research, vol. 20, No. 2, pp. 203-222.
World Bank (2000). “Vietnam Living Standards Survey (VNLSS), 1992-1993: Basic Information”,
Poverty and Human Resources Division (updated from 1994 version) (Washington, D.C.,
World Bank).
_______ (2001). “Vietnam Living Standards Survey (VNLSS), 1997-1998: Basic Information”,
Poverty and Human Resources Division (Washington, D.C., World Bank).
32 Asia-Pacific Population Journal, Vol. 23, No. 2

Spousal Abuse and In fant andChild Mor tality in In dia
It is clear from both bivariate and multivariate anal yses that physicalvi o lence against moth ers is as so ci ated pos i tively with the in creased
risk of death of their children in both in fancy and child hood.
By Abhishek Singh, Bidhubhusan Mahapatra and Subhra Dutta*
Violence against women continues to be a global epidemic that kills, tortures
and maims physically, psychologically, sexually and economically. It is one of the
most pervasive forms of human rights violations, denying women and girls’
equality, security, dignity, self-worth and right to enjoy fundamental freedoms.
Violence against women is present in every country, cutting across boundaries of
culture, class, education, income, ethnicity and age. The evidence of the magnitude
of the problem of domestic violence in developing countries is growing fast. In
recent years, there has been a greater understanding of the problem of domestic
Asia-Pacific Population Journal, August 2008 33
* Abhishek Singh, Lecturer, Department of Public Health & Mortality Studies, International Institutefor Population Sciences, India, e-mail: [email protected]; Bidhubhusan Mahapatra, ManagerMonitoring and Evaluation, Karnatake Health Promotion Trust, e-mail: [email protected]; andSubhra Dutta, Ph.D Scholar, International Institute for Population Sciences, India, e-mail:[email protected].
violence, which is one of the forms of violence against women, its causes and
consequences, and an international consensus has developed on the need to handle
this sensitive issue in an appropriate fashion.
While physical abuse may leave more “visible” scars than psychological
abuse, repeated humiliation and insults, forced isolation, limited social mobility,
constant threats of violence and injury, and the denial of economic resources are
more insidious forms of violence. The intangible nature of psychological abuse
makes it harder to define and report, leaving the woman in a situation where she is
often made to feel mentally destabilized and powerless. Domestic violence against
women leads to far-reaching physical (Abbot and others, 1995; Grisso and others,
1996; Asling-Monemi and others, 2003) and psychological (Koss, 1990; Walker,
1996) consequences, some with fatal outcomes.
The impact of violence against women is not limited to women; it has
far-reaching consequences for children as well. Studies in the developed world
reveal that physical violence against pregnant women increases their risk of
giving birth prematurely, the risk of foetal deaths and the risk of low birthweight
offspring. A prospective study of battered low-income women during pregnancy,
which was conducted in Baltimore and Houston in the United States of America,
suggests that one in every six women had been beaten during pregnancy. Women
who had experienced violence were significantly more likely than other women to
have delayed antenatal care (McFarlane and others, 1992). Other studies have
revealed that women who were subject to violence during pregnancy were twice
more likely than other women to have a miscarriage, and four times more likely to
have a baby with a low birthweight, a well-known predictor of infant mortality
(Stark and others, 1981; Bullock and McFarlane, 1989). In Costa Rica, a study of
battered women found that about half of them had been beaten during pregnancy,
and 8 per cent of those reported a miscarriage as a result (Ugalde, 1988). A
qualitative study conducted in the slums of Mumbai, India, concluded that a
relatively large proportion of women who had experienced foetal loss associated
the miscarriage or the stillbirth with a violent assault their husbands had inflicted
upon them (Ramasubban and Singh, 1997). Evidence from a multivariate study
suggested an association between wife battery and child mortality among women
in rural south India (Rao and Bloch, 1993). In one of her studies conducted in rural
settings of Tamil Nadu and Uttar Pradesh, Jejeebhoy (1998) found that the
prevalence of under-5 mortality among the children of battered women could be
high because battered women have less power, poor autonomy in
decision-making and mobility, and little or no access to resources. Another study
from north India found that women who had experienced domestic violence were
34 Asia-Pacific Population Journal, Vol. 23, No. 2
more prone to lose their babies during perinatal and neonatal periods (Ahmed,
Koenig and Stephenson, 2006).
Most of the studies on the relationship between child health and physical
violence against mothers have been conducted in developed countries. Few studies
on this topic have been conducted in developing countries such as India. Most of
these studies are small-scale and have established an association between wife
beating and child mortality at the state level or at an even lower level. None of
these studies have tried to establish an association between the two for the country
as a whole. Wife beating coupled with high levels of poverty, women’s having less
access to money and other resources, and women’s powerlessness in
decision-making in the household can have more severe consequences in
developing countries compared with those in developed countries. Therefore, the
present study tries to examine the relationship between wife beating and infant and
child mortality in India. India is a developing country and the problem of wife
beating has been prevalent in this society for a long time. The study further
explores the association between wife beating and the nutritional status of women
and children, wife beating and the reporting of pregnancy intendedness, and wife
beating and the utilization of maternal and child health services in India.
Data and methods
The data for the present study have been gleaned from the National Family
Health Survey, 1998-1999, India (NFHS-2). In NFHS-2, women were asked
questions regarding their experience of physical violence in their households from
the age of 15. Respondents had also been asked about the frequency of the physical
violence they had been experiencing during the 12 months preceding the survey. In
this study, women who were considered as beaten were those who had been beaten
either by their husband or by their in-laws since the age of 15. For the purpose of
the analysis, two data sets were created, based on two different age groups, one
being that of women aged between 15 and 30 years and the other being that of those
aged 15 to 49 years. The rationale behind selecting women aged 15 to 30 years was
to attain a greater number of recent reports of experience of child loss and wife
beating. Information on the survival status of children was obtained through the
survey from a women’s detailed birth history, over a 10-year period.
The independent variables considered in the analysis are the place of
residence, the educational level of the respondent, the standard of living index
(SLI) of the household, the body mass index (BMI) of the respondent, women’s
autonomy, religion, caste, the age of the respondent at the birth of a child,
preceding birth interval, the mass media exposure of the respondent and the work
Asia-Pacific Population Journal, August 2008 35

status of the respondent. These are some of the variables that are usually found to
have a significant effect on infant and child mortality. The explanatory variables
were categorized in such a way that all the categories had sufficient cell
frequencies for carrying out the analyses required.
The mass media category refers to radio, television and newspapers. The
information in this category helped in the assessment of the mass media exposure
of the respondents. Partial exposure referred to exposure to either one or two media
sources, while full exposure referred to exposure to all three types of mass media.
NFHS-2 had asked questions on different aspects of day-to-day activities to assess
the decision-making power of women in the family. The autonomy index is a
composite index computed from the information on the decision-making power of
respondents with regards to cooking, seeking health-care services, purchasing
jewellery, staying with family, going to the market and visiting friends or relatives.
If a respondent made a decision either by herself or jointly with her husband, a
score of 1 was assigned; otherwise, a score of 0 was assigned. If a respondent was
able to make a decision by herself in every component, she received a maximum
score of 6. Equal weight had been assigned to each component. In the study,
women who scored less than 4 were considered to have low autonomy; otherwise
they were considered to have high autonomy. SLI was used as a proxy measure for
the household’s economic condition. The index was formed by taking into account
information related to the type of house, the number of rooms, whether or not the
kitchen was a separate room, toilet facilities, the source of drinking water, the
source of lighting, the type of fuel used for cooking, and other resources and
material goods available in the household. Greater weightage was given to
responses reflecting a higher standard of living than other responses. The weights
assigned to different items are given in appendix 1. The scores ranged from 0 to 14
for a low SLI, 15 to 24 for medium SLI, and 25 to 67 for a high SLI (IIPS and ORC
Macro, 2000).
It is possible that some of the characteristics changed during the 10-year
period since the survey was conducted. A look at the variables considered in the
study suggests that only the SLI of the household, the place of residence of the
respondent and the exposure to mass media of the respondent may have changed
during this period. However, in India, in view of the place of urbanization and
economic development, it can be safely assumed that those characteristics may not
have changed drastically. In addition, these variables were used only as controls to
adjust the estimated effects of wife battery on infant and child mortality.
A problem in mortality analysis arises when, at the time of the survey, some of
the participants may not have completed the period of exposure for the event of
36 Asia-Pacific Population Journal, Vol. 23, No. 2
interest to occur. This problem is commonly known as censoring. To avoid the
problem of censoring, births were excluded that had taken place during 1994-1998 in
the case of child mortality and those that had occurred during the period 1997-1998 in
the case of infant mortality. Approximately 87,664 births took place during
1988-1997 for women in the age group 15-49. Women in the age group 15-30
experienced 53,634 births during 1988-1997. For women in the age group 15-49,
approximately 6,479 births resulted in infant deaths. For women in the age group
15-30, the number of infant deaths was 4,299. For the age group 15-49, it was found
that approximately 4,561 child deaths had occurred out of the 43,348 births that took
place during 1988-1993. For women in the age group 15-30, out of 21,404 births,
2,570 resulted in child deaths. Binary logistic regression models were employed to
assess the influence of different independent variables on infant and child mortality.
In the binary model, the dependent variable was treated as a binary outcome. In this
case, the death of the child represents the outcome variable. Hence, 0 was assigned if
the child was alive in the specified time period, and 1 was assigned otherwise.
Results
Table 1 shows the percentage of women who experienced infant and child
mortality in the age groups 15-49 and 15-30 years. The percentages of infant
deaths in both the age groups are higher for women who had experienced physical
violence by husbands or in-laws. Similarly, the extent of child mortality is lower
among non-battered women compared with that of their battered counterparts in
both age groups. In addition, the association between the experience of physical
violence and the experience of infant and child mortality is statistically significant
in the chi-square test.
Apart from the experience of wife beating, other socio-economic variables
also play an important role in explaining infant and child mortality. A higher
percentage of women from rural areas experience infant and child mortality
compared with those from urban areas. The experience of infant and child
mortality is also found to vary by caste and religion. Hindu women and women of
scheduled castes/tribes are more likely to experience infant and child mortality
compared with their counterparts in the remaining categories. As expected, the
percentage of women experiencing infant and child mortality declines with an
increase in their educational level. The differential by educational attainment is
much wider in the case of child mortality, the major concentration of child
mortality occurring among non-literate women. Exposure to mass media is another
important variable that has significant influence on demographic events. Women
who had no exposure to mass media experienced higher infant and child mortality
compared with those who had partial or full exposure.
Asia-Pacific Population Journal, August 2008 37

Table 1. Mortality of children during infancy and childhood by selectedsocio-economic and demographic characteristics of mothers, and physicalviolence against mothers, aged 15-49 and 15-30 years in India, 1998-1999
(percentage)
Background characteristics15-49 years 15-30 years
Infant deaths Child deaths Infant deaths Child deaths
Beaten by husband or in-laws**
No 7.2 10.0 7.5 10.8
Yes 8.8 12.2 9.0 13.1
Place of residence**
Rural 8.3 11.7 8.6 12.4
Urban 4.9 6.5 5.1 7.2
Educational level**
Illiterate 8.9 12.5 9.3 13.4
Literate, < middle school
completed 6.1 8.1 6.4 8.7
Middle school completed 4.7 5.5 5.0 5.8
High-school and above
completed 3.3 3.6 3.3 4.0
Standard of living index**
Low 9.2 13.4 9.6 14.1
Medium 7.2 9.8 7.4 10.5
High 4.5 5.6 4.8 6.3
Body mass index**
< 18.5 kg/m2 8.2 11.4 8.4 11.9
>= 18.5 kg/m2 7.0 9.9 7.4 11.0
Autonomy index**
Low 8.1 11.3 8.3 12.1
High 6.6 9.3 7.0 10.1
Religion**
Hindu 8.0 11.2 8.3 12.0
Muslim 6.1 8.3 6.1 9.0
Other 5.3 6.9 5.7 8.4
Caste**
Scheduled caste or tribe 8.5 12.4 8.9 13.0
Other backward class 7.9 10.8 8.3 11.9
Other 6.5 8.9 6.6 9.7
.../
38 Asia-Pacific Population Journal, Vol. 23, No. 2
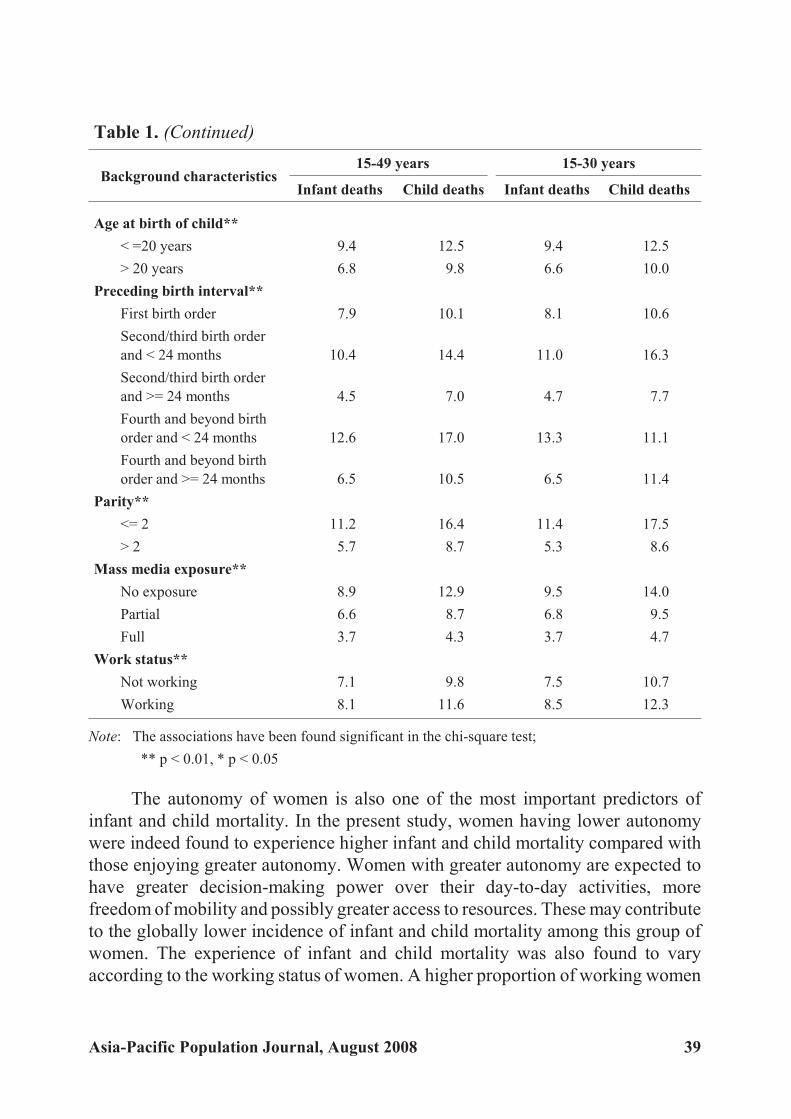
Table 1. (Continued)
Background characteristics15-49 years 15-30 years
Infant deaths Child deaths Infant deaths Child deaths
Age at birth of child**
< =20 years 9.4 12.5 9.4 12.5
> 20 years 6.8 9.8 6.6 10.0
Preceding birth interval**
First birth order 7.9 10.1 8.1 10.6
Second/third birth order
and < 24 months 10.4 14.4 11.0 16.3
Second/third birth order
and >= 24 months 4.5 7.0 4.7 7.7
Fourth and beyond birth
order and < 24 months 12.6 17.0 13.3 11.1
Fourth and beyond birth
order and >= 24 months 6.5 10.5 6.5 11.4
Parity**
<= 2 11.2 16.4 11.4 17.5
> 2 5.7 8.7 5.3 8.6
Mass media exposure**
No exposure 8.9 12.9 9.5 14.0
Partial 6.6 8.7 6.8 9.5
Full 3.7 4.3 3.7 4.7
Work status**
Not working 7.1 9.8 7.5 10.7
Working 8.1 11.6 8.5 12.3
Note: The associations have been found significant in the chi-square test;
** p < 0.01, * p < 0.05
The autonomy of women is also one of the most important predictors of
infant and child mortality. In the present study, women having lower autonomy
were indeed found to experience higher infant and child mortality compared with
those enjoying greater autonomy. Women with greater autonomy are expected to
have greater decision-making power over their day-to-day activities, more
freedom of mobility and possibly greater access to resources. These may contribute
to the globally lower incidence of infant and child mortality among this group of
women. The experience of infant and child mortality was also found to vary
according to the working status of women. A higher proportion of working women
Asia-Pacific Population Journal, August 2008 39
compared with that of non-working women experienced infant and child mortality.
This can be explained by the fact that, in India, women generally work to earn their
livelihood in unorganized sectors. Women working under such conditions may not
be able to take proper care of their offspring and may entrust less experienced and
unskilled siblings with this responsibility. This may not be the case with women
who are not working. The argument is strengthened by the fact that women with a
medium or high standard of living experienced lower infant and child mortality
compared with those with a lower standard of living.
Demographic factors again play a crucial role in determining infant and child
mortality. The experience of infant and child mortality varies with the age of
respondents at child birth, the number of living children, preceding birth interval
and birth order. Women with a low age at childbirth, fewer than two living
children, a preceding birth interval of less than 24 months, and a birth order of 2
and above all report a higher experience of infant and child mortality compared
with their counterparts in different situations.
Another variable that contributes immensely to the phenomenon of infant
and child mortality is the nutritional status of women. In large-scale surveys, the
nutrition of women is generally measured in terms of BMI. A BMI of less than 18.5
reflects chronic energy deficiency among women and can have serious
consequences for both the mother and the child. A higher percentage of women
with a BMI of less than 18.5 reported experiencing infant and child mortality
compared with their counterparts with a BMI greater than or equal to 18.5.
Many of the explanatory variables included in the analysis, such as the
education of women, are linked to both wife beating and infant and child mortality.
Uneducated women are more likely to experience beating due to their low
autonomy. They are also more likely to experience child loss. In the present study,
the explanatory variables that may affect wife beating as well as infant and child
mortality are education, the place of residence, caste, the autonomy of the
respondent and the standard of living of the household. To demonstrate the plight
of physically abused women in terms of the disproportionate loss of children, it is
important to separate women in these strata into battered and non-battered groups
and to show a statistically significant preponderance of child loss among the
battered group. This was performed for the sake of this study. A t-test was used to
determine whether the difference in the experience of child loss among the two
groups was statistically significant or not. Similar tests were performed for the
other explanatory variables as well. The experience of child loss among these
different groups of women is presented in table 2. However, the values of
t-statistics for every case are not included.
40 Asia-Pacific Population Journal, Vol. 23, No. 2

It is clear from table 2 that, among non-literate mothers aged 15 to 49, the children
of battered mothers are more likely to die during infancy and childhood compared with
the children of non-battered mothers. Significant differences in the risk of infant and child
mortality were also found among literate battered mothers and literate non-battered
mothers. Significant differences in the risk of infant mortality were observed between
battered and non-battered mothers aged 15-49 for all the explanatory variables.
Similarly, for women in the age group 15-30, the authors have found significant
differences between battered and non-battered groups for all explanatory variables,
except for mothers who belong to households with a medium standard of living, those
residing in urban areas and those from scheduled castes/tribes. In the case of child
mortality no significant difference between battered and non-battered groups of
mothers aged 15-49 were found, if the mothers were from households with a low
standard of living. Otherwise, for all categories of other explanatory variables
significant differences in the risk of mortality during infancy and childhood were
found between the battered and non-battered groups of mothers. For mothers in the
age group 15-30 who had reported child loss, the difference between battered and
non-battered groups was not significant if the mothers were from households with
either a low or high standard of living, were residing in urban areas or belonged to
other backward classes. The standardized results presented above clearly show battered
mothers with a higher proportion of child loss than non-battered mothers.
Multivariate analysis
A bivariate analysis shows a significant association between physical violence
against mothers and the increased risk of infant and child mortality for both groups of
mothers. To examine whether the difference in the risk of infant and child mortality
vary significantly among battered and non-battered mothers, a multivariate logistic
regression analysis was carried out. The socio-economic and demographic
characteristics used in the bivariate analysis were used as controls in the
multivariate analysis. The results of the logistic regression analysis are presented in
table 3. A positive association is found between physical violence against mothers
and the risk of the death of their children in infancy and childhood. The risk of
death in infancy is 12 per cent higher if the mother is exposed to physical violence
and is aged between 15 and 49, even after adjusting for other socio-economic and
demographic variables. Similarly, the risk of death during childhood is 10 per cent
higher if the mother is exposed to physical violence and is aged 15 to 49. A similar
association is found between physical violence against mothers aged 15 to 30 and
the increased risk of death of their children during infancy and childhood.
Results adjusted for important socio-economic and demographic variables
clearly show that a mother’s area of residence (when rural), educational level
Asia-Pacific Population Journal, August 2008 41

(non-literate), autonomy (low), religion (Hindu), exposure to mass media (no
exposure) and standard of living (low) are associated with higher infant and child
mortality. Among the demographic variables, mother’s age at first birth (below 20
years), preceding birth interval (less than 24 months) and parity are significantly
associated with a higher risk of infant and child mortality. Nutritional status of the
mother does not appear to be significant in explaining the risk of infant and child
mortality in the multivariate analysis. After adjusting for all other socio-economic
and demographic characteristics, the children of working mothers are found to
have a lower risk of infant and child mortality compared with children of
non-working mothers. The relationships are of a similar nature among mothers of
both age groups.
Table 2. Percentage of battered and non-battered mothers aged 15-49 and15-30 years having experienced infant and child mortality, by selected
socio-economic characteristics in India, 1998-1999
Socio-
economic
characteristics
15-49 years 15-30 years
Infant deaths Child deaths Infant deaths Child deaths
Bat
tered
Non-
battered
Bat
tered
Non-
battered
Bat
tered
Non-
battered
Bat-
tered
Non-
battered
Education of women
Illiterate 9.7 8.5 13.4 12.2 10.0 9.1 14.4 13.1
Literate 5.5 4.9 7.6 6.1 6.0 5.1 8.7 6.7
Standard of living index
Low 10.0 8.9 13.9 13.3 10.3 9.3 14.8 13.9
Medium 7.8 7.0 11.0 9.5 7.9 7.2 11.9 10.1
High 6.1 4.3 7.7 5.3 6.6 4.6 8.1 6.1
Autonomy of women
Low 9.3 7.7 13.0 10.8 9.5 8.0 13.9 11.5
High 7.7 6.3 10.5 8.9 8.1 6.7 11.7 9.7
Place of residence
Rural 9.3 7.7 13.0 10.8 9.5 8.0 13.9 11.5
Urban 7.7 6.3 10.5 8.9 8.1 6.7 11.7 9.7
Caste
Scheduled caste
or tribe 9.2 8.3 13.5 12.0 9.4 8.7 14.8 12.3
Other class 8.8 7.9 11.8 10.5 9.3 8.0 12.6 11.6
Other 8.3 6.0 11.1 8.4 8.2 6.3 11.8 9.2
42 Asia-Pacific Population Journal, Vol. 23, No. 2

It is clear from both bivariate and multivariate analyses that physical violence
against mothers is associated positively with the increased risk of death of their
children in both infancy and childhood. The study provides sufficient evidence to
support the hypothesis that children born to mothers who experience physical
violence before, during or after pregnancy stand a higher chance of death during
infancy and childhood than those born to mothers who do not experience such
violence. It can be concluded, therefore, that, apart from other important
socio-economic determinants of mortality during infancy and childhood, physical
violence against mothers is an important determinant.
Table 3. Odds of experiencing infant and child mortality
by mothers aged 15-49 and 15-30 years by selected socio-economic
and demographic factors in India, 1998-1999
Background
characteristics
15-49 years 15-30 years
Infant deaths Child deaths Infant deaths Child deaths
Beaten by husband or in-laws
No®
Yes 1.12 (1.06-1.19)** 1.10 (1.02-1.18)** 1.09 (1.01-1.17)* 1.11 (1.01-1.22)*
Place of residence
Rural®
Urban 0.79 (0.73-0.85)** 0.79 (0.72-0.87)** 0.79 (0.71-0.87)** 0.76 (0.67-0.87)**
Educational level
Illiterate®
Literate, < middle school
completed 0.73 (0.68-0.79)** 0.73 (0.66-0.81)** 0.74 (0.67-0.81)** 0.71 (0.62-0.80)**
Middle school completed 0.55 (0.48-0.63)** 0.48 (0.40-0.58)** 0.54 (0.46-0.63)** 0.43 (0.34-0.55)**
High school and above
completed 0.42 (0.36-0.49)** 0.35 (0.29-0.44)** 0.39 (0.32-0.46)** 0.36 (0.27-0.48)**
Standard of living index
Low®
Medium 0.92 (0.87-0.98)** 0.84 (0.79-0.91)** 0.93 (0.87-1.00)* 0.87 (0.79-0.96)**
High 0.79 (0.71-0.88)** 0.70 (0.62-0.81)** 0.83 (0.72-0.94)** 0.72 (0.60-0.87)**
Body mass index
< 18.5® kg/m2
>= 18.5 kg/m2 0.96 (0.91-1.01) 1.02 (0.95-1.09) 0.97 (0.91-1.04) 1.06 (0.97-1.15)
Autonomy index
Low®
High 0.88 (0.84-0.93)** 0.88 (0.82-0.94)** 0.89 (0.83-0.96)** 0.87 (0.80-0.96)**
.../
Asia-Pacific Population Journal, August 2008 43

Table 3. (Continued)
Background
characteristics
15-49 years 15-30 years
Infant deaths Child deaths Infant deaths Child deaths
Religion
Hindu®
Muslim 0.79 (0.73-0.86)** 0.77 (0.69-0.87)** 0.80 (0.72-0.89)** 0.82 (0.71-0.94)**
Other 0.84 (0.73-0.97)** 0.76 (0.63-0.91) 0.84 (0.71-1.01)* 0.81 (0.63-1.03)
Caste
Scheduled caste or tribe®
Other backward class 1.00 (0.93-1.06) 0.96 (0.88-1.03) 1.02 (0.94-1.10) 0.99 (0.89-1.10)
Other 0.94 (0.88-1.01) 0.94 (0.86-1.02) 0.89 (0.82-0.98)* 0.89 (0.80-1.00)
Age at birth
< = 20 years®
> 20 years 0.81 (0.76-0.87)** 0.79 (0.73-0.86 0.80 (0.75-0.87)** 0.84 (0.77-0.93)**
Preceding birth interval
First birth order®
Second/third birth order
and < 24 months 2.15 (1.99-2.34)** 2.21 (2.00-2.45)** 2.11 (1.93-2.30)** 2.21 (1.98-2.47)**
Second/third birth order
and >= 24 months 0.89 (0.82-0.97)** 0.99 (0.90-1.10) 0.83 (0.75-0.91)** 0.93 (0.83-1.06)
Fourth and beyond birth
order and < 24 months 4.01 (3.61-4.45)** 3.50 (3.09-3.96)** 3.65 (3.19-4.19)** 3.04 (2.52-3.68)**
Fourth and beyond birth
order and >= 24 months 1.93 (1.74-2.15)** 1.83 (1.62-2.07)** 1.72 (1.47-2.01)** 1.77 (1.40-2.25)**
Parity
<= 2 ®
>2 0.26 (0.25-0.28)** 0.27 (0.25-0.29)** 0.29 (0.27-0.31)** 0.30 (0.27-0.32)**
Mass media exposure
No exposure®
Partial 0.90 (0.84-0.95)** 0.79 (0.74-0.86)** 0.87 (0.81-0.94)** 0.78 (0.71-0.86)**
Full 0.74 (0.63-0.86)** 0.61 (0.50-0.76)** 0.69 (0.57-0.83)** 0.55 (0.41-0.74)**
Work status
Not working®
Working 0.92 (0.87-0.97)** 0.92 (0.86-0.98)* 0.90 (0.84-0.96)** 0.87 (0.80-0.95)**
* p < 0.05,
** p < 0.01
Note: Values in parentheses indicate confidence interval at 95 per cent level of confidence; R indicates reference category.
44 Asia-Pacific Population Journal, Vol. 23, No. 2

Dissimilarities between battered and non-battered women
In order to provide an explanation for the disparity of infant and child
mortality between battered and non-battered women, the characteristics of women
in those two groups were compared and the results are presented in this section.
The selected variables considered for comparison are the absence of an antenatal
check-up; unsafe delivery; non-institutional delivery; incomplete immunization;
the size of the baby at birth (smaller than average); women’s BMI (<8.5 kg/m2);
the percentage of women below -2 standard deviation (SD) for height/age and
weight/height; the percentage of children below -2SD for height/age,
weight/height and weight/age; the birthweight of the baby; and the pregnancy
intendedness of the respondent. Table 4 shows the differentials in the
above-mentioned indicators between the two groups of women.
Table 4. Maternal and child health-related service utilization, nutritionalstatus of women and children and reports of pregnancy intendedness by
battered and non-battered groups of women in India, 1998-1999
Characteristics Battered Non-battered
No antenatal check-up 41.0 32.3
Unsafe delivery 67.2 55.1
Non-institutional delivery 76.1 64.0
Incomplete immunization 77.6 72.2
Size of the baby at birth (less than average) 27.5 23.8
Body mass index of women (less than 18.5 kg/m2) 44.6 38.2
Percentage of women below -2SD for height/age 98.2 97.3
Percentage of women below -2SD for weight/height 94.5 90.9
Percentage of children below -2SD for height/age 78.1 75.8
Percentage of children below -2SD for weight/height 72.8 68.5
Percentage of children below -2SD for weight/age 82.6 79.0
Birthweight
<2500 g 4.0 6.1
>=2500 g 13.2 21.5
Not weighed 82.8 72.4
Pregnancy intendedness
Intended 74.4 81.1
Intended later 12.0 10.6
Not intended 13.6 8.3
Note: All associations were found statistically significant in the chi-square test.
Asia-Pacific Population Journal, August 2008 45

It is evident that non-battered women perform better compared with their
battered counterparts in terms of the various selected indicators. Battered women
are less likely to utilize antenatal care, to have an institutional delivery and to fully
immunize their children against vaccine-preventable diseases, and are more likely
to have unsafe deliveries compared with non-battered women. Moreover, they are
also more likely to have babies of less than average size at birth and are less likely
to have their babies weighed at the time of birth compared with non-battered
women. Battered women are more likely to report mistimed and unintended
pregnancies compared with non-battered women. It is clear that battered women
are less likely to utilize preventive and curative care for themselves as well as for
their children, a trend that may, to some extent, explain the higher incidence of
infant and child mortality among this group of women.
When comparing the nutritional status of battered women with that of
non-battered women, one finds that battered women tend to have poorer nutritional
status. Battered women are also more likely to have a BMI of less than 18.5 kg/m2
and are likely to be below -2SD for height/age and weight/height. The
above-mentioned indicators reflect measures of energy deficiency in battered
women, and are all found to be better for non-battered women. Not only is the
nutritional status of battered women poorer, the nutritional status of their children
is also poorer than that of the children of non-battered women.
Discussion
Using NFHS-2 data, this article has investigated the relationship between
domestic violence, wife beating in particular, and infant and child mortality. The
results of the logistic regression show that the survival chances of children whose
mothers are being beaten by either their husbands or their in-laws are significantly
lower compared with those of children of non-battered women, even after controlling
for the well-known determinants of child survival. The authors have also made a
comparison between battered and non-battered groups of women experiencing infant
and child mortality, by stratifying these two groups according to the selected
explanatory variables that appear to influence wife beating and child survival. In
order to explore the possible reasons for the high infant and child mortality among
battered women, characteristics that appear to have influenced child mortality were
compared with the characteristics of women having not experienced wife beating.
The results revealed that battered women and their children are always in a
disadvantageous position in terms of nutrition and other characteristics vital to child
survival. Women who are battered are less likely to utilize available services, such as
antenatal care, institutional delivery and the immunization of children. This group of
women is more likely to report mistimed and unintended births – events that are found
46 Asia-Pacific Population Journal, Vol. 23, No. 2

to have serious consequences for both mother and child (Marston and Cleland, 2003;
Joyce, Kaestner and Korenman, 2000).
The authors found clear evidence of an association between wife beating
and child survival in India. However, the association may be biased to some extent
because of the quality and type of data used for the analysis. The NFHS-2 data
used were based on questions posed to women retrospectively about their
experience of being beaten. Women were asked whether they had been beaten
from the age of 15. They were subsequently asked about the perpetrator of the
violence. Women were considered as battered if they had been beaten either by
their husbands or by their in-laws. The singulate mean age at marriage in India is
about 20 years (IIPS and ORC Macro, 2000). Women in the age groups 20-49 and
20-30 years were thus selected. The age group 15-30 was selected to capture
recent episodes of both wife beating and other forms of domestic violence. One
may argue that women might have experienced violence at the beginning of the
age group and experienced infant and child mortality at the end of the age group.
In India, most childbearing occurs in the age group 20-29 years. This is the age
group in which one can expect the highest proportion of births and deaths to occur.
Even after restricting the age group up to 30 years, the peak age group for
childbearing, the authors find that the association is significant.
The present study has three potential limitations. First, there could be an issue of
temporality in the data, that is, whether physical violence against mothers preceded
the event of interest or vice versa. This could be an issue particularly among mothers
aged 15-49. The results for mothers aged 15-30 may tackle some of the issues related
to temporality. As discussed earlier, for this group of mothers, recent episodes of
physical violence were expected. There is clearly a positive association between
physical violence against mothers aged 15-30 and the increased risk of mortality of
their offspring during infancy and childhood. This association among mothers aged
15-30 increases the validity of such an association even among those aged 15-49.
The second limitation is due to the lack of information on both the frequency
and the timing of beating. No information could be collected on when or how
frequently the woman was beaten. However, the information on the frequency and
timing of physical violence could have been of great use in explaining the severity
of physical violence and the association between physical violence against
mothers and the survival of their offspring.
The third and most fundamental concern is the possible underreporting of
physical violence by mothers. Given the culturally sensitive nature of this
behaviour, women may be reluctant to report the occurrence of physical violence.
Underreporting can also be a result of the presence of a third person at the time of
Asia-Pacific Population Journal, August 2008 47

the interview, which is likely to happen during data collection. The presence of the
mother-in-law or of elders at the time of the interview may affect the women’s
reporting of physical violence. However, several features of the study, such as
proper training for interviewers and efforts undertaken to ensure privacy and
protect the confidentiality of responses, are likely to have increased the validity of
the reporting of physical violence.
In general, the underreporting of violence is much commoner than
overreporting, mothers who have experienced the trauma of the death of a child
may be more likely to report violence if they believe it was precisely related to the
child’s death. In NFHS-2, data were collected on a wide spectrum of issues
ranging from fertility, family planning, the utilization of maternal and child
health-related services, the quality of care, along with domestic violence and
mortality during infancy and childhood. The data on mortality were collected in
the birth history section, at the beginning of the interview schedule, while the
questions on domestic violence were raised towards the end. Therefore, it is less
likely that the mothers who had experienced the trauma of the death of a child
associate the two events and systematically overreport the incidence of such an
event. Furthermore, it seems unlikely that selective overreporting by such
mothers would account for the strength of the associations that were found.
Past studies conducted to explain the association between physical violence
against mothers and the increased risk of infant and child mortality were criticized
particularly for not having collected information on issues such as pregnancy
intendedness and child abuse. Other factors that could be prominent in explaining
such an association are the prevalence of a low birthweight among babies; the
prevalence of malnutrition among children; the autonomy of women; and the
utilization of prenatal, natal and postnatal services. Without such data, it is difficult to
test the hypothesis that offspring born to mothers who experience violence before,
during and after pregnancy will be more likely to die than those born to mothers who
do not endure any violence. The present study clearly reveals that children of battered
mothers are more likely to be of a low birthweight or to remain underweight. The
present findings are consistent with those of other studies. A low birthweight may be a
direct consequence or an indirect consequence of physical violence. Furthermore, a
low birthweight is a well-known risk factor for increased infant mortality.
Violence may reduce the autonomy of women in terms of access to material
resources, affecting women’s ability to obtain adequate nutrition, rest, exercise and
medical care. Therefore, low autonomy coupled with cultural taboos in India may
contribute to children’s health more seriously than in other countries. Violence may
also interfere with the caring capacity of mothers. A study by Rao and Bloch (1993)
48 Asia-Pacific Population Journal, Vol. 23, No. 2

found that the children of battered women were more likely to be malnourished and to
receive less food than those of women who were not beaten. This study clearly shows
that not only are the children of battered women malnourished, but the battered
women themselves are, and tend to have chronic energy deficiencies. Elevated
maternal stress levels and poor nutrition are both associated with a low birthweight or
preterm delivery and are well-known risk factors for perinatal and infant mortality.
Also, the findings of this study are consistent with those of other studies, in that
women experiencing violence are more likely to receive late antenatal care or no
antenatal care at all and to report unintended births. By presenting data on the above
issues, this study sheds some light on the association between physical violence
against mothers and the increased risk of infant and child mortality. In this regard, the
present study overcomes the limitations of many of the previous studies carried out on
this particular subject.
The relationship between wife beating and child survival is well-established in
developed countries. There is little research, however, to provide evidence in support
of this relationship in a developing-country setting. The present analysis has
reinforced the fact that wife beating has serious consequences for child survival in the
latter setting, in particular in India. Wife beating also has serious consequences for the
overall well-being of women. Therefore, domestic violence is an important public
health concern and should be taken seriously by policymakers and policy planners.
Reproductive and child health programmes must aim at addressing domestic violence
against women in order to improve the overall well-being of both women and
children. Involving men in reproductive and child health programmes and
counselling them on matters related to maternal well-being and child health could be
one strategy to address the issue of wife battery. Involving men in maternal care and
childcare may, to some extent, help to avert the serious consequences of domestic
violence for both mothers and children.
Asia-Pacific Population Journal, August 2008 49

Appendix
Scores assigned to different items utilized to construct the standard of living index of households, National Family Health Survey, 1998-1999, India
Items Score
Type of house
Pucca 4
Semi-pucca 2
Kachha 0
Toilet facility
Private/with flush 4
Public or shared flush toilet/Private pit toilet 2
Shared or public pit toilet 1
None 0
Source of lighting
Electricity 2
Kerosene, gas or oil 1
Other source of lighting 0
Main fuel for cooking
Electricity, liquid petroleum gas, biogas 2
Coal, charcoal, kerosene 1
Other fuel 0
Source of drinking water
Pipe, hand pump or well in residence/yard/plot 2
Public tap, hand pump or well 1
Other water source 0
Separate room for cooking
Yes 1
No 0
Ownership of house
Yes 2
No 0
.../
50 Asia-Pacific Population Journal, Vol. 23, No. 2
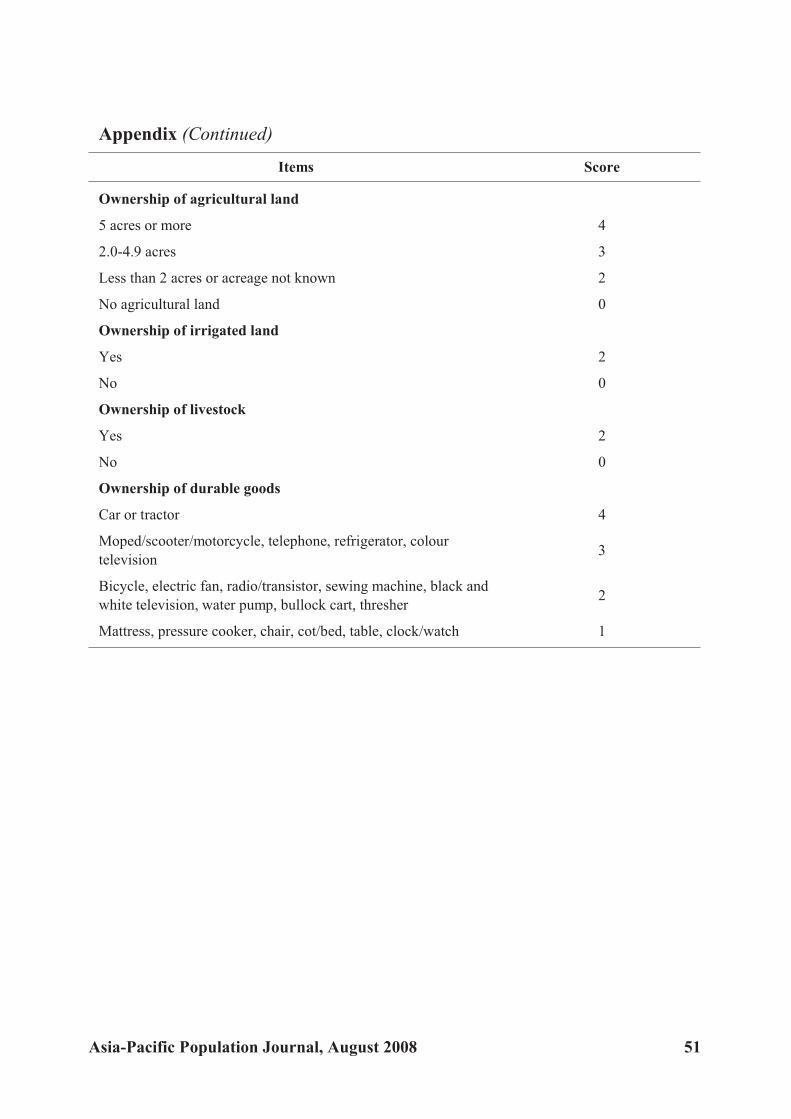
Appendix (Continued)
Items Score
Ownership of agricultural land
5 acres or more 4
2.0-4.9 acres 3
Less than 2 acres or acreage not known 2
No agricultural land 0
Ownership of irrigated land
Yes 2
No 0
Ownership of livestock
Yes 2
No 0
Ownership of durable goods
Car or tractor 4
Moped/scooter/motorcycle, telephone, refrigerator, colour
television3
Bicycle, electric fan, radio/transistor, sewing machine, black and
white television, water pump, bullock cart, thresher2
Mattress, pressure cooker, chair, cot/bed, table, clock/watch 1
Asia-Pacific Population Journal, August 2008 51

References
Abbot, Jane and others (1995). “Domestic violence against women: incidence and prevalence in anemergency department population”, The Journal of the American Medical Association, vol.273, No. 22, pp. 1763-1767.
Ahmed, Saifuddin, Michael A. Koenig and Rob Stephenson (2006). “Effects of domestic violence onperinatal and early-childhood mortality: evidence from north India.” American Journal ofPublic Health, vol. 96, No. 8, pp. 1423-1428.
Asling-Monemi, K. A. and others (2003). “Violence against women increases the risk of infant and childmortality: a case-referent study in Nicaragua”, Bulletin of the World Health Organization, vol.81, No.1, pp. 10-18.
Behrman, Richard (1992). “Prematurity and intrauterine growth retardation”, in Richard Behrman, RobertKliegman and Hal B. Jenson, eds., Nelson Textbook of Pediatrics (Philadelphia, United States, W. B. Saunders and Company).
Bullock, Linda F. C. and J. McFarlane (1989). “The birth-weight/battering connection”, AmericanJournal of Nursing, vol. 89, No. 9, pp. 1153-1155.
Butchart, A. and A. Villaveces (2003). “Violence against women and the risk of infant and childmortality”, Bulletin of the World Health Organization, vol. 81, No. 1, pp. 17-18.
Campbell, Jacqueline and others (1999). “Physical and nonphysical partner abuse and other risk factorsfor low birthweight among full term and preterm babies: a multiethnic case-control study”,American Journal of Epidemiology, vol. 150, No. 7, pp. 714-726.
Coker, Ann L., Maureen Sanderson and Beili Dong (2004). “Partner violence during pregnancy and riskof adverse pregnancy outcomes”, Paediatric and Perinatal Epidemiology, vol. 18, No. 4, pp.260-269.
Connolly, A. M. and others (1997). “Trauma and pregnancy”, American Journal of Perinatology, vol. 14,No. 6, pp. 331-336.
Curry, M. A., N. Perrin, and E. Wall (1998). “Effects of abuse on maternal complications and birth weightin adult and adolescent women”, Obstetrics & Gynecology, vol. 92, No. 4, pp. 530-534.
Dietz, P. M. and others (1997). “Delayed entry into prenatal care: effect of physical violence”, Obstetricsand Gynecology, vol. 90, No. 2, pp. 221-224.
Dye, Timothy D. and others (1995). “Violence, pregnancy and birth outcome in Appalachia”, Paediatricand Perinatal Epidemiology, vol. 9, No. 1, pp. 35-47.
Ellsberg, M. C. and others (1999). “Wife abuse among women of childbearing age in Nicaragua”,American Journal of Public Health, vol. 89, No. 2, pp. 241-244.
El-Zanaty, Fatma and others (1996). Egypt Demographic and Health Survey 1995 (Calverton, UnitedStates, National Population Council and Macro International).
Fikree, F. F. and L. I. Bhatti (1999). “Domestic violence and health of Pakistani women”, InternationalJournal of Gynaecology and Obstetrics, vol. 65, No. 2, pp. 195-201.
Gazmararian, J. A. and others (1995). “The relationship between pregnancy intendedness and physicalviolence in mothers of newborns”, Obstetrics & Gynecology, vol. 85, No. 6, pp. 1031-1038.
Grisso, J. A. and others (1996). “Injuries among inner-city minority women: a population-basedlongitudinal study”, American Journal of Public Health, vol. 86, No. 1, pp. 67-70.
52 Asia-Pacific Population Journal, Vol. 23, No. 2
Haj-Yahia, Muhammad M. and Jeffrey L. Edleson (1994). “Predicting the use of conflict resolutiontactics among engaged Arab-Palestinian men in Israel”, Journal of Family Violence, vol. 9,No. 1, pp. 47-62.
Hedin, L. W. and P. O. Janson (1999). “The invisible wounds: the occurrence of psychological abuse andanxiety compared with previous experience of physical abuse during the childbearing year”,Journal of Psychosomatic Obstetrics and Gynaecology, vol. 20, No. 3, pp.136-144.
Heise, Lori L., Jacqueline Pitanguay and Adrienne Germain (1994). Violence against Women: the HiddenHealth Burden, World Bank Discussion Paper No. 255 (Washington D.C., World Bank).
International Institute for Population Sciences (IIPS) and ORC Macro (2000). National Family HealthSurvey (NFHS II), 1998-99, India (Mumbai, IIPS).
Janssen, Patricia A. and others (2003). “Intimate partner violence and adverse pregnancy outcomes: apopulation-based study”, American Journal of Obstetrics & Gynecology, vol. 188, No. 5,pp.1341-1347.
Jasinski, Jana L. (2004). “Pregnancy and domestic violence: a review of the literature”, Trauma, Violence,& Abuse, vol. 5, No. 1, pp. 47-64.
Jejeebhoy, Shireen J. (1998). “Association between wife-beating and fetal and infant death: impressionsfrom a survey in rural India”, Studies in Family Planning, vol. 29, No. 3, pp. 300-308.
Jejeebhoy, Shireen and Rebecca J. Cook (1997). “State accountability for wife-beating: the Indianchallenge”, Lancet, No. 349, supplement 1, SL10-12.
Joyce, Ted J., Robert Kaestner and Sanders D. Korenman (2000). “The effect of pregnancy intention onchild development”, Demography, vol. 37, No. 1, pp. 83-94.
Kim, K. and Y. Cho (1992). “Epidemiological survey of spousal abuse in Korea”, in Emilio C. Viano, ed.,Intimate Violence: Interdisciplinary Perspectives (Washington, D.C., Hemisphere PublishingCorporation), pp. 277-282.
Kliegman, R. (1997). “Intrauterine growth retardation”, in Avroy A. Fanaroff and Richard J. Martin, eds.,Neonatal-Perinatal Medicine: Diseases of the Fetus and Infant, 6th edition, (Saint Louis,Missouri, C. V. Mosby), chapter 12.
Koenig, Michael A. and others (2003). “Domestic violence in rural Uganda: evidence from a communitybased study”, Bulletin of the World Health Organization, vol. 81, No. 1, pp. 53-60.
Koss, M. P. (1990). “The women’s mental health research agenda: violence against women”, AmericanPsychologist, vol. 45, No. 3, pp. 374-380.
Lipsky, Sherry and others (2003). “Impact of police-reported intimate partner violence during pregnancyon birth outcomes”, Obstetrics & Gynaecology, vol. 102, No. 3, pp. 557-564.
Marston, C. and J. C. Cleland (2003). “Do unintended pregnancies carried to term lead to adverseoutcomes for mother and child? An assessment in five developing countries”, PopulationStudies, vol. 57, No. 1, pp. 77–93.
Martin, Sandra L. and others (1999). “Domestic violence in northern India”, American Journal ofEpidemiology, vol. 150, No. 4, pp. 417-426.
McFarlane, J. and others (1992). “Assessing for abuse during pregnancy. Severity and frequency ofinjuries and associated entry into prenatal care”, The Journal of the American MedicalAssociation, vol. 267, No. 23, pp. 3176-3178.
McFarlane, J., B. Parker and K. Soeken (1996). “Abuse during pregnancy: associations with maternalhealth and infant birth weight”, Nursing Research, vol. 45, No. 1, pp. 37-42.
Asia-Pacific Population Journal, August 2008 53

Murphy, Claire C. and others (2001). “Abuse: a risk factor for low birth weight? A systematic review andmeta-analysis”, Canadian Medical Association Journal, vol.164, No. 11, pp. 1567-1572.
Omer, H. and G. S. Everly Jr. (1988). “Psychological factors in preterm labor: critical review andtheoretical synthesis”, The American Journal of Psychiatry, vol. 145, No. 12, pp. 1507-1513.
Paarlberg, K. M. and others (1995). “Psychosocial factors and pregnancy outcome: a review withemphasis on methodological issues”, Journal of Psychosomatic Research, vol. 39, No. 5, pp.563-595.
Parker, Barbara, Judith McFarlane and Karen Soeken (1994). “Abuse during pregnancy: effects onmaternal complications and birth weight in adult and teenage women”, Obstetrics &Gynecology, vol. 84, No. 3, pp. 323-328.
Pearlman, M. D., J. E. Tintinalli and R. P. Lorenz (1990). “Blunt trauma during pregnancy”, New EnglandJournal of Medicine, vol. 323, No. 23, pp. 1609-1613.
Petersen, R. and others (1997). “Violence and adverse pregnancy outcomes: a review of literature anddirections for future research”, American Journal of Preventive Medicine, vol. 13, No. 5, pp.366-373.
Profamilia (1995). Demographic and Health Survey for Colombia (Calverton, United States, MacroInternational Inc).
Ramasubban, Radhika and Bhanwar Singh (1998). “Ashaktapana (weakness) and reproductive healthamong women in a slum population in Mumbai”, in Carla Makhlou-Obermeyer, ed., CulturalPerspectives on Reproductive Health (Oxford, Oxford University Press).
Rao, Vijayendra and Francis Bloch (1993). “Wife-beating, its causes and its implications for nutritionallocations to children: an economic and anthropological case study of a rural south Indiancommunity” (Washington D.C., World Bank).
Schuler, Sidney Ruth and others (1996). “Credit programs, patriarchy and men’s violence against womenin rural Bangladesh”, Social Science & Medicine, vol. 43, No. 12, pp. 1729-1742.
Stark, Evan and others (1981). “Wife abuse in the medical setting: an introduction for health personnel”,Domestic Violence Monograph Series No. 7, National Clearinghouse on Domestic Violence(Washington D.C., United States Department of Health and Human Services).
Ugalde, Juan Gerardo (1988). “Sindrome de la Mujer Agredida”, Mujer (San Jose, Costa Rica, Cefemina),No. 5.
Valdez-Santiago, Rosario and L. H. Sanin-Aguirre (1996). “Domestic violence during pregnancy and itsrelationship with birth weight”, Salud Publica Mexicana, vol. 38, No. 5, pp. 352-362.
Walker, Lenore (1996). Abused Women and Survivor Therapy: a Practical Guide for the Psychotherapist(Washington D.C., American Psychological Association).
Williams, J. K., and others (1990). “Evaluation of blunt abdominal trauma in the third trimester ofpregnancy: maternal and fetal considerations”, Obstetrics & Gynecology, vol. 75, No. 1, pp.33-37.
54 Asia-Pacific Population Journal, Vol. 23, No. 2
Fer til ity Tran si tionand Pop u la tion Age ing
in the Asian and Pa cific Re gion
Con sid er ing the ex pe ri ence of low fer til ity coun tries, the Gov ern mentsof tran si tional and near-re place ment fer til ity coun tries and ar eas need
to foresee the consequences of declining fer tility rates. A crucialagenda for the Governments is therefore to plan for
an age ing so ci ety be fore fer til ity drops wellbelow replacement level.
By Bhakta Gubhaju *
During the past half century, the world has witnessed a remarkable decline in
total fertility rates (TFRs) from a high level of 5 children per woman in the period
1950-1955 to 2.8 children per woman in the period 2000-2005. While the fertility
transition was already well under way in Europe, North America, and Australia and
Asia-Pacific Population Journal, August 2008 55
* The paper was initially prepared as a background document for the High-level Meeting on theRegional Review of the Madrid International Plan of Action on Ageing, held in Macao, China from 9 to11 October 2007. E-mail: [email protected].

New Zealand during the period 1950-1955, TFR was very high in the Asian region,
at about 6 children per woman. Fertility continued to decline in Europe, from a
TFR of 2.7 in the period 1950-1955 to replacement level (2.1 children per woman)
during the 1970s. TFR is now far below replacement level in Europe (figure 1).
Figure 1. Fertility trends by major region of the world, 1950-2005*
Source: World Population Prospects: the 2006 Revision, Volume 1: Comprehensive Tables (UnitedNations publication, Sales No. 07.XIII.2).
* This graph is based on the subregional groupings of the United Nations Secretariat rather than onthose of ESCAP.
In North America, TFR declined from 3.5 in the period 1950-1955 to
replacement level in the early 1970s. It had reached the low level of 1.8 in the period
1980-1985, after which it increased slightly but remained stable at below replacement
level. In Australia and New Zealand, replacement level fertility was reached in the late
1970s, although there has been some decline, and TFR has levelled off at 1.8.
The Asian and Pacific region has also experienced remarkable success in
reducing fertility during the past 50 years. According to the 2007 ESCAP
Population Data Sheet, TFR in the region has dropped to 2.3 births per woman
from about 6 in 1950. This regional average, however, masks a considerable
difference in the levels observed among subregions. TFR has plummeted to below
replacement level in East, North-East, North and Central Asia (1.7 births per
woman). By sharp contrast, South and South-West Asia exhibit a TFR of 2.9 births
per woman. The South-East Asian and the Pacific subregions have a TFR of 2.3
births per woman (ESCAP, 2007).
56 Asia-Pacific Population Journal, Vol. 23, No. 2
0
1
2
3
4
5
6
7
1950-
1955
1955-
1960
1960-
1965
1965-
1970
1970-
1975
1975-
1980
1980-
1985
1985-
1990
1990-
1995
1995-
2000
2000-
2005
2005-
2010
To
tal
fert
ilit
yra
te
Europe
Northern America
Australia/New Zealand
Asia
Eastern Asia
South-Central Asia
South-Eastern Asia
Western Asia

Within subregions, TFRs vary to a large extent by country. Fertility has
dropped to below replacement level (2.1 births per woman) in all the populations of
East and North-East Asia. Below replacement fertility has been reached in
Myanmar, Singapore, Thailand and Viet Nam in South-East Asia, while Sri Lanka
is the only country in South and South-West Asia exhibiting below replacement
fertility. In North and Central Asia, Armenia, Azerbaijan, Georgia and the Russian
Federation have achieved below replacement fertility, while in the Pacific, below
replacement fertility has been reached in Australia, New Caledonia, New Zealand
and the Northern Mariana Islands.
The lowest fertility in the region has been recorded in Hong Kong, China
(1.0) and Macao, China (0.9). Countries and areas such as Armenia, Georgia,
Japan, the Northern Mariana Islands, the Russian Federation and Singapore have
reached a TFR of 1.5 or lower. By contrast, fertility continues to remain high, with
TFR exceeding 5 births per woman in Afghanistan, the Marshall Islands and
Timor-Leste. A large number of countries and areas, however, have fertility rates
that are at the intermediate level, ranging between 2.1 and 5.0 births per woman.
In view of the fact that countries in the region are at different levels of
fertility, it is pertinent to examine the levels and trends in fertility in the region. For
the purpose of this paper, countries and areas are classified into three categories
according to their level of fertility estimated during the period 2000-2005: high,
intermediate or low. The intermediate fertility level is further classified into either
transitional or near-replacement fertility, while the low fertility level is classified as
either low or lowest-low fertility (see table 1 for the classification of countries and
areas by TFR level).
The ESCAP region is diverse not only in its economic and social
development, but also in its levels of fertility. Country experiences reveal that
various factors have contributed to the decline in fertility. In some countries,
socio-economic development has played a major role in reducing fertility rates,
while in others strong family planning programmes �� in the absence of
development � have been successful in fostering a decline in fertility. However, it
has been documented that sustainable fertility declines occurred mostly in
countries with a higher human development index. By contrast, fertility declines
had slowed down or even stalled in countries where the fertility transition began at
a lower human development index (Gubhaju and Moriki-Durand, 2003a).
Against this backdrop, the paper first presents the levels and trends in fertility
over the past 30 years. It then discusses the implications of low fertility, such as the
inevitable phenomenon of population ageing, the decline in the working age
population and the feminization of older persons. Finally, this paper highlights new
Asia-Pacific Population Journal, August 2008 57

issues and challenges faced by low-fertility countries and proposes policy
recommendations for future key actions.
Levels and trends in fertility
Table 1 shows the classification of countries and areas by TFR during the
periods 1970-1975, 1990-1995 and 2000-2005. A large number of countries and
areas (37) in the ESCAP region fell under the high fertility category during the
period 1970-1975. Japan and the Russian Federation were the two countries that
had achieved below replacement fertility, while Australia, Georgia, New Zealand,
Singapore and Hong Kong, China had reached near-replacement fertility during
that period. As a result of the fertility transition taking place since the 1970s,
several countries had reached the near-replacement and low fertility levels, with
12 countries and areas achieving below replacement fertility during the period
1990-1995. Notably, Japan, the Russian Federation and Hong Kong, China had
even reached the lowest-low level. By contrast, during this period, 10 countries
and areas had high fertility. Currently, a total of 18 countries and areas in the
region have reached below replacement fertility, with Armenia, Georgia, the
Northern Mariana Islands, the Republic of Korea, Singapore and Macao, China
joining the lowest-low fertility category. By contrast, only Afghanistan, the
Marshall Islands and Timor-Leste continued to have high fertility during the
recent period 2000-2005.
Table 1. Fertility trends in Asia and the Pacific, 1970-1975 to 2000-2005
Fertility level 1970-1975 1990-1995 2000-2005
High Afghanistan Afghanistan AfghanistanTFR>=5 American Samoa Bhutan Marshall Islands
Bangladesh Cambodia Timor-LesteBhutan Lao People’s Democratic Brunei Darussalam RepublicCambodia MaldivesCook Islands Marshall IslandsFrench Polynesia NepalIndia PakistanIndonesia Solomon IslandsIran (Islamic Republic of) Timor-LesteKiribatiLao People’s Democratic RepublicMalaysiaMaldivesMarshall IslandsMicronesia (Federated States of)
.../
58 Asia-Pacific Population Journal, Vol. 23, No. 2

Table 1. (Continued)
Fertility level 1970-1975 1990-1995 2000-2005
MongoliaMyanmarNepalNew CaledoniaNorthern Mariana IslandsPakistanPalauPapua New GuineaPhilippinesSamoaSolomon IslandsTajikistanThailandTimor-LesteTongaTurkeyTurkmenistanUzbekistanVanuatuViet Nam
Transitional Armenia American Samoa American SamoaTFR 3.0 to 4.9 Azerbaijan Bangladesh Bangladesh
China Brunei Darussalam CambodiaDemocratic People’s Cook Islands Fiji Republic of Korea Fiji IndiaFiji French Polynesia KiribatiGuam Guam Lao People’s Democratic Kazakhstan India RepublicKyrgyzstan Iran (Islamic Republic of) Micronesia (FederatedMacao, China Kiribati States of) Nauru Kyrgyzstan NepalNiue Malaysia PakistanRepublic of Korea Micronesia (Federated Papua New GuineaSri Lanka States of) PhilippinesThailand Mongolia SamoaTuvalu Myanmar Solomon Islands
Papua New Guinea TajikistanPhilippines TongaSamoa TuvaluTajikistan VanuatuTongaTurkmenistanTuvaluUzbekistanVanuatuViet Nam
.../
Asia-Pacific Population Journal, August 2008 59
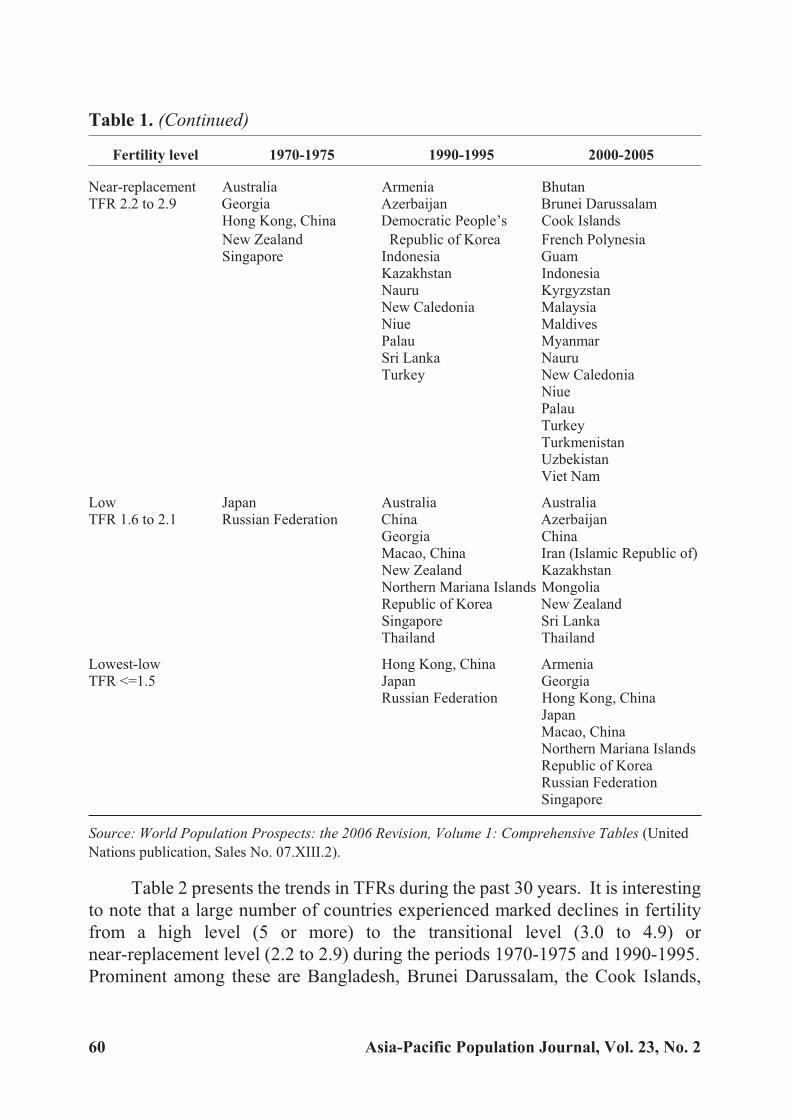
Table 1. (Continued)
Fertility level 1970-1975 1990-1995 2000-2005
Near-replacement Australia Armenia BhutanTFR 2.2 to 2.9 Georgia Azerbaijan Brunei Darussalam
Hong Kong, China Democratic People’s Cook Islands
New Zealand Republic of Korea French PolynesiaSingapore Indonesia Guam
Kazakhstan IndonesiaNauru KyrgyzstanNew Caledonia MalaysiaNiue MaldivesPalau MyanmarSri Lanka NauruTurkey New Caledonia
NiuePalauTurkeyTurkmenistanUzbekistanViet Nam
Low Japan Australia AustraliaTFR 1.6 to 2.1 Russian Federation China Azerbaijan
Georgia ChinaMacao, China Iran (Islamic Republic of)New Zealand KazakhstanNorthern Mariana Islands MongoliaRepublic of Korea New ZealandSingapore Sri LankaThailand Thailand
Lowest-low Hong Kong, China ArmeniaTFR <=1.5 Japan Georgia
Russian Federation Hong Kong, ChinaJapanMacao, ChinaNorthern Mariana IslandsRepublic of KoreaRussian FederationSingapore
Source: World Population Prospects: the 2006 Revision, Volume 1: Comprehensive Tables (United
Nations publication, Sales No. 07.XIII.2).
Table 2 presents the trends in TFRs during the past 30 years. It is interesting
to note that a large number of countries experienced marked declines in fertility
from a high level (5 or more) to the transitional level (3.0 to 4.9) or
near-replacement level (2.2 to 2.9) during the periods 1970-1975 and 1990-1995.
Prominent among these are Bangladesh, Brunei Darussalam, the Cook Islands,
60 Asia-Pacific Population Journal, Vol. 23, No. 2

French Polynesia, Indonesia, Malaysia, New Caledonia, Myanmar, Palau, Turkey,
Turkmenistan, Uzbekistan and Viet Nam, all of which registered more than a one
third decline in TFR.
Table 2. Decline in total fertility rate in Asia and the Pacific,1970-1975 to 2000-2005
Fertility level Country
TFRDecline
(percentage)
1970-
1975
1990-
1995
2000-
2005
1970-1975
to
1990-1995
1990-1995
to
2000-2005
High Afghanistan 7.7 8.0 7.5 3.9 -6.5
TFR>=5 Timor-Leste 6.2 5.7 7.0 -7.6 22.3
Marshall Islands 8.2 6.7 5.3 -18.3 -20.5
Transitional Samoa 5.7 4.7 4.4 -17.5 -6.0
TFR 3.0 to 4.9 Solomon Islands 7.2 5.5 4.4 -23.5 -21.3
Papua New Guinea 6.1 4.7 4.3 -22.7 -8.2
Micronesia (Federated
States of)
6.9 4.8 4.2 -30.5 -11.8
Vanuatu 6.1 4.8 4.2 -20.9 -14.0
Pakistan 6.6 5.8 4.0 -12.1 -31.1
Tajikistan 6.8 4.9 3.8 -28.6 -22.0
American Samoa 5.4 4.3 3.7 -21.0 -12.3
Tonga 5.5 4.5 3.7 -17.7 -17.6
Nepal 5.8 5.0 3.7 -13.7 -26.3
Tuvalu 3.2 3.4 3.7 4.7 9.0
Cambodia 5.5 5.5 3.6 0.3 -34.5
Lao People’s Democratic
Republic
6.4 5.9 3.6 -8.7 -38.8
Kiribati 5.0 4.6 3.6 -8.9 -21.9
Philippines 6.0 4.1 3.5 -31.0 -14.5
Bangladesh 6.2 4.1 3.2 -33.1 -21.7
India 5.3 3.9 3.1 -26.6 -19.4
Fiji 4.2 3.4 3.0 -20.2 -11.2
Near-replacement Bhutan 6.7 5.4 2.9 -19.2 -46.0
TFR 2.2 to 2.9 Malaysia 5.2 3.5 2.9 -32.6 -17.2
Maldives 7.0 5.6 2.8 -20.7 -49.5
Turkmenistan 6.2 4.0 2.8 -34.9 -31.6
Guam 4.1 3.1 2.7 -24.8 -11.6
Uzbekistan 6.3 3.9 2.7 -38.4 -29.4
Cook Islands 5.5 3.5 2.7 -36.4 -22.9
Brunei Darussalam 5.4 3.1 2.5 -42.8 -19.0
.../
Asia-Pacific Population Journal, August 2008 61

Table 2. (Continued)
Fertility level Country
TFRDecline
(percentage)
1970-
1975
1990-
1995
2000-
2005
1970-1975
to
1990-1995
1990-1995
to
2000-2005
Kyrgyzstan 4.7 3.6 2.5 -23.6 -30.8
French Polynesia 5.2 3.1 2.4 -40.8 -21.7
Indonesia 5.3 2.9 2.4 -45.3 -18.1
Niue 3.7 2.4 2.3 -35.1 -2.6
Viet Nam 6.7 3.3 2.3 -50.7 -29.6
Myanmar 5.9 3.1 2.2 -47.5 -27.4
Turkey 5.3 2.9 2.2 -45.2 -23.2
New Caledonia 5.2 2.9 2.2 -43.9 -23.0
Nauru 3.5 2.2 2.2 -37.1 0.0
Palau 5.5 2.8 2.2 -48.9 -22.8
Low Iran (Islamic Republic of) 6.4 4.3 2.1 -32.4 -50.9
TFR 1.6 to 2.1 Mongolia 7.3 3.4 2.1 -54.0 -38.6
Sri Lanka 4.1 2.5 2.0 -39.9 -18.5
Kazakhstan 3.5 2.6 2.0 -26.3 -21.3
New Zealand 2.8 2.1 2.0 -27.5 -4.7
Democratic People’s
Republic of Korea
3.7 2.4 1.9 -36.8 -18.4
Thailand 5.0 2.0 1.8 -59.7 -8.6
Australia 2.5 1.9 1.8 -26.6 -5.6
China 4.9 1.9 1.7 -60.5 -11.5
Azerbaijan 4.3 2.9 1.7 -32.4 -42.4
Lowest-low Georgia 2.6 2.0 1.5 -25.0 -24.2
TFR <=1.5 Singapore 2.6 1.8 1.4 -32.8 -23.2
Armenia 3.0 2.4 1.3 -21.6 -43.5
Russian Federation 2.0 1.5 1.3 -23.9 -16.0
Japan 2.1 1.5 1.3 -28.0 -13.4
Republic of Korea 4.3 1.7 1.2 -60.4 -26.8
Northern Mariana Islands 5.4 2.0 1.1 -63.7 -43.7
Hong Kong, China 2.9 1.3 0.9 -55.4 -27.0
Macao, China 3.2 1.6 0.8 -51.6 -45.7
Source: World Population Prospects: the 2006 Revision, Volume 1: Comprehensive Tables (United
Nations publication, Sales No. 07.XIII.02.
Among the low and lowest-low fertility countries and areas, fertility
remained fairly high until the period 1970-1975 in several countries, including
China, the Islamic Republic of Iran, Mongolia, the Republic of Korea, Sri Lanka
and Thailand. It is notable that Japan was the first country in the Asian and Pacific
62 Asia-Pacific Population Journal, Vol. 23, No. 2

region that had completed the fertility transition from high to low, which it had
done by the early 1960s (Jones and Leete, 2002). The fertility transition had begun
in most of the low and lowest-low fertility countries prior to the 1970s, followed by
a precipitous decline thereafter. Among the low fertility countries, China,
Mongolia and Thailand registered a spectacular decline in fertility between
1970-1975 and 1990-1995, with a reduction of 3 children per woman in China and
Thailand and a reduction of almost 4 children per woman in Mongolia. Sri Lanka
and the Democratic People’s Republic of Korea also experienced a sizable decline
in fertility during this period.
Among lowest-low fertility countries and areas, the Republic of Korea
registered a marked decline in TFR from 4.3 in 1970-1975 to 1.7 in 1990-1995, while
in the Northern Mariana Islands, TFR was reduced from a high of 5.4 to below
replacement level during this period. In Hong Kong, China and Macao, China,
fertility was reduced by more than half during this period. It is noteworthy that
Singapore exhibited a dramatic fall in TFR to 2.6 in the period 1970-1975, down from
the high level of 6.4 in the period 1950-1955. Singapore continued to experience a
further decline in fertility, reaching 1.8 in 1990-1995 and 1.4 in 2000-2005.
Between 1990-1995 and 2000-2005, several countries and areas exhibited
rapid fertility declines. A decline in fertility of more than one quarter was recorded
in transitional fertility and near-replacement fertility countries such as Bhutan,
Cambodia, the Lao People’s Democratic Republic, Kyrgyzstan, Maldives,
Myanmar, Nepal, Pakistan, Turkmenistan, Uzbekistan and Viet Nam.
Among low-fertility countries, the Islamic Republic of Iran experienced a
dramatic fall in TFR from 4.3 to 2.1 during this period. Azerbaijan reduced its TFR
by over 40 per cent, while Mongolia’s fertility further declined by 39 per cent during
the same period. It is also to be noted that, among lowest-low fertility countries and
areas, fertility dropped from 2.4 to 1.3 in Armenia and from 2.0 to 1.1 in the Northern
Mariana Islands during that period. It is most striking that fertility in Macao, China
was reduced by more than two fifths, registering a TFR of 0.8 – the lowest in the
world. In the Republic of Korea and Hong Kong, China, TFR was further reduced by
more than one quarter, from 1.7 to 1.2 in the former and 1.3 to 0.9 in the latter.
Low fertility and population ageing
As with fertility rates, there has been a remarkable improvement in mortality
rates globally. Worldwide, a child born today can be expected to live on average
65 years, which is an increase of 20 years from 50 years ago (United Nations
Population Division, 2006). There is, however, a considerable difference in life
expectancy at birth among major areas and regions of the world. While a newborn
Asia-Pacific Population Journal, August 2008 63
baby is expected to live more than 75 years in much of Europe, North America and
Australia and New Zealand, this indicator is just a little higher than 65 years in
Asia. The current life expectancy at birth in Asia as a whole is the same as it was in
Europe 50 years ago.
With the increase in life expectancy at birth, a wide gender disparity, which
favours females over males, has emerged in many low-mortality countries. In
general, females tend to outlive males by 5 to 7 years in Europe, North America and
Australia and New Zealand. By contrast, in Asia, the gender disparity in life
expectancy at birth is not as wide as in developed countries. However, in
South-Central Asia, owing to the high female mortality associated with the low
status of women, the life expectancy at birth of females was slightly lower than that
of males until the period 1980-1985. With the improvement in mortality rates,
especially among women, this trend has been reversed. As a result, the life
expectancy at birth in South-Central Asia is currently 62 years for females and 61
years for males.
Declining fertility, increasing longevity and the widening disparity in life
expectancy at birth between females and males have brought remarkable shifts in the
age and sex structures of the population. Europe, North America and Australia and
New Zealand initially experienced population ageing. While the transition from the
young-age population to the ageing population occurred over a much longer period in
the West, the speed of ageing was much faster in the low fertility countries of Asia.
For instance, it took 115 years for France and 85 years for Sweden to raise the
percentage of the population aged 65 years and older from 7 per cent to 14 per cent.
By stark contrast, Japan took only a quarter of a century to complete the fertility
transition. Similarly, other low fertility countries in Asia, such as China, the Republic
of Korea, Singapore and Thailand, are projected to follow the trend set by Japan. This
rapid ageing of the population is driven largely by sharp declines in fertility in recent
decades. This has emerged as a new issue challenging many low fertility countries in
this region. The implications are profound as they affect labour force shortages and
increase the elderly dependency ratios and the feminization of the elderly population.
There are other contentious issues related to health-care costs, social support and
financial security that are likely to be faced by an ageing society (National Research
Council and others, 2001).
As a result of low fertility, fewer children are born and progressively large
numbers of adults move into the older age groups. Changes in the age structure of
the population and population ageing are inevitable consequences of low fertility.
Figure 2 shows that declining fertility has had a significant impact on the rising
percentage of the population over age 60. It is also evident that the impact of the
64 Asia-Pacific Population Journal, Vol. 23, No. 2
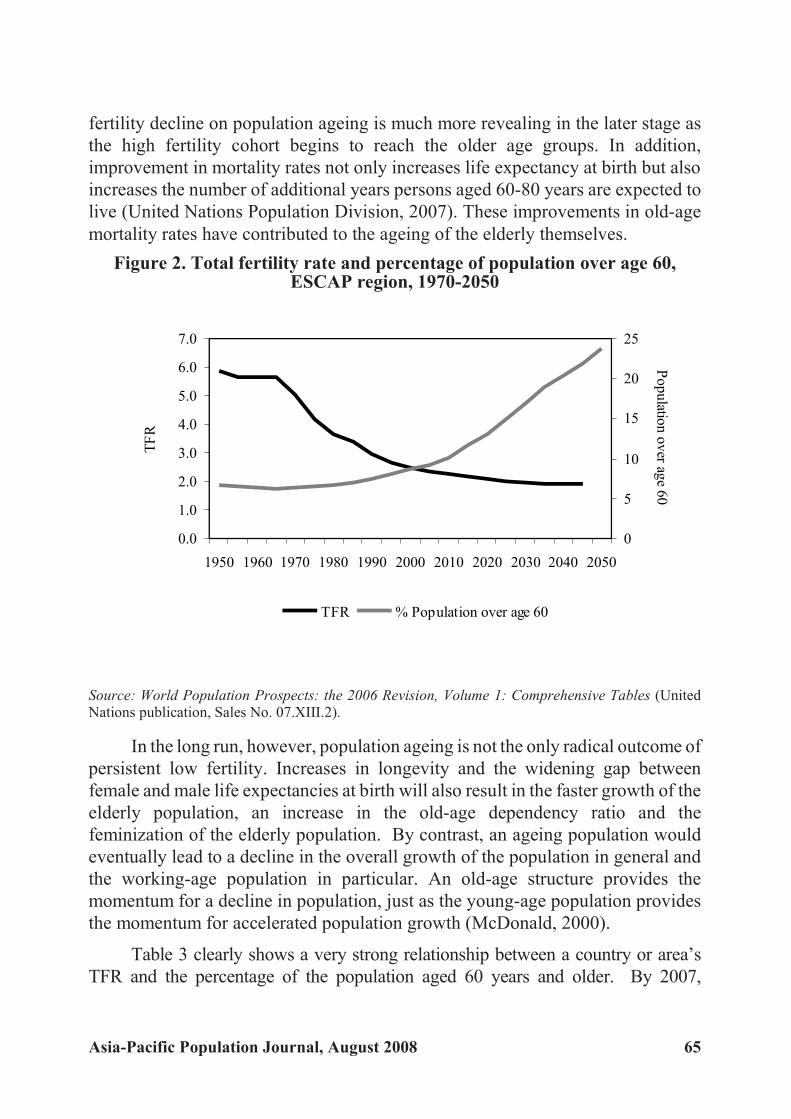
fertility decline on population ageing is much more revealing in the later stage as
the high fertility cohort begins to reach the older age groups. In addition,
improvement in mortality rates not only increases life expectancy at birth but also
increases the number of additional years persons aged 60-80 years are expected to
live (United Nations Population Division, 2007). These improvements in old-age
mortality rates have contributed to the ageing of the elderly themselves.
Figure 2. Total fertility rate and percentage of population over age 60,ESCAP region, 1970-2050
Source: World Population Prospects: the 2006 Revision, Volume 1: Comprehensive Tables (UnitedNations publication, Sales No. 07.XIII.2).
In the long run, however, population ageing is not the only radical outcome of
persistent low fertility. Increases in longevity and the widening gap between
female and male life expectancies at birth will also result in the faster growth of the
elderly population, an increase in the old-age dependency ratio and the
feminization of the elderly population. By contrast, an ageing population would
eventually lead to a decline in the overall growth of the population in general and
the working-age population in particular. An old-age structure provides the
momentum for a decline in population, just as the young-age population provides
the momentum for accelerated population growth (McDonald, 2000).
Table 3 clearly shows a very strong relationship between a country or area’s
TFR and the percentage of the population aged 60 years and older. By 2007,
Asia-Pacific Population Journal, August 2008 65
0.0
1.0
2.0
3.0
4.0
5.0
6.0
7.0
1950 1960 1970 1980 1990 2000 2010 2020 2030 2040 2050
TF
R
0
5
10
15
20
25
Po
pu
lation
ov
erag
e6
0
TFR % Population over age 60

countries and areas that had reached below replacement fertility had a markedly
higher percentage of older persons. A long-term decline in fertility would give rise to
a higher percentage of older persons. The speed of ageing is also determined by the
continuation of a decline in fertility. For example, in 2007, Japan had the largest
percentage of older persons (27.9 per cent), which is expected to rise further to 35.8
per cent by 2025 and 44 per cent by 2050. Similarly, a long-term decline in fertility in
Australia, Georgia, New Zealand and the Russian Federation has resulted in a high
percentage of older persons (between 17 and 18 per cent in 2007). These countries
will exhibit a further increase in older persons, exceeding 30 per cent by 2050.
Table 3. Percentage of population 60 years and older to total population,
2007, 2025, 2050 by fertility level
Fertility level CountryTFR
Percentage of population60 years and older
2000-2005 2007 2025 2050
ESCAP region 10.3 15.4 24.3
Lowest-low Macao, China 0.8 11.5 29.2 42.8
TFR<=1.5 Hong Kong, China 0.9 16.4 30.2 39.4
Republic of Korea 1.2 14.6 27.4 42.2
Japan 1.3 27.9 35.8 44.0
Russian Federation 1.3 17.4 23.8 32.4
Armenia 1.3 14.6 22.6 33.9
Singapore 1.4 13.8 31.6 39.8
Georgia 1.5 18.3 25.4 34.9
Low Azerbaijan 1.7 9.2 16.7 27.6
TFR 1.6 to 2.1 China 1.7 11.6 20.0 31.1
Australia 1.8 18.7 25.8 30.2
Thailand 1.8 12.0 21.5 29.8
Democratic People’s
Republic of Korea
1.9 13.7 16.6 24.6
New Zealand 2.0 17.3 24.9 30.2
Kazakhstan 2.0 10.4 15.3 24.1
Sri Lanka 2.0 10.6 19.7 29.0
Mongolia 2.1 5.9 10.8 25.1
Iran (Islamic Republic of) 2.1 6.6 10.9 25.6
Near-replacement Turkey 2.2 8.5 13.8 24.5
TFR 2.2 to 2.9 New Caledonia 2.2 10.6 16.9 26.0
Myanmar 2.2 8.2 13.9 25.6
Viet Nam 2.3 7.7 13.4 26.1
Indonesia 2.4 8.6 13.7 24.8
French Polynesia 2.4 8.5 15.0 24.7
.../
66 Asia-Pacific Population Journal, Vol. 23, No. 2

Table 3. (Continued)
Fertility level CountryTFR
Percentage of population
60 years and older
2000-2005 2007 2025 2050
Kyrgyzstan 2.5 7.3 11.6 21.5
Brunei Darussalam 2.5 5.1 11.2 20.1
Uzbekistan 2.7 6.2 10.6 20.9
Guam 2.7 10.1 16.6 22.3
Turkmenistan 2.8 6.2 10.8 21.2
Maldives 2.8 5.6 8.5 20.0
Malaysia 2.9 7.1 13.2 22.2
Bhutan 2.9 7.1 10.1 23.3
Transitional Fiji 3.0 7.4 12.7 19.6
TFR 3.0 to 4.9 India 3.1 7.7 11.5 20.2
Bangladesh 3.2 5.9 9.2 17.0
Philippines 3.5 6.2 9.8 18.2
Lao People’s Democratic
Republic
3.6 5.1 7.6 16.3
Cambodia 3.6 5.4 7.9 15.2
Nepal 3.7 5.9 7.8 14.0
Tonga 3.7 9.1 9.1 15.6
Tajikistan 3.8 5.1 8.1 16.1
Pakistan 4.0 6.0 8.6 16.5
Vanuatu 4.2 5.2 7.7 15.9
Micronesia (Federated States of) 4.2 5.6 9.2 15.3
Papua New Guinea 4.3 4.0 6.3 11.2
Solomon Islands 4.4 4.8 6.3 13.0
Samoa 4.4 6.6 10.3 17.4
High Timor-Leste 7.0 4.6 5.3 7.6
TFR =>5 Afghanistan 7.5 3.7 3.8 5.6
Source: World Population Prospects: the 2006 Revision, Volume 1: Comprehensive Tables (United
Nations publication, Sales No. 07.XIII.2).
It is also worth noting that Hong Kong, China; Macao, China; Singapore and
the Republic of Korea, which have witnessed rapid declines in fertility (currently at
the lowest-low level), will experience a vast increase in the number of older
persons. Between now and 2050, there will be significant increases in the
percentage of older persons in Hong Kong, China (from 16.4 per cent to 39.4 per
cent), Macao, China (from 11.5 per cent to 42.8 per cent), the Republic of Korea
(from 14.6 per cent to 42.2 per cent) and Singapore (from 13.8 per cent to 39.8 per
cent). Other low fertility countries will also see a dramatic increase in older
Asia-Pacific Population Journal, August 2008 67
persons. In the cases of the Islamic Republic of Iran and Mongolia, although the
percentage of older persons is currently below 7 per cent, the speed of ageing
would be much faster. The percentage of the older population is expected to rise to
about 11 per cent by 2025 and to over 25 per cent by 2050.
It is also evident from this table that, by 2025, all countries and areas in the
region, except Afghanistan, Papua New Guinea, Solomon Islands and Timor-Leste,
will have an ageing population (defined as having 7 per cent of the total population
aged 60 years and older). By 2050, Afghanistan is expected to be the only country
with less than 7 per cent of the population aged 60 years and older. For all countries
and areas with lowest-low fertility, more than one third of their population will be 60
years and older. Japan will be the most aged country in the region (with the older
population being 44 per cent of the total population), followed by Macao, China (42.8
per cent) and the Republic of Korea (42.2 per cent).
Changes in age structure
One of the implications brought about by low fertility is a substantial change
in the age structure of a country’s population. On one hand, the proportion of the
population under age 15 will experience a continuous fall, while on the other hand,
the proportion of the population aged 60 years and older will increase during the
period 2000-2050. Globally, the proportion of the population under age 15
(young-age population) and that of the population aged 60 years and older (old-age
population) will be converging during the next 50 years. The timing of the
crossover, however, varies depending on the timing and speed of the demographic
transition: the earlier and faster the transition, the earlier the crossover.
Asian and Pacific countries will also experience a tremendous shift in the
proportion of the young-age population and the old-age population between 2000
and 2050. During this period, the proportion of the population 60 years and older
is expected to increase by two and a half times, from 9 to 23 per cent, while the
proportion of the young-age population is likely to decline by one third, from 30
per cent to 19 per cent. In Asia as a whole, the old-age population will outnumber
the young-age population by the year 2040 (figure 3). However, as a consequence
of an earlier and faster fertility transition, the old-age population in Japan has
already surpassed the young-age population. In Singapore and the Republic of
Korea, such a crossover is expected to occur in 2010 and 2015 respectively.
The impact of a long-term decline in fertility will also give rise to a
substantial drop in the proportion of the population in the age group 15-59 years.
Globally, the proportion of the population representing this age group will remain
68 Asia-Pacific Population Journal, Vol. 23, No. 2
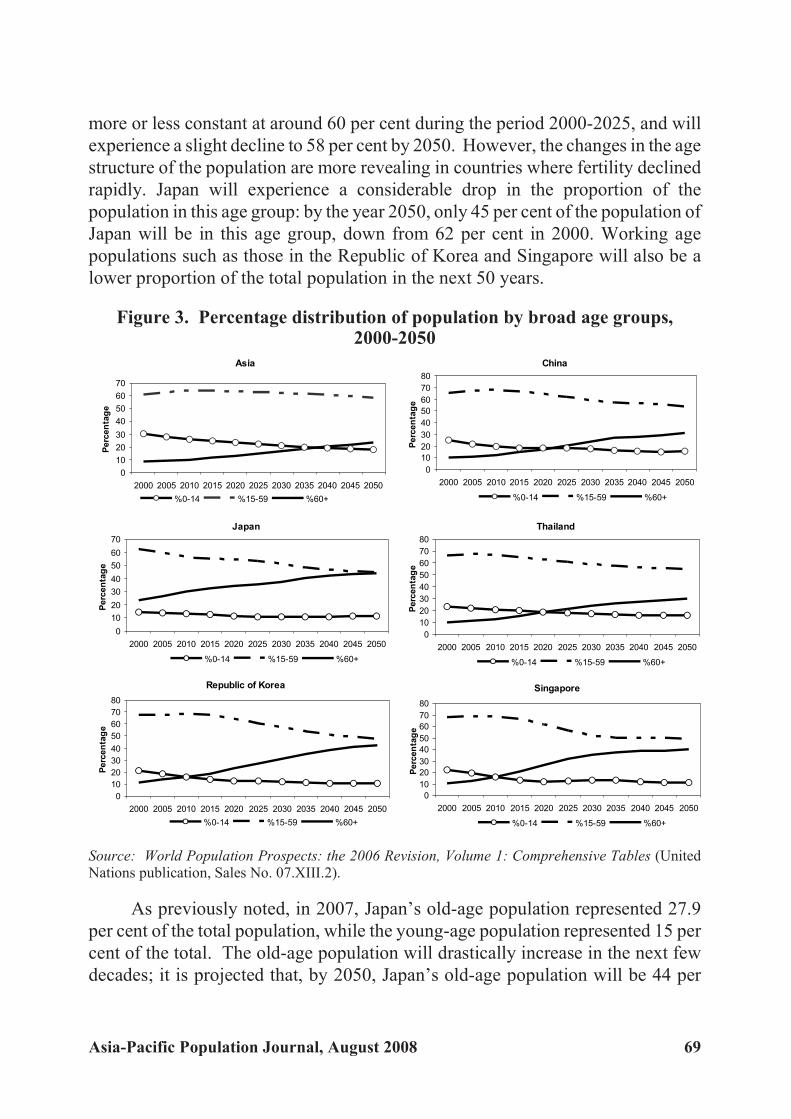
more or less constant at around 60 per cent during the period 2000-2025, and will
experience a slight decline to 58 per cent by 2050. However, the changes in the age
structure of the population are more revealing in countries where fertility declined
rapidly. Japan will experience a considerable drop in the proportion of the
population in this age group: by the year 2050, only 45 per cent of the population of
Japan will be in this age group, down from 62 per cent in 2000. Working age
populations such as those in the Republic of Korea and Singapore will also be a
lower proportion of the total population in the next 50 years.
Figure 3. Percentage distribution of population by broad age groups,2000-2050
Source: World Population Prospects: the 2006 Revision, Volume 1: Comprehensive Tables (UnitedNations publication, Sales No. 07.XIII.2).
As previously noted, in 2007, Japan’s old-age population represented 27.9
per cent of the total population, while the young-age population represented 15 per
cent of the total. The old-age population will drastically increase in the next few
decades; it is projected that, by 2050, Japan’s old-age population will be 44 per
Asia-Pacific Population Journal, August 2008 69
Asia
0
10
20
30
40
50
60
70
2000 2005 2010 2015 2020 2025 2030 2035 2040 2045 2050
Perc
en
tag
e
%0-14 %15-59 %60+
China
0
10
20
30
40
50
60
70
80
2000 2005 2010 2015 2020 2025 2030 2035 2040 2045 2050
Perc
en
tag
e
%0-14 %15-59 %60+
Japan
0
10
20
30
40
50
60
70
2000 2005 2010 2015 2020 2025 2030 2035 2040 2045 2050
Perc
en
tag
e
%0-14 %15-59 %60+
Republic of Korea
0
10
20
30
40
50
60
70
80
2000 2005 2010 2015 2020 2025 2030 2035 2040 2045 2050
Perc
en
tag
e
%0-14 %15-59 %60+
Singapore
0
10
20
30
40
50
60
70
80
2000 2005 2010 2015 2020 2025 2030 2035 2040 2045 2050
Perc
en
tag
e
%0-14 %15-59 %60+
Thailand
0
10
20
30
40
50
60
70
80
2000 2005 2010 2015 2020 2025 2030 2035 2040 2045 2050
Perc
en
tag
e
%0-14 %15-59 %60+
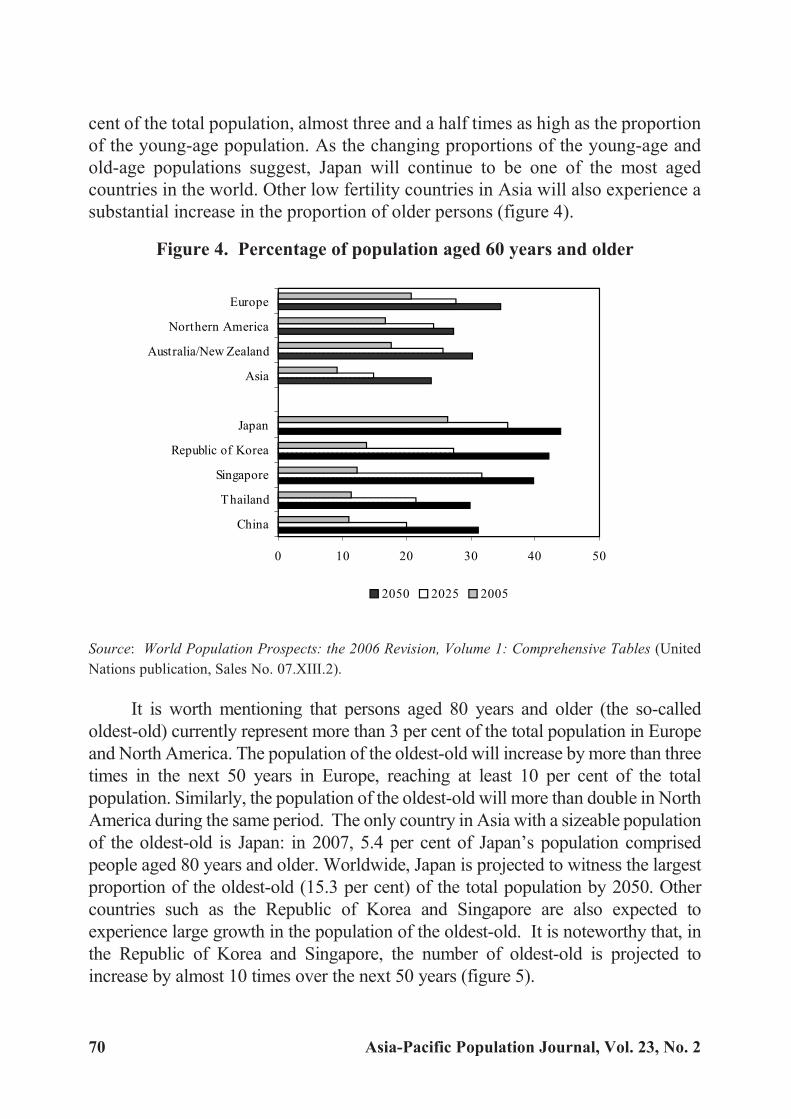
cent of the total population, almost three and a half times as high as the proportion
of the young-age population. As the changing proportions of the young-age and
old-age populations suggest, Japan will continue to be one of the most aged
countries in the world. Other low fertility countries in Asia will also experience a
substantial increase in the proportion of older persons (figure 4).
Figure 4. Percentage of population aged 60 years and older
Source: World Population Prospects: the 2006 Revision, Volume 1: Comprehensive Tables (United
Nations publication, Sales No. 07.XIII.2).
It is worth mentioning that persons aged 80 years and older (the so-called
oldest-old) currently represent more than 3 per cent of the total population in Europe
and North America. The population of the oldest-old will increase by more than three
times in the next 50 years in Europe, reaching at least 10 per cent of the total
population. Similarly, the population of the oldest-old will more than double in North
America during the same period. The only country in Asia with a sizeable population
of the oldest-old is Japan: in 2007, 5.4 per cent of Japan’s population comprised
people aged 80 years and older. Worldwide, Japan is projected to witness the largest
proportion of the oldest-old (15.3 per cent) of the total population by 2050. Other
countries such as the Republic of Korea and Singapore are also expected to
experience large growth in the population of the oldest-old. It is noteworthy that, in
the Republic of Korea and Singapore, the number of oldest-old is projected to
increase by almost 10 times over the next 50 years (figure 5).
70 Asia-Pacific Population Journal, Vol. 23, No. 2
0 10 20 30 40 50
China
Thailand
Singapore
Republic of Korea
Japan
Asia
Australia/New Zealand
Northern America
Europe
2050 2025 2005
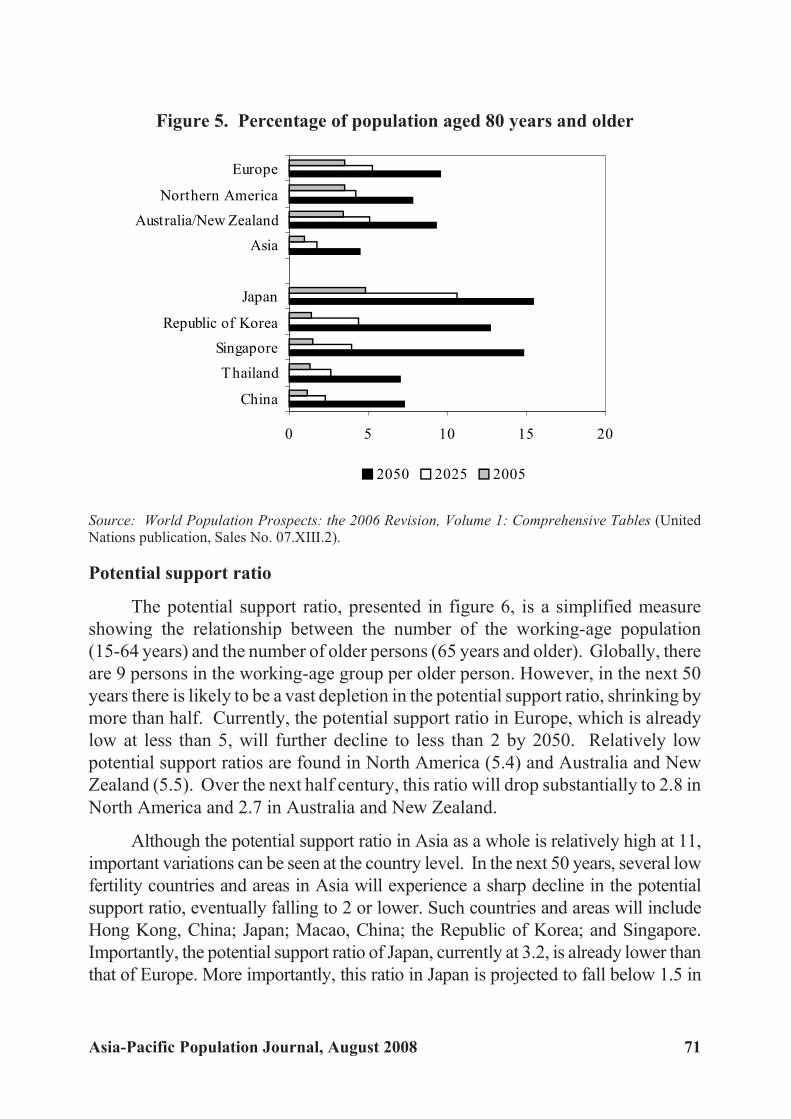
Figure 5. Percentage of population aged 80 years and older
Source: World Population Prospects: the 2006 Revision, Volume 1: Comprehensive Tables (UnitedNations publication, Sales No. 07.XIII.2).
Potential support ratio
The potential support ratio, presented in figure 6, is a simplified measure
showing the relationship between the number of the working-age population
(15-64 years) and the number of older persons (65 years and older). Globally, there
are 9 persons in the working-age group per older person. However, in the next 50
years there is likely to be a vast depletion in the potential support ratio, shrinking by
more than half. Currently, the potential support ratio in Europe, which is already
low at less than 5, will further decline to less than 2 by 2050. Relatively low
potential support ratios are found in North America (5.4) and Australia and New
Zealand (5.5). Over the next half century, this ratio will drop substantially to 2.8 in
North America and 2.7 in Australia and New Zealand.
Although the potential support ratio in Asia as a whole is relatively high at 11,
important variations can be seen at the country level. In the next 50 years, several low
fertility countries and areas in Asia will experience a sharp decline in the potential
support ratio, eventually falling to 2 or lower. Such countries and areas will include
Hong Kong, China; Japan; Macao, China; the Republic of Korea; and Singapore.
Importantly, the potential support ratio of Japan, currently at 3.2, is already lower than
that of Europe. More importantly, this ratio in Japan is projected to fall below 1.5 in
Asia-Pacific Population Journal, August 2008 71
0 5 10 15 20
China
Thailand
Singapore
Republic of Korea
Japan
Asia
Australia/New Zealand
Northern America
Europe
2050 2025 2005

2050; the only two other countries in the world in which such a low ratio is expected
are Italy and Spain (United Nations Population Division, 2007).
Figure 6. Potential support ratio (15-64 years/65 years and older)
Source: World Population Prospects: the 2006 Revision, Volume 1: Comprehensive Tables (UnitedNations publication, Sales No. 07.XIII.2).
Feminization of the elderly population
In addition to the increase in elderly dependency ratios, a large gender
disparity in the improvement of life expectancy at birth has been observed in low
mortality countries, with females having a higher life expectancy at birth than
males. As a result, women tend to outnumber men in the older age groups. It is
apparent from figures 7 and 8 that sex ratios at older ages are much lower in Europe
compared with those in North America, Australia and New Zealand, and Asia. This
is attributed to the fact that there is a large gender difference in longevity in Europe,
with females having a much higher life expectancy at birth than males. Currently,
in Europe, women outnumber men by 3 to 2 at ages 60 years and older, and by 5 to
2 at ages 80 years and older.
Significant differences in the sex ratios of the elderly population can be seen
among lowest-low fertility countries in Asia. The feminization of the elderly
population (more female elderly than male elderly) is particularly pronounced in
72 Asia-Pacific Population Journal, Vol. 23, No. 2
0.0 2.0 4.0 6.0 8.0 10.0 12.0
China
Thailand
Singapore
Republic of Korea
Japan
Asia
Australia/New Zealand
Northern America
Europe
2050 2025 2005
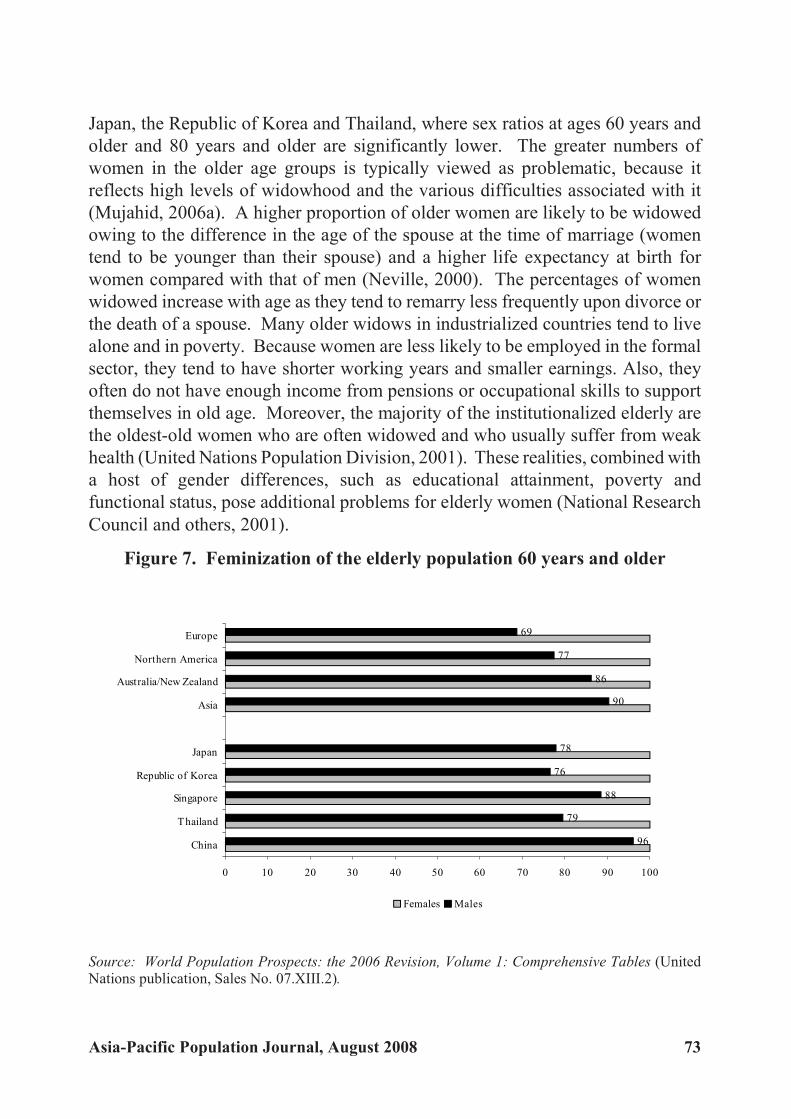
Japan, the Republic of Korea and Thailand, where sex ratios at ages 60 years and
older and 80 years and older are significantly lower. The greater numbers of
women in the older age groups is typically viewed as problematic, because it
reflects high levels of widowhood and the various difficulties associated with it
(Mujahid, 2006a). A higher proportion of older women are likely to be widowed
owing to the difference in the age of the spouse at the time of marriage (women
tend to be younger than their spouse) and a higher life expectancy at birth for
women compared with that of men (Neville, 2000). The percentages of women
widowed increase with age as they tend to remarry less frequently upon divorce or
the death of a spouse. Many older widows in industrialized countries tend to live
alone and in poverty. Because women are less likely to be employed in the formal
sector, they tend to have shorter working years and smaller earnings. Also, they
often do not have enough income from pensions or occupational skills to support
themselves in old age. Moreover, the majority of the institutionalized elderly are
the oldest-old women who are often widowed and who usually suffer from weak
health (United Nations Population Division, 2001). These realities, combined with
a host of gender differences, such as educational attainment, poverty and
functional status, pose additional problems for elderly women (National Research
Council and others, 2001).
Figure 7. Feminization of the elderly population 60 years and older
Source: World Population Prospects: the 2006 Revision, Volume 1: Comprehensive Tables (UnitedNations publication, Sales No. 07.XIII.2).
Asia-Pacific Population Journal, August 2008 73
96
79
88
76
78
90
86
77
69
0 10 20 30 40 50 60 70 80 90 100
China
Thailand
Singapore
Republic of Korea
Japan
Asia
Australia/New Zealand
Northern America
Europe
Females Males
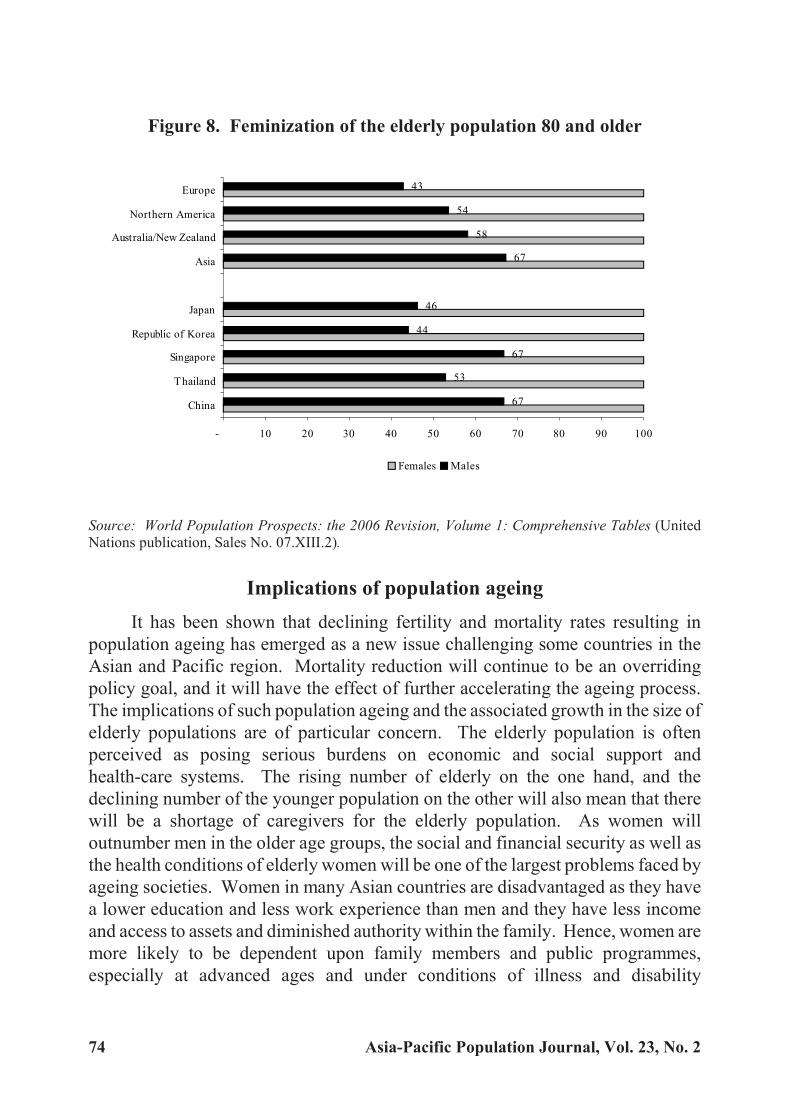
Figure 8. Feminization of the elderly population 80 and older
Source: World Population Prospects: the 2006 Revision, Volume 1: Comprehensive Tables (UnitedNations publication, Sales No. 07.XIII.2).
Implications of population ageing
It has been shown that declining fertility and mortality rates resulting in
population ageing has emerged as a new issue challenging some countries in the
Asian and Pacific region. Mortality reduction will continue to be an overriding
policy goal, and it will have the effect of further accelerating the ageing process.
The implications of such population ageing and the associated growth in the size of
elderly populations are of particular concern. The elderly population is often
perceived as posing serious burdens on economic and social support and
health-care systems. The rising number of elderly on the one hand, and the
declining number of the younger population on the other will also mean that there
will be a shortage of caregivers for the elderly population. As women will
outnumber men in the older age groups, the social and financial security as well as
the health conditions of elderly women will be one of the largest problems faced by
ageing societies. Women in many Asian countries are disadvantaged as they have
a lower education and less work experience than men and they have less income
and access to assets and diminished authority within the family. Hence, women are
more likely to be dependent upon family members and public programmes,
especially at advanced ages and under conditions of illness and disability
74 Asia-Pacific Population Journal, Vol. 23, No. 2
67
53
67
44
46
67
58
54
43
- 10 20 30 40 50 60 70 80 90 100
China
Thailand
Singapore
Republic of Korea
Japan
Asia
Australia/New Zealand
Northern America
Europe
Females Males

(Mujahid, 2006a). These needs put extra pressure on family members for
caregiving (Knodel, Ofstedal and Hermalin, 2002).
The rising number of older persons has important policy implications for the
provision of health and social services (Mujahid, 2006b). The family continues to
provide older persons with support and, in many societies of the Asian and Pacific
region, the tradition of older persons co-residing with their family members is
generally the norm (Knodel and others, 1999). However, as traditional means of
family support are being steadily eroded in most societies, Governments urgently
need to establish a social protection system, particularly to foster old-age security.
In many countries and areas of the region, the health-care infrastructure is
already weak and most of the resources are utilized to address the needs of mother
and child health services and to provide reproductive health services, including
family planning. Therefore, the provision of medical, public health and social
services and other facilities required to address the needs of older persons are
likely to put a severe strain on the economy (Knodel, Ofstedal and Hermalin,
2002). With an increasing number of younger women entering the labour force,
often away from home, the availability of caregivers for older persons is also
decreasing. With rapid urbanization, globalization and migration being
experienced by many countries and areas in the region, the situation is further
worsening, leading many older persons to be left behind in rural areas without
caregivers (Nizamuddin, 2003). These movements of the younger generation,
who are better educated than their rural counterparts, have led to the ageing
population structure in rural areas being referred to as “ageing in place” (Hermalin
and Myers, 2002).
The majority of countries and areas in the region do not have a social security
system for older persons, and even Governments that already have such a social
security system are facing problems in caring for frail older persons. These older
persons may have financial resources to support themselves, but they need
day-to-day physical care. Although the policy trends of the Governments seem to
be towards home-based community care, day-to-day care requires a lot of time and
labour from the supporting family members. The caregivers are usually women
who are caught between the responsibilities of raising children, caring for ageing
parents and engaging in economic activities (United Nations Population Division,
2001). Thus, more intensive and practical Government assistance is necessary to
successfully support frail older persons with a declining number of children. In the
case of an ageing society, such as that of Japan, it has been suggested that the
expansion of institutional care as an alternative to home care may alleviate the
heavy burden on middle-aged women taking care of elderly persons. However,
Asia-Pacific Population Journal, August 2008 75
besides the higher heath-care costs of providing such care in institutions, this is
likely to deteriorate the psychological and emotional well-being of the infirm
elderly. In view of the negative consequences, the Government of Japan started to
implement its insurance scheme for long-term care in 2000. However, the effect of
this new system on the well-being of the elderly and their families remains to be
seen (Ogawa, 2003a).
The desire and the need for continued employment have been expressed in
low fertility countries. For example, the Governments of Japan, the Republic of
Korea and Singapore have been trying to raise the retirement age to compensate
for increasing national expenditures on the elderly (Cheung, 1994; Cho, 2002;
United Nations Population Division, 2002). There is growing evidence that older
persons are willing to accept continued employment, mostly to maintain good
health and retain an income (Katsumata, 2002). Thus, it is important for
Governments to build more flexible work environments in which older persons
can be meaningfully employed.
As previously mentioned, low fertility and mortality produces an age
structure that has a high proportion of older persons. Moreover, if fertility
continues to decline to below replacement level and remains low, not only the
working-age population but also the general population itself will eventually start
to decline. In contrast to the economic and social advantages of falling fertility
rates, a constantly low rate creates the problem of an ageing society, including
labour shortages and the high cost of social welfare. For example, as a result of
continued low fertility in Japan, that society is facing serious problems associated
with ageing, and this demographic trend is depressing Japan’s economic
perspective. In order to recover from the demographic depression, it is necessary
to increase the input of the working-age population by either increasing
in-migration or female labour-force participation (Seetharam, 2002).
Hence, a pressing issue for lowest-low fertility countries and areas is the
ageing of the population. The rapidity of the process leading to low fertility has
not allowed enough time for these countries to adequately prepare for the
problems associated with the ageing of the population. For example, some ageing
countries, such as Japan, the Republic of Korea and Singapore, are facing the
problem of increasing national expenditures for old-age social security, a
shrinking labour force and mounting burdens of providing the growing number of
frail elderly with care. The shrinking labour force and the increase in the ageing
population have also contributed to lowering potential support ratios (United
Nations Population Division, 2007). Countries such as China and Thailand,
where fertility declined very rapidly and which have no established social security
76 Asia-Pacific Population Journal, Vol. 23, No. 2

system, will face the problem of supporting increasing proportions of elderly
persons when the proportion of the younger generation grows smaller (Gubhaju
and Moriki-Durand, 2003b; United Nations Population Fund, 2006a, 2006b).
Considering the experience of low fertility countries, the Governments of
transitional and near-replacement fertility countries and areas need to foresee the
consequences of declining fertility rates. A crucial agenda for the Governments is
therefore to plan for an ageing society before fertility drops well below
replacement level. In this regard, researchers are urging Governments to start
preparing policy measures to deal with the problems associated with an ageing
population as soon as possible (Mason, Lee and Russo, 2002). In other words, it is
particularly important for Asian countries to recognize the significance of ageing
problems and start formulating policies for the elderly, as it takes several decades
for Government old-age pension schemes to mature and operate at full scale
(Ogawa, 2003b). It would be more difficult for families to care for their older
members because families would be smaller, people would live longer and the
migration of young adults would mean that families would fragment. The present
trends pose a major challenge in addressing the needs of families. Therefore,
Governments are urged to consider the present trends in designing social policies,
to put the family at the centre of any future social policy development and to study
good national practices when designing a new approach to family policies.
While formulating policies, it is important also to understand the changing
needs of older persons. As a result of the socio-economic development that has
taken place over the past several decades, the younger generation is more educated,
urban and professional than the older generation. Although these attributes are
beneficial to society, they may be the source of problems, for those differences
across age groups are not only a potential source of intergenerational tension and
conflict, but they may also mean that the future elderly will have sharply different
characteristics than the current elderly. Therefore, policymakers need to take into
consideration the changing socio-economic characteristics of the elderly in
designing policies and approaches that will be suitable in the future (Hermalin and
Myers, 2002).
The momentum of population ageing in the world is likely to be the most
significant demographic process of the twenty-first century, with implications for a
wide range of human behaviour. In this regard, researchers have increasingly
recognized the need for multidisciplinary approaches to the ageing process.
Continuous changes in the population age structure will require new social
sensitivities and innovative policy responses (Kinsella and Phillips, 2005).
Asia-Pacific Population Journal, August 2008 77
Finally, it is also important to recognize the benefits of a changing population
age structure. A decline in fertility and an increase in life expectancy at birth, which
result in slower population growth, temporarily increase the relative size of the
workforce, opening an historic, one-time-only “demographic window” that
provides an opportunity for human and financial investment to spur economic
growth. This potential economic growth occurs within one generation and has
already been effectively taken advantage of in several East Asian countries
between the 1960s and the 1990s (Bloom, Canning and Sevilla, 2003). In this
regard, several countries and areas in South-East Asia and developing countries
and areas in other regions are projected to have a large segment of their population
of prime working age, with the likelihood of high economic output and savings.
This “demographic dividend” has the potential for stimulating economic growth if
appropriate economic and social policies are in place (Kinsella and Phillips, 2005;
Knodel, Ofstedal and Hermalin, 2002).
78 Asia-Pacific Population Journal, Vol. 23, No. 2

References
Bloom, David E., David Canning and Jaypee Sevilla (2003). The Demographic Dividend: a New Perspective
on the Economic Consequences of Population Change (Santa Monica, United States, RAND).
Cheung, Paul P. L. (1994). “Planning for the elderly in Singapore”, in Ageing of Asian Populations:
Proceedings of the United Nations Round Table on the Ageing of Asian Populations (United Nations publications, Sales No. E.94.XIII.10), pp. 112-117.
Cho, Namhoon (2002). “Policy responses to population ageing and population decline in the Republicof Korea”, in Population Bulletin of the United Nations: Policy Responses to Population
Ageing and Population Decline, Special Issue Nos. 44/45 (United Nations publication,Sales No. E.02.XIII.4), pp. 228-244.
ESCAP (2007). 2007 ESCAP Population Data Sheet (Bangkok, ESCAP).
Gubhaju, Bhakta B. and Yoshie Moriki-Durand (2003a). “Fertility transition in Asia: past experiencesand future directions”, Asia-Pacific Population Journal, vol.18, No. 3, pp. 41-68.
________ (2003b). “Below-replacement fertility in East and Southeast Asia: consequences and policyresponses”, Journal of Population Research, vol. 20, No. 1, pp. 1-18.
Hermalin, Albert I. and Lora G. Myers (2003). “Aging in Asia: facing the crossroads”, in Albert I.Hermalin, ed., The Well-Being of the Elderly in Asia: a Four-Country Comparative Study
(Ann Arbor, United States, The University of Michigan Press), pp. 1-23.
Jones, Gavin and Richard Leete (2002). “Asia’s family planning programs as low fertility is attained”,Studies in Family Planning, vol. 33, No. 1, pp. 114-126.
Katsumata, Yukiko (2002). “The impact of population decline and population ageing in Japan from theperspectives of social and labour policy”, in Population Bulletin of the United Nations:Policy Responses to Population Ageing and Population Decline, Special Issue Nos. 44/45
(United Nations publication, Sales No. E.02.XIII.4), pp. 208-227.
Kinsella, Kevin and David R. Phillips (2005). “Global ageing: the challenge of success”, Population
Bulletin, vol. 60, No. 1, pp. 1-40.
Knodel, John and others (1999). “Aging in Thailand: an overview of formal and informal support”,Comparative Study of the Elderly in Asia: Research Report No. 99-53, Institute for SocialResearch, Population Studies Center (Ann Arbor, United States, University of Michigan Press).
Knodel, John, Mary Beth Ofstedal and Albert I. Hermalin (2002). “The demographic, socioeconomic,and cultural context of the four study countries”, in Albert I. Hermalin, ed., The Well-Being
of the Elderly in Asia: a Four-Country Comparative Study, pp. 25-63 (Ann Arbor, UnitedStates, The University of Michigan Press).
Mason, Andrew, Sang-Hyop Lee and Gerard Russo (2002). “As Asia’s population ages, worries growabout the future”, Asia Pacific Issues, No. 58 (Honolulu, United States, East-West Center).
McDonald, Peter (2000). “Below replacement fertility in Australia: trends and implications”, in Low
Fertility and Policy Responses to Issues of Ageing and Welfare (Seoul, Korea Institute forHealth and Social Affairs and the United Nations Population Fund), pp.169-194.
Asia-Pacific Population Journal, August 2008 79
Mujahid, Ghazy (2006a). “Population ageing in East and South-East Asia: current situation and emerging
challenges”, Papers in Population Ageing, No.1, United Nations Population Fund (UNFPA)
Country Technical Services Team for East and South-East Asia (Bangkok, UNFPA).
_______ (2006b). “Population ageing in East and South-East Asia, 1950-2050: implications for elderly
care”, Asia-Pacific Population Journal, vol. 21, No. 2, pp. 25-44.
National Research Council and others (2001). Preparing for an Aging World: the Case for
Cross-National Research (Washington, D.C., The National Academies Press).
Neville, Warwick (2000). “Introduction”, in Low Fertility and Policy Responses to Issues of Ageing
and Welfare (Seoul, Korea Institute for Health and Social Affairs and United Nations
Population Fund), pp. 1-23.
Nizamuddin, M. (2003). “Population ageing: policy responses to population ageing in Asia and the
Pacific”, in Fifth Asian and Pacific Population Conference: Selected Papers, Asian
Population Studies Series No. 158 (Bangkok, ESCAP), pp. 95-116.
Ogawa, Naohiro (2003a). “Japan’s changing fertility mechanisms and its policy responses”, Journal of
Population Research, vol. 20, No. 1, pp. 89-106.
________ (2003b). “Ageing trends and policy responses in the ESCAP region”, in Population and
Development: Selected Issues, Asian Population Studies Series No. 161 (Bangkok,
ESCAP), pp. 89-127.
Seetharam, K. S. (2002). “Half a century of unparalleled demographic change: the Asia-Pacific
experience”, Asia-Pacific Population Journal, vol. 17, No. 4, pp. 13-30.
United Nations Population Division (2001). Population, Gender and Development: a Concise Report
(United Nations publication, Sales No. E.01.XIII.3).
________ (2002). “Population ageing and population decline: Government views and policies”, in
Population Bulletin of the United Nations: Policy Responses to Population Ageing and
Population Decline, Special Issue Nos. 44/45 (United Nations publication, Sales No.
E.02.XIII.4), pp. 35-73.
________ (2006). World Population Prospects: the 2006 Revision, Volume 1: Comprehensive Tables
(United Nations publication, Sales No. 07.XIII.2).
________ (2007). World Population Ageing 2007 (United Nations publication, Sales No. 07.XIII.5).
United Nations Population Fund (UNFPA) (2006a). Population Ageing in China: Facts and Figures
(Beijing, UNFPA China Office).
________ (2006b). Population Ageing in Thailand: Prognosis and Policy Response, (Bangkok,
UNFPA Thailand).
80 Asia-Pacific Population Journal, Vol. 23, No. 2

Dra matic Fer til ity Tran si tion inMon go lia and Its De ter mi nants:
the De mise of the Pronatalist State
It is pro jected that fer tility will con tinuously de cline in Mon golia al beitat a slower rate, and TFR is expected to fall from 2.4 to 1.8 children
per woman dur ing the period 2000-2025. This decline will havea con sid er able im pact on pop u la tion growth,
hence on the structure of the population.
By Altankhuyag Gereltuya*
The move from a centrally controlled economy to a market-driven economy has
had strong political implications for family planning and fertility in Mongolia. Under
socialist rule, Mongolia had a strong pronatalist population policy under which those
families having children were provided with generous benefits. The changes made to
these policies have had a considerable impact on fertility and family formation in
Mongolia. In the mid-1970s, the country started to experience a dramatic decrease in
Asia-Pacific Population Journal, August 2008 81
* Lecturer/Statistician, United Nations Statistical Institute for Asia and the Pacific, Chiba, Japan,e-mail: [email protected].

the level of fertility, which intensified when the country moved towards a market
economy. The country experienced a drop in its total fertility rate (TFR) from 7.2
children per woman (of reproductive age) in 1975 to about 3 children in 1995, and it
has remained constant at about 2.3 children since that time. Relatively few studies
have been carried out on fertility changes in Mongolia with explanations about their
causes, primarily owing to a lack of data sources.
The aim of this paper is to examine fertility changes in Mongolia with respect
to the changes in population policies and changes in the proximate determinants of
fertility that have occurred since the mid-1970s.
Data availability and quality
Until 1990, the majority of statistical data in Mongolia were confidential and
were reported only to high Government officials. Data dissemination was very
limited and distributed on an ad hoc basis and only if specifically requested by
interested users.
The first twentieth century Mongolian population census was conducted in
1918, with further censuses conducted in 1935, 1944, 1956, 1963, 1969, 1979, 1989
and 2000. The range of information collected in the first four censuses was very
narrow. Information collected included the age, sex, marital status and occupation of
respondents. The last four censuses have been more complete with the inclusion of
housing information. In general, census information is accurate and problems of
under-enumeration are comparatively small, particularly in the 1969, 1979, 1989 and
2000 censuses. The reporting of age, sex and fertility-related information and other
demographic, economic and social characteristics in those censuses is considered
relatively reliable. This reliability is based on the assessment of the accuracy of age
and sex reporting, in comparison with information obtained from other sources. The
National Statistical Office of Mongolia (NSOM) evaluated the 1969, 1979 and 1989
censuses using the “consistent correction of census and vital registration data”
developed by Luther and Retherford. According to an assessment by NSOM,
under-enumeration was 1.5 per cent in the 1969 census, 3.5 per cent in the 1979
census, and reached 6.5 per cent in the 1989 census. The under-enumeration of the
2000 population and housing censuses was evaluated using a post-enumeration
survey and was estimated to be at 0.8 per cent.
From the 1950s onwards, NSOM was charged with the registration and
compilation of vital events. In the mid-1980s, the responsibility for collecting civil
registration data (births, deaths, marriages, divorces, occupational status, change of
address, education, residential status and so forth) was transferred to the Central
Population Register Bureau, a newly created agency. The degree of completeness of
82 Asia-Pacific Population Journal, Vol. 23, No. 2

the registration of vital events in Mongolia slowly improved. The continuous
evaluation of the quality of data obtained from the 1969, 1979 and 1989 censuses
allowed for an improvement in the registration of births and deaths for each
intercensal year. The under-registration of births was approximately 5 per cent and
that of adult deaths was about 6 per cent. Indirect estimates were also calculated and
similar results obtained. There are, however, two exceptions: early age mortality and
the registration of population movements.
According to Mongolian law, parents must register the birth of a newborn baby
within one month of the birth. However, as in other developing countries, parents may
consider it futile to register both the birth and the death of a child who died at a very
young age. Therefore, it is likely that many infant deaths that occurred within one
month of birth may have never been registered. Even if a child dies after a month and
the birth has been registered, parents may fail to register his death. This is the case in
rural areas where ties with the Government are weaker and where burial permits are
not necessary most of the time. The use of indirect techniques to consistently access
the quality of data suggests an under-registration of nearly 30 per cent of infant deaths
from 1970 to 1989. The under-registration of infant deaths did not greatly improve,
even after 1990. However, NSOM conducted a number of surveys that helped to
better estimate real infant death rates in the 1990s. Recent demographic and
reproductive health surveys suggest that the real infant mortality rate may be as much
as 50 per cent higher than the official figures, owing to the underreporting of deaths.
One hypothesis suggests that there may be some misclassifications of infant deaths in
Mongolia as a result of existing regulations aimed at measuring the work performance
of medical units. During the socialist regime, the health of newborn babies was
strictly controlled by the Government. Each newborn was assigned to a district doctor
and her/his job performance was evaluated by the number of infant deaths occurring
in her/his district. Therefore, it could be the case that the infant deaths that occurred
during the first year of birth were actually reported as deaths occurring during the
second year, if the child’s birth had been registered. In other words, there might have
been a transfer from infants to children’s deaths. Thus, the number of births in
Mongolia could be biased as a result of underreported early neonatal and neonatal
infant deaths.
For this paper, data on the use of modern contraceptives were obtained from
various sources. The proportion of women using any modern method of
contraception in 1990 and 1992 was based on the estimates prepared by the Ministry
of Health and Social Welfare. These estimates include only contraceptives distributed
by Government-run programmes, while data on private access were not available.
The commercial distribution of contraceptives appears to have been limited to that
Asia-Pacific Population Journal, August 2008 83
time when the private distribution of medical and health products in general was still
negligible. Data on contraceptive use in 1995 and 1998 were based on sample surveys
conducted by the Mongolian National University and NSOM with assistance from the
United Nations Population Fund (UNFPA). These surveys used internationally
accepted methods of survey design; therefore, their results are reliable and among the
best data on the current use of contraceptives available to date.
In 1970, the Ministry of Health and Social Welfare issued an order on the
collection of data on abortion and approved an initial reporting statistical form.
This form has changed over time, reflecting changes in the abortion law. The most
recent version of this form was approved in 1997 by the Ministry of Health and
Social Welfare. For this paper, data on abortion were obtained from the
administrative records maintained by the Ministry of Health and Social Welfare.
However, caution is needed in interpreting trends observed in the rates of abortion.
It has been reported in a number of studies that abortion may have been practised
before its legalization in 1989 in the form of spontaneous abortions, or
miscarriages. In 1985, the number of spontaneous abortions per 1,000 births was
168.6, and by 1989 it had increased to 179.7. However, in 1990 this ratio fell to
95.3. This sharp decline in “spontaneous abortions” just after the legalization of
abortion suggests that many abortions had actually been induced.
Fertility transition and its onset
Figure 1 shows changes in population policies and in TFR in the period from
1963 to 1998. In the 1960s, TFR was 8 children per woman. In 1975, this number
fell to 7.2, in 1989 to 4.5, and subsequently, in 1998 to 2.3. Between 1963 and
1975, the number of children per woman fluctuated between 7 and 8. However,
from 1975 onwards, the decline in fertility became relatively steady until it
reached 2.6 children per woman in 1993. However, a slight rise occurred again in
1993-1997 before fertility levels declined further during the last three years of the
past century.
Figure 2 clearly indicates that, in the first half of the 1970s, fertility was
concentrated in four age groups: 20-24, 25-29, 30-34 and 35-39 years. Two
decades later, fertility was concentrated in two age groups only: 20-24 and 25-29
years. Although measures of fertility are subject to tempo and quantum influences ,
both figures roughly indicate that the fertility transition was underway in Mongolia
in 1975-1998. The Princeton’s approach is chosen for Mongolia to identify the
onset of the fertility transition. The reason for this is that, between 1960 and 1975,
the TFR of Mongolia fluctuated between 7and 8 children per woman and that there
was no clear picture of a continuous decline in fertility. TFR peaked in 1963 and
84 Asia-Pacific Population Journal, Vol. 23, No. 2

stood at 8 children per woman. The onset of the decline in fertility can be dated
back to 1975 when TFR reached 7.2 children per woman.
Figure 1. Population policies and total fertility rates, Mongolia
Source: Mongolia, National Statistical Office, Population of Mongolia, 1994 and Statistical Yearbook,2000 (Ulaanbataar).
Figure 2. Age specific fertility rates, 1969 - 2000, Mongolia
Source: Calculations are by the author using data from Mongolia, National Statistical Office,Population of Mongolia, 1994 and Statistical Yearbook, 2000 (Ulaanbataar)
Asia-Pacific Population Journal, August 2008 85
0
50
100
150
200
250
300
350
400
15-19 20-24 25-29 30-34 35-39 40-44 45-49
Age groups (in years)
Bir
ths
per
tho
usa
nd
wo
men
1969-1974 1979-1984 1990 1995 2000
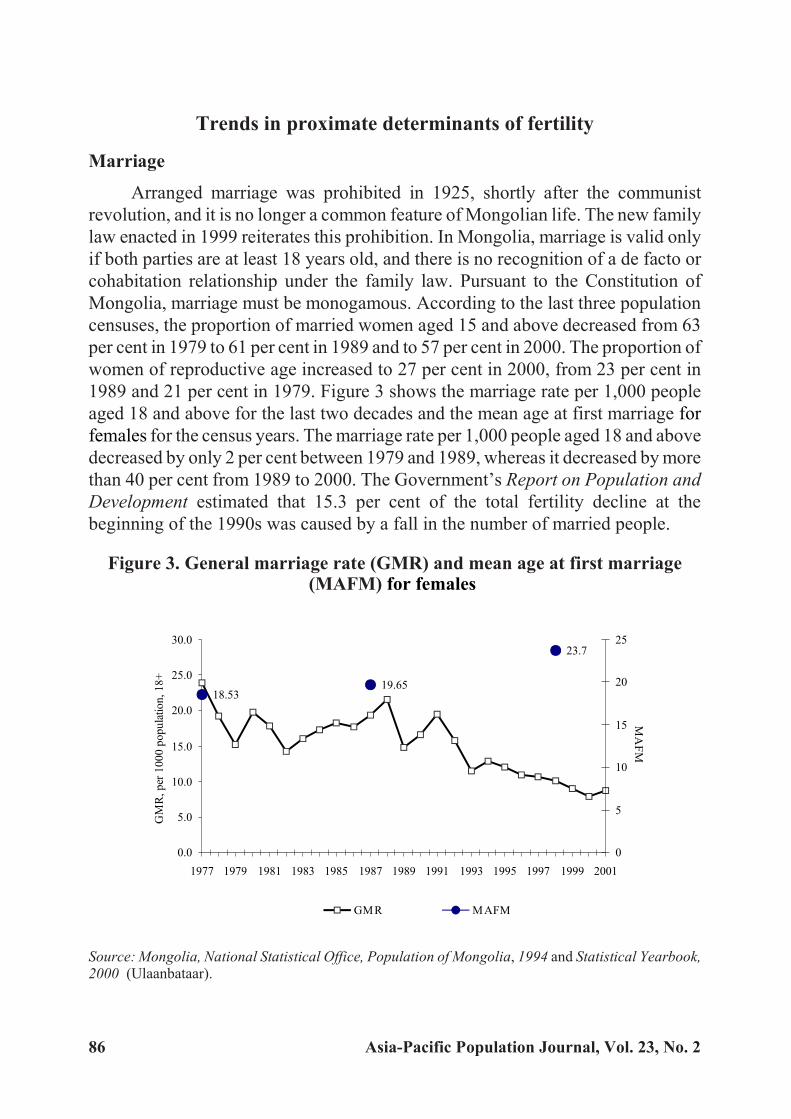
Trends in proximate determinants of fertility
Marriage
Arranged marriage was prohibited in 1925, shortly after the communist
revolution, and it is no longer a common feature of Mongolian life. The new family
law enacted in 1999 reiterates this prohibition. In Mongolia, marriage is valid only
if both parties are at least 18 years old, and there is no recognition of a de facto or
cohabitation relationship under the family law. Pursuant to the Constitution of
Mongolia, marriage must be monogamous. According to the last three population
censuses, the proportion of married women aged 15 and above decreased from 63
per cent in 1979 to 61 per cent in 1989 and to 57 per cent in 2000. The proportion of
women of reproductive age increased to 27 per cent in 2000, from 23 per cent in
1989 and 21 per cent in 1979. Figure 3 shows the marriage rate per 1,000 people
aged 18 and above for the last two decades and the mean age at first marriage for
females for the census years. The marriage rate per 1,000 people aged 18 and above
decreased by only 2 per cent between 1979 and 1989, whereas it decreased by more
than 40 per cent from 1989 to 2000. The Government’s Report on Population and
Development estimated that 15.3 per cent of the total fertility decline at the
beginning of the 1990s was caused by a fall in the number of married people.
Figure 3. General marriage rate (GMR) and mean age at first marriage(MAFM) for females
Source: Mongolia, National Statistical Office, Population of Mongolia, 1994 and Statistical Yearbook,2000 (Ulaanbataar).
86 Asia-Pacific Population Journal, Vol. 23, No. 2
18.5319.65
23.7
0.0
5.0
10.0
15.0
20.0
25.0
30.0
1977 1979 1981 1983 1985 1987 1989 1991 1993 1995 1997 1999 2001
GM
R,
per
10
00
po
pu
lati
on
,1
8+
0
5
10
15
20
25
MA
FM
GMR MAFM

Increases in the age at first marriage for females are expected to reduce the
level of fertility, and a minor increase (of about 6 per cent, that is, from 18.5 to 19.7
years) in the mean age at first marriage can be observed between 1979 and 1989.
However, the mean age at first marriage increased by 20 per cent (from 19.7 to 23.7
years) from 1989 to 2000.
The 1998 Mongolian Reproductive Health Survey indicated that women
who were 45 to 49 years of age in 1998 had been married at an earlier age than
their younger counterparts. For instance, in 1998, 48 per cent of women aged
45-49 years had had their first marriage before the age of 20, compared with only
30 per cent of those aged 30-34 years, and 36 per cent of those aged 25-29 years.
All these figures indicate that significant changes have been taking place in
marriage patterns and in the age at first marriage during the last decade, when the
country was moving towards a market economy.
In Mongolia, births take place mainly within the bounds of marriage.
However, the proportion of women aged 15-17 years who already have a child
increased from 2.3 per cent in 1996 to 8.5 per cent in 1998. When children are
born to women below age 18, this can be considered childbearing outside
marriage, because the legal age at marriage is 18 as regulated by the family law of
Mongolia. Within two years, from 1996 to 1998, the percentage distribution of
women aged 15-49 years by marital status had changed remarkably. For instance,
the proportion of women cohabitating outside of marriage had risen from 3.7 per
cent in 1996 to 5.7 per cent in 1998. Similarly, the share of separated women
increases to 1.1 per cent in 1998 from 0.7 per cent in 1996, while the percentage of
divorced women increased almost twofold during the same period.
Contraceptive use
Figure 4 illustrates recent trends in the abortion rate and the proportion of
women using any modern method of contraception. Even after the 1989 policy
shift, the proportion of women using modern contraceptives was very low.
According to estimates from the Ministry of Health and Social Welfare , about 11
per cent1 of the female population of reproductive age used a modern method of
contraception in 1990. This number increased to 15 per cent1 in 1992 and to 25
per cent in 1994 , before reaching 33.4 per cent in 1998. By contrast, the
proportion of traditional method users declined from 35.7 per cent in 1994 to 10
per cent in 1998. Neupert stated that the calendar method appears to have been the
main method of contraception used in Mongolia during the 1970s and 1980s.
However, he argued that it played a limited role in the fall of fertility. Pandey’s
later analysis suggested that it was the use of the intrauterine device � also an
Asia-Pacific Population Journal, August 2008 87

important method of contraception at the time – that most contributed to the
decline in fertility in Mongolia. The Report on Population and Development, by
the Government of Mongolia, estimated that the contribution of contraceptive use
accounted for up to 21.6 per cent of the total fertility decline in 1990-1993.
Abortion
With the law on the liberalization of abortion enacted in 1985 and then
amended in 1989, the number of induced abortions increased significantly. For
instance, the number of abortions per 1,000 live births was 155 in 1986, then
reached a peak of 442 in 1992 before decreasing to 312 in 1994. The number
decreased sharply in the following years along with the increase in the use of
modern contraceptives (figure 4).
Figure 4. Abortion rate and proportion of womencurrently using modern methods of contraception
Sources: Unwanted pregnancies and abortions in Mongolia, 2001, NCHD; Contraceptive use: 1990 �
Estimation of MOH; 1992 � Project report, MON/97/PO7; 1994 � Survey report, MNU,1994; 1996 �
Survey report, 1996; 1998 � RHS report, NSO, 1999.
The pronatalist policy pursued for almost three decades forced women to rely
on abortion to postpone or avoid childbearing. Several researchers concluded that
one of the possible reasons for the drop in fertility was the legalization of abortion,
which occurred in 1989.
In the Report on Population and Development, it was noted that 39.3 per cent
of the total fertility decline was attributed to a surge in the incidence of abortion
from 1991-1993. This clearly indicates that there was a significant unmet need for
contraceptives which probably led to the dramatic increase in the number of
88 Asia-Pacific Population Journal, Vol. 23, No. 2

abortions observed at the beginning of the 1990s, after abortion became legal in
1989. Furthermore, the report indicated that, owing to a lack of availability and
knowledge of contraceptives, abortion became the main method of fertility
regulation for Mongolian women. The main reasons for abortions were very short
birth intervals and the poor health of women. The Mongolian Reproductive Health
Survey (1998) found that age, the number of living children and marital status were
the determining factors of abortion. The Population Policy Programme of
Mongolia stated that abortion should not be promoted as a method of family
planning. However, in practice, abortion has been the most important intermediate
variable in the country’s fertility decline after 1989.
Breastfeeding
Data on breastfeeding trends are not available. However, continued
breastfeeding is common in Mongolia: 81 per cent2 of all children are breastfed
until they are 1 year of age and 61 per cent2 until 2 years of age. Considering the
experience of other developing countries, it is likely that this practice has increased
in Mongolia during the last three decades; therefore, breastfeeding (and in this
case, the lactational amenorrhea method of birth control) probably did not have a
major effect on the fertility decline.
Population policies
There were three different phases of the population policy of the Government
of Mongolia during the period from 1960 to 1998 (see figure 1): a) a strong
pronatalist policy from 1963 to 1975; b) a relaxation of the pronatalist policy from
the 1975 to 1989 and c) a non-pronatalist policy from 1989 to 1998. The following
paragraphs briefly describe the context of each phase and the likely effect of each
on the overall fertility trend.
Strong pronatalist population policy (1963-1975)
In the 1960s and 1970s, the Government of Mongolia had an interest in
encouraging high levels of fertility or at least in maintaining earlier levels in order
to bring to fruition a series of huge economic goals in the agricultural and
industrial sectors. During this period, two major economic events overlapped: the
collectivization of agricultural activities and industrialization. The First
Five-Year Plan (1948-1952) had concluded that the available labour force was
insufficient to realize two major desired economic events in the 1960s: the
collectivization of agricultural activities in rural areas and the construction of
industrial infrastructures in urban areas. This Five-Year Plan was the first policy
document to describe an interest in an increase in the size of the population, yet
Asia-Pacific Population Journal, August 2008 89

without suggesting any specific intervention. In the Third Five-Year Plan
(1961-1965), pronatalist interventions were included for the first time.
International immigration was never considered as an alternative or a complement
to the rise in fertility. Moreover, Mongolia did not have an excess of labour in
rural areas during that time because the process of large-scale collectivization
coincided with that of industrialization in urban areas. The desire for a sufficient
supply of labour through a population increase can be considered as an economic
factor that led to pronatalist policies in Mongolia.
The pronatalist population policy had several components. Women with
more than four children were awarded medals of honour, additional substantial
child allowances and subsidized holiday leave. Moreover, they were given earlier
retirement (at age 50) compared with other women. Generous maternity leave also
applied, and mothers were guaranteed that they could return to their original jobs
after having a child. In addition, special taxes were imposed on unmarried and
childless couples. The availability and use of modern contraceptives was severely
limited during this period. From the beginning of the 1960s up to the mid-1970s,
fertility rose with the implementation of pronatalist population policies. There
were dramatic improvements in the level of women’s education and their
participation in the labour force. Free and compulsory education at all levels for
both boys and girls was introduced throughout the socialist era, and a high rate of
female participation and equality with males was achieved, higher than in most
other Asian countries. By 1969, 75 per cent of women had received some form of
education.
The labour law3 that was amended in 1970 enabled women to undertake
work outside their home (Ardiin Ih Khural, 1970). Mongolian women had legal
equality, but once in the labour force they suffered the familiar double burden of
housework and childcare. In addition, Mongolia developed an extensive and
well-staffed health-care system that had made modern health technologies widely
accessible. In spite of economic and health developments, however, mortality
levels were high. For instance, the infant mortality rate was 75 per 1,000 life births
in 1965 and remained at this level roughly until 1975.
As the economy developed, the population increased, the society grew more
greatly differentiated and people came to have less in common. The population
was increasingly divided along occupational, educational and regional lines.
Social interactions also came to differ, from group to group. In sum,
socio-economic development, including women’s education and labour force
participation, might have been one of the main causes of the onset of the fertility
decline.
90 Asia-Pacific Population Journal, Vol. 23, No. 2
Relaxation of pronatalist population policy (1975-1989)
The main reasons for the shift from a strong pronatalist population policy to a
relaxation of the pronatalist policy were the high rates of infant and maternal mortality
and their reluctance to decline. In 1976, the first attempt was made to provide family
planning, albeit under only very special conditions. The intrauterine device became
legal in cases when pregnancy was not recommended, either because of the woman’s
health or age, or because the woman had experienced more than five pregnancies.
From 1976 onwards, access to contraceptives was progressively liberalized and
between 1985 and 1988, more policy changes occurred. Strict restrictions on abortion
lasted until 1985, when a decree of the Ikh Khural Presidium allowed abortions to be
performed upon a woman’s request. The limited family planning services were also
expanded at the end of the 1980s. The availability of the intrauterine device and
abortion services was extended to all women older than 35 years or with more than
five children, single women with more than three children, women pregnant less than
one year after the previous birth, women with three or more children and whose
husband was either disabled or imprisoned, and women who were themselves in
prison or in an orphanage.
Changes in the age-specific fertility rates (see figure 2) could be attributed to
a relaxation of the pronatalist population policy. Between the periods 1969-1974
and 1979-1984, there were sharp declines4 in fertility among women older than
age 30, while from the period 1979-1984 to 1990, fertility fell substantially in
almost all age groups.
By 1989, about 95 per cent of women had received some form of education.
Literacy levels rose and the gap between male and female literacy rates narrowed
from 16 per cent in 1963 to less than 3 per cent by 1989. The major change
regarding the position of Mongolian women was their nearly universal
participation at all levels of the educational system. In 1985, women made up to 63
per cent of students in higher educational establishments and up to 58 per cent of
those in specialized secondary schools. The number of women employed in
various economic sectors increased by 87.3 per cent from 1969 to 1989, compared
with an increase of 68.4 per cent for male employees during the same period.
Yet, male attitudes and public services did not catch up with the reality of an
increasing percentage of women being employed outside their home. There was
little cultural pressure on men to help with household chores, and child-rearing
continued to be the sole responsibility of women. Working mothers’ difficulties
were often compounded by cramped housing conditions, a lack of time- and
energy-saving appliances, and the absence of modern shopping facilities and
convenience services. These factors made child-rearing a major burden. Women’s
Asia-Pacific Population Journal, August 2008 91

household duties took up almost as much time as their job. Therefore, it is highly
possible that women immediately reacted to the relaxation of pronatalist policies
that took place in 1976 and 1989. Following the Russian model, Mongolia initially
devoted most resources to collectivization and the development of industry
(mainly mining and textiles), with relatively little being invested in the consumer
sector. As a result, the technology used by consumer industries was hardly
developed, leading to a low level of mechanization of housework, commerce and
services compared with that in Western countries. This was not a feature unique to
Mongolia; it also existed in other socialist countries, as documented by earlier
research. From the mid-1970s to 1989, female education and female labour force
participation, plus the lack of development of consumer industries, might have
been factors that were influential in women limiting their childbearing.
Non-pronatalist population policy (1989-1998)
In 1990, Mongolia embarked on a path of economic reform embracing all
spheres of political, economic and social life. This transformation has been
dramatic. The country has faced new social problems, such as unemployment,
poverty, declines in literacy and diminished access to education and health
services, that were mostly absent during the socialist rule. It is difficult to believe
that those changes have not affected Mongolian women’s childbearing behaviour.
Among the major reasons for the rapid decline in fertility in the 1990s, previous
work identified the negative impact of the economic transition on families and
family formation, and the changes in the population policy. The measures
recommended by the new population policy were outlined in the health law, which
was amended at the end of 1989. The amended health law, stating that a woman
had the right to decide about motherhood herself, fully legalized abortion and the
use of contraceptives. The new population policy removed all restrictions on the
use, distribution and import of contraceptives. With the exception of a continuing
prohibition on vasectomies, the last restrictions were lifted in 1989 and oral
contraceptives became available. By the end of 1989, abortion was fully legalized
to supplement the family planning policy with regard to women’s physiological
and mental health. This policy allowed every woman to have an induced abortion if
she did not want to carry on with the pregnancy.
The fall in fertility was substantial during the non-pronatalist policy period,
especially during 1989-1993 when the country also experienced an economic
collapse. Between 1990 and 1995, fertility declined dramatically in all age groups,
whereas in the period 1995-2000 there was a steep drop in the fertility of all age
groups with the exception of a noticeable decrease in the age group 20-24 (see
figure 2).
92 Asia-Pacific Population Journal, Vol. 23, No. 2

The transition to a market economy shaped the nature of women’s
employment opportunities. The unemployment rates of women were higher than
those of men, and the difference has remained within the range of 6 to 10 per cent.
The employment status of women has affected their income and hence their desire
to bear children. Women are important contributors to family income, partly
because two salaries have become essential to maintain a certain basic standard of
living. Though the traditional perception of males as the main breadwinners
remains unchanged, in reality women have been earning substantial incomes in
Mongolia in recent years. Besides paid work, women have been engaging in
unpaid work, such as household maintenance, rearing children, caring for
husbands and older persons. In this way, women carry a double burden, which has
a bearing on social reproduction and sustainable human development. Thus, many
factors may account for the falling birth rate since the beginning of the fertility
transition, including economic hardship and vulnerability, and the pressure to
pursue supplementary income sources . This has further decreased men’s
contribution in the home, while also increasing women’s unpaid household and
care work. Other influential factors are the higher costs of rearing children; social
and attitudinal factors, such as women’s education and employment opportunities;
the decline of childcare services; and young women’s attitudes towards marriage.
Summary and discussion
Dramatic fertility declines occurred in Mongolia between the 1960s and the
end of the 1990s, mainly owing to changes in population policies and other social
dimensions. Although still not at a low level, TFR in Mongolia as a whole has
declined from about 8 children per woman to about 2.3 within a span of 38 years.
Findings suggest that a fertility transition is under way in Mongolia and consists of
the following periods: a) pre-transition from 1960 to 1975; b) the onset of
transition in around 1975; and c) transition from 1976 to 1998. The latter itself can
be split into two phases: the socialist period and the market period.
At the beginning of the twentieth century, fertility was low in Mongolia
owing to widespread venereal disease, the adherence of men to religious life, and
high infant mortality. Since the 1950s, the total population of Mongolia has
increased as a result of rising fertility and decreasing mortality. The major part of
the increase in fertility is due to the post-war baby boom. In addition, the increased
participation of women in the labour force, combined with the non-availability of
contraceptives, contributed to shortening the duration of breastfeeding, which
itself may have resulted in increased levels of fertility. Moreover, the introduction
of modern medical services in the country reduced the prevalence of venereal
diseases, which could be a factor behind the fertility rise of the 1950s.
Asia-Pacific Population Journal, August 2008 93

During the 1960s, the two major economic events of collectivization and
industrialization overlapped. The labour supply was then insufficient to
implement huge economic goals in both rural and urban areas. An adequate labour
supply, to be achieved ultimately through population increase, was considered an
important economic factor and led to the formulation of the pronatalist population
policies. International migration was never considered as a serious alternative or a
complement to high fertility. From the beginning of the 1960s, Mongolia
implemented a strong pronatalist policy based on the restriction of import,
distribution and use of modern contraceptives, as well as on strict regulations of
abortions and sterilizations. The pronatalist policy had several components
encouraging women to bear many children. The availability and use of modern
contraceptives were severely limited during that period. Marriage was universal
and women were married at earlier ages. Abortion was strictly prohibited by law.
The population policy played an important role in increasing the fertility level of
Mongolian women during this period. Moreover, people at the time were more
homogenous in terms of social class, and the exchange of information or ideas
took place mostly within small communities.
As the economy developed in the 1970s and 1980s, the population increased,
the society grew more differentiated and people came to have less in common.
There were dramatic improvements in the level of women’s education and in their
participation in the labour force. The population became increasingly divided
along occupational, educational and regional lines. Consequently, social
interactions differed among people. Socio-economic development, including
women’s education and labour force participation, might have been the main
cause of the onset of the fertility decline.
Meanwhile, high levels of infant and maternal mortality imposed pressure on
the Government to revisit its population policy. In 1976, the first attempt was made
to provide family planning and, in 1988, the existing family planning services were
expanded and modifications were introduced in the abortion law. Thus, the fertility
decline from 1976 to 1989 was driven mainly by the relaxation of the pronatalist
policy, which initially gave Mongolian women limited access to contraception and
abortion services. Female education and female labour force participation, plus the
lack of development of consumer industries, might have been influential factors
that resulted in women limiting their childbearing from the mid-1970s up to 1989.
The shift from a centrally planned economy to a market-driven economy in
1989-1998 made the childbearing behaviour of Mongolian women similar to that
of women in other former socialist countries. Almost all Governmental incentives
to bear children were removed. By the end of 1989, abortion was fully legalized
94 Asia-Pacific Population Journal, Vol. 23, No. 2
and all restrictions on the use, distribution and import of contraceptives were
removed. Delayed marriage, the increased use of contraception and abortion and,
consequently, women’s intention to have fewer children became important
features of fertility changes in 1989-1998. In that period, fertility declined
abruptly.
Mongolia has a reverse gender gap in education which means higher
enrolment rates in education for girls than for boys. This gap increased over the
first half of the transition period and narrowed thereafter. The reverse gender gap
for children of herder families is higher than the national average. Parents tend to
assume that boys can do any type of job and sustain their lives, while girls may not
be able to do so. They also assume that education is the only avenue for girls’
economic security and opportunity, whereas for boys, the livestock sector and
business is viewed as offering the most opportunities. At the tertiary level of
education, female enrolment rates fell in the first half of the transition period and
increased again more recently. Educational opportunities for girls have become
dependent on parents’ ability and willingness to pay the related fees, and only
higher income families can afford these fees.
The reasons behind the abrupt decline in fertility in 1989-1998 were
inadequate parental incomes, the disappearance of many social services and
people’s developing awareness of individualism and self-fulfilment.
In sum, one can conclude that the most relevant determinants of the fertility
decline in Mongolia were the use of modern contraceptives and abortion services
and changes in marriage patterns. Changes in the population policy ruled the
availability of modern contraceptives and abortion services, which in turn affected
the changes in fertility level in 1960-1998. Further in-depth quantitative
investigation is required to examine underlying factors of fertility changes in
Mongolia from the onset of the fertility decline.
It is projected that fertility will continuously decline in Mongolia albeit at a
slower rate, and TFR is expected to fall from 2.4 to 1.8 children per woman during
the period 2000-2025. This decline will have a considerable impact on population
growth, hence on the structure of the population. It is likely that Mongolia, like
most East Asian countries, will face the ageing phenomenon and its various
implications. On policy grounds, the decline in fertility can easily exert profound
effects on many socio-economic issues in Mongolia, such as education, health
care, housing, immigration, retirement protection, business opportunities and
saving behaviours. Those effects will become more prominent in Mongolia when
the country’s fertility rates approach the replacement level, which is roughly equal
to 2.1 children per women.
Asia-Pacific Population Journal, August 2008 95
Acknowledgement
The author would like to thank Ian Diamond, Zoe Matthew, Jane
Falkingham, Tomas Frejka, Timothy Heleniak and Bhakta Gubhaju for their useful
comments on an early version of this paper, as well as participants at the Population
Association of America conference in Minneapolis, United States.
Endnotes
1 This estimate includes only contraceptives distributed by Government programmes; data on private
access are not included.
2 These data come from a household survey of breastfeeding practices conducted in May 1992 by the
Mongolian Nutrition Research Centre with the cooperation of the Mongolian National Centre for
Children and the United Nations Children’s Fund.
3 Because of the high percentage of women of childbearing age in the labour force, the labour law
contained provisions to protect pregnant women and women with children younger than 1 year of age.
Refusal to employ women, the reduction of their earnings, dismissal because of pregnancy or the
existence of children were all illegal. Pregnant women and mothers with infants were eligible for a
shortened workday and for a transfer to a position involving lighter work. They were not eligible for
night work, overtime or business trips. Women received 45 days’ pregnancy leave and 56 days’ birth
leave. Mothers also could combine maternity leave with annual leave. In addition, they could receive an
additional six months of unpaid leave and retain their jobs. Nursing mothers were granted paid breaks of
up to two hours per day to nurse infants younger than 6 months and one hour to nurse infants from 6 to
12 months. Workplaces with large numbers of female employees were required to provide facilities for
nurseries, for kindergartens, for nursing mothers and infant, and for personal hygiene.
4 The number of births per 1,000 women aged 30-34 in 1979-1984 fell by 22 per cent compared to that
in 1969-1974. Similarly, there was a decrease of 38 per cent for women aged 35-39, and of 9 per cent for
women aged 40-44 for the same time interval.
96 Asia-Pacific Population Journal, Vol. 23, No. 2
References
Aassve, Arnstein and Altankhuyag Gerultuya (2002). “Changing patterns of Mongolian fertility at a
time of social and economic transition”, Studies in Family Planning, vol. 33, No. 2, pp.
165-172.
Academy of Science of Mongolia (1991). Mongolian People’s Republic (Ulaanbaatar, Mongolian State
Printing Company).
Ardiin Ih Khural (1970). Labour Law (Ulaanbaatar, Mongolian State Printing Company).
Bongaarts, John and Griffith Feeney (1998). “On the quantum and tempo of fertility”, Population and
Development Review, vol. 24, No. 2, pp. 271-291.
Bulganchimeg, B. and C. Oyun (2001). Unwanted Pregnancies and Abortions in Mongolia
(Ulaanbaatar, National Centre for Health Development of Mongolia and United Nations
Population Fund in Mongolia).
Cleland, John and Christopher Wilson (1987). “Demand theories of the fertility transition: an
iconoclastic view”, Population Studies, vol. 41, No. 1, pp. 5-30.
Frejka, Tomas (1980). “Fertility trends and policies: Czechoslovakia in the 1970s”, Population and
Development Review, vol. 6, No. 1, pp. 65-93.
Gansukh, P. (2000). Mongolian Population Management (Ulaanbaatar, Munkhiin Useg Printing
Company Ltd).
Gereltuya, A. (2003). “Analysis of fertility changes in Mongolia with respect to changes in population
policies and determinants of fertility”.
Heitlinger, A. (1976). “Pro-natalist population policies in Czechoslovakia”, Population Studies, vol.
30, No. 1, pp. 123-135.
Jav, B. and I. Davaadorj (1994). Contraceptive Knowledge, Attitude and Practice (Ulaanbaatar,
Mongolian State Printing Company).
Kohler, Hans-Peter, Francesco C. Billari, and Jose Antonio Ortega (2002). “The emergence of
lowest-low fertility in Europe during the 1990s”, Population and Development Review, vol.
28, No. 4, pp. 641-680.
Luther, N. and R. Retherford (1988). “Consistent correction of census and vital registration data”,
Mathematical Population Studies, vol. 1, No. 1, pp. 1-20.
Asia-Pacific Population Journal, August 2008 97
Mongolia (1993). Mongolia’s National Programme of Action for the Development of Children in the
1990s (Ulaanbaatar, Mongolian State Printing Company).
_______ (1994). Report on Population and Development (Ulaanbaatar, Mongolian State Printing
Company).
Mongolia, Ministry of Health and Social Welfare (1991). Analysis of Maternal and Child
Health/Family Planning Data (Ulaanbaatar, Mongolian State Printing Company).
_______ (2002). Health Situation, Statistical and Policy Report, Mongolia (Ulaanbaatar, Ministry of
Health and Social Welfare).
Mongolia, Ministry of Health and Social Welfare, United Nations Population Fund (UNFPA), AVSC
International (2000). Report on a Situation Analysis Study of Mongolian Reproductive
Health Services Conducted by Staff of the Ministry of Health and Social Welfare, UNFPA
and AVSC International on March 9-27, 1998 (Ulaanbaatar, Ministry of Health and Social
Welfare, UNFPA in Mongolia and AVSC International).
Mongolia, National Statistical Office (1994). Population of Mongolia (Ulaanbaatar, Esen Erdene Ltd.).
_______(1999). Mongolia: Reproductive Health Survey 1998 (Ulaanbaatar, Admon Printing
Company, Ltd.)
_______ (2000). Statistical Yearbook (Ulaanbaatar, Admon Printing Company, Ltd).
_______ (2001). 2000 Population and Housing Census: Administrative Report Vol. 1 (Ulaanbaatar,
Printing Company of the National Statistical Office of Mongolia).
Mongolian National University (1996). Report of the Second Demographic Survey, Mongolia
(Ulaanbaatar, Mongolian National University).
Mongolian Parliament (1992). Mongolian Constitution (Ulaanbaatar, Mongolian State Printing
Company).
_______ (1996). Resolution on Population Policy Programme of Mongolia (Ulaanbaatar, Mongolian
State Printing Company).
_______ (1999). Family Law of Mongolia (Ulaanbaatar, Mongolian State Printing Company).
Neupert, Ricardo F. (1992). “Mongolia: recent demographic trends and implications”, Asia-Pacific
Population Journal, vol. 7, No. 4, pp. 3-24.
98 Asia-Pacific Population Journal, Vol. 23, No. 2

_______ (1996). Population Policies, Socioeconomic Development and Population Dynamics in
Mongolia (Canberra, Research School of Social Sciences, Australian National University).
Pandey, R. N. (1997). “Knowledge, attitude and practice of family planning in Mongolia”,
Demography India, vol. 26, No. 1, pp. 79-92.
_______ (2002). “The use of induced abortion as a contraceptive: the case of Mongolia”, Journal of
Biosocial Science, vol. 34, No. 1, pp. 91-108.
UNFPA (1994). Demographic Analysis of Mortality in Mongolia (Ulaanbaatar, UNFPA in Mongolia).
Asia-Pacific Population Journal, August 2008 99

Guidelines for contributors
Original contributions areinvited, especially papers by authorsfrom or familiar with the Asian andPacific region. Ideally, such paperswould discuss the policy and/orprogramme implications ofpopulation issues and solutions toproblems and report on experiencesfrom which others could benefit.
All material submitted for theconsideration of the Editorial Boardshould be in the English language.The paper should not exceed 7,000words, including tables, figures,references and other material. Itshould include a short abstract (100to 200 words) of the issues addressedand the most important findings. Themanuscript should be prepared inone of the major word-processingprograms and be double-spaced. Themargins should be at least 3 cm(roughly 1 in) wide, preferably morefor the left-hand margin. If possible,please submit the manuscript as ane-mail attachment to the addressgiven below. If e-mail attachment isnot possible, send a hard-copy (asingle-sided print copy on A4-sizedpaper), together with an e-file of thetext on CD-ROM or floppy disc.
A complete list of referencesarranged alphabetically by authorshould also be included at the end of
the manuscript together with a fewkeywords. Please refer to examplesin any issue of the Journal. Figuresand tables should be suppliedseparately either as e-mailattachments or in the e-file,preferably in Microsoft� Excel� orany major spreadsheet programme.
Manuscripts are accepted on theunderstanding that they may beedited. Contributors should submitonly material that has not previouslybeen published or submitted forpublication elsewhere; and theyshould so state in their coveringletter.
A brief introduction about theauthor(s)including title andaffiliations, should also besubmitted.
All manuscripts will be submittedto peer review. The name(s) of theauthor(s) or other identifyinginformation should therefore be placedonly on the title page in order topreserve anonymity.
Manuscripts may be sent by e-mailto the Editor, APPJ, [email protected]; or byairmail post to Editor, APPJ. SocialDevelopment Division, ESCAP,United Nations Building,Rajadamnern Nok Avenue, Bangkok10200, Thailand.
Asia-Pacific Population Journal

United Nations publication
Sales No. E.08.II.F.98
Copyright�United Nations 2008
All rights reserved
Manufactured in Thailand
ISBN: 978-92-1-120-558-9
Copyright © 2022 FDOKUMEN