ASHOK LEYLAND - JMFL Research Portal
15
21 April 2020 INDIA | AUTOMOBILES | RATING UPGRADE ASHOK LEYLAND Best play on the CV cycle Structural shift towards Tractor Trailers Focus on LCV & modular manufacturing Limited impact from DFC
-
Upload
khangminh22 -
Category
Documents
-
view
0 -
download
0
Transcript of ASHOK LEYLAND - JMFL Research Portal

21 April 2020
INDIA | AUTOMOBILES | RATING UPGRADE
ASHOK LEYLANDBest play on the CV cycle
Structural shift towards Tractor Trailers
Focus on LCV & modular manufacturing
Limited impact from DFC

21 April 2020
INDIA | AUTOMOBILES | RATING
UPGRADE
T ABLE OF CONTENTS
Investment Rationale 3
Analysis of past cycles 4
Replacement demand 5
Margin trajectory of AL during cycles 6
Dedicated Freight Corridors 6
MHCV (Goods) segments 7
Structural story of Tractor Trailers (TTs) 8
AL’s focus on LCVs 10
Valuation & Risks 11
RECENT REPORTS
BARBARIANS AT THE
GATE? Shared Mobility India used car report The 20/20 view Rural Safari X
JM Financial Institutional Securities Limited Page 2

21 April 2020
INDIA | AUTOMOBILES |RATING UPGRADE
Ashok Leyland
Best play on the CV cycle
LCV business and modular manufacturing: Despite an industry decline of 21% in FY20, AL was able to increase its market share
from 9% to 10% in LCV (Goods) driven by positive traction witnessed in the sales of ‘Partner’ and market share gain in 2-3.5T segment (now at 18% ahead of TTMT at 15%). The management remains focused on LCV business and plans to further de-risk its portfolio through introduction of LCVs in 3-6T segment (Exhibit 17). The new LCV in the segment, code named project ‘Phoenix’, is likely to aid volume growth for the company. The company also remains focused on reducing overheads and plans to introduce a modular manufacturing programme in FY21. The new modular
manufacturing programme would provide support to margins during the down-turn and is likely to aid margins thereafter.
On Tractor Trailers (TTs) & limited impact from DFC: Globally, TTs enjoy high share within HCVs (>16.2T): USA (90%), Brazil (80%), Europe (60%), Russia (60%) and China (44%). Although there has been a significant increase in share of TTs (within HCVs) in the
domestic market, India’s TT to HCV ratio is still low at 27% and has significant room to catch-up. AL is the market leader in TTs with 51% market share and remains the best play on the structural
shift. Basis a broad analysis, the upcoming Western and Eastern
Dedicated Freight Corridors (WDFC and EDFC) is likely to have a worst case impact of c.15,000 units or c.1,250 units p.m. on MHCV (Goods).
Recommendation and Price Target
Medium and heavy commercial vehicle (MHCV – Goods)
industry is cyclical in nature and usually follows a set pattern
of 3-5 years of up-cycle and 2 years of down-cycle. The previous up-cycle lasted from FY14 to FY19, posting a volume CAGR of 17%. Following the historical trends, FY20
and FY21 are likely to be the two down-cycle years for the industry. While bulk of the decline has already played out
during FY20, owing to COVID-19, we expect another round of moderate decline in FY21. As each of the previous cycles
have witnessed a peak-to-peak volume growth of 15-25%, the expected recovery from FY22 offers a long runway of
growth with volume CAGR of at least 20%.
What is a good time to BUY AL? Tracking the CV cycle and stock returns of AL, we found that the return profile
changes materially if accumulated during the down-cycle vs. the first year of volume recovery. We estimate revenue
growth of 12% CAGR and EBITDA growth of 45% CAGR over FY20-22E, driven by a sales up-cycle and margin
expansion. The EBITDA estimates have been reduced by
46%/24% for FY21E/F22E to factor in near-term volume pressures. The target price of INR 70 (INR 85 earlier) is based
on 14x FY22E EPS and INR 7 contribution from Hinduja Leyland Finance (1x FY22 BV and 30% holding company
discount). We UPGRADE the stock to a BUY rating.
Recommendation and Price Target Financial Summary (INR mn)
Current Reco BUY Y/E March FY18A FY19A FY20E FY21E FY22E
Previous Reco HOLD Sales 263,564 290,550 169,589 163,731 214,434
Current Price Target 70 Sales growth (%) 30.9% 10.2% -41.6% -3.5% 31.0%
Upside/(Downside) 58.7% EBITDA 29,635 31,357 11,464 11,737 23,946
Previous Price Target 85 EBITDA (%) 11.2% 10.8% 6.8% 7.2% 11.2%
Change -17.6% Adjusted net profit 17,462 20,407 3,823 3,485 12,692
Diluted EPS (INR) 6.0 7.0 1.3 1.2 4.3
Key Data – AL IN Diluted EPS Growth (%) 8.9% 16.5% -81.3% -8.8% 264.2%
Current Market Price INR44 ROIC (%) 84.1% 93.9% 8.9% 9.2% 37.2%
Market cap (bn) INR129.5/US$1.7 ROE (%) 26.1% 26.2% 4.8% 4.8% 18.2%
Free Float 57% PE (x) 8.0 6.9 36.9 40.4 11.1
Shares in issue (mn) 205.0 2,845.9 Price/Book Value (x) 1.9 1.7 1.9 2.1 2.0
Diluted share (mn) 205.0 2,935.1 EV/EBITDA (x) 4.5 4.0 13.0 13.4 6.6
3-mon avg daily val (mn) NA INR2,020.0/US$26.3 Dividend Yield (%) 5.1% 6.5% 6.5% 6.5% 6.5%
52-week range 347/250 96/34 Source: Company data, JM Financial. Note: Valuations as of 21 April 2020
Sensex/Nifty 38,095/11,462 30,637/8,981
INR/US 68.5 76.8
JM Financial Research is also available on: Bloomberg - JMFR <GO>, Thomson Publisher & Reuters, S&P Capital IQ,
FactSet & Visible Alpha
You can also access our portal: www.jmflresearch.com Please see Appendix I at the end of this report for Important Disclosures and Disclaimers and Research Analyst
Certification.
Price Performance
% 1M 6M 12M
Absolute 0.3 -43.1 -53.9
Relative* -2.0 -27.0 -41.2
*To the BSE Sensex
Vivek Kumar [email protected] Tel: (91 22) 66303019
Jayesh Chandra Gupta [email protected] Tel.(91 22) 66303054
Nitinn Aggarwala [email protected] Tel: (91 22) 66303125
JM Financial Institutional Securities Limited Page 3

Ashok Leyland 21 April 2020
JM Financial Institutional Securities Limited Page 4
Analysis of past 3 MHCV (Goods) cycles
In a little over 15 years, we have witnessed three MHCV (Goods) cycles. Our analysis of these
three cycles highlights that a typical up-cycle lasts 3-5 years. The up-cycle is usually followed
by a 2-year down-cycle where both volumes and margins contract c.50%. After the global
financial crisis (GFC) between FY09 and FY12, monthly sales of MHCV (Goods) doubled from
12,000 to 25,000 as large operators increased their fleet sizes, driven by a rise in demand.
However, the economic slowdown that started in FY12-13, led to lower fleet utilisation and
lowering of freight charges, impacting operators’ vehicle loan repayment capacities. This led
to a collapse in monthly sales from 25,000 to 13,500 (FY12 to FY14). Towards the end of
FY14, economic growth ramped up, supported by a change in government at the Centre. As
a result, replacement demand for 1 million vehicles sold during FY09-12 started to kick in and
continued until FY20, leading to a 120% increase from FY14 to FY19 (monthly run-rate of
13,500 became 29,200 during these years). Following the pattern of the previous cycles,
FY20 and FY21 are likely to represent the two down-cycle years for MHCV (Goods). FY20 has
already seen a sharp drop of 47% YoY in volume and COVID-19 may lead to a double-digit
correction in FY21. The question remains: Are we near the trough of the cycle? If yes, when
would the next peak be and how much volume can we anticipate?
MHCV (Goods) cycle, represented in ‘000 units per month Exhibit 1.
Source: JM Financial, SIAM
Peak to Peak and Trough to Trough sales growth of MHCV (Goods) (on a per month basis) Exhibit 2.
Source: JM Financial, SIAM
8
11
14 15
21 20
12
17
23 25
18 13
16
22 21
25
29
15
14
-
5
10
15
20
25
30
35
FY0
3
FY0
4
FY0
5
FY0
6
FY0
7
FY0
8
FY0
9
FY1
0
FY1
1
FY1
2
FY1
3
FY1
4
FY1
5
FY1
6
FY1
7
FY1
8
FY1
9
FY2
0
FY2
1e
Th
ou
san
ds
4yr. growth of 160%
3yr. growthof 100%
5yr. growth of 120%2yr.
declineof 40%
2yr. declineof 46%
Possible2yr declineof 53%
8
11
14 15
21
20
12
17 23
25
18
13
16
22 21 25
29
15 14
-
5
10
15
20
25
30
35
FY0
3
FY0
4
FY0
5
FY0
6
FY0
7
FY0
8
FY0
9
FY1
0
FY1
1
FY1
2
FY1
3
FY1
4
FY1
5
FY1
6
FY1
7
FY1
8
FY1
9
FY2
0
FY2
1e
Th
ou
san
ds
Peak to Peak increase of 21%Peak to Peak increase of 17%
Trough to Trough increase of 10%Trough to Trough increase of c.5%
Summary of findings
MHCV (Goods): 3-5 year up-cycle and 2-
year down-cycle.
In each up-cycle, volumes expand 100-
160% from the trough to peak and a
typical down-cycle over 2 years see a
c.50% correction.
In FY20, we saw a 47% decline, so an
additional 10-15% decline in FY21 is
possible.
Hence, between FY21 and FY24, we can
see volumes rebound by c.150% (from
14,000 p.m. to 35,000 p.m., excluding the
impact of DFCs).

Ashok Leyland 21 April 2020
JM Financial Institutional Securities Limited Page 5
Next possible up-cycle between FY21 to FY24; Assumptions: a) FY21 bottoms at 14,000 units p.m., b) FY24 peaks in the range of Exhibit 3.33,000-35,000 p.m. basis 15-20% peak to peak growth between FY19 and FY24
(‘000 units p.m.) FY19 FY20e FY21e FY22e FY23e FY24e
MHCV (Goods) sales p.m. 29 15 14 18 27 35
%YoY 15% -47% -10% 30% 50% 30%
Source: JM Financial, SIAM
Past MHCV (Goods) cycles hint towards 30-50%YoY growth during recovery years Exhibit 4.
Year MHCV (Goods) %YoY
FY03 95,732 NA
FY04 136,839 43%
FY05 172,871 26%
FY06 179,346 4%
FY07 246,835 38%
FY08 235,620 -5%
FY09 147,724 -37%
FY10 201,462 36%
FY11 275,408 37%
FY12 299,236 9%
FY13 221,776 -26%
FY14 161,791 -27%
FY15 195,366 21%
FY16 258,488 32%
FY17 255,267 -1%
FY18 304,664 19%
FY19 351,012 15%
FY20 185,000 -47%
Source: JM Financial, SIAM
Replacement demand- An early indication of a sales uptick
One of the key drivers of the MHCV cycle is replacement demand. As per industry experts, a
first-hand MHCV changes hands from the first to second owner in c.8 years. Also, as
replacement demand (as a % of total sales) inches towards 80%, the cycle reaches close to
its trough. 80% replacement demand indicates purchase by existing players who must
replace to cater to the existing business and no new players are buying MHCVs. We saw
MHCV replacement share of c.78% in FY14, which marked the bottom of the cycle. As per
our analysis and past data, it seems that FY20 volumes were totally driven by replacement
demand from previous years, as 70% of replacement sales from FY12 are equal to total
MHCV (Goods) sales in FY20.
Trend of annual MHCV (Goods) sales and likely share of replacement demand Exhibit 5.
FY11 FY12 FY13 FY14 FY15 FY16 FY17 FY18 FY19 FY20
MHCV (goods) sales 275,408 299,236 221,776 161,791 195,366 258,488 255,267 304,664 351,012 185,000
% growth 37% 9% -26% -27% 21% 32% -1% 19% 15% -47%
Replacement demand 67,012 95,787 1,21,010 1,25,542 1,72,785 1,64,934 1,03,407 1,41,023 1,92,786 2,09,465
% of sales 24% 32% 55% 78% 88% 64% 41% 46% 55% c.100%
Source: JM Financial, SIAM
‚Typically, replacement demand comprises
30%-40% of the market but in the last
two years it’s been 60-70%‛
Mr. Pisharody, ex-ED, Tata Motors, Sep’16
‚Typically the operating life of vehicle is 15
years and after 8-9 years the vehicle goes
to the second owner‛
Setco Automotive Company Management,
4Q18 Conference call.
Replacement demand is c.70% of sales from 8 years ago
Ashok Leyland 21 April 2020
JM Financial Institutional Securities Limited Page 6
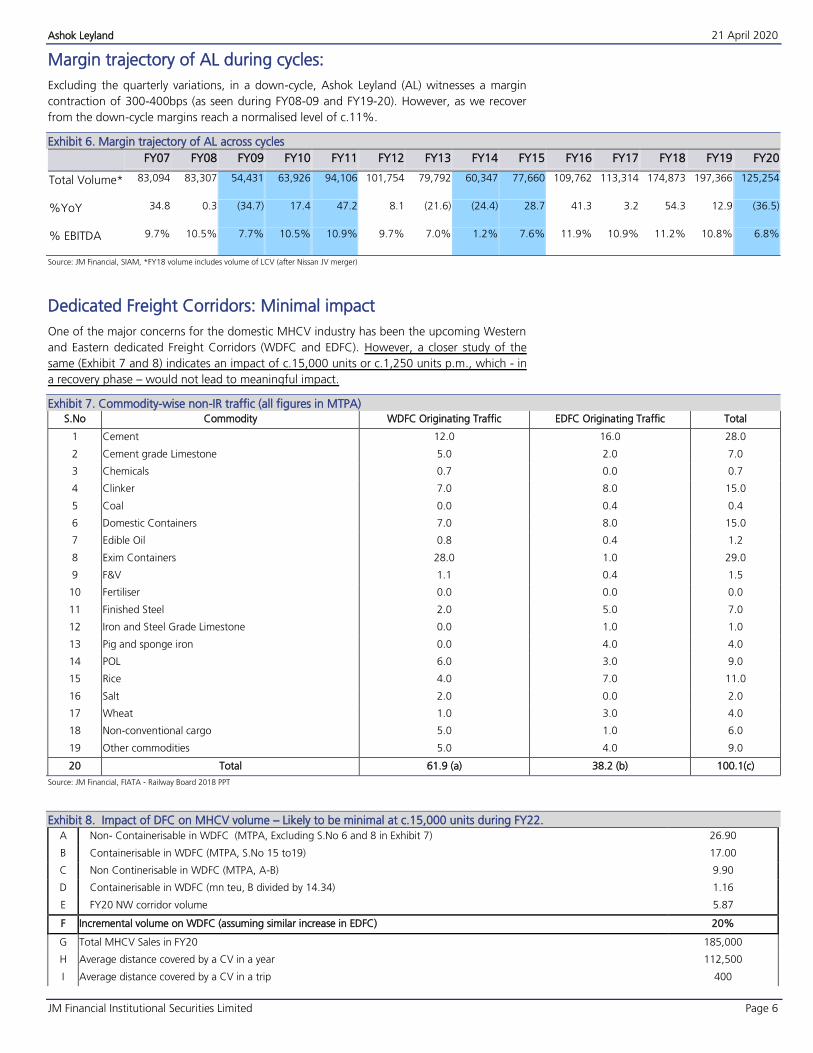
Margin trajectory of AL during cycles:
Excluding the quarterly variations, in a down-cycle, Ashok Leyland (AL) witnesses a margin
contraction of 300-400bps (as seen during FY08-09 and FY19-20). However, as we recover
from the down-cycle margins reach a normalised level of c.11%.
Margin trajectory of AL across cycles Exhibit 6.
FY07 FY08 FY09 FY10 FY11 FY12 FY13 FY14 FY15 FY16 FY17 FY18 FY19 FY20
Total Volume* 83,094 83,307 54,431 63,926 94,106 101,754 79,792 60,347 77,660 109,762 113,314 174,873 197,366 125,254
%YoY 34.8 0.3 (34.7) 17.4 47.2 8.1 (21.6) (24.4) 28.7 41.3 3.2 54.3 12.9 (36.5)
% EBITDA 9.7% 10.5% 7.7% 10.5% 10.9% 9.7% 7.0% 1.2% 7.6% 11.9% 10.9% 11.2% 10.8% 6.8%
Source: JM Financial, SIAM, *FY18 volume includes volume of LCV (after Nissan JV merger)
Dedicated Freight Corridors: Minimal impact
One of the major concerns for the domestic MHCV industry has been the upcoming Western
and Eastern dedicated Freight Corridors (WDFC and EDFC). However, a closer study of the
same (Exhibit 7 and 8) indicates an impact of c.15,000 units or c.1,250 units p.m., which - in
a recovery phase – would not lead to meaningful impact.
Commodity-wise non-IR traffic (all figures in MTPA) Exhibit 7.
S.No Commodity WDFC Originating Traffic EDFC Originating Traffic Total
1 Cement 12.0 16.0 28.0
2 Cement grade Limestone 5.0 2.0 7.0
3 Chemicals 0.7 0.0 0.7
4 Clinker 7.0 8.0 15.0
5 Coal 0.0 0.4 0.4
6 Domestic Containers 7.0 8.0 15.0
7 Edible Oil 0.8 0.4 1.2
8 Exim Containers 28.0 1.0 29.0
9 F&V 1.1 0.4 1.5
10 Fertiliser 0.0 0.0 0.0
11 Finished Steel 2.0 5.0 7.0
12 Iron and Steel Grade Limestone 0.0 1.0 1.0
13 Pig and sponge iron 0.0 4.0 4.0
14 POL 6.0 3.0 9.0
15 Rice 4.0 7.0 11.0
16 Salt 2.0 0.0 2.0
17 Wheat 1.0 3.0 4.0
18 Non-conventional cargo 5.0 1.0 6.0
19 Other commodities 5.0 4.0 9.0
20 Total 61.9 (a) 38.2 (b) 100.1(c)
Source: JM Financial, FIATA - Railway Board 2018 PPT
Impact of DFC on MHCV volume – Likely to be minimal at c.15,000 units during FY22. Exhibit 8.
A Non- Containerisable in WDFC (MTPA, Excluding S.No 6 and 8 in Exhibit 7) 26.90
B Containerisable in WDFC (MTPA, S.No 15 to19) 17.00
C Non Continerisable in WDFC (MTPA, A-B) 9.90
D Containerisable in WDFC (mn teu, B divided by 14.34) 1.16
E FY20 NW corridor volume 5.87
F Incremental volume on WDFC (assuming similar increase in EDFC) 20%
G Total MHCV Sales in FY20 185,000
H Average distance covered by a CV in a year 112,500
I Average distance covered by a CV in a trip 400

Ashok Leyland 21 April 2020
JM Financial Institutional Securities Limited Page 7
J Number of trips completed by 1 CV in a year 281
K Average capacity of a CV (Tonnes) 24
L Total carrying capacity of a CV in a year (J*K) 6,750
Impact on MHCV (Goods) annual volume – Assuming: a) complete movement of non-IR WDFC and EDFC originating traffic to railways
and, b) commissioning of DFC towards FY21 end, hence impact on FY22.
M Estimated number of MHCV (Goods) displaced (S.No 20 (c) from Exhibit 7 divided by L) 14,800
N Incremental growth wiped-out (M divided by MHCV Goods FY21e of 166,500) 8.9%
Source: JM Financial
MHCV (Goods) segments
MHCV (Goods) consists of 6 segments basis tonnage capacity (as highlighted in exhibit 9).
While Tractor Trailers>35T continued to gain market share from FY14 to FY18,
implementation of new axle load norms affected its share, leading to shift towards lower
tonnage vehicles (esp. 7.5-12T).
Increasing share of 7.5-12T segment driven by new axle load norms; Temporary reversal of share gains for TT>35T Exhibit 9.
Source: JM Financial, SIAM
Tonnage-wise classification under MHCV goods and specific usage Exhibit 10.
MHCV goods (tonne) Sectors applicable to Some models
1 7.5-12 Agriculture, FMCG, Industrial goods; Mining and
construction (tippers)
AL: Guru 1111, Ecomet 1012/T, Boss 913/1113
EIM: 1110XP, 1090, 1059XP
2 12-16.2 Agriculture, FMCG, Industrial goods; Mining and
construction (tippers)
AL: Boss 1213/1413, Ecomet 1212/T, 1214
EIM: 1114
3 16.2-25 4X2 Haulage: Agriculture, FMCG & Industrial goods AL: 1618; TTMT: LPK 1618; BharatBenz: 1623C
4X2 Tippers: mining & construction AL: 1618 T/C
4 >25
Long Haul: Multi axle vehicles (Agriculture, FMCG, Industrial goods)
AL: 3718 (Lift Axle), 3118; TTMT: 3718 (Lift Axle), 2523, 3123
Mining & Construction: Multi-axle tippers AL: 3118 Tipper, 2518; TTMT: 2528T
5 TT 26.4-35 Container, steel, cement and auto transportation AL: 3518, U3518; TTMT: 3518.S (Signa)
6 TT> 35
Container transportation: Reefer & dry
AL: 4923, 4019 ; TTMT: 4923S, 4018S Steel transportation
Cement bulk carriers
Auto carriers
Source: JM Financial
26%19% 17% 17% 19% 22%
29%
20%
17% 17% 18% 12%12%
16%
27%
26%22% 25%
18%22%
23%
19%
24%24% 20%
24%24%
17%
3%3%
3% 6%
4%2%
3%
6% 11% 16% 15%23% 18% 12%
FY14 FY15 FY16 FY17 FY18 FY19 FY20
7.5-12 12-16.2 16.2-25 >25 TT 26.4-35 TT>35
Ashok Leyland 21 April 2020
JM Financial Institutional Securities Limited Page 8
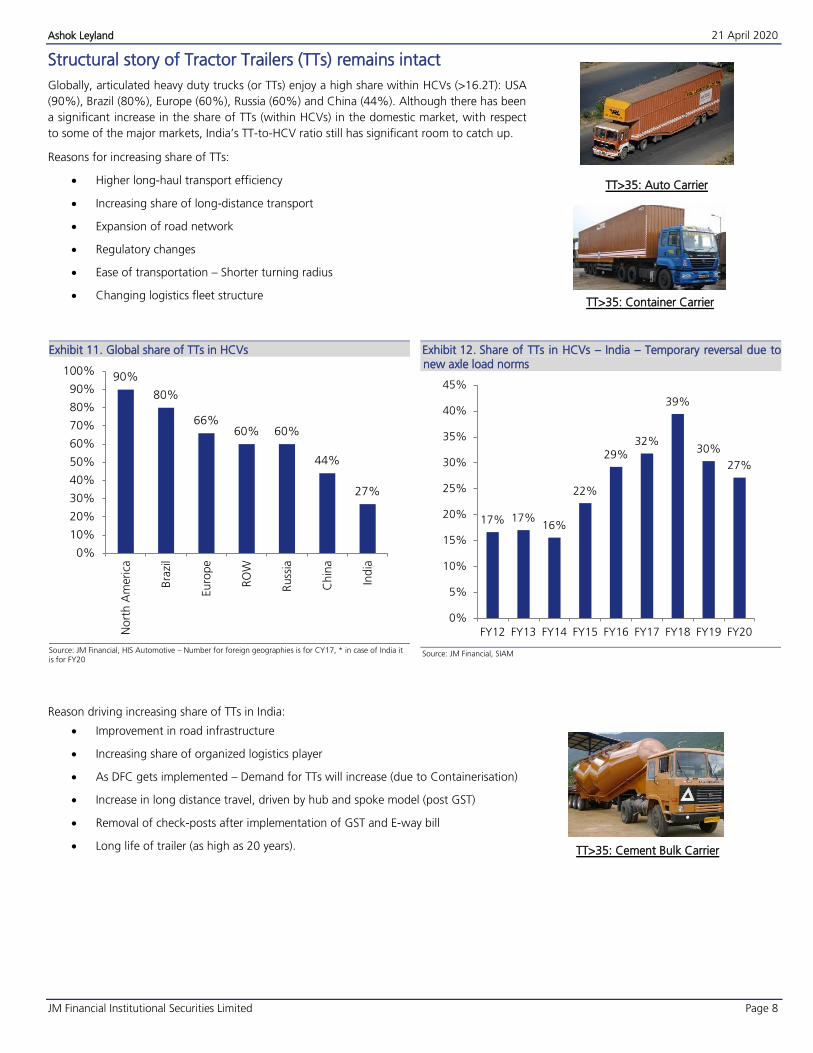
Structural story of Tractor Trailers (TTs) remains intact
Globally, articulated heavy duty trucks (or TTs) enjoy a high share within HCVs (>16.2T): USA
(90%), Brazil (80%), Europe (60%), Russia (60%) and China (44%). Although there has been
a significant increase in the share of TTs (within HCVs) in the domestic market, with respect
to some of the major markets, India’s TT-to-HCV ratio still has significant room to catch up.
Reasons for increasing share of TTs:
Higher long-haul transport efficiency
Increasing share of long-distance transport
Expansion of road network
Regulatory changes
Ease of transportation – Shorter turning radius
Changing logistics fleet structure
Global share of TTs in HCVs Exhibit 11.
Source: JM Financial, HIS Automotive – Number for foreign geographies is for CY17, * in case of India it is for FY20
Share of TTs in HCVs – India – Temporary reversal due to Exhibit 12.new axle load norms
Source: JM Financial, SIAM
Reason driving increasing share of TTs in India:
Improvement in road infrastructure
Increasing share of organized logistics player
As DFC gets implemented – Demand for TTs will increase (due to Containerisation)
Increase in long distance travel, driven by hub and spoke model (post GST)
Removal of check-posts after implementation of GST and E-way bill
Long life of trailer (as high as 20 years).
90%
80%
66%60% 60%
44%
27%
0%
10%
20%
30%
40%
50%
60%
70%
80%
90%
100%
Nort
h A
meri
ca
Bra
zil
Euro
pe
RO
W
Russ
ia
Chin
a
Ind
ia
17% 17%16%
22%
29%32%
39%
30%
27%
0%
5%
10%
15%
20%
25%
30%
35%
40%
45%
FY12 FY13 FY14 FY15 FY16 FY17 FY18 FY19 FY20
TT>35: Auto Carrier
TT>35: Container Carrier
TT>35: Cement Bulk Carrier

Ashok Leyland 21 April 2020
JM Financial Institutional Securities Limited Page 9
Rigid body trucks- higher turning radius (12.8m) Exhibit 13.
Source: JM Financial
TT – lower turning radius (12.2m) Exhibit 14.
Source: JM Financial
AL remains the market leader in TTs (>26.2T) and the best Exhibit 15.option to play the structural story
Source: JM Financial, SIAM
MHCV (Goods) Market share – AL remains the second Exhibit 16.largest player in MHCV
Source: JM Financial, SIAM
26%31%
36%40%
46%53% 54% 51%
69%65%
61%54% 46%
39% 41%42%
5% 4% 2% 3% 6% 6% 4% 5%
FY13 FY14 FY15 FY16 FY17 FY18 FY19 FY20
AL EIM TTMT Others
23% 23%27% 31% 33% 34% 33%
29%
14% 13%11%
10%11% 11% 11%
14%
57% 59% 57% 55% 51% 51% 52% 53%
6% 6% 5% 4% 4% 4% 4% 5%
FY13 FY14 FY15 FY16 FY17 FY18 FY19 FY20
AL EIM TTMT Others
Ashok Leyland 21 April 2020
JM Financial Institutional Securities Limited Page 10
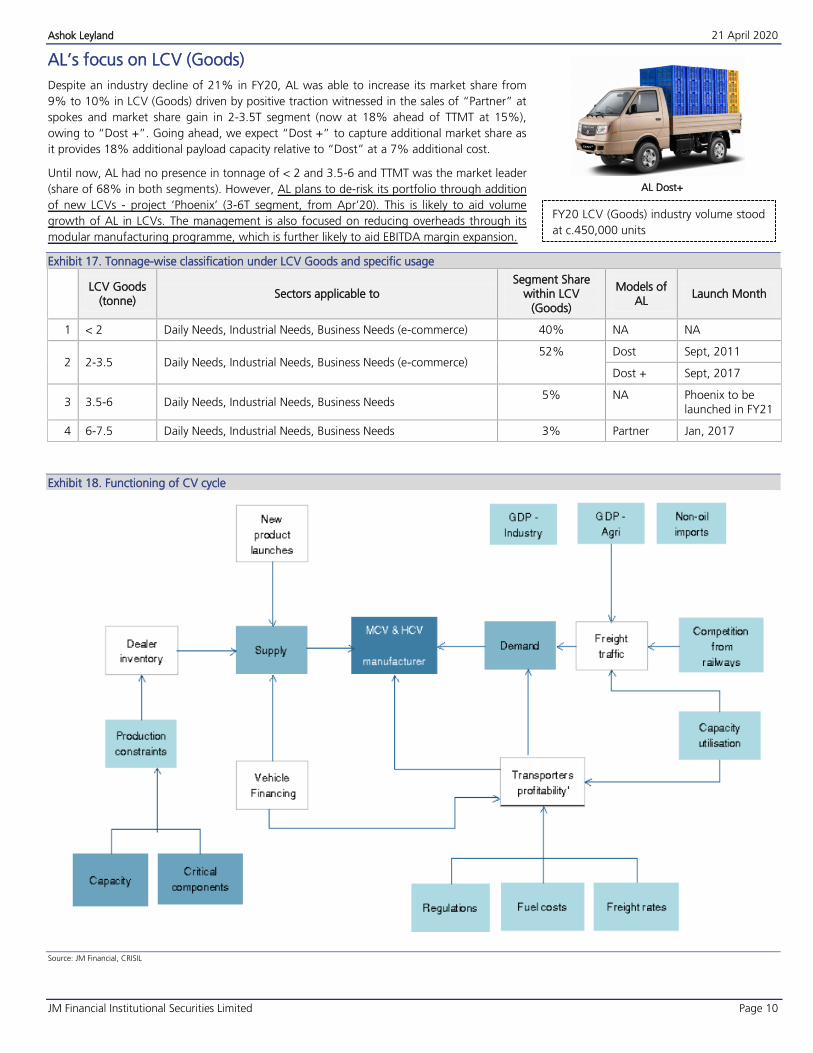
AL’s focus on LCV (Goods)
Despite an industry decline of 21% in FY20, AL was able to increase its market share from
9% to 10% in LCV (Goods) driven by positive traction witnessed in the sales of ‚Partner‛ at
spokes and market share gain in 2-3.5T segment (now at 18% ahead of TTMT at 15%),
owing to ‚Dost +‛. Going ahead, we expect ‚Dost +‛ to capture additional market share as
it provides 18% additional payload capacity relative to ‚Dost‛ at a 7% additional cost.
Until now, AL had no presence in tonnage of < 2 and 3.5-6 and TTMT was the market leader
(share of 68% in both segments). However, AL plans to de-risk its portfolio through addition
of new LCVs - project ‘Phoenix’ (3-6T segment, from Apr’20). This is likely to aid volume
growth of AL in LCVs. The management is also focused on reducing overheads through its
modular manufacturing programme, which is further likely to aid EBITDA margin expansion.
Tonnage-wise classification under LCV Goods and specific usage Exhibit 17.
LCV Goods (tonne)
Sectors applicable to Segment Share
within LCV (Goods)
Models of AL
Launch Month
1 < 2 Daily Needs, Industrial Needs, Business Needs (e-commerce) 40% NA NA
2 2-3.5 Daily Needs, Industrial Needs, Business Needs (e-commerce) 52% Dost Sept, 2011
Dost + Sept, 2017
3 3.5-6 Daily Needs, Industrial Needs, Business Needs 5% NA Phoenix to be
launched in FY21
4 6-7.5 Daily Needs, Industrial Needs, Business Needs 3% Partner Jan, 2017
Functioning of CV cycle Exhibit 18.
Source: JM Financial, CRISIL
AL Dost+
FY20 LCV (Goods) industry volume stood
at c.450,000 units
Ashok Leyland 21 April 2020
JM Financial Institutional Securities Limited Page 11
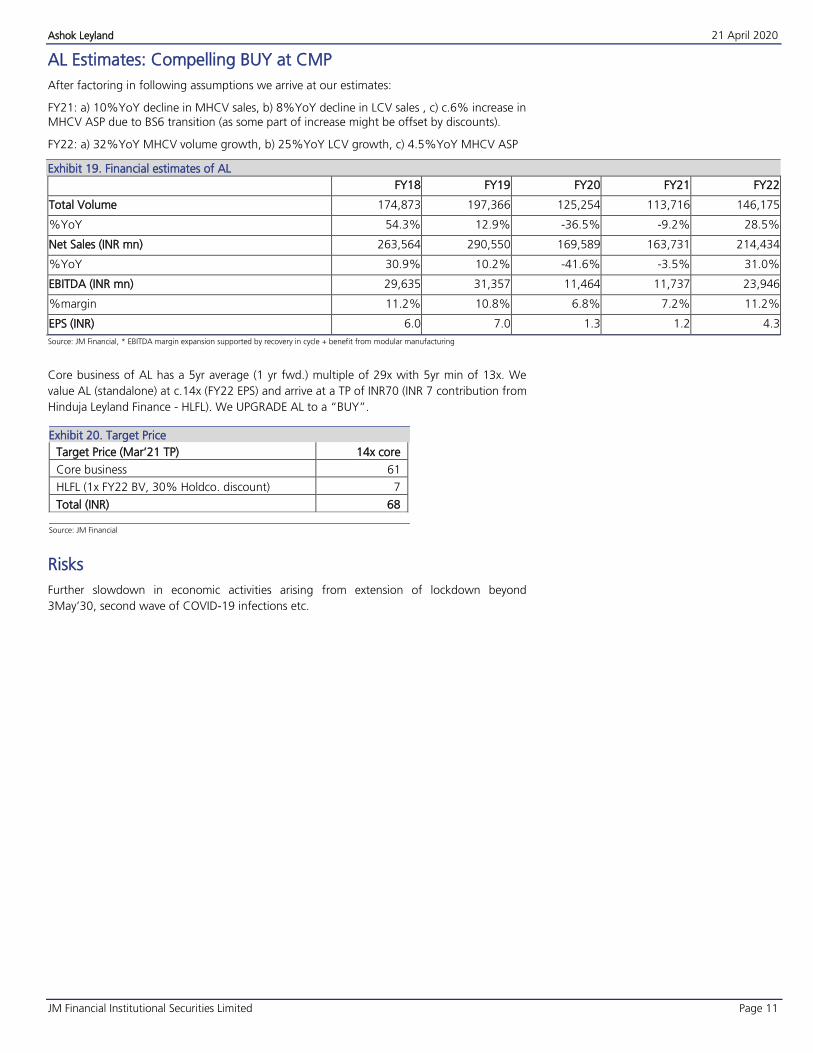
AL Estimates: Compelling BUY at CMP
After factoring in following assumptions we arrive at our estimates:
FY21: a) 10%YoY decline in MHCV sales, b) 8%YoY decline in LCV sales , c) c.6% increase in MHCV ASP due to BS6 transition (as some part of increase might be offset by discounts).
FY22: a) 32%YoY MHCV volume growth, b) 25%YoY LCV growth, c) 4.5%YoY MHCV ASP
Financial estimates of AL Exhibit 19.
FY18 FY19 FY20 FY21 FY22
Total Volume 174,873 197,366 125,254 113,716 146,175
%YoY 54.3% 12.9% -36.5% -9.2% 28.5%
Net Sales (INR mn) 263,564 290,550 169,589 163,731 214,434
%YoY 30.9% 10.2% -41.6% -3.5% 31.0%
EBITDA (INR mn) 29,635 31,357 11,464 11,737 23,946
%margin 11.2% 10.8% 6.8% 7.2% 11.2%
EPS (INR) 6.0 7.0 1.3 1.2 4.3
Source: JM Financial, * EBITDA margin expansion supported by recovery in cycle + benefit from modular manufacturing
Core business of AL has a 5yr average (1 yr fwd.) multiple of 29x with 5yr min of 13x. We
value AL (standalone) at c.14x (FY22 EPS) and arrive at a TP of INR70 (INR 7 contribution from
Hinduja Leyland Finance - HLFL). We UPGRADE AL to a ‚BUY‛.
Target Price Exhibit 20.
Target Price (Mar’21 TP) 14x core
Core business 61
HLFL (1x FY22 BV, 30% Holdco. discount) 7
Total (INR) 68
Source: JM Financial
Risks
Further slowdown in economic activities arising from extension of lockdown beyond
3May’30, second wave of COVID-19 infections etc.

Ashok Leyland 21 April 2020
JM Financial Institutional Securities Limited Page 12
Financial Tables (Standalone)
Income Statement (INR mn)
Y/E March FY18A FY19A FY20E FY21E FY22E
Net Sales 263,564 290,550 169,589 163,731 214,434
Sales Growth 30.9% 10.2% -41.6% -3.5% 31.0%
Other Operating Income 0 0 0 0 0
Total Revenue 263,564 290,550 169,589 163,731 214,434
Cost of Goods Sold/Op. Exp 184,311 206,796 119,993 114,718 148,430
Personnel Cost 18,378 20,988 15,068 15,500 17,398
Other Expenses 31,240 31,409 23,064 21,776 24,660
EBITDA 29,635 31,357 11,464 11,737 23,946
EBITDA Margin 11.2% 10.8% 6.8% 7.2% 11.2%
EBITDA Growth 34.5% 5.8% -63.4% 2.4% 104.0%
Depn. & Amort. 5,985 6,210 6,327 6,570 6,639
EBIT 23,650 25,147 5,137 5,166 17,307
Other Income 1,966 1,099 1,116 1,250 1,400
Finance Cost 1,473 704 1,066 1,794 1,874
PBT before Excep. & Forex 24,143 25,543 5,187 4,622 16,833
Excep. & Forex Inc./Loss(-) -32 -26 0 0 0
PBT 24,111 25,517 5,187 4,622 16,833
Taxes 6,681 5,136 1,364 1,137 4,141
Extraordinary Inc./Loss(-) -253 -549 -911 0 0
Assoc. Profit/Min. Int.(-) 0 0 0 0 0
Reported Net Profit 17,177 19,832 2,912 3,485 12,692
Adjusted Net Profit 17,462 20,407 3,823 3,485 12,692
Net Margin 6.6% 7.0% 2.3% 2.1% 5.9%
Diluted Share Cap. (mn) 2,927.1 2,935.1 2,935.1 2,935.1 2,935.1
Diluted EPS (INR) 6.0 7.0 1.3 1.2 4.3
Diluted EPS Growth 8.9% 16.5% -81.3% -8.8% 264.2%
Total Dividend + Tax 8,286 10,600 10,600 10,600 10,600
Dividend Per Share (INR) 2.4 3.1 3.1 3.1 3.1
Source: Company, JM Financial
Cash Flow Statement (INR mn)
Y/E March FY18A FY19A FY20E FY21E FY22E
Profit before Tax 24,111 25,517 5,187 4,622 16,833
Depn. & Amort. 5,985 6,210 6,327 6,570 6,639
Net Interest Exp. / Inc. (-) 1,473 704 1,066 1,794 1,874
Inc (-) / Dec in WCap. 36,588 -28,958 -2,063 9,311 5,084
Others 0 0 0 0 0
Taxes Paid -6,681 -5,136 -1,364 -1,137 -4,141
Operating Cash Flow 61,475 -1,663 9,153 21,160 26,290
Capex -13,924 -9,225 -13,605 -6,462 -6,688
Free Cash Flow 47,551 -10,888 -4,452 14,698 19,601
Inc (-) / Dec in Investments -33,050 27,164 -5,001 -10,906 -7,001
Others -1,473 -704 -1,066 -1,794 -1,874
Investing Cash Flow -48,447 17,235 -19,672 -19,162 -15,563
Inc / Dec (-) in Capital 81 8 0 0 0
Dividend + Tax thereon -8,286 -10,600 -10,600 -10,600 -10,600
Inc / Dec (-) in Loans -7,324 -2,142 16,186 2,000 0
Others 3,803 476 -911 0 0
Financing Cash Flow -11,726 -12,258 4,675 -8,600 -10,600
Inc / Dec (-) in Cash 1,302 3,314 -5,844 -6,602 127
Opening Cash Balance 9,120 10,422 13,736 7,891 1,289
Closing Cash Balance 10,422 13,736 7,891 1,289 1,416
Source: Company, JM Financial
Balance Sheet (INR mn)
Y/E March FY18A FY19A FY20E FY21E FY22E
Shareholders’ Fund 72,455 83,324 75,636 68,521 70,613
Share Capital 2,927 2,935 2,935 2,935 2,935
Reserves & Surplus 69,528 80,389 72,700 65,585 67,677
Preference Share Capital 0 0 0 0 0
Minority Interest 0 0 0 0 0
Total Loans 6,126 3,984 20,170 22,170 22,170
Def. Tax Liab. / Assets (-) 3,102 2,497 2,497 2,497 2,497
Total - Equity & Liab. 81,683 89,805 98,303 93,188 95,280
Net Fixed Assets 59,706 62,721 69,999 69,891 69,940
Gross Fixed Assets 68,858 75,734 88,810 98,914 105,377
Intangible Assets 0 0 0 0 0
Less: Depn. & Amort. 13,378 19,588 25,915 32,485 39,125
Capital WIP 4,226 6,576 7,105 3,462 3,688
Investments 63,067 35,903 40,904 51,810 58,811
Current Assets 50,591 83,619 65,739 50,501 57,136
Inventories 17,583 26,847 18,585 15,700 20,562
Sundry Debtors 9,448 25,057 18,585 10,766 14,687
Cash & Bank Balances 10,422 13,736 7,891 1,289 1,416
Loans & Advances 13,138 17,980 20,677 22,745 20,471
Other Current Assets 0 0 0 0 0
Current Liab. & Prov. 91,681 92,438 78,340 79,014 90,607
Current Liabilities 48,879 50,189 31,231 26,715 32,533
Provisions & Others 42,802 42,249 47,109 52,298 58,074
Net Current Assets -41,090 -8,819 -12,601 -28,513 -33,471
Total – Assets 81,683 89,805 98,303 93,188 95,280
Source: Company, JM Financial
Dupont Analysis
Y/E March FY18A FY19A FY20E FY21E FY22E
Net Margin 6.6% 7.0% 2.3% 2.1% 5.9%
Asset Turnover (x) 3.4 3.5 1.9 1.8 2.3
Leverage Factor (x) 1.1 1.1 1.2 1.3 1.3
RoE 26.1% 26.2% 4.8% 4.8% 18.2%
Key Ratios
Y/E March FY18A FY19A FY20E FY21E FY22E
BV/Share (INR) 24.8 28.4 25.8 23.3 24.1
ROIC 84.1% 93.9% 8.9% 9.2% 37.2%
ROE 26.1% 26.2% 4.8% 4.8% 18.2%
Net Debt/Equity (x) -0.1 -0.1 0.2 0.3 0.3
P/E (x) 8.2 7.0 37.6 41.3 11.3
P/B (x) 2.0 1.7 1.9 2.1 2.0
EV/EBITDA (x) 4.6 4.1 13.2 13.7 6.7
EV/Sales (x) 0.5 0.4 0.9 1.0 0.7
Debtor days 13 31 40 24 25
Inventory days 24 34 40 35 35
Creditor days 76 71 72 64 62
Source: Company, JM Financial

Ashok Leyland 21 April 2020
JM Financial Institutional Securities Limited Page 13
History of Earnings Estimate and Target Price
Date Recommendation Target Price % Chg.
26-May-17 Hold 90
25-Jul-17 Hold 100 11.1
10-Nov-17 Hold 100 0.0
5-Feb-18 Hold 135 35.0
19-Jul-18 Hold 125 -7.4
13-Nov-18 Hold 130 4.0
15-Feb-19 Hold 100 -23.1
26-May-19 Hold 110 10.0
1-Aug-19 Hold 85 -22.7
23-Sep-19 Hold 85 0.0
11-Nov-19 Hold 85 0.0
17-Feb-20 Hold 85 0.0
Recommendation History

Ashok Leyland 21 April 2020
JM Financial Institutional Securities Limited Page 14
APPENDIX I
JM Financial Inst itut ional Secur it ies Limited ( fo rmer l y known as JM F inanc ia l Secur i t i e s L im i ted)
Corporate Identity Number: U67100MH2017PLC296081
Member of BSE Ltd., National Stock Exchange of India Ltd. and Metropolitan Stock Exchange of India Ltd. SEBI Registration Nos.: Stock Broker - INZ000163434, Research Analyst – INH000000610
Registered Office: 7th Floor, Cnergy, Appasaheb Marathe Marg, Prabhadevi, Mumbai 400 025, India. Board: +9122 6630 3030 | Fax: +91 22 6630 3488 | Email: [email protected] | www.jmfl.com
Compliance Officer: Mr. Sunny Shah | Tel: +91 22 6630 3383 | Email: [email protected]
Definition of ratings
Rating Meaning
Buy Total expected returns of more than 15%. Total expected return includes dividend yields.
Hold Price expected to move in the range of 10% downside to 15% upside from the current market price.
Sell Price expected to move downwards by more than 10%
Research Analyst(s) Certification The Research Analyst(s), with respect to each issuer and its securities covered by them in this research report, certify that: All of the views expressed in this research report accurately reflect his or her or their personal views about all of the issuers and their securities; and No part of his or her or their compensation was, is, or will be directly or indirectly related to the specific recommendations or views expressed in this research report. Important Disclosures This research report has been prepared by JM Financial Institutional Securities Limited (JM Financial Institutional Securities) to provide information about the
company(ies) and sector(s), if any, covered in the report and may be distributed by it and/or its associates solely for the purpose of information of the select
recipient of this report. This report and/or any part thereof, may not be duplicated in any form and/or reproduced or redistributed without the prior written
consent of JM Financial Institutional Securities. This report has been prepared independent of the companies covered herein.
JM Financial Institutional Securities is registered with the Securities and Exchange Board of India (SEBI) as a Research Analyst and a Stock Broker having trading
memberships of the BSE Ltd. (BSE), National Stock Exchange of India Ltd. (NSE) and Metropolitan Stock Exchange of India Ltd. (MSEI). No material disciplinary
action has been taken by SEBI against JM Financial Institutional Securities in the past two financial years which may impact the investment decision making of the
investor.
JM Financial Institutional Securities renders stock broking services primarily to institutional investors and provides the research services to its institutional
clients/investors. JM Financial Institutional Securities and its associates are part of a multi-service, integrated investment banking, investment management,
brokerage and financing group. JM Financial Institutional Securities and/or its associates might have provided or may provide services in respect of managing
offerings of securities, corporate finance, investment banking, mergers & acquisitions, broking, financing or any other advisory services to the company(ies)
covered herein. JM Financial Institutional Securities and/or its associates might have received during the past twelve months or may receive compensation from
the company(ies) mentioned in this report for rendering any of the above services.
JM Financial Institutional Securities and/or its associates, their directors and employees may; (a) from time to time, have a long or short position in, and buy or sell
the securities of the company(ies) mentioned herein or (b) be engaged in any other transaction involving such securities and earn brokerage or other
compensation or act as a market maker in the financial instruments of the company(ies) covered under this report or (c) act as an advisor or lender/borrower to,
or may have any financial interest in, such company(ies) or (d) considering the nature of business/activities that JM Financial Institutional Securities is engaged in,
it may have potential conflict of interest at the time of publication of this report on the subject company(ies).
Neither JM Financial Institutional Securities nor its associates or the Research Analyst(s) named in this report or his/her relatives individually own one per cent or
more securities of the company(ies) covered under this report, at the relevant date as specified in the SEBI (Research Analysts) Regulations, 2014.
The Research Analyst(s) principally responsible for the preparation of this research report and members of their household are prohibited from buying or selling
debt or equity securities, including but not limited to any option, right, warrant, future, long or short position issued by company(ies) covered under this report.
The Research Analyst(s) principally responsible for the preparation of this research report or their relatives (as defined under SEBI (Research Analysts) Regulations,
2014); (a) do not have any financial interest in the company(ies) covered under this report or (b) did not receive any compensation from the company(ies) covered
under this report, or from any third party, in connection with this report or (c) do not have any other material conflict of interest at the time of publication of this
report. Research Analyst(s) are not serving as an officer, director or employee of the company(ies) covered under this report.
While reasonable care has been taken in the preparation of this report, it does not purport to be a complete description of the securities, markets or
developments referred to herein, and JM Financial Institutional Securities does not warrant its accuracy or completeness. JM Financial Institutional Securities may
not be in any way responsible for any loss or damage that may arise to any person from any inadvertent error in the information contained in this report. This
report is provided for information only and is not an investment advice and must not alone be taken as the basis for an investment decision.

Ashok Leyland 21 April 2020
JM Financial Institutional Securities Limited Page 15
The investment discussed or views expressed or recommendations/opinions given herein may not be suitable for all investors. The user assumes the entire risk of
any use made of this information. The information contained herein may be changed without notice and JM Financial Institutional Securities reserves the right to
make modifications and alterations to this statement as they may deem fit from time to time.
This report is neither an offer nor solicitation of an offer to buy and/or sell any securities mentioned herein and/or not an official confirmation of any transaction.
This report is not directed or intended for distribution to, or use by any person or entity who is a citizen or resident of or located in any locality, state, country or
other jurisdiction, where such distribution, publication, availability or use would be contrary to law, regulation or which would subject JM Financial Institutional
Securities and/or its affiliated company(ies) to any registration or licensing requirement within such jurisdiction. The securities described herein may or may not be
eligible for sale in all jurisdictions or to a certain category of investors. Persons in whose possession this report may come, are required to inform themselves of
and to observe such restrictions.
Persons who receive this report from JM Financial Singapore Pte Ltd may contact Mr. Ruchir Jhunjhunwala ([email protected]) on +65 6422 1888 in
respect of any matters arising from, or in connection with, this report.
Additional disclosure only for U.S. persons: JM Financial Institutional Securities has entered into an agreement with JM Financial Securities, Inc. ("JM Financial
Securities"), a U.S. registered broker-dealer and member of the Financial Industry Regulatory Authority ("FINRA") in order to conduct certain business in the
United States in reliance on the exemption from U.S. broker-dealer registration provided by Rule 15a-6, promulgated under the U.S. Securities Exchange Act of
1934 (the "Exchange Act"), as amended, and as interpreted by the staff of the U.S. Securities and Exchange Commission ("SEC") (together "Rule 15a-6").
This research report is distributed in the United States by JM Financial Securities in compliance with Rule 15a-6, and as a "third party research report" for
purposes of FINRA Rule 2241. In compliance with Rule 15a-6(a)(3) this research report is distributed only to "major U.S. institutional investors" as defined in Rule
15a-6 and is not intended for use by any person or entity that is not a major U.S. institutional investor. If you have received a copy of this research report and are
not a major U.S. institutional investor, you are instructed not to read, rely on, or reproduce the contents hereof, and to destroy this research or return it to JM
Financial Institutional Securities or to JM Financial Securities.
This research report is a product of JM Financial Institutional Securities, which is the employer of the research analyst(s) solely responsible for its content. The
research analyst(s) preparing this research report is/are resident outside the United States and are not associated persons or employees of any U.S. registered
broker-dealer. Therefore, the analyst(s) are not subject to supervision by a U.S. broker-dealer, or otherwise required to satisfy the regulatory licensing
requirements of FINRA and may not be subject to the Rule 2241 restrictions on communications with a subject company, public appearances and trading
securities held by a research analyst account.
JM Financial Institutional Securities only accepts orders from major U.S. institutional investors. Pursuant to its agreement with JM Financial Institutional Securities,
JM Financial Securities effects the transactions for major U.S. institutional investors. Major U.S. institutional investors may place orders with JM Financial
Institutional Securities directly, or through JM Financial Securities, in the securities discussed in this research report.
Additional disclosure only for U.K. persons: Neither JM Financial Institutional Securities nor any of its affiliates is authorised in the United Kingdom (U.K.) by the
Financial Conduct Authority. As a result, this report is for distribution only to persons who (i) have professional experience in matters relating to investments
falling within Article 19(5) of the Financial Services and Markets Act 2000 (Financial Promotion) Order 2005 (as amended, the "Financial Promotion Order"), (ii)
are persons falling within Article 49(2)(a) to (d) ("high net worth companies, unincorporated associations etc.") of the Financial Promotion Order, (iii) are outside
the United Kingdom, or (iv) are persons to whom an invitation or inducement to engage in investment activity (within the meaning of section 21 of the Financial
Services and Markets Act 2000) in connection with the matters to which this report relates may otherwise lawfully be communicated or caused to be
communicated (all such persons together being referred to as "relevant persons"). This report is directed only at relevant persons and must not be acted on or
relied on by persons who are not relevant persons. Any investment or investment activity to which this report relates is available only to relevant persons and will
be engaged in only with relevant persons.
Additional disclosure only for Canadian persons: This report is not, and under no circumstances is to be construed as, an advertisement or a public offering of the
securities described herein in Canada or any province or territory thereof. Under no circumstances is this report to be construed as an offer to sell securities or as
a solicitation of an offer to buy securities in any jurisdiction of Canada. Any offer or sale of the securities described herein in Canada will be made only under an
exemption from the requirements to file a prospectus with the relevant Canadian securities regulators and only by a dealer properly registered under applicable
securities laws or, alternatively, pursuant to an exemption from the registration requirement in the relevant province or territory of Canada in which such offer or
sale is made. This report is not, and under no circumstances is it to be construed as, a prospectus or an offering memorandum. No securities commission or
similar regulatory authority in Canada has reviewed or in any way passed upon these materials, the information contained herein or the merits of the securities
described herein and any representation to the contrary is an offence. If you are located in Canada, this report has been made available to you based on your
representation that you are an ‚accredited investor‛ as such term is defined in National Instrument 45-106 Prospectus Exemptions and a ‚permitted client‛ as
such term is defined in National Instrument 31-103 Registration Requirements, Exemptions and Ongoing Registrant Obligations. Under no circumstances is the
information contained herein to be construed as investment advice in any province or territory of Canada nor should it be construed as being tailored to the
needs of the recipient. Canadian recipients are advised that JM Financial Securities, Inc., JM Financial Institutional Securities Limited, their affiliates and authorized
agents are not responsible for, nor do they accept, any liability whatsoever for any direct or consequential loss arising from any use of this research report or the
information contained herein.