Artists, Brands and Products Appearances in the Billboard Hot ...
20
Full Terms & Conditions of access and use can be found at https://www.tandfonline.com/action/journalInformation?journalCode=wjpm20 Journal of Promotion Management ISSN: 1049-6491 (Print) 1540-7594 (Online) Journal homepage: https://www.tandfonline.com/loi/wjpm20 Brand Placement in Music Videos: Artists, Brands and Products Appearances in the Billboard Hot 100 from 2003 to 2016 Cande Sánchez-Olmos & Araceli Castelló-Marínez To cite this article: Cande Sánchez-Olmos & Araceli Castelló-Marínez (2020): Brand Placement in Music Videos: Artists, Brands and Products Appearances in the Billboard Hot 100 from 2003 to 2016, Journal of Promotion Management, DOI: 10.1080/10496491.2020.1745986 To link to this article: https://doi.org/10.1080/10496491.2020.1745986 Published online: 12 Apr 2020. Submit your article to this journal View related articles View Crossmark data
-
Upload
khangminh22 -
Category
Documents
-
view
3 -
download
0
Transcript of Artists, Brands and Products Appearances in the Billboard Hot ...

Full Terms & Conditions of access and use can be found athttps://www.tandfonline.com/action/journalInformation?journalCode=wjpm20
Journal of Promotion Management
ISSN: 1049-6491 (Print) 1540-7594 (Online) Journal homepage: https://www.tandfonline.com/loi/wjpm20
Brand Placement in Music Videos: Artists, Brandsand Products Appearances in the Billboard Hot 100from 2003 to 2016
Cande Sánchez-Olmos & Araceli Castelló-Marínez
To cite this article: Cande Sánchez-Olmos & Araceli Castelló-Marínez (2020): Brand Placementin Music Videos: Artists, Brands and Products Appearances in the Billboard Hot 100 from 2003 to2016, Journal of Promotion Management, DOI: 10.1080/10496491.2020.1745986
To link to this article: https://doi.org/10.1080/10496491.2020.1745986
Published online: 12 Apr 2020.
Submit your article to this journal
View related articles
View Crossmark data

REVIEW
Brand Placement in Music Videos: Artists, Brandsand Products Appearances in the Billboard Hot 100from 2003 to 2016
Cande S�anchez-Olmos and Araceli Castell�o-Mar�ınez
University of Alicante, Alacant, Spain
ABSTRACTThe aim of this paper is to analyze the presence of artists,brands and products in music videos in the best-selling songs;the Billboard Hot 100 from 2003 to 2016. Using a content ana-lysis, we look at 420 music videos at the top of the chart andwhich artists had more placements, what kind of brands andproducts were more likely to be linked to music, and the ratioof appearances between placements, brands and products.Firstly, some artists repeatedly appeared at the top of thechart, thereby implying there is a high concentration of a fewpop stars in the chart (Rihanna, Katy Perry, Beyonc�e and BrunoMars and Taylor Swift) and Chris Brown was the artist with thehighest number of placements. Secondly, results show thatAdidas, Nike and Chevrolet are the most brands placed.
KEYWORDSMarketing; communication;advertising; brandplacement; music videos;record industry; BillboardHot 100
Introduction
The main aim of this paper was to research brand placement, a communi-cation technique which consists in strategically blending a brand or serviceinto an audio-visual entertainment contents service so that the audiencecreates positive associations about the brand (Hudson & Hudson, 2006;Lehu, 2007). Brand placement is becoming ever more important in therecord industry because musicians have found it to be an alternative meansof boosting their sales, especially after the digital crisis the industry hasundergone. In fact, this technique is in constant growth. In 2017 brandplacement income in the USA grew by 14%, which in absolute terms comesto 15680 million dollars (PQ Media, 2018). According to this report, televi-sion is the channel where most brand placement income is received.However, what motivated this research was the finding that videoclips
and digital platforms showed twice as much growth. In this respect, if welook at the 100 most viewed videos on YouTube, 90 are videoclips and the
CONTACT Cande S�anchez-Olmos [email protected]; Araceli Castell�o-Mart�ınez [email protected] of Alicante, Communication and Social Phychology, Carrertera San Vicente del Raspeig S/N,
Alacant, 03690 Spain.� 2020 Taylor & Francis Group, LLC
JOURNAL OF PROMOTION MANAGEMENThttps://doi.org/10.1080/10496491.2020.1745986
rest are for children, many of which are music videos (YouTube, 2018). Inlight of these figures, this paper provides insights for expanding the analysisabout who are at the top of the chart, the artists with most placements intheir videoclips, the presence of brands and categories of products in musicvideos. Although this research is fundamentally exploratory and descriptive,it provides an overview of the relationship between artists, brands andproducts portrayed from 2003 until 2016.For the record industry, being at the top of this chart means more profit
(Parker, 1991) which ensures the musical future of artists. Therefore, onanalyzing this data, we will know who has been at the top of the chartsand what type of relationship they have had with the brands they act asinfluencers for. Brand placement in the Billboard Hot 100 should be ana-lyzed as in this advertising technique the implication is the target audiencehas seen advertising without being aware of whether it was for commercialpurposes or not.In addition, and according to the musicologist perspective, music plays
an important role in our society because, as Straw points out (2001), musicis one of the key identity symbols which young people use to differentiatethemselves from others. Furthermore, according to Frith (1996), music con-structs our sense of identity through experiences which let us imagine our-selves in cultural narratives. Together, these academics stress howimportant music is in our lives, and this is why the brand influencer roleartists have in music videos should be analyzed. In this respect, what effectsmusic videos have had in the age of the internet must be studied in con-text. Traditionally, a videoclip has been thought of as a by-product of amusical recording aimed at selling a song (Goodwin, 1993; Vernallis, 2004;Vi~nuela, 2009), although it has always been used as a vehicle for advertisingproducts which have been blended into the music video narrative (Englis,1991; Goodwin, 1993). Moreover, with the rise of MTV, brands found clipsto be excellent ways to showcase their products. However, with YouTube,videoclips no longer relied on the television media and, as a result, recordlabels opened their own channel networks on YouTube in order to makevideoclips profitable.
Review of literature
Brand placement in music videos
There is a large and growing body of literature on how this communicationtechnique has been applied. Generally speaking, the most outstanding con-tributions are those made by Galician (2004), Hudson and Hudson (2006),Karrh (1998) and Lehu (2007) to quote a few authors. Several studies inwhich brand placement has been researched have been carried out on
2 C. SÁNCHEZ-OLMOS AND A. CASTELLÓ-MARÍNEZ

cinema, TV and music. In terms of quantitative data, what is most note-worthy is the contents analysis of cinema by Galician and Bourdeau (2004),television by Smit et al. (2009), and music (Thornton and Burkhalter,2015). As regards the effects, attitudes and responses the audience has tobrand placement in music, research by Burkhalter and Thornton (2014),Ferguson and Burkhalter (2015) and Krishen and Sirgy (2016) show thepositive effects this technique has had according to different variables.Conversely, Sung and De Gregorio (2008) conclude that people reject
brand placement more in music and video games than in cinema and tele-vision. In the same critical vein P�erez-Ruf�ı et al. (2014) and S�anchez-Olmos(2018) found that rather than blending into the videoclips, brands imposethemselves on them, which detracts from the argument that the musicvideo is an expression of artistic post-modernism. In turn, other researchers(Soba and Aydin, 2013) question how ethical product placement is, claim-ing it to be an intrusive way of communicating with viewers.Research into brand placement has been carried out in different catego-
ries of products over the last decade. Galician and Bourdeau (2004)observed how product placement evolved in 1977, 1987 and 1997 in 15 ofthe highest earning American films. They found the kind of productswhich most appeared in films were cars, beer, soft drinks and liquors. Asfor brands, Coke, Mercedes, Miller, Chevy, Pepsi-Cola Schlitz, BMW, JackDaniels, Cadillac and CNN were the most seen ones. Another reference isthat carried out by Thornton and Burkhalter (2015) on hip hop videoclips,in which the categories with most product placements were cars (54.7%),then clothing/shoes (17.4%), spirits (9.3%) and jewelry (6.7%). Lastly, therewere similar findings in one piece of research (S�anchez-Olmos, 2018) onbranded content in music. The categories of products most involved inbranded content were clothing (25%), drinks (beer and soft drinks) whichtogether represented 34% of the total, and cars (10% of the sample). Thus,this paper extends the research about what kind of brands and productswere more likely to be linked to music, and the ratio of appearancesbetween placements, brands and products. In addition, we will observe whowere at the top of the chart and which artists had more placements.
Billboard hot 100
The Billboard Hot 100 chart shows the week’s most popular songs acrossall genres, ranked by radio airplay audience impressions as measured byNielsen Music, sales data as compiled by Nielsen Music and streamingactivity data provided by online music sources. The chart is significant inthat the higher the position a song reaches in it, the more media exposureit will obtain and therefore the more successful it will be. In this respect,
JOURNAL OF PROMOTION MANAGEMENT 3
the Billboard Hot 100 chart goes back to 1934, but the one we know todayhas been running since 1958 and is backed by large multinationalAmerican record companies, which means they influence other markets.Regarding the importance of these lists, as Parker (1991, p. 216) pointed
out “charts are essentially modernist reflections of capitalist practice, butthe impact of romantic discourses of the artist can be seen in their mytho-logical structure”. For this author, charts, such as the Billboard Hot 100,not only work to create a sense of belonging amongst young people, butalso reflect capitalist practices and reinforce the misconception that every-one, as they are free to purchase and choose music, can launch their favor-ite artist to the top of the charts. In the record industry, producers do notknow beforehand how consumers are going to react to songs. That is, just10% of the songs released are successful and these finance the other ones,so artists have become the bed fellows of the music industry. While Parker(1991) from a critical perspective considered consumers choice was notdemocratic, musicologists as Negus (1999) and Straw (2001) stressed thepopularity and success of any given artist or recording song is notoriouslydifficult to predict because consumption of popular music has long beenseen as incomprehensible.If we carry out a diachronic analysis and see the artists and music genres
which have most succeeded in the Hot 100 Billboard throughout its 60 yearsof history, we mainly find superstar artists. The top 10 artists with mostnumber ones in this chart are headed by The Beatles, followed by Madonna,Elton John, Elvis Presley, Mariah Carey, Stevie Wonder, Janet Jackson,Michael Jackson, Whitney Houston and Rihanna in tenth position. There area range of artists who perform different styles of pop and rock music.Ordanini and Nunes (2016) examined how the number of songs and artistsappearing annually in the Billboard Hot 100 singles chart changed between1974 and 2013 and concluded the evolution of recorded music technologyhas changed the charts when in the past there were fewer hits by many popstars and now there are more hits by fewer superstars. In other words, con-centration of superstars in popular music has been a trend since 2003 andeven the biggest stars require more than a year to be successful.In the period (2003-2016) important changes have taken place both in
the record industry and in advertising. Consumers have started to rejecttraditional interruptive advertising; so, brands began blending their prod-ucts into videoclips in order to absorb the values of the artist. In addition,brands help to fund videoclips in the record industry. Although both par-ties gain by this, Klein (2009) considers this partnership between the recordindustry and advertisers could be more parasitical than philanthropic ifmusicians depend on brands at the price of losing their freedomand creativity.
4 C. SÁNCHEZ-OLMOS AND A. CASTELLÓ-MARÍNEZ
From the perspective of the music industry, the former business modelbased on selling singles and albums is no longer enough. Due to the impactof new technologies, production, promotion and distribution of music haschanged as, advertising, streaming, digital music, live music and videostreaming have all emerged as new sources of revenue. In other words,before seeing a return to growth in 2015, the global recording industry lostnearly 40% in revenue from 1999 to 2014 (IFPI, 2017).The purpose of this type of advertising is to make the brands more
accessible to consumers in order to engage with them and their life styles(Meier, 2011), rather than to raise sales. This is because the impact of newtechnologies has also affected the advertising sector. Firstly, multiple enter-tainment platforms have evolved for winning over dispersed, demandingand disloyal users. Secondly, as consumer are saturated by advertising, theyhave come to reject traditional commercials. All this brings us to thenotion that the real challenge the advertising industry faces is not technol-ogy or new media, but consumers themselves, who avoid intrusive mes-sages and prefer experiences which are useful, important and negotiable,such as those found in videoclips.
Method
The main aim of this research is to analyze brand placements in music vid-eos from 2003 up to 2016. More specifically, we observed what brands andproducts were placed by artists in this period. At this point, we had the fol-lowing secondary objectives:
� To identify the main artists ranked in the Billboard Hot 100.� To observe what brands and what categories of products were most
placed in the music videos.� To find out the ratio of appearances between placements, brands and
products, music videos and years.
In this study, content analysis was used for carrying out this research.The sample was: the top thirty positions in each annual ranking of theBillboard Hot 100 chart from 2003 to 2016, which came to a total of 420music videos (Table 1). This is a purposive non-probability sample thatwas selected according to the aims of this study. The unit of analysis was
Table 1. Sample.No of analysis units per year 30Total No of analysis units 420No of years 14Period From 2003 to 2016
Source: prepared by the author.
JOURNAL OF PROMOTION MANAGEMENT 5
the entire music video. Each individual appearance of a brand, product orservice whether seen, mentioned, or used was registered. A coder with ahighly experience in collecting data on brands coded all the music videosbased on the same set of variables developed by the research team togetherwith the coder. According to the aims of this study, the variables were: art-ist name, song, title, product or service, and name of the brand. The sam-ple was recorded for three months in 2017; from September to November.All data was collected manually and entered into Excel. Brands were
identified by their logo or if their name was visible, through recognition ofunique branding (e.g.: triple stripe pattern on Adidas jacket or red soles forChristian Louboutin shoes) or extensive research online. The criteria forwhat brands were included was any recognizable branded consumer prod-uct except firearms. Any plain products that lacked distinctive features link-ing them to a brand or any other non-consumer product were excluded.For some data we were unable to identify any brand, whereby the brandvariable was simply marked with the symbol “?”. However, the productvariable was coded indicating the product represented. For instance, in themusic video “Work” (2016) by Rihanna a Land Rover was identified aswell as two more cars whose brands were unrecognizable which were codedas products. Unrecognizable brands accounted for about 20% of the databut were included to give macro statistics on total brand visibility.Regarding brand inclusion criteria, we made no distinction between
brands that just happened to be used in a music video and those that wereplaced as a result of a prior agreement between the brands and contentproducers. However, it is broadly accepted in the industry, that the term“product placement” encompasses any appearance by a brand in entertain-ment, especially if it is mainstream. Furthermore, it is difficult to knowwhether placements are organic or if they have been paid for unless theproducer of every individual music video is contacted.Although there are several intra-coder checks to ascertain reliability, we
use a percentage of agreement. Thus 10% of the sample was reanalyzed bythe first author of this study and overall, I agreed 92% of the time with theexperienced coder. Brands were coded by their names and products bytheir signifiers. The coder and author agreed on the products signifier.
Results
Artists
Firstly, 216 different artists accounted for the 420 songs, which came to anaverage of 1.94 songs per artist. However, 20.2% of the songs representedonly 10 artists, which means the same ones were highly concentrated at thetop of the chart: Rihanna (with 16 songs), Katy Perry (10 songs), Beyonc�e,
6 C. SÁNCHEZ-OLMOS AND A. CASTELLÓ-MARÍNEZ
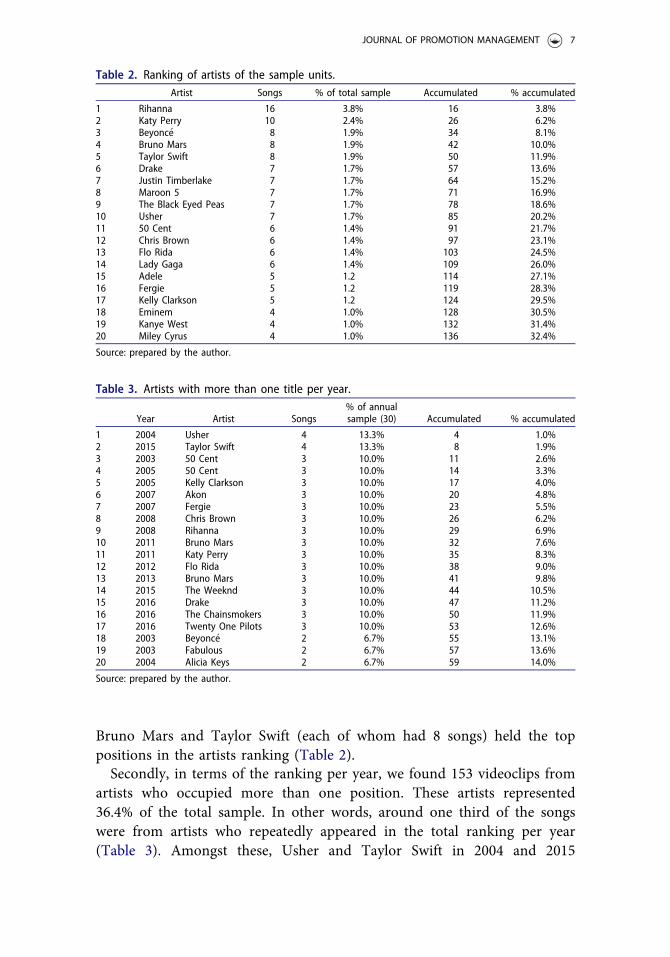
Bruno Mars and Taylor Swift (each of whom had 8 songs) held the toppositions in the artists ranking (Table 2).Secondly, in terms of the ranking per year, we found 153 videoclips from
artists who occupied more than one position. These artists represented36.4% of the total sample. In other words, around one third of the songswere from artists who repeatedly appeared in the total ranking per year(Table 3). Amongst these, Usher and Taylor Swift in 2004 and 2015
Table 2. Ranking of artists of the sample units.Artist Songs % of total sample Accumulated % accumulated
1 Rihanna 16 3.8% 16 3.8%2 Katy Perry 10 2.4% 26 6.2%3 Beyonc�e 8 1.9% 34 8.1%4 Bruno Mars 8 1.9% 42 10.0%5 Taylor Swift 8 1.9% 50 11.9%6 Drake 7 1.7% 57 13.6%7 Justin Timberlake 7 1.7% 64 15.2%8 Maroon 5 7 1.7% 71 16.9%9 The Black Eyed Peas 7 1.7% 78 18.6%10 Usher 7 1.7% 85 20.2%11 50 Cent 6 1.4% 91 21.7%12 Chris Brown 6 1.4% 97 23.1%13 Flo Rida 6 1.4% 103 24.5%14 Lady Gaga 6 1.4% 109 26.0%15 Adele 5 1.2 114 27.1%16 Fergie 5 1.2 119 28.3%17 Kelly Clarkson 5 1.2 124 29.5%18 Eminem 4 1.0% 128 30.5%19 Kanye West 4 1.0% 132 31.4%20 Miley Cyrus 4 1.0% 136 32.4%
Source: prepared by the author.
Table 3. Artists with more than one title per year.
Year Artist Songs% of annualsample (30) Accumulated % accumulated
1 2004 Usher 4 13.3% 4 1.0%2 2015 Taylor Swift 4 13.3% 8 1.9%3 2003 50 Cent 3 10.0% 11 2.6%4 2005 50 Cent 3 10.0% 14 3.3%5 2005 Kelly Clarkson 3 10.0% 17 4.0%6 2007 Akon 3 10.0% 20 4.8%7 2007 Fergie 3 10.0% 23 5.5%8 2008 Chris Brown 3 10.0% 26 6.2%9 2008 Rihanna 3 10.0% 29 6.9%10 2011 Bruno Mars 3 10.0% 32 7.6%11 2011 Katy Perry 3 10.0% 35 8.3%12 2012 Flo Rida 3 10.0% 38 9.0%13 2013 Bruno Mars 3 10.0% 41 9.8%14 2015 The Weeknd 3 10.0% 44 10.5%15 2016 Drake 3 10.0% 47 11.2%16 2016 The Chainsmokers 3 10.0% 50 11.9%17 2016 Twenty One Pilots 3 10.0% 53 12.6%18 2003 Beyonc�e 2 6.7% 55 13.1%19 2003 Fabulous 2 6.7% 57 13.6%20 2004 Alicia Keys 2 6.7% 59 14.0%
Source: prepared by the author.
JOURNAL OF PROMOTION MANAGEMENT 7

respectively, had four songs each, which accounted for 13.3% of the totalannual sample (30 songs).As for the partnership between superstars and brands, out of a total of
216 artists, 188 (87%) of them displayed brands in their music videos. Inthis respect, Chris Brown, Flo Rida, 50 Cent, Rihanna, Fetty Wap and JayZ were the artists with most placements in their videoclips 125, 122, 116,81, 73 and 69 appearances respectively (Figure 1).
Brands and categories of products
In total, brands appeared 3183 times. On average, brand placements wereidentified in 84.5% of the sample (in 355 out of 420 music videos), repre-senting a total of 3325 placements (Table 8). Music videos in which brandswere not identified accounted for 15.5% of the sample. For instance,“Crazy” (2006) by Gnarls Barkley is a music video made by animation andabstract graphics where brands could not be identified. In addition, wecoded products for 4.4% (146 units) of placements (3325) in these 355music videos, but we were unable to identify any specific brand. Thus,around 20% of the total were unidentified brands.The most placed ones in the sample (Table 4) were, Adidas (99 place-
ments), Nike (98 placements), Chevrolet (84 placements) and NY Yankees(80 placements). Additionally, 59% of the total number of brands coded(529) appeared just once, meaning that 16.6% of the total were placed justone time. Furthermore, 41% of the total (369) were placed more than onceand appeared 2654 times which accounted for 83.4% of the total numberof appearances.
Figure 1. Artists chart according to the number of placements in their videoclips.Source: prepared by the author
8 C. SÁNCHEZ-OLMOS AND A. CASTELLÓ-MARÍNEZ

Now, looking at the brands and products seen in the videoclips, wefound 898 different brands which appeared 3183 times (averaging 3.55appearances per brand) and 278 different products were placed 3325 times(averaging 11.96 placements per product). The reason why there were moreproducts than brand appearances is because a brand can place differentproducts. For instance, Adidas placed 3 different products: shoes, sportbras and jackets in the music video “Fancy” (2014) by Iggy Azalea.As for the products, 230 different objects or services were registered
according to their signifiers. Table 5 shows a list with forty different prod-ucts which have appeared in at least 0.3% of the sample (11 to 9 place-ments). The most popular product was the car with 608 placements (18.3%of the total). Cups came second with 357 placements (10.8%) followed byshoes with 277 placements (8.4%).In addition, Table 6 shows a list of the 125 products most placed ranked
by the number of times they were placed. Despite the diversity of productscoded, two group can be observed. First, accessories (caps, shoes, sunglasses, watches, hats, jewelry, glasses, belts, etc.) accounted for 23.4% ofthe total number of placements (778). Second, clothing (jackets, t-shirts,jerseys, jeans, underwear, sweaters, tracksuits, polo t-shirts, jumpers, etc.)represented 13.4% of the total (446). Finally, two smaller groups related to
Table 4. Brands ranking with more than 20 appearances.
Brand Appearances% of totalappearances Accumulated % accumulated
1 Adidas 99 3.1% 99 3.1%2 Nike 98 3.1% 197 6.2%3 Chevrolet 84 2.6% 281 8.8%4 NY Yankees 80 2.5% 361 11.3%5 Apple 56 1.8% 417 13.1%6 Ford 56 1.8% 473 14.9%7 New Era 47 1.5% 520 16.3%8 BMW 46 1.4% 566 17.8%9 MLB 45 1.4% 611 19.2%10 Beats by Dre 43 1.4% 654 20.5%11 Cadillac 40 1.3% 694 21.8%12 Mercedes-Benz 36 1.1% 730 22.9%13 Lamborghini 35 1.1% 765 24.0%14 Air Jordan 34 1.1% 799 25.1%15 Nokia 34 1.1% 833 26.2%16 Converse 33 1.0% 866 27.2%17 Atlanta braves 32 1.0% 898 28.2%18 Versace 30 0.9% 928 29.2%19 Rolls-Royce 28 0.9% 956 30.0%20 Dodge 26 0.8% 982 30.9%21 Yamaha 24 0.8% 1006 31.6%22 Gucci 22 0.7% 1028 32.3%23 LA Dodgers 22 0.7% 1050 33.0%24 Gibson 21 0.7% 1071 33.6%25 G-Unit 21 0.7% 1092 34.3%26 Louis Vuitton 21 0.7% 1113 35.0%27 Timberland 21 0.7% 1134 35.6%
Source: prepared by the author.
JOURNAL OF PROMOTION MANAGEMENT 9

technology (7% and 232 placements) and alcoholic drinks (4% and 135)completed the most frequent product categories.
Ratio of appearances between placements, brands and products
We first found the products-brand ratio which gave us the relationshipbetween both variables (Table 7) in percentage terms. In 29 cases (6.9% ofthe sample) this was over 100%. That means there were more productsthan brands, an example of which was “The Edge of Glory” (2011) by LadyGaga, where just one brand (Versace) placed five different products, so theratio was 500%. In 138 units (32.9%) the number of products and brandswas on par, giving us a ratio of 100%. Finally, in 188 cases (44.8%) the
Table 5. Products ranking with more than 0.3% appearances.Product Placements % Of Total Placements
1 Car 608 18.3%2 Cap 357 10.8%3 Shoes 277 8.4%4 Instrument 175 5.3%5 Jacket 117 3.5%6 Sun glasses 115 3.5%7 Mobile phone 104 3.1%8 Jersey 100 3.0%9 Bottle of alcoholic drink 95 2.9%10 T-shirt 79 2.4%11 Watch 63 1.9%12 Headphones 37 1.1%13 Amplifier 31 0.9%14 Sparkling wine 30 0.9%15 Beer 29 0.9%16 Computer 29 0.9%17 Motorbike 27 0.8%18 Film 25 0.8%19 Hat 24 0.7%20 Jewelry 23 0.7%21 Liquor 19 0.6%22 App 18 0.5%23 Jumper 18 0.5%24 Mp3 player 14 0.4%25 Glasses 13 0.4%26 Jeans 13 0.4%27 Underwear 13 0.4%28 Belt 12 0.4%29 Drink 12 0.4%30 Magazine 12 0.4%31 Sweater 12 0.4%32 Tracksuit 12 0.4%33 Camera 11 0.3%34 Jet 11 0.3%35 Polo shirt 11 0.3%36 Microphone 10 0.3%37 Neon sign 10 0.3%38 Soda 10 0.3%39 Speaker 10 0.3%40 Website 9 0.3%
Source: prepared by the author.
10 C. SÁNCHEZ-OLMOS AND A. CASTELLÓ-MARÍNEZ

number of products was less than the number of brands. In the rest of themusic videos (15.5%), brands were unidentified.Secondly, the brand-placements ratio showed that in 113 instances the
number of brands and placements coincided, while in the other 242 under100% did, so, brands were placed several times per videoclip. For example,in the “Cold Water” (2016) videoclip by Major Lazer featuring JustinBieber and MØ there was a sole brand and product, but 6 placements,which were the dancers� jackets. In the products-placements ratio, we cansee that in 74 units of the sample (17.6%) the number of products matchedthe number of placements. In addition, in 281 videoclips (67%) the numberof placements surpassed that of the different products. In the remainingmusic videos (15.5%) brands were unidentified. In Table 7 the videoclipsranking can be seen according to how many brand placements there were.If we combine the information about the songs (year, ranking position
and artist) with the placements identified (Table 7), we can see that theChris Brown videoclip “Look at me” (2011) at position 21 was the songwith the highest number of placements (48). This was followed by the vid-eoclip “679” by Fetty Wap at position 21 from the 2015 chart and consist-ently by “Loyal” by Chris Brown at position 30 from the 2014 chart where43 placements were identified.As for the number of videoclips in terms of the number of placements in
them (Table 8), we found three videoclips in which there were over 40
Table 6. List of the 125 products most placed.Products
1 Car 26 Jeans 51 Hoodie 76 Tyre(s) 101 Casette2 Cap 27 Underwear 52 Casino 77 Advertising screen 102 Cigar(s)3 Shoes 28 Belt 53 Scooter 78 Attachable lens 103 Club4 Instrument 29 Drink 54 Shirt 79 Boat 104 Condom(s)5 Jacket 30 Magazine 55 Toy 80 Bodysuit 105 Costume6 Sun glasses 31 Sweater 56 Tv 81 Boombox 106 Crop top7 Mobile phone 32 Tracksuit 57 Earphones 82 Boots 107 Chain8 Jersey 33 Camera 58 Tracksuit bottoms 83 Bra 108 Character9 Bottle of alcoholic
drink34 Jet 59 Tv channel 84 Cartoon 109 Chemical
10 T-shirt 35 Polo shirt 60 Water bottle 85 Coat 110 Chip(s)11 Watch 36 Microphone 61 Wine 86 Computer 111 Deodorant12 Headphones 37 Neon sign 62 Award 87 Credit/debit card 112 Drums13 Amplifier 38 Soda 63 Ball 88 Dressing gown 113 E-hookah14 Sparkling wine 39 Speaker 64 Building 89 Handbag 114 Exercise machine15 Beer 40 Website 65 Cereal 90 Monitor 115 Fashion show16 Computer 41 Shorts 66 Dj equipement 91 Phone 116 Headset17 Motorbike 42 Tablet 67 Energy drink 92 Store 117 Jewelry box18 Film 43 Bag 68 Fragrance 93 Tank top 118 Lip balm19 Hat 44 Comic book 69 Game 94 Venue 119 Luggage20 Jewelry 45 Food 70 Gloves 95 Video game 120 Make-up21 Liquor 46 Headband 71 Helicopter 96 Bank 121 Medication22 App 47 Helmet 72 Hotel 97 Bathroom product 122 Oil23 Jumper 48 Restaurant 73 Software 98 Bobblehead 123 Skateboard24 Mp3 player 49 Billboard 74 Sports team 99 Book 124 Skirt25 Glasses 50 Controller 75 TV Show 100 Cardigan 125 Swimwear
Source: prepared by the author.
JOURNAL OF PROMOTION MANAGEMENT 11
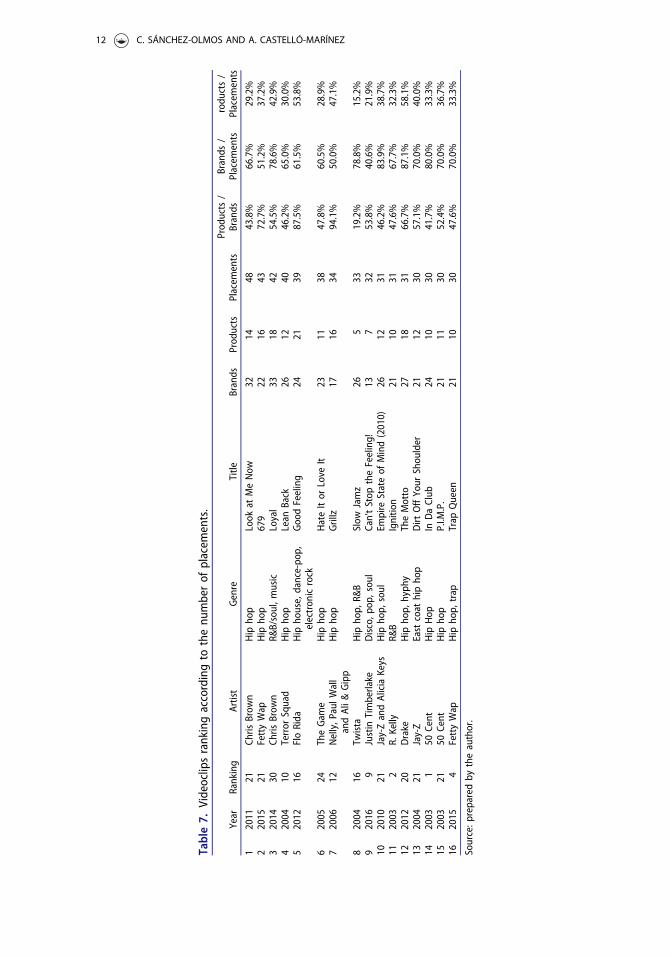
Table7.
Videoclipsrankingaccordingto
thenu
mberof
placem
ents.
Year
Ranking
Artist
Genre
Title
Brands
Prod
ucts
Placem
ents
Prod
ucts
/Brands
Brands
/Placem
ents
rodu
cts/
Placem
ents
12011
21Ch
risBrow
nHip
hop
Look
atMeNow
3214
4843.8%
66.7%
29.2%
22015
21FettyWap
Hip
hop
679
2216
4372.7%
51.2%
37.2%
32014
30Ch
risBrow
nR&
B/soul,m
usic
Loyal
3318
4254.5%
78.6%
42.9%
42004
10Terror
Squad
Hip
hop
Lean
Back
2612
4046.2%
65.0%
30.0%
52012
16FloRida
Hip
house,dance-po
p,electron
icrock
GoodFeeling
2421
3987.5%
61.5%
53.8%
62005
24TheGam
eHip
hop
HateItor
Love
It23
1138
47.8%
60.5%
28.9%
72006
12Nelly,P
aulW
all
andAli&
Gipp
Hip
hop
Grillz
1716
3494.1%
50.0%
47.1%
82004
16Tw
ista
Hip
hop,
R&B
Slow
Jamz
265
3319.2%
78.8%
15.2%
92016
9Justin
Timberlake
Disco,p
op,sou
lCan’tStop
theFeeling!
137
3253.8%
40.6%
21.9%
102010
21Jay-ZandAliciaKeys
Hip
hop,
soul
Empire
Stateof
Mind(2010)
2612
3146.2%
83.9%
38.7%
112003
2R.
Kelly
R&B
Ignitio
n21
1031
47.6%
67.7%
32.3%
122012
20Drake
Hip
hop,
hyph
yTheMotto
2718
3166.7%
87.1%
58.1%
132004
21Jay-Z
East
coat
hipho
pDirt
OffYour
Shou
lder
2112
3057.1%
70.0%
40.0%
142003
150
Cent
Hip
Hop
InDaClub
2410
3041.7%
80.0%
33.3%
152003
2150
Cent
Hip
hop
P.I.M
.P.
2111
3052.4%
70.0%
36.7%
162015
4FettyWap
Hip
hop,
trap
Trap
Queen
2110
3047.6%
70.0%
33.3%
Source:p
reparedby
theauthor.
12 C. SÁNCHEZ-OLMOS AND A. CASTELLÓ-MARÍNEZ

placements. In the largest range in the sample (49.3%) there were between2 and 10 placements, whilst in 19.3% of the sample there were from 11 to20 placements.Thirdly, and considering the 355 music videos (84.5% of the sample)
where brands were recognizable, the total number of placements per annualranking were summarized. Brand placements identified by annual ranking(Table 9) accounted for over 66% of the top 30 positions every year, andthis figure even reached 90% five times (2004, 2007, 2010, 2014 and 2015).In this respect, 2013 and 2006 were the years with least placements (66%and 70% respectively). As for the number of placements per year, the high-est figures were seen in 2015 and 2016 with 317 (9.6%) and 323 (9.7%)placements respectively (Table 9).What is surprising is that the songs which reached the top positions
were not necessarily those with the most placements (Figure 2). In fact, ifwe were to calculate the average number of placements per number of vid-eoclips with placements in each annual ranking, we would see that the vid-eoclips with most placements on average were those in positions 21, 16, 11,13 and 1 of the ranking, so products and brands appeared randomly andwere not related to the ranking position.
Table 8. Number of videoclips according to the number of placements.Placements Videoclips % of the sample
Over 40 3 0.7%From 31 to 40 9 2.1%From 21 to 30 21 5.0%From 11 to 20 81 19.3%From 2 to 10 207 49.3%1 34 8.1%None 65 15.5%
Source: prepared by the author.
Table 9. Placements per year.
YearSongs withappearances
% of annualsample Placements % of placements
1 2006 21 70.0% 161 4.9%2 2009 26 86.7% 156 4.7%3 2013 20 66.7% 184 5.6%4 2008 24 80.0% 178 5.4%5 2007 29 96.7% 208 6.3%6 2011 24 80.0% 202 6.1%7 2014 27 90.0% 226 6.8%8 2005 25 83.3% 293 8.8%9 2016 26 86.7% 323 9.7%10 2015 28 93.3% 317 9.6%11 2003 26 86.7% 258 7.8%12 2004 27 90.0% 294 8.9%13 2010 29 96.7% 226 6.8%14 2012 23 76.7% 299 9.0%15 355 84.5% 3325 100.3%
% of total sample
Source: prepared by the author.
JOURNAL OF PROMOTION MANAGEMENT 13

Discussion
Overall, these findings have helped us to understand the trend in brandplacement in music videos, and more specifically to know which artistsendorse brands and what kind of brands and products are more likely to belinked to music. These findings confirmed the record industry and brandsgo hand in hand; in 355 out of a total of 420 videoclips analyzed, (84.5%)brands appear. Therefore, seemingly, in general, it is hard to avoid brandplacements when watching music videos. For the record industry, brandshave merged as a new source of revenue: out of a total of 216 artists, 188(87%) of them displayed brands in their music videos. Our results confirmeda growing trend in using this technique, since in 2015 and 2016 the highestnumber of placements were seen (PQ Media, 2018). However, they also indi-cated how important brand placement was in 2004, a year marked by crisisin the record industry and in which, nevertheless, the greatest number ofbrands appeared in videoclips. Nevertheless, we cannot confirm any directrelationship between brand placement and the crisis in the record industrybecause there was an upturn in the music industry in 2015 and 2016, yearsthat marked the highest number of brand placements.Additionally, there were distinctive brand appearances in 2004, the year
before YouTube was founded and which was the sixth consecutive year inwhich a fall in revenue for music companies was registered. This periodheralded the start of a downward trend in income whose low point was2011, after which 2012 marked an upturn, and it appeared to stabilize in2016, according to how the data of the IFPI (2017) is interpreted.
Figure 2. Number of placements and number of videoclips according to the annualranking position.Source: prepared by the author.
14 C. SÁNCHEZ-OLMOS AND A. CASTELLÓ-MARÍNEZ

Secondly, the top positions of the chart are occupied by the same artists,which could imply, as Ordanini and Nunes (2016) stated, a concentrationof superstars at the top of the chart since 2003 where fewer artists reachedthe top of the chart after music became digitalized. These results showedthe artists who dominated the chart during this period, out of whichRihanna was the most successful, with 16 songs at the top. Not surpris-ingly, Rihanna has been one of the most important artists over the sixtyyears of the history of the Billboard Hot 100. In addition, the artists whomost stood out were Usher and Taylor Swift in 2004 and 2015, respectively,each of whom had four songs these years. Thus, around one third of thesesongs researched were by artists who had repeat appearances in the chartyear after year. This was more due to the tastes of fans had than to deliber-ate strategies set by multinationals. However, as Parker (1991) pointed out,consumer choices are first set by the music industry through marketingstrategies, which could influence what tastes and values listeners have.Regarding the second aim, (what brands and products were placed), our
results matched the findings of a study carried out by Galician andBourdeau (2004) in so far as brands such as Chevrolet, Mercedes andBMW were still the most placed ones. However, technology brands whichhad not appeared in previous research were identified in our analysis.These were Apple (position 5), Nokia (position 15) and the headphones ofBeats by Dre from Apple (position 10). In addition, these were stronglyconnected to the world of music and the digital revolution it underwent inthe period under study. Indeed, in 2003 iTunes was the first shop whichsold digital songs and Nokia was the first telephone to provide a songscatalog in 2006.As for the products, our results coincided with Burkhalter and Thornton
(2014) and S�anchez-Olmos (2018); the car was one of the most placedproducts, accounting for 18.3% of the total. This is no wonder, as it is thevehicle which transports young people to parties-the symbol of liberty andindividualism. Music is essential for attracting consumers because it pro-vides the sound track to experiences associated with it. However, luxurycar brands, such as Lamborghini and Rolls-Royce; or high-range Germanbrands such as Mercedes and BMW were those which stood out the most.Accessories and clothing, which accounted for 23.4% and 13.4% of the
total, are fashion-related product categories and they go together especiallywell with music because, although they set some rules of thumb for socialgroups to abide by, they both leave room for individual tastes. Music andfashion are crucial to constructing people’s identities and the cap, an iden-tity symbol for young people and the way by which a person transmits hisor her values and lifestyle, was the accessory which most appeared. Thisproduct was used by any sports brand such as Adidas (top 1), Nike
JOURNAL OF PROMOTION MANAGEMENT 15

(position 2), Air Jordan and Converse and in the videoclips the brands ofteams in the baseball league acted as symbols of American identity. Thesebrands established the differences, values and lifestyles of those who actedas influencers for and dressed these teams. This was seen in brands such asthe NY Yankees (position 3), the Atlanta Braves (position 17) and MLB(position 9).Finally, overall the ratio of products and brands was on par. However,
some brands like Versace in “The Edge of Glory” (2011) by Lady Gagaplaced five different products, where the ratio was 500%. That means thatthere two types of brand placements in music videos. The first and mostusual type is what we call “multi brand” and refers to music videos inwhich many different brands and products are placed, according to theirlink with the audio-visual narrative. The second and less common categoryis “exclusiveness”, where just one brand places different products. In thisevent, the brand does not compete with other ones and the audience mightengage more with it.
Managerial implications
This study’s conclusions may help practitioners find out about brand place-ment in music videos. On one hand, these findings demonstrated thatbrands placed in music videos have evolved in harmony with trends in ourlifestyles. On the other hand, there is no relationship between the top chartpositions and the videoclips with the largest number of placements. In fact,those with most placements on average appear in the middle or at the endof the ranking. Due to the great difficulty the record industry has in pre-dicting how successful a song will be (Negus, 1999; Straw, 2001), marketerscannot know in advance to what extent their brands might have an impact.As for the most placed brands, our findings closely matched those from
similar research in which cars, fashion (clothing, etc.) and accessories(cups, sun glasses, etc.) were the main categories of products involved inplacements. Moreover, technology goods appeared with brands such asApple or Nokia, whose expansion are symbolic of the change to a digitalsociety. Thus, music videos are an attractive format for promoting(Goodwin, 1993) products like cars, fashion and technological brands.Furthermore, media convergence includes materials and actions which aredifficult to classify from a traditional advertising perspective and creates sit-uations in which the attention of the consumer is sought by experienceswith the brand. In this context, as with the findings in this study, musicvideos are important for engaging consumers.However, on a critical note, we may wonder if videoclips are at risk of
being oversaturated by brands, especially if we bear in mind that the
16 C. SÁNCHEZ-OLMOS AND A. CASTELLÓ-MARÍNEZ

audience is unaware if placements are for commercial purposes or not.Despite the positive attitude the audience has toward product placementsin the Burkhalter and Thornton (2014) videoclips, the results of thisresearch show there to be an enormous number of brands in this content.Therefore, there must be a critical analysis of this technique since music iscrucial to forming the values people have (Straw, 2001). Consequently, theline between music and advertising has become blurred since music videoswork as a vehicle with which brands blend their products. This phenom-enon refers to more than just music. Actually, it is known as musicvertising(a blend of music and advertising), a neologism which expresses the notionthat music videos simultaneously encompass both the esthetics of musicand the marketing goals of brands (S�anchez-Olmos, 2018). Thus, apartfrom promoting songs, just as observed by other researchers in the MTVperiod (Englis, 1991; Goodwin,1993) videoclips have become advertisingmedia for promoting products, just as this research shows.
Limitations of the study
The shortcomings in this study is its exploratory and highly descriptivenature; it only describes artists, brands and categories of products but itdoes not delve into brand discernibility, nor why these categories of prod-uct were placed. Nevertheless, its strength is that not only does it cover animportant number of years (from 2003 to 2016) but also a crucial periodcharacterized by digital changes in the record industry. In fact, this study isthe first step for carrying out more ambitious and deeper research inthe future.
Future research
One important line of future research will be to analyze why the mostwatched music videos contain less brand placements. Furthermore, otherstudies could be made to analyze brand placements and different styles ofmusic. On a final note, this study was part of a wider project whose futurelines of research will focus on analyzing the way in which brands placeproducts in narratives. The integration or imposition of brands in musicvideos could be analyzed according to the following variables: brand dis-cernibility and visibility of the logo.
ORCID
Cande S�anchez-Olmos http://orcid.org/0000-0001-5080-2835
JOURNAL OF PROMOTION MANAGEMENT 17

References
Burkhalter, J. N., & Thornton, C. G. (2014). Advertising to the beat: Analysis of brandplacements in hip-hop music videos. Journal of Marketing Communications, 20(5),366–382. doi:10.1080/13527266.2012.710643
Englis, B. G. (1991). Music television and its influences on consumers culture, and thetransmission of consumption messages. Advances in Consumer Research, 18(1), 111–114.
Ferguson, N. S., & Burkhalter, J. N. (2015). Yo, DJ, That�s my band: An examination ofconsumer response to brand placement in hip-hop music. Journal of Advertising, 44(1),47–57. doi:10.1080/00913367.2014.935897
Frith, S. (1996). Performing rites: on the value of popular music. Oxford University Press.Galician, M. L. (2004). Product placement in the 21st century. Journal of Promotion
Management, 10(1-2), 241–258. doi:10.1300/J057v10n01_21Galician, M. L., & Bourdeau, P. G. (2004). The evolution of product placements in Hollywood
cinema. Journal of Promotion Management, 10(1-2), 15–36. doi:10.1300/J057v10n01_03Goodwin, A. (1993). Dancing in the distraction factory: music television and popular culture.
Routledge.Hudson, S., & Hudson, D. (2006). Branded entertainment: A new advertising technique or
product placement in disguise? Journal of Marketing Management, 22(5-6), 489–504. doi:10.1362/026725706777978703
IFPI. 2017. Digital Music Report. http://bit.ly/ifpi-2016.Karrh, J. A. (1998). Brand placement: A review. Journal of Current Issues & Research in
Advertising, 20(2), 31–49. doi:10.1080/10641734.1998.10505081Klein, B. (2009). As heard on TV: Popular music in advertising. Ashgate.Krishen, A. S., & Sirgy, M. J. (2016). Identifying with the brand placed in music videos
makes me like the brand. Journal of Current Issues & Research in Advertising, 37(1),45–58. doi:10.1080/10641734.2015.1119768
Lehu, J. M. (2007). Branded Entertainment: product placement & branded strategy in theentertainment business. Kogan Page Publishers.
Meier, L. M. (2011). Promotional ubiquitous music: Recording artists, brands, and “renderingauthenticity”. Popular Music and Society, 34(4), 399–415. doi:10.1080/03007766.2011.601569
Negus, K. (1999). Music genres and corporate cultures. Routledge. doi:10.4324/9780203169469Ordanini, A., & Nunes, J. C. (2016). From fewer blockbusters by more superstars to more
blockbusters by fewer superstars. International Journal of Research in Marketing, 33(2),297–313. doi:10.1016/j.ijresmar.2015.07.006
Parker, M. (1991). Reading the charts, making sense with the hit parade. Popular Music,10(2), 205–217. doi:10.1017/S0261143000004517
P�erez-Ruf�ı, J. P., Navarrete-Cardero, J. L., G�omez-P�erez, F. J. (2014). Product placement onmusic video: Content analysis of brand placement in the YouTube user’s favourite musicvideos. Doxa. Comunicaci�on 18, 83–104. http://bit.ly/perez-navarrete-gomez-2014. doi:10.31921/doxacom.n18a4
PQ Media. (2018). Global Branded Entertainment Marketing Forecast 2018. http://bit.ly/pqmedia-2018.
S�anchez-Olmos, C. (2018). Musicvertising in branded music content. An analysis of for-mats, features and sectors. Mediterranean Journal of Communication, 9(1), 305–319.http://bit.ly/sanchez-olmos-2018. doi:10.14198/MEDCOM2018.9.2.5
Smit, E., Van Reijmersdal, E., & Neijens, P. (2009). Today’s practice of brand placementand the industry behind it. International Journal of Advertising, 28(5), 761–782. doi:10.2501/S0265048709200898
18 C. SÁNCHEZ-OLMOS AND A. CASTELLÓ-MARÍNEZ

Soba, M., & Aydin, M. (2013). Product placement efficiency in marketing communicationstrategy. International Journal of Business & Management, 8(12), 111–116. http://bit.ly/soba-aydin-2013. doi:10.5539/ijbm.v8n12p111
Straw, W. (2001). Consumption. In S. Frith, W. Straw and J. Street (Eds.). The Cambridgecompanion to pop and rock. (pp. 53–90). Cambridge University Press. doi:10.1017/CCOL9780521553698.005
Sung, Y., & De Gregorio, F. (2008). New brand worlds: College student consumer attitudestoward brand placement in films, television shows, songs, and video games. Journal ofPromotion Management, 14(1-2), 85–101. doi:10.1080/10496490802498272
Thornton, C., & Burkhalter, J. (2015). Must be the music: examining the placement effectsof character-brand association and brand prestige on consumer brand interest within themusic video context. Journal of Promotion Management, 21(1), 126–141. doi:10.1080/10496491.2014.971212
Vernallis, C. (2004). Experiencing music video: Aesthetics and cultural context. ColumbiaUniversity Press.
Vi~nuela, E. (2009). El videoclip en Espa~na (1980-1995) [Music video in Spain (1980–1995)].ICCMU.
YouTube (2018). Most viewed videos of all time. http://bit.ly/top100videos-youtube.
JOURNAL OF PROMOTION MANAGEMENT 19