Artificial Intelligence By Example - Prolighting Group
476
-
Upload
khangminh22 -
Category
Documents
-
view
2 -
download
0
Transcript of Artificial Intelligence By Example - Prolighting Group


Artificial IntelligenceBy Example
Denis Rothman
BIRMINGHAM - MUMBAI

Artificial Intelligence By ExampleCopyright 2018 Packt Publishing
All rights reserved. No part of this book may be reproduced, stored in a retrieval system, or transmitted in any formor by any means, without the prior written permission of the publisher, except in the case of brief quotationsembedded in critical articles or reviews.
Every effort has been made in the preparation of this book to ensure the accuracy of the information presented.However, the information contained in this book is sold without warranty, either express or implied. Neither theauthor, nor Packt Publishing or its dealers and distributors, will be held liable for any damages caused or alleged tohave been caused directly or indirectly by this book.
Packt Publishing has endeavored to provide trademark information about all of the companies and productsmentioned in this book by the appropriate use of capitals. However, Packt Publishing cannot guarantee the accuracyof this information.
Commissioning Editor: Pravin DhandreAcquisition Editor: Tushar GuptaContent Development Editor: Mayur PawanikarTechnical Editor: Prasad RameshCopy Editor: Vikrant PhadkayProject Coordinator: Nidhi JoshiProofreader: Safis EditingIndexer: Tejal Daruwale SoniGraphics: Tania DuttaProduction Coordinator: Aparna Bhagat
First published: May 2018
Production reference: 1290518
Published by Packt Publishing Ltd.Livery Place35 Livery StreetBirminghamB3 2PB, UK.
ISBN 978-1-78899-054-7

To my family and friends for bringing me joy on the good daysand comfort on the bad ones.
-Denis Rothman

Mapt is an online digital library that gives you full access to over 5,000 books and videos, aswell as industry leading tools to help you plan your personal development and advanceyour career. For more information, please visit our website.
Why subscribe?Spend less time learning and more time coding with practical eBooks and Videosfrom over 4,000 industry professionals
Improve your learning with Skill Plans built especially for you
Get a free eBook or video every month
Mapt is fully searchable
Copy and paste, print, and bookmark content
PacktPub.comDid you know that Packt offers eBook versions of every book published, with PDF andePub files available? You can upgrade to the eBook version at and as aprint book customer, you are entitled to a discount on the eBook copy. Get in touch with usat for more details.
At , you can also read a collection of free technical articles, sign up for arange of free newsletters, and receive exclusive discounts and offers on Packt books andeBooks.

Contributors
About the authorDenis Rothman graduated from l'Universit Paris-Sorbonne and l'Universit Paris-Diderot,writing one of the very first word2matrix embedding solutions. He began his careerauthoring one of the first AI cognitive NLP chatbots applied as a language teacher for Mo tet Chandon and other companies. He authored an AI resource optimizer for IBM andapparel producers. He then authored an Advanced Planning and Scheduling (APS)solution used worldwide.
I want to thank the corporations who trusted me from the start to deliver artificialintelligence solutions and share the risks of continuous innovation. I also thank my family,who believed I would make it big at all times.

About the reviewersArmando Fandango creates AI-powered products by leveraging his expertise in deeplearning, machine learning, distributed computing, and computational methods. Headvises Owen.ai Inc., Real Engagement, and Loyalty Inc. on AI product strategy. Hefounded NeuraSights to create insights using neural networks. He was the chief datascientist and CTO for Epic Engg., Consulting Group LLC, and director of data science forSonobi. He has advised high-tech startups as an AI expert and advisory board member.
Nicolas Guet is a financial controller at GRDF. He was a project leader for ENGIE and aSAP BI consultant for Capgemini.
He graduated from Universit Pierre et Marie Curie (Paris VI) and Universit Paris Sud(Paris XI). He also designed a decision-making tool in Java that was part of an AI AdvancedPlanning System, managing hundreds of thousands of orders for 100+ suppliersworldwide. He is dedicated to promoting sustainable energy and smart grids.
J r mie Rothman is an IT project manager at the French National Forest Office (ONF). Hewas an IT consultant for TCS France and worked on a Total SA route optimizing project. Hegraduated from Universit Paris 1 Panth on Sorbonne in economics and holds a degree insoftware mathematics (Universit Paris 5 Ren Descartes).
He designed a Nash equilibrium theory of games algorithm to optimize warehouselocations for an AI Advanced Planning System (APS). The APS program is used to this day.
Packt is searching for authors like youIf you're interested in becoming an author for Packt, please visit and apply today. We have worked with thousands of developers and tech professionals,just like you, to help them share their insight with the global tech community. You canmake a general application, apply for a specific hot topic that we are recruiting an authorfor, or submit your own idea.

Table of ContentsPreface 1
Chapter 1: Become an Adaptive Thinker 8Technical requirements 9How to be an adaptive thinker 9
Addressing real-life issues before coding a solution 10Step 1 – MDP in natural language 11Step 2 – the mathematical representation of the Bellman equation and MDP 14
From MDP to the Bellman equation 14Step 3 – implementing the solution in Python 18
The lessons of reinforcement learning 20How to use the outputs 21Machine learning versus traditional applications 25
Summary 26Questions 27Further reading 27
Chapter 2: Think like a Machine 28Technical requirements 29Designing datasets – where the dream stops and the hard workbegins 30
Designing datasets in natural language meetings 30Using the McCulloch-Pitts neuron 31The McCulloch-Pitts neuron 32The architecture of Python TensorFlow 36
Logistic activation functions and classifiers 38Overall architecture 38Logistic classifier 39Logistic function 39Softmax 40
Summary 44Questions 45Further reading 45
Chapter 3: Apply Machine Thinking to a Human Problem 46Technical requirements 47Determining what and how to measure 47
Convergence 49Implicit convergence 50Numerical – controlled convergence 50

Table of Contents
[ ii ]
Applying machine thinking to a human problem 52Evaluating a position in a chess game 52Applying the evaluation and convergence process to a business problem 56Using supervised learning to evaluate result quality 58
Summary 62Questions 63Further reading 63
Chapter 4: Become an Unconventional Innovator 64Technical requirements 65The XOR limit of the original perceptron 65
XOR and linearly separable models 65Linearly separable models 66The XOR limit of a linear model, such as the original perceptron 67
Building a feedforward neural network from scratch 68Step 1 – Defining a feedforward neural network 68Step 2 – how two children solve the XOR problem every day 69Implementing a vintage XOR solution in Python with an FNN andbackpropagation 73
A simplified version of a cost function and gradient descent 75Linear separability was achieved 78
Applying the FNN XOR solution to a case study to optimize subsetsof data 80Summary 86Questions 87Further reading 87
Chapter 5: Manage the Power of Machine Learning and Deep Learning 88Technical requirements 89Building the architecture of an FNN with TensorFlow 89
Writing code using the data flow graph as an architectural roadmap 90A data flow graph translated into source code 91
The input data layer 91The hidden layer 92The output layer 93The cost or loss function 94Gradient descent and backpropagation 94Running the session 96Checking linear separability 97
Using TensorBoard to design the architecture of your machinelearning and deep learning solutions 98
Designing the architecture of the data flow graph 98Displaying the data flow graph in TensorBoard 100The final source code with TensorFlow and TensorBoard 100
Using TensorBoard in a corporate environment 101

Table of Contents
[ iii ]
Using TensorBoard to explain the concept of classifying customer productsto a CEO 102Will your views on the project survive this meeting? 102
Summary 105Questions 106Further reading 106References 106
Chapter 6: Don't Get Lost in Techniques – Focus on Optimizing YourSolutions 107
Technical requirements 108Dataset optimization and control 108
Designing a dataset and choosing an ML/DL model 109Approval of the design matrix 110
Agreeing on the format of the design matrix 110Dimensionality reduction 112The volume of a training dataset 113
Implementing a k-means clustering solution 113The vision 114
The data 114Conditioning management 115
The strategy 116The k-means clustering program 116
The mathematical definition of k-means clustering 118Lloyd's algorithm 119
The goal of k-means clustering in this case study 119The Python program 120
1 – The training dataset 1202 – Hyperparameters 1213 – The k-means clustering algorithm 1214 – Defining the result labels 1225 – Displaying the results – data points and clusters 122Test dataset and prediction 123
Analyzing and presenting the results 124AGV virtual clusters as a solution 125
Summary 127Questions 127Further reading 128
Chapter 7: When and How to Use Artificial Intelligence 129Technical requirements 130Checking whether AI can be avoided 130
Data volume and applying k-means clustering 131Proving your point 132
NP-hard – the meaning of P 132NP-hard – The meaning of non-deterministic 133The meaning of hard 133
Random sampling 133
Table of Contents
[ iv ]
The law of large numbers – LLN 134The central limit theorem 135
Using a Monte Carlo estimator 135Random sampling applications 136
Cloud solutions – AWS 136Preparing your baseline model 136
Training the full sample training dataset 136Training a random sample of the training dataset 137Shuffling as an alternative to random sampling 139
AWS – data management 141Buckets 141Uploading files 142Access to output results 142
SageMaker notebook 143Creating a job 144Running a job 146
Reading the results 147Recommended strategy 147
Summary 148Questions 148Further reading 149
Chapter 8: Revolutions Designed for Some Corporations andDisruptive Innovations for Small to Large Companies 150
Technical requirements 151Is AI disruptive? 151
What is new and what isn't in AI 152AI is based on mathematical theories that are not new 152Neural networks are not new 153Cloud server power, data volumes, and web sharing of the early 21st centurystarted to make AI disruptive 153Public awareness contributed to making AI disruptive 154
Inventions versus innovations 154Revolutionary versus disruptive solutions 155Where to start? 155
Discover a world of opportunities with Google Translate 156Getting started 156The program 157
The header 157Implementing Google's translation service 158
Google Translate from a linguist's perspective 159Playing with the tool 160Linguistic assessment of Google Translate 160
Lexical field theory 160Jargon 161Translating is not just translating but interpreting 162How to check a translation 163

Table of Contents
[ v ]
AI as a new frontier 164Lexical field and polysemy 165Exploring the frontier – the program 167
k-nearest neighbor algorithm 168The KNN algorithm 169The knn_polysemy.py program 171Implementing the KNN compressed function in Google_Translate_Customized.py 173Conclusions on the Google Translate customized experiment 181
The disruptive revolutionary loop 182Summary 182Questions 183Further reading 184
Chapter 9: Getting Your Neurons to Work 185Technical requirements 186Defining a CNN 187
Defining a CNN 187Initializing the CNN 189Adding a 2D convolution 190
Kernel 190Intuitive approach 191Developers' approach 192Mathematical approach 193
Shape 194ReLu 195
Pooling 197Next convolution and pooling layer 198Flattening 199Dense layers 199
Dense activation functions 200Training a CNN model 201
The goal 201Compiling the model 202
Loss function 202Quadratic loss function 202Binary cross-entropy 203
Adam optimizer 204Metrics 205
Training dataset 205Data augmentation 206Loading the data 206
Testing dataset 207Data augmentation 207Loading the data 208
Training with the classifier 208Saving the model 209
Next steps 210Summary 210

Table of Contents
[ vi ]
Questions 211Further reading and references 211
Chapter 10: Applying Biomimicking to Artificial Intelligence 212Technical requirements 213Human biomimicking 214
TensorFlow, an open source machine learning framework 214Does deep learning represent our brain or our mind? 215
A TensorBoard representation of our mind 217Input data 217Layer 1 – managing the inputs to the network 219
Weights, biases, and preactivation 220Displaying the details of the activation function through the preactivation process 223The activation function of Layer 1 225
Dropout and Layer 2 226Layer 2 227Measuring the precision of prediction of a network through accuracy values 228
Correct prediction 228accuracy 229
Cross-entropy 231Training 232
Optimizing speed with Google's Tensor Processing Unit 233Summary 236Questions 237Further reading 237
Chapter 11: Conceptual Representation Learning 238Technical requirements 239Generate profit with transfer learning 240
The motivation of transfer learning 240Inductive thinking 240Inductive abstraction 241The problem AI needs to solve 241
The Γ gap concept 243Loading the Keras model after training 243
Loading the model to optimize training 243Loading the model to use it 246
Using transfer learning to be profitable or see a project stopped 249Defining the strategy 250
Applying the model 250Making the model profitable by using it for another problem 251
Where transfer learning ends and domain learning begins 252Domain learning 252
How to use the programs 252The trained models used in this section 252The training model program 253
GAP – loaded or unloaded 253GAP – jammed or open lanes 256

Table of Contents
[ vii ]
The gap dataset 258Generalizing the Γ(gap conceptual dataset) 258Generative adversarial networks 259
Generating conceptual representations 260The use of autoencoders 261
The motivation of conceptual representation learning meta-models 262The curse of dimensionality 262The blessing of dimensionality 263
Scheduling and blockchains 263Chatbots 264Self-driving cars 265
Summary 265Questions 266Further reading 266
Chapter 12: Automated Planning and Scheduling 267Technical requirements 268Planning and scheduling today and tomorrow 269
A real-time manufacturing process 270Amazon must expand its services to face competition 270A real-time manufacturing revolution 270
CRLMM applied to an automated apparel manufacturing process 274An apparel manufacturing process 274Training the CRLMM 276
Generalizing the unit-training dataset 277Food conveyor belt processing – positive pγ and negative nγ gaps 277Apparel conveyor belt processing – undetermined gaps 278The beginning of an abstract notion of gaps 279
Modifying the hyperparameters 281Running a prediction program 282
Building the DQN-CRLMM 283A circular process 284Implementing a CNN-CRLMM to detect gaps and optimize 284Q-Learning – MDP 285
MDP inputs and outputs 286The input is a neutral reward matrix 286The standard output of the MDP function 287A graph interpretation of the MDP output matrix 288
The optimizer 289The optimizer as a regulator 290
Implementing Z – squashing the MDP result matrix 290Implementing Z – squashing the vertex weights vector 291
Finding the main target for the MDP function 293Circular DQN-CRLMM – a stream-like system that never starts nor ends 295
Summary 300Questions 300Further reading 300
Chapter 13: AI and the Internet of Things (IoT) 301

Table of Contents
[ viii ]
Technical requirements 302The Iotham City project 303Setting up the DQN-CRLMM model 303
Training the CRLMM 304The dataset 304Training and testing the model 305
Classifying the parking lots 306Adding an SVM function 306
Motivation – using an SVM to increase safety levels 306Definition of a support vector machine 308Python function 310
Running the CRLMM 312Finding a parking space 312Deciding how to get to the parking lot 315
Support vector machine 316The itinerary graph 318The weight vector 319
Summary 320Questions 320Further reading 321References 321
Chapter 14: Optimizing Blockchains with AI 322Technical requirements 323Blockchain technology background 323
Mining bitcoins 323Using cryptocurrency 324Using blockchains 325
Using blockchains in the A-F network 327Creating a block 327Exploring the blocks 328
Using naive Bayes in a blockchain process 329A naive Bayes example 329
The blockchain anticipation novelty 331The goal 332
Step 1 the dataset 332Step 2 frequency 333Step 3 likelihood 334Step 4 naive Bayes equation 334
Implementation 335Gaussian naive Bayes 335
The Python program 336Implementing your ideas 338
Summary 338Questions 339Further reading 340

Table of Contents
[ ix ]
Chapter 15: Cognitive NLP Chatbots 341Technical requirements 342IBM Watson 342
Intents 342Testing the subsets 344
Entities 345Dialog flow 347
Scripting and building up the model 348Adding services to a chatbot 350
A cognitive chatbot service 350The case study 351
A cognitive dataset 351Cognitive natural language processing 352
Activating an image + word cognitive chat 354Solving the problem 356
Implementation 357Summary 358Questions 358Further reading 359
Chapter 16: Improve the Emotional Intelligence Deficiencies ofChatbots 360
Technical requirements 361Building a mind 362
How to read this chapter 363The profiling scenario 364
Restricted Boltzmann Machines 364The connections between visible and hidden units 365Energy-based models 367
Gibbs random sampling 368Running the epochs and analyzing the results 368
Sentiment analysis 370Parsing the datasets 370
Conceptual representation learning meta-models 372Profiling with images 372
RNN for data augmentation 374RNNs and LSTMs 375
RNN, LSTM, and vanishing gradients 376Prediction as data augmentation 377
Step1 – providing an input file 377Step 2 – running an RNN 377Step 3 – producing data augmentation 378
Word embedding 378The Word2vec model 379
Principal component analysis 382

Table of Contents
[ x ]
Intuitive explanation 383Mathematical explanation 383
Variance 383Covariance 385Eigenvalues and eigenvectors 385Creating the feature vector 387Deriving the dataset 387Summing it up 387
TensorBoard Projector 387Using Jacobian matrices 388
Summary 389Questions 389Further reading 390
Chapter 17: Quantum Computers That Think 391Technical requirements 392The rising power of quantum computers 393
Quantum computer speed 393Defining a qubit 396
Representing a qubit 396The position of a qubit 397
Radians, degrees, and rotations 398Bloch sphere 399
Composing a quantum score 400Quantum gates with Quirk 400A quantum computer score with Quirk 402A quantum computer score with IBM Q 403
A thinking quantum computer 406Representing our mind's concepts 406Expanding MindX's conceptual representations 408Concepts in the mind-dataset of MindX 409
Positive thinking 409Negative thinking 410Gaps 412Distances 412
The embedding program 413The MindX experiment 415
Preparing the data 416Transformation Functions – the situation function 416Transformation functions – the quantum function 418Creating and running the score 419Using the output 420IBM Watson and scripts 421
Summary 422Questions 423Further reading 423

Table of Contents
[ xi ]
Appendix A: Answers to the Questions 424Chapter 1 – Become an Adaptive Thinker 424Chapter 2 – Think like a Machine 426Chapter 3 – Apply Machine Thinking to a Human Problem 427Chapter 4 – Become an Unconventional Innovator 428Chapter 5 – Manage the Power of Machine Learning and DeepLearning 430Chapter 6 – Don't Get Lost in Techniques, Focus on OptimizingYour Solutions 431Chapter 7 – When and How to Use Artificial Intelligence 433Chapter 8 – Revolutions Designed for Some Corporations andDisruptive Innovations for Small to Large Companies 435Chapter 9 – Getting Your Neurons to Work 437Chapter 10 – Applying Biomimicking to AI 439Chapter 11 – Conceptual Representation Learning 441Chapter 12 – Automated Planning and Scheduling 443Chapter 13 – AI and the Internet of Things 444Chapter 14 – Optimizing Blockchains with AI 445Chapter 15 – Cognitive NLP Chatbots 446Chapter 16 – Improve the Emotional Intelligence Deficiencies ofChatbots 448Chapter 17 – Quantum Computers That Think 449
Index 453

PrefaceThis book will take you through all of the main aspects of artificial intelligence:
The theory of machine learning and deep learningMathematical representations of the main AI algorithmsReal life case studiesTens of opensource Python programs using TensorFlow, TensorBoard, Keras andmoreCloud AI Platforms: Google, Amazon Web Services, IBM Watson and IBM Q tointroduce you to quantum computingAn Ubuntu VM containing all the opensource programs that you can run in one-clickOnline videos
This book will take you to the cutting edge and beyond with innovations that show how toimprove existing solutions to make you a key asset as a consultant, developer, professor orany person involved in artificial intelligence.
Who this book is forThis book contains the main artificial intelligence algorithms on the market today. Eachmachine learning and deep learning solution is illustrated by a case study and an opensource program available on GitHub.
Project managers and consultants: To understand how to manage AI inputdatasets, make a solution choice (cloud platform or development), and use theoutputs of an AI system.Teachers, students, and developers: This book provides an overview of many keyAI components, with tens of Python sample programs that run on Windows andLinux. A VM is available as well.Anybody who wants to understand how AI systems are built and what they areused for.
Preface
[ 2 ]
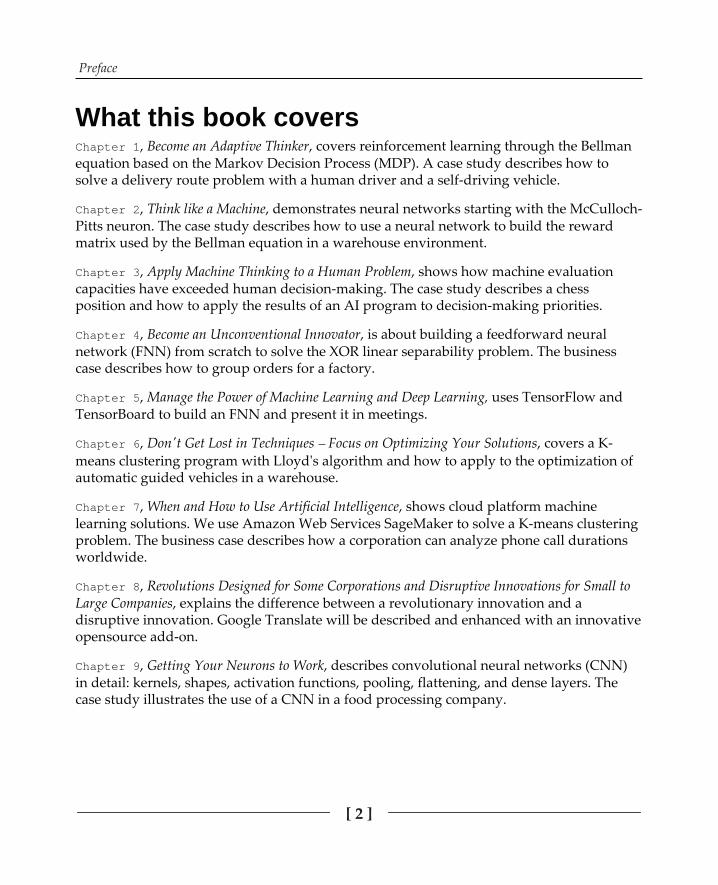
What this book covers, Become an Adaptive Thinker, covers reinforcement learning through the Bellman
equation based on the Markov Decision Process (MDP). A case study describes how tosolve a delivery route problem with a human driver and a self-driving vehicle.
, Think like a Machine, demonstrates neural networks starting with the McCulloch-Pitts neuron. The case study describes how to use a neural network to build the rewardmatrix used by the Bellman equation in a warehouse environment.
, Apply Machine Thinking to a Human Problem, shows how machine evaluationcapacities have exceeded human decision-making. The case study describes a chessposition and how to apply the results of an AI program to decision-making priorities.
, Become an Unconventional Innovator, is about building a feedforward neuralnetwork (FNN) from scratch to solve the XOR linear separability problem. The businesscase describes how to group orders for a factory.
, Manage the Power of Machine Learning and Deep Learning, uses TensorFlow andTensorBoard to build an FNN and present it in meetings.
, Don't Get Lost in Techniques Focus on Optimizing Your Solutions, covers a K-means clustering program with Lloyd's algorithm and how to apply to the optimization ofautomatic guided vehicles in a warehouse.
, When and How to Use Artificial Intelligence, shows cloud platform machinelearning solutions. We use Amazon Web Services SageMaker to solve a K-means clusteringproblem. The business case describes how a corporation can analyze phone call durationsworldwide.
, Revolutions Designed for Some Corporations and Disruptive Innovations for Small toLarge Companies, explains the difference between a revolutionary innovation and adisruptive innovation. Google Translate will be described and enhanced with an innovativeopensource add-on.
, Getting Your Neurons to Work, describes convolutional neural networks (CNN)in detail: kernels, shapes, activation functions, pooling, flattening, and dense layers. Thecase study illustrates the use of a CNN in a food processing company.

Preface
[ 3 ]
, Applying Biomimicking to Artificial Intelligence, describes the difference betweenneuroscience models and deep learning solutions when representing human thinking. ATensorFlow MNIST classifier is explained component by component and displayed indetail in TensorBoard. We cover images, accuracy, cross-entropy, weights, histograms, andgraphs.
, Conceptual Representation Learning, explains Conceptual RepresentationLearning (CRL), an innovative way to solve production flows with a CNN transformed intoa CRL Meta-model. The case study shows how to use a CRLMM for transfer and domainlearning, extending the model to scheduling and self-driving cars.
, Automated Planning and Scheduling, combines CNNs with MDPs to build aDQN solution for automatic planning and scheduling with an optimizer. The case study isthe optimization of the load of sewing stations in an apparel system, such as Amazon'sproduction lines.
, AI and the Internet of Things (IoT), covers Support Vector Machines (SVMs)assembled with a CNN. The case study shows how self-driving cars can find an availableparking space automatically.
, Optimizing Blockchains with AI, is about mining blockchains and describes howblockchains function. We use Naive Bayes to optimize the blocks of a Supply ChainManagement (SCM) blockchain by predicting transactions to anticipate storage levels.
, Cognitive NLP Chatbots, shows how to implement IBM Watson's chatbot withintents, entities, and a dialog flow. We add scripts to customize the dialogs, add sentimentanalysis to give a human touch to the system, and use conceptual representation learningmeta-models (CRLMMs) to enhance the dialogs.
, Improve the Emotional Intelligence Deficiencies of Chatbots, shows how to turn achatbot into a machine that has empathy by using a variety of algorithms at the same timeto build a complex dialog. We cover Restricted Boltzmann Machines (RBMs), CRLMM,RNN, word to vector (word2Vec) embedding, and principal component analysis (PCA). APython program illustrates an empathetic dialog between a machine and a user.
, Quantum Computers That Think, describes how a quantum computer works,with qubits, superposition, and entanglement. We learn how to create a quantum program(score). A case study applies quantum computing to the building of MindX, a thinkingmachine. The chapter comes with programs and a video.
, Answers to the Questions, contains answers to the questions listed at the end of thechapters.

Preface
[ 4 ]
To get the most out of this bookArtificial intelligence projects rely on three factors:
Subject Matter Experts (SMEs). This implies having a practical view of howsolutions can be used, not just developed. Find real-life examples around you toextend the case studies presented in the book.Applied mathematics and algorithms. Do not skip the mathematical equations ifyou have the energy to study them. AI relies heavily on mathematics. There areplenty of excellent websites that explain the mathematics used in the book.Development and production.
An artificial intelligence solution can be directly used on a cloud platform machine learningsite (Google, Amazon, IBM, Microsoft, and others) online or with APIs. In the book,Amazon, IBM, and Google are described. Try to create an account of your own to explorecloud platforms.
Development still remains critical for artificial intelligence projects. Even with a cloudplatform, scripts and services are necessary. Also, sometimes, writing an algorithm ismandatory because the ready-to-use online algorithms are insufficient for a given problem.Explore the programs delivered with the book. They are open source and free.
Download the example code filesYou can download the example code files for this book from your account at
. If you purchased this book elsewhere, you can visit and register to have the files emailed directly to you.
You can download the code files by following these steps:
Log in or register at .1.Select the SUPPORT tab.2.Click on Code Downloads & Errata.3.Enter the name of the book in the Search box and follow the onscreen4.instructions.

Preface
[ 5 ]
Once the file is downloaded, please make sure that you unzip or extract the folder using thelatest version of:
WinRAR/7-Zip for WindowsZipeg/iZip/UnRarX for Mac7-Zip/PeaZip for Linux
The code bundle for the book is also hosted on GitHub at . We also have other code
bundles from our rich catalog of books and videos available at . Check them out!
Download the color imagesWe also provide a PDF file that has color images of the screenshots/diagrams used in thisbook. You can download it here:
.
Code in ActionVisit the following link to check out videos of the code being run:
Conventions usedThere are a number of text conventions used throughout this book.
: Indicates code words in text, database table names, folder names, filenames,file extensions, pathnames, dummy URLs, user input, and Twitter handles. Here is anexample: "Mount the downloaded disk image file as another disk inyour system."
A block of code is set as follows:

Preface
[ 6 ]
When we wish to draw your attention to a particular part of a code block, the relevant linesor items are set in bold:
1.70999493 0.584411341.73355337 0.59234319
0.08329804 -3.26016158-1.2227973 2.213617010.30940653 2.59980058-0.06023325 -3.00127746
Bold: Indicates a new term, an important word, or words that you see onscreen. Forexample, words in menus or dialog boxes appear in the text like this. Here is an example:"For this example, click on Load data."
Warnings or important notes appear like this.
Tips and tricks appear like this.
Get in touchFeedback from our readers is always welcome.
General feedback: Email and mention the book title in thesubject of your message. If you have questions about any aspect of this book, please emailus at .
Errata: Although we have taken every care to ensure the accuracy of our content, mistakesdo happen. If you have found a mistake in this book, we would be grateful if you wouldreport this to us. Please visit , selecting your book,clicking on the Errata Submission Form link, and entering the details.

Preface
[ 7 ]
Piracy: If you come across any illegal copies of our works in any form on the Internet, wewould be grateful if you would provide us with the location address or website name.Please contact us at with a link to the material.
If you are interested in becoming an author: If there is a topic that you have expertise inand you are interested in either writing or contributing to a book, please visit
.
ReviewsPlease leave a review. Once you have read and used this book, why not leave a review onthe site that you purchased it from? Potential readers can then see and use your unbiasedopinion to make purchase decisions, we at Packt can understand what you think about ourproducts, and our authors can see your feedback on their book. Thank you!
For more information about Packt, please visit .

11Become an Adaptive Thinker
In May 2017, Google revealed AutoML, an automated machine learning system that couldcreate an artificial intelligence solution without the assistance of a human engineer. IBMCloud and Amazon Web Services (AWS) offer machine learning solutions that do notrequire AI developers. GitHub and other cloud platforms already provide thousands ofmachine learning programs, reducing the need of having an AI expert at hand. These cloudplatforms will slowly but surely reduce the need for artificial intelligence developers.Google Cloud's AI provides intuitive machine learning services. Microsoft Azure offersuser-friendly machine learning interfaces.
At the same time, Massive Open Online Courses (MOOC) are flourishing everywhere.Anybody anywhere can pick up a machine learning solution on GitHub, follow a MOOCwithout even going to college, and beat any engineer to the job.
Today, artificial intelligence is mostly mathematics translated into source code whichmakes it difficult to learn for traditional developers. That is the main reason why Google,IBM, Amazon, Microsoft, and others have ready-made cloud solutions that will requirefewer engineers in the future.
As you will see, starting with this chapter, you can occupy a central role in this new worldas an adaptive thinker. There is no time to waste. In this chapter, we are going to divequickly and directly into reinforcement learning, one of the pillars of Google Alphabet'sDeepMind asset (the other being neural networks). Reinforcement learning often uses theMarkov Decision Process (MDP). MDP contains a memoryless and unlabeled action-reward equation with a learning parameter. This equation, the Bellman equation (oftencoined as the Q function), was used to beat world-class Atari gamers.

Become an Adaptive Thinker Chapter 1
[ 9 ]
The goal here is not to simply take the easy route. We're striving to break complexity intounderstandable parts and confront them with reality. You are going to find out right fromthe start how to apply an adaptive thinker's process that will lead you from an idea to asolution in reinforcement learning, and right into the center of gravity of Google'sDeepMind projects.
The following topics will be covered in this chapter:
A three-dimensional method to implement AI, ML, and DLReinforcement learningMDPUnsupervised learningStochastic learningMemoryless learningThe Bellman equationConvergenceA Python example of reinforcement learning with the Q action-value functionApplying reinforcement learning to a delivery example
Technical requirementsPython 3.6x 64-bit from NumPy for Python 3.6xProgram on Github,
Check out the following video to see the code in action:
How to be an adaptive thinkerReinforcement learning, one of the foundations of machine learning, supposes learningthrough trial and error by interacting with an environment. This sounds familiar, right?That is what we humans do all our lives in pain! Try things, evaluate, and then continue;or try something else.

Become an Adaptive Thinker Chapter 1
[ 10 ]
In real life, you are the agent of your thought process. In a machine learning model, theagent is the function calculating through this trial-and-error process. Thisthought process in machine learning is the MDP. This form of action-value learning issometimes called Q.
To master the outcomes of MDP in theory and practice, a three-dimensional method is aprerequisite.
The three-dimensional approach that will make you an artificial expert, in general terms,means:
Starting by describing a problem to solve with real-life casesThen, building a mathematical modelThen, write source code and/or using a cloud platform solution
It is a way for you to enter any project with an adaptive attitude from the outset.
Addressing real-life issues before coding asolutionIn this chapter, we are going to tackle Markov's Decision Process (Q function) and apply itto reinforcement learning with the Bellman equation. You can find tons of source code andexamples on the web. However, most of them are toy experiments that have nothing to dowith real life. For example, reinforcement learning can be applied to an e-commercebusiness delivery person, self-driving vehicle, or a drone. You will find a program thatcalculates a drone delivery. However, it has many limits that need to be overcome. You asan adaptive thinker are going to ask some questions:
What if there are 5,000 drones over a major city at the same time?Is a drone-jam legal? What about the noise over the city? What about tourism?What about the weather? Weather forecasts are difficult to make, so how is thisscheduled?
In just a few minutes, you will be at the center of attention, among theoreticians who knowmore than you on one side and angry managers who want solutions they cannot get on theother side. Your real-life approach will solve these problems.

Become an Adaptive Thinker Chapter 1
[ 11 ]
A foolproof method is the practical three-dimensional approach:
Be a subject matter expert (SME): First, you have to be an SME. If a theoreticiangeek comes up with a hundred Google DeepMind TensorFlow functions to solvea drone trajectory problem, you now know it is going to be a tough ride if real-life parameters are taken into account.An SME knows the subject and thus can quickly identify the critical factors of agiven field. Artificial intelligence often requires finding a solution to a hardproblem that even an expert in a given field cannot express mathematically.Machine learning sometimes means finding a solution to a problem that humansdo not know how to explain. Deep learning, involving complex networks, solveseven more difficult problems.Have enough mathematical knowledge to understand AI concepts: Once youhave the proper natural language analysis, you need to build your abstractrepresentation quickly. The best way is to look around at your everyday life andmake a mathematical model of it. Mathematics is not an option in AI, but aprerequisite. The effort is worthwhile. Then, you can start writing solid sourcecode or start implementing a cloud platform ML solution.Know what source code is about as well as its potential and limits: MDP is anexcellent way to go and start working in the three dimensions that will make youadaptive: describing what is around you in detail in words, translating that intomathematical representations, and then implementing the result in your sourcecode.
Step 1 MDP in natural languageStep 1 of any artificial intelligence problem is to transpose it into something you know inyour everyday life (work or personal). Something you are an SME in. If you have a driver'slicense, then you are an SME of driving. You are certified. If you do not have a driver'slicense or never drive, you can easily replace moving around in a car by moving around onfoot.
Let's say you are an e-commerce business driver delivering a package in an area you do notknow. You are the operator of a self-driving vehicle. You have a GPS system with abeautiful color map on it. The areas around you are represented by the letters A to F, asshown in the simplified map in the following diagram. You are presently at F. Your goal isto reach area C. You are happy, listening to the radio. Everything is going smoothly, and itlooks like you are going to be there on time. The following graph represents the locationsand routes that you can possibly cover.

Become an Adaptive Thinker Chapter 1
[ 12 ]
The guiding system's state indicates the complete path to reach C. It is telling you that youare going to go from F to B to D and then to C. It looks good!
To break things down further, let's say:
The present state is the letter s.Your next action is the letter a (action). This action a is not location A.The next action a (not location A) is to go to location B. You look at your guidingsystem; it tells you there is no traffic, and that to go from your present state F toyour next state B will take you only a few minutes. Let's say that the next state Bis the letter B.
At this point, you are still quite happy, and we can sum up your situation with thefollowing sequence of events:
The letter s is your present state, your present situation. The letter a is the action you'redeciding, which is to go to the next area; there you will be in another state, s'. We can saythat thanks to the action a, you will go from s to s'.
Now, imagine that the driver is not you anymore. You are tired for some reason. That iswhen a self-driving vehicle comes in handy. You set your car to autopilot. Now you are notdriving anymore; the system is. Let's call that system the agent. At point F, you set your carto autopilot and let the self-driving agent take over.
The agent now sees what you have asked it to do and checks its mapping environment,which represents all the areas in the previous diagram from A to F.

Become an Adaptive Thinker Chapter 1
[ 13 ]
In the meantime, you are rightly worried. Is the agent going to make it or not? You arewondering if its strategy meets yours. You have your policy P your way ofthinking which is to take the shortest paths possible. Will the agent agree? What's goingon in its mind? You observe and begin to realize things you never noticed before. Since thisis the first time you are using this car and guiding system, the agent is memoryless, whichis an MDP feature. This means the agent just doesn't know anything about what went onbefore. It seems to be happy with just calculating from this state s at area F. It will usemachine power to run as many calculations as necessary to reach its goal.
Another thing you are watching is the total distance from F to C to check whether thingsare OK. That means that the agent is calculating all the states from F to C.
In this case, state F is state 1, which we can simplify by writing s1. B is state 2, which we cansimplify by write s2. D is s3 and C is s4. The agent is calculating all of these possible states tomake a decision.
The agent knows that when it reaches D, C will be better because the reward will be higherto go to C than anywhere else. Since it cannot eat a piece of cake to reward itself, the agentuses numbers. Our agent is a real number cruncher. When it is wrong, it gets a poor rewardor nothing in this model. When it's right, it gets a reward represented by the letter R. Thisaction-value (reward) transition, often named the Q function, is the core of manyreinforcement learning algorithms.
When our agent goes from one state to another, it performs a transition and gets a reward.For example, the transition can be from F to B, state 1 to state 2, or s1 to s2.
You are feeling great and are going to be on time. You are beginning to understand how themachine learning agent in your self-driving car is thinking. Suddenly your guiding systembreaks down. All you can see on the screen is that static image of the areas of the lastcalculation. You look up and see that a traffic jam is building up. Area D is still far away,and now you do not know whether it would be good to go from D to C or D to E to get ataxi that can take special lanes. You are going to need your agent!
The agent takes the traffic jam into account, is stubborn, and increases its reward to get toC by the shortest way. Its policy is to stick to the initial plan. You do not agree. You haveanother policy.
Become an Adaptive Thinker Chapter 1
[ 14 ]
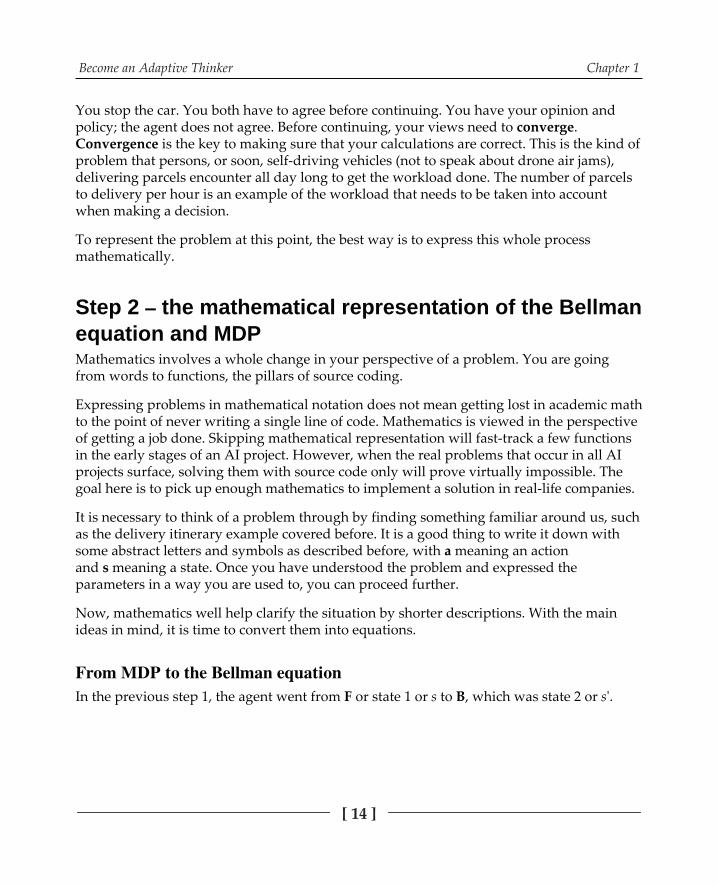
You stop the car. You both have to agree before continuing. You have your opinion andpolicy; the agent does not agree. Before continuing, your views need to converge.Convergence is the key to making sure that your calculations are correct. This is the kind ofproblem that persons, or soon, self-driving vehicles (not to speak about drone air jams),delivering parcels encounter all day long to get the workload done. The number of parcelsto delivery per hour is an example of the workload that needs to be taken into accountwhen making a decision.
To represent the problem at this point, the best way is to express this whole processmathematically.
Step 2 the mathematical representation of the Bellmanequation and MDPMathematics involves a whole change in your perspective of a problem. You are goingfrom words to functions, the pillars of source coding.
Expressing problems in mathematical notation does not mean getting lost in academic mathto the point of never writing a single line of code. Mathematics is viewed in the perspectiveof getting a job done. Skipping mathematical representation will fast-track a few functionsin the early stages of an AI project. However, when the real problems that occur in all AIprojects surface, solving them with source code only will prove virtually impossible. Thegoal here is to pick up enough mathematics to implement a solution in real-life companies.
It is necessary to think of a problem through by finding something familiar around us, suchas the delivery itinerary example covered before. It is a good thing to write it down withsome abstract letters and symbols as described before, with a meaning an actionand s meaning a state. Once you have understood the problem and expressed theparameters in a way you are used to, you can proceed further.
Now, mathematics well help clarify the situation by shorter descriptions. With the mainideas in mind, it is time to convert them into equations.
In the previous step 1, the agent went from F or state 1 or s to B, which was state 2 or s'.

Become an Adaptive Thinker Chapter 1
[ 15 ]
To do that, there was a strategy a policy represented by P. All of this can be shown in onemathematical expression, the MDP state transition function:
P is the policy, the strategy made by the agent to go from F to B through action a. Whengoing from F to B, this state transition is called state transition function:
a is the actions is state 1 (F) and s' is state 2 (B)
This is the basis of MDP. The reward (right or wrong) is represented in the same way:
That means R is the reward for the action of going from state s to state s'. Going from onestate to another will be a random process. This means that potentially, all states can go toanother state.
The example we will be working on inputs a reward matrix so that the program can chooseits best course of action. Then, the agent will go from state to state, learning the besttrajectories for every possible starting location point. The goal of the MDP is to go to C (line3, column 3 in the reward matrix), which has a starting value of 100 in the following Pythoncode.
100
Each line in the matrix in the example represents a letter from A to F, and each columnrepresents a letter from A to F. All possible states are represented. The values representthe nodes (vertices) of the graph. Those are the possible locations. For example, line 1represents the possible moves for letter A, line 2 for letter B, and line 6 for letter F. On thefirst line, A cannot go to C directly, so a value is entered. But, it can go to E, so a value isadded.

Become an Adaptive Thinker Chapter 1
[ 16 ]
Some models start with -1 for impossible choices, such as B going directly to C and valuesto define the locations. This model starts with 0 and 1 values. It sometimes takes weeks todesign functions that will create a reward matrix (see , Think like a Machine).
There are several properties of this decision process. A few of them are mentioned here:
The Markov property: The process is applied when the past is not taken intoaccount. It is the memoryless property of this decision process, just as you do in acar with a guiding system. You move forward to reach your goal. This is calledthe Markov property.Unsupervised learning: From this memoryless Markov property, it is safe to saythat the MDP is not supervised learning. Supervised learning would mean thatwe would have all the labels of the trip. We would know exactly what A meansand use that property to make a decision. We would be in the future looking atthe past. MDP does not take these labels into account. This means that this isunsupervised learning. A decision has to be made in each state without knowingthe past states or what they signify. It means that the car, for example, was on itsown at each location, which is represented by each of its states.Stochastic process: In step 1, when state B was reached, the agent controlling themapping system and the driver didn't agree on where to go. A random choicecould be made in a trial-and-error way, just like a coin toss. It is going to be aheads-or-tails process. The agent will toss the coin thousands of times andmeasure the outcomes. That's precisely how MDP works and how the agent willlearn.Reinforcement learning: Repeating a trial and error process with feedback fromthe agent's environment.Markov chain: The process of going from state to state with no history in arandom, stochastic way is called a Markov chain.
To sum it up, we have three tools:
Pa(s,s'): A policy, P, or strategy to move from one state to anotherTa(s,s'): A T, or stochastic (random) transition, function to carry out that action Ra(s,s'): An R, or reward, for that action, which can be negative, null, or positive
T is the transition function, which makes the agent decide to go from one point to anotherwith a policy. In this case, it will be random. That's what machine power is for, and that'show reinforcement learning is often implemented.

Become an Adaptive Thinker Chapter 1
[ 17 ]
Randomness is a property of MDP.
The following code describes the choice the agent is going to make.
Once the code has been run, a new random action (state) has been chosen.
The Bellman equation is the road to programming reinforcement learning.
Bellman's equation completes the MDP. To calculate the value of a state, let's use , for theQ action-reward (or value) function. The pre-source code of Bellman's equation can beexpressed as follows for one individual state:
The source code then translates the equation into a machine representation as in thefollowing code:
The source code variables of the Bellman equation are as follows:
: This is the value calculated for this state the total reward. In step 1 whenthe agent went from F to B, the driver had to be happy. Maybe she/he had acrunch in a candy bar to feel good, which is the human counterpart of the rewardmatrix. The automatic driver maybe ate (reward matrix) some electricity,renewable energy of course! The reward is a number such as 50 or 100 to showthe agent that it's on the right track. It's like when a student gets a good grade inan exam.
: This is the sum of the values up to there. It's the total reward at that point.

Become an Adaptive Thinker Chapter 1
[ 18 ]
= gamma: This is here to remind us that trial and error has a price. We'rewasting time, money, and energy. Furthermore, we don't even know whether thenext step is right or wrong since we're in a trial-and-error mode. Gamma is oftenset to . What does that mean? Suppose you're taking an exam. You study andstudy, but you don't really know the outcome. You might have 80 out of 100 (0.8)chances of clearing it. That's painful, but that's life. This is what makes Bellman'sequation and MDP realistic and efficient.
: s is one of the possible states that can be reached with Pa (s,s'); isthe highest value on the line of that state (location line in the reward matrix).
Step 3 implementing the solution in PythonIn step 1, a problem was described in natural language to be able to talk to experts andunderstand what was expected. In step 2, an essential mathematical bridge was builtbetween natural language and source coding. Step 3 is the software implementation phase.
When a problem comes up and rest assured that one always does it will be possible togo back over the mathematical bridge with the customer or company team, and evenfurther back to the natural language process if necessary.
This method guarantees success for any project. The code in this chapter is in Python 3.6. Itis a reinforcement learning program using the Q function with the following rewardmatrix:
is the reward matrix described in the mathematical analysis.

Become an Adaptive Thinker Chapter 1
[ 19 ]
inherits the same structure as , but all values are set to since this is a learning matrix.It will progressively contain the results of the decision process. The gamma variable is adouble reminder that the system is learning and that its decisions have only an 80% chanceof being correct each time. As the following code shows, the system explores the possibleactions during the process.
current_state_row >0
The agent starts in state 1, for example. You can start wherever you want because it's arandom process. Note that only values > 0 are taken into account. They represent thepossible moves (decisions).
The current state goes through an analysis process to find possible actions (next possiblestates). You will note that there is no algorithm in the traditional sense with many rules. It'sa pure random calculation, as the following function shows.
random.choice(PossibleAction
Now comes the core of the system containing Bellman's equation, translated into thefollowing source code:

Become an Adaptive Thinker Chapter 1
[ 20 ]
Q[current_state, action] = R[current_state, action] + gamma * MaxValue
You can see that the agent looks for the maximum value of the next possible state chosen atrandom.
The best way to understand this is to run the program in your Python environment and the intermediate values. I suggest that you open a spreadsheet and note the
values. It will give you a clear view of the process.
The last part is simply about running the learning process 50,000 times, just to be sure thatthe system learns everything there is to find. During each iteration, the agent will detect itspresent state, choose a course of action, and update the function matrix:
After the process is repeated and until the learning process is over, the program will printthe result in and the normed result. The normed result is the process of dividing allvalues by the sum of the values found. The result comes out as a normed percentage.
View the Python program at .
The lessons of reinforcement learningUnsupervised reinforcement machine learning, such as MDP and Bellman's equation, willtopple traditional decision-making software in the next few years. Memorylessreinforcement learning requires few to no business rules and thus doesn't require humanknowledge to run.

Become an Adaptive Thinker Chapter 1
[ 21 ]
Being an adaptive AI thinker involves three requisites the effort to be an SME, working onmathematical models, and understanding source code's potential and limits:
Lesson 1: Machine learning through reinforcement learning can beat humanintelligence in many cases. No use fighting! The technology and solutions arealready here.Lesson 2: Machine learning has no emotions, but you do. And so do the peoplearound you. Human emotions and teamwork are an essential asset. Become anSME for your team. Learn how to understand what they're trying to sayintuitively and make a mathematical representation of it for them. This job willnever go away, even if you're setting up solutions such as Google's AutoML thatdon't require much development.
Reinforcement learning shows that no human can solve a problem the way a machine does;50,000 iterations with random searching is not an option. The days of neuroscienceimitating humans are over. Cheap, powerful computers have all the leisure it takes tocompute millions of possibilities and choose the best trajectories.
Humans need to be more intuitive, make a few decisions, and see what happens becausehumans cannot try 50,000 ways of doing something. Reinforcement learning marks a newera for human thinking by surpassing human reasoning power.
On the other hand, reinforcement learning requires mathematical models to function.Humans excel in mathematical abstraction, providing powerful intellectual fuel to thosepowerful machines.
The boundaries between humans and machines have changed. Humans' ability to buildmathematical models and every-growing cloud platforms will serve online machinelearning services.
Finding out how to use the outputs of the reinforcement learning program we just studiedshows how a human will always remain at the center of artificial intelligence.
How to use the outputsThe reinforcement program we studied contains no trace of a specific field, as in traditionalsoftware. The program contains Bellman's equation with stochastic (random) choices basedon the reward matrix. The goal is to find a route to C (line 3, column 3), which has anattractive reward ( ):

Become an Adaptive Thinker Chapter 1
[ 22 ]
100
That reward matrix goes through Bellman's equation and produces a result in Python:
The result contains the values of each state produced by the reinforced learning process,and also a normed (highest value divided by other values).
As Python geeks, we are overjoyed. We made something rather difficult to work,namely reinforcement learning. As mathematical amateurs, we are elated. We know whatMDP and Bellman's equation mean.
However, as natural language thinkers, we have made little progress. No customer or usercan read that data and make sense of it. Furthermore, we cannot explain how weimplemented an intelligent version of his/her job in the machine. We didn't.
We hardly dare say that reinforcement learning can beat anybody in the company makingrandom choices 50,000 times until the right answer came up.
Furthermore, we got the program to work but hardly know what to do with the resultourselves. The consultant on the project cannot help because of the matrix format of thesolution.
Being an adaptive thinker means knowing how to be good in all the dimensions of asubject. To solve this new problem, let's go back to step 1 with the result.

Become an Adaptive Thinker Chapter 1
[ 23 ]
By formatting the result in Python, a graphics tool, or a spreadsheet, the result that isdisplayed as follows:
A B C D E F
A - - - - 258.44 -
B - - - 321.8 - 207.752
C - - 500 321.8 - -
D - 258.44 401. - 258.44 -
E 207.752 - - 321.8 - -
F - 258.44 - - - -
Now, we can start reading the solution:
Choose a starting state. Take F for example.The F line represents the state. Since the maximum value is 258.44 in the Bcolumn, we go to state B, the second line.The maximum value in state B in the second line leads us to the D state in thefourth column.The highest maximum of the D state (fourth line) leads us to the C state.
Note that if you start at the C state and decide not to stay at C, the D state becomes themaximum value, which will lead you to back to C. However, the MDP will never do thisnaturally. You will have to force the system to do it.
You have now obtained a sequence: F->B->D->C. By choosing other points of departure,you can obtain other sequences by simply sorting the table.
The most useful way of putting it remains the normalized version in percentages. Thisreflects the stochastic (random) property of the solution, which produces probabilities andnot certainties, as shown in the following matrix:
A B C D E F
A - - - - 51.68% -
B - - - 64.36% - 41.55%
C - - 100% 64.36% - -
D - 51.68% 80.2% - 51.68% -
E 41.55% - - 64.36% - -
F - 51.68% - - - -

Become an Adaptive Thinker Chapter 1
[ 24 ]
Now comes the very tricky part. We started the chapter with a trip on a road. But I made nomention of it in the result analysis.
An important property of reinforcement learning comes from the fact that we are workingwith a mathematical model that can be applied to anything. No human rules are needed.This means we can use this program for many other subjects without writing thousands oflines of code.
Case 1: Optimizing a delivery for a driver, human or not
This model was described in this chapter.
Case 2: Optimizing warehouse flows
The same reward matrix can apply to going from point F to C in a warehouse, as shown inthe following diagram:
In this warehouse, the F->B->D->C sequence makes visual sense. If somebody goes frompoint F to C, then this physical path makes sense without going through walls.
It can be used for a video game, a factory, or any form of layout.
Case 3: Automated planning and scheduling (APS)
By converting the system into a scheduling vector, the whole scenery changes. We have leftthe more comfortable world of physical processing of letters, faces, and trips. Thoughfantastic, those applications are social media's tip of the iceberg. The real challenge ofartificial intelligence begins in the abstract universe of human thinking.

Become an Adaptive Thinker Chapter 1
[ 25 ]
Every single company, person, or system requires automatic planning and scheduling (see, Automated Planning and Scheduling). The six A to F steps in the example of this
chapter could well be six tasks to perform in a given unknown order represented by thefollowing vector x:
The reward matrix then reflects the weights of constraints of the tasks of vector x toperform. For example, in a factory, you cannot assemble the parts of a product beforemanufacturing them.
In this case, the sequence obtained represents the schedule of the manufacturing process.
Case 4 and more: Your imagination
By using physical layouts or abstract decision-making vectors, matrices, and tensors, youcan build a world of solutions in a mathematical reinforcement learning model. Naturally,the following chapters will enhance your toolbox with many other concepts.
Machine learning versus traditional applicationsReinforcement learning based on stochastic (random) processes will evolve beyondtraditional approaches. In the past, we would sit down and listen to future users tounderstand their way of thinking.
We would then go back to our keyboard and try to imitate the human way of thinking.Those days are over. We need proper datasets and ML/DL equations to move forward.Applied mathematics has taken reinforcement learning to the next level. Traditionalsoftware will soon be in the museum of computer science.
An artificial adaptive thinker sees the world through applied mathematics translated intomachine representations.

Become an Adaptive Thinker Chapter 1
[ 26 ]
Use the Python source code example provided in this chapter in differentways. Run it; try to change some parameters to see what happens. Playaround with the number of iterations as well. Lower the number from50,000 down to where you find its best. Change the reward matrix a littleto see what happens. Design your own reward matrix trajectory. It can bean itinerary or a decision-making process.
SummaryPresently, artificial intelligence is predominantly a branch of applied mathematics, not ofneurosciences. You must master the basics of linear algebra and probabilities. That's adifficult task for a developer used to intuitive creativity. With that knowledge, you will seethat humans cannot rival with machines that have CPU and mathematical functions. Youwill also understand that machines, contrary to the hype around you, don't have emotionsalthough we can represent them to a scary point (See , Improve the EmotionalIntelligence Deficiencies of Chatbots, and , Quantum Computers That Think) inchatbots.
That being said, a multi-dimensional approach is a requisite in an AI/ML/DL project firsttalk and write about the project, then make a mathematical representation, and finally gofor software production (setting up an existing platform and/or writing code). In real-life,AI solutions do not just grow spontaneously in companies like trees. You need to talk to theteams and work with them. That part is the real fulfilling aspect of a project imagining itfirst and then implementing it with a group of real-life people.
MDP, a stochastic random action-reward (value) system enhanced by Bellman's equation,will provide effective solutions to many AI problems. These mathematical tools fit perfectlyin corporate environments.
Reinforcement learning using the Q action-value function is memoryless (no past) andunsupervised (the data is not labeled or classified). This provides endless avenues to solvereal-life problems without spending hours trying to invent rules to make a system work.
Now that you are at the heart of Google's DeepMind approach, it is time to go to , Think Like a Machine, and discover how to create the reward matrix in the first place
through explanations and source code.

Become an Adaptive Thinker Chapter 1
[ 27 ]
QuestionsThe answers to the questions are in Appendix B, with more explanations.
Is reinforcement learning memoryless? (Yes | No)1.Does reinforcement learning use stochastic (random) functions? (Yes | No)2.Is MDP based on a rule base? (Yes | No)3.Is the Q function based on the MDP? (Yes | No)4.Is mathematics essential to artificial intelligence? (Yes | No)5.Can the Bellman-MDP process in this chapter apply to many problems? (Yes |6.No)Is it impossible for a machine learning program to create another program by7.itself? (Yes | No)Is a consultant required to enter business rules in a reinforcement learning8.program? (Yes | No)Is reinforcement learning supervised or unsupervised? (Supervised |9.Unsupervised)Can Q Learning run without a reward matrix? (Yes | No)10.
Further readingAndrey Markov:
The Markov Process:

22Think like a Machine
The first chapter described a reinforcement learning algorithm through the Q action-valuefunction used by DQN. The agent was a driver. You are at the heart of DeepMind'sapproach to AI.
DeepMind is no doubt one of the world leaders in applied artificial intelligence. Scientific,mathematical, and applications research drives its strategy.
DeepMind was founded in 2010, was acquired by Google in 2014, and is now part ofAlphabet, a collection of companies that includes Google.
One of the focuses of DeepMind is on reinforcement learning. They came up with aninnovate version of reinforcement learning called DQN and referring to deep neuralnetworks using the Q function (Bellman's equation). A seminal article published inFebruary 2015 in Nature (see the link at the end of the chapter) shows how DQNoutperformed other artificial intelligence research by becoming a human game tester itself.DQN then went on to beat human game testers.
In this chapter, the agent will be an automated guided vehicle (AGV). An AGV takes overthe transport tasks in a warehouse. This case study opens promising perspectives for jobsand businesses using DQN. Thousands upon thousands of warehouses require complexreinforcement learning and customized transport optimization.
This chapter focuses on creating the reward matrix, which was the entry point of thePython example in the first chapter. To do so, it describes how to add a primitiveMcCulloch-Pitts neuron in TensorFlow to create an intelligent adaptive network and addan N (network) to a Q model. It's a small N that will become a feedforward neural networkin , Become an Unconventional Innovator, and more in , AutomatedPlanning and Scheduling. The goal is not to copy DQN but to use the conceptual power of themodel to build a variety of solutions.

Think like a Machine Chapter 2
[ 29 ]
The challenge in this chapter will be to think literally like a machine. The effort is not toimitate human thinking but to beat humans with machines. This chapter will take you veryfar from human reasoning into the depth of machine thinking.
The following topics will be covered in this chapter:
AGVThe McCulloch-Pitts neuronCreating a reward matrixLogistic classifiersThe logistic sigmoidThe softmax functionThe one-hot functionHow to apply machine learning tools to real-life problems such as warehousemanagement
Technical requirementsPython 3.6x 64-bit from NumPy for Python 3.6xTensorFlow from with TensorBoard
The following files:
Check out the following video to see the code in action:

Think like a Machine Chapter 2
[ 30 ]
Designing datasets where the dream stopsand the hard work beginsAs in the previous chapter, bear in mind that a real-life project goes through a three-dimensional method in some form or the other. First, it's important to just think and talkabout the problem to solve without jumping onto a laptop. Once that is done, bear in mindthat the foundation of machine learning and deep learning relies on mathematics. Finally,once the problem has been discussed and mathematically represented, it is time to developthe solution.
First, think of a problem in natural language. Then, make a mathematicaldescription of a problem. Only then, start the software implementation.
Designing datasets in natural language meetingsThe reinforcement learning program described in the first chapter can solve a variety ofproblems involving unlabeled classification in an unsupervised decision-making process.The Q function can be applied indifferently to drone, truck, or car deliveries. It can also beapplied to decision-making in games or real life.
However, in a real-life case study problem (such as defining the reward matrix in awarehouse for the AGV, for example), the difficulty will be to design a matrix thateverybody agrees with.
This means many meetings with the IT department to obtain data, the SME andreinforcement learning experts. An AGV requires information coming from differentsources: daily forecasts and real-time warehouse flows.
At one point, the project will be at a standstill. It is simply too complicated to get the rightdata for the reinforcement program. This is a real-life case study that I modified a little forconfidentiality reasons.
The warehouse manages thousands of locations and hundreds of thousands of inputs andoutputs. The Q function does not satisfy the requirement in itself. A small neural network isrequired.

Think like a Machine Chapter 2
[ 31 ]
In the end, through tough negotiations with both the IT department and the users, a datasetformat is designed that fits the needs of the reinforcement learning program and hasenough properties to satisfy the AGV.
Using the McCulloch-Pitts neuron The mathematical aspect relies on finding a model for inputs for huge volumes in acorporate warehouse.
In one mode, the inputs can be described as follows:
Thousands of forecast product arrivals with a low priority weight: w1 = 10Thousands of confirmed arrivals with a high priority weight: w2 = 70Thousands of unplanned arrivals decided by the sales department: w3 = 75Thousands of forecasts with a high priority weight: w4 = 60Thousands of confirmed arrivals that have a low turnover and so have a lowweight: w5 = 20
These weights represent vector w:
All of these products have to be stored in optimal locations, and the distance betweennearly 100 docks and thousands of locations in the warehouse for the AGV has tobe minimized.
Let's focus on our neuron. Only these weights will be used, though a system such as thisone will add up to more than 50 weights and parameters per neuron.
In the first chapter, the reward matrix was size 6x6. Six locations were described (A to F),and now six locations (l1 to l6) will be represented in a warehouse.
A 6x6 reward matrix represents the target of the McCulloch-Pitts layer implemented for thesix locations.

Think like a Machine Chapter 2
[ 32 ]
Also, this matrix was the input in the first chapter. In real life, and in real companies, youwill have to find a way to build datasets from scratch. The reward matrix becomes theoutput of this part of the process. The following source code shows the input of thereinforcement learning program used in the first chapter. The goal of this chapter describeshow to produce the following reward matrix.
For this warehouse problem, the McCulloch-Pitts neuron sums up the weights of thepriority vector described previously to fill in the reward matrix.
Each location will require its neuron, with its weights.
Inputs are the flows in a warehouse or any form of dataWeights will be defined in this model Bias is for stabilizing the weightsValues will be the output
There are as many ways as you can imagine to create reward matrices.This chapter describes one way of doing it that works.
The McCulloch-Pitts neuronThe McCulloch-Pitts neuron dates back to 1943. It contains inputs, weights, and anactivation function. This is precisely where you need to think like a machine and forgetabout human neuroscience brain approaches for this type of problem. Starting from
, Revolutions Designed for Some Corporations and Disruptive Innovations Small toLarge Companies, human cognition will be built on top of these models, but the foundationsneed to remain mathematical.

Think like a Machine Chapter 2
[ 33 ]
The following diagram shows the McCulloch-Pitts, neuron model.
This model contains a number of input x weights that are summed to either reach athreshold which will lead, once transformed, to y = 0, or 1 output. In this model, y will becalculated in a more complex way.
A Python-TensorFlow program, will be used to illustrate the neuron.
When designing neurons, the computing performance needs to be taken into account. Thefollowing source code configures the threads. You can fine-tune your model according toyour needs.
In the following source code, the placeholders that will contain the input values ( ), theweights ( ), and the bias ( ) are initialized. A placeholder is not just a variable that you candeclare and use later when necessary. It represents the structure of your graph:
In the original McCulloch-Pitts artificial neuron, the inputs ( ) were multiplied by thefollowing weights:
Think like a Machine Chapter 2
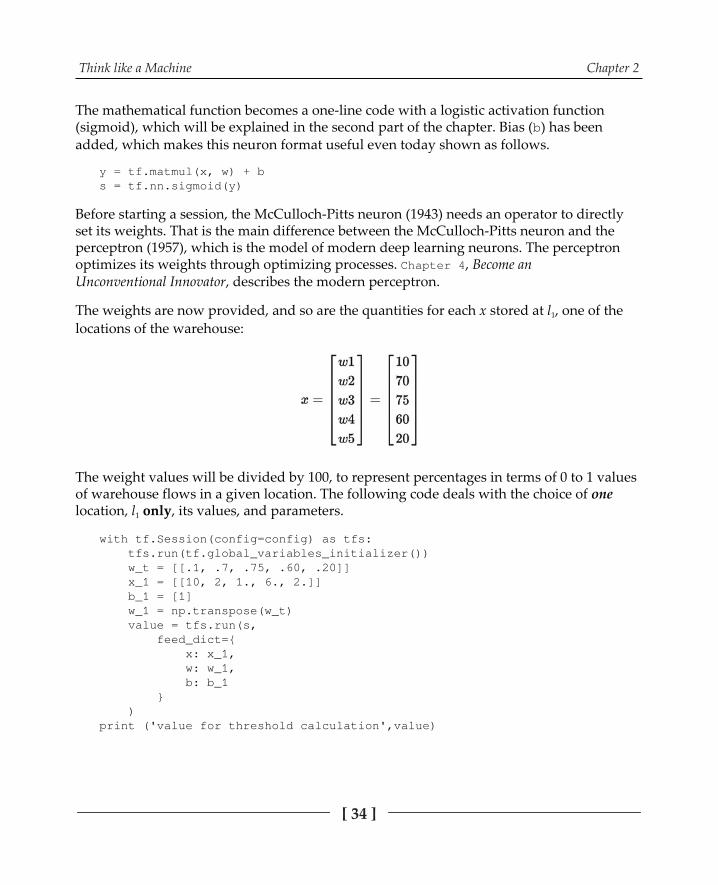
[ 34 ]
The mathematical function becomes a one-line code with a logistic activation function(sigmoid), which will be explained in the second part of the chapter. Bias ( ) has beenadded, which makes this neuron format useful even today shown as follows.
Before starting a session, the McCulloch-Pitts neuron (1943) needs an operator to directlyset its weights. That is the main difference between the McCulloch-Pitts neuron and theperceptron (1957), which is the model of modern deep learning neurons. The perceptronoptimizes its weights through optimizing processes. , Become anUnconventional Innovator, describes the modern perceptron.
The weights are now provided, and so are the quantities for each x stored at l1, one of thelocations of the warehouse:
The weight values will be divided by 100, to represent percentages in terms of 0 to 1 valuesof warehouse flows in a given location. The following code deals with the choice of onelocation, l1 only, its values, and parameters.

Think like a Machine Chapter 2
[ 35 ]
The session starts; the weights ( ) and the quantities ( ) of the warehouse flow areentered. Bias is set to in this model. is transposed to fit . The placeholders aresolicited with , and the value of the neuron is calculated using the sigmoidfunction.
The program returns the following value.
This value represents the activity of location l1 at a given date and a given time. The higher thevalue, the higher the probable saturation rate of this area. That means there is little spaceleft for an AGV that would like to store products. That is why the reinforcement learningprogram for a warehouse is looking for the least loaded area for a given product in thismodel.
Each location has a probable availability:
A = Availability = 1 - load
The probability of a load of a given storage point lies between 0 and 1.
High values of availability will be close to 1, and low probabilities will be close to 0 asshown in the following example:
For example, the load of l1 has a probable load of 0.99 and its probable availability is 0.002.The goal of the AGV is to search and find the closest and most available location tooptimize its trajectories. l1 is obviously not a good candidate at that day and time. Load is akeyword in production activities as in the Amazon example in , AutomatedPlanning and Scheduling.
When all of the six locations' availabilities has been calculated by the McCulloch-Pittsneuron each with its respective x quantity inputs, weights, and bias a location vector ofthe results of this system will be produced. This means that the program needs to beimplemented to run all six locations and not just one location:
A(L) = {a(l1),a(l2),a(l3),a(l4),a(l5),a(l6)}

Think like a Machine Chapter 2
[ 36 ]
The availability (1 - output value of the neuron) constitutes a six-line vector. The followingvector will be obtained by running the previous sample code on all six locations.
lv is the vector containing the value of each location for a given AGV to choose from. Thevalues in the vector represent availability. 0.0002 means little availability. 0.9 means highavailability. Once the choice is made, the reinforcement learning program presented in thefirst chapter will optimize the AGV's trajectory to get to this specific warehouse location.
The lv is the result of the weighing function of six potential locations for the AGV. It is alsoa vector of transformed inputs.
The architecture of Python TensorFlowImplementation of the McCulloch-Pitts neuron can best be viewed with TensorBoard, asshown in the following graph:

Think like a Machine Chapter 2
[ 37 ]
This is obtained by adding the following TensorBoard code at the end of your session. Thisdata flow graph will help optimize a program when things go wrong.
When you open the URL indicated in the code on your machine, you will see the followingTensorBoard data flow graph:

Think like a Machine Chapter 2
[ 38 ]
Logistic activation functions and classifiersNow that the value of each location of L={l1,l2,l3,l4,l5,l6} contains its availability in a vector,the locations can be sorted from the most available to least available location. From there,the reward matrix for the MDP process described in the first chapter can be built.
Overall architectureAt this point, the overall architecture contains two main components:
Chapter 1: Become an Adaptive Thinker: A reinforcement learning program basedon the value-action Q function using a reward matrix that is yet to be calculated.The reward matrix was given in the first chapter, but in real life, you'll often haveto build it from scratch. This could take weeks to obtain.Chapter 2: A set of six neurons that represent the flow of products at a given timeat six locations. The output is the availability probability from 0 to 1. The highestvalue is the highest availability. The lowest value is the lowest availability.
At this point, there is some real-life information we can draw from these two mainfunctions:
An AGV is moving in a warehouse and is waiting to receive its next location touse an MDP, in order to calculate an optimal trajectory of its mission, as shown inthe first chapter.An AGV is using a reward matrix that was given in the first chapter, but it needsto be designed in a real-life project through meetings, reports, and acceptance ofthe process.A system of six neurons, one per location, weighing the real quantities andprobable quantities to give an availability vector lv has been calculated. It isalmost ready to provide the necessary reward matrix for the AGV.
To calculate the input values of the reward matrix in this reinforcement learning warehousemodel, a bridge function between lv and the reward matrix R is missing.
That bridge function is a logistic classifier based on the outputs of the y neurons.
At this point, the system:
Took corporate dataUsed y neurons calculated with weightsApplied an activation function

Think like a Machine Chapter 2
[ 39 ]
The activation function in this model requires a logistic classifier, a commonly used one.
Logistic classifierThe logistic classifier will be applied to lv (the six location values) to find the best locationfor the AGV. It is based on the output of the six neurons (input x weight + bias).
What are logistic functions? The goal of a logistic classifier is to produce a probabilitydistribution from 0 to 1 for each value of the output vector. As you have seen so far, AIapplications use applied mathematics with probable values, not raw outputs. In thewarehouse model, the AGV needs to choose the best, most probable location, li. Even in awell-organized corporate warehouse, many uncertainties (late arrivals, product defects, or anumber of unplanned problems) reduce the probability of a choice. Aprobability represents a value between 0 (low probability) and 1 (high probability). Logisticfunctions provide the tools to convert all numbers into probabilities between 0 and 1 tonormalize data.
Logistic functionThe logistic sigmoid provides one of the best ways to normalize the weight of a givenoutput. This will be used as the activation function of the neuron. The threshold is usually avalue above which the neuron has a y=1 value; or else it has y=0. In this case, the minimumvalue will be 0 because the activation function will be more complex.
The logistic function is represented as follows.
e represents Euler's number, or 2.71828, the natural logarithm. x is the value to be calculated. In this case, x is the result of the logistic sigmoidfunction.
The code has been rearranged in the following example to show the reasoning process:

Think like a Machine Chapter 2
[ 40 ]
Thanks to the logistic sigmoid function, the value for the first location in the model comesout as (level of saturation of the location).
To calculate the availability of the location once the 0.99 has been taken into account, wesubtract the load from the total availability, which is 1, as follows:
As seen previously, once all locations are calculated in this manner, a final availabilityvector, lv, is obtained.
When analyzing lv, a problem has stopped the process. Individually, each line appears tobe fine. By applying the logistic sigmoid to each output weight and subtracting it from 1,each location displays a probable availability between 0 and 1. However, the sum of thelines in lv exceeds 1. That is not possible. Probability cannot exceed 1. The program needs tofix that. In the source code, lv will be named .
Each line produces a [0,1] solution, which fits the prerequisite of being a valid probability.
In this case, the vector lv contains more than one value and becomes a multiple distribution.The sum of lv cannot exceed 1 and needs to be normalized.
The softmax function provides an excellent method to stabilize lv. Softmax is widely used inmachine learning and deep learning.
Bear in mind that these mathematical tools are not rules. You can adapt them to your problemas much as you wish as long as your solution works.

Think like a Machine Chapter 2
[ 41 ]
SoftmaxThe softmax function appears in many artificial intelligence models to normalize data. Thisis a fundamental function to understand and master. In the case of the warehouse model,an AGV needs to make a probable choice between six locations in the lv vector. However,the total of the lv values exceeds 1. lv requires normalization of the softmax function S. Inthis sense, the softmax function can be considered as a generalization of the logistic sigmoidfunction. In the code, lv vector will be named .
The following code used is ; represents the lv vector in the following sourcecode.
lv
is the exp(i) result of each value in (lv in the warehouse example), as follows:
is the sum of iterations, as shown in the following code:
Now, each value of the vector can be normalized in this type of multinomial distributionstabilization by simply applying a division, as follows:

Think like a Machine Chapter 2
[ 42 ]
softmax(lv) provides a normalized vector with a sum equal to 1 and is shown in thiscompressed version of the code. The vector obtained is often described as containing logits.
The following code details the process:
The softmax function can be used as the output of a classifier (pixels for example) or tomake a decision. In this warehouse case, it transforms lv into a decision-making process.
The last part of the softmax function requires to be rounded to 0 or 1. Thehigher the value in , the more probable it will be. In clear-cut transformations,the highest value will be close to 1 and the others will be closer to 0. In a decision-makingprocess, the highest value needs to be found, as follows:
Once line 3 (value ) has been chosen as the most probable location, it is set to 1 andthe other, lower values are set to 0. This is called a one-hot function. This one-hot functionis extremely helpful to encode the data provided. The vector obtained can now be appliedto the reward matrix. The value 1 probability will become in the reward matrix, asfollows.
The softmax function is now complete. Location l3 or C is the best solution for the AGV. Theprobability value is multiplied by 100 in the R function and the reward matrix describedcan now receive the input.

Think like a Machine Chapter 2
[ 43 ]
Before continuing, take some time to play around with the values in thesource code and run it to become familiar with softmax.
We now have the data for the reward matrix. The best way to understand the mathematicalaspect of the project is to go to a paperboard and draw the result using the actualwarehouse layout from locations A to F.
Locations={l1-A, l2-B, l3-C, l4-D, l5-E, l6-F}
Value of locations in the reward matrix={0,0,100,0,0,0} where C (the third value) is now thetarget for the self-driving vehicle, in this case, an AGV in a warehouse.
We obtain the following reward matrix described in the first chapter.
State/values A B C D E FA - - - - 1 -B - - - 1 - 1C - - 100 1 - -D - 1 1 - 1 -E 1 - - 1 - -F - 1 - - - -
This reward matrix is exactly the one used in the Python reinforcement learning programusing the Q function in the first chapter. The output of this chapter is the input of the matrix in the first chapter. The 0 values are there for the agent to avoid those values. Thisprogram is designed to stay close to probability standards with positive values, as shown inthe following matrix.

Think like a Machine Chapter 2
[ 44 ]
At this point, the building blocks are in place to begin evaluating the results of thereinforcement learning program.
SummaryUsing a McCulloch-Pitts neuron with a logistic activation function in a one-layer networkto build a reward matrix for reinforcement learning shows how to build real-lifeapplications with AI technology.
Processing real-life data often requires a generalization of a logistic sigmoid functionthrough a softmax function, and a one-hot function applied to logits to encode the data.
This shows that machine learning functions are tools that must be understood to be able touse all or parts of them to solve a problem. With this practical approach to artificialintelligence, a whole world of projects awaits you.
You can already use these first two chapters to present powerful trajectory models such as Amazon warehouses and deliveries to your team or customers. Furthermore, Amazon,Google, Facebook, Netflix, and many others are growing their data centers as we speak.Each data center has locations with data flows that need to be calibrated. You can use theideas given in this chapter to represent the problems and real-time calculations required tocalibrate product and data flows.
This neuronal approach is the parent of the multi-layer perceptron that will be introducedin , Manage The Power of Machine Learning and Deep Learning. There, a shift frommachine learning to deep learning will be made.
However, before that, machine learning or deep learning requires evaluation functions. Noresult can be validated without evaluation, as explained in , Apply MachineThinking to a Human Problem. In the next chapter, the evaluation process will be illustratedwith chess and a real-life situation.

Think like a Machine Chapter 2
[ 45 ]
QuestionsWas the concept of using an artificial neuron discovered in 1990? (Yes | No)1.Does a neuron require a threshold? (Yes | No)2.A logistic sigmoid activation function makes the sum of the weights larger. (Yes |3.No)A McCulloch-Pitts neuron sums the weights of its inputs. (Yes | No)4.A logistic sigmoid function is a log10 operation. (Yes | No)5.A logistic softmax is not necessary if a logistic sigmoid function is applied to a6.vector. (Yes | No)A probability is a value between -1 and 1. (Yes | No)7.
Further readingExploring DeepMind The TensorFlow site, and support The original DQN article
Automated solutions in logistics

33Apply Machine Thinking to a
Human ProblemIn the first chapter, the MDP reinforcement program produced a result as an output matrix.In , Think Like a Machine, the McCulloch-Pitts system of neurons produced aninput reward matrix. However, the intermediate or final results of these two functions needto be constantly measured. Good measurement solves a substantial part of a given problemsince decisions rely on them. Reliable decisions are made with reliable evaluations. Thegoal of this chapter is to introduce measurement methods.
The key function of human intelligence, decision-making, relies on the ability to evaluate asituation. No decision can be made without measuring the pros and cons and factoring theparameters.
Mankind takes great pride in its ability to evaluate. However, in many cases, a machine cando better. Chess represents the pride of mankind in thinking strategy. A chessboard is oftenpresent in many movies to symbolize human intelligence.
Today, not a single chess player can beat the best chess engines. One of the extraordinarycore capacities of a chess engine is the evaluation function; it takes many parameters intoaccount more precisely than humans.
This chapter focuses on the main concepts of evaluation and measurement; they set thepath to deep learning gradient descent-driven models, which will be explained in thefollowing chapter.
The following topics will be covered in this chapter:
Evaluation of the episodes of a learning sessionNumerical convergence measurementsAn introduction to the idea of cross-entropy convergenceDecision tree supervised learning as an evaluation method
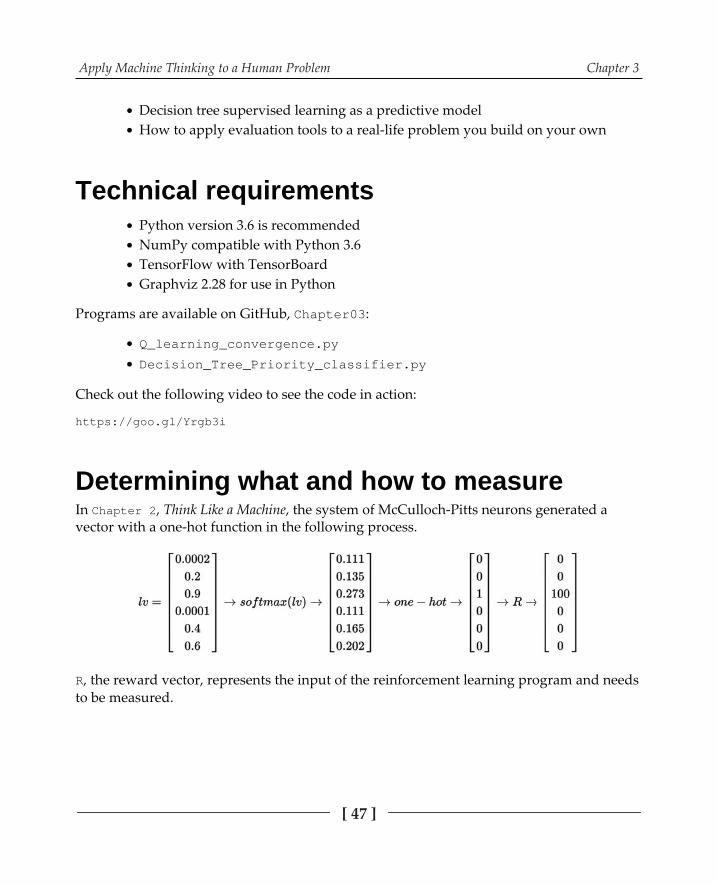
Apply Machine Thinking to a Human Problem Chapter 3
[ 47 ]
Decision tree supervised learning as a predictive modelHow to apply evaluation tools to a real-life problem you build on your own
Technical requirementsPython version 3.6 is recommendedNumPy compatible with Python 3.6TensorFlow with TensorBoardGraphviz 2.28 for use in Python
Programs are available on GitHub, :
Check out the following video to see the code in action:
Determining what and how to measureIn , Think Like a Machine, the system of McCulloch-Pitts neurons generated avector with a one-hot function in the following process.
, the reward vector, represents the input of the reinforcement learning program and needsto be measured.

Apply Machine Thinking to a Human Problem Chapter 3
[ 48 ]
This chapter deals with an approach designed to build a reward matrix based on thecompany data. It relies on the data, weights, and biases provided. When deep learningforward feedback neural networks based on perception are introduced ( , Becomean Unconventional Innovator), a system cannot be content with a training set. Systems have anatural tendency to learn training sets through backpropagation. In this case, one set ofcompany data is not enough.
In real-life company projects, a system will not be validated until tens of thousands ofresults have been produced. In some cases, a corporation will approve the system only afterhundreds of datasets with millions of data samples have been tested to be sure that allscenarios are accurate. Each dataset represents a scenario consultants can work on withparameter scripts. The consultant introduces parameter scenarios that are tested by thesystem and measured. In systems with up to 200 parameters per neuron, a consultant willremain necessary for many years to come in an industrial environment. As of
, Become an Unconventional Innovator, the system will be on its own without the help of aconsultant. Even then, consultants often are needed to manage the hyperparameters. Inreal-life systems, with high financial stakes, quality control will always remain essential.
Measurement should thus apply to generalization more than simply applying to a single orfew datasets. Otherwise, you will have a natural tendency to control the parameters andoverfit your model in a too-good-to-be-true scenario.
Beyond the reward matrix, the reinforcement program in the first chapter had a learningparameter = , as shown in the following code source.
The learning parameter in itself needs to be closely monitored because it introducesuncertainty into the system. This means that the learning process will always remain aprobability, never a certainty. One might wonder why this parameter is not just taken out.Paradoxically, that will lead to even more global uncertainty. The more the learningparameter tends to 1, the more you risk overfitting your results. Overfitting means that youare pushing the system to think it's learning well when it isn't. It's exactly like a teacherwho gives high grades to everyone in the class all the time. The teacher would beoverfitting the grade-student evaluation process, and nobody would know whether thestudents have learned something.

Apply Machine Thinking to a Human Problem Chapter 3
[ 49 ]
The results of the reinforcement program need to be measured as they go through episodes.The range of the learning process itself must be measured. In the following code, the rangeis set to 50,000 to make sure the learning process reaches its goal.
All of these measurements will have a deep effect on the results obtained.
ConvergenceBuilding the system was fun. Finding the factors that make the system go wrong is anotherstory.
The model presented so far can be summed up as follows:
From lv to R, the process creates the reward matrix ( , Think Like a Machine)required for the reinforcement learning program ( , Become an Adaptive Thinker),which runs from reading R (reward matrix) to the results. Gamma is the learningparameter, Q is the Q learning function, and the results are the states of Q described in thefirst chapter.
The parameters to be measured are as follows:
The company's input data. The training sets found on the Web such as MNISTare designed to be efficient. These ready-made datasets often contain some noise(unreliable data) to make them realistic. The same process must be achieved withraw company data. The only problem is that you cannot download a corporate datasetfrom somewhere. You have to build the datasets.The weights and biases that will be applied.The activation function (a logistic function or other).

Apply Machine Thinking to a Human Problem Chapter 3
[ 50 ]
The choices to make after the one-hot process.The learning parameter.Episode management through convergence.
The best way to start relies on measuring the quality of convergence of the system, the laststep of the whole process.
If the system provides good convergence, it will avoid the headache of having to go backand check everything.
Implicit convergenceIn the last part of in the first chapter, a rangeof 50,000 is implemented.
The idea is to set the number of episodes at such a level that convergence is certain. In thefollowing code, the range ( ) is a constant.
Convergence, in this case, will be defined as the point at which no matter how long you runthe system, the Q result matrix will not change anymore.
By setting the range to , you can test and verify this. As long as the reward matricesremain homogeneous, this will work. If the reward matrices strongly vary from onescenario to another, this model will produce unstable results.
Try to run the program with different ranges. Lower the ranges until yousee that the results are not optimal.
Numerical controlled convergenceThis approach can prove time-saving by using the target result, provided it existsbeforehand. Training the reinforcement program in this manner validates the process.

Apply Machine Thinking to a Human Problem Chapter 3
[ 51 ]
In the following source code, an intuitive cross-entropy function is introduced (see , Getting Your Neurons to Work, for more on cross-entropy).
Cross-entropy refers to energy. The main concepts are as follows:
Energy represents the difference between one distribution and anotherIt is what makes the system continue to trainWhen a lot of training needs to be done, there is a high level of energyWhen the training reaches the end of its cycles, the level of energy is lowIn the following code, cross-entropy value (CEV) measures the differencebetween a target matrix and the episode matrixCross-entropy is often measured in more complex forms when necessary (see
, Getting Your Neurons to Work, and , Applying Biomimickingto Artificial Intelligence)
In the following code, a basic function provides sufficient results.
The previous program stops before 50,000 epochs. This is because, in the model describedin this chapter (see the previous code excerpt), the system stops when it reaches anacceptable convergence value.

Apply Machine Thinking to a Human Problem Chapter 3
[ 52 ]
The program stopped at episode . Since the decision process is random, the samenumber will not be obtained twice in a row. Furthermore, the constant was known inadvance. This is possible in closed environments where a pre-set goal has been set. This isnot the case often but was used to illustrate the concept of convergence. The followingchapters will explore better ways to reach convergence, such as gradient descent.
The Python program is available at:
Applying machine thinking to a humanproblem
"An efficient manager has a high evaluation quotient. A machine has a better one, in chessand a number of increasing fields. The problem now is to keep up with what the machinesare learning!"
-Denis Rothman
Evaluation is one of the major keys to efficient decision making in all fields: from chess,production management, rocket launching, and self-driving cars to data center calibration,software development, and airport schedules. Chess engines are not high-level deep-learning-based software. They rely heavily on evaluations and calculations. They evaluatemuch better than humans, and there is a lot to learn from them. The question now is toknow whether any human can beat a chess engine or not. The answer is no.
To evaluate a position in chess, you need to examine all the pieces, their quantitative value,their qualitative value, cooperation between pieces, who owns each of the 64 squares, theking's safety, bishop pairs, knight positioning, and many other factors.
Evaluating a position in a chess gameEvaluating a position in a chess game shows why machines will surpass humans in quitesome decision-making fields within the next few years.

Apply Machine Thinking to a Human Problem Chapter 3
[ 53 ]
The following position is after move 23 in the Kramnik-Bluebaum 2017 game. It cannot becorrectly evaluated by humans. It contains too many parameters to analyze and too manypossibilities.
It is white's turn to play, and a close analysis shows that both players are lost at this point.In a tournament like this, they must each continue to keep a poker face. They often look atthe position with a confident face to hide their dismay. Some even shorten their thinkingtime to make their opponent think they know where they are going.
These unsolvable positions for humans are painless to solve with chess engines, evencheap, high-quality chess engines on a smartphone. This can be generalized to all humanactivity that has become increasingly complex, unpredictable and chaotic. Decision-makerswill increasingly rely on artificial intelligence to help them make the right choices.
No human can play chess and evaluate the way a chess engine does by simply calculatingthe positions of the pieces, their squares of liberty, and many other parameters. A chessengine generates an evaluation matrix with millions of calculations. The following table isthe result of an evaluation of only one position among many others (real and potential).
Positionevaluated 0,3
White 34
Initialposition position Value Quality
Value TotalValue
Pawn a2 a2 1 a2-b2 small pawn island 0,05 1,05Pawn b2 b2 1 a2-b2 small pawn island 0,05 1,05Pawn c2 x 0 captured 0 0

Apply Machine Thinking to a Human Problem Chapter 3
[ 54 ]
Pawn d2 d4 1 occupies center,defends Be5 0,25 1,25Pawn e2 e2 1 defends Qf3 0,25 1,25Pawn f2 x 0 captured 0 0Pawn g2 g5 1 unattacked, attacking 2 squares 0,3 1,3Pawn h2 h3 1 unattacked, defending g4 0,1 1,1
Rook a1 c1 5 occupying c-file, attacking b7 withNd5-Be5 1 6
Knight b1 d5 3 attacking Nb6, 8 squares 0,5 3,5
BishopDS c1 e5 3 central position, 10 squares,attacking c7 0,5 3,5
Queen d1 f3 9 battery with Bg2, defending Ne5, X-Ray b7 2 11
King e1 h1 0 X-rayed by Bb6 on a7-g1 diagonal -0,5 -0,5
BishopWS f1 g2 3 supporting Qf3 in defense andattack 0,5 3,5
Knight g1 x 0 captured 0 0Rook h1 x 0 captured 0 0 29 5 34
White:34
The value of the position of white is 34.
White 34Black 33,7
Initialposition position Value Quality
Value TotalValue
Pawn a7 a7 1 a7-b7 small pawn island 0,05 1,05Pawn b7 b7 1 a7-b7 small pawn island 0,05 1,05Pawn c7 x 0 captured 0 0Pawn d7 x 0 captured 0 0Pawn e7 f5 1 doubled, 2 squares 0 1Pawn f7 f7 1 0 1Pawn g7 g6 1 defending f5 but abandoning Kg8 0 1Pawn h7 h5 1 well advanced with f5,g6 0,1 1,1Rook a8 d8 5 semi-open d-file attacking Nd5 2 7Knight b8 x 0 captured 0 0BishopDS c8 b6 3 attacking d4, 3 squares 0,5 3,5Queen d8 e6 9 attacking d4,e5 , a bit cramped 1,5 10,5King e8 g8 0 f6,h6, g7,h8 attacked -1 -1BishopWS f8 x 0 captured, White lost bishop pair 0,5 0,5

Apply Machine Thinking to a Human Problem Chapter 3
[ 55 ]
Knight g8 e8 3 defending c7,f6,g7 1 4Rook h8 f8 5 out of play -2 3 31 2,7 Black:33,7
The value of black is 33.7.
So white is winning by 34-33.7 = 0.3.
The evaluation system can easily be represented with two McCulloch-Pitts neurons, one forblack and one for white. Each neuron would have 30 weights = {w1,w2....w30}, as shown inthe previous table. The sum of both neurons requires an activation function that convertsthe evaluation into 1/100th of a pawn, which is the standard measurement unit in chess.Each weight will be the output of squares and piece calculations. Then the MDP can beapplied to Bellman's equation with a random generator of possible positions.
Present-day chess engines contain barely more intelligence than this typeof pure calculation approach. They don't need more to beat humans.
No human, not even world champions, can calculate this position with this accuracy. Thenumber of parameters to take into account overwhelms them each time they reach aposition like this. They then play more or less randomly with some kind of idea in mind. Itresembles a lottery sometimes. Chess expert annotators discover this when they runhuman-played games with powerful chess engines to check the game. The playersthemselves now tend to reveal their incapacity when questioned.
Now bear in mind that the position analyzed represents only one possibility. A chessengine will test millions of possibilities. Humans can test only a few.
Measuring a result like this has nothing to do with natural human thinking. Only machinescan think like that. Not only do chess engines solve the problem, but also they areimpossible to beat.
At one point, there are problems humans face that only machines cansolve.

Apply Machine Thinking to a Human Problem Chapter 3
[ 56 ]
Applying the evaluation and convergenceprocess to a business problemWhat was once considered in chess as the ultimate proof of human intelligence has beenbattered by brute-force calculations with great CPU/RAM capacity. Almost any humanproblem requiring logic and reasoning can most probably be solved by a machine usingrelatively elementary processes expressed in mathematical terms.
Let's take the result matrix of the reinforcement learning example of the first chapter. It canalso be viewed as a scheduling tool. Automated planning and scheduling have become acrucial artificial intelligence field, as explained in , Automated Planning andScheduling. In this case, evaluating and measuring the result goes beyond convergenceaspects.
In a scheduling process, the input of the reward matrix can represent the priorities of thepackaging operation of some products in a warehouse. It would determine in which ordercustomer products must be picked to be packaged and delivered. These priorities extend tothe use of a machine that will automatically package the products in a FIFO mode (first in,first out). The systems provide good solutions, but, in real life, many unforeseen eventschange the order of flows in a warehouse and practically all schedules.
In this case, the result matrix can be transformed into a vector of a scheduled packagingsequence. The packaging department will follow the priorities produced by the system.
The reward matrix (see ) in this chapter is (see thefollowing code).
Its visual representation is the same as in , Become an Adaptive Thinker. But thevalues are a bit different for this application:
Negative values (-1): The agent cannot go there0 values: The agent can go there100 values: The agent should favor these locations

Apply Machine Thinking to a Human Problem Chapter 3
[ 57 ]
The result is produced in a Q function early in the first section of the chapter, in a matrixformat, displayed as follows:
From that result, the following packaging priority order matrix can be deduced.
Priorities O1 O2 O3 O4 O5 O6O1 - - - - 258.44 -O2 - - - 321.8 - 207.75O3 - - 500 321.8 - -O4 - 258.44 401 - 258.44 -O5 207.75 - - 321.8 - -O6 - 258.44 - - - -
The non-prioritized vector (npv) of packaging orders is np.
The npv contains the priority value of each cell in the matrix, which is not a location but anorder priority. Combining this vector with the result matrix, the results become priorities ofthe packaging machine. They now need to be analyzed, and a final order must be decidedto send to the packaging department.

Apply Machine Thinking to a Human Problem Chapter 3
[ 58 ]
Using supervised learning to evaluate resultqualityHaving now obtained the npv, a more business-like measurement must be implemented.
A warehouse manager, for example, will tell you the following:
Your reinforcement learning program looks satisfactory ( , Become anAdaptive Thinker)The reward matrix generated by the McCulloch-Pitts neurons works very well( , Think Like a Machine)The convergence values of the system look niceThe results on this dataset look satisfactory
But then, the manager will always come up with a killer question, How can you prove thatthis will work with other datasets in the future?
The only way to be sure that this whole system works is to run thousands of datasets withhundreds of thousands of product flows.
The idea now is to use supervised learning to create relationships between the input andoutput data. It's not a random process like MDP. They are not trajectories anymore. Theyare priorities. One method is to used decision trees. In , Become an UnconventionalInnovator, the problem will be solved with a feedforward backpropagation network.
In this model, the properties of the customer orders are analyzed so that we can classifythem. This can be translated into decision trees depending on real-time data, to create adistribution representation to predict future outcomes.
The first step is to represent the properties of the orders O1 to O6.1.
In this case, we will limit the model to three properties:
Priority/location, which is the most important property in awarehouse flow in this modelVolumes to transportOptimizing priority the financial and customer satisfactionproperty

Apply Machine Thinking to a Human Problem Chapter 3
[ 59 ]
The second step is to provide some priority parameters to the learning dataset:2.
Step 3 is providing the dataset input matrix, which is the output matrix of the3.reinforcement learning program. The values have been approximated but areenough to run the model. This simulates some of the intermediate decisions andtransformations that occur during the decision process (ratios applied,uncertainty factors added, and other parameters). The input matrix is :
The features in step 1 apply to each column.
The values in step 2 apply to every line.
Step 4 is running a standard decision tree classifier. This classifier will distribute4.the representations (distributed representations) into two categories:
The properties of high-priority ordersThe properties of low-priority orders
There are many types of algorithms. In this case, a standard function is called todo the job, as shown in the following source code.
Applied to thousands of orders on a given day, it will help adapt to real-time unplannedevents that destabilize all scheduling systems: late trucks, bad quality products, robotbreakdowns, and absent personnel. This means that the system must be able to constantlyadapt to new situations and provide priorities to replan in real time.

Apply Machine Thinking to a Human Problem Chapter 3
[ 60 ]
The program will produce the following graph, which separates the orders into prioritygroups.
The goal now is to separate the best orders to replan among hundreds of thousands ofsimulating orders. In this case, the learning dataset has the six values you have beenstudying in the first two chapters from various angles.
Priority/location<=360.0 is the division point between the most probableoptimized orders (high) and less interesting ones (low).Gini impurity. This would be the measure of incorrect labeling if the choice wererandom. In this case, the dataset is stable.The false arrow points out the two values that are not <=360, meaning they aregood choices, the optimal separation line of the representation. The ones that arenot classified as are considered as don't eliminate orders.The elements mean: eliminate orders as long as possible.The value result reads as [number of false elements, number of true elements] of thedataset.
If you play around with the values in steps 1, 2, and 3, you'll obtain different separationpoints and values. This sandbox program will prepare you for the more complexscheduling problems of , Automated Planning and Scheduling.
You can use this part of the source code to generate images of this decision tree-supervisedlearning program:

Apply Machine Thinking to a Human Problem Chapter 3
[ 61 ]
The preceding information represents a small part of what it takes to manage a real-lifeartificial intelligence program on premise.
A warehouse manager will want to run this supervised learning decision tree program ontop of the system described in , Think Like a Machine, and , ApplyMachine Thinking to a Human Problem. This is done to generalize these distributedrepresentations directly to the warehouse data to improve the initial corporate data inputs.With better-proven priorities, the system will constantly improve, week by week.
This way of scheduling shows that human thinking was not used nor necessary.
Contrary to the hype surrounding artificial intelligence, most problems can be solved withno human intelligence involved and relatively little machine learning technology.
Human intelligence simply proves that intelligence can solve a problem.
Fortunately for the community of artificial intelligence experts, there are very difficultproblems to solve that require more artificial intelligence thinking.
Such a problem will be presented and solved in , Become an UnconventionalInnovator.
The Python program is available at
.

Apply Machine Thinking to a Human Problem Chapter 3
[ 62 ]
SummaryThis chapter led artificial intelligence exploration one more step away from neuroscience toreproduce human thinking. Solving a problem like a machine means using a chain ofmathematical functions and properties.
The further you get in machine learning and deep learning, the more you will findmathematical functions that solve the core problems. Contrary to the astounding amount ofhype, mathematics relying on CPUs is replacing humans, not some form of alienintelligence.
The power of machine learning with beyond-human mathematical reasoning is thatgeneralization to other fields is easier. A mathematical model, contrary to the complexity ofhumans entangled in emotions, makes it easier to deploy the same model in many fields.The models of the first three chapters can be used for self-driving vehicles, drones, robots ina warehouse, scheduling priorities, and much more. Try to imagine as many fields you canapply these to as possible.
Evaluation and measurement are at the core of machine learning and deep learning. Thekey factor is constantly monitoring convergence between the results the system producesand the goal it must attain. This opens the door to the constant adaptation of the weights ofthe network to reach its objectives.
Machine evaluation for convergence through a chess example that has nothing to do withhuman thinking proves the limits of human intelligence. The decision tree example can beatmost humans in classification situations where large amounts of data are involved.
Human intelligence is not being reproduced in many cases and has often been surpassed.In those cases, human intelligence just proves that intelligence can solve a problem, nothingmore.
The next chapter goes a step further from human reasoning with self-weighting neuralnetworks and introduces deep learning.

Apply Machine Thinking to a Human Problem Chapter 3
[ 63 ]
QuestionsCan a human beat a chess engine? (Yes | No)1.Humans can estimate decisions better than machines with intuition when it2.comes to large volumes of data. (Yes | No)Building a reinforcement learning program with a Q function is a feat in itself.3.Using the results afterward is useless. (Yes | No)Supervised learning decision tree functions can be used to verify that the result4.of the unsupervised learning process will produce reliable, predictableresults. (Yes | No)The results of a reinforcement learning program can be used as input to a5.scheduling system by providing priorities. (Yes | No)Can artificial Intelligence software think like humans? (Yes | No)6.
Further readingFor more on decision trees:
For more on chess analysis by experts such as Zoran Petronijevic:

44Become an Unconventional
InnovatorIn corporate projects, there always comes the point when a problem that seemsimpossible to solve hits you. At that point, you try everything you learned, but it doesn'twork for what's asked of you. Your team or customer begins to look elsewhere. It's time toreact.
In this chapter, an impossible-to-solve business case regarding material optimization willbe implemented successfully with an example of a feedforward neural network (FNN)with backpropagation.
Feedforward networks are the building blocks of deep learning. The battle around the XORfunction perfectly illustrates how deep learning regained popularity in corporateenvironments. The XOR FNN illustrates one of the critical functions of neural networks:classification. Once information becomes classified into subsets, it opens the doors toprediction and many other functions of neural networks, such as representation learning.
An XOR FNN network will be built from scratch to demystify deep learning from the start.A vintage, start-from-scratch method will be applied, blowing the deep learning hype offthe table.
The following topics will be covered in this chapter:
How to hand build an FNNSolving XOR with an FNNClassificationBackpropagationA cost function

Become an Unconventional Innovator Chapter 4
[ 65 ]
Cost function optimizationError lossConvergence
Technical requirementsPython 3.6x 64-bit from NumPy for Python 3.6x
Programs from GitHub :
Check out the following video to see the code in action:
The XOR limit of the original perceptronOnce the feedforward network for solving the XOR problem is built, it will be applied to amaterial optimization business case. The material-optimizing solution will choose the bestcombinations of dimensions among billions to minimize the use of a material with thegeneralization of the XOR function. First, a solution to the XOR limitation of a perceptronmust be fully clarified.
XOR and linearly separable modelsIn the academic world, like the private world, competition exists. Such a situation tookplace in 1969. Minsky and Papert published Perceptrons. They proved mathematically that aperceptron could not solve an XOR function. Fortunately, today the perceptron and itsneocognitron version form the core model for neural networking.
One might be tempted to think, So what? However, the entire field of neural networks relieson solving problems such as this to classify patterns. Without pattern classification, images,sounds, and words mean nothing to a machine.

Become an Unconventional Innovator Chapter 4
[ 66 ]
Linearly separable modelsThe McCulloch-Pitts 1943 neuron (see , Think Like a Machine) lead to Rosenblatt's1957-1962 perceptron and the 1960 Widrow-Hoff adaptive linear element (Adaline).
These models are linear models based on f(x,w), requiring a line to separate results. A perceptron cannot achieve this goal and thus cannot classify many objects it faces.
A standard linear function can separate values. Linear separability can be represented inthe following graph:
Imagine that the line separating the preceding dots and the part under it represent a picturethat needs to be represented by a machine learning or deep learning application. The dotsabove the line represent clouds in the sky; the dots below the line represent trees on a hill.The line represents the slope of that hill.
To be linearly separable, a function must be able to separate the clouds from the trees toclassify them. The prerequisite to classification is separability of some sort, linear ornonlinear.

Become an Unconventional Innovator Chapter 4
[ 67 ]
The XOR limit of a linear model, such as the originalperceptronA linear model cannot solve the XOR problem expressed as follows in a table:
Value of x1 Value of x2 Output
1 1 0
0 0 0
1 0 1
0 1 1
The following graph shows the linear inseparability of the XOR function represented byone perceptron:
The values of the table represent the Cartesian coordinates in this graph. The circle with across at (1,1) and (0,0) cannot be separated from the circles at (1,0) and (0,11). That's a hugeproblem. It means that Frank Rosenblatt's f(x,w) perceptron cannot separate, and thus notclassify, these dots into clouds and trees; an object used to identify that requires linearseparability.
Having invented the most powerful concept of the 20th century a neuron that canlearn Frank Rosenblatt had to bear with this limitation through the 1960s.
Let's vindicate this injustice with a vintage solution.

Become an Unconventional Innovator Chapter 4
[ 68 ]
Building a feedforward neural network fromscratchLet's get into a time machine. In nanoseconds, it takes us back to 1969. We have today'sknowledge but nothing to prove it. Minsky and Papert have just published their book,Perceptrons. They've proven that a perceptron cannot implement the exclusive OR functionXOR.
We are puzzled. We know that deep learning will be a great success in the 21st century. Wewant to try to change the course of history. Thanks to our time machine, we land in a smallapartment. It's comfortable, with a vinyl record playing the music we like! There is amahogany desk with a pad, a pencil, sharpener, and eraser waiting for us. We sit. A warmcup of coffee appears in a big mug. We're ready to solve the XOR problem from scratch. Wehave to find a way to classify those dots with a neural network.
Step 1 Defining a feedforward neural networkWe look at our piece of paper. We don't have a computer. We're going to have to writecode; then we'll hopefully find a computer in a university or a corporation that has a 1960state-of-the-art language to program in.
We have to be unconventional to solve this problem. First, we must ignore Minsky andPapert's publication and also forget complicated words and theory of the 21st century. Infact, we don't remember much anyway. Time travel made our future fuzzy!
A perceptron is usually represented by a graph. But that doesn't mean much right now.After all, I can't compute circles and lines. In fact, beyond seeing circles and lines, we typecharacters in computer languages, not circles. So, I decide to simply to write a layer in high-school format. A hidden layer will simply be:
Ok, now I have one layer. In fact, I just realized that a layer is merely a function. Thisfunction can be expressed as:

Become an Unconventional Innovator Chapter 4
[ 69 ]
In which x is the input value and w is some kind of value to multiply x by. I also realizedthat hidden just means that it's the computation, just as x=2 and x+2 is the hidden layer thatleads to 4.
At this point, I've defined a neural network in three lines:
Input x.Some kind of function that changes its value, like 2 x 2 = 4, which transformed 2.That is a layer. And if the result is superior to 2, for example, then great! The output is 1, meaning yes or true. Since we don't see the computation, this is thehidden layer. An output.
Now that I know that basically any neural network is built with values transformed by anoperation to become an output of something, I need the logic to solve the XOR problem.
Step 2 how two children solve the XOR problemevery dayLet's see how two children solve the XOR problem using a plain everyday example. Istrongly recommend this method. I have taken very complex problems, broken them downinto small parts to children's level, and often solved them in a few minutes. Then, you getthe sarcastic answer from others such as Is that all you did? But, the sarcasm vanishes whenthe solution works over and over again in high-level corporate projects.
First, let's convert the XOR problem into a candy problem in a store. Two children go to thestore and want to buy candy. However, they only have enough money to buy one pack ofcandy. They have to agree on a choice between two packs of different candy. Let's say packone is chocolate and the other is chewing gum. Then, during the discussion between thesetwo children, 1 means yes, 0 means no. Their budget limits the options of these twochildren:
Going to the store and not buying any of chocolate or chewing gum = no, no (0,0).That's not an option for these children! So the answer is false.Going to the store and buying both chocolate and chewing gum = yes, yes (1,1).That would be fantastic, but that's not possible. It's too expensive. So, the answeris unfortunately false.Going to the store and either buying chocolate or chewing gum = (1,0 or 0,1) = yesor no/no or yes. That's possible. So, the answer is true.

Become an Unconventional Innovator Chapter 4
[ 70 ]
Sipping my coffee in 1969, I imagine the two children. The eldest one is reasonable. Theyounger one doesn't know really how to count yet and wants to buy both packs of candy.
I decide to write that down on my piece of paper:
x1 (eldest child's decision yes or no, 1 or 0) * w1 (what the elder child thinks).The elder child is thinking this, or:
The elder child weighs a decision like we all do every day, such as purchasing acar (x=0 or 1) multiplied by the cost (w1).
x2 (the younger child's decision yes or no, 1 or 0) * w3 (what the younger childthinks). The younger child is also thinking this, or:
Theory: x1 and x2 are the inputs. h1 and h2 are neurons (the result of acalculation). Since h1 and h2 contain calculations that are not visible duringthe process, they are hidden neurons. h1 and h2 thus form a hidden layer.
Now I imagine the two children talking to each other.
Hold it a minute! This means that now each child is communicating with the other:
x1 (the elder child) says w2 to the younger child. Thus w2 = this is what I think andam telling you:
x2 (the younger child) says please add my views to your decision, which isrepresented by: w4

Become an Unconventional Innovator Chapter 4
[ 71 ]
I now have the first two equations expressed in high-school-level code. It's what one thinks +what one says to the other asking the other to take that into account:
sums up what is going on in one child's mind: personal opinion + other child's opinion.
sums up what is going on in the other child's mind and conversation: personal opinion +other child's opinion.
Theory. The calculation now contains two input values and one hiddenlayer. Since in the next step we are going to apply calculations to and
, we are in a feedforward neural network. We are moving from theinput to another layer, which will lead us to another layer, and so on. Thisprocess of going from one layer to another is the basis of deep learning.The more layers you have, the deeper the network is. The reason and
form a hidden layer is that their output is just the input of anotherlayer.
I don't have time to deal with complicated numbers in an activation function such aslogistic sigmoid, so I decide to simply decide whether the output values are less than 1 ornot:
if h1+h2 >=1 then y1=1
if h1+h2<1 then y2=0
Theory: y1 and y2 form a second hidden layer. These variables can bescalars, vectors, or matrices. They are neurons.
Now, a problem comes up. Who is right? The elder child or the younger child?
The only way seems to be to play around, with the weights W representing all the weights.
I decided that at this point, I liked both children. Why would I have to hurt one of them? Sofrom now on, w3=w2,w4=w1. After all, I don't have a computer and my time travel window isconsuming a lot of energy. I'm going to be pulled back soon.
Now, somebody has to be an influencer. Let's leave this hard task to the elder child. Theelder child, being more reasonable, will continuously deliver the bad news. You have tosubtract something from your choice, represented by a minus (-) sign.

Become an Unconventional Innovator Chapter 4
[ 72 ]
Each time they reach the point hi, the eldest child applies a critical negative view onpurchasing packs of candy. It's -w of everything comes up to be sure not to go over thebudget. The opinion of the elder child is biased, so let's call the variable a bias, b1. Since theyounger child's opinion is biased as well, let's call this view a bias too b2. Since the eldestchild's view is always negative, -b1 will be applied to all of the eldest child's thoughts.
When we apply this decision process to their view, we obtain:
Then, we just have to use the same result. If the result is >=1 then the threshold has beenreached. The threshold is calculated as shown in the following function.
Since I don't have a computer, I decide to start finding the weights in a practical manner,starting by setting the weights and biases to 0.5, as follows:
It's not a full program yet, but its theory is done.
Only the communication going on between the two children is making the difference; Ifocus on only modifying w2 and b1 after a first try. An hour later, on paper, it works!
I can't believe that this is all there is to it. I copy the mathematical process on a clean sheetof paper:

Become an Unconventional Innovator Chapter 4
[ 73 ]
I'm overexcited by the solution. I need to get this little sheet of paper to a newspaper to getit published and change the course of history. I rush to the door, open it but find myselfback in the present! I jump and wake up in my bedroom sweating.
I rush to my laptop while this time-travel dream is fresh in my mind to get it into Pythonfor this book.
Why wasn't this deceiving simple solution found in 1969? Because it seemssimple today but wasn't so at that time like all inventions found by our geniuspredecessors. Nothing is easy at all in artificial intelligence andmathematics.
Implementing a vintage XOR solution in Pythonwith an FNN and backpropagationI'm still thinking that implementing XOR with so little mathematics might not be thatsimple. However, since the basic rule of innovating is to be unconventional, I write thecode.
To stay in the spirit of a 1969 vintage solution, I decide not to use NumPy, TensorFlow,Theano, or any other high-level library. Writing a vintage FNN with backpropagationwritten in high-school mathematics is fun.
This also shows that if you break a problem down into very elementary parts, youunderstand it better and provide a solution to that specific problem. You don't need to use ahuge truck to transport a loaf of bread.

Become an Unconventional Innovator Chapter 4
[ 74 ]
Furthermore, by thinking through the minds of children, I went against running 20,000 ormore episodes in modern CPU-rich solutions to solve the XOR problem. The logic usedproves that, basically, both inputs can have the same parameters as long as one bias isnegative (the elder reasonable critical child) to make the system provide a reasonableanswer.
The basic Python solution quickly reaches a result in 3 to 10 iterations (epochs or episodes)depending on how we think it through.
The top of the code simply contains a result matrix with four columns. Each represents thestatus ( =correct, =false) of the four predicates to solve:
The train variable is the number of predicates to solve: (0,0), (1,1),(1,0),(0,1). The variable ofthe predicate to solve is .
The core of the program is practically the sheet of paper I wrote, as in the following code.

Become an Unconventional Innovator Chapter 4
[ 75 ]
is an argument of the function from to . The four predicates can be represented inthe following table:
Predicate (pred) x1 x2 Expected result
0 1 1 0
1 0 0 0
2 1 0 1
3 0 1 1
That is why y must be <1 for predicates 0 and 1. Then, y must be >=1 for predicates 2 and 3.
Now, we have to call the following function limiting the training to 50 epochs, which aremore than enough:
At epoch 0, the weights and biases are all set to 0.5. No use thinking! Let the program dothe job. As explained previously, the weight and bias of x2 are equal.
Now the hidden layers and y calculation function are called four times, one for eachpredicate to train, as shown in the following code snippet:
A simplified version of a cost function and gradientdescentNow the system must train. To do that, we need to measure the number of predictions, 1 to4, that are correct at each iteration and decide how to change the weights/biases until weobtain proper results.

Become an Unconventional Innovator Chapter 4
[ 76 ]
A slightly more complex gradient descent will be described in the next chapter. In thischapter, only a one-line equation will do the job. The only thing to bear in mind as anunconventional thinker is: so what? The concept of gradient descent is minimizing loss orerrors between the present result and a goal to attain.
First, a cost function is needed.
There are four predicates (0-0, 1-1, 1-0, 0-1) to train correctly. We simply need to find outhow many are correctly trained at each epoch.
The cost function will measure the difference between the training goal (4) and the result ofthis epoch or training iteration (result).
When 0 convergence is reached, it means the training has succeeded.
contains a for each value if none of the four predicates has beentrained correctly. means two out of four predicates arecorrect. means that all four predicates have been trained and that thetraining can stop. , in this case, means that the correct training result was obtained. It canbe or . The array is the result counter.
The cost function will express this training by having a value of , , , , or as thetraining goes down the slope to .
Gradient descent measures the value of the descent to find the direction of the slope: up,down, or 0. Then, once you have that slope and the steepness of it, you can optimize theweights. A derivative is a way to know whether you are going up or down a slope.
In this case, I hijacked the concept and used it to set the learning rate with a one-linefunction. Why not? It helped to solve gradient descent optimization in one line:
By applying the vintage children buying candy logic to the whole XOR problem, I found thatonly needed to be optimized. That's why . That's because is doing the toughjob of saying something negative (-) all the time, which completely changes the course ofthe resulting outputs.

Become an Unconventional Innovator Chapter 4
[ 77 ]
The rate is set at , and the program finishes training in 10 epochs:
This is not a mathematical calculation problem but a logical one, a yes or no problem. Theway the network is built is pure logic. Nothing can stop us from using whatever trainingrates we wish. In fact, that's what gradient descent is about. There are many gradientdescent methods. If you invent your own and it works for your solution, that is fine.
This one-line code is enough, in this case, to see whether the slope is going down. As longas the slope is negative, the function is going downhill to cost = 0:
The following graph sums up the whole process:
Too simple? Well, it works, and that's all that counts in real-life development. If your codeis bug-free and does the job, then that's what counts.
Finding a simple development tool means nothing more than that. It's just another tool inthe toolbox. We can get this XOR function to work on a neural network and generateincome.

Become an Unconventional Innovator Chapter 4
[ 78 ]
Companies are not interested in how smart you are but how efficient (profitable)you can be.
Linear separability was achievedBear in mind that the whole purpose of this feedforward network with backpropagationthrough a cost function was to transform a linear non-separable function into a linearlyseparable function to implement classification of features presented to the system. In thiscase, the features had or value.
One of the core goals of a layer in a neural network is to make the inputmake sense, meaning to be able to separate one kind of information fromanother.
and will produce the Cartesian coordinate linear separability training axis, asimplemented in the following code:
Running the program provides a view of the nonlinear input values once they have beentrained by the hidden layers. The nonlinear values then become linear values in a linearlyseparable function:

Become an Unconventional Innovator Chapter 4
[ 79 ]
The intermediate result and goal are not a bunch of numbers on a screen to show that theprogram works. The result is a set of Cartesian values that can be represented in thefollowing linearly separated graph:
We have now obtained a separation between the top values (empty circle) representing theintermediate values of the 1,0 and 0,1 inputs, and the bottom values representing the 1,1and 0,0 inputs. We now have clouds on top and trees below the line that separates them.
The layers of the neural network have transformed nonlinear values into linear separablevalues, making classification possible through standard separation equations, such as theone in the following code:
The ability of a neural network to make non-separable information separable and classifiablerepresents one of the core powers of deep learning. From this technique, many operations can beperformed on data, such as subset optimization.

Become an Unconventional Innovator Chapter 4
[ 80 ]
Applying the FNN XOR solution to a casestudy to optimize subsets of dataThe case study described here is a real-life project. The environment and functions havebeen modified to respect confidentiality. But, the philosophy is the same one as that usedand worked on.
We are 7.5 billion people breathing air on this planet. In 2050, there will be about 2.5 billionmore. All of these people need to wear clothes and eat. Just those two activities involveclassifying data into subsets for industrial purposes. Grouping is a core concept for anykind of production. Production relating to producing clothes and food requires grouping tooptimize production costs. Imagine not grouping and delivering one t-shirt at a time fromone continent to another instead of grouping t-shirts in a container and grouping manycontainers (not just two on a ship). Let's focus on clothing, for example.
A brand of stores needs to replenish the stock of clothing in each store as the customerspurchase their products. In this case, the corporation has 10,000 stores. The brand producesjeans, for example. Their average product is a faded jean. This product sells a slow 50 unitsa month per store. That adds up to 10,000 stores x 50 units = 500,000 units or stock keepingunit (SKU) per month. These units are sold in all sizes grouped into average, small, andlarge. The sizes sold per month are random.
The main factory for this product has about 2,500 employees producing those jeans atan output of about 25,000 jeans per day. The employees work in the following main fields:cutting, assembling, washing, laser, packaging, and warehouse. See , AutomatedPlanning and Scheduling, for Amazon's patented approach to apparel production.
The first difficulty arises with the purchase and use of fabric. The fabric for this brand is notcheap. Large amounts are necessary. Each pattern (the form of pieces of the pants to beassembled) needs to be cut by wasting as little fabric as possible.
Imagine you have an empty box you want to fill up to optimize the volume. If you only putsoccer balls in it, there will be a lot of space. If you slip tennis balls in the empty spaces,space will decrease. If on top of that, you fill the remaining empty spaces with ping pongballs, you will have optimized the box.
Building optimized subsets can be applied to containers, warehouse flows andstorage, truckload optimizing, and almost all human activities.

Become an Unconventional Innovator Chapter 4
[ 81 ]
In the apparel business, if 1% to 10% of fabric is wasted while manufacturing jeans, thecompany will survive the competition. At over 10%, there is a real problem to solve. Losing20% on all the fabric consumed to manufacture jeans can bring the company down andforce it into bankruptcy.
The main rule is to combine larger pieces and smaller pieces to make optimizedcutting patterns.
Optimization of space through larger and smaller objects can be applied to cutting theforms which are patterns of the jeans, for example. Once they are cut, they will beassembled at the sewing stations.
The problem can be summed up as:
Creating subsets of the 500,000 SKUs to optimize the cutting process for themonth to come in a given factoryMaking sure that each subset contains smaller sizes and larger sizes to minimizeloss of fabric by choosing six sizes per day to build 25,000 unit subsets per dayGenerating cut plans of an average of three to six sizes per subset per day for aproduction of 25,000 units per day
In mathematical terms, this means trying to find subsets of sizes among 500,000 units for agiven day.
The task is to find six well-matched sizes among 500,000 units. This is calculated by thefollowing combination formula:
At this point, most people abandon the idea and just find some easy way out of this even ifit means wasting fabric. The problem was that in this project, I was paid on a percentage ofthe fabric I would manage to save. The contract stipulated that I must save 3% of all fabricconsumption per month for the whole company to get paid a share of that. Or receivenothing at all. Believe me, once I solved that, I kept that contract as a trophy and a tribute tosimplicity.
The first reaction we all have is that this is more than the number of stars in the universeand all that hype!

Become an Unconventional Innovator Chapter 4
[ 82 ]
That's not the right way to look at it at all. The right way is to look exactly in the oppositedirection. The key to this problem is to observe the particle at a microscopic level, at thebits of information level. This is a fundamental concept of machine learning and deeplearning. Translated into our field, it means that to process an image, ML and DL processpixels. So, even if the pictures to analyze represent large quantities, it will come down tosmall units of information to analyze:
yottabyte (YB) 1024 yobibyte (YiB) 280
Today, Google, Facebook, Amazon, and others have yottabytes of data to classify and makesense of. Using the word big data doesn't mean much. It's just a lot of data, and so what?
You do not need to analyze individual positions of each data point in a dataset, but use theprobability distribution.
To understand that, let's go to a store to buy some jeans for a family. One of the parentswants a pair of jeans, and so does a teenager in that family. They both go and try to findtheir size in the pair of jeans they want. The parent finds 10 pairs of jeans in size x. All ofthe jeans are part of the production plan. The parent picks one at random, and the teenagerdoes the same. Then they pay for them and take them home.
Some systems work fine with random choices: random transportation (taking jeans fromthe store to home) of particles (jeans, other product units, pixels, or whatever is to beprocessed) making up that fluid (a dataset).
Translated into our factory, this means that a stochastic (random) process can be introducedto solve the problem.
All that was required is that small and large sizes were picked at random among the500,000 units to produce. If six sizes from 1 to 6 were to be picked per day, the sizes couldbe classified as follows in a table:
Smaller sizes= S={1,2,3}
Larger sizes=L=[4,5,6}

Become an Unconventional Innovator Chapter 4
[ 83 ]
Converting this into numerical subset names, S=1 and L=6. By selecting large and small sizes toproduce at the same time, the fabric will be optimized:
Size of choice 1 Size of Choice 2 Output
6 6 0
1 1 0
1 6 1
6 1 1
Doesn't this sound familiar? It looks exactly like our vintage FNN, with 1 instead of 0 and 6instead of 1. All that has to be done is to stipulate that subset S=value 0, and subset L=value 1;and the previous code can be generalized.
If this works, then smaller and larger sizes will be chosen to send to the cut planningdepartment, and the fabric will be optimized. Applying the randomness concept ofBellman's equation, a stochastic process is applied, choosing customer unit orders atrandom (each order is one size and a unit quantity of 1):
The weights and bias are now constants obtained by the result of the XOR training FNN.The training is done; the FNN is simply used to provide results. Bear in mind that the wordlearning in machine learning and deep learning doesn't mean you have to train systemsforever. In stable environments, training is run only when the datasets change. At one pointin a project, you are hopefully using deep trained systems and are not just stuck in the deeplearning process. The goal is not to spend all corporate resources on learning but on usingtrained models.
Deep learning architecture must rapidly become deep trained models toproduce a profit or disappear from a corporate environment.
For this prototype validation, the size of a given order is random. 0 means the order fits inthe S subset; 1 means the order fits in the L subset. The data generation function reflects therandom nature of consumer behavior in the following six-size jean consumption model.

Become an Unconventional Innovator Chapter 4
[ 84 ]
Once two customer orders have been chosen at random chosen at random in the right sizecategory, the FNN is activated, the FNN is activated and runs like the previous example.Only the result array has been changed because no training is required. Only a yes (1) or no(0) is expected, as shown in the following code:
The number of subsets to produce needs to be calculated to determine the volume ofpositive results required.
The choice is made of six sizes among 500,000 units. But, the request is to produce a dailyproduction plan for the factory. The daily production target is 25,000. Also, each subset canbe used about 20 times. There is always, on average, 20 times the same size in a given pairof jeans available.
Each subset result contains two orders, hence two units:
R=2 x 20 = 120
Each result produced by the system represents a quantity of 120 for 2 sizes.
Six sizes are required to obtain good fabric optimization. This means that after threechoices, the result represents one subset of potential optimized choices:
R = 120 x 3 subsets of 2 sizes= 360

Become an Unconventional Innovator Chapter 4
[ 85 ]
The magic number has been found. For every 3 choices, the goal of producing 6 sizesmultiplied by a repetition of 20 will be reached.
The production per day request is 25,000:
The number of subsets requested = 25000/3=8333. 333
The system can run products as long as necessary to produce the volume of subsetsrequested. In this case, the range is set to products because only thepositive results are accepted. The system is filtering the correct subsets through thefollowing function:
When the subsets have been found respecting the smaller-larger size distribution, thesystem stops, as shown in the following output.
This prototype proves the point. Not only was this project a success with a similaralgorithm, but also the software ran for years in various forms on key production sites,reducing material consumption and generating a profit each time it ran. The software latermutated in a powerfully advanced planning and scheduling application.
Two main functions, among some minor ones, must be added:
After each choice, the orders chosen must be removed from the 500,000-orderdataset. This will preclude choosing the same order twice and reduce the numberof choices to be made.

Become an Unconventional Innovator Chapter 4
[ 86 ]
An optimization function to regroup the results by trained optimized patterns,by an automated planning program for production purposes, as described in
, Automated Planning and Scheduling.
Application information:
The core calculation part of the application is less than 50-lines longWhen a few control functions and dataset tensors are added, the program mightreach 200 lines maximumThis guarantees easy maintenance for a team
It takes a lot of time to break a problem down into elementary parts andfind a simple, powerful solution. It thus takes much longer than justtyping hundreds to thousands of lines of code to make things work. Thesimple solution, however, will always be more profitable and softwaremaintenance will prove more cost effective.
SummaryBuilding a small neural network from scratch provides a practical view of the elementaryproperties of a neuron. We saw that a neuron requires an input that can contain manyvariables. Then, weights are applied to the values with biases. An activation function thentransforms the result and produces an output.
Neuronal networks, even one- or two-layer networks, can provide real-life solutions in acorporate environment. The real-life business case was implemented using complex theorybroken down into small functions. Then, these components were assembled to be asminimal and profitable as possible.
Customers expect quick-win solutions. Artificial intelligence provides a large variety oftools that satisfy that goal. When solving a problem for a customer, do not look for the besttheory, but the simplest and fastest way to implement a profitable solution no matter howunconventional it seems.
In this case, an enhanced perceptron solved a complex business problem. In the nextchapter, an FNN will be introduced using TensorFlow.

Become an Unconventional Innovator Chapter 4
[ 87 ]
QuestionsCan the perceptron alone solve the XOR problem? (Yes | No)1.Is the XOR function linearly non-separable? (Yes | No)2.One of the main goals of layers in a neural network is classification. (Yes | No)3.Is deep learning the only way to classify data? (Yes | No)4.A cost function shows the increase in the cost of a neural network. (Yes | No)5.Can simple arithmetic be enough to optimize a cost function? (Yes | No)6.A feedforward network requires inputs, layers, and an output. (Yes | No)7.A feedforward network always requires training with backpropagation. (Yes |8.No)In real-life applications, solutions are only found by following existing theory.9.(Yes | No)
Further readingLinear separability:

55Manage the Power of Machine
Learning and Deep LearningMastering machine learning and deep learning is proportional to your ability to design thearchitectures of these solutions. As developers, we tend to rush to some sample code, run it,and then try to implement it somehow. That's like going to a big city we don't know, withno map and no guiding system, and trying to find a street. Even worse, it's like trying tobuild a 50-storey building with no architect or plans.
An efficient, well-thought architecture will lead to a good solution. Deep learning networksare data flow graph calculations as shown in , Become an Unconventional Innovator.A node or edge is, in fact, a mathematical operation. The lines connecting these nodes aredata flows and mathematical representations. Tools such as TensorFlow and TensorBoardhave been designed for data flow graph representations and calculations. Without usingTensorBoard, the graph representation of a network, there is little to no chance ofunderstanding and designing deep networks.
The sponsors of a project need to understand the concepts of a given solution. This chapterexplores how to use these tools and, at the same time, make a successful presentation to aCEO, top managers, or your team.
The following topics will be covered in this chapter:
Building a feedforward neural network (FNN) with TensorFlowUsing TensorBoard, a data flow graph, to design your program Using the data flow graph to write a programA cost function, a loss functionGradient descentBackpropagation in a feedforward network Presenting an FNN to a team or management

Manage the Power of Machine Learning and Deep Learning Chapter 5
[ 89 ]
Technical requirementsPython 3.6x 64-bit from NumPy for Python 3.6xTensorFlow from with TensorBoard
Programs: GitHub .
The Python programs delivered with this chapter constitute a sandbox foryou to play around with to become familiar with TensorFlow andTensorBoard. Feel free to run them, modify the TensorFlow data flowgraphs, and see what happens in TensorBoard.
: This program shows how to train an FNN to solvethe XOR problem in a few lines.
: This program adds TensorBoard metadata todisplay the data flow graph of the program.
: This program contains a data flowgraph of the program just to show that mastering the graph means mastering theprogram.
: This program runs with the preceding programs. Itfinds the file containing the data to display in TensorBoard and runs theTensorBoard local service.
: This program shows how totweak a to add some labels to prepare acorporate presentation.
Check out the following video to see the code in action:
Building the architecture of an FNN withTensorFlowBefore applying an FNN to a problem, an architecture of the network must be built. A TensorFlow architecture and solution to the XOR function is the place to start. Thearchitecture of the example differs from the vintage, built-from-scratch solution but theconcepts remain the same.

Manage the Power of Machine Learning and Deep Learning Chapter 5
[ 90 ]
Writing code using the data flow graph as anarchitectural roadmapTensorFlow is a graph-driven solution based on graph theory, a branch of mathematics.Designing deep learning without graphs would prove quite difficult. My XOR FNN builtfrom scratch in , Become an Unconventional Innovator, fits the need of the casestudy described. However, if thousands of nodes are required, TensorFlow, Keras (withTensorFlow backend), or other similar solutions will be needed. In this chapter, a neuralnetwork will be developed in TensorFlow.
The building blocks of graphs are nodes (or vertices, or points) and edges (or lines) thatconnect the nodes to one another.
In TensorFlow parlance, nodes are cleverly named ops for operations. In , Becomean Unconventional Innovator, the Python example shows exactly that: nodes as operationsand calculations.
Mathematical models will be described through a data flow graph. The first step is to buildthe model, your architecture.
In a TensorFlow program, the first top source code lines are not just a new way to describevariables that you will use later. They are the program. They are critical to the computationof the graph. In fact, TensorFlow uses the graph to compute the operations. The graph is thearchitecture, the roadmap that describes the whole computation process of a deep learning neuralnetwork. The following graph has taken the code lines and transformed them into a graph.Imagine that the following graph is a network of water pipes in the city. First, the citybuilds the pipes. Only then does the water (data in our case) flow in those pipes. The pipes(TensorFlow variables, arrays, and other objects) are not a formality. They represent thecore architecture of a system.
This graph is built with to show how to useTensorBoard to analyze your network. It will prove easier to fix design errors withTensorBoard. Click on the nodes to explore the details of each part of the graph. Run theprogram; then run to launch TensorBoard.
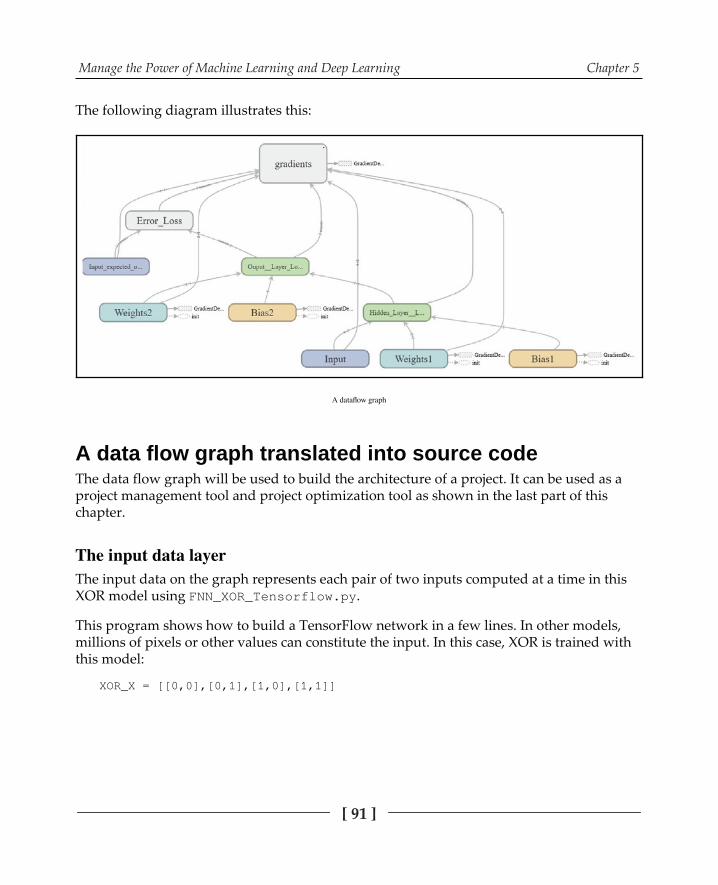
Manage the Power of Machine Learning and Deep Learning Chapter 5
[ 91 ]
The following diagram illustrates this:
A data flow graph translated into source codeThe data flow graph will be used to build the architecture of a project. It can be used as aproject management tool and project optimization tool as shown in the last part of thischapter.
The input data on the graph represents each pair of two inputs computed at a time in thisXOR model using .
This program shows how to build a TensorFlow network in a few lines. In other models,millions of pixels or other values can constitute the input. In this case, XOR is trained withthis model:

Manage the Power of Machine Learning and Deep Learning Chapter 5
[ 92 ]
The first two inputs are (0,0), for example. The input will contain x1=0 and x2=0. Thoseinputs are sent to the hidden layer along with the weights and biases:
The hidden layer contains a multiplication function of weights and an addition of biases, asshown in the following diagram:
The input is sent to the multiplication function along with the weights. Thus x1 and x2 willbe multiplied by the weights as explained in , Become an Unconventional Innovator.In this model, the bias variable is added to the result of the multiplications to each of thehidden neurons (one for each x). Go back to , Become an Unconventional Innovator,again to see the low-level mechanics of the system if necessary.
Bear in mind that there are several mathematical ways, and thus there are severalarchitectures represented in graphs that can solve the FNN XOR problem. Once the multiplication and addition have been computed, a logistic sigmoid function (see
, Think like a Machine) is applied to the result.

Manage the Power of Machine Learning and Deep Learning Chapter 5
[ 93 ]
Why is a logistic sigmoid function needed here?
In , Become an Unconventional Innovator, in my vintage program, I did not use one.I just rounded the values to 0 or 1. That works in a limited environment. However, asexplained in , Think like a Machine, the output of the neurons needs to benormalized to be useful when the input data starts increasing and diversifying. To sum itup, suppose we obtain 200 as an input of a neuron and 2 as an output of another neuron.That makes it very difficult to manage this in the next layer. It's as if you went to a shop andhad to pay for one product in a given currency and another product in a different currency.Now the cashier has to add that up. It's not practical at all in a shop and even less in anetwork with thousands of neurons.
The following logistic sigmoid is thus a very handy tool for the outputs to level thevalues:
Basically, the values are squashed into small numbers that are compatible with the nextstep, which is the computation of the output layer.
The output layer will now receive the result y = (input * weights+ bias) squashed by logisticsigmoid (y), as shown in the following diagram:
Manage the Power of Machine Learning and Deep Learning Chapter 5
[ 94 ]
The output layer takes the y output of the hidden layer (on the right-hand side of the graph)and receives the weights and bias to apply to this layer in this model. Once themultiplication of weights and addition of bias are computed, the logistic sigmoid functionsquashes this output as well. This is a very nice way of keeping values homogeneous overthe network. It's a tidy way of always sending small computable values to the next layer asimplemented in the following code.
Now that the output has been obtained, what is it worth? How is it evaluated and how arethe weights adjusted?
The following cost function compares the expected result with the present resultproduced by the network.
The is applied to the results to squash them for efficient comparisons.The supports a variety of cost functions; this is one way to calculate theerror between the training dataset and the intermediate result.
Another way to calculate a cost function, as shown in the following code, is to compare theoutput of the current iteration with the target output and square both to obtain a visibledifference.
Choosing a cost function will depend on your model. This method in its minimized formatis called least squares. It produces efficient results in this model.
Gradient descent defines two concepts:
Gradient or derivative measurement of the slope (up or down / how steep)Descent or reducing the error level between the present result, relying on theparameters (weights and biases), and the target training dataset
Manage the Power of Machine Learning and Deep Learning Chapter 5
[ 95 ]
There are several ways to measure whether you are going up or down a slope. Derivativesare the most commonly used mathematical tool for this. Let us say you have 15 steps to gofrom one floor of a building down to the next floor. At each step, you feel you are goingdown.
The slope or derivative is the function describing you going down those stairs:
S = slope of you going down the stairsdy = where you are once you have made a step (up, down, or staying on a step)dx = the size of your steps (one at a time, two at a time, and so on)f(x) = the fact of going downstairs, for example from step 4 to step 3, step by step.The derivative or slope is thus:
f(x) is the function of you going down (or up or stopping on a step). For example, when youmove one step forward, you are going from step 4 to step 3 (down). Thus f(x)=x-b, in whichb = 1 in this example. This is called a decreasing function. h = the number of steps you aregoing at each pace, for example, one step down if you are not in a hurry and two stepsdown if you are in a hurry. In this example, you are going down one step at a time fromstep 4 to 3; thus h = 1 (one step at a time).
We obtain the following formula:
This means that we are at step 3 after taking one step. We started at step 4, so we wentdown -1 step. The minus sign means you are going downstairs from step 4 to step 3 or -1step.
The gradient is the direction the function is taking. In this case, it is -1 step. If you go downtwo steps at a time, it would be -2. A straightforward way is just to take the derivative anduse it. If it's 0, we're not moving. If it's negative we're going down (less computation or lessremaining time to train).
If the slope is positive, we are in trouble, we're going up and increase the cost of thefunction (more training or more remaining time to train).

Manage the Power of Machine Learning and Deep Learning Chapter 5
[ 96 ]
The goal of an FNN is to converge to 0. This means that as long as the parameters (weightsand biases) are not optimized, the output is far from the target expected. In this case, forexample, there are four predicates to train (1-1,0-0,1-0,0-1). If only two results are correct,the present situation is negative, which is 2 - 4 = -2. When three results are correctly trained,the output gradient descent is 3 - 4 = -1. This will be translated into derivative gradientdescent form using the cost calculated. Descent means that 0 is the target when all fouroutputs out of four are correct. This arithmetic works for an example without complicatedcalculations. But TensorFlow provides functions for all situations to calculate the cost (costfunction), see whether the training session is going well (down), and optimize the weightsto be sure that the cost is diminishing (gradient descent). Thefollowing will optimize the training of the weights.
A current learning rate for the gradient descent optimizer is 0.01. However, in this model, itcan be sped up to .
The will make sure the slope is following adecreasing function's gradient descent by optimizing the weights of thenetwork accordingly.
In this TensorFlow example, the means of the output values are calculated and thensquashed with the logistic function. It will provide information for the inbuilt gradientdescent optimizer to minimize the cost, with a small training step (0.01). This means thatthe weights will be slightly changed before each iteration. An iteration definesbackpropagation. By going back running the FNN again, then measuring, and going backagain, we are propagating many combinations of weights hopefully in the right direction(down the slope) to optimize the network.
Stochastic gradient descent (SGD) consists of calculating gradientdescent on samples of random (stochastic) data instead of using the wholedataset every time.
The last step is to run the architecture that has just been designed. The thinking was done inthe previous steps.

Manage the Power of Machine Learning and Deep Learning Chapter 5
[ 97 ]
To run the program, the minimum code is for opening a session and running iterations, asshown in the following code snippet:
Feeding the data into the data flow graph is done with . Feed is a keyword inFNN. This is an important feature. It is possible to feed parts of a dataset, not all of the datain stochastic (picking only parts of the dataset to train) gradient descent models asexplained in , Don't Get Lost in Techniques Focus on Optimizing Your Solutions.
The session has now taken the four XOR linearly non-separable (see , Become anUnconventional Innovator) predicates, that is, four possibilities, and computed a linearlyseparable solution:
The input of the output expected was the following:
One of the results obtained is the following:
The results are separable as described in , Become an Unconventional Innovator. Ifyou plot the values, you can separate them with a line.

Manage the Power of Machine Learning and Deep Learning Chapter 5
[ 98 ]
The results are displayed by printing the intermediate values as the session runs, as shownin the following code:
These source code lines are difficult to visualize. Using a graph to represent yourarchitecture helps to see the strong and weak points of a solution.
Using TensorBoard to design thearchitecture of your machine learning anddeep learning solutions
contains no program in thetraditional sense. It contains an essential aspect of developing machine learning and neuralnetworks: the architecture. This program is overloaded with basic graph summariesto grasp the core concept of the data flow graph. In subsequent programs in this book, thesummaries will be less literal.
Master the architecture of a machine learning and deep learning programand you'll master your solutions.
Designing the architecture of the data flow graphFirst import TensorFlow with the following code:

Manage the Power of Machine Learning and Deep Learning Chapter 5
[ 99 ]
Then use the following code to give a name of the of each object you want to displayin one line. Write your variable or object on the second line and include it in theTensorBoard summary as an image (histograms, scalars, and other summaries are possible),as shown in the following code:
provides a label for the objects in the graph. is a way to groupthe names to simplify the visual representation of your architecture.
Repeat that with all the elements described in the previous section, as follows.
Then, once the session is created, set up the log writer directory, as shown in the followingcode:
Those are the basic steps to create the logs to display in TensorBoard.
Note that this source code only contains the architecture of the data flowgraph and no program running the data. The program is the architecturethat defines computations. The rest is defining the datasets how theywill be fed (totally or partially) to the graph. I recommend that you useTensorBoard to design the architecture of your solutions with theTensorFlow graph code. Only then, introduce the dynamics of feedingdata and running a program.

Manage the Power of Machine Learning and Deep Learning Chapter 5
[ 100 ]
Displaying the data flow graph in TensorBoardA practical way to obtain a visual display of your architecture and results is to have yourown little , as shown in the following lines of code:
All you have to do is the output directory to the log directory path in your program. Itcan be included in the main source code.
Once launched, you will see images of the previous section. You are now ready to entercorporate environments as a solid architect thinker and designer.
Use a TensorBoard reader such as this for your meetings. You will beviewed as an architect. You can use Microsoft PowerPoint or other toolsnaturally. But at one point, even a single view of this data flow graph,from a few seconds up to as long as your audience is interested, showsthat you master the architecture of the solution. That is, you master thesubject.
The final source code with TensorFlow andTensorBoardAfter running the programs, to make sure nothing is missing, the TensorFlow andTensorBoard models can be merged and simplified as shownin .
The summaries have been simplified, the cost function uses the optimized least squaresmethod, and XOR linear separability has been proven with this model.

Manage the Power of Machine Learning and Deep Learning Chapter 5
[ 101 ]
Using TensorBoard in a corporateenvironmentChoosing the right architecture for your machine learning or deep learning solution is keyto the technical success of your project.
Then, being able to explain it fewer than 2 minutes to a CEO, a top manager, or even amember of your team is key to the commercial success of your project. If they areinterested, they will ask more questions and you can drill down. First, you have tocaptivate their attention. You spend time on your work. However, selling that idea or workto somebody else is extremely difficult.
A slight change in the inputs can do the job, as shownin in the following code sample:
Show the graph in full-screen mode and double-click on each node to highlight it whilespeaking about a particular aspect of your architecture. The graph can be grouped intolarge scopes by putting placeholders under the same . For example, in thefollowing code, was added to make a presentation:
Use your imagination to find the best and clearest way to make your architectureunderstood.
Display the graph in full-screen mode and double-click on each node to highlight it whilespeaking about it.

Manage the Power of Machine Learning and Deep Learning Chapter 5
[ 102 ]
Using TensorBoard to explain the concept ofclassifying customer products to a CEODesigning solutions seem fine, but if you can't sell them to your team or management, theywon't go far. More often than not, we think that since we have a goodtechnical background, we'll be recognized. Nothing is more deceiving. In a world whereknowledge is everywhere, competition will be at your door everyday. Furthermore,managers will have less and less time to listen to what we have to say.
The architecture of your solution depends on what your buyers (teammanagers, prospects, or customers) ask you. Your freedom to implement yourviews depends on how well you present your architecture in a way that fits theirneeds.
It's 8:30. The CEO has dropped into your office and is touring the company. The CEO issharp, bright, and has no patience with people who can't express themselves clearly. Youlower your head and look in the garbage can to find something that's not there. It doesn'twork. The CEO comes straight to you, invites you to a meeting room and asks you topresent what you are doing. A few other managers come in to see what's going on andwhether you will survive the presentation.
Will your views on the project survive thismeeting?You can take your corporate PowerPoint out and bore your audience, or you can captivateit.
I have gone through these meetings hundreds of times with a 90% sales success rate andhave refined a method that can be summed up in my 2-minute pitch, which always goessomething like the following.

Manage the Power of Machine Learning and Deep Learning Chapter 5
[ 103 ]
I will display a chart and the following graph and say:
"Let's go straight to the point. We're trying to analyze the details of products based ontheir images and find the most profitable ones. Here is a one-page chart showing the list ofthe most promising products. Here is TensorBoard; it comes with TensorFlow package.The computation power of TensorFlow's data flow guarantees disruptive innovativeprofits for this project.At the bottom of the screen, you can see that we are going to input store products (point tothe box). What we expect is the profitable classification ofproducts: the best ones that represent our brand AND the ones that also generate the mostprofit. So basically, there are two main types of features to extract: forms, shapes, andcolors of the most trendy products; and profit.To achieve that, we feed (that's literally the language we use in code) the system with theresults we expect, a dataset of good choices (point to the
box). Then we run the system; it optimizes until ithas been trained through gradient descent (point your arm and finger downwards), whichis simply a cost function to lower (CEO's understand lowering costs in 1/1,000,000th of asecond) the errors. Once the weights (just as we weigh decisions) are optimized (I point tothe weights), that's it. We will provide you each day with reports to drive the marketingdepartment."

Manage the Power of Machine Learning and Deep Learning Chapter 5
[ 104 ]
Then I stop immediately, slowly look at everybody, and say:
"To sum it up, we select the most profitable products in real time with this system andprovide the marketing department with real-time AI reports to boost their marketingcampaigns. By analyzing the features of the products, they will have more precisemarketing data to drive their sales."
If you read this aloud slowly, it should take you be under 2 minutes, which is your first-level survival time.
The rules I've applied successfully are as follows:
Explain from off the top (global concepts).Use as few words as possible, but choose the right ones. Don't avoid technicalconcepts, but break them down into small key parts. This means that, once again,TensorBoard architecture will develop this ability.Speak slowly. Speaking slowly, stopping at each sentence, emphasizing eachkeyword, and pointing to the graph at the same time is the only way to makesure you are not losing anybody.After 2 minutes, sum your introduction up and ask: "Am I clear? Do you want meto continue. Questions?" If they want you to continue, then you can drill down,stopping at every key point to make sure that everybody is still with you.
Bear in mind that many CEOs are business visionaries. They see things wedon't. So, if they come up with an idea, be very constructive andinnovative.
Was the sales pitch convincing?
At this point, if you have a good project, the CEO will most probably say one of thefollowing:
"Gee, that was clear and I understand what you are doing. Thanks. Bye." That's not toobad.

Manage the Power of Machine Learning and Deep Learning Chapter 5
[ 105 ]
"That looks too simple to be true. Can you give some more details?" This could be anopportunity. The CEO wants me to explain more. So I drill down another 2minutes around the way the weights are optimized in a clear way just like thefirst 2 minutes. At that point, in 20% of my meetings, I ended up having lunch ordinner with the CEO, who always has 100 other ideas for uses of such a program.Bear in mind that many CEOs are business visionaries. They see things we don't.So, if a new idea comes up, I generally say, "Great. I'll look into this and get back toyou tomorrow." Then I spend the night coming up with something that works andis explained clearly."Good. I'd like you to talk to X and see where this is going." Not bad either.Hopefully, X will listen to the CEO.
Statistically, being short and concise with real technical tangible objects to show worked90% of the time for me. The 10% failures are lessons to learn from to keep the statistic upthe next time around.
The percentage of failure of our presentations is our cost function. We haveto bring that number down by learning from these failures bybackpropagation as well. We need to go back and change our parametersto adapt to the next run.
SummaryMastering the architecture of a machine learning and deep learning solution means first,and above all, becoming an expert in designing the architecture of a solution and being ableto explain it.
The early lines of a source code program are not just variable declaration lines; theyrepresent the data flow graph that drives the computation of a neural network. These linesdefine the architecture of your solutions. They are critical to the future of an artificialintelligence solution.
The architecture of the solution, represented by TensorBoard, for example, serves twopurposes. The first purpose defines the way the computation of the graph will behave. Thesecond purpose is to use the architecture as a communication tool to sell your project toyour team, management, prospects, and customers. Our environment defines our projectand not simply our technical abilities, no matter how much we know.
The next chapter focuses on analyzing the core problems of machine learning and deeplearning programs.
Manage the Power of Machine Learning and Deep Learning Chapter 5
[ 106 ]
QuestionsTensorBoard is simply a nice displaying program. (Yes | No).1.Defining functions at the beginning of the source code, is just like in standard2.programs. (Yes | No).TensorFlow is a library add-on to Python to get some cool functions. (Yes | No).3.TensorBoard is not necessary to deploy Machine Learning and Deep Learning4.programs. (Yes | No).As long as we're technical experts, we don't have to worry about our5.environment. They will adapt. (Yes | No).Presenting ML/DL projects doesn't change the architecture of a solution. (Yes |6.No).Managers don't need to understand the technical aspect of a solution as long as it7.works. (Yes | No).
Further reading
References/
66Don't Get Lost in Techniques –
Focus on Optimizing YourSolutions
No matter how much we know, the key point remains being able to deliver an artificialintelligence solution or not. Implementing a machine learning (ML) or deep learning (DL)program remains difficult and will become more complex as technology progresses atexponential rates. This will be shown in , Cognitive NLP Chatbots, on quantumcomputing, which may revolutionize computing with its mind-blowing concepts. There isno such thing as a simple or easy way to design AI systems. A system is either efficient ornot, beyond being either easy or not. Either the designed AI solution provides real-lifepractical uses or it builds up into a program that fails to work in various environmentsbeyond the scope of training sets.
This chapter doesn't deal with how to build the most difficult system possible to show ourknowledge and experience. It faces the hard truth of real-life delivery and ways toovercome obstacles. Without data, your project will never take off. Even an unsupervisedML program requires unlabeled data in some form or other.
Beyond understanding convolutional neural networks (CNN) that can recognizeModified National Institute of Standards and Technology (MNIST) training sets ofhandwritten images as described in , Applying Biomimicking to ArtificialIntelligence, efficiency comes first. In a corporate environment, you will often have to dealwith designing datasets and obtaining data. Doubts follow quickly. Are the datasets for agiven project reliable? How can this be measured? How many features need to beimplemented? What about optimizing the cost function and training functions?

Don't Get Lost in Techniques – Focus on Optimizing Your Solutions Chapter 6
[ 108 ]
This chapter provides the methodology and tools needed to overcome everyday artificialintelligence project obstacles. k-means clustering, a key ML algorithm, will be applied tothe increasing need for warehouse intelligence (Amazon and all online product-sellingsites). Quickly showing the solution to a problem will keep a project alive. Focusing on thesolution, and not the techniques, will get you there.
The following topics will be covered in this chapter:
Designing datasetsThe design matrixDimensionality reductionDetermining the volume of a training setk-means clusteringUnsupervised learningData conditioning management for the training datasetLloyd's algorithmBuilding a Python k-means clustering program from scratchHyperparametersTest dataset and predictionPresenting the solution to a team
Technical requirementsPython 3.6x 64-bit from
Programs, :
with
Check out the following video to see the code in action:

Don't Get Lost in Techniques – Focus on Optimizing Your Solutions Chapter 6
[ 109 ]
Dataset optimization and controlOn day one of a project, a manager or customer will inevitably ask the AI expert what kindof data is being dealt with, and in which format. Providing an answer to that will take somehard work. The AI expert never really thought of that, having acquired expertise using theavailable, optimized, and downloadable training datasets to test the programs. The expert'sname is Pert Ex (an anagram of expert) in this chapter. The expert likes to be called Pert.
The CEO of the corporation (or boss or customer) wants Pert to lead an Amazonizationproject. Pert doesn't quite understand what that means. The CEO has the patience toexplain that wholesale e-commerce has overtaken traditional ways of doing business.Wholesale means increasing use of warehouses. How those warehouses are managed willmake a difference to the cost of each project and the sales price.
Although the business is now huge and the warehouse is expanding, the costs of retrievingproducts from the warehouse locations have been increasing. The corporation, which wewill name AGV-AI in this chapter, represents the sum of several real-life projects I havemanaged on various warehouse and aerospace sites. Bear in mind that moving largecomponents in an aerospace project requires precise scheduling. Moving large volumes ofsmall products in an Amazonization process or small volumes of oversized products (25meters or 82 feet for example) such as aerospace components can be costly if badly planned.In AGV-AI, automatic guided vehicles (AGVs) are surprisingly taking longer routes froma warehouse location to a pier. AGV-AI manufactures, stores, and delivers large volumes ofconsumer goods.
The CEO wants Pert's team to find out what is going on and Pert must lead the technicalaspects of the project.
Designing a dataset and choosing an ML/DLmodelPert goes back to his desk in an open space occupied by a team of 50 people and tries torepresent what is wrong in the Amazonization process at the warehouse level.
On paper, it comes down to moving from warehouse locations to piers represented by adistance. The sum of the distances D could be a way to measure the process:
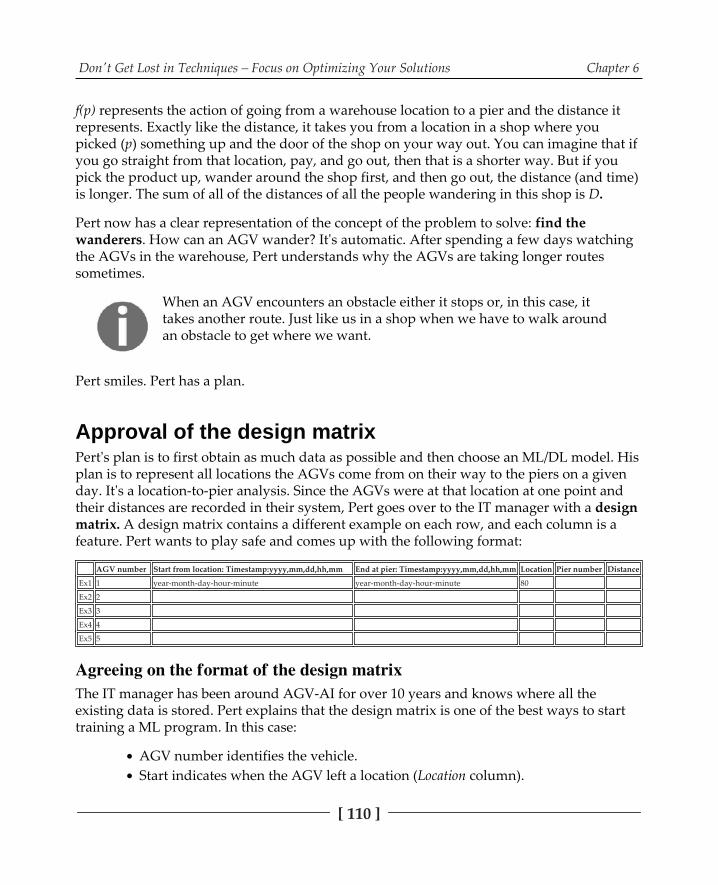
Don't Get Lost in Techniques – Focus on Optimizing Your Solutions Chapter 6
[ 110 ]
f(p) represents the action of going from a warehouse location to a pier and the distance itrepresents. Exactly like the distance, it takes you from a location in a shop where youpicked (p) something up and the door of the shop on your way out. You can imagine that ifyou go straight from that location, pay, and go out, then that is a shorter way. But if youpick the product up, wander around the shop first, and then go out, the distance (and time)is longer. The sum of all of the distances of all the people wandering in this shop is D.
Pert now has a clear representation of the concept of the problem to solve: find thewanderers. How can an AGV wander? It's automatic. After spending a few days watchingthe AGVs in the warehouse, Pert understands why the AGVs are taking longer routessometimes.
When an AGV encounters an obstacle either it stops or, in this case, ittakes another route. Just like us in a shop when we have to walk aroundan obstacle to get where we want.
Pert smiles. Pert has a plan.
Approval of the design matrixPert's plan is to first obtain as much data as possible and then choose an ML/DL model. Hisplan is to represent all locations the AGVs come from on their way to the piers on a givenday. It's a location-to-pier analysis. Since the AGVs were at that location at one point andtheir distances are recorded in their system, Pert goes over to the IT manager with a designmatrix. A design matrix contains a different example on each row, and each column is afeature. Pert wants to play safe and comes up with the following format:
AGV number Start from location: Timestamp:yyyy,mm,dd,hh,mm End at pier: Timestamp:yyyy,mm,dd,hh,mm Location Pier number Distance
Ex1 1 year-month-day-hour-minute year-month-day-hour-minute 80
Ex2 2
Ex3 3
Ex4 4
Ex5 5
The IT manager has been around AGV-AI for over 10 years and knows where all theexisting data is stored. Pert explains that the design matrix is one of the best ways to starttraining a ML program. In this case:
AGV number identifies the vehicle.Start indicates when the AGV left a location (Location column).

Don't Get Lost in Techniques – Focus on Optimizing Your Solutions Chapter 6
[ 111 ]
End indicates when the AGV reached a pier (Pier column).Distance is expressed in the metric system. Pert explains that most space agenciesaround the world use the metric system.
The IT manager starts off by saying the following:
The AGV number is not stored in the mainframe but the local system thatmanages the AGVsIn the mainframe, there is a start time when an AGV picks up its load at thelocation and an end time when it reaches the pierThe location can be obtained in the mainframe as well as the pierNo distance is recorded
Pert would like to have access to the data in the AGV's local system to retrieve the AGVnumber and correlate it with the data in the mainframe.
The IT manager looks at Pert and decides to tell the artificial intelligence expert the simpletruth:
Retrieving data from the AGV guiding system is not possible this fiscal year.1.Those vehicles are expensive and no additional budget can be allocated.Nobody knows the distance it takes from a location to a pier. As long as the2.AGVs deliver the proper products on time at the right piers, nobody so far hasbeen interested in distances.The AGV mission codes in the mainframe are not the same as in the local AGV3.guiding system, so they cannot be merged into a dataset without development.
The project is slipping away. AGV-AI doesn't have the leisure or budget to invest man daysin extracting data that may or may not be used to optimize warehouse distances in itsAmazonization process. Pert has to find a solution very quickly before the very busy ITmanager drops the whole idea. Pert decides to think of this overnight and come backquickly the next day.
Keeping an AI project alive means moving quickly.

Don't Get Lost in Techniques – Focus on Optimizing Your Solutions Chapter 6
[ 112 ]
Pert is in trouble, and he knows it. Not all the data Pert would have liked can be obtainedfor the moment. Some features must be left aside for the moment. He thinks back to hiswalk from the IT manager's office to his office and looks at his cup of coffee.
Dimensionality reduction comes up!
DL uses dimensionality reduction to reduce the number of features in, for example, animage. Each pixel of a 3D image, for example, is linked to a neuron, which in turn bringsthe representation down to a 2D view with some form of function. For example, convertinga color image into shades of a now-gray image can do the trick. Once that is done, simplyreducing the values to, for example, 1 (light) or 0 (dark) makes it even easier for thenetwork. Using an image converted to 0 and 1 pixels makes some classification processesmore efficient, just like when we avoid a car on the road. We just see the object and avoid it.We are not contemplating the nice color or the car to avoid or other dimensions.
We perform dimensionality reduction all day long. When you walk from one office toanother on the same floor of a building requiring no stairs or an elevator, you are notthinking that the earth is round and that you're walking over a slight curve. You haveperformed a dimensionality reduction. You are also performing a manifold operation.Basically, it means that locally, on that floor, you do not need to worry about the globalroundness of the earth. Your manifold view of earth in your dimensionality reductionrepresentation is enough to get you from your office to another one on that floor.
When you pick up your cup of coffee, you just focus on not missing it and aiming for theedges of it. You don't think about every single feature of that cup, such as its size, color,decoration, diameter, and the exact volume of coffee in it. You just identify the edge of thecup and pick it up. That is dimensionality reduction. Without dimensionality reduction,nothing can be accomplished. It would take you 10 minutes to analyze the cup of coffee andpick it up in that case!
When you pick that cup of coffee up, you test to see whether it is too hot, too cold, toowarm, or just fine. You don't put a thermometer in the cup to obtain the precisetemperature. You have again performed a dimensionality reduction of the features of thatcup of coffee. Furthermore, when you picked it up, you computed a manifoldrepresentation by just observing the little distance around the cup, reducing the dimensionof information around you. You are not worrying about the shape of the table, whether itwas dirty on the other side, and other features.
Pert begins to imagine a (CNN) with dimensionality reduction. But the data will beinsufficient for a CNN (see , Getting Your Neurons to Work).

Don't Get Lost in Techniques – Focus on Optimizing Your Solutions Chapter 6
[ 113 ]
There is no time to build a complicated DL program to compute dimensionality reductionand satisfy this need. Automatic dimensionality reduction will be dealt with later when theproject has been accepted.
ML and DL techniques such as dimensionality reduction can be viewed astools and be used in any field in which you find them useful. Reducingthe number of features or modifying them can be done on a spreadsheetby selecting the useful columns and/or modifying the data. By focusing onthe solution, you can use any tool in any way you want as long as it worksin a reliable way.
Pert then turns to a k-means clustering ML algorithm and decides to performdimensionality reduction by analysis of the data and defining it for a computation. Eachlocation will form a cluster as explained in the next section. With this intuition, Pert goesback and presents the following format:
Location Start from location:Timestamp:yyyy,mm,dd,hh,mm
End at location:Timestamp:yyyy,mm,dd,hh,mm
Ex1
The IT manager is puzzled. Pert explains that as long as each location represents a separateAGV task from start time to the end time and the pier, the rest will be calculated.
The IT manager says that it can be extracted in format within a couple of days for atest but asks how that makes the project possible. Pert says, "Provide the data, and I'll be backwith a prototype within a couple of days as well."
Pert decides to keep the dataset down to six locations over two days. Six locations arechosen in the main warehouse with a group of truck loading points. Taking around 5,000examples into account, that should represent the work of all the 25 AGVs purchased byAGI-AI running 24 hours a day. The IT manager delivers the file the next day.
Implementing a k-means clustering solutionPert now has a real dataset. The dataset needs to be converted into a prototypeto prove the financial value of the project he has in mind. The amount of the money savedmust capture the imagination of the CEO. Making a machine learning program work in acorporate environment means nothing without profit to justify its existence.

Don't Get Lost in Techniques – Focus on Optimizing Your Solutions Chapter 6
[ 114 ]
Do not speak about a project in a corporate environment without knowinghow much profit it represents and the cost of getting the job done.
The vision Pert's primary goal can be summed up in one sentence: finding profit by optimizing AGVs.Achieving that goal will lead to obtaining a budget for a full-scale project.
The data provided does not contain distances. However, an estimation can be made perlocation as follows:
distance=(end time- start time)/average speed of an AGV
The start location is usually a loading point near a pier in this particular warehouseconfiguration.
The dataThe data provided contains start times (st), end times (endt), and delivery locations. Tocalculate distances, Pert needs to convert those times into a distance (di) with the followingestimation for each location (ll):
di(ll)=(endt-st)/v
v = velocity of the AGV per minuteendt-st is expressed in minutesdi = estimated distance an AGV has gone in a given time
A Python program reads the initial file format and data and outputs a new file and formatas follows:
Distance Location
55 53
18 17

Don't Get Lost in Techniques – Focus on Optimizing Your Solutions Chapter 6
[ 115 ]
The data file is available at .
Data conditioning means preparing the data that will become the input of the system. Poorconditioning can have two outcomes:
Bad data making no difference (large volumes and minor errors)Bad data making a difference (regardless of volumes, the data influences theoutcome)
In this particular case, out of the 5,000 records provided for the dataset, 25 distances aremissing.
Pert has analyzed the warehouse and is lucky!
The location numbers start at #1. #1 is near the loading point of the products. The AGV hasto bring the products to this point. To be more precise, in this warehouse configuration, theAGV goes and gets a box (or crate) of products and brings them back to location 1. Atlocation 1, humans check the products and package them. After that, humans carefully loadthe products in the delivery trucks.
Having spent hours measuring distances in the warehouse, Pert knows that the distancefrom one location to the next is about 1 meter. For example, from location 1 to location 5,the distance is about 5 meters, or 5 m. Also since all locations lead to location 1 for theAGVs in this model, the theoretical distances will be calculated from location 1. Pertdecides to generalize the rule and defines a distance di for a location lj as follows:
di(lj)=lj
di is expressed in meters. Since the locations start at number 1 through n, the locationnumber is equal to the approximate distance from the first location from which the AGVsdepart. Looking at the data, it quickly appears that many distances are superior to theirlocation numbers. That is strange because the distance should be about equal to thelocation.
The time has come to build a strategy and program.

Don't Get Lost in Techniques – Focus on Optimizing Your Solutions Chapter 6
[ 116 ]
The strategyPert's strategy can be summed up as follows:
Quickly write a program to represent the AGV's trajectories in a visual wayGo to the warehouse to check the resultsCalculate the potential optimized profit with a solution that is yet to be foundGo back to present this to the top management to get a project budget approval
The k-means clustering programk-means clustering is a powerful unsupervised learning algorithm. We often perform k-means clustering in our lives. Take, for example, a lunch you want to organize for a team ofabout 50 people in an open space that can just fit those people. It will be a bit cramped but aproject must be finished that day and it is a good way to bind the team for the final sprint.
A friend and a friend first decide to set up a table in the middle. Your friend points out thatthe people in that room will form a big cluster k, and with only one table in the geometriccenter (or centroid) c, it will not be practical. The people near the wall will not have accessto the main table.
You have an idea. You call Pert, who runs a computation to confirm your friend's intuition.Pert shows them the problem with the following one-table plan:
The people not close to the table (rectangle in the middle) will not have easy access to thetable.

Don't Get Lost in Techniques – Focus on Optimizing Your Solutions Chapter 6
[ 117 ]
You go to the room with your friend and Pert and try moving two tables c1 and c2 in variousplaces for two clusters of people k1 and k2.
The people x1 to xn form a dataset X. Your friend still has doubts and says, "Look at table c1. Itis badly positioned. Some people x near the wall will be right next to it and the others too far away.We need the table c1 to be in the center of that cluster k1. The same goes for table c2."
You and your friend move a table c, and then estimate that the mean distance of the peoplex around it will be about the same in their group or cluster k. They do the same for the othertable. They draw a line with chalk on the floor to make sure that each group or cluster is atabout the mean distance from its table.
Pert speaks up and says, "Gee, we can simulate that with this Python program I am writing formy project!":
Step 1: You have been drawing lines with chalk to decide which group (cluster k)each person x will be in, by looking at the mean distance from the table cStep 2: You have been moving the tables around accordingly to optimize step 1
Pert shows them the two-table model computed by the k-means clustering program; itlooks exactly like what you just did. Then they finally add a third table and it looks good.Pert says, "Look at what you did on the following screenshot.":
You and your friend look at Pert and say, "So what?"

Don't Get Lost in Techniques – Focus on Optimizing Your Solutions Chapter 6
[ 118 ]
Pert smiles and says, "Well, you just re-invented Lloyd's algorithm to solve a k-means clusteringproblem!"
You and your friend are curious. You want to know more. So you each get a paperboard,and ask Pert to explain to you the warehouse project or any project with this model inmathematical terms.
The mathematical definition of k-means clusteringThe dataset X provides N points. These points or data points are formed by using distanceas the x axis in a Cartesian representation and the location as the y axis in a Cartesianrepresentation. If you have 1 person in on location 1 as the first record of your file, it will berepresented as x axis = 1 and y axis = 1 by the black dot, which is the data point, as shown inthe following diagram:
In this example, 5,000 records are loaded from , which is in the same directory asthe program. The data is unlabeled with no linear separation. The goal is to allocate the Xdata points to K clusters. The number of clusters is an input value. Each cluster will have itsgeometric center or centroid. If you decide to have three clusters K, then the result will be asfollows:
Three clusters K in three colors in a visual representation Three geometric centers or centroids representing the center of the mean of thesum of distances of x data points of that cluster
If you decide on six clusters, then you will obtain six centroids, and so on.
Described in mathematical terms, the formula in respect of Kk, k is as follows:

Don't Get Lost in Techniques – Focus on Optimizing Your Solutions Chapter 6
[ 119 ]
This means that the sum of each k (cluster) from 1 to the number of clusters K of the sum ofall distances of members xi to xn of each cluster K from their position to the geometric center(centroid) must be minimized.
The smaller the distance from each member x to centroid , the more the system isoptimized. Note that the distance is squared each time because this is a Euclidean distancein this version of the equation.
There are several variations of Lloyd's algorithm. But all of them follow a commonphilosophy.
For a given xn (data point), the distance from the centroid in its cluster must be less thangoing to another center. Exactly like how a person in the lunch example wants to be closerto one table rather than having to go far to get a sandwich because of the crowd!
The best centroid for a given xn is as follows:
This calculation is done for all (centroids) in all the clusters from k1 to K.
Once each xi has been allocated to a Kk, the algorithm recomputes by calculating themeans of all the points that belong to each cluster and readjusts the centroid k.
The goal of k-means clustering in this case studyThe goal must be clear, not simple, not easy, for Pert's managers to understand. Pertdecides to write a Python program first. Then if things go well, a full-scale project will bedesigned. The goal must be to find the gain zone. The gain zone will be the data points thatcould have been optimized in terms of distances.
In projects you build, distances can be replaced by costs, hours, or any optimizationmeasurement feature. Location can be replaced by a feature such as the number of people,phone calls, or any other measurement.
k-means clustering can be applied to a range of applications as explained in , When to Use Artificial Intelligence.

Don't Get Lost in Techniques – Focus on Optimizing Your Solutions Chapter 6
[ 120 ]
The Python programThe Python program uses the library (which contains efficient algorithms),
for data analysis (only used to import the data in this program), and to plot the results as data points (the coordinates of the data) and clusters (data pointsclassified in each cluster with a color). First the following models are imported:
NumPy is not a prerequisite since runs the computation.
The training dataset consists of 5,000 lines. The first line contains a header for maintenancepurposes (data checking), which is not used. k-means clustering is an unsupervisedlearning algorithm, meaning that it classifies unlabeled data into cluster-labeled data tomake future predictions. The following code displays the dataset:
The line can be useful though not necessary to check the training dataduring a prototype phase or for maintenance purposes. The following output confirms thatthe data was correctly imported:

Don't Get Lost in Techniques – Focus on Optimizing Your Solutions Chapter 6
[ 121 ]
Hyperparameters determine the behavior of computation method. In this case, twohyperparameters are necessary:
The number of clusters that will be computed. This number can and will bechanged during the case study meetings to find out the best organizationprocess, as explained in the next section. After a few runs, Pert intuitively set to
.The f number of features that will be taken into account. In this case, there aretwo features: distance and location.
The program implements a k-means function as shown in the following code:
Note that the hyperparameter is commented. In this case, the number of featuresis implicit and determined by the format of the training dataset, which contains twocolumns.
now does the job using the training dataset and hyperparameters in the followinglines of code:
The array contains the geometric centers or centroids and can be printed forverification purposes, as shown in this snippet:

Don't Get Lost in Techniques – Focus on Optimizing Your Solutions Chapter 6
[ 122 ]
These geometric centers need to be visualized with labels for decision-making purposes.
The initial unlabeled data can now be classified into cluster labels as shown in the followingcode:
Colors can be used for semantic purposes beyond nice display labels. A color for each topcustomer or leading product can be assigned, for example.
To make sense to a team or management, the program now prepares to display the resultsas data points and clusters. The data will be represented as coordinates and the clusters ascolors with a geometric center or centroid, as implemented in this code:
The dataset is now ready to be analyzed. The data has been transformed into data points(Cartesian points) and clusters (the colors). The x points represent the geometric centers orcentroids, as shown in the following screenshot:

Don't Get Lost in Techniques – Focus on Optimizing Your Solutions Chapter 6
[ 123 ]
In this case, the test dataset has two main functions. First, some test data confirms theprediction level of the trained and now-labeled dataset. The input contains randomdistances and locations. The following code implements the output that predicts whichcluster the data points will be in:
The second purpose, in future, will be to enter new warehouse data for decision-makingpurposes, as explained in the next section.

Don't Get Lost in Techniques – Focus on Optimizing Your Solutions Chapter 6
[ 124 ]
Analyzing and presenting the resultsPert knows the two-minute presentation rule.
If you have not captivated your manager or any audience within the twominutes of a presentation, it's over.
People will begin to look at their mail on their phones or laptops; pain replaces the pleasureof sharing a solution.
Pert decides to start the presentation with the following screenshot and a strongintroduction:
Pert points to the gain zone area and says:
From the computations made, that gain zone is only part of the losses of the present wayAGVs are used in our company. It takes only a few locations into account. I would saythat we could save 10% of the distances of our 25 AGVs on this site only. If we add nineother major sites in the world that adds up to:
10% of (25 AGVs * 10 sites) = a gain of 25 AGVs

Don't Get Lost in Techniques – Focus on Optimizing Your Solutions Chapter 6
[ 125 ]
That's because the AGVs are not going directly to the right locations but are wanderingaround unplanned obstacles.
Pert has everybody's attention!
In real life, I started my career with major corporations by making the following statementin similar cases (factories, warehouses, purchasing department, scheduling departments,and many other fields):
Pay me a percentage of that gain, and I will do the project for free until that is proven.
If the solution is mathematically solid and the data available, there is a risk to calculate toenter a corporation. When that is achieved once, it is easier the times after.
In this case, Pert's audience asks how this was estimated. The explanation is not simple butclear. The average distance from one location to another is 1 meter. The AGVs all start outfrom location 0 or 1. So the distance is strictly proportional to the locations in this particularexample (which is not always the case).
To find the gain zone of a location, you draw a red horizontal line from location 80, forexample, and a vertical line from distance 80 (add a couple of meters to take small variancesinto account).
None of the data points on the 80 location line should be beyond the maximum limit. Thelimit is 80 meters + a small variance of a few meters. Beyond that line, on the right-handside of the figure, is where the company is losing money and something must be done tooptimize the distances. This loss zone is the gain zone for a project. The gain zone on the k-means cluster results shows that some of the locations of 40 to 60 exceed 80 meters distance.
Something is wrong, and a project can fix it.
AGV virtual clusters as a solutionThe planners anticipate AGVs tasks. They send them to probable locations from which theywill have to pick up products and bring them back to the truck-loading points.

Don't Get Lost in Techniques – Focus on Optimizing Your Solutions Chapter 6
[ 126 ]
One of the solutions is to provide AGV virtual clusters as a business rule, as shown in thefollowing screenshot:
Rule 1: The line in the middle represents a new business rule. In phase 1 of theproject, an AGV used for locations 40 to 60 cannot go beyond that 60 meter +small variance line.Rule 2: A cluster will represent the pick-up zone for an AGV. The centroid willnow be its parking zone. Distances will be optimized until all the clusters respectrule 1.
The financial manager and CEO approve Pert's prototype. But there now two conditions forthis to become a project:
Present an architecture for large volumes for 10 sites, not just this site.Present the same model but with different features to optimize the e-commerce ofthe corporation's websites that now represent 90% of all sales. Using the solutionfor another project will generate more profit with this approach.

Don't Get Lost in Techniques – Focus on Optimizing Your Solutions Chapter 6
[ 127 ]
SummaryUp to this point, we have explored Python with , , ,
, and libraries. More platforms and libraries will be implemented inthis book. In the months and years to come, even more languages, libraries, frameworks,and platforms will appear on the market. However, artificial intelligence is not only aboutdevelopment techniques. It is a branch of applied mathematics that requires a real-life interestin the field to deliver. Building a k-means clustering program from scratch requires carefulplanning. The program relies on data that is rarely available as we expect it. That's whereour imagination comes in handy to find the right features for our datasets.
Once the dataset has been defined, poor conditioning can compromise the project. Somesmall changes in the data will lead to incorrect results.
Preparing the training dataset from scratch takes much more time that we would initiallyexpect. Artificial intelligence was designed to make life easier but that's after a project hasbeen successfully implemented. The problem is that building a solution requires majordataset work and constant surveillance.
Then comes the hard work of programming a k-means clustering solution that must beexplained to a team. Lloyd's algorithm comes in very handy to that effect by reducingdevelopment time.
k-means clustering can be applied to many fields and architectures as will be explained in, When to Use Artificial Intelligence.
QuestionsCan a prototype be built with random data in corporate environments? (Yes |1.No)Do design matrices contain one example per matrix? (Yes | No)2.AGVs can never be widespread. (Yes | No)3.Can k-means clustering be applied to drone traffic? (Yes | No)4.Can k-means clustering be applied to forecasting? (Yes | No)5.Llyod's algorithm is a two-step approach. (Yes | No)6.Do hyperparameters control the behavior of the algorithm? (Yes | No)7.Once a program works, the way it is presented does not really matter. (Yes | No)8.k-means is only a classification algorithm. It's not a prediction algorithm. (Yes |9.No)

Don't Get Lost in Techniques – Focus on Optimizing Your Solutions Chapter 6
[ 128 ]
Further readingThe scikit-learn website contains additional information on k-means clustering:
You can find Python's Data Analysis Library here:

77When and How to Use Artificial
IntelligenceUsing artificial intelligence (AI) in a corporate environment follows a normal process ofrisk assessment. Managers evaluate the feasibility of a project and return on investmentbefore giving a green signal to an AI implementation.
This chapter builds on the k-means clustering presentation that Pert Ex, our AI expert,made in , Don't Get Lost in Techniques Focus on Optimizing Your Solutions. Thetime has come to carefully deploy a large number of datasets by first showing that aclassical approach will not work. Then we use the proper architecture to get the project ontrack.
Amazon Web Services(AWS) SageMaker and Amazon S3 provide an innovative way totrain machine learning datasets. The goal here is not to suggest that AWS could be the bestsolution but to show the best of AWS. AWS will constantly evolve, just like Google, IBM,Microsoft, and other platforms.
However, even though machine learning platforms might differ, the implementationmethod will necessarily remain the same.
The following topics will be covered in this chapter:
Proving that AI must or not be usedData volume issuesProving the NP-hard characteristic of k-means clustering The central limit theorem (CLT)Random samplingMonte Carlo samplingStochastic sampling

When and How to Use Artificial Intelligence Chapter 7
[ 130 ]
Shuffling a training datasetHow to use AWS SageMaker for a machine learning training model
Technical requirementsYou will need Python 3.6x 64-bit from :
You will need programs from GitHub :
Check out the following video to see the code in action:
Checking whether AI can be avoidedTrying to avoid AI in a book on AI may seem paradoxical. However, AI tools can becompared to having a real toolkit in real life. If you are at home and you just need to changea light bulb, you do not have to get your brand new toolkit to show off to everybodyaround you. You just change the light bulb and that's it.
In AI, as in real life, use the right tools at the right time. If AI is notnecessary to solve a problem, do not use it.
Use a proof of concept (POC) approach to prove your point for an AI project. A POCshould cost much less than the project itself and helps to build a team that believes in theoutcome. The first step is exploring the data volume and the method that will be used.
When and How to Use Artificial Intelligence Chapter 7
[ 131 ]
Data volume and applying k-means clusteringAnybody who has run MNIST with 60,000 handwritten image examples on a laptop knowsthat it takes some time for a machine learning program to train and test these examples.Whether a machine learning program or a deep learning convolutional network is applied,it uses a lot of the local machine's resources. Even if you run it on training on GPUs (shortfor graphics processing unit) hoping to get better performance than with CPUs, it stilltakes a lot of time for the training process to run through all the learning epochs.
If you go on and you want to train your program on images, CIFAR-10, a-60,000 imagesubset of the tiny image dataset, will consume even more resources on your local machine.
Suppose now, in this case, Pert Ex has to start using k-means clustering in a corporationwith hundreds of millions of records of data to analyze in a SQL Server or Oracle database.Pert calls you in to manage the POC phase of the project. For example, you find that youhave to work for the phone operating activity of the corporation and apply a k-meansclustering program to the duration of phone calls to locations around the world everymorning for several weeks. That represents about several million records per day, addingup to 3 billion records in a month. Once that has been implemented, the top marketingmanager wants to use the visual result of the clusters and centroids for an investmentmeeting at the end of the month.
You go to the IT department and ask for a server to do the k-means clustering training andsimulation process. You get a flat number. Everybody knows that a machine learning k-means clustering training program running over 3 billion records will consume too muchCPU/GPU. A shrewd colleague points out that 3 billion records represent only one feature.If you talk about location and duration, that represents two features, bringing the datavolume to 6 billion cells in a matrix.
You clearly understand the point and agree that there is a resource problem here. You goback to the marketing manager with your "No" for the project to run on local servers. Youwant to obtain permission to use AWS (Amazon Web Services). Your marketing managerimmediately lets you use it. Obtaining those centroids per location cluster is critical to thebusiness plan of the company.

When and How to Use Artificial Intelligence Chapter 7
[ 132 ]
Proving your pointWhile you are gone, the IT department try to run a query on the SQL server database onone continent and the Oracle database on another. They come up with the duration perlocation but simply cannot provide the centroids and clusters. They are puzzled becausethey would like to avoid using AWS. Now that they've tried and failed, they are ready tomove forward and get the project rolling. They need an explanation first.
Never force a team to do what you think is necessary without provingwhy it is necessary. The explanation must be clear and each part of theproject must be broken down into elementary parts that everybody canunderstand, including yourself!
You start by explaining that solving a k-means clustering problem is NP-hard. The P standsfor polynomial and the N for non-deterministic.
The P here means that the time to solve or verify the solution of a problem is polynomial(poly=many, nomial=terms). For example, x3 is a polynomial.
Once x is known, then x3 will be computed. Applied to 3,000,000,000 records, an estimationcan be applied:
x3 = 3,000,000^3
It seems a lot but it isn't that much for two reasons:
In a world of big data, the number can be subject to large-scale randomizedsamplingK-means clustering can be trained by mini-batches (subsets of the dataset) tospeed up computations
The big difference between a polynomial function and an exponential function relies, in thiscase, on x being the variable, and 3 the exponent.
In an exponential function, x would be the variable and 3 the constant. With x as anexponent, the time to solve this problem would be exponential. It's certainly not apolynomial time you can predict.
33,000,000,000 is something you don't even want to think about!
When and How to Use Artificial Intelligence Chapter 7
[ 133 ]
Polynomial time means that this time will be more or less proportional to the size of theinput. Even if the time it takes to train the k-means clustering remains a bit fuzzy, as long asthe time it will take to verify the solution remains proportional to the size of the input, theproblem remains a polynomial.
The IT department feels better about the problem. The volume of the training process willoverload their servers. They do not have the time to purchase a server and set it up.
The IT department tried to find a solution with a query but did not succeed.
Non-deterministic problems require a heuristic approach, which implies some form ofpractical approach. The most widespread heuristic is trial and error. K-means goes beyondtrial and error. It is more like a progressive-iterative approximation of the goals to attain.
In any case, k-means clustering requires a well-tuned algorithm to solve the volume of datainvolved in this project.
NP-hard, as opposed to NP, can solve a problem in a straightforward deterministic way,without a non-deterministic method.
The IT department is not only satisfied with the answer but also very pleased that you tookthe time to explain why AWS was necessary and did not just say, "The boss said so."
AI requires clear explanations and scientific proof of its necessity.
The last question comes up: what are mini-batches and how are they used?
Random samplingA large portion of machine learning and deep learning contains random sampling invarious forms. In this case, a training set of 3,000,000,000 elements will prove difficult toimplement without random sampling.

When and How to Use Artificial Intelligence Chapter 7
[ 134 ]
Random sampling applies to many methods as described in this book: Monte Carlo,stochastic gradient descent, and many others. No matter what name the sampling takes,they share common concepts to various degrees depending on the size of the dataset. Thefollowing description fits the Monte Carlo philosophy.
The law of large numbers LLNIn probability, the law of large numbers states that when dealing with very large volumesof data, significant samples can be effective enough to represent the whole set of data. Weare all familiar with polling, for example, a population on all sorts of subjects.
This principle, like all principles, has its merits and limits. But whatever its limitations, thislaw applies to everyday machine learning algorithms.
In machine learning, sampling resembles polling. The right, smaller number of individualsmakes up efficient datasets.
In machine learning, the word "mini-batch" replaces a group of people in the pollingsystem.
Sampling mini-batches and averaging them can prove as efficient as calculating the wholedataset as long as a scientific method is applied:
Training with mini-batches or subsets of dataUsing an estimator in one form or another to measure the progression of thetraining session until a goal has been reached
You may be surprised to see "until a goal has been reached" and not "the optimal solution."
The optimal solution may not represent the best solution. All the features and all theparameters are often not expressed. This makes being too precise useless.
In this case, the marketing manager wants to know where the centroids (geometric center)of each cluster (region of locations) have been computed for his marketing campaign. Thecorporation may decide to open a new company at the location of each centroid andprovide additional services through local spin-offs to increase their market penetration.
Taking that into account, a centroid does not need to be extremely precise. Finding thenearest large city within a reasonable distance will prove good enough.
The LLN explains why random functions are widely used in machine learning and deeplearning.

When and How to Use Artificial Intelligence Chapter 7
[ 135 ]
The central limit theoremAs shown in by the LLN applied to this business case, the k-means clustering project mustprovide a reasonable set of centroids and clusters (regions of locations for long-durationphone calls).
This approach can now be extended to the CLT, which states, in machine learning parlance,that when training a large dataset, a subset of mini-batch samples is sufficient. Thefollowing two conditions define the main properties of the central limit theorem:
The variance between the data points of the subset (mini-batch) remainsreasonable. In this case, filtering only long-duration calls solves the problem.The normal distribution pattern with mini-batch variances close to the varianceof the whole dataset.
The name Monte Carlo comes from the casinos in Monte Carlo and gambling. Gamblingrepresents an excellent memoryless random example. No matter what happens before agambler plays, prior knowledge provides no insight.
Applied to machine learning, the sum of the distribution of f(x) is computed. Then randomsamples are extracted from the following dataset: x1, x2, x3, ..., xn.
No matter what form f(x) takes, such as in a k-means clustering process, to estimate theaverage result, it can be represented by the following equation:
The estimator represents an average of the result of the k-means clustering algorithm orany model implemented.

When and How to Use Artificial Intelligence Chapter 7
[ 136 ]
Random sampling applicationsRandom sampling can be applied to many functions and methods as we will see insubsequent chapters in this book: Monte Carlo sampling, as described previously, andstochastic gradient descent by extracting samples from the dataset to evaluate the costfunction and many other functions.
Randomness represents a key asset when dealing with large datasets.
Cloud solutions AWSImplementing large number data volumes involves using server resources in one form orthe other. We have to use on-premise servers or cloud platforms. In this case, it has beendecided to outsource server resources and algorithm development to face a large amount ofdata billion to train.
Several online cloud services offer the solution to machine learning projects. In this chapter,the project was carried out with AWS SageMaker on an AWS S3 data managementplatform.
Preparing your baseline model3,000,000 records containing two features, adding up to a 6,000,000 cell matrix dataset,require mini-batches as defined in the next section through hyperparameters.
In the AWS interface, the size of a mini-batch will be a number. To see what it does, let'sapply a mini-batch to the Python program example of , Don't Get Lost inTechniques Focus on Optimizing Your Solutions.
Training the full sample training datasetIn , Don't Get Lost in Techniques Focus on Optimizing Your Solutions, 5,000 recordsand a six-cluster configuration produced six centroids (geometric centers), as shown here:

When and How to Use Artificial Intelligence Chapter 7
[ 137 ]
The problem now is how to avoid costly machine resources to train this k-means clusteringdataset.
Training a random sample of the training datasetBefore spending resources on AWS, we must prepare a model locally and make sure itworks. AWS possesses efficient mini-batch algorithms. But to master them, a local baselinewill guarantee good AWS job management.
The file provides a way to verify the mini-batch solution.
The program begins by loading the data in the following lines of code:
Now a mini-batch dataset name will be randomly created using Monte Carlo'slarge data volume principle with a mini-batch size of 1,000. Many variations of themethod's Monte Carlo approaches apply to machine learning. The estimator within the k-means function will be used as the Monte Carlo type averaging function, as shown in thefollowing source code.

When and How to Use Artificial Intelligence Chapter 7
[ 138 ]
Finally, the k-means clustering algorithm runs on a standard basis, as shown in thefollowing snippet.
The following screenshot, displaying the result produced, resembles the full dataset trainedby k-means clustering in , Don't Get Lost in Techniques Focus on Optimizing YourSolutions.

When and How to Use Artificial Intelligence Chapter 7
[ 139 ]
The centroids obtained can solve the marketing problem as shown in this output.
Shuffling as an alternative to random samplingK-means clustering is an unsupervised training algorithm. As such, it trains unlabeled data.One random computation does not consume a high level of machine resources, but severalrandom selections in a row can.
Shuffling can reduce machine consumption costs.
Proper shuffling of the data before starting training, just like shuffling cards before a Pokergame, will avoid repetitive and random mini-batch computations. In this model, theloading data phase and training phase do not change. However, instead of one or severalrandom choices for , the mini-batch dataset, we shuffle the complete dataset oncebefore starting the training. The following code shows how to shuffle datasets.
Then we select the first 1,000 shuffled records for training, as shown in the following codesnippet.

When and How to Use Artificial Intelligence Chapter 7
[ 140 ]
The result in the following screenshot corresponds to the one with the full dataset and therandom mini-batch dataset sample.
The centroids produced can provide first-level results to confirm the model, as shown inthe following output.
Now that the model exists locally, the implementation on AWS can proceed.
Using shuffling instead of random mini-batches has two advantages:limiting the number of mini-batch calculations and avoiding training thesame samples twice.

When and How to Use Artificial Intelligence Chapter 7
[ 141 ]
AWS data managementNo matter which cloud solution you choose, data management will involve the following:
Security and permissions this will depend on your security policy and thecloud platform's policiesManaging input data and output data related to your machine learning model
BucketsAWS has a data repository named buckets. You can create a bucket on Amazon S3. Onother platforms, different names are used but the concept remains the same. Your data hasto reach the platform one way or the other with an API, a data connection, or loading of thedata. In the present example, the best choice remains a bucket, as shown in the followingscreenshot:

When and How to Use Artificial Intelligence Chapter 7
[ 142 ]
Uploading filesOnce the bucket has been created, files can be loaded in various formats. In this example,
was loaded without the headers. The used in the previous chapter hasbeen loaded without headers. AWS requires format verification (number of columns,possible indexes) on an ever-evolving platform. The following screenshot shows how youcan organize your data.
Access to output resultsSageMaker automatically writes the results of the k-means clustering training session in an
directory in the following Amazon S3 bucket as shown in the following screenshot.

When and How to Use Artificial Intelligence Chapter 7
[ 143 ]
SageMaker notebookTo create your machine jobs on any platform, you will have to configure an interface, usecommand lines, or write commands through APIs.
In this example, Amazon SageMaker notebooks will be managing the k-means clusteringjob. First, access AWS services with your account, as shown in this screenshot.

When and How to Use Artificial Intelligence Chapter 7
[ 144 ]
Then go to SageMaker, as shown in the following screenshot.
is the notebook instance for the k-means clustering baseline model that will be run.
Creating a jobTo create a job, we click on , as seen in the following screenshot.

When and How to Use Artificial Intelligence Chapter 7
[ 145 ]
Once the input data path and output path have been created, the most important partconsists of setting up the right hyperparameters (see the following screenshot) that willcontrol the behavior of the machine learning job.
The main parameters are these:
: This determines the number of clusters and centroids that will be computed.For this example, setting it to was used. If you are running handwritten letterrecognition, you might want to have a centroid per letter.
: The number of features in this example was set to . Many morefeatures can be integrated into your model as long as they prove necessary.
: Mini-batch, as described in the previous section. The wholedataset batch cannot be trained with large data volumes. A batch size of 5,000 forlarge datasets can produce interesting results. However, finding the rightparameter might take several tries.
: K-means generally starts with random ks centroids. The best wayremains to get the system to work and then explore other avenues with AWSdocumentation.
: Keeping this value to auto to start with remains a goodoption. AWS put a lot of work into optimizing the algorithm by managing(adding centers when necessary) the number of ks. In the end, the algorithm willalways return the right number of centroids.

When and How to Use Artificial Intelligence Chapter 7
[ 146 ]
: Lloyd's algorithm was described in the previouschapter. In brief, each data points goes to the closest centroid and becomes partof that cluster. The centroids are recalculated and the process continues until thedata points stabilize. This parameter limits the number of iterations.
: Early stopping occurs when a local minimum is reached. Thealgorithm can reach stability although the optimizing process remainsincomplete. The tolerance factor decides whether the variance is acceptable ornot.
: The number of trials in a local computationmeasure with loss function.
: The k-means clustering algorithm has a loss functionand evaluation metrics. As such, weights are updated as in other machinelearning algorithms. Weight decay is just like when you are on a highway andhave to get off at an exit. You must slow down or overshoot your exit goal.Weight decay reduces the values of weights exponentially has the loss functionoptimizes the clusters. At half-time, the weight will reach half of their value. Youcan choose not to trigger weight decay off by setting this parameter to .
: The number of episodes the algorithm will optimize the data points.: ["msd"] or ["ssd"] methods can be used as evaluation metrics. In
any case, distance measurement remains a key factor in k-means optimizingalgorithms.
Running a jobRunning starts by clicking on Create training job:
After a few minutes or hours, depending on the volume of data provided or the complexityof the machine learning algorithm chosen, AWS SageMaker provides the status of thetraining session, as shown in the following screenshot.
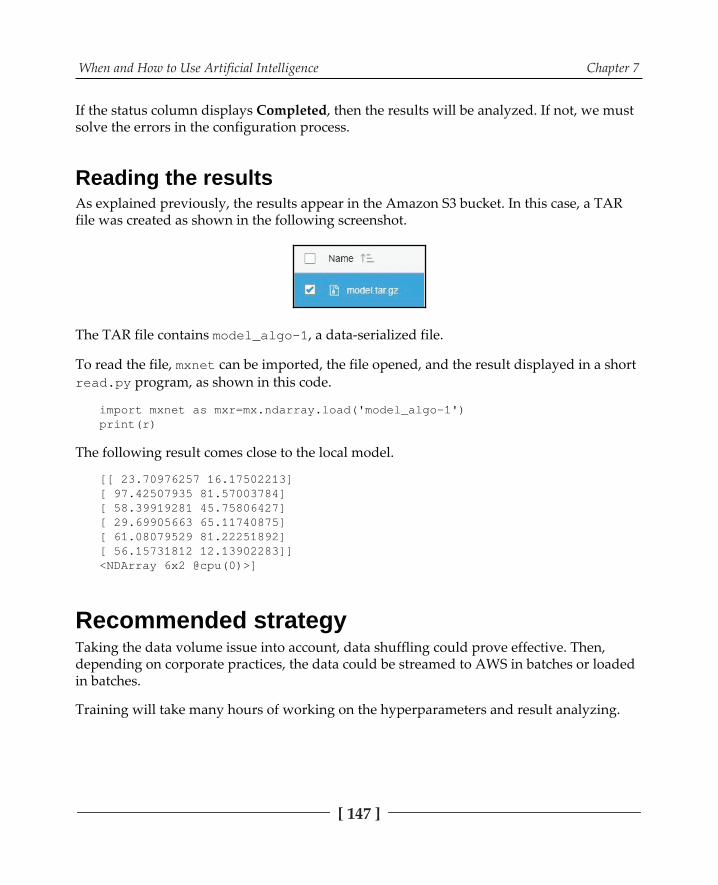
When and How to Use Artificial Intelligence Chapter 7
[ 147 ]
If the status column displays Completed, then the results will be analyzed. If not, we mustsolve the errors in the configuration process.
Reading the resultsAs explained previously, the results appear in the Amazon S3 bucket. In this case, a TARfile was created as shown in the following screenshot.
The TAR file contains , a data-serialized file.
To read the file, can be imported, the file opened, and the result displayed in a short program, as shown in this code.
The following result comes close to the local model.
Recommended strategyTaking the data volume issue into account, data shuffling could prove effective. Then,depending on corporate practices, the data could be streamed to AWS in batches or loadedin batches.
Training will take many hours of working on the hyperparameters and result analyzing.

When and How to Use Artificial Intelligence Chapter 7
[ 148 ]
SummaryIn any machine learning project, we should start by proving that classical programs usingSQL queries will not suffice. Then, a baseline or prototype using a sample should provethat the model will work.
Using a cloud platform such as AWS SageMaker with S3 will save corporate investmentresources in order to focus on the training job. This proves once again that the future ofartificial intelligence experts relies upon their ability to imagine solutions and not to get lostin programming.
No matter what happens, the basic steps will always remain the same, which includeproving that artificial intelligence is necessary, building a prototype model, datasetmanagement, and hyperparameter and job optimization.
Amazon, Google, IBM, Microsoft, and others will be offering more platforms, frameworks,and resources for machine learning. These platforms will constantly evolve and change. Asthese giants innovate, programming will become less and less necessary so that allcompanies, small or large, can access the AI cloud platforms. Programming AI will remainfascinating as well as standard non-AI development. However, nothing will stop cloudready-to-use platforms from expanding.
These platforms are the cutting edge of artificial intelligence and will lead you to thefascinating frontier of present knowledge. You can cross the border into the wild anddiscover new ways of solving hard problems. A cloud platform has limits that you canpush much further, as we will discover in the next chapter.
QuestionsThe questions will focus on the hyperparameters.
The number of k clusters is not that important. (Yes | No)1.Mini-batches and batches contain the same amount of data. (Yes | No)2.K-means can run without mini-batches. (Yes | No)3.Must centroids be totally optimized for result acceptance? (Yes | No)4.It does not take long to optimize hyperparameters. (Yes | No)5.It sometimes takes weeks to train a large dataset. (Yes | No)6.AWS SageMaker has a k-means algorithm only. (Yes | No)7.

When and How to Use Artificial Intelligence Chapter 7
[ 149 ]
Further readingFurther information on Amazon Web Services, Sagemaker, and k-meansclustering can be found here:
Further information on k-means clustering can be found here:
Further information on MXNET can be found here:

88Revolutions Designed for Some
Corporations and DisruptiveInnovations for Small to Large
CompaniesContrary to media hype, artificial intelligence has just begun innovating human processes.A huge amount of work remains to be done. To achieve progress, everybody must getinvolved, as shown in this chapter. Even if Google, Amazon, Microsoft, IBM, and othersoffer a solution, it does not mean it cannot be improved by third parties as add-ons toexisting solutions or new standalone products. After all, once Ford invented the Model Tover a hundred years ago, it did not mean it was no use inventing other better cars. On thecontrary, look around you!
This chapter first explains the differences between inventions, innovations, disruption,high-priced products, revolutions, and how to innovate in AI no matter what.
Then Google Translate will be explored to illustrate innovation concepts using naturallanguage processing. This is a prerequisite to building not only translation solutions butalso chatbots (see , Cognitive NLP Chatbots, and , Improve theEmotional Intelligence Deficiencies of Chatbots).
Google Translate entered the market in 2006 and was enhanced by neural networks in 2016,but still it often produces bad answers. Is that good news or bad news? Let's find out byexploring Google's API in a Python program, adding a k-nearest neighbor algorithm andmeasuring the results statistically.
Revolutions Designed for Some Corporations and Disruptive Innovations forSmall to Large Companies Chapter 8
[ 151 ]
The following topics will be covered in this chapter:
The difference between inventions and innovationsThe difference between standard sales and disruptive marketingGoogle Translate API implementation in PythonIntroducing linguistics (prerequisites to building chatbots)Natural language processing prerequisites (for translations and chatbots)k-nearest neighbor (KNN) algorithm
Technical requirementsYou will need Python 3.6x 64-bit from .
You will also need these libraries:
And you will need programs from GitHub :
(download in the same directory) (download in the same directory)
Check out the following video to see the code in action:
Is AI disruptive?The word "disruptive" is more often than not associated with artificial intelligence. Mediahype tells us that AI robots will soon have replaced humans around the world. Althoughmedia hype made it much easier to obtain AI budgets, we need to know where we stand ifwe want to implement an AI solution. If we want to innovate, we need to find the cuttingedge and build new ideas from there.

Revolutions Designed for Some Corporations and Disruptive Innovations forSmall to Large Companies Chapter 8
[ 152 ]
Why not just plunge into the tools and see what happens? Is that a good idea or a riskyone? Unlike corporations with huge budgets, a single human has limited resources. If youspend time learning in the wrong direction, it will take months to gather enough experiencein another better direction to reach your goal. For example, suppose you have troubleclassifying large amounts of data (see the example in , When and How to UseArtificial Intelligence); you spend months on a project on a server in your company and fail.It could cost you your job. If you find the right cloud platform as shown in ,When and How to Use Artificial Intelligence and learn the key concepts, your project can takeoff in a few days.
Before diving into a project, find out the best way to start it.
What is new and what isn't in AIMost AI theory and tools have been around for decades, if not centuries. We often tend tothink that since something appears new to us, it has just been invented or discovered. This mistakecan prove fatal in many projects. If you know that a theory or function has been around fordecades or centuries, you can do some deep research and use solutions found 100+ yearsago to solve your present problems.
Finding out what is new and what is not will make a major difference in your personal orprofessional AI projects.
AI is based on mathematical theories that are not newArtificial intelligence theory presently relies heavily on applied mathematics. In ,Become an Adaptive Thinker, the Markov Decision Process (MDP) was described. Google Brain has proudly and rightly so won some competitions using the MDP combined withneural networks.
However, Andrey Andreyevich Markov was a Russian mathematician born in 1856 whoinvented the MDP among other functions. Richard Bellman published an enhanced versionof the Markov Decision Process in 1957.
Bellman also coined the expression "curse of dimensionality" and published books onmathematical tools widely used today in AI. It is now well known that dimensionalityreduction can be performed to avoid facing thousands of dimensions (features, forexample) in an algorithm.

Revolutions Designed for Some Corporations and Disruptive Innovations forSmall to Large Companies Chapter 8
[ 153 ]
The logistic function (see , Think like a Machine) can be traced back to PierreFran ois Verhulst (1844-1845), a Belgian mathematician. The logistic function uses e, thenatural logarithm base, which is also named after Euler's number. Leonhard Euler(1707-1783), a Swiss mathematician who worked on this natural logarithm.
Thomas Bayes (1701-1761) invented the theorem that bears his name: Bayes' Theorem. It iswidely used in artificial intelligence.
In fact, almost all of the applied mathematics in artificial intelligence, machine learning, anddeep learning can be traced from 17th-century to 20th-century mathematicians.
We must look elsewhere for 21st century AI innovations.
Neural networks are not newNeural networks as explained in , Become an Unconventional Innovator, date backto the 1940s and 1950s. Even convolutional neural networks (CNN) date back to the 20thcentury. Yann LeCun, a French computer scientist, laid down the basics of a CNN (see
, Getting Your Neurons to Work) in the 1980s; he successfully applied them as weknow them today in the 1990s.
We must again look elsewhere for 21st AI innovations.
Cloud server power, data volumes, and web sharing ofthe early 21st century started to make AI disruptive The first sign of AI's innovative disruption appeared between 2000 and 2010. Before then,the internet existed, and servers existed. But starting from around 2005, cloud servers weremade widely available. With that kind of computer power, developers around the worldcould try using the highly greedy resources required by machine learning and deeplearning.
At the same moment, as powerful servers became available, the internetprovided the largest library of knowledge in the history of mankind.
On top of that, social networking became widely used. Sharing discoveries and source codebecame commonplace. The World Wide Web (WWW) encouraged open source software,boosting local research and development.

Revolutions Designed for Some Corporations and Disruptive Innovations forSmall to Large Companies Chapter 8
[ 154 ]
The era of artificial intelligence became possible for local experts starting from the middleof the first decade of the 21st century.
What makes artificial appear as an innovation today is the conjunction ofmore powerful machines and the availability of intellectual resources.
Public awareness contributed to making AI disruptive Public awareness of artificial intelligence remained dim for several years after the cloudarchitectural revolution occurred from around 1995 to 2005.
Artificial intelligence hit us hard by around 2015 when we all woke up realizing that AIcould massively replace humans and create job displacement at levels never seen in humanhistory.
Worse, we realized that machines could beat us in fields we took pride in, such as chess( , Apply Machine Thinking to a Human Problem), the game of Go, other videogames, manufacturing jobs with robots, office jobs with bots, and more fields that appearevery day.
For the first time in human history, the human species can be surpassed by a new species:bots. As developers, we thought we were safe until Google presented AutoML, a solutionthat could create machine learning solutions better than humans. At the same time, ready-to-use machine learning platforms have spread that can reduce and even replace AIsoftware development.
Artificial intelligence forces awe and fear upon us. How far will machines go? Will wesimply experience job displacement or will it go as far as species replacement?
Could this be an opportunity for many? Who knows? In any case, this chapter providessolutions to constantly innovating and being useful as humans.
Inventions versus innovationsSome artificial intelligence programs, especially deep learning algorithms, remainedinventions and not innovations until they were widely used by Google and other majorplayers.

Revolutions Designed for Some Corporations and Disruptive Innovations forSmall to Large Companies Chapter 8
[ 155 ]
If you have invented a better algorithm than Google for some applications, it remains aninvention until it actually changes something in your corporation or on the Web.
Suppose you find a quicker way to recognize an image through an optimized number ofneurons and a new activation function. If nobody uses it, then that invention remains apersonal theoretical fining no matter how good it appears. When others begin to use thisnew algorithm, then it becomes an innovation.
An invention becomes an innovation only when it changes a processwithin a company or by a sufficient number of private users.
Revolutionary versus disruptive solutionsSuppose the new image recognition algorithm described just now becomes an innovation ina significant corporation. This new algorithm has gone from being an invention (not really used)to an innovation (a solution making a difference).
The corporation now widely uses the algorithm. Every subsidiary has access to it. For thiscorporation, the new image recognition algorithm has attained revolutionary status.Corporate sales have gone up, and profit margins have as well.
But maybe this corporation does not dominate the market and nobody has followed itsexample. The innovation remains revolutionary but has not become disruptive.
Then the person who created the algorithm decides to leave the company and start abusiness with the algorithm. It appears on GitHub as an open source program. Everybodywants it and the number of downloads increases daily until 1,000,000+ users have begun toimplement it. Some very low priced add-ons are provided on the company website. Withina year, it becomes the new way of recognizing images. All companies must follow suit orstay behind. The solution has become disruptive because it has globally changed its market.
Where to start?We have finished reading about such fantastic innovations and have tested mind-blowingAI solutions, knowing that all of this can be discouraging. Where to start? First of all, evenif a solution exists, it has limits and can be improved, customized, packaged, and sold. Thismeans that if there is a limit, there is a market.

Revolutions Designed for Some Corporations and Disruptive Innovations forSmall to Large Companies Chapter 8
[ 156 ]
Never criticize the flaws you find in an AI solution. They are gold mines!
Where there is a limit, there lies an opportunity.
Let's go to the cutting edge and then over the border into unchartered territory usingGoogle Translate to illustrate this.
Discover a world of opportunities withGoogle TranslateStarting out with Google Translate to explore natural language processing (NLP) is a goodway to prepare for chatbots. Any disruptive web-based solution must be able to run in atleast a few languages.
Google provides many resources to use, explore, or improve Google Translate. Getting aPython code to run and then assess the quality of the results will prove vital beforeimplementing it for crucial translations in a company.
Getting startedGo the Google's developers API Client Libary page:
. On that page, you will see libraries for many languages: Java, PHP,.NET, JavaScript, Objective-C, Dart, Ruby,Node.js, Go, and probably more to come.
This does not change a thing about reaching the limits of Google Translate and entering theadventurous frontier of innovating the linguistic dimension of AI described in this chapter.
Then click on the GET STARTED option under Python. Follow the instructions to sign up,create a project in the Google API Console, and install the library.
To install the library, use (preferred):

Revolutions Designed for Some Corporations and Disruptive Innovations forSmall to Large Companies Chapter 8
[ 157 ]
If you encounter problems doing this part or do not wish to installanything yet, this chapter is self-contained. The source code is describedin the chapter.
You are now ready to go ahead, whether you installed the tools or not.
The programThe goal of this section is to implement Google Translate functionality. You can follow thesteps and get it working or simply read the chapter to get the idea.
The headerThe standard Google header provided by Google was enough for the program I wrote, asshown in the following code.
Considering the many languages Google manages, special characters are a major problemto handle. Many forums and example programs on the Web struggle with the header when using Google Translate. Many solutions are suggested, such as the followingsource code header.
Then, when Google translate returns the result, more problems occur and many developtheir own functions. They work fine but I was looking for a straightforward one-linesolution. The goal here was not to have many lines of code but focus on the limit of GoogleTranslate to discover the cutting-edge interpreting languages in AI.
So, I did not use the header but implemented this HTML parser.
When confronted with a result, the following one-line HTML parser code did the job.
It works well because, in fact, Google will return an HTML string or a text string dependingon what option you implement. This means that the HTML parser can do the job.

Revolutions Designed for Some Corporations and Disruptive Innovations forSmall to Large Companies Chapter 8
[ 158 ]
Implementing Google's translation service Google's translation service needs at least three values to return a result:
: This is the API key obtained at the end of the "getting started"process described previously
: In my code, I used : for English, for
French, and so on
More options are available as described in the following sections.
With this in mind, the translation function will work as follows:
In the program, and will be sent to the function toobtain a parsed result:
To sum up the program, let's translate Google Translate into French, which contains accentsparsed by the HTML parser:

Revolutions Designed for Some Corporations and Disruptive Innovations forSmall to Large Companies Chapter 8
[ 159 ]
works fine. The result will come out with the correct answer andthe parsed accent:
At this point, everyone is happy in our corporation, named Example-Corporation:
The developer has the starting point for whatever solution is requestedThe project manager has reached the goal set by the companyThe manager has a ready-to-use AI solution to translate commercial offers andcontracts into many languages in many countries
Google Translate has satisfied everyone. It is disruptive, has changed the world, and canreplace translators in many corporations for all corporate needs.
Fantastic!
In fact, we could end the chapter here, go to our favorite social network, and build somehype on our translation project!
Happy ending?
Well, not yet! The CEO, who happens to be the main shareholder of Example-Corporation,wants to make sure that everything really works before firing the 20 freelance translatorsworking in the corporation.
The CEO phones a linguist from Example_University and asks for some expert advice. Thenext day, professor Ustiling comes in, gray-haired and smiling, "You can call me Usty. So let'sget to work!"
Google Translate from a linguist's perspectiveUsty is fascinated by Google Translate as presented previously. The possibilities seemendless.
Usty applies a linguist's approach to the program.
By the time this book is published, maybe Google will have improved theexamples in this chapter. But don't worry; in this case, you will quicklyfind hundreds of other examples that are incorrect. The journey has justbegun!
Revolutions Designed for Some Corporations and Disruptive Innovations forSmall to Large Companies Chapter 8
[ 160 ]
Playing with the toolThey open the source code and Usty adds some paragraphs. This source code is saved as
. Usty has spent quite some time onautomatic translating as a professor.
Usty, like many linguists, wants to play with the program first to get a feel of the program.The first two examples go well from English to French. Then Usty complicates the thirdexample, as shown in the following code.
The first two examples look fine in French although the second translation is a bit strange.But in the third test, the expression means looking for trouble inEnglish not looking for lice as translated into French.
Usty has a worried look on his face. The corporate project teams ask him what is wrong.
Usty starts an assessment of Google Translate.
Linguistic assessment of Google TranslateProfessor Usty both wants to assess Google Translate correctly and likes limits.
Limits are the boundaries researchers crave for! We are frontiersmen!
Usty starts an expert assessment that will lead the project team to the frontier and beyond.
Lexical fields describe word fields. A word only acquires its full meanings in a context. Thiscontext often goes beyond a few other words or even a sentence.

Revolutions Designed for Some Corporations and Disruptive Innovations forSmall to Large Companies Chapter 8
[ 161 ]
Chercher des poux translated as such means look for lice. But in French, it can mean looking fortrouble or literally looking for lice. The result Google Translate comes up with contains threebasic problems.
Problem 1, the lexical field: There is no way of knowing whether this means really lookingfor lice or looking for trouble without a context.
Problem 2, metaphors or idiomatic expressions: Suppose you have to translate this isgiving you a headache. There is no way of knowing whether it is a physical problem or ametaphor meaning this is driving you crazy. These two idiomatic expressions happen tohave the same metaphors when translated into French. But the lice metaphor in Frenchmeans nothing in English.
Problem 3: chercher is an infinitive in French and the result should have been looking for licein English. But chercher des limites est int ressant provides the right answer, which is lookingfor:
The answer is correct because is splits the sentence into two, making it easier for GoogleTranslate to identify chercher as the first part of a sentence, thus using looking in English.
Professor Usty looks excited by these limits but this worries the project team. Will thisproject be shelved by the CEO or not?
Jargon arises when fields specialize. In AI, hidden neurons are jargon. This expressionmeans nothing for a lawyer for example. A lawyer may think you have hidden intelligenceon the subject somewhere or are hiding money in a cryptocurrency called hidden neuron.
In the same way, if somebody asks an artificial intelligence expert to explain how to file amotion, that would prove difficult.
In a legal corporate environment, beyond using Google Translate as a dictionary,translating sentences might be risky if only a random number of results prove to be correct.

Revolutions Designed for Some Corporations and Disruptive Innovations forSmall to Large Companies Chapter 8
[ 162 ]
Usty likes challenges. He goes online and takes a sentence from a standard description ofFrench commercial law:
The French sentence means that a company such as a SAS (a type of company like inc., ltd.,and so on). In English, SAS means Special Air Forces. Then comes the grammar that doesnot sound right.
A translator would write better English and also specify what a SAS is:
"A SAS (a type of company in France) must follow the recommendations that covercommercial practices."
Translating often means interpreting, not simply translating words.
In this case, a legal translator may interpret the text in a contract and go as far as writing:
The COMPANY must respect the legal obligation to treat all customers fairly.
The legal translator will suggest that COMPANY be defined in the contract so as to avoidconfusions such as the one Google Translate just made.
At this point, the project team is ready to give up. They are totally discouraged!
When reading about natural language processing, chatbots, andtranslation, everything seems easy. However, really working on GoogleTranslate can easily turn into a nightmare!
How can they go back to their CEO with Usty and explain that Google Translate provides arandom quality of results?

Revolutions Designed for Some Corporations and Disruptive Innovations forSmall to Large Companies Chapter 8
[ 163 ]
In fact, Google Translate is:
Sometimes correctSometimes wrongSometimes partly correct and partly wrong
Usty has much more to say but the team has had enough!
However, Usty will not give up and will want to explain a global fundamental problem.Then Usty offers to provide solutions. Google Translate is worth exploring and improvingbecause of the available online datasets provided through the API.
He tries to translate the following:
Google Translate provides the output in French:
In French, as in English, it is better just to say project team and not use of to say the team of theproject. In French quipe projet ( quipe = team used before project).
How can you check a translation if you do not know the language?
Be careful. If Google Translate provides randomly correct answers inanother language, then you have no way of knowing whether thetranslation is reliable or not.
You may even send the opposite of what you mean to somebody important for you. Youmay misunderstand a sentence you are trying to understand.
In a travel company, you write an email stating that the coach stopped and people werecomplaining:
Google Translate, for lexical field reasons, got it wrong and translated coach as a trainer(sports) in French, which would mean nothing in this context:

Revolutions Designed for Some Corporations and Disruptive Innovations forSmall to Large Companies Chapter 8
[ 164 ]
Even in this situation, if you do not speak French, you have to trust professor Usty on thisissue.
Now the situation gets worse. To help Google Translate, let's add some context.
The answer is worse. Google Translate translates broke down correctly with the Frenchexpression en panne but still translates coach as entraineur (trainer) in French, meaning thetrainer broke down, not the coach (bus).
Google will no doubt improve the program as it has done since 2006. Maybe this will beachieved even by the time you read this book or with some workarounds as shown in thenext section. But a human translator will find hundreds of expressions Google Translatecannot deal with yet.
Understanding a sentence in your native language can prove difficultwhen a word or an expression has several meanings. Adding a translationfunction to the issue makes it even more difficult to provide a reliableanswer.
And that is where we reach the frontier, just beyond the cutting edge.
As a researcher, Usty seems overexcited in contrast to the look of despair on the projectteam's faces. But soon the project team will share the excitement of discovering new AIlands.
AI as a new frontierGoogle has a great but very limited translation program. Use the flaws to innovate! AIresearch and development has just scratched the surface of the innovations to come.
First, implement an AI solution. Then use it for what it is. But don't acceptits limits. Don't be negative about it. Innovate! Imagine ideas or listen toother ideas you like, and build solutions in a team! Google might evenpublish your solutions!

Revolutions Designed for Some Corporations and Disruptive Innovations forSmall to Large Companies Chapter 8
[ 165 ]
Usty's excitement is contagious. The project team would like to build a prototype program.Usty suggests forgetting about generalizing the solution for the moment and just focusingon customizing Google Translation for their corporation. Usty decides to dive directly withthe team into a prototype Python program: .
Lexical field and polysemyA lexical field contains words that form sets and subsets. They differ from one language toanother. A language itself forms a set and contain subsets of lexical fields.
Colder countries have more words describing water in its frozen form than tropicalcountries where snow hardly ever falls. A lexical field of cold could be a subset of C:
C = {ice, hail, snowflakes, snowman, slushy, powder, flake, snowball, blizzard, melting, crunch....n}
The curse of dimensionality, well known in artificial intelligence, applies here. Wordscontain an incredible number of dimensions and definitions. To translate certainexpressions, Google Translate suppresses their dimension and reduces them.
Google Translate often uses n-grams to translate. An n-gram is a fixed-length sequence of tokens. Tokens can be a word, a character or evennumerical representations of words and characters.
The probability that token n means something is calculated given the preceding/followingn - x or n + x tokens. x is a variable depending on the algorithm applied.
For example, slushy has a special meaning in the expression slushy snow. The snow ispartly melting, it's watery and making slush sound when we walk through it. Melting isonly a component of the meaning of slush.
Google Translate, at this point, will only translate slushy snow in French by:
neige (snow) fondante (melting)
Google Translate will also translate melting snow by:
neige (snow) fondante (melting)

Revolutions Designed for Some Corporations and Disruptive Innovations forSmall to Large Companies Chapter 8
[ 166 ]
To translate slushy into French, you have to use a phrase. To find that phrase, you needsome imagination or have some parsed (searched) novels or other higher levels of speechrepresentations. That takes time and resources. It will most probably take years beforeGoogle Translate reaches an acceptable native level in all the languages publicized.
Another dimension to take into account is polysemy.
Polysemy means a word can have several very different meanings in alanguage. The equivalent word in another language may simply have onemeaning or other, very different meanings.
"Go + over" in English can mean go over a bridge or go over some notes. At this point(hopefully, it will improve by the time you read this book), it is translated in both cases inFrench by aller sur. This means to go on (not over), which is incorrect in both cases.Prepositions in English constitute a field in themselves, generating many meanings with thesame word. The verb go can have a wide list of meanings: go up (upstairs), go up (stockmarket), go down (downstairs), go down (fall apart), and many more possibilities.
Linguistics involves many more concepts and techniques than just statistics. More will bedescribed in , Cognitive NLP Chatbots, and , Improve the EmotionalIntelligence Deficiencies of Chatbots.
The prototype customized program starts with defining , a small dataset to translate thatwill be more than enough to get things going:
These sentences will be automatically translated by Google Translate.

Revolutions Designed for Some Corporations and Disruptive Innovations forSmall to Large Companies Chapter 8
[ 167 ]
, as implemented in the following code, defines some keywords statistically related tothe sentences; it applies the n-gram probability theory described previously.
Each line fits the corresponding line. As explained, this only remains a probability andmay not be correct.
We are not seeking perfection at this point but an improvement.
Exploring the frontier the programNow it's time to add some customized novelties. The use of the vectors in this section willbe explained in the next section, again through the source code that uses them.
A trigger vector will force the program to try an alternate method to translate amistranslated sentence. When the sentence has been identified and if its value in is equalto 1, it triggers a deeper translation function as implemented here:
and are flags. Each value represents a line in .
Note for developers: To use this method correctly, all the values of thisvector should be set to 1. That will automatically use several alternatemethods to translate Google Translate errors. A lot of work remains to bedone here.
The case study is a transportation business. A transport phrase dictionary should be built.In this case, a general dictionary has been implemented with oneexpression, as shown in the following array.

Revolutions Designed for Some Corporations and Disruptive Innovations forSmall to Large Companies Chapter 8
[ 168 ]
What remains to be done to fill up this dictionary ?
Scan all the documents of the company emails, letters, contracts, and everyform of written documents.Store the words and sentences.Run an embedding Word2Vector program (see , Improve the EmotionalIntelligence Deficiencies of Chatbots); it will find correlations between words. Addan expression correlation program to this search.Train the team to use the program to improve it by providing feedback (the rightanswer) in a learning interface when the system returns incorrect answers.
What Google Translate cannot do on a global scale, you can implement ata local scale to greatly improve the system.
k-nearest neighbor algorithmNo matter how you address a linguistic problem, it will always boil down to the word"context". When somebody does not understand somebody else, they say, you took my wordsout of their context or that is not what I meant; let me explain...
In , Improve the Emotional Intelligence Deficiencies of Chatbots, theembedding Word2Vector method will be explored. In any case,"proximity" and "nearness" remain the key concepts.
As explained before, in many cases, you cannot translate a word or expression without alexical field. The difficulty remains proportional to the polysemy property as the programwill show.
Using the k-nearest neighbor (KNN) algorithm as a classification method can proveextremely useful. In fact, any language interpretation (translation or chatbot) will have touse a context-orientated algorithm.
By finding the words closest (neighbors) to each other, KNN will create the lexical fieldsrequired to interpret a language. Even better, when provided with the proper datasets, itwill solve the polysemy problem as shown in the upcoming sections.

Revolutions Designed for Some Corporations and Disruptive Innovations forSmall to Large Companies Chapter 8
[ 169 ]
Generally, a word requires a context to mean something. Looking for "neighbors" close byprovides an efficient way to determine where the word belongs.
KNN is supervised because it uses the labels of the data provided to train its algorithm.KNN, in this case, is used for classification purposes. For a given point p, KNN willcalculate the distances to all other points. Then k represents the k-nearest neighbors to takeinto account.
Let's clear this up through an example. In English, the word "coach" can mean a trainer on afootball field, a bus, or a railroad passenger car. Since the prototype is for a transportationcompany, "coach" will mostly be a bus that should not be confused with a trainer:
Step 1: Parsing (examining in a detailed manner) texts with "coach" as a bus and"coach" as a trainer. Thus the program is searching for three target words: trainer,bus, and coach.Step 2: Finding some words that appear close to the target words we aresearching. As recommended do the following:
Parse all the company documents you can use with a standardprogramUse a Python function such as
In this case, the shown in the following output excerpt provided with the sourcecode contains the result of such a parsing function:
The program parsed emails, documents, and contracts. Each line represents the result ofparsing of one document. The numbers represent the occurrences (number of times theword was present). The numbers have been "squashed" (divided again and again) toremain small and manageable.

Revolutions Designed for Some Corporations and Disruptive Innovations forSmall to Large Companies Chapter 8
[ 170 ]
Progressively, the words that came out with "trainer" were "shouted" more than "stopped."For a bus, "broke" (broken down as in breaking down), "road" and "stopped" appearedmore than "shout."
"Coach" appeared on an average of "shouted", "stopped", "road" and broke because it couldbe either a trainer or a bus, hence the problem we face when translating this word. Thepolysemy (several meanings) of "coach" can lead to poor translations.
The KNN algorithm loaded the file that contains the data to be trained and findsthe following result:
The program determined the following:
The verb "broke" in blue has a better chance of applying to a bus (x axis value >6)than to a trainer (x axis value <4). However, "coach" remains above trainer andbelow "bus" because it can be both.The word "road" follows the same logic as the blue chart.The verb "stopped" can apply to a trainer and more to a bus. "Coach" remainsundecided again.

Revolutions Designed for Some Corporations and Disruptive Innovations forSmall to Large Companies Chapter 8
[ 171 ]
The verb "shouted" applies clearly to a trainer more than a bus. "Coach" remainsundecided again.
Note that the coordinates of each point in these charts are as follows:
y axis: bus = 1, coach=2, trainer=3x axis: The value represents the "squashed" occurrence (the number of times theword appeared) values.
This is the result of the search of those words in many sources.
When a new point, a data point named Pn, is introduced in the system, it will find itsnearest neighbor(s) depending on the value of k.
The KNN algorithm will calculate the Euclidean distance between Pn and all the otherpoints from P1 to Pn-1 using the Euclidean distance formula. The k in KNN represents thenumber of "nearest neighbors" the calculation will take into account for classificationpurposes. The Euclidean distance (d1) between two given points, for example,between Pn(x1,y1) and P1(x2,y2), is:
Considering the number of distances to calculate, a function such as the one provided bysklearn.neighbors proves necessary.
The program imports the file described before, prints a few lines, and prepares thelabels in the right arrays in their respective x axis and y axis, as shown in this source codeexample.

Revolutions Designed for Some Corporations and Disruptive Innovations forSmall to Large Companies Chapter 8
[ 172 ]
Then the model is trained as shown in the following code:
Once the model is trained, a prediction is requested and is provided by the following code.
This is the result displayed:
The initial data is plotted for visualization purposes, as implemented in the following code.

Revolutions Designed for Some Corporations and Disruptive Innovations forSmall to Large Companies Chapter 8
[ 173 ]
A compressed version of this program has been introduced in as shown here:
The description is as follows:
is the name of the file to read because it can be any file is the vector that needs to be predicted
In future, in the to do list, should replace and should replace so that the function can predict the values of any vector
The KNN classifier is called and the prediction returned
This program requires more time and focus because of the concepts of linguistics involved.The best way to grasp the algorithm is to run it in order.
Google Translate offers two translation methods, as shown in the following code:
These are explained as follows:
Phrase-Based Machine Translation (PBMT): This translates the whole sequenceof words. The phrase or rather phraseme (multi-word expression) is not alwaysquite a sentence.

Revolutions Designed for Some Corporations and Disruptive Innovations forSmall to Large Companies Chapter 8
[ 174 ]
Neural Machine Translation (NMT): This uses neural networks such asRecurrent Neural Network (RNN), which will be detailed later in this book. Thismethod goes beyond the phraseme and takes the whole sentence into account.On the dataset presented in this chapter, this neural network method providesslightly better results.
Both methods, though interesting, still require the type of additional algorithms, amongothers, presented in this chapter. As you have seen so far, the subject is extremely complexif you take the lexical fields and structures of the many languages on our planet intoaccount.
Step 1: Translating the X dataset line by line from English into French
The following code calls the translation function:
The code is explained here:
is the line number in . is the line in .
is the target language, in this case, (French). is the method (PBT or NMT) as described previously. In this case, is
applied.Then the Google Translate function is called as described earlier in this chapter.The result is stored in the variable.
Step 2: Back translation
How can somebody know the correctness of a translation from language L1 to language L2if L1 is the person's native language and L2 is a language the person does not understand atall?
This is one of the reasons, among others, that translators use back translation to checktranslations:
Translation = Initial translation from L1 to L2
Back translation = Translation back from L2 to L1

Revolutions Designed for Some Corporations and Disruptive Innovations forSmall to Large Companies Chapter 8
[ 175 ]
If the initial text is not obtained, then there is probably a problem. In this case, the length ofthe initial sentence L1 can be compared to the length of the same sentence translated backto L1. Back translation is called by the following code:
Length comparison can be used to improve the algorithm :
Length of the initial n-gram = Length of back translation
If it's equal, then the translation may be correct. If not, it could be incorrect. More methodsmust be applied during each translation. In this case, the source (initial sentence) iscompared to the back translation in the following code:
is a true counter is a false counter
The first line of runs as follows:
Eating fatty food is back translated as eating fat food, which is slightly wrong. Something maybe wrong.
The French sentence sounds wrong too. Fatty food cannot be translated as such. Usually,the common sentence is manger gras meaning eating (manger) fatty (gras) which cannot betranslated into English as such.
X[2] an X[3] come back as false as well.

Revolutions Designed for Some Corporations and Disruptive Innovations forSmall to Large Companies Chapter 8
[ 176 ]
At example X[4], I programmed a phrase-based translation using a trigger in the falsecondition in the following code.
Since I did not write a complete application for this book but just some examples that canbe extended in the future, I used as a trigger. If , then the
function is activated.
Step 3: Deeper translation with phrase-based translations
has two arguments:
: The initial sentence to translate: The target sentence
In this case, the problem to solve is an idiomatic expression that exists in English but doesnot exist in French:
To have a chip on the shoulder means to have an issue with something or somebody. Itexpresses some form of tension.
Google translated chip by assuming computer chip, or puce in French, which means bothcomputer chip and flea. The translation is meaningless.
Chip enters three categories and should be labeled as such:
Idiomatic expressionJargonPolysemy

Revolutions Designed for Some Corporations and Disruptive Innovations forSmall to Large Companies Chapter 8
[ 177 ]
At this point, the following function I created simulates the phrase-based solution toimplement deeper translations.
The looks for the translated sentence containing chip in thefollowing array (list, vector, or whatever is necessary).
The final result comes out with a translation, back translation, term search, and phrasetranslation. The following is the result produced, with comments added here before eachline:
The question is, where did the come from?
comes from , a list of keywords that should be in the translation. has beenentered manually but it should be a list of possibilities resulting from a KNN search on thewords in the sentence viewed as classes. This means that the sentence to be translatedshould have several levels of meaning, not just the literal one that is being calculated.
The actual true/false conditions contain the following deeper translation-level words tocheck:
Revolutions Designed for Some Corporations and Disruptive Innovations forSmall to Large Companies Chapter 8
[ 178 ]
In the present state of the prototype, only example four activates a phrase-basedtranslation. Otherwise, true is accepted. If false is the case, the deeper translation is onlyactivated for two cases in this sample code. The flag is in ( or ).
is called for either the phrase-based translation (describedpreviously) or the KNN routine, which is activated if the phrase-based translation did notwork.
If the translation did not work, an n-gram is prepared for the KNN algorithm, as shown inthe following code:
contains the keywords (n-grams) described in the preceding KNN algorithm for thetransport lexical field, as shown in the following code:
The source (sentence to translate) is parsed for each n-gram. If the n-gram is found, thepolysemy vector is activated with a nine value for that n-gram. The initial values are set to
, as shown in the following code.
The variable is activated, which informs the program that must be read for thiscase. An unlimited number of KNN references should be automatically created asdescribed previously in the KNN section.
In this case, only is activated. But after several months of working on the project for thecompany to customize their local needs, many other files should be created.

Revolutions Designed for Some Corporations and Disruptive Innovations forSmall to Large Companies Chapter 8
[ 179 ]
In this case, when is activated, it fills out the variables as follows.
indicates the KNN file to open is the first label of the vector and is the last label of the vector
is the prediction we expect
Now a condensed version of the KNN algorithm is called as described before for is called in the following code:
The example, in this case, is the polysemy feature of a coach as explained in the KNNsection. The output will be produced as follows:
The translation is false because Google Translate returns trainer instead of bus.
The term bus is identical in English and French.
The KNN routine returned bus in English as the correct word to use when broke down andstopped were found as shown in the KNN section.
The goal of the rest of the source code in the function is toreplace coach the word increasing the polysemy feature to translate by a better word(limited polysemy) to translate: .

Revolutions Designed for Some Corporations and Disruptive Innovations forSmall to Large Companies Chapter 8
[ 180 ]
The variable is initialized by the KNN function in the following code:
The function replaces coach by bus found by the KNN algorithm in the English sentence andthen asks Google Translate to try again. The correct answer is returned.
Instead of trying to translate a word with too many meanings (polysemy),the function first replaces the word with a betterword (less polysemy). Better results will often be attained.
A frequentist error probability function is added to measure the performance, as shown inthe following code:
is the number of false answers returned by Google Translate is the number of sentences translated
gives a straightforward error (translation) probability,
The function is called when a translation is false, or , as implemented in the followingcode:

Revolutions Designed for Some Corporations and Disruptive Innovations forSmall to Large Companies Chapter 8
[ 181 ]
is the error (translation) probability ( ) before the function is called
is the after the function is called
At the end of the program, a summary is displayed, as shown in the following output:
A subjective acceptance of an approximate result has been added to increase thetrue probability.The error rate should decrease as the quality of the KNN knowledge baseincreases. In frequent probability theory, this means that a stabilized predictionrate should be reached.
The final error (translation) probability produced is interesting, as shown in the followingoutput:
Even with its NMT model, Google Translate is still struggling.
This provides great opportunities for AI linguists, as shown with some of the methodspresented to improve Google Translate at a local level that could even go further.

Revolutions Designed for Some Corporations and Disruptive Innovations forSmall to Large Companies Chapter 8
[ 182 ]
This experiment with Google Translate shows that Google has just scratched the surface ofreal-life translations that sound right to the native speakers that receive these translations. Itwould take a real company project to get this on track with a financial analysis of itsprofitability before consuming resources.
The disruptive revolutionary loopAs you now see, Google Translate, like all artificial intelligence solutions, has limits. Oncethis limit has been reached, you are at the cutting edge.
Cross the border into AI Frontierland; innovate on your own or with ateam.
If you work for a corporation, you can create a revolutionary customized solution forhundreds of users. It does not have to go public. It can remain a strong asset to yourcompany.
At some point or another, the revolutionary add-on will reach beyond the company andothers will use it. It will become disruptive.
Finally, others will reach the limit of your now-disruptive solution. They will then innovateand customize it in their corporation as a revolutionary solution. This is what I call thedisruptive revolutionary loop. It is challenging and exciting because it means that AIdevelopers will not all be replaced soon by AutoAI bots!
SummaryDesigning a solution does not mean it will be an invention, an innovation, revolutionary, ordisruptive. But that does not really matter. What a company earns with a solutionrepresents more than the novelty of what it sells as long as it is profitable. That is rulenumber #1. That said, without innovating in its market, that company will not survivethrough the years.
If a product requires quality for security reasons, it should remain in its invention state aslong as necessary. If a product can produce sales at the low end of the market before itstotal completion, then the company should sell it. The company will acquire a reputationfor innovation, get more money to invest, and take over the territory of its competitors.

Revolutions Designed for Some Corporations and Disruptive Innovations forSmall to Large Companies Chapter 8
[ 183 ]
Google Translate is a good example of disruptive marketing. As shown the theory, themodel and even the cloud architecture are over 10 years old. But each time one of thehundreds of millions of users stumbles across it, it creates more disruption by hooking theuser onto Google solutions. The user will come back again and again to view moreadvertisements, and everyone is happy!
Artificial intelligence has only begun. Google Translate has been around since 2006.However, the results still leave room for developers, linguists, and mathematicians toimprove upon. Google has added a neural network, Google NMT, to improve translationsby analyzing whole sentences. How long will it take to be really reliable? In the meantime,the next chapter will describe a CNN in more detail and provide ideas to help ourcommunity to move AI forward beyond the cutting edge into Frontierland. Before movingon to the next chapter, check your knowledge of some aspects of disruptive innovations.
QuestionsIt is better to wait until you have a top quality product before putting it on the1.market? (Yes | No)Considering the investment made, a new product should always be2.priced high to reach the top segment of the market. (Yes | No)Inventing a new solution will make it known in itself. (Yes | No)3.Artificial Intelligence can solve most problems without using standard non-4.learning algorithms. (Yes | No)Google Translate can translate all languages in a satisfactory way. (Yes | No)5.If you are not creative, it is no use trying to innovate. (Yes | No)6.If you are not a linguist, it is no use bothering with trying to improve Google7.Translate. (Yes | No)Translation is too complicated to understand. (Yes | No)8.Artificial intelligence has already reached its limits. (Yes | No)9.

Revolutions Designed for Some Corporations and Disruptive Innovations forSmall to Large Companies Chapter 8
[ 184 ]
Further readingThe Harvard Business Review on disruptive innovations can be found here:
Google Translate documentation can be found here:
Insights on English-French translations that can be extended to all languageswith more difficulties:

99Getting Your Neurons to Work
The invention of convolutional neural networks (CNNs) applied to vision represents by farone of the most innovative achievements in the history of applied mathematics. With itsmultiple layers (visible and hidden), CNN has brought artificial intelligence from machinelearning to deep learning.
A CNN relies on two basic tools of linear algebra: kernels and applying them toconvolutions as described in this chapter. These tools have been used in appliedmathematics for decades.
However, it took the incredible imagination of Yan LeCunn, Yoshua Bengio, andothers who built a mathematical model of several layers to solve real-life problems withCNNs.
This chapter describes the marvels of CNNs, one of the pillars of Artificial NeuralNetworks (AANs). A CNN will be built from scratch, trained, and saved. The classificationmodel described will detect production failures on a food-processing production line.
A Python Keras program running with TensorFlow on the backend will be built layer bylayer and trained. Additional sample programs will illustrate key functions.
The following topics will be covered in this chapter:
The differences between 1D, 2D, and 3D CNNsAdding layers to a convolutional neural networkKernels and filtersShaping imagesReLU activation functionKernel initializationPoolingFlatteningDense layers

Getting Your Neurons to Work Chapter 9
[ 186 ]
Compiling the modelCross-entropy loss functionAdam optimizerTraining the modelSaving the modelVisualizing the PNG of a model
Technical requirementsYou will need Python 3.6x 64-bit from :
You will also need the following libraries:
Programs, GitHub :
Check out the following video to see the code in action:

Getting Your Neurons to Work Chapter 9
[ 187 ]
Defining a CNNThis section describes the basic components of a CNN. willillustrate the basic CNN components the chapter used to build the case study model for afood-processing conveyor belt. CNNs constitute one of the pillars of deep learning(multiple layers and neurons).
In this chapter, a Keras neural network written in Python will be running on top ofTensorFlow. If you do not have Python or do not wish to program, the chapter is self-contained with graphs and explanations.
Defining a CNNA convolutional neural network takes an image, for example, and processes it until it can beinterpreted.
For example, imagine you have to represent the sun with an ordinary pencil and a piece ofpaper. It is a sunny day, and the sun shines very brightly, too brightly. You put on a specialpair of very dense sunglasses. Now you can look at the sun for a few seconds. You have justapplied a color reduction filter, one of the first operations of a convolutional network. Thenyou try to draw the sun. You draw a circle and put some gray in the middle. You have justapplied an edge filter. Finally, you go over the circle several times to make it easy torecognize, reducing the image you saw progressively into a representation of it. Now withthe circle, some gray in the middle, and a few lines of the rays around it, anybody can seeyou drew a sun. You smile; you did it! You took a color image of the sun and made amathematical representation of it as a circle, which would probably look something likethis:
You just went through the basic processes of a convolutional network.

Getting Your Neurons to Work Chapter 9
[ 188 ]
The word convolutional means that you transformed the image of the sun you werelooking at into a drawing, area by area. But, you did not look at the whole sky at once. Youmade many eye movements to capture the sun, area by area, and you did the same whendrawing. If you made a mathematical representation of the way you transformed each areafrom vision to your paper abstraction, it would be a kernel.
With that concept in mind, the following graph shows the successive mathematical steps tofollow in this chapter's model for a machine to process an image just as you did. Aconvolutional network is a succession of steps that will transform what you see into aclassification status. In your example, it would serve to find out whether your drawingrepresents the sun. This falls under the binary classification model (yes or no, 1 or 0).

Getting Your Neurons to Work Chapter 9
[ 189 ]
Notice that the size of the outputs diminishes progressively until the outputs reach 1, thebinary classification status that will return (1 or 0). These successive steps, or layers,represent what you did when you went from observing the sun to drawing it. In the end, ifwe draw poorly and nobody recognizes the sun, it means that we have to go back to step 1and change some parameters (weights in this case). That way, we train to represent the sunbetter until somebody says, "Yes, it is a sun!" That is probability = 1. Another person maysay that it is not a sun (probability = 0; thus, more training would be required).
If you carry out this experiment of drawing the sun, you will notice that, as a human, youtransform one area at a time with your eye and pencil. You repeat the way you do it in eacharea. That mathematical repetition you perform is your kernel. Using a kernel per area isthe fastest way to draw. For us humans, in fact, it is the only way we can draw. A CNN isbased on this process.
This section describes each component of this model. Hundreds of different models can beimplemented. However, once you understand one model, you can implement the manyothers.
Initializing the CNNThe model used is a Keras model; it requires adding one layer at a time in acertain order with TensorFlow as the backend:
The import libraries will be used for each layer of the model. The model can now be built.

Getting Your Neurons to Work Chapter 9
[ 190 ]
Adding a 2D convolution In the example of a drawing (image), we used our inbuilt human spacial module, workingon a two-dimensional piece of paper with (x, y) coordinates. Two-dimensional relationshipscan be real-life images and also many other objects as described in this chapter. Thischapter describes a two-dimensional network, although others exist:
A one-dimensional CNN mostly describes a temporal mode, for example, asequence of sounds (phonemes = parts of words), words, numbers and any othertype of sequenceA volumetric module is a 3D convolution, such as recognizing a cube or a video
In this chapter, a spatial 2D convolution module will be applied to images of differentkinds. The main program, , will describe how to build and savea model.
will add a layer to the model. The name classifier does not represent afunction but simply the arbitrary name that was given to this model in this particularprogram. The model will end up with n layers. Look at the following line of code:
This line of code contains a lot of information: the filters (applied with kernels), the inputshape, and an activation function. The function contains many more options. Once youunderstand these in depth, you can implement other options one by one, as you deemnecessary, for each project you have to work on.
KernelJust to get started, intuitively let's take another everyday model. This model is a bit moremathematical and closer to CNN's kernel representation. Imagine a floor of verysmall square tiles in an office building. You would like each tile of the floor to be convertedfrom dirty to clean, for example. You can imagine a cleaning machine converting 3 x 3 smalltiles (pixels) at a time from dirty to clean. You would laugh if you saw somebody comewith 50 cleaning machines to clean all of the 32 x 32 tiles (pixels) at the same time. Youknow it would consume more resources, intuitively. Not only is a kernel an efficient way tofilter but also a kernel convolution is a time-saving resource process. The single cleaningmachine is the kernel (dirty-to-clean filter), which will save you that time to performthe convolution (going over all of the tiles to clean, 3 x 3 area by 3 x 3 area) of transformingthe floor from dirty to clean.
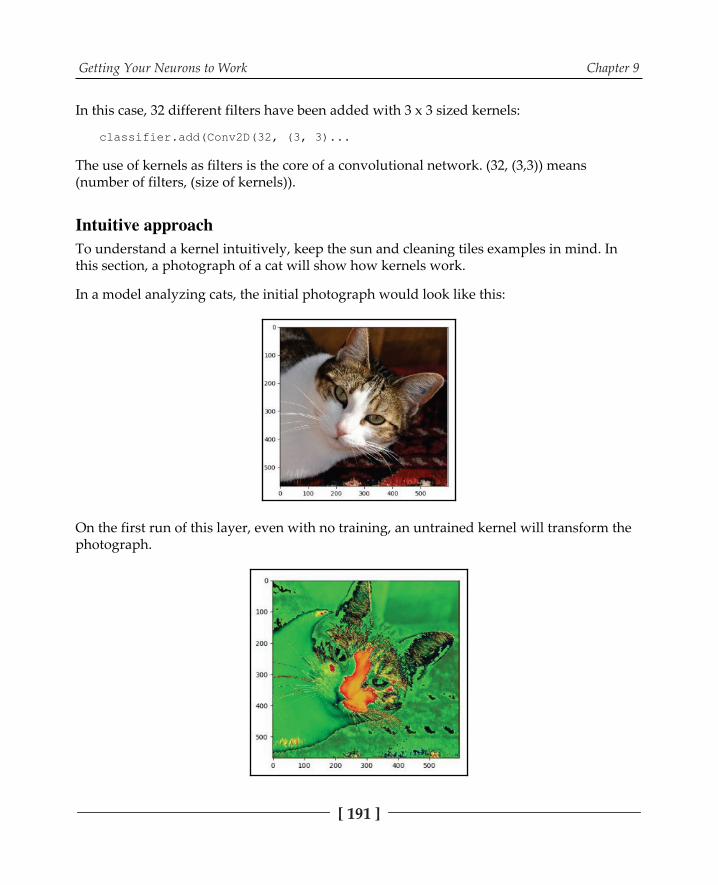
Getting Your Neurons to Work Chapter 9
[ 191 ]
In this case, 32 different filters have been added with 3 x 3 sized kernels:
The use of kernels as filters is the core of a convolutional network. (32, (3,3)) means(number of filters, (size of kernels)).
To understand a kernel intuitively, keep the sun and cleaning tiles examples in mind. Inthis section, a photograph of a cat will show how kernels work.
In a model analyzing cats, the initial photograph would look like this:
On the first run of this layer, even with no training, an untrained kernel will transform thephotograph.

Getting Your Neurons to Work Chapter 9
[ 192 ]
The first layer already has begun isolating the features of the cat. The edges have begun toappear: the cat's body, ears, nose, and eyes. In itself, this first filter (one of 32) with a size 3 x3 kernel in the first layer and with no training already produces effective results.
Each subsequent layer will make the features stand out much better with smaller andsmaller matrices and vectors until the program obtains a clear mathematical representation.
Developers like to see the result first to decide how to approach a problem.
Let's take a quick, tangible shortcut to understand kernelsthrough with an edge detection kernel.
The Kernel is a 3 x 3 matrix, like the cat example. But the values are preset, and not trainedwith weights. There is no learning here; only a matrix needs to be applied. The majordifference with a CNN network is that it will learn how to optimize kernels itself throughweights and biases.
is loaded, and the 3 x 3 matrix is applied to the pixels of the loaded image, area byarea:
The image before the convolution applying the kernel is the letter A (letter recognition):
Now the convolution transforms the image, as shown in the following code:

Getting Your Neurons to Work Chapter 9
[ 193 ]
The edges of A now appear clearly in white, as shown in the following graph:
The original image on top displayed a very thick A. In the preceding graph it displays athin identifiable A feature through thin edges that a neural network can classify within afew mathematical operations. The first layers of a convolutional network train to find theright weights to generate the right kernel automatically.
The initial image has a set of values you can display, as follows:

Getting Your Neurons to Work Chapter 9
[ 194 ]
The code will print a numerical output of the image as follows:
The convolution filter is applied using , a mathematical function, totransform the image and filter it.
The convolution filter function uses several variables:
The spatial index for the 3 x 3 kernel to apply; in this case, it must know how toaccess the data. This is performed through a spatial index, j, which manages datain grids. Databases also use spatial indexes to access data. The axes of those gridsdetermine the density of a spatial index. Kernels and the image are convolvedusing j over W, the weights kernel.W is the weights kernel.I is the input image.k is the coordinate of the center of W. The default value is 0 in this case.
These variables then enter the function as represented by the followingequation:
A CNN relies on kernels. Take all the time you need to explore convolutions through thethree dimensions required to master AI: intuitive approach, development testing, andmathematical representation.
ShapeShape defines the size of the image, which is 64 x 64 pixels (height x width), as shown here.
indicates the number of channels. In this case, indicates the three parameters of an RGBcolor. Each number can have a given value of 0 to 255.

Getting Your Neurons to Work Chapter 9
[ 195 ]
ReLuActivation functions provide useful ways to influence the transformation of the input dataweight bias calculations. Their output will change the course of a classification, aprediction, or whatever goal the network was built for. This model applies rectified linearunit (ReLU), as shown in the following code:
ReLU activation functions apply variations of the following function to an input value:
f(x) = max{0, x}
The function returns 0 for negative values; it returns the positive values as x; it returns 0 for0 values.
ReLU appears to be easier to optimize. Half of the domain of the function will return zeros.This means that when you provide positive values, the derivative will always be 1. Thisavoids the squashing effect of the logistic sigmoid function, for example. However, thedecision to use one activation function rather than another will depend on the goal of eachANN model.
In mathematical terms, a rectified linear unit function will take all the negative values andapply 0 to them. And all the positive values remain unchanged.
The program provides some functions including a NumPy function to test howReLu works.
You can enter test values or use the ones in the source code:
expects a negative value and expects a positive value for testing purposes for the and functions. Use the function if you wish to include zeros in
your testing session.

Getting Your Neurons to Work Chapter 9
[ 196 ]
The function will calculate the ReLU value:
In this case, the program will return the following result:
The result of a negative value becomes 0, and the positive value remains unchanged. Thederivative or slope is thus always one, which is practical in many cases and provides goodvisibility when debugging a CNN or any other ANN.
The NumPy function defined as follows will provide the same results.
Through trial and error, ANN research has come up with several variations of ReLU.
One important example occurs when many input values are negative. ReLu will constantlyproduce zeros, making gradient descent difficult if not impossible.
A clever solution was found using a leaky ReLU. A leaky ReLU does not return a zero for anegative value but a small value you can choose, 0.1 instead of 0, for example. See thefollowing equation:
f(x) = max{0.1, x}
Now gradient descent will work fine. In the sample code, the function is implemented asfollows:
Although many other variations of ReLUs exist, with this in mind, you have an idea ofwhat it does.

Getting Your Neurons to Work Chapter 9
[ 197 ]
Enter some values of your own, and the program will display the results as shown here:
The results will display the ReLU results as follows:
PoolingPooling reduces the size of an input representation, in this case, an image. Max poolingconsists of applying a max pooling window to a layer of the image:
This 2 x 2 window will first find the maximum value of the 2 x 2 matrix on thetop left of the image matrix. This first maximum value is 4. It is thus the first value of thepooling window on the right.
Then the max pooling window hops over two squares and finds that 5 is the highest value.5 is written in the max pooling window. The hop action is called a stride. A stride value of 2will avoid overlapping although some CNN models have strides that overlap. It alldepends on your goal. Look at the following diagram:

Getting Your Neurons to Work Chapter 9
[ 198 ]
The output size has now gone from a 62 x 62 x 32 (number of filters) to a 31 x 31 x 32, asshown in the following diagram:
Other pooling methods exist, such as average pooling, which will use the average of thepooling window and not the maximum value. This depends on the model and shows thehard work to put in to train a model.
Next convolution and pooling layerThe next two layers of the CNN repeat the same method as the first two describedpreviously, and it is implemented as follows in the source code:
These two layers have drastically downsized the input to 14 x 14 x 32, as shown in thisdiagram:
The next layer can now flatten the output.

Getting Your Neurons to Work Chapter 9
[ 199 ]
FlatteningThe flattening layer takes the output of the max pooling layer and transforms into a vectorof size x * y * z in the following code:
In this case, the layer vector will be 14 x 14 x 32 = 6,272, as shown in the following diagram:
This operation creates a standard layer with 6,272 very practical connections for the denseoperations that follow. After flattening has been carried out, a fully connected, densenetwork can be implemented.
Dense layersDense layers are fully connected. This has been made possible by the reductions in sizecalculated up to here, as shown before.
The successive layers in this sequential model have brought the size of the image downenough to use dense layers to finish the job. Dense 1 comes first, as shown here:

Getting Your Neurons to Work Chapter 9
[ 200 ]
The flattening layer produced 14 x 14 x 32 size 6,272 layer with a weight for each input. If ithad not gone through the previous layers, the flattening would have produced a muchlarger layer, and the features would not have been extracted by the filters. The result wouldproduce nothing effective.
With the main features extracted by the filters through successive layers and size reduction,the dense operations will lead directly to a prediction using the ReLu on the dense 1operation and the logistic sigmoid function on the dense operation.
Dense activation functionsThis is how to apply the ReLU activation function.
The domain of the ReLU activation function is applied to the result of the first denseoperation. The ReLU activation function will output the initial input for values >=0 and willoutput 0 for values <0:
f(input value) = max{0, input_value)
This is how to apply the logistic sigmoid activation function.
The logistic activation function applied to the second dense operation, as described in, Think like a Machine, will produce a value between 0 and 1:
LS(x)={0,1}
We will now discuss the last dense layer after the LS activation function.
The last dense layer is size 1 and will classify the initial input, an image in this case:
The layers of the model have now been added. Training can begin.

Getting Your Neurons to Work Chapter 9
[ 201 ]
Training a CNN modelTraining a CNN model involves four phases: compiling the model, loading the trainingdata, loading the test data, and running the model through epochs of loss evaluation andparameter-updating cycles.
In this section, the choice of the theme of the training dataset will be a real-life case studyfrom the food-processing industry.
The goalThe primary goal of this model consists of detecting production efficiency flaws on a food-processing conveyor belt. The use of CIFAR-10 (images) and MNIST (handwritten digitbase) proves useful to understand and train some models (see , ApplyingBiomimicking to Artificial Intelligence). However, at one point, real-life datasets must be usedto sell and implement deep learning and artificial intelligence in general.
The following photograph shows a section of the conveyor belt that contains an acceptablelevel of products, in this case, portions of chocolate cakes:
However, sometimes the production slows down, and the output goes down to an alertlevel, as shown in the following photograph:
The alert-level image shows a gap that will slow down the packaging section of the factorydramatically.

Getting Your Neurons to Work Chapter 9
[ 202 ]
, Applying Biomimicking to Artificial Intelligence, describes how this model canapply to the food-processing industry and be transferred to other applications.
Compiling the modelCompiling a Keras model requires a minimum of two options: a loss function and anoptimizer. You evaluate how much you are losing and then optimize your parameters, justas in real life. A metric option has been added to measure the performance of the model.With a metric, you can analyze your losses and optimize your situation, as shown in thefollowing code:
Loss functionThe loss function provides information on how far the state of the model y1 (weights,biases) is from its target state y.
A description of the quadratic loss function precedes that of the binary cross-entropyfunctions applied to the case study model in this chapter.
For gradient descent, see , Manage the Power of Machine Learning and DeepLearning. Let us refresh the concept. Imagine you are on a hill and want to walk down thathill. Your goal is to get to y, the bottom of the hill. Presently you are at a. Google Mapsshows you that you still have to go a certain distance:
That formula is great for the moment. But now suppose you are almost at the bottom of thehill, and the person walking in front of you dropped a coin. You have to slow down now,and Google Maps is not helping much because it doesn't display such small distances thatwell. You open an imaginary application called tiny maps that zooms into small distanceswith a quadratic objective (or cost) function:

Getting Your Neurons to Work Chapter 9
[ 203 ]
To make it more comfortable to analyze, O is divided by 2, producing a standard quadraticcost function:
y is the goal. a is the result of the operation of applying the weights, biases, and finally theactivation functions.
With the derivatives of the results, the weights and biases can be updated. In our hillexample, if you move one meter (y) per step (x), that is much more than moving 0.5 meters(y) per step. Depending on your position on the hill, you can see that you cannot apply aconstant learning rate (conceptually the length of your step); you adapt it just like Adam,the optimizer, does.
Cross-entropy comes in handy when the learning slows down. In the hill example, itslowed down at the bottom. But, remember, a path can lead you sideways, meaning youare momentarily stuck at a given height. Cross-entropy solves that by being able to functionwell with very small values (steps on the hill).
Suppose you have the following structure:
Inputs is {x1, x2, ..., xn}Weights is {w1, w2, ..., wn}A bias (or sometimes more) is bAn activation function(ReLU, logistic sigmoid, or other)
Before the activation, z represents the sum of the classical operations:.
Now the activation function is applied to z to obtain the present output of the model.

Getting Your Neurons to Work Chapter 9
[ 204 ]
With this in mind, the cross-entropy loss formula can be explained:
In this function:
n is the total number of items of the input training, with multiclass data. M > 2means situations in which a separate loss of each class label is calculated. Thechoice of the logarithm base (2, e, 10) will produce different effects.y is the output goal.y1 is the present value, as described previously.
This loss function is always positive; the values have a minus sign in front of them, and thefunction starts with a minus. The output produces small numbers that tend to zero as thesystem progresses.
The loss function in Keras, which uses TensorFlow, uses this basic concept with moremathematical inputs to update the parameters.
A binary cross-entropy loss function is a binomial function that will produce a probabilityoutput of 0 or 1 and not a value between 0 and 1 as in standard cross-entropy. In thebinomial classification model, the output will be 0 or 1.
In this case, the sum is not necessary when M (number of classes) = 2. The binary cross-entropy loss function is then as follows:
The whole concept of this loss function method is for the CNN network to be used inspecific real-life case studies described in the training dataset section and ,Applying Biomimicking to Artificial Intelligence.
Adam optimizerIn the hill example, you first walked with big strides down the hillusing momentum (larger strides because you are going in the right direction). Then youhad to take smaller steps to find the object. You are adapting your estimation ofyour moment to your need; hence, the name adaptive moment estimation (Adam).

Getting Your Neurons to Work Chapter 9
[ 205 ]
Adam constantly compares the mean past gradients to present gradients. In the hillexample, it compares how fast you were going.
The Adam optimizer represents an alternative to the classical gradient descent method orstochastic gradient descent method (see , Manage the Power of Machine Learningand Deep Learning). Adam goes further by applying its optimizer to random (stochastic)mini-batches of the dataset. This makes it a version of stochastic gradient descent.
Then, with even more inventiveness, Adam adds root-mean-square deviation (RMSprop)to the process by applying per-parameter learning weights. It analyzes how fast the meansof the weights are changing (such as the gradients in our hill slope example) and adapts thelearning weights.
MetricsMetrics are there to measure the performance of your model. The metric function behaveslike a loss function. However, it is not used to train the model.
In this case, the accuracy parameter was this:
Here, a value that descends towards 0 shows whether the training is on the right track andmoves up to one when the training requires Adam function optimizing to set the trainingon track again.
Training datasetThe training dataset is available on GitHub, along with the installation instructions andexplanations. The dataset contains the photo shown previously for the food-processingconveyor belt example.
The class A directory contains the acceptable level images of a production line thatis producing acceptable levels of products. The class B directory contains the alert-levelimages of a production line that is producing unacceptable levels of products.
The number of images of the dataset is limited because of the following:
For the purpose of training this limited industrial model, the images producedgood resultsThe training-testing phase runs faster to study the program

Getting Your Neurons to Work Chapter 9
[ 206 ]
The goal of the model is to detect the alert levels as described in more detail in ,Applying Biomimicking to Artificial Intelligence, when it will be applied to the trained imagesand generalized to similar ones.
Data augmentationData augmentation increases the size of the dataset by generating distorted versions of theimages provided.
The function generates batches of all images found in tensorformats. It will perform data augmentation by distorting the images (shear range, forexample). Data augmentation is a fast way to use the images you have and create morevirtual images through distortions:
The code description is as follows:
will rescale the input image if not 0 (or none). In this case, the data ismultiplied by 1/255 before applying any other operation.
will displace each value in the same direction determined, in thiscase by the 0.2. It will slightly distort the image at one point, giving some morevirtual images to train.
is the value of zoom. is set to true. This is a Boolean that randomly flips inputs
horizontally.
provides many more options for real-time data augmentation, suchas rotation range, height shift, and more.
Loading the dataLoading the data goes through the preprocessing function(described previously) and is implemented in the following code:

Getting Your Neurons to Work Chapter 9
[ 207 ]
The flow in this program uses the following options:
sets the directory + ' ' to the path wherethe two binary classes to train are stored.
will all be resized to that dimension. In this case, it is 64 x 64. is the size of batches of data. The default value is 32 and set to 10 in
this case. determines the label arrays returned: none or categorical will be 2D
one-hot encoded labels. In this case, binary returns 1D binary labels.
Testing datasetThe testing dataset flow follows the same structure as the training dataset flow describedpreviously. However, for testing purposes, the task can be made easier or more difficultdepending on the choice of the model. This can be done by adding images with defects ornoise. This will force the system into more training and the project team into more hardwork to fine-tune the model. Data augmentation provides an efficient way of producingdistorted images without adding images to the dataset. Both methods, among many others,can be applied at the same time when necessary.
Data augmentationIn this model, the data only goes through rescaling. Many other options could be added tocomplicate the training task to avoid overfitting, for example, or simply because the datasetis small:

Getting Your Neurons to Work Chapter 9
[ 208 ]
Loading the dataLoading the testing data remains limited to what is necessary for this model. Other optionscan fine-tune the task at hand:
Never underestimate dataset fine-tuning. Sometimes, this phase can last weeks beforefinding the right dataset and arguments.
Training with the classifierThe classifier has been built and can be run:
The function, which fits the model generated batch by batch, contains themain hyperparameters to run the training session through the following arguments in thismodel. The hyperparameters settings determine the behavior of the training algorithm:
is the training set flow described previously. is the total number of steps (batches of samples) to yield from
the generator. The variable used in the following code is estep. is the variable of the total number of iterations made on the data input.
The variable used is in the preceding code. is the testing data flow.
is used with the generator and defines the number ofbatches of samples to test as defined by in the following code:

Getting Your Neurons to Work Chapter 9
[ 209 ]
While the training runs, measurements are displayed: loss, accuracy, epochs, informationon the structure of the layers, and the steps calculated by the algorithm.
Here is an example of the loss and accuracy data displayed:
Saving the modelSaving the model, in this case, consists in saving three files.
First, we will discuss the model file.
, saved in the following code, contains serialized data describing the modelitself without weights. It contains the parameters and options of each layer. Thisinformation is very useful to fine-tune the model:
More details on this file are provided in the next section, in the Loading the model section.
Now we will discuss the weights file.
To understand a CNN model or any other type of model, having access to theweights can provide useful information when nothing works or to solve some ofthe problems that come up.
The weights are saved in the following code:

Getting Your Neurons to Work Chapter 9
[ 210 ]
A file
This file will display the layers of the model, the input, and output sizes. Thefollowing code saves the model in format:
can prove useful to understand how the model went down from thenumber of pixels of the original image to the binary classification layer containingthe classification status. The diagram at the beginning of the chapter, displayingthe layers and input/output values, was produced by this program.
Next stepsThe model has been built and trained. In , Applying Biomimicking to artificialintelligence, it will be loaded and implemented in the food-processing company and othersimilar applications through transfer leaning.
SummaryBuilding and training a CNN will only succeed with hard work at choosing the model, theright dataset, and hyperparameters. Convolutions, pooling, flattening, dense layers,activations, and optimizing parameters (weights and biases) form solid building blocks totrain and use a model.
Training a CNN to solve an everyday industrial problem helps sell AI to a manager or asales prospect. In this case, using the model to help a food-processing factory solve aconveyor belt productivity problem takes artificial intelligence a step further intoeveryday corporate life.
Saving the model provides a practical way to use it by loading it and applying it to newimages to classify them. This chapter concluded after we had trained and saved the model.
, Applying Biomimicking to Artificial Intelligence, will dive deeper into how neuralnetworks were inspired by human neural networks and describe how to analyze a neuralnetwork with TensorBoard tools in more detail. Then the saved model CNN model will beapplied to the food industry through transfer learning; and we'll expand far beyond thoselimits through domain learning in , Conceptual Representation Learning.

Getting Your Neurons to Work Chapter 9
[ 211 ]
QuestionsA CNN can only process images. (Yes | No)1.A kernel is a preset matrix used for convolutions. (Yes | No)2.Does pooling have a pooling matrix or is it random?3.The size of the dataset always has to be large. (Yes | No)4.Finding a dataset is not a problem with all the available image banks on the5.web. (Yes | No)Once a CNN is built, training it does not take much time. (Yes | No)6.A trained CNN model applies to only one type of images. (Yes | No)7.A quadratic loss function is not very efficient compared to a cross-entropy8.function. (Yes | No)The performance of a deep learning CNN does not a represent a real issue with9.modern CPUs and GPUs. (Yes | No)
Further reading and referencesKeras provides good explanations and samples from its community that will lead thereader to interesting aspects of CNNs and practical issues:

110Applying Biomimicking to
Artificial IntelligenceHeated debates have been raging over biomimicking humans in various forms of artificialintelligence for decades. In the 1940s, McCulloch and Pitts (see , Think like aMachine) came up with a human neuron. Then Rosenblatt came up with a humanperceptron ( , Become an Unconventional Innovator). Mimicking humans seemed tohave conquered the world of artificial intelligence networks. Then, in 1969, Minsky slowedresearch down by proving that a perceptron could not solve the XOR problem (see
, Become an Unconventional Innovator).
Today, deep learning networks reproduce our mental way of thinking. Neuroscientists nowwork on representing our physical brain functions. These two different fields, thoughdifferent, still inspire each other.
Neural networks provide good mathematical models of how our mind works on thenumber side. Mental images on top of words and numbers to describe them constitute thelarger part of human thinking. As shown in , Revolutions Designed for SomeCorporations and Disruptive Innovations Small to Large Companies, the uncharted territory ofAI must be continuously explored. Our community needs to make progress in thisdirection with tools that will represent our way of thinking at higher levels.
The following topics will be covered in this chapter:
Showing how a neural network mimics the way a human mind representsimagesShowing how to use the graph structure representation of deep learning neuralnetworks to build and debug themExploring how the mathematical model neural networks are built today withTensorBoard

Applying Biomimicking to Artificial Intelligence Chapter 10
[ 213 ]
Understanding the cutting edge of the mathematical data flow graph structuressuch as TensorFlow, which will lead us to the cutting edge of biomimickinghumans with these methodsThe difference between neuroscience computing models and deep learningmodelsA TensorFlow MNIST classifierTensorBoard dashboardsTensorFlow scopes, placeholders, variables, and other componentsAnalyzing accuracy, cross-entropy, and weights during the training process
This chapter prepares the reader for , Conceptual Representation Learning, whichgoes right over the cutting edge and into the uncharted territory of conceptualrepresentation learning (CRL) and meta networks.
Technical requirementsYou will need Python 3x with the following libraries:
For the TensorFlow classifier you will need this:

Applying Biomimicking to Artificial Intelligence Chapter 10
[ 214 ]
Programs from GitHub can be found here:
Check out the following video to see the code in action:
Human biomimickingIn this section, the difference between neuroscience research on the brain and deep learningresearch on the mind has led to TensorFlow and TensorBoard. With TensorFlow, ourrepresentation of image recognition in a mathematical graph data flow structure hasbecome an extremely efficient model. TensorBoard provides a visual representation of whatwe are building.
TensorFlow represents how our mind recognizes images (and other elements).TensorBoard enables our minds to visualize that representation and improve it.
TensorFlow, an open source machine learningframeworkTensorFlow relies on graph representations of data flow. The graph computesdependencies between operations.
When using Keras, as in , Getting Your Neurons to Work, the details of graphs andsessions do not appear. However, to compare our brain with deep learning, some detailsneed to be examined using , which classifies MNISThandwritten images and saves the summaries (information about the model).

Applying Biomimicking to Artificial Intelligence Chapter 10
[ 215 ]
The graph of the program is as shown in the following diagram:
The nodes (labels with lines around them) and edges (lines connecting the labels) constitutethe graph structure. The graph structure, in turn, indicates how the operations areconnected to one another.
, Getting Your Neurons to Work, described all the nodes except dropout. In thatchapter, two dense layers were added to the classifier model. Sometimes, whenconstructing a dense layer, some elements will not be trained. This is done toavoid overfitting (see the transfer learning section later), which means that the model willknow the training set too well and will not adapt efficiently to new objects (images, sounds,or words). This method, among others, helps to fine-tune the model duringthe regularization process (methods to avoid overfitting, for example). Thedropout regularization rate can be added to the graph structure. Dropouts can be usedseveral times and at different places in a given model.

Applying Biomimicking to Artificial Intelligence Chapter 10
[ 216 ]
Does deep learning represent our brain or our mind?After reading , Getting Your Neurons to Work, and the beginning of this chapter, ittakes a major effort to see how a data flow graph structure representing a deep learningmodel has something to do with our brain.
We have gone a long way since the McCulloch-Pitts neuron proudly tried to represent aneuron in our brain (see , Think like a Machine).
Neuroscience research that tries to create computer models of our brain is now namedcomputational neuroscience. Computer systems represent mathematical models of thebrain. Understanding how the brain works remains a critical field of physiology, nervoussystem, cognitive ability, and related research. It sometimes provides some ideas for deeplearning networks.
But a TensorFlow data flow graph structure represents a deep learning model (or othermodels) of a mathematical solution to a classification or prediction problem.
Deep learning networks have moved away from neuroscience, and their source ofinspiration comes mostly from other areas such as applied mathematics (linear algebra),probability, information theory (for entropy, for example), and other related fields.
Naturally, the media hype surrounding artificial intelligence seems a bit confusing becausemarketing managers make some impressive demonstrations of robots that look like us, tryto act like us, and speak like us. No matter what those systems do right now, their learningmodel relies on data flow graph structures based mostly on mathematical representationsof our mind, not our brain.
Our mind thinks and reasons. When we think, we do not feel our brain following throughneurons and synapses. Our mind acts like a high-level API between what we want to doand what our brain does for us.
To improve our API, we create abstract representations of almost everything around us. Wetry to make sense of the chaos of all the incoming perceptions and thoughts we have tomanage. The better our representations, the more efficient our API to our brain willbecome.
The TensorFlow data flow graph structure represents our mind's APIrelaying information seamlessly to our brain, not our brain structurewhich we cannot see when we think.
In the end, a deep learning network is a way of mimicking humans.

Applying Biomimicking to Artificial Intelligence Chapter 10
[ 217 ]
Biomimicking in deep learning simply mimics a deep learning networkand imitates our mathematical mind.
A TensorBoard representation of our mindNobody is sure how our brains can learn quickly with a few labeled objects and then applythe patterns to unsupervised, unlabeled learning. Research on the subject will eventuallyproduce some helpful explanations.
In the meantime, we must rely on our mind's representations to train deep learning models.
If you want to follow the explanations of this chapter through programs,first run as it is. Thenrun and follow the instructions in the code toopen TensorBoard in your browser. Otherwise, the chapter is self-contained with source code excerpts and screenshots.
Many of the concepts in the program were explained in, Getting your Neurons to Work.
The following sections focus on TensorFlow objects that are not always perceived withhigh-level interfaces, such as Keras.
Input dataThis program is a unit-testing model. It uses unit-testing data in a unit-testing deeplearning model:
refers to an MNIST (handwritten digits) unit testing dataset and arecommand-line parameters (in this case, path information).
means that the labels of the data must be encoded into values. The presenceof labels means that this is a supervised (with labels) training classifier and not anunsupervised (training with no labels) classifier.

Applying Biomimicking to Artificial Intelligence Chapter 10
[ 218 ]
The one-hot function (see , Think like a Machine) will encode labels into distinctone-hot values as in the following example:
# [[0, 1, 0, 0, 0, 0, 0, 0, 0, 0],# [0, 0, 0, 0, 0, 0, 0, 0, 0, 1],# ...]
The inputs are stored in placeholders as in the following code:
Placeholders are not just variables that will be filled up later. They define one of thefundamental building blocks of a TensorFlow data flow graph. They contain the methodsthat will be used in the node they are in.
is the title label that will appear on TensorBoard, and identifies thiselement of the graph. The following graph displays the input scope with its two inputs.
TensorBoard provides the visual representation our mind needs to think. The placeholdersare in nodes that are linked to other operations through edges (lines) that represent the flowof data and operations.
, as you can see, skips the function in layer 1; it goes straight tothe deeper operations of cross-entropy and accuracy as explained later.
goes through the input-reshape node in the following code:

Applying Biomimicking to Artificial Intelligence Chapter 10
[ 219 ]
defines the title, . The interesting part is the details youwill see if you click on the node and drill down, as shown in the following screenshot:
We usually represent the function as one channel output when in fact there arethree outputs to subsequent operations.
The IMAGES section provides a visual representation of the reshaped images as shown inthe following screenshot:
When building a model, TensorBoard visual representations of the reshaped images canprove helpful for validation purposes.
Layer 1 managing the inputs to the networkAs with the Keras, implementing a layer in TensorFlow is done in a few lines but withTensorBoard. Layer 1 takes , calculates a weight, applies an activation functionand sends its output directly to the training node and also to the dropout node. Thefollowing graph represents layer 1 and the result of the operations to OUTPUTS (dropoutand train):

Applying Biomimicking to Artificial Intelligence Chapter 10
[ 220 ]
The core lines have the visual representation TensorBoard functions as described before as implemented in the following code.

Applying Biomimicking to Artificial Intelligence Chapter 10
[ 221 ]
Notice the module in the code. Not only does TensorFlowprovide a data flow graph structure with the that showsthe operation, but also the values of the variables are storedwith . It stores the structure of the operations as well.
The values themselves can be viewed in following charts:
Each chart has its statistics described in a function that defines the informationneeded to fine-tune and debug a model.

Applying Biomimicking to Artificial Intelligence Chapter 10
[ 222 ]
contains a list of very useful pieces of information. Thefollowing Python source code contains comments that provide information on the variablesdefined:
With this number of quality controls, exploring TensorBoard will provide deep insightsinto the neural network.

Applying Biomimicking to Artificial Intelligence Chapter 10
[ 223 ]
We often focus on the activation function in a layer. However, when a system fails and wehave to debug it, having a peek at the preactivation function sometimes provides effectiveclues on what is going wrong. To visualize the preactivation output shown in the followinggraph, click on Wx_plus_b in layer 1, which shows that many events are influencing thetraining process:
Several notable operations occur with :
The weights and biases are connected to the training process, which iscontinuously modifying them; this happens even before the operation.Several tensors are sent to the training node and .The operation carries out the multiplications (Wx). But its output sendsinformation to the training node and produces an output for the node.The node itself sends its output to the activation function and also to thepreactivation data to the histogram summary so that we can analyze the behaviorof this hidden layer.

Applying Biomimicking to Artificial Intelligence Chapter 10
[ 224 ]
Now when we click on the HISTOGRAMS section on TensorBoard, we can visualize theevolution of weight and bias training in the following diagrams:
In this model, the preactivation diagrams show a smooth Gaussian-like bell (peak in themiddle and similar slopes on each side). When building a model, everything seems fine.But if the curves become erratic and training the model fails, these histograms will providecritical information.
You can zoom in and check the values if necessary as shown in the following screenshot:

Applying Biomimicking to Artificial Intelligence Chapter 10
[ 225 ]
TensorBoard makes hidden layer intermediate values visible, which enhances our mentalrepresentation of a model.
In a real-life project, if the activation node goes wrong, checking the preactivation status ofthe layer eliminates a possible cause of design errors.
The activation function of this model the is ReLU function (see , Getting YourNeurons to Work).
When we peek into its structure, once again we see that it is not just an activation functionin a sequential process. Its output goes to the dropout and training nodes with complexintermediate calculations as shown in the following description of the activation function:
TensorBoard provides us with yet another visual representation to control the distributionof preactivation and, in this case, activations. The DISTRIBUTIONS section enables us todetect anomalies in the activation phase once we have verified that the preactivationfunctions produce acceptable results.

Applying Biomimicking to Artificial Intelligence Chapter 10
[ 226 ]
The visual representation of the complex node and edge structure of a TensorFlow dataflow graph come in handy when design errors slow a project down.
Dropout and Layer 2Dropouts and the designing of a layer were explained previously.
However, let us focus on some features of the dropout node: dropout keep probability andthe outputs in the following diagram.
A dropout keep probability plays an overfitting reduction role. The probability leads todropping neurons during the training process. The scaling is done automatically.Furthermore, this dropout feature is turned on and off during testing:
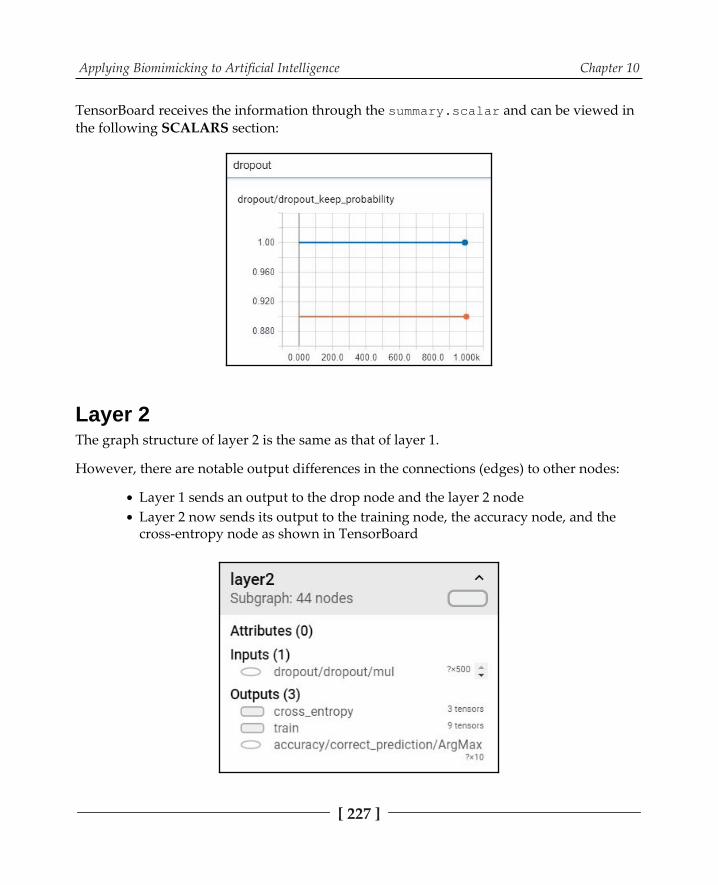
Applying Biomimicking to Artificial Intelligence Chapter 10
[ 227 ]
TensorBoard receives the information through the and can be viewed inthe following SCALARS section:
Layer 2The graph structure of layer 2 is the same as that of layer 1.
However, there are notable output differences in the connections (edges) to other nodes:
Layer 1 sends an output to the drop node and the layer 2 nodeLayer 2 now sends its output to the training node, the accuracy node, and thecross-entropy node as shown in TensorBoard

Applying Biomimicking to Artificial Intelligence Chapter 10
[ 228 ]
Measuring the precision of prediction of a networkthrough accuracy valuesThe accuracy node contains two parts: correct prediction and accuracy. The output value isnot sent to the training node but the correct predictions (see next section, Correct prediction)part of it is used by cross-entropy. Accuracy measures the performance of the system. Youcan stop training by limiting the number of epochs hyperparameter if you estimate that theaccuracy is sufficient to achieve your goals. Or you can use accuracy to fine-tune thetraining model to increase its rate faster by modifying the hyperparameters or the design ofyour model.
The following code implements , which uses an function.
will output the index of the largest value of the input tensors. This simplifiesthe task considerably by avoiding the need to manage scores of values. When things gowrong and they often do in real-life projects we can go back to the preceding nodes anddebug the data flow or improve the design of the data flow graph structure.
When accuracy fails to meet expectations, TensorBoard provides us with atwo-dimensional debugging approach: fine-tune the data flow graphstructure itself and also explore the data flow values that the nodeoperations produce and send to other nodes through the edges.

Applying Biomimicking to Artificial Intelligence Chapter 10
[ 229 ]
The following graph of the node has two inputs. The first one is the, which comes straight from the input node. The second input is the output of
layer 2, which has processed the input that came from its preceding nodes and iscommunicating with the core training and cross-entropy nodes as well.
is applied separately to both inputs and sent to the accuracy node, and correctpredictions are used by the cross-entropy node.
The uses the output of the correct prediction to compute the mean of theelements of the tensor in the following code:
calculates the mean in a standard way. For example, the mean of 2 and 4is 3. Reducing the values of the input gives a good picture of how the model is doingduring training without overloading the designer with too many values to analyze, asshown in the following diagram:

Applying Biomimicking to Artificial Intelligence Chapter 10
[ 230 ]
The accuracy scalar is sent to , which can be viewed in the following screenshotof the SCALARS section.
You will notice that the accuracy values go up and up until we almost reach a 1 top scorevalue.
Take another good look. This rarely happens in real-life projects.
Accuracy fails to increase in many real-life projects without hard workand analysis.
Bad accuracy will tell you to go back and do the following:
Check the data flow initial datasets, initial hyperparameters, and any value thatyou can check and change in the data flowCheck the data flow graph structure to find flaws and improve them

Applying Biomimicking to Artificial Intelligence Chapter 10
[ 231 ]
Then start the training process again.
Cross-entropyCross-entropy was described in , Getting Your Neurons to Work. The first inputcomes from layer 2, the result of the preceding nodes computing . The secondinput, , comes directly from the input node, as implemented in the following code:
TensorFlow measures its progression as shown in the and charts that follow:

Applying Biomimicking to Artificial Intelligence Chapter 10
[ 232 ]
Note how nicely the value of cross-entropy goes down a nice gradient (slope) as the lossfunction as the training progresses. This curve shows that the errors are being reduced.Then note how nicely the accuracy curve goes up as the errors diminish.
Think about it. In real-life projects, the cross-entropy completely slows down at one pointwhile accuracy becomes erratic. The effect of this will be limited because cross-entropytakes the correct predictions into account.
However, more often than not, hard work needs to be put in when facing ourimplementations.
TrainingAs in , Getting Your Neurons to Work, an algorithm with adaptive learning ratestrains the model. The Adam algorithm using a cross-entropy loss function just like
, Getting Your Neurons to Work, as shown here:
The similarity between the Keras model in , Getting YourNeurons to Work, and this TensorFlow model does not come as a surprisesince Keras uses TensorFlow as a backend.
The train node has several inputs from other nodes for its Adam optimizer, , , , and , as shown in the following graph:

Applying Biomimicking to Artificial Intelligence Chapter 10
[ 233 ]
At this point, TensorFlow provides all the necessary information to build and debug themodel.
Drill down into all the nodes in this model on the GRAPHS dashboard.Explore all of the information about all the other sections: SCALARS,IMAGES, DISTRIBUTIONS, and HISTOGRAMS provided by this unittesting program. The more you know when things go wrong, the fasteryou will correct them.
Optimizing speed with Google's TensorProcessing UnitExploring a unit-testing model represents an effort on our part. Now, imagine having tobuild a model that is 10 times this size. Training the model to find out where and whythings went wrong may prove time consuming.
Google has come up with an innovation: a Tensor Processing Unit (TPU). Google Search,Google Translate, and Google Photos use a TPU to speed up computations.
Making that available to us on its data centers will make a difference. TensorBoard alreadyhas a key function you might want to explore while building a complex and time-consuming model. This function is the TPU Compatibility option on TensorBoard (see thefollowing screenshot).

Applying Biomimicking to Artificial Intelligence Chapter 10
[ 234 ]
Click on TPU Compatibility (this chapter used the Structure option until now).
The following graph will now display the levels of TPU compatibility of each node (green +red proportions):
This means that, in future when you are designing a complex model, you should keep aneye on TPU compatibility if you are going to consume a lot of CPU/GPU.

Applying Biomimicking to Artificial Intelligence Chapter 10
[ 235 ]
TensorBoard also provides the following list, for example, to display each level you aredrilling down to:
Even if you do not have access to a TPU, the read nodes will signal where you have to becareful. You may want to optimize the model before even starting to train it.

Applying Biomimicking to Artificial Intelligence Chapter 10
[ 236 ]
One of the main nodes to keep an eye on is the training node that contains the Adamoptimizer, as shown in the following screenshot:
As models grow larger and larger, optimization will become a key field. Teams will have tooptimize data graph structures, data flows, and machine configuration, including networkspeeds (and balancing).
SummaryThe TensorFlow model represented in TensorBoard contains several basic building blocksof ANNs, whether they are CNNs, RNNs such as LTSM networks, or other forms. All ofthese models rely on numerical computation in one form or the other: weights,biases, operations, activation functions (logistic sigmoid, ReLU, or others), layers,optimizers, loss functions, and more. All of these tools belong to the field of appliedmathematics.
This approach has been around for decades. However, as time goes by, linguists,philosophers, historians, and many more people fascinated by AI will bring new ideas, newprogramming languages, interfaces, and APIs. Focus on the core concepts, not the tools,and you will always be able to keep up to date and innovate.
Biomimicking humans will inevitably be extended to conceptual representation learning,the fascinating world of our video-clipped minds.
Complex projects require conceptual representation.

Applying Biomimicking to Artificial Intelligence Chapter 10
[ 237 ]
, Conceptual Representation Learning, will lead you into the uncharted territory ofconceptual representation learning.
QuestionsDeep learning and machine learning mean the same thing. (Yes | No)1.Deep learning networks mostly reproduce human brain functions (Yes | No)2.Overfitting is unacceptable. (Yes | No)3.Transfer learning can save the cost of building another model. (Yes | No)4.Training a corporate model on MNIST is enough to implement it on a production5.line, for example. (Yes | No)Exploring artificial intelligence beyond the cutting edge is not necessary. It is6.easier to wait for the next ideas that are published. (Yes | No)Some researchers have reproduced all the physical and biological reasoning7.functions of the human brain in robots. In fact, some robots have human brainclones in them. (Yes | No)Artificial general intelligence software, a program that can adapt to any human8.function (natural language processing, image processing, or sound streams)better than a human, already exists in some labs. (Yes | No)Training deep learning networks has become a quick and easy task. (Yes | No)9.
Further readingMore on TensorFlow graphs and layers can be found here:

111Conceptual Representation
LearningArtificial intelligence has just begun its long tryst with human intellect. , GettingYour Neurons to Work, showed the possibilities of a CNN built with Keras. ,Applying Biomimicking to Artificial Intelligence, reproduced what humans use the most torepresent a problem: visualization.
Understanding cutting-edge machine learning, and deep learning theory only marks thebeginning of your adventure. The knowledge you have acquired should help you becomean AI visionary. Take everything you see as opportunities and see how it can fit in yourprojects. Reach the limits and skydive beyond them.
This chapter focuses on decision-making and visual representations and explains themotivation leading to conceptual representation learning (CRL) and meta models (MM),which form CRLMMs. I developed this CRLMM method successfully for automaticplanning and scheduling (APS) software (see , Automated Planning andScheduling) for corporate projects. I also used this CRLMM method for cognitive NLPchatbots (see , Cognitive NLP Chatbots, and , Improve the EmotionalIntelligence Deficiencies of Chatbots).
To plan, humans need to visualize necessary information (events, locations, and so on) andmore critical dimensions such as concepts. A human being thinks in mental images. When wethink, mental images flow through minds with numbers, sounds, odors, and sensations,transforming our environment into fantastic multidimensional representations similar tovideo clips.
Conceptual Representation Learning Chapter 11
[ 239 ]
The following topics will be covered in this chapter:
An approach to CRLMM in three steps: transfer learning, domain learning, andthe motivation for using CRLMM. Over the years, I've successfully implementedCRL in C++, Java, and logic programming (Prolog) in various forms on corporatesites. In this chapter, I used Python to illustrate the approach with the KerasConvolutional Neural Network (CNN) built in , Getting Your Neuronsto Work.Transfer learning using the Keras model trained in , Getting YourNeurons to Work, to generalize image recognition.Domain learning to extend image recognition trained in one field to anotherfield.Possible use of GANs (Generative Adversarial Networks) to produce CRLdatasets.The use (or not) of Autoencoders.
Technical requirementsPython 3.6x 64-bit from :
Packages and modules:

Conceptual Representation Learning Chapter 11
[ 240 ]
Programs in GitHub :
Check out the following video to see the code in action:
Generate profit with transfer learningWhen it comes to reasoning and thinking in general, we use mental images with somewords. Our thoughts contain concepts, on which we build solutions. The trained model of
, Getting Your Neurons to Work, can now classify images of a certain type. In thissection, the trained model will be loaded and then generalized through transfer learning toclassify similar images.
The motivation of transfer learningTransfer learning provides a cost-effective way of using trained models for other purposeswithin the same company, such as the food processing company described in ,Getting Your Neurons to Work. This chapter describes how this food processing companyused the model for other similar purposes.
The company that succeeds in doing this will progressively generalize the use of thesolution. By doing so, inductive abstraction will take place and lead to other AI projects,which proves gratifying to the management of a corporation and the teams providing thesolutions.
Inductive thinkingInduction uses inferences to reach a conclusion. For example, a food processing conveyorbelt with missing products will lead to packaging productivity problems. If insufficientamounts of products reach the packaging section, this will slow down the wholeproduction process.

Conceptual Representation Learning Chapter 11
[ 241 ]
By observing similar problems in other areas of the company, inferences from managerswill come up, such as, If insufficient amounts of products flow through the process, productionwill slow down.
Inductive abstractionThe project team in charge of improving efficiency in the company needs to find an abstractrepresentation of the problem to implement a solution through organization or software.This book deals with the AI side of solving the problem. Organizational processes need todefine how AI will fit in with several on-site meetings.
The problem AI needs to solveIn this particular case, each section of the factory has an optimal production rate definedper hour or per day, for example. The equation of an optimal production rate (OPR) perhour can be summed up as follows:
OPR : min(p(s))<=opr<=max(p(s))
Where:
p is the production rate of a given section (different production departments of afactory) s.p(s) is the production rate of the section.min(p(s)) is the historical minimum (trial and error over months of analysis).Under that level, the whole production process will slow down.max(p(s)) is the historical maximum. Over that level, the whole productionprocess will slow down as well.OPR is the optimal production rate.
The first time somebody sees this equation, it seems difficult to understand. The difficultyarises because one has to visualize the process, which is the goal of this chapter. Everywarehouse, industry, and service uses production rates as a constraint to reach profitablelevels.

Conceptual Representation Learning Chapter 11
[ 242 ]
Visualization requires representation at two levels:
Ensuring that if a packaging department is not receiving enough products, it willhave to slow down or even stop sometimes.Ensuring that if a packaging department receives too many products, it will notbe able to package them. If the input is a conveyor belt with no intermediatestorage (present-day trends), then it will have to be slowed down, slowing downor stopping the processes before that point.
In both cases, slowing down production leads to bad financial results and criticalsales problems through late deliveries.
In both cases, an OPR gap is a problem. To solve it, another level of abstraction is required.First, let's separate the OPR equation into two parts:
Now let's find a higher control level through variance variable v:
v min and v max are the absolute values of the variance in both situations (not enoughproducts to produce and too many to produce respectively).
The final representation is through a single control, detection, and learning rate (Greekgamma letter):
This means that the variance between the optimal production rate of a given section of acompany and its minimum speed (products per hour) will slow the following sectiondown. If too few cakes (vmin), for example, are produced, then the cake packagingdepartment will be waiting and stopping. If too many cakes are produced (vmax), then thissection will have to slow down or stop. Both variances will create problems in a companythat cannot manage intermediate storage easily, which is the case with the food processingindustry.
With this single parameter, , Getting Your Neurons to Work, Keras CNN, canstart teaching a fundamental production concept: what a physical gap is.

Conceptual Representation Learning Chapter 11
[ 243 ]
The gap conceptTeaching the CNN the gap concept will help it extend its thinking power to many fields:
A gap in production, as explained beforeA gap in a traffic lane for a self-driving vehicle to move intoAny incomplete, deficient areaAny opening or window
Let's teach a CNN the gap concept, or simply . To achieve that goal, the CNN Kerasmodel that was trained and saved in , Getting Your Neurons to Work, now needs tobe loaded and used. To grasp the implications of the concept, imagine the cost of notproducing enough customer orders or having piles of unfinished products everywhere. Thefinancial transposition of the physical gap is a profit variance on set goals. We all know thepain those variances lead to. Understanding and solving the -gap problem will constitutea primary goal in r 12, Automated Planning and Scheduling.
Loading the Keras model after trainingThe technical goal is to load and use the trained CNN Keras model and then use the samemodel for other similar areas. The practical goal is to teach the CNN how to use the concept to enhance the thinking abilities of the scheduling, chatbot, and other applications.
Loading the model has two main functions:
Loading the model to compile and classify new images without training themodelDisplaying the parameters used layer by layer and displaying the weightsreached during the learning and training phase
Loading the model to optimize trainingA limited number of headers suffice to read a saved model with , asimplemented in the following lines:

Conceptual Representation Learning Chapter 11
[ 244 ]
The model saved is now loaded from its file as shown here:
I used the function in the following code instead of to obtain a prettyprint formatted display of the model:
Reading the model is not a formality. The output of the program will help you train themodel. Each layer starts with a marker. In this case, indicates one of thelayers added. For example, in the following output provides vital information onthe parameters and additional options of that layer:

Conceptual Representation Learning Chapter 11
[ 245 ]
Each parameter contains very useful information. For example, means that padding has not been applied (no padding). In this model, the number and sizeof the kernels provide satisfactory results without padding and the shape decreases to thefinal status layer (classification) as shown here:
However, suppose you want to control the output shape of a layer so that the spatialdimensions do not decrease faster than necessary. One reason could be that the next layerwill explore the edge of the image and that we need to explore them with kernels that fit inthe shape.
In that case, a padding of size 1 can be added with values as shown in the followingmatrix:
0 0 0 0 0 0
0 1 3 24 4 0
0 3 7 8 5 0
0 6 4 5 4 0
0 5 4 3 1 0
0 0 0 0 0 0
A padding of size 2 would add two rows and columns around the initial shape.

Conceptual Representation Learning Chapter 11
[ 246 ]
With that in mind, fine-tuning your training model by adding as many options as necessarywill improve the quality of the results. The weights can be viewed by extracting them fromthe saved model file layer by layer, as shown in the following code snippet:
Analyzing the weights used by the program will provide useful information about the waythe optimizing process was carried out by the program. Sometimes, a program will getstuck, and the weights might seem off track. After all, a CNN can contain imperfections likeany other program.
A look at the following output, for example, can help understand where the system wentwrong:
Much has been written about how to build CNNs and little about how tomaintain them. This program provides one of the many tools to repairproblems.
Loading the model to use itLoading the model with to use it requires more headers. Iplayed it safe and loaded whatever would be needed to save the time otherwise spent incrashing and looking for imports as shown here:

Conceptual Representation Learning Chapter 11
[ 247 ]
Loading the file and weights is done by using the same code as inthe described previously. Once you load it, compile the model withthe function, as follows:
The model used for this case study and the image identification function has beenimplemented in two parts. First, we're loading and resizing the image with the followingfunction, for example:
Keras expects another dimension in the input array to predict, so one is added to fit themodel. In this case study, one image at a time needs to be identified. These little details aretime-savers in the development phase.
I added the following two prediction methods and returned one:

Conceptual Representation Learning Chapter 11
[ 248 ]
Two prediction methods are there because, basically, every component needs to be checkedin a CNN during a project's implementation phase to choose the best and fastest ones. Totest , just change the instruction.
Once a CNN is running, it can prove difficult to find out what wentwrong. Checking the output of each layer and component while buildingthe network saves fine-tuning time once the full-blown model producesthousands of results.
The following example detects product gaps on a conveyor belt in a food processingfactory. The program loads the first image stored in the directory to predict itsvalue. The program describes the prediction:
The program displays (optional) the shaped image, such as the following frame, whichshows that the conveyor belt has a sufficient number of products at that point:
The program then makes and displays its prediction , meaning no real gap has been foundon the conveyor belt on this production line:

Conceptual Representation Learning Chapter 11
[ 249 ]
means it is going to analyze the second image in the classify direction. Itloads, displays, and predicts its value as shown in the following frame:
The prediction (value = 1) correctly detected gaps on the conveyor belt, as shown in thefollowing output:
Now that the predictions of the CNN have been verified, the implementation strategyneeds approval. A convolutional neural network contains marvels of applied mathematics.CNNs epitomize deep learning in themselves. A researcher could easily spend hundreds ofhours studying them.
However, applied mathematics in the business world requires profitability. As such, thecomponents of CNNs appear as ever-evolving concepts. Added kernels, activationfunctions, pooling, flattening, dense layers, and compiling and training methods act as astarting point for architectures, not as a finality.
At one point, a company will demand results or shelve the project. If a spreadsheetrepresents a faster and a sufficient solution, a deep learning project will face potentialcompetition and rejection. Many engineers learning artificial intelligence will have toassume the role of standard SQL reporting experts before accessing real AI projects.
Transfer learning appears as a solution to the present cost of building and training a CNNprogram. Your model might just pay off that way. The idea is to get a basic AI modelrolling profits in fast for your customer and management. Then you will have everybody'sattention. To do that, you must define strategies.

Conceptual Representation Learning Chapter 11
[ 250 ]
Defining the strategyIf a deep learning CNN expert, for example, our friend Pert Ex, comes to a top managersaying that this CNN model can classify CIFAR-10 images of dogs, cats, cars, plants, andmore, the answer will be, So what? My 3-year-old child can too. In fact, so can my dog!
The IT manager in that meeting might even blurt out something like, We have all the decisiontools we need right now, and our profits are increasing. Why would we invest in a CNN?
The core problem of marketing AI to real-world companies is that it relies upon the belief inthe necessity of a CNN in the first place. Spreadsheets, SQL queries, standard automation,and software do 99% of the job. Most of the time, it does not take a CNN to replace manyjobs; just an automated spreadsheet, a query, or standard and straightforward software isenough. Jobs have been sliced into simple-enough parts for decades to replace humans withbasic software.
Before presenting a CNN, Pert Ex has to find out how much the company can earn usingit. Pert has found an area with a quick win to show the power of the system in a cost-effective way.
Understanding, designing, building, and running a CNN does not meanmuch regarding business. All the hard work we put in to understandingand running these complex programs will add up to nothing if we cannotprove that a solution will generate profit. Without profit, theimplementation costs cannot be recovered, and nobody will listen to apresentation about even a fantastic program.
Pert Ex describes the example in the previous section applied to this food processingcompany.
Applying the modelAt the food processing company, one of the packaging lines has a performance problem.Sometimes, randomly, some of the cakes are missing on the conveyor belt, as shown in thefollowing frame:
Conceptual Representation Learning Chapter 11
[ 251 ]
Pert explains that to start a cost-effective project, a cheap webcam could be installed overthe conveyor belt. It'll take a random sample picture every 10 seconds and process it to findthe holes as shown in the interval between the two blue lines. If a hole is detected, it meanssome cakes have not made it to the conveyor belt (production errors).
Pert estimates that a 2% to 5% productivity rate increase could beobtained by automatically sending a signal to the production robot whensome cakes are missing.
The CEO decides to try this system out and approves a prototype test budget.
Making the model profitable by using it for anotherproblemThe food processing experiment on the conveyor belt turns out to work well enough withdataset type d1 and the CNN model M to encourage generalization to another dataset, d2, inthe same company.
Transfer learning consists of going from M(d1) to M(d2) using the same CNN model M, withsome limited, cost-effective additional training. Variations will appear, but they will besolved by shifting a few parameters and working on the input data following some basicdataset preparation rules:
Overfitting: When the model fits the training data quickly with 100% accuracy,this may or not be a problem. In the case of classifying holes on the conveyor,belt overfitting might not prove critical. The shapes are always the same and theenvironment remains stable. However, in an unstable situation with all sorts ofdifferent images or products, then overfitting will limit the effectiveness of asystem.Underfitting: If the accuracy drops down to low levels such as 20%, then theCNN or any other model will not work. The datasets and parameters needoptimizing. Maybe the number of samples needs to be increased for M(d2), orreduced, or split into different groups.Regularization: Regularization, in general, involves the process of finding howto fix the generalization problem of M(d2), not the training errors of M(d2). Maybean activation function needs some improvements, or the way the weights havebeen implemented require attention.

Conceptual Representation Learning Chapter 11
[ 252 ]
There is no limit to the number of methods you can apply to find a solution, just likestandard software program improvement.
Transfer learning can be used for similar types of objects, or images in this case asexplained. The more similar images you can train within a company with the same model,the more the return on investment (ROI) it will produce and the more this company willask you for more AI innovations.
Domain learning takes a model such as the one described in , Getting yourNeurons to Work, and that describe in this chapter to generalize it. The generalizationprocess will lead us to domain learning.
Domain learningThis section on domain learning builds a bridge between classic transfer learning, asdescribed previously, and another use of domain learning I found profitable in corporateprojects: teaching a machine a concept (CRLMM). The chapter focuses on teaching amachine to learn to recognize a gap in situations other than at the food processingcompany.
How to use the programsYou can read the chapter first to grasp the concepts, or play with the programs first. In anycase, loads trained models (you do not have to train them againfor this chapter) and trains the models.
The trained models used in this sectionThis section uses to apply the trained models to the target conceptimages. (as shown previously) was convertedinto by adding variable directory paths (for the filesand images) and classification messages, as shown in the following code:

Conceptual Representation Learning Chapter 11
[ 253 ]
Each subdirectory contains four subdirectories:
: Contains the images to classify: The trained used to classify the images
: The test set of conceptual images: The training set of conceptual images
, Getting Your Neurons to Work, describes the whole process.
The training model programFor this chapter, you do not need to train the models; they were already trainedusing . This program is an extension of the training program in
, Getting Your Neurons to Work. The directory paths have become variables toaccess the subdirectories described previously. The paths can be called, as shown in thefollowing code:
You do not need to use this program for this chapter. The models were trained andautomatically stored in their respective subdirectories on the virtual machine deliveredwith the book.
For this chapter, focus on understanding the concepts. You can read thechapter without running the programs, open them without running them,or run them, whatever makes you comfortable. The main goal is to graspthe concepts to prepare for the subsequent chapters.
GAP loaded or unloadedIn , Automated Planning and Scheduling, CRLMM will be applied to automaticplanning and scheduling (APS). When planning in general, in a factory for example, a keyconcept of a gap is unloaded, loaded.

Conceptual Representation Learning Chapter 11
[ 254 ]
Set the scenario to 0 in to run this conceptualmodel: .
The gap concept has just become a polysemy word concept (polysemy means differentmeanings; see , Revolutions Designed for Some Corporations and DisruptiveInnovations Small to Large Companies).
In the cake situation, the gap was negative in its g1 subset of meaning and conceptsapplied to a CNN, relating it to negative images n+g1:
ng1={missing, not enough, slowing production down...bad}
The full-of-products image was positive, p+g2:
pg2={good production flow, no gap}
In this example, the CNN is learning how to distinguish an abstract representation, not animage like for the cakes. Another subset of (gap conceptual dataset) is loaded/unloaded.
The following abstract image is loaded. The squares represent some kind of productionmachine and the arrows represent the load-in time. This means that the x axis representstime and the y axis represents machine production resources.

Conceptual Representation Learning Chapter 11
[ 255 ]
The CNN model runs and produces the following result:
The CNN recognizes this as loaded. The task goes beyond classifying. The system needs torecognize this to make a decision.
Another image produces a different result. In this case, an unloaded gap appears in thefollowing screenshot:
And the CNN has a different output, as shown here:
The gap concept has added two other subsets, g3 and g4, to its dataset. We now have:
={ng1,g2,g3,g4...gn}

Conceptual Representation Learning Chapter 11
[ 256 ]
The four g1 to g4 subsets of are:
ng1={missing, not enough, slowing production down...bad}
pg2=pg2={good production flow, no gap}
g3={loaded}
g4={unloaded}
The remaining problem will take some time to solve. g4 (gap) can sometimes represent anopportunity for a machine that does not have a good workload to be open to moreproduction. In some cases, g4 becomes pg4(p = positive). In other cases, it will become ng4(n=negative) if production rates go down.
As in , Revolutions Designed for Some Corporations and Disruptive Innovations forSmall to Large Companies, the context had become strategic when a bus (coach) broke downand the translation came out as a trainer (coach) and not as a vehicle. The problem in thesesituations relies on the fact that additional input information is required. More words willnot help. CRLMM will bring additional concepts into the model.
GAP jammed or open lanesA self-driving car needs to recognize whether it is in a traffic jam or not. Also, the self-driving car has to know how to change lanes when it detects enough space (a gap) to dothat.
This produces two new subsets:
g5={traffic jam, heavy traffic...too much traffic}
g6={open lane, light traffic...normal traffic}

Conceptual Representation Learning Chapter 11
[ 257 ]
The model now detects g5 (traffic jam), as shown in the following screenshot:
The following output appears correctly:
g6 comes out right as well, as shown in this screenshot:

Conceptual Representation Learning Chapter 11
[ 258 ]
A potential lane change has become possible, as detected by the following code:
The gap datasetAt this point, the (gap conceptual dataset) has begun to learn several subsets:
={g1,g2,g3,g4,g5,g6}
In which:
ng1={missing, not enough, slowing production down...bad}
pg2=pg2={good production flow, no gap}
g2={loaded}
g3={unloaded}
pg4={traffic jam, heavy traffic...too much traffic}ng5={open lane, light traffic...normal traffic}
Notice that g2 and g3 do not have labels yet. The food processing context provided thelabel. Concept detection requires a context, which CRLMMs will provide.
Generalizing the (gap conceptual dataset)The generalization of (gap conceptual dataset) will provide a conceptual tool for meta-models.

Conceptual Representation Learning Chapter 11
[ 259 ]
(gap conceptual dataset) refers to negative, positive, or undeterminedspace between two elements (objects, locations, or products on aproduction line).
(gamma) also refers to a gap in time: too long, not long enough, too short, or not shortenough.
represents the distance between two locations: too far or too close.
represents a misunderstanding or an understanding between two parties: a divergence ofopinions or a convergence.
All of these examples refer to gaps in space and time viewed as space.
Generative adversarial networksUsing GANs to generate concept-word images can boost the production CRL datasets andproduce millions of concept-word images. No single solution will suffice. CNNs can do thejob; GANs can also.
Suppose the gap concept needs to be generalized to thousands of situations. Millions ofimages with words could be analyzed and automatically stored in a dataset, with tens ofthousands of image-word concepts of gaps.
A GAN could be built in a few lines with the following components:
Input data for the generatorThe generatorReal data inputA discriminator (detects fake data from real data)An optimizer (training)

Conceptual Representation Learning Chapter 11
[ 260 ]
The network starts by inputting real data and fake data (with the generator), as shown inthe following diagram:
The discriminator function accepts or rejects the generated data. If the data is rejected, thenwe are back to known territory (see , Getting Your Neurons to Work) with cross-entropy to measure the loss and an Adam optimizer, for example.
The system will train until it distinguishes right images from fake images like othernetworks.
What makes GANs interesting is the fact that the generator data has nodirect connection with the real data.
It has to go through the discriminator and be trained if it's wrong. Furthermore, thegenerated data can be labeled with accurate or inaccurate labels although the real data iscorrectly labeled.
A GAN can be used to generate the large datasets required for CRLMMs. The real datacould be a set of images with the correct word vectors. The generator could then producemillions of images and labels that the discriminator would work on. The accuratelygenerated datasets could be stored in a CRL repository.

Conceptual Representation Learning Chapter 11
[ 261 ]
A GAN can be implemented in a few lines of code in TensorFlow, for example. The Furtherreading section at the end of the chapter provides links that detail this simple but effectivetype of network.
The use of autoencoders must be explored although not recommended for the generation ofa conceptual learning dataset.
Data compression has become a part of our daily life through MP3 algorithms, for example.Autoencoding in machine learning is a data compression algorithm.
It takes the original data, compresses it, and can then reconstruct it:
Original inputThe encoder compresses the data (compressed representation)The decoder reconstructs the dataThe reconstructed output is produced
They were used for CNNs at a time for data representations. But as shown in ,Getting Your Neurons to Work, random weight initialization scenarios are as effective if notmore reliable and flexible.
Two main limitations of autoencoders have restrained their use:
Autoencoders need to be trained on specific data. Being data-specific makestransfer learning tedious.The decompressed output is not 100% reliable. They are lossy, which means thatinformation is lost during the encoding-decoding phase, unlike standard losslesscompression algorithms.
Autoencoders can be used in some cases of dimensionality reduction for data visualizationand data denoising.
Beyond that, present-day random weight initialization methods are favored for CNNapplications.

Conceptual Representation Learning Chapter 11
[ 262 ]
The motivation of conceptual representationlearning meta-modelsA CRLMM converts images into concepts. These abstract concepts will then be embeddedin vectors that become logits for a softmax function and in turn be converted intoparameters for complex artificial intelligence programs such as :
Automated planning and scheduling (see , Automated Planning andScheduling)Cognitive NLP Chatbots (see , Cognitive NLP Chatbots, and
, Improve the Emotional Intelligence Deficiencies of Chatbots)
At one point, in some artificial intelligence projects, dimension reduction does not producegood results. When scheduling maintenance on airplanes, rockets, and satellite launcher,for example, thousands of features enter the system without leaving any out. A singlemissing screw in the wrong place can create a disaster.
The curse of dimensionality The features for a given project can reach large numbers. The following example contains1,024 dimensions:

Conceptual Representation Learning Chapter 11
[ 263 ]
In , Getting Your Neurons to Work, and , Applying Biomimicking toArtificial Intelligence, kernels and pooling reduced the number of dimensions to extract keyfeatures. With those key features in tensors, arrays and/or vectors, classification andprediction processes are possible. This process produces effective results in many areas.
The limit of this approach occurs when the result does not reach expectations, such as insome of the cases we will discover in the following chapters. In those cases, CRLMMs willincrease the productivity of the solution providing a useful abstract model.
When a solution requires a large number of unreduced dimensions, kernels, pooling, andother dimension reduction methods cannot be applied. CRLMMs will provide a pair ofglasses to the system.
The blessing of dimensionality In some projects, when the model reaches limits that comprise a project, dimensionality is ablessing. Let's focus on three examples described in the next chapters: scheduling, chatbots,and self-driving cars.
An artificial neural network (ANN) system built on dimension reduction might sometimesbe seriously underfitted. As long as it was trained with ready-to-use datasets (MNIST,CIFAR, and others), the system worked fine. It even ran perfectly on small datasets.
Then all of a sudden, on the first week in the food processing industry, for example, itmistakes a positive gap (an available resource) for a negative gap (not enough production).
For example, since a gap meant missing products for several days, the AI system wronglypredicted a negative gap when it was not supposed to. In this circumstance, this was adeliberate choice of the management to slow production down due to resource shortages(see , Automated Planning and Scheduling). Dimensionality enhancements willsolve the problem.
Humans reduce the number of possibilities of a problem with logic and inbuilt decisiontrees. Machines can beat humans in some forms of computation with no logic at all usingrandom memoryless algorithms (MDP; see , Become an Adaptive Thinker).However, present-day deep learning networks, however innovative they are, reduce thedimensions of representation, layer by layer. They flatten them out, drop out informationand more to reach a result.

Conceptual Representation Learning Chapter 11
[ 264 ]
The future of AI will no doubt rely on increasing the number of dimensions waybeyond human limits and performing powerful calculations without present-daylevels of reduction. Today's state-of-the-art is tomorrow's past. Blow thenumber of dimensions up to indefinite numbers when it is necessary andpossible!
Most NLP algorithms use probabilities to predict the next words. Or they use presetsentences to answer questions without analyzing the real meaning.
This means building systems that guess, sometimes effectively, sometimes with errors. Inany case, they do not think. Many applications produce good results with statisticalapproaches. But for some projects, customizing a chatbot comes in handy.
For example, imagine that somebody is speaking to you in a language you do not know atall. You have the inbuilt ability of present NLP algorithms to predict representationsthrough statistics on your smartphone.
Although you do not understand a single word, you produce words, statistically, that couldfit the situation. For isolated words and simple sentences, you are doing well.
Then all of a sudden, the person frowns. You are totally off track, like many NLP systemstoday. The person is astonished by your ability to speak and has just said in French, forexample, "tu as la patate!"
You understand what Google Translate tells you: "You have the potato!" You have a bigquestion mark on your face. The other person frowns. Oops!
You just spoke in body language: your question mark, the person's frown. Body languageconstitutes a major part of real communication between humans. Body language needs tobe compensated for with empathy as we will explore in the chatbot chapters.
In the meantime, in French colloquial or slang language potate means pep (lots of energy) inEnglish.
Classifying documents, finding keywords, and doing first-level translations (see ,Revolutions Designed for Some Corporations and Disruptive Innovations for Small to LargeCompanies) is one thing; building a smart chatbot beyond language statistics whennecessary is another. A CRLMM solution will provide a deeper interaction between asystem and humans such as described in the chatbot chapters.

Conceptual Representation Learning Chapter 11
[ 265 ]
Self-driving cars will progressively drive everywhere for everything. In the meantime,accidents caused by self-driving cars grab the headlines. Let's imagine some solutions tohelp them avoid accidents and improve maintenance problems with small but effectiveCRLMM enhancements.
Humans increase dimensionality to solve problems, find new ideas, clearmisunderstandings up, and adapt.
The CRLMMs built as add-ons on the awesome tools we all have access to, give us theopportunity to push the limits of AI further every day.
SummaryIn this chapter, the Convolution Neural Network (CNN) architecture built in ,Getting Your Neurons to Work, was loaded to classify physical gaps in a food processingcompany.
Then the trained models were applied to transfer learning by identifying similar types ofimages. Some of these images represented concepts that lead the trained CNN to identify concept gaps.
concept gaps were applied to different fields using the CNN as a training andclassification tool in domain learning.
concept gaps have two main properties: negative n-gaps and positive p-gaps. Todistinguish one from the other, a CRLMM provides a useful add-on. In the food processingcompany, installing a webcam on the right food processing conveyor belt provided acontext for the system to decide whether the gap was positive or negative.
With these concepts in mind, let's build a solution for advanced planning and scheduling(APS) in the next chapter.

Conceptual Representation Learning Chapter 11
[ 266 ]
QuestionsThe curse of dimensionality leads to reducing dimensions and features in1.machine learning algorithms. (Yes | No)Transfer learning determines the profitability of a project. (Yes | No)2.Reading model.h5 does not provide much information. (Yes | No)3.Numbers without meaning are enough to replace humans. (Yes | No)4.Chatbots prove that body language doesn't mean that much. (Yes | No)5.Present-day ANNs provide enough theory to solve all AI requests. (Yes | No)6.Chatbots can now replace humans in all situations. (Yes | No)7.Self-driving cars have been approved and do not need conceptual training. (Yes |8.No)Industries can implement AI algorithms for all of their needs. (Yes | No)9.
Further readingMore on convolutional networks:
A Keras introduction to autoencoders:
More on GANs:

112Automated Planning and
SchedulingAmazon is one of the world's leading e-retailers, with sales exceeding US$ 170 billion US.Amazon's e-store sales exceed all of their other activities, such as AWS subscription services(premium, for example), retail third-party seller services, and physical stores.
This chapter focuses on Amazon Fashion, one of Amazon's web stores for which Amazonrecently registered a patent. Prime Wardrobe even offers a try-and-easy-return service. Thisnew activity requires planning and scheduling. Amazon took the matter seriously andregistered a patent for an apparel manufacturing system to control the production processof its apparel products.
Artificial intelligence already plays a role in automatic planning andscheduling in the apparel business, from customer order to delivery.
Recently, Google through its DeepMind projects is also working on improving theDeep Q-Network (DQN), a system that can beat humans at video games.
This chapter unites both systems with an innovation for the apparel manufacturingindustry and adds a Conceptual Representation Learning Meta Model (CRLMM) toDQN. Going from scratch to a prototype that could be implemented on site, thefoundations are being set for more applications in the coming chapters.
The following topics will be covered in this chapter:
Further generalization of the CRLMM described in , ConceptualRepresentation Learning, applied to an apparel production processFeeding the CRLMM Convolutional Neural Network (CNN) with a simulationof frames coming from a webcam on a production line

Automated Planning and Scheduling Chapter 12
[ 268 ]
Introducing an optimizer that will use weights applied to production stations toinput a reward matrix to a Markov Decision Process (MDP), which will thenupdate the weightsBuilding a program that will run continuously (no beginning, no end) on aproduction line using all the three components mentioned previously
Technical requirementsPython 3.6x 64-bit from .
Packages and modules:
GitHub :
Check out the following video to see the code in action:

Automated Planning and Scheduling Chapter 12
[ 269 ]
Planning and scheduling today andtomorrowWhen Amazon decided to launch Prime Wardrobe, it brought a new service to itscustomers. The customer can establish a purchase plan, the list of tasks to carry out:
Fill a box with clothing, for exampleTry the clothing at homeReturn the clothing if it does not fitPurchase the items that are kept
Once the customer agrees to follow this plan, the time sequence becomes crucial:
First, a box must be chosenThen there is a delivery timeThen there is a trying time (you cannot try the products forever)Finally, the customer has a purchase time
Whether Amazon Prime Wardrobe will remain a service in the years to come or not, theprecedent is set; just as physical bookstores disappear every year, shopping for clothingonline will continue its progression.
On top of that distribution, corporations will continue to expand their own production sitesto become manufacturing-distributing giants. Warehouses will progressively replace manystores as per the warehouse examples provided in some of the chapters in this book.
Supply Chain Management (SCM) combined with APS has become a necessity.Blockchains ensure the transactions (see , Optimizing Blockchains with AI) andthis technology will only expand with these trends.
SCM-APS constraints (depending on the manufacturer) have encouraged Amazon toproduce its own clothing. Amazon has produced its own in-house fashion labels withapparel and accessories sold worldwide.
To prove that it means business, Amazon registered patents for a blended reality mirror, anapparel manufacturing system, and more. This way a person can actually visualize how theclothing will fit.

Automated Planning and Scheduling Chapter 12
[ 270 ]
We will explore the planning and scheduling side of Amazon's apparel in-housemanufacturing plans which will have the same effect on apparel factories as it did onphysical bookstores and all types of shops. Many new jobs will emerge, such as hundredsof thousands of jobs in the artificial intelligence business, on websites, and in marketingand SCM. Many jobs will disappear as well. The improvement made will boost medicalprogress and also the defense industry. The social and economical implications are beyondthe scope of this book and possibly beyond our comprehension as in all disruptive eras inthe past.
We will focus in depth on the main aspects of Amazon's patented custom clothing process.As mentioned before, whether it turns into a success or not, the precedent is set.
A real-time manufacturing processThe key concept in Amazon's approach is real-time. Pushing the physical limits of centuriesof commerce, Amazon's brand takes the manufacturing process right beyond the cuttingedge.
Amazon must expand its services to face competitionAmazon could have continued to purchase products from its suppliers and notmanufacture them. Instead of using artificial intelligence to solve the conveyor beltproblem, several sensors could be installed with traditional software solutions.
Mankind could also have continued to use horses instead of cars and paper instead ofcomputers. However, once a disruptive innovation has been successfully launched by acompany, competition must either follow or disappear. Amazon needs to get involved inmanufacturing somehow with this apparel manufacturing patent, 3-D printers, and otherinnovations in order to increase its productivity.
Artificial intelligence needs to be confronted with difficult industrial problems to improveits experience and progress to achieve higher machine learning levels and meet greaterchallenges.
A real-time manufacturing revolutionArtificial intelligence software, though spectacular, is not the only revolution changing ourlives forever. Real-time is a strong force that will change every process in the world.

Automated Planning and Scheduling Chapter 12
[ 271 ]
Apparel manufacturing and manufacturing, in general, follow an advanced planning andscheduling process today. Amazon's manufacturing department, just like Elon Musk's Teslaself-driving cars (see , AI and The Internet of Things (IoT), and
, Optimizing Blockchains with AI), require automated planning and scheduling, notadvanced planning and scheduling.
The fundamental difference between the two systems relies on the time factor as shown inthe following comparison table. The difference between an advanced and an automatedsystem seems small but Amazon, like others, will change the course of history with thosedifferences. Both systems, in theory, can do both types of tasks. In practice, these methodswill specialize in the years to come:
A plan consists of processes preparing production for the future: purchasingmaterial components and adapting human resources and physical resources.Amazon, for example, has a yearly business plan: putting together the necessaryresources in advance in order to be ready for production. This means purchasingor building warehouses, hiring employees, and purchasing basic materialresources (boxes, labels, and other components).Scheduling confronts the plan with the time factor on a shorter horizon.Scheduling determines when each part of the plan will come first and beproduced. For example, now that the warehouse is built or purchased (plan), atwhat time (schedule) should the packaging start working next Monday and forthe weeks to come?
A schedule can be seen as a zoomed version of a plan.
If somebody walks into Jeff Bezos' office with a plan to build a warehouse at a givenlocation with the cost and general timing of the implementation, that is fine.
Then, that person might (I suggest not!) say: The plan is great since it will be ready in 10months. But I'm worried about the daily schedule in 1 year of shift #2. Should they start at 7:30 amor 7:45? Jeff Bezos will not be listening anymore. That zoom level is not part of his jobdescription. He has to focus on a higher level.

Automated Planning and Scheduling Chapter 12
[ 272 ]
The trend of automated planning and scheduling is becoming a time-squashed version ofadvanced planning and scheduling. The figures in the following table do not reflect theexact numbers but the trends:
Function Advanced planning andscheduling
Automated planning andscheduling
Long-term plan 1 month to 5 years A few days to less than amonth
Short-term plan 1 day 1 minute
Production or event measurement Taken into account on a dailybasis in general Real-time
Scheduling An hour to 1 week Real-time
Re-planning when there is a problem 1 hour to 1 month Real-time
Re-scheduling 1 hours to 1 week Real-time
Resource adjustment 1 day to 1 month Real-time
Load balancing 1 hour to 1 week Real-time
Automatic functions of planning andscheduling 80% 99%
Although this table contains approximate information, the underlying trend is extremelystrong.
An advanced planning and scheduling system mostly imports data fromERPs to make plans in the future. An automated planning and schedulingprogram mostly detects data with sensors to react and optimize in realtime. The present chapter deals with automated planning programs, notadvanced planning and scheduling systems.
Think of the evolution between an advanced APS and an automated APS as a logisticsigmoid function applied to planning-scheduling time squashing. Here are some examples:
The advanced plan to manufacture a car spans a month to a yearThe Google Maps itinerary automated plan for a self-driving car at its startingpoint: a few seconds to a minute depending on the connection status of thatlocationThe schedule to manufacture a car: 1 day to 1 monthThe schedule to pilot a self-driving car following the Google Map itineray=realtime

Automated Planning and Scheduling Chapter 12
[ 273 ]
To sum it up, the present trend represents a revolution in the history of human processes.
Amazon's manufacturing patent reflects the revolution of real-timeapplied to every field.
Planning in advance has moved up to planning in real time as shown in the followingequation.
In which:
x is a quantity to produce or any unit eventtx is the time (t) it takes for x to start and endA logistic function squashes tx
(lambda) is the learning factor; the more a task is carried out, the more it isoptimized
Xt is the total weight of a group of n tasks at a given time t:
Xt={x1,x2,x3...xn}
The difference between Xt and Z(Xt) is:
Xt is the actual time it takes to produce productsZ(Xt) is not the actual time it takes. Z(Xt) is the result of an activation functionthat squashes times as an output of Xt in a DQN-CRLMM network. Z(Xt) is aweighting factor.
The key to reducing the weighting factory further is a physical production process andother physical events (outputs, for example), that I call lambda: all the improvements inreal-life production that can reduce the production cycle as well as the natural events suchas production output.

Automated Planning and Scheduling Chapter 12
[ 274 ]
In , Conceptual Representation Learning, was introduced to reduce gaps. In thischapter, will be generalized a step further to optimize (lambda)
This means a DQN-CRLMM system will optimize a manufacturing process.
CRLMM applied to an automated apparelmanufacturing processWith an automated planning and scheduling system, not an advanced planning andscheduling system, Amazon has brought apparel manufacturing closer to the consumer.
Artificial intelligence will boost existing processes. In this section, a DQN-CRLMM willoptimize an apparel manufacturing process.
An apparel manufacturing processAmazon's apparel manufacturing patent can be summed up as follows:
P1: Grouping apparel customer orders by products and sizes. This process isaround since the origins of industrial apparel manufacturing centuries ago.P2: Automatically cutting lays (such as cutting a circle in several pieces of paperat the same time). P3: Moving the packs of the parts of clothing to the assembly lines on conveyorbelts (see , Conceptual Representation Learning).P4: Other operations depending on the products (packaging or printing or other).P5: Storing and optimizing the distribution process through warehouses anddeliveries and many more processes (tracking and data analysis, for example,finding late deliveries and optimizing their routes).

Automated Planning and Scheduling Chapter 12
[ 275 ]
The following figure represents the production flow at an apparel manufacturing company.First, the fabric is cut; then it is stacked in piles and sent by a conveyor belt to sewingstations to assemble the clothing:
A webcam is set up right over P3, the conveyor belt. The following image represents thewebcam above the conveyor belt:
The webcam freezes a frame (within the red rectangle) every n seconds. The frame isthe input of the CRL-CNN described later.
This image is a representation of the concepts. In reality, the webcam might be located atthe beginning of the conveyor belt or even over the output of the cutting process. For thepurpose of the prototype in this chapter, just keep in mind that every n seconds a frozenframe is sent to the trained CNN.

Automated Planning and Scheduling Chapter 12
[ 276 ]
This P1 to P5 flowchart provides a general idea of an apparel manufacturing process. In areal-life company, many more processes are required: market studies, designing products,testing prototypes, adding manufacturing processes for jeans (making holes with a laser,for example), and much more.
Every process described so far was individually invented 30+ years ago, includingautomatic cutting and conveyor belts applied to the apparel business. What's newhere? comes up in the minds of many apparel experts reading about Amazon. And that isthe mind trap! Thinking that Amazon's apparel patent does not contain new components.
Time squashing is the innovation. Bringing manufacturing closer to the consumer in near-real time is a revolution that will become disruptive. Add 3-D printers to the timesquashing equation and you will easily picture the future of our consumermarkets. However, artificial intelligence has the right to enter the optimizing competition aswell.
To illustrate this, let's build an AI model that optimizes P3, the conveyor belt. Manysolutions already exist as well, but DQN can most probably beat them just as it will inmany fields.
The first step is to generalize the model described in , ConceptualRepresentation Learning, a bit further. Then the DQN-CRLMM can be built.
Training the CRLMMIn , Getting Your Neurons to Work, and , Conceptual RepresentationLearning, the CRLMM program was trained to identify gaps inoutputs on the conveyor belt of a food processing factory. , ConceptualRepresentation Learning, introduced CRLMMs using (gap concept) to illustrate one.
In the previous, chapters, conceptual subsets around (gap concepts) were designed asfollows:
={g1,g2,g3,g4,g5,g6} which contains pgi (p=positive) and ngi(n=negative subsets)ng1 is a subset of ; ng1={missing, not enough, slowing production down...bad},pg2 is a subset of ;pg2=pg2={good production flow, no gap}g2={loaded}g3={unloaded},pg4={traffic jam, heavy traffic...too much traffic}ng5={open lane, light traffic...normal traffic}

Automated Planning and Scheduling Chapter 12
[ 277 ]
needs to be trained to recognize in an apparel productionenvironment as well as remember how to recognize former concepts:
The cutting section P2(A and B) output of apparel packs flowing on a conveyorbelt (P3)Remember know how to classify the cakes of the food processing company toteach the model to recognize more situations.Remember how to perform a traffic analysis (see , ConceptualRepresentation Learning)Learn how to be able to classify an abstract representation of a gap
Generalizing the unit-training datasetTo generalize the unit training dataset, six types of images were created. Each imagerepresents a webcam frame taken over a conveyor build every n seconds. Four images arefigurative in the sense of figurative painting. Two images bring the CRLMM program to ahigher level of abstraction, which will be applied to cognitive chatbots ( ,Cognitive NLP Chatbots, and , Improve the Emotional Intelligence Deficiencies ofChatbots) with further training.
In the food processing industry example (see , Getting Your Neurons to Work, and, Conceptual Representation Learning), a gap on the conveyor built was most often
negative, a negative gamma= n .
The following frame shows that the first line of production is complete but not lines twoand three:

Automated Planning and Scheduling Chapter 12
[ 278 ]
On the contrary, with approximately no gaps, the load on the conveyor built was viewed aspositive, a positive gamma= p .
The following frame shows that there is an acceptable number of products per line:
A gap in an apparel conveyor belt process is most often undetermined. This constitutes amajor optimization problem in itself. Naturally, if the conveyor belt is empty or totallysaturated, the variance will attract the attention of a human operator. However, most of thetime, optimization solves the problem.
The following frame shows a relatively well-loaded production flow of apparel packs ofpieces of clothing to be assembled (by sewing them together) further down the line:

Automated Planning and Scheduling Chapter 12
[ 279 ]
The following frame clearly shows a gap, meaning that the quantity that will be sent to asewing station will not be high:
Several observations are necessary to optimize this problem:
The conveyor built real-time problem excludes running an advanced planningand schedulingThis problem requires real-time automated planning and schedulingThe automated planning and scheduling solution will have to both plan andschedule in real timeIt will take planning constraints into account (as explained in the followingsections) to predict outputs It will take scheduling constraints into account to optimize the sewing sections
Amazon and others have slowly but surely brought many planninghorizon problems (longer) down to shorter scheduling horizons, pushingthe limits of SCM further and further.
The gaps shown have negative or positive properties depending on the context. TheCRLMM model now has to learn a metaconcept, an abstract representation of all the gapsmentioned up to now. These gaps are all flow gaps of one sort or the other. Something ismoving from one point to another in small packs. The packs, so are often not the same sizeand gaps form.

Automated Planning and Scheduling Chapter 12
[ 280 ]
These concepts can be applied to cattle herds, horse races, team sports attacks (football,soccer, rugby, basketball, handball, and other fields), Olympic races, marathons, conveyorbelts, and much more, as will be detailed in the chatbot in , Cognitive NLPChatbots, and , Improve the Emotional Intelligence Deficiencies of Chatbots.
When the packs in the flow are close to each other, an individual mental image comes up.Each person has a customized version. The following image is a generalized representationof a no gap concept:
Then the packs have leaders and followers, then an abstract representation comes up aswell. The following image shows a generalized representation of a gap concept:
Humans do not have a flow detection gap function for each thing they are observing.Humans have one brain that contains physical memories or other datasets, but moreimportantly, they have abstract datasets.
Every single of us billions of thinking bipeds have extremely efficient abstract datasets. Themeta-concept shown before means that through inferences, a human has a central meta-concept with a dataset of memories that fit with it through experience.

Automated Planning and Scheduling Chapter 12
[ 281 ]
A meta-model uses these datasets. The dataset in the directory "dataset" contains thebeginning of a CRLMM system. The program will learn what a flow gap is and then apply towhat it sees by analyzing the context.
This goal of this dataset leads to a CLR-MM, as explained in the following sections inwhich:
The abstract learned meta-concept is applied to a situation, in this case, a frame.The CRLMM then determines whether it is a gap or no gap situation.The CRLMM then makes a decision using a thinking optimizer based on adecision weight orientated activation function. This means that it is more than amathematical squash. It's literally weighing the pros and cons of a decision-makingprocess.
To apply this model in real life, the next step would be to spend thenecessary time to build a dataset from experience with thousands uponthousands of frames. This would take months of painful work.
Modifying the hyperparametersThe training was done with the same program described in
, Getting Your Neurons to Work, which was designed to be generalized forsubsequent chapters.
Once the dataset of the previous section has been installed, there are only twohyperparameters to change in the following code snippet:
This forces the program to train longer:
Three epochs: 5,000 steps per epoch:

Automated Planning and Scheduling Chapter 12
[ 282 ]
As the code that follows shows, the hyperparameters have been modified; the programruns and the new model is saved with its graph flow structure and weights:
The model has been trained to deal with a meta-concept. It now needs to go through aprediction program to check the network.
Running a prediction programThe same described in , Conceptual RepresentationLearning, was used. However, some new features were added to make this predictiontesting phase comfortable to use and watch.
The model is loaded and compiled as described in , Conceptual RepresentationLearning. The function contains the same philosophy. However,instead of showing the pre-processed image and having to click on it to close the window, amatplotlib function was added, as in the following code:
is a variable that can be set to . In that case, no image will be displayed.However, when developing convolutional networks, displaying images remains a practicalway of testing the program.
The image will be displayed for seconds and automatically closed. To keep thingsautomatic, the four frames and two meta-concepts run in a loop as in the code that follows:

Automated Planning and Scheduling Chapter 12
[ 283 ]
The predictions come out as with an message or with an message. Themessages can be changed or come from a message dataset depending on the goal of theprogram. The program will then display the classification, as follows:
The CRLMM has now learned to represent real-life memories and an inference of theassociated memories in a meta-concept.
Building the DQN-CRLMMThe full code of the DQN-CRLMM program is . It is built on the knowledgeand programs of the previous chapters and previous sections of this chapter.
The DQN-CRLMM contains three components:
A CRLMM convolutional network that will analyze each frame it receives fromthe webcam that is located right over the pieces of garment packs on theconveyor belt coming from the cutting section. An optimizer using a modified version of the Z(X) described before that planshow the assembly stations will be loaded in real-time.An MDP that will receive the input of the optimizer function and schedule thework of the assembly stations. It also produces the modified Z(X) updated valueof the weights of each assembly station for the next frame.
In the physical world, the conveyor belt transports the garment packs, a picture (frame) istaken every n seconds, and the DQN-CRL-MN runs. The output of the DQN-CRL-MNsends instructions to the conveyor belt and directs the garment backs to the optimized loadof the assembly stations as explained before.
Since describes a continuous DQN-CRLMM process, thereis no beginning or end to the program. The components are independentand are triggered by the input sent to them and they trigger others withtheir output.

Automated Planning and Scheduling Chapter 12
[ 284 ]
Thus, components will be described in the processing order but not in the code-in-lineorder. This is due to the fact that the functions defined by def + function() precede thefunction calls to them. Code line numbers will thus be inserted in the description of thecode.
is the code line number. It is not in the actual code but only given inthe book to find the functions. The code is complete and you can view theline numbers in an editor.
A circular processOnce the three main components of the system are explained later (CNN, MDP, optimizer);the circular property of this DQN-CRLMM is a stream-like system that never starts nor ends.
There is no beginning and no end to the flow of functions in this virtually memorylesssystem.
The conveyor belt's webcam provides a stream of frames, forcing thesystem into circular stream-like behavior.
Implementing a CNN-CRLMM to detect gaps andoptimizeThe CNN-CRLMM function was described in the Running a prediction program section andin , Conceptual Representation Learning. The prediction function is part of theMDP output analysis described later. The function is called as shown in thefollowing code:
The first part of this function squashes the vector described in the following section. Thesecond part of this function analyzes the input frame.

Automated Planning and Scheduling Chapter 12
[ 285 ]
Since no webcam is connected to the system at this point (that must be done during projectimplementation), a random image (frame) choice is made. The following random codesimulates the random occurrences of real-life production:
In a real-life situation, random quantities will be going through the conveyor belt. Statusbeing determined, the CNN simulates adding a frozen frame from the video stream comingfrom the webcam located right on the conveyor belt. It runs the identify (image) functiondescribed before and returns a or scenario for the optimizer (see the optimizersection). The following code describes a gap identification process:
Once has been detected, whether the load output of the cutting system is high orlow, a decision must be made. This will be done with the MDP.
Q-Learning MDP By adding an MDP Q-Learning decision function (see , Become an AdaptiveThinker) in this CNN-CRLMM program, we are now entering the family of DQNs, such asGoogle's DeepMind programs.
In this real-time system, there is no beginning, no end, and no realmemory beyond a few frames.

Automated Planning and Scheduling Chapter 12
[ 286 ]
The MDP program has been incorporated into . Thus, only thechanges made are described in this chapter.
MDP parameters come right after the import packages. Each vertex of the graph has itsown letter and its own location, as shown in the following code snippet:
When the program runs, the following graph will be displayed with red (target vertices) forthis frame. It is then up to the MDP to choose, as described as follows:
Notice that this is an undirected graph with vertices (the colored dots) and no edge (lines)directions. The MDP will provide directions for each frame in this model.
Each vertex represents an assembly station in this model. Each assembly station has a highworkload or a low workload. The workload is rarely stabilized because products keepflowing in and out as they are produced.
MDP inputs and outputsThe MDP process in this model uses a reward matrix as an input and produces a weightvector.
The MDP reward matrix (see , Become an Adaptive Thinker) is set to zero except forthe values representing the edges of the graph that can be physically accessed; these are setto one, a small neutral value.

Automated Planning and Scheduling Chapter 12
[ 287 ]
As it is, the MDP cannot provide a satisfactory result beyond reproducing the structure ofthis undirected graph. The reward matrix is now initialized and duplicated as shown in thefollowing code, starting from line ; at line , , the reward matrix is built, and at line
, , a duplicate of R is created:
, on line , is a copy of the initial-state zero-reward matrix. is reset to at every newframe. MDP trains the assembly location plan for each new frame in a memoryless,undirected graph and unsupervised approach.
is the learning matrix in which rewards will be learned/stored, as shown in the code online :
The load of the assembly stations is not the exact quantities produced. Theyare weights that are updated continuously during this continuous process as explainedfurther in the chapter.
At an initial state of the program, the initial weight of the vertices is set to in the followingline of code (line ):

Automated Planning and Scheduling Chapter 12
[ 288 ]
The weight vector (represented as an array) contains one value per assembly stationlocation or vertex.
An initial state is not a real beginning. It is like a pause button on a video. The initial statecan come from a holiday (no production), a maintenance day (no production), or a lack ofinput orders (no production). The initial state is just a case when the weights are equal to because there is nothing on the conveyor or assembly stations.
The weight vector is part 1 of the optimizer (see the following section). The MDP producesan output matrix (see , Become an Adaptive Thinker) after having optimized theundirected graph. The optimizer will have provided a target.
The program contains the same source code as in , Become an AdaptiveThinker, with Bellman's equation from start line . The MDP produces its result (
, Become an Adaptive Thinker) as shown in the following output:
Bear in mind that this whole NDQ-CRLMM is not only based on theundirected memoryless MDP function but also has no real beginning norend since it's a continuous and virtually memoryless process.
After each run, the MDP matrix also produces a graph interpretation of the values of pathsbetween the vertices from point to point (letter to letter), and displays it in the followingoutput:

Automated Planning and Scheduling Chapter 12
[ 289 ]
This way, if the values are taken from the highest to the lowest edges (lines and thus valuesbetween two letters), it gives a visual idea of how the MDP function calculated its waythrough the graph.
is the letter vector. It is empty after each frame. It will be filled by finding the values ofeach edge. It will contain the letters of the vertices (nodes and dots) connected by the edges(lines represented by the values).
is the value of the edges. The following code shows how to implement and andupdate the weights of the locations in the weight vector ( ):
The logistic function in the preceding code is being updated while and are beingupdated.
The optimizerI have written a number of optimizers for fabric optimization in the apparel industry. Inthis case, the optimizer will be used to regulate the flow of production.
The optimizer is not the CNN optimizer used in the previous chapters:
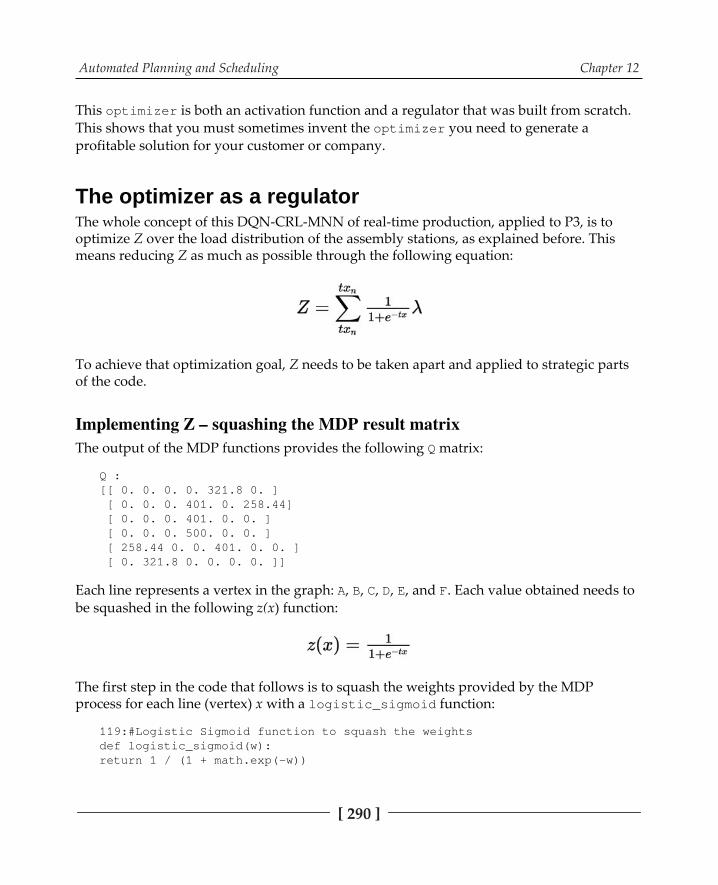
Automated Planning and Scheduling Chapter 12
[ 290 ]
This is both an activation function and a regulator that was built from scratch.This shows that you must sometimes invent the you need to generate aprofitable solution for your customer or company.
The optimizer as a regulator The whole concept of this DQN-CRL-MNN of real-time production, applied to P3, is to optimize Z over the load distribution of the assembly stations, as explained before. Thismeans reducing Z as much as possible through the following equation:
To achieve that optimization goal, Z needs to be taken apart and applied to strategic partsof the code.
The output of the MDP functions provides the following matrix:
Each line represents a vertex in the graph: , , , , , and . Each value obtained needs tobe squashed in the following z(x) function:
The first step in the code that follows is to squash the weights provided by the MDPprocess for each line (vertex) x with a function:

Automated Planning and Scheduling Chapter 12
[ 291 ]
The function is called by the transformation of the MDP Q output matrix into the weightvector for each column of each line, as shown in the following code:
At this point, each value of the MDP has lost any real-life value. It is a weight, just as in anyother network. The difference is that the whole system is controlled. In a real-life project,keeping an eye on the calculations through reports is necessary for maintenance purposes.Even an automatic system requires quality control.
The MDP matrix has now been flattened into a weight matrix, as shown in the followingoutput:
Each vertex (letter in the graph) now has a weight.
Squashed W (vertex weights) grow after each frame analysis and each MDP run since W[j]+is applied continuously and W is never set to zero.
The main reasons:
Once launched, the DQN-CRLMM is a continuous process, with no beginningand no end as long as the conveyor belt is runningThe conveyor belt is sending assembly (mostly sewing) work to the assemblystations that take some time (t) to get the job (x) represented by tx in the Zequation and the W vector in the programSo work is piling up on each vertex (A to F), which represents an assembly station
This is why the (lambda) variable in the Z equation is implemented as shown in the initialequation early in the chapter, as follows:

Automated Planning and Scheduling Chapter 12
[ 292 ]
(lambda) is implemented for two reasons:
The sewing or assembly stations send their finished work to the next operationon the production line, packaging for example. So every m minutes, theirworkload goes down and so does the load feature weight.Production managers are constantly working on learning curves on assemblylines. When a new product arrives, it takes some time for the teams to adapt.Their output is a bit slower than usual. However, well-trained teams bring thelearning period down regularly.
(lambda) combines both concepts in one variable. This might be enough for some projects.If not, more work and variables need to be added.
In this model, (lambda) is activated by the following:
represents the frequency of a vector update. In this example, is set to. This means that every frames, will be applied.
represents the output rate for the two reasons described before. This variablewill squash the vector by the given. In this example, . That meansthat only 20% of the weights will be retained. The rest has been finished.
The following code shows how to implement and :

Automated Planning and Scheduling Chapter 12
[ 293 ]
The vector has been squashed again, as shown in this output:
Finding the main target for the MDP function, the weight vector, is updated after each frame with a short-term memory of n frames.
This means that in every n frames, it's memory is emptied of useless information.
The goal of the optimizer is to provide a target for the MDP function. On the first episode,since it does not have any information, the optimizer selects a random state, as shown inthe following code excerpt:
This means that a random assembly station will be chosen on the MPD graph, whichrepresents the six assembly sewing stations. Once this episode has been completed, thesystem enters a circular real-time cycle (see next section).
The second episode has the vector to rely upon.
It runs the (described before) CNN-CRLMM network to determine whether theframe has a gap or no gap feature as shown in the following code:
The optimizer will use to:
Choose the vertex (sewing station) with somewhat the smallest weight if the CNNon the frame produces a result with (probability is zero). Since there isno gap that means that there are many pieces to sew. Thus, it is much better togive the work to an assembly station that has a lower load than others.

Automated Planning and Scheduling Chapter 12
[ 294 ]
Choose the vertex (sewing station) with somewhat the highest weight if the CNNon the frame produces a result with a (probability is one). Since there is agap, it means there are not that many pieces to sew. Thus it is much better to givethe work to an assembly station that already has a higher workload. It willbalance the loads and optimize the load distribution over all the stations.Introduce a choice to find one target assembly station for the MDP function ineach of these cases. It will look for stations (vertices, letters, dots in the graph)with the highest weight in one case and the lowest in another. Add the somewhat concept referred to before. The system must remain relativelyfree or it will keep choosing the same best sewing stations, depriving others ofwork. Thus each possibility ( or ) is limited to a random choice ofonly three among the six locations for each weight class (higher or lower).
The optimizing function, shown in the following snippet, can prove extremely profitable onreal-life industrial production lines:
is the main location chosen for the MDP reinforcement learning function, as shown inthe following code:
Reinforcement learning has to run every time since it faces new frames in the continuousprocess of the conveyor belt in the automated apparel system.

Automated Planning and Scheduling Chapter 12
[ 295 ]
Now the MDP reward matrix is reset to its initial state, as implemented in these lines of theprogram:
The target location is initialized with a value that fits the gap or no gap philosophy of theprogram. If there is , the value is higher and so will be the weight (represented loadof the station) in the end. If there is a , the value is lower and so will be the weight forthat station, as shown in the following lines of code:
Circular DQN-CRLMM a stream-like system thatnever starts nor endsA linear stream of a conveyor line has been converted into a circular process. The DQN-CRLMM solution:
Captures a frame of the output of the cutting section with a webcam and a CNN-CRLMMAnalyses the load (histograms of each sewing section) with the CRLMMOptimizes the sewing stations with an MDP

Automated Planning and Scheduling Chapter 12
[ 296 ]
The following graph represents the process:
Let's explore these steps in more detail.

Automated Planning and Scheduling Chapter 12
[ 297 ]
Step X: When the following frame arrives, the CRL-CNN is activated:
The solution calls the function, as shown in the following code:
The following code displays the status of the image: , :
The following weights of each sewing station (vertices to ) are taken into account:
The program displays them in text form:

Automated Planning and Scheduling Chapter 12
[ 298 ]
The program also displays the following bar chart of the weights of each sewing station:
STEP X+1 optimizer analyzes the weights to make a decision: Send small quantities to thesewing stations that have a lot of work and large quantities to sewing stations that have less work todo.
(gamma) has now reached a point at which it understands that a gap is a comparisonbetween two states and an inference of a conceptual distance:
Overloading: Too much Underloading: Not enough
(gamma) now contains two abstract concepts:
Enough to too muchNot enough to lacking
The goal of the circular process is to keep the bars at an approximatelysimilar height not an exact height, but also not a situation in which Awould have no work to do and E would be overloaded.

Automated Planning and Scheduling Chapter 12
[ 299 ]
STEP X+2 the MDP, as described in this chapter, receives instructions to optimize a givensewing station and spreads work out to its neighbors. This is often a production constraint:one station sews the sleeves of a t-shirt. For example, the station nearby sews a pocket onthe t-shirt. The MDP spreads out the work starting with the target location, as shown in the following graph:
The MDP sends its results directly to the conveyor belt, which automatically follows thepath instructions sent to it.
Then the MDP updates the weights, empties its reward matrix, and waits for a new one.The system goes back to Step X.
As you might have noticed, no human operator is involved in this whole process at all. Thisapplication is part of the IoT family of applications. , AI and The Internet ofThings (IoT), will take the application to the streets of our cities.

Automated Planning and Scheduling Chapter 12
[ 300 ]
SummaryApplying artificial intelligence to Amazon's real-time sales, production, and delivery forcesprojects into reality.
Learning machine learning and deep learning with MNIST, CIFAR, and other ready-to-usedatasets with ready-to-use programs is a prerequisite to mastering artificial intelligence.Learning mathematics is a must.
Building a few programs that can do various theoretical things cannot be avoided. Butmanaging a real project under corporate pressure will bring an AI expert up to anotherlevel. The constraints of corporate specifications make machine learning projects exciting.During those projects, experts learn valuable information on how AI solutions work andcan be improved.
This chapter described a DQN-CRLMM-CNN model with an optimizer and an MDPfunction. The next chapter explores an application of this solution with an SVM applied to aself-driving car situation in an IoT context.
QuestionsA CNN can be trained to understand an abstract concept? (Yes | No)1.Is it better to avoid concepts and only use real-life images? (Yes | No)2.Planning and scheduling mean the same thing? (Yes | No)3.Is Amazon's manufacturing patent a revolution? (Yes | No)4.Learning how warehouses function is not useful. (Yes | No)5.Online marketing does not require artificial intelligence. (Yes | No)6.
Further readingMore on Amazon's apparel manufacturing innovation:

113AI and the Internet of Things
(IoT)Some say Internet of Things (IoT) will turn out to become the fourth Industrial Revolution.I think we should wait a few years until the smoke clears and let historians figure out whatsort of revolution we went through.
In any case, connected objects have been changing our lives for 20+ years. In the past years,we can safely say that IoT has become disruptive.
Artificial intelligence has just begun its long journey through the human intellect. New,incredible innovations await us. Understand cutting-edge machine learning and deeplearning theory is only the beginning of your adventure. The knowledge you have acquiredshould help you become an AI visionary. Take everything you see seriously and see how itcan fit in your projects.
Your mind must remain open to what may seem the strangest things to come. For example,conceptual representation learning (see previous chapters) will bring new dimensions to amachine's thinking mind.
This chapter takes the technology of the previous chapter and applies it to a self-driving carworking for the mayor's office in a city called Iotham City. The previous chapter used awebcam and a program and sent instructions to the conveyor belt. It was in the family ofIoT. Let's add a support vector machine to the program and take it out on the streets ofIotham City to see what happens.
The chapter is divided into three main sections: Iotham City's project, the configuration ofthe model, and running the model.

AI and the Internet of Things (IoT) Chapter 13
[ 302 ]
The following topics will be covered in this chapter:
A self-driving solutionIntroducing a safe route parameter in trip plannersApplying CNNs to parking lotsApplying SVMs to safety on a trip planningTeaching an MDP to find the safest route (not necessarily the shortest way)
Technical requirementsPython 3.6x 64-bit from .
Packages and modules:
GitHub, :
Check out the following video to see the code in action:
AI and the Internet of Things (IoT) Chapter 13
[ 303 ]
The Iotham City projectA few years from now, the mayor and the city council of Iotham have decided toimplement a self-driving, home-to-homeless-shelter service:
Families at homes have clothing and food they would like to give to others thatneed them.The self-driving car can be started at a distance and goes to homes and takes thegoods to the shelters.The self-driving car does not need to have a base. It can park anywhere, goanywhere, and refuel at service stations with automatic electric recharging.
Some IoT projects plan to put sensors on every parking space and send the information tocontrol centers. Iotham City finds that too expensive. Instead, the city council has decidedto use a more cost-effective solution. A webcam will be installed on all the possible parkinglots in the project's grid. This smart grid is for transporting products from homes toshelters.
The model in this chapter can start at any point. This is circular, as described in theprevious chapter. Our scenario starts after the self-driving car has just delivered clothing toa shelter. Now the self-driving vehicle has to find a parking lot to park in until its nextmission.
Setting up the DQN-CRLMM modelThis section describes how to set up the previous chapter's model for this project and add afew functions.
A DQN-CRLMM model contains a convolutional neural network (CNN) and a MarkovDecision Process (MDP) linked together by an optimizer.
A conceptual representation learning meta-model contains:
A CNNAn optimizer linking it to an MDPAn MDP function
This system will now be referred to as a CRLMM.

AI and the Internet of Things (IoT) Chapter 13
[ 304 ]
Training the CRLMMIn previous chapters, the CRLMM program was trained toidentify (gamma concept) in outputs on the conveyor belt of a food processing factory.The end of the previous chapter brought up to a higher abstraction level.
As long as a member of (gamma) of the dataset is in an undetermined state, itsgeneralization encompasses ambivalent but similar concepts. Up to this chapter, these arethe concepts has learned (conceptual representation learning).
= { a gap, no gap, a load, no load, not enough load, enough load, too much load, a space on a lanefor a car, a distance between a high load of products and missing products on a conveyor belt,weights on sewing stations...n}
The next step in the chapter is to train the CRLMM built in the previous chapters torecognize a parking space in a parking lot and send a signal to the self-driving vehicle:
will now see gaps as space will now perceive space as a distance (gap) between two objects will need a context to find out whether this space between two objects is a
positive or negative distance
The datasetAs in the previous chapters, the directory of this chapter on GitHub contains:
The training setThe test setThe model trained by The directory used by
As explained in the previous chapters, a full dataset would take weeks, if not months, toprepare. They are projects in themselves.
For this example, has evolved into space (gap detection between (distance)) cars to find aparking space.

AI and the Internet of Things (IoT) Chapter 13
[ 305 ]
The following is a simulated frozen frame with no -space taken by a webcam located on abuilding, pointing down to a parking lot:
The following frame represents a small but sufficient parking space on the left of the screen.I copied the pavement over it to free the -space. It shows something like several availableparking spaces:
Training and testing the modelThe model was trained by using the same program as in
, Getting Your Neurons to Work.
Just be sure the directory in the header of the following program is pointing to ,which is scenario number 2:

AI and the Internet of Things (IoT) Chapter 13
[ 306 ]
The model is stored in . To test the model, the improved in the previous chapter was used. Just change the messages and limit the frameclassification loop to as shown in the following code snippet:
The following loaded image was already resized before applying the kernels of the CNN:
Now that the CRLMM has been trained to distinguish a full parking lot from a parking lotwith available space, once an available parking lot has been found, an SVM takes over as anintermediate step.
Adding an SVM functionThe self-driving car has delivered its packages to the shelters. Now it has to find a parkinglot and park there. Instead of having a base like many other systems, this saves Iotham Citymany useless trips.

AI and the Internet of Things (IoT) Chapter 13
[ 307 ]
Motivation using an SVM to increase safetylevelsThe support vector system adds a new function to itinerary calculations safety.
Most systems such as Google Maps focus on:
Shortest tripFastest tripTraffic
However, self-driving cars have to take extra precautions. In fact, many humans do not feelsecure on some roads. Iotham City has a good management policy. Safety will come first,no matter what. Once a suitable parking lot has been found, the SVM has to avoid traffic.
The goal is to find a path through traffic even if the distance is longer. A p parameter allowsfor a p% variance of the distance. For example, 10% allows a 10% longer distance and willprovide a safe passage, as shown in the following SVM result:
It is important to note that the data points are not the actual coordinates but arepresentation in a higher dimension, as explained in the following section.

AI and the Internet of Things (IoT) Chapter 13
[ 308 ]
Definition of a support vector machineA support vector machine (SVM) classifies data by transforming it into higher dimensions.It will then classify data into two classes, for example.
In the following example, the SVM will be used to separate risky driving locations fromsafer driving locations:
The example in the code is random (as in real-life traffic) but the model can be developedmuch further.
Safety is the key to this model, so each driving location (road, crossing) possesses featuresrelated to this goal:
Number of accidents at that locationTraffic at that locationExperience of driving through that location (near misses and no problems)
All of this data can be fed into an SVM program. The program will transform the data tomake it linearly separable (see , Become an Unconventional Innovator).
The blue dots on the left will be the good locations, and the brown ones on the left willbe the risky ones. To convert it back into GPS format, a function will just read the latitudeand longitude features of the data point.

AI and the Internet of Things (IoT) Chapter 13
[ 309 ]
For example, a blue dot on the left might be:
Location A One accident in the past 10 yearsZero problems driving through that point in 1 year
A brown dot might be:
Location D (a few blocks from A)Seventy-four accidents in 10 yearsFifteen problems driving through that point in 1 year
The blue dots and brown dots thus have nothing to do with the real location on thepreceding graph. The locations are labels. Their features have been separated as expected.
To send the data to a GPS guiding system, all that needs to be done is tofind the GPS coordinates of the locations that are part of the initial dataset.
Location A will be chosen, for example, instead of location D; so the program looks into thedataset and finds its GPS location.
Let's put some words on the following SVM graph:
The space between the dotted vertical lines is the margin. It's somewhat like the margin between two lines of a rugby or football team. When the players (datapoints) are lined up, an invisible space or margin separates them.

AI and the Internet of Things (IoT) Chapter 13
[ 310 ]
The dots that touch those margins are critical because they are the ones thatdecide where the margin will be in the first place. As the rugby or footballplayers line up in clusters, the SVM will calculate this (see the following Pythonfunction). These special data points are called support points. They can also becalled support vectors.The vertical line running in the middle of the margin is the decision line.Since the dots are separated by a line, the dataset is linearly separable (see
, Become an Unconventional Innovator). This means that a line can bedrawn between the data points and can separate them into classes. In this case,the system wants to obtain safe locations (blue dots) and avoid unsafe locations(brown dots).
Python function The packages provide the following function:
The function generates uniform data for this example in all directions. It isthus an isotropic distribution (iso=equal, tropy=way) of random data. A blob containspoints of data.
contains a Gaussian factor for the generation function. A Gaussian kernelapplies standard deviations from a mean. Imagine you are playing in a sandbox and youmake a little hill. Then, with your hand, you cut the pile in two. The mean is where you cutthe sand pile; the standard deviation is shown by the slopes going down on both sides.
It might take days, and sometimes weeks, to put a good dataset together. But with , you can do it in one line, as shown in the following code snippet:
This function offers many parameters. The ones used are as follows:
, which represents the number of points spread out between theclusters. In this example, 100 already represents subclusters of car concentrationsin an area.

AI and the Internet of Things (IoT) Chapter 13
[ 311 ]
is the number of centers to generate data from. In this example, represents areas close to the present location of the self-driving car and its futuredestination.
is the seed by the random number generator. It is where thesequence of random numbers will start. This is because what we think is randomis pseudo-random, so it has some deterministic basis.
In this example, a kernel is used to fit the model, as shown in the following code:
scikit-learn's SVM contains a parameter penalty, which explains the in . Thereare many more options, but the key option is the kernel. A linear kernel will produce alinear separation, as shown in the preceding screenshot.
An RBF kernel would produce a different result. The structure looks more regularized. Asshown in the following screenshot, an RBF kernel acts as an efficient structural regularizer:
Bear in mind that the SVM can be used for image recognition on the MNIST and CIFARdatasets, for example. Artificial intelligence provides more than one way to solve a givenproblem. It is up to you to choose the right tools by having a flexible trial-and-errorapproach where necessary.
AI and the Internet of Things (IoT) Chapter 13
[ 312 ]
The plot lines start at line 300. The main line to take into account is the function that willfind and use the decision line (see preceding definition) and scatter the data points on bothsides of the margin. This is achieved by using the following :
The result will be displayed as shown previously. The SVM is now a component of theCRLMM in this self-driving car model.
Running the CRLMMThe self-driving car's mission is a circular (no beginning, no end) one like the CRLMMdescribed in the previous chapter:
If it is in a parking lot, it can be activated by a home or a shelterIf it is at a given home, it will go to a shelterIf at a shelter, it can go to a home or a parking spaceIf it needs recharging, this can be done at a recharging space (or more probably ata parking space), which is already the case in some cities
At one point, the self-driving car has to go from a home to a parking space. This part of itsitinerary is the subject of the following sections.
Finding a parking space uses a fine-tuned version of the described in the
previous chapter.
A no- (no gamma, no gap, no space) is not acceptable.
If the function, which classifies parking lot images into full or available space,returns a , the program detects it and displays a message. The code samples contain theline number of the following code excerpt:

AI and the Internet of Things (IoT) Chapter 13
[ 313 ]
The program displays the following full sign and closes it after a few seconds:
The program must find a parking space. It will thus try searches of good parking lots asshown in line of this code snippet:
A thousand searches looks like a lot, but it isn't. Some cities already have parking spacesnear sidewalks with recharging stations.
Furthermore, looking for available parking spaces in a large city can be excruciating. Moreoften than not, it will not be suitable: there will be not enough available parking spaces tobe sure to find one in the time it will take to get there.

AI and the Internet of Things (IoT) Chapter 13
[ 314 ]
For this prototype, the number of optimal searches is limited to . Beyond that value, thefollowing function is activated:
After two fruitless searches, the program activates , a flag for the function.
The function now contains a random search function, which simulates the choice ofa parking lot and provides a first-level status:
The status represents a probabilistic estimate of the availability of the parking lot. The flag simulates a program yet to be added that will scan all the parking lots and run thisfunction to find an available space.
To present a prototype on a first meeting, you will always need enough toconvince, but if you go too far, the cost of doing this becomes a risk if youridea is rejected.
So if is activated, the system simulates a scan (to be developed) and forces the status to 1,as shown in the following code snippet:
The program then continues and runs the convolutional neural network (CNN) trained toidentify an available parking lot (see the screenshot that follows), as explained in thepreceding configuration section.

AI and the Internet of Things (IoT) Chapter 13
[ 315 ]
Now that a parking lot with available space has been found (the empty spaces on the topleft of the frame), the search function stops and the following instruction isactivated:
Deciding how to get to the parking lotThe CRLMM program has found a suitable parking lot, as shown in the following code,when :

AI and the Internet of Things (IoT) Chapter 13
[ 316 ]
It displays this message and a sign:
Support vector machineThe CRLMM now demands a safe route even if it means taking longer (time or distance).For Iotham, safety comes first.
The program reaches the following SVM function:

AI and the Internet of Things (IoT) Chapter 13
[ 317 ]
The SVM described in the configuration section provides a safe passage through traffic, asshown in this screenshot of the result:
For example, in this random case (traffic will be random most of the time), the blue dots onthe left represent sparser traffic and the brown dots represent areas with denser traffic.Explained as follows, the weights of the statistics of past accidents and the car's experiencecan be added to create a deeper vision of this safety model trip planner.
Suppose the self-driving car has to go to a point in the brown area. The SVM will:
Suggest an itinerary that goes through blue dot areas as much as possible andthen only in brown areasSend the information to Google Maps
Many drivers feel unsafe on loaded freeways or in dense cities. Adding the safest routefunction to mapping software would help.
The SVM brought the data points to a higher level (see the explanation in the configurationsection of the chapter).
The points represented in an SVM function are not the actual locations butan abstract representation. The dividing line needs to go through afunction that will transform that information into a real location datapoint.

AI and the Internet of Things (IoT) Chapter 13
[ 318 ]
Once the SVM boundaries have been converted into location data points, the itinerary ortrip graph is activated.
The itinerary graphThe prototype shows a simulation of an itinerary graph based on the SVM recommendations and its weight vector through the following function call:
The following graph displays the safest itinerary in red even if it takes longer (time ordistance):
For the purpose of the prototype, the SVM was not directly connected to the graph, whichwould require costly hours. Instead, the following function was inserted,which simulates the random availability of parking space anyway:
Bear in mind that it would be useless to develop more for a prototype for the firstpresentation to a prospect or manager.

AI and the Internet of Things (IoT) Chapter 13
[ 319 ]
This type of prototype is more powerful than a slide show because it proves yourlegitimacy. Slideshows are static and don't prove your abilities on this particular subject. Aprototype will show your expertise. But do not overdo it unless you have a budget!
The weight vectorThe weight vector is displayed. In this model, the weights represent the locations just likein the previous chapter. However, in this chapter, the weights are a rating:
Each weight has a high safety rank when few accidents have occurred aroundthat area in the past n years. It is a safety rank. This ranking should be part of ouritinerary software. We should be informed.Each weight will be customized by the self-driving car's experience. It is its owndriving record. Near misses because of its faulty software will bring the weightdown. Good track records will take the weights up. What seems easy for ahuman might be difficult for software and vice versa.
The system now displays the weights used with an internal update program to bedeveloped if the prototype is accepted. The following code calls the function that managesthe weights of the safest routes for the self-driving vehicle and displays a histogram:

AI and the Internet of Things (IoT) Chapter 13
[ 320 ]
SummaryThis chapter, like the previous chapter, described a connected IoT process with no humansinvolved. This trend will expand into every field in the years to come.
This also shows that knowing how to use a tool requires hard work, especially whenlearning artificial intelligence. Imagining a solution for a given market requires more thanhard work. Creativity does not come with work. It develops by freeing your mind from anyform of constraint.
Once the solution has been imagined, then comes the fine line between developing toomuch for a presentation and not showing enough. A CRLMM provides the kind offramework that helps build a technical solution (CNN, MDP, SVM, and optimizers) whilekeeping everyday concepts that others understand in mind.
For the first meeting with Iotham or any other city council members, a good slide showwith a working prototype, along with some past references, would be a good start. Arealistic approach would be to ask how far the prototype should be developed to have achance to be on the shortlist.
The next chapter will lead us deeper into the corporate world by applying artificialintelligence to blockchains.
QuestionsDriving quickly to a location is better than safety in any situation. (Yes | No)1.Self-driving cars will never really replace human drivers. (Yes | No)2.Will a self-driving fire truck with robots be able to put out a fire one day? (Yes |3.No)Do major cities need to invest in self-driving cars or avoid them? (Invest | Avoid)4.Would you trust a self-driving bus to take children to school and back? (Yes |5.No)Would you be able to sleep in a self-driving car on a highway? (Yes | No)6.Would you like to develop a self-driving program for a project for a city? (Yes |7.No)

AI and the Internet of Things (IoT) Chapter 13
[ 321 ]
Further readingFor more information on self-driving cars:
ReferencesHow to implement an SVM:

114Optimizing Blockchains with AI
IBM was founded in 1911, making it the most experienced company today in its field.Google, Amazon, and Microsoft also offer history-making machine learning platforms.However, IBM offers machine learning platforms with its valuable 100+ years of experience.
Some of IBM's 100+ years in the computer and software market were bumpy. Some terribledecisions cost the company a lot of problems across the world. IBM learned from thosemistakes and now offers robust solutions:
IBM Hyperledger for blockchain solutions (this chapter)IBM Watson for artificial intelligence applications, including chatbots (see
, Cognitive NLP Chatbots, and , Improve the EmotionalIntelligence Deficiencies of Chatbots)
IBM quantum computing (see , Quantum Computers That Think)
This chapter offers an overview of what blockchains mean for companies around the world,introduces naive Bayes, and explains where it could fit in a CRLMM.
Mining cryptocurrency represents one side of the use of blockchains. IBM advocates usingblockchains for corporate transactions and brings 100+ years of experience into the field.
The following topics will be covered in this chapter:
Using blockchains to mine bitcoinsUsing blockchains for business transactionsHow the blocks of a blockchain provide a unique dataset for artificial intelligenceApplying artificial intelligence to the blocks of a blockchain to predict andsuggest transactionsNaive BayesHow to use naive Bayes on blocks of a blockchain to predict further transactionsand blocks

Optimizing Blockchains with AI Chapter 14
[ 323 ]
Technical requirementsPython 3.6x 64-bit from .
Package and modules:
Programs from GitHub :
Check out the following video to see the code in action:
Blockchain technology background Blockchain technology will transform transactions in every field.
For 1,000+ years, transactions have been mostly local bookkeeping systems. For the past 100years, even though the computer age changed the way information was managed, thingsdid not change that much. Each company continued to keep its transactions to itself, onlysharing some information through tedious systems.
Blockchain makes a transaction block visible to the global network it has been generatedin.
The fundamental concepts to keep in mind are sharing and privacy control. The two ideasseem to create a cognitive dissonance, something impossible to solve. Yet it has beensolved, and it will change the world.
When a block (a transaction of any kind) is generated, it is shared with the whole network.Permissions to read the information within that block remain manageable and thus privateif the regulator of that block wants the information to stay private.
Whether the goal is to mine bitcoins through blocks or use blocks for transactions, artificialintelligence will enhance this innovation shortly.

Optimizing Blockchains with AI Chapter 14
[ 324 ]
Mining bitcoinsMining a bitcoin means creating a mathematical block for a valid transaction and addingthis block to the chain, the blockchain:
Blockchain = {block1,block2,the block just added...blockn}
The blockchain cannot go back in time. It is like a time-dating feature in life. On minute m,you do something, on minute m+1 something else, on minute m+n something else, and soon. You cannot travel back in time. What is done is done.
When a block is added to the bitcoin chain, there is no way of undoing the transaction.
The global network of bitcoin mining consists of nodes. With the appropriate software, youleave a port open, allocate around 150+ GB of disk space, and generate new blocks. Thenodes communicate with each other, and the information is relayed to the other nodesaround the whole network.
For a node to be a miner, it must solve complex mathematical puzzles that are part of thebitcoin program.
To solve the puzzle, the software must find a number that fits in a specific range whencombined with the data in the block being generated. The number is passed through a hashfunction.
You can call the number a nonce and it's used only once. For example, an integer between 0and 4,294,967,296 for a bitcoin must be generated.
The process is random. The software generates a number, passes it through the hashfunction, and sends it out to the network. The first miner who produces a number in theexpected range informs the whole network that that particular block has been generated.The rest of the network stops working on that block and moves on to another one.
The reward for the miner is naturally paid out in bitcoins. It represents a lot of money, butit's hard to get, considering the competition in the network and the cost required (CPU,electricity, disk space, and time) to produce correct results.
Keep an eye on quantum computers (see , Quantum ComputersThat Think) because their exponential power could dramatically changethe mining market.

Optimizing Blockchains with AI Chapter 14
[ 325 ]
Using cryptocurrency Be very careful with cryptocurrency. The concept sounds fascinating, but the result remainscurrency. Currency can be volatile, and you can lose your life's savings in less than an hourif a crash occurs.
Golden rule: If you cannot resist investing in cryptocurrencies, do notinvest more than you can afford to lose.
That being said, to use cryptocurrency, first set up a wallet to store your bitcoins, forexample. The wallet can be online, through a provider, or even offline.
Once that is done, you will be able to purchase bitcoins as you wish in hard cash, or usingcredit cards, debit cards, and transfers.
Remember, you are buying these currencies like any other currency with all the potential,but also all the risks, involved.
Using blockchainsIBM blockchain, based on Hyperledger Fabric, provides a way for companies around theworld to share a blockchain transaction network without worrying about mining or usingcryptocurrencies.
The system is based on the Linux Foundation project. Hyperledger is an open sourcecollaborative project hosted by the Linux Foundation.
At this level, Hyperledger uses blockchains to guarantee secure transactions without tryingto optimize the cryptocurrency aspect. The software generates blocks in a blockchainnetwork shared by all the parties involved, but they do not have to purchasecryptocurrencies in the currency sense only in the technological sense.
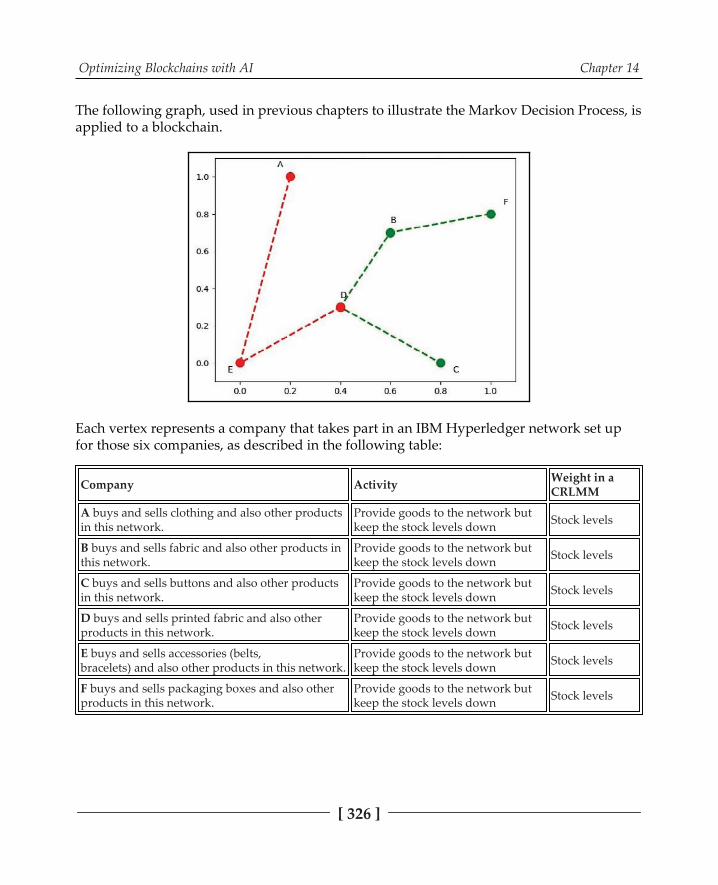
Optimizing Blockchains with AI Chapter 14
[ 326 ]
The following graph, used in previous chapters to illustrate the Markov Decision Process, isapplied to a blockchain.
Each vertex represents a company that takes part in an IBM Hyperledger network set upfor those six companies, as described in the following table:
Company Activity Weight in aCRLMM
A buys and sells clothing and also other productsin this network.
Provide goods to the network butkeep the stock levels down Stock levels
B buys and sells fabric and also other products inthis network.
Provide goods to the network butkeep the stock levels down Stock levels
C buys and sells buttons and also other productsin this network.
Provide goods to the network butkeep the stock levels down Stock levels
D buys and sells printed fabric and also otherproducts in this network.
Provide goods to the network butkeep the stock levels down Stock levels
E buys and sells accessories (belts,bracelets) and also other products in this network.
Provide goods to the network butkeep the stock levels down Stock levels
F buys and sells packaging boxes and also otherproducts in this network.
Provide goods to the network butkeep the stock levels down Stock levels

Optimizing Blockchains with AI Chapter 14
[ 327 ]
With millions of commercial transactions per year with a huge amount of transportation(truck, train, boat, air), it is impossible to manage this network effectively in the 21stcentury without a solution like IBM Hyperledger.
With IBM Hyperledger, the companies have one online transaction ledgerwith smart contracts (online) and real-time tracking.
The transactions are secure; they can be private or public among the members of thenetwork and they provide real-time optimization information for an artificial intelligencesolution.
Using blockchains in the A-F networkIBM Hyperledger provides artificial intelligence developers with a unique advantage overany other dataset a 100% reliable dataset updated in real time.
A block is formed with the method described for mining a bitcoin, except that this timecurrency is not a goal. The goal is a secure transaction with a smart contract whennecessary. The following screenshot is a standard IBM interface that can be customized:

Optimizing Blockchains with AI Chapter 14
[ 328 ]
You can see the individual and unique blocks that make up a blockchain. Each block in IBMHyperledger has a unique number. In this example, it is 111 with a zoom on block 103.
A block in the preceding A to F example can be the purchase of a product X with a contract.The next block can be the transportation of that product to another location and anytransaction within the A-F blockchain network.
The information attached to that block is in the Hyperledger repository: company name,address, phone number, transaction description, and any other type of data required by thenetwork of companies. Each block can be viewed by all or some depending on thepermission properties attached to it.
Exploring the blocks provides an artificial intelligence program with a gold mine: alimitless, real-life, and 100% reliable dataset.
The interesting part for AI optimization is the block information, as described in thefollowing screenshot. The present block was added to the chain along with the previousblock and the transaction code.

Optimizing Blockchains with AI Chapter 14
[ 329 ]
Notice that the block hash (see the preceding mining section) of a given block is linked tothe previous block hash and possesses a unique transaction code.
The CRLMM will use some of the critical information as features to optimize warehousestorage and product availability in a real-time process.
To implement the CRLMM, an additional component is required: a naive Bayes learningfunction. The naive Bayes learning function will learn the previous block to predict andoutput the next blocks that should be inserted in the blockchain.
Using naive Bayes in a blockchain processNaive Bayes is based on Bayes' theorem. Bayes' theorem applies conditional probability,defined as follows:
P(A|B) is a posterior probability, the probability of A after having observed some events (B). It is also a conditional probability: the likelihood of Ahappening given B has already happened.P(B|A) the probability of B given the prior observations A. It is also a conditionalprobability: the likelihood of B happening given A has already happened.P(A) is the probability of A prior to the observations.P(B) is the probability of the predictions.
Naive Bayes, although based on Bayes' theorem, assumes that the features in a classare independent of each other. In many cases, this makes predictions more practical toimplement. The statistical presence of features, related or not, will produce a prediction. Aslong as the prediction remains sufficiently efficient, naive Bayes provides a good solution.
A naive Bayes example, Automated Planning and Scheduling, described an apparel-manufacturing
process. The CRLMM program used there optimized the load of the sewing stations.

Optimizing Blockchains with AI Chapter 14
[ 330 ]
The load of a sewing station in an apparel industry is expressed in quantities, in stock keepunits (SKUs). An SKU, for example, can be product P: a pair of jeans of a given size.
Once the garment has been produced, it goes into storage. At that point, a block in ablockchain can represent that transaction with two useful features for a machine learningalgorithm:
The day the garment was storedThe total quantity of that SKU-garment now in storage
Since the blockchain contains the storage blocks of all A, B, C, D, E, and F locations that arepart of the network, a machine learning program can access the data and make predictions.
The goal is to spread the stored quantities of the given product evenly over the sixlocations, as represented in the following histogram:

Optimizing Blockchains with AI Chapter 14
[ 331 ]
This screenshot shows the storage level of product P distributed over six locations. Eachlocation in this blockchain network is a hub. A hub in supply chain management (SCM) isoften an intermediate storage warehouse. For example, to cover the area of these sixlocations, the same product will be stored at each location. This way, local trucks can comeand pick the goods for delivery.
The goal is to have an available product P at point A when needed. The delivery time fromA to a location point a1 (a store or home) will only take a few hours. If A did not store P,then the finer consumer would have to wait for the product to travel from C to A, forexample.
If the blockchain network is well organized, one location can specialize in producingproduct P (best production costs) and evenly distribute the quantity stored in the sixlocations, including itself.
This load optimization approach is the same as the CRLMM , AutomatedPlanning and Scheduling. Reusing a model in domain learning will generate profit and lowercosts. The more an AI solution can be applied to transfer, domain, and conceptual learning,the more powerful it will become. It will learn more and solve an endless number ofproblems.
The blockchain anticipation noveltyIn former days, all the warehouses at those six locations (A to F) had to ensure theminimum storage level for each location.
In a world of real-time producing and selling, distributors need to predict demand. Thesystem needs to be demand driven. Naive Bayes can solve that problem.
It will take the first two features into account:
DAY: The day the garment was storedSTOCK: The total quantity of that SKU-garment now in storage
Then it will add a novelty the number of blocks related to product P.
A high number of blocks at a given date means that this product was in demand in general(production, distribution). The more blocks there are, the more transactions there are. Also,if the storage levels (STOCK feature) are diminishing, this is an indicator; it means storagelevels must be replenished. The DAY feature time-stamps the history of the product.

Optimizing Blockchains with AI Chapter 14
[ 332 ]
The block feature is named BLOCK. Since the blockchain is shared by all, a machinelearning program can access reliable global data in seconds. The dataset reliability providedby blockchains constitutes a motivation in itself to optimize blocks.
The goalThis CRLMM is the same one as in , Conceptual Representation Learning. Thedifference is that instead of analyzing a conveyor belt to make a decision, the system willanalyze the blocks of a blockchain.
The program will take the DAY, STOCK, and BLOCKS (number of) features for a givenproduct P and produce a result. The result predicts whether this product P will be indemand or not. If the answer is yes or 1, the demand for this product requires anticipation.
The dataset contains raw data from prior events in a sequence, which makes it perfect forprediction algorithms. This constitutes a unique opportunity to see the data of allcompanies without having to build a database. The raw dataset will look like the followinglist:
This dataset contains the following:
Blocks of product P present in the blockchain on day x scanning the blockchainback by 30 days. No means no significant amounts of blocks has been found. Yesmeans a significant number of blocks have been found. If blocks have beenfound, this means that there is a demand for this product somewhere along theblockchain.

Optimizing Blockchains with AI Chapter 14
[ 333 ]
Some_blocks means that blocks have been found, but they are too sparse to betaken into account without overfitting the prediction. However, yes willcontribute to the prediction as well as no.No_blocks means there is no demand at all, sparse or not (Some_blocks),numerous (blocks) or not. This means trouble for this product P.
The goal is to avoid predicting demand on sparse (Some_blocks) or absent (No_blocks)products. This example is trying to predict a potential Yes for numerous blocks for thisproduct P. Only if Yes is predicted can the system trigger the automatic demand process(see the Implementation section later in the chapter).
Looking at the following frequency table provides additional information:
The Yes and No statuses of each feature (Blocks, Some_blocks, or No_blocks) for a givenproduct P for a given period (past 30 days) have been grouped by frequency.
The sum is on the bottom line for each no feature and yes feature. For example, Yes andNo_Blocks add up to 2.
Some additional information will prove useful for the final calculation:
The total number of samples = 10The total number of yes samples = 8The total number of no samples = 2

Optimizing Blockchains with AI Chapter 14
[ 334 ]
Now that the frequency table has been calculated, the following likelihood table is produced using that data:
The table contains the following statistics:
No = 2 = 20% = 0.2Yes = 8 = 80%=0.8Some blocks = 2 = 20%=0.2No blocks = 3 = 30%=0.3Blocks = 5 = 50%=0.5
Blocks represent an important proportion of the samples, which means that along withsome blocks, the demand looks good.
The goal now is to represent each variable of the Bayes' theorem in a naive Bayes equationto obtain the probability of having demand for product P and trigger a purchase scenariofor the blockchain network. Bayes' theorem can be expressed as follows:
P(Yes|Blocks)=P(Blocks|Yes) * P(Yes)/P(Blocks)P(Yes)=8/10 = 0.8P(Blocks)=5/10 = 0.5P(Blocks|Yes)=4/8 = 0.5P(Yes|Blocks)=(0.5*0.8)/0.5 = 0.8

Optimizing Blockchains with AI Chapter 14
[ 335 ]
The demand looks acceptable. However, penalties must be added and other factors must beconsidered as well (transportation availability through other block exploration processes).
This example and method show the concept of the naive Bayes approach. However, scikit-learn has excellent scientific functions that make implementation easier.
ImplementationThis section shows how to use an advanced version of naive Bayes and where to insert thiscomponent in the CRLMM described in , Conceptual Representation Learning.
Gaussian naive BayesIn implementation mode, a dataset with raw data from the blockchain will be used withoutthe feature interpretation function of naive Bayes in the following table:
DAY STOCK BLOCKS DEMAND
10 1455 78 1
11 1666 67 1
12 1254 57 1
14 1563 45 1
15 1674 89 1
10 1465 89 1
12 1646 76 1
15 1746 87 2
12 1435 78 2
Each line represents a block:
DAY: The day of the month scanned (dd/mm/yyyy can be used beyond aprototype)STOCK: The total inputs in a given location (A, B, or... F) found in the blocks andtotaled on that dayBLOCKS: The number of blocks containing product P for location A, for example

Optimizing Blockchains with AI Chapter 14
[ 336 ]
A high number of blocks in the BLOCK column and a low number of quantities in theSTOCK column mean that the demand is high.
DEMAND = 1. The proof of demand is a transaction block that contains apurchase in the past. These transaction blocks provide vital information.
A low number of blocks in the BLOCK column and a high number of quantities inthe STOCK column mean that the demand is low.
DEMAND = 2. Proof that no transaction was found.
However, in some cases, DEMAND = 1 when the stock is high and the blocks are low.That's why strict correlation is not so useful where naive Bayes just analyzes the statisticsand learns how to predict, ignoring the actual conditional probabilities.
The Python programThe Python program uses a class. Consider the following snippet:
It reads the dataset into the data structure. The following code reads into :
It prints the top of the file in the following output:

Optimizing Blockchains with AI Chapter 14
[ 337 ]
It prepares the training set, using to find and predict in the following code:
It chooses the class and trains the following model:
The program then takes some blocks of the blockchain, makes predictions, and prints themusing the following function:
The blocks are displayed and the following predictions are produced. means no demandfor the moment; will trigger a purchase block:
This is a replenishment program. It will mimic the demand. When no demand is found,nothing happens; when a demand is found, it triggers a purchase block. Some chain storesknow the number of garments purchased on a given day (or week or another unit) andautomatically purchase that amount. Others have other purchasing rules. Finding businessrules is part of the consulting aspect of a project.

Optimizing Blockchains with AI Chapter 14
[ 338 ]
Implementing your ideasBlocks in a blockchain provide sequences of unlimited data. Exploring the scikit-learnclasses for naive Bayes is an excellent way to start a gold mining adventure in the world ofblockchains.
Another way is to go back to the CRLMM program used in ,Automated Planning and Scheduling, and replace the content of the following functionon line with a :
When is called instead of using a CNN, naive Bayes will provide the same type ofinformation. It will predict a -gap in the storage level (literally a space to fill in thewarehouse) of the products in demand. You will have to modify the program a bit to have aparameter for to make it run a CNN or the naive Bayes approach.
Once that is processed, the Markov decision function in the CRLMM will take over tospread the load (products in demand) over the various locations in the blockchain network,precisely like the production stations in , Getting Your Neurons to Work. This loadfunction can be found at line in the following code:
The machine learning algorithms available on cloud platforms make blockchains a majorfield to optimize.
SummaryThe reliable sequence of blocks in a blockchain has opened the door to endless machinelearning algorithms. Naive Bayes appears to be a practical way to start optimizing theblocks of a blockchain. It calculates correlations and makes predictions by learning theindependent features of a dataset, whether the relationship is conditional or not.
Optimizing Blockchains with AI Chapter 14
[ 339 ]
This freestyle prediction approach fits the open-minded spirit of blockchains that propagateby the millions today with limitless resources.
IBM Hyperledger takes blockchain's "Frontierland" development to another level with theLinux Foundation project. IBM also offers a cloud platform and services.
IBM, Microsoft, Amazon, and Google provide cloud platforms with an arsenal of disruptivemachine learning algorithms. This provides a smooth approach to your market ordepartment, along with the ability to set up a blockchain prototype online in a short time.With this approach, you can enter some real prototype data in the model, export the data,or use an API to read the block sequences. Then you will be able to apply machine learningalgorithms to these reliable datasets.
The limit is our imaginations.
The next chapter will first take us into another IBM innovation, IBM Watson, applied tochatbots, and then beyond... into cognitive natural language processing (NLP).
QuestionsCryptocurrency is the only use of blockchains today. (Yes | No)1.Mining blockchains can be lucrative. (Yes | No)2.Blockchains for companies cannot be applied to sales. (Yes | No)3.Smart contracts for blockchains are more accessible to write than standard offline4.contracts. (Yes | No)Once a block is in a blockchain network, everyone in the network can read the5.content. (Yes | No)A block in a blockchain guarantees that absolutely no fraud is possible. (Yes |6.No)There is only one way of applying Bayes' theorem. (Yes | No)7.Training a naive Bayes dataset requires a standard function. (Yes | No)8.Machine learning algorithms will not change the intrinsic nature of the corporate9.business. (Yes | No)

Optimizing Blockchains with AI Chapter 14
[ 340 ]
Further readingFor more on scikit:
To explore IBM's Hyperledger solution:

115Cognitive NLP Chatbots
IBM Watson on IBM Cloud provides a set of tools to build a cognitive NLP chatbot. IBMproposes a well-thought process to design a chatbot. Good architecture remains the key to achatbot's success.
To make a chatbot meet user demands, IBM Watson has many services libraries (speech totext, text to speech, and much more).
The whole process can be customized with one's programs. This makes IBM Cloud anexcellent place to start creating chatbots. The TextBlob project offers another set of NLPmodules that provide some interesting ways of improving a chatbot.
This chapter starts by setting up an IBM Watson chatbot following IBM's standardprocedure and shows how to use IBM Watson to add one's cognitive chatbot functions. Acognitive service in Python will be described to solve a case study. The problem to addressis that of a tourist on a bus that just broke down. He needs to communicate with a policechatbot to get help. The solution uses a CNN, Google Translate, conceptual representationlearning (CRL) cognitive techniques, and sentiment analysis.
The following topics will be covered in this chapter:
IBM Watson's chatbot solutionDefining intents and entitiesDefining a dialog flowAdding scripts to the dialog flowCustomizing scripts for a chatbotUsing sentiment analysis to improve some dialogsUsing conceptual representation learning meta models (CRLMM) to enhancesome dialogs

Cognitive NLP Chatbots Chapter 15
[ 342 ]
Technical requirementsPython 3.6x 64-bit from .
Package and modules:
Program: GitHub .
Check out the following video to see the code in action:
IBM WatsonIBM's Watson conversation service has many development tools for creating a chatbot withcompatible standard services (translations, digitized voice, voice recognition, and so on).You can set up your own basic account in a few clicks.
To create a chatbot, you need three major objects: intents, entities, and a dialog flow. Tocomplete the dialog flow, there are additional features: conditions, context, and expressionsfor example. Then services can be added such as digitalized voice, speech recognition, andmore.
This section describes how to build an interview chatbot named HobChat, a diet bot thatcan interview users.

Cognitive NLP Chatbots Chapter 15
[ 343 ]
IntentsAn intent represents the initial subject of the conversation that the chatbot is initiating. Theuser input needs to be classified just as images need to be in a CNN, for example.
Let's say HobChat needs two types of information from the user:
#whatkindof and #food
You'll notice a fundamental concept here. We are getting information from a person andnot the other way around. In many chatbots, the user asks a question to obtain an answer.HobChat works the other way around. It's extracting information through interrogationtechniques.
Chatbots have different points of view:
Providing information for a user: tourism, online shopping, and other servicesObtaining information from a user: medical applications, dietitians, sportstrainers, and marketingProviding and gathering information
In this case, Hobchat's intent is to learn about #whatkindof #food the user likes. HobChat isprepared for the user to either answer or ask a question. To do that, we set up a list ofvariations of #whatkindof in the system in the following intents interface:

Cognitive NLP Chatbots Chapter 15
[ 344 ]
The intent name #whatkindof will be detected if a similar phrase comes up:
#whatkindof={what kindof, what type of, what sort ...n}
The number of sentences depends on the final use of the application. One similar phrasecould suffice in some cases; in others, hundreds are required.
In this example, we can see that if HobChat asks What kind of food do you like? and if a useranswers What type of what?, then the chatbot will apply a function f to the utterance.
f(utterance) will provide the intent. f(What kind of what?), for example, would be parsed andclassified in the #whatkindof intent.
The same has to be done with #food, for example, as shown in the following screenshot:
The #food intent subset is now ready to use:
food = {water, dessert, beverage, meat, dish, food}
Now that some intents have been created, it's time to test these subsets.
Testing the subsetsIBM Watson provides a dialog tool to test the chatbot throughout the creation process. The dialog tool can be set up intuitively in a few steps, as described in the following dialogsection.

Cognitive NLP Chatbots Chapter 15
[ 345 ]
The test dialog will run an initial dialog in the following dialog testing interface:
We can see that HobChat was activated to start a conversation called food interrogation.HobChat classifies the chatbot subject in #food (blue in the screenshot) and starts theinterview by asking a sort of generic text blob question What kind of food do you like toeat?.
This interview technology will also be beneficial for medical applications such as doctorsasking patients questions to classify types of pathologies.
The user answers, "What?"
"What?" is processed as f(utterance=f(what)= #whatkindof.
To pursue this conversation, the chatbot needs entities.
EntitiesNow, we need to clarify Hobchat's #food intent. What exactly are we talking about? Whatkind of food? To clarify our intent, we need entities that will describe our types of food inthe following interface:

Cognitive NLP Chatbots Chapter 15
[ 346 ]
Our food type entity is #foodtypes={salad, meat, french fries}. We also need as many synonymsfor each member of the #foodtype group :
salad={iceberg lettuce, green stuff, iceberg, lettuce}
meat = {T-Bone, hamburger, cheeseburger}
french fries={potatoes, chips, greasy potatoes, greasy}
Now we can clarify our dialog with the food type entity in the following interface:
We've gone through the first part. Hobchat has asked the user, a person who visibly doesnot like such questions, What kind of food do you like?
A surprise entity was added so that Hobchat can detect surprise (emotion) in the answer:
The user answers: Are you kidding me?
Real-life conversations involve emotional answers a chatbot must deal with.

Cognitive NLP Chatbots Chapter 15
[ 347 ]
The chatbot offers a calm response: We're just asking if you like green stuff or greasy stuff, that'sall to get this interview going. So what do you prefer, the green stuff or the greasy stuff?
To find out what's going to happen next, we have to set up the dialog flow.
Dialog flowIBM Watson has an interface to configure the dialog flows shown previously.
To teach your chatbot how to conduct an interview using IBM Watson, or any othersolution, requires a lot of cognitive science work to represent the expertise of a given field.Cognitive science involves linguistics, anthropology, psychology, philosophy, analyzingintelligence, and more.
The next section shows how to use services to implement a cognitive approach to solving aproblem encountered by a chatbot.
First, a basic dialog flow must be configured. We are ready to create dialog scenarios forHobchat. An IBM Watson conversation provides an efficient, ready-to-use platform, asshown in the following screenshot:

Cognitive NLP Chatbots Chapter 15
[ 348 ]
As you can see, it's a complex type of flowchart. You set up the dialog using your intentsand entities, with all the possible linguistic variations you can provide. Then you can createan unlimited number of nodes in a combinatory tree.
You can add conditions, expressions, context, and also script as much as you want.
Scripting and building up the modelIn the preceding dialog flow graph, you can enter scripts. For example, at then respondwith nodes, you can write your script as shown in the following script-editing interface:
In the preceding context script, on the top left, you can see then respond with. That meansyou can script your subdialogs within the dialog flow. You can add a random function suchas so that the system changes phrases every time.
Your intents and entities can also be enriched by importing data. Irecommend using big data map and retrieving techniques to boost thepower of the dialog. The dialog will come close to human dialogs.

Cognitive NLP Chatbots Chapter 15
[ 349 ]
IBM Watson entity features offer a vast number of entity feature add-ons, as the followingscreenshot shows:
The extracts names, the system extracts place names(country, state/province, city, town, and so on), extracts the time, extracts the date, and extracts the currency and other features.
The quality of a chatbot will depend on:
Not adding too many features, but just those required in some casesAdding all the necessary features when necessary, no matter how much time ittakes

Cognitive NLP Chatbots Chapter 15
[ 350 ]
Adding services to a chatbotIBM's Watson Conversation Service allows you to add all the services you want to yourdialog flow, as shown in the following list:
IBM Watson provides a robust framework and a cloud service to build a solid, reliablechatbot.
With IBM Watson services, your imagination will be your only limit.
You can also implement a service of your own, such as a cognitive service.
A cognitive chatbot serviceYou now have a chatbot running on IBM Watson or another platform. The architecture ofan efficient chatbot requires restricting the perimeter of the functions to a minimum andgetting it to work as quickly as possible.
With a solid foundation, the chatbot can now expand its limitless potential in the areasrequired. Services such as these can be added to a personal assistant, for example.
Cognitive NLP Chatbots Chapter 15
[ 351 ]
The case studyA bus of English-speaking tourists is traveling through France. Somewhere in thecountryside, on a small road, the bus breaks down. A tourist will use a personal assistantwith inbuilt functions to communicate with a police chatbot.
Nobody speaks French. One of the tourists has a tablet and an internet connection. It alsohas a personal assistant on it. It could be Google Assistant, Siri, Bixby, Alexa, Cortana, orany other.
For our purpose, let's assume it's Google Assistant and say we built a backend with GoogleTranslate, with the API described in , Revolutions Designed for Some Corporationsand Disruptive Innovations for Small to Large Companies.
The tourist types or says as described in that chapter: . GoogleTranslate produces a sentence in French, confusing "coach" with a sports coach and nottranslating it as "bus." As explained before, Google will no doubt correct this error, butthere are still thousands more to correct.
This is not a problem but a limitation that we, as a worldwide community of artificialintelligence, must expand by sharing ideas.
A cognitive datasetA cognitive NLP chatbot must provide cognition. Humans think in more than words.Mostly humans combine words and images.
Furthermore, for a human, a chat generates mental images, sounds, odors, feelings,sensations, and much more.
The scenario is expanded to images for this case study:
The tourist will chat with the police chatbot using the inbuilt functions of apersonal assistant.The police bot will answer that it does not understand the statement. Thetourist's personal assistant will trigger off a deeper conversation level.They will find a way to understand each other using images to solve theproblem.
In this section, will be described in a chronological way, following thesequence of the dialog.

Cognitive NLP Chatbots Chapter 15
[ 352 ]
The program starts with an explanation of the scenario and shows where this new cognitivefunction could be inserted in (see ,Revolutions Designed for Some Corporations and Disruptive Innovations for Small to LargeCompanies).
Conceptual representation learning meta-model (CRLMM) means describing concepts inwords plus images, beyond using mathematical numerical vectors.
If you run , the output comes as a detailed explanation of what theprogram is doing while it is running, as shown in the following code block. You can alsoview the video that comes with this chapter to get a feel of the program before running andviewing the following output:
The tourist now enters a sentence in the personal assistant (text or voice) that GoogleTranslate does not understand (but it will in the near future), as displayed in the followingsnippet:

Cognitive NLP Chatbots Chapter 15
[ 353 ]
The police bot answers and a sentiment analysis function detects a negative feeling, asshown in the following code snippet:
The following sentiment analysis function comes from TextBlob:
The sentiment has been analyzed through the function. Negative values meannegative feelings, positive feelings come out as positive values, and 0 is neutral. In this casestudy, will be OK.
The sentiment estimation for the policeman's sentence is -0.3, which is not good at all.
Our dialog flow (see the explanation in the first section of the chapter) does not wish to addconfusions to the present confusion. Since the sentiment is negative, instead of adding morewords that might or might not be correctly translated, an image is displayed. In thisexample, a frown is displayed, as implemented in the following code:
The frown will appear and disappear automatically on the tablet or smartphone. Thefollowing image is displayed by the program:

Cognitive NLP Chatbots Chapter 15
[ 354 ]
A / (conceptual chat) directory was added to this CRLMM model. The CRLMM isbeginning to use words + images to form concepts to express itself.
Words are sometimes confusing, especially in foreign-language environments on globalsocial networks or personal assistants. Images will help clarify the conversation.
You can add a whole library of emoticons that will be activated by asentiment analysis function such as TextBlob.
Activating an image + word cognitive chatTo resolve their misunderstanding the tourist and the police bot both have an inbuiltCRLMM function in their personal assistants and cloud chatbot platform.
On the policy side, a polysemy (several meanings to a word) function has automaticallybeen triggered by the sentiment analysis value. The function is activated andbegins to clarify the situation, as shown in the following code:
The program has already loaded its trained image model and compiled it, and thefollowing prediction function is ready:
The images were trained by the same program described in the previous chapters. Thetraining has been orientated towards defining images conceptually more than classifyingthem. The prediction function is also the same as described in earlier chapters.

Cognitive NLP Chatbots Chapter 15
[ 355 ]
, Improve the Emotional Intelligence Deficiencies of Chatbots, willdetail this conceptual training approach for image-word concepts.
The police bot displays what was understood by its system. Using more words will addmore confusion. This is why an image provides a clear message. The program will displaythe following image:
The system displays the following message:
I recommend adding a yes or no icon.
The user will answer: no.
The conceptual (images + words) polysemy has been triggered by the mistake the systemmade. Another image is displayed as follows, with a question:
The tourist may or may not understand the policeman's question. The question may or maynot be correctly translated. But providing a yes or no answer to an image simplifies thecommunication problem.
The user answers yes (or clicks on a yes icon). The tourist + personal assistant bot and thepolice bot are now beginning to understand each other.

Cognitive NLP Chatbots Chapter 15
[ 356 ]
Solving the problem The chatbot has escalated into image + word chat mode. Confusing words have beenreplaced by an image and a yes/no clarified communication function. The system nowthinks it understands. However, the bot has to make sure that it understands as shown inthe following screenshot of the program's dialog:
It displays the following image of the situation (concept + words):
The tourist will recognize the bus and a sort of problem sign even if the words remainunclear.
The user answers yes. The following snippet runs a sentiment analysis and displays animage:
The system produces a scenario sentence (see IBM Watson's dialog flow), the produces a value and displays the following image.

Cognitive NLP Chatbots Chapter 15
[ 357 ]
The police bot and the tourist now understand each other.
The police bot produces an image and a text in case the message is confusing. The followingsnippet shows the police reply with an image to clarify the message:
The image confirms or replaces the text. The police bot informs the tourist that theestimated time of arrival is .
The police bot had received a sensor message from the bus. The bus had an inbuilt alertingsystem. But the emphatic cognitive chatbot was glad to help, just like a real-life policeofficer.
ImplementationImplementing a cognitive chatbot using CRLMM, as for any chatbot, needs to follow somewell-organized steps:
Identify the intents and entitiesCreate the dialog scenariosDialog controls all that the user clicks and answersMake an emoticon images repositoryMake a conceptual images repositoryTrain and test the model with all sorts of scenarios; especially look out for theones that fail to improve the system

Cognitive NLP Chatbots Chapter 15
[ 358 ]
SummaryIBM Watson provides a complete set of tools on IBM Cloud to build a chatbot, add servicesto it, and customize it with your own cognitive programs.
A good chatbot fits the need. Thinking the architecture through before startingdevelopment avoids underfitting (not enough functionality) or overfitting (functions thatwill not be used) of the model.
Determining the right intent (what is expected of the chatbot), determining the entities todescribe the intent (the subsets of phrases and words), and creating a proper dialog willtake quite some time.
If necessary, adding services and specially customized machine learning functions willenhance the quality of the system. The use of CRLMM introduces concepts (images +words) into chatbots, bringing them closer to how humans communicate.
NLP parses and learns words. CRL adds a higher dimension to those words with images.These images clarify interpretation and mistranslation problems. To close the gap betweenmachines and humans, AI must bring emotional intelligence into chatbot dialogs.
The next chapter explores emotional intelligence through a Boltzmann machine (recentlyused by Netflix) and principal component analysis applied to a CRLMM's image + word(concept) approach.
QuestionsCan a chatbot communicate like a human? (Yes | No)1.Are chatbots necessarily artificial intelligence programs? (Yes | No)2.Chatbots only need words to communicate. (Yes | No)3.Do humans only chat with words? (Yes | No)4.Humans only think in words and numbers. (Yes | No)5.To build a cognitive chatbot, mental images are necessary. (Yes | No)6.For a chatbot to function, a dialog flow needs to be planned. (Yes | No)7.A chatbot possesses general artificial intelligence, so no prior development is8.required. (Yes | No)A chatbot translates fine without any function other than a translation API. (Yes |9.No)Chatbots can already chat like humans in most cases. (Yes | No)10.

Cognitive NLP Chatbots Chapter 15
[ 359 ]
Further readingFor more on IBM Cloud Watson: For more on TextBlob:

116Improve the Emotional
Intelligence Deficiencies ofChatbots
Recent disruptive AI technology provides all the tools to eliminate emotional deficiencies inartificial intelligence applications. Conceptual representation learning meta-models(CRLMM) can convert mathematical outputs into somewhat human mind models.Classical machine learning and deep learning programs mostly produce mathematicaloutputs. In previous chapters, CRLMM models produced enhanced conceptualrepresentations, closing the gap between machine and human thinking.
The goal is clearly to build a mind, not an output, through several machine learningtechniques: an RBM, sentiment analysis, CRLMM, RNN, LSTM, Word2Vec, and PCA. Foreach step, an application is available on a Windows or Linux platform, along with a video.
RBMs were presented in a Netflix competition for prediction purposes, namely to predictuser choices. The ultimate goal of this model is not to predict what a person will say or dobut to make an approximate mental clone of a human mind to build thinking and feelingmachines.
Building a mind requires teamwork between several AI models. This chapter describes aprofiler solution that will build a profile of a person named X. A mental projection will beshown, representing part of the profile to prepare for a deeper profile by unleashing thepower of quantum computing (see , Quantum Computers That Think).
Starting to build a mind is the beginning of what will be one of the major adventures of the21st century.

Improve the Emotional Intelligence Deficiencies of Chatbots Chapter 16
[ 361 ]
The following topics will be covered in this chapter:
Restricted Boltzmann Machine (RBM)CRLMMSentiment analysisRecurrent neural networks (RNN) and Long Short-Term Memory (LSTM)RNNsWord2Vec (word to vector) embeddingPrincipal Component Analysis (PCA)Jacobian matrix
Technical requirementsPython 3.6x 64-bit from .
Package and modules:

Improve the Emotional Intelligence Deficiencies of Chatbots Chapter 16
[ 362 ]
Programs needed:
with its
and its
Check out the following video to see the code in action:
Building a mind The following method represents a starting point to build a mind in a machine.
It is based on a cognitive NLP chatbot I successfully delivered many years ago. It was designed for language teaching and would teach a student, but more importantly, itwould learn who that student was by memorizing the chats and storing words, images,and sounds. The bot would know more about the student after each session and askquestions about past conversations.
A random memory sentence was produced among many, such as:
Then the profile dataset of the person was used to add:
football
The voice was digitized (and a bit bumpy because of intonation problems), but it scared oneof the first users enough to make the student stand up and go look to see if there wassomebody behind the computer playing a prank.

Improve the Emotional Intelligence Deficiencies of Chatbots Chapter 16
[ 363 ]
I had to build everything from scratch, which was excruciating but incredibly exhilarating.This project was fun and very profitable for a while, but that was 25+ years ago! There wasno internet and no need to replace people. So that was it. I got some media attention buthad to move on.
I then used the CRLMM model I had been describing during the previous chapters tointroduce deep human concepts in an advanced planning and scheduling system; this is notmeant to be a real-time planning tool like the one described in , AutomatedPlanning and Scheduling.
This proves that building a mind is possible and will now happen. Maybe you can takeeverything in this book and become the architect of a thinking machine, and sell it to acorporation for deep decision-making purposes or as an advanced cognitive NLP chatbot.
Outer space, way above the sky, is the limit and might lead you to build the technology fora smart rocket on its road to Mars. It's at the touch of your fingertips.
How to read this chapterThe goal is to show how to build a mind using several artificial intelligence techniques.Each technique will be briefly explained and then applied. At this point in the book, youknow that all the network models encountered in machine learning contain inputs,activation functions, and outputs going through layers (visible and hidden). The flow istrained with an optimizer (loss function) and weights (with biases). There are manycombinations of these models.
Each section contains a Python program you can run, explore, and view through a video.The video shows how a mind thinks in a 3D projection of thoughts and concepts. Imageembedding was used to represent concepts (conceptual representation learning). Then PCAwas applied.
The target scenario is for us to use machine learning tools and bots to gather data on aperson named X. In , Quantum Computers That Think, we will explore the mindof X the very beginning of its machine clone that can be used to make decisions, chat, orsimply dream and have fun.
Improve the Emotional Intelligence Deficiencies of Chatbots Chapter 16
[ 364 ]
The profiling scenarioThe goal is to learn who X is and build a mind for X through a CRLMM approach added toother techniques.
Building a machine mind requires using all the machine learningtechniques we can put together. It would take several months to producea thinking machine for decision-making or chatbot purposes.
This x step scenario will provide enough data to start building a mind:
An RBM that will not try to predict what a user will do but will profile person Xbased on their Netflix ratings in an advanced approachA sentiment analysis function to gather information through X's social networks A CRLMM function to gather images and begin to fit them with the words as Xwould doUsing an RNN to generate sentences X could say in a data augmentationapproach Applying word embedding (word2vec) to the text to gather information on howX perceives words, not their general statistical meaningRepresenting some of X's professional environment words with word2vec inTensorFlow projector with PCA, to obtain a personal mental representation ofhow X sees the world (not the statistical representation)
The goal is not to classify X or predict what X would do, but tounderstand X by representing X's mind.
Restricted Boltzmann MachinesRBMs are random and undirected graph models generally built with a visible and a hiddenlayer. They were used in a Netflix competition to predict future user behaviors. The goalhere is not to predict what X will do but find out who X is and store the data in X's profile-structured mind-dataset.

Improve the Emotional Intelligence Deficiencies of Chatbots Chapter 16
[ 365 ]
The input data represents the features to be trained to learn about person X. Each columnrepresents a feature of X's potential personality and tastes. The following code (and thissection) is in :
Each of the following lines is a movie X watched containing those six features; for them, Xgave a five-star rating:
The goal of this RBM is to find out more about X's personality through the output of theRBM.
The connections between visible and hiddenunitsThe RBM model used contains two layers:
A visible layerA hidden layer
Many types of RBMs exist, but generally, they contain these properties:
There is no connection between the visible unitsThere is no connection between the hidden units

Improve the Emotional Intelligence Deficiencies of Chatbots Chapter 16
[ 366 ]
The visible and hidden layers are connected by a weight matrix and a bias vector,as shown in the following diagram:
The network contains six visible and two hidden units, producing a weight matrix of 2 x 6values. Note that there are no connections between the visible or hidden units. Thefollowing Python code initializes the model with the units:
The weight matrix is initialized with random weights between the following:
-sqrt(6./(num_hidden+visible)+sqrt(6./(num_hidden+visible)
It is implemented with the following random states and values:
The bias will now be inserted in the first row and the first column in the following code:

Improve the Emotional Intelligence Deficiencies of Chatbots Chapter 16
[ 367 ]
The goal of this model will be to observe the behavior of the weights. Observing theweights will determine how to interpret the result in this model based on calculationsbetween the visible and hidden units. The following output displays the weight values:
1.71400554 0.576206381.73764972 0.584203330.09742497 -3.26198615-1.21252634 2.194323930.30175338 2.59991769-0.04781768 -3.00195143
The first row and column are the biases. Only the weights will be analyzed for the profilingfunctions. The weights and biases are now in place.
Energy-based modelsAn RBM is an energy-based model (EBM). An EBM uses probabilistic distributions definedby an energy function.
For a given x, E(x) or E(v,h) is one way of expressing the energy function of an RBM in asimplified, conceptual line. It is:
This energy function drives the model and will be used to direct weight and biasoptimization:
The v (visible) and h (hidden) units are connected by W (the weights)b is an offset of the units that acts as a bias
Then the energy will be measured with a probabilistic function p:

Improve the Emotional Intelligence Deficiencies of Chatbots Chapter 16
[ 368 ]
Z is a partition function for making sure that the sum of the probabilities of each x inputdoes not exceed 1:
The partition function is the sum of all the individual probabilities of each x:
With each p(x) divided by Z (the sum of all the probabilities), we will reach 1. The wholesystem is based on the energy between the visible and hidden units until the loss isoptimized, as shown in the following code:
Gibbs random samplingAn RBM increases in efficiency when random variable sampling is applied during the training process. Gibbs sampling generates a Markov chain of samples that takes the nearbysamples into account as well.
Random sampling makes the system more objective. Hidden units remain latent (this is atwo-layer system), which confers its dream property.
Running the epochs and analyzing the resultsOnce the RBM has optimized the weight-bias matrix for n epochs, the matrix will providethe following information for the profiler system of person X:
1.71400554 0.576206381.73764972 0.584203330.09742497 -3.26198615-1.21252634 2.194323930.30175338 2.59991769-0.04781768 -3.00195143

Improve the Emotional Intelligence Deficiencies of Chatbots Chapter 16
[ 369 ]
When reaches this point, it asks you if you want to profile , as shown in thefollowing output:
I strongly recommend that only bots access this type of data and that theprovider protects the data as much as possible. For users to accept thesemodels, they must first trust them.
If you accept, it will train the input and display the features added to X's profile.
The weights of the features have been trained for person X. The first line is the bias andexamines column 2 and 3. The following six lines are the weights of X's features:
1.70999493 0.584411341.73355337 0.59234319
0.08329804 -3.26016158-1.2227973 2.213617010.30940653 2.59980058-0.06023325 -3.00127746
The weights (in bold) are lines 2 to 6 and columns 2 to 3. The first line and first column arethe biases.
The weight matrix will provide a profile of X by summing the weight lines of the feature, asshown in the following code:
The features are now labeled, as displayed in this output:

Improve the Emotional Intelligence Deficiencies of Chatbots Chapter 16
[ 370 ]
A value>0 is positive, close to 0 slightly positive.A value<0 is negative, close to 0 slightly negative.
We can see that beyond standard movie classifications, X likes horizons somewhat, doesnot like violence, and likes action. X finds happiness and love important but not family atthis point.
The RBM has provided a personal profile of X not a prediction but getting ready for asuggestion through a chatbot or just building X's machine mind-dataset.
will now begin sentiment analysis.
Sentiment analysis leaves the realm of RBMs and enters a tone analyzer phase using sentiment
analysis to parse X's social networks.
The following code triggers the bot to ask you once again whether you agree (the mind-dataset-building bot) to parse X's social networks:
Parsing the datasetsFor this to work, a bot has read through X's data. A bot can use big data map and retrievefunctions that Google, Amazon, Facebook, LinkedIn, and other social networks have beendeveloping.
The sentiment analysis function is a TextBlob module. Entering the text andtext+ will return the following sentiment analysis:

Improve the Emotional Intelligence Deficiencies of Chatbots Chapter 16
[ 371 ]
The output will contain two values:
Polarity
A value>0 is positive, close to 0 slightly positive.A value<0 is negative, close to 0 slightly negative.
Subjectivity: The higher the value, the more X's subjectivity influences the result
For mind-dataset building purposes, a high level of subjectivity provides insideinformation on X's feelings, which increases the quality of the dataset.
At the same time, the total dialog is loaded in a TextBlob for each sentence analyzed asshown in the following code:
contains the sentence to be analyzed. contains the complete dialog. At theend of the analysis, is parsed for key noun phrases, as shown in this code:
The result will produce sentiment analysis for each sentence and the noun phrases at theend. The output provides useful information to add to X's mind-dataset. The followingsentences were scanned on X's social networks:

Improve the Emotional Intelligence Deficiencies of Chatbots Chapter 16
[ 372 ]
now asks you, the profiler bot, whether you want to complete X's profile withimages gathered on X's social network pages with the following authorization:
Conceptual representation learning meta-modelsThe CRLMM phase is there to find images that constitute a mental representation for X.
Humans mostly think in words+images and feel with words+images.Sounds, sensations, and odors are critical as well. That parameter can alsobe explored.
Profiling with imagesHumans communicate widely through images, symbols, and pictures. They also have alarge number of mental image datasets images that have been transformed and linked towords.
The goal of the bot's conversation now is to confirm the profile of X and suggest a movie toX, just for fun. An image was stored by X, and the name of a movie comes up called Lost?with a dark picture. It is supposed to appeal to the emotions of somebody who yearns forhappiness and love and is curious to see whether something will be found.

Improve the Emotional Intelligence Deficiencies of Chatbots Chapter 16
[ 373 ]
The following picture illustrates the darkness of being lost, with a forest as a symbol andlight through the trees (hope?):
Now the streaming website chatbot will detect that a viewer has been scrolling for over 5minutes without making a choice, for example. It would like to make a suggestion.
The bot starts with a random choice of sentences in the following structured class and addskeywords:
X is curious about this movie. Will something be found? Happiness? Something else? Xanswers, I sure do.
The program manages the following dialog sequence. If you use the program, enter I suredo! when asked if you want to be person X:

Improve the Emotional Intelligence Deficiencies of Chatbots Chapter 16
[ 374 ]
It picks up and obtains the following sentiment analysis, which it will now addto X's mind-dataset:
Note that the goal here was first to profile X and build a mind-dataset of X's features, notmovie categories. Then only suggest a movie, not based on its category, but on moreintrinsic features.
The next phase will be to increase the size of the mind-dataset with an RNN.
RNN for data augmentationAn RNN models sequences, in this case, words. It analyzes anything in a sequence,including images. To speed the mind-dataset process up, data augmentation can be appliedhere exactly as it is to images in other models. In this case, an RNN will be applied towords.
A first look at its graph data flow structure shows that an RNN is a neural network like theothers previously explored. The following graphs were obtained by first running and then :

Improve the Emotional Intelligence Deficiencies of Chatbots Chapter 16
[ 375 ]
The inputs (test data) go to the loss function ( ) . The inputs (training data)will be transformed through weights and biases into logits with a softmax function. A zoominto the RNN area of the graph shows the following :
What makes an RNN special is to be found in the LSTM cell.
RNNs and LSTMsAn LSTM is an RNN that best shows how RNNs work.
An RNN contains functions that take the output of a layer and feed it back to the input insequences simulating time. This feedback process takes information in a sequence. Forexample:
The->movie->was->interesting->but->I->didn't->like->It
An RNN will unroll a stack of words into a sequence and parse a window of words to theright and to the left. For example, in this sentence, an RNN can start with interesting (bold)and then read the words on the right and left (italics). These are some of thehyperparameters of the RNN.
This sequence aspect opens the door to sequence prediction. Instead of recognizing a wholepattern of data at the same time, it is recognizing the sequence of data, as in this example.

Improve the Emotional Intelligence Deficiencies of Chatbots Chapter 16
[ 376 ]
A network with no RNN will recognize the following vector as a week, a pattern just likeany other one:
An RNN will explore the same data in a sequence by unrolling streams of data.
Monday->Tuesday-Wednesday->Thursday->Friday->Saturday-Sunday
The main difference lies in the fact that once trained, the network will predict the following:if Wednesday is the input, Thursday could be one of the outputs. This is shown in the nextsection.
RNN, LSTM, and vanishing gradientsTo simulate sequences and memory, an RNN and an LSTM will use backpropagationalgorithms.
An RNN often has problems of gradients when calculating them over deeper and deeperlayers in the network. Sometimes, it vanishes (too close to 0) due to the sequence property,just like us when a memory sequence becomes too long.
The backpropagation (just like us in a sequence) becomes less efficient. The are manybackpropagation algorithms such as vanilla backpropagation, which is commonly used.This algorithm performs efficient backpropagation because it updates the weights afterevery training pattern.
One way to force the gradient not to vanish is to use a ReLU activation function,f(x)=max(0,x), forcing values on the model so that it will not get stuck.
Another way is to use an LSTM cell containing a forget gate between the input and theoutput cells, a bit like us when we get stuck in a memory sequence and we say "whatever"and move on.

Improve the Emotional Intelligence Deficiencies of Chatbots Chapter 16
[ 377 ]
To explore this type of network deeper, runs on a MNISTexample. will display the data flow graphstructure.
The LSTM cell will act as a memory gate with 0 and 1 values, for example. This cell willforget some information to have a fresh view of the information it has unrolled into asequence.
The key idea of an RNN is that it unrolls information into sequences.
Prediction as data augmentation, a Vanilla RNN model, shows how person X's profile can be enhanced in three
steps.
Step1 providing an input file contains texts picked up in X's dialogues with the chatbot, social networks,
messaging, and more, as shown in the following output:
The ultimate goal is to automatically collect the largest file possible with thousands ofwords to have a representative dataset.
Step 2 running an RNNThe RNN, based on a vanilla algorithm, starts by reading the stream of characters. It firstopens , the reference text, as follows:

Improve the Emotional Intelligence Deficiencies of Chatbots Chapter 16
[ 378 ]
The RNN has hidden layers connected to the visible input and a learning rate,, as shown in the following snippet:
Then the specific parameter of an RNN is added the length of the sequence, to unroll:
Next, the weights are initialized with random functions. The program then runs forwardpasses to parse the elements of the sequence and backward to compute gradients.
Step 3 producing data augmentationThe program will now generate text that can be added to X's text profile dataset. Dataaugmentation by text generation will:
Help understand X's profile betterBe used in chatbot conversations when this technology improves
This approach takes time and resources, and the results are not always efficient. However,research and development should continue by combining text generators with conceptrepresentation learning and more.
An intermediate result at iteration provided the following output:
contains some interesting emotional information: .
To explore this type of network deeper, consult and the video ofthis chapter.

Improve the Emotional Intelligence Deficiencies of Chatbots Chapter 16
[ 379 ]
Word embeddingThe mind-dataset of X has begun to pile up a lot of data. It's time to introduce a word tovector model to determine how X sees words.
Building a mind-dataset is not like a dictionary that provides a standard definition foreverybody. In this project, we want to target person X's personality.
This approach is about profiling X to understand how X perceives a word. For example, adictionary might depict the season spring as something flowery. But X does not like springas we have seen. X prefers autumn and its mild sadness.
So in X's dictionary, the definition of autumn is closer to satisfying than summer. This typeof bot takes personal views into account to build a personal profiled mind-dataset. On thecontrary, a standard dictionary would not suggest a preference between two seasons.
Word2vec will be used for customized phrases.
The Word2vec modelA vector space model (VSM) takes words and transforms them into a vector space. In this continuous space, similar words are represented in points near each other. This vectorialmapping process is called embedding.
Word2vec takes raw text, finds the words nearest to each other, and maps them intovectors. The system will take words, build them into a dictionary, and then input indexes.
A skip-gram model is applied to the sequences with a skip window. In that skip window,a number of words are taken into consideration on the left and the right. Then the modelskips, and it will reuse and input several times to produce a label as implemented in
. The embedding size, skip window, and the number of skips are initializedand described in the following snippet:
Once the whole process is over, the model will have produced a number of vector featuresof the dataset with groups of nearest words to each other.

Improve the Emotional Intelligence Deficiencies of Chatbots Chapter 16
[ 380 ]
For our profile, analyzes a text written by X on artificial intelligence. Theseare texts written after reading this book. We will know more about X in a workplace.
The following paragraphs describe the key functions of .For more info, view the complete source code on GitHub.
starts by reading a file called , which is in a ZIP file andcontains a text that X wrote after reading this book, as shown in the following code:
The words are stored as labels in the label filename , as shown in the followingcode snippet:
A dataset is built in real time in the following code:
represents unknown words that are generally simply skipped.
Then, training batches are generated by the following function:
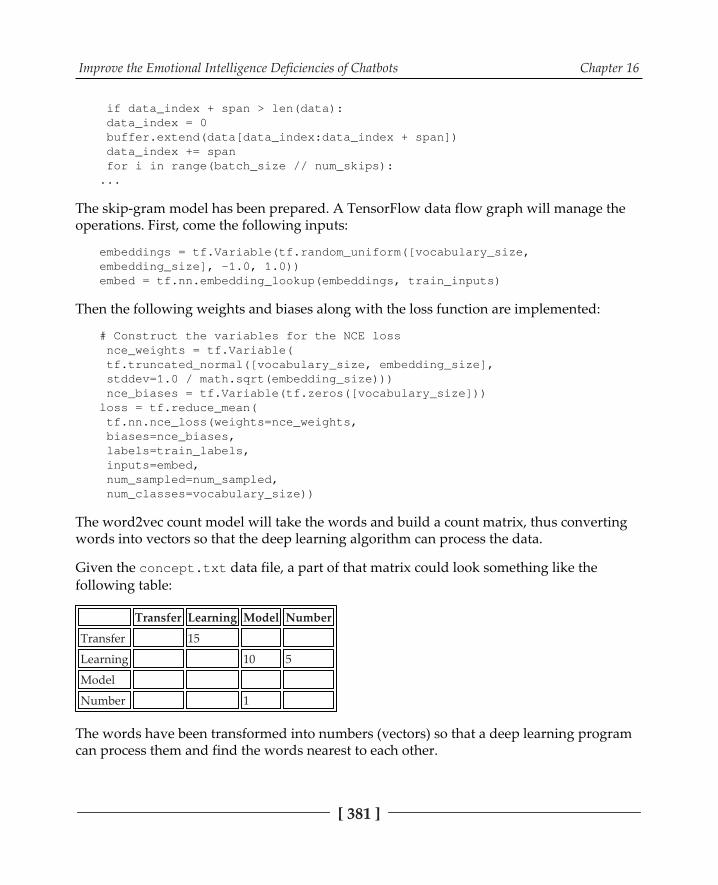
Improve the Emotional Intelligence Deficiencies of Chatbots Chapter 16
[ 381 ]
The skip-gram model has been prepared. A TensorFlow data flow graph will manage theoperations. First, come the following inputs:
Then the following weights and biases along with the loss function are implemented:
The word2vec count model will take the words and build a count matrix, thus convertingwords into vectors so that the deep learning algorithm can process the data.
Given the data file, a part of that matrix could look something like thefollowing table:
Transfer Learning Model Number
Transfer 15
Learning 10 5
Model
Number 1
The words have been transformed into numbers (vectors) so that a deep learning programcan process them and find the words nearest to each other.

Improve the Emotional Intelligence Deficiencies of Chatbots Chapter 16
[ 382 ]
The output represents the features of the word with properties expressed in numbers,which in turn can be viewed as words through the stored labels ( ).
The output of the input file shows the nearest words to each keyword. Forexample, for such, the system displays the following output:
It does not look so exciting at first glance. However, if more text is added and deepercalculations are allowed, it will make progress.
To obtain a 3D view of the result with PCA (see next section), the information forTensorBoard projector is initialized, as shown in the following snippet:
TensorFlow Projector is now ready to be launched.
Principal component analysisGeneral dictionary or encyclopedia representations of words, images, and concepts satisfymany needs. The probabilistic machine learning approach is applied very efficiently tomarketing by Facebook, Amazon, Google, Microsoft, IBM, and many other corporations.
Probabilistic machine learning training remains efficient when targeting apparels, food,books, music, travel, cars, and other market consumer segments.
However, humans are not just consumers; they are human beings. When they contactwebsites or call centers, standard answers or stereotyped emotional tone analysisapproaches can depend on one's nerves. When humans are in contact with doctors,lawyers, and other professional services, a touch of humanity is necessary if major personalcrises occur.
The PCA phase is there to build a mental representation of X's profile either tocommunicate with X or use X's mind as a powerful, mind-full chatbot or decision maker.
The input data for this PCA is the output of described in the previoussection. TensorFlow stored the model, data and labels in its directory.
TensorBoard projector has an inbuilt PCA loader.

Improve the Emotional Intelligence Deficiencies of Chatbots Chapter 16
[ 383 ]
Intuitive explanation PCA takes data and represents it at a higher level.
For example, imagine you are in your bedroom. You have some books, magazines, andmusic (maybe on your smartphone) around the room. If you consider your room as a 3DCartesian coordinate system, the objects in your room are all in specific x, y, z coordinates.
For experimentation purposes, take your favorite objects and put them on your bed. Put theobjects you like the most near each other and your second choices a bit further away. If youimagine your bed as a 2D Cartesian space, you have just made your objects changedimensions.
They are not in their usual place anymore; they are on your bed and at specific coordinatesdepending on your tastes.
That is the philosophy of PCA. If the number of data points in the dataset is very large, thePCA of a mental dataset of one person will always be different from the PCArepresentation of another person like DNA.
That is what CRLMM is about as applied to a person's mentalrepresentation. Each person is different, and each person deserves acustomized chatbot or bot treatment.
Mathematical explanationThe mains steps for calculating PCA are important for understanding how to go from theintuitive approach to how TensorBoard projector represents datasets using PCA.
VarianceStep 1: Calculate the mean of the array .
You can check this with the , as shown in the following function:

Improve the Emotional Intelligence Deficiencies of Chatbots Chapter 16
[ 384 ]
The answer is . The mean is not the median (the middle value of an array).
Step 2: Calculate the mean of array .
The mean calculation is done with the following standard function:
The answer is:
The bar above the X signifies that it is a mean.
Step 3: Calculate the variance using the following equation:
Now NumPy will calculate the variance with the absolute value of each minus the mean,sum them up, and divide the sum by n as shown in the following snippet.
Some variances are calculated with n-1 depending on the population of the dataset.
The result of the program for variances is as displayed in the following output:
We can already see that varies a lot more than . Do they fit together? Are theirvariances close or not? Do they vary in the same way?

Improve the Emotional Intelligence Deficiencies of Chatbots Chapter 16
[ 385 ]
CovarianceOur goal in this section is to find out whether two words, for example, will often be foundtogether or close to each other, taking the output of the embedding program into account.
Covariance will tell us whether these datasets vary together or not. The equation followsthe same philosophy as variance, but now both variances are joined to see whether theybelong together or not:
As with the variance, the denominator can be n-1 depending on your model. Also, in thisequation, the numerator is expanded to visualize the co-part of covariance, as implementedin the following array in :
NumPy's output is a covariance matrix a:
If you increase some of the values of the dataset, it will increase the value of the parts of thematrix. If you decrease some of the values of the dataset, the elements of the covariancematrix will decrease.
Looking at some of the elements of the matrix increase or decrease that way takes time andobservation. What if we could find one value or two values that would give us thatinformation?
Eigenvalues and eigenvectorsTo make sense out of the covariance of the covariance matrix, the eigenvector will point tothe direction in which the covariances are going. The eigenvalues will express themagnitude or importance of a given feature.

Improve the Emotional Intelligence Deficiencies of Chatbots Chapter 16
[ 386 ]
To sum it up, an eigenvector will provide the direction and the eigenvalue the importancefor the covariance matrix a. With those results, we will be able to represent the PCA withTensorBoard projector in a multi-dimensional space.
Let w be an eigenvalue(s) of a. An eigenvalue(s) must satisfy the following equation:
There must exist a vector v for which dot(a,v) is the same as w*v:
NumPy will do the math through the following function:
The eigenvalues are (in ascending order) displayed in the following output:
Now we need the eigenvectors to see in which direction these values should be applied.NumPy provides a function to calculate both the eigenvalues and eigenvectors together.That is because eigenvectors are calculated using the eigenvalues of a matrix as shown inthis code snippet:
The output of the program is:
Eigenvalues come in a 1D array with the eigenvalues of .
Eigenvectors come in a 2D square array with the corresponding (to each eigenvalue) incolumns.

Improve the Emotional Intelligence Deficiencies of Chatbots Chapter 16
[ 387 ]
Creating the feature vectorThe remaining step is to sort the eigenvalues from the highest to the lowest value. Thehighest eigenvalue will provide the principal component (most important). The eigenvectorthat goes with it will be its feature vector. You can choose to ignore the lowest values orfeatures. In the dataset, there will be hundreds and often thousands of features to represent.Now we have the feature vector:
Feature Vector=FV={eigenvector1,eigenvector2...n}
n means that there could be many more features to transform into a PCA feature vector.
Deriving the datasetThe last step is to transpose the feature vector and original dataset and multiply the rowfeature vector by row data:
Data that will be displayed=row of feature vector * row of data
Summing it upThe highest value of eigenvalues is the principal component. The eigenvector willdetermine in which direction the data points will be oriented when multiplied by thatvector.
TensorBoard ProjectorTensorBoard projector loads the metadata from the output of the located inthe directory. First, run . Then run . For this example,click on Load data and load the file from the directory generated by
.

Improve the Emotional Intelligence Deficiencies of Chatbots Chapter 16
[ 388 ]
Next, TensorBoard runs a PCA calculation (the option on the left in the TensorBoardwindow) as explained previously. It then displays a 3D view, as shown in the followingscreenshot:
You can now select words on the right-hand side of the window, move the projectionaround in 3D, zoom, and explore the workplace mind of X.
Using Jacobian matricesUsing a matrix of partial derivatives is also possible. It shows the local trend of the databeing explored. A Jacobian matrix contains partial derivatives.
A Jacobian matrix that contains the partial derivatives of X's mind functions producedbetween two periods of time can prove useful when minute trends need to be analyzed.The philosophy remains the same as for measuring covariances. The goal is to see thetrends in the variables of X's mind.
Improve the Emotional Intelligence Deficiencies of Chatbots Chapter 16
[ 389 ]
SummaryEfficient machine learning programs produce good results but do not build a mind. Toproduce complex AI solutions, no single technique (MDP, CNN, RNN, or any other) willsuffice. An efficient artificial intelligence solution to a complex problem will necessarily bean innovative combination of various techniques. This chapter showed how to startbuilding one using an RBM, a tone analyzer (sentiment analysis), a CRLMM, an RNN, aword2vec program, and PCA.
X's mind-dataset has been enriched with the beginning of an actual memory with word andfeeling associations as image and word associations. This brings X's mind-dataset profilebeyond dictionary definitions, predictive statistics, and linear dimensional personalitydefinitions.
Artificial intelligence will go beyond the present trend of mathematical probabilisticapproaches into the realms of our minds.
Great progress has been made by major corporations distributing machine learning cloudplatforms (Google, Amazon, IBM, Microsoft, and many more). CRLMM will become anecessity to solve complex problems that mathematical probabilities cannot, such asempathetic chatbots or deep thinking machines.
Much more work needs to be done during each phase described in this chapter to obtain apowerful mind that resembles X's. Quantum computing possesses the tremendous powerand complexity to bring a thinking machine to another level.
QuestionsRBMs are based on directed graphs. (Yes | No)1.The hidden units of an RBM are generally connected to each other. (Yes | No)2.Random sampling is not used in an RBM. (Yes | No)3.Is there a method to prevent gradients from vanishing in an RNN? (Yes | No)4.LSTM cells never forget. (Yes | No)5.

Improve the Emotional Intelligence Deficiencies of Chatbots Chapter 16
[ 390 ]
word2vec transforms words into indexes along with their labels. (Yes | No)6.PCA transforms dates into higher dimensions. (Yes | No)7.In a covariance matrix, the eigenvector shows the direction of the vector,8.representing that matrix, and the eigenvalue shows the size of that vector. (Yes |No)It is impossible to represent a human mind in a machine. (Yes | No)9.A machine cannot learn concepts, which is why classical applied mathematics is10.enough to make efficient artificial intelligence programs for every field. (Yes |No)
Further readingInformation on RNNs: More on embedding:

117Quantum Computers That
ThinkIBM has begun to build quantum computers for research and business purposes. In a fewyears, quantum computing will become disruptive and will provide exponential computerpower.
This unique computer capacity in the history of humanity opens the doors to obtainingresults that would be impossible to reach with classical computers. Quantum computers inthemselves will not provide revolutionary algorithms. But quantum computer power willtake present-day algorithms beyond the limits of our imagination.
This chapter explains why quantum computers are superior to classical computers, what aquantum bit is, how to use it, and how the Quantum Mind experiment can lead to aquantum thinking machine. Quantum Mind is based on CRLMM, which I have beensuccessfully applying to many corporate sites. Quantum Mind is named MindX.
The following topics will be covered in this chapter:
Explaining why quantum computers are more powerful than other classicalcomputersDefining what a quantum bit isBloch sphereQuantum computingPCA representation of a CRLMMHow to build a MindX, a thinking quantum computer

Quantum Computers That Think Chapter 17
[ 392 ]
How to read this chapter
Dive into X's mind through this video of this chapter, link in the nextsection. A mind contains emotions, doubts, happiness, sadness, positivethoughts, negative feelings, and more. Use the explanations on quantumcomputing to imagine how powerful a personal mental representationcould become with CRLMM. Use the explanations on MindX(representing a mind) to imagine how powerful and likable a chatbot orany AI solution could be by combining quantum computing power withpersonalized CRLMM models.
Technical requirementsYou will need Python 3.6x 64-bit from
Package and modules:
These programs will be used:
with the data directory and
Check out the following video to see the code in action:
Quantum Computers That Think Chapter 17
[ 393 ]
The rising power of quantum computersTo understand how to build MindX, a thinking quantum computer, this section describes:
Why quantum computers are fasterWhat a qubit isHow it is measured (its position) How to create a quantum score (program) with quantum gatesHow to run the quantum score and use its results for a cognitive NLP chatbot
The goal of this chapter is not to go into the details of quantum computingbut to teach you enough how to build a thinking quantum computer.
Quantum computer speedA standard computer bit has a 0 or a 1 state. A classical computer will manage 0 or 1, as thesystem chooses, but it remains limited to choosing 1 or (XOR) 0. It cannot manage bothstates at the same time.
A quantum computer is not constrained by an XOR state. It is an AND state. It can manage0 and 1 at the same time until it is measured. A quantum state is unknown until observed,so a quantum program can use 0 and 1 at the same time. Once observed, the qubit will takea value of 0 or 1 because of the physical instability of a quantum state.
Just observing a quantum state makes the state break down. In quantumcomputing, this is called decoherence. It is not magic as some sci-fi hypesuggests. Qubits are unstable. When observed, the quantum state breaksdown.
This means quantum computing is memoryless once it is measured. Storage does not existin a quantum computer. The input is made by a classical computer and the output goesback to a classical computer to be stored through the following process:
A Classical computer provides an inputA Quantum Computer processes the input and produces an outputA Classical computer interprets the output

Quantum Computers That Think Chapter 17
[ 394 ]
That being said, the computing power of a quantum computer fully justifies thisarchitectural constraint.
Until a qubit is observed, it can have a 0 or 1 state or a probability in between, such as 0.1,0.7, or 0.9.
Observing the situation is called measuring the state. When measured, only 0 or (XOR) 1will become the result.
Until the state is measured, a large number of probabilities are possible. If a qubit is addedto the system, we now have two qubits and four elementary combinations all at the sametime.
Unlike standard computer logic, all four of the states can be used to compute algorithms atthe same time in a parallel process. The volume of possible states of a given algorithm willthus expand with the number of qubits involved. An estimation of the volume of states canbe made with the following number, in which q is the number of qubits:
2q
Looking at the tiny equation does not seem awesome at all. Now, let's see what it looks likein a loop that runs up to 100 qubits:
The program does not appear fearsome either. However, the following output is awesome:

Quantum Computers That Think Chapter 17
[ 395 ]
Presently, big data is often calculated in petabytes. A petabyte=1015 or about 250 bytes.
Facebook stores data for 2 billion-plus accounts. Imagine Facebook reaches 500 petabytes inthe near future. Let's see what petabytes approximately add up to in the followingcode:
The output is quite surprising because it is about the size of data of a 100-qubit quantumcomputer can compute in one run:
This means that a single quantum computer with 100 qubits can run a calculation of thesize of all data that 2,000,000,000+ Facebook accounts might represent in the near future.
The quantum computer will not actually contain that volume of data at all, but it showsthat it can produce a calculation with that volume of computation information.
More importantly, this also means that a single quantum computer can run a mind-datasetof a single mind (see the next section) and calculate associations. This thinking process cangenerate an exponential volume of connections.
A classical n-bit computer manages n-bits whereas a quantum computer will manage 2n bitsor 2q bits.
Compared to quantum computers 2q exponential power, soon classical computers will seemlike relics of the past for scientific calculations. Classical computers will still be in use. Butquantum computers will be the tools to explore the world beyond the present limits ofartificial intelligence.
Visualize all the AI solutions you saw in this book. They will already seemto have some dust of the past on them once you get your hands onquantum computing.
Quantum computers will beat any other computer in many fields in the years to come. Inone parallel computation, a quantum will do in one run what would take years for classicalcomputers to calculate.

Quantum Computers That Think Chapter 17
[ 396 ]
Now think about what a network of many quantum computers can do!
Often, we try to compare large volumes with the number of stars in the universe. And wesay, That's more than the number of stars in our universe. We must now look in the oppositedirection.
The lesson is clear: The future lies in nano models. Quantum computing represents both achallenge and an opportunity.
Defining a qubitA qubit, a quantum bit, has a physical counterpart. For example, a quantum state can beencoded in oscillating currents with a superconductor loops. Google and IBM haveexperimented with this approach. Another way is to encode a qubit in an ion trapped in anelectromagnetic field in a vacuum trap.
Photons, electrons, the state of light, and other technologies have emerged. Whatever theapproach, calculations with 50+ qubit quantum computers will outrun classicalsupercomputers.
The competition is fierce because the market will rapidly become huge. Get ready now toface the disruption that's coming!
Representing a qubitThe mathematical representation of a qubit is:
|0 for a 0 value|1 for a 1 value
|0 where alpha is a probability parameter|1 where beta is a probability parameter
These brackets are called bracket or bra-ket notation.
This linear representation is called superposition. In itself, it explains most of the power ofquantum computing.

Quantum Computers That Think Chapter 17
[ 397 ]
The superposition of 0 and 1 in a quantum state can thus be expressed as follows in ketssuch as |1> and not bras such as in <1|:
The alpha and beta probabilities look like weights and the total probabilities of thoseprobable states of qubit must add up to 1. We use partition functions, softmax, and othertechniques to make sure to keep the sum of probabilities equal to 1. This is no surprise sincecomputers geek like us designed the way to program quantum computers. Translated intomathematics, this means that the probabilities of and must add up to 1. In the case ofqubit probabilities, the values are squared, leading to the following constraint:
To describe the probable state of a qubit, we thus need three numbers: the0 and 1 possible states and a number to determine the value of theprobabilities (the other is implicit since the total must add up to 1).
Since qubits interact in their respective states, an interaction is described as anentanglement. An entanglement designates at least two interacting qubits. They cannot bedescribed without taking all the states of all the qubits into account.
This has been reproduced physically, which means that this entanglement seems strangebecause their quantum entanglement (relation) can occur at a distance. One qubit caninfluence a qubit that is physically far away.
Albert Einstein called entanglement "spooky action at a distance."
The position of a qubit One of the main ways to represent the state of a qubit is a Bloch's sphere. It shows how aqubit spins and can be used to describe qubit states. The following section refreshes someproperties of a circle.

Quantum Computers That Think Chapter 17
[ 398 ]
Radians, degrees, and rotationsThe radius is the distance between the center of a circle and its circumference, as shown inthe following diagram:
The radius of a circle is half of the circle's diameter. The relation between the radius r andthe circumference C is (where =3.14):
If the length of the radius is wrapped around the circumference of a circle, that arc forms aradian, as shown in the following diagram:
The angle formed by a radian is equal to about 57.29 (degrees).

Quantum Computers That Think Chapter 17
[ 399 ]
The properties of the radian can be used for rotations:
3,14 x 57,29 = about 180 thus radians = 180
Rotations are often described by radians expressed in , as displayed in the following table:
Degrees Radians
30 /6
45 /4
60 /3
90 /2
180
270 3 /2
360 2
Bloch sphereThe radian table shown just now is a practical way to describe rotations. A Bloch sphere, asshown in the following figure, provides a visual representation of the position and rotationof a qubit:

Quantum Computers That Think Chapter 17
[ 400 ]
The North and South pole (polar coordinates) represent the basic states of a qubit:
A qubit can take any value on the sphere.
Composing a quantum scoreComposing a quantum score consists of positioning gates on a stave (or circuit) and addinga measurement. The input comes from a classical computer. After the measurement phase,the output goes back to a classical computer. The reason is that quantum computers haveno memory and thus cannot store their intermediate states because of their instability.
This section uses Quirk, a very educative quantum circuit simulator, to present quantumgates and a quantum composer.
Quantum gates with QuirkThe qubits are represented by the lines, and they start on the left, as shown in followingquantum gate programming interface:

Quantum Computers That Think Chapter 17
[ 401 ]
The gates are logic gates that will transform the state of the qubits:
Not gate:
A not gate will transform a ket-zero |0 into a ket-one |1 . It will transform a ket-one |1into a ket-zero|0 .
In circuit description, is the ket-one state and is the ket-zero state, as shown in thefollowing quantum score:
You can see that:
A not gate symbol is a circle with a vertical and horizontal line inside itThe on status means that the state is |1The Bloch Sphere representation is at (starting from the top of the Blochsphere) as it should
H gate
An H gate, or Hadamard Gate will perform the following transformation:

Quantum Computers That Think Chapter 17
[ 402 ]
The following 50% chance will be displayed in a rectangle and the position on the Blochsphere as well:
The fundamental role of a gate is to turn the qubits on a Bloch sphere and produce aprobable condition if measured. There are many possible gates to be explored and used, asshown in this design menu diagram:
These gates are more than enough to build many algorithms.
A quantum computer score with QuirkBuilding a quantum score (or circuit) with Quirk means the following:
Dragging and dropping gates that will make a qubit turn in a specific directionand produce probable outcomesAdding another qubit, doing the same, and so onBeing able to perform an intermediate measurement, although this is impossiblefor a real physical quantum computer (the observations make the systemcollapse)

Quantum Computers That Think Chapter 17
[ 403 ]
A score is represented as follows, for example:
There are two qubits with a gate on each line to start. Then the intermediate result isshown, making the simulator very educational. Then two more gates are added. Finally, thefollowing measurement probe is added at the end:
Once the measurement is made, the final result is displayed on the right of themeasurement symbols.
A quantum computer score with IBM QIBM Q provides a cloud platform to run a real physical quantum computer.
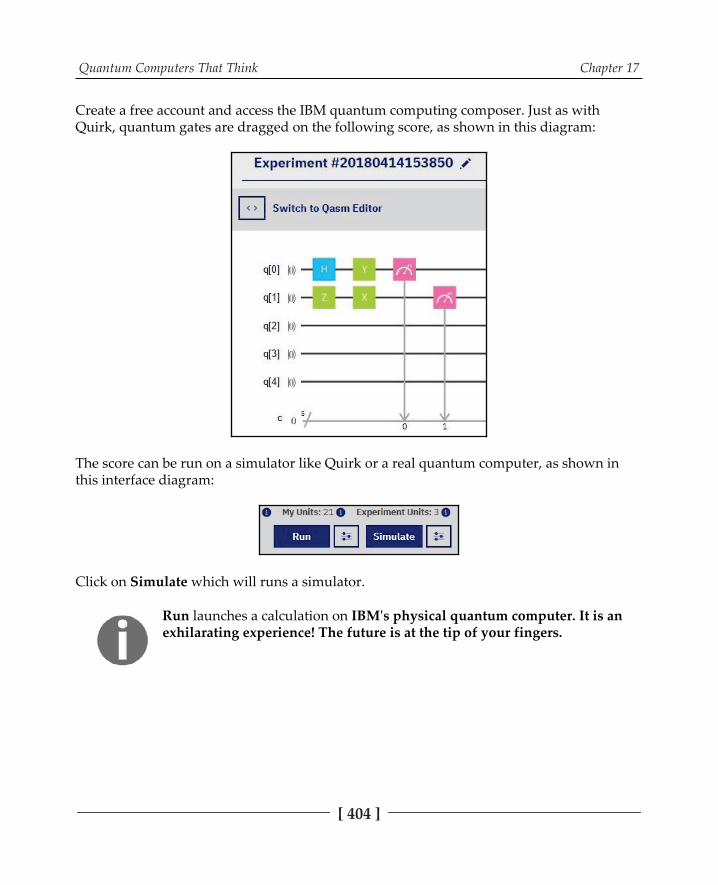
Quantum Computers That Think Chapter 17
[ 404 ]
Create a free account and access the IBM quantum computing composer. Just as withQuirk, quantum gates are dragged on the following score, as shown in this diagram:
The score can be run on a simulator like Quirk or a real quantum computer, as shown inthis interface diagram:
Click on Simulate which will runs a simulator.
Run launches a calculation on IBM's physical quantum computer. It is anexhilarating experience! The future is at the tip of your fingers.

Quantum Computers That Think Chapter 17
[ 405 ]
The following output is interesting. It is a bit different from Quirk for the same score, butthe probabilities add up to 1 as expected:
IBM also possesses a source code version (QASM) of the score, as shown in the followingcode:

Quantum Computers That Think Chapter 17
[ 406 ]
This language is an Open Quantum Assembly Language. It can be written in an editor likeany other language on IBM Q's platform. A development kit can also be downloaded, andthe APIs are functional.
All of this being said, let's find out how quantum computing can boost an AI project. It isnow time to define the thinking quantum computer project.
A thinking quantum computerA thinking quantum computer is not a reproduction of brain function but a representationof the mind of a person. Neuroscientists are making progress on using machine learning tounderstand the brain. But artificial intelligence mostly uses algorithms that simulate ourway of thinking, not our brain's functions.
The endeavor of the Quantum MindX experiment is to build a personal mind namedMindX, with memories of past events, conversations, chats, photographies, and more asdescribed in , Improve the Emotional Intelligence Deficiencies of Chatbots.
This section describes how to build MindX, a thinking computer. It is not the project itself,which would be beyond the scope of the book. I've been doing research on this subject formany years. The power of quantum computation will no doubt boost research in this field.
All the diagram in this section are part of the datasets used by the programsprovided with the book (see Technical requirements section). You can also viewthe video showing the program running.
Representing our mind's concepts A conceptual representation learning meta model (CRLMM) can be implemented with aquantum computer.
The input consists of encoding a state of mind of a PCA CRLMM representation. TheCRLMM representation is not a general dictionary or encyclopedia dataset but a mind-dataset of actual personal data that is collected, classified, and transformed into a PCA 3Dview as described in , Improving the Emotional Intelligence of Chatbots.

Quantum Computers That Think Chapter 17
[ 407 ]
The following diagram is an extraction of some of the words and concepts that the mind ofperson X picked up by reading this book:
This person's mind added to other information gathered in , Improve theEmotional Intelligence Deficiencies of Chatbots will now be in the mind of MindX.
A frame of MindX's PCA state will be submitted to a quantum computer. The quantumcomputer will then think as humans do, by associating concepts, mental images, sounds,sensations, feelings, and everything that makes up our mind. The result will be decodedinto coordinates of the PCA CRLMM representation of the machine's mind and willproduce a sentence.
The sequence is thus a classical computer input, a quantum computer calculation, and aclassical computer interpretation of the output.
The input and outputs can be as follows:
Connected to a chatbotUsed for CRLMM decision-making purposes as seen in previous chapters

Quantum Computers That Think Chapter 17
[ 408 ]
Expanding MindX's conceptual representationsMindX's mind dataset will grow continuously if implemented beyond this researchexperiment. It will have sensors to process body temperature for emotion classification,facial recognition for expression detection, body language detectors, and more. All of thistechnology is already available.
contains one of the first methods of enriching the mind-dataset ofMindX to obtain concepts. A version was presented in , Improve the EmotionalIntelligence Deficiencies of Chatbots. This version was built with a larger mind-dataset.
The following is a screenshot of the PCA TensorBoard Projector 3D representation of amind:
A sample dataset of concepts based on personal experience, and not general data, has beencreated. Some samples were generated by CRLMM CNN classification (see previouschapters); some were created for this sample. But all can be generated automatically usingthe program in , Improve the Emotional Intelligence Deficiencies of Chatbots.

Quantum Computers That Think Chapter 17
[ 409 ]
Concepts in the mind-dataset of MindXFor the quantum MindX experiment, some personal concepts of MindX have been created.
Positive thinkingTo think, a mind must have memories and personal ideas. The following screenshot comesfrom the sprite generated by (see the following section). A sprite isan image that contains thumbnails: small images of the dataset. Once loaded intoTensorBoard Projector with their features, they will be represented in a 3D mind projectionas displayed in this diagram:
Quantum Computers That Think Chapter 17
[ 410 ]
As you can see, the following is true about MindX:
It has superposed words and images, associating them to form memories. A fieldof flowers has become a field of love, forming a positive memory. It has memorized parking space available, picked up in this book as something verypositive as well. A person who has been looking for a parking space for sometime in a big city feels blessed to have found an available space.It has associated motivation with positive words and put the face of a colleagueon the concept. It will continuously enrich the mind-dataset through everyday experience andmemories and store the decisions (good or bad) made.
Negative thinkingTo think, a mind must accept negative thinking and have feelings. A positive feeling is feltby contrast with a negative feeling. A positive thought is felt by contrast to a negativefeeling.
Empathy is based on the ability to feel both positive and negative feelings. Otherwise, themind is only half of a mind.
As you can see MindX does not pretend to be 100% perfect and positive; 100% efficiencymay be good for optimizing like a machine but it certainly does not exist in humans. MindXhas weaknesses and it knows this. This is what makes MindX a powerful thinking andfeeling entity.

Quantum Computers That Think Chapter 17
[ 411 ]
MindX is nearly human, so it can have negative thoughts. The following screenshot of thePCA Tensorbard Projection of MindX shows negative feelings:
MindX, as in the positive PCA area:
Has doubts.Can think better with this very useful dimension (avoiding a mistake, beingcareful, self-interrogation, or reconsidering an opinion on another person).MindX will be more sensitive and sensible.Has, on the left of doubts, cracks appearing close by in the gap area. Doubtsimages are near the fields of love positive thoughts appear by contrast.Associating different types of concepts is what makes a mind deep.
In MindX, as in humans, doubts are often not flaws but ways ofreconsidering a decision more deeply.

Quantum Computers That Think Chapter 17
[ 412 ]
GapsGaps constitute a major concept in a mind's way of thinking something missing, theconcept of insufficient, a gap between people, a gap in factory goals, and many moreconcepts (see , Conceptual Representation Learning).
The following image is a TensorBoard screenshot of the gap features of MindX'srepresentation of its environment:
MindX has associated gaps with cracks, abstract holes in the sky, holes in rocks, "mind thegap" messages in cities, and cracks in the earth.
DistancesMindX has acquired experience and dreams of distances.

Quantum Computers That Think Chapter 17
[ 413 ]
The following image is a TensorBoard screenshot of MindX's representation of distances:
MindX has memories of "freedom roads," and sea travel. It has associated horizons, hope, andlove to distances and travel. MindX has MDP graphs in mind and much more.
The embedding program has started the MindX Quantum experiment with four main
classes and 4,096 dimensions. This dataset can be automatically enhanced using thesolutions described in , Improve the Emotional Intelligence Deficiencies of Chatbots.
The human brain has a maximum of around 100,000,000,000 neurons (100 billion), which isa small number compared to what we saw a quantum computer could manage in onecalculation.

Quantum Computers That Think Chapter 17
[ 414 ]
Of course, human neurons combine and do a lot more than just being a mass ofneurons. But this means that expanding the mind-dataset of MindX beyond any humanbeing's capacity is possible today with the right parameters. MindX could be representedby an endless number of separate PCA feature sets connected in the largest personal mindthat ever existed. The following code in Python starts by loading the four classes of datadescribed before:
A MindX project requires many more classes and subsets. You can certainlyenhance this project and build a powerful chatbot by assembling theprograms in this book and running a quantum score.
The following code describes how the feature vectors are now loaded. See , Improve the Emotional Intelligence Deficiencies of Chatbots, for details on how to produce
feature vectors in the PCA section:
The metadata files are written with the following few lines:

Quantum Computers That Think Chapter 17
[ 415 ]
The sprite image is created. It contains small thumbnail images of the dataset forTensorBoard Projector, displaying purposes as shown in the following code:
The metadata class labels are saved along with the necessary files for TensorBoard Projector(see the source code).
Now is launched, and TensorBoard Projector will show thepersonal mind-dataset of MindX.
MindX is now ready to think with a quantum computer.
Quantum Computers That Think Chapter 17
[ 416 ]
The MindX experimentThe aim of the Quantum MindX experiment is to build a mind and let it think with thepower of a quantum computer. This section will show how to run a 16-qubit mind.
The size of numbers needed to describe a 16-qubit quantum simulation is 65,536.
The section first describes how to do the following:
Prepare the dataCreate and run a quantum scoreUse the output
Preparing the data To prepare data for higher dimension calculations, I have been using aconcept encoding method for corporate projects for 30+ years to provide embedded data tothe algorithms I developed. This guarantees high-level abstraction to solve problems. It is avery profitable way to implement transfer learning and domain learning. This way, you canapply the same model to many different fields.
The method consists of embedding data with the methods described in this book. The goalalways remains the same to transform the data points into higher dimensions to visualizefeatures.
For quantum computing, the method remains the same for the MindX experiment.
Transformation Functions the situation function
The mind dataset that has been built in the past chapters through CRLMM has undergonePCA ( , Improve the Emotional Intelligence Deficiencies of Chatbots) transformation.Variances, covariances, covariance matrices, eigenvalues, eigenvectors, and then featurevectors were applied to the data.
Now two functions need to be applied before creating and running a score: a situationfunction and a quantum transformation function.
The situation function consists of building a vector of features in PCA dimensions. In, Improve the Emotional Intelligence Deficiencies of Chatbots, the chatbot was able to
use person X's mind-dataset to suggest a movie. In this chapter, MindX now is that person.

Quantum Computers That Think Chapter 17
[ 417 ]
This chatbot has a nascent personal mind, not a general mind that can recognize, classify,and predict like a machine. MindX has a mind that is biased by its way of thinking likehumans. MindX has an exceptionally open mind to adapt to everyone, which gives itempathy.
MindX can doubt. Thus it can learn better than dogmatic machines.
A situation function will create a situation matrix for a movie suggestion by the MindX botthat will communicate with consumers. In a movie suggestion situation by the MindX bot,for example, it could be something as follows for 16 qubits:
Qubit Concept Image Initial polarity
1 cities parking 0.146
2 darkness dark forest 0.5
3 nostalgia autumn leaves 0.5
4 worrying dark background 0.146
5 job sad face 0.5
.. ..
15 consider movie "Lost" 0.38
16 decision to suggest"Lost" 0.0
MindX is not analyzing person X anymore. It has now loaded an empathy matrix from itsmind-dataset that contains the actual images of the dataset used in this chapter andrepresented in PCA TensorBoard Projector. MindX loads its mind plus the mind of anotherperson.
Empathy colors your thoughts and feelings with the thoughts and feelings ofanother person.
The 16-qubit matrix shown just now contains four columns:
Qubit: The line for this qubit on the quantum composerConcept: The concept loaded in MindX's situation dataset

Quantum Computers That Think Chapter 17
[ 418 ]
Image: The actual image in the datasetInitial polarity: The sentiment analysis of MindX's profile (see ,Improve the Emotional Intelligence Deficiencies of Chatbots)
The first lines (1 to 5) show that MindX has perceived the person X as a bit sad anddisappointed. The last two lines(15 and 16) show that MindX thinks that maybe the movieLost would please person X.
Before suggesting the movie named Lost, MindX needs to think about it. For the moment,MindX seems reluctant to suggest the movie Lost.
This movie example is for explaining how to create a thinking, empatheticchatbot. This approach can be applied to other commercial marketsegments or any situation in which a chatbot is required to think beyondpreset answers.
Transformation functions the quantum functionThe situation function has produced a qubit line number with labels (concepts and images).Each line also possesses a sentiment analysis polarity expressed in normalized values from0 to 1 in probabilistic format. Negative is close to 0, positive close to 1, and the intermediatevalues give a more detailed approximation. 0.4 to 0.6 is a turning point.
This first transformation into another dimension is the first step to initialize quantumtransformation function. The quantum transformation function consists in initializing thefirst column of all 16 qubits with a quantum gate.
Just like datasets were transformed into principal component features, the polaritytransformation function enables the quantum transformation function to bring the datasetinto a quantum universe.
The function will automatically find the quantum gates which represent the normalizedsentiment analysis polarity of the data points of the following situation matrix:
Initial polarity Quantum gate
0.146 X1/4
0.5 X1/2
0.5 X1/2
0.146 X1/4

Quantum Computers That Think Chapter 17
[ 419 ]
0.5 X1/2
..
0.38 X1/8
0.0 Z1/8
The situation matrix and its concepts have now been transformed into a quantumdimension, in which the data status can be traced throughout the creation of the quantumscore.
Creating and running the scoreA thought process of MindX is described in a quantum score. There are two ways to buildthis score :
Manually, just like a musician writing a music score. This requires thinking aboutthe previous logic gate and the effect of the next one, taking a decision processinto account. It is like writing any artificial intelligence program.Automatically, by building a function that reads a rule base of MindX's way ofthinking and applies the quantum gates through that rule base.
In any case, it requires writing an algorithm. This algorithm is a decision-making algorithmthat takes emotions into account. Doubt, for example, is what keeps many humans frommaking wrong decisions. Too much doubt, for example, will make a person back out fromthat situation.
Here is the quantum transcription of such an algorithm that takes MindX's concepts intoaccount and represents how they interact. This requires very precise thinking and cognitivescience programming.

Quantum Computers That Think Chapter 17
[ 420 ]
The following is an experimental quantum score I built with Quirk:
Once the quantum score has been run and the measurement made, the green rectangles onthe right provide the output.
Using the outputThe output of the quantum score is now added as a column to the situation matrix. MindXhas now attained the right to be a cognitive NLP chatbot. MindX has proven its cognitiveabilities.
Qubit Concept ImageInitial NormalizedPolarity expressed inquantum gate form
Quantum outputdirectly interpreted assentiment analysispolarity
1 cities parking 0.146 0.677
2 darkness dark forest 0.5 0.691

Quantum Computers That Think Chapter 17
[ 421 ]
3 nostalgia autumn leaves 0.5 0.5
4 worrying dark background 0.146 0.48
5 job sad face 0.5 0.36
.. ..
15 consider movie "Lost" 0.38 0.82
16 decision to suggest"Lost" 0.0 0.75
MindX has given a 65,536 quantum state description of its thoughts about suggesting agiven movie to person X. Lines 15 and 16 show that the normalized polarity value has risenover 0.5 to a positive feeling about the movie.
The reasoning is that the first lines show that MindX feels person X's doubts about life atthat moment:
That person X will identify to the "Lost" concept The movie has a happy ending (MindX knows that through the features of themovie)That person X's spirits will be most probably lifted after watching the movie
IBM Watson and scriptsWith that output, the program can activate an IBM Watson movie-choice dialog created bythe company who wants to optimize marketing chatbots as shown in , CognitiveNLP Chatbots.
The dialog in , Improve the Emotional Intelligence Deficiencies of Chatbots, betweenMindX and person X could be enhanced to something such as this:
MindX: I've noticed you have been scrolling to find a movie on our website. CanI help you?"PersonX: Why not? MindX: Well, feel some doubts myself about things right now.PersonX: What???MindX: Oh, I forgot to introduce myself. I'm MindX a Quantum Mind program. Ican think and feel. I'm not just about statistics and predictions.PersonX: Wow!MindX: Anyway, I was saying that I have some doubts myself and a moviecalled 'Lost' reflects my frame of mind. What do you think?

Quantum Computers That Think Chapter 17
[ 422 ]
PersonX: "Why would a movie like that (lines 15 and 16 of the situation matrix)be good for me?"MindX: Mmmm. Let me think a minute... (the quantum score runs)MindX: Ok. (the quantum score is over)MindX: I thought about it. Ok. I feel doubts today also, but the movie is all aboutpeople that are Lost and trying to find there way in life. I can't tell you more, butit looks exciting!. Do you see what I mean?PersonX: I sure do! But first, tell me more about you please!MindX: ....the rest of the IBM Watson dialog + AI Scripts + Quantum thinkingscores...
SummaryQuantum computers have opened the door to scientific experiments that could never havebeen carried out with classical computers. Within a few years, quantum computers willhave become mainstream, unavoidable, and a key asset for businesses and research labs.The race has begun to conquer the market.
CRLMM applied to quantum computers could make MindX one of the most powerfulthinking minds on earth, human or machine.
With an unlimited mind-dataset and a 2q quantum computer starting at 250, a 50-qubitmachine, MindX could gain the thinking power and experience of a human who wouldhave lived 1,000 years. MindX's thinking power and an exponential amount of real-timememory of past experiences, loaded through transformation functions, could help solvemany medical, logistic, and other decision-making problems.
Quantum thinking has just begun to change the perception of the world. Then, DNA-basedcomputers will appear with new perspectives. Conceptual AI models such as CRLMM willno doubt be the starting point of the next generation of AI solutions. These CRLMM modelswill be much more powerful because they will be gifted with empathy and complex minds.
Artificial intelligence has only begun its long journey into our lives. Alwaystrust innovations. Never trust a solution that solves a problem withoutopening the door to a universe of questions and ideas!

Quantum Computers That Think Chapter 17
[ 423 ]
QuestionsBeyond the hype, no quantum computer exists? (Yes | No)1.A quantum computer can store data? (Yes | No)2.The effect of quantum gates on qubits can be viewed with a Bloch sphere? (Yes |3.No)A mind that thinks with past experiences, images, words, and other bits of every4.day like stored memory will find deeper solutions to problems that mathematicsalone cannot solve? (Yes | No)A quantum computer will solve medical research problems that cannot be solved5.today? (Yes | No)A quantum computer can solve mathematical problems exponentially faster than6.classical computers? (Yes | No)Classical computers will soon disappear and smartphone processors also? (Yes |7.No)A quantum score cannot be written in source code format but only with a visual8.interface? (Yes | No)Quantum simulators can run as fast as quantum computers? (Yes | No)9.Quantum computers produce intermediate results when they are running10.calculations? (Yes | No)
Further readingExplore IBM Q and discover how you can implement quantum scores:
Use Quirk, an intuitive quantum score designing tool:

Answers to the Questions
Chapter 1 Become an Adaptive Thinker1. Is reinforcement learning memoryless? (Yes | No)
The answer is yes. Reinforcement learning is memoryless. The agent calculates thenext state without looking into the past. This is significantly different to humans.Humans rely heavily on memory. A CPU-based reinforcement learning system findssolutions without experience. Human intelligence merely proves that intelligence cansolve a problem. No more, no less. An adaptive thinker can then imagine new forms ofmachine intelligence.
2. Does reinforcement learning use stochastic (random) functions? (Yes | No)
The answer is yes. In the particular Markov Decision Process model, the choices arerandom. In just two questions, you can see that the Bellman equation is memorylessand makes random decisions. No human reasons like that. Being an adaptive thinkeris a leap of faith. You will have to leave who you were behind and begin to think interms of equations.
3. Is the Markov Decision Process based on a rule base?
The answer is no. Human rule base experience is useless in this process. Furthermore,the Markov Decision Process provides efficient alternatives to long consulting timeswith future users that cannot clearly express their problem.
4. Is the Q function based on the Markov Decision Process? (Yes | No)
The answer is yes. The use of the expression "Q" appeared around the time theBellman equation, based on the Markov Decision Process, came into fashion. It is moretrendy to say you are using a Q function than to speak about Bellman, who put all ofthis together in 1957. The truth is that Andrey Markov was Russian and applied thismethod in 1913 using a dataset of 20,000 letters to predict future use of letters in anovel. He then extended that to a dataset of 100,000 letters. This means that the theorywas there 100 years ago. Q fits our new world of impersonal and powerful CPUs.

Answers to the Questions
[ 425 ]
5. Is mathematics essential to artificial intelligence? (Yes | No)
The answer is yes. If you master the basics of linear algebra and probability, you willbe on top of all the technology that is coming. It is worth spending a few months onthe subject in the evening or taking a MOOC. Otherwise, you will depend on others toexplain things to you.
6. Can the Bellman-MDP process in this chapter apply to many problems? (Yes | No)
The answer is yes. You can use this for robotics, market analysis, IoT, linguistics, andscores of other problems.
7. Is it impossible for a machine learning program to create another program by itself? (Yes| No)
The answer is no. It is not impossible. It has already been done by Google withAutoML. Do not be surprised. Now that you have become an adaptive thinker andknow that these systems rely on equations, not humans, you can easily understandthat mathematical systems are not that difficult to reproduce.
8. Is a consultant required to enter business rules in a reinforcement learning program? (Yes| No)
The answer is no. It is only an option. Reinforcement learning in the MDP process ismemoryless and random. Consultants are there to manage, explain, and train in theseprojects.
9. Is reinforcement learning supervised or unsupervised? (Supervised | Unsupervised)
The answer is unsupervised. The whole point is to learn from unlabeled data. If thedata is labeled, then we enter the world of supervised learning; that will be searchingfor patterns and learning them. At this point, you can easily see you are at sea in anadventure a memoryless, random, and unlabeled world for you to discover.
10. Can Q Learning run without a reward matrix? (Yes | No)
The answer is no. A smart developer could always find a way around this, of course.The system requires a starting point. You will see in the second chapter that it is quitea task to find the right reward matrix in real-life projects.

Answers to the Questions
[ 426 ]
Chapter 2 Think like a Machine1. The concept of using an artificial neuron was discovered in 1990. (Yes | No)
The answer is no. Warren McCulloch and Walter Pitts invented the first neuron andpublished a paper in 1943. Legend has it that at age 12 years in 1935, Walter Pitts, apoor child living in a bad neighborhood, was chased by bullies and sought refuge in alibrary. There he discovered Principia Mathematica by Bertrand Russell and AlfredWhitehead. Anyway, not only did he find mistakes in the reasoning, but also he sent aletter to Bertrand Russell! From then on, Walter was noted for his genius inmathematics. With Waren McCulloch, another genius, they invented the first neuron.It seems simple. But it's the result of sleepless nights. Just as the invention of the wheelappears simple, nothing better has been found to this day. This concept of a the neuronis the wheel of artificial intelligence.
2. Does a McCulloch-Pitts neuron require a threshold? (Yes | No)
The answer is yes. Adding up weights does not mean much if you do not havesomething to measure the value. It took months of work for McCulloch and Pitt to putthis together. At first, time was in the equation, just like it is in our brain. But then, likeJoseph Fourier (1768-1830), they found cycles that repeated themselves periods thatdid not require much more than that neuron.
3. A logistic sigmoid activation function makes the sum of the weights larger. (Yes | No)
The answer is no. The whole point is to reduce the sums when necessary to havecomparable numbers to work with.
4. A McCulloch-Pitts neuron sums the weights of its inputs. (Yes | No)
The answer is yes. It's only when you sum the weights that they make sense.
5. A logistic sigmoid function is a log10 operation? (Yes | No)
The answer is no. The sigmoid function is based on Euler's number, e, a constant that isequal to 2.71828. This number produces a natural logarithm. Leonhard Euler(1707-1783) discovered this in the 18th century with a quill no scientific calculator orcomputer! Did you notice that the main mathematical functions used in artificialintelligence run far back in history? This aspect of the hype around what we think wehave found now but has existed for decades, and sometimes centuries, will be dealtwith in the following chapters.

Answers to the Questions
[ 427 ]
6. A Logistic Softmax is not necessary if a logistic sigmoid function is applied to a vector.(Yes | No)
The answer is no. Calculating the sum of several numbers of a vector and thendividing each number by that sum gives a view of the proportions involved. It is aprecious tool to keep in mind.
7. A probability is a value between -1 and 1. (Yes | No)
The answer is no. Probabilities lie between 0 and 1.
Chapter 3 Apply Machine Thinking to aHuman Problem1. Can a human beat a chess engine? (Yes | No)
The answer is no. Today, the highest level chess tournaments are not between humansbut between chess engines. Each chess engine software editor prepares for thesecompetitions by making their algorithms faster and requiring less CPU. In fact today, atop chess engine running on a smartphone can beat humans. In human-to-humanchess competitions, the level of chess has reached very high limits of complexity.Humans now mostly train against machines.
2. Humans can estimate decisions better than machines with intuition when it comes tolarge volumes of data. (Yes | No)
The answer is no. The sheer CPU power of an average machine or even a smartphonecan generate better results than humans with the proper algorithms.
3. Building a reinforcement learning program with a Q function is a feat in itself. Using theresults afterward is useless. (Yes | No)
The answer is no. While learning artificial intelligence, just verifying the results arecorrect is enough. In real-life applications, the results are used in databases or as inputto other systems.

Answers to the Questions
[ 428 ]
4. Supervised learning Decision Tree functions can be used to verify that the result of theunsupervised learning process will produce reliable, predictable results. (Yes | No)
The answer is yes. Decision Tree functions are not intelligent, but they are veryefficient in many cases. When large volumes are involved, Decision Tree functions canbe used to analyze the results of the machine learning process and contribute to aprediction process.
5. The results of a reinforcement learning program can be used as input to a schedulingsystem by providing priorities. (Yes | No)
The answer is yes. The output of reinforcement learning Q function can, in fact, beinjected as input into another Q function. Several results and be consolidated in phase1 and become the reward matrix of a phase 2 reinforcement learning session.
6. Artificial intelligence software thinks like humans. (Yes | No)
The answer is yes and no. In early days, this was attempted with neuroscience-basedmodels. However, applying mathematical models is presently far more efficient.Pretending otherwise at this point is hype. Who knows what will happen in futureresearch? But for the time being, deep learning, the main trend, is based onmathematical functions.
Chapter 4 Become an UnconventionalInnovator1. Can the perceptron alone solve the XOR problem? (Yes | No)
The answer was no in 1969. A neural network, or some other mathematical process, isnecessary to solve this problem. For the record, this is a common problem for electriccircuits that function with "feedforward" electricity, and was solved long ago.

Answers to the Questions
[ 429 ]
2. Is the XOR function linearly separable? (Yes | No)
The answer is no if you use a single neuron and yes if you use a hidden layer with atleast two neurons. That is a major problem to address in deep learning. If you cannotseparate the features of a face, for example, in a picture, recognizing that face willprove difficult. Imagine a picture with one half of the face in shadow and the other halfin bright sunlight. Since the eye and features of one half are in shadow, a poor deeplearning program might only capture half of the face, separating the face in the wrongplace with a poor edge detection function. Linear separability is thus a key aspect ofmachine learning.
3. One of the main goals of layers in a neural network is classification. (Yes | No)
The answer is yes. Once the data is identifiable with a given neural networkarchitecture, predictions, and many other functions become possible. The key to deeplearning is to be able to transform data into pieces of information that will make sense.
4. Is deep learning the only way to classify data? (Yes | No)
The answer is no. You can classify data with an SQL query, artificial intelligence,machine learning, and standard source code. Deep learning becomes vital when manydimensions of classification are involved: first finding the edges of objects in a picture,then forms, and then determining what the object represents. To do this with millionsof pictures is beyond the scope of standard programming or early AI and MLprograms.
5. A cost function shows the increase in the cost of neural network. (Yes | No)
The answer is no. A cost function determines how much the training costs you.Running 100,000 epochs is more expensive than running 50,000 epochs. So at eachepoch, the cost of training (how far the system is from its goal) must be estimated.Thus, a good cost function will decrease the cost of running a neural network.
6. Can simple arithmetic be enough to optimize a cost function? (Yes | No)
The answer is yes. As long as you know to what extent your cost function is increasingor decreasing, anything that works is fine.
7. A feedforward network requires inputs, layers, and an output. (Yes | No)
The answer is yes. Without layers, there is no network.

Answers to the Questions
[ 430 ]
8. A feedforward network always requires training with backpropagation. (Yes | No)
The answer is often yes in changing environments.. Since the field is new, we tend tothink that once the training is done, the work is done. If the datasets are very stable ina repetitive environment, such as recognizing the difference between various constantproducts in a shop, warehouse or factory, then the neural network will do theclassification it is designed for. If new products are introduced, then training can beinitiated again.
9. In real-life applications, solutions are only found by respecting academic theory. (Yes |No)
The answer is no. Without academic research, deep learning would not even exist.Without universities, the ideas used would be so simple that they would never workwell. On the other hand, researchers need real-life feedback. If we find new ways ofdoing things they recommended, we should publish them to help global research. It's atwo-way street.
Chapter 5 Manage the Power of MachineLearning and Deep Learning1. TensorBoard is simply a nice displaying program. (Yes | No)
The answer is yes and no. Yes, TensorBoard is a friendly interface for visualizing adataflow graph. No, TensorBoard is not only nice but is also critical to designing thearchitecture of a project even before the data feed aspect of the program is written. Inreal-life projects, a good architecture shows that you can manage the power of ML/DLprograms.
2. Defining functions at the beginning of the source code is just like standard programs.(Yes | No)
No. Seeing variables and arrays at the beginning of a TensorFlow program could leadone to think that it is just a formality. However, these lines are in fact the real program,the dataflow graph, the architecture.
3. TensorFlow is a library add-on to Python that provides some cool functions. (Yes | No)
The answer is no. It is a strategic tool for designing the dataflow graph of anapplication.

Answers to the Questions
[ 431 ]
4. TensorBoard is not necessary to deploy machine learning and deep learning programs.(Yes | No)
The answer is yes. TensorBoard refreshes every n seconds automatically (this can bedeactivated). When running large datasets during the training process, it is crucial tosee whether the cost function is going up or down. And even if it is going down,converging to 0 or near 0, it is vital to see how fast the slope (gradient) is decreasing(descent).
5. As long as we're technical experts, we don't have to worry about our environment. It willadapt. (Yes | No)
The answer is no. Those days are over. Our environment decides whether our projectwill survive or not. It is critical to developing not only code but also communicationskills to defend ongoing projects.
6. Presenting ML/DL projects doesn't change the architecture of a solution. (Yes | No)
The answer is no. If the presentation has been well defined and made to the rightpeople, the architecture can be tremendously improved by optimizing the datasets,training phase, test phase, and expected results.
7. Managers don't need to understand the technical aspect of a solution as long as it works.(Yes | No)
The answer is no. This is a myth. It works early in a project, or in a dream world whereprojects never go wrong. But large projects always go wrong at some point because ofdataset problems, bugs, communication tensions, sick leave, vacations, budgetlimitations, and scores of unexpected events. When that happens, communicating thekey points and reasons of every aspect of the problem becomes essential.
Chapter 6 Don't Get Lost in Techniques,Focus on Optimizing Your Solutions1. Can a prototype be built with random data in corporate environments? (Yes | No)
The answer is yes and no. To start developing a prototype, using random data canhelp make sure that the basic algorithm works as planned.

Answers to the Questions
[ 432 ]
However, once the prototype is advanced, it will be more reliable to use a well-designed dataset. Then, once the training has been successfully accomplished, randomdata can help again to see how your system behaves in all situations.
2. Do design matrices contain one example per matrix? (Yes | No)
The answer is no. A good design matrix contains one example in each row or eachcolumn depending on the shape you want it to have. But be careful; a design matrixthat contains data that is too efficient might overfit. That means the learning algorithmwill be efficient with that data but not adapt to new data. On the other hand, if thedataset contains too many errors, then the algorithm might underfit, meaning it won'tlearn correctly. A good design matrix should contain reliable data, some imprecisedata, and some noise (some data that can influence the algorithm in unreliable ways).
3. Automatic Guided Vehicle will never be widespread. (Yes | No)
The answer is that AGVs will expand endlessly from now on: drones, cars, planes,warehouse vehicles, industrial vehicles, and more. AGVs, added to artificialintelligence and IoT, constitute the fourth industrial revolution.
4. Can k-means clustering be applied to drone traffic? (Yes | No)
The answer is yes. Seeing where traffic builds up will prevent drone jams (dronescircling and waiting).
5. Can k-means clustering be applied to forecasting? (Yes | No)
The answer is yes and will be explained in , Applying Biomimicking toArtificial Intelligence; it'll be applied to all types of traffic.
6. Lloyd's algorithm is a two-step approach. (Yes | No)
Yes, Lloyd's algorithm first classifies each data point in the best cluster. Then, once thatis done, it calculates the geometric center or centroid of that center. When no datapoint changes the cluster anymore, the algorithm has been trained.
7. Do hyperparameters control the behavior of the algorithm? (Yes | No)
The answer is yes. Hyperparameters determine the course of the computation: thenumber of clusters, features, batch sizes, and more.

Answers to the Questions
[ 433 ]
8. Once a program works, the way it is presented does not matter. (Yes | No)
The answer is no. Without a clear presentation of the results, the whole trainingprocess is confusing at best and useless at worst.
9. K-means is only a classification algorithm. It's not a prediction algorithm. (Yes | No)
The answer is no. K-means clustering can be used as a prediction algorithm as well.
Chapter 7 When and How to Use ArtificialIntelligenceThe questions will focus on the hyperparameters.
1. The number of k clusters is not that important. (Yes | No)
The answer is no. The number of clusters requires careful selection, possibly a trial-and-error approach. Each project will lead to different clusters.
2. Mini-batches and batches contain the same amount of data. (Yes | No)
The answer is no. "Batch" generally refers to the dataset and "mini-batch" represents a"subset" of data.
3. K-means can run without mini-batches. (Yes | No)
The answer is yes and no. If the volume of data remains small, then the trainingepochs can run on the whole dataset. If the data volume exceeds a reasonable amountof computer power (CPU or GPU), mini-batches must be created to optimize trainingcomputation.
4. Must centroids be optimized for result acceptance? (Yes | No)
The answer is yes and no. Suppose you want to put a key in a keyhole. The keyholerepresents the centroid of your visual cluster. You must be precise. If you are simplythrowing a piece of paper in your garbage can, you do not need to aim at the perfectcenter (centroid) of the cluster (marked by the rim of the garbage can) to attain thatgoal. Centroid precision depends on what is asked of the algorithm.

Answers to the Questions
[ 434 ]
5. It does not take long to optimize hyperparameters. (Yes | No)
The answer is yes and no. If it's a simple project, it will not take long. If you are facinga large dataset, it will take some time to find the optimal hyperparameters.
6. Can it sometimes take weeks to train a large dataset? (Yes | No)
The answer is yes. Media hype and hard work are two different worlds. Machinelearning and deep learning are are still tough projects to implement.
7. AWS SageMaker only offers a k-means algorithm. (Yes | No)
The answer is no. AWS Sagemaker offers a complete range of algorithms in the jobcreation interface. You can also use your algorithms choosing Custom.

Answers to the Questions
[ 435 ]
Chapter 8 Revolutions Designed for SomeCorporations and Disruptive Innovations forSmall to Large Companies1. It is better to wait until you have a top-quality product before putting it on the market.(Yes | No)
The answer is yes and no. In the early 21st century, Airbus was struggling to completethe A380, the largest ever passenger airplane. Their engineers worked on hundreds ofimprovements before transporting commercial passengers. We would not expect less!
In the case of Google Translate, it is a massive no. By putting Google Translate onlineand providing an API, Google encouraged thousands of artificial intelligencedevelopers, linguists, consultants and users to provide feedback and improvements.Furthermore, Google, once again, occupies a large share of the web market.
2. Considering the investment made, a new product should always be highly priced toreach the top segment of the market. (Yes | No)
The answer is yes and no. When Ferrari puts a new car on the market, the price has tobe high for two reasons; the quality of the car and cost of production make it necessaryto do so to make the innovation profitable. Also, Ferrari avoids mass production tokeep its quality at high levels.
When Amazon Web Services put machine learning on the market with SageMaker, itputs a "pay-as-you-go" policy in place, starting at a very low end of the market. Theproduct had and has limits. But Amazon now has tremendous feedback andcontinuously improves the product.
3. Inventing a new solution will make it known in itself. (Yes | No)
You might be surprised to know that saving a camera picture by drawing it dates sofar back in history that nobody knows for sure when it was first used. Nobody knowsif it was invented or discovered. In any case, the first camera obscura was revolutionary.It is now proven that famous painters used the technique. The picture was projectedon a paper or canvas. The "printer" was manual. The painter was the "printer." However, cameras as we know only become disruptive in the 20th century.

Answers to the Questions
[ 436 ]
4. Artificial intelligence can solve most problems without using standard non-learningalgorithms. (Yes | No)
The answer is no. Artificial intelligence relies on cloud servers, architectures, standardlanguages (C++, Java, Python, and others), and Apache servers. Even on a self-drivingcar, the sensors installed require standard hard work to get them working andinterpreting information before AI comes in to solve some of the problems.
AI is like our brain. Without a body, it cannot function.
5 . Google Translate can translate all languages in a satisfactory way. (Yes | No)
After reading this chapter, you might be surprised to have a yes and no answer. If youare using Google Translate to say "hello," "how are you," "thanks for the message," andsimilar friendly phrases on your favorite social network or in an email, it is goodenough.
But when dealing with more detailed phrases and sentences, Google Translateprovides random satisfactory results. From a user's perspective, this is bad news. For adeveloper, it is a goldmine!
6. If you are not creative, it is no use trying to innovate. (Yes | No)
The answer is a massive no. You certainly do not need to be either imaginative orcreative to innovate. Do not let anybody convince you of such nonsense. If you aredesigning a solution and find a missing component, look for some alternativecomponents on the web, talk about it, and find people that can help. Then get it donethrough teamwork. This works every time!
Even the great Bill Gates was smart enough to ask Tim Patterson for help to developMS-DOS, and he went on to become a billionaire.
7. If you are not a linguist, it is no use bothering trying to improve Google Translate. (Yes |No)
The answer is no! Once again, never let somebody convince you of such nonsense.Innovating is teamwork. If you like Google Translate and you understand this chapterand have ideas, team up with a linguist around you or through a social network. Theworld is yours to improve!

Answers to the Questions
[ 437 ]
8. Translation is too complicated to understand. (Yes | No)
No. The way some explain it is too complicated. If you speak a language, you are anexpert of translating your thoughts into words. With work, you can get into thetranslation business.
9. Artificial intelligence has already reached its limits. (Yes | No)
Certainly not! We have just scratched the surface of both theory and applications.
Chapter 9 Getting Your Neurons to Work1. A convolutional neural network (CNN) can only process images. (Yes | No)
The answer is no. CNNs can process words, sounds, or video sequences, to classifyand predict.
2. A kernel is a preset matrix used for convolutions. (Yes | No)
The answer is yes and no. There are many preset matrices used to process images suchas the one used in in this chapter. However, in thischapter, kernels were created randomly and then the network trained their weights tofit the target images.
3. Does pooling have a pooling matrix or is it random?
A pooling matrix has a size that is an option when the pooling layer is added to themodel, such as a 2x2 pooling window.
4. The dataset always has to be large. (Yes | No)
No. A dataset does not have a standard size. It depends on the training model. If thetarget images, for example, do not contain complex features, the dataset will be smallerthan a complex feature dataset. Furthermore, the function willexpand the data by distorting it with the provided options.
5. Finding a dataset is not a problem with all the available image banks on the web. (Yes |No)
The answer is yes and no. Yes because if the model remains a standard academic one,then the available images (CIFAR, MNIST, or others) will suffice.

Answers to the Questions
[ 438 ]
No, because in real-life corporate situations, you will have to build your dataset andadd images containing noise. Noise requires more fine-tuning of the model to becomereliable and generalized.
6. Once a CNN is built, training it does not take much time. (Yes | No)
The answer is no. Whatever the model is, training will remain time-consuming if youwant it to be reliable. As seen in this chapter, a model requires a lot of options andmathematical thinking.
7. A trained CNN model applies to only one type of image. (Yes | No)
Yes and no. There are three main types of overfitting:
Overfitting a model for a certain type of images with absolutely no consequenceof implementation. In this case, the model classifies and predicts enough tosatisfy the goals set.Overfitting a model that creates implementation problems because it cannotadapt to different images of the same time. The model will then go through moretraining.Overfitting a model that trains a certain type of image quite well but does not fitsimilar types of images when needed.
Each situation has its constraints. As long as the model works, no general rules apply.It is up to you to decide.
8. A quadratic loss function is not very efficient compared to cross-entropy function. (Yes |No)
The answer is no. Each model has its constraints. Quadratic loss functions work fine onsome models and do not provide good results on others. This represents the mainproblems of training a model. No general rules will help you. You have to use yourneurons or write a program that modifies the model automatically.
9. The performance of a deep learning CNN does not a represent a real issue with modernCPUs and GPUs. (Yes | No)
The answer is yes and no. If the model runs quickly enough for your needs, thenperformance will not limit the outcome of your project. However, in many cases, itremains a problem. Reducing features to simply focus on the best ones is one of thereasons that the layers bring the size to analyze down, layer by layer.

Answers to the Questions
[ 439 ]
Chapter 10 Applying Biomimicking to AI1. Deep learning and machine learning mean the same thing. (Yes | No)
No. When an AI program contains a network, especially a deep one (with severallayers), that is deep learning. Deep learning is a subset of machine learning.
When programs such as an Markov Decision Process (MDP) are used, that is machinelearning.
To sum it up, not all artificial intelligence programs have to learn. Machine learning isa subset of artificial intelligence programs that learn but do not require networks.Deep learning is a subset of machine learning that uses networks.
2. Deep learning networks mostly reproduce human brain functions. (Yes | No)
Yes in neuroscience research on the human brain. Computer models of the brain usingdeep learning can provide interesting models.
Sometimes yes, when deep learning networks try to reproduce human vision forimage recognition applications.
No, when it comes many programs using statistics and probability for languageprocessing, for example.
3. Overfitting is unacceptable. (Yes | No)
Yes, when an application has been implemented and requires the ability to adaptconstantly to new data.
No, when an application has been implemented, and the same images are submitted tothe AI program.
No, when a prototype is first built and used as a proof of concept that the solutionappears interesting.
4. Transfer learning can save the cost of building another model. (Yes | No)
Yes. A reusable model can become quickly very profitable.

Answers to the Questions
[ 440 ]
5. Training a corporate model on MNIST is enough to implement it on a production line, forexample. (Yes | No)
Yes and no. Yes because if a model works on MNIST, it contains the proper functionsto learn. No, because if the goal of the project is not close to MNIST data, it will notwork. Experiment with MNIST in an image project that contains similar sorts of simpleimages.
6. Exploring artificial intelligence beyond the cutting edge is not necessary. It is easier towait for the next ideas that are published. (Yes | No)
Yes, when a team does not have ideas but excels in implementation, for example.GitHub can provide thousands of ideas, along with social networks, publications, andmore.
No, when a team is creative and wants to occupy the market with innovations.
7. Some researchers have reproduced all the physical and biological reasoning functions ofthe human brain in robots. In fact, some robots have human brain clones in them. (Yes |No)
No. Intelligent human-cloned robots only exist in fiction and social hype.
8. Artificial General Intelligence software, a program that can adapt to any human function(natural language processing, image processing, and sound streams) better than a human,already exists in some labs. (Yes | No)
No. This will take much more time if it ever succeeds. Corporations might rather besatisfied with profits generated by narrow artificial intelligence that solves specificproblems.
9. Training deep learning networks has become a quick and easy task. (Yes | No)
No. Even if it appears fast and simple sometimes, it is mostly a tough task to build anetwork from scratch and get it to work properly.

Answers to the Questions
[ 441 ]
Chapter 11 Conceptual RepresentationLearning1. The curse of dimensionality leads to reducing dimensions and features in machinelearning algorithms. (Yes | No)
Yes. The volume of data and features makes it necessary to extract the main features ofan observed event (an image, sound, and words) to make sense of it.
Overfitting and underfitting apply to dimensionality reduction as well. Reducing thefeatures until the system works in a lab (overfitting) might lead to nowhere once theapplication faces real-life data. Trying to use all the features might lead to underfittingbecause the application solves no problem at all.
Regularization applies not just to data but to every aspect of a project.
2. Transfer learning determines the profitability of a project. (Yes | No)
Yes if an application of an AI model in itself was unprofitable the first time but couldgenerate profit if used for a similar type of learning. Reusing some functions wouldgenerate profit, no doubt.
No, if the first application was extremely profitable but "overfitted" to meet thespecifications of a given project.
3. Reading model.h5 does not provide much information. (Yes | No)
No. Saving the weights of a TensorFlow model is vital during the training process tocontrol the values. Furthermore, trained models often use HDF files (.H5) to load thetrained weights. A Hierarchical Data Format (HDF) contains multidimensional arraysof scientific data.
4. Numbers without meaning are enough to replace humans. (Yes | No)
Yes. In many cases, mathematics provides enough tools to replace humans for manytasks (games, optimization algorithms, and image recognition).
No. Sometimes mathematics cannot solve problems that require concepts such asmany aspects of NLP.

Answers to the Questions
[ 442 ]
5. Chatbots prove that body language doesn't mean that much. (Yes | No)
Yes. In many applications, body language does not provide additional information. Ifonly a yes or no answer is required, body language will not add much to theconversation.
No. If emotional intelligence is required to understand the tone of the user of achatbot, a webcam detecting body language could provide useful information.
6. Present-day ANNs provide enough theory to solve all AI requests. (Yes | No)
No. Artificial Neural Networks (ANN) cannot solve thousands of problems, forexample, translating poetry novels or recognizing images with forms that constantlyvary.
7. Chatbots can now replace humans in all situations. (Yes | No)
No. Concepts need to be added. The market provides all the necessary tools. It willtake some years to be able to speak effectively with chatbots.
8. Self-driving cars have been approved and do not need conceptual training. (Yes | No)
Yes, that could be true. Sensor, mathematics (linear algebra, probabilities) mightsucceed within a few years.
No. Certain problems will require concepts (and more robotics) when emergencysituations that require creative solutions occur. If a self-driving car encounters awounded person lying on the road, what is the best approach? The choices are to callfor help, find another person if the help arrives too late, pick up the victim, drive themto a hospital (robotics), and much more.
9. Industries can implement AI algorithms for all of their needs. (Yes | No)
Yes. All the tools are there to be used. If the right team decides to solve a problem withAI and robotics, it can be done.
No. Some tools are missing, such as real-time management decision tools when facedwith unplanned events. If a system breaks down, humans can still adapt faster to findalternative solutions to continue production.

Answers to the Questions
[ 443 ]
Chapter 12 Automated Planning andScheduling1 A CNN can be trained to understand an abstract concept. (Yes | No)
Yes. A CNN can classify images and make predictions. But CNNs can analyze anytype of object or representation. An image, for example, can be linked to a word orphrase. The image thus becomes a message in itself.
2. It is better to avoid concepts and only use real-life images. (Yes | No)
No. Images provide many practical applications, but at some point, more is required tosolve planning problems for example.
Planning requires much more than this type of dataset.
3. Planning and scheduling mean the same thing. (Yes | No)
No. Planning describes the tasks that must be carried out. Scheduling adds a timefactor. Planning tells us what to do, and scheduling tells us when.
4. Amazon's manufacturing patent is a revolution. (Yes | No)
No. Manufacturing clothing has been mastered by factories around the world.
Yes. With such a worldwide distribution, Amazon has come very close to the end user.The end user can choose a new garment and it will be manufactured directly ondemand. This connectivity will change the apparel manufacturing processes and forceits competitors to find new ways of making and selling garments.
5. Learning how warehouses function is not useful. (Yes | No)
No. False. Online shopping requires more and more warehouse space and processes.The number of warehouses will now increase faster than shops. There are manyopportunities for artificial intelligence applications in warehouses.
6. Online marketing does not require artificial intelligence. (Yes | No)
No. On the contrary, artificial intelligence is used by applications for online marketingevery day, and this will continue for decades.

Answers to the Questions
[ 444 ]
Chapter 13 AI and the Internet of Things1. Driving quickly to a location is better than safety in any situation. (Yes | No)
Yes and No.
Self-driving cars face the same difficulties as human-driven cars: getting to a locationon time, respecting speed limits, or driving as safely as possible. Self-driving cars, likehumans, are constantly improving their driving abilities through experience.
Yes. Sometimes, a self-driving car will perform better on a highway with little traffic.
No. Sometimes, if the highways are dangerous (owing to weather conditions andheavy traffic) a self-driving car should take a safer road defined by slow speed andlittle to no traffic. This way, if difficulties occur, the self-driving car can slow down andeven stop more easily than on a highway.
2. Self-driving cars will never really replace human drivers. (Yes | No)
Nobody can answer that question. As self-driving cars build their abilities andexperience, they might well end up driving better than humans.
In very unpredictable situations, humans can go off the road to avoid another car andback off a bit, for example. It will take more work to get a self-driving car to do that.
One thing is certain, though. If a human is driving all night and falls asleep, the self-driving car will detect the head slumping movement, take over, and save lives. Theself-driving car can also save lives if the human has a medical problem while driving.
3. Will a self-driving fire truck with robots be able to put out a fire one day? (Yes | No)
Yes. Combining self-driving fire trucks with robots will certainly save many liveswhen a fire department faces difficult fires to extinguish. Those saved lives includefiremen who risk their own lives. It might help firemen focus on helping people whilethe robots do the tougher jobs. This robot-human team will no doubt save thousandsof lives in the future.
4. Do major cities need to invest in self-driving cars or avoid them? (Invest | Avoid)
Invest. With slow but safe self-driving cars, commuters could share public, free or verycheap, electric self-driving cars instead of having to drive. It would be like having apersonal chauffeur.

Answers to the Questions
[ 445 ]
5. Would you trust a self-driving bus to take children to school and back? (Yes | No)
No. Not in the present state of self-driving cars.
Yes, when self-driving cars, buses, and trucks prove that they can outperform humans.Self-driving vehicles will not make mistakes humans do: using smartphones whiledriving, talking to passengers without looking at the road, and much more.
6. Would you be able to sleep in a self-driving car on a highway? (Yes | No)
Not in the present state of self-driving vehicle technology.
Yes, when reliability replaces doubts.
7. Would you like to develop a self-driving program for a project for a city? (Yes | No)
That one is for you to think about! You can also apply the technology to warehousesfor AGVs by contacting the companies or AGV manufacturers directly.
Chapter 14 Optimizing Blockchains with AI1. Cryptocurrency is the only use of blockchains today. (Yes | No)
No. IBM HyperLedger, for example, uses blockchains to organize secure transactionsin a supply chain environment.
2. Mining blockchains can be lucrative. (Yes | No)
Yes. But it is a risk, like any other mining operation. Some companies have hugeresources to mine cryptocurrency, meaning that they can beat smaller competitors tocreating a block.
3. Using blockchains for companies cannot be applied to sales. (Yes | No)
No. False. Blockchain cloud platforms provide smart contracts and a secure way ofmanaging transactions during a sales process.
4. Smart contracts for blockchains are more accessible to write than standard offlinecontracts. (Yes | No)
Yes. If they are standard contracts, this speeds the transaction up.
No. If the transaction is complex and requires customization, a lawyer will have towrite the contract, which can then only be used on a blockchain cloud platform.

Answers to the Questions
[ 446 ]
5. Once a block is in a blockchain network, everyone in the network can read the content.(Yes | No)
Yes if no privacy rule has been enforced.
No. IBM Hyperledger, for example, provides privacy functions.
6. A block in a blockchain guarantees that absolutely no fraud is possible. (Yes | No)
Yes. A block in a blockchain can never be changed again, avoiding fraud. Nobody cantamper with the data.
No. If the transaction is illegal in the first place, then the block will be fraudulent aswell.
7. There is only one way of applying Bayes' theorem. (Yes | No)
No. There are many variations of Bayes Theorem. Using Naive Bayes, for example,avoids the conditional probability constraint. But another approach could useconditional probability.
8. Training a Naive Bayes dataset requires a standard function. (Yes | No)
No. Gaussian functions, for example, can be used to calculate Naive Bayes algorithms,among others.
9. Machine learning algorithms will not change the intrinsic nature of the corporatebusiness. (Yes | No)
No. False. Machine learning will disrupt every area of businesses as algorithms spreadthrough the company, optimizing processes.
Chapter 15 Cognitive NLP Chatbots1. Can a chatbot communicate like a human? (Yes | No)
No. Communicating like a human means being human: having a body with bodylanguage, sensations, odors, fear hormones, and much more.
Yes. In certain situations, if a quantum mind ( , Quantum Computers ThatThink) is built, a chatbot will produce near-human conversations.

Answers to the Questions
[ 447 ]
2. Are chatbots necessarily artificial intelligence programs? (Yes | No)
No. Many call centers use the "press 1, press 2...press n" method, which requirescareful organization but no artificial intelligence.
3. Chatbots only need words to communicate. (Yes | No)
Yes. Simple chatbots can communicate with words in a controlled situation.
No. When polysemy (several meanings for a same word or situation) is involved,pictograms and more will add more efficient dimensions.
4. Do humans only chat with words? (Yes | No)
No. In fact, humans express with the tone of their voice, body language, or music, forexample.
5. Humans only think in words and numbers. (Yes | No)
No. Certainly not. Humans think in images, sounds, odors, and feelings.
6. To build a cognitive chatbot, mental images are necessary. (Yes | No)
No. In limited "press 1 or press 2 " situations, chatbots can perform well with limitedcognitive capacities.
Yes. To engage in a real conversation with a human, mental images are the key toproviding an empathetic exchange.
7. For a chatbot to function, a dialog flow needs to be planned. (Yes | No)
Yes. It will provide better results in a business environment.
No. If you want the chatbot to talk freely, you need to free it a bit. This still requiresplanning of the dialog but it is more flexible.
8. A chatbot possesses general artificial intelligence, so no prior development is required.(Yes | No)
No. This is presently impossible. Only narrow (specific to one or a few fields) artificialintelligence exists in real life, contrary to science fiction movies and media hype.

Answers to the Questions
[ 448 ]
9. A chatbot translates fine without any function other than a translation API. (Yes | No)
No. See , Revolutions Designed for Some Corporations and Disruptive Innovationsfor Small to Large Companies.
10. Chatbots can already chat like humans in most cases. (Yes | No)
No. , Revolutions Designed for Some Corporations and Disruptive Innovations forSmall to Large Companies, shows that interpreting a language will take quite some morechallenging work and contributions.
Chapter 16 Improve the EmotionalIntelligence Deficiencies of Chatbots1. Restricted Boltzmann Machines are based on directed graphs. (Yes | No)
No. RBM graphs are undirected, unsupervised, and memoryless, and the decisionmaking is based on random calculations.
2. The hidden units of an RBM are generally connected to each other. (Yes | No)
No. The hidden units of an RBM are not generally connected to each other.
3. Random sampling is not used in an RBM. (Yes | No)
No. False. Gibbs random sampling is frequently applied to RBMs.
4. Is there a method to prevent gradients from vanishing in an RNN? (Yes | No)
Yes. When the gradient gets "stuck" around 0, for example, a ReLU function can solvethis problem. It will force negative values to become 0 (or a fixed value in a leakyReLU), and the positive values will not change.
5. LSTM cells never forget. (Yes | No)
No. False. LSTM cells "forget" by skipping connections, adding connections from thepast to the present, and other techniques.
6. Word2vector transforms words into indexes along with their labels. (Yes | No)
Yes. Word2vector transforms words into numbers and also keeps track of their labels.
Answers to the Questions
[ 449 ]
7. Principal Component Analysis (PCA) transforms data into higher dimensions. (Yes | No)
Yes. The whole point of PCA is to transform data into higher dimensions to find theprincipal component (highest eigenvalue of a covariance matrix), then the secondhighest, and down to the lowest values.
8. In a covariance matrix, the eigenvector shows the direction of the vector representing thatmatrix, and the eigenvalue shows the size of that vector. (Yes | No)
Yes. Eigenvalues indicate how important a feature is, and eigenvectors provide adirection.
9. It is impossible to represent a human mind in a machine. (Yes | No)
No. It is possible.
, Quantum Computers That Think, shows how to build a machine mind. Ittakes quite some work to include sensors, but the technology is there.
10. A machine cannot learn concepts, which is why classical applied mathematics is enoughto make efficient artificial intelligence programs for every field. (Yes | No)
No. Never believe that. Progress is being made and will never stop until mind-machines become mainstream.
Chapter 17 Quantum Computers ThatThink1. Beyond the hype, no quantum computer exists. (Yes | No)
No. False. You can already run a quantum computer on IBM Q's cloud platform.
The following screenshot is the result of a real IBM quantum computer calculation Iran on a quantum score explained in the chapter:

Answers to the Questions
[ 450 ]
2. A quantum computer can store data. (Yes | No)
No. Instability prevents any form of storage at this point.

Answers to the Questions
[ 451 ]
3. The effect of quantum gates on qubits can be viewed with a Bloch Sphere. (Yes | No)
Yes. A Bloch sphere will display the state of a qubit.
4. A mind that thinks with past experiences, images, words, and other bits of every day likestored in memory will find deeper solutions to problems that mathematics alone cannotsolve. (Yes | No)
No. False. Many researchers believe that mathematics alone can solve all humanproblems.
Yes. True. Mathematics alone cannot replace deep thinking. Even if computers haveincredible power and can beat human players at chess, for example, they still cannotadapt to new situations without going through a design and training process.Concepts need to be added and experienced (memory as well).
I bet that machine mind concepts will become progressively more mainstream to solvedeep thinking problems.
5. A quantum computer will solve medical research problems that cannot be solved today.(Yes | No)
Yes. There is no doubt about that. The sheer computing power of a quantum computercan provide exponential DNA sequencing programs for epigenetic research.
6. A quantum computer can solve mathematical problems exponentially faster thanclassical computers. (Yes | No)
Yes. Classical computers function at 2 x n (number of bits) and quantum computersrun at 2n (n being the number of qubits)!
7. Classical computers and smartphone processors will soon disappear and smartphoneprocessors also. (Yes | No)
No. Quantum computers require such a large amount of space and physical stabilitythat this will not happen in the near future. Furthermore, classical computers andsmartphones can store data. Quantum computers cannot.

Answers to the Questions
[ 452 ]
8. A quantum score cannot be written in source code format but only with a visualinterface. (Yes | No)
No. False. IBM, for example, can swap the quantum from score to QASM interface ordisplay both, as shown here:
9. Quantum simulators can run as fast as quantum computers. (Yes | No)
Certainly not! A simulator just shows how a quantum score would behave on a realquantum computer. Although the simulator can help build the score, a quantumcomputer will run exponentially faster than the simulator.
10. Quantum computers produce intermediate results while they are running calculations.(Yes | No)
No. This is not possible. The qubits are too unstable. Observing them makes thesystem collapse. However, simulators such as Quirk come in handy. Since they are notreal, intermediate results can be displayed to design a quantum score.

Index
AA-F network blockchains, using accuracy values precision, measuring of network activation function about displaying, through preactivation process AGV virtual clusters as solution Amazon Prime Wardrobe Amazonization project apparel conveyor belt processing approval, of design matrix about dimension reduction format , volume, of training dataset artificial intelligence (AI) about , as frontier avoiding based on mathematical theories inventions, versus innovations revolutionary, versus disruptive solutions automatic guided vehicles (AGVs) AWS about baseline model, preparing data management full sample training dataset, training random sample, training of training dataset
Bbackpropagation vintage XOR solution, implementing in Python
biases bitcoin minting Bloch sphere block creating , exploring blockchain anticipation novelty about dataset frequency table likelihood table naive Bayes equation blockchain process naive Bayes, using in Blockchain technology background blockchains about using using, in A-F network buckets
Ccentral limit theorem chatbot , circle degrees properties radians rotations circular DQN-CRLMM , , classifier cloud solutions AWS

[ 454 ]
CNN model applying profitable, making strategy, defining CNN-CRLMM implementing, for gaps detection cognitive chatbot service about case study image + word cognitive chat, activating implementation issue, solving cognitive dataset cognitive natural language processing , computational neuroscience conceptual representation learning meta-models
(CRLMM) about , blessing of dimensionality curse of dimensionality motivation profiling, with images conditional probability conditioning management convolutional neural network (CNN) , cost function , covariance CRLMM, applying to automated apparel
manufacturing process about apparel manufacturing process , CRLMM, training hyperparameters, modifying prediction program, running unit training dataset, generalizing CRLMM dataset directory model, testing model, training parking lots, classifying parking space, finding , , running suitable parking lot, finding training cross-entropy
cryptocurrency using
Ddata flow graph, into source code about backpropagation cost function gradient descent hidden layer input data layer linear separability, checking loss function output layer session, running data flow graph architecture, designing displaying, in TensorBoard data management, AWS access, to output results buckets files, uploading dataset optimization datasets designing , designing, in natural language meetings deep learning DeepMind design matrix approval dimension reduction domain learning about programs, using trained models training model program DQN-CRLMM building circular process components MDP Q-Learning decision function setting up dropout node features

[ 455 ]
Eeigenvalues eigenvector embedding energy-based model (EBM) entities
Ffeed keyword feedforward neural network building defining , vintage XOR solution, implementing in Python
FNN architecture building, with TensorFlow FNN XOR solution applying, to case study , , food conveyor belt processing frontier exploring ,
Ggap concept about jammed lanes loaded open lanes unloaded gap conceptual dataset gap dataset gaps abstract notions Gaussian naive Bayes about , Python program generative adversarial networks about autoencoders conceptual representations Gibbs random sampling Google Translate about customized experiment
header linguist's perspective linguistic assessment Google translation service, implementing , Google_Translate_Customized.py KNN compressed function, implementing ,
, , gradient descent grouping
HHadamard gate hidden neuron HobChat hub human biomimicking Hyperledger
IIBM Watson about dialog flow dialog tool entities intent model, building model, scripting services, adding to chatbot intent Iotham City project
JJacobian matrices using jargon job creating , running
Kk-means clustering solution data implementing

[ 456 ]
vision k-means clustering about , applying goal mathematical definition k-nearest neighbor (KNN) algorithm , , Keras model loading, after training loading, for optimizing training , , loading, for usage , , KNN compressed function implementing, in
Google_Translate_Customized.py , ,,
knn_polysemy.py program ,
Llaw of large numbers (LLN) lexical field , linear separability , , linearly separable models linguistic assessment, Google Translate jargon lexical field theory Lloyd's algorithm logistic activation functions logistic classifier logistic function logistic sigmoid function
Mmachine mind, building Markov Decision Process (MDP) , mathematical explanation, PCA covariance dataset, deriving eigenvalues eigenvectors feature vector creation variance , McCulloch-Pitts neuron about , ,
using , MDP function main target, finding MDP output matrix graph interpretation MDP process inputs outputs mind building, in machine MindX experiment about data preparation IBM Watson output, using quantum function score, creating score, running situation function , MindX conceptual representations, expanding distances embedding program gaps negative thinking , positive thinking , ML/DL model selecting Monte Carlo estimator using
Nnaive Bayes example ideas, implementing using, in blockchain process natural language meetings datasets, designing in natural language processing (NLP) Neural Machine Translation (NMT) neural networks NP-hard hard non-deterministic polynomial
[ 457 ]
OOpen Quantum Assembly Language optimal production rate (OPR) optimizers about as regulator
Pparking lot, CRLMM program itinerary graph support vector machine , weight vector Pert about results, analyzing results, presenting Phrase-Based Machine Translation (PBMT) plan polysemy posterior probability preactivation prediction, as data augmentation about data augmentation, providing input file, providing RNN, running principal component analysis about intuitive explanation mathematical explanation profit generating, with transfer learning proof of concept (POC) approach Python TensorFlow architecture Python vintage XOR solution, implementing
Qquantum computer score with IBM Q , with Quirk , quantum computer about
speed , , , thinking quantum computer quantum gates with Quirk quantum score composing qubit defining position representing ,
Rrandom sampling about applications central limit theorem LLN real-time manufacturing process real-time manufacturing revolution Recurrent Neural Network (RNN) about for data augmentation LSTM vanishing gradients working Restricted Boltzmann Machines (RBMs) about energy-based model (EBM) epochs, running Gibbs random sampling hidden layers results, analyzing visible layers return on investment (ROI) reward matrix
SSageMaker notebook scheduling , self-driving cars sentiment analysis about datasets, parsing shuffling

alternative, to random sampling skip-gram model sklearn hyperparameters k-means clustering algorithm result labels, defining results, displaying training dataset softmax function , stochastic gradient descent (SGD) stock keeping unit (SKU) subnets testing Supply Chain Management (SCM) support vector machine (SVM) defining Python function safety levels, increasing support vectors SVM function adding SVM graph margin support points
TTensor Processing Unit (TPU) used, for optimizing speed , TensorBoard Projector TensorBoard about architecture, designing of deep learning solutions
architecture, designing of machine learning data flow graph, displaying input data inputs, managing of network using, in corporate environment , ,
TensorFlow about , code, writing with data flow graph as architectural
roadmap FNN architecture, building thinking quantum computer transfer learning inductive abstraction inductive thinking motivation profit, generating with using translation checking ,
Uunit testing model Usty
Vvariance vector space model (VSM) vintage XOR solution implementing, in Python
Wweights word embedding Word2vec model ,
XXOR function XOR limit of linear model of original perceptron XOR problem solving, example , ,