argente_arizon_maria_pilar.pdf - Universidad Autónoma de ...
264
UNIVERSIDAD AUTÓNOMA DE MADRID Facultad de Medicina Departamento de Pediatría SEX AND AGE AS DETERMINING FACTORS IN THE PERIPHERAL AND CENTRAL RESPONSES TO NEONATAL OVERNUTRITION. POSSIBLE IMPLICATIONS OF HYPOTHALAMIC ASTROCYTES IN THE SEXUAL DIMORPHIC RESPONSE TO METABOLIC CHALLENGES Memoria para optar al grado de Doctor con Mención Internacional de la licenciada Doña MARÍA PILAR ARGENTE ARIZÓN DIRECTORES: Prof. Dr. D. Jesús Argente Oliver Dra. Doña Julie Ann Chowen King Madrid, 2016
-
Upload
khangminh22 -
Category
Documents
-
view
2 -
download
0
Transcript of argente_arizon_maria_pilar.pdf - Universidad Autónoma de ...

UNIVERSIDAD AUTÓNOMA DE MADRID
Facultad de Medicina
Departamento de Pediatría
SEX AND AGE AS DETERMINING FACTORS IN THE PERIPHERAL AND
CENTRAL RESPONSES TO NEONATAL OVERNUTRITION. POSSIBLE
IMPLICATIONS OF HYPOTHALAMIC ASTROCYTES IN THE SEXUAL
DIMORPHIC RESPONSE TO METABOLIC CHALLENGES
Memoria para optar al grado de Doctor
con Mención Internacional de la
licenciada
Doña MARÍA PILAR ARGENTE ARIZÓN
DIRECTORES:
Prof. Dr. D. Jesús Argente Oliver
Dra. Doña Julie Ann Chowen King
Madrid, 2016


Este trabajo ha sido realizado con cargo a proyectos del Ministerio de Ciencia e
Innovación (BFU2011–27492 and BFU2014-51836-C2-2-R), del Fondo de
Investigación Sanitaria (PI1007047,) (PI13/02195), del CIBER de Fisiopatología de la
Obesidad y Nutrición (CB06-03) Igualmente, ha sido financiado gracias a la
Fundación de Endocrinología y Nutrición del Hospital Infantil Universitario Niño
Jesús.
Pilar Argente Arizón ha recibido financiación del Fondo de Investigación Sanitaria del
Instituto de Salud Carlos III (FI11-00340).


RESUMEN


Resumen
Diversos estudios sugieren que la respuesta a los desafíos metabólicos es
diferente entre machos y hembras. Como consecuencia de un aumento en el
consumo de calorías, se producen diferencias en la ganancia de peso, así como
en el aumento y distribución de tejido adiposo, pero, además, la respuesta al
sobrepeso y obesidad es diferente entre los sexos. Sin embargo, aunque se sabe
que las alteraciones nutricionales tempranas pueden tener efectos a largo plazo
en el metabolismo, las diferentes respuestas entre los sexos son
insuficientemente conocidas hasta la fecha. Junto a ello, estudios recientes
indican que los astrocitos hipotalámicos están implicados en el control
neuroendocrino del metabolismo, así como en el desarrollo de las
complicaciones secundarias asociadas a la obesidad. No obstante, se desconoce
en gran medida si los astrocitos hipotalámicos de machos y hembras responden
de manera diferente a los desafíos metabólicos.
El objetivo de esta Tesis fue determinar si la sobrenutrición neonatal como
resultado de una reducción en el número de crías por madre durante el período
de lactancia, produce efectos similares en el crecimiento y metabolismo de ratas
macho y hembra a lo largo del desarrollo. Es bien sabido que los esteroides
sexuales desempeñan una función crítica en las diferencias post-puberales entre
machos y hembras en su metabolismo y distribución y función del tejido adiposo.
No obstante, los efectos metabólicos de las variaciones en los esteroides sexuales
durante la etapa neonatal deben ser estudiados en mayor profundidad. Por esta
razón, empleamos también un modelo de androgenización neonatal en hembras
para determinar sus efectos a corto y largo plazo en el metabolismo. Igualmente,
la respuesta hipotalámica y, concretamente de los astrocitos hipotalámicos a la
sobrenutrición neonatal, fue estudiada en ambos sexos.
Por tanto, en el estudio de sobrenutrición neonatal en machos y hembras,
se analizó el perfil metabólico, las respuestas inflamatorias y distribución y
función del tejido adiposo, así como posibles alteraciones en los astrocitos

Resumen
hipotalámicos. Para ahondar en el estudio de las posibles diferencias entre los
sexos específicamente en los astrocitos hipotalámicos, se estudió la respuesta in
vitro de estas células gliales a determinados ácidos grasos, así como el posible
efecto protector de los estrógenos a la inflamación producida por los ácidos
grasos.
Los resultados de estos estudios indican la diferente respuesta entre los
sexos a alteraciones nutricionales en el periodo neonatal, siendo esta respuesta
diferente también, en función de la edad o etapa del desarrollo en la que se
encuentran. Asimismo, las modificaciones en los esteroides sexuales en el
neonato, podrían contribuir a las diferencias metabólicas observadas a largo
plazo a consecuencia de la sobrenutrición neonatal, así como en los diferentes
efectos vistos en machos y hembras. Aún más, los astrocitos hipotalámicos
procedentes de ratas macho y hembra, responden de manera diferente a la
sobrenutrición neonatal, así como a los tratamientos in vitro con ácidos grasos y
estrógenos.
Por consiguiente, los astrocitos hipotalámicos no solamente estarían
implicados en la fisiología y fisiopatología del control neuroendocrino del
metabolismo, sino que también podrían estar participando en las respuestas a los
cambios nutricionales tempranos y en las respuestas sexualmente dimórficas del
sistema metabólico.
PALABRAS CLAVE: dimorfismo sexual, sobrenutrición neonatal, desarrollo, hipotálamo, astrocitos.

SUMMARY


Summary
The responses to metabolic challenges are suggested to be different in
males and females. Not only is there a difference in weight gain and adipose tissue
accumulation and distribution in response to increased energy intake, but the
secondary complications in response to being overweight or obese also differ
between the sexes. However, less is known about the differential sex response to
early nutritional changes that can affect long-term metabolism. In addition, recent
studies have indicated that hypothalamic astrocytes are involved in the
neuroendocrine control of metabolism, as well as the development of secondary
complications in response to obesity. However, whether hypothalamic astrocytes
from male and female rats respond differently to metabolic challenges remains to
be thoroughly analyzed.
The aim of this thesis was to determine if neonatal overnutrition as a
consequence of the reduction in the number of pups per dam during nursing
produces similar effects on growth and metabolism in male and female rats
throughout development. Moreover, although sex steroids are clearly involved in
the post-pubertal differences between males and females in metabolism and
adipose tissue distribution and function, less is known regarding the effect of
changes in the neonatal sex steroid environment on metabolism. Hence, we
employed a model of neonatal androgenization of females to determine how this
affected both short-term and long-term metabolism.
Metabolic profile, inflammatory responses and adipose tissue distribution
and function, as well as possible alterations in hypothalamic astrocytes were
analyzed in these studies. To further explore the sex differences in hypothalamic
astrocytes, the response of these glial cells to fatty acids and the possible
protective effect of estrogens against fatty acid-induced inflammation were
analyzed in vitro employing primary hypothalamic astrocyte cultures.
The results of these studies indicate that the response to nutritional
disturbances during the neonatal period differ between the sexes and are age

Summary
dependent. In addition to changes in insulin and leptin levels, differences in the sex
steroid environment during the neonatal stage could participate in the distinct
long-term metabolic responses to neonatal overnutrition and the differential
effects in males and females. We also demonstrate that hypothalamic astrocytes of
male and female rats respond differently to neonatal overnutrition, as well as to
fatty acid and hormonal treatments in vitro.
Thus, hypothalamic astrocytes are not only involved in the physiological and
physiopathological neuroendocrine control of metabolism, but they may also
participate in developmental responses to early nutritional changes and sexually
dimorphic metabolic responses.
KEY WORDS: sexual dimorphism, neonatal overnutrition, development,
hypothalamus, astrocytes.

ABREVIATIONS


Abreviations
Ab/Am: Antibiotic/Antimitotic.
ACS: acetyl-coA synthase
AgRP: Agouti related protein.
Akt: Protein kinase B.
AMPK: AMP-protein kinase
ANOVA: Analysis of variance.
ApoE: Apolipoprotein E.
ARC: Arcuate nucleus of the hypothalamus.
ABC: Avidin-biotin complex.
BDNF: Brain derived neurotrophic factor.
Β-EP: Beta-endorphin.
BMI: Body mass index.
BSA: Bovine serum albumin.
BL: Body length.
BW: Body weight.
CART: Cocaine and amphetamine-related transcript.
CCK: Cholescystokinin
cDNA: Complementary DNA.
cm: centimeters.
CNS: Central nervous system.
CPT-1: Carnitine palmitoyl transferase 1.
CREB: cAMP response element-binding protein.
CVDE: Cristal violet dye elution.
DMEM/F12: Dulbecco’s modified Eagle’s medium: Nutrient mixture F-12.
DMH: Dorsomedial nucleus of the hypothalamus.
ELISA: Enzyme-linked immunosorbent assay.
ER: Endoplasmic reticulum stress.
ER: Estrogen receptors.
ER-α: Estrogen receptor alpha.
ER-β: Estrogen receptor beta.
ERK: Extracellular signaling-regulated kinase.
FA: Fatty acid.
FBS: Fetal bovine serum.
FFAs: Free fatty acids.
FI: Food intake.
FOXO: forkhead-O transcription factor.
g: Grams.
h: Hours.
GA: glutaraldehyde
GABA: Gamma-aminobutyric acid.
Galc: Galactocerebroside.
GFAP: Glial fibrillary acidic protein.
GLUT: Glucose transporter.
GLP-1: Glucagon-like peptide 1.
HFD: High fat diet.
Iba1: Ionized calcium-binding adapter molecule 1.
ICV: Intra-cerebral ventricular.
IKBKB: Inhibitor of kappa light polypeptide gene enhancer in B-cells, kinase beta.
JNK: c-Jun N-terminal kinase.
IL-1β: Interleukin 1 beta.
IL-10: Interleukin 10.
IL-6: Interleukin 6.
IP: Intraperitoneal.
IR: Insulin receptor.
JNKs: c-Jun N-terminal kinases

Abreviations
kDa: Kilodalton.
KO: Knock-out.
LCFAs: Long chain fatty acids.
LCFA-CoA: Long chain fatty acyl-CoA.
LHA: Lateral hypothalamic area.
MAPK: Mitogen-activated protein kinase.
MC3-R: Melanocortin receptor 3.
MC4-R: Melanocortin receptor 4.
mM: Mili molar.
mRNA: Messenger ribonucleic acid.
MSH: Melanocyte-stimulating hormone.
NaNO2: Sodium nitrate.
NEDD: Ethylenediamine dihydrochloride.
NF-κB: Nuclear factor of kappa-light-chain-enhancer of activated B cells.
NFKBIA: Nuclear factor of kappa light polypeptide gene enhancer in B-cells inhibitor, alpha.
NIH: National Institute of Health.
NO2: Nitrites.
NO3: Nitrates.
NON: Neonatal overnutrition.
NPY: Neuropeptide Y.
NS: Not significant.
OA: Oleic acid.
Ob-R: Leptin receptor.
O/N: Overnight.
OGTT: Oral glucose tolerance test.
OVN: Over-nutrition
P38: P38 mitogen activated protein kinase.
P70s6k: P70 S6 kinase.
PA: Palmitic acid
PB: Phosphate buffer.
PBS: Phosphate buffered saline.
PFA: Paraformaldehyde.
PI3/Akt: Phosphoinositide-3 kinase
pathway
PND: Postnatal day.
POMC: Proopiomelanocortin.
PPAR-α: Proliferator activated receptor α.
PPAR-γ: Proliferator activated receptor γ.
PVN: Paraventricular nucleus of the hypothalamus.
RPM: Revolutions per minute.
RNA: Ribonucleic acid
RT: Room temperature.
RT-PCR: Real time-polymerase chain reaction.
S100A4: S100 calcium binding protein A4.
SCAT: Subcutaneous adipose tissue.
SCG: Superior cervical ganglion.
Ser727: Serine-727.
STAT3: Signal transducer and activator of transcription 3.
STAT5: Signal transducer and activator of transcription 5.
T2D: Type 2 diabetes.
TG: Triglycerides.
TNF-α: Tumor necrosis factor alpha.
Tyr705: Tyrosine-705
µg: Micrograms.
µl: Microliters.
µm: Micra

Abreviations
VAT: Visceral adipose tissue.
VCl3: Vanadium (III) chloride.
WAT: White adipose tissue.
WB: Western blotting.
WHO: World Health Organization.
WT: Wild type
Experimental groups:
AF: Androgenized females.
Ct: Control group.
Ct 0 h: Control group after 0 hours.
Ct 24 h: Control group after 24 hours.
F: Females.
FL12: Females from control litters.
FL4: Females from small litters.
L12: Litters of 12 pups per dam (control
litter).
L4: Litters of 4 pups per dam (small litter).
M: Males.
ML12: Males from control litters.
ML4: Males from small litters.
OA: Oleic acid treatment.
PA: Palmitic acid treatment.


INDEX


Index
I. INTRODUCTION ................................................................................................................................ 1
1. Obesity and energy balance ........................................................................................................... 1
2. Early life nutritional influences on metabolism .............................................................................. 2
3. Differences between the sexes in obesity and metabolism ........................................................... 6 3.1 Sex differences in the propensity to become obese, adipose tissue physiology and the
development of secondary complications ........................................................................................... 6 3.2 Sexual dimorphic responses to perinatal changes......................................................................... 9
4. Hypothalamic regulation of energy homeostasis ......................................................................... 10
5. The control of food intake: communication between the periphery and central nervous system 12 5.1 Signals from adipose tissue.......................................................................................................... 13
5.1.1 Leptin .................................................................................................................................... 14 5.1.1.1 Leptin’s structure .......................................................................................................... 15 5.1.1.2 Leptin receptors and signaling ...................................................................................... 15 5.1.1.3 Mechanism of action of leptin ...................................................................................... 16 5.1.1.4 Leptin’s functions .......................................................................................................... 18 5.1.1.5 Leptin and astrocytes .................................................................................................... 19
5.1.2 Adiponectin .......................................................................................................................... 19 5.2 Signals from the pancreas ............................................................................................................ 21
5.2.1 Insulin ................................................................................................................................... 21 5.2.1.1 Peripheral and central effects of insulin ....................................................................... 21 5.2.1.2 Insulin and brain development ..................................................................................... 22
5.3 Gastrointestinal (GI) hormones ................................................................................................... 23 5.4 Sex steroids in metabolism .......................................................................................................... 24
5.4.1 Estrogens .............................................................................................................................. 24 5.4.1.1 Estrogens in food intake regulation .............................................................................. 25
5.5 Nutrient derived signals: Glucose and fatty acids ....................................................................... 26 5.5.1 Hypothalamic glucose sensing ............................................................................................. 26 5.5.2 Hypothalamic fatty acid sensing........................................................................................... 28
6. Inflammation in obesity ............................................................................................................... 30
7. Glial cells in metabolic control ..................................................................................................... 32 7.1 Astrocytes in metabolic control ................................................................................................... 32
7.1.1 Astrocyte functions .............................................................................................................. 32 7.1.2 Astrocytes in glucose and fatty acids sensing ...................................................................... 33 7.1.3 Influence of metabolic hormones on astrocytes .................................................................. 34
7.2 Microglia in metabolic control ..................................................................................................... 37
8. The question in context ............................................................................................................... 39
II. HYPOTHESIS ................................................................................................................................... 41
III. OBJECTIVES .................................................................................................................................... 43
IV. MATERIALS AND METHODS ............................................................................................................ 45
1. Experimental Models ................................................................................................................... 46 1.1 IN VIVO STUDIES ........................................................................................................................... 46
1.1.1 Neonatal overnutrition throughout development ............................................................... 46 1.1.2 Neonatal androgenization .................................................................................................... 51

Index
1.2 IN VITRO STUDIES ........................................................................................................................ 53 1.2.1 Primary cultures of hypothalamic astrocytes ....................................................................... 54
1.2.1.1 Treatments .................................................................................................................... 56
2. Techniques and Protocols ........................................................................................................... 58 2.1 Determination of glycemia and serum hormone, cytokine and lipid concentrations ................. 58
2.1.1. Blood glucose levels ............................................................................................................ 58 2.1.2 Determination of serum levels of leptin, adiponectin, estradiol and testosterone by
enzyme-linked immunosorbent assay (ELISA) ............................................................................... 58 2.1.3 Determination of serum levels of insulin, interleukin 6, interleukin 1β and tumor necrosis
factor α with a multiplex bead immunoassay ............................................................................... 60 2.1.4 Determination of triglycerides in serum samples ................................................................ 60 2.1.5 Determination of non-esterified free fatty acids in serum samples .................................... 61
2.2 Protein analysis ............................................................................................................................ 61 2.2.1 Total protein extraction ............................................................................................................ 61
2.2.2 Quantification of protein concentration .............................................................................. 62 2.2.3 Western blotting .................................................................................................................. 63 2.2.4 Determination of hypothalamic levels of leptin, IL1β, IL6, IL10 and TNFα by using a
multiplex magnetic bead immunoassay ........................................................................................ 64 2.2.5 Multi-pathway magnetic bead kit primary cultures ............................................................. 64
2.3 Quantification of relative levels of mRNA ................................................................................... 65 2.3.1 Total RNA isolation ............................................................................................................... 65 2.3.2 Quantitative real-time polymerase chain reaction assay (qRT-PCR) .................................... 65
2.4 Transcardial perfusion ................................................................................................................. 67 2.4.1 Histological sections ............................................................................................................. 68
2.4.1.1 Perfused brain sections ................................................................................................. 68 2.4.1.2 Visceral adipose tissue sections .................................................................................... 68
2.5 Staining techniques for histological studies ................................................................................ 68 2.5.1 Immunohistochemistry in the hypothalamus ...................................................................... 68 2.5.2 Double immunohistofluorescence ....................................................................................... 70 2.5.3 Hematoxylin and eosin staining of visceral adipose tissue (VAT)......................................... 70
2.6 Quantification of GFAP+ cells and morphological analysis .......................................................... 71 2.7 Double immunocytofluorescence for GFAP and Iba1 in primary astrocyte cultures ................. 72 2.8 Detection of nitrites and nitrates in culture media ..................................................................... 73 2.9 Estimation of the number of cells ................................................................................................ 73 2.10 Statistical analysis ...................................................................................................................... 74
V. RESULTS ......................................................................................................................................... 75
1. Effects of neonatal overnutrition throughout development in male and female rats .................. 76 1.1 Effects of sex, litter size and age on body weight, body length and food intake. ....................... 76
1.1.1 Body weight .......................................................................................................................... 76 1.1.2 Body length .......................................................................................................................... 80 1.1.3 Mean food intake per day .................................................................................................... 82
1.2 Effects of litter size and sex on adipose tissue quantity and distribution .................................... 83 1.2.1 Subcutaneous adipose tissue ............................................................................................... 84 1.2.2 Visceral adipose tissue ......................................................................................................... 85
1.3 Effects of litter size and sex on circulating hormones and cytokines. .......................................... 86 1.3.1 Glycemia ............................................................................................................................... 86 1.3.2 Circulating insulin levels ....................................................................................................... 87 1.3.3 Homeostatic model assessment-insulin resistance (HOMA-IR) ........................................... 87

Index
1.3.4 Oral glucose tolerance test (OGTT) ..................................................................................... 89 1.3.5 Circulating leptin levels ........................................................................................................ 89 1.3.6 Circulating adiponectin levels............................................................................................... 90 1.3.7 Serum IL1β levels .................................................................................................................. 92 1.3.8 Serum IL6 levels .................................................................................................................... 92 1.3.9 Serum TNFα levels ................................................................................................................ 92 1.3.10 Testosterone levels ............................................................................................................ 94 1.3.11 17β-Estradiol levels ............................................................................................................ 94 1.3.12 Circulating triglycerides at PND150. ................................................................................... 95 1.3.13 Non-sterified fatty acids (NEFA) at PND150. ...................................................................... 96
1.4 Effects of litter size, sex and age on adipokine expression in adipose tissue .............................. 96 1.4.1 Adipokine expression in subcutaneous adipose tissue ........................................................ 96 1.4.2 Adipokine expression in visceral adipose tissue ................................................................... 98
1.5 Central effects of early overnutrition throughout development in males and females. ........... 101 1.5.1 Hypothalamic cytokine levels at PND 10 ............................................................................ 102 1.5.2 Hypothalamic cytokine levels at PND50 ............................................................................. 103 1.5.3 Hypothalamic cytokine levels at PND 150 .......................................................................... 103 1.5.4 Effects of early overnutrition and sex on hypothalamic glial proteins ............................... 105 1.5.5 Early overnutrition and sex influence on astrocyte cell number and morphology ............ 109 1.5.6 Early overnutrition and sex effects on microglia cell number ............................................ 111
2. Neonatal androgenization ......................................................................................................... 112 2.1 Metabolic effects of neonatal androgenization ........................................................................ 112
2.1.1 Metabolic effects of neonatal androgenization at PND10 ................................................. 112 2.1.2 Metabolic effects of neonatal androgenization at PND90 ................................................. 114
2.2 Cytokine profile in adipose tissue .............................................................................................. 117 2.2.1 Expression of cytokines in subcutaneous adipose tissue at PND10 ................................... 117 2.2.2 Expression of adipokines and cytokines in subcutaneous adipose tissue at PND90 .......... 118 2.2.3 Expression of adipokines and cytokines in visceral adipose tissue at PND90 .................... 118
2.3 Histological analysis of visceral adipose tissue at PND90 .......................................................... 119 2.4 Central effects of neonatal androgenization of female rats ...................................................... 120
2.4.1 Effects of neonatal androgenization on glial proteins in the hypothalamus at postnatal
days 10 and 90............................................................................................................................. 120
3. Primary astrocyte cultures ......................................................................................................... 121 3.1 Dose response curve of male and female hypothalamic astrocytes to palmitic acid ................ 121
3.1.1 Change in cell number in response to palmitic acid treatment ......................................... 121 3.1.2 Changes in the mRNA levels of GFAP, IL6, IL1β, TNFα, CHOP and IGF-1 in response to
increasing concentrations of palmitic acid .................................................................................. 122 3.1.3 Nitrites and nitrates released in response to PA ................................................................ 126
3.2 Response of male and female astrocytes to saturated and unsaturated fatty acids. ............... 126 3.2.1 Changes in the mRNA levels of GFAP, CPT-1a IL-6, IL-1β, TNFα, CHOP and IGF-1 ............. 127 3.2.2 Nitrites and nitrates released to the culture media after FAs treatment .......................... 131
3.3 Palmitic acid and 17β -estradiol................................................................................................. 132 3.4 Palmitic acid and the Toll receptor 4 antagonist RS-LPS............................................................ 137 3.5 Intracellular signaling in astrocytes in response to PA .............................................................. 141
VI. DISCUSSION .................................................................................................................................. 142
1. Effects of neonatal overnutrition on food intake, body weight and body length throughout
development ................................................................................................................................. 144

Index
2. Effects of neonatal overnutrition on circulating parameters throughout development: hormones
and cytokines ................................................................................................................................ 146
3. Effects of neonatal overnutrition on adipose tissue throughout development: amount,
distribution and cytokine gene expression .................................................................................... 151
4. The neonatal sex steroid environment influences the long-term responses to neonatal
overnutrition ................................................................................................................................. 156
5. Central response to neonatal overnutrition in males and females ............................................. 158 Astrocytes in neuroendocrine control ............................................................................................. 158 5.1 Effects of neonaltal overnutrition on astrocytes ....................................................................... 159 5.2 Hypothalamic inflammatory signals in response to neonatal overnutrition ............................. 163
6. Sex differences in the responses to neonatal overnutrition ....................................................... 166 6.1 Response of male and female hypothalamic astrocytes in vitro ............................................... 167
7. The effect of fatty acids on hypothalamic primary astrocytes from male and female rats ......... 168 7.1 Palmitic acid ............................................................................................................................... 168 7.2 Palmitic and oleic acids interaction ........................................................................................... 171 7.3 Protective effects of estrogens against palmitic acid ................................................................ 173 7.4 Palmitic acid and the Toll receptor 4 antagonist RS-LPS............................................................ 174 7.5 Intracellular signaling in astrocytes in response to PA .............................................................. 176
VII. CONCLUSIONS .............................................................................................................................. 177
VIII. CONCLUSIONES ........................................................................................................................... 180
IX. BIBLIOGRAPHY ............................................................................................................................. 183

I. INTRODUCTION


Introduction
1
1. Obesity and energy balance
Obesity and overweight are major public health concerns throughout the
industrialized world as both conditions are risk factors for the development of
additional diseases such as type 2 diabetes (T2D), cardiovascular diseases or cancer
(Lustig and Weiss, 2008; Daniels, 2009; Anteneh et al., 2015). Obesity can be defined as
an abnormal/excessive fat accumulation (Garrow, 1988; Ofei, 2005) that usually leads
to an increase in total body weight. Body mass index (BMI) is used as a simple
indirect measurement of obesity. A person’s BMI is calculated as their weight (in
kilograms) divided by the square of his or her height (in meters). When the BMI is
30 or higher, a person is considered to be obese (WHO, 1995).
It is well accepted that the accumulation of excessive adiposity is due to an
imbalance between energy intake and energy expenditure over time (Garrow, 1988),
although the specific causes of the dramatic rise in this epidemic are still under
debate. The genetic make-up of each individual, as well as the hormonal and
nutritional environment and psychosocial factors are all involved in the etiology of
this metabolic imbalance (Dong et al., 2003; Mendieta-Zeron et al., 2008; Argente, 2011;
Stein et al., 2011). Therefore, development of obesity in an individual depends on
their genetic predisposition, environmental factors such as lack of exercise and/or
poor dietary habits, and the interaction between these factors (Figure 1).
Figure 1. Overweight and obesity occur due to an imbalance between calorie intake and energy
expenditure over time, with the genetic make-up of each individual, hormonal and nutritional
environment, psychosocial factors, stress and circadian rhythms influencing this imbalance.

Introduction
2
The prevalence of obesity began to increase at an alarming rate at the end
of the 20th century and continues to rise, with no signs of abating. Indeed, obesity is
considered to be the most important epidemic of the 21st century, with at least 2.8
million people dying each year as a result of being overweight or obese, according
to the World Health Organization (WHO) (WHO, 2015). Obesity affects all ages,
including children and adolescents, particularly in developing countries (Ogden et al.,
2007; Prevention, 2013). Obesity during infancy is currently one of the most serious
public health concerns and its rates have doubled over the past 20 years, while in
adolescents the rate has tripled (Ford et al., 2014). Obese children will likely continue
to be obese as adults and thus, will have an increased probability of developing
obesity-associated comorbidities in the future including T2D, cardiovascular
diseases, insulin resistance syndrome, arthritis, dyslipidemias, infertility or
psychological disorders among others (Horvath, 2005; Despres, 2007; Gundogan et al.,
2009; Martos-Moreno and Argente, 2011; Gungor, 2014). The dramatic rise in the
incidence of obesity, in concert with the huge economic impact attributed to its
associated disorders, makes obesity a primary health concern and emphasizes the
need for a deeper understanding of its etiology and the identification of new
targets to fight against this disease.
2. Early life nutritional influences on metabolism
Poor nutrition, the lack of physical activity and the interaction of these two
factors with an individual’s genetic background, predispose a person to weight
gain, due to excessive fat accumulation, that finally leads to them being overweight
and/or obesity. In addition, animal models and human studies have demonstrated
that early environmental influences, including nutritional factors, can have effects
on adult metabolic homeostasis (Roseboom et al., 2006; Barker, 2007; Levin, 2008;
Fuente-Martin et al., 2012b; Spencer, 2012; Liu et al., 2013; Collden et al., 2015; Long et al.,
2015). Thus, not only does a person’s current lifestyle and genetic background make
them susceptible to becoming obese, but an increased propensity to develop
obesity can begin in utero or during the early postnatal stages, such as during
lactation. Indeed, an excessive nutrient supply and rapid weight gain in early life

Introduction
3
can have long-term effects, even when the individual or animal is exposed to a
normal diet during postnatal life (Barker, 2007; Levin, 2008; Fuente-Martin et al., 2012b;
Spencer, 2012; Liu et al., 2013; Collden et al., 2015; Long et al., 2015).
Maternal health and nutrition during gestation, as well as fetal exposure to
stress, abnormal levels of hormones and environmental toxins, have all been
shown to disrupt metabolic homeostasis in later life (Roseboom et al., 2006; Barker,
2007; Shin et al., 2012; Regnier et al., 2015). For example, maternal obesity and
diabetes frequently complicate pregnancy (Anna et al., 2008), altering maternal
metabolism and thus potentially disrupting metabolic homeostasis in the offspring
(Yu et al., 2013). In rodents, the initial postnatal weeks are critical for the formation
of hypothalamic neurocircuits, with approximately postnatal day (PND) 20 being
the end of this critical period for hypothalamic differentiation and development
(Bouret et al., 2004a; Grayson et al., 2006). In contrast, this sensitive period in humans
predominantly occurs in utero during the third trimester of gestation (Clancy et al.,
2007).
Although the majority of studies analyzing the long-term effects of early
environmental influences on metabolism have been performed in males, here is
evidence that the metabolic responses to these early disturbances may be different
in females (Garcia-Caceres et al., 2010; Fuente-Martin et al., 2012c; Mela et al., 2012;
Reynolds et al., 2015b). In addition, these responses may also be age dependent, for
example appearing in some occasions only in later adulthood (Habbout et al., 2013;
Granado et al., 2014).
Animal studies have illustrated that modification of the litter size in which
animals are reared can have long term-effects on their metabolic homeostasis.
Diverse studies show that when the number of pups per dam is reduced, weight
gain is promoted, while the opposite occurs when the number of pups per dam is
greatly enlarged during nursing (Frolkis et al., 1993; Plagemann et al., 1999c; Cunha et al.,
2009; Fuente-Martin et al., 2012b; Fuente-Martin et al., 2012c; Kayser et al., 2015). Some
studies have attributed this weight gain to overfeeding as a result of increased food
Introduction
4
availability during suckling that engenders increased energy intake (Fiorotto et al.,
1991; Fink et al., 2001; Cunha et al., 2009). The consequences of this increased food
intake and weight gain are involved in the observed long-term metabolic effects.
Other factors, such as maternal nurturing, can also participate in the long-term
effects due to litter size modification (Connor et al., 2012; Reynolds et al., 2014; Segovia
et al., 2014). In rodents, these early nutritional modifications during nursing are
taking place precisely when neuronal circuits are developing and the central
nervous system (CNS) is still maturating. Hence, the perinatal nutritional
environment could have a decisive influence on the development of neuronal
circuits involved in energy balance and metabolic homeostasis.
Under normal physiological conditions, at the same time that hypothalamic
neurocircuits are maturing, there is a surge in circulating leptin levels in neonatal
rodents. Leptin levels increase progressively by PND 5, and peak between PND 9
and PND 10 remaining elevated until approximately day 13 (Ahima et al., 1998;
Delahaye et al., 2008). This increase in leptin is crucial for the outgrowth of key
neuronal projections in the hypothalamus. Indeed, either a deficiency or an excess
in leptin levels during the perinatal period can cause important changes in
hypothalamic circuits involved in metabolic homeostasis, appetite and food intake
behavior, possibly predisposing an individual to obesity and metabolic disorders
later in life (Bouret and Simerly, 2007). Importantly, not only are neurons affected
during this critical period but also, astrocytes proliferate and expand within the
brain, with leptin suggested to promote astrogenesis during this early age (Ahima et
al., 1999; Rottkamp et al., 2015).
It should be taken into consideration that unlike rodents, the increase in
leptin in humans takes place in utero, with leptin concentrations increasing
dramatically in fetal arterial cord blood by the end of gestation, with newborns
with intrauterine growth retardation reported to have lower leptin levels than
those with normal growth (Jaquet et al., 1998). Although experiments have shown
that leptin appears to be secreted preferentially to the maternal side of the
placenta, there is also secretion to the fetal side (Linnemann et al., 2000; Hoggard et

Introduction
5
al., 2001). The rat placenta is reported to be permeable to leptin (Smith and Waddell,
2003). Both human (Masuzaki et al., 1997) and murine (Hoggard et al., 1997) placenta
express leptin and the leptin receptor (Hoggard et al., 1997; Masuzaki et al., 1997;
Linnemann et al., 2000), suggesting that this hormone has an important role during
gestation. In addition, during lactation, leptin can pass from the mother to the
offspring through the maternal milk (Teixeira et al., 2002).
Although insulin does not cross the placenta or in very low amounts, glucose
from the mother does, and this glucose acts on the fetal pancreas to stimulate
insulin secretion (Buse et al., 1962; Freinkel et al., 1979). Studies have demonstrated
that obesity in the mother, produced by gestational diabetes or an inadequate diet,
is associated with hyperinsulinemia, hyperleptinemia, hyperphagia and increased
adiposity in the offspring (Catalano et al., 2003; Harvey et al., 2007; Samuelsson et al.,
2008; Nivoit et al., 2009). Thus, the long-term effects on the offspring’s metabolism
may occur not only through modifications in leptin, but also insulin levels, as this
hormone also influences hypothalamic development (Vogt et al., 2014).
A well-known and important example of the dramatic influence of early
nutritional factors on human offspring is what occurred during the Second World
War, when pregnant women suffered from famine. The offspring were affected in
different ways depending on which trimester of gestation the mother suffered
starvation. Several studies have illustrated that the offspring from mothers affected
during the first trimester of pregnancy, had a higher risk for the development of a
wider spectrum of metabolic diseases than babies born from mothers affected
either in the second or third trimester of pregnancy. However, the offspring from
mothers experiencing starvation during the second or third trimester had a higher
risk to develop metabolic diseases than a baby born from a healthy mother (Kyle
and Pichard, 2006; Lumey et al., 2011; Roseboom et al., 2011).
Therefore, nutritional modifications produced during both the intrauterine
and the perinatal period should be considered as potential risk factors for
metabolic alterations in the adult. Part of these alterations is most likely due to

Introduction
6
modifications in hormonal signals at critical moments in the development of
hypothalamic metabolic circuits.
3. Differences between the sexes in obesity and metabolism
The importance of taking into consideration the differences between males
and females has been recently highlighted by the National Institutes of Health (NIH)
in the United States, as the inclusion of both sexes in clinical trials and basic
research has become mandatory (Clayton and Collins, 2014; Health, 2014). Indeed,
understanding how physiological processes and the responses to metabolic
challenges differ between males and females will allow more accurate treatments
according to sex.
3.1 Sex differences in the propensity to become obese, adipose tissue
physiology and the development of secondary complications
The relation between obesity and associated complications and mortality is
well established (Gundogan et al., 2009; Martos-Moreno and Argente, 2011). However,
the link between obesity and its secondary complications has been more
thoroughly studied in men than in women. Studies indicate that the propensity to
become obese is different between the sexes and that this is largely owing to the
direct influence of sex steroids. Indeed, estrogens protect from body weight gain,
fat mass accumulation and obesity complications (Stubbins et al., 2012; Dakin et al.,
2015). They also have inhibitory effects on appetite and increase energy
expenditure by increasing the activity of anorexigenic signals and exert the
opposite effect on orexigenic signals (Tarttelin and Gorski, 1971; Clegg et al., 2006; Clegg
et al., 2007; Shen et al., 2010; Zhu et al., 2013). Declining androgens levels have also
been associated with obesity and metabolic disorders such as T2D (Dhindsa et al.,
2010; Grossmann, 2011). Differences between men and women in the propensity to
become obese also reside in their dissimilarities regarding adipose tissue
distribution.
Adipose tissue is an active endocrine organ in constant communication with
the CNS by releasing numerous adipokines and responding to hormones and

Introduction
7
neuropeptides from the CNS (Galic et al., 2010; Rosen and Spiegelman, 2014). Expansion
of fat mass can occur by hypertrophy of the existing adipocytes or by hyperplasia
due to recruitment of new preadipocytes (Jo et al., 2009). Some studies relate
hyperplasia with subcutaneous adipose tissue (SCAT) and hypertrophy with visceral
adipose tissue (VAT) (Wang et al., 2013). An increase in the size of adipocytes is
associated with higher metabolic risk (Lundgren et al., 2007). Estrogens are suggested
to favor hyperplasia, increasing adipocyte progenitor cells and facilitating vascular
supply to adipose tissue (Gealekman et al., 2011; Kim et al., 2014b).
Males and females differ not only as to the amount and distribution of
adipose tissue (Kotani et al., 1994), but also with regard to adipose tissue metabolism
and function (Havel et al., 1996; Tran et al., 2008; Macotela et al., 2009). It is clear that
differences in circulating sex steroids play a critical role in some of the observed
sexual dimorphisms, but not all metabolic dissimilarities can be explained by
differences in gonadal hormone levels. Indeed, some sex differences in metabolism
are present even before puberty (Taylor et al., 2010), although they become more
evident in adulthood. In addition, as reported by Chen et al, the number of X
chromosomes also influences adiposity in mice (Chen et al., 2012).
Unlike males, which reach their maximum levels of fat accumulation at
puberty, females have a continuous increase in fat mass throughout development,
with women having higher levels of adiposity compared to men throughout
lifespan (Gallagher et al., 1996). Females tend to accumulate more SCAT in the gluteal
and femoral zones, acquiring what is often referred to as the typical pear shape
(Figure 2). In contrast, males accumulate more visceral (abdominal) adipose tissue
with the characteristic apple shape distribution (White and Tchoukalova, 2014). It is
well known that the accumulation of fat mass in the upper zone of the body
(abdominal fat) is more related to obesity-associated comorbidities such as
cardiovascular diseases or diabetes; on the contrary, fat mass accumulation in the
gluteal-femoral region is not and could even be protective (Wajchenberg, 2000; Tran
et al., 2008; Manolopoulos et al., 2010).

Introduction
8
Figure 2. Apple-shaped (male) and pear-shaped (female) distribution of adipose tissue. Men tend to
accumulate fat above the waist, whereas women do so below the waist.
Different fat mass localization implies different adipose tissue function,
including variations in regards to adipokine production, insulin sensitivity,
mitochondrial function, fatty acid release and lipolysis, as well as the inflammatory
profile (Power and Schulkin, 2008; Macotela et al., 2009). For example, serum levels of
leptin exhibit a sexual dimorphic pattern in both humans and rodents. Women
have higher circulating leptin levels than men (Hickey et al., 1996; Argente et al., 1997).
Inversely, male rodents have higher serum leptin levels compared to female
rodents (Landt et al., 1998). These differences are not only due to the variations in
the amount and distribution of adipose tissue, but also to its capacity to produce
this adipokine.
The signals that adipose tissue receives from the CNS are also sexually
dimorphic. Neurons projecting to visceral fat are more numerous in males than in
females, whereas in females the neurons projecting to subcutaneous fat are more
abundant than in males (Adler et al., 2012). In addition, female brains appear to be
more sensitive to the effects of leptin on the regulation of food intake and energy
expenditure, which is suggested to indicate a tight relationship between leptin and
estrogens (Clegg et al., 2006).
MEN
Apple shape
More visceral fat
Higher risk of obesity related comorbidities
WOMEN
Pear shape
Less visceral fat
Lower risk of obesity related comorbidities

Introduction
9
3.2 Sexual dimorphic responses to perinatal changes
The long-term effects of early nutritional modifications can be sex specific
(Cheverud et al., 2011; Fuente-Martin et al., 2012b; Sanchez-Garrido et al., 2013). However,
the majority of the experimental studies analyzing these effects have not been
performed simultaneously in both sexes. Males and females have metabolically
different responses not only to early nutritional changes (Sardinha et al., 2006;
Erhuma et al., 2007; Fuente-Martin et al., 2012b), but also to stressful conditions during
early life (Bowman et al., 2004; Garcia-Caceres et al., 2010; Mela et al., 2012; Tibu et al.,
2014). Moreover, the sexually dimorphic responses to these early interventions
often vary according to age (Fuente-Martin et al., 2012b; Mela et al., 2012). Although
gonadal steroids are clearly responsible for some of the post-pubertal differences
between males and females (Kanaley et al., 2001; Stubbins et al., 2012; Dakin et al.,
2015), they cannot explain all of these differences, let alone sex differences
observed in early neonatal life. Males experience a surge in testosterone during
neonatal life (Miyachi et al., 1973). As alterations in gonadal steroid levels during
development have been implicated in metabolic disturbances in adulthood (Nohara
et al., 2013c; Ongaro et al., 2015), it is possible that this event is involved in the
development of some of the sexually dimorphic characteristics of metabolism.
Administration of testosterone to neonatal females has been classically used
as an experimental model to study the mechanisms underlying sexual dimorphism
in the brain (Raisman and Field, 1973). This experimental model of androgenization
has also been employed to study the long-term effects of increased neonatal
androgen levels on the female reproductive axis and the development of polycystic
ovary syndrome (Dunlap et al., 1972; Gellert et al., 1977; Goomer et al., 1977; Ongaro et
al., 2015). More recently, this experimental model of neonatal androgenization has
been used to study metabolic abnormalities in females (Nohara et al., 2013b; Mauvais-
Jarvis, 2014; Ongaro et al., 2015).

Introduction
10
4. Hypothalamic regulation of energy homeostasis
Food intake, energy balance and body weight are regulated by the CNS,
which senses the overall metabolic status through the reception of hormonal and
nutritional signals. A wide range of circulating peptides from the gut (stomach,
small intestine and pancreas) and adipose tissue act on the hypothalamus, brain
stem and afferent autonomic nerves through the vagus nerve and the superior
cervical ganglion (SCG) to modulate energy metabolism (Halford and Blundell, 2000;
Ring and Zeltser, 2010). The CNS then integrates these inputs and executes the
appropriate hunger or satiety signal by releasing orexigenic or anorexigenic
neuropeptides, respectively.
Although various brain regions such as the solitary nucleus, the amygdala
and prefrontal cortex are implicated in metabolic control, the hypothalamus is
considered the main integration site for the regulation of feeding behavior
(Schwartz et al., 2000; Horvath, 2005; Abizaid and Horvath, 2008). Hypothalamic
involvement in the control of food intake was first observed when alterations in
food intake were produced in animals with hypothalamic lesions (Hetherington and
Ranson, 1940; Hetherington and Ranson, 1942) and later, in animals with hypothalamic
tumors (Brobeck, 1946).
The hypothalamus is the brain region where peripheral signals, including
hormones and metabolites such as glucose and fatty acids, converge and are
integrated to achieve appropriate appetite regulation, with the arcuate nucleus
being key in this process. This nucleus is located adjacent to the floor of the third
ventricle and the median eminence, making it more accessible to incoming
peripheral signals. Lesions of the arcuate nucleus in rats have been shown to
produce a profound deregulation of appetite that leads to hyperphagia, with some
of the first demonstrations of this phenomenon occurring over 4 decades ago
(Olney, 1969; Young et al., 1994).
The arcuate nucleus contains two of the main populations of neurons
implicated in the regulation of energy balance (Cone, 2005). From the arcuate

Introduction
11
nucleus, these neurons send their projections to other hypothalamic nuclei
involved in food intake regulation, including
the paraventricular nucleus (PVN), the
dorsomedial hypothalamus (DMH) and the
lateral hypothalamic area (LHA) (Elias et al.,
1998b; Elmquist et al., 1998b) (Figure 3).
These neuronal populations located
in the arcuate nucleus are known as
primary order neurons and express
neuropeptides that exert opposite actions (Figure 4). One neuronal population co-
expresses neuropeptide Y (NPY) and agouti-related protein (AgRP) (Tatemoto et al.,
1982; Hahn et al., 1998), as well as the inhibitory neurotransmitter gamma-
aminobutyric acid (GABA) (Horvath et al., 1997). Both neuropeptides exert a potent
orexigenic action, which means that their actions will stimulate appetite (Horvath et
al., 1997). These neurons are activated in deficient energy states, such as during
fasting or when leptin and insulin levels are below normal, to promote food intake
and inhibit energy expenditure. On the contrary, high levels of leptin and insulin
inhibit this neuronal population (Schwartz et al., 2000).
The other important neuronal population is anorexigenic, inhibiting appetite
and stimulating energy expenditure, and co-expresses proopiomelanocortin
(POMC) and cocaine and amphetamine-related transcript (CART). The precursor
POMC protein is processed to produce α and β melanocyte-stimulating hormone
(MSH), amongst other peptides (Cone et al., 1996). These melanocortin peptides
have anorexigenic effects by acting through the melanocortin receptors 3 (MC3-R)
and 4 (MC4-R). A positive energy balance activates these neurons, in part due to
the resulting high concentrations of leptin, stimulating melanocortin release and
subsequently inhibiting food intake and stimulating energy expenditure (Elias et al.,
1998a). These anorexigenic neurons receive innervation from NPY/AgRP neurons,
with AgRP having antagonistic effects on MC3-R and MC4-R (Fan et al., 1997; Ollmann
et al., 1997). Thus, AgRP is a potent orexigenic signal not only by directly stimulating
Figure 3. Hypothalamic nuclei

Introduction
12
food intake, but it also acts indirectly through inhibition of anorexigenic signals at
melanocortin receptors. Another POMC-derived peptide is β-endorphin (β-EP),
which has orexigenic effects and also antagonizes the effects of MSH on food
intake and body weight (Grossman et al., 2003; Dutia et al., 2012; Koch et al., 2015).
Figure 4. NPY and POMC/AgRP neurons in the ARC nucleus of the hypothalamus are first order neurons
that respond to circulating signals from adipose tissue (e.g., leptin), stomach (e.g., ghrelin) and pancreas
(e.g., insulin). These neurons release orexigenic (NPY and AgRP) or anorexigenic (CART and the POMC-
derived peptide α-MSH) peptides, which impact on second order neurons in other areas of the
hypothalamus to regulate food intake and energy homeostasis by stimulating or inhibiting hunger and
satiety (B).
5. The control of food intake: communication between the periphery
and central nervous system
Communication between peripheral signals and the CNS includes a complex
gut-brain-adipose network in which the interaction and actions of hormones and
neuropeptides is crucial in the control of metabolic homeostasis and energy
balance. Peripheral signals coming from diverse organs or tissues and nutrients are

Introduction
13
integrated by the hypothalamus, where, according to the information received, the
appropriate signals will be elaborated in order that energy requirements are
adequately fulfilled. These hormones come from at least three different sites:
adipocytes, the gastrointestinal (GI) tract and the pancreas.
5.1 Signals from adipose tissue
Adipose tissue, once relegated to the category of a passive organ storing
triglycerides (TG), is now considered to be an active endocrine organ per se (Antuna-
Puente et al., 2008; Coelho et al., 2013). There is a constant dialogue between adipose
tissue and the CNS (Figure 5), mediated by a variety of adipokines secreted by the
adipose tissue, which inform the brain about energy stores. Regarding their actions
in the brain, leptin is the most well studied adipokine (Halaas et al., 1995; Maffei et al.,
1995a). Although CNS actions of other adipokines such as adiponectin, resistin and
apelin have also been reported (Rajala et al., 2004; Kadowaki et al., 2006; Pope et al.,
2012). Moreover, the brain produces “adipotropins” that act on adipocytes through
the activation of specific receptors (Schaffler et al., 2006).
Figure 5. Adipose tissue and brain communication, showing an active role of adipose tissue in the
regulation of food intake.
Introduction
14
5.1.1 Leptin
In 1994, the cloning and characterization of the Ob gene by Jeffrey Friedman
and colleagues (Zhang et al., 1994b) resulted in the identification of its protein
product, leptin (leptos from latin: thin). This discovery was a milestone in the
understanding of appetite control since leptin is one of the most important signals
secreted by adipose tissue participating in the regulation of energy homeostasis
and the pathogenesis of obesity. Leptin is anorexigenic and is secreted almost
exclusively by adipose tissue, although to a minor extent by the liver, stomach,
hypothalamus, placenta and ovaries (Hoggard et al., 1997; Bado et al., 1998; Mantzoros,
1999). Defects in leptin expression in ob/ob mice (Drel et al., 2006), as well as rare
mutations of the leptin gene in humans leading to leptin deficiency, result in
profound obesity with affected individuals showing hyperphagia and decreased
energy expenditure (Farooqi et al., 1999). Leptin replacement in humans has been
shown to normalize these symptoms (Farooqi et al., 2002).
Plasma leptin concentrations positively correlate with fat stores and also
increase with overfeeding and decrease in starvation states (Considine et al., 1996;
Friedman and Halaas, 1998). However, in addition to food intake and BMI, leptin
concentrations also vary according to sex, age and circadian rhythms (Argente et al.,
1997; Blum et al., 1997; Mantzoros, 1999). Leptin circulates either free or bound to a
soluble form of its receptor, Ob-R (Ob-Re). Leptin passes through the blood-brain-
barrier (BBB) by using a saturable transporter system and reaches one of its main
sites of action, the hypothalamus, where it acts to decrease food intake and
increase energy expenditure (Frederich et al., 1995a; Houseknecht et al., 1998).
Specifically, leptin exerts its anorexigenic effects in the arcuate nucleus by
inhibiting NPY/AgRP neurons and stimulating POMC neurons. (Schwartz et al., 2000;
Horvath, 2005; Simpson et al., 2009). In 1997, Halaas and colleges showed that intra-
cerebral ventricular (ICV) injection of leptin provoked these effects without
modifying circulating leptin levels, indicating a central action of leptin (Halaas et al.,
1997). Under normal conditions, there is a tight relationship between circulating
Introduction
15
leptin levels and its transport into the brain. Thus, fasting states decrease the
transport of leptin into the brain due to its low levels in blood, while food
consumption produces both an increase in circulating levels and in the transport of
leptin across the BBB (Kastin and Pan, 2000).
5.1.1.1 Leptin’s structure
Leptin, a 167 amino acid peptide hormone with a molecular weight of 16
kilodalton (kDa) is encoded by the Ob gene. The human Ob gene is located on
chromosome 7q31-3 and is composed of three exons separated by two introns (Isse
et al., 1995). The three-dimensional structure of leptin is organized into four
antiparallel α-helices connected by two long crossover links and one short loop.
There is an interchain disulphide bond that is key for the stability and biological
activity of this hormone (Zhang et al., 1997; Fruhbeck, 2006). Human leptin shares high
homology with that of other mammals, sharing up to 84% of homology with mouse
leptin and 83% with rat leptin.
5.1.1.2 Leptin receptors and signaling
The leptin receptor, Ob-R, was discovered in 1995 by Tartaglia and
coworkers and resembles a class 1 cytokine receptor (Tartaglia et al., 1995). While
the CNS accounts for the majority of leptin’s target sites (Elmquist et al., 1998a; Cohen
et al., 2001; McMinn et al., 2005; Pan et al., 2008), Ob-R is also expressed in other
tissues, including pancreatic beta cells, adipose tissue and the testis (Kielar et al.,
1998; Tena-Sempere et al., 2001; Covey et al., 2006). This receptor is encoded by the
diabetes (db) gene and has at least six-splice variants, denoted Ob-Ra to Ob-Rf.
These isoforms can be classified into three classes: short, long and secretory
(Tartaglia et al., 1995).
Ob-Ra, Ob-Rc, Ob-Rd and Ob-Rf, the short isoforms of the leptin receptor
lacking the intracellular domain, are involved in the internalization and breakdown
of leptin (Tartaglia et al., 1995; Uotani et al., 1999). Ob-Ra is the most ubiquitous
isoform in most tissues and cells (Tartaglia et al., 1995). Ob-Re is the soluble and

Introduction
16
smallest isoform and is involved in transporting circulating leptin to its membrane
receptors.
Ob-Rb, the longest leptin receptor isoform with the longest intracellular C-
terminal domain, has intracellular signal-transducing capabilities. Ob-Rb is highly
expressed in the hypothalamus (Tartaglia, 1997; Scott et al., 2009) and is
predominantly responsible for mediating leptin’s metabolic actions in the CNS.
(Schwartz et al., 2000). Both POMC/CART and NPY/AgRP neurons express Ob-Rb
(Cheung et al., 1997; Baskin et al., 1999), as do neurons distributed throughout the
VMH, DMH and LHA that participate in the regulation of feeding (Elmquist et al.,
1998a; Dhillon et al., 2006; Hommel et al., 2006). In addition to neurons, astrocytes also
express Ob-Rb (Pan et al., 2008; Kim et al., 2014a), suggesting that these cells also
participate in mediating leptin’s effects on metabolism.
The amino acid sequences of human and murine leptin receptors also share
high homology, including 78% identity in the extracellular and 71% in the
intracellular domains (Chen et al., 1996). While the majority of transcripts encoding
the short intracellular domain isoforms are found in almost all tissues, the long
intracellular domain form is less abundant except for in the hypothalamus, where it
is expressed at high levels (Ghilardi et al., 1996). Similar to leptin deficient humans
and mice, leptin receptor deficient humans and mutant mice (db/db) display
hyperphagia and decreased energy expenditure, presenting early onset obesity
(Chua et al., 1996).
5.1.1.3 Mechanism of action of leptin
Leptin binds to Ob-Rb to activate intracellular signaling transduction through
the Janus Activated Kinases (JAK)/Signal Transducer and Activators of Transcription
(STAT) pathway. Although this is not the only pathway activated by leptin, it is the
most studied with regards to food intake control. Leptin binds Ob-Rb causing a
conformational change and inducing auto-phosphorylation and activation of JAK
family proteins, in particular JAK-2 tyrosine kinase, which in turn produces
phosphorylation of STAT family proteins (Figure 6) (Vaisse et al., 1996; Banks et al.,

Introduction
17
2000), which have two important phosphorylation sites. First, STAT-3 is
phosphorylated on tyrosine-705 (Tyr705), which causes dimerization, translocation
to the nucleus and DNA binding (Guschin et al., 1995). Then, a second
phosphorylation takes place at serine-727 (Ser727). Whereas Tyr705
phosphorylation is mediated by Janus kinases, Ser727 activation may be mediated
by several kinases and has a role in transcriptional activation (Zhang et al., 1998;
Decker and Kovarik, 2000). This signaling cascade results in the activation of the key
genes involved in mediating leptin’s actions (Ghilardi et al., 1996; Harvey and Ashford,
2003; Allison and Myers, 2014). The phosphorylation of the STAT family proteins also
induces the expression of genes such as suppressor of cytokine signaling 3 (SOCS3),
which mediates feedback inhibition of the leptin pathway (Bjorbaek et al., 1998). Of
note, leptin suppresses AMP-protein kinase (AMPK) stimulating food intake
(Minokoshi et al., 2004).
Figure 6. Simplification of the leptin signaling pathway. Leptin is secreted by adipose tissue to the
bloodsteam postpandrially. Leptin binds to Ob-Rb to activate JAK2 and then STAT3, which translocates
to the nucleus to activate the expression of the key genes involved in leptin’s satiety effects. STAT3 also
induces the expression of SOCS3 that has an inhibitory effect on JAK2, suppressing leptin’s actions. The
leptin pathway converges with the insulin intracellular signaling pathway at the level of PI3K activation.

Introduction
18
5.1.1.4 Leptin’s functions
As stated above, leptin is an anorectic hormone secreted to the bloodstream
accordingly to the amount of stored adipose tissue an individual has (Frederich et al.,
1995a; Argente et al., 1997). Although leptin has been used as an efficient treatment
in obese leptin deficient patients to reduce the amount of adipose tissue (Farooqi et
al., 2002; Mantzoros et al., 2011), high leptin levels are usually found in obese
individuals. This implies that there is a resistance to leptin’s effects on weight loss
(Frederich et al., 1995b; Maffei et al., 1995b). In addition, obese individuals are reported
to have reduced leptin transport across the BBB, which would contribute to the
leptin resistance observed in obese subjects (El-Haschimi et al., 2000). Indeed, diverse
studies exposing mice to high fat diet (HFD) showed an increase in food intake
probably due to the development of leptin resistance (Lin et al., 2000; Enriori et al.,
2007; Knight et al., 2010).
Leptin also influences brain development and participates in the maturation
of neuronal circuits implicated in appetite control and food intake behavior (Bouret
et al., 2004b). As previously stated, either a deficiency or an excess of leptin during
this perinatal period can have long-term effects on the metabolic control (Steppan
and Swick, 1999; Bouret, 2010a; Granado et al., 2014; Mela et al., 2015) and this is at least
in part due to modifications in the development of metabolic circuits. In rodents,
the projections from the arcuate nucleus to other important hypothalamic nuclei
implicated in feeding behavior are immature at birth, becoming fully mature
around PND20 (Bouret et al., 2004a). Mice genetically lacking leptin (ob/ob mice)
have modifications in the number of projections and synaptic inputs to NPY and
POMC neurons. This synaptic connectivity can be rapidly restored to that seen in
wild type (WT) mice by administration of leptin (Pinto et al., 2004). Bouret and
colleges demonstrated that ob/ob mice have permanent alterations in the
neuronal projections from the arcuate nucleus. Leptin treatment during the
neonatal period rescues the development of these projections, while no effect is
found in adult animals, indicating that there is a critical window when leptin is

Introduction
19
capable of influencing the development of hypothalamic feeding circuits (Bouret et
al., 2004b).
Leptin modulates lipid and glucose metabolism, stimulating lipolysis and
inhibiting lipogenesis in liver and adipose tissue (Hynes and Jones, 2001). It also has
antagonic effects on insulin, decreasing glucose-stimulated insulin secretion (Hynes
and Jones, 2001; Muzumdar et al., 2003). Leptin is also implicated in numerous other
physiological functions such as reproduction, immunity and adipogenesis (Friedman
and Halaas, 1998).
5.1.1.5 Leptin and astrocytes
Astrocytes express receptors for leptin (Pan et al., 2008; Hsuchou et al., 2009;
Kim et al., 2014a) and leptin also plays an important role in astrocyte development
(Pan et al., 2012; Rottkamp et al., 2015). Calcium waves are induced in astrocytes in
response to leptin, indicating that the leptin receptors in these glial cells are
functional (Hsuchou et al., 2009). Increased expression of leptin receptors in
astrocytes has been reported in obese animals (Pan et al., 2008; Hsuchou et al., 2009).
Moreover, we have previously shown that leptin induces morphological changes in
astrocytes, both in vivo and in vitro (Garcia-Caceres et al., 2011; Kim et al., 2014a), and
these morphological changes are involved in leptin-induced modifications in
synaptic inputs to NPY and POMC neurons (Kim et al. 2014). Leptin also modifies the
ability of hypothalamic astrocytes to transport both glutamate and glucose, with
the time of leptin exposure producing different responses (Fuente-Martin et al.,
2012a).
5.1.2 Adiponectin
Adiponectin is a 30kDa protein composed of 247 amino acids. It is
exclusively and abundantly secreted by adipose tissue and is thought to play
important roles in glucose and lipid metabolism (Hu et al., 1996; Brochu-Gaudreau et
al., 2010). Adiponectin is released into the bloodstream in three different isoforms
that differ in molecular weight, with the activity of adiponectin in tissues
Introduction
20
depending on the amount of each isoform (Waki et al., 2003).
At least in the adult, adiponectin is associated with beneficial effects and it is
reported to be an anti-diabetic hormone. This is due to its activation of AMPK
(Yamauchi et al., 2002) and the peroxisome proliferator activated receptor α (PPARα)
(Kersten et al., 2000) in liver and skeletal muscle. The adiponectin receptor AdipoR1,
is abundantly expressed in skeletal muscle, while AdipoR2 is more highly expressed
in liver. Although the neuroendocrine function of adiponectin has been less
studied, receptors for this adipokine are also expressed in the arcuate nucleus of
the hypothalamus (Koch et al., 2014). Binding of adiponectin to these receptors
stimulates the activation of AMPK and PPARα, respectively (Yamauchi et al., 2003).
Oxidative stress in adipose tissue is associated with decreased plasma adiponectin
levels (Kadowaki and Yamauchi, 2005; Yamauchi et al., 2007). Adiponectin has been
associated with anti-inflammatory effects, with increased plasma adiponectin
levels reducing adipose tissue inflammation in obesity through PPARα activation
(Tsuchida et al., 2005). Adiponectin can also up-regulate interleukin 10 (IL-10)
expression in macrophages and leukocytes, resulting in a potent anti-inflammatory
activity (Wolf et al., 2004).
The effect of adiponectin on hypothalamic metabolic circuit development
remains unknown; however, levels of this adipokine in cord blood are positively
correlated with leptin levels and adiposity and it is suggested to play a role in early
growth (Tsai et al., 2004; Ballesteros et al., 2011). Although adiponectin is reported to
increase insulin sensitivity in adults (Yamauchi et al., 2001), in neonates adiponectin
levels do not correlate with insulin sensitivity (Meral et al., 2011).
Adiponectin expression by white adipose tissue (WAT) is reported to be
sexually dimorphic, with females having higher adiponectin production (Amengual-
Cladera et al., 2012; Capllonch-Amer et al., 2014). Secretion of this adipokine is
influenced by testosterone, as castrated rodents and hypogonadal men have higher
serum total and high molecular weight adiponectin concentrations, while
testosterone treatments decreases its levels (Nishizawa et al., 2002; Xu et al., 2005).

Introduction
21
5.2 Signals from the pancreas
5.2.1 Insulin
Insulin was isolated for the first time by Banting and Best in 1922 (Banting,
1924; Raju, 2006). It is almost exclusively secreted by the pancreas and, once in the
circulation, it crosses the BBB by a saturable transport system (Baura et al., 1993). In
the CNS, insulin also communicates the metabolic status to the hypothalamus, thus
being another key molecule for the control of energy homeostasis (Vogt and Bruning,
2013). Pancreatic beta cells secrete this protein in response to elevated blood
glucose levels, after consumption of a meal for example, with insulin thus being the
major regulator of glycemia. It stimulates the uptake of glucose by liver, muscle and
adipose tissue and suppresses hepatic glucose production (Kahn, 1994). Importantly,
and like leptin, circulating insulin levels are correlated to body adiposity (Polonsky et
al., 1988).
Insulin exerts its actions in both the periphery and the CNS after binding to
its receptor (IR), a tyrosine kinase receptor (Kahn, 1994). Insulin receptors are
present throughout the brain, including the hypothalamus (Wozniak et al., 1993)
where they are highly expressed in the arcuate nucleus (van Houten et al., 1979).
Insulin activation of the phosphoinositide-3 kinase pathway (PI3/Akt), where AKT
triggers forkhead-O transcription factor (FOXO) phosphorylation which is
translocated to the nucleus and degraded, is essential for maintenance of energy
homeostasis by the CNS (Plum et al., 2006), and the mitogen-activated protein kinase
(MAPK) signaling pathway (White, 2003), which negatively regulates FOXO activity
(Biggs et al., 1999). There is crosstalk between insulin and leptin signaling pathways
in the hypothalamus and specifically, insulin signaling converges with leptin
signaling at the level of PI3K activation to increase the firing of POMC neurons
(Niswender et al., 2003; Belgardt et al., 2009). Blockade of PI3K inhibits the anorexic
effects on food intake of both leptin and insulin (Niswender and Schwartz, 2003).
5.2.1.1 Peripheral and central effects of insulin

Introduction
22
Glucose-stimulated insulin secretion regulates appetite through direct
activation of POMC and inhibition of AgRP expression (van Houten et al., 1979; Bruning
et al., 2000), causing inhibition of food intake and increased energy expenditure
(Woods et al., 1979; Qiu et al., 2014). Correct IR signaling is indeed important for body
weight control, as IR deficiency in mice leads to increased fat mass and leptin levels
(Bruning et al., 2000). It is important to note that insulin exerts independent actions
in the periphery and centrally, with this hormone having important functions on
metabolism, neural plasticity and cognition (Banks et al., 2012). In the brain, IR
expression is reported to be higher in neurons than glial cells (Unger et al., 1989).
Moreover, aging is associated to decreased IR density in the brain (Frolich et al.,
1998; Bosco et al., 2011), which is related with decreased cognitive function and could
also have a role in the increased propensity to gain weight with age.
Hyperinsulinemia as a consequence of obesity can lead to insulin resistance
and eventually type 2 diabetes (Moller and Flier, 1991). Hyperinsulinemia and
decreased insulin sensitivity have been proposed to be perpetuated by the
inflammatory state that occurs in obesity, due to an abnormal accumulation of
lipids in adipose tissue and the production of proinflammatory cytokines (De Souza
et al., 2005; Shoelson et al., 2006), with serine kinases such as c-Jun N-terminal kinases
(JNKs) mediating the proinflammatory signals and impairing insulin signaling
(Hirosumi et al., 2002; Hotamisligil, 2003). Indeed, TNFα and IL6 production by adipose
tissue of obese individuals can induce peripheral insulin resistance (Hotamisligil et al.,
1993; Rotter et al., 2003).
5.2.1.2 Insulin and brain development
Insulin is essential for adequate CNS development and function, including
neuronal differentiation, maturation and survival (Recio-Pinto et al., 1986; Valenciano
et al., 2006), synaptic plasticity, learning and memory (Dou et al., 2005) and neuronal
circuitry formation (Chiu et al., 2008; Chong et al., 2015). Equilibrated insulin levels
during prenatal and neonatal life are fundamental, as insulin actively participates in
the normal development of metabolic neuronal circuits (Dorner and Plagemann, 1994;
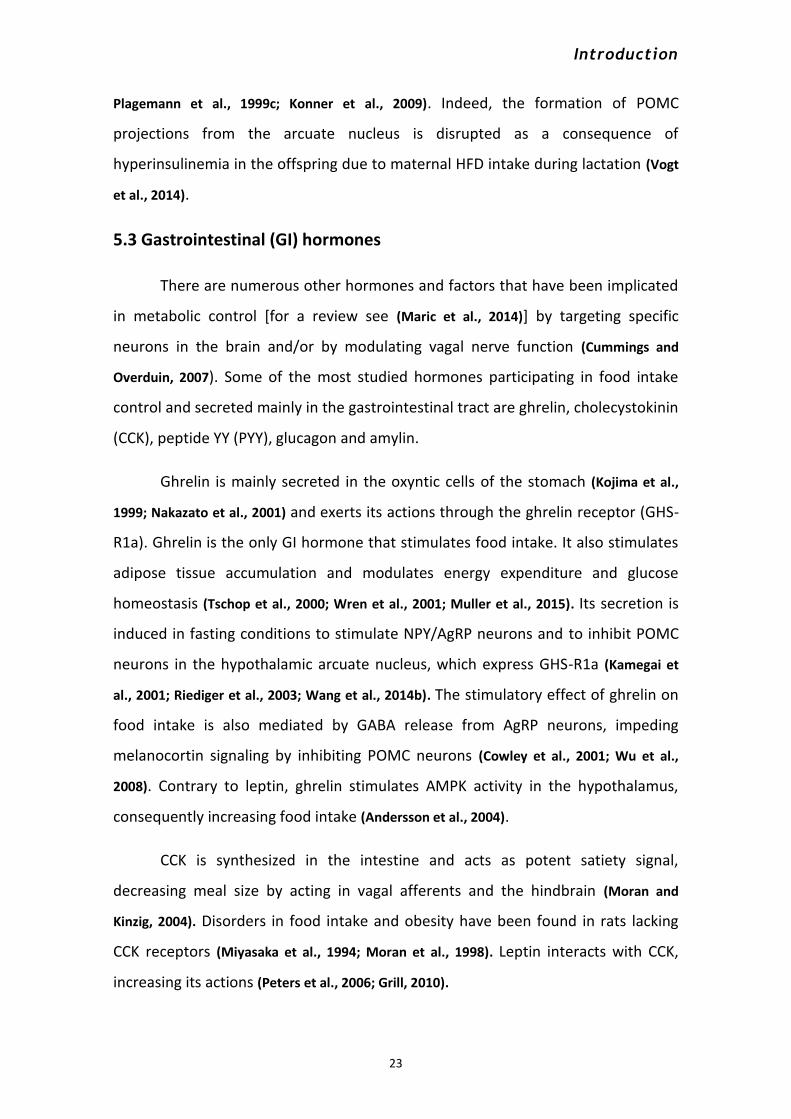
Introduction
23
Plagemann et al., 1999c; Konner et al., 2009). Indeed, the formation of POMC
projections from the arcuate nucleus is disrupted as a consequence of
hyperinsulinemia in the offspring due to maternal HFD intake during lactation (Vogt
et al., 2014).
5.3 Gastrointestinal (GI) hormones
There are numerous other hormones and factors that have been implicated
in metabolic control [for a review see (Maric et al., 2014)] by targeting specific
neurons in the brain and/or by modulating vagal nerve function (Cummings and
Overduin, 2007). Some of the most studied hormones participating in food intake
control and secreted mainly in the gastrointestinal tract are ghrelin, cholecystokinin
(CCK), peptide YY (PYY), glucagon and amylin.
Ghrelin is mainly secreted in the oxyntic cells of the stomach (Kojima et al.,
1999; Nakazato et al., 2001) and exerts its actions through the ghrelin receptor (GHS-
R1a). Ghrelin is the only GI hormone that stimulates food intake. It also stimulates
adipose tissue accumulation and modulates energy expenditure and glucose
homeostasis (Tschop et al., 2000; Wren et al., 2001; Muller et al., 2015). Its secretion is
induced in fasting conditions to stimulate NPY/AgRP neurons and to inhibit POMC
neurons in the hypothalamic arcuate nucleus, which express GHS-R1a (Kamegai et
al., 2001; Riediger et al., 2003; Wang et al., 2014b). The stimulatory effect of ghrelin on
food intake is also mediated by GABA release from AgRP neurons, impeding
melanocortin signaling by inhibiting POMC neurons (Cowley et al., 2001; Wu et al.,
2008). Contrary to leptin, ghrelin stimulates AMPK activity in the hypothalamus,
consequently increasing food intake (Andersson et al., 2004).
CCK is synthesized in the intestine and acts as potent satiety signal,
decreasing meal size by acting in vagal afferents and the hindbrain (Moran and
Kinzig, 2004). Disorders in food intake and obesity have been found in rats lacking
CCK receptors (Miyasaka et al., 1994; Moran et al., 1998). Leptin interacts with CCK,
increasing its actions (Peters et al., 2006; Grill, 2010).

Introduction
24
PYY is secreted in the lower intestine and regulates appetite, mediating its
effects through the NPY receptors. Serum PYY levels rise postpandrially, in
response to calorie intake, resulting in the inhibition of food intake (Batterham et al.,
2002; Batterham and Bloom, 2003).
The peptide hormone glucagon is secreted in the alpha cells of the pancreas.
It is released to the bloodstream when glucose levels are low in order to restore
glycemia levels by converting glycogen stored in the liver into glucose (Woods et al.,
2006). It is also secreted postpandrially, providing a satiety signal (Geary, 1990).
Amylin is synthesized by pancreatic β-cells to decrease food intake. Amylin
can interact with leptin to regulate metabolism (Lutz, 2010).
5.4 Sex steroids in metabolism
5.4.1 Estrogens
Estrogens are an important group of hormones produced mainly by the
ovaries in females and the testes in males, although they are also produced to a
lesser extent by other tissues including adipose tissue (Simpson, 2003). In addition to
their role in the reproductive system (Christensen et al., 2012), estrogens also
modulate the neuroendocrine, skeletal, adipogenic, and cardiovascular systems
(Hughes et al., 2009; Xiao et al., 2010). Estrogens mediate their actions through
estrogen receptors (ERs), including estrogen receptor alpha (ER-α) and estrogen
receptor beta (ER-β) which are located throughout the CNS, including the arcuate
nucleus of the hypothalamus (Simerly et al., 1990; Shughrue et al., 1997; Osterlund et al.,
1998; Mitra et al., 2003) and are encoded by distinct genes and located in different
chromosomes (Kong et al., 2003). Of note, ERβ expression in the hypothalamus is
lower than ERα and, importantly, ERα is the isoform that is most implicated in
energy homeostasis (Heine et al., 2000).
ERs belong to the steroid hormone superfamily of nuclear receptors (NRs), which
act as transcription factors after binding to estrogen (Osz et al., 2012). ERα and ERβ
are expressed in adipose tissue of both males and females and influence adiposity
Introduction
25
(Mizutani et al., 1994; Shimizu et al., 1997; Davis et al., 2013). Estrogens are suggested to
increase the sympathetic tone to adipose tissue depots, in a different manner in
men and women, favoring lipid deposition in the subcutaneous depot in women
and visceral in men, as shown by increased abdominal adiposity in females as a
consequence of ERα deletion in certain neurons (Xu et al., 2011). In the brain,
estrogens play an important role in neuronal development and circuit formation in
the fetus and neonate (Arai et al., 1986; McCarthy, 2008) and also modulate dendritic
morphology, synaptic inputs, neurotransmitter and neuropeptide secretion and
nuclear volume in the post-pubertal animal (DeVoogd and Nottebohm, 1981; Garcia-
Segura et al., 1986; Carrer et al., 2005). They also regulate the expression of BDNF in
the hypothalamus that can be related with the browning of fat (Cao et al., 2011;
Nookaew et al., 2013).
Not only neurons, but also astrocytes are involved in the neuroprotective
actions of estradiol (Acaz-Fonseca et al., 2014; Arevalo et al., 2015). Indeed, ERs are also
expressed in astroglial cells (Jung-Testas et al., 1991; Langub and Watson, 1992), with
glial cells participating in the metabolism of gonadal hormones and the synthesis of
endogenous steroids (Kabbadj et al., 1993; Melcangi et al., 1993; Garcia-Segura et al.,
1996a).
5.4.1.1 Estrogens in food intake regulation
Estrogens have protective effects against weight gain, increased adiposity
and obesity associated disorders (Stubbins et al., 2012; Dakin et al., 2015), with 17β-
estradiol being the most potent endogenous estrogen in appetite regulation (Geary,
2000), functioning at least in part by decreasing food intake and increasing leptin
sensitivity (Palmer and Gray, 1986). Activation of ERα in the CNS has been shown to
regulate food intake, glucose homeostasis and energy expenditure (Musatov et al.,
2007; Xu et al., 2011). Estrogens have been shown to exert their “protection” on
metabolism due to their inhibitory effects on appetite by increasing the activity of
anorexigenic signals such as leptin, cholecystokinin, BDNF or apolipoprotein A-IV
and decreasing orexigenic signals like ghrelin or melanin-concentrating hormone

Introduction
26
(Tarttelin and Gorski, 1971; Clegg et al., 2006; Clegg et al., 2007; Shen et al., 2010; Zhu et al.,
2013).
The menstrual cycle in women is reported to induce fluctuations in calorie
intake, with a decrease during the periovulatory phase when estradiol reaches its
peak (Barr et al., 1995; Buffenstein et al., 1995; Davidsen et al., 2007). This is also seen in
female rodents, which consume less during diestrous (right after the preovulatory
rise in estradiol secretion) and increase food intake during estrus when estradiol
levels are lower, reinforcing the association between estradiol levels and food
intake (Tarttelin and Gorski, 1971; Asarian and Geary, 2013). In addition, female rats are
reported to gain less weight compared to males when exposed to a HFD, but this
sex difference is no longer observed after ovariectomy (Stubbins et al., 2012).
Estrogens also increase energy expenditure (Gambacciani et al., 1997). Indeed,
activation of ERs in the VMN of the hypothalamus in rodent models increases
energy expenditure (Musatov et al., 2007; Xu et al., 2011). Post-menupausal women
generally tend to increase body weight due to decreased estradiol levels and they
are also reported to have a lower rate of energy expenditure during exercise and
sleep (Lovejoy et al., 2008). Therefore, estrogens protect against weight gain through
both inhibition of food intake and stimulation of energy expenditure. Estrogens are
also important for men as blockade of androgen conversion to estrogen leads to
impaired insulin sensitivity and metabolism (Finkelstein et al., 2013).
5.5 Nutrient derived signals: Glucose and fatty acids
Control of energy homeostasis by the hypothalamus is modulated not only
by peripheral hormones, but also by nutrients such as glucose or fatty acids.
5.5.1 Hypothalamic glucose sensing
Claude Bernard observed that hypothalamic lesions produced
hyperglycemia in dogs, with this being the first observation that the brain is
Introduction
27
implicated in the control of blood glucose levels (Bernard, 1855). Later, specific cells
in the hypothalamus that monitor glucose concentrations and translate the
variations in glucose levels into chemical signals to control feeding were identified
(Mayer, 1953). Subsequently, numerous studies have illustrated that glucose acts on
hypothalamic sites that are involved in the control of energy homeostasis (Jordan et
al., 2010; Levin et al., 2011). Due to its location close to the median eminence, the
arcuate nucleus is one of the first central sites to be exposed to circulating glucose
levels.
Neurons with the ability to sense blood glucose levels alter their action
potential frequency in response to changes in interstitial glucose levels (Ashford et
al., 1990). Of special interest are glucose-sensing neurons found in the
ventromedial, lateral, paraventricular and arcuate nuclei (Oomura et al., 1964; Kow
and Pfaff, 1989; Song et al., 2001; Wang et al., 2004). In the arcuate nucleus, in addition
to glucose-sensing neurons (Wang et al., 2004; Fioramonti et al., 2007), astrocytes
(Morgello et al., 1995; Kacem et al., 1998; Fuente-Martin et al., 2012a) and other glial cells
like tanycytes (García et al., 2003; Salgado et al., 2014) surrounding the third ventricle
are also involved in sensing glucose levels.
Glucose transport and sensing in the brain is carried-out through glucose
transporters (GLUT) 1, 2, 3 and 4, expressed in the vasculature, glial cells and
neurons. GLUT1 is highly expressed in the astrocyte endfeet that envelop capillaries
and is the principal glucose transporter in the BBB (Morgello et al., 1995; Kacem et al.,
1998). GLUT2 is expressed in hypothalamic astrocytes, ependymal-glial cells,
tanycytes and glucose-sensitive neurons (García et al., 2003; Guillod-Maximin et al.,
2004; Kang et al., 2004) and is especially important for the glucose-sensing process,
actively participating in the homeostatic control of circulating glucose levels (Bady
et al., 2006; Stolarczyk et al., 2010). GLUT3 is mainly expressed in neurons (Gerhart et
al., 1995). AMPK is a fuel sensor (Kemp et al., 1999) and is suggested to be a mediator
of hypothalamic glucose-sensing, as it is activated when energy stores are low (low
generation of ATP) and stimulates food intake (Claret et al., 2007; Jordan et al., 2010).

Introduction
28
Direct icv administration of glucose inhibits feeding through modulation of
glucose-sensing neurons (Kurata et al., 1986; Chang et al., 2005). However, this central
hypophagic effect of glucose is abolished when an individual is exposed to chronic
high fat diet during 8 weeks, with glucose-excited (POMC) and glucose-inhibited
(NPY) neurons being less responsive to glucose fluctuations (Levin et al., 1998; de
Andrade et al., 2015), suggesting defective neuronal activation by glucose caused by
high fat diet.
5.5.2 Hypothalamic fatty acid sensing
Although glucose is the primary source of energy for neurons and acts as a
signaling molecule, some hypothalamic neurons also sense long-chain fatty acids
(LCFAs) (Oomura et al., 1975). Moreover, enzymes responsible for fatty acid synthesis
are also present in neurons of the arcuate nucleus (Kim et al., 2002). Like insulin and
leptin, levels of fatty acids and glycerol are proportional to adiposity and thus are
also signals of nutrient abundance that modulate hypothalamic function to
maintain homeostasis (Kennedy, 1953; Friedman, 2000).
The intake of fat rich diets has increased alarmingly and, although certain
levels of fatty acids are necessary, elevated levels of free fatty acids (FFAs) can be
harmful. Serum FFAs are increased in obesity (Reaven et al., 1988; Boden, 2008) and
their elevation is associated with adipocyte dysfunction and the development of
insulin resistance (Boden et al., 2001; Guilherme et al., 2008). Moreover, elevated levels
of FFAs in perinatal life may also affect hypothalamic neurocircuit development
(Sullivan et al., 2011). In addition, FFAs, especially saturated fatty acids, can activate
an inflammatory response in different cell types (Boden and Shulman, 2002; Iyer et al.,
2010), as well as induce endoplasmic reticulum (ER) stress (Gregor and Hotamisligil,
2007). Excess FFAs derived from the diet accumulate in the adipocyte and form TGs
that are stored as energy (one TG is composed of three fatty acids and one
molecule of glycerol) in fat droplets in the adipocyte (Gregor and Hotamisligil, 2007).
The main features of the most abundant fatty acids in diet are summarized in Figure
7.
Introduction
29
Figure 7. Main characteristics of the most abundant unsaturated (oleic acid) and saturated (palmitic
acid) fatty acids in the diet.
Circulating fatty acids access the brain through passive diffusion (Hamilton
and Brunaldi, 2007) or by active transport (Mitchell et al., 2011) and are reported to
access the CNS in proportion to their concentrations in plasma (Miller et al., 1987;
Rapoport, 1996), although Goto and Spitzer quantified around 6% in the cerebro
spinal fluid of their plasma concentration in fasting dogs (Goto and Spitzer, 1971).
Once LCFAs enter into the brain and then into hypothalamic glial cells and neurons,
they are esterified by acetyl-coA synthase (ACS) to long chain fatty acyl-CoA (LCFA-
CoA), whose accumulation will induce inhibitory effects on food intake and glucose
production by the liver. Thus, LCFA-CoA accumulation is essential for lipid sensing
in the hypothalamus and consequent inhibition of glucose production in the liver
(Woods et al., 1984; Chu et al., 2002; Yue and Lam, 2012). LCFA-CoA enters the
mitochondria for beta oxidation by carnitine palmitoyl transferase 1 (CPT-1) (Caspi

Introduction
30
et al., 2007). This oxidation is regulated by malonyl-CoA that inhibits CPT-1 activity
(McGarry et al., 1983). Hence, circulating lipids also act as signals to the
hypothalamus regarding the nutritional status and modulate neuronal activity to
control energy homeostasis (Woods et al., 1984; Matzinger et al., 2000).
LCFAs are able to excite or inhibit neurons in the arcuate nucleus (Morgan et
al., 2004; Migrenne et al., 2006; Le Foll et al., 2014). Centrally infused oleic acid inhibits
food intake and glucose production by the liver, at least in part through inhibiting
the expression of the orexigenic neuropeptides NPY and AgRP (Obici, 2002; Morgan et
al., 2004). In addition, oleic acid has been reported to stimulate neurogenesis of
metabolic neurons (Nascimento et al., 2015) and to improve insulin resistance in
obese mice (Oliveira et al., 2015). In contrast, exposure to saturated LCFAs, like
palmitic acid, leads to resistance to leptin’s anorexigenic actions (Milanski et al.,
2009) and appears to exacerbate the inflammatory responses observed in obesity
and to cause lipotoxicity (Listenberger et al., 2001; Beeharry et al., 2003). Palmitic acid is
reported to cause inflammatory responses in both astrocytes and microglia (Gupta
et al., 2012; Valdearcos et al., 2014), which most likely participates in the disruption of
appropriate metabolic sensing in neurons.
6. Inflammation in obesity
Inflammation is a host response to protect against an insult and is necessary
to repair the tissue and restore homeostasis (Calder et al., 2009). Obesity is
characterized by a chronic, low-grade inflammatory state (Gregor and Hotamisligil,
2011). However, the inflammation associated with obesity is different from the
classical inflammation in which pain, redness, swelling and heat are typical and a
rapid immune response eliminates the insult and resolves the inflammation in the
site of injury (Medzhitov, 2008). The first report of systemic inflammation related to
obesity was published by Hotamisligil and co-workers, where they reported an
elevation in TNFα levels in obese compared to lean mice (Hotamisligil et al., 1993;
Hotamisligil et al., 1995). In addition to TNFα, the expression of other inflammatory

Introduction
31
cytokines, such as IL1β and IL6, has also been shown to be elevated in obesity (Berg
and Scherer, 2005; Shoelson et al., 2006).
In obesity, adipose tissue is the main site of increased systemic cytokine
production, including IL6, TNFα and IL1β amongst others, with excess nutrient
intake suggested to activate this inflammatory response (Fried et al., 1998). The
increased secretion of inflammatory cytokines such as TNFα can impair insulin
signaling and thus contribute to the development of insulin resistance (Stephens et
al., 1997). The inflammatory response in adipose tissue is associated with adipocyte
hypertrophy, but not adipocyte proliferation (Weisberg et al., 2003). Indeed,
adipocyte hypertrophy is associated with immune cell, macrophage and T cell
infiltration in addition to the local proinflammatory environment (Minihane et al.,
2015). The distribution of adipose tissue in overweight and obese subjects seems to
be important in determining the inflammatory milieu, with VAT appearing to
contribute to a greater extent than SCAT to the inflammatory process and cytokine
production (Weiss, 2007a).
Importantly, the cytokines released by adipose tissue are also metabolic
signals that can cross the BBB and reach the metabolic control units, including both
neurons and astrocytes within the hypothalamus (Banks et al., 1995; Benveniste,
1998). Moreover, these cytokines can also be locally produced in the brain
(Benveniste, 1998). Indeed, in addition to adipose tissue, other tissues involved in
metabolism such as the brain (De Souza et al., 2005), liver (Cai et al., 2005), pancreas
(Nicol et al., 2013) and muscle (Saghizadeh et al., 1996) may also participate in the
inflammatory state in obesity.
There is evidence that inflammatory responses can be directly evoked by
nutrients (Aljada et al., 2004; Cani et al., 2007; Erridge et al., 2007). Nutrients and/or
inflammatory signals can activate JNK, a major intracellular contributor to the
induction of inflammation in metabolic tissues, inhibitor of nuclear factor kappa-B
kinase (IKK) and/or other kinases, which can interfere with the insulin-signaling

Introduction
32
cascade by targeting IRS-1 for inhibitory phosphorylation (Boura-Halfon and Zick,
2009; Tanti and Jager, 2009).
Sex differences in inflammatory markers have been investigated in a few
studies, but the reported studies are contradictory. Some studies report no
differences between male and female humans and mice (Forsey et al., 2003;
Medrikova et al., 2012), while others indicate a sex difference in humans and
chimpanzees (Bouman et al., 2004; Obanda et al., 2014). Hence, further investigation is
required where both sexes are compared in order to achieve clear conclusions in
this field.
7. Glial cells in metabolic control
7.1 Astrocytes in metabolic control
The contribution of astrocytes, the most abundant glial cells in the CNS, to
the physiological and pathophysiological control of metabolism is increasingly
evident (Garcia-Caceres et al., 2012; Argente-Arizón et al., 2015), although further
investigation is needed to completely understand their role in both physiological
and pathophysiological metabolic control.
7.1.1 Astrocyte functions
Astrocytes are essential for the communication between the periphery and
the CNS (Tsacopoulos and Magistretti, 1996). These glial cells are strategically
positioned to sense the nutritional status, being part of the BBB and in intimate
contact with vascular and synaptic elements (Abbott et al., 2010; Wang et al., 2014c).
They are therefore capable of providing blood-borne nutrients to neurons,
promoting neuronal survival and contributing to CNS homeostasis.
Astrocytes regulate neuronal differentiation, proliferation, and
synaptogenesis during development (Nedergaard et al., 2003; Clarke and Barres, 2013).
These glial cells highly express the glutamate transporters GLT-1 and GLAST and

Introduction
33
modulate synaptic transmission by up-taking glutamate from the synaptic cleft
(Pines et al., 1992; Schmitt et al., 1997). This not only terminates excitatory
transmission, but also protects against excitotoxicity (Araque et al., 1999; Ransom et
al., 2003). One single astrocyte contacts various neurons and thousands of synapses
(Bushong et al., 2002; Theodosis et al., 2008), highlighting the importance of how
changes in astrocytes can extensively influence neuronal activity.
In response to CNS injuries, infections or foreign substances, astrocytes
become activated and respond by producing cytokines, thus participating in central
immune responses (Aschner, 1998a; b). Depending on the type of stimulus and its
intensity or time of exposure, the cytokines produced from astrocytes can have
protective or beneficial effects or, in contrast, detrimental inflammatory effects
often associated with scar tissue formation (Choi et al., 2014). Astrocytes also
participate in diverse processes that could affect metabolism, such as glucose and
lipid sensing, and they express receptors for various hormones that participate in
the control of food intake, including leptin, insulin, ghrelin and glucocorticoid
receptors (Vielkind et al., 1990; Zhu et al., 1990; Hsuchou et al., 2009; Baquedano et al.,
2013).
7.1.2 Astrocytes in glucose and fatty acids sensing
The astrocyte endfeet surrounding blood vessels express glucose
transporters GLUT1 and GLUT2 to transport glucose from the circulation into the
brain (Morgello et al., 1995; Vannucci et al., 1997; Marty et al., 2005; Stolarczyk et al.,
2010). Glucose can be stored inside astrocytes as glycogen or be metabolized to
lactate, which can be released to serve as an energy substrate for neurons (Levin et
al., 2011). Notably, astrocytes also secrete endozepines, which in addition to
exerting anorexigenic effects (do Rego et al., 2007), participate in glucose-sensing,
possible through the melanocortin pathway (Lanfray et al., 2013).
Astrocytes are the sole cells in the CNS able to β-oxidize FAs to produce
ketone bodies; thus, these cells are the main source of FA oxidation in the brain.
Ketone bodies produced by astrocytes serve as a fuel to neurons, especially in
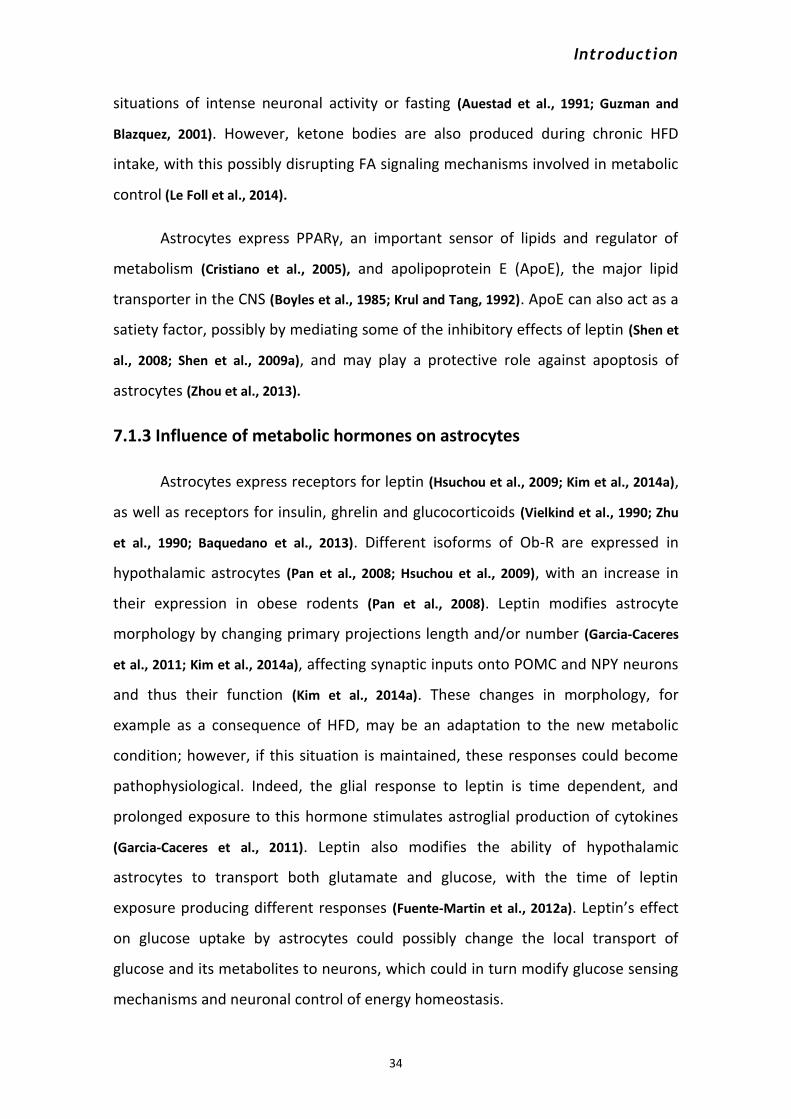
Introduction
34
situations of intense neuronal activity or fasting (Auestad et al., 1991; Guzman and
Blazquez, 2001). However, ketone bodies are also produced during chronic HFD
intake, with this possibly disrupting FA signaling mechanisms involved in metabolic
control (Le Foll et al., 2014).
Astrocytes express PPARγ, an important sensor of lipids and regulator of
metabolism (Cristiano et al., 2005), and apolipoprotein E (ApoE), the major lipid
transporter in the CNS (Boyles et al., 1985; Krul and Tang, 1992). ApoE can also act as a
satiety factor, possibly by mediating some of the inhibitory effects of leptin (Shen et
al., 2008; Shen et al., 2009a), and may play a protective role against apoptosis of
astrocytes (Zhou et al., 2013).
7.1.3 Influence of metabolic hormones on astrocytes
Astrocytes express receptors for leptin (Hsuchou et al., 2009; Kim et al., 2014a),
as well as receptors for insulin, ghrelin and glucocorticoids (Vielkind et al., 1990; Zhu
et al., 1990; Baquedano et al., 2013). Different isoforms of Ob-R are expressed in
hypothalamic astrocytes (Pan et al., 2008; Hsuchou et al., 2009), with an increase in
their expression in obese rodents (Pan et al., 2008). Leptin modifies astrocyte
morphology by changing primary projections length and/or number (Garcia-Caceres
et al., 2011; Kim et al., 2014a), affecting synaptic inputs onto POMC and NPY neurons
and thus their function (Kim et al., 2014a). These changes in morphology, for
example as a consequence of HFD, may be an adaptation to the new metabolic
condition; however, if this situation is maintained, these responses could become
pathophysiological. Indeed, the glial response to leptin is time dependent, and
prolonged exposure to this hormone stimulates astroglial production of cytokines
(Garcia-Caceres et al., 2011). Leptin also modifies the ability of hypothalamic
astrocytes to transport both glutamate and glucose, with the time of leptin
exposure producing different responses (Fuente-Martin et al., 2012a). Leptin’s effect
on glucose uptake by astrocytes could possibly change the local transport of
glucose and its metabolites to neurons, which could in turn modify glucose sensing
mechanisms and neuronal control of energy homeostasis.

Introduction
35
As demonstrated by Kim and colleges (Kim et al., 2014a), loss of Ob-R
specifically in GFAP positive cells, affects the synaptic organization of the
melanocortin system, modifying the satiety response to leptin and increasing the
ghrelin response to fasting. The number and length of astrocyte projections in the
arcuate nucleus is reduced in the absence of Ob-R. This is associated with
decreased astrocytic coverage of POMC neurons and an increase in the number of
synaptic inputs to these neurons in addition to modification in the electrical activity
of both POMC and AgRP neurons.
Astrocytes also express receptors for estrogens, androgens and
progesterone (Pfaff and Keiner, 1973; Garcia-Segura et al., 1996b; Melcangi et al., 2001;
Garcia-Ovejero et al., 2005) with gonadal steroid modulation of these glial cells
possibly participating in the reported sexual dimorphism in the inflammatory
response to HFD (Louwe et al., 2012; Morselli et al., 2014). Indeed, females are
suggested to be more resistant than males to obesity associated comorbidities, at
least in part, due to the expression of ERα in astrocytes (Morselli et al., 2014).
Although how leptin and estrogens affect astrocytes has begun to be
elucidated, little is known regarding how other metabolic hormones or nutrients
modulate astrocyte function and participation in metabolic control. For instance,
glucocorticoids modulate astrocytes in the suprachiasmatic nucleus (Maurel et al.,
2000), but whether this affects circadian rhythms of food intake remains to be
elucidated. The orexigenic hormone ghrelin has also been reported to have direct
effects on hypothalamic astrocytes (Garcia-Caceres et al., 2014), although how this
affects overall metabolism is still unknown. Although most studies on the role of
astrocytes in obesity have been performed in models of HFD-induced obesity,
fructose is also able to induce astrogliosis (Li et al., 2014). However, a high sucrose
diet, which causes increased adiposity, does not produce the classical hypothalamic
astrogliosis reported in HFD-induced obesity (Fuente-Martin et al., 2013b). Hence,
although astrocytes appear to be involved in mediating central metabolic signals,
there is still much to be learned regarding the mechanisms involved. Illustration of
Introduction
36
hypothalamic astrocytes in a physiological and a pathophysiological state is shown
in Figure 8.
Figure 8. Hypothalamic astrocytes in a normal physiological and in a pathological state in response to
HFD or obesity.
A. Astrocytes are sensors of the general metabolic status due to its privileged location between the
periphery and the central nervous system. They are the main energy source in brain by providing energy
to neurons from circulation supplying them with glucose, lactate or ketone bodies. Only astrocytes can
βoxidize fatty acids to produce ketone bodies. The major lipid carrier protein in the CNS, ApoE is
produced by astrocytes. Astrogial cells express receptors for important metabolic hormones, such as
leptin and insulin, and thus may participate in their signaling effects. They also release endozepines,
which exert anorexigenic effects and act as gliotransmitters by modulation of neuronal activity through
GABA.
Together these functions make astrocytes key elements for neuronal support and survival, regulation of
synaptic transmission, maintenance of the BBB and players in the central immune response.
B. High fat diet consumption and in consequence, obesity, leads to disruption of metabolic status and to
an increase in important metabolic hormones as leptin. Astrocytes can be activated, changing their
morphology, affecting their contact with blood vessels and neuronal coverage, as well as the number of
Introduction
37
synaptic inputs to metabolic neurons. Astrocytes also increase the number of receptors for leptin,
possibly causing changes in leptin transport.
If the elevated exposition to leptin is prolonged and, in consequence astrocyte activation, production of
cytokines and neurotoxic substances by astrocytes can occur, leading eventually, to detrimental effects.
Ketone bodies produced by astrocytes from fatty acids are a source of energy for neurons in cases of
high neuronal activity or fasting. However, in chronic HFD, they are also synthesized, impairing FA
signaling.
Figure legend: EZ:Endozepines; FA: Fatty acids; KB: Ketone bodies; BBB: blood brain barrier; IL-6:
Interleukin 6; IL1β: Interleukin 1 β; TNFα: Tumor necrosis factor α; MCT-1: Monocarboxylate transporter
1; MCT-4: Monocarboxylate transporter 4; GLAST: Glutamate aspartate transporter; GLUT-1: Glucose
transporter 1; GLUT-2: Glucose transporter 2; ApoE: Apolipoprotein E; PPARγ: Peroxisome proliferator
activated receptor γ; NO: Nitric oxide.
7.2 Microglia in metabolic control
Microglia are the immune cells of the CNS (Rivest, 2009). In physiological
conditions, these cells are continuously maintaining the cellular environment by
cleaning debris (Aloisi, 2001; Nimmerjahn et al., 2005), modulating synapses (Batchelor
et al., 1999; Zhong et al., 2010), as well as through the production of diverse
substances that include cytokines when necessary (Shoelson et al., 2006). It has been
proposed that microglia and astrocytes cooperate to support and modulate neural
communication (Schafer et al., 2013).
Microglia can become reactive as a consequence of HFD or obesity, resulting
in morphological changes and the release of diverse substances. Saturated fatty
acids can directly active these glial cells (Milanski et al., 2009), and this activation
occurs specifically in the hypothalamus after HFD intake (Thaler et al., 2012). This
microglial response can involve the production of cytokines, reactive oxygen
species (ROS) and nitric oxide (NO) that, upon becoming chronic, can exacerbate
microglia activation and may cause neuronal impairment and toxicity, with POMC
neurons being particularly vulnerable (Block and Hong, 2007). In turn, NPY and α-MSH
can modulate the release of cytokines and NO by microglia (Delgado et al., 1998;

Introduction
38
Ferreira et al., 2011; Gonçalves et al., 2012), suggesting that there is direct
communication between metabolic neurons and microglia and that this cross-talk
may participate in the inflammatory process.
Leptin can directly active microglia (Tang et al., 2007; Lafrance et al., 2010; Gao et
al., 2014), suggesting that this hormone participates in the activation of these cells
in obese subjects. Ob/Ob mice that lack leptin have lower levels of hypothalamic
microglia activation than control mice (Gao et al., 2014). Despite the fact that HFD
intake by these mice increases microglia activation in the hypothalamus, it does not
reach control levels. Moreover, leptin administration increases microglia number
and ramification even though these animals lose weight (Gao et al., 2014). Thus,
independently of body weight, metabolic hormones and nutrients control
hypothalamic microglial activity.
Pro-inflammatory cytokines released by activated microglia may also
participate in the development of insulin resistance that can accompany central
inflammation (De Souza et al., 2005; Shoelson et al., 2006). Of note, exercise
counteracts microglia activation produced by HFD, as well as improves glucose
tolerance (Yi et al., 2012). Thus, exercise not only has beneficial effects by increasing
energy expenditure, but it also ameliorates central inflammation.
The early nutritional environment influences the maturation of these immune
cells, causing long lasting effects in the response to neuroimmune challenges (Bilbo
et al., 2010; Clarke et al., 2012). Indeed, HFD intake during gestation and the release of
proinflammatory cytokines by microglia has been shown to affect the development
of the melanocortin circuit in nonhuman primates (Grayson et al., 2006). In rodent
models, the offspring of mothers fed with a HFD during gestation had increased
hippocampal microglial activation at birth, as well as increased microglial density in
adulthood (Bilbo and Tsang, 2010). Moreover, neonatal overnutrition in rats results in
microglial activation in hypothalamic areas and other brain areas, which is
accompanied by an increase in the expression of inflammatory genes in the adult
hypothalamus (Tapia-González et al., 2011; Tu et al., 2011; Ziko et al., 2014).

Introduction
39
The number of microglia and their morphology is reported to differ between
the sexes in some brain areas (Schwarz et al., 2012). However, there is little
information in the literature as to whether males and females differ in their
microglial response to metabolic challenges.
8. The question in context
As stated above, it is clear that the early nutritional status has long-term
effects on energy homeostasis, with specific metabolic outcomes possibly being
affected differently depending on age. Moreover, although males and females are
known to respond differently to metabolic challenges, the mechanisms underlying
this dimorphism are not fully elucidated. Differences in gonadal steroid production
are obviously involved in postpubertal sex differences, but they cannot explain
what occurs in early development. As the neonatal hormonal/nutritional
environment modulates the development of hypothalamic neuronal circuits
involved in the control of energy homeostasis, it is possible that differences
between males and females exist even during this early developmental stage and
this impacts on the development of these circuits. Moreover, the response to
metabolic challenges during perinatal life could also affect males and females
differently.
Studies analyzing the effect of early nutritional/hormonal changes on the
development of hypothalamic metabolic circuits have focused on neurons.
However, glial cells are involved not only in the development, but also the correct
functioning of these circuits in adulthood. Indeed, the involvement of astrocytes
and microglia in the physiological and pathophysiological neuroendocrine control
of metabolism has become an area of increasing interest in the investigation of
obesity, but little is known regarding the effect of perinatal nutritional changes on
glial cell development or their involvement in later metabolic abnormalities.
Moreover, how astrocytes differ between males and females remains to be fully
explore.

Introduction
40
Obesity courses with a chronic mild inflammatory state that includes the
hypothalamus, a process in which astrocytes and microglia participate. These glial
cells also respond to specific hormonal and nutritional signals, becoming activated
and producing cytokines and other factors, with hypothalmic gliosis and
inflammation being implicated in the development of secondary complications of
obesity. Thus, if hypothalamic astrocytes differ between males and females, they
could participate not only in the physiological differences between the sexes in
metabolic control, but also the pathophysiologial consequeces of a poor diet and
obesity.
Together, these observations have lead us to the following hypothesis and
objectives.

II. HYPOTHESIS

Hypothesis
42
Males and females respond differently to nutritional
challenges and this could be in part due to sex differences
in hypothalamic astrocytes.


III. OBJECTIVES


Objectives
44
Objective 1. To evaluate the changes in peripheral hormones, body
weight and adipose tissue in response to overnutrition due to a
reduction in litter size of male and female rats at different stages of
postnatal development.
Objective 2. To correlate the peripheral changes as a consequence of
the reduction in litter size, with central changes in the hypothalamus
and specifically in astrocytes, throughout development of male and
female rats.
Objective 3. To analyze whether males and females respond
differently to neonatal over-nutrition.
Objective 4. To investigate whether hypothalamic astrocytes from
male and female rats respond differently to free fatty acids.
Objective 5. To determine if estrogens affect the response of
hypothalamic astrocytes to free fatty acids.


IV. MATERIALS AND METHODS


Materials and methods
46
1. Experimental Models
All experiments were designed according to the European Communities
Council Directive (86/609/EEC; 2010/63/UE) and NIH guidelines for animal care.
Experiments in these studies complied with the Royal Decree 53/2013 pertaining to
the protection of experimental animals. The studies were approved by the
Commission of Investigation of the Hospital Infantil Universitario Niño Jesús and the
corresponding university ethics committee where the experiments were performed,
including the Ethical Committee of Animal Experimentation of the Universidad
Complutense de Madrid, Ethical Committee of Animal Experimentation of the
Universidad Autónoma de Madrid, Ethical Committee of Animal Experimentation of
the Universidad de Córdoba or the Institutional Animal Care and Use Committee of
Yale University. The animals were always treated respectfully and the least possible
number of animals was used in all experiments.
1.1 IN VIVO STUDIES
1.1.1 Neonatal overnutrition throughout development
Male and female adult Wistar rats were purchased from Harlan Interfauna
Ibérica S.A., (Barcelona, Spain) and allowed to acclimate for two weeks before
mating. One male was placed in a cage with three virgin females (all weighing
approximately 150 g) females. Each dam was then housed individually and fed ad
libitum. Rats were maintained at a constant temperature (22-24ºC) and humidity
(50-55%) in a 12 hour light-dark cycle, with lights on at 07:30. Animals were given
free access to chow (commercial diet for rodents A04-10/15022, Panlab, Barcelona,
Spain) and tap water.
a) Experimental design
Only mothers that gave birth to between 8 and 12 pups were employed for
the study (mean litter size 10.3 ± 0.2 pups born/litter). All litters were arranged on
the day of birth, postnatal day (PND) 0. At this time, pups were weighed, measured
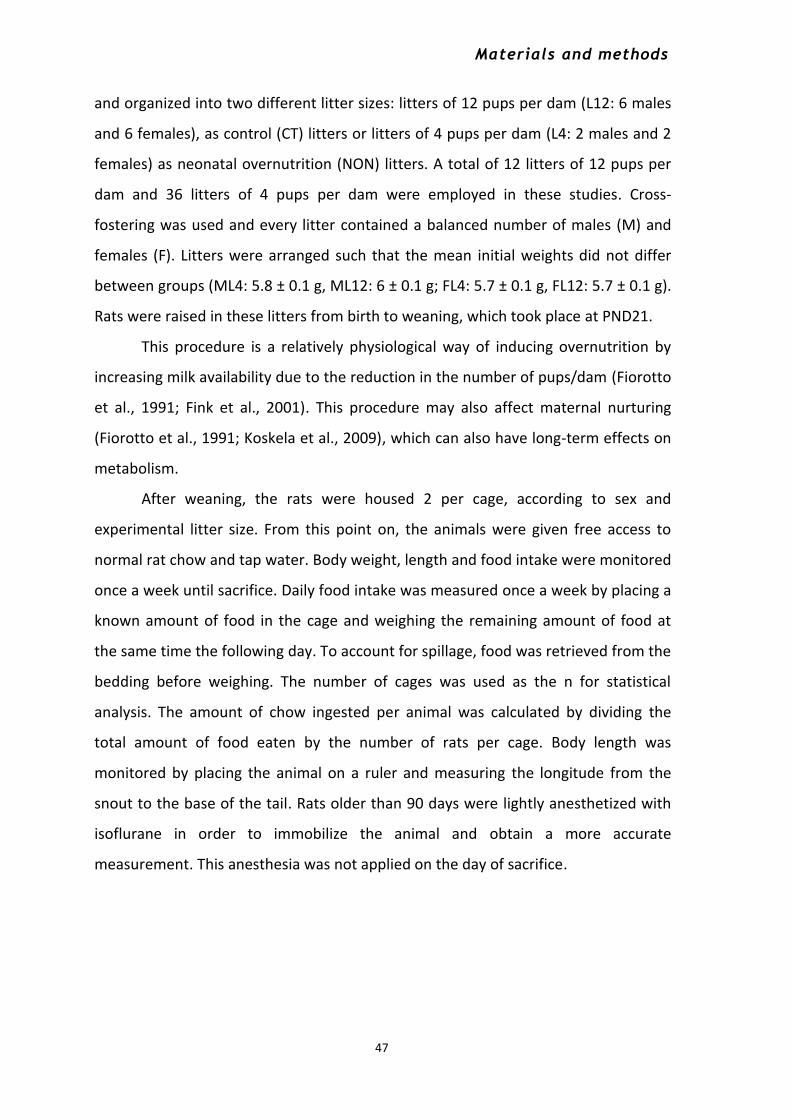
Materials and methods
47
and organized into two different litter sizes: litters of 12 pups per dam (L12: 6 males
and 6 females), as control (CT) litters or litters of 4 pups per dam (L4: 2 males and 2
females) as neonatal overnutrition (NON) litters. A total of 12 litters of 12 pups per
dam and 36 litters of 4 pups per dam were employed in these studies. Cross-
fostering was used and every litter contained a balanced number of males (M) and
females (F). Litters were arranged such that the mean initial weights did not differ
between groups (ML4: 5.8 ± 0.1 g, ML12: 6 ± 0.1 g; FL4: 5.7 ± 0.1 g, FL12: 5.7 ± 0.1 g).
Rats were raised in these litters from birth to weaning, which took place at PND21.
This procedure is a relatively physiological way of inducing overnutrition by
increasing milk availability due to the reduction in the number of pups/dam (Fiorotto
et al., 1991; Fink et al., 2001). This procedure may also affect maternal nurturing
(Fiorotto et al., 1991; Koskela et al., 2009), which can also have long-term effects on
metabolism.
After weaning, the rats were housed 2 per cage, according to sex and
experimental litter size. From this point on, the animals were given free access to
normal rat chow and tap water. Body weight, length and food intake were monitored
once a week until sacrifice. Daily food intake was measured once a week by placing a
known amount of food in the cage and weighing the remaining amount of food at
the same time the following day. To account for spillage, food was retrieved from the
bedding before weighing. The number of cages was used as the n for statistical
analysis. The amount of chow ingested per animal was calculated by dividing the
total amount of food eaten by the number of rats per cage. Body length was
monitored by placing the animal on a ruler and measuring the longitude from the
snout to the base of the tail. Rats older than 90 days were lightly anesthetized with
isoflurane in order to immobilize the animal and obtain a more accurate
measurement. This anesthesia was not applied on the day of sacrifice.

Materials and methods
48
Rats were sacrificed at different time points throughout development. These
time-points were chosen as they represent key developmental periods (Figure 9. For
a review on how a rat’s age relates to that in humans see (Sengupta, 2013).
Figure 9: “The laboratory rat: relating rat’s age to that in humans”. Taken from Sengupta, 2013.
In the present study, rats were sacrificed on the following days:
- Postnatal day 10: Day 10 is a crucial stage in rat development due to the leptin
surge that takes place around this period of time. Serum leptin levels start to
increase around PND 5 and peak at PND 9-10 (Ahima et al., 1998; Delahaye et al.,
2008).
- Postnatal day 21: Rats were weaned at PND 21, thus concluding the period of
exposure to different nutritional environments due to litter size. From this point
on, all rats were allowed to eat and drink ad libitum.
- Posnatal day 30: Rats are still pre-pubertal on day 30 after birth, but
approaching pubertal onset. In our facilities, males reach sexual maturation
around PND 42-44 and females around PND 32-35 (Castellano et al., 2011).
- Postnatal day 50: At this age rats are post-pubertal, but still in the
periadolescent period, approaching adulthood.
- Postnatal day 85: At PND85 rats are adult, with numerous published studies
using rats between PND60-PND90 for metabolic analysis.
- Postnatal day 150: This stage allows the study of older adult rat where some
effects of aging on metabolism may begin to appear.
Materials and methods
49
The experimental design of neonatal overnutrition protocol is shown in Figure
10.
Figure 10. Diagram of the experimental design for neonatal overnutrition (NON) throughout development
in male and female Wistar rats. N= 12 for each experimental group; BW: body weight, BL: body length, FI:
food intake, PND= Postnatal day. HPT = Hypothamamus, SCAT = Subcutaneous adipose tissue, VAT =
Visceral adipose tissue.
b) Sacrifice and sample collection
Animals were placed under fasting conditions 12 hours before sacrifice,
except for the rats sacrificed on PNDs 10 and 21, which were allowed to nurse until
sacrificed in order to not induce additional stress on being removed from their
mothers. On the day of sacrifice, body weight and length were measured. Blood
glucose levels were determined in a drop of blood from the tip of the tail by using a
glucometer (Optimum Xceed, Abbot). A quick vaginal swap was performed in the
female rats to determine the estrous cycle stage at the moment of sacrifice.
A total of twelve animals per group were sacrificed between 09:00 and 11:00.
Six rats were processed to obtain fresh tissue and the other six were perfused as
described below. Of note, PND10 and PND21 rats were not transcardially perfused,
but their brains and fat pads were directly fixed by placing the brains and fat pads in
4% paraformaldehyde and left overnight (O/N). To obtain fresh tissue, rats were
killed by rapid decapitation. Blood was collected from the trunk, allowed to clot and
preserved on ice before being centrifuged at 3000 RPM during 20 minutes at 4°C to
obtain serum. Serum samples were kept at -80°C until processed.

Materials and methods
50
After decapitation, the brain was rapidly removed and the hypothalamus,
defined rostrally by the optic chiasm and caudally by the anterior margin of the
mammillary bodies, was dissected out with a depth of approximately 2 mm.
Subcutaneous (inguinal) and visceral (perigonadal) adipose depots were removed,
weighed, frozen on dry ice and stored at -80°C until processed. Six animals per group
were perfused transcardially and the tissue then collected as described below.
Serum samples were processed for the analysis of leptin, insulin, interleukin
(IL) 1β, 6, tumor necrosis factor alpha (TNFα) and adiponectin, as described below.
Testosterone and 17β-estradiol were measured in males and females, respectively.
Rats that were killed at PND150 were subjected to an oral glucose tolerance
test (OGTT) one week before sacrifice. Rats were fasted over-night (from 20:00 to
8:00 h) and at 8:00 h basal glycemia was measured with a glucometer (Optium Plus,
Abbot Diabetes Care, Witney Oxon, UK). A bolus of 3 mg/g-bw of glucose was then
orally administered to the rats by means of a lavage tube. Glycemia was measured at
30, 60 and 120 min after glucose administration by venous tail puncture. The total
area under the curve (AUC) for the glucose response was calculated by using the
following formula: AUC = 0.25 × (fasting value) + 0.5 × (30-min value) + 0.75 × (1-h
value) + 0.5 × (2-h value).
Proteins involved in gliosis and intracellular signaling pathways were analyzed
in the hypothalamus by Western blotting. Relative levels of mRNA of various
cytokines and adipokines were quantified in the hypothalamus and adipose tissue by
real time PCR.
Perfused brains from PND150 rats were processed for GFAP and Iba1
immunohistochemistry to determine the number and morphology of GFAP and
number of Iba1 positive cells in the hypothalamus. Double immunohistochemistry
was also performed to analyze the expression of the leptin receptor (ObR) in GFAP
positive cells.

Materials and methods
51
Table 1 and 2 outline the experimental groups and ages of sacrifice, as well as
the description of the samples collected at each age and the analysis performed in
each of them.
EXPERIMENTAL GROUPS
Males from litters of 12 pups ML12
Males from litters of 4 pups ML4
Females from litters of 12 pups FL12
Females from litters of 4 pups FL4
Table 1 & 2. Description of the experimental groups, the ages at which they were sacrificed as well as the samples collected and the analysis performed. PND: postnatal day, AT: adipose tissue, IHC: Immuohistochemistry.
1.1.2 Neonatal androgenization
Wistar rats raised in the animal facility of the Medical School of University of
Córdoba, Spain, were used for this study. The rats were kept under conditions of
constant temperature (22-24ºC) and humidity (50-55%) and 12 hour light-dark
AGE OF SACRIFICE
PND 10 PND 21 PND 30 PND 50 PND 85 PND 150
Samples
BLOOD X X X X X X
HYPOTHALAMUS X X X X X X
SCAT X X X X
VAT X X X
Perfused brain X
Analysis
Serum hormones and cytokines X X X X X X
Serum lipids X
Cytokine expression in AT X X X X
Proteins involved in gliosis X X X X X X
IHC X

Materials and methods
52
cycles. They were allowed ad libitum access to chow diet (A04-10/15022 Panlab,
Barcelona, Spain) and tap water.
c) Experimental design
In order to better understand the effect of neonatal sex steroids on
metabolism, three groups of animals were generated. On PND1, female rats received
a subcutaneous injection of 1.25 mg of testosterone propionate (SIGMA T-1875)
dissolved in 100 µL of olive oil [approximately 208 mg/kg; androgenized females
(AF)] or 100 µL of olive oil, as vehicle (control females, F). Males (M) also received
vehicle (100 µL of olive oil). Rats were sacrifice on PND10 or PND90. Vehicle treated
adult females sacrificed at PND90 were monitored to control the estrus cycle by
performing vaginal swabs two weeks before sacrifice being all of them sacrificed on
the morning of diestrus. Androgenized females did not show external signs of
puberty or regular cycles. The experimental design is shown in Figure 11.
Figure 11. Schematic representation of the neonatal androgenization protocol in male (M), female (F) and
androgenized female (AF) Wistar rats. T: testosterone; V: vehicle; PND: postnatal day.
d) Sacrifice and sample collection
Half of each group was killed on PND10 and half on PND90. PND 90 animals
were fasted for 12 hours before sacrifice. At PND 90, 3-4 rats of each group were
perfused transcardially as described below. The number of animals in each group is
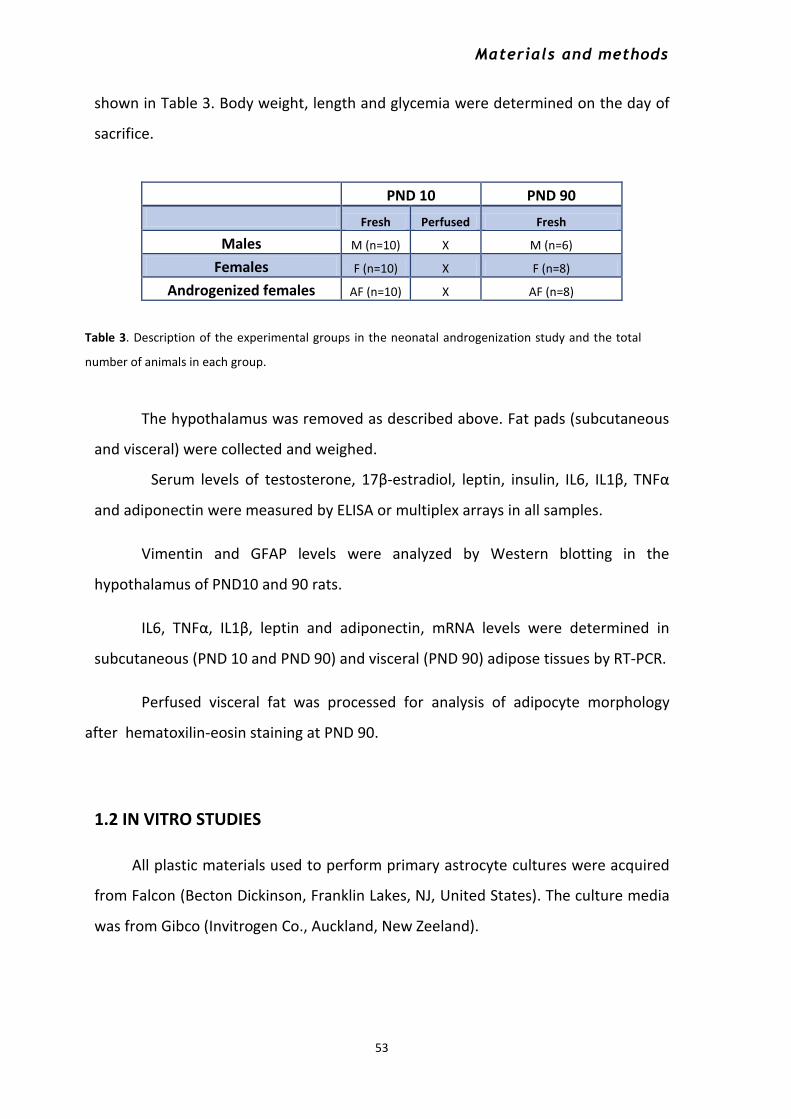
Materials and methods
53
shown in Table 3. Body weight, length and glycemia were determined on the day of
sacrifice.
PND 10 PND 90
Fresh Perfused Fresh
Males M (n=10) X M (n=6)
Females F (n=10) X F (n=8)
Androgenized females AF (n=10) X AF (n=8)
Table 3. Description of the experimental groups in the neonatal androgenization study and the total
number of animals in each group.
The hypothalamus was removed as described above. Fat pads (subcutaneous
and visceral) were collected and weighed.
Serum levels of testosterone, 17β-estradiol, leptin, insulin, IL6, IL1β, TNFα
and adiponectin were measured by ELISA or multiplex arrays in all samples.
Vimentin and GFAP levels were analyzed by Western blotting in the
hypothalamus of PND10 and 90 rats.
IL6, TNFα, IL1β, leptin and adiponectin, mRNA levels were determined in
subcutaneous (PND 10 and PND 90) and visceral (PND 90) adipose tissues by RT-PCR.
Perfused visceral fat was processed for analysis of adipocyte morphology
after hematoxilin-eosin staining at PND 90.
1.2 IN VITRO STUDIES
All plastic materials used to perform primary astrocyte cultures were acquired
from Falcon (Becton Dickinson, Franklin Lakes, NJ, United States). The culture media
was from Gibco (Invitrogen Co., Auckland, New Zeeland).

Materials and methods
54
1.2.1 Primary cultures of hypothalamic astrocytes
Primary cultures of hypothalamic astrocytes were prepared from PND2
Wistar rat pups. Both sexes were used and male and female cells were cultured
separately. Ano-genital distance was used to determine the sex of the animal. Pups
were sacrificed by decapitation and the brain quickly removed and immediately
placed on ice in Dulbecco’s modified Eagle’s medium: Nutrient mixture F-12
(DMEM/F12) supplemented with 1% penicillin/streptomycin and anti-mycotic
(Ab/Am; Gibco). Hypothalami were carefully dissected and the meninges carefully
removed. Hypothalami were then triturated in the same media. The tissue was
dissociated by first using a P1000 pipette and then pulled Pasteur pipettes several
times until the suspension was clear. The suspension was then centrifuged at 1000
rpm for 7 minutes. The resulting pellet was resuspended in DMEM/F12 enriched
with 10% fetal bovine serum (FBS) plus 1% Ab/Am solution. Cells (1 mL) were then
seeded in 75 cm2 culture flasks (BD Falcon), containing 9 mL of DMEM/F12 plus 10%
FBS and 1% Ab/Am. The cells were incubated at 37 °C and 5% CO2. After three days,
the flasks were washed twice with tempered phosphate buffered saline (PBS) and
fresh media was added. Media was changed three times a week and after a total of
9-10 days of incubation, when the cells reached approximately 90% confluence,
flasks were placed in a 37 °C shaking incubator (SI-300, Jeoi Tech; Medline Scientific)
at 280 rpm for 6 hours.
After shaking, flasks were washed twice with PBS to remove non-attached
cells. Then, 1 mL of trypsin (0.05% trypsin/EDTA solution; Biochrom AG) was added
and the flasks hit together 10 times (in order to detach and harvest the astrocytes).
DMEM/F12 plus 10% FBS and 1% Ab/Am was added to the flasks to stop the action
of the trypsin and resuspend the cells. The suspension was centrifuged for 5 minutes
at 1150 rpm. After centrifugation, the supernatant was discarded and the pellet
resuspended in DMEM/F12 plus 10% FBS and 1% Ab/Am. Astrocytes were seeded in
60 mm or 100 mm culture plates, that had been previously treated with poly-L-lysine
hydrobromide (10 μg/ml; Sigma-Aldrich), at a density of 4.35X10⁵ or 1X10⁶
cells/plate, respectively. Cells were then grown for 24 hours. After 24 hours, the
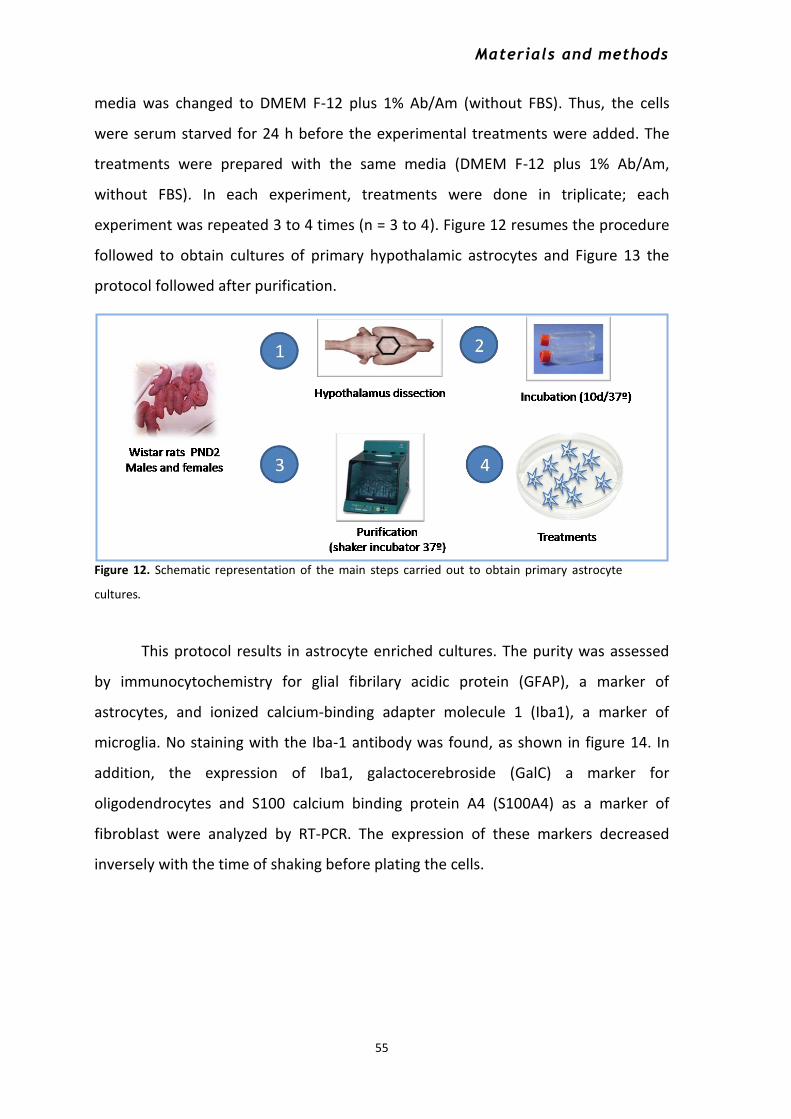
Materials and methods
55
media was changed to DMEM F-12 plus 1% Ab/Am (without FBS). Thus, the cells
were serum starved for 24 h before the experimental treatments were added. The
treatments were prepared with the same media (DMEM F-12 plus 1% Ab/Am,
without FBS). In each experiment, treatments were done in triplicate; each
experiment was repeated 3 to 4 times (n = 3 to 4). Figure 12 resumes the procedure
followed to obtain cultures of primary hypothalamic astrocytes and Figure 13 the
protocol followed after purification.
Figure 12. Schematic representation of the main steps carried out to obtain primary astrocyte
cultures.
This protocol results in astrocyte enriched cultures. The purity was assessed
by immunocytochemistry for glial fibrilary acidic protein (GFAP), a marker of
astrocytes, and ionized calcium-binding adapter molecule 1 (Iba1), a marker of
microglia. No staining with the Iba-1 antibody was found, as shown in figure 14. In
addition, the expression of Iba1, galactocerebroside (GalC) a marker for
oligodendrocytes and S100 calcium binding protein A4 (S100A4) as a marker of
fibroblast were analyzed by RT-PCR. The expression of these markers decreased
inversely with the time of shaking before plating the cells.
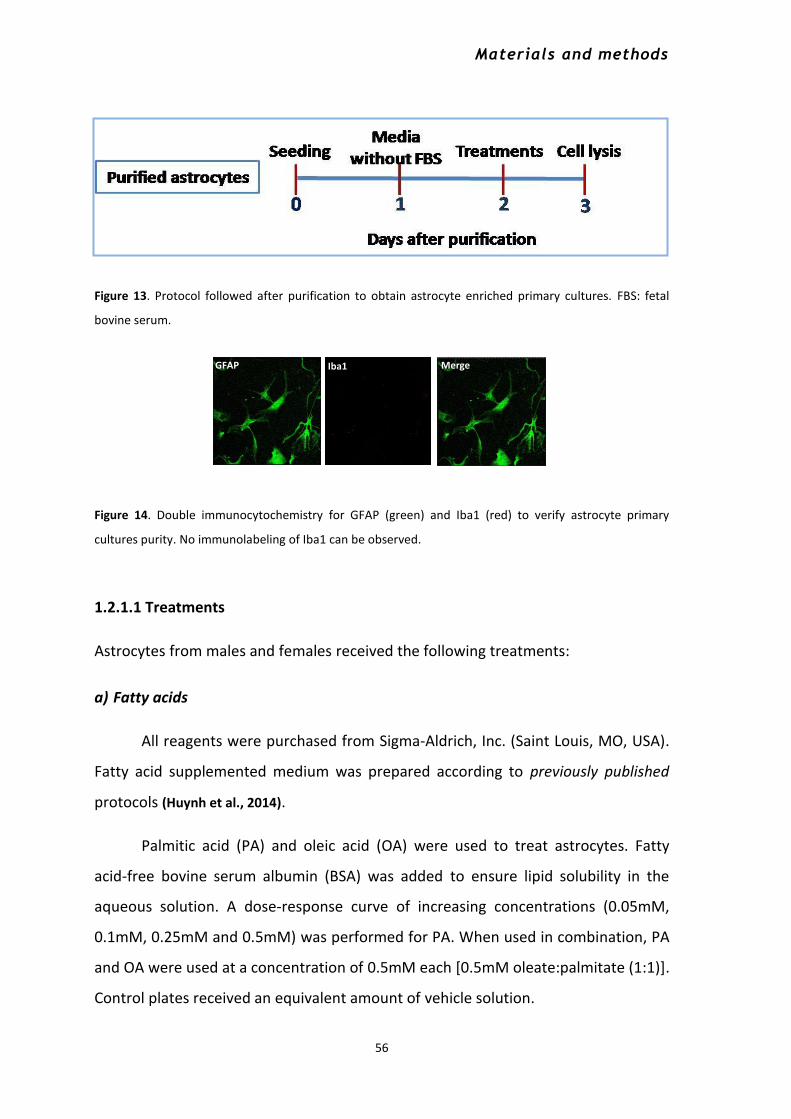
Materials and methods
56
Figure 13. Protocol followed after purification to obtain astrocyte enriched primary cultures. FBS: fetal
bovine serum.
Figure 14. Double immunocytochemistry for GFAP (green) and Iba1 (red) to verify astrocyte primary
cultures purity. No immunolabeling of Iba1 can be observed.
1.2.1.1 Treatments
Astrocytes from males and females received the following treatments:
a) Fatty acids
All reagents were purchased from Sigma-Aldrich, Inc. (Saint Louis, MO, USA).
Fatty acid supplemented medium was prepared according to previously published
protocols (Huynh et al., 2014).
Palmitic acid (PA) and oleic acid (OA) were used to treat astrocytes. Fatty
acid-free bovine serum albumin (BSA) was added to ensure lipid solubility in the
aqueous solution. A dose-response curve of increasing concentrations (0.05mM,
0.1mM, 0.25mM and 0.5mM) was performed for PA. When used in combination, PA
and OA were used at a concentration of 0.5mM each [0.5mM oleate:palmitate (1:1)].
Control plates received an equivalent amount of vehicle solution.
GFAP
Merge
GFAP Iba1 Merge

Materials and methods
57
Stock solutions of sodium oleate (Sigma, O-3880), palmitic acid (Sigma, P-
5585), BSA (Sigma, A-9205) and L- carnitine (Sigma, C-0283) were prepared and
sterilized by filtration with 0.45 µm filters and stored at -20°C until used.
A stock solution of 100 mM sodium oleate was prepared in H2O. To facilitate
solubilization of the fatty acid, 25 µL of 1N NaOH were added. The solution was
incubated at 37°C in a water bath during approximately 30 minutes and vortexed
occasionally until the solution was clear. The PA stock solution was prepared at 200
mM in ethanol and vortexed until the solution was clear. The BSA stock solution was
prepared at 30% and L-carnitine at 200 mM; both of them were dissolved in H2O.
Fatty acids were then conjugated with fatty acid-free BSA to act as a carrier
and ensure lipid solubility in the aqueous solution. Fatty acid-albumin solutions were
diluted in DMEM F-12 plus 1% Ab/Am (without FBS) medium to achieve the desired
final fatty acid concentration. The L-carnitine (1 mM) was added to the final fatty
acid concentration solution before being added to cultures, as this appears to be an
essential component of the lipid-induced insulin resistance with certain fatty acids.
b) β-estradiol
17β-estradiol (Sigma, E-8875) was purchased from Sigma-Aldrich. A stock
solution of 1 mg/mL was prepared in ethanol. Then, 10-9 M working solution was
made in DMEM F-12 plus 1% Ab/Am (without FBS) medium to treat cultured
astrocytes.
When 17β-estradiol was used in combination with PA, astrocytes were “pre-
treated” with 10-9 M β-estradiol for 3 hours previous to PA addition.
c) Ultrapure lipopolysaccharide from Rhodobacter sphaeroides (LPS-RS) - TLR4
antagonist
LPS-RS Ultrapure was purchased from InvivoGen (San Diego, CA, USA) as a
purified preparation of the TLR4 antagonist LPS-RS. A stock solution of 1mg/mL was
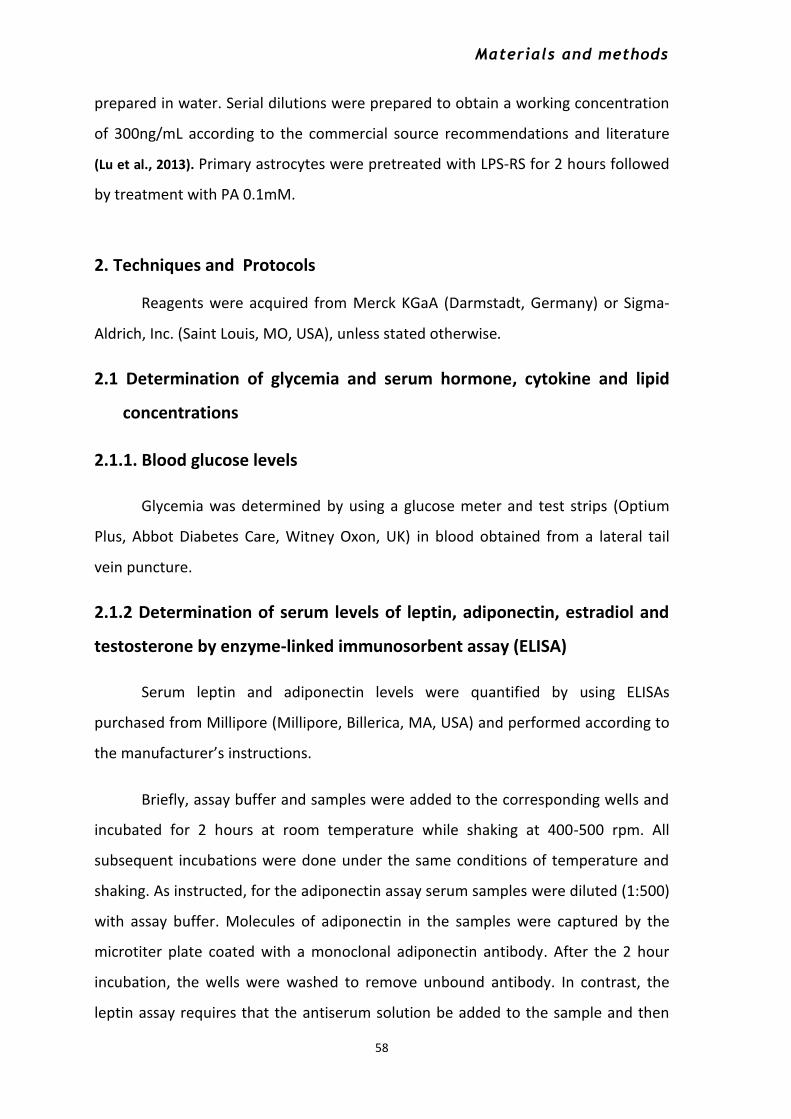
Materials and methods
58
prepared in water. Serial dilutions were prepared to obtain a working concentration
of 300ng/mL according to the commercial source recommendations and literature
(Lu et al., 2013). Primary astrocytes were pretreated with LPS-RS for 2 hours followed
by treatment with PA 0.1mM.
2. Techniques and Protocols
Reagents were acquired from Merck KGaA (Darmstadt, Germany) or Sigma-
Aldrich, Inc. (Saint Louis, MO, USA), unless stated otherwise.
2.1 Determination of glycemia and serum hormone, cytokine and lipid
concentrations
2.1.1. Blood glucose levels
Glycemia was determined by using a glucose meter and test strips (Optium
Plus, Abbot Diabetes Care, Witney Oxon, UK) in blood obtained from a lateral tail
vein puncture.
2.1.2 Determination of serum levels of leptin, adiponectin, estradiol and
testosterone by enzyme-linked immunosorbent assay (ELISA)
Serum leptin and adiponectin levels were quantified by using ELISAs
purchased from Millipore (Millipore, Billerica, MA, USA) and performed according to
the manufacturer’s instructions.
Briefly, assay buffer and samples were added to the corresponding wells and
incubated for 2 hours at room temperature while shaking at 400-500 rpm. All
subsequent incubations were done under the same conditions of temperature and
shaking. As instructed, for the adiponectin assay serum samples were diluted (1:500)
with assay buffer. Molecules of adiponectin in the samples were captured by the
microtiter plate coated with a monoclonal adiponectin antibody. After the 2 hour
incubation, the wells were washed to remove unbound antibody. In contrast, the
leptin assay requires that the antiserum solution be added to the sample and then

Materials and methods
59
the resulting complexes are added and bound to the wells that were previously
coated with another anti-leptin antibody (sandwich). The following steps were
similar for both assays. A purified biotinylated antibody (anti-rat adiponectin or anti-
rat leptin) was added to detect the immobilized adiponectin or leptin molecules and
incubated for 1 hour. After the corresponding washes were carried out in a
HydroFlex (Tecan) microplate washer, streptavidin-horseradish peroxidase conjugate
was added for during 30 minutes to bind to the immobilized biotinylated antibody
and washed afterwards to remove the excess of free enzyme conjugates. Lastly,
peroxidase substrate was added and horseradish peroxidase (HRP) activity
monitored until the stop solution was added. Quantification was measured in a
spectrophotometer (Tecan Infinite M200, Grödig, Austria) at a wavelength of 450 nm
and corrected at 590 nm. The increase in absorbency is directly proportional to the
amount of captured rat leptin or adiponectin in the unknown samples. The
concentrations were calculated from the standard curve supplied with the kits.
Sensitivities of the method for leptin and adiponectin were 0.08 and 0.4 ng/ml,
respectively. All samples were run in duplicate. The intra-assay coefficient of
variation (CV) was 2.2 % for leptin and 1.3% for adiponectin and the inter-assay CV
was 3.4 % for leptina and 6.9 % for adiponectin.
Serum estradiol and testosterone levels were determined by using an ELISA
kit from Cusabio Biotech CO., LTD (Wuhan, P.R. China) according to the
manufacturer’s protocol. Microtiter plates pre-coated with a goat-anti-rabbit
antibody towards the substance to be analyzed were used. Standards or samples
were added in duplicate to the appropriate wells followed by addition of HRP-
conjugated testosterone or estradiol. Then, a specific antibody was added to each
well. The plates were incubated for 1 hour for the testosterone assay and 2 hours for
estradiol. After incubation and the appropriate washes, substrate solutions were
added to each well and incubated for 15 minutes at 37ºC. Stop solution was then
added to terminate the enzyme-substrate reaction. Finally, the color change was
measured at a wavelength of 450 nm (Tecan Infinite M200). Estradiol and

Materials and methods
60
testosterone concentrations in the samples were calculated comparing the O.D. of
the samples to the standard curve. The estradiol assay has a sensitivity of 25 pg/ml
and the testosterone assay 0.06 ng/mL. Inter- and intra-assay coefficients of
variation are <15% for both assays. All samples were run in duplicate.
2.1.3 Determination of serum levels of insulin, interleukin 6, interleukin
1β and tumor necrosis factor α with a multiplex bead immunoassay
Circulating levels of insulin, IL6, IL1β and TNFα were determined in duplicate
by using a multiplexed bead immunoassay kit according to manufacturer’s
specifications (Millipore). Briefly, beads conjugated to the appropriate antibodies
and serum samples (25 µl each) were incubated overnight at 4°C and under
moderate shaking. The next morning, plate wells were washed three times with the
provided wash buffer. Then, the biotinylated detection antibody (50 µl) was added
and incubated for 2 hours at RT while shaking at 500 rpm. Finally, 50 µl of the
reporter dye, streptavidin-conjugated phycoerythrin, was added and incubated for
30 minutes. After washing, the beads were analyzed in a Bio-Plex suspension array
system 200 (Bio-Rad Laboratories, Hercules, CA, USA) and mean fluorescence
intensity was analyzed using Bio-Plex Manager Software 4.1.
Insulin IL-6 IL1-β TNF-α
Sensitivity (pg/mL) 52.5 8.8 1.2 3.2
Intra-assay CV (%) 1.7-4.2 1.7-4.2 1.7-4.2 1.7-4.2
Inter-assay CV (%) 2.8-13.6 2.8-13.6 2.8-13.6 2.8-13.6
Table 4. Assay sensitivities (minimum detectable concentrations, pg/mL), intra- and inter-assay coefficient
of variation for multiplex bead immunoassay. CV=coefficient of variation
2.1.4 Determination of triglycerides in serum samples
Total triglycerides were measured in serum samples of PND150 rats by using
a commercial kit purchased from Randox Laboratories Limited (United Kingdom).
Serum samples were diluted 1:2 in saline. Triglycerides in the samples are quantified
after enzymatic hydrolysis with lipases. The colorimetric indicator is quinoneimine

Materials and methods
61
formed from hydrogen-peroxide, 4-aminophenazone and 4-chlorophenol under the
catalytic influence of peroxidase. The reaction mix was incubated for 10 minutes at
room temperature and the absorbance measured at a wavelength of 500 nm (Tecan
Infinite M200). Triglyceride concentrations (mg/dl) in the samples were calculated
comparing the O.D. of the samples to the standard curve.
2.1.5 Determination of non-esterified free fatty acids in serum samples
The kits for the quantitative determination of non-esterified free fatty acids
(NEFA) were purchased from Wako (Neuss, Germany) and followed the ACS-ACOD
(Acyl-CoA synthethase – Acyl-CoA oxidase) method. The concentrations of NEFA
were determined by a reaction of the serum sample with reactive A (0.3 kU/l acyl-
CoA-synthetase, 3 kU/l ascorbate oxydase; 06 g/l coenzyma A, 5 mmol/l ATP, 1.5
mmol/l 4-aminophenazone, 50 mmol/l phosphate buffer, pH = 6.9; 3 mmol/l
magnesium chloride ). After an incubation of 10 minutes at 37 ºC reactive B (6.6 kU/l
acylCoA oxidase; 7,5 kU/l peroxidase; 1.2 mmol/l methyl-N-ethyl-N-hydroxyethyl
aniline) was added. The mixture was incubated again for 10 minutes at at 37 ºC,
after which the absorbance was measured at 550 nm. The concentration of NEFA
was than determined by comparison with a standard curve prepared from serial
dilutions of oleic acid in saline.
2.2 Protein analysis
2.2.1 Total protein extraction
a) Protein extraction from tissue
Individual hypothalami were homogenized on ice in 300-500 ul of lysis buffer,
with the volume of buffer varying according to the size of the hypothalamus. The
lysis buffer, radioimmunoprecipitation assay buffer (RIPA), contained sodium
phosphate buffer (PBS, 0.1 M, pH 7.4), 1 % Triton X-100, sodium dodecyl sulphate
(SDS, 0.1 %), sodium azide (0.5 %), ethylenediaminetetraacetic acid (EDTA; 2 mM),
sodium deoxycholate (0.5 %), phenylmethanesulfonyl fluoride (PMSF; 1 mM) and a

Materials and methods
62
protease inhibitor cocktail (Roche Diagnostics, GmbH). Lysates were incubated
overnight at -80°C and then centrifuged at 14000 rpm for 10 minutes at 4°C.
Supernatants were collected and stored at -80°C for later use. Total protein
concentration was determined by the method of Bradford (Protein Assay; Bio-Rad
Laboratories).
b) Protein extraction from hypothalamic astrocytes primary cultures
To extract protein from primary astrocyte cultures, the cells were first washed
twice with PBS. The PBS was then totally removed and the cells lysed with 200 µl of
lysis buffer (25 mM HEPES, 150 mM KCl, 2 mM EDTA, 0.1% Igepal, 1 mM PMSF, 10
uM benzamidine and leupeptin and 0.5 mM DTT) in each dish. The samples were
frozen at - 80°C to boost cell lysis. Next, samples were centrifuged for 20 minutes at
14000 rpm (4°C). Following centrifugation, supernatants were removed and frozen
over night. Finally, the samples were lyophilized (Cryodos. TELSTAR. Tarragona,
Spain) and the resulting pellet resuspended in 40 µl of sterile water and stored at –
80°C.
Total protein concentration was determined by the method of Bradford (Protein
Assay; Bio-Rad Laboratories).
2.2.2 Quantification of protein concentration
Total protein concentration was determined by the method of Bradford
(Protein Assay; Bio-Rad Laboratories), developed by Marion M. Bradford in 1976
(Bradford, 1976). This colorimetric method is based on the principle of protein-dye
binding and the shifts caused in the absorbance that is measured by using a
spectrophotometer.
Samples were diluted in distilled water (primary cultures) or lysis buffer
(tissue) and mixed with Bradford reagent (Bio-Rad Laboratories, Inc., Hercules, CA,
USA), following the manufacturer’s instructions and incubated for 5 minutes at room
temperature (RT). For each assay, a standard curve was prepared with increasing
concentrations, from 0 to 25 µg/µl of BSA. The standard curve and unknown samples

Materials and methods
63
were pipetted into a 96-well plate and the absorbance measured at 595 nm in an
TECAN Infinite M200 spectrophotometer.
2.2.3 Western blotting
The reagents used for western blotting analysis were purchased from Bio-Rad
Laboratories, Inc. except when indicated.
An appropriate concentration of total protein (10, 40 or 60 µg depending on
the protein to be analyzed) was mixed with an equal volume of Laemmli buffer (2x),
containing Tris-HCl (1 M, pH 6.8), glycerol (25 %), SDS (2 %) and bromophenol blue
(0.01 %) and denatured in a thermoblock for 5 minutes at 100 ºC.
The protein was resolved on SDS-polyacrylamide gels under denaturing
conditions and electro-transferred to polyvinylidene difluoride (PVDF) membranes.
Transfer efficiency was determined by Ponceau red dyeing. Membranes were
blocked with Tris-buffered saline (TBS, 20 mM) containing 0.1% Tween 20 and 5%
nonfat dried milk or 5% BSA for 2 hrs and incubated overnight at 4°C under agitation
with the primary antibody at a concentration of 1:1000 unless otherwise stated.
Primary antibodies used were against glial structural proteins and indicators of glial
activation: GFAP, vimentin, Iba1; intra- cellular signaling proteins: pAKT (1:500), AKT,
pIKB (1:500), STAT3, pSTAT3(tyr705) (1:500), pSTAT3(Ser634) (1:500), pIRS (1:500), pPTEN
(1:500), PTEN, SOCS3 and the housekeeping protein glyceraldehyde 3-phosphate
dehydrogenase (GAPDH) and actin. Membranes were washed with TBS and
incubated with the corresponding secondary antibodies conjugated with peroxidase
(Pierce Biotechnology, Rockford, IL, USA). Peroxidase activity was visualized by
chemiluminescence (Perkin Elmer Life Science, Boston, MA, USA) and quantified with
a Kodak Gel Logic 1500 Image Analysis system and Molecular Imaging Software,
version 4.0 (Rochester, NY, USA) and ImageQuant Las 4000 Software (GE Healthcare
Life Sciences, Barcelona, Spain). Gel loading variability was normalized with either
the non-phosphorylated form of the protein, GAPDH or actin. Data were normalized
to control values on each gel.

Materials and methods
64
2.2.4 Determination of hypothalamic levels of leptin, IL1β, IL6, IL10 and
TNFα by using a multiplex magnetic bead immunoassay
Hypothalamic levels of leptin, IL6, IL1β, IL10 and TNFα were determined in
duplicated by a multiplexed magnetic bead immunoassay kit according to the
manufacturer’s specifications (Millipore). Beads conjugated to the appropriate
antibodies and 5 µg of hypothalamic lysate in assay buffer (25 µl each) were
incubated for 2 hours at RT and under moderate shaking. Afterwards, plate wells
were washed two times with the provided wash buffer and 25 µl of the biotinylated
detection antibody was added and incubated for 1 hour at RT while shaking at 500
rpm. Finally, 25 µl of the reporter dye, streptavidin-conjugated phycoerythrin, was
added and incubated for 30 minutes. After washing, the beads were analyzed in a
Bio-Plex suspension array system 200 (Bio-Rad Laboratories) and mean fluorescence
intensity was analyzed using Bio-Plex Manager Software 4.1.
Leptin IL-6 IL1-β IL10 TNF-α
Sensitivity (pg/mL) 10.2 30.7 2.8 2.7 1.9
Intra-assay CV (%) 3.4 2.3 3.6 3.8 2.7
Inter-assay CV (%) 14.3 12.7 11.3 9 10.8
Table 5. Assay sensitivities (minimum detectable concentrations, pg/mL), intra- and inter-assay coefficient
of variation for rat cytokine magnetic bead immunoassay. CV = coefficient of variation
2.2.5 Multi-pathway magnetic bead kit primary cultures
A Multi-Pathway Signaling Magnetic Bead kit, was used to detect changes in
phosphorylated ERK/MAP kinase 1/2 (Thr185/Tyr187), Akt (Ser473), STAT3 (Ser727),
JNK (Thr183/Tyr185), p70 S6 kinase (Thr412), NFkB (Ser536), STAT5A/B
(Tyr694/699), CREB (Ser133), and p38 (Thr180/Tyr182) and the corresponding total
protein levels in astrocyte cell lysates using the Luminex® xMAP® technology.
After corresponding treatments, astrocytes were lysed in the supplied lysis
buffer with protease inhibitors added. The amount of protein/well was adjusted to a
concentration of 15 µg by diluting with the provided assay buffer. The protocol was
followed according to the manufacturer’s specifications (Millipore). Beads

Materials and methods
65
conjugated to the appropriate antibodies and astrocytes cell lysates (25 µl each)
were incubated O/N at 4°C with shaking and protected from light. The next morning,
plate wells were washed two times with the provided assay buffer and 25 µl of the
biotinylated detection antibody was added and incubated for 1 hour at RT with
shaking and in dark. Then, 25 µl of the reporter dye, streptavidin-conjugated
phycoerythrin, was added and incubated for 15 minutes after which 25 µl
amplification buffer was added for 15 minutes. Finally, the beads were analyzed in a
Bio-Plex suspension array system 200 and mean fluorescence intensity was analyzed
using Bio-Plex Manager Software 4.1.
2.3 Quantification of relative levels of mRNA
2.3.1 Total RNA isolation
Total mRNA was isolated from the entire hypothalamus, subcutaneous and
visceral fat pads, and astrocyte cultured cells using the TRIzol® Reagent method
(Invitrogen) and according to manufacturer’s instructions. Primary astrocytes grown
in petri dishes were rinsed with ice-cold PBS before 1 mL of TRIzol® was added in
order to lyse and collect the cells. For the hypothalamus or adipose tissue, 1 mL of
TRI-Reagent was used.
Total mRNA concentration was quantified using the spectrophotometer
Nanodrop 1000, from Thermo Scientific.
2.3.2 Quantitative real-time polymerase chain reaction assay (qRT-PCR)
Relative mRNA levels were quantified in subcutaneous and visceral adipose
tissue and primary cultured astrocytes by qRT-PCR. Complementary DNA (cDNA) was
synthesized from 1 or 2 μg of total mRNA by using a high capacity cDNA reverse
transcription kit (Applied Biosystems, Foster City, CA, USA).
Quantitative RT-PCR was performed by using assay-on-demand kits (Applied
Biosystems, Foster City, CA, USA). Taq-Man Universal PCR Master Mix (Applied
Materials and methods
66
Biosystems) was used for amplification according to the manufacturer’s protocol in
an ABI PRISM 7000 Sequence Detection System (Applied Biosystems). Values were
normalized to the housekeeping genes 18S and Rpl13a. According to manufacturer’s
guidelines, the ΔΔCT method was used to determine relative expression levels.
Statistics were performed using ΔΔCT values. All data are expressed as % control at
each age.
In adipose tissue, leptin, adiponectin, (IL) 1β, 6 and TNFα genes were
analyzed. In adipose tissue, various housekeeping genes were analyzed to find an
internal control that did not vary between groups. However, we were unable to find
suitable housekeeping genes that did not vary with age, sex and litter size; thus, the
mRNA levels of the genes analyzed in adipose tissue were not compared between
ages. Results are compared at each age to determine the effects of sex and litter size
and were normalized to two of the following: phosphoglycerate kinase 1 (Pgk-1),
cyclophilin A (PPIA) or ribosomal protein S 18-like (Rps18). The housekeeping genes
used did not change between groups at a given age. All data are expressed as the
percent of the values of L12 males at each age.
In primary cultures the following genes were analyzed: GFAP, vimentin, (IL)
1β, 6, TNFα DDIT, IGF-1, Esr1, Esr2, NFκb, Iκbb Results were normalized to Rps18 or
ribosomal protein L13a (Rpl13a).
The primers (Applied Biosystems) employed for the analysis of gene
expression by RT-PCR are shown in Table 6.

Materials and methods
67
Gene Reference
Adiponectin Rn00595250_m1
CHOP Rn00492098_g1
GFAP Rn00566603_m1
IGF-1 Rn99999087_m1
IKBKB Rn00584379_m1
IL-1β Rn01336189_m1
IL-6 Rn01410330_m1
IL-10 Rn00563409_m1
Leptin Rn00565158_m1
NFKBIA Rn01473657_m1
PPIA Rn00690933
Pgk-1 Rn00821429
Rpl13a Rn00821946_g1
TNFα Rn01525859_g1
Vimentin Rn00579738_m1
18s Rn01428915_g1
Table 6. List of primers used in adipose tissue and astrocyte primary cultures.
2.4 Transcardial perfusion
Tissue fixation was carried out by transcardial perfusion in vivo with 0.1 M
phosphate buffer (PB) and then PB-buffered 4% paraformaldehyde (PFA; pH 7.4) and
1% glutaraldehyde (GA) in PB, perfusing approximately 300 mL/rat. The animals
were previously profoundly anesthetized with an intraperitoneal (IP) injection of
pentobarbital (1 mg/kg; Braun Vetcare, Barcelona. Spain).
When perfusion was completed, brains and subcutaneous and visceral fat
pads were collected and post-fixed overnight in 4% PFA overnight at 4°C. After three
washes with PB 0.1 M, they were stored in cryoprotection solution (30% sucrose,
30% ethylene glycol in PB) at -18°C until used. PND 10 and 21 rats were not perfused
in vivo. At sacrifice, the brains and fat pads were directly placed into 4% PFA (pH 7.4)
and fixed in this solution overnight at 4°C.
Materials and methods
68
2.4.1 Histological sections
2.4.1.1 Perfused brain sections
Perfused brains were used to obtain 40 µm coronal sections by using a
vibratome (Leica VT1200S, Leica Biosystems Nussloch GmbH, Nussloch, Germany).
According to Paxinos and Watson atlas “The rat brain in stereotaxic coordinates”, all
sections that contained the arcuate nucleus (between 2.3 and 3.3 mm from Bregma),
were collected and preserved in cryoprotecion solution and stored at -18ºC until
used for immunohistochemistry.
2.4.1.2 Visceral adipose tissue sections
Visceral adipose tissue was sectioned for subsequent histological study of
adipocyte morphology. Sections of 15 µm were obtained with a cryostat (Leica,
Madrid, España).
Samples were equilibrated to -15ºC inside the cryostat workstation for 45
minutes. A block of frozen visceral fat was then carefully attached to a microtome
chuck with aspecial tissue glue that allows frozen sectioning at the optimal cutting
temperature (OCT media; Tissue Tek, Electron Microscopy Sciences, Hatfield, PA,
USA).
The 15 µm sections were mounted onto poly-lysine treated microscope slides
and stored at -20ºC until stained with hematoxilyn-eosin for examination.
2.5 Staining techniques for histological studies
2.5.1 Immunohistochemistry in the hypothalamus
Immunohistochemistry was performed on coronal free-floating brain sections
(40 µm). Six sections per animal were selected throughout the arcuate nucleus. All
experimental groups were assayed in parallel.

Materials and methods
69
All washes and antibody incubations were done under mild shaking on a
rotating platform. The wash solution (PBT) consisted of PB (0.1M; pH 7.4), 0.3%
Triton X-100 and 0.3% BSA. This buffer was used in all washes and incubations.
Free-floating sections were first washed several times with PB to completely
remove the cryoprotection solution. Next, suppression of endogenous peroxidase
activity was carried-out by incubating the sections in 30% methanol containing 3%
hydrogen peroxide for 30 minutes at room temperature. The sections were rinsed
with wash solution (3 times, 10 minutes each) and incubated in blocking solution (3%
triton X-100 and 3% BSA in PB) for 2 hours at room temperature to reduce non-
specific binding.
The sections were then incubated with a primary antibody that recognizes
either GFAP (Sigma, 1:1000) or Iba1 (Wako, 1:500) overnight at 4ºC. The following
day, the sections were washed (3 times for ten minutes each) and incubated in
biotinylated anti-mouse secondary antibody (1:2000 for 2 hours at RT) or
biotinylated anti-rabbit secondary antibody (1:1000 for 2 hours at RT). Afterwards, 3
washes were done and sections were placed in avidin-biotin complex (ABC 32020;
Pierce Biotechnology) for signal amplification during 2 hours. The ABC complex was
diluted 1:500 in washing solution plus 5% BSA. The slices were then washed 3 times.
Finally, peroxidase activity was revealed by incubating sections with 0.03% 3-
3’ diaminobenzidine (DAB; Sigma) and 0.01% hydrogen peroxide in PB. The reaction
was monitored until the signal was clearly developed (approximately 2-3minutes).
The sections were then placed in 0.1 M PB and mounted on poly-L-lysine hydro-
bromide (50 µg/ml; Sigma) coated glass slides. Lastly, and after dehydration in
increasing concentrations of ethanol (70%, 96%, 100%) and then xylol, samples were
covered with Depex (BDH Laboratory Supplies, United Kingdom) and a coverslip
applied. The slides were examined by using an optical microscope (ZEISS.
Thornwood, NY, USA). Images were captured at 40X magnification by using a digital
camera and Image Pro-Plus software. Immunostaining was absent when the primary
antibody was omitted.

Materials and methods
70
2.5.2 Double immunohistofluorescence
Double labeling for GFAP (Sigma) and leptin receptor, Ob-R (Santa Cruz
Biotechnology Inc., Santa Cruz, CA, USA) was performed on coronal free-floating
brain sections (40 µm). Six sections per animal were selected throughout the arcuate
nucleus. All experimental groups were assayed in parallel.
The same solution for washes, blocking and antibody incubation as described
in 2.3.1 section were used for immunohistofluorescence. Free-floating sections were
washed several times with PB to completely remove the cryoprotection solution
followed by one wash with PBT and then incubated for 1.5 h in the blocking solution.
Primary antibodies were then added, GFAP (mouse, 1:1000) and leptin receptor Ob-
R (goat, 1:250)., and incubated at 4ºC under mild shaking for 48 hours.
After primary antibody incubation, the sections were washed (3 times for ten
minutes each) and incubated in biotinylated anti-goat secondary antibody (1:1000
for 5 hours at RT) for Ob-R signal amplification. Afterwards, 3 washes were done and
sections were placed in the secondary antibody Alexa Fluor® 633 goat anti-mouse
IgG (Molecular Probes. Eugene, OR, USA, 1:2000) and streptavidin, Alexa Fluor® 488
conjugate (Molecular Probes, 1:2000) and incubated in the dark for 1.5 h. The slices
were then washed 3 times with 0.1 M PB and carefully mounted while being
protected from the light and then a coverslip was placed over the tissue using Clear
Mount.
Images were captured using a confocal fluorescence microscope (Leica) with
wavelengths of 495 nm and 632 nm being used for the excitation of Alexa-Fluor-488
and Alexa-Fluor-633 fluorophores, respectively. Negative controls, where the
primary antibody was omitted, were included in every assay and in which
immunofluorescence signal was absent.
2.5.3 Hematoxylin and eosin staining of visceral adipose tissue (VAT)
Visceral adipose tissue slices (15 µm thick) were stained with hematoxylin-
eosin. First, sections were fixed in a 10% buffered formalin solution for 15 minutes.
Following a rinse with distilled water, sections are soaked in hematoxylin (Panreac,

Materials and methods
71
Barcelona, Spain) for 10 minutes to stain the nuclei. Next, eosin (Leica Biosystems,
Barcelona, Spain) staining was carried out during 1 minute and the slides then rinsed
with water. Sections were dehydrated in increasing concentrations of ethanol (70°,
96°, 100°) for 1 minute each and then 3 minutes in xylol. Depex was used to place a
coverslip over the tissue. Sections were imaged with an optical microscope (ZEISS)
using a 40X objective and the digital images were captured with a digital camera (JAI
Corporation, CV-S3200, Japan) and analyzed with Image-Pro Plus software (version
5.0; Media Cybernetics Inc., Silver Spring, MD, USA). The mean perimeter and area of
the adipocytes were calculated from visceral adipose tissue slices from 4 animals per
group, analyzing 4 sections per animal and measuring 5-10 cells per section.
2.6 Quantification of GFAP+ cells and morphological analysis
For the quantitative evaluation of astrocytes, six sections per animal
throughout the arcuate nucleus were analyzed. In each section, images of a single
focal plane from twenty rectangular fields of the arcuate nucleus (area of 19.5 mm2
per field), ten on each side of the third ventricle, were captured using 40X
magnification with an optical microscope attached to a digital camera. Images were
processed using Image-Pro Plus software.
The number of GFAP immunoreactive (GFAP+) cells per field was counted, as
well as the number of primary projections (those emerging from the soma) of each
GFAP positive cell determined with ImageJ software. All morphometric analyses
were performed without previous knowledge of the experimental group (samples
were blinded for analysis).
Analysis of the mean levels of Ob-R immunoreactivity in GFAP positive cells in
the arcuate nucleus was performed using ImageJ software. The red and green signals
over individual somas were separated, measured and recorded in a mean of 10 cells
per field and 10 fields/animal throughout the arcuate nucleus. From these
measurements, the mean intensity of Ob-R immunoreactivity in the soma of GFAP
positive cells was determined.

Materials and methods
72
2.7 Double immunocytofluorescence for GFAP and Iba1 in primary
astrocyte cultures
Double immunocytofluorescence was performed in hypothalamic astrocytes
primary cultures from postnatal day 2 Wistar rats in order to determine if microglia
can be detected in the enriched astrocyte cultures. An antibody against GFAP was
used to label astrocytes, whereas the Iba 1 antibody was used to identify microglia.
Cells were seeded on round coverslips that had been placed in 24-well plates
and previously treated with poly-L-lysine hydrobromide (10 μg/ml; Sigma-Aldrich).
All steps were performed in the well plate until coverslips were removed to be
mounted.
Forty-eight hours after the cells were seeded the wells were washed three
times with cool PBS and fixed with 4% paraformaldehyde for 15 minutes at room
temperature. The wells were washed 3 times and then equilibrated with buffer
consisting of 0.1 M PB (pH 7.4), 0.1% BSA and 0.3% Triton-X100 for 15 minutes.
Blocking solution [0.1 M PBS, (pH 7.4), 0.3% BSA and 0.3% Triton-X100] was added to
the samples for 1.5 hours. The two primary antibodies, mouse anti-GFAP (Sigma,
1:1000) and rabbit anti-Iba1 (Wako, 1:1000) were added to the corresponding wells
and incubation was then carried out overnight at 4ºC.
The following morning, the primary antibody solution was removed and the
wells rinsed with PB 0.1M, three times, 5 minutes each wash. The two secondary
antibodies (diluted in blocking solution) were added and incubated during 1 hour in
the dark and at room temperature. The secondary antibodies (1:1000) used were
goat anti-mouse and goat anti-rabbit IgG conjugated with Alexa Fluor® 488 and
Alexa Fluor® 633 (Molecular Probes. Eugene, OR, USA), respectively. The final three
washes (10 minutes each) were done in the dark and the coverslips were carefully
mounted on microscope slides cover glasses using a drop of Clear Mount mounting
medium and stored in the dark at 4ºC until examination.
Images were captured using a confocal fluorescence microscope. Negative
controls, where the primary antibody was omitted, were included in every assay and
in which immunofluorescence signal was absent.

Materials and methods
73
Antigen Host Working dilution
Commercial source
GFAP Mouse 1:1000 Sigma
Iba 1 Mouse 1:1000 Wako
Ob-R Goat 1:500 Santa Cruz
Table 7. Antibodies used for immunohistochemistry and immunocytochemistry
2.8 Detection of nitrites and nitrates in culture media
Culture media was collected and kept frozen at -80ºC until used.
Quantification of nitrites and nitrates (NO3- and NO2
-) was performed according to
Miranda and colleagues (Miranda et al., 2001). The assay is based on the
simultaneous detection of nitrate and nitrite concentrations by reducing nitrates
with vanadium (III) and the combined detection by using the acidic Griess reaction
(Griess, 1879). The resulting color is spectrophotometrically quantified at a
wavelength of 540nm.
Briefly, in a 96-well plate, 100 μL of vanadium (III) chloride (VCl3) was added
to 100 μL of each cell culture media sample and, immediately, 100 μL of Griess
reagent was added. The Griess reagent was prepared just before use by mixing equal
volume of ethylenediamine dihydrochloride (NEDD) and sulfonamide. The plate was
then incubated for 30 minutes at RT and the absorbance read (Tecan Infinite M200).
The results were compared to a standard curve consisting of sodium nitrate (NaNO2)
in concentrations from 1 to 200 μM.
2.9 Estimation of the number of cells
The cristal violet dye elution (CVDE) method was employed to determine cell
viability in response to each in vitro cell treatment. The cristal violet dye binds to cell
nuclei, which is then solubilized and quantified spectrophotometrically. The resulting
absorbance is proportional to DNA content and therefore, cell number.

Materials and methods
74
For this assay, cells were grown in 24 well plates. The cells were washed twice
with PBS and then 1 mL of 1% GT was added in order to fix the cells. After 10
minutes, the GT was removed and the cells were washed twice with PBS. The cristal
violet solution (0.1%) was then added (1 mL) and the cells incubated at RT for 20
minutes. The cristal violet solution was removed and the cells rinsed under running
tap water for 20 minutes. The plate was then left at RT for 2 hours or at 37°C for 30
minutes to dry completely. The cristal violet was then dissolved with 10% acetic acid,
mixed well and 200 µL added to a 96 well plate and the absorbance read at 590 nm.
The number of cells is calculated according to the following equation: Number of
cells = (265030* absorbance)-1950.
2.10 Statistical analysis
The program SPSS version 19.0 (SPSS Inc., Chicago, IL, USA) was used for data
analysis. To determine the effect and/or interaction of two or more factors two or
three-way ANOVAs were used. When significant effects were found with the two or
three-way analyses, a subsequent two-way and/or one-way ANOVA followed by
Scheffé’s f test was used to determine whether specific differences existed amongst
the experimental groups. Bonferroni correction was used for multiple comparisions
in case of primary astrocyte cultures studies. Two-tailed Student’s t tests were used
to compare differences between two independent groups. All data are presented as
mean ± SEM. The results were considered statistically significant at p<0.05. The p
values in the figures represent the results of the one-way ANOVA or Student’s t test
when indicated.


V. RESULTS


Results
76
1. Effects of neonatal overnutrition throughout development in male and
female rats
1.1 Effects of sex, litter size and age on body weight, body length and food
intake.
1.1.1 Body weight
On the day of birth (PND0), all litters were organized and cross-fostered such
that the mean starting weight did not differ between groups, as shown in Figure 15A.
It is of note that body weight at birth was higher in males than females (F(1,284) = 34.1,
p<0.0001; Figure 15B).
Figure 15. A. Mean body weight (BW) of each experimental group on the day of birth. N = 62-66 for each
experimental group. NS = not significant. B. Mean BW of males and females on the day of birth n =124-
126. Student’s T test: *** = p<0.0001.
The changes in body weight, body length and food intake were studied from
birth to PND150. There was an effect of sex (F(1,1923) = 12539.4, p<0.0001), litter size
(F(1,1923) = 210.05, p<0.0001) and age (F(20,1923) = 4546.4, p<0.0001) on BW, with
interactions between sex and litter size (F(1,1923) = 20.9, p<0.0001), sex and age
(F(20,1923) = 381.1, p<0.0001) and litter size and age (F(20,1923) = 2.8, p<0.0001). Figure 16
shows the evolution of BW from birth to PND150.
A
A B

Results
77
Figure 16. Change in body weight (BW) throughout development in male and female rats raised in control
litters (L12) and small litters (L4). Data are expressed as mean ± SEM. (F(83,2006) = 1253.8); p<0.0001. a=
Effect of litter size on BW in males; b= Effect of litter size on BW in females; c= Effect of sex on BW in small
litters (L4); d= Effect of sex on BW in control litters (L12). ANOVA repeated measures: Sex effect (F(1, 42):
496.15, p<0.0001) and Litter size effect: (F(1, 42): 10.1, p<0.003).
Neonatal overnutrition produced changes in body weight as early as PND10.
At this early postnatal age, both males and females from L4 weighed more than
those from L12, (F(1, 48) = 128.0, p<0.0001), with no differences between sexes (Figure
17).
a
b
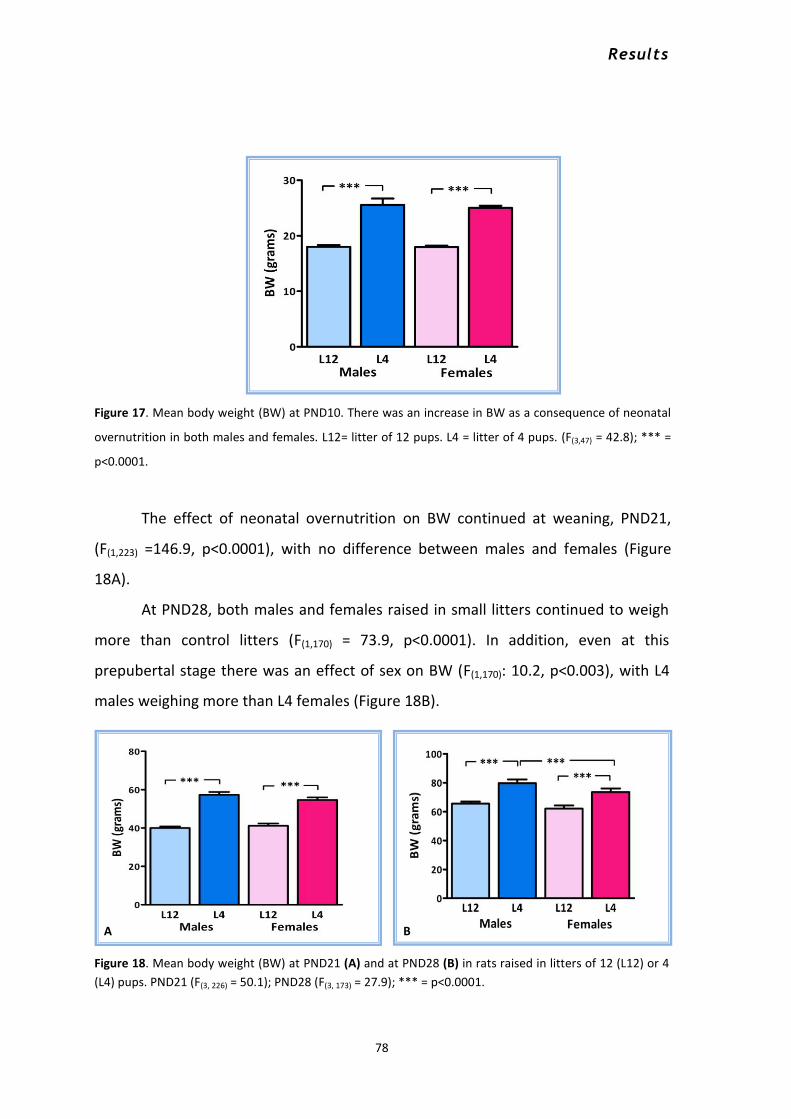
Results
78
Figure 17. Mean body weight (BW) at PND10. There was an increase in BW as a consequence of neonatal
overnutrition in both males and females. L12= litter of 12 pups. L4 = litter of 4 pups. (F(3,47) = 42.8); *** =
p<0.0001.
The effect of neonatal overnutrition on BW continued at weaning, PND21,
(F(1,223) =146.9, p<0.0001), with no difference between males and females (Figure
18A).
At PND28, both males and females raised in small litters continued to weigh
more than control litters (F(1,170) = 73.9, p<0.0001). In addition, even at this
prepubertal stage there was an effect of sex on BW (F(1,170): 10.2, p<0.003), with L4
males weighing more than L4 females (Figure 18B).
Figure 18. Mean body weight (BW) at PND21 (A) and at PND28 (B) in rats raised in litters of 12 (L12) or 4
(L4) pups. PND21 (F(3, 226) = 50.1); PND28 (F(3, 173) = 27.9); *** = p<0.0001.
A B

Results
79
As can be observed in Figure 19, at PND56 males weighed more than females
regardless of their experimental group and this effect remained until the end of the
study. However, the effect of litter size on body weight ceased to be observed at
approximately PND56 in both sexes.
Figure 19. Mean body weight (BW) at PND56 in rats reared in litters of 12 (L12) or 4 (L4) pups when the
effect of litter size was no longer observed in either sex. (F(3,95) = 89.2; *** = p<0.0001.
Although the effect of litter size on BW ceased to be observed at
approximately PND56, it was again manifest at approximately PND90, but only in
males (Figure 20A). Male rats from L4 weighed significantly more than those from
L12 throughout the rest of the study, with no further effect seen in females (Figure
20 B).
Figure 20. Body weight at PND91 (A), when males from litters of 4 pups (L4) again weighed more than
those from litters of 12 pups (L12). Males continued to weigh more than females regardless of litter size.
B A
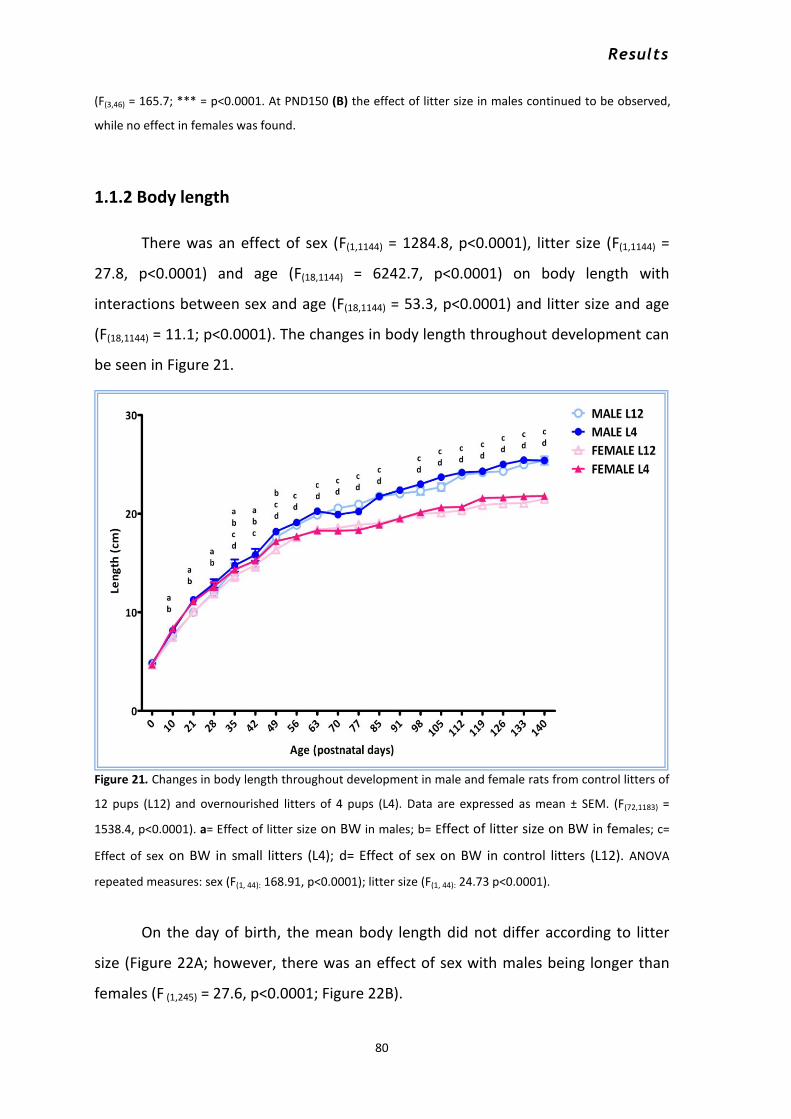
Results
80
(F(3,46) = 165.7; *** = p<0.0001. At PND150 (B) the effect of litter size in males continued to be observed,
while no effect in females was found.
1.1.2 Body length
There was an effect of sex (F(1,1144) = 1284.8, p<0.0001), litter size (F(1,1144) =
27.8, p<0.0001) and age (F(18,1144) = 6242.7, p<0.0001) on body length with
interactions between sex and age (F(18,1144) = 53.3, p<0.0001) and litter size and age
(F(18,1144) = 11.1; p<0.0001). The changes in body length throughout development can
be seen in Figure 21.
Figure 21. Changes in body length throughout development in male and female rats from control litters of
12 pups (L12) and overnourished litters of 4 pups (L4). Data are expressed as mean ± SEM. (F(72,1183) =
1538.4, p<0.0001). a= Effect of litter size on BW in males; b= Effect of litter size on BW in females; c=
Effect of sex on BW in small litters (L4); d= Effect of sex on BW in control litters (L12). ANOVA
repeated measures: sex (F(1, 44): 168.91, p<0.0001); litter size (F(1, 44): 24.73 p<0.0001).
On the day of birth, the mean body length did not differ according to litter
size (Figure 22A; however, there was an effect of sex with males being longer than
females (F (1,245) = 27.6, p<0.0001; Figure 22B).

Results
81
Figure 22. A. Mean body length of each experimental group on the day of birth N = 64-66, NS = not
significant. B. Mean body length of male and female rats showing differences between the sexes on the
day of birth. N=124-126. *** = p <0.0001.
By PND10, both males and females with neonatal overnutrition (L4) were
longer than those from control litters (L12) (F(1,48) = 50.3, p<0.0001), as can be seen in
Figure 23. The litter size effect continued at PND21 (F(1,179) = 85.4, p<0.0001) and
PND28 (F(1,128) = 39.8; p<0.0001).
Figure 23. On postnatal day 10, both males and females from litters of 4 pups (L4) were longer than those
from litters of 12 pups (L12). There was no effect of sex observed at this time. (F(3, 47) = 18.1, *** =
p<0.0001, n =12.
At PND35, males were found to be longer than females (F(1,94) = 27.2;
p<0.0001) and remained so at all subsequent ages. A litter size effect (F(1,94) = 24.6;
A B
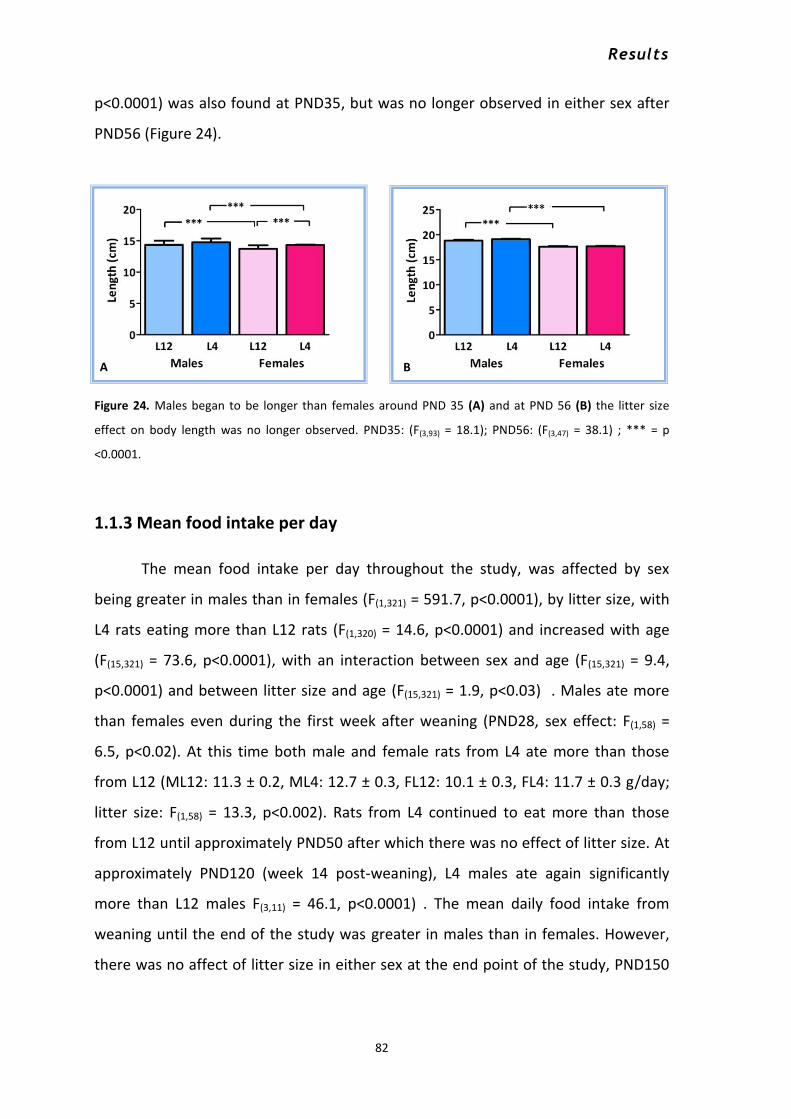
Results
82
p<0.0001) was also found at PND35, but was no longer observed in either sex after
PND56 (Figure 24).
Figure 24. Males began to be longer than females around PND 35 (A) and at PND 56 (B) the litter size
effect on body length was no longer observed. PND35: (F(3,93) = 18.1); PND56: (F(3,47) = 38.1) ; *** = p
<0.0001.
1.1.3 Mean food intake per day
The mean food intake per day throughout the study, was affected by sex
being greater in males than in females (F(1,321) = 591.7, p<0.0001), by litter size, with
L4 rats eating more than L12 rats (F(1,320) = 14.6, p<0.0001) and increased with age
(F(15,321) = 73.6, p<0.0001), with an interaction between sex and age (F(15,321) = 9.4,
p<0.0001) and between litter size and age (F(15,321) = 1.9, p<0.03) . Males ate more
than females even during the first week after weaning (PND28, sex effect: F(1,58) =
6.5, p<0.02). At this time both male and female rats from L4 ate more than those
from L12 (ML12: 11.3 ± 0.2, ML4: 12.7 ± 0.3, FL12: 10.1 ± 0.3, FL4: 11.7 ± 0.3 g/day;
litter size: F(1,58) = 13.3, p<0.002). Rats from L4 continued to eat more than those
from L12 until approximately PND50 after which there was no effect of litter size. At
approximately PND120 (week 14 post-weaning), L4 males ate again significantly
more than L12 males F(3,11) = 46.1, p<0.0001) . The mean daily food intake from
weaning until the end of the study was greater in males than in females. However,
there was no affect of litter size in either sex at the end point of the study, PND150
B A

Results
83
(ML12: 21.3 ± 0.9, ML4: 23.2 ± 0.5, FL12: 15.3 ± 0.3, FL4: 16.1 ± 1.1 g/rat/day;
p<0.0001).
Figure 25. Mean daily food intake measured at each week post-weaning in male and female rats from
control litters of 12 pups (L12) and overnourished litters of 4 pups (L4). Data are expressed as mean ±
SEM. (F(63, 384) = 29.4 , p<0.001). a= Effect of litter size on food intake in males (M12 different from M4); b=
Effect of litter size on food intake in females; c= Effect of sex on food intake in small litters (L4); d= Effect
of sex on food intake in control litters (L12).
1.2 Effects of litter size and sex on adipose tissue quantity and distribution
As described above, over-nutrition during early postnatal life resulted in rapid
weight gain. However, this effect was attenuated in early adulthood, only to appear
again around PND90 selectively in males. Although no litter size effect was observed
on body weight in early adulthood, body composition could be affected. Moreover,
it is well established that adult males and females have different adipose tissue
distribution both in rodents (Grove et al., 2010) and in humans (Schreiner et al., 1996;
Jackson et al., 2002; Goodpaster et al., 2005; Shen et al., 2009b), but little is known
regarding this sex difference during prepubertal life.

Results
84
1.2.1 Subcutaneous adipose tissue
The amount of SCAT was influenced by sex (F(1,164) = 152.5, p<0.0001), litter
size (F(1,164) = 78.3, p<0.0001) and age (F(5,164) = 214.8, p<0.0001) with interactions
between sex and litter size (F(1,164) = 5.2, p<0.05), sex and age (F(5,164) = 57.3,
p<0.0001), litter size and age (F(5,164) = 3.2, p<0.009), and sex, litter size and age
(F(4,164) = 6.6, p<0.0001). When the amount of SCAT was normalized to body weight
(g/100 g BW), these effects remained [sex (F(1,164): 74.0, p<0.0001), litter size (F(1,164) =
23.8, p<0.0001) and age (F(5,164) = 85.2, p<0.0001)] with interactions between sex and
age (F(5,164) = 87.8; p<0.0001, litter size and age (F(5,164) = 13.6; p<0.0001) and sex,
litter size and age (F(5,164) = 3.7; p<0.01).
At PND10, the amount of SCAT was affected by sex (F(1,47) = 20.5, p<0.0001)
and litter size (F(1,47) = 150.5, p<0.0001), with animals from small litters having more
SCAT than those from control litters in both sexes. In addition, L4 females had a
greater increase in % SCAT than L4 males (F(3,46) = 59.3), p<0.0001.
Upon weaning at PND21, the influence of litter size in the amount of SCAT
remained (F(1,46) = 54.3, p<0.0001), as well as the sex effect (F(1,46) = 19.3, p<0.0001).
The amount of SCAT continued to be higher in L4 rats of both sexes, with females
having more than males of their corresponding litter size (Figure 27).
The effect of litter size (F (1, 24) = 10.5, p<0.005) continued to be present at
PND30, as well as an overall influence of sex (F (1, 24) = 4.5, p<0.05).
At PND 50, no differences between males and females were observed;
however, the effect of litter size remained (F (1, 24) = 6.5, p<0.03).
The effect of litter size (F (1, 24) = 4.6, p<0.05) was still present at PND85, when
males had an overall higher percentage of SCAT than females (F(1, 24) = 8.61, p<0.01).
At PND150, there was no significant effect of litter size, but L4 males tended
to have higher levels compared to control males, with an overall effect of sex
observed (F(1,23) = 5.2, p<0.05).
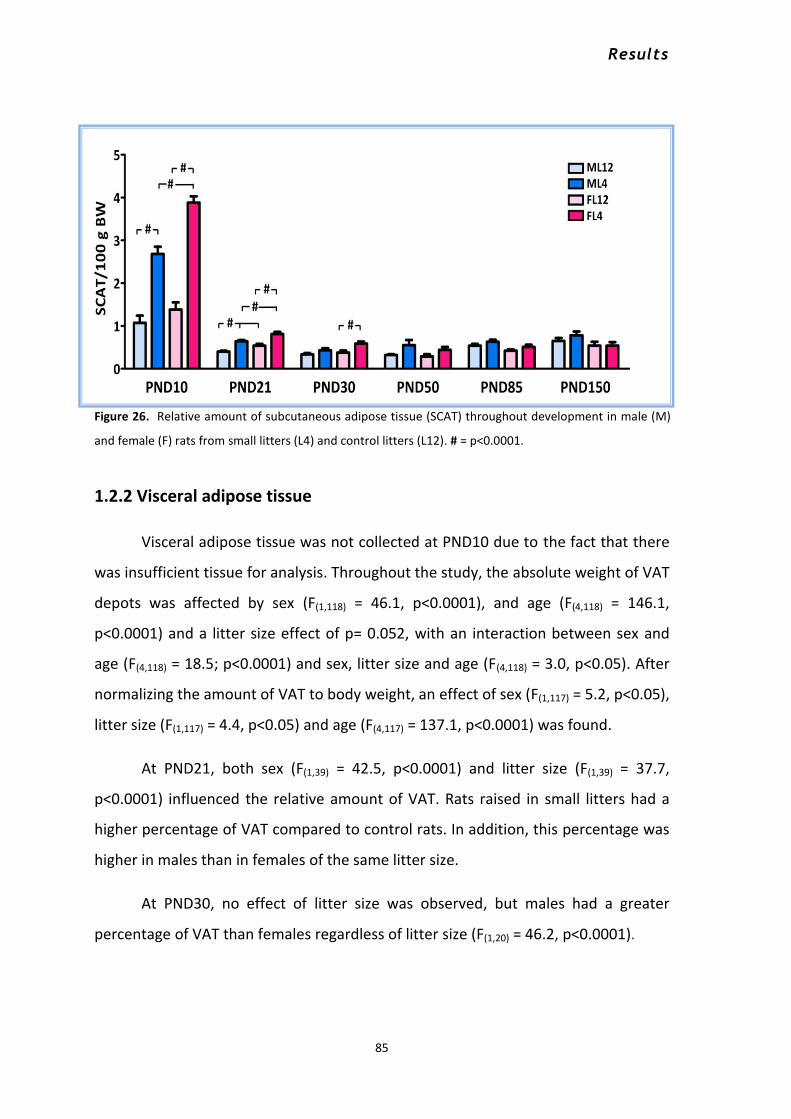
Results
85
Figure 26. Relative amount of subcutaneous adipose tissue (SCAT) throughout development in male (M)
and female (F) rats from small litters (L4) and control litters (L12). # = p<0.0001.
1.2.2 Visceral adipose tissue
Visceral adipose tissue was not collected at PND10 due to the fact that there
was insufficient tissue for analysis. Throughout the study, the absolute weight of VAT
depots was affected by sex (F(1,118) = 46.1, p<0.0001), and age (F(4,118) = 146.1,
p<0.0001) and a litter size effect of p= 0.052, with an interaction between sex and
age (F(4,118) = 18.5; p<0.0001) and sex, litter size and age (F(4,118) = 3.0, p<0.05). After
normalizing the amount of VAT to body weight, an effect of sex (F(1,117) = 5.2, p<0.05),
litter size (F(1,117) = 4.4, p<0.05) and age (F(4,117) = 137.1, p<0.0001) was found.
At PND21, both sex (F(1,39) = 42.5, p<0.0001) and litter size (F(1,39) = 37.7,
p<0.0001) influenced the relative amount of VAT. Rats raised in small litters had a
higher percentage of VAT compared to control rats. In addition, this percentage was
higher in males than in females of the same litter size.
At PND30, no effect of litter size was observed, but males had a greater
percentage of VAT than females regardless of litter size (F(1,20) = 46.2, p<0.0001).

Results
86
In postpubertal rats (PND50, PND85 and PND150) the amount of VAT tended
to be greater in males than females and in those animals raised in small litters
compared to control litters, but these effects were not statistically significant, most
likely due to the high variability within the groups.
Figure 27. Relative amount of visceral adipose tissue (VAT) throughout development in male (M) and
female (F) rats from small litters (L4) and control litters (L12). # = p<0.0001.
1.3 Effects of litter size and sex on circulating hormones and cytokines.
To determine how overnutrition during early life influences circulating
metabolic hormones and cytokines in males and females throughout development
glucose, insulin, leptin, adiponectin, IL6, IL1β and TNFα, as well as testosterone and
17β-estradiol levels were measured.
1.3.1 Glycemia
Through development, glucose levels were affected by litter size (F(1,248) =
10.4, p<0.002) and age (F(5,248) = 139.4, p<0.0001) with interactions between these
two factors (F(5,248) = 6.2, p<0.0001; Table 8).
At PND10, when rats were still nursing, with both L4 males and females had
higher levels of glucose than L12 rats (F(1, 44) = 9.6, p<0.001;
The effect of litter size remained at weaning (F(1, 42) = 25.9, p<0.0001) .

Results
87
At PND30, glycemia decreased in rats of all groups. Between PND85 and
PND150 glycemia rose significantly in all groups except L12 females, where this rise
was more gradual starting at PND50.
1.3.2 Circulating insulin levels
Throughout the study, insulin levels (Table 8) were affected by sex (F(1,117) =
12.8, p<0.003) and age (F(5,117) = 23.0, p<0.0001), with an interaction between these
two factors (F(1,117) = 5.8, p<0.0001). Circulating levels of this hormone were
significantly increased at PND150 in all groups.
At PND10, sex (F(1,20) = 9.5, p<0.006) and litter size (F(1, 20) = 29.5, p<0.0001)
affected insulin levels, with males from L4 having higher levels compared to those
from L12 (F(3,23) = 13.8, p<0.0001). Females from smaller litters also tended to have
higher levels than control females, although this difference was not significant. In
addition, L4 males had higher insulin levels than L4 females.
At PND21, the litter size effect continued (F(1,20) = 10.0, p<0.005), although
there was no difference between the sexes.
The effects of sex and litter size were not observed between PND21 and
PND150. However, at the end of the study the effect of sex on insulin levels was
again present (F(1,23) = 11.9, p<0.002).
1.3.3 Homeostatic model assessment-insulin resistance (HOMA-IR)
As an index of insulin sensitivity, homeostatic model assessment (HOMA;
Table 8) was calculated (insulin (mIU/ml) x glucose mg/dl/405) (Table 8). There was
an effect of sex (F(1,132) = 13.0, p<0.0005), litter size F(1,132) =7.4, p<0.008 and age
(F(5,132) =16.3, p<0.0001), with an interaction between sex and age (F(5,132) = 5.4,
p<0.0002).
Males had a higher HOMA than females at PND10 (sex effect: F(1,20) = 6.5,
p<0.02) and PND150 (F(1,22) = 4.8, p<0.01). At PND10, L4 rats of both sexes had a
higher HOMA index than L12 animals (litter effect: F(1,20) = 23.7, p<0.0001, with males
L4 having a higher index than L4 females (F(3,20) = 10.9, p<0.0002). The effect of litter

Results
88
size was maintained in both sexes at PND21 (F(1,20) = 10.9, p<0.004). There were no
differences between groups at P30, 50 or 85. In females, HOMA decreased between
PND21 and PND30, and then rose again at PND150 regardless of litter size (F(11,65) =
3.02 p<0.003). In males, HOMA decreased between PND10 and PND30 and also
increased between PND85 and PND150 (F(11,68) = 7.0, p<0.0001).
GLUCOSE (mg/dl) INSULIN (ng/ml) HOMA
PND 10*
ML12 114.4±4.1 0.44±0.07 3.2±0.5
ML4 130.9±5.9a 0.92±0.10a 7.7±1.2 a
FL12 121.6±5.1 0.34±0.02 2.4±0.2
FL4 135.8±4.5a 0.60±0.06b 4.8±0.5 a,b
PND 21*
ML12 103.6±5.3 0.32±0.05 2.1±0.4
ML4 131.7±5.5 0.69±0.24 a 5.4±1.9 a
FL12 109.3±2.9 0.22±0.04 1.5±0.3
FL4 125.6±3.1 0.80±0.16 a 6.0±1.3 a
PND 30
ML12 68.2±2.9c 0.19±0.03 0.8±0.1 c
ML4 76.9±4.7 c 0.23±0.05 1.1±0.2 c
FL12 72.7±4.8 c 0.13±0.01 0.6±0.1 c
FL4 75.8±4.0 c 0.57±0.37 2.6±1.8 c
PND 50
ML12 65.7±3.3 0.89±0.44 3.5±1.8
ML4 63.8±3.8 0.73±0.36 3.1±1.7
FL12 63.8±2.4 0.71±0.31 2.6±1.1
FL4 69.7±3.4 0.37±0.07 1.6±0.3
PND 85
ML12 68.8±3.7 0.70±0.18 3.1±0.9
ML4 61.0±2.4 0.94±0.37 3.5±1.3
FL12 73.3±3.4 0.15±0.03 0.7±0.2
FL4 66.3±2.9 0.60±0.22 2.2±0.9
PND 150
ML12 85.7±4.0c 3.46±0.99c 13.5±4.4 c
ML4 78.4±4.0c 2.82±0.25c 12.1±1.1 c
FL12 81.3±8.7 1.03±0.35c 3.8±1.4b,c
FL4 84.9±6.3c 1.55±0.40c 6.1±1.7b,c

Results
89
Table 8. Circulating glucose and insulin levels at 10, 21, 30, 50, 85 and 150 days of age, from small (L4)
and control litters (L12). Glycemia: F(23, 271)= 32.2, p<0.0001; Insulin: F(23, 140)= 7.1, p<0.0001; HOMA: F(23,
150)= 7.1, p<0.0001 adifferent from rats of same age and sex (litter size effect),
bdifferent from males of
same age and litter size, cdifferent from preceding age (same sex and litter size). * non-fasting samples.
1.3.4 Oral glucose tolerance test (OGTT)
To further investigate insulin resistance, we performed an oral glucose
tolerance test (OGTT) in the animals scarified at PND 150 one week before sacrifice
as described in 1.1.1 b section.
Blood glucose levels were measured 30, 60 and 120 minutes after glucose
administration in all groups. No differences were found after 30 or 60 minutes.
However, there was an effect of litter size on blood glucose levels at 120 min after
glucose oral administration (F(1,24) = 6.5, p<0.02), with L4 rats of both sexes having
higher blood glucose levels (ML12: 98.3 ± 3.8, ML4: 114.5 ± 4, FL12: 98.7 ± 5.2, FL4:
115.2 ± 10.3). There were no significant differences in the area under the curve
(AUC).
1.3.5 Circulating leptin levels
Circulating leptin levels (Table 9) were dependent on age (F(5,129) = 21.7,
p<0.0001) and litter size (F(1,129) = 4.9, p<0.03), with an interaction between these
two factors (F(1,129) = 3.0, p<0.02).
At PND10, there was an effect of litter size (F(1,28) = 24.0, p<0.0001) with both
L4 males and females having higher levels of circulating leptin than their controls.
This effect remained at PND21 (F(1,18) = 9.3, p<0.007).
Serum leptin levels increased in all groups between PND85 and PND150. In
addition, at PND150 males had higher leptin concentrations than females regardless
of litter size and males from small litters had significantly higher leptin levels than
their controls (F(3,33) = 23.0, p<0.0001).

Results
90
1.3.6 Circulating adiponectin levels
Throughout development, circulating adiponectin levels (Table 9) were
influenced by litter size (F(1,113) = 7.1, p<0.009) and age (F(5,113) = 71.8, p<0.0001), with
an interaction between sex and age (F(5, 113) = 4.21; p<0.002) and sex, litter size and
age (F(5,113) = 2.4, p<0.05). Levels of this adipokine increased with age.
At 10 days of age, both males and females from smaller litters had higher
levels of circulating adiponectin than control litters (F(1,20) = 108.4, p<0.0001). When
weaned, the effect of litter size continued (F(1,20) = 16.2, p<0.003), but only in females
(F(3,23) = 10.9, p<0.0001). At PND21, there was also an effect of sex (F(1,20) = 11.9,
p<0.001), with L4 females having higher levels than L4males.
At PND30, there was an effect of sex effect on serum adiponectin levels (F(1,20)
= 4.8, p<0.05), while at PND 50, no effect of either sex or litter size was observed.
Females had higher levels than their corresponding male groups at PND85
[sex effect (F(1,16) = 6.2, p<0.05)]. At PND150, L12 female rats had higher adiponectin
levels than L12 males. Adiponectin levels were lower in L4 than L12 females, but the
inverse occurred in males [litter size and sex interaction: (F(1,23) = 6.9, p<0.02)]).

Results
91
LEPTIN (ng/ml)
ADIPONECTIN (ng/ml)
PND 10*
ML12 1.25±0.21 21.5±2.8
ML4 2.61±0.32a 40.0±2.3 a
FL12 1.24±0.16 17.5±2.3
FL4 2.43±0.322a 41.9±1.5 a
PND 21*
ML12 1.12±0.18 27.6±1.8
ML4 1.80±0.21 31.9±1.6
FL12 0.99±0.22 30.3±1.7
FL4 1.91±0.48a 43.9±3.2 a,b
PND 30
ML12 0.43±0.12 62.1±6.0c
ML4 0.97±0.44 58.4±6.3 c
FL12 0.71±0.32 42.6±3.0 b
FL4 1.04±0.54 54.2±5.7
PND 50
ML12 0.96±0.32 55.2±4.2
ML4 0.69±0.29 76.2±5.9 a
FL12 0.77±0.29 62.2±10.1
FL4 0.64±0.31 60.9±9.7
PND 85
ML12 1.65±0.20 71.6±14.0
ML4 1.42±0.21 78.0±19.1
FL12 1.22±0.44 108.2±9.1 b
FL4 1.04±0.18 105.2±2.5 b
PND 150
ML12 9.57±1.05c 80.6±11.1
ML4 14.46±1.23c 109.4±7.4
FL12 4.33±0.80b,c 108.2±7.5
FL4 4.56±0.90b,c 86.4±12.3
Table 9. Circulating leptin and adiponectin levels at 10, 21, 30, 50, 85 and 150 days of age, in rats from
small (L4) and control litters (L12). Leptin: F(23, 146 )= 5.7, p<0.0001 ; Adiponectin: F(23,136 )= 15.7, p<0.0001. adifferent from rats of same age and sex (litter size effect),
bdifferent from males of same age and litter
size, cdifferent from preceding age (same sex and litter size). * non-fasting samples.

Results
92
1.3.7 Serum IL1β levels
The levels of the inflammatory cytokine IL1β (Table 10) were affected by age
(F(5,124) = 5.1, p<0.0001) with an interaction between sex and litter size (F(1,124) = 5.1,
p<0.03).
At PND10, there was an effect of litter size on circulating IL1β levels (F(1,28) =
7.5, p<0.02) with males and females from L4 tending to have lower levels of this
cytokine; however, this effect was not significant between specific groups in the
post hoc analysis. At weaning, males from L4 tend to have higher levels of IL1β than
L12 males, with females having the opposite tendency.
This pattern (L4 males having higher levels than L12 males and L4 females
having lower levels than L12 females) was repeated at most ages, but these
differences did not reach statistical significance.
1.3.8 Serum IL6 levels
There was an overall effect of age on IL6 levels (F(5,125) = 6.2, p<0.0001; Table
10). At PND 10, there was an overall effect of sex with males having overall higher
levels of this cytokine than females (F(1,26) = 4.3, p<0.05). Circulating IL6 levels did not
vary between groups at PND21 or 30.
At PND50, there was an effect of sex on circulating IL6 levels (F(1,19) = 4.6,
p<0.05). There was no effect of sex or litter size at PND85 or PND150, with many
animals having values below the limit of detection.
1.3.9 Serum TNFα levels
There was an effect of age (F(5,131) = 5.5, p<0.0001) on circulating TNFα levels
(Table 10).
At PND 10, there were overall effects of sex (F(1,28) = 6.9, p<0.02) and litter size
(F(1,28) = 10.9, p<0.003) on circulating TNFα levels. Females from small litters had
lower levels than control females and lower levels than males from small litters.

Results
93
There was no effect of either sex or litter size at PND21 or 30. After PND50,
most of the animals had circulating TNFα levels at the limit of detection of the assay.
IL-1β (pg/dl) IL-6 (pg/ml) TNFα (ng/ml)
PND 10*
ML12 14.9±3.1 126.1±38.5 5.1±0.3
ML4 5.1±1.2a
89.2±44.6 3.4±0.7a
FL12 15.0±4.1 16.4±12.2 4.0±0.6
FL4 7.9±2.0a
40.9±29.7 1.3±0.4 a,b
PND 21*
ML12 19.6±6.8 56.5±44.6 4.6±1.0
ML4 46.9±11.3 85.6±39.7 2.5±1.2
FL12 28.0±9.4 60.4±34.3 2.5±0.8
FL4 22.8±3.7 112.1±69.8 1.9±0.6
PND 30
ML12 32.1±8.0 76.2±47.4 1.6 ±0.4
ML4 61.3±41.4 18.4±14.4 2.0±0.9
FL12 67.5±29.0 86.5±35.0 4.1±1.3
FL4 29.2±13.6 78.3±23.8 2.1±0.7
PND 50
ML12 10.6±2.3 0.62 BLD
ML4 20.9±3.9 0.62 BLD
FL12 19.3±8.9 17.7±12.7 BLD
FL4 7.3±2.4 22.1±11.4 BLD
PND 85
ML12 15.6±5.5 5.63±5.01 BLD
ML4 15.7±6.6 4.50±3.88 BLD
FL12 6.1±2.1 2.58±1.96 BLD
FL4 6.7±2.1 0.62 BLD
PND 150
ML12 23.4±9.6 14.5±6.2 BLD
ML4 35.3±20.0 15.5±3.6 BLD
FL12 29.3±26.4 16.4±3.7 BLD
FL4 22.6±8.0 19.1±0.7 BLD
Table 10. Circulating levels of IL-1β, IL-6 and TNFα at 10, 21, 30, 50, 85 and 150 days of age, from small
(L4) and control (L12) litters. IL-1β: F(23, 147)= 1.6 , p<0.05; IL-6: F(23, 148)= 2.1 , p<0.005; TNFα: F(3, 31)= 6.1 ,
p<0.003. adifferent from rats of same age and sex (litter size effect),
bdifferent from males of same age
and litter size, cdifferent from preceding age (same sex and litter size), BLD: below limit of detection *
non-fasting samples.

Results
94
1.3.10 Testosterone levels
Circulating testosterone levels in males varied according to age (F(5,50) = 15.1,
p<0.0001), showing an increase in levels at PND85 and a further increase at PND150.
(Table 11).
Testosterone (ng/dl)
PND 10* ML12 0.19±0.05
ML4 0.76±0.27 a
PND 21* ML12 0.60±0.20
ML4 0.63±0.21
PND 30 ML12 0.48±0.24
ML4 0.35±0.13
PND 50 ML12 0.72±0.41
ML4 0.63±0.15
PND 85 ML12 2.60±0.91
ML4 2.61±0.87
PND 150 ML12 11.55±3.42
ML4 18.68±4.46
Table 11. Circulating testosterone levels at 10, 21, 30, 50, 85 and 150 days of age in males from small and
control litters. a: Litter size effect.
1.3.11 17β-Estradiol levels
Circulating 17β-estradiol levels were affected by age (F(5,41) = 6.4, p<0.0001),
with an interaction between age and litter size (F(5,41) = 2.7; p<0.04). At PND21,
females from small litters tended to have higher levels than control females (F(1,5) =
7.5, p=0.052), as well as at PND30 (F(1,7) = 6.1; p= 0.06). No differences were
observed at PND50 or PND85. However, 17β-estradiol levels increased at PND150 in
L4 females such that they were higher than in L12 females (F(1, 16) = 7.78; p<0.02;
Table 12).

Results
95
17β-estradiol (pg/ml)
PND 10* FL12 10.96±1.51
FL4 8.51±3.53
PND 21* FL12 7.06±3.07
FL4 17.60±2.23
PND 30 FL12 16.69±1.72
FL4 26.18±3.90
PND 50 FL12 22.86±1.61
FL4 24.10±1.39
PND 85 FL12 26.61±4.68
FL4 24.31±1.99
PND 150 FL12 32.45±4.42
FL4 89.38±18.78a
Table 12. Circulating 17β-estradiol levels at 10, 21, 30, 50, 85 and 150 days of age, in females from small
and control litters. a Litter size effect.
1.3.12 Circulating triglycerides at PND150.
Circulating triglyceride levels at PND150 were affected by litter size (F(1,21) =
5.7, p<0.03), being increased in rats from small litters, but only in males (F(3, 24) = 4.1,
p<0.05; Figure 28).
Figure 28. Circulating triglyceride levels at PND150 in male and female rats from L12 and L4 litters. * =
p<0.05.

Results
96
1.3.13 Non-sterified fatty acids (NEFA) at PND150.
Niether litter size nor sex affected circulating NEFA levels at PND150 (ML12:
0.77 ± 0.06, ML4: 1.00 ± 0.08, FL12: 1.03 ± 0.09, FL4: 0.96 ± 0.09 mmol/L).
1.4 Effects of litter size, sex and age on adipokine expression in adipose
tissue
Because the amount of adipose tissue changed as a consequence of neonatal
overnutrition in a sexually dimorphic manner, as did circulating adipokine levels, we
analyzed adipokine expression in adipose tissue at PNDs 10, 21, 85 and 150 to better
understand these changes.
1.4.1 Adipokine expression in subcutaneous adipose tissue
As early as 10 days of life, overnutrition (F(1,20) = 12.8, p<0.002) produced an
increase in leptin mRNA levels (Figure 29A) in SCAT of both sexes, although this
increase was only statistically significant in males. Adiponectin mRNA levels (Figure
29 B) were not significantly modified.
Figure 29. Relative leptin (A) and adiponectin (B) mRNA levels in subcutaneous adipose tissue at PND10 in
male and female rats from litters of 4 (L4) and 12 (L12) pups. Leptin mRNA: (F (3, 19) = 4.9) * = p<0.02.
IL-1β mRNA levels (Table 13) were reduced in L4 compared to L12 rats (F(1,16) =
11.6; p<0.004) with this being significant only in females. IL-6 and TNFα mRNA levels
(Table 13) were not affected by either sex or litter size.
B A

Results
97
At PND21, litter size (F(1,19) = 14.7, p<0.001) continued to affect leptin mRNA
levels in SCAT, but with this being significant only in males (Figure 30 A). Adiponectin
mRNA levels were modulated by litter size (F(1,19) = 20.7, p<0.0001) with an
interaction between litter size and sex (F(1,19) = 5.7, p<0.03) as this affect was only
significant in males (Figure 30 B).
Figure 30. Leptin (A) and adiponectin (B) mRNA levels in subcutaneous adipose tissue at PND21 in male
and female rats from litters of 4 (L4) and 12 (L12) pups. Leptin mRNA: (F(3, 22) = 7.1); Adiponectin mRNA:
(F(3, 22) = 8.7). * = p<0.02; **= p<0.001.
In general, the expression of cytokines in SCAT tended to be decreased in
over-nourished animals at PND21, although a significant effect of litter size was only
observed on IL6 levels (F(1,18) = 6.5, p<0.02), with L12 rats having higher levels than
L4 in both sexes. No effect of litter size or sex was found on IL1β or TNFα mRNA
levels at PND21.
At PND85 there was an overall effect of sex on leptin mRNA levels (F(1,18) = 5.3,
p<0.04, Figure 31A). Likewise, IL1β mRNA levels were affected by sex (ML12: 100 ±
27.7, ML4: 78.2 ± 27.2, FL12: 7.6 ± 2.2, FL4: 8.2 ± 4.1; F(1,18) = 6.9, p<0.02).
Adiponectin mRNA levels (Figure 31B) were not statistically different between
groups. As to IL6 and TNFα levels most of the results were very late in amplifying and
thus not reliable.
A B
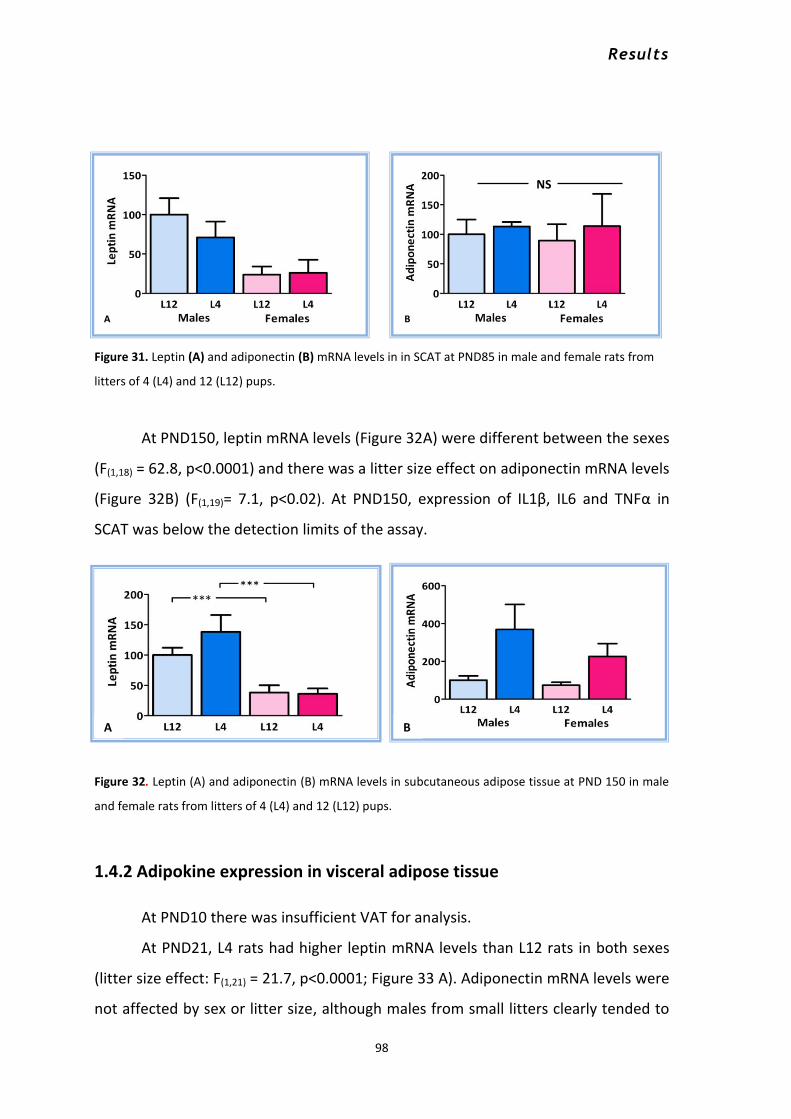
Results
98
Figure 31. Leptin (A) and adiponectin (B) mRNA levels in in SCAT at PND85 in male and female rats from
litters of 4 (L4) and 12 (L12) pups.
At PND150, leptin mRNA levels (Figure 32A) were different between the sexes
(F(1,18) = 62.8, p<0.0001) and there was a litter size effect on adiponectin mRNA levels
(Figure 32B) (F(1,19)= 7.1, p<0.02). At PND150, expression of IL1β, IL6 and TNFα in
SCAT was below the detection limits of the assay.
Figure 32. Leptin (A) and adiponectin (B) mRNA levels in subcutaneous adipose tissue at PND 150 in male
and female rats from litters of 4 (L4) and 12 (L12) pups.
1.4.2 Adipokine expression in visceral adipose tissue
At PND10 there was insufficient VAT for analysis.
At PND21, L4 rats had higher leptin mRNA levels than L12 rats in both sexes
(litter size effect: F(1,21) = 21.7, p<0.0001; Figure 33 A). Adiponectin mRNA levels were
not affected by sex or litter size, although males from small litters clearly tended to
A B
NS
A B

Results
99
have increased expression levels of this adipokine compared to control males and
females (Figure 33B).
Figure 33. Leptin (A) and adiponectin (B) mRNA levels in visceral adipose tissue at PND21 in male and
female rats from litters of 4 (L4) and 12 (L12) pups. Leptin mRNA levels: F(3,20) = 7.3 **= p<0.003.
IL6 mRNA levels in VAT were increased in L4 rats of both sexes (F(3,23) = 6.6;
p<0.01). Males had higher levels of the inflammatory cytokine IL1β than females (sex
effect: F(1,19) = 12.7, p<0.002), with this being significant between control males and
females (F(3,22) = 5.2; p<0.009; Table 14). Males also had higher TNFα mRNA levels in
VAT compared to females (sex effect: F(1,20) = 4.9; p<0.04).
At PND85, leptin mRNA levels in VAT were lower in females compared to
males (sex effect: F(1,24) = 18.1, p<0.0001, Figure 34A). There was a similar effect of
sex on adiponectin (F(1,24) = 11.1, p<0.003 Figure 34B), IL1β (F(1,19) = 8.9, p<0.008), IL6
(F(1,22) = 23.9, p<0.0001) and TNFα (F(1,23) = 22.6, p<0.0001) (Table 15), with females
having lower levels than males.
NS
A B

Results
100
Figure 34. Leptin (A) and adiponectin (B) mRNA levels in visceral adipose tissue at PND85 in male and
female rats from litters of 4 (L4) and 12 (L12) pups. Leptin mRNA: (F(3,23) = 6.7); Adiponectin mRNA: (F (3,23)
= 4.5) **= p<0.01; *= p<0.03.
At PND150, leptin expression remained higher in males than females (F(1, 22) =
71.2; p<0.0001) regardless of litter size (Figure 35A). Adiponectin mRNA levels were
also higher in males than females from both litter sizes (F(1,23) = 63.8; p<0.0001;
Figure 35B).
Figure 35 . Leptin (A) and adiponectin (B) mRNA levels in visceral adipose tissue at PND150 in male and
female rats from litters of 4 (L4) and 12 (L12) pups. Leptin mRNA: F(3, 21) = 24.4; Adiponectin mRNA: F(3, 22) =
24.5; ***=p<0.0001.
However, IL1β mRNA were higher in females compared to males (F(1,23) = 29.4,
p<0.0001) with both L12 and L4 females having higher IL1β mRNA levels than L12
and L4 males (F(3,22) = 9.99; p<0.0001; Table 16). TNFα mRNA levels were affected by
litter size (F(1,23) = 9.9, p<0.01), being higher in L4 compared to L12 males (F (3, 22) =
4.22, p<0.03.
A B
A B

Results
101
IL6 mRNA levels were below the detection limit in many of the samples and
therefore not reported.
SCAT mRNA VAT mRNA
IL1β IL6 TNFα IL1β IL6 TNFα
PND 10*
ML12 100±21.3 100±10.5 100±10.5 TNA TNA TNA
ML4 100.5±29.6 99.6±56.6 88.9±13.2 TNA TNA TNA
FL12 156.4±44.6 94.9±22.4 89.8±12.3 TNA TNA TNA
FL4 32.4±13.3a 38.7±12.1 54.3±11.1 TNA TNA TNA
PND 21*
ML12 100±55.4 100±38.7 100±28.9 100±23.7 100±18.5 100±21.5
ML4 42.5±9.3 19.3±1.7a 95.0±25.7 70.3±21.5 339.8±73.8a 161.4±53.6
FL12 97.8±42.5 112.3±46.6 142.1±32.9 18.4±4.7b 72.8±20.1 50.2±13.8
FL4 51.3±23.6 20.7±8.2a 41.7±6.3 36.2±8.1 331.0±79.9a 75.4±13.2
PND 85
ML12 BLD BLD BLD 100±42.1 100±28.9 100.0±28.8
ML4 BLD BLD BLD 70.0±19.3 124.3±30.3 124.3±30.3
FL12 BLD BLD BLD 47.7±29.1 174.8±135.4 31.8±24.7b
FL4 BLD BLD BLD 51.0±23.5 22.9±12.4b 15.8±90.1b
PND 150
ML12 BLD BLD BLD 100±29.5 BLD 100±39.5
ML4 BLD BLD BLD 80.5±37.0 BLD 450.5±186.6a
FL12 BLD BLD BLD 703.9±142.6b BLD 211.0±49.4
FL4 BLD BLD BLD 617.3±145.8b BLD 256.4±65.2
Table 16. Relative mRNA levels of cytokines in subcutaneous and visceral adipose tissue at post-natal days
(PND) 10, 21, 85 and 150 in male (M) and female (F) rats raised in litters (L) 4 or 12 pups. a
different from
rats of same age and sex (litter effect),b
different from males of same age and litter size (sex effect).
@Litter size effect by 2-ways ANOVA. * Non-fasting samples. TNA: tissue not available. BLD: below limit of
detection
1.5 Central effects of early overnutrition throughout development in
males and females.
To correlate the metabolic changes observed as a consequence of neonatal
overnutrition with possible signs of hypothalamic inflammation, hypothalamic levels
of leptin, IL-6, IL-1β, IL-10 and TNF-α were determined at PND10, 50 and 150.

Results
102
1.5.1 Hypothalamic cytokine levels at PND 10
At PND10 there was an overall litter size effect on hypothalamic leptin levels
(F(1,24) = 6.7, p<0.02), with L4 rats tending to have higher levels than L12 rats (Figure
36A).
There was an interaction between sex and litter size (F(1,20) = 5.3, p<0.05) on
hypothalamic IL6 levels, with this cytokine tending to increase in L4 males and
decrease in L4 females.
Figure 36. Leptin (A) and IL6 (B) levels in the hypothalamus at PND 10 in male and female rats from litters
of 4 (L4) and 12 (L12) pups. IL6: T-test, *p<0.05.
No significant differences were found in hypothalamic IL-1β, IL-10, or TNF-α
levels, although there was a trend for all of these cytokines to increase in L4 males
(Table 17).
Hypothalamic cytokine levels
IL10
(pg/mL) IL1β
(pg/mL) TNFα
(pg/mL)
PND 10*
ML12 22.7±5.7 27.1±4.9 1.8±0.1
ML4 42±11.1 39.6±8.7 4.5±1.6
FL12 31.7±7.7 34.1±6.3 2.5±1.2
FL4 27.4±3.9 29.2±3.4 0.8±0.1
Table 17. Hypothalamic levels of IL10, IL1 β and TNFα at PND10 in males and females from L12 and L4.
*: Non- fasting samples.
A B
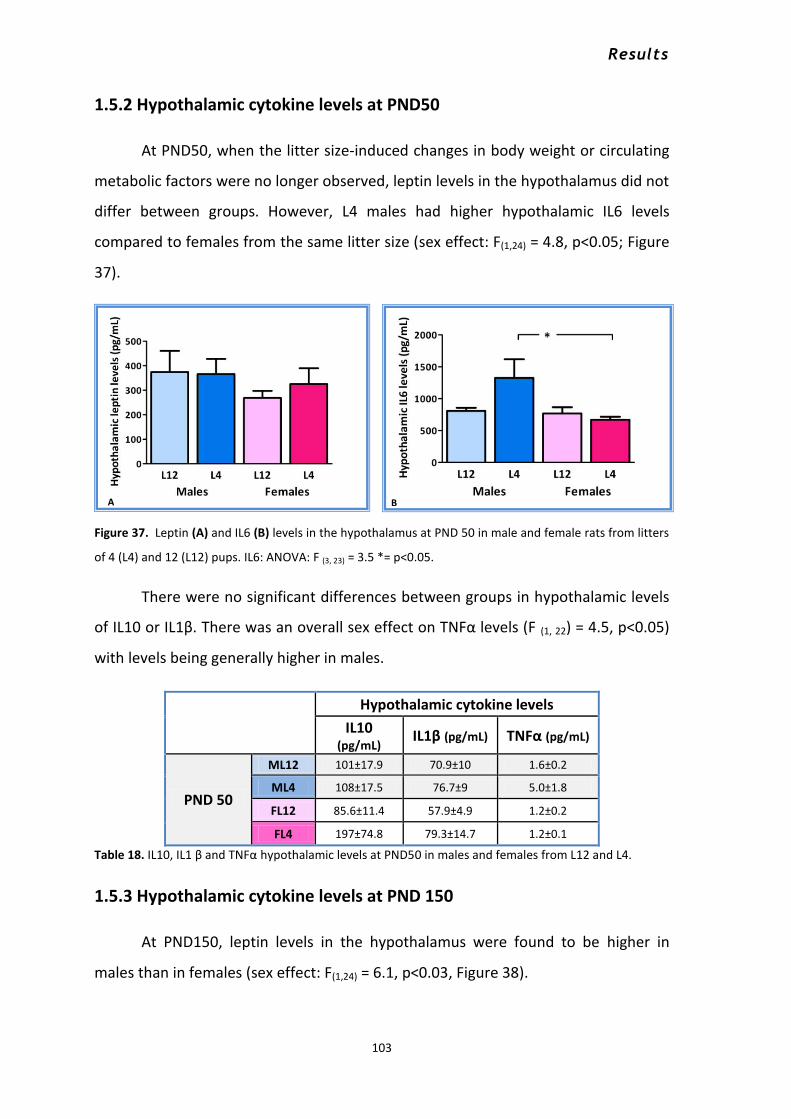
Results
103
1.5.2 Hypothalamic cytokine levels at PND50
At PND50, when the litter size-induced changes in body weight or circulating
metabolic factors were no longer observed, leptin levels in the hypothalamus did not
differ between groups. However, L4 males had higher hypothalamic IL6 levels
compared to females from the same litter size (sex effect: F(1,24) = 4.8, p<0.05; Figure
37).
Figure 37. Leptin (A) and IL6 (B) levels in the hypothalamus at PND 50 in male and female rats from litters
of 4 (L4) and 12 (L12) pups. IL6: ANOVA: F (3, 23) = 3.5 *= p<0.05.
There were no significant differences between groups in hypothalamic levels
of IL10 or IL1β. There was an overall sex effect on TNFα levels (F (1, 22) = 4.5, p<0.05)
with levels being generally higher in males.
Hypothalamic cytokine levels
IL10 (pg/mL)
IL1β (pg/mL) TNFα (pg/mL)
PND 50
ML12 101±17.9 70.9±10 1.6±0.2
ML4 108±17.5 76.7±9 5.0±1.8
FL12 85.6±11.4 57.9±4.9 1.2±0.2
FL4 197±74.8 79.3±14.7 1.2±0.1
Table 18. IL10, IL1 β and TNFα hypothalamic levels at PND50 in males and females from L12 and L4.
1.5.3 Hypothalamic cytokine levels at PND 150
At PND150, leptin levels in the hypothalamus were found to be higher in
males than in females (sex effect: F(1,24) = 6.1, p<0.03, Figure 38).
A B

Results
104
Figure 38. Leptin levels in the hypothalamus at PND 150 in male and female rats from litters of 4 (L4) and
12 (L12) pups.
No significant differences in hypothalamic IL1β, IL6 or IL10 levels were found,
although L4 males tended to have higher levels of all these cytokines (Table 19).
Hypothalamic cytokine levels
IL10 (pg/mL) IL1β (pg/mL) IL-6 (pg/mL)
PND 150
ML12 50.0±12.0 45.3±7.7 706.5±205.4
ML4 69.7±14.3 51.9±7.3 1144.1±417.2
FL12 55.4±8.9 42.3±4.2 614.9±88.6
FL4 53.1±5.3 40.6±3.8 347.6±55.1
Table 19. Hypothalamic IL10, IL1 β and IL6 levels at PND150 in males and females from L12 and L4.
In contrast, TNFα levels in the hypothalamus were affected by sex (F(1,11) =
42.6, p<0.0001) and litter size (F(1,11) = 22.17, p<0.02), with an interaction between
these two factors (F(1,11) = 14.3, p<0.01). Males from small litters had higher
hypothalamic TNFα levels than those from control litters and higher levels than
females from small litters (Figure 39).

Results
105
Figure 39. Hypothalamic TNFα levels at PND150 in male and female rats from litters of 4 (L4) and 12 (L12)
pups. F(3,10) = 24.2, ***= p<0.0001.
1.5.4 Effects of early overnutrition and sex on hypothalamic glial proteins
Hypothalamic GFAP protein levels were not affected by sex or litter size at
PND10, PND21, PND30, PND50 or PND85 (Table 20). At PND 150, hypothalamic GFAP
levels were affected by litter size (F(1, 20) = 5.5, p<0.03; Figure 40A), with L4 males
having higher levels than L12 males.
At PND150, the microglia marker, Iba 1, was influenced by litter size (F(1, 20) =
5.9, p<0.03; Figure 40B), with its levels being lower in the rats that had been exposed
to neonatal overnutrition, regardless of sex.
Figure 40.Relative hypothalamic GFAP (A) and Iba1 (B) protein levels in male and female rats from L12 and
L4 at PND 150. N=6. #: p<0.05 Litter size effect by 2-ways ANOVA.
GFAP
Actin
a
Iba 1
Actin
Results
106
GFAP
PND 10*
ML12 100 ± 7.8
ML4 97.7 ± 12.9
FL12 93.7 ± 12.9
FL4 103.1 ± 12.9
PND 21*
ML12 100 ± 6.7
ML4 101 ± 8.4
FL12 101 ± 6.5
FL4 107.6 ± 12
PND 30
ML12 100 ± 4.2
ML4 73.9 ± 14.2
FL12 105.8 ± 5.7
FL4 95.7 ± 12.2
PND 50
ML12 100 ± 12.6
ML4 106.1 ± 17.4
FL12 98.8 ± 10
FL4 81.6 ± 17.2
PND 85
ML12 100 ± 10
ML4 88.4 ± 5
FL12 117.1 ± 202
FL4 87.8 ± 5.8
Table 20. Hypothalamic GFAP protein levels at PND10, PND21, PND30, PND50 and PND85, which
levels were not significantly different between the experimental groups.
Hypothalamic vimentin protein levels were affected by litter size at PND30 (F
(1, 24) = 6.5, p<0.02; Figure 41), when the animals exposed to early over nutrition had
lower levels of this protein. There was no effect at any other ages (results not
shown).

Results
107
Figure 41. Relative hypothalamic vimentin protein levels in male and female rats from L12 and L4 at PND
30. N=6
To investigate whether neuronal maturation was affected by neonatal
overnutrition during the prepubertal stages, nestin levels were analyzed at PND 10,
21 and 30. There was no effect of sex or litter size at PND10 or 21. In contrast, at
PND30, nestin protein levels tended to be increased in the animals raised in small
litters in both sexes (ML12: 100 ± 28.1, ML4: 191.1 ± 79.0, FL12: 37.3 ± 11.8,
FL4:175.5 ± 60.1 %ML12; litter size effect p=0.058).
Given that changes in hypothlamic GFAP levels were found in response to
early overnutrition in males, but not females, at PND150 we asked whether this was
associated with increased markers of inflammation and/or changes in the activation
of intracellular pathways associated with leptin and insulin signaling.
The p-Stat3(Tyr705) protein levels were increased by litter size (F(1,20) = 6.1,
p<0.03) in both sexes. However, p-Stat3(Ser 634) protein levels were unaffected (data
not shown).
Vimentin
GAPDH

Results
108
Figure 42. Relative hypothalamic pSTAT3(Tyr705) protein levels in male and female rats from L12 and L4 at
PND 30. N=6 #: p<0.03 litter size effect by 2-ways ANOVA.
There was an interaction between litter size and sex on SOCS3 protein levels (F(1,18) =
5.1, p<0.05), with this inhibitor of cytokine signaling tending to decrease in L4 males
and increase in L4 females.
Figure 43. Relative hypothalamic SOCS3 protein levels in male and female rats from L12 and L4 at PND 30.
N=6
Hypothalamic protein levels of p-IRS, p-AKT, p-Iκβ and p-PTEN were not
different between groups at PND150 (data not shown).
SOCS3
Actin
STAT3
pSTAT3(Tyr705)

Results
109
1.5.5 Early overnutrition and sex influence on astrocyte cell number and
morphology
Although neonatal overnutrition did not increased GFAP levels in PND150
females, it is possible that the number or morphology of astrocytes could be
affected. Hence, we analyzed the number and morphology of astrocytes in the
hypothalamus of male and female rats at PND150.
There was an effect of litter size (F (1,19) = 9.8, p<0.005; Figure 44A), with an
increase in the mean number of GFAP cells/area in the arcuate nucleus of the
hypothalamus of males that had been exposed to early overnutrition. There was an
overall effect of sex (F (1,19) = 5.4, p<0.04; Figure 44B) on the number of projections
per GFAP cell, with females tending to have more primary projections. Primary
projections were also measured to determine their length, an effect of litter size was
found (F (1,19) = 19.4, p<0.003; Figure 44C), with ML4 having shorter primary
projections than ML12 and no effect on females.

Results
110
Figure 44. Number of GFAP positive cells/area (A), number of projections per GFAP positive cell (B) and
primary projections length (C) in the arcuate nucleus of male and female rats from L12 and L4 at PND 150.
Number of cells/area: F(3, 22) = 3.8, *=p<0.0 3; Length of projections: F(3,22)= 8.1**=p<0.01
As leptin receptor expression in astrocytes has been reported to increase in
hypothalamic astrocytes as a result of HFD-induced obesity (Hsuchou et al., 2009), we
analyzed whether the increase in weight in male rats due to neonatal nutrition is
associated with changes in LepR levels in astrocyte of the arcuate nucleus. The level of
LepR immunoreactivity over GFAP positive somas was increased in rats raised in a small
litter (litter effect: F(1,8)=24.6, p<0.001; Figure 45), regardless of sex.
A B C
ML12 ML4
FL12 FL4

Results
111
Figure 45. Relative signal intensity of ObR over GFAP cells in male and female rats from L12 and L4 at PND
90.
1.5.6 Early overnutrition and sex effects on microglia cell number
There were no significant differences in the mean number of Iba1+ cells/area
in the arcuate nucleus of the hypothalamus of 150 day old rats (Figure 46), although
the number of Iba1+ cells tended to decrease in rats with neonatal overnutrition,
similar to that observed for Iba1 protein levels in the hypothalamus.
Figure 46. Mean number of Iba1 positive cells/ and immunohistochemitry images in the arcuate nucleus
of male and female rats from L12 and L4 at PND 150.
ML4 ML12
FL12 FL4

Results
112
2. Neonatal androgenization
2.1 Metabolic effects of neonatal androgenization
2.1.1 Metabolic effects of neonatal androgenization at PND10
At PND10, testosterone levels remained elevated in females that received
testosterone on PND1 (M: 6.6 ± 3.4, F: 1.2 ± 0.4. AF: 7.0 ± 2.9 ng/ml). To determine if
neonatal testosterone levels could play a role in the development of the sexually
dimorphic effects observed at PND10 in the neonatal overnutrition study,
testosterone levels were also measured in females at this age. At PND10 there was
an effect of litter size (F(1,18) = 4.4, p<0.05) with an interaction between sex and litter
size (F(1,18) = 5.7, p<0.03), as L12 males had lower levels than L4 males, but with no
effect in females (ML12: 0.19 ± 0.05, ML4: 0.76 ± 0.27, FL12PND10: 0.35 ± 0.04,
FL4PND10: 0.31 ± 0.02 ng/ml).
Circulating 17β-estradiol levels showed no differences between groups (M:
37.2 ± 4.0, F: 39.7 ± 6.1, AF: 28.4 ± 2.3 pg/ml)
Neonatal androgenization did not alter body weight (M: 17.7 ± 0.4, F: 17.8 ±
0.4, AF: 18.3 ± 0.4 g) or body length (M: 7.4 ± 0.1, F: 7.5 ± 0.1, AF: 7.7 ± 0.1 cm) at
PND10.
The amount of SCAT was higher in females than in males and even greater in
androgenized females (Figure 47).
Figure 47. Percentage (A) and absolute (B) amount of subcutaneous fat (SCAT) at PND10 in males, females
and androgenized females SCAT/100g BW: (F(2,28)= 53.9); SCAT (g): (F (2,28)= 47.8) ***= p<0.0001.
A B

Results
113
At PND10, glycemia (M: 112.3 ± 3.1, F: 104.1 ± 4.0, AF: 102.1 ± 3.7 mg/dl) and
insulin levels (M: 0.69 ± 0.24, F: 0.72 ± 0.19, AF: 0.49 ± 0.07 ng/ml) were not
different between groups.
Serum leptin levels were higher in females compared to males, but
androgenized females were not different from either males or females (F(1,18) = 10.3;
p<0.01; Figure 48). There was a similar effect on serum adiponectin levels, with
higher levels of this adipokine in females compared to males (F(1,25) = 11.3; p<0.01)
with androgenization reducing adiponectin levels so that they were no longer
different from males.
Figure 48. Serum leptin (A) and adiponectin (B) levels at PND10 in males, females and androgenized
females. Leptin: (F(2,17) = 6.3, p<0.02; Adiponectin: (F(2,22) = 5.6; p<0.01) *= p<0.05.
Circulating levels of the inflammatory cytokines IL1β (M: 41.8 ± 24.7, F: 39.2 ±
9.2, AF: 27.1 ± 14.9 pg/ml) and TNFα (M: 1.7 ± 0.3, F: 1.1 ± 0.4, AF: 1.0 ± 0.4 pg/ml)
were not affected by neonatal androgenization. In contrast, circulating IL6 levels
were lower in females than in males, with androgenization of females ablating this
difference (F(2,16) = 4.0, p<0.05; (Figure 49).
A B
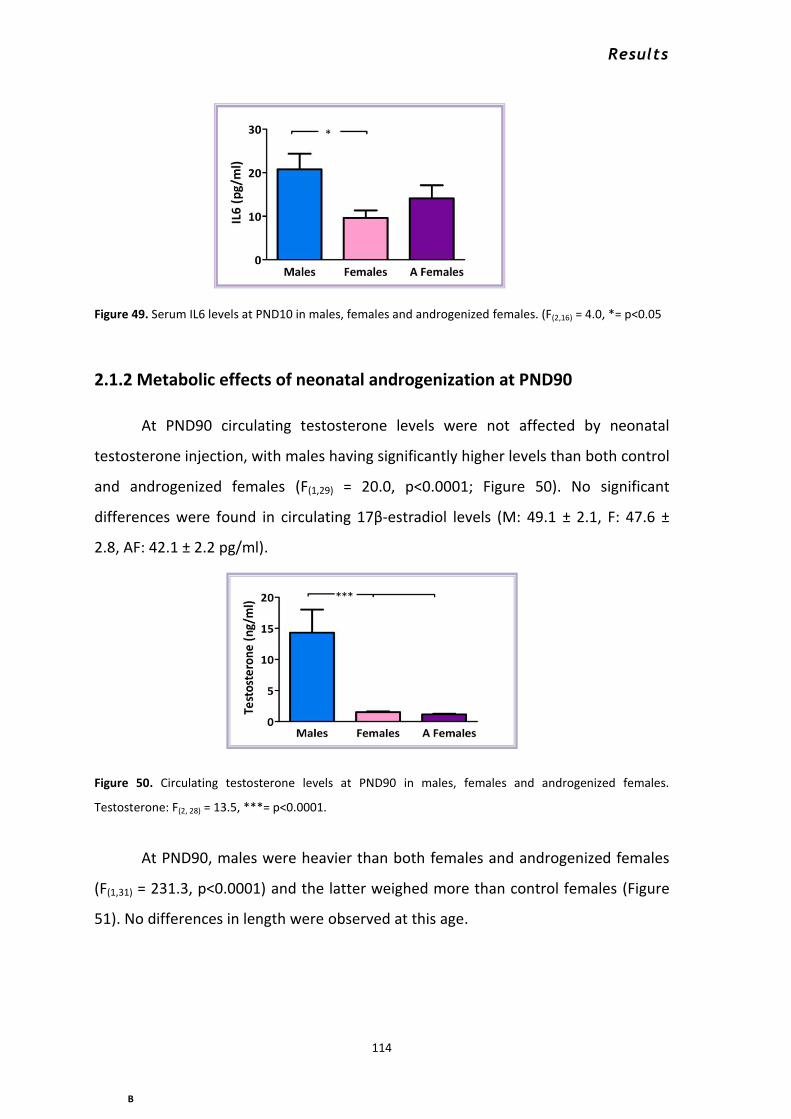
Results
114
Figure 49. Serum IL6 levels at PND10 in males, females and androgenized females. (F(2,16) = 4.0, *= p<0.05
2.1.2 Metabolic effects of neonatal androgenization at PND90
At PND90 circulating testosterone levels were not affected by neonatal
testosterone injection, with males having significantly higher levels than both control
and androgenized females (F(1,29) = 20.0, p<0.0001; Figure 50). No significant
differences were found in circulating 17β-estradiol levels (M: 49.1 ± 2.1, F: 47.6 ±
2.8, AF: 42.1 ± 2.2 pg/ml).
Figure 50. Circulating testosterone levels at PND90 in males, females and androgenized females.
Testosterone: F(2, 28) = 13.5, ***= p<0.0001.
At PND90, males were heavier than both females and androgenized females
(F(1,31) = 231.3, p<0.0001) and the latter weighed more than control females (Figure
51). No differences in length were observed at this age.
A B
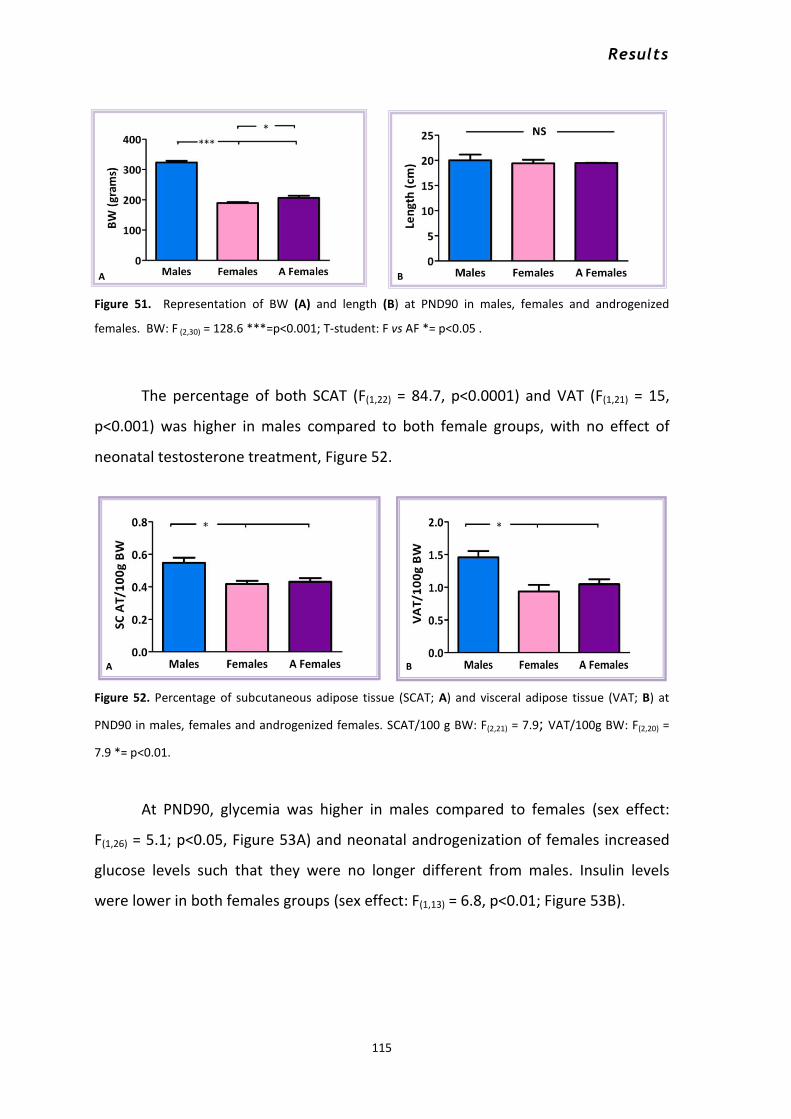
Results
115
Figure 51. Representation of BW (A) and length (B) at PND90 in males, females and androgenized
females. BW: F (2,30) = 128.6 ***=p<0.001; T-student: F vs AF *= p<0.05 .
The percentage of both SCAT (F(1,22) = 84.7, p<0.0001) and VAT (F(1,21) = 15,
p<0.001) was higher in males compared to both female groups, with no effect of
neonatal testosterone treatment, Figure 52.
Figure 52. Percentage of subcutaneous adipose tissue (SCAT; A) and visceral adipose tissue (VAT; B) at
PND90 in males, females and androgenized females. SCAT/100 g BW: F(2,21) = 7.9; VAT/100g BW: F(2,20) =
7.9 *= p<0.01.
At PND90, glycemia was higher in males compared to females (sex effect:
F(1,26) = 5.1; p<0.05, Figure 53A) and neonatal androgenization of females increased
glucose levels such that they were no longer different from males. Insulin levels
were lower in both females groups (sex effect: F(1,13) = 6.8, p<0.01; Figure 53B).
A B
A B
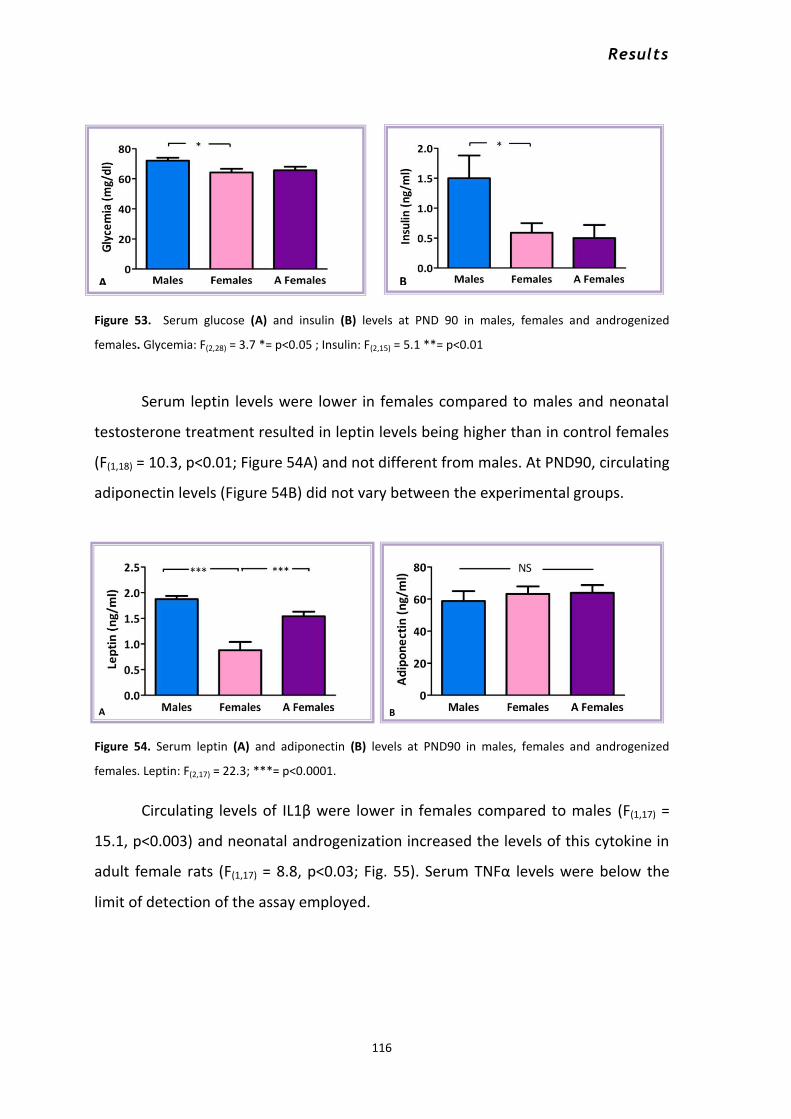
Results
116
Figure 53. Serum glucose (A) and insulin (B) levels at PND 90 in males, females and androgenized
females. Glycemia: F(2,28) = 3.7 *= p<0.05 ; Insulin: F(2,15) = 5.1 **= p<0.01
Serum leptin levels were lower in females compared to males and neonatal
testosterone treatment resulted in leptin levels being higher than in control females
(F(1,18) = 10.3, p<0.01; Figure 54A) and not different from males. At PND90, circulating
adiponectin levels (Figure 54B) did not vary between the experimental groups.
Figure 54. Serum leptin (A) and adiponectin (B) levels at PND90 in males, females and androgenized
females. Leptin: F(2,17) = 22.3; ***= p<0.0001.
Circulating levels of IL1β were lower in females compared to males (F(1,17) =
15.1, p<0.003) and neonatal androgenization increased the levels of this cytokine in
adult female rats (F(1,17) = 8.8, p<0.03; Fig. 55). Serum TNFα levels were below the
limit of detection of the assay employed.
A B
A B

Results
117
Figure 55. Serum IL1β levels at PND90 in males, females and androgenized females. ANOVA: F (2,16) = 5.9
*= p<0.03.
2.2 Cytokine profile in adipose tissue
2.2.1 Expression of cytokines in subcutaneous adipose tissue at PND10
The injection of testosterone to neonatal females had no significant effect on
the mRNA levels of leptin, adiponectin, IL1β, IL6 or TNFα in SCAT (Table 21) at
PND10.
Leptin mRNA
Adiponectin mRNA
IL1β mRNA IL6 mRNA TNFα mRNA
MALES 100 ± 26.3 100 ± 21.0 100 ± 22.8 100± 20.8 100±34.1
FEMALES 138.8± 21.7 130.4 ± 9.5 57.8± 14.8 74.1±16.3 115.1±13.3
ANDROGENIZED FEMALES
142.9± 27.2 103.7 ± 15.3 80.3± 14.4 94.1±17.6 132.5 ± 13
Table 21. Expression of leptin, adiponectin, IL1β, IL6 and TNFα mRNA levels in subcutaneous adipose
tissue at PND10 in males, females and androgenized females. All data are normalized to the expression
level of males.

Results
118
2.2.2 Expression of adipokines and cytokines in subcutaneous adipose
tissue at PND90
The expression of leptin, adiponectin and TNFα did not differ between groups
in SCAT, while IL1β and IL6 were not reliably detectable in most samples (Table 22)
at PND90.
Leptin mRNA
Adiponectin mRNA
IL1β mRNA IL6 mRNA TNFα mRNA
MALES 100 ± 67.8 100 ± 50.2 BLD BLD 100 ± 64.8
FEMALES 151.2 ±
77.6 188.1 ± 27.1 BLD BLD 156.6 ± 43.9
ANDROGENIZED FEMALES
170.2 ± 74.3
293.8 ± 90.3 BLD BLD 129.5 ± 19.8
Table 22. Expression of leptin, adiponectin, IL1β, IL6 and TNFα mRNA levels in subcutaneous adipose
tissue at PND90 in males, females and androgenized females. BLD= below limits of detection. Data are
normalized to the levels in males.
2.2.3 Expression of adipokines and cytokines in visceral adipose tissue at
PND90
At PND90, leptin mRNA levels in VAT were higher in males compared to
females of both groups, but androgenization of females increased leptin expression
so that it was higher than in normal females (F(2,14) = 18.5, p<0.0002; Fig. 56).
Adiponectin (F(2,14) = 6.5, p<0.01; Fig. 57A), IL6 (F(2,15) = 9.7, p<0.003; Fig 57B) and
TNFα (F(2,15) = 15.1, p<0.0001; Fig. 57C) were lower in both groups of females
compared to males. IL1β mRNA levels were not significantly different between
groups (M: 100 ± 41.4, F: 30.6 ± 23.7, AF: 282.9 ± 154.9 % M).

Results
119
Figure 56. Relative leptin mRNA levels in visceral adipose tissue at PND90 in males, females and
androgenized females. ***= p<0.0001.
Figure 57. Relative adiponectin (A), IL6 (A) and TNFα (B) mRNA levels in visceral adipose tissue at PND 90
in males, females and androgenized females. **= p<0.001, ***=p<0.0001.
2.3 Histological analysis of visceral adipose tissue at PND90
The histological study of VAT at PND90, indicated that VAT adipocytes were
larger in males than females and andogenized females (F(1,7) = 21.9, p<0.003; Figure
58), with no differences between females and androgenized females.
Figure 58. Relative adipocyte area in visceral adipose tissue at PND 90 in males, females and
androgenized females. F(2,9) = 13.9, **= p<0.005.
B A C
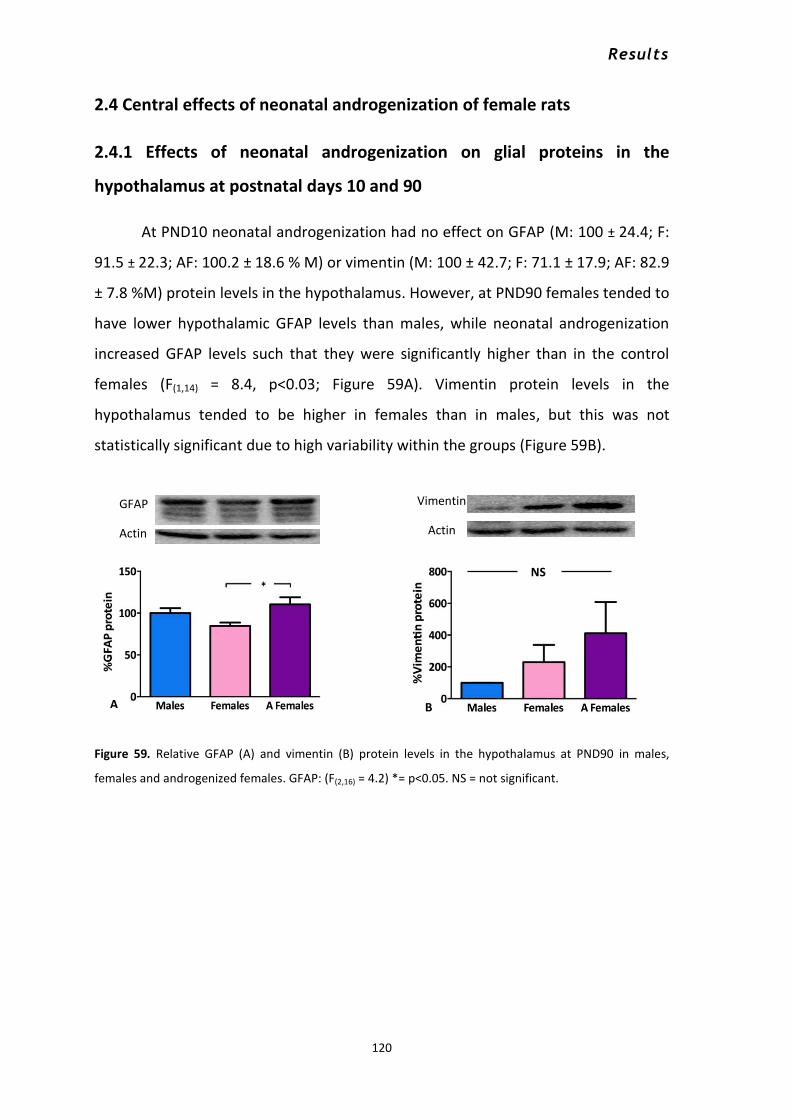
Results
120
2.4 Central effects of neonatal androgenization of female rats
2.4.1 Effects of neonatal androgenization on glial proteins in the
hypothalamus at postnatal days 10 and 90
At PND10 neonatal androgenization had no effect on GFAP (M: 100 ± 24.4; F:
91.5 ± 22.3; AF: 100.2 ± 18.6 % M) or vimentin (M: 100 ± 42.7; F: 71.1 ± 17.9; AF: 82.9
± 7.8 %M) protein levels in the hypothalamus. However, at PND90 females tended to
have lower hypothalamic GFAP levels than males, while neonatal androgenization
increased GFAP levels such that they were significantly higher than in the control
females (F(1,14) = 8.4, p<0.03; Figure 59A). Vimentin protein levels in the
hypothalamus tended to be higher in females than in males, but this was not
statistically significant due to high variability within the groups (Figure 59B).
Figure 59. Relative GFAP (A) and vimentin (B) protein levels in the hypothalamus at PND90 in males,
females and androgenized females. GFAP: (F(2,16) = 4.2) *= p<0.05. NS = not significant.
Vimentin
Actin
GFAP
Actin
NS
A B

Results
121
3. Primary astrocyte cultures
Neonatal overnutrition resulted in changes in GFAP expression in the
hypothalamus of male, but not female, rats. Indeed, the number of GFAP positive
cells was higher in males from small litters compared to control males at PND150.
Moreover, the effects seen on hypothalamic inflammatory markers were different
between males and females. Therefore, we analyzed whether male and female
hypothalamic astrocytes in vitro respond differently to hormonal signals and fatty
acids (FAs).
3.1 Dose response curve of male and female hypothalamic astrocytes to
palmitic acid
We performed a dose response curve to palmitic acid in primary astrocyte
cultures of both sexes. Astrocytes were exposed to increasing concentrations of
palmitic acid: 0.05, 0.1, 0.25 and 0.5mM during 24 hours as concentrations between
0.05 and 0.6 mM have been shown to induce cytokine release and are within a
physiological range in serum, as NEFA levels in rat range from 100–200 μM in
control, non-fasting conditions to 500–600 μM in fasted animals (Rustan et al. 1992),
(Xu et al. 2010). Samples were processed to determine if the expression of diverse
proteins was affected as a consequence of FAs exposure.
3.1.1 Change in cell number in response to palmitic acid treatment
We first determined if PA affects the number of astrocytes in vitro. No
significant change in the number of cells was found in response to this FA (Figure
60).

Results
122
Figure 60. Number of cells in primary astrocyte cultures from 2 day old male and female Wistar rats after
treatment with increasing levels of palmitic acid (PA) for 24 hours. N=4 cultures with each experimental
group being performed in triplicate in each culture.
3.1.2 Changes in the mRNA levels of GFAP, IL6, IL1β, TNFα, CHOP and IGF-
1 in response to increasing concentrations of palmitic acid
GFAP mRNA levels were progressively decreased in response to increasing
concentrations of PA (F(4,30) = 21.34; p<0.0001; Figure 61).
Figure 61. Relative GFAP mRNA levels in primary hypothalamic astrocyte cultures from 2 day old male and
female Wistar rats. (F(9,39) = 9.9; p<0.0001). Ct: control; PA: Palmitic acid. N=4 cultures with at least 3
repetitions of each group in experiment.

Results
123
Carnitine palmytoil transferase 1a increased in astrocytes from both sexes in
response to PA (F(4,31) = 6; p<0.002; Figure 62), although specific differences between
the groups were not found in the posthoc analysis.
Figure 62. Relative CPT-1a mRNA levels in primary hypothalamic astrocyte cultures from 2 day old male
and female Wistar rats. (F(9,40) = 2.9; p<0.02). Ct: control; PA: Palmitic acid. N=4 cultures with at least 3
repetitions of each group in experiment.
The expression of IL6 increased with increasing levels of palmitic acid in both
sexes (F(4, 29) = 5.4, p<0.003; Figure 63).
Figure 63. Relative IL6 mRNA levels in primary hypothalamic astrocyte cultures from 2 day old male and
female Wistar rats. Ct: control; PA: Palmitic acid. ANOVA: (F(9,38) = 3, p<0.03). N=4 cultures with at least 3
repetitions of each group in each experiment.

Results
124
No significant effects were found on IL1β mRNA levels (Males: Ct0: 100,
Ct24h: 49.9 ± 15.7, PA 0.05 mM: 61.2 ± 18.6, PA 0.1 mM: 91.2 ± 34.2, PA 0.25 mM:
96.0 ± 50.9, PA 0.5mM: 159 ± 115.7; Females: Ct0h: 104.3 ± 35.8, Ct24h: 54.9 ± 21,
PA 0.05 mM: 116.9 ± 31.6, PA 0.1 mM: 83.4 ± 28.9, PA 0.25 mM: 34.4 ± 8.8, PA 0.5
mM: 144.1 ± 66.6 %Ct0 Males).
There was an effect of sex on TNFα expression, with females expressing
lower levels than males (F(1,29) = 4.7, p<0.05; Figure 64). No effect of PA was found.
Figure 64. Relative TNFα mRNA levels in primary hypothalamic astrocyte cultures from 2 day old male and
female Wistar rats. Ct: control; PA: Palmitic acid. N=4 cultures with at least 3 repetitions of each group in
each experiment.
Levels of CHOP mRNA were increased after PA exposure (F(4,31) = 8.6,
p<0.0001; Figure 65). This difference reached significance at the highest dose in
males.

Results
125
Figure 65. Relative CHOP mRNA levels in primary hypothalamic astrocyte cultures from 2 day old male and
female Wistar rats. Ct: control; PA: Palmitic acid. ANOVA: (F(9,40) = 4, p<0.003). N=4 cultures with at least 3
repetitions of each group in each experiment.
On the contrary, the mRNA levels of the trophic factor IGF1 were reduced
when exposed to PA (F(4,31) = 6.3, p<0.003; Figure 66), with this effect being more
pronounced in females.
Figure 66. IGF-1 mRNA levels in primary hypothalamic astrocyte cultures from 2 day old male and female
Wistar rats. Ct: control; PA: Palmitic acid. ANOVA: (F(9,40) = 3.8, p<0.003) **p<0.003. N=4 cultures with at
least, 3 repetitions of each group in each experiment.
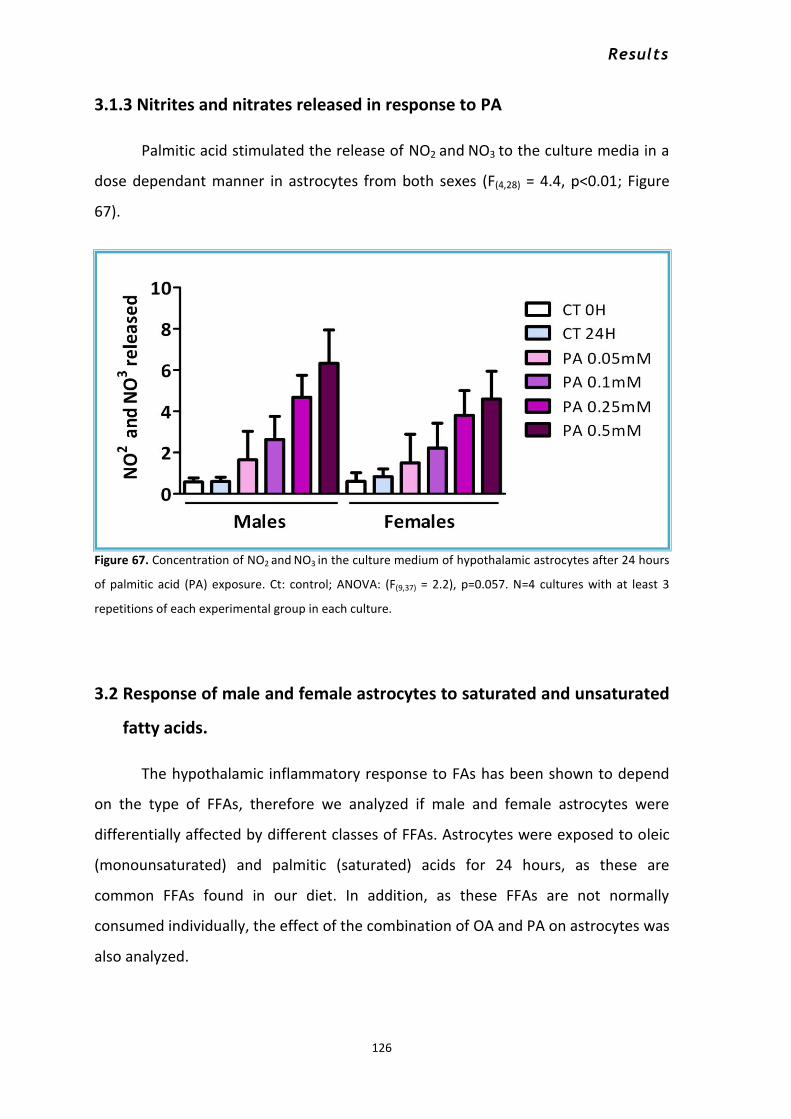
Results
126
3.1.3 Nitrites and nitrates released in response to PA
Palmitic acid stimulated the release of NO2 and NO3 to the culture media in a
dose dependant manner in astrocytes from both sexes (F(4,28) = 4.4, p<0.01; Figure
67).
Figure 67. Concentration of NO2 and NO3 in the culture medium of hypothalamic astrocytes after 24 hours
of palmitic acid (PA) exposure. Ct: control; ANOVA: (F(9,37) = 2.2), p=0.057. N=4 cultures with at least 3
repetitions of each experimental group in each culture.
3.2 Response of male and female astrocytes to saturated and unsaturated
fatty acids.
The hypothalamic inflammatory response to FAs has been shown to depend
on the type of FFAs, therefore we analyzed if male and female astrocytes were
differentially affected by different classes of FFAs. Astrocytes were exposed to oleic
(monounsaturated) and palmitic (saturated) acids for 24 hours, as these are
common FFAs found in our diet. In addition, as these FFAs are not normally
consumed individually, the effect of the combination of OA and PA on astrocytes was
also analyzed.

Results
127
3.2.1 Changes in the mRNA levels of GFAP, CPT-1a IL-6, IL-1β, TNFα, CHOP
and IGF-1
Astrocyte cultures were treated with 0.5 mM of each FA, as this is reported to
be at the high end of physiological concentrations (Thaler and Schwartz, 2010; Gupta et al.,
2012; Yuan et al., 2013).
Palmitic acid alone drastically reduced the mRNA levels of the astroglial
marker GFAP (F(1,24) = 47.7, p<0.0001). There was no effect of OA on GFAP mRNA
levels; However, there was an interaction between PA and OA (F(1,24) = 9, p<0.01),
with OA partially blocking the effect of PA. In addition, GFAP mRNA levels were
affected by sex (F(1,24) = 4.3, p<0.05; Figure68).
Figure 68. Relative GFAP mRNA levels in primary hypothalamic astrocyte cultures from 2 day old male and
female Wistar rats. Ct: control; F(7, 31) = 10; ***: p<0.0001, @: p<0.05 by T-test. N=4 cultures with at least 3
repetitions of each experimental group in each one.
CPT-1a mRNA levels were modulated by OA (F(1, 17) = 24.3 p<0.0001), with this
FA increasing CPT-1a mRNA levels regardless of the presence or not of PA (Figure69).

Results
128
Figure 69. Relative CPT-1a mRNA levels in primary hypothalamic astrocyte cultures from 2 day old male
and female Wistar rats. Ct: control; F(7, 31) = 11.2; ***: p<0.0001. N=4 cultures with at least 3 repetitions of
each experimental group in each one.
Palmitic acid induced the expression of IL6 mRNA levels in both sexes (F (1, 17) =
24.3 p<0.0001;Figure 70). Oleic acid had no effect alone, but reduced the effect of
PA (F(1, 17) = 24.3 p<0.0001).
Figure 70. Relative IL6 mRNA levels in primary astrocyte cultures from 2 day old male and female Wistar
rats. Ct: control; (F(7,24) = 5.1); **:p<0.005. N=4 cultures with at least, 3 repetitions of each experimental
groups in each one.
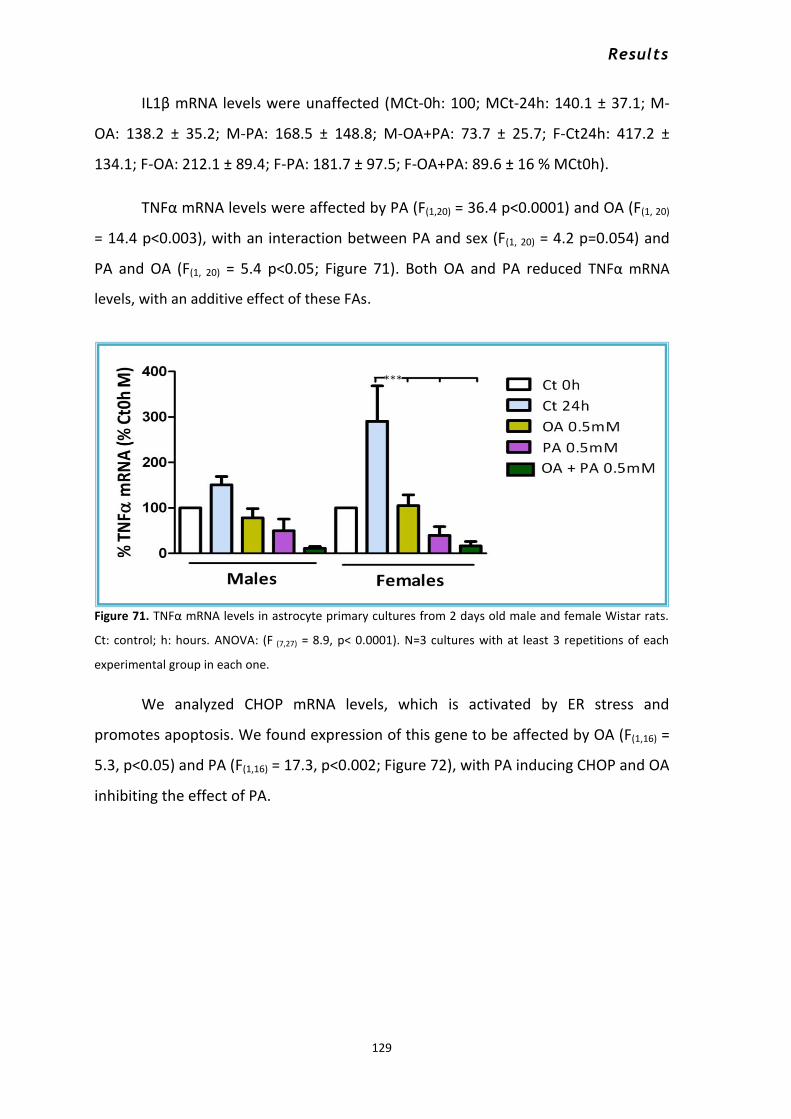
Results
129
IL1β mRNA levels were unaffected (MCt-0h: 100; MCt-24h: 140.1 ± 37.1; M-
OA: 138.2 ± 35.2; M-PA: 168.5 ± 148.8; M-OA+PA: 73.7 ± 25.7; F-Ct24h: 417.2 ±
134.1; F-OA: 212.1 ± 89.4; F-PA: 181.7 ± 97.5; F-OA+PA: 89.6 ± 16 % MCt0h).
TNFα mRNA levels were affected by PA (F(1,20) = 36.4 p<0.0001) and OA (F(1, 20)
= 14.4 p<0.003), with an interaction between PA and sex (F(1, 20) = 4.2 p=0.054) and
PA and OA (F(1, 20) = 5.4 p<0.05; Figure 71). Both OA and PA reduced TNFα mRNA
levels, with an additive effect of these FAs.
Figure 71. TNFα mRNA levels in astrocyte primary cultures from 2 days old male and female Wistar rats.
Ct: control; h: hours. ANOVA: (F (7,27) = 8.9, p< 0.0001). N=3 cultures with at least 3 repetitions of each
experimental group in each one.
We analyzed CHOP mRNA levels, which is activated by ER stress and
promotes apoptosis. We found expression of this gene to be affected by OA (F(1,16) =
5.3, p<0.05) and PA (F(1,16) = 17.3, p<0.002; Figure 72), with PA inducing CHOP and OA
inhibiting the effect of PA.

Results
130
Figure 72. CHOP mRNA levels in astrocyte primary cultures from 2 days old male and female Wistar rats.
Ct: control; h: hours. ANOVA: (F (7, 23) = 4, p< 0.02). **: p<0.02. N=4 cultures with at least 3 repetitions of
each experimental group in each one.
As IGF-1 production by astrocytes is involved neuronal protection, we
analyzed the expression of this trophic factor. IGF-1 mRNA levels (Figure 73) were
decreased by PA (F(1,24) = 16.5, p<0.0001). On the contrary, OA stimulated IGF-1
expression (F(1, 24) = 11.8, p<0.03), with this effect being significant in male astrocyte
cultures. The addition of both FAs simultaneously resulted in no change in IGF-1
mRNA levels, suggesting that PA affects the ability of these cells to produce this
neuronal protector factor in response to OA.
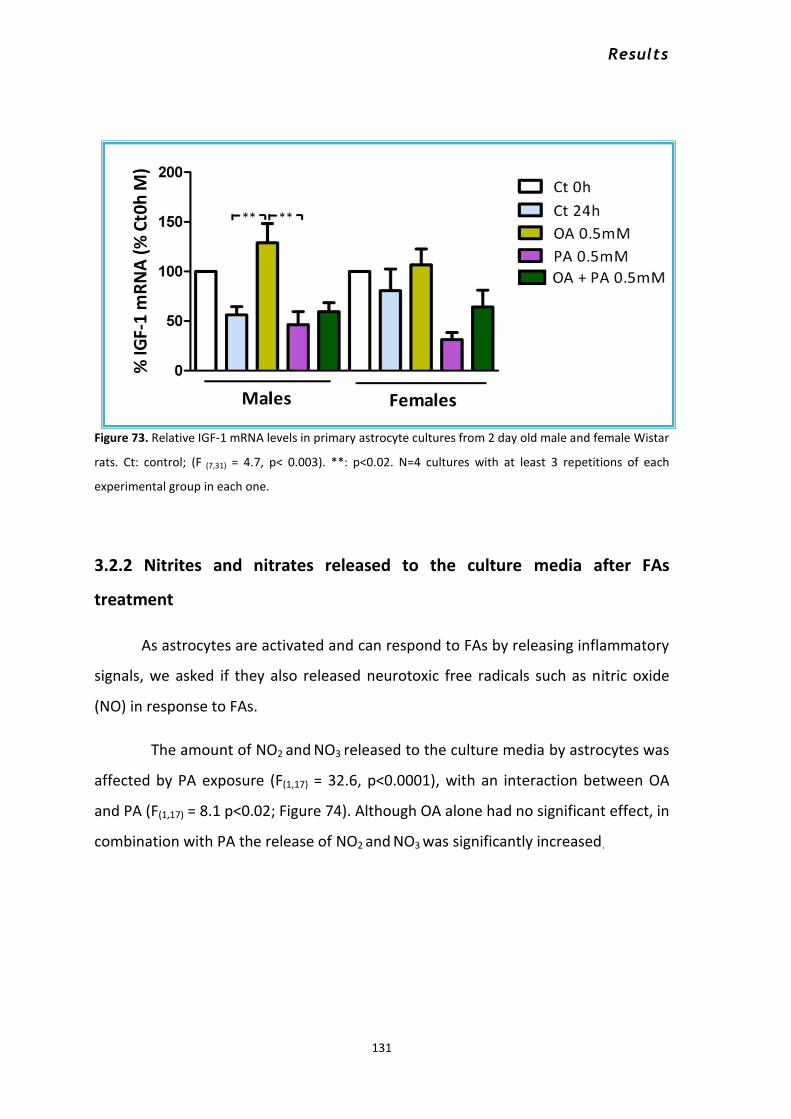
Results
131
Figure 73. Relative IGF-1 mRNA levels in primary astrocyte cultures from 2 day old male and female Wistar
rats. Ct: control; (F (7,31) = 4.7, p< 0.003). **: p<0.02. N=4 cultures with at least 3 repetitions of each
experimental group in each one.
3.2.2 Nitrites and nitrates released to the culture media after FAs
treatment
As astrocytes are activated and can respond to FAs by releasing inflammatory
signals, we asked if they also released neurotoxic free radicals such as nitric oxide
(NO) in response to FAs.
The amount of NO2 and NO3 released to the culture media by astrocytes was
affected by PA exposure (F(1,17) = 32.6, p<0.0001), with an interaction between OA
and PA (F(1,17) = 8.1 p<0.02; Figure 74). Although OA alone had no significant effect, in
combination with PA the release of NO2 and NO3 was significantly increased.

Results
132
Figure 74. Concentration of NO2 and NO3 in the culture media of hypothalamic astrocytes after 24 hours of
exposure to palmitic acid (PA), oleic acid (OA) or a combination of these two fatty acids. Ct: control; (F(7,24)
= 6.1, p< 0.002). N=4 cultures with at least 3 repetitions of each experimental group in each one.
3.3 Palmitic acid and 17β -estradiol
To determine if estrogens can modify the astrocytic response to PA, 17β–
estradiol (E2) was added to the astrocyte cultures 3 hours before PA (0.1 mM)
exposure. There was no effect of sex on the mRNA levels of either ERα or ERβ. ERα
mRNA levels (Figure 75) were decreased by PA (F(1,17) = 15.4, p<0.002) and E2
increased the levels of this receptor (F(1,17) = 16.7, p<0.002). Besides, E2
pretreatment followed by PA impede the decrease in ERα in females but not in
males.

Results
133
Figure 75. Relative ERα mRNA levels in primary astrocyte cultures from 2 day old male and female Wistar
rats. Ct: control; PA: Palmitic acid; E2: 17β-estradiol. ANOVA (F(7,24) = 3.5, p<0.03).
N=4 cultures with at least, 3 repetitions of each experimental groups in each one.
As found in the previous experiments, GFAP expression was reduced by PA, but
this decrease did not reach significance in this experiment (Figure 76).
Figure 76. Relative GFAP mRNA levels in primary astrocyte cultures from 2 day old male and female
Wistar rats. Ct: control; PA: Palmitic acid; E2: 17β-estradiol. N=4 cultures with at least 3 repetitions of
each experimental group in each one.

Results
134
IL6 mRNA levels (Figure 77) were affected by PA (F (1, 20) = 48, p<0.0001), E2 (F
(1, 20) = 15.4, p<0.002) and the interaction between these two factors (F (1, 34) = 13.4,
p<0.03). Palmitic acid increased IL6 mRNA levels, and the previous addition of E2
reduced this effect.
Figure 77. Relative IL6 mRNA levels in primary hypothalamic astrocyte cultures from 2 day old male and
female Wistar rats. Ct: control; PA: Palmitic acid; E2: 17β-estradiol. ANOVA (F (7, 27)= 10.6, p<0.0001). N=4
cultures with at least 3 repetitions of each experimental group in each one.
The expression of IL1β (Figure 78) was also affected by PA (F (1, 19) = 7.9, p<0.02)
and E2 (F(1, 19) = 4.7, p<0.05). Although PA increased IL-1β levels and this was reduced
by E2, no significance differences were found by one-way ANOVA probably due to
the increased variability.
e
e
w
q

Results
135
Figure 78. Relative IL1β mRNA levels in primary astrocyte cultures from 2 day old male and female Wistar
rats. Ct: control; PA: Palmitic acid; E2: 17β-estradiol. N=4 cultures with at least 3 repetitions of each
experimental group in each one.
Similar results were found with TNFα mRNA levels, where PA tended to
increase the levels of this cytokine and E2 impeded this increase, although these
changes were not significant (MCt-24h: 147 ± 4.4; M-PA: 215.9 ± 86.9; M-E2: 124.4 ±
32.1; M-PA+E2: 132.3 ± 28.3; F-Ct24h: 169.9 ± 66.2; F-PA: 204.3 ± 82.3; F-E2: 164.2 ±
31.9; F-PA+E2: 196.6 ± 109.8), again most likely due to the high variability.
IL10 mRNA levels decreased in astrocytes in response to PA (F(1,19) = 13.4,
p<0.003; Figure 79), but with individual differences not being found in the posthoc
analysis.

Results
136
Figure 79. Relative IL10 mRNA levels in primary astrocyte cultures from 2 day old male and female Wistar
rats. Ct: control; PA: Palmitic acid; E2: 17β-estradiol. ANOVA (F(7, 26) = 2.9, p<0.03). N=4 cultures with at
least 3 repetitions of each experimental group in each one.
The mRNA levels of IGF-1 tended to decrease with PA, but these effects did
not reach significance in this experiment (MCt0h: 100; MCt-24h: 92.7 ± 18.2; M-PA:
65.2 ± 6.8; M-E2: 89 ± 25; M-PA+E2: 62.4 ± 7.4; F-Ct24h: 68.7 ± 12.9; F-PA: 50 ± 18.3;
F-E2: 72.8 ± 12.2; F-PA+E2: 68.3 ± 11.8).
The mRNA levels of CHOP (Figure 80) were affected after PA exposure (F(1,17) =
29, p<0.0001), E2 (F(1,17) = 5.6, p<0.05) and the interaction between these two factors
(F(1,19) = 5.4, p<0.05 ). There was an increase in response to PA that was reduced by
pre-incubation with E2.

Results
137
Figure 80. Relative CHOP mRNA levels in primary astrocyte cultures from 2 day old male and female
Wistar rats. Ct: control; PA: Palmitic acid; E2: 17β-estradiol. ANOVA (F (7, 24) = 5.8, p<0.002). N=4 cultures
with at least 3 repetitions of each experimental group in each one.
3.4 Palmitic acid and the Toll receptor 4 antagonist RS-LPS
It has been proposed that FAs can activate glial cells through activation of
TLR4 (Milanski et al., 2009). Hence, we analyzed whether the observed astroglial
responses to palmitic acid could be inhibited with a TLR4 antagonist. Palmitic acid at
0.1mM was combined with LPS-RS to determine if the expression of inflammatory
cytokines induced by PA was via Toll receptor 4 in astrocytes. The mRNA levels of (IL)
1β, 6, TNFα, CHOP, nuclear factor of kappa light polypeptide gene enhancer in B-cells
inhibitor alpha (NFKBIA) and inhibitor of kappa light polypeptide gene enhancer in B-
cells kinase beta (IKBKB) were determined.
IL1β mRNA levels (MCt-24h: 60 ± 9.3; M-RS-LPS: 685.5 ± 2031; M-PA: 105.5 ±
8.9; M-PA+RS-LPS: 1330.5 ± 684.8; F-Ct24h: 39.9 ± 2.9; F-RS-LPS: 420 ± 246.4; F-PA:
46.4 ± 9.6; F-PA+RS-LPS: 843.8 ± 574) were increased by RS-LPS (F(1,16) = 10.2, p<0.01)
and females tended to have lower levels than males, although no specific differences
were found in the posthoc analysis.

Results
138
IL6 mRNA levels (Figure 81) were increased by both PA (F(1,16) = 8.9, p<0.01)
and RS-LPS (F(1,16) = 10.9, p<0.01), with this increase being greatest with the
combination of these two substances.
Figure 81. Relative IL6 mRNA levels in primary astrocyte cultures from 2 day old male and female Wistar
rats. Ct: control; PA: Palmitic acid; LPS-RS: Lipopolysaccharide from the photosynthetic bacterium
Rhodobacter sphaeroides. ANOVA (F(7,23) = 4.5, p<0.01). N=4 cultures with at least 3 repetitions of all
experimental groups in each one.
TNFα mRNA levels (Figure 82) were increased by RS-LPS (F(1,16) = 17.8, p<0.01).
Figure 82. TNFα mRNA levels in astrocyte primary cultures from 2 days old male and female Wistar rats.
Ct: control; h: hours; PA: Palmitic acid; LPS-RS: Lipopolysaccharide from the photosynthetic bacterium
Rhodobacter sphaeroides. mM: mili Molar. ANOVA (F (7, 23) = 2.9, p<0.05). N=4 cultures with at least, 3
experimental groups in each one

Results
139
CHOP mRNA levels (Figure 83) were affected by PA (F(1,16) = 9.6, p<0.01) and
RS-LPS (F(1, 16) = 5.5, p<0.05).
Figure 83. CHOP mRNA levels in astrocyte primary cultures from 2 days old male and female Wistar rats.
Ct: control; h: hours; PA: Palmitic acid; LPS-RS: Lipopolysaccharide from the photosynthetic bacterium
Rhodobacter sphaeroides. mM: mili Molar. N=4 cultures with at least, 3 experimental groups in each one.
NFκB inhibitor α (NFKBIA) (F (1, 16) = 6.5, p<0.03; Figure 84) and IKKβ (IKBKB) (F
(1, 16) = 11, p<0.01; Figure 85) mRNA levels tended to increase by RS-LPS and the
combination with PA although these differences did not reach significance due to
variability.
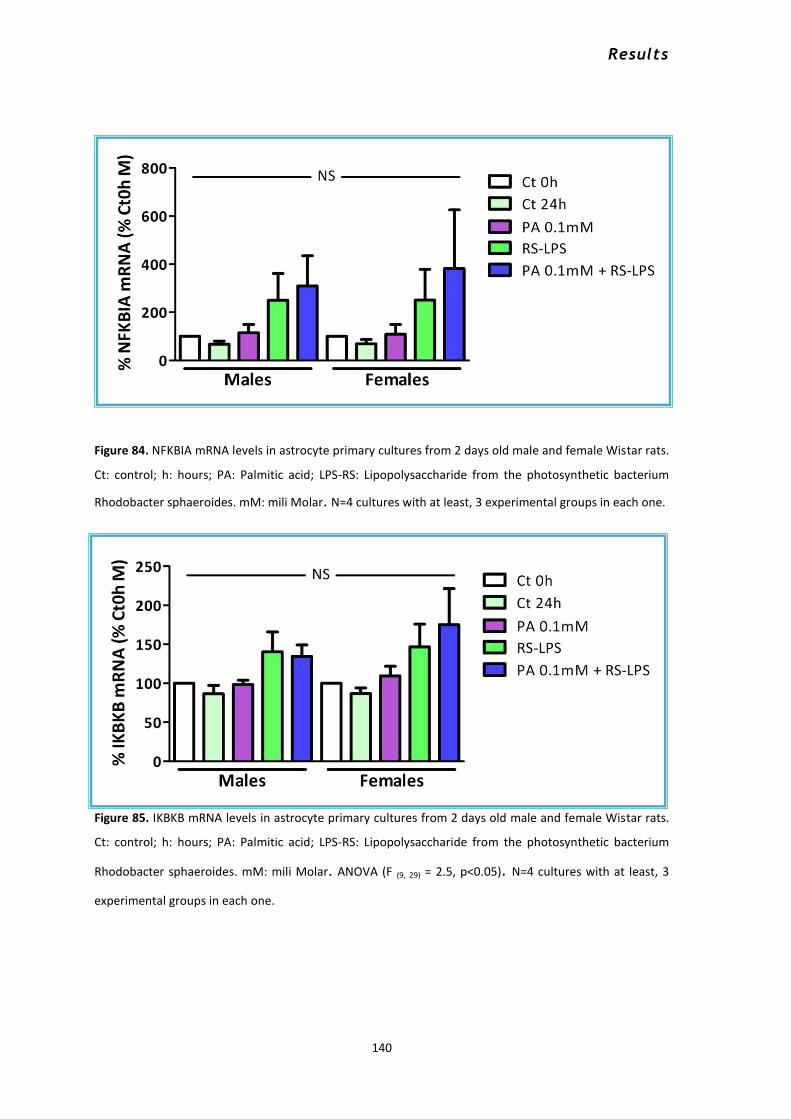
Results
140
Figure 84. NFKBIA mRNA levels in astrocyte primary cultures from 2 days old male and female Wistar rats.
Ct: control; h: hours; PA: Palmitic acid; LPS-RS: Lipopolysaccharide from the photosynthetic bacterium
Rhodobacter sphaeroides. mM: mili Molar. N=4 cultures with at least, 3 experimental groups in each one.
Figure 85. IKBKB mRNA levels in astrocyte primary cultures from 2 days old male and female Wistar rats.
Ct: control; h: hours; PA: Palmitic acid; LPS-RS: Lipopolysaccharide from the photosynthetic bacterium
Rhodobacter sphaeroides. mM: mili Molar. ANOVA (F (9, 29) = 2.5, p<0.05). N=4 cultures with at least, 3
experimental groups in each one.

Results
141
3.5 Intracellular signaling in astrocytes in response to PA
Astrocyte lysates were processed after PA 0.1mM exposure to detect possible
changes in the following phosphoproteins: cAMP response element-binding protein
(CREB), c-Jun N-terminal kinase (JNK), nuclear factor kappa-light-chain-enhancer of
activated B cells (NF-κB), P38 mitrogen activated protein kinase (p38), extracellular
signaling-regulated kinases 1 (ERK1) and 2 (ERK2), protein kinase B (Akt), the 70kDa
ribosomal S6 kinase (p70S6K), STAT3 and signal transducer and activator of
transcription 5 (STAT5).
Table 22 encompasses the mean fluorescent intensity of the cited
phosphoproteins corrected by their corresponding total proteins.
Males Females Ct 15 min PA 15 min Ct 15 min PA 15 min
p-CREB 100 ± 0 66.6 ± 23.9 79.7 ± 24.6 43.1 ± 17
p-JNK 100 ± 0 109.2 ± 50.6 82.5 ± 29.1 113.5 ± 68.6
p-NF-κB 100 ± 0 138.8 ± 41.2 166 ± 105.9 351.3 ± 236.9
p-P38 100 ± 0 88.7 ± 24.9 99.6 ± 49 158.7 ± 115.7
p-AKT 100 ± 0 91.3 ± 21.4 99.4 ± 24.7 123.2 ± 50.6
p-ERK 100 ± 0 99.1 ± 3.1 96.2 ± 0.9 97.7 ± 2.1
p-P70s6k 100 ± 0 111.6 ± 43 83.4 ± 26 146.6 ± 44.1
p-STAT3 100 ± 0 105.3 ± 42.5 88.4 ± 38.3 132.1 ± 64.3
p-STAT5 100 ± 0 145.5 ± 15.4a 125.9 ± 31.6 159.4 ± 71.2
Table 22. Mean fluorescent intensity of CREB, JNK, (NF-κB), p38, ERK2, Akt, p70S6K
, STAT3 STAT5 in
primary astrocyte cultures after 15 minutes with PA incubation. a
different from control group of the same
sex by T-test, p<0.05. Ct: control group; PA: Palmitic acid group. N= 3.

VI. DISCUSSION

Discussion
143
Obesity and its associated comorbidities continue to be one of the major
public health concerns in developing countries, without signs of a decrease in this
epidemic. We now know that becoming overweight or obese is not only the result of
poor nutrition and/or the lack of physical activity, but also that early nutritional
perturbations can have long-term consequences on metabolism. The experimental
model employed here, neonatal overnutrition, is known to cause abnormal
metabolic responses and obesity in adulthood (Godfrey and Barker, 2000; Stettler et al.,
2002; Viner and Cole, 2006; Barker, 2007; Gluckman et al., 2007; Freedman et al., 2009;
Reynolds et al., 2015a). In addition, although not thoroughly studied, males and
females have been previously reported to respond differently to this and other early
nutritional alterations (Fuente-Martin et al., 2012c; Reynolds et al., 2015a). The studies
reported here indicate that early postnatal weight gain as a consequence of being
raised in a small litter not only causes alterations in diverse metabolic parameters,
but that many of these alterations are both age and sex dependent.
In rodents, the long-term disruption of energy homeostasis induced by
overfeeding during critical periods of development has been shown to be at least
partially due to effects on metabolic neurocircuit formation (Plagemann et al., 1999b;
Fuente-Martin et al., 2012c; Vogt et al., 2014; Collden et al., 2015). Here we show that
being raised in a small litter, which results in increased food intake during this early
age due to increased maternal milk availability (Fiorotto et al., 1991; Fink et al., 2001),
resulted in increased body weight, body length and fat mass, as well as elevated
serum glucose, insulin, leptin and adiponectin levels during the period of nursing in
rats of both sexes. Some of the changes could be involved in the modifications in
neurocircuit formation. Importantly, increased weight gain during this critical period
was not only associated with systemic metabolic alterations, but also with
hypothalamic changes, with both metabolic and central changes being different
between males and females.

Discussion
144
1. Effects of neonatal overnutrition on food intake, body weight and body
length throughout development
In rodents, the neonatal period is the most sensitive developmental stage
with regards to hormonal programming of the brain, with hormonal fluctuations
during this period having an impact in the adult brain (Sun et al., 2012; Vogt et al., 2014).
The increased availability and intake of milk (Fiorotto et al., 1991; Cunha et al., 2009) is
most likely a direct cause of the increased body weight gain of pups raised in small
litters, but it is the resulting hormonal and metabolic changes that induce the long-
term effects.
We found that pups raised in small litters showed increased body weight,
length, SCAT and glycemia, as well as hyperinsulinemia and hyperleptinemia, as early
as PND10. These early modifications in L4 pups are most likely due to the increased
energy intake during nursing as described above, but could also be influenced by
changes in maternal nurturing (Connor et al., 2012; Reynolds et al., 2014; Segovia et al.,
2014). Even after weaning, when all rats had ad libitum access to a chow diet, L4 rats
of both sexes continued to eat more than L12 rats, but only until approximately
PND50, suggesting that at this point in the study their higher energy intake is not
due to more food availability, but probably to having an increased appetite. An
increase in food intake in adult rats previously exposed to early overnutrition has
been reported by some authors (Rodrigues et al., 2011; Fuente-Martin et al., 2012b;
Collden et al., 2015), while other studies report no effect (Stefanidis and Spencer, 2012;
Bei et al., 2015). These discrepancies could be due to differences in the age at which
the animals were studied, as here we found that this effect changed throughout
postnatal development. In addition, even before pubertal onset, males ate more
than females, with L4 males already being heavier than L4 females, indicating that
even before the influence of post-pubertal gonadal steroids there are differences
between the sexes. These early difference could be at least partially due to the
neonatal peak of testosterone in males that could affect the neuronal circuits
involved in food intake regulation.

Discussion
145
The effect of litter size on food intake was present until approximately PND50
and then waned until later adulthood, when L4 males again began to eat more than
control males. In association with this, during adolescence and early adulthood, the
effects of litter size on body weight and metabolic hormone levels also disappeared.
This observation is in accordance with several studies showing that some of the
changes produced in the early ages, are normalized when the animal reaches young
adulthood (Vickers et al., 2005; Glavas et al., 2010; Stefanidis and Spencer, 2012). As many
hormonal and metabolic changes occur during puberty, it is possible that the early
neonatal effects are masked or modified during this period.
Despite the attenuation of some of these outcomes in young adult rats, the
effect of early overnutrition on body weight reappeared in later adulthood, but in a
sexually dimorphic manner, as it was only present in males. Litter size effects on
body weight and leptin levels have been previously shown to vary with age in male
rats, being present early in development and disappearing at 11 weeks of age
(Velkoska et al., 2005), while Wiedmer and colleagues (Wiedmer et al., 2002) reported
that male rats from small litters weighed more than those from large litters from 2
to 5 weeks of age and then again from 10 to 12 weeks of age. Metabolism is known
to change with age (Aasum et al., 2003), with an animal or individual becoming more
susceptible to body weight gain and fat accumulation as they become older (Han et
al., 2013). This can occur although energy intake is not increased, as there is an age
dependent decrease in energy expenditure (Han et al., 2011). Thus, it is possible that
neonatal overnutrition advances the physiological aging of metabolism, with males
being more susceptible to this process. Moreover, some of the intracellular
mechanisms involved in aging are identical to those activated in obesity associated
complications (Tang et al., 2015). For instance, low-grade hypothalamic inflammation
can be triggered by both obesity (De Souza et al., 2005; Zhang et al., 2008; Purkayastha et
al., 2011; Cai, 2013) and aging (Tang and Cai, 2013; Zhang et al., 2013). Several studies have
reported that inflammation in the hypothalamus induces the development of
systemic aging (Purkayastha and Cai, 2013; Tang and Cai, 2013; Zhang et al., 2013).
Likewise, ER stress is also linked to both overnutrition (Zhang et al., 2008; Ozcan et al.,

Discussion
146
2009) and aging (Greenamyre and Hastings, 2004; Katayama et al., 2004; Wootz et al., 2004).
This inflammation in the hypothalamus also involves glial cells, including astrocytes
that can produce cytokines, as well as diverse factors such as transforming growth
factor beta (TGF-β) in response to obesity or aging conditions. This process can lead
to loss of function of IκBα and consequently, activation of NF-κB (Yan et al., 2014).
Here not only did L4 males begin to gain more weight as adults, but they also
demonstrated signs of hypothalamic inflammation as TNFα levels were increased.
Neither of these processes were observed in females at PND150, but this does not
negate the fact that they might occur at an older age.
At PND90, when an increase in body weight was again found in L4 males,
there was no difference in food intake. This suggests that the metabolic efficiency of
the neonatally over-nourished rats may begin to be affected at this time, at least in
males. This is in agreement with a report by Stefanidis and Spencer indicating that
there is metabolic compensation by these rats in attempt to restore a normal body
weight, but this compensation is different between the sexes (Stefanidis and Spencer,
2012). Around PND119, food intake again began to be higher in males from small
litters compared to their controls. During the following weeks there are variations in
food intake in the neonatally over-nourished rats compared to their controls and this
could indicate that these animals are continuously trying to readjust their body
weight/food intake. In addition to increased food intake, a decrease in energy
expenditure, especially as they get older, could also contribute to body weight gain,
but this was not analyzed here.
2. Effects of neonatal overnutrition on circulating parameters throughout
development: hormones and cytokines
The long-term effects of being raised in a small litter could be due to
modification of the postnatal leptin surge as a result of neonatal overfeeding. Leptin
is a key signal in determining the development of hypothalamic neuronal circuits
involved in feeding behavior (Bouret et al., 2004a; Bouret and Simerly, 2007; Bouret, 2013).
Although in the rodent most neurons are born prenatally, the outgrowth of their

Discussion
147
projections occurs after birth (Ishii and Bouret, 2012). Hence, changes in leptin levels in
perinatal life can impact on the development of hypothalamic “wiring” and result in
lifelong metabolic deregulation (Bouret et al., 2008). Some long-term effects of
changes in neonatal leptin levels have been shown to become manifest only later in
adulthood (Granado et al., 2011; Granado et al., 2014); here we found long-term effects
until approximately PND50, which disappear to reappear again in later adulthood. In
the studies by Granado et al., leptin levels were directly modified; here other factors
such as insulin levels in addition to leptin were indirectly modified. This, as well as
the temporal differences in these hormonal changes, could underlie the differential
outcomes of our studies. Variations in neonatal leptin concentrations can also
modify leptin receptors expression in the hypothalamus, possibly modifying
feedback mechanisms of this hormone. Rodrigues et al reported higher leptin levels
at PND21 as a consequence of neonatal overnutrition; but they show no change in
leptin receptor protein levels at PND21 or PND180 (Rodrigues et al., 2009). However,
Toste et al showed a decrease in leptin receptor levels in the adult hypothalamus
after leptin treatment during lactation (Toste et al., 2006), We observed that
neonatally overfed male and female adults presented higher intensity of leptin
receptor immunoreactivity specifically over GFAP-positive cells, this is in accordance
with (Hsuchou et al., 2009), who showed that diet-induced obesity increases astrocytic
leptin receptor expression.
A change in neonatal leptin levels could also have direct effects on adipose
tissue development and adipocyte functions, which could modify their ability to
produce metabolic cytokines (Harris et al., 1998). Leptin expression in adipose tissue
was increased at PND10 and PND21 in L4 rats of both sexes, a similar effect has
been previously observed in lambs whose mothers where overfed in late gestation
(Muhlhausler et al., 2007). Thus, the higher circulating leptin levels at this age are most
likely due to the rise in fat mass, as well as increased relative leptin production per
gram of adipose tissue. These results suggest that leptin could indeed play a role in
the observed long-term effects on metabolism by inducing permanent changes in

Discussion
148
the hypothalamic feeding circuits during this sensitive period of development and
possibly in adipose tissue development, although this remains to be demonstrated.
Perinatal insulin levels are also implicated in hypothalamic maturation, as this
hormone affects the development of projections of the main metabolic neuronal
populations (Plagemann et al., 1999a; Konner et al., 2009; Vogt et al., 2014), with aberrant
development due to changes in insulin levels disrupting glucose homeostasis and
possibly leading to obesity and metabolic disorders such as T2D (Vogt et al., 2014).
Here, glycemia and circulating insulin levels were higher in prepubertal L4 rats
compared to L12 rats of both sexes. These results are in accordance with several
studies that have reported elevated insulin levels in neonatally over-nourished
rodents (Boullu-Ciocca et al., 2005; Pereira et al., 2006). Therefore, this perinatal
hyperinsulinemia could also participate in the development of metabolic alterations
seen in the adult. Moreover, at PND 10 insulin levels in L4 males were higher than in
L4 females, which could possibly contribute to the sex differences observed in the
long-term outcomes of this experimental manipulation.
At PND 10, adiponectin levels were elevated in L4 male and female rats, with
this elevation remaining at weaning in females. The effect of adiponectin on
hypothalamic metabolic circuit development remains unknown; however, this
adipokine is positively correlated with leptin levels and adiposity in cord blood and is
suggested to play a role in early growth (Kotani et al., 2004; Tsai et al., 2004; Ballesteros
et al., 2011). Moreover, adiponectin receptors are expressed in the embryonic mouse
brain (Zhou et al., 2005). Although adiponectin is implicated in glucose metabolism,
with high adiponectin levels acting to increase insulin sensitivity and, on the
contrary, decreased adiponectin levels associated with a higher risk of developing
insulin resistance (Yamauchi et al., 2001), there is little evidence linking adiponectin
with insulin sensitivity in neonates (Kotani et al., 2004; Meral et al., 2011). Thus, it is
possible that during early life, adiponectin has a different physiological role; indeed,
PND10 and PND21 pups from L4 litters had higher adiponectin levels despite having
higher insulin and HOMA index than their control litter mates. Supporting these
observations, neonates are reported to have higher adiponectin levels at birth and in
Discussion
149
contrast to adults, adiponectin levels in neonates are positively correlated with birth
weight (Kotani et al., 2004; El-Mazary et al., 2015). Hence, in neonatal overnutrition,
insulin and adiponectin, two metabolic hormones involved in the control of glucose
homeostasis in adulthood, are elevated in early ages and this could participate in
development of the observed metabolic effects. Moreover, these hormones are
increased in a sexually dimorphic manner and this could possibly contribute to the
sex differences in the long-term metabolic outcomes.
Obesity is reported to course with systemic inflammation (Gregor and
Hotamisligil, 2011), but the increased weight gain due to neonatal overnutrition did
not result in a rise in circulating cytokines at any age. Indeed, in adult animals levels
of these cytokines were either very low or undetectable. This of course could be due
to the fact that the increase in weight gain was not severe, at least in adults.
However, during the neonatal and peripubertal periods, although there was
approximately a 40% increase in body weight at PND10 and a 50% increase at PND21
in both sexes, the cytokines measured either decreased or did not change. At
PND10, TNF-α and IL-1β levels were actually lower in rats raised in small litters, with
no significant change in IL-6 levels. One possibility is that the developing animal
responds differently to this increase in weight gain, as discussed below.
The decrease in circulating TNF-α and IL-1β were associated with a significant
decline in the mRNA levels of IL-1β in SCAT of females at PND10, but not in males. It
is possible that at this age circulating levels of these cytokines do not reflect their
production by SCAT. On the contrary, there was no effect of neonatal overnutrition
on circulating cytokine levels at PND21, but the mRNA levels of IL6 were increased in
VAT and decreased in SCAT of both sexes. These opposite changes in the expression
of IL-6 could result in a net result of no change in circulating levels. This interleukin
has a dual role, as it can be either anti-inflammatory or pro-inflammatory depending
on the basal situation, the type and/or duration of the stimuli and the tissue where it
is exerting its actions, with the correlation between IL-6 and obesity and insulin
resistance being controversial (Wallenius et al., 2002; Di Gregorio et al., 2004; Vida et al.,
2015). In this line, while IL-6 is reported to induce insulin resistance in adipocytes

Discussion
150
(Rotter et al., 2003), IL-6 treatment improves insulin-stimulated glucose metabolism in
humans and enhances glucose uptake and fatty acid oxidation in myotubes, in
addition to exerting anti-inflammatory actions (Starkie et al., 2003; Carey et al., 2006).
Although there was no effect of litter size on IL-6 levels at these early ages, there
was an effect of sex, with males having higher IL-6 levels than females, which could
also contribute to the metabolic differences observed between the sexes.
At PND10, testosterone levels were higher in L4 males compared to L12
males, with 17β-estradiol levels being unaffected by neonatal overnutrition.
Therefore, the neonatal testosterone surge that occurs in males (Raisman and Field,
1973) appears to be modified by early overnutrition and this could be involved in the
sexually dimorphic long-term responses. Indeed, the early sex steroid environment is
important for the correct development of the hypothalamus (Lenz and McCarthy,
2010), and modifications in androgen levels during early development have been
shown to modify later metabolism (Nohara et al., 2013a; Nohara et al., 2013b; Ongaro et
al., 2015). Hence, during neonatal overnutrition there are early changes in the
hormonal environment, including leptin, insulin, adiponectin and testosterone that
could influence the normal development of hypothalamic feeding circuits, as well as
adipose tissue development and, thereby condition the metabolic status later in life.
During the adolescent and young adult stages (PND30, 50 and 85), few effects
of neonatal overnutrition were found. However, as mentioned above, in older adults
(PND150) males were again found to be affected, although females were not. Not
only was weight increased, but these rats were also hyperleptinemic, as reported in
other studies (Fuente-Martin et al., 2012b; Stefanidis and Spencer, 2012; Ye et al., 2012).
Circulating adiponectin levels were unaffected, which is in accordance with other
studies analyzing neonatally overnourished male rats of 120 (Velkoska et al., 2005) and
180 days of age (Rodrigues et al., 2011). In contrast, Boullu-Ciocca et al. reported
hypoadiponectinemia in over-nourished male rats at PND150 (Boullu-Ciocca et al.,
2008). However, there was an interaction between sex and litter size on adiponectin
levels, which tended to be higher in L4 males compared to their controls, with the
inverse occurring in females. Adult females had higher adiponectin levels than males

Discussion
151
and this could be associated with the lower insulin levels in females, as adiponectin
acts as an anti-diabetic hormone.
Triglyceride levels were also elevated in PND150 male rats, in association with
the increased body weight. This is consistent with a study by Cai and coworkers in
which higher levels of triglycerides were found in males from small litters, in addition
to being more elevated than in females (Cai et al., 2014). In contrast, no significant
change or sex differences were found in circulating NEFA levels. Together these
results suggest that male rats are more susceptible than females to the long-term
metabolic effects of neonatal overnutrition.
3. Effects of neonatal overnutrition on adipose tissue throughout
development: amount, distribution and cytokine gene expression
Many studies have established that WAT distribution in adult humans and
animals is different between the sexes (Power and Schulkin, 2008; Fuente-Martin et al.,
2013a). Men are prone to accumulate central visceral fat, whereas women store
peripheral or SCAT (Kotani et al., 1994; Demerath et al., 2007). However, less is known
regarding fat distribution and its possible implications in the prepubertal period. In
our experimental model, there was a very rapid increase in SCAT as a consequence
of increased food intake during the neonatal period. Moreover, this increase in SCAT
was sexually dimorphic even before puberty, with overnourished females having a
greater increase in SCAT than males from the same litter size. The same pattern was
observed at weaning, but at this age, both female groups had a greater percentage
of SCAT than both male groups. These differences in SCAT continued at PND30 with
litter size continuing to increase the amount of SCAT at PNDs 50 and 85. However, at
PNDs 85 and 150, the sex differences are inverted, with males having more SCAT
than females, which suggest a possible influence of post-pubertal gonadal steroids.
Visceral adipose tissue was also increased by neonatal overnutrition at
PND21, but in this case L4 males accumulated more VAT than L4 females. Although
the effect of litter size did not persist at PND30, males continued to accumulate
more VAT than females. SCAT and VAT differences between over-nourished and
Discussion
152
control rats dissipated in the young adult rat, being coincident with the loss of effect
of neonatal overnutrition on food intake, body weight and body length. At the end of
the study, males tended to have higher amounts of both SCAT and VAT than females
without reaching significant differences, most likely due to high variability among the
experimental groups and the method used. A more refined method, such as MRI,
would be more suitable to detect these changes (Johnson et al., 2008).
Therefore, even before the pubertal rise in gonadal steroids, clear sex
differences exist regarding adipose tissue distribution and accumulation in response
to overnutrition. Excess VAT accumulation is a source of proinflammatory cytokines,
which contribute to the development of insulin resistance, type 2 diabetes and
cardiovascular diseases (Carey et al., 1997; Weiss, 2007b; Macotela et al., 2009; Shulman,
2014). In contrast, SCAT has been associated with beneficial metabolic effects, such
as lower cardiovascular and diabetes mortality and protecting against impaired
glucose metabolism (Van Pelt et al., 2002; Tran et al., 2008; Manolopoulos et al., 2010),
with the greater accumulation of SCAT possibly protecting females from some of the
negative consequences of obesity. Hence, as the amount and distribution of adipose
tissue differs significantly between males and females during the early postnatal
period, this could contribute to the earlier development of metabolic complications
in males. This is consistent with the fact that at PND10 and PND21 males had a
greater increase in circulating insulin levels, which could be associated to the
increased amount of VAT and cytokine production by VAT (discussed below), which
is related to insulin resistance (Hotamisligil et al., 1993; Uysal et al., 1997; Bastard et al.,
2002; Jager et al., 2007; Nov et al., 2010). Therefore, even before sex steroids rise, there
is a sexual dimorphic response to overnutrition in adipose tissue distribution.
The early increase in fat mass in L4 pups was also directly related with
elevated leptin mRNA levels in adipose tissue and circulating leptin concentrations.
At PND21, L4 males had higher leptin expression in SCAT than L12 males, an effect
that was not significant in females. At this age, VAT expression of leptin was higher
in L4 than L12 pups of both sexes. In adulthood (PND85 and 150) males, expressed
more leptin mRNA levels than females in SCAT and VAT, regardless of litter size as

Discussion
153
previously shown by others in humans and rodents (Montague et al., 1997; Shen et al.,
2009b). These increases in leptin expression in adipose tissue correlated with
circulating leptin levels.
In normal adults, adiponectin expression in adipose tissue is inversely
correlated with the amount of fat mass (Kern et al., 2003). In contrast, during the
neonatal period when fat mass was greater in L4 rats, we found circulating
adiponectin levels to also be higher. This was coincident with significantly increased
expression of adiponectin in adipose tissue in L4 males, with the same trend
occurring in females. In adult rats, although there was no effect of neonatal
overnutrition on circulating adiponectin levels, there was an overall increase in the
expression levels in SCAT at PND150 and in VAT at PND85 and PND150 in males,
whereas circulating adiponectin levels were higher in females. How this change in
cytokine production affects overall metabolism cannot be determined from the
studies presented here, but it is of interest that apparent rise in production is found
when effects on bodyweight have begun to reappear in males and males had higher
adiponectin mRNA levels than females in both adipose depots. These differences
could be attributed to the greater affectation of metabolic control in males, with the
increased expression of adiponectin in males being a protective response.
Obesity and the accumulation of white adipose tissue particularly, VAT, are
often accompanied by a chronic low-grade inflammatory state (Gregor and
Hotamisligil, 2011). At PND10, although there was a significant increase in SCAT in the
over-nourished rats, cytokine mRNA levels were not increased. One possibility is that
the organism must be exposed to the inflammatory-inducing factors associated with
increased weight gain for a more extended period of time. In addition, adipose tissue
is still developing in these animals and the characteristics of developing adipose
tissue differ from mature adipose tissue (Rosen and Spiegelman, 2014). At this young
age, the increase in fat mass could be due to hyperplasia (formation of new
adipocytes) more than to hypertrophy (increase in adipocyte size) of the existing
adipocytes. The two mechanisms of adipose tissue growth, hyperplasia and
hypertrophy, have different outcomes; whereas hyperplasia is characterized by an

Discussion
154
increase in adipocyte number by infiltration and proliferation of new and small
preadipocytes, which have a higher fat storage capacity and are more sensitive to
insulin; hypertrophy of adipose tissue implies that the volume of the adipocyte
increases, which is associated with higher metabolic risk (Weisberg et al., 2003;
Lundgren et al., 2007). Therefore, the observed decrease in expression of IL-1β and IL-6
in SCAT at PND21, as well as in IL-1β at PND10 in females SCAT, could possibly be
associated with adipose tissue expansion due to proliferation more than
hypertrophy of the existing adipocytes, although this observation requires further
investigation. Indeed, as adipocytes differentiate, their expression of cytokines
changes, with for example, only mature adipocytes producing leptin (Rosen and
Spiegelman, 2014). Hence, the early changes in adipokine expression could be
representative of modifications in adipocyte proliferation and maturation in
response to early over-nutrition.
In contrast, at PND21, over-nourished rats had higher expression of IL-6 in
VAT. This observation does not necessarily indicate inflammation, as it is possible
that the initial response to nutrient and energy excess in VAT is to produce this
cytokine as an acute anti-inflammatory response in an attempt to fight against the
excessive nutritional insult. IL-6 has been shown to have inhibitory actions on TNF-α
and IL-1β through activation of interleukin-1 receptor antagonist (IL-1ra) (Tilg et al.,
1994). Although this anti-inflammatory effect has been more thoroughly studied in
response to the IL6 increase after exercise (Starkie et al., 2003), it is possible that this
mechanism could participate in other situations such as early overnutrition.
However, if weight gain becomes chronic, this cytokine could contribute to the
pathophysiological inflammatory process in obesity (Rotter et al., 2003).
In adults, cytokine expression in SCAT was undetectable, indicating the lack of
inflammatory processes in this tissue. The only indication of inflammation in VAT
was the increased expression of TNF-α in L4 males, which is coincident with the
increase in bodyweight in these animals. Males raised in small litters are reported to
have increased content of IL-6 mRNA in mesenteric adipose tissue at 150 days of age
(Boullu-Ciocca et al., 2008), although the expression of this cytokine was undetectable

Discussion
155
in the two adipose depots studied here. As different functions and implications on
health are associated with the different types of adipose tissue, this cytokine may
also have different roles in each type of adipose tissue. In this line, it has been
reported that omental adipose tissue release 2-3 times more IL6 than subcutaneous
abdominal adipose tissue (Fried et al., 1998). Visceral adipose tissue is directly related
with secondary complications of obesity and this may be the first site that responds
to the excess of calories, secreting IL-6 at first as an anti-inflammatory signal, as
explained above. It is also possible that this rise in IL6 represents a signal that is
already associated with the induction of insulin resistance, as previously reported
(Rotter et al., 2003). These changes did not occur in SCAT, which is not as tightly
associated with obesity secondary complications.
Increased TNF-α is reported to be directly related to metabolic syndrome and
impairment of insulin signaling (Hotamisligil et al., 1993). However, although L4 males
had increased expression of TNF-α in VAT at PND150, no change in their HOMA
index suggests that systemic insulin resistance is not present. Circulating levels of
this cytokine were below the level of detection of the assay employed, thus other
tissues might not be affected. Moreover, it is suggested that TNF-α does not induce
insulin resistance when IL6 is down regulated in adipose tissue (Sultan et al., 2009),
and here IL-6 expression was undetectable in VAT. High circulating leptin levels also
contribute to maintain the chronic inflammatory state (Paz-Filho et al., 2012) and at
the same time, pro-inflammatory cytokines induce the increase in circulating leptin
levels and its expression in adipose tissue (Grunfeld et al., 1996; Faggioni et al., 1998).
Thus, together these results could indicate that these male rats are beginning to
exhibit signs of further metabolic impairment. Moreover, leptin has differential
effects on male and female adipocytes (Guo et al., 2009) and this could also contribute
to the sex differences observed.

Discussion
156
4. The neonatal sex steroid environment influences the long-term
responses to neonatal overnutrition
Adult males and females are known to respond differently to some metabolic
challenges, including being raised in a small or large litter (Fuente-Martin et al., 2012c;
Sanchez-Garrido et al., 2014; Sanchez-Garrido et al., 2015),and this is at least partially due
to post-pubertal differences in sex steroids (Castellano et al., 2011; Sanchez-Garrido et
al., 2013). As males and females responded differently to neonatal overnutrition even
prepubertally, we hypothesized that these differences could be due, at least in part,
to sex differences in the neonatal hormonal milieu. It is possible that the neonatal
testosterone surge that occurs in males (Miyachi et al., 1973) could be involved, not
only in the differential response to overnutrition during the neonatal period, but also
in the sex differences in long-term metabolic outcomes. Administration of
testosterone to neonatal females has been classically used as an experimental model
to study the mechanisms underlying sex differences in the brain (Raisman and Field,
1973). This model has also been employed to analyze the long-term effects of
increased neonatal androgen levels on the female reproductive axis and the
development of polycystic ovary syndrome (Dunlap et al., 1972; Gellert et al., 1977;
Goomer et al., 1977; Ongaro et al., 2015), and more recently on metabolic abnormalities
(Nohara et al., 2013c; Mauvais-Jarvis, 2014; Ongaro et al., 2015).
Testosterone levels remained elevated at PND10 in females that had received
an injection of this sex steroid on PND1, and this was associated with the loss of
some early sex differences. For example, the higher levels of adiponectin seen at
PND10 in females compared to males in the neonatal overnutrition experiment were
reduced by androgenization of females, such that they were no longer different from
males. This could be due to the direct inhibitory effect of testosterone on
adiponectin synthesis (Xu et al., 2005; Capllonch-Amer et al., 2014). Likewise, the lower
levels of IL-6 in PND10 females were increased in androgenized females and were no
longer different from males. This could be due to androgen effects on adipocyte
differentiation, which can affect their expression of cytokines (Chazenbalk et al., 2013;
O'Reilly et al., 2014). However, neonatal androgenization exacerbated the sex
Discussion
157
difference in subcutaneous fat mass observed at PND10. This observation is of
interest as studies have indicated that the number of X chromosomes determines
adiposity (Chen et al., 2012) and the results obtained here suggest that this might also
affect the response to early sex steroid levels. Indeed, hyperandrogenism in
polycystic ovarian syndrome (PCOS) is associated with increased abdominal fat in
women (Dunaif, 1997). Thus, some of the sex differences seen at PND10 could be at
least partially due to sex differences in testosterone levels at this early age.
Furthermore, testosterone levels were increased in over-nourished PND10 males
compared to their controls. This rise in sex steroid levels could play a role in the
development of long-term metabolic effects in over-nourished males and contribute
to the sexually dimorphic outcomes of this experimental manipulation.
Adult levels of testosterone and estradiol were unaffected in females that had
received testosterone neonatal treatment. However, there were long-term changes
in metabolic parameters in response to neonatal androgenization, as previously
reported in other studies (Perello et al., 2003; Ongaro et al., 2013). Although body
weight and glycemia were slightly increased at PND90 in androgenized females, the
most drastic effects were observed on circulating leptin and IL1β levels, which rose
above normal female values. The rise in serum leptin correlated with increased
expression of this adipokine in VAT, while the sexual dimorphism in visceral adipose
expression of IL6 and TNFα was not affected by neonatal testosterone. Thus, the
neonatal rise in testosterone in males could play a role in the development of sexual
dimorphisms in adipose tissue function. However, the fact that the production of
some adipokines was actually increased above the levels found in both males and
females suggests that female rats exposed to increased levels of testosterone, at
least at this period of development, are prone to develop metabolic pathologies.
Indeed, neonatal androgenization of females is associated with metabolic
dysfunctions and PCOS development in the adult (Roland et al., 2010; Nohara et al.,
2013c; Mauvais-Jarvis, 2014).
The factors involved in the sex differences observed in the long-term
responses to neonatal overnutrition could thus include differential changes in

Discussion
158
testosterone and some metabolic factors such as insulin. These changes could affect
the development of central metabolic circuits, as previously shown (Mauvais-Jarvis,
2014; Vogt et al., 2014), as well as that of other metabolic tissues such as adipose
tissue. These developmental modifications would then also interact with the
differential hormonal environment found in post-pubertal animals. For example,
higher estrogen levels in post-pubertal females would have protective effects
through inhibition of food intake and increasing energy expenditure (Palmer and Gray,
1986; Musatov et al., 2007; Xu et al., 2011) and it is possible that this could reduce or
delay the long-term effects of rapid neonatal weight gain. Estrogens also modulate
adipose tissue deposition and function, favoring lipid accumulation in the
subcutaneous depot in women and visceral fat deposition in men. Indeed, direct
administration of estrogens to the CNS was shown to drastically reduce visceral
adiposity (Adler et al., 2012) and increase thermogenesis (Martínez de Morentin et al.,
2014). Thus, another factor involved in the sexual dimorphic responses could be the
differences found with regards to the amount, distribution and function of adipose
tissue between the sexes from very early ages, as previously discussed, and the later
interaction of this adipose tissue with the adult sex steroid environment.
5. Central response to neonatal overnutrition in males and females
Neonatal overnutrition has been previously reported to modify the levels of
hypothalamic neuropeptides in the adult (Davidowa et al., 2003; Velkoska et al., 2005;
Bouret et al., 2007; Chen et al., 2009). Here we analyzed the association between the
rapid early weight gain due to neonatal overnutrition and the hypothalamic changes
regarding inflammatory markers specifically, in glial cells.
Astrocytes in neuroendocrine control
Astrocytes participate in the regulation of the neuroendocrine functions
including reproduction, osmotic control and energy homeostasis (Tweedle and Hatton,
1977; Garcia-Segura et al., 1996b; Garcia-Caceres et al., 2012). Although astrocytes have
also been shown to participate in the neuroendocrine control of metabolism

Discussion
159
(Cheunsuang and Morris, 2005; Horvath et al., 2010; Garcia-Caceres et al., 2011; Yi et al., 2011;
Fuente-Martin et al., 2012a), much is yet to be learned , including whether astrocytes
participate in the long-term metabolic effects of neonatal nutritional or hormonal
changes.
Hypothalamic development in rodents takes place mainly during the
postnatal period (Markakis, 2002; Bouret, 2013; Alvarez-Bolado et al., 2015), with
astrogenesis occurring primarily during the second and third postnatal weeks
(Bandeira et al., 2009; Freeman, 2010). Therefore, changes in the hormonal
environment, such as in leptin, glucocorticoids, insulin, sex steroids or in other
factors known to influence the development of this brain area (Bouret, 2010b; 2013),
occurring during this period could affect not only neuronal, but also astrocyte
development. Moreover, astrocytes are essential for neuronal proliferation,
maturation, synaptic connectivity and homeostasis maintenance in the extracellular
space (Chowen et al., 1996; Fields and Stevens-Graham, 2002), which indicates that any
modification in these glial cells could impact on neuronal development and function,
including the regulation of energy homeostasis and overall metabolism.
5.1 Effects of neonaltal overnutrition on astrocytes
In the hypothalamus of adult male rats that had been exposed to neonatal
overnutrition, GFAP levels are increased and this is associated with an increase in the
number of GFAP-positive astrocytes and structural changes in these glial cells (Garcia-
Caceres et al., 2011; Fuente-Martin et al., 2012a). One possibility is that this increase in
the number of hypothalamic astrocytes is due to developmental influences. The
neonatal leptin surge that normally occurs between postnatal days 5 and 13
promotes not only promotes neuronal outgrowth and maturation, but also
astrogenesis (Ahima et al., 1998; Bandeira et al., 2009; Rottkamp et al., 2015) and astrocyte
development (Udagawa et al., 2006; Fisette and Alquier, 2015). Moreover, Wang et al
recently showed that leptin receptor ablation in GFAP-positive astrocytes of
embryonic mice reduces leptin-induced STAT3 activation in the hypothalamus and
make these mice more vulnerable to diet-induced obesity (Wang et al., 2015),

Discussion
160
indicating a key role of leptin signaling in astrocytes in the organization of
hypothalamic neurocircuits. Thus, it is coherent to hypothesize that the rise in
circulating leptin levels induced at PND10 by neonatal overnutrition could modulate
astrocyte development. However, at this early age, GFAP protein levels in the
hypothalamus were not modified in L4 pups despite having increased leptin levels.
This does not necessarily indicate that there is no change in astrocyte development
or even the number of astrocytes at this age. We have to take into consideration
that GFAP protein levels were analyzed in the whole hypothalamus and not in
specific hypothalamic areas directly involved in food intake regulation. Of note,
immature astrocytes and radial glia mainly express vimentin early in development;
whereas GFAP is more highely expressed in differentiated astroglial cells(Bignami and
Dahl, 1995; Gomes et al., 1999). Moreover, during CNS development, GFAP can label
radial glial, which give rise to neurons, astrocytes and oligodendrocytes. Thus, it is
possible that at this early age, GFAP levels also reflect other cell types. Under normal
circumstances GFAP levels increase with age (Nichols et al., 1993) and it is possible that
at this early age, when the astrocyte population is being formed, a high percentage
of astrocytes are GFAP negative (Sofroniew, 2009). Althgouh vimentin is expressed in
immature astrocytes (Pixley and de Vellis, 1984; Bignami and Dahl, 1995), at PND10
hypothalamic vimentin did not vary in L4 pups from control levels in males or
females. However, at PND30 vimentin levels were lower in L4 pups of both sexes,
suggesting overnutrition might accelerate astrocyte maturation.
Further studies are necessary to determine if astrocyte
proliferation/development is affected by this manipulation. However, it is of interest
to note that the level of expression of the leptin receptor in hypothalamic astrocytes
appears to be increased, as indicated by the double immunohistochemistry analysis
reported here. These changes were found in the hypothalamus of both adult male
and female rats that had experienced neonatal overnutrition. In contrast, although
the number of GFAP positive cells in the hypothalamus of adult males that had
experienced neonatal overnutrition was increased as previously reported (Fuente-
Martin et al., 2012a), this effect was not observed in females. Based on these results,
Discussion
161
one might hypothesize that both the number and phenotype of the hypothalamic
astrocytes are modulated by the early nutritional environment.
Neonatal overnutrition did not affect hypothalamic levels of GFAP at any
timpoint throughout development until PND150, when neonatally overnourished
males had higher levels than control males. The changes in GFAP levels did not
correlate with changes in bodyweight, as L4 males began to weigh more than their
controls around PND90. Moreover, as stated above over-nourished animals of both
sexes weighed more than their controls before weaning and GFAP levels were
unaffected. Although it has been reported that activation of glial cells is not directly
related to changes in body weight and that signals such as leptin are most likely
involved (Gao et al., 2014), here changes in GFAP levels did not correlate with
modifications in either body weight or serum leptin levels, at least in neonatal
animals. Previously we have found hypothalamic GFAP levels to be modified in
neonatally overnourished males at PND85-90, (Fuente-Martin et al., 2012a); however,
in contrast to what we observed here the animals in the previous study were already
hyperleptinemic at this earlier age. It is unclear why there was a delay in the
development of hyperleptinema in the rats in the studies reported here, even
though the rats had begun to weigh significantly more than their controls. However,
it does appear that there is an influence of hyperleptinemia on the increase in
hypothalamic GFAP levels, although other factors are most likely involved.
Hypothalamic GFAP levels have been shown to increase in other models of
obesity, such as in HFD-induced obese rats (Hsuchou et al., 2009). These obese animals
are hyperleptinemic and leptin increases GFAP levels both in vivo and in vitro (Garcia-
Caceres et al., 2011), whereas low or null leptin levels are associated with decreased
GFAP in spite of the animals presenting obesity (Ahima et al., 1999). Hyperleptinemia
is reported to be associated with increased hypothalamic leptin levels (Hsuchou et al.,
2009). In our study, at PND150 neonatally overnourished male rats were
hyperleptinemic, but the levels of leptin in the hypothalamus were not significantly
increased, although there was a tendancy to do so. This could indicate a possible
impairment of the leptin transport system in L4 males, which is suggested to occur
Discussion
162
into become saturated in obese animals (Banks et al., 1999; Burguera et al., 2000). It is of
interest to note that males had higher hypothalamic leptin levels than females,
reflecting what occurs in serum.
Circulating leptin increases in obese individuals and in response to fat rich
diets (Argente et al., 1997; Hoffler et al., 2009), and obese subjects often develop leptin
resistance which is thought to participate in further weight gain and secondary
complications (El-Haschimi et al., 2000; Scarpace and Zhang, 2009). The increased
resistance is reported to be partially due to decreased leptin transport into the brain
(Caro et al., 1996; Schwartz et al., 1996) and/or decreased signaling in response to leptin
(Van Heek et al., 1997). At PND150, hypothalamic p-Stat3(Tyr705) levels were increased
by neonatal overnutrition in both sexes with no changes in SOCS3 levels, an inhibitor
of cytokine signaling including of the leptin signaling pathway; thus, we found no
signs of central leptin resistance. This observation is in contrast to a study by
Rodrigues et al where they found decreased pSTAT3 and an increase in SOCS3
expression in the hypothalamus of neonatally overnourished rats (Rodrigues et al.,
2011). In the study by Rodrigues the rats also desplayed persistent hyperphagia,
which also indicates central leptin resistance; however, the detected no
hyperleptinemia in these 180 day old animals. The explanation for this is unclear. .
At PND150, in our study the animals were also eating more, so it is possible that a
failure in leptin signaling is beginning to appear although not detected here. Indeed,
the age of the rats could be an important factor, since the animals in which central
leptin resistance was found were 180 days old and it is possible that our animals
would continue to develop further metabolic complications, including central leptin
resistance.
As mentioned above, we found an increase in the intensity of leptin receptor
immunoreactivity over GFAP positive cells in hypothalamic astrocytes of male and
female adult rats that were neonatally overfed. This increase in astrocytic leptin
receptor expression was correlated with increased weight in both sexes, as the
neonatally overnourished rats of both sexes weighed more at the timpoint used in
this study. This increased leptin receptor expression in adulthood could be the result

Discussion
163
of developmental influences, or of signals related to the weight gain. The increase in
leptin concentrations due to early overnutrition have been previously reported to
modify the expression of the leptin receptor in the hypothalamus (Toste et al., 2006;
Manuel-Apolinar et al., 2010). Thus, the observed hyperleptinemia at PND10 and 21 in
both sexes could be responsible for the increase in leptin receptors in astrocytes in
adulthood.
The expression of leptin receptors in astrocytes increases in response to diet
induced-obesity, at least in males (Hsuchou et al., 2009). The physiological role of
leptin signaling in astrocytes was established by Kim et al (Kim et al., 2014a). In this
study that the lack of the leptin receptor in adult GFAP-positive cells, was shown to
blunt the anorectic effect of leptin and increase the response to ghrelin as well as
the response to fasting when the animals were refeeding. In addition, leptin receptor
ablation in GFAP cells modified astrocyte morphology, reduced glial coverage and
altered synaptic inputs to AgRP and POMC neurons of the ARC.
Together these data indicate that astrocytes are respond to early nutritional
disturbances, possibly in a sexually dimorphic pattern, and that they could be
involved in the long-term metabolic consequences. However, further investigation is
required todetermine the different responses to metabolic challenges in male and
female astrocytes.
5.2 Hypothalamic inflammatory signals in response to neonatal
overnutrition
The hypothalamus is now known to be an important site of cytokine
bioactivity within the CNS, as they appear to modulate appetite and energy
homeostasis (Schobitz et al., 1993; Wong and Pinkney, 2004). Hypothalamic inflammation
was first reported in obese rodents by De Souza and coworkers approximately 10
years ago, when mice maintained on HFD were found to have an increase in the
production of inflammatory cytokines and insulin resistance in the hypothalamus (De
Souza et al., 2005). Inflammation within the hypothalamus in association with obesity

Discussion
164
appears to occur as a consequence of a combination of factors, including the type of
diet and the resulting changes in circulating nutrients and hormones. These factors
can to lead to an inflammatory response disrupting metabolic, glucose and
cardiovascular homeostasis (Cai and Liu, 2012). The inflammatory response of the
hypothalamus to HFD-induced obesity can thus lead to decreased sensitivity to
leptin and/or insulin and therefore have negative consequences on the regulation of
food intake, triggering the development of secondary complications, such as type 2
diabetes (Carvalheira et al., 2003). However, there is little information regarding the
changes in cytokine levels in obesity that is not due to HFD, such as increased
weight gain as a result of early overnutrition, or in young animals.
At PND10, hypothalamic IL-6 levels were increased by overnutrition in males,
but not in females. This could indicate an increase in central production of this
cytokine, or increased transport of IL-6 across the BBB (Banks et al., 1995), although no
increase in serum levels was found. The fact that this rise was only observed in
males in response to overnutrition is of interest, as both sexes had increased weight
gain and increased leptin levels. Androgenization of females resultsed in a rise in
circulating IL6, and it is possible that the central differences in this cytokine are due
to the sex steroid environment at this time. The increase of IL-6 at this early age
could be related to the regulation of food intake (Wallenius et al., 2002; Flores et al.,
2006; Senaris et al., 2011), and not necessarily inflammatory processes.
Hypothalamic inflammation during development in response to early
overfeeding was studied in pups by Ziko et al., where they found a reduction in IL-1β
expression in overfed pups at PND14 and suppression of TNFα in overfed pups at
PND7 (Ziko et al., 2014), with no change in IL-6 expression at any of these early ages.
This is similar to our observations, where we found no change in protein levels of IL-
1β or TNFα, and supports the hypothesis that hypothalamic inflammation does not
occur in these young overweight animals.
Peripheral and central IL-6 levels have been previously reported to be
increased in adult male rats (8 weeks old) in response to neonatal overfeeding

Discussion
165
(Stofkova et al., 2009; Tapia-González et al., 2011; Ziko et al., 2014) and we found an
increase in the hypothalamus of males at PND50, although it did not reach signficance.
The higher levels of central IL-6 were not associated with a change in body weight at
this age and IL-6 could act as an anorectic signal to prevent overfeeding (Ropelle et al.,
2010). Indeed, in older animals that had increased food intake and were overweight,
IL-6 levels in the hypothalamus were not increased.
No differences in hypothalamic IL-1β or TNF-α levels were found at PND50,
which was in accordance with Ziko et al. where no changes in these proinflammatory
cytokines were found in the hypothalamus of neonatally overfed male adults at
PND70 (Ziko et al., 2014). Here similar results are also shown in females. Levels of the
proinflammatory cytokine IL-1β in the hippocampus are reported to be higher in
males than in females (Bilbo and Tsang, 2010), but we found no differences between
the sexes in the levels of hypothalamic IL-1β, IL6, or IL10. In contrast, TNFα levels
were higher in males than in females, regardless of littersize.
Hypothalamic inflammation has been tightly associated with increased TNF-α
levels and signaling (Thaler et al., 2012; Wang et al., 2012; Valdearcos et al., 2015). At
PND150, hypothalamic TNF-α levels were only found to be increased in neonatally
overnourished males, which was associated to increased body weight. This
observation could indicate that these animals could develop hypothalamic insulin
and/or leptin resistance, as observed in other studies (De Souza et al., 2005; Milanski et
al., 2009; Posey et al., 2009; Thaler et al., 2013), although hypothalamic levels of p-
Stat3(Tyr705) were increased with no change in SOCS3. However, the techniques
employed would not detect changes if only select cell populations become leptin or
insulin resistant. The elevated hypothalamic TNFα levels could be related to the
increase in GFAP protein levels and GFAP+ cell number in L4 males. Increased
hypothalamic TNF-α levels in response to saturated fatty acids has been associated
with activated microglia (Valdearcos et al., 2014); however, here we did not detect
changes in Iba1 protein levels or immunostaining as a consequence of neonatal
overnutrition. Microglial activation does not always correlate with weight gain
(Fuente-Martin et al., 2013b; Gao et al., 2014; Garcia-Caceres et al., 2014), indicating that

Discussion
166
other factors are involved, such as the diet associated with the weight gain. At
PND150, hypothalamic TNF-α levels were higher in males than females, regardless of
litter size. This could also indicate that overfed males are starting to show
vulnerability to the early overnutrition as they get older, which does not occur in
females, at least at this age. Thus TNFα could be one factor participating in the
sexual dimorphism in response to aging.
6. Sex differences in the responses to neonatal overnutrition
According to the results presented, it is clear that modification of the
nutritional status during the sensitive period of lactation, produces a hormonal
imbalance during the initial postnatal weeks in L4 pups and triggers short and long-
term effects not only on peripheral, but also central systems that regulate energy
balance in a sexually dimorphic manner. The most striking differences that we found
between the sexes were the long-term effects of neonatal overnutrition reflected in
an increased body weight in males, but not females, as well as a change in GFAP
immunopositive cells in males but not females. This is consistent with previous
studies in which neonatal overnutrition alters body weight in adulthood (Glavas et al.,
2010; Hou et al., 2011; Fuente-Martin et al., 2012b; Bei et al., 2015; Collden et al., 2015) and is
associated with an increase in the number of GFAP-positive cells in the
hypothalamus (Garcia-Caceres et al., 2011; Fuente-Martin et al., 2012a), although all of
these studies employed only male animals. In addition, androgenized females had
increased hypothalamic GFAP compared to control females and this was associated
with higher body weight and circulating leptin levels, which is consistent with
previous studies that show that perinatal androgens cause sexual differences in
GFAP expression and morphology in different brain areas (Garcia-Segura et al., 1988;
Chowen et al., 1995; Mong et al., 1999; Amateau and McCarthy, 2002; Conejo et al., 2005).
Whether glial changes due to early weight gain as a consequence of neonatal
overnutrition affect synaptic inputs to metabolic neurons and if this is sexually
dimorphic requires further investigation.

Discussion
167
Thus, taking together body weight, GFAP protein levels and the number of
GFAP positive cells, these results suggest that males and females have a differential
long-term response to neonatal overnutrition. There are scarce data showing the
long-term effects in females. However, as seen here some studies indicate that long-
term effects are influenced by sex, with males suggested to be more susceptible
than females to early nutritional disturbances (Bassett and Craig, 1988; Boubred et al.,
2009; Fuente-Martin et al., 2012c; Stefanidis and Spencer, 2012). As previously discussed,
neonatal testosterone among other factors could be involved in the sexually
dimorphic long-term effects of early nutritional alterations.
6.1 Response of male and female hypothalamic astrocytes in vitro
Astrocytes can participate in hypothalamic inflammation and HFD-induced
obesity results in hypothalamic astrogliosis (Horvath et al., 2010; Thaler et al., 2012;
Buckman et al., 2013). Along with microglia, astrocytes participate in the central
inflammatory response (Rivest, 2009; Thaler et al., 2012; Buckman et al., 2014; Morselli et
al., 2014; Valdearcos et al., 2014), producing pro- and anti-inflammatory cytokines,
chemokines or other factors in response to a stimulus; therefore, these glial cells
could be the source of the increases in central cytokine levels. Indeed, astrocytes are
directly exposed to nutrients, including FAs, and have essential roles in relaying
information concerning hormonal and nutritional signals to neurons; therefore, FAs
could produce modifications in astrocytes that could indirectly affect neuronal
regulation of energy balance. Specifically, the saturated FA, palmitic acid, is reported
to induce pro-inflammatory cytokine production and central leptin sensitivity, but
this leptin resistance is not observed in response to the unsaturated oleic acid
(Karaskov et al., 2006; Milanski et al., 2009; Gupta et al., 2012; Morselli et al., 2014). The
initial responses of glial cells are thought to be mainly protective; however, a
prolonged inflammatory response and glial activation can be damaging and
contribute to further metabolic complications.
Studies indicate that the inflammatory response of astrocytes differs between
the sexes, with a more exaggerated inflammatory response from male compared to

Discussion
168
female astrocytes. (Liu et al., 2007; Santos-Galindo et al., 2011; Morselli et al., 2015),
Likewise, we found sex differences in the long-term glial and inflammatory response
to neonatal overnutrition, including changes in GFAP and hypothalamic cytokines,
with males being more affected than females. Estrogens could be involved in the
protective effects in females (Wang et al., 2014a; Zhang et al., 2014), but sex differences
in astrocytes could also be due to differences in the sex chromosomes or from sex
steroid exposure during development (Arnold, 2009). Here we analyzed whether the
response of these glial cells to fatty acids was sex dependent and if estrogens
affected this response.
7. The effect of fatty acids on hypothalamic primary astrocytes from male
and female rats
7.1 Palmitic acid
Studies show that excesive ingestion of dietary fats is associated with
increased GFAP expression and astrocyte reactivity in the brain (Hsuchou et al., 2009;
Horvath et al., 2010). Palmitic acid is the most abundant saturated FA in the diet and in
plasma. In addition, plasma PA levels increase in obesity (Opie and Walfish, 1963;
Reaven et al., 1988) and this FA has been suggested to directly induce hypothalamic
inflammation (Milanski et al., 2009; Cheng et al., 2015). Importantly, obese patients with
metabolic syndrome have a higher FA uptake into the brain than healthy patients,
with HFD intake increasing this uptake (Wang et al., 1994; Karmi et al., 2010). However,
in addition to FAs, other metabolic signals are modified in obesity and reach the
brain and therefore, could be also responsible for the observed changes in glia and
inflammation. Indeed, HFD ingestion alters circulating levels of insulin,
glucocorticoids, estrogens and cytokines (Tannenbaum et al., 1997; Kubota et al., 1999;
Cohen, 2000; Hoffler et al., 2009), which can modify astrocytes (Toran-Allerand et al., 1991;
Garcia-Segura et al., 1996b; Garcia-Caceres et al., 2011) and these factors could be
involved in astrocyte activation independently of FAs. Indeed, ob/ob mice in which
leptin levels are nule, GFAP levels are decreased (Ahima et al., 1999). Astrocytes from
mixed male and female cerebral cortices have been shown to respond to FAs in vitro

Discussion
169
(Gupta et al., 2012); hence, we aimed to further understand the response of these glial
cells, but specifically in the hypothalamus, to increased levels of FAs in both sexes.
Hypothalamic astrocytes cultured in vitro responded to palmitic by decreasing
GFAP mRNA levels and this response was similar in both sexes. The decrease in GFAP
expression was not associated with a decrease in cell number. These results are in
contrast to the study by Morselli and colleagues (Morselli et al., 2015) where GFAP
expression was increased after exposure to palmitic acid. In the study by Morselli et
al., the time of exposure to this fatty acid was only 8 hours compared to 24 hours
used here. As the protein levels of GFAP in the hypothalamus and in hypothalamic
astrocyte cultures change in a biophasic manner in response to leptin (Garcia-Caceres
et al., 2011), it is possible that a similar phenomenon occurs in response to FAs.
Another possibility is that palmitic acid is inhibiting growth, as shown by Beeharry et
al (Beeharry et al., 2003), and this occurs after longer exposition. Moreover, the
astrocyte cultures of Morselli et al were derived from mice and thus the response
could be different in rat astrocytes. In support of this, we have found that the GFAP
response to ghrelin differs between astrocyte cultures from male mice and male rats
(Fuente-Martin et al., in press). Reactive astrocyes are structurally more complex and
present higher GFAP level (Gomes et al., 1999), therefore a decrease in GFAP levels
could indicate decreased astrocyte differentiation and/or proliferation. Moreover,
astrocyte morphology could also be affected and the decrease in GFAP due to fewer
or shorter projections as a result of palmitc acid. Further studies are necessary to
determine if the change in mRNA levels is associated with similar changes in protein
levels and in astrocyte morphology, as well as to determine if the changes in GFAP
mRNA levels in response to palmitic acid depend on the time of exposure to this FA.
Free fatty acids, especially saturated FAs, can activate an inflammatory
response in different cell types (Boden and Shulman, 2002; Iyer et al., 2010), as well as ER
stress (Gregor and Hotamisligil, 2007). In addition to inducing central inflammation
(Milanski et al., 2009; Gupta et al., 2012; Morselli et al., 2014), palmitate causes ER stress,
ERK activation, and apoptosis in adipocytes (Guo et al., 2007) and hepatocytes (Malhi et
Discussion
170
al., 2006), as well as in hypothalamic neurons (Mayer and Belsham, 2010). In agreement
with this, we found that in astrocytes palmitic acid increased IL6 and CHOP
production in a dose dependent manner. Astrocytes are the predominant source of
IL-6 in the CNS (Van Wagoner and Benveniste, 1999) and the PA-induced increase in IL-6
expression could be part of an inflammatory response, as IL-6 is one of the effectors
of the neuroinflammatory cascade (Rothwell and Hopkins, 1995; Allan and Rothwell,
2003). However, IL-6 could also be functioning as a neuroprotective beneficial signal,
avoiding brain damage and enhancing neuronal survival (Van Wagoner et al., 1999).
Indeed, an increase in IL6 in astrocytes and microglia has also been shown to have a
protective role from diet induced obesity, preventing further weight gain and
limiting the adverse hypothalamic consequences (Hidalgo et al., 2010). Moreover, IL-6
functions as a neuroendocrine signal and could be acting as an anorectic signal to inhibit food
intake in response to FA excess (Ropelle et al., 2010).
The increase in CHOP production by palmitic acid suggests ER stress, which
has been linked to obesity, with increased levels of FFAs known to contribute to the
development of ER stress in other cell types (Oyadomari and Mori, 2004; Ozcan et al.,
2004; Nakatani et al., 2005; Ozcan et al., 2006; Szegezdi et al., 2006; Ron and Walter, 2007;
Zhang et al., 2008). Increased ER stress can induce cytokine production, and thus induce
inflammatory processes that can lead to insulin resistance (Ozcan et al., 2004; Ozcan et
al., 2006; Shi et al., 2006) and can also lead to apoptotic cell death (Oyadomari and Mori,
2004; Karaskov et al., 2006; Szegezdi et al., 2006).
Palmitic acid also stimulated the release of nitrites and nitrates to the culture
media in a dose dependent manner, which can have a cytotoxic role on the
surrounding cells under pathological circumstances (Moncada et al., 1991; Zhang et al.,
1994a). Nitric oxide production increases in pancreatic β-cells in response to palmitic
acid (Shimabukuro et al., 1997). Nitric oxide is proposed to link ER stress and
inflammation (Gotoh and Mori, 2006) and is associated with insulin resistance (Kaneki et
al., 2007). There is evidence of induction of CHOP by nitric oxide (Kawahara et al., 2001;
Gotoh et al., 2004), which is consistent with our results. Studies have indicated that in
vitro, hypothalamic neurons do not have an inflammatory response to saturated

Discussion
171
fatty acids, although an ER stress response does occur (Choi et al., 2010). Prolonged
HFD is reported to induce neuronal apoptosis (Moraes et al., 2009) and to decrease the
neuronal number in the hypothalamus (Thaler et al., 2012). A similar response was also
observed in neural stem cells (NSCs), which differentiate into neurons and
astrocytes, after exposure to palmitic acid (Yuan et al., 2013). Therefore, FAs induce
stress in hypothalamic astrocytes with these glial cells releasing factors that could
regulate or damage surrounding neurons and thus indirectly affect neuronal
regulation of energy balance.
Astrocytic production of IGF-1 is involved in neuroprotection (Madathil et al.,
2013; Genis et al., 2014) and IGF-1 protects astrocytes from oxidative stress (Davila et
al., 2016). PA reduced IGF-1 mRNA levels in astrocytes, with this reduction being more
apparent in females at higher doses. Whether this decrease in IGF-1 production is
related to the increased ER stress in response to PA, as well as whether there is a
decreased protective effect of astrocytes on the surrounding neurons, remains to be
demonstrated.
The increase in CHOP mRNA levels in response to PA was significant in males,
but not in females. In addition, the release of nitrites and nitrates and the increase in
IL-6 expression was higher in males than females, although this did not reach
statistical significance. This is probably due to the large variability in some groups,
and the large number of groups being analyzed. Indeed, if the sexes are analyzed
separately, some changes do become significant. Moreover, increasing the number
of experiments could possibly reduce the variability in these results.
7.2 Palmitic and oleic acids interaction
There are distinct inflammatory responses to the different fatty acids present
in our diet. Likewise, saturated and unsaturated fatty acids are reported to produce
different effects on energy homeostasis (Lee et al., 2001; Karaskov et al., 2006; Gupta et
al., 2012; Itariu et al., 2012; Kien et al., 2014). Here, the response of hypothalamic
astrocytes to oleic acid was significantly different from that seen in response to
palmitic acid.

Discussion
172
Oleic acid did not produce the dramatic decrease in GFAP seen in response to
PA exposure, nor were IL-6 or CHOP expression levels or the release of nitrites and
nitrates increased by OA. Moreover, when OA was added, it was capable of blocking
the effects of PA on GFAP, IL-6 and CHOP mRNA levels. However, although the
increased release of nitrites and nitrates that was found after PA exposure was
unapparent with OA, the combination of both fatty acids still stimulated the release
of nitrites and nitrates, which was significant in males but not in females.
This suggests that OA does not trigger the inflammatory, ER stress or certain
cytotoxic effects on astrocytes that are seen with PA and supports the fact that
saturated and unsaturated FAs can have different impacts on energy homeostasis
(Lee et al., 2001; Beeharry et al., 2003; Karaskov et al., 2006; Benoit et al., 2009; Milanski et
al., 2009; Cintra et al., 2012; Gupta et al., 2012; Itariu et al., 2012; Kien et al., 2014). Here we
show that some of these differential effects of fatty acids could possibly be mediated by
astrocytes.
The observation that CPT1A mRNA levels were differentially regulated by
palmitic and oleic acids in astrocytes is of interest. This enzyme is essential for fatty
acid oxidation, as it is the first and rate-limiting step in the formation of
palmitoylcarnitine (Lee et al., 2011). Palmitoylcarnitine, or acyl-carnitine, is then
moved to the inner mitochondrial membrane through a specific shuttle system to be
oxidized. The fact that palmitic acid is less capable than oleic acid of inducing CPT1A
in astrocytes, and thus of initiating fatty acid oxidation in these cells, could
contribute to its toxicity. In combination with OA, palmitic acid could be more freely
shuttled into the mitochondria and oxidized due to the increased levels of CPT1A
and this could decrease its toxicity.
Interestingly, OA increased the expression of IGF-1, with this elevation being
significant in males, but not in females. Although PA alone had no effect on the
expression of this neuroprotective factor, it inhibited the effect of OA in males. In
contrast in females, PA reduced IGF-1 mRNA levels and OA blocked this reduction.
Further studies are necessary to determine the mechanisms by which fatty acids
modulate IGF-1 production in astrocytes, including whether this is a primary

Discussion
173
response to the fatty acids, or an indirect response through previous modulation of
other factors. Indeed, these studies were done at 24 hours of exposure to fatty
acids. However, it is of interest that this neuroprotective factor (Genis et al., 2014) is
differently modulated by these fatty acids in males and females.
In contrast to the studies with PA alone, here we found a decrease in TNFα
mRNA levels in response to both PA and OA, with the combination of these fatty
acids being additive. The fact that the variability in the results of the first
experiments was greater could explain this differential result as there was also a
tendency to decrease in the previous study. This decrease in TNFα mRNA levels was
unexpected, as this cytokine has been directly associated with the inflammatory
response to fatty acids, however TNFα is also reported to be inhibited by IL-6;
therefore, it could be that the increased production of IL-6 in response to PA is
exerting an inhibitory effect on TNFα levels (Oh et al., 1998; Calder et al., 2013).
7.3 Protective effects of estrogens against palmitic acid
The central anti-inflammatory effects of estradiol have been widely studied
(Arevalo et al., 2010; Cerciat et al., 2010; Guo et al., 2012). However, less is known
regarding the effect of estradiol specifically in hypothalamic astrocytes in
overnutrition or obese conditions. Here we found that PA decreased the expression
of ERα in primary astrocytes of both sexes, but estradiol had the opposite effect and
was able to block the effect of PA, especially in female astrocytes. It has been
reported that female hypothalamic astrocytes express higher levels of ERα in in
response to estradiol stimulation (Kuo et al., 2010). This was in accordance to the
observations of Morselli et al (Morselli et al., 2014), despite that they employed
hypothalamic astrocytes from mice, the estradiol concentration used was higher, the
PA concentration lower and the treatment exposuretime was only 8 hours.
Pretreatment of astrocytes with estradiol reversed some of the changes
produced by palmitic acid, such as IL6 and CHOP production, showing protective
effects in both sexes. Neuroprotection and anti-inflammatory effects through ERα
has been shown in astrocytes and neurons (Barreto et al., 2009; Spence et al., 2013;
Discussion
174
Arevalo et al., 2015). Moreover, estrogens are known to be inhibitors of inflammatory
cytokines such as IL6 and IL1β in peripheral tissues and brain (Koka et al., 1998; Bruce-
Keller et al., 2000).
Although IGF-1 production tended to decrease after PA, no effect of estradiol
was found. As IGF-1 is produced by astrocytes as a neuroprotective factor and as
protection against oxidative stress (Genis et al., 2014), it would be coherent to think
that estradiol may protect astrocytes and thus surrounding neurons by modulating
the release of IGF-1. However, although female astrocytes showed a slight increase,
there was no significant increase in IGF-1 levels after estradiol pre-treatment ,
although with an increased “n” the effect could possibly be found to be significant.
Likewise, the anti-inflammatory cytokine IL-10 showed a light increase in response to
estradiol alone and estradiol plus PA compared to PA alone in females, but not in
males. These results suggest that estradiol may mediate its protective effects in
females by stimulating the release of IGF-1 and IL-10 in response to PA, althoug
further experiments are needed to confirm this hypothesis.
These data indicate that estradiol could play an important role as an anti-
inflammatory or anti-ER stress factor in astrocytes when exposed to saturated fatty
acids. In males, estradiol was less capable of protecting against the decline in ERα
expression induced by PA, which could possibly decrease the ability of estradiol to
impede neuronal damage, as previously shown (Carbonaro et al., 2009). The increase in
IL-6 and CHOP expression induced by PA were similarly reversed by estradiol in
males and females. However, as in vivo females have higher circulating levels of
estradiol than males, this mechanism could be involved in the higher level of
protection against high fat diets observed in females.
7.4 Palmitic acid and the Toll receptor 4 antagonist RS-LPS
Activation of TLR signaling cascades produce a wide array of proinflammatory
cytokines, including IL-1β, IL-6 and TNF-α, in addition to reactive oxygen and
nitrogen species mediators such as NO (Takeda and Akira, 2015). In response to PA, the
most striking results that we observed were the increase in CHOP, IL-6 and the

Discussion
175
amount of nitrites and nitrates released to the media, which are signs of
inflammation and oxidative stress. Importantly, oxidative stress activates
mechanisms that result in glia-mediated inflammation, which can produce secondary
neuronal damage. As saturated fatty acids have been proposed to activate TLR4 in
the hypothalamus (Milanski et al., 2009), we asked whether PA activated TLR4 in
astrocytes. It is well known that TLR4 is activated by lipopolysaccharide (LPS)
(Poltorak et al., 1998). Whereas LPS stimulates TLR4 in microglia, the main cells
responsible for the immune response in the CNS to activate an inflammatory
response (Qin et al., 2005; Rivest, 2009), lower constitutive expression of TLR4 is found
in astrocytes. However, TLR4 activation in astrocytes is also reported to activate
proinflammatory processes mediated by the NFκB, MAPK and Jak1/Stat1 signaling
pathways (Carpentier et al., 2005; Gorina et al., 2011). We used a form of LPS, RS-LPS,
that is purported to antagonize TLR4 (Kutuzova et al., 2001) to determine if
hypothamic astrocytes respond to PA through this receptor. However, not only did
RS-LPS not block the effects of PA, but it also stimulated IL-6, CHOP, IL-1β, Nfκbia
(IκBα) mRNA levels and this was additive with the effects of PA. This could indicate
that in astrocytes the expression of these factors in response to PA is not dependant
on TLR4 activation. Inflammation could be activated in astrocytes through another
TLR, such as TLR3, which is reported to be more highly expressed in these glial cells
than is TLR4 (Farina et al., 2005). This receptor mediates the release of a wide variety of
predominantly anti-inflammatory and neuroprotective, as well as pro-inflammatory
factors, IL-6 among them (Bsibsi et al., 2006), whereas TLR4 mainly triggers the release
of pro-inflammatory mediators such as TNF-α (van Noort and Bsibsi, 2009). What is
clear is that RS-LPS is not acting as a TLR4 antagonist in these cells, but as at least a
partial agonist. Moreover, the effects of PA and RS-LPS appear to be additive.
Astrocytes from cerebral cortex are reported to release proinflammatory
cytokines in response to TLR4 activation (Gorina et al., 2011) and the TLR4 antagonist
used here has been shown to attenuate inflammation in microglial cells by reducing
TLR4 and NF-κB and MAPKs signaling pathways (Gaikwad and Agrawal-Rajput, 2015).
However, the activation of TLRs in astrocytes and microglia is not the same, as

Discussion
176
astrocytes respond later than microglia to activation of TLRs (Rivest, 2003; Owens,
2005). Thus, the mechanism of activation could be different and could possibly
explain the lack of an antagonist response to this factor in astrocytes.
7.5 Intracellular signaling in astrocytes in response to PA
We found that male astrocytes rapidly increased the amount of STAT5 in
response to PA. The STAT family has a central role in inflammatory reactions and is
stimulated by multiple cytokines to regulate the expression of inflammatory
mediators. Particularly, STAT5 has been shown to be activated by glycogen synthase
kinase-3 (GSK-3) in primary cultures of cerebral cortical astrocytes to trigger
inflammatory responses (Beurel and Jope, 2008; Wang et al., 2011) and PA induces GSK-3
activation in cultures of primary hepatocytes (Ibrahim et al., 2011). Thus, STAT5
activation appears to be one of the inflammatory signaling pathway activated by PA.
In addition, STAT5 participates in the regulation of glycogen storage in astrocytes
(Bosier et al., 2013) and the increase found in STAT5 could indicate an increase in
glycogen storage in response to fatty acids, however if GSK-3 is activated to induce
STAT5 increase and trigger inflammation, glycogen synthase would be inactivated by
GSK-3 and thus glycogen storage inhibited. Further studies are necessary to
determine the implication of this signaling pathway in astrocytes response to
nutrient–derived signals.
Stress and inflammation can also activate NFκB, ERK and JNK pathways in
astrocytes leading to the synthesis and release of inflammatory mediators (Gao and Ji,
2010; Gorina et al., 2011). NFκB and MAPKs play an important role in triggering
microglia activation and subsequent secretion of inflammatory mediators
(Vallabhapurapu and Karin, 2009). However, we found no changes in the activation of
these pathways. This could be due to the degree of variability found in these result .
Moreover, as only one time-point after exposure to PA is reported here, it is possible
that some of these pathways are activated either more rapidly, or at a later time-
point.

VII. CONCLUSIONS


Conclusions
178
1. Males and females respond differently to increased food intake even
during the neonatal period; thus, the sex differences in metabolic control
cannot be solely attributed to post-pubertal differences in circulating
gonadal steroid levels.
2. Neonatal overnutrition induces significant changes in circulating insulin,
leptin, and adiponectin levels during a critical period of hypothalamic
development. Hence, modifications in the levels of these hormones, some
of which are known to influence hypothalamic development, could be
involved in the long-term metabolic effects of early overnutrition.
3. The hormonal changes induced by overnutrition differed between males
and females during the neonatal period. The greater increase in serum
insulin, as well as in testosterone levels in males, during this critical
developmental period, could be involved in the differential long-term
metabolic outcomes observed between the sexes.
4. The long-term effects of neonatal overnutrition change throughout
development, with males being more susceptible to metabolic alterations
during adulthood.
5. Increased weight gain during the perinatal period was not associated with
any indication of systemic inflammation, which could be due to the ability
of adipose tissue to expand due to hyperplasia during early development.
This observation supports the fact that obesity during childhood is
different from that seen in adults.
6. The increased bodyweight in adult male rats was associated with
significant elevations in the hypothalamic levels of the inflammatory
cytokine TNFα and the astroglial marker GFAP, as well as the number of
GFAP+ astrocytes. However, there was no increase in other markers of
astrocyte activation, such as vimentin, or in microglial markers or
inflammatory signaling. This suggests that the inflammatory and gliosis
responses in the hypothalamus may occur gradually in conditions of
increased weight gain that are not due to ingestion of diets, such as those
high in fats, that have direct effects on inflammatory processes and on
glial cells.

Conclusions
179
7. Hypothalamic astrocytes respond differentially to palmitic acid and oleic
acid, with oleic acid protecting against the inflammatory processes
induced by palmitic acid. Thus, the harmful effects of a high fat diet will
depend on the relative composition of the different fatty acids and not
only the quantity.
8. Higher circulating levels of estrogens in adult females can have protective
effects on astrocytes against palmitic acid.

VIII. CONCLUSIONES


Conclusiones
181
1. Machos y hembras responden de forma diferente al incremento de la
ingesta de alimentos, incluso durante el periodo neonatal. Por
consiguiente, las diferencias sexuales en el control metabólico no pueden
atribuirse únicamente a las diferencias postpuberales en los niveles
circulantes de esteroides gonadales.
2. La sobrenutrición neonatal induce cambios significativos en los niveles
circulantes de insulina, leptina y adiponectina durante un periodo crítico
del desarrollo hipotalámico. Por tanto, las modificaciones en los niveles de
estas hormonas, algunas de las cuales son conocidas por influenciar el
desarrollo hipotalámico, podrían afectar los efectos metabólicos a largo
plazo de la sobrenutrición temprana.
3. Los cambios hormonales inducidos por la sobrenutrición difieren entre
machos y hembras durante el periodo neonatal. El mayor incremento en
insulina sérica, así como de los niveles de testosterona, en machos
durante este periodo crítico de desarrollo, podría intervenir en la
diferenciación de los efectos metabólicos a largo plazo observados entre
ambos sexos.
4. Los efectos a largo plazo de la sobrenutrición neonatal se modifican
durante el desarrollo, siendo los machos más susceptibles a las
alteraciones metabólicas durante la época adulta.
5. El incremento de la ganancia ponderal durante el periodo perinatal no se
asoció con ningún signo de inflamación sistémica. Este hecho podría
deberse a la capacidad del tejido adiposo a expandirse debido a la
hiperplasia durante el desarrollo temprano. Esta observación apoya el
hecho de que la obesidad durante la infancia es diferente a la que se
aprecia en adultos.
6. El incremento del peso corporal en las ratas adultas se asoció con
elevaciones significativas en los niveles hipotalámicos de citoquina TNFα y
del marcador astroglial GFAP, así como del número de astrocitos GFAP+.
No obstante, no se evidenció incremento de otros marcadores de la
activación astrocítica, tales como vimentina, o marcadores de microglía o
de señalización inflamatoria. Esto sugiere que las respuestas inflamatorias
y de gliosis en el hipotálamo pueden acontecer gradualmente en
situaciones de ganancia ponderal que no son debidas a la ingesta de
Conclusiones
182
dietas, como es el caso de aquellas ricas en grasas, que tienen efectos
directos sobre los procesos inflamatorios y sobre las células de la glía.
7. Los astrocitos hipotalámicos responden de forma diferente a los ácidos
palmítico y oleico. En efecto, el ácido oleico es capaz de proteger contra
los procesos inflamatorios inducidos por el ácido palmítico. Por
consiguiente, los efectos nocivos de una dieta con alto contenido graso,
dependerán de la composición relativa de los diferentes ácidos grasos y
no únicamente de su cantidad.
8. Los niveles circulantes más elevados de estrógenos en las ratas hembra
adultas pueden tener efectos protectores en los astrocitos contra el ácido
palmítico.

IX. BIBLIOGRAPHY


Bibliography
184
Aasum, E., Hafstad, A.D., Severson, D.L., and Larsen, T.S. (2003). Age-dependent changes in metabolism, contractile function, and ischemic sensitivity in hearts from db/db mice. Diabetes 52, 434-441.
Abbott, N.J., Patabendige, A.A., Dolman, D.E., Yusof, S.R., and Begley, D.J. (2010). Structure and function of the blood-brain barrier. Neurobiology of Disease 37, 13-25.
Abizaid, A., and Horvath, T. (2008). Brain Circuits Regulating Energy Homeostasis. Regulatory peptides. 2008;149(1-3):3-10.
Acaz-Fonseca, E., Sanchez-Gonzalez, R., Azcoitia, I., Arevalo, M.A., and Garcia-Segura, L.M. (2014). Role of astrocytes in the neuroprotective actions of 17beta-estradiol and selective estrogen receptor modulators. Mol Cell Endocrinol 389, 48-57.
Adler, E.S., Hollis, J.H., Clarke, I.J., Grattan, D.R., and Oldfield, B.J. (2012). Neurochemical characterization and sexual dimorphism of projections from the brain to abdominal and subcutaneous white adipose tissue in the rat. J Neurosci 32, 15913-15921.
Ahima, R.S., Bjorbaek, C., Osei, S., and Flier, J.S. (1999). Regulation of neuronal and glial proteins by leptin: implications for brain development. Endocrinology 140, 2755-2762.
Ahima, R.S., Prabakaran, D., and Flier, J.S. (1998). Postnatal leptin surge and regulation of circadian rhythm of leptin by feeding. Implications for energy homeostasis and neuroendocrine function. J Clin Invest 101, 1020-1027.
Aljada, A., Mohanty, P., Ghanim, H., Abdo, T., Tripathy, D., Chaudhuri, A., and Dandona, P. (2004). Increase in intranuclear nuclear factor kappaB and decrease in inhibitor kappaB in mononuclear cells after a mixed meal: evidence for a proinflammatory effect. Am J Clin Nutr 79, 682-690.
Allan, S.M., and Rothwell, N.J. (2003). Inflammation in central nervous system injury. Philos Trans R Soc Lond B Biol Sci 358, 1669-1677.
Allison, M.B., and Myers, M.G., Jr. (2014). 20 years of leptin: connecting leptin signaling to biological function. J Endocrinol 223, T25-35.
Aloisi, F. (2001). Immune function of microglia. Glia 36, 165-179.
Alvarez-Bolado, G., Grinevich, V., and Puelles, L. (2015). Editorial: Development of the hypothalamus. Front Neuroanat 9, 83.
Amateau, S.K., and Mccarthy, M.M. (2002). Sexual differentiation of astrocyte morphology in the developing rat preoptic area. J Neuroendocrinol 14, 904-910.
Amengual-Cladera, E., Llado, I., Gianotti, M., and Proenza, A.M. (2012). Retroperitoneal white adipose tissue mitochondrial function and adiponectin expression in response to ovariectomy and 17beta-estradiol replacement. Steroids 77, 659-665.
Andersson, U., Filipsson, K., Abbott, C.R., Woods, A., Smith, K., Bloom, S.R., Carling, D., and Small, C.J. (2004). AMP-activated protein kinase plays a role in the control of food intake. J Biol Chem 279, 12005-12008.
Anna, V., Van Der Ploeg, H.P., Cheung, N.W., Huxley, R.R., and Bauman, A.E. (2008). Sociodemographic correlates of the increasing trend in prevalence of gestational diabetes mellitus in a large population of women between 1995 and 2005. Diabetes Care 31, 2288-2293.
Anteneh, Z.A., Gedefaw, M., Tekletsadek, K.N., Tsegaye, M., and Alemu, D. (2015). Risk Factors of Overweight and Obesity among High School Students in Bahir Dar City, North West Ethiopia: School Based Cross-Sectional Study. Adv Prev Med 2015, 294902.

Bibliography
185
Antuna-Puente, B., Feve, B., Fellahi, S., and Bastard, J.P. (2008). Adipokines: the missing link between insulin resistance and obesity. Diabetes Metab 34, 2-11.
Arai, Y., Matsumoto, A., and Nishizuka, M. (1986). Synaptogenesis and Neuronal Plasticity to Gonadal Steroids: Implications for the Development of Sexual Dimorphism in the Neuroendocrine Brain. Current Topics in Neuroendocrinology. Morphology of Hypothalamus and Its Connections Volume 7 of the series Current Topics in Neuroendocrinology pp 291-307.
Araque, A., Parpura, V., Sanzgiri, R.P., and Haydon, P.G. (1999). Tripartite synapses: glia, the unacknowledged partner. Trends in Neurosciences 22, 208-215.
Arevalo, M.A., Azcoitia, I., and Garcia-Segura, L.M. (2015). The neuroprotective actions of oestradiol and oestrogen receptors. Nat Rev Neurosci 16, 17-29.
Arevalo, M.A., Santos-Galindo, M., Bellini, M.J., Azcoitia, I., and Garcia-Segura, L.M. (2010). Actions of estrogens on glial cells: Implications for neuroprotection. Biochim Biophys Acta 1800, 1106-1112.
Argente, J. (2011). [Obesity in childhood and adolescence: a heterogeneous disease with new pathophysiological bases]. An Pediatr (Barc) 75, 1-5.
Argente, J., Barrios, V., Chowen, J.A., Sinha, M.K., and Considine, R.V. (1997). Leptin plasma levels in healthy Spanish children and adolescents, children with obesity, and adolescents with anorexia nervosa and bulimia nervosa. J Pediatr 131, 833-838.
Argente-Arizón, P., Freire-Regatillo, A., Argente, J., and Chowen, J. (2015). Role of non-neuronal cells in body weight and appetite control. Frontiers in Endocrinology.
Arnold, A.P. (2009). The organizational-activational hypothesis as the foundation for a unified theory of sexual differentiation of all mammalian tissues. Horm Behav 55, 570-578.
Asarian, L., and Geary, N. (2013). Sex differences in the physiology of eating. Am J Physiol Regul Integr Comp Physiol 305, R1215-1267.
Aschner, M. (1998a). Astrocytes as mediators of immune and inflammatory responses in the CNS. Neurotoxicology 19, 269-281.
Aschner, M. (1998b). Immune and inflammatory responses in the CNS: modulation by astrocytes. Toxicology letters 102-103, 283-287.
Ashford, M.L., Boden, P.R., and Treherne, J.M. (1990). Glucose-induced excitation of hypothalamic neurones is mediated by ATP-sensitive K+ channels. Pflugers Arch 415, 479-483.
Auestad, N., Korsak, R.A., Morrow, J.W., and Edmond, J. (1991). Fatty acid oxidation and ketogenesis by astrocytes in primary culture. J. Neurochem. 56, 1376-1386.
Bado, A., Levasseur, S., Attoub, S., Kermorgant, S., Laigneau, J.P., Bortoluzzi, M.N., Moizo, L., Lehy, T., Guerre-Millo, M., Le Marchand-Brustel, Y., and Lewin, M.J. (1998). The stomach is a source of leptin. Nature 394, 790-793.
Bady, I., Marty, N., Dallaporta, M., Emery, M., Gyger, J., Tarussio, D., Foretz, M., and Thorens, B. (2006). Evidence from glut2-null mice that glucose is a critical physiological regulator of feeding. Diabetes 55, 988-995.
Ballesteros, M., Simon, I., Vendrell, J., Ceperuelo-Mallafre, V., Miralles, R.M., Albaiges, G., Tinahones, F., and Megia, A. (2011). Maternal and cord blood adiponectin multimeric forms in gestational diabetes mellitus: a prospective analysis. Diabetes Care 34, 2418-2423.

Bibliography
186
Bandeira, F., Lent, R., and Herculano-Houzel, S. (2009). Changing numbers of neuronal and non-neuronal cells underlie postnatal brain growth in the rat. Proc Natl Acad Sci U S A 106, 14108-14113.
Banks, A.S., Davis, S.M., Bates, S.H., and Myers, M.G., Jr. (2000). Activation of downstream signals by the long form of the leptin receptor. J Biol Chem 275, 14563-14572.
Banks, W.A., Dipalma, C.R., and Farrell, C.L. (1999). Impaired transport of leptin across the blood-brain barrier in obesity. Peptides 20, 1341-1345.
Banks, W.A., Kastin, A.J., and Broadwell, R.D. (1995). Passage of cytokines across the blood-brain barrier. Neuroimmunomodulation 2, 241-248.
Banks, W.A., Owen, J.B., and Erickson, M.A. (2012). Insulin in the brain: there and back again. Pharmacol Ther 136, 82-93.
Banting, F. (1924). Medical research and the discovery of insulin. Hygeia 2:288-292.
Baquedano, E., Chowen, J.A., Argente, J., and Frago, L.M. (2013). Differential effects of GH and GH-releasing peptide-6 on astrocytes. J. Endocrinol. 218, 263-274.
Barker, D.J. (2007). Obesity and early life. Obes Rev 8 Suppl 1, 45-49.
Barr, S.I., Janelle, K.C., and Prior, J.C. (1995). Energy intakes are higher during the luteal phase of ovulatory menstrual cycles. Am J Clin Nutr 61, 39-43.
Barreto, G., Santos-Galindo, M., Diz-Chaves, Y., Pernía, O., Carrero, P., Azcoitia, I., and Garcia-Segura, L.M. (2009). Selective Estrogen Receptor Modulators Decrease Reactive Astrogliosis in the Injured Brain: Effects of Aging and Prolonged Depletion of Ovarian Hormones. Endocrinology 150, 5010-5015.
Baskin, D.G., Breininger, J.F., and Schwartz, M.W. (1999). Leptin receptor mRNA identifies a subpopulation of neuropeptide Y neurons activated by fasting in rat hypothalamus. Diabetes 48, 828-833.
Bassett, D.R., and Craig, B.W. (1988). Influence of early nutrition on growth and adipose tissue characteristics in male and female rats. J Appl Physiol (1985) 64, 1249-1256.
Bastard, J.P., Maachi, M., Van Nhieu, J.T., Jardel, C., Bruckert, E., Grimaldi, A., Robert, J.J., Capeau, J., and Hainque, B. (2002). Adipose tissue IL-6 content correlates with resistance to insulin activation of glucose uptake both in vivo and in vitro. J Clin Endocrinol Metab 87, 2084-2089.
Batchelor, P.E., Liberatore, G.T., Wong, J.Y., Porritt, M.J., Frerichs, F., Donnan, G.A., and Howells, D.W. (1999). Activated macrophages and microglia induce dopaminergic sprouting in the injured striatum and express brain-derived neurotrophic factor and glial cell line-derived neurotrophic factor. J. Neurosci. 19, 1708-1716.
Batterham, R.L., and Bloom, S.R. (2003). The gut hormone peptide YY regulates appetite. Ann N Y Acad Sci 994, 162-168.
Batterham, R.L., Cowley, M.A., Small, C.J., Herzog, H., Cohen, M.A., Dakin, C.L., Wren, A.M., Brynes, A.E., Low, M.J., Ghatei, M.A., Cone, R.D., and Bloom, S.R. (2002). Gut hormone PYY(3-36) physiologically inhibits food intake. Nature 418, 650-654.
Baura, G.D., Foster, D.M., Porte, D., Jr., Kahn, S.E., Bergman, R.N., Cobelli, C., and Schwartz, M.W. (1993). Saturable transport of insulin from plasma into the central nervous system of dogs in vivo. A mechanism for regulated insulin delivery to the brain. J Clin Invest 92, 1824-1830.

Bibliography
187
Beeharry, N., Lowe, J.E., Hernandez, A.R., Chambers, J.A., Fucassi, F., Cragg, P.J., Green, M.H., and Green, I.C. (2003). Linoleic acid and antioxidants protect against DNA damage and apoptosis induced by palmitic acid. Mutat Res 530, 27-33.
Bei, F., Jia, J., Jia, Y.Q., Sun, J.H., Liang, F., Yu, Z.Y., and Cai, W. (2015). Long-term effect of early postnatal overnutrition on insulin resistance and serum fatty acid profiles in male rats. Lipids Health Dis 14, 96.
Belgardt, B.F., Okamura, T., and Bruning, J.C. (2009). Hormone and glucose signalling in POMC and AgRP neurons. J Physiol 587, 5305-5314.
Benoit, S.C., Kemp, C.J., Elias, C.F., Abplanalp, W., Herman, J.P., Migrenne, S., Lefevre, A.L., Cruciani-Guglielmacci, C., Magnan, C., Yu, F., Niswender, K., Irani, B.G., Holland, W.L., and Clegg, D.J. (2009). Palmitic acid mediates hypothalamic insulin resistance by altering PKC-theta subcellular localization in rodents. J Clin Invest 119, 2577-2589.
Benveniste, E.N. (1998). Cytokine actions in the central nervous system. Cytokine Growth Factor Rev 9, 259-275.
Berg, A.H., and Scherer, P.E. (2005). Adipose tissue, inflammation, and cardiovascular disease. Circ Res 96, 939-949.
Bernard, C. (1855). Leçons de physiologie expérimentale appliquée à la médecine. Baille`re et Fils Paris 2:296–313.
Beurel, E., and Jope, R.S. (2008). Differential regulation of STAT family members by glycogen synthase kinase-3. J Biol Chem 283, 21934-21944.
Biggs, W.H., 3rd, Meisenhelder, J., Hunter, T., Cavenee, W.K., and Arden, K.C. (1999). Protein kinase B/Akt-mediated phosphorylation promotes nuclear exclusion of the winged helix transcription factor FKHR1. Proc Natl Acad Sci U S A 96, 7421-7426.
Bignami, A., and Dahl, D. (1995). Gliosis. In: Kettenmann H, Ransom BR, editors. Neuroglia. New York, NY: Oxford University Press, p 843-858.
Bilbo, S.D., and Tsang, V. (2010). Enduring consequences of maternal obesity for brain inflammation and behavior of offspring. FASEB J. 24, 2104-2115.
Bilbo, S.D., Wieseler, J.L., Barrientos, R.M., Tsang, V., Watkins, L.R., and Maier, S.F. (2010). Neonatal bacterial infection alters fever to live and simulated infections in adulthood. Psychoneuroendocrinology 35, 369-381.
Bjorbaek, C., Elmquist, J.K., Frantz, J.D., Shoelson, S.E., and Flier, J.S. (1998). Identification of SOCS-3 as a potential mediator of central leptin resistance. Mol Cell 1, 619-625.
Block, M.L., and Hong, J.S. (2007). Chronic microglial activation and progressive dopaminergic neurotoxicity. Biochemical Society Transactions 35, 1127-1132.
Blum, W.F., Englaro, P., Hanitsch, S., Juul, A., Hertel, N.T., Muller, J., Skakkebaek, N.E., Heiman, M.L., Birkett, M., Attanasio, A.M., Kiess, W., and Rascher, W. (1997). Plasma leptin levels in healthy children and adolescents: dependence on body mass index, body fat mass, gender, pubertal stage, and testosterone. J Clin Endocrinol Metab 82, 2904-2910.
Boden, G. (2008). Obesity and free fatty acids. Endocrinol Metab Clin North Am 37, 635-646, viii-ix.

Bibliography
188
Boden, G., Lebed, B., Schatz, M., Homko, C., and Lemieux, S. (2001). Effects of acute changes of plasma free fatty acids on intramyocellular fat content and insulin resistance in healthy subjects. Diabetes 50, 1612-1617.
Boden, G., and Shulman, G.I. (2002). Free fatty acids in obesity and type 2 diabetes: defining their role in the development of insulin resistance and beta-cell dysfunction. Eur J Clin Invest 32 Suppl 3, 14-23.
Bosco, D., Fava, A., Plastino, M., Montalcini, T., and Pujia, A. (2011). Possible implications of insulin resistance and glucose metabolism in Alzheimer's disease pathogenesis. J Cell Mol Med 15, 1807-1821.
Bosier, B., Bellocchio, L., Metna-Laurent, M., Soria-Gomez, E., Matias, I., Hebert-Chatelain, E., Cannich, A., Maitre, M., Leste-Lasserre, T., Cardinal, P., Mendizabal-Zubiaga, J., Canduela, M.J., Reguero, L., Hermans, E., Grandes, P., Cota, D., and Marsicano, G. (2013). Astroglial CB1 cannabinoid receptors regulate leptin signaling in mouse brain astrocytes. Mol Metab 2, 393-404.
Boubred, F., Daniel, L., Buffat, C., Feuerstein, J.M., Tsimaratos, M., Oliver, C., Dignat-George, F., Lelievre-Pegorier, M., and Simeoni, U. (2009). Early postnatal overfeeding induces early chronic renal dysfunction in adult male rats. Am J Physiol Renal Physiol 297, F943-951.
Boullu-Ciocca, S., Achard, V., Tassistro, V., Dutour, A., and Grino, M. (2008). Postnatal programming of glucocorticoid metabolism in rats modulates high-fat diet-induced regulation of visceral adipose tissue glucocorticoid exposure and sensitivity and adiponectin and proinflammatory adipokines gene expression in adulthood. Diabetes 57, 669-677.
Boullu-Ciocca, S., Dutour, A., Guillaume, V., Achard, V., Oliver, C., and Grino, M. (2005). Postnatal diet-induced obesity in rats upregulates systemic and adipose tissue glucocorticoid metabolism during development and in adulthood: its relationship with the metabolic syndrome. Diabetes 54, 197-203.
Bouman, A., Schipper, M., Heineman, M.J., and Faas, M.M. (2004). Gender difference in the non-specific and specific immune response in humans. Am J Reprod Immunol 52, 19-26.
Boura-Halfon, S., and Zick, Y. (2009). Phosphorylation of IRS proteins, insulin action, and insulin resistance. Am J Physiol Endocrinol Metab 296, E581-591.
Bouret, S.G. (2010a). Neurodevelopmental actions of leptin. Brain Res 1350, 2-9.
Bouret, S.G. (2010b). Role of early hormonal and nutritional experiences in shaping feeding behavior and hypothalamic development. J Nutr 140, 653-657.
Bouret, S.G. (2013). Organizational actions of metabolic hormones. Front Neuroendocrinol 34, 18-26.
Bouret, S.G., Burt-Solorzano, C., C.-H., W., and B., S.R. (2007). Impact of neonatal nutrition on development of brain metabolic circuits in mice. In: Proceedings of the 37th Annual Meeting the Society for Neuroscience, San Diego, CA.
Bouret, S.G., Draper, S.J., and Simerly, R.B. (2004a). Formation of projection pathways from the arcuate nucleus of the hypothalamus to hypothalamic regions implicated in the neural control of feeding behavior in mice. J Neurosci 24, 2797-2805.
Bouret, S.G., Draper, S.J., and Simerly, R.B. (2004b). Trophic action of leptin on hypothalamic neurons that regulate feeding. Science 304, 108-110.
Bouret, S.G., Gorski, J.N., Patterson, C.M., Chen, S., Levin, B.E., and Simerly, R.B. (2008). Hypothalamic neural projections are permanently disrupted in diet-induced obese rats. Cell Metab 7, 179-185.

Bibliography
189
Bouret, S.G., and Simerly, R.B. (2007). Development of leptin-sensitive circuits. J Neuroendocrinol 19, 575-582.
Bowman, R.E., Maclusky, N.J., Sarmiento, Y., Frankfurt, M., Gordon, M., and Luine, V.N. (2004). Sexually dimorphic effects of prenatal stress on cognition, hormonal responses, and central neurotransmitters. Endocrinology 145, 3778-3787.
Boyles, J.K., Pitas, R.E., Wilson, E., Mahley, R.W., and Taylor, J.M. (1985). Apolipoprotein E associated with astrocytic glia of the central nervous system and with nonmyelinating glia of the peripheral nervous system. Journal of Clinical Investigation 76, 1501-1513.
Bradford, M.M. (1976). A Rapid and Sensitive Method for the Quantitation of Microgram Quantities of Protein Utilizing the Principle of Protein-Dye Binding. ANALYTICAL BIOCHEMISTRY 72, 248-254.
Brobeck, J.R. (1946). Mechanism of the development of obesity in animals with hypothalamic lesions. Physiol Rev 26, 541-559.
Brochu-Gaudreau, K., Rehfeldt, C., Blouin, R., Bordignon, V., Murphy, B.D., and Palin, M.F. (2010). Adiponectin action from head to toe. Endocrine 37, 11-32.
Bruce-Keller, A.J., Keeling, J.L., Keller, J.N., Huang, F.F., Camondola, S., and Mattson, M.P. (2000). Antiinflammatory effects of estrogen on microglial activation. Endocrinology 141, 3646-3656.
Bruning, J.C., Gautam, D., Burks, D.J., Gillette, J., Schubert, M., Orban, P.C., Klein, R., Krone, W., Muller-Wieland, D., and Kahn, C.R. (2000). Role of brain insulin receptor in control of body weight and reproduction. Science 289, 2122-2125.
Bsibsi, M., Persoon-Deen, C., Verwer, R.W., Meeuwsen, S., Ravid, R., and Van Noort, J.M. (2006). Toll-like receptor 3 on adult human astrocytes triggers production of neuroprotective mediators. Glia 53, 688-695.
Buckman, L.B., Thompson, M.M., Lippert, R.N., Blackwell, T.S., Yull, F.E., and Ellacott, K.L.J. (2014). Evidence for a novel funcional role of astrocytes in the acute homeostatic response to HFD. Molecular Metabolism.
Buckman, L.B., Thompson, M.M., Moreno, H.N., and Ellacott, K.L. (2013). Regional astrogliosis in the mouse hypothalamus in response to obesity. J Comp Neurol 521, 1322-1333.
Buffenstein, R., Poppitt, S.D., Mcdevitt, R.M., and Prentice, A.M. (1995). Food intake and the menstrual cycle: a retrospective analysis, with implications for appetite research. Physiol Behav 58, 1067-1077.
Burguera, B., Couce, M.E., Curran, G.L., Jensen, M.D., Lloyd, R.V., Cleary, M.P., and Poduslo, J.F. (2000). Obesity is associated with a decreased leptin transport across the blood-brain barrier in rats. Diabetes 49, 1219-1223.
Buse, M.G., Roberts, W.J., and Buse, J. (1962). The role of the human placenta in the transfer and metabolism of insulin. J Clin Invest 41, 29-41.
Bushong, E.A., Martone, M.E., Jones, Y.Z., and Ellisman, M.H. (2002). Protoplasmic astrocytes in CA1 stratum radiatum occupy separate anatomical domains. J Neurosci. 22, 183-192.
Cai, D. (2013). Neuroinflammation and neurodegeneration in overnutrition-induced diseases. Trends Endocrinol Metab 24, 40-47.
Cai, D., and Liu, T. (2012). Inflammatory cause of metabolic syndrome via brain stress and NF-kappaB. Aging (Albany NY) 4, 98-115.

Bibliography
190
Cai, D., Yuan, M., Frantz, D.F., Melendez, P.A., Hansen, L., Lee, J., and Shoelson, S.E. (2005). Local and systemic insulin resistance resulting from hepatic activation of IKK-beta and NF-kappaB. Nat Med 11, 183-190.
Cai, G., Dinan, T., Barwood, J.M., De Luca, S.N., Soch, A., Ziko, I., Chan, S.M., Zeng, X.Y., Li, S., Molero, J., and Spencer, S.J. (2014). Neonatal overfeeding attenuates acute central pro-inflammatory effects of short-term high fat diet. Front Neurosci 8, 446.
Calder, P.C., Ahluwalia, N., Albers, R., Bosco, N., Bourdet-Sicard, R., Haller, D., Holgate, S.T., Jonsson, L.S., Latulippe, M.E., Marcos, A., Moreines, J., M'rini, C., Muller, M., Pawelec, G., Van Neerven, R.J., Watzl, B., and Zhao, J. (2013). A consideration of biomarkers to be used for evaluation of inflammation in human nutritional studies. Br J Nutr 109 Suppl 1, S1-34.
Calder, P.C., Albers, R., Antoine, J.M., Blum, S., Bourdet-Sicard, R., Ferns, G.A., Folkerts, G., Friedmann, P.S., Frost, G.S., Guarner, F., Lovik, M., Macfarlane, S., Meyer, P.D., M'rabet, L., Serafini, M., Van Eden, W., Van Loo, J., Vas Dias, W., Vidry, S., Winklhofer-Roob, B.M., and Zhao, J. (2009). Inflammatory disease processes and interactions with nutrition. Br J Nutr 101 Suppl 1, S1-45.
Cani, P.D., Amar, J., Iglesias, M.A., Poggi, M., Knauf, C., Bastelica, D., Neyrinck, A.M., Fava, F., Tuohy, K.M., Chabo, C., Waget, A., Delmee, E., Cousin, B., Sulpice, T., Chamontin, B., Ferrieres, J., Tanti, J.F., Gibson, G.R., Casteilla, L., Delzenne, N.M., Alessi, M.C., and Burcelin, R. (2007). Metabolic endotoxemia initiates obesity and insulin resistance. Diabetes 56, 1761-1772.
Cao, L., Choi, E.Y., Liu, X., Martin, A., Wang, C., Xu, X., and During, M.J. (2011). White to brown fat phenotypic switch induced by genetic and environmental activation of a hypothalamic-adipocyte axis. Cell Metab 14, 324-338.
Capllonch-Amer, G., Llado, I., Proenza, A.M., Garcia-Palmer, F.J., and Gianotti, M. (2014). Opposite effects of 17-beta estradiol and testosterone on mitochondrial biogenesis and adiponectin synthesis in white adipocytes. J Mol Endocrinol 52, 203-214.
Carbonaro, V., Caraci, F., Giuffrida, M.L., Merlo, S., Canonico, P.L., Drago, F., Copani, A., and Sortino, M.A. (2009). Enhanced expression of ERalpha in astrocytes modifies the response of cortical neurons to beta-amyloid toxicity. Neurobiol Dis 33, 415-421.
Carey, A.L., Steinberg, G.R., Macaulay, S.L., Thomas, W.G., Holmes, A.G., Ramm, G., Prelovsek, O., Hohnen-Behrens, C., Watt, M.J., James, D.E., Kemp, B.E., Pedersen, B.K., and Febbraio, M.A. (2006). Interleukin-6 increases insulin-stimulated glucose disposal in humans and glucose uptake and fatty acid oxidation in vitro via AMP-activated protein kinase. Diabetes 55, 2688-2697.
Carey, V.J., Walters, E.E., Colditz, G.A., Solomon, C.G., Willett, W.C., Rosner, B.A., Speizer, F.E., and Manson, J.E. (1997). Body fat distribution and risk of non-insulin-dependent diabetes mellitus in women. The Nurses' Health Study. Am J Epidemiol 145, 614-619.
Caro, J.F., Kolaczynski, J.W., Nyce, M.R., Ohannesian, J.P., Opentanova, I., Goldman, W.H., Lynn, R.B., Zhang, P.L., Sinha, M.K., and Considine, R.V. (1996). Decreased cerebrospinal-fluid/serum leptin ratio in obesity: a possible mechanism for leptin resistance. Lancet 348, 159-161.
Carpentier, P.A., Begolka, W.S., Olson, J.K., Elhofy, A., Karpus, W.J., and Miller, S.D. (2005). Differential activation of astrocytes by innate and adaptive immune stimuli. Glia 49, 360-374.
Carrer, H.F., Cambiasso, M.J., and Gorosito, S. (2005). Effects of estrogen on neuronal growth and differentiation. J Steroid Biochem Mol Biol 93, 319-323.
Carvalheira, J.B.C., Ribeiro, E.B., Araújo, E.P., Guimarães, R.B., Telles, M.M., Torsoni, M., Gontijo, J.a.R., Velloso, L.A., and Saad, M.J.A. (2003). Selective impairment of insulin signalling in the hypothalamus of obese Zucker rats. Diabetologia 46, 1629-1640.

Bibliography
191
Caspi, L., Wang, P.Y., and Lam, T.K. (2007). A balance of lipid-sensing mechanisms in the brain and liver. Cell Metab 6, 99-104.
Castellano, J.M., Bentsen, A.H., Sanchez-Garrido, M.A., Ruiz-Pino, F., Romero, M., Garcia-Galiano, D., Aguilar, E., Pinilla, L., Dieguez, C., Mikkelsen, J.D., and Tena-Sempere, M. (2011). Early metabolic programming of puberty onset: impact of changes in postnatal feeding and rearing conditions on the timing of puberty and development of the hypothalamic kisspeptin system. Endocrinology 152, 3396-3408.
Catalano, P.M., Kirwan, J.P., Haugel-De Mouzon, S., and King, J. (2003). Gestational diabetes and insulin resistance: role in short- and long-term implications for mother and fetus. J Nutr 133, 1674s-1683s.
Cerciat, M., Unkila, M., Garcia-Segura, L.M., and Arevalo, M.A. (2010). Selective estrogen receptor modulators decrease the production of interleukin-6 and interferon-gamma-inducible protein-10 by astrocytes exposed to inflammatory challenge in vitro. Glia 58, 93-102.
Chang, G.Q., Karatayev, O., Davydova, Z., Wortley, K., and Leibowitz, S.F. (2005). Glucose injection reduces neuropeptide Y and agouti-related protein expression in the arcuate nucleus: a possible physiological role in eating behavior. Brain Res Mol Brain Res 135, 69-80.
Chazenbalk, G., Singh, P., Irge, D., Shah, A., Abbott, D.H., and Dumesic, D.A. (2013). Androgens inhibit adipogenesis during human adipose stem cell commitment to preadipocyte formation. Steroids 78, 920-926.
Chen, H., Charlat, O., Tartaglia, L.A., Woolf, E.A., Weng, X., Ellis, S.J., Lakey, N.D., Culpepper, J., Moore, K.J., Breitbart, R.E., Duyk, G.M., Tepper, R.I., and Morgenstern, J.P. (1996). Evidence that the diabetes gene encodes the leptin receptor: identification of a mutation in the leptin receptor gene in db/db mice. Cell 84, 491-495.
Chen, H., Simar, D., and Morris, M.J. (2009). Hypothalamic neuroendocrine circuitry is programmed by maternal obesity: interaction with postnatal nutritional environment. PLoS One 4, e6259.
Chen, X., Mcclusky, R., Chen, J., Beaven, S.W., and Tontonoz, P. (2012). The number of x chromosomes causes sex differences in adiposity in mice. PLoS Genet 8.
Cheng, L., Yu, Y., Szabo, A., Wu, Y., Wang, H., Camer, D., and Huang, X.F. (2015). Palmitic acid induces central leptin resistance and impairs hepatic glucose and lipid metabolism in male mice. J Nutr Biochem 26, 541-548.
Cheung, C.C., Clifton, D.K., and Steiner, R.A. (1997). Proopiomelanocortin neurons are direct targets for leptin in the hypothalamus. Endocrinology 138, 4489-4492.
Cheunsuang, O., and Morris, R. (2005). Astrocytes in the arcuate nucleus and median eminence that take up a fluorescent dye from the circulation express leptin receptors and neuropeptide Y Y1 receptors. Glia 52, 228-233.
Cheverud, J.M., Lawson, H.A., Fawcett, G.L., Wang, B., Pletscher, L.S., A, R.F., Maxwell, T.J., Ehrich, T.H., Kenney-Hunt, J.P., Wolf, J.B., and Semenkovich, C.F. (2011). Diet-dependent genetic and genomic imprinting effects on obesity in mice. Obesity (Silver Spring) 19, 160-170.
Chiu, S.L., Chen, C.M., and Cline, H.T. (2008). Insulin receptor signaling regulates synapse number, dendritic plasticity, and circuit function in vivo. Neuron 58, 708-719.
Choi, S.J., Kim, F., Schwartz, M.W., and Wisse, B.E. (2010). Cultured hypothalamic neurons are resistant to inflammation and insulin resistance induced by saturated fatty acids. Am J Physiol Endocrinol Metab 298, E1122-1130.

Bibliography
192
Choi, S.S., Lee, H.J., Lim, I., Satoh, J., and Kim, S.U. (2014). Human astrocytes: secretome profiles of cytokines and chemokines. PLoS One 9, e92325.
Chong, A.C., Vogt, M.C., Hill, A.S., Bruning, J.C., and Zeltser, L.M. (2015). Central insulin signaling modulates hypothalamus-pituitary-adrenal axis responsiveness. Mol Metab 4, 83-92.
Chowen, J.A., Argente, J., Busiguina, S., and Garcia-Segura, L.M. (1996). The role of glia in the neuroendocrine hypothalamus: possible implications in hormone secretion. Horm Res 45 Suppl 1, 15-18.
Chowen, J.A., Busiguina, S., and Garcia-Segura, L.M. (1995). Sexual dimorphism and sex steroid modulation of glial fibrillary acidic protein messenger RNA and immunoreactivity levels in the rat hypothalamus. Neuroscience 69, 519-532.
Christensen, A., Bentley, G.E., Cabrera, R., Ortega, H.H., Perfito, N., Wu, T.J., and Micevych, P. (2012). Hormonal regulation of female reproduction. Horm Metab Res 44, 587-591.
Chu, C.A., Sherck, S.M., Igawa, K., Sindelar, D.K., Neal, D.W., Emshwiller, M., and Cherrington, A.D. (2002). Effects of free fatty acids on hepatic glycogenolysis and gluconeogenesis in conscious dogs. Am J Physiol Endocrinol Metab 282, E402-411.
Chua, S.C., Jr., Chung, W.K., Wu-Peng, X.S., Zhang, Y., Liu, S.M., Tartaglia, L., and Leibel, R.L. (1996). Phenotypes of mouse diabetes and rat fatty due to mutations in the OB (leptin) receptor. Science 271, 994-996.
Cintra, D.E., Ropelle, E.R., Moraes, J.C., Pauli, J.R., Morari, J., Souza, C.T., Grimaldi, R., Stahl, M., Carvalheira, J.B., Saad, M.J., and Velloso, L.A. (2012). Unsaturated fatty acids revert diet-induced hypothalamic inflammation in obesity. PLoS One 7, e30571.
Clancy, B., Finlay, B.L., Darlington, R.B., and Anand, K.J. (2007). Extrapolating brain development from experimental species to humans. Neurotoxicology 28, 931-937.
Claret, M., Smith, M.A., Batterham, R.L., Selman, C., Choudhury, A.I., Fryer, L.G., Clements, M., Al-Qassab, H., Heffron, H., Xu, A.W., Speakman, J.R., Barsh, G.S., Viollet, B., Vaulont, S., Ashford, M.L., Carling, D., and Withers, D.J. (2007). AMPK is essential for energy homeostasis regulation and glucose sensing by POMC and AgRP neurons. J Clin Invest 117, 2325-2336.
Clarke, L.E., and Barres, B.A. (2013). Emerging roles of astrocytes in neural circuit development. Nat Rev Neurosci 14, 311-321.
Clarke, M.A., Stefanidis, A., and Spencer, S.J. (2012). Postnatal overfeeding leads to obesity and exacerbated febrile responses to lipopolysaccharide throughout life. J Neuroendocrinol 24, 511-524.
Clayton, J.A., and Collins, F.S. (2014). Policy: NIH to balance sex in cell and animal studies. Nature 509, 282-283.
Clegg, D.J., Brown, L.M., Woods, S.C., and Benoit, S.C. (2006). Gonadal hormones determine sensitivity to central leptin and insulin. Diabetes 55, 978-987.
Clegg, D.J., Brown, L.M., Zigman, J.M., Kemp, C.J., Strader, A.D., Benoit, S.C., Woods, S.C., Mangiaracina, M., and Geary, N. (2007). Estradiol-dependent decrease in the orexigenic potency of ghrelin in female rats. Diabetes 56, 1051-1058.
Coelho, M., Oliveira, T., and Fernandes, R. (2013). Biochemistry of adipose tissue: an endocrine organ. Arch Med Sci 9, 191-200.
Bibliography
193
Cohen, L.A. (2000). Re: Meta-analysis: dietary fat intake, serum estrogen levels, and the risk of breast cancer. J Natl Cancer Inst 92, 78.
Cohen, P., Zhao, C., Cai, X., Montez, J.M., Rohani, S.C., Feinstein, P., Mombaerts, P., and Friedman, J.M. (2001). Selective deletion of leptin receptor in neurons leads to obesity. J Clin Invest 108, 1113-1121.
Collden, G., Balland, E., Parkash, J., Caron, E., Langlet, F., Prevot, V., and Bouret, S.G. (2015). Neonatal overnutrition causes early alterations in the central response to peripheral ghrelin. Mol Metab 4, 15-24.
Cone, R.D. (2005). Anatomy and regulation of the central melanocortin system. Nat Neurosci 8, 571-578.
Cone, R.D., Lu, D., Koppula, S., Vage, D.I., Klungland, H., Boston, B., Chen, W., Orth, D.N., Pouton, C., and Kesterson, R.A. (1996). The melanocortin receptors: agonists, antagonists, and the hormonal control of pigmentation. Recent Prog Horm Res 51, 287-317; discussion 318.
Conejo, N.M., Gonzalez-Pardo, H., Cimadevilla, J.M., Arguelles, J.A., Diaz, F., Vallejo-Seco, G., and Arias, J.L. (2005). Influence of gonadal steroids on the glial fibrillary acidic protein-immunoreactive astrocyte population in young rat hippocampus. J Neurosci Res 79, 488-494.
Connor, K.L., Vickers, M.H., Beltrand, J., Meaney, M.J., and Sloboda, D.M. (2012). Nature, nurture or nutrition? Impact of maternal nutrition on maternal care, offspring development and reproductive function. The Journal of Physiology 590, 2167-2180.
Considine, R.V., Sinha, M.K., Heiman, M.L., Kriauciunas, A., and Stephens, T.W. (1996). Serum immunoreactive-leptin concentrations in normal-weight and obese humans. N Engl J Med 334.
Covey, S.D., Wideman, R.D., Mcdonald, C., Unniappan, S., Huynh, F., Asadi, A., Speck, M., Webber, T., Chua, S.C., and Kieffer, T.J. (2006). The pancreatic beta cell is a key site for mediating the effects of leptin on glucose homeostasis. Cell Metab 4, 291-302.
Cowley, M.A., Smart, J.L., Rubinstein, M., Cerdan, M.G., Diano, S., Horvath, T.L., Cone, R.D., and Low, M.J. (2001). Leptin activates anorexigenic POMC neurons through a neural network in the arcuate nucleus. Nature 411, 480-484.
Cristiano, L., Cimini, A., Moreno, S., Ragnelli, A.M., and Paola Ceru, M. (2005). Peroxisome proliferator-activated receptors (PPARs) and related transcription factors in differentiating astrocyte cultures. Neuroscience 131, 577-587.
Cummings, D.E., and Overduin, J. (2007). Gastrointestinal regulation of food intake. J Clin Invest 117, 13-23.
Cunha, A.C., Pereira, R.O., Pereira, M.J., Soares Vde, M., Martins, M.R., Teixeira, M.T., Souza, E.P., and Moura, A.S. (2009). Long-term effects of overfeeding during lactation on insulin secretion--the role of GLUT-2. J Nutr Biochem 20, 435-442.
Dakin, R.S., Walker, B.R., Seckl, J.R., Hadoke, P.W., and Drake, A.J. (2015). Estrogens protect male mice from obesity complications and influence glucocorticoid metabolism. Int J Obes (Lond) 39, 1539-1547.
Daniels, S.R. (2009). Complications of obesity in children and adolescents. Int J Obes (Lond) 33 Suppl 1, S60-65.
Davidowa, H., Li, Y., and Plagemann, A. (2003). Altered responses to orexigenic (AGRP, MCH) and anorexigenic (alpha-MSH, CART) neuropeptides of paraventricular hypothalamic neurons in early postnatally overfed rats. Eur J Neurosci 18, 613-621.

Bibliography
194
Davidsen, L., Vistisen, B., and Astrup, A. (2007). Impact of the menstrual cycle on determinants of energy balance: a putative role in weight loss attempts. Int J Obes (Lond) 31, 1777-1785.
Davila, D., Fernandez, S., and Torres-Aleman, I. (2016). Astrocyte Resilience to Oxidative Stress Induced by Insulin-like Growth Factor I (IGF-I) Involves Preserved AKT (Protein Kinase B) Activity. J Biol Chem 291, 2510-2523.
Davis, K.E., M, D.N., Sun, K., W, M.S., J, D.B., J, A.Z., Zeve, D., L, D.H., D, W.C., L, M.G., Xu, Y., Z, V.W., S, A.K., and Clegg, D.J. (2013). The sexually dimorphic role of adipose and adipocyte estrogen receptors in modulating adipose tissue expansion, inflammation, and fibrosis. Mol Metab 2, 227-242.
De Andrade, I.S., Zemdegs, J.C., De Souza, A.P., Watanabe, R.L., Telles, M.M., Nascimento, C.M., Oyama, L.M., and Ribeiro, E.B. (2015). Diet-induced obesity impairs hypothalamic glucose sensing but not glucose hypothalamic extracellular levels, as measured by microdialysis. Nutr Diabetes 5, e162.
De Souza, C.T., Araujo, E.P., Bordin, S., Ashimine, R., Zollner, R.L., Boschero, A.C., Saad, M.J., and Velloso, L.A. (2005). Consumption of a fat-rich diet activates a proinflammatory response and induces insulin resistance in the hypothalamus. Endocrinology 146, 4192-4199.
Decker, T., and Kovarik, P. (2000). Serine phosphorylation of STATs. Oncogene 19, 2628-2637.
Delahaye, F., Breton, C., Risold, P.Y., Enache, M., Dutriez-Casteloot, I., Laborie, C., Lesage, J., and Vieau, D. (2008). Maternal perinatal undernutrition drastically reduces postnatal leptin surge and affects the development of arcuate nucleus proopiomelanocortin neurons in neonatal male rat pups. Endocrinology 149, 470-475.
Delgado, R., Carlin, A., Airaghi, L., Demitri, M.T., Meda, L., Galimberti, D., Baron, P., Lipton, J.M., and Catania, A. (1998). Melanocortin peptides inhibit production of proinflammatory cytokines and nitric oxide by activated microglia. J. Leukoc. Biol. 63, 740-745.
Demerath, E.W., Sun, S.S., Rogers, N., Lee, M., Reed, D., Choh, A.C., Couch, W., Czerwinski, S.A., Chumlea, W.C., Siervogel, R.M., and Towne, B. (2007). Anatomical patterning of visceral adipose tissue: race, sex, and age variation. Obesity (Silver Spring) 15, 2984-2993.
Despres, J.P. (2007). Cardiovascular disease under the influence of excess visceral fat. Crit Pathw Cardiol 6, 51-59.
Devoogd, T., and Nottebohm, F. (1981). Gonadal hormones induce dendritic growth in the adult avian brain. Science 214, 202-204.
Dhillon, H., Zigman, J.M., Ye, C., Lee, C.E., Mcgovern, R.A., Tang, V., Kenny, C.D., Christiansen, L.M., White, R.D., Edelstein, E.A., Coppari, R., Balthasar, N., Cowley, M.A., Chua, S., Jr., Elmquist, J.K., and Lowell, B.B. (2006). Leptin directly activates SF1 neurons in the VMH, and this action by leptin is required for normal body-weight homeostasis. Neuron 49, 191-203.
Dhindsa, S., Miller, M.G., Mcwhirter, C.L., Mager, D.E., Ghanim, H., Chaudhuri, A., and Dandona, P. (2010). Testosterone concentrations in diabetic and nondiabetic obese men. Diabetes Care 33, 1186-1192.
Di Gregorio, G.B., Hensley, L., Lu, T., Ranganathan, G., and Kern, P.A. (2004). Lipid and carbohydrate metabolism in mice with a targeted mutation in the IL-6 gene: absence of development of age-related obesity. Am J Physiol Endocrinol Metab 287, E182-187.
Do Rego, J.C., Orta, M.H., Leprince, J., Tonon, M.C., Vaudry, H., and Costentin, J. (2007). Pharmacological characterization of the receptor mediating the anorexigenic action of the octadecaneuropeptide: evidence for an endozepinergic tone regulating food intake. Neuropsychopharmacology 32, 1641-1648.

Bibliography
195
Dong, C., Wang, S., Li, W.D., Li, D., Zhao, H., and Price, R.A. (2003). Interacting genetic loci on chromosomes 20 and 10 influence extreme human obesity. Am J Hum Genet 72, 115-124.
Dorner, G., and Plagemann, A. (1994). Perinatal hyperinsulinism as possible predisposing factor for diabetes mellitus, obesity and enhanced cardiovascular risk in later life. Horm Metab Res 26, 213-221.
Dou, J.T., Chen, M., Dufour, F., Alkon, D.L., and Zhao, W.Q. (2005). Insulin receptor signaling in long-term memory consolidation following spatial learning. Learn Mem 12, 646-655.
Drel, V.R., Mashtalir, N., Ilnytska, O., Shin, J., Li, F., Lyzogubov, V.V., and Obrosova, I.G. (2006). The leptin-deficient (ob/ob) mouse: a new animal model of peripheral neuropathy of type 2 diabetes and obesity. Diabetes 55, 3335-3343.
Dunaif, A. (1997). Insulin resistance and the polycystic ovary syndrome: mechanism and implications for pathogenesis. Endocr Rev 18, 774-800.
Dunlap, J.L., Preis, L.K., Jr., and Gerall, A.A. (1972). Compensatory ovarian hypertrophy as a function of age and neonatal androgenization. Endocrinology 90, 1309-1314.
Dutia, R., Meece, K., Dighe, S., Kim, A.J., and Wardlaw, S.L. (2012). beta-Endorphin antagonizes the effects of alpha-MSH on food intake and body weight. Endocrinology 153, 4246-4255.
El-Haschimi, K., Pierroz, D.D., Hileman, S.M., Bjorbaek, C., and Flier, J.S. (2000). Two defects contribute to hypothalamic leptin resistance in mice with diet-induced obesity. J Clin Invest 105, 1827-1832.
El-Mazary, A.A., Nasif, K.A., Abdel-Hakeem, G.L., Sherif, T., Farouk, E., and El-Gezawy, E.M. (2015). Adiponectin, leptin and insulin levels at birth and in early postnatal life in neonates with hypoxic ischemic encephalopathy. J Diabetes Metab Disord 14, 87.
Elias, C.F., Lee, C., Kelly, J., Aschkenasi, C., Ahima, R.S., Couceyro, P.R., Kuhar, M.J., Saper, C.B., and Elmquist, J.K. (1998a). Leptin activates hypothalamic CART neurons projecting to the spinal cord. Neuron 21, 1375-1385.
Elias, C.F., Saper, C.B., Maratos-Flier, E., Tritos, N.A., Lee, C., Kelly, J., Tatro, J.B., Hoffman, G.E., Ollmann, M.M., Barsh, G.S., Sakurai, T., Yanagisawa, M., and Elmquist, J.K. (1998b). Chemically defined projections linking the mediobasal hypothalamus and the lateral hypothalamic area. J Comp Neurol 402, 442-459.
Elmquist, J.K., Bjorbaek, C., Ahima, R.S., Flier, J.S., and Saper, C.B. (1998a). Distributions of leptin receptor mRNA isoforms in the rat brain. J Comp Neurol 395, 535-547.
Elmquist, J.K., Maratos-Flier, E., Saper, C.B., and Flier, J.S. (1998b). Unraveling the central nervous system pathways underlying responses to leptin. Nat Neurosci 1, 445-450.
Enriori, P.J., Evans, A.E., Sinnayah, P., Jobst, E.E., Tonelli-Lemos, L., Billes, S.K., Glavas, M.M., Grayson, B.E., Perello, M., Nillni, E.A., Grove, K.L., and Cowley, M.A. (2007). Diet-induced obesity causes severe but reversible leptin resistance in arcuate melanocortin neurons. Cell Metab 5, 181-194.
Erhuma, A., Bellinger, L., Langley-Evans, S.C., and Bennett, A.J. (2007). Prenatal exposure to undernutrition and programming of responses to high-fat feeding in the rat. Br J Nutr 98, 517-524.
Erridge, C., Attina, T., Spickett, C.M., and Webb, D.J. (2007). A high-fat meal induces low-grade endotoxemia: evidence of a novel mechanism of postprandial inflammation. Am J Clin Nutr 86, 1286-1292.

Bibliography
196
Faggioni, R., Fantuzzi, G., Fuller, J., Dinarello, C.A., Feingold, K.R., and Grunfeld, C. (1998). IL-1 beta mediates leptin induction during inflammation. Am J Physiol 274, R204-208.
Fan, W., Boston, B.A., Kesterson, R.A., Hruby, V.J., and Cone, R.D. (1997). Role of melanocortinergic neurons in feeding and the agouti obesity syndrome. Nature 385, 165-168.
Farina, C., Krumbholz, M., Giese, T., Hartmann, G., Aloisi, F., and Meinl, E. (2005). Preferential expression and function of Toll-like receptor 3 in human astrocytes. J Neuroimmunol 159, 12-19.
Farooqi, I.S., Jebb, S.A., Langmack, G., Lawrence, E., Cheetham, C.H., Prentice, A.M., Hughes, I.A., Mccamish, M.A., and O'rahilly, S. (1999). Effects of recombinant leptin therapy in a child with congenital leptin deficiency. N Engl J Med 341, 879-884.
Farooqi, I.S., Matarese, G., Lord, G.M., Keogh, J.M., Lawrence, E., Agwu, C., Sanna, V., Jebb, S.A., Perna, F., Fontana, S., Lechler, R.I., Depaoli, A.M., and O'rahilly, S. (2002). Beneficial effects of leptin on obesity, T cell hyporesponsiveness, and neuroendocrine/metabolic dysfunction of human congenital leptin deficiency. J Clin Invest 110, 1093-1103.
Ferreira, R., Santos, T., Viegas, M., Cortes, L., Bernardino, L., Vieira, O.V., and Malva, J.O. (2011). Neuropeptide Y inhibits interleukin-1beta-induced phagocytosis by microglial cells. J. Neuroinflammation 8, 169.
Fields, R.D., and Stevens-Graham, B. (2002). New insights into neuron-glia communication. Science 298, 556-562.
Fink, R., Tauson, A.H., Hansen, K.B., Wamberg, S., and Kristensen, N.B. (2001). Energy intake and milk production in mink (Mustela vison)--effect of litter size. Arch Tierernahr 55, 221-242.
Finkelstein, J.S., Yu, E.W., and Burnett-Bowie, S.A. (2013). Gonadal steroids and body composition, strength, and sexual function in men. N Engl J Med 369, 2457.
Fioramonti, X., Contie, S., Song, Z., Routh, V.H., Lorsignol, A., and Penicaud, L. (2007). Characterization of glucosensing neuron subpopulations in the arcuate nucleus: integration in neuropeptide Y and pro-opio melanocortin networks? Diabetes 56, 1219-1227.
Fiorotto, M.L., Burrin, D.G., Perez, M., and Reeds, P.J. (1991). Intake and use of milk nutrients by rat pups suckled in small, medium, or large litters. Am J Physiol 260, R1104-1113.
Fisette, A., and Alquier, T. (2015). AstroGenesis: And there was leptin on the sixth day. Mol Metab 4, 755-757.
Flores, M.B., Fernandes, M.F., Ropelle, E.R., Faria, M.C., Ueno, M., Velloso, L.A., Saad, M.J., and Carvalheira, J.B. (2006). Exercise improves insulin and leptin sensitivity in hypothalamus of Wistar rats. Diabetes 55, 2554-2561.
Ford, E.S., Maynard, L.M., and Li, C. (2014). Trends in mean waist circumference and abdominal obesity among US adults, 1999-2012. Jama 312, 1151-1153.
Forsey, R.J., Thompson, J.M., Ernerudh, J., Hurst, T.L., Strindhall, J., Johansson, B., Nilsson, B.O., and Wikby, A. (2003). Plasma cytokine profiles in elderly humans. Mech Ageing Dev 124, 487-493.
Frederich, R.C., Hamann, A., Anderson, S., Lollmann, B., Lowell, B.B., and Flier, J.S. (1995a). Leptin levels reflect body lipid content in mice: evidence for diet-induced resistance to leptin action. Nat Med 1, 1311-1314.

Bibliography
197
Frederich, R.C., Lollmann, B., Hamann, A., Napolitano-Rosen, A., Kahn, B.B., Lowell, B.B., and Flier, J.S. (1995b). Expression of ob mRNA and its encoded protein in rodents. Impact of nutrition and obesity. J Clin Invest 96, 1658-1663.
Freedman, D.S., Dietz, W.H., Srinivasan, S.R., and Berenson, G.S. (2009). Risk factors and adult body mass index among overweight children: the Bogalusa Heart Study. Pediatrics 123, 750-757.
Freeman, M.R. (2010). Specification and morphogenesis of astrocytes. Science 330, 774-778.
Freinkel, N., Lewis, N.J., Johnson, R., and Hellerstrom, C. (1979). Maturation of stimulus recognition and insulin secretion during tissue culture of fetal pancreatic islets. Trans Am Clin Climatol Assoc 90, 86-93.
Fried, S.K., Bunkin, D.A., and Greenberg, A.S. (1998). Omental and subcutaneous adipose tissues of obese subjects release interleukin-6: depot difference and regulation by glucocorticoid. J Clin Endocrinol Metab 83, 847-850.
Friedman, J.M. (2000). Obesity in the new millennium. Nature 404, 632-634.
Friedman, J.M., and Halaas, J.L. (1998). Leptin and the regulation of body weight in mammals. Nature 395, 763-770.
Frolich, L., Blum-Degen, D., Bernstein, H.G., Engelsberger, S., Humrich, J., Laufer, S., Muschner, D., Thalheimer, A., Turk, A., Hoyer, S., Zochling, R., Boissl, K.W., Jellinger, K., and Riederer, P. (1998). Brain insulin and insulin receptors in aging and sporadic Alzheimer's disease. J Neural Transm (Vienna) 105, 423-438.
Frolkis, V.V., Grigorov, Y.G., and Pisarchuk, K.L. (1993). Long-term effects of litter size in early postnatal period on metabolism, aging and life span in rats. Arch Gerontol Geriatr 17, 65-73.
Fruhbeck, G. (2006). Intracellular signalling pathways activated by leptin. Biochem J 393, 7-20.
Fuente-Martin, E., Argente-Arizon, P., Ros, P., Argente, J., and Chowen, J.A. (2013a). Sex differences in adipose tissue: It is not only a question of quantity and distribution. Adipocyte 2, 128-134.
Fuente-Martin, E., Garcia-Caceres, C., Diaz, F., Argente-Arizon, P., Granado, M., Barrios, V., Argente, J., and Chowen, J.A. (2013b). Hypothalamic inflammation without astrogliosis in response to high sucrose intake is modulated by neonatal nutrition in male rats. Endocrinology 154, 2318-2330.
Fuente-Martin, E., Garcia-Caceres, C., Granado, M., De Ceballos, M.L., Sanchez-Garrido, M.A., Sarman, B., Liu, Z.W., Dietrich, M.O., Tena-Sempere, M., Argente-Arizon, P., Diaz, F., Argente, J., Horvath, T.L., and Chowen, J.A. (2012a). Leptin regulates glutamate and glucose transporters in hypothalamic astrocytes. J Clin Invest 122, 3900-3913.
Fuente-Martin, E., Garcia-Caceres, C., Granado, M., Sanchez-Garrido, M.A., Tena-Sempere, M., Frago, L.M., Argente, J., and Chowen, J.A. (2012b). Early postnatal overnutrition increases adipose tissue accrual in response to a sucrose-enriched diet. Am J Physiol Endocrinol Metab 302, E1586-1598.
Fuente-Martin, E., Granado, M., Garcia-Caceres, C., Sanchez-Garrido, M.A., Frago, L.M., Tena-Sempere, M., Argente, J., and Chowen, J.A. (2012c). Early nutritional changes induce sexually dimorphic long-term effects on body weight gain and the response to sucrose intake in adult rats. Metabolism 61, 812-822.
Gaikwad, S., and Agrawal-Rajput, R. (2015). Lipopolysaccharide from Rhodobacter sphaeroides Attenuates Microglia-Mediated Inflammation and Phagocytosis and Directs Regulatory T Cell Response. Int J Inflam 2015, 361326.

Bibliography
198
Galic, S., Oakhill, J.S., and Steinberg, G.R. (2010). Adipose tissue as an endocrine organ. Mol Cell Endocrinol 316, 129-139.
Gallagher, D., Visser, M., Sepulveda, D., Pierson, R.N., Harris, T., and Heymsfield, S.B. (1996). How useful is body mass index for comparison of body fatness across age, sex, and ethnic groups? Am J Epidemiol 143, 228-239.
Gambacciani, M., Ciaponi, M., Cappagli, B., Piaggesi, L., De Simone, L., Orlandi, R., and Genazzani, A.R. (1997). Body weight, body fat distribution, and hormonal replacement therapy in early postmenopausal women. J Clin Endocrinol Metab 82, 414-417.
Gao, Y., Ottaway, N., Schriever, S.C., Legutko, B., Garcia-Caceres, C., De La Fuente, E., Mergen, C., Bour, S., Thaler, J.P., Seeley, R.J., Filosa, J., Stern, J.E., Perez-Tilve, D., Schwartz, M.W., Tschop, M.H., and Yi, C.X. (2014). Hormones and diet, but not body weight, control hypothalamic microglial activity. Glia 62, 17-25.
Gao, Y.J., and Ji, R.R. (2010). Chemokines, neuronal-glial interactions, and central processing of neuropathic pain. Pharmacol Ther 126, 56-68.
García, M.A., Millán, C., Balmaceda-Aguilera, C., Castro, T., Pastor, P., Montecinos, H., Reinicke, K., Zúñiga, F., Vera, J.C., Oñate, S.A., and Nualart, F. (2003). Hypothalamic ependymal-glial cells express the glucose transporter GLUT2, a protein involved in glucose sensing. J. Neurochem. 86, 709-724.
Garcia-Caceres, C., Diz-Chaves, Y., Lagunas, N., Calmarza-Font, I., Azcoitia, I., Garcia-Segura, L.M., Frago, L.M., Argente, J., and Chowen, J.A. (2010). The weight gain response to stress during adulthood is conditioned by both sex and prenatal stress exposure. Psychoneuroendocrinology 35, 403-413.
Garcia-Caceres, C., Fuente-Martin, E., Argente, J., and Chowen, J.A. (2012). Emerging role of glial cells in the control of body weight. Mol. Metab. 1, 37-46.
Garcia-Caceres, C., Fuente-Martin, E., Burgos-Ramos, E., Granado, M., Frago, L.M., Barrios, V., Horvath, T., Argente, J., and Chowen, J.A. (2011). Differential acute and chronic effects of leptin on hypothalamic astrocyte morphology and synaptic protein levels. Endocrinology 152, 1809-1818.
Garcia-Caceres, C., Fuente-Martin, E., Diaz, F., Granado, M., Argente-Arizon, P., Frago, L.M., Freire-Regatillo, A., Barrios, V., Argente, J., and Chowen, J.A. (2014). The opposing effects of ghrelin on hypothalamic and systemic inflammatory processes are modulated by its acylation status and food intake in male rats. Endocrinology 155, 2868-2880.
Garcia-Ovejero, D., Azcoitia, I., Doncarlos, L.L., Melcangi, R.C., and Garcia-Segura, L.M. (2005). Glia-neuron crosstalk in the neuroprotective mechanisms of sex steroid hormones. Brain Res. Brain Res. Rev. 48, 273-286.
Garcia-Segura, L.M., Baetens, D., and Naftolin, F. (1986). Synaptic remodelling in arcuate nucleus after injection of estradiol valerate in adult female rats. Brain Res 366, 131-136.
Garcia-Segura, L.M., Chowen, J.A., and Naftolin, F. (1996a). Endocrine glia: roles of glial cells in the brain actions of steroid and thyroid hormones and in the regulation of hormone secretion. Front Neuroendocrinol 17, 180-211.
Garcia-Segura, L.M., Chowen, J.A., and Naftolin, F. (1996b). Endocrine glia: roles of glial cells in the brain actions of steroid and thyroid hormones and in the regulation of hormone secretion. Front. Neuroendocrinol. 17, 180-211.
Garcia-Segura, L.M., Suarez, I., Segovia, S., Tranque, P.A., Cales, J.M., Aguilera, P., Olmos, G., and Guillamon, A. (1988). The distribution of glial fibrillary acidic protein in the adult rat brain is influenced by the neonatal levels of sex steroids. Brain Res. 456, 357-363.

Bibliography
199
Garrow, J. (1988). Obesity and related diseases. London, Churchill Livingstone.
Gealekman, O., Guseva, N., Hartigan, C., Apotheker, S., Gorgoglione, M., Gurav, K., Tran, K.V., Straubhaar, J., Nicoloro, S., Czech, M.P., Thompson, M., Perugini, R.A., and Corvera, S. (2011). Depot-specific differences and insufficient subcutaneous adipose tissue angiogenesis in human obesity. Circulation 123, 186-194.
Geary, N. (1990). Pancreatic glucagon signals postprandial satiety. Neurosci Biobehav Rev 14, 323-338.
Geary, N. (2000). Estradiol and appetite. Appetite 35, 273-274.
Gellert, R.J., Lewis, J., and Petra, P.H. (1977). Neonatal treatment with sex steroids: relationship between the uterotropic response and the estrogen "receptor" in prepubertal rats. Endocrinology 100, 520-528.
Genis, L., Davila, D., Fernandez, S., Pozo-Rodrigalvarez, A., Martinez-Murillo, R., and Torres-Aleman, I. (2014). Astrocytes require insulin-like growth factor I to protect neurons against oxidative injury. F1000Res 3, 28.
Gerhart, D.Z., Leino, R.L., Borson, N.D., Taylor, W.E., Gronlund, K.M., Mccall, A.L., and Drewes, L.R. (1995). Localization of glucose transporter GLUT 3 in brain: comparison of rodent and dog using species-specific carboxyl-terminal antisera. Neuroscience 66, 237-246.
Ghilardi, N., Ziegler, S., Wiestner, A., Stoffel, R., Heim, M.H., and Skoda, R.C. (1996). Defective STAT signaling by the leptin receptor in diabetic mice. Proc Natl Acad Sci U S A 93, 6231-6235.
Glavas, M.M., Kirigiti, M.A., Xiao, X.Q., Enriori, P.J., Fisher, S.K., Evans, A.E., Grayson, B.E., Cowley, M.A., Smith, M.S., and Grove, K.L. (2010). Early Overnutrition Results in Early-Onset Arcuate Leptin Resistance and Increased Sensitivity to High-Fat Diet. Endocrinology 151, 1598-1610.
Gluckman, P.D., Lillycrop, K.A., Vickers, M.H., Pleasants, A.B., Phillips, E.S., Beedle, A.S., Burdge, G.C., and Hanson, M.A. (2007). Metabolic plasticity during mammalian development is directionally dependent on early nutritional status. Proc Natl Acad Sci U S A 104, 12796-12800.
Godfrey, K.M., and Barker, D.J. (2000). Fetal nutrition and adult disease. Am J Clin Nutr 71, 1344s-1352s.
Gomes, F.C., Paulin, D., and Moura Neto, V. (1999). Glial fibrillary acidic protein (GFAP): modulation by growth factors and its implication in astrocyte differentiation. Braz J Med Biol Res 32, 619-631.
Gonçalves, J., Ribeiro, C.F., Malva, J.O., and Silva, A.P. (2012). Protective role of neuropeptide Y Y2 receptors in cell death and microglial response following methamphetamine injury. Eur. J. Neurosci. 36, 3173-3183.
Goodpaster, B.H., Krishnaswami, S., Harris, T.B., Katsiaras, A., Kritchevsky, S.B., Simonsick, E.M., Nevitt, M., Holvoet, P., and Newman, A.B. (2005). Obesity, regional body fat distribution, and the metabolic syndrome in older men and women. Arch Intern Med 165, 777-783.
Goomer, N., Saxena, R.N., and Sheth, A.R. (1977). Effect of neonatal testosterone and oestradiol treatment on the development of the hypothalamo-hypophysial axis in the female rat. J Reprod Fertil 50, 239-243.
Gorina, R., Font-Nieves, M., Marquez-Kisinousky, L., Santalucia, T., and Planas, A.M. (2011). Astrocyte TLR4 activation induces a proinflammatory environment through the interplay between MyD88-dependent NFkappaB signaling, MAPK, and Jak1/Stat1 pathways. Glia 59, 242-255.
Goto, M., and Spitzer, J.J. (1971). Fatty acid profiles of various lipids in the cerebrospinal fluid. Proc Soc Exp Biol Med 136, 1294-1296.

Bibliography
200
Gotoh, T., and Mori, M. (2006). Nitric oxide and endoplasmic reticulum stress. Arterioscler Thromb Vasc Biol 26, 1439-1446.
Gotoh, T., Terada, K., Oyadomari, S., and Mori, M. (2004). hsp70-DnaJ chaperone pair prevents nitric oxide- and CHOP-induced apoptosis by inhibiting translocation of Bax to mitochondria. Cell Death Differ 11, 390-402.
Granado, M., Diaz, F., Fuente-Martin, E., Garcia-Caceres, C., Argente, J., and Chowen, J.A. (2014). The metabolic response to postnatal leptin in rats varies with age and may be litter dependent. Horm Metab Res 46, 462-470.
Granado, M., Garcia-Caceres, C., Fuente-Martin, E., Diaz, F., Mela, V., Viveros, M.P., Argente, J., and Chowen, J.A. (2011). Effects of acute changes in neonatal leptin levels on food intake and long-term metabolic profiles in rats. Endocrinology 152, 4116-4126.
Grayson, B.E., Allen, S.E., Billes, S.K., Williams, S.M., Smith, M.S., and Grove, K.L. (2006). Prenatal development of hypothalamic neuropeptide systems in the nonhuman primate. Neuroscience 143, 975-986.
Greenamyre, J.T., and Hastings, T.G. (2004). Biomedicine. Parkinson's--divergent causes, convergent mechanisms. Science 304, 1120-1122.
Gregor, M.F., and Hotamisligil, G.S. (2007). Thematic review series: Adipocyte Biology. Adipocyte stress: the endoplasmic reticulum and metabolic disease. J Lipid Res 48, 1905-1914.
Gregor, M.F., and Hotamisligil, G.S. (2011). Inflammatory mechanisms in obesity. Annu Rev Immunol 29, 415-445.
Griess, P. (1879). Bemerkungen zu der Abhandlung der HH. Weselsky und Benedikt „Ueber einige Azoverbind . Berichte der deutschen chemischen Gesellschaft 12, 426-428.
Grill, H.J. (2010). Leptin and the systems neuroscience of meal size control. Front Neuroendocrinol 31, 61-78.
Grossman, H.C., Hadjimarkou, M.M., Silva, R.M., Giraudo, S.Q., and Bodnar, R.J. (2003). Interrelationships between mu opioid and melanocortin receptors in mediating food intake in rats. Brain Res 991, 240-244.
Grossmann, M. (2011). Low testosterone in men with type 2 diabetes: significance and treatment. J Clin Endocrinol Metab 96, 2341-2353.
Grove, K.L., Fried, S.K., Greenberg, A.S., Xiao, X.Q., and Clegg, D.J. (2010). A microarray analysis of sexual dimorphism of adipose tissues in high-fat-diet-induced obese mice. Int J Obes (Lond) 34, 989-1000.
Grunfeld, C., Zhao, C., Fuller, J., Pollack, A., Moser, A., Friedman, J., and Feingold, K.R. (1996). Endotoxin and cytokines induce expression of leptin, the ob gene product, in hamsters. J Clin Invest 97, 2152-2157.
Guilherme, A., Virbasius, J.V., Puri, V., and Czech, M.P. (2008). Adipocyte dysfunctions linking obesity to insulin resistance and type 2 diabetes. Nat Rev Mol Cell Biol 9, 367-377.
Guillod-Maximin, E., Lorsignol, A., Alquier, T., and Penicaud, L. (2004). Acute intracarotid glucose injection towards the brain induces specific c-fos activation in hypothalamic nuclei: involvement of astrocytes in cerebral glucose-sensing in rats. J Neuroendocrinol 16, 464-471.
Gundogan, K., Bayram, F., Capak, M., Tanriverdi, F., Karaman, A., Ozturk, A., Altunbas, H., Gokce, C., Kalkan, A., and Yazici, C. (2009). Prevalence of metabolic syndrome in the Mediterranean region of

Bibliography
201
Turkey: evaluation of hypertension, diabetes mellitus, obesity, and dyslipidemia. Metab Syndr Relat Disord 7, 427-434.
Gungor, N.K. (2014). Overweight and obesity in children and adolescents. J Clin Res Pediatr Endocrinol 6, 129-143.
Guo, J., Duckles, S.P., Weiss, J.H., Li, X., and Krause, D.N. (2012). 17beta-Estradiol prevents cell death and mitochondrial dysfunction by an estrogen receptor-dependent mechanism in astrocytes after oxygen-glucose deprivation/reperfusion. Free Radic Biol Med 52, 2151-2160.
Guo, K., Mogen, J., Struzzi, S., and Zhang, Y. (2009). Preadipocyte transplantation: an in vivo study of direct leptin signaling on adipocyte morphogenesis and cell size. Am J Physiol Regul Integr Comp Physiol 296, R1339-1347.
Guo, W., Wong, S., Xie, W., Lei, T., and Luo, Z. (2007). Palmitate modulates intracellular signaling, induces endoplasmic reticulum stress, and causes apoptosis in mouse 3T3-L1 and rat primary preadipocytes. Am J Physiol Endocrinol Metab 293, E576-586.
Gupta, S., Knight, A.G., Gupta, S., Keller, J.N., and Bruce-Keller, A.J. (2012). Saturated long-chain fatty acids activate inflammatory signaling in astrocytes. J Neurochem 120, 1060-1071.
Guschin, D., Rogers, N., Briscoe, J., Witthuhn, B., Watling, D., Horn, F., Pellegrini, S., Yasukawa, K., Heinrich, P., Stark, G.R., and Et Al. (1995). A major role for the protein tyrosine kinase JAK1 in the JAK/STAT signal transduction pathway in response to interleukin-6. Embo j 14, 1421-1429.
Guzman, M., and Blazquez, C. (2001). Is there an astrocyte-neuron ketone body shuttle? Trends Endocrinol Metab 12, 169-173.
Habbout, A., Li, N., Rochette, L., and Vergely, C. (2013). Postnatal Overfeeding in Rodents by Litter Size Reduction Induces Major Short- and Long-Term Pathophysiological Consequences. The Journal of Nutrition 143, 553-562.
Hahn, T.M., Breininger, J.F., Baskin, D.G., and Schwartz, M.W. (1998). Coexpression of Agrp and NPY in fasting-activated hypothalamic neurons. Nat Neurosci 1, 271-272.
Halaas, J.L., Boozer, C., Blair-West, J., Fidahusein, N., Denton, D.A., and Friedman, J.M. (1997). Physiological response to long-term peripheral and central leptin infusion in lean and obese mice. Proc Natl Acad Sci U S A 94, 8878-8883.
Halaas, J.L., Gajiwala, K.S., Maffei, M., Cohen, S.L., Chait, B.T., Rabinowitz, D., Lallone, R.L., Burley, S.K., and Friedman, J.M. (1995). Weight-reducing effects of the plasma protein encoded by the obese gene. Science 269, 543-546.
Halford, J.C., and Blundell, J.E. (2000). Pharmacology of appetite suppression. Prog Drug Res 54, 25-58.
Hamilton, J.A., and Brunaldi, K. (2007). A model for fatty acid transport into the brain. J Mol Neurosci 33, 12-17.
Han, T.S., Tajar, A., and Lean, M.E. (2011). Obesity and weight management in the elderly. Br Med Bull 97, 169-196.
Han, T.S., Wu, F.C., and Lean, M.E. (2013). Obesity and weight management in the elderly: a focus on men. Best Pract Res Clin Endocrinol Metab 27, 509-525.
Harris, R.B., Zhou, J., Redmann, S.M., Jr., Smagin, G.N., Smith, S.R., Rodgers, E., and Zachwieja, J.J. (1998). A leptin dose-response study in obese (ob/ob) and lean (+/?) mice. Endocrinology 139, 8-19.

Bibliography
202
Harvey, J., and Ashford, M.L. (2003). Leptin in the CNS: much more than a satiety signal. Neuropharmacology 44, 845-854.
Harvey, N.C., Poole, J.R., Javaid, M.K., Dennison, E.M., Robinson, S., Inskip, H.M., Godfrey, K.M., Cooper, C., and Sayer, A.A. (2007). Parental determinants of neonatal body composition. J Clin Endocrinol Metab 92, 523-526.
Havel, P.J., Kasim-Karakas, S., Dubuc, G.R., Mueller, W., and Phinney, S.D. (1996). Gender differences in plasma leptin concentrations. Nat Med 2, 949-950.
Health, N.I.O. (2014). Methods and Techniques for Integrating the Biological Variable Sex into Preclinical Research. NIH October Workshop.
Heine, P.A., Taylor, J.A., Iwamoto, G.A., Lubahn, D.B., and Cooke, P.S. (2000). Increased adipose tissue in male and female estrogen receptor-alpha knockout mice. Proc Natl Acad Sci U S A 97, 12729-12734.
Hetherington, A., and Ranson, S. (1940). Hypothalamic lesions and adiposity in the rat. Anat Rec 78: 149.
Hetherington, A., and Ranson, S. (1942). The relation of various hypothalamic lesions to adiposity in the rat. J Comp Neurol 76: 475-499.
Hickey, M.S., Israel, R.G., Gardiner, S.N., Considine, R.V., Mccammon, M.R., Tyndall, G.L., Houmard, J.A., Marks, R.H., and Caro, J.F. (1996). Gender differences in serum leptin levels in humans. Biochem Mol Med 59, 1-6.
Hidalgo, J., Florit, S., Giralt, M., Ferrer, B., Keller, C., and Pilegaard, H. (2010). Transgenic mice with astrocyte-targeted production of interleukin-6 are resistant to high-fat diet-induced increases in body weight and body fat. Brain Behav Immun 24, 119-126.
Hirosumi, J., Tuncman, G., Chang, L., Gorgun, C.Z., Uysal, K.T., Maeda, K., Karin, M., and Hotamisligil, G.S. (2002). A central role for JNK in obesity and insulin resistance. Nature 420, 333-336.
Hoffler, U., Hobbie, K., Wilson, R., Bai, R., Rahman, A., Malarkey, D., Travlos, G., and Ghanayem, B.I. (2009). Diet-induced obesity is associated with hyperleptinemia, hyperinsulinemia, hepatic steatosis, and glomerulopathy in C57Bl/6J mice. Endocrine 36, 311-325.
Hoggard, N., Crabtree, J., Allstaff, S., Abramovich, D.R., and Haggarty, P. (2001). Leptin secretion to both the maternal and fetal circulation in the ex vivo perfused human term placenta. Placenta 22, 347-352.
Hoggard, N., Hunter, L., Duncan, J.S., Williams, L.M., Trayhurn, P., and Mercer, J.G. (1997). Leptin and leptin receptor mRNA and protein expression in the murine fetus and placenta. Proc Natl Acad Sci U S A 94, 11073-11078.
Hommel, J.D., Trinko, R., Sears, R.M., Georgescu, D., Liu, Z.W., Gao, X.B., Thurmon, J.J., Marinelli, M., and Dileone, R.J. (2006). Leptin receptor signaling in midbrain dopamine neurons regulates feeding. Neuron 51, 801-810.
Horvath, T.L. (2005). The hardship of obesity: a soft-wired hypothalamus. Nat Neurosci 8, 561-565.
Horvath, T.L., Bechmann, I., Naftolin, F., Kalra, S.P., and Leranth, C. (1997). Heterogeneity in the neuropeptide Y-containing neurons of the rat arcuate nucleus: GABAergic and non-GABAergic subpopulations. Brain Res 756, 283-286.
Horvath, T.L., Sarman, B., Garcia-Caceres, C., Enriori, P.J., Sotonyi, P., Shanabrough, M., Borok, E., Argente, J., Chowen, J.A., Perez-Tilve, D., Pfluger, P.T., Bronneke, H.S., Levin, B.E., Diano, S., Cowley, M.A.,

Bibliography
203
and Tschop, M.H. (2010). Synaptic input organization of the melanocortin system predicts diet-induced hypothalamic reactive gliosis and obesity. Proc. Natl. Acad. Sci. USA 107, 14875-14880.
Hotamisligil, G.S. (2003). Inflammatory pathways and insulin action. Int J Obes Relat Metab Disord 27 Suppl 3, S53-55.
Hotamisligil, G.S., Arner, P., Caro, J.F., Atkinson, R.L., and Spiegelman, B.M. (1995). Increased adipose tissue expression of tumor necrosis factor-alpha in human obesity and insulin resistance. J Clin Invest 95, 2409-2415.
Hotamisligil, G.S., Shargill, N.S., and Spiegelman, B.M. (1993). Adipose expression of tumor necrosis factor-alpha: direct role in obesity-linked insulin resistance. Science 259, 87-91.
Hou, M., Liu, Y., Zhu, L., Sun, B., Guo, M., Buren, J., and Li, X. (2011). Neonatal overfeeding induced by small litter rearing causes altered glucocorticoid metabolism in rats. PLoS One 6, e25726.
Houseknecht, K.L., Baile, C.A., Matteri, R.L., and Spurlock, M.E. (1998). The biology of leptin: a review. J Anim Sci 76, 1405-1420.
Hsuchou, H., He, Y., Kastin, A.J., Tu, H., Markadakis, E.N., Rogers, R.C., Fossier, P.B., and Pan, W. (2009). Obesity induces functional astrocytic leptin receptors in hypothalamus. Brain 132, 889-902.
Hu, E., Liang, P., and Spiegelman, B.M. (1996). AdipoQ is a novel adipose-specific gene dysregulated in obesity. J Biol Chem 271, 10697-10703.
Hughes, Z.A., Liu, F., Marquis, K., Muniz, L., Pangalos, M.N., Ring, R.H., Whiteside, G.T., and Brandon, N.J. (2009). Estrogen receptor neurobiology and its potential for translation into broad spectrum therapeutics for CNS disorders. Curr Mol Pharmacol 2, 215-236.
Huynh, F.K., Green, M.F., Koves, T.R., and Hirschey, M.D. (2014). Measurement of fatty acid oxidation rates in animal tissues and cell lines. Methods Enzymol 542, 391-405.
Hynes, G.R., and Jones, P.J. (2001). Leptin and its role in lipid metabolism. Curr Opin Lipidol 12, 321-327.
Ibrahim, S.H., Akazawa, Y., Cazanave, S.C., Bronk, S.F., Elmi, N.A., Werneburg, N.W., Billadeau, D.D., and Gores, G.J. (2011). Glycogen synthase kinase-3 (GSK-3) inhibition attenuates hepatocyte lipoapoptosis. J Hepatol 54, 765-772.
Ishii, Y., and Bouret, S.G. (2012). Embryonic birthdate of hypothalamic leptin-activated neurons in mice. Endocrinology 153, 3657-3667.
Isse, N., Ogawa, Y., Tamura, N., Masuzaki, H., Mori, K., Okazaki, T., Satoh, N., Shigemoto, M., Yoshimasa, Y., Nishi, S., and Et Al. (1995). Structural organization and chromosomal assignment of the human obese gene. J Biol Chem 270, 27728-27733.
Itariu, B.K., Zeyda, M., Hochbrugger, E.E., Neuhofer, A., Prager, G., Schindler, K., Bohdjalian, A., Mascher, D., Vangala, S., Schranz, M., Krebs, M., Bischof, M.G., and Stulnig, T.M. (2012). Long-chain n-3 PUFAs reduce adipose tissue and systemic inflammation in severely obese nondiabetic patients: a randomized controlled trial. Am J Clin Nutr 96, 1137-1149.
Iyer, A., Fairlie, D.P., Prins, J.B., Hammock, B.D., and Brown, L. (2010). Inflammatory lipid mediators in adipocyte function and obesity. Nat Rev Endocrinol 6, 71-82.
Jackson, A.S., Stanforth, P.R., Gagnon, J., Rankinen, T., Leon, A.S., Rao, D.C., Skinner, J.S., Bouchard, C., and Wilmore, J.H. (2002). The effect of sex, age and race on estimating percentage body fat from body mass index: The Heritage Family Study. Int J Obes Relat Metab Disord 26, 789-796.

Bibliography
204
Jager, J., Gremeaux, T., Cormont, M., Le Marchand-Brustel, Y., and Tanti, J.F. (2007). Interleukin-1beta-induced insulin resistance in adipocytes through down-regulation of insulin receptor substrate-1 expression. Endocrinology 148, 241-251.
Jaquet, D., Leger, J., Levy-Marchal, C., Oury, J.F., and Czernichow, P. (1998). Ontogeny of leptin in human fetuses and newborns: effect of intrauterine growth retardation on serum leptin concentrations. J Clin Endocrinol Metab 83, 1243-1246.
Jo, J., Gavrilova, O., Pack, S., Jou, W., Mullen, S., Sumner, A.E., Cushman, S.W., and Periwal, V. (2009). Hypertrophy and/or Hyperplasia: Dynamics of Adipose Tissue Growth. PLoS Comput Biol 5, e1000324.
Johnson, D.H., Flask, C.A., Ernsberger, P.R., Wong, W.C., and Wilson, D.L. (2008). Reproducible MRI measurement of adipose tissue volumes in genetic and dietary rodent obesity models. J Magn Reson Imaging 28, 915-927.
Jordan, S.D., Konner, A.C., and Bruning, J.C. (2010). Sensing the fuels: glucose and lipid signaling in the CNS controlling energy homeostasis. Cell Mol Life Sci 67, 3255-3273.
Jung-Testas, I., Renoir, J.M., Gasc, J.M., and Baulieu, E.E. (1991). Estrogen-inducible progesterone receptor in primary cultures of rat glial cells. Exp Cell Res 193, 12-19.
Kabbadj, K., El-Etr, M., Baulieu, E.E., and Robel, P. (1993). Pregnenolone metabolism in rodent embryonic neurons and astrocytes. Glia 7, 170-175.
Kacem, K., Lacombe, P., Seylaz, J., and Bonvento, G. (1998). Structural organization of the perivascular astrocyte endfeet and their relationship with the endothelial glucose transporter: a confocal microscopy study. Glia 23, 1-10.
Kadowaki, T., and Yamauchi, T. (2005). Adiponectin and adiponectin receptors. Endocr Rev 26, 439-451.
Kadowaki, T., Yamauchi, T., Kubota, N., Hara, K., Ueki, K., and Tobe, K. (2006). Adiponectin and adiponectin receptors in insulin resistance, diabetes, and the metabolic syndrome. J Clin Invest 116, 1784-1792.
Kahn, C.R. (1994). Banting Lecture. Insulin action, diabetogenes, and the cause of type II diabetes. Diabetes 43, 1066-1084.
Kamegai, J., Tamura, H., Shimizu, T., Ishii, S., Sugihara, H., and Wakabayashi, I. (2001). Chronic central infusion of ghrelin increases hypothalamic neuropeptide Y and Agouti-related protein mRNA levels and body weight in rats. Diabetes 50, 2438-2443.
Kanaley, J.A., Sames, C., Swisher, L., Swick, A.G., Ploutz-Snyder, L.L., Steppan, C.M., Sagendorf, K.S., Feiglin, D., Jaynes, E.B., Meyer, R.A., and Weinstock, R.S. (2001). Abdominal fat distribution in pre- and postmenopausal women: The impact of physical activity, age, and menopausal status. Metabolism 50, 976-982.
Kaneki, M., Shimizu, N., Yamada, D., and Chang, K. (2007). Nitrosative stress and pathogenesis of insulin resistance. Antioxid Redox Signal 9, 319-329.
Kang, L., Routh, V.H., Kuzhikandathil, E.V., Gaspers, L.D., and Levin, B.E. (2004). Physiological and molecular characteristics of rat hypothalamic ventromedial nucleus glucosensing neurons. Diabetes 53, 549-559.
Karaskov, E., Scott, C., Zhang, L., Teodoro, T., Ravazzola, M., and Volchuk, A. (2006). Chronic palmitate but not oleate exposure induces endoplasmic reticulum stress, which may contribute to INS-1 pancreatic beta-cell apoptosis. Endocrinology 147, 3398-3407.

Bibliography
205
Karmi, A., Iozzo, P., Viljanen, A., Hirvonen, J., Fielding, B.A., Virtanen, K., Oikonen, V., Kemppainen, J., Viljanen, T., Guiducci, L., Haaparanta-Solin, M., Nagren, K., Solin, O., and Nuutila, P. (2010). Increased brain fatty acid uptake in metabolic syndrome. Diabetes 59, 2171-2177.
Kastin, A.J., and Pan, W. (2000). Dynamic regulation of leptin entry into brain by the blood-brain barrier. Regul Pept 92, 37-43.
Katayama, T., Imaizumi, K., Manabe, T., Hitomi, J., Kudo, T., and Tohyama, M. (2004). Induction of neuronal death by ER stress in Alzheimer's disease. J Chem Neuroanat 28, 67-78.
Kawahara, K., Oyadomari, S., Gotoh, T., Kohsaka, S., Nakayama, H., and Mori, M. (2001). Induction of CHOP and apoptosis by nitric oxide in p53-deficient microglial cells. FEBS Lett 506, 135-139.
Kayser, B.D., Goran, M.I., and Bouret, S.G. (2015). Perinatal overnutrition exacerbates adipose tissue inflammation caused by high-fat feeding in C57BL/6J mice. PLoS One 10, e0121954.
Kemp, B.E., Mitchelhill, K.I., Stapleton, D., Michell, B.J., Chen, Z.P., and Witters, L.A. (1999). Dealing with energy demand: the AMP-activated protein kinase. Trends Biochem Sci 24, 22-25.
Kennedy, G.C. (1953). The role of depot fat in the hypothalamic control of food intake in the rat. Proc R Soc Lond B Biol Sci 140, 578-596.
Kern, P.A., Di Gregorio, G.B., Lu, T., Rassouli, N., and Ranganathan, G. (2003). Adiponectin expression from human adipose tissue: relation to obesity, insulin resistance, and tumor necrosis factor-alpha expression. Diabetes 52, 1779-1785.
Kersten, S., Desvergne, B., and Wahli, W. (2000). Roles of PPARs in health and disease. Nature 405, 421-424.
Kielar, D., Clark, J.S., Ciechanowicz, A., Kurzawski, G., Sulikowski, T., and Naruszewicz, M. (1998). Leptin receptor isoforms expressed in human adipose tissue. Metabolism 47, 844-847.
Kien, C.L., Bunn, J.Y., Stevens, R., Bain, J., Ikayeva, O., Crain, K., Koves, T.R., and Muoio, D.M. (2014). Dietary intake of palmitate and oleate has broad impact on systemic and tissue lipid profiles in humans. Am J Clin Nutr 99, 436-445.
Kim, E.K., Miller, I., Landree, L.E., Borisy-Rudin, F.F., Brown, P., Tihan, T., Townsend, C.A., Witters, L.A., Moran, T.H., Kuhajda, F.P., and Ronnett, G.V. (2002). Expression of FAS within hypothalamic neurons: a model for decreased food intake after C75 treatment. Am J Physiol Endocrinol Metab 283, E867-879.
Kim, J.G., Suyama, S., Koch, M., Jin, S., Argente-Arizón, P., Argente, J., Liu, Z.W., Zimmer, M.R., Jeong, J.K., Szigeti-Buck, K., Gao, Y., Garcia-Caceres, C., Yi, C.X., Salmaso, N., Vaccarino, F.M., Chowen, J., Diano, S., Dietrich, M.O., Tschop, M.H., and Horvath, T.L. (2014a). Leptin signaling in astrocytes regulates hypothalamic neuronal circuits and feeding. Nat. Neurosci. 17, 908-910.
Kim, M., Neinast, M.D., Frank, A.P., Sun, K., Park, J., Zehr, J.A., Vishvanath, L., Morselli, E., Amelotte, M., Palmer, B.F., Gupta, R.K., Scherer, P.E., and Clegg, D.J. (2014b). ERalpha upregulates Phd3 to ameliorate HIF-1 induced fibrosis and inflammation in adipose tissue. Mol Metab 3, 642-651.
Knight, Z.A., Hannan, K.S., Greenberg, M.L., and Friedman, J.M. (2010). Hyperleptinemia is required for the development of leptin resistance. PLoS One 5, e11376.
Koch, C.E., Lowe, C., Legler, K., Benzler, J., Boucsein, A., Bottiger, G., Grattan, D.R., Williams, L.M., and Tups, A. (2014). Central adiponectin acutely improves glucose tolerance in male mice. Endocrinology 155, 1806-1816.

Bibliography
206
Koch, M., Varela, L., Kim, J.G., Kim, J.D., Hernandez-Nuno, F., Simonds, S.E., Castorena, C.M., Vianna, C.R., Elmquist, J.K., Morozov, Y.M., Rakic, P., Bechmann, I., Cowley, M.A., Szigeti-Buck, K., Dietrich, M.O., Gao, X.B., Diano, S., and Horvath, T.L. (2015). Hypothalamic POMC neurons promote cannabinoid-induced feeding. Nature 519, 45-50.
Kojima, M., Hosoda, H., Date, Y., Nakazato, M., Matsuo, H., and Kangawa, K. (1999). Ghrelin is a growth-hormone-releasing acylated peptide from stomach. Nature 402, 656-660.
Koka, S., Petro, T.M., and Reinhardt, R.A. (1998). Estrogen inhibits interleukin-1beta-induced interleukin-6 production by human osteoblast-like cells. J Interferon Cytokine Res 18, 479-483.
Kong, E.H., Pike, A.C., and Hubbard, R.E. (2003). Structure and mechanism of the oestrogen receptor. Biochem Soc Trans 31, 56-59.
Konner, A.C., Klockener, T., and Bruning, J.C. (2009). Control of energy homeostasis by insulin and leptin: targeting the arcuate nucleus and beyond. Physiol Behav 97, 632-638.
Koskela, E., Mappes, T., Niskanen, T., and Rutkowska, J. (2009). Maternal investment in relation to sex ratio and offspring number in a small mammal - a case for Trivers and Willard theory? J Anim Ecol 78, 1007-1014.
Kotani, K., Tokunaga, K., Fujioka, S., Kobatake, T., Keno, Y., Yoshida, S., Shimomura, I., Tarui, S., and Matsuzawa, Y. (1994). Sexual dimorphism of age-related changes in whole-body fat distribution in the obese. Int J Obes Relat Metab Disord 18, 207-202.
Kotani, Y., Yokota, I., Kitamura, S., Matsuda, J., Naito, E., and Kuroda, Y. (2004). Plasma adiponectin levels in newborns are higher than those in adults and positively correlated with birth weight. Clin Endocrinol (Oxf) 61, 418-423.
Kow, L.M., and Pfaff, D.W. (1989). Responses of hypothalamic paraventricular neurons in vitro to norepinephrine and other feeding-relevant agents. Physiol Behav 46, 265-271.
Krul, E.S., and Tang, J. (1992). Secretion of apolipoprotein E by an astrocytoma cell line. Journal of Neuroscience Research 32, 227-238.
Kubota, N., Terauchi, Y., Miki, H., Tamemoto, H., Yamauchi, T., Komeda, K., Satoh, S., Nakano, R., Ishii, C., Sugiyama, T., Eto, K., Tsubamoto, Y., Okuno, A., Murakami, K., Sekihara, H., Hasegawa, G., Naito, M., Toyoshima, Y., Tanaka, S., Shiota, K., Kitamura, T., Fujita, T., Ezaki, O., Aizawa, S., Kadowaki, T., and Et Al. (1999). PPAR gamma mediates high-fat diet-induced adipocyte hypertrophy and insulin resistance. Mol Cell 4, 597-609.
Kuo, J., Hamid, N., Bondar, G., Dewing, P., Clarkson, J., and Micevych, P. (2010). Sex differences in hypothalamic astrocyte response to estradiol stimulation. Biol Sex Differ 1, 7.
Kurata, K., Fujimoto, K., Sakata, T., Etou, H., and Fukagawa, K. (1986). D-glucose suppression of eating after intra-third ventricle infusion in rat. Physiol Behav 37, 615-620.
Kutuzova, G.D., Albrecht, R.M., Erickson, C.M., and Qureshi, N. (2001). Diphosphoryl lipid A from Rhodobacter sphaeroides blocks the binding and internalization of lipopolysaccharide in RAW 264.7 cells. J Immunol 167, 482-489.
Kyle, U.G., and Pichard, C. (2006). The Dutch Famine of 1944-1945: a pathophysiological model of long-term consequences of wasting disease. Curr Opin Clin Nutr Metab Care 9, 388-394.
Lafrance, V., Inoue, W., Kan, B., and Luheshi, G.N. (2010). Leptin modulates cell morphology and cytokine release in microglia. Brain, Behavior, and Immunity 24, 358-365.

Bibliography
207
Landt, M., Gingerich, R.L., Havel, P.J., Mueller, W.M., Schoner, B., Hale, J.E., and Heiman, M.L. (1998). Radioimmunoassay of rat leptin: sexual dimorphism reversed from humans. Clin Chem 44, 565-570.
Lanfray, D., Arthaud, S., Ouellet, J., Compere, V., Do Rego, J.L., Leprince, J., Lefranc, B., Castel, H., Bouchard, C., Monge-Roffarello, B., Richard, D., Pelletier, G., Vaudry, H., Tonon, M.C., and Morin, F. (2013). Gliotransmission and brain glucose sensing: critical role of endozepines. Diabetes 62, 801-810.
Langub, M.C., Jr., and Watson, R.E., Jr. (1992). Estrogen receptor-immunoreactive glia, endothelia, and ependyma in guinea pig preoptic area and median eminence: electron microscopy. Endocrinology 130, 364-372.
Le Foll, C., Dunn-Meynell, A.A., Miziorko, H.M., and Levin, B.E. (2014). Regulation of hypothalamic neuronal sensing and food intake by ketone bodies and fatty acids. Diabetes 63, 1259-1269.
Lee, J.Y., Sohn, K.H., Rhee, S.H., and Hwang, D. (2001). Saturated fatty acids, but not unsaturated fatty acids, induce the expression of cyclooxygenase-2 mediated through Toll-like receptor 4. J Biol Chem 276, 16683-16689.
Lee, K., Kerner, J., and Hoppel, C.L. (2011). Mitochondrial carnitine palmitoyltransferase 1a (CPT1a) is part of an outer membrane fatty acid transfer complex. J Biol Chem 286, 25655-25662.
Lenz, K.M., and Mccarthy, M.M. (2010). Organized for sex - steroid hormones and the developing hypothalamus. Eur J Neurosci 32, 2096-2104.
Levin, B.E. (2008). Epigenetic influences on food intake and physical activity level: review of animal studies. Obesity (Silver Spring) 16 Suppl 3, S51-54.
Levin, B.E., Govek, E.K., and Dunn-Meynell, A.A. (1998). Reduced glucose-induced neuronal activation in the hypothalamus of diet-induced obese rats. Brain Res 808, 317-319.
Levin, B.E., Magnan, C., Dunn-Meynell, A., and Le Foll, C. (2011). Metabolic sensing and the brain: who, what, where, and how? Endocrinology 152, 2552-2557.
Li, J.M., Ge, C.X., Xu, M.X., Wang, W., Yu, R., Fan, C.Y., and Kong, L.D. (2014). Betaine recovers hypothalamic neural injury by inhibiting astrogliosis and inflammation in fructose-fed rats. Mol. Nutr. Food Res.
Lin, S., Thomas, T.C., Storlien, L.H., and Huang, X.F. (2000). Development of high fat diet-induced obesity and leptin resistance in C57Bl/6J mice. Int J Obes Relat Metab Disord 24, 639-646.
Linnemann, K., Malek, A., Sager, R., Blum, W.F., Schneider, H., and Fusch, C. (2000). Leptin production and release in the dually in vitro perfused human placenta. J Clin Endocrinol Metab 85, 4298-4301.
Listenberger, L.L., Ory, D.S., and Schaffer, J.E. (2001). Palmitate-induced apoptosis can occur through a ceramide-independent pathway. J. Biol. Chem. 276, 14890-14895.
Liu, M., Hurn, P.D., Roselli, C.E., and Alkayed, N.J. (2007). Role of P450 aromatase in sex-specific astrocytic cell death. J Cereb Blood Flow Metab 27, 135-141.
Liu, Z., Lim, C.Y., Su, M.Y., Soh, S.L., Shui, G., Wenk, M.R., Grove, K.L., Radda, G.K., Han, W., and Xiao, X. (2013). Neonatal overnutrition in mice exacerbates high-fat diet-induced metabolic perturbations. J Endocrinol 219, 131-143.
Long, N.M., Rule, D.C., Tuersunjiang, N., Nathanielsz, P.W., and Ford, S.P. (2015). Maternal obesity in sheep increases fatty acid synthesis, upregulates nutrient transporters, and increases adiposity in adult male offspring after a feeding challenge. PLoS One 10, e0122152.

Bibliography
208
Louwe, M.C., Van Der Hoorn, J.W., Van Den Berg, S.A., Jukema, J.W., Romijn, J.A., Van Dijk, K.W., Rensen, P.C., Smit, J.W., and Steendijk, P. (2012). Gender-dependent effects of high-fat lard diet on cardiac function in C57Bl/6J mice. Appl. Physiol. Nutr. Metab. 37, 214-224.
Lovejoy, J.C., Champagne, C.M., De Jonge, L., Xie, H., and Smith, S.R. (2008). Increased visceral fat and decreased energy expenditure during the menopausal transition. Int J Obes (Lond) 32, 949-958.
Lu, Z., Zhang, X., Li, Y., Jin, J., and Huang, Y. (2013). TLR4 antagonist reduces early-stage atherosclerosis in diabetic apolipoprotein E-deficient mice. Journal of Endocrinology 216, 61-71.
Lumey, L.H., Stein, A.D., and Susser, E. (2011). Prenatal famine and adult health. Annu Rev Public Health 32, 237-262.
Lundgren, M., Svensson, M., Lindmark, S., Renstrom, F., Ruge, T., and Eriksson, J.W. (2007). Fat cell enlargement is an independent marker of insulin resistance and 'hyperleptinaemia'. Diabetologia 50, 625-633.
Lustig, R.H., and Weiss, R. (2008). Disorders of energy balance. In: Sperling
MA (ed) Pediatric Endocrinology (third edition). Saunders
Elsevier, Philadelphia, PA 2008:788-838.
Lutz, T.A. (2010). The role of amylin in the control of energy homeostasis. Am J Physiol Regul Integr Comp Physiol 298, R1475-1484.
Macotela, Y., Boucher, J., Tran, T.T., and Kahn, C.R. (2009). Sex and depot differences in adipocyte insulin sensitivity and glucose metabolism. Diabetes 58, 803-812.
Madathil, S.K., Carlson, S.W., Brelsfoard, J.M., Ye, P., D'ercole, A.J., and Saatman, K.E. (2013). Astrocyte-Specific Overexpression of Insulin-Like Growth Factor-1 Protects Hippocampal Neurons and Reduces Behavioral Deficits following Traumatic Brain Injury in Mice. PLoS One 8, e67204.
Maffei, M., Fei, H., Lee, G.H., Dani, C., Leroy, P., Zhang, Y., Proenca, R., Negrel, R., Ailhaud, G., and Friedman, J.M. (1995a). Increased expression in adipocytes of ob RNA in mice with lesions of the hypothalamus and with mutations at the db locus. Proc Natl Acad Sci U S A 92, 6957-6960.
Maffei, M., Halaas, J., Ravussin, E., Pratley, R.E., Lee, G.H., Zhang, Y., Fei, H., Kim, S., Lallone, R., Ranganathan, S., and Et Al. (1995b). Leptin levels in human and rodent: measurement of plasma leptin and ob RNA in obese and weight-reduced subjects. Nat Med 1, 1155-1161.
Malhi, H., Bronk, S.F., Werneburg, N.W., and Gores, G.J. (2006). Free fatty acids induce JNK-dependent hepatocyte lipoapoptosis. J Biol Chem 281, 12093-12101.
Manolopoulos, K.N., Karpe, F., and Frayn, K.N. (2010). Gluteofemoral body fat as a determinant of metabolic health. Int J Obes (Lond) 34, 949-959.
Mantzoros, C.S. (1999). The role of leptin in human obesity and disease: a review of current evidence. Ann Intern Med 130, 671-680.
Mantzoros, C.S., Magkos, F., Brinkoetter, M., Sienkiewicz, E., Dardeno, T.A., Kim, S.Y., Hamnvik, O.P., and Koniaris, A. (2011). Leptin in human physiology and pathophysiology. Am J Physiol Endocrinol Metab 301, E567-584.
Manuel-Apolinar, L., Zarate, A., Rocha, L., and Hernandez, M. (2010). Fetal malnutrition affects hypothalamic leptin receptor expression after birth in male mice. Arch Med Res 41, 240-245.
Bibliography
209
Maric, G., Gazibara, T., Zaletel, I., Labudovic Borovic, M., Tomanovic, N., Ciric, M., and Puskas, N. (2014). The role of gut hormones in appetite regulation (review). Acta Physiol Hung 101, 395-407.
Markakis, E.A. (2002). Development of the neuroendocrine hypothalamus. Front Neuroendocrinol 23, 257-291.
Martínez de morentin, Pablo b., González-García, I., Martins, L., Lage, R., Fernández-Mallo, D., Martínez-Sánchez, N., Ruíz-Pino, F., Liu, J., Morgan, Donald a., Pinilla, L., Gallego, R., Saha, Asish k., Kalsbeek, A., Fliers, E., Bisschop, Peter h., Diéguez, C., Nogueiras, R., Rahmouni, K., Tena-Sempere, M., and López, M. (2014). Estradiol Regulates Brown Adipose Tissue Thermogenesis via Hypothalamic AMPK. Cell Metabolism 20, 41-53.
Martos-Moreno, G.A., and Argente, J. (2011). [Paediatric obesities: from childhood to adolescence]. An Pediatr (Barc) 75, 63 e61-23.
Marty, N., Dallaporta, M., Foretz, M., Emery, M., Tarussio, D., Bady, I., Binnert, C., Beermann, F., and Thorens, B. (2005). Regulation of glucagon secretion by glucose transporter type 2 (glut2) and astrocyte-dependent glucose sensors. J. Clin. Invest. 115, 3545-3553.
Masuzaki, H., Ogawa, Y., Sagawa, N., Hosoda, K., Matsumoto, T., Mise, H., Nishimura, H., Yoshimasa, Y., Tanaka, I., Mori, T., and Nakao, K. (1997). Nonadipose tissue production of leptin: leptin as a novel placenta-derived hormone in humans. Nat Med 3, 1029-1033.
Matzinger, D., Degen, L., Drewe, J., Meuli, J., Duebendorfer, R., Ruckstuhl, N., D'amato, M., Rovati, L., and Beglinger, C. (2000). The role of long chain fatty acids in regulating food intake and cholecystokinin release in humans. Gut 46, 688-693.
Maurel, D., Sage, D., Mekaouche, M., and Bosler, O. (2000). Glucocorticoids up-regulate the expression of glial fibrillary acidic protein in the rat suprachiasmatic nucleus. Glia 29, 212-221.
Mauvais-Jarvis, F. (2014). Developmental androgenization programs metabolic dysfunction in adult mice: Clinical implications. Adipocyte 3, 151-154.
Mayer, C.M., and Belsham, D.D. (2010). Palmitate attenuates insulin signaling and induces endoplasmic reticulum stress and apoptosis in hypothalamic neurons: rescue of resistance and apoptosis through adenosine 5' monophosphate-activated protein kinase activation. Endocrinology 151, 576-585.
Mayer, J. (1953). Glucostatic mechanism of regulation of food intake. N Engl J Med 249, 13-16.
Mccarthy, M.M. (2008). Estradiol and the developing brain. Physiol Rev 88, 91-124.
Mcgarry, J.D., Mills, S.E., Long, C.S., and Foster, D.W. (1983). Observations on the affinity for carnitine, and malonyl-CoA sensitivity, of carnitine palmitoyltransferase I in animal and human tissues. Demonstration of the presence of malonyl-CoA in non-hepatic tissues of the rat. Biochem J 214, 21-28.
Mcminn, J.E., Liu, S.M., Liu, H., Dragatsis, I., Dietrich, P., Ludwig, T., Boozer, C.N., and Chua, S.C., Jr. (2005). Neuronal deletion of Lepr elicits diabesity in mice without affecting cold tolerance or fertility. Am J Physiol Endocrinol Metab 289, E403-411.
Medrikova, D., Jilkova, Z.M., Bardova, K., Janovska, P., Rossmeisl, M., and Kopecky, J. (2012). Sex differences during the course of diet-induced obesity in mice: adipose tissue expandability and glycemic control. Int J Obes (Lond) 36, 262-272.
Medzhitov, R. (2008). Origin and physiological roles of inflammation. Nature 454, 428-435.

Bibliography
210
Mela, V., Diaz, F., Lopez-Rodriguez, A.B., Vazquez, M.J., Gertler, A., Argente, J., Tena-Sempere, M., Viveros, M.P., and Chowen, J.A. (2015). Blockage of the neonatal leptin surge affects the gene expression of growth factors, glial proteins and neuropeptides involved in the control of metabolism and reproduction in peri-pubertal male and female rats. Endocrinology, en20141981.
Mela, V., Llorente-Berzal, A., Diaz, F., Argente, J., Viveros, M.P., and Chowen, J.A. (2012). Maternal deprivation exacerbates the response to a high fat diet in a sexually dimorphic manner. PLoS One 7, e48915.
Melcangi, R.C., Celotti, F., Castano, P., and Martini, L. (1993). Differential localization of the 5 alpha-reductase and the 3 alpha-hydroxysteroid dehydrogenase in neuronal and glial cultures. Endocrinology 132, 1252-1259.
Melcangi, R.C., Magnaghi, V., Galbiati, M., and Martini, L. (2001). Glial cells: a target for steroid hormones. Prog. Brain Res. 132, 31-40.
Mendieta-Zeron, H., Lopez, M., and Dieguez, C. (2008). Gastrointestinal peptides controlling body weight homeostasis. Gen Comp Endocrinol 155, 481-495.
Meral, C., Cekmez, F., Pirgon, O., Asya Tanju, I., Metin Ipcioglu, O., Karademir, F., and Gocmen, I. (2011). The relationship between serum visfatin, adiponectin, and insulin sensitivity markers in neonates after birth. J Matern Fetal Neonatal Med 24, 166-170.
Migrenne, S., Cruciani-Guglielmacci, C., Kang, L., Wang, R., Rouch, C., Lefèvre, A.-L., Ktorza, A., Routh, V.H., Levin, B.E., and Magnan, C. (2006). Fatty Acid Signaling in the Hypothalamus and the Neural Control of Insulin Secretion. Diabetes 55, S139-S144.
Milanski, M., Degasperi, G., Coope, A., Morari, J., Denis, R., Cintra, D.E., Tsukumo, D.M., Anhe, G., Amaral, M.E., Takahashi, H.K., Curi, R., Oliveira, H.C., Carvalheira, J.B., Bordin, S., Saad, M.J., and Velloso, L.A. (2009). Saturated fatty acids produce an inflammatory response predominantly through the activation of TLR4 signaling in hypothalamus: implications for the pathogenesis of obesity. J. Neurosci. 29, 359-370.
Miller, J.C., Gnaedinger, J.M., and Rapoport, S.I. (1987). Utilization of plasma fatty acid in rat brain: distribution of [14C]palmitate between oxidative and synthetic pathways. J Neurochem 49, 1507-1514.
Minihane, A.M., Vinoy, S., Russell, W.R., Baka, A., Roche, H.M., Tuohy, K.M., Teeling, J.L., Blaak, E.E., Fenech, M., Vauzour, D., Mcardle, H.J., Kremer, B.H., Sterkman, L., Vafeiadou, K., Benedetti, M.M., Williams, C.M., and Calder, P.C. (2015). Low-grade inflammation, diet composition and health: current research evidence and its translation. Br J Nutr 114, 999-1012.
Minokoshi, Y., Alquier, T., Furukawa, N., Kim, Y.B., Lee, A., Xue, B., Mu, J., Foufelle, F., Ferre, P., Birnbaum, M.J., Stuck, B.J., and Kahn, B.B. (2004). AMP-kinase regulates food intake by responding to hormonal and nutrient signals in the hypothalamus. Nature 428, 569-574.
Miranda, K.M., Espey, M.G., and Wink, D.A. (2001). A rapid, simple spectrophotometric method for simultaneous detection of nitrate and nitrite. Nitric Oxide 5, 62-71.
Mitchell, R.W., On, N.H., Del Bigio, M.R., Miller, D.W., and Hatch, G.M. (2011). Fatty acid transport protein expression in human brain and potential role in fatty acid transport across human brain microvessel endothelial cells. J Neurochem 117, 735-746.
Mitra, S.W., Hoskin, E., Yudkovitz, J., Pear, L., Wilkinson, H.A., Hayashi, S., Pfaff, D.W., Ogawa, S., Rohrer, S.P., Schaeffer, J.M., Mcewen, B.S., and Alves, S.E. (2003). Immunolocalization of estrogen receptor beta in the mouse brain: comparison with estrogen receptor alpha. Endocrinology 144, 2055-2067.

Bibliography
211
Miyachi, Y., Nieschlag, E., and Lipsett, M.B. (1973). The Secretion of Gonadotropins and Testosterone by the Neonatal Male Rat. Endocrinology 92, 1-5.
Miyasaka, K., Kanai, S., Ohta, M., Kawanami, T., Kono, A., and Funakoshi, A. (1994). Lack of satiety effect of cholecystokinin (CCK) in a new rat model not expressing the CCK-A receptor gene. Neurosci Lett 180, 143-146.
Mizutani, T., Nishikawa, Y., Adachi, H., Enomoto, T., Ikegami, H., Kurachi, H., Nomura, T., and Miyake, A. (1994). Identification of estrogen receptor in human adipose tissue and adipocytes. J Clin Endocrinol Metab 78, 950-954.
Moller, D.E., and Flier, J.S. (1991). Insulin resistance--mechanisms, syndromes, and implications. N Engl J Med 325, 938-948.
Moncada, S., Palmer, R.M., and Higgs, E.A. (1991). Nitric oxide: physiology, pathophysiology, and pharmacology. Pharmacol Rev 43, 109-142.
Mong, J.A., Glaser, E., and Mccarthy, M.M. (1999). Gonadal steroids promote glial differentiation and alter neuronal morphology in the developing hypothalamus in a regionally specific manner. J Neurosci 19, 1464-1472.
Montague, C.T., Prins, J.B., Sanders, L., Digby, J.E., and O'rahilly, S. (1997). Depot- and sex-specific differences in human leptin mRNA expression: implications for the control of regional fat distribution. Diabetes 46, 342-347.
Moraes, J.C., Coope, A., Morari, J., Cintra, D.E., Roman, E.A., Pauli, J.R., Romanatto, T., Carvalheira, J.B., Oliveira, A.L., Saad, M.J., and Velloso, L.A. (2009). High-fat diet induces apoptosis of hypothalamic neurons. PLoS One 4, e5045.
Moran, T.H., Katz, L.F., Plata-Salaman, C.R., and Schwartz, G.J. (1998). Disordered food intake and obesity in rats lacking cholecystokinin A receptors. Am J Physiol 274, R618-625.
Moran, T.H., and Kinzig, K.P. (2004). Gastrointestinal satiety signals II. Cholecystokinin. Am J Physiol Gastrointest Liver Physiol 286, G183-188.
Morgan, K., Obici, S., and Rossetti, L. (2004). Hypothalamic responses to long-chain fatty acids are nutritionally regulated. J Biol Chem 279, 31139-31148.
Morgello, S., Uson, R.R., Schwartz, E.J., and Haber, R.S. (1995). The human blood-brain barrier glucose transporter (GLUT1) is a glucose transporter of gray matter astrocytes. Glia 14, 43-54.
Morselli, E., Frank, A.P., Palmer, B.F., Rodriguez-Navas, C., Criollo, A., and Clegg, D.J. (2015). A sexually dimorphic hypothalamic response to chronic high-fat diet consumption. Int J Obes (Lond).
Morselli, E., Fuente-Martin, E., Finan, B., Kim, M., Frank, A., and Garcia-Caceres, C. (2014). Hypothalamic PGC-1α Protects Against High-Fat Diet Exposure by Regulating ERα. Cell Reports 9, 633-645.
Muhlhausler, B.S., Duffield, J.A., and Mcmillen, I.C. (2007). Increased maternal nutrition increases leptin expression in perirenal and subcutaneous adipose tissue in the postnatal lamb. Endocrinology 148, 6157-6163.
Muller, T.D., Nogueiras, R., Andermann, M.L., Andrews, Z.B., Anker, S.D., Argente, J., Batterham, R.L., Benoit, S.C., Bowers, C.Y., Broglio, F., Casanueva, F.F., D'alessio, D., Depoortere, I., Geliebter, A., Ghigo, E., Cole, P.A., Cowley, M., Cummings, D.E., Dagher, A., Diano, S., Dickson, S.L., Dieguez, C., Granata, R., Grill, H.J., Grove, K., Habegger, K.M., Heppner, K., Heiman, M.L., Holsen, L., Holst, B., Inui, A., Jansson, J.O., Kirchner, H., Korbonits, M., Laferrere, B., Leroux, C.W., Lopez, M., Morin, S., Nakazato, M., Nass, R., Perez-Tilve, D., Pfluger, P.T., Schwartz, T.W., Seeley, R.J., Sleeman, M., Sun,

Bibliography
212
Y., Sussel, L., Tong, J., Thorner, M.O., Van Der Lely, A.J., Van Der Ploeg, L.H., Zigman, J.M., Kojima, M., Kangawa, K., Smith, R.G., Horvath, T., and Tschop, M.H. (2015). Ghrelin. Mol Metab 4, 437-460.
Musatov, S., Chen, W., Pfaff, D.W., Mobbs, C.V., Yang, X.-J., Clegg, D.J., Kaplitt, M.G., and Ogawa, S. (2007). Silencing of estrogen receptor α in the ventromedial nucleus of hypothalamus leads to metabolic syndrome. Proceedings of the National Academy of Sciences of the United States of America 104, 2501-2506.
Muzumdar, R., Ma, X., Yang, X., Atzmon, G., Bernstein, J., Karkanias, G., and Barzilai, N. (2003). Physiologic effect of leptin on insulin secretion is mediated mainly through central mechanisms. Faseb j 17, 1130-1132.
Nakatani, Y., Kaneto, H., Kawamori, D., Yoshiuchi, K., Hatazaki, M., Matsuoka, T.A., Ozawa, K., Ogawa, S., Hori, M., Yamasaki, Y., and Matsuhisa, M. (2005). Involvement of endoplasmic reticulum stress in insulin resistance and diabetes. J Biol Chem 280, 847-851.
Nakazato, M., Murakami, N., Date, Y., Kojima, M., Matsuo, H., Kangawa, K., and Matsukura, S. (2001). A role for ghrelin in the central regulation of feeding. Nature 409, 194-198.
Nascimento, L.F., Souza, G.F., Morari, J., Barbosa, G.O., Solon, C., Moura, R.F., Victorio, S.C., Ignacio-Souza, L.M., Razolli, D.S., Carvalho, H.F., and Velloso, L.A. (2015). Omega-3 fatty acids induce neurogenesis of predominantly POMC-expressing cells in the hypothalamus. Diabetes.
Nedergaard, M., Ransom, B., and Goldman, S.A. (2003). New roles for astrocytes: redefining the functional architecture of the brain. Trends Neurosci. 26, 523-530.
Nichols, N.R., Day, J.R., Laping, N.J., Johnson, S.A., and Finch, C.E. (1993). GFAP mRNA increases with age in rat and human brain. Neurobiol Aging 14, 421-429.
Nicol, L.E., Grant, W.F., Comstock, S.M., Nguyen, M.L., Smith, M.S., Grove, K.L., and Marks, D.L. (2013). Pancreatic inflammation and increased islet macrophages in insulin-resistant juvenile primates. J Endocrinol 217, 207-213.
Nimmerjahn, A., Kirchhoff, F., and Helmchen, F. (2005). Resting microglial cells are highly dynamic surveillants of brain parenchyma in vivo. Science 308, 1314-1318.
Nishizawa, H., Shimomura, I., Kishida, K., Maeda, N., Kuriyama, H., Nagaretani, H., Matsuda, M., Kondo, H., Furuyama, N., Kihara, S., Nakamura, T., Tochino, Y., Funahashi, T., and Matsuzawa, Y. (2002). Androgens decrease plasma adiponectin, an insulin-sensitizing adipocyte-derived protein. Diabetes 51, 2734-2741.
Niswender, K.D., Gallis, B., Blevins, J.E., Corson, M.A., Schwartz, M.W., and Baskin, D.G. (2003). Immunocytochemical detection of phosphatidylinositol 3-kinase activation by insulin and leptin. J Histochem Cytochem 51, 275-283.
Niswender, K.D., and Schwartz, M.W. (2003). Insulin and leptin revisited: adiposity signals with overlapping physiological and intracellular signaling capabilities. Front Neuroendocrinol 24, 1-10.
Nivoit, P., Morens, C., Van Assche, F.A., Jansen, E., Poston, L., Remacle, C., and Reusens, B. (2009). Established diet-induced obesity in female rats leads to offspring hyperphagia, adiposity and insulin resistance. Diabetologia 52, 1133-1142.
Nohara, K., Liu, S., Meyers, M.S., Waget, A., and Ferron, M. (2013a). Developmental androgen excess disrupts reproduction and energy homeostasis in adult male mice. J Endocrinol 219.

Bibliography
213
Nohara, K., Waraich, R.S., Liu, S., Ferron, M., and Waget, A. (2013b). Developmental androgen excess programs sympathetic tone and adipose tissue dysfunction and predisposes to a cardiometabolic syndrome in female mice. Am J Physiol Endocrinol Metab 304.
Nohara, K., Waraich, R.S., Liu, S., Ferron, M., Waget, A., Meyers, M.S., Karsenty, G., Burcelin, R., and Mauvais-Jarvis, F. (2013c). Developmental androgen excess programs sympathetic tone and adipose tissue dysfunction and predisposes to a cardiometabolic syndrome in female mice. Am J Physiol Endocrinol Metab 304, E1321-1330.
Nookaew, I., Svensson, P.A., Jacobson, P., Jernas, M., Taube, M., Larsson, I., Andersson-Assarsson, J.C., Sjostrom, L., Froguel, P., Walley, A., Nielsen, J., and Carlsson, L.M. (2013). Adipose tissue resting energy expenditure and expression of genes involved in mitochondrial function are higher in women than in men. J Clin Endocrinol Metab 98, E370-378.
Nov, O., Kohl, A., Lewis, E.C., Bashan, N., Dvir, I., Ben-Shlomo, S., Fishman, S., Wueest, S., Konrad, D., and Rudich, A. (2010). Interleukin-1beta may mediate insulin resistance in liver-derived cells in response to adipocyte inflammation. Endocrinology 151, 4247-4256.
O'reilly, M.W., House, P.J., and Tomlinson, J.W. (2014). Understanding androgen action in adipose tissue. J Steroid Biochem Mol Biol 143, 277-284.
Obanda, V., Omondi, G.P., and Chiyo, P.I. (2014). The influence of body mass index, age and sex on inflammatory disease risk in semi-captive Chimpanzees. PLoS One 9, e104602.
Obici, S. (2002). Central Administration of Oleic Acid Inhibits Glucose Production and Food Intake.
Ofei, F. (2005). Obesity, a preventable disease. Ghana Medical Journal.
Ogden, C.L., Yanovski, S.Z., Carroll, M.D., and Flegal, K.M. (2007). The epidemiology of obesity. Gastroenterology 132, 2087-2102.
Oh, J.W., Van Wagoner, N.J., Rose-John, S., and Benveniste, E.N. (1998). Role of IL-6 and the soluble IL-6 receptor in inhibition of VCAM-1 gene expression. J Immunol 161, 4992-4999.
Oliveira, V., Marinho, R., Vitorino, D., Santos, G.A., Moraes, J.C., Dragano, N., Sartori-Cintra, A., Pereira, L., Catharino, R.R., Da Silva, A.S., Ropelle, E.R., Pauli, J.R., De Souza, C.T., Velloso, L.A., and Cintra, D.E. (2015). Diets containing alpha-linolenic (omega 3) or oleic (omega 9) fatty acids rescues obese mice from insulin resistance. Endocrinology, en20141880.
Ollmann, M.M., Wilson, B.D., Yang, Y.K., Kerns, J.A., Chen, Y., Gantz, I., and Barsh, G.S. (1997). Antagonism of central melanocortin receptors in vitro and in vivo by agouti-related protein. Science 278, 135-138.
Olney, J.W. (1969). Brain lesions, obesity, and other disturbances in mice treated with monosodium glutamate. Science 164, 719-721.
Ongaro, L., Giovambattista, A., and Spinedi, E. (2013). Impact of neonatal manipulation of androgen receptor function on endocrine-metabolic programming in the juvenile female rat. ISRN Endocrinol 2013, 181950.
Ongaro, L., Salvetti, N.R., Giovambattista, A., Spinedi, E., and Ortega, H.H. (2015). Neonatal androgenization-induced early endocrine-metabolic and ovary misprogramming in the female rat. Life Sci 130, 66-72.
Oomura, Y., Kimura, K., Ooyama, H., Maeno, T., Iki, M., and Kuniyoshi, M. (1964). RECIPROCAL ACTIVITIES OF THE VENTROMEDIAL AND LATERAL HYPOTHALAMIC AREAS OF CATS. Science 143, 484-485.

Bibliography
214
Oomura, Y., Nakamura, T., Sugimori, M., and Yamada, Y. (1975). Effect of free fatty acid on the rat lateral hypothalamic neurons. Physiol Behav 14, 483-486.
Opie, L.H., and Walfish, P.G. (1963). Plasma Free Fatty Acid Concentrations in Obesity. New England Journal of Medicine 268, 757-760.
Osterlund, M., Kuiper, G.G., Gustafsson, J.A., and Hurd, Y.L. (1998). Differential distribution and regulation of estrogen receptor-alpha and -beta mRNA within the female rat brain. Brain Res Mol Brain Res 54, 175-180.
Osz, J., Brelivet, Y., Peluso-Iltis, C., Cura, V., Eiler, S., Ruff, M., Bourguet, W., Rochel, N., and Moras, D. (2012). Structural basis for a molecular allosteric control mechanism of cofactor binding to nuclear receptors. Proc Natl Acad Sci U S A 109, E588-594.
Owens, T. (2005). Toll-like receptors on astrocytes: patterning for immunity. J Neuroimmunol 159, 1-2.
Oyadomari, S., and Mori, M. (2004). Roles of CHOP/GADD153 in endoplasmic reticulum stress. Cell Death Differ 11, 381-389.
Ozcan, L., Ergin, A.S., Lu, A., Chung, J., Sarkar, S., Nie, D., Myers, M.G., Jr., and Ozcan, U. (2009). Endoplasmic reticulum stress plays a central role in development of leptin resistance. Cell Metab 9, 35-51.
Ozcan, U., Cao, Q., Yilmaz, E., Lee, A.H., Iwakoshi, N.N., Ozdelen, E., Tuncman, G., Gorgun, C., Glimcher, L.H., and Hotamisligil, G.S. (2004). Endoplasmic reticulum stress links obesity, insulin action, and type 2 diabetes. Science 306, 457-461.
Ozcan, U., Yilmaz, E., Ozcan, L., Furuhashi, M., Vaillancourt, E., Smith, R.O., Gorgun, C.Z., and Hotamisligil, G.S. (2006). Chemical chaperones reduce ER stress and restore glucose homeostasis in a mouse model of type 2 diabetes. Science 313, 1137-1140.
Palmer, K., and Gray, J.M. (1986). Central vs. peripheral effects of estrogen on food intake and lipoprotein lipase activity in ovariectomized rats. Physiol Behav 37, 187-189.
Pan, W., Hsuchou, H., He, Y., Sakharkar, A., Cain, C., Yu, C., and Kastin, A.J. (2008). Astrocyte leptin receptor (ObR) and leptin transport in adult-onset obese mice. Endocrinology 149, 2798-2806.
Pan, W., Hsuchou, H., Jayaram, B., Khan, R.S., Huang, E.Y., Wu, X., Chen, C., and Kastin, A.J. (2012). Leptin action on nonneuronal cells in the CNS: potential clinical applications. Ann N Y Acad Sci 1264, 64-71.
Paz-Filho, G., Mastronardi, C., Franco, C.B., Wang, K.B., Wong, M.L., and Licinio, J. (2012). Leptin: molecular mechanisms, systemic pro-inflammatory effects, and clinical implications. Arq Bras Endocrinol Metabol 56, 597-607.
Pereira, R.O., Moreira, A.S., De Carvalho, L., and Moura, A.S. (2006). Overfeeding during lactation modulates insulin and leptin signaling cascade in rats' hearts. Regul Pept 136, 117-121.
Perello, M., Castrogiovanni, D., Moreno, G., Gaillard, R.C., and Spinedi, E. (2003). Neonatal hypothalamic androgenization in the female rat induces changes in peripheral insulin sensitivity and adiposity function at adulthood. Neuro Endocrinol Lett 24, 241-248.
Peters, J.H., Simasko, S.M., and Ritter, R.C. (2006). Modulation of vagal afferent excitation and reduction of food intake by leptin and cholecystokinin. Physiol Behav 89, 477-485.
Pfaff, D., and Keiner, M. (1973). Atlas of estradiol-concentrating cells in the central nervous system of the female rat. J. Comp. Neurol. 151, 121-158.
Bibliography
215
Pines, G., Danbolt, N.C., Bjoras, M., Zhang, Y., Bendahan, A., Eide, L., Koepsell, H., Storm-Mathisen, J., Seeberg, E., and Kanner, B.I. (1992). Cloning and expression of a rat brain L-glutamate transporter. Nature 360, 464-467.
Pinto, S., Roseberry, A.G., Liu, H., Diano, S., Shanabrough, M., Cai, X., Friedman, J.M., and Horvath, T.L. (2004). Rapid rewiring of arcuate nucleus feeding circuits by leptin. Science 304, 110-115.
Pixley, S.K., and De Vellis, J. (1984). Transition between immature radial glia and mature astrocytes studied with a monoclonal antibody to vimentin. Brain Res 317, 201-209.
Plagemann, A., Harder, T., Janert, U., Rake, A., Rittel, F., Rohde, W., and Dorner, G. (1999a). Malformations of hypothalamic nuclei in hyperinsulinemic offspring of rats with gestational diabetes. Dev Neurosci 21, 58-67.
Plagemann, A., Harder, T., Rake, A., Melchior, K., Rohde, W., and Dorner, G. (1999b). Increased number of galanin-neurons in the paraventricular hypothalamic nucleus of neonatally overfed weanling rats. Brain Res 818, 160-163.
Plagemann, A., Harder, T., Rake, A., Voits, M., Fink, H., Rohde, W., and Dorner, G. (1999c). Perinatal elevation of hypothalamic insulin, acquired malformation of hypothalamic galaninergic neurons, and syndrome x-like alterations in adulthood of neonatally overfed rats. Brain Res 836, 146-155.
Plum, L., Belgardt, B.F., and Bruning, J.C. (2006). Central insulin action in energy and glucose homeostasis. J Clin Invest 116, 1761-1766.
Polonsky, K.S., Given, B.D., Hirsch, L., Shapiro, E.T., Tillil, H., Beebe, C., Galloway, J.A., Frank, B.H., Karrison, T., and Van Cauter, E. (1988). Quantitative study of insulin secretion and clearance in normal and obese subjects. J Clin Invest 81, 435-441.
Poltorak, A., He, X., Smirnova, I., Liu, M.Y., Van Huffel, C., Du, X., Birdwell, D., Alejos, E., Silva, M., Galanos, C., Freudenberg, M., Ricciardi-Castagnoli, P., Layton, B., and Beutler, B. (1998). Defective LPS signaling in C3H/HeJ and C57BL/10ScCr mice: mutations in Tlr4 gene. Science 282, 2085-2088.
Pope, G.R., Roberts, E.M., Lolait, S.J., and O'carroll, A.M. (2012). Central and peripheral apelin receptor distribution in the mouse: species differences with rat. Peptides 33, 139-148.
Posey, K.A., Clegg, D.J., Printz, R.L., Byun, J., Morton, G.J., Vivekanandan-Giri, A., Pennathur, S., Baskin, D.G., Heinecke, J.W., Woods, S.C., Schwartz, M.W., and Niswender, K.D. (2009). Hypothalamic proinflammatory lipid accumulation, inflammation, and insulin resistance in rats fed a high-fat diet. Am J Physiol Endocrinol Metab 296, E1003-1012.
Power, M.L., and Schulkin, J. (2008). Sex differences in fat storage, fat metabolism, and the health risks from obesity: possible evolutionary origins. Br J Nutr 99, 931-940.
Prevention, C.F.D.C.A. (2013). Vital signs: obesity among low-income, preschool-aged children--United States, 2008-2011. MMWR Morb Mortal Wkly Rep 62, 629-634.
Purkayastha, S., and Cai, D. (2013). Neuroinflammatory basis of metabolic syndrome. Mol Metab 2, 356-363.
Purkayastha, S., Zhang, G., and Cai, D. (2011). Uncoupling Obesity-related Hypertension by Targeting Hypothalamic IKKβ/NF-κB. Nature medicine 17, 883-887.
Qin, L., Li, G., Qian, X., Liu, Y., Wu, X., Liu, B., Hong, J.S., and Block, M.L. (2005). Interactive role of the toll-like receptor 4 and reactive oxygen species in LPS-induced microglia activation. Glia 52, 78-84.
Bibliography
216
Qiu, J., Zhang, C., Borgquist, A., Nestor, C.C., Smith, A.W., Bosch, M.A., Ku, S., Wagner, E.J., Ronnekleiv, O.K., and Kelly, M.J. (2014). Insulin excites anorexigenic proopiomelanocortin neurons via activation of canonical transient receptor potential channels. Cell Metab 19, 682-693.
Raisman, G., and Field, P.M. (1973). Sexual dimorphism in the neuropil of the preoptic area of the rat and its dependence on neonatal androgen. Brain Res 54, 1-29.
Rajala, M.W., Qi, Y., Patel, H.R., Takahashi, N., Banerjee, R., Pajvani, U.B., Sinha, M.K., Gingerich, R.L., Scherer, P.E., and Ahima, R.S. (2004). Regulation of resistin expression and circulating levels in obesity, diabetes, and fasting. Diabetes 53, 1671-1679.
Raju, T.N. (2006). A mysterious something: the discovery of insulin and the 1923 Nobel Prize for Frederick G. Banting (1891-1941) and John J.R. Macleod (1876-1935). Acta Paediatr 95, 1155-1156.
Ransom, B., Behar, T., and Nedergaard, M. (2003). New roles for astrocytes (stars at last). Trends Neurosci. 26, 520-522.
Rapoport, S.I. (1996). In vivo labeling of brain phospholipids by long-chain fatty acids: relation to turnover and function. Lipids 31 Suppl, S97-101.
Reaven, G.M., Hollenbeck, C., Jeng, C.Y., Wu, M.S., and Chen, Y.D. (1988). Measurement of plasma glucose, free fatty acid, lactate, and insulin for 24 h in patients with NIDDM. Diabetes 37, 1020-1024.
Recio-Pinto, E., Rechler, M.M., and Ishii, D.N. (1986). Effects of insulin, insulin-like growth factor-II, and nerve growth factor on neurite formation and survival in cultured sympathetic and sensory neurons. J Neurosci 6, 1211-1219.
Regnier, S.M., Kirkley, A.G., Ye, H., El-Hashani, E., Zhang, X., Neel, B.A., Kamau, W., Thomas, C.C., Williams, A.K., Hayes, E.T., Massad, N.L., Johnson, D.N., Huang, L., Zhang, C., and Sargis, R.M. (2015). Dietary exposure to the endocrine disruptor tolylfluanid promotes global metabolic dysfunction in male mice. Endocrinology 156, 896-910.
Reynolds, C.M., Gray, C., Li, M., Segovia, S.A., and Vickers, M.H. (2015a). Early Life Nutrition and Energy Balance Disorders in Offspring in Later Life. Nutrients 7, 8090-8111.
Reynolds, C.M., Vickers, M.H., Harrison, C.J., Segovia, S.A., and Gray, C. (2014). High fat and/or high salt intake during pregnancy alters maternal meta-inflammation and offspring growth and metabolic profiles. Physiol Rep 2.
Reynolds, C.M., Vickers, M.H., Harrison, C.J., Segovia, S.A., and Gray, C. (2015b). Maternal high fat and/or salt consumption induces sex-specific inflammatory and nutrient transport in the rat placenta. Physiol Rep 3.
Riediger, T., Traebert, M., Schmid, H.A., Scheel, C., Lutz, T.A., and Scharrer, E. (2003). Site-specific effects of ghrelin on the neuronal activity in the hypothalamic arcuate nucleus. Neurosci Lett 341, 151-155.
Ring, L.E., and Zeltser, L.M. (2010). Disruption of hypothalamic leptin signaling in mice leads to early-onset obesity, but physiological adaptations in mature animals stabilize adiposity levels. J Clin Invest 120, 2931-2941.
Rivest, S. (2003). Molecular insights on the cerebral innate immune system. Brain Behav Immun 17, 13-19.
Rivest, S. (2009). Regulation of innate immune responses in the brain. Nat Rev Immunol 9, 429-439.

Bibliography
217
Rodrigues, A.L., De Moura, E.G., Passos, M.C., Dutra, S.C., and Lisboa, P.C. (2009). Postnatal early overnutrition changes the leptin signalling pathway in the hypothalamic-pituitary-thyroid axis of young and adult rats. J Physiol 587, 2647-2661.
Rodrigues, A.L., De Moura, E.G., Passos, M.C., Trevenzoli, I.H., Da Conceicao, E.P., Bonono, I.T., Neto, J.F., and Lisboa, P.C. (2011). Postnatal early overfeeding induces hypothalamic higher SOCS3 expression and lower STAT3 activity in adult rats. J Nutr Biochem 22, 109-117.
Roland, A.V., Nunemaker, C.S., Keller, S.R., and Moenter, S.M. (2010). Prenatal androgen exposure programs metabolic dysfunction in female mice. J Endocrinol 207, 213-223.
Ron, D., and Walter, P. (2007). Signal integration in the endoplasmic reticulum unfolded protein response. Nat Rev Mol Cell Biol 8, 519-529.
Ropelle, E.R., Flores, M.B., Cintra, D.E., Rocha, G.Z., Pauli, J.R., Morari, J., De Souza, C.T., Moraes, J.C., Prada, P.O., Guadagnini, D., Marin, R.M., Oliveira, A.G., Augusto, T.M., Carvalho, H.F., Velloso, L.A., Saad, M.J., and Carvalheira, J.B. (2010). IL-6 and IL-10 anti-inflammatory activity links exercise to hypothalamic insulin and leptin sensitivity through IKKbeta and ER stress inhibition. PLoS Biol 8.
Roseboom, T., De Rooij, S., and Painter, R. (2006). The Dutch famine and its long-term consequences for adult health. Early Hum Dev 82, 485-491.
Roseboom, T.J., Painter, R.C., Van Abeelen, A.F., Veenendaal, M.V., and De Rooij, S.R. (2011). Hungry in the womb: what are the consequences? Lessons from the Dutch famine. Maturitas 70, 141-145.
Rosen, E.D., and Spiegelman, B.M. (2014). What we talk about when we talk about fat. Cell 156, 20-44.
Rothwell, N.J., and Hopkins, S.J. (1995). Cytokines and the nervous system II: Actions and mechanisms of action. Trends Neurosci 18, 130-136.
Rotter, V., Nagaev, I., and Smith, U. (2003). Interleukin-6 (IL-6) induces insulin resistance in 3T3-L1 adipocytes and is, like IL-8 and tumor necrosis factor-alpha, overexpressed in human fat cells from insulin-resistant subjects. J Biol Chem 278, 45777-45784.
Rottkamp, D.M., Rudenko, I.A., Maier, M.T., Roshanbin, S., Yulyaningsih, E., Perez, L., Valdearcos, M., Chua, S., Koliwad, S.K., and Xu, A.W. (2015). Leptin potentiates astrogenesis in the developing hypothalamus. Mol Metab 4, 881-889.
Saghizadeh, M., Ong, J.M., Garvey, W.T., Henry, R.R., and Kern, P.A. (1996). The expression of TNF alpha by human muscle. Relationship to insulin resistance. J Clin Invest 97, 1111-1116.
Salgado, M., Tarifeno-Saldivia, E., Ordenes, P., Millan, C., Yanez, M.J., Llanos, P., Villagra, M., Elizondo-Vega, R., Martinez, F., Nualart, F., Uribe, E., and De Los Angeles Garcia-Robles, M. (2014). Dynamic localization of glucokinase and its regulatory protein in hypothalamic tanycytes. PLoS One 9, e94035.
Samuelsson, A.M., Matthews, P.A., Argenton, M., Christie, M.R., Mcconnell, J.M., Jansen, E.H., Piersma, A.H., Ozanne, S.E., Twinn, D.F., Remacle, C., Rowlerson, A., Poston, L., and Taylor, P.D. (2008). Diet-induced obesity in female mice leads to offspring hyperphagia, adiposity, hypertension, and insulin resistance: a novel murine model of developmental programming. Hypertension 51, 383-392.
Sanchez-Garrido, M.A., Castellano, J.M., Ruiz-Pino, F., Garcia-Galiano, D., Manfredi-Lozano, M., Leon, S., Romero-Ruiz, A., Dieguez, C., Pinilla, L., and Tena-Sempere, M. (2013). Metabolic programming of puberty: sexually dimorphic responses to early nutritional challenges. Endocrinology 154, 3387-3400.

Bibliography
218
Sanchez-Garrido, M.A., Ruiz-Pino, F., Manfredi-Lozano, M., Leon, S., Garcia-Galiano, D., Castano, J.P., Luque, R.M., Romero-Ruiz, A., Castellano, J.M., Dieguez, C., Pinilla, L., and Tena-Sempere, M. (2014). Obesity-induced hypogonadism in the male: premature reproductive neuroendocrine senescence and contribution of Kiss1-mediated mechanisms. Endocrinology 155, 1067-1079.
Sanchez-Garrido, M.A., Ruiz-Pino, F., Manfredi-Lozano, M., Leon, S., Heras, V., Castellano, J.M., Castano, J.P., Luque, R.M., Vazquez, M.J., Roa, J., Romero-Ruiz, A., Dieguez, C., Pinilla, L., and Tena-Sempere, M. (2015). Metabolic and Gonadotropic Impact of Sequential Obesogenic Insults in the Female: Influence of the Loss of Ovarian Secretion. Endocrinology 156, 2984-2998.
Santos-Galindo, M., Acaz-Fonseca, E., Bellini, M.J., and Garcia-Segura, L.M. (2011). Sex differences in the inflammatory response of primary astrocytes to lipopolysaccharide. Biology of Sex Differences 2, 7-7.
Sardinha, F.L., Telles, M.M., Albuquerque, K.T., Oyama, L.M., Guimaraes, P.A., Santos, O.F., and Ribeiro, E.B. (2006). Gender difference in the effect of intrauterine malnutrition on the central anorexigenic action of insulin in adult rats. Nutrition 22, 1152-1161.
Scarpace, P.J., and Zhang, Y. (2009). Leptin resistance: a prediposing factor for diet-induced obesity. Am J Physiol Regul Integr Comp Physiol 296, R493-500.
Schafer, D.P., Lehrman, E.K., and Stevens, B. (2013). The "quad-partite" synapse: microglia-synapse interactions in the developing and mature CNS. Glia. 61, 24-36.
Schaffler, A., Scholmerich, J., and Buechler, C. (2006). The role of 'adipotropins' and the clinical importance of a potential hypothalamic-pituitary-adipose axis. Nat Clin Pract Endocrinol Metab 2, 374-383.
Schmitt, A., Asan, E., Puschel, B., and Kugler, P. (1997). Cellular and regional distribution of the glutamate transporter GLAST in the CNS of rats: nonradioactive in situ hybridization and comparative immunocytochemistry. J. Neurosci. 17, 1-10.
Schobitz, B., De Kloet, E.R., Sutanto, W., and Holsboer, F. (1993). Cellular localization of interleukin 6 mRNA and interleukin 6 receptor mRNA in rat brain. Eur J Neurosci 5, 1426-1435.
Schreiner, P.J., Terry, J.G., Evans, G.W., Hinson, W.H., Crouse, J.R., 3rd, and Heiss, G. (1996). Sex-specific associations of magnetic resonance imaging-derived intra-abdominal and subcutaneous fat areas with conventional anthropometric indices. The Atherosclerosis Risk in Communities Study. Am J Epidemiol 144, 335-345.
Schwartz, M.W., Peskind, E., Raskind, M., Boyko, E.J., and Porte, D., Jr. (1996). Cerebrospinal fluid leptin levels: relationship to plasma levels and to adiposity in humans. Nat Med 2, 589-593.
Schwartz, M.W., Woods, S.C., Porte, D., Jr., Seeley, R.J., and Baskin, D.G. (2000). Central nervous system control of food intake. Nature 404, 661-671.
Schwarz, J.M., Sholar, P.W., and Bilbo, S.D. (2012). Sex differences in microglial colonization of the developing rat brain. J. Neurochem. 120, 948-963.
Scott, M.M., Lachey, J.L., Sternson, S.M., Lee, C.E., Elias, C.F., Friedman, J.M., and Elmquist, J.K. (2009). Leptin targets in the mouse brain. J Comp Neurol 514, 518-532.
Segovia, S.A., Vickers, M.H., Gray, C., and Reynolds, C.M. (2014). Maternal obesity, inflammation, and developmental programming. Biomed Res Int 2014, 418975.
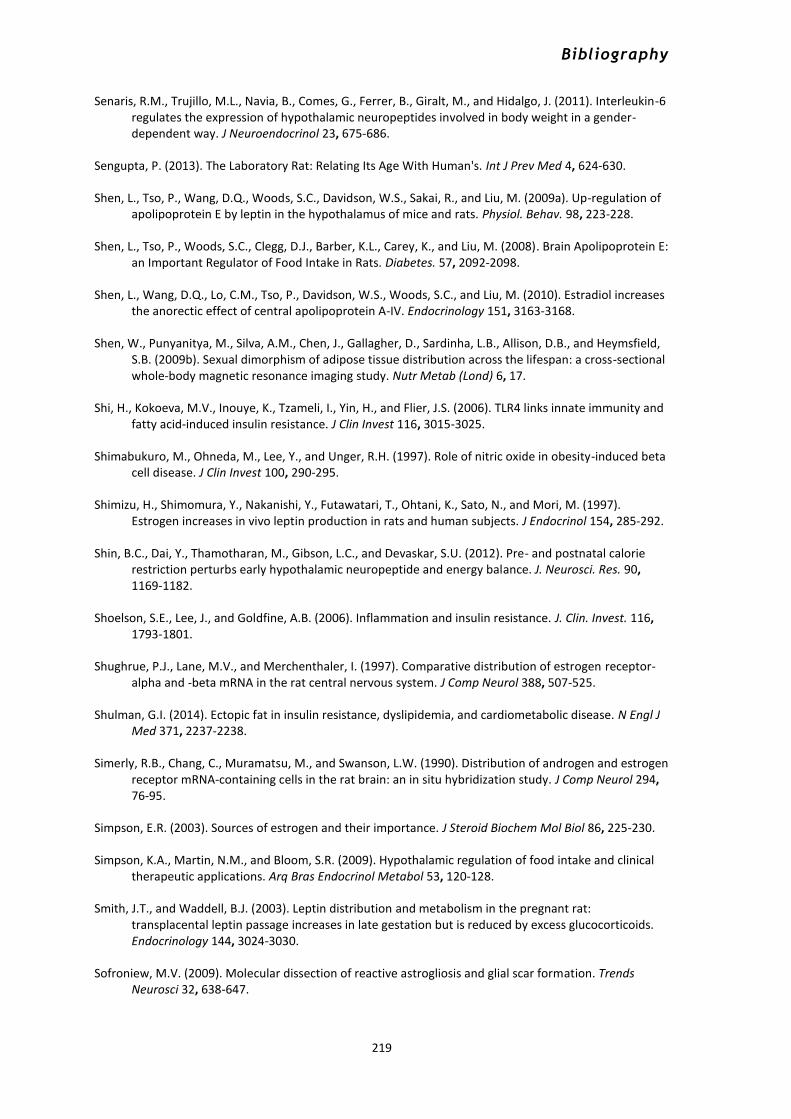
Bibliography
219
Senaris, R.M., Trujillo, M.L., Navia, B., Comes, G., Ferrer, B., Giralt, M., and Hidalgo, J. (2011). Interleukin-6 regulates the expression of hypothalamic neuropeptides involved in body weight in a gender-dependent way. J Neuroendocrinol 23, 675-686.
Sengupta, P. (2013). The Laboratory Rat: Relating Its Age With Human's. Int J Prev Med 4, 624-630.
Shen, L., Tso, P., Wang, D.Q., Woods, S.C., Davidson, W.S., Sakai, R., and Liu, M. (2009a). Up-regulation of apolipoprotein E by leptin in the hypothalamus of mice and rats. Physiol. Behav. 98, 223-228.
Shen, L., Tso, P., Woods, S.C., Clegg, D.J., Barber, K.L., Carey, K., and Liu, M. (2008). Brain Apolipoprotein E: an Important Regulator of Food Intake in Rats. Diabetes. 57, 2092-2098.
Shen, L., Wang, D.Q., Lo, C.M., Tso, P., Davidson, W.S., Woods, S.C., and Liu, M. (2010). Estradiol increases the anorectic effect of central apolipoprotein A-IV. Endocrinology 151, 3163-3168.
Shen, W., Punyanitya, M., Silva, A.M., Chen, J., Gallagher, D., Sardinha, L.B., Allison, D.B., and Heymsfield, S.B. (2009b). Sexual dimorphism of adipose tissue distribution across the lifespan: a cross-sectional whole-body magnetic resonance imaging study. Nutr Metab (Lond) 6, 17.
Shi, H., Kokoeva, M.V., Inouye, K., Tzameli, I., Yin, H., and Flier, J.S. (2006). TLR4 links innate immunity and fatty acid-induced insulin resistance. J Clin Invest 116, 3015-3025.
Shimabukuro, M., Ohneda, M., Lee, Y., and Unger, R.H. (1997). Role of nitric oxide in obesity-induced beta cell disease. J Clin Invest 100, 290-295.
Shimizu, H., Shimomura, Y., Nakanishi, Y., Futawatari, T., Ohtani, K., Sato, N., and Mori, M. (1997). Estrogen increases in vivo leptin production in rats and human subjects. J Endocrinol 154, 285-292.
Shin, B.C., Dai, Y., Thamotharan, M., Gibson, L.C., and Devaskar, S.U. (2012). Pre- and postnatal calorie restriction perturbs early hypothalamic neuropeptide and energy balance. J. Neurosci. Res. 90, 1169-1182.
Shoelson, S.E., Lee, J., and Goldfine, A.B. (2006). Inflammation and insulin resistance. J. Clin. Invest. 116, 1793-1801.
Shughrue, P.J., Lane, M.V., and Merchenthaler, I. (1997). Comparative distribution of estrogen receptor-alpha and -beta mRNA in the rat central nervous system. J Comp Neurol 388, 507-525.
Shulman, G.I. (2014). Ectopic fat in insulin resistance, dyslipidemia, and cardiometabolic disease. N Engl J Med 371, 2237-2238.
Simerly, R.B., Chang, C., Muramatsu, M., and Swanson, L.W. (1990). Distribution of androgen and estrogen receptor mRNA-containing cells in the rat brain: an in situ hybridization study. J Comp Neurol 294, 76-95.
Simpson, E.R. (2003). Sources of estrogen and their importance. J Steroid Biochem Mol Biol 86, 225-230.
Simpson, K.A., Martin, N.M., and Bloom, S.R. (2009). Hypothalamic regulation of food intake and clinical therapeutic applications. Arq Bras Endocrinol Metabol 53, 120-128.
Smith, J.T., and Waddell, B.J. (2003). Leptin distribution and metabolism in the pregnant rat: transplacental leptin passage increases in late gestation but is reduced by excess glucocorticoids. Endocrinology 144, 3024-3030.
Sofroniew, M.V. (2009). Molecular dissection of reactive astrogliosis and glial scar formation. Trends Neurosci 32, 638-647.

Bibliography
220
Song, Z., Levin, B.E., Mcardle, J.J., Bakhos, N., and Routh, V.H. (2001). Convergence of pre- and postsynaptic influences on glucosensing neurons in the ventromedial hypothalamic nucleus. Diabetes 50, 2673-2681.
Spence, R.D., Wisdom, A.J., Cao, Y., Hill, H.M., Mongerson, C.R.L., Stapornkul, B., Itoh, N., Sofroniew, M.V., and Voskuhl, R.R. (2013). Estrogen Mediates Neuroprotection and Anti-Inflammatory Effects during EAE through ERα Signaling on Astrocytes But Not through ERβ Signaling on Astrocytes or Neurons. The Journal of Neuroscience. 33, 10924-10933.
Spencer, S.J. (2012). Early life programming of obesity: the impact of the perinatal environment on the development of obesity and metabolic dysfunction in the offspring. Curr Diabetes Rev 8, 55-68.
Starkie, R., Ostrowski, S.R., Jauffred, S., Febbraio, M., and Pedersen, B.K. (2003). Exercise and IL-6 infusion inhibit endotoxin-induced TNF-alpha production in humans. Faseb j 17, 884-886.
Stefanidis, A., and Spencer, S.J. (2012). Effects of neonatal overfeeding on juvenile and adult feeding and energy expenditure in the rat. PLoS One 7, e52130.
Stein, Q.P., Mroch, A.R., De Berg, K.L., and Flanagan, J.D. (2011). The influential role of genes in obesity. S D Med Spec No, 12-15, 17.
Stephens, J.M., Lee, J., and Pilch, P.F. (1997). Tumor necrosis factor-alpha-induced insulin resistance in 3T3-L1 adipocytes is accompanied by a loss of insulin receptor substrate-1 and GLUT4 expression without a loss of insulin receptor-mediated signal transduction. J Biol Chem 272, 971-976.
Steppan, C.M., and Swick, A.G. (1999). A role for leptin in brain development. Biochem Biophys Res Commun 256, 600-602.
Stettler, N., Zemel, B.S., Kumanyika, S., and Stallings, V.A. (2002). Infant weight gain and childhood overweight status in a multicenter, cohort study. Pediatrics 109, 194-199.
Stofkova, A., Skurlova, M., Kiss, A., Zelezna, B., Zorad, S., and Jurcovicova, J. (2009). Activation of hypothalamic NPY, AgRP, MC4R, AND IL-6 mRNA levels in young Lewis rats with early-life diet-induced obesity. Endocr Regul 43, 99-106.
Stolarczyk, E., Guissard, C., Michau, A., Even, P.C., Grosfeld, A., Serradas, P., Lorsignol, A., Penicaud, L., Brot-Laroche, E., Leturque, A., and Le Gall, M. (2010). Detection of extracellular glucose by GLUT2 contributes to hypothalamic control of food intake. Am. J. Physiol. Endocrinol. Metab. 298, E1078-1087.
Stubbins, R.E., Holcomb, V.B., Hong, J., and Nunez, N.P. (2012). Estrogen modulates abdominal adiposity and protects female mice from obesity and impaired glucose tolerance. Eur J Nutr 51, 861-870.
Sullivan, E.L., Smith, M.S., and Grove, K.L. (2011). Perinatal exposure to high-fat diet programs energy balance, metabolism and behavior in adulthood. Neuroendocrinology 93, 1-8.
Sultan, A., Strodthoff, D., Robertson, A.K., Paulsson-Berne, G., Fauconnier, J., Parini, P., Ryden, M., Thierry-Mieg, N., Johansson, M.E., Chibalin, A.V., Zierath, J.R., Arner, P., and Hansson, G.K. (2009). T cell-mediated inflammation in adipose tissue does not cause insulin resistance in hyperlipidemic mice. Circ Res 104, 961-968.
Sun, B., Purcell, R.H., Terrillion, C.E., Yan, J., Moran, T.H., and Tamashiro, K.L. (2012). Maternal high-fat diet during gestation or suckling differentially affects offspring leptin sensitivity and obesity. Diabetes 61, 2833-2841.
Szegezdi, E., Logue, S.E., Gorman, A.M., and Samali, A. (2006). Mediators of endoplasmic reticulum stress-induced apoptosis. EMBO Rep 7, 880-885.

Bibliography
221
Takeda, K., and Akira, S. (2015). Toll-like receptors. Curr Protoc Immunol 109, 14.12.11-14.12.10.
Tang, C.H., Lu, D.Y., Yang, R.S., Tsai, H.Y., Kao, M.C., Fu, W.M., and Chen, Y.F. (2007). Leptin-induced IL-6 production is mediated by leptin receptor, insulin receptor substrate-1, phosphatidylinositol 3-kinase, Akt, NF-kappaB, and p300 pathway in microglia. J. Immunol. 179, 1292-1302.
Tang, Y., and Cai, D. (2013). Hypothalamic inflammation and GnRH in aging development. Cell Cycle 12, 2711-2712.
Tang, Y., Purkayastha, S., and Cai, D. (2015). Hypothalamic microinflammation: a common basis of metabolic syndrome and aging. Trends Neurosci 38, 36-44.
Tannenbaum, B.M., Brindley, D.N., Tannenbaum, G.S., Dallman, M.F., Mcarthur, M.D., and Meaney, M.J. (1997). High-fat feeding alters both basal and stress-induced hypothalamic-pituitary-adrenal activity in the rat. Am J Physiol 273, E1168-1177.
Tanti, J.F., and Jager, J. (2009). Cellular mechanisms of insulin resistance: role of stress-regulated serine kinases and insulin receptor substrates (IRS) serine phosphorylation. Curr Opin Pharmacol 9, 753-762.
Tapia-González, S., García-Segura, L.M., Tena-Sempere, M., Frago, L.M., Castellano, J.M., Fuente-Martín, E., García-Cáceres, C., Argente, J., and Chowen, J.A. (2011). Activation of microglia in specific hypothalamic nuclei and the cerebellum of adult rats exposed to neonatal overnutrition. J. Neuroendocrinol. 23, 365-370.
Tartaglia, L.A. (1997). The leptin receptor. J Biol Chem 272, 6093-6096.
Tartaglia, L.A., Dembski, M., Weng, X., Deng, N., Culpepper, J., Devos, R., Richards, G.J., Campfield, L.A., Clark, F.T., Deeds, J., Muir, C., Sanker, S., Moriarty, A., Moore, K.J., Smutko, J.S., Mays, G.G., Wool, E.A., Monroe, C.A., and Tepper, R.I. (1995). Identification and expression cloning of a leptin receptor, OB-R. Cell 83, 1263-1271.
Tarttelin, M.F., and Gorski, R.A. (1971). Variations in food and water intake in the normal and acyclic female rat. Physiol Behav 7, 847-852.
Tatemoto, K., Carlquist, M., and Mutt, V. (1982). Neuropeptide Y--a novel brain peptide with structural similarities to peptide YY and pancreatic polypeptide. Nature 296, 659-660.
Taylor, R.W., Grant, A.M., Williams, S.M., and Goulding, A. (2010). Sex differences in regional body fat distribution from pre- to postpuberty. Obesity (Silver Spring) 18, 1410-1416.
Teixeira, C., Passos, M., Ramos, C., Dutra, S., and Moura, E. (2002). Leptin serum concentration, food intake and body weight in rats whose mothers were exposed to malnutrition during lactation. J Nutr Biochem 13, 493.
Tena-Sempere, M., Manna, P.R., Zhang, F.P., Pinilla, L., Gonzalez, L.C., Dieguez, C., Huhtaniemi, I., and Aguilar, E. (2001). Molecular mechanisms of leptin action in adult rat testis: potential targets for leptin-induced inhibition of steroidogenesis and pattern of leptin receptor messenger ribonucleic acid expression. J Endocrinol 170, 413-423.
Thaler, J.P., Guyenet, S.J., Dorfman, M.D., Wisse, B.E., and Schwartz, M.W. (2013). Hypothalamic inflammation: marker or mechanism of obesity pathogenesis? Diabetes 62, 2629-2634.
Thaler, J.P., and Schwartz, M.W. (2010). Minireview: Inflammation and obesity pathogenesis: the hypothalamus heats up. Endocrinology 151, 4109-4115.

Bibliography
222
Thaler, J.P., Yi, C.X., Schur, E.A., Guyenet, S.J., Hwang, B.H., Dietrich, M.O., Zhao, X., Sarruf, D.A., Izgur, V., Maravilla, K.R., Nguyen, H.T., Fischer, J.D., Matsen, M.E., Wisse, B.E., Morton, G.J., Horvath, T.L., Baskin, D.G., Tschop, M.H., and Schwartz, M.W. (2012). Obesity is associated with hypothalamic injury in rodents and humans. J. Clin. Invest. 122, 153-162.
Theodosis, D.T., Poulain, D.A., and Oliet, S.H. (2008). Activity-dependent structural and functional plasticity of astrocyte-neuron interactions. Physiol. Rev. 88, 983-1008.
Tibu, F., Hill, J., Sharp, H., Marshall, K., Glover, V., and Pickles, A. (2014). Evidence for sex differences in fetal programming of physiological stress reactivity in infancy. Dev Psychopathol 26, 879-888.
Tilg, H., Trehu, E., Atkins, M.B., Dinarello, C.A., and Mier, J.W. (1994). Interleukin-6 (IL-6) as an anti-inflammatory cytokine: induction of circulating IL-1 receptor antagonist and soluble tumor necrosis factor receptor p55. Blood 83, 113-118.
Toran-Allerand, C.D., Bentham, W., Miranda, R.C., and Anderson, J.P. (1991). Insulin influences astroglial morphology and glial fibrillary acidic protein (GFAP) expression in organotypic cultures. Brain Res 558, 296-304.
Toste, F.P., De Moura, E.G., Lisboa, P.C., Fagundes, A.T., De Oliveira, E., and Passos, M.C. (2006). Neonatal leptin treatment programmes leptin hypothalamic resistance and intermediary metabolic parameters in adult rats. Br J Nutr 95, 830-837.
Tran, T.T., Yamamoto, Y., Gesta, S., and Kahn, C.R. (2008). Beneficial effects of subcutaneous fat transplantation on metabolism. Cell Metab 7, 410-420.
Tsacopoulos, M., and Magistretti, P.J. (1996). Metabolic coupling between glia and neurons. J. Neurosci. 16, 877-885.
Tsai, P.J., Yu, C.H., Hsu, S.P., Lee, Y.H., Chiou, C.H., Hsu, Y.W., Ho, S.C., and Chu, C.H. (2004). Cord plasma concentrations of adiponectin and leptin in healthy term neonates: positive correlation with birthweight and neonatal adiposity. Clin Endocrinol (Oxf) 61, 88-93.
Tschop, M., Smiley, D.L., and Heiman, M.L. (2000). Ghrelin induces adiposity in rodents. Nature 407, 908-913.
Tsuchida, A., Yamauchi, T., Takekawa, S., Hada, Y., Ito, Y., Maki, T., and Kadowaki, T. (2005). Peroxisome proliferator-activated receptor (PPAR)alpha activation increases adiponectin receptors and reduces obesity-related inflammation in adipose tissue: comparison of activation of PPARalpha, PPARgamma, and their combination. Diabetes 54, 3358-3370.
Tu, Y.F., Tsai, Y.S., Wang, L.W., Wu, H.C., Huang, C.C., and Ho, C.J. (2011). Overweight worsens apoptosis, neuroinflammation and blood-brain barrier damage after hypoxic ischemia in neonatal brain through JNK hyperactivation. J. Neuroinflammation. 8, 40.
Tweedle, C.D., and Hatton, G.I. (1977). Ultrastructural changes in rat hypothalamic neurosecretory cells and their associated glia during minimal dehydration and rehydration. Cell Tissue Res 181, 59-72.
Udagawa, J., Hashimoto, R., Suzuki, H., Hatta, T., Sotomaru, Y., Hioki, K., Kagohashi, Y., Nomura, T., Minami, Y., and Otani, H. (2006). The role of leptin in the development of the cerebral cortex in mouse embryos. Endocrinology 147, 647-658.
Unger, J., Mcneill, T.H., Moxley, R.T., 3rd, White, M., Moss, A., and Livingston, J.N. (1989). Distribution of insulin receptor-like immunoreactivity in the rat forebrain. Neuroscience 31, 143-157.

Bibliography
223
Uotani, S., Bjorbaek, C., Tornoe, J., and Flier, J.S. (1999). Functional properties of leptin receptor isoforms: internalization and degradation of leptin and ligand-induced receptor downregulation. Diabetes 48, 279-286.
Uysal, K.T., Wiesbrock, S.M., Marino, M.W., and Hotamisligil, G.S. (1997). Protection from obesity-induced insulin resistance in mice lacking TNF-alpha function. Nature 389, 610-614.
Vaisse, C., Halaas, J.L., Horvath, C.M., Darnell, J.E., Jr., Stoffel, M., and Friedman, J.M. (1996). Leptin activation of Stat3 in the hypothalamus of wild-type and ob/ob mice but not db/db mice. Nat Genet 14, 95-97.
Valdearcos, M., Robblee, M.M., Benjamin, D.I., Nomura, D.K., Xu, A.W., and Koliwad, S.K. (2014). Microglia dictate the impact of saturated fat consumption on hypothalamic inflammation and neuronal function. Cell Rep 9, 2124-2138.
Valdearcos, M., Xu, A.W., and Koliwad, S.K. (2015). Hypothalamic inflammation in the control of metabolic function. Annu Rev Physiol 77, 131-160.
Valenciano, A.I., Corrochano, S., De Pablo, F., De La Villa, P., and De La Rosa, E.J. (2006). Proinsulin/insulin is synthesized locally and prevents caspase- and cathepsin-mediated cell death in the embryonic mouse retina. J Neurochem 99, 524-536.
Vallabhapurapu, S., and Karin, M. (2009). Regulation and function of NF-kappaB transcription factors in the immune system. Annu Rev Immunol 27, 693-733.
Van Heek, M., Compton, D.S., France, C.F., Tedesco, R.P., Fawzi, A.B., Graziano, M.P., Sybertz, E.J., Strader, C.D., and Davis, H.R., Jr. (1997). Diet-induced obese mice develop peripheral, but not central, resistance to leptin. J Clin Invest 99, 385-390.
Van Houten, M., Posner, B.I., Kopriwa, B.M., and Brawer, J.R. (1979). Insulin-binding sites in the rat brain: in vivo localization to the circumventricular organs by quantitative radioautography. Endocrinology 105, 666-673.
Van Noort, J.M., and Bsibsi, M. (2009). Toll-like receptors in the CNS: implications for neurodegeneration and repair. Prog Brain Res 175, 139-148.
Van Pelt, R.E., Evans, E.M., Schechtman, K.B., Ehsani, A.A., and Kohrt, W.M. (2002). Contributions of total and regional fat mass to risk for cardiovascular disease in older women. Am J Physiol Endocrinol Metab 282, E1023-1028.
Van Wagoner, N.J., and Benveniste, E.N. (1999). Interleukin-6 expression and regulation in astrocytes. J Neuroimmunol 100, 124-139.
Van Wagoner, N.J., Oh, J.W., Repovic, P., and Benveniste, E.N. (1999). Interleukin-6 (IL-6) production by astrocytes: autocrine regulation by IL-6 and the soluble IL-6 receptor. J Neurosci 19, 5236-5244.
Vannucci, S.J., Maher, F., and Simpson, I.A. (1997). Glucose transporter proteins in brain: delivery of glucose to neurons and glia. Glia 21, 2-21.
Velkoska, E., Cole, T.J., and Morris, M.J. (2005). Early dietary intervention: long-term effects on blood pressure, brain neuropeptide Y, and adiposity markers. Am J Physiol Endocrinol Metab 288, E1236-1243.
Vickers, M.H., Gluckman, P.D., Coveny, A.H., Hofman, P.L., Cutfield, W.S., Gertler, A., Breier, B.H., and Harris, M. (2005). Neonatal leptin treatment reverses developmental programming. Endocrinology 146, 4211-4216.

Bibliography
224
Vida, M., Gavito, A.L., Pavón, F.J., Bautista, D., Serrano, A., Suarez, J., Arrabal, S., Decara, J., Romero-Cuevas, M., Rodríguez De Fonseca, F., and Baixeras, E. (2015). Chronic administration of recombinant IL-6 upregulates lipogenic enzyme expression and aggravates high-fat-diet-induced steatosis in IL-6-deficient mice. Disease Models & Mechanisms 8, 721-731.
Vielkind, U., Walencewicz, A., Levine, J.M., and Bohn, M.C. (1990). Type II glucocorticoid receptors are expressed in oligodendrocytes and astrocytes. J. Neurosci. Res. 27, 360-373.
Viner, R.M., and Cole, T.J. (2006). Who changes body mass between adolescence and adulthood? Factors predicting change in BMI between 16 year and 30 years in the 1970 British Birth Cohort. Int J Obes (Lond) 30, 1368-1374.
Vogt, M.C., and Bruning, J.C. (2013). CNS insulin signaling in the control of energy homeostasis and glucose metabolism - from embryo to old age. Trends Endocrinol Metab 24, 76-84.
Vogt, M.C., Paeger, L., Hess, S., Steculorum, S.M., Awazawa, M., Hampel, B., Neupert, S., Nicholls, H.T., Mauer, J., Hausen, A.C., Predel, R., Kloppenburg, P., Horvath, T.L., and Bruning, J.C. (2014). Neonatal insulin action impairs hypothalamic neurocircuit formation in response to maternal high-fat feeding. Cell 156, 495-509.
Wajchenberg, B.L. (2000). Subcutaneous and visceral adipose tissue: their relation to the metabolic syndrome. Endocr Rev 21, 697-738.
Waki, H., Yamauchi, T., Kamon, J., Ito, Y., Uchida, S., Kita, S., Hara, K., Hada, Y., Vasseur, F., Froguel, P., Kimura, S., Nagai, R., and Kadowaki, T. (2003). Impaired multimerization of human adiponectin mutants associated with diabetes. Molecular structure and multimer formation of adiponectin. J Biol Chem 278, 40352-40363.
Wallenius, V., Wallenius, K., Ahren, B., Rudling, M., Carlsten, H., Dickson, S.L., Ohlsson, C., and Jansson, J.O. (2002). Interleukin-6-deficient mice develop mature-onset obesity. Nat Med 8, 75-79.
Wang, C., Jie, C., and Dai, X. (2014a). Possible roles of astrocytes in estrogen neuroprotection during cerebral ischemia. Rev Neurosci 25, 255-268.
Wang, H., Brown, J., and Martin, M. (2011). Glycogen synthase kinase 3: a point of convergence for the host inflammatory response. Cytokine 53, 130-140.
Wang, Q., Liu, C., Uchida, A., Chuang, J.C., Walker, A., Liu, T., Osborne-Lawrence, S., Mason, B.L., Mosher, C., Berglund, E.D., Elmquist, J.K., and Zigman, J.M. (2014b). Arcuate AgRP neurons mediate orexigenic and glucoregulatory actions of ghrelin. Mol Metab 3, 64-72.
Wang, Q.A., Tao, C., Gupta, R.K., and Scherer, P.E. (2013). Tracking adipogenesis during white adipose tissue development, expansion and regeneration. Nat Med 19, 1338-1344.
Wang, R., Liu, X., Hentges, S.T., Dunn-Meynell, A.A., Levin, B.E., Wang, W., and Routh, V.H. (2004). The regulation of glucose-excited neurons in the hypothalamic arcuate nucleus by glucose and feeding-relevant peptides. Diabetes 53, 1959-1965.
Wang, S.W., Wang, M., Grossman, B.M., and Martin, R.J. (1994). Effects of dietary fat on food intake and brain uptake and oxidation of fatty acids. Physiol Behav 56, 517-522.
Wang, X., Ge, A., Cheng, M., Guo, F., Zhao, M., Zhou, X., Liu, L., and Yang, N. (2012). Increased hypothalamic inflammation associated with the susceptibility to obesity in rats exposed to high-fat diet. Exp Diabetes Res 2012, 847246.
Wang, Y., Hsuchou, H., He, Y., Kastin, A.J., and Pan, W. (2015). Role of Astrocytes in Leptin Signaling. J Mol Neurosci.

Bibliography
225
Wang, Y., Jin, S., Sonobe, Y., Cheng, Y., Horiuchi, H., Parajuli, B., Kawanokuchi, J., Mizuno, T., Takeuchi, H., and Suzumura, A. (2014c). Interleukin-1beta induces blood-brain barrier disruption by downregulating sonic hedgehog in astrocytes. PLoS One 9, e110024.
Weisberg, S.P., Mccann, D., Desai, M., Rosenbaum, M., Leibel, R.L., and Ferrante, A.W., Jr. (2003). Obesity is associated with macrophage accumulation in adipose tissue. J Clin Invest 112, 1796-1808.
Weiss, R. (2007a). Fat distribution and storage: how much, where, and how? Eur J Endocrinol 157 Suppl 1, S39-45.
Weiss, R. (2007b). Impaired glucose tolerance and risk factors for progression to type 2 diabetes in youth. Pediatr Diabetes 8 Suppl 9, 70-75.
White, M.F. (2003). Insulin signaling in health and disease. Science 302, 1710-1711.
White, U.A., and Tchoukalova, Y.D. (2014). Sex dimorphism and depot differences in adipose tissue function. Biochim Biophys Acta 1842, 377-392.
Who (1995). Physical status: the use and interpretation of anthropometry. Report of a WHO Expert Committee. World Health Organ Tech Rep Ser 854, 1-452.
Who (2015). Obesity and overweight. Geneva, World Health Organization Technical Report Series Fact sheet N°311.
Wiedmer, P., Klaus, S., and Ortmann, S. (2002). Energy metabolism of young rats after early postnatal overnutrition. Br J Nutr 88, 301-306.
Wolf, A.M., Wolf, D., Rumpold, H., Enrich, B., and Tilg, H. (2004). Adiponectin induces the anti-inflammatory cytokines IL-10 and IL-1RA in human leukocytes. Biochem Biophys Res Commun 323, 630-635.
Wong, S., and Pinkney, J. (2004). Role of cytokines in regulating feeding behaviour. Curr Drug Targets 5, 251-263.
Woods, S.C., Lotter, E.C., Mckay, L.D., and Porte, D., Jr. (1979). Chronic intracerebroventricular infusion of insulin reduces food intake and body weight of baboons. Nature 282, 503-505.
Woods, S.C., Lutz, T.A., Geary, N., and Langhans, W. (2006). Pancreatic signals controlling food intake; insulin, glucagon and amylin. Philos Trans R Soc Lond B Biol Sci 361, 1219-1235.
Woods, S.C., Stein, L.J., Mckay, L.D., and Porte, D., Jr. (1984). Suppression of food intake by intravenous nutrients and insulin in the baboon. Am J Physiol 247, R393-401.
Wootz, H., Hansson, I., Korhonen, L., Napankangas, U., and Lindholm, D. (2004). Caspase-12 cleavage and increased oxidative stress during motoneuron degeneration in transgenic mouse model of ALS. Biochem Biophys Res Commun 322, 281-286.
Wozniak, M., Rydzewski, B., Baker, S.P., and Raizada, M.K. (1993). The cellular and physiological actions of insulin in the central nervous system. Neurochem Int 22, 1-10.
Wren, A.M., Seal, L.J., Cohen, M.A., Brynes, A.E., Frost, G.S., Murphy, K.G., Dhillo, W.S., Ghatei, M.A., and Bloom, S.R. (2001). Ghrelin enhances appetite and increases food intake in humans. J Clin Endocrinol Metab 86, 5992.
Wu, Q., Howell, M.P., and Palmiter, R.D. (2008). Ablation of neurons expressing agouti-related protein activates fos and gliosis in postsynaptic target regions. J Neurosci 28, 9218-9226.

Bibliography
226
Xiao, J., Wang, N.L., Sun, B., and Cai, G.P. (2010). Estrogen receptor mediates the effects of pseudoprotodiocsin on adipogenesis in 3T3-L1 cells. Am J Physiol Cell Physiol 299, C128-138.
Xu, A., Chan, K.W., Hoo, R.L., Wang, Y., Tan, K.C., Zhang, J., Chen, B., Lam, M.C., Tse, C., Cooper, G.J., and Lam, K.S. (2005). Testosterone selectively reduces the high molecular weight form of adiponectin by inhibiting its secretion from adipocytes. J Biol Chem 280, 18073-18080.
Xu, Y., Nedungadi, T.P., Zhu, L., Sobhani, N., Irani, B.G., Davis, K.E., Zhang, X., Zou, F., Gent, L.M., Hahner, L.D., Khan, S.A., Elias, C.F., Elmquist, J.K., and Clegg, D.J. (2011). Distinct Hypothalamic Neurons Mediate Estrogenic Effects on Energy Homeostasis and Reproduction. Cell metabolism 14, 453-465.
Yamauchi, T., Kamon, J., Ito, Y., Tsuchida, A., Yokomizo, T., Kita, S., Sugiyama, T., Miyagishi, M., Hara, K., Tsunoda, M., Murakami, K., Ohteki, T., Uchida, S., Takekawa, S., Waki, H., Tsuno, N.H., Shibata, Y., Terauchi, Y., Froguel, P., Tobe, K., Koyasu, S., Taira, K., Kitamura, T., Shimizu, T., Nagai, R., and Kadowaki, T. (2003). Cloning of adiponectin receptors that mediate antidiabetic metabolic effects. Nature 423, 762-769.
Yamauchi, T., Kamon, J., Minokoshi, Y., Ito, Y., Waki, H., Uchida, S., Yamashita, S., Noda, M., Kita, S., Ueki, K., Eto, K., Akanuma, Y., Froguel, P., Foufelle, F., Ferre, P., Carling, D., Kimura, S., Nagai, R., Kahn, B.B., and Kadowaki, T. (2002). Adiponectin stimulates glucose utilization and fatty-acid oxidation by activating AMP-activated protein kinase. Nat Med 8, 1288-1295.
Yamauchi, T., Kamon, J., Waki, H., Terauchi, Y., Kubota, N., Hara, K., Mori, Y., Ide, T., Murakami, K., Tsuboyama-Kasaoka, N., Ezaki, O., Akanuma, Y., Gavrilova, O., Vinson, C., Reitman, M.L., Kagechika, H., Shudo, K., Yoda, M., Nakano, Y., Tobe, K., Nagai, R., Kimura, S., Tomita, M., Froguel, P., and Kadowaki, T. (2001). The fat-derived hormone adiponectin reverses insulin resistance associated with both lipoatrophy and obesity. Nat Med 7, 941-946.
Yamauchi, T., Nio, Y., Maki, T., Kobayashi, M., Takazawa, T., Iwabu, M., Okada-Iwabu, M., Kawamoto, S., Kubota, N., Kubota, T., Ito, Y., Kamon, J., Tsuchida, A., Kumagai, K., Kozono, H., Hada, Y., Ogata, H., Tokuyama, K., Tsunoda, M., Ide, T., Murakami, K., Awazawa, M., Takamoto, I., Froguel, P., Hara, K., Tobe, K., Nagai, R., Ueki, K., and Kadowaki, T. (2007). Targeted disruption of AdipoR1 and AdipoR2 causes abrogation of adiponectin binding and metabolic actions. Nat Med 13, 332-339.
Yan, J., Zhang, H., Yin, Y., Li, J., Tang, Y., Purkayastha, S., Li, L., and Cai, D. (2014). Obesity- and aging-induced excess of central transforming growth factor-beta potentiates diabetic development via an RNA stress response. Nat Med 20, 1001-1008.
Ye, Z., Huang, Y., Liu, D., Chen, X., Wang, D., Huang, D., Zhao, L., and Xiao, X. (2012). Obesity induced by neonatal overfeeding worsens airway hyperresponsiveness and inflammation. PLoS One 7, e47013.
Yi, C.X., Al-Massadi, O., Donelan, E., Lehti, M., Weber, J., Ress, C., Trivedi, C., Müller, T.D., Woods, S.C., and Hofmann, S.M. (2012). Exercise protects against high-fat diet-induced hypothalamic inflammation. Physiology & Behavior 106, 485-490.
Yi, C.X., Habegger, K.M., Chowen, J.A., Stern, J., and Tschop, M.H. (2011). A role for astrocytes in the central control of metabolism. Neuroendocrinology 93, 143-149.
Young, J.K., Mckenzie, J.C., Brady, L.S., and Herkenham, M. (1994). Hypothalamic lesions increase levels of neuropeptide Y mRNA in the arcuate nucleus of mice. Neurosci Lett 165, 13-17.
Yu, Z., Han, S., Zhu, J., Sun, X., Ji, C., and Guo, X. (2013). Pre-pregnancy body mass index in relation to infant birth weight and offspring overweight/obesity: a systematic review and meta-analysis. PLoS One 8, e61627.
Bibliography
227
Yuan, Q., Zhao, S., Wang, F., Zhang, H., Chen, Z.J., Wang, J., Wang, Z., Du, Z., Ling, E.A., Liu, Q., and Hao, A. (2013). Palmitic acid increases apoptosis of neural stem cells via activating c-Jun N-terminal kinase. Stem Cell Res 10, 257-266.
Yue, J.T., and Lam, T.K. (2012). Lipid sensing and insulin resistance in the brain. Cell Metab 15, 646-655.
Zhang, F., Basinski, M.B., Beals, J.M., Briggs, S.L., Churgay, L.M., Clawson, D.K., Dimarchi, R.D., Furman, T.C., Hale, J.E., Hsiung, H.M., Schoner, B.E., Smith, D.P., Zhang, X.Y., Wery, J.P., and Schevitz, R.W. (1997). Crystal structure of the obese protein leptin-E100. Nature 387, 206-209.
Zhang, G., Li, J., Purkayastha, S., Tang, Y., Zhang, H., Yin, Y., Li, B., Liu, G., and Cai, D. (2013). Hypothalamic programming of systemic ageing involving IKK-beta, NF-kappaB and GnRH. Nature 497, 211-216.
Zhang, J., Dawson, V.L., Dawson, T.M., and Snyder, S.H. (1994a). Nitric oxide activation of poly(ADP-ribose) synthetase in neurotoxicity. Science 263, 687-689.
Zhang, J.J., Zhao, Y., Chait, B.T., Lathem, W.W., Ritzi, M., Knippers, R., and Darnell, J.E., Jr. (1998). Ser727-dependent recruitment of MCM5 by Stat1alpha in IFN-gamma-induced transcriptional activation. Embo j 17, 6963-6971.
Zhang, Q.G., Wang, R., Tang, H., Dong, Y., Chan, A., Sareddy, G.R., Vadlamudi, R.K., and Brann, D.W. (2014). Brain-derived estrogen exerts anti-inflammatory and neuroprotective actions in the rat hippocampus. Mol Cell Endocrinol 389, 84-91.
Zhang, X., Zhang, G., Zhang, H., Karin, M., Bai, H., and Cai, D. (2008). Hypothalamic IKKβ/NF-κB and ER Stress Link Overnutrition to Energy Imbalance and Obesity. Cell 135, 61-73.
Zhang, Y., Proenca, R., Maffei, M., Barone, M., Leopold, L., and Friedman, J.M. (1994b). Positional cloning of the mouse obese gene and its human homologue. Nature 372, 425-432.
Zhong, Y., Zhou, L.J., Ren, W.J., Xin, W.J., Li, Y.Y., Zhang, T., and Liu, X.G. (2010). The direction of synaptic plasticity mediated by C-fibers in spinal dorsal horn is decided by Src-family kinases in microglia: the role of tumor necrosis factor-alpha. Brain Behav. Immun. 24, 874-880.
Zhou, S., Wu, H., Zeng, C., Xiong, X., Tang, S., Tang, Z., and Sun, X. (2013). Apolipoprotein E protects astrocytes from hypoxia and glutamate-induced apoptosis. FEBS Letters. 587, 254-258.
Zhou, Y., Sun, X., Jin, L., Stringfield, T., Lin, L., and Chen, Y. (2005). Expression profiles of adiponectin receptors in mouse embryos. Gene Expr Patterns 5, 711-715.
Zhu, S.Q., Kum, W., Ho, S.K., Young, J.D., and Cockram, C.S. (1990). Structure-function relationships of insulin receptor interactions in cultured mouse astrocytes. Brain Res. 529, 329-332.
Zhu, Z., Liu, X., Senthil Kumar, S.P., Zhang, J., and Shi, H. (2013). Central expression and anorectic effect of brain-derived neurotrophic factor are regulated by circulating estradiol levels. Horm Behav 63, 533-542.
Ziko, I., De Luca, S., Dinan, T., Barwood, J.M., Sominsky, L., Cai, G., Kenny, R., Stokes, L., Jenkins, T.A., and Spencer, S.J. (2014). Neonatal overfeeding alters hypothalamic microglial profiles and central responses to immune challenge long-term. Brain Behav. Immun. 41, 32-43.