Are soils of Iowa USA currently a carbon sink or source? Simulated changes in SOC stock from 1972 to...
7
Agriculture, Ecosystems and Environment 140 (2011) 106–112 Contents lists available at ScienceDirect Agriculture, Ecosystems and Environment journal homepage: www.elsevier.com/locate/agee Are soils of Iowa USA currently a carbon sink or source? Simulated changes in SOC stock from 1972 to 2007 Shuguang Liu a , Zhengxi Tan b,∗ , Zhengpeng Li b , Shuqing Zhao c , Wenping Yuan d a U.S. Geological Survey (USGS) Earth Resources Observation and Science (EROS) Center, Sioux Falls, SD 57198, USA b ARTS at U.S. Geological Survey (USGS) Earth Resources Observation and Science (EROS) Center, Sioux Falls, SD 57198, USA c College of Urban and Environmental Sciences, Peking University, Beijing 100871, China d College of Global Change and Earth System Science, Beijing Normal University, Beijing 100875, China article info Article history: Received 25 May 2010 Received in revised form 12 November 2010 Accepted 20 November 2010 Available online 24 December 2010 Keywords: Biogeochemical modeling Land use change Soil organic carbon Tile drainage Western Corn Belt abstract Upscaling the spatial and temporal changes in carbon (C) stocks and fluxes from sites to regions is a critical and challenging step toward improving our understanding of the dynamics of C sources and sinks over large areas. This study simulated soil organic C (SOC) dynamics within 0–100 cm depth of soils across the state of Iowa in the USA from 1972 to 2007 using the General Ensemble biogeochemical Modeling System (GEMS). The model outputs with variation coefficient were analyzed and assembled from simulation unit to the state scale based upon major land use types at annual step. Results from this study indicate that soils (within a depth of 0–100 cm) in Iowa had been a SOC source at a rate of 190 ± 380 kg C ha −1 yr −1 . This was likely caused by the installation of a massive drainage system which led to the release of SOC from deep soil layers previously protected under poor drainage conditions. The annual crop rotation was another major force driving SOC variation and resulted in spatial variability of annual budgets in all croplands. Annual rate of change of SOC stocks in all land types depended significantly on the baseline SOC levels; soils with higher SOC levels tended to be C sources, and those with lower levels tended to be C sinks. Management practices (e.g., conservation tillage and residue management practices) slowed down the C emissions from Iowa soils, but could not reverse the general trend of net SOC loss in view of the entire state due mainly to a high level of baseline SOC stocks. © 2010 Elsevier B.V. All rights reserved. 1. Introduction Due to the importance of agricultural land in terrestrial car- bon (C) accounting many studies on agricultural ecosystems since the mid-1990s have focused on C dynamics and their associated driving forces (Paustian et al., 1997; Lal, 2004). Carbon account- ing at some long-term agricultural experimental sites suggests that land use changes caused substantial soil organic C (SOC) loss from North American terrestrial ecosystems between the 1850s and the 1950s; since the 1970s, improved farming practices (e.g., conser- vation tillage and residue management, crop rotation, and elevated fertilization rates) in many areas stabilized or increased SOC stock (Paustian et al., 1997; Roose et al., 2006). However, most such studies have some drawbacks: (1) sites were specific and under experimental control; (2) the studies were limited to the top soil layer (usually less than 30 cm in depth); and (3) the results from those studies were derived from either a static land use scenario or land use change statistics with decadal time intervals. The magni- ∗ Corresponding author. Tel.: +1 605594 6903; fax: +1 605594 6529. E-mail address: [email protected] (Z. Tan). tude and spatial variations of C sources or sinks in crop-dominated ecosystems over large areas are still uncertain because of the diffi- culty in quantifying the spatial variability of site conditions (such as antecedent SOC stock and contemporary land use change) and the diversity of land management. For the U.S. Corn Belt, few regional C estimates are available. Brenner et al. (2001) reported that conven- tional farming systems (including reduced tillage) in Iowa made the soil a C sink of 80 kg C ha −1 in 1996. Evrendilek and Wali (2004) reported that Ohio croplands (except for the corn-for-grain cropland) acted as a C source of 56 kg C ha −1 in 1996, while the continuous corn cropland turned out to be a C sink of 26 g C m −2 in the same year. Those estimates depended highly on their specific natural and management variables. Land use and land cover change (LUCC) information is critical for estimating regional C budget. Changes in cropland area, crop com- position, fertilization rate, tillage, and other management practices influence C fluxes over cropping systems (Kern and Johnson, 1993). Unfortunately, many previous C modeling studies could not include temporal land use change because of the limited availability of tem- poral LUCC data. The General Ensemble biogeochemical Modeling System (GEMS) is a new type of LUCC-oriented, regional level, bio- geochemical simulation system designed for assimilating dynamic 0167-8809/$ – see front matter © 2010 Elsevier B.V. All rights reserved. doi:10.1016/j.agee.2010.11.017
-
Upload
independent -
Category
Documents
-
view
3 -
download
0
Transcript of Are soils of Iowa USA currently a carbon sink or source? Simulated changes in SOC stock from 1972 to...
AS
Sa
b
c
d
a
ARR1AA
KBLSTW
1
btdilN1vf(seltl
0d
Agriculture, Ecosystems and Environment 140 (2011) 106–112
Contents lists available at ScienceDirect
Agriculture, Ecosystems and Environment
journa l homepage: www.e lsev ier .com/ locate /agee
re soils of Iowa USA currently a carbon sink or source? Simulated changes inOC stock from 1972 to 2007
huguang Liua, Zhengxi Tanb,∗, Zhengpeng Lib, Shuqing Zhaoc, Wenping Yuand
U.S. Geological Survey (USGS) Earth Resources Observation and Science (EROS) Center, Sioux Falls, SD 57198, USAARTS at U.S. Geological Survey (USGS) Earth Resources Observation and Science (EROS) Center, Sioux Falls, SD 57198, USACollege of Urban and Environmental Sciences, Peking University, Beijing 100871, ChinaCollege of Global Change and Earth System Science, Beijing Normal University, Beijing 100875, China
r t i c l e i n f o
rticle history:eceived 25 May 2010eceived in revised form2 November 2010ccepted 20 November 2010vailable online 24 December 2010
eywords:iogeochemical modeling
a b s t r a c t
Upscaling the spatial and temporal changes in carbon (C) stocks and fluxes from sites to regions is a criticaland challenging step toward improving our understanding of the dynamics of C sources and sinks overlarge areas. This study simulated soil organic C (SOC) dynamics within 0–100 cm depth of soils across thestate of Iowa in the USA from 1972 to 2007 using the General Ensemble biogeochemical Modeling System(GEMS). The model outputs with variation coefficient were analyzed and assembled from simulation unitto the state scale based upon major land use types at annual step. Results from this study indicate thatsoils (within a depth of 0–100 cm) in Iowa had been a SOC source at a rate of 190 ± 380 kg C ha−1 yr−1.This was likely caused by the installation of a massive drainage system which led to the release of SOC
and use changeoil organic carbonile drainageestern Corn Belt
from deep soil layers previously protected under poor drainage conditions. The annual crop rotationwas another major force driving SOC variation and resulted in spatial variability of annual budgets in allcroplands. Annual rate of change of SOC stocks in all land types depended significantly on the baselineSOC levels; soils with higher SOC levels tended to be C sources, and those with lower levels tended tobe C sinks. Management practices (e.g., conservation tillage and residue management practices) sloweddown the C emissions from Iowa soils, but could not reverse the general trend of net SOC loss in view of
ly to
the entire state due main. Introduction
Due to the importance of agricultural land in terrestrial car-on (C) accounting many studies on agricultural ecosystems sincehe mid-1990s have focused on C dynamics and their associatedriving forces (Paustian et al., 1997; Lal, 2004). Carbon account-
ng at some long-term agricultural experimental sites suggests thatand use changes caused substantial soil organic C (SOC) loss fromorth American terrestrial ecosystems between the 1850s and the950s; since the 1970s, improved farming practices (e.g., conser-ation tillage and residue management, crop rotation, and elevatedertilization rates) in many areas stabilized or increased SOC stockPaustian et al., 1997; Roose et al., 2006). However, most suchtudies have some drawbacks: (1) sites were specific and under
xperimental control; (2) the studies were limited to the top soilayer (usually less than 30 cm in depth); and (3) the results fromhose studies were derived from either a static land use scenario orand use change statistics with decadal time intervals. The magni-∗ Corresponding author. Tel.: +1 605594 6903; fax: +1 605594 6529.E-mail address: [email protected] (Z. Tan).
167-8809/$ – see front matter © 2010 Elsevier B.V. All rights reserved.oi:10.1016/j.agee.2010.11.017
a high level of baseline SOC stocks.© 2010 Elsevier B.V. All rights reserved.
tude and spatial variations of C sources or sinks in crop-dominatedecosystems over large areas are still uncertain because of the diffi-culty in quantifying the spatial variability of site conditions (such asantecedent SOC stock and contemporary land use change) and thediversity of land management. For the U.S. Corn Belt, few regional Cestimates are available. Brenner et al. (2001) reported that conven-tional farming systems (including reduced tillage) in Iowa madethe soil a C sink of 80 kg C ha−1 in 1996. Evrendilek and Wali(2004) reported that Ohio croplands (except for the corn-for-graincropland) acted as a C source of 56 kg C ha−1 in 1996, while thecontinuous corn cropland turned out to be a C sink of 26 g C m−2 inthe same year. Those estimates depended highly on their specificnatural and management variables.
Land use and land cover change (LUCC) information is critical forestimating regional C budget. Changes in cropland area, crop com-position, fertilization rate, tillage, and other management practicesinfluence C fluxes over cropping systems (Kern and Johnson, 1993).
Unfortunately, many previous C modeling studies could not includetemporal land use change because of the limited availability of tem-poral LUCC data. The General Ensemble biogeochemical ModelingSystem (GEMS) is a new type of LUCC-oriented, regional level, bio-geochemical simulation system designed for assimilating dynamic
s and
Ldpsadccc(el2cmfe
d(tmiecoad
cssLcfewpdpaywc2mi(1fdv
breii
2
2
p
S. Liu et al. / Agriculture, Ecosystem
UCC data (Liu, 2009). GEMS can spatially simulate the impacts ofynamic land use and climate, as well as the effects of managementractices. GEMS can also estimate uncertainty through ensembleimulations, which transfer uncertainties from inputs to outputsnd capture the spatial and temporal variability of net primary pro-uctivity (NPP) and crop yield. For agricultural ecosystems, GEMSan generate crop rotations/combinations based upon agriculturalensus data and produce various soil input data for biogeochemi-al simulations. This model has been applied in diverse ecosystemsLiu et al., 2004a,b; Tan et al., 2005, 2006a, 2009a,b, 2010; Zhaot al., 2010). GEMS can also function as a platform to encapsu-ate other biogeochemical models (e.g., CENTURY, EDCM (Liu et al.,003; Zhao et al., 2010)); additionally, it can drive and automati-ally parameterize them with the same input data (with or withoutinimum modifications) to the encapsulated models; this is use-
ul for reusing models that are difficult to modify (Liu, 2009; Zhaot al., 2010).
To simulate the dynamics of SOC under nonequilibrium con-itions, models with a multi-soil-layer structure are necessarySharpley and Williams, 1990). Because of soil erosion or deposi-ion, characteristics of a soil profile and SOC stocks in all soil layers
ay change dynamically. If the thickness of the top layer is fixed,ts SOC content must experience a dynamic replacement (Hardent al., 1999; Liu et al., 2003). Therefore, soil decomposition pro-esses must be changed as well due to the increase (under erosion)r decrease (under deposition) of exposure of SOC in deep layers,nd the biomass, growth, and death of plant roots must also changeynamically (Liu et al., 2003).
The role of conventional tillage practices in SOC losses fromropland and the potential to sequester atmospheric C into croppedoils by adopting conservation tillage measures have been inten-ively investigated and widely realized (West and Post, 2002;al, 2004). Beside tillage disturbances, drainage condition (espe-ially internal drainage) has been recognized as the second majororce driving SOC dynamic in cropland (Baker et al., 2007). Gen-rally, poorly drained environments favor SOC accumulation andell-drained environment enhance the soil organic matter decom-osition and C emissions (Tan et al., 2004). Improvement ofrainage conditions through an internal tile drainage system withinoorly drained soils can promote crop root development and lead ton increase in crop biomass (both above- and below-ground) andield (Kanwar et al., 1988). For instance, internal (tile) drainageas reported to lead to yield increases of 630–2820 kg ha−1 for
orn and 100–400 kg ha−1 for soybean in Iowa (Wright and Sands,001; Drury et al., 2009) even though tile drainage could also pro-ote the NO3-N leaching (Randall et al., 1997) due to soil aeration
mprovement for microbial activities to increase N mineralizationUpdegraff et al., 1995) and subsequent nitrification (Regina et al.,996). However, there are no systematic observation data availableor demonstrating the effects of internal drainage system on SOCynamics over large areas yet, especially for illustrating the verticalariability through the soil body above the tile system.
In this study, we integrated existing research capabilities iniogeochemical cycling, remote sensing, and ecosystem science toespond to the need for information by policy makers and landown-rs regarding how annual crop rotation, tillage practices, and soilnternal drainage affect the SOC budgets within the 0–100 cm soilsn the Western Corn Belt of the United States.
. Materials and methods
.1. Study area
The study area, the state of Iowa, is located in the north-centralart of the United States and covers an area of 144,066 km2; it is
Environment 140 (2011) 106–112 107
a core part of the Western Corn Belt Plains Ecoregion (Omernik,1987). Average annual precipitation varies from 710 mm in thenortheast to 965 mm in the southwest, and average annual min-imum temperature is only 0.5 ◦C in the northeast and 6.1 ◦C inthe southwest, with monthly average temperatures ranging from−14.3 to 30.1 ◦C. Soils in the central and northern regions have rela-tively lower clay content, higher bulk density, and higher SOC stocklevels than other parts of the state. Cropland accounts for more than85% of the state, and much of the remaining land is used for feedgrain to support livestock production. Major crops include corn,soybean, alfalfa, and grain sorghum.
2.2. Modeling system—GEMS-EDCM
2.2.1. The encapsulated plot-scale model EDCMThe Erosion Deposition Carbon Model (EDCM) (Liu et al., 2003;
Zhao et al., 2010) was used in this study to quantify SOC stocks,while GEMS (see Liu, 2009 for detail) was used as a platform toencapsulate EDCM, drive the encapsulated model with the sameinput data and automatically parameterize the EDCM according tobiophysical conditions of any land parcel, and deploy it across spacewithout considering the interactions among land pixels from plotscale to regional scale (Liu et al., 2003).
EDCM, similar to CENTURY (Parton et al., 1987), is a process-based biogeochemical model (Liu et al., 2003; Zhao et al., 2010)and was developed to characterize the SOC dynamics in a soil pro-file and to be capable of evaluating the impacts of soil erosion anddeposition. CENTURY has a one-topsoil-layer structure for simu-lating C cycle, but EDCM adopts a multiple soil-layer structure toaccount for the stratification of a soil profile and SOC stock in eachsoil layer. EDCM dynamically tracks the evolution of the soil profileand C storage as influenced by soil erosion and deposition. It wasselected in this study as the underlying ecosystem biogeochemicalmodel in GEMS to simulate C and N cycles.
EDCM, like the CENTURY, can simulate C and N cycles in diverseecosystems at a monthly time step and model the impacts of man-agement practices including LUCC, fertilization, and cultivation(e.g., Liu et al., 2003; Zhao et al., 2010). The major inputs for EDCMinclude land cover and land use type, monthly average maximumand minimum air temperature, monthly precipitation, soil texture,initial SOC level, atmospheric N deposition, and various manage-ment practices. The major output variables relevant to the proposedproject include NPP, grain yield, C decomposition, C exchange ratesbetween ecosystems and the atmosphere, biomass removal by har-vesting, and C stocks in vegetation and soils.
Stochastic simulation ensembles have been used in GEMS to (1)incorporate variances and covariance of input data and (2) trans-fer input data uncertainty into model outputs. Through ensemblesimulations, the nonlinearity of the ecosystem models are ade-quately addressed, and the uncertainty of the model outputsquantified by performing 20 ensemble stochastic model simu-lations were performed for each simulation unit to capture theheterogeneity and uncertainty of the data that define the simu-lation unit.
2.2.2. Computing and partitioning SOC pools in a soil profile formodeling
The STATSGO soil database (USDA, 1994) was used in this studyto provide the initial soil information for GEMS (e.g., soil layerdepth, soil organic matter content, bulk density, soil texture frac-tions). The STATSGO database for the state of Iowa contains 76 map
units where each map unit consists of numerical components. Thenumbers of soil layers for a soil map unit may vary from 1 to 6 andthe depth of each layer ranges from 10 cm to 160 cm. EDCM modelcan simulate up to 10 soil layers with an equal layer depth of either10 cm or 20 cm. In this study, the values of soil variables from the
1 s and
dt
uTayslhStaGs2
A
S
wb
i
2
a
(
(
(
(
(
(
A
(
08 S. Liu et al. / Agriculture, Ecosystem
atabase were recalculated at an equal interval of 20 cm based onhe depth weight of each soil layer.
Soil organic C stock is usually partitioned into three pools basedpon resistance to microbial degradation as defined in the CEN-URY model (Parton et al., 1987, 1994): labile (or active), slow,nd passive. Labile C pool has a short turnover time (less than 5ears) and consists of rapidly decomposable SOC fractions. Pas-ive C pool has a turnover time of several hundred years or evenonger, and consists of microbial-resistant components such asumic substances (Nicolardot et al., 1994). The dynamics of eachOC pool and their fractions in the total SOC stock vary with soilype and horizon (depth). Generally, the passive SOC fraction isbout 0.5 and the labile fraction is about 0.1 for the top layer.EMS uses the following algorithms to partition the total SOCtock into the three C fractions within a soil profile (see Liu et al.,003):
Passive SOC pool = 0.86 − 0.69 ∗ Passive deep + (1.69
∗ Passive deep − 0.86) ∗ (1 − EXP(−0.05 ∗ Soil depth) (1)
ctive SOC pool = 0.06 ∗ EXP(−0.018 ∗ Soil depth) (2)
low SOC pool = 1 − passive–active (3)
here Passive deep is the passive SOC fraction in deep layers (cane 0–1).
Soil depth in cm is the middle depth of each layer. For example,t could be 10 cm for the top 20 cm layer of soil.
.2.3. Supporting data for automated model parameterizationBelow are the essential geospatial datasets used in this study
nd most of them are required by GEMS:
1) Annual cropland grid maps from 2000 to 2007. They werederived from the Cropland Data Layer (CDL) that weregenerated by USDA National Agricultural Statistics Serviceand downloaded from http://www.nass.usda.gov/research/Cropland/SARS1a.htm.
2) Climatic variables grids covering the years from 1972 to 2007(consisting of mean monthly precipitation and mean monthlyminimum and maximum temperatures). These grid layerswere derived from PRISM Group of Oregon State University(http://www.prism.oregonstate.edu/).
3) Iowa STATSGO soil database (USDA, 1994). This soil map con-sists of 2028 polygons that are associated with 76 STASGO mapunits across the state of Iowa.
4) Nitrogen deposition map. This map spatially depicts the totalatmospheric N deposition from wet and dry sources. It wasgathered from the National Atmospheric Deposition Program(http://nadp.sws.uiuc.edu/).
5) Drainage class grid layer. It was derived from the CompoundTopographical Index (CTI) map using an empirical approach(see Eq. (4) in Section 2.2.4). The original CTI map was obtainedfrom the U.S. Geological Survey (USGS) Earth Resources Obser-vation and Science (EROS).
6) Irrigation distribution map. It was extracted from the 2001 U.S.national irrigation layer generated by USGS EROS.
GIS layer of the county codes (FIPS) of Iowa.Other attribute data include the following:
1) Crop composition and crop rotation probabilities, which werederived from the National Resources Inventory (NRI) database(http://www.nrcs.usda.gov/technical/NRI/).
Environment 140 (2011) 106–112
(2) Forest Inventory and Analysis (FIA) data, including forestspecies and age distribution, cutting or logging records, etc.They were obtained from USDA Forest Service.
(3) Tillage practices and residue management statistics from 1989to 2008. They were collected from the Conservation TechnologyInformation Center (2008).
All geospatial data layers were processed to be an identical pro-jection and coordinate system, and then overlain to form one gridlayer with a common cell size of 2 km by 2 km (spatial resolution).This grid layer is called the “Joint Frequency Distribution” (JFD)layer and its attribute table is called the JFD table, which was usedin GEMS. There were 35,370 different JFD cases in this study, andeach JFD case was the simulation unit in GEMS.
2.2.4. Impact of tile drainageIt is critical to represent the dramatic change in drainage con-
ditions throughout Iowa. A massive tile drainage system wasdeveloped in Iowa to convert native prairies and wetlands to highlyproductive croplands. An empirical model was developed to definedrainage conditions at any depth in a soil profile and is describedas follows:
Drainage = drain0
∗ (1 − 1/(1 + EXP(−d0 ∗ (depth − tile depth + 40))))(1 − 1/(1 + EXP(d0 ∗ (tile depth − 40))))
(4)
where Drainage is the drainage change coefficient ranging from 0 to1 representing classes from poorly drained to well-drained; drain0is the drainage at the top of the soil surface; d0 is the drainagechange coefficient or drainage curve flatness transitioning fromwell-drained to poorly drained; tile depth is the burial depth oftile drainage system, and depth is the middle point of each layer.The unit for all depths is in cm.
Tile depth is an important parameter in the estimation ofdrainage in a soil profile. Most tile drainage systems were buriedbetween 75 cm and 120 cm below the soil surface (Singh et al.,2007). For the first run, we set tile depth = 100 cm, then investi-gated the sensitivity of SOC stock to the tile depth (between 75 cmand 120 cm).
Following Eq. (4), it can be seen that a smaller d0 value indicatesgradual and long-tail vertical distribution of drainage, and a largerd0 value indicates a sudden change. The values greater than 0.2 donot create any significant differences. So the value for d0 should befrom 0 to 0.2. With d0 = 0, the value of drainage does not changevertically, and the EDCM returns to the original EDCM values. ForEq. (4), we set d0 = 0.05, and drain0 = 1.0 which represents the well-drained class in this study. The uncertainty of tile drainage on SOCdynamics was quantified by EDCM based on the built-in algorithms(see Liu et al., 2003).
2.2.5. Automation of model parameterizationBecause most information in spatial databases is aggregated to
the map unit level, direct injection of such information into mod-eling processes is often problematic and subject to potential biases(Kimball et al., 1999; Reiners et al., 2002). Consequently, scalingmethods are usually needed to incorporate field-scale spatial het-erogeneities of state and driving variables into the simulations. Anautomated model parameterization system (AMPS) in GEMS gen-erally consists of two major interdependent parts: (1) data searchand retrieval algorithms and (2) data processing mechanisms. The
first part searches and retrieves relevant information from variousdatabases according to the keys provided by the JFD table that wasassociated with the JFD layer as defined in Section 2.2.3. The dataprocessing mechanisms downscale the aggregated information atthe map unit level to the field scale using a Monte Carlo approach.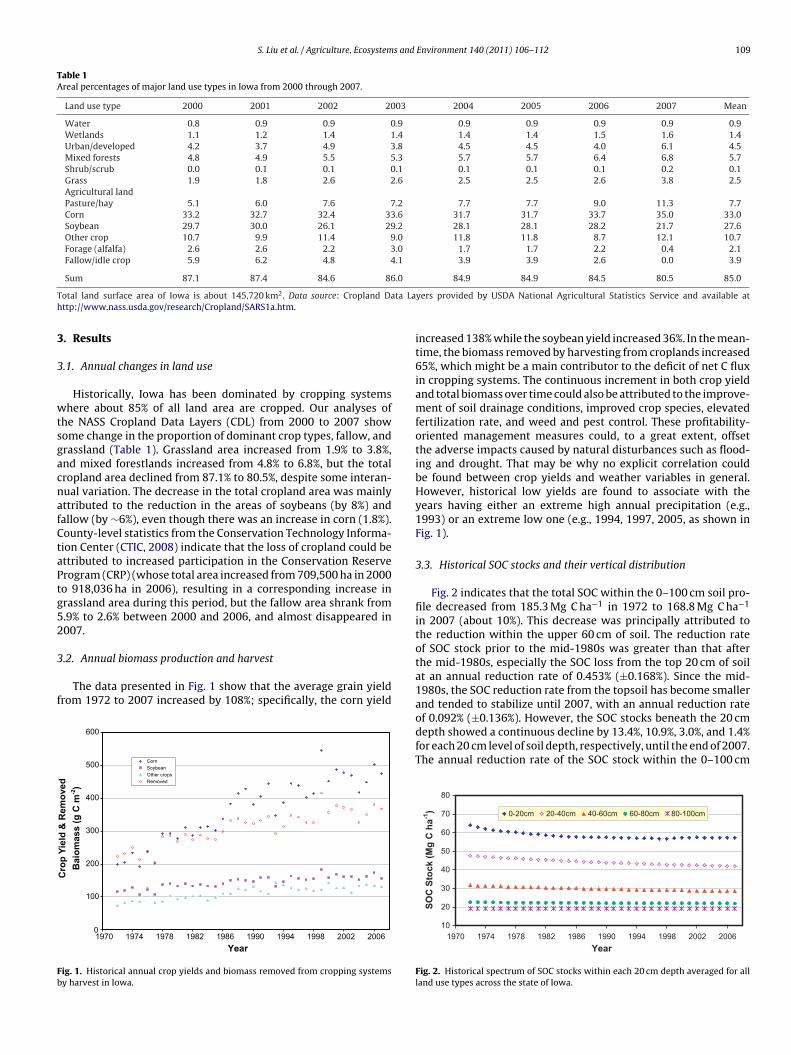
S. Liu et al. / Agriculture, Ecosystems and Environment 140 (2011) 106–112 109
Table 1Areal percentages of major land use types in Iowa from 2000 through 2007.
Land use type 2000 2001 2002 2003 2004 2005 2006 2007 Mean
Water 0.8 0.9 0.9 0.9 0.9 0.9 0.9 0.9 0.9Wetlands 1.1 1.2 1.4 1.4 1.4 1.4 1.5 1.6 1.4Urban/developed 4.2 3.7 4.9 3.8 4.5 4.5 4.0 6.1 4.5Mixed forests 4.8 4.9 5.5 5.3 5.7 5.7 6.4 6.8 5.7Shrub/scrub 0.0 0.1 0.1 0.1 0.1 0.1 0.1 0.2 0.1Grass 1.9 1.8 2.6 2.6 2.5 2.5 2.6 3.8 2.5Agricultural landPasture/hay 5.1 6.0 7.6 7.2 7.7 7.7 9.0 11.3 7.7Corn 33.2 32.7 32.4 33.6 31.7 31.7 33.7 35.0 33.0Soybean 29.7 30.0 26.1 29.2 28.1 28.1 28.2 21.7 27.6Other crop 10.7 9.9 11.4 9.0 11.8 11.8 8.7 12.1 10.7Forage (alfalfa) 2.6 2.6 2.2 3.0 1.7 1.7 2.2 0.4 2.1Fallow/idle crop 5.9 6.2 4.8 4.1 3.9 3.9 2.6 0.0 3.9
.0
T ta Lah
3
3
wtsgacnafCtaPtg52
3
f
Fb
Sum 87.1 87.4 84.6 86
otal land surface area of Iowa is about 145,720 km2. Data source: Cropland Dattp://www.nass.usda.gov/research/Cropland/SARS1a.htm.
. Results
.1. Annual changes in land use
Historically, Iowa has been dominated by cropping systemshere about 85% of all land area are cropped. Our analyses of
he NASS Cropland Data Layers (CDL) from 2000 to 2007 showome change in the proportion of dominant crop types, fallow, andrassland (Table 1). Grassland area increased from 1.9% to 3.8%,nd mixed forestlands increased from 4.8% to 6.8%, but the totalropland area declined from 87.1% to 80.5%, despite some interan-ual variation. The decrease in the total cropland area was mainlyttributed to the reduction in the areas of soybeans (by 8%) andallow (by ∼6%), even though there was an increase in corn (1.8%).ounty-level statistics from the Conservation Technology Informa-ion Center (CTIC, 2008) indicate that the loss of cropland could bettributed to increased participation in the Conservation Reserverogram (CRP) (whose total area increased from 709,500 ha in 2000o 918,036 ha in 2006), resulting in a corresponding increase inrassland area during this period, but the fallow area shrank from.9% to 2.6% between 2000 and 2006, and almost disappeared in007.
.2. Annual biomass production and harvest
The data presented in Fig. 1 show that the average grain yieldrom 1972 to 2007 increased by 108%; specifically, the corn yield
0
100
200
300
400
500
600
1970 1974 1978 1982 1986 1990 1994 1998 2002 2006
Year
Cro
pY
ield
& R
emo
ved
Bai
om
ass
(g C
m-2)
Corn
Soybean
Other crops
Removed
ig. 1. Historical annual crop yields and biomass removed from cropping systemsy harvest in Iowa.
84.9 84.9 84.5 80.5 85.0
yers provided by USDA National Agricultural Statistics Service and available at
increased 138% while the soybean yield increased 36%. In the mean-time, the biomass removed by harvesting from croplands increased65%, which might be a main contributor to the deficit of net C fluxin cropping systems. The continuous increment in both crop yieldand total biomass over time could also be attributed to the improve-ment of soil drainage conditions, improved crop species, elevatedfertilization rate, and weed and pest control. These profitability-oriented management measures could, to a great extent, offsetthe adverse impacts caused by natural disturbances such as flood-ing and drought. That may be why no explicit correlation couldbe found between crop yields and weather variables in general.However, historical low yields are found to associate with theyears having either an extreme high annual precipitation (e.g.,1993) or an extreme low one (e.g., 1994, 1997, 2005, as shown inFig. 1).
3.3. Historical SOC stocks and their vertical distribution
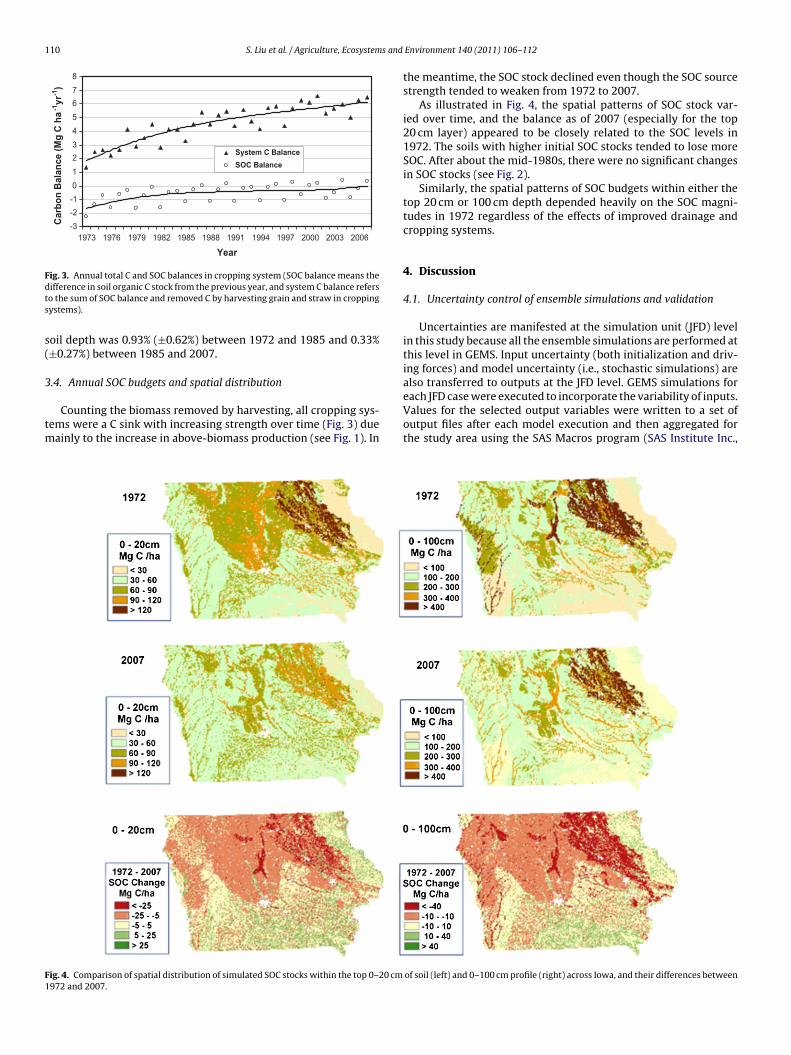
Fig. 2 indicates that the total SOC within the 0–100 cm soil pro-file decreased from 185.3 Mg C ha−1 in 1972 to 168.8 Mg C ha−1
in 2007 (about 10%). This decrease was principally attributed tothe reduction within the upper 60 cm of soil. The reduction rateof SOC stock prior to the mid-1980s was greater than that afterthe mid-1980s, especially the SOC loss from the top 20 cm of soilat an annual reduction rate of 0.453% (±0.168%). Since the mid-1980s, the SOC reduction rate from the topsoil has become smaller
and tended to stabilize until 2007, with an annual reduction rateof 0.092% (±0.136%). However, the SOC stocks beneath the 20 cmdepth showed a continuous decline by 13.4%, 10.9%, 3.0%, and 1.4%for each 20 cm level of soil depth, respectively, until the end of 2007.The annual reduction rate of the SOC stock within the 0–100 cm10
20
30
40
50
60
70
80
1970 1974 1978 1982 1986 1990 1994 1998 2002 2006
Year
SO
C S
tock
(M
g C
ha-1
) 0-20cm 20-40cm 40-60cm 60-80cm 80-100cm
Fig. 2. Historical spectrum of SOC stocks within each 20 cm depth averaged for allland use types across the state of Iowa.
110 S. Liu et al. / Agriculture, Ecosystems and
-3
-2
-1
0
1
2
3
4
5
6
7
8
200620032000199719941991198819851982197919761973
Year
Car
bo
n B
alan
ce (
Mg
C h
a-1
yr-1
)
System C Balance
SOC Balance
Fdts
s(
3
tm
F1
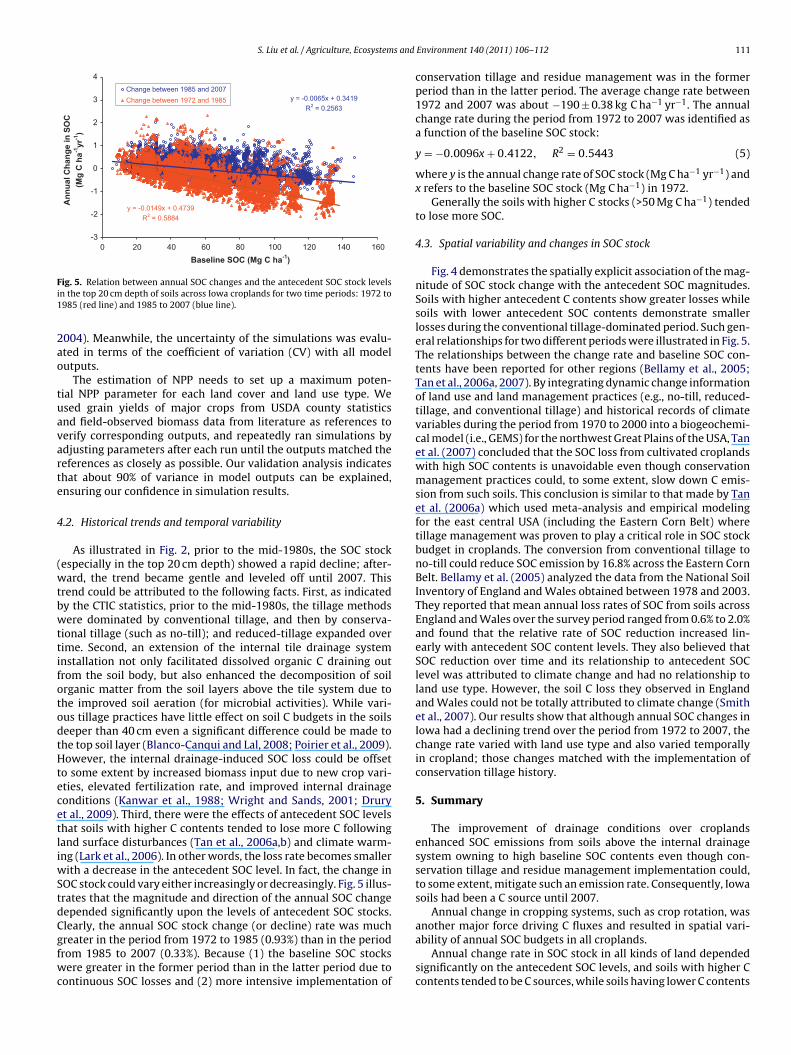
ig. 3. Annual total C and SOC balances in cropping system (SOC balance means theifference in soil organic C stock from the previous year, and system C balance referso the sum of SOC balance and removed C by harvesting grain and straw in croppingystems).
oil depth was 0.93% (±0.62%) between 1972 and 1985 and 0.33%±0.27%) between 1985 and 2007.
.4. Annual SOC budgets and spatial distribution
Counting the biomass removed by harvesting, all cropping sys-ems were a C sink with increasing strength over time (Fig. 3) due
ainly to the increase in above-biomass production (see Fig. 1). In
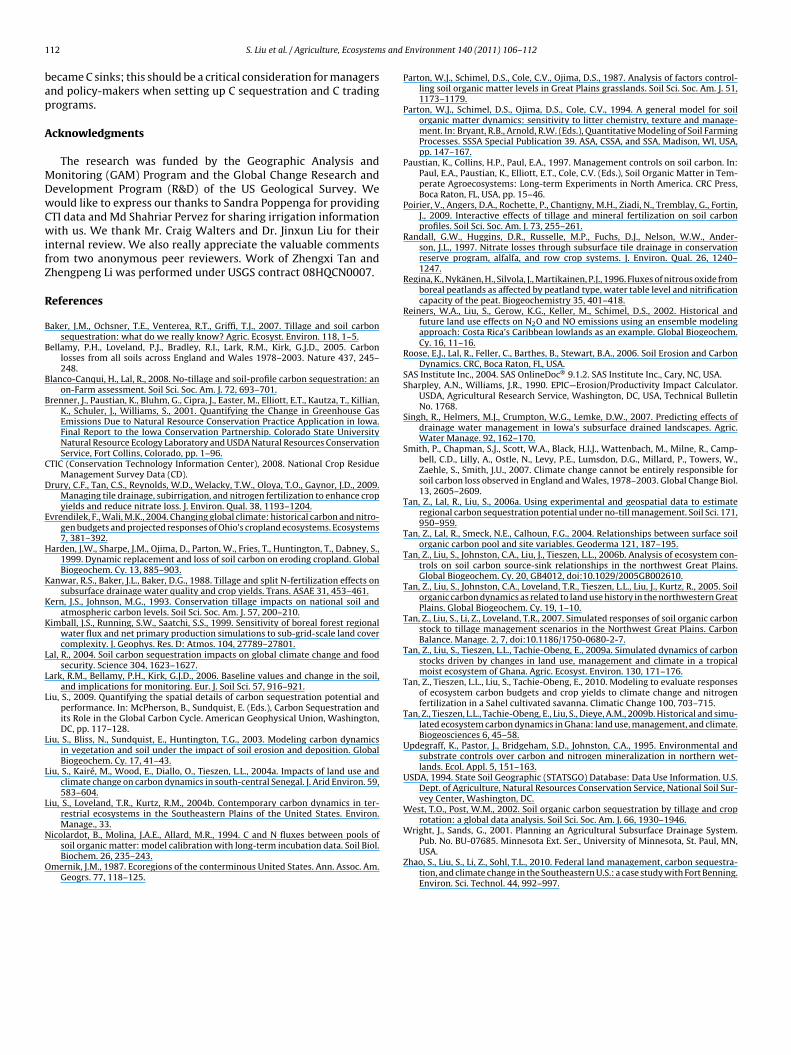
ig. 4. Comparison of spatial distribution of simulated SOC stocks within the top 0–20 cm972 and 2007.
Environment 140 (2011) 106–112
the meantime, the SOC stock declined even though the SOC sourcestrength tended to weaken from 1972 to 2007.
As illustrated in Fig. 4, the spatial patterns of SOC stock var-ied over time, and the balance as of 2007 (especially for the top20 cm layer) appeared to be closely related to the SOC levels in1972. The soils with higher initial SOC stocks tended to lose moreSOC. After about the mid-1980s, there were no significant changesin SOC stocks (see Fig. 2).
Similarly, the spatial patterns of SOC budgets within either thetop 20 cm or 100 cm depth depended heavily on the SOC magni-tudes in 1972 regardless of the effects of improved drainage andcropping systems.
4. Discussion
4.1. Uncertainty control of ensemble simulations and validation
Uncertainties are manifested at the simulation unit (JFD) levelin this study because all the ensemble simulations are performed atthis level in GEMS. Input uncertainty (both initialization and driv-ing forces) and model uncertainty (i.e., stochastic simulations) are
also transferred to outputs at the JFD level. GEMS simulations foreach JFD case were executed to incorporate the variability of inputs.Values for the selected output variables were written to a set ofoutput files after each model execution and then aggregated forthe study area using the SAS Macros program (SAS Institute Inc.,of soil (left) and 0–100 cm profile (right) across Iowa, and their differences between
S. Liu et al. / Agriculture, Ecosystems and
y = -0.0065x + 0.3419
R = 0.2563
y = -0.0149x + 0.4739
R = 0.5884
-3
-2
-1
0
1
2
3
4
0 20 40 60 80 100 120 140 160
Baseline SOC (Mg C ha-1)
An
nu
al C
han
ge
in S
OC
(Mg
C h
a-1
yr-1
)
Change between 1985 and 2007
Change between 1972 and 1985
Fi1
2ao
tuavarte
4
(wtbwttifotodtHtecetliwStdCgfwc
ig. 5. Relation between annual SOC changes and the antecedent SOC stock levelsn the top 20 cm depth of soils across Iowa croplands for two time periods: 1972 to985 (red line) and 1985 to 2007 (blue line).
004). Meanwhile, the uncertainty of the simulations was evalu-ted in terms of the coefficient of variation (CV) with all modelutputs.
The estimation of NPP needs to set up a maximum poten-ial NPP parameter for each land cover and land use type. Wesed grain yields of major crops from USDA county statisticsnd field-observed biomass data from literature as references toerify corresponding outputs, and repeatedly ran simulations bydjusting parameters after each run until the outputs matched theeferences as closely as possible. Our validation analysis indicateshat about 90% of variance in model outputs can be explained,nsuring our confidence in simulation results.
.2. Historical trends and temporal variability
As illustrated in Fig. 2, prior to the mid-1980s, the SOC stockespecially in the top 20 cm depth) showed a rapid decline; after-ard, the trend became gentle and leveled off until 2007. This
rend could be attributed to the following facts. First, as indicatedy the CTIC statistics, prior to the mid-1980s, the tillage methodsere dominated by conventional tillage, and then by conserva-
ional tillage (such as no-till); and reduced-tillage expanded overime. Second, an extension of the internal tile drainage systemnstallation not only facilitated dissolved organic C draining outrom the soil body, but also enhanced the decomposition of soilrganic matter from the soil layers above the tile system due tohe improved soil aeration (for microbial activities). While vari-us tillage practices have little effect on soil C budgets in the soilseeper than 40 cm even a significant difference could be made tohe top soil layer (Blanco-Canqui and Lal, 2008; Poirier et al., 2009).owever, the internal drainage-induced SOC loss could be offset
o some extent by increased biomass input due to new crop vari-ties, elevated fertilization rate, and improved internal drainageonditions (Kanwar et al., 1988; Wright and Sands, 2001; Druryt al., 2009). Third, there were the effects of antecedent SOC levelshat soils with higher C contents tended to lose more C followingand surface disturbances (Tan et al., 2006a,b) and climate warm-ng (Lark et al., 2006). In other words, the loss rate becomes smaller
ith a decrease in the antecedent SOC level. In fact, the change inOC stock could vary either increasingly or decreasingly. Fig. 5 illus-rates that the magnitude and direction of the annual SOC changeepended significantly upon the levels of antecedent SOC stocks.
learly, the annual SOC stock change (or decline) rate was muchreater in the period from 1972 to 1985 (0.93%) than in the periodrom 1985 to 2007 (0.33%). Because (1) the baseline SOC stocksere greater in the former period than in the latter period due toontinuous SOC losses and (2) more intensive implementation of
Environment 140 (2011) 106–112 111
conservation tillage and residue management was in the formerperiod than in the latter period. The average change rate between1972 and 2007 was about −190 ± 0.38 kg C ha−1 yr−1. The annualchange rate during the period from 1972 to 2007 was identified asa function of the baseline SOC stock:
y = −0.0096x + 0.4122, R2 = 0.5443 (5)
where y is the annual change rate of SOC stock (Mg C ha−1 yr−1) andx refers to the baseline SOC stock (Mg C ha−1) in 1972.
Generally the soils with higher C stocks (>50 Mg C ha−1) tendedto lose more SOC.
4.3. Spatial variability and changes in SOC stock
Fig. 4 demonstrates the spatially explicit association of the mag-nitude of SOC stock change with the antecedent SOC magnitudes.Soils with higher antecedent C contents show greater losses whilesoils with lower antecedent SOC contents demonstrate smallerlosses during the conventional tillage-dominated period. Such gen-eral relationships for two different periods were illustrated in Fig. 5.The relationships between the change rate and baseline SOC con-tents have been reported for other regions (Bellamy et al., 2005;Tan et al., 2006a, 2007). By integrating dynamic change informationof land use and land management practices (e.g., no-till, reduced-tillage, and conventional tillage) and historical records of climatevariables during the period from 1970 to 2000 into a biogeochemi-cal model (i.e., GEMS) for the northwest Great Plains of the USA, Tanet al. (2007) concluded that the SOC loss from cultivated croplandswith high SOC contents is unavoidable even though conservationmanagement practices could, to some extent, slow down C emis-sion from such soils. This conclusion is similar to that made by Tanet al. (2006a) which used meta-analysis and empirical modelingfor the east central USA (including the Eastern Corn Belt) wheretillage management was proven to play a critical role in SOC stockbudget in croplands. The conversion from conventional tillage tono-till could reduce SOC emission by 16.8% across the Eastern CornBelt. Bellamy et al. (2005) analyzed the data from the National SoilInventory of England and Wales obtained between 1978 and 2003.They reported that mean annual loss rates of SOC from soils acrossEngland and Wales over the survey period ranged from 0.6% to 2.0%and found that the relative rate of SOC reduction increased lin-early with antecedent SOC content levels. They also believed thatSOC reduction over time and its relationship to antecedent SOClevel was attributed to climate change and had no relationship toland use type. However, the soil C loss they observed in Englandand Wales could not be totally attributed to climate change (Smithet al., 2007). Our results show that although annual SOC changes inIowa had a declining trend over the period from 1972 to 2007, thechange rate varied with land use type and also varied temporallyin cropland; those changes matched with the implementation ofconservation tillage history.
5. Summary
The improvement of drainage conditions over croplandsenhanced SOC emissions from soils above the internal drainagesystem owning to high baseline SOC contents even though con-servation tillage and residue management implementation could,to some extent, mitigate such an emission rate. Consequently, Iowasoils had been a C source until 2007.
Annual change in cropping systems, such as crop rotation, was
another major force driving C fluxes and resulted in spatial vari-ability of annual SOC budgets in all croplands.Annual change rate in SOC stock in all kinds of land dependedsignificantly on the antecedent SOC levels, and soils with higher Ccontents tended to be C sources, while soils having lower C contents
1 s and
bap
A
MDwCwifZ
R
B
B
B
B
C
D
E
H
K
K
K
L
L
L
L
L
L
N
O
12 S. Liu et al. / Agriculture, Ecosystem
ecame C sinks; this should be a critical consideration for managersnd policy-makers when setting up C sequestration and C tradingrograms.
cknowledgments
The research was funded by the Geographic Analysis andonitoring (GAM) Program and the Global Change Research andevelopment Program (R&D) of the US Geological Survey. Weould like to express our thanks to Sandra Poppenga for providingTI data and Md Shahriar Pervez for sharing irrigation informationith us. We thank Mr. Craig Walters and Dr. Jinxun Liu for their
nternal review. We also really appreciate the valuable commentsrom two anonymous peer reviewers. Work of Zhengxi Tan andhengpeng Li was performed under USGS contract 08HQCN0007.
eferences
aker, J.M., Ochsner, T.E., Venterea, R.T., Griffi, T.J., 2007. Tillage and soil carbonsequestration: what do we really know? Agric. Ecosyst. Environ. 118, 1–5.
ellamy, P.H., Loveland, P.J., Bradley, R.I., Lark, R.M., Kirk, G.J.D., 2005. Carbonlosses from all soils across England and Wales 1978–2003. Nature 437, 245–248.
lanco-Canqui, H., Lal, R., 2008. No-tillage and soil-profile carbon sequestration: anon-Farm assessment. Soil Sci. Soc. Am. J. 72, 693–701.
renner, J., Paustian, K., Bluhm, G., Cipra, J., Easter, M., Elliott, E.T., Kautza, T., Killian,K., Schuler, J., Williams, S., 2001. Quantifying the Change in Greenhouse GasEmissions Due to Natural Resource Conservation Practice Application in Iowa.Final Report to the Iowa Conservation Partnership. Colorado State UniversityNatural Resource Ecology Laboratory and USDA Natural Resources ConservationService, Fort Collins, Colorado, pp. 1–96.
TIC (Conservation Technology Information Center), 2008. National Crop ResidueManagement Survey Data (CD).
rury, C.F., Tan, C.S., Reynolds, W.D., Welacky, T.W., Oloya, T.O., Gaynor, J.D., 2009.Managing tile drainage, subirrigation, and nitrogen fertilization to enhance cropyields and reduce nitrate loss. J. Environ. Qual. 38, 1193–1204.
vrendilek, F., Wali, M.K., 2004. Changing global climate: historical carbon and nitro-gen budgets and projected responses of Ohio’s cropland ecosystems. Ecosystems7, 381–392.
arden, J.W., Sharpe, J.M., Ojima, D., Parton, W., Fries, T., Huntington, T., Dabney, S.,1999. Dynamic replacement and loss of soil carbon on eroding cropland. GlobalBiogeochem. Cy. 13, 885–903.
anwar, R.S., Baker, J.L., Baker, D.G., 1988. Tillage and split N-fertilization effects onsubsurface drainage water quality and crop yields. Trans. ASAE 31, 453–461.
ern, J.S., Johnson, M.G., 1993. Conservation tillage impacts on national soil andatmospheric carbon levels. Soil Sci. Soc. Am. J. 57, 200–210.
imball, J.S., Running, S.W., Saatchi, S.S., 1999. Sensitivity of boreal forest regionalwater flux and net primary production simulations to sub-grid-scale land covercomplexity. J. Geophys. Res. D: Atmos. 104, 27789–27801.
al, R., 2004. Soil carbon sequestration impacts on global climate change and foodsecurity. Science 304, 1623–1627.
ark, R.M., Bellamy, P.H., Kirk, G.J.D., 2006. Baseline values and change in the soil,and implications for monitoring. Eur. J. Soil Sci. 57, 916–921.
iu, S., 2009. Quantifying the spatial details of carbon sequestration potential andperformance. In: McPherson, B., Sundquist, E. (Eds.), Carbon Sequestration andits Role in the Global Carbon Cycle. American Geophysical Union, Washington,DC, pp. 117–128.
iu, S., Bliss, N., Sundquist, E., Huntington, T.G., 2003. Modeling carbon dynamicsin vegetation and soil under the impact of soil erosion and deposition. GlobalBiogeochem. Cy. 17, 41–43.
iu, S., Kairé, M., Wood, E., Diallo, O., Tieszen, L.L., 2004a. Impacts of land use andclimate change on carbon dynamics in south-central Senegal. J. Arid Environ. 59,583–604.
iu, S., Loveland, T.R., Kurtz, R.M., 2004b. Contemporary carbon dynamics in ter-restrial ecosystems in the Southeastern Plains of the United States. Environ.
Manage., 33.icolardot, B., Molina, J.A.E., Allard, M.R., 1994. C and N fluxes between pools ofsoil organic matter: model calibration with long-term incubation data. Soil Biol.Biochem. 26, 235–243.
mernik, J.M., 1987. Ecoregions of the conterminous United States. Ann. Assoc. Am.Geogrs. 77, 118–125.
Environment 140 (2011) 106–112
Parton, W.J., Schimel, D.S., Cole, C.V., Ojima, D.S., 1987. Analysis of factors control-ling soil organic matter levels in Great Plains grasslands. Soil Sci. Soc. Am. J. 51,1173–1179.
Parton, W.J., Schimel, D.S., Ojima, D.S., Cole, C.V., 1994. A general model for soilorganic matter dynamics: sensitivity to litter chemistry, texture and manage-ment. In: Bryant, R.B., Arnold, R.W. (Eds.), Quantitative Modeling of Soil FarmingProcesses. SSSA Special Publication 39. ASA, CSSA, and SSA, Madison, WI, USA,pp. 147–167.
Paustian, K., Collins, H.P., Paul, E.A., 1997. Management controls on soil carbon. In:Paul, E.A., Paustian, K., Elliott, E.T., Cole, C.V. (Eds.), Soil Organic Matter in Tem-perate Agroecosystems: Long-term Experiments in North America. CRC Press,Boca Raton, FL, USA, pp. 15–46.
Poirier, V., Angers, D.A., Rochette, P., Chantigny, M.H., Ziadi, N., Tremblay, G., Fortin,J., 2009. Interactive effects of tillage and mineral fertilization on soil carbonprofiles. Soil Sci. Soc. Am. J. 73, 255–261.
Randall, G.W., Huggins, D.R., Russelle, M.P., Fuchs, D.J., Nelson, W.W., Ander-son, J.L., 1997. Nitrate losses through subsurface tile drainage in conservationreserve program, alfalfa, and row crop systems. J. Environ. Qual. 26, 1240–1247.
Regina, K., Nykänen, H., Silvola, J., Martikainen, P.J., 1996. Fluxes of nitrous oxide fromboreal peatlands as affected by peatland type, water table level and nitrificationcapacity of the peat. Biogeochemistry 35, 401–418.
Reiners, W.A., Liu, S., Gerow, K.G., Keller, M., Schimel, D.S., 2002. Historical andfuture land use effects on N2O and NO emissions using an ensemble modelingapproach: Costa Rica’s Caribbean lowlands as an example. Global Biogeochem.Cy. 16, 11–16.
Roose, E.J., Lal, R., Feller, C., Barthes, B., Stewart, B.A., 2006. Soil Erosion and CarbonDynamics. CRC, Boca Raton, FL, USA.
SAS Institute Inc., 2004. SAS OnlineDoc® 9.1.2. SAS Institute Inc., Cary, NC, USA.Sharpley, A.N., Williams, J.R., 1990. EPIC—Erosion/Productivity Impact Calculator.
USDA, Agricultural Research Service, Washington, DC, USA, Technical BulletinNo. 1768.
Singh, R., Helmers, M.J., Crumpton, W.G., Lemke, D.W., 2007. Predicting effects ofdrainage water management in Iowa’s subsurface drained landscapes. Agric.Water Manage. 92, 162–170.
Smith, P., Chapman, S.J., Scott, W.A., Black, H.I.J., Wattenbach, M., Milne, R., Camp-bell, C.D., Lilly, A., Ostle, N., Levy, P.E., Lumsdon, D.G., Millard, P., Towers, W.,Zaehle, S., Smith, J.U., 2007. Climate change cannot be entirely responsible forsoil carbon loss observed in England and Wales, 1978–2003. Global Change Biol.13, 2605–2609.
Tan, Z., Lal, R., Liu, S., 2006a. Using experimental and geospatial data to estimateregional carbon sequestration potential under no-till management. Soil Sci. 171,950–959.
Tan, Z., Lal, R., Smeck, N.E., Calhoun, F.G., 2004. Relationships between surface soilorganic carbon pool and site variables. Geoderma 121, 187–195.
Tan, Z., Liu, S., Johnston, C.A., Liu, J., Tieszen, L.L., 2006b. Analysis of ecosystem con-trols on soil carbon source-sink relationships in the northwest Great Plains.Global Biogeochem. Cy. 20, GB4012, doi:10.1029/2005GB002610.
Tan, Z., Liu, S., Johnston, C.A., Loveland, T.R., Tieszen, L.L., Liu, J., Kurtz, R., 2005. Soilorganic carbon dynamics as related to land use history in the northwestern GreatPlains. Global Biogeochem. Cy. 19, 1–10.
Tan, Z., Liu, S., Li, Z., Loveland, T.R., 2007. Simulated responses of soil organic carbonstock to tillage management scenarios in the Northwest Great Plains. CarbonBalance. Manage. 2, 7, doi:10.1186/1750-0680-2-7.
Tan, Z., Liu, S., Tieszen, L.L., Tachie-Obeng, E., 2009a. Simulated dynamics of carbonstocks driven by changes in land use, management and climate in a tropicalmoist ecosystem of Ghana. Agric. Ecosyst. Environ. 130, 171–176.
Tan, Z., Tieszen, L.L., Liu, S., Tachie-Obeng, E., 2010. Modeling to evaluate responsesof ecosystem carbon budgets and crop yields to climate change and nitrogenfertilization in a Sahel cultivated savanna. Climatic Change 100, 703–715.
Tan, Z., Tieszen, L.L., Tachie-Obeng, E., Liu, S., Dieye, A.M., 2009b. Historical and simu-lated ecosystem carbon dynamics in Ghana: land use, management, and climate.Biogeosciences 6, 45–58.
Updegraff, K., Pastor, J., Bridgeham, S.D., Johnston, C.A., 1995. Environmental andsubstrate controls over carbon and nitrogen mineralization in northern wet-lands. Ecol. Appl. 5, 151–163.
USDA, 1994. State Soil Geographic (STATSGO) Database: Data Use Information. U.S.Dept. of Agriculture, Natural Resources Conservation Service, National Soil Sur-vey Center, Washington, DC.
West, T.O., Post, W.M., 2002. Soil organic carbon sequestration by tillage and croprotation: a global data analysis. Soil Sci. Soc. Am. J. 66, 1930–1946.
Wright, J., Sands, G., 2001. Planning an Agricultural Subsurface Drainage System.Pub. No. BU-07685. Minnesota Ext. Ser., University of Minnesota, St. Paul, MN,USA.
Zhao, S., Liu, S., Li, Z., Sohl, T.L., 2010. Federal land management, carbon sequestra-tion, and climate change in the Southeastern U.S.: a case study with Fort Benning.Environ. Sci. Technol. 44, 992–997.