Approximation of the TG curve through a temperature power series in order to evaluate the...
21
thermochimica acta ELSEVIER Thermochimica Acta 275 (1996) 193 213 Approximation of the TG curve through a temperature power series in order to evaluate the non-isothermal kinetic parameters of solid-gas decompositions and degradation P. Budrugeac a'*, Alice Luminita Petre b, E. Segal b " ICPE-Research and Development Institute for Electrieal Engineerin 9, Splaiul lndependentei, Nr. 313, Sector 3, Bucharest 74204, Romania b Department of Physical Chemistry, Faculty of Chemistry, University of Bucharest, Bd. Republicii, Nr. 13, Bucharest, Romania Received 4 May 1995:accepted 27 August 1995 Abstract A procedure has been developed for evaluating non-isothermal kinetic parameters based on the development of the degree of conversion in a temperature power series. The procedure was applied to the dehydration of calcium oxalate monohydrate and to the thermooxidative degradation of an unsaturated polyester resin. Keywords: Calcium oxalate; Non-isothermal kinetic parameters; Solid-gas decomposition; Solid gas degradation; Temperature power series; TG curve approximation 1. Introduction The general rate equation in terms of the degree of conversion, time and temperature has the form: d:~ d~ = k( T) f(c0 (1) where the separation of the functions of temperature and conversion is not rigorously justified [1]. Eq. (1) is the basis of the differential and integral methods used in order to * Corresponding author. 0040-6031/96/$15.00 '~'5~ 1996- Elsevier Science B.V. All rights reserved SSDI 0040-6031(95)02725-4
Transcript of Approximation of the TG curve through a temperature power series in order to evaluate the...

thermochimica acta
ELSEVIER Thermochimica Acta 275 (1996) 193 213
Approximation of the TG curve through a temperature power series in order to evaluate the non-isothermal kinetic
parameters of solid-gas decompositions and degradation
P. Budrugeac a'*, Alice Luminita Petre b, E. Segal b
" ICPE-Research and Development Institute for Electrieal Engineerin 9, Splaiul lndependentei, Nr. 313, Sector 3, Bucharest 74204, Romania
b Department of Physical Chemistry, Faculty of Chemistry, University of Bucharest, Bd. Republicii, Nr. 13, Bucharest, Romania
Received 4 May 1995: accepted 27 August 1995
Abstract
A procedure has been developed for evaluating non-isothermal kinetic parameters based on the development of the degree of conversion in a temperature power series. The procedure was applied to the dehydration of calcium oxalate monohydrate and to the thermooxidative degradation of an unsaturated polyester resin.
Keywords: Calcium oxalate; Non-isothermal kinetic parameters; Solid-gas decomposition; Solid gas degradation; Temperature power series; TG curve approximation
1. Introduction
The general rate equat ion in terms of the degree of conversion, time and temperature has the form:
d:~ d~ = k( T) f(c0 (1)
where the separation of the functions of temperature and conversion is not rigorously justified [1]. Eq. (1) is the basis of the differential and integral methods used in order to
* Corresponding author.
0040-6031/96/$15.00 '~'5~ 1996 - Elsevier Science B.V. All rights reserved SSDI 0040-6031(95)02725-4

194 P. Budruoeac et al./Thermochimica Acta 275 (1996) 193-213
evaluate non-isothermal kinetic parameters [2]. Among the methods which do not require the knowledge of the analytical form of f(~) in order to obtain the value of the activation energy, one has to mention the isoconversional ones due to Friedman [3], Ozawa [4] and Flynn-Wall [5]. The main disadvantage of these methods consists in the fact that the second activation parameter, the preexponential factor, cannot be directly evaluated in their framework.
This paper deals with a procedure to evaluate non-isothermal kinetic parameters by means of a differential method which uses TG curves. The procedure is based on approximation of a portion of the TG curve, corresponding to the investigated change, by a temperature power series. From the known analytical form of the TG curve, one can evaluate the reaction rate for various degrees of conversion, ~i, and consequently differential methods for the evaluation of the non-isothermal kinetic parameters can be applied. This procedure is applied to the dehydration of calcium oxalate monohydrate and thermooxidative degradation of a styrenated unsaturated polyester resin.
2. Procedure for evaluating non-isothermal kinetic parameters
In the following we shall consider Eq. (1) as correct, the function k(T) being given by the Arrhenius equation:
k(T) = A e x p ( - E/RT) (2)
where A is the preexponential factor, E is the activation energy, T is the temperature (K) and R is the gas constant.
From Eqs. (1) and (2) we obtain:
1 da n ~ - = lnA -~E-T + lnf(a) (3)
Thus for ~ = const., the plot of (In d ~/d t) versus (I /T) is a straight line whose slope enables the evaluation of the activation energy.
This is, in fact, the principle of Friedman's method [33. In order to obtain reliable values of the reaction rate, the thermogravimetric curves, in coordinates ~, T (the values of ~ and T being determined with rather high precision) have to be used. For a given range of degrees of conversion we shall try the following approximation:
N
~(T)= ~ Ci Ti (4) i = 0
where c i values are constants and i an integer. In order to determine the constants c i a fitting program was used [63.
Once the values of c i are known the reaction rate at the temperature T can be calculated taking into account that:
d~ d~ - fl (5)
dt d T

P. Budrugeac et al./Thermochimica Acta 275 (1996) 193 213 195
where/~ is the heating rate, and according to Eq. (4):
d ~ N
d ~ = ~ iciT i-1 (6) i = 1
Thus combining Eqs. (5) and (6) it follows that:
d ~ N ~ = f l ~ ici Ti-1 (7)
i = l
Eq. (7) can be used directly to evaluate the reaction rates and the activation energy with the help of the Friedman method.
Concerning the form of the conversion function which expresses the reaction mechanism, among the procedures suggested for its determination one has to mention that of Dollimore et al. [7, 8] based on the use o f D T G (d~/d T versus T) curves. In our opinion, the application of such a method to the thermal or thermooxidative degrada- tion of complex materials like polymers can lead to unrealistic values of kinetic parameters. As will be shown in this paper the peak of the DTG curve for the thermooxidative degradation of a polyester resin may correspond to several successive degradation processes.
In this work we suggest another procedure for finding the differential conversion function f(~) which consists in the evaluation of the activation energy using an isoconversional method, like Friedman's, and then the function f(~) which leads to almost the same value of E from the plot (ln [(d~/d T)/f(~)] versus 1/T).
3. Applications
3.1. The dehydration of calcium oxalate monohydrate
In order to evaluate the activation energy the data shown in Table 1 have been used [9]. These data enabled us to evaluate the activation energy by integration of the rate equation over small changes of variables. It has been shown that the activation energy decreases with the degree of conversion. Some of the results obtained are given in Fig. 1.
In the same figure the values of the activation energy obtained by the Flynn-Wall- Ozawa method are also shown.
Our calculations have shown that for 0.10 _< ~ <0.75 a good approximation of the curves ~(T) is given by a fourth degree power series in T with the values of the coefficients c i given in Table 2. Comparison with the data given in Table 1 shows that the experimentally determined c~ values are in fairly good agreement with those calculated using the power series. Using the values of c/, the values of (d ~/d t) - /3(d ~/d T) have been calculated. Fig. 2 shows the curves ln(/3(d~/d T)) versus :¢ which have been used to draw the curves ln(/3(dcc/dT)) versus lIT (Fig. 3), from whose slopes we obtain the values of the activation energy (r > 0.998). According to these results, the values of E decrease from 155.1 kJ mol - 1 for ~ = 0.15 to 88.8 kJ tool 1 for ~ = 0.75. These values (see Fig. 1) agree with those obtained using the Urbanovici-

196 P. Budrugeac et al./Thermochimica Acta 275 (1996) 193 213
Table 1 Values of the degree of conversion for the dehydration of calcium oxalate monohydrate determined experimentally and values calculated using power series Eq. (4)
fil = 0.987/(K min 1) fi2 = 2.353/(K min- l) f13 =4.988/(Kmin 1) f14 = 9.573/(K min l)
T/K cq¢, ~calc T/K ~det ~calc T/K ~det ~,~ T/K ~d~,t a¢~,¢
412.5 0.10 0.12 420.9 0.10 0.105 425.3 0.10 0.10 430.8 0.10 0.09 414 0.15 0.13 424.5 0.15 0.15 429.5 0.15 0.145 436.5 0.15 0.15 418.4 0.20 0.20 428.1 0.20 0.20 434 0.20 0.21 441 0.20 0.21 420 0.25 0.23 430.5 0.25 0.24 437 0.25 0.25 444 0.25 0.25 422.8 0.30 0.30 433.1 0.30 0.30 440.2 0.30 0.31 447.6 0.30 0.31 424.8 0.35 0.36 435.5 0.35 0.355 442 0.35 0.34 450 0.35 0.35 426.2 0.40 0.40 437.2 0.40 0.40 445.3 0.40 0.41 453.2 0.40 0.405 427.8 0.45 0.45 439.2 0.45 0.45 447 0.45 0.45 455 0.45 0.44 429.2 0.50 0.50 441 0.50 0.51 449.2 0.50 0.50 458 0.50 0.50 430.5 0.55 0.55 442.5 0.55 0.55 450.8 0.55 0.54 460 0.55 0.54 431.9 0.60 0.61 443.8 0.60 0.595 455.1 0.60 0.60 462.4 0.60 0.60 433 0.65 0.66 445.5 0.65 0.65 455 0.65 0.65 464.5 0.65 0.65 434 0.70 0.70 446.6 0.70 0.69 456.8 0.70 0.70 466.2 0.70 0.69 434.5 0.75 0.72 448 0.75 0.74 458.5 0.75 0.75 469 0.75 0.76
Table 2 The values of the constants c i in the power series ~(T)= ~_.U,_oc~Ti for dehydration of calcium oxalate monohydrate
f l / ( K m i n 1) CO C 1 × 10³ C 2 × 10⁶ C 3 × 10⁸ C 4 X 101° r"
0.987 39.3069 -58.56 - 239.80 - 9.3790 11.172 0.9989 2.353 66.5702 - 252.01 -9.1845 69.158 - 3.2935 0.9998 4.988 6.2344 2.0978 -27,550 -27.547 5.9074 0.9996 9.573 -49.4300 303.96 - 447,33 - 41.462 10.086 0.9995
a The correlation coefficient of the power series.
Segal m e t h o d [9] , b u t a re l o w e r t h a n t h o s e o b t a i n e d us ing F l y n n - W a l l - O z a w a
m e t h o d .
F o r the d e h y d r a t i o n o f c a l c ium o x a l a t e m o n o h y d r a t e it has b e e n s h o w n [10, 11] t h a t
the a c t i v a t i o n e n e r g y is c o r r e l a t e d wi th the p r e e x p o n e n t i a l f ac to r t h r o u g h the c o m p e n -
s a t i on effect. T h e p r o b l e m of e v a l u a t i o n of t he p r e e x p o n e n t i a l f ac to r as well as o f t he
c o m p e n s a t i o n p a r a m e t e r s for th is s y s t e m is d i s c u s s e d e l s ewhe re [11] .
3.2. The thermooxidative degradation of a styrenated unsaturated polyester resin
T h e ana lys i s o f the t h e r m o g r a v i m e t r i c d a t a for the t h e r m o o x i d a t i v e d e g r a d a t i o n o f
p o l y m e r i c m a t e r i a l s ra i ses the f o l l o w i n g p r o b l e m s :

P. Budrugeac et al./ Thermochimica A cta 275 (1996) 193 -213
180
197
170
160
150
"6
130
120
110
100
90
8O o o} 0.2 03 0.,(, 0.5 0.6 ~27 0.8 0.9
Fig. 1. The curve E(~) for the dehydration of calcium oxalate monohydrate. Methods of evaluating the activation energy according to: O Urbanovici and Segal for fli = 0.987 K min 1 and f12 = 2.353 K mint . + Urbanovici and Segal for f12 = 2.353 K m i n t and fla = 4.988 K min 1; ~ Flynn Wall Ozawa; • Fried- man (power series).
(1) to find the analytical form of the differential conversion function, f(ct), as well as the range of variables in which this function describes the degradation;
(2) to find the dependence of the kinetic parameters on the heating rate; (3) to find the dependence of the kinetic parameters on the degree of degradat ion
In order to find the power form of f(~), the isothermal degradat ion of polymeric materials should also be investigated. The results of such long experiments in conjunc- tion with those obtained under non-isothermal conditions led to the correct form off(a) for the proper range of experimental variable changes.
In order to illustrate these statements we have investigated the thermooxidat ive degradat ion of a styrenated unsaturated polyester resin (resin A).

0 0
P. Budrugeac et al./ Thermochimica A cta 275 (1996) 193-213
78
5 0 0.1 0.2 0.3 OA 0,5 O6 0.7 08
Fig. 2. The curves ln( /~(d~/dT)) versus ~ for the dehydra t ion of ca lc ium oxa la te m o n o h y d r a t e
o f l = 0 . 9 8 7 K m i n 1 ; × / ~ = 2 . 3 5 3 K m i n 1 ; A / ~ = 4 . 9 8 8 K m i n 1 ; + / ~ = 9 . 5 7 3 K m i n - L
) -ln(/~-~7 _/× °
Z~
70
6.6
6,2
5 8
5.,~
198
2.1g 2.18 2.22 2.26 2.:30 2,:3g 2,38
/~/K-7 Fig. 3. The s t ra igh t l ines l n ( ~ ( d a / d T ) ) versus I/T for the dehydra t ion of ca lc ium oxala te m o n o h y d r a t e x ~ = 0.20; • ~ = 0.30; A ~ = 0.40; [] ~ = 0.50; + ~ = 0.60.

P. Budrugeac et al./Thermochimica Acta 275 (1996) 193 213 199
4. Experimental
Resin A, a highly reactive unsaturated polyester, Nestrapol 450, manufactured by Polycolor-Bucharest (Romania), was used as raw material. This resin contains 65% (weight percentage) unsaturated polyester formed from maleic anhydride, phthalic anhydride and propylene glycol and 35% styrene (0.51 mol styrene per 100g un- saturated polyester; ~ 1.72mol styrene per gram-equivalent double bonds in the polyester). The characterization of the resin Nestrapol 450 gave the following results: density 1.135gcm 3; acidity index 30.7mg KOH g 1; hydroxyl index 16.0mg K O H g -1.
The resin was prepared by block-copolymerization in the presence of 1% t-butyl perbenzoate (16h at 80°C + 1 h at 90°C + 2h at 100°C). A thermosetting resin was obtained by this procedure.
The results concerning the isothermal and non-isothermal thermooxidative degra- dation of a similar material are reported in another paper [12].
The isothermal degradation of resin A was investigated using a WSU oven in which the temperature was kept constant with a precision of _+ 2°C.
The heating curves of the powdered samples were obtained with a Q-1500D MOM Budapest-type Paulik-Paulik Erdey derivatograph in static air atmosphere in the temperature range 20-500°C at the heating rates: 0.68, 1.45,2.97,5.95 and 12.20K min ~.
5. Results and discussion
5.1. The isothermal degradation of resin A
Fig. 4 shows the weight loss (%) versus ageing time isotherms at 190°C, 200°C, 210°C and 220°C.
/
o - i £ 36o 55o 72o
Fig. 4. The isotherm of weight loss of the resin A. × 190C; + 200°C; ± 210°C; [] 220'C.

200 P. Budrugeac et al./ Thermochimica Acta 275 (1996) 193-213
The inspection of these curves shows that for all the temperatures, after an initial period characterized by a fast weight loss (t < 3 h) a relatively slow degradation o c c u r s .
As will be shown subsequently from the non-isothermal data, the fast initial weight loss is followed by a slower degradation which ends at Am ~ 35%. The kinetic parameters of this latter reaction will be determined.
For the kinetic analysis of the data obtained under isothermal conditions we assume Eqs. (1) and (2) to be valid. The degree, of conversion can be written in term of weight loss, Am, as follows:
Am - ( 8 )
A Fglma x
where Aroma x is the total weight loss in the process of interest. The integration of Eq. (1) leads to :
E In t = In F(Am) - In A + - - (9)
R T
1 fA'" d(Am) w h e r e : F(Am)- Aroma x mo f ( Am "~
\ A m m a x J
where Am o is the initial weight loss. For Am = const, the plot ofln t versus 1/T should be a straight line the slope of which
enables the evaluation of the activation energy. Fig. 5 shows the three straight lines obtained for Am = 20%, Am = 25% and Am = 30%.
For 20% < Am < 35%, the values of the activation energy located in the range 140.4( + 7.1) kJ m o l - 1-151.7( + 15.0) kJ mol 1 (r > 0.99) can be considered practically constant.
The following relationship which can be derived from Eqs. (1), (2) and (8):
(&) , ,0, In = ln A(Ammax) f - R T
was used to evaluate the activation energy. This parameter can be obtained from the slope of the straight line ln(d(Am)/dt) versus l iT at Am = const. The degradation rate, d(Am)/dt, was evaluated considering the development:
N Am = ~ bi ti (11)
i=1
for N = 4. For all the isothermal curves the development in power series gave r > 0.999. For 20% < Am < 35%, the values of E are in the range 158.0(+ 16.0) kJ too!- 1-160.1 (4- 16.0) kJ m o l - 1 (r > 0.985). These values are in satisfactory agreement with those obtained from the straight lines of In t versus 1/T.

P. Budrugeac et al./Thermochimica Acta 275 (1996) 193 213 201
5.s
5.2
4.8
4.0
3.6
3 2
28
24
2.0
In t ( t , " J
2 2.Oh 2n 8 2.12 2.16
tOrOOl K-I
Fig. 5. The straight lines In t versus 1/T for the isothermal degradation of the resin A. G Am = 20%; ~, Am = 25%; + Am = 30%.
F o r 15 % < A m < 3 5 % the fo l lowing fo rm of the d i f ferent ia l c o n v e r s i o n func t ion will be cons ide red :
A m ~ - " f(~) = c~ " - \A--~m~ j
(12)
where 1 _< n < 2. Th is func t ion is c h a r a c t e r i s t i c of d i f fus ion - l imi t ed r e a c t i o n s [2, 13] (n = 1, u n i d i m e n s i o n a l d i f fus ion o r p a r a b o l i c law; n = 2, cub ic law).
F r o m Eqs. (9) a n d (12) it t u rns o u t that :
(Am) .+ 1 = (Amo).+ 1 - - (/,/ 71_ 1)(Ammax).+ l k t ° + (n + 1)(Ammax) n+ a k t (13)
The ana lys i s of the e x p e r i m e n t a l d a t a s h o w e d tha t for n = 1.0 a n d n = 1.1, p lo t s of (Am) "+1 versus t a re s t r a igh t l ines wi th r > 0.999 (Figs. 6 a n d 7).
T a k i n g in to a c c o u n t Eqs. (2) a n d (13), p lo t s o f l n [(n + 1)k(Ammax)" + 1 ] versus I / T for n = 1.0 a n d n = 1.1 have been d r a w n (Fig. 8). F r o m the p a r a m e t e r s of the so o b t a i n e d

202 P. Budrugeac et al./Thermochimica Acta 275 (1996) 193-213
,o l /
! I
~o
4 ~
/ I i
2oo i / 1 /
40 80 q20 q#0 200 240 280 320 360
Fig. 6. The verification of Eq. (12) for the isothermal degradation of the resin A, n = 1. × 190°C; + 200°C; z~ 210°C; [] 220°C.
s t ra ight lines the values of E and A(Ammax) "+ 1 have been eva lua ted (Table 3). One has to not ice tha t the same values of E have been ob ta ined in bo th the cases. The value lies in the range ob ta ined with the help of the i soconvers ional me thods app l ied to the i so thermal data . We in terpre t these results as p roo f of the form of Eq. (12) for f(~).
5.2. The non-isothermal degradation o f resin A
Fig. 9 shows the TG, D T G and D T A curves ob ta ined at a heat ing rate fl = 2.97 K rain 1; s imilar curves were ob ta ined for o ther hea t ing rates. The curves show tha t in the

P. Budrugeac et al./Thermochimica Acta 275 (1996) 193- 213 203
(.,rn ) 2.7.
f600
~0
¢,00
r 't / /
/ / / ,
1
f /h
Fig. 7. The verification of Eq. (12) for the isothermal degradation of the resin A. n = 1.1. × 190'C; + 200C; ,~ 210:'C; [] 2 2 0 " £
Table 3 Values of the kinetic parameters for the isothermal degradation of resin A
n E/(kJ mol - 1) In A (Amma x }n ~ I r" (A(Am.,ax) "+ Is)
1.0 150.1 ± 13.0 31.22 4-3.26 0.9892 1.1 150.1 ± 13.0 33.00 + 3.25 0.9892
a r is the correlation coefficient of the linear regression corresponding to the plot of In [(n + 1 )k (A m.,ax V + ~ ] values versus 1/T (Fig. 8).
temperature range 20-500°C the following successive thermodegradation processes occur: an initial change I with 8.5% weight loss; an exothermic change II for which the weight loss reaches 36%; and a third change noted by III. The total weight loss of 78-80% is practically the same as that obtained under isothermal conditions at 220c'C (see Fig. 4).

204 P. Budruyeac et al./Thermochimica Acta 275 (1996) 193 213
3.8
3,Z,
3 . 0
E E 2.6
2.2
1.8
1.0 2
[]
O
2.b~ 2.08 2)2 2116
Fig. 8. The Arrhenius straight line for the isothermal degradat ion of resin A. o n = 1; [] n = 1.1.
/, m /%
0
10
20
20
,(0
50
60
70
80
Dr5
I
DTA
i
I
. . . . . . . . i S t h
]I i
{ENDO i
180 200 220 2~0 260 280 300 320 3~0 360
Fig, 9. The der ivatogram of resin A in static air a tmosphere at fl = 2.97 K m i n - 1.

P. Budrugeac et al./Thermochimica Acta 275 (1996) 193 213 205
The initial change corresponds to the fast initial weight loss observed for isothermal degradation. Considering that in Eq. (13) t o ~ 0, from the intercept of the straight lines (Am),+ 1 versus t (see Figs. 6 and 7) it turns out that 9.0% < Am < 10.5%, i.e. values which are relatively close to the non-isothermal value.
The exothermic change lI is delimited by the beginning of the change of the degradation rate after the peak I in the DTG curve and the beginning of the change II in the DTA curve. In order to determine that the change II corresponds to a thermooxida- tion, the thermal analysis curves of the resin A have been recorded in an oxygen atmosphere. A derivatogram similar to that from Fig. 9 was obtained but with more intense DTA peaks. It was also noticed that the TG and D TG curves were shifted toward lower temperatures (A T ~ - 15 K) with respect to the same curve obtained in air.
For 15% _< Am < 35 % the Flynn-Wall-Ozawa diagrams for isoconversional condi- tions [5] have been recorded using local heating rates for 10 K < A T < 15 K (Fig. 10).
The inspection of these diagrams shows that the degradation mechanism of resin A depends on the heating rate. For fl < 1.45 K min- 1 the kinetic parameter values are different from those obtained at 1.45 K rain- 1 < fl < 12.20 K rain- ~ (the linear portion of the Flynn-Wall-Ozawa diagram). For this linear portion the values obtained for activation energy are listed in Table 4.
2.6 j~}~ ~/~ ~'~~ '0% ~
2.2 ~
!.0 X x
0.6
0.2 i
-o.2 I
-0.6 i 1.6,(, 1.68 1.72 1.76 1.80 1.-8/~ 1.88 1.92
~_0 /, K "1 Fig. 10. Flynn Wall Ozawa isoconversion diagram for the thermal degradation of resin A.

206 P. Budrugeac et al./Therrnochimica Acta 275 (1996) 193 213
Table 4 The values of the activation energy for various weight losses of the resin A determined with the help of isoconversional methods for 1.45 K min- ~ < fl _< 12.20 K min
Am Flynn-Wall Ozawa Friedman with hot C Friedman power series %
E/(kJmo1-1) r E/(kJmol 1) r E/(kJmol 1) r
15 194.4 + 22.0 0.9835 201.9 + 14.0 0.9954 221.1 + 24.0 0.9860 20 196.9 ___ 14.5 0.9964 197.7 + 10.0 0.9977 199.0 _+ 15.5 0.9941 25 188.9 + 17.3 0.9921 186.8 + 13.8 0.9957 187.3 _+ 17.6 0.9912 30 184.3 + 17.5 0.9913 177.2 + 17.1 0.9915 183.5 _+ 13.8 0.9944 35 185.2 + 14.6 0.9937 178.9 + 10.0 0.9979 185.2 _+ 15.9 0.9927
One can notice that for 15% < Am < 35%, E is practically constant (185 kJ mol 1_ 197kJmol 1). The values of E are higher than those obtained for the isothermal degradation.
The activation energy was also evaluated using the isoconversional method of Friedmann [3]. In order to use this method, Eq. (3), where ~ was transcribed in weight loss terms, (Eq. (8)) has been used. Thus the working equation has the form:
( In = I n f l ~ T - j lnAAmmax+ \ZXmmax/ R T (14)
The ln(fl(d(Am)/d T)) have been evaluated:
(1) From the D T G curve, fl(d(Am)/d T) being directly proportional to the ordinate of hov C (see Fig. 9);
(2) From the TG curve, considering that Am can be developed in a fourth degree temperature power series.
Fig. 11 shows the Friedman diagram In hDv ~ versus 1/T for 15 % < A m < 35 %. The analysis of this diagram confirms that for fl < 1.45 K min- 1 the values of the kinetic parameters differ from those obtained for 1.45 K m i n - 1 < fl < 12.20Kmin- 1 (the linear portion of the diagram). The values of the activation energy obtained for the linear portion of the diagram In hovc versus lIT are listed in Table 4.
In order to evaluate the differential ratio (d(Am)/dt), from the TG curve, Am was developed in a power series of T. The coefficients of the series for the heating rates at which the derivatograms have been recorded and 15% < A m < 35% are given in Table 5. The values of Am calculated using these series are practically the same as those determined experimentally. Then ln(fl(d(Am)/d T)) values have been calculated with these values ofc i. Fig. 12 shows the curves ln(fl(d(Am)/d T)) versus Am which have been used in order to draw the curves ln(fl(d(Am)/d T)) versus 1/T (Fig. 13). The diagram from Fig. 13 shows also that for fl < 1.45 K min-1, the kinetic parameter values differ from those obtained for 1.45 K min- 1 < fl < 12.20 K min 1 (the linear portion of the diagrams). The values of the activation energy obtained for the linear portion of the

P. Budruoeac et al./Thermochimica Acta 275 (1996) 193-213 207
In hoR 5
4.8
~.0
2.6
2,.2
2.8
2.4
2.0
1.6
1.2
0.8
0.4
• 3 0 %
~ .25 %
20 %
15 %
L66 1.70 1.72 1.78 1.82 1.86 1}00/ -1
Fig. 11. F r i e d m a n d i a g r a m (In hn-ro versus 1/T) for the t he rma l d e g r a d a t i o n of resin A.
T a b l e 5 The va lues o f the c o n s t a n t s c i f r om the p o w e r series for c h a n g e II o f resin A
fl/(Kmin 1) C O X 10 2 C I X 102 C 2 X 10³ C 3 × 10⁶ C 4 X 10⁹ r
0.68 8.5083 - 292.19 - 4 .9554 - 11.631 13.413
1.45 9 .3584 - - 1 4 9 . 5 7 - 1 . 8 0 2 0 - -2 .6161 9 .6870
2.97 4 .9629 - - 1 . 0 7 6 0 - 1.7320 - 6 .2126 11.823
5.95 7 .9150 - - 9 9 . 4 3 0 - -3 .1101 1.8050 4.4635
12.20 9.1918 - 1 9 4 . 5 0 - 1 . 3 9 2 0 2.1546 2.4575
0 .9992 0.9993
0.9999
0 .9994
0 .9994

208 P. Budrugeac et al./Thermochimica Acta 275 (1996) 193-213
- in ( ,edd-~)
1 5.6
5.2
4.8
~,.Z,
3.6
3.2
2.8
2.4,
2.0
1.6 10
A m ~ %
Fig. 12. The curves ln(~/(d(Arn)/d T)) versus Am for the thermal degradation of resin A. [] 0.68 K min- 1; × 1.45Kmin l;~2.97Kmin-l;+ 5.95 K min- l; [] 12.20Kmin 1.
curves of ln(fl(d(Am)/d T)) versus 1/T are shown in Table 4. The value of E obtained using this method for A m = 15% is higher than the values obtained using the other methods and exhibits a rather high error. This is because of the higher errors of reaction rate evaluation which are inherent to the lower boundary of the weight loss range.
Table 4 shows that the values of the activation energy determined with the help of the three isoconversional methods are in rather good agreement. The correctness of the method which uses power series of T is justified by the agreement of the results obtained by using the two variants of the Friedman method (using the DTG curves and the power series of temperature for Am).
P. Budrugeac et al./Thermochimica Acta 275 (1996) 193 213 209
58
5~
50
~6
42
38
3~
? 0
2 6
22
- l n ( ~ d~,m •
7/# /,,%
/ 425 % /o I8
lss z'7o i?x 7'78 1182 786 190 19~
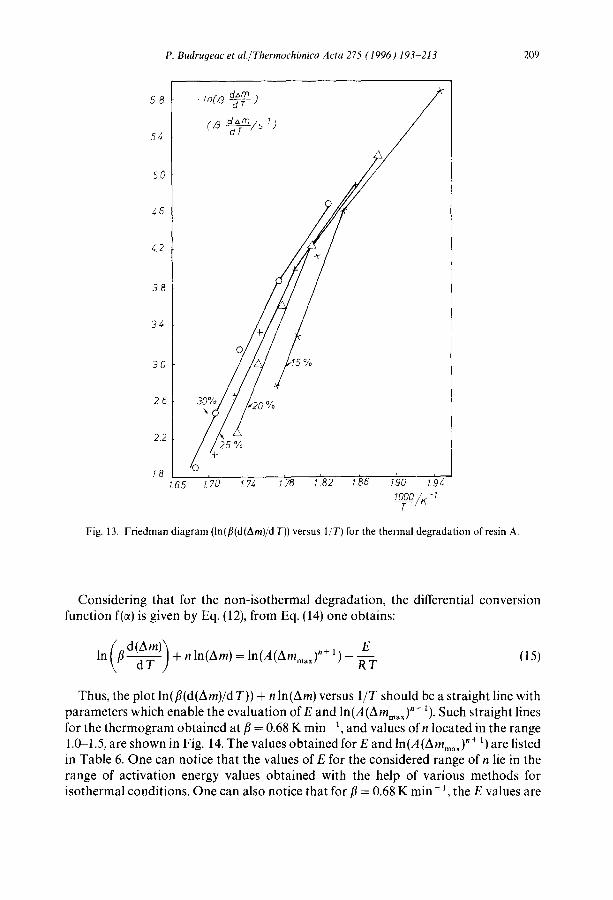
Fig. 13. Friedman diagram (ln(fl(d(Am)/d T)) versus 1/T) for the thermal degradation of resin A.
Considering that for the non-isothermal degradation, the differential conversion function f(~) is given by Eq. (12), from Eq. (14) one obtains:
(fld(Am))+nln(Am)=ln(A(Ammax)n+l) E (15) in \ dT / -R--~
Thus, the plot ln(fl(d(Am)/d T)) + n In(Am) versus 1/T should be a straight line with parameters which enable the evaluation of E and In (A (A mm, x)" + 1). Such straight lines for the thermogram obtained at fl = 0.68 K min 1, and values ofn located in the range 1.0-1.5, are shown in Fig. 14. The values obtained for E and ln(A(Ammax) "÷ 1) are listed in Table 6. One can notice that the values of E for the considered range of n lie in the range of activation energy values obtained with the help of various methods for isothermal conditions. One can also notice that for fl = 0.68 K min 1, the E values are

210 P. Budrugeac et al./Thermochimica Acta 275 (1996) 193 213
In(~3 - ~ ) + n In .~m
+
-2
-1
1.80 1.82 1.84 1.86 1.88 1.90 1.92 1.9/,
Fig. 14. The straight line [ln(fl(d(Am)/d T))+ nln(Am)] versus 1/T corresponding to the TG curve ob- tained a t f l = 0 . 6 8 K m i n - 1 . × n = l . 0 ; A n = l . l ; • n = l . 2 ; + n = l . 3 ; [ ] n = l . 4 ; o n = l . 5 .
Table 6 The values of the kinetic parameters for the non-isothermal degradation of the resin A (the thermogram was recorded at fl = 0.68 K min 1)
n E/(kJ min l) In A(Amm.x) "+ 1 r (A(Amm.x). + 1 s)
1.0 136.7 + 1.9 28.97 + 0.43 1.1 142.5 + 1.7 30.57 _+ 0.39 1.2 148.4 + 1.7 32.19 + 0.34 1.3 153.8 -I- 1.2 33.76 _+ 0.32 1.4 159.7 + 1.2 35.36 + 0.29 1.5 165.1 -t- 1.2 36.95 + 0.27
0.9995 0.9996 0.9997 0.9998 0.9998 0.9999

P. Budruyeac et al./Thermochimica Acta 275 ( 1996 ) 193-213 211
lower than those obtained with the help of isoconversional methods for 1.45 K min- 1 < fl < 12.20 K m i n t . For n = 1.0 and n = 1.1, the values ofln(A(Am,aax) "+ 1) obtained from thermogravimetric data (fl = 0.68 K min t) are in good agreement with those obtained from isothermal data (see Table 3). Thus, as expected, the non-isothermal kinetic parameter values obtained for the lowest value of the heating rate are close to the values obtained from isothermal data.
For 1 .45Kmin -~ A f t < 12.20Kmin -~ we have shown that if Am=cons t . , the F lynn-Wal l -Ozawa and Friedman plots are straight lines. Thus in this range of heating rates the degradation mechanism does not change. Considering that under such conditions Eq. (15) is still valid, for T = const, the plot l n ( f l (d (Am) /d T)) versus In(Am) should be a straight line, the slope of which enables the evaluation of n. In such a way it has been found that in the considered range of heating rates, 1.3 < n < 1.5 (r > 0.985). For this range of n, from the parameters of the straight line ln(fi(d(A m)/d T)) versus I /T , the non-isothermal kinetic parameter values of the degradation have been obtained. Such straight lines for fl = 2.97 K rain 1 are shown in Fig. 15. Similar straight lines have been obtained for other heating rates. The values of the so obtained non- isothermal kinetic parameters are listed in Table 7. For all the n values a slight decrease of E values with increasing heating rate can be noticed. A comparison of the results
In(~3 ~T m) ~ n/ham
0
- 0 , ~
170 172 ZTg 1.76 178 180 1.82 IOTOO/K'1
Fig. 15. The straight line [ln(fl(d(Am)/d T)) + n ln(Am)] versus 1/T corresponding to the TG curve obtained at[]=2.97Kmin 1. × n=1.3;An=1.4;+n=l.5.

212 P. Budrugeac et al./Thermochimica Acta 275 (1996) 193-213
Table 7 The values of the kinetic parameters for the non-isothermal degradation of resin A for 1.45 K min 1 <_/3 <_ 12.20K min i
fl/(K min- 1) E/(kJ mol- 1) In A(Ammax) n+ 1 r (A(Ammax) n+ Is)
n= 1.3
1.45 188.5 + 4.6 40.83 ___ 0.59 0.9987 2.97 178.1 + 4.6 38.45 ± 0.98 0.9983 5.95 170.1 + 1.7 36.89 + 0.31 0.9998
12.20 165.5 ± 2.5 36.17 ± 0.51 0.9996
n= 1.4
1.45 196.9 + 5.0 42.92 + 1.07 0.9987 2.97 185.6 + 4.2 40.32 ± 0.96 0.9985 5.95 177.2 + 1.5 38.70 ± 0.30 0.9998
12.20 173.0 ± 2.5 38.00 ± 0.53 0.9996
n= 1.5
1.45 204.8 ± 50 45.00 ± 1.09 0.9988 2.97 192.7 ± 4.2 42.18 ± 0.94 0.9987 5.95 184.3 + 1.5 40.51 ± 0.30 0.9998
12.20 180.2 + 2.5 39.83 ± 0.54 0.9996
given in this table with those obta ined with the help of the isoconversional method
(Table 4) shows that for n = 1.4 and n = 1.5, the values of E are in a quite good agreement.
6. Conclusions
A method has been developed for evaluat ing non- iso thermal kinetic parameters from thermogravimetr ic data based on the development of the degree of conversion in a temperature power series. A procedure to find the form of the differential funct ion of
conversion was suggested. The proposed method for non- i so thermal kinetic analysis leads to values of the
kinetic parameters in fairly good agreement with those obta ined using other methods.
References
[1] J.H. Flynn, J. Therm. Anal., 34 (1988) 367. I-2] E. Segal and D. F~ttu, Introduction to Non-Isothermal Kinetics, Publishing House of the Academy of
R.S. Romania, Bucharest 1983, (in Roman±an). [-3] H.L. Friedman, J. Polym. Sci., 50 (1965) 183.

P. Budru(teac et al./Thermochimica Acta 275 (1996) 193 213 213
[4] T. Ozawa, Bull. Chem. Soc. Jpn, 38 (1965) 1881 (in Japanesel. [5] J.H. Flynn and L.A. Wall, Polym. Lett., 4 (1966) 191. [6] K. Ebert, H. Ederev and T.L. Isenhour, Computer Applications in Chemistry, VCH, 1989, p. 379. [7] D. Dollimore, in E.L. Charsley and S.B. Warrington (Eds.) Thermal Analysis- Techniques and
Applications, Royal Society of Chemistry, Cambridge, 1992, p. 31. [8] D. Dollimore, T.A. Evans, Y.F. Lee and F.W. Wilburn, in I.R. Harrison (Ed.), Proc. 19th North Am.
Therm. Anal. Soc., 1990, p. 397. [9] E. Urbanovici and E. Segal, Thermochim. Acta, 107 (1986) 339.
[10] E. Urbanovici and E. Segal, Thermochim. Acta, 98 (1986) 385. [11] P. Budrugeac and E. Segal, Thermochim. Acta, (in press). [12] P. Budrugeac, E. Segal, E. Stere and Alice Luminita Petre, J. Therm. Anal., (in press). [13] I.G. Murgulescu, Tatiana Oncescu and E. Segal, Introduction to Physical Chemistry, Vol. II.2,
Publishing House of the Academy of R.S. Romania, Bucharest, 1981, p. 708, (in Romanian).