Applying the revised Chinese Job Content Questionnaire to assess psychosocial work conditions among...
8
RESEARCH ARTICLE Open Access Applying the revised Chinese Job Content Questionnaire to assess psychosocial work conditions among Taiwan’s hospital workers Tsair-Wei Chien 1,2† , Wen-Pin Lai 3† , Hsien-Yi Wang 4 , Sen-Yen Hsu 5 , Roberto Vasquez Castillo 6 , How-Ran Guo 7 , Shih-Chung Chen 8 and Shih-Bin Su 9,10* Abstract Background: For hospital accreditation and health promotion reasons, we examined whether the 22-item Job Content Questionnaire (JCQ) could be applied to evaluate job strain of individual hospital employees and to determine the number of factors extracted from JCQ. Additionally, we developed an Excel module of self- evaluation diagnostic system for consultation with experts. Methods: To develop an Excel-based self-evaluation diagnostic system for consultation to experts to make job strain assessment easier and quicker than ever, Rasch rating scale model was used to analyze data from 1,644 hospital employees who enrolled in 2008 for a job strain survey. We determined whether the 22-item Job Content Questionnaire (JCQ) could evaluate job strain of individual employees in work sites. The respective item responding to specific groups’ occupational hazards causing job stress was investigated by using skewness coefficient with its 95% CI through item-by-item analyses. Results: Each of those 22 items on the questionnaire was examined to have five factors. The prevalence rate of Chinese hospital workers with high job strain was 16.5%. Conclusions: Graphical representations of four quadrants, item-by-item bar chart plots and skewness 95% CI comparison generated in Excel can help employers and consultants of an organization focusing on a small number of key areas of concern for each worker in job strain. Background With the increasing concern about job strain, many researchers have addressed psychosocial job strain and its adverse effects on health [1-3]. The topic of occupational strain receives considerable research attention and is an important occupational safety and health issue. Research evidence shows that perceived stress overtime and quan- titative job overload negatively impact worker mental health. The prevalence of workers reporting mental stress due to job overload increased from 51% in 1982 to 63% in 1997 among Japanese workers and job stressors caus- ing 60% to 80% of occupational accidents and absentee- ism in Taiwan [2,4]. Job Content Questionnaire (JCQ) The Job Content Questionnaire (JCQ) based on Karasek’s Demand-Control Model, i.e., subscales of job control and psychological demands, is the most popular[1,5], among many instruments designed for the assessment of psycho- social work environment. Karasek and Theorell later incorporated this questionnaire with work-related social support (i.e., subscales of supervisor support and co- worker support) as the Demand-Control-Support Model [1]. Most of the epidemiological studies utilize the JCQ to measure the ‘content’ of a respondent’s work tasks in a general manner, which is applicable to all jobs and work- ers for predicting job related stress and coronary heart disease in many countries[6-11], and also they are used for studying worker motivation, job satisfaction, absen- teeism, and labor turnover [5,8]. The 22-item core JCQ Chinese version (C-JCL) was verified and published in an * Correspondence: [email protected] † Contributed equally 9 Department of Biotechnology, Southern Taiwan University, Tainan, Taiwan Full list of author information is available at the end of the article Chien et al. BMC Public Health 2011, 11:478 http://www.biomedcentral.com/1471-2458/11/478 © 2011 Chien et al; licensee BioMed Central Ltd. This is an Open Access article distributed under the terms of the Creative Commons Attribution License (http://creativecommons.org/licenses/by/2.0), which permits unrestricted use, distribution, and reproduction in any medium, provided the original work is properly cited.
-
Upload
independent -
Category
Documents
-
view
1 -
download
0
Transcript of Applying the revised Chinese Job Content Questionnaire to assess psychosocial work conditions among...
RESEARCH ARTICLE Open Access
Applying the revised Chinese Job ContentQuestionnaire to assess psychosocial workconditions among Taiwan’s hospital workersTsair-Wei Chien1,2†, Wen-Pin Lai3†, Hsien-Yi Wang4, Sen-Yen Hsu5, Roberto Vasquez Castillo6, How-Ran Guo7,Shih-Chung Chen8 and Shih-Bin Su9,10*
Abstract
Background: For hospital accreditation and health promotion reasons, we examined whether the 22-item JobContent Questionnaire (JCQ) could be applied to evaluate job strain of individual hospital employees and todetermine the number of factors extracted from JCQ. Additionally, we developed an Excel module of self-evaluation diagnostic system for consultation with experts.
Methods: To develop an Excel-based self-evaluation diagnostic system for consultation to experts to make jobstrain assessment easier and quicker than ever, Rasch rating scale model was used to analyze data from 1,644hospital employees who enrolled in 2008 for a job strain survey. We determined whether the 22-item Job ContentQuestionnaire (JCQ) could evaluate job strain of individual employees in work sites. The respective item respondingto specific groups’ occupational hazards causing job stress was investigated by using skewness coefficient with its95% CI through item-by-item analyses.
Results: Each of those 22 items on the questionnaire was examined to have five factors. The prevalence rate ofChinese hospital workers with high job strain was 16.5%.
Conclusions: Graphical representations of four quadrants, item-by-item bar chart plots and skewness 95% CIcomparison generated in Excel can help employers and consultants of an organization focusing on a small numberof key areas of concern for each worker in job strain.
BackgroundWith the increasing concern about job strain, manyresearchers have addressed psychosocial job strain and itsadverse effects on health [1-3]. The topic of occupationalstrain receives considerable research attention and is animportant occupational safety and health issue. Researchevidence shows that perceived stress overtime and quan-titative job overload negatively impact worker mentalhealth. The prevalence of workers reporting mental stressdue to job overload increased from 51% in 1982 to 63%in 1997 among Japanese workers and job stressors caus-ing 60% to 80% of occupational accidents and absentee-ism in Taiwan [2,4].
Job Content Questionnaire (JCQ)The Job Content Questionnaire (JCQ) based on Karasek’sDemand-Control Model, i.e., subscales of job control andpsychological demands, is the most popular[1,5], amongmany instruments designed for the assessment of psycho-social work environment. Karasek and Theorell laterincorporated this questionnaire with work-related socialsupport (i.e., subscales of supervisor support and co-worker support) as the Demand-Control-Support Model[1]. Most of the epidemiological studies utilize the JCQto measure the ‘content’ of a respondent’s work tasks in ageneral manner, which is applicable to all jobs and work-ers for predicting job related stress and coronary heartdisease in many countries[6-11], and also they are usedfor studying worker motivation, job satisfaction, absen-teeism, and labor turnover [5,8]. The 22-item core JCQChinese version (C-JCL) was verified and published in an
* Correspondence: [email protected]† Contributed equally9Department of Biotechnology, Southern Taiwan University, Tainan, TaiwanFull list of author information is available at the end of the article
Chien et al. BMC Public Health 2011, 11:478http://www.biomedcentral.com/1471-2458/11/478
© 2011 Chien et al; licensee BioMed Central Ltd. This is an Open Access article distributed under the terms of the Creative CommonsAttribution License (http://creativecommons.org/licenses/by/2.0), which permits unrestricted use, distribution, and reproduction inany medium, provided the original work is properly cited.
international journal [12]. However, few papers illu-strated a graphical presentation of job strain interpreta-tion for workers, especially in friendly used Excel, to helpmental health experts focussing on a small number ofkey areas of concern.
Four exposure groups classified by JCQJob Demand-Control (or Job Strain) Model involves fourquadrants displaying psychological job demands (PD),namely high and low strain and active and passive jobs[13,14], those are jointly separated by another subscaleof decision latitude (DL). High strain jobs with low DLand high PD are particularly perceived to cause themost adverse psychological reactions [15]. Many pro-spective studies have supported this hypothesis. Fourexposure groups including (i) high strain (exposed tolow DL and high PD); (ii) low strain (high DL and lowPD); (iii) passive (low DL and low PD); and (iv) active(high DL and high PD) could be graphically illustratedfor identifying examinee’s high or low job strain.
Study ObjectivesCalculating a sum of weighted item scores for each sub-scale of those 22 items by the specific calculation for-mulas of the originators is subjective and cumbersome[1,12]. None study, until now, was conducted using the22-item C-JCL to generate diagnostic reports for work-ers by a graphical representation to identify their jobstresses.For the graphical representations, it is worthy of (1)
depicting a four-quadrant diagram reporting individualjob stressors and strains; (2) developing item-by-itembar chart plots to examine person’s response on itemswhich can help consultants focusing on a small numberof key areas of concern; and (3) make a comparison ofthe inter-group and inter-occupation differences byitem-by-item box plots of disclosure for a sample usingskewness coefficients and 95% confidence intervals (CIs)to justify occupational job stress whether it is positive ornegative skew to an issue (i.e., item or question).
MethodsStudy ParticipantsThe setting was a 1,200-bed hospital located in southernTaiwan in which 2,791 workers participated in a job per-ception examination in August of 2008. Self-administeredquestionnaires were distributed to all the employees ofthe hospital, and 1,863 employees responded (return rate,66.75%). We further excluded 219 participants who hadincomplete information on age, gender, and those withwork tenure of three months or less, and part-time work-ers. As a result, 1,644 workers (or 58.9% of 2,791) wereavailable for this study (Table 1).
Steps of instrument selection1. QuestionnaireWith permission from the author of the Chinese Ver-sion of the JCQ (C-JCL) [12], 22 core items wereselected, including the four subscales such as DL mea-sured by nine items, i.e., skill job discretion (6 items)and decision authority (3 items), PD measured by fiveitems, and supervisor and co-worker support, both mea-sured by four items. For each item, the response wasrecorded using a four-point Likert scale ranging from 1(strongly disagree) to 4 (strongly agree). We used theWINSTEPS software [16] to estimate each person’s psy-chometric characteristics by combining all 22 items andseparating items for respective subscales.2. Validation Procedure(1). Rasch modeling analysis We programmed an Excelmodule helping workers examine their job strain. The 22core items are required to identify number of factorsextracting from data. Rasch [17] model was applied toanalyze data in Excel for the assessment of job strain forworkers. The great advantage of using a Rasch model isthat it is an explicit empirical model of the latent trait,which allows for the testing of data fit to the model whiledealing with missing response values and transformingraw scores into a linear interval score in a logit (log odd)unit [18-21].(2) Dimensional checking for C-JCQ We detected thenumber of factors for C-JCQ using parallel analysis [22],one of the most recommended methods for dealing withthe number-of-factors-to-retain problem [23,24] toobserve C-JCQ dimensionality. ViSta version 7.9.2.6
Table 1 Demographic Characteristics (N = 1,644)
Male Female Total
n = 290 n = 1354 n = 1,644
Age (Avg. yrs) 38 33 35
Age (%)
21~30 25% 43% 40%
31~40 45% 39% 40%
41~50 20% 13% 15%
51~60 7% 2% 3%
Work tenure
Within 1 yr 25% 8% 12%
1-5 6% 39% 33%
5-10 24% 17% 18%
Above 10 yrs 41% 36% 37%
Job title
Physician 35% 4% 10%
Nurse 18% 64% 56%
Technician 22% 16% 17%
Administrator 24% 15% 17%
Others 1% 1% 1%
Chien et al. BMC Public Health 2011, 11:478http://www.biomedcentral.com/1471-2458/11/478
Page 2 of 8
(2010, April) [25] was performed to plot the graphicalparallel analysis with 95% confidence intervals.
Prevalence rate of high strain in hospital workersWe used formula (1) to calculate the prevalence rate touncover participants with work-related stress comparedto the total population at risk of contracting that stress.
Prevalence rate =Number of existing events in a specified periodNumber of people exposed to risk in this period
(1)
Excel module combined with WINSTEPS estimatingmeasuresRasch transformed scores in each domain will be gener-ated by separately estimating person measures using theExcel module which was incorporated with WINSTEPSsoftware to easily estimate the individual measures. Thediagram of four quadrants in Excel were plotted to classifyworkers by DL and SD subscales for individual examinees.Item-by-item bar chart plots to examine person’s place-ment will be developed in Excel. Those two graphicalrepresentations are expected to help consultants to easily,quickly and clearly identify job strain for each worker.
Job stress monitored by skewness analysesSkewness coefficient was suggested to report in evaluatingdissimilarity of examinee group [26]. In a skewed (unba-lanced, lopsided) distribution, the mean is farther out in thelong tail than is the median. If there is no skewness (i.e., thedistribution is symmetric) then the mean = the median =the mode. It can be applied to workplace for graphicalhealth performance reports as an indicator of examineegroup discrimination on a single item regarding job stress.If we are concerned with the occupational (or demo-
graphic) group which is ascribed to the job stress withpositively skewed population which indicates that most ofthem perform worse (i.e., most persons with lowerresponding score) on the single item. It is required usingcomputer efficiently to screen them for further assess-ment. The skewness coefficient and its 95% CI yielded byBootstrap [27] for all types of occupational group on itemsare estimated by author programmed Excel-VBA module.
Ethics Review Board ApprovalThe protocol of this study was approved by theResearch and Ethics Review Board of Chi-Mei MedicalCenter. All authors certify that there are no known con-flicts of interest with any third party.
ResultsDescriptive StatisticsTable 1 summarizes the demographic characteristics ofthe study population. The average age of the men and
women were 38 and 33 years, respectively, and themean duration of work tenure was about 4.8 years forboth men and women. The majority of respondentswere nurses (56%), whereas only 10% were physicians.
Checking dimensions of C-JCQAll the 22 items fit the expectations for the Rasch modelfairly well, with infit and outfit MNSQs between 0.60and 1.40, respectively (Table 2). The most difficult (i.e.,the least occurrence) item to appear was conflictingwork (item 14; 2.76 logits; SE = 0.04). The easiest (i.e.,the most frequent) to present was learning new things(item 1; -2.18 logits; SE = 0.05). Cronbach’s alpha coeffi-cient is 0.8 similar to the previous study (Cheng, Luh,Guo, 2003) [12].Tennant and Pallant suggested [28] that exploratory
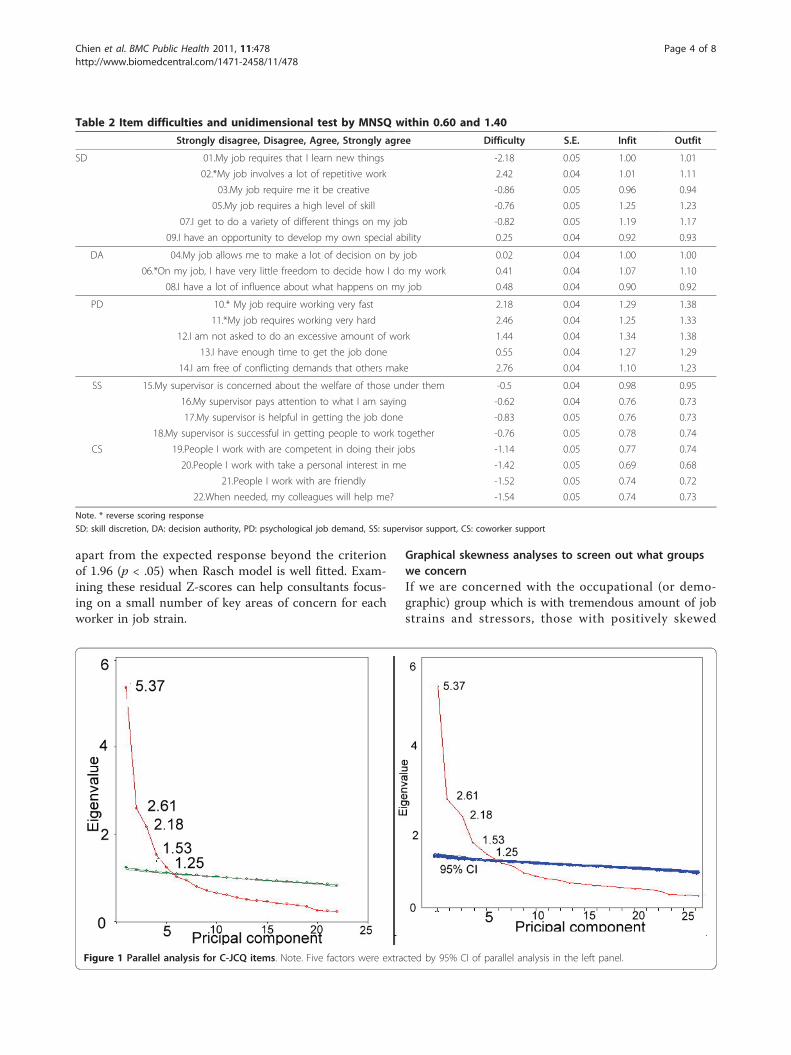
factor analysis (EFA), especially using parallel analysis(PA)[22], should be undertaken to ensure the dimen-sionality of study data before conducting a Rasch ana-lysis. Parallel analysis was performed to identify thatC-JCQ has five factors extracted from those 22 items(Figure 1).
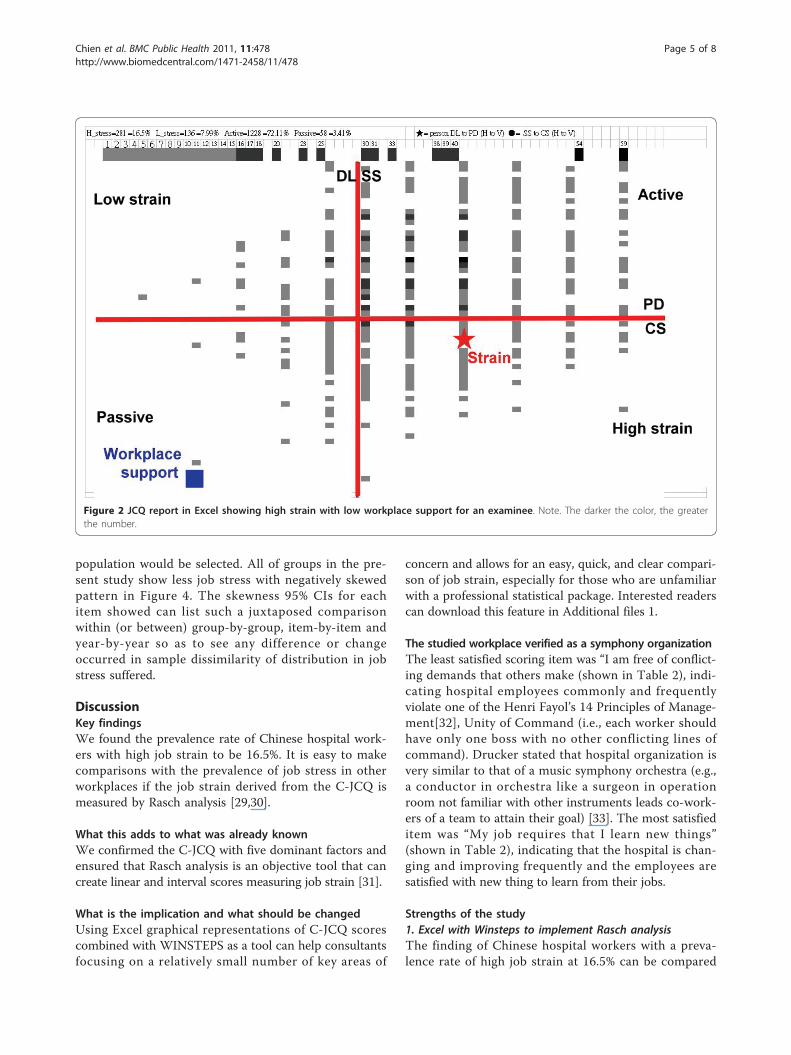
Excel module plotting graphical representations of fourexposure groupsIn order to develop a self-administered assessment to helpworkers diagnose their job strain, we illustrate a workercorresponding to the relationship between four exposuregroups in Figure 2. They were 281 (16.5%), 136 (7.99%),1228 (72.11%) and 58 (3.41%) for high and low strain, andactive and passive jobs, respectively. In the diagram, wesee that the number that occurred in each group is shownin different color (the darker the color, the greater thenumber). The worker’s scores displayed in the diagramshowing high strain in the VI quadrant (symbolized by anasterisk) and low scores of SSs (supervisor support) andCSs (co-worker support) in the III quadrant (symbolizedby a square), indicating that the worker should be paidmore concern for an obviously depressive disorder on jobenvironment without satisfying social support in the work-place. The graphical representation in Excel can help con-sultants examine the relation of worker’s job strain andsupport from supervisor and co-worker so that they canbe easily, quickly and clearly identified.
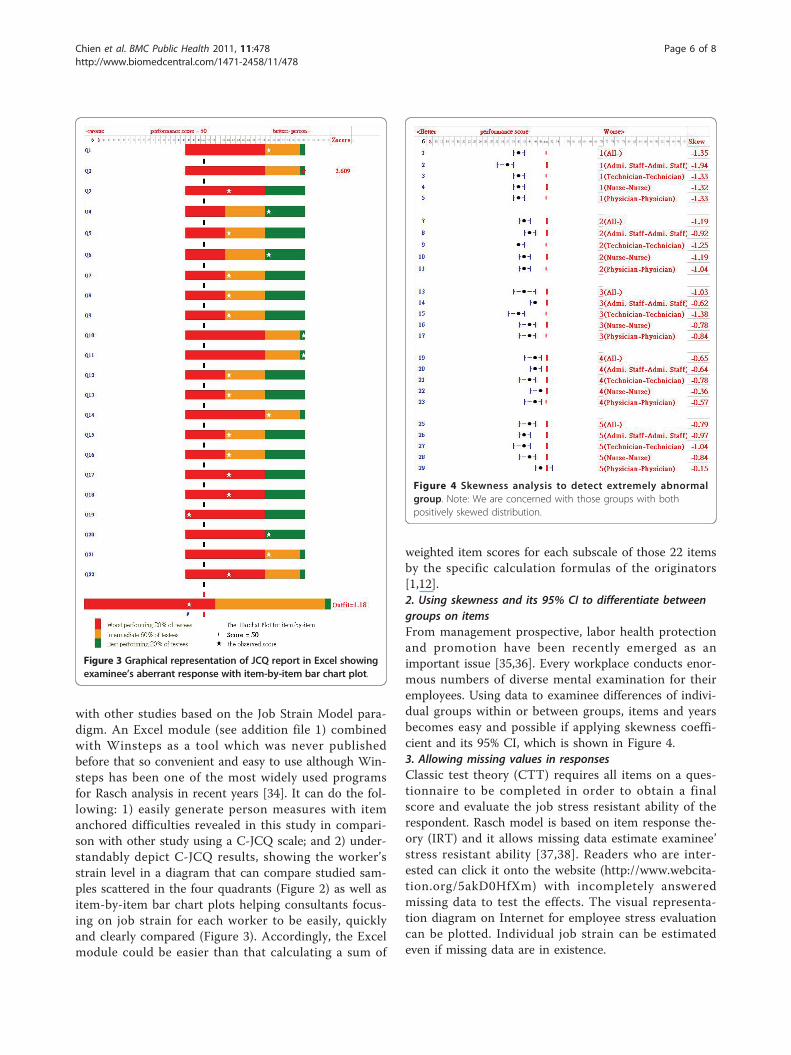
Excel module plotting item-by-item bar charts forindividual workersFigure 3 shows item-by-item box plots for a particularworker. On the right-hand side of the figure, the outlierresidual Z-score (2.609 on item 2) is shown, indicatingthat such items responding to this worker violatingmodel’s expectation are required for a further discus-sion, indicating that the observed score is greatly far
Chien et al. BMC Public Health 2011, 11:478http://www.biomedcentral.com/1471-2458/11/478
Page 3 of 8
apart from the expected response beyond the criterionof 1.96 (p < .05) when Rasch model is well fitted. Exam-ining these residual Z-scores can help consultants focus-ing on a small number of key areas of concern for eachworker in job strain.
Graphical skewness analyses to screen out what groupswe concernIf we are concerned with the occupational (or demo-graphic) group which is with tremendous amount of jobstrains and stressors, those with positively skewed
Table 2 Item difficulties and unidimensional test by MNSQ within 0.60 and 1.40
Strongly disagree, Disagree, Agree, Strongly agree Difficulty S.E. Infit Outfit
SD 01.My job requires that I learn new things -2.18 0.05 1.00 1.01
02.*My job involves a lot of repetitive work 2.42 0.04 1.01 1.11
03.My job require me it be creative -0.86 0.05 0.96 0.94
05.My job requires a high level of skill -0.76 0.05 1.25 1.23
07.I get to do a variety of different things on my job -0.82 0.05 1.19 1.17
09.I have an opportunity to develop my own special ability 0.25 0.04 0.92 0.93
DA 04.My job allows me to make a lot of decision on by job 0.02 0.04 1.00 1.00
06.*On my job, I have very little freedom to decide how I do my work 0.41 0.04 1.07 1.10
08.I have a lot of influence about what happens on my job 0.48 0.04 0.90 0.92
PD 10.* My job require working very fast 2.18 0.04 1.29 1.38
11.*My job requires working very hard 2.46 0.04 1.25 1.33
12.I am not asked to do an excessive amount of work 1.44 0.04 1.34 1.38
13.I have enough time to get the job done 0.55 0.04 1.27 1.29
14.I am free of conflicting demands that others make 2.76 0.04 1.10 1.23
SS 15.My supervisor is concerned about the welfare of those under them -0.5 0.04 0.98 0.95
16.My supervisor pays attention to what I am saying -0.62 0.04 0.76 0.73
17.My supervisor is helpful in getting the job done -0.83 0.05 0.76 0.73
18.My supervisor is successful in getting people to work together -0.76 0.05 0.78 0.74
CS 19.People I work with are competent in doing their jobs -1.14 0.05 0.77 0.74
20.People I work with take a personal interest in me -1.42 0.05 0.69 0.68
21.People I work with are friendly -1.52 0.05 0.74 0.72
22.When needed, my colleagues will help me? -1.54 0.05 0.74 0.73
Note. * reverse scoring response
SD: skill discretion, DA: decision authority, PD: psychological job demand, SS: supervisor support, CS: coworker support
Figure 1 Parallel analysis for C-JCQ items. Note. Five factors were extracted by 95% CI of parallel analysis in the left panel.
Chien et al. BMC Public Health 2011, 11:478http://www.biomedcentral.com/1471-2458/11/478
Page 4 of 8
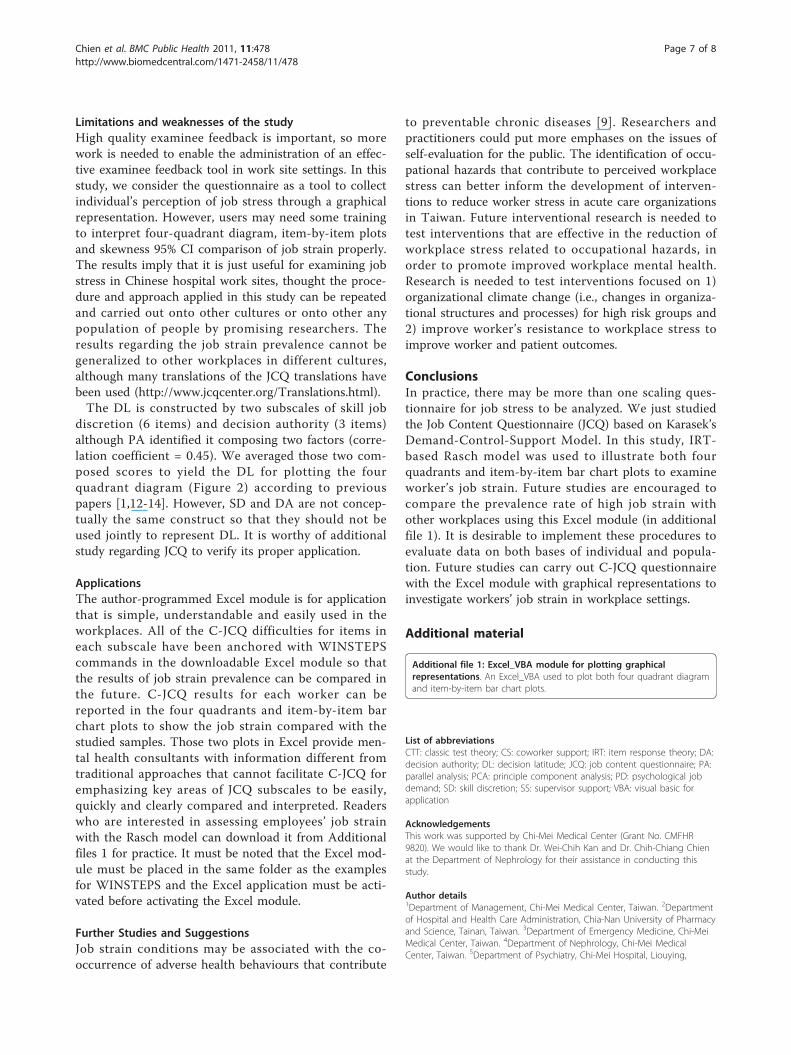
population would be selected. All of groups in the pre-sent study show less job stress with negatively skewedpattern in Figure 4. The skewness 95% CIs for eachitem showed can list such a juxtaposed comparisonwithin (or between) group-by-group, item-by-item andyear-by-year so as to see any difference or changeoccurred in sample dissimilarity of distribution in jobstress suffered.
DiscussionKey findingsWe found the prevalence rate of Chinese hospital work-ers with high job strain to be 16.5%. It is easy to makecomparisons with the prevalence of job stress in otherworkplaces if the job strain derived from the C-JCQ ismeasured by Rasch analysis [29,30].
What this adds to what was already knownWe confirmed the C-JCQ with five dominant factors andensured that Rasch analysis is an objective tool that cancreate linear and interval scores measuring job strain [31].
What is the implication and what should be changedUsing Excel graphical representations of C-JCQ scorescombined with WINSTEPS as a tool can help consultantsfocusing on a relatively small number of key areas of
concern and allows for an easy, quick, and clear compari-son of job strain, especially for those who are unfamiliarwith a professional statistical package. Interested readerscan download this feature in Additional files 1.
The studied workplace verified as a symphony organizationThe least satisfied scoring item was “I am free of conflict-ing demands that others make (shown in Table 2), indi-cating hospital employees commonly and frequentlyviolate one of the Henri Fayol’s 14 Principles of Manage-ment[32], Unity of Command (i.e., each worker shouldhave only one boss with no other conflicting lines ofcommand). Drucker stated that hospital organization isvery similar to that of a music symphony orchestra (e.g.,a conductor in orchestra like a surgeon in operationroom not familiar with other instruments leads co-work-ers of a team to attain their goal) [33]. The most satisfieditem was “My job requires that I learn new things”(shown in Table 2), indicating that the hospital is chan-ging and improving frequently and the employees aresatisfied with new thing to learn from their jobs.
Strengths of the study1. Excel with Winsteps to implement Rasch analysisThe finding of Chinese hospital workers with a preva-lence rate of high job strain at 16.5% can be compared
Figure 2 JCQ report in Excel showing high strain with low workplace support for an examinee. Note. The darker the color, the greaterthe number.
Chien et al. BMC Public Health 2011, 11:478http://www.biomedcentral.com/1471-2458/11/478
Page 5 of 8
with other studies based on the Job Strain Model para-digm. An Excel module (see addition file 1) combinedwith Winsteps as a tool which was never publishedbefore that so convenient and easy to use although Win-steps has been one of the most widely used programsfor Rasch analysis in recent years [34]. It can do the fol-lowing: 1) easily generate person measures with itemanchored difficulties revealed in this study in compari-son with other study using a C-JCQ scale; and 2) under-standably depict C-JCQ results, showing the worker’sstrain level in a diagram that can compare studied sam-ples scattered in the four quadrants (Figure 2) as well asitem-by-item bar chart plots helping consultants focus-ing on job strain for each worker to be easily, quicklyand clearly compared (Figure 3). Accordingly, the Excelmodule could be easier than that calculating a sum of
weighted item scores for each subscale of those 22 itemsby the specific calculation formulas of the originators[1,12].2. Using skewness and its 95% CI to differentiate betweengroups on itemsFrom management prospective, labor health protectionand promotion have been recently emerged as animportant issue [35,36]. Every workplace conducts enor-mous numbers of diverse mental examination for theiremployees. Using data to examinee differences of indivi-dual groups within or between groups, items and yearsbecomes easy and possible if applying skewness coeffi-cient and its 95% CI, which is shown in Figure 4.3. Allowing missing values in responsesClassic test theory (CTT) requires all items on a ques-tionnaire to be completed in order to obtain a finalscore and evaluate the job stress resistant ability of therespondent. Rasch model is based on item response the-ory (IRT) and it allows missing data estimate examinee’stress resistant ability [37,38]. Readers who are inter-ested can click it onto the website (http://www.webcita-tion.org/5akD0HfXm) with incompletely answeredmissing data to test the effects. The visual representa-tion diagram on Internet for employee stress evaluationcan be plotted. Individual job strain can be estimatedeven if missing data are in existence.
Figure 3 Graphical representation of JCQ report in Excel showingexaminee’s aberrant response with item-by-item bar chart plot.
Figure 4 Skewness analysis to detect extremely abnormalgroup. Note: We are concerned with those groups with bothpositively skewed distribution.
Chien et al. BMC Public Health 2011, 11:478http://www.biomedcentral.com/1471-2458/11/478
Page 6 of 8
Limitations and weaknesses of the studyHigh quality examinee feedback is important, so morework is needed to enable the administration of an effec-tive examinee feedback tool in work site settings. In thisstudy, we consider the questionnaire as a tool to collectindividual’s perception of job stress through a graphicalrepresentation. However, users may need some trainingto interpret four-quadrant diagram, item-by-item plotsand skewness 95% CI comparison of job strain properly.The results imply that it is just useful for examining jobstress in Chinese hospital work sites, thought the proce-dure and approach applied in this study can be repeatedand carried out onto other cultures or onto other anypopulation of people by promising researchers. Theresults regarding the job strain prevalence cannot begeneralized to other workplaces in different cultures,although many translations of the JCQ translations havebeen used (http://www.jcqcenter.org/Translations.html).The DL is constructed by two subscales of skill job
discretion (6 items) and decision authority (3 items)although PA identified it composing two factors (corre-lation coefficient = 0.45). We averaged those two com-posed scores to yield the DL for plotting the fourquadrant diagram (Figure 2) according to previouspapers [1,12-14]. However, SD and DA are not concep-tually the same construct so that they should not beused jointly to represent DL. It is worthy of additionalstudy regarding JCQ to verify its proper application.
ApplicationsThe author-programmed Excel module is for applicationthat is simple, understandable and easily used in theworkplaces. All of the C-JCQ difficulties for items ineach subscale have been anchored with WINSTEPScommands in the downloadable Excel module so thatthe results of job strain prevalence can be compared inthe future. C-JCQ results for each worker can bereported in the four quadrants and item-by-item barchart plots to show the job strain compared with thestudied samples. Those two plots in Excel provide men-tal health consultants with information different fromtraditional approaches that cannot facilitate C-JCQ foremphasizing key areas of JCQ subscales to be easily,quickly and clearly compared and interpreted. Readerswho are interested in assessing employees’ job strainwith the Rasch model can download it from Additionalfiles 1 for practice. It must be noted that the Excel mod-ule must be placed in the same folder as the examplesfor WINSTEPS and the Excel application must be acti-vated before activating the Excel module.
Further Studies and SuggestionsJob strain conditions may be associated with the co-occurrence of adverse health behaviours that contribute
to preventable chronic diseases [9]. Researchers andpractitioners could put more emphases on the issues ofself-evaluation for the public. The identification of occu-pational hazards that contribute to perceived workplacestress can better inform the development of interven-tions to reduce worker stress in acute care organizationsin Taiwan. Future interventional research is needed totest interventions that are effective in the reduction ofworkplace stress related to occupational hazards, inorder to promote improved workplace mental health.Research is needed to test interventions focused on 1)organizational climate change (i.e., changes in organiza-tional structures and processes) for high risk groups and2) improve worker’s resistance to workplace stress toimprove worker and patient outcomes.
ConclusionsIn practice, there may be more than one scaling ques-tionnaire for job stress to be analyzed. We just studiedthe Job Content Questionnaire (JCQ) based on Karasek’sDemand-Control-Support Model. In this study, IRT-based Rasch model was used to illustrate both fourquadrants and item-by-item bar chart plots to examineworker’s job strain. Future studies are encouraged tocompare the prevalence rate of high job strain withother workplaces using this Excel module (in additionalfile 1). It is desirable to implement these procedures toevaluate data on both bases of individual and popula-tion. Future studies can carry out C-JCQ questionnairewith the Excel module with graphical representations toinvestigate workers’ job strain in workplace settings.
Additional material
Additional file 1: Excel_VBA module for plotting graphicalrepresentations. An Excel_VBA used to plot both four quadrant diagramand item-by-item bar chart plots.
List of abbreviationsCTT: classic test theory; CS: coworker support; IRT: item response theory; DA:decision authority; DL: decision latitude; JCQ: job content questionnaire; PA:parallel analysis; PCA: principle component analysis; PD: psychological jobdemand; SD: skill discretion; SS: supervisor support; VBA: visual basic forapplication
AcknowledgementsThis work was supported by Chi-Mei Medical Center (Grant No. CMFHR9820). We would like to thank Dr. Wei-Chih Kan and Dr. Chih-Chiang Chienat the Department of Nephrology for their assistance in conducting thisstudy.
Author details1Department of Management, Chi-Mei Medical Center, Taiwan. 2Departmentof Hospital and Health Care Administration, Chia-Nan University of Pharmacyand Science, Tainan, Taiwan. 3Department of Emergency Medicine, Chi-MeiMedical Center, Taiwan. 4Department of Nephrology, Chi-Mei MedicalCenter, Taiwan. 5Department of Psychiatry, Chi-Mei Hospital, Liouying,
Chien et al. BMC Public Health 2011, 11:478http://www.biomedcentral.com/1471-2458/11/478
Page 7 of 8
Taiwan. 6Director of Local Integral Health Assistance System (SILAIS), Carazo,Nicaragua, Central America. 7Department of Environmental and OccupationalHealth, National Cheng Kung University, Taiwan. 8Institute of BiomedicalEngineering, Southern Taiwan University, Tainan, Taiwan. 9Department ofBiotechnology, Southern Taiwan University, Tainan, Taiwan. 10Department ofFamily Medicine, Chi-Mei Medical Center, Tainan, Taiwan.
Authors’ contributionsTWC, WPL and SBS provided concepts and ideas for research design, writing,data analysis, facilities and equipment and fund procurement. SYH, HYW andSCC provided institutional liaison and project management. HRG and RVCprovided consultation (including English revision and review of manuscriptbefore submission) All authors read and approved the final manuscript.
Competing interests1. Authors’ declaration of personal interests: None.2. Declaration of funding interests: This study was funded in full by Chi-MeiMedical Center (Grant No. CMFHR 9820).
Received: 14 June 2010 Accepted: 18 June 2011Published: 18 June 2011
References1. Karasek R, Theorell T: The psychosocial work environment. Healthy work-
stress, productivity, and the reconstruction of working life New York: BasicBooks; 1990, 1-82.
2. Kawakami N, Haratani T: Epidemiology of job stress and health in Japan:Review of current evidence and future direction. Industrial Health 1999,37(2):174-186.
3. Schnall PL, Schwartz JE, Landsbergis PA, et al: Relation between job strain,alcohol, and ambulatory blood pressure. Hypertension 1992, 19:488-494.
4. Hurrell JJ Jr, Murphy LR: Occupational strss intervention. Am J Ind Med1996, 29:338-41.
5. Hurrell JJ Jr, Nelson DL, Simmons BL: Measuring job stressors and strains:Where we have been, where we are, and where we need to go. Journalof Occupational Health Psychology 1998, 3:368-389.
6. Cheng Y, Kawachi I, Coakley EH, et al: Association between psychosocialwork characteristics and health functioning in American women:prospective study. BMJ 2000, 320(7247):1432-6.
7. Fenster L, Schaefer C, Mathur A, et al: Psychologic stress in the workplaceand spontaneous abortion. Am J Epidemiol 1995, 142(11):1176-83.
8. Karasek RA, Theorell T, Schwartz JE, et al: Job characteristics in relation tothe prevalence of myocardial infarction in the US Health ExaminationSurvey (HES) and the Health and Nutrition Examination Survey (HANES).American Journal of Public Health 1988, 78:910-918.
9. Kouvonen A, Kivimäki M, Väänänen A, Heponiemi T, Elovainio M, et al: Jobstrain and adverse health behaviors: the Finnish Public Sector Study.J Occup Environ Med 2007, 49(1):68-74.
10. Mohan GM, Elangovan S, Prasad PS, Krishna PR, Mokkapati AK: Prevalenceof job strain among Indian foundry shop floor workers. Work 2008,30(4):353-7.
11. Schnall PL, Landsbergis PA, Baker D: Job strain and cardiovascular disease.Annual Review of Public Health 1994, 15:381-411.
12. Cheng Y, Luh WM, Guo YL: Reliability and Validity of the Chinese Versionof the Job Content Questionnaire (C-JCQ) in Taiwanese Workers.International Journal of Behavioral Medicine 2003, 10(1):15-30.
13. Maizura H, Retneswari M, Moe H, Hoe VC, Bulgiba A: Job strain amongMalaysian office workers of a multinational company. Occup Med (Lond)2010, 60(3):219-24.
14. Karasek R, Brisson C: The Job Content Questionnaire (JCQ): an instrumentfor internationally comparative assessments of psychosocial jobcharacteristics. Journal of Occupational Health Psychology 1998,3(4):322-355.
15. Garcia AM, Checkoway H: A glossary for research in occupational health.JEpidemiolCommunity Health 2003, 57:7-10.
16. Linacre JM: WINSTEPS [computer program]. Chicago, IL; 2008 [http://www.winsteps.com].
17. Rasch G: Probabilistic Models for Some Intelligent and Attainment Tests.Copenhagen, Denmark: Institute of Educational Research; 1960.
18. Hsueh IP, Wang WC, Sheu CF, Hsieh CL: Rasch analysis of combining twoindices to assess comprehensive ADL function in stroke patients. Stroke2004, 35:721-726.
19. Smith AB, Wright P, Selby PJ, Velikova G: A Rasch and factor analysis ofthe Functional Assessment of Cancer Therapy-General (FACT-G). HealthQual Life Outcomes 2007, 20:5-19.
20. Chien TW, Lin SJ, Wang WC, Leung HW, Lai WP, Chan AL: Reliability of95% confidence interval revealed by expected quality-of-life scores: anexample of nasopharyngeal carcinoma patients after radiotherapy usingEORTC QLQ-C 30. Health Qual Life Outcomes 2010, 13:8-68.
21. Olsen RV, Garratt AM, Iversen HH, Bjertnaes OA: Rasch analysis of thePsychiatric Out-Patient Experiences Questionnaire (POPEQ). BMC HealthServ Res 2010, 10(1):282.
22. Horn JL: A rationale and test for the number of factors in factor analysis.Psychometrika 1965, 30:179-185.
23. Humphreys LG, Montanelli RG: An examination of the parallel analysiscriterion for determining the number of common factors. MultivariateBehavioral Research 1975, 10:193-206.
24. Silverstein AB: Note on the parallel analysis criterion for determining thenumber of common factors or principal components. PsychologicalReports 1987, 61:351-354.
25. Young FW, Valero-Mora PM, Friendly M: Visual statistics: seeing data withdynamic interactive graphics. Wiley Inc 2006.
26. Chien TW, Lin SJ, Wang WC, Leung HW, Lai WP, Chan AL: Reliability of95% confidence interval revealed by expected quality-of-life scores: anexample of nasopharyngeal carcinoma patients after radiotherapy usingEORTC QLQ-C 30. Health Qual Life Outcomes 2010, 13:8-68.
27. Efron B, Tibshirani R: An introduction to the bootstrap. Chapman & Hall/CRC 1994.
28. Tennant A, Pallant J: Unidimensionality matters. Rasch MeasurementTransactions 2006, 20:1048-1051.
29. Stenner AJ: Objectivity, Units of Measurement and Zeroes. RaschMeasurement Transactions 1997, 11(2):560-561.
30. Smith AB, Rush R, Fallowfield LJ, Velikova G, Sharpe M: Rasch fit statisticsand sample size considerations for polytomous data. BMC MedicalResearch Methodology 2008, 8:33.
31. Salzberger T: Does the Rasch Model Convert an Ordinal Scale into anInterval Scale? Rasch Measurement Transactions 2010, 24:1273-5.
32. Rodrigues CA: Fayol’s 14 principles of management then and now:aframework for managing today’s organizations effectively. ManagementDecision 2001, 39(10):880-889.
33. Drucker PF: Management Challenges for the 21st Century. Harper-CollinsPublishers; 1999.
34. Wang WC, Chen CT: Item parameter recovery, standard error estimateand fit statistics of the WINSTEPS program for the family of Raschmodels. Educational and Psychological Measurement 2005, 65:376-404.
35. Kawachi I: Globalization and workers’ health. Ind Health 2008, 46(5):421-3.36. Doig B: Rasch down down. Rasch Meas Trans 1990, 4(1):96-100.37. Wright BD, Masters GN: Rating Scale Analysis. Chicago, Ill: MESAPress; 1982.38. Wright BD, Mok M: Understanding Rasch Measurement: Rasch Models
Overview. J Appl Meas 2000, , 1: 83-106.
Pre-publication historyThe pre-publication history for this paper can be accessed here:http://www.biomedcentral.com/1471-2458/11/478/prepub
doi:10.1186/1471-2458-11-478Cite this article as: Chien et al.: Applying the revised Chinese JobContent Questionnaire to assess psychosocial work conditions amongTaiwan’s hospital workers. BMC Public Health 2011 11:478.
Chien et al. BMC Public Health 2011, 11:478http://www.biomedcentral.com/1471-2458/11/478
Page 8 of 8