Application to Fusion Welding and Future Wire Arc Add - MDPI
26
Citation: Shaloo, M.; Schnall, M.; Klein, T.; Huber, N.; Reitinger, B. A Review of Non-Destructive Testing (NDT) Techniques for Defect Detection: Application to Fusion Welding and Future Wire Arc Additive Manufacturing Processes. Materials 2022, 15, 3697. https:// doi.org/10.3390/ma15103697 Academic Editor: Giulio Marchese Received: 28 March 2022 Accepted: 18 May 2022 Published: 21 May 2022 Publisher’s Note: MDPI stays neutral with regard to jurisdictional claims in published maps and institutional affil- iations. Copyright: © 2022 by the authors. Licensee MDPI, Basel, Switzerland. This article is an open access article distributed under the terms and conditions of the Creative Commons Attribution (CC BY) license (https:// creativecommons.org/licenses/by/ 4.0/). materials Review A Review of Non-Destructive Testing (NDT) Techniques for Defect Detection: Application to Fusion Welding and Future Wire Arc Additive Manufacturing Processes Masoud Shaloo 1, * , Martin Schnall 1 , Thomas Klein 1, *, Norbert Huber 2 and Bernhard Reitinger 2 1 LKR Light Metals Technologies Ranshofen, Austrian Institute of Technology, Lamprechtshausenerstraße 61, 5282 Ranshofen, Austria; [email protected] 2 RECENDT Research Center for Non Destructive Testing GmbH, Science Park 2/2. OG, Altenberger Straße 69, 4040 Linz, Austria; [email protected] (N.H.); [email protected] (B.R.) * Correspondence: [email protected] (M.S.); [email protected] (T.K.) Abstract: In Wire and Arc Additive Manufacturing (WAAM) and fusion welding, various defects such as porosity, cracks, deformation and lack of fusion can occur during the fabrication process. These have a strong impact on the mechanical properties and can also lead to failure of the manu- factured parts during service. These defects can be recognized using non-destructive testing (NDT) methods so that the examined workpiece is not harmed. This paper provides a comprehensive overview of various NDT techniques for WAAM and fusion welding, including laser-ultrasonic, acoustic emission with an airborne optical microphone, optical emission spectroscopy, laser-induced breakdown spectroscopy, laser opto-ultrasonic dual detection, thermography and also in-process defect detection via weld current monitoring with an oscilloscope. In addition, the novel research conducted, its operating principle and the equipment required to perform these techniques are presented. The minimum defect size that can be identified via NDT methods has been obtained from previous academic research or from tests carried out by companies. The use of these techniques in WAAM and fusion welding applications makes it possible to detect defects and to take a step towards the production of high-quality final components. Keywords: Wire and Arc Additive Manufacturing (WAAM); fusion welding; NDT; laser-ultrasonic; laser-induced breakdown spectroscopy; laser opto-ultrasonic dual detection; thermography; acoustic emission; airborne optical microphone 1. Introduction In 1925, Backer introduced a novel technology named Wire and Arc Additive Manu- facturing (WAAM) [1,2]. WAAM also known as Shape Metal Deposition (SMD), Shape Welding (SW) and Shape Melting (SM) belongs to Directed Energy Deposition (DED) based on ASTM F2792-12a [3]. It combines arc welding technologies, such as Gas Metal Arc Welding (GMAW), Gas Tungsten Arc Welding (GTAW) and Plasma Arc Welding (PAW), and wire materials to manufacture near net shape metallic components via a layer-by-layer deposition approach [4–6]. The difference between WAAM and welding is the geometry of the component and resultant effects on the temperature distribu- tion. WAAM is assumed to be one of the most promising AM techniques in various industries, such as the aerospace, space and marine industries, owing to its capability of manufacturing complex and large components, high deposition rate and reduced wasted material and lead time resulting in cost reduction [2,7–9]. In general, the WAAM process is made up of the following steps: (i) creating a CAD model, (ii) slicing the 3D model into layers, (iii) generating an adequate deposition path, (iv) selecting proper welding parameters, such as, travel speed, current and voltage, (v) material deposition and (vi) post-processing [7]. Various materials, such as steel-, aluminium-, titanium- and Materials 2022, 15, 3697. https://doi.org/10.3390/ma15103697 https://www.mdpi.com/journal/materials
-
Upload
khangminh22 -
Category
Documents
-
view
1 -
download
0
Transcript of Application to Fusion Welding and Future Wire Arc Add - MDPI

Citation: Shaloo, M.; Schnall, M.;
Klein, T.; Huber, N.; Reitinger, B. A
Review of Non-Destructive Testing
(NDT) Techniques for Defect
Detection: Application to Fusion
Welding and Future Wire Arc
Additive Manufacturing Processes.
Materials 2022, 15, 3697. https://
doi.org/10.3390/ma15103697
Academic Editor: Giulio Marchese
Received: 28 March 2022
Accepted: 18 May 2022
Published: 21 May 2022
Publisher’s Note: MDPI stays neutral
with regard to jurisdictional claims in
published maps and institutional affil-
iations.
Copyright: © 2022 by the authors.
Licensee MDPI, Basel, Switzerland.
This article is an open access article
distributed under the terms and
conditions of the Creative Commons
Attribution (CC BY) license (https://
creativecommons.org/licenses/by/
4.0/).
materials
Review
A Review of Non-Destructive Testing (NDT) Techniques forDefect Detection: Application to Fusion Welding and FutureWire Arc Additive Manufacturing ProcessesMasoud Shaloo 1,* , Martin Schnall 1, Thomas Klein 1,*, Norbert Huber 2 and Bernhard Reitinger 2
1 LKR Light Metals Technologies Ranshofen, Austrian Institute of Technology, Lamprechtshausenerstraße 61,5282 Ranshofen, Austria; [email protected]
2 RECENDT Research Center for Non Destructive Testing GmbH, Science Park 2/2. OG, Altenberger Straße 69,4040 Linz, Austria; [email protected] (N.H.); [email protected] (B.R.)
* Correspondence: [email protected] (M.S.); [email protected] (T.K.)
Abstract: In Wire and Arc Additive Manufacturing (WAAM) and fusion welding, various defectssuch as porosity, cracks, deformation and lack of fusion can occur during the fabrication process.These have a strong impact on the mechanical properties and can also lead to failure of the manu-factured parts during service. These defects can be recognized using non-destructive testing (NDT)methods so that the examined workpiece is not harmed. This paper provides a comprehensiveoverview of various NDT techniques for WAAM and fusion welding, including laser-ultrasonic,acoustic emission with an airborne optical microphone, optical emission spectroscopy, laser-inducedbreakdown spectroscopy, laser opto-ultrasonic dual detection, thermography and also in-processdefect detection via weld current monitoring with an oscilloscope. In addition, the novel researchconducted, its operating principle and the equipment required to perform these techniques arepresented. The minimum defect size that can be identified via NDT methods has been obtained fromprevious academic research or from tests carried out by companies. The use of these techniques inWAAM and fusion welding applications makes it possible to detect defects and to take a step towardsthe production of high-quality final components.
Keywords: Wire and Arc Additive Manufacturing (WAAM); fusion welding; NDT; laser-ultrasonic;laser-induced breakdown spectroscopy; laser opto-ultrasonic dual detection; thermography; acousticemission; airborne optical microphone
1. Introduction
In 1925, Backer introduced a novel technology named Wire and Arc Additive Manu-facturing (WAAM) [1,2]. WAAM also known as Shape Metal Deposition (SMD), ShapeWelding (SW) and Shape Melting (SM) belongs to Directed Energy Deposition (DED)based on ASTM F2792-12a [3]. It combines arc welding technologies, such as Gas MetalArc Welding (GMAW), Gas Tungsten Arc Welding (GTAW) and Plasma Arc Welding(PAW), and wire materials to manufacture near net shape metallic components via alayer-by-layer deposition approach [4–6]. The difference between WAAM and weldingis the geometry of the component and resultant effects on the temperature distribu-tion. WAAM is assumed to be one of the most promising AM techniques in variousindustries, such as the aerospace, space and marine industries, owing to its capabilityof manufacturing complex and large components, high deposition rate and reducedwasted material and lead time resulting in cost reduction [2,7–9]. In general, the WAAMprocess is made up of the following steps: (i) creating a CAD model, (ii) slicing the 3Dmodel into layers, (iii) generating an adequate deposition path, (iv) selecting properwelding parameters, such as, travel speed, current and voltage, (v) material depositionand (vi) post-processing [7]. Various materials, such as steel-, aluminium-, titanium- and
Materials 2022, 15, 3697. https://doi.org/10.3390/ma15103697 https://www.mdpi.com/journal/materials

Materials 2022, 15, 3697 2 of 26
Ni-based alloys are employed in WAAM [2]. In this technology, defects, such as porosity,cracking and oxidization may appear on the surface and subsurface of the final partsduring the fabrication process as a results of higher heat accumulation in the part, inproper parameter configuration, contamination and inconstant weld pool dynamics [2,8].These defects may cause the failure of the manufactured component; thus, it is extremelycrucial to detect the defects in order to prevent failure during service [2]. The finalwelding properties are directly impacted by the welding parameters, such as voltage(polarity), current, travel speed, interpass temperature or preheat temperature. Controlof the welding parameters makes it possible to enhance the properties of manufacturedcomponents [10]. Non-Destructive Testing (NDT) techniques have gained the interestof researchers due to their ability of detecting welding defects [11]. Despite traditionalinspection techniques, the quality of additively manufactured or welded componentscan be evaluated cost efficiently and in real time using NDT methods so that the exam-ined workpiece is not harmed [11–14]. Several NDT techniques are currently available,however, most of them are not applicable for real-time and automatic process monitoringfor weld defect inspection in WAAM and fusion welding [9]. Kah et al. [11] investi-gated three different NDT techniques including eddy current, ultrasonic and real-timeradiography and their types. It was reported that eddy current testing (ET) can detectsmall welding defects and discontinues in real time but only for conductive materials.Furthermore, deep welding imperfections cannot be inspected. In contrast, an UltrasonicTesting (UT) technique covers these limitations and detects deeper welding defects inmetals and plastics. Conventional UT transducers are not suitable for real-time and in-process monitoring of welded parts, as conventional UT transducers require contact withthe specimen as well; they cannot withstand the very high temperatures of the WAAMand fusion welding processes. This limitation is overcome using laser ultrasonic [15].Honarvar et al. [16] presented a review on distinct ultrasonic NDTs. The principle andtheir capability for in situ and offline inspection in additive manufacturing applicationswere discussed. Lopez et al. [9] reviewed various NDT techniques for WAAM appli-cations in detail; however, the real-time acoustic emission inspection using an opticalmicrophone as well as laser-induced breakdown spectroscopy were not discussed intheir work. Table 1 provides additional information of reviewed NDT techniques byLopez et al. [9] and Ricardo et al. [17]. The minimum detected defect size using eachNDT method was extracted from the previous conducted academic research or from testsperformed by companies. It must be pointed out that detecting the minimum size of thedefects depends on various parameters, such as material (grain size, anisotropy, thermalconductivity), welding process, thickness of the sample and resolution of the equipment.These methods must be tested individually in order to acquire the best method for aspecific application.
The demand on reducing manufacturing lead times and increasing welding qualitypersuaded many researchers to develop available NDT techniques to inspect weldingdefects in real time and automatically [11]. Faramarzi et al. [18] merged image processingand radiographic non-destructive testing techniques to detect welding imperfections suchas burn through, lack of fusion, lack of penetration and slag, automatically, as illustrated inFigure 1. Firstly, a program in MATLAB [19] was implemented in order to detect the burnthrough defects using data fusion and image processing. Then, the developed programwas successfully applied for other above-mentioned welding defects. The developedimage processing algorithm can be summarized in the following steps: (i) smoothing andthresholding, (ii) morphology operations, (iii) smoothing and (iv) boundary functions.Although radiography can be employed to automatically inspect all types of weldingdefects in complex welding geometries, very fine defects cannot be detected [11], and it alsoendangers human health [9]. Other image-based NDT, such as X-ray computed tomographyand X-ray backscatter, are not suitable for real-time and on-line quality assessment as theserequire too much time to detect defects [9].

Materials 2022, 15, 3697 3 of 26Materials 2022, 15, x FOR PEER REVIEW 3 of 27
Brun Through Lack of Fusion Lack of Penetration Slag
Figure 1. A combination of radiographic and image processing techniques for welding defect detection conducted by Faramarzi et al. [18].
Seow et al. [20] employed dye penetrant testing, conventional ultrasonic testing and digital X-ray radiography to recognize crack-like imperfections in a WAAM Alloy 718 component. As depicted in Figure 2, these technologies are able to find crack-like defects in WAAM.
Figure 2. A comparison between dye penetrant testing (the dashed section in (A) depicts the area examined with ultrasound techniques shown in (B)) (A), conventional ultrasonic (B) and X-ray radiographic technologies (C) carried out by Seow et al. [20].
Wang et al. [21] employed 3D computed tomography technology and could find various defect types, including small spherical pores, inverted pear-shaped pores and cavities in a molybdenum WAAM component. Bento et al. [22] designed and examined an eddy current probe to detect flaws of an aluminium (AA 6082-T6) WAAM part during the manufacturing process. They revealed that intentionally made defects at a depth up to 5 mm and with a minimum thickness of 0.350 mm can be identified. In addition, the ability of defect detecting increases, as the number of coil turns rises. Lopez et al. [23] studied the ability of Phased Array Ultrasonic Testing (PAUT) to identify defects inside WAAM parts made of aluminium alloy (AA2319) with rough surfaces. They carried out some numerical simulations to determine the proper testing parameters and select an adequate transducer and then conducted some defect detection experiments. They reported that it was possible to detect defects sized between 2 and 5 mm. Chabot et al. [24] have demonstrated that PAUT is capable of detecting defects of 0.6 to 1 mm in aluminium WAAM components. Javadi et al. [12] applied PAUT and a total focusing method to detect artificially introduced tungsten carbide spheres with various diameters in a 20-layer wall made using WAAM. They were able to successfully detect most of the defects using a
Figure 1. A combination of radiographic and image processing techniques for welding defectdetection conducted by Faramarzi et al. [18].
Seow et al. [20] employed dye penetrant testing, conventional ultrasonic testingand digital X-ray radiography to recognize crack-like imperfections in a WAAM Alloy718 component. As depicted in Figure 2, these technologies are able to find crack-likedefects in WAAM.
Materials 2022, 15, x FOR PEER REVIEW 3 of 27
Brun Through Lack of Fusion Lack of Penetration Slag
Figure 1. A combination of radiographic and image processing techniques for welding defect detection conducted by Faramarzi et al. [18].
Seow et al. [20] employed dye penetrant testing, conventional ultrasonic testing and digital X-ray radiography to recognize crack-like imperfections in a WAAM Alloy 718 component. As depicted in Figure 2, these technologies are able to find crack-like defects in WAAM.
Figure 2. A comparison between dye penetrant testing (the dashed section in (A) depicts the area examined with ultrasound techniques shown in (B)) (A), conventional ultrasonic (B) and X-ray radiographic technologies (C) carried out by Seow et al. [20].
Wang et al. [21] employed 3D computed tomography technology and could find various defect types, including small spherical pores, inverted pear-shaped pores and cavities in a molybdenum WAAM component. Bento et al. [22] designed and examined an eddy current probe to detect flaws of an aluminium (AA 6082-T6) WAAM part during the manufacturing process. They revealed that intentionally made defects at a depth up to 5 mm and with a minimum thickness of 0.350 mm can be identified. In addition, the ability of defect detecting increases, as the number of coil turns rises. Lopez et al. [23] studied the ability of Phased Array Ultrasonic Testing (PAUT) to identify defects inside WAAM parts made of aluminium alloy (AA2319) with rough surfaces. They carried out some numerical simulations to determine the proper testing parameters and select an adequate transducer and then conducted some defect detection experiments. They reported that it was possible to detect defects sized between 2 and 5 mm. Chabot et al. [24] have demonstrated that PAUT is capable of detecting defects of 0.6 to 1 mm in aluminium WAAM components. Javadi et al. [12] applied PAUT and a total focusing method to detect artificially introduced tungsten carbide spheres with various diameters in a 20-layer wall made using WAAM. They were able to successfully detect most of the defects using a
Figure 2. A comparison between dye penetrant testing (the dashed section in (A) depicts the areaexamined with ultrasound techniques shown in (B)) (A), conventional ultrasonic (B) and X-rayradiographic technologies (C) carried out by Seow et al. [20].
Wang et al. [21] employed 3D computed tomography technology and could findvarious defect types, including small spherical pores, inverted pear-shaped pores andcavities in a molybdenum WAAM component. Bento et al. [22] designed and examined aneddy current probe to detect flaws of an aluminium (AA 6082-T6) WAAM part during themanufacturing process. They revealed that intentionally made defects at a depth up to 5mm and with a minimum thickness of 0.350 mm can be identified. In addition, the abilityof defect detecting increases, as the number of coil turns rises. Lopez et al. [23] studied theability of Phased Array Ultrasonic Testing (PAUT) to identify defects inside WAAM partsmade of aluminium alloy (AA2319) with rough surfaces. They carried out some numericalsimulations to determine the proper testing parameters and select an adequate transducerand then conducted some defect detection experiments. They reported that it was possibleto detect defects sized between 2 and 5 mm. Chabot et al. [24] have demonstrated thatPAUT is capable of detecting defects of 0.6 to 1 mm in aluminium WAAM components.Javadi et al. [12] applied PAUT and a total focusing method to detect artificially introducedtungsten carbide spheres with various diameters in a 20-layer wall made using WAAM.They were able to successfully detect most of the defects using a TFM technique. Later,

Materials 2022, 15, 3697 4 of 26
Lukacs et al. [25] adopted Laser-Induced Phased Array (LIPA), full matrix capture dataacquisition and a Total Focusing Method (TFM) to inspect a titanium alloy (Ti-6Al-4V)fabricated using plasma arc WAAM. As illustrated in Figures 3 and 4, they clearly indicatethat defects located at a depth of up to 10 mm inside the sample can be found offline bymeans of high-quality images.
Materials 2022, 15, x FOR PEER REVIEW 4 of 27
TFM technique. Later, Lukacs et al. [25] adopted Laser-Induced Phased Array (LIPA), full matrix capture data acquisition and a Total Focusing Method (TFM) to inspect a titanium alloy (Ti-6Al-4V) fabricated using plasma arc WAAM. As illustrated in Figure 3 and Figure 4, they clearly indicate that defects located at a depth of up to 10 mm inside the sample can be found offline by means of high-quality images.
Figure 3. Inspected WAAM component. D1, D2 and D3 represent the welding defects [25].
Figure 4. Intentionally introduced defects (D1, D2 and D3 in Figure 3) are detected by means of TFM image of the component using ultrasonic longitudinal waves [25].
In addition, it was found that the full matrix capture in LIPA is time consuming (nearly 14 min) due to the synthetic measurement approach including a large number of acquired A-scan signals, the physical scan of the laser and signal averaging. Therefore, it is currently not possible to implement this technique in real time and inline inspection.
Each NDT technique has its own benefits and limitations and is able to detect specific defects and is used for specific materials. Thus, various NDTs must be combined to mon-itor the WAAM and fusion welding process. A lot of research has been conducted to in-vestigate various NDT techniques in WAAM and fusion welding applications. Only little has been done on combining distinct contactless NDT techniques and sensor technologies in order to automatically detect welding defects in real time, monitor the weld pool and part characteristics, measure the temperature distribution and also process parameters. The main focus of this work is on WAAM. However, since most of the defects that can form during WAAM and fusion welding processing are similar (differences can result from different thermal fields and cooling conditions), non-destructive testing methods can also be applied to fusion welding. Therefore, in addition to WAAM, fusion welding is also covered in this paper. This review paper presents a concept of a combination of a set of contactless NDT and novel sensor technologies which possess the capability to be imple-mented and integrated in WAAM and fusion welding setups to automatically detect de-fects in real time and monitor the processes.
Figure 3. Inspected WAAM component. D1, D2 and D3 represent the welding defects [25].
Materials 2022, 15, x FOR PEER REVIEW 4 of 27
TFM technique. Later, Lukacs et al. [25] adopted Laser-Induced Phased Array (LIPA), full matrix capture data acquisition and a Total Focusing Method (TFM) to inspect a titanium alloy (Ti-6Al-4V) fabricated using plasma arc WAAM. As illustrated in Figure 3 and Figure 4, they clearly indicate that defects located at a depth of up to 10 mm inside the sample can be found offline by means of high-quality images.
Figure 3. Inspected WAAM component. D1, D2 and D3 represent the welding defects [25].
Figure 4. Intentionally introduced defects (D1, D2 and D3 in Figure 3) are detected by means of TFM image of the component using ultrasonic longitudinal waves [25].
In addition, it was found that the full matrix capture in LIPA is time consuming (nearly 14 min) due to the synthetic measurement approach including a large number of acquired A-scan signals, the physical scan of the laser and signal averaging. Therefore, it is currently not possible to implement this technique in real time and inline inspection.
Each NDT technique has its own benefits and limitations and is able to detect specific defects and is used for specific materials. Thus, various NDTs must be combined to mon-itor the WAAM and fusion welding process. A lot of research has been conducted to in-vestigate various NDT techniques in WAAM and fusion welding applications. Only little has been done on combining distinct contactless NDT techniques and sensor technologies in order to automatically detect welding defects in real time, monitor the weld pool and part characteristics, measure the temperature distribution and also process parameters. The main focus of this work is on WAAM. However, since most of the defects that can form during WAAM and fusion welding processing are similar (differences can result from different thermal fields and cooling conditions), non-destructive testing methods can also be applied to fusion welding. Therefore, in addition to WAAM, fusion welding is also covered in this paper. This review paper presents a concept of a combination of a set of contactless NDT and novel sensor technologies which possess the capability to be imple-mented and integrated in WAAM and fusion welding setups to automatically detect de-fects in real time and monitor the processes.
Figure 4. Intentionally introduced defects (D1, D2 and D3 in Figure 3) are detected by means of TFMimage of the component using ultrasonic longitudinal waves [25].
In addition, it was found that the full matrix capture in LIPA is time consuming (nearly14 min) due to the synthetic measurement approach including a large number of acquiredA-scan signals, the physical scan of the laser and signal averaging. Therefore, it is currentlynot possible to implement this technique in real time and inline inspection.
Each NDT technique has its own benefits and limitations and is able to detect specificdefects and is used for specific materials. Thus, various NDTs must be combined tomonitor the WAAM and fusion welding process. A lot of research has been conducted toinvestigate various NDT techniques in WAAM and fusion welding applications. Only littlehas been done on combining distinct contactless NDT techniques and sensor technologiesin order to automatically detect welding defects in real time, monitor the weld pool andpart characteristics, measure the temperature distribution and also process parameters.The main focus of this work is on WAAM. However, since most of the defects that canform during WAAM and fusion welding processing are similar (differences can resultfrom different thermal fields and cooling conditions), non-destructive testing methods canalso be applied to fusion welding. Therefore, in addition to WAAM, fusion welding isalso covered in this paper. This review paper presents a concept of a combination of aset of contactless NDT and novel sensor technologies which possess the capability to beimplemented and integrated in WAAM and fusion welding setups to automatically detectdefects in real time and monitor the processes.

Materials 2022, 15, 3697 5 of 26
Table 1. A review of NDT methods and the smallest detected defect for WAAM and fusion welding.(
Materials 2022, 15, x FOR PEER REVIEW 6 of 27
Microfocus RTR with Image Processing
[11]
X-ray backscatter [9]
One of the main comparison between the X-ray backscatter and con-ventional X-ray technique is that the returned X-ray energy from a single side of the tested sample is recorded in the X-ray backscatter
technique [9,37].
✓/✓ [17] >20 [9]
Computed tomogra-phy [9]
A number of 2D X-ray images are captured surrounding a rotation axis. These are collected and used to create a 3D model of the sample
by applying algorithms [9,38]. X/✓ [17]
>600 [39] >10
for micro-CT [40]
Infrared Thermogra-phy [9]
During the monitoring, an IR camera is used to measure the temper-ature difference on the surface of the sample caused by the presence
of the defects [9]. ✓/✓ [17] >400 [41]
Eddy current ther-mography [9]
The heat is generated in the examined material generated by eddy current method and recorded by an IR camera [9]. ✓/✓ [9] >400 [41]
Vibrothermography [9]
The produced soundwaves by an UT transducer inside the material collide with the defects and cause a heat release as a consequence of
friction. Then, the released heat is captured via an IR camera [9]. X/✓ [9] >400 [41]
Laser thermography [9]
The sample is heated up using a laser. The energy interacts with the defects. Assessing the heat distribution surrounding the laser spot on
the surface of the material allows the defects to be identified [9]. ✓/✓ [9] >400 [41]
Voltage and current evaluation
During WAAM and fusion welding processes, voltage and current are captured in real time and/then analysed by means of statistical
analysis tools or machine/ deep learning techniques to detect defects [42].
✓/X No information available
Optical emission spectroscopy [17]
The electronic temperature profile is determined during the process by means of assessing the generated light during welding process. This electronic temperature profile is then correlated with existing
flaws in the component [17].
✓/X [17] No information available
2. Laser-Ultrasonics Testing The oscillation/space displacement of particles, their position restoring forces and
their linkage to the surrounding particles which in turn leads to an energy transport is known as elastic or sound waves. The elastic waves typically used in non-destructive testing are so-called ultrasonic waves characterized by frequencies higher than the range audible to humans (>20 kHz) and therefore cannot be heard. However, they can be detected using different types of transducers. Transducers transform these elastic waves into electrical signals that can be monitored as visual signals on a monitor [43] and further analysed. The most commonly used ultrasound transducer technology is based on the piezo effect where stress leads to electric charge. A number of further technologies are available such as Electromagnetic Acoustic Transducers (EMAT), Capacitive Micromachined Ultrasonic Transducers (CMUT), magnetostrictive transducers and Laser Ultrasound (LU) to both generate and receive ultrasonic waves [16]. In this section we are going to focus in more detail on the contactless NDT technology LU. LU is a non-contact NDT technique that is typically composed of two systems, a pulsed laser (q-switched ns-laser) to excite elastic waves and a long pulsed or Continuous Wave (CW) laser in combination with an interferometer to detect the surface movement caused by these elastic waves [44,45]. It can be used in automation processes and harsh environments [46]. As shown in Figure 5, the LU test system consists of the mentioned units including electronic data acquisition and processing hardware [47].
represents suitable method and X stands for unsuitable technique).
NDT Method Summary of the Operation ProcedureSuitable for
Online/OfflineMonitoring
The Smallest DetectedDefect (µm)
Visual inspection [17]An expert evaluates the workpiece with a naked
eye or various simple equipment such as magnifiersor endoscopes [17].
X/
Materials 2022, 15, x FOR PEER REVIEW 6 of 27
Microfocus RTR with Image Processing
[11]
X-ray backscatter [9]
One of the main comparison between the X-ray backscatter and con-ventional X-ray technique is that the returned X-ray energy from a single side of the tested sample is recorded in the X-ray backscatter
technique [9,37].
✓/✓ [17] >20 [9]
Computed tomogra-phy [9]
A number of 2D X-ray images are captured surrounding a rotation axis. These are collected and used to create a 3D model of the sample
by applying algorithms [9,38]. X/✓ [17]
>600 [39] >10
for micro-CT [40]
Infrared Thermogra-phy [9]
During the monitoring, an IR camera is used to measure the temper-ature difference on the surface of the sample caused by the presence
of the defects [9]. ✓/✓ [17] >400 [41]
Eddy current ther-mography [9]
The heat is generated in the examined material generated by eddy current method and recorded by an IR camera [9]. ✓/✓ [9] >400 [41]
Vibrothermography [9]
The produced soundwaves by an UT transducer inside the material collide with the defects and cause a heat release as a consequence of
friction. Then, the released heat is captured via an IR camera [9]. X/✓ [9] >400 [41]
Laser thermography [9]
The sample is heated up using a laser. The energy interacts with the defects. Assessing the heat distribution surrounding the laser spot on
the surface of the material allows the defects to be identified [9]. ✓/✓ [9] >400 [41]
Voltage and current evaluation
During WAAM and fusion welding processes, voltage and current are captured in real time and/then analysed by means of statistical
analysis tools or machine/ deep learning techniques to detect defects [42].
✓/X No information available
Optical emission spectroscopy [17]
The electronic temperature profile is determined during the process by means of assessing the generated light during welding process. This electronic temperature profile is then correlated with existing
flaws in the component [17].
✓/X [17] No information available
2. Laser-Ultrasonics Testing The oscillation/space displacement of particles, their position restoring forces and
their linkage to the surrounding particles which in turn leads to an energy transport is known as elastic or sound waves. The elastic waves typically used in non-destructive testing are so-called ultrasonic waves characterized by frequencies higher than the range audible to humans (>20 kHz) and therefore cannot be heard. However, they can be detected using different types of transducers. Transducers transform these elastic waves into electrical signals that can be monitored as visual signals on a monitor [43] and further analysed. The most commonly used ultrasound transducer technology is based on the piezo effect where stress leads to electric charge. A number of further technologies are available such as Electromagnetic Acoustic Transducers (EMAT), Capacitive Micromachined Ultrasonic Transducers (CMUT), magnetostrictive transducers and Laser Ultrasound (LU) to both generate and receive ultrasonic waves [16]. In this section we are going to focus in more detail on the contactless NDT technology LU. LU is a non-contact NDT technique that is typically composed of two systems, a pulsed laser (q-switched ns-laser) to excite elastic waves and a long pulsed or Continuous Wave (CW) laser in combination with an interferometer to detect the surface movement caused by these elastic waves [44,45]. It can be used in automation processes and harsh environments [46]. As shown in Figure 5, the LU test system consists of the mentioned units including electronic data acquisition and processing hardware [47].
No information available
Liquid penetrant testing [9]
The fluorescent penetrant is applied on the surfaceof the material. It penetrates the defects, then theadditional fluorescent is cleaned, and a developerused, which causes the defects to be identified [9].
X/
Materials 2022, 15, x FOR PEER REVIEW 6 of 27
Microfocus RTR with Image Processing
[11]
X-ray backscatter [9]
One of the main comparison between the X-ray backscatter and con-ventional X-ray technique is that the returned X-ray energy from a single side of the tested sample is recorded in the X-ray backscatter
technique [9,37].
✓/✓ [17] >20 [9]
Computed tomogra-phy [9]
A number of 2D X-ray images are captured surrounding a rotation axis. These are collected and used to create a 3D model of the sample
by applying algorithms [9,38]. X/✓ [17]
>600 [39] >10
for micro-CT [40]
Infrared Thermogra-phy [9]
During the monitoring, an IR camera is used to measure the temper-ature difference on the surface of the sample caused by the presence
of the defects [9]. ✓/✓ [17] >400 [41]
Eddy current ther-mography [9]
The heat is generated in the examined material generated by eddy current method and recorded by an IR camera [9]. ✓/✓ [9] >400 [41]
Vibrothermography [9]
The produced soundwaves by an UT transducer inside the material collide with the defects and cause a heat release as a consequence of
friction. Then, the released heat is captured via an IR camera [9]. X/✓ [9] >400 [41]
Laser thermography [9]
The sample is heated up using a laser. The energy interacts with the defects. Assessing the heat distribution surrounding the laser spot on
the surface of the material allows the defects to be identified [9]. ✓/✓ [9] >400 [41]
Voltage and current evaluation
During WAAM and fusion welding processes, voltage and current are captured in real time and/then analysed by means of statistical
analysis tools or machine/ deep learning techniques to detect defects [42].
✓/X No information available
Optical emission spectroscopy [17]
The electronic temperature profile is determined during the process by means of assessing the generated light during welding process. This electronic temperature profile is then correlated with existing
flaws in the component [17].
✓/X [17] No information available
2. Laser-Ultrasonics Testing The oscillation/space displacement of particles, their position restoring forces and
their linkage to the surrounding particles which in turn leads to an energy transport is known as elastic or sound waves. The elastic waves typically used in non-destructive testing are so-called ultrasonic waves characterized by frequencies higher than the range audible to humans (>20 kHz) and therefore cannot be heard. However, they can be detected using different types of transducers. Transducers transform these elastic waves into electrical signals that can be monitored as visual signals on a monitor [43] and further analysed. The most commonly used ultrasound transducer technology is based on the piezo effect where stress leads to electric charge. A number of further technologies are available such as Electromagnetic Acoustic Transducers (EMAT), Capacitive Micromachined Ultrasonic Transducers (CMUT), magnetostrictive transducers and Laser Ultrasound (LU) to both generate and receive ultrasonic waves [16]. In this section we are going to focus in more detail on the contactless NDT technology LU. LU is a non-contact NDT technique that is typically composed of two systems, a pulsed laser (q-switched ns-laser) to excite elastic waves and a long pulsed or Continuous Wave (CW) laser in combination with an interferometer to detect the surface movement caused by these elastic waves [44,45]. It can be used in automation processes and harsh environments [46]. As shown in Figure 5, the LU test system consists of the mentioned units including electronic data acquisition and processing hardware [47].
>750 [26]
Magnetic particle testing [9]
In the first step, component magnetization occurs.Imperfections cause a magnetic current to penetratethe material. After that, the particles are spread onthe surface of the component, leading to particleaccumulation in the penetration zone and, finally,
welding defects detection [9].
X/
Materials 2022, 15, x FOR PEER REVIEW 6 of 27
Microfocus RTR with Image Processing
[11]
X-ray backscatter [9]
One of the main comparison between the X-ray backscatter and con-ventional X-ray technique is that the returned X-ray energy from a single side of the tested sample is recorded in the X-ray backscatter
technique [9,37].
✓/✓ [17] >20 [9]
Computed tomogra-phy [9]
A number of 2D X-ray images are captured surrounding a rotation axis. These are collected and used to create a 3D model of the sample
by applying algorithms [9,38]. X/✓ [17]
>600 [39] >10
for micro-CT [40]
Infrared Thermogra-phy [9]
During the monitoring, an IR camera is used to measure the temper-ature difference on the surface of the sample caused by the presence
of the defects [9]. ✓/✓ [17] >400 [41]
Eddy current ther-mography [9]
The heat is generated in the examined material generated by eddy current method and recorded by an IR camera [9]. ✓/✓ [9] >400 [41]
Vibrothermography [9]
The produced soundwaves by an UT transducer inside the material collide with the defects and cause a heat release as a consequence of
friction. Then, the released heat is captured via an IR camera [9]. X/✓ [9] >400 [41]
Laser thermography [9]
The sample is heated up using a laser. The energy interacts with the defects. Assessing the heat distribution surrounding the laser spot on
the surface of the material allows the defects to be identified [9]. ✓/✓ [9] >400 [41]
Voltage and current evaluation
During WAAM and fusion welding processes, voltage and current are captured in real time and/then analysed by means of statistical
analysis tools or machine/ deep learning techniques to detect defects [42].
✓/X No information available
Optical emission spectroscopy [17]
The electronic temperature profile is determined during the process by means of assessing the generated light during welding process. This electronic temperature profile is then correlated with existing
flaws in the component [17].
✓/X [17] No information available
2. Laser-Ultrasonics Testing The oscillation/space displacement of particles, their position restoring forces and
their linkage to the surrounding particles which in turn leads to an energy transport is known as elastic or sound waves. The elastic waves typically used in non-destructive testing are so-called ultrasonic waves characterized by frequencies higher than the range audible to humans (>20 kHz) and therefore cannot be heard. However, they can be detected using different types of transducers. Transducers transform these elastic waves into electrical signals that can be monitored as visual signals on a monitor [43] and further analysed. The most commonly used ultrasound transducer technology is based on the piezo effect where stress leads to electric charge. A number of further technologies are available such as Electromagnetic Acoustic Transducers (EMAT), Capacitive Micromachined Ultrasonic Transducers (CMUT), magnetostrictive transducers and Laser Ultrasound (LU) to both generate and receive ultrasonic waves [16]. In this section we are going to focus in more detail on the contactless NDT technology LU. LU is a non-contact NDT technique that is typically composed of two systems, a pulsed laser (q-switched ns-laser) to excite elastic waves and a long pulsed or Continuous Wave (CW) laser in combination with an interferometer to detect the surface movement caused by these elastic waves [44,45]. It can be used in automation processes and harsh environments [46]. As shown in Figure 5, the LU test system consists of the mentioned units including electronic data acquisition and processing hardware [47].
[17] >1000 [27]
Eddy currents [9]
A magnetic field is created surrounding theexamined workpiece by means of an emitted coil.
The generated eddy currents inside the sample arealternated by the existing welding flaws. The
welding defects can be detected via the variations inthe impedance of the coil equivalent to the
alternation of the eddy currents [9].
Materials 2022, 15, x FOR PEER REVIEW 6 of 27
Microfocus RTR with Image Processing
[11]
X-ray backscatter [9]
One of the main comparison between the X-ray backscatter and con-ventional X-ray technique is that the returned X-ray energy from a single side of the tested sample is recorded in the X-ray backscatter
technique [9,37].
✓/✓ [17] >20 [9]
Computed tomogra-phy [9]
A number of 2D X-ray images are captured surrounding a rotation axis. These are collected and used to create a 3D model of the sample
by applying algorithms [9,38]. X/✓ [17]
>600 [39] >10
for micro-CT [40]
Infrared Thermogra-phy [9]
During the monitoring, an IR camera is used to measure the temper-ature difference on the surface of the sample caused by the presence
of the defects [9]. ✓/✓ [17] >400 [41]
Eddy current ther-mography [9]
The heat is generated in the examined material generated by eddy current method and recorded by an IR camera [9]. ✓/✓ [9] >400 [41]
Vibrothermography [9]
The produced soundwaves by an UT transducer inside the material collide with the defects and cause a heat release as a consequence of
friction. Then, the released heat is captured via an IR camera [9]. X/✓ [9] >400 [41]
Laser thermography [9]
The sample is heated up using a laser. The energy interacts with the defects. Assessing the heat distribution surrounding the laser spot on
the surface of the material allows the defects to be identified [9]. ✓/✓ [9] >400 [41]
Voltage and current evaluation
During WAAM and fusion welding processes, voltage and current are captured in real time and/then analysed by means of statistical
analysis tools or machine/ deep learning techniques to detect defects [42].
✓/X No information available
Optical emission spectroscopy [17]
The electronic temperature profile is determined during the process by means of assessing the generated light during welding process. This electronic temperature profile is then correlated with existing
flaws in the component [17].
✓/X [17] No information available
2. Laser-Ultrasonics Testing The oscillation/space displacement of particles, their position restoring forces and
their linkage to the surrounding particles which in turn leads to an energy transport is known as elastic or sound waves. The elastic waves typically used in non-destructive testing are so-called ultrasonic waves characterized by frequencies higher than the range audible to humans (>20 kHz) and therefore cannot be heard. However, they can be detected using different types of transducers. Transducers transform these elastic waves into electrical signals that can be monitored as visual signals on a monitor [43] and further analysed. The most commonly used ultrasound transducer technology is based on the piezo effect where stress leads to electric charge. A number of further technologies are available such as Electromagnetic Acoustic Transducers (EMAT), Capacitive Micromachined Ultrasonic Transducers (CMUT), magnetostrictive transducers and Laser Ultrasound (LU) to both generate and receive ultrasonic waves [16]. In this section we are going to focus in more detail on the contactless NDT technology LU. LU is a non-contact NDT technique that is typically composed of two systems, a pulsed laser (q-switched ns-laser) to excite elastic waves and a long pulsed or Continuous Wave (CW) laser in combination with an interferometer to detect the surface movement caused by these elastic waves [44,45]. It can be used in automation processes and harsh environments [46]. As shown in Figure 5, the LU test system consists of the mentioned units including electronic data acquisition and processing hardware [47].
/
Materials 2022, 15, x FOR PEER REVIEW 6 of 27
Microfocus RTR with Image Processing
[11]
X-ray backscatter [9]
One of the main comparison between the X-ray backscatter and con-ventional X-ray technique is that the returned X-ray energy from a single side of the tested sample is recorded in the X-ray backscatter
technique [9,37].
✓/✓ [17] >20 [9]
Computed tomogra-phy [9]
A number of 2D X-ray images are captured surrounding a rotation axis. These are collected and used to create a 3D model of the sample
by applying algorithms [9,38]. X/✓ [17]
>600 [39] >10
for micro-CT [40]
Infrared Thermogra-phy [9]
During the monitoring, an IR camera is used to measure the temper-ature difference on the surface of the sample caused by the presence
of the defects [9]. ✓/✓ [17] >400 [41]
Eddy current ther-mography [9]
The heat is generated in the examined material generated by eddy current method and recorded by an IR camera [9]. ✓/✓ [9] >400 [41]
Vibrothermography [9]
The produced soundwaves by an UT transducer inside the material collide with the defects and cause a heat release as a consequence of
friction. Then, the released heat is captured via an IR camera [9]. X/✓ [9] >400 [41]
Laser thermography [9]
The sample is heated up using a laser. The energy interacts with the defects. Assessing the heat distribution surrounding the laser spot on
the surface of the material allows the defects to be identified [9]. ✓/✓ [9] >400 [41]
Voltage and current evaluation
During WAAM and fusion welding processes, voltage and current are captured in real time and/then analysed by means of statistical
analysis tools or machine/ deep learning techniques to detect defects [42].
✓/X No information available
Optical emission spectroscopy [17]
The electronic temperature profile is determined during the process by means of assessing the generated light during welding process. This electronic temperature profile is then correlated with existing
flaws in the component [17].
✓/X [17] No information available
2. Laser-Ultrasonics Testing The oscillation/space displacement of particles, their position restoring forces and
their linkage to the surrounding particles which in turn leads to an energy transport is known as elastic or sound waves. The elastic waves typically used in non-destructive testing are so-called ultrasonic waves characterized by frequencies higher than the range audible to humans (>20 kHz) and therefore cannot be heard. However, they can be detected using different types of transducers. Transducers transform these elastic waves into electrical signals that can be monitored as visual signals on a monitor [43] and further analysed. The most commonly used ultrasound transducer technology is based on the piezo effect where stress leads to electric charge. A number of further technologies are available such as Electromagnetic Acoustic Transducers (EMAT), Capacitive Micromachined Ultrasonic Transducers (CMUT), magnetostrictive transducers and Laser Ultrasound (LU) to both generate and receive ultrasonic waves [16]. In this section we are going to focus in more detail on the contactless NDT technology LU. LU is a non-contact NDT technique that is typically composed of two systems, a pulsed laser (q-switched ns-laser) to excite elastic waves and a long pulsed or Continuous Wave (CW) laser in combination with an interferometer to detect the surface movement caused by these elastic waves [44,45]. It can be used in automation processes and harsh environments [46]. As shown in Figure 5, the LU test system consists of the mentioned units including electronic data acquisition and processing hardware [47].
[17] >350 [22]
Laser opto-ultrasonic dualdetection [28,29]
It combines both laser ultrasonic and laser-inducedbreakdown spectroscopy technologies to detect
defects and acquire elemental information of thetested material during the process [28,29].
Materials 2022, 15, x FOR PEER REVIEW 6 of 27
Microfocus RTR with Image Processing
[11]
X-ray backscatter [9]
One of the main comparison between the X-ray backscatter and con-ventional X-ray technique is that the returned X-ray energy from a single side of the tested sample is recorded in the X-ray backscatter
technique [9,37].
✓/✓ [17] >20 [9]
Computed tomogra-phy [9]
A number of 2D X-ray images are captured surrounding a rotation axis. These are collected and used to create a 3D model of the sample
by applying algorithms [9,38]. X/✓ [17]
>600 [39] >10
for micro-CT [40]
Infrared Thermogra-phy [9]
During the monitoring, an IR camera is used to measure the temper-ature difference on the surface of the sample caused by the presence
of the defects [9]. ✓/✓ [17] >400 [41]
Eddy current ther-mography [9]
The heat is generated in the examined material generated by eddy current method and recorded by an IR camera [9]. ✓/✓ [9] >400 [41]
Vibrothermography [9]
The produced soundwaves by an UT transducer inside the material collide with the defects and cause a heat release as a consequence of
friction. Then, the released heat is captured via an IR camera [9]. X/✓ [9] >400 [41]
Laser thermography [9]
The sample is heated up using a laser. The energy interacts with the defects. Assessing the heat distribution surrounding the laser spot on
the surface of the material allows the defects to be identified [9]. ✓/✓ [9] >400 [41]
Voltage and current evaluation
During WAAM and fusion welding processes, voltage and current are captured in real time and/then analysed by means of statistical
analysis tools or machine/ deep learning techniques to detect defects [42].
✓/X No information available
Optical emission spectroscopy [17]
The electronic temperature profile is determined during the process by means of assessing the generated light during welding process. This electronic temperature profile is then correlated with existing
flaws in the component [17].
✓/X [17] No information available
2. Laser-Ultrasonics Testing The oscillation/space displacement of particles, their position restoring forces and
their linkage to the surrounding particles which in turn leads to an energy transport is known as elastic or sound waves. The elastic waves typically used in non-destructive testing are so-called ultrasonic waves characterized by frequencies higher than the range audible to humans (>20 kHz) and therefore cannot be heard. However, they can be detected using different types of transducers. Transducers transform these elastic waves into electrical signals that can be monitored as visual signals on a monitor [43] and further analysed. The most commonly used ultrasound transducer technology is based on the piezo effect where stress leads to electric charge. A number of further technologies are available such as Electromagnetic Acoustic Transducers (EMAT), Capacitive Micromachined Ultrasonic Transducers (CMUT), magnetostrictive transducers and Laser Ultrasound (LU) to both generate and receive ultrasonic waves [16]. In this section we are going to focus in more detail on the contactless NDT technology LU. LU is a non-contact NDT technique that is typically composed of two systems, a pulsed laser (q-switched ns-laser) to excite elastic waves and a long pulsed or Continuous Wave (CW) laser in combination with an interferometer to detect the surface movement caused by these elastic waves [44,45]. It can be used in automation processes and harsh environments [46]. As shown in Figure 5, the LU test system consists of the mentioned units including electronic data acquisition and processing hardware [47].
/X No information available
Conventional acousticemission [9]
A piezoelectric transducer placed on the surfacedetects the generated acoustic waves during the
manufacturing process [9].
Materials 2022, 15, x FOR PEER REVIEW 6 of 27
Microfocus RTR with Image Processing
[11]
X-ray backscatter [9]
One of the main comparison between the X-ray backscatter and con-ventional X-ray technique is that the returned X-ray energy from a single side of the tested sample is recorded in the X-ray backscatter
technique [9,37].
✓/✓ [17] >20 [9]
Computed tomogra-phy [9]
A number of 2D X-ray images are captured surrounding a rotation axis. These are collected and used to create a 3D model of the sample
by applying algorithms [9,38]. X/✓ [17]
>600 [39] >10
for micro-CT [40]
Infrared Thermogra-phy [9]
During the monitoring, an IR camera is used to measure the temper-ature difference on the surface of the sample caused by the presence
of the defects [9]. ✓/✓ [17] >400 [41]
Eddy current ther-mography [9]
The heat is generated in the examined material generated by eddy current method and recorded by an IR camera [9]. ✓/✓ [9] >400 [41]
Vibrothermography [9]
The produced soundwaves by an UT transducer inside the material collide with the defects and cause a heat release as a consequence of
friction. Then, the released heat is captured via an IR camera [9]. X/✓ [9] >400 [41]
Laser thermography [9]
The sample is heated up using a laser. The energy interacts with the defects. Assessing the heat distribution surrounding the laser spot on
the surface of the material allows the defects to be identified [9]. ✓/✓ [9] >400 [41]
Voltage and current evaluation
During WAAM and fusion welding processes, voltage and current are captured in real time and/then analysed by means of statistical
analysis tools or machine/ deep learning techniques to detect defects [42].
✓/X No information available
Optical emission spectroscopy [17]
The electronic temperature profile is determined during the process by means of assessing the generated light during welding process. This electronic temperature profile is then correlated with existing
flaws in the component [17].
✓/X [17] No information available
2. Laser-Ultrasonics Testing The oscillation/space displacement of particles, their position restoring forces and
their linkage to the surrounding particles which in turn leads to an energy transport is known as elastic or sound waves. The elastic waves typically used in non-destructive testing are so-called ultrasonic waves characterized by frequencies higher than the range audible to humans (>20 kHz) and therefore cannot be heard. However, they can be detected using different types of transducers. Transducers transform these elastic waves into electrical signals that can be monitored as visual signals on a monitor [43] and further analysed. The most commonly used ultrasound transducer technology is based on the piezo effect where stress leads to electric charge. A number of further technologies are available such as Electromagnetic Acoustic Transducers (EMAT), Capacitive Micromachined Ultrasonic Transducers (CMUT), magnetostrictive transducers and Laser Ultrasound (LU) to both generate and receive ultrasonic waves [16]. In this section we are going to focus in more detail on the contactless NDT technology LU. LU is a non-contact NDT technique that is typically composed of two systems, a pulsed laser (q-switched ns-laser) to excite elastic waves and a long pulsed or Continuous Wave (CW) laser in combination with an interferometer to detect the surface movement caused by these elastic waves [44,45]. It can be used in automation processes and harsh environments [46]. As shown in Figure 5, the LU test system consists of the mentioned units including electronic data acquisition and processing hardware [47].
/X [17] No information available
Acoustic emission usingoptical microphone [30]
An airborne optical microphone with the ability tohear the frequencies up to 2 MHz is used to detect
the soundwaves during the process [30].
Materials 2022, 15, x FOR PEER REVIEW 6 of 27
Microfocus RTR with Image Processing
[11]
X-ray backscatter [9]
One of the main comparison between the X-ray backscatter and con-ventional X-ray technique is that the returned X-ray energy from a single side of the tested sample is recorded in the X-ray backscatter
technique [9,37].
✓/✓ [17] >20 [9]
Computed tomogra-phy [9]
A number of 2D X-ray images are captured surrounding a rotation axis. These are collected and used to create a 3D model of the sample
by applying algorithms [9,38]. X/✓ [17]
>600 [39] >10
for micro-CT [40]
Infrared Thermogra-phy [9]
During the monitoring, an IR camera is used to measure the temper-ature difference on the surface of the sample caused by the presence
of the defects [9]. ✓/✓ [17] >400 [41]
Eddy current ther-mography [9]
The heat is generated in the examined material generated by eddy current method and recorded by an IR camera [9]. ✓/✓ [9] >400 [41]
Vibrothermography [9]
The produced soundwaves by an UT transducer inside the material collide with the defects and cause a heat release as a consequence of
friction. Then, the released heat is captured via an IR camera [9]. X/✓ [9] >400 [41]
Laser thermography [9]
The sample is heated up using a laser. The energy interacts with the defects. Assessing the heat distribution surrounding the laser spot on
the surface of the material allows the defects to be identified [9]. ✓/✓ [9] >400 [41]
Voltage and current evaluation
During WAAM and fusion welding processes, voltage and current are captured in real time and/then analysed by means of statistical
analysis tools or machine/ deep learning techniques to detect defects [42].
✓/X No information available
Optical emission spectroscopy [17]
The electronic temperature profile is determined during the process by means of assessing the generated light during welding process. This electronic temperature profile is then correlated with existing
flaws in the component [17].
✓/X [17] No information available
2. Laser-Ultrasonics Testing The oscillation/space displacement of particles, their position restoring forces and
their linkage to the surrounding particles which in turn leads to an energy transport is known as elastic or sound waves. The elastic waves typically used in non-destructive testing are so-called ultrasonic waves characterized by frequencies higher than the range audible to humans (>20 kHz) and therefore cannot be heard. However, they can be detected using different types of transducers. Transducers transform these elastic waves into electrical signals that can be monitored as visual signals on a monitor [43] and further analysed. The most commonly used ultrasound transducer technology is based on the piezo effect where stress leads to electric charge. A number of further technologies are available such as Electromagnetic Acoustic Transducers (EMAT), Capacitive Micromachined Ultrasonic Transducers (CMUT), magnetostrictive transducers and Laser Ultrasound (LU) to both generate and receive ultrasonic waves [16]. In this section we are going to focus in more detail on the contactless NDT technology LU. LU is a non-contact NDT technique that is typically composed of two systems, a pulsed laser (q-switched ns-laser) to excite elastic waves and a long pulsed or Continuous Wave (CW) laser in combination with an interferometer to detect the surface movement caused by these elastic waves [44,45]. It can be used in automation processes and harsh environments [46]. As shown in Figure 5, the LU test system consists of the mentioned units including electronic data acquisition and processing hardware [47].
/X [31] No information available
Conventional ultrasonictesting [9]
Acoustic waves generated by a transducer, whichhas contact with the sample, are propagated into
the specimen. These waves interact with thewelding defects and then return to the surface of thespecimen. These waves are detected and evaluated
to recognize the defects [9].
X/
Materials 2022, 15, x FOR PEER REVIEW 6 of 27
Microfocus RTR with Image Processing
[11]
X-ray backscatter [9]
One of the main comparison between the X-ray backscatter and con-ventional X-ray technique is that the returned X-ray energy from a single side of the tested sample is recorded in the X-ray backscatter
technique [9,37].
✓/✓ [17] >20 [9]
Computed tomogra-phy [9]
A number of 2D X-ray images are captured surrounding a rotation axis. These are collected and used to create a 3D model of the sample
by applying algorithms [9,38]. X/✓ [17]
>600 [39] >10
for micro-CT [40]
Infrared Thermogra-phy [9]
During the monitoring, an IR camera is used to measure the temper-ature difference on the surface of the sample caused by the presence
of the defects [9]. ✓/✓ [17] >400 [41]
Eddy current ther-mography [9]
The heat is generated in the examined material generated by eddy current method and recorded by an IR camera [9]. ✓/✓ [9] >400 [41]
Vibrothermography [9]
The produced soundwaves by an UT transducer inside the material collide with the defects and cause a heat release as a consequence of
friction. Then, the released heat is captured via an IR camera [9]. X/✓ [9] >400 [41]
Laser thermography [9]
The sample is heated up using a laser. The energy interacts with the defects. Assessing the heat distribution surrounding the laser spot on
the surface of the material allows the defects to be identified [9]. ✓/✓ [9] >400 [41]
Voltage and current evaluation
During WAAM and fusion welding processes, voltage and current are captured in real time and/then analysed by means of statistical
analysis tools or machine/ deep learning techniques to detect defects [42].
✓/X No information available
Optical emission spectroscopy [17]
The electronic temperature profile is determined during the process by means of assessing the generated light during welding process. This electronic temperature profile is then correlated with existing
flaws in the component [17].
✓/X [17] No information available
2. Laser-Ultrasonics Testing The oscillation/space displacement of particles, their position restoring forces and
their linkage to the surrounding particles which in turn leads to an energy transport is known as elastic or sound waves. The elastic waves typically used in non-destructive testing are so-called ultrasonic waves characterized by frequencies higher than the range audible to humans (>20 kHz) and therefore cannot be heard. However, they can be detected using different types of transducers. Transducers transform these elastic waves into electrical signals that can be monitored as visual signals on a monitor [43] and further analysed. The most commonly used ultrasound transducer technology is based on the piezo effect where stress leads to electric charge. A number of further technologies are available such as Electromagnetic Acoustic Transducers (EMAT), Capacitive Micromachined Ultrasonic Transducers (CMUT), magnetostrictive transducers and Laser Ultrasound (LU) to both generate and receive ultrasonic waves [16]. In this section we are going to focus in more detail on the contactless NDT technology LU. LU is a non-contact NDT technique that is typically composed of two systems, a pulsed laser (q-switched ns-laser) to excite elastic waves and a long pulsed or Continuous Wave (CW) laser in combination with an interferometer to detect the surface movement caused by these elastic waves [44,45]. It can be used in automation processes and harsh environments [46]. As shown in Figure 5, the LU test system consists of the mentioned units including electronic data acquisition and processing hardware [47].
[9] >500 [32]
Phased array ultrasonictesting [9]
A PC is employed to control each multi-elementprobe instead of single element probe in
conventional ultrasonic testing to create aconcentrated ultrasonic beam, and a software to
direct it [9].
Materials 2022, 15, x FOR PEER REVIEW 6 of 27
Microfocus RTR with Image Processing
[11]
X-ray backscatter [9]
One of the main comparison between the X-ray backscatter and con-ventional X-ray technique is that the returned X-ray energy from a single side of the tested sample is recorded in the X-ray backscatter
technique [9,37].
✓/✓ [17] >20 [9]
Computed tomogra-phy [9]
A number of 2D X-ray images are captured surrounding a rotation axis. These are collected and used to create a 3D model of the sample
by applying algorithms [9,38]. X/✓ [17]
>600 [39] >10
for micro-CT [40]
Infrared Thermogra-phy [9]
During the monitoring, an IR camera is used to measure the temper-ature difference on the surface of the sample caused by the presence
of the defects [9]. ✓/✓ [17] >400 [41]
Eddy current ther-mography [9]
The heat is generated in the examined material generated by eddy current method and recorded by an IR camera [9]. ✓/✓ [9] >400 [41]
Vibrothermography [9]
The produced soundwaves by an UT transducer inside the material collide with the defects and cause a heat release as a consequence of
friction. Then, the released heat is captured via an IR camera [9]. X/✓ [9] >400 [41]
Laser thermography [9]
The sample is heated up using a laser. The energy interacts with the defects. Assessing the heat distribution surrounding the laser spot on
the surface of the material allows the defects to be identified [9]. ✓/✓ [9] >400 [41]
Voltage and current evaluation
During WAAM and fusion welding processes, voltage and current are captured in real time and/then analysed by means of statistical
analysis tools or machine/ deep learning techniques to detect defects [42].
✓/X No information available
Optical emission spectroscopy [17]
The electronic temperature profile is determined during the process by means of assessing the generated light during welding process. This electronic temperature profile is then correlated with existing
flaws in the component [17].
✓/X [17] No information available
2. Laser-Ultrasonics Testing The oscillation/space displacement of particles, their position restoring forces and
their linkage to the surrounding particles which in turn leads to an energy transport is known as elastic or sound waves. The elastic waves typically used in non-destructive testing are so-called ultrasonic waves characterized by frequencies higher than the range audible to humans (>20 kHz) and therefore cannot be heard. However, they can be detected using different types of transducers. Transducers transform these elastic waves into electrical signals that can be monitored as visual signals on a monitor [43] and further analysed. The most commonly used ultrasound transducer technology is based on the piezo effect where stress leads to electric charge. A number of further technologies are available such as Electromagnetic Acoustic Transducers (EMAT), Capacitive Micromachined Ultrasonic Transducers (CMUT), magnetostrictive transducers and Laser Ultrasound (LU) to both generate and receive ultrasonic waves [16]. In this section we are going to focus in more detail on the contactless NDT technology LU. LU is a non-contact NDT technique that is typically composed of two systems, a pulsed laser (q-switched ns-laser) to excite elastic waves and a long pulsed or Continuous Wave (CW) laser in combination with an interferometer to detect the surface movement caused by these elastic waves [44,45]. It can be used in automation processes and harsh environments [46]. As shown in Figure 5, the LU test system consists of the mentioned units including electronic data acquisition and processing hardware [47].
/
Materials 2022, 15, x FOR PEER REVIEW 6 of 27
Microfocus RTR with Image Processing
[11]
X-ray backscatter [9]
One of the main comparison between the X-ray backscatter and con-ventional X-ray technique is that the returned X-ray energy from a single side of the tested sample is recorded in the X-ray backscatter
technique [9,37].
✓/✓ [17] >20 [9]
Computed tomogra-phy [9]
A number of 2D X-ray images are captured surrounding a rotation axis. These are collected and used to create a 3D model of the sample
by applying algorithms [9,38]. X/✓ [17]
>600 [39] >10
for micro-CT [40]
Infrared Thermogra-phy [9]
During the monitoring, an IR camera is used to measure the temper-ature difference on the surface of the sample caused by the presence
of the defects [9]. ✓/✓ [17] >400 [41]
Eddy current ther-mography [9]
The heat is generated in the examined material generated by eddy current method and recorded by an IR camera [9]. ✓/✓ [9] >400 [41]
Vibrothermography [9]
The produced soundwaves by an UT transducer inside the material collide with the defects and cause a heat release as a consequence of
friction. Then, the released heat is captured via an IR camera [9]. X/✓ [9] >400 [41]
Laser thermography [9]
The sample is heated up using a laser. The energy interacts with the defects. Assessing the heat distribution surrounding the laser spot on
the surface of the material allows the defects to be identified [9]. ✓/✓ [9] >400 [41]
Voltage and current evaluation
During WAAM and fusion welding processes, voltage and current are captured in real time and/then analysed by means of statistical
analysis tools or machine/ deep learning techniques to detect defects [42].
✓/X No information available
Optical emission spectroscopy [17]
The electronic temperature profile is determined during the process by means of assessing the generated light during welding process. This electronic temperature profile is then correlated with existing
flaws in the component [17].
✓/X [17] No information available
2. Laser-Ultrasonics Testing The oscillation/space displacement of particles, their position restoring forces and
their linkage to the surrounding particles which in turn leads to an energy transport is known as elastic or sound waves. The elastic waves typically used in non-destructive testing are so-called ultrasonic waves characterized by frequencies higher than the range audible to humans (>20 kHz) and therefore cannot be heard. However, they can be detected using different types of transducers. Transducers transform these elastic waves into electrical signals that can be monitored as visual signals on a monitor [43] and further analysed. The most commonly used ultrasound transducer technology is based on the piezo effect where stress leads to electric charge. A number of further technologies are available such as Electromagnetic Acoustic Transducers (EMAT), Capacitive Micromachined Ultrasonic Transducers (CMUT), magnetostrictive transducers and Laser Ultrasound (LU) to both generate and receive ultrasonic waves [16]. In this section we are going to focus in more detail on the contactless NDT technology LU. LU is a non-contact NDT technique that is typically composed of two systems, a pulsed laser (q-switched ns-laser) to excite elastic waves and a long pulsed or Continuous Wave (CW) laser in combination with an interferometer to detect the surface movement caused by these elastic waves [44,45]. It can be used in automation processes and harsh environments [46]. As shown in Figure 5, the LU test system consists of the mentioned units including electronic data acquisition and processing hardware [47].
[17] >600 [24]
Immersion ultrasonictesting [9]
In comparison to conventional ultrasonic, theexamined component is plunged into the liquid(usually water). Using this technology eases thetransmission of the waves into the sample [9].
X/
Materials 2022, 15, x FOR PEER REVIEW 6 of 27
Microfocus RTR with Image Processing
[11]
X-ray backscatter [9]
One of the main comparison between the X-ray backscatter and con-ventional X-ray technique is that the returned X-ray energy from a single side of the tested sample is recorded in the X-ray backscatter
technique [9,37].
✓/✓ [17] >20 [9]
Computed tomogra-phy [9]
A number of 2D X-ray images are captured surrounding a rotation axis. These are collected and used to create a 3D model of the sample
by applying algorithms [9,38]. X/✓ [17]
>600 [39] >10
for micro-CT [40]
Infrared Thermogra-phy [9]
During the monitoring, an IR camera is used to measure the temper-ature difference on the surface of the sample caused by the presence
of the defects [9]. ✓/✓ [17] >400 [41]
Eddy current ther-mography [9]
The heat is generated in the examined material generated by eddy current method and recorded by an IR camera [9]. ✓/✓ [9] >400 [41]
Vibrothermography [9]
The produced soundwaves by an UT transducer inside the material collide with the defects and cause a heat release as a consequence of
friction. Then, the released heat is captured via an IR camera [9]. X/✓ [9] >400 [41]
Laser thermography [9]
The sample is heated up using a laser. The energy interacts with the defects. Assessing the heat distribution surrounding the laser spot on
the surface of the material allows the defects to be identified [9]. ✓/✓ [9] >400 [41]
Voltage and current evaluation
During WAAM and fusion welding processes, voltage and current are captured in real time and/then analysed by means of statistical
analysis tools or machine/ deep learning techniques to detect defects [42].
✓/X No information available
Optical emission spectroscopy [17]
The electronic temperature profile is determined during the process by means of assessing the generated light during welding process. This electronic temperature profile is then correlated with existing
flaws in the component [17].
✓/X [17] No information available
2. Laser-Ultrasonics Testing The oscillation/space displacement of particles, their position restoring forces and
their linkage to the surrounding particles which in turn leads to an energy transport is known as elastic or sound waves. The elastic waves typically used in non-destructive testing are so-called ultrasonic waves characterized by frequencies higher than the range audible to humans (>20 kHz) and therefore cannot be heard. However, they can be detected using different types of transducers. Transducers transform these elastic waves into electrical signals that can be monitored as visual signals on a monitor [43] and further analysed. The most commonly used ultrasound transducer technology is based on the piezo effect where stress leads to electric charge. A number of further technologies are available such as Electromagnetic Acoustic Transducers (EMAT), Capacitive Micromachined Ultrasonic Transducers (CMUT), magnetostrictive transducers and Laser Ultrasound (LU) to both generate and receive ultrasonic waves [16]. In this section we are going to focus in more detail on the contactless NDT technology LU. LU is a non-contact NDT technique that is typically composed of two systems, a pulsed laser (q-switched ns-laser) to excite elastic waves and a long pulsed or Continuous Wave (CW) laser in combination with an interferometer to detect the surface movement caused by these elastic waves [44,45]. It can be used in automation processes and harsh environments [46]. As shown in Figure 5, the LU test system consists of the mentioned units including electronic data acquisition and processing hardware [47].
[17] >500 [32]
Electro-magnetic acoustictransducer [9]
An electro-magnetic sensor is employed near to thesurface of the sample to generate and capture the
acoustic waves. This technology is contactless anddoes not require any couplant [9,33].
Materials 2022, 15, x FOR PEER REVIEW 6 of 27
Microfocus RTR with Image Processing
[11]
X-ray backscatter [9]
One of the main comparison between the X-ray backscatter and con-ventional X-ray technique is that the returned X-ray energy from a single side of the tested sample is recorded in the X-ray backscatter
technique [9,37].
✓/✓ [17] >20 [9]
Computed tomogra-phy [9]
A number of 2D X-ray images are captured surrounding a rotation axis. These are collected and used to create a 3D model of the sample
by applying algorithms [9,38]. X/✓ [17]
>600 [39] >10
for micro-CT [40]
Infrared Thermogra-phy [9]
During the monitoring, an IR camera is used to measure the temper-ature difference on the surface of the sample caused by the presence
of the defects [9]. ✓/✓ [17] >400 [41]
Eddy current ther-mography [9]
The heat is generated in the examined material generated by eddy current method and recorded by an IR camera [9]. ✓/✓ [9] >400 [41]
Vibrothermography [9]
The produced soundwaves by an UT transducer inside the material collide with the defects and cause a heat release as a consequence of
friction. Then, the released heat is captured via an IR camera [9]. X/✓ [9] >400 [41]
Laser thermography [9]
The sample is heated up using a laser. The energy interacts with the defects. Assessing the heat distribution surrounding the laser spot on
the surface of the material allows the defects to be identified [9]. ✓/✓ [9] >400 [41]
Voltage and current evaluation
During WAAM and fusion welding processes, voltage and current are captured in real time and/then analysed by means of statistical
analysis tools or machine/ deep learning techniques to detect defects [42].
✓/X No information available
Optical emission spectroscopy [17]
The electronic temperature profile is determined during the process by means of assessing the generated light during welding process. This electronic temperature profile is then correlated with existing
flaws in the component [17].
✓/X [17] No information available
2. Laser-Ultrasonics Testing The oscillation/space displacement of particles, their position restoring forces and
their linkage to the surrounding particles which in turn leads to an energy transport is known as elastic or sound waves. The elastic waves typically used in non-destructive testing are so-called ultrasonic waves characterized by frequencies higher than the range audible to humans (>20 kHz) and therefore cannot be heard. However, they can be detected using different types of transducers. Transducers transform these elastic waves into electrical signals that can be monitored as visual signals on a monitor [43] and further analysed. The most commonly used ultrasound transducer technology is based on the piezo effect where stress leads to electric charge. A number of further technologies are available such as Electromagnetic Acoustic Transducers (EMAT), Capacitive Micromachined Ultrasonic Transducers (CMUT), magnetostrictive transducers and Laser Ultrasound (LU) to both generate and receive ultrasonic waves [16]. In this section we are going to focus in more detail on the contactless NDT technology LU. LU is a non-contact NDT technique that is typically composed of two systems, a pulsed laser (q-switched ns-laser) to excite elastic waves and a long pulsed or Continuous Wave (CW) laser in combination with an interferometer to detect the surface movement caused by these elastic waves [44,45]. It can be used in automation processes and harsh environments [46]. As shown in Figure 5, the LU test system consists of the mentioned units including electronic data acquisition and processing hardware [47].
/
Materials 2022, 15, x FOR PEER REVIEW 6 of 27
Microfocus RTR with Image Processing
[11]
X-ray backscatter [9]
One of the main comparison between the X-ray backscatter and con-ventional X-ray technique is that the returned X-ray energy from a single side of the tested sample is recorded in the X-ray backscatter
technique [9,37].
✓/✓ [17] >20 [9]
Computed tomogra-phy [9]
A number of 2D X-ray images are captured surrounding a rotation axis. These are collected and used to create a 3D model of the sample
by applying algorithms [9,38]. X/✓ [17]
>600 [39] >10
for micro-CT [40]
Infrared Thermogra-phy [9]
During the monitoring, an IR camera is used to measure the temper-ature difference on the surface of the sample caused by the presence
of the defects [9]. ✓/✓ [17] >400 [41]
Eddy current ther-mography [9]
The heat is generated in the examined material generated by eddy current method and recorded by an IR camera [9]. ✓/✓ [9] >400 [41]
Vibrothermography [9]
The produced soundwaves by an UT transducer inside the material collide with the defects and cause a heat release as a consequence of
friction. Then, the released heat is captured via an IR camera [9]. X/✓ [9] >400 [41]
Laser thermography [9]
The sample is heated up using a laser. The energy interacts with the defects. Assessing the heat distribution surrounding the laser spot on
the surface of the material allows the defects to be identified [9]. ✓/✓ [9] >400 [41]
Voltage and current evaluation
During WAAM and fusion welding processes, voltage and current are captured in real time and/then analysed by means of statistical
analysis tools or machine/ deep learning techniques to detect defects [42].
✓/X No information available
Optical emission spectroscopy [17]
The electronic temperature profile is determined during the process by means of assessing the generated light during welding process. This electronic temperature profile is then correlated with existing
flaws in the component [17].
✓/X [17] No information available
2. Laser-Ultrasonics Testing The oscillation/space displacement of particles, their position restoring forces and
their linkage to the surrounding particles which in turn leads to an energy transport is known as elastic or sound waves. The elastic waves typically used in non-destructive testing are so-called ultrasonic waves characterized by frequencies higher than the range audible to humans (>20 kHz) and therefore cannot be heard. However, they can be detected using different types of transducers. Transducers transform these elastic waves into electrical signals that can be monitored as visual signals on a monitor [43] and further analysed. The most commonly used ultrasound transducer technology is based on the piezo effect where stress leads to electric charge. A number of further technologies are available such as Electromagnetic Acoustic Transducers (EMAT), Capacitive Micromachined Ultrasonic Transducers (CMUT), magnetostrictive transducers and Laser Ultrasound (LU) to both generate and receive ultrasonic waves [16]. In this section we are going to focus in more detail on the contactless NDT technology LU. LU is a non-contact NDT technique that is typically composed of two systems, a pulsed laser (q-switched ns-laser) to excite elastic waves and a long pulsed or Continuous Wave (CW) laser in combination with an interferometer to detect the surface movement caused by these elastic waves [44,45]. It can be used in automation processes and harsh environments [46]. As shown in Figure 5, the LU test system consists of the mentioned units including electronic data acquisition and processing hardware [47].
[17] >500 [32]
Laser ultrasonic testing [9] The excitation and reception of the soundwavesoccurs by means of two different lasers [9].
Materials 2022, 15, x FOR PEER REVIEW 6 of 27
Microfocus RTR with Image Processing
[11]
X-ray backscatter [9]
One of the main comparison between the X-ray backscatter and con-ventional X-ray technique is that the returned X-ray energy from a single side of the tested sample is recorded in the X-ray backscatter
technique [9,37].
✓/✓ [17] >20 [9]
Computed tomogra-phy [9]
A number of 2D X-ray images are captured surrounding a rotation axis. These are collected and used to create a 3D model of the sample
by applying algorithms [9,38]. X/✓ [17]
>600 [39] >10
for micro-CT [40]
Infrared Thermogra-phy [9]
During the monitoring, an IR camera is used to measure the temper-ature difference on the surface of the sample caused by the presence
of the defects [9]. ✓/✓ [17] >400 [41]
Eddy current ther-mography [9]
The heat is generated in the examined material generated by eddy current method and recorded by an IR camera [9]. ✓/✓ [9] >400 [41]
Vibrothermography [9]
The produced soundwaves by an UT transducer inside the material collide with the defects and cause a heat release as a consequence of
friction. Then, the released heat is captured via an IR camera [9]. X/✓ [9] >400 [41]
Laser thermography [9]
The sample is heated up using a laser. The energy interacts with the defects. Assessing the heat distribution surrounding the laser spot on
the surface of the material allows the defects to be identified [9]. ✓/✓ [9] >400 [41]
Voltage and current evaluation
During WAAM and fusion welding processes, voltage and current are captured in real time and/then analysed by means of statistical
analysis tools or machine/ deep learning techniques to detect defects [42].
✓/X No information available
Optical emission spectroscopy [17]
The electronic temperature profile is determined during the process by means of assessing the generated light during welding process. This electronic temperature profile is then correlated with existing
flaws in the component [17].
✓/X [17] No information available
2. Laser-Ultrasonics Testing The oscillation/space displacement of particles, their position restoring forces and
their linkage to the surrounding particles which in turn leads to an energy transport is known as elastic or sound waves. The elastic waves typically used in non-destructive testing are so-called ultrasonic waves characterized by frequencies higher than the range audible to humans (>20 kHz) and therefore cannot be heard. However, they can be detected using different types of transducers. Transducers transform these elastic waves into electrical signals that can be monitored as visual signals on a monitor [43] and further analysed. The most commonly used ultrasound transducer technology is based on the piezo effect where stress leads to electric charge. A number of further technologies are available such as Electromagnetic Acoustic Transducers (EMAT), Capacitive Micromachined Ultrasonic Transducers (CMUT), magnetostrictive transducers and Laser Ultrasound (LU) to both generate and receive ultrasonic waves [16]. In this section we are going to focus in more detail on the contactless NDT technology LU. LU is a non-contact NDT technique that is typically composed of two systems, a pulsed laser (q-switched ns-laser) to excite elastic waves and a long pulsed or Continuous Wave (CW) laser in combination with an interferometer to detect the surface movement caused by these elastic waves [44,45]. It can be used in automation processes and harsh environments [46]. As shown in Figure 5, the LU test system consists of the mentioned units including electronic data acquisition and processing hardware [47].
/
Materials 2022, 15, x FOR PEER REVIEW 6 of 27
Microfocus RTR with Image Processing
[11]
X-ray backscatter [9]
One of the main comparison between the X-ray backscatter and con-ventional X-ray technique is that the returned X-ray energy from a single side of the tested sample is recorded in the X-ray backscatter
technique [9,37].
✓/✓ [17] >20 [9]
Computed tomogra-phy [9]
A number of 2D X-ray images are captured surrounding a rotation axis. These are collected and used to create a 3D model of the sample
by applying algorithms [9,38]. X/✓ [17]
>600 [39] >10
for micro-CT [40]
Infrared Thermogra-phy [9]
During the monitoring, an IR camera is used to measure the temper-ature difference on the surface of the sample caused by the presence
of the defects [9]. ✓/✓ [17] >400 [41]
Eddy current ther-mography [9]
The heat is generated in the examined material generated by eddy current method and recorded by an IR camera [9]. ✓/✓ [9] >400 [41]
Vibrothermography [9]
The produced soundwaves by an UT transducer inside the material collide with the defects and cause a heat release as a consequence of
friction. Then, the released heat is captured via an IR camera [9]. X/✓ [9] >400 [41]
Laser thermography [9]
The sample is heated up using a laser. The energy interacts with the defects. Assessing the heat distribution surrounding the laser spot on
the surface of the material allows the defects to be identified [9]. ✓/✓ [9] >400 [41]
Voltage and current evaluation
During WAAM and fusion welding processes, voltage and current are captured in real time and/then analysed by means of statistical
analysis tools or machine/ deep learning techniques to detect defects [42].
✓/X No information available
Optical emission spectroscopy [17]
The electronic temperature profile is determined during the process by means of assessing the generated light during welding process. This electronic temperature profile is then correlated with existing
flaws in the component [17].
✓/X [17] No information available
2. Laser-Ultrasonics Testing The oscillation/space displacement of particles, their position restoring forces and
their linkage to the surrounding particles which in turn leads to an energy transport is known as elastic or sound waves. The elastic waves typically used in non-destructive testing are so-called ultrasonic waves characterized by frequencies higher than the range audible to humans (>20 kHz) and therefore cannot be heard. However, they can be detected using different types of transducers. Transducers transform these elastic waves into electrical signals that can be monitored as visual signals on a monitor [43] and further analysed. The most commonly used ultrasound transducer technology is based on the piezo effect where stress leads to electric charge. A number of further technologies are available such as Electromagnetic Acoustic Transducers (EMAT), Capacitive Micromachined Ultrasonic Transducers (CMUT), magnetostrictive transducers and Laser Ultrasound (LU) to both generate and receive ultrasonic waves [16]. In this section we are going to focus in more detail on the contactless NDT technology LU. LU is a non-contact NDT technique that is typically composed of two systems, a pulsed laser (q-switched ns-laser) to excite elastic waves and a long pulsed or Continuous Wave (CW) laser in combination with an interferometer to detect the surface movement caused by these elastic waves [44,45]. It can be used in automation processes and harsh environments [46]. As shown in Figure 5, the LU test system consists of the mentioned units including electronic data acquisition and processing hardware [47].
[17] >100 [34]
Radiographic inspection [9]
Although the sample uniformly receives the excitedradiation energy, imperfections, density alternationand thickness areas captured the radiation energy
ununiformly. Thereafter, film(s) or electronicdevices are used to capture the
absorption differences [9].
X/
Materials 2022, 15, x FOR PEER REVIEW 6 of 27
Microfocus RTR with Image Processing
[11]
X-ray backscatter [9]
One of the main comparison between the X-ray backscatter and con-ventional X-ray technique is that the returned X-ray energy from a single side of the tested sample is recorded in the X-ray backscatter
technique [9,37].
✓/✓ [17] >20 [9]
Computed tomogra-phy [9]
A number of 2D X-ray images are captured surrounding a rotation axis. These are collected and used to create a 3D model of the sample
by applying algorithms [9,38]. X/✓ [17]
>600 [39] >10
for micro-CT [40]
Infrared Thermogra-phy [9]
During the monitoring, an IR camera is used to measure the temper-ature difference on the surface of the sample caused by the presence
of the defects [9]. ✓/✓ [17] >400 [41]
Eddy current ther-mography [9]
The heat is generated in the examined material generated by eddy current method and recorded by an IR camera [9]. ✓/✓ [9] >400 [41]
Vibrothermography [9]
The produced soundwaves by an UT transducer inside the material collide with the defects and cause a heat release as a consequence of
friction. Then, the released heat is captured via an IR camera [9]. X/✓ [9] >400 [41]
Laser thermography [9]
The sample is heated up using a laser. The energy interacts with the defects. Assessing the heat distribution surrounding the laser spot on
the surface of the material allows the defects to be identified [9]. ✓/✓ [9] >400 [41]
Voltage and current evaluation
During WAAM and fusion welding processes, voltage and current are captured in real time and/then analysed by means of statistical
analysis tools or machine/ deep learning techniques to detect defects [42].
✓/X No information available
Optical emission spectroscopy [17]
The electronic temperature profile is determined during the process by means of assessing the generated light during welding process. This electronic temperature profile is then correlated with existing
flaws in the component [17].
✓/X [17] No information available
2. Laser-Ultrasonics Testing The oscillation/space displacement of particles, their position restoring forces and
their linkage to the surrounding particles which in turn leads to an energy transport is known as elastic or sound waves. The elastic waves typically used in non-destructive testing are so-called ultrasonic waves characterized by frequencies higher than the range audible to humans (>20 kHz) and therefore cannot be heard. However, they can be detected using different types of transducers. Transducers transform these elastic waves into electrical signals that can be monitored as visual signals on a monitor [43] and further analysed. The most commonly used ultrasound transducer technology is based on the piezo effect where stress leads to electric charge. A number of further technologies are available such as Electromagnetic Acoustic Transducers (EMAT), Capacitive Micromachined Ultrasonic Transducers (CMUT), magnetostrictive transducers and Laser Ultrasound (LU) to both generate and receive ultrasonic waves [16]. In this section we are going to focus in more detail on the contactless NDT technology LU. LU is a non-contact NDT technique that is typically composed of two systems, a pulsed laser (q-switched ns-laser) to excite elastic waves and a long pulsed or Continuous Wave (CW) laser in combination with an interferometer to detect the surface movement caused by these elastic waves [44,45]. It can be used in automation processes and harsh environments [46]. As shown in Figure 5, the LU test system consists of the mentioned units including electronic data acquisition and processing hardware [47].
[17]>45
Digital Radiographic [35]

Materials 2022, 15, 3697 6 of 26
Table 1. Cont.
NDT Method Summary of the Operation ProcedureSuitable for
Online/OfflineMonitoring
The Smallest DetectedDefect (µm)
Real-time radiography(RTR) [36]
Compared to conventional radiography, digital dataare generated during X-ray penetration in
the sample [36].
Materials 2022, 15, x FOR PEER REVIEW 6 of 27
Microfocus RTR with Image Processing
[11]
X-ray backscatter [9]
One of the main comparison between the X-ray backscatter and con-ventional X-ray technique is that the returned X-ray energy from a single side of the tested sample is recorded in the X-ray backscatter
technique [9,37].
✓/✓ [17] >20 [9]
Computed tomogra-phy [9]
A number of 2D X-ray images are captured surrounding a rotation axis. These are collected and used to create a 3D model of the sample
by applying algorithms [9,38]. X/✓ [17]
>600 [39] >10
for micro-CT [40]
Infrared Thermogra-phy [9]
During the monitoring, an IR camera is used to measure the temper-ature difference on the surface of the sample caused by the presence
of the defects [9]. ✓/✓ [17] >400 [41]
Eddy current ther-mography [9]
The heat is generated in the examined material generated by eddy current method and recorded by an IR camera [9]. ✓/✓ [9] >400 [41]
Vibrothermography [9]
The produced soundwaves by an UT transducer inside the material collide with the defects and cause a heat release as a consequence of
friction. Then, the released heat is captured via an IR camera [9]. X/✓ [9] >400 [41]
Laser thermography [9]
The sample is heated up using a laser. The energy interacts with the defects. Assessing the heat distribution surrounding the laser spot on
the surface of the material allows the defects to be identified [9]. ✓/✓ [9] >400 [41]
Voltage and current evaluation
During WAAM and fusion welding processes, voltage and current are captured in real time and/then analysed by means of statistical
analysis tools or machine/ deep learning techniques to detect defects [42].
✓/X No information available
Optical emission spectroscopy [17]
The electronic temperature profile is determined during the process by means of assessing the generated light during welding process. This electronic temperature profile is then correlated with existing
flaws in the component [17].
✓/X [17] No information available
2. Laser-Ultrasonics Testing The oscillation/space displacement of particles, their position restoring forces and
their linkage to the surrounding particles which in turn leads to an energy transport is known as elastic or sound waves. The elastic waves typically used in non-destructive testing are so-called ultrasonic waves characterized by frequencies higher than the range audible to humans (>20 kHz) and therefore cannot be heard. However, they can be detected using different types of transducers. Transducers transform these elastic waves into electrical signals that can be monitored as visual signals on a monitor [43] and further analysed. The most commonly used ultrasound transducer technology is based on the piezo effect where stress leads to electric charge. A number of further technologies are available such as Electromagnetic Acoustic Transducers (EMAT), Capacitive Micromachined Ultrasonic Transducers (CMUT), magnetostrictive transducers and Laser Ultrasound (LU) to both generate and receive ultrasonic waves [16]. In this section we are going to focus in more detail on the contactless NDT technology LU. LU is a non-contact NDT technique that is typically composed of two systems, a pulsed laser (q-switched ns-laser) to excite elastic waves and a long pulsed or Continuous Wave (CW) laser in combination with an interferometer to detect the surface movement caused by these elastic waves [44,45]. It can be used in automation processes and harsh environments [46]. As shown in Figure 5, the LU test system consists of the mentioned units including electronic data acquisition and processing hardware [47].
/
Materials 2022, 15, x FOR PEER REVIEW 6 of 27
Microfocus RTR with Image Processing
[11]
X-ray backscatter [9]
One of the main comparison between the X-ray backscatter and con-ventional X-ray technique is that the returned X-ray energy from a single side of the tested sample is recorded in the X-ray backscatter
technique [9,37].
✓/✓ [17] >20 [9]
Computed tomogra-phy [9]
A number of 2D X-ray images are captured surrounding a rotation axis. These are collected and used to create a 3D model of the sample
by applying algorithms [9,38]. X/✓ [17]
>600 [39] >10
for micro-CT [40]
Infrared Thermogra-phy [9]
During the monitoring, an IR camera is used to measure the temper-ature difference on the surface of the sample caused by the presence
of the defects [9]. ✓/✓ [17] >400 [41]
Eddy current ther-mography [9]
The heat is generated in the examined material generated by eddy current method and recorded by an IR camera [9]. ✓/✓ [9] >400 [41]
Vibrothermography [9]
The produced soundwaves by an UT transducer inside the material collide with the defects and cause a heat release as a consequence of
friction. Then, the released heat is captured via an IR camera [9]. X/✓ [9] >400 [41]
Laser thermography [9]
The sample is heated up using a laser. The energy interacts with the defects. Assessing the heat distribution surrounding the laser spot on
the surface of the material allows the defects to be identified [9]. ✓/✓ [9] >400 [41]
Voltage and current evaluation
During WAAM and fusion welding processes, voltage and current are captured in real time and/then analysed by means of statistical
analysis tools or machine/ deep learning techniques to detect defects [42].
✓/X No information available
Optical emission spectroscopy [17]
The electronic temperature profile is determined during the process by means of assessing the generated light during welding process. This electronic temperature profile is then correlated with existing
flaws in the component [17].
✓/X [17] No information available
2. Laser-Ultrasonics Testing The oscillation/space displacement of particles, their position restoring forces and
their linkage to the surrounding particles which in turn leads to an energy transport is known as elastic or sound waves. The elastic waves typically used in non-destructive testing are so-called ultrasonic waves characterized by frequencies higher than the range audible to humans (>20 kHz) and therefore cannot be heard. However, they can be detected using different types of transducers. Transducers transform these elastic waves into electrical signals that can be monitored as visual signals on a monitor [43] and further analysed. The most commonly used ultrasound transducer technology is based on the piezo effect where stress leads to electric charge. A number of further technologies are available such as Electromagnetic Acoustic Transducers (EMAT), Capacitive Micromachined Ultrasonic Transducers (CMUT), magnetostrictive transducers and Laser Ultrasound (LU) to both generate and receive ultrasonic waves [16]. In this section we are going to focus in more detail on the contactless NDT technology LU. LU is a non-contact NDT technique that is typically composed of two systems, a pulsed laser (q-switched ns-laser) to excite elastic waves and a long pulsed or Continuous Wave (CW) laser in combination with an interferometer to detect the surface movement caused by these elastic waves [44,45]. It can be used in automation processes and harsh environments [46]. As shown in Figure 5, the LU test system consists of the mentioned units including electronic data acquisition and processing hardware [47].
[11]
>250 conventional RTR [11]
>250RTR with Image Processing
[11]
>50Microfocus RTR with Image
Processing [11]
X-ray backscatter [9]
One of the main comparison between the X-raybackscatter and conventional X-ray technique is
that the returned X-ray energy from a single side ofthe tested sample is recorded in the X-ray
backscatter technique [9,37].
Materials 2022, 15, x FOR PEER REVIEW 6 of 27
Microfocus RTR with Image Processing
[11]
X-ray backscatter [9]
One of the main comparison between the X-ray backscatter and con-ventional X-ray technique is that the returned X-ray energy from a single side of the tested sample is recorded in the X-ray backscatter
technique [9,37].
✓/✓ [17] >20 [9]
Computed tomogra-phy [9]
A number of 2D X-ray images are captured surrounding a rotation axis. These are collected and used to create a 3D model of the sample
by applying algorithms [9,38]. X/✓ [17]
>600 [39] >10
for micro-CT [40]
Infrared Thermogra-phy [9]
During the monitoring, an IR camera is used to measure the temper-ature difference on the surface of the sample caused by the presence
of the defects [9]. ✓/✓ [17] >400 [41]
Eddy current ther-mography [9]
The heat is generated in the examined material generated by eddy current method and recorded by an IR camera [9]. ✓/✓ [9] >400 [41]
Vibrothermography [9]
The produced soundwaves by an UT transducer inside the material collide with the defects and cause a heat release as a consequence of
friction. Then, the released heat is captured via an IR camera [9]. X/✓ [9] >400 [41]
Laser thermography [9]
The sample is heated up using a laser. The energy interacts with the defects. Assessing the heat distribution surrounding the laser spot on
the surface of the material allows the defects to be identified [9]. ✓/✓ [9] >400 [41]
Voltage and current evaluation
During WAAM and fusion welding processes, voltage and current are captured in real time and/then analysed by means of statistical
analysis tools or machine/ deep learning techniques to detect defects [42].
✓/X No information available
Optical emission spectroscopy [17]
The electronic temperature profile is determined during the process by means of assessing the generated light during welding process. This electronic temperature profile is then correlated with existing
flaws in the component [17].
✓/X [17] No information available
2. Laser-Ultrasonics Testing The oscillation/space displacement of particles, their position restoring forces and
their linkage to the surrounding particles which in turn leads to an energy transport is known as elastic or sound waves. The elastic waves typically used in non-destructive testing are so-called ultrasonic waves characterized by frequencies higher than the range audible to humans (>20 kHz) and therefore cannot be heard. However, they can be detected using different types of transducers. Transducers transform these elastic waves into electrical signals that can be monitored as visual signals on a monitor [43] and further analysed. The most commonly used ultrasound transducer technology is based on the piezo effect where stress leads to electric charge. A number of further technologies are available such as Electromagnetic Acoustic Transducers (EMAT), Capacitive Micromachined Ultrasonic Transducers (CMUT), magnetostrictive transducers and Laser Ultrasound (LU) to both generate and receive ultrasonic waves [16]. In this section we are going to focus in more detail on the contactless NDT technology LU. LU is a non-contact NDT technique that is typically composed of two systems, a pulsed laser (q-switched ns-laser) to excite elastic waves and a long pulsed or Continuous Wave (CW) laser in combination with an interferometer to detect the surface movement caused by these elastic waves [44,45]. It can be used in automation processes and harsh environments [46]. As shown in Figure 5, the LU test system consists of the mentioned units including electronic data acquisition and processing hardware [47].
/
Materials 2022, 15, x FOR PEER REVIEW 6 of 27
Microfocus RTR with Image Processing
[11]
X-ray backscatter [9]
One of the main comparison between the X-ray backscatter and con-ventional X-ray technique is that the returned X-ray energy from a single side of the tested sample is recorded in the X-ray backscatter
technique [9,37].
✓/✓ [17] >20 [9]
Computed tomogra-phy [9]
A number of 2D X-ray images are captured surrounding a rotation axis. These are collected and used to create a 3D model of the sample
by applying algorithms [9,38]. X/✓ [17]
>600 [39] >10
for micro-CT [40]
Infrared Thermogra-phy [9]
During the monitoring, an IR camera is used to measure the temper-ature difference on the surface of the sample caused by the presence
of the defects [9]. ✓/✓ [17] >400 [41]
Eddy current ther-mography [9]
The heat is generated in the examined material generated by eddy current method and recorded by an IR camera [9]. ✓/✓ [9] >400 [41]
Vibrothermography [9]
The produced soundwaves by an UT transducer inside the material collide with the defects and cause a heat release as a consequence of
friction. Then, the released heat is captured via an IR camera [9]. X/✓ [9] >400 [41]
Laser thermography [9]
The sample is heated up using a laser. The energy interacts with the defects. Assessing the heat distribution surrounding the laser spot on
the surface of the material allows the defects to be identified [9]. ✓/✓ [9] >400 [41]
Voltage and current evaluation
During WAAM and fusion welding processes, voltage and current are captured in real time and/then analysed by means of statistical
analysis tools or machine/ deep learning techniques to detect defects [42].
✓/X No information available
Optical emission spectroscopy [17]
The electronic temperature profile is determined during the process by means of assessing the generated light during welding process. This electronic temperature profile is then correlated with existing
flaws in the component [17].
✓/X [17] No information available
2. Laser-Ultrasonics Testing The oscillation/space displacement of particles, their position restoring forces and
their linkage to the surrounding particles which in turn leads to an energy transport is known as elastic or sound waves. The elastic waves typically used in non-destructive testing are so-called ultrasonic waves characterized by frequencies higher than the range audible to humans (>20 kHz) and therefore cannot be heard. However, they can be detected using different types of transducers. Transducers transform these elastic waves into electrical signals that can be monitored as visual signals on a monitor [43] and further analysed. The most commonly used ultrasound transducer technology is based on the piezo effect where stress leads to electric charge. A number of further technologies are available such as Electromagnetic Acoustic Transducers (EMAT), Capacitive Micromachined Ultrasonic Transducers (CMUT), magnetostrictive transducers and Laser Ultrasound (LU) to both generate and receive ultrasonic waves [16]. In this section we are going to focus in more detail on the contactless NDT technology LU. LU is a non-contact NDT technique that is typically composed of two systems, a pulsed laser (q-switched ns-laser) to excite elastic waves and a long pulsed or Continuous Wave (CW) laser in combination with an interferometer to detect the surface movement caused by these elastic waves [44,45]. It can be used in automation processes and harsh environments [46]. As shown in Figure 5, the LU test system consists of the mentioned units including electronic data acquisition and processing hardware [47].
[17] >20 [9]
Computed tomography [9]
A number of 2D X-ray images are capturedsurrounding a rotation axis. These are collected and
used to create a 3D model of the sample byapplying algorithms [9,38].
X/
Materials 2022, 15, x FOR PEER REVIEW 6 of 27
Microfocus RTR with Image Processing
[11]
X-ray backscatter [9]
One of the main comparison between the X-ray backscatter and con-ventional X-ray technique is that the returned X-ray energy from a single side of the tested sample is recorded in the X-ray backscatter
technique [9,37].
✓/✓ [17] >20 [9]
Computed tomogra-phy [9]
A number of 2D X-ray images are captured surrounding a rotation axis. These are collected and used to create a 3D model of the sample
by applying algorithms [9,38]. X/✓ [17]
>600 [39] >10
for micro-CT [40]
Infrared Thermogra-phy [9]
During the monitoring, an IR camera is used to measure the temper-ature difference on the surface of the sample caused by the presence
of the defects [9]. ✓/✓ [17] >400 [41]
Eddy current ther-mography [9]
The heat is generated in the examined material generated by eddy current method and recorded by an IR camera [9]. ✓/✓ [9] >400 [41]
Vibrothermography [9]
The produced soundwaves by an UT transducer inside the material collide with the defects and cause a heat release as a consequence of
friction. Then, the released heat is captured via an IR camera [9]. X/✓ [9] >400 [41]
Laser thermography [9]
The sample is heated up using a laser. The energy interacts with the defects. Assessing the heat distribution surrounding the laser spot on
the surface of the material allows the defects to be identified [9]. ✓/✓ [9] >400 [41]
Voltage and current evaluation
During WAAM and fusion welding processes, voltage and current are captured in real time and/then analysed by means of statistical
analysis tools or machine/ deep learning techniques to detect defects [42].
✓/X No information available
Optical emission spectroscopy [17]
The electronic temperature profile is determined during the process by means of assessing the generated light during welding process. This electronic temperature profile is then correlated with existing
flaws in the component [17].
✓/X [17] No information available
2. Laser-Ultrasonics Testing The oscillation/space displacement of particles, their position restoring forces and
their linkage to the surrounding particles which in turn leads to an energy transport is known as elastic or sound waves. The elastic waves typically used in non-destructive testing are so-called ultrasonic waves characterized by frequencies higher than the range audible to humans (>20 kHz) and therefore cannot be heard. However, they can be detected using different types of transducers. Transducers transform these elastic waves into electrical signals that can be monitored as visual signals on a monitor [43] and further analysed. The most commonly used ultrasound transducer technology is based on the piezo effect where stress leads to electric charge. A number of further technologies are available such as Electromagnetic Acoustic Transducers (EMAT), Capacitive Micromachined Ultrasonic Transducers (CMUT), magnetostrictive transducers and Laser Ultrasound (LU) to both generate and receive ultrasonic waves [16]. In this section we are going to focus in more detail on the contactless NDT technology LU. LU is a non-contact NDT technique that is typically composed of two systems, a pulsed laser (q-switched ns-laser) to excite elastic waves and a long pulsed or Continuous Wave (CW) laser in combination with an interferometer to detect the surface movement caused by these elastic waves [44,45]. It can be used in automation processes and harsh environments [46]. As shown in Figure 5, the LU test system consists of the mentioned units including electronic data acquisition and processing hardware [47].
[17]
>600 [39]
>10for micro-CT [40]
Infrared Thermography [9]
During the monitoring, an IR camera is used tomeasure the temperature difference on the surface
of the sample caused by the presence ofthe defects [9].
Materials 2022, 15, x FOR PEER REVIEW 6 of 27
Microfocus RTR with Image Processing
[11]
X-ray backscatter [9]
One of the main comparison between the X-ray backscatter and con-ventional X-ray technique is that the returned X-ray energy from a single side of the tested sample is recorded in the X-ray backscatter
technique [9,37].
✓/✓ [17] >20 [9]
Computed tomogra-phy [9]
A number of 2D X-ray images are captured surrounding a rotation axis. These are collected and used to create a 3D model of the sample
by applying algorithms [9,38]. X/✓ [17]
>600 [39] >10
for micro-CT [40]
Infrared Thermogra-phy [9]
During the monitoring, an IR camera is used to measure the temper-ature difference on the surface of the sample caused by the presence
of the defects [9]. ✓/✓ [17] >400 [41]
Eddy current ther-mography [9]
The heat is generated in the examined material generated by eddy current method and recorded by an IR camera [9]. ✓/✓ [9] >400 [41]
Vibrothermography [9]
The produced soundwaves by an UT transducer inside the material collide with the defects and cause a heat release as a consequence of
friction. Then, the released heat is captured via an IR camera [9]. X/✓ [9] >400 [41]
Laser thermography [9]
The sample is heated up using a laser. The energy interacts with the defects. Assessing the heat distribution surrounding the laser spot on
the surface of the material allows the defects to be identified [9]. ✓/✓ [9] >400 [41]
Voltage and current evaluation
During WAAM and fusion welding processes, voltage and current are captured in real time and/then analysed by means of statistical
analysis tools or machine/ deep learning techniques to detect defects [42].
✓/X No information available
Optical emission spectroscopy [17]
The electronic temperature profile is determined during the process by means of assessing the generated light during welding process. This electronic temperature profile is then correlated with existing
flaws in the component [17].
✓/X [17] No information available
2. Laser-Ultrasonics Testing The oscillation/space displacement of particles, their position restoring forces and
their linkage to the surrounding particles which in turn leads to an energy transport is known as elastic or sound waves. The elastic waves typically used in non-destructive testing are so-called ultrasonic waves characterized by frequencies higher than the range audible to humans (>20 kHz) and therefore cannot be heard. However, they can be detected using different types of transducers. Transducers transform these elastic waves into electrical signals that can be monitored as visual signals on a monitor [43] and further analysed. The most commonly used ultrasound transducer technology is based on the piezo effect where stress leads to electric charge. A number of further technologies are available such as Electromagnetic Acoustic Transducers (EMAT), Capacitive Micromachined Ultrasonic Transducers (CMUT), magnetostrictive transducers and Laser Ultrasound (LU) to both generate and receive ultrasonic waves [16]. In this section we are going to focus in more detail on the contactless NDT technology LU. LU is a non-contact NDT technique that is typically composed of two systems, a pulsed laser (q-switched ns-laser) to excite elastic waves and a long pulsed or Continuous Wave (CW) laser in combination with an interferometer to detect the surface movement caused by these elastic waves [44,45]. It can be used in automation processes and harsh environments [46]. As shown in Figure 5, the LU test system consists of the mentioned units including electronic data acquisition and processing hardware [47].
/
Materials 2022, 15, x FOR PEER REVIEW 6 of 27
Microfocus RTR with Image Processing
[11]
X-ray backscatter [9]
One of the main comparison between the X-ray backscatter and con-ventional X-ray technique is that the returned X-ray energy from a single side of the tested sample is recorded in the X-ray backscatter
technique [9,37].
✓/✓ [17] >20 [9]
Computed tomogra-phy [9]
A number of 2D X-ray images are captured surrounding a rotation axis. These are collected and used to create a 3D model of the sample
by applying algorithms [9,38]. X/✓ [17]
>600 [39] >10
for micro-CT [40]
Infrared Thermogra-phy [9]
During the monitoring, an IR camera is used to measure the temper-ature difference on the surface of the sample caused by the presence
of the defects [9]. ✓/✓ [17] >400 [41]
Eddy current ther-mography [9]
The heat is generated in the examined material generated by eddy current method and recorded by an IR camera [9]. ✓/✓ [9] >400 [41]
Vibrothermography [9]
The produced soundwaves by an UT transducer inside the material collide with the defects and cause a heat release as a consequence of
friction. Then, the released heat is captured via an IR camera [9]. X/✓ [9] >400 [41]
Laser thermography [9]
The sample is heated up using a laser. The energy interacts with the defects. Assessing the heat distribution surrounding the laser spot on
the surface of the material allows the defects to be identified [9]. ✓/✓ [9] >400 [41]
Voltage and current evaluation
During WAAM and fusion welding processes, voltage and current are captured in real time and/then analysed by means of statistical
analysis tools or machine/ deep learning techniques to detect defects [42].
✓/X No information available
Optical emission spectroscopy [17]
The electronic temperature profile is determined during the process by means of assessing the generated light during welding process. This electronic temperature profile is then correlated with existing
flaws in the component [17].
✓/X [17] No information available
2. Laser-Ultrasonics Testing The oscillation/space displacement of particles, their position restoring forces and
their linkage to the surrounding particles which in turn leads to an energy transport is known as elastic or sound waves. The elastic waves typically used in non-destructive testing are so-called ultrasonic waves characterized by frequencies higher than the range audible to humans (>20 kHz) and therefore cannot be heard. However, they can be detected using different types of transducers. Transducers transform these elastic waves into electrical signals that can be monitored as visual signals on a monitor [43] and further analysed. The most commonly used ultrasound transducer technology is based on the piezo effect where stress leads to electric charge. A number of further technologies are available such as Electromagnetic Acoustic Transducers (EMAT), Capacitive Micromachined Ultrasonic Transducers (CMUT), magnetostrictive transducers and Laser Ultrasound (LU) to both generate and receive ultrasonic waves [16]. In this section we are going to focus in more detail on the contactless NDT technology LU. LU is a non-contact NDT technique that is typically composed of two systems, a pulsed laser (q-switched ns-laser) to excite elastic waves and a long pulsed or Continuous Wave (CW) laser in combination with an interferometer to detect the surface movement caused by these elastic waves [44,45]. It can be used in automation processes and harsh environments [46]. As shown in Figure 5, the LU test system consists of the mentioned units including electronic data acquisition and processing hardware [47].
[17] >400 [41]
Eddy currentthermography [9]
The heat is generated in the examined materialgenerated by eddy current method and recorded by
an IR camera [9].
Materials 2022, 15, x FOR PEER REVIEW 6 of 27
Microfocus RTR with Image Processing
[11]
X-ray backscatter [9]
One of the main comparison between the X-ray backscatter and con-ventional X-ray technique is that the returned X-ray energy from a single side of the tested sample is recorded in the X-ray backscatter
technique [9,37].
✓/✓ [17] >20 [9]
Computed tomogra-phy [9]
A number of 2D X-ray images are captured surrounding a rotation axis. These are collected and used to create a 3D model of the sample
by applying algorithms [9,38]. X/✓ [17]
>600 [39] >10
for micro-CT [40]
Infrared Thermogra-phy [9]
During the monitoring, an IR camera is used to measure the temper-ature difference on the surface of the sample caused by the presence
of the defects [9]. ✓/✓ [17] >400 [41]
Eddy current ther-mography [9]
The heat is generated in the examined material generated by eddy current method and recorded by an IR camera [9]. ✓/✓ [9] >400 [41]
Vibrothermography [9]
The produced soundwaves by an UT transducer inside the material collide with the defects and cause a heat release as a consequence of
friction. Then, the released heat is captured via an IR camera [9]. X/✓ [9] >400 [41]
Laser thermography [9]
The sample is heated up using a laser. The energy interacts with the defects. Assessing the heat distribution surrounding the laser spot on
the surface of the material allows the defects to be identified [9]. ✓/✓ [9] >400 [41]
Voltage and current evaluation
During WAAM and fusion welding processes, voltage and current are captured in real time and/then analysed by means of statistical
analysis tools or machine/ deep learning techniques to detect defects [42].
✓/X No information available
Optical emission spectroscopy [17]
The electronic temperature profile is determined during the process by means of assessing the generated light during welding process. This electronic temperature profile is then correlated with existing
flaws in the component [17].
✓/X [17] No information available
2. Laser-Ultrasonics Testing The oscillation/space displacement of particles, their position restoring forces and
their linkage to the surrounding particles which in turn leads to an energy transport is known as elastic or sound waves. The elastic waves typically used in non-destructive testing are so-called ultrasonic waves characterized by frequencies higher than the range audible to humans (>20 kHz) and therefore cannot be heard. However, they can be detected using different types of transducers. Transducers transform these elastic waves into electrical signals that can be monitored as visual signals on a monitor [43] and further analysed. The most commonly used ultrasound transducer technology is based on the piezo effect where stress leads to electric charge. A number of further technologies are available such as Electromagnetic Acoustic Transducers (EMAT), Capacitive Micromachined Ultrasonic Transducers (CMUT), magnetostrictive transducers and Laser Ultrasound (LU) to both generate and receive ultrasonic waves [16]. In this section we are going to focus in more detail on the contactless NDT technology LU. LU is a non-contact NDT technique that is typically composed of two systems, a pulsed laser (q-switched ns-laser) to excite elastic waves and a long pulsed or Continuous Wave (CW) laser in combination with an interferometer to detect the surface movement caused by these elastic waves [44,45]. It can be used in automation processes and harsh environments [46]. As shown in Figure 5, the LU test system consists of the mentioned units including electronic data acquisition and processing hardware [47].
/
Materials 2022, 15, x FOR PEER REVIEW 6 of 27
Microfocus RTR with Image Processing
[11]
X-ray backscatter [9]
One of the main comparison between the X-ray backscatter and con-ventional X-ray technique is that the returned X-ray energy from a single side of the tested sample is recorded in the X-ray backscatter
technique [9,37].
✓/✓ [17] >20 [9]
Computed tomogra-phy [9]
A number of 2D X-ray images are captured surrounding a rotation axis. These are collected and used to create a 3D model of the sample
by applying algorithms [9,38]. X/✓ [17]
>600 [39] >10
for micro-CT [40]
Infrared Thermogra-phy [9]
During the monitoring, an IR camera is used to measure the temper-ature difference on the surface of the sample caused by the presence
of the defects [9]. ✓/✓ [17] >400 [41]
Eddy current ther-mography [9]
The heat is generated in the examined material generated by eddy current method and recorded by an IR camera [9]. ✓/✓ [9] >400 [41]
Vibrothermography [9]
The produced soundwaves by an UT transducer inside the material collide with the defects and cause a heat release as a consequence of
friction. Then, the released heat is captured via an IR camera [9]. X/✓ [9] >400 [41]
Laser thermography [9]
The sample is heated up using a laser. The energy interacts with the defects. Assessing the heat distribution surrounding the laser spot on
the surface of the material allows the defects to be identified [9]. ✓/✓ [9] >400 [41]
Voltage and current evaluation
During WAAM and fusion welding processes, voltage and current are captured in real time and/then analysed by means of statistical
analysis tools or machine/ deep learning techniques to detect defects [42].
✓/X No information available
Optical emission spectroscopy [17]
The electronic temperature profile is determined during the process by means of assessing the generated light during welding process. This electronic temperature profile is then correlated with existing
flaws in the component [17].
✓/X [17] No information available
2. Laser-Ultrasonics Testing The oscillation/space displacement of particles, their position restoring forces and
their linkage to the surrounding particles which in turn leads to an energy transport is known as elastic or sound waves. The elastic waves typically used in non-destructive testing are so-called ultrasonic waves characterized by frequencies higher than the range audible to humans (>20 kHz) and therefore cannot be heard. However, they can be detected using different types of transducers. Transducers transform these elastic waves into electrical signals that can be monitored as visual signals on a monitor [43] and further analysed. The most commonly used ultrasound transducer technology is based on the piezo effect where stress leads to electric charge. A number of further technologies are available such as Electromagnetic Acoustic Transducers (EMAT), Capacitive Micromachined Ultrasonic Transducers (CMUT), magnetostrictive transducers and Laser Ultrasound (LU) to both generate and receive ultrasonic waves [16]. In this section we are going to focus in more detail on the contactless NDT technology LU. LU is a non-contact NDT technique that is typically composed of two systems, a pulsed laser (q-switched ns-laser) to excite elastic waves and a long pulsed or Continuous Wave (CW) laser in combination with an interferometer to detect the surface movement caused by these elastic waves [44,45]. It can be used in automation processes and harsh environments [46]. As shown in Figure 5, the LU test system consists of the mentioned units including electronic data acquisition and processing hardware [47].
[9] >400 [41]
Vibrothermography [9]
The produced soundwaves by an UT transducerinside the material collide with the defects andcause a heat release as a consequence of friction.
Then, the released heat is captured via anIR camera [9].
X/
Materials 2022, 15, x FOR PEER REVIEW 6 of 27
Microfocus RTR with Image Processing
[11]
X-ray backscatter [9]
One of the main comparison between the X-ray backscatter and con-ventional X-ray technique is that the returned X-ray energy from a single side of the tested sample is recorded in the X-ray backscatter
technique [9,37].
✓/✓ [17] >20 [9]
Computed tomogra-phy [9]
A number of 2D X-ray images are captured surrounding a rotation axis. These are collected and used to create a 3D model of the sample
by applying algorithms [9,38]. X/✓ [17]
>600 [39] >10
for micro-CT [40]
Infrared Thermogra-phy [9]
During the monitoring, an IR camera is used to measure the temper-ature difference on the surface of the sample caused by the presence
of the defects [9]. ✓/✓ [17] >400 [41]
Eddy current ther-mography [9]
The heat is generated in the examined material generated by eddy current method and recorded by an IR camera [9]. ✓/✓ [9] >400 [41]
Vibrothermography [9]
The produced soundwaves by an UT transducer inside the material collide with the defects and cause a heat release as a consequence of
friction. Then, the released heat is captured via an IR camera [9]. X/✓ [9] >400 [41]
Laser thermography [9]
The sample is heated up using a laser. The energy interacts with the defects. Assessing the heat distribution surrounding the laser spot on
the surface of the material allows the defects to be identified [9]. ✓/✓ [9] >400 [41]
Voltage and current evaluation
During WAAM and fusion welding processes, voltage and current are captured in real time and/then analysed by means of statistical
analysis tools or machine/ deep learning techniques to detect defects [42].
✓/X No information available
Optical emission spectroscopy [17]
The electronic temperature profile is determined during the process by means of assessing the generated light during welding process. This electronic temperature profile is then correlated with existing
flaws in the component [17].
✓/X [17] No information available
2. Laser-Ultrasonics Testing The oscillation/space displacement of particles, their position restoring forces and
their linkage to the surrounding particles which in turn leads to an energy transport is known as elastic or sound waves. The elastic waves typically used in non-destructive testing are so-called ultrasonic waves characterized by frequencies higher than the range audible to humans (>20 kHz) and therefore cannot be heard. However, they can be detected using different types of transducers. Transducers transform these elastic waves into electrical signals that can be monitored as visual signals on a monitor [43] and further analysed. The most commonly used ultrasound transducer technology is based on the piezo effect where stress leads to electric charge. A number of further technologies are available such as Electromagnetic Acoustic Transducers (EMAT), Capacitive Micromachined Ultrasonic Transducers (CMUT), magnetostrictive transducers and Laser Ultrasound (LU) to both generate and receive ultrasonic waves [16]. In this section we are going to focus in more detail on the contactless NDT technology LU. LU is a non-contact NDT technique that is typically composed of two systems, a pulsed laser (q-switched ns-laser) to excite elastic waves and a long pulsed or Continuous Wave (CW) laser in combination with an interferometer to detect the surface movement caused by these elastic waves [44,45]. It can be used in automation processes and harsh environments [46]. As shown in Figure 5, the LU test system consists of the mentioned units including electronic data acquisition and processing hardware [47].
[9] >400 [41]
Laser thermography [9]
The sample is heated up using a laser. The energyinteracts with the defects. Assessing the heatdistribution surrounding the laser spot on the
surface of the material allows the defects tobe identified [9].
Materials 2022, 15, x FOR PEER REVIEW 6 of 27
Microfocus RTR with Image Processing
[11]
X-ray backscatter [9]
One of the main comparison between the X-ray backscatter and con-ventional X-ray technique is that the returned X-ray energy from a single side of the tested sample is recorded in the X-ray backscatter
technique [9,37].
✓/✓ [17] >20 [9]
Computed tomogra-phy [9]
A number of 2D X-ray images are captured surrounding a rotation axis. These are collected and used to create a 3D model of the sample
by applying algorithms [9,38]. X/✓ [17]
>600 [39] >10
for micro-CT [40]
Infrared Thermogra-phy [9]
During the monitoring, an IR camera is used to measure the temper-ature difference on the surface of the sample caused by the presence
of the defects [9]. ✓/✓ [17] >400 [41]
Eddy current ther-mography [9]
The heat is generated in the examined material generated by eddy current method and recorded by an IR camera [9]. ✓/✓ [9] >400 [41]
Vibrothermography [9]
The produced soundwaves by an UT transducer inside the material collide with the defects and cause a heat release as a consequence of
friction. Then, the released heat is captured via an IR camera [9]. X/✓ [9] >400 [41]
Laser thermography [9]
The sample is heated up using a laser. The energy interacts with the defects. Assessing the heat distribution surrounding the laser spot on
the surface of the material allows the defects to be identified [9]. ✓/✓ [9] >400 [41]
Voltage and current evaluation
During WAAM and fusion welding processes, voltage and current are captured in real time and/then analysed by means of statistical
analysis tools or machine/ deep learning techniques to detect defects [42].
✓/X No information available
Optical emission spectroscopy [17]
The electronic temperature profile is determined during the process by means of assessing the generated light during welding process. This electronic temperature profile is then correlated with existing
flaws in the component [17].
✓/X [17] No information available
2. Laser-Ultrasonics Testing The oscillation/space displacement of particles, their position restoring forces and
their linkage to the surrounding particles which in turn leads to an energy transport is known as elastic or sound waves. The elastic waves typically used in non-destructive testing are so-called ultrasonic waves characterized by frequencies higher than the range audible to humans (>20 kHz) and therefore cannot be heard. However, they can be detected using different types of transducers. Transducers transform these elastic waves into electrical signals that can be monitored as visual signals on a monitor [43] and further analysed. The most commonly used ultrasound transducer technology is based on the piezo effect where stress leads to electric charge. A number of further technologies are available such as Electromagnetic Acoustic Transducers (EMAT), Capacitive Micromachined Ultrasonic Transducers (CMUT), magnetostrictive transducers and Laser Ultrasound (LU) to both generate and receive ultrasonic waves [16]. In this section we are going to focus in more detail on the contactless NDT technology LU. LU is a non-contact NDT technique that is typically composed of two systems, a pulsed laser (q-switched ns-laser) to excite elastic waves and a long pulsed or Continuous Wave (CW) laser in combination with an interferometer to detect the surface movement caused by these elastic waves [44,45]. It can be used in automation processes and harsh environments [46]. As shown in Figure 5, the LU test system consists of the mentioned units including electronic data acquisition and processing hardware [47].
/
Materials 2022, 15, x FOR PEER REVIEW 6 of 27
Microfocus RTR with Image Processing
[11]
X-ray backscatter [9]
One of the main comparison between the X-ray backscatter and con-ventional X-ray technique is that the returned X-ray energy from a single side of the tested sample is recorded in the X-ray backscatter
technique [9,37].
✓/✓ [17] >20 [9]
Computed tomogra-phy [9]
A number of 2D X-ray images are captured surrounding a rotation axis. These are collected and used to create a 3D model of the sample
by applying algorithms [9,38]. X/✓ [17]
>600 [39] >10
for micro-CT [40]
Infrared Thermogra-phy [9]
During the monitoring, an IR camera is used to measure the temper-ature difference on the surface of the sample caused by the presence
of the defects [9]. ✓/✓ [17] >400 [41]
Eddy current ther-mography [9]
The heat is generated in the examined material generated by eddy current method and recorded by an IR camera [9]. ✓/✓ [9] >400 [41]
Vibrothermography [9]
The produced soundwaves by an UT transducer inside the material collide with the defects and cause a heat release as a consequence of
friction. Then, the released heat is captured via an IR camera [9]. X/✓ [9] >400 [41]
Laser thermography [9]
The sample is heated up using a laser. The energy interacts with the defects. Assessing the heat distribution surrounding the laser spot on
the surface of the material allows the defects to be identified [9]. ✓/✓ [9] >400 [41]
Voltage and current evaluation
During WAAM and fusion welding processes, voltage and current are captured in real time and/then analysed by means of statistical
analysis tools or machine/ deep learning techniques to detect defects [42].
✓/X No information available
Optical emission spectroscopy [17]
The electronic temperature profile is determined during the process by means of assessing the generated light during welding process. This electronic temperature profile is then correlated with existing
flaws in the component [17].
✓/X [17] No information available
2. Laser-Ultrasonics Testing The oscillation/space displacement of particles, their position restoring forces and
their linkage to the surrounding particles which in turn leads to an energy transport is known as elastic or sound waves. The elastic waves typically used in non-destructive testing are so-called ultrasonic waves characterized by frequencies higher than the range audible to humans (>20 kHz) and therefore cannot be heard. However, they can be detected using different types of transducers. Transducers transform these elastic waves into electrical signals that can be monitored as visual signals on a monitor [43] and further analysed. The most commonly used ultrasound transducer technology is based on the piezo effect where stress leads to electric charge. A number of further technologies are available such as Electromagnetic Acoustic Transducers (EMAT), Capacitive Micromachined Ultrasonic Transducers (CMUT), magnetostrictive transducers and Laser Ultrasound (LU) to both generate and receive ultrasonic waves [16]. In this section we are going to focus in more detail on the contactless NDT technology LU. LU is a non-contact NDT technique that is typically composed of two systems, a pulsed laser (q-switched ns-laser) to excite elastic waves and a long pulsed or Continuous Wave (CW) laser in combination with an interferometer to detect the surface movement caused by these elastic waves [44,45]. It can be used in automation processes and harsh environments [46]. As shown in Figure 5, the LU test system consists of the mentioned units including electronic data acquisition and processing hardware [47].
[9] >400 [41]
Voltage and currentevaluation
During WAAM and fusion welding processes,voltage and current are captured in real time
and/then analysed by means of statistical analysistools or machine/deep learning techniques to
detect defects [42].
Materials 2022, 15, x FOR PEER REVIEW 6 of 27
Microfocus RTR with Image Processing
[11]
X-ray backscatter [9]
One of the main comparison between the X-ray backscatter and con-ventional X-ray technique is that the returned X-ray energy from a single side of the tested sample is recorded in the X-ray backscatter
technique [9,37].
✓/✓ [17] >20 [9]
Computed tomogra-phy [9]
A number of 2D X-ray images are captured surrounding a rotation axis. These are collected and used to create a 3D model of the sample
by applying algorithms [9,38]. X/✓ [17]
>600 [39] >10
for micro-CT [40]
Infrared Thermogra-phy [9]
During the monitoring, an IR camera is used to measure the temper-ature difference on the surface of the sample caused by the presence
of the defects [9]. ✓/✓ [17] >400 [41]
Eddy current ther-mography [9]
The heat is generated in the examined material generated by eddy current method and recorded by an IR camera [9]. ✓/✓ [9] >400 [41]
Vibrothermography [9]
The produced soundwaves by an UT transducer inside the material collide with the defects and cause a heat release as a consequence of
friction. Then, the released heat is captured via an IR camera [9]. X/✓ [9] >400 [41]
Laser thermography [9]
The sample is heated up using a laser. The energy interacts with the defects. Assessing the heat distribution surrounding the laser spot on
the surface of the material allows the defects to be identified [9]. ✓/✓ [9] >400 [41]
Voltage and current evaluation
During WAAM and fusion welding processes, voltage and current are captured in real time and/then analysed by means of statistical
analysis tools or machine/ deep learning techniques to detect defects [42].
✓/X No information available
Optical emission spectroscopy [17]
The electronic temperature profile is determined during the process by means of assessing the generated light during welding process. This electronic temperature profile is then correlated with existing
flaws in the component [17].
✓/X [17] No information available
2. Laser-Ultrasonics Testing The oscillation/space displacement of particles, their position restoring forces and
their linkage to the surrounding particles which in turn leads to an energy transport is known as elastic or sound waves. The elastic waves typically used in non-destructive testing are so-called ultrasonic waves characterized by frequencies higher than the range audible to humans (>20 kHz) and therefore cannot be heard. However, they can be detected using different types of transducers. Transducers transform these elastic waves into electrical signals that can be monitored as visual signals on a monitor [43] and further analysed. The most commonly used ultrasound transducer technology is based on the piezo effect where stress leads to electric charge. A number of further technologies are available such as Electromagnetic Acoustic Transducers (EMAT), Capacitive Micromachined Ultrasonic Transducers (CMUT), magnetostrictive transducers and Laser Ultrasound (LU) to both generate and receive ultrasonic waves [16]. In this section we are going to focus in more detail on the contactless NDT technology LU. LU is a non-contact NDT technique that is typically composed of two systems, a pulsed laser (q-switched ns-laser) to excite elastic waves and a long pulsed or Continuous Wave (CW) laser in combination with an interferometer to detect the surface movement caused by these elastic waves [44,45]. It can be used in automation processes and harsh environments [46]. As shown in Figure 5, the LU test system consists of the mentioned units including electronic data acquisition and processing hardware [47].
/X No information available
Optical emissionspectroscopy [17]
The electronic temperature profile is determinedduring the process by means of assessing thegenerated light during welding process. This
electronic temperature profile is then correlatedwith existing flaws in the component [17].
Materials 2022, 15, x FOR PEER REVIEW 6 of 27
Microfocus RTR with Image Processing
[11]
X-ray backscatter [9]
One of the main comparison between the X-ray backscatter and con-ventional X-ray technique is that the returned X-ray energy from a single side of the tested sample is recorded in the X-ray backscatter
technique [9,37].
✓/✓ [17] >20 [9]
Computed tomogra-phy [9]
A number of 2D X-ray images are captured surrounding a rotation axis. These are collected and used to create a 3D model of the sample
by applying algorithms [9,38]. X/✓ [17]
>600 [39] >10
for micro-CT [40]
Infrared Thermogra-phy [9]
During the monitoring, an IR camera is used to measure the temper-ature difference on the surface of the sample caused by the presence
of the defects [9]. ✓/✓ [17] >400 [41]
Eddy current ther-mography [9]
The heat is generated in the examined material generated by eddy current method and recorded by an IR camera [9]. ✓/✓ [9] >400 [41]
Vibrothermography [9]
The produced soundwaves by an UT transducer inside the material collide with the defects and cause a heat release as a consequence of
friction. Then, the released heat is captured via an IR camera [9]. X/✓ [9] >400 [41]
Laser thermography [9]
The sample is heated up using a laser. The energy interacts with the defects. Assessing the heat distribution surrounding the laser spot on
the surface of the material allows the defects to be identified [9]. ✓/✓ [9] >400 [41]
Voltage and current evaluation
During WAAM and fusion welding processes, voltage and current are captured in real time and/then analysed by means of statistical
analysis tools or machine/ deep learning techniques to detect defects [42].
✓/X No information available
Optical emission spectroscopy [17]
The electronic temperature profile is determined during the process by means of assessing the generated light during welding process. This electronic temperature profile is then correlated with existing
flaws in the component [17].
✓/X [17] No information available
2. Laser-Ultrasonics Testing The oscillation/space displacement of particles, their position restoring forces and
their linkage to the surrounding particles which in turn leads to an energy transport is known as elastic or sound waves. The elastic waves typically used in non-destructive testing are so-called ultrasonic waves characterized by frequencies higher than the range audible to humans (>20 kHz) and therefore cannot be heard. However, they can be detected using different types of transducers. Transducers transform these elastic waves into electrical signals that can be monitored as visual signals on a monitor [43] and further analysed. The most commonly used ultrasound transducer technology is based on the piezo effect where stress leads to electric charge. A number of further technologies are available such as Electromagnetic Acoustic Transducers (EMAT), Capacitive Micromachined Ultrasonic Transducers (CMUT), magnetostrictive transducers and Laser Ultrasound (LU) to both generate and receive ultrasonic waves [16]. In this section we are going to focus in more detail on the contactless NDT technology LU. LU is a non-contact NDT technique that is typically composed of two systems, a pulsed laser (q-switched ns-laser) to excite elastic waves and a long pulsed or Continuous Wave (CW) laser in combination with an interferometer to detect the surface movement caused by these elastic waves [44,45]. It can be used in automation processes and harsh environments [46]. As shown in Figure 5, the LU test system consists of the mentioned units including electronic data acquisition and processing hardware [47].
/X [17] No information available
2. Laser-Ultrasonics Testing
The oscillation/space displacement of particles, their position restoring forces andtheir linkage to the surrounding particles which in turn leads to an energy transport isknown as elastic or sound waves. The elastic waves typically used in non-destructivetesting are so-called ultrasonic waves characterized by frequencies higher than the rangeaudible to humans (>20 kHz) and therefore cannot be heard. However, they can bedetected using different types of transducers. Transducers transform these elastic wavesinto electrical signals that can be monitored as visual signals on a monitor [43] and fur-ther analysed. The most commonly used ultrasound transducer technology is based onthe piezo effect where stress leads to electric charge. A number of further technologiesare available such as Electromagnetic Acoustic Transducers (EMAT), Capacitive Mi-cromachined Ultrasonic Transducers (CMUT), magnetostrictive transducers and Laser

Materials 2022, 15, 3697 7 of 26
Ultrasound (LU) to both generate and receive ultrasonic waves [16]. In this sectionwe are going to focus in more detail on the contactless NDT technology LU. LU is anon-contact NDT technique that is typically composed of two systems, a pulsed laser(q-switched ns-laser) to excite elastic waves and a long pulsed or Continuous Wave (CW)laser in combination with an interferometer to detect the surface movement caused bythese elastic waves [44,45]. It can be used in automation processes and harsh environ-ments [46]. As shown in Figure 5, the LU test system consists of the mentioned unitsincluding electronic data acquisition and processing hardware [47].
Materials 2022, 15, x FOR PEER REVIEW 7 of 27
Figure 5. Laser ultrasonic inspection system [48].
A number of different propagation types (modes) of elastic waves can be used in UT inspection. Table 2 illustrates the most relevant propagation modes in solids. Generally, elastic waves can be categorized into bulk waves and guided waves. Bulk waves are di-vided into longitudinal (compression) or transverse (shear) waves. Guided waves own various modes, such as surface (Rayleigh) waves, plate (Lamb including Zero Group Ve-locity (ZGV) modes) waves [16,49–51]. Typically for LU, these waves can be excited and propagate simultaneously in the material and can further be distinguished via data pro-cessing and prior knowledge on the physical nature of the elastic wave. These waves can be generated either via a thermoelastic mechanism at lower laser energy [52] or ablation of the component via vaporization of a small amount of the upper layers at higher laser energy.
Table 2. The most relevant propagation modes of ultrasonic waves in solids [49–51].
Propagation Mode Description Longitudinal (compression) The particle motion is parallel to the wave travel direction.
Transverse (shear) The particle vibration is perpendicular to the wave travel direction.
Surface (Rayleigh) The wave is generated at the surface of thick solids caused by an elliptical motion of particles.
Plate (Lamb including ZGV modes) A complex particle motion happens throughout the thickness and parallel to the surface of the material.
Figure 6 shows a symbolic sketch of two different ultrasound wave excitation phe-nomena: thermoelastic and ablative. Thermoelastic wave generation is a non-destructive method, in which a short-pulsed laser, with an energy density lower than the damage threshold of the material, excites a short pulse on the surface of the material. This causes heating, including thermal expansion of the surface of the material, in a very short time, which leads to particle motion and therefore elastic waves. Ablative generation is enabled by enhancing the laser energy density higher than the damage threshold of the material surface. A small amount of material is vaporized, which causes a backdraft to the surface, and this generates elastic waves revealing much higher amplitudes. The most prominent difference between the two ultrasonic excitation phenomena are different elastic wave amplitudes, different wave dispersion behaviours and being destructive and non-destruc-tive [53,54]. In the next step, the excited elastic waves are detected by the second laser optical system [16,47,48,55,56], which in the majority of cases illuminates a certain spot on the material surface. The elastic waves generate small vibrations of the surface which lead to a phase modulation (Doppler shift) of the reflected laser light of the detection system. This is further demodulated to an amplitude modulation via the use of different interfer-ometer systems (homodyne, heterodyne, self-interference, two beam, photorefractive, time delay).
Figure 5. Laser ultrasonic inspection system [48].
A number of different propagation types (modes) of elastic waves can be used in UTinspection. Table 2 illustrates the most relevant propagation modes in solids. Generally,elastic waves can be categorized into bulk waves and guided waves. Bulk waves aredivided into longitudinal (compression) or transverse (shear) waves. Guided waves ownvarious modes, such as surface (Rayleigh) waves, plate (Lamb including Zero GroupVelocity (ZGV) modes) waves [16,49–51]. Typically for LU, these waves can be excitedand propagate simultaneously in the material and can further be distinguished via dataprocessing and prior knowledge on the physical nature of the elastic wave. These wavescan be generated either via a thermoelastic mechanism at lower laser energy [52] orablation of the component via vaporization of a small amount of the upper layers athigher laser energy.
Table 2. The most relevant propagation modes of ultrasonic waves in solids [49–51].
Propagation Mode Description
Longitudinal (compression) The particle motion is parallel to the wavetravel direction.
Transverse (shear) The particle vibration is perpendicular to the wavetravel direction.
Surface (Rayleigh) The wave is generated at the surface of thick solidscaused by an elliptical motion of particles.
Plate (Lamb including ZGV modes) A complex particle motion happens throughout thethickness and parallel to the surface of the material.
Figure 6 shows a symbolic sketch of two different ultrasound wave excitation phe-nomena: thermoelastic and ablative. Thermoelastic wave generation is a non-destructivemethod, in which a short-pulsed laser, with an energy density lower than the damagethreshold of the material, excites a short pulse on the surface of the material. This causesheating, including thermal expansion of the surface of the material, in a very short time,which leads to particle motion and therefore elastic waves. Ablative generation is en-abled by enhancing the laser energy density higher than the damage threshold of the

Materials 2022, 15, 3697 8 of 26
material surface. A small amount of material is vaporized, which causes a backdraftto the surface, and this generates elastic waves revealing much higher amplitudes. Themost prominent difference between the two ultrasonic excitation phenomena are differentelastic wave amplitudes, different wave dispersion behaviours and being destructive andnon-destructive [53,54]. In the next step, the excited elastic waves are detected by thesecond laser optical system [16,47,48,55,56], which in the majority of cases illuminates acertain spot on the material surface. The elastic waves generate small vibrations of thesurface which lead to a phase modulation (Doppler shift) of the reflected laser light of thedetection system. This is further demodulated to an amplitude modulation via the useof different interferometer systems (homodyne, heterodyne, self-interference, two beam,photorefractive, time delay).
Materials 2022, 15, x FOR PEER REVIEW 8 of 27
Figure 6. Thermoelastic (a) and ablative (b) phenomena in UL [57].
LU enables competitive advantages compared to conventional ultrasonic NDT tech-niques, such as the ability to operate contactless, in real time, at various distances, even more than 1 m, and at any temperature, to measure the thickness, to inspect flaws and to characterize the material even on non-stationary components [45,47,58]. Furthermore, it requires no couplant between the transducer and the component, and it can operate at a very high bandwidth (from 1 MHz to 100 MHz or even more) [58]. Cracks, lack of fusion, porosity and residual stresses can be detected via UT in powder- and wire-based DED processes [16]. In addition, it has the capability to detect defects larger than 100 μm and up to 700 μm deep [9]. Many researchers focused on LU to implement it in AM applica-tions because of its ability to contactlessly detect defects. Levesque et al. [59] investigated the use of laser ultrasound for offline defect analysis of INCONEL718 and Ti-6AL-4V cou-pons and compared the results with X-ray tomography. The coupons were processed us-ing a laser powder, a laser wire and an electron beam wire deposition process. Laser ul-trasound results were reconstructed using the Synthetic Aperture Focusing Technique (SAFT) method, improving resolution and the Signal-to-Noise Ratio (SNR). Defects such as porosity with typical sizes of about 0.4mm and lack of fusion in the laser wire deposi-tion process could be clearly identified. It should be noted that the measurements were made from the bottom side of the coupon. Use on a rough surface for a later inline appli-cation still has to be tested. To overcome this, Levesque et al. [60] showed in a later publi-cation the possibility of using LU for defect analysis of thick welded structures (butt welds). Since similar surface roughness and geometry problems are expected here as in the previous investigations, a comparison can be made to the applicability of LU to WAAM structures. LU was applied directly to the machined surface, and the reconstruc-tion of the data using SAFT was corrected for the geometry information obtained via a profile camera. In this way, artificial defects (EDM slits in one) with a size of 2‒3 mm could be resolved at a depth of 50 mm. In contrast to the works presented so far, Klein et al. [61] researched the possibility of using surface acoustic waves (Raleigh waves) to detect de-fects positioned near the surface. The use of SAW waves in contrast to the bulk wave ap-proach should offer advantages in his explanations especially for near-surface defects. The analysis of the Surface Acoustic Wave (SAW) waves and their temporal displacement, induced by defects, was carried out in the work by means of wavelet analysis and numer-ical simulations. Artificial defects (flat bottom drilled holes, 1 mm diameter and 0.4 mm deep) were clearly detected on titanium and steel samples with machined surfaces. Fol-lowing studies have to show the applicability on typical WAAM components with their relatively high surface roughness. A similar approach was taken by Dixon et al. [62], based on a pulsed laser to excite SAW waves and an EMAT (Electromagnetic Acoustic Trans-ducer) detector. The combination of laser and EMAT allowed on the one hand a low-cost detector (in contrast to the typical laser-based LU detectors) and on the other hand the use of EMAT on materials with low electrical conductivity or magnetic properties. With this setup, samples with artificial defects and real components with porosities were investi-
Figure 6. Thermoelastic (a) and ablative (b) phenomena in UL [57].
LU enables competitive advantages compared to conventional ultrasonic NDT tech-niques, such as the ability to operate contactless, in real time, at various distances, evenmore than 1 m, and at any temperature, to measure the thickness, to inspect flaws and tocharacterize the material even on non-stationary components [45,47,58]. Furthermore, itrequires no couplant between the transducer and the component, and it can operate at avery high bandwidth (from 1 MHz to 100 MHz or even more) [58]. Cracks, lack of fusion,porosity and residual stresses can be detected via UT in powder- and wire-based DEDprocesses [16]. In addition, it has the capability to detect defects larger than 100 µmand up to 700 µm deep [9]. Many researchers focused on LU to implement it in AMapplications because of its ability to contactlessly detect defects. Levesque et al. [59]investigated the use of laser ultrasound for offline defect analysis of INCONEL718 andTi-6AL-4V coupons and compared the results with X-ray tomography. The couponswere processed using a laser powder, a laser wire and an electron beam wire depositionprocess. Laser ultrasound results were reconstructed using the Synthetic Aperture Fo-cusing Technique (SAFT) method, improving resolution and the Signal-to-Noise Ratio(SNR). Defects such as porosity with typical sizes of about 0.4mm and lack of fusion inthe laser wire deposition process could be clearly identified. It should be noted that themeasurements were made from the bottom side of the coupon. Use on a rough surfacefor a later inline application still has to be tested. To overcome this, Levesque et al. [60]showed in a later publication the possibility of using LU for defect analysis of thickwelded structures (butt welds). Since similar surface roughness and geometry problemsare expected here as in the previous investigations, a comparison can be made to theapplicability of LU to WAAM structures. LU was applied directly to the machinedsurface, and the reconstruction of the data using SAFT was corrected for the geometryinformation obtained via a profile camera. In this way, artificial defects (EDM slits inone) with a size of 2–3 mm could be resolved at a depth of 50 mm. In contrast to theworks presented so far, Klein et al. [61] researched the possibility of using surface acous-tic waves (Raleigh waves) to detect defects positioned near the surface. The use of SAW

Materials 2022, 15, 3697 9 of 26
waves in contrast to the bulk wave approach should offer advantages in his explanationsespecially for near-surface defects. The analysis of the Surface Acoustic Wave (SAW)waves and their temporal displacement, induced by defects, was carried out in the workby means of wavelet analysis and numerical simulations. Artificial defects (flat bottomdrilled holes, 1 mm diameter and 0.4 mm deep) were clearly detected on titanium andsteel samples with machined surfaces. Following studies have to show the applicabilityon typical WAAM components with their relatively high surface roughness. A similarapproach was taken by Dixon et al. [62], based on a pulsed laser to excite SAW wavesand an EMAT (Electromagnetic Acoustic Transducer) detector. The combination oflaser and EMAT allowed on the one hand a low-cost detector (in contrast to the typicallaser-based LU detectors) and on the other hand the use of EMAT on materials with lowelectrical conductivity or magnetic properties. With this setup, samples with artificialdefects and real components with porosities were investigated. The defects could befound, but in the conclusion, it is pointed out that a characterization of the defects insize and location is not possible at the time of publication, and therefore, this hybridsystem could be used as a pre-screening technology. Zeng et al. [63] numerically andexperimentally investigated three intentionally embedded defects in WAAM withoutany surface treatment: a crack with a width of 0.2 mm and a depth of 2 mm, a flatbottom hole with a diameter of 2 mm and a depth of 1 mm, and a through hole witha diameter of 2 mm and a depth of 2.5 mm. They successfully identified the above-mentioned defects utilizing laser ultrasound technology. Fang et al. [64] determinedthat LU in transmission mode allows subsurface defects as small as 1 mm in diameterinside the additively manufactured A 316 L stainless steel part to be detected. Thecomponent was scanned simultaneously with a laser generator on one side and anultrasonic detector on the other side of the probe. The time delay was measured using across-correlation algorithm. The position of the internal defects was evaluated basedon the sample thickness and two maximum signal delay points at the left and rightscanning. Guo et al. [65] merged a convolutional neural network (CNN) and wavelettransform techniques to evaluate the laser ultrasound signals and automatically de-tected the width of the subsurface defects artificially introduced into an aluminiumalloy (AW 2024) plate. The laser ultrasound signals were transformed into images usingthe wavelet transform method. Afterwards, the transformed images were adopted astraining data for the CNN approach. They proved that the applied technique is aneffective methodology with a very high detection accuracy. Nomura et al. [15] assessedthe feasibility of laser ultrasonic technology for real-time defect detection in GMAWof a mild steel. Two defects were investigated, including a lack of penetration and asolidification crack. For this purpose, a pulsed laser with a pulse width of 9 ns and afrequency of 100 Hz, placed at a distance of 50 mm behind the welding torch and 4.5mm behind the melt pool, generated the sound waves in ablation mode, and a laserdetector received the excited sound waves. The synthesis Aperture Focusing Technique(SAFT) [55,60,66,67] was adopted to acquire images by means of longitudinal soundwave velocities. Although the depth position of the defects was estimated inaccurately(around 5% deviation) due to the difference between the applied room temperature andthe true value for the ultrasonic waves, it was successfully shown that LU is capable ofdetecting defects in real time as well as during the welding process. In addition, it wasproposed that the heat diffusion caused by the welding process should be taken intoaccount to overcome this deviation. Wei Zeng et al. [68] performed a Finite ElementMethod (FEM) simulation to study the interaction of generated soundwaves using laserultrasonic with the subsurface defects in an aluminium sample. It was claimed thatsubsurface defects depth alternation impacts the maximum displacement of the echoand oscillating waves. Karabutov et al. [69] reported the detection of subsurface stressdistribution for titanium and nickel alloys using LU.

Materials 2022, 15, 3697 10 of 26
3. Acoustic Emission
Acoustic Emission (AE) belongs to the NDT techniques which enable detection ofwelding imperfections and metallurgical transformations in a component under useor stress cost effectively. As these phenomena happen inside a material, a specificamount of energy discharges rapidly resulting in the generation of transient elasticwaves. The elastic waves travel within the material to the surface and can be detectedin real time using sensors, e.g., a piezoelectric transducer in conventional AE, mountedon the surface of the tested material or via vibrometers [42,70]. Transducers convertthe generated mechanical motion on the surface into the electrical signal. Then, a LowNoise Preamplifier (LNA) is applied to increase signal amplitude and possibly reduceelectrical noises (bandpass filtering). The signals are collected, post processed andfurther analysed. The AE frequency ranges typically from 150 up to 300 kHz [43,71–75].AE detects the generated soundwaves during the process and therefore is a passivetechnology. In contrast, the ultrasonic testing method generates the soundwaves usingan external soundwaves generator, such as a piezoelectric transducer (or a laser in LU)and consequently is an active technology. Conventional AE is not adequate for real-timeinspection of WAAM and fusion welding processes [9]. Figure 7 indicates a graphicalillustration of a conventional AE measurement system.
Materials 2022, 15, x FOR PEER REVIEW 10 of 27
piezoelectric transducer (or a laser in LU) and consequently is an active technology. Con-ventional AE is not adequate for real-time inspection of WAAM and fusion welding pro-cesses [9]. Figure 7 indicates a graphical illustration of a conventional AE measurement system.
Figure 7. Graphical illustration of a conventional AE measurement system [76].
Besides piezoelectric transducers, wide-band transducers and optical microphones are employed in AE [74,77]. A microphone is a sensor that has been applied since the last century to detect pressure waves (sound waves) in gas or fluids. It is made up of a solid diaphragm and a displacement transducer and may be equipped with some extra compo-nents, e.g., mufflers and focusing reflector. It converts sound waves into electrical signal via its diaphragm vibrations caused by soundwaves collision. However, this feature con-strains standard microphones to detect high frequency airborne sound waves intrinsically via the mechanical construction (leading to oscillations and high frequency damping) [78,79]. To overcome this limitation, commercial systems based on laser interferometry provide real-time, non-contact detection of sound waves in air with a variable frequency from 10 kHz up to 2 MHz using a laser interferometer replaced by a vibrating diaphragm in conventional microphones [30]. Figure 8 shows a sketch of the membrane-free optical microphone. The interaction of the ultrasonic waves and air results in a change of density and consequently the optical refractive index of the air. As a result, the wavelength of the laser beam, which is trapped inside the tiny laser interferometer, is affected. The intensity of the returned laser beam is obtained using a photodiode [77,80,81].
Figure 8. Schematic of the membrane-free optical microphone by Xarion [77].
Various research has been conducted in order to gain deeper knowledge about the AE technology. Ramalho [82] et al. explored the impact of different impurities on the sound waves recorded by a microphone during the WAAM process by means of power spectral density and Short Time Fourier Transform (STFT) analysis techniques. They were able to successfully detect defects. Aboali et al. [83] employed energy, number of counts and amplitude of the AE signals to detect pre-introduced lack of fusion, porosity and slags
Figure 7. Graphical illustration of a conventional AE measurement system [76].
Besides piezoelectric transducers, wide-band transducers and optical microphonesare employed in AE [74,77]. A microphone is a sensor that has been applied since the lastcentury to detect pressure waves (sound waves) in gas or fluids. It is made up of a soliddiaphragm and a displacement transducer and may be equipped with some extra compo-nents, e.g., mufflers and focusing reflector. It converts sound waves into electrical signal viaits diaphragm vibrations caused by soundwaves collision. However, this feature constrainsstandard microphones to detect high frequency airborne sound waves intrinsically viathe mechanical construction (leading to oscillations and high frequency damping) [78,79].To overcome this limitation, commercial systems based on laser interferometry providereal-time, non-contact detection of sound waves in air with a variable frequency from10 kHz up to 2 MHz using a laser interferometer replaced by a vibrating diaphragm inconventional microphones [30]. Figure 8 shows a sketch of the membrane-free opticalmicrophone. The interaction of the ultrasonic waves and air results in a change of densityand consequently the optical refractive index of the air. As a result, the wavelength of thelaser beam, which is trapped inside the tiny laser interferometer, is affected. The intensityof the returned laser beam is obtained using a photodiode [77,80,81].

Materials 2022, 15, 3697 11 of 26
Materials 2022, 15, x FOR PEER REVIEW 10 of 27
piezoelectric transducer (or a laser in LU) and consequently is an active technology. Con-ventional AE is not adequate for real-time inspection of WAAM and fusion welding pro-cesses [9]. Figure 7 indicates a graphical illustration of a conventional AE measurement system.
Figure 7. Graphical illustration of a conventional AE measurement system [76].
Besides piezoelectric transducers, wide-band transducers and optical microphones are employed in AE [74,77]. A microphone is a sensor that has been applied since the last century to detect pressure waves (sound waves) in gas or fluids. It is made up of a solid diaphragm and a displacement transducer and may be equipped with some extra compo-nents, e.g., mufflers and focusing reflector. It converts sound waves into electrical signal via its diaphragm vibrations caused by soundwaves collision. However, this feature con-strains standard microphones to detect high frequency airborne sound waves intrinsically via the mechanical construction (leading to oscillations and high frequency damping) [78,79]. To overcome this limitation, commercial systems based on laser interferometry provide real-time, non-contact detection of sound waves in air with a variable frequency from 10 kHz up to 2 MHz using a laser interferometer replaced by a vibrating diaphragm in conventional microphones [30]. Figure 8 shows a sketch of the membrane-free optical microphone. The interaction of the ultrasonic waves and air results in a change of density and consequently the optical refractive index of the air. As a result, the wavelength of the laser beam, which is trapped inside the tiny laser interferometer, is affected. The intensity of the returned laser beam is obtained using a photodiode [77,80,81].
Figure 8. Schematic of the membrane-free optical microphone by Xarion [77].
Various research has been conducted in order to gain deeper knowledge about the AE technology. Ramalho [82] et al. explored the impact of different impurities on the sound waves recorded by a microphone during the WAAM process by means of power spectral density and Short Time Fourier Transform (STFT) analysis techniques. They were able to successfully detect defects. Aboali et al. [83] employed energy, number of counts and amplitude of the AE signals to detect pre-introduced lack of fusion, porosity and slags
Figure 8. Schematic of the membrane-free optical microphone by Xarion [77].
Various research has been conducted in order to gain deeper knowledge about theAE technology. Ramalho [82] et al. explored the impact of different impurities on thesound waves recorded by a microphone during the WAAM process by means of powerspectral density and Short Time Fourier Transform (STFT) analysis techniques. Theywere able to successfully detect defects. Aboali et al. [83] employed energy, number ofcounts and amplitude of the AE signals to detect pre-introduced lack of fusion, porosityand slags in a carbon steel welded part. The results were compared with those of adefect-free part. It was demonstrated that the lowest values of energy and amplitudeand the highest value of number of counts was registered for the defect-free part. Theregistered AE parameters were mostly impacted by slag defects followed by porosityand lack of fusion. The ability of AE to detect welding defects, including slag, porosityand crack was studied by Droubi et al. [84]. It was clearly evidenced that defect detectionis much more straightforward using AE energy, Root Mean Square (RMS) and peakamplitude parameters. The recognition and detection of welding defects was preciselyconducted via wavelet transform results. In addition, it was claimed that the distancebetween the sensor and the model clearly impacts the results. Luo et al. [85] applied theAE count statistic, Root Mean Square (RMS) waveform calculation and power spectrumdistribution methods to analyse the AE signals during pulsed YAG laser welding. Theyclaimed that plasma plume produces the recoil force and the thermal vibration. These arethe source of the generated AE waves during pulsed YAG laser welding. Grad et al. [86]registered the produced AE waves using a microphone and a piezoelectric sensor duringa GMAW process. It was stated that short circuiting and arc reignition are the mainsources of generated acoustic waves during the GMAW process. Furthermore, theacoustic parameters are affected by the type of applied shielding gas and a wire extensionlength of greater than 12 mm. Zhang et al. [87] used acoustic emission and air coupledultrasonic testing to study in real time the presence of burn through in GTAW. As shownin Figure 9, it was proved that when welding defects appear, a sudden surge in the AEabsolute energy occurs.
Lee et al. [88] investigated the generated plasma in CO2 laser lap welding using aphotodiode and microphone. It was shown that as the pores and spatter formation amountincrease, the signal intensity decreases.
The data analysis of the AE results, on which the subsequent interpretation is based,refers in most cases to the so-called detection of “signal events”. This means the char-acterization of acoustic signals, which exceed a certain amplitude limit, on number ofcounts (statistics), amplitude energy, spectrum distribution, etc. An exciting new areafor the analysis and interpretation of AE signals is the use of machine (deep) learningmethods. Here, some very interesting approaches similar to the process of LPBF (LaserPowder Bed Fusion) have already been made and could also be transferred/applied toWAAM. For further studies on this topic, we would like to refer the reader to the followingnon-exhaustive bibliography [89–93].

Materials 2022, 15, 3697 12 of 26
Materials 2022, 15, x FOR PEER REVIEW 11 of 27
in a carbon steel welded part. The results were compared with those of a defect-free part. It was demonstrated that the lowest values of energy and amplitude and the highest value of number of counts was registered for the defect-free part. The registered AE parameters were mostly impacted by slag defects followed by porosity and lack of fusion. The ability of AE to detect welding defects, including slag, porosity and crack was studied by Droubi et al. [84]. It was clearly evidenced that defect detection is much more straightforward using AE energy, Root Mean Square (RMS) and peak amplitude parameters. The recogni-tion and detection of welding defects was precisely conducted via wavelet transform re-sults. In addition, it was claimed that the distance between the sensor and the model clearly impacts the results. Luo et al. [85] applied the AE count statistic, Root Mean Square (RMS) waveform calculation and power spectrum distribution methods to analyse the AE signals during pulsed YAG laser welding. They claimed that plasma plume produces the recoil force and the thermal vibration. These are the source of the generated AE waves during pulsed YAG laser welding. Grad et al. [86] registered the produced AE waves us-ing a microphone and a piezoelectric sensor during a GMAW process. It was stated that short circuiting and arc reignition are the main sources of generated acoustic waves dur-ing the GMAW process. Furthermore, the acoustic parameters are affected by the type of applied shielding gas and a wire extension length of greater than 12 mm. Zhang et al. [87] used acoustic emission and air coupled ultrasonic testing to study in real time the presence of burn through in GTAW. As shown in Figure 9, it was proved that when welding defects appear, a sudden surge in the AE absolute energy occurs.
Figure 9. A correlation between acoustic emission absolute energy and welding defect [87]. (a) depicts the inspected sample. (b) shows the acquired AE absolute energy of the inspected weld seam.
Figure 9. A correlation between acoustic emission absolute energy and welding defect [87]. (a) depictsthe inspected sample. (b) shows the acquired AE absolute energy of the inspected weld seam.
4. Optical Emission Spectroscopy
In Optical Emission Spectroscopy (OES) the electronic temperature profile is deter-mined during the process by means of assessing the generated light during the weldingprocess. This temperature profile is then correlated with existing flaws in the compo-nent [17,94]. Figure 10 illustrates a schematic of OES analysis.
Materials 2022, 15, x FOR PEER REVIEW 12 of 27
Lee et al. [88] investigated the generated plasma in CO2 laser lap welding using a photodiode and microphone. It was shown that as the pores and spatter formation amount increase, the signal intensity decreases.
The data analysis of the AE results, on which the subsequent interpretation is based, refers in most cases to the so-called detection of “signal events”. This means the charac-terization of acoustic signals, which exceed a certain amplitude limit, on number of counts (statistics), amplitude energy, spectrum distribution, etc. An exciting new area for the analysis and interpretation of AE signals is the use of machine (deep) learning methods. Here, some very interesting approaches similar to the process of LPBF (Laser Powder Bed Fusion) have already been made and could also be transferred/applied to WAAM. For further studies on this topic, we would like to refer the reader to the following non-ex-haustive bibliography [89–93].
4. Optical Emission Spectroscopy In Optical Emission Spectroscopy (OES) the electronic temperature profile is deter-
mined during the process by means of assessing the generated light during the welding process. This temperature profile is then correlated with existing flaws in the component [17,94]. Figure 10 illustrates a schematic of OES analysis.
Figure 10. A schematic of the OES technique [95]. In this illustration, the recorded electronic temperature is correlated with the existing welding defects (A, B and C).
OES has been discussed by a great number of authors in literature. Mills et al. [96] discussed the applicability of different emission spectroscopy techniques in GTAW. Mirapeix et al. [97] proposed a real-time technique according to the electronic temperature determination of the plasma to identify small defects in GTAW. Zhang et al. [98] applied optical emission spectroscopy for the first time to study the structural characteristics of WAAM of an Al alloy. It was proved that the spectral intensity, electron density and the width of the deposited layer are linearly related. The spectral intensity and the electron density rose with the increase in the number of deposited layers. These showed a steady state tendency, after which the number of deposited layers reached 5 to 7. In addition, it was evidenced that the porosity could be roughly identified via spectral analysis of the arc properties due to the relation between hydrogen content and porosity. Kisielewicz et al. [99] used inline optical spectroscopy to monitor laser blown powder directed energy deposition (LBP DED) of Alloy 718. It was found that spectroscopy can be a solution for inspecting the LBP-DED process for the deposition of Alloy 718, and it was also reported that laser power variables and continuum radiation intensity do clearly correlate. Nassar et al. [100] combined OES, data acquisition and a control system to recognize the prede-fined defects in real time during DED of a Ti-6Al-4V part. It was demonstrated that a correlation exists between atomic titanium (Ti I) and vanadium (V I) emissions and pre-defined defects in the part.
Figure 10. A schematic of the OES technique [95]. In this illustration, the recorded electronictemperature is correlated with the existing welding defects (A, B and C).

Materials 2022, 15, 3697 13 of 26
OES has been discussed by a great number of authors in literature. Mills et al. [96]discussed the applicability of different emission spectroscopy techniques in GTAW. Mi-rapeix et al. [97] proposed a real-time technique according to the electronic temperaturedetermination of the plasma to identify small defects in GTAW. Zhang et al. [98] appliedoptical emission spectroscopy for the first time to study the structural characteristicsof WAAM of an Al alloy. It was proved that the spectral intensity, electron density andthe width of the deposited layer are linearly related. The spectral intensity and theelectron density rose with the increase in the number of deposited layers. These showeda steady state tendency, after which the number of deposited layers reached 5 to 7. Inaddition, it was evidenced that the porosity could be roughly identified via spectralanalysis of the arc properties due to the relation between hydrogen content and porosity.Kisielewicz et al. [99] used inline optical spectroscopy to monitor laser blown powderdirected energy deposition (LBP DED) of Alloy 718. It was found that spectroscopy canbe a solution for inspecting the LBP-DED process for the deposition of Alloy 718, andit was also reported that laser power variables and continuum radiation intensity doclearly correlate. Nassar et al. [100] combined OES, data acquisition and a control systemto recognize the predefined defects in real time during DED of a Ti-6Al-4V part. It wasdemonstrated that a correlation exists between atomic titanium (Ti I) and vanadium (V I)emissions and predefined defects in the part.
5. Laser-Induced Breakdown Spectroscopy
Laser induced breakdown spectroscopy (LIBS) is a real-time chemical analysistechnology that can determine the qualitative and quantitative chemical composition ofa material based on the wavelength and spectral intensity emitted by a laser-inducedplasma. As shown in Figure 11, a pulsed laser, focusing optics, light collection optics,a spectrometer and a computer system are typically required to perform LIBS analysis.Usually, LIBS uses a Q-switched Nd:YAG laser that emits a short laser pulse (commonlywith a pulse duration of 5–100 ns) which is focused onto the surface of the specimen.Owing to the high energy of the laser beam, a tiny amount of the sample is vaporedand forms a plasma vapor cloud above the surface. The light emitted by the plasma iscaptured and transmitted into a spectrometer via an optical fibre, where the measurementof spectral intensities takes place. The LIBS process is controlled, and the collected dataare analysed via a computer system [56,101].
Materials 2022, 15, x FOR PEER REVIEW 13 of 27
5. Laser-Induced Breakdown Spectroscopy Laser induced breakdown spectroscopy (LIBS) is a real-time chemical analysis tech-
nology that can determine the qualitative and quantitative chemical composition of a ma-terial based on the wavelength and spectral intensity emitted by a laser-induced plasma. As shown in Figure 11, a pulsed laser, focusing optics, light collection optics, a spectrom-eter and a computer system are typically required to perform LIBS analysis. Usually, LIBS uses a Q-switched Nd:YAG laser that emits a short laser pulse (commonly with a pulse duration of 5–100 ns) which is focused onto the surface of the specimen. Owing to the high energy of the laser beam, a tiny amount of the sample is vapored and forms a plasma vapor cloud above the surface. The light emitted by the plasma is captured and transmit-ted into a spectrometer via an optical fibre, where the measurement of spectral intensities takes place. The LIBS process is controlled, and the collected data are analysed via a com-puter system [56,101].
Figure 11. Picture of the LIBS setup [56].
LIBS is widely applied in various industrial applications, e.g., for the inspection of solar cells to detect impurities. It provides several advantages over other analytical tech-niques, such as Inductively Coupled Plasma Atomic Emission Spectroscopy (ICP-AES), Atomic Absorption Spectroscopy (AAS), X-ray Fluorescence (XRF) and Energy Dispersive X-ray (EDX) spectroscopy, e.g., it requires no sample pre-treatment and little or no sample preparation. Furthermore, it is performed in real time, in situ, in the field and contact-lessly. It also possesses some limitations, for instance, lower accuracy, matrix effects, and lower spectral intensities, due to the emission absorption of adjacent atoms around the generated plasma [56,101]. Later, Double-Pulse LIBS (DP-LIBS), multi-pulse LIBS and Hand-Held LIBS (HH-LIBS) were developed. In comparison to conventional LIBS, DB-LIBS applies two laser pulses in sequence with different parameters, and multi-pulse LIBS performs the analysis using several laser pulses to enhance the acquired intensities [56].
A series of recent studies has indicated that LIBS is a powerful tool for the in-process analysis of the welded and additively manufactured parts. Lednev et al. [102] investigated the LIBS method to detect laser welding process failures in situ. They tested three meth-ods, which included passive detection of the weld pool and weld plasma emission, online LIBS sampling of the solidified hot weld and in situ LIBS measurements of the weld pool surface. Among them, in situ LIBS measurements successfully identified the defective
Figure 11. Picture of the LIBS setup [56].
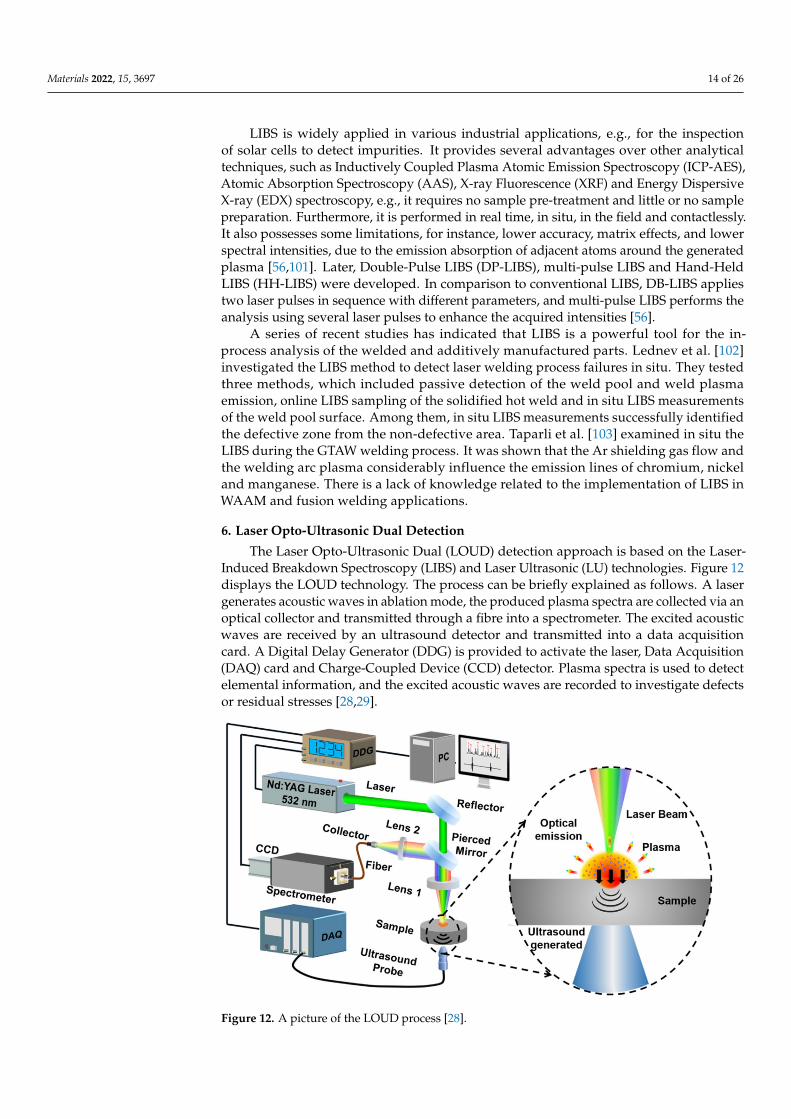
Materials 2022, 15, 3697 14 of 26
LIBS is widely applied in various industrial applications, e.g., for the inspectionof solar cells to detect impurities. It provides several advantages over other analyticaltechniques, such as Inductively Coupled Plasma Atomic Emission Spectroscopy (ICP-AES),Atomic Absorption Spectroscopy (AAS), X-ray Fluorescence (XRF) and Energy DispersiveX-ray (EDX) spectroscopy, e.g., it requires no sample pre-treatment and little or no samplepreparation. Furthermore, it is performed in real time, in situ, in the field and contactlessly.It also possesses some limitations, for instance, lower accuracy, matrix effects, and lowerspectral intensities, due to the emission absorption of adjacent atoms around the generatedplasma [56,101]. Later, Double-Pulse LIBS (DP-LIBS), multi-pulse LIBS and Hand-HeldLIBS (HH-LIBS) were developed. In comparison to conventional LIBS, DB-LIBS appliestwo laser pulses in sequence with different parameters, and multi-pulse LIBS performs theanalysis using several laser pulses to enhance the acquired intensities [56].
A series of recent studies has indicated that LIBS is a powerful tool for the in-process analysis of the welded and additively manufactured parts. Lednev et al. [102]investigated the LIBS method to detect laser welding process failures in situ. They testedthree methods, which included passive detection of the weld pool and weld plasmaemission, online LIBS sampling of the solidified hot weld and in situ LIBS measurementsof the weld pool surface. Among them, in situ LIBS measurements successfully identifiedthe defective zone from the non-defective area. Taparli et al. [103] examined in situ theLIBS during the GTAW welding process. It was shown that the Ar shielding gas flow andthe welding arc plasma considerably influence the emission lines of chromium, nickeland manganese. There is a lack of knowledge related to the implementation of LIBS inWAAM and fusion welding applications.
6. Laser Opto-Ultrasonic Dual Detection
The Laser Opto-Ultrasonic Dual (LOUD) detection approach is based on the Laser-Induced Breakdown Spectroscopy (LIBS) and Laser Ultrasonic (LU) technologies. Figure 12displays the LOUD technology. The process can be briefly explained as follows. A lasergenerates acoustic waves in ablation mode, the produced plasma spectra are collected via anoptical collector and transmitted through a fibre into a spectrometer. The excited acousticwaves are received by an ultrasound detector and transmitted into a data acquisitioncard. A Digital Delay Generator (DDG) is provided to activate the laser, Data Acquisition(DAQ) card and Charge-Coupled Device (CCD) detector. Plasma spectra is used to detectelemental information, and the excited acoustic waves are recorded to investigate defectsor residual stresses [28,29].
Materials 2022, 15, x FOR PEER REVIEW 14 of 27
zone from the non-defective area. Taparli et al. [103] examined in situ the LIBS during the GTAW welding process. It was shown that the Ar shielding gas flow and the welding arc plasma considerably influence the emission lines of chromium, nickel and manganese. There is a lack of knowledge related to the implementation of LIBS in WAAM and fusion welding applications.
6. Laser Opto-Ultrasonic Dual Detection The Laser Opto-Ultrasonic Dual (LOUD) detection approach is based on the Laser-
Induced Breakdown Spectroscopy (LIBS) and Laser Ultrasonic (LU) technologies. Figure 12 displays the LOUD technology. The process can be briefly explained as follows. A laser generates acoustic waves in ablation mode, the produced plasma spectra are collected via an optical collector and transmitted through a fibre into a spectrometer. The excited acous-tic waves are received by an ultrasound detector and transmitted into a data acquisition card. A Digital Delay Generator (DDG) is provided to activate the laser, Data Acquisition (DAQ) card and Charge-Coupled Device (CCD) detector. Plasma spectra is used to detect elemental information, and the excited acoustic waves are recorded to investigate defects or residual stresses [28,29].
Figure 12. A picture of the LOUD process [28].
Figure 13 illustrates a possible concept of an online LOUD monitoring system pro-posed by Ma et al. [28], in which the ultrasonic detector and optical collector are attached to the robot arm.
Figure 12. A picture of the LOUD process [28].

Materials 2022, 15, 3697 15 of 26
Figure 13 illustrates a possible concept of an online LOUD monitoring system proposedby Ma et al. [28], in which the ultrasonic detector and optical collector are attached to therobot arm.
Materials 2022, 15, x FOR PEER REVIEW 15 of 27
Figure 13. A schematic of a proposed laser opto-ultrasonic setup for online monitoring by Ma et al. [28].
Ma et al. [28] successfully utilized the LOUD approach for the first time to determine residual stresses and elemental information, as well as defects of an aluminium alloy (A6061) produced with WAAM in-process and simultaneously. The use of LOUD as an NDT online monitoring tool in WAAM was recommended due to its time and cost effi-ciency. In another work by Ma et al. [29], they investigated at the same time the grain size and elemental distribution in an aluminium alloy produced in WAAM using LOUD. The results were in accordance with those obtained using Electron Backscatter Diffraction (EBSD). It was also reported that LOUD is an excellent tool for evaluating the mechanical and chemical characteristics of AM parts. There is lack of information regarding applying LOUD for other metals, such as titanium alloy and other aluminium alloy-based parts.
7. Thermography Thermography is commonly employed in many fields as it is able to detect subsur-
face faults, determine thermophysical properties and measure the coating thickness of the components [104]. There are various criteria for the classification of thermography, e.g., testing approach and applied stimulation source. As shown in Figure 14, thermography is divided into two main techniques according to the testing approach: 1) active thermog-raphy and 2) passive thermography. Based on the applied stimulation source, active ther-mography is subdivided into five categories, including, Lock-In Thermography (LIT), Pulsed Thermography (PT), Vibro-Thermography (VT), Step Heating Thermography (SHT), and eddy current thermography [105–107].
Figure 13. A schematic of a proposed laser opto-ultrasonic setup for online monitoring byMa et al. [28].
Ma et al. [28] successfully utilized the LOUD approach for the first time to determineresidual stresses and elemental information, as well as defects of an aluminium alloy(A6061) produced with WAAM in-process and simultaneously. The use of LOUD asan NDT online monitoring tool in WAAM was recommended due to its time and costefficiency. In another work by Ma et al. [29], they investigated at the same time thegrain size and elemental distribution in an aluminium alloy produced in WAAM usingLOUD. The results were in accordance with those obtained using Electron BackscatterDiffraction (EBSD). It was also reported that LOUD is an excellent tool for evaluatingthe mechanical and chemical characteristics of AM parts. There is lack of informationregarding applying LOUD for other metals, such as titanium alloy and other aluminiumalloy-based parts.
7. Thermography
Thermography is commonly employed in many fields as it is able to detect subsurfacefaults, determine thermophysical properties and measure the coating thickness of the com-ponents [104]. There are various criteria for the classification of thermography, e.g., testingapproach and applied stimulation source. As shown in Figure 14, thermography is dividedinto two main techniques according to the testing approach: (1) active thermography and(2) passive thermography. Based on the applied stimulation source, active thermographyis subdivided into five categories, including, Lock-In Thermography (LIT), Pulsed Ther-mography (PT), Vibro-Thermography (VT), Step Heating Thermography (SHT), and eddycurrent thermography [105–107].
Figure 15 indicates an illustration of defect detection by means of the thermogra-phy method. Figure 16 shows a schematic of the active thermography technology. Inactive thermography, the under-inspection component is exposed to thermal stimu-lation (cold or warm) from an external source, such as halogen lamps, pulsed lampsand laser. However, in passive thermography, the heat distribution inside the mate-rial is inherent, e.g., as a result of the manufacturing process. The homogenous heat

Materials 2022, 15, 3697 16 of 26
distribution inside the material interacts with the imperfections within the material.This inhomogeneous heat diffusion on the surface of the part caused by existing defectsinside the material is recorded via an infrared (IR) camera. The IR camera receivesthe emitted infrared waves from the surface of the material and converts them intoelectrical signals and subsequently into IR images. Then, the defects can be visualizedby analysing the images [105–107].
Materials 2022, 15, x FOR PEER REVIEW 16 of 27
Figure 14. Thermography NDT techniques [105,106].
Figure 15 indicates an illustration of defect detection by means of the thermography method. Figure 16 shows a schematic of the active thermography technology. In active thermography, the under-inspection component is exposed to thermal stimulation (cold or warm) from an external source, such as halogen lamps, pulsed lamps and laser. How-ever, in passive thermography, the heat distribution inside the material is inherent, e.g., as a result of the manufacturing process. The homogenous heat distribution inside the material interacts with the imperfections within the material. This inhomogeneous heat diffusion on the surface of the part caused by existing defects inside the material is rec-orded via an infrared (IR) camera. The IR camera receives the emitted infrared waves from the surface of the material and converts them into electrical signals and subsequently into IR images. Then, the defects can be visualized by analysing the images [105–107].
Figure 15. Defect detection by means of the thermography technology performed by Broberg [108]. (a) displays the defect (the arrow shows its position). (b) shows the captured thermal image, in which the defect can be recognised.
Lock-in thermography: It belongs to NDT techniques according to photothermal ra-diometry, in which one or some heat sources are used to continuously heat the surface of the part under inspection. The heat waves are transmitted to the components though ra-diation. They interact with the imperfections within the part and return. An infrared cam-era is used to capture the returned heat waves and a lock-in amplifier measures the am-plitude and phase of the modulation. The phase and amplitude of the returned thermal waves change owing to the difference of the thermal properties of the defected and non-
Figure 14. Thermography NDT techniques [105,106].
Materials 2022, 15, x FOR PEER REVIEW 16 of 27
Figure 14. Thermography NDT techniques [105,106].
Figure 15 indicates an illustration of defect detection by means of the thermography method. Figure 16 shows a schematic of the active thermography technology. In active thermography, the under-inspection component is exposed to thermal stimulation (cold or warm) from an external source, such as halogen lamps, pulsed lamps and laser. How-ever, in passive thermography, the heat distribution inside the material is inherent, e.g., as a result of the manufacturing process. The homogenous heat distribution inside the material interacts with the imperfections within the material. This inhomogeneous heat diffusion on the surface of the part caused by existing defects inside the material is rec-orded via an infrared (IR) camera. The IR camera receives the emitted infrared waves from the surface of the material and converts them into electrical signals and subsequently into IR images. Then, the defects can be visualized by analysing the images [105–107].
Figure 15. Defect detection by means of the thermography technology performed by Broberg [108]. (a) displays the defect (the arrow shows its position). (b) shows the captured thermal image, in which the defect can be recognised.
Lock-in thermography: It belongs to NDT techniques according to photothermal ra-diometry, in which one or some heat sources are used to continuously heat the surface of the part under inspection. The heat waves are transmitted to the components though ra-diation. They interact with the imperfections within the part and return. An infrared cam-era is used to capture the returned heat waves and a lock-in amplifier measures the am-plitude and phase of the modulation. The phase and amplitude of the returned thermal waves change owing to the difference of the thermal properties of the defected and non-
Figure 15. Defect detection by means of the thermography technology performed by Broberg [108].(a) displays the defect (the arrow shows its position). (b) shows the captured thermal image, in whichthe defect can be recognised.
Lock-in thermography: It belongs to NDT techniques according to photothermalradiometry, in which one or some heat sources are used to continuously heat the surfaceof the part under inspection. The heat waves are transmitted to the components thoughradiation. They interact with the imperfections within the part and return. An infraredcamera is used to capture the returned heat waves and a lock-in amplifier measures theamplitude and phase of the modulation. The phase and amplitude of the returned thermalwaves change owing to the difference of the thermal properties of the defected and non-defected regions inside the component [106,109]. Data acquisition takes more time inlock-in thermography [110].

Materials 2022, 15, 3697 17 of 26
Materials 2022, 15, x FOR PEER REVIEW 17 of 27
defected regions inside the component [106,109]. Data acquisition takes more time in lock-in thermography [110].
Figure 16. A schematic of active thermography [106].
Pulsed Thermography (PT): It has been employed in aerospace industry for various applications, such as for the evaluation of airplane components [104]. This technology is able to detect online and very quickly various defects such as cracks, fatigue damage, rust and delamination in different materials [111]. Infrared lamps, halogen lamps and hot air guns are used to generate one or more thermal pulse(s) on the surface of the components within 2‒10 ms. Heat transfers inside the material and interacts with the existing defects. The inhomogeneous heat distribution on the surface of the part caused by the internal defects is measured using an IR camera. Figure 17 illustrates a common PT setup. An ex-ternal heat generator (infrared lamps, halogen lamps, hot air guns), an infrared camera, a control unit and a computer with data processing software are usually the required equip-ment to perform PT [111,112].
Figure 17. Pulse thermography setup [105].
Step pulsed thermography: Compared to pulsed thermography, step pulsed ther-mography applies longer, homogenous and uninterrupted pulses with a low energy den-sity to detect defects located at a deeper distance from the surface of the material. Defects
Figure 16. A schematic of active thermography [106].
Pulsed Thermography (PT): It has been employed in aerospace industry for variousapplications, such as for the evaluation of airplane components [104]. This technology isable to detect online and very quickly various defects such as cracks, fatigue damage, rustand delamination in different materials [111]. Infrared lamps, halogen lamps and hot airguns are used to generate one or more thermal pulse(s) on the surface of the componentswithin 2–10 ms. Heat transfers inside the material and interacts with the existing defects.The inhomogeneous heat distribution on the surface of the part caused by the internaldefects is measured using an IR camera. Figure 17 illustrates a common PT setup. Anexternal heat generator (infrared lamps, halogen lamps, hot air guns), an infrared camera,a control unit and a computer with data processing software are usually the requiredequipment to perform PT [111,112].
Materials 2022, 15, x FOR PEER REVIEW 17 of 27
defected regions inside the component [106,109]. Data acquisition takes more time in lock-in thermography [110].
Figure 16. A schematic of active thermography [106].
Pulsed Thermography (PT): It has been employed in aerospace industry for various applications, such as for the evaluation of airplane components [104]. This technology is able to detect online and very quickly various defects such as cracks, fatigue damage, rust and delamination in different materials [111]. Infrared lamps, halogen lamps and hot air guns are used to generate one or more thermal pulse(s) on the surface of the components within 2‒10 ms. Heat transfers inside the material and interacts with the existing defects. The inhomogeneous heat distribution on the surface of the part caused by the internal defects is measured using an IR camera. Figure 17 illustrates a common PT setup. An ex-ternal heat generator (infrared lamps, halogen lamps, hot air guns), an infrared camera, a control unit and a computer with data processing software are usually the required equip-ment to perform PT [111,112].
Figure 17. Pulse thermography setup [105].
Step pulsed thermography: Compared to pulsed thermography, step pulsed ther-mography applies longer, homogenous and uninterrupted pulses with a low energy den-sity to detect defects located at a deeper distance from the surface of the material. Defects
Figure 17. Pulse thermography setup [105].
Step pulsed thermography: Compared to pulsed thermography, step pulsed thermog-raphy applies longer, homogenous and uninterrupted pulses with a low energy densityto detect defects located at a deeper distance from the surface of the material. Defectshave a different temperature and heat transfer rate in comparison to non-damaged parts ofthe under-inspection component. An IR camera is used to record the whole heating andcooling process in step pulsed thermography. The surface temperature alternations arecaptured and analysed to detect defects [113,114].
Vibrothermography: It combines an ultrasonic testing method and thermography todetect subsurface and near-surface defects, such as cracks, disbands and delamination

Materials 2022, 15, 3697 18 of 26
quickly and precisely. As depicted in Figure 18, the soundwaves created by a vibrationsource, e.g., a piezoelectric transducer, travel through the component. As they meetthe defects, the vibration energy is converted into heat due to friction. The generatedheat is transferred to the surface and captured via an IR camera. A common setup forvibrothermography is composed of an ultrasonic vibration source, an infrared camera, acontrol unit and a PC with a data processing software [112,115].
Materials 2022, 15, x FOR PEER REVIEW 18 of 27
have a different temperature and heat transfer rate in comparison to non-damaged parts of the under-inspection component. An IR camera is used to record the whole heating and cooling process in step pulsed thermography. The surface temperature alternations are captured and analysed to detect defects [113,114].
Vibrothermography: It combines an ultrasonic testing method and thermography to detect subsurface and near-surface defects, such as cracks, disbands and delamination quickly and precisely. As depicted in Figure 18, the soundwaves created by a vibration source, e.g., a piezoelectric transducer, travel through the component. As they meet the defects, the vibration energy is converted into heat due to friction. The generated heat is transferred to the surface and captured via an IR camera. A common setup for vibrother-mography is composed of an ultrasonic vibration source, an infrared camera, a control unit and a PC with a data processing software [112,115].
Figure 18. A picture of a vibrothermography setup [116].
Eddy current thermography: This technology is categorized under non-optical ther-mography methods [106] and takes advantage of eddy current and thermography NDT approaches. Figure 19 displays an illustration of eddy current thermography. Eddy cur-rent flow is created inductively inside the electroconductive materials. This results in an increasing temperature of the component. When defects exist inside the material being tested, the current flow and subsequently the heat distribution is disturbed. The non-uni-form heat distribution is captured through an IR camera [117]. Eddy current thermogra-phy makes it possible to quickly and contactlessly inspect the components with a high resolution [110].
Figure 19. An illustration of eddy current thermography [118].
Figure 18. A picture of a vibrothermography setup [116].
Eddy current thermography: This technology is categorized under non-opticalthermography methods [106] and takes advantage of eddy current and thermographyNDT approaches. Figure 19 displays an illustration of eddy current thermography. Eddycurrent flow is created inductively inside the electroconductive materials. This resultsin an increasing temperature of the component. When defects exist inside the materialbeing tested, the current flow and subsequently the heat distribution is disturbed. Thenon-uniform heat distribution is captured through an IR camera [117]. Eddy currentthermography makes it possible to quickly and contactlessly inspect the componentswith a high resolution [110].
Materials 2022, 15, x FOR PEER REVIEW 18 of 27
have a different temperature and heat transfer rate in comparison to non-damaged parts of the under-inspection component. An IR camera is used to record the whole heating and cooling process in step pulsed thermography. The surface temperature alternations are captured and analysed to detect defects [113,114].
Vibrothermography: It combines an ultrasonic testing method and thermography to detect subsurface and near-surface defects, such as cracks, disbands and delamination quickly and precisely. As depicted in Figure 18, the soundwaves created by a vibration source, e.g., a piezoelectric transducer, travel through the component. As they meet the defects, the vibration energy is converted into heat due to friction. The generated heat is transferred to the surface and captured via an IR camera. A common setup for vibrother-mography is composed of an ultrasonic vibration source, an infrared camera, a control unit and a PC with a data processing software [112,115].
Figure 18. A picture of a vibrothermography setup [116].
Eddy current thermography: This technology is categorized under non-optical ther-mography methods [106] and takes advantage of eddy current and thermography NDT approaches. Figure 19 displays an illustration of eddy current thermography. Eddy cur-rent flow is created inductively inside the electroconductive materials. This results in an increasing temperature of the component. When defects exist inside the material being tested, the current flow and subsequently the heat distribution is disturbed. The non-uni-form heat distribution is captured through an IR camera [117]. Eddy current thermogra-phy makes it possible to quickly and contactlessly inspect the components with a high resolution [110].
Figure 19. An illustration of eddy current thermography [118]. Figure 19. An illustration of eddy current thermography [118].
Thermography has been widely researched to detect various welding defects in-process in real time. Bacelar et al. [17] utilised passive thermography to detect fourintentionally introduced holes during the WAAM process. It was found that the defectivearea has a higher temperature compared to the flawless region as it dissipated less heatto the surroundings. Yang et al. [119] monitored the surface temperature of the depositedlayers in the WAAM process by means of passive thermography and reported that

Materials 2022, 15, 3697 19 of 26
thermography is able to precisely measure the surface temperature during the process.Mireles et al. [39] explored the ability of the IR thermography to monitor in situ the partsproduced by powder bed fusion technology. They purposely placed different defectswith diverse sizes and shapes into an assembly part. An IR camera with a resolution of640 × 480 and a pixel length of 260 µm was adopted to capture the component underinspection. It was reported that defects smaller than 600 µm were not detected with thesetup used. Runnemalm et al. [120] evaluated three types of excitation sources, includinga flash lamp, eddy current induction and a continuous laser for thermography to studysurface defects such as cracks, pores and lack of penetration. A combination of a flashlamp positioned at a distance of 120 mm with 6 kJ energy within 0.05 s, a FLIR SC5650IR camera with a spectral range of 2.5–5.1 µm and an optical lens of 27 mm allowed anotch to be detected with a length of 760 µm and a width of 400 µm. Five holes with adiameter of 1.0 to 2.5 mm were created on the workpiece, which were examined via eddycurrent thermography. An induction coil located at a distance of greater than 10 mmfrom the component heated up the component. All holes were recognized via eddycurrent thermography. It was possible to detect all eight artificially produced defectson the component under evaluation by means of the laser. Roemer et al. [112] drewa comparison between laser thermography and vibrothermography for fatigue crackdetection in an aluminium bar. They coated the sample surface with black paint due tothe fact that aluminium has a lower heat emissivity. They applied a laser power of 100 Wwith a pulse length of 100 ms to generate a 5 K temperature increase and to perform thelaser thermography experiment. The heat diffusion was monitored with an IR camerawith a resolution of 256 × 320 and a frequency of 60 Hz. In the second experiment, anultrasonic transducer with a frequency of 35 kHz and a power of 500 W generated soundwaves with a pulse duration of 500 ms. The process was recorded with an IR camerawith the same resolution as before and a frequency of 150 Hz. In both experiments,fatigue cracks were identified easily. They also claimed that an IR camera equipped witha zoom and focus lens enables the detection of micro size defects in laser thermography.Sreedhar et al. [121] utilized the passive thermography method for real-time inspectionof a TIG-welded aluminium alloy-based tank (aluminium alloy 2219). An IR camera wasattached on the welding arm at an angle of 60◦ to the welding plate and 150 mm behindthe welding arc to capture a newly welded area of 100 mm. They could detect a clusterpore of size 0.6 mm × 0.4 mm by means of passive thermography. Elkihel et al. [122]studied the thermal propagation of a weld joint using an active thermography method.They heated the weld joint inductively up to 80 ◦C and captured the heat propagationon the weld joint using an FLIR T440 infrared camera with a resolution of 320 × 240 anda bandwidth of 7.5 to 13 µm pixels. It was claimed that the heat loss on the weld zoneis much more significant than that of the defective region. Some researchers combinedimage processing and thermography techniques to ensure the quality of the weld seam.Massaro et al. [123] proposed a novel technique for identifying weld defects on a weldedsteel tank (AISI 304/316) using infrared thermography and image processing. They cutout a specimen and excited it with a heat gun. The heat distribution on the surface wasregistered using a FLIR T 1020 with a resolution of 1024 × 768 pixels. It was reported thata combination of IR thermography and various image processing techniques, includingthe line calculus method, 2D K-Means algorithm, 2D morphology functions and a LongShort Term Memory (LSTM) artificial neural network can be a powerful tool for real-time identification and classification of weld defects. Ziegler et al. [124] evaluatedthe use of high-power laser excitation sources in the lock-in thermography technique.They claimed that the use of high-power lasers instead of LEDs and halogen lamps haspractically no influence on the thermal emission generated by the excited sample, astheir emission is based on electroluminescence. Thus, it can be performed in single sidedtransient thermography. Furthermore, it is possible to use high-power laser arrays forthe analysis of highly reflective materials, such as aluminium, if additional power scalingor focusing is provided. Cerniglia et al. [125] evaluated two additively manufactured

Materials 2022, 15, 3697 20 of 26
Inconel 600 specimens with various intentionally inserted micro-sized defects located atdifferent depths to establish an analogy between laser ultrasonic and laser thermographytechniques. Both methods demonstrated their ability to inspect the samples in-line.They emphasized that for the deployment of laser thermography for automatic inlineinspection, liquid-cooled IR cameras should be replaced by microbolometric IR camerassince they are more expensive and larger. In addition, using laser thermography forcomponent surfaces with low emissivity values requires a high-power laser.
8. Defect Detection by Monitoring WAAM and Fusion Welding Process Parameters
Various physical phenomena, such as metal transfer, short circuiting, spatter, ion-ization, gas-metal reactions occur very fast during the welding process, which causesvariations in current and voltage. Distinct welding parameters can be assessed, if the cur-rent and voltage signals are recorded simultaneously as these phenomena take place [126].High speed data acquisition systems, such as digital storage oscilloscopes (DSOs) are ableto register these signals [127].
DSOs have been widely used in the academic area to monitor welding parameters.Mician et al. [128] utilised a digital oscilloscope in combination with other equipmentsuch as a galvanic separator and a notebook with a software to capture the instantaneouscurrent and voltage of the CMT process during MIG brazing of automotive components.Kumar et al. [129] employed a DSO with a sample rate of 40 KHz to collect the weldingparameters for two inverter and two generator power sources during the welding usingtwo different electrodes. It was claimed that a commercial DSO is able to obtain the weldingdata and can be further used to assess the welding process in situ and online and can bea powerful competitor to other data acquisition systems designed for the same purposedue to the comparable data acquisition speed, volume and accuracy. Savyasachi et al. [130]took advantage of a DSO and a high-speed camera simultaneously to monitor the ShieldedMetal Arc Welding (SMAW). They proved that combining both technologies allows theinvestigation of different physical phenomena during the process at once. In addition, thecollected data from a DSO require proper filtering to analyse the data. In another studyconducted by Kumar et al. [126], it was found that Fast Fourier Transform Low Pass Filter(FFT LPF) is a suitable method to filter the acquired signals during SMAW due to its highersignal-to-noise ratio value compared to other techniques. In addition, a 100 KHz samplerate is a sufficient value for data acquisition using a DSO during SMAW. Mazlan et al. [131]successfully combined a DSO and a Short Time Energy (STE) method to detect weldingdefects in GMAW. The acquired welding current using a DSO was applied as input data forthe STE analysis method conducted in MATLAB/Simulink. Using this method enabled thesmooth current and disturbance current to be distinguished. This results in differentiatingthe defective weld from the non-defective weld. Šoštaric et al. [10] introduced an onlinemonitoring system to acquire the main welding parameters and to process the data inresistance welding and arc welding. They made an analogy between the acquired resultsusing a self-developed online monitoring system and those obtained using an oscilloscope.The results demonstrated that the self-developed online monitoring has the ability to beimplemented in practical applications.
9. Summary and Conclusions
This paper provides a comprehensive review of various NDT techniques, includinglaser-ultrasonic, acoustic emission with an airborne optical microphone, optical emissionspectroscopy, laser-induced breakdown spectroscopy, laser opto-ultrasonic dual detection,thermography and also in-process defect detection via monitoring the process parametersin WAAM and fusion welding. In addition, novel research results, operating principles andthe equipment required to perform these techniques have been presented.
The minimum detectable welding defect size of most current NDT techniques wascollected via previous research or experience of companies. According to this review paper,the following conclusions can be drawn:

Materials 2022, 15, 3697 21 of 26
• LU is a fast technique and capable of detecting internal defects as small as 100 µmin WAAM and fusion welding. It requires no contact with the sample and can beimplemented in harsh environments and also for the automation processes. However,LU vaporizes a small amount of the component under inspection.
• Acoustic emission is able to measure the soundwaves ranges from 150 up to 300kHz during the manufacturing process. It is cost-effective and can be used for defectdetection during WAAM and fusion welding. Since it is a passive technology, it cannotbe used for offline monitoring. In addition, there is lack of knowledge on applying amembrane-free optical microphone for defect detection in WAAM and fusion welding.
• Laser induced breakdown spectroscopy is capable of acquiring elemental informationof the sample and detecting defects such as porosity by means of assessing the chemicalelements of the sample. Detecting other types of the defects in WAAM and fusionwelding has not been investigated yet.
• Laser opto-ultrasonic dual detection can rapidly detect defects and elemental informa-tion at the same time during the manufacturing process without having contact withthe sample.
• OES is a contactless technique and able to detect defects in situ. However, it is notappropriate for offline monitoring.
• Thermography is able to detect surface and subsurface defects and recognize flaws assmall as 600 µm in WAAM and fusion welding. It requires no contact with the sampleand can measure the thermophysical properties of the part online. It can be used asa signal for real-time closed-loop control systems, however, a heated sample and aproper machine learning algorithm for evaluation are required.
• Monitoring process parameters, such as voltage and current using DSOs or dataacquisition systems enables real-time defect detection. These signals are fast andsensitive and suitable for real-time closed-loop control systems.
As each method possesses its own merits and demerits, a combination of differentNDT methods is required to monitor the WAAM and fusion welding processes in real timeand to ensure production of high quality and defect-free final parts. Future work shouldfocus on the combination of the most suited NDT techniques at the laboratory scale todetect defects in real time during WAAM of light metal alloys.
Author Contributions: Conceptualization, M.S. (Masoud Shaloo), M.S. (Martin Schnall), T.K., N.H.and B.R.; methodology, M.S. (Masoud Shaloo), N.H. and B.R.; investigation, M.S. (Masoud Shaloo); re-sources, T.K.; data curation, M.S. (Masoud Shaloo); writing—original draft preparation, M.S. (MasoudShaloo); writing—review and editing, M.S. (Masoud Shaloo), M.S. (Martin Schnall), T.K., N.H. andB.R.; visualization, M.S. (Masoud Shaloo); supervision, T.K., N.H. and B.R.; project administration,M.S. (Masoud Shaloo), M.S. (Martin Schnall); funding acquisition, T.K. All authors have read andagreed to the published version of the manuscript.
Funding: The consortium would like to thank the ministry of “Climate Action, Environment, En-ergy, Mobility, Innovation and Technology” (BMK), the ministry of “Digital and Economic Affairs”(BMDW), the Austrian Funding Agency (FFG), as well as the four federal funding agencies Amt derOberösterreichischen Landesregierung, Steirische Wirtschaftsförderungsgesellschaft m.b.H., Amt derNiederösterreichischen Landesregierung and Wirtschaftsagentur Wien and Ein Fonds der Stadt Wienfor funding project “We3D” (FFG Nr. 886184) in the framework of the 8th COMET call. Further thanksgo to the industry partners for their financial contributions as well as their research contributions inthe five multi-firm projects.
Data Availability Statement: The data can be found in the original works cited throughout this article.
Acknowledgments: The authors would like to thank the academic partners involved in the projectfor fruitful discussions.
Conflicts of Interest: The authors declare no conflict of interest.

Materials 2022, 15, 3697 22 of 26
References1. Williams, S.W.; Martina, F.; Addison, A.C.; Ding, J.; Pardal, G.; Colegrove, P. Wire + Arc Additive Manufacturing.
Mater. Sci. Technol. 2016, 32, 641–647. [CrossRef]2. Wu, B.; Pan, Z.; Ding, D.; Cuiuri, D.; Li, H.; Xu, J.; Norrish, J. A review of the wire arc additive manufacturing of metals: Properties,
defects and quality improvement. J. Manuf. Process. 2018, 35, 127–139. [CrossRef]3. ASTM D907-15; Standard Terminology for Additive Manufacturing Technologies. ASTM: West Conshohocken, PA, USA, 2013;
pp. 10–12. [CrossRef]4. Mehnen, J.; Ding, J.; Lockett, H.; Kazanas, P. Design study for wire and arc additive manufacture. Int. J. Prod. Dev. 2014, 19, 2–20.
[CrossRef]5. Rodrigues, T.A.; Duarte, V.; Miranda, R.M.; Santos, T.G.; Oliveira, J.P. Current Status and Perspectives on Wire and Arc Additive
Manufacturing (WAAM). Materials 2019, 12, 1121. [CrossRef]6. Köhler, M.; Fiebig, S.; Hensel, J.; Dilger, K. Wire and Arc Additive Manufacturing of Aluminum Components. Metals 2019, 9, 608.
[CrossRef]7. Knezovic, N.; Topic, A. Wire and Arc Additive Manufacturing (WAAM)—A New Advance in Manufacturing. In New Technologies,
Development and Applications; Lecture Notes in Networks and Systems; Springer International Publishing: New York, NY, USA,2019; pp. 65–71. ISBN 978-3-319-90892-2.
8. He, X.; Wang, T.; Wu, K.; Liu, H. Automatic defects detection and classification of low carbon steel WAAM products usingimproved remanence/magneto-optical imaging and cost-sensitive convolutional neural network. Measurement 2020, 173, 108633.[CrossRef]
9. Lopez, A.; Bacelar, R.; Pires, I.; Santos, T.G.; Sousa, J.P.; Quintino, L. Non-destructive testing application of radiography andultrasound for wire and arc additive manufacturing. Addit. Manuf. 2018, 21, 298–306. [CrossRef]
10. Soštaric, D.; Vinko, D.; Žagar, D.; Samardžic, I. Reliability of welding parameters monitoring system. Strojarstvo 2010, 52, 217–226.11. Kah, P.; Mvola, B.; Martikainen, J.; Suoranta, R. Real Time Non-Destructive Testing Methods of Welding. Adv. Mater. Res. 2014,
933, 109–116. [CrossRef]12. Javadi, Y.; MacLeod, C.N.; Pierce, S.; Gachagan, A.; Lines, D.; Mineo, C.; Ding, J.; Williams, S.; Vasilev, M.; Mohseni, E.; et al.
Ultrasonic phased array inspection of a Wire + Arc Additive Manufactured (WAAM) sample with intentionally embedded defects.Addit. Manuf. 2019, 29, 100806. [CrossRef]
13. Yusof, F.; Jamaluddin, M. Welding Defects and Implications on Welded Assemblies. Compr. Mater. Process 2014, 6, 125–134.[CrossRef]
14. Thornton, M.; Han, L.; Shergold, M. Progress in NDT of resistance spot welding of aluminium using ultrasonic C-scan. NDT E Int.2012, 48, 30–38. [CrossRef]
15. Nomura, K.; Otaki, S.; Kita, R.; Asai, S. In-situ detection of weld defect during the welding process by laser ultrasonic technique.Proc. Mtgs. Acoust. 2019, 38, 030016. [CrossRef]
16. Honarvar, F.; Varvani-Farahani, A. A review of ultrasonic testing applications in additive manufacturing: Defect evaluation,material characterization, and process control. Ultrasonics 2020, 108, 106227. [CrossRef]
17. Bacelar, R. Evaluation of WAAM Parts by NDT. Master’s Thesis, Instituto Superior Técnico, Lisboa, Portugal, 2017.18. Faramarzi, F.; Motamedi, M. Image processing for radiographic films of weld inspection. In Proceedings of the International
Conference on Image Processing, Computer Vision, and Pattern Recognition (IPCV), Las Vegas, NV, USA, 18–21 July 2011;pp. 337–343.
19. The MathWorks Inc: MATLAB. Available online: https://de.mathworks.com/company.html?s_tid=hp_ff_a_company(accessed on 17 August 2021).
20. Seow, C.E.; Zhang, J.; Coules, H.E.; Wu, G.; Jones, C.; Ding, J.; Williams, S. Effect of crack-like defects on the fracture behaviour ofWire + Arc Additively Manufactured nickel-base Alloy 718. Addit. Manuf. 2020, 36, 101578. [CrossRef]
21. Wang, J.; Cui, Y.; Liu, C.; Li, Z.; Wu, Q.; Fang, D. Understanding internal defects in Mo fabricated by wire arc additivemanufacturing through 3D computed tomography. J. Alloy Compd. 2020, 840, 155753. [CrossRef]
22. Bento, J.B.; Lopez, A.; Pires, I.; Quintino, L.; Santos, T.G. Non-destructive testing for wire + arc additive manufacturing ofaluminium parts. Addit. Manuf. 2019, 29, 100782. [CrossRef]
23. Lopez, A.B.; Santos, J.; Sousa, J.P.; Santos, T.G.; Quintino, L. Phased Array Ultrasonic Inspection of Metal Additive ManufacturingParts. J. Nondestruct. Eval. 2019, 38, 62. [CrossRef]
24. Chabot, A.; Laroche, N.; Carcreff, E.; Rauch, M.; Hascoët, J.-Y. Towards defect monitoring for metallic additive manufacturingcomponents using phased array ultrasonic testing. J. Intell. Manuf. 2019, 31, 1191–1201. [CrossRef]
25. Lukacs, P.; Davis, G.; Stratoudaki, T.; Williams, S.; MacLeod, C.N.; Gachagan, A. Remote Ultrasonic Imaging of a Wire ArcAdditive Manufactured Ti-6AI-4V Component using Laser Induced Phased Array. In Proceedings of the 2021 IEEE InternationalInstrumentation and Measurement Technology Conference (I2MTC), Glasgow, UK, 17–20 May 2021; pp. 1–6. [CrossRef]
26. Shipway, N.; Barden, T.; Huthwaite, P.; Lowe, M. Automated defect detection for Fluorescent Penetrant Inspection using RandomForest. NDT E Int. 2018, 101, 113–123. [CrossRef]
27. Company TPA KKS GmbH. Telephone Communication with TPA KKS GmbH Austria. Available online: https://www.tpa-kks.at/home/ (accessed on 27 March 2022).

Materials 2022, 15, 3697 23 of 26
28. Ma, Y.; Hu, Z.; Tang, Y.; Ma, S.; Chu, Y.; Li, X.; Luo, W.; Guo, L.; Zeng, X.; Lu, Y. Laser opto-ultrasonic dual detection forsimultaneous compositional, structural, and stress analyses for wire + arc additive manufacturing. Addit. Manuf. 2019, 31, 100956.[CrossRef]
29. Ma, Y.; Hu, X.; Hu, Z.; Sheng, Z.; Ma, S.; Chu, Y.; Wan, Q.; Luo, W.; Guo, L. Simultaneous Compositional and Grain SizeMeasurements Using Laser Opto-Ultrasonic Dual Detection for Additive Manufacturing. Materials 2020, 13, 2404. [CrossRef]
30. Stefano, Z.; Christian, S.; Sommerhuber, R. Akustische Überwachung für die Lasermaterialbearbeitung. pp. 36–38. Availableonline: https://xarion.com/de/medien/publikationen/process-control/107-akustische-%C3%BCberwachung-f%C3%BCr-die-lasermaterialbearbeitung (accessed on 12 December 2021).
31. Company XARION Laser Acoustics GmbH Germany. Email Communication with XARION Laser Acoustics GmbH. 2021.Available online: https://xarion.com/en/ (accessed on 27 March 2022).
32. Company SONOTEC GmbH. Personal Communication with SONOTEC GmbH Germany. Available online: https://www.sonotec.de/ (accessed on 27 March 2022).
33. Chang, M.K.; Lin, Z.L.; Jeng, J.J. The Study on Defects of 6-Inch Cylinder by Electro Magnetic Acoustic Transducer (EMAT).Adv. Sci. Lett. 2011, 4, 1062–1066. [CrossRef]
34. Santos, T.; Vilaça, P.; Miranda, R. Electrical conductivity field analysis for evaluation of FSW joints in AA6013 and AA7075 alloys.J. Mater. Process. Technol. 2011, 211, 174–180. [CrossRef]
35. Lindgren, E. Detection, 3-D positioning, and sizing of small pore defects using digital radiography and tracking. EURASIP J. Adv.Signal Process. 2014, 2014, 9. [CrossRef]
36. Company IRISNDT Real Time Radiography (RTR). Canada. Available online: https://www.irisndt.com/us/contact/ (accessedon 5 November 2021).
37. Shedlock, D.; Edwards, T.; Toh, C.; Thompson, D.O.; Chimenti, D.E. X-ray backscatter imaging for aerospace applications.AIP Conf. Proc. 2011, 1335, 509. [CrossRef]
38. Sun, W.; Brown, S.B.; Leach, R.K. An Overview of Industrial X-ray Computed Tomography. Available online: https://eprintspublications.npl.co.uk/5385/ (accessed on 19 November 2021).
39. Mireles, J.; Ridwan, S.; Morton, P.A.; Hinojos, A.; Wicker, R.B. Analysis and correction of defects within parts fabricated usingpowder bed fusion technology. Surf. Topogr. Metrol. Prop. 2015, 3, 034002. [CrossRef]
40. du Plessis, A.; le Roux, S.G.; Els, J.; Booysen, G.; Blaine, D.C. Application of microCT to the non-destructive testing of an additivemanufactured titanium component. Case Stud. Nondestruct. Test. Eval. 2015, 4, 1–7. [CrossRef]
41. Company Volton GmbH. Telephone Communication with Volton GmbH. Available online: https://volton.at/ (accessed on27 March 2022).
42. Madhvacharyula, A.S.; Pavan, A.V.S.; Gorthi, S.; Chitral, S.; Venkaiah, N.; Kiran, D.V. In situ detection of welding defects: Areview. Weld. World 2022, 66, 611–628. [CrossRef]
43. Heillier, C.J. Handbook of Nondestructive Evaluation 4.0; The McGraw-Hill Companies, Inc.: New York, NY, USA, 2003.44. Klein, M.B.; Bacher, G.D. Design and engineering of photorefractive materials for use in adaptive laser ultrasonic receivers.
Int. Soc. Opt. Photonics 1998, 3263, 96–101. [CrossRef]45. Kruger, S.E.; Moreau, A.; Bescond, C.; Monchalin, J.P. Real-time sensing of metallurgical transformations by laser-ultrasound. In
Proceedings of the 16th World Conference on Nondestructive Testing, Montreal, QC, Canada, 30 August–3 September 2004.46. Laser-Ultraschall-LUS. Available online: https://www.recendt.at/de/LUS.html (accessed on 1 November 2021).47. Monchalin, J.-P. Laser-ultrasonics: Principles and industrial applications. In Ultrasonic and Advanced Methods for Nondestructive
Testing and Material Characterization; World Scientific: Singapore, 2007; pp. 79–115. [CrossRef]48. Klein, M.B.; Ansari, H. Signal processing methods for non-destructive evaluation using ultrasonics. NDT E Int. 1998, 31, 93–97.49. Ganjei, J. Advantages and Disadvantages. Print. Circuit Fabr. 1997, 20, 1–36. [CrossRef]50. Veres, I.A.; Berer, T.; Reitinger, B.; Burgholzer, P. Numerical modeling of thermoelastic laser-generation of ultrasonic waves.
In Proceedings of the 2011 IEEE International Ultrasonics Symposium, Orlando, FL, USA, 18–21 October 2011; pp. 1091–1094.[CrossRef]
51. Grünsteidl, C.; Veres, I.A.; Murray, T.W. Experimental and numerical study of the excitability of zero group velocity Lamb wavesby laser-ultrasound. J. Acoust. Soc. Am. 2015, 138, 242–250. [CrossRef]
52. Veres, I.A.; Berer, T.; Burgholzer, P. Numerical modeling of thermoelastic generation of ultrasound by laser irradiation in thecoupled thermoelasticity. Ultrasonics 2012, 53, 141–149. [CrossRef]
53. Scruby, C.B.; Drain, L.E. Laser Ultrasonics: Techniques and Applications; Routledge: England, UK, 2019; ISBN 9780203749098.54. Murray, T.W.; Wagner, J.W. Laser generation of acoustic waves in the ablative regime. J. Appl. Phys. 1999, 85, 2031–2040. [CrossRef]55. Ochiai, M. Development and Applications of Laser-ultrasonic Testing in Nuclear Industry. In Proceedings of the 1st International
Symposium on Laser Ultrasonics: Science, Technology and Applications, Montreal, QC, Canada, 16–18 July 2008; pp. 4–12.56. Shah, S.K.H.; Iqbal, J.; Ahmad, P.; Khandaker, M.U.; Haq, S.; Naeem, M. Laser induced breakdown spectroscopy methods and
applications: A comprehensive review. Radiat. Phys. Chem. 2020, 170, 108666. [CrossRef]57. Djordjevic, B.B.; Cerniglia, D.; Cosenza, C. Guided Wave Non-Contact Ultrasonic for NDE. 2004. Available online: https:
//www.ndt.net/article/wcndt2004/pdf/guided_waves/649_djordjevic.pdf (accessed on 17 May 2022).58. Moreau, A. Laser-Ultrasonic Characterization of the Microstructure of Aluminium. Mater. Sci. Forum 2006, 519–521, 1373–1378.
[CrossRef]

Materials 2022, 15, 3697 24 of 26
59. Lévesque, D.; Bescond, C.; Lord, M.; Cao, X.; Wanjara, P.; Monchalin, J.-P. Inspection of additive manufactured parts using laserultrasonics. AIP Conf. Proc. 2016, 1706, 130003. [CrossRef]
60. Lévesque, D.; Asaumi, Y.; Lord, M.; Bescond, C.; Hatanaka, H.; Tagami, M.; Monchalin, J.-P. Inspection of thick welded jointsusing laser-ultrasonic SAFT. Ultrasonics 2016, 69, 236–242. [CrossRef]
61. Klein, M.; Sears, J. Laser Ultrasonic Inspection of Laser Cladded 316LSS and TI-6-4. J. Laser Appl. 2004, 1006. [CrossRef]62. Dixon, S.; Edwards, C.; Palmer, S. A laser–EMAT system for ultrasonic weld inspection. Ultrasonics 1999, 37, 273–281. [CrossRef]63. Zeng, Y.; Wang, X.; Qin, X.; Hua, L.; Xu, M. Laser Ultrasonic inspection of a Wire + Arc Additive Manufactured (WAAM) sample
with artificial defects. Ultrasonics 2020, 110, 106273. [CrossRef] [PubMed]64. Fang, H.; Ye, G.; Liang, J.; Yang, Y.; Zhang, B. Laser Ultrasonic in Transmission Mode for Defect Detection of Additive
Manufactured Parts. In Proceedings of the 2021 IEEE 5th Advanced Information Technology, Electronic and Automation ControlConference (IAEAC), Chongqing, China, 12–14 March 2021; Volume 2021, pp. 2403–2407.
65. Guo, S.; Feng, H.; Fenga, W.; Lv, G.; Chen, D.; Liu, Y.; Wu, X. Automatic Quantification of Subsurface Defects by Analyzing LaserUltrasonic Signals Using Convolutional Neural Networks and Wavelet Transform. IEEE Trans. Ultrason. Ferroelectr. Freq. Control.2021, 68, 3216–3225. [CrossRef]
66. Lévesque, D.; Blouin, A.; Néron, C.; Monchalin, J.-P. Performance of laser-ultrasonic F-SAFT imaging. Ultrasonics 2002, 40,1057–1063. [CrossRef]
67. Blouin, A.; Levesque, D.; Neron, C.; Drolet, D.; Monchalin, J.-P. Improved resolution and signal-to-noise ratio in laser-ultrasonicsby SAFT processing. Opt. Express 1998, 2, 531–539. [CrossRef]
68. Zeng, W.; Yao, Y.; Qi, S.; Liu, L. Finite element simulation of laser-generated surface acoustic wave for identification of subsurfacedefects. Optik 2019, 207, 163812. [CrossRef]
69. Karabutov, A.; Devichensky, A.; Ivochkin, A.; Lyamshev, M.; Pelivanov, I.; Rohadgi, U.; Solomatin, V.; Subudhi, M. Laserultrasonic diagnostics of residual stress. Ultrasonics 2008, 48, 631–635. [CrossRef]
70. Polytec GmbH NoiseImage Basic. Available online: https://www.polytec.com/us/acoustics/products/software/noiseimage-basic (accessed on 6 September 2021).
71. Senthilkumar, S.; Boopathi, M.; Srivani, A.; Mannayee, G. A review on application of acoustic emission analysis in friction stirwelding. J. Chem. Pharm. Sci. 2017, 10, 715–723.
72. Gholizadeh, S.; Leman, Z.; Baharudin, B. A review of the application of acoustic emission technique in engineering.Struct. Eng. Mech. 2015, 54, 1075–1095. [CrossRef]
73. Grosse, C.U.; Ohtsu, M. Acoustic Emission Testing: Basics for Research-Applications in Civil Engineering; Springer: Lepzig, Germany,2008; ISBN 9783540698951.
74. Sridharan, S. Delamination Behaviour of Composites; Elsevier: Amsterdam, The Netherlands, 2008; ISBN 9781845692445. Availableonline: http://www.sciencedirect.com/science/book/9781845692445 (accessed on 17 May 2022).
75. Chuang, S.Y. Real-Time Aircraft Structural Monitoring Using Acoustic Emission. In Review of Progress in Quantitative NondestructiveEvaluation; Springer: Boston, MA, USA, 1987; pp. 371–377. [CrossRef]
76. Karbhari, V.M.; Lee, L.S. Service Life Estimation and Extension of Civil Engineering Structures; Elsevier: Amsterdam, The Netherlands,2010; ISBN 9781845693985.
77. Rohringer, W.; Heine, T.; Sommerhuber, R.; Lehmann, N.; Fischer, B. Optical Microphone as Laser-Ultrasound Detector. Avail-able online: https://xarion.com/itrfile/_1_/27059ddf4f50b42f54dd6dc08d3f1fe0/XARION_DAGA_2018.pdf.pdf (accessed on18 August 2021).
78. Sonoda, Y.; Nakazono, Y. Development of Optophone with No Diaphragm and Application to Sound Measurement in Jet Flow.Adv. Acoust. Vib. 2012, 2012. [CrossRef]
79. Fraden, J. Handbook of Modern Sensors; Springer International Publishing: Berlin/Heidelberg, Germany, 2016; ISBN 9783319193021.80. Fischer, B. Optical microphone hears ultrasound. Angew. Chem. Int. Ed. 2016, 6, 951–952. [CrossRef]81. Rohringer, W.R.W.; GmbH, V.X.L.A.; Sommerhuber, R.S.R.; Csaszar, L.C.L.; Panzer, N.P.N.; Wald, S.W.S.; Fischer, B.F.B.; Garrecht,
H.G.H.; Grüner, F.G.F.; Frick, J.F.J.; et al. Material characterization via contact-free detection of surface waves using an opticalmicrophone. In Proceedings of the 5th International Conference on Sustainable Construction Materials and Technologies SCMT5,London, UK, 14–17 July 2019. [CrossRef]
82. Ramalho, A.; Santos, T.G.; Bevans, B.; Smoqi, Z.; Rao, P.; Oliveira, J. Effect of contaminations on the acoustic emissions duringwire and arc additive manufacturing of 316L stainless steel. Addit. Manuf. 2021, 51, 102585. [CrossRef]
83. Aboali, A.; El-Shaib, M.; Sharara, A.; Shehadeh, M. Screening for Welding Defects Using Acoustic Emission Technique.Adv. Mater. Res. 2014, 1025–1026, 7–12. [CrossRef]
84. Droubi, M.G.; Faisal, N.; Orr, F.; Steel, J.A.; El-Shaib, M. Acoustic emission method for defect detection and identification incarbon steel welded joints. J. Constr. Steel Res. 2017, 134, 28–37. [CrossRef]
85. Luo, Y.; Zhu, L.; Han, J.; Xie, X.; Wan, R.; Zhu, Y. Study on the acoustic emission effect of plasma plume in pulsed laser welding.Mech. Syst. Signal Process. 2019, 124, 715–723. [CrossRef]
86. Grad, L.; Grum, J.; Polajnar, I.; Slabe, J.M. Feasibility study of acoustic signals for on-line monitoring in short circuit gas metal arcwelding. Int. J. Mach. Tools Manuf. 2004, 44, 555–561. [CrossRef]
87. Zhang, L.; Basantes-Defaz, A.C.; Ozevin, D.; Indacochea, E. Real-time monitoring of welding process using air-coupled ultrasonicsand acoustic emission. Int. J. Adv. Manuf. Technol. 2018, 101, 1623–1634. [CrossRef]

Materials 2022, 15, 3697 25 of 26
88. Lee, C.-J.; Kim, J.-D.; Kim, Y.-C. Study on monitoring of plasma emission signal in lap welding of Zn coated steel sheet using CO2laser. Int. J. Precis. Eng. Manuf. 2015, 16, 495–500. [CrossRef]
89. Shevchik, S.; Le-Quang, T.; Meylan, B.; Farahani, F.V.; Olbinado, M.P.; Rack, A.; Masinelli, G.; Leinenbach, C.; Wasmer, K.Supervised deep learning for real-time quality monitoring of laser welding with X-ray radiographic guidance. Sci. Rep. 2020,10, 3389. [CrossRef]
90. Taheri, H.; Koester, L.W.; Bigelow, T.A.; Faierson, E.J.; Bond, L.J. In Situ Additive Manufacturing Process Monitoring Withan Acoustic Technique: Clustering Performance Evaluation Using K-Means Algorithm. J. Manuf. Sci. Eng. 2019, 141, 041011.[CrossRef]
91. Mahmoud, D.; Magolon, M.; Boer, J.; Elbestawi, M.A.; Mohammadi, M.G. Applications of Machine Learning in Process Monitoringand Controls of L-PBF Additive Manufacturing: A Review. Appl. Sci. 2021, 11, 11910. [CrossRef]
92. Wasmer, K.; Saeidi, F.; Meylan, B.; Le, Q.T.; Shevchik, S.A. When AE (Acoustic Emission) Meets AI (Artificial Intelligence) II.Laboratory for Advanced Materials Processing, Empa-Swiss Federal Laboratories Abstract. In Proceedings of the 33rd EuropeanConference on Acoustic Emission Testing, Senlis, France, 12–14 September 2018; pp. 1–12.
93. Masinelli, G.; Shevchik, S.A.; Pandiyan, V.; Quang-Le, T.; Wasmer, K. Artificial Intelligence for Monitoring and Control of MetalAdditive Manufacturing. In Industrializing Additive Manufacturing; Meboldt, M., Klahn, C., Eds.; Springer International Publishing:Cham, Switzerland, 2021; pp. 205–220. ISBN 978-3-030-54333-4.
94. Sibillano, T.; Ancona, A.; Berardi, V.; Lugarà, P.M. A Real-Time Spectroscopic Sensor for Monitoring Laser Welding Processes.Sensors 2009, 9, 3376–3385. [CrossRef] [PubMed]
95. Alfaro, S.C.A.; Mendonça, D.d.S.; Matos, M.S. Emission spectrometry evaluation in arc welding monitoring system. J. Mater.Process. Technol. 2006, 179, 219–224. [CrossRef]
96. Mills, G.S. Use of Emission Spectroscopy for Welding Arc Analysis. Weld. J. 1977, 56, 93–96.97. Mirapeix, J.; Cobo, A.; Conde, O.; Quintela, M.A.; Lopez-Higuera, J.-M. Spectroscopic analysis technique for arc-welding process
control. Photonics Appl. Ind. Res. IV 2005, 5948, 594824. [CrossRef]98. Zhang, C.; Gao, M.; Chen, C.; Zeng, X. Spectral diagnosis of wire arc additive manufacturing of Al alloys. Addit. Manuf. 2019,
30, 100869. [CrossRef]99. Kisielewicz, A.; Sikström, F.; Christiansson, A.-K.; Ancona, A. Spectroscopic monitoring of laser blown powder directed energy
deposition of Alloy 718. Procedia Manuf. 2018, 25, 418–425. [CrossRef]100. Nassar, A.R.; Spurgeon, T.J.; Reutzel, E.W. Sensing Defects during Directed-Energy ADDITIVE manufacturing of Metal Parts
Using Optical Emissions Spectroscopy. In Proceedings of the 2014 International Solid Freeform Fabrication Symposium, Austin,TX, USA, 4–6 August 2014.
101. Harmon, R.; Russo, R. Laser-Induced Breakdown Spectroscopy. In Treatise Geochemistry, 2nd ed.; Elsevier: Amsterdam, TheNetherlands, 2014; Volume 245–272. [CrossRef]
102. Lednev, V.N.; Sdvizhenskii, P.; Asyutin, R.D.; Tretyakov, R.S.; Grishin, M.Y.; Stavertiy, A.Y.; Pershin, S.M. In situ multi-elementalanalysis by laser induced breakdown spectroscopy in additive manufacturing. Addit. Manuf. 2018, 25, 64–70. [CrossRef]
103. Taparli, U.A.; Jacobsen, L.; Griesche, A.; Michalik, K.; Mory, D.; Kannengiesser, T. In situ laser-induced breakdown spectroscopymeasurements of chemical compositions in stainless steels during tungsten inert gas welding. Spectrochim. Acta Part B At. Spectrosc.2018, 139, 50–56. [CrossRef]
104. Avdelidis, N.P.; Almond, D.P.; Dobbinson, A.; Hawtin, B.C. Pulsed thermography: Philosophy, qualitative and quantitativeanalysis on certain aircraft applications. Insight-Non-Destr. Test. Cond. Monit. 2006, 48, 286–289. [CrossRef]
105. Chung, Y.; Shrestha, R.; Lee, S.; Kim, W. Thermographic Inspection of Internal Defects in Steel Structures: Analysis of SignalProcessing Techniques in Pulsed Thermography. Sensors 2020, 20, 6015. [CrossRef] [PubMed]
106. Andonova, A.; Todorov, D. Thermographic NDT System. Annu. J. Electron. 2013, 78, 139–143.107. Jolly, M.R.; Prabhakar, A.; Sturzu, B.; Hollstein, K.; Singh, R.; Thomas, S.; Foote, P.; Shaw, A. Review of Non-destructive Testing
(NDT) Techniques and their Applicability to Thick Walled Composites. Procedia CIRP 2015, 38, 129–136. [CrossRef]108. Broberg, P. Surface crack detection in welds using thermography. NDT E Int. 2013, 57, 69–73. [CrossRef]109. Bagavac, P. Lock-in Thermography Image Processing, Faculty of Electrical Engineering, Mechanical Engineering and Naval
Architecture, University of Split. Available online: https://hrcak.srce.hr/file/251414, (accessed on 28 August 2021).110. He, Y.; Pan, M.; Chen, D.; Tian, G.; Zhang, H. Eddy current step heating thermography for quantitatively evaluation.
Appl. Phys. Lett. 2013, 103, 194101. [CrossRef]111. Qu, Z.; Jiang, P.; Zhang, W. Development and Application of Infrared Thermography Non-destructive Testing Techniques. Sensors
2020, 20, 3851. [CrossRef]112. Roemer, J.; Pieczonka, L.; Szwedo, M.; Uhl, T.; Staszewski, W.J. Thermography of Metallic and Composite Structures-review of
applications. In Proceedings of the International Workshop on SMART MATERIALS, STRUCTURES & SHM NDT in Canada2013 Conference & NDT for the Energy Industry, Calgary, AB, Canada, 7–10 October 2013.
113. Marani, R.; Palumbo, D.; Galietti, U.; D’Orazio, T. Deep learning for defect characterization in composite laminates inspected bystep-heating thermography. Opt. Lasers Eng. 2021, 145, 106679. [CrossRef]
114. Kaminska, P.; Ziemkiewcz, J.; Synaszko, P.; Dragan, K. Comparison of Pulse Thermography (PT) and Step Heating (SH)Thermography in Non-Destructive Testing of Unidirectional GFRP Composites. Fatigue Aircr. Struct. 2019, 2019, 87–102.[CrossRef]

Materials 2022, 15, 3697 26 of 26
115. Renshaw, J.; Chen, J.C.; Holland, S.D.; Thompson, R.B. The sources of heat generation in vibrothermography. NDT E Int. 2011, 44,736–739. [CrossRef]
116. Pieczonka, L.; Szwedo, M. “Vibrothermography” in Advanced Structural Damage Detection: From Theory to Engineering Applications;Stepinski, T., Uhl, T., Staszewski, W., Eds.; Wiley: Hoboken, NJ, USA, 2013; ISBN 9781118536148.
117. Zenzinger, G.; Bamberg, J.; Satzger, W.; Carl, V. Thermographic crack detection by eddy current excitation. Nondestruct. Test. Eval.2007, 22, 101–111. [CrossRef]
118. Swiderski, W.; Hlosta, P. Pulsed Eddy Current Thermography for Defects Detection in Joints of Metal Sheets. In Proceedings ofthe 11th European Conference on Non-Destructive Testing, Prague, Czech Republic, 6–10 October 2014.
119. Yang, D.; Wang, G.; Zhang, G. Thermal analysis for single-pass multi-layer GMAW based additive manufacturing using infraredthermography. J. Mater. Process. Technol. 2017, 244, 215–224. [CrossRef]
120. Runnemalm, A.; Broberg, P.; Fernandez, E.; Garcia, A.; Yedra, D.E.L.A.; Henrikson, P.; Thorpe, N. Automatic thermographyinspection of welded components with limited access. In Proceedings of the 6th International Symposium on NDT in Aerospace,Madrid, Spain, 12–14 November 2014.
121. Sreedhar, U.; Krishnamurthy, C.; Balasubramaniam, K.; Raghupathy, V.; Ravisankar, S. Automatic defect identification usingthermal image analysis for online weld quality monitoring. J. Mater. Process. Technol. 2012, 212, 1557–1566. [CrossRef]
122. Elkihel, A.; Bakdid, A.; Jeffali, F.; Gziri, H. Evaluation of thermal losses for welded structures. Mater. Today Proc. 2020, 31, S78–S82.[CrossRef]
123. Massaro, A.; Panarese, A.; Dipierro, G.; Cannella, E.; Galiano, A. Infrared Thermography and Image Processing applied onWeldings Quality Monitoring. In Proceedings of the 2020 IEEE International Workshop on Metrology for Industry 4.0 & IoT,Roma, Italy, 3–5 June 2020; pp. 559–564. [CrossRef]
124. Ziegler, M.; Thiel, E.; Ahmadi, S. Lock-in Thermography using High-Power Laser Sources 2. Laser Thermography–Evolutionfrom a highly specialised into a versatile tool for NDT. In Proceedings of the 12th European Conference on Non-DestructiveTesting 2018, Gothenburg, Sweden, 11–15 June 2018.
125. Cerniglia, D.; Montinaro, N. Defect Detection in Additively Manufactured Components: Laser Ultrasound and Laser Thermogra-phy Comparison. Procedia Struct. Integr. 2018, 8, 154–162. [CrossRef]
126. Kumar, V.; Albert, S.K.; Chandrasekhar, N. Signal processing approach on weld data for evaluation of arc welding electrodesusing probability density distributions. Measurement 2018, 133, 23–32. [CrossRef]
127. Kumar, V.; Albert, S.K.; Chandrasekhar, N.; Jayapandian, J.; Venkatesan, M.V. Performance analysis of arc welding parametersusing self organizing maps and probability density distributions. In Proceedings of the 2016 IEEE First International Conferenceon Control, Measurement and Instrumentation (CMI), Kolkata, India, 8–10 January 2016; pp. 196–200. [CrossRef]
128. Mician, M.; Marônek, M. Analysis of the Arc Current of CMT Brazing Process; Research Papers; Faculty of Materials Science andTechnology, Slovak University of Technology: Bratislava, Slovakia, 2018; Volume 26, pp. 103–108. [CrossRef]
129. Kumar, V.; Chandrasekhar, N.; Albert, S.; Jayapandian, J. Analysis of arc welding process using Digital Storage Oscilloscope.Measurement 2016, 81, 1–12. [CrossRef]
130. Savyasachi, N.; Chandrasekar, N.; Albert, S.K.; Surendranathan, A.O. Evaluation of Arc Welding Process Using Digital StorageOscilloscope and High Speed Camera. Indian Weld. J. 2015, 48, 35. [CrossRef]
131. Mazlan, A.; Daniyal, H.; Mohamed, A.I.; Ishak, M.; Hadi, A.A. Monitoring the quality of welding based on welding current andste analysis. IOP Conf. Ser. Mater. Sci. Eng. 2017, 257, 012043. [CrossRef]