Application of Failure Mode and Effect Analysis (FMEA), Cause and Effect Analysis, and Pareto...
14
Original article Application of failure mode and effect analysis (FMEA) and cause and effect analysis for industrial processing of common octopus (Octopus vulgaris) – Part II Ioannis S. Arvanitoyannis 1 * & Theodoros H. Varzakas 2 1 Department of Agriculture, Animal Production and Aquatic Environment, School of Agricultural Sciences, University of Thessaly, Fytoko Street, 38446 Nea Ionia Magnesias, Volos, Hellas, Greece 2 Department of Processing of Agricultural Products, School of Agricultural Sciences, Technological Educational Institute of Kalamata, Hellas, Greece (Received 23 April 2007; Accepted in revised form 21 May 2007) Summary Failure mode and effect analysis (FMEA) model was applied in conjunction with cause-and-effect analysis for the risk assessment of octopus processing (Octopus vulgaris). Critical control points were identified and implemented in the cause-and-effect diagram (also known as Ishikawa, tree diagram and fishbone diagram). The main emphasis was put on the quantification of risk assessment by determining the risk priority numbers (RPN) per identified processing hazard. Chemically contaminated product, decomposed raw materials, scombrotoxin presence in the final product, incorrectly labelled product, storage in cans (foreign matter) and defective products, were identified as those with the highest RPN (378, 294, 280, 252, 245 and 144 respectively) and corrective actions were undertaken. Following the application of corrective actions, a second calculation of RPN values was carried out, leading to considerably lower values (below the upper acceptable limit of 130). It is concluded that the incorporation of FMEA analysis within the ISO2200 system of an octopus-processing industry is imperative. Keywords Cause-and-effect diagrams, FMEA analysis, octopus processing. Introduction The quality, including safety, of products has tradition- ally been controlled by inspection of the final product. This is the case with food as well as with other products. Veterinary food (meat) inspection began almost 150 years ago, after veterinary pathologists and para- sitologists had found ways to identify human pathogens in food animals. Meat inspection is still a large-scale function of veterinary medicine (http://nsgl.gso.uri.edu/ flsgp/flsgph01002.pdf). Current meat inspection is based on 100% inspection of the live animals, their carcasses and organs, ante mortem and postmortem. This system has not changed significantly over the last 100 years. The problem is that 100% inspection does not mean 100% detection of human pathogens, and this has led to a search for other ways to ensure food safety (FAO, 2001). The inefficiency of the present inspection system is associated with changes in the ways meat (food) is produced, processed, marketed and prepared when compared with that done 100 years ago (http://www.codexalimentarius.net/ download/report/633/al28_18e.pdf). Hazard Analysis Critical Control Point (HACCP) was developed in the 1960s by the US food industry and National Aeronautics and Space Administration (NASA) as a ‘zero-defect’ approach for feeding astro- nauts. The bases of HACCP are that it is a process control rather than a product control and that it focuses control on steps in the processing system that are critical to consumer health (Arvanitoyannis & Tzouros, 2006). HACCP has won wide acceptance as a voluntary control programme in the food industry, and is now a prescribed part of meat and poultry slaughter in the US, as well as seafood and juices. There is also a growing interest in using HACCP to control the safety of live animal production ⁄ pre-harvest food safety (http://www.codex alimentarius.net/download/report/633/al28_18e.pdf). There can hardly be HACCP without Good Manu- facturing or Management Practices (GMP). Briefly, GMP is a description of all the steps (which should represent good practice) in a processing facility, while HACCP is a documentation that the steps important to *Correspondent: Fax: +302421093144; e-mail: [email protected] International Journal of Food Science and Technology 2009, 44, 79–92 79 doi:10.1111/j.1365-2621.2007.01640.x Ó 2008 The Authors. Journal compilation Ó 2008 Institute of Food Science and Technology
Transcript of Application of Failure Mode and Effect Analysis (FMEA), Cause and Effect Analysis, and Pareto...

Original article
Application of failure mode and effect analysis (FMEA) and cause
and effect analysis for industrial processing of common octopus
(Octopus vulgaris) – Part II
Ioannis S. Arvanitoyannis1* & Theodoros H. Varzakas2
1 Department of Agriculture, Animal Production and Aquatic Environment, School of Agricultural Sciences, University of Thessaly, Fytoko
Street, 38446 Nea Ionia Magnesias, Volos, Hellas, Greece
2 Department of Processing of Agricultural Products, School of Agricultural Sciences, Technological Educational Institute of Kalamata, Hellas,
Greece
(Received 23 April 2007; Accepted in revised form 21 May 2007)
Summary Failure mode and effect analysis (FMEA) model was applied in conjunction with cause-and-effect analysis
for the risk assessment of octopus processing (Octopus vulgaris). Critical control points were identified and
implemented in the cause-and-effect diagram (also known as Ishikawa, tree diagram and fishbone diagram).
The main emphasis was put on the quantification of risk assessment by determining the risk priority numbers
(RPN) per identified processing hazard. Chemically contaminated product, decomposed raw materials,
scombrotoxin presence in the final product, incorrectly labelled product, storage in cans (foreign matter) and
defective products, were identified as those with the highest RPN (378, 294, 280, 252, 245 and 144
respectively) and corrective actions were undertaken. Following the application of corrective actions, a
second calculation of RPN values was carried out, leading to considerably lower values (below the upper
acceptable limit of 130). It is concluded that the incorporation of FMEA analysis within the ISO2200 system
of an octopus-processing industry is imperative.
Keywords Cause-and-effect diagrams, FMEA analysis, octopus processing.
Introduction
The quality, including safety, of products has tradition-ally been controlled by inspection of the final product.This is the case with food as well as with other products.Veterinary food (meat) inspection began almost150 years ago, after veterinary pathologists and para-sitologists had found ways to identify human pathogensin food animals. Meat inspection is still a large-scalefunction of veterinary medicine (http://nsgl.gso.uri.edu/flsgp/flsgph01002.pdf).Current meat inspection is based on 100% inspection
of the live animals, their carcasses and organs, antemortem and postmortem. This system has not changedsignificantly over the last 100 years. The problem is that100% inspection does not mean 100% detection ofhuman pathogens, and this has led to a search for otherways to ensure food safety (FAO, 2001). The inefficiencyof the present inspection system is associated withchanges in the ways meat (food) is produced, processed,
marketed and prepared when compared with thatdone 100 years ago (http://www.codexalimentarius.net/download/report/633/al28_18e.pdf).Hazard Analysis Critical Control Point (HACCP)
was developed in the 1960s by the US food industryand National Aeronautics and Space Administration(NASA) as a ‘zero-defect’ approach for feeding astro-nauts. The bases of HACCP are that it is a processcontrol rather than a product control and that it focusescontrol on steps in the processing system that are criticalto consumer health (Arvanitoyannis & Tzouros, 2006).HACCP has won wide acceptance as a voluntary controlprogramme in the food industry, and is now a prescribedpart of meat and poultry slaughter in the US, as well asseafood and juices. There is also a growing interest inusing HACCP to control the safety of live animalproduction ⁄pre-harvest food safety (http://www.codexalimentarius.net/download/report/633/al28_18e.pdf).There can hardly be HACCP without Good Manu-
facturing or Management Practices (GMP). Briefly,GMP is a description of all the steps (which shouldrepresent good practice) in a processing facility, whileHACCP is a documentation that the steps important to
*Correspondent: Fax: +302421093144;
e-mail: [email protected]
International Journal of Food Science and Technology 2009, 44, 79–92 79
doi:10.1111/j.1365-2621.2007.01640.x
� 2008 The Authors. Journal compilation � 2008 Institute of Food Science and Technology

Table 1 Failure mode and effect analysis – basic table – CCP 1
FMEA table of hazardous processing methods
Defective products
Estimated
corrective
actions result
Failure mode Consequences S Failure causes O Ways of control D RPN
Corrective
actions S O D RPN
Can come
from a
possible
malfunction
of the filler
Due to the high
technique control
this case could be
impossible for the
most of the
products. So that it
is not a noticeable
point
2 1) Unsuitable control
equipment
2) Poor maintenance
3) Insufficient
personnel skills
4) Insufficient use
5) Old machinery
(Kreuzer, 1984)
5 1) More funding,
better management
2) Frequent
Validation
3) Completed
staff training
4) Completed staff
training, more
funding
5) More funding,
Better management
6 60 Not required 2 5 6 60
Can come
from the low
quality of
raw
materials
Due to the low
ingredient quantity
present, even if
there are unsuitable
raw materials 1%, it
allows certification
towards to
customers that the
final product have
been repeatedly
controlled.
3 1) Men’s hygiene
2) Microorganism
and bacteria from
the toxic area
3) Polluted water for
washing
4) Insufficient
conditions of
storage of raw
materials
5) High temperature
(Vaz-Pires et al., 2004)
7 1) Extra hygiene
measures and staff
training
2) Extra hygiene measures
3) Water control,
pumping potable
water- non from
industrial area
4) Keeping of raw
materials in cool
and shady place
5) Keeping low
temperature by
using isothermal
packing
4 84 Not required 3 7 4 84
Can come
from
insufficient
personnel
skills
Even if the case of
Insufficient
personnel skills it is
not remarkable from
the appearance of
the final product by
the customer, the
most of products
could not pass all
control tests
6 1) No staff
cooperation
2) Incomplete staff
training
3) No senior
management
commitment ⁄cooperation
4) Unreliable supplier
8 1) Extra funding
2) Extra funding
3) Completed
management
training
4) Extra control
measures
3 144* Extra control
measures,
Extra Funding,
Better
management.
GMP and GLP
application.
3 6 2 36
Can come
from the
low quality
of the
packaging
materials
Important effects by
heavy metals
presence in ingredient
higher than the critical
limit. Possible
obligation for special
labelling for
non-permitted CL of
heavy metals. All the
customers are
affected. Possible
trade failure of
product
8 1) Contaminated raw
material over transfer
2) Low-purity reference
materials, insufficient
inspection
3) Bad maintenance of
the canned products
4) Insufficient ⁄ low
sterilisation
5) Low quality of
methods
3 1) Extra control
measures
2) Better
management, extra
control measure,
completed training
3) Keeping low
temperature and use
of ear driers to avoid
the moisture low.
4) Completed training
5) Extra funding
6 144* Extra control
measures, extra
funding, better
management
6 2 5 60
*When RPN is over 130, corrective action is required.
Failure analysis in octopus processing I. S. Arvanitoyannis and T. H. Varzakas80
International Journal of Food Science and Technology 2009 � 2008 The Authors. Journal compilation � 2008 Institute of Food Science and Technology

consumer health are under control. Proposed GMPs forfood production are often called Good AgriculturalPractices (GAPs); at this point, GAPs are advisory,rather than mandatory. Sanitation standard operatingprocedures (SSOPs) are also a needed (and oftenrequired) prerequisite to HACCP (http://www.afdo.org/afdo/upload/Sushi.pdf; Miliou et al., 2005).
Using FMEAs to assess risk
Describe the product or process
A clear and specific description of the product or processundergoing failure modes and effects analyses (FMEA)must first be articulated. The creation of this descriptionensures that the responsible engineer fully understandsthe ‘form, fit and function’ of the product or process(Kececioglu & Dimitri, 1991).
Draw a block diagram of the product or process
A block diagram of the product ⁄process needs to bedeveloped to show the logical relationships betweenthe components of the product or the steps ⁄ stages ofthe process. A block diagram may be in the form ofboxes connected by lines, with each box correspondingto a major component of the product or a major step
of the process. The lines correspond to how theproduct components or process steps are relatedto each other (http://www.npd-solutions.com/pdforum.html).
Complete the header of the FMEA table
Failure modes and effects analyses table (Table 1)headers vary from one to the next, as they are supposedto be customised according to the requirements of thecompanies using them. Generally the header requires,among others that you may wish to add, the followinginformation: Product ⁄Process ⁄System Name, Compo-nent ⁄Step Name; Product Designer or Process Engineer,Name of the Person who prepared the FMEA form;FMEA Date; Revision Level (letter or number);and Revision Date (http://www.npd-solutions.com/pdforum.html).
Enumerate the items (components, functions, steps, etc.)that make up the product or process
Break down the product or process being subjected toFMEA into its major components or steps. List downeach of these components or steps in column 1 of theFMEA table. The items must be listed down in a logicalmanner (http://www.fmeainfocentre.com/).
DefectiveProducts
Malfunction of Filler
Low Quality ofPackaging materials
Law Quality of Raw Material
Personnel
Insufficient Personnelskills
Insufficient Use
Old Machinery
Insufficient Conditions of Storageof Raw Materials
Polluted Waterfor Washing
Unsuitable ControlEquipment
Law Funding
Low Funding
Low Funding
Low Funding
Low Funding
Low Funding
Low Funding
Badmanagement
Badmanagement
Bad management
Infrequent Validation
Poor Maintenance
Incomplete Staff Training
Incomplete Staff Training
Incomplete management Training
Incomplete Staff Training
Raw MaterialContaminated over Transfer
Unreliable supplier Unreliable suppliers
Unreliable supplier
Insufficient inspection
Inadequate traning
Inadequate traning
High temperature
Incomplete training procedures
Low Sterilization
Low Quality of Metals
Bad Maintenance ofCanned Products
No Staff Cooperation
Inadequate quality controlNo Senior Management
commitment/cooperationDiscontinuingelectricity flow
High temperature
Industrial district
Low Hygiene Personnel’s Habits
Toxic Area
Heavy Metals
Polluted area
InadequateHygiene
Microorganismand Bacteria
Comes fromindustrial area
Figure 1 Cause-and-effect diagram for raw material cephalopod reception – CCP 1 (defective products).
Failure analysis in octopus processing I. S. Arvanitoyannis and T. H. Varzakas 81
� 2008 The Authors. Journal compilation � 2008 Institute of Food Science and Technology International Journal of Food Science and Technology 2009

Identify all potential failure modes associated withthe product or process
A failure mode is defined as how a system, product,or process is failing. Now here arises some confusionin the semiconductor industry, which usually measuresits failure modes in terms of how the product orprocess is deviating from its specifications. A productor process can have hundreds of different failuremodes based on this definition, most of which arehighly correlated to each other because of a commonfailure mechanism behind them (Kececioglu & Dim-itri, 1991). A failure mechanism is defined as thephysical phenomenon behind the failure mode(s)observed, e.g. die cracking, corrosion, electro-migra-tion, etc. To simplify the use of FMEA in thesemiconductor industry, therefore, the engineer maychoose whether to construct the FMEA table in termsof failure modes or in terms of failure mechanisms(Stamatis, 1995).
List down each failure mode using its technical term
Using an official technical term for listing the failuremode prevents confusion. All potential failure modesshould be listed down for each item (product component
or process step). Column 2 of the FMEA table shallbe used for this purpose (http://www.dyadem.com/downloads/trial).
Describe the effects of each of the failure modes listedand assess the severity of each of these effects
For each of the failure modes in column 2, a corre-sponding effect (or effects) must be identified and listedin column 3 of the FMEA table. A failure effect is whatthe customer will experience or perceive once the failureoccurs. A customer may either be internal or external, soeffects to both must be included. Examples of effectsinclude inoperability or performance degradation of theproduct or process, injury to the user and damage toequipment (Stamatis, 1995).Assign a severity rating to each effect. Each company
may develop its own severity rating system, dependingon the nature of its business. A common industrystandard is to use a 1-to-10 scale system, with the ‘1’corresponding to ‘no effect’ and the ‘10’ to maximumseverity, such as the occurrence of personal injury ordeath with no warning, or a very costly breakdown of anenormous system. Column 4 of the FMEA table is usedfor the severity rating (SEV) of the failure mode(Kececioglu & Dimitri, 1991).
Decomposed Frozen
Raw Material
Freezer Malfunction
Low Quality ofRaw Materials
InsufficientFreezing Methods
Insufficient Personnel Skills
Unreliable Suppliers
Inadequate quality control
No Senior Management Commitment/ Cooperation
IncompleteManagement training
Incomplete Staff training
No Staff Cooperation
Low Funding
Low Funding
Unreliable Suppliers
Raw MaterialDecomposition over transfer
Insufficient inspection
Insufficient Maintenance of Raw MaterialsHigh Temperature
Discontinuing Electricity flow
InsufficientFrozen Storage
High Level of Parasites
Insufficient SterilizationIncomplete Training procedures
InsufficientFrozen Storage
Old Machinery
Bad maintenance
Bad Management
Bad Management
Infrequent ReplacementLow Funding
Low Funding
Infrequent Machinery Control
Low Quality Machinery
Insufficient personnel training
Bad Management
Bad Management
Bad Management
Unsuitable ControlEquipment
Bad Management
Bad Management
Bad Management
Bad Management
Low Funding
Low Funding
Low Funding
Low Funding
Low purity of water
Unreliable Suppliers
Pure Maintenance ofControl Equipment
Low Purity materials
Infrequentvalidation
Insufficient UseOf the Freezing Method
Comes from Industrial area
Incomplete Staff Training
Inadequate Quality Control
No Suppliers Control Plan
No Incoming MaterialsControl Plan
Incomplete training procedures
Unsuitable Environmental
Conditions
Inadequate Cephalopod Industrial
Storage Conditions
Inadequate Cephalopod Industry Storehouse Conditions
Inadequate SuppliersStorage Conditions
InadequateTransfer Conditions
Incomplete or Insufficient Contracts Procedures
Inadequate SuppliersStorehouse Structure
Incomplete or Insufficient Contracts Procedures
Low Funding
Low Funding
Low Funding
Low Funding
Figure 2 Cause-and-effect diagram for freezing & frozen storage – CCP 2 (decomposed frozen raw materials).
Failure analysis in octopus processing I. S. Arvanitoyannis and T. H. Varzakas82
International Journal of Food Science and Technology 2009 � 2008 The Authors. Journal compilation � 2008 Institute of Food Science and Technology

Identify the possible cause(s) of each failure mode
Aside from its effect(s), the potential cause(s) of everylisted failure mode must also be enumerated. Apotential cause should be something that can actuallytrigger the failure to occur. Examples of failure causesinclude improper equipment set-up, operator error,use of worn-out tools, use of incorrect softwarerevision and contamination. The potential causes arelisted in column 5 of the FMEA table (http://www.fmeainfocentre.com/).
Quantify the probability of occurrence PF of eachof the failure mode causes
The likelihood of each of the potential failure causeoccurring must be quantified. Every failure cause willthen be assigned a number [probability factor (PF)],indicating this likelihood or probability of occurrence.A common industry standard for this is to assign a ‘1’to a cause that is very unlikely to occur and a ‘10’ to acause that is frequently encountered. PF values foreach of the failure causes are indicated in column 6 of
the FMEA table (http://www.dyadem.com/downloads/trial).
Identify all existing controls (current controls) thatcontribute to the prevention of the occurrence of eachof these failure mode causes
Existing controls that prevent the cause of the failuremode from occurring or detect the failure before itreaches the customer must be identified and evaluatedfor its effectiveness in performing its intended function.Each of the controls must be listed in column 7 of theFMEA table (http://pagead2.googlesyndication.com/pagead/iclk).
Determine the ability of each control in preventingor detecting the failure mode or its cause
The effectiveness of each of the listed controls mustthen be assessed in terms of its likelihood of prevent-ing or detecting the occurrence of the failure modeor its failure cause. As usual, a number must beassigned to indicate the detection effectiveness
Scombrotoxinpresence in
final product
Insufficient Personnel Skills
Methods
Machinery’sMalfunction
Low QualityRaw Materials
UnsuitableStorehouse Place
No incomingMaterials Control Plan
No SuppliersOf Storied Materials
Control PlanBad Management
Low FundingIncomplete training
ProceduresBad Management
Low FundingIncomplete Corrective
And preventive actions
Inadequate Training
Insufficient FMEA Plan
Raw MaterialsContaminated over Storage
No Detoxify Method Application
Insufficient training
Low Funding
Workers HabitsInsufficient training
Bad Management
Raw MaterialsContaminated over Transfer
No Detoxify Method Application
Insufficient training
Low Funding
Insufficient Inspection
Raw Materials Come fromToxic area
Microorganism andBacteria
Poor HygieneRaw Materials Contaminated
During their Cultivation
Low Quality of FoodLow Quality of Water
Poor Hygiene
Non-certifiedexternal laboratory
Bad Management
Low Funding
Insufficient Control Methods
Low Funding
Bad Management
Inadequate LaboratoryEquipmentOld Machinery
Low Funding
Non-replaced Machinery
Bad Management
Low FundingPoor Maintenance
Of storage Machines Equipment
InfrequentReplacement
Low Funding
Unreliable Suppliers
Inadequate Quality Control
Incomplete Stuff Training
Bad Management
No Staff Cooperation
Low Funding
No Senior Management Commitment/
CooperationInadequate StorageIndustry’s Conditions
Toxic Area
Industrial Area
No Detoxify Application
Insufficient training
Inadequate CephalopodIndustry Structure
Incomplete or Insufficient Contract Procedures
Bad Management
Figure 3 Cause-and-effect diagram for raw material storage – CCP 3 (scombrotoxin presence in final product).
Failure analysis in octopus processing I. S. Arvanitoyannis and T. H. Varzakas 83
� 2008 The Authors. Journal compilation � 2008 Institute of Food Science and Technology International Journal of Food Science and Technology 2009

(DET) of each control. DET numbers are shown incolumn 8 of the FMEA table (Kececioglu & Dimitri,1991).
Calculate the RPN
The risk priority number (RPN) is simply the product ofthe failure mode severity (SEV), failure cause probabil-ity (PF), and control detection effectiveness (DET)ratings. Thus, RPN = SEV · PF · DET). RPN, whichis listed in column 9 of the FMEA table, is used inprioritising which items require additional quality plan-ning or action (http://www.semiconfareast.com/fmea.htm).
Identify action(s) to address potential failure modes thathave a high RPN
A high RPN needs the immediate attention of theengineer as it indicates that the failure mode can result inan enormous negative effect, its failure cause has a highlikelihood of occurring and there are insufficient controls
to catch it. Thus, action items must be defined to addressfailure modes that have high RPN values (SAE Aero-space Recommended Practice ARP5580, 2001). Theseactions include but should not be limited to thefollowing: inspection, testing, monitoring, redesign,de-rating, conduct of preventative maintenance, redun-dancy, process evaluation ⁄optimisation, etc. Column 10of the FMEA tables is used to list down applicableaction items (http://pagead2.googlesyndication.com/pagead/iclk).
Implement the defined actions
Assign a responsible owner and a target date ofcompletion for each of the actions defined. This makesownership of the actions clear-cut and facilitates track-ing of the actions’ progress. The responsible owner andtarget completion dates must be indicated in column11 of the FMEA table. The status or outcome ofeach action item must also be indicated in column 12of the FMEA table (http://www.semiconfareast.com/fmea.htm).
Chemically Contaminated
Product
Personnel
Methods
UnsuitableMachinery
Unsuitable Materials
Ingredients ContaminatedOver their production
No GMP, GAP, GLPapplication
Raw Material/Ingredient
ContaminatedOver transfer
Worker's habits
Inadequate Training
No GMPapplication
Inadequate TrainingInsufficientInspection
Raw Materials come from Contaminated area
No Heavy MetalDetection Plan
Bad Management
No Suppliers Control Plan
Bad Management
Low Funding Incomplete Training
Procedures
Bad Management
Low FundingIncomplete Review
Procedures
Incomplete CorrectiveAnd Preventive Actions
Inadequate Training
Incomplete StaffTraining
Unreliable Supplier
Bad Management
Old Machinery
Unsuitable Control Equipment
Low Funding
Bad Management
No-certified External Laboratory
Unsuitable Laboratory Equipment
No GLP Application
Bad Management
Low Funding
Poor MaintenanceOf Control Equipment
Low PurityReference Materials
UnsuitableEnvironmental
Conditions
Inadequate Supplier’sStorehouse Structure
Incomplete or InsufficientContracts Procedures
Inadequate transferconditions
Incomplete or InsufficientContracts Procedures
Inadequate SuppliersStorage conditions
Inadequate Cephalopod Industry Storehouse Stracture
Low Funding Inadequate Cephalopod
Industry Storage Conditions
Insufficient RecallProcesses of non- conformed
No Senior ManagementCommitment/Cooperation
No Staff Cooperation
Low Funding
Inadequate QualityControl
Bad Management
Low Funding
Bad Management
Low Funding
Figure 4 Cause-and-effect diagram for butchering ⁄ packaging – CCP 4 (chemically contaminated product).
Failure analysis in octopus processing I. S. Arvanitoyannis and T. H. Varzakas84
International Journal of Food Science and Technology 2009 � 2008 The Authors. Journal compilation � 2008 Institute of Food Science and Technology

Review the results of the actions taken and reassessthe RPN values
After the defined actions have been completed, theiroverall effect on the failure mode they are supposed toaddress must be reassessed. The engineer must updatethe SEV, PF and DET numbers accordingly. The newRPN must then be recalculated once the new SEV, PFand DET numbers have been established. The new RPNshould help the engineer decide if more actions areneeded or if the actions are sufficient. Columns 13, 14,15 and 16 of the FMEA table are used to indicate thenew SEV, PF, DET and RPN respectively (http://www.fmeainfocentre.com/).
Keep the FMEA table updated
Update the FMEA table every time the product designor process changes or new actions or information causethe SEV, PF or DET to change (SAE AerospaceRecommended Practice ARP5580, 2001).
Cause-and-effect diagram
The cause-and-effect diagram is the brainchild ofKaoru Ishikawa, who pioneered quality management
processes in the Kawasaki shipyards, and in theprocess, became one of the founding fathers ofmodern management. The cause and effect diagramis used to explore all the potential or real causes (orinputs) that result in a single effect (or output). Causesare arranged according to their level of importance ordetail, resulting in a depiction of relationships andhierarchy of events. This can help anyone search forroot causes, identify areas where there may beproblems, and compare the relative importance ofdifferent causes (http://mot.vuse.vanderbilt.edu/mt322/Ishikawa.htm).Causes in a cause-and-effect diagram are frequently
arranged into four major categories. The most impor-tant ones are the following: manpower, methods,materials and machinery (recommended for manufac-turing); equipment, policies, procedures and people(recommended for administration and service) (http://www.semiconfareast.com/ishikawa.htm).The cause-and-effect diagram is also known as the
fishbone diagram because it was drawn to resemble theskeleton of a fish, with the main causal categories drawnas ‘bones’ attached to the spine of the fish (http://www.isixsigma.com/tt/cause_and_effect/).Cause-and-effect diagrams can also be drawn as tree
diagrams, resembling a tree turned on its side. From a
IncorrectLabeledProduct
Personnel Methods
Machinery Materials
No LabelingControl Plan
Bad ManagementNo Labeled Product
Control Plan Bad Management
IncompleteTraining Procedures
Bad Management
Low FundingIncomplete
Review Procedures
Bad ManagementIncomplete Corrective And Preventve Actions
Inadequate Training
IncorrectLabels
Bad Management
Insufficient Training
Low Funding
Product changeDuring the procedure
No DetectionControl Plan
Bad Management
Unsuitable Labeling Materials
Unreliable Suppliers
Bad Management
Unsuitable Control Equipment
Bad ManagementLow Funding
Inadequate or IncompleteMachinery Equipment
Bad ManagementLow Funding
Poor Maintenance ofLabeling Machines
Bad Management
Infrequent Validation
Low Funding
Low Funding
Old MachineryNon-replaced
Machinery
Bad Management
Low Funding
No Stuff Cooperation
Insufficient Training
Incomplete Staff Training
Low Funding
Bad ManagementLow Funding
Unreliable SupplierInadequate
Quality Control
No GMP Application
Figure 5 Cause-and-effect diagram for packing – CCP 5 (incorrect labelled product).
Failure analysis in octopus processing I. S. Arvanitoyannis and T. H. Varzakas 85
� 2008 The Authors. Journal compilation � 2008 Institute of Food Science and Technology International Journal of Food Science and Technology 2009

single outcome or trunk, branches extend that representmajor categories of inputs or causes that create thatsingle outcome. These large branches then lead tosmaller and smaller branches of causes all the waydown to twigs at the ends. The tree structure has anadvantage over the fishbone-style diagram. As a fish-bone diagram becomes more and more complex, itbecomes difficult to find and compare items that are ofthe same distance from the effect because they aredispersed over the diagram. With the tree structure, allitems on the same causal level are aligned vertically(http://www.saferpak.com/cause_effect.htm).Ishikawa diagrams have been drawn for the different
CCPs. Figure 1 depicts the cause-and-effect diagram forraw material cephalopod reception – CCP 1 (defectiveproducts). Figure 2 shows the cause-and-effect diagramfor freezing & frozen storage – CCP 2 (decomposedfrozen raw materials). Figure 3 shows the cause-and-effect diagram for raw material storage – CCP 3(scombrotoxin presence in final product). Figure 4shows the cause-and-effect diagram for butcher-ing ⁄packaging – CCP 4 (chemically contaminatedproduct). Figure 5 depicts the cause-and-effect diagram
for packing– CCP 5 (incorrect labelled product) andfinally Fig. 6 depicts the cause-and-effect diagram forstorage in cans (mechanical) – CCP 6 (productscontaining foreign matter).
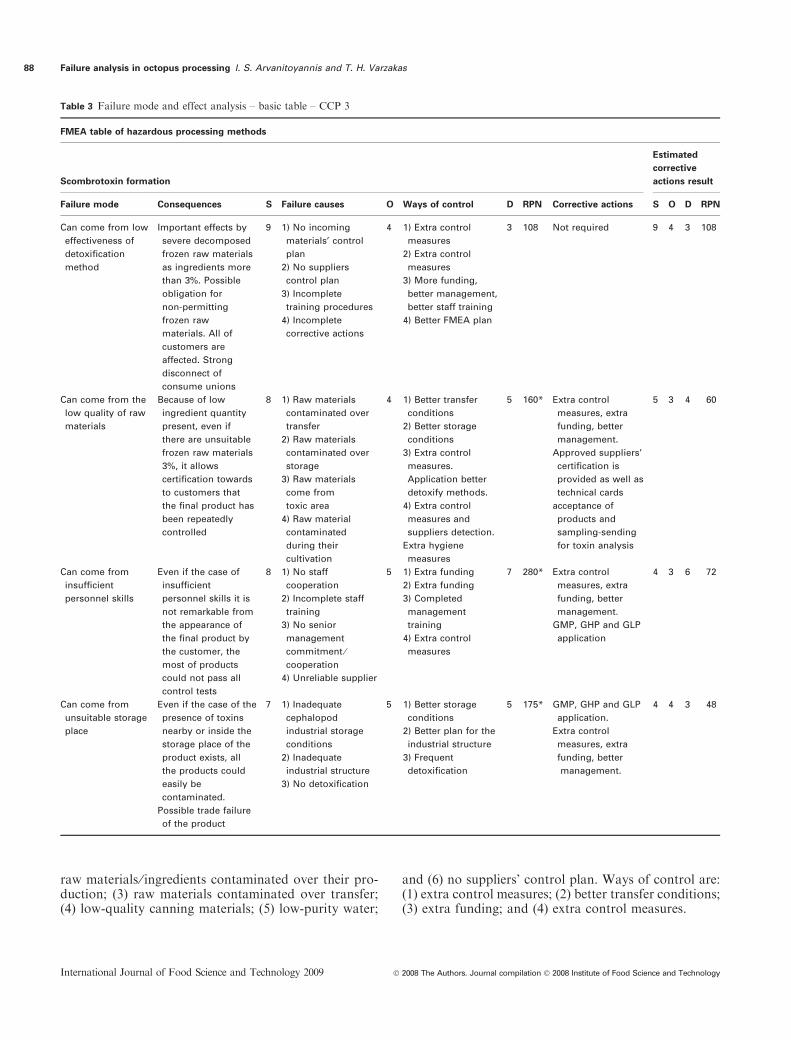
Mollusk processing line
Table 1 shows the FMEA – basic table for CCP 1(cephalopods reception). Table 2 shows the FMEA –basic table for CCP 3 (scombrotoxin formation).Causes of failure are the following: (1) no incomingmaterials’ control plan; (2) no suppliers’ control plan;(3) incomplete training procedures; and (4) incompletecorrective actions. Ways of control are the following:(1) extra control measures; (2) more funding, bettermanagement and better staff training; and (3) betterFMEA plan.Table 3 shows the FMEA for CCP 4 (chemically
contaminated product). Causes of failure are thefollowing: (1) raw materials ⁄ ingredients contami-nated over their production; (2) raw materials ⁄ ingre-dients contaminated over transfer; and (3) rawmaterials obtained from contaminated area. Ways of
ProductsContaining
Foreign Materials
Personnel InsufficientControl Methods
MachineryMaterials
No incoming MaterialsControl Plan
Bad Management
IncompleteTraining Procedures
Bad Management
Low FundingIncomplete Review
Procedures
Bad Management
Incomplete CorrectiveAnd Preventive Actions
Inadequate Training
Ingredient contain Objectionable Matter
Unreliable Suppliers
Bad Management
Low Funding Product Include Low Quality Raw Material
Low Funding
Low Purity of Water
Low Funding
Low Quality ofCanning Materials
Unreliable Suppliers
Bad Management
Insufficient Recall Processes
Of Non- conformed
No Staff Cooperation
Low Funding
Pure Staff Hygiene
Workers Habits
Inadequate TrainingUnreliable Supplier
No GHP, GMP application
Inadequate Quality Control
Insufficient Staff Training
Bad Management
UnsuitableControl Equipment
Low Funding
Bad Management
Non CerrtifiedMachinery
Unreliable Suppliers
Inadequate or IncompleteMachinery Equipment
Bad Management
Low Funding
Pure Maintenanceof Machinery
Infrequent Control
Bad Management
Incomplete Staff Training
Low Funding
Figure 6 Cause-and-effect diagram for storage in cans (mechanical) – CCP 6 (products containing foreign matter).
Failure analysis in octopus processing I. S. Arvanitoyannis and T. H. Varzakas86
International Journal of Food Science and Technology 2009 � 2008 The Authors. Journal compilation � 2008 Institute of Food Science and Technology

control are: (1) better workers’ training; (2) extracontrol and detection measures; and (3) bettermanagement.
Table 4 shows the FMEA for CCP 6 (productcontains foreign matter). Causes of failure are thefollowing: (1) no incoming material’s control plan; (2)
Table 2 Failure mode and effect analysis – basic table – CCP 2
FMEA table of hazardous processing methods
Decomposed frozen raw materials
Estimated
corrective
actions
result
Failure mode Consequences S Failure causes O Ways of control D RPN Corrective actions S O D RPN
Can come from
a possible
malfunction
of the freezer
Because of the high
technique control this
case could be impossible
for the most of the
products. So that it isn’t
a noticeable point
3 1) Unsuitable control
equipment
2) Poor maintenance
3) Insufficient
personnel skills
4) Insufficient use
5) Old machinery
6) Infrequent control
of the freezer
5 1) More funding,
better management
2) Frequent validation
3) Completed staff
training
4) Completed staff
training, more funding
5) More funding,
better management
6) Frequent control
4 60 Not required 3 5 4 60
Can come from
the low quality
of raw
materials
Because of low ingredient
quantity present, even if
there are unsuitable
frozen raw materials
1%, it allows
certification towards to
customers that the final
product has been
repeatedly controlled
2 1) Unreliable
suppliers
2) Raw materials
decomposed
over transfer
3) Bad maintenance
of frozen raw
materials
4) High quantity of
parasites or toxins
5 1) Extra control
measures
2) Better inspection
3) Keeping of raw
materials in cool and
shady place
4) Extra hygiene
measures and staff
training
3 30 Not required 2 5 3 30
Can come from
insufficient
personnel
skills
Even if the case of
insufficient
personnel skills it is not
remarkable from the
appearance of the final
product
by the customer,
the most of
products couldn’t
pass all
control tests.
7 1) No Staff
cooperation
2) Incomplete staff
training
3) No senior
management
commitment ⁄cooperation
4) Unreliable supplier
6 1) Extra funding
2) Extra funding
3) Completed
management training
4) Extra control
measures
7 294* Extra control
measures, extra
funding, better
management.
approved supplier’s
certification is
provided as well
as technical cards
4 5 4 80
Can come from
the low quality
of the freezing
method
Important effects by
decomposed frozen raw
materials
as ingredients more
than 30%.
Possible obligation for
non-permitting
frozen raw materials. All
of customers
are affected. Strong
disconnect of
consume unions.
Possible trade
failure of product
8 1) Low purity of water
for the freezer
2) Insufficient use of
the freezing method
3) Inadequate quality
control
4) No incoming
material’s
control plan
5) No suppliers
control plan
6) Incomplete
corrective and
preventive actions
5 1) Extra control
measures
2) Completed Staff
Training, More
funding
3) Extra control
measures
4) >>
5) >>
6)>>
6 240* Extra control
measures, Extra
Funding, Better
management.
Approved
supplier’s
certification is
provided as
well as
Technical Cards
4 5 4 80
*When the RPN is over 130, corrective action is required.
Failure analysis in octopus processing I. S. Arvanitoyannis and T. H. Varzakas 87
� 2008 The Authors. Journal compilation � 2008 Institute of Food Science and Technology International Journal of Food Science and Technology 2009
raw materials ⁄ ingredients contaminated over their pro-duction; (3) raw materials contaminated over transfer;(4) low-quality canning materials; (5) low-purity water;
and (6) no suppliers’ control plan. Ways of control are:(1) extra control measures; (2) better transfer conditions;(3) extra funding; and (4) extra control measures.
Table 3 Failure mode and effect analysis – basic table – CCP 3
FMEA table of hazardous processing methods
Scombrotoxin formation
Estimated
corrective
actions result
Failure mode Consequences S Failure causes O Ways of control D RPN Corrective actions S O D RPN
Can come from low
effectiveness of
detoxification
method
Important effects by
severe decomposed
frozen raw materials
as ingredients more
than 3%. Possible
obligation for
non-permitting
frozen raw
materials. All of
customers are
affected. Strong
disconnect of
consume unions
9 1) No incoming
materials’ control
plan
2) No suppliers
control plan
3) Incomplete
training procedures
4) Incomplete
corrective actions
4 1) Extra control
measures
2) Extra control
measures
3) More funding,
better management,
better staff training
4) Better FMEA plan
3 108 Not required 9 4 3 108
Can come from the
low quality of raw
materials
Because of low
ingredient quantity
present, even if
there are unsuitable
frozen raw materials
3%, it allows
certification towards
to customers that
the final product has
been repeatedly
controlled
8 1) Raw materials
contaminated over
transfer
2) Raw materials
contaminated over
storage
3) Raw materials
come from
toxic area
4) Raw material
contaminated
during their
cultivation
4 1) Better transfer
conditions
2) Better storage
conditions
3) Extra control
measures.
Application better
detoxify methods.
4) Extra control
measures and
suppliers detection.
Extra hygiene
measures
5 160* Extra control
measures, extra
funding, better
management.
Approved suppliers’
certification is
provided as well as
technical cards
acceptance of
products and
sampling-sending
for toxin analysis
5 3 4 60
Can come from
insufficient
personnel skills
Even if the case of
insufficient
personnel skills it is
not remarkable from
the appearance of
the final product by
the customer, the
most of products
could not pass all
control tests
8 1) No staff
cooperation
2) Incomplete staff
training
3) No senior
management
commitment ⁄cooperation
4) Unreliable supplier
5 1) Extra funding
2) Extra funding
3) Completed
management
training
4) Extra control
measures
7 280* Extra control
measures, extra
funding, better
management.
GMP, GHP and GLP
application
4 3 6 72
Can come from
unsuitable storage
place
Even if the case of the
presence of toxins
nearby or inside the
storage place of the
product exists, all
the products could
easily be
contaminated.
Possible trade failure
of the product
7 1) Inadequate
cephalopod
industrial storage
conditions
2) Inadequate
industrial structure
3) No detoxification
5 1) Better storage
conditions
2) Better plan for the
industrial structure
3) Frequent
detoxification
5 175* GMP, GHP and GLP
application.
Extra control
measures, extra
funding, better
management.
4 4 3 48
Failure analysis in octopus processing I. S. Arvanitoyannis and T. H. Varzakas88
International Journal of Food Science and Technology 2009 � 2008 The Authors. Journal compilation � 2008 Institute of Food Science and Technology

Table 4 Failure mode and effect analysis – basic table – CCP 4
FMEA table of hazardous processing methods
Chemically contaminated product
Estimated
corrective
actions result
Failure mode Consequences S Failure causes O Ways of control D RPN Corrective actions S O D RPN
Can come from
unsuitable raw
materials
Because of the very
important effect by
several chemically
contaminated raw
materials, more than
5%, the use of those
products is not
permitted. They are
very dangerous
products
9 1) Raw materials ⁄ingredients
contaminated
over their
production
2) Raw materials ⁄ingredients
contaminated
over transfer
3) Raw materials
come from
contaminated area
7 1) Better workers
training
2) Extra control and
detection measures
3) Better
management
6 378* GMP, GHP and GLP
application.
Extra control
measures, Extra
Funding, Better
management.
6 4 4 96
Can come from
Insufficient
Personnel Skills
Even if the case of
Insufficient
personnel skills it is
not remarkable from
the appearance of
the final product by
the customer, the
most of products
couldn’t pass all
control tests.
5 1) No Staff
Cooperation
2) Incomplete Staff
training
3) No Senior
Management
Commitment ⁄Cooperation
4) Unreliable Supplier
7 1) Extra funding
2) Extra funding
3) Completed
management
training
4) Extra control
measures
6 210 GMP, GHP and GLP
application.
Better management
3 3 4 36
Can come from the
low effective
chemical clearing
method
Important effect due
to severe chemical
presence in
ingredient greater
than 0.5%. Possible
obligation for
special labelling for
non-permitting
chemicals. Large
part of customers
affected. Strong
disconnect of
environmental
organisations and
consumer unions.
Possible trade
failure of product
8 1) No incoming
material control plan
2) No suppliers’
control plan
3) Incomplete
training procedures
4) Incomplete
corrective actions
4 1) Extra control
measures
2) >>
3) More funding,
better management,
better staff training
4) Better FMEA plan
3 96 Not required 8 4 3 96
Can come from a
possible
malfunction of
machineries
Because of the high
technique control
this case could be
impossible for the
most of the
products. So that it
is not a noticeable
point (Seixas et al.,
2005)
5 1) Unsuitable control
equipment
2) Poor maintenance
3) Insufficient
personnel skills
4) Insufficient use
5) Old machinery
4 1) More funding,
better management
2) Frequent validation
3) Completed staff
training
4) Completed staff
training, more
funding
5) More funding,
better management
4 80 Not required 5 4 4 80
*When the RPN is over 130, corrective action is required.
Failure analysis in octopus processing I. S. Arvanitoyannis and T. H. Varzakas 89
� 2008 The Authors. Journal compilation � 2008 Institute of Food Science and Technology International Journal of Food Science and Technology 2009

Table 5 shows the FMEA for CCP 2 (decomposedfrozen raw materials). Causes of failure are the follow-ing: (1) unsuitable control equipment; (2) poor main-tenance; (3) insufficient personnel skills; (4) insufficientuse; (5) old machinery; and (6) infrequent control of thefreezer. Ways of control are through: (1) more funding,better management; (2) frequent validation; (3) com-
pleted staff training; (4) completed staff training, morefunding; (5) more funding, better management; and (6)frequent control.Table 6 shows the FMEA for CCP 5 (incorrectly
labelled product). Causes of failure are the following:(1) unsuitable control equipment; (2) poor main-tenance; (3) insufficient personnel skills; (4) insufficient
Table 5 Failure mode and effect analysis – basic table – CCP 5
FMEA table of hazardous processing methods
Incorrectly labelled product
Estimated
corrective
actions result
Failure mode Consequences S Failure causes O Ways of control D RPN Corrective actions S O D RPN
Can come from a
possible
malfunction of
machineries
Same customers may
have allergies to
some ingredients of
this product. So, it is
important to stick
the correct labels,
otherwise, this could
be dangerous or
with undesirable
effects to customers.
6 1) Unsuitable control
equipment
2) Poor maintenance
3) Insufficient
personnel skills
4) Insufficient use
5) Old machinery
5 1) More funding,
better management
2) Frequent validation
3) Completed staff
training
4) Completed staff
training, more
funding
5) More funding,
better management
6) Frequent
machineries control
2 60 Not required 6 5 2 60
Can come from
insufficient
personnel skills
Even if the case of
insufficient
personnel skills it is
not remarkable from
the appearance of
the final product by
the customer, the
most of products
could not pass all
control tests
6 1) No Staff
cooperation
2) Incomplete staff
training
3) No senior
management
commitment ⁄cooperation
4) Unreliable supplier
6 1) Extra funding
2) Extra funding
3) Completed
management
training
4) Extra control
measures
7 252* GMP, GHP and GLP
application.
3 4 4 48
Can come from the
low effective
labelling
control method
Some customers will
not take this product
again. With the pass
of time it will be the
most unreliable
trade. Although, it is
not so important
and dangerous
factor for trade
failure
4 1) No labels control
plan
2) Incomplete
training procedures
3) Incomplete review
procedures
4) Incomplete
corrective and
preventive actions
3 1) Extra control measures
2) Extra training procedures
3) Extra control measures
4) Better management
3 36 Not required 4 3 3 36
Can come from
unsuitable
materials
Because of the many
controls during the
procedure of the
product some
incorrect labelling
materials will not
affect so mach the
customers
2 1) Incorrect labels
2) Labels change
during the retail
3) Unsuitable
labelling materials
3 1) Extra control
measures
2) Stronger labelling
materials
3) Extra funding
3 18 Not required 2 3 3 18
*When the RPN is over 130, corrective action is required.
Failure analysis in octopus processing I. S. Arvanitoyannis and T. H. Varzakas90
International Journal of Food Science and Technology 2009 � 2008 The Authors. Journal compilation � 2008 Institute of Food Science and Technology

use; and (5) old machinery. Ways of control are thefollowing: (1) more funding, better management; (2)frequent validation; (3) completed staff training;
(4) completed staff training, more funding; (5)more funding, better management; and (6) frequentmachinery control.
Table 6 Failure mode and effect analysis – basic table – CCP 6
FMEA table of hazardous processing methods
Product contains foreign matter
Estimated
corrective
actions result
Failure mode Consequences S Failure causes O Ways of control D RPN Corrective actions S O D RPN
Can come from the
low quality of raw
materials
Because of low
ingredient quantity
present, even if
there are foreign
materials 1%, it
allows certification
towards to
customers that the
final product has
been repeatedly
controlled
5 1) No incoming
material’s control
plan
2) Raw materials ⁄ingredients
contaminated over
their production
3) Raw materials
contaminated over
transfer
4) Low-quality
canning materials
5) Low-purity water
6) No suppliers’
control plan
4 1) Extra control
measures
2)>>
3) Better transfer
conditions
4) Extra funding
5) >>
6) Extra control
measures
3 60 Not required 5 4 3 60
Can come from a
possible
malfunction of
machineries
Because of the high
technique control
this case could be
impossible for the
most of the
products. So that it
is not a noticeable
point
3 1) Unsuitable control
equipment
2) Poor maintenance
3) Insufficient
personnel skills
4) Insufficient use
5) Old machinery
3 1) More funding,
better management
2) Frequent validation
3) Completed
staff training
4) Completed staff
training, more
funding
5) More funding,
better management
6) Frequent
machinery control
2 18 Not required 3 3 2 18
Can come from
insufficient
personnel skills
Even if the case of
insufficient
personnel skills it is
not remarkable from
the appearance of
the final product by
the customer, the
most of products
could not pass all
control tests
5 1) No staff
cooperation
2) Incomplete staff
training
3) No senior
management
Commitment ⁄cooperation
4) Unreliable supplier
7 1) Extra funding
2) Extra funding
3) Completed
management
training
4) Extra control
measures
7 245* GMP, GHP and GLP
application.
3 4 5 60
Can come from the
low effective control
method
Because of the high
technique control
this case could be
impossible for the
most of the
products. So that it
is not a noticeable
point
2 1) No incoming
material control plan
2) No suppliers’
control plan
3) Incomplete
training procedures
4) Incomplete
corrective actions
4 1) Extra control
measures
2) More funding,
better management,
better staff training
3) Better FMEA plan
3 24 Not required 2 4 3 24
*When the RPN is over 130, corrective action is required.
Failure analysis in octopus processing I. S. Arvanitoyannis and T. H. Varzakas 91
� 2008 The Authors. Journal compilation � 2008 Institute of Food Science and Technology International Journal of Food Science and Technology 2009

Conclusions
The main emphasis was put on the quantification of riskassessment by determining the RPN per identifiedprocessing hazard. Chemically contaminated product,decomposed raw materials, scombrotoxin presence infinal product, incorrectly labelled product, storage incans (foreign matter) and defective products were theprocesses identified as those with the highest RPN (378,294, 280, 252, 245 and 144 respectively) and correctiveactions were undertaken. Following the application ofcorrective actions, a second calculation of RPN valueswas carried out leading to considerably lower values(below the upper acceptable limit of 130). It is note-worthy that the application of Ishikawa (cause-and-effect or tree diagram) led to converging results, thuscorroborating the validity of conclusions derived fromrisk assessment and FMEA. Therefore, the incorpora-tion of FMEA analysis within the ISO2200 system of anoctopus-processing industry is considered imperative.
References
Arvanitoyannis, I.S. & Tzouros, N.H. (2006). ISO 22000, The NewFood Quality and Safety Standard. Athens: Stamoulis S.A.
FAO, 2001. Fish and Fisheries Products. Food Outlook 1, February,vol. 11. Rome: FAO ⁄GIEWS.
Kececioglu, D. (1991). Reliability Engineering Handbook, vol. 2.Englewood Cliffs, NJ: Prentice-Hall Inc .
Kreuzer, R. (1984). Cephalopods: Handling, Processing and Products.Pp. 108. FAO Fish. Tech. Pap. 254
Miliou, H., Fintikaki, M., Kountouris, T. & Verriopoulos, G. (2005).Combined effects of temperature and body weight on growth andprotein utilization of the common octopus, Octopus vulgaris.Aquaculture, 249, 245–256.
SAE Aerospace Recommended Practice ARP5580 (2001). Recom-mended Failure Modes and Effects Analysis (FMEA) Practices forNon-Automobile Applications. Warrendale, PA: SAE International.
Seixas, S., Bustamante, P. & Pierce, G.J. (2005). Interannual patternsof variation in concentrations of trace elements in arms of Octopusvulgaris. Chemosphere, 59, 1113–1124.
Stamatis, D.H. (1995). Failure Mode and Effect Analysis: FMEA fromTheory to Execution. Milwaukee, WI: American Society for Quality(ASQ).
Vaz-Pires, P, Seixas, P. & Barbosa, A. (2004). Aquaculture potential ofthe common octopus (Octopus vulgaris Cuvier, 1797): a review.Aquaculture, 238, 221–238.
Internet sources
• http://www.npd-solutions.com/pdforum.html
• http://www.fmeainfocentre.com/
• http://www.fmeainfocentre.com/download/umich.pdf
• http://www.npd-solutions.com/fmea.html
• http://www.informatik.uni-bremen.de/uniform/gdpa_d/
methods/m-fmea.htm
• http://www.relexsoftware.com/products/fmeafmeca.asp
• http://www.ivt.ntnu.no/bat/bm/buildphys/proceedings/
68_Nielsen.pdf
• http://mot.vuse.vanderbilt.edu/mt322/Ishikawa.htm
• http://www.isixsigma.com/tt/cause_and_effect/
• http://www.saferpak.com/cause_effect.htm
• http://www.semiconfareast.com/ishikawa.htm
• http://mielsvr2.ecs.umass.edu/virtual_econ/module2/
Cause_effect.htm
• http://animaldiversity.ummz.umich.edu/site/resources/
Grzimek_inverts/Cephalopoda/Octopus_vulgaris.jpg/
view.html
• http://nsgl.gso.uri.edu/flsgp/flsgph01002.pdf
• http://www.afdo.org/afdo/upload/Sushi.pdf
• http://www.fao.org/docrep/meeting/008/j1682e/
j1682e04.htm
• http://www.codexalimentarius.net/download/report/
633/al28_18e.pdf
• http://europa.eu.int/comm/food/fvo/act_getPDF.
cfm?PDF_ID = 4573
• http://www.fish.wa.gov.au/docs/pub/SeafoodRetailers-
Guide/SeafoodRetailersGuidlelines.pdf
• http://www.nhmrc.gov.au/publications/_files/eh38.pdf
• http://www-nehc.med.navy.mil/downloads/prevmed/
MILHBK3006A.pdf
• http://www.e-haccp.org.uk/previousconference/
Conference_proceedings1.pdf
• http://www.blackwell-synergy.com/links/doi/10.1046/
j.1471-5740.2002.00038.x/pdf?cookieSet=1
Failure analysis in octopus processing I. S. Arvanitoyannis and T. H. Varzakas92
International Journal of Food Science and Technology 2009 � 2008 The Authors. Journal compilation � 2008 Institute of Food Science and Technology


![Biological and molecular diagnosis of three different symptoms of TYLCV-disease [tomato yellow leaf curl virus] in open field](https://static.fdokumen.com/doc/165x107/63153b705cba183dbf07e655/biological-and-molecular-diagnosis-of-three-different-symptoms-of-tylcv-disease.jpg)