Application for Zoning Ordinance Amendment for Special Use ...
709
Application for Zoning Ordinance Amendment for Special Use District and Height Variance Torrance Wind Projects Cowboy Mesa LLC, Duran Mesa LLC, Red Cloud Wind LLC, Tecolote Wind LLC, Viento Loco LLC Project No. 101335 Final 8/8/2018
-
Upload
khangminh22 -
Category
Documents
-
view
3 -
download
0
Transcript of Application for Zoning Ordinance Amendment for Special Use ...

Application for Zoning Ordinance Amendment for Special Use District and
Height Variance
Torrance Wind Projects
Cowboy Mesa LLC, Duran Mesa LLC, Red Cloud Wind LLC, Tecolote Wind LLC, Viento Loco LLC
Project No. 101335
Final 8/8/2018

Application for Zoning Ordinance Amendment for Special Use District and Height Variance
prepared for
Torrance Wind Projects Cowboy Mesa LLC, Duran Mesa LLC, Red Cloud Wind LLC,
Tecolote Wind LLC, Viento Loco LLC Torrance County, NM
Project No. 101335
Final 8/8/2018
prepared by
Burns & McDonnell Engineering Company, Inc. La Jolla, CA
COPYRIGHT © 2018 BURNS & McDONNELL ENGINEERING COMPANY, INC

Application for Zoning Ordinance Amendment Final Executive Summary
Pattern Energy LP ES-1 Burns & McDonnell
Torrance Wind Projects Application for Zoning Ordinance Amendment for Special Use District and Height
Variance Project No. 101335
Torrance County, New Mexico
Executive Summary
This is a request by Cowboy Mesa LLC, Duran Mesa LLC, Red Cloud Wind LLC, Tecolote Wind LLC,
and Viento Loco LLC (Applicants), for a Zoning Ordinance Amendment for a Special Use District (SUD)
and Height Variance to develop the proposed Cowboy Mesa, Duran Mesa, Red Cloud Wind, Tecolote
Wind, and Viento Loco Wind Projects (“Torrance Wind Projects” or “Projects”) within Torrance County,
New Mexico. The Torrance Wind Projects are part of the larger 2,200 megawatts (MW) Corona Wind
Projects, which cover approximately 300,000 acres of private and state land within Torrance, Lincoln, and
Guadalupe Counties, which are being developed by Ancho Wind LLC, Cowboy Mesa LLC, Duran Mesa
LLC, Red Cloud Wind LLC, Tecolote Wind LLC, and Viento Loco LLC, (collectively, the Corona Wind
Companies). This Application is limited to the Projects’ area within approximately 131,000 acres of
private and state land within Torrance County, New Mexico, spanning north and south of State Highway
54 (the SUD). Wind turbine and additional infrastructure locations discussed and depicted in this
application and the exhibits are preliminary and may be altered based upon the results of continued
collection and analysis of meteorological, environmental, engineering, and design data. The Torrance
Wind Projects would be Torrance County’s fourth built utility-scale wind power facility.
The development of these wind energy facilities conforms to applicable goals and objectives of the
Zoning Ordinance and Comprehensive Land Use Plan of Torrance County (Tables ES-1 and ES-2).
Development of these Projects would contribute towards the goals of the State of New Mexico, the New
Mexico Public Regulation Commission, public utilities, and the Western Governors’ Association to
diversify the state’s power infrastructure, generate clean energy from local renewable sources, and
provide long-term rural economic development to the region and Torrance County.

Application for Zoning Ordinance Amendment Final Executive Summary
Pattern Energy LP ES-2 Burns & McDonnell
Table ES-1: Conformance with Torrance County Zoning Ordinance
Zoning Ordinance Goals Torrance Wind Projects’ Goal Conformance Descriptiona
Promote health and the general welfare of the County
As described throughout this application, wind energy facilities are safe when sited and operated in accordance with all applicable county, state, and federal standards and requirements. The infrastructure proposed for the Projects is proven reliable, is held to the highest international standards of quality, and would be operated and maintained by a highly trained, locally based operations team. As the owner of the Torrance Wind Projects, Pattern Development holds itself to a high standard with regard to health and safety, and contractors for Pattern Development are also required to meet strict safety qualifications. Wind creates clean energy from a non-depleting, local energy source that consumes little water, does not discharge water, has no air emissions, and emits no odors.
Secure safety from fire, flood, and other dangers
The Projects would comply with all rules and regulations administered by the federal, state, and local land management agencies concerning the use, prevention, and suppression of fires, including any fire prevention orders that may be in effect at the time of the construction, operation, or maintenance activity. The Projects would work with the departments to ensure the safety of the firefighters, landowners, neighbors, livestock, and other users of the land. The Projects facilities would be set back from channel banks to avoid impacts (such as channel alteration and flow modification) and, therefore, impacts to floodplains would be low.
Protect local water resources
The Projects would have a very low impact on local water resources. Water would be required during construction for dust abatement and to mix concrete for turbine foundations. Water for the Projects use would likely be obtained from one or more existing wells within the SUD or the broader Project areas. During operation, turbine blades may be washed to prevent dust build-up. Potable water would be used to service the operations and maintenance (O&M) building.
Facilitate adequate provisions for transportation
The Projects would not impose burdens on County Roads beyond temporary use during construction. New access and service roads on private land would be constructed for the Projects. These roads would remain private and would not require maintenance by Torrance County. The Projects intend to enter into a Road Use agreement with Torrance County to address any use of County roads during construction and operation of the Projects.
Solid waste management
All construction waste including trash and litter, garbage, other solid waste, petroleum products, and other potentially hazardous materials would be removed to a disposal facility authorized to accept such materials weekly.
Facilitate adequate provisions for schools, parks, and other community requirements
The Projects intend to enter into an Industrial Revenue Bond (IRB) and associated Payment in Lieu of Taxes (PILT) agreements with Torrance County and its associated school districts, providing new county and school revenues to support local schools and County services. The Projects would employ up to 100 permanent staff that would live locally, thereby further stimulating the local economy. Local schools have adequate facilities to accommodate the potential increase in new students associated with these positions. Other community services would easily accommodate the limited needs of any new residents brought to the area to support the Projects operations.

Application for Zoning Ordinance Amendment Final Executive Summary
Pattern Energy LP ES-3 Burns & McDonnell
Zoning Ordinance Goals Torrance Wind Projects’ Goal Conformance Descriptiona
Conserve the value of property
Multiple studies and independent analyses have been conducted to analyze the impact of wind farms on neighboring property values in various regions of the U.S. These studies have shown that the presence of a wind farm has no overall adverse effect on residential property values. Additionally, some studies of property sale values have demonstrated an increase in value. Furthermore, the Projects will bring revenue to participating landowners with wind turbines and associated infrastructure on their properties.
Compatible development of land and other natural resources
Wind energy is a compatible land use with ranching and other agriculture activities. Typically, less than two percent of the land within the Projects areas would be used by turbines, service roads, and other infrastructure following construction. Cattle would still be able to graze at the base of the turbines, and wildlife would be able to use the area around the turbines.
Wind energy development provides economic diversification for ranchers; in many cases, wind energy development helps provide an alternative to selling their land or subdividing it, thus protecting a rural way of life.
(a) See also Section 8 of this application
Table ES-2: Conformance with Torrance County Comprehensive Land Use Plan
Comprehensive Land Use Plan Goal Torrance Wind Projects’ Goal Conformance
Descriptiona Goal A, Objective 2: Preserve and protect land for farming and ranching
Wind energy development is a compatible land use with ranching and other agricultural activities. Post-construction, typically less than two percent of the Projects areas would be occupied by the turbines, service roads, O&M facility, and Projects substations. Cattle would remain able to graze up to the base of the turbines, and wildlife would be able to use the area around the turbines. Throughout the U.S., wind energy development has enabled ranchers and farmers to diversify the economic returns from their lands and reinvest in ranching and farming activities, helping to preserve a rural way of life and providing a viable alternative to subdividing or selling their land.

Application for Zoning Ordinance Amendment Final Executive Summary
Pattern Energy LP ES-4 Burns & McDonnell
Comprehensive Land Use Plan Goal Torrance Wind Projects’ Goal Conformance
Descriptiona Goal B: Plan and guide development in the County in a manner which encourages optimum efficiency and cost- effectiveness in the delivery of infrastructure and County services
The Projects would be designed as a self-sufficient development, placing minimal demand on County services. Unlike many other types of developments, wind energy facilities make significant direct tax payments, stimulate the local economy, and create new jobs; all while placing minimal demand on existing infrastructure and services. Few Torrance County roads would be utilized by the Projects, and most access roads would be newly constructed on private land. The Applicants would work with the Torrance County Road Department to obtain necessary approvals for use of County roads. As previously described, although the Projects would place minimal demand on County services, the Applicants would also work Torrance County emergency management services for this development.
Goal F, Objective 1: Promote the Estancia Basin as the prime location for new, but low water consumptive agriculture and agri-business
Wind energy facilities harvest the wind, use minimal water post-construction, and generate no emissions or pollutants. Wind energy facilities typically use water during construction for concrete and dust abatement, and during operation for periodic power-washing of turbine blades and facilities at the O&M building. The Projects consume far less water than standard agricultural uses.
Goal F, Objective 2: Preserve and protect grazing and ranching lands from development that is detrimental to existing land use
Wind energy development is highly compatible with grazing and ranching activities, which are the current land uses within the Projects areas. Wind energy development can help by using land in place of other potential uses that could disrupt or impede grazing and ranching activities.

Application for Zoning Ordinance Amendment Final Executive Summary
Pattern Energy LP ES-5 Burns & McDonnell
Comprehensive Land Use Plan Goal Torrance Wind Projects’ Goal Conformance
Descriptiona Goal J: Ensure an adequate supply of quality water for current and future needs of the County
The Projects are anticipated to have a low impact on local water resources. Water would only be required during construction for dust abatement and to mix concrete for turbine foundations. Construction water would likely be obtained from one or more existing wells within the SUD or the broader Projects area. Wind energy also uses minimal water post-construction. During operation, turbine blades would be periodically power-washed to prevent dust build-up. Potable water would be available at the O&M facilities for use by staff. The Projects would provide Torrance County with quality economic development with no negative impact on the current and future water needs of Torrance County.
Goal M, Objective 2: Provide power services to meet the future needs of the County
While energy generated by the Projects would be delivered to the regional electric grid, interconnection and transmission system upgrades for the Projects would enhance the capacity of the overall local and regional electrical transmission systems.
Goal M, Objective 3: Investigate the potential for wind and solar generated power in the County
By issuing the Zoning Ordinance Amendment, Special Use District, and Height Variance, Torrance County would be allowing the Projects to advance to further development stages. Torrance County has supported the Applicants in their analysis of potential wind generated power potential within Torrance County through approval to establish temporary MET towers within the areas where the Projects are anticipated to be developed.
Goal N: Encourage the attraction, retention, and expansion of businesses in order to provide quality jobs for County residents
Wind energy is one of the fastest growing industries across the country and the globe, and the fastest growing energy source in the world. Wind energy projects provide quality jobs, a new source of revenue for ranchers, and an increased local tax base for rural communities. The Projects would generate an estimated 1,186 full time equivalent jobs during construction during the anticipated 2019 to 2020 construction year, and about 94 full-time jobs during operation from 2020 up to 2050, or the life of the Projects.
Application for Zoning Ordinance Amendment Final Executive Summary
Pattern Energy LP ES-6 Burns & McDonnell
Comprehensive Land Use Plan Goal Torrance Wind Projects’ Goal Conformance
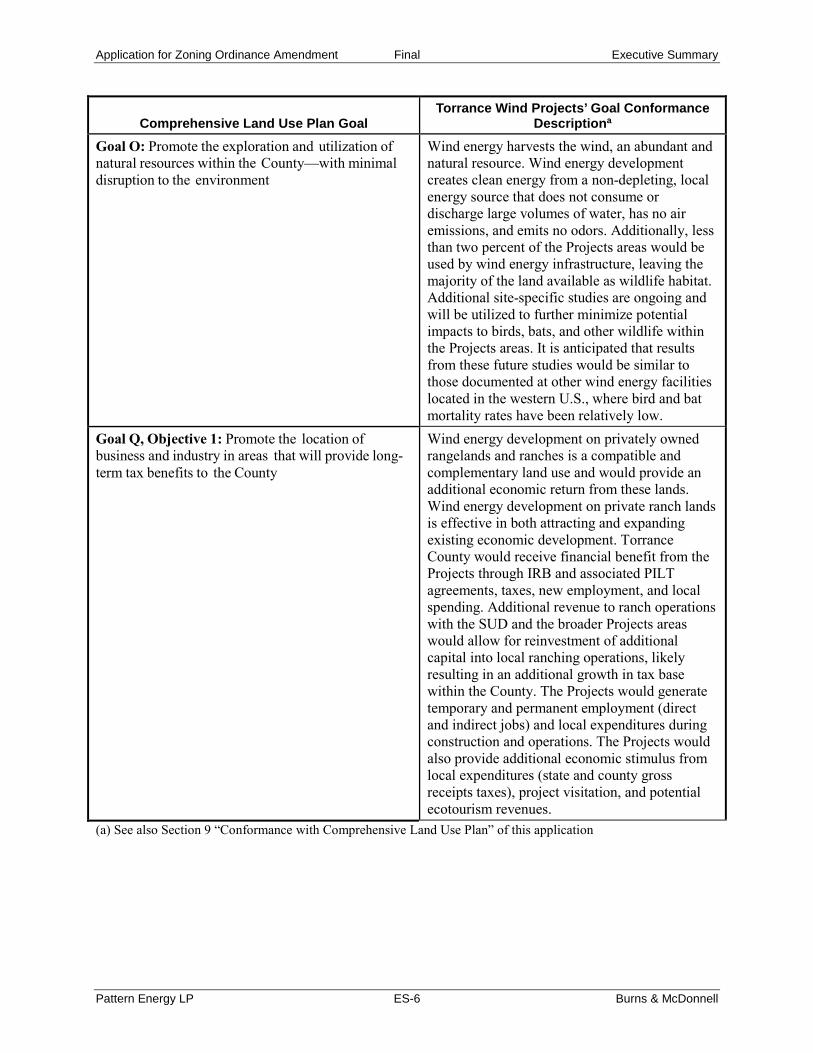
Descriptiona Goal O: Promote the exploration and utilization of natural resources within the County—with minimal disruption to the environment
Wind energy harvests the wind, an abundant and natural resource. Wind energy development creates clean energy from a non-depleting, local energy source that does not consume or discharge large volumes of water, has no air emissions, and emits no odors. Additionally, less than two percent of the Projects areas would be used by wind energy infrastructure, leaving the majority of the land available as wildlife habitat. Additional site-specific studies are ongoing and will be utilized to further minimize potential impacts to birds, bats, and other wildlife within the Projects areas. It is anticipated that results from these future studies would be similar to those documented at other wind energy facilities located in the western U.S., where bird and bat mortality rates have been relatively low.
Goal Q, Objective 1: Promote the location of business and industry in areas that will provide long-term tax benefits to the County
Wind energy development on privately owned rangelands and ranches is a compatible and complementary land use and would provide an additional economic return from these lands. Wind energy development on private ranch lands is effective in both attracting and expanding existing economic development. Torrance County would receive financial benefit from the Projects through IRB and associated PILT agreements, taxes, new employment, and local spending. Additional revenue to ranch operations with the SUD and the broader Projects areas would allow for reinvestment of additional capital into local ranching operations, likely resulting in an additional growth in tax base within the County. The Projects would generate temporary and permanent employment (direct and indirect jobs) and local expenditures during construction and operations. The Projects would also provide additional economic stimulus from local expenditures (state and county gross receipts taxes), project visitation, and potential ecotourism revenues.
(a) See also Section 9 “Conformance with Comprehensive Land Use Plan” of this application
Application for Zoning Ordinance Amendment Final Table of Contents
Pattern Energy LP TOC-1 Burns & McDonnell
TABLE OF CONTENTS
EXECUTIVE SUMMARY Page No.
1.0 INTRODUCTION ............................................................................................... 1-1
2.0 PROJECT DEVELOPER .................................................................................. 2-1 2.1 Development ........................................................................................................ 2-1 2.2 Operations ............................................................................................................ 2-1 2.3 Technologies ........................................................................................................ 2-2
3.0 PROJECTS SITES, LEGAL DESCRIPTION .................................................... 3-1
4.0 LAND ENTITLEMENT ...................................................................................... 4-1
5.0 REQUEST FOR ZONING AMENDMENT ......................................................... 5-1 5.1 Special Use District.............................................................................................. 5-1 5.2 Height Variance ................................................................................................... 5-1
6.0 PROJECT DESCRIPTION ................................................................................ 6-1 6.1 Wind Energy Facilities Description ..................................................................... 6-1 6.2 Site Suitability ...................................................................................................... 6-1
6.2.1 Adequate Wind Resources .................................................................... 6-2 6.2.2 Transmission Access ............................................................................. 6-3 6.2.3 Accessibility .......................................................................................... 6-3 6.2.4 Competitive Economics ........................................................................ 6-3 6.2.5 Rural Location ...................................................................................... 6-4 6.2.6 Communication Interference ................................................................ 6-4 6.2.7 Cultural Resources ................................................................................ 6-4 6.2.8 Environmental ....................................................................................... 6-4
6.3 Project Development Resources .......................................................................... 6-7 6.4 Timeline and Milestones ...................................................................................... 6-8 6.5 Wind Energy ........................................................................................................ 6-9
6.5.1 Electricity Generation ........................................................................... 6-9 6.5.2 Interconnection ..................................................................................... 6-9 6.5.3 Power Market ........................................................................................ 6-9
6.6 Wind Energy Equipment, Infrastructure ............................................................ 6-10 6.6.1 Wind Energy Generation Turbines ..................................................... 6-10 6.6.2 Electrical Collection System and Substations..................................... 6-13 6.6.3 Meteorological Towers ....................................................................... 6-13
6.7 Project Construction........................................................................................... 6-14 6.7.1 Site Reclamation ................................................................................. 6-16 6.7.2 Protection of Private Property and Environmental Resources ............ 6-16

Application for Zoning Ordinance Amendment Final Table of Contents
Pattern Energy LP TOC-2 Burns & McDonnell
6.7.3 Construction Generated Wastes and Wastewater ............................... 6-17 6.7.4 Stormwater, Soil, and Sediment Control ............................................ 6-18 6.7.5 Fencing ................................................................................................ 6-19
6.8 Operation and Maintenance ............................................................................... 6-19 6.8.1 Operation............................................................................................. 6-19 6.8.2 Maintenance ........................................................................................ 6-19
6.9 Lighting and Airspace ........................................................................................ 6-20 6.10 Sound ................................................................................................................. 6-20
7.0 SITE ACCESS ROADS ..................................................................................... 7-1
8.0 CONFORMANCE WITH ZONING ORDINANCE GOALS................................. 8-1 8.1 Conformance With Ordinance..............................................................................8-1 8.2 Conformance With Zoning Ordinance Goals ...................................................... 8-1 8.3 Appropriate Use for Zoning District .................................................................... 8-2
8.3.1 Special Use District............................................................................... 8-2 8.3.2 Height Variance .................................................................................... 8-3
9.0 CONFORMANCE WITH COMPREHENSIVE LAND USE PLAN ..................... 9-1 9.1 GOAL A............................................................................................................... 9-1 9.2 GOAL B ............................................................................................................... 9-1 9.3 GOAL F ............................................................................................................... 9-1 9.4 GOAL J ................................................................................................................ 9-2 9.5 GOAL M .............................................................................................................. 9-2 9.6 GOAL N............................................................................................................... 9-3 9.7 GOAL O............................................................................................................... 9-3 9.8 GOAL Q............................................................................................................... 9-3
10.0 PUBLIC OUTREACH AND CITIZEN PARTICIPATION ................................. 10-1
11.0 SUMMARY ...................................................................................................... 11-1
12.0 CONCLUSION ................................................................................................ 12-1
13.0 APPLICANTS CONTACT INFORMATION ..................................................... 13-1
EXHIBIT A PROJECT OVERVIEW EXHIBIT B RECORDED MEMOS OF LEASE AGREEMENTS EXHIBIT C LAND COVER OF THE PROJECT AREA EXHIBIT D ASSESSORS PARCEL MAPS EXHIBIT E LEGAL LAND DESCRIPTIONS EXHIBIT F BOUNDARIES AND FACILITIES MAP EXHIBIT G METEOROLOGICAL TOWER INFORMATION EXHIBIT H NEW MEXICO WIND RESOURCE MAP

Application for Zoning Ordinance Amendment Final Table of Contents
Pattern Energy LP TOC-3 Burns & McDonnell
EXHIBIT I EXISTING AND PROPOSED TRANSMISSION FACILITIES MAP EXHIBIT J PROJECT VISBILITY MAP EXHIBIT K CULTURAL RESOURCES DATA EXHIBIT L BIOLOGICAL EVALUATION EXHIBIT M AVIAN POWER LINE INTERACTION COMMITTEE GUIDELINES
AND WIND ENERGY GUIDELINES EXHIBIT N SIEMENS SG 2.7-129 WIND TURBINE BROCHURE EXHIBIT O TURBINE, TOWER AND FOUNDATION SPECIFICATIONS EXHIBIT P PROJECT SENSITIVITIES MAP EXHIBIT Q TORRANCE COUNTY ZONING MAP EXHIBIT R VISUAL SIMULATIONS

Application for Zoning Ordinance Amendment Final Table of Contents
Pattern Energy LP TOC-4 Burns & McDonnell
LIST OF TABLES
Page No.
Table 6-1: Summary of Environmental Review ...................................................................... 6-4

Application for Zoning Ordinance Amendment Final List of Abbreviations
Pattern Energy LP i Burns & McDonnell
LIST OF ABBREVIATIONS
Abbreviation Term/Phrase/Name
AC alternating current
AFB Air Force Base
APLIC Avian Power Line Interaction Committee
Burns & McDonnell Burns & McDonnell Engineering Company, Inc.
DoD Department of Defense
FAA Federal Aviation Administration
IRB Industrial Revenue Bond
kV kilovolt(s)
MET Meteorological
mph mile(s) per hour
MW megawatt(s)
NESC National Electrical Safety Code Interpretations
NMDGF New Mexico Department of Game and Fish
NPDES National Pollution Discharge Elimination System
NRCS National Resource Conservation Service
NTIA National Telecommunications and Information Administration
OEM Original Equipment Manufacturer
O&M operations and maintenance
OSHA U.S. Occupational Safety and Health Administration
PILT Payment in Lieu of Taxes
Project Torrance Wind Projects

Application for Zoning Ordinance Amendment Final List of Abbreviations
Pattern Energy LP ii Burns & McDonnell
Abbreviation Term/Phrase/Name
PV Photovoltaic
ROW right-of-way
rpm revolution(s) per minute
SCADA Supervisory Control and Data Acquisition
SH State Highway
SODAR Sonic Detection and Ranging
SUD Special Use District
SWPPP Stormwater Pollution Prevention Plan
USFWS U.S. Fish and Wildlife Service
WEGs Wind Energy Guidelines
WTG wind turbine generators

Application for Zoning Ordinance Amendment Final Introduction
Pattern Energy LP 1-1 Burns & McDonnell
1.0 INTRODUCTION
Cowboy Mesa LLC, Duran Mesa LLC, Red Cloud Wind LLC, Tecolote Wind LLC, and Viento Loco
LLC are seeking a Zoning Ordinance Amendment for a Special Use District (SUD) and Height Variance
for development of the proposed portion of the Torrance Wind Projects (Projects) located in Torrance
County, approximately 0.08 miles east of the community of Duran, New Mexico. The Projects areas also
cover portions of neighboring Lincoln County and Guadalupe County. See Exhibit A, Projects Overview.
As planned, the Projects would include up to 600 wind turbines (within Torrance County) that are
generally aligned in north- to south-oriented rows spanning approximately 131,000 acres (within
Torrance County) of privately owned land north and south of State Highway (SH) 54 (see Exhibit A,
Projects Overview). Final locations of the proposed wind turbines would be dependent on the successful
collection and analysis of meteorological (MET) data from the area and the completion of appropriate
environmental, engineering, and design analyses. Additional infrastructure associated with the Projects
would include an electrical collection system connecting the turbines, up to five step-up/collection
substations, approximately 35 miles of 345-kilovolt (kV) transmission line (within Torrance County),
operations and maintenance (O&M) buildings, and service roads. In its current design, the Projects would
have multiple access points on the north and south sides of State Highway 54, as shown in Exhibit A,
Projects Overview. The Projects would use County roads in some cases. However, the majority of access
roads are expected to be newly constructed on private land due to the remote, rural location of the
Projects. Approximately two percent of the Projects areas are anticipated to be used for infrastructure.
The remaining land (approximately 98 percent) would continue to be used for traditional land uses,
primarily ranching.
The Torrance Wind Projects’ construction schedule forecasts activity commencing in 2019 and
concluding by the end of 2020. The Torrance Wind Projects are anticipated to commence operations by
the end of 2020. The Projects are designed to provide clean renewable electricity for the regional electric
grid for the life of the Projects. For financial evaluation and contractual purposes, the facilities are
assumed to have a useful life of 30 years. The trend in the wind energy industry, however, has been to
“repower” older wind energy projects by upgrading existing towers and other infrastructure with more
efficient turbines and related equipment. Based on today’s market for renewable power, it is likely that
the facilities will be upgraded with more efficient equipment and, therefore, could have a useful life for
much longer than 30 years. At such time, any additional permits would be obtained from Torrance
County, as required.

Application for Zoning Ordinance Amendment Final Project Developer
Pattern Energy LP 2-1 Burns & McDonnell
2.0 PROJECT DEVELOPER
Cowboy Mesa LLC, Duran Mesa LLC, Red Cloud Wind LLC, Tecolote Wind LLC, and Viento Loco
LLC are limited liability companies, organized under the laws of the State of Delaware and are indirectly
held subsidiaries of Pattern Energy Group 2 LP (together with Pattern Energy Group LP, Pattern
Development). Pattern Development has developed and constructed other wind projects of significant size
and scope in Imperial County, California; Shasta County, California; Benton County, Indiana; White Pine
County, Nevada; Carson County, Texas; Comanche County, Texas; Kennedy County, Texas; and Curry
County, New Mexico. Pattern Development has also developed and constructed additional wind projects
in Puerto Rico and Canada.
Pattern Development is affiliated with Pattern Energy Group Inc. (PEGI) (collectively, Pattern Group).
The Pattern Group currently owns and operates over 5,000 MW of wind energy across 18 wind projects.
The Pattern Group has offices in San Francisco, California; San Diego, California; Houston, Texas;
Toronto, Canada; Mexico City, Mexico; Santiago, Chile; and Tokyo, Japan. The Corona Wind
Companies and the Pattern Group entities are not public utilities under New Mexico law.
2.1 Development The Pattern Group is a leading U.S.-based independent renewable energy company with a proven track
record with more than 40 projects completed and more than $8 billion in capital raised from more than 40
institutions.
2.2 Operations The Pattern Group’s operations are built on a foundation of respect for its customers, its communities, the
land, and its investors. The professionals who manage the day-to-day operations of its sites employ
engineering, data analytics, and proven technologies to continuously improve the safety, reliability, and
productivity of its expanding portfolio. Operations also includes community engagement, land
reclamation, and ongoing communication between its facilities. The Pattern Group’s team closely models
and monitors the performance of each of the facilities. Its 24/7 Operations Control Center in Houston puts
the world of energy at its team’s fingertips. Consistent with its continuous efforts to improve its
operations, they are growing its in-house resources to perform ongoing maintenance at its facilities. They
increase operational capacities by advancing:
• Best safety practices
• Equipment optimization and reliability

Application for Zoning Ordinance Amendment Final Project Developer
Pattern Energy LP 2-2 Burns & McDonnell
• Routine training, including regular safety drills and equipment instruction
• 24/7 monitoring and fleet management
• Advanced data analytics and predictive software
• Proprietary resource and financial modeling
• Long-term service, maintenance and upgrades of hardware and software
• Community engagement
• Commitments to environmental stewardship
2.3 Technologies The Pattern Group’s fleet is built and maintained with state-of-the-art technologies, from top-tier turbines
to predictive software and virtual tools. These resources pave the way to consistently deliver clean energy
to its customers today and serve as a foundation for the advanced technologies of tomorrow.

Application for Zoning Ordinance Amendment Final Projects Sites, Legal Description
Pattern Energy LP 3-1 Burns & McDonnell
3.0 PROJECTS SITES, LEGAL DESCRIPTION
The Projects would be located on both state and private lands. The Applicants currently holds lease option
agreements with all of the private landowners within the Projects areas and have applied for leases with
the New Mexico State Lands Office. The Projects do not intend to install wind turbines or any other
related wind farm infrastructure on surface estates owned by the U.S. Government. See Exhibit A,
Projects Overview, and Exhibit B, Recorded Memos of Lease Agreements documenting the private lands
in the Projects to date.
Approximately 72 percent of the Projects areas are designated as Western Great Plains Shortgrass Prairie.
The remaining 28 percent of land cover in the Projects areas includes Southern Rocky Mountain Juniper
Woodland and Savanna (22.7 percent), Southern Rocky Mountain Pinyon-Juniper Woodland (2.7
percent), and Colorado Plateau Mixed Low Sagebrush Shrubland (1.3 percent). Another 24 landcover
classes are present in the remaining Projects area, totaling 1.4 percent. See Exhibit C, Land Cover of the
Projects areas. The land within the Projects areas have historically been used as rangeland for ranching
activities. Ranch homes and residential areas are scattered sparsely throughout the Projects areas. The
community of Duran is the closest populated area, overlapping a portion of the northern boundary of the
Projects. Several other small towns are scattered throughout the county. Major state and federal properties
in the county include Manzano Mountains State Park and Cibola National Forest, and scattered U.S.
Bureau of Land Management lands. Assessor’s parcel map numbers of the Projects sites are indicated on
Exhibit D.

Application for Zoning Ordinance Amendment Final Land Entitlement
Pattern Energy LP 4-1 Burns & McDonnell
4.0 LAND ENTITLEMENT
The Applicants have obtained lease agreements for all private landowners within the Projects areas. See
Exhibit B, Recorded Memos of Lease Agreements, and Exhibit E, Legal Land Descriptions. The
Applicants have rights to develop, construct, own, and operate wind energy facilities on the land included
in the leases and land descriptions. In certain few instances, the foregoing rights are currently under
negotiation and these lands included in the SUD in this application are characterized in Exhibit E, Legal
Land Descriptions for Lands Under Negotiation. The Applicants request in this Application the inclusion
of these properties in the SUD with the understanding that no activities by the Applicants can occur on
properties for which the Applicants have not secured rights to develop, construct, own, and operate wind
energy facilities on these lands. As described earlier, the Applicants have applied for state land leases
with the New Mexico State Lands Office.

Application for Zoning Ordinance Amendment Final Request for Zoning Amendment
Pattern Energy LP 5-1 Burns & McDonnell
5.0 REQUEST FOR ZONING AMENDMENT
The Applicants are seeking a Zoning Ordinance Amendment for a Special Use District and a Height
Variance for development of the Projects.
5.1 Special Use District A Special Use District is requested to develop the Projects within the Projects areas. See Exhibit B,
Recorded Memos of Lease Agreements, and Exhibit A, Projects Overview, for the private lands
(including the approximately 35 miles of transmission line within Torrance County) proposed for the
Special Use District.
5.2 Height Variance The Applicants request a height variance for the installation of wind energy generation turbines up to
590 feet in height and up to 7 permanent MET assessment towers within Torrance County. The height of
the turbine towers, or “hub height” (height from the base of the tower to the center of the rotor hub on top
of tower), would be approximately 260 to 360 feet. The total turbine height (i.e., height at the highest
blade tip position) would be approximately 440 to 590 feet. The MET towers would be approximately
200 feet in height (See Exhibit G, Meteorological Tower Information).

Application for Zoning Ordinance Amendment Final Project Description
Pattern Energy LP 6-1 Burns & McDonnell
6.0 PROJECT DESCRIPTION
6.1 Wind Energy Facilities Description The Projects will consist of up to 1,800 MW of wind power facilities and will be located within
approximately 131,000 acres of private and state land within Torrance County in New Mexico. As
previously described, the Applicants have applied for state land leases with the New Mexico State Lands
Office. To produce the desired energy, up to 600 wind turbines (within Torrance County) are anticipated,
with a nameplate capacity ranging from 2.3 to 3.0 MW. Each of the turbines will be connected by 34.5-
kV collection lines to new substations to be located within each of the Projects areas. The collection lines
will be buried underground unless local conditions make burial impracticable. A final determination of
the number of turbines to be used and the siting of the turbines, collection lines and generation Projects
substations will be made over time, and such information will be made available to the county. For a
preliminary layout of the Projects, refer to Exhibit A, Projects Overview and Exhibit F, Boundaries &
Facilities Map.
6.2 Site Suitability A strong wind resource is an essential element in selecting the location of a wind project, as is the specific
turbine placement within a defined project boundary. Pattern’s senior management team has extensive
experience developing wind projects throughout the U.S., Europe, and Central America. Based on this
experience and by following guidelines established by the National Wind Coordinating Committee, the
American Wind Energy Association, and the European Wind Energy Association, Pattern has developed
a comprehensive and practical methodology for selecting wind project sites.
In addition to the strong essential wind resources that were identified in the Torrance County area, these
Projects were sited within this particular region for a number of additional reasons. Pattern Development
has identified numerous advantages with siting the Torrance Wind Projects within this County. These
advantages include the following:
• Assist in meeting local policy objectives within the Torrance County Zoning Ordinance and
Comprehensive Land Use Plan to increase contributions through renewable energy resources
• No adverse impacts on air quality of the region from operation of the Projects —to the extent that
power generated by the facilities displaces fossil-fuel based energy generation sources, it would
contribute to the improvement of the region’s air quality
• Provide economic opportunities associated with clean, renewable electric generation to a region,
which does not currently participate significantly in this economic sector. Private landowners

Application for Zoning Ordinance Amendment Final Project Description
Pattern Energy LP 6-2 Burns & McDonnell
would receive economic benefit from wind lease agreement payments while retaining compatible
land uses (ranching). The County and local schools will also receive economic benefits through
internal revenue bonds / PILT structure. The land lease and easement agreements with the private
landowners on which the wind generation facilities would be sited would provide direct new
revenues to landowners within the footprint of development.
In applying this methodology to the Projects, Pattern has established the site suitability criteria and
placement and configuration criteria discussed in the following subsections.
6.2.1 Adequate Wind Resources Determining the adequacy of wind is a detailed, iterative process that includes evaluation of wind maps
(See Exhibit H, New Mexico Wind Resource Map), detailed modeling, and onsite data generated by MET
towers. Adequacy of wind is not merely a function of wind speeds, but also of wind speed stability and
consistency, wind direction and directional variability, seasonal and daily variability, wind shear, and
turbulence potentially imparted by topographical features. Locations that produce adequate wind speeds
(quantity) may prove to be inadequate due to the quality of the wind resource.
The process of evaluating a potential site and determining the expected production of a wind project can
often take several years to complete. The MET data collection process can also take several years and
would occur throughout the life of a wind project.
Preliminary MET towers are strategically located in representative locations within a project area to
determine the scope and range of the wind resource. Following the collection of at least 1 year of MET
data, a turbine layout is designed by the lead meteorologist for the project. The turbine layout is optimized
for energy efficiency according to available land, wind direction, and wind speed. Stringent setbacks are
applied between turbines to prevent detrimental wake effects on nearby turbines. The layout is then
optimized using state-of-the-art wind modeling computer software to obtain the highest possible energy
yield while maintaining appropriate setbacks.
The Projects areas are suitable for a utility-scale wind project, as determined by MET data collected since
2007 from the existing MET towers. There are currently 16 MET towers and 3 remote sensing devices
located in the Torrance County Projects area, and these continue to collect data. All of the MET towers
within the entire Projects areas are currently temporary. During construction, the temporary towers will be
removed and up to 7 permanent MET towers will be installed to measure the wind when the Projects are
operating. Preliminary estimates from the collected data over the 11-year period suggest that the Projects
areas have an excellent wind resource to support utility-scale wind energy facilities.

Application for Zoning Ordinance Amendment Final Project Description
Pattern Energy LP 6-3 Burns & McDonnell
6.2.2 Transmission Access Existing and proposed transmission lines (100-kV or above) in the vicinity of the Projects include the
existing Willard to Duran 115-kV line, situated along the northwest portion of the Projects areas; and the
proposed Pinal Central to SunZia Transmission LLC's East terminus 500-kV line, planned to be situated
along the southwest portion of the Projects in Lincoln County. Power generated from the Projects is
planned to be delivered to the Southwest region of the United States via SunZia Transmission LLC's 500-
kV transmission line. Additional transmission infrastructure associated with Pattern Development’s wind
development projects (e.g., the Mesa Canyons Wind Project adjacent to the Projects in Lincoln County) in
Guadalupe, Lincoln, and Torrance Counties are likely to pass through the Corona SUD. The foregoing
existing and proposed transmission facilities (including the East Terminus of SunZia and a 1-mile
corridor where the additional transmission infrastructure may be located) are displayed in Exhibit I.
As part of the site selection process, the Applicants performed background transmission and load-impact
modeling to determine the feasibility of a grid interconnection. The Applicants used various models and
analytical methods to assess impacts to utility transmission and distribution systems.
6.2.3 Accessibility The Projects sites are accessible to construction equipment and heavy machinery, including cranes and
special-purpose trailers, which transport tower sections, nacelles, and other components. The Projects
would be accessed from SH 60 and/or SH 247, off of which new private access roads would be
constructed, thereby minimizing traffic impacts on local roads. All necessary access, crossing, and
driveway permits will be obtained from the applicable jurisdictions as needed.
6.2.4 Competitive Economics Competitive project economics are achieved at sites that have the best combination of key attributes,
including, but not limited to, a strong wind resource. Economic feasibility also depends on the presence of
interested landowners who are willing to provide rights to both the site and the interconnection right-of-
way at reasonable costs. Other considerations include suitable soil conditions. There are a number of
fixed costs for a wind energy facility. Such costs include a majority of the baseline environmental
surveys, interconnection filing fees and studies, foundation design, and project engineering. Accordingly,
projects must be sized appropriately to distribute the fixed costs over a large enough number of wind
turbines, to make the project economically viable.

Application for Zoning Ordinance Amendment Final Project Description
Pattern Energy LP 6-4 Burns & McDonnell
6.2.5 Rural Location Turbine locations would maintain a minimum setback between the tower and the nearest non-
participating residence, compliant with Torrance County setback requirements, which state “…each wind
turbine shall be set back from the nearest property line a distance no less than 1.1 times its total height,
unless appropriate easements are secured from adjacent property owners.” This setback minimizes
potential visual and sound effects of the turbines on neighboring landowners adjacent to or in close
proximity to the Projects. The turbine locations would also maintain a minimum setback from public
roads. Refer to Exhibit J, Projects Visibility Map.
6.2.6 Communication Interference Turbines would be sited outside of known microwave pathways and Fresnel zones (areas surrounding a
line-of-site used to determine obstruction loss to communication signals) to minimize the effect they may
have on local communications. Additionally, the Applicants are currently performing a communications
study through the National Telecommunications and Information Administration (NTIA). Based on the
results of that study, the location of Projects components will be modified accordingly to avoid
interference with commercial communications.
6.2.7 Cultural Resources Based on a preliminary review, it is anticipated that all Projects components would be sited and
constructed to avoid adverse physical effects on prehistoric or historic archeological resources, as
recommended by the Projects’ cultural resources specialists. See Exhibit K, Cultural Resources Survey
reports.
6.2.8 Environmental Initial studies in the Projects areas have been completed to determine potential impacts to area resources.
The results of these studies are summarized below in Table 6-1.
Table 6-1: Summary of Environmental Review
Resource Category Comments Wildlife and Plants Seven animal and three plant species that are
either federally listed or considered an experimental, non-essential population under the Endangered Species Act (ESA) may potentially occur in the Projects areas. Eight state-listed endangered or threatened bird species may potentially occur in the Projects areas. Eighteen bat species in New Mexico have ranges overlapping the Projects areas. None of

Application for Zoning Ordinance Amendment Final Project Description
Pattern Energy LP 6-5 Burns & McDonnell
Resource Category Comments these species is federally listed as threatened or endangered and only the spotted bat is state listed. Further, the spotted bat has not been recorded as a fatality at any wind facilities in the United States to the Applicants’ knowledge. The spotted bat’s cliff habitat is generally lacking in the Projects areas, although species may forage within or migrate through these areas.
The Applicants have consulted with the New Mexico Department of Game and Fish (NMDGF) and will continue to do so as the Projects approach final design. A preliminary study of habitat quality has been conducted to help guide siting of the Projects infrastructure to minimize impacts to wildlife habitat. As described in Exhibit L, Biological Evaluation, the Projects will not affect threatened or endangered species or critical habitat.
A preliminary review of environmental resources and potential impacts as a result of the Projects based on publicly and readily available information and agency consultation is discussed as follows and the results of a Biological Evaluation of the Projects areas are provided in Exhibit L.
Avian and Bat Species Avian and bat species occur in the Projects areas. General bird and bat surveys would be conducted prior to Projects construction in order to determine use of the area by these groups. Pattern Development is currently, and will continue to, conduct avian and bat species surveys.
Birds can be impacted by collision with or electrocution from powerlines. Electrocution risk can be managed in a variety of ways and it is an increasingly common practice to utilize established guidelines to implement measures to reduce this risk. Pattern Development has and will continue to follow the U.S. Fish and Wildlife Service (USFWS) Land-Based Wind Energy Guidelines (WEGs), as it does at all its projects across the United States, and integrate into powerline siting decisions the 2012 Avian Power Line Interaction Committee (APLIC) collision guideline, Reducing Avian Collisions with Power Lines APLIC guidelines for

Application for Zoning Ordinance Amendment Final Project Description
Pattern Energy LP 6-6 Burns & McDonnell
Resource Category Comments reducing avian mortality from powerlines. Please see Exhibit M for the WEG and APLIC guidelines.
The APLIC guidelines on electrocution and collision are voluntary guidance documents that are the result of industry, non-profits, and government agencies, such as USFWS, working together to create standardized processes for analyzing and minimizing risk of avian mortality as a result of collision with or electrocution by operating powerlines. These guidelines provide a step-wise methodology to assessing and minimizing impacts to birds from powerlines and are not associated with wind energy development per se. The Projects have elected to implement the APLIC guidelines because these guidelines have long served as an effective tool developed with diverse stakeholder input for addressing potential impacts from powerlines to avian species. The APLIC collision guidelines, Reducing Avian Collision with Power Lines, will help direct siting and risk assessment of the Projects’ gen-ties. These guidelines will help identify areas where the risk of avian collision is more or less likely.
The APLIC electrocution guidelines, however, are not material to the Torrance Wind Projects. This is because the Torrance Wind Projects consists entirely of 345-kV transmission lines which, because of the design and larger dimensions of 345-kV lines, do not pose a material risk of electrocution. The majority of birds colliding with transmission lines are small passerine species with high fecundity rates and short lifespans that are more resilient to mortality at the population level (risk factors are detailed in the APLIC collision guidelines, including proximity to agricultural fields, water resources, and parks). As such, after a line has been sited, the most effective measure for minimizing avian mortality at transmission lines, will be the installation of bird diverters. Bird diverters are visual deterrents installed on transmission lines to make the lines stand out visually to flying birds. Bird diverters will be installed in identified areas along a transmission line, based on various risk factors detailed in

Application for Zoning Ordinance Amendment Final Project Description
Pattern Energy LP 6-7 Burns & McDonnell
Resource Category Comments the APLIC guidelines on transmission line conductors. They are designed to be visually conspicuous to birds.
Environmentally Sensitive and Protected Areas No sensitive or protected areas are present within the Projects vicinity. The closest national park is Salinas Pueblo Missions National Monument, which is approximately 15 miles west of the Projects areas. The Projects will not affect management of the national park areas.
Surface Water, Wetlands, and Waters of the U.S. While wetland and water features are present onsite, these areas will be avoided by siting turbines and other wind farm infrastructure away from them. No impacts to wetlands and water features are anticipated.
Visual Sound Concerns Both day and night visual impacts are anticipated and would be mitigated through site design and community outreach. In addition to the Projects areas being sparsely populated, the level of sound emitted by wind turbines would be minimal and mitigated by setbacks.
Community Issues Community engagement would still be sought prior to final layout and design to address any potential community concerns.
Land Use, Zoning, and Development A Special Use Permit for a Zoning Ordinance Amendment for a Special Use District would be required by the county for the Projects. Both the MET towers and the turbines would require a Height Variance. The Projects are compatible with current land use.
Cultural Resources Known archeological and historical resources would be avoided during construction.
6.3 Project Development Resources The Applicants would construct and operate the Projects consistent with Pattern’s corporate commitment
to meeting all applicable state and federal OSHA safety regulations. Each turbine and all electrical
equipment would be inspected under rigorous commissioning procedures. In addition, the interconnecting
utility would also perform and require inspections, testing, and commissioning documentation for grid
and system safety prior to line activation. Once turbines are commissioned, qualified personnel would
routinely inspect and repair them as necessary, pursuant to preventive maintenance schedules.

Application for Zoning Ordinance Amendment Final Project Description
Pattern Energy LP 6-8 Burns & McDonnell
The Projects would be operated and maintained by a team of up to 100 full-time, locally based O&M
personnel. The O&M team would staff the Projects during normal working hours, with weekend shifts
and extended hours as required to maintain operations. Pattern operates its wind farms with employees
that are trained in safety regulations and procedures, operational standards, and applicable staff
certifications.
The Projects’ central Supervisory Control and Data Acquisition (SCADA) system provides remote
operation of the wind turbines, and collects operating and performance data 24 hours per day. In the event
of turbine or facility outage, the SCADA system sends alarm messages to on-call technicians via pager or
cell phone to notify them of the outage. The Projects would have an on-call local technician who can
respond quickly in the event of emergency notification or critical outage. Wind turbines are managed by
computer controllers that are installed in each unit. In the event of that a unit is tripped due to electrical
error, high winds, icing, etc., the turbines would be automatically shut down by the computer controller.
Along with Pattern’s other projects located throughout the country, the Pattern Operations Center, located
in Houston, would continuously monitor and control the Projects. This Operations Center coupled with
operations oversight at the Projects locations would provide close monitoring of operations.
6.4 Timeline and MilestonesThe Projects will be developed in the next two years, with expected development schedules based on the
current deadline of December 31, 2020. The construction is expected to take approximately 12-18
months, depending on the results of interconnection studies and final design. The construction schedule
forecasts activity commencing early 2019 and concluding by the end of 2020. The Torrance Wind
Projects are expected to commence operations by the end of 2020. The Projects are designed to generate
electricity for a minimum of 25 to 30 years, or the life of the Projects. The preliminary Projects milestone
timeline consists of the of the following:
• Q3, 2018: Corona Wind Projects New Mexico Public Regulation Commission location control
approval and ROW width approval
• Q3 - Q4, 2018: Torrance County Special Use District approval, Lincoln County Wind Energy
Conversion System Ordinance approval
• Q4, 2018 – Q2 2019: Industrial Revenue Bonds and Payments in Lieu of Taxes agreements
finalized in Guadalupe, Lincoln, and Torrance Counties

Application for Zoning Ordinance Amendment Final Project Description
Pattern Energy LP 6-9 Burns & McDonnell
• Q2, 2019: Receipt of Determinations of No Hazard from the Federal Aviation Administration
(FAA)
• Q2-Q3, 2019: Start of construction of wind facilities of the Corona Wind Projects
• Q4, 2020: Completion of construction and start of commercial operations
6.5 Wind Energy
6.5.1 Electricity Generation As planned, the Projects would generate up to 1,800 MW of clean, renewable energy within Torrance
County (2,200 MW in total). As discussed previously, the turbine vendor, size, number, and actual
generating capacity have not yet been determined. This application describes impacts for the most likely
turbine size that represents typical scale and impacts of turbines that could potentially be used by the
Projects. The final layout would have up to approximately 600 turbines (located in Torrance County), with
any combination of 2.3 MW turbines to 3.0 MW turbines.
6.5.2 Interconnection As discussed in Section 6.2.2, the Projects are designed to interconnect with the East Terminus of the
SunZia Transmission Project as indicated in Exhibit I. It should be noted that all transmission above
230-kV associated with the Torrance Wind Projects is subject to a New Mexico Public Regulation
Commission permit process currently underway. The interconnection facilities proposed for the Projects
will consist of 34.5/345-kV step-up substations, single-circuit and double-circuit 345-kV transmission
lines, and one 345/500-kV step-up substation. The substations will also include main-power transformers,
breakers, control buildings, and other miscellaneous voltage support equipment necessary for the
operation and maintenance of the facilities.
6.5.3 Power Market Pattern Development, on behalf of its wind farm companies negotiates power supply contracts with
companies nationwide on a regular basis, including public utility districts, investor owned utilities, electric
cooperatives, and federal power marketing administrations. Pattern Development is currently pursuing
power purchase agreements with several buyers for its Corona Wind Projects.

Application for Zoning Ordinance Amendment Final Project Description
Pattern Energy LP 6-10 Burns & McDonnell
6.6 Wind Energy Equipment, Infrastructure
6.6.1 Wind Energy Generation Turbines The Projects are designed to use industry-standard three-blade, upwind machines. The Projects are
currently being modeled using the Siemens SG 2.7-129 wind turbine, which has a nameplate capacity of
2.75 MW. However, because the Projects are not anticipated to be completed until the end of 2020,
market factors such as availability and cost may dictate the use of an alternate wind turbine type. Any
wind turbine ultimately selected for the Projects would be similar in design and appearance to the
Siemens SG 2.7-129 wind turbine. See Exhibit N, Siemens SG 2.7-129 Wind Turbine Brochure.
The turbines that would be used for the Projects would be new turbines; they would not be used,
experimental, or prototype equipment. Each wind turbine will be required to have a Type Certificate. This
certificate is an analysis performed by an independent third-party engineer (e.g., DNV GL) in order to
review the Original Equipment Manufacturer’s (OEM) wind turbine design and performance in order to
verify it meets international standards. Achieving a Type Certificate is the benchmark of design for all
wind turbines. More information on type certification can be found in Exhibit O.
On each project, Pattern Development supplies OEMs with onsite data which has been collected in
accordance with relevant standards and practices. This data includes, but is not limited to, wind speeds,
air density, wind shear, and ambient temperature. Pattern Development provides this onsite data and
turbine layout to the OEMs, which then process the data on a pad by pad basis to review suitability of the
proposed turbine. This review has a different nomenclature for each OEM, but all include a review of
design parameters of the wind turbines by each pad, any recommended weather packages (hot or cold),
loads analysis of each pad. In the event that a proposed turbine exceeds design parameters of the turbine,
the OEM will recommend a “load mode” to operate the turbine in. This could be accomplished by various
means, but typically involves limiting the revolutions per minute of the rotor and operating the turbine
with a lower output.
Near the financing process, a reputable independent engineer will review all aspects of the Projects. This
review includes, but is not limited to, all engineering design, wind turbine generator suitability, review of
major project agreements (Turbine Supply Agreement, O&M Agreement, EPC Agreement, Power
Purchase Agreement, Operating Agreement, etc.), permits, and relevant financial models. By going
through this project review, Pattern Development is able to show that the Projects have been developed
appropriately and will be constructed and operated as required by all relevant parties.

Application for Zoning Ordinance Amendment Final Project Description
Pattern Energy LP 6-11 Burns & McDonnell
Each wind turbine consists of four major components: the nacelle, the rotor, the tower, and the
foundation. The hub is mounted on a nacelle. The height of the tower, or “hub height” (height from the
base of the tower to the center of the rotor hub on top of tower) would be approximately 260 to 360 feet.
The total turbine height (i.e., height at the highest blade tip position) would be approximately 440 to 590
feet. Descriptions of the major turbine components are provided below.
6.6.1.1 Nacelle At the top of the tower section is the nacelle. The exterior is typically made of fiberglass with a structural
steel frame which protects the internal, main mechanical components of the wind turbine from the
environment and dampens noise emissions. The housing is designed to allow for adequate ventilation to
cool internal machinery, and is approximately 36 feet long, 13 feet tall, and 10 feet wide. It is externally
equipped with an anemometer, which measures wind speed, and a wind vane, which measures wind
direction. This information is used by the turbine controller to turn the machine on and off, and to rotate
or “yaw” it into the correct position. The components housed within the nacelle include the generator, the
main shaft, the gearbox, and an electric control unit which relays information and data received from the
generator and the weather station on the roof of the nacelle to the main control cabinets at the base of the
tower. The nacelle is mounted on a sliding ring that allows it to yaw into the wind to maximize energy
capture. The Siemens SG 2.7-129 wind turbine mounts a dry- type generator step-up transformer
(electrical) in the nacelle.
6.6.1.2 Rotor The rotor assembly is mounted on the drive shaft, and is operated upwind of the tower. Each rotor
consists of three fiberglass composite blades approximately 177 to 250 feet in length (total rotor diameter
of 354 to 467 feet) and a hub or nose cone that is mounted on a drive shaft. The rotor attaches to the drive
shaft at the front of the nacelle. The shaft is connected to the gearbox and generator contained within the
nacelle. All turbine rotors would rotate in the same direction and would be configured to rotate clockwise.
Electric servo motors within the rotor hub vary the pitch of each blade according to wind conditions,
which enable the turbine to operate efficiently at varying wind speeds while maintaining a constant
rotational speed. The wind turbines begin generating energy at wind speeds as low as 6.7 miles per hour
(mph) and automatically shut down at wind speeds above 55.9 mph. The maximum rotor speed is
approximately 17.6 revolutions per minute (rpm). All turbine rotors would be painted a non-reflective,
unobtrusive, off-white color.
Application for Zoning Ordinance Amendment Final Project Description
Pattern Energy LP 6-12 Burns & McDonnell
6.6.1.3 Tower The tubular towers used for the Projects would be conical steel structures typically manufactured in four
or five sections, each of which would be trucked separately to the site and would then be bolted together
using internal flanges. The towers have a base diameter of approximately 15 to 18 feet and a top diameter
of approximately eight feet. Each tower would have a locked access door at the base, internal lighting,
control cabinets, and an internal ladder to access the nacelle. The towers would be uniformly painted in a
non-reflective and unobtrusive off-white color approved by the FAA for daylight marking. By design, the
tubular steel towers cannot be climbed externally, and no appurtenances would be connected to the
outside of any of the wind towers.
6.6.1.4 Foundation The wind turbines’ freestanding tubular towers would be connected by anchor bolts to a reinforced
concrete foundation. Foundation design for the turbines would be based on project-specific geotechnical
investigations and design. For the range of turbine sizes proposed, typically Pattern uses spread-footing
type foundations that are about 65 feet in diameter and 10 feet in depth (only a short foundation pedestal
would be above ground). At each wind tower location, soil borings would be performed to characterize
the underlying soils. A licensed geotechnical engineer would analyze and recommend specific
requirements to provide adequate foundational strength for each of the proposed wind power generation
towers. Reinforced concrete foundations would be designed by a Professional Engineer according to
manufacturer’s and geotechnical engineer’s recommendations. See Exhibit O, Turbine, Tower and
Foundation Specifications.
Pattern Development will conduct a foundation design process in order to ensure that the foundations are
within certain design parameters. As part of this design, Pattern Development evaluates the site-specific
OEM foundation loadings, site specific geotechnical borings at each turbine location, depth of the
underground water table, water content of soils, etc. This design is typically performed by a reputable
structural engineering firm which has performed thousands of designs for various developers and
engineering, procurement, and construction /balance of plant contractors throughout North America and
the world.
During the foundation structural design and after it is completed, an independent engineer will review the
proposed wind turbine foundation structural drawings and calculations. The independent engineer will
independently confirm and verify that the foundation design was performed in accordance with prudent
industry standards, applicable building codes, and site-specific design criteria.

Application for Zoning Ordinance Amendment Final Project Description
Pattern Energy LP 6-13 Burns & McDonnell
6.6.1.5 Turbine Siting Turbines will be sited in accordance with current Torrance County Zoning Ordinance regulations. As
applicable to the Projects, each wind turbine will be set back from the nearest property line, a distance of
no less than 1.1 times its total height, unless appropriate easements are secured from adjacent property
owners. In addition. Each wind turbine will be set back from the nearest public road a distance no less
than 1.1 times its total height, determined at the nearest boundary of the underlying right-of-way for such
public road. Lastly, as applicable, each wind turbine will be set back from the nearest above-ground
public electric power line or telephone line a distance no less than 1.1 times its total height, determined
from the existing power line or telephone line.
The final turbine locations would be determined based on additional geotechnical studies, environmental
studies, meteorological data, and site engineering design. Final turbine location coordinates would be
provided to Torrance County when the Applicants submit the building permit application. For these
reasons, the Applicants request micro-siting flexibility to place turbines at optimal locations within the
Projects areas.
6.6.2 Electrical Collection System and Substations Electricity generated by the wind turbines would be gathered via buried electrical collection system lines
that will be charged at 34.5-kV. The collection system circuits would be gathered at the Torrance Wind
Projects’ step-up substations where the voltage would be increased from 34.5-kV to 345-kV via large
power transformers. The Torrance Wind Projects’ step-up substations would be connected to each other
via a 345-kV transmission line. The Projects are designed to interconnect with the East Terminus of the
SunZia Transmission Project. The decision on the number of 34.5 to 345-kV step-up substations would be
made prior to construction and would be determined by design efficiencies that reduce total electrical
infrastructure needed and minimize electrical losses. The transmission line(s) would consist of an
overhead line operated at 345-kV. The length of the transmission line would depend on final design. The
transmission line would require a right-of-way (ROW) width of about 180 feet.
6.6.3 Meteorological Towers The first MET tower was installed in December 2007 and continues to collect data. Additional MET
towers have been installed since then with varying periods of record (25 towers/remote sensing devices
have been recently installed in 2017-2018 over the entire Projects areas; approximately 15 towers
collected data from 2009 to 2013). The Projects could include up to 7 permanent MET towers in Torrance
County, once constructed.

Application for Zoning Ordinance Amendment Final Project Description
Pattern Energy LP 6-14 Burns & McDonnell
6.7 Project Construction Construction will be managed by Pattern Development's in-house construction group, which has
successfully completed over 5,000 MW of wind projects including the Broadview wind farms in Curry
County, New Mexico.
Using all of the data collected for the Projects (including geotechnical information, environmental
conditions, site topography, logistics, etc.), the Applicants will develop a set of site-specific construction
specifications for the various components of the Projects. The design specifications comply with
construction standards established by various industry practice groups, including the following:
• American Concrete Institute (ACI)
• Institute for Electrical and Electronic Engineers (IEEE)
• National Electric Code (NEC)
• National Fire Protection Agency (NFPA)
• Construction Standards Institute (CSI)
The Projects engineering team ensures that all aspects of the specifications, as well as the actual onsite
construction, comply with all applicable federal, state, and local codes and good industry practice. The
Pattern Development and/or contractor would coordinate directly with the local code enforcement officers
in order to assure that all aspects of specifications/inspections of the Projects are properly communicated
and understood.
Construction survey work for the proposed Torrance Wind Projects consists of ascertaining soil and
geotechnical conditions for foundations, determining specific pole and turbine locations, and work area
boundaries, and, in some areas, roads to access work areas. Following the completion of survey work and
the issuance of all necessary permits, construction would begin with road building and turbine site
preparation. Construction activities are anticipated to occur only during daylight hours.
Temporary construction staging areas would be established within the areas of the Projects. These lay-
down or staging areas would be used to temporarily store tower sections, turbine components, and
infrastructure components and equipment. They would also be used as parking areas for construction
vehicles and construction employees’ personal vehicles, and as storage areas for other construction
equipment.

Application for Zoning Ordinance Amendment Final Project Description
Pattern Energy LP 6-15 Burns & McDonnell
Temporary laydown material staging areas would be required to store materials and equipment and to
assemble structures for the duration of construction. The staging areas would be up to 20 acres in size and
located at level areas in close proximity to existing roads within the areas of the Projects. The laydown
staging areas would be used to store material and equipment prior to delivery to the structure sites, park
vehicles, and, possibly, station a portable construction trailer. The staging areas would be surveyed for
potential environmental impacts, and if any are found, the staging areas would be relocated or shifted to
avoid such sensitive areas. The staging areas would be revegetated and reclaimed after completion of the
Projects.
The construction of permanent foundations for the wind generator towers would include soil excavation
and compaction, preparation of formwork, and placement of structural concrete with appropriate steel
reinforcement, as directed by the tower supplier and the foundation designer. Areas surrounding the
turbine locations would be cleared to allow for construction of the foundation and crane pads, and blade
assembly. Depending on the terrain and density of vegetation, a majority of the surface area could remain
undisturbed.
The beginning of turbine foundation construction is expected to occur after initial portions of the access
roads are completed. Foundation construction would occur in several stages including excavation, outer
form setting, rebar and bolt cage assembly, casting and finishing of the concrete, backfilling, tensioning
of the bolts, and finally site restoration. Excavation and foundation construction would be conducted in a
manner that would minimize the size and duration of excavated areas required to install foundations.
Should geologic conditions exist requiring blasting, the Projects would adhere to applicable Torrance
County regulations.
Once the foundation concrete is sufficiently cured, the excavated area around the foundation would be
carefully backfilled with the excavated on-site material. Additional offsite materials would only be
brought in if necessary. The tower would be secured directly to the top of the concrete foundation and the
pedestal. The finished grade around the foundation pedestal and base of the tower would be surfaced with
a graveled area.
Crane pads would be installed adjacent to each turbine foundation to provide the main crane a stable, well
compacted, level base from which to accomplish heavy lifting. Crane pad dimensions are typically 40 feet
wide and 60 feet long. A crane pad is constructed in a manner similar to the construction of access roads.
Vegetation and compressible, organic soils and topsoil may be removed as part of initial site preparation.
Following the initial site preparation, the ground immediately around the tower would be surfaced with

Application for Zoning Ordinance Amendment Final Project Description
Pattern Energy LP 6-16 Burns & McDonnell
gravel and successive layers of well-compacted crushed aggregate would be laid for a radius of
approximately 40 feet. This permanent surfacing would provide a stable surface area for maintenance
vehicles, and would minimize surface erosion and runoff from the pad areas. After the initial construction
phase, the crane pads would only be used periodically during the operations phase for activities such as;
the replacement of a blade, maintenance tasks and equipment replacement, and post-construction
environmental monitoring, which are facilitated by cleared areas around turbines.
Turbine components would then be delivered and staged at turbine locations, and the cranes would be
used to erect the turbines. Turbine mechanics would be completed next, along with electrical engineering,
followed by the construction of the electrical collection system, the Projects substations, and the
transmission line. Typically, the Projects substations transformers are delivered during this timeframe and
the Projects substations can then be energized. Meanwhile, the interconnection substations would be built
followed by commissioning the turbines for operations.
6.7.1 Site Reclamation Work sites would be reclaimed using excess materials, native or similar vegetation, and topsoil stockpiled
for that purpose. The contractor would dispose of excess soil materials, rock, and other objectionable
materials that cannot be used in reclamation work.
Disturbed areas, with the exception of access roads, would be reclaimed, to the extent possible, to its
original contour and reseeded where appropriate. Ripping and other surface scarification on construction
roads or other areas would be done as necessary. Depending on the amount of soil compaction and
vegetation destruction, ripping may not be required for reclamation. This would be determined on a case-
by-case basis.
The Projects will implement best management practices and follow all applicable laws and regulations
relating to reclamation activities. Furthermore, the Projects have committed to reclaim disturbed areas in
landowner agreements and will implement published standards that will be identified in consultation with
the Claunch Pinto Soil & Water Conservation District, the Natural Resource Conservation Service
(NRCS) (e.g., the NRCS Critical Area Planting Conservation Practice Standard).
6.7.2 Protection of Private Property and Environmental Resources Existing improvements would be repaired or replaced if they are damaged by construction activities. All
existing roads would be left in a condition generally equal to or better than its condition prior to the
construction of the Projects. Fences and gates would be installed or repaired and replaced (if they are
damaged by construction activities) to its original conditions as required by the landowner.

Application for Zoning Ordinance Amendment Final Project Description
Pattern Energy LP 6-17 Burns & McDonnell
Temporary gates would be installed only with the permission of the landowner and would be restored to
original condition following construction unless otherwise agreed with the landowner. Gates would be
closed and locked, depending on the agreement with the private landowners.
Prior to construction, all supervisory construction personnel would be instructed on the protection of
ecological and cultural resources. To assist in this effort, the construction contract would address: (1)
federal, state, and local laws regarding wetlands, vegetation, wildlife, and cultural resources; (2) the
importance of these resources and the purpose and necessity of protecting them; and (3) methods for
protecting sensitive resources.
All waste products, including food garbage, from construction sites would be deposited in a covered
waste receptacle, or removed daily. Garbage would be hauled to a suitable and appropriately permitted
disposal facility.
To reduce the number of sensitive features disturbed in designated areas, facilities would be sited during
the engineering design process so as to avoid sensitive features such as, but not limited to, riparian areas
and watercourses. See Exhibit P, Projects Sensitivities Map
6.7.3 Construction Generated Wastes and Wastewater A variety of nonhazardous, inert construction wastes may be generated during construction. Construction
wastes would primarily consist of concrete waste from turbine pad construction, wood waste from wood
forms used for concrete pad construction, and scrap metal steel from turbine tower construction. Some
additional wastes could include erosion control materials, such as straw bales and silt fencing, and
packaging materials from associated turbine parts and other electrical equipment. Solid wastes related to
the construction of the Projects would be promptly transported offsite and recycled, or disposed of in
accordance with federal, state, and local laws. Excess soil generated as a result of construction activities
would be tamped around turbines and power poles, or spread throughout the Projects areas. All hazardous
materials related to construction, operation, and maintenance of the Projects would be handled, stored,
transported, and disposed of in accordance with all applicable local, state, and federal laws.
Construction sites, laydown and material storage yards, and access roads would be kept in an orderly
condition throughout the construction period. Refuse and trash would be removed from the sites and
disposed of in an approved manner, including recycling options. Oils and fuels would be hauled to an
approved site for disposal. No open burning of construction trash would occur at any time.

Application for Zoning Ordinance Amendment Final Project Description
Pattern Energy LP 6-18 Burns & McDonnell
Wastewater would be generated during construction from the washdown of concrete trucks after concrete
loads have been emptied. The Projects’ implemented SWPPP would be used in support of a NPDES
Construction General Permit. The SWPPP would also identity methods to minimize and prevent impacts
from this material.
The Applicants require their contractors to follow best management practices and to minimize concrete
waste wherever possible. Upon completion of the turbine foundations, concrete resulting from spill or
washout is collected as part of the normal reclamation and restoration of the areas adjacent to the wind
turbine.
6.7.4 Stormwater, Soil, and Sediment Control Unlike other electricity generators, the Projects do not involve any water intake or discharge. The Projects
would therefore avoid all environmental problems associated with the intake and discharge of cooling
water. However, because the Projects would disturb over one acre of land, it has the potential to generate
stormwater runoff that could discharge to surface waters or wetlands. The Projects therefore would be
evaluated in connection with U.S. Environmental Protection Agency’s National Pollution Discharge
Elimination System (NPDES) Construction General Permit. In connection with this permit, a Stormwater
Pollution Prevention Plan (SWPPP) would be completed prior to construction. Where appropriate,
stormwater drainage systems would be designed and constructed to maintain existing drainage patterns to
the extent possible. The Applicants would implement proper temporary and permanent erosion control
measures, including construction monitoring, and proper restoration actions as required.
Potential stormwater BMPs, including erosion and sediment control structures, as well as new culverts,
might require inspection, maintenance, and/or repair throughout the operational life of the Projects
facilities to reduce soil erosion or sedimentation to surface water. Temporary access, not retained for
operations, would be seeded with a native grass mix and allowed to revegetate, thereby minimizing the
surface exposed to erosive conditions. The areas used for construction would be reclaimed as soon as
possible, which may include regrading to original land contours, topsoil replacement, and revegetation.
Protection measures that would be implemented to reduce any potential negative soil impacts from
construction activities include:
• Construction crews will reduce the amount of soil compaction by using equipment with more
tires and wider tires to distribute the weight of the vehicle, and tilling the severely compacted
areas after construction is completed or using ground mats when the ground is wet.

Application for Zoning Ordinance Amendment Final Project Description
Pattern Energy LP 6-19 Burns & McDonnell
• To the extent possible, topsoil will be placed separately from sub-soils/bedrock during excavation
and not comingled. Pattern Development will replace soil in reverse order, to help preserve
topsoil.
• Pattern Development will reduce erosion by applying and maintaining standard erosion and
sediment control methods. These may include using certified weed-free straw wattles, bale
barriers, and silt fencing, which would be placed at construction boundaries and where soil would
be disturbed near a wetland or water body. Specific erosion and sediment control measures and
locations will be specified in a SWPPP.
6.7.5 Fencing No perimeter fencing is required or recommended for the Projects, and therefore, none is proposed. The
Projects would be located entirely on privately owned lands. Access to turbines by O&M personnel
would be via a reinforced and locked steel door at the base of each tower. The O&M facilities and
Projects substations would be surrounded by chain link fencing with a three-strand barbed wire at the top
for security purposes.
6.8 Operation and Maintenance Operation and maintenance of the Torrance Wind Projects is anticipated to include the following.
6.8.1 Operation After energization, land uses compatible with safety regulations and activities associated with O&M
would be permitted within and adjacent to the ROW. Existing land uses such as agriculture and grazing
are generally permitted within the ROW. Incompatible land uses include construction of permanent
dwellings and any use requiring changes in surface elevation that would affect National Electrical Safety
Code Interpretations (NESC) electrical clearances of existing or planned facilities.
6.8.2 Maintenance Maintenance of the Projects would be performed as needed. When access is required for non-emergency
maintenance and repairs, the same precautions taken during construction activities would be implemented
to the extent practicable. Landowners would be contacted when access to their lands is required for
maintenance activities on the Projects.
Emergency maintenance would involve prompt movement of crews to repair or replace any damage.
Crews would be instructed to protect vegetation, wildlife, and other environmental resources to the extent

Application for Zoning Ordinance Amendment Final Project Description
Pattern Energy LP 6-20 Burns & McDonnell
possible. Reclamation procedures following completion of repair work would be similar to those
prescribed for normal construction.
6.9 Lighting and Airspace The Projects would comply with all applicable FAA requirements. As mitigation for any risk the Projects
may pose to aviation, and in accordance with federal regulations, the Projects would illuminate some of
the turbines to meet the FAA requirements for obstruction lighting or marking of structures over 200 feet
above ground surface (U.S. DOT FAA Advisory Circular 70/7460-I K dated 2/1/2007).
The FAA’s wind turbine lighting guidance (DOT/FAA/AR-TN05/50 dated 11/05) requires lighting the
Projects as one large obstruction with lights spaced approximately 3,000 feet apart. The FAA has
determined that the standard turbine color is sufficient daylight marking and white strobe lights would not
be used. As a result, wind farms are lit with synchronized red flashing lights at night and only a subset of
the turbines are lit. To minimize potential visual effects, the Applicants would use lights that pulse 20
times per minute and have a beam spread of three degrees, which is the lowest allowable amount required
by the FAA. This approach maximizes “dark space” between flashes and per minute, and minimizes
ground scatter or “light noise” because less light from the beam reaches the ground. The up to 7 proposed
permanent MET towers in Torrance County would also be lit in accordance with FAA guidance.
Pattern Development, on behalf of the Corona Wind Companies, began consulting with the DoD and
potentially affected local Air Force bases (AFB) and other local military facilities including Cannon AFB,
Kirtland AFB, Holloman AFB, Ft. Bliss Army Base, and White Sands Missile Range in 2017. This
consultation has been aimed at pursuing the development of the Corona Wind Projects so as to take into
account and address military use of airspace over Guadalupe, Lincoln, and Torrance Counties. Early in
2018, Pattern Development initiated informal consultation and review of the Corona Wind Projects with
the DoD’s Military Aviation and Installation Assurance Clearinghouse (Clearinghouse) pursuant to Title
32 C.F.R. Part 211 §7. This review process typically precedes any specific filing of turbines locations
with the DoD Clearinghouse so as to provide opportunity for dialogue between a project developer, the
DoD and the FAA that may result in adjustments to a project’s ultimate turbine configuration.
6.10 Sound Wind turbine sound emissions are typically either mechanical or aerodynamic in origin. Mechanical
sources of sound include the generator, gear box, cooling fans, and the yaw system (the component used
to rotate the turbine into the wind). Most of these mechanical systems are located inside the nacelle
enclosure and incorporate a number of noise-attenuating features. Because mechanical components are

Application for Zoning Ordinance Amendment Final Project Description
Pattern Energy LP 6-21 Burns & McDonnell
enclosed and acoustically mitigated, the aerodynamic noise of the blades rotating through the air is
typically the dominate source of audible sound. The sound emissions from both the mechanical and
aerodynamic components are determined in accordance with IEC61400-11, Wind Turbine Generator
Systems - Part 11: Acoustic Noise Measurement Techniques (IEC, 2006). The resulting Projects sound
level would depend on a number of factors including the selected turbine model, the number of turbines
and their proximity to the measurement point.
The sound level emitted by wind turbines increases with increasing wind speed and typically reaches a
maximum level when winds are between 18 to 22 mph. For the most part, the sounds emitted by wind
turbines are broadband in nature and related to the aerodynamic noise of the blades. When the wind
speeds are high at both the turbine elevation and ground level, the sound of the turbines may be fully or
partially masked by wind-induced background noise. When winds are calm or slight at ground level and
sufficient at turbine height for operations an audible “swooshing” sound may be observed as the blades
rotate through the air. The observed sound level would depend on a number of factors the most significant
of which is the distance from the turbines. No existing federal, state, or local regulations limit noise levels
at wind energy facilities. Potential sound emissions from the Projects may be analyzed and assessed, if
necessary, for the selected turbine type, and the associated electrical substations during the final micro-
siting and Projects refinement process. Aerodynamic turbine blade tips and mechanical turbine
component designs minimize noise emissions. Due to the remote location of the Projects and flexibility in
siting, sound impacts are not anticipated.

Application for Zoning Ordinance Amendment Final Site Access Roads
Pattern Energy LP 7-1 Burns & McDonnell
7.0 SITE ACCESS ROADS
The Torrance Wind Projects would use existing roads and overland travel wherever feasible for access in
order to reduce new disturbance. Some new permanent or temporary access/short spur roads may be
required to access structure locations within the ROW. New access roads within the existing ROW would
retain access for maintenance. Portions of existing access roads located outside of the proposed ROW
may require improvements as well as new access roads (temporary or permanent). To reduce ground
disturbance and/or reduce visual contrast with the landscape, the alignment of any new temporary access
roads or cross-country routes would follow landform contours in designated areas where practicable,
provided that such alignment does not impact other resource values additionally. All temporary access
roads would be revegetated with native or similar grasses and forbs following construction. Where ground
disturbance is substantial, surface preparation and reseeding would occur. The method of restoration
would normally consist of loosening the soil surface, reseeding, installing cross drains for erosion control,
placing water bars in the former access road, and filling temporary ditches and swales.
All new access that is not required for maintenance would be closed with concurrence of the landowner.
Gates, where present or if installed, would be closed and/or locked, depending on the agreement with
each landowner. Access roads on private property may be maintained with mutual consent of the land
owner.

Application for Zoning Ordinance Amendment Final Conformance With Zoning Ordinance Goals
Pattern Energy LP 8-1 Burns & McDonnell
8.0 CONFORMANCE WITH ZONING ORDINANCE GOALS
8.1 Conformance With Ordinance Pursuant to REV: Ord. No. 2008-003, 4/23/08, Wind Energy Facilities are an allowable use for a Special
Use District.
8.2 Conformance With Zoning Ordinance Goals The Projects are in conformance with, and enhance fulfillment of the following Zoning Ordinance Goals
(Section 2. Purpose):
“Promote Health and the general welfare of the County”
• As described throughout this application, wind energy facilities are safe when sited and operated
in accordance with all applicable county, state, and federal standards and requirements. The
infrastructure proposed for the Projects is proven reliable, is held to the highest international
standards of quality, and would be operated and maintained by a highly trained, locally based
operations team. The Applicants hold themselves to a high standard with regards to health and
safety, and all construction general contractors are required to meet strict safety qualifications.
Wind creates clean energy from a non-depleting, local energy source that does not consume or
discharge water, has no air emissions, and emits no odors.
“Protect local water resources”
• The Projects would have a low impact on local water resources during operation. Water would be
required during construction for dust abatement and to mix concrete for turbine foundations, and
would likely be obtained from an existing well within the Project areas. During operation, turbine
blades may be washed to prevent dust build-up. Potable water would be used to service the O&M
building.
“Facilitate adequate provisions for transportation”
• The Projects would not impose burdens on county roads beyond temporary use during
construction. New access and service roads on private land would be constructed for the Projects.
These roads would remain private and would not require maintenance by Torrance County.
“Facilitate adequate provisions for schools, parks, and other community requirements”

Application for Zoning Ordinance Amendment Final Conformance With Zoning Ordinance Goals
Pattern Energy LP 8-2 Burns & McDonnell
• The Projects would create new net property and gross receipts taxes, or, new revenue streams
from payments in lieu of taxes, providing new county revenues to support local schools and
county services. The Projects would employ up to 100 permanent staff that would live locally,
thereby further stimulating the local economy. Local schools have adequate facilities to
accommodate these new students. Other community services would easily accommodate the
limited needs of any new residents brought to the area to support operations of the Projects.
“Conserve the value of property”
• Multiple studies and independent analyses have been conducted to analyze the impact of wind
farms on neighboring property values in various regions of the U.S. These studies have shown
that the presence of a wind farm has no overall adverse effect on residential property values.
Additionally, some studies of property sale values have demonstrated an increase in value.
“Compatible development of land and other natural resources”
• Wind energy is a compatible land use with rangeland activities, and other agriculture. Typically,
less than 2 percent of the land within the Project areas would be used by turbines, service roads,
and other infrastructure following construction. Cattle would still be able to graze at the base of
the turbines and wildlife would be able to use the area around the turbines. Wind energy
development provides economic diversification for ranchers; in many cases helping to provide an
alternative to selling their land or subdividing it, thus protecting a rural way of life.
8.3 Appropriate Use for Zoning District
8.3.1 Special Use District Pursuant to REV: Ord. No. 2008-003, 4/23/08, Wind Energy Facilities, are an allowable use for a Special
Use District. The Projects are located in an Agricultural District (A), a rural land use designation for
unincorporated areas of Torrance County that are not specifically designated in any other zone
classification (see Exhibit Q, Torrance County Zoning Map). The land use within the Project areas has
historically been rangeland/dry agriculture; this land use would continue into the future as wind energy
and ranching activities are compatible land uses.
This Application Narrative provides assurance of the following:
• The Torrance Wind Projects is a compatible property use
Application for Zoning Ordinance Amendment Final Conformance With Zoning Ordinance Goals
Pattern Energy LP 8-3 Burns & McDonnell
• The Projects would preserve the integrity and character of the area, and the utility and value of
the property
• The Special Use District would not become detrimental to the public health, safety, or general
welfare of Torrance County
See Exhibit A, Projects Overview, for lands proposed for the Special Use District. Images of computer-
enhanced photos to simulate the appearance of the as-built site facilities as they would appear from
specific locations identified by Torrance County are show in Exhibit R, Visual Simulations of the
Projects.
8.3.2 Height Variance The wind turbines selected for the Projects would be state-of-the-art equipment with a maximum vertical
dimension of approximately 260 to 360 feet; they are designed to generate optimal energy for a wind
energy facility in this wind regime. The up to 7 approximate 200-foot-tall MET towers are necessary to
monitor wind turbine performance and plant maintenance activities to reliably operate the facilities. This
Height Variance, therefore, conforms to allowable uses for this zoning district.

Application for Zoning Ordinance Amendment Final Conformance With Comprehensive Land Use Plan
Pattern Energy LP 9-1 Burns & McDonnell
9.0 CONFORMANCE WITH COMPREHENSIVE LAND USE PLAN
The Torrance Wind Projects conforms to and helps fulfill numerous goals of the Comprehensive Land
Use Plan for Torrance County.
9.1 GOAL A Objective 2: Preserve and Protect Land for Farming and Ranching
Wind energy development is a compatible land use with ranching and other agricultural activities. Post-
construction, typically less than 2 percent of the Project areas would be occupied by the turbines, service
roads, O&M facilities, and Projects substations. Cattle would remain able to graze at the base of the
turbines and wildlife would be able to use the area around the turbines.
Throughout the United States, wind energy development has enabled ranchers and farmers to diversify
the economic returns from their lands, helping to preserve a rural way of life, and providing a viable
alternative to subdividing or selling their land.
9.2 GOAL B Plan and guide development in the County in a manner which encourages optimum efficiency and
cost-effectiveness in the delivery of infrastructure and County services
The Projects would be designed as a self-sufficient development, placing minimal or no demand on
county services. Unlike many other types of developments, wind energy facilities make significant direct
tax payments, stimulate the local economy, and create new jobs; all while placing minimal demand on
existing infrastructure and services. Few Torrance County roads would be utilized by the Projects and
most access roads would be newly constructed on private land. The Applicants would work with the
Torrance County Road Department to obtain necessary approvals for use of county roads. In addition, it
would not be necessary for Torrance County to augment emergency management services for this
development.
9.3 GOAL F Objective 1: Promote the Estancia Basin as the prime location for new, but low water consumptive
agriculture and agri-business
Wind energy facilities “harvest” the wind, use minimal water post-construction, and generate no
emissions or pollutants. Wind energy facilities typically only use water during construction for concrete

Application for Zoning Ordinance Amendment Final Conformance With Comprehensive Land Use Plan
Pattern Energy LP 9-2 Burns & McDonnell
and dust abatement, and during operation for periodic power-washing of turbine blades and facilities at
the O&M building. The Projects consume far less water than standard agricultural uses.
Objective 2: Preserve and protect grazing and ranching lands from development that is detrimental to
existing land use
Wind energy development is highly compatible with grazing and ranching activities, which are the
current land uses within the Project areas. Wind energy development can help by providing economic
stability for landowners in place of other potential uses that could disrupt or impede grazing and ranching
activities.
9.4 GOAL J Ensure an adequate supply of quality water for current and future needs of the County
The Projects are anticipated to have a low impact on local water resources during operation. Water would
be required during construction for dust abatement and to mix concrete for turbine foundations.
Construction water would likely be obtained from an existing well within the Project areas.
Wind energy also uses minimal water post-construction. During operation, turbine blades would be
periodically power-washed to prevent dust buildup. Potable water would be available at the O&M
facilities for use by a five- to ten-person staff. The Projects would provide Torrance County with quality
economic development with no negative impact on the current and future water needs of Torrance
County.
9.5 GOAL M Objective 2: Provide power services to meet the future needs of the County
While energy generated by the Projects would be delivered to the regional electric grid, interconnection
and transmission system upgrades for the Projects would enhance the capacity of the overall local and
regional electrical transmission systems.
Objective 3: Investigate the potential for wind and solar generated power in the County
By issuing the Zoning Ordinance Amendment, Special Use District, and Height Variance, Torrance
County would allow the Projects to demonstrate the feasibility of wind-generated power in the county.

Application for Zoning Ordinance Amendment Final Conformance With Comprehensive Land Use Plan
Pattern Energy LP 9-3 Burns & McDonnell
9.6 GOAL N Encourage the attraction, retention and expansion of businesses in order to provide quality jobs for
County residents
Wind energy is one of the fastest growing industries across the country and the globe, and the fastest
growing energy source in the world. Wind energy projects provide quality jobs, a new source of revenue
for ranchers, and an increased local tax base for rural communities. The Projects would generate full time
equivalent jobs during construction during the anticipated 2019 to 2020 construction year, and full-time
jobs during operation from 2020 up to 2050, or the life of the Project.
9.7 GOAL O Promote the exploration and utilization of natural resources within the County—with minimal
disruption to the environment
Wind energy harvests the wind, an abundant and natural resource. Wind energy development creates
clean energy from a non-depleting, local energy source that does not consume or discharge large volumes
of water, has no air emissions, and emits no odors. Additionally, less than two percent of the Project areas
would be used by wind energy infrastructure, leaving the majority of the land available as wildlife habitat.
Additional site-specific studies are ongoing and will be utilized to further minimize potential impacts to
birds, bats, and other wildlife within the Project areas. It is anticipated that results from these future
studies would be similar to those documented at other wind energy facilities located in the western United
States, where bird and bat mortality rates have been relatively low. See Section 6.2.8 for a detailed
summary of the preliminary review of environmental resources and potential impacts as a result of the
Projects. Also refer to Exhibit L, Biological Evaluation.
9.8 GOAL Q Objective 1: Promote the location of business and industry in areas that will provide long-term tax
benefits to the County
Wind energy development on privately owned rangelands and ranches is a compatible and
complementary land use and would provide an additional economic return from these lands. Wind energy
development on private ranch lands is effective in both attracting and expanding existing economic
development. Torrance County would receive financial benefit from the Projects through taxes, new
employment, and local spending. The Projects would generate significant temporary and permanent
employment (direct and indirect jobs) and local expenditures during construction and operations. The

Application for Zoning Ordinance Amendment Final Conformance With Comprehensive Land Use Plan
Pattern Energy LP 9-4 Burns & McDonnell
Projects would also provide additional economic stimulus from local expenditures (state and county gross
receipts taxes), project visitation, and potential ecotourism revenues.

Application for Zoning Ordinance Amendment Final Public Outreach and Citizen Participation
Pattern Energy LP 10-1 Burns & McDonnell
10.0 PUBLIC OUTREACH AND CITIZEN PARTICIPATION
Community support for the Projects is vital. The active participation of the local community in the
development process is essential for a successful wind project. Appropriate levels of outreach are
necessary to explain a project, respond to questions, and engage in a conversation about wind power in
general and with respect to a particular site.
Pattern Development has conducted ongoing outreach throughout the development process of the
Projects. This includes but is not limited to a number of meetings with Torrance County staff,
presentations to the Torrance County Board of Commissioners and the Torrance County Planning and
Zoning Commission, and local organizations such as the Estancia Valley Economic Development
Association. Additionally, Pattern Development has met with numerous landowners in Torrance County,
both those participating directly in the project and those who had elected to not participate in the project
or do not currently plan to do so. Such outreach is ongoing.

Application for Zoning Ordinance Amendment Final Summary
Pattern Energy LP 11-1 Burns & McDonnell
11.0 SUMMARY
The Torrance Wind Projects is in accord with the objectives and purposes of the Zoning Ordinance and is
an appropriate land use for its location and surroundings. The Projects are a minimal impact development
that is complementary to and compatible with the rural environment and existing rangeland activities.
The Projects would generate non-polluting, renewable energy equivalent to the needs of 509,400 homes
over the course of each year; help to diversify New Mexico’s energy infrastructure; harvest a local
renewable resource; and provide economic benefits, including direct expenditures on labor, materials, and
services during construction and operations, payments to landowners, and payments to Torrance County
and State of New Mexico.

Application for Zoning Ordinance Amendment Final Conclusion
Pattern Energy LP 12-1 Burns & McDonnell
12.0 CONCLUSION
As identified in the narrative, the request to install the Projects within the Agricultural District (A) (see
Exhibit Q, Torrance County Zoning Map) satisfies the goals and objectives for a Zoning Ordinance
Amendment for a Special Use District and Height Variance. The proposal is consistent with, and
conforms to, the goals and objectives of the Torrance County Comprehensive Plan.
Pattern Development would like to thank the Torrance County Commissioners, Torrance County
Planning and Zoning Commission, the Torrance County Planning & Zoning Department, and all Staff for
the opportunity to process this application for the Torrance Wind Projects. We look forward to working
closely with Torrance County to bring these Projects to fruition in 2020.

Application for Zoning Ordinance Amendment Final Applicants Contact Information
Pattern Energy LP 13-1 Burns & McDonnell
13.0 APPLICANTS CONTACT INFORMATION
Adam Cernea Clark
Manager, Environmental and Natural Resources, Pattern Development
(713) 308-4296
Pattern Energy LP 13-1 Burns & McDonnell
EXHIBIT A PROJECT OVERVIEW

Source: Esri, NFS, Pattern Development, and Burns & McDonnell Engineering Company, Inc. Issued: 8/6/2018
Exhibit AProject Overview
Pattern DevelopmentTorrance Wind Projects
Torrance County, New Mexico
#*
#*
#*#*
#*
#*
#*
#*
#*
#*
#*
#*
#*
#*
#*
#*
#*
#*
!
!
!
!
!
!
!
!
!
!
!
!
!
!
!
!
!
!
!
!
!
!
!
!
!
!
!
!
!
!
!
!
!
!
!
!
!
!
!
!
!
!
!
!
!
!
!
!
!
!
!
!
!
!
!
!
!
!
!
!
!
!
!
!
!
!
!
!
!
!
!
!
!
!
!
!
!
!
!
!
!
!
!
!
!
!
!
!
!
!
!
!
!
!
!
!
!
!
!
!
!
!
!
!
!
!
!
!
!
!
!
!
!
!
!
!
!!
!
!
!
!
!
!
!
!
!
!
!
!
!
!
!
!
!
!
!
!
!
!
!
!
!
!
!
!
!
!
!
!
!
!!
!
!
!
!
!
!
!
!
!
!
!
!
!
!
!
!
!
!
!
!
!
!
!
!
!
!
!
!
!
!
!
!
!
!
!
!
!
!
!
!
!
!
!
!
!
!
!
!
!
!
!
!
!
!
!!
!
!
!
!
!
!
!
!
!
!
!
!
!
!!
!
!
!
!
!
!
!
!
!
!
!
!
!
!
!
!
!
!
!
!
!
!
!
!
!
!
!
!
!
!
!
!
!
!
!
!
!
!
!
!
!
!
!
!
!
!
!
!
!
!
!
!
!
!
!
!
!
!
!
!
!!
!
!
!
!
!
!
!
!
!
!
!
!
!
!
!
!
!
!
!
!
!
!
!
!
!
!
!
!
!
!!
!
!
!
!
!
!
!
!
!
!
!
!
!
!
!
!
!
!
!
!
!
!
!
!
!
!
!!
!
!
!
!
!
!
!
!
!
!
!
!
!
!
!
!
!
!
!
!
!
!
!
!
!
!
!!
!
!
!
!
!
!
!
!
!
!
!
!!
!
!
!
!
!
!
!
!
!
!
!
!
!
!
!
!
!
!
!
!
!
!
!
!
!
!!
!
!
!
!
!
!
!
!
!
!
!
!
!
!
!
!
!
!
!
!
!
!
!
!
!
!
!
!
!
!
!
!
!
!
!
!
!
!
!
!
!
!
!
!
!
!
!
!
!
!
!
!
!
!
!
!
!
!
!
!
!
!
!
!
!
!
!
!
!
!
!
!
!!
!
!
!
!
!
!!
!
!
!
!
!
!
!
!
!
!
!
!
!
!
!
!
!!
!
!
!
!
!
!
!!
!
!
!
!
!
!!
!
!
!
!
!
!
!
!
!
!
!
!
!
!
!
!
!
!
!
!
!
!
!
!
!
!
!
!
!
!
!
!
!
!
!
!
!
!
!
!
!
!
!
!
!
!
!
!
!
!
!
!
!
!
!
!
!
!
!
!
!
!
!
!
!
!
!
!
!
!
!
!
!!
!
!
!
!
!
!
!
!
!
!
!
!
!
!
!
!
!
!
!
!
!
!
!
!
!
!
!
!
!
!
!
!
!
!
!
!
!
!
!
!
!
!
!
!
!
!
!
!
!
!
!
!
!
!
!
!
!
!
!
!
!
!
!
!
!
!
!
!
!
!
!
!
!
!
!
!
!
!
!
!
!
!
!
!
!
!
!
!
!
!
!
!
!
!
!
!
!
!
!
!
!
!
!
!
!
!
^̂
^̂
^̂
^̂
^̂
^̂
^̂̂̂̂̂̂̂̂̂
^̂
^̂̂^̂̂^̂
^̂
^̂
^̂
^̂
^̂
^̂
#*
#*
#*
#*
#*
#*
ST247
ST42
ST3
£¤60
£¤54
L i n c o l nC o u n t y
T o r r a n c eC o u n t y
CibolaNationalForest
Project Elements! Preliminary Turbine Location#* Met Tower
#* SubstationsWind Project Area
Access RoadAccess Road/Crane PathCrane PathProject Transmission Line
£¤66
£¤285
£¤60
£¤380
£¤54§̈¦40
L i n c o l nC o u n t y
T o r r a n c eC o u n t y
Legend^̂ House
RailroadHighwaysMajor RoadsCounty Boundary
NWI WetlandNational/State Park/Forest
Land OwnershipState LandBLMForest Service
COPY
RIGH
T © 20
18 B
URNS
& Mc
DONN
ELL E
NGIN
EERI
NG C
OMPA
NY, IN
C.Se
rvice
Laye
r Cred
its: S
ource
: Esri
, Digi
talGl
obe,
GeoE
ye, E
arths
tar G
eogra
phics
, CNE
S/Airb
us D
S, U
SDA,
USGS
, Aero
GRID
, IGN,
and t
he G
IS U
ser C
ommu
nity
0 31.5
Scale in Miles
NORTH

Pattern Energy LP 13-2 Burns & McDonnell
EXHIBIT B RECORDED MEMOS OF LEASE AGREEMENTS


RECORDING REQUESTED BY AND WHEN RECORDED RETURN TO: VIENTO LOCO LLC c/o General Counsel Pier 1, Bay 3 San Francisco, CA 94111
(Space above this line for Recorder’s use only)
MEMORANDUM OF OPTION AGREEMENT FOR LAND LEASE AND WIND EASEMENT
THIS MEMORANDUM OF OPTION AGREEMENT FOR LAND LEASE AND WIND EASEMENT is made and entered into as of ___________________, 2018 (“Effective Date”), by and between William Dean Brinkman and Sharon D. Hanna, husband and wife, as joint tenants, with an address at HC 68 Box 17, Corona, NM 88318 (collectively, “Owner”), and VIENTO LOCO LLC, a Delaware limited liability company, with an address at Pier 1, Bay 3, San Francisco, CA 94111 (together with its successors and assigns, “Developer”).
WHEREAS:
A. The Parties have entered into an Option Agreement for Land Lease and Wind Easement (the “Option Agreement”) which, among other things, by its terms grants to Developer an option to acquire a wind easement (the “Option”) and further grants to Developer present easements for wind and weather monitoring and access on and across certain land which is more particularly described in Exhibit A attached hereto and incorporated by this reference (the “Property”);
B. The term of the Option commences on the Effective Date and ends upon the first to occur of (a) the time the Option is exercised by Developer or its successors or assigns by recording a Notice of Exercise of Option in the real property records of the county in which the Property is located (“Notice of Exercise”), or (b) up to ten (10) years after the Effective Date, unless terminated in accordance with the Terms of the Option Agreement;
C. If the Option is exercised, then Developer and its successors and assigns will hold a Land Lease and Wind Easement for, among other things, wind energy development and related rights over, on, across and through the Property or, portions thereof, at Developer’s option, during a term commencing upon the date of the recording of the Notice of Exercise (the “Operation Date”) and ending upon the end of the “Operating Term,” which Operating Term commences upon Operation Date, and which Operating Term ends thirty (30) years after the Operation Date, with an option in Developer to extend for two (2) ten (10) year Renewal Terms;
D. The Parties desire to enter into this Memorandum of Option and Lease which is to be recorded in order that third parties may have notice of the interests of Developer in the Property and of the existence of the Option to enter into the Land Lease and Wind Easement

covering the Property, or portions thereof, as set forth in the Option Agreement, and of certain easements and rights in the Property granted to Developer in the Option Agreement.
NOW, THEREFORE, in consideration of the rents and covenants provided in the Option Agreement to be paid and performed by Developer and other good and valuable consideration, the receipt and adequacy of which are acknowledged by Owner, Owner hereby grants to Developer, among other things, (i) certain easements with respect to the Property during the term of the Option, as more particularly set forth in the Option Agreement, and (ii) that certain exclusive Option to enter into a Land Lease and Wind Easement covering the Property, or portions thereof, on the terms and conditions set forth in the Option Agreement, together with certain present easements to use and enjoy the Property, all more particularly set forth in the Option Agreement. All of the terms, conditions, provisions, and covenants of the Option Agreement are hereby incorporated into this Memorandum of Option and Lease by reference as though fully set forth herein, and the Option Agreement and this Memorandum of Option and Lease shall be deemed to constitute a single instrument or document. Should there be any inconsistency between the terms of this Memorandum of Option and Lease and the Option Agreement, the terms of the Option Agreement shall prevail.
The Option evidenced by this Memorandum of Option and Lease may be exercised by Developer’s sole execution and recording of a Notice of Exercise in the real property records of the county in which the Property is located, whereupon all the easements and rights that are the subject of the Option shall immediately become effective and binding upon Owner and the Property, or such portions thereof as Developer may identify in the Notice of Exercise, and on all successive owners of such portions thereof or entirety of the Property and the successors and assigns of Owner, all for the benefit of Developer and its successors and assigns. This Memorandum of Option and Lease may be executed in multiple counterparts, all of which, when taken together, shall constitute one and the same agreement.

IN WITNESS WHEREOF, the Parties have executed this Memorandum of Option and Lease as of the date set forth above.
“OWNER” WILLIAM DEAN BRINKMAN SHARON D. HANNA “DEVELOPER” VIENTO LOCO LLC By:
Name:
Title:

INDIVIDUAL ACKNOWLEDGMENT
STATE OF ________ § § COUNTY OF ___________ §
The foregoing instrument was acknowledged before me this _______ day of _________________, 2018 by SHARON D. HANNA.
WITNESS my hand and official seal.
My Commission Expires: _____________ ______________________________ Notary Public STATE OF ________ § § COUNTY OF ___________ §
The foregoing instrument was acknowledged before me this _______ day of _________________, 2018 by WILLIAM DEAN BRINKMAN.
WITNESS my hand and official seal.
My Commission Expires: _____________ ______________________________ Notary Public

CORPORATE ACKNOWLEDGMENT
STATE OF __________ § § COUNTY OF __________ § The foregoing instrument was acknowledged before me this _____ day of __________________________, 2018, by ____________________________, as _______________________ of VIENTO LOCO LLC. [SEAL] Notary Public for the State of Texas
My commission expires: Commission No.:

EXHIBIT A TO MEMORANDUM OF OPTION AGREEMENT FOR LAND LEASE AND WIND
EASEMENT
DESCRIPTION OF THE PROPERTY The following real property all located in Torrance County, New Mexico as conveyed to Owner pursuant to that certain Warranty Deed – Joint Tenants from William Dean Brinkman and Sharon D. Hanna as Grantor to Owner as Grantee dated May 2, 2011 and recorded on May 2, 2011 in Book 324, Page 2498 in the Real Property Records of Torrance County, New Mexico as more particularly described as follows: Township 2 North, Range 13 East: Section 27: 32 acres in the SE4 Section 34: E2


After regordins, return to:
TECOLOTE WIND LLC1201 Louisiana Street, Suite 3200Houston, Texas 77002Attention: Land Department
r o-L_l,A N C E c o u N î YLI¡'DÀ ,lÀÂÀMt Lto, cl.sRK002173386
Bóok 33? pâge AB:-3I o¡ s72-/--07 / ZOLl OS! 1S | 42 ÞMBY SYLVIA i
^.-ttrtî¡J;lrtf*,
ãsisffiAt:Ë¡'är;l:ç$
ASSIGNMENT AND ASSUMPTION OFOPTION AGREEMENT FOR LAI\D LEASE AND \ilIND EASEMENT
THIS ASSIGNMENT AND ASSUMPTION OF OPTION AGREEMENT FOR LANDLEASE AND WfND EASEMENT (this "Assignment") is made and entered into and effective asof the (.A day of December, 2AI7 $he "Effective Date"), by and between VIENTO LOCOLLC, a Delaware limited liability compâny ("A.ssignor"), whose mailing address is Pier l,Bay 3,San Francisco, Califomia 94111, Attention: General Counsel, and TECOLOTE WIND LLC, aDelaware limited liability company (o'Assignee"), whose mailing address is Pier 1, Bay 3, SanFrancisco, California 94111, Attention: General Counsel. Assignor and Assignee are sometimesreferred to herein collectivelv as the "Parties".
WITNESSETH:
V/HEREAS, Assignor and Gallina Creek Ranch, Randal Biebelle and Joyce Bielbee enteredinto that certain Option Agreement for Land Lease and Wind Easement dated effective December20, 2016 (the "Option ,Agreemenf'), pertaining to certain real properly situated in TorranceCounty, New Mexico, and being more particularly described in the Option Agreernent and inExhibit A attached hereto (the "Property"); and
WHEREAS, a Memorandum of Option Agreement for Land Lease and Wind Easementdated as of Ðecember 2A, 2016, was previously recorded as Document No. 0Q2I632I2 onDecember 28,2016, in the real prcperty records of Torrance County, New Mexico; and
V/HEREAS, Assignor desires to assign to Assignee the Option Agreement pertaining to theProperty and all of Assignor's rights, title and interests in, to and under said Option Agreement; and
WHEREAS, Assignee desires to accept such assignment and assume the Option Agreementand all of Assignor's obligations, covenants, agreements and undertakings under the OptionAgreement, upon the terms and conditions contained herein.
NO'W, THEREFORE, the Parties do hereby agree as follows:
1. Assignor, for and in consideration of the sum of One Dollar ($l.OO¡ and othervaluable consideration, the receipt and sufficiency of which are hereby acknowledged, herebygrants, hansfers, assigns and conveys the Option Agreement and all of its rights, title and interestsin, to and under the Option Agreement to Assignee.
1.

2. Assignee, in consideration of the assignment of the Option Agreement by Assignor,hereby assumes and agrees to faithfully perform, discharge and fulfill all of the obligations,covenants, agreernents and undertakings of Assignor under the Option Agreement accruing andattributable for the period frorn and after the Effective Date,
3. Assignor and Assignee agree that this Assignment shall release Assignor frorn itsobligations, covenantso agreements and undertaking under the Option Agreement to the extentaccruing and attributable to the period frotn and after the Effective Date, and Assignee herebyagr€es to indemnify and hold Assignor harmless from and against any and all losses, costs,expenses, claims, liabilities and/or damages arising out of or relating to any and all such obligations,covenants, agreements and undertakings to the extent accruing and atfributable to the period fromand after the Effective Date. Assignor hereby agrees to indemnify and hold Assignee harmlessfrom and against any and all losses, costs, expenses, claims, liabilities and.lor damages arising out ofor relating to any and a1l such obligations, covenants, agreements and undertakings to the extentaccruing and attributable to the period prior to the Effective Date.
4. Assignor and Assignee hereby ratfi, reaffïrm and adopt and agree that the OptionAgreement shall be in full force and effect as to Assignee. Assignor acknowledges, to the best ofAssignor's knowledge, that there are no uncured defaults by Assignor under the Option Agreement,nor state of facts which, with the passage of tirne or the giving of notice or both, would constitute a
default by Assignor under the Option Agreement.
5. The Parties shall execute such further documents, and perf-orm such further acts, as
may be necessary to grant, transfer, assign and convey to Assignee the Option Agreement and all ofAssignor's rights, title and interests in, to and under the Option Agreement and to otherwise cornplywith the terms of this Assignment and consummate the transaction conternplated hereby.
6. This Assignment and its provisions shall be binding upon Assignor's successors andlegal representatives and shall inure to the benefit ofthe succossors, legal representative and assignsof Assignee and all future assigns thereof.
7. Assignor hereby grants, transfers, assigns and conveys to Assignee any and all ofAssignor's rights, title and interests in and to any amounts that may become payable to Assígnorunder the terms of the Option Agreement.
L This Assignment can be amended, supplemented, modified or changed, and anyprovision hereof can be waived, only by written instrument making specific reference to thisAssignment signed by the party against whom enforcement of any such amendment, supplement,modification or waiver is sought.
L This Assignment shall be governed by and construed in accordance with the laws ofthe State of New Mexico, without regard to the conflicts of law rules of such state.
10. This Assignment may be executed in counterparts, each of which shall be deemed an
original, and all of which shall constitute one and the same agreement and shall become effective
)TORRANCE COUNTY
',rNDÀ tARAMll,t,o' cLEnK0021?3386
Book 33? Pãqe Å8142 of. 5
!2/o1/20:^1 05r15r42 PM
BY SYLVIA

when one or more counterparts have been signed by each of the Parties and delivered (by electronicmail or otherwise) to the other party, it being understood that the Parties need not sign the samecounteqpart.
11. This Assignment will be recorded in the real property records of the County in whíchthe Property ís situated.
fS i gnatur e page foll ow s)
lORRANCE COUNlYLI.NDA i'ARÀ¡.{I¡¡LO, CLERK
0021?3386Bôok 33? Pege 487S' 3 of 5
ï2/01 /2o17 05 I 15 r d 2BÏ S YI]VIA
P !.i
3

IN WITNESS \MHEREOF, the parties hereto have executed this Assignment as of the dayand year first above written.
ASSIGNOR: Á.SSIGNEE
By: By:Rasmussen
Signatory Authorized Signatory
STATE OF TEXAS
COUNTY OF HARzuS
This instrument was acknowledged before me this day of December, 2Ol7 by BlakeRasmussen, Authorized Signatory of VIENTO LOCO LLC, a limited liability company,on behalf of said limited liability company
(NOTARY SEAL)
otary of
STATE OF TEXAS
COUNTY OF HARRIS
This instrument was acknowledged before me this day of December,2017 by BlakeRasmussen, Authorized Signatory of TECOLOTEcompany, on behalf of said limited liability company.
a Delaware limited liability
(NOTARY SEAL)
Notary ofTexas
4' "'T:ï-tîïiî
iii r":l* "
,r!"o'i tiiå^'ä : 15 I 4 2 PM
TMILY MCCIAÍìY LiAVISNûrâry i.tilirlic, State of Tax¡sCcr*im. Expires O1-1 ú:¿C21
ficlary lö 13104ðt}e2
E M I LY I'/CCLÂRY i]A\,¡i sl.lctery Pr.rblic, $tâlé cfCrrrrm. Ixpires öJ"1 fi-Zü?-1
iricr¡a tD 13104üs82

Exhibit Ä - Legal Description of the Property
The following real property all located in Torance County, New Mexico as convçyed to GallinaCreek Ranch, pursuant to that certain Warranty Deed from Elizabeth Ann McConnell, PersonalRepresentative of the Estate of Estate of Elsie Mae Snodgrass, deceased, as Grantor to GallinaCreek Ranch as Grantee dated January 22,1998 and recorded on January 28, 1998 in Book 278,Page 4032 in the Real Property Records of Tonance County, New Mexico as more particularlydescribed as follows:
T2N R14ESECTION 25: 32 (320 ACRES)SECTION 26: SE4 (160 ACRES)
T2N R158,SECTION 30: LOTS 3 &,4 Q7.63 ACRES)
TlN R148,SECTION 3: NE4, N2SE4 Q39.52 ACRES)SECTION 10: S2NE4, SE4 (240 ACRES)SECTION 11: ALL ( 640 ACRES)SECTION 13: ALL ( 640 ACRES)SECTION 14 ALL ( 640 ACRES)SECTION 15: ALL ( 640 ACRES)SECTION 22: ALL ( 640 ACRES)SECTION 23: ALL ( 640 ACRES)SECTION 24: ALL ( 640 ACRES)SECTION 25: A¡LL ( 640 ACRES)SECTION 26: ALL LESS 3.29 ACRES (636.71 ACRES)SECTION 27: 32 (17.04 ACRES FROM HOWELL)SECTION 27:N2 LESS 22.74 ACRES TO HOWELL(297.1ACRES)
TORRÀNCE COUNTYL¡NDÀ ûÀÂAMI1,L0, ci,ERK
Û021?3386Book 33? Page {8??
5 of 512/01 1?OI1 05r15t 42 Ê14
BY SYLVIA
5


RECORDING REQUESTED BY ANDWHEN RECORDED RETURN TO:
VIENTO LOCO LLCc/o General CounselPier 1, Bay 3San Francisco, CA 94lll
TORRANCE COUNlY
,\\\\\lll'!"'rr,,lt-¡\l-E- ç
tt,,
.ìs:i¿ u ñ ;lt'''-io]i'o" 'r'a;'---
:â,EHALjË¡27," "
*uS
''ß:1r E p.Y'':<f.sz,?t#;"*,s,':'s
LINDA JARAMILLO, CLERK0021,71646
Bo¡k 336 pâ9è A474L of 4
BY TINDARK06/15/20L7 08:58:t j. AM
(Space above this line for Recorder's use only)
MEMORANDUM OF OPTION AGREEMENTFOR LAND LEASE AND \ryIND EASEMENT
THIS MEMORANDUM OF OPTION AGREEMENT FOR LAND LEASE AND WINDEASEMENT is made and entered into as of rtl n n- X, .20t7 ("Effective Date"), byand between Dawn D. Johns, a single woman, with an address at HC 68 Box 8 Corona, NM 88318("Owner"), and VIENTO LOCO LLC, a Delaware limited liability company, with an address atPier 1, Bay 3, San Francisco, CA 94III (together with its successors and assigns, "Developer").
WHEREAS:
A. The Parties have entered into an Option Agreement for Land Lease and ÏVindEasement (the "Option Agreement") which, among other things, by its terms grants to Developeran option to acquire a wind easement (the "Option") and further grants to Developer presenteasements foluvind and weather monitoring and access on and across certain land v¡hich is moreparticularly described in Exhibit A attached hereto and incorporated by this reference (the"Property");
B. The term of the Option commences on the Effective Date and ends upon the first tooccur of (a) the time the Option is exercised by Developer or its successors or assigns by recordinga Notice of Exercise of Option in the real property records of the county in which the Property islocated ("Notice of Exercise"), or (b) up to ten (10) years after the Effective Date, unlessterminated in accordance with the Terms of the Option Agreement;
C. If the Option is exercised, then Developer and its successors and assigns will hold aLand Lease and Wind Easement for, among other things, wind energy development and relatedrights over, on, across and through the Property or, portions thereof, at Developer's option, duringa term commencing upon the date of the recording of the Notice of Exercise (the "OperationDate") and ending upon the end of the "Operating Term," which Operating Term commences uponOperation Date, and which Operating Term ends thirty (30) years after the Operation Date, with anoption in Developer to extend for two (2) ten (10) year Renewal Terms;
D. The Parties desire to enter into this Memorandum of Option and Lease which is tobe recorded in order that third parties may have notice of the interests of Developer in the Propertyand of the existence of the Option to enter into the Land Lease and Wind Easement covering theProperty, or portions thereof, as set forth in the Option Agreement, and of certain easements andrights in the Property granted to Developer in the Option Agreement.

TORRANCE COUNTYLINDA ,'ARAMT LLO, CLERK
aa271L646BÕok 336 Pâ9e 4475
2 of 4
A6/15/2071 08:58:11 AMBY LINDARK
NOW, THEREFORE, in consideration of the rents and covenants provided in the OptionAgreement to be paid and performed by Developer and other good and valuable consideration, the
receipt and adequacy of which are acknowledged by Owner, Owner hereby grants to Developer,
among other things, (i) certain easements with respect to the Property during the term of the
Option, as more partierrlarly set forth in the Option Agreement, and (ii) that eertain exeh-¡sive
Option to enter into a Land Lease and Wind Easement covering the Property, or portions thereof,
on the terms and conditions set forth in the Option Agreement, together with certain present
easements to use and enjoy the Property, all more particularly set forth in the Option Agreement.
All of the terms, conditions, provisions, and covenants of the Option Agreement are hereby
incorporated into this Memorandum of Option and Lease by reference as though fully set forthherein, and the Option Agreement and this Memorandum of Option and Lease shall be deemed to
eonstitr-lte a single instrument or docr.lment. Shor-rld there be any ineonsistene,v between the terms
of this Memorandum of Option and Lease and the Option Agreement, the terms of the OptionAgreement shall prevail.
The Option evidenced by this Memorandum of Option and Lease may be exercised byDeveloper's sole execution and recording of aNotice of Exercise in the real property records of the
county in which the Property is located, whereupon all the easements and rights that are the subject
of the Option shall immediately become effective and binding upon Owner and the Property, orsr-teh portions thereof a.s Developer may iclenti$z in the Notise of Exercise, and on all sr-tecessive
owners of such portions thereof or entirety of the Property and the successors and assigns ofOwner, all for the benefit of Developer and its successors and assigns. This Memorandum ofOption and Lease may be executed in multiple counterparts, all of which, when taken together,
shall constitute one and the same agreement.
IN WITNESS WHEREOF, the Parties have executed this Memorandum of Option and
Lease as of the date set forth above.
..OWNER"
Dawn D. Johns
..DEVELOPER"ITIñLIMAY-1l:/Iìl.v
By:
N
Title:

STATE OF fUL¡ tA trr c c.r
COI.JNTY OF -K ê14aL (-
INDIVIDUAL ACKNOWLEDGMENT
TORRANCE COUNTYLINDA .]ARAMI LLO, CLERK
002r11646Book 336 Page 4476
3 0f 4
06/I5/2A17 08:58:1L AMBY LTNDARK
lA ø.t
$
$
$
The foregoing instrument was acknowledged before me this 2lrLauy of2017 by Dawn D Johns.
V/ITNESS my hand and official seal
My Commission Expires: 2-lu'Lo2oNotary Public
CORPORATE ACKNOWLEDGMENT
7,r oSTATE OF
COTINTY OF
IsEAL]
$$
$
The instrument was acknowledged before me this2017, by
VIENTO LOCO LLC.
Notary for the StateMy commission expires
8 day ofAS
otrtÀrlALLoralee Hrr*
t¡OIAFf Pt,ItCoqnHoo
STAItsOF
ILYTexa
sAVIDLABYcMÇME IolStateb c,PuNotarY026-203-ExpiresComm
4698203IDN
Commission No.:2-l

¡. r orfrfoool*i"fr.3, o.Tul*, "0a2I7L646
Book 336 paqe 447706_/1.s) rïi, oÍ, se : 1r. AMBY LTNDARR
EXHIBIT A TOMEMORANDUM OF OPTION AGREEMENT FOR LAND LEASE AND WIND
EASEMENT
DESCRIPTION OF' THN PROPERTY
The following real propefiy all located in Torrance County, New Mexico as conveyed to Wayne E. andDawn D Johns, pursuant to that certain Warranty Deed from Nolan and Bonnie Tracey as Grantor toWayne E. and Dawn D Johns as Grantee dated February 12,2000 and recorded on February 2I,2000 inBook 286, Page 2188 in the Real Property Records of Torrance County, New Mexico as more particularlydescribed as follows:
TOWNSHIP 1N RANGE 14E
Section 18: SW4SE4
TOTAL: 40 ACRES

RECORDING REQUESTED BY AND\JVHEN RECORDED RETURN TO:
COWBOY MESA LLCc/o Land Department1201 Louisiana St., Suite 3200Houston, TX77002
TORRANCE COUNTYLlNDA JARAMILLO, CLERK
002L12322Book 331 Paqe 1675
L of 8
08 /24 /201"7 09:41-t 44 AMBY LINDARK
(Space above this line for Recorder's use only)
MEMORANDUM OF OPTION AGREEMENTFOR LAND LEASE AND WIND EASEMENT
THIS MEMORANDUM OF OPTION AEASEMENT is made and entered into as of
FOR LAND LEASE AND WIND2017 ("Effective Date"), by
and between Kizer LGT Ranch, LLC, a Limited ty company, with an address at 438 S
Roosevelt Rd. 30 Causey, NM 88113 (collectively, "owner"), and CoWBoy MESA LLC, aDelaware limited liability company, with an address at Pier 1, Bay 3, San Francisco, CA 94i11(together with its successors and assigns, "Developer").
WHEREAS:
A. The Parties have entered into an Option Agreement for Land Lease and WindEasement (the "Option Agreement") which, among other things, by its terms grants to Developeran option to acquire a wind easement (the "Option") and further grants to Developer presenteasements for wind and weather monitoring and access on and across certain land which is moreparticularly described in Exhibit A attached hereto and incorporated by this reference (the"Properly");
B. The term of the Option commences on the Effective Date and ends upon the first tooccur of (a) the time the Option is exercised by Developer or its successors or assigns by recordinga Notice of Exercise of Option in the real property records of the county in which the Property islocated ("Notice of Exercise"), or (b) up to ten (10) years after the Effective Date, unlessterminated in accordance with the Terms of the Option Agreement;
C. If the Option is exercised, then Developer and its successors and assigns will hold aLand Lease and V/ind Easement for, among other things, wind energy development and relatedrights over, on, across and through the Property or, portions thereof, at Developer's option, duringa term commencing upon the date of the recording of the Notice of Exercise (the "OperationDate") and ending upon the end of the "Operating Term," which Operating Term commences uponOperation Date, and which Operating Term ends thirty (30) years after the Operation Date, with anoption in Developer to extend for two (2) ten (10) year Renewal Ternts;
D. The Parties desire to enter into this Memorandum of Option and Lease which is tobe recorded in order that third parties may have notice of the interests of Developer in the Properlyand of the existence of the Option to enter into the Land Lease and Wind Easement covering the

Property, or portions thereof, as set forth in the Option Agreement, and of certain easements andrights in the Property granted to Developer in the Option Agreement.
NOW, TI{EREFORE, in consideration of the rents and covenants provided in the OptionAgreement to be paid and performed by Developer and other good and valuable consideration, thereceipt and adequacy of which are acknowledged by Owner, Owner hereby grants to Developer,among other things, (i) certain easements with respect to the Property during the term of theOption, as more particularly set forth in the Option Agreement, and (ii) that certain exclusiveOption to enter into a Land Lease and Wind Easement covering the Property, or portions thereof,on the terms and conditions set forth in the Option Agreement, together with certain presenteasements to use and enjoy the Property, all more particularly set forth in the Option Agreement.All of the terms, conditions, provisions, and covenants of the Option Agreement are herebyincorporated into this Memorandum of Option and Lease by reference as though fully set forthherein, and the Option Agreement and this Memorandum of Option and Lease shall be deemed toconstitute a single instrument or document. Should there be any inconsistency between the termsof this Memorandum of Option and Lease and the Option Agreement, the terms of the OptionAgreement shall prevail.
The Option evidenced by this Memorandum of Option and Lease may be exercised byDeveloper's sole execution and recording of a Notice of Exercise in the real property records ofthecounty in which the Property is located, whereupon all the easements and rights that are the subjectof the Option shall immediately become effective and binding upon Owner and the Property, orsuch portions thereof as Developer may identify in the Notice of Exercise, and on all successiveowners of such portions thereof or entirety of the Property and the successors and assigns ofOwner, all for the benefit of Developer and its successors and assigns. This Memorandum ofOption and Lease may be executed in multiple counterparts, all of which, when taken together,shall constitute one and the same agreement.
IN V/ITNESS WHEREOF, the Parties have executed this Memorandum of Option andLease as of the date set forth above.
"o'WNER"RANCH,
By:ToRRAN¿-Þ
t,rr¡¡ ;À¡À¡rirrå. iy.L.r "ô^ã.- ' "u!õ^
Book sái'í",,^lz Ãí, .:e" L676
08/24tcÃì- ^:BY ii,,iol^iet41:44 AM
Name
Title:
..DEVELOPER'
By
Name
C
Title

INDIVIDUAL ACKNOWLEDGMENT
STATE OF d mLto'cÐ ss
$COUNTY OF C*rn.
The foregoing i acknowledged before me this thOuy of 4.",t,^.12017 by \r
nstrument wasìâV\r'\Ò'-,\ ll f-et p¡as ) oc-t , k Z.o Lq T ß.^^-(^, LLL :
WITNESS my hand and official seal.
My Commission Expires )- lt¿ ,2o z o
Mt Comrnisi;"
OFFICruSEAL
Loralee HuntNC)TARYPIJBLIC
STATE OFNEWMBXICOtrtur*o.*kLþ@-
Notary Public
CORPORATE ACKNO\ilLEDGMENT
srArn or l4¿/úS $
$
$
TORRANCE COUNTYLTNDA JARAMILLO, CLERK
002!7 2322Book 337 Page I677
J OT ð
08/24/2017 09r41:44 AM
BY LINDARK
COUNTY OF
foregoing instrument was
ISEAL]
2017, byCO\ryBOY MESA LLC
otaryMy commis ston
before t5 daythis
the State of T
ofAS
LYq
AVtLARYMMETexasofS tateb ic,PuotaryN
5-2003-ExpiresComm2I0469UotaN
Commission No

EXHIBIT A TOMEMORANDUM OF OPTION AGREEMENT FOR LAND LEASE AND \ilIND
EASEMENT
DESCRIPTION OF THE PROPERTY
The following real property all located in Guadalupe, Torrance and Lincoln Counties, NewMexico as conveyed to Kizer LGT Ranch, LLC, a New Mexico limited liability company,pursuant to that certain Warranty Deed from JLW LLC., as Grantor to Kizer LGT Ranch, LLC as
Grantee dated August 4,2014 and recorded on August 18, 2014 in Book 134, Pages I 18-128 in theReal Property Records of Guadalupe County, New Mexico and recorded on August 18, 2014 inBook 2QI4, Page 4619 in the Real Property Records of Lincoln County and more particularlydescribed as follows:
(EestcmPordon)
¡Sccdon tE: Áll,6¿edo¡ tl¡ WrA NF/d TV/, SE/4, SE/{ SE 1
TOWùI$IIP rWO Ol NORTE TI NGB FIGHÎEFN llSt EAStr NMÞM. cuÆ)tt¡¡pE coü¡ry. Ntt
8ccüo¡ lSi AIIñccüo¡23¡ &fl'$æCo¡ 2l¡ tll
6ædo¡26: E/2é¡cüou1?: l¡¡vSccüo¡33¡ All,Ó¡cdor3l: All
;6ædon lf : l{Ílr SiW{, WA SE/4Scdo¡ lf : Srl SE/¿l
Sccdo¡l* \T/2S¡c{o¡ 13¡ All$ccüo¡ 1{: l{¿L SF/{, E¿ Srìil/{ScdontS: MINEI{Sccdo¡ t6l S[t/{S¡cdou1?¡ NF/{Snt/4Sætlo¡19: NfÍ/4NW{Sætton2& lül
.-fccdo¡tl: l{W{l{W{Scctlo¡l* AllSætlou24: l{/2rM!g2Sædon2Sl SñV/4Sccdo¡26: MÌ
TORRANCE COUNTYLTNDA .]ARAMT LLO. CLERK
0 0 21.7 2322Book 337 Page 1678
4 of 8
Og /24 /2A11 09t 41". 44 AM
BY L1NDARK
!ilpNsf,rP rT9 frlNoRnl. RANFE ilTNErrE*rlqJ EASr. ¡nprrf. grlp^unE con{rv. NM
$ædo¡ lt: I¡td SE/1 $V/4, Y2 SE/dScdo¡llh I¡t 1r2,3 ¡nd4Scctlon3Q: áll.

¡¡{D
Àlt of ùc followtng dcêdêd l¡nd¡ to thê ctrtê¡t ¡ucb l¡¡d¡ llc E¡:t of thc dlvlslon llne (F¡ccpt rr lotod botor)whlch dt¡'ldo¡ ll¡c l¡ ilcrcrlbc! et thc nAllgnrcnt Dcrcrlptlo¡rt on plrt of ¡an'Gy by Gconctrol Surracj,S¡$cor drûcd July 2, 1993' updttcd Novcmbcr f 7' ß93 rnd filcd Dcccnbcr 9, 1993, lrr Book B, prç 256 oltbc plrt rceordc of tbc Gn¡drlupc Coonty clcr¡L
'li:owNsrllP Í}Vo nì No8lq. R.{NGE sEx/rNlEEN fin B./rc?. NñÍp,M. GUAD r {rÞrl couNr'l¡. ìtM
tdlgdoo 16: All-fècdon11: Slr4NE/{.,,ðccüo¡ !t¡ SEllr Sn. NE {, liW/4 NE/¡í, W¿ly8ig{on 3i}: Si,|2 SE/¿|, [.ESS A¡{Þ EXCEFT dt lrnd ¡orth of th tbc rllvlslon lllcv8Êcdo¡ 3{: A'U, LESS Al{D EXCEPT thc wcst¡¡n pordon of Sacdon 34 bou¡rlcd by the dhlston ttnc
(Wcsbm Por{on}
TOI¡'NSEI? lWO 12) NQRÎIL n^NcF SDffEEN f16ì EAS'r. NMPM. CttApALr¡F E. Corriì¡Ty..lw
s/,S/¿NF/{,SE {NE {rEfzSE/¡lA¡IfilN\Y/4¡nr'/,tv2 TORRANCE COUNTY
LINDA JARAMITLO¡ CLERK002172322
Book 31? påge 16195 ot g
08 /24/207i 0gt 41,t 44 AMBY LTNDARK
Älll{\¡l/{NE¡t,W¿lwr2wl
u,zScc{on 3:,Socdon *ø.scdon 9:r'$or r0:
¿Secdon 16:
lacdon2l:.zSoc{lon 2t:iÆccuon l¡:"Sct{on
25:
,Sccdon 27:
,.8Écdon 28:¡!Êcüon3it:
çÆccdon 3{:T$ccdoa 351
,r8cclon36:
AllEn
rqsr{$Infivof2tNoRIE R^t{c" sFrrE-sI"ENfi?Eágr.MúpMÊuAD.{LnpECOgtTTï¡}ût
tr/2W¿Ä¡r¡t
-Sccdon¡Áftcdon¡$ccüonr,.Sccdo¡
All ott{ folowbg qccdcd l¡ndc to tùo c¡ænt ¡¡cb lr¡d¡ llc \Ycst of tbc dhl¡ton lllo @rccpt rr notcd bctow)rùlch dþlslon llnc l¡ dc¡crlbd rr tbc trAllgnncn!_D9{4ptlqn:' on_plrt ol run'cy by Gcooctrou Sun'cySq6t drtd Juty 2t f993' updrtcd on Novcnbcr 17, 1993 r¡rl ûlcd Dcccnbcr 9, 1993¡ ln Book B, prç 25ãof tbc pht rcco¡dr of thc Gurdelupc Coûty Cxcr¡L
29¡ AII30¡ AIItl¡ All32: All
AltD
loVl{SEIP lwo clì NORTII B+lItGP SEïENTP,FN tlzt F rST. ¡nfPü¡ Cur¡¿rurpB cOr¡vrv. mr
..Scctlon 16: All",ÆAo¡ 28: SE/a' Si/2 NE/4' lNtt/4 NE/{' W/2çlðcüon 33: S/2 SE 4 LESS Al{D IXCEFT rll lr¡d ¡o¡th 0f thc dMshn llnc¿Sccdon :t& All. LESS A¡Ul E (CEP[ ¡lI of tbc nnrlnlng portlon of Scctlon 3{ not bounded by tbc dtvl¡lon
llnc

(Te¡.lor Fortlol)
TOWNSEIP lWO Ctì NORTE. R-ANGÌI SrTTFtry $6t E^SIINIÍPìú cU^D^LttpF COItNre. I\rFW ÀrFvrcq
Sccdonll S¿
¡Sccüon 2:zSbcdo¡ l:r*cüon,l:/Scdo¡ l0:",Srdo¡ Il¡¿icdon?;.lÉtlon9:¡lccdon 12:
ÂltSlìP/{ NE/¡l r¡d N/! SEl4sE/4 SEi/rNE'4 NE/4SIV/¿I Stl'l¿l ¡nd Sfl SE/4Irc3,4E ¡SWr{lItA¡I
Iilt¡H¡ile îEREF l3), BO&f,E ¡I/N!¡GE SDTTEEN flô FrtsT. ¡IIUI,M. GUÁDALU?E CouNIy.-¡rqWUEECA
S¡cdo¡36: AJI
Scctb¡31:Sccdon32¡Sccdon3t:Scctlo¡ 35:
, Sccdol36:
taûr I,2,3 rnd {â¡tÆT
Nrz SEI/dÁll
Propcry located in lomrncÊ Countyf New l\[edco, e¡ follows¡
TOWNSHIP O¡IE (1) NORTE RIÌ{GE FIFTEEN (1Ð EAST, N.lf,P.l{.
Secdon 1Section 2Secdon 11
Secüon 12Sectton 13Sectio¡ 23Section 2{Scction 25SccËon 26.
ÄJrAJIAIIrul.åJt
å.n.ütNorth Half (N112)North Eatf C{1/2)
TORRAN.Ftrroe -oonÀ"ï..8, u.ïril*t t
uUZl'?2a))Book ¡¡z pãõ" 16806 of o-oto,, n /
??,1_1 oé : 4 1, ¡ q 4 AMD I LTNDARK

Township 1 North, Rrnge 16 Easq N.I\[PJVÎ., Lincoln County, Nerv Me¡ico:
/Sestíon 1:'Sec6oo 2:Section 3:Scstion 4:Scction 5:
Section 6:Scstion 7z
Section 8:Scction 9:ScEtion 13:
/Soetion 14:'section 16:Sætion 17:
Scction 18:Scstion 19:Scction20:Sccdon2l:Segtion 29:Sestíon30:
AllAllL¡t 4, SW/4NW4, S¡/2SW4\[tåWD, (Sometimes refer¡ed to as lnt 4, SW/4l.ISt/4 WI2SïU/4)En, EnSW/d IÆts 3 and 4, \lllzsW4, S2NW4Lots 1, 2,3,4,5,6 and ?, SE/4NW/4, S¿NE/4, Sg4, E/2SW4w n, \t nÈn, E/2NF/4, NE/4SF/4N/2N12, N¿2S12, S/2NW4, SW/4NS4, S¿2SE/4, SH4SW4, S\r//4S\ñ//4Eå, Sw/4, E¿zlifW/d \M¿1.[W4N/2,, NE/4SW4, S/2Sw/4, SE/4ENEN.AtlAüLot 3 (also knounr as the lW4SlU/4), t{l[Y/4SE/4I¡u 3 and 4, E/2S\M/4, Sg4s¿Nl2,lw4sw4All[-ots 1,2, 3 and4, F/å-FnWn
AllAltSl2N/:4 S2SW/4AllENEå,N/2NW{S¿SW4Atr
TORRANCE COUNlYLINDA JARAMILLOI CLERK
002772322Book 337 pâge 1681
7 of 808/24/20L7 Ogt4Lt44 AMBY LINDARK
lowushlp 1 Northo Range 17 Eest, N.IVLP.À[, LÍncohl Couuç, Nem'Merico¡
Scstion 1:
/Section 2:Sectíon 5:Scction 6:Section 7z
Scstion 10:
Section 15:

Townshþ l Nort\ Rengc 1? E¡¡q N.IWPå'f., Lincoln Counç, Ncw l\fe¡leol
All oftbc following decded lsnals to ùe ortsrt of n¡ch lands lie West of the divisiou ttnc (andNorth oftbc Soutberly pottioa of tbc division li¡c a¡d Sor¡h ofthcNorthecly portion of thedivision li¡c i¡ Sectios33, æd North of the Soutberly portiou of the divisioir iinc and Sor¡th ofthcNolherly portion of tbe divisionlins in Sectio¡ 34, Toumship 2 Nortl¡, Range 1? Eest) rl¡hicbdivision linc is described as the [,{lignmcot Dæctiption" on tbat ccrtein p}rt of sunrey byGcomcÊ¡on Survcy Systcns dated Iuty 2,1993,r¡pdåtcd onNoveober 17, 1993 and filealDcccnber 9, 1993, inBookB, pagc256 of tbcplatrecords oflhe Gradalupo Cou¡ty Cled<, andalso flod,{príl 19, 1994 in Cabinct q $ide 400 of thc plat rccords of thc Lincoln Couoty Clerk;
Scetion 4: E2SW4, S¿NW/4Section & S\[I/4,W2SE/4,SF/4SF/4,NF/4NF/4Sectioû 9: AJI
Scction 16.: All
Tornuhþ 1 North, Renge t7 Ea¡t, N.l\[P.l\[, Líncoln Couaty, New [fe.dco:
All of thc following dÊeild l¡nds to thc c¡cænt of sr¡ch lands lic Eest of the dMslou ttne (udNorü ofthc Southerly portion of ùe divisíon linc aûd South of thc Nortbcrly porüon of thcdivision li¡e in Scction 33, andNorth of üe Southerly portion ofùe ilívlsion line and Soutb of .
tbc Nortbcrly pottion of tbe divísim li¡e in Sestion 34, Township 2 Nortlq Range 17 E¡sr) uùiùdivision lino is dæccibcd a¡ tbc "Alignmeat Dcscripionn on th¡t ccrtain plat of srrvey byGçoocûon Sunrcy Systcns ilatodJuty2, l993,updatcdonNovcmbcr 17, 1993 and ûlcdDeccobcr 9, 1993, i¡Book B, pagc 256 of üc plæ rccords of the Gradalupc Cormty Clcch rn¿atso ñld April 19, 1994 itr Cabibstg Slide 400 oftbe plæ æcords of thc Lincol¡ Cor¡nty Cle¡lc
/Sestíon ¿t:
Sestion 8:Scgtion 9:Sectiou 16:
wlzsv4, E¿sw4, s¿2Ì'wf/4sw4, wI2sF/4, SE/4SEÍ4, NF/4N84AltAlt
ToÀRAN¡nrrroe ¡ÀnÀ¡rir.5, u.f"l*t
"002ttczi."""f ,:¡i pãsâ tuez
oB/24t2õi, nå.,.BY ii,uìenirtqtt44 AM


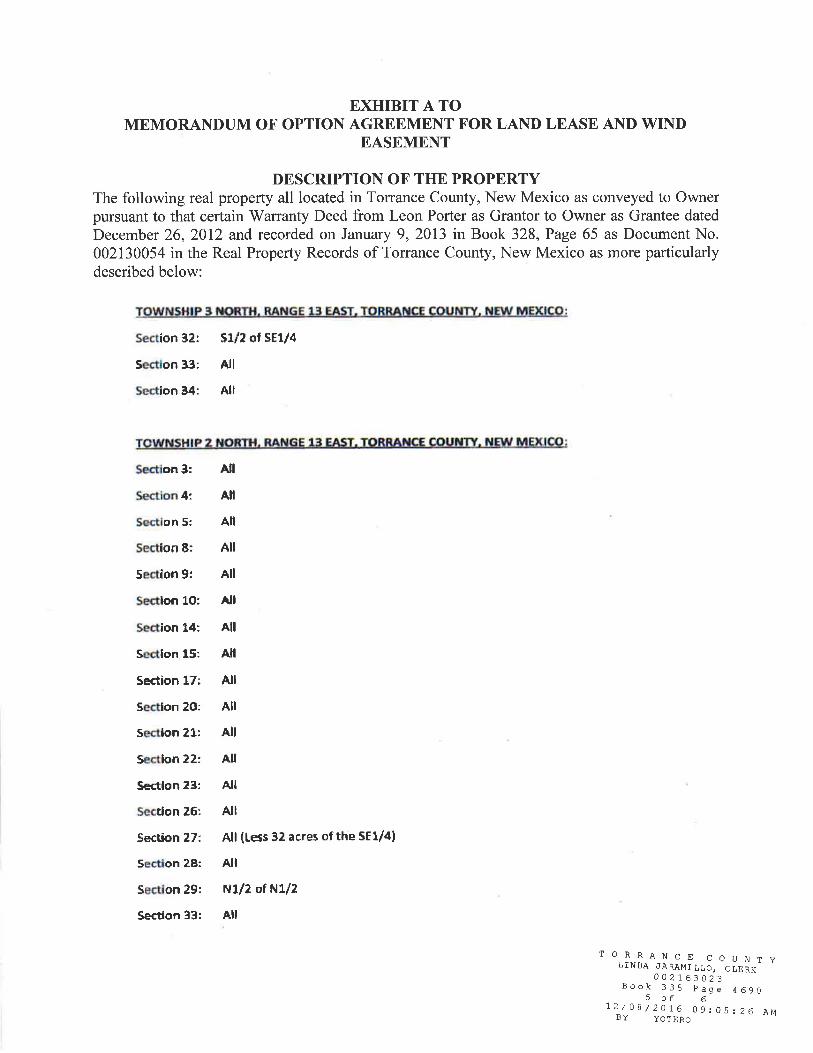


RECORDING REQUESTED BY ANDWHEN RECORDED RETURN TO
DURAN MESA LLCc/o Land Department1201 Louisiana St., Suite 3200Houston, TX77002
TORRANCE COUNTYLINDA .JARAMT LLO, CLERK
0021.72323Book 337 page t6g3
r or 608/24/20L7 09:S2r29 AM
BY LINDARK
-..Èqï*i ,\rrrr{t,
isisEALjË=
Aa*=,ü$(Space above this line for Recorder's use only)
MEMORANDUM OF OPTION AGREEMENTFOR LAND LEASE AND WIND EASEMENT
THIS MEMORANDUM OF OPTION REEMENT FEASEMENT is made and entered into as oand between NABAY HINDI AND SONS, INl+( ,hU.ßnv4â. Durn¡, nlM e44ot
LAND LEASE AND WIND2017 ("Effective Date"), by
N/.M. corporation, with an address at'Öwner"), and DURAN MESA LLC, aat Pier 1, Bay 3, San Francisco, CA94lll
('belawarè tiñlted tiiuitity ðömpany, with an address(together with its successors and assigns, "Developer")
WHEREAS
A. The Parties have entered into an Option Agreement for Land Lease and V/indEasement (the "Option Agreement") which, among other things, by its terms grants to Developeran option to acquire a r.vind easement (the "Option") and further grants to Developer presenteasements for wind and weather monitoring and access on and across certain land which is moreparticularly described in Exhibit A attached hereto and incorporated by this reference (the"Property");
B. The term of the Option commences on the Effective Date and ends upon the first tooccur of (a) the time the Option is exercised by Developer or its successors or assigns by recordinga Notice of Exercise of Option in the real property records of the county in which the Property islocated ("Notice of Exercise"), or (b) up to ten (10) years after the Effective Date, unlessterminated in accordance with the Terms of the Option Agreement;
C. If the Option is exercised, then Developer and its successors and assigns will hold aLand Lease and Wind Easement for, among other things, wind energy development and relatedrights over, on, across and through the Property or, portions thereof, at Developer's option, duringa term commencing upon the date of the recording of the Notice of Exercise (the "OperationDate") and ending upon the end of the "Operating Tem," which Operating Term commences uponOperation Date, and which Operating Term ends thirty (30) years after the Operation Date, with anoption in Developer to extend for two (2) ten (10) year Renewal Terms;
D. The Parties desire to enter into this Memorandum of Option and Lease which is tobe recorded in order that third parties may have notice of the interests of Developer in the Propertyand of the existence of the Option to enter into the Land Lease and V/ind Easement covering theProperty, or portions thereof, as set forth in the Option Agreement, and of certain easements andrights in the Property granted to Developer in the Option Agreement.

NOW, THEREFORE, in consideration of the rents and covenants provided in the OptionAgreement to be paid and performed by Developer and other good and valuable consideration, thereceipt and adequacy of which are acknowledged by Owner, Owner hereby grants to Developer,among other things, (i) certain easements with respect to the Property during the term of theOption, as more particularly set forth in the Option Agreement, and (ii) that certain exclusiveOption to enter into a Land Lease and Wind Easement covering the Property, or portions thereof,on the terms and conditions set forth in the Option Agreement, together with certain presenteasements to use and enjoy the Property, all more particularly set forth in the Option Agreement.
Notice is hereby given that the Land Lease and Wind Easement provides for certainpayment obligations to Karbon Zero LLC, a New Mexico limited liability company, and itssuccessors and assigns, in addition to the payment obligations to the Owner.
All of the terms, conditions, provisions, and covenants of the Option Agreement arehereby incorporated into this Memorandum of Option and Lease by reference as though fully setforth herein, and the Option Agreement and this Memorandum of Option and Lease shall bedeemed to constitute a single instrument or document. Should there be any inconsistency betweenthe terms of this Memorandum of Option and Lease and the Option Agreement, the terms of theOption Agreement shall prevail.
The Option evidenced by this Memorandum of Option and Lease may be exercised byDeveloper's sole execution and recording of a Notice of Exercise in the real property records of thecounty in which the Property is located, whereupon all the easements and rights that are the subjectof the Option shall immediately become effective and binding upon Owner and the Property, orsuch portions thereof as Developer may identify in the Notice of Exercise, and on all successiveowners of such portions thereof or entirety of the Property and the successors and assigns ofOwner, all for the benefit of Developer and its successors and assigns. This Memorandum ofOption and Lease may be executed in multiple counterparts, all of which, when taken together,shall constitute one and the same agreement.
TORRANCE COUNTY^ - riuna .lARAMl LLo' cLERKoo2!12323
Book 337 Page L6842 0t o
og/247zot¡ 09252t29 AM
BY LTNDARK

IN V/ITNESS WHEREOF, the Parties have executed this Memorandum of Option andLease as of the date set forth above.
"owNER"NABAY HINDI AND SONS,INC.
By:
Name:
Title:
,n
TORRANCE C^r,in,ü"0Änìn,irr3, o.l"l*t "
- f-)u21-72323eook 3l? Page r685
J Ot Âoe./.,24/?917 oõ: s¿ tzs AMöY LINDARK
..DEVELOPER"
D
By:
Name
Title:
CORPORATE ACKNOWLEDGMENT
TORRANCE COUNTYLlNDA .]ARAMI LLO, CLERK
4021-72323Book 337 Page L686
4 of 608/2A/20I7 09t52:29 AM
BY LÎNDARKsrArEor U¿at M€utcyl
-$COI_INTY OF lorran(t $
The foregoing instrument was before me this I I dav ofr'hl,:a.t A. t-J, U, ULJ!'
oi' ;.T
acknowledged2017, by
Of NABAY HINDI AND SONS, fNC.
Notary for theMy expiles:CommissionNo.
offlctAL sEAtKEttY VEl{TRIGLIA
llot¡ty PublicStat! ol N€w
My Comm. ËxPires

TORRANCE COUNTYLINDA .]ARAMI LLO, CLERK
0021.72323Book 337 pågê \697
5 of 608 / 24 / 201.'7 09: S2: 2 9 AMBY LINDARK
CORPORATE ACKNOWLEDGMENT
STATE OF
COUNTY OF
fore instrument was
úrt, $
$
$
before this day2017, by
ofAS
DURAN MESA
lsEALI Notary the State of TMy commission 3-/s-)Ð2y'CommissionNo.:EMILY MCCLARY DAVIS
Notary Public, State of Texas
Comm. ExPires 03-1 5-2021
Not lD 13i046982

EXHIBIT A TOMEMORANDUM OF OPTION AGREEMENT FOR LAND LEASE AND WIND
EASEMENTToRR,qNcE c^nn,
DEScRrprIoN oF THE pRopERTy ""^ ,'þ^,ïå'ri;.i'i-' "Book 33? p¿9g 16g8
0,",", n;llj;^l E, s 2,2 e AM
The following real property all located in Torrance County, New Mexico as conveyed to NabayHindi and Sons, Inc., pursuant to that certain Quitclaim Deed from Hindi Sheep Co. as Grantor tôNabay Hindi and Sons, Inc., as Grantee dated August 2,1983 and recorded on December 14, 19g3in Book 247,Pages3973-3979 in the Real Property Records of Torrance County, New Mexico andalso pursuant to that certain Quitclaim Deed from Hindi Sheep Co., as Grantor io Nabay Hindi andSons, Inc., as Grantee dated March 25,1986 and recorded on May 27,1986 in Book 250, pages3703 in the Real Property Records of Torrance County, New Mexico as more particulailydescribed as follows:
TO\ryNSHIP 1 NORTH. RANGE 15 EASTSection 3 ALL (640)Section 4- N2, SE4 (480)Section 5- NW4, NE4SW4, S2SW4, SV/4SE4 (320)Section 6- SE4SW4, S2SE4, NE4SE4 (160)Section 7. Lots I,2,3,4, E2SW4, SE4NW4, SW4NE4, SE4 (480)Section 8- ALL (640)Section 9- ALL (640)Section 10- ALL (640)Section 15- ALL (640)Section 16- ALL (640)Section 17-F,2 (320)Section 20- NE4 (160)Section 21- N2 (320)Section 22-N2 (320)
TO\ryNSHIP 2 NORTH. RANGE 15 EASTSection 20- SE4 (160)Section 2l- 32 (320)Section 22 - ALL except NW4 (480)Section 27- ALL (640)Section 28- ALL (640)Section 29- ALL (640)Section 30-E2, E2NW4 (400)Section 32- ALL (640)Section 34- ALL (640)
Containing approximately 10,960 acres, more or less


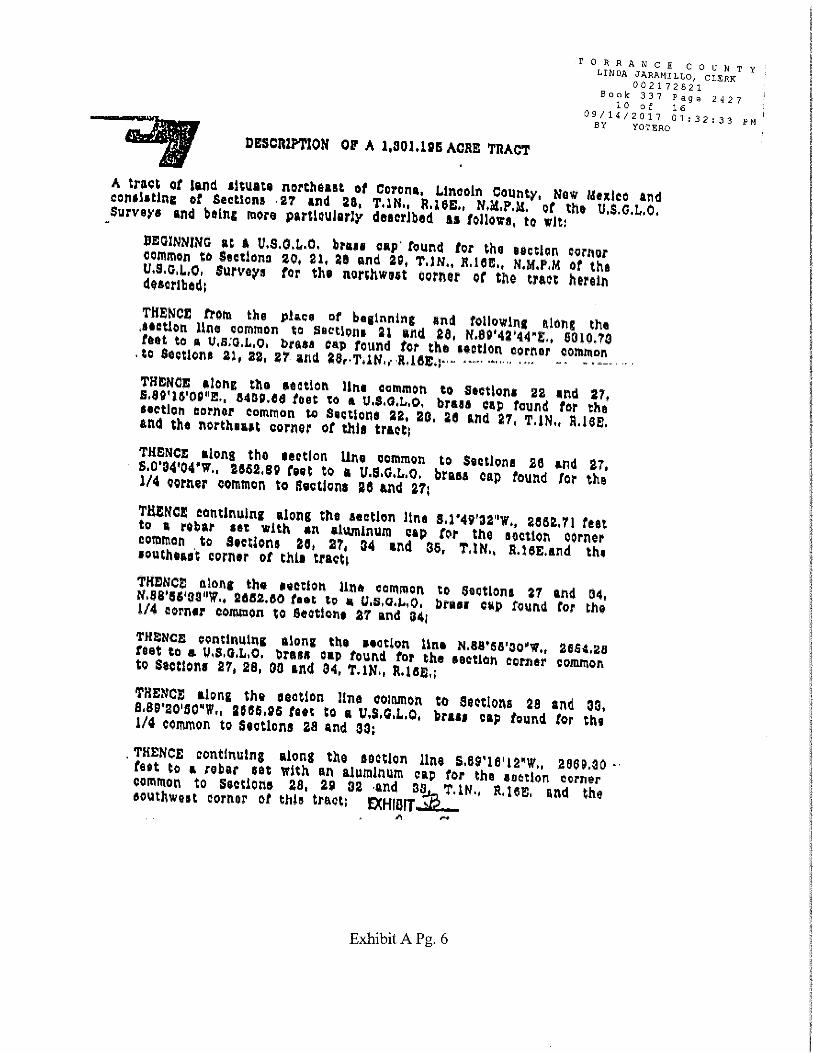

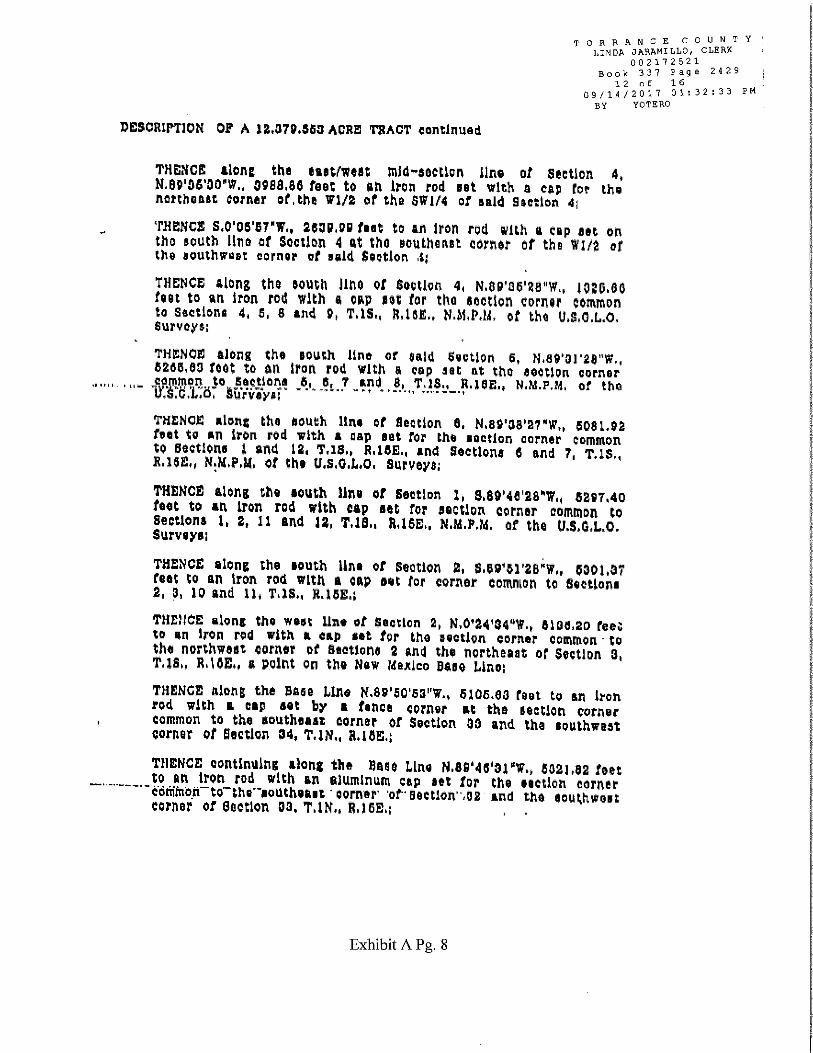


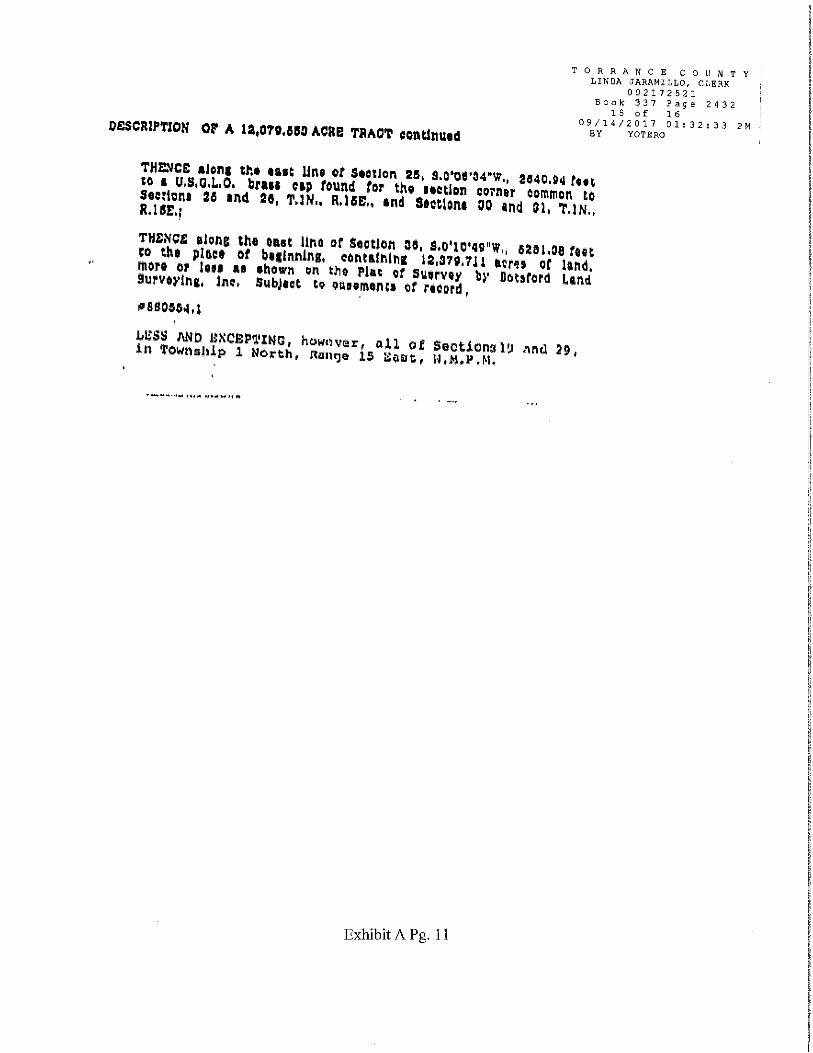


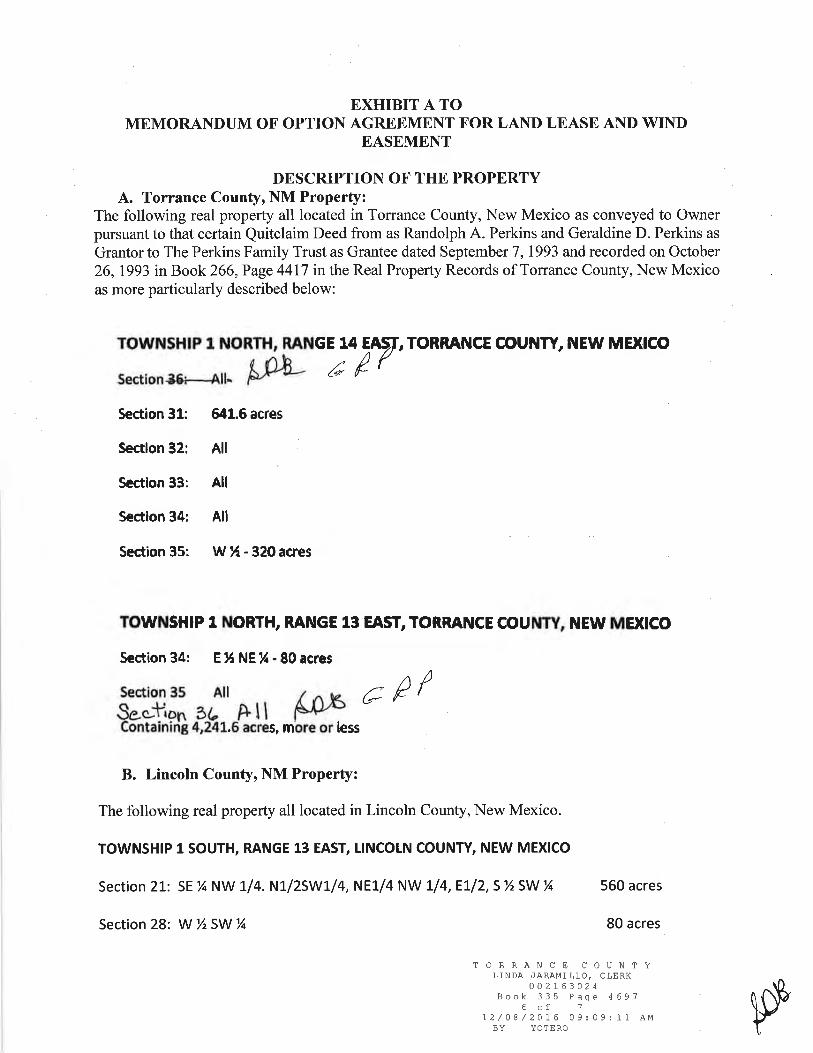


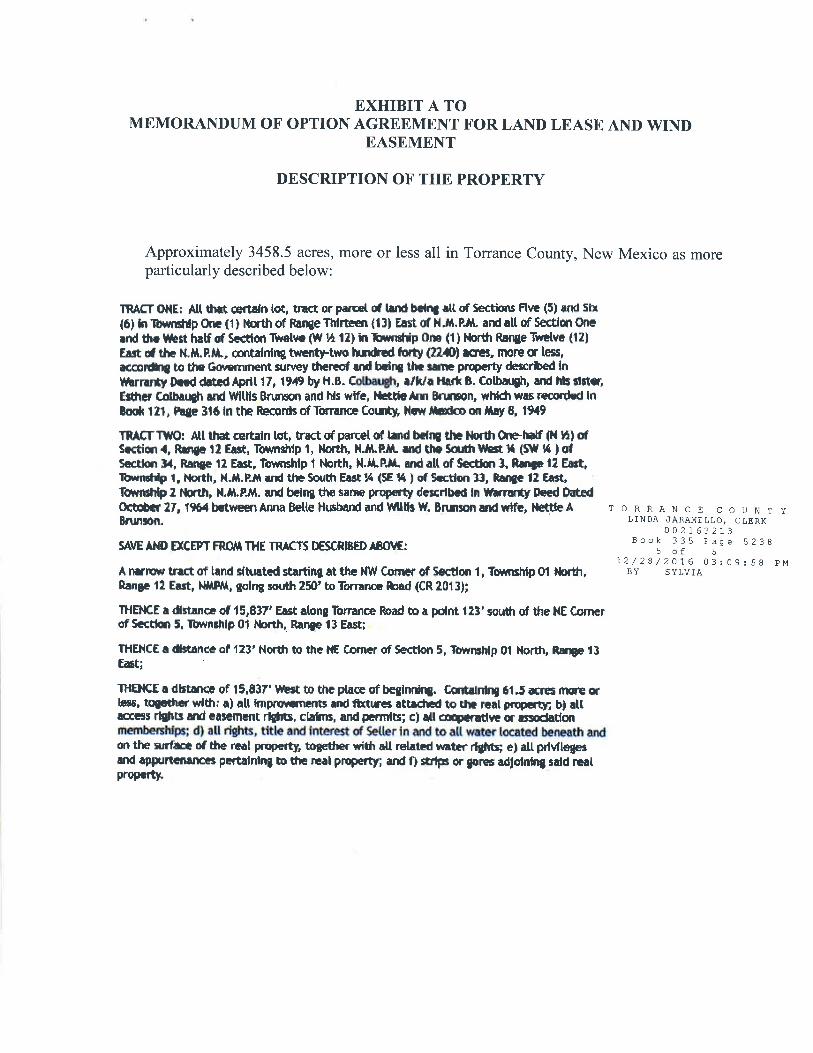


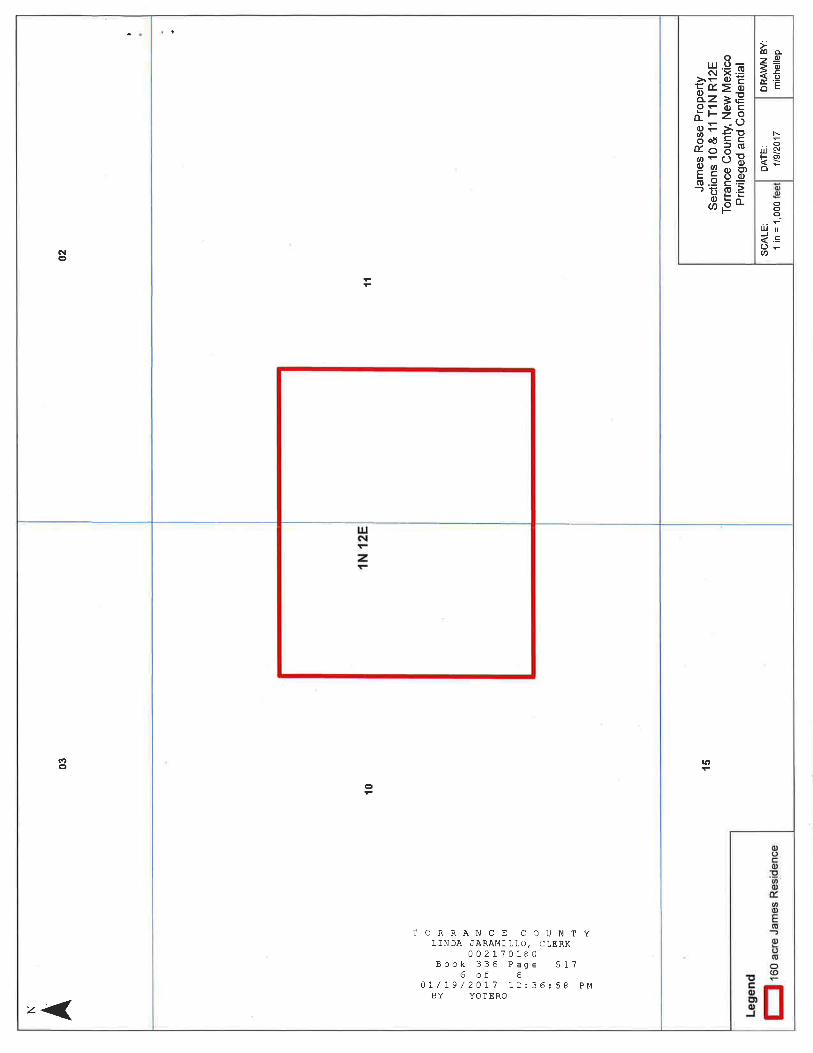

RECORDING REQUES BY ANDWHEN RECORDED RETURN TO
DURAN MESA LLCc/o Land Depaftment1201 Louisiana St., Suite 3200Houston, TX77002
TORRANCE COUNTYLINDA iTARAMI LLO, CLERK
002L'72324Book 337 Page 1689
L of 608/24/2017 10:05:34 AM
BY LINDARK
..-Èiìffi
:iiseALj¡:%;;;,.is{s
(Space above this line for Recorder's use only)
MEMORANDUM OF OPTION AGREEMENTFOR LAND LEASE AND WIND EASEMENT
THiS MEMORANDUM OF OPTION AEASEMENT is made and entered into as of
FOR LAND LEASE AND WINDY 2017 ("Effective Date"), by
and between SHAFIE RANCH COMP )a New Mexico corporation, with an addressat ("Owner"), and DURAN MESA LLC,a Delaware limited liability company, with an address at Pier 1, Bay 3, San Francisco, CAg4llI(together with its successors and assigns, "Developer")
WHEREAS
A, The Parlies have entered into an Option Agreement for Land Lease and WindEasement (the "Option Agreement") which, among other things, by its terms grants to Developeran option to acquire a wind easement (the "Option") and further grants to Developer presenteasements for wind and weather monitoring and access on and across certain land which is moreparticularly described in Exhibit A attached hereto and incorporated by this reference (the"Property");
B. The term of the Option commences on the Effective Date and ends upon the first tooccur of (a) the time the Option is exercised by Developer or its successors or assigns by recordinga Notice of Exercise of Option in the real property records of the county in which the Property islocated ("Notice of Exercise"), or (b) up to ten (10) years after the Effective Date, unlessterminated in accordance with the Terms of the Option Agreement;
C. If the Option is exercised, then Developer and its successors and assigns will hold aLand Lease and Wind Easement for, among other things, wind energy development and relatedrights over, on, across and through the Property or, portions thereof, at Developer's option, duringa term commencing upon the date of the recording of the Notice of Exercise (the "OperationDate") and ending upon the end of the "Operating Term," which Operating Term commences uponOperation Date, and which Operating Term ends thirty (30) years after the Operation Date, with anoption in Developer to extend for two (2) ten (10) year Renewal Terms;
D. The Parties desire to enter into this Memorandum of Option and Lease which is tobe recorded in order that third parties may have notice of the interests of Developer in the Propertyand of the existence of the Option to enter into the Land Lease and Wind Easement covering the
RECOIÌDEÞ ËLECTRONICAT.LY1¡ åtott64l"14 -Cøunry Áu.)" lfo
tlttate 1f4/¡¿tz Time 4:qf?rfl
.iinpi;f,i. wu r.simplifile,com Bû0.46C 5657

Ur,uT¿^>ø'RECoRDING REeuESrôn ey exnWHEN RECORDED RETURN TO:
State of New Mexico, Counlv of Guadalupe
Patrick Z.lt1arlinezGuadalupe County Clerk
t\ Filed for RecordL(ilan V Èhtt'X'u
i:-,itçcrerk/DeRutvÉA&-.:,ï:
-"åå ,r=*ti{S
"r,8f,,Ï,F,Su"'.DURAN MESA LLCc/o Land Depaftment120i Louisiana St., Suite 3200Houston, TX77002
By:
TORR uvurrr rLINDÀ JARÀI{I LLO, CLERK
002t72324Book 33? pâge 1609
1 of 608 /24/20L1 10: 05:34 Àtl
BT- LINDÀRR
(Space above this line for Recorder's use only)
MEMORÁNDUM OF OPTION AGREEMENTFOR LAND LEASE AND \ryIND EASEMENT
and between Si-IAFIE HINDI COMP ,a New Mexico corporation, with an addressat ("Owner"), and DURAN MESA LLC,a Delaware limited company, with an address at Pier 1, Bay 3, San Francisco, CA 94111(togetheruvith its successors and assigns, "Developer").
WHEREAS
A. The Parties have entered i¡rto an Option Agrcenrent for Land Lease and WindEasement (the "Option Agreement") which, among other things, by its terms grants to Developeran option to acquire a wind easement (the "Option") aud fufther grants to Developer presenteasements for vi'ind and weather monitoring and access on and across certain land which is moreparticularly described in Exhibit A attached hereto and incorporated by this reference (the"Property'');
B. The term of the Option commences on the Effective Date and ends upon the first tooccur of (a) the time the Option is exercised by Developer or its successors or assigns by recordinga Notice of Exercise of Option in the real properfy records of the county in which the Property islocated ("Notice of Exercise"), s¡ (b) up to ten (10) years after the Effective Date, unlessterminated in accordance with the Temts of the Option Agreement;
C. If the Option is exercised, then Developer and its successors ar:d assigns will hold a
Land Lease and Wind Easenent for, among other things, wind energy development and relatedrights over, on, across and through the Property or, portions thereof, at Developer's option, duringa tenn commencing upon the clate of the recording of the Notice of Exercise (the "OperationDate") and ending upon the end of the "Operating Term," which Operating Term commences upollOperation Date, and which Operating Temr ends thirty (30) years after the Operation Date, with anoption in Developer to extend for two (2) ten (10) year Renewal Tenns;
D. The Parties desire to entel into this Memorandum of Option and Lease lvhich is tobe recorded in order that third parties may have notice of the interests of Developer in the Propertyand of the existence of the Option to enter into the Land Lease and Wind Easement covering the
THIS MEMORANDUM OF OPTION AEASEMENT is mâde and entered into as of
FOR LAND LEASE AND WIND-v 2017 ("Effective Date"), by
800K141 PAGE 253- 258 DATE 09-14-17DOC 201 764694
TIME 04:45 PM

Property, or portions thereof, as set forth in the Option Agreement, and of certain easements andrights in the Property granted to Developer in the Option Agreement.
NO'W, THEREFORE, in consideration of the rents and covenants provided in the OptionAgreement to be paid and performed by Developer and other good and valuable consideration, thereceipt and adequacy of which are acknowledged by Owner, Owner hereby grants to Developer,among other things, (i) certain easements with respect to the Property during the term of theOption, as more particularly set forth in the Option Agreement, and (ii) that certain exclusiveOption to enter into a Land Lease and V/ind Easement covering the Property, or portions thereofon the terms and conditions set forth in the Option Agreement, together with certain presenteasements to use and enjoy the Property, all more particularly set forth in the Option Agreement.
Notice is hereby given that the Land Lease and V/ind Easement provides for certainpayment obligations to Karbon Zero LLC, a New Mexico limited liability company, and itssuccessors and assigns, in addition to the payment obligations to the Owner.
All of the terms, conditions, provisions, and covenants of the Option Agreement are
hereby incorporated into this Memorandum of Option and Lease by reference as though fully set
forth herein, and the Option Agreement and this Memorandum of Option and Lease shall bedeemed to constitute a single instrument or document. Should there be any inconsistency betweenthe terms of this Memorandum of Option and Lease and the Option Agreement, the terms of theOption Agreement shall prevail.
The Option evidenced by this Memorandum of Option and Lease may be exercised byDeveloper's sole execution and recording of a Notice of Exercise in the real property records of thecounty in which the Property is located, whereupon all the easements and rights thatare the subjectof the Option shall immediately become effective and binding upon Owner and the Property, orsuch portions thereof as Developer may identify in the Notice of Exercise, and on all successiveowners of such portions thereof or entirety of the Property and the successors and assigns ofOwner, all for the benefit of Developer and its successors and assigns. This Memorandum ofOption and Lease may be executed in multiple counterparts, all of which, when taken together,shall constitute one and the same agreement.
TORRANCE COUNTYLINDA .]ARAMILLO, CLERK
002L7Z324Book 337 Page 1690
2 of 608/24/2017 t0:05:34 AM
BY LINDARK
IN WITNESS V/HEREOF, the Parties have executed this Memorandum of Option andLease as of the date set forth above.
OOOWNER"
I RAN MP aNew Mexico corporation ,
Bv:
Name:
Title:
t
Þn.i.s..* TORRANCE COUNTYLINDA .]ARAMI LLO, CLERK
002172324Book 337 Page 1691"
3 of 6A8/24/2AI7 10:05r34 AM
BY LINDARK
..DEVELOPER"
DURAN
By:
Name:
Title:

I
u
CORPORATE ACKNO\ryLEDGMENT
couNrY or@!flÀ,ld_
Ñt¡ t',l'H,o $
$
$
TORRANCE COUNTY
STATE OF
The
corporation.
LINDA .]ARAMI LLO, CLERK002L12324
Book 337 Pagè I6924 of 6
08/24 /201.7 10: 05:34 ÀMBY LINDARK
foregoing instrument was acknowledged2017, by
of HINDI RANCH COMPANY, a New Mexico
me this tr_ day ofas
MyCommissionNo
I
Publi the State
expres:
offrcrAr 8€¡LJASoX8 XoHEU
iol¡ry PubllcSt.tr! ol l{tr
Comm,

¡
CORPORATE ACKNO\ilLEDGMENT
srArE orle y S $
$
$
TORRANCE COUNTYLTNDA ,]ARAMT LLO, CLERK
002L7232433'7 Page 1693of 601? 10:05:34 AM1 NDARK
08 / 2 4
BY
instrument \Mas acknowledged before me this2017, by
MESA
otary the State ofMy commissionCommissionNo.
k5/)
L
BoÕ
COUNTY OF
IsEAL]
day ofAS
5-o
Notary Public, State of Texas
Comm' ËxPires 03'1 5'2021
EMILY M CCLARY DAVIS
NotarY tD 131046982

EXHIBIT A TOMEMORANDUM OF OPTION AGRE,EMENT FOR LAND LEASE AND WIND
EASEMENT
DESCRIPTION OF THE PROPERTY
Situated within the County of Torrance, State of New Mexico.
Township 2N. Range 158- N %, Section I (320)- Section 2, all (640)- Section 12; all (640)
TORRANCE COUNTYTINDA .]ARAM] tLO, CTERK
0 0 2I1 232 4Book 337 pege I694
6 of 608/24/2AI1 10r05:34 AM
BY LINDARK
Township 3N. Ranee 158- SY2, Section 25 (320)- Section 34, all (640)
Section 35, all (640)- Section 36, all (640)
Situated within the County of Guadalupe, State of New Mexico
Township 2N. Ranee 16E- Section 5, all (640)- Section 6, all (640)- Section 7, all (640)- Section 8, all (640)
Township 3N. Range 16E- Section 29, all (640)- Section 30, all (640)- N %SEY+; SW %; N %, Section 31 (560)- Section 32, all (640)- Section 33, all (640)- Section 34, all (640)
Total Acreages - 10,160 acres


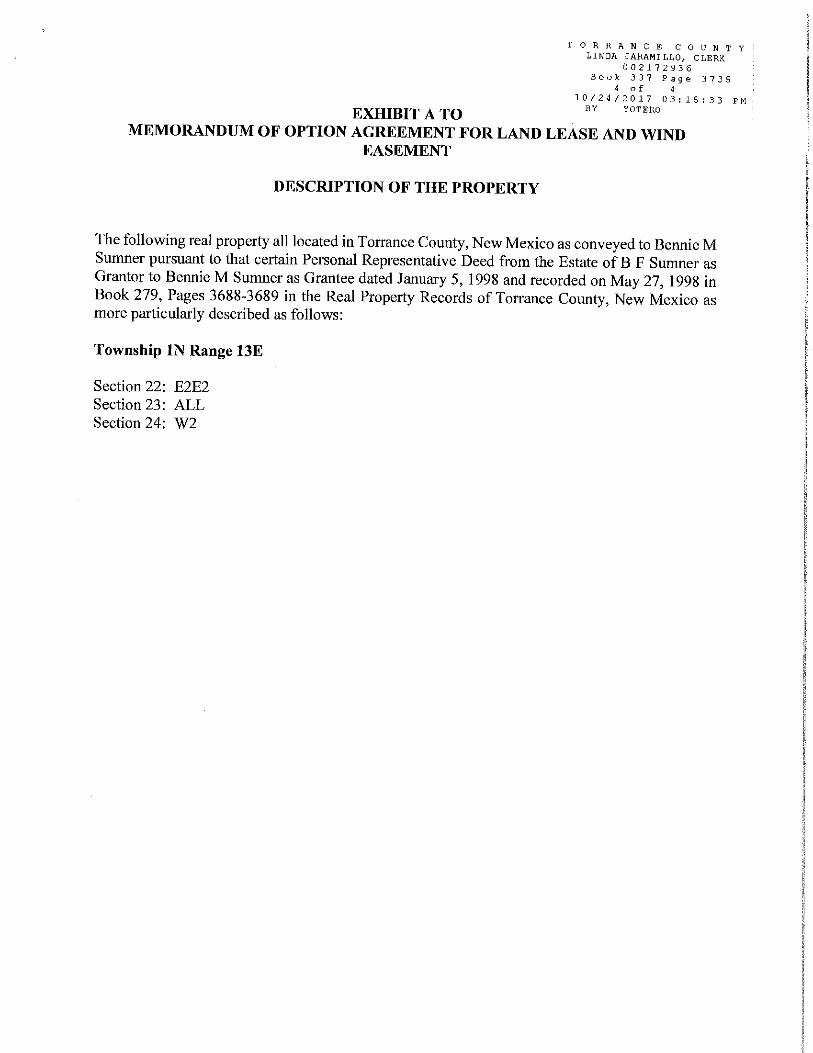

Torrance County, NM Leased Property Descriptions


T2N R12E Section 8- E2 (320) Section 17- NE4 (160) T3N R12E Section 1- ALL (636.80) Section 3- S2 (320)

Section 4- E2 (317.04) Section 12- ALL (640) Section 13- ALL less E2SE4 (560) Section 14- E2W2, E2 (480) Section 17- S2SE4 (80) Section 20- NE4, N2SE4 (240) Section 21- ALL (640) Section 22- ALL (640) Section 23- E2NE4, S2 (400) Section 24- W2 (320) Section 27- NW4, N2SW4, SE4SW4, SE4 (440) Section 28- E2 (320) T3N R13E Section 6- NW4, E2SW4, SE4 (375.40)+ Section 7- E2NW4, SW4, E2 (540.58) Section 8- SW4 (160) Section 17- NW4, NW4SW4 (200) Section 18- NE4SE4 (40) T4N R12E Section 25- ALL (640) T2N R12E Section 8- E2 (320) Section 17- NE4 (160) T3N R12E Section 1- ALL (636.80) Section 3- S2 (320) Section 4- E2 (317.04) Section 12- ALL (640) Section 13- ALL less E2SE4 (560) Section 14- E2W2, E2 (480) Section 17- S2SE4 (80) Section 20- NE4, N2SE4 (240) Section 21- ALL (640) Section 22- ALL (640) Section 23- E2NE4, S2 (400) Section 24- W2 (320) Section 27- NW4, N2SW4, SE4SW4, SE4 (440) Section 28- E2 (320) T3N R13E Section 6- NW4, E2SW4, SE4 (375.40)+ Section 7- E2NW4, SW4, E2 (540.58) Section 8- SW4 (160) Section 17- NW4, NW4SW4 (200) Section 18- NE4SE4 (40)

T4N R12E Section 25- ALL (640) T2N R12E Section 1- ALL (640.38) Section 4- W2 (319.81) Section 11- SE4, E2SW4 (240) Section 12- ALL Less State Land (540) Section 13- ALL (640) Section 14- E2 (320) Section 15- E2 (320) Section 22- NE4 (160), S2 (320) Section 23- SE4, SW4NE4 (200) W2, N2NE4, SE4NE4 (440) Section 24- E2NE4 (80), W2, W2E2, E2SE4 (560) Section 25- N2N2 (160) Section 26- NW4, W2NE4, NE4NE4 (280), S2, SE4NE4 (1 Acre Homesite) (360) Section 27- E2 (320), W2 (320) Section 34- E2 (320) Section 35- N2, N2S2, SW4SE4, SE4SW4, SW4SW4 (less 7 Acres to HWY) (593) T2N R13E Section 6- all (612.85) Section 7- all (614.02) Section 18- all (618.88) Section 19- N2 (310.73), S2 (311.57) Section 30- N2N2 (156.10) T3N R12E Section 20- S2SE4 (80), Section 25- S2SW4, SE4 (240) Section 27- NE4 (160), Section 28- NW4, TR A Lands of Steve Pounds in W2 B/134 (170), Section 29- N2NE4 (80) Section 33- E2 (320) Section 35- SW4, N2SE4 (240) Section 36- NE4, N2SE4, 1 Acre Homesite/Shop (240) T3N R13E Section 18- W2, NE4 (446.90), Section 31- NW4, NW4SW4, 1 Acre Homesite/Bunkhouse (180.55)


RECORDING REQUESTED BY ANDWHEN RECORDED RETURN TO:
VIENTO LOCO LLCc/o General CounselPier 1, Bay 3San Francisco, CA 94llI
TORRANCE COUNTYLINDA iTARAMT LLO' CLERK
oo2L-72005Book 337 Page '7\4
L of 9
A7 /19/201'7 02:592 47 PMBY LINDARK
-,.rrÈ'.:¡:;i:ea
ä:€^dtsä;,ii$ì:"t.
(Space above this line for Recorder's use only)
MEMORANDUM OF OPTION AGREEMENTFOR LAND LEASE AND \ryIND EASEMENT
THIS MEMORANDUM OF OPTIONEASEMENT is made and entered into as of tuL,tn I
LAND LEASE AND WINDFORß. 2017 ("Effective Date"), by
and between Nolan F. and Bonnie L. Tracey, Rhonda dàrhck and Forrest Tracey, with an addressat P.O. Box 4466, Medford, OR 97501 (collectively, "Owner"), and VIENTO LOCO LLC, a
Delaware limited liability company, with an address at Pier 1, Bay 3, San Francisco, CA 94111(together with its successors and assigns, "Developer").
WHEREAS:
A. The Parties have entered into an Option Agreement for Land Lease and WindEasement (the "Option Agreement") which, among other things, by its terms grants to Developeran option to acquire a wind easement (the "Option") and further grants to Developer presenteasements for wind and weather monitoring and access on and across certain land which is moreparticularly described in Exhibit A attached hereto and incorporated by this reference (the"Property");
B. The term of the Option commences on the Effective Date and ends upon the first tooccur of (a) the time the Option is exercised by Developer or its successors or assigns by recordinga Notice of Exercise of Option in the real property records of the county in which the Property islocated ("Notice of Exercise"), or (b) up to ten (10) years after the Effective Date, unlessterminated in accordance with the Terms of the Option Agreement;
C. If the Option is exercised, then Developer and its successors and assigns will hold aLand Lease and Wind Easement for, among other things, wind energy development and relatedrights over, on, across and through the Property or, portions thereof, at Developer's option, duringa term commencing upon the date of the recording of the Notice of Exercise (the "OperationDate") and ending upon the end of the "Operating Term," which Operating Term commences uponOperation Date, and which Operating Term ends thirty (30) years after the Operation Date, with an
option in Developer to extend for two (2) ten (10) year Renewal Terms;
D. The Parlies desire to enter into this Memorandum of Option and Lease which is tobe recorded in order that third parties may have notice of the interests of Developer in the Propertyand of the existence of the Option to enter into the Land Lease and V/ind Easement covering the

Property, or portions thereof, as set forth in the Option Agreement, and of certain easements andrights in the Property granted to Developer in the Option Agreement.
NOW, THEREFORE, in consideration of the rents and covenants provided in the OptionAgreement to be paid and perfonned by Developer and other good and valuable consideration, thereceipt and adequacy of which are acknowledged by Owner, Owner hereby grants to Developer,among other things, (i) certain easements with respect to the Property during the term of theOption, as more particularly set forth in the Option Agreement, and (ii) that certain exclusiveOption to enter into a Land Lease and Wind Easement covering the Property, or portions thereof,on the terms and conditions set forth in the Option Agreement, together with certain presenteasements to use and enjoy the Property, all more particularly set forth in the Option Agreement.All of the terms, conditions, provisions, and covenants of the Option Agreement are herebyincorporated into this Memorandum of Option and Lease by reference as though fully set forthherein, and the Option Agreement and this Memorandum of Option and Lease shall be deemed toconstitute a single instrument or document. Should there be any inconsistency between the terrrsof this Memorandum of Option and Lease and the Option Agreement, the terms of the OptionAgreement shall prevail.
The Option evidenced by this Memorandum of Option and Lease may be exercised byDeveloper's sole execution and recording of a Notice of Exercise in the real property records of thecounty in which the Property is located, whereupon all the easements and rights that are the subjectof the Option shall immediately become effective and binding upon Owner and the Property, orsuch portions thereof as Developer may identify in the Notice of Exercise, and on all successiveo\ryners of such portions thereof or entirety of the Property and the successors and assigns ofOwner, all for the benefit of Developer and its successors and assigns. This Memorandum ofOption and Lease may be executed in multiple counterparts, all of which, when taken together,shall constitute one and the same agreement.
IN WITNESS WHEREOF, the Parties have executed this Memorandum of Option andLease as of the date set forth above.
"oWNER"TÔRRANCE COUNTY' "rì*oo"tol^il
it"; u
ttï:.Book 331 Påge
2 Õl !
^a/1qiróit a2t59t41 PM
" '*"- - LTNDARK
L. Tracey
RhondaB. Garlick
Forrest C. Tracey

NOW, THEREFORE, in consideration of the rents and covenants provided in the OptionAgreement to be paid and performed by Developer and other good and valuable consideration, thereceipt and adequacy of which are acknowledged by Owner, Owner hereby grants to Developer,among other things, (i) certain easements with respect to the Property during the term of theOption, as more particularly set forth in the Option Agreement, and (ii) that certain exclusiveOption to enter into a Land Lease and V/ind Easement covering the Property, or portions thereof,on the terms and conditions set forth in the Option Agreement, together with certain presenteasements to use and enjoy the Property, all more particularly set forth in the Option Agreement.All of the terms, conditions, provisions, and covenants of the Option Agreement are herebyincorporated into this Memorandum of Option and Lease by reference as though fully set forthherein, and the Option Agreement and this Memorandum of Option and Lease shall be deemed toconstitute a single instrument or document. Should there be any inconsistency between the termsof this Memorandum of Option and Lease and the Option Agreement, the terms of the OptionAgreement shall prevail.
The Option evidenced by this Memorandum of Option and Lease may be exercised byDeveloper's sole execution and recording of a Notice of Exercise in the real property records of thecounty in which the Property is located, whereupon all the easements and rights thatare the subjectof the Option shall immediately become effective and binding upon Owner and the Property, orsuch portions thereof as Developer may identify in the Notice of Exercise, and on all successiveowners of such portions thereof or entirety of the Property and the successors and assigns ofOwner, all for the benefit of Developer and its successors and assigns. This Memorandum ofOption and Lease may be executed in multiple counterparts, all of which, when taken together,shall constitute one and the same agreement.
IN WITNESS WHEREOF, the Parties have executed this Memorandum of Option andLease as of the date set forth above.
"oWNER"
Nolan F. Tracey
Bonnie L. Tracey
ilre,J*ø, ,U.r/tURhonda B. Garlick
Forrest C. Tracey
^^uNTY" 'tu"**
'"j*lJ,låsïï",ju' rr6- UU"-; ça0êu""!,"itr.',
onr;un" n' PM
o rJ"t, , "u-r*oo**

NOW;,THEREFORE, in consideration of the rents and covenants provided in the OptionAgreement to be paid and performed by Developer and other good and valuable consideration, the
receipt and adequacy of which are acknowledged by Owner, Owner hereby grants to Developer,
among other things, (i) certain easements with respect to the Property during the term of the
Option, as more particularly set forth in the Option Agreement, and (ii) that certain exclusiveOption to enter into a Land Lease and tü/ind Easement covering the Property, or portions thereof,
on the terms and conditions set forth in the Option Agreement, together with certain present
easements to use and enjoy the Property, all more particularly set forth in the Option Agreement.All of the terms, conditions, provisions, and covenants of the Option Agreement are hereby
incorporated into this Memorandum of Option and Lease by reference as though fully set forthherein, and the Option Agreement and this Memorandum of Option and læase shall be deemed toconstitute a single instrument or document. Should there be any inconsistency between the terms
of this Memorandum of Option and Lease and the Option Agreement, the terms of the OptionAgreement shall prevail.
The Option evidenced by this Memorandum of Option and Lease may be exercised byDeveloper's sole execution and recording of a Notice of Exercise in the real property records of the
county in which the Property is located, whereupon all the easements and rights that are the subject
of the Option shall immediately become effective and binding upon Owner and the Property, orsuch portions thereof as Developer may identify in the Notice of Exercise, and on all successive
owners of such portions thereof or entirety of the Property and the successors and assigns ofOwner, all for the benefit of Developer and its successors and assigns. This Memorandum ofOption and læase may be executed in multiple counterparts, all of which, when taken together,
shall constitute one and the same agreement.
IN WITNESS V/HEREOF, the Parties have executed this Memorandum of Option and
Lease as of the date set forth above.
"owNER"
Nolan F. Tracey
ñ^DÞÀNCE COUNTY' ""ìtoo'-tÁRAMTLLo' cLERK
002L?2005Book 337 Page Itt
4 ot J
01/rs)zótt o2t5ez41 PM
BY LINDARK
Bonnie L. Tracey
Rhonda B. Garlick
c

..DEVELOPER''
VIENTO LOCO LLC
By:
Name
Title:
STATE OF 4xaCOT]NTY OF
The
ft
instrument was
f
$
$
$
before
O LOCO
NotaryMy commissionCommission No.
Book5
07 / t,g /BY
this day ofâS*20t7, by
lsEAL] State of
I () Þ b
LINDÀiï:i",flr:,j.l"t*' "
JJ I Paqe ?1ô
l,r';*l 3-' sg, n)" ,,
4 /vIJI r l{h ¡flY)A¿l
MILY MCCLARY DAVISNotary Publ¡c, Stato ofComm. Expires Og-15-2021
Notary tD 13r04ô982
E

TORLIN
Bo
R-A N C E C O U N T YDA ,lARAMr r,lo, ci¡n*002772005
ok 33? paoe ?tqo ot 9
INDIVIDUALACKNOWLEDGMENT O'U'N
LINDARK79/201.'t 02¡59: 47 PM
srArE o¡ oQÈØÀ)
COUNTY OFSfuI(s¿ÀJ
The foregoing instrument was acknowledged before me this2017 by Nolan F. Tracey.
WITNESS my hand and offrcial seal
My Commission Expires: t>lf o laArø
STATE OF ARçAOX)
couNrY oF Jk¡¿g}.)
The foregoing instrument was acknowledged before me this2017 by Bonnie L. Tracey.
WITNESS my hand and official seal.
$
$
$
$
$
$
91tl day or
N
Êr**roM,
My commission Expires: PlfO laAføPublic
(Þffinc0n8$0il lFcæt0,¿0t8

STATE OF
COUNTY OF
The foregoing instrument was acknowledged before me this2Ol7 by Fonest C. Tracey.
TWITNESS my hand and official seal.
$
$
$
TORRANCE COUNTYLINDA .]ÀRAMl LLO, CLERK
002172005Book 337 Page 120
7 of 907/I9/20L7 02t59t47 pM
BY LINDARK
Theforegoinginstrumentwasacknowledgedbeforemethisdayof-,2Ol7 by Rhonda B. Gadick.
WITNESS my hand and official seal.
My Commission Expires:Notary Public
STATE OF Â.,)¿,., lk¿". L(\
COUNTY Of!-s:aJ,!fr)
z7*q
g
$
$
day of 'l r > r.r (-
My Commission Expires: r-¿ )ltr'Z
@,,OFFICIAL SEAL
8RtltAf,¡AE 8ß0WNilotrry Publlc
Sl¡þ of flaw MexlcoComm. Erplrlr

TORRANCE COUNlYLINDA .]ARAMI LLO¡ CLERK
Book8
07 / 19 /
002772005337 Pâge 721,of 9
20f7 02259:47 pMBY LINDARK
STATE OF hCoUNTY oF AúA,NS
$
$
$
The foregoing instrument was acknowledged before me this 21 day of2017 by Rhonda B. Garlick.
fJ^*,^L ø' dtuWITNESS my hand and official seal
My Commission Expir "rt '/Vtot'5, l3 tlUl
Public
STATE OF
CO[-ì-NTY OF
The foregoing instrument was acknowledged before me this day of2017 by Fomest C. Tracey.
WITNESS my hand and official seal.
My Commission ExpiresNotary Public
ò
Ut,a,
$
$
$

EXHIBIT A TOMEMORANDUM OF OPTION AGREEMENT FOR LAND LEASE AND \ilIND
EASEMENT
DESCRIPTION OF THE PROPERTY
The following real property all located in Torrance County, New Mexico as conveyed to Nolan F.Tracey, Rhonda B. Garlick and Forrest C. Tracey, as Tenants In Common, pursuant to that certain
Quitclaim Deed from David Tracey as Grantor to Nolan F. Tracey, Rhonda B. Garlick and ForrestC. Tracey as Grantee dated July 28, 2009 and recorded on September 03, 2009 in Book 320,Page2338 in the Real Property Records of Torrance County, New Mexico as more particularlydescribed as follows:
Township lN Range 14E, Torrance County, NMSection 18: NV/4, N2SW4, N2W2 SE4
TOTAL 280 ACRES TORRANCE COUNTYLINDA JARAMTLLO, CLERK
002172005Book 33? Page 722
9 of 9
O7 / rg / 2O11 A2t 59: 4 7 PM
BY LINDARK


Pattern Energy LP 13-3 Burns & McDonnell
EXHIBIT C LAND COVER OF THE PROJECT AREA

Source: Esri, USGS Gap, Pattern Development, and Burns & McDonnell Engineering Company, Inc. Issued: 8/6/2018
0 31.5
Scale in Miles
Exhibit CLand Cover of the Project Area
Pattern DevelopmentTorrance Wind ProjectsTorrance County, NM
!
!
!
!
!
!
!
!
!
!
!
!
!!
!
!
!
!!
!
!
!
!
!
!
!
!
!
!
!
!
!
!
!
!!
!
!
!
!
!
!
!
!
!
!
!
!
!
!
!
!
!
!
!
!
!
!
!
!
!
!
!
!
!
!
!
!
!
!
!
!
!
!
!
!
!
!
!
!
!
!!
!
!
!
!!
!
!
!
!
!
!
!
!
!
!
!
!
!
!
!
!
!
!
!
!
!
!
!
!
!
!
!
!
!!
!
!
!
!
!
!
!
!
!
!
!
!
!
!
!
!
!
!
!
!
!
!
!
!
!
!
!
!
!
!
!
!
!
!
!
!
!
!
!
!
!
!
!
!
!
!
!
!
!
!
! !
!
!
!
!
!
!
!
!
!
!
!
!
!
!!
!
!
!
!
!
!
!
!
!
!
!
!
!
!
!
!
!
!
!
!
!
!
!
!
!
!
!
!
!
!
!
!
!
!
!
!
!
!
!
!
!
!
!
!
!
!
!
!
!
!
!
!
!
!
!
!!
!
!
!
!
!
!
!
!
!!
!
!
!
!
!
!
!
!
!
!
!
!
!
!
!
!
!
!!
!
!
!
!
!
!
!
!
!
!
!
!
!
!
!!
!
!
!
!
!
!
!
!
!!
!
!
!
!
!
!
!
!
!
!
!
!
!
!
!
!
!
!
!
!
!
!
!!
!
!
!
!
!
!
!
!
!
!
!
!!
!
!
!
!
!
!
!
!!
!
!
!!!
!!!
!
!!
!
!
!!
!
!
!
!
!
!
!
!
!
!
!
!
!
!
!!!
!!
!
!
!!
!
!!!
!
!
!
!
!!
!
!
!
!
!
!
!!
!
!
!!
!
!
!
!
!
!!
!!
!!!
!
!
!
!
!
!!!
!
!!!
!
!!
!
!!!
!
!
!
!!
!!
!
!
!
!
!
!!!!!
!
!
!!
!!
!
!!
!
!!
!!
!
!!
!
!!!!
!!
!!!
!!
!!
!!
!!
!!!
!!
!!
!
!
!
!!
! !!
!
!
!!
!
!
!
!
!
!!
!
!!
!
!
!
!
!!!
!
!
!
!
!
!
!
!
!!!
!
!
!!!
!!
!!!!!!!
!!!
!!!
!!!!!!!!
!!!
!!
!!!!!!!!!
!!!!
!!
!
!
!!!!!!!
!
!!
!!
!!
!!!
!!
!!!!
!!!!!!
!!
!!
!
!!
!!!
!!
!
!!
!
!
!!
!
!
!
Wind Project Area! Preliminary Turbine Location
Project Transmission LineCounty Boundary
LandcoverApacherian-Chihuahuan Semi-Desert Grassland andSteppeChihuahuan Gypsophilous Grassland and SteppeChihuahuan Mixed Salt Desert ScrubColorado Plateau Mixed Low Sagebrush ShrublandDeveloped, Low IntensityDeveloped, Medium IntensityDeveloped, Open SpaceInter-Mountain Basins Greasewood FlatInter-Mountain Basins Mat Saltbush ShrublandInter-Mountain Basins Mixed Salt Desert ScrubInter-Mountain Basins Semi-Desert Shrub SteppeMadrean Juniper SavannaMadrean Pine-Oak Forest and WoodlandMadrean Pinyon-Juniper WoodlandNorth American Warm Desert Active and StabilizedDune
North American Warm Desert Bedrock Cliff andOutcropNorth American Warm Desert PlayaRocky Mountain Gambel Oak-Mixed MontaneShrublandRocky Mountain Lower Montane Riparian Woodlandand ShrublandRocky Mountain Lower Montane-Foothill ShrublandSouthern Rocky Mountain Juniper Woodland andSavannaSouthern Rocky Mountain Pinyon-Juniper WoodlandSouthern Rocky Mountain Ponderosa Pine WoodlandSouthwestern Great Plains CanyonWestern Great Plains Cliff and OutcropWestern Great Plains Foothill and Piedmont GrasslandWestern Great Plains Riparian Woodland andShrublandWestern Great Plains Shortgrass Prairie
COPY
RIGH
T © 20
18 B
URNS
& Mc
DONN
ELL E
NGIN
EERI
NG C
OMPA
NY, IN
C.
NORTH

Pattern Energy LP 13-4 Burns & McDonnell
EXHIBIT D ASSESSORS PARCEL MAPS

Source: Esri, Torrance Co., Pattern Development, and Burns & McDonnell Engineering Company, Inc. Issued: 8/6/2018
Exhibit DAssessors Parcel MapPattern Development
Torrance Wind ProjectsLincoln &Torrance County, NM
Page 1 of 9
1 0 7 4 0 1 4 3 4 4 3 3 9
1 0 6 8 0 1 30 1 1 3 2 5 ST
ATE L
AND
S T A T E L A N D
S T A T E L A N D
S T A T E L A N D
S T A T E L A N D
S T A T E L A N DS T A T E L A N D
S T A T E L A N D
S T A T E L A N D
S T A T E L A N D
STAT
E LAN
D
S T A T E L A N D
S T A T E L A N D
S T A T E L A N D
S T A T E L A N D
1 0 7 4 0 1 09 3 8 9 9 0
1 0 7 3 0 1 45 0 9 1 3 5
1 0 7 3 0 1 41 8 8 1 3 4
1 0 7 3 0 1 50 7 4 3 5 4
1 0 7 3 0 1 50 7 4 3 5 4
1 0 7 6 0 1 44 2 5 2 1 9
1073
013
1431
14
1 0 6 7 0 2 15 2 6 1 7 8
1 0 6 7 0 2 15 2 6 1 7 8
1 0 6 7 0 2 15 2 6 1 7 8
1 0 6 7 0 2 15 2 6 1 7 8
1 0 6 7 0 2 15 2 6 1 7 8
1 0 6 7 0 2 15 2 6 1 7 8
1 0 6 7 0 2 15 2 6 1 7 8
1 0 7 4 0 1 82 0 1 5 2 4
1 0 7 4 0 1 82 0 1 5 2 4
1 0 7 4 0 1 82 0 1 5 2 4
1 0 7 4 0 1 82 0 1 5 2 4
1 0 7 4 0 1 82 0 1 5 2 4
1 0 7 4 0 1 82 0 1 5 2 4
1 0 7 2 0 1 44 0 0 4 7 1 1 0 7 3 0 1 4
3 7 6 4 0 0
1 0 7 5 0 2 43 3 9 1 2 2
1 0 7 5 0 2 43 3 9 1 2 2
1 0 7 3 0 1 54 7 4 6 9 3
1 0 7 2 0 1 12 4 1 0 5 9
1 0 7 3 0 1 34 1 0 4 0 0
1 0 6 9 0 1 99 3 6 6 6 7
1 0 6 9 0 1 99 3 6 6 6 7
1 0 6 9 0 1 99 3 6 6 6 7
1 0 6 9 0 1 99 3 6 6 6 7
1 0 6 9 0 1 99 3 6 6 6 7
1 0 6 9 0 1 99 3 6 6 6 7
1 0 7 3 0 1 12 5 1 2 6 6
1 0 7 3 0 1 12 5 1 2 6 6
1 0 7 3 0 1 12 5 1 2 6 6
1 0 7 3 0 1 12 5 1 2 6 6
1 0 7 3 0 1 12 5 1 2 6 6
1 0 7 3 0 1 12 5 1 2 6 6
1 0 7 3 0 1 12 5 1 2 6 6
1 0 7 0 0 1 61 2 0 6 1 7
1 0 7 0 0 1 61 2 0 6 1 7
1 0 7 0 0 1 61 2 0 6 1 7
1 0 7 0 0 1 61 2 0 6 1 7
1 0 7 0 0 1 61 2 0 6 1 7
1 0 7 0 0 1 61 2 0 6 1 7
1 0 7 1 0 1 43 7 8 2 8 8
1 0 7 1 0 1 62 5 0 3 0 7
1 0 7 1 0 1 62 5 0 3 0 7
1 0 7 1 0 1 62 5 0 3 0 7
1 0 7 1 0 1 62 5 0 3 0 7
1 0 7 1 0 1 62 5 0 3 0 7
1 0 7 1 0 1 62 5 0 3 0 7
1 0 7 1 0 1 62 5 0 3 0 7
1 0 7 1 0 1 62 5 0 3 0 7
1 0 7 1 0 1 62 5 0 3 0 7
1 0 7 1 0 1 62 5 0 3 0 7
1 0 7 1 0 1 62 5 0 3 0 7
1 0 7 1 0 1 62 5 0 3 0 7
1 0 7 1 0 1 62 5 0 3 0 7
1 0 7 1 0 1 62 5 0 3 0 7
1 0 7 1 0 1 62 5 0 3 0 7
1 0 7 1 0 1 62 5 0 3 0 7
1 0 7 1 0 1 62 5 0 3 0 7
1 0 7 1 0 1 62 5 0 3 0 7
1 0 7 0 0 1 11 7 4 3 1 7
1 0 6 7 0 1 74 3 5 1 5 8
1 0 6 7 0 1 74 3 5 1 5 8
1 0 6 7 0 1 74 3 5 1 5 8
1 0 6 7 0 1 74 3 5 1 5 8
1 0 6 7 0 1 74 3 5 1 5 8
1 0 6 7 0 1 22 5 9 1 0 5
1074
014
1823
151 0 6 5 0 1 5
4 5 9 1 5 6
1 0 6 9 0 1 34 0 0 2 6 9
1 0 6 9 0 1 34 0 0 2 6 9
1 0 7 3 0 1 41 2 2 4 0 4
1 0 6 8 0 1 30 1 1 3 2 5
Parcel Wind Project AreaCounty Boundary
COPY
RIGH
T © 20
18 B
URNS
& M
cDON
NELL
ENG
INEE
RING
COM
PANY
, INC.
0 5,0002,500Feet
NORTH
3 4 5
6 7 8 9
12

Source: Esri, Torrance Co., Pattern Development, and Burns & McDonnell Engineering Company, Inc. Issued: 8/6/2018
Exhibit DAssessors Parcel MapPattern Development
Torrance Wind ProjectsLincoln &Torrance County, NM
Page 2 of 9
!
!
!
!
!
!
!
!
!
!
!
!
!
!
!
!
!
!
!
!
!
!
!
!
!
!
!
!
1074
010
9389
9010
7100
746
6067
STAT
E LA
ND
STATE LAND
STATE LAND
STATE LAND
STATE LAND
STATE LANDSTATE LAND
STAT
E LAN
D
STATE LAND
STATE LAND
STATE LAND
STATE LAND
STATE LAND
STATE LAND
STATE LAND
STATE LAND
STAT
E LA
ND
STAT
E LA
ND
1066
013
1952
651067
013
0662
69
1067005498402
1073
014
5091
351070007121393
1073014188134
1073015074354
1076014425219
1073
013
1431
14
1072014400471
1072006081265
1072006081265
1073014376400
1071009528397
1071009528397
1071009528397
1071009528397
1071009528397
1071009528397
1071009528397
1071009528397
1071009528397
1068010397001
1073015474693
1072011241059
1072011241059
1072011241059
1072011241059
1072011241059
1071008084509
1071008084509
1069008444099
1069008267164
1068006798126
1068006798126
1068006798126
1073013410400
1073011251266
1073011251266
1073011251266
1073011251266
1073011251266
1073011251266
1073011251266
1073011251266
1073011251266
1073011251266
1071014378288
1071016250307
1071016250307
1071016250307 1071016
2503071071016250307
1070011174317
1070011174317
1070011174317
1070011174317
1070011174317
1067017435158
1067009179349
1067012259105
1067012259105
1067012259105
1065015459156
1065015459156
1069013400269
1069013400269
1073014122404
1068013011325
1068013011325
1068008267066
1068008267066
1066006306327
1066006306327
1066006306327
1068009118498
1068009118498
1068009118498
! Preliminary Turbine LocationAccess Road Crane PathAccess Road OnlyParcel
Wind Project AreaCounty Boundary
COPY
RIGH
T © 20
18 B
URNS
& M
cDON
NELL
ENG
INEE
RING
COM
PANY
, INC.
0 5,0002,500Feet
NORTH
3 4 5
6 7 8 9
12

Source: Esri, Torrance Co., Pattern Development, and Burns & McDonnell Engineering Company, Inc. Issued: 8/6/2018
Exhibit DAssessors Parcel MapPattern Development
Torrance Wind ProjectsLincoln &Torrance County, NM
Page 3 of 9
!
!
!
!
!
!
!!
!
!
!
!
!
!
!
!
!
!
!
!
!
!
!
!
!
!
!
!
!
!
!
!
!
!
!
!
!
!
!
!
!
!
!
!
!
!
!
!
!
!
!
!
1 0 7 4 0 1 4 3 4 4 3 3 9
1 0 7 3 0 1 12 5 1 2 6 6
1 0 7 8 0 1 62 6 8 5 6 4
1 0 7 4 0 1 09 3 8 9 9 0
1 0 7 4 0 1 09 3 8 9 9 0
1 0 7 4 0 1 09 3 8 9 9 0
1 0 7 4 0 1 09 3 8 9 9 0
1 0 7 4 0 1 09 3 8 9 9 0
1 0 7 4 0 1 09 3 8 9 9 0
1 0 7 4 0 1 09 3 8 9 9 0
1 0 7 4 0 1 09 3 8 9 9 0
1 0 7 4 0 1 09 3 8 9 9 0
1 0 7 4 0 1 09 3 8 9 9 0
1 0 7 3 0 1 45 0 9 1 3 510
7301
418
8134
1 0 7 3 0 1 50 7 4 3 5 4
1 0 8 2 0 1 00 5 6 2 2 5
1 0 7 6 0 1 44 2 5 2 1 9
1 0 7 6 0 1 44 2 5 2 1 9
1 0 7 6 0 1 44 2 5 2 1 9
1 0 7 6 0 1 44 2 5 2 1 9
1 0 7 6 0 1 44 2 5 2 1 9 1 0 7 9 0 1 4
3 4 4 1 1 9
1 0 7 3 0 1 43 7 6 4 0 0
1 0 7 1 0 0 95 2 8 3 9 7
1 0 7 3 0 1 54 7 4 6 9 3
1 0 7 8 0 1 12 8 5 4 3 2
1 0 7 8 0 1 12 8 5 4 3 2
1 0 7 8 0 1 12 8 5 4 3 2
1 0 7 8 0 1 12 8 5 4 3 2
1 0 7 2 0 1 12 4 1 0 5 9
1 0 8 0 0 0 85 4 9 5 3 4
1 0 7 9 0 1 13 6 5 7 6 4
1 0 7 9 0 1 13 6 5 7 6 4
1 0 7 1 0 0 74 6 6 0 6 7
1 0 7 1 0 0 74 6 6 0 6 7
1 0 7 1 0 0 74 6 6 0 6 7
1 0 7 1 0 0 74 6 6 0 6 7
1 0 7 1 0 0 74 6 6 0 6 7
1 0 7 1 0 0 74 6 6 0 6 7
1 0 7 1 0 0 74 6 6 0 6 7
1 0 7 1 0 0 74 6 6 0 6 7
1080
014
4962
29
1 0 7 9 0 1 44 5 0 4 9 7
1 0 7 8 0 1 52 6 5 1 3 4
1 0 7 8 0 1 53 3 6 4 9 7
1 0 7 3 0 1 34 1 0 4 0 0
1 0 8 0 0 1 54 9 8 4 6 3
1 0 7 3 0 1 12 5 1 2 6 6
1 0 7 1 0 1 62 5 0 3 0 7
1 0 7 8 0 0 85 1 0 3 1 7
1 0 7 8 0 0 85 1 0 3 1 7
1 0 7 8 0 0 85 1 0 3 1 7
1074
014
1 82 3
1 5
1074
014
4681
84
1 0 7 9 0 1 32 8 4 2 6 5
1 0 7 6 0 0 6 2 2 5 3 0 21 0 7 6 0 0 7 3 9 8 2 6 6
STAT
E LA N
D
STAT
E LAN
D
S T A T E L A N D
S T A T E L A N D
S T A T E L A N D
S T A T E L A N DS T A T E L A N D
S T A T E L A N D
S T A T E L A N D
S T A T E L A N D
S T A T E L A N D
S T A T E L A N D
S T A T E L A N D
S T A T E L A N D
S T A T E L A N D
S T A T E L A N D
S T A T E L A N D
S T A T E L A N D
S T A T E L A N D
S T A T E L A N D
S T A T E L A N D
S T A T E L A N D
S T A T E L A N D
! Preliminary Turbine LocationAccess Road Crane PathParcel
Wind Project AreaCounty Boundary
COPY
RIGH
T © 20
18 B
URNS
& M
cDON
NELL
ENG
INEE
RING
COM
PANY
, INC.
0 5,0002,500Feet
NORTH
3 4 5
6 7 8 9
12

Source: Esri, Torrance Co., Pattern Development, and Burns & McDonnell Engineering Company, Inc. Issued: 8/6/2018
Exhibit DAssessors Parcel MapPattern Development
Torrance Wind ProjectsLincoln &Torrance County, NM
Page 4 of 9
!
!
!
!
!
!
!
!
!
!
!
!
!
!
!
!
!
!
!
!
!
!
!
!
!
!
!
!
!
!
!
!
!
!
!
!
!
!
!
!
!
!
!
!
!
!
!
!
!
!
!!!
!
!
!
!
!
!
!
!
!
!
!!
!
!
!
!
!
!
!
!
!
!
!
!
!
!
!
!
!
!
!
!
!
!
!
!
!
!
!
!
!
!
!
!
!
!
!
!
!
!
!
!
!
!
!
1087004206135
1080018245576
1083015152137
1083015152137
1082012228114
1082012228114
1082010056225
1082010056225
1081013262136
1079014344119
1085014251020
1082013523272
1081013169434
1081017137106
1080016168443
1078011285432
1078011285432
1080003469170
1080008549534
1080008549534
1079011365764
1079011365764
1079011365764
1079011365764
1079011365764
1079011365764
1086009292326
1080014496229
1082016133263
1086013217416
1086013217416
1079014450497
1079014450497
1079017235174
1080015498463
1080015498463
1086019238427
1086019238427
1086019238427
1086019238427
1086019238427
1086019238427
1086011034226
1086011034226
1086011034226
1086011034226
1086011034226
1086011034226
1086011034226
1086011034226
1086011034226
1086011034226
1086011034226
1086011034226
1086011034226
1086011034226
1083014398267
1083014398267
1083014398267
1083014398267
1085014308421
1078008510317
1084016216329
1086015134455
1079013284265
1085014110246
STATE LAND
STATE LAND
STATE LAND
STATE LAND
STATE LAND
STATE LAND
STAT
E LAN
D
STATE LANDSTATE LAND
STATE LAND
STATE LAND
! Preliminary Turbine LocationProject Transmission LineAccess Road Crane PathAccess Road OnlyParcel
Wind Project AreaCounty Boundary
COPY
RIGH
T © 20
18 B
URNS
& M
cDON
NELL
ENG
INEE
RING
COM
PANY
, INC.
0 5,0002,500Feet
NORTH
3 4 5
6 7 8 9
12

Source: Esri, Torrance Co., Pattern Development, and Burns & McDonnell Engineering Company, Inc. Issued: 8/6/2018
Exhibit DAssessors Parcel MapPattern Development
Torrance Wind ProjectsLincoln &Torrance County, NM
Page 5 of 9
!
!
!
!
!
!
!
!
!
!
!
!
!
!
!
!
!
!
!
!
!
!
!
!!
!
!
!
!
!
!
!
!
!
!
!
!
!
!
!
!
!
!
!!
!
!
!
!
!
!
!
!
!
!
!
!
!
!
!
!
!
!
!
!
!
!
!
!
!
!
!
!
!
!
!
!
!
!
!
!
!
!
!
!
!
!
!
!
!
!
!
!
!
!
!
!
!
!
!
!
!
!
!
!
!!
!
!
!
!
!
!
!
!
!
!
!
!
!
!
!
!
!
!
!
!
!
!
!
!
!
!
!
!
!
!
1090016470838
1090016470838
1090016470838
1090016470838
1089007531795
1089007531795
1087015815452
1087015815452
1087015815452
1087015815452
1087015815452
1085
014
2510
20
1090011263244
1089012440313
1087013389268
1086009292326
1086009292326
1086013217416
1086013217416
1086013217416
1087004206135
1087004206135
1087014264267
1089010529269
1086019238427
1086019238427
1086019238427
1086019238427
1086011034226
1086011034226
1086011034226
1086011034226
1086011034226
1086011034226
1086011034226
1086011034226
1086011034226
1086011034226
1085
014
3084
21
1086015416128
1090015270139
1089013401401
1089013401401
1089013401401
1089013401401
1088014265267
1089014271263
1086015441353
1086015134455
1090014267399
BLM
STATE LAND
BLM
! Preliminary Turbine LocationProject Transmission LineAccess Road Crane PathAccess Road OnlyParcel
Wind Project AreaCounty Boundary
COPY
RIGH
T © 20
18 B
URNS
& M
cDON
NELL
ENG
INEE
RING
COM
PANY
, INC.
0 5,0002,500Feet
NORTH
3 4 5
6 7 8 9
12

Source: Esri, Torrance Co., Pattern Development, and Burns & McDonnell Engineering Company, Inc. Issued: 8/6/2018
Exhibit DAssessors Parcel MapPattern Development
Torrance Wind ProjectsLincoln &Torrance County, NM
Page 6 of 9
!
!
!
!
!
!
!
!
!
!
!
!
!
!
!
!
!
!
!
!
!
!
!
!
!
!
!
!
!
!
!
!
!
!
!
!
!
!
!
!
!
!
!
!
!
!
!
!
!
!
!
!
!
!
!
!
!
!
!
!
!
!
!
!
STAT
E LA
NDSTATE LAND
STATE LAND
STATE LAND
STATE LAND
STATE LAND
STATE LAND
STATE LAND
STATE LAND
STATE LAND
STATE LAND
STATE LAND
STATE LAND
US FOREST
US FOREST
US FOREST
US FOREST
US FOREST
US FOREST
US FOREST
US FOREST
US FOREST
US FOREST
US FOREST
US FOREST
US FOREST
US FOREST
US FOREST
US FOREST
US FOREST
US FOREST
US FOREST
US FOREST
US FOREST
US FOREST
US FOREST
US FOREST
US FOREST
US FOREST
STATE LAND
1068005398269
1067005498402
1070007121393
1072006081265
1072006081265
1072006081265
1072006081265
1072006081265
1072006081265
1071009528397
1071009528397
1071009528397
1071009528397
1070004283682
1070004283682
1070004283682
1070004283682
1070004283682
1070004283682
1070004283682
1071007 466067
1071008084509
1069008444099
1069008267164
1071003366499
1068006798126
1068006798126
1076
004
3971
1110
7600
439
7111
1068003315923
1073005436132
1073005436132
1073005436132
1073005436132
1073005436132
1072
004
2291
07
1072
004
3650
91
1072004365091
1072004365091
1067003599184
1068004799252
1068004799252
1076
006
2253
02
1068008267066
1068008267066
! Preliminary Turbine LocationAccess Road Crane PathAccess Road OnlyParcel
Wind Project AreaCounty Boundary
COPY
RIGH
T © 20
18 B
URNS
& M
cDON
NELL
ENG
INEE
RING
COM
PANY
, INC.
0 5,0002,500Feet
NORTH
3 4 5
6 7 8 9
12
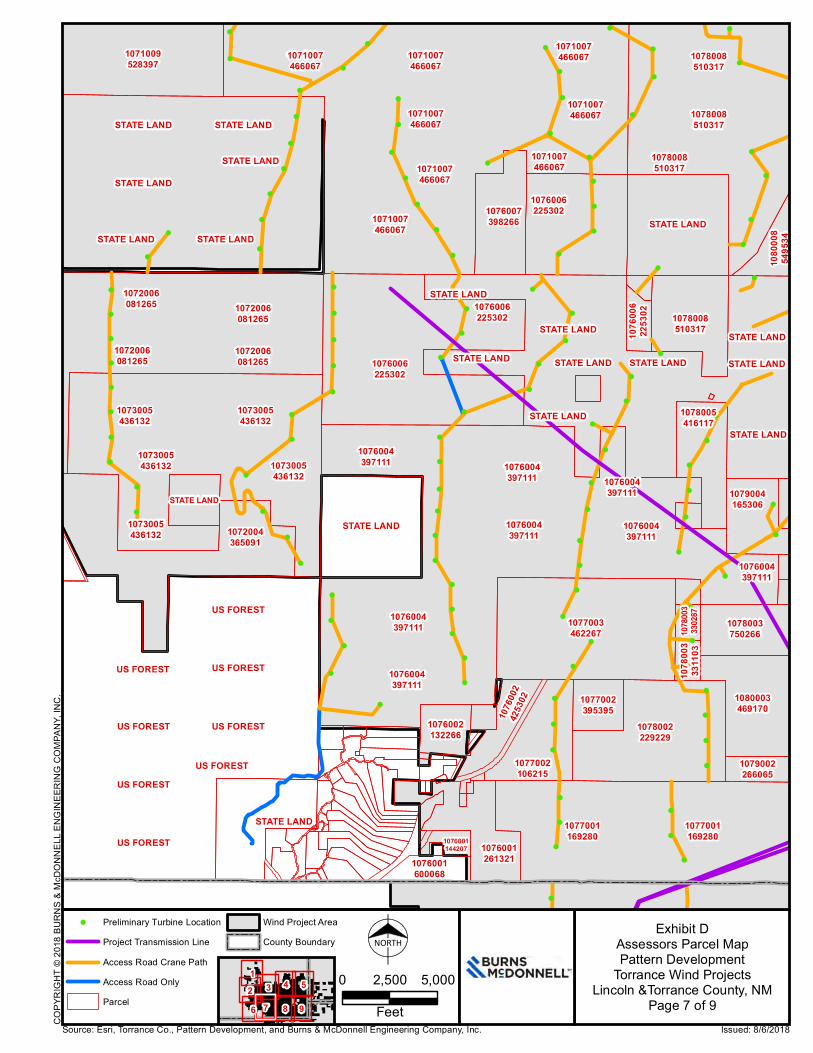
Source: Esri, Torrance Co., Pattern Development, and Burns & McDonnell Engineering Company, Inc. Issued: 8/6/2018
Exhibit DAssessors Parcel MapPattern Development
Torrance Wind ProjectsLincoln &Torrance County, NM
Page 7 of 9
!
!
!
!
!
!
!
!
!
!
!
!
!
!
!
!
!
!
!
!
!
!
!
!
!
!
!
!
!
!
!
!
!
!
!
!
!
!
!
!
!
!
!
!
!
!
!
!
!
!
!
!
!
!
!
!
!
!
!
!
!
!
!
!
!
!
!
!
!
!
!
!
!
!
!
!
!
!
!
!
!
!
!
!
!
!
!
!
!!
!
!
!
!
!
!
!
!
!
!
!
!
!
!
!
!
!
!
!
!
!
!
!
!
!
!
!
!
!
!
!
!
!
!
!
!
!
!
!
STATE LAND
STATE LAND
STATE LAND
STATE LAND
STATE LAND
STATE LAND
STATE LAND
STATE LAND
STATE LAND
STATE LAND
STATE LAND
STATE LAND
STATE LAND
STATE LAND
STATE LAND
STATE LAND
STATE LAND
STATE LAND
US FOREST
US FOREST
US FOREST
US FOREST
US FOREST
US FOREST
US FOREST
US FOREST
STATE LAND
1077002395395
1078
003
3302
87
1078005416117
1078
003
3311
03
1072006081265
1072006081265
1072006081265
1072006081265
1071009528397
1076002132266
1076001261321
1080003469170
1079002266065
1080
008
5495
34
1071007466067
1071007466067
1071007466067
1071007466067
1071007466067
1071007466067
1071007466067
1071007466067
1076004397111
1076004397111
1076004397111
1076004397111
1076004397111
1076004397111
1076004397111
1076004397111
1078002229229
1078003750266
1078008510317
1078008510317
1078008510317
1078008510317
1079004165306
1073005436132
1073005436132
1073005436132
1073005436132
1073005436132
1072004365091
1076001144207
1076001600068
1077003462267
1077001169280
1077001169280
1076
002
4253
02
1077002106215
1076
006
2253
02
1076006225302
1076006225302
1076006225302
1076007398266
! Preliminary Turbine LocationProject Transmission LineAccess Road Crane PathAccess Road OnlyParcel
Wind Project AreaCounty Boundary
COPY
RIGH
T © 20
18 B
URNS
& M
cDON
NELL
ENG
INEE
RING
COM
PANY
, INC.
0 5,0002,500Feet
NORTH
3 4 5
6 7 8 9
12
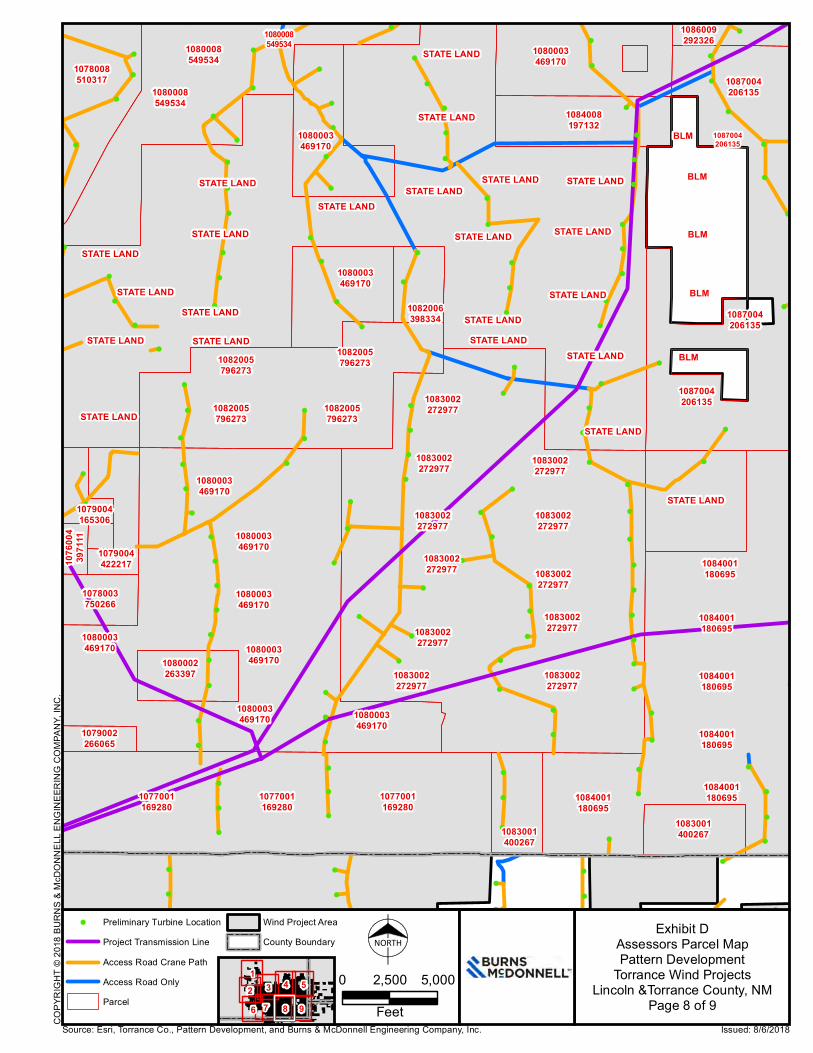
Source: Esri, Torrance Co., Pattern Development, and Burns & McDonnell Engineering Company, Inc. Issued: 8/6/2018
Exhibit DAssessors Parcel MapPattern Development
Torrance Wind ProjectsLincoln &Torrance County, NM
Page 8 of 9
!
!
!
!
!
!
!
!
!
!
!
!
!
!
!
!
!
!
!
!
!
!
!
!
!
!
!
!
!
!
!
!
!
!
!
!
!
!
!
!
!
!
!
!
!
!
!
!
!
!
!
!
!
!
!
!
!
!
!
!
!
!
!
!
!
!
!
!
!
!
!
!
!
!
!
!
!
!
!
!
!
!
!
!
!
!
!
!
!
!
!
!
!
!
!
!
!
!
!
!
!
!
!
!
!
!
!
!
!
!
!
!
!
!
!
!
!
!
!
!
!
!
!
!
!
!
!
!
!
!
!
!
!
!
!
!
!
!
!
!
!
!
!
!
!
!
!
!
!
!
!
!
!
!
!
1084001180695
1084001180695
1084001180695
1084001180695
1084001180695
1084001180695
1083002272977
1083002272977
1083002272977
1083002272977
1083002272977
1083002272977
1083002272977
1083002272977
1083002272977
1083002272977
1083002272977
1084008197132
10830014002671083001
400267
1082006398334
1082005796273
1082005796273
1082005796273
1082005796273
1080003469170
1080003469170
1080003469170
1080003469170
1080003469170
1080003469170
1080003469170
1080003469170
1080003469170
10800034691701079002
266065
1080008549534
1080008549534
1080008549534
1086009292326
1087004206135
1087004206135
1087004206135
1087004206135
1076
004
3971
11
1080002263397
1078003750266
1079004422217
1078008510317
1079004165306
1077001169280
1077001169280
1077001169280
BLM
STATE LAND
STATE LAND
STATE LAND
STATE LAND
STATE LAND
STATE LAND
STATE LAND
STATE LAND
STATE LAND
STATE LANDSTATE LAND
STATE LAND
STATE LAND
STATE LANDSTATE LAND
STATE LAND
STATE LAND
STATE LAND
STATE LAND
STATE LAND
STATE LAND
STATE LAND
BLM
BLM
BLM
BLM
! Preliminary Turbine LocationProject Transmission LineAccess Road Crane PathAccess Road OnlyParcel
Wind Project AreaCounty Boundary
COPY
RIGH
T © 20
18 B
URNS
& M
cDON
NELL
ENG
INEE
RING
COM
PANY
, INC.
0 5,0002,500Feet
NORTH
3 4 5
6 7 8 9
12

Source: Esri, Torrance Co., Pattern Development, and Burns & McDonnell Engineering Company, Inc. Issued: 8/6/2018
Exhibit DAssessors Parcel MapPattern Development
Torrance Wind ProjectsLincoln &Torrance County, NM
Page 9 of 9
!
!
!
!
!
!
!
!
!
!
!
!
!
!
!
!
!
!
!
!
!
!
!
!
!
!
!
!
!
!
!
!
!
!
!
!
!
!
!
!
!
!
!
!
!
!
!
!
!
!
!
!!
!
!
!
!
!
!
!
!
!
!
!
!
!
!
!
!
!
!
!
!
!
!
!
!
!
!
!
!
!
!
!
!
!
!
!
!
!
!
!
!
!
!
!
!
!
!
!
!
!
!
!
!
!
!
!
!
!
!
!
!
!
!
!
!
!
!
!
!
!
!
!
!
!
!
!
!
!
!
!
!
!
!
!
!
!
!
!
!
1089007531795
1089007531795
1089007531795
1084001180695
1084001180695
1084001180695
1084001180695
1084001180695
1084001180695
1084001180695
1084001180695
1084001180695
1084001180695
1084001180695
1084001180695
1084001180695
1084001180695
1084001180695
1084001180695
1084001180695
1084
008
1971
32
1083001400267
1080
003
4691
70
1086009292326
1087004206135
1087004206135
1087004206135
1087004206135
1087004206135
1087004206135
1087004206135
1087004206135
1087004206135
1087004206135
1087004206135
1087004206135
1087004206135
1087004206135
1087004206135
1090004035415
1090004035415
1090004035415
1090004035415
1090004035415
1090004035415
BLM
BLM
STATE LAND
BLM
BLM
BLM
BLM
BLM
BLM
BLM
! Preliminary Turbine LocationProject Transmission LineAccess Road Crane PathAccess Road OnlyParcel
Wind Project AreaCounty Boundary
COPY
RIGH
T © 20
18 B
URNS
& M
cDON
NELL
ENG
INEE
RING
COM
PANY
, INC.
0 5,0002,500Feet
NORTH
3 4 5
6 7 8 9
12

Pattern Energy LP 13-5 Burns & McDonnell
EXHIBIT E LEGAL LAND DESCRIPTIONS

Torrance County, NM Leased Property Descriptions


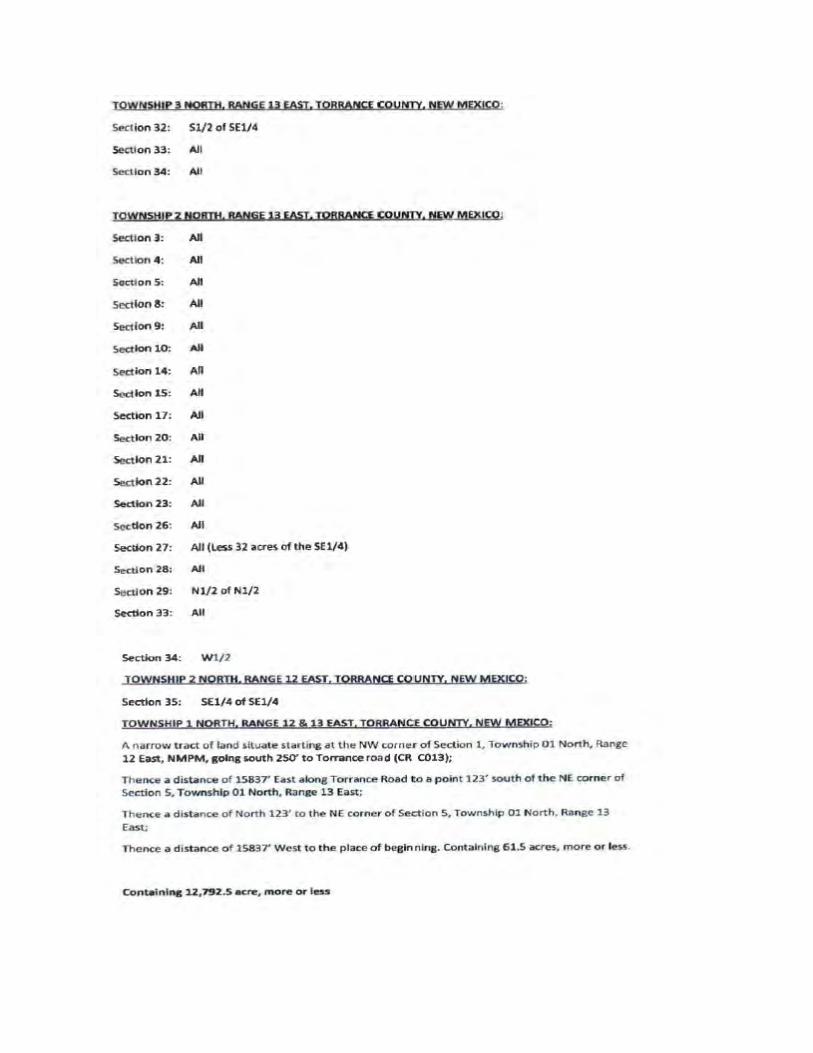


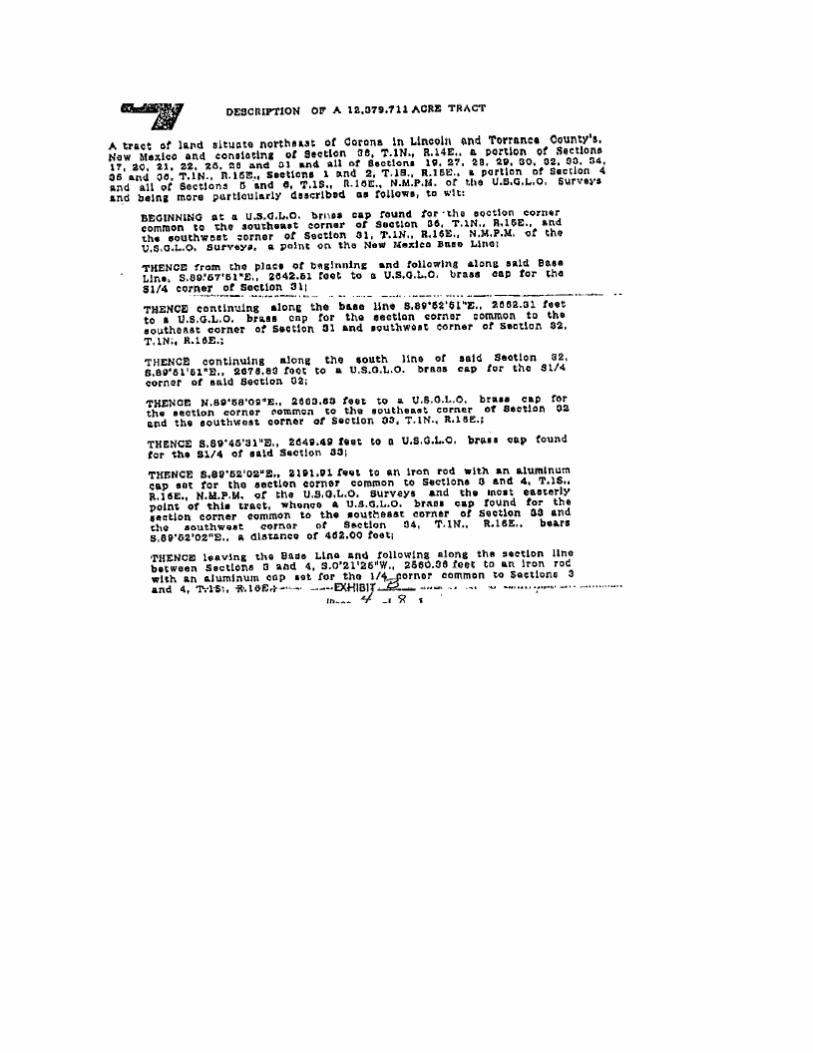
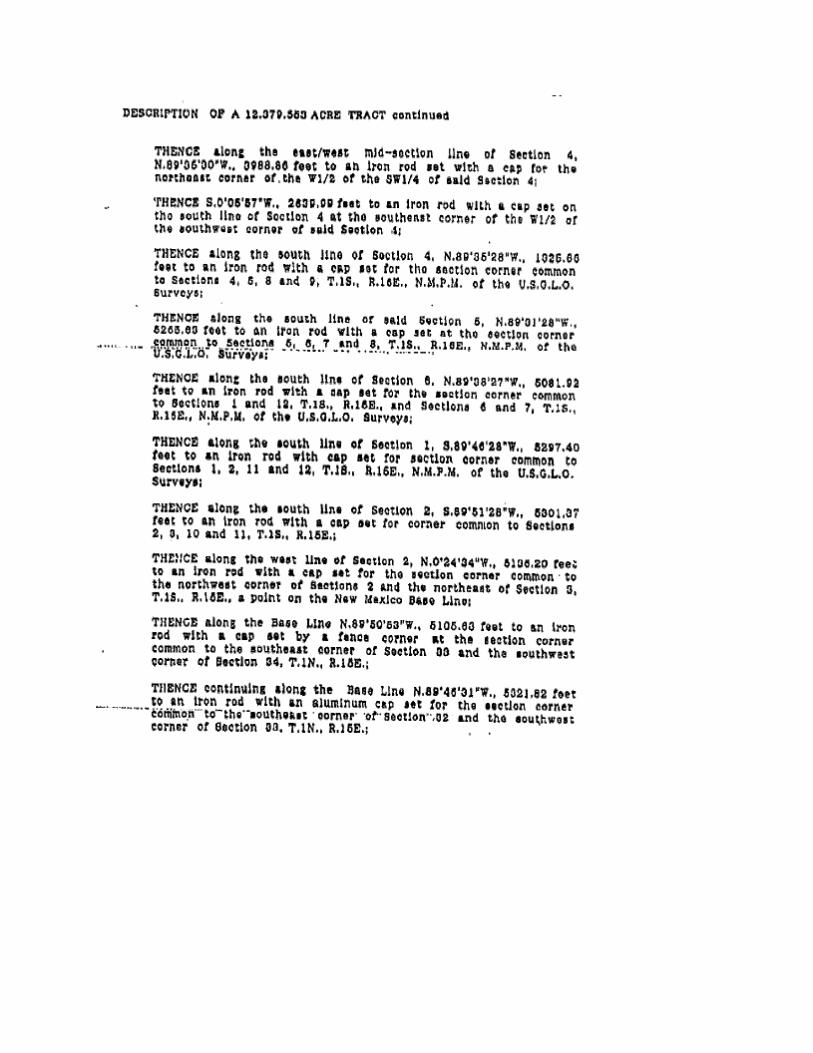


T2N R12E Section 8- E2 (320) Section 17- NE4 (160) T3N R12E Section 1- ALL (636.80) Section 3- S2 (320)

Section 4- E2 (317.04) Section 12- ALL (640) Section 13- ALL less E2SE4 (560) Section 14- E2W2, E2 (480) Section 17- S2SE4 (80) Section 20- NE4, N2SE4 (240) Section 21- ALL (640) Section 22- ALL (640) Section 23- E2NE4, S2 (400) Section 24- W2 (320) Section 27- NW4, N2SW4, SE4SW4, SE4 (440) Section 28- E2 (320) T3N R13E Section 6- NW4, E2SW4, SE4 (375.40)+ Section 7- E2NW4, SW4, E2 (540.58) Section 8- SW4 (160) Section 17- NW4, NW4SW4 (200) Section 18- NE4SE4 (40) T4N R12E Section 25- ALL (640) T2N R12E Section 8- E2 (320) Section 17- NE4 (160) T3N R12E Section 1- ALL (636.80) Section 3- S2 (320) Section 4- E2 (317.04) Section 12- ALL (640) Section 13- ALL less E2SE4 (560) Section 14- E2W2, E2 (480) Section 17- S2SE4 (80) Section 20- NE4, N2SE4 (240) Section 21- ALL (640) Section 22- ALL (640) Section 23- E2NE4, S2 (400) Section 24- W2 (320) Section 27- NW4, N2SW4, SE4SW4, SE4 (440) Section 28- E2 (320) T3N R13E Section 6- NW4, E2SW4, SE4 (375.40)+ Section 7- E2NW4, SW4, E2 (540.58) Section 8- SW4 (160) Section 17- NW4, NW4SW4 (200) Section 18- NE4SE4 (40)

T4N R12E Section 25- ALL (640) T2N R12E Section 1- ALL (640.38) Section 4- W2 (319.81) Section 11- SE4, E2SW4 (240) Section 12- ALL Less State Land (540) Section 13- ALL (640) Section 14- E2 (320) Section 15- E2 (320) Section 22- NE4 (160), S2 (320) Section 23- SE4, SW4NE4 (200) W2, N2NE4, SE4NE4 (440) Section 24- E2NE4 (80), W2, W2E2, E2SE4 (560) Section 25- N2N2 (160) Section 26- NW4, W2NE4, NE4NE4 (280), S2, SE4NE4 (1 Acre Homesite) (360) Section 27- E2 (320), W2 (320) Section 34- E2 (320) Section 35- N2, N2S2, SW4SE4, SE4SW4, SW4SW4 (less 7 Acres to HWY) (593) T2N R13E Section 6- all (612.85) Section 7- all (614.02) Section 18- all (618.88) Section 19- N2 (310.73), S2 (311.57) Section 30- N2N2 (156.10) T3N R12E Section 20- S2SE4 (80), Section 25- S2SW4, SE4 (240) Section 27- NE4 (160), Section 28- NW4, TR A Lands of Steve Pounds in W2 B/134 (170), Section 29- N2NE4 (80) Section 33- E2 (320) Section 35- SW4, N2SE4 (240) Section 36- NE4, N2SE4, 1 Acre Homesite/Shop (240) T3N R13E Section 18- W2, NE4 (446.90), Section 31- NW4, NW4SW4, 1 Acre Homesite/Bunkhouse (180.55)

The Property below is under negotiations. Township 1 North, Range 13 East: Section 25: All Section 26: SE4

Torrance County, NM Leased Property Descriptions


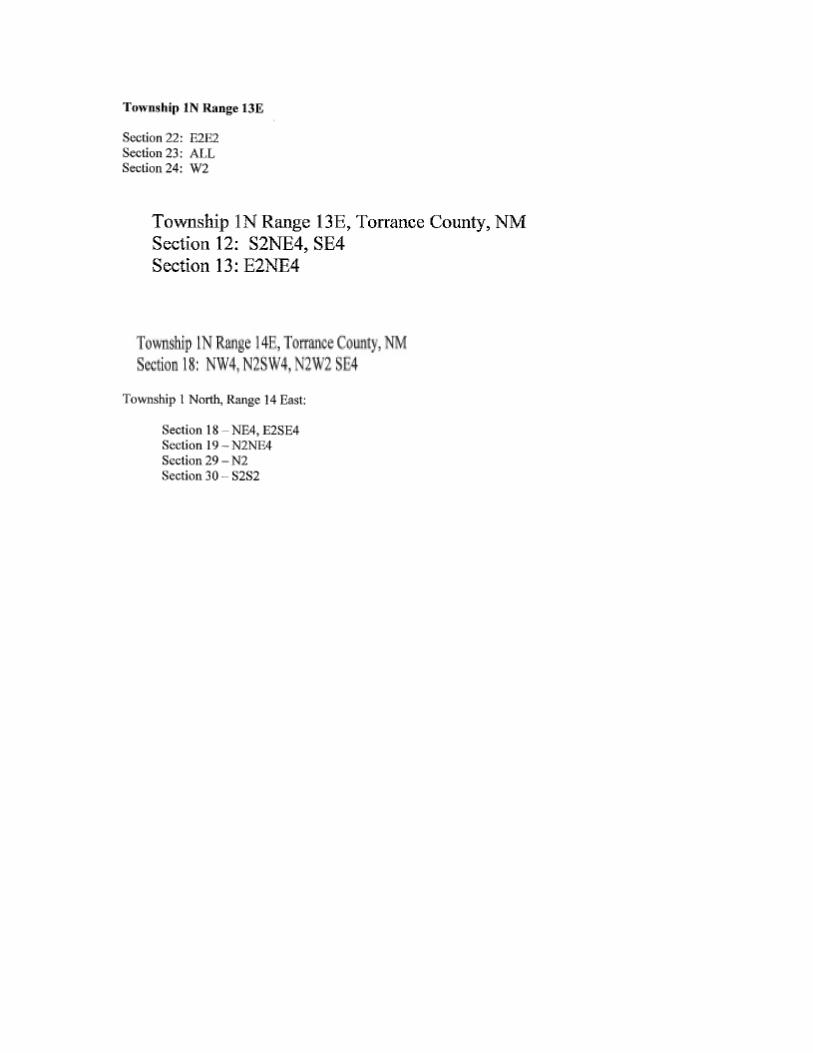

T2N R12E Section 8- E2 (320) Section 17- NE4 (160) T3N R12E Section 1- ALL (636.80) Section 3- S2 (320)

Section 4- E2 (317.04) Section 12- ALL (640) Section 13- ALL less E2SE4 (560) Section 14- E2W2, E2 (480) Section 17- S2SE4 (80) Section 20- NE4, N2SE4 (240) Section 21- ALL (640) Section 22- ALL (640) Section 23- E2NE4, S2 (400) Section 24- W2 (320) Section 27- NW4, N2SW4, SE4SW4, SE4 (440) Section 28- E2 (320) T3N R13E Section 6- NW4, E2SW4, SE4 (375.40)+ Section 7- E2NW4, SW4, E2 (540.58) Section 8- SW4 (160) Section 17- NW4, NW4SW4 (200) Section 18- NE4SE4 (40) T4N R12E Section 25- ALL (640) T2N R12E Section 8- E2 (320) Section 17- NE4 (160) T3N R12E Section 1- ALL (636.80) Section 3- S2 (320) Section 4- E2 (317.04) Section 12- ALL (640) Section 13- ALL less E2SE4 (560) Section 14- E2W2, E2 (480) Section 17- S2SE4 (80) Section 20- NE4, N2SE4 (240) Section 21- ALL (640) Section 22- ALL (640) Section 23- E2NE4, S2 (400) Section 24- W2 (320) Section 27- NW4, N2SW4, SE4SW4, SE4 (440) Section 28- E2 (320) T3N R13E Section 6- NW4, E2SW4, SE4 (375.40)+ Section 7- E2NW4, SW4, E2 (540.58) Section 8- SW4 (160) Section 17- NW4, NW4SW4 (200) Section 18- NE4SE4 (40)

T4N R12E Section 25- ALL (640) T2N R12E Section 1- ALL (640.38) Section 4- W2 (319.81) Section 11- SE4, E2SW4 (240) Section 12- ALL Less State Land (540) Section 13- ALL (640) Section 14- E2 (320) Section 15- E2 (320) Section 22- NE4 (160), S2 (320) Section 23- SE4, SW4NE4 (200) W2, N2NE4, SE4NE4 (440) Section 24- E2NE4 (80), W2, W2E2, E2SE4 (560) Section 25- N2N2 (160) Section 26- NW4, W2NE4, NE4NE4 (280), S2, SE4NE4 (1 Acre Homesite) (360) Section 27- E2 (320), W2 (320) Section 34- E2 (320) Section 35- N2, N2S2, SW4SE4, SE4SW4, SW4SW4 (less 7 Acres to HWY) (593) T2N R13E Section 6- all (612.85) Section 7- all (614.02) Section 18- all (618.88) Section 19- N2 (310.73), S2 (311.57) Section 30- N2N2 (156.10) T3N R12E Section 20- S2SE4 (80), Section 25- S2SW4, SE4 (240) Section 27- NE4 (160), Section 28- NW4, TR A Lands of Steve Pounds in W2 B/134 (170), Section 29- N2NE4 (80) Section 33- E2 (320) Section 35- SW4, N2SE4 (240) Section 36- NE4, N2SE4, 1 Acre Homesite/Shop (240) T3N R13E Section 18- W2, NE4 (446.90), Section 31- NW4, NW4SW4, 1 Acre Homesite/Bunkhouse (180.55)

Torrance County, NM Soon to be Leased Property Descriptions (Added to leased land list)
Township 1 North, Range 13 East: Section 25: All Section 26: SE4

Pattern Energy LP 13-6 Burns & McDonnell
EXHIBIT F BOUNDARIES AND FACILITIES MAP

Source: Esri, USGS, Pattern Development, and Burns & McDonnell Engineering Company, Inc. Issued: 8/6/2018
Exhibit FBoundaries and Facilities Map
Pattern DevelopmentTorrance Wind Projects
Lincoln &Torrance County, NM
#
#
#
#
#
#
!
!
!
!
!
!
!
!
!
!
!
!
!!
!
!
!
!!
!
!
!
!
!
!
!
!
!
!
!
!
!
!
!
!
!
!
!
!
!
!
!
!
!
!!
!
!
!
!
!
!
!
!
!
!
!
!
!
!
!
!
!
!
!
!
!
!
!
!
!
!
!
!
!
!
!
!
!
!
!
!
!
!
!
!
!
!
!
!
!
!
!
!
!
!
!
!
!
!
!
!
!
!
!
!
!
!
!
!
!
!!
!
!
!
!!
!
!
!
!
!
!
!
!
!
!
!
!
!
!
!
!
!
!
!
!
!
!
!
!
!
!
!
!
!
!
!
!
!
!
!!
!
!
!
!
!
!
!
!
!
!
!
!
!
!
!
!
!
!
!
!
!
!
!
!
!
!
!
!
!
!
!
!
!
!
!
!
!
!
!
!
!
!
!
!
!
!
!
!
!
!
!
!
!
!
!
! !
!
!
!
!
!
!
!
!
!
!
!
!
!
!!
!
!
!
!
!
!
!
!
!
!
!
!
!
!
!
!
!
!
!
!
!
!
!
!
!
!
!
!
!
!
!
!
!
!
!
!
!
!
!
!
!
!
!
!
!
!
!
!
!
!
!
!
!
!
!
!
!
!
!
!
!
!!
!
!
!
!
!
!
!
!
!!
!
!
!
!
!
!
!
!
!
!
!
!
!
!
!
!
!
!
!
!!
!
!
!
!
!
!
!
!
!
!
!
!
!
!
!!
!
!
!
!
!
!
!
!
!
!
!!
!
!
!
!
!
!
!
!
!
!
!
!
!
!
!
!
!
!
!
!
!
!
!
!
!
!
!!
!
!
!
!
!
!
!
!
!
!
!
!!
!
!
!
!
!
!
!
!
!!
!
!
!
!
!
!!
!
!
!
!!!
!!!
!
!
!!
!
!!
!
!
!
!
!
!
!
!
!
!!
!!
!
!
!
!
!
!!!
!!
!
!
!!
!
!!!
!
!
!
!
!!
!
!
!
!
!
!!!
!
!
!!
!
!
!
!
!
!!
!!
!!!
!
!
!
!
!
!!!
!
!!!!
!!
!
!
!!
!
!
!
!!
!!
!
!
!
!
!!!
!!!
!
!
!!
!!
!
!!
!
!!
!!
!
!
!
!
!!!!
!!
!!!
!!
!
!
!!
!!
!!!
!!
!!
!
!
!
!!
!
!
!
!
!!
!
!
!!
!!
!
!
!
!
!
!!
!
!!
!
!
!
!
!!!
!
!
!
!
!
!
!
!
!!!
!
!
!
!
!
!!
!!
!!!!!!!
!!!
!!!
!!!!!!!!
!!!
!!
!!!!!!!!!
!!!!
!!
!
!!!!!!!!
!
!!
!!
!!
!!!
!!
!!!!
!!!!!!
!!
!!
!
!!
!!!
!!!!
!
!
!
!
!
!
!!
!!
_
_
_
_
_
_
_____
_
____
_
_
_
_
_
_
L i n c o l nC o u n t y
T o r r a n c eC o u n t y
_ House! Preliminary Turbine Location# Substation
Project Transmission Line
Access Road Crane PathAccess Road OnlyWind Project AreaCounty Boundary
COPY
RIGH
T © 20
18 B
URNS
& Mc
DONN
ELL E
NGIN
EERI
NG C
OMPA
NY, IN
C.Se
rvice
Laye
r Cred
its: E
sri, H
ERE,
Garm
in, U
SGS,
Inter
map,
INCR
EMEN
T P, N
RCan
, © O
penS
treetM
ap co
ntribu
tors,
and t
he G
IS Us
er Co
mmun
ity, H
ERE,
Garm
in, ©
Ope
nStre
etMap
contr
ibutor
s
0 31.5
Scale in Miles
NORTH

Pattern Energy LP 13-7 Burns & McDonnell
EXHIBIT G METEOROLOGICAL TOWER INFORMATION

62
N
RG
_60m
_a
nd
_50m
_X
HD
_T
allT
ow
er_
Insta
llatio
n_M
anu
al_
and_S
pecific
atio
ns_R
ev_1.0
6.d
ocx
6 M
ay 2
009
60
m X
HD
with
S
tan
dard
Fo
otp
rint
Sta
mp
ed
Dra
win
g

Pattern Energy LP 13-8 Burns & McDonnell
EXHIBIT H NEW MEXICO WIND RESOURCE MAP
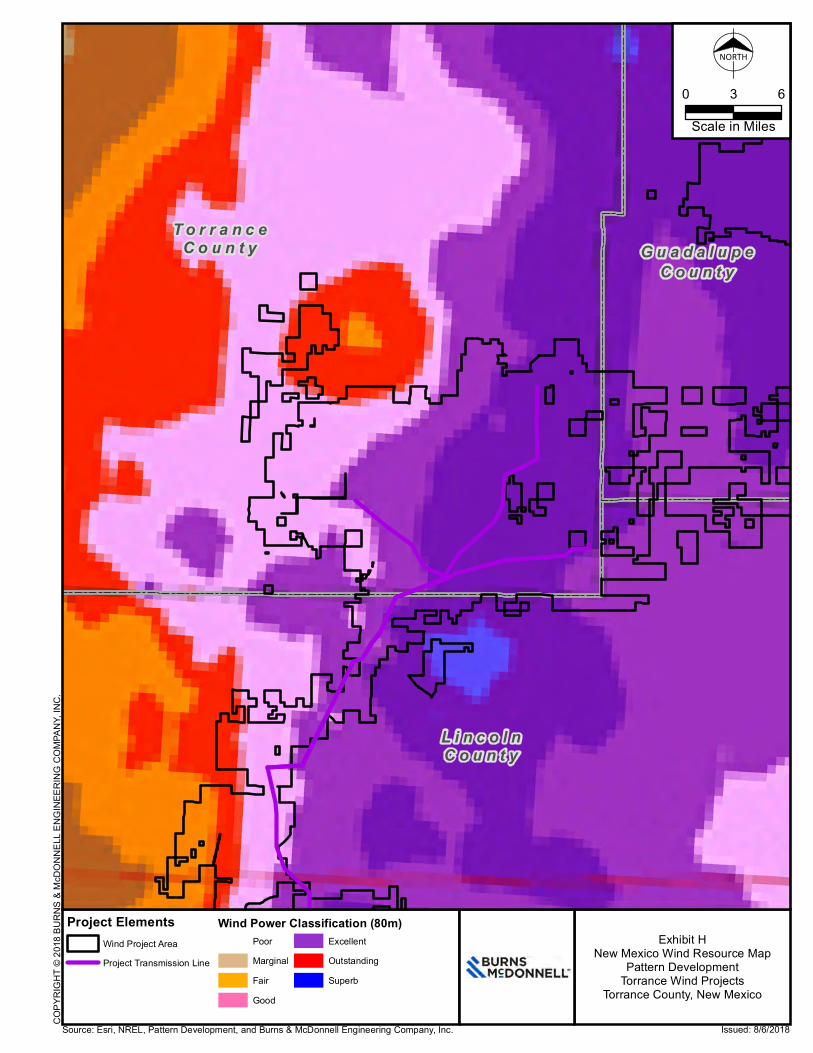
Source: Esri, NREL, Pattern Development, and Burns & McDonnell Engineering Company, Inc. Issued: 8/6/2018
Exhibit HNew Mexico Wind Resource Map
Pattern DevelopmentTorrance Wind Projects
Torrance County, New Mexico
L i n c o l nC o u n t y
T o r r a n c eC o u n t y G u a d a l u p e
C o u n t y
Project ElementsWind Project AreaProject Transmission Line
COPY
RIGH
T © 20
18 B
URNS
& Mc
DONN
ELL E
NGIN
EERI
NG C
OMPA
NY, IN
C.
0 63
Scale in Miles
NORTH
PoorMarginalFairGood
ExcellentOutstandingSuperb
Wind Power Classification (80m)

Pattern Energy LP 13-9 Burns & McDonnell
EXHIBIT I EXISTING AND PROPOSED TRANSMISSION FACILITIES MAP

Source: Esri, Energy Velocity, Pattern Development, and Burns & McDonnell Engineering Company, Inc. Issued: 9/12/2018
Exhibit IExisting and Proposed Transmission
Facilities MapPattern Development
Torrance Wind ProjectsTorrance County, New Mexico
L i n c o l nC o u n t y
T o r r a n c eC o u n t y
COPY
RIGH
T © 20
18 B
URNS
& Mc
DONN
ELL E
NGIN
EERI
NG C
OMPA
NY, IN
C.
0 42
Scale in Miles
NORTHSe
rvice
Laye
r Cred
its: E
sri, H
ERE,
DeL
orme,
USGS
, Inter
map,
INCR
EMEN
T P, N
GCC,
© O
penS
treetM
ap co
ntribu
tors,
and t
he G
IS U
ser C
ommu
nity
Project ElementsProject Transmission Line 345-kVTorrance Wind Projects Area - Proposed SUD

Pattern Energy LP 13-10 Burns & McDonnell
EXHIBIT J PROJECT VISBILITY MAP

COPY
RIGH
T © 20
18 B
URNS
& Mc
DONN
ELL E
NGIN
EERI
NG C
OMPA
NY, IN
C.
Source: Esri, USGS, Pattern Development, and Burns & McDonnell Engineering Company, Inc. Issued: 8/6/2018
Exhibit JProject Visibility MapPattern Development
Torrance Wind ProjectsLincoln &Torrance County, NM
^T o r r a n c e
C o u n t y
^ Center of Torrance Portion of Project3 Mile Buffer from Center of ProjectProject Transmission LineWind Project AreaCounty Boundary
Area Visible from Center of Project
Servi
ce La
yer C
redits
: Cop
yrigh
t:© 20
13 N
ation
al Ge
ograp
hic S
ociet
y, i-c
ubed
0 10.5
Scale in Miles
NORTH

Pattern Energy LP 13-11 Burns & McDonnell
EXHIBIT K CULTURAL RESOURCES DATA

December 29, 2017
Ms. Adam Cernea Clark Cowboy Mesa Wind LLC c/o Pattern Renewables Development Company LLC 1201 Louisiana Street, Suite 3200 Houston TX 77002
Re: Cultural Resources Survey for 15 Proposed Wind Turbine Locations at the Cowboy Mesa Wind Project, Torrance County, New Mexico
Dear Mr. Clark:
Cowboy Mesa Wind LLC proposes to construct 15 wind turbine foundations and access roads to these foundations in preparation for the later construction of the Cowboy Mesa Wind Project in central New Mexico. The 15 proposed wind turbine locations (herein referred to as “Project”) are located on private property approximately 5.5 miles east of Corona, New Mexico (Figure 1, attached). In November 2017, Blanton & Associates, Inc. (B&A) was contracted to conduct a 100 percent pedestrian cultural resources survey on the Project. This document presents the results of the survey.
Archaeological sites on private lands in New Mexico are not typically protected by State or Federal statutes, except where Federal or State funding or permitting is involved. However, there are two exceptions: unmarked and marked human burials are protected on lands in New Mexico under the New Mexico Antiquities Code (NMAC) § 4.10.11. Furthermore, private land owners may opt to have archaeological sites on their property afforded protection by the State by taking advantage of special zoning pursuant to § 18-6-10 of the Cultural Properties Act. This zoning gives the landowner certain tax breaks and other benefits and allows the State to regulate activities within the archaeological zone. There are no such zones within the Project.
Cowboy Mesa Wind LLC requested a 100 percent pedestrian survey of all Project infrastructure to determine if historic properties that are listed on, determined to be eligible for listing on, or potentially eligible for listing on the National Register of Historic Places (NRHP) would be adversely affected by construction and operation of the Project. While cultural resources are not protected on private properties with no State or Federal nexus, Project crossings of waters of the U.S. may be authorized under a Nationwide Permit (NWP). In order to qualify for authorization under a NWP without a pre-construction notification (PCN), the construction activities must, among other requirements, comply with General Condition 20 (Historic Properties) of the NWP program. General Condition 20 requires that non-federal permittees submit a PCN to the U.S. Army Corps of Engineers (USACE) District Engineer if any historic properties on, determined to be eligible for listing on, or potentially eligible for listing on the NRHP could

CULTURAL RESOURCES SURVEY FOR COWBOY MESA WIND PROJECT DECEMBER 29, 2017
PAGE 2
be affected by construction activities. The cultural resources survey of the Project was conducted specifically to determine whether NRHP properties or potentially eligible properties occurred at any of the turbine or access road locations.
PROJECT AREA
The proposed Project will be located approximately 5.5 miles east of Corona, New Mexico on the foothills southeast of Cameleon Peak (Figure 1, attached). Generally, the Project area has experienced low impacts from ranching and other agricultural uses. The majority of the landscape is gently rolling and is uncultivated rangeland dotted with piñon and juniper (Photo 1).
Photo 1. Project area overview.
METHODOLOGY
Prior to conducting archaeological field investigations, a background literature and records review was conducted for the Project and surrounding area. A search of the New Mexico Cultural Information System was conducted in order to identify previously recorded archaeological sites and other listed historic resources such as New Mexico Historic Landmarks, as well as properties listed on the NRHP.
Following the literature review, a pedestrian survey was conducted to inventory and assess archaeological resources that may be impacted from construction and operation of the Project. The survey consisted of examination by professional archaeologists of all areas within the proposed facility footprint. High

CULTURAL RESOURCES SURVEY FOR COWBOY MESA WIND PROJECT DECEMBER 29, 2017
PAGE 3
probability areas, identified prior to field investigations, where given extra scrutiny and included the edges of water features, arroyos, and elevated landforms. Any new sites recorded during the survey were assessed in terms of eligibility for listing on the NRHP.
A buffer was surveyed along and around all proposed infrastructure. A 75 meters wide area centered on proposed road easements and a 120-meter diameter area around each turbine location was inspected for cultural resources. Survey transect spacing during the survey ranged from 15 to 25 meters.
When an artifact was encountered during the survey, extra scrutiny was given to the area surrounding it. If the item(s) was/were isolated or did not meet the Project criteria to qualify as a site (described below), it was noted as an Isolated Occurrence (IO). If the area included features or a concentration of artifacts, it was recorded as a cultural resource site. The site definition criteria utilized for the survey were as follows:
1) One or more features; features were defined as 10 or more pieces of fire-cracked limestone, or any other material type within a 2-meter x 2-meter area.
2) One formal tool if associated with other cultural material or, if not associated with other materials, multiple formal tools.
3) An occurrence of artifacts (such as pottery sherds, chipped-stone, or historic items) with one of the following:
a) Three or more types of artifacts; b) Two types of artifacts with a minimum density of 10 items per 100 square meters; c) A single type of artifact or cultural material with a minimum density of at least 25 items per
100 square meters; and d) A rock art site including either pictographs or petroglyphs.
When a cultural resource was identified, it was recorded with a global positioning system (GPS) utilizing a data dictionary. The data dictionary was created by the archaeologists and contained menus of artifacts and cultural features anticipated for this Project area. These menus identified artifact type (i.e., debitage, projectile point, biface, etc.), raw material (sandstone, chert, etc.), and other important details. For cultural features, the menus recorded feature type (burned rock concentrations, hearths, cairns, etc.), dimensions, degree of intactness, and other morphological data. The data dictionary was designed to be flexible to account for new or unexpected artifact and feature types encountered in the field. It is important to note that the digital recording of cultural resources did not preclude paper notes, sketches, and descriptions of sites. Rather, the GPS and GIS were used to augment traditional methods of recording sites, not replace them. Shovel testing was conducted to help define the boundaries of the sites.
At the end of each field day, all of the digital data gathered from the GPS and digital camera were downloaded to a laptop computer. The data were then differentially corrected via the Internet with a New Mexico Department of Transportation (NMDOT) base station located in Alamogordo, Texas.

CULTURAL RESOURCES SURVEY FOR COWBOY MESA WIND PROJECT DECEMBER 29, 2017
PAGE 4
RESULTS OF INVESTIGATIONS AND RECOMMENDATIONS
The background literature review identified no previously recorded archaeological sites in the Project vicinity. The results of the archaeological survey revealed that few archaeological materials are present in the direct footprint of most of the proposed Project. B&A discovered one historic archaeological site designated CM-01 (Figure 2, attached) within the Project area. The site is considered to have some research potential and, in our opinion, the site has potential to be eligible for listing on the NRHP. The following offers a brief description of the site.
Site Descriptions
Archaeological site CM-01 is a historic dugout site. The site measures about 60 meters east/west by 40 meters north/south. The site is dominated by the remains for a 1910’s to 1920’s era dugout and a deep cistern. Scattered across the site are a number of historic artifacts related to ranching and early living in the area. Based on our knowledge of wind farm construction, it seems that the site can be avoided by narrowing the clearing of the ROW near the southernmost edge of the site.
Based on the amount and type of artifacts present as well as the historic dugout, it is our opinion that site CM-01 may be eligible for the NRHP. The proposed Project was redesigned to avoid impacts to the site.
Isolated Occurrences
Eight isolated occurrences of cultural materials were identified during the survey. The artifacts were random discoveries encountered outside of the context of an archaeological site as defined for this Project. Isolated occurrences lack significance and do not need to be avoided.
Recommendations
As discussed earlier, there is no regulatory protection for archaeological sites located on private lands, with no State or Federal nexus, with few exceptions. Site CM-01 is not located at a water of the U.S. crossing; therefore, no Federal nexus exists for the protection of the site. The proposed Project was redesigned to avoid impacts to the site.
The recommendations provided here are voluntary, as avoidance or minimization measures are not required by law or regulation, except were human burials and prehistoric rock art panels are present, as previously mentioned.
It should be noted that only the road corridors and turbine locations provided by Cowboy Mesa Wind LLC have been intensively surveyed for cultural resources. It is possible that additional, and potentially significant, archaeological sites could be present beyond the current areas of planned construction. If changes are made to the project (i.e., relocations of turbines or roads), B&A suggests that those areas be examined by an archaeologist prior to construction.

CULTURAL RESOURCES SURVEY FOR COWBOY MESA WIND PROJECT DECEMBER 29, 2017
PAGE 5
Thank you for the opportunity to provide our services to Cowboy Mesa Wind LLC. If you have any questions, please do not hesitate to contact me or Gary Galbraith at (512) 264-1095.
Sincerely,
Mark Willis Archaeologist Blanton & Associates, Inc.
Attachments: Figure 1. Project Location Map Figure 2. Cultural Resources

CULTURAL RESOURCES SURVEY FOR COWBOY MESA WIND PROJECT DECEMBER 29, 2017
ATTACHMENTS

CULTURAL RESOURCES SURVEY FOR COWBOY MESA WIND PROJECT DECEMBER 29, 2017
ATTACHMENTS

December 29, 2017
Mr. Adam Cernea Clark Duran Mesa Wind LLC c/o Pattern Renewables Development Company LLC 1201 Louisiana Street, Suite 3200 Houston TX 77002
Re: Cultural Resources Survey for 15 Proposed Wind Turbine Locations at the Duran Mesa Wind Project, Torrance County, New Mexico
Dear Mr. Clark:
Duran Mesa Wind LLC proposes to construct 15 wind turbine foundations and access roads to these foundations in preparation for the later construction of the Duran Mesa Wind Project in central New Mexico. The 15 proposed wind turbine locations (herein referred to as “Project”) are located on private property approximately 3 miles north of Corona, New Mexico (Figure 1, attached). In November 2017, Blanton & Associates, Inc. (B&A) was contracted to conduct a 100 percent pedestrian cultural resources survey on the Project. This document presents the results of the survey.
Archaeological sites on private lands in New Mexico are not typically protected by State or Federal statutes, except where Federal or State funding or permitting is involved. However, there are two exceptions: unmarked and marked human burials are protected on lands in New Mexico under the New Mexico Antiquities Code (NMAC) § 4.10.11. Furthermore, private land owners may opt to have archaeological sites on their property afforded protection by the State by taking advantage of special zoning pursuant to § 18-6-10 of the Cultural Properties Act. This zoning gives the landowner certain tax breaks and other benefits and allows the State to regulate activities within the archaeological zone. There are no such zones within the Project.
Duran Mesa Wind LLC requested a 100 percent pedestrian survey of all Project infrastructure to determine if historic properties that are listed on, determined to be eligible for listing on, or potentially eligible for listing on the National Register of Historic Places (NRHP) would be adversely affected by construction and operation of the Project. While cultural resources are not protected on private properties with no State or Federal nexus, Project crossings of waters of the U.S. may be authorized under a Nationwide Permit (NWP). In order to qualify for authorization under a NWP without a pre-construction notification (PCN), the construction activities must, among other requirements, comply with General Condition 20 (Historic Properties) of the NWP program. General Condition 20 requires that non-federal permittees submit a PCN to the U.S. Army Corps of Engineers (USACE) District Engineer if any historic properties on, determined

CULTURAL RESOURCES SURVEY FOR DURAN MESA WIND PROJECT DECEMBER 29, 2017
PAGE 2
to be eligible for listing on, or potentially eligible for listing on the NRHP could be affected by construction activities. The cultural resources survey of the Project was conducted specifically to determine whether NRHP properties or potentially eligible properties occurred at any of the turbine or access road locations.
PROJECT AREA
The proposed Project will be located approximately 3 miles north of Corona, New Mexico south of Duran Mesa (Figure 1, attached). Generally, the Project area has experienced low impacts from ranching and other agricultural uses. The majority of the landscape is gently rolling and is uncultivated rangeland dotted with juniper and cholla (Photo 1).
Photo 1. Project area overview.
METHODOLOGY
Prior to conducting archaeological field investigations, a background literature and records review was conducted for the Project and surrounding area. A search of the New Mexico Cultural Information System was conducted in order to identify previously recorded archaeological sites and other listed historic resources such as New Mexico Historic Landmarks, as well as properties listed on the NRHP.
Following the literature review, a pedestrian survey was conducted to inventory and assess archaeological resources that may be impacted from construction and operation of the Project. The survey consisted of examination by professional archaeologists of all areas within the proposed facility footprint. High

CULTURAL RESOURCES SURVEY FOR DURAN MESA WIND PROJECT DECEMBER 29, 2017
PAGE 3
probability areas, identified prior to field investigations, where given extra scrutiny and included the edges of water features, arroyos, and elevated landforms. Any new sites recorded during the survey were assessed in terms of eligibility for listing on the NRHP.
A buffer was surveyed along and around all proposed infrastructure. A 75 meters wide area centered on proposed road easements and a 120-meter diameter area around each turbine location was inspected for cultural resources. Survey transect spacing during the survey ranged from 15 to 25 meters.
When an artifact was encountered during the survey, extra scrutiny was given to the area surrounding it. If the item(s) was/were isolated or did not meet the Project criteria to qualify as a site (described below), it was noted as an Isolated Occurrence (IO). If the area included features or a concentration of artifacts, it was recorded as a cultural resource site. The site definition criteria utilized for the survey were as follows:
1) One or more features; features were defined as 10 or more pieces of fire-cracked limestone, or any othermaterial type within a 2-meter x 2-meter area.
2) One formal tool if associated with other cultural material or, if not associated with other materials,multiple formal tools.
3) An occurrence of artifacts (such as pottery sherds, chipped-stone, or historic items) with one of thefollowing:
a) Three or more types of artifacts;b) Two types of artifacts with a minimum density of 10 items per 100 square meters;c) A single type of artifact or cultural material with a minimum density of at least 25 items per
100 square meters; andd) A rock art site including either pictographs or petroglyphs.
When a cultural resource was identified, it was recorded with a global positioning system (GPS) utilizing a data dictionary. The data dictionary was created by the archaeologists and contained menus of artifacts and cultural features anticipated for this Project area. These menus identified artifact type (i.e., debitage, projectile point, biface, etc.), raw material (sandstone, chert, etc.), and other important details. For cultural features, the menus recorded feature type (burned rock concentrations, hearths, cairns, etc.), dimensions, degree of intactness, and other morphological data. The data dictionary was designed to be flexible to account for new or unexpected artifact and feature types encountered in the field. It is important to note that the digital recording of cultural resources did not preclude paper notes, sketches, and descriptions of sites. Rather, the GPS and GIS were used to augment traditional methods of recording sites, not replace them. Shovel testing was conducted to help define the boundaries of the sites.
At the end of each field day, all of the digital data gathered from the GPS and digital camera were downloaded to a laptop computer. The data were then differentially corrected via the Internet with a New Mexico Department of Transportation (NMDOT) base station located in Alamogordo, Texas.

CULTURAL RESOURCES SURVEY FOR DURAN MESA WIND PROJECT DECEMBER 29, 2017
PAGE 4
RESULTS OF INVESTIGATIONS AND RECOMMENDATIONS
The background literature review identified two previously recorded archaeological sites (LA148937 and LA148938) in the Project vicinity. Both sites were recorded as small lithic scatters and not recommended for listing on the NRHP. Neither of the sites is in an area of planned construction. Both sites are located more than 80 meters away from proposed ROW. The results of the archaeological survey revealed that few archaeological materials are present in the direct footprint of most of the proposed Project. B&A did not discover any historic or prehistoric cultural resources within the survey corridors.
Isolated Occurrences
Ten isolated occurrences of cultural material were identified during the survey. The artifacts were random discoveries encountered outside of the context of an archaeological site as defined for this Project. The artifacts were historic pieces of metal debris. Isolated occurrences lack significance and do not need to be avoided.
Recommendations
As discussed earlier, there is no regulatory protection for archaeological sites located on private lands, with no State or Federal nexus, with few exceptions. As no archaeological sites were identified, we recommend construction proceed as planned. It should be noted that only the road corridors and turbine locations provided by Duran Mesa Wind LLC have been intensively surveyed for cultural resources. It is possible that potentially significant, archaeological sites could be present beyond the current areas of planned construction. If changes are made to the project (i.e., relocations of turbines or roads), B&A suggests that those areas be examined by an archaeologist prior to construction.
Thank you for the opportunity to provide our services to Duran Mesa Wind LLC. If you have any questions, please do not hesitate to contact me or Gary Galbraith at (512) 264-1095.
Sincerely,
Mark Willis Archaeologist Blanton & Associates, Inc.
Attachments: Figure 1. Project Location Map Figure 2. Cultural Resources

CULTURAL RESOURCES SURVEY FOR DURAN MESA WIND PROJECT DECEMBER 29, 2017
ATTACHMENTS

CULTURAL RESOURCES SURVEY FOR DURAN MESA WIND PROJECT DECEMBER 29, 2017
ATTACHMENTS

CULTURAL RESOURCES SURVEY FOR DURAN MESA WIND PROJECT DECEMBER 29, 2017
ATTACHMENTS

December 29, 2017
Mr. Adam Cernea Clark Red Cloud Wind LLC c/o Pattern Renewables Development Company LLC 1201 Louisiana Street, Suite 3200 Houston TX 77002
Re: Cultural Resources Survey for 21 Proposed Wind Turbine Locations and Access Roads at the Red Cloud Wind Project, Torrance County, New Mexico
Dear Mr. Clark:
Red Cloud Wind LLC proposes to construct 21 wind turbine foundations and access roads to these foundations in preparation for the later construction of the Red Cloud Wind Project in central New Mexico. The 21 proposed wind turbine locations and access roads (herein referred to as “Project”) are located on private property and New Mexico State University (NMSU) deeded land approximately 12.7 miles east of Corona, New Mexico (Figure 1, attached). In November 2017, Blanton & Associates, Inc. (B&A) was contracted to conduct a 100 percent pedestrian cultural resources survey on the Project. This document presents the results of the survey.
Archaeological sites on private lands in New Mexico are not typically protected by State or Federal statutes, except where Federal or State funding or permitting is involved. However, there are two exceptions: unmarked and marked human burials are protected on lands in New Mexico under the New Mexico Antiquities Code (NMAC) § 4.10.11. Furthermore, private land owners may opt to have archaeological sites on their property afforded protection by the State by taking advantage of special zoning pursuant to § 18-6-10 of the Cultural Properties Act. This zoning gives the landowner certain tax breaks and other benefits and allows the State to regulate activities within the archaeological zone. There are no such zones within the Project. Shad Cox of NMSU was consulted about the status of NMSU deeded lands. According to Mr. Cox and officials at NMSU, deeded land is not subject to New Mexico State Historic Preservation Office review.
Red Cloud Wind LLC requested a 100 percent pedestrian survey of all Project infrastructure to determine if historic properties that are listed on, determined to be eligible for listing on, or potentially eligible for listing on the National Register of Historic Places (NRHP) would be adversely affected by construction and operation of the Project. While cultural resources are not protected on private properties with no State or Federal nexus, Project crossings of waters of the U.S. (WOTUS) may be authorized under a Nationwide Permit (NWP). In order to qualify for authorization under a NWP without a pre-construction notification (PCN), the construction activities must, among other requirements, comply with General Condition 20

CULTURAL RESOURCES SURVEY FOR RED CLOUD WIND PROJECT DECEMBER 29, 2017
PAGE 2
(Historic properties) of the NWP program. General Condition 20 requires that non-federal permittees submit a PCN to the U.S. Army Corps of Engineers (USACE) District Engineer if any historic properties on, determined to be eligible for listing on, or potentially eligible for listing on the NRHP could be affected by construction activities. The cultural resources survey of the Project was conducted specifically to determine whether NRHP properties or potentially eligible properties occurred at any of the turbine or access road locations.
PROJECT AREA
The proposed Project will be located approximately 12.7 miles east of Corona, New Mexico on the foothills east of Cameleon Peak (Figure 1, attached). Generally, the Project area has experienced low impacts from ranching and other agricultural uses. The majority of the landscape is gently rolling and is uncultivated rangeland dotted with and juniper and cholla (Photo 1).
Photo 1. Project area overview.
METHODOLOGY
Prior to conducting archaeological field investigations, a background literature and records review was conducted for the Project and surrounding area. A search of the New Mexico Cultural Information System was conducted in order to identify previously recorded archaeological sites and other listed historic resources such as New Mexico Historic Landmarks, as well as properties listed on the NRHP.
Following the literature review, a pedestrian survey was conducted to inventory and assess archaeological resources that may be impacted from construction and operation of the Project. The survey consisted of examination by professional archaeologists of all areas within the proposed facility footprint, plus a 75-

CULTURAL RESOURCES SURVEY FOR RED CLOUD WIND PROJECT DECEMBER 29, 2017
PAGE 3
meter wide buffer along the access road and a 120-meter area around each turbine. Survey transect spacing during the survey ranged from 15 to 25 meters. High probability areas, identified prior to field investigations, where given extra scrutiny and included the edges of water features, arroyos, and elevated landforms. Any new sites recorded during the survey were assessed in terms of eligibility for listing on the NRHP.
When an artifact was encountered during the survey, extra scrutiny was given to the area surrounding it. If the item(s) was/were isolated or did not meet the Project criteria to qualify as a site (described below), it was noted as an Isolated Occurrence (IO). If the area included features or a concentration of artifacts, it was recorded as a cultural resource site. The site definition criteria utilized for the survey were as follows:
1) One or more features; features were defined as 10 or more pieces of fire-cracked limestone, or any othermaterial type within a 2-meter by 2-meter area.
2) One formal tool if associated with other cultural material or, if not associated with other materials,multiple formal tools.
3) An occurrence of artifacts (such as pottery sherds, chipped-stone, or historic items) with one of thefollowing:
a) Three or more types of artifacts;b) Two types of artifacts with a minimum density of 10 items per 100 square meters;c) A single type of artifact or cultural material with a minimum density of at least 25 items per
100 square meters; andd) A rock art site including either pictographs or petroglyphs.
When a cultural resource was identified, it was recorded with a global positioning system (GPS) utilizing a data dictionary. The data dictionary was created by the archaeologists and contained menus of artifacts and cultural features anticipated for this Project area. These menus identified artifact type (i.e., debitage, projectile point, biface, etc.), raw material (sandstone, chert, etc.), and other important details. For cultural features, the menus recorded feature type (burned rock concentrations, hearths, cairns, etc.), dimensions, degree of intactness, and other morphological data. The data dictionary was designed to be flexible to account for new or unexpected artifact and feature types encountered in the field. It is important to note that the digital recording of cultural resources did not preclude paper notes, sketches, and descriptions of sites. Rather, the GPS and geographic information system (GIS) were used to augment traditional methods of recording sites, not replace them. Shovel testing was conducted to help define the boundaries of the sites.
At the end of each field day, all of the digital data gathered from the GPS and digital camera were downloaded to a laptop computer. The data were then differentially corrected via the Internet with a New Mexico Department of Transportation (NMDOT) base station located in Alamogordo, New Mexico.
RESULTS OF INVESTIGATIONS AND RECOMMENDATIONS
The background literature review identified no previously recorded archaeological sites in the Project vicinity. The results of the archaeological survey at the Project revealed that archaeological materials are present in the vicinity of the proposed Project. B&A discovered eight prehistoric archaeological sites

CULTURAL RESOURCES SURVEY FOR RED CLOUD WIND PROJECT DECEMBER 29, 2017
PAGE 4
(RC01-RC08) and one historic archaeological site designated RC-09 (Figure 2, attached) within the Project area. The sites are considered to have some research potential and, in our opinion, site RC-09 has potential to be eligible for listing on the NRHP. The following offers a brief description of the sites.
Site Descriptions Archaeological Sites RC01-08 are very similar in nature. All are located within sandy areas dominated by a juniper overstory. The sites consist of prehistoric cooking features, grinding tools such as manos and metates, brownware pottery, stone tool debitage, and the occasional projectile point (aka arrow head). All sites appear to have buried components and should be considered potentially significant. Site RC-09 is a historic dugout and associated stone alignment which may represent a tent pad. Based on artifacts found there, the site likely dates to the late 1910s to the 1920s. The site may be significant. The proposed project was redesigned to avoid impacts to all the sites.
Isolated Occurrences
Forty isolated occurrences of cultural materials were identified during the survey. The artifacts were random discovery encountered outside of the context of an archaeological site as defined for this Project. Isolated occurrences lack significance and do not need to be avoided.
Recommendations As discussed earlier, there is no regulatory protection for archaeological sites located on private lands with no State or Federal nexus, or for those sites on NMSU deeded lands, with few exceptions. Red Cloud Wind LLC voluntarily avoided all the sites discovered during this survey by redesigning the project layout. It should be noted that only the road corridors and turbine locations provided by Red Cloud Wind LLC have been intensively surveyed for cultural resources. It is possible that additional, and potentially significant, archaeological sites could be present beyond the current areas of planned construction. If changes are made to the project (i.e., relocations of turbines or roads), B&A suggests that those areas be examined by an archaeologist prior to construction.
Thank you for the opportunity to provide our services to Red Cloud Wind LLC. If you have any questions, please do not hesitate to contact me or Gary Galbraith at (512) 264-1095.
Sincerely,
Mark Willis Archaeologist Blanton & Associates, Inc.
Attachments: Figure 1. Project Location Map Figure 2. Cultural Resources
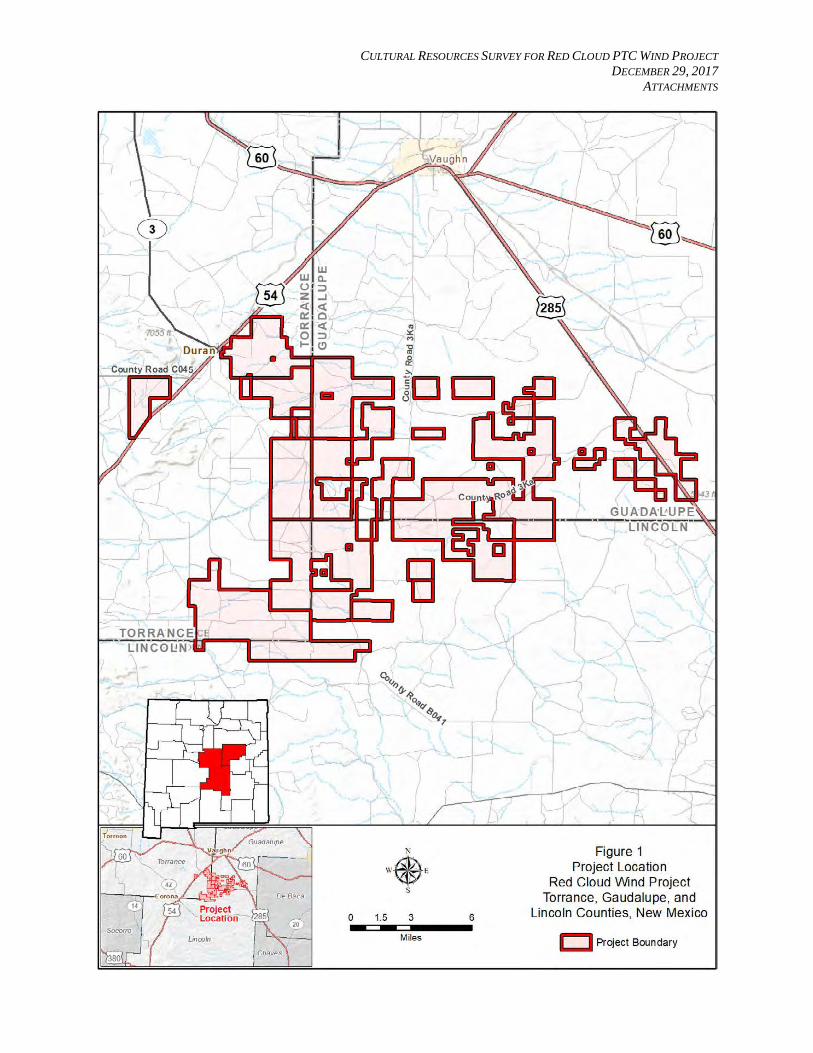
CULTURAL RESOURCES SURVEY FOR RED CLOUD PTC WIND PROJECT DECEMBER 29, 2017
ATTACHMENTS

CULTURAL RESOURCES SURVEY FOR RED CLOUD PTC WIND PROJECT DECEMBER 29, 2017
ATTACHMENTS

December 22, 2017
Mr. Adam Cernea Clark Manager, Environmental & Permitting Tecolote Wind LLC c/o Pattern Renewables Development Company 2 LLC 1201 Louisiana Street, Suite 3200 Houston TX 77002
Re: Cultural Resources Survey for 16 Proposed Wind Turbine Locations at the Tecolote Wind Project, Torrance County, New Mexico
Dear Mr. Clark:
Tecolote Wind LLC proposes to construct 16 wind turbine foundations and access roads to these foundations in preparation for the later construction of the Tecolote Wind Project in central New Mexico. The 16 proposed wind turbine locations and access roads (herein referred to as “Project”) are located on private property and New Mexico State University (NMSU) deeded land approximately 9 miles east of Corona, in Torrance County, New Mexico (Figures 1 and 2, attached). In November 2017, Blanton & Associates, Inc. (B&A) was contracted to conduct a 100 percent pedestrian cultural resources survey on the Project. This document presents the results of those investigations.
Archaeological sites on private lands in New Mexico are not typically protected by State or Federal statutes, except where Federal or State funding or permitting is involved. However, there are two exceptions: unmarked and marked human burials are protected on lands in New Mexico under the New Mexico Antiquities Code (NMAC) § 4.10.11. Furthermore, private land owners may opt to have archaeological sites on their property afforded protection by the State by taking advantage of special zoning pursuant to § 18-6-10 of the Cultural Properties Act. This zoning gives the landowner certain tax breaks and other benefits and allows the State to regulate activities within the archaeological zone. There are no such zones within the Project. Shad Cox of NMSU was consulted about the status of NMSU deeded lands. According to Mr. Cox and officials at NMSU, deeded land is not subject to New Mexico State Historic Preservation Office review.
Tecolote Wind requested a 100 percent pedestrian survey of all Project infrastructure to determine if historic properties that are listed on, determined to be eligible for listing on, or potentially eligible for listing on the National Register of Historic Places (NRHP) would be adversely affected by construction and operation of the Project. While cultural resources are not protected on private properties with no State or Federal nexus, Project crossings of waters of the U.S. may be authorized under Nationwide Permit (NWP). In order to qualify for authorization under a NWP without a pre-construction notification (PCN), the construction

CULTURAL RESOURCES SURVEY FOR TECOLOTE WIND PROJECT DECEMBER 22, 2017
PAGE 2
activities must, among other requirements, comply with General Condition 20 (Historic Properties) of the NWP program. General Condition 20 requires that non-federal permittees submit a PCN to the U.S. Army Corps of Engineers (USACE) District Engineer if any historic properties on, determined to be eligible for listing on, or potentially eligible for listing on the NRHP could be affected by construction activities. The cultural resources surveys of the Project were conducted specifically to determine whether NRHP properties or potentially eligible properties occurred at any of the turbine or access road locations.
PROJECT AREA
The proposed Project will be located approximately 9 miles east of Corona, New Mexico (Figure 1, attached). Generally, the Project area has experienced low impacts from ranching and other agricultural uses. The majority of the landscape is gently rolling and is uncultivated grazing land dotted with scattered juniper (Photo 1).
Photo 1. Project area overview.
METHODOLOGY
Prior to conducting archaeological field investigations, a background literature and records review was conducted for the Project and surrounding area. A search of the New Mexico Cultural Information System was conducted in order to identify previously recorded archaeological sites and other listed historic resources such as New Mexico Historic Landmarks, as well as properties listed on the NRHP.
Following the literature review, a pedestrian survey was conducted to inventory and assess archaeological resources that may be impacted from construction and operation of the Project. The survey consisted of

CULTURAL RESOURCES SURVEY FOR TECOLOTE WIND PROJECT DECEMBER 22, 2017
PAGE 3
examination by professional archaeologists of all areas within the proposed facility footprint, plus a 75-meter wide buffer along the access road and a 120-meter area around each turbine. Survey transect spacing during the survey ranged from 15 to 25 meters. High probability areas, identified prior to field investigations, where given extra scrutiny and included the edges of water features, arroyos, and elevated landforms. Any new sites recorded during the survey were assessed in terms of eligibility for listing on the NRHP.
When an artifact was encountered during the survey, extra scrutiny was given to the area surrounding it. If the item(s) was/were isolated or did not meet the Project criteria to qualify as a site (described below), it was noted as an Isolated Occurrence (IO). If the area included features or a concentration of artifacts, it was recorded as a cultural resource site. The site definition criteria utilized for the survey were as follows:
1) One or more features; features were defined as 10 or more pieces of fire-cracked limestone, or any other material type within a 2-meter x 2-meter area.
2) One formal tool if associated with other cultural material or, if not associated with other materials, multiple formal tools.
3) An occurrence of artifacts (such as pottery sherds, chipped-stone, or historic items) with one of the following:
a) Three or more types of artifacts; b) Two types of artifacts with a minimum density of 10 items per 100 square meters; c) A single type of artifact or cultural material with a minimum density of at least 25 items per
100 square meters; and d) A rock art site including either pictographs or petroglyphs.
When a cultural resource was identified, it was recorded with the global positioning system (GPS) utilizing a data dictionary. The data dictionary was created by the archaeologists and contained menus of artifacts and cultural features anticipated for this Project area. These menus identified artifact type (i.e., debitage, projectile point, biface, etc.), raw material (sandstone, chert, etc.), and other important details. For cultural features, the menus recorded feature type (burned rock concentrations, hearths, cairns, etc.), dimensions, degree of intactness, and other morphological data. The data dictionary was designed to be flexible to account for new or unexpected artifact and feature types encountered in the field. It is important to note that the digital recording of cultural resources did not preclude paper notes, sketches, and descriptions of sites. Rather, the GPS and geographic information system (GIS) were used to augment traditional methods of recording sites, not replace them. Shovel testing was conducted to help define the boundaries of the sites.
At the end of each field day, all of the digital data gathered from the GPS and digital camera were downloaded to a laptop computer. The data were then differentially corrected via the Internet with a New Mexico Department of Transportation (NMDOT) base station located in Alamogordo, New Mexico.

CULTURAL RESOURCES SURVEY FOR TECOLOTE WIND PROJECT DECEMBER 22, 2017
PAGE 4
RESULTS OF INVESTIGATIONS AND RECOMMENDATIONS
The background literature review identified no previously recorded archaeological sites in the Project vicinity. B&A discovered no archaeological sites near the 16 turbine locations and access roads.
Isolated Occurrences
Twelve isolated occurrences of cultural materials were identified during the survey. This artifacts were random discoveries encountered outside of the context of an archaeological site as defined for this Project. All of the artifacts were historic tin cans or other metal debris. Isolated occurrences lack significance and do not need to be avoided.
Recommendations
As discussed previously, there is no regulatory protection for archaeological sites located on private lands, with no State or Federal nexus nor on NMSU deeded lands, with few exceptions. As no archaeological sites were identified, we recommend construction proceed as planned.
It should be noted that only the road corridors and turbine locations provided by Tecolote Wind LLC have been intensively surveyed for cultural resources. It is possible that archaeological sites could be present beyond the current areas of planned construction. If changes are made to the project (i.e., relocations of turbines or roads), B&A suggests that those areas be examined by an archaeologist prior to construction.
Thank you for the opportunity to provide our services to Tecolote Wind LLC. If you have any questions, please do not hesitate to contact me or Gary Galbraith at (512) 264-1095.
Sincerely,
Mark Willis Archaeologist Blanton & Associates, Inc.
Attachments: Figure 1. Project Location Map Figure 2. Cultural Resources Survey Area
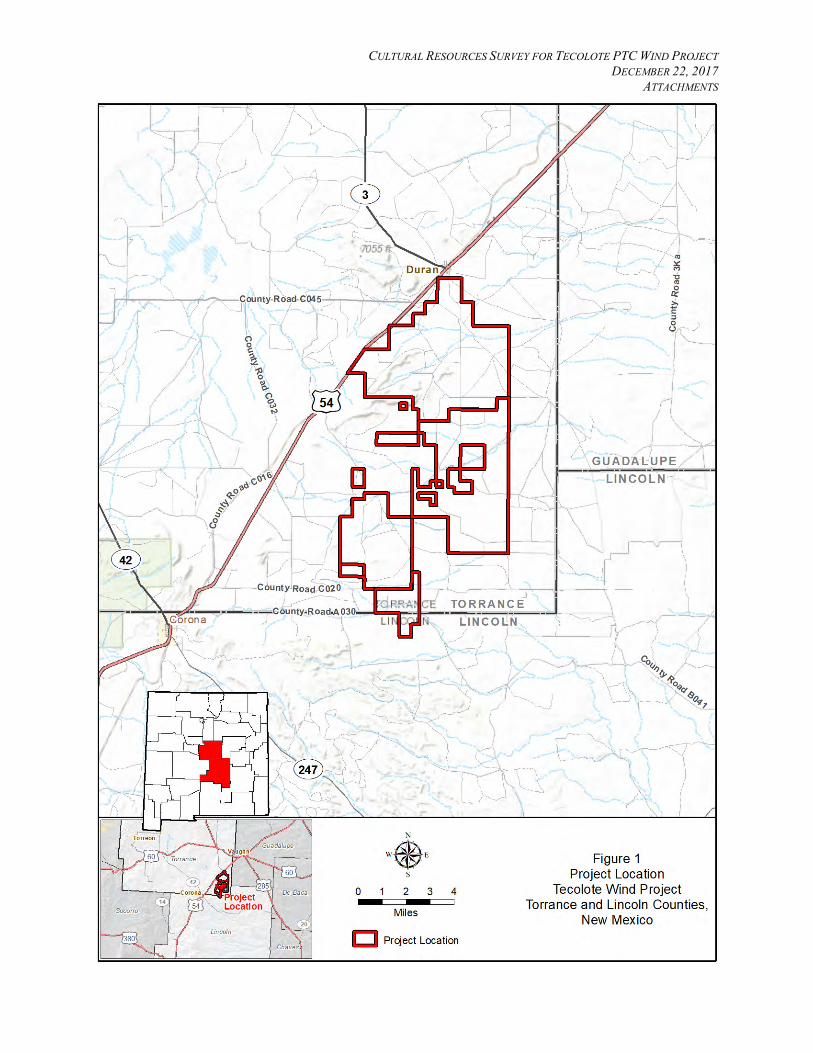
CULTURAL RESOURCES SURVEY FOR TECOLOTE PTC WIND PROJECT DECEMBER 22, 2017
ATTACHMENTS

CULTURAL RESOURCES SURVEY FOR TECOLOTE PTC WIND PROJECT DECEMBER 22, 2017
ATTACHMENTS

December 22, 2017
Mr. Adam Cernea Clark Manager, Environmental & Permitting Viento Loco LLC c/o Pattern Renewables Development Company 2 LLC 1201 Louisiana Street, Suite 3200 Houston TX 77002
Re: Cultural Resources Survey of 11 Proposed Wind Turbine Locations at Viento Loco Wind Project, Torrance County, New Mexico
Dear Mr. Clark:
Viento Loco LLC proposes to construct 11 wind turbine foundations and access roads to these foundations in preparation for the later construction of the Viento Loco Wind Project in central New Mexico. The 11 proposed wind turbine locations and access roads (herein referred to as “Project”) are located on private property approximately 4.3 miles north of Corona, in Torrance County, New Mexico (Figures 1 and 2, attached). In November 2017, Blanton & Associates, Inc. (B&A) was contracted to conduct a 100 percent pedestrian cultural resources survey on the Project. This document presents the results of those investigations.
Archaeological sites on private lands in New Mexico are not typically protected by State or Federal statutes, except where Federal or State funding or permitting is involved. However, there are two exceptions: unmarked and marked human burials are protected on lands in New Mexico under the New Mexico Antiquities Code (NMAC) § 4.10.11. Furthermore, private land owners may opt to have archaeological sites on their property afforded protection by the State by taking advantage of special zoning pursuant to § 18-6-10 of the Cultural Properties Act. This zoning gives the landowner certain tax breaks and other benefits and allows the State to regulate activities within the archaeological zone. There are no such zones within the Project.
Viento Loco LLC requested a 100 percent pedestrian survey of all Project infrastructure to determine if historic properties that are listed on, determined to be eligible for listing on, or potentially eligible for listing on the National Register of Historic Places (NRHP) would be adversely affected by construction and operation of the Project. While cultural resources are not protected on private properties with no State or Federal nexus, Project crossings of waters of the U.S. may be authorized under Nationwide Permit (NWP). In order to qualify for authorization under a NWP without a pre-construction notification (PCN), the construction activities must, among other requirements, comply with General Condition 20 (Historic Properties) of the NWP program. General Condition 20 requires that non-federal permittees submit a PCN to the U.S. Army Corps of Engineers (USACE) District Engineer if any historic properties on, determined

CULTURAL RESOURCES SURVEY FOR VIENTO LOCO WIND PROJECT DECEMBER 22, 2017
PAGE 2
to be eligible for listing on, or potentially eligible for listing on the NRHP could be affected by construction activities. The cultural resources surveys of the Project were conducted specifically to determine whether NRHP properties or potentially eligible properties occurred at any of the turbine or access road locations.
PROJECT AREA
The proposed Project will be located approximately 4.3 miles north of Corona, New Mexico (Figure 1, attached). Generally, the Project area has experienced low impacts from ranching and other agricultural uses. The majority of the landscape is gently rolling and is uncultivated grazing land (Photo 1).
Photo 1. Project area overview.
METHODOLOGY
Prior to conducting archaeological field investigations, a background literature and records review was conducted for the Project and surrounding area. A search of the New Mexico Cultural Information System was conducted to identify previously recorded archaeological sites and other listed historic resources such as New Mexico Historic Landmarks, as well as properties listed on the NRHP.
Following the literature review, a pedestrian survey was conducted to inventory and assess archaeological resources that may be impacted from construction and operation of the Project. The survey consisted of examination by professional archaeologists of all areas within the proposed facility footprint, plus a 75-meter wide buffer along the access road and a 120-meter area around each turbine. Survey transect spacing during the survey ranged from 15 to 25 meters. High probability areas, identified prior to field investigations, where given extra scrutiny and included the edges of water features, arroyos, and elevated

CULTURAL RESOURCES SURVEY FOR VIENTO LOCO WIND PROJECT DECEMBER 22, 2017
PAGE 3
landforms. Any new sites recorded during the survey were assessed in terms of eligibility for listing on the NRHP.
When an artifact was encountered during the survey, extra scrutiny was given to the area surrounding it. If the item(s) was/were isolated or did not meet the Project criteria to qualify as a site (described below), it was noted as an Isolated Occurrence (IO). If the area included features or a concentration of artifacts, it was recorded as a cultural resource site. The site definition criteria utilized for the survey were as follows:
1) One or more features; features were defined as 10 or more pieces of fire-cracked limestone, or any other material type within a 2-meter x 2-meter area.
2) One formal tool if associated with other cultural material or, if not associated with other materials, multiple formal tools.
3) An occurrence of artifacts (such as pottery sherds, chipped-stone, or historic items) with one of the following:
a) Three or more types of artifacts; b) Two types of artifacts with a minimum density of 10 items per 100 square meters; c) A single type of artifact or cultural material with a minimum density of at least 25 items per
100 square meters; and d) A rock art site including either pictographs or petroglyphs.
When a cultural resource was identified, it was recorded with the global positioning system (GPS) utilizing a data dictionary. The data dictionary was created by the archaeologists and contained menus of artifacts and cultural features anticipated for this Project area. These menus identified artifact type (i.e., debitage, projectile point, biface, etc.), raw material (sandstone, chert, etc.), and other important details. For cultural features, the menus recorded feature type (burned rock concentrations, hearths, cairns, etc.), dimensions, degree of intactness, and other morphological data. The data dictionary was designed to be flexible to account for new or unexpected artifact and feature types encountered in the field. It is important to note that the digital recording of cultural resources did not preclude paper notes, sketches, and descriptions of sites. Rather, the GPS and geographic Information system (GIS) were used to augment traditional methods of recording sites, not replace them. Shovel testing was conducted to help define the boundaries of the sites.
At the end of each field day, all of the digital data gathered from the GPS and digital camera were downloaded to a laptop computer. The data were then differentially corrected via the Internet with a New Mexico Department of Transportation (NMDOT) base station located in Alamogordo, New Mexico.
RESULTS OF INVESTIGATIONS AND RECOMMENDATIONS
The background literature review identified two previously recorded archaeological sites (LA148937 and LA148938) in the Project vicinity. Both sites were recorded as small lithic scatters and not recommended for listing on the NRHP. Neither of the sites are in areas of planned constructions are located more than 80

CULTURAL RESOURCES SURVEY FOR VIENTO LOCO WIND PROJECT DECEMBER 22, 2017
PAGE 4
meters away from proposed access road. B&A did not discover any historic or prehistoric cultural resources within the survey corridors of the access roads or turbine locations.
Isolated Occurrences
Ten isolated occurrences of cultural material were identified during the survey. The artifacts were random discoveries encountered outside of the context of an archaeological site as defined for this Project. The artifacts were historic pieces of metal debris. Isolated occurrences lack significance and do not need to be avoided.
Recommendations
As discussed earlier, there is no regulatory protection for archaeological sites located on private lands, with no State or Federal nexus, with few exceptions. As no archaeological sites were identified, we recommend construction proceed as planned.
It should be noted that only the road corridors and turbine locations provided by Viento Loco LLC have been intensively surveyed for cultural resources. It is possible that archaeological sites could be present beyond the current areas of planned construction. If changes are made to the project (i.e., relocations of turbines or roads), B&A suggests that those areas be examined by an archaeologist prior to construction.
Thank you for the opportunity to provide our services to Viento Loco LLC. If you have any questions, please do not hesitate to contact me or Gary Galbraith at (512) 264-1095.
Sincerely,
Mark Willis Archaeologist Blanton & Associates, Inc.
Attachments: Figure 1. Project Location Map Figure 2. Cultural Resources

CULTURAL RESOURCES SURVEY FOR VIENTO LOCO WIND PROJECT DECEMBER 22, 2017
ATTACHMENTS

CULTURAL RESOURCES SURVEY FOR VIENTO LOCO WIND PROJECT DECEMBER 22, 2017
ATTACHMENTS

Pattern Energy LP 13-12 Burns & McDonnell
EXHIBIT L BIOLOGICAL EVALUATION

December 29, 2017
Mr. Adam Cernea Clark Cowboy Mesa Wind LLC c/o Pattern Renewables Development Company LLC 1201 Louisiana Street, Suite 3200 Houston TX 77002
Re: Waters of the U.S. and Biological Resources Assessments for 15 Proposed Wind Turbine Locations and Access Roads at the Cowboy Mesa Wind Project, Torrance County, New Mexico
Dear Mr. Clark:
Cowboy Mesa Wind LLC proposes to construct 15 wind turbine foundations and access roads to these foundations in preparation for the later construction of the Cowboy Mesa Wind Project in central New Mexico. The 15 proposed wind turbine locations and access roads (herein referred to as “Project”) are located on private property approximately 6 miles northeast of Corona, New Mexico (Figure 1 in Attachment 1). In November 2017, Blanton & Associates, Inc. (B&A) was contracted to assess potential waters of the U.S. (WOTUS) and sensitive biological resources that might occur on the Project. This document presents the results of those investigations.
Project Area
The Project area is located on the western edge of the Great Plains vegetation area as defined by Barkley (1986). This region of New Mexico consists primarily of grasslands that include tallgrass, mixed-grass, and shortgrass prairies, with large areas in crop production. It has also been referred to as the western plains (Kirkpatrick 1992) or plains and mesa grasslands (Dick-Peddie 1993). According to Griffith et al. (2006), the Project area is within the Southwestern Tableland ecoregion which is characterized by sub-humid grassland and semiarid rangeland with little land used for cropland. However, the immediate area encompassing the proposed turbine foundations and access roads consists primarily of juniper savanna (Photo 1 in Attachment 2). The dominant woody species in this juniper savanna is one-seed juniper (Juniperus monosperma), but also includes pinyon pine (Pinus edulis), blue grama (Bouteloua gracilis), buffalograss (Buchloe dactyloides), threeawns (Aristida spp.), lovegrass (Eragrostis spp.), cane-cholla (Cylindropuntia imbricata), soaptree yucca (Yucca elata), and small soapweed (Yucca glauca).
Waters of the U.S.
The proposed Project is situated in two watersheds, the Gallo Arroyo (HUC 13060006) and the Upper Pecos (HUC 13060003). Surface water features in the vicinity of Project area include ephemeral drainages and stock ponds (Figure 2 in Attachment 1).

WATERS OF U.S. AND BIOLOGICAL RESOURCES ASSESSMENTS FOR COWBOY MESA WIND PROJECT DECEMBER 29, 2017
PAGE 2
B&A conducted a waters of the U.S. assessment of the proposed Project to identify potentially jurisdictional waters of the U.S., including wetlands that could potentially be affected by Project construction. B&A’s waters of the U.S. investigation was based on a desktop review of existing maps and data, as well as on a field investigation conducted on November 15-17, 2017. The field investigation relied on methods outlined in the U.S. Army Corps of Engineers (USACE) Wetland Delineation Manual (USACE 1987) and the Regional Supplement to the USACE Wetland Delineation Manual: Great Plains Region (Version 2.0) (USACE 2010). The investigation described herein was conducted to address the Project’s compliance with Sections 404 and 401 of the Clean Water Act and Section 10 of the Rivers and Harbors Act.
Review of maps and aerial photographs prior to on-site investigation indicated that there was one potential waters of the U.S., an ephemeral headwater stream, located between proposed turbines T13 and T14 where a proposed access road would cross (Figure 2 in Attachment 1). However, field investigations determined that this was not a waters of the U.S., but simply a grassy swale with a ranch two-track road running down the middle of it (Photo 2 in Attachment 2).
As currently designed, the Project avoids permanent impacts to waters of the U.S. and will not require a Section 404 permit, Section 10 Permit, or Section 401 water quality certification. If the Project design or proposed construction methods are changed and an Individual Permit or Nationwide Permit is required, then compliance with New Mexico Section 401 water quality certification conditions will be required.
Biological Resources
B&A conducted a biological resources assessment of the proposed Project area to determine whether threatened, endangered, or other protected species (e.g., eagles) are of potential occurrence and, if so, whether they could be affected by the project. A literature and database review was conducted, followed by a brief field investigation to assess habitat and/or identify possible species attractants (i.e., prairie dog towns). The site visit was conducted on November 15-17, 2017.
The U.S. Fish and Wildlife Service (USFWS) Environmental Conservation Online System (ECOS) (USFWS 2017a) and the USFWS Information for Planning and Conservation (IPaC) (USFWS 2017b) websites were both queried prior to field investigation. The results of the query indicated that two federally listed species of potential occurrence in Torrance County: the yellow-billed cuckoo (Coccyzus americanus) and Mexican spotted owl (Strix occidentalis lucida). The USFWS IPAC website indicated that the bald eagle (Haliaeetus leucocephalus) and the golden eagle (Aquila chrysaetos), both protected under the Bald and Golden Eagle Protection Act (BGEPA), are also of potential occurrence in Torrance County (NMDGF 2017). The New Mexico Department of Game and Fish (NMDGF) Biota Information System of New Mexico (BISON-M) was also queried for information on sensitive species. In addition to the species listed above, BISON-M lists the peregrine falcon (Falco peregrinus), Baird’s sparrow (Ammodramus bairdii), and southwestern willow flycatcher (Empidonax traillii extimus) as species of potential occurrence in Torrance County. A list of federal and state-listed threatened or endangered species potentially occurring in Torrance County is provided in Table 1.

WATERS OF U.S. AND BIOLOGICAL RESOURCES ASSESSMENTS FOR COWBOY MESA WIND PROJECT DECEMBER 29, 2017
PAGE 3
Table 1. Protected Species Potentially Occurring in Torrance County, New Mexico
Common Name Scientific Name
Nearest Distance of Recorded
Observation from Project Area (eBird)
Federal Status State Status
Yellow-billed Cuckoo Coccyzus americanus 52 miles south T -
Mexican Spotted Owl Strix occidentalis lucida
87 miles northwest T -
Southwestern Willow Flycatcher
Empidonax traillii extimus
74 miles west E E
Bald Eagle Haliaeetus leucocephalus
53 miles south BGEPA T
Golden Eagle Aquila chrysaetos 2.5 miles west BGEPA -
Peregrine Falcon Falco peregrinus 17 miles west - T
Baird’s Sparrow Ammodramus bairdii 65 miles west - T T = Threatened; E = Endangered; BGEPA = protected under the Bald and Golden Eagle Protection Act Sources: USFWS 2017a; USFWS 2017b; NMDGF BISON 2017; eBird 2017
In addition to federal and state government web sites, eBird was also queried for information on protected bird sightings in the Project area. eBird is a vast online database owned and maintained by the Cornell Lab of Ornithology and the National Audubon Society that gives locations of avian observations recorded by recreational and professional bird watchers. The nearest recorded observation of each species to the Project area is shown in Table 1.
Yellow-billed Cuckoo The yellow-billed cuckoo is a neotropical migrant that winters in South America and breeds in riparian woodlands of North America. The western Distinct Population Segment (DPS) of the yellow-billed cuckoo encompasses much of the western U.S. and extends through the western two-thirds of New Mexico, including Torrance County (Halterman et al. 2015). Yellow-billed cuckoos are riparian obligates and nest almost exclusively in low to moderate elevation riparian woodlands with native broadleaf trees and shrubs that are 20 hectares (ha) or more in extent within arid to semiarid landscapes (Hughes 1999). They are most commonly associated with cottonwood (Populus spp.) – willow (Salix spp.) dominated vegetation cover, but the composition of dominant riparian vegetation can vary across its range (Halterman et al. 2015). No riparian woodlands occur in the Project vicinity and the closest eBird sighting is approximately 52 miles south of the Project site (eBird 2017). Construction of the proposed wind turbine foundations and access road should have no impact on the yellow-billed cuckoo.
Mexican Spotted Owl The Mexican spotted owl occurs in forested mountains and rocky canyon lands throughout the southwestern U.S. and Mexico (Gutiérrez et al. 1995, Ward et al. 1995). Its range includes Arizona, Colorado, Utah, New Mexico, Texas, and several states in Mexico. Mexican spotted owls utilize mixed-conifer and pine-oak forests throughout most of the range; however, they can be found in pinyon (Pinus edulis)-juniper (Juniperus spp.) and ponderosa pine (Pinus ponderosa). The Project area is primarily grassland with a few

WATERS OF U.S. AND BIOLOGICAL RESOURCES ASSESSMENTS FOR COWBOY MESA WIND PROJECT DECEMBER 29, 2017
PAGE 4
scattered one-seed junipers and provides no suitable habitat for the Mexican spotted owl. The closest reported sighting of the Mexican spotted owl is approximately 87 miles northwest of the Project area (eBird 2017). No impacts to Mexican spotted owls are expected to occur from construction of the Project.
Southwestern Willow Flycatcher The southwestern willow flycatcher is one of four subspecies of willow flycatcher recognized in North America (Hubbard 1987, Unitt 1987, Browning 1993). The flycatcher's breeding range includes southern California, Arizona, New Mexico, western Texas, southwestern Colorado, southern portions of Nevada and Utah, and extreme northwestern Mexico (Hubbard 1987, Unitt 1987). Breeding habitat consists of riparian areas with dense stands of willow (Salix spp.), baccharis (Baccharis spp.), arrowweed (Pluchea spp.), and tamarisk (Tamarix spp.), sometimes with a scattered overstory of cottonwood (Populus spp.) (Grinnell and Miller 1944, Phillips 1948, Hubbard 1987, Unitt 1987, Brown 1991, and Sogge 1995). No riparian habitat occurs within the Project area or vicinity. The closest reported sighting of the southwestern willow flycatcher is approximately 74 miles west of the Project area (eBird 2017). Therefore, the Project should have no impact on the southwestern willow flycatcher.
Bald Eagle The bald eagle is primarily a fishing species that typically prefers habitats associated with large bodies of water (USFWS 1989). Wintering and nesting activity occurs mainly near large freshwater impoundments with standing timber located in or around the water (Mabie 1989). No large water bodies or standing timber occur in the Project area. Additionally, no active prairie dog towns or other areas that might provide foraging opportunities occur in the immediate vicinity of the Project area. Furthermore, the nearest reported sighting of a bald eagle is located approximately 53 miles south of the Project area (eBird 2017). Therefore, although their presence cannot be completely ruled out, bald eagles are not expected to regularly utilize the Project area.
Golden Eagle The golden eagle occupies a variety of habitats in western North America ranging from Arctic to desert. It is found primarily in mountains up to 12,000 feet, canyon lands, rimrock terrain, and riverside cliffs and bluffs, but is also found in flat open spaces where it forages near cliffs that provide nesting or overwintering sites. Golden eagles nest on cliffs and steep escarpments in grassland, chaparral, shrubland, forest, and other vegetated areas. This species subsists primarily on rabbits, hares, ground squirrels, and prairie dogs, though they are capable of taking much larger prey such as cranes, wild ungulates, and domestic livestock (Kochert et al. 2002). No active prairie dog towns occur in the near vicinity of the Project area. The nearest reported sighting of a golden eagle is located approximately 2.5 miles west of the Project area (eBird 2017). No nesting habitat for the golden eagle occurs in the Project vicinity, although it could be expected to periodically forage in the grasslands of the Project area.
Peregrine Falcon The peregrine falcon is known not only to migrate through New Mexico but to breed there, as well. These birds breed locally in mountainous areas typically on cliff ledges that generally exceed 200 feet in height and typically over-winter near their breeding areas. The project area does not provide suitable nesting habitat for this species. The nearest reported sighting of a peregrine falcon occurred approximately 17 miles

WATERS OF U.S. AND BIOLOGICAL RESOURCES ASSESSMENTS FOR COWBOY MESA WIND PROJECT DECEMBER 29, 2017
PAGE 5
west of the Project area (eBird 2017). It is possible that peregrine falcons may occur in the Project area during migration or when foraging.
Baird’s Sparrow Baird’s sparrow is a small, short-tailed sparrow that nests in the northern Great Plains and winters primarily in northern Mexico. This species is a transient in New Mexico, usually migrating through the eastern plains. The closest reported sighting is approximately 65 miles west of the Project area (eBird 2017). It is possible that Baird’s sparrow may migrate through the Project area.
Conclusions
No jurisdictional WOTUS would be impacted by construction of the 15 proposed turbine foundations or access roads, as currently designed. Therefore, no Section 404 permit, Section 10 permit, or Section 401 water quality certification would be required. No breeding habitat for any of the federally protected species discussed above occurs in the Project area. There are no unique foraging habitats for eagles or the peregrine falcon, or attractants for any of the protected species located within the Project area. Therefore, although the presence of eagles or falcons cannot be completely ruled out, none of these species is expected to heavily or regularly utilize the Project area.
If you have any questions, please do not hesitate to contact me at (512) 264-1095.
Sincerely,
Gary L. Galbraith Blanton & Associates, Inc.
Attachments: Literature Cited Attachment 1: Figures Attachment 2: Representative Photos

WATERS OF U.S. AND BIOLOGICAL RESOURCES ASSESSMENTS FOR COWBOY MESA WIND PROJECT DECEMBER 29, 2017
PAGE 6
Literature Cited
Barkley, T. M. 1986. Flora of the Great Plains. In The Great Plains flora association, eds. University Press of Kansas, Lawrence, Kansas, USA.
Brown, B. T. 1991. Status of Nesting Willow Flycatchers along the Colorado River from Glen Canyon Dam to Cardenas Creek, Arizona. Endangered Species Report No. 20. Submitted to the U.S. Fish and Wildlife Service, Phoenix, Arizona.
Browning, M. R. 1993. Comments on the taxonomy of Empidonax traillii (willow flycatcher). Western Birds 24:241-257.
Dick-Peddie, W. A. 1993. New Mexico vegetation, past, present, and future. University of New Mexico Press, Albuquerque, New Mexico, USA.
eBird. 2017. eBird: An online database of bird distribution and abundance [web application]. Ithaca, New York. Available: http://www.ebird.org. Accessed December 2017.
Griffith, G. E., J. M. Omernik, M. M. McGraw, G. Z. Jacobi, C. M. Canavan, T. S. Schrader, D. Mercer, R. Hill, and B. C. Moran. 2006. Ecoregions of New Mexico (2-sided color poster with map, descriptive text, summary tables, and photographs). U. S. Geological Survey, Reston, VA. Scale 1:1,400,000.
Grinnell, J., and A. H. Miller. 1944. The distribution of the birds of California. Pacific Coast Avifauna 27.
Gutiérrez, R. J., A. B. Franklin, and W. S. LaHaye. 1995. Spotted owls (Strix occidentalis). In Poole, A. and F. Gill (eds.). The Birds of North America, No. 179. The Academy of Natural Sciences, Philadelphia, and the American Ornithologists' Union, Washington, D.C.
Halterman, M., M. J. Johnson, J. A. Holmes and S. A. Laymon. 2015. A Natural History Summary and Survey Protocol for the Western Distinct Population Segment of the Yellow-billed Cuckoo: U.S. Fish and Wildlife Techniques and Methods, 45 p.
Hubbard, J. P. 1987. The status of the willow flycatcher in New Mexico. Unpublished Report, Endangered Species Program, New Mexico Department of Game and Fish, Santa Fe.
Hughes, J.M. 1999. Yellow-billed Cuckoo (Coccyzus americanus). In The Birds of North America, No. 148 (A. Poole and F. Gill, eds.). The Birds of North America, Inc., Philadelphia, PA. 28 pp.
Kirkpatrick, Z. M. 1992. A field guide: Wildflowers of the Western Plains. University of Texas Press, Austin, Texas, USA.
Kochert, M. N., K. Steenhof, C. L. McIntyre, and E. H. Craig. 2002. Golden Eagle (Aquila chrysaetos). In The Birds of North America, no. 684 (A. Poole and F. Gill Eds.). The Birds of North America, Inc. Philadelphia, Pennsylvania, USA.

WATERS OF U.S. AND BIOLOGICAL RESOURCES ASSESSMENTS FOR COWBOY MESA WIND PROJECT DECEMBER 29, 2017
PAGE 7
Mabie, D. W. 1989. Bald eagle nest survey and management. Federal Aid Project No. W-103-R-19. Job No. 30. Texas Parks and Wildlife Department, Austin, Texas, USA.
New Mexico Department of Game and Fish (NMDGF). 2017. Biota Information System of New Mexico (BISON-M). http://www.bison-m.org/speciesreports.aspx. Accessed December 2017.
Phillips, A. R. 1948. Geographic variation in Empidonax traillii. Auk 65:507-514.
Sogge, M. K. 1995. Southwestern willow flycatcher (Empidonax traillii extimus) monitoring at Tuzigoot National Monument. Progress Report to the National Park Service by National Biological Service Colorado Plateau Research Station, Northern Arizona University, Flagstaff, Arizona. 20 pp.
Unitt, P. 1987. Empidonax traillii extimus: An endangered subspecies. Western Birds 18:137-162.
U.S. Fish and Wildlife Service (USFWS). 1989. Southeastern states bald eagle recovery plan. USFWS Endangered Species Office, Atlanta, Georgia, USA.
______. 2017a. Environmental Conservation Online System (ECOS) website. Species by County Report Torrance County, New Mexico. Available at https://ecos.fws.gov/ecp)/reports/species-by-current-range-county?fips=35027. Accessed December 2017.
______. 2017b. Information for Planning and Consultation (IPaC) website Torrance County, New Mexico. Available at https://ecos.fws.gov/ipac/location/RUZWZ3JRPVCMPBMK3675 SRQEFQ/resources. Accessed December 2017.
Ward, J. P., Jr., A. B. Franklin, S. E. Rinkevich, and F. Clemente. 1995. Distribution and abundance of Mexican spotted owl. Chapter 1 (14 pp) in: USDI Fish and Wildlife Service. Recovery plan for the Mexican spotted owl (Strix occidentalis lucida), Volume II. U.S. Department of the Interior, Fish and Wildlife Service, Albuquerque, New Mexico.

WATERS OF U.S. AND BIOLOGICAL RESOURCES ASSESSMENTS FOR COWBOY MESA WIND PROJECT DECEMBER 29, 2017
ATTACHMENTS
Attachment 1 Figures

WATERS OF U.S. AND BIOLOGICAL RESOURCES ASSESSMENTS FOR COWBOY MESA WIND PROJECT DECEMBER 29, 2017
ATTACHMENTS

WATERS OF U.S. AND BIOLOGICAL RESOURCES ASSESSMENTS FOR COWBOY MESA WIND PROJECT DECEMBER 29, 2017
ATTACHMENTS

WATERS OF U.S. AND BIOLOGICAL RESOURCES ASSESSMENTS FOR COWBOY MESA WIND PROJECT DECEMBER 29, 2017
ATTACHMENTS
Attachment 2 Representative Photos

WATERS OF U.S. AND BIOLOGICAL RESOURCES ASSESSMENTS FOR COWBOY MESA WIND PROJECT DECEMBER 29, 2017
ATTACHMENTS
Photo 1 Juniper savannah near proposed turbine T10
Photo 2 Grassy swale between proposed turbines T13 and T14

December 29, 2017
Mr. Adam Cernea Clark Duran Mesa Wind LLC c/o Pattern Renewables Development Company LLC 1201 Louisiana Street, Suite 3200 Houston TX 77002
Re: Waters of the U.S. and Biological Resources Assessments for 15 Proposed Wind Turbine Locations and Access Roads at the Duran Mesa Wind Project, Torrance County, New Mexico
Dear Mr. Clark:
Duran Mesa Wind LLC proposes to construct 15 wind turbine foundations and access roads to these foundations in preparation for the later construction of the Duran Mesa Wind Project in central New Mexico. The 15 proposed wind turbine locations and access roads (herein referred to as “Project”) are located on private property approximately 5 miles north of Corona, New Mexico (Figure 1 in Attachment 1). In November 2017, Blanton & Associates, Inc. (B&A) was contracted to assess potential waters of the U.S. (WOTUS) and sensitive biological resources that might occur on the Project. This document presents the results of those investigations.
Project Area
The Project area is located on the western edge of the Great Plains vegetation area as defined by Barkley (1986). This region of New Mexico consists primarily of grasslands that include tallgrass, mixed-grass, and shortgrass prairies, with large areas in crop production. It has also been referred to as the western plains (Kirkpatrick 1992) or plains and mesa grasslands (Dick-Peddie 1993). According to Griffith et al. (2006), the Project area is within the Southwestern Tableland ecoregion which is characterized by sub-humid grassland and semiarid rangeland with little land used for cropland.The immediate area encompassing the proposed turbine foundations and access roads consists of two vegetation types, shortgrass prairie and juniper savanna (Photos 1 and 2 in Attachment 2). Dominant species in shortgrass prairie include blue grama (Bouteloua gracilis), buffalograss (Buchloe dactyloides), threeawns (Aristida spp.), lovegrass (Eragrostis spp.), cane-cholla (Cylindropuntia imbricata), soaptree yucca (Yucca elata), and small soapweed (Yucca glauca). The dominant species in juniper savanna is one-seed juniper (Juniperus monosperma), pinyon pine (Pinus edulis), and also includes many of the grass species mentioned above.
Waters of the U.S.
The proposed Project is situated in two watersheds, the Eastern Estancia (HUC 13050002) and the Upper Pecos (HUC 13060003). Surface water features in the vicinity of Project area include ephemeral drainages and stock ponds (Figure 2 in Attachment 1).

WATERS OF U.S. AND BIOLOGICAL RESOURCES ASSESSMENTS FOR DURAN MESA WIND PROJECT DECEMBER 29, 2017
PAGE 2
B&A conducted a WOTUS assessment of the proposed Project to identify potentially jurisdictional waters, including wetlands that could potentially be affected by Project construction. B&A’s WOTUS investigation was based on a desktop review of existing maps and data, as well as on a field investigation conducted on November 15-17, 2017. The investigation described herein was conducted to address the Project’s compliance with Sections 404 and 401 of the Clean Water Act and Section 10 of the Rivers and Harbors Act.
Review of maps and aerial photographs prior to on-site investigation indicated that there were no potential WOTUS at the 15 wind turbine sites or crossed by the proposed access roads (Figure 2 in Attachment 1). Field investigations confirmed that no potential WOTUS will be impacted from construction of the wind turbine foundations or access roads.
As currently designed, the Project avoids permanent impacts to WOTUS and will not require a Section 404 permit, Section 10 Permit, or Section 401 water quality certification. If the Project design or proposed construction methods are changed and an Individual Permit or Nationwide Permit is required, then compliance with New Mexico Section 401 water quality certification conditions will be required.
Biological Resources
B&A conducted a biological resources assessment of the proposed Project area to determine whether threatened, endangered, or other protected species (e.g., eagles) are of potential occurrence and, if so, whether they could be affected by the project. A literature and database review was conducted, followed by a brief field investigation to assess habitat and/or identify possible species attractants (i.e., prairie dog towns). The site visit was conducted on November 15-17, 2017.
The U.S. Fish and Wildlife Service (USFWS) Environmental Conservation Online System (ECOS) (USFWS 2017a) and the USFWS Information for Planning and Conservation (IPaC) (USFWS 2017b) websites were both queried prior to field investigation. The results of the query indicated that two federally listed species of potential occurrence in Torrance County: the yellow-billed cuckoo (Coccyzus americanus) and Mexican spotted owl (Strix occidentalis lucida). The USFWS IPAC website indicated that the bald eagle (Haliaeetus leucocephalus) and the golden eagle (Aquila chrysaetos), both protected under the Bald and Golden Eagle Protection Act (BGEPA), are also of potential occurrence in Torrance County (NMDGF 2017). The New Mexico Department of Game and Fish (NMDGF) Biota Information System of New Mexico (BISON-M) was also queried for information on sensitive species. In addition to the species listed above, BISON-M lists the peregrine falcon (Falco peregrinus), Baird’s sparrow (Ammodramus bairdii), and southwestern willow flycatcher (Empidonax traillii extimus) as species of potential occurrence in Torrance County. A list of federal and state-listed threatened or endangered species potentially occurring in Torrance County is provided in Table 1.

WATERS OF U.S. AND BIOLOGICAL RESOURCES ASSESSMENTS FOR DURAN MESA WIND PROJECT DECEMBER 29, 2017
PAGE 3
Table 1. Protected Species Potentially Occurring in Torrance County, New Mexico
Common Name Scientific Name
Nearest Distance of Recorded
Observation from Project Area (eBird)
Federal Status State Status
Yellow-billed Cuckoo Coccyzus americanus 53 miles south T -
Mexican Spotted Owl Strix occidentalis lucida
84 miles northwest T -
Southwestern Willow Flycatcher
Empidonax traillii extimus
70 miles west E E
Bald Eagle Haliaeetus leucocephalus
54 miles south BGEPA T
Golden Eagle Aquila chrysaetos 1.5 miles east BGEPA -
Peregrine Falcon Falco peregrinus 13 miles west - T
Baird’s Sparrow Ammodramus bairdii 61 miles west - T T = Threatened; E = Endangered; BGEPA = protected under the Bald and Golden Eagle Protection Act Sources: USFWS 2017a; USFWS 2017b; NMDGF BISON 2017; eBird 2017
In addition to federal and state government web sites, eBird was also queried for information on protected bird sightings in the Project area. eBird is a vast online database owned and maintained by the Cornell Lab of Ornithology and the National Audubon Society that gives locations of avian observations recorded by recreational and professional bird watchers. The nearest recorded observation of each species to the Project area is shown in Table 1.
Yellow-billed Cuckoo The yellow-billed cuckoo is a neotropical migrant that winters in South America and breeds in riparian woodlands of North America. The western Distinct Population Segment (DPS) of the yellow-billed cuckoo encompasses much of the western U.S. and extends through the western two-thirds of New Mexico, including Torrance County (Halterman et al. 2015). Yellow-billed cuckoos are riparian obligates and nest almost exclusively in low to moderate elevation riparian woodlands with native broadleaf trees and shrubs that are 20 hectares (ha) or more in extent within arid to semiarid landscapes (Hughes 1999). They are most commonly associated with cottonwood (Populus spp.) – willow (Salix spp.) dominated vegetation cover, but the composition of dominant riparian vegetation can vary across its range (Halterman et al. 2015). No riparian woodlands occur in the Project vicinity and the closest eBird sighting is approximately 53 miles south of the Project site (eBird 2017). Construction of the proposed wind turbine foundations and access road should have no impact on the yellow-billed cuckoo.
Mexican Spotted Owl The Mexican spotted owl occurs in forested mountains and rocky canyon lands throughout the southwestern U.S. and Mexico (Gutiérrez et al. 1995, Ward et al. 1995). Its range includes Arizona, Colorado, Utah, New Mexico, Texas, and several states in Mexico. Mexican spotted owls utilize mixed-conifer and pine-oak forests throughout most of the range; however, they can be found in pinyon (Pinus edulis)-juniper (Juniperus spp.) and ponderosa pine (Pinus ponderosa). The Project area is primarily grassland with a few

WATERS OF U.S. AND BIOLOGICAL RESOURCES ASSESSMENTS FOR DURAN MESA WIND PROJECT DECEMBER 29, 2017
PAGE 4
scattered one-seed junipers and provides no suitable habitat for the Mexican spotted owl. The closest reported sighting of the Mexican spotted owl is approximately 84 miles northwest of the Project area (eBird 2017). No impacts to Mexican spotted owls are expected to occur from construction of the Project.
Southwestern Willow Flycatcher The southwestern willow flycatcher is one of four subspecies of willow flycatcher recognized in North America (Hubbard 1987, Unitt 1987, Browning 1993). The flycatcher's breeding range includes southern California, Arizona, New Mexico, western Texas, southwestern Colorado, southern portions of Nevada and Utah, and extreme northwestern Mexico (Hubbard 1987, Unitt 1987). Breeding habitat consists of riparian areas with dense stands of willow (Salix spp.), baccharis (Baccharis spp.), arrowweed (Pluchea spp.), and tamarisk (Tamarix spp.), sometimes with a scattered overstory of cottonwood (Populus spp.) (Grinnell and Miller 1944, Phillips 1948, Hubbard 1987, Unitt 1987, Brown 1991, and Sogge 1995). No riparian habitat occurs within the Project area or vicinity. The closest reported sighting of the southwestern willow flycatcher is approximately 70 miles west of the Project area (eBird 2017). Therefore, the Project should have no impact on the southwestern willow flycatcher.
Bald Eagle The bald eagle is primarily a fishing species that typically prefers habitats associated with large bodies of water (USFWS 1989). Wintering and nesting activity occurs mainly near large freshwater impoundments with standing timber located in or around the water (Mabie 1989). No large water bodies or standing timber occur in the Project area. Additionally, no active prairie dog towns or other areas that might provide foraging opportunities occur in the immediate vicinity of the Project area. Furthermore, the nearest reported sighting of a bald eagle is located approximately 54 miles south of the Project area (eBird 2017). Therefore, although their presence cannot be completely ruled out, bald eagles are not expected to regularly utilize the Project area.
Golden Eagle The golden eagle occupies a variety of habitats in western North America ranging from Arctic to desert. It is found primarily in mountains up to 12,000 feet, canyon lands, rimrock terrain, and riverside cliffs and bluffs, but is also found in flat open spaces where it forages near cliffs that provide nesting or overwintering sites. Golden eagles nest on cliffs and steep escarpments in grassland, chaparral, shrubland, forest, and other vegetated areas. This species subsists primarily on rabbits, hares, ground squirrels, and prairie dogs, though they are capable of taking much larger prey such as cranes, wild ungulates, and domestic livestock (Kochert et al. 2002). No active prairie dog towns occur in the near vicinity of the Project area. The nearest reported sighting of a golden eagle is located approximately 1.5 miles east of the Project area (eBird 2017). No nesting habitat for the golden eagle occurs in the Project vicinity, although it could be expected to periodically forage in the grasslands of the Project area.
Peregrine Falcon The peregrine falcon is known not only to migrate through New Mexico but to breed there, as well. These birds breed locally in mountainous areas typically on cliff ledges that generally exceed 200 feet in height and typically over-winter near their breeding areas. The project area does not provide suitable nesting habitat for this species. The nearest reported sighting of a peregrine falcon occurred approximately 13 miles

WATERS OF U.S. AND BIOLOGICAL RESOURCES ASSESSMENTS FOR DURAN MESA WIND PROJECT DECEMBER 29, 2017
PAGE 5
west of the Project area (eBird 2017). It is possible that peregrine falcons may occur in the Project area during migration or when foraging.
Baird’s Sparrow Baird’s sparrow is a small, short-tailed sparrow that nests in the northern Great Plains and winters primarily in northern Mexico. This species is a transient in New Mexico, usually migrating through the eastern plains. The closest reported sighting is approximately 61 miles west of the Project area (eBird 2017). It is possible that Baird’s sparrow may migrate through the Project area.
Conclusions
No jurisdictional WOTUS would be impacted by construction of the 15 proposed turbine foundations or access roads, as currently designed. Therefore, no Section 404 permit, Section 10 permit, or Section 401 water quality certification would be required. No breeding habitat for any of the federally protected species discussed above occurs in the Project area. There are no unique foraging habitats for eagles or the peregrine falcon, or attractants for any of the protected species located within the Project area. Therefore, although the presence of eagles or falcons cannot be completely ruled out, none of these species is expected to heavily or regularly utilize the Project area.
If you have any questions, please do not hesitate to contact me at (512) 264-1095.
Sincerely,
Gary L. Galbraith Blanton & Associates, Inc.
Attachments: Literature Cited Attachment 1: Figures Attachment 2: Representative Photos

WATERS OF U.S. AND BIOLOGICAL RESOURCES ASSESSMENTS FOR DURAN MESA WIND PROJECT DECEMBER 29, 2017
PAGE 6
Literature Cited
Barkley, T. M. 1986. Flora of the Great Plains. In The Great Plains flora association, eds. University Press of Kansas, Lawrence, Kansas, USA.
Brown, B. T. 1991. Status of Nesting Willow Flycatchers along the Colorado River from Glen Canyon Dam to Cardenas Creek, Arizona. Endangered Species Report No. 20. Submitted to the U.S. Fish and Wildlife Service, Phoenix, Arizona.
Browning, M. R. 1993. Comments on the taxonomy of Empidonax traillii (willow flycatcher). Western Birds 24:241-257.
Dick-Peddie, W. A. 1993. New Mexico vegetation, past, present, and future. University of New Mexico Press, Albuquerque, New Mexico, USA.
eBird. 2017. eBird: An online database of bird distribution and abundance [web application]. Ithaca, New York. Available: http://www.ebird.org. Accessed December 2017.
Griffith, G. E., J. M. Omernik, M. M. McGraw, G. Z. Jacobi, C. M. Canavan, T. S. Schrader, D. Mercer, R. Hill, and B. C. Moran. 2006. Ecoregions of New Mexico (2-sided color poster with map, descriptive text, summary tables, and photographs). U. S. Geological Survey, Reston, VA. Scale 1:1,400,000.
Grinnell, J., and A. H. Miller. 1944. The distribution of the birds of California. Pacific Coast Avifauna 27.
Gutiérrez, R. J., A. B. Franklin, and W. S. LaHaye. 1995. Spotted owls (Strix occidentalis). In Poole, A. and F. Gill (eds.). The Birds of North America, No. 179. The Academy of Natural Sciences, Philadelphia, and the American Ornithologists' Union, Washington, D.C.
Halterman, M., M. J. Johnson, J. A. Holmes and S. A. Laymon. 2015. A Natural History Summary and Survey Protocol for the Western Distinct Population Segment of the Yellow-billed Cuckoo: U.S. Fish and Wildlife Techniques and Methods, 45 p.
Hubbard, J. P. 1987. The status of the willow flycatcher in New Mexico. Unpublished Report, Endangered Species Program, New Mexico Department of Game and Fish, Santa Fe.
Hughes, J.M. 1999. Yellow-billed Cuckoo (Coccyzus americanus). In The Birds of North America, No. 148 (A. Poole and F. Gill, eds.). The Birds of North America, Inc., Philadelphia, PA. 28 pp.
Kirkpatrick, Z. M. 1992. A field guide: Wildflowers of the Western Plains. University of Texas Press, Austin, Texas, USA.
Kochert, M. N., K. Steenhof, C. L. McIntyre, and E. H. Craig. 2002. Golden Eagle (Aquila chrysaetos). In The Birds of North America, no. 684 (A. Poole and F. Gill Eds.). The Birds of North America, Inc. Philadelphia, Pennsylvania, USA.
WATERS OF U.S. AND BIOLOGICAL RESOURCES ASSESSMENTS FOR DURAN MESA WIND PROJECT DECEMBER 29, 2017
PAGE 7
Mabie, D. W. 1989. Bald eagle nest survey and management. Federal Aid Project No. W-103-R-19. Job No. 30. Texas Parks and Wildlife Department, Austin, Texas, USA.
New Mexico Department of Game and Fish (NMDGF). 2017. Biota Information System of New Mexico (BISON-M). http://www.bison-m.org/speciesreports.aspx. Accessed December 2017.
Phillips, A. R. 1948. Geographic variation in Empidonax traillii. Auk 65:507-514.
Sogge, M. K. 1995. Southwestern willow flycatcher (Empidonax traillii extimus) monitoring at Tuzigoot National Monument. Progress Report to the National Park Service by National Biological Service Colorado Plateau Research Station, Northern Arizona University, Flagstaff, Arizona. 20 pp.
Unitt, P. 1987. Empidonax traillii extimus: An endangered subspecies. Western Birds 18:137-162.
U.S. Fish and Wildlife Service (USFWS). 1989. Southeastern states bald eagle recovery plan. USFWS Endangered Species Office, Atlanta, Georgia, USA.
______. 2017a. Environmental Conservation Online System (ECOS) website. Species by County Report Torrance County, New Mexico. Available at https://ecos.fws.gov/ecp)/reports/species-by-current-range-county?fips=35027. Accessed December 2017.
______. 2017b. Information for Planning and Consultation (IPaC) website Torrance County, New Mexico. Available at https://ecos.fws.gov/ipac/location/RUZWZ3JRPVCMPBMK3675 SRQEFQ/resources. Accessed December 2017.
Ward, J. P., Jr., A. B. Franklin, S. E. Rinkevich, and F. Clemente. 1995. Distribution and abundance of Mexican spotted owl. Chapter 1 (14 pp) in: USDI Fish and Wildlife Service. Recovery plan for the Mexican spotted owl (Strix occidentalis lucida), Volume II. U.S. Department of the Interior, Fish and Wildlife Service, Albuquerque, New Mexico.

WATERS OF U.S. AND BIOLOGICAL RESOURCES ASSESSMENTS FOR DURAN MESA WIND PROJECT DECEMBER 29, 2017
ATTACHMENTS
Attachment 1 Figures

WATERS OF U.S. AND BIOLOGICAL RESOURCES ASSESSMENTS FOR DURAN MESA WIND PROJECT DECEMBER 29, 2017
ATTACHMENTS

WATERS OF U.S. AND BIOLOGICAL RESOURCES ASSESSMENTS FOR DURAN MESA WIND PROJECT DECEMBER 29, 2017
ATTACHMENTS

WATERS OF U.S. AND BIOLOGICAL RESOURCES ASSESSMENTS FOR DURAN MESA WIND PROJECT DECEMBER 29, 2017
ATTACHMENTS

WATERS OF U.S. AND BIOLOGICAL RESOURCES ASSESSMENTS FOR DURAN MESA WIND PROJECT DECEMBER 29, 2017
ATTACHMENTS
Attachment 2 Representative Photos

WATERS OF U.S. AND BIOLOGICAL RESOURCES ASSESSMENTS FOR DURAN MESA WIND PROJECT DECEMBER 29, 2017
ATTACHMENTS
Grasslands of Project area
Juniper savanna of Project area

December 29, 2017
Mr. Adam Cernea Clark Red Cloud Wind LLC c/o Pattern Renewables Development Company LLC 1201 Louisiana Street, Suite 3200 Houston TX 77002
Re: Waters of the U.S. and Biological Resources Assessments for 21 Proposed Wind Turbine Locations and Access Roads at the Red Cloud Wind Project, Torrance County, New Mexico
Dear Mr. Clark:
Red Cloud LLC proposes to construct 21 wind turbine foundations and access roads to these foundations in preparation for the later construction of the Red Cloud Wind Project in central New Mexico. The 21 proposed wind turbine locations and access roads (herein referred to as “Project”) are located on private property and New Mexico State University (NMSU) deeded land approximately 12.7 miles east of Corona, New Mexico (Figure 1, in Attachment 1). In November 2017, Blanton & Associates, Inc. (B&A) was contracted to assess potential waters of the U.S. (WOTUS) and sensitive biological resources that might occur on the Project. This document presents the results of those investigations.
Project Area
The Project area is located on the western edge of the Great Plains vegetation area as defined by Barkley (1986). This region of New Mexico consists primarily of grasslands that include tallgrass, mixed-grass, and shortgrass prairies, with large areas in crop production. It has also been referred to as the western plains (Kirkpatrick 1992) or plains and mesa grasslands (Dick-Peddie 1993). According to Griffith et al. (2006), the Project area is within the Southwestern Tableland ecoregion which is characterized by sub-humid grassland and semiarid rangeland with little land used for cropland. The immediate area encompassing the proposed turbine foundations and access roads consists of two vegetation types, shortgrass prairie and juniper savanna (see Photos in Attachment 2). Dominant species in shortgrass prairie include blue grama (Bouteloua gracilis), buffalograss (Buchloe dactyloides), threeawns (Aristida spp.), lovegrass (Eragrostis spp.), cane-cholla (Cylindropuntia imbricata), soaptree yucca (Yucca elata), and small soapweed (Yucca glauca). The dominant species in juniper savanna is one-seed juniper (Juniperus monosperma), pinyon pine (Pinus edulis), and also includes many of the grass species mentioned above.

WATERS OF U.S. AND BIOLOGICAL RESOURCES ASSESSMENTS FOR RED CLOUD WIND PROJECT DECEMBER 29, 2017
PAGE 2
Waters of the U.S.
The proposed Project is situated in the Gallo Arroyo watershed (Hydrologic Unit Code [HUC] 13060006) (U.S. Geological Survey 2017). Surface water features in the vicinity of the Project include ephemeral drainages and stock ponds (Figure 2, in Attachment 1).
B&A conducted a WOTUS assessment of the proposed Project to identify potentially jurisdictional waters, including wetlands that could potentially be affected by Project construction. B&A’s WOTUS investigation was based on a desktop review of existing maps and data, as well as on a field investigation conducted on November 29 and 30, 2017. The investigation described herein was conducted to address the Project’s compliance with Sections 404 and 401 of the Clean Water Act (CWA) and Section 10 of the Rivers and Harbors Act.
A review of maps and aerial photographs prior to the on-site investigation indicated that all turbine locations were situated in uplands and that four ephemeral drainages will be crossed by the proposed access roads (Figure 2). The field investigations confirmed that all turbines were located in uplands. None of the four drainages crossed by the proposed access roads exhibited a defined bed and bank or an ordinary high water mark (OHWM). Based on the lack of an OHWM the drainages are not considered WOTUS and are not subject to Section 404 of the CWA.
As currently designed, the Project avoids impacts to WOTUS and will not require a Section 404 permit, Section 10 permit, or Section 401 water quality certification. If the Project design or proposed construction methods are changed and an Individual Permit or Nationwide Permit is required, then compliance with New Mexico Section 401 water quality certification conditions will be required.
Biological Resources
B&A conducted a biological resources assessment of the proposed Project area to determine whether threatened, endangered, or other protected species (e.g., eagles) are of potential occurrence and, if so, whether they could be affected by the project. A literature and database review was conducted, followed by a brief field investigation to assess habitat and/or identify possible species attractants (i.e., prairie dog towns). The site visit was conducted on November 29 and 30, 2017.
The U.S. Fish and Wildlife Service (USFWS) Environmental Conservation Online System (ECOS) (USFWS 2017a) and the USFWS Information for Planning and Conservation (IPaC) websites (USFWS 2017b) were both queried prior to field investigation. The results of the query indicated that two federally listed threatened species of potential occurrence in Torrance County: the yellow-billed cuckoo (Coccyzus americanus) and Mexican spotted owl (Strix occidentalis lucida). The USFWS IPaC website indicated that the bald eagle (Haliaeetus leucocephalus) and the golden eagle (Aquila chrysaetos), both protected under the Bald and Golden Eagle Protection Act (BGEPA), are also of potential occurrence in Torrance County. The New Mexico Department of Game and Fish (NMDGF) Biota Information System of New Mexico (BISON-M) was also queried for information on sensitive species. In addition to the species listed above, BISON-M lists the peregrine falcon (Falco peregrinus), Baird’s sparrow (Ammodramus bairdii), and
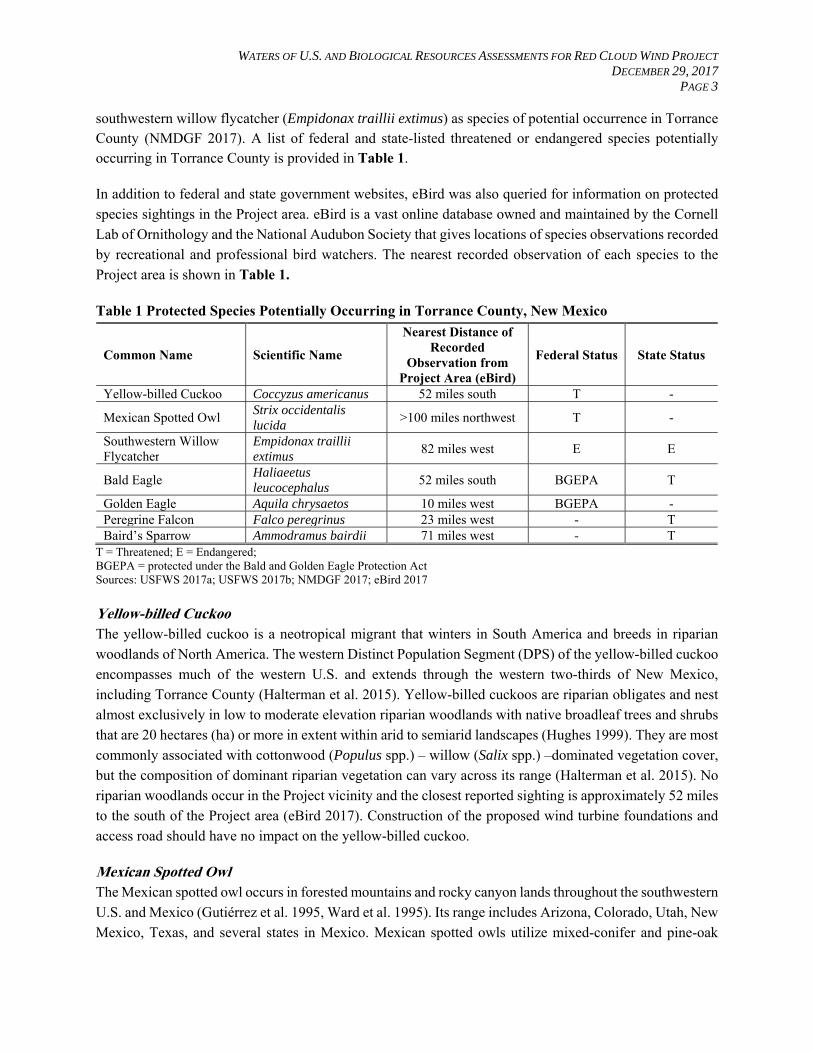
WATERS OF U.S. AND BIOLOGICAL RESOURCES ASSESSMENTS FOR RED CLOUD WIND PROJECT DECEMBER 29, 2017
PAGE 3
southwestern willow flycatcher (Empidonax traillii extimus) as species of potential occurrence in Torrance County (NMDGF 2017). A list of federal and state-listed threatened or endangered species potentially occurring in Torrance County is provided in Table 1.
In addition to federal and state government websites, eBird was also queried for information on protected species sightings in the Project area. eBird is a vast online database owned and maintained by the Cornell Lab of Ornithology and the National Audubon Society that gives locations of species observations recorded by recreational and professional bird watchers. The nearest recorded observation of each species to the Project area is shown in Table 1.
Table 1 Protected Species Potentially Occurring in Torrance County, New Mexico
Common Name Scientific Name
Nearest Distance of Recorded
Observation from Project Area (eBird)
Federal Status State Status
Yellow-billed Cuckoo Coccyzus americanus 52 miles south T -
Mexican Spotted Owl Strix occidentalis lucida
>100 miles northwest T -
Southwestern Willow Flycatcher
Empidonax traillii extimus
82 miles west E E
Bald Eagle Haliaeetus leucocephalus
52 miles south BGEPA T
Golden Eagle Aquila chrysaetos 10 miles west BGEPA - Peregrine Falcon Falco peregrinus 23 miles west - T Baird’s Sparrow Ammodramus bairdii 71 miles west - T
T = Threatened; E = Endangered; BGEPA = protected under the Bald and Golden Eagle Protection Act Sources: USFWS 2017a; USFWS 2017b; NMDGF 2017; eBird 2017
Yellow-billed Cuckoo The yellow-billed cuckoo is a neotropical migrant that winters in South America and breeds in riparian woodlands of North America. The western Distinct Population Segment (DPS) of the yellow-billed cuckoo encompasses much of the western U.S. and extends through the western two-thirds of New Mexico, including Torrance County (Halterman et al. 2015). Yellow-billed cuckoos are riparian obligates and nest almost exclusively in low to moderate elevation riparian woodlands with native broadleaf trees and shrubs that are 20 hectares (ha) or more in extent within arid to semiarid landscapes (Hughes 1999). They are most commonly associated with cottonwood (Populus spp.) – willow (Salix spp.) –dominated vegetation cover, but the composition of dominant riparian vegetation can vary across its range (Halterman et al. 2015). No riparian woodlands occur in the Project vicinity and the closest reported sighting is approximately 52 miles to the south of the Project area (eBird 2017). Construction of the proposed wind turbine foundations and access road should have no impact on the yellow-billed cuckoo.
Mexican Spotted Owl The Mexican spotted owl occurs in forested mountains and rocky canyon lands throughout the southwestern U.S. and Mexico (Gutiérrez et al. 1995, Ward et al. 1995). Its range includes Arizona, Colorado, Utah, New Mexico, Texas, and several states in Mexico. Mexican spotted owls utilize mixed-conifer and pine-oak

WATERS OF U.S. AND BIOLOGICAL RESOURCES ASSESSMENTS FOR RED CLOUD WIND PROJECT DECEMBER 29, 2017
PAGE 4
forests throughout most of the range; however, they can be found in pinyon (Pinus edulis)-juniper (Juniperus spp.) and ponderosa pine (Pinus ponderosa). The Project area is primarily grassland and provides no suitable habitat for the Mexican spotted owl. The closest reported sighting of the Mexican spotted owl is over 100 miles northwest of the Project area (eBird 2017). No impacts to Mexican spotted owls are expected to occur from construction of the Project.
Southwestern Willow Flycatcher The southwestern willow flycatcher is one of four subspecies of willow flycatcher recognized in North America (Hubbard 1987, Unitt 1987, Browning 1993). The flycatcher's breeding range includes southern California, Arizona, New Mexico, western Texas, southwestern Colorado, southern portions of Nevada and Utah, and extreme northwestern Mexico (Hubbard 1987, Unitt 1987, Wilbur 1987). Breeding habitat consist of riparian areas with dense stands of willow (Salix spp.), baccharis (Baccharis spp.), arrowweed (Pluchea spp.), and tamarisk (Tamarix spp.), sometimes with a scattered overstory of cottonwood (Populus spp.) (Grinnell and Miller 1944, Phillips 1948, Zimmerman 1970, Whitmore 1977, Hubbard 1987, Unitt 1987, Whitfield 1990, Brown and Trosset 1989, Brown 1991, and Sogge et al. 1997). No riparian habitat occurs within the Project area or vicinity. The closest reported sighting of the southwestern willow flycatcher is approximately 82 miles west of the Project area (eBird 2017). Therefore, the Project should have no impact on the southwestern willow flycatcher.
Bald Eagle The bald eagle is primarily a fishing species that typically prefers habitats associated with large bodies of water (USFWS 1989). Wintering and nesting activity occurs mainly near large freshwater impoundments with standing timber located in or around the water (Mabie 1989). No large water bodies or standing timber occur in the Project area. Additionally, no active prairie dog towns or other areas that might provide foraging opportunities occur in the immediate vicinity of the Project area. Furthermore, the nearest reported sighting of a bald eagle is located approximately 52 miles south of the Project area (eBird 2017). Therefore, although their presence cannot be completely ruled out, bald eagles would not be expected to regularly utilize the Project area.
Golden Eagle The golden eagle occupies a variety of habitats in western North America ranging from Arctic to desert. It is found primarily in mountains up to 12,000 feet, canyon lands, rimrock terrain, and riverside cliffs and bluffs, but is also found in flat open spaces where it forages near cliffs that provide nesting or overwintering sites. Golden eagles nest on cliffs and steep escarpments in grassland, chaparral, shrubland, forest, and other vegetated areas. This species subsists primarily on rabbits, hares, ground squirrels, and prairie dogs, though they are capable of taking much larger prey such as cranes, wild ungulates, and domestic livestock (Kochert et al. 2002). No active prairie dog towns occur in the near vicinity of the Project area. The nearest reported sighting of a golden eagle is located approximately 10 miles west of the Project area (eBird 2017). No nesting habitat for the golden eagle occurs in the Project vicinity, although it could be expected to periodically forage in the grasslands of the Project area.
WATERS OF U.S. AND BIOLOGICAL RESOURCES ASSESSMENTS FOR RED CLOUD WIND PROJECT DECEMBER 29, 2017
PAGE 5
Peregrine Falcon The peregrine falcon is known not only to migrate through New Mexico but to breed there, as well. These birds breed locally in mountainous areas typically on cliff ledges that generally exceed 200 feet in height and typically over-winter near their breeding areas. The project area does not provide suitable nesting habitat for this species. The nearest reported sighting of a peregrine falcon occurred approximately 23 miles west of the Project area (eBird 2017). It is possible that peregrine falcons may occur in the Project area during migration or when foraging.
Baird’s Sparrow Baird’s sparrow is a small, short-tailed sparrow that nests in the northern Great Plains and winters primarily in northern Mexico. This species is a transient in New Mexico, usually migrating through the eastern plains. The closest reported sighting is approximately 71 miles west of the Project area (eBird 2017). It is possible that Baird’s sparrow may migrate through the Project area.
Conclusions
No jurisdictional WOTUS would be impacted by construction of the 21 proposed turbine foundations or access roads, as currently designed. Therefore, no Section 404 permit, Section 10 permit, or Section 401 water quality certification would be required. No breeding habitat for any of the federally protected species discussed above occurs in the Project area. There are no unique foraging habitats for eagles or the peregrine falcon, or attractants for any of the protected species located within the Project area. Therefore, although the presence of eagles or falcons cannot be completely ruled out, none of these species is expected to heavily or regularly utilize the Project area.
If you have any questions, please do not hesitate to contact me at (512) 264-1095.
Sincerely,
Gary L. Galbraith Blanton & Associates, Inc.
Attachments: Literature Cited Attachment 1 Figures Attachment 2 Representative Photos

WATERS OF U.S. AND BIOLOGICAL RESOURCES ASSESSMENTS FOR RED CLOUD WIND PROJECT DECEMBER 29, 2017
PAGE 6
Literature Cited
Barkley, T. M. 1986. Flora of the Great Plains. In The Great Plains flora association, eds. University Press of Kansas, Lawrence, Kansas, USA.
Brown, B. T. 1991. Status of Nesting Willow Flycatchers along the Colorado River from Glen Canyon Dam to Cardenas Creek, Arizona. Endangered Species Report No. 20. Submitted to the U.S. Fish and Wildlife Service, Phoenix, Arizona.
Brown, B. T., and M. W. Trosset. 1989. Nesting-habitat relationships of riparian birds along the Colorado River in Grand Canyon, Arizona. The Southwestern Naturalist 34:260-270.
Browning, M. R. 1993. Comments on the taxonomy of Empidonax traillii (willow flycatcher). Western Birds 24:241-257.
Dick-Peddie, W. A. 1993. New Mexico vegetation, past, present, and future. University of New Mexico Press, Albuquerque, New Mexico, USA.
eBird. 2017. eBird: An online database of bird distribution and abundance [web application]. Ithaca, New York. Available: http://www.ebird.org. Accessed February 2017.
Griffith, G. E., J. M. Omernik, M. M. McGraw, G. Z. Jacobi, C. M. Canavan, T. S. Schrader, D. Mercer, R. Hill, and B. C. Moran. 2006. Ecoregions of New Mexico (2 sided color poster with map, descriptive text, summary tables, and photographs). U.S. Geological Survey, Reston, VA. Scale 1:1,400,000.
Grinnell, J., and A. H. Miller. 1944. The distribution of the birds of California. Pacific Coast Avifauna 27.
Gutiérrez, R. J., A. B. Franklin, and W. S. LaHaye. 1995. Spotted owls (Strix occidentalis). In Poole, A. and F. Gill (eds.). The Birds of North America, No. 179. The Academy of Natural Sciences, Philadelphia, and the American Ornithologists' Union, Washington, D.C.
Halterman, M., M. J. Johnson, J. A. Holmes, and S. A. Laymon. 2015. A Natural History Summary and Survey Protocol for the Western Distinct Population Segment of the Yellow-billed Cuckoo: U.S. Fish and Wildlife Techniques and Methods, 45 p.
Hubbard, J. P. 1987. The status of the willow flycatcher in New Mexico. Unpublished Report, Endangered Species Program, New Mexico Department of Game and Fish, Santa Fe.
Hughes, J. M. 1999. Yellow-billed Cuckoo (Coccyzus americanus). In The Birds of North America, No. 148 (A. Poole and F. Gill, eds.). The Birds of North America, Inc., Philadelphia, PA. 28 pp.
Kirkpatrick, Z. M. 1992. A field guide: Wildflowers of the Western Plains. University of Texas Press, Austin, Texas, USA.
Kochert, M. N., K. Steenhof, C. L. McIntyre, and E. H. Craig. 2002. Golden Eagle (Aquila chrysaetos). In The Birds of North America, no. 684 (A. Poole and F. Gill Eds.). The Birds of North America, Inc. Philadelphia, Pennsylvania, USA.

WATERS OF U.S. AND BIOLOGICAL RESOURCES ASSESSMENTS FOR RED CLOUD WIND PROJECT DECEMBER 29, 2017
PAGE 7
Mabie, D. W. 1989. Bald eagle nest survey and management. Federal Aid Project No. W-103-R-19. Job No. 30. Texas Parks and Wildlife Department, Austin, Texas, USA.
New Mexico Department of Game and Fish (NMDGF). 2017. Biota Information System of New Mexico (BISON-M). http://www.bison-m.org/speciesreports.aspx. Accessed December 2017.
Phillips, A. R. 1948. Geographic variation in Empidonax traillii. Auk 65:507-514.
Sogge, M. K., R.M. Marshall, S.J. Sferra, and T.J. Tibbitts. 1997. A southwestern willow flycatcher natural history summary and survey protocol. National Park Service Technical Report NPS/NAUCPRS/NRTR-97/12. 37 pp.
Unitt, P. 1987. Empidonax traillii extimus: An endangered subspecies. Western Birds 18:137-162.
U.S. Fish & Wildlife Service (USFWS). 1989. Southeastern states bald eagle recovery plan. USFWS Endangered Species Office, Atlanta, Georgia, USA.
_____. 2017a. Environmental Conservation Online System (ECOS) website. Species by County Report Torrance County, New Mexico. Available at https://ecos.fws.gov/ecp0/reports/species-by-current-range-county?fips=35027. Accessed December 2017.
_____. 2017b. Information for Planning and Consultation (IPaC) website Torrance County, New Mexico. Available at https://ecos.fws.gov/ipac/location/RUZWZ3JRPVCMPBMK3675SRQEFQ/ resources. Accessed December 2017.
U.S. Geological Survey. 2017 The National Map Viewer. https://viewer.nationalmap.gov/advanced-viewer/. Accessed December 2017.
Ward, J. P., Jr., A. B. Franklin, S. E. Rinkevich, and F. Clemente. 1995. Distribution and abundance of Mexican spotted owl. Chapter 1 (14 pp) in: USDI Fish and Wildlife Service. Recovery plan for the Mexican spotted owl (Strix occidentalis lucida), Volume II. U.S. Department of the Interior, Fish and Wildlife Service, Albuquerque, New Mexico.
Whitfield, M. J. 1990. Willow flycatcher reproductive response to brown-headed cowbird parasitism. Masters Thesis, California State University, Chico.
Whitmore, R. C. 1977. Habitat partitioning in a community of passerine birds. Wilson Bulletin 89:253-265.
Wilbur, S. R. 1987. Birds of Baja California. University of California Press, Berkeley, California.
Zimmerman, D.A. 1970. Birds and bird habitat on National Forest lands in the Gila River Valley, southwestern New Mexico. Department of Biological Sciences, Western New Mexico University.

WATERS OF U.S. AND BIOLOGICAL RESOURCES ASSESSMENTS FOR RED CLOUD WIND PROJECT DECEMBER 29,2017
ATTACHMENTS
Attachment 1 Figures

WATERS OF U.S. AND BIOLOGICAL RESOURCES ASSESSMENTS FOR RED CLOUD WIND PROJECT DECEMBER 29,2017
ATTACHMENTS

WATERS OF U.S. AND BIOLOGICAL RESOURCES ASSESSMENTS FOR RED CLOUD WIND PROJECT DECEMBER 29,2017
ATTACHMENTS
Figure 2. Water Resources Viento Loco Wind Project

WATERS OF U.S. AND BIOLOGICAL RESOURCES ASSESSMENTS FOR RED CLOUD WIND PROJECT DECEMBER 29,2017
ATTACHMENTS
Attachment 2 Representative Photos

WATERS OF U.S. AND BIOLOGICAL RESOURCES ASSESSMENTS FOR RED CLOUD WIND PROJECT DECEMBER 29,2017
ATTACHMENTS
Grasslands looking towards T-1 through T-5 from access road.

WATERS OF U.S. AND BIOLOGICAL RESOURCES ASSESSMENTS FOR RED CLOUD WIND PROJECT DECEMBER 29,2017
ATTACHMENTS
Shrubland northwest of turbine T-09

WATERS OF U.S. AND BIOLOGICAL RESOURCES ASSESSMENTS FOR RED CLOUD WIND PROJECT DECEMBER 29,2017
ATTACHMENTS
Open woodlands southwest of turbine T-17

December 22, 2017
Mr. Adam Cernea Clark Tecolote Wind LLC c/o Pattern Renewables Development Company 2 LLC 1201 Louisiana Street, Suite 3200 Houston TX 77002
Re: Waters of the U.S. and Biological Resources Assessments for 16 Proposed Wind Turbine Locations and Access Roads at the Tecolote Wind Project, Torrance County, New Mexico
Dear Mr. Clark:
Tecolote Wind LLC proposes to construct 16 wind turbine foundations and access roads to these foundations in preparation for the later construction of the Tecolote Wind Project in central New Mexico. The 16 proposed wind turbine locations and access roads (herein referred to as “Project”) are located on New Mexico State University land approximately 10 miles east of Corona in Torrance County, New Mexico (Figure 1, attached). In November 2017, Blanton & Associates, Inc. (B&A) was contracted to assess potential waters of the U.S. (WOTUS) and sensitive biological resources that might occur on the Project. This document presents the results of those investigations.
Project Area
The Project area is located on the western edge of the Great Plains vegetation area as defined by Barkley (1986). This region of New Mexico consists primarily of grasslands that include tallgrass, mixed-grass, and shortgrass prairies, with large areas in crop production. It has also been referred to as the western plains (Kirkpatrick 1992) or plains and mesa grasslands (Dick-Peddie 1993). According to Griffith et al. (2006), the Project area is within the Southwestern Tableland ecoregion which is characterized by sub-humid grassland and semiarid rangeland with little land used for cropland. The immediate area encompassing the proposed turbine foundations and access roads consists of shortgrass prairie vegetated with blue grama (Buteloua gracilis), sideoats grama (Bouteloua curtipendula), buffalograss (Buchloe dactyloides), threeawns (Aristida spp.), broomweed (Gutierrezia sarothrae), soapweed yucca, (Yucca glauca), cane-cholla (Cylindropuntia imbricata), starvation prickly pear (Opuntia polyacantha), and one-seed juniper (Juniperus monosperma).
Waters of the U.S.
The proposed Project is situated in the Gallo Arroyo watershed (HUC 13060006), which is a tributary of the Pecos River (U.S. Environmental Protection Agency 2017). Surface water features in the Project area include five ephemeral stream channels (Figure 2, attached).

WATERS OF U.S. AND BIOLOGICAL RESOURCES ASSESSMENTS FOR TECOLOTE WIND PROJECT DECEMBER 22, 2017
PAGE 2
B&A conducted a WOTUS assessment of the proposed Project to identify potentially jurisdictional waters, including wetlands that could potentially be affected by Project construction. B&A’s WOTUS investigation was based on a desktop review of existing maps and data, as well as on a field investigation conducted on November 28 and 30, 2017. The field investigation relied on methods outlined in the U.S. Army Corps of Engineers (USACE) Wetland Delineation Manual (USACE 1987) and the Regional Supplement to the USACE Wetland Delineation Manual: Great Plains Region (Version 2.0) (USACE 2010). The investigation described herein was conducted to address the Project’s compliance with Sections 404 and 401 of the Clean Water Act and Section 10 of the Rivers and Harbors Act.
Review of maps and aerial photographs prior to on-site investigations indicated that there are six proposed access road crossings of five ephemeral drainages (Figure 2). Field investigations revealed that none of the drainages exhibited a defined bed and bank or an ordinary high water mark (OHWM), which defines the limit of USACE jurisdiction on a stream. Based on the lack of an OHWM and the lack of hydrophytic vegetation, the ephemeral drainages are not considered WOTUS and are not subject to Section 404 of the Clean Water Act.
As currently designed, the Project avoids permanent impacts to WOTUS and will not require a Section 404 permit, Section 10 Permit, or Section 401 water quality certification. If the Project design or proposed construction methods are changed and an Individual Permit or Nationwide Permit is required, then compliance with New Mexico Section 401 water quality certification conditions will be required.
Biological Resources
B&A conducted a biological resources assessment of the proposed Project to determine whether threatened, endangered, or other protected species (e.g., eagles) are of potential occurrence, and if so, whether they could be affected by the Project. A literature and database review was conducted, followed by a brief field investigation to assess habitats and/or identify possible species attractants (i.e., prairie dog towns). The site visit was conducted on November 28 and 30, 2017.
The U.S. Fish and Wildlife Service (USFWS) Environmental Conservation Online System (ECOS) web site (USFWS 2017a) and the USFWS Information for Planning and Conservation (IPaC) web site (USFWS 2017b) were both queried prior to field investigation. The results of the query indicated that two federally listed threatened species may occur in Torrance County: the yellow-billed cuckoo (Coccyzus americanus) and Mexican spotted owl (Strix occidentalis lucida). The USFWS IPaC website indicated that the bald eagle (Haliaeetus leucocephalus) and the golden eagle (Aquila chrysaetos), both protected under the Bald and Golden Eagle Protection Act (BGEPA), are also of potential occurrence in Torrance County. The New Mexico Department of Game and Fish (NMDGF) Biota Information System of New Mexico (BISON-M) was also queried for information on sensitive species (NMDGF 2017). In addition to the species listed above, BISON-M lists the federally and state endangered southwestern willow flycatcher (Empidonax traillii extimus) as a species of potential occurrence in Torrance County, along with the state-threatened peregrine falcon (Falco peregrinus), and Baird’s sparrow (Ammodramus bairdii) (NMDGF 2017).

WATERS OF U.S. AND BIOLOGICAL RESOURCES ASSESSMENTS FOR TECOLOTE WIND PROJECT DECEMBER 22, 2017
PAGE 3
In addition to federal and state government web sites, eBird was also queried for information on protected species sightings in the Project area. eBird is a vast online database owned and maintained by the Cornell Lab of Ornithology and the National Audubon Society that gives locations of species observations recorded by recreational and professional bird watchers. Table 1 below lists protected species of potential occurrence in Torrance County, their regulatory status, and the nearest recorded eBird observations.
Table 1 Protected Species of Potential Occurrence in Torrance County, new Mexico
Common Name Scientific Name
Nearest Distance of Recorded
Observation from Project Area (eBird)
Federal Status State Status
Yellow-billed Cuckoo Coccyzus americanus 52.0 miles south T -
Mexican Spotted Owl Strix occidentalis lucida >100.0 miles northwest T -
Southwestern Willow Flycatcher
Empidonax traillii extimus 78.0 miles west E E
Bald Eagle Haliaeetus leucocephalus 51.5 miles south BGEPA T
Golden Eagle Aquila chrysaetos 6.5 miles northwest BGEPA - Peregrine Falcon Falco peregrinus 20.5 miles west - T Baird’s Sparrow Ammodramus bairdii 70.5 miles west - T
T = Threatened; E = Endangered; BGEPA = protected under the Bald and Golden Eagle Protection Act Sources: USFWS 2017a; USFWS 2017b; NMDGF 2017; eBird 2017
Yellow-billed Cuckoo The yellow-billed cuckoo is a neotropical migrant that winters in South America and breeds in riparian woodlands of North America. The western Distinct Population Segment (DPS) of the yellow-billed cuckoo encompasses much of the western U.S. and extends through the western two-thirds of New Mexico, including Torrance County (Halterman et al. 2015). Yellow-billed cuckoos are riparian obligates and nest almost exclusively in low to moderate elevation riparian woodlands with native broadleaf trees and shrubs that are 20 hectares (ha) or more in extent within arid to semiarid landscapes (Hughes 1999). They are most commonly associated with cottonwood (Populus spp.) – willow (Salix spp.) –dominated vegetation cover, but the composition of dominant riparian vegetation can vary across its range (Halterman et al. 2015). No riparian woodlands occur in the Project vicinity and the closest eBird sighting is approximately 52 miles south of the Project (eBird 2017). Construction of the proposed wind turbine foundations and access road should have no impact on the yellow-billed cuckoo.
Mexican Spotted Owl The Mexican spotted owl occurs in forested mountains and rocky canyon lands throughout the southwestern U.S. and Mexico (Gutiérrez et al. 1995, Ward et al. 1995). Its range includes Arizona, Colorado, Utah, New Mexico, Texas, and several states in Mexico. Mexican spotted owls utilize mixed-conifer and pine (Pinus spp.) -oak (Quercus spp.) forests throughout most of the range; however, they can be found in pinyon (Pinus edulis) -juniper (Juniperus spp.) and ponderosa pine (Pinus ponderosa). The Project area is grassland and provides no habitat for Mexican spotted owls, and no Mexican spotted owls have been sighted within 100

WATERS OF U.S. AND BIOLOGICAL RESOURCES ASSESSMENTS FOR TECOLOTE WIND PROJECT DECEMBER 22, 2017
PAGE 4
miles of the Project site (eBird 2017). No impacts to Mexican spotted owls will occur from construction of the Project.
Southwestern Willow Flycatcher The southwestern willow flycatcher is one of four subspecies of willow flycatcher recognized in North America (Hubbard 1987, Unitt 1987, Browning 1993). The flycatcher's breeding range includes southern California, Arizona, New Mexico, western Texas, southwestern Colorado, southern portions of Nevada and Utah, and extreme northwestern Mexico (Hubbard 1987, Unitt 1987, Wilbur 1987). Breeding habitat consist of riparian areas with dense stands of willow (Salix spp.), baccharis (Baccharis spp.), arrowweed (Pluchea spp.), and tamarisk (Tamarix spp.), sometimes with a scattered overstory of cottonwood (Populus spp.) (Grinnell and Miller 1944, Phillips 1948, Zimmerman 1970, Whitmore 1977, Hubbard 1987, Unitt 1987, Whitfield 1990, Brown and Trosset 1989, Brown 1991, and Sogge et al. 1997). No riparian habitat occurs within the Project area or vicinity. The closest eBird sighting of the southwestern willow flycatcher is approximately 78 miles west of the Project site; therefore, the Project should have no impact on the southwestern willow flycatcher.
Bald Eagle The bald eagle is primarily a fishing species that typically prefers habitats associated with large bodies of water (USFWS 1989). Wintering and nesting activity occurs mainly near large freshwater impoundments with standing timber located in or around the water (Mabie 1989). No large water bodies or standing timber occur in the Project area. Additionally, no active prairie dog towns or other potential attractants that might provide foraging opportunities occur in the immediate vicinity of the Project. The nearest sighting of a bald eagle is approximately 51.5 miles south of the Project area (eBird 2017). Although their presence cannot be completely ruled out, bald eagles would not be expected to regularly utilize the Project area.
Golden Eagle The golden eagle occupies a variety of habitats in western North America ranging from Arctic to desert. It is found primarily in mountains up to 12,000 feet, canyon lands, rimrock terrain, and riverside cliffs and bluffs, but is also found in flat open spaces where it forages near cliffs that provide nesting or overwintering sites. Golden eagles nest on cliffs and steep escarpments in grassland, chaparral, shrubland, forest, and other vegetated areas. This species subsists primarily on rabbits, hares, ground squirrels, and prairie dogs, though they are capable of taking much larger prey such as cranes, wild ungulates, and domestic livestock (Kochert et al. 2002). No active prairie dog towns or other potential attractants that might provide foraging opportunities occur in the Project vicinity. The nearest sighting of a golden eagle is located approximately 6.5 miles northwest of the Project area. No nesting habitat for the golden eagle occurs in the Project vicinity, although it could be expected to periodically forage in the grasslands of the Project site.
Peregrine Falcon The peregrine falcon is known not only to migrate through New Mexico but to breed there, as well. These birds breed locally in mountainous areas typically on cliff ledges that generally exceed 200 feet in height and typically over-winter near their breeding areas. The project area does not provide suitable nesting habitat for this species. The nearest sighting of a peregrine falcon occurred approximately 20.5 miles west
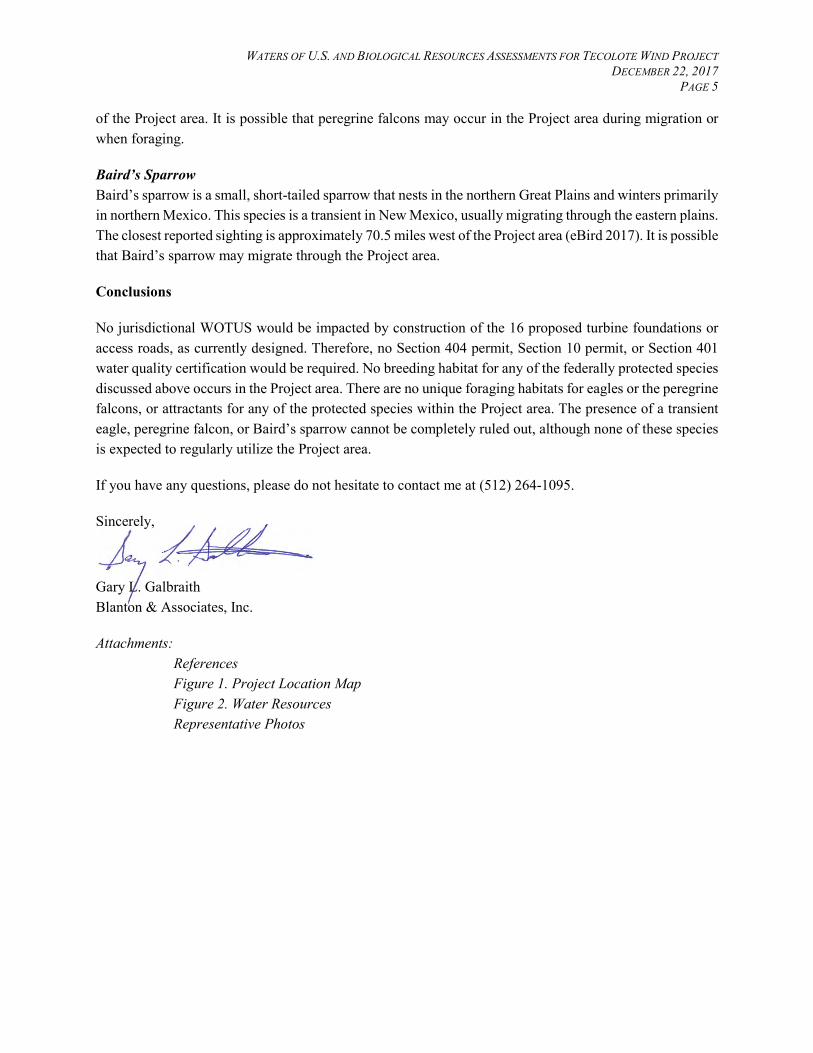
WATERS OF U.S. AND BIOLOGICAL RESOURCES ASSESSMENTS FOR TECOLOTE WIND PROJECT DECEMBER 22, 2017
PAGE 5
of the Project area. It is possible that peregrine falcons may occur in the Project area during migration or when foraging.
Baird’s Sparrow Baird’s sparrow is a small, short-tailed sparrow that nests in the northern Great Plains and winters primarily in northern Mexico. This species is a transient in New Mexico, usually migrating through the eastern plains. The closest reported sighting is approximately 70.5 miles west of the Project area (eBird 2017). It is possible that Baird’s sparrow may migrate through the Project area.
Conclusions
No jurisdictional WOTUS would be impacted by construction of the 16 proposed turbine foundations or access roads, as currently designed. Therefore, no Section 404 permit, Section 10 permit, or Section 401 water quality certification would be required. No breeding habitat for any of the federally protected species discussed above occurs in the Project area. There are no unique foraging habitats for eagles or the peregrine falcons, or attractants for any of the protected species within the Project area. The presence of a transient eagle, peregrine falcon, or Baird’s sparrow cannot be completely ruled out, although none of these species is expected to regularly utilize the Project area.
If you have any questions, please do not hesitate to contact me at (512) 264-1095.
Sincerely,
Gary L. Galbraith Blanton & Associates, Inc.
Attachments: References Figure 1. Project Location Map Figure 2. Water Resources Representative Photos

Waters of U.S. and Biological Resources Assessments for Ancho Wind Project December 22, 2017
Page 6
References
Barkley, T. M. 1986. Flora of the Great Plains. In The Great Plains flora association, eds. University Press of Kansas, Lawrence, Kansas, USA.
Biota Information System of New Mexico (BISON-M). 2017. New Mexico Department of Game and Fish. Available at: http://www.bison-m.org/. Accessed December 2017.
Brown, B. T. 1991. Status of Nesting Willow Flycatchers along the Colorado River from Glen Canyon Dam to Cardenas Creek, Arizona. Endangered Species Report No. 20. Submitted to the U.S. Fish and Wildlife Service, Phoenix, Arizona.
Brown, B.T. and M.W. Trosset. 1989. Nesting-habitat relationships of riparian birds along the Colorado River in Grand Canyon, Arizona. The Southwestern Naturalist 34:260-270.
Browning, M. R. 1993. Comments on the taxonomy of Empidonax traillii (willow flycatcher). Western Birds 24:241-257.
Dick-Peddie, W. A. 1993. New Mexico vegetation, past, present, and future. University of New Mexico Press, Albuquerque, New Mexico, USA.
eBird. 2017. eBird: An online database of bird distribution and abundance [web application]. Ithaca, New York. Available: http://www.ebird.org. Accessed December 2017.
Griffith, G.E., J.M. Omernik, M.M. McGraw, G.Z. Jacobi, C.M. Canavan, T.S. Schrader, D. Mercer, R. Hill, and B.C. Moran. 2006. Ecoregions of New Mexico (2 sided color poster with map, descriptive text, summary tables, and photographs). U.S. Geological Survey, Reston, VA. Scale 1:1,400,000.
Grinnell, J., and A. H. Miller. 1944. The distribution of the birds of California. Pacific Coast Avifauna 27.
Gutiérrez, R. J., A. B. Franklin, and W. S. LaHaye. 1995. Spotted owls (Strix occidentalis). In Poole, A. and F. Gill (eds.). The Birds of North America, No. 179. The Academy of Natural Sciences, Philadelphia, and the American Ornithologists' Union, Washington, D.C.
Halterman, M., M.J. Johnson, J.A. Holmes and S.A. Laymon. 2015. A Natural History Summary and Survey Protocol for the Western Distinct Population Segment of the Yellow-billed Cuckoo: U.S. Fish and Wildlife Techniques and Methods, 45 p.
Hubbard, J. P. 1987. The status of the willow flycatcher in New Mexico. Unpublished Report, Endangered Species Program, New Mexico Department of Game and Fish, Santa Fe.
Hughes, J.M. 1999. Yellow-billed Cuckoo (Coccyzus americanus). In The Birds of North America, No. 148 (A. Poole and F. Gill, eds.). The Birds of North America, Inc., Philadelphia, PA. 28 pp.
Kirkpatrick, Z. M. 1992. A field guide: Wildflowers of the Western Plains. University of Texas Press, Austin, Texas, USA.

Waters of U.S. and Biological Resources Assessments for Ancho Wind Project December 22, 2017
Page 7
Kochert, M. N., K. Steenhof, C. L. McIntyre, and E. H. Craig. 2002. Golden Eagle (Aquila chrysaetos). In The Birds of North America, no. 684 (A. Poole and F. Gill Eds.). The Birds of North America, Inc. Philadelphia, Pennsylvania, USA.
Mabie, D. W. 1989. Bald eagle nest survey and management. Federal Aid Project No. W-103-R-19. Job No. 30. Texas Parks and Wildlife Department, Austin, Texas, USA.
New Mexico Department of Game and Fish (NMDGF). 2017. Biota Information System of New Mexico (BISON-M). http://www.bison-m.org/speciesreports.aspx. Accessed December 2017.
Phillips, A. R. 1948. Geographic variation in Empidonax traillii. Auk 65:507-514.
Sogge, M. K., R.M. Marshall, S.J. Sferra, and T.J. Tibbitts. 1997. A southwestern willow flycatcher natural history summary and survey protocol. National Park Service Technical Report NPS/NAUCPRS/NRTR-97/12. 37 pp.
Unitt, P. 1987. Empidonax traillii extimus: An endangered subspecies. Western Birds 18:137-162.
U.S. Army Corps of Engineers (USACE). 1987. Corps of Engineers Wetlands Delineation Manual. Technical Report Y-87-1. USACE Waterways Experiment Station, Vicksburg, Mississippi.
______. 2010. Regional Supplement to the Corps of Engineers Wetland Delineation Manual: Great Plains Region (Version 2.0). ERDC/EL TR-10-1. USACE Engineer Research and Development Center, Vicksburg, Mississippi.
U.S. Environmental Protection Agency. 2017. Surf Your Watershed. Gallo Arroyo Watershed – 13060006. https://cfpub.epa.gov/surf/huc.cfm?huc_code=13060006. Accessed December 2017.
U.S. Fish & Wildlife Service (USFWS). 1989. Southeastern states bald eagle recovery plan. USFWS Endangered Species Office, Atlanta, Georgia, USA.
______. 2017a. U.S. Fish and Wildlife Service Environmental Conservation Online System (ECOS). Available at: https://ecos.fws.gov/ecp/. Accessed December 2017.
______. 2017b. U.S. Fish and Wildlife Service Information for Planning and Consultation (IPaC). Available at: https://ecos.fws.gov/ipac/. Accessed December 2017.
Ward, J. P., Jr., A. B. Franklin, S. E. Rinkevich, and F. Clemente. 1995. Distribution and abundance of Mexican spotted owl. Chapter 1 (14 pp) in: USDI Fish and Wildlife Service. Recovery plan for the Mexican spotted owl (Strix occidentalis lucida), Volume II. U.S. Department of the Interior, Fish and Wildlife Service, Albuquerque, New Mexico.
Whitfield, M.J. 1990. Willow flycatcher reproductive response to brown-headed cowbird parasitism.
Masters Thesis, California State University, Chico.
Whitmore, R.C. 1977. Habitat partitioning in a community of passerine birds. Wilson Bulletin 89:253-265.

Waters of U.S. and Biological Resources Assessments for Ancho Wind Project December 22, 2017
Page 8
Wilbur, S. R. 1987. Birds of Baja California. University of California Press, Berkeley, California.
Williams, S. O., III. 1998. New Mexico, summer season 1998. Field Notes 52:487-490.
Zimmerman, D.A. 1970. Birds and bird habitat on National Forest lands in the Gila River Valley, southwestern New Mexico. Department of Biological Sciences, Western New Mexico University.

WATERS OF U.S. AND BIOLOGICAL RESOURCES ASSESSMENTS FOR TECOLOTE WIND PROJECT DECEMBER 22, 2017
ATTACHMENTS

WATERS OF U.S. AND BIOLOGICAL RESOURCES ASSESSMENTS FOR TECOLOTE WIND PROJECT DECEMBER 22, 2017
ATTACHMENTS
Figure 2. Water Resources Viento Loco Wind Project

WATERS OF U.S. AND BIOLOGICAL RESOURCES ASSESSMENTS FOR TECOLOTE WIND PROJECT DECEMBER 22, 2017
ATTACHMENTS
Photo 1. Intersection of Access Road and County Road C020

WATERS OF U.S. AND BIOLOGICAL RESOURCES ASSESSMENTS FOR TECOLOTE WIND PROJECT DECEMBER 22, 2017
ATTACHMENTS
Photo 2. Access Road Just North of County Road C020
Looking North Toward Turbine T-12

WATERS OF U.S. AND BIOLOGICAL RESOURCES ASSESSMENTS FOR TECOLOTE WIND PROJECT DECEMBER 22, 2017
ATTACHMENTS
Photo 3. Turbine T-10 Looking East Toward Access Road

WATERS OF U.S. AND BIOLOGICAL RESOURCES ASSESSMENTS FOR TECOLOTE WIND PROJECT DECEMBER 22, 2017
ATTACHMENTS
Photo 4. Turbine T-01 Looking South

WATERS OF U.S. AND BIOLOGICAL RESOURCES ASSESSMENTS FOR TECOLOTE WIND PROJECT DECEMBER 22, 2017
ATTACHMENTS
Photo 5. Turbine T-16 Looking West

December 22, 2017
Mr. Adam Cernea Clark Viento Loco LLC c/o Pattern Renewables Development Company 2 LLC 1201 Louisiana Street, Suite 3200 Houston TX 77002
Re: Waters of the U.S. and Biological Resources Assessments for 11 Proposed Wind Turbine Locations and Access Roads at the Viento Loco Wind Project, Torrance County, New Mexico
Dear Mr. Clark:
Viento Loco LLC proposes to construct 11 wind turbine foundations and access roads to these foundations in preparation for the later construction of the Viento Loco Wind Project in central New Mexico. The 11 proposed wind turbine locations and access roads (herein referred to as “Project”) are located on private property approximately 5.5 miles north of Corona, New Mexico (Figure 1, attached). In November 2017, Blanton & Associates, Inc. (B&A) was contracted to assess potential waters of the U.S. (WOTUS) and sensitive biological resources that might occur on the Project. This document presents the results of those investigations.
Project Area
The Project area is located on the western edge of the Great Plains vegetation area as defined by Barkley (1986). This region of New Mexico consists primarily of grasslands that include tallgrass, mixed-grass, and shortgrass prairies, with large areas in crop production. It has also been referred to as the western plains (Kirkpatrick 1992) or plains and mesa grasslands (Dick-Peddie 1993). According to Griffith et al. (2006) the project area is within the Southwestern Tableland ecoregion which is characterized by sub-humid grassland and semiarid rangeland with little land used for cropland. The immediate area encompassing the proposed turbine foundations and access roads consists of shortgrass prairie vegetated with blue grama (Buteloua gracilis), sideoats grama (Bouteloua curtipendula), buffalograss (Buchloe dactyloides), threeawns (Aristida spp.), silverleaf nightshade (Solanum elaeagnifolium), soaptree yucca (Yucca elata), cane-cholla (Cylindropuntia imbricata), and one-seed juniper (Juniperus monosperma).
Waters of the U.S.
The proposed Project is situated in the Eastern Estancia Watershed (HUC 13050002) (U.S. Geological Survey 2017). Surface water features in the vicinity of the Project area include ephemeral drainages and one stock pond (Figure 2, attached).

WATERS OF U.S. AND BIOLOGICAL RESOURCES ASSESSMENTS FOR VIENTO LOCO WIND PROJECT DECEMBER 22, 2017
PAGE 2
B&A conducted a WOTUS assessment of the proposed Project to identify potentially jurisdictional waters, including wetlands that could potentially be affected by Project construction. B&A’s WOTUS investigation was based on a desktop review of existing maps and data, as well as on a field investigation conducted on November 30, 2017. The field investigation and delineation relied on methods outlined in the U.S. Army Corps of Engineers (USACE) Wetland Delineation Manual (USACE 1987) and the Regional Supplement to the USACE Wetland Delineation Manual: Great Plains Region (Version 2.0) (USACE 2010). The investigation described herein was conducted to address the Project’s compliance with Sections 404 and 401 of the Clean Water Act and Section 10 of the Rivers and Harbors Act.
Review of maps and aerial photographs prior to on-site investigation indicated that one ephemeral drainage is located to the west and south of the proposed Project. Field investigations confirmed that none of the turbine locations are located in jurisdictional waters and no jurisdictional streams will be crossed by the proposed access roads. As currently designed, the Project avoids impacts to WOTUS and will not require a Section 404 permit, Section 10 Permit, or Section 401 water quality certification. If the Project design or proposed construction methods are changed and an Individual Permit or Nationwide Permit is required, then compliance with New Mexico Section 401 water quality certification conditions will be required.
Biological Resources
B&A conducted a biological resources assessment of the proposed Project area to determine whether threatened, endangered, or other protected species (e.g., eagles) are of potential occurrence and, if so, whether they could be affected by the project. A literature and database review was conducted, followed by a brief field investigation to assess habitat and/or identify possible species attractants (i.e., prairie dog towns). The site visit was conducted on November 30, 2017.
The U.S. Fish and Wildlife Service (USFWS) Environmental Conservation Online System (ECOS) (USFWS 2017a) and the USFWS Information for Planning and Conservation (IPaC) web site (USFWS 2017b) were both queried prior to field investigation. The results of the query indicated that two federally listed threatened species of potential occurrence in Torrance County: the yellow-billed cuckoo (Coccyzus americanus) and Mexican spotted owl (Strix occidentalis lucida). The USFWS IPaC website indicated that the bald eagle (Haliaeetus leucocephalus) and the golden eagle (Aquila chrysaetos), both protected under the Bald and Golden Eagle Protection Act (BGEPA), are also of potential occurrence in Torrance County. The New Mexico Department of Game and Fish (NMDGF) Biota Information System of New Mexico (BISON-M) was also queried for information on sensitive species. In addition to the species listed above, BISON-M lists the federally and state endangered southwestern willow flycatcher (Empidonax traillii extimus) as a species of potential occurrence in Torrance County, along with the state-threatened peregrine falcon (Falco peregrinus), and Baird’s sparrow (Ammodramus bairdii) (NMDGF 2017).
In addition to federal and state government web sites, eBird was also queried for information on protected species sightings in the Project area. eBird is a vast online database owned and maintained by the Cornell Lab of Ornithology and the National Audubon Society that gives locations of species observations recorded by recreational and professional bird watchers. Table 1 lists protected species of potential occurrence in Torrance County, their regulatory status, and the nearest recorded eBird observations.

WATERS OF U.S. AND BIOLOGICAL RESOURCES ASSESSMENTS FOR VIENTO LOCO WIND PROJECT DECEMBER 22, 2017
PAGE 3
Table 1. Protected Species Potentially Occurring in Torrance County, New Mexico
Common Name Scientific Name
Nearest Distance of Recorded
Observation from Project Area (eBird)
Federal Status State Status
Yellow-billed Cuckoo Coccyzus americanus 50.0 miles northwest T -
Mexican Spotted Owl Strix occidentalis lucida 85.0 miles northwest T -
Southwestern Willow Flycatcher
Empidonax traillii extimus 66.5 miles west E E
Bald Eagle Haliaeetus leucocephalus 51.0 miles northwest BGEPA T
Golden Eagle Aquila chrysaetos 4.6 miles east BGEPA - Peregrine Falcon Falco peregrinus 10.5 miles southwest - T Baird’s Sparrow Ammodramus bairdii 59.3 miles west - T
T = Threatened; E = Endangered; BGEPA = protected under the Bald and Golden Eagle Protection Act Sources: USFWS 2017a; USFWS 2017b; NMDGF 2017; eBird 2017
Yellow-billed Cuckoo The yellow-billed cuckoo is a neotropical migrant that winters in South America and breeds in riparian woodlands of North America. The western Distinct Population Segment (DPS) of the yellow-billed cuckoo encompasses much of the western U.S. and extends through the western two-thirds of New Mexico, including Torrance County (Halterman et al. 2015). Yellow-billed cuckoos are riparian obligates and nest almost exclusively in low to moderate elevation riparian woodlands with native broadleaf trees and shrubs that are 20 hectares (ha) or more in extent within arid to semiarid landscapes (Hughes 1999). They are most commonly associated with cottonwood (Populus spp.) – willow (Salix spp.) –dominated vegetation cover, but the composition of dominant riparian vegetation can vary across its range (Halterman et al. 2015). No riparian woodlands occur in the Project vicinity and the closest reported sighting is approximately 50 miles to the northwest of the Project site (eBird 2017). Construction of the proposed wind turbine foundations and access road should have no impact on the yellow-billed cuckoo.
Mexican Spotted Owl The Mexican spotted owl occurs in forested mountains and rocky canyon lands throughout the southwestern U.S. and Mexico (Gutiérrez et al. 1995, Ward et al. 1995). Its range includes Arizona, Colorado, Utah, New Mexico, Texas, and several states in Mexico. Mexican spotted owls utilize mixed-conifer and pine (Pinus spp.)-oak (Quercus spp.) forests throughout most of the range; however, they can be found in pinyon (Pinus edulis)-juniper (Juniperus spp.) and ponderosa pine (Pinus ponderosa). The Project area is grassland with scattered one-seed juniper trees and shrubs and provides no habitat for Mexican spotted owls. The closest reported sighting of Mexican spotted owls is approximately 85 miles northwest of the Project site (eBird 2017). No impacts to Mexican spotted owls will occur from construction of the Project.
Southwestern Willow Flycatcher The southwestern willow flycatcher is one of four subspecies of willow flycatcher recognized in North America (Hubbard 1987, Unitt 1987, Browning 1993). The flycatcher's breeding range includes southern California, Arizona, New Mexico, western Texas, southwestern Colorado, southern portions of Nevada and

WATERS OF U.S. AND BIOLOGICAL RESOURCES ASSESSMENTS FOR VIENTO LOCO WIND PROJECT DECEMBER 22, 2017
PAGE 4
Utah, and extreme northwestern Mexico (Hubbard 1987, Unitt 1987, Wilbur 1987). Breeding habitat consist of riparian areas with dense stands of willow (Salix spp.), baccharis (Baccharis spp.), arrowweed (Pluchea spp.), and tamarisk (Tamarix spp.), sometimes with a scattered overstory of cottonwood (Populus spp.) (Grinnell and Miller 1944, Phillips 1948, Zimmerman 1970, Whitmore 1977, Hubbard 1987, Unitt 1987, Whitfield 1990, Brown and Trosset 1989, Brown 1991, and Sogge et al. 1997). No riparian habitat occurs within the Project area or vicinity. The closest reported sighting of the southwestern willow flycatcher is approximately 66.5 miles west of the Project site (eBird 2017). The Project should have no impact on the southwestern willow flycatcher.
Bald Eagle The bald eagle is primarily a fishing species that typically prefers habitats associated with large bodies of water (USFWS 1989). Wintering and nesting activity occurs mainly near large freshwater impoundments with standing timber located in or around the water (Mabie 1989). No large water bodies or standing timber occur in the Project area. Additionally, no active prairie dog towns or other areas that might provide foraging opportunities occur in the immediate vicinity to any of the 11 turbine foundations or access roads. The nearest reported sighting of a bald eagle is located more than 51 miles northwest of the Project area (eBird 2017). Although their presence cannot be completely ruled out, bald eagles would not be expected to regularly utilize the Project area.
Golden Eagle The golden eagle occupies a variety of habitats in western North America ranging from Arctic to desert. It is found primarily in mountains up to 12,000 feet, canyon lands, rimrock terrain, and riverside cliffs and bluffs, but is also found in flat open spaces where it forages near cliffs that provide nesting or overwintering sites. Golden eagles nest on cliffs and steep escarpments in grassland, chaparral, shrubland, forest, and other vegetated areas. This species subsists primarily on rabbits, hares, ground squirrels, and prairie dogs, though they are capable of taking much larger prey such as cranes, wild ungulates, and domestic livestock (Kochert et al. 2002). No active prairie dog towns occur in the near vicinity to any of the 11 turbine foundations or access roads. The nearest reported sighting of a golden eagle is located approximately 4.6 miles east of the Project area (eBird 2017). No nesting habitat for the golden eagle occurs in the Project vicinity, although it could be expected to periodically forage in the Project area.
Peregrine Falcon The peregrine falcon is known not only to migrate through New Mexico but to breed there, as well. These birds breed locally in mountainous areas typically on cliff ledges that generally exceed 200 feet in height and typically over-winter near their breeding areas. The project area does not provide suitable nesting habitat for this species. The nearest reported sighting of a peregrine falcon occurred approximately 10.5 miles southwest of the Project area (eBird 2017). It is possible that peregrine falcons may occur in the Project area during migration or when foraging.
Baird’s Sparrow Baird’s sparrow is a small, short-tailed sparrow that nests in the northern Great Plains and winters primarily in northern Mexico. This species is a transient in New Mexico, usually migrating through the eastern plains.

WATERS OF U.S. AND BIOLOGICAL RESOURCES ASSESSMENTS FOR VIENTO LOCO WIND PROJECT DECEMBER 22, 2017
PAGE 5
The closest reported sighting is 59.3 miles west of the Project area (eBird 2017). It is possible that Baird’s sparrow may migrate through the Project area.
Conclusions
No jurisdictional WOTUS would be impacted by construction of the 11 proposed turbine foundations or access roads, as currently designed. Therefore, no Section 404 permit, Section 10 permit, or Section 401 water quality certification would be required. No breeding habitat for any of the federally protected species discussed above occurs in the Project area. There are no unique foraging habitats for eagles or the peregrine falcon, or attractants for any of the protected species located within the Project area. Therefore, although the presence of eagles or falcons cannot be completely ruled out, none of these species is expected to heavily or regularly utilize the Project area.
If you have any questions, please do not hesitate to contact me at (512) 264-1095.
Sincerely,
Gary L. Galbraith Blanton & Associates, Inc.
Attachments: Figure 1. Project Location Map Figure 2. Water Resources Representative Photos
Literature Cited
Barkley, T. M. 1986. Flora of the Great Plains. In The Great Plains flora association, eds. University Press of Kansas, Lawrence, Kansas, USA.
Brown, B. T. 1991. Status of Nesting Willow Flycatchers along the Colorado River from Glen Canyon Dam to Cardenas Creek, Arizona. Endangered Species Report No. 20. Submitted to the U.S. Fish and Wildlife Service, Phoenix, Arizona.
Brown, B.T. and M.W. Trosset. 1989. Nesting-habitat relationships of riparian birds along the Colorado River in Grand Canyon, Arizona. The Southwestern Naturalist 34:260-270.
Browning, M. R. 1993. Comments on the taxonomy of Empidonax traillii (willow flycatcher). Western Birds 24:241-257.
Dick-Peddie, W. A. 1993. New Mexico vegetation, past, present, and future. University of New Mexico Press, Albuquerque, New Mexico, USA.
eBird. 2017. eBird: An online database of bird distribution and abundance [web application]. Ithaca, New York. Available: http://www.ebird.org. Accessed February 2017.

WATERS OF U.S. AND BIOLOGICAL RESOURCES ASSESSMENTS FOR VIENTO LOCO WIND PROJECT DECEMBER 22, 2017
PAGE 6
Griffith, G.E., J.M. Omernik, M.M. McGraw, G.Z. Jacobi, C.M. Canavan, T.S. Schrader, D. Mercer, R. Hill, and B.C. Moran. 2006. Ecoregions of New Mexico (2 sided color poster with map, descriptive text, summary tables, and photographs). U.S. Geological Survey, Reston, VA. Scale 1:1,400,000.
Grinnell, J., and A. H. Miller. 1944. The distribution of the birds of California. Pacific Coast Avifauna 27.
Gutiérrez, R. J., A. B. Franklin, and W. S. LaHaye. 1995. Spotted owls (Strix occidentalis). In Poole, A. and F. Gill (eds.). The Birds of North America, No. 179. The Academy of Natural Sciences, Philadelphia, and the American Ornithologists' Union, Washington, D.C.
Halterman, M., M.J. Johnson, J.A. Holmes and S.A. Laymon. 2015. A Natural History Summary and Survey Protocol for the Western Distinct Population Segment of the Yellow-billed Cuckoo: U.S. Fish and Wildlife Techniques and Methods, 45 p.
Hubbard, J. P. 1987. The status of the willow flycatcher in New Mexico. Unpublished Report, Endangered Species Program, New Mexico Department of Game and Fish, Santa Fe.
Hughes, J.M. 1999. Yellow-billed Cuckoo (Coccyzus americanus). In The Birds of North America, No. 148 (A. Poole and F. Gill, eds.). The Birds of North America, Inc., Philadelphia, PA. 28 pp.
Kirkpatrick, Z. M. 1992. A field guide: Wildflowers of the Western Plains. University of Texas Press, Austin, Texas, USA.
Kochert, M. N., K. Steenhof, C. L. McIntyre, and E. H. Craig. 2002. Golden Eagle (Aquila chrysaetos). In The Birds of North America, no. 684 (A. Poole and F. Gill Eds.). The Birds of North America, Inc. Philadelphia, Pennsylvania, USA.
Mabie, D. W. 1989. Bald eagle nest survey and management. Federal Aid Project No. W-103-R-19. Job No. 30. Texas Parks and Wildlife Department, Austin, Texas, USA.
New Mexico Department of Game and Fish (NMDGF). 2017. Biota Information System of New Mexico (BISON-M). http://www.bison-m.org/speciesreports.aspx. Accessed December 2017.
Phillips, A. R. 1948. Geographic variation in Empidonax traillii. Auk 65:507-514.
Sogge, M. K., R.M. Marshall, S.J. Sferra, and T.J. Tibbitts. 1997. A southwestern willow flycatcher natural history summary and survey protocol. National Park Service Technical Report NPS/NAUCPRS/NRTR-97/12. 37 pp.
Unitt, P. 1987. Empidonax traillii extimus: An endangered subspecies. Western Birds 18:137-162.
U.S. Fish & Wildlife Service. 1989. Southeastern states bald eagle recovery plan. USFWS Endangered Species Office, Atlanta, Georgia, USA.

WATERS OF U.S. AND BIOLOGICAL RESOURCES ASSESSMENTS FOR VIENTO LOCO WIND PROJECT DECEMBER 22, 2017
PAGE 7
______. 2017a. U.S. Fish and Wildlife Service Environmental Conservation Online System (ECOS). Available at: https://ecos.fws.gov/ecp/. Accessed December 2017.
______. 2017b. U.S. Fish and Wildlife Service Information for Planning and Consultation (IPaC). Available at: https://ecos.fws.gov/ipac/. Accessed December 2017.
U.S. Geological Survey. 2017 The National Map Viewer. https://viewer.nationalmap.gov/advanced-viewer/. Accessed December 2017.
Ward, J. P., Jr., A. B. Franklin, S. E. Rinkevich, and F. Clemente. 1995. Distribution and abundance of Mexican spotted owl. Chapter 1 (14 pp) in: USDI Fish and Wildlife Service. Recovery plan for the Mexican spotted owl (Strix occidentalis lucida), Volume II. U.S. Department of the Interior, Fish and Wildlife Service, Albuquerque, New Mexico.
Whitfield, M.J. 1990. Willow flycatcher reproductive response to brown-headed cowbird parasitism. Masters Thesis, California State University, Chico.
Whitmore, R.C. 1977. Habitat partitioning in a community of passerine birds. Wilson Bulletin 89:253-265.
Wilbur, S. R. 1987. Birds of Baja California. University of California Press, Berkeley, California.
Zimmerman, D.A. 1970. Birds and bird habitat on National Forest lands in the Gila River Valley, southwestern New Mexico. Department of Biological Sciences, Western New Mexico University.

WATERS OF U.S. AND BIOLOGICAL RESOURCES ASSESSMENTS FOR VIENTO LOCO PTC WIND PROJECT DECEMBER 22, 2017
ATTACHMENTS
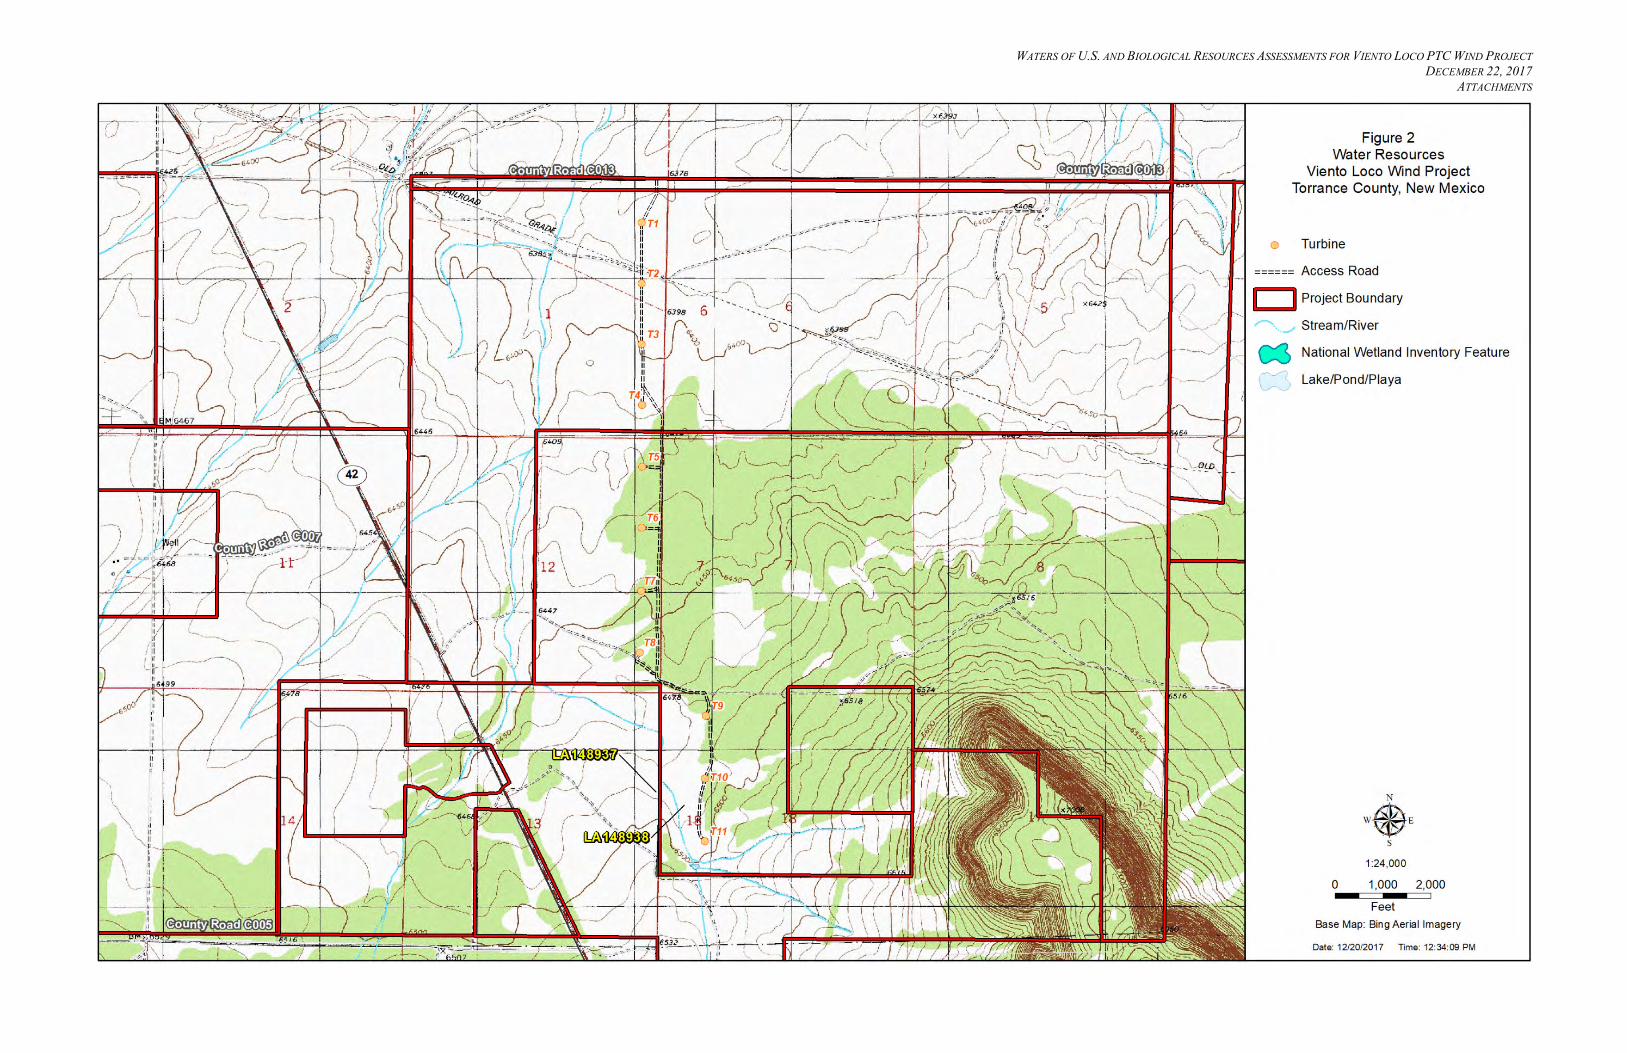
WATERS OF U.S. AND BIOLOGICAL RESOURCES ASSESSMENTS FOR VIENTO LOCO PTC WIND PROJECT DECEMBER 22, 2017
ATTACHMENTS
Figure 2. Water Resources Viento Loco Wind Project

WATERS OF U.S. AND BIOLOGICAL RESOURCES ASSESSMENTS FOR VIENTO LOCO PTC WIND PROJECT DECEMBER 22, 2017
ATTACHMENTS
Photo 1. Grassland west of turbine T-01

WATERS OF U.S. AND BIOLOGICAL RESOURCES ASSESSMENTS FOR VIENTO LOCO PTC WIND PROJECT DECEMBER 22, 2017
ATTACHMENTS
Photo 2. Grassland west of turbine T-03

WATERS OF U.S. AND BIOLOGICAL RESOURCES ASSESSMENTS FOR VIENTO LOCO PTC WIND PROJECT DECEMBER 22, 2017
ATTACHMENTS
Photo 3. Shrubland southeast of turbine T-04

WATERS OF U.S. AND BIOLOGICAL RESOURCES ASSESSMENTS FOR VIENTO LOCO PTC WIND PROJECT DECEMBER 22, 2017
ATTACHMENTS
Photo 4. Open woodlands east of turbine T-05

WATERS OF U.S. AND BIOLOGICAL RESOURCES ASSESSMENTS FOR VIENTO LOCO PTC WIND PROJECT DECEMBER 22, 2017
ATTACHMENTS
Photo 5. Shrubland east of turbine T-07 along access road

WATERS OF U.S. AND BIOLOGICAL RESOURCES ASSESSMENTS FOR VIENTO LOCO PTC WIND PROJECT DECEMBER 22, 2017
ATTACHMENTS
Photo 6. Shrubland east of turbine T-8

WATERS OF U.S. AND BIOLOGICAL RESOURCES ASSESSMENTS FOR VIENTO LOCO PTC WIND PROJECT DECEMBER 22, 2017
ATTACHMENTS
Photo 7. Open woodlands southwest of turbine T-09

WATERS OF U.S. AND BIOLOGICAL RESOURCES ASSESSMENTS FOR VIENTO LOCO PTC WIND PROJECT DECEMBER 22, 2017
ATTACHMENTS
Photo 8. Shrubland northwest of turbine T-11

Pattern Energy LP 13-13 Burns & McDonnell
EXHIBIT M AVIAN POWER LINE INTERACTION COMMITTEE GUIDELINES AND WIND ENERGY GUIDELINES

SAM
PLE
Reducing Avian Collisions with Power Lines
The State of the Art in 2012

SAM
PLE
THIS PAGE INTENTIONALLY LEFT BLANK

SAM
PLE
Reducing Avian Collisions with Power Lines
The State of the Art in 2012
Prepared by:
Avian Power Line Interaction Committee
October 2012
SAM
PLE
Additional copies of this book may be obtained through:
the Avian Power Line Interaction Committee (www.aplic.org) and the Edison Electric Institute (www.eei.org).
This book should be cited as follows:
Avian Power Line Interaction Committee (APLIC). 2012. Reducing Avian Collisions with Power Lines: The Stateof the Art in 2012. Edison Electric Institute and APLIC. Washington, D.C.
Cover photos copyright © (from left to right): Florida Fish and Wildlife Conservation Commission (transmission lines),Greg Forcey (great blue heron [Ardea herodias]), Jerry Liguori (American white pelican [Pelecanus erythrorhynchos]),Jerry Liguori (Canada geese [Branta canadensis] flying over power lines), and Laura C. Williams (whooping crane[Grus americana]).
Section header photos copyright © Jerry Liguori (Chapters 1 through 6), U.S. Fish and Wildlife Service (Chapter 7), Greg Forcey (Appendix A), Jerry Liguori (Appendices B, C, D, and E).
© 2012 by the Edison Electric Institute (EEI). All rights reserved. Published 2012.Printed in the United States of America.
No part of this publication may be reproduced or transmitted in any form or by any means, electronic ormechanical, including photocopying, recording, or any information storage or retrieval system or method,now known or hereinafter invented or adopted, without the express prior written permission of theEdison Electric Institute.
Published by:Edison Electric Institute701 Pennsylvania Avenue, N.W.Washington, D.C. 20004-2696Phone: 202-508-5000 Website: www.eei.org
Attribution Notice and Disclaimer
This work was prepared by the Avian Power Line Interaction Committee (APLIC) for the Edison ElectricInstitute (EEI). When used as a reference, attribution to APLIC is requested. APLIC, any member ofAPLIC, and any person acting on its behalf (a) does not make any warranty, express or implied, withrespect to the accuracy, completeness, or usefulness of the information, advice, or recommendationscontained in this work and (b) does not assume and expressly disclaims any liability with respect to theuse of or for damages resulting from the use of any information, advice, or recommendations contained in this work.
The views and opinions expressed in this work do not necessarily reflect those of APLIC, EEI, or anymember of APLIC or EEI. This material and its production, reproduction, and distribution by EEI doesnot imply endorsement of the material.

SAM
PLE
Contents | iii
c o n t e n t s
Abstract xi
Foreword xv
Acknowledgements xvii
Dedication: Richard “Dick” S. Thorsell (1927 – 2012) xix
Chapter 1 Introduction 1Purpose and Scope of the Manual 1Reader Guide to the Manual 3Overview of Power Lines 4Perspectives for Dealing with Bird Collisions 10
Chapter 2 Progress in Dealing with Collision Issues 13North America 13International 17Future Research Priorities 19
Chapter 3 Avian Regulations and Compliance 21Overview of Existing Laws and Policies 21Permit Requirements 26
Chapter 4 Understanding Bird Collisions 29Susceptibility of Birds to Power Line Collisions 30Identifying Collision Mortality 30Variability in Reported Mortality Rates 31Biological Significance of Collision Mortality 32Biological Characteristics Influencing Avian Collision Risks 36Environmental Conditions Influencing Avian Collision Risks 46Engineering Aspects Influencing Avian Collision Risks 50
Chapter 5 Minimizing Collision Risks 53Opportunities for Minimizing Collision Risks 53Modifying Existing Power Lines 54Planning New Power Lines 64Public Participation to Address Social and Cultural Issues 72

SAM
PLE
iv | Contents
c o n t e n t s
Chapter 6 Line Marking to Reduce Collisions 75Overview of Line Marking Devices 75Effectiveness of Designs 77Marking Constraints and Considerations 80Line Marking Devices 85Large Diameter Wire 100
Chapter 7 Avian Protection Plans 103Overview of Avian Protection Plans 103Components of an Avian Protection Plan 104Creating and Implementing an Avian Protection Plan 109
Appendix A: Literature Cited and Bibliography 111
Appendix B: Designing Site-Specific Studies for Collision Monitoring 137Considerations for Site-Specific Collision Monitoring 138Issues Related to Estimating Mortality Rates 143
Appendix C: Glossary 147
Appendix D: Acronyms 153
Appendix E: Resources 155

SAM
PLE
Illustrations | v
i l l u s t r at i o n s
1.1 The highest wire on a transmission line is the shield wire, which can be difficult for birds, especially flocking birds such as waterfowl, to see. 2
1.2 Schematic of the electric power system from the generation facility to the customer (modified from Rural Utilities Service). 4
1.3 Transmission lines (left) and distribution lines (right). 41.4 Height comparison of transmission (typically 18.3 to 58 m
[60 to 190 ft] tall) (A) and distribution structures (typically 6.4 to 14.6 m [21 to 48 ft] tall) (B). 5
1.5 Horizontal (A) and vertical (B) transmission line configurations. 51.6 Bundled phase conductors on a three-phase, single-circuit,
138-kV transmission line. 61.7 Distribution underbuild on a double-circuit transmission line. 61.8 Shield wires are the highest wires on a transmission line. 71.9 The neutral wire is usually positioned below the phase conductors
on a distribution line. 71.10 Typical high voltage direct current transmission line structures. 81.11 Biologists gather data to assess the risk of bird collisions. 101.12 Engineers work with biologists to reduce risk through appropriate
design and routing of power facilities. 111.13 Engaging the public may help a utility meet requirements for
electrical reliability and reduce collision risk to birds. 12
2.1 APLIC has helped fund studies on the effectiveness of different types of line marking devices in reducing bird collisions with power lines. 14
2.2 In Canada, the first reported collision victims were snow geese. 162.3 Researchers have studied the effects of power line collisions on
vulnerable species, such as the Ludwig’s bustard of Europe, Asia, and Africa. 18
2.4 Because of the susceptibility of some endangered species, such as the whooping crane, power lines in these species’ ranges require careful evaluation and routing. 19
2.5 APLIC, EPRI, and CEC are three organizations that provide some funding for research on avian/power line interactions. 20
3.1 The Migratory Bird Treaty Act of 1918 is the legal cornerstone of bird protection in the United States, protecting more than 1,000 North American bird species such as this cedar waxwing (Bombycilla cedrorum). 22
FIGURE PAGE

SAM
PLE
vi | Illustrations
i l l u s t r at i o n s
FIGURE PAGE
3.2 Habitat Conservation Plans help landowners incorporate conservation measures for species, such as the wood stork (Mycteria americana), into their development plans. 23
3.3 Canada geese (Branta canadensis) are protected by both the Migratory Bird Treaty Act and Canada’s equivalent, the Migratory Birds Convention Act. 24
3.4 Most songbirds, such as these horned larks (Eremophilia alpestris),are protected by the Migratory Bird Treaty Act. 26
3.5 Bald eagles are protected under the Bald and Golden Eagle Protection Act and the Migratory Bird Treaty Act. 27
4.1 Collision risk is highly variable among species, with heavy-bodied birds, such as this common loon (Gavia immer), being more vulnerable because they cannot readily maneuver. 31
4.2 Because of their higher reproductive rates, common bird species are generally at less risk of population effects from power line collisions. 32
4.3 The United States’ population of endangered whooping cranes has had such significant mortality from natural causes that additional power line collision mortality is now viewed as a threat to the species. 34
4.4 Whooping crane migration corridor in North America (2005 data from Stehn and Wassenich 2007). 35
4.5 Collision mortality has occurred with the expansion of the reintroduced population of the endangered California condor. 35
4.6 Wing loading and aspect ratio, among other factors, influence susceptibility to collisions (after Bevanger 1998). 36
4.7 Birds with high wing loading, such as swans, are more susceptible to collisions. 37
4.8 Flocking species, such as these snow geese, can be more vulnerable to collisions. 38
4.9 Aerial hunters that forage in flight within a couple hundred meters (several hundred feet) of the ground, such as swallows, can become collision victims. 39
4.10 Swans’ poor frontal vision, along with their large size, increases their susceptibility to collisions. 40
4.11 Because they are nearsighted and fly at high speeds, mergansers may be unable to readily detect small diameter wires as they approach them. 41
4.12 Some juvenile birds, such as sandhill cranes, collide with power lines more frequently than their adult counterparts. 42
4.13 Endangered Newell’s shearwater mortalities at a Kauai power line were mostly non-breeding adult and subadult birds. 42
4.14 Gulls (pictured) and waterfowl tend to make feeding flights at dusk and dawn, when reduced light increases collision risk. 43

SAM
PLE
Illustrations | vii
i l l u s t r at i o n s
FIGURE PAGE
4.15 Power lines located between the foraging and roosting sites of wading birds, such as this white ibis (Eudocimus albus), may result in higher collision risk. 45
4.16 Research conflicts on whether or not overhead wires within a single habitat, such as this wetland, are more likely to cause collisions than those between two habitats. 45
4.17 Power lines crossing agricultural fields with seasonally attractive crops or residue can contribute to collision risk for some flocking species, such as cranes, waterfowl, songbirds, and these trumpeter swans (Cygnus buccinator). 47
4.18 Birds usually initiate migration in favorable weather conditions, but when they encounter inclement weather they may decrease their flight altitude, which increases collision risk when power lines are present. 49
4.19 Orientation of power lines parallel to ridges or narrow, low altitude flyways presents a lower risk of collision than perpendicular orientation. 51
5.1 Opportunities and strategies for minimizing collision risks. 545.2 The Bird Strike Indicator, a tool used to detect bird strikes with
power lines, can be installed from a bucket truck or helicopter. 575.3 Reducing collisions in wooded areas. A tree line or other obvious
obstacle at the appropriate height warns birds to gain altitude, which results in birds flying over the power line screened by the trees (after Thompson 1978). 59
5.4 Habitat modifications, such as cooperative programs to encourage earlier plowing of grain stubble, which is attractive to migrating sandhill cranes, may help to reduce collision risk. 60
5.5 Removing shield wires can reduce bird collisions but leaves the lines unprotected from lightning strikes and jeopardizes service reliability. 61
5.6 Buried power lines may be a solution to bird collisions in some instances, but can cost from 3 to 20 times more than overhead lines and have other environmental impacts. 63
5.7 Conceptual model of avian collision risk assessment. 655.8 Schematic of the terminology used when planning new
transmission lines. 675.9 Potential collision risk (A) has been reduced (B) when bird-use areas
are on the same side of the line (modified from Thompson 1978). 685.10 Routing with respect to local topographic features
(after Thompson 1978). 695.11 Reducing collisions by clustering lines in one right-of-way
(after Thompson 1978). 70

SAM
PLE
viii | Illustrations
i l l u s t r at i o n s
5.12 Collision risks for separate (A) and clustered (B) lines (after Thompson 1978). 71
5.13 Public participation programs may provide information through a public relations campaign, but they also go further to engage the public in discussions and decision making (after EEI 2001). 72
6.1 Studies at the San Luis National Wildlife Refuge show that the line marking devices tested work well for most species, the exception being the American coot, which is more vulnerable to collisions because it primarily flies at night. 79
6.2 A helicopter crew installing line marking devices on a power line. 816.3 Positioning of line marking devices on the central portion of
two shield wires on transmission lines (after Eskom Transmission [South Africa] 2009). 83
6.4 Positioning of line marking devices on one shield wire or staggered on two parallel shield wires. 83
6.5 Line marking devices staggered on a distribution line. 836.6 When a device is added to a power line, it may add to the loading
of the line, which further increases under icy or windy conditions and may also cause problems for deicing operations. 84
6.7 Power structures and line markers can become targets for vandalism and a detriment to service reliability. Public participation and outreach programs, like this hotline, may reduce vandalism. 85
6.8 Aerial marker spheres, also known as aviation balls, were designed to make power lines more visible to aircraft operators. 86
6.9 Aerial marker spheres in use on a power line above a wetland habitat. 866.10 Spiral vibration dampers act to reduce line vibration, and they also
make power lines more visible to birds. 886.11 The Bird-Flight™ Diverter is a spiral device made of PVC. 896.12 Bird-Flight™ Diverters installed on a distribution line. 896.13 The Swan-Flight™ Diverter is a double-ended spiral device. 916.14 Swan-Flight™ Diverters installed on the phase conductors of
a distribution line. 926.15 Examples of suspended devices (swinging and fixed). 946.16 The FireFly™ FF (left) has a swinging tag for use in light
winds and the FireFly™ HW (right) has a fixed tag to withstand higher, sustained winds. 95
6.17 BirdMark BM-AG (After Glow) in daylight (left) and darkness (right). 966.18 Hanging strips of neoprene, such as this Spanish-made Baliza
Avifauna, are being used as line marking devices in Europe and South Africa. 97
FIGURE PAGE

SAM
PLE
Illustrations | ix
i l l u s t r at i o n s
6.19 Baliza Avifauna installed on a power line in Europe. 976.20 The Avifaune Spiral is commonly used in France and other
parts of Europe. 986.21 Avifaune Spirals installed. 986.22 The Mace Bird Lite is a spiral device with a central fluorescent tube
that is illuminated by the ambient electrical field. 986.23 The RIBE line marking device is available as a swinging triangular
tag or as a series of black-and-white, rigid plastic pieces that swing (pictured). 99
6.24 The Inotec BFD 88, a South African device, is a reflective stainless steel sphere reported to be visible from all angles and in low-light conditions. 99
6.25 Tree wire on all three phases of a distribution line marked with suspended devices. 100
6.26 Tree wire (right of pole) and standard wire (left of pole) on a distribution line. 101
6.27 Collision-electrocutions cause an electrical short, like this one caused by tree branches, and can kill two or three birds in a flock even if only one bird makes phase-to-phase contact. 101
6.28 Tree wire on the top phase conductor of a two-phase distribution line (vertical configuration) with line marking devices. 102
7.1 Utility employee training should include the reasons and methods for reporting bird mortalities, nest management protocols, proper disposal of carcasses, applicable regulations, and the consequences of non-compliance. 104
7.2 An Avian Protection Plan may include opportunities to enhance avian populations or habitat with nesting structures, habitat restoration, or other projects. 107
7.3 Raising public awareness about avian collisions and the utility’s commitment to avian protection can increase support for an Avian Protection Plan. 108
7.4 Integrating an Avian Protection Plan into an electric utility’s operations will help the utility meet demands for reliable, cost-efficient, and environmentally compatible power delivery while protecting and enhancing bird populations. 110
B.1 Classes used to describe birds’ approach, crossing, and departure altitudes in collision studies on transmission lines (after James and Haak 1979). 139
FIGURE PAGE

SAM
PLE
x | Tables
ta b l e s
1.1 Quick guide to the Collision Manual. 31.2 Voltage classifications in North America. 4
4.1 Typical evidence of bird injuries or mortalities from power line collisions. 30
4.2 Average distance of collision mortalities from nearest water body. 46
6.1 Summary of data on line marking devices available in the United States. 766.2 Distance of collision mortalities from the nearest pole (parallel
to distribution lines in the right-of-way). 826.3 Spacing and positioning for aerial marker spheres (aviation balls). 866.4 Representative studies for aerial marker spheres (aviation balls). 876.5 Spacing and positioning for spiral vibration dampers (SVDs). 886.6 Representative studies for spiral vibration dampers (SVDs). 886.7 Spacing and positioning for Bird-Flight Diverters (BFDs). 906.8 Representative studies for Bird-Flight Diverters (BFDs). 916.9 Spacing and positioning for Swan-Flight Diverters (SFDs). 926.10 Representative studies for Swan-Flight Diverters (SFDs). 936.11 Spacing and positioning for general designs of suspended devices. 946.12 Representative studies for general designs of suspended devices. 956.13 Spacing and positioning for FireFlys. 966.14 Representative studies for FireFlys. 966.15 Spacing and positioning for BirdMark BM-AG. 97
B.1 Summary of considerations and issues for designing site-specific collision monitoring. 137
TABLE PAGE

SAM
PLE
Abstract | xi
a b s t rac t
PURPOSE AND SCOPE OF THIS MANUALReducing Avian Collisions with Power Lines (Colli-sion Manual) was first published by the AvianPower Line Interaction Committee (APLIC)and Edison Electric Institute (EEI) in 1994under the title Mitigating Bird Collisions withPower Lines. The 2012 edition of this manualprovides electric utilities, wildlife agencies, andother stakeholders with guidance for reducingbird collisions with power lines based on themost current information. This is especiallyimportant given the need to reduce birdinjury and mortality from collisions, complywith bird protection laws, and enhance thereliability of electrical energy delivery.
PROGRESS IN DEALING WITH COLLISION ISSUESIn the United States, most studies of birdcollisions have occurred since the late 1970s.These studies described the problem and ledto a growing awareness among stakeholders.In 1989, APLIC was founded to addresswhooping crane (Grus americana) collisionswith power lines. APLIC published its firstCollision Manual in 1994 to summarize theknowledge of bird collisions with power linesat that time. National and international collab-oration on bird/power line interactions hassince grown. Research today includes studies oncollision reduction, monitoring systems, andstandardization of collision mortality datacollection. Future priorities include improv-ing the comparability of studies, testing anddocumenting line marker efficacy, and refin-ing remote collision detection devices.As power line infrastructure expands to
meet the growing demand for electricity, the collision risk to avian species also seemslikely to increase. Yet, this risk may be reducedby assessing potential avian impacts duringline siting and routing, improving line mark-ing devices, standardizing study methods, andincreasing awareness.
AVIAN REGULATIONS AND COMPLIANCEIn the United States, three federal laws protect almost all native avian species andprohibit taking (killing or injuring) them evenif the act was unintended and occurred as a result of otherwise legal activities. TheMigratory Bird Treaty Act (16 U.S.C. 703-712) protects 1,007 (2012) North Americanmigratory bird species (50 CFR 10.13). The Bald and Golden Eagle Protection Act(16 U.S.C. 668-668c) provides additionalprotection for these two species. The Endan-gered Species Act (16 U.S.C. 1531-1555)provides protection to federally listed species(designated as threatened or endangered) and to their critical habitat. Utilities in theUnited States should work with both theU.S. Fish and Wildlife Service (USFWS) and state wildlife agencies to identify permitsand procedures that may be required.In Canada, two laws protect avian species
by prohibiting take. The Migratory BirdsConvention Act protects most species ofmigratory birds in Canada. The CanadianSpecies at Risk Act provides for the protec-tion and recovery of threatened and endan-gered species. Additional protection forspecies at risk has been developed by theprovincial governments, such as the AlbertaWildlife Act. Utilities in Canada should work with the Canadian Wildlife Service andprovincial wildlife agencies to identify permitsand procedures that may be required.
UNDERSTANDING BIRD COLLISIONSUnderstanding the nature of bird collisions isessential for minimizing them. Bird collisionswith power lines result from a complex mixtureof biological, environmental, and engineeringfactors. Biological characteristics includebody size, weight, maneuverability, flightbehavior, vision, age, sex, health, time of day,season, habitat, and habitat use. Environmentalconditions include land uses, weather, visibili-ty, lighting, and sudden disturbances.

SAM
PLE
xii | Abstract
a b s t rac t
Engineering aspects include size of lines, lineplacement, line orientation, line configuration,structure type, and sometimes obstructionlighting under Federal Aviation Administra-tion rules. It is difficult to extrapolate collision risk
from one power line study and apply or compare it with other studies because of site-specific conditions and the lack of standardstudy methods, which result in variability ofreported mortality rates. Species of birdsreported to be susceptible to collisions generally have a large body size, long wingspan, heavy body, and poor maneuverability.Examples include species of loons, storks,grebes, waterfowl, and some species of hawksand eagles. Flight behavior and other biologi-cal attributes contribute to species risk. Individual losses from collision mortality are unlikely to affect large and robust pop-ulations. However, for species that are rare or endangered, the loss of a few or even oneindividual may impact a local population orthe overall population’s viability.
MINIMIZING COLLISION RISKS Engineers and biologists can work together to identify and address collision issues whenmodifying existing lines or planning newlines. Early consideration of risk factors mayreduce the need for costly modifications later.In addition, while a utility is taking steps tominimize collision risk, a proactive publicparticipation program can address socialissues by building positive relationships,increasing public knowledge, identifying and responding to public concerns early, andpromoting responsible behavior (e.g., discour-aging vandalism of line marking devices). When modifying existing lines, study
options include collision monitoring, linemodification studies, and avian risk assess-ment. Line modifications must be carefullyevaluated to identify, quantify, and balance theexisting risks with the potential effectiveness
and risks posed by the alternatives. Riskreduction options include line marking, man-aging surrounding lands, removing the shieldwire, changing the size or configuration ofwires, rerouting the line, and burying lines.Typically, the first options are line markingand managing surrounding lands because theremaining options are seldom feasible. When planning new lines, three study
options can be used to identify the optimalroute: spatial analysis using GIS, field assess-ment, and avian risk assessment. Risk reduc-tion options could include line placement,orientation, and configuration relative to biological and environmental factors.
LINE MARKING DEVICESStudies suggest that most bird collisionsoccur with the shield wire, which is the small-est diameter and highest wire on a transmis-sion line. Many studies of lines with highcollision rates indicate that collision risk canbe lowered by 50% to 80% when these linesare marked, though the most recent studypublished at this writing demonstrated only a9.6% reduction (Barrientos 2012). However,recommendations for which device is themost effective and standard spacing are notpossible due to differences in study designsand site-specific conditions. As a result ofthese differences, reduction rates may not bereplicable from one line or study to another.Since 1994, line marking devices have
been further developed in North America,Europe, and South Africa. Advances in aerialmarker spheres, spirals, and suspendeddevices include changes to design, colors,attachments, and materials in an effort toimprove effectiveness and durability and toreduce possible damage to lines.
AVIAN PROTECTION PLANS In 2005, APLIC and the USFWS announcedtheir jointly developed Avian Protection PlanGuidelines (Guidelines). An Avian Protection

SAM
PLE
Abstract | xiii
a b s t rac t
Plan (APP) is a voluntary, utility-specificplan for reducing the risks to birds and system reliability that result from avian interactions with electric utility facilities. An APP provides the framework necessaryfor implementing a program to reduce bird
mortalities, document utility actions, improveservice reliability, and comply with bird protection laws. The Guidelines are intendedto help utilities craft their own APPs formanaging avian/power line issues that areparticular to their location and operations.

SAM
PLE
THIS PAGE INTENTIONALLY LEFT BLANK

SAM
PLE
Foreword | xv
f o r e wo rd
Avian interactions with power lines,including collisions, electrocutions,and nesting have been documented
since the early 1900s. Collisions with tele-graph lines were first reported in 1876.However, it was not until the 1970s thatbiologists, engineers, resource agencies, andconservationists began to realize the extent ofthese interactions. It was then that they beganinvestigating and addressing collision issues.We commend this early professional leader-ship in tackling a complex issue and buildinga foundation of credibility and cooperationthat characterizes the relationship betweenthe U.S. Fish and Wildlife Service (USFWS)and the Avian Power Line Interaction Com-mittee (APLIC) today.In December 1983, an ad hoc group
began to address whooping crane (Grus americana) collisions with power lines in theSan Luis Valley, Colorado. This work led tothe 1989 founding of APLIC and the publi-cation of Mitigating Bird Collisions with PowerLines: State of the Art in 1994 (Collision Manual),which became the companion of SuggestedPractices for Raptor Protection on Power Lines: Stateof the Art in 1981 (Electrocution Manual). The1994 Collision Manual brought together whatwas known about collision mitigation andpresented research protocols for studyingproblem lines. It focused on standardizingthese protocols so that data from variousstudies might be comparable and applicableto the issues experienced by electric utilitiesnationwide. This theme is carried forth andexpanded upon in this 2012 revision.
Today electric utilities across NorthAmerica recognize that bird/power lineinteractions may create operational risks,health and safety concerns, and avian injuriesor mortalities, all of which reduce electricalreliability and increase a utility’s liability. TheUSFWS is responsible for conserving andprotecting United States trust resources covered by the Migratory Bird Treaty Act,Bald and Golden Eagle Protection Act, andEndangered Species Act. It is within thispotentially adversarial framework that thelongstanding collaborative partnershipbetween industry and agency has emerged.With this edition of the Collision Manual
(now titled Reducing Avian Collisions with PowerLines) along with the 2006 Electrocution Manual,the 2005 Avian Protection Plan Guidelines, andEdison Electric Institute’s 2001 Introduction toPublic Participation, utilities have a toolbox ofthe latest technology, science, expertise, andfield experience. APLIC and the USFWShope you will use this edition of the CollisionManual, along with its companion documents,to help implement avian protection plans,conserve protected birds, and improve electrical system reliability.
Jerome FordUSFWS, Assistant Director Migratory Bird Program
Dave BouchardAPLIC, Immediate Past Chair
Peggy JelenAPLIC, Chair

SAM
PLE
xvi | Acknowledgements
ac k n ow l e d g e m e n t s
APLIC wishes to express appreciation to the following individuals and organizations for contributing their time, resources, and expertise to making the 2012 edition of this manual possible.
PROJECT LEADERS
Dave BouchardProject Manager, Lead EditorAmerican Electric Power
Misti SchrinerProject Manager, Science EditorWestern Area Power Administration
Karen C. HillProject Manager, Technical Editor-WriterNormandeau Associates, Inc.
James R. NewmanLead Author, Technical ReviewerNormandeau Associates, Inc.
CONTRIBUTORS AND REVIEWERS
Mike BestTechnical Reviewer Pacific Gas and Electric
Jenny CarterEditorNormandeau Associates, Inc.
Peter ColversonContributing AuthorNormandeau Associates, Inc.
Kara DonohueContributing Author, Technical ReviewerSouthern California Edison
Haley EdwardsContributing Author, Technical ReviewerPuget Sound Energy
Greg ForceyContributing AuthorNormandeau Associates, Inc.
Caleb GordonTechnical ContributorNormandeau Associates, Inc.
Nikki Heck Contributing Author, Technical ReviewerAltaLink
Sherry LiguoriTechnical Reviewer PacifiCorp
Albert M. Manville, IIContributing Author, Technical ReviewerU.S. Fish and Wildlife Service
Susan MarynowskiContributing Editor
Rocky PlettnerTechnical Reviewer Nebraska Public Power District
Von Pope Technical Reviewer Chelan County Public Utility
Dennis RankinContributing AuthorUSDA Rural Utilities Service
Tom Stehn Technical Reviewer U.S. Fish and Wildlife Service (ret.)
Natalie TurleyContributing Author, Technical ReviewerIdaho Power Company
Mel WaltersContributing Author, Technical ReviewerPuget Sound Energy
Ondine WellsContributing AuthorNormandeau Associates, Inc.

SAM
PLE
Acknowledgements | xvii
ac k n ow l e d g e m e n t s
SPECIAL THANKSAPLIC recognizes those who pioneeredresearch in avian collisions with power linesand those whose contributions made the 1994edition of this manual possible: Carroll Belser,Bill Bolin, Wendy M. Brown, Jim Burruss,Edward Colson, Alan Ansel, Bob Turner, JimLewis, Rod Drewien, Sidney A. Gauthreaux,Jr., Franz Koops, John Ledger, A. Dean Miller,Judith H. Montgomery, Maurice Murphy,Dan Pearson, Leroy Sanchez, Frank Schlicht,Dick Thorsell, Pete Quincy, Phil Havens,Frank Moseley, Mark Czaplewski, Sheila Byrne,Jerry Roppe, Jerry Martinez, Joel Mazelis,and Echo Films’ Morley Nelson, NormanNelson, and Tyler Nelson. The vision, effort,and energy of each of these individuals con-tinue to contribute to the growing under-standing of this complicated issue. APLIC also wishes to thank the following
individuals for their service during the pro-duction of this edition of the manual: Brad
Loveless, Dave Bouchard, and Peggy Jelen for serving as Chair of APLIC and RickLoughery for serving as the Edison ElectricInstitute Liaison to APLIC.
ADDITIONAL THANKSAdditional content was provided by MichelleTurner with the Canadian Electricity Associ-ation. Additional technical review was pro-vided by the following engineers: ArtisKarnei (American Electric Power), ChuckWright (PacifiCorp), Bard Jackson (USDARural Utilities Service), and Wayne Galli(Clean Line Energy Partners).
CONTRIBUTING LITERATUREA diverse collection of literature was used inthe research to prepare this manual. APLICacknowledges the great contribution that thisbody of literature made. This literature isincluded in Appendix A. Literature Cited and Bibliography.
This manual was funded by the Edison Electric Institute and the Avian Power Line Interaction Committee.

SAM
PLE
xviii | Acknowledgements
ac k n ow l e d g e m e n t s
APLIC COLLISION SUBCOMMITTEEThe APLIC Collision Subcommittee deserves special recognition for their dedication to avian collision research and protection efforts and for their review and guidance in creating the 2012 edition of this manual.
Sarah BallEdison Electric Institute
Mike BestPacific Gas and Electric
Dave BouchardAmerican Electric Power
Jim CandlerGeorgia Power Company
Amy DierolfProgress Energy
Kara DonohueSouthern California Edison
Haley EdwardsPuget Sound Energy
Jodie GlessFlorida Power & Light
Donald HarronAltaLink
Nikki Heck AltaLink
Peggy JelenArizona Public Service
Brendon JonesAltaLink
Carl KellerBonneville Power Administration
Sherry LiguoriPacifiCorp
Jim LindsayFlorida Power & Light
Rick LougheryEdison Electric Institute
Brad LovelessWestar Energy
Al ManvilleU.S. Fish and Wildlife Service
Sam MilodragovichNorthwestern Energy
Chuck PartridgePacific Gas and Electric
Mike PehoshNational Rural Electric Cooperative Association
Rocky PlettnerNebraska Public Power District
Von PopeChelan County Public Utility District
Dennis RankinUSDA Rural Utilities Service
John Rasmussen AltaLink
Misti SchrinerWestern Area Power Administration
Tom StehnU.S. Fish and Wildlife Service (ret.)
Natalie TurleyIdaho Power Company
Mel WaltersPuget Sound Energy

SAM
PLE
ick Thorsell had a lifetime devotionto birds and was one of the foundersof APLIC. He brought electric utili-
ties, government agencies, and environmentalgroups together to work in cooperation tostudy and mitigate bird deaths from powerline collisions and electrocutions. Dick cameto the Edison Electric Institute (EEI) in 1970after serving as the Executive Director of theStony Brook–Millstone Watershed Associationin New Jersey. Dick was the producer of filmson utility/natural resource issues, includingSilver Wires, Golden Wings.The film featuredMorley Nelson’s work on understanding andreducing raptor electrocutions. It broughtawareness of electrocution issues to electricutilities and credibility to the industry for itsefforts to address the problem. Dick was a WWII Navy veteran, and in
1953 he graduated from Lehigh Universitywith a B.A. in Conservation. During the summer of 1950, he took a job as a RangerNaturalist for the U.S. National Park Service.In 1954, as a graduate student, he travelled to Bermuda to help determine what wasdestroying nests of the Bermuda petrel, orcahow (Petrodroma cahow), a bird that until
1951 was thought to have been extinct formore than 300 years. During 47 days of fieldobservations he conceived a way to reducenest predation of the cahow by the moreaggressive white-tailed tropic bird (Phaethonlepturus), known in the islands as the longtail.His solution was credited as one of the mostcritical developments in the cahow’s recoveryand conservation.In 1988, Dick was honored by the Raptor
Research Foundation for his pioneeringefforts in raptor protection: “All who appreciatethe flight, spirit, and symbolism of the golden eagle arein your debt; and those who know you well enoughunderstand that having hundreds, if not thousands of living eagles to your credit, is sufficient personalaward for your accomplishments.”Dick received APLIC’s Morley Nelson
Award in 2009 to acknowledge his efforts inpioneering avian/power line conservation andhis dedication to developing and maintainingpositive partnerships among the key interestsin avian/power line issues.Dick retired from EEI in1991 and pur-
sued his personal interests while remainingever ready to advise the industry on develop-ing issues and to keep us on track.
this publication is dedicated to the memory of
Richard “Dick” S. Thorsell(April 11, 1927 – April 15, 2012)
D

SAM
PLE
THIS PAGE INTENTIONALLY LEFT BLANK

SAM
PLE
Introduction | 11c h a p t e r 1
Introduction
Reducing Avian Collisions with Power Lines (Colli-sion Manual) was first published by the AvianPower Line Interaction Committee (APLIC)and the Edison Electric Institute (EEI) in1994, under the title Mitigating Bird Collisionswith Power Lines, as a comprehensive review ofavian collisions with power lines (collisions)and recommendations for minimizing them.Since 1994, the understanding of bird colli-sions and the methods for reducing them hasgrown (e.g., Bevanger 1994, 1998; Janss 2000;Rubolini et al. 2005; and Jenkins et al. 2010).Collisions with power lines cannot be elimi-nated, but they can be reduced. This editionof the manual builds upon the foundation ofthe 1994 Collision Manual using the researchand experience gained through the years sinceits original publication.Power lines are an integral part of the
modern landscape. Estimates of the numberof miles of transmission lines in the United
States range from 862,000 kilometers (km)(535,622 miles [mi]) (J. Goodrich-Mahoney,EPRI, pers. comm.) to 1,024,534 km(636,616 mi) (EEI 2010) based on 2009and 2010 data from the Federal Energy Regulatory Commission, North AmericanElectric Reliability Corporation, and othersources. For distribution lines, the number of miles is less certain, but it is about five tosix times that of transmission lines based ontwo large company systems (D. Bouchard,pers. comm.).Some bird species that are active in the
vicinity of power lines are more susceptible tocollision and electrocution risk than others.The risks and reduction measures for birdelectrocutions are addressed in the publicationSuggested Practices for Avian Protection on Power Lines:The State of the Art in 2006 (APLIC 2006).Power lines are only one of numerous
anthropogenic causes of bird collision mor-
Some birds flying in the vicinity of power lines may be susceptible to collision. While powerlines are only one of numerous causes of bird injury and mortality, collisions with power linescan be reduced. This chapter introduces the problem of bird collisions, defines the categoriesand configurations of power lines, and presents the biological, engineering, economic, andsocial and cultural perspectives on bird/power line collisions.
IN THIS CHAPTER Purpose and Scope of the ManualReader Guide to the Manual
Overview of Power LinesPerspectives for Dealing with Bird Collisions
chapter 1 | Introduction | 1
PURPOSE AND SCOPE OF THE MANUAL

SAM
PLE
12 | chapter 1
tality. Others include tall buildings, windows,vehicles, communication towers, airplanes,and wind turbines (Avery et al. 1980; Erick-son et al. 2005). Estimates of bird collisionmortality vary widely because of differencesin mortality monitoring and extrapolations ofthose data. Based on reviews, Erickson et al.(2005) estimated that buildings and windowsaccount for most bird collision mortality inthe United States, followed by power lines,automobiles, communication towers, andwind turbines. This manual only addressesbird collisions with power lines. Interactions between birds and power lines
are a complex mixture of biological, environ-mental, and engineering factors. Electric utilitystakeholders need to understand the nature ofbird interactions with power lines when siting,routing, and designing power lines and deter-mining mortality reduction measures. This isespecially true given the need to reduce birdcollisions, comply with bird protection laws,and enhance reliable electrical energy delivery. This manual was developed for electric
utilities, wildlife agencies, and other stake-
holders and is based on what is known todate about collisions. It is intended to providethis audience with:
• An overview of power lines and perspec-tives on dealing with avian/power line collisions (Chapter 1)
• A summary of current knowledge, litera-ture, and field experience related to aviancollisions with power lines and the factorsthat influence them (Chapters 2 and 4)
• A discussion of the laws, regulations, andthe operational implications of avian collisions (Chapter 3)
• A review and discussion of current prac-tices for planning, management options,study design, and devices used to minimizeavian collisions with power lines (Chapter 5,Chapter 6 and Appendix B)
• An overview for developing an Avian Protection Plan (Chapter 7)
• A compilation of collision literature spanning several decades (Appendix A)
• A glossary of collision terms and resources forfurther information (Appendices C and E)
FIGURE 1.1: The highest wire on a transmission line is the shield wire, which can be difficultfor birds, especially flocking birds such as waterfowl, to see.
© J
ER
RY L
IGU
OR
I

SAM
PLE
Introduction | 3
• Chapter 1. Introduction• Chapter 2. Progress in Dealingwith Collision Issues
• Chapter 3. Avian Regulationsand Compliance
• Chapter 4. Understanding Bird Collisions
• Chapter 5. Minimizing Collision Risks
• Chapter 6. Line Marking toReduce Collisions
• Chapter 7. Avian ProtectionPlans
• Appendix A. Literature Cited and Bibliography
• Appendix B. Designing Site-Specific Studies for Collision Monitoring
• Appendix C. Glossary • Appendix D. Acronyms• Appendix E. Resources
Table 1.1 provides a quick guide to common collision topics in this manual. Readers can alsosearch the electronic version (a CD is included) for specific keywords. This man ual consists of the following chapters and appendices.
Subject Chapter(s)
Power lines, voltage, and the electric power system 1
Perspective of power line engineers 1, 4, 5, 6
Perspective of biologists 1, 4, 5, Appendix B
Perspective of the public and other stakeholders 1, 5, 6, 7
Advantages and disadvantages of underground power lines 1, 5
History of bird collisions and mitigation 2, 6, Appendix A
Current state of knowledge related to bird collisions 2, 4, 5, Appendix A
Funding organizations for collision research 2, Appendix E
Study methods and options 2, 4, 5, Appendix B
Strategies and approaches to address bird collisions 2, 4, 5, 6, 7
Laws and policies governing birds and bird mortality 3
Permits related to bird laws and policies 3
Factors that contribute to collisions 4
Variability in reported collision mortality rates 4
Significance of mortality for bird populations 4
Scientific methods to assess risk and impacts 4, 5, Appendix B
Methods for reducing bird collisions on an existing power line 5, 6
Methods for routing and designing a new power line while minimizing bird collisions 5, 6
Benefits of public participation 5, 7
Legal issues and other considerations for line marking 6
Effectiveness of line marking devices 6
How to develop a voluntary, utility-specific Avian Protection Plan 7
TABLE 1.1: Quick guide to the Collision Manual.
READER GUIDE TO THE MANUAL

SAM
PLE
TRANSMISSION VERSUS DISTRIBUTION LINESPower lines are rated and categorized, in part,by the level of electrical voltage they carry.Because the amount of electricity is large,voltage is usually specified as kilovolts (kV)where 1 kV is equal to 1,000 volts (V). In a power system, from the power generationfacility to the customer (Figure 1.2), fourvoltage classifications are used: power source,transmission, distribution, and utilization(Table 1.2). Although there are exceptions to
14 | chapter 1
these voltage classifications, they hold in gen-eral and will be used this way in this manual.Voltage classification also depends on the
purpose a power line serves. Transmission lines(≥60 to 765 kV) are used to transmit largeblocks of electricity from the power generationfacility to the load centers (communities).Within load centers, the high voltage of trans-mission lines is reduced at substations and thendelivered via distribution lines (2.4 to 60 kV)for residential, commercial, and industrialuses. The distribution voltages are againstepped down to the lower voltages for theend user (120 to 600 V) usually by pole- andpad-mounted transformers. Both transmissionand distribution lines are power lines, a termused throughout this manual (Figure 1.3).
OVERVIEW OFPOWER LINES
Distribution Substation
Transformer
Towers
Poles
Transmission Substation
Power Generation Facility
High Voltage Transmission Lines
Distribution Lines
FIGURE 1.2: Schematic of the electric power system from thegeneration facility to the customer (modified from Rural UtilitiesService).
Classification Voltage
Power Generation Facility 12 V to 22 kV
Transmission 60 to 765 kV*
Distribution 2.4 to 60 kV
Utilization 120 to 600 V
* This is the typical range for transmission; however, there are exceptions.
TABLE 1.2: Voltage classifications in North America.
FIGURE 1.3: Transmission lines (left) and distribution lines (right).
© J
ER
RY L
IGU
OR
I (LE
FT) A
ND
DAV
E B
OU
CH
AR
D, A
EP (R
IGH
T)

SAM
PLE
Introduction | 5
FIGURE 1.4: Height comparison oftransmission (typically 18.3 to 58 m [60 to190 ft] tall) (A) and distribution structures(typically 6.4 to 14.6 m [21 to 48 ft] tall) (B).
POWER LINE CONFIGURATIONPower lines may be energized (carrying electric-ity) or non-energized (grounded). Energizedlines are called phase conductors. Distribu-tion lines may have one, two, or three phaseconductors per circuit. Alternating current(AC) transmission lines always have threephases per circuit, and structures may carrymultiple circuits. For example, a three-phase,double-circuit line would have six phase con-ductors. Phase conductors may be configuredhorizontally or vertically on the tower or pole(Figure 1.5). High voltage transmission linesmay be bundled, which means two to six linesper phase are placed in close proximity toeach other instead of using only one line perphase (Figure 1.6). Distribution lines mayalso be installed on transmission structuresbelow the transmission lines; this is referredto as a distribution underbuild (Figure 1.7).
A. Horizontal Configuration on a Typical 115 kV Wood H-Frame Structure
Front View Side View Front View Side View
B. Vertical Configuration on Typical 115 kV Structure
Phase Conductors Phase Conductors
Shield WiresShield Wires
Energized Grounded
FIGURE 1.5: Horizontal (A) and vertical (B) transmission line configurations.
45.7 m(150 ft)
12.2 m(40 ft)
A B

SAM
PLE
Non-energized conductors are at groundpotential or zero voltage potential. There aretwo kinds of non-energized conductors:shield wire (also called static wire or overheadground wire) and neutral wire. Shield wires are installed above the phase
conductors on transmission lines to protectthem from lightning (Figure 1.8). Static elec-tricity from the shield wire is taken to earth(ground) by grounding conductors. In a lowlightning area, some transmission lines withlower voltages (e.g., 69 kV) may not have ashield wire. Shield wires are the lines most
16 | chapter 1
FIGURE 1.6: Bundled phase conductors on a three-phase,single-circuit, 138-kV transmission line.
FIGURE 1.7: Distribution underbuild on a double-circuit transmission line.
associated with bird collisions on transmis-sion lines because they are the highest wire andare smaller in diameter (1 to 1.3 centimeters[cm]; 0.4 to 0.5 inches [in])1 than phase con-ductors (2.5 to 5 cm [1 to 2 in]; bundled linesare multiples of these), making them moredifficult to see (e.g., Savereno et al. 1996). Whenbirds are flying at the elevation of shield wiresor gaining altitude to avoid the more visiblephase conductors, the potential for collisionwith the shield wire increases. For more infor-mation on how power line configurationaffects collision risk, see Chapters 4 and 5.
1 Measurements are provided first in metric, then in English form.
Bundled PhaseConductors
Shield Wire
© D
AVE B
OU
CH
AR
D, A
EP
© J
ER
RY L
IGU
OR
I
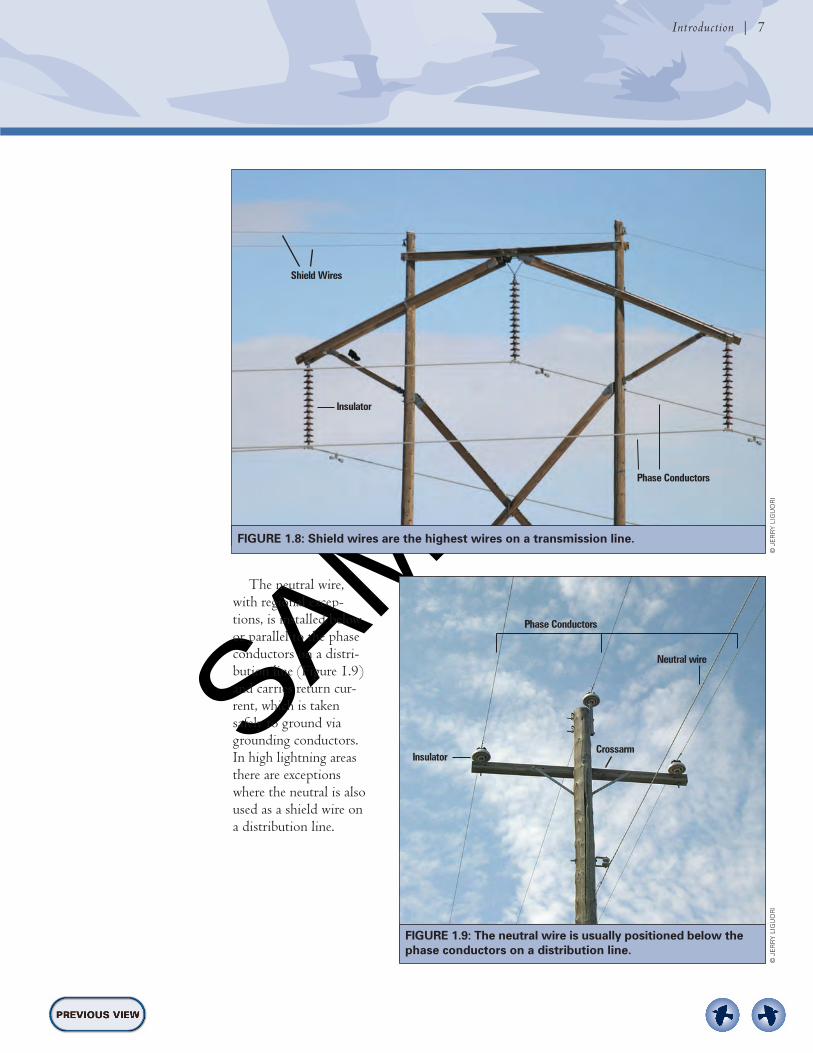
SAM
PLE
The neutral wire,with regional excep-tions, is installed belowor parallel to the phaseconductors on a distri-bution line (Figure 1.9)and carries return cur-rent, which is takensafely to ground viagrounding conductors.In high lightning areasthere are exceptionswhere the neutral is alsoused as a shield wire ona distribution line.
Introduction | 7
FIGURE 1.8: Shield wires are the highest wires on a transmission line.
FIGURE 1.9: The neutral wire is usually positioned below thephase conductors on a distribution line.
Shield Wires
Insulator
Phase Conductors
Phase Conductors
CrossarmInsulator
Neutral wire
© J
ER
RY L
IGU
OR
I ©
JER
RY L
IGU
OR
I

SAM
PLE
18 | chapter 1
High Voltage: Alternating Current versus Direct Current
Alternating current (AC) transmission and distributionsystems are the world’s most prevalent type of line. ACtransmission systems consist of three phases, eachphase consists of 1 to 6 wires (two or more is a bun-dle). Three phases make a circuit, and a line may havemore than one circuit. AC phases may be arrangedeither horizontally or vertically. As voltage increases,loss over distance decreases, but at some distance highvoltage direct current (HVDC) becomes more efficientthan high voltage alternating current (HVAC). HVDCtransmission systems have a growing presence in theUnited States and the world. They are most effective intransmitting electricity long distances at high voltages
(400 to 600 kV in North America and up to 800 kVin other countries). HVDC structure design is similarto HVAC designs, but with two poles instead of threephases (Figure 1.10). HVDC is transmitted on twobundled conductors known as positive and negativepoles. The poles are spaced at least 9.1 meters (m) (30 feet [ft]) apart and are always arranged horizontally.Both systems require shield wires for lightning protec-tion. Most importantly, both systems have the samecautions for attaching collision-preventive devices, i.e.,these devices may be applied to shield wires, but are notalways compatible with energized lines ≥150 kV or asmanufacturers have otherwise demonstrated.
FIGURE 1.10: Typical high voltage direct current transmission line structures.
Shield wire
Monopole Structure Lattice Structure
Shield Wire
Conductor Bundle
120-160'
120-200'
Conductor Bundle
Energized Grounded

SAM
PLE
MEETING ELECTRICAL POWER DEMANDS(LOAD REQUIREMENTS)A power line’s voltage, configuration, conduc-tor spacing, location, and structure type aredetermined by the present and anticipatedpower demands or load requirements the linewill serve. Because electric utilities are requiredby law to provide reliable electrical service,they plan, fund, and build new power lines. If enough power is available in an area, thenbuilding new distribution lines can sometimesmeet the increasing demand. Alternatively oradditionally, transmission lines can be built to
Introduction | 9
bring power to the load center from distantpower generation facilities. Transmission line corridors are deter-
mined by the location of power generationfacilities and substations in relation to loadcenters. Within the corridor, the preferredand alternative routes are determined, amongother things, by rights-of-way (ROWs) avail-ability, land use patterns, potential environ-mental impacts, terrain, archeological sites,proximity to habitable dwellings, and cross-ings over water, highways, and other powerlines (see Planning New Power Lines in Chapter5 for a discussion and illustration of theplanning process). Different ROW widths are required for
different transmission line voltage ratings;these are generally determined by statestatutes and the National Electrical SafetyCode. ROW widths are also a function ofstructure height, span length, the conductorheight above ground, and the low point ofthe conductor. ROW widths for transmissionlines will vary from 15.2 m (50 ft) to morethan 60.9 m (200 ft). Because ROWs arebecoming increasingly difficult to obtain,
Overhead versus Underground Power Lines
Electric utilities install power lines eitheroverhead or underground depending uponnumerous considerations. Some key factorsinclude customer needs, costs, code require-ments, terrain, voltage, and technological andenvironmental restrictions. Cost is a majorconcern as electric utilities have mandates toserve customers with high quality, reliableelectric service at the lowest cost possible. Power lines, particularly residential dis-
tribution lines, are installed undergroundin many areas throughout the country
where it has been found technically andfinancially feasible to do so. However, attransmission voltages, there are many moreareas where installing lines underground isnot feasible (see Burying Power Lines on page62). It becomes more practical to buildthem overhead as the voltage of the lineincreases. Therefore, the focus of this man-ual is to provide guidance for addressingissues associated with reducing collisionrisks on overhead power lines.
Transmission Lines and Renewable Energy
Current renewable energy mandates areleading to the development of wind,solar, and other renewable sources.Because these renewable energy sourcesare typically remote, new transmissionlines are often needed to connect themto the grid and carry electricity to loadcenters.

SAM
PLE
it is a common practice to increase the volt-age levels of lines in existing ROWs whenstatutes and safety allow. As voltages increase,the amount of power that can be transmitted
110 | chapter 1
increases by a greater multiple.2 Transmissionvoltages for carrying electricity long distancesare generally in the range of 115 to 765 kVin the United States.
FIGURE 1.11: Biologists gather data to assess the risk of birdcollisions.
2 The carrying capacity of a line increases at a greater rate than the increase in voltage, i.e., one 765-kV circuit = three 500-kV circuits = six 345-kV circuits. Another advantage of higher voltage is that the voltage drop or loss over distance decreases as the voltage increases.
PERSPECTIVES FOR DEALING WITH BIRD COLLISIONS
A single approach is rarely successful in solv-ing a complicated, multi-faceted issue such asbird collisions with power lines. An integrat-ed approach that considers the biological,environmental, engineering, economic, andsocial and cultural perspectives of collisionsis needed.
BIOLOGICAL AND ENVIRONMENTALPERSPECTIVESBiologists generally focus on gathering datato better understand the problem and creat-ing solutions to minimize collision risk. Util-ity biologists and/or their consultants maybe responsible for site evaluation studies andcollision studies (see Chapters 5 and 6 andAppendix B). Site evaluation studies deter-mine baseline avian and habitat conditionsand assess the possible collision risks to birds
following power line construction. Collisionstudies can help determine reliable mortalityrates and quantify the effectiveness of mea-sures taken to minimize collisions.Collecting high quality data is critical for
collision studies. Utilities should plan theirstudies carefully, using methods and metricsthat can be replicated to gather and analyzedata. The data should be sufficient for use inestimating the likelihood of collisions and formeasuring the effectiveness of collisionreduction efforts. In addition, methods mustbe sufficiently flexible to accommodate thespecies and site-specific conditions beingstudied and applied consistently throughout astudy and between studies (Bevanger 1999;Barrientos et al. 2011). In most cases, the approach to these studies
is based on type of information needed tomake management decisions, determine if linemodifications are effective, and/or identifyareas of bird activity and high collision risk.In some cases, wildlife agencies may recom-mend specific studies or protocols, and it isadvisable to obtain their comments on a studydesign. Utilities and their consultants shouldalso consider peer review by independent sci-entists for the study findings, since the resultsmay undergo rigorous legal cross-examinationif the issue is litigated. Publication in a refer-eed scientific journal is encouraged because it makes the data more widely available and contributes to a greater resource pool for thedevelopment of study design methods.
© J
ER
RY L
IGU
OR
I

SAM
PLE
Introduction | 11
ENGINEERING PERSPECTIVEEngineering research, development, anddesign are essential in the integratedapproach to preventing or minimizingbird/power line collisions. Utility engineersshould work with biologists early in thedesign and routing process to identify thekey collision issues (see Chapter 4) and todevelop feasible collision reduction strategieswhen modifying existing lines and planningnew lines (see Chapters 5 and 6). Early sci-ence-based site evaluations and avian riskassessments can be part of improving routeselection and line configurations to minimizecollision problems. This can reduce or elimi-nate the need for costly modifications afterconstruction. Design decisions also includeother factors such as cost, routing throughpublic or private land, crew availability, andmaterial availability; as a result, a less favor-able design for avian interactions may needto be used.
FIGURE 1.12: Engineers work with biologists to reduce risk through appropriate design androuting of power facilities.
ECONOMIC PERSPECTIVENo integrated approach would be completewithout considering the economics of con-struction, operation, and maintenance of apower line. The cost for bird friendly powerlines and configurations needs to be includedduring the design phase and route selection.A cost benefit analysis of appropriate collisionminimization designs and mitigation can beperformed. The later in the process that abiological or engineering solution is initiated,the more difficult, time-consuming, and costlyit can become. Since electrical reliability ismandated by utility commissions, avoidingpower outages, including those caused bybirds, is a priority for electric utilities. Earlyplanning can help meet requirements for reli-ability, regulatory compliance, efficiency,public acceptance, and cost-effectiveness.
© U
SD
A/A
RS

SAM
PLE
SOCIAL AND CULTURAL PERSPECTIVESIn addition to cost and power reliability, thepublic may have concerns about power linedesign and placement, including esthetics,environmental effects, wildlife, and safety.Vandalism is also a persistent problem. Elec-trical components and line marking deviceson power lines can become targets. Engagingthe public may make it easier for a utility tomeet the requirements of providing reliableelectricity while reducing risks to birds. It
can also reduce delays and costs associatedwith controversy and litigation (EEI 2001). Utilities and their consultants can use a
variety of public participation tools to engagethe public (see Chapter 5 and Appendix E).Used effectively, these tools can build positiverelationships, increase public knowledge,identify and respond to public concerns early, and promote responsible behavior (e.g., discouraging vandalism of line marking devices).
112 | chapter 1
FIGURE 1.13: Engaging the public may help a utility meet requirements for electricalreliability and reduce collision risk to birds.
© U
SFW
S

SAM
PLE
Progress in Dealing with Collision Issues | 132c h a p t e r 2
Progress in Dealing with Collision Issues
UNITED STATESThe first reported bird collision with overheadlines in the United States was documented in1876 (Coues 1876); numerous bird carcasses,mostly horned larks (Eremophilia alpestris), werereported during one week in a 5.8-kilometer(km) (3-mile [mi]) section of an overheadtelegraph line between Cheyenne, Wyoming,and Denver, Colorado. Coues indicated thatsuch collisions had already been reported inEurope, although no references were given.Another early report of collisions with electricwires in the United States was documented in 1904 (Emerson 1904). Emerson reportedthat shorebirds, as well as a black rail (Lateral-lus jamaicensis), collided with electrical wiresover a salt marsh and evaporation ponds in the San Francisco Bay area. Avery et al.(1980) provides an annotated bibliography of other early power line collision literature.
Most collision studies have been publishedsince the late 1970s and have led to a growingawareness among stakeholders. During the1970s, Bonneville Power Administration conducted studies on reducing collisions withpower lines (Lee and Meyer 1977; James andHaak 1980; and Beaulaurier 1981). Lee andMeyer (1977) proposed using devices such asimage intensifiers for nocturnal observationand collision detectors that would measurethe number of bird strikes on wires. Theyalso suggested using thermal imaging, a rela-tively new technique at the time, to view birdsand bats flying near power lines and windturbines. Lee and his colleagues set a new scientific standard for studies of the interac-tion between birds in flight and power lines.
In 1978 bird/power line issues wereaddressed at a national conference sponsoredby the U.S. Fish and Wildlife Service (USFWS),
Much progress has been made since the 1970s in understanding and addressing birdcollisions with power lines. This chapter recalls the conferences and studies that haveoccurred in North America and internationally. The major avian power line researchorganizations are introduced, along with future research priorities.
IN THIS CHAPTER North America International Future Research Priorities
chapter 2 | Progress in Dealing with Collision Issues | 13
NORTH AMERICA

SAM
PLE
214 | chapter 2
the Environmental Protection Agency, andthe Oak Ridge Associated Universities (Avery1978).3 This conference was followed by a1978 meeting at the Edison Electric Institute(EEI) in Washington, D.C. There, EEI andthe Electric Power Research Institute (EPRI)discussed a research program on bird/powerline interactions. EPRI funded an assessmentof completed, ongoing, and planned research;an analysis of future research needs regardingthe impact of power lines on birds in flight;and a series of studies aimed at developingdifferent methods for measuring the impactof power lines on birds in flight.
In 1989, a group of biologists represent-ing a wide range of utility interests, togetherwith representatives from the USFWS andthe National Audubon Society, formed theAvian Power Line Interaction Committee(APLIC).4 APLIC, in cooperation with the
USFWS, funded a study on the effectivenessof different types of line markers in the SanLuis Valley of Colorado. Such a study wasneeded because aerial marker spheres werecommonly recommended for power lineswhere bird collision potential existed,although there were no data that establishedtheir effectiveness. Further details can befound in Brown and Drewien (1995).
APLIC and EPRI were also instrumentalin developing and providing funding for aninternational conference on bird interactionswith utility structures (Miami, September1992). The proceedings of that workshopincluded papers and case studies by researchersfrom various utilities and universities in theUnited States, Canada, South Africa, andIndia, and other organizations and agenciesincluding the USFWS, Bureau of Land Management, and U.S. Navy.
3 Avery 1978 is the citation for the USFWS version of the proceedings; the original proceedings were documented by Oak Ridge Associated Universities. This reference will be noted as Avery 1978 in this document.
4 Founding APLIC utility members included Bonneville Power Administration, Edison Electric Institute, Central and South West Services (currently American Electric Power), Florida Power & Light Company, Houston Lighting and Power Company (currentlyCenterPoint), Nebraska Public Power District, Pacific Gas and Electric Company, Pacific Power & Light Company (currently Pacifi-Corp), Public Service Company of Colorado (currently Xcel Energy), San Luis Rural Electric Cooperatives, Southern California Edison Company, and Virginia Power (currently Dominion). A list of current APLIC members can be found at www.aplic.org.
FIGURE 2.1: APLIC has helped fund studies on the effectiveness of different types of linemarking devices in reducing bird collisions with power lines.
© JERRY LIGUORI

SAM
PLE
Progress in Dealing with Collision Issues | 15
• Corona Testing Devices Used to Mitigate BirdCollisions (EDM 2004).
• Assessment of Avian Mortality from Collisionsand Electrocutions (Dorin and Spiegel 2005)
• Preventing Raptor Electrocutions in an UrbanEnvironment (Dwyer and Mannan 2007)
• Evaluating and Reducing Avian Collisions withDistribution Power Lines at Cosumnes RiverPreserve (Yee 2007)
• Bird Strike Indicator Field Deployment at theAudubon National Wildlife Refuge in NorthDakota (Pandey et al. 2008)
• Raptor and Corvid Response to Power Distribution Line Perch Deterrents in Utah(Prather and Messmer 2010)
• Evaluating Diverter Effectiveness in ReducingAvian Collisions with Distribution Lines at SanLuis National Wildlife Refuge Complex, MercedCounty, California (Ventana Wildlife Society2009)
• Contemporary Knowledge and Research NeedsRegarding the Potential Effects of Tall Structureson Sage-grouse (UWIN Cooperative 2010)
• Protocol for Investigating the Effects of Tall Structures on Sage-grouse (Centrocercus spp.)Within Designated or Proposed Energy Corridors(UWIN 2011)
• Line Marking Study near Coleharbor, ND,2006-2008 (WAPA 2011)
In 1994, APLIC published Mitigating BirdCollisions with Power Lines (APLIC 1994) tocompile the research on bird collision issuesto date. Since then, research and reviews ofthis issue have continued. In 1999, EPRIheld a workshop sponsored by APLIC andEEI entitled Avian Interactions with Utilityand Communication Structures, whichincluded papers and discussions on the birdcollision issues these two industries face (seeEPRI 2001). Every three to four years since1976, electric utilities and utility organiza-tions including EEI, EPRI, and APLIC helpsponsor the International Symposium onEnvironmental Concerns in Rights-of-WayManagement. This symposium often includespapers on bird collisions. APLIC also con-ducts avian protection workshops at its semi-annual business meetings and at other times through the year upon request(see www.aplic.org for information onupcoming workshops).
Since the early 2000s, the California Ener-gy Commission (CEC) has sponsored a largenumber of research projects including identi-fication of research needs on avian collisionswith power lines in California: A Roadmap forPIER Research on Avian Collisions with PowerLines in California (Hunting 2002). CEC alsohas a searchable database on avian collisionliterature, An Annotated Bibliography of AvianInteractions with Utility Structures (CEC 2011).
Other CEC, APLIC, and EPRI sponsoredstudies include:
• Human-related Causes of Raptor Mortality inWestern Montana: Things are not Always as They Seem (Olson 2001)
• Bird Strike Indicator/Bird Activity Monitor and Field Assessment of Avian Fatalities(EPRI 2003)
• Raptor and Raven Electrocutions in NorthwesternMexico (Cartron et al. 2004)
Bibliographies of Collision Literature
Appendix A of this manual includesthe literature cited and a bibliographyof collision literature. An annotatedbibliography of early collision literaturewas provided by Avery et al. (1980). Inaddition, the California Energy Com-mission hosts a searchable database oncollisions: On-Line Annotated Bibliographyof Avian Interactions with Utility Structures(CEC 2011).

SAM
PLE
CANADAThe first reported bird collision in Canadawas published by Blokpoel and Hatch (1976)after several thousand snow geese (Chencaerulescens) were flushed by an aircraft into atransmission line. The geese had been feedingon a stubble field near Winnipeg, Manitoba.Between 25 and 75 geese were reportedlyinjured or killed after striking the wires.Since then, there have been few published
accounts of bird collisions in Canada. In1997, the Blue Jay published a discussion on birds and power line risk (Curtis 1997).Other accounts can be found in proceedingsfrom the Canadian hosted 5th and 7th
International Symposium on Environmental Concerns in Rights-of-Way Management in Quebec (1993) and Alberta (2000). In2007, a study on using a landscape-scalemodel to predict the risk of collisions inAlberta was completed (Heck 2007; Quinnet al. 2011). It examined the practicality ofusing GIS spatial modeling to predict areaswith elevated collision frequency across large,existing electric service territories.
216 | chapter 2
Bird/power line interaction knowledge isgrowing in Canada and more emphasis isbeing placed on identifying the root cause in relation to a utility’s reliability issues. Thecause of many outages has been identified as adirect result of wildlife interactions, includingbirds. Many utilities are also installing linemarking devices in areas where collisions havebeen reported or suspected.Depending on the species, collisions with
power lines may be violations of federal andprovincial wildlife laws (see Chapter 3) andcan result in penalties. Most bird species present in Canada are migratory and are veryoften the same species present in the UnitedStates and subject to many of the same collision risks, which stem from the same biological, environmental, and engineeringfactors outlined in Chapter 4. Although Canada has wildlife laws in
place, as of 2011 there is not a Canadianorganization addressing the management ofbird interactions with power lines; so Canadi-an companies have turned to American utili-ties for support by joining APLIC. In 2012,the first APLIC workshop in Canada washeld in Banff. Electric utility representatives,consultants, contractors, and government regulators from across the country attended. In addition to legal requirements and due
diligence, Canadian companies have recognizedthat bird collisions need to be minimized forenvironmental, public relations, and publichealth reasons. Through increased manage-ment of avian collision issues, companies have been better able to demonstrate to utilitystaff, regulators, and the public, their commit-ment to reducing utility impacts on birds.
MEXICOIn Mexico, the USFWS has been workingwith officials of the Mexican governmentthrough the Trilateral Committee of theNorth American Free Trade Agreement, the
FIGURE 2.2: In Canada, the first reported collision victims were snow geese.
© D
AVE
MA
NK
E, U
SFW
S

SAM
PLE
Progress in Dealing with Collision Issues | 17
Important collision research has been con-ducted in Europe, Asia, and Africa. In 2003,BirdLife International prepared the guideProtecting Birds from Power Lines: A practical guideon the risks to birds from electricity transmissionfacilities and how to minimize any such adverse effect(BirdLife International 2003). It reviewed therisks from power lines, including collisions,and recommended standards to protect birds,siting considerations, use of undergroundpower lines, hiding or obscuring power linesagainst more prominent landscape features,and the use of line marking devices. In 2007,BirdLife International developed a policyposition statement on the risks to birds fromtransmission lines (BirdLife International2007). In 2009, the Council of Europeissued Follow-up Recommendation No 110, 2004(Schuerenberg et al. 2009) on minimizingadverse effects of power lines on birds. Itreviews standards and retrofitting methodsand provides an exhaustive list of actionstaken by 26 European countries.
In 2011, the United Nations Environ-ment Programme (UNEP) for the African-Eurasian Waterbird Agreement (AEWA) andthe Convention on Migratory Species (CMS)released a Review of the Conflict between MigratoryBirds and Electricity Power Grids in the African-Eurasian Region (CMS 2011a) and the Guide-lines for Mitigating Conflict between MigratoryBirds and Electricity Power Grids (CMS 2011b).CMS (2011a) provides a summary of colli-sion issues and hot spots in Europe, Asia,and Africa. Also in 2011, the Budapest Decla-ration on Bird Protection and Power Lines (MME2011) was adopted by the participants of the
Migratory Bird Treaty with Mexico, Partnersin Flight, and the National Wind Coordinat-ing Collaborative to help Mexico betteraddress avian collision and electrocutionissues. These efforts are also tied to Mexico’s
land-based wind energy development, whichincludes power line issues (R. Villegas-Patraca, pers. comm.; A. Manville, pers.comm.; Mexico Institute of Ecology andUSFWS, unpubl. reports, respectively).
INTERNATIONAL Budapest Conference, Power Lines and BirdMortality in Europe. The declaration aimsfor all new construction of power poles to bebird-safe by 2016 and all dangerous poles tobe retrofitted by 2020. The conference wasattended by 123 participants from 29 Euro-pean and Central Asian countries, the Euro-pean Commission, UNEP AWEA, six energyand utility companies, experts, businesses,and non-government organizations.
In Asia, the risk of bird collisions withpower lines is being recognized as more studies are conducted on bird electrocutionsassociated with new power line structures.For example, in Mongolia, while performinga review of raptor electrocutions on new con-crete poles with metal crossarms, researchersfound that Pallas’ sandgrouse (Syrrhaptes para-doxus) were killed after colliding with powerlines during an unusual seasonal relocation(Gombobaatar et al. 2010).
In Uzbekistan, systematic collision moni-toring using standard protocols has not beenconducted and therefore reported mortalitiescan only be considered anecdotal. However,these observations have shown that certainspecies are more susceptible to collisions and/or electrocutions. It is known that duringspring and autumn migration, medium andlarge size birds collide with or are electrocut-ed on the power lines, which include rare anddeclining species like the steppe eagle (Aquilanipalensis), golden eagle (Aquila chrysaetos),imperial eagle (Aquila heliaca), osprey (Pandionhaliaetus), short-toed eagle (Circaetus gallicus),and Saker falcon (Falco cherrug) (Abdunazarov1987; Shernazarov and Lanovenko 1994).

SAM
PLE
In Kazakhstan,researchers found409 bird carcasses of34 different speciesduring a 2006 sur-vey of power linemortality. Manydeaths were due toelectrocutions and44% were raptors.Deaths due to collisions were alsonoted (Lasch et al.2010).
The great bustard(Otis tarda), whichonce ranged fromManchuria to Portu-gal, is now extirpatedor endangered acrossmuch of the conti-nent because ofhabitat loss, disease,and mortality frompower line collisions(Janss and Ferrer2000; Garcia-Montijanoi et al. 2002; Alonsoand Martin 2005). It is one of the world’sheaviest flying birds with a maximum weightof 21 kilograms (46 pounds). As a result,great bustards maneuver slowly in flight andare not able to avoid wires spotted at the lastmoment. Collisions have been observed byresearchers in Mongolia (Kessler 2007). The research group notes that great bustardcollisions with power lines are a commonoccurrence in developed Western Europe and are becoming more frequent in China.
In South Africa, The Endangered WildlifeTrust has a Wildlife & Energy Program thatcoordinates and sponsors research onbird/power line interactions (EWT 2011)(see Appendix E). This includes a study on
the vision characteristics of the Ludwig’s bustard (Neotis ludwigii) and blue crane(Anthropoides paradiseus) with respect to theirability to see power lines while in flight andhow to reduce the collision risk for thesespecies. It also includes a range-wide study ofthe collision rates of the Ludwig’s bustard.5
In Kenya, a 2009 risk assessment of birdinteractions with electrical infrastructureidentified several sites of high collision risk tobirds of conservation concern. These speciesincluded the grey-crowned crane (Balearica regulorum), lesser flamingo (Phoeniconaiasminor), white stork (Ciconia ciconia), secretary-bird (Sagittarius serpentarius), and a number ofvultures and raptors (Smallie and Virani2010).
218 | chapter 2
5 The range of the Ludwig’s bustard includes Angola, Botswana, Lesotho, Namibia, and South Africa.
FIGURE 2.3: Researchers have studied the effects of power linecollisions on vulnerable species, such as the Ludwig’s bustard ofEurope, Asia, and Africa.
© HANS HILLE
WAERT/CC-BY-SA-3.0

SAM
PLE
As more power lines are built across the land-scape, collision risk is anticipated to increase.Yet, this risk may be offset through assessmentof potential avian impacts during siting androute selection, improved line marking devicesand study methods, and increased awarenessamong stakeholders. With the continuedgrowth in power line mileage, more collisionresearch is needed. Because of the susceptibilityof some endangered species, such as the whoop-ing crane (Grus americana) and California con-dor (Gymnogyps californianus), power lines in thesespecies’ ranges will require careful evaluationand routing in addition to line marking devicesand/or other collision reduction measures.
National and international collaboration onbird/utility interactions has increased marked-ly since the late 1990s. Guidelines for thedevelopment of Avian Protection Plans are a
Progress in Dealing with Collision Issues | 19
product of this collaboration (see Chapter 7).Electric utilities are increasingly adoptingavian protection policies, plans, and conser-vation measures, and APLIC will continue to provide guidance on bird collision issues.Cooperation in addressing collision issues willcontinue between electric utilities and wildlifeagencies. This relationship will advance thecollision risk reduction measures discussed in this manual (see Chapters 5 and 6).
Regional and species-specific studies ofcollision mortality and methods for minimiz-ing collisions would be especially helpful. Atthis time there is no organized attempt tounderstand the extent and magnitude of collision mortality from power lines. Currentknowledge of collisions is geographically,regionally, and site biased because most studieshave been conducted on lines with knowncollision problems. In addition, avian/powerline collision risk is not uniformly distributedbecause it is highly dependent on species andhabitat variables. Bevanger (1999) recommend-ed several areas of investigation that combinewell-planned observational studies withexperimental studies rather than non-standard-ized collision records that cannot be scientifi-cally or statistically compared. Recent studieson the effectiveness of line markers (e.g., Yee2008 and Murphy et al. 2009) follow theserecommendations. Standardized protocolsfor monitoring mortality at communicationtowers (e.g., Manville 2002, 2009b; Gehringet al. 2009) and wind turbines (e.g., CalWEA2011) could also provide models that could beadapted for power line mortality assessments.
The effectiveness of line marking devicesneeds further study. In particular, moreresearch is required to determine the deviceand spacing best suited to different environ-mental conditions and species. Except forstudies sponsored by the CEC and APLIC(e.g., Ventana Wildlife Society 2009; Yee 2008;WAPA 2011) relatively few systematic studieshave looked at the comparative effectiveness
FUTURERESEARCHPRIORITIES
FIGURE 2.4: Because of the susceptibilityof some endangered species, such as thewhooping crane, power lines in thesespecies’ ranges require careful evaluationand routing.
© LAURA C. W
ILLIAMS

SAM
PLE
220 | chapter 2
Funding Organizations for Collision Research
APLIC, EPRI, and CEC are three organizations thatprovide some funding for research on avian/power lineinteractions (see Appendix E). The USFWS conductslimited primary research and funds state researchthrough Section 6 Endangered Species Act grants.
APLIC funds research projects that further theknowledge of avian/power line interactions including:
of different line marking devices. Barrientoset al. (2011) conducted a meta-analysis ofline marking studies, discussed the limita-tions, and provided recommendations formore scientifically rigorous evaluations. Inaddition, no systematic comparison of the
effectiveness of these devices with differentspecies, in different habitats, or in differentweather conditions has been conducted. Asnew styles of line markers continue to bedeveloped and existing markers are modified,associated effectiveness testing will be needed.
FIGURE 2.5: APLIC, EPRI, and CEC are three organizationsthat provide some funding for research on avian/powerline interactions.
• Assessments of collision and/or electrocutionrates associated with power lines
• Risk assessments to identify factors contributing to collisions and electrocution mortality risks fordifferent species
• Evaluations of impacts of power line constructionon bird species
EPRI’s research priorities emphasize informationand monitoring systems that will improve under-standing of and mitigating for avian interactionswith utility facilities. These include the Bird ActivityMonitoring System and avian vision studies that mayhelp develop more effective collision preventiondevices.
The CEC (Hunting 2002) identified a number ofresearch priorities that still apply today and need tobe considered to better understand avian collisionswith power lines. These include:
• Standardizing mortality estimation• Testing and documenting the efficacy of line
marking devices• Testing and documenting the efficacy and
limitations of remote collision detection devices• Determining collision risk levels associated with
potential high avian-use habitats• Monitoring and reporting over the long term
© JERRY LIGUORI

SAM
PLE
Avian Regulations and Compliance | 21
3c h a p t e r 3
Avian Regulations and Compliance
UNITED STATESMigratory Bird Treaty ActThe Migratory Bird Treaty Act of 1918(MBTA) (16 U.S.C. 703–712) is the legalcornerstone of migratory bird conservationand protection in the United States. It is a strict liability statute, meaning that proofof intent is not required in the prosecution ofa taking (injuring or killing) violation. Mostactions that result in taking or possessing aprotected species, its nest, parts, and/or eggs are violations.The MBTA states: “Unless and except
as permitted by regulations . . . it shall beunlawful at any time, by any means, or in any manner to pursue, hunt, take, capture, kill . . .possess, offer for sale, sell . . .purchase . . . ship,export, import . . . transport or cause to betransported . . . any migratory bird, any part,nest, or eggs of any such bird, or any product. . . composed in whole or in part, of any suchbird or any part, nest, or egg thereof. . . .”
Generally speaking, the MBTA protectsthe majority of birds that nest in NorthAmerica (50 CFR 10.13). As of 2012 therewere 1,007 bird species on the list of migratorybird species protected under the MBTA. Thelist includes waterfowl, shorebirds, seabirds,wading birds, raptors, and songbirds. The1972 MBTA amendment extended protec-tion to birds of prey—eagles, hawks, falcons,and owls—and to corvids, such as crows andravens. However, the MBTA does not protectnon-migratory upland game birds (such asgrouse and quail) or introduced species suchas house (English) sparrows (Passer domesticus),European starlings (Sturnus vulgaris), rockpigeons (common/feral pigeons, Columbalivia), monk parakeets (Myiopsitta monachus),and 121 other less commonly encounteredspecies that have been excluded from protec-tion by the MBTA (USFWS 2005a [70 Fed.Reg. 49, 15 March 2005]).
Most native North American birds are protected by the Migratory Bird Treaty Act. Additionalstatutes provide further protection for bald and golden eagles (Haliaeetus leucocephalusand Aquila chrysaetos) and birds that are threatened or endangered. This chapter describesUnited States’ and Canada’s federal regulations that protect these birds, their habitat, andthe corresponding conservation and permitting measures.
IN THIS CHAPTER Overview of Existing Laws and Policies Permit Requirements
chapter 3 | Avian Regulations and Compliance | 21
OVERVIEW OF EXISTING LAWS AND POLICIES

SAM
PLE
322 | chapter 3
An individual, which can mean a corpora-tion or other organization, who violates theMBTA may be fined up to $15,000 and/orimprisoned for up to six months for a misde-meanor conviction. An individual who know-ingly takes any migratory bird with the intentto sell, offer to sell, barter, or offer to bartersuch bird or who knowingly sells, offers forsale, barters, or offers to barter any migratorybird is subject to a felony violation with finesof up to $250,000 and/or imprisonment forup to two years. The MBTA has no provisionfor permitting incidental or accidental take.Federal agencies taking actions that have,
or are likely to have, a measurable negativeeffect on migratory bird populations aredirected by Executive Order 13186 (3 CFR2001; Office of the President 2001. [66 Fed.Reg. 11, 17 January 2001]) to develop andimplement a memorandum of understanding(MOU) with the U.S. Fish and Wildlife Service (USFWS) that shall promote theconservation of migratory bird populations.
This includes federal agencies’ power lineinfrastructure-related collisions and electrocu-tions of protected birds. To date (2012),MOUs have been signed by the Departmentof Defense, Department of Energy, U.S. For-est Service, National Park Service, Bureau ofLand Management, Minerals ManagementService/Bureau of Ocean Energy Manage-ment, and the Federal Energy RegulatoryCommission, with others under development.
Bald and Golden Eagle Protection ActThe Bald and Golden Eagle Protection Act of 1940 (BGEPA) (16 U.S.C. 668–668d)provides additional protection to these eaglespecies. If a proposed project or action wouldoccur in areas where nesting, feeding, orroosting eagles occur, then utilities may needto take additional conservation measures toachieve compliance with the BGEPA. The BGEPA prohibits the take, possession,
sale, purchase, barter, offer to sell, purchase,or barter, transport, export or import, of anybald or golden eagle, alive or dead, includingany part, nest, or egg, unless allowed by per-mit ([16 USC 668(a)]. Take under this statuteis defined as “to pursue, shoot, shoot at, poi-son, wound, kill, capture, trap, collect, molestor disturb” (50 CFR 22.3). Programmatic takeis defined as “take that (1) is recurring, butnot caused solely by indirect effects, and (2)occurs over the long-term and/or in a loca-tion or locations that cannot be specificallyidentified” (50 CFR 22.26). Disturb isdefined as “to agitate, or bother a bald orgolden eagle to a degree that causes, or is like-ly to cause, based on the best scientific infor-mation available, (1) injury to an eagle, (2) adecrease in its productivity, by substantiallyinterfering with normal breeding, feeding, orsheltering behavior, or (3) nest abandonment,by substantially interfering with normalbreeding, feeding, or sheltering behavior”(50 CFR 22.3). Violators may be fined up
FIGURE 3.1: The Migratory Bird Treaty Act of 1918 is the legalcornerstone of bird protection in the United States, protectingmore than 1,000 North American bird species such as this cedarwaxwing (Bombycilla cedrorum).
© BILL TH
OMPSON, U
SFW
S

SAM
PLE
Avian Regulations and Compliance | 23
the USFWS will not authorize take for golden eagles east of approximately 100°west longitude, except for take of nests forsafety emergency situations (USFWS2009a).
Endangered Species ActThe Endangered Species Act of 1973 (ESA)(16 U.S.C. 1531–1544) protects the UnitedStates’ native plants and animals that are indanger of becoming extinct and may also protect their habitats. Federal agencies aredirected to use their authority to conservelisted and candidate6 species and to ensurethat their actions do not further jeopardizethese species or adversely modify designatedcritical habitat for them. The law is admin-istered by the USFWS and the NationalMarine Fisheries Service (NMFS). TheUSFWS has responsibility for terrestrial and freshwater organisms, while the NMFSoversees endangered marine life. These twoagencies work with other agencies to plan ormodify federal projects to minimize projectimpacts on listed species and their habitats.Protection is also gained through USFWS’financial and technical assistance partnershipswith states, tribes, and private landowners.
Section 9 of the ESA makes it unlawfulfor a person to take a listed species. Takeunder the ESA is defined as “. . . to harass,7
harm,8 pursue, hunt, shoot, wound, kill,trap, capture, or collect or attempt to engagein any such conduct.” The ESA authorizesthe USFWS to issue Incidental Take Permits (ITP) for take resulting from otherwise legal activity.
Section 10 of the ESA allows HabitatConservation Plans (HCP) for the con-
to $100,000 and/or imprisoned for up toone year. Individuals with subsequent convic-tions or who commit intentional takes facepenalties of up to $250,000 and/or twoyears imprisonment.
The BGEPA has been amended to providea permit for non-purposeful take, includingtake resulting in disturbance and limited takeresulting in mortality that may occur as a resultof otherwise lawful activities, provided thebreeding populations are stable or increasing.Because there are no breeding populations inthe eastern United States that can sustain take,
6 Candidate species are those in decline which may be added to the list of threatened and endangered species in the near future.7 Harass is defined as an intentional or negligent act or omission, which creates the likelihood of injury to wildlife by annoying it to
such an extent as to significantly impair normal behavioral patterns including breeding, feeding, or sheltering (50 CFR 17.3).8 Harm is defined as an act which actually kills or injures wildlife. Such acts may include significant habitat modification or degradation
when it actually kills or injures wildlife by significantly impairing essential behavioral patterns including breeding, feeding, or sheltering (50 CFR 17.3).
FIGURE 3.2: Habitat Conservation Plans help landownersincorporate conservation measures for species, such as the wood stork (Mycteria americana), into their development plans.
© N
OR
MA
ND
EA
U A
SS
OC
IATE
S, I
NC
.

SAM
PLE
struction and management of facilities, e.g.,transmission lines, on private lands that areused by endangered species. These plans help landowners incorporate conservationmeasures into their land and/or water development plans. Landowners who developand implement HCPs can also receive ITPs that allow their activities to proceed withauthorization for limited take.
State Policies and RegulationsStates have additional bird protection regulations. A utility should consult with itsrespective state wildlife agency to determinewhether more regulations apply and if permits are required.
324 | chapter 3
CANADAMigratory Birds Convention ActThe Migratory Birds Convention Act(MBCA) of 1917 and amended 1994 (1994,c.22) is Canada’s equivalent of the UnitedStates’ MBTA (1918), which provides legalprotection for migratory birds. One notableexception is raptors, which are protected byprovincial and territorial wildlife acts insteadof MBCA. The MBCA satisfies the terms ofthe Migratory Birds Convention of 1916,when both countries recognized concernsabout overhunting waterfowl and shorebirds.The MBCA recognizes three classifications ofprotected birds: migratory game birds, migra-tory insectivorous birds, and migratory non-game birds. It further lists them by family andgives examples.In Canada, the MBCA is administered
by the Wildlife Enforcement Division ofEnvironment Canada in cooperation withprovincial and territorial governments.Enforcement of the Act is made in concertwith the Canadian Wildlife Service (CWS),Royal Canadian Mounted Police, and provin-cial and territorial enforcement authorities.The MBCA and its associated regulations
state that “No person shall hunt a migratorybird except under authority of a permit,” and“Subject to subsection 5(9), no person shall(a) disturb, destroy, or take a nest, egg, nestshelter, eider duck shelter or duck box of amigratory bird, or (b) have in his possession a live migratory bird, or a carcass, skin, nestor egg of a migratory bird.”Individuals, which includes corporations,
who violate the MBCA and associated regulations may be subject to a fine of up to$300,000 and/or six months imprisonment.Upon summary conviction or upon indict-ment, fines of up to $1,000,000 and/or twoyears imprisonment may be applied.
FIGURE 3.3: Canada geese (Branta canadensis) are protected byboth the Migratory Bird Treaty Act and Canada’s equivalent, theMigratory Birds Convention Act.
© JERRY LIGUORI

SAM
PLE
Avian Regulations and Compliance | 25
Species at Risk ActThe Canadian Species at Risk Act (SARA)was enacted in 2003. The objective of SARAis to protect native species from extinction,ensure measures are taken for the recovery ofthreatened or endangered species, andencourage best management practices formaintaining healthy populations. SARA adopted the Committee on the
Status of Endangered Wildlife in Canada(COSEWIC) as an advisory body to assesspotentially at-risk wildlife species, identifyexisting and potential threats to the species,and classify the status of the species (i.e.,extinct, extirpated, endangered, threatened, of special concern, or not currently at risk).Established in 1977, COSEWIC is an inde-pendent committee of wildlife experts andscientists from federal, provincial and territor-ial governments, universities, and non-govern-ment organizations that uses the best availablescience to support its recommendations.Under SARA, the government of Canada willtake COSEWIC’s designations into consider-ation when establishing the legal list ofwildlife species at risk (COSEWIC 2009).SARA states that “No person shall kill,
harm, harass, capture or take an individual ofa wildlife species that is listed as an extirpat-ed species, an endangered species or a threat-ened species.” However, SARA does makeallowance for the incidental take of animalsthrough the issuance of permits (similar tothe ESA in the United States).
Provincial Policy and RegulationsFederal and provincial governments haveworked together to develop complementarypolicy and programs to protect species atrisk. For example, the Alberta Wildlife Actand Regulations seek to protect wildlifewhereby “a person shall not hunt wildlifeunless the person holds a licence authorizing
9 The term “house” includes artificial structures such as bird boxes and nesting platforms.
the person, or is authorized by or under alicence, to hunt wildlife of that kind.” Thelegislation also states that “a person shall notwilfully molest, disturb or destroy a house,9
nest or den of prescribed wildlife” wherewildlife is defined as “big game, birds ofprey, fur bearing animals, migratory gamebirds, non game animals, non-licence animalsand upland game birds.” Similarly, otherprovinces have enacted legislation for theprotection of wildlife, including birds.
INTERNATIONAL POLICIES AND AGREEMENTSSince 2000, there has been an increasinginternational awareness of the issue of birdcollisions for certain species. International conventions and policies (see CMS 2011a)that are relevant to bird collisions include:
• Agreement on the Conservation ofAfrican-Eurasian Migratory Waterbirds(AEWA)
• Convention on Biological Diversity (CBD)• Ramsar Convention on Wetlands, List ofWetlands of International Importance
• Convention on the Conservation ofMigratory Species of Wild Animals (CMS)
• MOU on the Convention of MigratoryBirds of Prey in Africa and Eurasia
• MOU on the Conservation and Management of the Middle-EuropeanPopulation of the Great Bustard
• Convention on the Conservation of European Wildlife and Natural Habitats(Bern Convention)
• Various European Union Directives
These agreements have resulted inresearch, reviews, and guidance on bird collisions that may provide some furtherinsight into bird collisions.

SAM
PLE
UNITED STATESFederal and state permits may be required foractivities that may affect species protected bythe MBTA, BGEPA, ESA, or state laws. Forspecies protected by the MBTA, utilities areencouraged to contact their regional USFWSMigratory Bird Permit Office and their statewildlife agency to identify permit require-ments and, if necessary, obtain permit appli-cations. For species protected by the ESA andBGEPA, utilities must contact their USFWSEcological Services field office.
Migratory Bird PermitsMigratory bird permits are issued by theregional USFWS Migratory Bird PermitOffices. Permits are issued for falconry, raptor propagation, scientific collection, reha-bilitation, conservation education, migratorygame bird propagation, salvage, take of depre-dating birds, taxidermy, waterfowl sale anddisposal, and special purpose. Annual report-ing to the USFWS is required as a conditionof each permit. Policy for migratory birdpermits is developed by the Division ofMigratory Bird Management. The regula-tions governing migratory bird permits can befound in 50 CFR part 13, General Permit
Procedures, and 50 CFR part 21, MigratoryBird Permits.
In 2003, the USFWS issued a memoran-dum clarifying the definition of take under theMBTA as it applies to active nests (nests con-taining eggs or young). Under the MBTA, thecollection, possession, and transfer of inactivebird nests requires a permit, but the destruc-tion of nests that do not contain eggs orbirds is permissible. This does not apply toeagles or species listed by the ESA, whoseactive and inactive nests are protected. Thememo also stated that the USFWS mayissue permits for the removal of occupiednests when public safety is at risk (see 50CFR 21.27).
Bald and Golden Eagle PermitsBGEPA permits are administered by theregional USFWS Migratory Bird PermitOffices in coordination with the Division ofMigratory Bird Management’s Washington,D.C. office and the local Ecological Servicesfield office where an eagle take might occur.
Under BGEPA (50 CFR parts 22.26 and22.27), the USFWS can issue permits to takebald eagles and golden eagles or their nests,where the taking is associated with, but not thepurpose of, the activity and cannot practica-bly be avoided. Permits may be authorized fornon-purposeful take, which includes take result-ing in disturbance or limited take resulting in mor-tality provided the breeding populations arestable or increasing. USFWS will not issuegolden eagle take permits east of the 100°meridian (see BGEPA discussion on page 22).
USFWS may also issue permits for programmatic take (e.g., recurring take for anentire power line over a specified amount of time) or for individual take (e.g., for distur-bance due to one-time construction of apower line where the location of the take andwhen it will occur are known). Programmatictake permits may be issued to entities, such aselectric utilities or transportation providers,that may currently take eagles in the course of
326 | chapter 3
FIGURE 3.4: Most songbirds, such as these horned larks(Eremophilia alpestris), are protected by the Migratory Bird Treaty Act.
© J
ER
RY
LIG
UO
RI
PERMIT REQUIREMENTS

SAM
PLE
otherwise lawful activities but who can workwith the USFWS to develop and implementadvanced conservation practices (ACPs).ACPs are defined as “scientifically supportablemeasures that are approved by the Service and represent the best available techniques to reduce eagle disturbance and ongoingmortalities to a level where remaining takeis unavoidable” (50 CFR 22.3).The regulations are intended to provide
a mechanism—under carefully consideredcircumstances—where non-purposeful takeof bald and golden eagles can be legallyauthorized. How-ever, BGEPA provides theSecretary of Interior with the authority toissue eagle take permits only if it is able todetermine that the take is compatible witheagle conservation. This must be “. . . consis-tent with the goal of increasing or stablebreeding populations.”
Avian Regulations and Compliance | 27
Regulation establishes the issuance of per-mits for removing eagle nests where (1) nec-essary to alleviate a safety emergency to peo-ple or eagles, (2) necessary to ensure publichealth and safety, (3) the nest prevents theuse of a human-engineered structure, or (4)the activity or mitigation for the activity willprovide a net benefit to eagles (50 CFR 22.27).Only inactive nests may be taken except in thecase of safety emergencies. Inactive eaglenests are defined by the continuous absenceof any adult, egg, or dependent young at thenest for at least 10 consecutive days leadingup to the time of taking the nest.
Special Purpose or Salvage orMiscellaneous Permit In compliance with federal regulations, utili-ties may need certain permits to handle or“possess” injured or dead birds found alongpower lines. Salvaging and possessing car-casses of birds protected under the MBTArequires a Federal Special Purpose or Salvageor Miscellaneous Permit (50 CFR 21.27).This permit allows the burial or incinerationof migratory birds found dead on a utilityproperty or temporary possession for transporting to a suitable disposal location,rehabilitation facility, repository, or wildlifepathology laboratory. Permit conditions mayvary but if the bird is a federally endangeredor threatened species or eagle, most permitsrequire the USFWS to be notified within 48hours of discovery of the carcass. Dependingon permit requirements, a quarterly and/oran annual report must be submitted to theUSFWS regional permit office.
Endangered Species Act Consultation,Incidental Take Permit (ITP), and HabitatConservation Plan (HCP)When utilities propose the construction of,for example, power generation or transmissionfacilities where a federal nexus exists (i.e., onfederal lands, with federal funding, or requir-ing federal authorization or permits), they
FIGURE 3.5: Bald eagles are protected under the Bald and GoldenEagle Protection Act and the Migratory Bird Treaty Act.
© JERRY LIGUORI

SAM
PLE
328 | chapter 3
must first consult with the USFWS throughSection 7 of the ESA if any threatened orendangered species may be at risk. Before initiating an action, the federal agency owningthe land or providing the funding or the non-federal permit applicant (e.g., an electric utili-ty) should ask the USFWS to provide a listof threatened, endangered, proposed, andcandidate species and designated critical habitats that may be present in the projectarea. The USFWS has developed a handbookthat describes the consultation process indetail (USFWS and NMFS 1998). Based on a Biological Assessment, an ITP may beissued under Section 7 of the ESA.When non-federal activities (i.e., lacking a
federal nexus) will or may take threatened orendangered species, an ITP is required underSection 10 of the ESA. Approval of an ITPissued in conjunction with an HCP requiresthe Secretary of the Interior to find, after anopportunity for public comment, that amongother things, the taking will be incidental andthat the applicant will, to the maximumextent practicable, minimize and mitigate theimpacts of such taking. An HCP must accom-pany the application for an ITP. The HCPassociated with the permit is to ensure thatconservation measures are adequate for avoiding jeopardy to the species or adverselymodifying critical habitat. Information about consultations and HCPs can be obtained by contacting the local USFWS EcologicalServices field office.
CANADABoth MBCA and SARA provide for permit-ting and authorization of incidental take ofmigratory birds and species at risk. However,for MBCA, the Canadian government, through
the CWS, has declared that they will notdevelop the permitting system; instead theyrecommend that companies use due diligenceto prevent incidental impacts to migratorybirds through best management practices. SARA does provide for incidental harm to
a species or destruction of its critical habitatunder carefully controlled circumstances pro-vided the activity does not jeopardize the sur-vival or recovery of the species. These provi-sions include permits (three-year duration) or agreements (five-year duration). Theseauthorizations are tied to strictly prescribedconditions. The government continues towork with stakeholders to develop opera-tional policies to better implement SARA.The requirement to protect critical habitat
for migratory birds only applies in federallands such as national parks, national wildlifeareas, and bird sanctuaries. For critical habitatlocated in federally protected lands, the pro-hibition on destruction of this habitat appliesautomatically once the Environment Ministerposts a description of the critical habitat inthe Canada Gazette (typically within 90 daysafter the recovery strategy/action plan isposted to the SARA Public Registry).The Environment Minister can recom-
mend that the Cabinet protect a migratorybird species and/or the critical habitat of aspecies not on federal land if there is reasonto believe the province or territory is not sufficiently protecting the species. However,the decision by the Cabinet to order protec-tion is discretionary. There is also a speciesand habitat harm exemption clause in SARAfor activities that have been authorized byother permits or agreements. This clause hasnot been implemented to date (2012).

SAM
PLE
Understanding Bird Collisions | 29
4c h a p t e r 4
Understanding Bird Collisions
Some bird species have a greater collision riskthan others. Because of the need for powerlines to deliver electricity, engineering designrequirements, and potential interaction ofbirds with power lines, collisions cannot beeliminated, but they can be reduced. Theunderstanding of bird collisions has grownsince 1994 and revolves around the followingprinciples:
• Exposure to collisions is largely a functionof behavior. Specific behaviors (such asflushing, courtship displays, and aerialhunting) may distract birds from the presence of power lines.
• Exposure is increased for birds that makeregular and repeated flights between nesting,
Understanding the nature of bird collisions is essential for minimizing and mitigating them.This chapter presents what is known about bird collisions including the susceptibility ofcertain species, variability in reported mortality rates, biological significance of collisionmortality, and the biological, environmental, and engineering factors that influencecollision risk.
IN THIS CHAPTER Susceptibility of Birds to Power Line CollisionsIdentifying Collision MortalityVariability in Reported Mortality RatesBiological Significance of Collision MortalityBiological Characteristics Influencing Avian Collision RisksEnvironmental Conditions Influencing Avian Collision RisksEngineering Aspects Influencing Avian Collision Risks
chapter 4 | Understanding Bird Collisions | 29
feeding, and roosting areas in proximity to power lines.
• Susceptibility to collisions is partially afunction of wing and body size and vision.Larger, heavy-bodied birds with short wingspans and poorer vision are more susceptibleto collisions than smaller, lighter-weightbirds with relatively large wing spans, agility,and good vision.
• Environmental conditions (such asinclement weather and darkness) may distract birds from the presence of power lines or obscure their visibility.
• Engineering aspects, including design andplacement, can increase or decrease theexposure for collisions.

SAM
PLE
430 | chapter 4
Summaries of studies on birds’ susceptibilityto collisions have primarily come from Europe(see Bevanger 1998; Janss 2000; Rubolini etal. 2005). Based on the Bevanger (1998)summary of risk, the orders of birds reportedto be most susceptible to collisions included:
• Gaviforms (e.g., loons)• Podicipediformes (e.g., grebes)• Procellariiformes (e.g., shearwaters, albatross, petrels)
• Pelecaniformes (e.g., pelicans, cormorants)• Cicioniformes (e.g., storks, ibis, herons)• Anseriformes (e.g., ducks, geese)• Falconiformes (e.g., hawks, eagles)• Galliformes (e.g., grouse)• Gruiformes (e.g., rails, cranes)• Charadriformes (e.g., gulls, terns)
• Apodiformes (e.g., swifts)• Columbiformes (e.g., pigeons, doves)• Strigiformes (e.g., owls)• Passeriformes (e.g., song birds)
The reasons for this susceptibility arefunctions of species characteristics, in par-ticular the birds’ body size, weight, wingshape, flight behavior, and nesting habits(see Biological Characteristics Influencing AvianCollision Risks on page 36). For example, liter-ature shows that, in general, birds of prey aregood fliers, have the ability to avoid obstacles,and are not prone to collisions. It is whenthey are engaged in certain activities (e.g.,territorial defense, pursuing prey) that theircollision risk increases (see Harness et al.2003; Olendorff and Lehman 1986).
Reporting bird injuries and mortalities is partof the U.S. Fish and Wildlife Service (USFWS)permit requirements (see Chapter 3) and per-mits are an element of utility Avian Protec-tion Plans (APPs; see Chapter 7). In order toreport mortalities correctly, the affected speciesand the cause (collision or electrocution)needs to be properly identified. Field guidescan be used to identify the bird species, and aguide for identifying raptor remains is also
SUSCEPTIBILITYOF BIRDS TOPOWER LINECOLLISIONS
IDENTIFYING COLLISION MORTALITY
available (CEC 2005). The U.S. GeologicalSurvey’s National Wildlife Health Center alsoprovides information and technical assistancefor identifying bird carcasses (USGS 2011).See Appendix E for resources. Table 4.1 lists the typical damage evident
in bird carcasses from collision injuries. Elec-trocution injuries often occur as burn markson the feathers and feet (see APLIC 2006).Collisions can also lead to electrocutions
Evidence Description
Predominant bone fractures Fractured wings, legs, shoulder bones, vertebra, or skull; torn off limbs
Damage to plumage Mechanical damage, such as torn off or broken feathers
Skin injuries Skin torn open or off, and open muscle, sinew, and bone tissue visible; power line may leave imprint in skin where the bird struck the line; necropsy may reveal internal bleeding and bruising
Secondary damage to extremities Limited areas of infection at open wounds, bones, sinews, and muscles
General condition of injured birds State of shock; handicapped by injuries and secondary damage
* Source: Adapted from BirdLife International (2003)
TABLE 4.1: Typical evidence of bird injuries or mortalities from power line collisions.*

SAM
PLE
Understanding Bird Collisions | 31
It is difficult to extrapolate collision risk fromone study and apply it to other power lines orcompare it with other studies because of site-specific conditions and varying study methodsand metrics. Likewise, many collision studieshave been conducted in high risk areas andwould not be applicable to lower risk areas.Numerous authors have summarized collisionmortality with power lines (e.g., Faanes 1987;Bevanger 1998; Alonso and Alonso 1999;Rubolini et al. 2005; and Jenkins et al. 2010)and report mortality rates ranging from nobirds killed to several hundred birds killedalong a given segment of line per year. TheCalifornia Energy Commission (CEC) study
(called collision-electrocutions) if the bird’ssize is sufficient to make simultaneous con-tact with two phase conductors or with a phase
conductor and grounded equipment, or if thecollision causes two lines to slap together orget close enough to cause an electric arc.
Bibliographies of Collision Literature
Appendix A of this manual includesthe literature cited and a bibliographyof collision literature. An annotatedbibliography of early collision literaturewas provided by Avery et al. (1980). Inaddition, the California Energy Com-mission hosts a searchable database oncollisions: On-Line Annotated Bibliographyof Avian Interactions with Utility Structures(CEC 2011).
VARIABILITY IN REPORTED MORTALITY RATES
(Hunting 2002) provides a summary of collision mortality rates per unit area per distance. Reported mortality rates are highlyvariable and do not lend themselves toextrapolation to other lines because of site-and study-specific differences in:
• Species involved, such as ducks and sandhill cranes (Grus canadensis)
• Habitats, such as wetlands and agriculture• Time periods and sampling regimes, suchas single seasons versus multiple seasons
• Weather conditions, such as fog, wind, etc.• Sampling biases, such as scavenger removalrates and searcher efficiency
• Types of power lines
Another limit to extrapolating bird/powerline collision mortality estimates is the ten-dency to select worst-case scenarios as casestudies (e.g., Koops 1987; Erickson et al.2001; Manville 2005a). The CEC study(Hunting 2002) points out the difficulty in generalizing collision rates, and Bevanger(1999) provides an excellent summary of the
FIGURE 4.1: Collision risk is highly variable among species, withheavy-bodied birds, such as this common loon (Gavia immer),being more vulnerable because they cannot readily maneuver.
© J
ER
RY
LIG
UO
RI
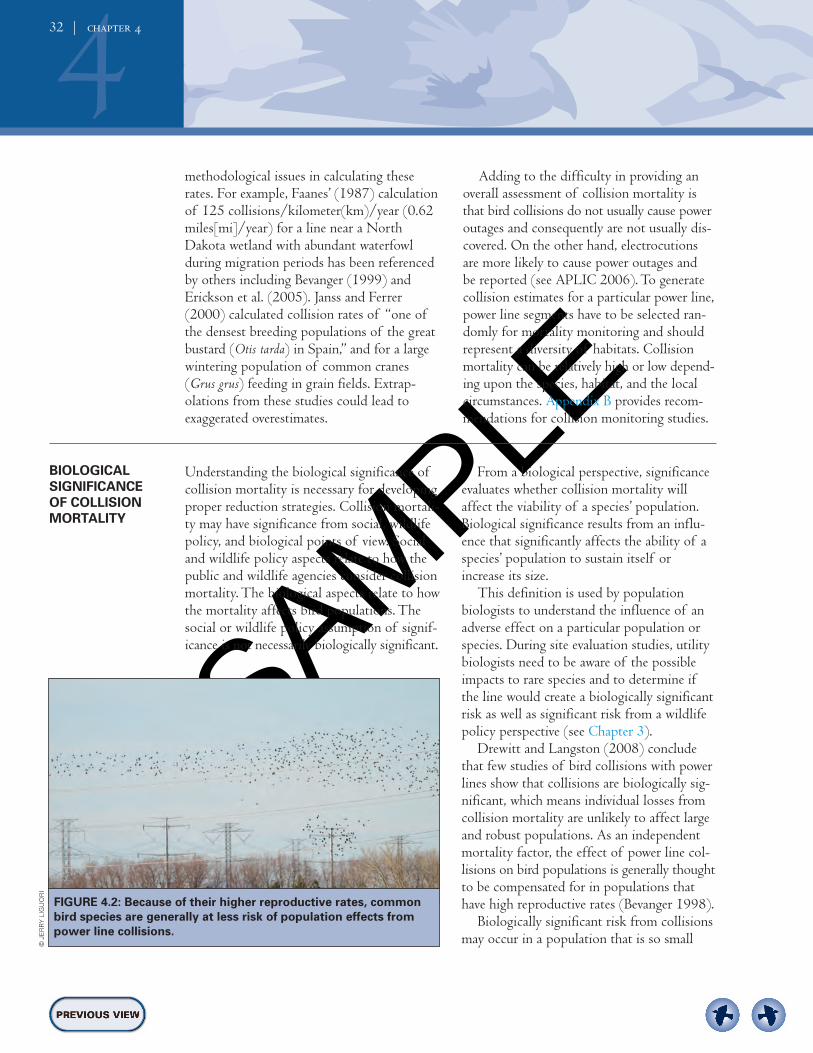
SAM
PLE
methodological issues in calculating theserates. For example, Faanes’ (1987) calculationof 125 collisions/kilometer(km)/year (0.62miles[mi]/year) for a line near a NorthDakota wetland with abundant waterfowlduring migration periods has been referencedby others including Bevanger (1999) andErickson et al. (2005). Janss and Ferrer(2000) calculated collision rates of “one ofthe densest breeding populations of the greatbustard (Otis tarda) in Spain,” and for a largewintering population of common cranes(Grus grus) feeding in grain fields. Extrap-olations from these studies could lead toexaggerated overestimates.
Adding to the difficulty in providing anoverall assessment of collision mortality isthat bird collisions do not usually cause poweroutages and consequently are not usually dis-covered. On the other hand, electrocutionsare more likely to cause power outages and be reported (see APLIC 2006). To generatecollision estimates for a particular power line,power line segments have to be selected ran-domly for mortality monitoring and shouldrepresent a diversity of habitats. Collisionmortality can be relatively high or low depend-ing upon the species, habitat, and the localcircumstances. Appendix B provides recom-mendations for collision monitoring studies.
432 | chapter 4
Understanding the biological significance ofcollision mortality is necessary for developingproper reduction strategies. Collision mortali-ty may have significance from social, wildlifepolicy, and biological points of view. Socialand wildlife policy aspects relate to how thepublic and wildlife agencies consider collisionmortality. The biological aspects relate to howthe mortality affects bird populations. Thesocial or wildlife policy assumption of signif-icance is not necessarily biologically significant.
BIOLOGICAL SIGNIFICANCE OF COLLISION MORTALITY
From a biological perspective, significanceevaluates whether collision mortality willaffect the viability of a species’ population.Biological significance results from an influ-ence that significantly affects the ability of aspecies’ population to sustain itself orincrease its size. This definition is used by population
biologists to understand the influence of anadverse effect on a particular population orspecies. During site evaluation studies, utilitybiologists need to be aware of the possibleimpacts to rare species and to determine ifthe line would create a biologically significantrisk as well as significant risk from a wildlifepolicy perspective (see Chapter 3). Drewitt and Langston (2008) conclude
that few studies of bird collisions with powerlines show that collisions are biologically sig-nificant, which means individual losses fromcollision mortality are unlikely to affect largeand robust populations. As an independentmortality factor, the effect of power line col-lisions on bird populations is generally thoughtto be compensated for in populations thathave high reproductive rates (Bevanger 1998). Biologically significant risk from collisions
may occur in a population that is so small
FIGURE 4.2: Because of their higher reproductive rates, commonbird species are generally at less risk of population effects frompower line collisions.
© JERRY LIGUORI

SAM
PLE
Understanding Bird Collisions | 33
that the loss of a few individuals may impactlocal, rare, or endangered populations (Crowder 2000). Power line collisions may be significant to very small and/or decliningpopulations, as they may not be capable ofcompensating for this loss (Bevanger 1998).Drewitt and Langston (2008) note that lowreproductive rates and small populations ofsome species may further contribute to thelikelihood of population effects. In addition,there are examples where collision mortalityhas occurred locally and concern has beenexpressed. Although not a federally endangeredspecies, recent studies of sandhill cranes inNebraska have shown that local populationscan be affected by collision mortality (Murphyet al. 2009). Collisions during spring migra-tion stopovers at major night roosts along thePlatte River in Buffalo County, Nebraska,have been historically high near two 69-kilo-volt (kV) transmission lines. The Newell’sshearwater (Puffinus auricularis newelli), anendangered species in Hawaii, is an exampleof a species with a relatively small andrestricted population that is threatened bymultiple factors including power line collisions(Podolosky et al. 1998). Other threats includeground nest predation by dogs, cats, rats, pigs,and mongooses; collisions with buildings, cars,and other objects; and attraction to lightsthat may disorient them and cause them tofly around the light until they fall fromexhaustion. Power line collisions appear to bea major contributor to the threats to Newell’sshearwater’s survival (Podolosky et al. 1998;Day et al. 2003; R. Podolosky, pers. comm.).Outside North America, collision mortali-
ty is considered biologically significant forthese species with low population numbers:
• Red-crowned cranes (Grus japonensis) in Japan (Archibald 1987, cited in Crowder 2000)
• Wattled cranes (Bugeranus carunculatus) inSouth Africa (Van Rooyen and Ledger
1999, cited in Crowder 2000)• Capercaillie (Tetrao urogallus) in Norway(Bevanger 1995; Bevanger and Broseth2004)
• Dalmatian pelicans (Pelecanus crispus) innorthern Greece (Crivelli et al. 1988, cited in Drewitt and Langston 2008)
• Bonelli's eagle (Aquila fasciata) in Spain(Mañosa and Real 2001)
• Sarus crane (Grus antigone) in India (Sundar and Choudury 2005)
• Eagle owl (Bubo bubo) in Sweden (Herren 1969)
• Mute swans (Cygnus olor) in the UnitedKingdom (Kelly and Kelly 2005)
In the United States, collision mortality frompower lines is considered biologically significantfor two species with small populations: thewhooping crane (Grus americana) and theCalifornia condor (Gymnogyps californianus).
WHOOPING CRANE Losses of wild and reintroduced (or experi-mental) whooping cranes to power line colli-sions have been reported (Crowder 2000;Brown et al. 1987; Morkill and Anderson1991; Stehn and Wassenich 2007). The onenatural wild population, the Aransas-WoodBuffalo Population (AWBP), has been sub-jected to significant natural causes of mortal-ity such that additional collision mortality isviewed as a threat to the species. The loss of57 cranes (21.4% of the flock of 266) thatdied of starvation and infectious disease inthe 12 months following spring 2008 (34between spring and fall, 23 during the winter)was a serious setback (T. Stehn, pers. comm.).The additional loss of more than 10 birdsper year for any reason could destabilize thisspecies’ recovery. However, the populationhas shown resilience with 279 whoopingcranes at the Aransas National Wildlife Refugein the spring of 2011 (T. Stehn, pers. comm.)compared to 247 in the spring of 2009.

SAM
PLE
The actual percentage of whooping cranemortality caused by collisions with power linesis hard to extrapolate for the AWBP becausemonitoring the small population during migra-tion over such a large area (Figure 4.4)10 is sodifficult. In the 1980s, two of nine radio-markedjuvenile whooping cranes in the AWBP diedwithin the first 18 months of life as a resultof power line collisions; that is 33% of totalpost-fledging losses (n = 6) of the radio-marked birds during the study (Kuyt 1992).Five of 13 known causes of mortality (38%)for the AWBP between April and Novemberfrom 1950 to 1987 resulted from collisionswith power lines (total mortality from allcauses equaled 133 cranes) (Lewis 1992). Collisions have been reported in other
whooping crane populations as well. In thenon-migratory Florida population, 20 out of166 cases with known causes of mortality(12%) were from collisions with power lines,and in the migratory Wisconsin population,3 out of 18 mortalities (17%) were from col-lisions with power lines (Stehn and Wassenich2007). From 1950 to 2008, out of 508fledged whooping cranes that have died, only44 (8.7%) of the carcasses were recovered(C. Strobel, USFWS, unpubl. data). Of the44 carcasses recovered, no cause of deathcould be determined for 17. Of the remain-ing 27 carcasses where a cause of death wasestablished, 9 (33%) were from power linestrikes and 18 (67%) were from other causes(e.g., disease, predators, and shooting).
434 | chapter 4
FIGURE 4.3: The United States’ population of endangered whooping cranes has had suchsignificant mortality from natural causes that additional power line collision mortality isnow viewed as a threat to the species.
10 The whooping crane migration corridor is 322 km (200 mi) wide and extends 4,023 km (2,500 mi) from Wood Buffalo National Park in the Alberta and Northwest territories in Canada to the Aransas National Wildlife Refuge on the Gulf Coast of Texas (see Stehn and Wassenich 2007).
© USFW
S

SAM
PLE
CALIFORNIA CONDOR The federally endangered California condorwas rescued from extinction when the lastremaining wild individuals were captured
Understanding Bird Collisions | 35
from the mountains of southern Californiain 1987 to establish a captive breeding andreintroduction program. In 1991, reintroduc-tion of captive-bred individuals began inselect areas of the southwestern UnitedStates. As of December 2011, the total wildpopulation of California condors was 210individuals (NPS 2011). Reintroduced indi-viduals from the captive breeding programhave come into contact with power lines andcollision mortality has occurred. For example,in a six-month period, three of eight condorsthat died in the wild died after colliding withpower lines (D. Pearson, pers. comm.).
FIGURE 4.4: Whooping crane migration corridor in North America(2005 data from Stehn and Wassenich 2007).
FIGURE 4.5: Collision mortality hasoccurred with the expansion of thereintroduced population of the endangered California condor.
Wood BuffaloNational Park
Running Median ofAll Sightings
0 100 200 MilesPowerline CollisionsSightings USFWS & CWS
100-Mile Wide Corridor7 Collisions or 77%2102 Sightings or 82%
200-Mile Wide Corridor8 Collisions or 88%2422 Sightings or 94%
Aransas Wildlife Refuge
© U
SFW
S
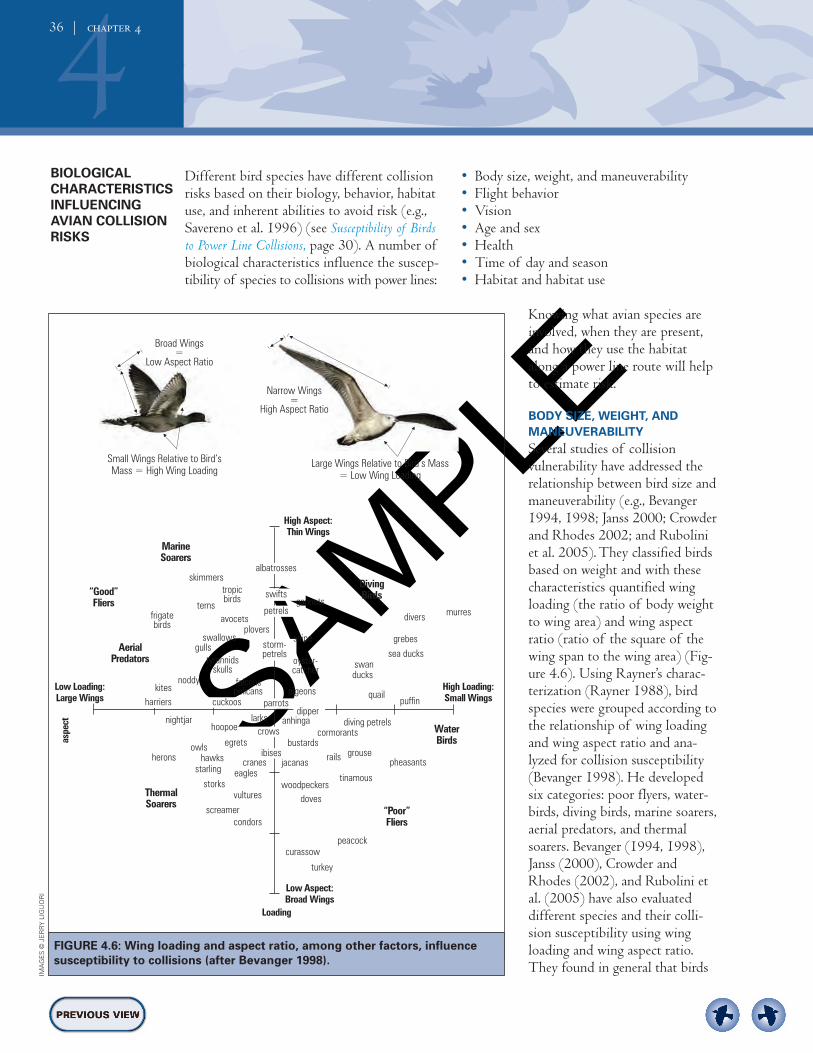
SAM
PLE
• Body size, weight, and maneuverability • Flight behavior• Vision• Age and sex • Health• Time of day and season• Habitat and habitat use
Knowing what avian species areinvolved, when they are present,and how they use the habitatalong a power line route will helpto estimate risk.
BODY SIZE, WEIGHT, ANDMANEUVERABILITYSeveral studies of collision vulnerability have addressed therelationship between bird size andmaneuverability (e.g., Bevanger1994, 1998; Janss 2000; Crowderand Rhodes 2002; and Ruboliniet al. 2005). They classified birdsbased on weight and with thesecharacteristics quantified wingloading (the ratio of body weightto wing area) and wing aspectratio (ratio of the square of thewing span to the wing area) (Fig-ure 4.6). Using Rayner’s charac-terization (Rayner 1988), birdspecies were grouped according tothe relationship of wing loadingand wing aspect ratio and ana-lyzed for collision susceptibility(Bevanger 1998). He developedsix categories: poor flyers, water-birds, diving birds, marine soarers,aerial predators, and thermalsoarers. Bevanger (1994, 1998),Janss (2000), Crowder andRhodes (2002), and Rubolini etal. (2005) have also evaluated different species and their colli-sion susceptibility using wingloading and wing aspect ratio.They found in general that birds
Different bird species have different collisionrisks based on their biology, behavior, habitatuse, and inherent abilities to avoid risk (e.g.,Savereno et al. 1996) (see Susceptibility of Birdsto Power Line Collisions, page 30). A number ofbiological characteristics influence the suscep-tibility of species to collisions with power lines:
436 | chapter 4
BIOLOGICAL CHARACTERISTICS INFLUENCING AVIAN COLLISION RISKS
Broad Wings=
Low Aspect Ratio
Narrow Wings=
High Aspect Ratio
Small Wings Relative to Bird’sMass = High Wing Loading
Large Wings Relative to Bird’s Mass= Low Wing Loading
nightjar
egrets
larks
kitesnoddy
gullsswallows
avocetsplovers
terns
skimmers
divers
grebessea ducks
ducksswan
murresfrigatebirds
tyrannidsskulls
pigeons
diving petrelscormorants
grouserails pheasants
tinamous
quailpuffin
bustards
craneseagles
vulturesstorks
owlsherons hawks
starling
screamercondors
jacanas
woodpeckersdoves
peacockcurassow
turkey
High Loading:Small Wings
DivingBirds
High Aspect:Thin Wings
Low Aspect:Broad Wings
“Poor”Fliers
“Good”Fliers
WaterBirds
ThermalSoarers
AerialPredators
Marine Soarers
Loading
Low Loading:Large Wings
aspe
ct
swifts
petrels
storm-petrels
albatrosses
gannetstropicbirds
snipe
oyster-catcher
parrotscuckoos
falconspelicans
harriersdipper
anhinga
ibises
crowshoopoe
FIGURE 4.6: Wing loading and aspect ratio, among other factors, influencesusceptibility to collisions (after Bevanger 1998).
IMA
GE
S ©
JE
RR
Y L
IGU
OR
I
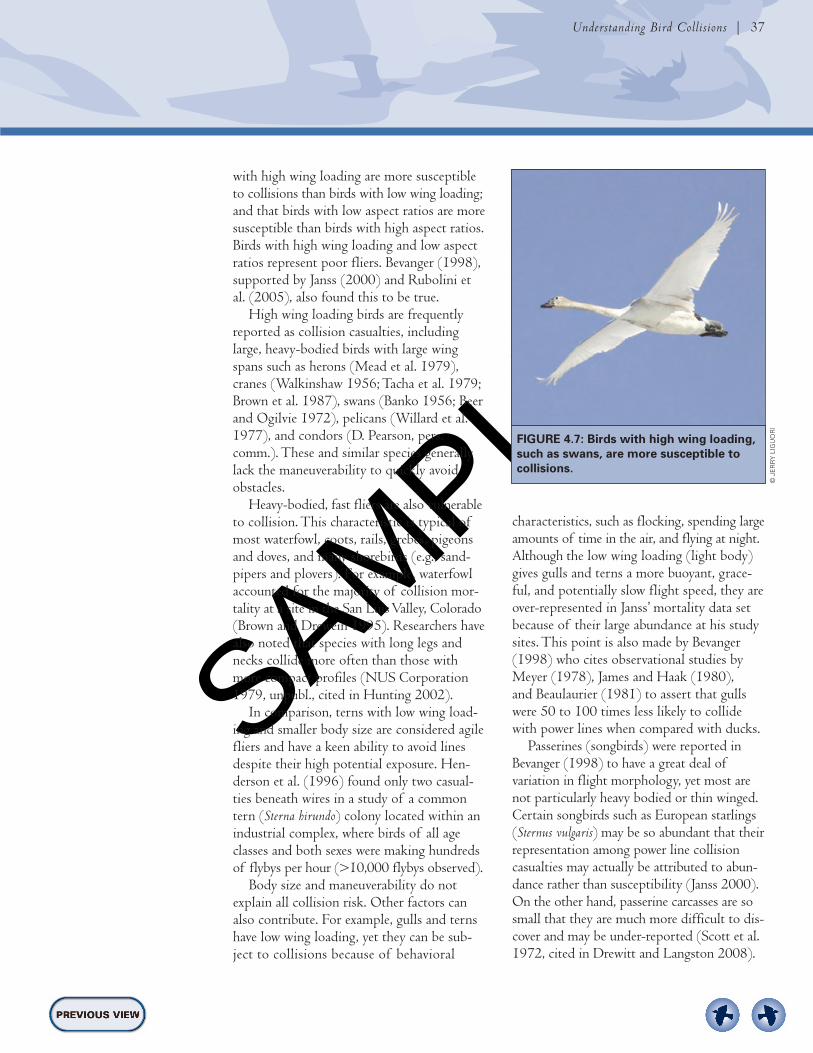
SAM
PLE
with high wing loading are more susceptibleto collisions than birds with low wing loading;and that birds with low aspect ratios are moresusceptible than birds with high aspect ratios.Birds with high wing loading and low aspectratios represent poor fliers. Bevanger (1998),supported by Janss (2000) and Rubolini etal. (2005), also found this to be true. High wing loading birds are frequently
reported as collision casualties, includinglarge, heavy-bodied birds with large wingspans such as herons (Mead et al. 1979),cranes (Walkinshaw 1956; Tacha et al. 1979;Brown et al. 1987), swans (Banko 1956; Beerand Ogilvie 1972), pelicans (Willard et al.1977), and condors (D. Pearson, pers.comm.). These and similar species generallylack the maneuverability to quickly avoidobstacles.Heavy-bodied, fast fliers are also vulnerable
to collision. This characteristic is typical ofmost waterfowl, coots, rails, grebes, pigeonsand doves, and many shorebirds (e.g., sand-pipers and plovers). For example, waterfowlaccounted for the majority of collision mor-tality at a site in the San Luis Valley, Colorado(Brown and Drewein 1995). Researchers havealso noted that species with long legs andnecks collide more often than those withmore compact profiles (NUS Corporation1979, unpubl., cited in Hunting 2002). In comparison, terns with low wing load-
ing and smaller body size are considered agilefliers and have a keen ability to avoid linesdespite their high potential exposure. Hen-derson et al. (1996) found only two casual-ties beneath wires in a study of a commontern (Sterna hirundo) colony located within anindustrial complex, where birds of all ageclasses and both sexes were making hundredsof flybys per hour (>10,000 flybys observed). Body size and maneuverability do not
explain all collision risk. Other factors canalso contribute. For example, gulls and ternshave low wing loading, yet they can be sub-ject to collisions because of behavioral
Understanding Bird Collisions | 37
characteristics, such as flocking, spending largeamounts of time in the air, and flying at night.Although the low wing loading (light body)gives gulls and terns a more buoyant, grace-ful, and potentially slow flight speed, they areover-represented in Janss’ mortality data setbecause of their large abundance at his studysites. This point is also made by Bevanger(1998) who cites observational studies byMeyer (1978), James and Haak (1980), and Beaulaurier (1981) to assert that gullswere 50 to 100 times less likely to collidewith power lines when compared with ducks. Passerines (songbirds) were reported in
Bevanger (1998) to have a great deal of variation in flight morphology, yet most arenot particularly heavy bodied or thin winged.Certain songbirds such as European starlings(Sternus vulgaris) may be so abundant that theirrepresentation among power line collisioncasualties may actually be attributed to abun-dance rather than susceptibility (Janss 2000).On the other hand, passerine carcasses are sosmall that they are much more difficult to dis-cover and may be under-reported (Scott et al.1972, cited in Drewitt and Langston 2008).
FIGURE 4.7: Birds with high wing loading,such as swans, are more susceptible tocollisions.
© JERRY LIGUORI

SAM
PLE
FLIGHT BEHAVIORUnderstanding the flight behavior of birdsactive near a power line can be useful in iden-tifying the potential risk for collisions andhow those risks might be reduced. The fol-lowing flight behaviors have been reported in the literature (e.g., Drewitt and Langston2008) as influencing collision risk:
• Flocking • Flight altitude patterns of migrating and non-migrating birds
• Courtship, nest building, and feedingflights to and from and around the nest,especially for colonial species
• Flight ability of fledglings and juveniles • Flights between nesting/roosting and foraging areas
Flocking species, such as waterfowl andwading birds, are more vulnerable to colli-sions than solitary species (Bevanger 1998;Crowder 2000; Crowder and Rhodes 2002;
438 | chapter 4
Drewitt and Langston 2008). The density of large flocks leaves little room to maneuveraround obstacles; in fact, birds sometimes collide with each other when panicked(Brown 1993). Bevanger (1998) and Drewittand Langston (2008), citing several studies,conclude that flocking behavior may lead togreater susceptibility, as trailing birds haveobstructed views of an upcoming obstacle.Crowder (2000) and Crowder and Rhodes(2002) observed that flocks react to powerlines at a greater distance from the line thando solitary birds. Scott et al. (1972) andJames and Haak (1980) stated that flockingbehavior was an important factor in starlingcollisions, as did Blokpoel and Hatch (1976)for snow geese (Chen caerulescens). A numberof birds within large flocks of sandhill craneswere involved in power line collisions in thePlatte River area, Nebraska; in several instancescollisions of some birds within flocks wereobserved (Murphy et al. 2009).Flight altitude is a function of species and
environmental conditions such as winds, thermalconditions, visibility, precipitation, and timeof day, as well as the type of flight (Newton2008). Two types of bird flight altitude areobserved: migrating or non-migrating. Migrating birds take advantage of thermals
and stronger tail winds when conditions per-mit, allowing them to conserve energy (New-ton 2008) while staying well above powerlines. In general, flight altitudes of migratingbirds range from a couple hundred meters(m) (several hundred feet [ft]) to more than6,000 m (20,000 ft). Weather conditions(e.g., wind speed and direction) influenceflight altitude of migrants (see Weather Condi-tions and Visibility, page 48). Most transmissiontowers in the United States range from 15.2m (50 ft) to less than 60.9 m (200 ft)11 highdepending upon design and voltage. If a
FIGURE 4.8: Flocking species, such as these snow geese, can bemore vulnerable to collisions.
11 Some structures exceed 61 m (200 ft) in height especially at river crossings and to clear other lines that might otherwise intersect (M. Schriner, pers. comm.; D. Bouchard, pers. comm.).
© J
ER
RY
LIG
UO
RI

SAM
PLE
bird’s flight altitude is at or below the heightof power lines, collision risk can increase. There are two basic types of migrating
birds: long distance and daily migrants. Long distance migrants can fly thousands ofkilometers (miles) without stopping and willhave the least exposure to power lines duringmigration (e.g., some shorebirds, swallows,swifts, and terns). Most long distancemigrants migrate at night, resting and feedingduring the day (Manville 2007a). Dailymigrants take shorter flights and makenumerous stops to rest and feed (Newton2008). Daily migrants include cranes, ducks,geese, and raptors. If power lines are in theirlanding or take-off paths, collision riskincreases.For non-migrating birds, flight altitude
is likely to be within the range of power lineheight. Their flight is a function of theirfeeding, reproductive, and foraging behaviors.These behaviors usually occur within approx-imately 200 m (660 ft) of the ground, whichcan expose birds to collision risk when in theproximity of power lines. For predatory birds,the exposure to collision risk can be related,in part, to the pursuit of prey. Bevanger(1994) suggests that aerial hunters such as swifts, swallows, and certain raptors, such as the peregrine falcon (Falco peregrines), golden eagle (Aquila chrysaetos), and goshawk(Accipiter gentilis), typically have excellentmaneuverability and very good vision. Yetbecause they chase prey at high speeds, the presence of a power line may not be perceived soon enough to avoid a collisionwith it.Flight related to nesting behavior can
increase collision risk if nests occur in closeproximity to power lines. Such behaviorincludes courtship (e.g., aerial displays andpursuit), nest building, fledgling flights, feed-ing flights to and from the nest, territorialdefense, and general flying around the nest orcolony. These behaviors are most important
Understanding Bird Collisions | 39
FIGURE 4.9: Aerial hunters that forage inflight within a couple hundred meters(several hundred feet) of the ground, suchas swallows, can become collision victims.
for birds that nest in colonies, such as heronsand egrets. Risks can also be associated withthe age of a bird (i.e., adults and juveniles).Older birds are often acclimated to thepresence of a line and will exhibit lower collision risk through well-developed flightpatterns. Fledgling birds have less control ofthe flights and are more vulnerable to colli-sions than adults (see Age and Sex, page 41).There may also be risks for birds crossing apower line from the nesting site to a foragingarea. Again, this is most important for colo-nial birds that will travel together to feed (seealso Habitat and Habitat Use, page 44). Collision risks to foraging birds will occurwhen birds departing from and returning to a colony have to cross power lines. Their riskwill be a function of the direction of forag-ing flights and the frequency of crossings.Mojica et al. (2009) reported 21 bald eagle(Haliaeetus leucocephalus) mortalities attributedto power line collisions in a study in Mary-land conducted from 1985 to 2007.
© J
ER
RY
LIG
UO
RI
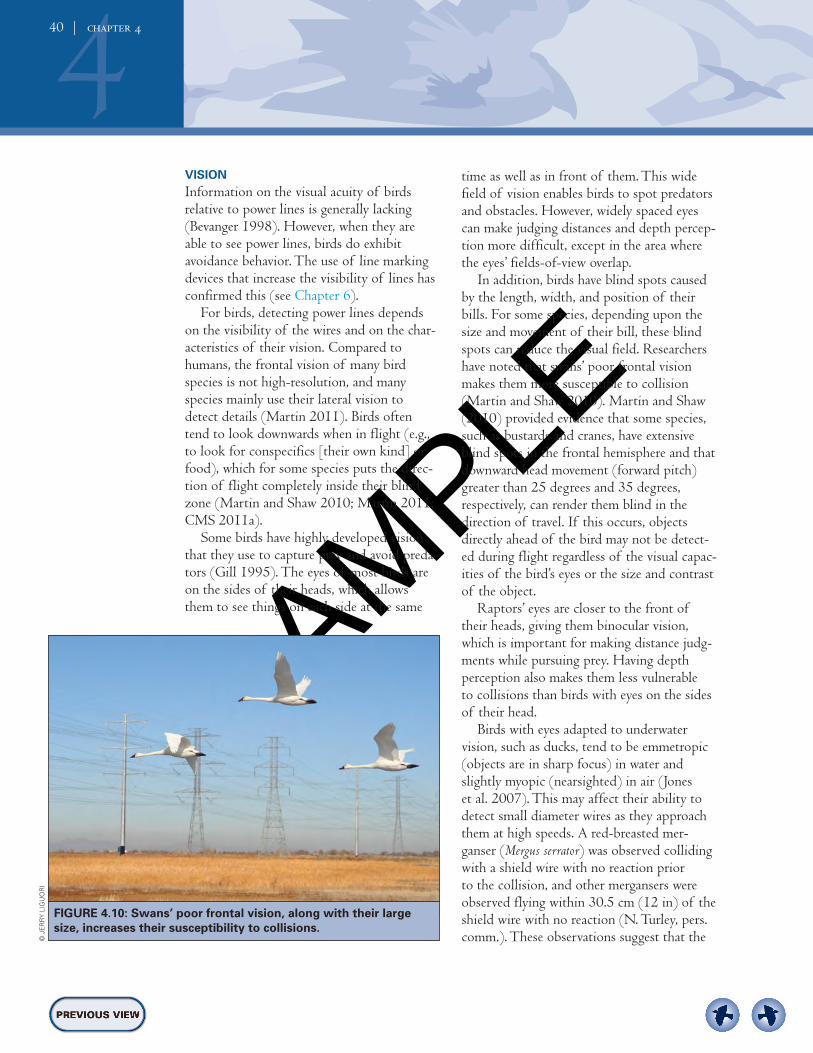
SAM
PLE
VISIONInformation on the visual acuity of birds relative to power lines is generally lacking(Bevanger 1998). However, when they areable to see power lines, birds do exhibitavoidance behavior. The use of line markingdevices that increase the visibility of lines hasconfirmed this (see Chapter 6). For birds, detecting power lines depends
on the visibility of the wires and on the char-acteristics of their vision. Compared tohumans, the frontal vision of many birdspecies is not high-resolution, and manyspecies mainly use their lateral vision todetect details (Martin 2011). Birds oftentend to look downwards when in flight (e.g.,to look for conspecifics [their own kind] orfood), which for some species puts the direc-tion of flight completely inside their blindzone (Martin and Shaw 2010; Martin 2011;CMS 2011a). Some birds have highly developed vision
that they use to capture prey and avoid preda-tors (Gill 1995). The eyes of most birds areon the sides of their heads, which allowsthem to see things on each side at the same
440 | chapter 4
time as well as in front of them. This widefield of vision enables birds to spot predatorsand obstacles. However, widely spaced eyescan make judging distances and depth percep-tion more difficult, except in the area wherethe eyes’ fields-of-view overlap. In addition, birds have blind spots caused
by the length, width, and position of theirbills. For some species, depending upon thesize and movement of their bill, these blindspots can reduce the visual field. Researchershave noted that swans’ poor frontal visionmakes them more susceptible to collision(Martin and Shaw 2010). Martin and Shaw(2010) provided evidence that some species,such as bustards and cranes, have extensiveblind spots in the frontal hemisphere and thatdownward head movement (forward pitch)greater than 25 degrees and 35 degrees,respectively, can render them blind in thedirection of travel. If this occurs, objectsdirectly ahead of the bird may not be detect-ed during flight regardless of the visual capac-ities of the bird’s eyes or the size and contrastof the object. Raptors’ eyes are closer to the front of
their heads, giving them binocular vision,which is important for making distance judg-ments while pursuing prey. Having depth perception also makes them less vulnerable to collisions than birds with eyes on the sidesof their head. Birds with eyes adapted to underwater
vision, such as ducks, tend to be emmetropic(objects are in sharp focus) in water andslightly myopic (nearsighted) in air (Jones et al. 2007). This may affect their ability todetect small diameter wires as they approachthem at high speeds. A red-breasted mer-ganser (Mergus serrator) was observed collidingwith a shield wire with no reaction prior to the collision, and other mergansers wereobserved flying within 30.5 cm (12 in) of theshield wire with no reaction (N. Turley, pers.comm.). These observations suggest that the
FIGURE 4.10: Swans’ poor frontal vision, along with their largesize, increases their susceptibility to collisions.
© JERRY LIGUORI

SAM
PLE
mergansers were not aware ofthe wire, which indicates thatvision characteristics mayplay a role in collision risk.Examples of other birds inthis group with eyes adaptedto underwater vision includeloons, grebes, other divingducks (buffleheads, scoters,and eiders), gannets, andkingfishers.Some species have the
ability to keep objects at different distances in focussimultaneously. For example,they are able to scan thehorizon while keeping theground in focus duringflight, regardless of changesin elevation. This is believed to be achievedby asymmetry of the lens and cornea aboutan optical axis (Jones et al. 2007). Thisresults in the eye being emmetropic in someparts of the visual field (the lateral and upperlateral visual fields) and myopic in others(lower lateral visual fields). For prey speciessuch as pigeons, these characteristics allowthe bird to scan the horizon for predatorsand conspecifics while foraging for objects onthe ground. This same ability is also found inquail and sandhill cranes (Jones et al. 2007),but is generally not possessed by raptors orother species that must capture mobile prey.In the last two decades, research on avian
vision has indicated that ultraviolet sensitivityis an important component of avian vision.Birds detect a wider bandwidth of light inthe violet and ultraviolet (UV) spectrum(440 nanometers [nm] to 10 nm) thanhumans do. This difference in sensitivity may relate to many different aspects of birdbehavior including prey detection, foraging,display and mating, navigation, and circadianrhythm (Hart et al 1998; Bennett and Thery2007). Based on this research, UV materials
Understanding Bird Collisions | 41
FIGURE 4.11: Because they are nearsighted and fly at highspeeds, mergansers may be unable to readily detect smalldiameter wires as they approach them.
have been applied to line marking devices to help birds detect hazards that otherwisewould not be seen. However, these UV materials have not been systematically tested in collision studies.Regardless of a bird’s vision, environmen-
tal conditions such as inclement weather andthe time of day (e.g., low light or dark) canreduce a bird’s ability to see even markedpower lines. A number of line modificationand marking strategies can be used to reducethe effect of these factors (see Chapter 5 andChapter 6).
AGE AND SEXAge and sex have a species-specific influenceon collision risk. Crowder (2000) citesnumerous studies showing that juveniles aremore susceptible than adults (Thompson1978; McNeil et al. 1985; Brown et al. 1987;Crivelli 1988; Savereno et al. 1996; Mathias-son 1999) but also notes two examples whereadults are more susceptible (Ogilvie 1966;Anderson 1978). Brown et al. (1987) andMorkill and Anderson (1991) demonstratedstatistically that juvenile sandhill cranes col-
© JERRY LIGUORI

SAM
PLE
lided with power lines more fre-quently than their proportionof the population would indi-cate. Conversely, Anderson(1978) found that adult mal-lards (Anas platyrhynchos) weremore vulnerable to collisionsthan juveniles. Ogilvie (1966)suggested that age was not afactor in collision susceptibilityfor mute swans.
Many authors suggest thatyoung birds or those unfamiliarwith the area are more vulnera-ble than experienced birds(Anderson 1978; Thompson1978; McNeil et al. 1985). The less-con-trolled flight of young birds also increasestheir collision risk. These birds are generally
442 | chapter 4
believed to be more susceptible to both elec-trocution and collision, though this may beconfounded by the greater proportion ofyoung birds in the population (Bevanger1998). Most (11 of 14 = 78.6%) ofNewell’s shearwater collisions at a Kauai,Hawaii, power line were non-breeding birds,though many of those were likely subadults.The proportions of non-breeding adults andsubadults in the population were not reported(Cooper and Day 1998). Juveniles of manymigratory species are especially at risk becausethey have not yet encountered nor learned toavoid the assortment of risks they face.
Less information about the differing vulnerability of sexes exists because com-parative data are rarely available. However,several studies have presented evidence thatmale ducks are more prone to collisions than females (Boyd 1961; Avery et al. 1977;Willard et al. 1977; Brown and Drewien1995). The courtship and pursuit behaviorsof male ducks greatly increase their frequencyof local flights and can distract them fromseeing and avoiding power lines. Distractionsfor other species also include pursuit ofmates, competitors, or prey, which canincrease collision risk (Willard et al. 1977;Anderson 1978).
FIGURE 4.12: Some juvenile birds, such as sandhillcranes, collide with power lines more frequently thantheir adult counterparts.
FIGURE 4.13: Endangered Newell’s shearwater mortalitiesat a Kauai power line were mostly non-breeding adult and subadult birds.
© K
EIT
H S
WIN
DLE
, US
FWS
© U
SFW
S

SAM
PLE
HEALTH AND CONDITION OF THE BIRDStudies of birds killed by power line colli-sions indicate that poor health may increasecollision risk. Mute swans with elevatedblood lead levels had higher collision riskthan did healthier birds (Kelly and Kelly2005). Low weight swans and swans withheavy burdens of toxins were over-represent-ed among swans killed by collisions in Sweden (Mathiasson 1999). The ability of the bird to maneuver can
also be impaired by entanglement with fish-ing lines and other anthropogenic materials.Manville (2005b) reported on entanglementissues involving Canada geese (Branta canaden-sis) and other waterbird species with six-packbeverage rings and monofilament fishing line,along with plastic debris ingestion, all of whichmay increase their susceptibility to power linecollisions due to weakened conditions, alteredaero-dynamics, and impaired health.Collision mortality can also lead to health
effects in populations of birds. In rare instances,collisions that occur in high enough numberscan indirectly contribute to some diseases,
Understanding Bird Collisions | 43
such as botulism. Malcom (1982) reportedthe deaths of several thousand grebes andducks from botulism that were initiated bythe victims of collisions with a transmissionline in south central Montana. The collisionvictims fell into a wetland where their car-casses provided the energy substrate in whichdormant Clostridium botulinum spores becameactive. These bacteria produce a toxin thatinvertebrates consume and concentrate with-out ill effects. Those toxin-laden invertebrates(e.g., fly-egg-maggot) become food for otherducks and a vicious cycle can develop andbecome protracted (Rocke and Friend 1999),much as Malcom observed.
TIME OF DAY AND SEASONTime of DayStudies have shown that time of day isimportant to collision frequency in dailyflights and during migration. Differentspecies generally feed at different times ofday. Non-breeding birds, including migratingspecies, generally feed continuously duringthe day and are considered to have continu-ous exposure to power lines in the vicinity of their feeding areas. When birds are nest-ing, they often show a periodicity in feeding.Collisions are much more likely during the
night than the day (Scott et al. 1972; Krapu1974; Anderson 1978; and James and Haak1980; all cited in Crowder 2000; Pandey etal. 2008). Gulls and waterfowl tend to makefeeding flights after sunset and before sunrise.Many waterbird species regularly fly at nightin response to tidal cycles or prey activity(Black and Collopy 1982; Erwin 1977;Robert et al. 1989; Dodd and Colwell 1998)or predator avoidance. Inability to see thewires due to low light conditions probablyraises the collision risk for these species(Scott et al. 1972; Krapu 1974; James andHaak 1980; Brown and Drewien 1995). At the San Luis National Wildlife Refuge Complex in California, bird flight diverterswere effective on waterfowl but not on coots,which authors attribute to the fact that coots
FIGURE 4.14: Gulls (pictured) and waterfowl tend to make feedingflights at dusk and dawn, when reduced light increases collisionrisk.
© JERRY LIGUORI

SAM
PLE
fly at night and cannot see the diverters (Ventana Wildlife Society 2009).Species that migrate at night, such as song-
birds and herons, may be vulnerable to colli-sions if weather forces them to fly at low alti-tudes. However, generalizing from one speciesto another or one habitat to another that noc-turnal flight behavior may be more risky thandiurnal flight behavior needs to be cautioned.Deng and Frederick (2001) investigated nocturnal bird flights of wading birds in thevicinity of a 550-kV transmission line adja-cent to the Everglades in south Florida. Theyobserved nine species of wading birds includ-ing herons, egrets, and wood storks (Mycteriaamericana). The investigation showed that noc-turnal-flying wading birds were less responsiveto the power lines than diurnal-flying birds;however, the birds generally flew higher overthe power lines at night than during the day.No collisions were observed but the authorsstated that the sampling period was short(118 hours). One of the suggested reasonsfor the lack of collisions was that the birdswere acclimated to the presence of the line. Similarly, radar data collected by Harmata
et al. (1997) along the Missouri River indi-cated that birds flying at night flew at heightswell above power lines. By flying higher atnight, waterbirds and other species may lowercollision risk with natural and anthropogenicobstacles. However, there may be risks fromlines that occur in the departing and arrivingzones for roosting or foraging habitats. Forexample, dark-rumped petrels (Pterodromaphaeopygia) and Newell’s shearwaters in Kauai,Hawaii, crossed much closer to power lines inmorning seaward flights than in evening land-ward flights, and all recorded Newell’s shear-water collisions occurred during morningflights (Cooper and Day 1998).
SeasonSeasonal bird abundance is also correlatedwith collision mortality. For example, season-al flight behavior differences resulted in more
wintertime collisions for ptarmigan in Nor-way (Bevanger and Broseth 2004). Migrationseasons generally pose a greater risk tomigrating birds because of both higher fly-over frequency and unfamiliarity with locallandscapes. The nighttime proportion ofcrane and waterfowl collision mortality versustotal collision mortality was 31.8% in the fall(1990) during migration and 7.7% in thespring (1991) in San Luis Valley, Colorado(Brown and Drewein 1995). Willard (1978) described a situation in
the Klamath Basin, Oregon, that illustrateshow both collision mortality and its popula-tion effects can increase during the breedingseason. At Lower Klamath Lake NationalWildlife Refuge, adult American white peli-cans (Pelecanus erythrorhynchos) flew low overcanals and collided with power lines whilesearching for food. For this species, thismeant a double loss: first, the loss of theadult that collided with the line, and second,the loss of the young, which rarely fledgeafter one parent is lost because both parentsmust forage extensively to feed them.
HABITAT AND HABITAT USEPower lines located near habitats with highavian use (such as nesting, foraging, roosting,and resting sites) may pose greater exposureto collisions for some species. For example,power lines between foraging and roostingsites of wading birds will be frequentlycrossed, which increases the collision riskpotential. This is especially true when only a short distance separates the two habitats.Birds in these situations typically fly at lowaltitudes, potentially putting them at theheight of power lines. Willard et al. (1977)suggested that overhead wires within a singlehabitat (e.g., within a wetland) are more likelyto cause collisions than those between twohabitats (e.g., wetlands and uplands); otherstudies have found the opposite to be true(e.g., Faanes 1987; Brown et al. 1987;Morkill and Anderson 1991).
444 | chapter 4

SAM
PLE
The critical questions arehow often, and in whatnumbers, do birds fly acrossa power line during theirdaily routines? For example,in a study in the San LuisValley of Colorado, Brownet al. (1987) found thatpower lines dividing wet-lands (used for roosting)from grain fields (used forfeeding) caused the mostcollisions for sandhill cranes and field-feeding waterfowl.This occurred because thesehabitats encouraged thebirds to cross the lines atlow altitudes several timeseach day. However, the samepower lines had little effecton diving ducks, which hadrestricted their activities towetlands. Thus, the risk of a particularpower line depends in part upon the wayeach species uses the adjacent habitat.
Understanding Bird Collisions | 45
Power lines, including those that borderhabitat such as a wetland used by many birds,may present little risk if the adjacent habitat
separated by the power linesis not attractive to birds (e.g.,a city rail yard). Conversely,if the adjacent habitat is agrain field, collisions mayresult in fall and winter forfield-feeding birds that makedaily flights between wetlandroosts and foraging sites,including sandhill cranes,Canada geese, mallards, and pintails (Anas acuta)(Thompson 1978; Brown et al. 1987; Morkill andAnderson 1991). The sameline may represent lower riskduring the breeding seasonwhen these birds remain inwetlands throughout the day.Although forested habitatslocated near power lines can
FIGURE 4.15: Power lines located between the foraging androosting sites of wading birds, such as this white ibis(Eudocimus albus), may result in higher collision risk.
FIGURE 4.16: Research conflicts on whether or not overheadwires within a single habitat, such as this wetland, are morelikely to cause collisions than those between two habitats.
© NIKKI H
ECK
© JERRY LIGUORI

SAM
PLE
sometimes reduce collision risk (see ManagingSurrounding Lands on page 58), in some forest-ed habitats where there are open clearings forthe power lines, collision risk may be higherfor birds that fly across the open corridorwhile going between forested areas.During migration, birds make stopovers in
their preferred habitats. When migratory birds’staging, roosting, resting, and foraging areasare located near power lines, especially wheningress or egress coincides with inclementweather, collision risk increases (Manville2005a, 2009a). This can be especially truewhen there are large concentrations of birds;for example, sandhill cranes that number inthe tens of thousands along the Platte Riverin Nebraska (Murphy et al. 2009). Some habitats, such as lakes and ponds, have
seasonal use patterns. Proximity to shorelinehabitat was linked to bald eagle collisions (21)and electrocutions (24) at Aberdeen Proving
Grounds, Maryland (Mojica et al. 2009).Higher collision mortality was found at powerlines near shorelines used as feeding areas. The16,000 hectare (39,537 acre) area on Chesa-peake Bay had 42 resident pairs and sevenknown communal roosts used by migrants from the north and south during the winter and summer months, respectively. In a high birdconcentration area along Lake Ontario, double-crested cormorants (Phalacrocorax auritus) werethe most commonly reported collision victim,although they were over-represented relative totheir abundance in the area, and gulls andwaterfowl were the next most commonlyreported species to collide with lines (Barrettand Weseloh 2008). A PacifiCorp study cal-culated the distance of collision mortalities to the nearest water body using survey datacollected in Oregon, California, Idaho, Utah,and Wyoming from 2004 to 2009 (S. Liguori,PacifiCorp, unpubl. data) (Table 4.2).
446 | chapter 4
Species Sample Size Average Distance
Snow goose (Chen caerulescens) 37 82.3 m (270 ft)
American white pelican (Pelecanus erythrorhynchos) 17 82.6 m (271 ft)
Tundra swan (Cygnus columbianus) 3 89.3 m (293 ft)
Sandhill crane (Grus canadensis) 7 119.8 (393 ft)
Great blue heron (Ardea herodias) 7 154 m (505 ft)
Mallard (Anas platyrhynchos) 5 213.4 m (700 ft)
* Source: PacifiCorp, unpubl. data
TABLE 4.2: Average distance of collision mortalities from nearest water body.*
ENVIRONMENTAL CONDITIONS INFLUENCING AVIAN COLLISION RISKS
Environmental conditions that can increasethe risk for collisions with power linesinclude:
• Land uses • Weather conditions and visibility• Sudden disturbances
The relative importance of these condi-tions varies with location, season, species, anddifferent populations of the same species.
LAND USESLand uses, such as conservation, recreational,residential, agricultural, and industrial, have

SAM
PLE
habitats and management practices that can attract or discourage bird use. Collisionrisk depends on the location of power lines within these areas and the bird species thatare drawn to them.
Conservation and Nature-BasedRecreation LandsConservation areas and wildlife refuges varygreatly in size and habitat type and are oftenmanaged for specific types of wildlife and/ornature-based recreation uses. Many conserva-tion lands have distribution lines that supplytheir power needs and may also be crossed bytransmission lines. These lines may presentcollision risk depending on the habitats, species,and human activities present. The potentialfor disturbing and flushing birds into nearbypower lines can be higher in recreation areasdue to increased human activity or lower ifresident birds are acclimated to human activi-ty. Power lines that cross high avian-use habi-tats such as wetlands or are placed betweenforaging and roosting areas may also result ina higher risk of bird collisions (see Habitat
Understanding Bird Collisions | 47
FIGURE 4.17: Power lines crossing agricultural fields withseasonally attractive crops or residue can contribute to collisionrisk for some flocking species, such as cranes, waterfowl,songbirds, and these trumpeter swans (Cygnus buccinator).
and Habitat Use on page 44). Although a pro-posed power line route may not be able toavoid such conservation areas, managers needto be aware of the potential risks so they maybe minimized (see Chapter 5).
Residential and Urban Recreation LandsResidential and urban recreation lands varywidely in their attractiveness to birds (e.g.,Chace and Walsh 2006). Generally, urbanrecreation lands such as parks and golf cours-es are interspersed within or between denselypopulated residential areas. These lands oftenbecome habitat islands. For example, they mayhave small wetlands that are used by variousprotected birds. Distribution lines may beespecially plentiful in residential and recre-ational areas and can pose a collision risk,depending on the susceptibility of the species,when situated in the flight patterns of birds.
Agricultural LandsAgricultural fields and ponds can attract birds;for example, grain crops are seasonally attrac-tive to many flocking species such as cranes,waterfowl, and blackbirds, along with rodentsthat attract raptors. Because grain fields areused only as feeding areas by these species,they may be attractive when they are in closeproximity to nesting, roosting, or winteringhabitat. Agricultural fields, especially thosethat are managed with burning or flooding orhave nearby wetlands, can also attract a vari-ety of bird species during staging and migra-tion and may even result in shortstopping,i.e., drawing birds to these attractive sites forthe winter rather than their historical winter-ing sites (Viverette et al. 1996). Collisionproblems may develop when birds must crosspower lines to make daily, low-altitude flightsbetween feeding areas and nesting or roostingsites. See also Habitat and Habitat Use (page 44).
Industrial LandsIndustrial lands sometimes provide attractivebird habitat. Gulls, vultures, crows, ravens, and©
HA
LEY
ED
WA
RD
S, P
UG
ET
SO
UN
D E
NE
RG
Y

SAM
PLE
other scavengers often gather at landfills inlarge numbers. Cooling ponds at electricitygeneration facilities, municipal sewage ponds,settling ponds at mines, and other industrialwater bodies can attract waterbirds, shorebirds,and raptors. As with other types of land use,the degree of hazard posed by power lines willvary depending upon the proximity of thelines to these avian-use areas (see Habitat andHabitat Use on page 44). If bird collisionsbecome a problem, property managers may be able to choose from a variety of options tomodify or discourage bird use of the area (see Managing Surrounding Lands on page 58).
WEATHER CONDITIONS AND VISIBILITYWeather conditions play a very important rolein both the visibility of power lines and inthe behavior of birds in flight during migrationand local movements, such as daily foragingactivity. When weather conditions interact withbiological characteristics (e.g., flight behavior,wing loading and aspect ratio, and season),collision risk may be dramatically affected.Adverse weather conditions, such as fog,
dense cloud cover, high and variable windspeeds, precipitation, and reduced or zero visibility are associated with greater collisionrisk. Reduced visibility and high wind speedscan also cause birds to fly at lower altitudes,potentially putting them at the same height as power lines. The influence of weather onflight altitude was reviewed in depth byShamoun-Baranes et al. (2006), and theeffect of weather on flight height and behav-ior has been observed in many bird species(Drewitt and Langston 2008; Newton 2008). Weather and biological factors are often
interrelated and may affect flights within highbird-use areas. The timing of daily flights maysubject certain species to adverse weather con-ditions associated with collisions, such as fog(Scott et al. 1972; Tacha et al. 1979) or wind(Brown 1993). This is especially true in coastaland low-lying areas that are frequently foggyor windy. When possible, birds will avoid fly-
448 | chapter 4
ing in heavy precipitation or fog. Problemsmost often occur when birds unexpectedlyencounter these conditions. Storms or fog canarise quickly and birds may collide withpower lines when attempting to leave feedingareas for protected roosts (Wheeler 1966; Tachaet al. 1979). In foul weather, birds may beattracted to lighted areas on the ground(Manville 2007a). If power lines are also in or near those areas they could be in thelanding approach of the attracted birds andbecome a collision risk (see Lighting, page 52).Wind, wind shear, and turbulence most
often appear to influence collisions whenbirds fly at power line heights. Some birdsdecrease flight altitude in high winds (Scott et al. 1972; Raevel and Tombal 1991). Poorconditions—wet feathers, precipitation, highwinds, wind gusts, and turbulence—alsohamper birds’ ability to control flight and further increase collision risk (Walkinshaw1956; Avery et al. 1977; Willard et al. 1977;Anderson 1978). In high-velocity winds,birds may collide with other birds, buffetingthem into fully visible and familiar powerlines (Brown et al. 1987; Morkill and Anderson 1991; Raevel and Tombal 1991;Brown and Drewien 1995). In the San Luis Valley, Colorado, collisions
occurred more frequently on days with winds>24 km per hour (15 mi per hour) (Brownand Drewein 1995). Collisions were alsomore likely with tailwinds, which increase abird’s ground speed, than with headwinds,which have the opposite effect (Savereno et al.1996). Crowder (2000) reviewed older evi-dence of power line collisions resulting fromstormy (Wheeler 1966), foggy (Tacha et al.1979), or windy (Brown et al. 1987; Morkilland Anderson 1991) conditions. These stud-ies showed that wind, especially associatedwith stormy weather, is an important contrib-utor to collisions. It has been suggested thatbirds, such as gulls, with a high aspect ratioand low wing loading are more susceptible to being blown into lines than other bird

SAM
PLE
species without these physical characteristics(Bevanger 1998).The impact of weather is also related to
season, as adverse weather may pose a greaterrisk during migration (APLIC 2007) andcan influence the initiation of migration(Shamoun-Baranes et al. 2010). Songbirdsusually begin migration in favorable condi-tions, but may encounter inclement weatheren route. The weather hazard may be wors-ened when migratory birds respond to fogand precipitation by decreasing their flightaltitude (Gauthreaux 1978a) or by attempt-ing to land (Manville 2007a). In known orhistoric staging, roosting, resting, feeding, orstopover areas for migratory birds located inimmediate proximity to power lines, there can be a substantial increase in collision risk,especially when bird ingress or egress coin-cides with inclement weather (Manville2005a, 2009a). This effect is magnified when flocks are very large, as with migratingsandhill cranes in the Platte River area ofNebraska (Murphy et al. 2009).
Understanding Bird Collisions | 49
The flight altitudes of migratory birdscan vary greatly and are strongly correlatedwith winds aloft, air clarity, turbulence, thermals, and weather, both day and night. Inparticular, thunderstorms and low cloud ceilingconditions are known to cause nocturnallymigrating songbirds to land or to fly at loweraltitudes that increase collision risk, particu-larly with illuminated structures (Winkelman1995; Gill et al. 1996; Erickson et al. 2001;Johnson et al. 2002; Kerlinger 2003). Variousradar studies have estimated that under nor-mal weather conditions, 84% to 97% ofnocturnally migrating songbirds fly at alti-tudes of 125 m (410 ft) or more aboveground level where they are not exposed to riskof collision with power lines (Mabee andCooper 2002; Cooper 2004; Mabee 2004).
SUDDEN DISTURBANCESSudden disturbance can panic and flushbirds, especially flocks of birds, into nearbypower lines and has been well documented as a contributing factor to collisions (Krapu1974; Blokpoel and Hatch 1976; Anderson1978; Brown et al. 1984; Archibald 1987).Birds may be flushed by vehicles, trains,pedestrians, aircraft, farm equipment, hazing,hunters, predators, etc., along ROWs andmay collide with power lines in their effort to escape (APLIC 2007). Crowder (2000)reviewed older evidence of power line collisionsresulting from sudden disturbance of geeseby vehicles (Schroeder 1977) or airplanes(Blokpoel and Hatch 1976). One such dis-turbance resulted in a collision event withmallards during Crowder’s (2000) field study.Murphy et al. (2009) support the idea thatmost sandhill crane collisions at Platte River,Nebraska, occur when closely congregatedbirds are flushed after dark. In Washington,roosting American white pelicans collided withan adjacent distribution line when flushedduring the night by a passing train, eventhough line marking devices were installed (S. Liguori, PacifiCorp, pers. comm.).
FIGURE 4.18: Birds usually initiate migration in favorable weatherconditions, but when they encounter inclement weather they maydecrease their flight altitude, which increases collision risk whenpower lines are present.
© JERRY LIGUORI

SAM
PLE
The following engineering aspects can influ-ence the risk of collisions with power lines:
• Diameter of lines (shield wires versusphase conductors)
• Line placement (proximity to avian habitat)• Line orientation (relative to biological andenvironmental factors)
• Line configuration (aligned vertically orhorizontally and the number of lines)
• Structure type (guyed versus self-supporting)• Lighting (steady burning versus blinking)
DIAMETER OF LINESThe smaller diameter of transmission lineshield wires compared to phase conductorsinfluences the risk of collisions, with shieldwires being the lines most often involved(Scott et al. 1972; Willard et al. 1977; Brownet al. 1987; Faanes 1987; APLIC 1994;Savereno et al. 1996; Jenkins et al. 2010).Because of their smaller diameter (1 to 1.3centimeters [0.4 to 0.5 inches]) compared tophase conductors (2.5 to 5 cm [1 to 2 in])and their position above the phase conduc-tors, shield wires are the least visible type of power lines and they are in the flight pathof birds that gain altitude to avoid the moreobvious phase conductors. The shield wireprotects, or shields, the phase conductorsfrom lightning strikes. Distribution lines consist of phase con-
ductors and a neutral wire, which is at thesame level or below the phase conductors.Though it is not absolute, most birds gainaltitude to avoid an obvious line, which impliesthat neutral lines are less likely to be involvedin collisions.
LINE PLACEMENTThe proximity of power lines to bird take-offand landing areas can affect collision risk (Lee1978; Thompson 1978; Faanes 1987), butno specific setback distance has been foundin the literature. Brown et al. (1984, 1987)
found that no sandhill crane or waterfowlcollisions occurred where distances frompower lines to bird-use areas were ≥1.6 km(1 mi). Faanes (1987) found that collisionrates dropped off dramatically after 400 m(1,312 ft). Faanes (1987) stated that “amongthe sites I examined, power lines situated 400 m(1,312 ft) or more from the edge of the watergenerally had lower observed mortality thansites where the power line was within this dis-tance.” Quinn et al. (2011) found no birdcarcasses under power lines that were situatedmore than 500 m (1,640 ft) from the edgeof the water; at distances of 60 m (197 ft),collision mortality dropped off dramatically(p = 0.0012, df = 3). See also Habitat andHabitat Use on page 44. See Chapter 5 forexamples of risk and reduced risk situations.
LINE ORIENTATIONOrientation of power lines relative to biologi-cal characteristics (e.g., flight behavior, season,habitat, and habitat use) and environmentalconditions (e.g., topographical features andweather patterns) can influence collision risk.When planning power line routes, featuresthat are traditional flight corridors, such asmountain ridges, river valleys, and shorelines,should be considered (Colson and Yeoman1978; Faanes 1987). Power lines that parallelprimary bird flight paths pose less risk than aperpendicular orientation (Crowder 2000;Scott et al. 1972; McNeil et al. 1985). Forexample, the perpendicular orientation of aline relative to a topographical feature poses a greater collision risk to local and migratingbirds than a parallel orientation (see Figure4.19). Lines that are at or below the height of
nearby trees rarely present a problem to smalltree-dwelling birds because of their maneu-verability; furthermore, large birds will gainaltitude to fly over the tree line and conse-quently avoid the power line (Thompson1978; Raevel and Tombal 1991). For example,
450 | chapter 4
ENGINEERINGASPECTSINFLUENCINGAVIANCOLLISION RISKS

SAM
PLE
a power line that crosses a narrow river bor-dered by trees that are taller than the line islikely to have a lower collision risk than linescrossing broad rivers because most birds willfly over the tree tops to cross the narrow rivervalley (CMS 2011a).Strong tail winds can be detrimental to
birds’ ability to execute avoidance maneuvers.Brown (1993) suggested that north-southorientation of lines increased collision fre-quency for cranes and waterfowl in the SanLuis Valley, Colorado, because birds crossingthem on an easterly heading were often sub-jected to prevailing westerly winds. See alsoBiological Characteristics, on page 36, and Weather Conditions and Visibility on page 48.
LINE CONFIGURATIONLine configuration—phase conductors alignedvertically or horizontally, and the number ofconductors—is a collision factor that intu-itively makes sense, but there are too few stud-ies to draw conclusions. Most researchers agreethat keeping the vertical arrangement ofmulti-conductor transmission lines to a minimum is beneficial because it reduces the
Understanding Bird Collisions | 51
height of the collision zone. However, a sin-gle-pole vertical structure is often estheticallymore acceptable and requires less ROW width.Thompson (1978) and others (Bevanger
1998; Crowder 2000; Drewitt and Langston2008) have suggested that clustering lines(i.e., several power lines sharing the sameROW) may reduce the risk of collisionsbecause the resulting network of wires isconfined to a smaller area and is more visible.Birds only have to make a single ascent tocross lines before resuming their preferredaltitude. However, when there is decreasedvisibility, collision risk for birds may increasewhere several lines are clustered together. Inaddition, when there are two shield wires atdifferent heights, and only the higher one ismarked, there may be collisions at the lowerunmarked shield wire, thus both shield wiresmay need to be marked (S. Liguori, pers.comm.). See Chapter 5 for examples of riskand reduced risk situations.
STRUCTURE TYPEBecause of the collision risk posed by guyedcommunication towers (e.g., Shire et al.2000; Manville 2007a; Gehring et al. 2009;Gehring et al. 2011; Longcore et al. 2012),the question of collision risk associated withguyed power line structures has occasionallybeen asked. Guy wires on power line struc-tures are used for support and stability espe-cially where a line ends (deadend structure)or changes direction (e.g., makes a 90-degreeturn). There is no published information tosuggest that guyed power line structures posea significant collision risk for birds. Pacifi-Corp has surveyed over 120,000 poles in sixstates and has not found collision victims atany of the guyed structures (S. Liguori, pers.comm.). Based on exposure alone, the relativeshort lengths of the guy wires and the lowheights on power lines pose much less risk tobirds than do the longer, multiple guy wireson communication towers whose height can
FIGURE 4.19: Orientation of power lines parallel to ridges ornarrow, low altitude flyways presents a lower risk of collision than perpendicular orientation.
© JERRY LIGUORI

SAM
PLE
exceed 300 m (>1,000 ft; Gehring et al.2011). In addition, some types of lighting oncommunication towers can attract birds intothe collision zone in low visibility weather.Because transmission towers are, with veryfew exceptions, unlit, they are not expected to have the same risk.
LIGHTINGStudies of bird collisions with communicationtowers and other tall structures have shownthat steady-burning white or red lights candisorient migrating birds at night especiallywhen migration coincides with inclementweather (Manville 2007a, 2009; Gehring etal. 2009, 2011). This disorientation cancause birds to collide with the lighted struc-ture, guy wires on a communication tower, oreach other. It can also cause the birds to circlethe light source, which may also result inexhaustion and injury or death. Collisionincidence on lighted communication towers,for example, depends on the type and intensi-ty of the lights (i.e., steady burning, blinking,or strobe) as well as whether the birds arenavigating visually or magnetically. In aMichigan communication tower study, ex-tinguishing steady-burning, L-810, red side
lights, while leaving on the red, blinkingincandescent pilot warning lights, reducedbird collision mortality by up to 72%(Manville 2007a; Gehring et al. 2009).However, any light, including blinking incandescent and strobe lights, can causesome bird attraction, even during clear weather (Manville 2009a).In the United States, any structure that is
≥60.9 m (200 ft) above ground level is sub-ject to Federal Aviation Administration (FAA)lighting requirements for aviation safety.Transmission towers in the United States aretypically <60.9 m (200 ft) tall12 and do nothave lights. However, shorter structures mayalso require lighting depending on their loca-tion (e.g., in proximity to airports). If light-ing is used on transmission lines, it should becompatible with FAA regulations, the Cana-dian Aviation Regulation, and USFWS birdprotection guidelines, and these agenciesshould be consulted on lighting. The FAA no longer recommends using L-810 steady-burning red lights.13 In general, the USFWSrecommends avoiding lights, particularlysteady-burning lights, and using motion- and heat-sensitive lighting where feasible (e.g., for infrastructure security lighting).
452 | chapter 4
12 Some structures exceed 60.1 m (200 ft) in height, especially at river crossings and to clear other lines that might otherwise intersect(M. Schriner, pers. comm.; D. Bouchard, pers. comm.).
13 This change is expected to be included in the revision to the FAA’s 2007 lighting circular, which is underway at this time (2012). As apreliminary step, in June 2012 the FAA published the results of its pilot conspicuity studies on the elimination of steady-burning red (L-810) side lights at communication towers.

SAM
PLE
Minimizing Collision Risks | 53
5c h a p t e r 5
Minimizing Collision Risks
By working together, engineers and bio-logists can identify and address collisionissues when modifying existing lines andplanning new lines (Figure 5.1). Collisionissues typically develop or are discoveredlong after a power line is built, which makes
minimizing collision risk more difficult.However, early evaluation of factors thatinfluence collisions (see Chapter 4) canreduce collision potential and may reducethe need for costly modifications later.
There are a number of design and engineering strategies for minimizing collision risk with power lines. This chapter introduces evaluation studies and risk reduction strategiesfor modifying existing lines and planning new lines. This chapter also discusses how toaddress social and cultural issues through public participation programs.
IN THIS CHAPTER Opportunities for Minimizing Collision RisksModifying Existing Power LinesPlanning New Power LinesPublic Participation to Address Social and Cultural Issues
chapter 5 | Minimizing Collision Risks | 53
OPPORTUNITIES FOR MINIMIZING COLLISION RISKS

SAM
PLE
554 | chapter 5
EVALUATION STUDIES FOR LINEMODIFICATIONSIf a significant collision risk has beenobserved along a segment of line, it may bepossible to eliminate or minimize the risk by modifying the line in various ways. Linemodifications should be supported by colli-sion monitoring studies that examine thecauses and conditions associated with a highcollision rate (e.g., bird species involved, avian
MODIFYING EXISTING POWER LINES
use patterns, mortality rates, weather, andbiological significance of mortality levels).Although collision monitoring study methodsmust be tailored to site-specific biological,environmental, and engineering factors (seeChapter 4), basic, standardized ornithologicalfield survey procedures should be used toproduce results that would be comparable toother studies. Appendix B presents considera-tions and issues for designing site-specific
Modifying Existing Power Lines
Evaluation studies include:
• Collision monitoring to examine thecauses and conditions associated with the risk and to help determine the typeand effectiveness of modifications.
• Avian risk assessment and spatial analysisto prioritize line segments for modification.
Risk reduction options include:• Line marking to increase the visibility ofthe line.
• Managing surrounding land to influencebird use.
• Removing the shield wire if lightning is notan issue or if lightning arresters can beused instead.
• Increasing the diameter or changing theconfiguration of wires when a line is beingrebuilt.
• Rerouting the line if all other attemptshave been exhausted and populations aresignificantly impacted.
• Burying the lines if feasible and warranted.
Planning New Power Lines
Evaluation studies include:
• Spatial analysis that considers habitatvariables, species, behavior, and otherfactors to help choose the optimal route.
• Field assessment to identify species,abundance, and high bird-use areas.
• Avian risk assessment to evaluate collisionrisk along potential routes.
Risk reduction options include:
• Line placement that takes migratorypatterns and high bird-use areas intoaccount.
• Line orientation that considers biologicaland environmental factors such as birdflight paths, prevailing winds, andtopographical features.
• Line configuration that reduces verticalspread of lines, clusters multiple lines inthe same right-of-way (ROW), increasesthe visibility of lines, and/or decreases thespan length if such options are feasible.
• Line marking to increase the visibility ofthe line.
• Burying lines if feasible and warranted.
Engineers and biologists can reduce collisions when…
FIGURE 5.1: Opportunities and strategies for minimizing collision risks.

SAM
PLE
Minimizing Collision Risks | 55
study methods for collision monitoring.Once monitoring data are collected, linemodification options can be evaluated toidentify, quantify, and balance existing riskswith the effectiveness and risks posed by the modifications.
Collision Monitoring StudiesTo design a collision monitoring study, anumber of key questions need to be answered:
• What species is/are at risk? • What is the magnitude of risk? • Does this risk contribute to population
level impacts? • What biological, environmental, and
engineering factors contribute to collision risk?
• Is the study protocol scientifically sound? • What are the regulatory and policy
considerations of collisions? • What methods effectively minimize
collisions for new and existing power lines?
Collision monitoring results shouldinclude the following information:
• Collision rates among species andbetween sexes and ages (if known) within a single species
• Collision rates expressed as the number of bird collisions relative to the number
Comparing the Effectiveness of Line Modifications
Assessments of line modification effectiveness are often based on pre- and post-modification mortality (Rigby 1978;Beaulaurier 1981; Archibald 1987; Brown et al. 1987).Although evaluations based on casual observations or limitedsampling of collisions contribute to the knowledge of line modification effectiveness, more rigorous studies are necessaryto adequately compare the effectiveness of various measures(e.g., Crowder 2000; Yee 2007, 2008; Ventana Wildlife Society2009; and Pandey et al. 2008).
of birds that are exposed to the line in thestrike zone, i.e., collisions/flybys
• Biological, environmental, and engineeringfactors affecting collision risks (see Chapter 4)
• Mortality corrected for site-specific sampling bias (see Appendix B)
• Behavioral responses of different species to the lines and to line marking devices orother modifications
• Effectiveness of line marking devices basedon changes in mortality after markingdevices were installed or other line modifications were made
These and other monitoring considerationsare discussed in greater detail in Appendix B.
To understand the mortality risk for anentire line, it is essential to study representa-tive segments of the line rather than focusingonly on high collision segments, since doingso will overestimate the overall mortality risk.The study method should ensure that testand control segments are of comparablelength and that they have as much environ-mental homogeneity as possible (see Appen-dix B). On lines with high environmentalvariability across their length, stratified ran-dom sampling may allow the investigator totreat the segments similarly enough to collectmeaningful data.
The greatest problem faced by researchersin most field studies is controlling for exter-nal variables (e.g., Alonso and Alonso 1999;Jenkins et al. 2010; Barrientos et al. 2011).The results of Brown and Drewien (1995)support the hypothesis of Thompson (1978)that collision rates are not predictable fromone study to another and one season toanother. They found that rates varied amongspecies, seasons, and years and attributed muchof the variability to changes in the local environment, which, in turn, influenced bird densities (see also Blair 1996). This suggeststhat, ideally, studies should compare test

SAM
PLE
556 | chapter 5
and control line segments within the sametime period.
Regardless of whether assessments aremade before or after line modification or byusing test and control segments, collision risk comparisons are most meaningful if collisions are expressed in relation to birdnumbers or, preferably, flybys. This allows a collision rate to be calculated. Where feasible,observations of birds’ avoidance behaviorwhen crossing the lines are valuable in under-standing how a line affects flight behavior.Actual mortality may be low, which presents astatistical challenge in comparing retrofittingoptions. This condition should be anticipatedand integrated into the study design (seeAppendix B).
Collision monitoring studies should incor-porate the basic methods used in other mor-tality evaluations (see Appendix B) including:
• Defining the collision zone for birds crossing lines
• Establishing an adequate search area formortalities (increasing with the height of the line)
• Obtaining sampling bias estimates forinjuries, searcher efficiency, scavengerremoval, and habitat differences
Evaluation of bird behavior at marked andunmarked lines provides insight to collisionrates. Morkill and Anderson (1991) andBrown and Drewien (1995) demonstratedthat bird responses varied with marked andunmarked lines. Observations should bemade on marked and unmarked portionssimultaneously to minimize environmentalvariability. For example, Deng and Frederick(2001) showed that the number of birds flying above or below marked and unmarkedlines was not statistically significant; however,they observed that the birds approaching amarked line reacted earlier than birdsapproaching an unmarked line.
Behavioral criteria evaluated may include:
• Type of reaction to lines• Distance from the line that the
reaction occurred• Height above the line when crossing
Because these estimates require evaluationsby observers, it is important to standardizesurvey procedures (see Appendix B). Allobservers should be given training and prac-tice time before the study begins and, whenpossible, the same observers should be usedthroughout the study. Brown and Drewien(1995) found that most observers requiredabout 12 hours of practice before theybecame consistent. As an alternative to fieldobservers, the Bird Strike Indicator (BSI), avibration sensing and recording tool, can beinstalled on lines to detect bird strikes (seebox, page 57). However, the BSI does notidentify what species struck the line; hence,mortality monitoring or field observations,which would also reveal pre-strike behavior,would be required.
Avian Risk Assessment and Spatial AnalysisAvian risk assessment and spatial analysis canbe used to prioritize segments of line formodification. See Evaluation Studies for SitingNew Power Lines on page 64.
OPTIONS FOR MODIFYING EXISTING LINES Potential options for line modificationinclude line marking, managing surroundingland, removing the shield wire, changing the diameter or configuration of wires, andrerouting or burying existing lines where fea-sible. Utilities are encouraged to work withwildlife agencies (see Chapter 3) to evaluatecollision risks to species of concern andoptions for reducing those risks. Typically, thefirst option is marking high risk segments ofthe line and/or managing the surroundinglands. Redesigning, reframing, relocating, or

SAM
PLE
Minimizing Collision Risks | 57
Remote Sensing with the Bird Strike Indicator
The Bird Strike Indicator (BSI) is an automated vibra-tion sensing and recording tool designed by ElectricPower Research Institute (EPRI) to detect bird strikeson overhead lines. Previously, the only means for identifying whether collisions were occurring was forobservers to monitor lines and to conduct groundsurveys for bird carcasses. Manually monitoring birdcollisions is labor-intensive, expensive, and its effective-ness is limited to daylight hours. Carcass surveys maycorrect for lack of monitoring during low-light peri-ods, but these are often associated with vegetation,water, and scavenger detection biases (see Appendix B).Some birds also may fly beyond the search zone afterthe collision. If the collision itself was not observedthen this type of contact would be missed by standardmonitoring methods.
FIGURE 5.2: The Bird Strike Indicator, a tool used todetect bird strikes with power lines, can be installedfrom a bucket truck or helicopter.
BSI sensors can be installed on phase conductors or shield wires. Each installation will be unique to thesurrounding environment. For example, the lightweightaccelerometers in BSIs are meant to detect stress wavescaused by avian collisions, but in one study, BSIs alsopicked up the vibrations from daily trains (M. Schriner,pers. comm.). For a horizontal line configuration, theBSI is only needed on the outside wires (M. Schriner,pers. comm.). The BSI generates a collision log includ-ing the wire struck along with the date, time, and tem-perature. The BSI wirelessly transmits these data to abase station in real time. Base stations serve multiplesensors simultaneously and are accessible through aninterface. Each sensor is designed for up to six monthsof autonomous operation between battery replacements.The units check and report their health each morningand can be reprogrammed remotely.
Research during the development of the BSI(Pandey et al. 2008) and independent trials conductedafterwards (Murphy et al. 2009) demonstrated thatthe BSI is as reliable as human observers for detectingcollisions during daylight. The technology is especiallyuseful for monitoring collisions in low-light or no-light conditions and over-water crossings where carcassrecovery is compromised. However, unlike humanobservations, BSI does not identify the species thatstruck the line; mortality monitoring or field observa-tions would be required to determine this. The BSI hasalso been successfully used to monitor communicationtower guy wire collisions in Cold Bay, Alaska, whichdemonstrated that the BSI allows continuous linemonitoring under all lighting and weather conditions(R. Harness, pers. comm.).
As of 2012, a new companion technology to the BSI, called the Bird Activity Monitoring System(BAMS), is in its technical development phase withEPRI funding and is envisioned as an intelligent,image-based, sensing and recording tool that will assist with detailed study of wildlife interactions with various types of structures including power lines.
© EPRI, CEC, A
ND EDM IN
TERNAT
IONAL, IN
C.

SAM
PLE
burying power lines may not be economicallyor technically feasible. Such options are usual-ly a last resort and only contemplated whenan avian resource has been documented to beseriously affected.
Line MarkingMost studies have shown a reduction in collisions and/or an increase in behavioralavoidance at marked lines when compared tounmarked lines, but this can vary with loca-tion, type of line marking device, and birdspecies (Jenkins et al. 2010; Barrientos et al.2011; see Chapter 6 for detailed informationon devices and effectiveness). There are threegeneral categories of line marking devices:aerial marker spheres, spirals, and suspendeddevices (swinging, flapping, and fixed). Largediameter wire may also improve line visibilityand has been used with line marking devicesto reduce risk of collision-electrocutions andcollisions (see Chapter 6). Line markingdevices are selected based on product avail-ability and durability, cost, ease of installa-tion, compliance and legal issues, spacing andpositioning, safety codes related to ice andwind loading, corona effects, esthetics, andpotential for vandalism. Lighting has also been successfully used to
reduce collisions. In Washington, a spot light(using the line as a power source) was installedin an uninhabited area to illuminate a sectionof marked distribution line at night. Thiseffectively reduced collisions of Americanwhite pelicans (Pelecanus erythrorhynchos) thatroost adjacent to the distribution line. Thepelicans had collided with the line whenflushed during the night by passing trains,even though line marking devices were installed(S. Liguori, PacifiCorp, pers. comm.). InBotswana and South Africa, the Mace BirdLite, a spiral device with a fluorescent light,has been used to reduce flamingo collisions(Eskom 2003; Eskom Transmission 2009; seeDevices Available in Other Countries on page 97).
When using lighting, the effects of lightingon birds as well as applicable regulations forlighting should be considered (see Lighting onpage 52).
Managing Surrounding LandsThe location and condition of habitat andthe surrounding or nearby land uses, such aswetlands and agriculture, and their proximityto power lines influences collision risk (seeChapter 4). Modifying habitat, land uses, ormanagement practices to influence bird use instrategic areas can reduce collision risk wherethere is a willing agency or landowner. Some-times, land management can be less costly andmore effective than other line modifications.Options are discussed for conservation, recre-ation, residential, agricultural, and industrialland uses.
Planting TreesWhere climate and location will allow, planti-ng native trees that will grow to or above theheight of nearby power lines, without inter-fering with line operations, may prevent colli-sions by forcing birds to gain enough altitudeto clear the more visible tree line (Thompson1978; Raevel and Tombal 1991). For instance,greater white-fronted geese (Anser albifrons)flew over power lines more in woodlands thanover lines in rice fields in Japan (Shimada2001), and areas with shorter trees had highercollision rates than areas with taller trees forptarmigan in Norway (Bevanger and Broseth2004). For mitigation purposes, tree plantingis a long-term strategy because of the time ittakes for trees to grow to the desired height;thus, short-term mitigation would likely benecessary in the interim. Because trees canpotentially cause operational and reliabilityproblems with lines, a design engineer and a forester should be consulted concerningminimum clearances and line maintenancerequirements so appropriate tree species andplanting locations can be determined.
558 | chapter 5

SAM
PLE
Removing DisturbancesReducing and modifying human accesspoints to decrease the likelihood that humanactivities will disturb birds where they con-gregate near power lines can reduce collisionscaused by frightening and flushing birds intothe power lines (see Sudden Disturbances onpage 49). Restricting access roads on powerline ROWs to utility-related activities is anoption that may be open to landowners or
Minimizing Collision Risks | 59
land managers. Conservation area managersand private landowners can limit or prohibithunting or other high-disturbance activitiesnear power lines. On public access roads,speed limit restrictions and signage indicatingbird-use areas may reduce flushing of birds.Crane and waterfowl collisions at Bosque del Apache National Wildlife Refuge in New Mexico were reduced simply by havingpersonnel drive slowly and stop when birds
A. Risk Situation
B. Reduced Risk Situation
FIGURE 5.3: Reducing collisions in wooded areas. A tree line or other obvious obstacle at the appropriate height warns birds to gain altitude, which results in birds flying over the power line screened by the trees (after Thompson 1978).
Energized Grounded
Energized Grounded

SAM
PLE
Management Practices on Agricultural LandsSometimes it is possible to enlist the help oflandowners to modify management practices,including the timing of practices that may beattractive to birds, such as burning or flood-ing fields, where a line is experiencing a highcollision rate. For example, in the San LuisValley, Colorado, farmers plow barley stubbleinto the ground in preparation for planting inlate fall and early spring—times when sand-hill and, in the past, whooping cranes (Gruscanadensis and Grus americana) forage in thestubble. The cranes may collide with powerlines that border these fields, especially whenfeeding very close to the line. Through a pro-gram sponsored by utility companies, farmerswere encouraged to begin plowing the stubbleclosest to the lines before the birds arrived.This reduced the risk of collisions by causing
were on refuge roads, which allowed the birds to leave the area without panic. How-ever, this was not successful enough and thelines were eventually buried. (J. Bradenburg,pers. comm.)
Habitat Modification on Conservation,Recreation, and Residential LandsLand managers and landowners may be ableto manipulate bird habitat to minimize colli-sion risk. For example, when waterfowl needto use two distinct habitat types (e.g., one for feeding and one for roosting), they willgenerally select those that are closest to eachother. If a power line divides those habitats,the collision risk is greater. It may be possibleto create both habitat types on one side ofthe line to reduce the crossing frequency (see Line Placement on page 66).
560 | chapter 5
FIGURE 5.4: Habitat modifications, such as cooperative programs to encourage earlierplowing of grain stubble, which is attractive to migrating sandhill cranes, may help toreduce collision risk.
© J
ER
RY
LIG
UO
RI

SAM
PLE
the birds to forage farther from the lineswhere the stubble remained standing (C. Bryant, pers. comm.).
Discourage Bird Use of Industrial LandsFor industrial features such as landfills, cool-ing ponds, municipal sewage ponds, settlingponds at mines, and other industrial waterbodies, property managers can choose from a variety of options that will discourage birduse, such as covering garbage, placing netsover a pond, and using visual or sonic deter-rents. Cost, effectiveness, and maintenanceshould be considered when evaluating birddissuasion options.
Removing the Shield WireRemoval of the shield wire from transmis-sion structures (AC or DC) can reduce birdcollisions (Beaulaurier 1981; Brown et al.1987), but is rarely a viable option because it
Minimizing Collision Risks | 61
exposes the lines to lightning strikes, whichjeopardize service reliability (Figure 5.5).Shield wires are typically installed on the topof transmission structures to protect thephase conductors from lightning strikes andthe electric grid from lightning related poweroutages. This overhead shielding has provento be the most effective and economicallightning protection for transmission lines.
The lightning arrester system, one alterna-tive to the shield wire, is effective when usedon lines with distribution voltages from 4.2to 35 kilovolts (kV) and provides sufficientprotection to the line and associated equip-ment. However, lightning arresters may notbe a viable option due to cost, design charac-teristics, and effectiveness for transmissionvoltages. Their presence would also increasethe electrocution risk to birds that perch onpower line structures. Because the shield wireoften incorporates a fiberoptic communica-tion line, the cost of modifications to thecommunications system would also need tobe included in the analysis.
Changing the Line ConfigurationWhen collisions cannot be reduced by anoth-er method such as line marking or managingsurrounding lands, the configuration of anexisting line can sometimes be changed tominimize collisions. This is usually only pos-sible for new construction or when a line isbeing rebuilt. Effective design changes wouldneed to be based on studies of the flightbehaviors of the bird species at risk (see Evaluation Studies for Line Modifications, page 54).In addition, the redesigned section(s) of linewould need to be compatible with the rest ofthe line. Options for changes might include:
• Lowering the height of the lines (e.g., below the tree line)
• Changing the wire diameter • Bundling wires• Using spacers to improve visibility
FIGURE 5.5: Removing shield wires can reduce bird collisions butleaves the lines unprotected from lightning strikes and jeopardizesservice reliability.
© NOAA

SAM
PLE
• Rearranging wire configuration (e.g., converting from vertical to horizontal)
• Changing the structure type to increase its visibility
• Decreasing span length (e.g., by adding apole mid-span)
Rerouting Existing LinesIf all other attempts to reduce significant collision risks to an acceptable level have beenexhausted, rerouting may need to be consid-ered. This option would require routinganalysis, acquisition of a new or additionalROW, removal and relocation of existingstructures, and a scheduled outage for thework. The rerouting analysis should include a comparative risk assessment to evaluate thecollision risk for the new line (i.e., whether its risk is measurably lower than that of theexisting line) to determine if the rerouting isjustified (see Avian Risk Assessment on page65). Environmental benefits and economiccost should be part of the risk analysis. Giventhe potential land costs and limited optionsfor ROW , together with the cost of structurechanges, the economics and logistics ofrerouting make this option rarely possible.
Burying Power LinesBurying power lines with voltages less than345 kV have been proposed to reduce colli-sions. However, there are innate characteristicsof buried lines that make them only rarelyfeasible. These include voltage and type ofcable, land use patterns, soil conditions, regu-latory acceptance, outage risk and reliabilityrequirements, termination facility require-ments, length and operating limits, and otherenvironmental concerns. Depending on thesecharacteristics, the cost of buried power linescan vary from 3 to 20 times that of an over-head line (Bumby et al. 2009).
562 | chapter 5
Voltage and Type of CableAs the voltage increases, costs increase. Thetype of cable (power line) used also affectsthe cost. Current options include paper-insulated cable installed in oil-filled pipes,and solid dielectric cables installed in con-duits or buried directly in the earth withselected backfill (see Soil Conditions, page 63).
Lines ≥69 kV are normally installed inpressurized, oil-filled pipes in order to elimi-nate voids and moisture pockets in the cableinsulation. They have an excellent reliabilityrecord when properly designed, installed, andmaintained. The oil also tends to dissipate the heat generated by the current flow in the cables. If the oil can be circulated under pressure, the capacity and reliability of thecable will be enhanced.
Solid dielectric cables are currently beingused for 115-kV and 230-kV applications.They are less reliable than oil-filled pipes.The preferred design is to place them in a conduit so that construction in highlydeveloped areas may move rapidly and thenecessary excavation can be covered quickly to reduce the impact and inconvenience to the public. The conduit also provides somephysical protection to the cable from accidental excavations.
Land Use Patterns (Urban, Rural, etc.)In highly developed areas where other utilitiesare buried (e.g., water, sewer, gas, communica-tion), costs and space are at a premium. Inrural areas, some conflict may exist withpipelines, rivers, and lakes (see Figure 5.6 andEnvironmental Concerns on page 63). In undevel-oped areas, geologic formations may preventeconomical trenching. In addition, undergroundlines require termination areas at both ends,similar to small substations, to accommodatethe overhead-to-underground transitions.

SAM
PLE
Soil ConditionsThe soils must be able to dissipate heat dur-ing periods of high electricity demand. Soilcondition also directly affects constructioncost (i.e., sandy soils are more easily trenchedthan rocky soils). In many cases, the spoilsfrom the cable trench have to be hauled awayand replaced with heat-dissipating sands tomeet the cable design standards.
Regulatory AcceptanceUtility regulatory commissions set rates andcontrol costs. This can have a direct bearingon the feasibility of an underground project.There are documented projects where regula-tory commissions have instructed the partiesrequesting underground construction to paythe difference in installation cost (e.g., Col-orado Public Utility Commission DecisionNo. R82-93).
Minimizing Collision Risks | 63
FIGURE 5.6: Buried power lines may be a solution to bird collisionsin some instances, but can cost from 3 to 20 times more thanoverhead lines and have other environmental impacts.
Outage Risk and Reliability RequirementsCable failures are difficult to locate and theline must be dug up for repairs and mainte-nance. Extended outages normally resultbecause of the length of time it takes tolocate and repair a fault in the cable. Certaincustomers, such as hospitals and large industrial or mining operations, have higherreliability requirements than others.
Requirements for Termination FacilitiesThese include access for large equipment, afenced area, transition structures, switchesand other protective equipment, a transmis-sion line tower or distribution structure, andin some cases a pumping station. Such over-head electrical facilities should be designed to minimize avian electrocution risk (see Suggested Practices for Avian Protection on PowerLines, APLIC 2006).
Length and Operating LimitationsAs the length of the line increases, the operat-ing limitations are approached and the optionsto address this will further increase costs.
Environmental ConcernsEnvironmental damage can result if a buriedpower line is near or crosses a waterway or isin wetlands or other sensitive habitats (Figure5.6). If an oil-filled pipe leaks, the oil wouldcontaminate the water and surrounding soils.Ground disturbance during construction,repairs, and maintenance can result in large,permanent displacement of excavated soiland subsequent issues with re-establishingnative vegetation and preventing the over-growth of invasive species. A University ofCalifornia study (Bumby et al. 2009) foundthat underground power lines have moreenvironmental impacts than overhead powerlines for all categories and most scenarios insouthern California.

SAM
PLE
EVALUATION STUDIES FOR SITING NEWPOWER LINESThe potential for avian/power line interac-tions can be identified and addressed duringcorridor and routing evaluations such as spa-tial analysis, field assessment, and avian riskassessment. Methods for these evaluationsdiffer because every route is unique withregard to the species, habitat, and line design.Ornithologists or wildlife biologists knowl-edgeable in local bird issues should be con-sulted for pertinent information on birdmovement patterns and the presence ofspecies of concern that could be affected bycollisions with power lines. Habitats thatinfluence bird presence and movement maypresent a collision risk and should be identi-fied. Other biological, environmental, andengineering factors that contribute to collisionrisk should be understood (see Chapter 4)and considered as well.
Spatial AnalysisThe siting process for new lines is in largepart a geospatial analysis that facilitates theselection of a route that is compatible withregulatory, land use and availability, environ-mental, economic, and engineering considera-tions. Spatial analysis of habitats has beenaided by the development of GIS software,which can help identify and characterize risk.GIS is often preferred because it can predictthe optimal route by incorporating all thevariables under consideration. Features insome GIS software systems can apply seg-ment weighting to help determine the opti-mal route. GIS software specifically for sitingand routing power lines has been developedby the Transmission Line Siting Methodolo-gy research project (see EPRI 2006). It uses amulti-step approach that starts with a largestudy area (corridor) and through various levels of evaluation selects potential routesand a preferred route. GIS software can alsobe used to create maps, which may be used to
564 | chapter 5
rank habitats for their prospective bird usewithin potential line routes. This approach isespecially useful when species of concernoccur along a proposed route.
Field AssessmentField assessment can often minimize collisionrisks (see Chapter 4) by identifying high-usebird habitats to avoid during route evaluation.Study designs should be scientifically defensi-ble and developed to meet the needs of theproject. Ideally, the following informationshould be obtained during the field assessment:
• Presence and abundance of bird species in the vicinity of the alternative routes
• Occurrence of species of concern, such as endangered species
• Location of habitat used by birds of concern
• Daily and seasonal use patterns for eachspecies, including a differentiation between migration and daily use
This information can be obtained by usingstandard bird survey techniques, such as pointcounts, and from existing avian databases,such as the Christmas Bird Count and eBird(see Appendix E).
PLANNING NEWPOWER LINES
About GIS
GIS (geographic information systems)software incorporates, stores, analyzes,manages, and presents data linked to aspecific geographical location. It mergescartography, statistical analysis, anddatabase technology. As a tool, GISsoftware helps decision-makers under-stand and predict the relationshipsbetween human uses and naturalresources such as wildlife and habitat.

SAM
PLE
Avian Risk AssessmentAvian risk assessment can be used to charac-terize the collision risk of a planned or exist-ing line and to prioritize the segments that
Minimizing Collision Risks | 65
FIGURE 5.7: Conceptual model of avian collision risk assessment.
need to be modified. Risk assessment is asystematic process for characterizing theprobability of an adverse effect occurring(USEPA 1998). It has been adapted for a
Potential Collision Stressors of Power Lines
Overhead Wires
Potential Receptors
MigratingPopulations
Various Age Classes (e.g., Adults, Juveniles, and Immatures)
Breeding Populations
ForagingPopulations
Potential Assessment Endpoints
Survivorship of Individuals and Populations
Potential Influences on ExposurePower Line Structure Type
Distribution Pole or Transmission Tower
Structure Height and Line Height and Length
Line ConfigurationNumber of Lines, Spacing Between Them and Whether
Horizontally or Vertically Arranged
Line Placement and OrientationProximity of Line to Nesting, Foraging, and Migratory Habitats
Visibility of LinesLine Diameter, Weather, Time of Day, and Landscape Features
Biological ExposureFlight Heights, Times, Direction, Frequency, and Abundance
Human Activities in or near ROWCausing Flushing of Birds
Potential Primary EffectsInjury or Mortality from Collisions
Potential Secondary EffectsReduced Productivity
Risk Assessment CharacterizationRisk to Individual Birds in Proximity to Power LinesRisk to Bird Populations in Proximity to Power Lines
Risk ManagementMinimizing Risks in Routing New Lines,
Modifying Existing Lines, and/or Line Marking to Reduce Collisions
J. NEWMAN, N
ORMANDEAU ASSOCIATE
S, INC.

SAM
PLE
wide range of applications, including avian/power line interactions. Avian risk assessmentin this context evaluates the collision risk thata power line may pose to birds. It includesseveral steps: problem formulation (e.g., iden-tifying species affected and specific collisionissues), characterization of exposure andeffects, risk assessment, and risk management.Figure 5.7 presents a conceptual model ofavian collision risk assessment.
Both qualitative and quantitative estimatesof risk can be used. One or both of theseapproaches may be appropriate dependingupon the type of risk characterizationrequired and the data available.
Qualitative risk assessment provides a non-numeric narrative description of risks. Theresulting risk statement is descriptive (notmathematically quantifiable) and provides anestimate of risk, such as low, moderate, high,etc. This approach uses existing informationabout the proposed site, its ecologicalresources, literature on the physiology andbehavior of species of concern, and reportedeffects (e.g., accounts of known collisionmortality at existing power line projects).Implementing a qualitative methodology doesnot generally require field studies before con-struction, but uses site visits to confirm con-ditions and supplement available information.
Quantitative risk assessments provide estimates of the number of birds anticipatedto be at risk to collisions. A quantitativeapproach accounts for, among other things,the spatial configuration of the stressor(power lines) and the spatial and temporalexposure of the receptor (birds) (i.e., thenumber of receptors that interact with thestressors in question).14 Quantitative riskassessments can be developed using literatureand other data but, because this method istypically used when greater precision is need-
566 | chapter 5
ed, it is frequently supplemented by site-specific data on power line engineering and/or design and site-specific observations andstudies to further assess collision potential.
Sometimes a tiered risk assessment can beused starting with a qualitative assessmentand proceeding to a quantitative assessment.For example, if more than one route is beingcompared for risks, a higher or lower riskranking may be appropriate using a qualitativeapproach. If a specific prediction of theamount of mortality is required, a quantita-tive or modeled approach may be appropriate.Spatial analyses have been used with quantita-tive modeling to identify and prioritize highrisk bird collision areas with varying degreesof success depending upon the quality andquantity of the data (see Heck 2007; Shaw et al. 2010; and Quinn et al. 2011).
OPTIONS FOR MINIMIZING COLLISION RISK DURING ROUTE EVALUATIONEngineering aspects such as line placement,line orientation, and line configuration allcontribute to either increasing or decreasingthe level of collision risk relative to biologicaland environmental factors (see Chapter 4).However, line routing is primarily a functionof the origin and destination of the powerbeing carried by these lines (see Figure 5.8),so other options such as line marking in areaswhere there is unavoidable collision risk andburying power lines where feasible and warranted may need to be considered.
Line PlacementBroadly, line routing should consider migra-tory patterns, areas of high bird use, and, ifavailable, historical bird abundance informa-tion. On a finer scale, proximity to bird habi-tats (e.g., wetlands, trees, and other roosting,nesting, and foraging sites) is an important
14 A stressor is a hazard in the environment that is capable of causing an adverse effect on a receptor. A wildlife receptor can be wildlife individuals, populations, or habitats that are subject to the potential impacts of a stressor.

SAM
PLE
Minimizing Collision Risks | 67
Terminology Used When Planning New Transmission Lines
For transmission line planning, the following termsmay have different meanings to various stakeholders.Figure 5.8 illustrates these terms, which will be used inthis manual in the following way.
Planning is the process that identifies the need for a transmission line to deliver electricity from the generation facility to a load or demand center.
Siting determines where the ends of the line need to be—Point A and Point B.
Corridor or study area is usually a rectangular bound-ary between Points A and B within which the alterna-tive and preferred transmission line routes are plotted.
Alternative routes through the corridor are identifiedbased on a long list of considerations that includeendangered species and wildlife habitat. Examples of additional considerations are:
• Cities and towns• Landowner agreement• Crossings, such as highway, water, other power lines• Airports• Heliports• Cemeteries• Communication towers• Historic places and archaeological sites• Wetlands• Land availability
• Land use• Homes/businesses/schools• Hospitals• Parks/recreation• Pipelines• Churches• Wells• Bridges• Topography• Line voltage, design, engineering, and construction
Determining a route through public land is distinctlydifferent than through private land. On public land, an agreement with only a few landowners is necessary;whereas on private land, hundreds of landowners maybe involved along with a diversity of land uses andconcerns to consider.
The preferred route is suggested by the utility. Afterstakeholder participation, the public utility commis-sion determines the final route, which may be the preferred route, an alternative route, or a combinationof the preferred and alternative routes.
The right-of-way (ROW) is the land that will be used for the power line. Easements along the ROWgive utility crews access to the line for maintenance and are legal agreements, including compensation,between the utility and the landowner.
FIGURE 5.8: Schematic of the terminology used when planning new transmission lines.
Corridor (Study Area) Alternative Routes Preferred Route Substation Siting (Ends of the Line)A, B
AB
Town
TownTown
Town

SAM
PLE
relative to bird migration and habitat use patterns (see SpatialAnalysis on page 64).
Line OrientationOrientation of power lines relativeto biological characteristics (e.g.,flight behavior, season, and habitatuse) and environmental conditions(e.g., weather patterns and topo-graphical features) can influencecollision risk. When planning powerline routes, features such as moun-tain ridges, river valleys, and shore-lines that are in traditional flightcorridors should be considered(Colson and Yeoman 1978; Faanes1987; Figure 5.10). Power lines thatparallel primary bird flight pathspose less risk than a perpendicularorientation (Crowder 2000; Scott et al. 1972; McNeil et al. 1985).For example, the perpendicular orientation of a line relative to a topographical feature poses agreater collision risk to local andmigrating birds, whereas a parallelorientation reduces risk. Where perpendicular orientationcannot be avoided, forest habitatslocated near power lines can some-times reduce collision risk (see Fig-ure 5.3) Lines that are at or belowthe height of nearby trees rarely
present a problem to small tree-dwelling birdsbecause of their maneuverability; further-more, large birds will gain altitude to fly overthe tree line and will consequently avoid thepower line (Thompson 1978; Raevel andTombal 1991). For example, a power linecrossing a narrow river bordered by trees that are taller than the line is likely to pose alower collision risk than a broad river crossingbecause most birds will fly over the tree topsto cross the narrow river valley (CMS 2011a).
consideration when selecting a line route (seeChapter 4). The proximity of power lines tobird take-off and landing areas can affect the risk of collision (Lee 1978; Thompson1978; Faanes 1987; Brown et al. 1984, 1987;Heck 2007; Quinn et al. 2011). For resultsof studies on distance of collision mortalitiesfrom specific areas, see Habitat and Habitat Use(page 44) and Line Placement (page 50). Spatialanalysis with GIS is useful for evaluating different power line placement options
568 | chapter 5
Feeding Area
Feeding Area
Resting Area
Power Lines
A. Risk Situation
B. Reduced Risk Situation
Resting Area
FIGURE 5.9: Potential collision risk (A) has been reduced (B) when bird-useareas are on the same side of the line (modified from Thompson 1978).

SAM
PLE
Strong tail winds can be detrimental tobirds’ ability to maneuver. Brown (1993) suggested that north-south orientation oflines increased collision frequency for cranesand waterfowl in the San Luis Valley, Col-orado, because birds crossing them on aneasterly heading were often subjected to prevailing westerly winds.
Line ConfigurationLine configuration—phase conductorsaligned vertically or horizontally and the
Minimizing Collision Risks | 69
number of conductors—is a collision factorthat intuitively makes sense, but there are too few studies to draw conclusions. Mostresearchers agree that keeping the verticalarrangement of multi-conductor transmis-sion lines to a minimum is beneficial becauseit reduces the height of the collision zone.However, a single-pole, vertical structure isoften esthetically more acceptable andrequires less ROW width.
Thompson (1978) and others (Bevanger1998; Crowder 2000; Drewitt and Langston
A. Risk Situation (Line Proximity to High-use Habitat)
B. Reduced Risk Situation (Line Situated Near Natural Feature)
FIGURE 5.10: Routing with respect to local topographic features (after Thompson 1978).
Energized Grounded

SAM
PLE
2008) have suggested that clustering lines(i.e., several power lines sharing the sameROW) may reduce collision risk because theresulting network of wires is confined to asmaller area and is more visible. Birds onlyhave to make a single ascent and descent tocross lines in this arrangement (Figure 5.11and Figure 5.12). However, when there isdecreased visibility, collision risk for birdsmay increase where several lines are clustered.When there are two shield wires at different
heights, and only the higher one is marked,there may be collisions at the lower unmarkedshield wire; both shield wires may need to bemarked (S. Liguori, pers. comm.).
Other configuration options include:
• Lowering the height of the lines (e.g., below the tree line)
• Changing the wire diameter • Bundling wires• Using spacers to improve visibility
570 | chapter 5
A. Risk Situation
B. Reduced Risk Situation
FIGURE 5.11: Reducing collisions by clustering lines in one right-of-way (after Thompson 1978).
Energized Grounded
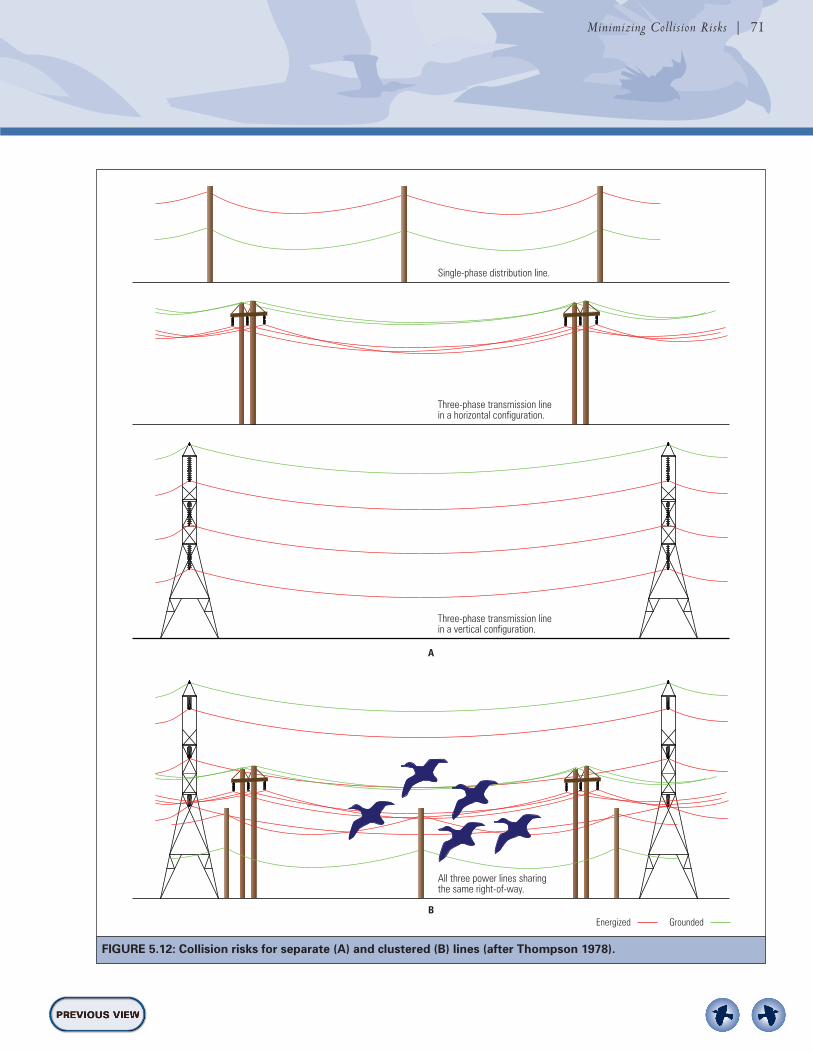
SAM
PLE
Minimizing Collision Risks | 71
A
B
Single-phase distribution line.
Three-phase transmission line in a horizontal configuration.
Three-phase transmission line in a vertical configuration.
All three power lines sharing the same right-of-way.
FIGURE 5.12: Collision risks for separate (A) and clustered (B) lines (after Thompson 1978).
Energized Grounded

SAM
PLE
• Rearranging wire configuration (e.g., converting from vertical to horizontal)• Changing the structure type to increase its visibility• Decreasing span length (e.g., by adding a pole mid-span)
Line MarkingIn areas where there is collision risk, linemarking devices should be considered. Moststudies have shown a reduction in collisionsand/or an increase in behavioral avoidance atmarked lines when compared to unmarkedlines, but this can vary with location, type ofline marking device, and bird species (Jenkinset al. 2010; Barrientos et al. 2011; see Chap-ter 6 for detailed information on devices and
572 | chapter 5
effectiveness).There are three general cate-gories of line marking devices: aerial markerspheres, spirals, and suspended devices(swinging, flapping, and fixed). Large diame-ter wire may also improve line visibility andhas been used with line marking devices toreduce risk of collision-electrocutions andcollisions (see Chapter 6). Line markingoptions are based on accessibility of the line,product availability and durability, ease ofinstallation, cost, compliance and legal issues,spacing and positioning, safety codes relatedto ice and wind loading, corona effects,esthetics, and potential for vandalism.
Burying Power LinesSee the discussion on Burying Power Lines underOptions for Modifying Existing Lines (page 62).
FIGURE 5.13: Public participation programsmay provide information through a publicrelations campaign, but they also go further to engage the public in discussionsand decision making (after EEI 2001).
PUBLIC PARTICIPATION TO ADDRESS SOCIAL AND CULTURAL ISSUES
The public may have concerns about powerline design and placement, including esthetics,environmental effects, wildlife, and safety. Van-dalism is also a persistent problem—electricalequipment and line marking devices can be-come targets. When a utility is taking steps tominimize collision risk, a public participationprogram can help build positive relationships,increase public knowledge, identify and respond
to public concerns, and promote responsiblebehavior (e.g., discouraging vandalism of linemarking devices).
WHAT IS PUBLIC PARTICIPATION?Public participation is different from publicrelations or public information programs.While a public relations campaign providesinformation to the public, public participa-tion programs actively engage the public indiscussions and decision making. A well-designed public participation programrequires the expertise of someone who cancommunicate technical information in an easily accessible way, facilitate groups, andcultivate trust with stakeholders. For a publicparticipation program to succeed, the com-mitment and involvement of top managementincluding the key decision makers is essential.Utilities can use a variety of public par-
ticipation tools to address social and culturalaspects of collision risk (see EEI 2001 andAppendix E for resources). Exhibits, signs,publications, web pages, and public announce-ments can be used to inform the public.Other techniques, such as webcasts, public
PublicParticipation
PublicRelations

SAM
PLE
forums, interviews, polls, retreats, citizenadvisory panels, social media communications,and workshops promote engagement in theprocess. All efforts should be based onknowledge of the target audiences, consistentmessages, audience participation in building ashared understanding, complete and objectiveinformation, and partnerships with support-
Minimizing Collision Risks | 73
ive organizations and businesses. EdisonElectric Institute’s (EEI) Introduction to PublicParticipation (EEI 2001) is an excellent sourceof practical information for electric utilities.
BENEFITS OF EFFECTIVE PUBLIC PARTICIPATIONPast experience shows that public partici-pation has a record of creating cooperativeworking relationships (EEI 2001). Accordingto EEI (2001), public participation:
• Reduces delays and costs associated withcontroversy and litigation. It often reducesimplementation time because the publicalready supports or accepts the decision.
• Builds a positive relationship with the public, which is important even when it isnecessary to make an unpopular decision.
• Develops and maintains credibility evenwith those who disagree with a given decision. A negative public image in onearena can affect a company’s bottom lineand trigger opposition in other arenas.
• Creates collaborative problem solving for achieving better and more acceptable decisions. When people believe that utilitydecisions are being imposed on them, theyare more likely to increase their opposition.
• Gathers information from the public thatthe utility needs to make informed decisions.
• Can improve programs and policies, whichwill enjoy greater support.
• Can help management understand thattechnical issues have important social com-ponents. Some decisions appear to be tech-nical, but are actually decisions about values.
CREATING A STRUCTURED PROGRAMThere are three phases to establishing a suc-cessful public participation program: deci-sion analysis, program planning, and imple-mentation. For case studies and a thoroughdescription of how to plan and implement apublic participation program use Introductionto Public Participation (EEI 2001) as your guide.
Case Study: How Public Participation Benefitted Transmission Line Routing
The Project: Florida Power & Light (FPL) Crane-Bridge-Plumosis Transmission Line in southeast Florida (Martin andPalm Beach counties).
The Issue: FPL sought licensing for a 64.4-kilometer (40-mile)transmission line that traversed two densely populated counties.The route chosen for the power line generated some controversybecause it included residential areas and a sensitive environmen-tal tract. Alternative routes were proposed and submitted by various non-governmental and neighborhood groups as well asindividuals. Continued opposition was expected.
Public Participation: A Citizens Advisory Panel (CAP) wasappointed that included members from many different interestgroups. The CAP recommended a route that was similar to theone originally recommended by FPL staff and consultants. FPLchose the panel’s route.
The Result:The chosen route was initially rejected by the per-mitting agency but formed the basis of the final approved route.
Benefits of Public Participation: By establishing and workingwith the CAP, FPL precluded numerous separate meetings withdifferent interest groups. The CAP increased understanding andsupport for the project despite initial opposition by individualparties. The discussions led to acceptable compromises, andcostly appeals and reviews were avoided. In the end, FPL had an approved route that was similar to their preferred route andmany members of the CAP felt positive that their input resultedin an improved project. The goodwill developed in the commu-nity benefited FPL’s public image and set the stage for betterrelations on future projects.
(Modified from a case study that originally appeared in EEI 2001)

SAM
PLE
Phase 1: Decision AnalysisClearly identify the decision-making processfor the project and establish what role thepublic will play. Consider who will be affect-ed by the project and if public support forthe project is needed. Determine whether reg-ulatory requirements or constraints may limitthe opportunities for public participation. Athorough decision analysis will ensure thatyou engage the public for the right reasonsand are not promising something that is notin your power to provide.
Phase 2: Program PlanningSuccessful participation plans address the needsand goals of both the utility and the public.The steps in creating a participation plan are:
• Identify the issues that will be importantand assess the level of controversy of each.Issues and concerns typically focus on one or more of the following: mandate, economics, health, proximity, values, andexisting uses of the property or area.
• Identify the parties (stakeholders) thatneed to be represented in the process.Invite a cross-section of the public includ-ing those who will be affected, those with a vested interest, and those who have decision-making power.
574 | chapter 5
• Determine the goals for your public partic-ipation program. Goals provide focus and a course of action for the process. Clearlydefined goals also make it easier to evaluatethe success of the process.
• Define the level of public participationneeded and state this clearly when invitingparticipants. In some cases, the publicmay be making decisions, while in othercases they may be providing support or recommendations.
• Select appropriate techniques of publicparticipation based on the issues, level ofcontroversy, and audience. Techniques, suchas newsletters, web pages, exhibits or newsreleases provide information, whereas focusgroups, meetings, workshops, polls, andinterviews foster active public participationand collaboration.
• Outline the decision-making processincluding all steps from identifying theproblem to formulating, evaluating, andselecting alternative approaches.
Phase 3: ImplementationImplement the program according to the collaboratively developed plan. During implementation, participants may see theneed to make adjustments or changes, so be flexible and prepared.
Characteristics of Successful Public Participation
Successful public participation programs often do the following:
• Make public participation an integral part of the project, rather than an afterthought.• Commit to a decision-making process at the outset and maintain that commitment.• Ensure that the interested public is involved in all phases of decision making:
definition of the problem, range of possible alternatives, criteria used to evaluatealternatives, and selection of the final course of action.
• Carefully assess the needs of different audiences and choose techniques appropriatefor all groups and for the information that will be collected.
• Ensure that management is engaged and has endorsed the program. This will create aclimate of acceptance, which is essential to meaningful public participation.

SAM
PLE
Line Marking to Reduce Collisions | 75
6c h a p t e r 6
Line Marking to Reduce Collisions
A common observation in collision studies is that birds show the ability to avoid a powerline if they see the lines early enough. Many of these studies indicate that collision riskcan be lowered by more than half and, in some cases, by as much as 80% after lineshave been marked. This chapter discusses what is known about line marking, includingthe different devices, their reported effectiveness, and considerations in their use.
IN THIS CHAPTER Overview of Line Marking DevicesEffectiveness of DesignsMarking Constraints and ConsiderationsLine Marking DevicesLarge Diameter Wire
chapter 6 | Line Marking to Reduce Collisions | 75
OVERVIEW OF LINE MARKING DEVICES
Studies suggest that the majority of bird collisions occur with the smallest diameterwire, which is typically the shield wire locatedabove the phase conductors on transmissionlines (e.g., Savereno et al. 1996) or the phaseconductor and neutral wire on distributionlines. Most collisions occur mid-span (e.g.,Eskom Transmission 2009). As a result, mostof the efforts to reduce bird collisions havefocused on marking the shield wires on trans-mission lines and the phase conductors ondistribution lines. As discussed in Chapter 4,different biological, environmental, and engi-neering factors contribute to birds’ ability to see and avoid a power line; each should be considered when choosing among linemarking options.
There are three general types of line mark-ing devices: aerial marker spheres, spirals, andsuspended devices (swinging, flapping, andfixed). In addition, large diameter wire, thoughnot a marking device, may also improve linevisibility and has been used with line markingdevices to reduce risk of collision-electrocu-tions and collisions (see Large Diameter Wire onpage 100). Since 1994, aerial marker spheres,spirals, and suspended devices have been further developed. Advances include changesto shape, colors and color patterns, andattachments, along with UV resistance, whichimproves durability and colorfastness. Otherdesigns have been developed, but are not currently available in the United States (seeDevices Available in Other Countries on page 97).

SAM
PLE
676 | chapter 6
Because there are few comparative studies,no single device is considered to be the bestperforming. However, Jenkins et al. (2010)concluded that any sufficiently large linemarking device that thickens the appearanceof the line for at least 20 centimeters (cm)(7.8 inches [in]) in length and is placed withat least 5 to 10 meters (m) (16.4 to 32.8 feet[ft]) spacing is likely to lower collision ratesby 50% to 80%. In addition, the SouthAfrican Electric Supply Commission (EskomTransmission 2009) describes its use of spi-rals and suspended devices on transmissionlines and recommends suspended devices oversmall-diameter spirals because their swinging
or flapping motion makes them more visibleand more effective.
Devices can be purchased in a variety ofcolors, which may be important but there areinsufficient comparative studies to providefirm conclusions. In general, what seems to be effective is to alternate the colors to makethe lines more obvious (Eskom Transmission2009). For aerial marker spheres, yellowseems to be the preferred choice over inter-national orange because they provide bettercontrast in poor light conditions.
Table 6.1 provides a general description of the most commonly used devices that areavailable in the United States.
TABLE 6.1: Summary of data on line marking devices available in the United States.*
General Comments Name† Description Dimensions Spacing§ on Effectiveness§
Aerial Marker Spheres
Aerial Marker Large, colored spheres that Diameter ranges from 23 cm Up to 100 m (328 ft) apart. Reduction in collisions noted Spheres or attach to wires. (9 in) to 137 cm (54 in). The See Table 6.3 for details. in certain situations. SometimesAviation Balls 23 cm (9 in) and 30.5 cm this marker is used in conjunction
(12 in) are most often used for with other line marking devices. line marking. See Table 6.4 for details.
Spirals
Spiral Vibration Extruded plastic (PVC) spiral Various lengths, ranging from Often placed about 3 m Reduction in collisions noted. Damper (SVD) device that fits over the 112 to 165 cm (46 to 65 in), (9.8 ft) apart on the shield Not as commonly studied as
shield wire and distribution to fit different conductor sizes. wire. Stagger on distribution other line marking devices. See conductors. lines to prevent interphase Table 6.6 for details.
contact.
Bird-Flight™ Spiral device made from high Lengths range from 17.8 to Ranges from 4.6 to 21 m Shows varying amounts of Diverter (BFD) impact PVC that attaches at 59.7 cm (7 to 23.5 in). (15 to 68.9 ft) apart. See effectiveness in collision risk
one end to the shield wire or Diameter at the large end Table 6.7 for details. reduction and flight behavior distribution conductor and ranges from 3.8 to 12.7 cm alteration. Commonly included in increases in diameter at the (1.5 to 5 in). collision studies. See Table 6.8other end. for details.
Swan-Flight™ Similar to the BFD, but this Lengths range from 50.8 to Ranges from 15 to 30 m Shows varying amounts of Diverter (SFD) device attaches at both ends 116.8 cm (20 to 46 in). (49.2 to 98.4 ft) apart. See effectiveness in collision risk
with the larger diameter Diameter of central spiral Table 6.9 for details. reduction and flight behavior spirals in the center. ranges from 17.8 to 20.3 cm alteration. Commonly included
(7 to 8 in). in collision studies. See Table 6.10 for details.
Continued

SAM
PLE
Line Marking to Reduce Collisions | 77
EARLY STUDIES (1960 TO 1994)In Europe during the 1960s and 1970s,numerous studies addressed the effectivenessof different devices to make power lines morevisible so collision rates could be reduced.Most of these studies tested aerial markerspheres (aviation balls) and various types ofplastic or rubber strips attached to the lines.These studies found that increasing the visibility of lines resulted in a statistically significant reduction of collision risk.
In 1964, a 275-kilovolt (kV) line nearTeeside, England, was marked with 15-cm(6-in) black vanes (flags). Koops and de Jong(1982) reported that this effort was successful
EFFECTIVENESS OF DESIGNS
in reducing bird collisions, although no quan-titative data were given. Renssen et al. (1975,cited in Beaulaurier 1981) investigated severalmarking schemes: black, white, and orangeaerial marker spheres on the shield wire.
Overall, the dozen or more studies duringthis period (see lists in Beaulaurier 1981 andHunting 2002) found that marking devicesranged from no effect to a 60% reduction incollisions. The limitation of these early stud-ies was that most were conducted over a shortperiod of time or they were not held to rig-orous experimental protocols. Often, quanti-fying and comparing flight intensities overmarked and unmarked lines were not done.
TABLE 6.1: Summary of data on line marking devices available in the United States.* (cont.)
General Comments Name† Description Dimensions Spacing§ on Effectiveness§
Suspended Devices
General Swinging and fixed devices; Size and shape varies with 5 to 30 m (16.4 to 98.4 ft) Shows varying amounts of Designs plastic flapper of various device and design. apart. Staggering devices on effectiveness in collision risk
shapes and colors with parallel lines is recommended. reduction and flight behavior reflective and glowing surfaces; See Table 6.11 for details. alteration. Commonly included in connected to a clamp that collision studies. See Table 6.12attaches to the power line. for details.
FireFly™ Swinging and fixed models; Acrylic plastic tag measures 4.6 to 15.2 m (15 to 50 ft) Shows varying amounts of rectangular devices with 9 cm x 15 cm (3.5 in x 6 in). apart. See Table 6.13 for effectiveness in collision risk reflective and glowing surfaces; details. reduction and flight behavior connected to a clamp that alteration. See Table 6.14 for attaches to the power line. details.
BirdMark Swinging perforated disk has 29.21 cm (11.5 in) long with 4.6 m (15 ft) apart Mentioned in reviews, but no BM-AG a reflective center and spins a 13.33-cm (5.25-in) diameter scientific studies were found.
and flutters, it also glows; disk.connected to a clamp that attaches to the power line; perforations allow device more wear resistance in high wind locations.
* Source: Summarized from available literature and Hunting (2002); see Line Marking Devices on page 85 for detailed information and sources. † This table only includes devices that are available in the United States; see Devices Available in Other Countries on page 97. § Summarized from different sources and studies with varying methodologies, environments, and species; see tables in Line Marking Devicesfor detailed information and sources.

SAM
PLE
678 | chapter 6
In addition, the durability of these deviceswas often very limited because of the plasticand cloth materials used.
LATER STUDIES (1995 TO 2012)Testing and reporting on the effectiveness of line marking devices have broadened toinclude the behavioral responses of birdsapproaching power lines. Hunting (2002),Lislevand (2004), Jenkins et al. (2010), andBarrientos et al. (2011) identified approxi-mately two dozen studies that have focusedon the effectiveness of certain devices forselected species. However, most of thesestudies involved transmission lines, and relatively few have looked at the comparativeeffectiveness of different devices. Hunting(2002) also concluded that making recom-mendations on the comparative device effec-tiveness is not possible due to the variation instudy designs.
Barrientos et al. (2011) conducted a meta-analysis of published and unpublished colli-sion studies to evaluate whether line markingreduced the number of collisions and whichdevices might be more effective. Althoughthey showed that line marking reduced collision rates by 78%, the variability instudy designs made it impossible to comparethe effectiveness of these devices with differ-ent species, in different habitats, in differentweather conditions, or on different line con-figurations. Barrientos et al. (2012), a before-after-control-impact (BACI) study of theeffectiveness of two spiral devices (the smallerbird flight diverter and the larger swan flightdiverter), concluded that line marking is aneffective way of reducing mortality on distri-bution and transmission lines. Their estimateof overall effectiveness was significant, butnot as high as others have reported; moredefinitive predictions were not possiblebecause of study design and data limitations.
Comparison studies that use the samemonitoring time intervals, control for habitatdifferences, and standardization of the peri-odicity of carcass searches are necessary todetermine the device best suited to a given set of environmental conditions and speciesintended for protection. The following exam-ples reflect various approaches to studying the effectiveness of line marking devices. (For studies on the effectiveness of eachdevice, see Line Marking Devices on page 85.)
In San Luis Valley, Colorado, Brown andDrewien (1995) evaluated the effectiveness oftwo devices: yellow spiral vibration dampers(SVDs) and yellow swinging fiberglass plateswith a diagonal black stripe (30.5 cm × 30.5cm [12 in × 12 in]). Marked segments 0.8kilometers (km) (0.5 mile [mi]) long werecompared with unmarked segments of equallength during spring and fall seasons over athree-year period. They found that SVDsreduced sandhill crane (Grus canadensis) andwaterfowl mortality by 60% and the swingingplates reduced mortality by 63%. Flightintensities were quantified. Evaluation of theflight behavior of sandhill cranes, Canadageese (Branta canadensis), and ducks at markedand unmarked lines indicated that birds react-ed to marked lines by increasing their altitudeand reaction distance. Although both devicessignificantly reduced mortality, the swingingplates damaged power lines.15 The authorssuggested that the silhouette of the swingingplate also provided an important benefit inlow-light conditions.
In west-central Spain, Janss and Ferrer(1998) studied the effectiveness of threedevices (white spiral, series of crossed bands,and thin black strips) on marked andunmarked transmission (380 kV and 132 kV)and distribution (13 kV) lines over a four-year period. The three devices were examinedby comparing marked to unmarked spans
15 The concept of swinging plates has developed into a variety of suspended devices. This new generation of suspended devices hasreduced the line-wear problem while maintaining effectiveness.

SAM
PLE
along the same power line.Monthly carcass searcheswere conducted withoutcorrecting for monitoringbiases (see Appendix B).The species exhibiting thehighest mortality includedbustards, cranes, andshorebirds. The white spi-ral devices (30 cm × 100cm [11.8 in × 39.4 in]),similar to a Swan-Flight™Diverter (SFD), reducedexpected mortality by81% for all birds. Theseries of two black,crossed bands (35 cm × 5cm [13.8 in × 1.9 in])reduced expected mortali-ty by 76% for all birds but not for great bus-tard (Otis tarda). The thin black strips (70 cm× 0.8 cm [28.6 in × 0.3 in]) placed at 12-m(39.4 ft) intervals from the central conductordid not reduce mortality. The authors statethat the data could not be used for statisticalcomparison of effectiveness of the differentdiverters for specific species.
The Ventana Wildlife Society (2009) conducted a comparative effectiveness studyof Bird�Flight™ Diverters (BFD) and SFDsat six sites at San Luis National WildlifeRefuge Complex in California. Althoughapproximately 800 hours of observation were made during three winter seasons from2005 to 2008, few collisions were observed.However, many reactions to power lines weredocumented, such as altitude changes or sudden changes in flight direction called flut-ter or flare. The birds exhibited reactions atgreater distances from power lines after flightdiverters were installed, especially on lineswith SFDs. Estimated total collisions weresignificantly higher for the unmarked controllines than for the lines marked with BFDs orSFDs. The difference in estimated total colli-sions between control lines and marked lines
Line Marking to Reduce Collisions | 79
was even greater when the analysis excludedthe American coot (Fulica americana), which primarily flies at night and accounted forapproximately half of all carcasses found.The study concluded that both diverters wereineffective for the American coot. The studyalso suggested that site-specific differencescan influence the effectiveness of diverters.
Western Area Power Administration con-ducted a line marking study along 3.2 km(2 mi) of line in 2006, 2007, and 2008(WAPA 2011). Three line marking deviceswere used: SFD, BirdMark (solid orange), andFireFly™. The study occurred near Colehar-bor, North Dakota, along the Auduboncauseway, which separates Lake Audubon on the east from Lake Sakakawea on thewest. More than 1,000 bird carcasses (fromroad mortality and collisions with powerlines) and 300 hours of observational datawere collected. The results indicated thatmarking the line decreased the number ofobserved flyovers for the majority of species;rather than flying over the lines, birds turnedand flew parallel to the line. The study alsoindicated that the differences in device effi-cacy were minimal.
FIGURE 6.1: Studies at the San Luis National WildlifeRefuge show that the line marking devices tested workwell for most species, the exception being the Americancoot, which is more vulnerable to collisions because itprimarily flies at night.
© JERRY LIGUORI

SAM
PLE
The choice of marking device is often basedon consideration of product availability anddurability, cost, ease of product installation,compliance and legal issues, spacing andpositioning, safety codes related to ice andwind loading, corona effects, esthetics, andvandalism. Utilities are encouraged to investi-gate and test products before installing themon a large scale. A general discussion of theseconsiderations is presented here. For specificconsiderations on each device, see Line Mark-ing Devices on page 85. For additional infor-mation on what devices may be appropriate,utility companies can consult with the manu-facturer and with other utilities.
PRODUCT AVAILABILITY AND DURABILITYThree general types of devices are available inNorth America: aerial marker spheres, spirals,and suspended devices. In addition, largerdiameter wire can be considered for increas-ing line visibility. Several distributors supplythese devices, so utility managers should con-sult with their suppliers for available options.Other devices have been developed, but arenot currently available in the United States(see Devices Available in other Countries, page 97).
The durability of line marking devicesand diverters was a commonly reported concern in the 1990s and 2000s. Since thenmost manufacturers have redesigned thesedevices to withstand ultraviolet (UV) lightdegradation, and they have improved theattachment clamps on suspended devices sothat damage to the power line is reduced oreliminated—device specifications can beobtained from the manufacturer.
Static devices (such as spirals) and dynam-ic devices (such as some suspended devices)have different durability. Static devices have
been more durable since they do not havemoving parts. However, they have had limitedsuccess in South Africa since they can be lessvisible than dynamic devices. It is assumedthat the motion is what makes the dynamicdevices more visible. The disadvantage ofdynamic devices is that they are subject towear and have a more limited useful life thanstatic devices. Some dynamic devices can alsocause wear damage on the power line (EskomTransmission 2009). In high wind areas,some devices with moving parts broke within several months (PacifiCorp, unpubl. data).
COST CONSIDERATIONSCosts will vary with power line access, installation method, type of device, spacing,number of devices needed, and durability of the device. These depend in part on theline design, voltage, and length of line to bemarked. Cost will also vary if the marking isdone during construction of new lines orretrofitting existing lines. Power lines that arehigher or over a water body (e.g., rivers, lakes,etc.) can be difficult to access and requiremore costly installation methods, such as aboat or helicopter. The durability of eachdevice also varies, which makes long-termmaintenance and impacts on line reliabilityadditional considerations in cost estimates.Product cost contributes the least to the overall cost of line marking.
EASE OF INSTALLATIONThe various types of line marking devicesrequire different installation techniques: fromthe ground, bucket truck, boat, helicopter,line trolley, or other means. Some devices canbe attached by hand and others need to beattached by a hot stick. Devices that coil onto
680 | chapter 6
Regardless of the variability in studies onthe effectiveness of devices, most studies haveshown a reduction in collisions and/or an
increase in behavioral avoidance when compared to unmarked sections of a line.
MARKING CONSTRAINTS AND CONSIDERATIONS

SAM
PLElines may be easier to install by hand, if
possible, than by hot stick. Some, such assuspended devices, may be installed by eitherone or two people, and a tool may berequired for one-person installation.16
In areas where access to the power line is difficult, product durability may be a moreimportant consideration than ease of instal-lation. For products with a shorter lifespan,the ease of product removal for repairs orreplacement should also be considered.
COMPLIANCE AND LEGAL ISSUES Associated issues must be considered toensure that the line marking system complieswith all applicable company, industry, andlegal requirements. Installation must notreduce National Electrical Safety Code(NESC) clearance requirements, cause damage to standard power line hardware,conductors, and/or supporting structures, or affect the line or system reliability. Attach-ment procedures must adhere to worker andindustry safety standards and be compatiblewith standard industry tools and equipment.Where facilities are shared, the easement documents may have restrictions concerning
Line Marking to Reduce Collisions | 81
additions or modifications. In addition, legal counsel of some utility companies mayobject to the use of aerial marker spheres forpreventing bird collisions because they preferthat the spheres only be used in compliancewith Federal Aviation Administration (FAA)regulations to mark hazards to aircraft.
SPACING AND POSITIONINGSpacing and positioning determine the abilityof marking devices to increase line visibility,the number of devices needed to mark eachspan, and how much the marking will add to the ice and wind loading. Over the years,studies have discussed spacing and position-ing of devices on power lines. However, therehave been no systematic comparisons ofdevices and their spacing and positioning.The following are general recommendationsfor spacing and positioning. For specific recommendations on each device, see LineMarking Devices on page 85.
Spacing recommendations vary dependingon species considerations, environmentalconditions, line location, and engineeringspecifications (e.g., wind and ice loading,conductor size, and the presence or absenceof the shield wire). In general, intervals of 5to 30 m (16 to 98 ft) have been most com-monly used and recommended for all but theaerial marker spheres (aviation balls), where agreater spacing is used, and SVDs, where lessspacing is used (see Table 6.1). Jenkins et al.(2010) concluded that any sufficiently largeline marking device that increases the diame-ter of the line by at least 20 cm (8 in) for alength of at least 10 to 20 cm (4 to 8 in)and is placed at intervals of 5 to 10 m (16 to 32 ft) is likely to lower general collisionrates by 50% to 80%.
For positioning, Eskom Transmission(2009) recommends marking only 60% of aspan, the central portion of the shield wireson transmission lines, since this is where
FIGURE 6.2: A helicopter crew installingline marking devices on a power line.
16 A utility should consult with its safety department to determine appropriate practices for individual or crew work.
© DAVE BOUCHARD, A
EP

SAM
PLE
markers on each individual line and each line’sice and wind loading.
SAFETY CODES: ICE AND WIND LOADINGThe NESC identifies minimum safety andengineering standards for power lines withinthe United States. The NESC ice and windloading and safety criteria for conductors andsupporting structures must be reviewed priorto marking. These guidelines are used whendesigning a line so the constructed powerlines meet or exceed NESC criteria. In addi-tion, some states have adopted additionalcodes and regulations that further specifydesign criteria.
When any device is added to an overheadpower line, it adds to the weight or loading ofthe line. Ice or wind adds still more loadingto the line and supporting structures. Theadded weight of the devices and the extrawind and ice loading must not exceed line
most collisions occur. In surveys conductedfrom 2004 to 2009 in Oregon, California,Idaho, Utah, and Wyoming, PacifiCorp(unpubl. data) found that most waterfowlcollision mortalities were found mid-span inthe right-of-way (ROW), parallel to distribu-tion lines, at distances of 12 to 18 m (39 to61 ft) from the nearest pole (Table 6.2); typi-cal span lengths were 91.5 to 121.9 m (300 to400 ft). Sandhill cranes (Grus canadensis), Ameri-can white pelicans (Pelecanus erythrorhynchos),and raptors were found farther from the nearest pole than were other species (Pacifi-Corp, unpubl. data.). These distances canhelp direct the placement of line markingdevices (Figure 6.3).
Another commonly recommended strategyis to stagger the devices on parallel lines in thesame plane to increase the visual density ofthe marked power line (Figure 6.4 and Figure6.5). This would also reduce the number of
682 | chapter 6
DistanceTaxa or Species Sample SizeMean Std Dev Range
Geese 43 11.9 ± 10.7 m 0.6 to 45.7 m (39 ± 35 ft) (2 to 150 ft)
Ducks 25 16.2 ± 13.1 m 0.6 to 48.8 m (53 ± 43 ft) (2 to 160 ft)
Swans 5 18.6 ± 9.4 m 6.1 to 60.9 m (61 ± 31 ft) (20 to 200 ft)
Raptors 12 37.5 ± 11.9 m 18.3 to 54.9 m(123 ± 39 ft) (60 to 180 ft)
Great blue heron 7 17.4 ± 12.8 m 1.5 to 33.5 m (Ardea herodias) (57 ± 42 ft) (5 to 110 ft)
American white pelican 16 19.8 ± 15.2 m 1.8 to 45.7 m (Pelecanus erythrorhynchos) (65 ± 50 ft) (6 to 150 ft)
Sandhill crane 6 21.9 ± 16.5 m 6.1 to 45.7 m (Grus canadensis) (72 ± 54 ft) (20 to 150 ft)
* Source: PacifiCorp, unpubl. data
TABLE 6.2: Distance of collision mortalities from the nearest pole (parallel to distributionlines in the right-of-way).*

SAM
PLE
Line Marking to Reduce Collisions | 83
60% of Span Length
60% of Span Length
Shield Wires
Phase Conductors
10m
Line Marking Devices
White Color
Black Color
Tower
Overhead View
Horizontal View
Top of PoleShield Wire
Line Marking Device
Line Marking Device
10 m (16.4 ft)
Overhead View
20 m(33 ft)
FIGURE 6.4: Positioning of line markingdevices on one shield wire or staggered ontwo parallel shield wires.
FIGURE 6.5: Line marking devices staggered on a distribution line.
FIGURE 6.3: Positioning of line marking devices on the central portion of two shield wires on transmission lines(after Eskom Transmission [South Africa] 2009).
Grounded
Energized Grounded
© DAVE BOUCHARD, A
EP

SAM
PLE
design limits and code requirements or causeadditional sag that could lead to interphasecontact (one conductor contacting another)and an outage. Consultation with the designengineers is imperative to ensure that addingany type of line marking device will notexceed design criteria. For existing lines, additional loading must be considered whenretrofitting with line marking devices. Whendesigning new power lines that may requiremarking, include allowances for the additionalloading of those marking systems to preventsafety criteria from being exceeded.
CORONA EFFECTS Electric corona occurs when the voltage of aphase conductor, typically 115 kV or greater,ionizes the surrounding air, which alsobecomes a conductor (Hurst 2004). Corona
684 | chapter 6
can degrade certain materials over time(Hurst 2004). Corona discharges appear asbluish tufts or streamers around the phaseconductor, generally concentrated at irregu-larities on the conductor surface. A hissingsound, an odor of ozone, and local radiointerference often occurs. Sharp corners ofenergized parts and voids, bubbles, and otherheterogeneous components within solid mate-rials (e.g., diverters) can cause corona effects.
Hurst (2004) tested several devices (BirdFlapper, FireFly™, BirdMark BM-AG, BFD,and SFD) at three simulated voltages. Thestudy found that most of the devices had verylittle or no corona at 115 kV (except forsome of the suspended devices) but did havecorona effects at 230 kV and 345 kV. Thebest-performing devices at 115 kV were theBFD and the SFD, neither of which had anydetectable corona discharge. At 230 kV, theBFD and the SFD had a medium level ofcorona, whereas suspended devices were char-acterized with a high level. At 345 kV, all ofthe devices had a very high level of corona.The corona generally occurred at the point ofattachment to the phase conductor and at thetop of the Bird Flapper and FireFly.
ESTHETICSVisual management and esthetics have becomeconcerns related to the construction or modi-fication of power lines. With appearance as aconsideration, dull rather than shiny materialsare now widely used for overhead lines. Con-sequently, power lines were designed to blendwith the background and be as invisible aspossible, particularly in heavily forested areas.However, with growing concern about birdcollisions, design goals are changing towardmaking the line acceptable to people but notinvisible to birds.
If the power line is located where the view-shed is an environmental value, such as on ornear public land or in residential areas, theaddition of line marking devices may becomean esthetic issue. For public lands and resi-
FIGURE 6.6: When a device is added to apower line, it may add to the loading of the line, which further increases under icyor windy conditions and may also causeproblems for deicing operations.
© M
ANITOBA HYDRO
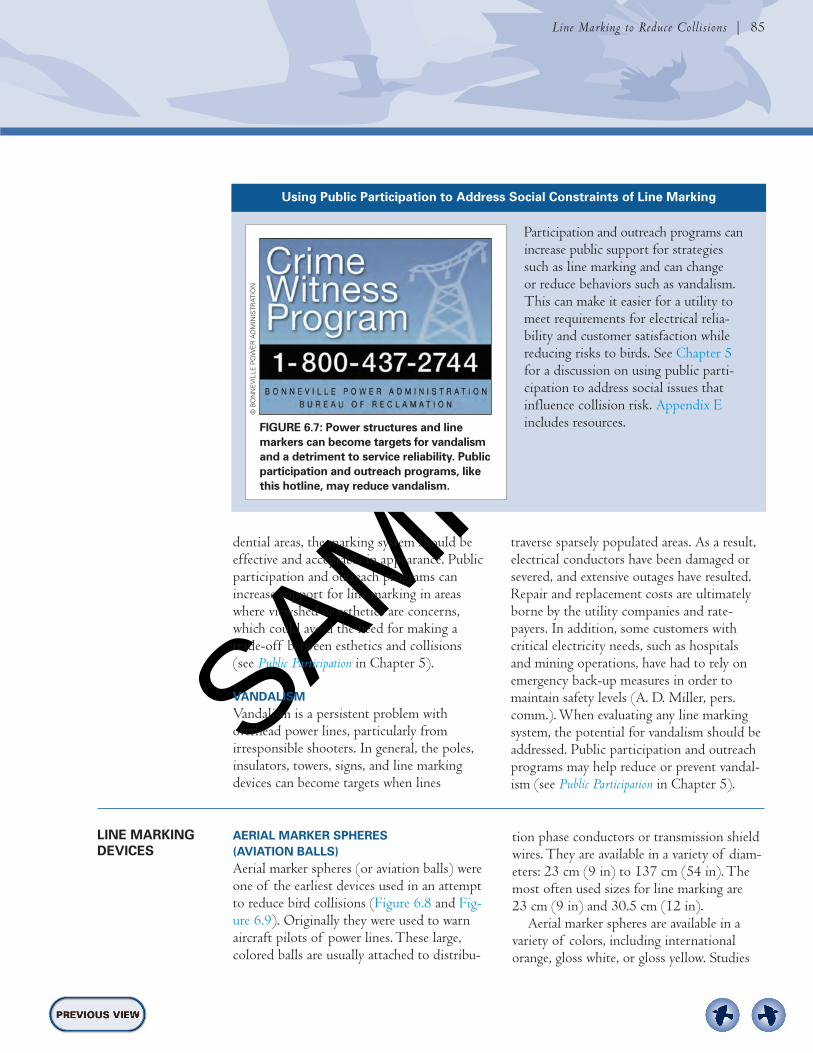
SAM
PLE
dential areas, the marking system should beeffective and acceptable in appearance. Publicparticipation and outreach programs canincrease support for line marking in areaswhere viewshed or esthetics are concerns,which could avoid the need for making atrade-off between esthetics and collisions (see Public Participation in Chapter 5).
VANDALISMVandalism is a persistent problem with overhead power lines, particularly from irresponsible shooters. In general, the poles,insulators, towers, signs, and line markingdevices can become targets when lines
traverse sparsely populated areas. As a result,electrical conductors have been damaged orsevered, and extensive outages have resulted.Repair and replacement costs are ultimatelyborne by the utility companies and rate-payers. In addition, some customers with critical electricity needs, such as hospitals and mining operations, have had to rely onemergency back-up measures in order tomaintain safety levels (A. D. Miller, pers.comm.). When evaluating any line markingsystem, the potential for vandalism should beaddressed. Public participation and outreachprograms may help reduce or prevent vandal-ism (see Public Participation in Chapter 5).
Line Marking to Reduce Collisions | 85
Using Public Participation to Address Social Constraints of Line Marking
Participation and outreach programs canincrease public support for strategiessuch as line marking and can change or reduce behaviors such as vandalism.This can make it easier for a utility tomeet requirements for electrical relia-bility and customer satisfaction whilereducing risks to birds. See Chapter 5for a discussion on using public parti-cipation to address social issues thatinfluence collision risk. Appendix Eincludes resources.FIGURE 6.7: Power structures and line
markers can become targets for vandalismand a detriment to service reliability. Publicparticipation and outreach programs, likethis hotline, may reduce vandalism.
LINE MARKING DEVICES
AERIAL MARKER SPHERES (AVIATION BALLS)Aerial marker spheres (or aviation balls) wereone of the earliest devices used in an attemptto reduce bird collisions (Figure 6.8 and Fig-ure 6.9). Originally they were used to warnaircraft pilots of power lines. These large,colored balls are usually attached to distribu-
tion phase conductors or transmission shieldwires. They are available in a variety of diam-eters: 23 cm (9 in) to 137 cm (54 in). Themost often used sizes for line marking are 23 cm (9 in) and 30.5 cm (12 in).
Aerial marker spheres are available in avariety of colors, including internationalorange, gloss white, or gloss yellow. Studies
© BONNEVILLE POWER ADMINISTR
ATION

SAM
PLE
regarding the effectiveness of color for warning pilots have shown that interna-tional orange is not the most effective colorfor all lighting conditions (Electrical World1986). The FAA suggests a combination ofinternational orange, gloss white, or glossyellow for marking lines for aircraft. Inbird collision studies, yellow has beenshown useful because it reflects light betterat dawn and dusk, and it does not blend inwith the background colors as readily asinternational orange.
Recommended spacing between spheresgenerally ranges from 30 to 100 m (100 to328 ft) (Table 6.3 and Table 6.4). For anexisting line that crosses water, where theaddition of aerial marker spheres may notbe suitable, a separate (non-energized)cable for the purpose of holding the aerialmarkers could be installed. In this applica-tion, a larger size cable (visible to birds)should be used so that it does not con-tribute to bird collisions. This may provideadequate marking to reduce collisions.
686 | chapter 6
FIGURE 6.8: Aerial marker spheres,also known as aviation balls, weredesigned to make power lines morevisible to aircraft operators.
FIGURE 6.9: Aerial marker spheres in use on apower line above a wetland habitat.
Utility Industry Manufacturer Spacing Lengths Used in Device Practices Recommendations Experimental Studies†
Aerial Marker Spheres 30 to 100 m (98.4 to Spacing is not critical and will Up to 100 m (328 ft) apart. (Aviation Balls) 328 ft) apart (APLIC) depend upon local conditions. Some studies staggered devices
The general rule is 20 m (65.6 ft) on parallel lines to increase apart (Preformed Line Products) visual density.
* Actual spacing depends on engineering requirements, manufacturer specifications, species involved, and site-specific conditions.
† See Table 6.4 for study details and sources.
TABLE 6.3: Spacing and positioning for aerial marker spheres (aviation balls).*
© P&R TECHNOLO
GIES, INC.
© JERRY LIGUORI

SAM
PLE
Line Marking to Reduce Collisions | 87
Location/ Power Line EffectivenessDescription/Spacing Species Characteristics Behavioral Avoidance Reduction in Collisions Reference
Yellow spheres with black vertical Nebraska/ Transmission, Behavioral avoidance was Significantly reduced Morkill and stripe, 30 cm (11.8 in)/spacing: sandhill cranes 69 kV to 345 kV greater (birds flew higher collisions Anderson 1991irregular intervals and reacted sooner) for
marked versus unmarked line
Yellow aviation balls with black South Carolina/ Transmission, Behavioral avoidance was Collision rate was 53% Savereno et al. stripes, 30 cm (11.8 in)/spacing: various 115 kV greater (birds reacted lower at marked line 1996100 m (328 ft); staggered on waterfowl sooner) for marked versus opposing shield wires for a visual species unmarked lineeffect of 50 m (164 ft)
Yellow aviation marker ball with Hawaii/ – – Reduced collisions Telfer 1999 20.3 cm (8 in) black dots/spacing: shearwaters cited in Bridges not provided et al. 2008
TABLE 6.4: Representative studies for aerial marker spheres (aviation balls).
Considerations for Aerial Marker Spheres (Aviation Balls)
• Improper design or installation of aerial markerspheres on phase conductors or shield wires cancause spheres to work loose and slide to the centerof the span or be pushed by wind to the end of aspan. Line damage from this may cause an outage.
• Aerial marker sphere size should be compatible withthe design constraints of the line. For example, verylarge spheres can be heavy and should only be usedon lines that can handle this weight.
• Adding aerial marker spheres can affect line tension and structure design more than otherdevices, particularly in areas where heavy ice andwind loading occurs. Accommodating the additional loading could affect construction costs.
• When installed on higher voltage conductors, therecan be corona damage (depending on the type ofmarker balls). To avoid corona damage, marker ballsdesigned for installation on higher voltage lines,though more costly, should be used.
• Spheres are moderately labor-intensive to install onan existing line, but less costly when added to a newline during construction.
• Although aerial marker spheres are more costly perunit than spirals, the overall cost of marking new orexisting lines would be about the same because fewerspheres would be required.
• The legal counsel of some utility companies objectsto the use of aerial marker spheres to prevent birdcollisions. They prefer that spheres be used only incompliance with FAA regulations to mark hazards to aircraft.
• Depending upon the location, aerial marker spherescan be targets for irresponsible shooters.
• The size and number of aerial marker spheres usedmay result in visual degradation of environmentswhere esthetics are important (tourist areas, scenicmountain views, historic areas, etc.)
SPIRALSSpirals available in the United States includespiral vibration dampers (SVDs), Bird-Flight™Diverters (BFDs), and Swan-Flight™ Diverters (SFDs).
Spiral Vibration Damper (SVD)Spiral vibration dampers (SVDs) are pre-formed PVC spirals that were designed toreduce line vibration (aeolian vibration), butwere also found to increase line visibility and
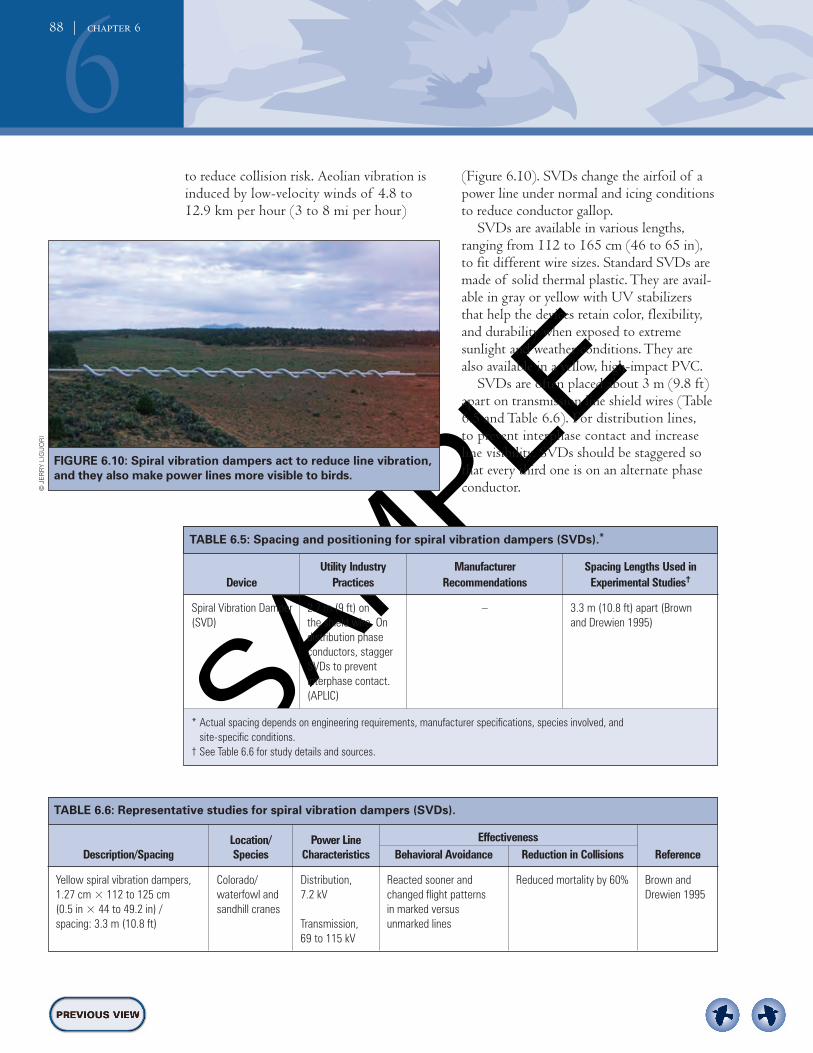
SAM
PLE
to reduce collision risk. Aeolian vibration isinduced by low-velocity winds of 4.8 to12.9 km per hour (3 to 8 mi per hour)
688 | chapter 6
(Figure 6.10). SVDs change the airfoil of apower line under normal and icing conditionsto reduce conductor gallop.
SVDs are available in various lengths,ranging from 112 to 165 cm (46 to 65 in),to fit different wire sizes. Standard SVDs aremade of solid thermal plastic. They are avail-able in gray or yellow with UV stabilizersthat help the devices retain color, flexibility,and durability when exposed to extreme sunlight and weather conditions. They arealso available in a yellow, high-impact PVC.
SVDs are often placed about 3 m (9.8 ft)apart on transmission line shield wires (Table6.5 and Table 6.6). For distribution lines, to prevent interphase contact and increaseline visibility, SVDs should be staggered sothat every third one is on an alternate phaseconductor.
FIGURE 6.10: Spiral vibration dampers act to reduce line vibration,and they also make power lines more visible to birds.
Utility Industry Manufacturer Spacing Lengths Used in Device Practices Recommendations Experimental Studies†
Spiral Vibration Damper 2.7 m (9 ft) on – 3.3 m (10.8 ft) apart (Brown (SVD) the shield wire. On and Drewien 1995)
distribution phase conductors, stagger SVDs to prevent interphase contact. (APLIC)
* Actual spacing depends on engineering requirements, manufacturer specifications, species involved, and site-specific conditions.
† See Table 6.6 for study details and sources.
TABLE 6.5: Spacing and positioning for spiral vibration dampers (SVDs).*
Location/ Power Line EffectivenessDescription/Spacing Species Characteristics Behavioral Avoidance Reduction in Collisions Reference
Yellow spiral vibration dampers, Colorado/ Distribution, Reacted sooner and Reduced mortality by 60% Brown and 1.27 cm × 112 to 125 cm waterfowl and 7.2 kV changed flight patterns Drewien 1995(0.5 in × 44 to 49.2 in) / sandhill cranes in marked versus spacing: 3.3 m (10.8 ft) Transmission, unmarked lines
69 to 115 kV
TABLE 6.6: Representative studies for spiral vibration dampers (SVDs).
© JER
RY LIGUORI

SAM
PLE
Bird-Flight™ Diverter (BFD) BFDs are preformed, increasing-radius spiralsmade of extruded, high-impact PVC (Figure6.11 and Figure 6.12). One end of the spiral
Line Marking to Reduce Collisions | 89
grips the power line while the radius quicklyincreases toward the other end of the spiral.BFDs were developed in Great Britain andhave been used in Europe since the early1970s and more recently in the United Statesand South Africa. They are also called “smallpigtails” in South Africa (Eskom Transmis-sion 2009). Since 1994, more designs havebecome available.
Considerations for Spiral Vibration Dampers
• When installed on triangularly spaced distribution lines,SVDs should be staggered on all three phase conductors.Despite their light weight, if they are only applied on the topor ridge phase conductor, wind or ice may make the top phasesag, which may cause interphase contact.
• When installed on a single shield wire, given the relativelylight weight of SVDs, the rate of coverage, and the distancebetween the shield wire and the phase conductors, line sag onthe shield wire would rarely present an issue.
• SVDs are not recommended for use on transmission phaseconductors (AC or DC) with voltage ≥230 kV because ofcorona effects (see Corona Effects, page 84). However, futuredesign materials may address this issue.
• Installation of SVDs is moderately labor intensive on lower-height distribution lines and more so on transmission linesthat range from 15.2 to 59 m (50 to 195 ft) above the ground.
FIGURE 6.11: The Bird-Flight™ Diverter is a spiral device made of PVC.
FIGURE 6.12: Bird-Flight™ Diverters installed on a distribution line.
© PREFO
RMED LINE PRODUCTS, INC.
© DAVE BOUCHARD, A
EP
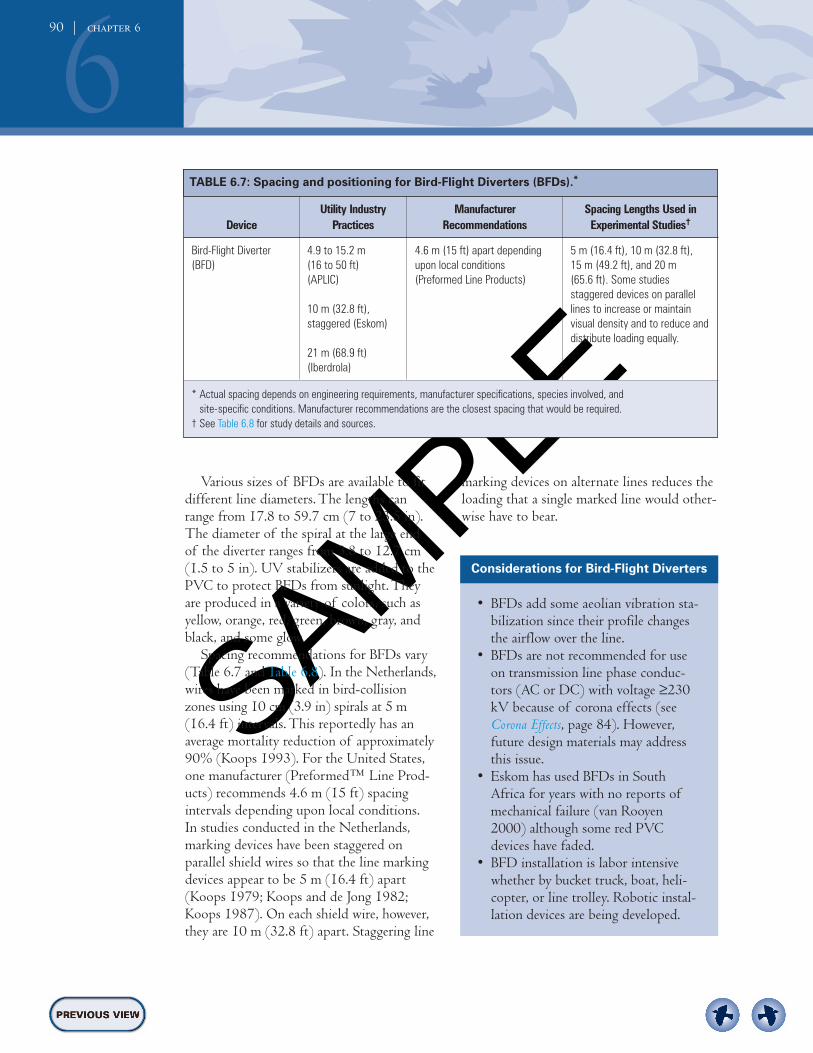
SAM
PLEmarking devices on alternate lines reduces the
loading that a single marked line would other-wise have to bear.
Various sizes of BFDs are available to fitdifferent line diameters. The lengths canrange from 17.8 to 59.7 cm (7 to 23.5 in).The diameter of the spiral at the large end of the diverter ranges from 3.8 to 12.7 cm(1.5 to 5 in). UV stabilizers are added to thePVC to protect BFDs from sunlight. Theyare produced in a variety of colors, such asyellow, orange, red, green, brown, gray, andblack, and some glow.
Spacing recommendations for BFDs vary(Table 6.7 and Table 6.8). In the Netherlands,wires have been marked in bird-collisionzones using 10 cm (3.9 in) spirals at 5 m(16.4 ft) intervals. This reportedly has anaverage mortality reduction of approximately90% (Koops 1993). For the United States,one manufacturer (Preformed™ Line Prod-ucts) recommends 4.6 m (15 ft) spacingintervals depending upon local conditions. In studies conducted in the Netherlands,marking devices have been staggered on parallel shield wires so that the line markingdevices appear to be 5 m (16.4 ft) apart(Koops 1979; Koops and de Jong 1982;Koops 1987). On each shield wire, however,they are 10 m (32.8 ft) apart. Staggering line
690 | chapter 6
Utility Industry Manufacturer Spacing Lengths Used in Device Practices Recommendations Experimental Studies†
Bird-Flight Diverter 4.9 to 15.2 m 4.6 m (15 ft) apart depending 5 m (16.4 ft), 10 m (32.8 ft), (BFD) (16 to 50 ft) upon local conditions 15 m (49.2 ft), and 20 m
(APLIC) (Preformed Line Products) (65.6 ft). Some studies staggered devices on parallel
10 m (32.8 ft), lines to increase or maintain staggered (Eskom) visual density and to reduce and
distribute loading equally.21 m (68.9 ft) (Iberdrola)
* Actual spacing depends on engineering requirements, manufacturer specifications, species involved, and site-specific conditions. Manufacturer recommendations are the closest spacing that would be required.
† See Table 6.8 for study details and sources.
TABLE 6.7: Spacing and positioning for Bird-Flight Diverters (BFDs).*
Considerations for Bird-Flight Diverters
• BFDs add some aeolian vibration sta-bilization since their profile changesthe airflow over the line.
• BFDs are not recommended for useon transmission line phase conduc-tors (AC or DC) with voltage ≥230kV because of corona effects (seeCorona Effects, page 84). However,future design materials may addressthis issue.
• Eskom has used BFDs in SouthAfrica for years with no reports ofmechanical failure (van Rooyen2000) although some red PVCdevices have faded.
• BFD installation is labor intensivewhether by bucket truck, boat, heli-copter, or line trolley. Robotic instal-lation devices are being developed.

SAM
PLE
Swan-FlightTM Diverter (SFD)The SFD is another spiral design, which isalso called a Double Loop Bird FlightDiverter (Figure 6.13 and Figure 6.14).SFDs have two gripping ends and a centralspiral with a larger diameter.
Sizes are available to fit different conduc-tor diameters. The lengths can range from50.8 to 116.8 cm (20 to 46 in). The diame-ter of the central spiral can range from 17.8to 20.3 cm (7 to 8 in). SFDs are extruded inyellow and gray high-impact PVC with UV
Line Marking to Reduce Collisions | 91
Location/ Power Line EffectivenessDescription/Spacing Species Characteristics Behavioral Avoidance Reduction in Collisions Reference
White BFD, 5 cm (1.9 in) diameter/ Netherlands/ – – When spaced at 20 m Koops 1987; spacing: 5 m, 10 m, and 20 m various species (32.8 ft), they reduced Koops and de (16.5, 32.8, and 65.6 ft) collisions by 58%. Total Jong 1982;
mortality was reduced by Koops 1993 White BFD, 10 cm (3.9 in) 57% to 89%, depending (cited in Janss diameter/spacing: 15 m (49.2 ft) upon the size and spacing and Ferrer 1998)
Red spiral BFD, 30 cm (11.8 in) Spain/various Transmission, 61% reduction in birds 60% reduction in collisions Alonso et al. maximum diameter, 1 m (3.3 ft) species 380 kV with crossing the lines, more 1994long/spacing:10 m (32.8 ft) including cranes dual shield wires birds flying over, fewer
and bustards flying through lines
Yellow and gray BFD Indiana/ Transmission, Reduced bird collision by Crowder 2000waterfowl 345 kV 73.3% compared to
unmarked lines
Yellow PVC BFD spirals, 25 cm Colombia/ Transmission, Birds detected BFD line at Reduction in collision De La Zerda and(9.8 in) diameter, 80 cm (31.5 in) night flying 500 kV a greater distance than frequency for marked Roselli 2003length /spacing: 10 m (32.3 ft); rallids, herons, unmarked line, fewer flew versus unmarked lines, staggered on both shield wires and ducks at conductor height but collision rate was
highly variable regardless of line condition
Yellow and gray BFD/ spacing: California/ Distribution Birds exhibited greater Reduced waterfowl Ventana Wildlife 4.6 m (15 ft); staggered on waterfowl reactive distances collisions, but not coot Society 20093 phase conductors collisions (coots fly
at night)
Small spirals, 10 cm (3.9 in) Spain/various Distribution and – Reduced collisions overall Barrientos et al. diameter, 24 cm (9.4 in) long/ species including transmission after line marking (9.6%) 2012spacing was not provided bustards, storks,
and doves
TABLE 6.8: Representative studies for Bird-Flight Diverters (BFDs).
FIGURE 6.13: The Swan-FlightTM Diverter is a double-ended spiral device.
© PREFO
RMED LINE PRODUCTS, INC.

SAM
PLE
692 | chapter 6
FIGURE 6.14: Swan-FlightTM Diverters installed on the phaseconductors of a distribution line.
Utility Industry Manufacturer Spacing Lengths Used in Device Practices Recommendations Experimental Studies†
Swan-Flight Diverter 15.2 m (50 ft) Spacing is not critical and will 5 m (16.4 ft), 10 m (32.8 ft), and (SFD) (APLIC) depend upon local conditions. 15 m (49.2 ft). Some studies
The recommended ranges are staggered devices on parallel 21 m (68.9 ft) 10 to 15 m (32.8 to 49.2 ft) lines to increase visual density (Iberdrola) (Preformed Line Products) up to and distribute loading equally.
30 m (98.4 ft) (FCI)
* Actual spacing depends on engineering requirements, manufacturer specifications, species involved, and site-specific conditions.
† See Table 6.10 for study details and sources.
TABLE 6.9: Spacing and positioning for Swan-Flight Diverters (SFDs).*
Considerations for Swan-Flight Diverters
• SFDs can be used on the shield wires of high-voltage lines.
• SFDs on the line add some aeolianvibration stabilization since theirprofile changes the airflow over the line.
• SFDs are not recommended for useon transmission line phase conduc-tors (AC or DC) with voltages ≥230 kV because of corona effects(see Corona Effects, page 84). Howev-er, future design materials mayaddress this issue.
• Wind and ice loading should be con-sidered, as these have been a concernin Canada and the northern UnitedStates (N. Heck, pers. comm.).
• Colors of some SFDs may fade.• Installation is labor intensive
whether done from bucket truck,boat, helicopter, or line trolley.Robotic installation devices are also being developed.
stabilization. Gray is the standard color butSFDs are available in: black, blue, brown,green, purple, red, orange, and pink, andsome that glow.
Spacing depends upon local conditions(Table 6.9 and Table 6.10).
© JERRY LIGUORI

SAM
PLE
Line Marking to Reduce Collisions | 93
Location/ Power Line EffectivenessDescription/Spacing Species Characteristics Behavioral Avoidance Reduction in Collisions Reference
White spirals (SFD), 30 cm Spain/various Various size – Effective at reducing Roig-Soles and (11.8 in) diameter/ spacing: species including distribution and collisions Navazo-Lopez 10 m (32.8 ft) cranes, storks, transmission 1997
and bustards lines
White polypropylene spirals, 1 m Spain/cranes Transmission, – Small sample size did not Janss and (3.3 ft) long, 30 cm (11.8 in) 380 kV and permit specific species Ferrer 1998maximum diameter/spacing: 132 kV evaluation. Reduced 10 m (32.8 ft); staggered on mortality for common 2 shield wires for a visual effect Distribution, cranes. The reduction in of 5-m (16.4-ft) intervals 13 kV actual versus predicted
mortality for all birds was 81%
Yellow and gray SFD/spacing Indiana/ Transmission, – Reduced collisions by Crowder 2000was not provided waterfowl 345 kV 37.5% on marked lines
compared to unmarked lines
Yellow SFD/ spacing: 15.2 m Wisconsin/ Distribution, – Eliminated collisions Rasmussen (50 ft); staggered on parallel trumpeter swans 23.9 kV completely 2001, cited in wires for a visual effect of (Cygnus Hunting 20027.6-m (25-ft) spacing buccinator)
Red SFD, 32 cm (12.6 in) for the England/ Transmission, – Reduced collisions Frost 2008gripping section and 17.5 cm mute swans 132 kV (6.9 in) for the outside diameter of (Cygnus olor)the central spiral/spacing: 5-m (16.4-ft) intervals on shield wire
Gray SFD/ spacing: 4.6 m (15 ft); California/ Distribution Birds exhibited greater Reduced waterfowl Ventana Wildlifestaggered on 3 phase conductors waterfowl reactive distances collisions, but not coot Society 2009
collisions (coots fly at night)
Large spirals, 35 cm (13.8 in) Spain/various Distribution and – Reduced collisions overall Barrientos et al. diameter, 1 m (3.3 ft) long/ species including transmission after line marking (9.6%) 2012spacing was not provided bustards, storks,
and doves
TABLE 6.10: Representative studies for Swan-Flight Diverters (SFDs).

SAM
PLE
694 | chapter 6
General DesignsSuspended devices have a polycarbonate, UVstabilized, plastic flapper (swinging or fixed)connected to a clamp that attaches to thepower line (Figure 6.15). The movement andreflectivity of the device enhances the visibili-ty of the line. Suspended devices are availablein many colors and shapes with panels thatreflect visible and UV light and glow. Theycan be attached to distribution phase conduc-tors up to 40 kV and to shield wires up to adiameter of 1.9 cm (0.75 in) (Table 6.11 andTable 6.12).
FIGURE 6.15: Examples of suspended devices (swinging and fixed).
SUSPENDED DEVICES (SWINGING,FLAPPING, AND FIXED)There are several types of suspended devicesincluding general designs and branded designs(e.g., FireFly™ and BirdMark BM-AG),which are discussed separately on page 95and page 96. They have a clamp that attachesto the power line so that the device can movein the wind. Some are designed to swing, flap,and spin, while others, for use in high windlocations, are nearly immobile but do allowsome motion. Some have reflective and glow-in-the-dark properties.
Utility Industry Manufacturer Spacing Lengths Used in Device Practices Recommendations Experimental Studies†
Swinging or fixed device 5 m (16.4 ft), Staggering devices on parallel –staggered lines is recommended. The (Eskom) general spacing rule is 10 to
15 m (32.8 to 49.2 ft) (Preformed Line Products).
* Actual spacing depends on engineering requirements, manufacturer specifications, species involved, and site-specific conditions.
TABLE 6.11: Spacing and positioning for general designs of suspended devices.*
ESKOM 2009

SAM
PLEFireFly™
There are several types of FireFlys, two ofwhich (the FireFly FF and the FireFly HW)are designed as suspended devices (Figure6.16). FireFlys have a strong spring-loadedclamp that attaches to the line so that thedevice can swing. The device increases theline profile slightly, but its motion and
Line Marking to Reduce Collisions | 95
reflectivity attract attention and alert birds ofthe line’s presence.
The FireFly FF has an acrylic plastic tagthat measures 9 cm × 15 cm (3.5 in × 6 in),is 3 mm (0.13 in) thick, and is covered withyellow and orange reflective tape and photo-reactive coatings. They are UV light stabi-lized and constructed to be highly reflectiveduring the day. According to the manufacturerthey glow for up to 10 to 12 hours after sun-set. They are attached to the clamp by swivelsso they swing and spin in the wind.
The FireFly HW is similar in size to theFireFly FF but the HW model’s plastic tagdoes not swivel and is designed to withstandhigher, sustained winds. The manufacturerclaims similar effectiveness. Results frominstallation in a high raptor use area on a newpower line in central California have shownthese devices to be effective without anydamage to the line or failure of the devices(M. Schriner, pers. comm.).
FireFlys have been attached 4.6 to 15.2 m(15 to 50 ft) apart. For lines with parallelshield wires, they can be staggered so that the device density appears greater, e.g., whenspaced at 12.2 m (40 ft) on each shield wireand staggered, they appear to be 6.1 m (20 ft)apart (Table 6.13 and Table 6.14).
Location/ Power Line EffectivenessDescription/Spacing Species Characteristics Behavioral Avoidance Reduction in Collisions Reference
Swinging or fixed device South Africa/ Distribution, – Reduced collisions More van Rooyen (specifications and spacing bustards and 22 kV effective than the BFD 2000; not provided) cranes Anderson 2001;
Transmission, up McCann 2001to 440 kV –
Yellow fiberglass swinging plate, Colorado/ Distribution, Birds reacted earlier and 63% reduction in mortality Brown and 30.5 x 30.5 cm, (12 × 12 in) with sandhill cranes 7.2 kV flew higher over marked rates overall, but there Drewien 1995a black stripe/ spacing: 20 to and waterfowl lines than unmarked lines was considerable seasonal 30 m (65.6 to 98.4 ft) on shield Transmission, variation. Over 30% of wires or center phase conductor 69 kV to 115 kV collisions in fall occurred
at night.
TABLE 6.12: Representative studies for general designs of suspended devices.
FIGURE 6.16: The FireFly™ FF (left) has a swinging tag for use inlight winds and the FireFly™ HW (right) has a fixed tag towithstand higher, sustained winds.
© P&R TECHNOLO
GIES, INC.

SAM
PLE
BirdMark BM-AG (After Glow)The BirdMark BM-AG (After Glow) has aperforated swinging disk that spins and flut-ters (Figure 6.17). This device is 29.21 cm(11.5 in) long with a 13.33 cm (5.25 in)diameter disk with a reflective center. TheBirdMark BM-AG is designed with a strongspring-loaded clamp that attaches to wires upto a diameter of 6.4 cm (2.5 in). The reflec-tive disks glow for up to 10 hours after sunsetand are available in orange, white, and red.
The manufacturer recommends 4.6 m (15 ft) spacing (Table 6.15). The movementof the device adds to the visibility of the line.
696 | chapter 6
Utility Industry Manufacturer Spacing Lengths Used in Device Practices Recommendations Experimental Studies†
FireFly™ 15.2 m (50 ft) Recommendations depend on 5 to 12 m (16.4 to 39.3 ft) spacing, staggered the tower height: 4.6 m (15 ft) apart. Some studies staggered on alternating wires apart for towers less than 30.5 m devices on parallel lines to (PacifiCorp) (100 ft) and 9.1 m (30 ft) apart either increase visual density
for towers that are greater than or distribute loading equally.30.5 m (100 ft) tall (Birdbusters).
* Actual spacing depends on engineering requirements, manufacturer specifications, species involved, and site-specific conditions.
† See Table 6.14 for study details and sources.
TABLE 6.13: Spacing and positioning for FireFlys.*
Location/ Power Line EffectivenessDescription/Spacing Species Characteristics Behavioral Avoidance Reduction in Collisions Reference
FireFly™, 9 cm × 15 cm California/ Distribution, No changes in flight height 60% reduction in collision Yee 2008(3.5 in × 6 in), 3 mm (0.13 in) sandhill crane, 12 kV or reaction distance frequency on marked lines, thick, luminescent strip, spinning song birds, collision frequency also swivel, contrasting reflective other species decreased on adjacent colors on opposite sides/spacing: spans5 m (16.4 ft); staggered on conductors
FireFly™, acrylic plastic tag Nebraska/ Transmission, Cranes reacted more Reduced collisions by half Murphy et al. measures 9 cm × 15 cm sandhill cranes 69 kV quickly (mainly by gradually 2009(3.5 in × 6 in), 3 mm (0.13 in) gaining altitude) to avoid thick, yellow and orange reflective the marked line than they tape and photo-reactive coatings/ did to unmarked lines spacing: 12-m (39.3-ft) intervals
TABLE 6.14: Representative studies for FireFlys.
FIGURE 6.17: BirdMark BM-AG (After Glow) in daylight(left) and darkness (right).
© P&R TECHNOLO
GIES, INC.

SAM
PLEDEVICES AVAILABLE IN OTHER COUNTRIESThe following devices are not distributed inthe United States at this time (2012).
Baliza AvifaunaThe Baliza Avifauna is manufactured inSpain by Saprem. It is a variation of hangingstrips that consists of two black neoprenecrossed bands (measuring 6 cm × 28 cm [2.4 in × 11 in]). Some versions have a phosphorescent stripe.
Janss and Ferrer (1998) describe a similardevice (with crossed bands measuring 5 cm ×35 cm [1.9 in × 13.8 in]) that was staggeredon the conductors every 24 m (78.7 ft) (a visual effect of 12 m [39.3 ft] intervals).The device consisted of two black neoprenecrossed bands slightly shorter than the com-
Line Marking to Reduce Collisions | 97
Utility Industry Manufacturer Spacing Lengths Used in Device Practices Recommendations Experimental Studies
BirdMark BM-AG – 4.6 m (15 ft) (P&R Technologies) No scientific studies on theBirdMark BM-AG were found.
* Actual spacing depends on engineering requirements, manufacturer specifications, species involved, and site-specific conditions.
TABLE 6.15: Spacing and positioning for BirdMark BM-AG.*
Considerations for Suspended Devices
• In some of the earlier versions, there were problems with the device shifting (van Rooyen 2000).
• Depending upon the location, suspended devices can be targets for irresponsible shooters.
• The devices can be installed and removed from the ground or bucket truck with a hot stick. Two people are required for installation unless a special tool is used; homemade toolshave worked better than some manufactured tools (S. Liguori, pers. comm.). New manufactured tools are being made and tested.
• Corona effects can occur depending upon the voltage (see Corona Effects, page 84).
• Installation cost increases with line height and in areas thatare difficult to access such as river and lake crossings.
• Swivels have failed prematurely in high wind locations.
FIGURE 6.19: Baliza Avifauna installed on a power line in Europe.
FIGURE 6.18: Hanging strips of neoprene,such as this Spanish-made Baliza Avifauna,are being used as line marking devices inEurope and South Africa.
© DAVE BOUCHARD, A
EP
© SAPREM
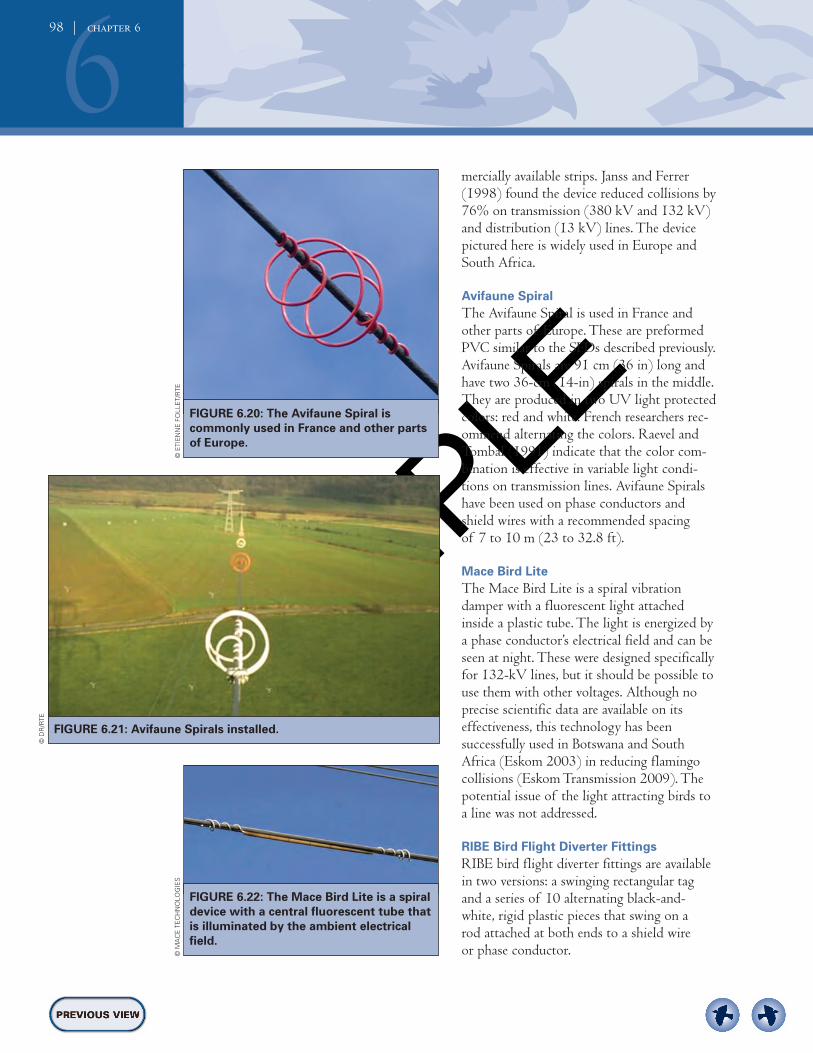
SAM
PLE
698 | chapter 6
mercially available strips. Janss and Ferrer(1998) found the device reduced collisions by76% on transmission (380 kV and 132 kV)and distribution (13 kV) lines. The devicepictured here is widely used in Europe andSouth Africa.
Avifaune SpiralThe Avifaune Spiral is used in France andother parts of Europe. These are preformedPVC similar to the SFDs described previously.Avifaune Spirals are 91 cm (36 in) long andhave two 36-cm (14-in) spirals in the middle.They are produced in two UV light protectedcolors: red and white. French researchers rec-ommend alternating the colors. Raevel andTombal (1991) indicate that the color com-bination is effective in variable light condi-tions on transmission lines. Avifaune Spiralshave been used on phase conductors andshield wires with a recommended spacing of 7 to 10 m (23 to 32.8 ft).
Mace Bird Lite The Mace Bird Lite is a spiral vibrationdamper with a fluorescent light attachedinside a plastic tube. The light is energized bya phase conductor’s electrical field and can beseen at night. These were designed specificallyfor 132-kV lines, but it should be possible touse them with other voltages. Although noprecise scientific data are available on itseffectiveness, this technology has been successfully used in Botswana and SouthAfrica (Eskom 2003) in reducing flamingocollisions (Eskom Transmission 2009). Thepotential issue of the light attracting birds toa line was not addressed.
RIBE Bird Flight Diverter FittingsRIBE bird flight diverter fittings are availablein two versions: a swinging rectangular tagand a series of 10 alternating black-and-white, rigid plastic pieces that swing on a rod attached at both ends to a shield wire or phase conductor.
FIGURE 6.20: The Avifaune Spiral iscommonly used in France and other partsof Europe.
FIGURE 6.21: Avifaune Spirals installed.
FIGURE 6.22: The Mace Bird Lite is a spiraldevice with a central fluorescent tube thatis illuminated by the ambient electricalfield.
© ETIENNE FOLLET/RTE
© DR/RTE
© M
ACE TECHNOLO
GIES

SAM
PLE
According to the manufacturer, resultsfrom a three-year field trial on the Bernbrug-Susigke 110-kV line in South Africa showedthat these are effective at reducing bird collisions with power lines when compared to lines without diverters. The information suggests that closer spacing (20 m versus 40 m [65.6 ft versus 131.2 ft] apart) is moreeffective. However no description of thestudy design nor specific data was provided.
Inotec BFD 88The Inotec BFD 88 is a relatively new device with characteristics of both suspendeddevices and spheres. It is a reflective stainlesssteel sphere, 7 cm (2.8 in) in diameter,attached to a metal spiral, which is attachedto the wire. When installed they appear assmall metal spheres suspended from the wire.
This device is made of 316-grade stainlesssteel and is naturally reflective and corrosionresistant. The crimp is made from marine-grade aluminum, a highly durable adhesive,and conductive rubber. According to the
Line Marking to Reduce Collisions | 99
FIGURE 6.23: The RIBE line marking deviceis available as a swinging triangular tag oras a series of black-and-white, rigid plasticpieces that swing (pictured). manufacturer, the clamp does not come into
contact with the phase conductor, so there is no chance of galvanic cell reaction ormechanical damage to the power line. Thestainless steel sphere does not sway and cannot touch the power line.
Eskom Transmission (2009) indicates thatthese metal spheres are visibly superior tocolored (red, yellow, white, or black) objectsin low light, especially at dawn and duskwhen birds are flying between roosting andfeeding areas. The spherical shape reflectsavailable light and is claimed to be visiblefrom all directions including above or belowthe diverter. When viewed during low-lightconditions, the device is visible against darkbackgrounds such as the ground, trees, orhigh ground. It is also visible against brightclouds when viewed from below (EskomTransmission 2009).
The diverter can be attached while a line isenergized and installed from the ground witha hot stick. Because of the spherical design, it does not display corona. It was developedin South Africa for use on shield wires andphase conductors up to 88 kV, and no radiointerference was detected up to 88 kV.
FIGURE 6.24: The Inotec BFD 88, a SouthAfrican device, is a reflective stainless steelsphere reported to be visible from allangles and in low-light conditions.
© RIBE
© IN
OTEC

SAM
PLE
PLASTIC TUBESArchibald (1987) reported that yellow plastic tubes placed on power lines nearHokkaido, Japan, in 1982 reduced mortality
of red-crowned cranes (Grus japonensis). Plastic tubes along with various versions of ribbons, however, are not durable enoughfor use.
6100 | chapter 6
LARGE DIAMETER WIRE
OVERSIZED SHIELD WIRE FORTRANSMISSION LINESA limited study compared the use of an over-sized shield wire with a conventional shieldwire (Brown et al. 1987; Miller 1990). Theoversized wire was 2.52 cm (1 in) in diameter,or 2.6 times greater than standard shield wire(0.95 cm [0.4 in]). Researchers found thatthere was no significant difference betweenthese wires. Other studies have identified theconventional, small-diameter shield wire asthe highest risk wire for collisions with trans-mission lines (e.g., Savereno et al. 1996),which suggests that diameter and distance visibility are factors involved in collision risk.The use of larger-diameter shield wire is con-siderably more expensive. Though anecdotalreports suggest larger diameter shield wire is
effective, studies of its effectiveness are neededbefore it can be recommended for reducingcollision risk.
TREE WIRE TO PREVENT COLLISION-ELECTROCUTIONS ON DISTRIBUTION LINESTree wire is a type of insulated phase con-ductor used on distribution lines to provideprotection from momentary contact with treebranches, which would otherwise cause anelectric arc (Figure 6.25, Figure 6.26, andFigure 6.27). The insulation is also suffi-cient17 to protect birds from collision-electro-cutions, which are caused by phase-to-phasecontact when large birds, such as eagles andswans, brush phase conductors while flyingbetween them. The electric arc created in collision-electrocutions can kill multiple birdsin a flock, even if only one bird makes phase-to-phase contact. Because tree wire can pre-vent collision-electrocutions, it has even beenused in some open areas for rebuilt and newdistribution lines (M. Walters, pers. comm.).
Tree wire may also be an effective means ofreducing collision incidence because the insu-lated covering increases the diameter of thewire, making the line more visible. However,no scientific studies were found to verify this.
Retrofitting a line with tree wire is usuallyonly a consideration when outages are causedby tree branches. It would be unusual toretrofit an existing line with tree wire to pre-vent collisions because line marking devicesare more cost effective. However, when adistribution line is being upgraded or a newline is being built, tree wire may be a cost-effective option when used for the center
17 The insulation on tree wire is not considered protective for human safety.
FIGURE 6.25: Tree wire on all three phases of a distribution linemarked with suspended devices.
Tree Wire
Neutral
© M
EL WALTERS, PUGET SOUND ENERGY

SAM
PLE
phase. The difference in cost (2011 $)between tree wire (336ACSR TW= $0.89per 30.5 cm [12 in]) and standard wire(397KCM = $0.77 per 30.5 cm [12 in]) is approximately $0.12 per 30.5 cm (12 in)or $1,900 per 1.6 km (1 mi) for a standardthree-phase distribution feeder. Tree wire isalso heavier than standard wire and mayrequire higher class poles, more poles (1 to 2per 1.6 km [1 mi]), and possibly additionalguying. The average lifespan of tree wire is 40years. The advantages to tree wire are that itreduces the risk of collision-electrocution atmid-span for flying birds, reduces the risk ofelectrocution for perching birds, and reducesthe maintenance requirements usually associ-ated with suspended devices.
Unpublished observations show that treewire used in conjunction with line markingdevices, such as the FireFly™ and/or Bird-Mark BM-AG, is effective at reducing colli-sion-electrocutions and collisions for trum-peter swans (Cygnus buccinator), waterfowl, and raptors (M. Walters, pers. comm.). Whenrebuilding lines already equipped with flightdiverters, the diverters are reinstalled on thenew tree wire lines. The increased visibility of tree wire reduces the risk, which is furtherreduced by installing FireFlys (M. Walters,pers. comm.).
In the Chimacum Valley, Washington, from2000 to 2007, an eight-span lateral line aver-aged three bird-caused outages per year dueto swan and waterfowl collisions, including10 swan mortalities in 2006 alone. In 2007,the line was modified with tree wire to preventcollision-electrocutions and with FireFlys toreduce collision risk. No swan mortalities or outages have occurred since the line wasmodified in spite of increasing swan popula-tions and their continued use of this flightcorridor. The landowner reported that theswan flight path is much higher over the lines since these modifications were made(M. Walters, pers. comm).
Line Marking to Reduce Collisions | 101
FIGURE 6.26: Tree wire (right of pole) and standard wire (left of pole) on a distribution line.
FIGURE 6.27: Collision-electrocutions cause an electrical short, likethis one caused by tree branches, and can kill two or three birds ina flock even if only one bird makes phase-to-phase contact.
Tree WireStandard Wire
© M
EL WALTERS, PUGET SOUND ENERGY
© ROBERT LAWTO
N, W
IKIM
EDIA COMMONS

SAM
PLE
At another site in western Washington’sSkagit Valley, five swan mortalities occurredon a single-phase line in the winter of2008–2009, and others had been document-ed in previous years. The line was rebuilt in athree-phase configuration during the summerof 2009, which included tree wire on thecenter phase along with alternating FireFly™
and BirdMark BM-AG devices on all threephase conductors. In the following winterseason, no mortalities or outages occurred,although swan populations continue toincrease. Between 1,000 and 2,000 swans forage in this area throughout the winter (M. Walters, pers. comm.).
6102 | chapter 6
FIGURE 6.28: Tree wire on the top phase conductor of a two-phase distribution line (vertical configuration) with line marking devices.
© M
EL WALTERS, PUGET SOUND ENERGY
Tree WireStandard Wire
Neutral WireCommunication Line

SAM
PLE
Avian Protection Plans | 103
7c h a p t e r 7
Avian Protection Plans
An Avian Protection Plan is a voluntary, utility-specific plan that provides a framework forreducing bird mortalities, documenting utility actions, and improving service reliability. In2005, the U.S. Fish and Wildlife Service and the Avian Power Line Interaction Committeejointly published Avian Protection Plan Guidelines to provide utilities with resources andguidance for developing Avian Protection Plans. This chapter is based on those guidelines.
IN THIS CHAPTER Overview of Avian Protection PlansComponents of an Avian Protection PlanCreating and Implementing an Avian Protection Plan
chapter 7 | Avian Protection Plans | 103
OVERVIEW OF AVIAN PROTECTIONPLANS
An Avian Protection Plan (APP) is a utility-specific program for reducing the operationaland avian risks that result from avian interac-tions with electric utility facilities. In 2005, the Avian Power Line Interaction Committee(APLIC) and the U.S. Fish and WildlifeService (USFWS) announced their jointlydeveloped Avian Protection Plan Guidelines(Guidelines) that are intended to help utilitiesmanage their avian/power line issues. TheGuidelines offer resources for developing APPsand provide a toolbox from which utilities mayselect and tailor APP components to fit theirneeds. An APP should provide the frameworknecessary for developing a program to reducebird mortalities, document utility actions, andimprove service reliability. The APP compo-nents are summarized in this section. The com-plete version of the Guidelines can be obtainedfrom either the APLIC (www.aplic.org) orUSFWS (www.fws.gov) websites.
An APP represents a utility’s commitmentto reducing its avian impacts. Since they are created by a utility, APPs are more easily modified to address newly developing orunforeseen problems. Despite the fact thatAPPs are generally initiated by utilities, acooperative dialog between the utility and theUSFWS is encouraged during developmentand implementation. This sets the tenor for those conversations that will inevitablyfollow as the APP is implemented and refined over time.Implementing the Guidelines will reduce
avian collision and electrocution risks. An APPrepresents responsible environmental practicesto all stakeholders, and a utility that createsan APP to address its specific avian issues canbenefit through regulatory compliance, relia-bility improvements, potential long-term costsavings, and positive recognition from regula-tors, employees, and customers.

SAM
PLE
7104 | chapter 7
Although each utility’s APP will be different,the overall goal of reducing avian mortality isthe same. The Guidelines provide a frameworkalong with principles and examples to help a utility craft an APP to best fit its needs.Because of utility-specific circumstances,some of the Guidelines’ elements may not beapplicable. The Guidelines present a compre-hensive overview of the elements that shouldbe considered in an APP. The APP shouldalso be a “living document” that is modifiedover time to improve its effectiveness. Someor all of the following elements may beimplemented:
• Corporate policy• Training• Permit compliance• Construction design standards
• Nest management• Avian reporting system• Risk assessment methodology• Mortality reduction measures• Avian enhancement options• Quality control• Public awareness• Key resources
Details on the nature of these elementsand how they may be developed by a utilityare discussed on the following pages.
CORPORATE POLICYAn APP usually includes a statement that balances the company’s commitment to mini-mizing its impact on migratory birds, com-plying with bird-protection regulations, andproviding reliable, cost-effective electrical service. To do this, it will comply with allnecessary permits, monitor avian mortalityincidents, and make reasonable efforts toconstruct and alter infrastructure to reducethe incidence of avian mortality.
TRAININGTraining is an integral component of an APP.Workshops and short courses on avian/powerline interactions are provided by APLIC (www.aplic.org) and Edison Electric Institute (EEI)(www.eei.org). A two-hour overview of avianelectrocutions and collisions intended for train-ing use is also available to APLIC membersthrough the APLIC website as part of theAPP toolbox. Each company will have itsown approach to training. All appropriateutility personnel, including managers, super-visors, line crews, engineering, dispatch, designpersonnel, and vegetation management per-sonnel should be trained in avian issues. Thistraining should encompass the reasons, needs,and methods for reporting avian mortalities,following nest management protocols, dispos-ing of carcasses, complying with applicable
FIGURE 7.1: Utility employee training should include the reasonsand methods for reporting bird mortalities, nest managementprotocols, proper disposal of carcasses, applicable regulations, and the consequences of non-compliance.
COMPONENTS OF AN AVIAN PROTECTION PLAN
© JERRY LIGUORI

SAM
PLE
regulations, and understanding the potentialconsequences of non-compliance. Supple-mental training also may be appropriate whenthere are changes in regulations, personnel,permit conditions, construction standards,bird protection materials, or internal policies.
PERMIT COMPLIANCEEach utility developing an APP should familiarize itself with the different avian regu-lations and permit types and should workwith wildlife agencies to determine whetherpermits are required for operational activitiesthat may affect protected avian species (seeChapter 3). An APP should discuss how thisis done and identify company permits. Partic-ular attention should be given to activities thatmay require special purpose or related per-mits, including but not limited to nest reloca-tion, temporary possession, depredation, sal-vage or disposal, scientific collection, and mis-cellaneous. State permits may also be requiredto manage protected bird nests or for tempo-rary possession of nests, birds, or their parts.
CONSTRUCTION DESIGN STANDARDSTo improve system reliability, avian interac-tions should be considered when siting anddesigning new facilities and when operatingand maintaining existing facilities. For thosereasons the accepted standards for both newconstruction and retrofitting for risk mini-mization should be included in an APP.Companies can either rely upon the recom-mendations in APLIC documents for electro-cutions and collisions or develop their ownstandards that meet or exceed these guidelines.An APP may indicate that all new or
rebuilt lines in identified avian-use areas orpotential problem areas be built to currentstandards for minimizing electrocutions andcollisions. Employing avian-safe constructionstandards in such areas will reduce future
legal and public relations problems and willenhance service reliability.
NEST MANAGEMENTAn APP may include procedures for manag-ing nests on utility structures and in powerline rights-of-way (ROW). This could includeprocedures for handling problem nests (onesthat need to be relocated or removed) as wellas for creating safe nest sites. These proceduresshould be explained to company employeesduring training to ensure uniform treatmentof avian nest issues and compliance with regulations or permits related to nest manage-ment. For more detailed guidance regardingnest management, see Suggested Practices forAvian Protection on Power Lines (APLIC 2006).
AVIAN REPORTING SYSTEMAn avian reporting system is used for documenting bird injuries, fatalities, and nestmanagement activities. This system should bedescribed in the APP and designed to meetthe needs of the utility and applicable avianpermit reporting requirements. The reportingsystem should be compatible with a utility’sother data management and analysis pro-grams so this information can be effectivelycollected and recorded. The system could bebased on paper forms or may be an internalweb-based program. The information collect-ed should be used to help a utility conductrisk assessments of avian problem areas andhigh risk structures or lines. To protect birdsand minimize outages, these data can be prioritized for corrective actions. Avian infor-mation collected by a utility should be main-tained internally. Reporting is required as acondition of the USFWS permit for directtake of birds or their nests (see Chapter 3). The USFWS Office of Law Enforcement
also maintains a voluntary, internet-basedBird Fatality/Injury Reporting Program.18
Avian Protection Plans | 105
18 The USFWS (2012) has been internally referring to this as the Bird Information and Mortality Reporting System. The title on theweb page may assume this title as well (A. Manville pers. comm.).

SAM
PLE
This program provides a clearinghouse ofuseful information for the electric utilityindustry to mitigate the impacts of energydelivery systems on birds and to address spe-cific bird/power line problems on an inci-dent-specific basis (USFWS 2009b). Thisdatabase was designed to collect informationabout bird collisions and electrocutions tohelp with preventing future bird/power lineincidents. It is also intended for utilities tosee which structures pose a greater risk thanothers and under what conditions they occur.Utilities can establish a password-protectedaccount with this voluntary program, and pri-vacy and confidentiality are protected includ-ing several exemptions from the Freedom ofInformation Act (FOIA). The data collectedinclude the characteristics of the fatality orinjury, location, configuration of the equip-ment, environmental conditions, etc. To date(2012), at least 33 electric utilities have beenvoluntarily reporting through this program.
RISK ASSESSMENT METHODOLOGYA utility can cost-effectively reduce avianmortalities by focusing its efforts on the areasof greatest risk. Therefore, an APP shouldinclude a method for evaluating and prioritiz-ing the risks that a company’s operations poseto migratory birds. A risk assessment willoften begin with a review of available datathat address areas of high avian use, avianmortality, problem nests, established flyways,migration corridors, concentration and staging areas, other preferred habitats, preypopulations, perch availability, effectivenessof existing procedures, remedial actions, andother factors that can increase avian interac-tions with utility facilities. The avian report-ing system discussed in the previous section is an integral component of this risk assess-ment, as is the use of avian experts, birders,and biologists who can provide additionalinformation on avian distribution. A riskassessment can be used to develop modelsthat will enable a company to use biologicaland electrical design information to choose
an optimal route during corridor and ROWsiting and to prioritize existing poles andlines most in need of modification. A riskassessment may also provide data about thevarious causes of avian mortality as well as the benefits birds receive from utility structures. For more discussion on avian risk assessment, see Chapter 5.
MORTALITY REDUCTION MEASURESAs a part of an APP, a mortality reductionprocess is described. A utility can use theresults of an avian risk assessment to focus its efforts on areas of concern, ensure that its responses are not out of proportion to the risks presented to protected birds, anddetermine whether avian mortality reductionplans need to be implemented. Mortality reduction plans may use strate-
gies that include preventive, reactive, andproactive measures that focus on issues, risks,and reliability commitments facing a utility.The following are examples of how thismulti-faceted approach may be used.
• Preventive: Construct all new or rebuiltlines in high avian-use areas to avian-safestandards. Apply collision minimizationmeasures for new construction in high riskareas. Ensure that the APP is in compliancewith applicable laws, regulations, and permits.
• Reactive: Document bird mortalities andproblem nests, conduct assessment ofproblems, and apply remedial measureswhere appropriate. Notify resource agencies in accordance with the utility’spermits and policies.
• Proactive: Provide resources and training to improve employees’ knowledge andawareness. Partner with organizations that conduct research on effects of birdinteractions with power lines. Evaluaterisks of existing lines in high avian-useareas and prioritize structures or lines forretrofitting or mitigation according to their risk level.
7106 | chapter 7

SAM
PLE
A successful APP and mortality reductionplan requires management support as well asthe following:
• Assessment of facilities to identify risks• Allocation of resources• Standards for new or retrofit construction• Budget for operation and maintenance andcapital investment
• System for tracking remedial actions andassociated costs
• Timely implementation of remedial measures• Positive working relationships with agencies
An APP should be reviewed annually in thecontext of risk assessment and modified asappropriate, ideally with wildlife agency input.
AVIAN ENHANCEMENT OPTIONSIn addition to reducing avian mortality risk,an APP also may include descriptions ofopportunities for a utility to enhance avianpopulations or habitat. These opportunitiesmay include installing nest platforms, manag-ing habitats to benefit migratory birds, or
Avian Protection Plans | 107
working with agencies or organizations inthese efforts. Where feasible, new ideas andmethods for protecting migratory birdsshould be encouraged and explored.There are also opportunities to collabo-
rate with agencies or organizations and toeducate the public about the company’s APPand its partnerships. USFWS and statewildlife agencies, as well as other experts, canbe consulted for recommendations on habitatenhancement projects. Nest box construc-tion, maintenance, and monitoring can bedone in conjunction with volunteers, such asBoy Scouts, Girl Scouts, and avian/wildlifeconservation organizations.
QUALITY CONTROLA quality control mechanism can and shouldbe incorporated into an APP to evaluate theeffectiveness of a company’s avian protectionprocedures. Some examples of quality con-trol include the following:
• Effectiveness of remedial actions in reducing avian mortality
• Effectiveness of avian protection devices as well as their ease of application anddurability
• Mortality reporting procedures to ensurethat discoveries of avian mortalities areproperly documented
• Response to avian mortalities to ensurethat appropriate and timely actions are taken
• Compliance with company policy toensure that personnel are consistently following company procedures for avian-safe construction, mortality reporting, nest management, training, etc.
• Public and agency feedback and opinionson system reliability and avian protection
The quality control component of an APPis a continuous process that is used to ensurethat a company’s APP is accomplishing what
FIGURE 7.2: An Avian Protection Plan may include opportunities to enhance avian populations or habitat with nesting structures,habitat restoration, or other projects.
© JERRY LIGUORI

SAM
PLE
it is intended to do. Information gatheredduring assessments of existing practicesshould be used to improve the effectivenessand timeliness of avian protection efforts,which, in turn, can help to reduce costs associated with such efforts.
7108 | chapter 7
PUBLIC AWARENESSAn APP may include a method for educatingthe public about avian collision issues, thecompany’s avian protection program, and itssuccesses in avian protection. A public aware-ness program can be an integral part of anAPP and can be used to enhance publicawareness and support for a company’s APP.Public participation allows stakeholders suchas government agencies, tribes, non-profitorganizations, wildlife rehabilitators, andother interested parties an opportunity toprovide input to the decision-making process,enabling all parties to work openly and col-laboratively towards recommendations thatcan be effectively implemented. This collabo-ration often leads to improved relationshipswithin the community and to more efficientand positive projects (see Chapter 5). Therelationships developed through this processmay also encourage the public to report birdmortalities and encourage them to seek assis-tance for birds that have been injured inpower line-related accidents. Communicating an APP can be accom-
plished through a variety of public outreachtools, including fact sheets, newsletters,brochures, videos, websites, public workshops,short courses, special training sessions, andspeaker bureau presentations. These tools canalso be used to record the success of an APP,thereby documenting the utility and electricindustry’s efforts to reduce avian mortalities.The goal of these outreach efforts is to con-vey to the public that electric utilities areresponsible environmental stewards workingcooperatively with wildlife agencies towardsreducing avian mortalities while continuing toprovide safe, reliable, and affordable electricityto their customers.Many utilities have examples of their envi-
ronmental stewardship and of the innovativeways they have reduced environmental impactsthrough their business decisions. A company’sefforts to minimize avian mortalities should
FIGURE 7.3: Raising public awarenessabout avian collisions and the utility’scommitment to avian protection canincrease support for an Avian ProtectionPlan.
© PACIFIC GAS AND ELE
CTR
IC COMPA
NY

SAM
PLE
be shared with the public and resource agen-cies. For more information, see Public Partici-pation in Chapter 5.
KEY RESOURCESAn APP should identify the key resources thataddress avian protection issues. Key resourcesinclude utility personnel and external con-tacts. This would include a list of expertswho may be called upon to help resolveavian-caused problems. Experts could includecompany specialists, consultants, state andfederal resource agents, university faculty, orother biologists. Internal personnel mayinclude representatives from environmental,engineering, operations and maintenance,standards, procurement, outage management,etc. Engineers may find that company per-sonnel such as environmental specialists (orbiologists) can help find creative solutions to
Avian Protection Plans | 109
CREATING AND IMPLEMENTING AN AVIAN PROTECTION PLAN
Integrating an APP into an electric utility’soperations will help the utility meet demandsfor reliable, cost-efficient, and environmentallycompatible power delivery. A utility that creates and manages an APP will quicklybecome familiar with the avian-related sci-ence, engineering, and laws. It will also needto satisfy utility employees, utility customers,investors, and other stakeholders.The ease of creating and implementing an
APP will depend on a utility’s size, the loca-tion of its transmission and distribution sys-tem, the range of avian species in the servicearea, and the frequency of bird/power lineinteractions. The extent of bird/power lineinteractions may not be realized until severalyears into a fully implemented reporting pro-gram. Thus, APP implementation and opera-tion is a long-term commitment and a processof continual evaluation and improvement. Depending on the company’s culture, the
rate of adoption may vary. An APP may bethe first species-oriented environmental com-
pliance initiative to which utility employeesare exposed. High-profile endorsements bycorporate officers and managers can facilitatea program’s implementation. Some largerutilities have effectively linked APP compli-ance with financial incentives, similar to morecommon budget, schedule, and safety incen-tives. Compliance with an APP will reduceutility costs in the long term through improvedreliability and reduced regulatory risk.Creating and implementing an APP will be
more successful if all the affected departmentswithin the utility also support it. An effectiveway to build a broad consensus during APPpreparation is to form a team within the utilitythat includes representatives from standards,engineering, environmental services, vegeta-tion management, construction, operationsand maintenance, public relations, customerservice, and other departments that will beimpacted by the APP. Considerable input andassistance from team members are needed tounderstand how APP implementation will
avian interaction problems. An understandingof avian behavior can also influence how andwhen avian protection should be provided.An APP that connects biologists with utilitydecision-makers may reduce bird mortalityand improve system reliability.Members of organizations like APLIC
can help with workshops, materials, and contacts. External resources may includebiologists and law enforcement agents fromwildlife agencies, avian specialists fromNGOs or universities, wildlife rehabilitators,and industry consultants. Utility industryresources include APLIC, EEI, ElectricPower Research Institute, Institute of Electri-cal and Electronics Engineers, National RuralElectric Cooperative Association, and theRural Utilities Service. Contact informationand websites for a number of resources areavailable in the Guidelines (see www.aplic.org).

SAM
PLE
best fit the operations of each department.Solutions to reduce avian mortality can bedeveloped that are responsive to the workrequirements of each functional unit. In thismanner, individuals from each departmentwill feel invested in the mortality reductionsolutions they helped develop and will havean interest in assuring APP effectiveness.Beyond developing and communicating a
corporate APP policy, the most important
7110 | chapter 7
component of an APP is a consistent andmandatory reporting process. An electronicor paper form of documenting bird/powerline conflicts (e.g., time, place, equipment)becomes the foundation for appropriate corrective action—both to correct unsafe situations and to build a dataset to guidefuture engineering/construction needs. Managing data for these purposes, as well as for meeting any state and federal agencyreporting requirements, is an important function of APP administration. Using GIStechnology to track and report bird mortali-ties, remedial actions, outages, and avian risksenables a utility to identify problems and totrack the effectiveness of its APP.Use of existing processes and systems (e.g.,
outage reporting, environmental review, assetmanagement, and accounting) will help controlcosts of developing and implementing an APP.Whether an APP is driven by an environmental,engineering, or operations department, coop-eration will be necessary across all departmentsto reduce actual and potential avian/powerline conflicts. As with any project, better plan-ning yields better results. The goals of an APPare a measurable decrease in avian/power lineinjuries and mortalities and an increase inelectric service reliability—ultimately benefit-ing the birds, the utility, its customers, theregulators, and the affected public.
FIGURE 7.4: Integrating an AvianProtection Plan into an electric utility’soperations will help the utility meetdemands for reliable, cost-efficient, andenvironmentally compatible powerdelivery while protecting and enhancingbird populations.
© USFW
S

SAM
PLE
Appendix A | Literature Cited and Bibliography | 111
Aa p p e n d i x a
Literature Cited and Bibliography
appendix a | Literature Cited and Bibliography | 111
*Abdunazarov, B. B. 1987. Prevention ofdeath of birds at power supply lines inUzbekistan. Information message No. 411.Tashkent, Fan. Page 11.
*Alonso, J. C., J. A. Alonso, and R. Munoz-Pulido. 1994. Mitigation of bird collisionswith transmission lines through groundwiremarking. Biol. Conserv. 67:129–134.
*Alonso, J. A., and J. C. Alonso. 1999.Mitigation of bird collisions withtransmission lines through groundwiremarking. Chapter 5 in M. Ferrer and G. F.E. Janns (eds.), Birds and Power Lines.Quercus: Madrid.
*____, and C. A. Martin. 2005. The greatbustard (Otis tarda) in Andalusia, southernSpain: status, distribution, and trends. Ardeola 52(1):67–78
Anderson, B. A., and S. M. Murphy. 1988.Lisburne terrestrial monitoring program—1986 and 1987. The effects of the Lisburnepower line on birds. Final Report. Preparedby Alaska Biological Research, Inc. forARCO Alaska, Inc., Anchorage, AK 99510.60 pp.
*Anderson, M. D. 2001. The effectiveness of two different marking devices to reducelarge terrestrial bird collisions with overheadelectricity cables in the eastern Karoo,South Africa. Draft Report to Eskom Resources and Strategy Division,Johannesburg, South Africa.
Anderson, S. H., K. Mann, and H. H.Shugart, Jr. 1977. The effect oftransmission-line corridors on birdpopulations. Am. Midl. Nat. 97:216–221.
*Anderson, W. L. 1978. Waterfowl collisionswith power lines at a coal-fired power plant.Wildlife Soc. B. 6:77–83.
____, and S. S. Hurley. 1974. Waterfowlstudies at Lake Sangchris: an in-progressreport. Illinois Natural History Survey,Urbana.
____, ____, and J. W. Seets. 1975. Section8 waterfowl studies at Lake Sangchris.Illinois Natural History Survey, Urbana.
* Indicates references that have been cited in the text.

SAM
PLE
*Archibald, K. 1987. The conservation statusof the breeding ground of the red-crownedcrane in Hokkaido, Japan. Pages 64–86 inG. Archibald and R. Pasquier (eds.), Proc.International Crane Workshop, Bharatpur,India, 1983. Intl. Crane Foundation, Bara-boo, WI.
Arnett, E. B. 2006. A preliminary evaluationon the use of dogs to recover bat fatalitiesat wind energy facilities. Wildlife Soc. B.34:1440–1445.
Avatar Environmental, LLC, EDM Inter-national, Inc., and Pandion Systems, Inc.2004. Notice of inquiry comment reviewavian/communication tower collisions, final.Prepared for the Federal CommunicationsCommission. 223 pp.
*Avery, M. L. (ed.). 1978. Impacts of trans-mission lines on birds in flight: Proceedingsof a workshop. U.S. Fish and Wildlife Service, Biological Services Program, FWS/OBS-78/48. 151 pp.
____, and T. Clement. 1972. Bird mortalityat four towers in eastern North Dakota: fall1972. The Prairie Naturalist 4:87–95.
____, P. F. Springer, and J. F. Cassell. 1975.Progress report on bird losses at the OmegaTower, southeastern North Dakota. Proc.North Dakota Academy of Science, Part II27:40–49.
*____, ____, and ____. 1977. Weatherinfluences on nocturnal bird mortality at a North Dakota tower. Wilson Bull.89:291–299.
*____, ____, and N. S. Dailey. 1980. Avianmortality at man-made structures: an anno-tated bibliography (revised). U.S. Fish andWildlife Service, Biological Services Pro-gram, National Power Plant Team. FWS/OBS-80/54, 152 pp.
*Avian Power Line Interaction Committee(APLIC). 1994. Mitigating bird collisionswith power lines: the state of the art in1994. Edison Electric Institute, Washington, D.C. 78 pp.
*____. 2006. Suggested practices for avianprotection on power lines: the state of theart in 2006. Edison Electric Institute, APLIC,and the California Energy Commission,Washington, D.C., and Sacramento, CA.
*____. 2007. Causes of avian collisions with power lines and methods for collisionreduction. In APLIC Avian Protection ShortCourse/Workshop, Collisions Section.
____ . 2008. Avian interactions with powerlines: an overview of avian protection planguidelines, laws, and techniques for theprotection of avian species. Two-hourshort course.
*____ and U.S. Fish and Wildlife Service(USFWS). 2005. Avian protection plan(APP) guidelines. Washington, D.C. 88 pp.
Bahat, O. 2008. Wintering black storks(Ciconia nigra) cause severe damage to trans-mission lines in Israel: a study on the riskand mitigation possibilities. In Proc. of theEDM and EPRI Internatl. Conf. on Over-head Lines. 31 March–3 April 2008. FortCollins, CO.
Baines, D., and R. W. Summers. 1997.Assessment of bird collisions with deerfences in Scottish forests. J. Appl. Ecol.34:941–948.
*Banko, W. E. 1956. The trumpeter swan: its history, habits, and population in the United States. N. Amer. Fauna63:325–326.
A112 | appendix a
SAM
PLE
*Barrett, G. C., and D. V. Weseloh. 2008.Bird mortality near high voltage transmis-sion lines in Burlington and Hamilton,Ontario, Canada. Pages 421–428 in J. W.Goodrich-Mahoney, L. P. Abrahamson, J. L.Ballard, and S. M. Tikalsky (eds.), Proc. ofthe Eighth International Symposium onEnvironmental Concerns in Rights-of-WayManagement. 12–16 September 2004,Saratoga Springs, NY. Elsevier, Amsterdam,The Netherlands.
*Barrientos, R., J. C. Alonso, C. Ponce, andC. Palacín. 2011. Meta-analysis of theeffectiveness of marked wire in reducingavian collisions with power lines. Conserv.Biol. 25:893–903
*____, C. Ponce, C. Palacín, C. A. Martín, B.Martín, and J. C. Alonso. 2012. Wire mark-ing results in a small but significant reduc-tion in avian mortality at power lines: ABACI designed study. PLoS ONE 7(3):e32569.
Bart, J., K. P. Burnham, E. H. Dunn, C. M.Francis, and C. J. Ralph. 2004. Goals andstrategies for estimating trends in landbirdabundance. J. Wildlife Manage. 68:611–626.
Bayle 1999. Preventing birds of prey problems at transmission lines in WesternEurope. J. Raptor Res. 33:43–48.
Beason, R. C. 2003. Through a bird’s eye:exploring avian sensory perception. USDAWildlife Services, National WildlifeResearch Center, Sandusky, Ohio, Special Scientific Report.
*Beaulaurier, D. L. 1981. Mitigation of birdcollisions with transmission lines. BonnevillePower Admin., U.S. Department of Energy,Portland, OR. 82 pp.
*Beer, K. V., and M. A. Ogilvie. 1972. Mortality. Pages 125–142 in Peter Scottand the Wildfowl Trust, the swans,Houghton Mifflin Co., Boston.
*Bennett, A. T. D., and M. Thery. 2007.Avian color vision and coloration: multi-disciplinary evolutionary biology. Am. Nat.169: S1–S6.
Berger, R. P. 1995. Fur, feathers, and transmission lines: how rights of ways affectwildlife. Second edition. Manitoba Hydro.www.hydro.mb.ca/environment
*Bevanger, K. 1994. Bird interactions withutility structures: collision and electrocu-tion, causes and mitigating measures. Ibis136:412–425.
*____. 1995. Estimates and population consequences of tetraonid mortality causedby collisions with high tension power linesin Norway. J. Appl. Ecol. 32:745–753.
*____. 1998. Biological and conservationaspects of bird mortality caused by electricity power lines: a review. Biol. Conserv. 86:67–76.
*____. 1999. Estimating bird mortalitycaused by collision and electrocution withpower lines: a review of methodology. Pages29–56 in M. Ferrer and G. F. E. Janss (eds.),Birds and Power Lines: Collision, Electrocu-tion, and Breeding, Quercus, Madrid, Spain.
____, and H. Broseth. 2001. Bird collisionswith power lines: an experiment with ptarmi-gan (Lagopus spp.). Biol. Conserv. 99:341–346.
*____, and ____. 2004. Impact of powerlines on bird mortality in a subalpine area.Animal Biodiversity and Cons. 27:67–77.
Literature Cited and Bibliography | 113

SAM
PLE
BioResource Consultants. 2009. Identifyingelectric distribution poles for priority retro-fitting to reduce bird mortality. CaliforniaEnergy Commission, PIER Energy-RelatedEnvironmental Research. CEC-500-08-055.
*BirdLife International. 2003. Protectingbirds from power lines: a practical guide onthe risks to birds from electricity transmis-sion facilities and how to minimise any suchadverse effects. 31 pp.
*____. 2007. Position statement on birdsand power lines on the risks to birds fromelectricity transmission facilities and how tominimise any such adverse effects. 12 pp.
Birkhead, M. E., and C. Perrins. 1986. The Mute Swan. Croom-Helm, London.
Bishop, J. A., and W. L. Myers. 2004. Associ-ations between avian functional guild responseand regional landscape properties for conser-vation planning. Ecol. Indic. 5:33–48.
*Black, B. B., and M. W. Collopy. 1982. Nocturnal activity of Great Blue Herons ina north Florida salt marsh. J. Field Ornithol.53:403–406.
Blackwell, B. F., and G. E. Bernhardt. 2004.Efficacy of aircraft landing lights in stimu-lating avoidance behavior in birds. J. WildlifeManage. 68:725–732.
____, E. Fernandez-Juricic, T. W. Seamans,and T. Dolan. 2009. Avian visual systemconfiguration and behavioural response toobject approach. Anim. Behav. 77:673–684.
*Blair, R. B. 1996. Land use and avianspecies diversity along an urban gradient.Ecol. Appl. 6:506–519.
Blokpoel, H. 1971. A preliminary study on height and density of nocturnal fallmigration. Canadian Wildlife ServiceReport Series, Number 14:95–104.
*____, and P. R. M. Hatch. 1976. Snowgeese, disturbed by aircraft, crash into power lines. Can. Field Nat. 90:195.
Boren, J. C., D. M. Engle, M. W. Palmer, R.E. Masters, and T. Criner. 1999. Land usechange effects on breeding bird communitycomposition. J. Range Manage. 52:420–430.
Bourne, W. R. P. 1976. Petrels and lights at night. Notornis 23:201–202.
*Boyd, H. 1961. Reported casualties toringed ducks in the spring and summer.Wildfowl Trust Ann. Rep. 12:144–146.
Bridges, J. M., and T. R. Anderson. 2002.Mitigating the impacts of electric facilitiesto birds. In J. W. Goodrich-Mahoney, D.Mutrie, and C. Guild (eds.), Proc. of theSeventh International Symposium Environ-mental Concerns in Rights-of-Way Man-agement. 9–13 September 2000, Calgary,Alberta, Canada. Elsevier, Oxford, UK.
____, and R. Lopez. 1995. Reducing largebird electrocutions on a 12.5 kV distribu-tion line originally designed to minimizeelectrocutions. Pages 263–265 in G. J.Doucet, C. Séguin, and M. Giguère (eds.),Proc. of the Fifth International Symposiumon Environmental Concerns in Rights-of-Way Management. 19–22 September1993, Montreal, Canada. Hydro-Quebec,Montreal, Canada.
____, and D. McConnon. 1981. Use ofraptor nesting platforms in a central NorthDakota high voltage transmission line. Pages46–49 inW. R. Byrnes and H. A. Holt(eds.), Proc. of the Fourth Symposium onEnvironmental Concerns in Rights-of-WayManagement. 25–28 October 1987, Indianapolis, IN. Purdue University, West Lafayette, IN.
A114 | appendix a

SAM
PLE
*____, T. R. Anderson, D. Shulund, L.Spiegel, and T. Chervick. 2008. Minimizingbird collisions: what works for the birds andwhat works for the utility? Pages 331–335in J. W. Goodrich-Mahoney, L. P. Abraham-son, J. L. Ballard, and S. M. Tikalsky (eds.),Proc. of the Eighth International Sympo-sium on Environmental Concerns inRights-of-Way Management. 12–16 September 2004, Saratoga Springs, NY.Elsevier, Amsterdam, The Netherlands.
Brittain, C. C., and P. Jelen. 2006. Bird on a wire: an elevated state. Arizona Public Service. Unpubl. rep. Prescott, AZ. 6 pp.
*Brown, W. M. 1993. Avian collisions withutility structures: biological perspectives. In Proc. of the Intl. Workshop on AvianInteractions with Utility Structures, 13–16September 1992, Miami, Florida. ElectricPower Research Institute and Avian PowerLine Interaction Committee, Palo Alto, CA.
*____, and R. C. Drewien. 1995. Evaluationof two power line markers to reduce craneand waterfowl collision mortality. WildlifeSoc. B. 23:217–227.
*____, ____, and D. L. Walker. 1984. Craneflight behavior and mortality associatedwith power liners in the San Luis Valley,Colorado. Forest, Wildlife and RangeExperiment Station, University of Idaho,Moscow, ID. 16 pp.
*____, ____, ____, and E. G. Bizeau. 1987.Mortality of cranes and waterfowl frompower line collisions in the San Luis Valley,Colorado. Pages 128–136 in J. C. Lewis(ed.), Proc. 1985 Crane Workshop. PlatteRiver Whooping Crane Maintenance Trust,Grand Island, NE.
Literature Cited and Bibliography | 115
Brunetti, O. A. 1965. Supplementaryreport. Cause of death of the Pinehurstcondor. California Dept. Fish and Game,Unpubl. rep.
*Bumby, S., K. Druzhinina, R. Feraldi, andD. Werthmann. 2009. Life cycle assessment(LCA) of overhead versus underground primary power distribution systems inSouthern California. Donald Bren School of Environmental Science and Management,University of California, Santa Barbara, CA.125 pp.
Buffington, J. P. 1976. A synthetic definitionof biological significance. Pages 319–327 inProc. of the Workshop on the BiologicalSignificance of Environmental Impacts. U.S.Nuclear Reg. Comm., Washington, D.C.
Burnham, J., R. Carlton, E. A. Cherney, G. Couret, K. T. Eldridge, M. Farzaneh, S. D. Frazier, R. S. Gorur, R. Harness, D.Shaffner, S. Siegel, and J. Varner. 2004. Preventive measures to reduce bird-relatedpower outages—part I: electrocution andcollision. IEEE Transactions on PowerDelivery 19:1843–1847.
Byrne, S. 1999. Avian Power Line Interac-tion Committee, consultant report. CaliforniaEnergy Commission, PIER Energy-RelatedEnvironmental Research. Contract no. 500-97-010, project no. 06, San Francisco, CA.
____. 2000. Bird strike monitor, consultantreport. California Energy Commission,PIER Energy-Related EnvironmentalResearch. Contract no. 500-97-010, projectno. 05, San Ramona, CA.
*California Energy Commission (CEC).2005. Guide to raptor remains. www.energy.ca.gov

SAM
PLE
*____. 2011. On-line annotated bibliographyof avian interactions with utility structures.www.energy.ca.gov/research/environmental/avian_bibliography
*California Wind Energy Association (CalWEA). 2011. Improving methods forestimating fatality of birds and bats at windenergy facilities in California. Public InterestEnergy Research Program, EnvironmentalArea, Contract Number: PIR-08-028.
Casado, E., J. Balbontin, and M. Ferrer.2002. Plasma chemistry in booted eagle(Hieraaetus pennatus) during breeding season.Comp. Biochem. Physiol., Part A: Molecularand Integrative Physiol. 131:233–241.
*Catron, J., R. Rodríguez-Estrella, R. C.Rogers, L. B. Rivera, and B. Granados.2004. Raptor and raven electrocutions innorthwestern Mexico: A preliminary regionalassessment of the impact of concrete powerpoles. Report prepared for the Avian PowerLine Interaction Committee.
*Chace, J. F., and J. J. Walsh. 2006. Urbaneffects on native avifauna: a review. LandscapeUrban. Plan. 74:46–69. Elsevier Science,Amsterdam, The Netherlands.
Chalfoun, A. D., M. J. Ratnaswamy, and F. R. Thompson, III. 2002. Songbird nestpredators in forest-pasture edge and forestinterior in a fragmented landscape. Ecol.Appl. 12:858–867.
Clarke, T. L. 2004. An autonomous birddeterrent system. Unpubl. dissertation. University of Southern Queensland, Australia. 110 pp.
Cochran, W. W., and R. R. Graber. 1958.Attraction of nocturnal migrants by lightson a television tower. Wilson Bull.70:378–380.
A116 | appendix a
Cohen, D. A. 1896. California department.Osprey 1:14–15.
*Colorado Public Utility Commission. 1982[January 21]. Decision No. R82-93. PublicService Company of Colorado, Clark-JordanRoad 230-kV Cable Project.
*Colson, E. W., and E. H. Yeoman. 1978.Routing transmission lines through waterbird habitat in California. Pages 87–90 inM. L. Avery (ed.), Impacts of transmissionlines on birds in flight. FWS/OBS 778/48. U.S. Fish and Wildlife Service, Wash-ington, D.C.
*Committee on the Status of the EndangeredWildlife in Canada (COSEWIC). 2009.About COSEWIC. www.cosewic.gc.ca/eng/sct6/sct6_3_e.cfm#hist
*Cooper, B. 2004. Radar studies of noctur-nal migration at wind sites in the easternU.S. In Proc. of the Wind Energy and Birds/Bats Workshop: Understanding and Resolv-ing Bird And Bat Impacts. RESOLVE, Inc.Washington, D.C. 66–71pp.
Cooper, B. A., and R. H. Day. 1992. Interaction of Newell’s shearwaters anddark-rumped petrels with utility structureson Kauai, Hawaii: Results of pilot study, all 1992. Prepared for the Electric PowerResearch Institute, Palo Alto, CA. 51 pp.
*____, and ____. 1998. Summer behaviorand mortality of dark-rumped petrels andNewell’s shearwater at power lines on Kauai.Col. Waterbird 21:11–19.
____, ____, R. H. Ritchie, and C. L. Cranor. 1991. An improved marine radarsystem for studies of bird migration. J. FieldOrnithol. 62:367–377.

SAM
PLE
Literature Cited and Bibliography | 117
Cornwell, G., and H. A. Hochbaum. 1971.Collisions with wires: a source of anatidmortality. Wilson Bull. 83:305–306.
*Coues, E. 1876. The destruction of birdsby telegraph wire. Am. Nat. 10:734–736.
*Convention on Migratory Species (CMS).2011a. Review of the conflict betweenmigratory birds and electricity power gridsin the African-Eurasian region. Prepared forthe UNEP African-Eurasian WaterbirdsAgreement and CMS. Prepared by BureauWaardenburg, Boere Conservation Consul-tancy, STRIX Ambiente e Inovação, andEndangered Wildlife Trust—Wildlife &Energy Program.
*____. 2011b. Guidelines for mitigatingconflict between migratory birds and electricity power grids. First draft for consultation with the AEWA TechnicalCommittee and the CMS Scientific Council. Prepared by Bureau Waardenburg,Endangered Wildlife Trust—Wildlife &Energy Program, Boere Conservation Consultancy, and STRIX Ambiente e Inovação.
Cousquer, G. 2005. Ophthalmological find-ings in free-living tawny owls (Strix aluco)examined at a wildlife veterinary hospital.Vet. Rec. 156:734–739.
*Curtis, C. 1997. Birds and transmissionlines. Blue Jay 55:43–47.
*Crawford, R. L., and R. T. Engstrom. 2001.Characteristics of avian mortality at a northFlorida television tower: a 29-year study. J.Field Ornithol. 72(3):380–388.
Critchlow, R., K. Collins, R. Sharp, and D.Bradley. 2008. Use of methyl anthranilatefog to haze nuisance birds at high-voltageelectric substation. In Proc. of the EDMand EPRI Internatl. Conf. on OverheadLines. 31 March–3 April 2008. FortCollins, CO.
*Crivelli, A. J., H. Jerrentrup, and T. Mitchev.1988 . Electric power lines: a cause of mortality in Pelecanus crispus Bruch, a worldendangered species, in Porto-Lago, Greece.Col. Waterbird 11:301–305.
*Crowder, M. R. 2000. Assessment ofdevices designed to lower the incidence ofavian power line strikes. Master’s Thesis,Purdue University.
*____, and O. E. Rhodes, Jr. 2002. Rela-tionships between wing morphology andbehavioral responses to unmarked powertransmission lines. In J. W. Goodrich-Mahoney, D. Mutrie, and C. Guild (eds.),Proc. of the Seventh International Symposium Environmental Concerns in Rights-of-Way Management. 9–13 September 2000, Calgary, Alberta, Canada.Elsevier, Oxford, UK.
*Day, R. H., B. A. Cooper, and T. C. Telfer.2003. Decline of Townsend’s (Newell’s)shearwaters (Puffinus auricularis newelli) onKauai, Hawaii. Auk 120:669–679.
De La Zerda, S., and L. Rosselli. 2002.Mitigating collision of birds against trans-mission lines in wetland areas in Colombia,by marking the ground wire with bird flightdiverters (BFD). In J. W. Goodrich-Mahoney,D. Mutrie, and C. Guild (eds.), Proc. of theSeventh International Symposium Environ-mental Concerns in Rights-of-Way Man-agement. 9–13 September 2000, Calgary,Alberta, Canada. Elsevier, Oxford, UK.

SAM
PLE
*____, and ____. 2003. Mitigación de colisión de aves contra líneas de transmisióneléctrica con marcaje del cable de guarda[Mitigation of collisions of birds with high-tension electric power lines by marking theground wire]. Ornitología Colombiana1:42–62.
DeLong, J. P., S. W. Cox, and N. S. Cox.2005. A comparison of avian use of high-and low-elevation sites during autumnmigration in central New Mexico. J. FieldOrnithol. 76:326–333.
De Lucas, M., G. F. E. Janss, D. P. Whitfield, and M. Ferrer. 2008. Collision fatal ity of raptors in wind farms does not depend on raptor abundance. J. Appl.Ecol. 45:1695–1703.
*Deng, J., and P. Frederick. 2001. Nocturnalflight behavior of waterbirds in close proximity to a transmission power line inthe Florida Everglades. Waterbirds24:419–424.
Dieni, J. S., and S. L. Jones. 2002. A fieldtest of the area search method for measuringbreeding bird populations. J. Field Ornithol.73:253–257.
Dillingham, P. W., and D. Fletcher. 2008.Estimating the ability of birds to sustainadditional human-caused mortalities using asimple decision rule and allometric relation-ships. Biol. Conserv. 141:1783–1792.
*Dodd, S. L., and M. A. Colwell. 1998. Environmental correlates of diurnal andnocturnal foraging patterns of nonbreedingshorebirds. Wilson Bull. 110(2):182–189.
*Dorin, M., and L. Spiegel. 2005. Assess-ment of avian mortality from collisions and electrocutions. California Energy Commission, Sacramento, CA. TechnicalReport CEC-700-2005-015.
A118 | appendix a
*Drewitt, A. L., and R. H. W. Langston.2008. Collision effects of wind-power generators and other obstacles on birds.Annals NY Acad. Sci. 1134:233–266.
Dunn, E. H. 1993. Bird mortality fromstriking residential windows in winter. J.Field Ornithol. 64:302–309.
Dwyer, J. F. 2004. Investigating and mitigating raptor electrocutions in an urbanenvironment. M.S. Thesis, Univ. of Arizona.71 pp.
*____, and R. W. Mannan. 2007. Preventingraptor electrocutions in an urban environment.J. Raptor Res. 41:259–267.
E. Oppenheimer & Son and BirdLife. 2010.Bustard beat, no. 1. South Africa. 21 pp.
Eastwood, E. 1967. Radar ornithology.Methuen & Co. Ltd., London. 287 pp.
*Edison Electric Institute. 2001. Introduc-tion to public participation, revised thirdedition. Prepared by James L. Creighton,Creighton & Creighton, Inc. www2.eei.org/products_and_services/descriptions_and_access/intro_pub_partic.htm
*____. 2010. Statistical yearbook of theelectric utility industry. Edison ElectricInstitute. Available from: http://www.eei.org
*EDM International, Inc. (EDM). 2004.Corona testing devices used to mitigate birdcollisions. California Energy Commission,PIER Energy-Related EnvironmentalResearch. Technical Report 500-04-086F. Electric Power Research Institute (EPRI).1993. Proceedings: avian interactions withutility structures. International Workshop,13–16 September 1992. EPRI TechnicalReport TR-103268.

SAM
PLE
*____. 2001. Avian interactions with utilityand communication structures workshopproceedings. 2–3 December 1999.Charleston, SC. EPRI Technical Report No. 1006907. R. Carlton, Project Manager.
*____. 2003. Bird strike indicator/birdactivity monitor and field assessment ofavian fatalities. EPRI, Palo Alto, CA;Audubon National Wildlife Refuge, Coleharbor, ND; Edison Electric Institute,Washington, D.C.; Bonneville PowerAdministration, Portland, OR; CaliforniaEnergy Commission, Sacramento CA;NorthWestern Energy, Butte, MT; OtterTail Power Company, Fergus Falls, MN;Southern California Edison, Rosemead, CA;Western Area Power Administration, Lake-wood, CO.
*____. 2006. EPRI-GTC overhead electrictransmission line siting methodology. EPRI,Palo Alto, CA, and Georgia TransmissionCorporation, Tucker, GA. 1013080.
____. 2010. 2010 Research portfolio.Rights-of-way: siting, vegetation manage-ment, and avian issues, program 57. http://portfolio.epri.com/ProgramTab.aspx?sId=ENV&rId=134&pId=5117
Electrical World. July 1986. Boost visibilityof OH conductors. 44 pp.
*Emerson, W. O. 1904. Destruction of birdsby wires. Condor 6:37–38.
Endler, J. A., and M. Thery. 1996. Interact-ing effects of Lek placement, display behav-ior, ambient light, and color patterns inthree neotropical forest-dwelling birds. Am.Nat. 148:421–452.
*Endangered Wildlife Trust (EWT). 2011.Wildlife & Energy Programme (WEP).www.ewt.org.za/WHATWEDO/OurProgrammes/WildlifeEnergyProgramme.aspx
*Erickson, W. P., G. D. Johnson, M. D.Strickland, D. P. Young Jr., K. J. Sernka, and R. E. Good. 2001. Avian collisions with wind turbines: a summary of existingstudies and comparisons to other sources of avian collision mortality in the UnitedStates. National Wind Coordinating Com-mittee, RESOLVE, Inc., Washington, D.C.
*____, ____, and D. P. Young, Jr. 2005. Asummary and comparison of bird mortalityfrom anthropogenic causes with an emphasison collisions. USDA USFS Gen. Tech. Rep.PSW-GTR-191.
*Erwin, R. M. 1977. Foraging and breedingadaptations to different food regimes inthree seabirds: the common tern (Sternahirundo), royal tern (Sterna maxima), andblack skimmer (Rynchops niger). Anim. Behav.27:1054–1062.
*Eskom. 2003. The management of wildlifeinteractions with overhead power lines.African Centre for Energy and Environment(ACEE). Johannesburg, South Africa. 72 pp.
Eskom Transmission. 2005. Transmissionbird collision guidelines. Johannesburg,South Africa. 21 pp.
____. 2008. Specifications for bird flightdiverter installation on a transmission line.Johannesburg, South Africa. 1 p.
*____. 2009. Transmission bird collisionprevention guidelines. Johannesburg, SouthAfrica. 10 pp.
Evans, W. R., Y. Akashi, N. S. Altman, andA. M. Manville, II. 2007. Response ofnight-migrating birds in clouds to coloredand flashing light. North American Birds60:476–488.
Literature Cited and Bibliography | 119

SAM
PLE
Faanes, C. A. 1983. Assessment of powerline siting in relation to bird strikes in thenorthern Great Plains. U.S. Fish andWildlife Service, Jamestown, ND. 105 pp.
*____. 1987. Bird behavior and mortality in relation to power lines in prairie habitats.U.S. Fish and Wildlife Service. Serv. Gen.Tech. Rep. 7. 24 pp.
Finger, E., and D. Burkhardt. 1994. Biological aspects of bird colouration andavian colour vision including ultravioletrange. Vision Res. 34:1509–1514.
*Frost, D. 2008. The use of ‘flight diverters’reduces mute swan (Cygnus color) collisionwith power lines at Abberton Reservoir,Essex, England. Conservation Evidence5:83–91.
*García-Montijano, M., A. M. Tébar, B. Bar-reiro, P. Rodríguez, J. C. Alonso, C. Martín,M. Magaña, C. Palacín, J. Alonso, A. Mon-tesinos, and I. Luaces. 2002. Postmortemfindings in wild great bustards (Otis tarda)from Spain: a clinical approach. EuropeanAssociation of Zoo and Wildlife Veterinarians(EAZWV) 4th scientific meeting, jointwith the annual meeting of the EuropeanWildlife Disease Association (EWDA).May 8–12, 2002, Heidelberg, Germany.
Gauthreaux, S. A., Jr. 1970. Weather radarquantification of bird migration. BioScience20:17–20.
____. 1972. Behavioral responses ofmigrating birds to daylight and darkness: aradar and direct visual study. Wilson Bull.84:136–148.
*____. 1978a. Migratory behavior and flightpatterns. Pages 23–50 in M. L. Avery (ed.),Impacts of transmission lines on birds inflight. FWS/OBS-78/48. U.S. Fish andWildlife Service, Washington, D.C.
____. 1978b. The impact of transmissionlines on migratory birds: assessment ofcompleted, ongoing, and planned researchand an analysis of future research needs.Consultant’s Report. Prepared for the Electric Power Research Institute, Palo Alto, CA. 43 pp.
____. 1980. Direct visual and radar methods for the detection, quantification,and prediction of bird migration. SpecialPublication No. 2, Department of Zoology,Clemson University, Clemson, SC. 67 pp.
____. 1981. Avian interactions with transmission lines: radar and direct visualmethods of study, phase I. Final TechnicalReport. Electric Power Research Institute,Palo Alto, CA. 42 pp.
____. 1984. The use of small mobile radars to detect, monitor, and quantify bird movement. Pages 121–131 in M. J.Harrison, S. A. Gauthreaux, and L. A.Abron-Robinson (eds.), Proc. of theWildlife Hazards to Aircraft Conferenceand Training Workshop, Charleston, SC.Federal Aviation Administration.DOT/FAA/AAS/84-1.
____. 1985. Radar, electro-optical, andvisual methods of studying bird flight neartransmission lines. Electric Power ResearchInstitute. EPRI EA-4120. 76 pp.
____. 1988. The behavioral responses ofmigrating birds to aircraft strobe lights:attraction or repulsion? Final TechnicalReport. Headquarters, United States AirForce/Air Force Systems Command, AirForce Engineering and Services Center, Tyndall Air Force Base, FL 32403.
____. 1991. Low altitude movements ofbirds through the corridor for the Isle ofPalms 115 kV TAP. Prepared for The South Carolina Electric & Gas Company,Columbia, SC. 121 pp.
A120 | appendix a

SAM
PLE
____. 1995. Suggested practices for monitoring bird populations, movementsand mortality in wind resource areas. InProc. of the National Avian-Wind PowerPlanning Meeting, 20–21 July 1994. Lakewood, CO.
*____, and C. G. Belser. 2003. Overviewradar ornithology and biological conservation. Auk 120(2):266–277.
*Gehring, J., P. Kerlinger, and A. M. Manville,II. 2009. Communication towers, lights, andbirds: successful methods of reducing thefrequency of avian collisions. Ecol. Appl.19:505–514.
*____, ____, and ____. 2011. The role oftower height and guy wires on avian collisionswith communication towers. J. WildlifeManage. 75(4):848–855.
Gilbert Commonwealth, Inc. 1985. A reviewof available bird collision information anddescription of submarine cable crossingimpacts. Conducted for Central Power and Light Company. Jackson, MI. 16 pp.
*Gill, F. B. 1995. Ornithology. Second edition. W. H. Freeman and Company, New York.
Gill, J. A., W. J. Sutherland, and A. R.Watkinson. 1996. A method to quantify the effects of human disturbance on animalpopulations. J. Appl. Ecol. 33:786–792.
*Gill, J. P., M. Townsley, and G. P. Mudge.1996. Review of the impacts of wind farmsand other aerial structures upon birds. Scottish Natural Heritage Review No. 21.Scottish Natural Heritage, Edinburgh.
*Gombobaatar, S., R. Harness, and P. Amartuvshin. 2010. Raptor surveys of highpower electric lines and avian protectionplans in the Mongolian steppe. NationalUniversity of Mongolia, Asia Research Center. Report 2009.04.01-2010.04.01.
Hager, S. B. 2009. Human-related threats tourban raptors. J. Raptor Res. 43:210–226.
Halverson, P. G., S. J. Syracuse, R. Clark,and F. M. Tesche 2008. Non-contact sensorsystem for real-time high-accuracy monitor-ing of overhead transmission lines. In Proc.of the EDM and EPRI Internatl. Conf. onOverhead Lines. 31 March–3 April 2008.Fort Collins, CO.
Hamer Environmental, L.P. 2008. Use ofmodified horizontal and vertical radar toinvestigate avian collision potential near proposed or existing overhead lines. Pages137–141 in Proc. of the EDM and EPRIInternatl. Conf. on Overhead Lines. 31March–3 April 2008. Fort Collins, CO.
Harden, J., 2002. An overview of anthropogenic causes of avian mortality. J. Wildlife Rehabil. 25:4–11.
*Harmata, A. R., K. M. Podruzy, J. R. Zelenak,and H. Gabler. 1997. Temporal and spatialprofile of avian movement and mortalitybefore and after installation of a 100 kVtransmission line over the Missouri River.Montana Fish and Wildlife Program, Montana State University, Bozeman, MT.42 pp.
*Harness, R., S. Milodragovich, and J.Schomburg. 2003. Raptors and power linecollisions. Colorado Birds 37(3).
____, S. Gombobaatar, and R. Yosef. 2008.Mongolia distribution power lines and raptor electrocutions. Institute of Electricaland Electronics Engineers 52:1–6.
Literature Cited and Bibliography | 121

SAM
PLE
Harrison, J. 1963. Heavy mortality of MuteSwan from electrocution. Wildfowl TrustAnn. Rep. 14:164–165.
*Hart, N., J. Partridge, and I. Cuthill. 1998.Visual pigments, oil droplets and cone photoreceptor distribution in the Europeanstarling (Sturnus vulgaris). J. Exp. Biol.201:1433–1446.
*Hartman, P. A., S. Byrne, and M. F. Dedon.1992. Bird mortality in relation to the Mare Island 115-kV transmission line: final report 1988–1991. Prepared forDepartment of the Navy, Western Division,San Bruno, CA 94066-2402. PG&E ReportNumber 443-91.3. 118 pp.
*Heck, N. 2007. A landscape-scale model to predict the risk of bird collisions withelectric power transmission lines in Alberta.M.E. Des Thesis, University of Calgary,Calgary, Alberta Canada.
Heijinis, R. 1976. Vogels onderweg [Birdsunderway]. Ornithological mortality andenvironmental aspects of aboveground hightension lines. Koog aan de Zaan, Holland.160 pp.
____. 1980. Vogeltod durch Drahtanflügebei Hochspannungsleitungen [Bird death bywire approaches in high-voltage lines]. Ökol.Vögel 2:111–129.
*Henderson, I. G., R. H. W. Langston, and N. A. Clark. 1996. The response ofcommon terns (Sterna hirundo) to powerlines: an assessment of risk in relation tobreeding commitment, age and wind speed.Biol. Conserv. 77:185–192.
Herbert, A. D. 1970. Spatial disorientationin birds. Wilson Bull. 82:400–419.
*Herren, H. 1969. The status of the peregrine falcon in Switzerland. Pages231–238 in Peregrine Falcon Population:Their Biology and Decline. University ofWisconsin Press, Madison.
*Hiltunen, E. 1953. On electric and telephone wire incidents in birds. Suomen Riista 8: 70–76, 222–223.
*Homan, H. J., G. Linz, and B. D. Peer.2001. Dogs increase recovery of passerinecarcasses in dense vegetation. Wildlife Soc.B. 29:292–296.
Houston, C. S., and F. Scott. 2006. Entanglement threatens ospreys atSaskatchewan nest. J. Raptor Res.40:226–228.
Howard, R. P., B. L. Keller, F. L. Rose, J.Connley, Jr., and J. Hupp. 1987. Impacts ofthe Tincup Loop transmission line on cranesin Caribou County, Idaho. Pages 140–144in J. C. Lewis (ed.), Proc. 1985 CraneWorkshop. Platte River Whooping CraneMaintenance Trust, Grand Island, NE.
Hugie, R. D., J. M. Bridges, B. S. Chanson,and M. Skougard. 1992. Results of a post-construction bird monitoring study on theGreat Falls-Conrad 230-kV transmissionline. Prepared by BIO/WEST, Inc., Logan,UT for Western Area Power Administra-tion. 17 pp.
Hunt, F. R. 1975. Automatic radar equip-ment to determine bird strike probability,part 1. Night-time passerine migration.National Research Council of Canada,Ottawa, Field Note No. 69, p. 24.
*Hunting, K. 2002. A roadmap for PIERresearch on avian collisions with power linesin California. California Energy Commis-sion, PIER Energy-Related EnvironmentalResearch. Technical Report P500-02-071F.
A122 | appendix a

SAM
PLE
*Hurst, N. 2004. Corona testing of devicesused to mitigate bird collisions. EDM International, Inc. California Energy Commission, PIER Energy-Related Environmental Research. 500-04-086F.
*Huso, M. P. 2011. An estimator of wildlifefatality from observed carcasses. Environ-metrics 22:318–329.
Hylton, R. A., P. C. Frederick, T. E. De LaFuente, and M. G. Spalding. 2006. Effectsof nestling health on postfledging survivalof wood storks. Condor 108:97–106.
Igl, L. D., and D. H. Johnson. 1985. Migratory bird population changes inNorth Dakota. In E. T. LaRoe, G. S. Farris,C. E. Puckett, P. D. Doran, and M. J. Mac(eds.), Our living resources: a report to thenation on the distribution, abundance, and health of U.S. plants, animals, andecosystems. U.S. Department of the Interior, National Biological Service, Washington, D.C.
Imber, M. J. 1975. Behavior of petrels inrelation to the moon and artificial lights.Notornis 22:302–306.
Inouye, D. W., B. Barr, K. B. Armitage, andB. D. Inouye. 2000. Climate change is affect-ing altitudinal migrants and hibernatingspecies. Proc. of National Academy of Sciences 97:1630–1633.
* James, B. W., and B. A. Haak. 1979. Factorsaffecting avian flight behavior and collisionmortality at transmission lines. BonnevillePower Administration, U.S. Department ofEnergy, Portland, OR. 109 pp.
*____, and ____. 1980. Impact of theAshe-Slatt 500-kV transmission line on birdsat Crow Butte Island: pre-construction study.Bonneville Power Administration, U.S.Department of Energy, Portland, OR. 98 pp.
* Janss, G. F. E. 2000. Avian mortality frompower lines: a morphologic approach of aspecies-specific mortality. Biol. Conserv.95:353–359.
*____, and M. Ferrer. 1998. Rate of birdcollision with power lines: effects of conductor-marking and static wire-marking.J. Field Ornithol. 69:8–17.
*____, and ____. 2000. Common crane andgreat bustard collision with power lines: collision rate and risk exposure. Wildlife.Soc. B. 28:675–680.
____, A. Lazo, and M. Ferrer. 1999. Use ofraptor models to reduce avian collisions withpower lines. J. Raptor Res. 33:154–159.
* Jenkins, A. R., J. J. Smallie, and M. Diamond. 2010. Avian collisions withpower lines: a global review of causes andmitigation with a South African perspective.Bird Conserv. Int. 20:263–278.
* Johnson, G. D., W. P. Erickson, M. D.Strickland, M. F. Shepherd, D. A. Shepherd,and S. A. Sarappo. 2002. Collision mortalityof local and migrant birds at a large-scalewind-power development on Buffalo Ridge,Minnesota. Wildlife Soc. B. 30:879–887.
Jones, J., and C. M. Francis. 2003. The effectsof light characteristics on avian mortality atlighthouses. J. Avian Biol. 34:328–333.
* Jones, M. P., K. E. Pierce, Jr., and D. Ward.2007. Avian vision: a review of form andfunction with special consideration to birdsof prey. J. Exot. Pet Med. 2:69–87.
Literature Cited and Bibliography | 123

SAM
PLE
Kabouche, B., J. Bayeul, L. Zimmermann,and P. Bayle. 2006. La mortalité des oiseauxsur le réseau électrique aérien: enjeux et perspectives en Provence-Alpes-Côte d’Azur[The mortality of birds on aerial powerlines: challenges and prospects in Provence-Alpes-Cote d’Azur]. Rapport DIRENPACA - LPO PACA, Hyères. 109 pp.
*Kelly, A., and S. Kelly. 2005. Are muteswans with elevated blood lead levels morelikely to collide with overhead power lines?Waterbirds 28:331–334.
*Kerlinger, P. 2003. Addendum to the phaseI avian risk assessment for the Flat RockWind Power Project, Lewis County, NewYork: phase one and phase two. Prepared forAtlantic Renewable Energy Corporation,William Moore, Project Manager. Preparedby Curry & Kerlinger, LLC, Cape May, NJ.
*Kessler, A. 2007. Great bustard in CentralAsia: Tsengel died due to collision withpower line. www.public.asu.edu/~aekessle
Kjaersgaard, A., C. Pertoldi, V. Loeschcke,and D. W. Hansen. 2008. Tracking the gazeof birds. J. Avian Biol. 39:466–469.
Klem, D., Jr. 1990. Collisions between birdsand windows: mortality and prevention. J. Field Ornithol. 61:120–128.
____. 2009. Avian mortality at windows:the second largest human source of birdmortality on earth. Pages 244–251 inT. D.Rich, C. Arizmendi, D. Demarest, and C.Thompson (eds.), Tundra to tropics: con-necting habitats and people. Proc. of the4th International Partners in Flight Confer-ence, 13–16 February 2008, McAllen, TX.
____, D. C. Keck, K. L. Marty, A. J. MillerBall, E. E. Niciu, and C. T. Platt. 2004.Effects of window angling, feeder place-ment, and scavengers on avian mortality atplate glass. Wilson Bull. 116:69–73.
____, C. J. Farmer, N. Delacretaz, Y. Gelb,and P. G. Saenger. 2009. Architectural andlandscape risk factors associated with bird-glass collisions in an urban environment.Wilson J. Ornithol. 121:126–134.
Klimentjew, D., N. Hendrich, J. Zhang.2010. Multi sensor fusion of camera and3D laser range finder for object recognition.In proceedings of Multisensor Fusion andIntegration for Intelligent Systems, 2010IEEE Conference. 5–7 September 2010,Salt Lake City, UT.
Koford, C. B. 1953. The California condor.Natl. Audubon Soc. Res. Rep. 4. 154 pp.
*Koops, F. B. J. 1979. Een miljoen draad-slachtoffers wat kunnen we ertegen doen?[One million bird collisions: what can we doto improve this situation?] De Lepelaar, No.63:20-21.
*____. 1987. Collision victims of high-tension lines in the Netherlands and effects of marking. KEMA Report 01282-MOB86-3048.
*____. 1993. Collision victims of high-tension lines in the Netherlands and effectsof marking. Unpubl. rep., N. V. KEMA, Arnhem. 6 pp.
*____, and J. de Jong. 1982. Verminderingvan draadslachtoffers door markering vanhoogspanningsleidingen in de omgeving vanHeerenveen [Reducing the number of birdcollisions by marking high-voltage lines inthe Heerenveen area]. Overdruk uit: Elektrotechniek 60(12):641–646.
Korschgen, C. D., W. L. Green, W. L. Flock,and E. A. Hibbard. 1984. Use of radar witha stationary antenna to estimate birds in alow-level flight corridor. J. Field Ornithol.55:369–375.
A124 | appendix a

SAM
PLE
*Kostecke, R. M., G. M. Linz, and W. J.Bleier. 2001. Survival of avian carcasses andphotographic evidence of predators andscavengers. J. Field Ornithol. 72:439–447.
*Krapu, G. L. 1974. Avian mortality fromcollisions with overhead wires in NorthDakota. The Prairie Naturalist 6:1–6.
Krochko, N. 2005. Bird collisions with electric power transmission lines: frequentlyasked questions (FAQs). AltaLink, Calgary,Alberta, Canada. 5 pp.
Kroodsma, R. L. 1978. Evaluation of a proposed transmission line’s impact onwaterfowl and eagles. Pages 69–76 in M. L.Avery (ed.), Impacts of transmission lineson birds in flight. FWS/OBS-78/48. U.S.Fish and Wildlife Service, Washington, D.C.
Krüger, O. 2002. Analysis of nest occupan-cy and nest reproduction in two sympatricraptors: common buzzard (Buteo buteo) andgoshawk (Accipiter gentilis). Ecography25:523–532.
____, R. Liversidge, and J. Lindström.2002. Statistical modeling of the popula-tion dynamics of a raptor community in asemi-desert environment. J. Anim. Ecol.71:603–613.
Kunz, T. H., E. B. Arnett, B. M. Cooper, W.P. Erickson, R. P. Larkin, T. Mabee, M. L.Morrison, M. D. Strickland, and J. M.Szewczak. 2007. Assessing impacts of windenergy development on nocturnally activebirds and bats: a guidance document. J.Wildlife Manage. 71:2249–2486.
*Kuyt, E. 1992. Aerial radio-tracking ofwhooping cranes migrating between WoodBuffalo National Park and Aransas NationalWildlife Refuge, 1981–84. OccasionalPaper Number 74. Canadian Wildlife Service.Ottawa, Canada.
Larkin, R. P., and P. J. Sutherland. 1977.Migrating birds respond to project seafarer’selectromagnetic field. Science 195:777–779.
*Lasch, U., S. Zerbe, and M. Lenk. 2010.Electrocution of raptors at power lines inCentral Kazakhstan. Waldökologie, Land-schaftsforschung, und Naturschutz 9 (2010)[Forest Ecology, Landscape Research, andNature Conservation 9 (2010)] http://afsv.de/download/literatur/waldoekologie-online/waldoekologie-online_heft-9-2.pdf
Lawson, A. B., and M. J. Wyndham. 1993.A system of monitoring wildlife interactionswith electricity distribution installations in a supply region of the Cape Province inSouthern Africa. In Proc. of the AvianInteractions with Utility Structures Interna-tional Workshop, 13–16 September 1992.Electric Power Research Institute and theAvian Power line Interaction Committee.EPRI Technical Report TR-103268.
Ledger, J. A., J. C. A. Hobbs, and T. V.Smith. 1993. Avian interactions with utilitystructures: southern African experiences. InProc. of the Avian Interactions with UtilityStructures International Workshop, 13–16September 1992. Electric Power ResearchInstitute and the Avian Power line Interac-tion Committee. EPRI Technical ReportTR-103268.
*Lee, J. M., Jr. 1978. A summary of reportsof bird collisions with power and communi-cation lines. Bonneville Power Administra-tion, Portland, OR. 8 pp.
____. 1983. Site visit and data analysis:waterfowl collisions at the Missouri River.Bonneville Power Administration, Portland,OR. 14 pp.
Literature Cited and Bibliography | 125

SAM
PLE
*____, and J. R. Meyer. 1977. Work plan fora study of the effects of Bonneville PowerAdministration transmission lines on birdflight behavior and collision mortality.Unpubl. Research Proposal, BonnevillePower Administration, Portland, OR. 9 pp.
____, and ____. 1978. Effects of transmission lines on bird flights: studies of Bonneville Power Administration Lines.Pages 93–116 in M. L. Avery (ed.), Impactsof transmission lines on birds in flight. U.S.Fish and Wildlife Service, Washington, D.C.
Lehman, R. N., P. L. Kennedy, and J. A.Savidge. 2007. The state of the art in raptorelectrocution research: a global review. Biol. Conserv. 136:159–174.
Leitner, P., and G. S. Grant. 1978. Preliminary observations of waterbird flightpatterns at Salton Sea, California, October1976–February 1977. Prepared jointly forthe Department of Energy and SouthernCalifornia Edison. 34 pp.
Leppers, P. H. 1966. Hoogspanningsdraden:doodsvijand nr. 1 [High-voltage wires: deadly enemy no. 1]. Duivengazet 19:16–17.
*Lewis, J. C. 1992. The contingency plan for Federal-State cooperative protection ofwhooping cranes. Pages 293–300 in D. A.Wood (ed.), Proc. 1988 N. Am. CraneWorkshop. Florida Game and Fresh WaterFish Commission, Tallahassee.
Liguori, S., and J. Burruss. 2008. PacifiCorp’sbird management program: integrating reactive, proactive, and preventative measuresto reduce avian mortality on power lines.Pages 325–329 in J. W. Goodrich-Mahoney,L. P. Abrahamson, J. L. Ballard, and S. M. Tikalsky (eds.), Proc. of the Eighth International Symposium on EnvironmentalConcerns in Rights-of-Way Management.12–16 September 2004, Saratoga Springs,NY. Elsevier, Amsterdam, The Netherlands.
Linz, G. M., J. E. Davis, Jr., R. M. Enge-man, D. L. Otis, and M. L. Avery. 1991.Estimating survival of bird carcasses in cat-tail marshes. Wildlife Soc. B. 19:195–199.
*Lislevand, T. 2004. Fugler og kraftledninger:metoder for å redusere risikoen for kollisjoner og elektrokusjon [Birds andpower lines: methods to reduce the risk of collisions and electrocutions]. Norsk Ornitologisk Forening. Rapport nr 2-2004. 40 s.
Longcore, T., C. Rich, and S. A. Gauthreaux,Jr. 2008. Height, guy wires, and steady-burning lights increase hazard of communi-cation towers to nocturnal migrants: a reviewand meta-analysis. Auk 125:485–492.
*____, ____, P. Mineau, B. MacDonald, D. G. Bert, L. M. Sullivan, E. Mutrie, S. A.Gauthreaux Jr., M. L. Avery, R. L. Craw-ford, A. M. Manville II, E. R. Travis, and D. Drake. 2012. An estimate of avian mortality at communication towers in theUnited States and Canada. PLoS ONE7(4), April 25th.
*Longridge, M. W. 1986. The impacts oftransmission lines on bird flight behaviour,with reference to collision mortality and systems reliability. Bird Res. Comm.,ESCOM. Report: 1-279.
Luman, I. D. 1978. The Klamath Basin case.Pages 91–104 in M. L. Avery (ed.), Impactson transmission lines on birds in flight. U.S.Fish and Wildlife Service, Washington, D.C.FWS/OBS-78/48.
*Mabee, T. J., and B. A. Cooper. 2002. Noc-turnal bird migration at the Stateline andVansycle Wind Energy Projects, 2000–2001.Prepared for CH2MHILL and FPL EnergyVansycle, LLC, Juno Beach, FL, by ABR,Inc., Forest Grove, OR. 16 p.
A126 | appendix a

SAM
PLE
*____, ____, and J. H. Plissner. 2004.Radar study of nocturnal bird migration at the proposed Mount Storm Wind-PowerDevelopment, West Virginia, fall 2003.Final Report. Prepared for Western EcoSystems Technology (WEST), Inc.,Cheyenne, WY, and NedPower US LLC,Chantilly, VA, by ABR, Inc., Forest Grove, OR.
Maehr, D. S., A. G. Spratt, and D. K. Voights.1983. Bird casualties at a central Floridapower plant. Florida Field Nat. 11:45–49.
*Magyar Madártani és TermészetvédelmiEgyesület (MME). 2011. Budapest declaration on bird protection and powerlines. Adopted by the conference, Powerlines and bird mortality in Europe;Budapest, Hungary; 13 April 2011.www.mme.hu/termeszetvedelem/budapest-conference-13-04-2011/1429.html
*Malcolm, J. M. 1982. Bird collisions with apower transmission line and their relation tobotulism at a Montana wetland. WildlifeSoc. B. 10:297–304.
*Mañosa, S., and J. Real. 2001. Potentialnegative effects of collisions with transmis-sion lines on a Bonelli’s Eagle population. J. Raptor Res. 35:247–252.
Mantyla, E., T. Klemola, P. Sirkia, and T. Laaksonen. 2008. Low light reflectancemay explain the attraction of birds to defoliated trees. Behav. Ecol. 19:325–330.
*Manville, A. M., II. 2002. Protocol formonitoring the impact of cellular telecommunication towers on migratorybirds within the Coconino, Prescott, andKaibab National Forests, Arizona. ResearchProtocol Prepared for U.S. Forest ServiceCellular Telecommunications Study. U.S.Fish and Wildlife Service, Division ofMigratory Bird Management.
*____. 2005a. Bird strikes and electrocutionsat power lines, communication towers, andwind turbines: state of the art and state ofthe science, next steps toward mitigation.Pages 1051–1064 in C. J. Ralph and T. D.Rich (eds.), Bird conservation implementa-tion in the Americas. Proc. of the 3rd International Partners in Flight Conference2002. USDA Forest Service General Technical Report PSW-GTR-191, PacificSouthwest Research Station, Albany, CA.
*____. 2005b. Seabird and waterbird bycatchin fishing gear: next steps in dealing with aproblem. Pages 1071–1082 in C. J. Ralphand T. D. Rich (eds.), Bird conservationimplementation in the Americas. Proc. of the3rd International Partners in Flight Confer-ence 2002. USDA Forest Service GeneralTechnical Report PSW-GTR-191, PacificSouthwest Research Station, Albany, CA.
*____. 2007a. Comments of the U.S. Fishand Wildlife Service submitted electronicallyto the FCC on 47 CFR parts 1 and 17,WT Docket 03-187, FCC 06-164, Noticeof Proposed Rulemaking, “Effects of Communication Towers on MigratoryBirds.” February 2, 2007. 32 pp.
____. 2007b. Briefing paper on the need for research into the cumulative impacts ofcommunication towers on migratory birdsand other wildlife in the United States.Division of Migratory Bird Management,U.S. Fish and Wildlife Service, Arlington,VA, for Public Release.
*____. 2009a. Towers, turbines, power lines,and buildings: steps being taken by the U.S. Fish and Wildlife Service to avoid orminimize take of migratory birds at thesestructures. Pages 262–272 inT. D. Rich, C.Arizmendi, D. Demarest, and C. Thompson(eds.), Tundra to tropics: connecting habitats and people. Proc. of the 4th International Partners in Flight Conference,13–16 February 2008, McAllen, TX.
Literature Cited and Bibliography | 127

SAM
PLE
*____. 2009b. Briefing paper on the need for research into the cumulative impacts ofcommunication towers on migratory birdsand other wildlife in the United States: document for public release. U.S. Fish andWildlife Service, Division of MigratoryBird Management.
Manville, R. H. 1963. Accidental mortalityin bats. Mammalia 27:361–366.
Martin, G. R. 2010. Bird collisions: a visual or a perceptual problem? In Proc. ofthe British Ornithologists’ Union 2010 Conference: Climate Change and Birds. 6–8 April 2010. University of Leicester,Leicester, UK.
*____. 2011. Understanding bird collisionswith man-made objects: A sensory ecologyapproach. Ibis 153:239–254.
*____, and J. M Shaw. 2010. Bird collisionswith power lines: failing to see the wayahead? Biol. Conserv. 143: 2695–2702.
*Mathiasson, S. 1999. Swans and electricalwires, mainly in Sweden. Pages 83–111 inM. Ferrer and G. F. E. Janss (eds.), Birdsand power lines; collision, electrocution and breeding. Servicios Informativos Ambientales/Quercus, Madrid, Spain.
*McCann, K. 2001. Eskom/EWT partner-ship: the wattled crane marking project inSouth Africa. In Avian Interactions withUtility and Communication StructuresWorkshop Proceedings. 2–3 December1999. Charleston, SC. EPRI TechnicalReport No. 1006907. R. Carlton, ProjectManager.
McCrary, M. D., R. L. McKernan, and R.W. Schreiber. 1981. Nocturnal bird migra-tion in the Coachella Valley, spring 1981.Prepared for Southern California EdisonCompany, Rosemead, CA. 42 pp.
____, ____, ____, and S. D. Wagner.1988. Assessment of bird collisions alongthe Devers-Valley 500-kV transmission linein the San Jacinto Valley. Final Report.Southern California Edison, 88-RD-5.
McKernan, R., M. McCrary, W. Wagner, R.Landry, and R. Schreiber. 1982. Observa-tions on nocturnal and diurnal bird use inrelation to the Devers-Valley 500-kV trans-mission line in the San Jacinto Valley, winter1981–82. Prepared for Southern CaliforniaEdison Company, Rosemead, CA. 63 pp.
*McNeil, R., J. R. Rodriguez, and H. Ouellet. 1985. Bird mortality at a powertransmission line in NortheasternVenezuela. Biol. Conserv. 31:153–65.
____, A. McSween, and P. Lachapelle.2005. Comparison of the retinal structureand function in four bird species as a func-tion of the time they start singing in themorning. Brain Behav. Evolut. 65:202–214.
*Mead, C. J., P. M. North, and B. R. Wat-mough. 1979. The mortality of British greyherons. Bird Study 26:13–22.
*Meyer, J. R. 1978. Effects of transmissionlines on bird flight behavior and collisionmortality. Prepared for Bonneville PowerAdministration, U.S. Department of Energy, Portland, OR. 200 pp.
*Miller, A. D. 1990. A study to determinethe effectiveness of power line marking systems to reduce avian collision mortality.Unpublished report for APLIC. 15 pp.
*Mojica, E. K., B. D. Watts, J. T. Paul, S. T.Voss, and J. Pottie. 2009. Factors contribut-ing to bald eagle electrocutions and line collisions on Aberdeen Proving Ground,Maryland. J. Raptor Res. 43:57–61.
A128 | appendix a

SAM
PLE
*Morkill, A. E., and S. H. Anderson. 1991.Effectiveness of marking power lines toreduce sandhill crane collisions. WildlifeSoc. B. 19:442–449.
*Murphy, R. K., S. M. McPherron, G. D.Wright, and K. L. Serbousek. 2009. Effective-ness of avian collision averters in preventingmigratory bird mortality from power linestrikes in the Central Platte River, Nebraska.2008–2009 Final Report. 30 September2009, Dept. of Biology, University of Nebraska- Kearney, Kearney, NE. 32 pp.
*National Park Service (NPS). 2011. California condor (Gymnogyps californianus)recovery program: population size and distribution, December 31, 2011. Availablefrom: www.nps.gov/pinn/naturescience/upload/Condor-Program-Monthly-Status-One-Page-Summary-2011-12-3134.pdf
Negro, J. J., and M. Ferrer. 1995. Mitigatingmeasures to reduce electrocution of birds onpower lines: a comment on Bevanger’s review.Ibis 137:423–424.
New York Power Authority (NYPA). 2005.Estimates of bird mortality associated withtransmission lines. Niagara Power Project,FERC #2216. Prepared for NYPA by URSCorporation.
Newton, I. 2007. Weather-related mass-mortality events in migrants. Ibis149:453–467.
*____. 2008. The migration ecology of birds. Academic Press, Amsterdam, The Netherlands.
Nielson, L. 2010. Bird collision monitoringwith a BSI. Northwest Public Power Associ-ation, Avian Protection Plan Workshop.16–17 March 2010. Seattle, WA.
Niemi, G. J., and J. M. Hanowski. 1984.Effects of a transmission line on bird populations in the Red Lake Peatland,northern Minnesota. Auk 101:487–498.
*NUS Corporation. 1979. Impacts of over-head wires on birds: a review. Unpublishedreport. Prepared for the Electric PowerResearch Institute, Palo Alto, Calif. 47 pp.Summary available from www.energy.ca.gov/research/environmental/avian_bibliography
Nygård, T., K. Bevanger, and O. Reitan. 2008.Forholdet mellom fugler og vindmøller ogandre lufthindringer. En litteraturoversikt[The relationship between birds and windturbines and other air barriers. A literaturereview]. NINA Rapport 413. 167 s.
Office of the President. 2001. ExecutiveOrder 13186 of January 10, 2001. Respon-sibilities of federal agencies to protectmigratory birds. Federal Register 66:11 (17January 2001). Pp 3853-3856. Availablefrom: http://www.archives.gov/federal-register/executive-orders/2001-clinton.html
*Ogilvie, M. A. 1966. Population changesand mortality of the mute swan in Britain.Wildfowl Trust Ann. Rep. 18:64–73.
Olendorff, R. R., A. D. Miller, and R. N.Lehman. 1981. Suggested practices for raptor protection on power lines: the stateof the art in 1981. Raptor Research ReportNo. 4, Raptor Research Foundation, Inc.111 pp.
*____, ____, and ____. 1986. Raptor collisions with utility lines: an analysis using subjective field observations. PacificGas and Electric Co., San Ramon, CA. 73 pp.
Literature Cited and Bibliography | 129

SAM
PLE
*Olson, C. 2001. Human-related causes ofraptor mortality in western Montana: thingsare not always as they seem. In Avian Inter-actions with Utility and CommunicationStructures Workshop Proceedings. 2–3December 1999. Charleston, SC. EPRITechnical Report No. 1006907.
Padding, P. I., and H. H. Prince. 1991. Final report: Karn-Weadock transmissionline mortality study. Department of Fisheries and Wildlife, Michigan State University, East Lansing, MI. 12 pp.
*Pandey, A. K., R. E. Harness, and M. K.Schriner. 2008. Bird strike indicator fielddeployment at the Audubon NationalWildlife Refuge in North Dakota: phasetwo. California Energy Commission, PIEREnergy-Related Environmental ResearchProgram. CEC-500-2008-020.
Patten, M. A., and D. T. Bolger. 2003. Variation in top-down control of avianreproductive success across a fragmentationgradient. Oikos 101:479–488.
*Peterson, C. A., S. L. Lee, and J. E. Elliott.2001. Scavenging of waterfowl carcasses by birds in agricultural fields of BritishColumbia. J. Field Ornithol. 72:150–159.
Philibert, H., G. Wobeser, and R. G. Clark.1993. Counting dead birds: examination ofmethods. J. Wildlife Dis. 29:284–289.
Ping, F., M. Farzaneha, and G. Boucharda.2006. Two-dimensional modeling of the iceaccretion process on transmission line wiresand conductors. Cold Reg. Sci. Technol.46:132–146.
*Podolsky, R., D. G. Ainley, G. Spencer, L.Deforest, and N. Nur. 1998. Mortality ofNewell’s shearwaters caused by collisionswith urban structures on Kauai. Colon.Waterbird 21:20–34.
*Prather, P. R., and T. A. Messmer. 2010.Raptor and corvid response to power distribution line perch deterrents in Utah. J. Wildlife Manage. 74(4):796–800.
Prinsen, H., and R. Smits. 2009. Collisionrisk of birds with a 150 kV power line: acase study from the Netherlands. BureauWaardenburg, Ltd., The Netherlands.
*Prosser, P., C. Nattrass, and C. Prosser.2008. Rate of removal of bird carcasses inarable farmland by predators and scavengers.Ecotox. Environ. Safe. 71:601–608.
*Quinn, M., N. Heck, S. Alexander, and G. Chernoff. 2011. Identification of birdcollision hotspots along transmission powerlines in Alberta: an expert-based geographicinformation system (GIS) approach. Journalof Environmental Informatics 18(1):12–21.
*Raevel, P., and J. C. Tombal. 1991. Impactdes lignes haute-tension sur l’avifaune[Impact of high-voltage lines on birds]. Les Cahiers de L’A.M.B.E. et Environment,Vol. 2. 31 pp.
*Rasmussen, P. J. 2001. Problem resolutionsfor avian interactions at two NSP facilities.In Proc. Avian Interactions with Utility andCommunication Structures Workshop. 2–3December 1999. Charleston, SC. EPRITechnical Report No. 1006907.
*Rayner, J. M. V. 1988. Form and functionin avian flight. Curr. Ornithol. 5:1–77.
Reijnen, R., R. Foppen, and G. Veenbaas.1997. Disturbance by traffic of breedingbirds: evaluation of the effect and consid-erations in planning and managing road corridors. Biodivers. Conserv. 6:567–581.
A130 | appendix a

SAM
PLE
Reiter, A. S. 2000. Casualties of great bustards on overhead power lines in thewestern Weinvertel (Lower Austria). Egretta 43:37–54.
*Renssen, T. A., A. Bruin, J. H. van deDoorn, A. Gerritsen, H. C. Greven, and J. Kamp. 1975. Vogelsterfte in Nederlandtengevolge van aanvaringen met hoogspan-ningslijnen [Bird mortality in the Nether-lands due to collisions with power lines].Rijksinstitut voor Naturbeheer. 65 pp.
Richardson, W. J. 2000. Bird migration and wind turbines: migration timing, flightbehavior, and collision risk. Pages132–140in National Avian-Wind Power PlanningMeeting III. San Diego, CA, LGL Ltd.,Environmental Research Associates, KingCity, Ontario, Canada.
*Rigby, R. W. 1978. October 19 letter fromrefuge manager, Bosque del Apache NationalWildlife Refuge, Socorro, NM, to MichaelAvery, National Power Plant Team, AnnArbor, MI. 1 p.
*Rivera-Milan, F. F., M. E. Zaccagnini, and S. B. Canavelli. 2004. Field trials ofline-transect surveys of bird carcasses inagro-ecosystems of Argentina’s Pampasregion. Wildlife Soc. B. 32:1219–1228.
Robbins, C. 2002. Direct testimony ofChandler S. Robbins Dec. 6, 2002, in thematter of the application of Clipper 101MW generating facility in Garrett County,MD, Windpower, Inc. Case #8938.
*Robert, M., R. McNeil, and A. Leduc.1989. Conditions and significance of nightfeeding in shorebirds and other water birdsin a tropical lagoon. Auk 106:94–101.
*Rocke, T. E., and Friend, M. 1999. Avianbotulism. Chapter 38 in Field manual ofwildlife diseases: General field proceduresand diseases of birds. U.S. Department ofthe Interior. U.S. Geological Survey.
*Roig-Soles, J., and V. Navazo-Lopez. 1997.A five-year Spanish research project on birdelectrocution and collision with electriclines. Pages 317–325 in J. R. Williams, J. W.Goodrich-Mahoney, J. R. Wisniewski, and J.Wisniewski (eds.), Environmental Concernsin Rights-of-Way Management. 22–26,February. New Orleans, LA. Elsevier Science Ltd., Amsterdam, The Netherlands.
Ross, R. C. 1946. People in glass housesshould draw their shades. Condor 48:142.
RTE. 2009. RTE Rhône-Alpes Auvergne:pose de balises de protection de l’avifaunepar RTE dans la réserve naturelle régionaledes étangs de Mépieu [RTE Rhône-AlpesAuvergne: Attaching tags to protect thebirds by RTE in the regional natural reserveof ponds Mépieu]. Paris, France. 7 pp.
*Rubolini, D., M. Gustin, G. Bogliani, and R.Garavaglia. 2005. Birds and power lines inItaly: an assessment. Bird Conserv. Int.15:131–145.
*Rusz, P. J., H. H. Price, R. D. Rusz, and G.A. Dawson. 1986. Bird collisions withtransmission lines near a power plant cooling pond. Wildlife Soc. B. 14:441–444.
*Savareno, A. J., L. A. Savareno, R. Boettcher,and S. M. Haig. 1996. Avian behavior andmortality at power lines in coastal SouthCarolina. Wildlife Soc. B. 24:636–648.
*Schroeder, C. H. 1977. Geese hit powertransmission line. North Dakota Outdoors40(2): inside cover.
Literature Cited and Bibliography | 131

SAM
PLE
*Schuerenberg, B., R. Schneider, and H. Jerrentrup. 2009. Follow-up of recom-mendation No. 110 (2004) on minimisingadverse effects of above-ground electricitytransmission facilities (power lines) on birds.Council of Europe, Convention on theConservation of European Wildlife andNatural Habitats, Standing Committee,29th Meeting, 23–26 November. Bern,Switzerland. 39 pp.
*Scott, R. E., L. J. Roberts, and C. J. Cadbury. 1972. Bird deaths from powerlines at Dungeness. Brit. Birds 65:273–286.
Seamans, T. W., S. C. Barras, and A. J. Patton. 2003. Are birds scared by rotatingmirrors? In Proc. of the 2003 Bird StrikeCommittee USA/Canada, 5th Joint AnnualMeeting, Toronto, Ontario, Canada.
Sergio, F., P. Pedrini, and L. Marchesi. 2003. Spatio-temporal shifts in gradients of habitat quality for an opportunistic avianpredator. Ecography 26:243–255.
*Shamoun-Baranes, J., E. van Loon, H. vanGasteren, J. van Belle, W. Bouten, and L.Buurma. 2006. A comparative analysis ofthe influence of weather on the flight altitudes of birds. B. Am. Meteorol. Soc.87:47–61.
*____, W. Bouten, and E. van Loon. 2010.Integrating meteorology into research onmigration. Integr. Comp. Biol. 50:280–292.
*Shaw, J., A. Jenkins, J. Smallie, and P. Ryan.2010. Modeling power-line collision riskfor the blue crane (Anthropoides paradiseus) inSouth Africa. Ibis 152:590–599.
*Shernazarov, E., and E. N. Lanovenko.1994. Assessment of impact of anthro-pogenic loads on ornithological fauna ofUzbekistan. Pages 32–35 in materials ofseminar “Environmental Impact Assessmentprocedure during development of FeasibilityStudy and Designs of Construction of Eco-nomic Facilities and Complexes” Tashkent.
*Shimada, T. 2001. Choice of daily flightroutes of greater white-fronted geese: effectsof power lines. Waterbirds 24:425–429.
*Shire, G. G., K. Brown, and G. Winegrad.2000. Communication towers: a deadly hazard to birds. Report Documents. AReport Compiled by American Bird Conservancy, June 2000.
Siegfried, W. R. 1972. Ruddy ducks collid-ing with wires. Wilson Bull. 84:486–487.
Simmons, R. E. 2002. Siblicide providesfood benefits for raptor chicks: re-evaluatingbrood manipulation studies. Anim. Behav.64:F19–F24.
*Smallie, J., and M. Z. Virani. 2010. A preliminary assessment of the potential risksfrom electrical infrastructure to large birdsin Kenya. Scopus 30:32–39.
Smith, J. R., and J. T. Schletz. 1991. Bird/power line collision detection system. FinalReport. Pacific Gas and Electric Company,Department of Research and Development.
Sorenson, K. J., L. J. Burnett, and J. R. Davis.2001. Status of the California condor andmortality factors affecting recovery. Endan-gered Species Update, July–August 2001.
Stallknecht, D. E. 2007. Impediments to wildlife disease surveillance, research, and diagnostics. Curr. Top. Microbiol.315:445–461.
A132 | appendix a

SAM
PLE
Steenhof, K., M. N. Kochert, and J. A.Roppe. 1993. Nesting by raptors and common ravens on electrical transmissionline towers. J. Wildlife Manage.57:271–281.
*Stehn, T., and T. Wassenich. 2007. Whooping crane collisions with power lines: an issue paper. 2006 North AmericanCrane Workshop.
Stout, J., and G. W. Cornwell. 1976. Non-hunting mortality of fledged North Americanwaterfowl. J. Wildlife Manage. 40:681–693.
*Sundar, K. S. G., and B. C. Choudhury. 2005.Mortality of sarus cranes (Grus antigone) dueto electricity wires in Uttar Pradesh, India.Environ. Conserv. 32:260–269.
Sundararajan, R., and R. Gorur. 2005.When birds and power lines collide. Transmission and Distribution World,December 2005:16–26.
Synder, L. L. 1946. “Tunnel fliers” andwindow fatalities. Condor 48:278.
*Tacha, T. C., D. C. Martin, and C. G. Endicott. 1979. Mortality of sandhillcranes associated with utility highlines inTexas. Pages 175–176 in J. C. Lewis (ed.),Proc. 1978 Crane Workshop. NationalAudubon Society, NY.
Thompson, L. S. 1977. Overhead trans-mission lines: impact on wildlife. MontanaDepartment of Natural Resources & Conservation, Helena, MT. 60 pp.
*____. 1978. Transmission line wire strikes:mitigation through engineering design andhabitat modification. Pages 51–92 in M. L.Avery (ed.), Impacts of transmission lineson birds in flight. U.S. Fish and WildlifeService, Washington, D.C.
Todd, L. D., R. G. Poulin, and R. M.Brigham. 1997. Diet of common nighthawks(Chordeiles minor: Caprimulgidae) relative toprey abundance. Am. Midl. Nat. 139:20–28.
Tucker, W. A. 1975. Flight energetics. Pages49–63 in M. Peaker (ed.), Avian physiology.Academic Press, London.
U.S. Department of Agriculture (USDA).1985. USDA handbook 478. National Forest Landscaped Management, Volume 2,Chapter 2, Utilities.
U.S. Department of Energy (USDOE).2007. National electric transmission corridor report and the ordered nationalcorridor designations. http://nietc.anl.gov/nationalcorridor/index.cfm
*U.S. Environmental Protection Agency(USEPA). 1998. Guidelines for ecologicalrisk assessment. U.S. Environmental Protection Agency, Risk Assessment Forum,Washington, D.C. EPA/630/R095/002F.
U.S. Fish and Wildlife Service (USFWS).Undated. Bird fatality/injury reporting program filer instructions. 16 pp.
*____. 2005a. Final list of bird species towhich the Migratory Bird Treaty Act doesnot apply. Federal Register 70:49 (15March 2005). Pp 12710–12716. Availablefrom: www.federalregister.gov/articles/2005/03/15.
____. 2005b. Collisions: Clear the way forbirds. International Migratory Bird Day. 8 pp.
*____. 2009a. Final environmental assess-ment. Proposal to permit take as providedunder the Bald and Golden Eagle ProtectionAct. Available from: http://www.fws.gov/migratorybirds/CurrentBirdIssues/BaldEagle/FEA_EagleTakePermit_Final.pdf
Literature Cited and Bibliography | 133

SAM
PLE
*____. 2009b. Standard recommendations to avoid, minimize and mitigate potentialimpacts of wind energy projects in Oklahoma. Oklahoma Ecological Services Field Office, Tulsa, OK. 5 pp.
____. 2010. Species profile: California condor (Gymnogyps californianus). http://ecos.fws.gov/speciesProfile/profile/speciesProfile.action?spcode=B002
*____ and National Marine Fisheries Service(NMFS). 1998. Consultation handbook:Procedures for conducting consultation andconference activities under Section 7 of theEndangered Species Act.
*U.S. Geological Survey (USGS). 2011.National wildlife health center.www.nwhc.usgs.gov
*Utah Wildlife in Need (UWIN). 2010.Contemporary knowledge and research needsregarding the potential effects of tall struc-tures on sage-grouse (Centrocercus urophasianusand C. minimus). Available from: http://utahcbcp.org/htm/tall-structure-info
*____. 2011. Protocol for investigating theeffects of tall structures on sage-grouse(Centrocercus spp.) within designated or proposed energy corridors. Available from:http://utahcbcp.org/htm/tall-structure-info
van Rooyen, C. Undated. Bird impact scoping study Gerus-Mururane Gate350kV DC transmission line. EndangeredWildlife Trust, South Africa. 19 pp.
*____. 2000. An overview of vulture electrocutions in South Africa. VultureNews 43: 5–22. Vulture Study Group,Johannesburg, South Africa.
____. 2001. Bird impact assessment study cape strengthening programmegamma-omega 765kV transmission line.Endangered Wildlife Trust, South Africa. 12 pp.
____. 2006. Environmental assessmentaddendum of the proposed Otjikoto–Katima Mulilo 350kV DC, ornithologicalcomponent. Endangered Wildlife Trust,South Africa. 8 pp.
*____, and J. A. Ledger. 1999. Birds andutility structures: developments in SouthAfrica. Pages 205–230 in M. Ferrer and G. F. E. Janss (eds.), Birds and power lines:collision, electrocution and breeding.Madrid: Quercus.
*Ventana Wildlife Society. 2009. Evaluatingdiverter effectiveness in reducing avian collisions with distribution lines at San Luis National Wildlife Refuge complex,Merced County, California. California Energy Commission, PIER Energy-Related Environmental Research. CEC-500-2009-078.
Verhiejen, F. J. 1958. The mechanisms ofthe trapping effect of artificial light sourcesupon animals. Arch. Neer. Zool.13:1–107.
Virginia Joint Commission on Technologyand Science. Undated. Dominion estimatedtransmission costs: overhead vs. undergroundcost comparison 5 mile, 230 kV single cir-cuit line example 1035 MVA capacity initialcost analysis. Richmond, VA. 9 pp. http://jcots.state.va.us/pdf/CostAnalysis.pdf
Viverette, C. B., S. Struve, L. J. Goodrich,and K. L. Bildstein. 1996. Decreases inmigrating sharp-shinned hawks (Accipiterstriatus) at traditional raptor-migrationwatch sites in eastern North America. Auk 113:32–40
A134 | appendix a

SAM
PLE
*Walkinshaw, L. H. 1956. Sandhill craneskilled by flying into a power line. WilsonBull. 68:325–326.
Weir, R. D. 1976a. Annotated bibliographyof bird kills at man-made obstacles: a reviewof the state of the art and solutions. Can.Wildl. Serv., Ont. Reg., Ottawa. 85 pp.
____. 1976b. Bird kills at the Lennox Generating plant: spring and autumn 1976.Blue Bill 23:41–43.
West, H. J., and G. G. Stults. 1980. A birdflight theodolite tracking system. Divisionof Laboratories Report No. ERFE-80-23.Bonneville Power Administration, U.S.Dept. of Energy, Portland, OR. 17 pp.
*Western Area Power Administration(WAPA). 2011. Line marking study nearColeharbor, ND, 2006–2008: data andsummary [webpage]. www.wapa.gov
Western Systems Coordinating Council.December 1971. Environmental guidelines.
*Wheeler, R. H. 1966. Sandhill crane casualties in the blizzard of March 22,1966. Nebr. Bird Rev. 34:69–70.
Wiese, J. C. 1979. Study of the reproduc-tive biology of herons, egrets, and ibis nest-ing on Pea Patch Island, Delaware. Preparedfor Delmarva Power and Light Company, Wilmington, DE. 255 pp.
*Willard, D. E. 1978. The impact of transmission lines on birds (and vice versa).Pages 3–7 in M. L. Avery (ed.), Impacts oftransmission lines on birds in flight: proc. of a workshop. Oak Ridge Associated Universities, Oak Ridge, TN. 31 January–2 February, 1978. U.S. Fish and WildlifeService, Biological Services.
____, and B. J. Willard. 1978. The interac-tion between some human obstacles andbirds. Environ. Manage. 2:331–340.
*____, J. T. Harris, and M. J. Jaeger. 1977.The impact of a proposed 500-kV trans-mission route on waterfowl and other birds.A Report for the Public Utility Commis-sioner of the State of Oregon. Salem, OR.89 pp.
____, ____, and ____. 1978. The impactof transmission lines on birds (and viceversa). Pages 5–13 in M. L. Avery (ed.),Impacts of transmission lines on birds inflight. U.S. Fish and Wildlife Service, Washington, D.C.
*Willdan Associates. 1981. Impact of theAshe-Slatt 500-kV transmission line onbirds at Crow Butte Island: postconstructionstudy year 1. Prepared for Bonneville PowerAdministration, U.S. Dept. of Energy, Portland, OR. 110 pp.
*____. 1982. Impact of the Ashe-Slatt 500-kV transmission line on birds at CrowButte Island: postconstruction study finalreport. Prepared for Bonneville PowerAdministration, U.S. Dept. of Energy, Portland, OR. 155 pp.
Williams, T. 2000. Zapped! Audubon: January/February: 32–34.
Williams, T. C., J. Settel, P. O’Mahoney, andJ. M. Williams. 1972. An ornithologicalradar. American Birds 26:555–557.
____, ____, ____, and ____. 1984. Howto use marine radar for bird watching.American Birds 38:982–983.
Wilmore, S. B. 1974. Swans of the world.Taplinger Publishing, New York.
Literature Cited and Bibliography | 135

SAM
PLE
Wiltschko, R., T. Ritz, K. Stapput, P. Thalau,and W. Wiltschko. 2005. Two different typesof light-dependent responses to magneticfields in birds. Curr. Biol. 15:1518–1523.
Wiltschko, W., and R. Wiltschko. 1999. Theeffect of yellow and blue light on magneticcompass orientation in European robins(Erithacus rubecula). J. Comp. Physiol.184:295–299.
____, U. Munro, H. Ford, and R. Wiltschko.1993. Red light disrupts magnetic orientationof migratory birds. Nature 364:525–527.
Winkelman, J. E. 1992. De invloed van deSep-proefwindcentrale te Oosterbierum opvogels [The impact of the September trialwind power station at Oosterbierum onbirds]. 2. Nachtelijke aanvaringskansen.IBN-DLO, RIN-rapport 92/3.
*____. 1995. Bird/wind turbine investiga-tions in Europe. Pages 43-47 in Proc. of the National Avian-Wind Power PlanningMeeting. 20–21 July 1994. Lakewood, CO.
Wobeser, G., and A. G. Wobeser. 1992.Carcass disappearance and estimation ofmortality in a simulated die-off of smallbirds. J. Wildlife Dis. 28:548–554.
Wolfe, D. H., M. A. Patten, E. Shochat, C.L. Pruett, and S. K. Sherrod. 2007. Causesand patterns of mortality in lesser prairie-chickens Tympanuchus pallidicinctus and implications for management. Wildlife Biol.13:95–104.
*Yee, M. L. 2007. Evaluating and reducingavian collisions with distribution power linesat Cosumnes River Preserve. CaliforniaEnergy Commission, Public Interest EnergyResearch (PIER) Program and CaliforniaState University, Sacramento, CA.
*____. 2008. Testing the effectiveness of an avian flight diverter for reducing aviancollisions with distribution power lines inthe Sacramento Valley, CA. California Energy Commission, PIER Energy-RelatedEnvironmental Research Program. CEC-500-2007-122.
Zapata-Sánchez, J. A., M. Carrete, A. Gravilov, S. Sklyarenko, O. Ceballos, J. A.Donázar, and F. Hiraldo. 2003. Land usechanges and raptor conservation in steppehabitats of eastern Kazakhstan. Biol. Conserv. 111:71–77.
Zimmerman, A. L., B. E. Jamison, J. A.Dechant, D. H. Johnson, C. M. Goldade, J.O. Church, and B. R. Euliss. 2002. Effectsof management practices on wetland birds:sora. Northern Prairie Wildlife ResearchCenter, Jamestown, ND. 31 pp.
A136 | appendix a

SAM
PLE
Designing Site-Specific Studies for Collision Monitoring | 137
Ba p p e n d i x b
Designing Site-Specific Studies for Collision Monitoring
With any study design for collision monitoring it is important that the resulting data can be compared to similarstudies (see Variability of Reported MortalityRates in Chapter 4 and Effectiveness of Designsin Chapter 6). The information in this
appendix will help you design site-specificstudy methods that produce useful andcomparable results. Table B.1 summarizesthe considerations and issues presented inthis appendix.
appendix b | Designing Site-Specific Studies for Collision Monitoring | 137
Considerations for Site-Specific Issues Related to Estimating Collision Monitoring Mortality Rates
Behavioral Monitoring
• Bird density• Evaluation criteria• Estimating bird flight height• Radar observation and detection• Metrics• Study segments
Mortality Monitoring
• Differences in sampling design• Questions to ask• Data to record• Remote sensing
Equations for Calculating Mortality Rate
• Accuracy• Variability in methods
Sampling Biases
• Crippling loss• Searcher efficiency• Scavenger removal• Habitat differences
TABLE B.1: Summary of considerations and issues for designing site-specific collisionmonitoring.

SAM
PLE
B138 | appendix b
BEHAVIORAL MONITORING SURVEYSThe most direct way to determine how colli-sions are occurring is to observe behavior asbirds are approaching, crossing, or collidingwith power lines. Behavioral monitoring isused to characterize the birds’ reaction tolines by giving each reaction a behavioralavoidance value. In line modification studies,behavioral monitoring can be used to measurethe effectiveness of line marking devices.
Bird DensityPast studies (e.g., Bevanger 1999; Janss 2000)have counted collisions per flyby (observedcollisions per number of birds flying by aline). With high bird density, counting colli-sions per flyby is feasible. But with low birddensity, counting flybys is not practicalbecause so few observations can be made,even over an extended period of time. Directobservation can be especially time consumingwith low bird density or intermittent highbird density. Observations may also berestricted by poor visibility due to weather ortime of day. In such cases, the most feasiblemethod may be to conduct mortality moni-toring to estimate collisions (see MortalityMonitoring Surveys on page 141). Bird colli-sions with power lines can also be detectedwith remote sensing devices (see Remote Sensingon page 142), although they do not yieldbehavioral and species data.
Evaluation CriteriaA study’s behavioral criteria may include thetype of reaction to lines, distance from theline when the reaction occurred, and heightabove the line when crossing. Because esti-mates are provided by different observers, all observers must be trained and given timeto practice before the study begins, and thesame observers should be used throughoutthe study when possible to minimize observerbias. Records of approach, crossing, anddeparture heights should be kept. If behav-ioral avoidance is observed, the reaction to
and distance from the line should be recorded.The following are possible reaction categoriesand definitions:
• No reaction—Birds maintain constant altitude and unaltered flight
• Swerve and over—Birds turn from course,flying up and over line
• Swerve and under—Birds turn fromcourse, flying down and under line
• Over and swerve—Birds flying over lineswerve immediately after crossing the lines
• Turn and leave—Birds turn and retreatfrom the line after approaching within 50meters (m) (164 feet [ft]) of the line
• Collision and fly—Birds in flight hit a linebut keep flying outside of the transectboundaries
• Collision and fall—Birds in flight hit a line and drop within the study transect (the specific line should be noted in thecomments section)
• Land on line—Birds land on line or pole
Estimating Bird Flight HeightBird flight altitude information should beestimated relative to the structure height andthe height of phase conductors, neutral wires,and shield wires. Height classes will varydepending on the type of power line (e.g.,conductor arrangement, voltage) and thespecies studied. Figure B.1 provides an exam-ple of altitude classes for transmission lines.Since power lines will vary in design, site-specific altitude criteria should be developed.
The manner of recording flight altitudeshould be modified according to line configu-ration and the species studied. If the wires arein the same horizontal plane, then the areaincluded in the study is above and below theline for a certain number of meters (feet). If the wires are in a vertical configuration,then the area observed is above and below themultiple planes including the shield wire anda distribution underbuild if present. If thestructure type is an H-frame, then the obser-
CONSIDERATIONSFOR SITE-SPECIFICCOLLISIONMONITORING

SAM
PLE
vational box might be different than if thetower is steel lattice or a V-shape supportedby guy wires. The size of the line structuremay warrant extending the observational areafarther from the poles (i.e., begin recording at30.5 m (100 ft) away from a distributionsingle pole, but 152.4 m (500 ft) from asteel lattice transmission tower) in order to account for reaction times related to thesize of the structure and the height andarrangement of the lines.
Bird flight height can be estimated andmeasured in various ways with varyingdegrees of expense, effort, accuracy, and efficiency. Visual categorization, rangefinders,and radar systems can all collect data on theflight height and each approach has its advan-tages and disadvantages (see Radar Observationand Detection on page 140). When choosingwhich techniques to use, the following mustbe considered: project goals, species identifi-cation and concentration, migration data,
Designing Site-Specific Studies for Collision Monitoring | 139
Below Phase Conductor (Class 1)
Between Upper and Lower Most Phase Conductor (Class 2)
Between Phase Conductor and Shield Wire (Class 3)
Shield Wire to 10 m (32.8 ft) (Class 4)
10 to 50 m (32.8 to 163.8 ft) Above Shield Wire (Class 5)
Greater than 50 m (163.8 ft) Above Shield Wire (Class 6)
FIGURE B.1: Classes used to describe birds’ approach, crossing,and departure altitudes in collision studies on transmission lines(after James and Haak 1979).
and project budget. For example, if the majorbird migration occurs in spring, data needs to be collected for a sufficient period in thespring to characterize bird movement andbehavior. If you need to estimate the overallimpacts of the mortality to the local birdpopulation, you will need an understanding ofthat population in the area surrounding thestudy site throughout its seasonal fluctuationsincluding breeding, migration, and wintering.
One of the simplest field techniques forestimating flight height is to visually catego-rize height, such as above the lines, below thelines, etc. This approach only requires a knownreference point in the field. Survey flags andreaction zones can help observers estimatethe distance from the line and the section ofthe line as they record behavioral avoidance.For example, survey flags can be placed 5 m(16.4 ft), 5 to 25 m (16.4 to 82 ft), and>25 m (>82 ft) from the line (Brown andDrewien 1995). This technique works well interrestrial situations and eliminates the needfor a rangefinder. In another approach, areaction zone of 200 m (656.2 ft) on eachside of a 500-kV transmission line has beenused (Willdan Associates 1981, 1982).
This approach can be expanded by usingvisual estimation in conjunction with elec-tronic rangefinders, which are used to mea-sure the height of reference structures in thefield. Electronic rangefinders come equippedwith a laser and built in clinometers, whichmeasure straight line distance to the bird andthe angle of the measurement above horizon-tal. The measurements can be used to esti-mate an object’s (bird’s) height above ground.Height is calculated as:
SIN([Angle1])*[Distance to Object] = Flight height
1 if calculating in Excel use the radian function toconvert degree units into radians so the number will be compatible with the SIN function

SAM
PLE
Once the heights are known for several tall objects in the area, bird flight heights canbe estimated. This approach can be furtherexpanded by directly measuring the flightheights of birds using an electronic range-finder. This approach can be effective if birdsare in close range and are big and reflectiveenough to bounce a signal back to the range-finder. Other factors that affect successfulmeasuring of flight height using therangefinder include:
• Distance of the observer to the bird(shorter distances reflect better signals)
• Size of the bird (larger birds reflect thelaser better than smaller birds)
• Reflectivity of the bird (white birds reflectthe signal better than dark birds; Kliment-jew et al. 2010; M. Schriner, pers. comm.)
A limitation of measuring bird flightheight directly is that it is difficult to recordmultiple heights simultaneously. In areaswhere bird passage rates are high, multipleobservers, digital tape recorders, or videocameras may be needed to adequately capturemultiple measurements of flight height.
Radar Observation and DetectionAlthough the use of radar in power line studies is not common, it is a useful tool forcharacterizing bird movements. Two types ofradar, Nexrad and portable radar, have beenused in bird studies to collect data on noctur-nal movements and broad front migrations,which may be missed by field observations.Nexrad radar (Next-Generation Radar) is anetwork of Doppler weather radars operatedby the National Weather Service. Nexradradar has the advantage of being able to collect data on the density of targets withinan area and examine the temporal variation in target activity over many years. Portableradars are smaller and include systems such asmodified marine, pencil beam tracking, andother specialized radar systems. Portable
radar collects data on flight height, direction,and speed of targets and can distinguish dif-ferent size classes of targets which providessome level of certainty as to what is beingdetected (e.g., songbirds versus herons).
Despite the unique information that radarcan collect, it does have limitations. Nexradcannot distinguish between birds, bats, andinsects, and the height of airspace that is sur-veyed is dependent on the distance from theNexrad station. Portable radar detects targets(e.g., birds, bats, insects, weather, etc.) inflight and can classify them by size and speedand movement patterns (R. Larkin, pers.comm.). Software filters can help refine targetspecificity by removing weather images, leav-ing images of desired targets. While sizeclasses can be used to indicate species groupsto some extent, distinguishing betweenspecies groups that are of similar size is notpossible. Ground clutter, visual obstructions,and inclement weather can also limit the ability of radar to detect objects at a distance.The longer the distance between radar andsubject, the more likely ground clutter willinterfere. Finally, the cost of radar systemscan be high, which limits their applicability.
MetricsMetrics used in behavioral observations of collisions are generally expressed as the number of observed collisions per number ofbirds flying by a line (flybys), often expressedas a percentage. For example, Meyer (1978,cited in Bevanger 1998) observed the numberof collisions to be 0.003% to 0.07% of fly-bys for waders and gulls. Janss and Ferrer(2000) reported collisions per flyby as 3.93× 10⁻⁵ for the common crane (Grus grus) and6.34 × 10-3 for the great bustard (Otis tarda).
Study SegmentsIt is essential that study segments representthe line as a whole (unless there is a need toidentify high risk areas), that test and controlsegments be of comparable length, and that
B140 | appendix b

SAM
PLE
they have as much environmental homogene-ity as possible. Variability will be reduced byincluding an adequate number of test andcontrol segments. Contiguous segments areconvenient but not essential. Koops and deJong (1982) marked alternating spans, andBrown and Drewien (1995) marked alternate0.8-kilometer (km) (0.5-mile [mi]) segmentsof eight different test lines. The length ofstudy segments may vary according to birddensity, seasonal use, habitat type, size of thepower line, etc. However, in line modificationstudies it is important that test and controlsegments are separated sufficiently so controlsegments are not affected by the presence ofmarkers on the test segments. Thus, whenevaluating markers on small distribution linesthat have short spans (pole to pole distance),each test and control segment should consistof several spans. Barrientos et al. (2011) provides recommendations on reasons forstandardizing segment length.
MORTALITY MONITORING SURVEYS The most common way to determine if collisions have occurred is to survey thepower line right-or-way (ROW) for dead and injured birds and attempt to identify the cause of injury or death. Mortalitymonitoring surveys provide a more accurateassessment of collision mortality.
Differences in Sampling DesignThere are numerous monitoring approachesand each has different strengths and weak-nesses (e.g., APLIC 1994; Bevanger 1999;Hunting 2002). Mortality surveys conductedthrough 2011 generally differ in samplingdesign including:
• Segment selection• Lengths of lines sampled• Width of the area sampled • Duration and intensity of the study• Seasonal sampling
Designing Site-Specific Studies for Collision Monitoring | 141
The fact that all these considerations arenot routinely included leads to difficulty incomparing studies (Hunting 2002; Barrientoset al. 2011). Typically the sampling biases(i.e., searcher efficiency, crippling loss, scav-enger removal, and habitat differences; seeSampling Biases on page 143), which need tobe accounted for to correct the estimated mor-tality rates, are not implemented systematicallyor in a manner that is consistent with theexpected monitoring program survey designs.In addition, because of sampling uncertainty, avariety of statistical methods are applied toestimate the actual number of birds affectedbased on the number of birds found.
Site-specific study designs and correctionfactors need to be developed for mortalitymonitoring to account for these variables.Bevanger (1999) concluded that, given thesite-specific factors and local conditions (e.g.,biological, environmental, and engineering)that influence collision and mortality estima-tion, it is not expedient to develop a set ofstandard study design methods or use generalcorrection factors. Barrientos et al. (2011)presented three recommendations for conduct-ing line marking device effectiveness studiesthat also apply to mortality monitoring:
1. Collecting data on carcass counts andflight frequency for the same length oftime and at the same time of the year atmarked and unmarked wire segments
2. Studying marked (test segment) andunmarked (control segment) lines in areaswith similar vegetation and topography,with similar lengths of time spent search-ing for carcasses, and with transects ofequal lengths and widths
3. Standardizing the timing of carcasssearches and search area widths
For search area width, searches shouldcover the width of ROW with reference tothe height of the power line (James and Haak1979; Raevel and Tombal 1991) and thezone in which carcasses are expected to fall.

SAM
PLE
Questions to Ask The study design phase should focus on thequestions being asked, the data needed toanswer these questions, and the appropriatemethods, including duration and intensity, toprovide those data. A series of hierarchicalquestions that need to be considered mayinclude the following:
1. Are collision injuries and/or mortalitiesoccurring?
2. What species of birds are involved? Arethey protected species?
3. Where along the power line are the birdscolliding?
4. When are they being killed?5. Under what circumstances (e.g., weather,
time of day) are they being killed? 6. What biological, environmental, and
engineering factors appear to be important in influencing collisions?
7. What line modification actions can betaken to reduce these collisions?
Questions 1 and 2 are the simplest toanswer if the carcasses are detected. Many of the past studies have focused on answeringthe first two questions and sometimes 3 and4. More recent studies have attempted toaddress questions 5, 6, and 7. There is a ten-dency to focus on sampling worst-case situa-tions or locations where high numbers of col-lisions have occurred as opposed to samplingrepresentative locations along a given powerline to understand the overall collision risk.Although results from worst-case situationsmay skew general mortality risk, determiningthis information is still important because itprovides data needed for reducing risk.
B142 | appendix b
Data to RecordFor each bird found, the following informationshould be gathered when possible:
• Location of the carcass in proximity to thepower line (e.g., GPS position)
• Species• Sex • Age: adult or juvenile • Date or approximate time of death • Physical injuries and conditions (e.g.,
broken bones, lacerations, abrasions, blood, discolorations, gunshot wounds,decomposition, feather spots, feeding by scavengers)
• Probable cause of death • Necropsy19
Environmental conditions should also berecorded, especially visibility, wind speed anddirection, weather events, avian habitats, aswell as the type and abundance of birdspecies in the study area.
Remote Sensing An alternative to directly observing bird collisions is to use a Bird Strike Indicator(BSI). BSI is a vibration sensing and recordingtool that is fitted to a power line to detectcollisions with that line. It is especially usefulfor monitoring collisions in low-light or no-light conditions. However, BSI does notidentify what species struck the line; mortali-ty monitoring or field observations would berequired to determine this. See Chapter 5 fora discussion on the BSI.
19 In the United States, the possession of any protected migratory bird will require a Special Purpose or Scientific Collecting permit (see Chapter 3), unless otherwise instructed by an agent of U.S. Fish and Wildlife Service Office of Law Enforcement.

SAM
PLE
Designing Site-Specific Studies for Collision Monitoring | 143
EQUATIONS FOR CALCULATINGMORTALITY RATEAccuracyFew mathematical equations for estimatingmortality have been tested for accuracy usingexperimentally designed, rigorous field stud-ies (Bevanger 1999). Furthermore, there areno agreed upon methods that link the equa-tion to the type of field trials necessary forsite-specific calculation of mortality, nor aremethods for incorporating uncertainty oftenprovided.
These issues are not unique to power lines.Similar uncertainty is found in calculatingactual mortality from estimates of bird car-casses collected from wind turbine collisions,building window collisions, pesticide applica-tion, and avian diseases. Although the causesof mortality are different, the ability to findbird carcasses in the field is affected by thesame sampling biases (i.e., crippling loss,searcher efficiency, scavenger removal, andhabitat differences; see discussion on thispage). Huso (2011) evaluated the accuracyand precision of mortality estimators forpower lines and other structures and pro-posed one that improves reliability. This limi-tation in calculating mortality rates is alsopresently being investigated by the windindustry, U.S. Fish and Wildlife Service, U.S.Geological Survey, and others. The CaliforniaEnergy Commission (CEC) is funding a con-trolled field study through the CaliforniaWind Energy Association strictly looking atthe mathematical relationships of scavengerremoval and searcher efficiency as they relateto calculating actual mortality rates. Thestudy report should be available in 2012 (J.Newman, pers. comm.).
Variability in MethodsWhile designing a study, the most recent lit-erature on mortality rate calculations shouldbe reviewed before selecting a particularmethod. Bevanger (1999) and Hunting
(2002) provide an excellent review of collisionmortality for power lines. A mortality rate ofthe number of carcasses/distance of line sur-veyed/time period is the most commonlyused metric found in the literature. However,the search area (i.e., estimated annual mortal-ity/hectare/kilometer [/acre/mile]) alsoneeds to be included (Hunting 2002).
Finally, as mentioned earlier, there is greatvariability in monitoring methods, which pre-vents useful comparison of mortality rates andeffectiveness of markers to reduce collisions.
SAMPLING BIASESWhen conducting mortality monitoring, themortality rate calculation must take a numberof sampling biases into account, includingthe following:
• Crippling loss• Searcher efficiency• Scavenger removal• Habitat differences
Crippling Loss BiasThe crippling loss bias occurs when birdsstrike a line and fall outside the search area or when injured birds move out of the searcharea and are not observed by searchers.Bevanger (1999) cites several studies thatfound 22% (Hiltunen 1953) to 50%(Renssen et al. 1975) to 74% (Beaulaurier1981) of birds fatally injured in power linecollisions move far enough away from thepower line before dying that they are notfound during carcass searches.
In Beaulaurier’s (1981) study, cripplingloss bias was defined as the percent ofobserved collisions in which birds continuedflying out of the study area after the collision.Because she did not observe a collision duringher study, she used an estimate of 74%—theaverage measure of crippling loss bias calcu-lated by Meyer (1978) as 75% and James andHaak (1980) as 73%. These authors assume
ISSUES RELATEDTO ESTIMATINGMORTALITYRATES

SAM
PLE
a worst-case estimate with all injured birdsdying from their injuries. The estimates werealso based on collisions with shield wires.
Because great time and effort are involvedin monitoring flights and recording collisions,crippling loss bias estimates are extremely difficult to obtain and they are the least likelyto be calculated in a study. Application ofestimates from other studies is inappropriate,and, in fact, very misleading. Once again, the size of the bird may make a significantdifference because of flight dynamics. Acrane or swan that just tips a line is more likely to tumble to the ground and sustainfatal injuries than is a smaller, lighter bird that may be able to recover its flight mid-airand die later at some distance from the line (W. Brown, pers. comm.). Consequently,smaller birds might have a higher cripplingloss bias than larger birds. This may need tobe examined in future research.
Searcher Efficiency BiasDuring carcass searches, some of the carcasseswill be missed depending on several variables(e.g., number of observers, their skill andexperience, and how the surveys are conduct-ed). This is called searcher efficiency bias orsearcher bias. Searcher bias is also influencedby vegetation type, height, and density, searchpattern, presence of waterbodies, bird size,and other factors (Bevanger 1999; Ericksonet al. 2005). Searcher bias in carcass detectionmust be carefully controlled (Bevanger 1999;Erickson et al. 2005). Searcher efficiencybiases are specific to the site and the season.Bias needs to be determined while the mor-tality monitoring is taking place and notextrapolated from or to other locations, sea-sons, or studies (Bevanger 1999; Barrientos et al. 2011). APLIC (1994) and Bevanger(1999) give examples of the calculations fordetermining searcher bias. CEC is also study-ing searcher efficiency factors for calculatingwind turbine-caused bird mortality.
B144 | appendix b
The use of trained dogs in mortality mon-itoring studies can increase carcass recovery,particularly of small carcasses in dense vegeta-tion (Homan et al. 2001; Anderson 1978;Rusz et al. 1986; Bevanger 1995, cited inBevanger 1999). However, the availability oftrained dogs is limited and their efficiencyvaries with individuals, seasons, weather conditions, vegetation structure, breed, length of use, and level of fatigue.
Scavenger Removal BiasScavengers may remove carcasses before asearch is completed, which results in under-estimating mortality. Scavenging rates arevery important to include in mortality rateestimation (Bevanger 1999; Rivera-Milan etal. 2004; Erickson et al. 2005; Gehring etal. 2009). Bevanger (1999) gives an exampleof the calculation. Scavenging rate varies byhabitat, season, time of day, scavenger type,bird size, bird species, etc. (Bevanger 1999;Erickson et al. 2005). Evidence of seasonalvariation in scavenging rates in UnitedKingdom farmland is presented by Prosseret al. (2008).
In some cases scavenging can be a quickprocess, occurring in a matter of minutesdepending on the scavenger species as well as the bird species involved. A review of thescavenging studies from various mortalitymonitoring studies (including power lines,communication towers, wind turbines, pesti-cide application, and bird disease) indicatesthat the majority of scavenging takes placewithin a short period of time after death formany species. For example, preliminary resultsof a scavenging removal study at one commu-nication tower location on the Alaska Penin-sula suggest that carcass removal from scav-enging is as high as 50% removal per day (P.Flint, USGS pers. comm.; E. Lance, USFWSpers. comm.; USFWS 2007 unpubl. Data,cited in Manville 2007a); scavenged carcassesincluded eiders, waterfowl, and shorebirds,

SAM
PLE
among others. This degree of scavenging isconsistent with what Herbert Stoddard(Crawford and Engstrom 2001) found in a29-year study of a communication tower inFlorida where about 92% of carcasses wereremoved by scavengers within 24 hours. Peter-son et al. (2001) reported that in BritishColumbia, Canada, 52/54 poisoned water-fowl carcasses were discovered by avian scav-engers within 72 hours. Kostecke et al. (2001)reported carcasses scavenged mostly by skunkswith 66% of carcasses scavenged within fivedays in a South Dakota study. Erickson et al.(2005) cites a number of case studies withaverage carcass persistence times ranging fromless than one to 28 days. In other cases it canbe longer (Brown and Drewien 1995). Theyfound that crane carcasses sometimes remainedfor as much as a year after death and that nocrane carcasses were removed by scavengersduring the removal studies. Likewise, largebird carcasses (e.g., raptors, pelicans) maypersist for extended periods (several monthsto 32 months) without scavenger removal (S. Liguori, pers. comm.). Raevel and Tombal(1991) and others have noted that removalbias varies with the size of the birds (i.e.,smaller birds usually disappear more quicklyand more frequently). Consequently, theeffects of size and perhaps species must beincluded in calculations of removal bias for a
study. In controlled studies where a knownnumber of carcasses were placed in the fieldshowed that many carcasses were removedwithin a short period time, e.g. days; however,even small birds can persist in the field forlong periods of time as they become desic-cated and less preferred for scavenging.
Scavenger removal bias is site-specific andneeds to be determined when the mortalitymonitoring is taking place rather than extrap-olating it from other locations, seasons, orstudies (Bevanger 1999). Scavengers canquickly learn where carcasses or injured birdsare readily available, suggesting the need toupdate these bias correction factors through-out the study, as needed, to account for learning behavior.
Habitat Differences BiasHabitat bias is used to account for unsearch-able areas. Some portions of a study area may not be searchable because of water, bogs,dense vegetation, or topography. Researchersshould not extrapolate beyond the area sampled because the rate of collision mayvary with habitat type. Habitat bias should be used only in situations where unsearchablehabitat is finely interspersed with searchablehabitat and where researchers can demonstratethat the numbers of birds found in searchableand unsearchable habitats are similar.
Designing Site-Specific Studies for Collision Monitoring | 145

SAM
PLE
THIS PAGE INTENTIONALLY LEFT BLANK
SAM
PLE
Appendix A | Literature Cited and Bibliography | 147
Ca p p e n d i x c
Glossary
appendix c | Glossary | 147
adultA bird that has acquired its final plumage.
aspect ratioAspect ratio is the wing breadth dividedby wing length. A low aspect ratio generallycorrelates with relatively thin wings andhigh aspect ratio with relatively wide wings.
avian-safeA power pole configuration designed tominimize avian electrocution risk.
circuit (multiple)A configuration that supports more thanone circuit.
circuit (single)A conductor or system of conductorsthrough which an electric current isintended to flow. The circuit is energizedat a specified voltage.
conductivityThe capacity to transmit electrical energy.
conductorThe material (usually copper or aluminum)—usually in the form of awire, cable, or bus bar—suitable for carrying an electric current (AC, DC, and shield); a material that offers littleresistance to the flow of electricity.
conductor gallopAlso known as galloping. The high-amplitude, low-frequency oscillation ofoverhead power lines often due to wind.The movement of the wires occurs mostcommonly in the vertical plane, althoughhorizontal or rotational motion is alsopossible. Galloping can cause power linesto slap together, which results in outagesand damage to the lines and equipment.Icing conditions, wind velocity, and conductor tension are some of the factors that interact to cause galloping.
configurationThe arrangement of parts or equipment.A distribution configuration wouldinclude the necessary arrangement ofcrossarms, braces, insulators, etc. to support one or more electrical circuits.

SAM
PLE
conspecificMembers of the same species.
corona A process by which current in a conduc-tor with a high potential ionizes the airsurrounding it to create a plasma. Theions generated eventually pass charge tonearby areas of lower potential or recombine to form neutral gas molecules.
corridorThe broad area between the origin andtermination of a new line, within whichthe potential routes lie. The area in which a new line’s routing alternatives are proposed and evaluated before thefinal route is determined.
corvidBirds belonging to the family Corvidae;includes crows, ravens, magpies, and jays.
crossarmA horizontal supporting member used tosupport electrical conductors and equip-ment for the purpose of distributingelectrical energy. Usually made of wood,fiberglass, or steel, and manufactured invarious lengths.
currentA movement or flow of electricity passing through a conductor. Current is measured in amperes.
distribution lineLower-voltage wires, energized at voltagesfrom 2.4 kV to 60 kV, and used to distribute electricity to residential, industrial, and commercial customers,i.e., end users.
facilityAs used in this manual, this term refersto all the equipment, wires, structures(e.g., poles and towers), etc., that areinvolved in carrying electricity.
faultA power disturbance that interrupts thequality of electrical supply. A fault canhave a variety of causes including fires,ice storms, lightning, animal collisions/electrocutions, or equipment failures.Also known as arc, short circuit, or flash.
flappersSuspended collision reduction devicesthat clamp to and hang from a line andswing and spin in the wind. There arevariations on this theme that have littleor no motion, which are used when highwinds cause moving parts to wear rapidly.
flaringA sudden panic avoidance reaction topower lines, in which birds ascend almostvertically with rapid wing beats or foldtheir wings and fall down and backwardsaway from the obstacle.
fledglingA bird that has recently learned to flyand left the nest, but may still be dependent on its parents for food.
groundMaterial that conducts electricity andmakes an electrical connection with theearth.
ground rodNormally a copper-clad steel rod or gal-vanized steel rod, driven into the groundso that the necessary parts of a facilitycan be physically connected to groundpotential.
C148 | appendix c

SAM
PLE
grounding conductorA conductor used to ground the shieldand neutral wires. Grounding conductorsmay be copper-clad, solid copper, orstranded galvanized wires and are attachedto the structure. Sometimes also called a down wire. When steel structures are used the structure becomes thegrounding conductor.
guySecures the upright position of a poleand offsets physical loads imposed byconductors, wind, ice, etc. Guys are normally attached to anchors that aresecurely placed in the ground.
immatureAll plumages other than adult.
juvenile(Plumage)—first plumage of a bird.(Bird)—a bird in its first year of life.
Kilovolt (kV)1,000 volts
latticeworkThe combination of steel members connected together to make completestructures, such as transmission towers or substation structures.
lightning arresterAn electrical protection device used todivert the energy of lightning strikes tothe earth.
lightning daysLightning or thunderstorm days. A daywith one or more lightning storms wouldbe classified as a lightning day.
maneuvering Any change in flight behavior, height, ordirection, and in this context, in responseto obstacles such as power lines.
necropsy Postmortem examination of wildlifeoften used to determine cause of death.
nestlingA young bird that has not yet reachedsufficient size and maturity to leave thenest.
neutral wire A non-energized conductor that carriesthe primary current back to its substation.The neutral is at ground potential (i.e., it grounds a distribution power line system).
outageEvent that occurs when the energy source is cut off from the load.
overhead ground wireSee shield wire.
phase conductorAn energized power line that carriesalternating current electricity.
phase-to-groundThe contact of an energized conductorto ground potential. A bird can cause aphase-to-ground fault when fleshy partsof its body touch an energized phase andground simultaneously.
phase-to-phaseThe contact of two energized conduc-tors. Birds can cause a phase-to-phasefault when the fleshy part of their wingsor other body parts contact two ener-gized conductors of different phases atthe same time.
Glossary | 149

SAM
PLE
pole1. A vertical structure used to support
electrical conductors and equipmentfor the purpose of transporting electrical energy. It can be made ofwood, fiberglass, concrete, or steel and manufactured in various heights.
2. DC transmission lines use bundledconductors also known as poles,which refers to the positively and negatively charged conductors in aDC design.
power generation facilityThe location where electricity is generated,which may be a power plant, station,wind turbines, solar farm, or hydro-electric dam, among others.
power lineA line made of conductive material thattransmits electricity from its source to itspoint of use.
rampingA contemplated maneuver frequentlyseen in wading birds approaching a powerline at or below conductor levels. Duringtheir approach waders swerve and con-tinue parallel to the power line until sufficient altitude is reached for crossing.Ramping is most frequently observed on clear days with moderate winds andapparently allows birds to assess andnegotiate the power line before crossing.
raptorBird of prey. Raptors are members of theorders Falconiformes (diurnal raptors)and Strigiformes (owls). Raptors have asharp hooked bill and sharp talons usedfor killing and eating prey.
rebuildThe act of upgrading an existing line byreplacing its wires and/or structures.
reliabilityThe percentage of time a line is delivering uninterrupted electricity.
rerouteThe act of removing an existing linefrom the original right-of-way andrebuilding it along another route that will avoid the interactions encountered in the original route.
retrofitThe modification of an existing electricalpower line structure to make it avian-safe.
right-of-way (ROW)The strip of land that has been acquiredby an agreement between two or moreparties for the purpose of constructingand maintaining a utility easement. Thewidth of right-of-way required by eachvoltage level is generally dictated by statestatutes and the National Electrical SafetyCode (NESC) and is a function of span length, the conductor height aboveground, and the conductor’s low point of sag.
routeThe pathway on which a right-of-waywill be cleared and the new line constructed.
sailingCrossing of conductors and shield wireswith wings set. Most frequently seen in birds flying through or close to the conductor-shield wire complex.
C150 | appendix c

SAM
PLE
separationThe physical distance between energizedconductors or between energized andnon-energized conductors.
shield wire Also called static wire or overheadground wire. A conductor that provides a path to ground for static electricity.Lightning is its most common source ofstatic electricity. Since lightning followspathways to ground, the shield wire protects phase (AC) and pole (DC) conductors from lightning strikes.
shortstoppingWintering in more northerly latitudesthan has been historic for the species.
sitingThe process of identifying the points inthe electrical system that need new linesof connection to deliver electricity togrowing or new demand centers.
spanThe pole-to-pole or tower-to-tower distance of a power line.
static wireSee shield wire.
structureA pole or lattice assembly that supportselectrical conductors and equipment forthe transmission or distribution of electricity.
subadultStage of a bird between juvenile andadult.
substationA transitional point (where voltage isincreased or decreased) in transmissionand distribution systems.
transmission linePower line that delivers electricity fromits source over long distances to sub-stations where the voltage is reduced fordistribution. Transmission voltages rangefrom 60 to 765 kV in the United States.
trust resourceWildlife held in the public trust andmanaged and protected by federal andstate agencies. These trust agencies aredesignated by statute and regulations asresponsible for upholding the protection,conservation, and management of theseresources.
underbuildRefers to a circuit that is placed on thesame pole but underneath another circuitof a higher voltage. The lower circuit isoften referred to as the underbuilt circuit.
voltThe measure of electrical potential.
voltageElectromotive force can be expressed in volts. Power lines are rated and categorized by voltage.
Glossary | 151

SAM
PLE
voltage ratingThe voltage rating of a transmission linedepends on the utility’s existing trans-mission system voltages, interconnectionswith other utilities, potential deliverypoints, and the amount of power thatmust be transmitted to meet loadrequirements. As voltages increase, theamount of power that can be transmittedincreases. Various line-design parameterssuch as conductor size and configuration,spacing, and the number of conductorsper phase (bundling) allow for increasedtransmission capability. Transmissionvoltages for carrying energy long distances are generally in the 115- to 765-kV range in North America.
wing loadingWing loading is a bird’s mass divided byits wing surface area. High wing loadingdescribes a bird that is heavy relative toits wing area. Low wing loading describesa bird that is light relative to its wing area.
C152 | appendix c
SAM
PLE
Appendix A | Literature Cited and Bibliography | 153
Da p p e n d i x d
Acronyms
appendix d | Acronyms | 153
AC Alternating CurrentACP Advanced Conservation PracticeAPLIC Avian Power Line Interaction
CommitteeAPP Avian Protection PlanAWBP Aransas-Wood Buffalo
Population (whooping cranes)BAMS Bird Activity Monitoring SystemBFD Bird-FlightTM DiverterBGEPA Bald and Golden Eagle
Protection Act (United States)BSI Bird Strike IndicatorCAP Citizens Advisory PanelCEC California Energy Commissioncm centimeterCFR Code of Federal Regulations
(United States)COSEWIC Committee on the Status of
Endangered Wildlife in CanadaCWS Canadian Wildlife ServiceDC Direct CurrentEEI Edison Electric InstituteEPRI Electric Power Research InstituteESA Endangered Species Act
(United States)FAA Federal Aviation Administrationft feet
GIS Geographic Information SystemsGPS Global Positioning SystemHCP Habitat Conservation PlanHVAC High Voltage Alternating CurrentHVDC High Voltage Direct Currentin inchITP Incidental Take Permitkm kilometerkV kilovoltm metermi mileMBCA Migratory Birds Convention Act
(Canada)MBTA Migratory Bird Treaty Act
(United States)MOU Memorandum of Understanding NESC National Electrical Safety CodeNMFS National Marine Fisheries
Service (United States) NRECA National Rural Electric
Cooperative AssociationPVC Polyvinyl ChlorideROW Right-of-Way (singular),
Rights-of-Way (plural)SARA Species at Risk Act (Canada)SFD Swan-FlightTM DiverterSVD Spiral Vibration Damper

SAM
PLE
USEPA U.S. Environmental ProtectionAgency
USFWS U.S. Fish and Wildlife Service
USGS U.S. Geological SurveyUV UltravioletV Volt
D154 | appendix d

SAM
PLE
Appendix A | Literature Cited and Bibliography | 155
Ea p p e n d i x e
Resources
appendix e | Resources | 155
BIRD IDENTIFICATION AND NATURAL HISTORY
All About BirdsCornell Lab of OrnithologyIncludes bird identification information and bird songs.www.allaboutbirds.org/Page.aspx?pid=1189
Birds of North America Cornell Lab of OrnithologyComprehensive reference covering the life histories of North America’s breeding birds.http://bna.birds.cornell.edu/bna
Tools for Learning About Birds USGS Patuxent Wildlife Research Center Includes bird pictures and songs.www.mbr-pwrc.usgs.gov/bbs/ident.html
Bird Identification Pages Idaho Museum of Natural History Includes a visual key with silhouettes.http://imnh.isu.edu/digitalatlas/bio/birds/main/birdid.htm
Florida Bird Sounds Florida Museum of Natural History www.flmnh.ufl.edu/birds/sounds.htm
BIRD DATABASES AND CONSERVATIONINFORMATION
Migratory Bird Program USFWS Division of Migratory BirdsResources and regulations for the conserva-tion and management of migratory birds.www.fws.gov/migratorybirds
Migratory Bird Treaty Act (MBTA)USFWS Division of Migratory Birdswww.fws.gov/laws/lawsdigest/migtrea.html
Bald and Golden Eagle Protection Act(BGEPA)USFWS Division of Migratory Birdswww.fws.gov/laws/lawsdigest/baldegl.html
Endangered Species Act of 1973 (ESA)USFWS Division of Migratory Birdswww.fws.gov/laws/lawsdigest/esact.html
Endangered Species Consultation Handbook (1998)USFWS and NMFSProcedures for conducting consultation andconference activities under Section 7 of theEndangered Species Act.www.fws.gov/midwest/endangered/section7/index.html

SAM
PLE
North American Waterfowl Management PlanUSFWS Division of Bird Habitat ConservationIncludes waterfowl status reports.www.fws.gov/birdhabitat/NAWMP/index.shtm
Bird Conservation Initiatives U.S. Environmental Protection Agency Portal to major United States bird conservation plans and organizations.www.epa.gov/owow/birds/bird.html
Conservation Plans, Databases, Strategies,and AssessmentsPartners in Flight—U.S.www.partnersinflight.org
North American Landbird ConservationPlan (2004) Partners in Flightwww.pwrc.usgs.gov/pif/cont_plan
U.S. Shorebird Conservation Plan (2001)USFWSwww.fws.gov/shorebirdplan
North American Waterbird ConservationPlan (2002)Waterbird Conservation for the Americaswww.pwrc.usgs.gov/nacwcp/nawcp.html
Migratory Birds (Canada)Environment CanadaConservation, monitoring and reporting, andregulations for Canadian migratory birds.www.ec.gc.ca/nature/default.asp?lang=En&n=FDF836EF-1
Migratory Birds Convention Act and Regulations (Canada)Environment CanadaPolices, regulations, and list of birds protected in Canada under the MBCA.www.ec.gc.ca/nature/default.asp?lang=En&n=7CEBB77D-1
Species at Risk Public Registry (Canada)Government of CanadaInformation and regulations for at-riskspecies in Canada.www.sararegistry.gc.ca/default_e.cfm
Committee on the Status of EndangeredWildlife in CanadaCommittee of experts that assesses wildlifespecies in danger of disappearing.www.cosewic.gc.ca/eng/sct5/index_e.cfm
North American Bird Conservation Initiative Bird Studies CanadaDescribes and maps the North American bird conservation regions.www.bsc-eoc.org/nabci.html
Christmas Bird Counts National Audubon SocietyAnnual “snapshot” of North American birdpopulations over many decades. Because ofissues with detection and database limitations,this database should only be used for indica-tions of species presence and season of use.http://birds.audubon.org/christmas-bird-count
eBirdAudubon and Cornell Lab of OrnithologyInternational database of bird observationswith graphs and range maps. Because ofissues with detection and database limitations,this database should only be used for indications of species presence and season of use.http://ebird.org/content/ebird
Avian Knowledge Network (AKN)Downloadable version of the eBird referencedataset for the Western Hemisphere.www.avianknowledge.net/content
E156 | appendix e

SAM
PLE
National Biological Information Infrastructure: Bird ConservationUSGS Biological Informatics ProgramPortal to maps, data, and bird conservationprocedures for conservation of bird popu-lations and their habitats in North America.www.nbii.gov/portal/server.pt/community/bird_conservation/460
Ornithological Information System(ORNIS)National Science Foundation Data from collections of a network of museum and academic partners.www.ornisnet.org
North American Breeding Bird Survey U.S. Geological SurveyData since 1966 on the status and trends ofNorth American bird populations. Because ofissues with detection and database limitations,this database should only be used for indica-tions of species presence and season of use.www.pwrc.usgs.gov/BBS
Landbird Population Estimates Database Partners in Flight/Rocky Mountain Bird ObservatoryBased on the Breeding Bird Survey data of the 1990s.www.rmbo.org/pif_db/laped/default.aspx
Raptor Information System U.S. Geological Survey Keyword catalog of over 32,000 referenceson the biology and management of raptors.http://ris.wr.usgs.gov
BIRD/ENERGY PROGRAMS AND AVIANPROTECTION PLANNING
Suggested Practices for Avian Protection onPower Lines: The State of the Art in 2006 Avian Power Line Interaction Committeewww.aplic.org/documents.php
Avian Protection Plan Guidelines 2005Avian Power Line Interaction Committee andUSFWSwww.aplic.org/uploads/files/2634/APPguidelines_final-draft_Aprl2005.pdf
Short Courses and Workshops on Avian-Power Line InteractionsAvian Power Line Interaction Committeewww.aplic.org (see Upcoming Events)
California Energy Commissionwww.energy.ca.gov/index.html
On-Line Annotated Bibliography of AvianInteractions with Utility StructuresCalifornia Energy Commissionwww.energy.ca.gov/research/environmental/avian_bibliography
Right-of-Way Siting, Vegetation Management, and Avian Issues—Program 57Electric Power Research Institutehttp://portfolio.epri.com/ProgramTab.aspx?sId=ENV&rId=134&pId=5117
Conserving Birds and Their Habitats onDepartment of Defense Lands U.S. Department of Defense and Partners in FlightIncludes a variety of resources such as birdconservation maps and avian protection planning guidelines.www.dodpif.org
Materials on Bird-Power Line Interactionsfor Electric Utilities and their EmployeesNew Mexico Avian Protection Working Grouphttp://nmavianprotection.org//resources.html
Wildlife and Energy Programme Endangered Wildlife Trustwww.ewt.org.za/WHATWEDO/OurProgrammes/WildlifeEnergyProgramme.aspx
Resources | 157

SAM
PLE
HIGH VOLTAGE DIRECT CURRENT (HVDC)TRANSMISSION SYSTEMS
Technology Information, Resource Library,and Student/Teacher EducationClean Line Energy Partnerswww.cleanlineenergy.com
AVIAN HEALTH, MORTALITY, ANDCARCASS IDENTIFICATION
National Wildlife Health Center U.S. Geological Surveywww.nwhc.usgs.gov
Field Manual of Wildlife Diseases, GeneralField Procedures and Diseases of BirdsU.S. Geological Surveywww.nwhc.usgs.gov/publications/field_manual
Wildlife Health Bulletin #06-02: Wildbird mortality reportingU.S. Geological Surveywww.nwhc.usgs.gov/publications/wildlife_health_bulletins/WHB_06_02.jsp
Avian Necropsy Manual for Biologists in Remote RefugesU.S. Geological Surveyhttp://www.nwhc.usgs.gov/publications/necropsy_manuals/index.jsp
Causes of Mortality in Common LoonsU.S. Geological Surveywww.nwhc.usgs.gov/publications/documents/92JCF.CLE01.pdf
Field Guide to Raptor RemainsCalifornia Energy Commissionwww.energy.ca.gov/index.html
Wing and Tail Image Collection (Useful for Carcass Identification)University of Puget Soundwww.pugetsound.edu/academics/academic-resources/slater-museum/biodiversity-resources/birds/wing-image-collection
PUBLIC PARTICIPATION RESOURCES
Introduction to Public ParticipationEdison Electric InstitutePractical information for working with the public as a partner.www2.eei.org/products_and_services/descriptions_and_access/intro_pub_partic.htm
Bird Education NetworkCouncil for Environmental EducationCoalition developing a national strategy for bird education.www.birdeducation.org
Flying Wild Council for Environmental EducationClassroom bird education resources.www.flyingwild.org
International Migratory Bird Day Environment for the AmericasAnnual event focusing on migratory birds of the Americas.www.birdday.org
Project BEAK (Bird Education and Awareness for Kids)Nebraska Partnership for All-Bird Conservation,Nebraska Environmental Trust, Nebraska Game and Fish Commission, U.S. Environmental Protection AgencyExemplary bird education program.http://projectbeak.org
E158 | appendix e

SAM
PLE
National Wildlife Refuge SystemU.S. Fish and Wildlife Service552 refuges, many of which focus on birdconservation and public outreach.www.fws.gov/refuges
FUNDING ORGANIZATIONS
Avian Power Line Interaction CommitteeAPLIC funds research projects that furtherthe knowledge of avian/power line inter-actions, including causes and solutions toavian mortalities due to power line electrocutions and collisions.www.aplic.org/proposals.php
California Energy CommissionCEC funds various programs; see their website for a complete list. www.energy.ca.gov/contracts/index.html
Electric Power Research InstituteEPRI funds research and developmentthrough competitive selection of contractors. http://my.epri.com(see About EPRI and Contractor Resources)
Resources | 159

SAM
PLE
THIS PAGE INTENTIONALLY LEFT BLANK

SAM
PLE
THIS PAGE INTENTIONALLY LEFT BLANK

SAM
PLE
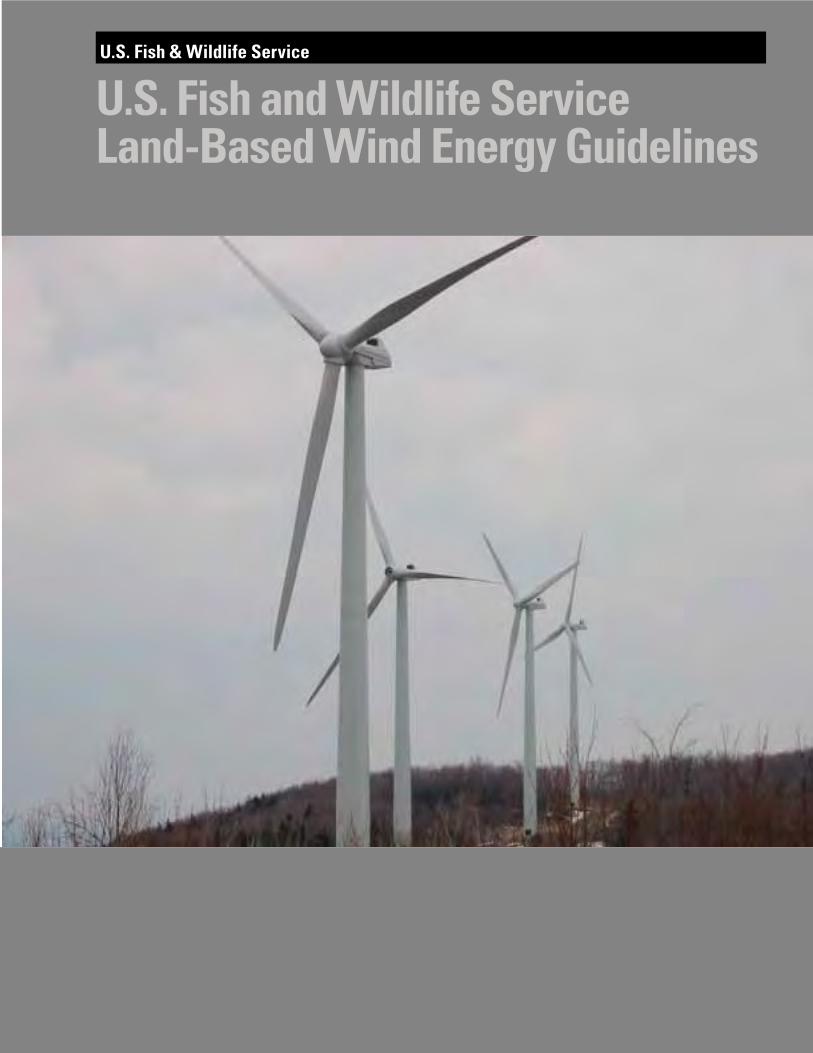
U.S. Fish and Wildlife ServiceLand-Based Wind Energy Guidelines
U.S. Fish & Wildlife Service

Cover Photo:
Wind Turbine. Photo by Stefanie Stavrakas, USFWS

i
U.S. Fish and Wildlife Service Land-Based Wind Energy Guidelines
OMB Control No, 1018-0148 Expiration Date: 12/31/2014
U.S. Fish and Wildlife Service Land-Based Wind Energy Guidelines
March 23, 2012

ii
U.S. Fish and Wildlife Service Land-Based Wind Energy Guidelines
The U.S. Fish and Wildlife Service (Service) would like to recognize and thank the Wind Turbine Guidelines Advisory Committee for its dedication and preparation of its Recommendations. The Recommendations have served as the basis from which the Service’s team worked to develop the Service’s Land-Based Wind Energy Guidelines. The Service also recognizes the tireless efforts of the Headquarters, Regional and Field Office staff that helped to review and update these Guidelines.
Acknowledgements
Paperwork Reduction Act Statement: The Land-Based Wind Energy Guidelines contain reporting and recordkeeping requirements that require Office of Management and Budget approval in accordance with the Paperwork Reduction Act of 1995. Your response is voluntary. We collect this information in order to provide technical assistance related to addressing wildlife conservation concerns at all stages of land-based wind energy development. For each response, we estimate the time necessary to provide the information as follows:
Tier 1 – 83 hours Tier 2 – 375 hours Tier 3 – 2,880 hours Tier 4 – 2,550 hours Tier 5 – 2,400 hours
The above estimates include time for reviewing instructions, gathering and maintaining data, and preparing and transmitting reports. Send comments regarding these estimates or any other aspect of the requirements to the Service Information Collection Clearance Officer, U.S. Fish and Wildlife Service, 4401 N. Fairfax Drive, MS 2042-PDM, Arlington, VA 22203.
We may not conduct and you are not required to respond to a collection of information unless it displays a currently valid OMB control number.

iii
U.S. Fish and Wildlife Service Land-Based Wind Energy Guidelines
Table of Contents
Executive Summary……………………………………………………………………………………………… vi
Chapter 1 - General Overview…………………………………………………………………………………… 1
Statutory Authorities……………………………………………………………………………………… 1
Migratory Bird Treaty Act……………………………………………………………………… 2 Bald and Golden Eagle Protection Act………………………………………………………… 2 Endangered Species Act……………………………………………………………………………3
Implementation of the Guidelines………………………………………………………………………… 4 Consideration of the Guidelines in MBTA and BGEPA Enforcement……………………… 6 Scope and Project Scale of the Guidelines……………………………………………………… 6 Service Review Period…………………………………………………………………………… 7 Introduction to the Decision Framework Using a Tiered Approach…………………………………… 7 Considering Risk in the Tiered Approach………………………………………………………………… 10
Cumulative Impacts of Project Development…………………………………………………………… 10
Other Federal Agencies…………………………………………………………………………………… 10
Relationship to Other Guidelines………………………………………………………………………… 11
Chapter 2: Tier 1 – Preliminary Site Evaluation………………………………………………………………… 12
Tier 1 Questions…………………………………………………………………………………………… 13
Tier 1 Methods and Metrics……………………………………………………………………………… 13
Tier 1 Decision Points……………………………………………………………………………………… 13
Chapter 3: Tier 2 – Site Characterization………………………………………………………………………… 14
Tier 2 Questions ………………………………………………………………………………………………14
Tier 2 Methods and Metrics…………………………………………………………………………… 15
Tier 2 Decision Points……………………………………………………………………………………… 18
Chapter 4: Tier 3 – Field Studies to Document Site Wildlife and Habitat and Predict Project Impacts………… 19
Tier 3 Questions …………………………………………………………………………………………… 19
Tier 3 Study Design Considerations……………………………………………………………………… 24
Assessing Presence……………………………………………………………………………… 24 Assessing Site Use/Behavior…………………………………………………………………… 24 Duration/Intensity of Studies…………………………………………………………………… 25 Assessing Risk to Species of Concern…………………………………………………………… 25
Tier 3 Technical Resources………………………………………………………………………………… 26
Tier 3, Question 1………………………………………………………………………………… 26 Tier 3, Question 2………………………………………………………………………………… 27

iv
U.S. Fish and Wildlife Service Land-Based Wind Energy Guidelines
Tier 3, Question 3………………………………………………………………………………… 28 Tier 3 Decision Points……………………………………………………………………………………… 33
Chapter 5: Tier 4 – Post-construction Studies to Estimate Impacts…………………………………………… 34
Tier 4a – Fatality Studies………………………………………………………………………………… 34
Tier 4a Questions………………………………………………………………………………… 35 Tier 4a Protocol Design Considerations……………………………………………………… 35 Tier 4a Study Objectives…………………………………………………………………………………… 37
Tier 4b – Assessing direct and indirect impacts of habitat loss, degradation, and fragmentation…… 40
Tier 4b Protocol Design Considerations………………………………………………………… 41 Tier 4b Decision Points………………………………………………………………………… 41
Chapter 6: Tier 5 – Other Post-construction Studies …………………………………………………………… 43
Tier 5 Questions …………………………………………………………………………………………… 43
Tier 5 Study Design Considerations……………………………………………………………………… 44 Tier 5 Examples………………………………………………………………………………… 44 Tier 5 Studies and Research…………………………………………………………………… 46
Chapter 7: Best Management Practices………………………………………………………………………… 49
Site Construction and Operation………………………………………………………………………… 49
Retrofitting, Repowering, and Decommissioning……………………………………………………… 51 Retrofitting……………………………………………………………………………………… 51 Repowering……………………………………………………………………………………… 51 Decommissioning………………………………………………………………………………… 52 Chapter 8: Mitigation…………………………………………………………………………………………… 53
NEPA Guidance on Mitigation…………………………………………………………………………… 53
Compensatory Mitigation………………………………………………………………………………… 54
Migratory Birds and Eagles……………………………………………………………………………… 54
Endangered Species……………………………………………………………………………………… 54
Chapter 9: Advancing Use, Cooperation and Effective Implementation………………………………………… 55
Conflict Resolution………………………………………………………………………………………… 55
Bird and Bat Conservation Strategies (BBCS)………………………………………………………… 55 Project Interconnection Lines…………………………………………………………………………… 55
Confidentiality of Site Evaluation Process as Appropriate…………………………………………… 56
Collaborative Research…………………………………………………………………………………… 56
Service - State Coordination and Cooperation………………………………………………………… 56

v
U.S. Fish and Wildlife Service Land-Based Wind Energy Guidelines
Service Tribal Consultation and Coordination………………………………………………………… 57
Tribal Wind Energy Development on Reservation Lands…………………………………… 57 Tribal Wind Energy Development on Lands that are not held in Trust……………………… 57 Non-Tribal Wind Energy Development – Consultation with Indian Tribal Governments… 57 Non-Governmental Organization Actions……………………………………………………………… 58 Non-Governmental Organization Conservation Lands………………………………………………… 58 Appendix A: Glossary…………………………………………………………………………………………… 59
Appendix B: Literature Cited…………………………………………………………………………………… 64
Appendix C: Sources of Information Pertaining to Methods to Assess Impacts to Wildlife…………………… 70
List of Figures and Tables
Table 1. Suggested Communications Protocol…………………………………………………………… 5
Figure 1. General Framework of Tiered Approach……………………………………………………… 9 Table 2. Decision Framework for Tier 4a Fatality Monitoring of Species of Concern.……………… 39
Table 3. Decision Framework to Guide Studies for Minimizing Impacts to Habitat and Species of Habitat Fragmentation (HF) Concern.…………………………………………………………………… 42

vi
U.S. Fish and Wildlife Service Land-Based Wind Energy Guidelines
Executive Summary
As the Nation shifts to renewable energy production to supplant the need for carbon-based fuel, wind energy will be an important source of power. As wind energy production increases, both developers and wildlife agencies have recognized the need for a system to evaluate and address the potential negative impacts of wind energy projects on species of concern. These voluntary Guidelines provide a structured, scientific process for addressing wildlife conservation concerns at all stages of land-based wind energy development. They also promote effective communication among wind energy developers and federal, state, and local conservation agencies and tribes. When used in concert with appropriate regulatory tools, the Guidelines form the best practical approach for conserving species of concern. The Guidelines have been developed by the Interior Department’s U.S. Fish and Wildlife Service (Service) working with the Wind Turbine Guidelines Advisory Committee. They replace interim voluntary guidance published by the Service in 2003.
The Guidelines discuss various risks to “species of concern” from wind energy projects, including collisions with wind turbines and associated infrastructure; loss and degradation of habitat from turbines and infrastructure; fragmentation of large habitat blocks into smaller segments that may not support sensitive species; displacement and behavioral changes; and indirect effects such as increased predator populations or introduction of invasive plants. The Guidelines assist developers in identifying species of concern that may potentially be affected by their proposed project, including migratory birds; bats; bald and
golden eagles and other birds of prey; prairie and sage grouse; and listed, proposed, or candidate endangered and threatened species. Wind energy development in some areas may be precluded by federal law; other areas may be inappropriate for development because they have been recognized as having high wildlife value based on their ecological rarity and intactness.
The Guidelines use a “tiered approach” for assessing potential adverse effects to species of concern and their habitats. The tiered approach is an iterative decision-making process for collecting information in increasing detail; quantifying the possible risks of proposed wind energy projects to species of concern and their habitats; and evaluating those risks to make siting, construction, and operation decisions. During the pre-construction tiers (Tiers 1, 2, and 3), developers are working to identify, avoid and minimize risks to species of concern. During post-construction tiers (Tiers 4 and 5), developers are assessing whether actions taken in earlier tiers to avoid and minimize impacts are successfully achieving the goals and, when necessary, taking additional steps to compensate for impacts. Subsequent tiers refine and build upon issues raised and efforts undertaken in previous tiers. Each tier offers a set of questions to help the developer evaluate the potential risk associated with developing a project at the given location.
Briefly, the tiers address:
• Tier 1 – Preliminary site evaluation (landscape-scale screening of possible project sites)
• Tier 2 – Site characterization (broad characterization of one or more potential project sites)
• Tier 3 – Field studies to document site wildlife and habitat and predict project impacts
• Tier 4 – Post-construction studies to estimate impacts1
• Tier 5 – Other post-construction studies and research
The tiered approach provides the opportunity for evaluation and decision-making at each stage, enabling a developer to abandon or proceed with project development, or to collect additional information if required. This approach does not require that every tier, or every element within each tier, be implemented for every project. The Service anticipates that many distributed or community facilities will not need to follow the Guidelines beyond Tiers 1 and 2. Instead, the tiered approach allows efficient use of developer and wildlife agency resources with increasing levels of effort.
If sufficient data are available at a particular tier, the following outcomes are possible:
1. The project proceeds to the next tier in the development process without additional data collection.
2. The project proceeds to the next tier in the development process with additional data collection.
3. An action or combination of actions, such as project
1 The Service anticipates these studies will include fatality monitoring as well as studies to evaluate habitat impacts.

vii
U.S. Fish and Wildlife Service Land-Based Wind Energy Guidelines
modification, mitigation, or specific post-construction monitoring, is indicated.
4. The project site is abandoned because the risk is considered unacceptable.
If data are deemed insufficient at a tier, more intensive study is conducted in the subsequent tier until sufficient data are available to make a decision to modify the project, proceed with the project, or abandon the project.
The most important thing a developer can do is to consult with the Service as early as possible in the development of a wind energy project. Early consultation offers the greatest opportunity for
avoiding areas where development is precluded or where wildlife impacts are likely to be high and difficult or costly to remedy or mitigate at a later stage. By consulting early, project developers can also incorporate appropriate wildlife conservation measures and monitoring into their decisions about project siting, design, and operation.
Adherence to the Guidelines is voluntary and does not relieve any individual, company, or agency of the responsibility to comply with laws and regulations. However, if a violation occurs the Service will consider a developer’s documented efforts to communicate with the Service and adhere to the Guidelines. The Guidelines include a Communications Protocol which
provides guidance to both developers and Service personnel regarding appropriate communication and documentation.
The Guidelines also provide Best Management Practices for site development, construction, retrofitting, repowering, and decommissioning. For additional reference, a glossary of terms and list of literature cited are included in the appendices.
Wind Resource Map. Credit: NREL
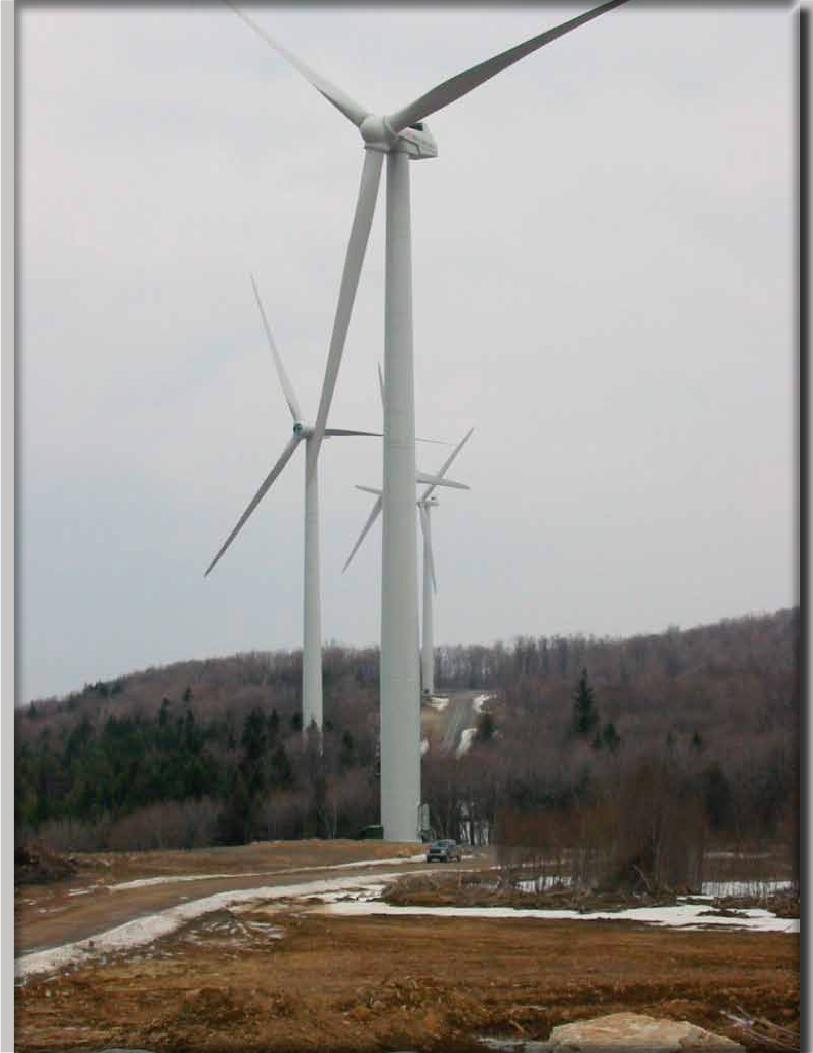
viii
U.S. Fish and Wildlife Service Land-Based Wind Energy Guidelines

U.S. Fish and Wildlife Service Land-Based Wind Energy Guidelines
1
Chapter 1 - General Overview
The mission of the U.S. Fish and Wildlife Service (Service) is working with others to conserve, protect and enhance fish, wildlife, plants and their habitats for the continuing benefit of the American people. As part of this, the Service implements statutes including the Endangered Species Act, Migratory Bird Treaty Act, and Bald and Golden Eagle Protection Act. These statutes prohibit taking of federally listed species, migratory birds, and eagles unless otherwise authorized.
Recent studies have documented that wind energy facilities can kill birds and bats. Mortality rates in fatalities per nameplate MW per year vary among facilities and regions. Studies have indicated that relatively low raptor (e.g., hawks, eagles) fatality rates exist at most modern wind energy developments with the exception of some facilities in California and Wyoming. Turbine-related bat deaths have been reported at each wind facility to date. Generally, studies in the West have reported lower rates of bat fatalities than facilities in the East. There is still much uncertainty regarding geographic distribution and causes of bat fatalities (NWCC 2010).
These Guidelines are intended to:
(1) Promote compliance with relevant wildlife laws and regulations;
(2) Encourage scientifically rigorous survey, monitoring, assessment, and research designs proportionate to the risk to species of concern;
(3) Produce potentially comparable data across the Nation;
(4) Mitigate, including avoid, minimize, and compensate for potential adverse effects on species of concern and their habitats; and,
(5) Improve the ability to predict and resolve effects locally, regionally, and nationally.
As the United States moves to expand wind energy production, it also must maintain and protect the Nation’s wildlife and their habitats, which wind energy production can negatively affect. As with all responsible energy development, wind energy projects should adhere to high standards for environmental protection. With proper diligence paid to siting, operations, and management of projects, it is possible to mitigate for adverse effects to wildlife, and their habitats. This is best accomplished when the wind energy project developer communicates as early as possible with the Service and other stakeholders. Such early communication allows for the greatest range of development and mitigation options. The following website contains contact information for the Service Regional and Field offices as well as State wildlife agencies: http://www.fws.gov/offices/statelinks.html.
In response to increasing wind energy development in the United States, the Service released a set of voluntary, interim guidelines for
reducing adverse effects to fish and wildlife resources from wind energy projects for public comment in July 2003. After the Service reviewed the public comments, the Secretary of the Interior (Secretary) established a Federal Advisory Committee2 to provide recommendations to revise the guidelines related to land-based wind energy facilities. In March 2007, the U.S. Department of the Interior established the Wind Turbine Guidelines Advisory Committee (the Committee). The Committee submitted its final Recommended Guidelines (Recommendations) to the Secretary on March 4, 2010. The Service used the Recommendations to develop its Land-Based Wind Energy Guidelines.
The Service encourages project proponents to use the process described in these voluntary Land-based Wind Energy Guidelines (Guidelines) to address risks to species of concern. The Service intends that these Guidelines, when used in concert with the appropriate regulatory tools, will form the best practical approach for conservation of species of concern.
Statutory Authorities
These Guidelines are not intended nor shall they be construed to limit or preclude the Service from exercising its authority under any law, statute, or regulation, or from conducting enforcement action against any individual, company, or agency. They are not meant to relieve any individual, company, or agency of its obligations to comply with any applicable federal, state,
2 Committee membership, from 2008 to 2011, has included: Taber Allison, Massachusetts Audubon; Dick Anderson, California Energy Commission; Ed Arnett, Bat Conservation International; Michael Azeka, AES Wind Generation; Thomas Bancroft, National Audubon; Kathy Boydston, Texas Parks and Wildlife Department; René Braud, EDP Renewables; Scott Darling, Vermont Fish and Wildlife Department; Michael Daulton, National Audubon; Aimee Delach, Defenders of Wildlife; Karen Douglas, California Energy Commission; Sam Enfield, MAP Royalty; Greg Hueckel, Washington Department of Fish and Wildlife; Jeri Lawrence, Blackfeet Nation; Steve Lindenberg, U.S. Department of Energy; Andy Linehan, Iberdrola Renewables; Rob Manes, The Nature Conservancy, Kansas; Winifred Perkins, NextEra Energy Resources; Steven Quarles, Crowell & Moring; Rich Rayhill, Ridgeline Energy; Robert Robel, Kansas State University; Keith Sexson, Association of Fish and Wildlife Agencies; Mark Sinclair, Clean Energy States Alliance; David Stout, U.S. Fish and Wildlife Service; Patrick Traylor, Hogan Lovells.

U.S. Fish and Wildlife Service Land-Based Wind Energy Guidelines
2
tribal, or local laws, statutes, or regulations. The Guidelines do not prevent the Service from referring violations of law for enforcement when a company has not followed the Guidelines.
Ultimately it is the responsibility of those involved with the planning, design, construction, operation, maintenance, and decommissioning of wind projects to conduct relevant wildlife and habitat evaluation and determine, which, if any, species may be affected. The results of these analyses will inform all efforts to achieve compliance with the appropriate jurisdictional statutes. Project proponents are responsible for complying with applicable state and local laws.
Migratory Bird Treaty Act
The Migratory Bird Treaty Act (MBTA) is the cornerstone of migratory bird conservation and protection in the United States. The MBTA implements four treaties that provide for international protection of migratory birds. It is a strict liability statute, meaning that proof of intent, knowledge, or negligence is not an element of an MBTA violation. The statute’s language is clear that actions resulting in a “taking” or possession (permanent or temporary) of a protected species, in the absence of a Service permit or regulatory authorization, are a violation of the MBTA.
The MBTA states, “Unless and except as permitted by regulations … it shall be unlawful at any time, by any means, or in any manner to pursue, hunt, take, capture, kill … possess, offer for sale, sell … purchase … ship, export, import … transport or cause to be transported … any migratory bird, any part, nest, or eggs of any such bird …. [The Act] prohibits the taking, killing, possession, transportation, import and export of migratory birds, their eggs, parts, and nests, except when specifically authorized by the Department of the Interior.” 16 U.S.C. 703. The word “take” is defined by regulation as “to pursue,
hunt, shoot, wound, kill, trap, capture, or collect, or attempt to pursue, hunt, shoot, wound, kill, trap, capture, or collect.” 50 CFR 10.12.
The MBTA provides criminal penalties for persons who commit any of the acts prohibited by the statute in section 703 on any of the species protected by the statute. See 16 U.S.C. 707. The Service maintains a list of all species protected by the MBTA at 50 CFR 10.13. This list includes over one thousand species of migratory birds, including eagles and other raptors, waterfowl, shorebirds, seabirds, wading birds, and passerines. The MBTA does not protect introduced species such as the house (English) sparrow, European starling, rock dove (pigeon), Eurasian collared-dove, and non-migratory upland game birds. The Service maintains a list of introduced species not protected by the Act. See 70 Fed. Reg. 12,710 (Mar. 15, 2005).
Bald and Golden Eagle Protection Act
Under authority of the Bald and Golden Eagle Protection Act (BGEPA), 16 U.S.C. 668–668d, bald eagles and golden eagles are afforded additional legal protection. BGEPA prohibits the take, sale, purchase, barter, offer of sale, purchase, or barter, transport, export or import, at any time or in any manner of any bald or golden eagle, alive or dead, or any part, nest, or egg thereof. 16 U.S.C. 668. BGEPA also defines take to include “pursue, shoot, shoot at, poison, wound, kill, capture, trap, collect, molest, or disturb,” 16 U.S.C. 668c, and includes criminal and civil penalties for violating the statute. See 16 U.S.C. 668. The Service further defined the term “disturb” as agitating or bothering an eagle to a degree that causes, or is likely to cause, injury, or
either a decrease in productivity or nest abandonment by substantially interfering with normal breeding, feeding, or sheltering behavior. 50 CFR 22.3. BGEPA authorizes the Service to permit the take of eagles for certain purposes and under certain circumstances, including scientific or exhibition purposes, religious purposes of Indian tribes, and the protection of wildlife, agricultural, or other interests, so long as that take is compatible with the preservation of eagles. 16 U.S.C. 668a.
In 2009, the Service promulgated a final rule on two new permit regulations that, for the first time, specifically authorize the incidental take of eagles and eagle nests in certain situations under BGEPA. See 50 CFR 22.26 & 22.27. The permits authorize limited, non-purposeful (incidental) take of bald and golden eagles; authorizing individuals, companies, government agencies (including tribal governments), and other organizations to disturb or otherwise take eagles in the course of conducting lawful activities such as operating utilities and airports.
Bald Eagle, Credit: USFWS

U.S. Fish and Wildlife Service Land-Based Wind Energy Guidelines
3
Removal of active eagle nests would usually be allowed only when it is necessary to protect human safety or the eagles. Removal of inactive nests can be authorized when necessary to ensure public health and safety, when a nest is built on a human-engineered structure rendering it inoperable, and when removal is necessary to protect an interest in a particular locality, but only if the take or mitigation for the take will provide a clear and substantial benefit to eagles.
To facilitate issuance of permits under these new regulations, the Service has drafted Eagle Conservation Plan (ECP) Guidance. The ECP Guidance is compatible with these Land-Based Wind Energy Guidelines. The Guidelines guide developers through the process of project development and operation. If eagles are identified as a potential risk at a project site, developers are strongly encouraged to refer to the ECP Guidance. The ECP Guidance describes specific actions that are recommended to comply with the regulatory requirements in BGEPA for an eagle take permit, as described in 50 CFR 22.26 and 22.27. The ECP Guidance provides a national framework for assessing and mitigating risk specific to eagles through development of ECPs and issuance of programmatic incidental takes of eagles at wind turbine facilities. The Service will make its final ECP Guidance available to the public through its website.
Endangered Species Act
The Endangered Species Act (16 U.S.C. 1531–1544; ESA) was enacted by Congress in 1973 in recognition that many of our Nation’s native plants and animals were in danger of becoming extinct. The ESA directs the Service to identify and protect these endangered and threatened species and their critical habitat, and to provide a means to conserve their ecosystems. To this end, federal agencies are directed to utilize their authorities to conserve listed species, and ensure that their actions
are not likely to jeopardize the continued existence of these species or destroy or adversely modify their critical habitat. Federal agencies are encouraged to do the same with respect to “candidate” species that may be listed in the near future. The law is administered by the Service and the Commerce Department’s National Marine Fisheries Service (NMFS). For information regarding species protected under the ESA, see: http://www.fws.gov/endangered/.
The Service has primary responsibility for terrestrial and freshwater species, while NMFS generally has responsibility for marine species. These two agencies work with other agencies to plan or modify federal projects so that they will have minimal impact on listed species and their habitats. Protection of species is also achieved through partnerships with the states, through federal financial assistance and a system of incentives available to encourage state participation. The Service also works with private landowners, providing financial and technical assistance for management
actions on their lands to benefit both listed and non-listed species.
Section 9 of the ESA makes it unlawful for a person to “take” a listed species. Take is defined as “... to harass, harm, pursue, hunt, shoot, wound, kill, trap, capture, or collect or attempt to engage in any such conduct.” 16 U.S.C. 1532(19). The terms harass and harm are further defined in our regulations. See 50 CFR 17.3. However, the Service may authorize “incidental take” (take that occurs as a result of an otherwise legal activity) in two ways.
Take of federally listed species incidental to a lawful activity may be authorized through formal consultation under section 7(a)(2) of the ESA, whenever a federal agency, federal funding, or a federal permit is involved. Otherwise, a person may seek an incidental take permit under section 10(a)(1)(B) of the ESA upon completion of a satisfactory habitat conservation plan (HCP) for listed species. Developers not receiving federal funding or authorization should contact the Service to obtain an incidental take permit if a wind
Indiana bat. Credit: USFWS

U.S. Fish and Wildlife Service Land-Based Wind Energy Guidelines
4
energy project is likely to result in take of listed threatened or endangered wildlife species. For more information regarding formal consultation and the requirements of obtaining HCPs, please see the Endangered Species Consultation Handbook at http://www.fws.gov/endangered/esa-library/index.html#consultations and the Service’s HCP website, http://www.fws.gov/endangered/what-we-do/hcp-overview.html.
Implementation of the Guidelines
Because these Guidelines are voluntary, the Service encourages developers to use them as soon as possible after publication. To receive the considerations discussed on page 6 regarding enforcement priorities, a wind energy project would fall into one of three general categories relative to timing and implementation:
•Forprojectsinitiatedafterpublication, the developer has applied the Guidelines, including the tiered approach, through site selection, design, construction, operation and post-operation phases of the project, and has communicated and shared
information with the Service and considered its advice.
•Forprojectsinitiatedpriortopublication, the developer should consider where they are in the planning process relative to the appropriate tier and inform the Service of what actions they will take to apply the Guidelines.
•Forprojectsoperatingatthetime of publication, the developer should confer with the Service regarding the appropriate period of fatality monitoring consistent with Tier 4, communicate and share information with the Service on monitoring results, and consider Tier 5 studies and mitigation options where appropriate.
Projects that are already under development or are in operation are not expected to start over or return to the beginning of a specific tier. Instead, these projects should implement those portions of the Guidelines relevant to the current phases of the project per the bullets above.
The Service is aware that it will take time for Service staff and other personnel, including wind energy developers and their biologists, to develop expertise in the implementation of these Guidelines. Service staff and many staff associated with the wind energy industry have been involved with developing these Guidelines. Therefore, they have a working knowledge of the Guidelines. To further refine their training, the Service will make every effort to offer an in-depth course within 6 months of the final Guidelines being published.
The Communications Protocol on page 5 provides guidance to Service staff and developers in the exchange of information and recommendations at each tier in the process. Although the advice of the Service is not binding, a developer should review such advice, and either accept or reject it. If they reject it, they
should contemporaneously document with reasoned justification why they did so. Although the Guidelines leave decisions up to the developer, the Service retains authority to evaluate whether developer efforts to mitigate impacts are sufficient, to determine significance, and to refer for prosecution any unlawful take that it believes to be reasonably related to lack of incorporation of Service recommendations or insufficient adherence with the Guidelines.
Utility-Scale Wind turbine with an anemometer tower in the background. Credit: University of Minnesota College of Science and Engineering

U.S. Fish and Wildlife Service Land-Based Wind Energy Guidelines
5
Table 1. Suggested Communications Protocol This table provides examples of potential communication opportunities between a wind energy project developer and the Service. Not all projects will follow all steps indicated below.
TIER Project Developer/Operator Role Service Role
Tier 1: Preliminary site evaluation
• Landscape level assessment of habitat for species of concern
• Request data sources for existing information and literature
• Provide lists of data sources and references, if requested
Tier 2: Site characterization
• Assess potential presence of species of concern, including species of habitat fragmentation concern, likely to be on site
• Assess potential presence of plant communities present on site that may provide habitat for species of concern
• Assess potential presence of critical congregation areas for species of concern
• One or more reconnaissance level site visit by biologist
• Communicate results of site visits and other assessments with the Service
• Provide general information about the size and location of the project to the Service
• Provide species lists, for species of concern, including species of habitat fragmentation concern, for general area, if available
• Provide information regarding plant communities of concern, if available
• Respond to information provided about findings of biologist from site visit
• Identify initial concerns about site(s) based on available information
• Inform lead federal agencies of communications with wind project developers
Tier 3: Field studies and impact prediction
• Discuss extent and design of field studies to conduct with the Service
• Conduct biological studies• Communicate results of all studies to Service
field office in a timely manner• Evaluate risk to species of concern from
project construction and operation• Identify ways to mitigate potential direct and
indirect impacts of building and operating the project
• Respond to requests to discuss field studies• Advise project proponent about studies to
conduct and methods for conducting them• Communicate with project proponent(s)
about results of field studies and risk assessments
• Communicate with project proponents(s) ways to mitigate potential impacts of building and operating the project
• Inform lead federal agencies of communications with wind project developers
Tier 4: Post construction studies to estimate impacts
• Discuss extent and design of post-construction studies to conduct with the Service
• Conduct post-construction studies to assess fatalities and habitat-related impacts
• Communicate results of all studies to Service field office in a timely manner
• If necessary, discuss potential mitigation strategies with Service
• Maintain appropriate records of data collected from studies
• Advise project operator on study design, including duration of studies to collect adequate information
• Communicate with project operator about results of studies
• Advise project operator of potential mitigation strategies, when appropriate
Tier 5: Other post-construction studies and research
• Communicate with the Service about the need for and design of other studies and research to conduct with the Service, when appropriate, particularly when impacts exceed predicted levels
• Communicate with the Service about ways to evaluate cumulative impacts on species of concern, particularly species of habitat fragmentation concern
• Conduct appropriate studies as needed• Communicate results of studies with the
Service• Identify potential mitigation strategies to
reduce impacts and discuss them with the Service
• Advise project proponents as to need for Tier 5 studies to address specific topics, including cumulative impacts, based on information collected in Tiers 3 and 4
• Advise project proponents of methods and metrics to use in Tier 5 studies
• Communicate with project operator and consultants about results of Tier 5 studies
• Advise project operator of potential mitigation strategies, when appropriate, based on Tier 5 studies

U.S. Fish and Wildlife Service Land-Based Wind Energy Guidelines
6
Consideration of the Guidelines in MBTA and BGEPA Enforcement
The Service urges voluntary adherence to the Guidelines and communication with the Service when planning and operating a facility. While it is not possible to absolve individuals or companies from MBTA or BGEPA liability, the Office of Law Enforcement focuses its resources on investigating and prosecuting those who take migratory birds without identifying and implementing reasonable and effective measures to avoid the take. The Service will regard a developer’s or operator’s adherence to these Guidelines, including communication with the Service, as appropriate means of identifying and implementing reasonable and effective measures to avoid the take of species protected under the MBTA and BGEPA.3 The Chief of Law Enforcement or more senior official of the Service will make any decision whether to refer for prosecution any alleged take of such species, and will take such adherence and communication fully into account when exercising discretion with respect to such potential referral. Each developer or operator will be responsible for maintaining internal records sufficient to demonstrate adherence to the Guidelines and response to communications from the Service. Examples of these records could include: studies performed in the implementation of the tiered approach; an internal or external review or audit process; a bird and bat conservation strategy; or a wildlife management plan.
If a developer and operator are not the same entity, the Service expects the operator to maintain sufficient records to demonstrate adherence to the Guidelines.
Scope and Project Scale of the Guidelines
The Guidelines are designed for “utility-scale” land-based wind
energy projects to reduce potential impacts to species of concern, regardless of whether they are proposed for private or public lands. A developer of a distributed or community scale wind project may find it useful to consider the general principles of the tiered approach to assess and reduce potential impacts to species of concern, including answering Tier 1 questions using publicly available information. In the vast majority of situations, appropriately sited small wind projects are not likely to pose significant risks to species of concern. Answering Tier 1 questions will assist a developer of distributed or community wind projects, as well as landowners, in assessing the need to further communicate with the Service, and precluding, in many cases, the need for full detailed pre-construction assessments or monitoring surveys typically called for in Tiers 2 and 3. If landowners or community/distributed wind developers encounter problems locating information about specific sites they can contact the Service and/or state wildlife agencies to determine potential risks to species of concern for their particular project.
The tiered approach is designed to lead to the appropriate amount of evaluation in proportion to the anticipated level of risk that a project may pose to species of concern and their habitats. Study plans and the duration and intensity of study efforts should be tailored specifically to the unique characteristics of each site and the corresponding potential for significant adverse impacts on species of concern and their habitats as determined through the tiered approach. This is why the tiered approach begins with an examination of the potential location of the project, not the size of the project. In all cases, study plans and selection of appropriate study methods and techniques may be tailored to the relative scale, location, and potential for significant adverse impacts of the proposed site.
The Service considers a “project” to include all phases of wind energy development, including, but not limited to, prospecting, site assessment, construction, operation, and decommissioning, as well as all associated infrastructure and interconnecting electrical lines. A “project site” is the land and airspace where development occurs
Communication with Christy Johnson-Hughes. Credit: Rachel London, USFWS
3 With regard to eagles, this paragraph will only apply when a project is not likely to result in take. If Tiers 1, 2, and/or 3 identify a potential to take eagles, developers should consider developing an ECP and, if necessary, apply for a take permit

U.S. Fish and Wildlife Service Land-Based Wind Energy Guidelines
7
or is proposed to occur, including the turbine pads, roads, power distribution and transmission lines on or immediately adjacent to the site; buildings and related infrastructure, ditches, grades, culverts; and any changes or modifications made to the original site before development occurs. Project evaluations should consider all potential effects to species of concern, which includes species 1) protected by the MBTA, BGEPA, or ESA (including candidate species), designated by law, regulation or other formal process for protection and/or management by the relevant agency or other authority, or that have been shown to be significantly adversely affected by wind energy development; and 2) determined to be possibly affected by the project.
These Guidelines are not designed to address power transmission beyond the point of interconnection to the transmission system.
Service Review Period
The Service is committed to providing timely responses. Service Field Offices should typically respond to requests by a wind energy developer for information and consultation on proposed site locations (Tiers 1 and 2), pre- and post-construction study designs (Tiers 3 and 4), and proposed mitigation (Tier 3) within 60 calendar days. The request should be in writing to the Field Office and copied to the Regional Office with information about the proposed project, location(s) under consideration, and point of contact. The request should contain a description of the information needed from the Service. The Service will provide a response, even if it is to notify a developer of additional review time, within the 60 calendar day review period. If the Service does not respond within 60 calendar days of receipt of the document, then the developer can proceed through Tier 3 without waiting for Service input. If the Service provides comments at a
later time, the developer should incorporate the comments if feasible. It is particularly important that if data from Tier 1-3 studies predict that the project is likely to produce significant adverse impacts on species of concern, the developer inform the Service of the actions it intends to implement to mitigate those impacts. If the Service cannot respond within 60 calendar days, this does not relieve developers from their MBTA, BGEPA, and ESA responsibilities.
The tiered approach allows a developer in certain limited circumstances to move directly from Tier 2 to construction (e.g., adequate survey data for the site exists). The developer should notify the Service of this decision and give the Service 60 calendar days to comment on the proposed project prior to initiating construction activities.
Introduction to the Decision Framework Using a Tiered Approach
The tiered approach provides a decision framework for collecting information in increasing detail to evaluate risk and make siting and operational decisions. It provides the opportunity for evaluation and decision-making at each tier, enabling a developer to proceed with or abandon project development, or to collect additional information if necessary. This approach does not require that every tier, or every element within each tier, be implemented for every project. Instead, it allows efficient use of developer and wildlife agency resources with increasing levels of effort until sufficient information and the desired precision is acquired for the risk assessment.
Figure 1 (“General Framework of Tiered Approach”) illustrates the tiered approach, which consists of up to five iterative stages, or tiers:
• Tier 1 – Preliminary site evaluation (landscape-scale screening of possible project sites)
• Tier 2 – Site characterization (broad characterization of one or more potential project sites)
• Tier 3 – Field studies to document site wildlife and habitat and predict project impacts
• Tier 4 – Post-construction studies to estimate impacts4
• Tier 5 – Other post-construction studies and research
At each tier, potential issues associated with developing or operating a project are identified and questions formulated to guide the decision process. Chapters Two through Six outline the questions to be posed at each tier, and describe recommended methods and metrics for gathering the data needed to answer those questions.
The first three tiers correspond to the pre-construction evaluation phase of wind energy development. At each of the three tiers, the Guidelines provide questions that developers should answer, followed by recommended methods and metrics to use in answering the questions. Some questions are repeated at each tier, with successive tiers requiring a greater investment in data collection to answer certain questions. For example, while Tier 2 investigations may discover some existing information on federal or state-listed species and their use of the proposed development site, it may be necessary to collect empirical data in Tier 3 studies to determine the presence of federal or state-listed species.
Developers decide whether to proceed to the next tier. Timely communication and sharing of information will allow opportunities for the Service to provide, and developers to consider, technical advice. A developer should base the decision on the information obtained from adequately answering the questions in this tier, whether the methods used were appropriate for the site selected, and the resulting
4 The Service anticipates these studies will include fatality monitoring as well as studies to evaluate habitat impacts.

U.S. Fish and Wildlife Service Land-Based Wind Energy Guidelines
8
assessment of risk posed to species of concern and their habitats.
If sufficient data are available at a particular tier, the following outcomes are possible:
1. The project proceeds to the next tier in the development process without additional data collection.
2. The project proceeds to the next tier in the development process with additional data collection.
3. An action or combination of actions, such as project modification, mitigation, or specific post-construction monitoring, is indicated.
4. The project site is abandoned because the risk is considered unacceptable.
If data are deemed insufficient at a tier, more intensive study is conducted in the subsequent tier until sufficient data are available to make a decision to modify the project, proceed with the project, or abandon the project.
The tiered approach used in these Guidelines embodies adaptive management by collecting increasingly detailed information that is used to make decisions about project design,
construction, and operation as the developer progresses through the tiers. Adaptive management is an iterative learning process producing improved understanding and improved management over time (Williams et al 2007). DOI has determined that its resource agencies, and the natural resources they oversee, could benefit from adaptive management. Use of adaptive management in DOI is guided by the DOI Policy on Adaptive Management. DOI has adopted the National Research Council’s 2004 definition of adaptive management, which states: “Adaptive management promotes flexible decision making that can be adjusted in the face of uncertainties as outcomes from management actions and other events become better understood. Careful monitoring of these outcomes both advances scientific understanding and helps adjust policies or operations as part of an iterative learning process. Adaptive management also recognizes the importance of natural variability in contributing to ecological resilience and productivity. It is not a ‘trial and error’ process, but rather emphasizes learning while doing. Adaptive management does not represent an end in itself, but rather a means to more effective decisions and enhanced benefits. Its true
measure is in how well it helps meet environmental, social, and economic goals, increases scientific knowledge, and reduces tensions among stakeholders.”
This definition gives special emphasis to uncertainty about management effects, iterative learning to reduce uncertainty, and improved management as a result of learning. The DOI Adaptive Management Technical Guide is located on the web at: www.doi.gov/initiatives/AdaptiveManagement/index.html.
Wind turbines in California. Credit: Rachel London, USFWS

U.S. Fish and Wildlife Service Land-Based Wind Energy Guidelines
9
Figu
re 1
. Gen
eral
Fra
mew
ork
of T
iere
d A
ppro
ach
TIER
1
A.Sp
ecie
s of c
once
rn k
now
n to
be
pres
ent?
1.
No
……
……
……
……
……
……
……
……
……
……
……
……
……
……
proc
eed
to T
ier 2
2.
Unk
now
n - I
nsuf
ficie
nt o
r inc
oncl
usiv
e da
ta …
….…
…pr
ocee
d to
Tie
r 2
3.Ye
s……
……
……
……
……
……
……
……
……
aban
don
site
or p
roce
ed to
Tie
r 2
TIER
2
A.Pr
obab
ility
of s
igni
fican
t adv
erse
impa
cts?
1.
Unk
now
n - I
nsuf
ficie
nt o
r inc
oncl
usiv
e da
ta …
……
….p
roce
ed to
Tie
r 3
2.Lo
w…
……
……
proc
eed
to o
btai
n st
ate
and
loca
l per
mit
(if r
equi
red)
, de
sign,
and
con
stru
ctio
n fo
llow
ing
BMPs
3.
Mod
erat
e …
……
……
……
……
….…
……
……
.pro
ceed
to T
ier 3
and
miti
gate
4.
High
, and
: a.
can
be a
dequ
atel
y m
itiga
ted.
..mod
ify p
roje
ct a
nd p
roce
ed to
Tie
r 3
b.ca
nnot
be
adeq
uate
ly m
itiga
ted.
.……
……
……
……
…...
aban
don
proj
ect
TIER
3
A.Pr
obab
ility
of s
igni
fican
t adv
erse
impa
cts?
1.
Low
……
……
……
……
……
……
……
……
…..…
……
……
……
……
.pro
ceed
to T
ier 4
2.
Mod
erat
e to
hig
h, a
nd:
a.ce
rtai
nty
rega
rdin
g m
itiga
tion
……
……
……
……
…...
... p
roce
ed to
Tie
r 4
b.un
cert
aint
y re
gard
ing
miti
gatio
n …
……
……
……
……
…pr
ocee
d to
Tie
r 4
3.Hi
gh, a
nd:
a.ca
n be
ade
quat
ely
miti
gate
d……
…..…
……
……
……
…..p
roce
ed to
Tie
r 4
b.ca
nnot
be
adeq
uate
ly m
itiga
ted
……
……
..mod
ify o
r aba
ndon
pro
ject
TIER
4a
(See
Tab
le 2
, pg
39)
A.Ti
er 3
stud
ies i
ndic
ate
low
pro
babi
lity
of si
gnifi
cant
adv
erse
impa
cts
1.Do
cum
ente
d fa
talit
ies
are
equa
l to
or
lo
wer
th
an
pred
icte
d……
……
…...
…no
furt
her s
tudi
es o
r miti
gatio
n ne
eded
2.
Docu
men
ted
fata
litie
s ar
e hi
gher
than
pre
dict
ed, b
ut n
ot s
igni
fican
t, an
d:
a.co
mpa
rabl
e da
ta
are
avai
labl
e th
at
supp
ort
findi
ngs
of
not
signi
fican
t……
……
……
……
……
……
……
……
…...
.no
furt
her s
tudi
es n
eede
d b.
com
para
ble
data
no
t av
aila
ble
to
supp
ort
findi
ngs
of
not
signi
fican
t……
……
…..a
dditi
onal
yea
r(s)
of m
onito
ring
reco
mm
ende
d 3.
Docu
men
ted
fata
litie
s ar
e hi
gher
th
an
pred
icte
d an
d ar
e sig
nific
ant…
……
……
……
……
……
……
……
……
…..c
omm
unic
ate
with
Ser
vice
B.Ti
er 3
stu
dies
ind
icat
e m
oder
ate
prob
abili
ty o
f sig
nific
ant
adve
rse
impa
cts
1.Do
cum
ente
d fa
talit
ies a
re lo
wer
than
or n
o di
ffere
nt p
redi
cted
, and
: a.
are
not
signi
fican
t an
d no
ES
A or
BG
EPA
spec
ies
are
affe
cted
……
……
.……
……
.no
furt
her m
onito
ring
or m
itiga
tion
need
ed
b.ar
e sig
nific
ant
OR
ESA
or
BGEP
A sp
ecie
s ar
e af
fect
ed ..
......
......
......
......
......
......
......
......
..com
mun
icat
e w
ith S
ervi
ce
2.Do
cum
ente
d fa
talit
ies a
re g
reat
er th
an p
redi
cted
and
are
like
ly to
be
signi
fican
t O
R ES
A or
BG
EPA
spec
ies
are
affe
cted
.……
……
……
……
……
……
……
….…
……
…co
mm
unic
ate
with
Ser
vice
C.Ti
er 3
stud
ies i
ndic
ate
high
pro
babi
lity
of si
gnifi
cant
adv
erse
impa
cts
1.Do
cum
ente
d fa
talit
ies
are
less
th
an
pred
icte
d an
d ar
e no
t sig
nific
ant,
and
no
ESA
or
BGEP
A sp
ecie
s ar
e af
fect
ed…
……
……
…..…
.....n
o fu
rthe
r mon
itorin
g or
miti
gatio
n ne
eded
2.
Docu
men
ted
fata
litie
s are
less
than
pre
dict
ed b
ut a
re st
ill si
gnifi
cant
, an
d no
ES
A or
BG
EPA
spec
ies
are
affe
cted
……
……
……
…fu
rthe
r m
onito
ring
or m
itiga
tion
need
ed
3.Fa
talit
ies
are
equa
l to
or g
reat
er t
han
pred
icte
d an
d ar
e sig
nific
ant
OR
ESA
or B
GEPA
spe
cies
are
affe
cted
……
……
…..…
..com
mun
icat
e w
ith S
ervi
ce re
gard
ing
addi
tiona
l miti
gatio
n
TIER
4b
(See
Tab
le 3
, pg.
42)
A.
Spec
ies o
f hab
itat f
ragm
enta
tion
conc
ern
pote
ntia
lly p
rese
nt?
1.N
o……
……
……
……
……
……
……
……
……
……
……
….n
o fu
rthe
r stu
dies
nee
ded
2.Ye
s, a
nd:
a.Ti
er 3
stud
ies d
o no
t con
firm
pre
senc
e…no
furt
her s
tudi
es n
eede
d b.
Tier
3
stud
ies
conf
irm
pres
ence
, bu
t no
sig
nific
ant
adve
rse
impa
cts p
redi
cted
, and
: i.
Tier
4b
stud
ies c
onfir
m T
ier 3
pre
dict
ions
…..…
……
….…
.no
furt
her
stud
ies o
r miti
gatio
n ne
eded
ii.
Tier
4b
st
udie
s in
dica
te
pote
ntia
lly
signi
fican
t ad
vers
e im
pact
s ……
……
……
.Tie
r 5 st
udie
s and
miti
gatio
n m
ay b
e ne
eded
c.
Tier
3 s
tudi
es c
onfir
m p
rese
nce,
and
sig
nific
ant
adve
rse
impa
cts
pred
icte
d an
d m
itiga
tion
plan
is
deve
lope
d an
d im
plem
ente
d,
and:
i.
Tier
4b
stud
ies
dete
rmin
e m
itiga
tion
is ef
fect
ive
……
……
……
….n
o fu
rthe
r stu
dies
or m
itiga
tion
need
ed
ii.Ti
er 4
b st
udie
s de
term
ine
miti
gatio
n no
t effe
ctiv
e……
…...
furt
her
miti
gatio
n an
d, w
here
app
ropr
iate
, Tie
r 5 st
udie
s nee
ded

U.S. Fish and Wildlife Service Land-Based Wind Energy Guidelines
10
Considering Risk in the Tiered Approach
In the context of these Guidelines, risk refers to the likelihood that adverse impacts will occur to individuals or populations of species of concern as a result of wind energy development and operation. Estimates of fatality risk can be used in a relative sense, allowing comparisons among projects, alternative development designs, and in the evaluation of potential risk to populations. Because there are relatively few methods available for direct estimation of risk, a weight-of-evidence approach is often used (Anderson et al. 1999). Until such time that reliable risk predictive models are developed regarding avian and bat fatality and wind energy projects, estimates of risk would typically be qualitative, but should be based upon quantitative site information.
For the purposes of these Guidelines, risk can also be defined in the context of populations, but that calculation is more complicated as it could involve estimating the reduction in population viability as indicated by demographic metrics such as growth rate, size of the population, or survivorship, either for local populations, metapopulations, or entire species. For most populations, risk cannot easily be reduced to a strict metric, especially in the absence of population viability models for most species. Consequently, estimating the quantitative risk to populations is usually beyond the scope of project studies due to the difficulties in evaluating these metrics, and therefore risk assessment will be qualitative.
Risk to habitat is a component of the evaluation of population risk. In this context, the estimated loss of habitat is evaluated in terms of the potential for population level effects (e.g., reduced survival or reproduction).
The assessment of risk should synthesize sufficient data collected at a project to estimate exposure and predict impact for individuals and their habitats for the species
of concern, with what is known about the population status of these species, and in communication with the relevant wildlife agency and industry wildlife experts. Predicted risk of these impacts could provide useful information for determining appropriate mitigation measures if determined to be necessary. In practice in the tiered approach, risk assessments conducted in Tiers 1 and 2 require less information to reach a risk-based decision than those conducted at higher tiers.
Cumulative Impacts of Project Development
Cumulative impacts are the comprehensive effect on the environment that results from the incremental impact of a project when added to other past, present, and reasonably foreseeable future actions. Developers are encouraged to work closely with federal and state agencies early in the project planning process to access any existing information on the cumulative impacts of individual projects on species and habitats at risk, and to incorporate it into project development and any necessary wildlife studies. To achieve that goal, it is important that agencies and organizations take the following actions to improve cumulative impacts analysis:
• reviewtherangeofdevelopment-related significant adverse impacts;
• determinewhichspeciesofconcern or their habitats within the landscape are most at risk of significant adverse impacts from wind development in conjunction with other reasonably foreseeable significant adverse impacts; and
• makethatdataavailableforregional or landscape level analysis.
The magnitude and extent of the impact on a resource depend on whether the cumulative impacts exceed the capacity for resource sustainability and productivity.
For projects that require a federal permit, funding, or other federal nexus, the lead federal agency is required to include a cumulative impacts analysis in their National Environmental Policy Act (NEPA) review. The federal action agency coordinates with the developer to obtain the necessary information for the NEPA review and cumulative impacts analysis. To avoid project delays, federal and state agencies are encouraged to use existing wildlife data for the cumulative impacts analysis until improved data are available.
Where there is no federal nexus, individual developers are not expected to conduct their own cumulative impacts analysis. However, a cumulative impacts analysis would help developers and other stakeholders better understand the significance of potential impacts on species of concern and their habitats.
Other Federal Agencies
Other federal agencies, such as the Bureau of Land Management, National Park Service, U.S. Department of Agriculture Forest Service and Rural Utility Service, Federal Energy Regulatory Commission and Department of Energy are often interested in and involved with wind project developments. These agencies have a variety of expertise and authorities they implement. Wind project developers on public lands will have to comply with applicable regulations and policies of those agencies. State and local agencies and Tribes also have additional interests and knowledge. The Service recommends that, where appropriate, wind project developers contact these agencies early in the tiered process and work closely with them throughout project planning and development to assure that projects address issues of concern to those agencies. The definition of “species of concern” in these Guidelines includes species which are trust resources of States and of federal agencies (See Glossary). In those instances where a project may significantly affect State trust

U.S. Fish and Wildlife Service Land-Based Wind Energy Guidelines
11
resources, wind energy developers should work closely with appropriate State agencies.
Relationship to Other Guidelines
These Guidelines replace the Service’s 2003 interim voluntary guidelines. The Service intends that these Guidelines, when used in concert with the appropriate regulatory tools, will form the best practical approach for conservation of species of concern. For instance, when developers find that a project
may affect an endangered or threatened species, they should comply with Section 7 or 10 of the ESA to obtain incidental take authorization. Other federal, state, tribal and local governments may use these Guidelines to complement their efforts to address wind energy development/wildlife interactions. They are not intended to supplant existing regional or local guidance, or landscape-scale tools for conservation planning, but were developed to provide a means of improving consistency
with the goals of the wildlife statutes that the Service is responsible for implementing. The Service will continue to work with states, tribes, and other local stakeholders on map-based tools, decision-support systems, and other products to help guide future development and conservation. Additionally, project proponents should utilize any relevant guidance of the appropriate jurisdictional entity, which will depend on the species and resources potentially affected by proposed development.
Pronghorn Antelope. Credit: Steve Hillebrand, USFWS

U.S. Fish and Wildlife Service Land-Based Wind Energy Guidelines
12
Chapter 2: Tier 1 – Preliminary Site Evaluation
For developers taking a first look at a broad geographic area, a preliminary evaluation of the general ecological context of a potential site or sites can serve as useful preparation for working with the federal, state, tribal, and/or local agencies. The Service is available to assist wind energy project developers to identify potential wildlife and habitat issues and should be contacted as early as possible in the company's planning process. With this internal screening process, the developer can begin to identify broad geographic areas of high sensitivity due to the presence of: 1) large blocks of intact native landscapes; 2) intact ecological communities; 3) fragmentation-sensitive species' habitats; or 4) other important landscape-scale wildlife values.
Tier 1 may be used in any of the following three ways:
1. To identify regions where wind energy development poses significant risks to species of concern or their habitats, including the fragmentation of large-scale habitats and threats to regional populations of federal- or state-listed species.
2. To “screen” a landscape or set of multiple potential sites to avoid those with the highest habitat values.
3. To begin to determine if a single identified potential site poses serious risk to species of concern or their habitats.
Tier 1 can offer early guidance about the sensitivity of the site within a larger landscape context; it can help direct development away from sites that will be associated with additional study need, greater mitigation requirements, and uncertainty; or it can identify those sensitive resources that will need
to be studied further to determine if the site can be developed without significant adverse impacts to the species of concern or local population(s). This may facilitate discussions with the federal, state, tribal, and/or local agencies in a region being considered for development. In some cases, Tier 1 studies could reveal serious concerns indicating that a site should not be developed.
Developers of distributed or community scale wind projects are typically considering limited geographic areas to install turbines. Therefore, they would not likely consider broad geographic areas. Nevertheless, they should consider the presence of habitats or species of concern before siting projects.
Development in some areas may be precluded by federal law. This designation is separate from a determination through the tiered approach that an area is not appropriate for development due to feasibility, ecological reasons, or other issues. Developers are encouraged to visit Service and other publicly available databases
or other available information during Tier 1 or Tier 2 to see if a potential wind energy area is precluded from development by federal law. Some areas may be protected from development through state or local laws or ordinances, and the appropriate agency should be contacted accordingly. Service field offices are available to answer questions where they are knowledgeable, guide developers to databases, and refer developers to other agency contacts.
Some areas may be inappropriate for large scale development because they have been recognized according to scientifically credible information as having high wildlife value, based solely on their ecological rarity and intactness (e.g., Audubon Important Bird Areas, The Nature Conservancy portfolio sites, state wildlife action plan priority habitats). It is important to identify such areas through the tiered approach, as reflected in Tier 1, Question 2 below. Many of North America's native landscapes are greatly diminished, with some existing at less than 10 percent of their pre-settlement occurrence.
Attwater’s prairie chicken. Credit: Gary Halvorsen, USFWS

U.S. Fish and Wildlife Service Land-Based Wind Energy Guidelines
13
Herbaceous scrub-shrub steppe in the Pacific Northwest and old growth forest in the Northeast represent such diminished native resources. Important remnants of these landscapes are identified and documented in various databases held by private conservation organizations, state wildlife agencies, and, in some cases, by the Service. Developers should collaborate with such entities specifically about such areas in the vicinity of a prospective project site.
Tier 1 Questions
Questions at each tier help determine potential environmental risks at the landscape scale for Tier 1 and project scale for Tiers 2 and 3. Suggested questions to be considered for Tier 1 include:
1. Are there species of concern present on the potential site(s), or is habitat (including designated critical habitat) present for these species?
2. Does the landscape contain areas where development is precluded by law or areas designated as sensitive according to scientifically credible information? Examples of designated areas include, but are not limited to: federally-designated critical habitat; high-priority conservation areas for non-government organizations (NGOs); or other local, state, regional, federal, tribal, or international categorizations.
3. Are there known critical areas of wildlife congregation, including, but not limited to: maternity roosts, hibernacula, staging areas, winter ranges, nesting sites, migration stopovers or corridors, leks, or other areas of seasonal importance?
4. Are there large areas of intact habitat with the potential for fragmentation, with respect to species of habitat fragmentation
concern needing large contiguous blocks of habitat?
Tier 1 Methods and Metrics
Developers who choose to conduct Tier 1 investigations would generally be able to utilize existing public or other readily available landscape-level maps and databases from sources such as federal, state, or tribal wildlife or natural heritage programs, the academic community, conservation organizations, or the developers’ or consultants’ own information. The Service recommends that developers conduct a review of the publicly available data. The analysis of available sites in the region of interest will be based on a blend of the information available in published and unpublished reports, wildlife range distribution maps, and other such sources. The developer should check with the Service Field Office for data specific to wind energy development and wildlife at the landscape scale in Tier 1.
Tier 1 Decision Points
The objective of the Tier 1 process is to help the developer identify a site or sites to consider further for wind energy development. Possible outcomes of this internal screening process include the following:
1. One or more sites are found within the area of investigation where the answer to each of the above Tier 1 questions is “no,” indicating a low probability of significant adverse impact to wildlife. The developer proceeds to Tier 2 investigations and characterization of the site or sites, answering the Tier 2 questions with site-specific data to confirm the validity of the preliminary indications of low potential for significant adverse impact.
2. If a developer answers “yes” to one or more of the Tier 1 questions, they should proceed to Tier 2 to further assess the probability of significant adverse
impacts to wildlife. A developer may consider abandoning the area or identifying possible means by which the project can be modified to avoid or minimize potential significant adverse impacts.
3. The data available in the sources described above are insufficient to answer one or more of the Tier 1 questions. The developer proceeds to Tier 2, with a specific emphasis on collecting the data necessary to answer the Tier 2 questions, which are inclusive of those asked at Tier 1.

U.S. Fish and Wildlife Service Land-Based Wind Energy Guidelines
14
Chapter 3: Tier 2 – Site Characterization
At this stage, the developer has narrowed consideration down to specific sites, and additional data may be necessary to systematically and comprehensively characterize a potential site in terms of the risk wind energy development would pose to species of concern and their habitats. In the case where a site or sites have been selected without the Tier 1 preliminary evaluation of the general ecological context, Tier 2 becomes the first stage in the site selection process. The developer will address the questions asked in Tier 1; if addressing the Tier 1 questions here, the developer will evaluate the site within a landscape context. However, a distinguishing feature of Tier 2 studies is that they focus on site-specific information and should include at least one visit by a knowledgeable biologist to the prospective site(s). Because Tier 2 studies are preliminary, normally one reconnaissance level site visit will be adequate as a “ground-truth” of available information. Notwithstanding, if key issues are identified that relate to varying conditions and/or seasons, Tier 2 studies should include enough site visits during the appropriate times of the year to adequately assess these issues for the prospective site(s).
If the results of the site assessment indicate that one or more species of concern are present, a developer should consider applicable regulatory or other agency processes for addressing them. For instance, if migratory birds and bats are likely to experience significant adverse impacts by a wind project at the proposed site, a developer should identify and document possible actions that will avoid or compensate for those impacts. Such actions might include, but not be limited to, altering locations of turbines or turbine arrays, operational changes, or compensatory mitigation. As soon as a developer anticipates that
a wind energy project is likely to result in a take of bald or golden eagles, a developer should prepare an ECP and, if necessary, apply for a programmatic take permit. As soon as a developer realizes endangered or threatened species are present and likely to be affected by a wind project located there, a federal agency should consult with the Service under Section 7(a)(2) of the ESA if the project has a federal nexus or the developer should apply for a section 10(a)(1)(B) incidental take permit if there is not a federal nexus, and incidental take of listed wildlife is anticipated. State, tribal, and local jurisdictions may have additional permitting requirements.
Developers of distributed or community scale wind projects are typically considering limited geographic areas to install turbines. Therefore, they would likely be familiar with conditions at the site where they are considering installing a turbine. Nevertheless, they should do preliminary site evaluations to determine the presence of habitats or species of concern before siting projects.
Tier 2 Questions
Questions suggested for Tier 2 can be answered using credible, publicly available information that includes published studies, technical reports, databases, and information from agencies, local conservation organizations, and/or local experts. Developers or consultants working on their behalf should contact the federal, state, tribal, and local agencies that have jurisdiction or management authority and responsibility over the potential project.
1. Are known species of concern present on the proposed site, or is habitat (including designated critical habitat) present for these species?
2. Does the landscape contain areas where development is precluded by law or designated as sensitive according to scientifically credible information? Examples of designated areas include, but are not limited to: federally-designated critical habitat;
Open landscape with wind turbines. Credit: NREL

U.S. Fish and Wildlife Service Land-Based Wind Energy Guidelines
15
high-priority conservation areas for NGOs; or other local, state, regional, federal, tribal, or international categorizations.
3. Are there plant communities of concern present or likely to be present at the site(s)?
4. Are there known critical areas of congregation of species of concern, including, but not limited to: maternity roosts, hibernacula, staging areas, winter ranges, nesting sites, migration stopovers or corridors, leks, or other areas of seasonal importance?
5. Using best available scientific information has the developer or relevant federal, state, tribal, and/or local agency identified the potential presence of a population of a species of habitat fragmentation concern?
6. Which species of birds and bats, especially those known to be at risk by wind energy facilities, are likely to use the proposed site based on an assessment of site attributes?
7. Is there a potential for significant adverse impacts to species of concern based on the answers to the questions above, and considering the design of the proposed project?
Tier 2 Methods and Metrics
Obtaining answers to Tier 2 questions will involve a more thorough review of the existing site-specific information than in Tier 1. Tier 2 site characterizations studies will generally contain three elements:
1. A review of existing information, including existing published or available literature and databases and maps of topography, land use and land cover, potential wetlands, wildlife, habitat, and sensitive plant distribution. If agencies have documented potential habitat for species of habitat fragmentation concern,
this information can help with the analysis.
2. Contact with agencies and organizations that have relevant scientific information to further help identify if there are bird, bat or other wildlife issues. The Service recommends that the developer make contact with federal, state, tribal, and local agencies that have jurisdiction or management authority over the project or information about the potentially affected resources. In addition, because key NGOs and relevant local groups are often valuable sources of relevant local environmental information, the Service recommends that developers contact key NGOs, even if confidentiality concerns preclude the developer from identifying specific project location information at this stage. These contacts also provide an opportunity to identify other potential issues and data not already identified by the developer.
3. One or more reconnaissance level site visits by a wildlife biologist to evaluate current vegetation/habitat coverage and land management/use. Current habitat and land use practices will be noted to help in determining the baseline against which potential impacts from the project would be evaluated. The vegetation/habitat will be used for identifying potential bird and bat resources occurring at the site and the potential presence of, or suitable habitat for, species of concern. Vegetation types or habitats will be noted and evaluated against available information such as land use/land cover mapping. Any sensitive resources located during the site visit will be noted and mapped or digital location data recorded for future reference. Any individuals or signs of species of concern observed during the site visit will be noted. If land access agreements are not in place, access to the site will be limited to public roads.
Specific resources that can help answer each Tier 2 question include:
1. Are known species of concern present on the proposed site, or is habitat (including designated critical habitat) present for these species?
Information review and agency contact: locations of state and federally listed, proposed and candidate species and species of concern are frequently documented in state and federal wildlife databases. Examples include published literature such as: Natural Heritage Databases, State Wildlife Action Plans, NGOs publications, and developer and consultant information, or can be obtained by contacting these entities.
Site Visit: To the extent practicable, the site visit(s) should evaluate the suitability of habitat at the site for species identified and the likelihood of the project to adversely affect the species of concern that may be present.
2. Does the landscape contain areas where development is precluded by law or designated as sensitive according to scientifically credible information? Examples of designated areas include, but are not limited to: federally-designated critical habitat; high-priority conservation areas for NGOs; or other local, state, regional, federal, tribal, or international categorizations.
Information review and agency contact such as: maps of political and administrative boundaries; National Wetland Inventory data files; USGS National Land Cover data maps; state, federal and tribal agency data on areas that have been designated to preclude development, including wind energy development; State Wildlife Action Plans; State Land and Water Resource Plans; Natural Heritage databases; scientifically credible information provided by NGO and local

U.S. Fish and Wildlife Service Land-Based Wind Energy Guidelines
16
resources; and the additional resources listed in Appendix C: Sources of Information Pertaining to Methods to Assess Impacts to Wildlife of this document, or through contact of agencies and NGOs, to determine the presence of high priority habitats for species of concern or conservation areas.
Site Visit: To the extent practicable, the site visit(s) should characterize and evaluate the uniqueness of the site vegetation relative to surrounding areas.
3. Are plant communities of concern present or likely to be present at the site(s)?
Information review and agency contact such as: Natural Heritage Data of state rankings (S1, S2, S3) or globally (G1, G2, G3) ranked rare plant communities.
Site Visit: To the extent practicable, the site visit should evaluate the topography, physiographic features and uniqueness of the site vegetation in relation to the surrounding region. If plant communities of concern are present, developers should also assess in Tier 3 whether the proposed project poses risk of significant adverse impacts and opportunities for mitigation.
4. Are there known critical areas of wildlife congregation, including, but not limited to, maternity roosts, hibernacula, staging areas, winter ranges, nesting sites, migration stopovers or corridors, leks, or other areas of seasonal importance?
Information review and agency contact such as: existing databases, State Wildlife Action Plan, Natural Heritage Data, and NGO and agency information regarding the presence of Important Bird Areas, migration corridors or stopovers, leks, bat hibernacula or maternity roosts, or game winter ranges at the site and in the surrounding area.
Site Visit: To the extent practicable, the site visit should, during appropriate times to adequately assess these issues for prospective site(s), evaluate the topography, physiographic features and uniqueness of the site in relation to the surrounding region to assess the potential for the project area to concentrate resident or migratory birds and bats.
5. Using best available scientific information, has the relevant federal, state, tribal, and/or local agency determined the potential presence of a population of a species of habitat fragmentation concern? If not, the developer need not assess impacts of the proposed project on habitat fragmentation.
Habitat fragmentation is defined as the separation of a block of habitat for a species into segments, such that the genetic or demographic viability of the populations surviving in the remaining habitat segments is reduced; and risk, in this case, is defined as the probability that this fragmentation will occur as a result of the project. Site clearing, access roads, transmission lines and turbine tower arrays remove habitat and displace some species
Tall grass prairie. Credit: Amy Thornburg, USFWS

U.S. Fish and Wildlife Service Land-Based Wind Energy Guidelines
17
of wildlife, and may fragment continuous habitat areas into smaller, isolated tracts. Habitat fragmentation is of particular concern when species require large expanses of habitat for activities such as breeding and foraging.
Consequences of isolating local populations of some species include decreased reproductive success, reduced genetic diversity, and increased susceptibility to chance events (e.g. disease and natural disasters), which may lead to extirpation or local extinctions. In addition to displacement, development of wind energy infrastructure may result in additional loss of habitat for some species due to “edge effects” resulting from the break-up of continuous stands of similar vegetation resulting in an interface (edge) between two or more types of vegetation. The extent of edge effects will vary by species and may result in adverse impacts from such effects as a greater susceptibility to colonization by invasive species, increased risk of predation, and competing species favoring landscapes with a mosaic of vegetation.
Site Visit: If the answer to Tier 2 Question 5 is yes, developers should use the general framework for evaluating habitat fragmentation at a project site in Tier 2 outlined below. Developers and the Service may use this method to analyze the impacts of habitat fragmentation at wind development project sites on species of habitat fragmentation concern. Service field offices may be able to provide the available information on habitat types, quality and intactness. Developers may use this information in combination with site-specific information on the potential habitats to be impacted by a potential development and how they will be impacted.
General Framework for Evaluating Habitat Fragmentation at a Project Site (Tier 2)
A. The developer should define the study area. The study area should not only include the project site for the proposed project, but be based on the distribution of habitat for the local population of the species of habitat fragmentation concern.
B. The developer should analyze the current habitat quality and spatial configuration of the study area for the species of habitat fragmentation concern.
i. Use recent aerial and remote imagery to determine distinct habitat patches, or boundaries, within the study area, and the extent of existing habitat fragmenting features (e.g., highways).
ii. Assess the level of fragmentation of the existing habitat for the species of habitat fragmentation concern and categorize into three classes:
• High quality: little or no apparent fragmentation of intact habitat
• Medium quality: intact habitat exhibiting some recent disturbance activity
• Low quality: Extensive fragmentation of habitat (e.g., row-cropped agricultural lands, active surface mining areas)
C. The developer should determine potential changes in quality and spatial configuration of the habitat in the study area if development were to proceed as proposed using existing site information.
D. The developer should provide the collective information from steps A-C for all potential developments to the Service for use in assessing whether the habitat impacts, including habitat fragmentation, are likely to affect population viability of the potentially affected species of habitat fragmentation concern.
6. Which species of birds and bats, especially those known to be at risk by wind energy facilities, are likely to use the proposed site based on an assessment of site attributes?
Information review and agency contact: existing published information and databases from NGOs and federal and state resource agencies regarding the potential presence of:
• Raptors:speciespotentiallypresent by season
• Prairiegrouseandsagegrouse: species potentially present by season and location of known leks
• Otherbirds:speciespotentially present by season that may be at risk of collision or adverse impacts to habitat, including loss, displacement and fragmentation
• Bats:specieslikelytobeimpacted by wind energy facilities and likely to occur on or migrate through the site
Site Visit: To the extent practicable, the site visit(s) should identify landscape features or habitats that could be important to raptors, prairie grouse, and other birds that may be at risk of adverse impacts, and bats, including nesting and brood-rearing habitats, areas of high prey density, movement corridors and features such as ridges that may concentrate raptors. Raptors, prairie grouse, and other presence or sign of species of concern seen during the site visit should be noted, with species identification if possible.
7. Is there a potential for significant adverse impacts to species of concern based on the answers to the questions above, and considering the design of the proposed project?

U.S. Fish and Wildlife Service Land-Based Wind Energy Guidelines
18
The developer has assembled answers to the questions above and should make an initial evaluation of the probability of significant adverse impacts to species of concern and their habitats. The developer should make this evaluation based on assessments of the potential presence of species of concern and their habitats, potential presence of critical congregation areas for species of concern, and any site visits. The developer is encouraged to communicate the results of these assessments with the Service.
Tier 2 Decision Points
Possible outcomes of Tier 2 include the following:
1. The most likely outcome of Tier 2 is that the answer to one or more Tier 2 questions is inconclusive to address wildlife risk, either due to insufficient data to answer the question or because of uncertainty about what the answers indicate. The developer proceeds to Tier 3, formulating questions, methods, and assessment of potential mitigation measures based on issues raised in Tier 2 results.
2. Sufficient information is available to answer all Tier 2 questions, and the answer to each Tier 2 question indicates a low probability of significant adverse impact to wildlife (for example, infill or expansion of an existing facility where impacts have been low and Tier 2 results indicate that conditions are similar, therefore wildlife risk is low). The developer may then decide to proceed to obtain state and local permit (if required), design, and construction following best management practices (see Chapter 7: Best Management Practices).
3. Sufficient information is available to answer all Tier 2 questions, and the answer to each Tier 2 question indicates a moderate probability of significant adverse impacts to species of concern or their
habitats. The developer should proceed to Tier 3 and identify measures to mitigate potential significant adverse impacts to species of concern.
4. The answers to one or more Tier 2 questions indicate a high probability of significant adverse impacts to species of concern or their habitats that:
a) Cannot be adequately mitigated. The proposed site should be abandoned.
b) Can be adequately mitigated. The developer should proceed to Tier 3 and identify measures to mitigate potential significant adverse impacts to species of concern or their habitats.
Greater sage grouse, Credit: Stephen Ting, USFWS

U.S. Fish and Wildlife Service Land-Based Wind Energy Guidelines
19
Chapter 4: Tier 3 – Field Studies to Document Site Wildlife and Habitat and Predict Project ImpactsTier 3 is the first tier in which a developer would conduct quantitative and scientifically rigorous studies to assess the potential risk of the proposed project. Specifically, these studies provide pre-construction information to:
• Furtherevaluateasitefordetermining whether the wind energy project should be developed or abandoned
• Designandoperateasitetoavoidor minimize significant adverse impacts if a decision is made to develop
• Designcompensatorymitigationmeasures if significant adverse habitat impacts cannot acceptably be avoided or minimized
• Determinedurationandlevelof effort of post-construction monitoring. If warranted, provide the pre-construction component of post-construction studies necessary to estimate and evaluate impacts
At the beginning of Tier 3, a developer should communicate with the Service on the pre-construction studies. At the end of Tier 3, developers should communicate with the Service regarding the results of the Tier 3 studies and consider the Service’s comments and recommendations prior to completing the Tier 3 decision process. The Service will provide written comments to a developer that identify concerns and recommendations to resolve the concerns based on study results and project development plans.
Not all Tier 3 studies will continue into Tiers 4 or 5. For example, surveys conducted in Tier 3 for species of concern may indicate one or more species are not present at the proposed project site, or siting decisions could be made in Tier 3 that remove identified concerns, thus removing the need for continued efforts in later tiers. Additional detail on the design issues for post-construction studies that begin in Tier 3 is provided in the discussion of methods and metrics in Tier 3.
Tier 3 Questions
Tier 3 begins as the other tiers, with problem formulation: what additional studies are necessary to enable a decision as to whether the proposed project can proceed to construction or operation or should be abandoned? This step includes an evaluation of data gaps identified by Tier 2 studies as well as the gathering of data necessary to:
• Designaprojecttoavoidorminimize predicted risk
• Evaluatepredictionsofimpact and risk through post-construction comparisons of estimated impacts
• Identifycompensatorymitigationmeasures, if appropriate, to offset significant adverse impacts that cannot be avoided or minimized
The problem formulation stage for Tier 3 also will include an assessment of which species identified in Tier 1 and/or Tier 2 will be studied further in the site risk assessment. This determination is based on analysis of existing data from Tier 1 and existing site-specific data and Project Site (see Glossary in Appendix A) visit(s) in Tier 2, and on the likelihood of presence and the degree of adverse impact to species or their habitat. If the habitat is suitable for a species needing further study and the site occurs within the historical range of the species, or is near the existing range of the species but presence has not been documented, additional field studies may be appropriate. Additional analyses should not be necessary if a species is unlikely to be present or is present but adverse impact is unlikely or of minor significance.
Tier 3 studies address many of the questions identified for Tiers 1 and 2, but Tier 3 studies differ because they attempt to quantify
Turkey vulture and wind turbine. Credit: Rachel London, USFWS

U.S. Fish and Wildlife Service Land-Based Wind Energy Guidelines
20
the distribution, relative abundance, behavior, and site use of species of concern. Tier 3 data also attempt to estimate the extent that these factors expose these species to risk from the proposed wind energy facility. Therefore, in answering Tier 3 questions 1-3, developers should collect data sufficient to analyze and answer Tier 3 questions 4-6. High risk sites may warrant additional years of pre-construction studies. The duration and intensity of studies needed should be determined through communication with the Service.
If Tier 3 studies identify species of concern or important habitats, e.g., wetlands, which have specific regulatory processes and requirements, developers should work with appropriate state, tribal, or federal agencies to obtain required authorizations or permits.
Tier 3 studies should be designed to answer the following questions:
1. Do field studies indicate that species of concern are present on or likely to use the proposed site?
2. Do field studies indicate the potential for significant adverse impacts on affected population of species of habitat fragmentation concern?
3. What is the distribution, relative abundance, behavior, and site use of species of concern identified in Tiers 1 or 2, and to what extent do these factors expose these species to risk from the proposed wind energy project?
4. What are the potential risks of adverse impacts of the proposed wind energy project to individuals and local populations of species of concern and their habitats? (In the case of rare or endangered species, what are the possible impacts to such species and their habitats?)
5. How can developers mitigate identified significant adverse impacts?
6. Are there studies that should be initiated at this stage that would be continued in post-construction?
The Service encourages the use of common methods and metrics in Tier 3 assessments for measuring wildlife activity and habitat features. Common methods and metrics provide great benefit over the long-term, allowing for comparisons among projects and for greater certainty regarding what will be asked of the developer for a specific project. Deviation from commonly used methods should be carefully considered, scientifically justifiable and discussed with federal, tribal, or state natural resource agencies, or other credible experts, as appropriate. It may be useful to consult other scientifically credible information sources.
Tier 3 studies will be designed to accommodate local and regional characteristics. The specific protocols by which common methods and metrics are implemented in Tier 3 studies depend on the question being addressed, the species or ecological communities being studied and the characteristics of the study sites. Federally-listed threatened and endangered species, eagles, and some other species of concern and their habitats, may have specific protocols required by local, state or federal agencies. The need for special surveys and mapping that address these species and situations should be discussed with the appropriate stakeholders.
In some instances, a single method will not adequately assess potential collision risk or habitat impact. For example, when there is concern about moderate or high risk to nocturnally active species, such as migrating passerines and local and migrating bats, a combination of remote sensing tools such as radar, and acoustic monitoring for bats and indirect inference from diurnal
bird surveys during the migration period may be necessary. Answering questions about habitat use by songbirds may be accomplished by relatively small-scale observational studies, while answering the same question related to wide-ranging species such as prairie grouse and sage grouse may require more time-consuming surveys, perhaps including telemetry.
Because of the points raised above and the need for flexibility in application, the Guidelines do not make specific recommendations on protocol elements for Tier 3 studies. The peer-reviewed scientific literature (such as the articles cited throughout this section) contains numerous recently published reviews of methods for assessing bird and bat activity, and tools for assessing habitat and landscape level risk. Details on specific methods and protocols for recommended studies are or will be widely available and should be consulted by industry and agency professionals.
Many methods for assessing risk are components of active research involving collaborative efforts of public-private research partnerships with federal, state and tribal agencies, wind energy developers and NGOs interested in wind energy-wildlife interactions (e.g., Bats and Wind Energy Cooperative and the Grassland Shrub Steppe Species Cooperative). It is important to recognize the need to integrate the results of research that improves existing methods or describes new methodological developments, while acknowledging the value of utilizing common methods that are currently available.
The methods and metrics that may be appropriate for gathering data to answer Tier 3 questions are compiled and outlined in the Technical Resources section, page 26. These are not meant to be all inclusive and other methods and metrics are available, such as the NWCC Methods & Metrics document (Strickland et al. 2011) and others listed in Appendix C:

U.S. Fish and Wildlife Service Land-Based Wind Energy Guidelines
21
Sources of Information Pertaining to Methods to Assess Impacts to Wildlife.
Each question should be considered in turn, followed by a discussion of the methods and their applicability.
1. Do field studies indicate that species of concern are present on or likely to use the proposed site?
In many situations, this question can be answered based on information accumulated in Tier 2. Specific presence/absence studies may not be necessary, and protocol development should focus on answering the remaining Tier 3 questions. Nevertheless, it may be necessary to conduct field studies to determine the presence, or likelihood of presence, when little information is available for a particular site. The level of effort normally contemplated for Tier 3 studies should detect common species and species that are relatively rare, but which visit a site regularly (e.g., every year). In the event a species of concern is very rare and only occasionally visits a site, a determination of “likely to occur” would be inferred from the habitat at the site and historical records of occurrence on or near the site.
State, federal and tribal agencies often require specific protocols be followed when species of concern are potentially present on a site. The methods and protocols for determining presence of species of concern at a site are normally established for each species and required by federal, state and tribal resource agencies. Surveys should sample the wind turbine sites and applicable disturbance area during seasons when species are most likely present. Normally, the methods and protocols by which they are applied also will include an estimate of relative abundance. Most presence/absence surveys should be done following a probabilistic sampling protocol to allow statistical extrapolation to the area and time of interest.
Determining the presence of diurnally or nocturnally active mammals, reptiles, amphibians, and other species of concern will typically be accomplished by following agency-required protocols. Most listed species have required protocols for detection (e.g., the black-footed ferret). State, tribal and federal agencies should be contacted regarding survey protocols for those species of concern. See Corn and Bury 1990, Olson et al. 1997, Bailey et al. 2004, Graeter et al. 2008 for examples of reptile and amphibian protocols, survey and analytical methods. See Tier 3 Study Design Considerations on page 24 for further details.
2. Do field studies indicate the potential for significant adverse impacts on affected populations of species of habitat fragmentation concern?
If Tier 2 studies indicate the presence of species of habitat fragmentation concern, but existing information did not allow for a complete analysis of potential impacts and decision-making, then additional studies and analyses should take place in Tier 3.
As in Tier 2, the particulars of the analysis will depend on the species of habitat fragmentation concern and how habitat block size and
fragmentation are defined for the life cycles of that species, the likelihood that the project will adversely affect a local population of the species and the significance of these impacts to the viability of that population.
To assess habitat fragmentation in the project vicinity, developers should evaluate landscape characteristics of the proposed site prior to construction and determine the degree to which habitat for species of habitat fragmentation concern will be significantly altered by the presence of a wind energy facility.
A general framework for evaluating habitat fragmentation at a project site, following that described in Tier 2, is outlined on page 27. This framework should be used in those circumstances when the developer, or a relevant federal, state, tribal and/or other local agency determines the potential presence of a population of a species of habitat fragmentation concern that may be adversely affected by the project. Otherwise, the developer need not assess the impacts of the proposed project on habitat fragmentation. This method for analysis of habitat fragmentation at project sites must be adapted to the local population of the species of habitat fragmentation concern potentially affected by the proposed development.
3. What is the distribution, relative abundance, behavior, and site use of species of concern identified in Tiers 1 or 2, and to what extent do these factors expose these species to risk from the proposed wind energy project?
For those species of concern that are considered at risk of collisions or habitat impacts, the questions to be answered in Tier 3 include: where are they likely to occur (i.e., where is their habitat) within a project site or vicinity, when might they occur, and in what abundance. The spatial distribution of species at risk of collision can influence how a site is developed. This distribution should include the airspace for flying species with respect to the rotor-
Avian Radar

U.S. Fish and Wildlife Service Land-Based Wind Energy Guidelines
22
swept zone. The abundance of a species and the spatial distribution of its habitat can be used to determine the relative risk of impact to species using the sites, and the absolute risk when compared to existing projects where similar information exists. Species abundance and habitat distribution can also be used in modeling risk factors.
Surveys for spatial distribution
and relative abundance require coverage of the wind turbine sites and applicable site disturbance area, or a sample of the area using observational methods for the species of concern during the seasons of interest. As with presence/absence (see Tier 3, question 1, above) the methods used to determine distribution, abundance, and behavior may vary with the species and its ecology. Spatial distribution is determined by applying presence/absence or using surveys in a probabilistic manner over the entire area of interest. Suggested survey protocols for
birds, bats, and other wildlife are found in the Technical Resources section on page 26.
4. What are the potential risks of adverse impacts of the proposed wind energy project to individuals and local populations of species of concern and their habitats? (In the case of rare or endangered species, what are the possible
impacts to such species and their habitats?)
Methods used for estimating risk will vary with the species of concern. For example, estimating potential bird fatalities in Tier 3 may be accomplished by comparing exposure estimates (described earlier in estimates of bird use) at the proposed site with exposure estimates and fatalities at existing projects with similar characteristics (e.g., similar technology, landscape, and weather conditions). If models are used, they may provide an additional tool for estimating
fatalities, and have been used in Australia (Organ and Meredith 2004), Europe (Chamberlin et al. 2006), and the United States (Madders and Whitfield 2006). As with other prediction tools, model predictions should be evaluated and compared with post-construction fatality data to validate the models. Models should be used as a subcomponent of a risk assessment based on the best available empirical data. A statistical model based on the relationship of pre-construction estimates of raptor abundance and post-construction raptor fatalities is described in Strickland et al. (2011) and promises to be a useful tool for risk assessment.
Collision risk to individual birds and bats at a particular wind energy facility may be the result of complex interactions among species distribution, relative abundance, behavior, weather conditions (e.g., wind, temperature) and site characteristics. Collision risk for an individual may be low regardless of abundance if its behavior does not place it within the rotor-swept zone. If individuals frequently occupy the rotor-swept zone but effectively avoid collisions, they are also at low risk of collision with a turbine (e.g., ravens). Alternatively, if the behavior of individuals frequently places them in the rotor-swept zone, and they do not actively avoid turbine blade strikes, they are at higher risk of collisions with turbines regardless of abundance. For a given species (e.g., red-tailed hawk), increased abundance increases the likelihood that individuals will be killed by turbine strikes, although the risk to individuals will remain about the same. The risk to a population increases as the proportion of individuals in the population at risk to collision increases.
At some projects, bat fatalities are higher than bird fatalities, but the exposure risk of bats at these facilities is not fully understood (National Research Council (NRC) 2007). Horn et al. (2008) and Cryan (2008) hypothesize that bats are attracted to turbines, which, if true, would further complicate estimation
Whooping crane. Credit: Ryan Hagerty, USFWS

U.S. Fish and Wildlife Service Land-Based Wind Energy Guidelines
23
of exposure. Further research is required to determine if bats are attracted to turbines and if so, to evaluate 1) the influence on Tier 2 methods and predictions, and 2) if this increased individual risk translates into higher population-level impacts for bats.
The estimation of indirect impact risk requires an understanding of animal behavior in response to a project and its infrastructure, and a pre-construction estimate of presence/absence of species whose behavior would cause them to avoid areas in proximity to turbines, roads and other components of the project. The amount of habitat that is lost to indirect impacts will be a function of the sensitivity of individuals to the project and to the activity levels associated with the project’s operations. The population-level significance of this indirect impact will depend on the amount of habitat available to the affected population. If the indirect impacts include habitat fragmentation, then the risk to the demographic and genetic viability of the isolated animals is increased. Quantifying cause and effect may be very difficult, however.
5. How can developers mitigate identified significant adverse impacts?
Results of Tier 3 studies should provide a basis for identifying measures to mitigate significant adverse impacts predicted for species of concern. Information on wildlife use of the proposed area is most useful when designing a project to avoid or minimize significant adverse impacts. In cases of uncertainty with regard to impacts to species of concern, additional studies may be necessary to quantify significant adverse impacts and determine the need for mitigation of those impacts.
Chapter 7, Best Management Practices, and Chapter 8, Mitigation, outline measures that can be taken
to mitigate impacts throughout all phases of a project.
The following discussion of prairie grouse and sage grouse as species of concern illustrates the uncertainty mentioned above by describing the present state of scientific knowledge relative to these species, which should be considered when designing mitigation measures. The extent of the impact of wind energy development on prairie grouse and sage grouse lekking activity (e.g., social structure, mating success, persistence) and the associated impacts on productivity (e.g., nesting, nest success, chick survival) is poorly understood (Arnett et al. 2007, NRC 2007, Manville 2004). However, recent published research documents that anthropogenic features (e.g., tall structures, buildings, roads, transmission lines) can adversely impact vital rates (e.g., nesting, nest success, lekking behavior) of lesser prairie-chickens (Pruett et al. 2009, Pitman et al. 2005, Hagen et al. 2009, Hagen et al. 2011) and greater prairie-chickens over long distances. Pitman et al. (2005) found that transmission lines reduced nesting of lesser prairie chicken by 90 percent out to a distance of 0.25 miles, improved roads at a distance of 0.25 miles, a house at 0.3 miles, and a power plant at >0.6 miles. Reduced nesting activity of lesser prairie chickens may extend farther, but Pitman et al. (2005) did not analyze their data for lower impacts (less than 90 percent reduction in nesting) of those anthropogenic features on lesser prairie chicken nesting activities at greater distances. Hagen et al. (2011) suggested that development within 1 to 1 ½ miles of active leks of prairie grouse may have significant adverse impacts on the affected grouse population. It is not unreasonable to infer that impacts from wind energy facilities may be similar to those from these other anthropogenic structures. Kansas State University, as part of the National Wind Coordinating
Collaborative’s Grassland and Shrub Steppe Species Subgroup, is undertaking a multi-year telemetry study to evaluate the effects of a proposed wind-energy facility on displacement and demographic parameters (e.g., survival, nest success, brood success, fecundity) of greater prairie-chickens in Kansas.5
The distances over which anthropogenic activities impact sage grouse are greater than for prairie grouse. Based primarily on data documenting reduced fecundity (a combination of nesting, clutch size, nest success, juvenile survival, and other factors) in sage grouse populations near roads, transmissions lines, and areas of oil and gas development/production (Holloran 2005, Connelly et al. 2000), development within three to five miles (or more) of active sage grouse leks may have significant adverse impacts on the affected grouse population. Lyon and Anderson (2003) found that in habitats fragmented by natural gas development, only 26 percent of hens captured on disturbed leks nested within 1.8 miles of the lek of capture, whereas 91 percent of hens from undisturbed areas nested within the same area. Holloran (2005) found that active drilling within 3.1 miles of sage grouse lek reduced the number of breeding males by displacing adult males and reducing recruitment of juvenile males. The magnitudes and proximal causes (e.g., noise, height of structures, movement, human activity, etc.) of those impacts on vital rates in grouse populations are areas of much needed research (Becker et al. 2009). Data accumulated through such research may improve our understanding of the buffer distances necessary to avoid or minimize significant adverse impacts to prairie grouse and sage grouse populations.
When significant adverse impacts cannot be fully avoided or adequately minimized, some form of compensatory mitigation may be
5 www.nationalwind.org

U.S. Fish and Wildlife Service Land-Based Wind Energy Guidelines
24
appropriate to address the loss of habitat value. For example, it may be possible to mitigate habitat loss or degradation for a species of concern by enhancing or restoring nearby habitat value comparable to that potentially influenced by the project.
6. Are there studies that should be initiated at this stage that would be continued in post-construction?
During Tier 3 problem formulation, it is necessary to identify the studies needed to address the Tier 3 questions. Consideration of how the resulting data may be used in conjunction with post-construction Tier 4 and 5 studies is also recommended. The design of post-construction impact or mitigation assessment studies will depend on the specific impact questions being addressed. Tier 3 predictions will be evaluated using data from Tier 4 studies designed to estimate fatalities for species of concern and impacts to their habitat, including species of habitat fragmentation concern. Tier 3 studies may demonstrate the need for mitigation of significant adverse impacts. Where Tier 3 studies indicate the potential for significant adverse direct and indirect impacts to habitat, Tier 4 studies will provide data that evaluate predictions of those impacts, and Tier 5 studies, if necessary, will provide data to evaluate the effect of those impacts on populations and the effectiveness of mitigation measures. Evaluations of the impacts of a project on demographic parameters of local populations, habitat use, or some other parameter(s) are considered Tier 5 studies, and typically will require data on these parameters prior to as well as after construction of the project.
Tier 3 Study Design Considerations
Specific study designs will vary from site to site and should be adjusted to the circumstances of individual projects. Study designs will depend on the types of questions, the specific project, and practical considerations. The most common considerations
include the area being studied, the species of concern and potential risk to those species, potentially confounding variables, time available to conduct studies, project budget, and the magnitude of the anticipated impacts. Studies will be necessary in part to assess a) which species of concern are present within the project area; b) how these species are using the area (behavior); and c) what risks are posed to them by the proposed wind energy project.
Assessing Presence
A developer should assess whether species of concern are likely to be present in the project area during the life of the project. Assessing species use from databases and site characteristics is a potential first step. However, it can be difficult to assess potential use by certain species from site characteristics alone. Various species in different locations may require developers to use specific survey protocols or make certain assumptions regarding presence. Project developers should seek local wildlife expertise, such as Service Field Office staff, in using the proper procedures and making assumptions.
Some species will present particular
challenges when trying to determine potential presence. For instance, species that a) are rare or cryptic; b) migrate, conduct other daily movements, or use areas for short periods; c) are small or nocturnal; or d) have become extirpated in parts of their historical range can be difficult to observe. One of these challenges is migration, broadly defined as the act of moving from one spatial unit to another (Baker 1978), or as a periodic movement of animals from one location to another. Migration is species-specific, and for birds and bats occurs throughout the year.
Assessing Site Use/Behavior
Developers should monitor potential sites to determine the types of migratory species present, what type of spatial and temporal use these species make of the site (e.g., chronology of migration or other use), and the ecological function the site may provide in terms of the migration cycle of these species. Wind developers should determine not only what species may migrate through a proposed development site and when, but also whether a site may function as a staging area or stopover habitat for wildlife on their migration pathway.
Rows of wind turbines. Credit: Joshua Winchell, USFWS

U.S. Fish and Wildlife Service Land-Based Wind Energy Guidelines
25
For some species, movements between foraging and breeding habitat, or between sheltering and feeding habitats, occur on a daily basis. Consideration of daily movements (morning and evening; coming and going) is a critical factor when considering project development.
Duration/Intensity of Studies
Where pre-construction assessments are warranted to help assess risk to wildlife, the studies should be of sufficient duration and intensity to ensure adequate data are collected to accurately characterize wildlife presence and use of the area. In ecological systems, resource quality and quantity can fluctuate rapidly. These fluctuations occur naturally, but human actions can significantly affect (i.e., increase or decrease) natural oscillations. Pre-construction monitoring and assessment of proposed wind energy sites are “snapshots in time,” showing occurrence or no occurrence of a species or habitat at the specific time surveyed. Often due to prohibitive costs, assessments and surveys are conducted for very low percentages (e.g., less than 5 percent) of the available sample time in a given year, however, these data are used to support risk analyses over the projected life of a project (e.g., 30 years of operations).
To establish a trend in site use and conditions that incorporates annual and seasonal variation in meteorological conditions, biological factors, and other variables, pre-construction studies may need to occur over multiple years. However, the level of risk and the question of data requirements will be based on site sensitivity, affected species, and the availability of data from other sources. Accordingly, decisions regarding studies should consider information gathered during the previous tiers, variability within and between seasons, and years where variability is likely to substantially affect answers to the Tier 3 questions. These studies should also be designed to collect data during relevant breeding, feeding, sheltering, staging, or migration
periods for each species being studied. Additionally, consideration for the frequency and intensity of pre-construction monitoring should be site-specific and determined through consultation with an expert authority based on their knowledge of the specific species, level of risk and other variables present at each individual site.
Assessing Risk to Species of Concern
Once likely presence and factors such as abundance, frequency of use, habitat use patterns, and behavior have been determined or assumed, the developer should consider and/or determine the consequences to the “populations” and species.
Below is a brief discussion of several types of risk factors that can be considered. This does not include all potential risk factors for all species, but addresses the most common ones.
Collision
Collision likelihood for individual birds and bats at a particular wind energy facility may be the result of complex interactions among species distribution, “relative abundance," behavior, visibility, weather conditions, and site characteristics. Collision likelihood for an individual may be low regardless of abundance if its behavior does not place it within the “rotor-swept zone.” Individuals that frequently occupy the rotor-swept zone but effectively avoid collisions are also at low likelihood of collision with a turbine.
Alternatively, if the behavior of individuals frequently places them in the rotor-swept zone, and they do not actively avoid turbine blade strikes, they are at higher likelihood of collisions with turbines regardless of abundance. Some species, even at lower abundance, may have a higher collision rate than similar species due to subtle differences in their ecology and behavior.
At many projects, the numbers of bat fatalities are higher than the numbers of bird fatalities, but
the exposure risk of bats at these facilities is not fully understood. Researchers (Horn et al. 2008 and Cryan 2008) hypothesize that some bats may be attracted to turbines, which, if true, would further complicate estimation of exposure. Further research is required to determine whether bats are attracted to turbines and if so, whether this increased individual risk translates into higher population-scale effects.
Habitat Loss and Degradation
Wind project development results in direct habitat loss and habitat modification, especially at sites previously undeveloped. Many of North America's native landscapes are greatly diminished or degraded from multiple causes unrelated to wind energy. Important remnants of these landscapes are identified and documented in various databases held by private conservation organizations, state wildlife agencies, and, in some cases, by the Service. Species that depend on these landscapes are susceptible to further loss of habitat, which will affect their ability to reproduce and survive. While habitat lost due to footprints of turbines, roads, and other infrastructure is obvious, less obvious is the potential reduction of habitat quality.
Habitat Fragmentation
Habitat fragmentation separates blocks of habitat for some species into segments, such that the individuals in the remaining habitat segments may suffer from effects such as decreased survival, reproduction, distribution, or use of the area. Site clearing, access roads, transmission lines, and arrays of turbine towers may displace some species or fragment continuous habitat areas into smaller, isolated tracts. Habitat fragmentation is of particular concern when species require large expanses of habitat for activities such as breeding, foraging, and sheltering.
Habitat fragmentation can result in increases in “edge” resulting in direct effects of barriers

U.S. Fish and Wildlife Service Land-Based Wind Energy Guidelines
26
and displacement as well as indirect effects of nest parasitism and predation. Sensitivity to fragmentation effects varies among species. Habitat fragmentation and site modification are important issues that should be assessed at the landscape scale early in the siting process. Identify areas of high sensitivity due to the presence of blocks of native habitats, paying particular attention to known or suspected “species sensitive to habitat fragmentation.”
Displacement and Behavioral Changes
Estimating displacement risk requires an understanding of animal behavior in response to a project and its infrastructure and activities, and a pre-construction estimate of presence/absence of species whose behavior would cause them to avoid or seek areas in proximity to turbines, roads, and other components of the project. Displacement is a function of the sensitivity of individuals to the project and activity levels associated with operations.
Indirect Effects
Wind development can also have indirect effects to wildlife and habitats. Indirect effects include reduced nesting and breeding densities and the social ramifications of those reductions; loss or modification of foraging habitat; loss of population vigor and overall population density; increased isolation between habitat patches, loss of habitat refugia; attraction to modified habitats; effects on behavior, physiological disturbance, and habitat unsuitability. Indirect effects can result from introduction of invasive plants; increased predator populations or facilitated predation; alterations in the natural fire regime; or other effects, and can manifest themselves later in time than the causing action.
When collection of both pre- and
post-construction data in the areas of interest and reference areas is possible, then the Before-After-Control-Impact (BACI) is the most statistically robust design. The BACI design is most like the classic manipulative experiment.6 In the absence of a suitable reference area, the design is reduced to a Before-After (BA) analysis of effect where the differences between pre- and post-construction parameters of interest are assumed to be the result of the project, independent of other potential factors affecting the assessment area. With respect to BA studies, the key question is whether the observations taken immediately after the incident can reasonably be expected within the expected range for the system (Manly 2009). Reliable quantification of impact usually will include additional study
components to limit variation and the confounding effects of natural factors that may change with time.
The developer’s timeline for the development of a wind energy facility often does not allow for the collection of sufficient
pre-construction data and/or identification of suitable reference areas to complete a BACI or BA study. Furthermore, alterations in land use or disturbance over the course of a multi-year BACI or BA study may complicate the analysis of study results. Additional discussion of these issues can be found in Tier 5 Study Design Considerations.
Tier 3 Technical Resources
The following methods and metrics are provided as suggested sources for developers to use in answering the Tier 3 questions.
Tier 3, Question 1
Acoustic monitoring can be a practical method for determining the presence of threatened, endangered or otherwise rare species of bats throughout a proposed project (Kunz et al. 2007). There are two general types of acoustic detectors used for collection of information on bat activity and species identification: the full-spectrum, time-expansion and the zero-crossing techniques for ultrasound bat detection (see Kunz et al. 2007 for detailed discussion). Full-spectrum time expansion detectors provide nearly complete species discrimination, while zero-crossing detectors provide reliable and cost-effective estimates of total bat use at a site and some species discrimination. Myotis species can be especially difficult to discriminate with zero-crossing detectors (Kunz et al. 2007). Kunz et al. (2007) describe the strengths and weaknesses of each technique for ultrasonic bat detection, and either type of detector may be useful in most situations except where species identification is especially important and zero-crossing methods are inadequate to provide the necessary data. Bat acoustics technology is evolving rapidly and study objectives are an important consideration when selecting detectors. When rare or endangered species of bats are suspected, sampling should occur during different seasons and at
Virginia big-eared bat. Credit: USFWS
6 In this context, such designs are not true experiments in that the treatments (project development and control) are not randomly assigned to an experimental unit, and there is often no true replication. Such constraints are not fatal flaws, but do limit statistical inferences of the results.

U.S. Fish and Wildlife Service Land-Based Wind Energy Guidelines
27
multiple sampling stations to account for temporal and spatial variability.
Mist-netting for bats is required in some situations by state agencies, Tribes, and the Service to determine the presence of threatened, endangered or otherwise rare species. Mist-netting is best used in combination with acoustic monitoring to inventory the species of bats present at a site, especially to detect the presence of threatened or endangered species. Efforts should concentrate on potential commuting, foraging, drinking, and roosting sites (Kuenzi and Morrison 1998, O'Farrell et al. 1999). Mist-netting and other activities that involve capturing and handling threatened or endangered species of bats will require permits from state and/or federal agencies.
Tier 3, Question 2
The following protocol should be used to answer Tier 3, Question 2. This protocol for analysis of habitat fragmentation at project sites should be adapted to the species of habitat fragmentation concern as identified in response to Question 5 in Tier 2 and to the landscape in which development is contemplated. The developer should:
1. Define the study area. The study area for the site should include the “footprint” for the proposed facility plus an appropriate surrounding area. The extent of the study area should be based on the area where there is potential for significant adverse habitat impacts, including indirect impacts, within the distribution of habitat for the species of habitat fragmentation concern.
2. Determine the potential for occupancy of the study area based on the guidance provided for the species of habitat fragmentation concern described above in Question 1.
3. Analyze current habitat quality and spatial configuration of the study area for the species of habitat fragmentation concern.
a. Use recent aerial or remote imagery to determine distinct habitat patches or boundaries within the study area, and the extent of existing habitat fragmenting features.
i. Assess the level of fragmentation of the existing habitat for the species of habitat fragmentation concern and categorize into three classes:
• High quality: little or no apparent fragmentation of intact habitat
• Medium quality: intact habitat exhibiting some recent disturbance activity
• Low quality: extensive fragmentation of habitat (e.g., row-cropped agricultural lands, active surface mining areas)
ii. Determine edge and interior habitat metrics of the study area:
• Identify habitat, non-habitat landscape features and existing fragmenting features relative to the species of habitat fragmentation concern, to estimate existing edge
• Calculate area and acres of edge
• Calculate area of intact patches of habitat and compare to needs of species of habitat fragmentation concern
b. Determine potential changes in quality and spatial configuration of the habitat in the study area if development proceeds as proposed using existing site information and the best available spatial data regarding placement of wind turbines and ancillary infrastructure:
i. Identify, delineate and classify all additional features added by the development that potentially fragment habitat for the species of habitat fragmentation concern (e.g., roads, transmission lines, maintenance structures, etc.)
ii. Assess the expected future size and quality of habitat patches for the species of habitat fragmentation concern and the additional fragmenting features, and categorize into three classes as described above
iii. Determine expected future acreages of edge and interior habitats
iv. Calculate the area of the remaining patches of intact habitat
c. Compare pre-construction and expected post-construction fragmentation metrics:
i. Determine the area of intact habitat lost (to the displacement footprint or by alteration due to the edge effect)
ii. Identify habitat patches that are expected to be moved to a lower habitat quality classification as a result of the development
4. Assess the likelihood of a significant reduction in the demographic and genetic viability of the local population of the species of habitat fragmentation concern using the habitat fragmentation information collected under item 3 above and any currently available demographic and genetic data. Based on this assessment, the developer makes the finding whether or not there is significant reduction. The developer should share the finding with the relevant agencies. If the developer finds the likelihood of a significant reduction, the developer should

U.S. Fish and Wildlife Service Land-Based Wind Energy Guidelines
28
consider items a, b or c below:
a. Consider alternative locations and development configurations to minimize fragmentation of habitat in communication with species experts, for all species of habitat fragmentation concern in the area of interest.
b. Identify high quality habitat parcels that may be protected as part of a plan to limit future loss of habitat for the impacted population of the species of habitat fragmentation concern in the area.
c. Identify areas of medium or low quality habitat within the range of the impacted population that may be restored or improved to compensate for losses of habitat that result from the project (e.g., management of unpaved roads and ORV trails).
Tier 3, Question 3
The following protocols are suggested for use in answering Tier 3, Question 3.
Bird distribution, abundance, behavior and site use
Diurnal Avian Activity Surveys
The commonly used data collection methods for estimating the spatial distribution and relative abundance of diurnal birds includes counts of birds seen or heard at specific survey points (point count), along transects (transect surveys), and observational studies. Both methods result in estimates of bird use, which are assumed to be indices of abundance in the area surveyed. Absolute abundance is difficult to determine for most species and is not necessary to evaluate species risk. Depending on the characteristics of the area of interest and the bird species potentially affected by the project, additional pre-construction study methods may be necessary. Point counts or line transects should collect vertical as well as horizontal data to identify
levels of activity within the rotor-swept zone.
Avian point counts should follow the general methodology described by Reynolds et al. (1980) for point counts within a fixed area, or the line transect survey similar to Schaffer and Johnson (2008), where all birds seen within a fixed distance of a line are counted. These methods are most useful for pre- and post-construction studies to quantify avian use of the project site by habitat, determine the presence of species of concern, and to provide a baseline for assessing displacement effects and habitat loss. Point counts for large birds (e.g., raptors) follow the same point count method described by Reynolds et al. (1980), Ralph et al. (1993) and Ralph et al. 1995).
Point count plots, transects, and observational studies should allow
for statistical extrapolation of data and be distributed throughout the area of interest using a probability sampling approach (e.g., systematic sample with a random start). For most projects, the area of interest is the area where wind turbines and permanent meteorological (met) towers are proposed or expected to be sited. Alternatively, the centers of the larger plots can be located at vantage points throughout the potential area being considered with the objective of covering most of the area of interest. Flight height should also be collected to focus estimates of use on activity occurring in the rotor-swept zone.
Sampling duration and frequency will be determined on a project-by-project basis and by the questions being addressed. The most important consideration for sampling frequency when estimating abundance is the amount of variation
Hoary bat. Credit: Paul Cryan, USGS

U.S. Fish and Wildlife Service Land-Based Wind Energy Guidelines
29
expected among survey dates and locations and the species of concern.
The use of comparable methods and metrics should allow data comparison from plot to plot within the area of interest and from site to site where similar data exist. The data should be collected so that avian activity can be estimated within the rotor-swept zone. Relating use to site characteristics requires that samples of use also measure site characteristics thought to influence use (i.e., covariates such as vegetation and topography) in relation to the location of use. The statistical relationship of use to these covariates can be used to predict occurrence in unsurveyed areas during the survey period and for the same areas in the future.
Surveys should be conducted at different intervals during the year to account for variation in expected bird activity with lower frequency during winter months if avian activity is low. Sampling frequency should also consider the episodic nature of activity during fall and spring migration. Standardized protocols for estimating avian abundance are well-established and should be consulted (e.g., Dettmers et al. 1999). If a more precise estimate of density is required for a particular species (e.g., when the goal is to determine densities of a special-status breeding bird species), the researcher will need more sophisticated sampling procedures, including estimates of detection probability.
Raptor Nest Searches
An estimate of raptor use of the project site is obtained through appropriate surveys, but if potential impacts to breeding raptors are a concern on a project, raptor nest searches are also recommended. These surveys provide information to predict risk to the local breeding population of raptors, for micro-siting decisions, and for developing an appropriate-sized non-disturbance buffer around nests. Surveys also provide baseline data for estimating impacts and determining mitigation
requirements. A good source of information for raptor surveys and monitoring is Bird and Bildstein (2007).
Searches for raptor nests or raptor breeding territories on projects with potential for impacts to raptors should be conducted in suitable habitat during the breeding season. While there is no consensus on the recommended buffer zones around nest sites to avoid disturbance of most species (Sutter and Jones 1981), a nest search within at least one mile of the wind turbines and transmission lines, and other infrastructure should be conducted. However, larger nest search areas are needed for eagles, as explained in the Service’s ECP Guidance, when bald or golden eagles are likely to be present.
Methods for these surveys are fairly common and will vary with the species, terrain, and vegetation within the survey area. The Service recommends that protocols be discussed with biologists from the lead agency, Service, state wildlife agency, and Tribes where they have jurisdiction. It may be useful to consult other scientifically credible information sources. At minimum, the protocols should contain the list of target raptor species for nest surveys and the appropriate search
protocol for each site, including timing and number of surveys needed, search area, and search techniques.
Prairie Grouse and Sage Grouse Population Assessments
Sage grouse and prairie grouse merit special attention in this context for three reasons:
1. The scale and biotic nature of their habitat requirements uniquely position them as reliable indicators of impacts on, and needs of, a suite of species that depend on sage and grassland habitats, which are among the nation’s most diminished ecological communities (Vodehnal and Haufler 2007).
2. Their ranges and habitats are highly congruent with the nation’s richest inland wind resources.
3. They are species for which some known impacts of anthropogenic features (e.g., tall structures, buildings, roads, transmission lines, wind energy facilities, etc.) have been documented.
Populations of prairie grouse and sage grouse generally are assessed by either lek counts (a count of the maximum number of males attending a lek) or lek surveys (classification of known leks as active or inactive) during the breeding season (e.g., Connelly et al. 2000). Methods for lek counts vary slightly by species but in general require repeated visits to known sites and a systematic search of all suitable habitat for leks, followed by repeated visits to active leks to estimate the number of grouse using them.
Recent research indicates that viable prairie grouse and sage grouse populations are dependent on suitable nesting and brood-rearing habitat (Connelly et al. 2000, Hagen et al. 2009). These habitats generally are associated with leks. Leks are the approximate centers of nesting and brood-rearing habitats (Connelly et al. 2000, but see Connelly et al. 1988 and Becker et al. 2009). High quality nesting and
Red-tailed hawk. Credit: Dave Menke, USFWS

U.S. Fish and Wildlife Service Land-Based Wind Energy Guidelines
30
brood rearing habitats surrounding leks are critical to sustaining viable prairie grouse and sage grouse populations (Giesen and Connelly 1993, Hagen et al. 2004, Connelly et al. 2000). A population assessment study area should include nesting and brood rearing habitats that may extend several miles from leks. For example, greater and lesser prairie-chickens generally nest in suitable habitats within one to two miles of active leks (Hagen et al. 2004), whereas the average distances from nests to active leks of non-migratory sage grouse range from 0.7 to four miles (Connelly et al. 2000), and potentially much more for migratory populations (Connelly et al. 1988).
While surveying leks during the spring breeding season is the most common and convenient tool for monitoring population trends of prairie grouse and sage grouse, documenting available nesting and brood rearing habitat within and adjacent to the potentially affected area is recommended. Suitable nesting and brood rearing habitats can be mapped based on habitat requirements of individual species. The distribution and abundance of nesting and brood rearing habitats can be used to help in the assessment of adverse impacts of the proposed project to prairie grouse and sage grouse.
Mist-Netting for Birds
Mist-netting is not recommended as a method for assessing risk of wind development for birds. Mist-netting cannot generally be used to develop indices of relative bird abundance, nor does it provide an estimate of collision risk as mist-netting is not feasible at the heights of the rotor-swept zone and captures below that zone may not adequately reflect risk. Operating mist-nets requires considerable experience, as well as state and federal permits.
Occasionally mist-netting can help confirm the presence of rare species at documented fallout or migrant stopover sites near a proposed project. If mist-netting is to be used, the Service recommends that procedures for operating nets
and collecting data be followed in accordance with Ralph et al. (1993).
Nocturnal and Crepuscular Bird Survey Methods
Additional studies using different methods should be conducted if characteristics of the project site and surrounding areas potentially pose a high risk of collision to night migrating songbirds and other nocturnal or crepuscular species. For most of their flight, songbirds and other nocturnal migrants are above the reach of wind turbines, but they pass through the altitudinal range of wind turbines during ascents and descents and may also fly closer to the ground during inclement weather (Able, 1970; Richardson, 2000). Factors affecting flight path, behavior, and “fall-out” locations of nocturnal migrants are reviewed elsewhere (e.g., Williams et al., 2001; Gauthreaux and Belser, 2003; Richardson, 2000; Mabee et al., 2006).
In general, pre-construction nocturnal studies are not recommended unless the site has features that might strongly concentrate nocturnal birds, such as along coastlines that are known to be migratory songbird corridors. Biologists knowledgeable about nocturnal bird migration and familiar with patterns of migratory stopovers in the region should assess the potential risks to nocturnal migrants at a proposed project site. No single method can adequately assess the spatial and temporal variation in nocturnal bird populations or the potential collision risk. Following nocturnal study methods in Kunz et al. (2007) is recommended to determine relative abundance, flight direction and flight altitude for assessing risk to migrating birds, if warranted. If areas of interest are within the range of nocturnal species of concern (e.g., marbled murrelet, northern spotted owl, Hawaiian petrel, Newell’s shearwater), surveyors should use species-specific protocols recommended by state wildlife agencies, Tribes or Service to assess the species’ potential presence in the area of interest.
In contrast to the diurnal avian survey techniques previously described, considerable variation and uncertainty exist on the optimal protocols for using acoustic monitoring devices, radar, and other techniques to evaluate species composition, relative abundance, flight height, and trajectory of nocturnal migrating birds. While an active area of research, the use of radar for determining passage rates, flight heights and flight directions of nocturnal migrating animals has yet to be shown as a good indicator of collision risk. Pre- and post-construction studies comparing radar monitoring results to estimates of bird and bat fatalities will be necessary to evaluate radar as a tool for predicting collision risk. Additional studies are also needed before making recommendations on the number of nights per season or the number of hours per night that are appropriate for radar studies of nocturnal bird migration (Mabee et al., 2006).
Bat survey methods
The Service recommends that all techniques discussed below be conducted by biologists trained in bat identification, equipment use, and the analysis and interpretation of data resulting from the design and conduct of the studies. Activities that involve capturing and handling bats may require permits from state and/or federal agencies.
Acoustic Monitoring
Acoustic monitoring provides information about bat presence and activity, as well as seasonal changes in species occurrence and use, but does not measure the number of individual bats or population density. The goal of acoustic monitoring is to provide a prediction of the potential risk of bat fatalities resulting from the construction and operation of a project. Our current state of knowledge about bat-wind turbine interactions, however, does not allow a quantitative link between pre-construction acoustic assessments of bat activity and operations fatalities. Discussions with experts, state wildlife trustee agencies, Tribes, and

U.S. Fish and Wildlife Service Land-Based Wind Energy Guidelines
31
Service will be needed to determine whether acoustic monitoring is warranted at a proposed project site.
The predominance of bat fatalities detected to date are migratory species and acoustic monitoring should adequately cover periods of migration and periods of known high activity for other (i.e., non-migratory) species. Monitoring for a full year is recommended in areas where there is year round bat activity. Data on environmental variables such as temperature and wind speed should be collected concurrently with acoustic monitoring so these weather data can be used in the analysis of bat activity levels.
The number and distribution of sampling stations necessary to adequately estimate bat activity have not been well established but will depend, at least in part, on the size of the project area, variability within the project area, and a Tier 2 assessment of potential bat occurrence.
The number of detectors needed to achieve the desired level of precision will vary depending on the within-site variation (e.g., Arnett et al. 2006, Weller 2007, See also, Bat Conservation International website for up-to-date survey methodologies). One frequently used method is to place acoustic
detectors on existing met towers, approximately every two kilometers across the site where turbines are expected to be sited. Acoustic detectors should be placed at high positions (as high as practicable, based on tower height) on each met tower included in the sample to record bat activity at or near the rotor swept zone, the area of presumed greatest risk for bats. Developers should evaluate whether it would be cost effective to install detectors when met towers are first established on a site. Doing so might reduce the cost of installation later and might alleviate time delays to conduct such studies.
If sampling at met towers does not adequately cover the study area or provide sufficient replication, additional sampling stations can be established at low positions (~1.5-2 meters) at a sample of existing met towers and one or more mobile units (i.e., units that are moved to different locations throughout the study period) to increase coverage of the proposed project area. When practical and based on information from Tier 2, it may be appropriate to conduct some acoustic monitoring of features identified as potentially high bat use areas within the study area (e.g., bat roosts and caves) to determine use of such features.
There is growing interest in determining whether “low” position
samples (~1.5-2 meters) can provide equal or greater correlation with bat fatalities than “high” position samples (described above) because this would substantially lower cost of this work. Developers could then install a greater number of detectors at lower cost resulting in improved estimates of bat activity and, potentially, improved qualitative estimates of risk to bats. This is a research question that is not expected to be addressed at a project.
Other bat survey techniques
Occasionally, other techniques may be needed to answer Tier 3 questions and complement the information from acoustic surveys. Kunz et al. (2007), NAS (2007), Kunz and Parsons (2009) provide comprehensive descriptions of bat survey techniques, including those identified below that are relevant for Tier 3 studies at wind energy facilities.
Roost Searches and Exit Counts
Pre-construction survey efforts may be recommended to determine whether known or likely bat roosts in mines, caves, bridges, buildings, or other potential roost sites occur within the project vicinity, and to confirm whether known or likely bat roosts are present and occupied by bats. If active roosts are detected, it may be appropriate to address questions about colony size and species composition of roosts. Exit counts and roost searches are two approaches to answering these questions, and Rainey (1995), Kunz and Parsons (2009), and Sherwin et al. (2009) are resources that describe options and approaches for these techniques. Roost searches should be performed cautiously because roosting bats are sensitive to human disturbance (Kunz et al. 1996). Known maternity and hibernation roosts should not be entered or otherwise disturbed unless authorized by state and/or federal wildlife agencies. Internal searches of abandoned mines or caves can be dangerous and should only be conducted by trained researchers. For mine survey protocol and
Tri-colored bat. Credit: USFWS

U.S. Fish and Wildlife Service Land-Based Wind Energy Guidelines
32
guidelines for protection of bat roosts, see the appendices in Pierson et al. (1999). Exit surveys at known roosts generally should be limited to non-invasive observation using low-light binoculars and infrared video cameras.
Multiple surveys should be conducted to determine the presence or absence of bats in caves and mines, and the number of surveys needed will vary by species of bats, sex (maternity or bachelor colony) of bats, seasonality of use, and type of roost structure (e.g., caves or mines). For example, Sherwin et al. (2003) demonstrated that a minimum of three surveys are needed to determine the absence of large hibernating colonies of Townsend’s big-eared bats in mines (90 percent probability), while a minimum of nine surveys (during a single warm season) are necessary before a mine could be eliminated as a bachelor roost for this species (90 percent probability). An average of three surveys was needed before surveyed caves could be eliminated as bachelor roosts (90 percent probability). The Service recommends that decisions on level of effort follow discussion with relevant agencies and bat experts.
Activity Patterns
If active roosts are detected, it may be necessary to answer questions about behavior, movement patterns, and patterns of roost use for bat species of concern, or to further investigate habitat features that might attract bats and pose fatality risk. For some bat species, typically threatened, endangered, or state-listed species, radio telemetry or radar may be recommended to assess both the direction of movement as bats leave roosts, and the bats’ use of the area being considered for development. Kunz et al. (2007) describe the use of telemetry, radar and other tools to evaluate use of roosts, activity patterns, and flight direction from roosts.
Mist-Netting for Bats
While mist-netting for bats is required in some situations by state agencies, Tribes, and the Service to determine the presence of threatened, endangered or other bat species of concern, mist-netting is not generally recommended for determining levels of activity or assessing risk of wind energy
development to bats for the following reasons: 1) not all proposed or operational wind energy facilities offer conditions conducive to capturing bats, and often the number of suitable sampling points is minimal or not closely associated with the project location; 2) capture efforts often occur at water sources offsite or at nearby roosts and the results may not reflect species presence or use on the site where turbines are to be erected; and 3) mist-netting isn’t feasible at the height of the rotor-swept zone, and captures below that zone may not adequately reflect risk of fatality. If mist-netting is employed, it is best used in combination with acoustic monitoring to inventory the species of bats present at a site.
White-Nose Syndrome
White-nose syndrome is a disease affecting hibernating bats. Named for the white fungus that appears on the muzzle and other body parts of hibernating bats, WNS is associated with extensive mortality of bats in eastern North America. All contractors and consultants hired by developers should employ the most current version of survey and handling protocols to avoid
transmitting white-nose syndrome between bats.
Other wildlife
While the above guidance emphasizes the evaluation of potential impacts to birds and bats, Tier 1 and 2 evaluations may identify other species of concern. Developers are encouraged to assess adverse impacts potentially caused by development for those species most likely to be negatively affected by such development. Impacts to other species are primarily derived from potential habitat loss or displacement. The general guidance on the study design and methods for estimation of the distribution, relative abundance, and habitat use for birds is applicable to the study of other wildlife. References regarding monitoring for other wildlife are available in Appendix C: Mule deer. Credit: Tupper Ansel Blake, USFWS

U.S. Fish and Wildlife Service Land-Based Wind Energy Guidelines
33
Sources of Information Pertaining to Methods to Assess Impacts to Wildlife. Nevertheless, most methods and metrics will be species-specific and developers are advised to work with the state, tribal, or federal agencies, or other credible experts, as appropriate, during problem formulation for Tier 3.
Tier 3 Decision Points
Developers and the Service should communicate prior to completing the Tier 3 decision process. A developer should inform the Service of the results of its studies and plans. The Service will provide written comments to a developer on study and project development plans that identify concerns and recommendations to resolve the concerns. The developer and, when applicable, the permitting authority will make a decision regarding whether and how to develop the project. The decision point at the end of Tier 3 involves three potential outcomes:
1. Development of the site has a low probability of significant adverse impact based on existing and new information.
There is little uncertainty regarding when and how development should proceed, and adequate information exists to satisfy any required permitting. The decision process proceeds to permitting, when required, and/or development, and Tier 4.
2. Development of the site has a moderate to high probability of significant adverse impacts without proper measures being taken to mitigate those impacts. This outcome may be subdivided into two possible scenarios:
a. There is certainty regarding how to develop the site to adequately mitigate significant adverse impacts. The developer bases their decision to develop the site adopting proper mitigation measures and appropriate post-construction fatality and habitat studies (Tier 4).
b. There is uncertainty regarding how to develop the site to adequately mitigate significant adverse impacts, or a permitting process requires additional information on potential significant adverse wildlife impacts before permitting future phases of the project. The developer bases their decision to develop the site adopting proper mitigation measures and appropriate post-construction fatality and habitat studies (Tier 4).
3. Development of the site has a high probability of significant impact that:
a. Cannot be adequately mitigated.
Site development should be delayed until plans can be developed that satisfactorily mitigate for the significant adverse impacts. Alternatively, the site should be abandoned in favor of known sites with less potential for environmental impact, or the developer
begins an evaluation of other sites or landscapes for more acceptable sites to develop.
b. Can be adequately mitigated.
Developer should implement mitigation measures and proceed to Tier 4.
Little brown bat with white nose syndrome. Credit: Marvin Moriarty, USFWS

U.S. Fish and Wildlife Service Land-Based Wind Energy Guidelines
34
Chapter 5: Tier 4 – Post-construction Studies to Estimate ImpactsThe outcome of studies in Tiers 1, 2, and 3 will determine the duration and level of effort of post-construction studies.
Tier 4 post-construction studies are designed to assess whether predictions of fatality risk and direct and indirect impacts to habitat of species of concern were correct. Fatality studies involve searching for bird and bat carcasses beneath turbines to estimate the number and species composition of fatalities (Tier 4a). Habitat studies involve application of GIS and use data collected in Tier 3 and Tier 4b and/or published information. Post-construction studies on direct and indirect impacts to habitat of species of concern, including species of habitat fragmentation concern need only be conducted if Tier 3 studies indicate the potential for significant adverse impacts.
Tier 4a – Fatality Studies
At this time, community- and utility-scale projects should conduct at least one year of fatality monitoring. The intensity of the studies should be related to risks of significant adverse impacts identified in pre-construction assessments. As data collected with consistent methods and metrics increases (see discussion below), it is possible that some future projects will not warrant fatality monitoring, but such a situation is rare with the present state of knowledge.
Fatality monitoring should occur over all seasons of occupancy for the species being monitored, based on information produced in previous tiers. The number of seasons and total length of the monitoring may be determined separately for bats and birds, depending on the pre-construction risk assessment, results of Tier 3 studies and Tier 4 monitoring from comparable sites (see Glossary in Appendix A) and
the results of first year fatality monitoring. Guidance on the relationship between these variables and monitoring for fatalities is provided in Table 2.
It may be appropriate to conduct monitoring using different durations
and intervals depending on the species of concern. For example, if raptors occupy an area year-round, it may be appropriate to monitor for raptors throughout the year (12 months). It may be warranted to monitor for bats when they are active (spring, summer and fall or
A male Eastern red bat perches among green foliage. Credit: ©MerlinD.Tuttle,BatConservationInternational,www.batcon.org

U.S. Fish and Wildlife Service Land-Based Wind Energy Guidelines
35
approximately eight months). It may be appropriate to increase the search frequency during the months bats are active and decrease the frequency during periods of inactivity. All fatality monitoring should include estimates of carcass removal and carcass detection bias likely to influence those rates.
Tier 4a Questions
Post-construction fatality monitoring should be designed to answer the following questions as appropriate for the individual project:
1. What are the bird and bat fatality rates for the project?
2. What are the fatality rates of species of concern?
3. How do the estimated fatality rates compare to the predicted fatality rates?
4. Do bird and bat fatalities vary within the project site in relation to site characteristics?
5. How do the fatality rates compare to the fatality rates from existing projects in similar landscapes with similar species composition and use?
6. What is the composition of fatalities in relation to migrating and resident birds and bats at the site?
7. Do fatality data suggest the need for measures to reduce impacts?
Tier 4a studies should be of sufficient statistical validity to address Tier 4a questions and enable determination of whether Tier 3 fatality predictions were correct. Fatality monitoring results also should allow comparisons with other sites, and provide a basis for determining if operational changes or other mitigation measures at the site are appropriate. The Service encourages project operators to discuss Tier 4 studies with local, state, federal, and tribal wildlife agencies. The number of years of monitoring is based on outcomes of
Tier 3 and Tier 4 studies and analysis of comparable Tier 4 data from other projects as indicated in Table 2. The Service may recommend multiple years of monitoring for projects located near a listed species or bald or golden eagle, or other situations, as appropriate.
Tier 4a Protocol Design Considerations
The basic method of measuring fatality rates is the carcass search. Search protocols should be standardized to the greatest extent possible, especially for common objectives and species of concern, and they should include methods for adequately accounting for sampling biases (searcher efficiency and scavenger removal). However, some situations warrant exceptions to standardized protocol. The responsibility of demonstrating that an exception is appropriate and applicable should be on the project operator to justify increasing or decreasing the duration or intensity of operations monitoring.
Some general guidance is given below with regard to the following fatality monitoring protocol design issues:
• Durationandfrequencyofmonitoring
• Numberofturbinestomonitor
• Delineationofcarcasssearchplots, transects, and habitat mapping
• Generalsearchprotocol
• Fieldbiasanderrorassessment
• Estimatorsoffatality
More detailed descriptions and methods of fatality search protocols can be found in the California (California Energy Commission 2007) and Pennsylvania (Pennsylvania Game Commission 2007) state guidelines and in Kunz et al. (2007), Smallwood (2007), and Strickland et al. (2011).
Duration and frequency of monitoring
Frequency of carcass searches (search interval) may vary for birds and bats, and will vary depending on the questions to be answered, the species of concern, and their seasonal abundance at the project site. The carcass searching protocol should be adequate to answer applicable Tier 4 questions at an appropriate level of precision to make general conclusions about the project, and is not intended to provide highly precise measurements of fatalities. Except during low use times (e.g. winter months in northern states), the Service recommends that protocols be designed such that carcass searches occur at some turbines within the project area most days each week of the study.
The search interval is the interval between carcass searches at individual turbines, and this interval may be lengthened or shortened depending on the carcass removal rates. If the primary focus is on fatalities of large raptors, where carcass removal is typically low, then a longer interval between searches (e.g., 14-28 days) is sufficient. However, if the focus is on fatalities of bats and small birds and carcass removal is high, then a shorter search interval will be necessary.
There are situations in which studies of higher intensity (e.g., daily searches at individual turbines within the sample) may be appropriate. These would be considered only in Tier 5 studies or in research programs because the greater complexity and level of effort goes beyond that recommended for typical Tier 4 post construction monitoring. Tier 5 and research studies could include evaluation of specific measures that have been implemented to mitigate potential significant adverse impacts to species of concern identified during pre-construction studies.
Number of turbines to monitor
If available, data on variability among turbines from existing

U.S. Fish and Wildlife Service Land-Based Wind Energy Guidelines
36
projects in similar conditions within the same region are recommended as a basis for determining needed sample size (see Morrison et al., 2008). If data are not available, the Service recommends that an operator select a sufficient number of turbines via a systematic sample with a random start point. Sampling plans can be varied (e.g., rotating panels [McDonald 2003, Fuller 1999, Breidt and Fuller 1999, and Urquhart et al. 1998]) to increase efficiency as long as a probability sampling approach is used. If the project contains fewer than 10 turbines, the Service recommends that all turbines in the area of interest be searched unless otherwise agreed to by the permitting or wildlife resource agencies. When selecting turbines, the Service recommends that a systematic sample with a random start be used when selecting search plots to ensure interspersion among turbines. Stratification among different habitat types also is recommended to account for differences in fatality rates among different habitats (e.g., grass versus cropland or forest); a sufficient number of turbines should be sampled in each strata.
Delineation of carcass search plots, transects, and habitat mapping
Evidence suggests that greater than 80 percent of bat fatalities fall within half the maximum distance of turbine height to ground (Erickson 2003 a, b), and a minimum plot width of 120 meters from the turbine should be established at sample turbines. Plots will need to be larger for birds, with a width twice the turbine height to ground. Decisions regarding search plot size should be made in discussions with the Service, state wildlife agency, permitting agency and Tribes. It may be useful to consult other scientifically credible information sources.
The Service recommends that each search plot should be divided into oblong subplots or belt transects and that each subplot be searched. The objective is to find as many carcasses as possible so the width of the belt will vary depending on the ground cover and its influence on carcass visibility. In most situations, a search width of 6 meters should be adequate, but this may vary from 3-10 meters depending on ground cover.
Searchable area within the theoretical maximum plot size varies, and heavily vegetated areas (e.g., eastern mountains) often do not allow surveys to consistently extend to the maximum plot width. In other cases it may be preferable to search a portion of the maximum plot instead of the entire plot. For example, in some landscapes it may be impractical to search the entire plot because of the time required to do an effective search, even if it is accessible (e.g., croplands), and data from a probability sample of subplots within the maximum plot size can provide a reasonable estimate of fatalities. It is important to accurately delineate and map the area searched for each turbine to adjust fatality estimates based on the actual area searched. It may be advisable to establish habitat visibility classes in each plot to account for differential detectability, and to develop visibility classes for different landscapes (e.g., rocks, vegetation) within each search plot. For example, the Pennsylvania Game Commission (2007) identified four classes based on the percentage of
bare ground.
The use of visibility classes requires that detection and removal biases be estimated for each class. Fatality estimates should be made for each class and summed for the total area sampled. Global positioning systems (GPS) are useful for accurately mapping the actual total area searched and area searched in each habitat visibility class, which can be used to adjust fatality estimates. The width of the belt or subplot searched may vary depending on the habitat and species of concern; the key is to determine actual searched area and area searched in each visibility class regardless of transect width. An adjustment may also be needed to take into account the density of fatalities as a function of the width of the search plot.
General search protocol
Personnel trained in proper search techniques should look for bird and bat carcasses along transects or subplots within each plot and record and collect all carcasses located in the searchable areas. The Service will work with developers and operators to provide necessary permits for carcass possession. A complete search of the area should be accomplished and subplot size (e.g., transect width) should be adjusted to compensate for detectability differences in the search area. Subplots should be smaller when vegetation makes it difficult to detect carcasses; subplots can be wider in open terrain. Subplot width also can vary depending on the size of the species being looked for. For example, small species such as bats may require smaller subplots than larger species such as raptors.
Data to be recorded include date, start time, end time, observer, which turbine area was searched (including GPS coordinates) and weather data for each search. When a dead bat or bird is found, the searcher should place a flag near the carcass and continue the search. After searching the entire plot, the searcher returns to each carcass and records information
Wind turbine. Credit: NREL

U.S. Fish and Wildlife Service Land-Based Wind Energy Guidelines
37
on a fatality data sheet, including date, species, sex and age (when possible), observer name, turbine number, distance from turbine, azimuth from turbine (including GPS coordinates), habitat surrounding carcass, condition of carcass (entire, partial, scavenged), and estimated time of death (e.g., <1 day, 2 days). The recorded data will ultimately be housed in the FWS Office of Law Enforcement Bird Mortality Reporting System. A digital photograph of the carcass should be taken. Rubber gloves should be used to handle all carcasses to eliminate possible transmission of rabies or other diseases and to reduce possible human scent bias for carcasses later used in scavenger removal trials. Carcasses should be placed in a plastic bag and labeled. Unless otherwise conditioned by the carcass possession permit, fresh carcasses (those determined to have been killed the night immediately before a search) should be redistributed at random points on the same day for scavenging trials.
Field bias and error assessment
During searches conducted at wind turbines, actual fatalities are likely incompletely observed. Therefore carcass counts must be adjusted by some factor that accounts for imperfect detectability (Huso 2011). Important sources of bias and error include: 1) fatalities that occur on a highly periodic basis; 2) carcass removal by scavengers; 3) differences in searcher efficiency; 4) failure to account for the influence of site (e.g. vegetation) conditions in relation to carcass removal and searcher efficiency; and 5) fatalities or injured birds and bats that may land or move outside search plots.
Some fatalities may occur on a highly periodic basis creating a potential sampling error (number 1 above). The Service recommends that sampling be scheduled so that some turbines are searched most days and episodic events are more likely detected, regardless of the search interval. To address bias sources 2-4 above, it is strongly recommended that all fatality studies conduct carcass removal
and searcher efficiency trials using accepted methods (Anderson 1999, Kunz et al. 2007, Arnett et al. 2007, NRC 2007, Strickland et al. 2011). Bias trials should be conducted throughout the entire study period and searchers should be unaware of which turbines are to be used or the number of carcasses placed beneath those turbines during trials. Carcasses or injured individuals may land or move outside the search plots (number 5 above). With respect to Tier 4a fatality estimates, this potential sampling error is considered to be small and can be assumed insignificant (Strickland et al. 2011).
Prior to a study’s inception, a list of random turbine numbers and random azimuths and distances (in meters) from turbines should be generated for placement of each bat or bird used in bias trials. Data recorded for each trial carcass prior to placement should include date of placement, species, turbine number, distance and direction from turbine, and visibility class surrounding the carcass. Trial carcasses should be distributed as equally as possible among the different visibility classes throughout the study period and study area. Studies should attempt to avoid “over-seeding” any one turbine with carcasses by placing no more than one or two carcasses at any one time at a given turbine. Before placement, each carcass must be uniquely marked in a manner that does not cause additional attraction, and its location should be recorded. There is no agreed upon sample size for bias trials, though some state guidelines recommend from 50 - 200 carcasses (e.g., PGC 2007).
Estimators of fatality
If there were a direct relationship between the number of carcasses observed and the number killed, there would be no need to develop a complex estimator that adjusts observed counts for detectability, and observed counts could be used as a simple index of fatality (Huso 2011). But the relationship is not direct and raw carcass counts recorded using different search intervals and under
different carcass removal rates and searcher efficiency rates are not directly comparable. It is strongly recommended that only the most contemporary equations for estimating fatality be used, as some original versions are now known to be extremely biased under many commonly encountered field conditions (Erickson et al. 2000b, Erickson et al. 2004, Johnson et al. 2003, Kerns and Kerlinger 2004, Fiedler et al. 2007, Kronner et al. 2007, Smallwood 2007, Huso 2011, Strickland et al. 2011).
Tier 4a Study Objectives
In addition to the monitoring protocol design considerations described above, the metrics used to estimate fatality rates must be selected with the Tier 4a questions and objectives in mind. Metrics considerations for each of the Tier 4a questions are discussed briefly below. Not all questions will be relevant for each project, and which questions apply would depend on Tier 3 outcomes.
1. What are the bird and bat fatality rates for the project?
The primary objective of fatality searches is to determine the overall estimated fatality rates for birds and bats for the project. These rates serve as the fundamental basis for all comparisons of fatalities, and if studies are designed appropriately they allow researchers to relate fatalities to site characteristics and environmental variables, and to evaluate mitigation measures. Several metrics are available for expressing fatality rates. Early studies reported fatality rates per turbine. However, this metric is somewhat misleading as turbine sizes and their risks to birds vary significantly (NRC 2007). Fatalities are frequently reported per nameplate capacity (i.e. MW), a metric that is easily calculated and better for comparing fatality rates among different sized turbines. Even with turbines of the same name plate capacity, the size of the rotor swept area may vary among manufacturers, and turbines at various sites may operate for

U.S. Fish and Wildlife Service Land-Based Wind Energy Guidelines
38
different lengths of time and during different times of the day and seasons. With these considerations in mind, the Service recommends that fatality rates be expressed on a per-turbine and per-nameplate MW basis until a better metric becomes available.
2. What are the fatality rates of species of concern?
This analysis simply involves calculating fatalities per turbine of all species of concern at a site when sample sizes are sufficient to do so. These fatalities should be expressed on a per nameplate MW basis if comparing species fatality rates among projects.
3. How do the estimated fatality rates compare to the predicted fatality rates?
There are several ways that predictions can be evaluated with actual fatality data. During the planning stages in Tier 2, predicted fatalities may be based on existing data at similar facilities in similar landscapes used by similar species. In this case, the assumption is that use is similar, and therefore that fatalities may be similar at the proposed facility. Alternatively, metrics derived from pre-construction assessments for an individual species or group of species – usually an index of activity or abundance at a proposed project – could be used in conjunction with use and fatality estimates from existing projects to develop a model for predicting fatalities at the proposed project site. Finally, physical models can be used to predict the probability of a bird of a particular size striking a turbine, and this probability, in conjunction with estimates of use and avoidance behavior, can be used to predict fatalities.
The most current equations for estimating fatality should be used to evaluate fatality predictions. Several statistical methods can be found in the revised Strickland et
al. 2011 and used to evaluate fatality predictions. Metrics derived from Tier 3 pre-construction assessments may be correlated with fatality rates, and (using the project as the experimental unit), in Tier 5 studies it should be possible to determine if different preconstruction metrics can in fact accurately predict fatalities and, thus, risk.
4. Do bird and bat fatalities vary within the project site in relation to site characteristics?
Data from pre-construction studies can demonstrate patterns of activity that may depend upon the site characteristics. Turbines placed near escarpments or cliffs may intrude upon airspace used by raptors soaring on thermals. Pre-construction and post construction studies and assessments can be used to avoid siting individual, specific turbines within an area used by species of concern. Turbine-specific fatality rates may be related to site characteristics such as proximity to water, forest edge, staging and roosting sites, known stop-over sites, or other key resources, and this relationship may be estimated using regression analysis. This information is particularly useful for evaluating micro-siting options when planning a future facility or, on a broader scale, in determining the location of the entire project.
5. How do the fatality rates compare to the fatality rates from existing facilities in similar landscapes with similar species composition and use?
Comparing fatality rates among facilities with similar characteristics can be useful to determine patterns and broader landscape relationships. Developers should communicate with the Service to ensure that such comparisons are appropriate to avoid false conclusions. Fatality rates should be expressed on a per nameplate MW or some other standardized metric basis for comparison with other projects,
and may be correlated with site characteristics – such as proximity to wetlands, riparian corridors, mountain-foothill interface, wind patterns, or other broader landscape features – using regression analysis. Comparing fatality rates from one project to fatality rates of other projects provides insight into whether a project has relatively high, moderate or low fatalities.
6. What is the composition of fatalities in relation to migrating and resident birds and bats at the site?
The simplest way to address this question is to separate fatalities per turbine of known resident species (e.g., big brown bat, prairie horned lark) and those known to migrate long distances (e.g. hoary bat, red-eyed vireo). These data are useful in determining patterns of species composition of fatalities and possible mitigation measures directed at residents, migrants, or perhaps both, and can be used in assessing potential population effects.
Big brown bat. Credit: USFWS
7 In situations where a project operator was not the developer, the Service expects that obligations of the developer for adhering to the Guidelines transfer with the project.

U.S. Fish and Wildlife Service Land-Based Wind Energy Guidelines
39
Probability of Significant Adverse Impacts in Tier 3
Recommended Fatality Monitoring Duration and Effort
Possible Outcomes of Monitoring Results
Tier 3 Studies indicate LOW probability of significant adverse impacts
Duration: At least one year of fatality monitoring to estimate fatalities of birds and bats. Field assessments should be sufficient to confirm that risk to birds and/or bats is indeed “low.”
1. Documented fatalities are approximately equal to or lower than predicted risk. No further fatality monitoring or mitigation is needed.
2. Fatalities are greater than predicted, but are not likely to be significant (i.e., unlikely to affect the long-term status of the population). If comparable fatality data at similar sites also supports that impacts are not likely to be high enough to affect population status, no further monitoring or mitigation is needed. If no comparable fatality data are available or such data indicates high risk, one additional year of fatality monitoring is recommended. If two years of fatality monitoring indicate levels of impacts that are not significant, no further fatality monitoring or mitigation is recommended.
3. Fatalities are greater than predicted and are likely to be significant OR federally endangered or threatened species or BGEPA species are affected. Communication with the Service is recommended. Further efforts to address impacts to BGEPA or ESA species may be warranted, unless otherwise addressed in an ESA or BGEPA take permit.
Tier 3 studies indicate MODERATE probability of significant adverse impacts
Duration: Two or more years of fatality monitoring may be necessary.
Field assessments should be sufficient to confirm that risk to birds and/or bats is indeed “moderate.” Closely compare estimated effects to species to those determined from the risk assessment protocol(s).
1. Documented fatalities after the first two years are lower or not different than predicted and are not significant and no federally endangered species or BGEPA species are affected - no further fatality monitoring or mitigation is needed.
2. Fatalities are greater than predicted and are likely to be significant OR federally endangered or threatened species or BGEPA species are affected, communication with the Service is recommended. Further efforts to address impacts to BGEPA or ESA species may be warranted, unless otherwise addressed in an ESA or BGEPA take permit.
Tier 3 studies indicate HIGH probability of significant adverse impacts
Duration: Two or more years of fatality monitoring may be necessary to document fatality patterns.
If fatality is high, developers should shift emphasis to exploring opportunities for mitigation rather than continuing to monitor fatalities. If fatalities are variable, additional years are likely warranted.
1. Documented fatalities during each year of fatality monitoring are less than predicted and are not likely to be significant, and no federally endangered or threatened species or BGEPA species are affected – no further fatality monitoring or mitigation is needed.
2. Fatalities are equal to or greater than predicted and are likely to be significant - further efforts to reduce impacts are necessary; communication with the Service are recommended. Further efforts, such as Tier 5 studies, to address impacts to BGEPA or ESA species may be warranted, unless otherwise addressed in an ESA or BGEPA take permit.
Table 2. Decision Framework for Tier 4a Fatality Monitoring of Species of Concern.8
8 Ensure that survey protocols, and searcher efficiency and scavenger removal bias correction factors are the most reliable, robust, and up to date (after Huso 2009).

U.S. Fish and Wildlife Service Land-Based Wind Energy Guidelines
40
7. Do fatality data suggest the need for measures to reduce impacts?
The Service recommends that the wind project operator7 and the relevant agencies discuss the results from Tier 4 studies to determine whether these impacts are significant. If fatalities are considered significant, the wind project operator and the relevant agencies should develop a plan to mitigate the impacts.
Tier 4b – Assessing direct and indirect impacts of habitat loss, degradation, and fragmentation
The objective of Tier 4b studies is to evaluate Tier 3 predictions of direct and indirect impacts to habitat and the potential for significant adverse impacts on species of concern as a result of these impacts. Tier 4b studies should be conducted if Tier 3 studies indicate the presence of species of habitat fragmentation concern, or if Tier 3 studies indicate significant direct and indirect adverse impacts to species of concern (see discussion below). Tier 4b studies should also inform project operators and the Service as to whether additional mitigation is necessary.
Tier 4b studies should evaluate the following questions:
1. How do post-construction habitat quality and spatial configuration of the study area compare to predictions for species of concern identified in Tier 3 studies?
2. Were any behavioral modifications or indirect impacts noted in regard to species of concern?
3. If significant adverse impacts were predicted for species of concern, and the project was altered to mitigate for adverse impacts, were those efforts successful?
4. If significant adverse impacts were predicted for species of
concern, and the project was altered to mitigate for adverse impacts, were those efforts successful?
The answers to these questions will be based on information estimating habitat loss, degradation, and fragmentation information collected in Tier 3, currently available demographic and genetic data, and studies initiated in Tier 3. As in the case of Tier 4a, the answers to these questions will determine the need to conduct Tier 5 studies. For example, in the case that significant adverse impacts to species of concern were predicted, but mitigation was not successful, then additional mitigation and Tier 5 studies may be necessary. See Table 3 for further guidance.
1. How do post-construction habitat quality and spatial configuration of the study area compare to predictions for species of concern identified in Tier 3 studies?
GIS and demographic data collected in Tier 3 and/or published information can be used to determine predictions of impacts to species of concern from habitat loss, degradation, and fragmentation. The developer can provide development assumptions based on Tier 3 information that can be compared to post-construction information. Additional post-construction studies on impacts to species of concern due to direct and indirect impacts to habitat should only be conducted if Tier 3 studies indicate the potential for significant adverse impacts.
2. Were any behavioral modifications or indirect impacts noted in regard to affected species?
Evaluation of this question is based on the analysis of observed use of the area by species of concern prior to construction in comparison with observed use during operation. Observations and demographic data collected during Tier 3, and assessment of published information about the potential for displacement
and demographic responses to habit impacts could be the basis for this analysis. If this analysis suggests that direct and/or indirect loss of habitat for a species of concern leads to behavioral modifications or displacement that are significant, further studies of these impacts in Tier 5 may be appropriate.
3. If significant adverse impacts were not predicted in Tier 3 because of loss, degradation, or fragmentation of habitat, but Tier 4b studies indicate such impacts have the potential to
occur, can these impacts be mitigated?
When Tier 4b studies indicate significant impacts may be occurring, the developer may need to conduct an assessment of these impacts and what opportunities exist for additional mitigation.
4. If significant adverse impacts were predicted for species of concern, and the project was altered to mitigate for adverse impacts, were those efforts successful?
When Tier 4b studies indicate significant impacts may be occurring, the developer may need to conduct an assessment of these impacts and what opportunities exist for additional mitigation. Evaluation of the effectiveness of mitigation is a Tier 4 study and should follow design considerations discussed in Tier 5 and from guidance in the scientific literature (e.g. Strickland et al. 2011).
When Tier 3 studies identified potential moderate or high risks to species of concern that caused a developer to incorporate mitigation measures into the project, Tier 4b studies should evaluate the effectiveness of those mitigation measures. Determining such effectiveness is important for the project being evaluated to ascertain whether additional mitigation measures are appropriate as well as informing future decisions about how to improve mitigation at wind

U.S. Fish and Wildlife Service Land-Based Wind Energy Guidelines
41
energy facilities being developed.
Tier 4b Protocol Design Considerations
Impacts to a species of concern resulting from the direct and indirect loss of habitat are important and must be considered when a wind project is being considered for development. Some species of concern are likely to occur at every proposed wind energy facility. This occurrence may range from a breeding population, to seasonal occupancy, such as a brief occurrence while migrating through the area. Consequently the level of concern regarding impacts due to direct and indirect loss of habitat will vary depending on the species and the impacts that occur.
If a breeding population of a species of habitat fragmentation concern occurs in the project area and Tier 3 studies indicate that fragmentation of their habitat is possible, these predictions should be evaluated following the guidance indicated in Table 3 using the protocols described in Tier 3. If the analysis of post-construction GIS data on direct and indirect habitat loss suggests that fragmentation is likely, then additional displacement studies and mitigation may be necessary. These studies would typically begin immediately and would be considered Tier 5 studies using design considerations illustrated by examples in Tier 5 below and from guidance in the scientific literature (e.g. Strickland et al. 2011).
Significant direct or indirect loss of habitat for a species of concern may occur without habitat fragmentation if project impacts result in the reduction of a habitat resource that potentially is limiting to the affected population. Impacts of this type include loss of use of breeding habitat or loss of a significant portion of the habitat of a federally or state protected species. This would be evaluated by determining the amount of the resource that is lost and determining if this loss would potentially result in significant impacts to the affected population. Evaluation of potential significant
impacts would occur in Tier 5 studies that measure the demographic response of the affected population.
The intention of the Guidelines is to focus industry and agency resources on the direct and indirect loss of habitat and limiting resources that potentially reduce the viability of a species of concern. Not all direct and indirect loss of a species’ habitat will affect limiting resources for that species, and when habitat losses are minor or non-existent no further study is necessary.
Tier 4b Decision Points
The developer should use the results of the Tier 4b studies to evaluate whether further studies and/or mitigation are needed. The developer should communicate the results of these studies, and decisions about further studies and mitigation, with the Service. Table 3 provides a framework for evaluating the need for further studies and mitigation. Level of effort for studies should be sufficient to answer all questions of interest. Refer to the relevant methods sections for Tier 2 Question 5 and Tier 3 Question 2 in the text for specific guidance on study protocols.
Black-capped Vireo. Credit: Greg W. Lasley

U.S. Fish and Wildlife Service Land-Based Wind Energy Guidelines
42
Table 3. Decision Framework to Guide Studies for Minimizing Impacts to Habitat and Species of Habitat Fragmentation (HF) Concern.
Outcomes of Tier 2 Outcomes of Tier 3 Outcomes of Tier 4b Suggested Study/Mitigation
• NospeciesofHFconcernpotentially present
• Nofurtherstudiesneeded • n/a • n/a
• SpeciesofHFconcernpotentially present
• NospeciesofHFconcernconfirmed to be present
• Nofurtherstudiesneeded • n/a
• SpeciesofHFconcerndemonstrated to be present, but no significant adverse impacts predicted
• Tier4bstudiesconfirmTier 3 predictions
• Tier4bstudiesindicatepotentially significant adverse impacts
• Nofurtherstudiesormitigation needed
• Tier5studiesandmitigation may be needed
• SpeciesofHFconcernpotentially present
• SpeciesofHFconcerndemonstrated to be present; significant adverse impacts predicted
• Mitigationplandevelopedand implemented
• Tier4bstudiesdeterminemitigation plan is effective; no significant adverse impacts demonstrated
• Tier4bstudiesdeterminemitigation plan is NOT effective; potentially significant adverse impacts
• Nofurtherstudiesormitigation needed
• Furthermitigationand,where appropriate, Tier 5 studies

U.S. Fish and Wildlife Service Land-Based Wind Energy Guidelines
43
Chapter 6: Tier 5 – Other Post-construction Studies
Tier 5 studies will not be necessary for most wind energy projects. Tier 5 studies can be complex and time consuming. The Service anticipates that the tiered approach will steer projects away from sites where Tier 5 studies would be necessary.
When Tier 5 studies are conducted, they should be site-specific and intended to: 1) analyze factors associated with impacts in those cases in which Tier 4 analyses indicate they are potentially significant; 2) identify why mitigation measures implemented for a project were not adequate; and 3) assess demographic effects on local populations of species of concern when demographic information is important, including species of habitat fragmentation concern.
Tier 5 Questions
Tier 5 studies are intended to answer questions that fall in three major categories; answering yes to any of these questions might indicate a Tier 5 study is needed:
1. To the extent that the observed fatalities exceed anticipated fatalities, are those fatalities potentially having a significant adverse impact on local populations? Are observed direct and indirect impacts to habitat having a significant adverse impact on local populations?
For example, in the Tier 3 risk assessment, predictions of collision fatalities and habitat impacts (direct and indirect) are developed. Post-construction studies in Tier 4 evaluate the accuracy of those predictions by estimating impacts. If post-construction studies demonstrate potentially significant adverse impacts, Tier 5 studies may also be warranted and should be designed to understand observed versus predicted impacts.
2. Were mitigation measures implemented (other than fee in lieu) not effective? This includes habitat mitigation measures as well as measures undertaken to reduce collision fatalities.
Tier 4a and b studies can assess the effectiveness of measures taken to reduce direct and indirect impacts as part of the project and to identify such alternative or additional measures as are necessary. If alternative or additional measures were unsuccessful, the reasons why
would be evaluated using Tier 5 studies.
3. Are the estimated impacts of the proposed project likely to lead to population declines in the species of concern (other than federally-listed species)?
Impacts of a project will have population level effects if the project causes a population decline in the species of concern. For non-listed species, this assessment will apply only to the local population.
Wind turbines and habitat. Credit: NREL

U.S. Fish and Wildlife Service Land-Based Wind Energy Guidelines
44
Tier 5 studies may need to be conducted when:
•Realized fatality levels for individual species of concern reach a level at which they are considered significant adverse impacts by the relevant agencies.
For example, if Tier 4a fatality studies document that a particular turbine or set of turbines exhibits bird or bat collision fatality higher than predicted, Tier 5 studies may be useful in evaluating alternative mitigation measures at that turbine/turbine string.
•There is the potential for significant fatality impacts or significant adverse impacts to habitat for species of concern, there is a need to assess the impacts more closely, and there is uncertainty over how these impacts will be mitigated.
•Fatality and/or significant adverse habitat impacts suggest the potential for a reduction in the viability of an affected population, in which case studies on the potential for population impacts may be warranted.
•A developer evaluates the effectiveness of a risk reduction measure before deciding to continue the measure permanently or whether to use the measure when implementing future phases of a project.
In the event additional turbines are proposed as an expansion of an existing project, results from Tier 4 and Tier 5 studies and the decision-making framework contained in the tiered approach can be used to determine whether the project should be expanded and whether additional information should be collected. It may also be necessary to evaluate whether additional measures are warranted to reduce significant adverse impacts to species.
Tier 5 Study Design Considerations
As discussed in Chapter 4 Tier 3, Tier 5 studies will be highly variable
and unique to the circumstances of the individual project, and therefore these Guidelines do not provide specific guidance on all potential approaches, but make some general statements about study design. Specific Tier 5 study designs will depend on the types of questions, the specific project, and practical considerations. The most common practical considerations include the area being studied, the time period of interest, the species of concern, potentially confounding variables, time available to conduct studies, project budget, and the magnitude of the anticipated impacts. When possible it is usually desirable to collect data before construction to address Tier 5 questions. Design considerations for these studies are including in Tier 3.
One study design is based on an experimental approach to evaluating mitigation measures, where the project proponent will generally select several alternative management approaches to design, implement, and test. The alternatives are generally incorporated into sound experimental designs. Monitoring and evaluation of each alternative helps the developer to decide which alternative is more effective in meeting objectives, and informs adjustments to the next round of management decisions. The need for this type of study design can be best determined by communication between the project operator, the Service field office, and the state wildlife agency, on a project-by-project basis. This study design requires developers and operators to identify strategies to adjust management and/or mitigation measures if monitoring indicates that anticipated impacts are being exceeded. Such strategies should include a timeline for periodic reviews and adjustments as well as a mechanism to consider and implement additional mitigation measures as necessary after the project is developed.
When pre-construction data are unavailable and/or a suitable reference area is lacking, the reference Control Impact Design
(Morrison et al. 2008) is the recommended design. The lack of a suitable reference area also can be addressed using the Impact Gradient Design, when habitat and species use are homogenous in the assessment area prior to development. When applied both pre- and post-construction, the Impact Gradient Design is a suitable replacement for the classic BACI (Morrison et al. 2008).
In the study of habitat impacts, the resource selection function (RSF) study design (see Anderson et al 1999; Morrison et al. 2008; Manly et al. 2002) is a statistically robust design, either with or without pre-construction and reference data. Habitat selection is modeled as a function of characteristics measured on resource units and the use of those units by the animals of interest. The RSF allows the estimation of the probability of use as a function of the distance to various environmental features, including wind energy facilities, and thus provides a direct quantification of the magnitude of the displacement effect. RSF could be improved with pre-construction and reference area data. Nevertheless, it is a relatively powerful approach to documenting displacement or the effect of mitigation measures designed to reduce displacement even without those additional data.
Tier 5 Examples
As described earlier, Tier 5 studies will not be conducted at most projects, and the specific Tier 5 questions and methods for addressing these questions will depend on the individual project and the concerns raised during pre-construction studies and during operational phases. Rather than provide specific guidance on all potential approaches, these Guidelines offer the following case studies as examples of studies that have attempted to answer Tier 5 questions.
Habitat impacts - displacement and demographic impact studies

U.S. Fish and Wildlife Service Land-Based Wind Energy Guidelines
45
Studies to assess impacts may include quantifying species’ habitat loss (e.g., acres of lost grassland habitat for grassland songbirds) and habitat modification. For example, an increase in edge may result in greater nest parasitism and nest predation. Assessing indirect impacts may include two important components: 1) indirect effects on wildlife resulting from displacement, due to disturbance, habitat fragmentation, loss, and alteration; and 2) demographic effects that may occur at the local, regional or population-wide levels due to reduced nesting and breeding densities, increased isolation between habitat patches, and effects on behavior (e.g., stress, interruption, and modification). These factors can individually or cumulatively affect wildlife, although some species may be able to habituate to some or perhaps all habitat changes. Indirect impacts may be difficult to quantify but their effects may be significant (e.g., Stewart et al. 2007, Pearce-Higgins et al. 2008, Bright et al. 2008, Drewitt and Langston 2006, Robel et al. 2004, Pruett et al. 2009).
Example: in southwestern Pennsylvania, development of a project is proceeding at a site located
within the range of a state-listed terrestrial species. Surveys were performed at habitat locations appropriate for use by the animal, including at control sites. Post-construction studies are planned at all locations to demonstrate any displacement effects resulting from the construction and operation of the project.
The Service recognizes that indirect impact studies may not be appropriate for most individual projects. Consideration should be given to developing collaborative research efforts with industry, government agencies, and NGOs to conduct studies to address indirect impacts.
Indirect impacts are considered potentially significant adverse threats to species such as prairie grouse (prairie chickens, sharp-tailed grouse), and sage grouse, and demographic studies may be necessary to determine the extent of these impacts and the need for mitigation.
Displacement studies may use any of the study designs describe earlier. The most scientifically robust study designs to estimate displacement effects are BACI, RSF, and impact
gradient. RSF and impact gradient designs may not require specialized data gathering during Tier 3.
Telemetry studies that measure impacts of the project development on displacement, nesting, nest success, and survival of prairie grouse and sage grouse in different environments (e.g., tall grass, mixed grass, sandsage, sagebrush) will require spatial and temporal replication, undisturbed reference sites, and large sample sizes covering large areas. Examples of study designs and analyses used in the studies of other forms of energy development are presented in Holloran et al. (2005), Pitman et al. (2005), Robel et al. (2004), and Hagen et al. (2011). Anderson et al. (1999) provides a thorough discussion of the design, implementation, and analysis of these kinds of field studies and should be consulted when
designing the BACI study.
Studies are being initiated to evaluate effects of wind energy development on greater sage grouse in Wyoming. In addition to measuring demographic patterns, these studies will use the RSF study design (see Sawyer et al. 2006) to estimate the probability of sage grouse use as a function of the distance to environmental features, including an existing and a proposed project.
In certain situations, such as for a proposed project site that is relatively small and in a more or less homogeneous landscape, an impact gradient design may be an appropriate means to assess avoidance of the wind energy facility by resident populations (Strickland et al., 2002). For example, Leddy et al. 1999 used the impact gradient design to evaluate grassland bird density as a function of the distance from wind turbines. Data were collected at various distances from turbines along transects.
This approach provides information on whether there is an effect, and may allow quantification of the gradient of the effect and the distance at which the displacement
Rows of wind turbines. Credit: Joshua Winchell, USFWS

U.S. Fish and Wildlife Service Land-Based Wind Energy Guidelines
46
effect no longer exists – the assumption being that the data collected at distances beyond the influence of turbines are the reference data (Erickson et al., 2007). An impact gradient analysis could also involve measuring the number of breeding grassland birds counted at point count plots as a function of distance from the wind turbines (Johnson et al. 2000).
Sound and Wildlife
Turbine blades at normal operating speeds can generate levels of sound beyond ambient background levels. Construction and maintenance activities can also contribute to sound levels by affecting communication distance, an animal’s ability to detect calls or danger, or to forage. Sound associated with developments can also cause behavioral and/or physiological effects, damage to hearing from acoustic over-exposure, and masking of communication signals and other biologically relevant sounds (Dooling and Popper 2007). Some birds are able to shift their vocalizations to reduce the masking effects of noise. However, when shifts don’t occur or are insignificant, masking may prove detrimental to the health and survival of wildlife (Barber et al. 2010). Data suggest noise increases of 3 dB to 10 dB correspond to 30 percent to 90 percent reductions in alerting distances for wildlife, respectively (Barber et al. 2010).
The National Park Service has been investigating potential impacts to wildlife due to alterations in sound level and type. However, further research is needed to better understand this potential impact. Research may include: how wind facilities affect background sound levels; whether masking, disturbance, and acoustical fragmentation occur; and how turbine, construction, and maintenance sound levels can vary by topographic area.
Levels of fatality beyond those predicted
More intensive post-construction fatality studies may be used to
determine relationships between fatalities and weather, wind speed or other covariates, which usually require daily carcass searches. Fatalities determined to have occurred the previous night can be correlated with that night’s weather or turbine characteristics to establish important relationships that can then be used to evaluate the most effective times and conditions to implement measures to reduce collision fatality at the project.
Measures to address fatalities
The efficacy of operational changes (e.g. changing turbine cut-in speed) of a project to reduce collision fatalities has only recently been evaluated (Arnett et al. 2009, Baerwald et al 2009). Operational changes to address fatalities should be applied only at sites where collision fatalities are predicted or demonstrated to have significant adverse impacts.
Tier 5 Studies and Research
The Service makes a distinction between Tier 5 studies focused on project-specific impacts and research (which is discussed earlier in the Guidelines). For example, developers may be encouraged to participate in collaborative studies (see earlier discussion of Research) or asked to conduct a study on an experimental mitigation technique, such as differences in turbine cut-in speed to reduce bat fatalities. Such techniques may show promise in mitigating the impacts of wind energy development to wildlife, but their broad applicability for mitigation purposes has not been demonstrated. Such techniques should not be routinely applied to projects, but application at appropriate sites will contribute to the breadth of knowledge regarding the efficacy of such measures in addressing collision fatalities. In addition, studies involving multiple sites and academic researchers can provide more robust research results, and such studies take more time and resources than are appropriately carried out by one developer at a single site. Examples below demonstrate collaborative
research efforts to address displacement, operational changes, and population level impacts.
Studies of Indirect Effects
The Service provides two examples below of ongoing studies to assess the effects of indirect impacts related to wind energy facilities.
Kansas State University, as part of the NWCC Grassland Shrub-steppe Species Collaborative, is undertaking a multi-year research project to assess the effects of wind energy facilities on populations of greater prairie-chickens (GPCH) in Kansas. Initially the research was based on a Before/After Control/Impact (BACI) experimental design involving three replicated study sites in the Flint Hills and Smoky Hills of eastern Kansas. Each study site consisted of an impact area where a wind energy facility was proposed to be developed and a nearby reference area with similar rangeland characteristics where no development was planned. The research project is a coordinated field/laboratory effort, i.e., collecting telemetry and observational data from adult and juvenile GPCH in the field, and determining population genetic attributes of GPCH in the laboratory from blood samples of birds and the impact and reference areas. Detailed data on GPCH movements, demography, and population genetics were gathered from all three sites from 2007 to 2010. By late 2008, only one of the proposed wind energy facilities was developed (the Meridian Way Wind Farm in the Smoky Hills of Cloud County), and on-going research efforts are focused on that site. The revised BACI study design now will produce two years of pre-construction data (2007 and 2008), and three years of post-construction data (2009, 2010, and 2011) from a single wind energy facility site (impact area) and its reference area. Several hypotheses were formulated for testing to determine if wind energy facilities impacted GPCH populations, including but not limited to addressing issues relating to: lek attendance, avoidance of turbines and associated features,

U.S. Fish and Wildlife Service Land-Based Wind Energy Guidelines
47
nest success and chick survival, habitat usage, adult mortality and survival, breeding behavior, and natal dispersal. A myriad of additional significant avenues are being pursued as a result of the rich database that has been developed for the GPCH during this research effort. GPCH reproductive data will be collected through the summer of 2011 whereas collection of data from transmitter-equipped GPCH will extend through the lekking season of 2012 to allow estimates of survival of GPCH over the 2011-2012 winter. At the conclusion of the study, the two years of pre-construction data and three years of post-construction data will be analyzed and submitted to peer-reviewed journals for publication.
Erickson et al. (2004) evaluated the displacement effect of a large wind energy facility in the Pacific Northwest. The study was conducted in a relatively homogeneous grassland landscape. Erickson et al. (2004) conducted surveys of breeding grassland birds along 300 meter transects perpendicular to strings of wind turbines. Surveys were conducted prior to construction and after commercial operation. The basic study design follows the Impact Gradient Design (Morrison et al. 2008) and in this application, conformed to a special case of BACI where areas at the distal end of each transect were considered controls (i.e., beyond the influence of the turbines). In this study, there is no attempt to census birds in the area, and observations per survey are used as an index of abundance. Additionally, the impact-gradient study design resulted in less effort than a BACI design with offsite control areas. Erickson et al. (2004) found that grassland passerines as a group, as well as grasshopper sparrows and western meadowlarks, showed reduced use in the first 50 meter segment nearest the turbine string. About half of the area within that segment, however, had disturbed vegetation and separation of behavior avoidance from physical loss of habitat in this portion of the area was impossible. Horned larks and savannah sparrows appeared
unaffected. The impact gradient design is best used when the study area is relatively small and homogeneous.
Operational Changes to Reduce Collision Fatality
Arnett et al. (2009) conducted studies on the effectiveness of changing turbine cut-in speed on reducing bat fatality at wind turbines at the Casselman Wind Project in Somerset County, Pennsylvania. Their objectives were to: 1) determine the difference in bat fatalities at turbines with different cut-in-speeds relative to fully operational turbines; and 2) determine the economic costs of the experiment and estimated costs for the entire area of interest under different curtailment prescriptions and timeframes. Arnett et al. (2009) reported substantial reductions in bat fatalities with relatively modest power losses.
In Kenedy County, Texas, investigators are refining and testing a real-time curtailment protocol. The projects use an avian profiling radar system to detect approaching “flying vertebrates” (birds and bats), primarily during spring and fall bird and bat migrations. The blades automatically idle when risk reaches a certain level and weather conditions are particularly risky. Based on estimates of the number and timing of migrating raptors, feathering (real-time curtailment) experiments are underway in Tehuantepec, Mexico, where raptor migration through a mountain pass is extensive.
Other tools, such as thermal imaging (Horn et al. 2008) or acoustic detectors (Kunz et al. 2007), have been used to quantify post-construction bat activity in relation to weather and turbine characteristics for improving operational change efforts. For example, at the Mountaineer project in 2003, Tier 4 studies (weekly searches at every turbine) demonstrated unanticipated and high levels of bat fatalities (Kerns and Kerlinger 2004). Daily searches were instituted in 2004 and revealed
that fatalities were strongly associated with low-average-wind-speed nights, thus providing a basis for testing operational changes (Arnett 2005, Arnett et al. 2008). The program also included behavioral observations using thermal imaging that demonstrated higher bat activity at lower wind speeds (Horn et al. 2008).
Studies are currently underway to design and test the efficacy of an acoustic deterrent device to reduce bat fatalities at wind facilities (E.B. Arnett, Bat Conservation International, under the auspices of BWEC). Prototypes of the device have been tested in the laboratory and in the field with some success. Spanjer (2006) tested the response of big brown bats to a prototype eight speaker deterrent emitting broadband white noise at frequencies from 12.5–112.5 kHz and found that during non-feeding trials, bats landed in the quadrant containing the device significantly less when it was broadcasting broadband noise. Spanjer (2006) also reported that during feeding trials, bats never successfully took a tethered mealworm when the device broadcast sound, but captured mealworms near the device in about 1/3 of trials when it was silent. Szewczak and Arnett (2006, 2007) tested the same acoustic deterrent in the field and found that when placed by the edge of a small pond where nightly bat activity was consistent, activity dropped significantly on nights when the deterrent was activated. Horn et al. (2007) tested the effectiveness of a larger, more powerful version of this deterrent device on reducing nightly bat activity and found mixed results. In 2009, a new prototype device was developed and tested at a project in Pennsylvania. Ten turbines were fitted with deterrent devices, daily fatality searches were conducted, and fatality estimates were compared with those from 15 turbines without deterrents (i.e., controls) to determine if bat fatalities were reduced. This experiment found that estimated bat fatalities per turbine were 20 to 53 percent lower at treatment turbines compared to controls.

U.S. Fish and Wildlife Service Land-Based Wind Energy Guidelines
48
More experimentation is required. At the present time, there is not an operational deterrent available that has demonstrated effective reductions in bat kills (E. B. Arnett, Bat Conservation International, unpublished data).
Assessment of Population-level Impacts
The Altamont Pass Wind Resource Area (APWRA) has been the subject of intensive scrutiny because of avian fatalities, especially for raptors, in an area encompassing more than 5,000 wind turbines (e.g., Orloff and Flannery 1992; Smallwood and Thelander 2004, 2005). Field studies on golden eagles, a long-lived raptor species, have been completed using radio telemetry at APWRA to understand population demographics, assess impacts from wind turbines, and explore measures to effectively reduce the incidence of golden eagle mortality for this area. (Hunt et al. 1999, and Hunt 2002). Results from nesting surveys (Hunt 2002) indicated that there was no decline in eagle territory occupancy. However Hunt (2002) also found that subadult and floater components of golden eagle populations at APWRA are highly vulnerable to wind turbine mortality and results from this study indicate that turbine mortality prevented the maintenance of substantial reserves of nonbreeding adults characteristic of healthy populations elsewhere, suggesting the possibility of an eventual decline in the breeding population (Hunt and Hunt 2006). Hunt conducted follow-up surveys in 2005 (Hunt and Hunt 2006) and determined that all 58 territories occupied by eagle pairs in 2000 were occupied in 2005. It should be noted however that golden eagle studies at APWRA (Hunt et al. 1999, Hunt 2002, and Hunt and Hunt 2006) were all conducted after the APWRA was constructed and the species does not nest within the footprint of the APWRA itself (Figure 4; Hunt and Hunt 2006). The APWRA is an area of about 160 sq. km (Hunt 2002) and presumably golden eagles formerly nested within this area. The loss of breeding eagle pairs from the APWRA suggests these birds have all been displaced
by the project, or lost due to various types of mortality including collisions with turbine blades.
Golden eagle. Credit: George Gentry, USFWS

U.S. Fish and Wildlife Service Land-Based Wind Energy Guidelines
49
Chapter 7: Best Management Practices
Site Construction and Operation
During site planning and development, careful attention to reducing risk of adverse impacts to species of concern from wind energy projects, through careful site selection and facility design, is recommended. The following BMPs can assist a developer in the planning process to reduce potential impacts to species of concern. Use of these BMPs should ensure that the potentially adverse impacts to most species of concern and their habitats present at many project sites would be reduced, although compensatory mitigation may be appropriate at a project level to address significant site-specific concerns and pre-construction study results.
These BMPs will evolve over time as additional experience, learning, monitoring and research becomes available on how to best minimize wildlife and habitat impacts from wind energy projects. Service should work with the industry, stakeholders and states to evaluate, revise and update these BMPs on a periodic basis, and the Service should maintain a readily available publication of recommended, generally accepted best practices.
1. Minimize, to the extent practicable, the area disturbed by pre-construction site monitoring and testing activities and installations.
2. Avoid locating wind energy facilities in areas identified as having a demonstrated and unmitigatable high risk to birds and bats.
3. Use available data from state and federal agencies, and other sources (which could include maps or databases), that show the location of sensitive resources and the results of Tier 2 and/or 3 studies to establish the layout
of roads, power lines, fences, and other infrastructure.
4. Minimize, to the maximum extent practicable, roads, power lines, fences, and other infrastructure associated with a wind development project. When fencing is necessary, construction should use wildlife compatible design standards.
5. Use native species when seeding or planting during restoration. Consult with appropriate state and federal agencies regarding native species to use for restoration.
6. To reduce avian collisions, place low and medium voltage connecting power lines associated with the wind energy development underground to the extent possible, unless burial of the lines is prohibitively expensive (e.g., where shallow bedrock exists) or where greater adverse impacts to biological resources would result:
a. Overhead lines may be acceptable if sited away
from high bird crossing locations, to the extent practicable, such as between roosting and feeding areas or between lakes, rivers, prairie grouse and sage grouse leks, and nesting habitats. To the extent practicable, the lines should be marked in accordance with Avian Power Line Interaction Committee (APLIC) collision guidelines.
b. Overhead lines may be used when the lines parallel tree lines, employ bird flight diverters, or are otherwise screened so that collision risk is reduced.
c. Above-ground low and medium voltage lines, transformers and conductors should follow the 2006 or most recent APLIC “Suggested Practices for Avian Protection on Power Lines.”
7. Avoid guyed communication towers and permanent met towers at wind energy project sites. If guy wires are necessary,
Wind electronic developers. Credit: NREL

U.S. Fish and Wildlife Service Land-Based Wind Energy Guidelines
50
bird flight diverters or high visibility marking devices should be used.
8. Where permanent meteorological towers must be maintained on a project site, use the minimum number necessary.
9. Use construction and management practices to minimize activities that may attract prey and predators to the wind energy facility.
10. Employ only red, or dual red and white strobe, strobe-like, or flashing lights, not steady burning lights, to meet Federal Aviation Administration (FAA) requirements for visibility lighting of wind turbines, permanent met towers, and communication towers. Only a portion of the turbines within the wind project should be lighted, and all pilot warning lights should fire synchronously.
11. Keep lighting at both operation and maintenance facilities and substations located within half a mile of the turbines to the minimum required:
a. Use lights with motion or heat sensors and switches to keep lights off when not required.
b. Lights should be hooded downward and directed to minimize horizontal and skyward illumination.
c. Minimize use of high-intensity lighting, steady-burning, or bright lights such as sodium vapor, quartz, halogen, or other bright spotlights.
d. All internal turbine nacelle and tower lighting should be extinguished when unoccupied.
12. Establish non-disturbance buffer zones to protect sensitive habitats or areas of high risk for species of concern identified in pre-construction studies.
Determine the extent of the buffer zone in consultation with the Service and state, local and tribal wildlife biologists, and land management agencies (e.g., U.S. Bureau of Land Management (BLM) and U.S. Forest Service (USFS)), or other credible experts as appropriate.
13. Locate turbines to avoid separating bird and bat species of concern from their daily roosting, feeding, or nesting sites if documented that the turbines’ presence poses a risk to species.
14. Avoid impacts to hydrology and stream morphology, especially where federal or state-listed aquatic or riparian species may be involved. Use appropriate erosion control measures in construction and operation to eliminate or minimize runoff into water bodies.
15. When practical use tubular towers or best available technology to reduce ability of birds to perch and to reduce risk of collision.
16. After project construction, close roads not needed for site operations and restore these roadbeds to native vegetation, consistent with landowner agreements.
17. Minimize the number and length of access roads; use existing roads when feasible.
18. Minimize impacts to wetlands and water resources by following all applicable provisions of the Clean Water Act (33 USC 1251-1387) and the Rivers and Harbors Act (33 USC 301 et seq.); for instance, by developing and implementing a storm water management plan and taking measures to reduce erosion and avoid delivery of road-generated sediment into streams and waters.
19. Reduce vehicle collision risk to wildlife by instructing project personnel to drive at appropriate speeds, be alert for wildlife, and
use additional caution in low visibility conditions.
20. Instruct employees, contractors, and site visitors to avoid harassing or disturbing wildlife, particularly during reproductive seasons.
21. Reduce fire hazard from vehicles and human activities (instruct employees to use spark arrestors on power equipment, ensure that no metal parts are dragging from vehicles, use caution with open flame, cigarettes, etc.). Site development and operation plans should specifically address the risk of wildfire and provide appropriate cautions and measures to be taken in the event of a wildfire.
22. Follow federal and state measures for handling toxic substances to minimize danger to water and wildlife resources from spills. Facility operators should maintain Hazardous Materials Spill Kits on site and train personnel in the use of these.
23. Reduce the introduction and spread of invasive species by following applicable local policies for invasive species prevention, containment, and control, such as cleaning vehicles and equipment arriving from areas with known invasive species issues, using locally sourced topsoil, and monitoring for and rapidly removing invasive species at least annually.
24. Use invasive species prevention and control measures as specified by county or state requirements, or by applicable federal agency requirements (such as Integrated Pest Management) when federal policies apply.
25. Properly manage garbage and waste disposal on project sites to avoid creating attractive nuisances for wildlife by providing them with supplemental food.
26. Promptly remove large animal carcasses (e.g., big game,

U.S. Fish and Wildlife Service Land-Based Wind Energy Guidelines
51
domestic livestock, or feral animal).
27. Wildlife habitat enhancements or improvements such as ponds, guzzlers, rock or brush piles for small mammals, bird nest boxes, nesting platforms, wildlife food plots, etc. should not be created or added to wind energy facilities. These wildlife habitat enhancements are often desirable but when added to a wind energy facility result in increased wildlife use of the facility which may result in increased levels of injury or mortality to them.
Retrofitting, Repowering, and Decommissioning
As with project construction, these Guidelines offer BMPs for the retrofitting, repowering, and decommissioning phases of wind energy projects.
Retrofitting
Retrofitting is defined as replacing portions of existing wind turbines or project facilities so that at least part of the original turbine, tower, electrical infrastructure or foundation is being utilized. Retrofitting BMPs include:
1. Retrofitting of turbines should use installation techniques that minimize new site disturbance, soil erosion, and removal of vegetation of habitat value.
2. Retrofits should employ shielded, separated or insulated electrical conductors that minimize electrocution risk to avian wildlife per APLIC (2006).
3. Retrofit designs should prevent nests or bird perches from being established in or on the wind turbine or tower.
4. FAA visibility lighting of wind turbines should employ only red, or dual red and white strobe, strobe-like, or flashing lights, not steady burning lights.
5. Lighting at both operation and maintenance facilities and
substations located within half a mile of the turbines should be kept to the minimum required:
a. Use lights with motion or heat sensors and switches to keep lights off when not required.
b. Lights should be hooded downward and directed to minimize horizontal and skyward illumination.
c. Minimize use of high intensity lighting, steady-burning, or bright lights such as sodium vapor, quartz, halogen, or other bright spotlights.
6. Remove wind turbines when they are no longer cost effective to retrofit.
Repowering
Repowering may include removal and replacement of turbines and associated infrastructure. BMPs include:
1. To the greatest extent practicable, existing roads, disturbed areas and turbine strings should be re-used in repower layouts.
2. Roads and facilities that are no longer needed should be demolished, removed, and their footprint stabilized and re-seeded with native plants appropriate for the soil conditions and adjacent habitat and of local seed sources where feasible, per landowner requirements and commitments.
3. Existing substations and ancillary facilities should be re-used in repowering projects to the extent practicable.
4. Existing overhead lines may be acceptable if located away from high bird crossing locations, such as between roosting and feeding areas, or between lakes, rivers and nesting areas. Overhead lines may be used when they parallel tree lines, employ bird flight diverters, or are otherwise screened so that collision risk is reduced.
5. Above-ground low and medium voltage lines, transformers and conductors should follow the 2006 or most recent APLIC “Suggested Practices for Avian Protection on Power Lines.”
6. Guyed structures should be avoided. If use of guy wires is absolutely necessary, they should be treated with bird flight diverters or high visibility marking devices, or are located where known low bird use will occur.
7. FAA visibility lighting of wind turbines should employ only red, or dual red and white strobe, strobe-like, or flashing lights, not steady burning lights.
8. Lighting at both operation and maintenance facilities and substations located within ½ mile of the turbines should be kept to the minimum required.
a. Use lights with motion or heat sensors and switches to keep lights off when not required.
b. Lights should be hooded downward and directed to minimize horizontal and skyward illumination.
Towers are being lifted as work continues on the 2 MW Gamesa wind turbine that is being installed at the NWTC . Credit: NREL

U.S. Fish and Wildlife Service Land-Based Wind Energy Guidelines
52
c. Minimize use of high intensity lighting, steady-burning, or bright lights such as sodium vapor, quartz, halogen, or other bright spotlights.
Decommissioning
Decommissioning is the cessation of wind energy operations and removal of all associated equipment, roads, and other infrastructure. The land is then used for another activity. During decommissioning, contractors and facility operators should apply BMPs for road grading and native plant re-establishment to ensure that erosion and overland flows are managed to restore pre-construction landscape conditions. The facility operator, in conjunction with the landowner and state and federal wildlife agencies, should restore the natural hydrology and plant community to the greatest extent practical.
1. Decommissioning methods should minimize new site disturbance and removal of native vegetation, to the greatest extent practicable.
2. Foundations should be removed to a minimum of three feet below surrounding grade, and covered with soil to allow adequate root penetration for native plants, and so that subsurface structures do not substantially disrupt ground water movements. Three feet is typically adequate for agricultural lands.
3. If topsoils are removed during decommissioning, they should be stockpiled and used as topsoil when restoring plant communities. Once decommissioning activity is complete, topsoils should be restored to assist in establishing and maintaining pre-construction native plant communities to the extent possible, consistent with landowner objectives.
4. Soil should be stabilized and re-vegetated with native plants appropriate for the soil conditions and adjacent habitat, and of local seed sources where feasible, consistent with landowner objectives.
5. Surface water flows should be restored to pre-disturbance conditions, including removal of stream crossings, roads, and pads, consistent with storm water management objectives and requirements.
6. Surveys should be conducted by qualified experts to detect populations of invasive species, and comprehensive approaches to preventing and controlling invasive species should be implemented and maintained as long as necessary.
7. Overhead pole lines that are no longer needed should be removed.
8. After decommissioning, erosion control measures should be installed in all disturbance areas where potential for erosion exists, consistent with storm water management objectives and requirements.
9. Fencing should be removed unless the landowner will be utilizing the fence.
10. Petroleum product leaks and chemical releases should be remediated prior to completion of decommissioning.

U.S. Fish and Wildlife Service Land-Based Wind Energy Guidelines
53
Chapter 8: Mitigation
Mitigation is defined in this document as avoiding or minimizing significant adverse impacts, and when appropriate, compensating for unavoidable significant adverse impacts, as determined through the tiered approach described in the recommended Guidelines. The Service places emphasis in project planning on first avoiding, then minimizing, potential adverse impacts to wildlife and their habitats. Several tools are available to determine appropriate mitigation, including the Service Mitigation Policy (USFWS Mitigation Policy, 46 FR 7656 (1981)). The Service policy provides a common basis for determining how and when to use different mitigation strategies, and facilitates earlier consideration of wildlife values in wind energy project planning.
Under the Service Mitigation Policy, the highest priority is for mitigation to occur on-site within the project planning area. The secondary priority is for the mitigation to occur off-site. Off-site mitigation should first occur in proximity to the planning area within the same ecological region and secondarily elsewhere within the same ecological region. Generally, the Service prefers on-site mitigation over off-site mitigation because this approach most directly addresses project impacts at the location where they actually occur. However, there may be individual cases where off-site mitigation could result in greater net benefits to affected species and habitats. Developers should work with the Service in comparing benefits among multiple alternatives.
In some cases, a project’s effects cannot be forecast with precision. The developer and the agencies may be unable to make some mitigation decisions until post-construction data have been collected. If significant adverse effects have not been adequately addressed,
additional mitigation for those adverse effects from operations may need to be implemented.
Mitigation measures implemented post-construction, whether in addition to those implemented pre-construction or whether they are new, are appropriate elements of the tiered approach. The general terms and funding commitments for future mitigation and the triggers or thresholds for implementing such compensation should be developed at the earliest possible stage in project development. Any mitigation implemented after a project is operational should be well defined, bounded, technically feasible, and commensurate with the project effects.
NEPA Guidance on Mitigation
CEQ issued guidance in February 2011 on compliance with the National Environmental Policy Act (NEPA) entitled, “Appropriate Use of Mitigation and Monitoring and Clarifying the Appropriate Use of
Mitigated Findings of No Significant Impact.” This new guidance clarifies that when agencies premise their Finding of No Significant Impact on a commitment to mitigate the environmental impacts of a proposed action, they should adhere to those commitments, publicly report on those efforts, monitor how they are implemented, and monitor the effectiveness of the mitigation.
To the extent that a federal nexus with a wind project exists, for example, developing a project on federal lands or obtaining a federal permit, the lead federal action agency should make its decision based in part on a developer’s commitment to mitigate adverse environmental impacts. The federal action agency should ensure that the developer adheres to those commitments, monitors how they are implemented, and monitors the effectiveness of the mitigation. Additionally, the lead federal action agency should make information on mitigation monitoring available to the public through its web site;
Greater prairie chicken. Credit: Amy Thornburg, USFWS

U.S. Fish and Wildlife Service Land-Based Wind Energy Guidelines
54
and should ensure that mitigation successfully achieves its goals.
Compensatory Mitigation
Compensatory mitigation as defined in this document refers to replacement of project-induced losses to fish and wildlife resources. Substitution or offsetting of fish and wildlife resource losses with resources considered to be of equivalent biological value.
- In-kind – Providing or managing substitute resources to replace the value of the resources lost, where such substitute resources are physically and biologically the same or closely approximate to those lost.
- Out-of-kind – Providing or managing substitute resources to replace the value of the resources lost, where such substitute resources are physically or biologically different from those lost. This may include conservation or mitigation banking, research or other options.
The amount of compensation, if necessary, will depend on the effectiveness of any avoidance and minimization measures undertaken. If a proposed wind development is poorly sited with regard to wildlife effects, the most important mitigation opportunity is largely lost and the remaining options can be expensive, with substantially greater environmental effects.
Compensation is most often appropriate for habitat loss under limited circumstances or for direct take of wildlife (e.g., Habitat Conservation Plans). Compensatory mitigation may involve contributing to a fund to protect habitat or otherwise support efforts to reduce existing impacts to species affected by a wind project. Developers should communicate with the Service and state agency prior to initiating such an approach.
Ideally, project impact assessment is a cooperative effort involving
the developer, the Service, tribes, local authorities, and state resource agencies. The Service does not expect developers to provide compensation for the same habitat loss more than once. But the Service, state resource agencies, tribes, local authorities, state and federal land management agencies may have different species or habitats of concern, according to their responsibilities and statutory authorities. Hence, one entity may seek mitigation for a different group of species or habitat than does another.
Migratory Birds and Eagles
Some industries, such as the electric utilities, have developed operational and deterrent measures that when properly used can avoid or minimize “take” of migratory birds. Many of these measures to avoid collision and electrocution have been scientifically tested with publication in peer-reviewed, scientific journals. The Service encourages the wind industry to use these measures in siting, placing, and operating all power lines, including their distribution and grid-connecting transmission lines.
E.O. 13186, which addresses responsibilities of federal agencies to protect migratory birds, includes a directive to federal agencies to restore and enhance the habitat of migratory birds as practicable. E.O. 13186 provides a basis and a rationale for compensating for the loss of migratory bird habitat that results from developing wind energy projects that have a federal nexus.
Regulations concerning eagle take permits in 50 CFR 22.26 and 50 CFR 22.27 may allow for compensation as part of permit issuance. Compensation may be a condition of permit issuance in cases of nest removal, disturbance or take resulting in mortality that will likely occur over several seasons, result in permanent abandonment of one or more breeding territories, have large scale impacts, occur at multiple locations, or otherwise contribute to cumulative negative effects. The draft ECP Guidance
has additional information on the use of compensation for programmatic permits.
Endangered Species
The ESA has provisions that allow for compensation through the issuance of an Incidental Take Permit (ITP). Under the ESA, mitigation measures are determined on a case by case basis, and are based on the needs of the species and the types of effects anticipated. If a federal nexus exists, or if a developer chooses to seek an ITP under the ESA, then effects to listed species need to be evaluated through the Section 7 and/or Section 10 processes. If an ITP is requested, it and the associated HCP must provide for minimization and mitigation to the maximum extent practicable, in addition to meeting other necessary criteria for permit issuance. For further information about compensation under federal laws administered by the Service, see the Service’s Habitat and Resource Conservation website http://www.fws.gov/habitatconservation.
Bald eagle. Credit: USFWS
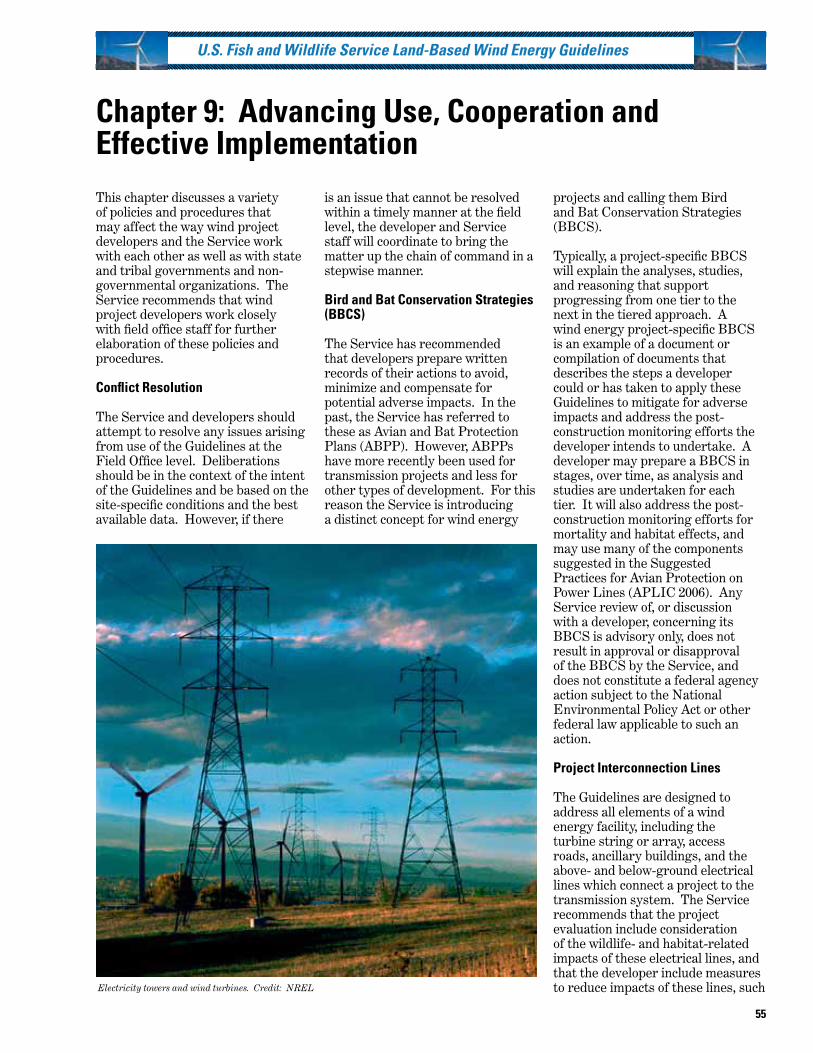
U.S. Fish and Wildlife Service Land-Based Wind Energy Guidelines
55
Chapter 9: Advancing Use, Cooperation and Effective ImplementationThis chapter discusses a variety of policies and procedures that may affect the way wind project developers and the Service work with each other as well as with state and tribal governments and non-governmental organizations. The Service recommends that wind project developers work closely with field office staff for further elaboration of these policies and procedures.
Conflict Resolution
The Service and developers should attempt to resolve any issues arising from use of the Guidelines at the Field Office level. Deliberations should be in the context of the intent of the Guidelines and be based on the site-specific conditions and the best available data. However, if there
is an issue that cannot be resolved within a timely manner at the field level, the developer and Service staff will coordinate to bring the matter up the chain of command in a stepwise manner.
Bird and Bat Conservation Strategies (BBCS)
The Service has recommended that developers prepare written records of their actions to avoid, minimize and compensate for potential adverse impacts. In the past, the Service has referred to these as Avian and Bat Protection Plans (ABPP). However, ABPPs have more recently been used for transmission projects and less for other types of development. For this reason the Service is introducing a distinct concept for wind energy
projects and calling them Bird and Bat Conservation Strategies (BBCS).
Typically, a project-specific BBCS will explain the analyses, studies, and reasoning that support progressing from one tier to the next in the tiered approach. A wind energy project-specific BBCS is an example of a document or compilation of documents that describes the steps a developer could or has taken to apply these Guidelines to mitigate for adverse impacts and address the post-construction monitoring efforts the developer intends to undertake. A developer may prepare a BBCS in stages, over time, as analysis and studies are undertaken for each tier. It will also address the post-construction monitoring efforts for mortality and habitat effects, and may use many of the components suggested in the Suggested Practices for Avian Protection on Power Lines (APLIC 2006). Any Service review of, or discussion with a developer, concerning its BBCS is advisory only, does not result in approval or disapproval of the BBCS by the Service, and does not constitute a federal agency action subject to the National Environmental Policy Act or other federal law applicable to such an action.
Project Interconnection Lines
The Guidelines are designed to address all elements of a wind energy facility, including the turbine string or array, access roads, ancillary buildings, and the above- and below-ground electrical lines which connect a project to the transmission system. The Service recommends that the project evaluation include consideration of the wildlife- and habitat-related impacts of these electrical lines, and that the developer include measures to reduce impacts of these lines, such Electricity towers and wind turbines. Credit: NREL

U.S. Fish and Wildlife Service Land-Based Wind Energy Guidelines
56
as those outlined in the Suggested Practices for Avian Protection on Power Lines (APLIC 2006). The Guidelines are not designed to address transmission beyond the point of interconnection to the transmission system. The national grid and proposed smart grid system are beyond the scope of these Guidelines.
Confidentiality of Site Evaluation Process as Appropriate
Some aspects of the initial pre-construction risk assessment, including preliminary screening and site characterization, occur early in the development process, when land or other competitive issues limit developers’ willingness to share information on projects with the public and competitors. Any consultation or coordination with agencies at this stage may include confidentiality agreements.
Collaborative Research
Much uncertainty remains about predicting risk and estimating impacts of wind energy development on wildlife. Thus there is a need for additional research to improve scientifically based decision-making when siting wind energy facilities, evaluating impacts on wildlife and habitats, and testing the efficacy of mitigation measures. More extensive studies are needed to further elucidate patterns and test hypotheses regarding possible solutions to wildlife and wind energy impacts.
It is in the interests of wind developers and wildlife agencies to improve these assessments to better mitigate the impacts of wind energy development on wildlife and their habitats. Research can provide data on operational factors (e.g. wind speed, weather conditions) that are likely to result in fatalities. It could
also include studies of cumulative impacts of multiple wind energy projects, or comparisons of different methods for assessing avian and bat activity relevant to predicting risk. Monitoring and research should be designed and conducted to ensure unbiased data collection that meets technical standards such as those used in peer review. Research projects may occur at the same time as project-specific Tier 4 and Tier 5 studies.
Research would usually result from collaborative efforts involving appropriate stakeholders, and is not the sole or primary responsibility of any developer. Research partnerships (e.g., Bats and Wind Energy Cooperative (BWEC)9, Grassland and Shrub Steppe Species Collaborative (GS3C)10 ) involving diverse players will be helpful for generating common goals and objectives and adequate funding to conduct studies (Arnett and Haufler 2003). The National Wind Coordinating Collaborative (NWCC)11 , the American Wind Wildlife Institute (AWWI)12 , and the California Energy Commission (CEC)’s Public Interest Energy Research Program13 all support research in this area.
Study sites and access will be necessary to design and implement research, and developers are encouraged to participate in these research efforts when possible. Subject to appropriations, the Service also should fund priority research and promote collaboration and information sharing among research efforts to advance science on wind energy-wildlife interactions, and to improve these Guidelines.
Service - State Coordination and Cooperation
The Service encourages states to increase compatibility between
state guidelines and these voluntary Guidelines, protocols, data collection methods, and recommendations relating to wildlife and wind energy. States that desire to adopt, or those that have formally adopted, wind energy siting, permitting, or environmental review regulations or guidelines are encouraged to cooperate with the Service to develop consistent state level guidelines. The Service may be available to confer, coordinate and share its expertise with interested states when a state lacks its own guidance or program to address wind energy-wildlife interactions. The Service will also use states’ technical resources as much as possible and as appropriate.
The Service will explore establishing a voluntary state/federal program to advance cooperation and compatibility between the Service and interested state and local governments for coordinated review of projects under both federal and state wildlife laws. The Service, and interested states, will consider using the following tools to reach agreements to foster consistency in review of projects:
• Cooperationagreementswithinterested state governments.
• Jointagencyreviewstoreduceduplication and increase coordination in project review.
• Acommunicationmechanism:
• To share information about prospective projects
• To coordinate project review
• To ensure that state and federal regulatory processes, and/or mitigation requirements are being adequately addressed
9 www.batsandwind.org 10 www.nationalwind.org 11 www.nationalwind.org 12 http://www.awwi.org 13 http://www.energy.ca.gov/research

U.S. Fish and Wildlife Service Land-Based Wind Energy Guidelines
57
• To ensure that species of concern and their habitats are fully addressed
• Establishingconsistentandpredictable joint protocols, data collection methodologies, and study requirements to satisfy project review and permitting.
• DesignatingaServicemanagement contact within each Regional Office to assist Field Offices working with states and local agencies to resolve significant wildlife-related issues that cannot be resolved at the field level.
• Cooperativestate/federal/industry research agreements relating to wind energy -wildlife interactions.
The Service will explore opportunities to:
• Providetrainingtostates.
• Fosterdevelopmentofanationalgeographic data base that identifies development-sensitive ecosystems and habitats.
• Supportanationaldatabaseforreporting of mortality data on a consistent basis.
• EstablishnationalBMPsforwindenergy development projects.
• Developrecommendedguidanceon study protocols, study techniques, and measures and metrics for use by all jurisdictions.
• Assistinidentifyingandobtainingfunding for national research priorities.
Service - Tribal Consultation and Coordination
Federally-recognized Indian Tribes enjoy a unique government-to-government relationship with the United States. The United States Fish and Wildlife Service (Service) recognizes Indian tribal governments as the authoritative voice regarding the management of
tribal lands and resources within the framework of applicable laws. It is important to recall that many tribal traditional lands and tribal rights extend beyond reservation lands.
The Service consults with Indian tribal governments under the authorities of Executive Order 13175 “Consultation and Coordination with Indian Tribal Governments” and supporting DOI and Service policies. To this end, when it is determined that federal actions and activities may affect a Tribe’s resources (including cultural resources), lands, rights, or ability to provide services to its members, the Service must, to the extent practicable, seek to engage the affected Tribe(s) in consultation and coordination.
Tribal Wind Energy Development on Reservation Lands
Indian tribal governments have the authority to develop wind energy projects, permit their development, and establish relevant regulatory guidance within the framework of applicable laws.
The Service will provide technical assistance upon the request of Tribes that aim to establish regulatory guidance for wind energy development for lands under
the Tribe’s jurisdiction. Tribal governments are encouraged to strive for compatibility between their guidelines and these Guidelines.
Tribal Wind Energy Development on Lands that are not held in Trust
Indian tribal governments may wish to develop wind energy projects on lands that are not held in trust status. In such cases, the Tribes should coordinate with agencies other than the Service. At the request of a Tribe, the Service may facilitate discussions with other regulatory organizations. The Service may also lend its expertise in these collaborative efforts to help determine the extent to which tribal resource management plans and priorities can be incorporated into established regulatory protocols.
Non-Tribal Wind Energy Development – Consultation with Indian Tribal Governments
When a non-Tribal wind energy project is proposed that may affect a Tribe’s resources (including cultural resources), lands, rights, or ability to govern or provide services to its members, the Service should seek to engage the affected Tribe(s) in consultation and coordination as
Wind turbine in California.. Credit: NREL

U.S. Fish and Wildlife Service Land-Based Wind Energy Guidelines
58
early as possible in the process. In siting a proposed project that has a federal nexus, it is incumbent upon the regulatory agency to notify potentially affected Tribes of the proposed activity. If the Service or other federal agency determines that a project may affect a Tribe(s), they should notify the Tribe(s) of the action at the earliest opportunity. At the request of a Tribe, the Service may facilitate and lend its expertise in collaborating with other organizations to help determine the extent to which tribal resource management plans and priorities can be incorporated into established regulatory protocols or project implementation. This process ideally should be agreed to by all involved parties.
In the consultative process, Tribes should be engaged as soon as possible when a decision may affect a Tribe(s). Decisions made that affect Indian Tribal governments without adequate federal effort to engage Tribe(s) in consultation have been overturned by the courts. See, e.g., Quechan Tribe v. U.S. Dep’t of the Interior, No. 10cv2241 LAB (CAB), 2010 WL 5113197 (S.D. Cal. Dec. 15, 2010). When a tribal government is consulted, it is neither required, nor expected that all of the Tribe’s issues can be resolved in its favor. However, the Service must listen and may not arbitrarily dismiss concerns of the tribal government. Rather, the Service must seriously consider and respond to all tribal concerns. Regional Native American Liaisons are able to provide in-house guidance as to government-to-government consultation processes. (See Service - State Coordination and Cooperation, above).
Non-Governmental Organization Actions
If a specific project involves actions at the local, state, or federal level that provide opportunities for public participation, non-governmental organizations (NGOs) can provide meaningful contributions to the discussion of biological issues associated with that project, through the normal processes such as scoping, testimony at public
meetings, and comment processes. In the absence of formal public process, there are many NGOs that have substantial scientific capabilities and may have resources that could contribute productively to the siting of wind energy projects. Several NGOs have made significant contributions to the understanding of the importance of particular geographic areas to wildlife in the United States. This work has benefited and continues to benefit from extensive research efforts and from associations with highly qualified biologists. NGO expertise can – as can scientific expertise in the academic or private consulting sectors – serve highly constructive purposes. These can include:
• Providinginformationtohelp identify environmentally sensitive areas, during the screening phases of site selection (Tiers 1 and 2, as described in this document)
• Providingfeedbacktodevelopers and agencies with respect to specific sites and site and impact assessment efforts
• Helpingdevelopersandagenciesdesign and implement mitigation or offset strategies
• Participatinginthedefining,assessing, funding, and implementation of research efforts in support of improved predictors of risk, impact assessments and effective responses
• Articulatingchallenges,concerns, and successes to diverse audiences
Non-Governmental Organization Conservation Lands
Implementation of these Guidelines by Service and other state agencies will recognize that lands owned and managed by non-government conservation organizations represent a significant investment that generally supports the mission of state and federal wildlife agencies. Many of these lands represent an investment of federal conservation
funds, through partnerships between agencies and NGOs. These considerations merit extra care in the avoidance of wind energy development impacts to these lands. In order to exercise this care, the Service and allied agencies can coordinate and consult with NGOs that own lands or easements which might reasonably be impacted by a project under review.

U.S. Fish and Wildlife Service Land-Based Wind Energy Guidelines
59
Appendix A: Glossary
Accuracy – The agreement between a measurement and the true or correct value.
Adaptive management – An iterative decision process that promotes flexible decision-making that can be adjusted in the face of uncertainties as outcomes from management actions and other events become better understood. Comprehensively applying the tiered approach embodies the adaptive management process.
Anthropogenic – Resulting from the influence of human beings on nature.
Area of interest – For most projects, the area where wind turbines and meteorological (met) towers are proposed or expected to be sited, and the area of potential impact.
Avian – Pertaining to or characteristic of birds.
Avoid – To not take an action or parts of an action to avert the potential effects of the action or parts thereof. First of three components of “mitigation,” as defined in Service Mitigation Policy. (See mitigation.)
Before-after/control-impact (BACI) – A study design that involves comparisons of observational data, such as bird counts, before and after an environmental disturbance in a disturbed and undisturbed site. This study design allows a researcher to assess the effects of constructing and operating a wind turbine by comparing data from the “control” sites (before and undisturbed) with the “treatment” sites (after and disturbed).
Best management practices (BMPs) – Methods that have been determined by the stakeholders to be the most effective, practicable means of avoiding or minimizing significant adverse impacts to individual species, their habitats or an ecosystem, based on the best available information.
Buffer zone – A zone surrounding a resource designed to protect the resource from adverse impact, and/or a zone surrounding an existing or proposed wind energy project for the purposes of data collection and/or impact estimation.
Community-scale – Wind energy projects greater than 1 MW, but generally less than 20 MW, in name-plate capacity, that produce electricity for off-site use, often partially or totally owned by members of a local community or that have other demonstrated local benefits in terms of retail power costs, economic development, or grid issues.
Comparable site – A site similar to the project site with respect to topography, vegetation, and the species under consideration.
Compensatory mitigation – Replacement of project-induced losses to fish and wildlife resources. Substitution or offsetting of fish and wildlife resource losses with resources considered to be of equivalent biological value.
- In-kind – Providing or managing substitute resources to replace the value of the resources lost, where such substitute resources are physically and biologically the same or closely approximate to those lost.
- Out-of-kind – Providing or managing substitute resources to replace the value of the resources lost, where such substitute resources are physically or biologically different from those lost. This may include conservation or mitigation banking, research or other options.
Cost effective – Economical in terms of tangible benefits produced by money spent.
Covariate – Uncontrolled random variables that influence a response to a treatment or impact, but do not interact with any of the treatments or impacts being tested.
Critical habitat – For listed species, consists of the specific areas designated by rule making pursuant to Section 4 of the Endangered Species Act and displayed in 50 CFR § 17.11 and 17.12.
Cumulative impacts – See impact.

U.S. Fish and Wildlife Service Land-Based Wind Energy Guidelines
60
Curtailment – The act of limiting the supply of electricity to the grid during conditions when it would normally be supplied. This is usually accomplished by cutting-out the generator from the grid and/or feathering the turbine blades.
Cut-in Speed – The wind speed at which the generator is connected to the grid and producing electricity. It is important to note that turbine blades may rotate at full RPM in wind speeds below cut-in speed.
Displacement – The loss of habitat as result of an animal’s behavioral avoidance of otherwise suitable habitat. Displacement may be short-term, during the construction phase of a project, temporary as a result of habituation, or long-term, for the life of the project.
Distributed wind – Small and mid-sized turbines between 1 kilowatt and 1 megawatt that are installed and produce electricity at the point of use to off-set all or a portion of on-site energy consumption.
Ecosystem – A system formed by the interaction of a community of organisms with their physical and chemical environment. All of the biotic elements (i.e., species, populations, and communities) and abiotic elements (i.e., land, air, water, energy) interacting in a given geographic area so that a flow of energy leads to a clearly defined trophic structure, biotic diversity, and material cycles. Service Mitigation Policy adopted definition from E. P. Odum 1971 Fundamentals of Ecology.
Edge effect – The effect of the juxtaposition of contrasting environments on an ecosystem.
Endangered species – See listed species.
Extirpation – The species ceases to exist in a given location; the species still exists elsewhere.
Fatality – An individual instance of death.
Fatality rate – The ratio of the number of individual deaths to some parameter of interest such as megawatts of energy produced, the number of turbines in a wind project, the number of individuals exposed, etc., within a specified unit of time.
Feathering – Adjusting the angle of the rotor blade parallel to the wind, or turning the whole unit out of the wind, to slow or stop blade rotation.
Federal action agency – A department, bureau, agency or instrumentality of the United States which plans, constructs, operates or maintains a project, or which reviews, plans for or approves a permit, lease or license for projects, or manages federal lands.
Federally listed species – See listed species.
Footprint – The geographic area occupied by the actual infrastructure of a project such as wind turbines, access roads, substation, overhead and underground electrical lines, and buildings, and land cleared to construct the project.
G1 (Global Conservation Status Ranking) Critically Imperiled – At very high risk of extinction due to extreme rarity (often five or fewer populations), very steep declines, or other factors.
G2 (Global Conservation Status Ranking) Imperiled – At high risk of extinction or elimination due to very restricted range, very few populations, steep declines, or other factors.
G3 (Global Conservation Status Ranking) Vulnerable – At moderate risk of extinction or elimination due to a restricted range, relatively few populations, recent and widespread declines, or other factors.
Guy wire – Wires used to secure wind turbines or meteorological towers that are not self-supporting.
Habitat – The area which provides direct support for a given species, including adequate food, water, space, and cover necessary for survival.
Habitat fragmentation – Habitat fragmentation separates blocks of habitat for some species into segments, such that the individuals in the remaining habitat segments may suffer from effects such as decreased survival, reproduction, distribution, or use of the area.
U.S. Fish and Wildlife Service Land-Based Wind Energy Guidelines
61
Impact – An effect or effects on natural resources and on the components, structures, and functioning of affected ecosystems.
- Cumulative – Changes in the environment caused by the aggregate of past, present and reasonably foreseeable future actions on a given resource or ecosystem.
- Direct – Effects on individual species and their habitats caused by the action, and occur at the same time and place.
- Indirect impact – Effects caused by the action that are later in time or farther removed in distance, but are still reasonably foreseeable. Indirect impacts include displacement and changes in the demographics of bird and bat populations.
Infill – Add an additional phase to the existing project, or build a new project adjacent to existing projects.
In-kind compensatory mitigation – See compensatory mitigation.
Intact habitat – An expanse of habitat for a species or landscape scale feature, unbroken with respect to its value for the species or for society.
Intact landscape – Relatively undisturbed areas characterized by maintenance of most original ecological processes and by communities with most of their original native species still present.
Lattice design – A wind turbine support structure design characterized by horizontal or diagonal lattice of bars forming a tower rather than a single tubular support for the nacelle and rotor.
Lead agency – Agency that is responsible for federal or non-federal regulatory or environmental assessment actions.
Lek – A traditional site commonly used year after year by males of certain species of birds (e.g., greater and lesser prairie-chickens, sage and sharp-tailed grouse, and buff-breasted sandpiper), within which the males display communally to attract and compete for female mates, and where breeding occurs.
Listed species – Any species of fish, wildlife or plant that has been determined to be endangered or threatened under section 4 of the Endangered Species Act (50 CFR §402.02), or similarly designated by state law or rule.
Local population – A subdivision of a population of animals or plants of a particular species that is in relative proximity to a project.
Loss – As used in this document, a change in wildlife habitat due to human activities that is considered adverse and: 1) reduces the biological value of that habitat for species of concern; 2) reduces population numbers of species of concern; 3) increases population numbers of invasive or exotic species; or 4) reduces the human use of those species of concern.
Megawatt (MW) – A measurement of electricity-generating capacity equivalent to 1,000 kilowatts (kW), or 1,000,000 watts.
Migration – Regular movements of wildlife between their seasonal ranges necessary for completion of the species lifecycle.
Migration corridor – Migration routes and/or corridors are the relatively predictable pathways that a migratory species travel between seasonal ranges, usually breeding and wintering grounds.
Migration stopovers – Areas where congregations of wildlife assemble during migration. Such areas supply high densities of food or shelter.
Minimize – To reduce to the smallest practicable amount or degree.
Mitigation – (Specific to these Guidelines) Avoiding or minimizing significant adverse impacts, and when appropriate, compensating for unavoidable significant adverse impacts.

U.S. Fish and Wildlife Service Land-Based Wind Energy Guidelines
62
Monitoring – 1) A process of project oversight such as checking to see if activities were conducted as agreed or required; 2) making measurements of uncontrolled events at one or more points in space or time with space and time being the only experimental variable or treatment; 3) making measurements and evaluations through time that are done for a specific purpose, such as to check status and/or trends or the progress towards a management objective.
Mortality rate – Population death rate, typically expressed as the ratio of deaths per 100,000 individuals in the population per year (or some other time period).
Operational changes – Deliberate changes to wind energy project operating protocols, such as the wind speed at which turbines “cut in” or begin generating power, undertaken with the object of reducing collision fatalities. Considered separately from standard mitigation measures due to the fact that operational changes are considered as a last resort and will rarely be implemented if a project is properly sited.
Passerine – Describes birds that are members of the Order Passeriformes, typically called “songbirds.”
Plant communities of concern –Plant communities of concern are unique habitats that are critical for the persistence of highly specialized or unique species and communities of organisms. Often restricted in distribution or represented by a small number of examples, these communities are biological hotspots that significantly contribute to the biological richness and productivity of the entire region. Plant communities of concern often support rare or uncommon species assemblages, provide critical foraging, roosting, nesting, or hibernating habitat, or perform vital ecosystem functions. These communities often play an integral role in the conservation of biological integrity and diversity across the landscape. (Fournier et al. 2007) Also, any plant community with a Natural Heritage Database ranking of S1, S2, S3, G1, G2, or G3.
Population – A demographically and genetically self-sustaining group of animals and/or plants of a particular species.
Practicable – Capable of being done or accomplished; feasible.
Prairie grouse – A group of gallinaceous birds, includes the greater prairie-chicken, the lesser prairie-chicken, and the sharp-tailed grouse.
Project area – The area that includes the project site as well as contiguous land that shares relevant characteristics.
Project commencement – The point in time when a developer begins its preliminary evaluation of a broad geographic area to assess the general ecological context of a potential site or sites for wind energy project(s). For example, this may include the time at which an option is acquired to secure real estate interests, an application for federal land use has been filed, or land has been purchased.
Project Site – The land that is included in the project where development occurs or is proposed to occur.
Project transmission lines – Electrical lines built and owned by a project developer.
Raptor – As defined by the American Ornithological Union, a group of predatory birds including hawks, eagles, falcons, osprey, kites, owls, vultures and the California condor.
Relative abundance – The number of organisms of a particular kind in comparison to the total number of organisms within a given area or community.
Risk – The likelihood that adverse effects may occur to individual animals or populations of species of concern, as a result of development and operation of a wind energy project. For detailed discussion of risk and risk assessment as used in this document see Chapter One - General Overview.
Rotor – The part of a wind turbine that interacts with wind to produce energy. Consists of the turbine’s blades and the hub to which the blades attach.
Rotor-swept area – The area of the circle or volume of the sphere swept by the turbine blades.
Rotor-swept zone – The altitude within a wind energy project which is bounded by the upper and lower limits of the rotor-swept area and the spatial extent of the project.

U.S. Fish and Wildlife Service Land-Based Wind Energy Guidelines
63
S1 (Subnational Conservation Status Ranking) Critically Imperiled – Critically imperiled in the jurisdiction because of extreme rarity or because of some factor(s) such as very steep declines making it especially vulnerable to extirpation from the jurisdiction.
S2 (Subnational Conservation Status Ranking) Imperiled – Imperiled in the jurisdiction because of rarity due to very restricted range, very few populations, steep declines, or other factors making it very vulnerable to extirpation from jurisdiction.
S3 (Subnational Conservation Status Ranking) Vulnerable – Vulnerable in the jurisdiction due to a restricted range, relatively few populations, recent and widespread declines, or other factors making it vulnerable to extirpation.
Sage grouse – A large gallinaceous bird living in the sage steppe areas of the intermountain west, includes the greater sage grouse and Gunnison’s sage grouse.
Significant – For purposes of characterizing impacts to species of concern and their habitats, “significance” takes into account the duration, scope, and intensity of an impact. Impacts that are very brief or highly transitory, do not extend beyond the immediate small area where they occur, and are minor in their intensity are not likely to be significant. Conversely, those that persist for a relatively long time, encompass a large area or extend well beyond the immediate area where they occur, or have substantial consequences are almost certainly significant. A determination of significance may include cumulative impacts of other actions. There is probably some unavoidable overlap among these three characteristics, as well as some inherent ambiguity in these terms, requiring the exercise of judgment and the development of a consistent approach over time.
Species of concern – For a particular wind energy project, any species which 1) is either a) listed as an endangered, threatened or candidate species under the Endangered Species Act, subject to the Migratory Bird Treaty Act or Bald and Golden Eagle Protection Act; b) is designated by law, regulation, or other formal process for protection and/or management by the relevant agency or other authority; or c) has been shown to be significantly adversely affected by wind energy development, and 2) is determined to be possibly affected by the project.
Species of habitat fragmentation concern—Species of concern for which a relevant federal, state, tribal, and/or local agency has found that separation of their habitats into smaller blocks reduces connectivity such that the individuals in the remaining habitat segments may suffer from effects such as decreased survival, reproduction, distribution, or use of the area. Habitat fragmentation from a wind energy project may create significant barriers for such species.
String – A number of wind turbines oriented in close proximity to one another that are usually sited in a line, such as along a ridgeline.
Strobe – Light consisting of pulses that are high in intensity and short in duration.
Threatened species – See listed species.
Tubular design – A type of wind turbine support structure for the nacelle and rotor that is cylindrical rather than lattice.
Turbine height – The distance from the ground to the highest point reached by the tip of the blades of a wind turbine.
Utility-scale – Wind projects generally larger than 20 MW in nameplate generating capacity that sell electricity directly to utilities or into power markets on a wholesale basis.
Voltage (low and medium) – Low voltages are generally below 600 volts, medium voltages are commonly on distribution electrical lines, typically between 600 volts and 110 kV, and voltages above 110 kV are considered high voltages.
Wildlife – Birds, fishes, mammals, and all other classes of wild animals and all types of aquatic and land vegetation upon which wildlife is dependent.
Wildlife management plan – A document describing actions taken to identify resources that may be impacted by proposed development; measures to mitigate for any significant adverse impacts; any post-construction monitoring; and any other studies that may be carried out by the developer.
Wind turbine – A machine for converting the kinetic energy in wind into mechanical energy, which is then converted to electricity..

U.S. Fish and Wildlife Service Land-Based Wind Energy Guidelines
64
Appendix B: Literature Cited
Anderson, R., M. Morrison, K. Sinclair, and D. Strickland. 1999. Studying Wind Energy/Bird Interactions: A Guidance Document. Metrics and Methods for Determining or Monitoring Potential Impacts on Birds at Existing and Proposed Wind Energy Sites. National Wind Coordinating Committee/RESOLVE. Washington, D.C., USA.
Arnett, E.B., and J.B. Haufler. 2003. A customer-based framework for funding priority research on bats and their habitats. Wildlife Society Bulletin 31 (1): 98–103.
Arnett, E.B., technical editor. 2005. Relationships between Bats and Wind Turbines in Pennsylvania and West Virginia: An Assessment of Bat Fatality Search Protocols, Patterns of Fatality, and Behavioral Interactions with Wind Turbines. A final report submitted to the Bats and Wind Energy Cooperative. Bat Conservation International. Austin, Texas, USA. http://www.batsandwind.org/pdf/ar2004.pdf
Arnett, E.B., J.P. Hayes, and M.M.P. Huso. 2006. An evaluation of the use of acoustic monitoring to predict bat fatality at a proposed wind facility in south-central Pennsylvania. An annual report submitted to the Bats and Wind Energy Cooperative. Bat Conservation International. Austin, Texas, USA.
http://batsandwind.org/pdf/ar2005.pdf.
Arnett, E.B., D.B. Inkley, D.H. Johnson, R.P. Larkin, S. Manes, A.M. Manville, R. Mason, M. Morrison, M.D. Strickland, and R. Thresher. 2007. Impacts of Wind Energy Facilities on Wildlife and Wildlife Habitat. Issue 2007-2. The Wildlife Society, Bethesda, Maryland, USA.
Arnett, E.B., K. Brown, W.P. Erickson, J. Fiedler, B. Hamilton, T.H. Henry, G. D. Johnson, J. Kerns, R.R. Kolford, C.P. Nicholson, T. O’Connell, M. Piorkowski, and R. Tankersley, Jr. 2008. Patterns of fatality of bats at wind energy facilities in North America. Journal of Wildlife Management 72: 61–78.
Arnett, E.B., M. Schirmacher, M.M.P. Huso, and J.P. Hayes. 2009. Effectiveness of changing wind turbine cut-in speed to reduce bat fatalities at wind facilities. An annual report submitted to the Bats and Wind Energy Cooperative. Bat Conservation International. Austin, Texas, USA.
http://batsandwind.org/pdf/Curtailment_2008_Final_Report.pdf.
Arnett, E.B., M. Baker, M.M.P. Huso, and J. M. Szewczak. In review. Evaluating ultrasonic emissions to reduce bat fatalities at wind energy facilities. An annual report submitted to the Bats and Wind Energy Cooperative. Bat Conservation International. Austin, Texas, USA.
Avian Powerline Interaction Committee (APLIC). 2006. Suggested Practices for Avian Protection on Power Lines: The State of the Art in 2006. Edison Electric Institute, APLIC, and the California Energy Commission. Washington D.C. and Sacramento, CA. http://www.aplic.org/SuggestedPractices2006(LR-2watermark).pdf.
Baerwald, E.F., J. Edworthy, M. Holder, and R.M.R. Barclay. 2009. A Large-Scale Mitigation Experiment to Reduce Bat Fatalities at Wind Energy Facilities. Journal of Wildlife Management 73(7): 1077-81.
Bailey, L.L., T.R. Simons, and K.H. Pollock. 2004. Spatial and Temporal Variation in Detection Probability of Plethodon Salamanders Using the Robust Capture-Recapture Design. Journal of Wildlife Management 68(1): 14-24.
Becker, J.M., C.A. Duberstein, J.D. Tagestad, J.L. Downs. 2009. Sage-Grouse and Wind Energy: Biology, Habits, and Potential Effects from Development. Prepared for the U.S. Department of Energy, Office of Energy Efficiency and Renewable Energy, Wind & Hydropower Technologies Program, under Contract DE-AC05-76RL01830.
Breidt, F.J. and W.A. Fuller. 1999. Design of supplemented panel surveys with application to the natural resources inventory. Journal of Agricultural, Biological, and Environmental Statistics 4(4): 391-403.

U.S. Fish and Wildlife Service Land-Based Wind Energy Guidelines
65
Bright J., R. Langston, R. Bullman, R. Evans, S. Gardner, and J. Pearce-Higgins. 2008. Map of Bird Sensitivities to Wind Farms in Scotland: A Tool to Aid Planning and Conservation. Biological Conservation 141(9): 2342-56.
California Energy Commission and California Department of Fish and Game. 2007. California Guidelines for Reducing Impacts to Birds and Bats from Wind Energy Development. Commission Final Report. California Energy Commission, Renewables Committee, and Energy Facilities Siting Division, and California Department of Fish and Game, Resources Management and Policy Division. CEC-700-2007-008-CMF.
Chamberlain, D.E., M.R. Rehfisch, A.D. Fox, M. Desholm, and S.J. Anthony. 2006. The Effect of Avoidance Rates on Bird Mortality Predictions Made by Wind Turbine Collision Risk Models. Ibis 148(S1): 198-202.
“Clean Water Act.” Water Pollution Prevention and Control. Title 33 U.S. Code, Sec. 1251 et. seq. 2006 ed., 301-482. Print.
Connelly, J.W., H.W. Browers, and R.J. Gates. 1988. Seasonal Movements of Sage Grouse in Southeastern Idaho. Journal of Wildlife Management 52(1): 116-22.
Connelly, J.W., M.A. Schroeder, A.R. Sands, and C.E. Braun. 2000. Guidelines to manage sage grouse population and their habitats. Wildlife Society Bulletin 28(4):967-85.
Corn, P.S. and R.B. Bury. 1990. Sampling Methods for Terrestrial Amphibians and Reptiles, Gen. Tech. Rep. PNW-GTR-256. Portland, OR: U.S. Department of Agriculture, Forest Service, Pacific Northwest Research Station.
Cryan, P.M. 2008. Mating Behavior as a Possible Cause of Bat Fatalities at Wind Turbines. Journal of Wildlife Management 72(3): 845-49.
Dettmers, R., D.A. Buehler, J.G. Bartlett, and N.A. Klaus. 1999. Influence of Point Count Length and Repeated Visits on Habitat Model Performance. Journal of Wildlife Management 63(3): 815-23.
Drewitt, A.L. and R.H.W. Langston. 2006. Assessing the Impacts of Wind Farms on Birds. Ibis 148: 29-42.
Erickson, W.P., M.D. Strickland, G.D. Johnson, and J.W. Kern. 2000b. Examples of Statistical Methods to Assess Risk of Impacts to Birds from Windplants. Proceedings of the National Avian-Wind Power Planning Meeting III. National Wind Coordinating Committee, c/o RESOLVE, Inc., Washington, D.C.
Erickson, W.P., J. Jeffrey, K. Kronner, and K. Bay. 2004. Stateline Wind Project Wildlife Monitoring Final Report: July 2001 - December 2003. Technical report for and peer-reviewed by FPL Energy, Stateline Technical Advisory Committee, and the Oregon Energy Facility Siting Council, by Western EcoSystems Technology, Inc. (WEST), Cheyenne, Wyoming, and Walla Walla, Washington, and Northwest Wildlife Consultants (NWC), Pendleton, Oregon, USA. December 2004. http://www.west-inc.com.
Erickson, W., D. Strickland, J.A. Shaffer, and D.H. Johnson. 2007. Protocol for Investigating Displacement Effects of Wind Facilities on Grassland Songbirds. National Wind Coordinating Collaborative, Washington, D. C. http://www.nationalwind.org/workgroups/wildlife/SongbirdProtocolFinalJune07.pdf
Fiedler, J.K., T.H. Henry, C.P. Nicholson, and R.D. Tankersley. 2007. Results of Bat and Bird Mortality Monitoring at the Expanded Buffalo Mountain Windfarm, 2005. Tennessee Valley Authority, Knoxville, Tennessee, USA. https://www.tva.gov/environment/bmw_report/results.pdf
Fournier, D., J. Fraser, M. Coppoletta, M. Johnson, B. Brady, S. Dailey, B. Davidson, M. Vollmer, E. Carey, E. Kelchin, C. Shade, A. Stanton, M. Morrison. 2007. Technical Supplement and Appendix for PATHWAY 2007 Evaluation Report: Vegetation Resource, Draft. Tahoe Regional Planning Agency.
Fuller, W.A. 1999. Environmental surveys over time. Journal of Agricultural, Biological, and Environmental Statistics 4(4): 331-45.
Gauthreaux, S.A., Jr., and C.G. Belser. 2003. Radar ornithology and biological conservation. Auk 120(2):266–77.
Giesen, K.M. and J.W. Connelly. 1993. Guidelines for management of Columbian sharp-tailed grouse habitats. Wildlife Society Bulletin 21(3):325-33.

U.S. Fish and Wildlife Service Land-Based Wind Energy Guidelines
66
Graeter, G.J., B.B. Rothermel, and J.W. Gibbons. 2008. Habitat Selection and Movement of Pond-Breeding Amphibians in Experimentally Fragmented Pine Forests. Journal of Wildlife Management 72(2): 473-82.
Hagen, C.A., B.E. Jamison, K.M. Giesen, and T.Z. Riley. 2004. Guidelines for managing lesser prairie-chicken populations and their habitats. Wildlife Society Bulletin 32(1):69-82.
Hagen, C.A., B.K. Sandercock, J.C. Pitman, R.J. Robel, and R.D. Applegate. 2009. Spacial variation in lesser prairie-chicken demography: a sensitivity analysis of population dynamics and management alternatives. Journal of Wildlife Management 73:1325-32.
Hagen, C.A., J.C. Pitman, T.M. Loughin, B.K. Sandercock, and R.J. Robel. 2011. Impacts of anthropogenic features on lesser prairie-chicken habitat use. Studies in Avian Biology. 39: 63-75.
Holloran, M.J. 2005. Greater Sage-Grouse (Centrocercus urophasianus) Population Response to Natural Gas Field Development in Western Wyoming. Ph.D. dissertation. University of Wyoming, Laramie, Wyoming, USA.
Holloran, M.J., B.J. Heath, A.G. Lyon, S.J. Slater, J.L. Kuipers, S.H. Anderson. 2005. Greater Sage-Grouse Nesting Habitat Selection and Success in Wyoming. Journal of Wildlife Management 69(2): 638-49.
Horn, J.W., E.B. Arnett and T.H Kunz. 2008. Behavioral responses of bats to operating wind turbines. Journal of Wildlife Management 72(1):123-32.
Hunt, G. 2002. Golden Eagles in a Perilous Landscape: Predicting the Effects of Mitigation for Wind Turbine Bladestrike Mortality. California Energy Commission Report P500-02-043F. Sacramento, California, USA.
Hunt, G. and T. Hunt. 2006. The Trend of Golden Eagle Territory Occupancy in the Vicinity of the Altamont Pass Wind Resource Area: 2005 Survey. California Energy Commission, PIER Energy-Related Environmental Research. CEC-500-2006-056.
Huso, M. 2009. Comparing the Accuracy and Precision of Three Different Estimators of Bird and Bat Fatality and Examining the Influence of Searcher Efficiency, Average Carcass Persistence and Search Interval on These. Proceedings of the NWCC Wind Wildlife Research Meeting VII, Milwaukee, Wisconsin. Prepared for the Wildlife Workgroup of the National Wind Coordinating Collaborative by RESOLVE, Inc., Washington, D.C., USA. S. S. Schwartz, ed. October 28-29, 2008.
Johnson, G.D., D.P. Young, Jr., W.P. Erickson, C.E. Derby, M.D. Strickland, and R.E. Good. 2000. Wildlife Monitoring Studies, SeaWest Windpower Project, Carbon County, Wyoming, 1995-1999. Final report prepared for SeaWest Energy Corporation, and the Bureau of Land Management by Western EcoSystems Technology, Inc. Cheyenne, Wyoming, USA.
Johnson, G.D., W.P. Erickson, and J. White. 2003. Avian and Bat Mortality During the First Year of Operation at the Klondike Phase I Wind Project, Sherman County, Oregon. March 2003. Technical report prepared for Northwestern Wind Power, Goldendale, Washington, by Western EcoSystems Technology, Inc. (WEST), Cheyenne, Wyoming, USA. http://www.west-inc.com.
Kerns, J. and P. Kerlinger. 2004. A Study of Bird and Bat Collision Fatalities at the Mountaineer Wind Energy Center, Tucker County, West Virginia: Annual Report for 2003. Prepared for FPL Energy and the Mountaineer Wind Energy Center Technical Review Committee by Curry and Kerlinger, LLC. http://www.wvhighlands.org/Birds/MountaineerFinalAvianRpt-%203-15-04PKJK.pdf
Kronner, K., B. Gritski, Z. Ruhlen, and T. Ruhlen. 2007. Leaning Juniper Phase I Wind Power Project, 2006-2007: Wildlife Monitoring Annual Report. Unpublished report prepared by Northwest Wildlife Consultants, Inc. for PacifiCorp Energy, Portland, Oregon, USA.
Kuenzi, A.J. and M.L. Morrison. 1998. Detection of Bats by Mist-Nets and Ultrasonic Sensors. Wildlife Society Bulletin 26(2): 307-11.
Kunz, T.H., G.C. Richards, and C.R. Tidemann. 1996. Small Volant Mammals. In D. E. Wilson, F. R. Cole, J. D. Nichols, R. Rudran, and M. S. Foster, (eds.), Measuring and Monitoring Biological Diversity: Standard Methods for Mammals. Smithsonian Institution Press, Washington, D.C. USA. pp. 122-46.

U.S. Fish and Wildlife Service Land-Based Wind Energy Guidelines
67
Kunz, T. H., E. B. Arnett, B. M. Cooper, W. P. Erickson, R. P. Larkin, T. Mabee, M. L. Morrison, M. D. Strickland, and J. M. Szewczak. 2007. Assessing impacts of wind-energy development on nocturnally active birds and bats: a guidance document. Journal of Wildlife Management 71: 2449-2486.
Kunz, T.H. and S. Parsons, eds. 2009. Ecological and Behavioral Methods for the Study of Bats. Second Edition. Johns Hopkins University Press.
Leddy, K.L., K.F. Higgins, and D.E. Naugle. 1999. Effects of Wind Turbines on Upland Nesting Birds in Conservation Reserve Program Grasslands. Wilson Bulletin 111(1): 100-4.
Mabee, T. J., B. A. Cooper, J. H. Plissner, and D. P. Young. 2006. Nocturnal bird migration over an Appalachian ridge at a proposed wind power project. Wildlife Society Bulletin 34(3): 682–90.
Madders, M. and D.P. Whitfield. 2006. Upland Raptors and the Assessment of Wind Farm Impacts. Ibis 148: 43-56.
Manly, B.F., L. McDonald, D.L. Thomas, T.L. McDonald, and W.P. Erickson. 2002. Resource Selection by Animals: Statistical Design and Analysis for Field Studies. 2nd Edition. Kluwer, Boston.
Manly, B.F.J. 2009. Statistics for Environmental Science and Management. 2nd edition. CRC Press, Boca Raton, Florida, USA.
Manville, A. M. II. 2004. Prairie grouse leks and wind turbines: U.S. Fish and Wildlife Service justification for a 5-mile buffer from leks; additional grassland songbird recommendations. Division of Migratory Bird Management, Service, Arlington, VA, peer-reviewed briefing paper.
Master, L.L., B.A. Stein, L.S. Kutner and G.A. Hammerson. 2000. Vanishing Assets: Conservation Status of U.S. Species. pp. 93-118 IN B.A. Stein, L.S. Kutner and J.S. Adams (eds.). Precious Heritage: the Status of Biodiversity in the United States. Oxford University Press, New York. 399 pages. (“S1, S2, S3; G1, G2, G3”)
McDonald, T.L. 2003. Review of environmental monitoring methods: survey designs. Environmental Monitoring and Assessment 85(2): 277-92.
Morrison, M.L., W.M. Block, M.D. Strickland, B.A. Collier, and M.J. Peterson. 2008. Wildlife Study Design. Second Edition. Springer, New York, New York, USA. 358 pp.
Murray, C. and D. Marmorek. 2003. Chapter 24: Adaptive Management and Ecological Restoration. In: P. Freiderici (ed.), Ecological Restoration of Southwestern Ponderosa Pine Forests. Island Press, Washington, California, and London. Pp. 417-28.
National Research Council (NRC). 2007. Environmental Impacts of Wind-Energy Projects. National Academies Press. Washington, D.C., USA. www.nap.edu
National Wind Coordinating Collaborative. 2010. Wind Turbine Interactions with Birds, Bats and Their Habitats: A Summary of Research Results and Priority Questions. NWCC Spring 2010 Fact Sheet.
O’Farrell, M.J., B.W. Miller, and W.L. Gannon. 1999. Qualitative Identification of Free-Flying Bats Using the Anabat Detector. Journal of Mammalogy 80(1): 11-23.
Olson, D., W.P. Leonard, and B.R. Bury, eds. 1997. Sampling Amphibians in Lentic Habitats: Methods and Approaches for the Pacific Northwest. Society for Northwestern Vertebrate Biology, Olympia, Washington, USA.
Organ, A. & Meredith, C. 2004. 2004 Avifauna Monitoring for the proposed Dollar Wind Farm – Updated Risk Modeling. Biosis Research Pty. Ltd. Report for Dollar Wind Farm Pty. Ltd.
Orloff, S. and A. Flannery. 1992. Wind Turbine Effects on Avian Activity, Habitat Use, and Mortality in Altamont Pass and Solano County Wind Resource Areas, 1989-1991. Final Report P700-92-001 to Alameda, Costra Costa, and Solano Counties, and the California Energy Commission by Biosystems Analysis, Inc., Tiburon, California, USA.

U.S. Fish and Wildlife Service Land-Based Wind Energy Guidelines
68
Pearce-Higgins, J.W., L. Stephen, R.H.W. Langston, & J.A. Bright. (2008) Assessing the cumulative impacts of wind farms on peatland birds: a case study of golden plover Pluvialis apricaria in Scotland. Mires and Peat, 4(01), 1– 13.
Pennsylvania Game Commission (PGC). 2007. Wind Energy Voluntary Cooperation Agreement. Pennsylvania Game Commission, USA. http://www.pgc.state.pa.us/pgc/lib/pgc/programs/voluntary_agreement.pdf
Pierson, E.D., M.C. Wackenhut, J.S. Altenbach, P. Bradley, P. Call, D.L. Genter, C.E. Harris, B.L. Keller, B. Lengas, L. Lewis, B. Luce, K.W. Navo, J.M. Perkins, S. Smith, and L. Welch. 1999. Species Conservation Assessment and Strategy for Townsend’s Big-Eared Bat (Corynorhinus townsendii townsendii and Corynorhinus townsendii pallescens). Idaho Conservation Effort, Idaho Department of Fish and Game, Boise, Idaho, USA.
Pitman, J.C., C.A. Hagen, R.J. Robel, T.M. Loughlin, and R.D. Applegate. 2005. Location and Success of Lesser Prairie-Chicken Nests in Relation to Vegetation and Human Disturbance. Journal of Wildlife Management 69(3):1259-69.
Pruett, C.L., M.A. Patten and D.H. Wolfe. Avoidance Behavior by Prairie Grouse: Implications for Development of Wind Energy. Conservation Biology. 23(5):1253-59.
Rainey, W.E. 1995. Tools for Low-Disturbance Monitoring of Bat Activity. In: Inactive Mines as Bat Habitat: Guidelines for Research, Survey, Monitoring, and Mine Management in Nevada. B. R. Riddle, ed. Biological Resources Research Center, University of Nevada-Reno, Reno, Nevada, USA.148 pp.
Ralph, C. John; Geupel, Geoffrey R.; Pyle, Peter; Martin, Thomas E.; DeSante, David F. 1993.
Handbook of field methods for monitoring landbirds. Gen. Tech. Rep. PSW-GTR-144-www. Albany, CA: Pacific Southwest Research Station, Forest Service, U.S. Department of Agriculture; 41 p.
Ralph, C.J., J.R. Sauer, and S. Droege, eds. 1995. Monitoring Bird Populations by Point Counts. U.S. Department of Agriculture, Forest Service General Technical Report PSW-GTR-149.
Reynolds R.T., J.M. Scott, R.A. Nussbaum. 1980. A variable circular-plot method for estimating bird numbers. Condor. 82(3):309–13.
Richardson, W.J. 2000. Bird Migration and Wind Turbines: Migration Timing, Flight Behavior, and Collision Risk. In: Proceedings of the National Avian Wind Power Planning Meeting III (PNAWPPM-III). LGL Ltd., Environmental Research Associates, King City, Ontario, Canada, San Diego, California. www.nationalwind.org/publications/wildlife/avian98/20-Richardson-Migration.pdf
“Rivers and Harbors Act.” Protection of Navigable Waters and of Rivers and of Harbor and River Improvements Generally. Title 33 U.S. Code, Sec. 401 et. seq. 2006 ed., 42-84. Print.
Robel, R.J., J. A. Harrington, Jr., C.A. Hagen, J.C. Pitman, and R.R. Reker. 2004. Effect of Energy Development and Human Activity on the Use of Sand Sagebrush Habitat by Lesser Prairie-Chickens in Southwestern Kansas. North American Wildlife and Natural Resources Conference 69: 251-66.
Sawyer, H., R.M. Nielson, F. Lindzey, and L.L. McDonald. 2006. Winter Habitat Selection of Mule Deer Before and During Development of a Natural Gas Field. Journal of Wildlife Management 70(2): 396-403. http://www.west-inc.com
Shaffer, J.A. and D.H. Johnson. 2008. Displacement Effects of Wind Developments on Grassland Birds in the Northern Great Plains. Presented at the Wind Wildlife Research Meeting VII, Milwaukee, Wisconsin, USA. Wind Wildlife Research Meeting VII Plenary. http://www.nationalwind.org/pdf/ShafferJill.pdf
Sherwin, R.E., W.L. Gannon, and J.S. Altenbach. 2003. Managing Complex Systems Simply: Understanding Inherent Variation in the Use of Roosts by Townsend’s Big-Eared Bat. Wildlife Society Bulletin 31(1): 62-72.
Smallwood, K.S. and C.G. Thelander. 2004. Developing Methods to Reduce Bird Fatalities in the Altamont Wind Resource Area. Final report prepared by BioResource Consultants to the California Energy Commission, Public Interest Energy Research-Environmental Area, Contract No. 500-01-019; L. Spiegel, Project Manager.

U.S. Fish and Wildlife Service Land-Based Wind Energy Guidelines
69
Smallwood, K.S. and C.G. Thelander. 2005. Bird Mortality at the Altamont Pass Wind Resource Area: March 1998 - September 2001. Final report to the National Renewable Energy Laboratory, Subcontract No. TAT-8-18209-01 prepared by BioResource Consultants, Ojai, California, USA.
Smallwood, K.S. 2007. Estimating Wind Turbine-Caused Bird Mortality. Journal of Wildlife Management 71(8): 2781-91.
Stewart, G.B., A.S. Pullin and C.F. Coles. 2007. Poor evidence-base for assessment of windfarm impacts on birds. Environmental Conservation 34(1):1:1-11.
Strickland, M.D., G. Johnson and W.P. Erickson. 2002. Application of methods and metrics at the Buffalo Ridge Minnesota Wind Plant. Invited Paper. EPRI Workshop on Avian Interactions with Wind Power Facilities, Jackson, WY, October 16-17, 2002.
Strickland, M. D., E. B. Arnett, W. P. Erickson, D. H. Johnson, G. D. Johnson, M. L., Morrison, J.A. Shaffer, and W. Warren-Hicks. In Review. Studying Wind Energy/Wildlife Interactions: a Guidance Document. Prepared for the National Wind Coordinating Collaborative, Washington, D.C., USA.
Suter, G.W. and J.L. Jones. 1981. Criteria for Golden Eagle, Ferruginous Hawk, and Prairie Falcon Nest Site Protection. Journal of Raptor Research 15(1): 12-18.
Urquhart, N.S., S.G. Paulsen, and D.P. Larsen. 1998. Monitoring for policy-relevant regional trends over time. Ecological Applications 8(2):246-57.
U.S. Fish and Wildlife Service. 2009. DRAFT Rising to the Challenge: Strategic Plan for Responding to Accelerating Climate Change.
U.S. Fish and Wildlife Service Mitigation Policy; Notice of Final Policy, 46 Fed. Reg. 7644-7663 (January 23, 1981). Print.
Vodehnal. W.L., and J.B. Haufler, Compilers. 2007. A grassland conservation plan for prairie grouse. North American Grouse Partnership. Fruita, CO.
Walters, C. J., and C. S. Holling. 1990. Large-scale management experiments and learning by doing. Ecology 71(6): 2060–68.
Weller, T.J. 2007. Evaluating Preconstruction Sampling Regimes for Assessing Patterns of Bat Activity at a Wind Energy Development in Southern California. California Energy Commission, PIER Energy-Related Environmental Research Program. CEC-500-01-037.
Williams, T.C., J.M. Williams, P.G. Williams, and P. Stokstad. 2001. Bird migration through a mountain pass studied with high resolution radar, ceilometers, and census. The Auk 118(2):389-403.
Williams, B. K., R. C. Szaro, and C. D. Shapiro. 2009. Adaptive Management: The U.S. Department of the Interior Technical Guide. Adaptive Management Working Group, U.S. Department of the Interior, Washington, DC.

U.S. Fish and Wildlife Service Land-Based Wind Energy Guidelines
70
Appendix C: Sources of Information Pertaining to Methods to Assess Impacts to WildlifeThe following is an initial list of references that provide further information on survey and monitoring methods. Additional sources may be available.
Anderson, R., M. Morrison, K. Sinclair, D. Strickland. 1999. Studying wind energy and bird interactions: a guidance document. National Wind Coordinating Collaborative (NWCC). Washington, D.C.
Bird D.M., and K.L. Bildstein, (eds). 2007. Raptor Research and Management Techniques. Hancock House Publishers, Surrey, British Columbia.
Braun. C.E. (ed). 2005. Techniques for Wildlife Investigations and Management. The Wildlife Society. Bethesda, MD.
California Bat Working Group. 2006. Guidelines for assessing and minimizing impacts to bats at wind energy development sites in California. http://www.wbwg.org/conservation/papers/CBWGwindenergyguidelines.pdf
California Energy Commission and California Department of Fish and Game. 2007. California Guidelines for Reducing Impacts to Birds and Bats from Wind Energy Development Commission Final Report. http://www.energy.ca.gov/windguidelines/index.html
Corn, P.S. and R.B. Bury. 1990. Sampling Methods for Terrestrial Amphibians and Reptiles, Gen. Tech. Rep. PNW-GTR-256. Portland, OR: U.S. Department of Agriculture, Forest Service, Pacific Northwest Research Station.
Environment Canada’s Canadian Wildlife Service. 2006. Wind turbines and birds, a guidance document for environmental assessment. March version 6. EC/CWS, Gatineau, Quebec. 50 pp.
Environment Canada’s Canadian Wildlife Service. 2006. Recommended protocols for monitoring impacts of wind turbines and birds. July 28 final document. EC/CWS, Gatineau, Quebec. 33 pp.
Heyer, W.R., M.A. Donnelley, R.W. McDiarmid, L.C. Hayek, and M.S. Foster (Eds.) 1994. Measuring and monitoring biological diversity: standard methods for amphibians. Smithsonian Institution Press. Washington, D.C., USA.
Knutson, M. G., N. P. Danz, T. W. Sutherland, and B. R. Gray. 2008. Landbird Monitoring Protocol for the U.S. Fish and Wildlife Service, Midwest and Northeast Regions, Version 1. Biological Monitoring Team Technical Report BMT-2008-01. U.S. Fish and Wildlife Service, La Crosse, WI.
Kunz, T.H., E.B. Arnett, B.M. Cooper, W.P. Erickson, R.P. Larkin, T. Mabee, M.L. Morrison, M.D. Strickland, and J.M. Szewczak. 2007. Assessing impacts of wind-energy development on nocturnally active birds and bats: a guidance document. Journal Wildlife Management 71:2249-2486.
Kunz, T.H. and S. Parsons, eds. 2009. Ecological and Behavioral Methods for the Study of Bats. Second Edition. Johns Hopkins University Press.
Oklahoma Lesser-Prairie Chicken Spatial Planning Tool, at http://wildlifedepartment.com/lepcdevelopmentplanning.htm, Citation: Horton, R., L. Bell, C. M. O’Meilia, M. McLachlan, C. Hise, D. Wolfe, D. Elmore and J.D. Strong. 2010. A Spatially-Based Planning Tool Designed to Reduce Negative Effects of Development on the Lesser Prairie-Chicken (Tympanuchus pallidicinctus) in Oklahoma: A Multi-Entity Collaboration to Promote Lesser Prairie-Chicken Voluntary Habitat Conservation and Prioritized Management Actions. Oklahoma Department of Wildlife Conservation. Oklahoma City, Oklahoma. 79 pp. http://www.wildlifedepartment.com/lepcdevelopmentplanning.htm
Ralph, C. J., G. R. Geupel, P. Pyle, T.E. Martin, E. Thomas, D.F. DeSante. 1993. Handbook of field methods for monitoring landbirds. Gen. Tech. Rep. PSW-GTR-144-www. Albany, CA: Pacific Southwest Research Station, Forest Service, U.S. Department of Agriculture; 41 p.

U.S. Fish and Wildlife Service Land-Based Wind Energy Guidelines
71
Ralph C.J, J.R. Sauer, S. Droege (Tech. Eds). 1995. Monitoring Bird Populations by Point Counts. U.S. Forest Service General Technical Report PSW-GTR-149, Pacific Southwest Research Station, Albany, California. iv 187 pp.
Strickland, M.D., E.B. Arnett, W.P. Erickson, D.H. Johnson, G.D. Johnson, M.L. Morrison, J.A. Shaffer, and W. Warren-Hicks. 2011. Comprehensive Guide to Studying Wind Energy/Wildlife Interactions. Prepared for the National Wind Coordinating Collaborative, Washington, D.C. USA.
Wilson, D. E., F.R. Cole, J.D. Nichols, R. Rudra and M.S. Foster (Eds). 1996. Measuring and monitoring biological diversity: standard methods for mammals. Smithsonian Institution Press. Washington, D.C., USA.

U.S. Fish & Wildlife Servicehttp://www.fws.gov
March 2012

Pattern Energy LP 13-14 Burns & McDonnell
EXHIBIT N SIEMENS SG 2.7-129 WIND TURBINE BROCHURE

SG 2.7-129New SGRE turbine with increased capacity factor for greater returns

First SGRE turbine designed for the diverse site conditions of the American marketSG 2.7-129: Combines the trusted technology and continuous innovation from two industry leaders now united
One of the key aspects to Siemens Gamesa’s success is the continuous development of new and advanced products adapted to the business case of every customer. We strive to provide the best technological solutions for each project, while driving down the LCoE.We know that needs vary greatly. In response to those needs, we offer an optimized, streamlined catalog of proven solutions for different site conditions and financial
performance indicators. Our solutions are backed by:
Our reputation as a trusted and stable partner (+84.5 GW installed worldwide).
A proven track record spanning over 35 years that makes Siemens Gamesa a benchmark for wind projects.
The recognition of the wind power sector.
Siemens Gamesa, your trusted technology partner

New SG 2.7-129 wind turbine for medium to low-wind sitesThe SG 2.7-129 wind turbine is the latest Siemens Gamesa onshore turbine developed to meet the medium to low-wind site and market conditions of the American market. The turbine is designed based on the foundation of the proven 2.3 MW geared product series, one of the most robust and successful turbine lines in the market, with over half of the more than 9,100 units installed globally, installed in North America (more than 6,100 units). The product configuration maintains a similar design utilizing components from its predecessor, the SWT-2.625-120.
To deliver the lowest Cost of Energy and maximize performance across various sites in the U.S., the SG 2.7-129 is designed with the higher capacity factor our customers demand. This new model enhances our wind turbine catalog by demonstrating our ability to offer flexible solutions for every context.
Proven technologyThe knowledge acquired through our latest products, specifically in the optimization of design, prototyping, validation and industrialization processes, has been a key factor in the development of the SG 2.7-129 wind turbine.
Siemens Gamesa has incorporated proven technologies through best practices into this wind turbine, boosting capacity and simplifying maintenance.
Aeroelastic tailored blades with 129-m rotor diameter. IntegralBlade® technology, DinoTails® Next Generation,
Vortex Generators and optimized cross-sections (airfoils) design.
Adaptive yaw system for optimized performance. Gearbox with two planetary stages and one helical for
increased capacity. Efficient direct cooling system.
SG 2.7-129
(1) Different versions and optional kits are available to adapt machinery to high or low temperatures and saline (C4) or dusty environments.
(2) Power factor at generator output terminals before transformer input.
Technical specifications
General details
Rated power 2.75 MW
Wind class S
Control Pitch and variable speed
Standard operating temperature Range from -20ºC to 35ºC (1)
Rotor
Diameter 129 m
Swept area 13,070 m2
Rotational speed 12.5 rpm
Power density 210.41 W/m2
Blades
Length 63.5 m
Airfoils Siemens Gamesa
Material Fiberglass reinforced with epoxy resin
Tower
Type Tubular steel tower with concrete base
Height 87 m and site-specific
Gearbox
Type 3 stages
Ratio 1:129
Generator
Type Full scale converter
Voltage 690 V AC
Frequency 60 Hz
Protection class IP 34
Power factor 0.9 CAP-0.9 IND throughout the power range (2)
Swept area increase
SG 2.7-129
~16%
SWT-2.625-120
AEP increase SG 2.7-129 vs. SWT-2.625-120
Average wind speed (m/s)
+8.4%AEP MWh @ k=2.5
5000
10000
15000
20000
9.598.587.576.565.5

The present document, its content, its annexes and/or amendments has been drawn up by Siemens Gamesa Renewable Energy, S.A. for information purposes only and could be modified without prior notice. The information given only contains general descriptions and/or performance features which may not always specifically reflect those described, or which may undergo modification in the course of further development of the products. The requested performance features are binding only when they are expressly agreed upon in the concluded contract. All the content of the document is protected by intellectual and industrial property rights owned by Siemens Gamesa Renewable Energy, S.A. The addressee shall not reproduce any of the information, neither totally nor partially.
02/2018
www.siemensgamesa.com
Siemens Gamesa Renewable Energy, Inc.3500 Quadrangle BoulevardQuad 14, Orlando, FL 32817Phone: +1 407 [email protected]
Australia160 Herring Road, Macquarie ParkSydney, NSW 2113
AustriaSiemensstraße 90Wien 1210Phone: +43 51707 0
BelgiumDe Gijzeleer Industrial Park Indus-triezone NeerdorpHuizingen, Guido Gezellestraat 123Vlaams-Brabant, 1654 BeerselPhone: +32 (2) 536 2111
BrazilEldorado Business TowerAv. das Nações Unidas, 8.5015º andarPinheiros, São Paulo - SPPhone: +55 (11) 3096-4444
Canada1577 North Service Road EastOakville, Ontario, L6H 0H6Phone: +1 905-465-8000
ChileAvenida Vitacura 2969Oficina 1002Las Condes, Santiago
China23rd Floor, No. 1 BuildingProsper Center, No. 5 Institution Guanghua Road, Chaoyang DistrictBeijing 100020Phone: +86 (10) 5789 0899
CroatiaHeinzelova 70aHR-10000 ZagrebPhone: +385 (1) 6105 494
DenmarkBorupvej 167330 BrandePhone: +45 9942 2222
Egypt3, Rd 218 Degla11431 MaadiCairoPhone: +202 25211048
France40 avenue des Fruitiers93200 Saint-DenisPhone: +33 (0)1 85 57 00 00
GermanyBerliner-Tor-CenterBeim Strohhause 17-3120097 HamburgPhone: +49 (40) 2889 0
Greece9 Adrianiou str11525 Neo Psychiko, AthensPhone: +30 2106753300
Hong Kong35th Floor Central Plaza18, Harbour Road, Wan ChaiPhone: +852 2593 1140
HungaryGizella út 51-571143 BudapestPhone: +36 (1) 471 1410
India#334, 8th Floor, Block-BThe Futura Tech ParkSholinganallurChennai-119Phone: +91 44 39242424
IranNo. 13, Bandar Anzali StreetAyatollah Taleghani Avenue15936-43311 TehranPhone: +98 (21) 8518 1
IrelandInnovation House, DCU AlphaOld Finglas Road, GlasnevinDublin 11
ItalyVia Vipiteno 420128 MilanPhone: +39 022 431
JapanGate City Osaki West Tower1-11-1 Osaki, Shinagawa-kuTokyo, 141-0032Phone: +81 (3) 3493-6378
KoreaSeoul Square 12th Floor, 416Hangang-daero, Jung-guSeoul 04637Phone: +82 (2) 6270 4800
MexicoPaseo de la Reforma nº 505, piso 37 Torre Mayor, Col. Cuauhtémoc06500 Mexico CityPhone: +52 55 50179700
MoroccoAnfa Place Blvd. de la CornicheCentre d’Affaires “Est”, RDC20200 CasablancaPhone: +212 5 22 67 68 01
NetherlandsPrinses Beatrixlaan 800Zuid-Holland, 2595 BN Den HaagPhone: +31 (70) 333 2712
NorwayØstre Aker vei 880596 Oslo
Philippines22nd Floor, Tower 1The Enterprise Center I6766 Ayala Avenue cor.Paseo de Roxas, Makati City 1200Phone: +63 2 729 7221
Polandul. Zupnicza 11, Mazowieckie03-821 WarsawPhone: +48 (22) 870 9000
Singapore1 Susionopolis Place, #03-20 Galaxis (west lobby)Singapore 138522Phone: +65 6809 1100
South AfricaSiemens Park, Halfway House300 Janadel AvenueMidrand 1685Phone: +27 (11) 652 2148
SpainParque Tecnológico de Bizkaia, Edif. 22248170, Zamudio, Vizcaya, SpainPhone: +34 944 03 73 52
Sri LankaNo. 51/1, Colombo RoadKurana, KatunayakeGampaha, Western ProvincePhone: +94 312235890
SwedenJohanneslundsvägen 12-14SE-194 87 Upplands VaesbyPhone: +46 (8) 728 1000
Thailand98 North Sathom Road37/F Sathom SquareSilom, Bangkok, 10500Phone: +66 2 105 6300
TurkeyEsentepe mahallesi, KartalYakacik Caddesi No 11134870 IstanbulPhone: +90 (216) 459 2000
United KingdomFaraday HouseSir William Siemens SquareFrimley, Camberley GU16 8QD

Pattern Energy LP 13-15 Burns & McDonnell
EXHIBIT O TURBINE, TOWER AND FOUNDATION SPECIFICATIONS

Part:
-
This document must not be copied or madeavailable to any third party without our writtenpermission. The contents must be used only asagreed with us. Breach of the above will causelegal action.
Weight app.: kg Proprietary class: Restricted
ECN No.:
Sheet no.:
EC -
Siemens Wind Power A/SBorupvej 16 DK-7330 Brande
+45 9942 2222
Revision:
Draw. scale
001
D1726216
Draw. format:
Siemens Wind Power A/S
SG 2.7-129 Elevation drawingA2
ISO
1:500 1/1
Design ID:
Additional technical requirementsAdditional requirements regarding base-material, welding,non desctructive testing, surface treatment etc. see submitedtechnical specifications given by the purchase order.
Tota
l Hei
ght
Hub
Hei
ght
4180
Rot
or D
iam
eter
Safe Access Foundation (SAF)
Entrance level inside tower (~150mm)
Natural ground level
Siemens Gamesa Renewable Energy and its affiliates reserve the right to change the above specifications without prior notice.
SG 2.7-129Rotor Diameter 129 m*Hub Height 87 mTotal Height 151.847 m
1
1
2
2
3
3
4
4
5
5
6
6
7
7
8
8
A A
B B
C C
D D
E E
Steel structure
*Rotor actual diameter is 129.694 m

In today’s energy market it’s crucial for wind turbine manufacturers to convince customers of their new design’s capability. You need to give them maximum assurance your design is up to specifications.
A DNV GL Type Certificate provides the verification of your wind turbine design. It provides independent proof of performance and safety in accordance with international standards and systems. It is invaluable in demonstrating your new design’s capabilities to your customers – because they see wind turbine type certification as a must.
Our experience in type certification for the wind turbine industry dates back to the 1980s. That gives us a unique capability to support you in all aspects of turbine type certification. Our independent certification services extend from initial evaluations, through type testing and measurements, to final evaluation.
In order to support our type certification service, DNV GL participates in international standardisation as well as in international harmonisation of certification schemes e.g. within IECRE.
The DNV GL globally recognised type certification schemes for wind turbines are described in the following DNV GL service specifications:
• DNVGL-SE-0074, Type and component certification of wind turbines according to IEC 61400-22
• DNVGL-SE-0441, Type and component certification of wind turbines
In addition, DNV GL offers type certification including additional national requirements for countries like Denmark and India as well as maintenance of existing type certificates according to old schemes like GL Guidelines (GL-IV-1 and GL-IV-2) and IEC WT 01.
In order to achieve global recognition by authorities and other stakeholders, the DNV GL type certification services are all accredited by the accreditation body DAkkS.
Your way to a DNV GL Type Certificate
ENERGY SERVICES WIND TURBINE TYPE CERTIFICATION
Wind turbine type certificationA DNV GL Type Certificate provides the verification of your wind turbine design.
DNVGL.com uses cookies to give you the best possible experience on our site. By browsing the site you agree to our use of cookies. You can click “Close” to remove this message. For more information please visit our cookie information page.
Close
Page 1 of 2Wind turbine type certification - DNV GL
6/5/2018https://www.dnvgl.com/services/wind-turbine-type-certification-70124

Page 2 of 2Wind turbine type certification - DNV GL
6/5/2018https://www.dnvgl.com/services/wind-turbine-type-certification-70124

Pattern Energy LP 13-16 Burns & McDonnell
EXHIBIT P PROJECT SENSITIVITIES MAP
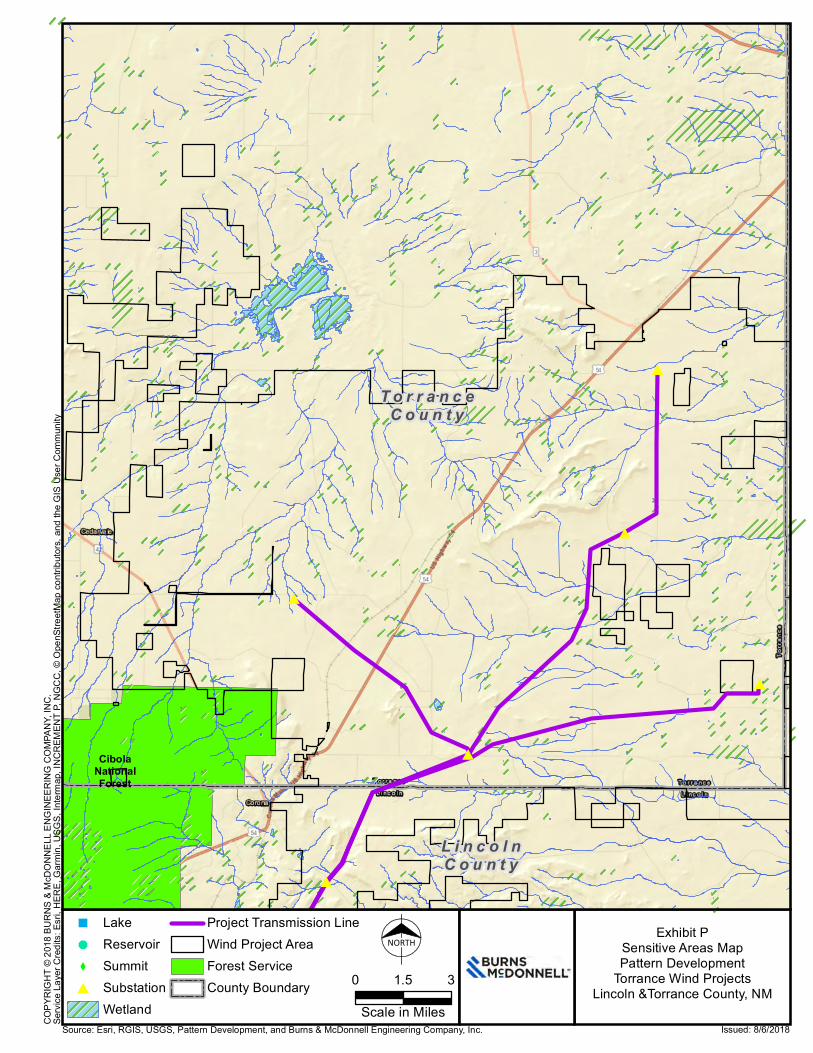
Issued: 8/6/2018
Exhibit PSensitive Areas MapPattern Development
Torrance Wind ProjectsLincoln &Torrance County, NM
#
#
#
#
#
#
L i n c o l nC o u n t y
T o r r a n c eC o u n t y
CibolaNationalForest
" Lake& ReservoirX Summit# Substation
Wetland
Project Transmission LineWind Project AreaForest ServiceCounty Boundary 0 31.5
Scale in MilesSource: Esri, RGIS, USGS, Pattern Development, and Burns & McDonnell Engineering Company, Inc.CO
PYRI
GHT ©
2018
BUR
NS &
McDO
NNEL
L ENG
INEE
RING
COM
PANY
, INC.
NORTH
Servi
ce La
yer C
redits
: Esri
, HER
E, G
armin,
USG
S, In
terma
p, IN
CREM
ENT P
, NGC
C, ©
Ope
nStre
etMap
contr
ibutor
s, an
d the
GIS
Use
r Com
munit
y

Pattern Energy LP 13-17 Burns & McDonnell
EXHIBIT Q TORRANCE COUNTY ZONING MAP

Source: Esri, Torrance County, USGS, Pattern Development, and Burns & McDonnell Engineering Company, Inc. Issued: 8/6/2018
Exhibit QTorrance County Zoning Map
Pattern DevelopmentTorrance Wind ProjectsTorrance County, NM
#
#
#
#
#
#
L i n c o l nC o u n t y
T o r r a n c eC o u n t y
# SubstationProject Transmission LineWind Project AreaCounty Boundary
SU 34 El Cabo Wind Farm
SW 6 Solid Waste Management Dist.
SW 7 Solid Waste Management Dist.
A Agricultural
COPY
RIGH
T © 20
18 B
URNS
& Mc
DONN
ELL E
NGIN
EERI
NG C
OMPA
NY, IN
C.Se
rvice
Laye
r Cred
its: E
sri, H
ERE,
Garm
in, U
SGS,
Inter
map,
INCR
EMEN
T P, N
GCC,
© O
penS
treetM
ap co
ntribu
tors,
and t
he G
IS U
ser C
ommu
nity,
HERE
, Garm
in, ©
Ope
nStre
etMap
contr
ibutor
s
0 31.5
Scale in Miles
NORTH

Pattern Energy LP 13-18 Burns & McDonnell
EXHIBIT R VISUAL SIMULATIONS


Burns & McDonnell World Headquarters 4225 Executive Square, Suite 500
La Jolla, CA 92037 O 858-260-5982 F 714-256-1764
www.burnsmcd.com