
APPENDIX A SITE VISIT FIELD FORMS AND PICTURES
786
APPENDIX A SITE VISIT FIELD FORMS AND PICTURES Brunswick Glynn County JWSC Applied Technology & Management, Inc. Water Sewer Master Plan
-
Upload
khangminh22 -
Category
Documents
-
view
2 -
download
0
Transcript of APPENDIX A SITE VISIT FIELD FORMS AND PICTURES

APPENDIX A SITE VISIT FIELD FORMS AND PICTURES
Brunswick Glynn County JWSC Applied Technology & Management, Inc.
Water Sewer Master Plan

APPENDIX A – WATER SYSTEM COMPONENT SITE VISIT FIELD FORMS AND PICTURES
Brunswick Glynn County JWSC Applied Technology & Management, Inc.
Water Sewer Master Plan

JWSC WATER SYSTEM COMPONENTS EVALUATION6/27/2008
Facility Name: Golden Isles I - Glynco JetportFacility Permit No: Georgia EPD 063-0038
Permitted two wells with 2.000 MGD monthly average/2.000 MGD annual average capacityMiocene Aquifer Withdrawals
Components of Facility
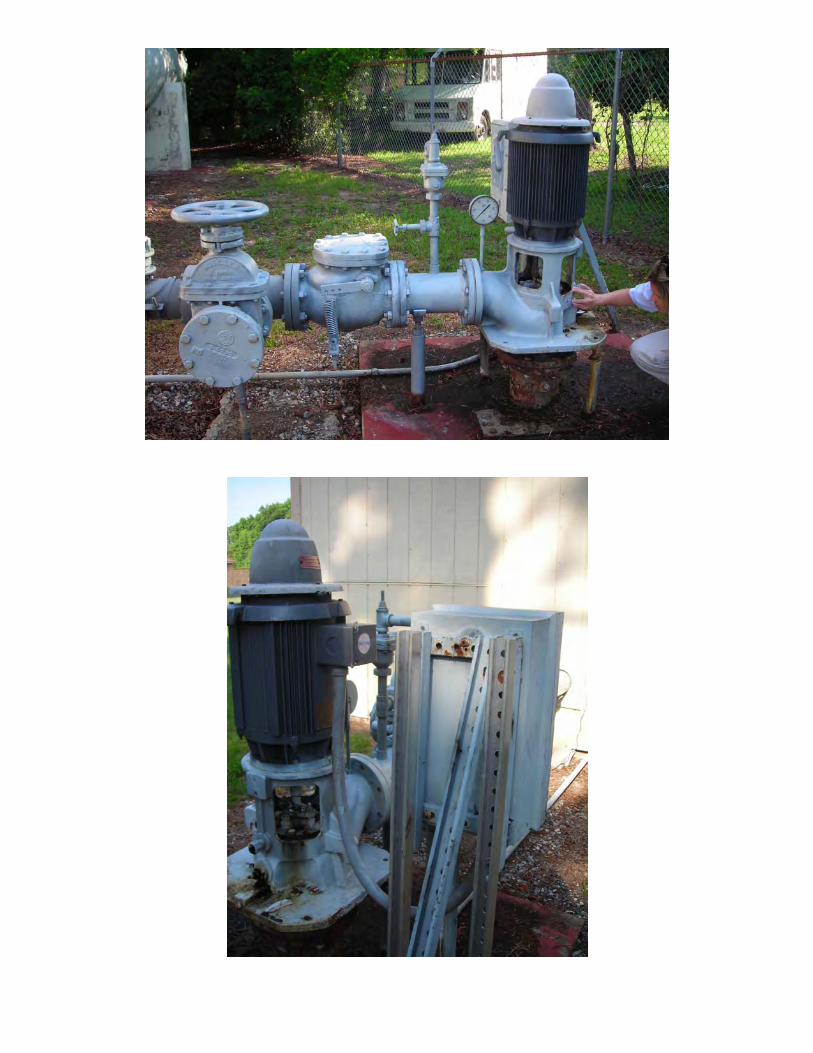
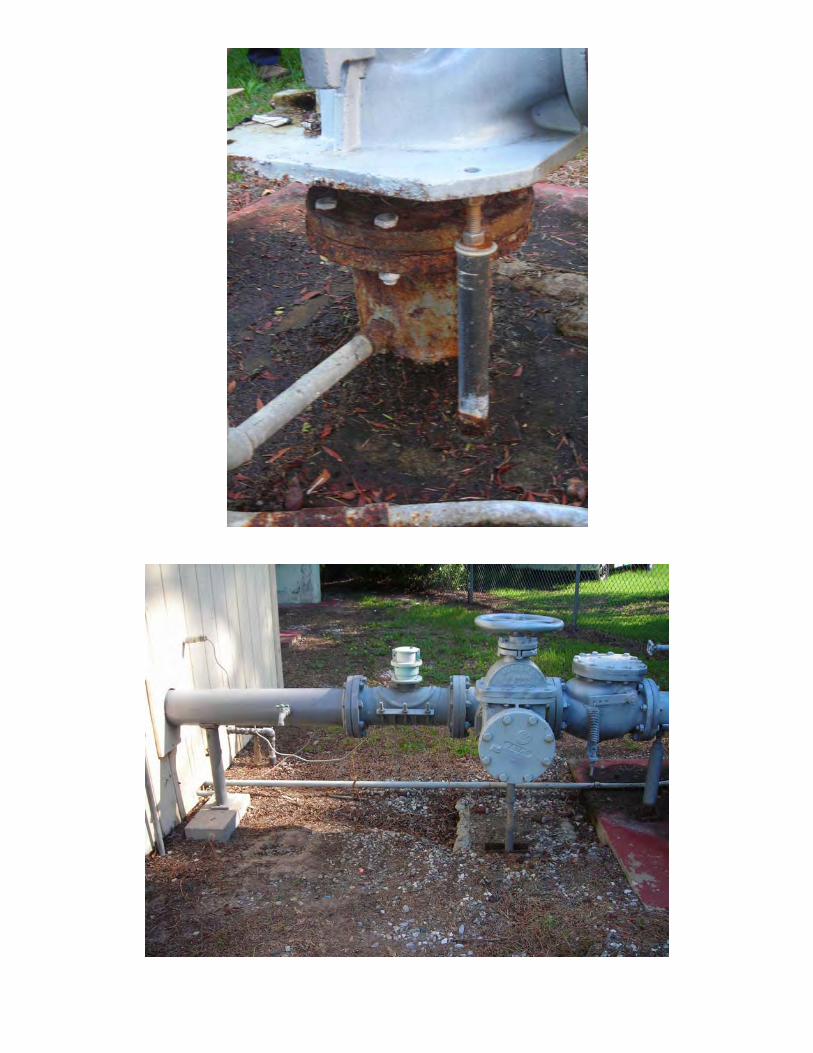
Wells(Y/N): Yes No. of Wells: 1Year of Well(s): UnknownDepth of Well(s) UnknownSize of Well(s)/Casing: UnknownDischarge Piping Size/Mtl: 8" DIPBrackish Water Issues:Well Pump o M tor: No.1
Horsepower: 40 HpVoltage:Phase: 3 PhaseRPM: 1775 RPMMfct/Model No: US Electric Motors High ThrustSerial Nos. ID# B08-5310A-M C3Design Operating Condition 1050 gpm
Control Method of Wells: GST levels - 12.0 on; 14.0 off SCADA: YesChlorination at Well Site(Y/N): YesFluoride Feed (Y/N): YesCondition of Well Heads: Some corrosion on well casing, flange, and pump/motor shaft
Concrete is in good condition - no cracks or debris around well headCondition of Piping: Good
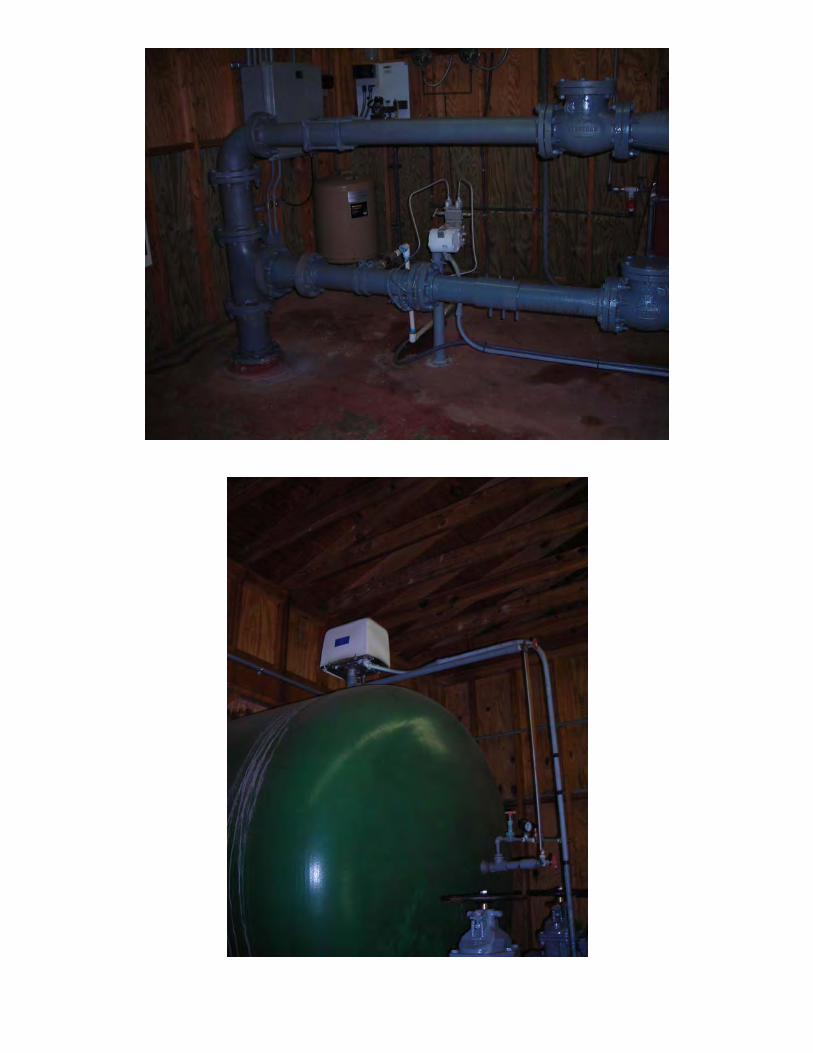
Ground Storage (Y/N): Yes Hydro Tank(Y/N): NoMaterial: 1998 Crom Concrete TankDia of Tank:Dia of Tank:Height of Tank: 17 ft - full water levelVolume of Tank: 200,000 gallonsAerator Condition: Cascade Aerator - good condition but some rust/white scale on screen
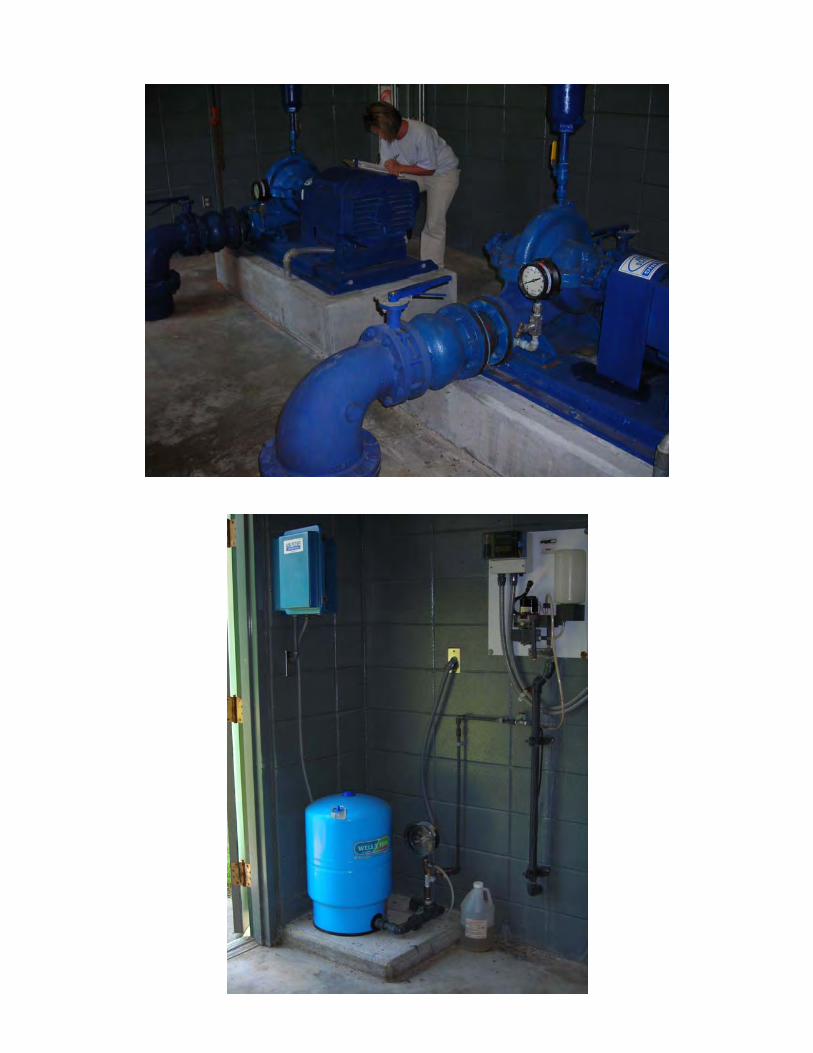
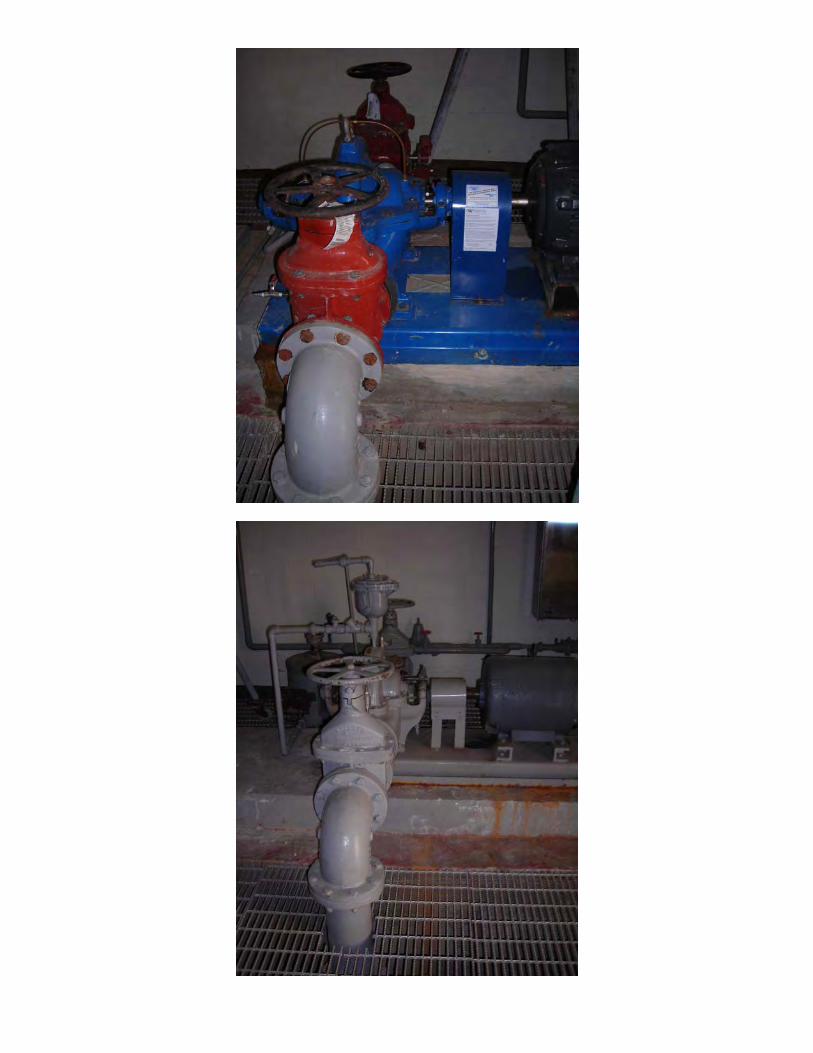
High Service Dist. Pumps (Y/N): Yes No. of Pumps: 2No.1 No. 2
Horsepower: 60 Hp 60 HpVoltage: 230/460 V 230/460 VPhase: 3 Phase 3 PhaseRPM: 1785 RPM 1785 RPMMfct/Model No: Peerless Pumps Model 5AE14 Peerless Pumps Model 5AE14Serial Nos. 226347B 226347BMotor Mfct/Model: US Electric Motors 638033A US Electric Motors 638033ASerial Nos. ID C03-838033A-M ID C03-838033A-MDesign Operating ConditionCondition of Discharge Piping: Good - painted
Control Method of Pumps: HSPs on timers set at 51 Hz SCADA: YesPress Switch: Also have local pressure transmitter
HSPs on Variable Frequency Drives US Filter Control System - Pressure Transmitter 150 psi
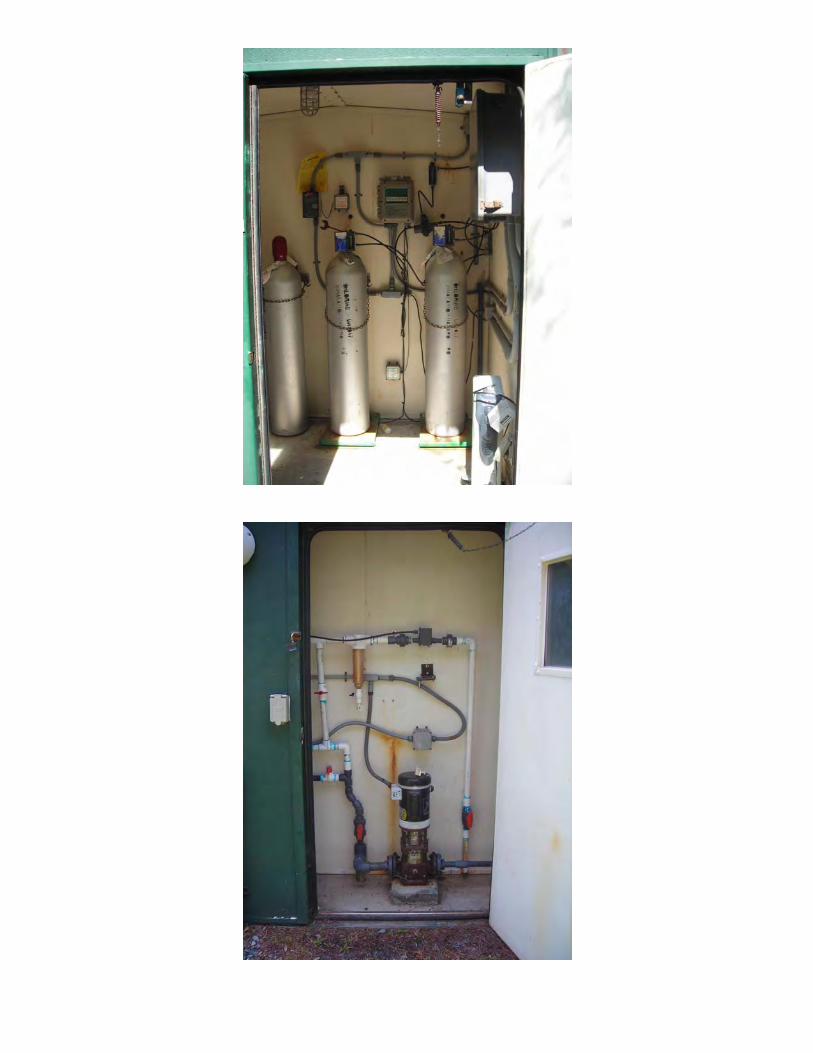
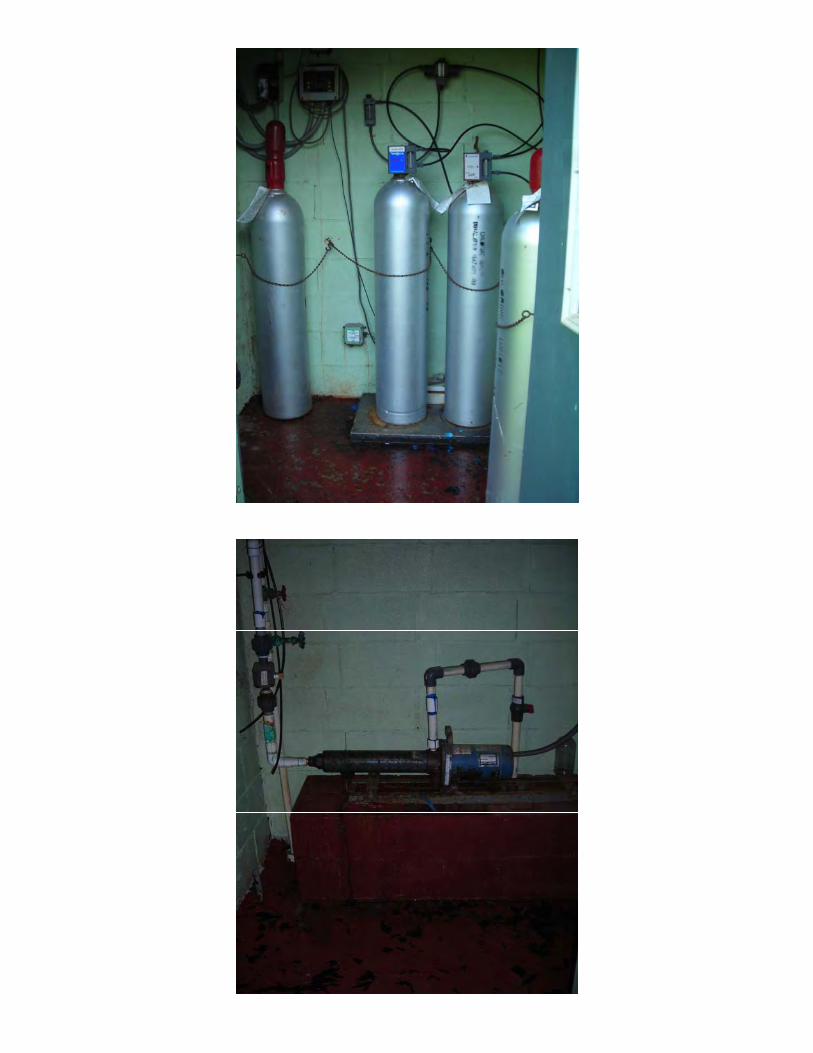
Chlorination Facilities (Y/N): YesMfct: Hydro Series 800 RegulatorsSize Gas CL Cylinders 150 lb dual cylinders; 4 spare cylindersNo. of Cylinders 2Enclosure: Stand alone fiberglass buildingVentilation: Fan located in chlorine room - workingSet Point: 45 PPD Well Only Rota Meter Setting; 1.5 - 2.0 residual
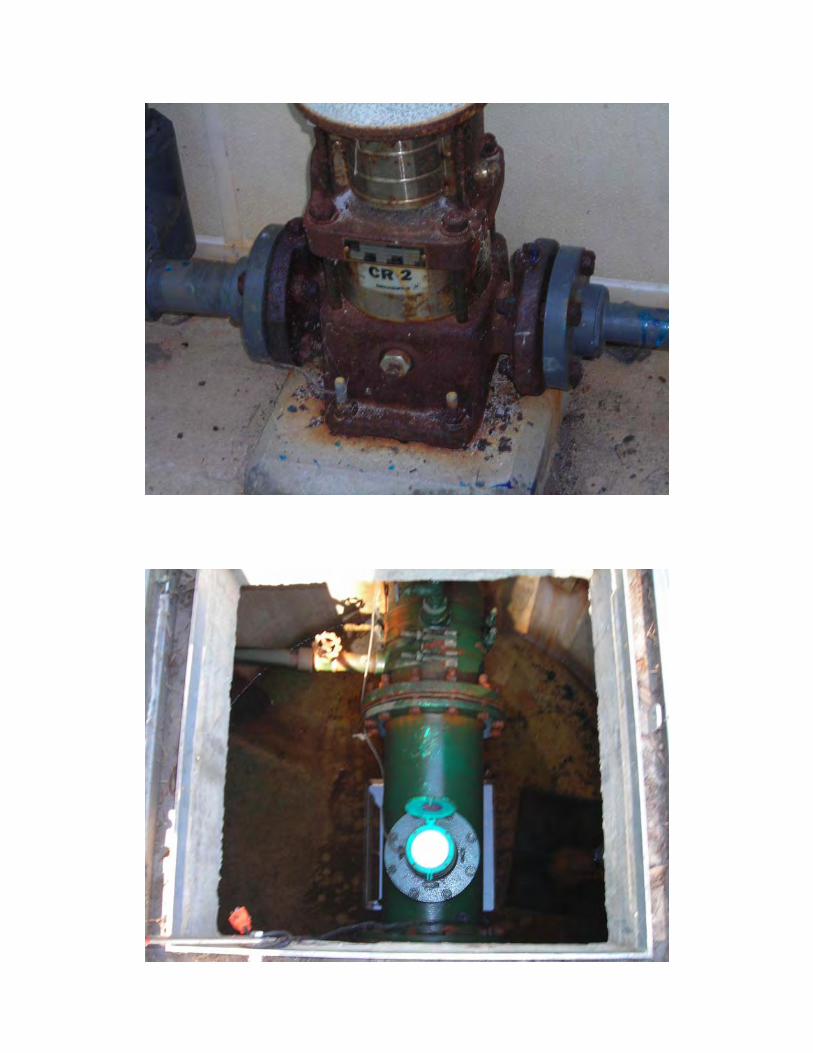
Booster Pump: Chlorine booster pump located on other side in chlorine building from cylinders

Grundfos CR2 - lot of corrosion on pumpChlorine feed in to ground storage tankEagle Microsystems residual analyzer located in HSP and control building - reading 0.00 mg/L during visitXtrol water tank for residual analyzer system
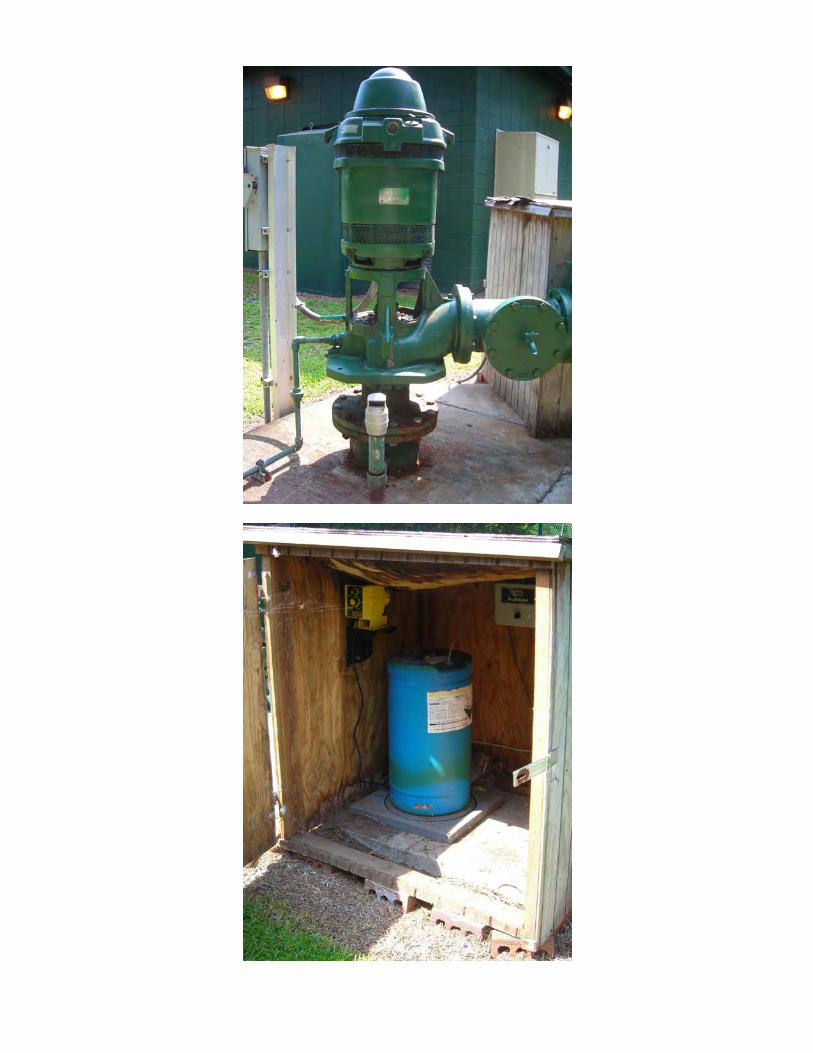
Fluoride Feed (Y/N): Yes - Hydrofluorosilic AcidChemical storage and Milton Roy metering located in wooden doghouse next to well- roof caved inroof is sitting on metering - not sure feeding
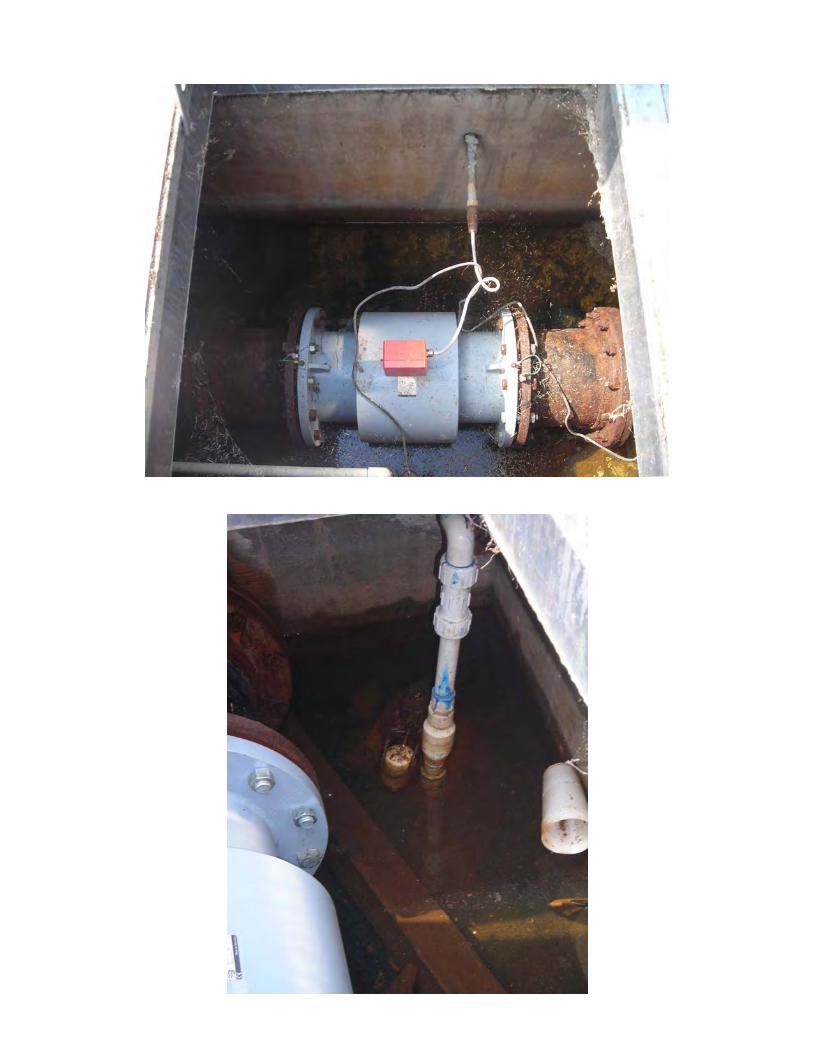
Flow Monitoring (Y/N): YesRaw water flow meter located on well discharge pipingFinished water flow monitor (some corrosion) in concrete vault - good condition
Generator (Y/N): No
Site Fenced/Secured: Yes - fenced and with site lighting
Rehabilitated: Partial CompleteDate: N/A
Deficiencies:Roof caved in on doghouse over HFS tank (fluoride)Well - some corrosion on well casing/flange and pump/motor shaft
concrete in good condition - no debris aroundCascade aerator - some rust/white scale on screenChlorine booster pump - Groundfos CR2 has a lot of corrosion
Overall Condition: Good - equipment and block building in good condition
Additional Information:The well at this facility was the first Miocene well used for drinking water in Glynn CountyRecently added 20 additional feet of drop pipe to the well (extra column in shaft)
and flow went to 1050 gpmAt time of visit there were 13 ft of water in ground storage tankg gOne of HSPs operating during visit - gauge reads approximately 30 psiThere were daily chlorine readings listed in operator's logMilltronics Hydroranger level monitoringBlock buildng for high service pumps and controls

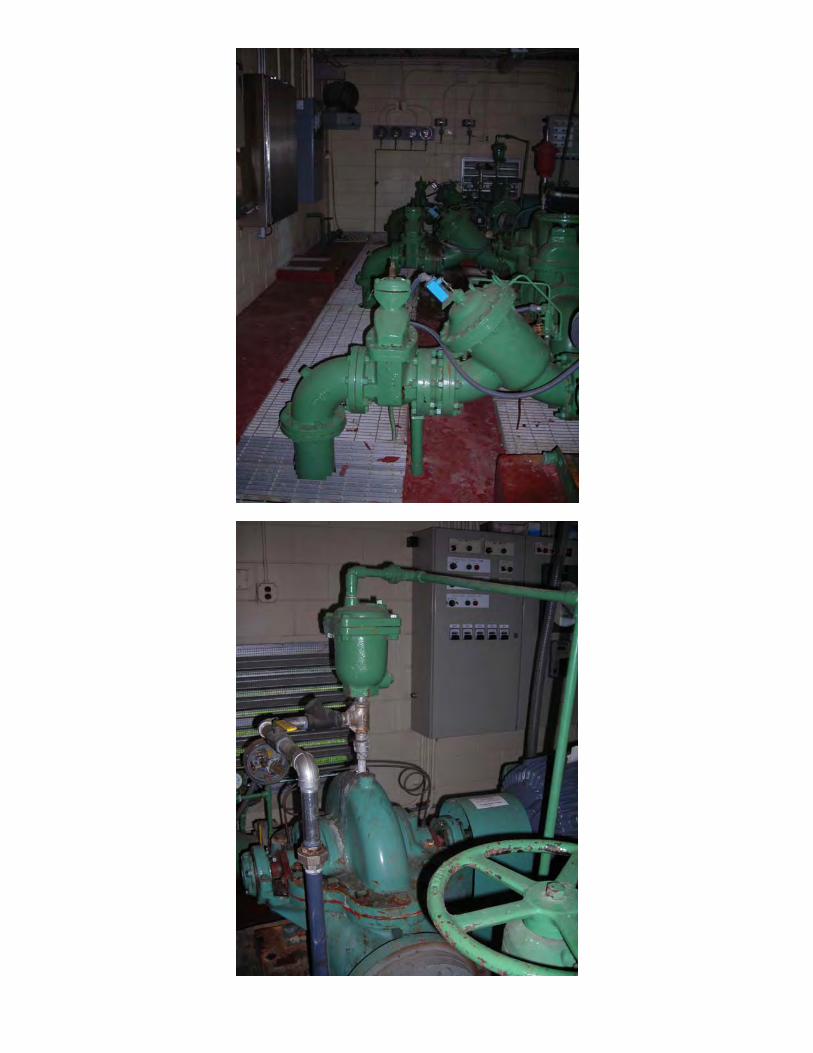
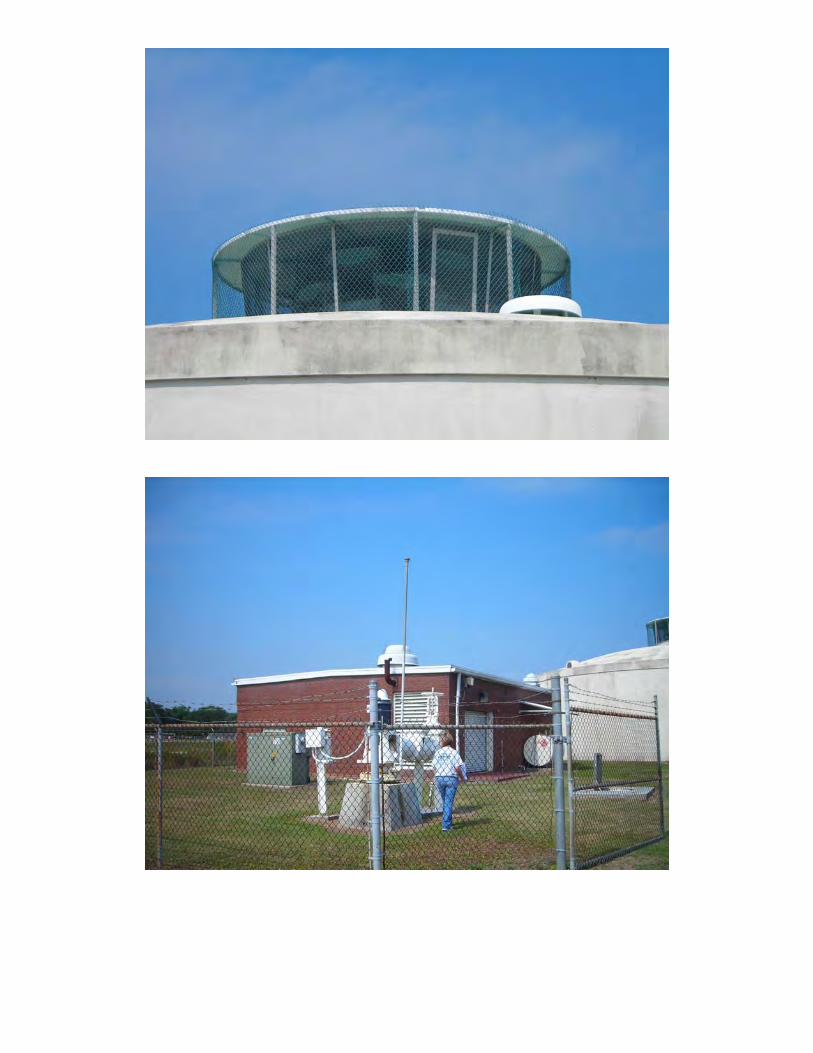
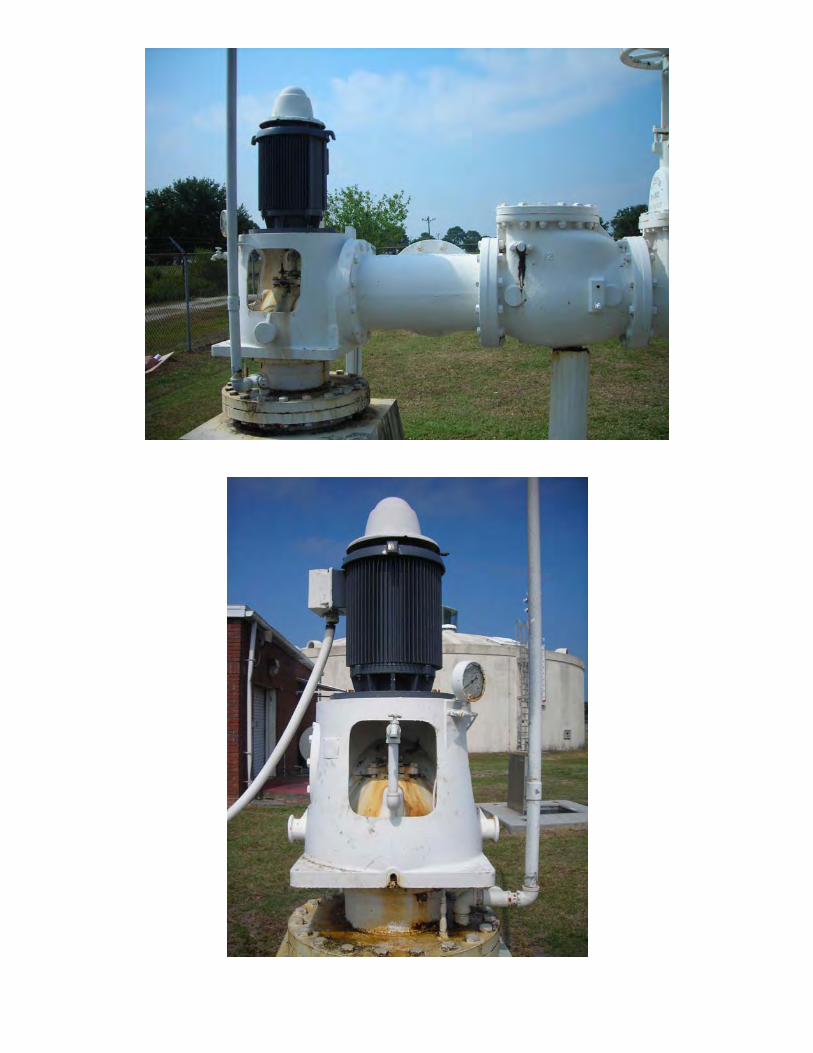
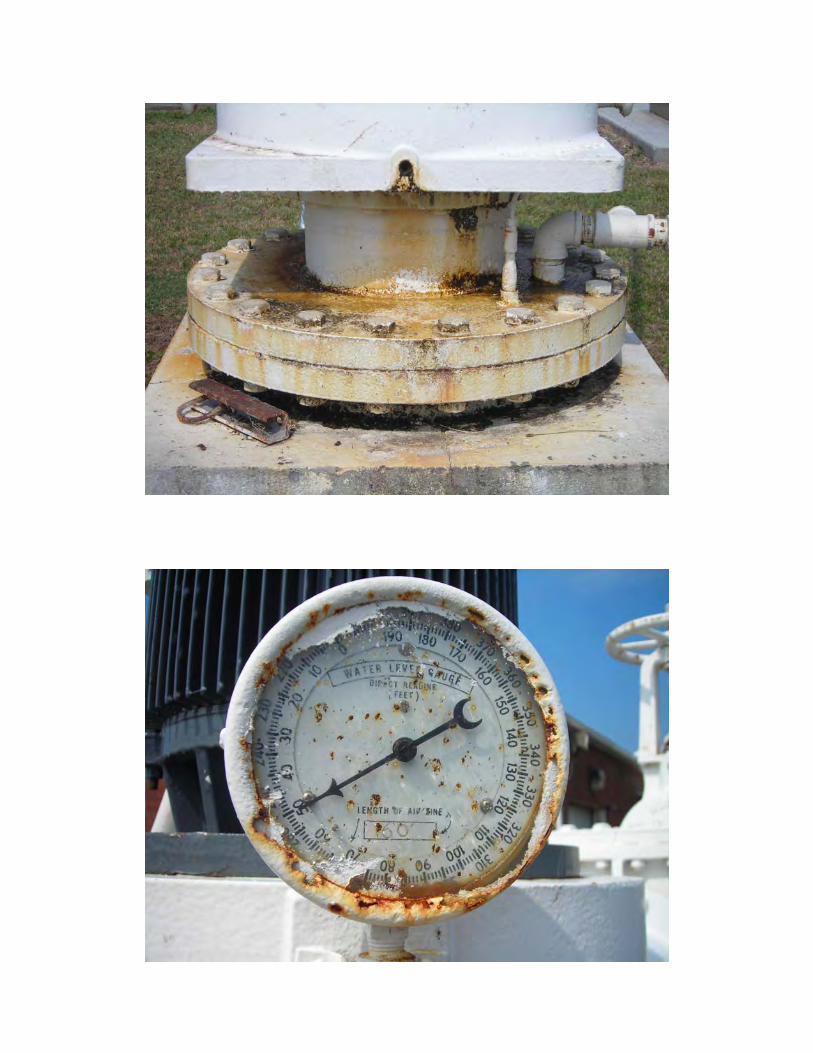
JWSC Golden Isles I (JetPort) Water Production Facility Site Evaluation Photos
June 27, 2008

C
JWSC WATER SYSTEM COMPONENTS EVALUATION6/17/2008
Facility Name: Golden Isles IIFacility Permit No: Georgia EPD 063-0038
Permitted two wells with 2.000 MGD monthly average/2.000 MGD annual average capacityMiocene Aquifer Withdrawals
Components of Facility
Wells(Y/N): Yes No. of Wells: 1Year of Well(s): UnknownDepth of Well(s) UnknownSize of Well(s)/Casing: UnknownDischarge Piping Size/Mtl: 8" DIP from wellBrackish Water Issues:Well Pump o M tor: No.1
Horsepower: 60 HpVoltage: 480 VPhase: 3 PhaseRPM: 1760 RPMMfct/Model No: Flowserve Pump Model 12BM14Serial Nos. 05M2012Design Operating Condition 800 GPM @ 215 ft TDH
Control Method of Wells: GST levels - 14.0 on; 15.0 off SCADA: YesChlorination at Well Site(Y/N): YesCondition of Well Heads: Some minor corrosion on plate/flange for well headFluoride Feed (Y/N):Condition of Piping: Good condition
Ground Storage (Y/N): Yes Hydro Tank(Y/N): NoMaterial: 2006 Concrete Crom tank with cascade aerator - good conditionDia of Tank:Height of Tank:Height of Tank:Volume of Tank: 250,000 gallonsAerator Condition: aerator in good condition - minor rust
High Service Dist. Pumps (Y/N): Yes No. of Pumps: 2No.1 No. 2
Horsepower: 75 Hp 75 HpVoltage: 230/460 V 230/460 VPhase: 3 Phase 3 PhaseRPM: 1785 RPM 1785 RPMMfct/Model No: Peerless Pump 5AE14 Peerless Pump 5AE14Serial Nos. 693106A 693106BMotor Mfct/Model: Emerson Motors Emerson MotorsSerial Nos. HZ5P2B-C 6212-2Z-J/ HZ5P2B-C 6212-2Z-J/C3Design Operating ConditionCondition of Discharge Pipine: 10"x 6" DI suction piping; 10"x 6" DI discharge piping
Pumps located in building; piping painted and in very good conditionControl Method of Pumps: Cate Road EST Levels SCADA: Yes
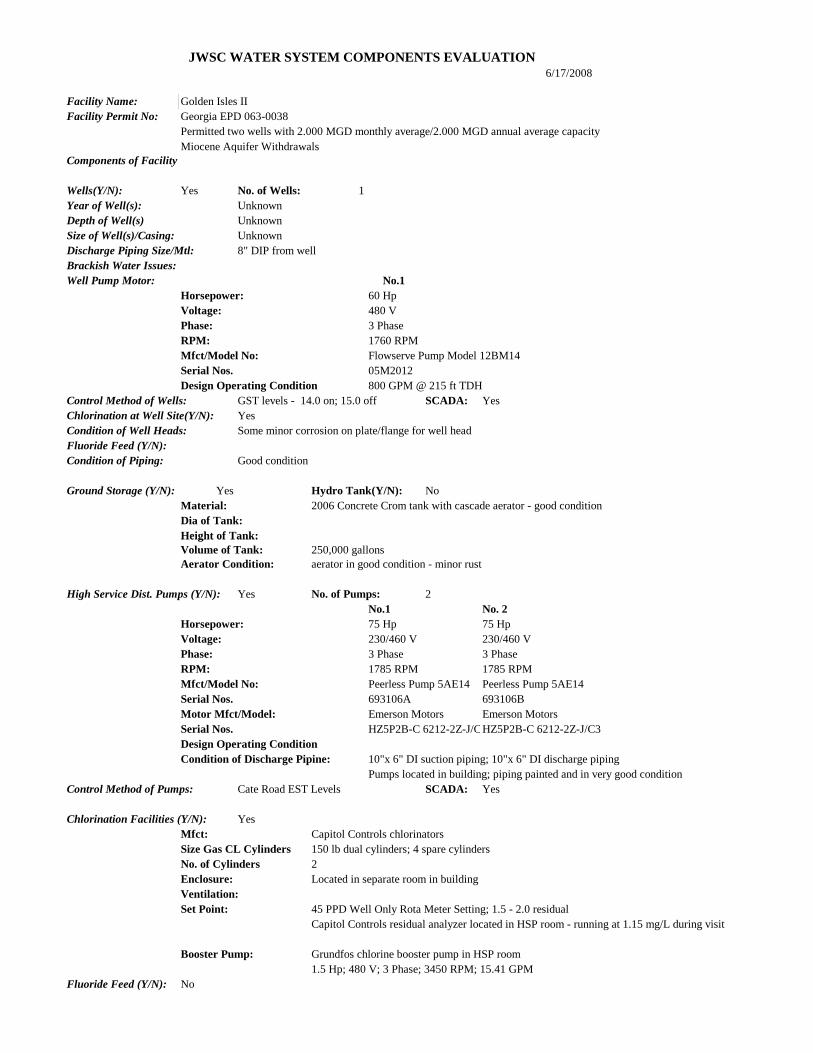
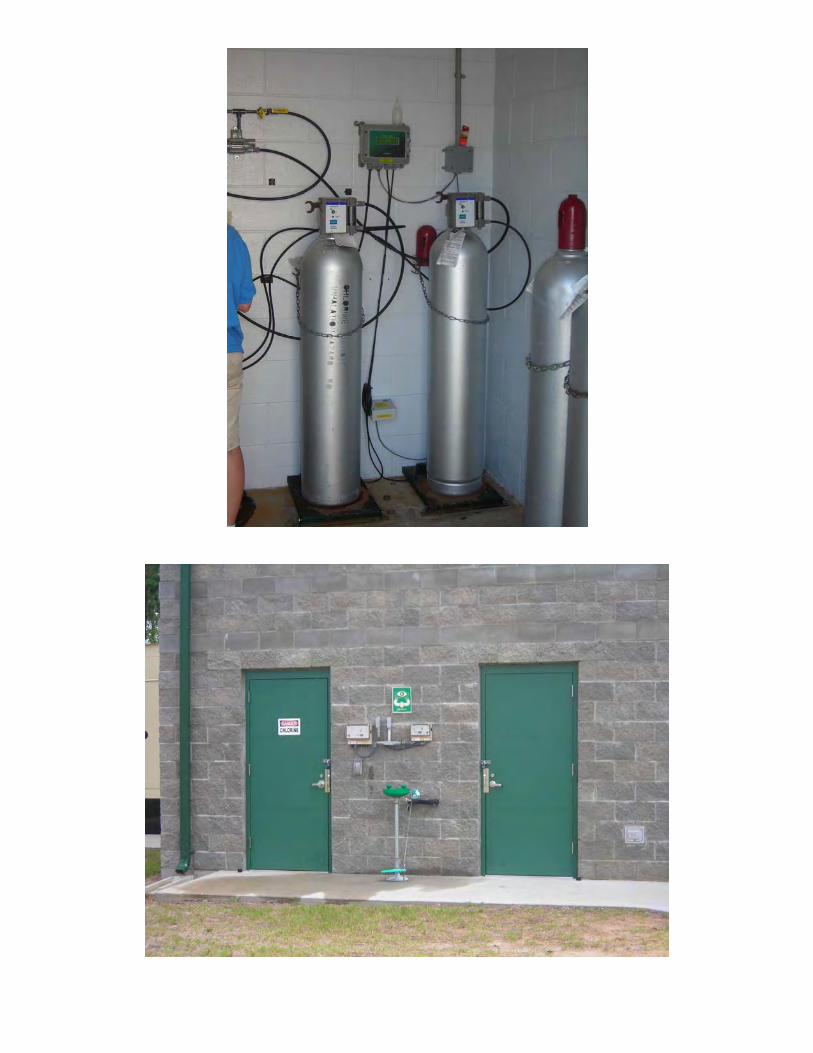
Chlorination Facilities (Y/N): YesMfct: Capitol Controls chlorinatorsSize Gas CL Cylinders 150 lb dual cylinders; 4 spare cylindersNo. of Cylinders 2Enclosure: Located in separate room in buildingVentilation:Set Point: 45 PPD Well Only Rota Meter Setting; 1.5 - 2.0 residual
Capitol Controls residual analyzer located in HSP room - running at 1.15 mg/L during visit
Booster Pump: Grundfos chlorine booster pump in HSP room1.5 Hp; 480 V; 3 Phase; 3450 RPM; 15.41 GPM
Fluoride Feed (Y/N): No

Flow Monitoring (Y/N): YesFlow monitor on well discharge pipingFinished water flow monitor in manhole/vault located outside of building
Generator (Y/N): Yes - located behind building
Site Fenced/Secured: Yes
Rehabilitated: Partial CompleteDate: X - new facility 2006
Deficiencies:some minor corrosion on plate/flange for well headminor rust on cascade aeratorbroken concrete slab around valve box outside of flow monitor vault - soil eroded
Overall Condition: Very good condition - new facility
Additional Information:Entire facility newly constructed and in good condition

JWSC Golden Isles No. 2 Water Production Facility Site Evaluation Photos
June 17, 2008


JWSC WATER SYSTEM COMPONENTS EVALUATION6/18/2008
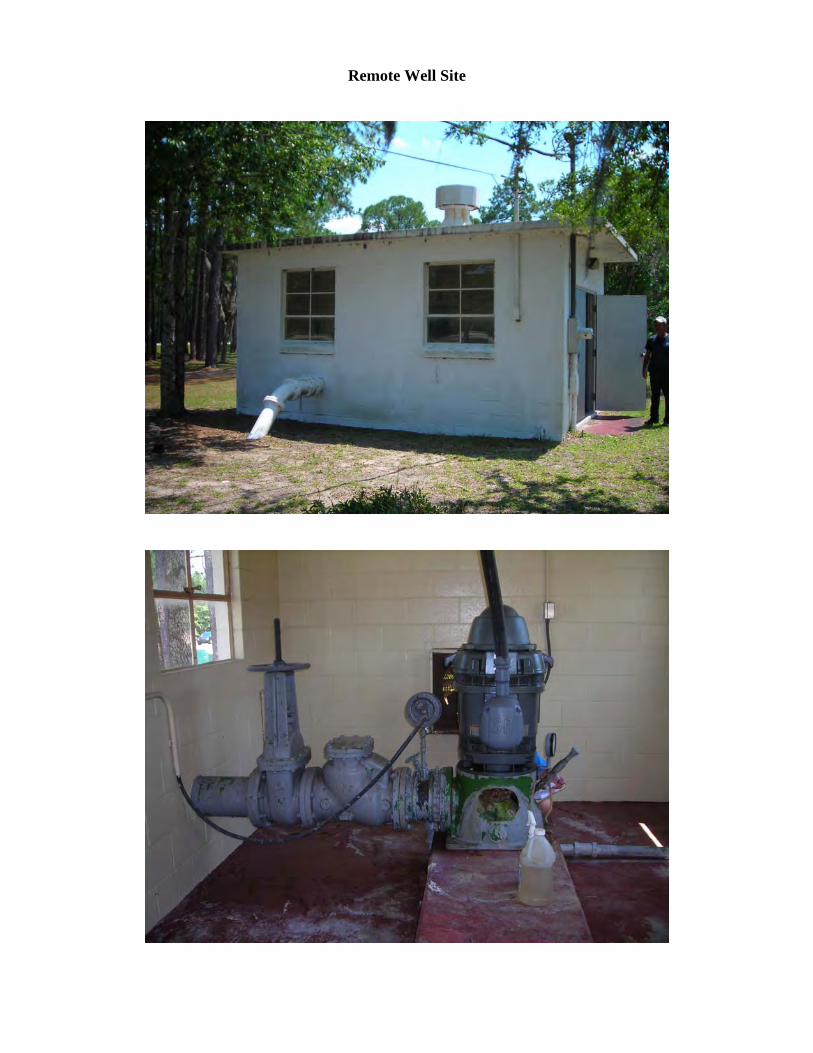
Facility Name: Perry Lane Road WPF (Ridgewood)Facility Permit No: EPD 063-0023
0.450 MGD monthly average and 0.350 MGD annual averageUpper Floridan Aquifer Withdrawals
Components of Facility
Wells(Y/N): Yes No. of Wells: 2Year of Well(s): UnknownDepth of Well(s) UnknownSize of Well(s)/Casing: Well No. 1 - 6"; Well No. 2 - 12" CasingDischarge Piping Size/Mtl:Brackish Water Issues:Well Pump o M tor: No. 1 Fire Well No.2 Small Well
Horsepower: 60 Hp 15 HpVoltage: 460 V 230/460 VPhase: 3 Phase 3 PhaseRPM: 1760 RPM 1770 RPMMfct/Model No: Peerless 12MB-3FD Goulds Imp. No. TI-44210 0R4400627-CHC-6 5/01Motor Mfct/Model: US Electric MotorsSerial Nos. ID614359/S09S1650565R-2Design Operating Condition 1000 gpm @ 175 ft TDHCondition of Discharge Piping: Well No. 1 Piping Very good - piping all painted and in good condition
Well No. 2 Piping Good - except for corrosion at well; piping is paintedWell No. 1 - 12" piping feeds distribution system (fire well)Well No. 2 - 6" discharge piping feeds hydropneumatic tank
Control Method of Wells: Well No. 2 on timer - operates 497 minutes/day; Well No. 1 - fire well - unknown if automatic based on local system pressure or manualSCADA:SCADA: YesYes
Condition of Well Heads: Well No. 1 Fair Condition - lot of corrosion on well flange; concrete pad in good condition; some debris on pad
Well No. 2 Good Condition - a few cracks in concrete pad; some corrosion under well head somepaint bubbling where pipe meets concrete
Chlorination at Well Site(Y/N): Yes - 2 chlorine feed lines chlorine booster pump feeds in to both 6" and 12" well discharge piping
Fluoride Feed (Y/N): No
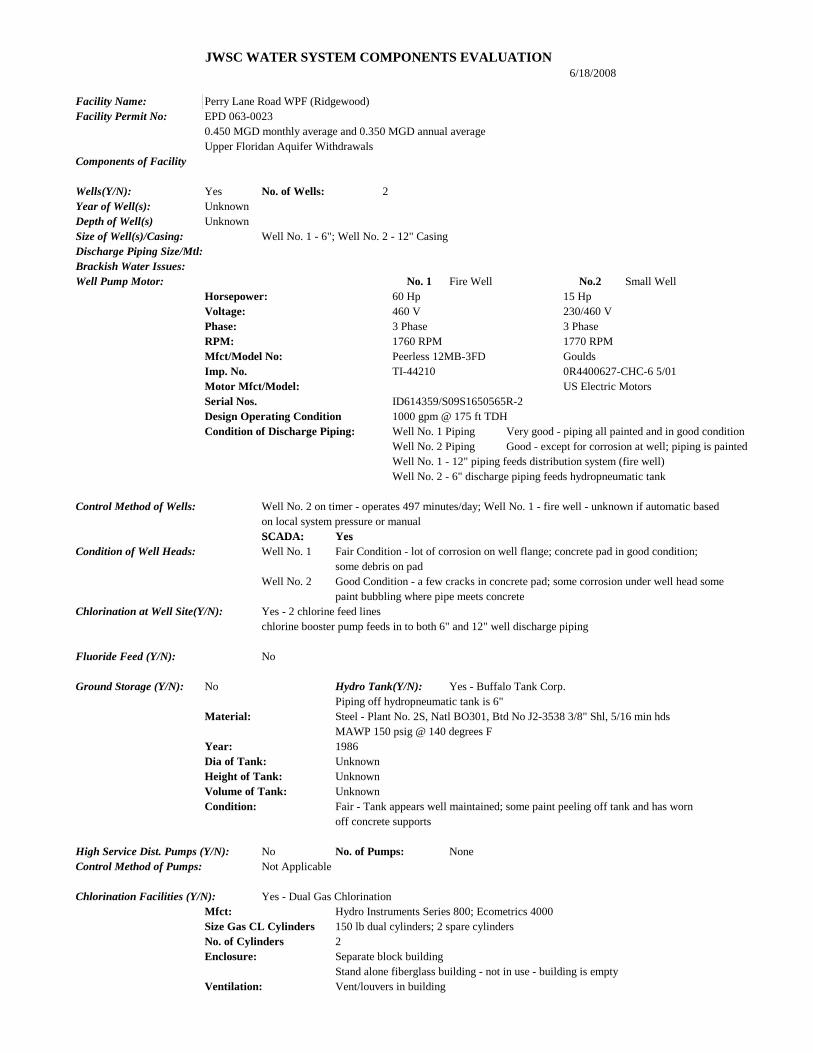
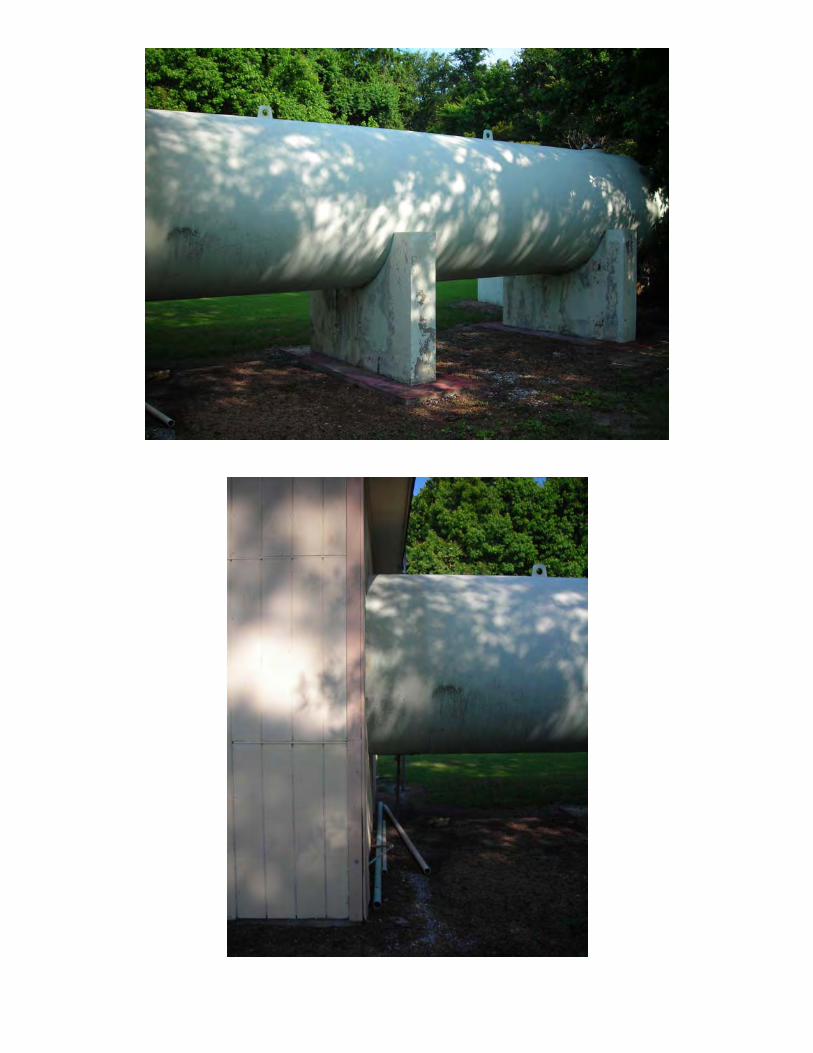
Ground Storage (Y/N): No Hydro Tank(Y/N): Yes - Buffalo Tank Corp.Piping off hydropneumatic tank is 6"
Material: Steel - Plant No. 2S, Natl BO301, Btd No J2-3538 3/8" Shl, 5/16 min hdsMAWP 150 psig @ 140 degrees F
Year: 1986Dia of Tank: UnknownHeight of Tank: UnknownVolume of Tank: UnknownCondition: Fair - Tank appears well maintained; some paint peeling off tank and has worn
off concrete supports
High Service Dist. Pumps (Y/N): No No. of Pumps: NoneControl Method of Pumps: Not Applicable
Chlorination Facilities (Y/N): Yes - Dual Gas ChlorinationMfct: Hydro Instruments Series 800; Ecometrics 4000Size Gas CL Cylinders 150 lb dual cylinders; 2 spare cylindersNo. of Cylinders 2Enclosure: Separate block building
Stand alone fiberglass building - not in use - building is emptyVentilation: Vent/louvers in building

Set Point: 12 PPD Well Ony Rota Meter Setting; 1.0 - 1.5 residualBooster Pump: Yes
Flow Monitoring (Y/N): Yes Flow meter located in 6" DIP discharge piping off Well No. 1Flow meter of Well No. 2 on 12" DIP discharge piping in ground; has bypass
Building Condition: Wooden siding building - good condition; painted - houses end of hydrotank; piping; MCC
Generator (Y/N): No
Site Fenced/Secured: Yes
Rehabilitated: No Partial CompleteDate: N/A
Deficiencies:No site lightWell No 2 well head has some paint peeling and some corrosion under well head
some DI pipe under well corroding - paint bubbling and at bottom where pipe meets concretesome cracks in concrete pad
Well No. 1 - a lot of corrosion on well flange - concrete pad good conditionsome debris on concrete pad
Hydrotank - well maintained but some paint peeling/worn off - over 20 years old
Overall Condition: Good
Additional Information: Facility has SCADADual voltage on site - Well No. 1 is 230 V; Well No. 2 is 480 VSmall pneumatic tank in building - not used for chlorination system is used forhydropneumatic tank to keep mercury switches from short cycling - fire well and small well each have switches

JWSC Perry Lane (Ridgewood) Water Production Facility Site Evaluation Photos
June 18, 2008


JWSC WATER SYSTEM COMPONENTS EVALUATION6/18/2008
Facility Name: Canal Road WellFacility Permit No: Georgia EPD 063-0023
Permitted three wells with 0.450 MGD monthly average/0.350 MGD annual average capacityUpper Floridan Aquifer Withdrawals
Components of Facility
Wells(Y/N): Yes No. of Wells: 1Year of Well(s): UnknownDepth of Well(s) UnknownSize of Well(s)/Casing: UnknownDischarge Piping Size/Mtl: 12"x8" DIP into pump suction; 12" DIP discharge pipingBrackish Water Issues:Well Pump/Motor: No.1 No. 2
Horsepower:Voltage:Phase:RPM: 1770 RPMMfct/Model No: Peerless Pump Model 12MB-3Imp. No.Motor Mfct/Model:Serial Nos. TI-37902Design Operating Condition 1400 gpm @ 150' TDHCondition of Discharge Pipine: Good - painted; no significant corrosion
Well pumps directly into distribution system
Well has auto flush for first 30 seconds of operation; flushes off bypass drain pipe through microswitch 8" check valve (flush valve); drain line also has blind flange
Control Method of Wells: Cate Road EST Levels SCADA: YesChlorination at Well Site(Y/N): YesFluoride Feed (Y/N):Fluoride Feed (Y/N): NoNoCondition of Well Heads: Very good - pipe and concrete are painted - no corrosion
Condition of Piping: Very good - painted; no significant corrosion
Ground Storage (Y/N): No Hydro Tank(Y/N): NoMaterial: N/ADia of Tank: N/AHeight of Tank: N/AVolume of Tank: N/AAerator Condition: N/A
High Service Dist. Pumps (Y/N): No No. of Pumps: N/A
Chlorination Facilities (Y/N): YesMfct: Premier Series - Cl2 and residual readingsSize Gas CL Cylinders 150 lb dual cylinders; 0 spare cylindersNo. of Cylinders 2Enclosure: Stand alone fiberglass buildingVentilation: Fan located in chlorine room - workingSet Point: 45 - 50 PPD Well Only Rota Meter Setting; 1.0 - 1.5 residualBooster Pump: Yes
Well Xtrol WX202 water tank for chlorine booster pump - located in MCC building
Flow Monitoring (Y/N): Yes Flow meter in valve vault - fair conditionOnly one flow meter as well pumps directly in to distribution system
Generator (Y/N): Yes Natural gas generator on site - Generac
Site Fenced/Secured: Yes - chain link fence secured; buildings locked

Rehabilitated: No Partial CompleteDate: N/A
Deficiencies: No significant deficiencies
Overall Condition: Very Good
Additional Information: Site lightSmall wooden "doghouse" next to well - can not open; locked

JWSC Canal Road Water Production Facility Site Evaluation Photos
June 18, 2008


JWSC WATER SYSTEM COMPONENTS EVALUATION6/19/2008
Facility Name: WS-03 Goodyear WPFFacility LocationFacility Permit No: Georgia EPD 063-0011
Permitted eight wells with 9.000 MGD monthly average/8.440 MGD annual average capacityFloridan Aquifer Withdrawals
Components of Facility
Wells(Y/N): Yes No. of Wells: 1Year of Well(s): UnknownDepth of Well(s) UnknownSize of Well(s)/Casing: 10" well casingDischarge Piping Size/Mtl: 10" DIP discharge pipingBrackish Water Issues:Well Pump/Motor: No.1
Horsepower: 30 HpVoltage: 230/460 VPhase: 3 PhaseRPM: 1760 RPMMfct/Model No: Peerless Pump F405AImp. No.Motor Mfct/Model: US Motors AUDP 2861Serial Nos. T06T113R03FDesign Operating ConditionCondition of Discharge Piping: Piping painted and in good condition
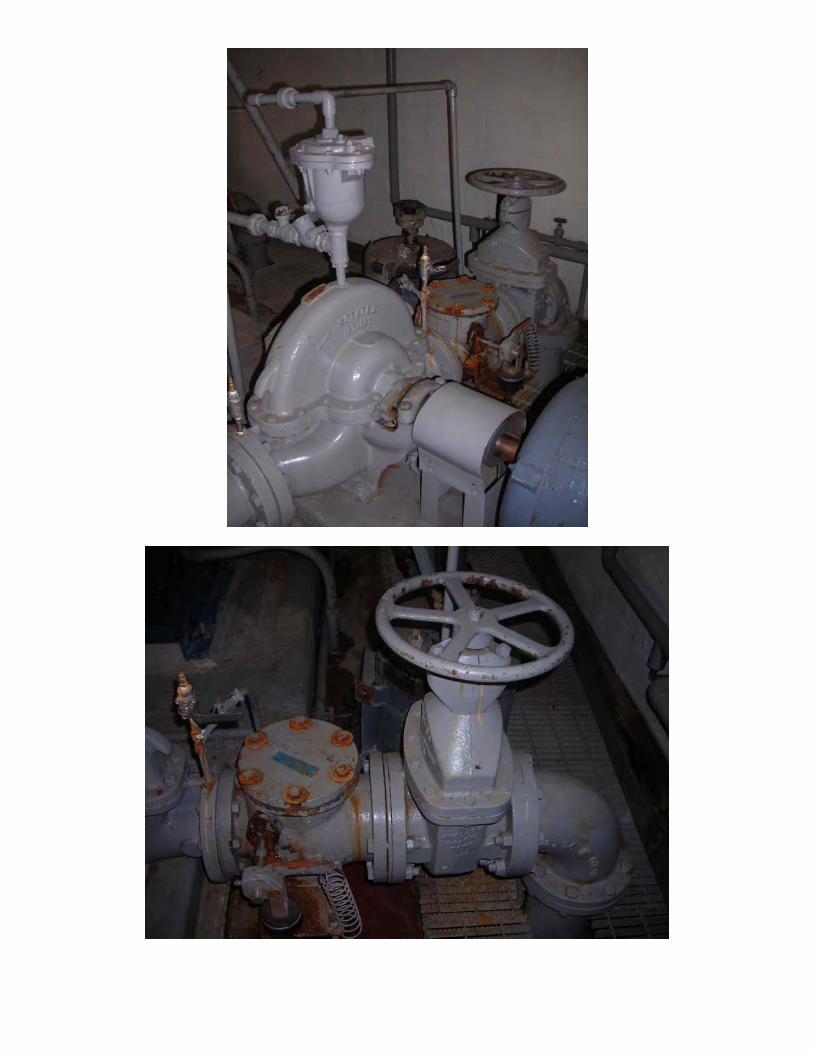
Control Method of Wells: GST levels 7.0 on; 8.5 off SCADA: YesCondition of Well Heads: Good - concrete painted; some rust/corrosion on flange; gasket starting to corrode
Condition of Piping: Good condition - 10" discharge piping; some paint peeling off top check valve and bend after gate valve
Ground Storage (Y/N): Yes Hydro Tank(Y/N): NoMaterial: Concrete - tank is mostly buriedDia of Tank: UnknownHeight of Tank: UnknownVolume of Tank: 113,000 gallons (approx)Aerator Condition: Cascade aerator is in good condition
Tank is painted, well maintained, and in good condition
High Service Dist. Pumps (Y/N): Yes No. of Pumps: 2No.1 No. 2
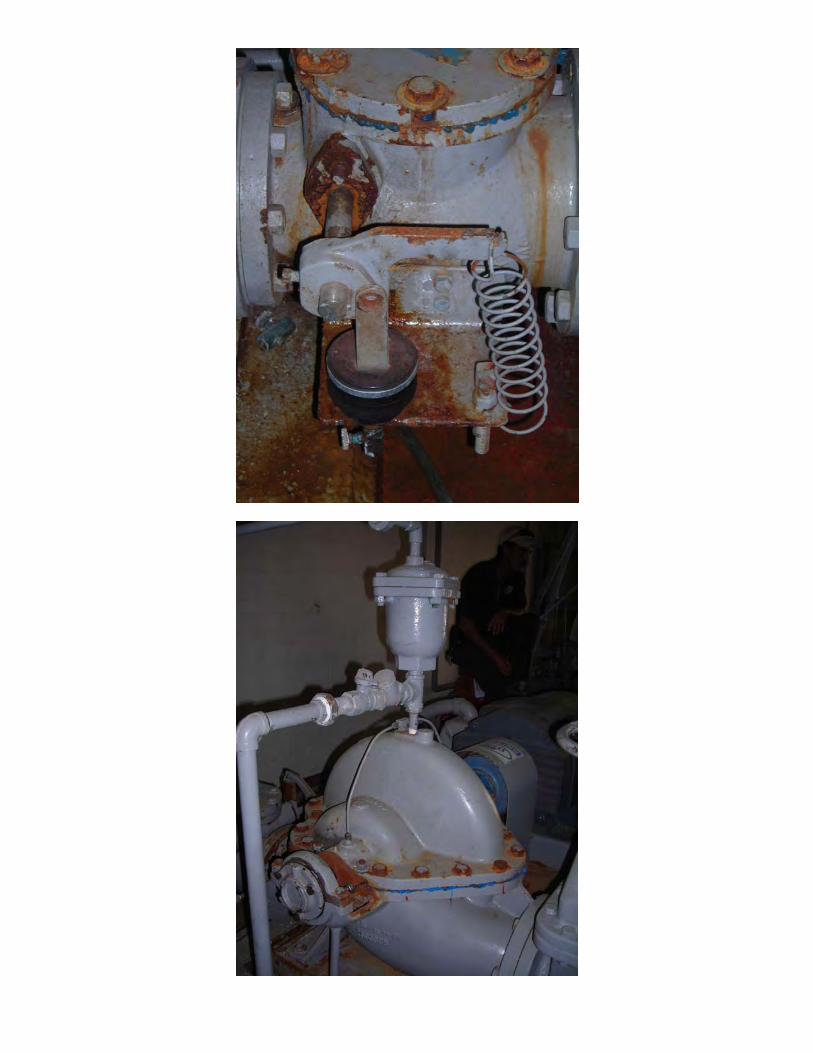
Horsepower: 75 Hp 75 HpVoltage: 230/460 V 230/460 VPhase: 3 Phase 3 PhaseRPM: 1775 RPM 1775 RPMMfct/Model No: Peerless Pump 6AE14 Peerless Pump 6AE14Serial Nos. 708188A 708188AMotor Mfct/Model: General Electric General ElectricSerial Nos. 5K365AL215C 5K365AL215CDesign Operating ConditionCondition of Discharge Piping: Fair - some paint peeling off discharge piping at 90 degree bend
No. 1 pump - a lot of corrosion on pump around flangeNo. 2 pump - some corrosion on pump around flange
8" DIP suction piping to each pump; potential to add suction piping to feed a 3rd HSP6" DIP discharge piping off pumps; to 8"x6" and 12"x6" piping;12" DIP discharge manifold
Control Method of Pumps: 1st and Brailsford EST levels SCADA: Yes; Pump 1 lead; Pump 2 lag
Chlorination Facilities (Y/N): YesMfct: US Filter RegulatorsSize Gas CL Cylinders 150 lb dual cylinders; 9 spare cylinders

No. of Cylinders 2Enclosure: Separate room in block buildingVentilation: Fan and louver at bottomSet Point:Booster Pump:
Fluoride Feed (Y/N): Yes Flouride tank located in WPF building; metering pump on shelf above
Additional Chemical Feed: PO4 Phosphates fed into discharge line at well - day tank and metering pump in aluminum buildingBulk storage tank located in WPF building and pumps to small tank outside in aluminum building
Flow Monitoring (Y/N): Yes Raw water flow meter in manhole beside ground storage tankpipe corroding; paint peeling off; standing water in manhole; sump pump in manholeFinished water flow meter in valve vault outside building
Generator (Y/N): Yes Generator located on site in building
Site Fenced/Secured: Yes; site fenced; located in medical facility complex
Building Condition: Good condition - block building with wood roof and good aluminum doorsbuilding is painted
Rehabilitated: No Partial CompleteDate: N/A
Deficiencies: Raw water flow monitor in manhole - pipe corroding; paint coming off; standing water(Per JWSC staff - 2009 - flow meter has been taken out of manhole and put in vault)Piping off well good condition but some paint peeling off top of check valveWell head - good condition but some rust on flange - starting to corrodeErosion around raw water flow meter vaultBoth HSPs have a a lot of corrosion on pump around flangeHSP No 1 - some paint peeling off discharge 90 degree bend(Per JWSC staff - 2009 - pumps have been replaced and piping painted)(Per JWSC staff 2009 pumps have been replaced and piping painted)Per JWSC staff - 2009 - emergency battery backup lighting will be installed by end September 2009
Overall Condition: Good
Additional Information: Badger meter screen located on wall in WPF buildingAnnual inspections done of the facility - contractor come in to inspect and paint
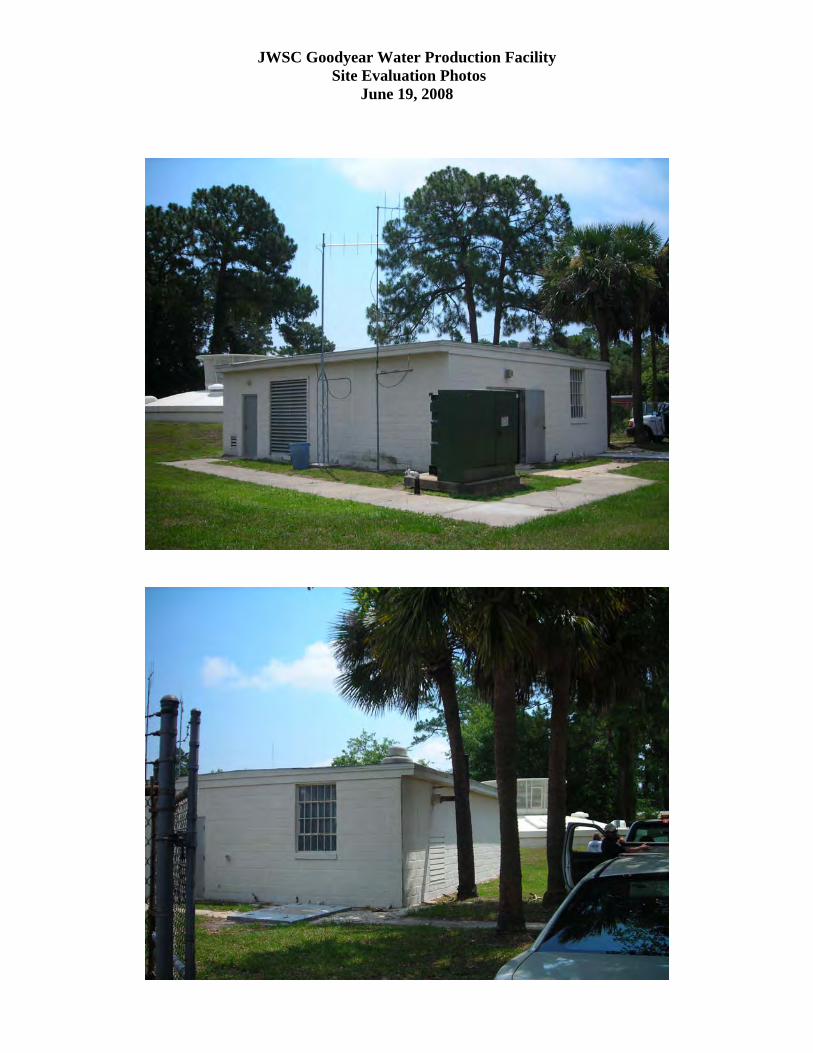
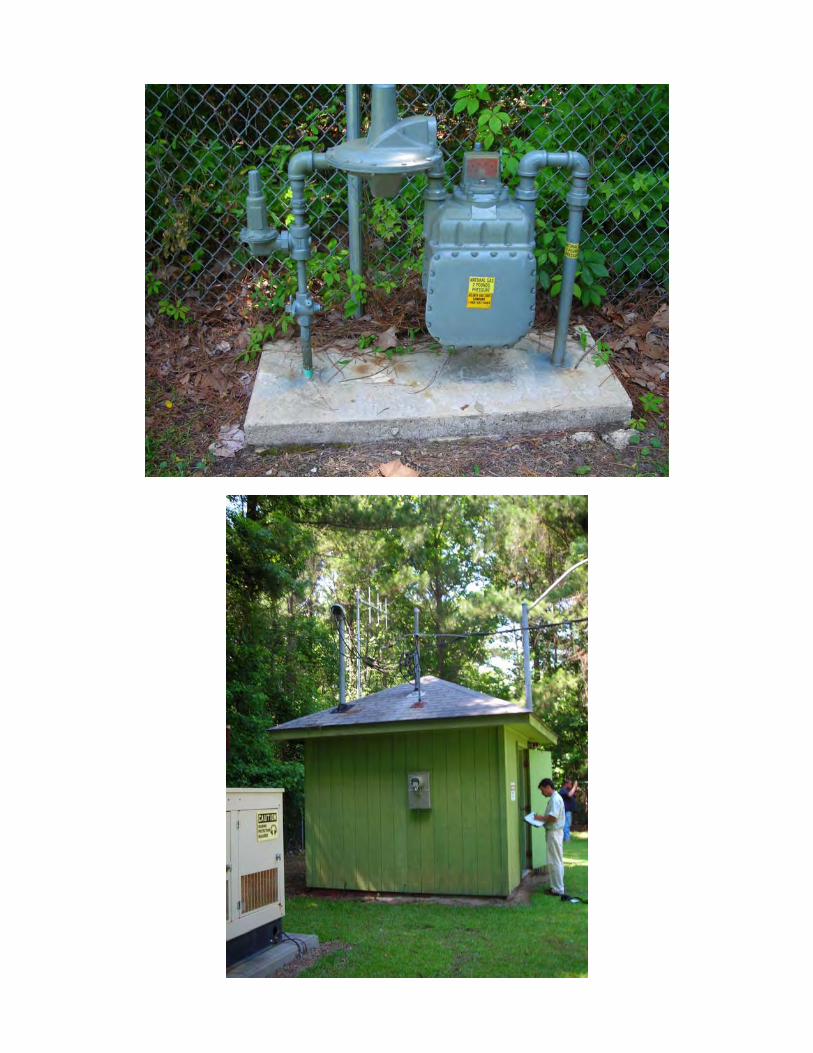
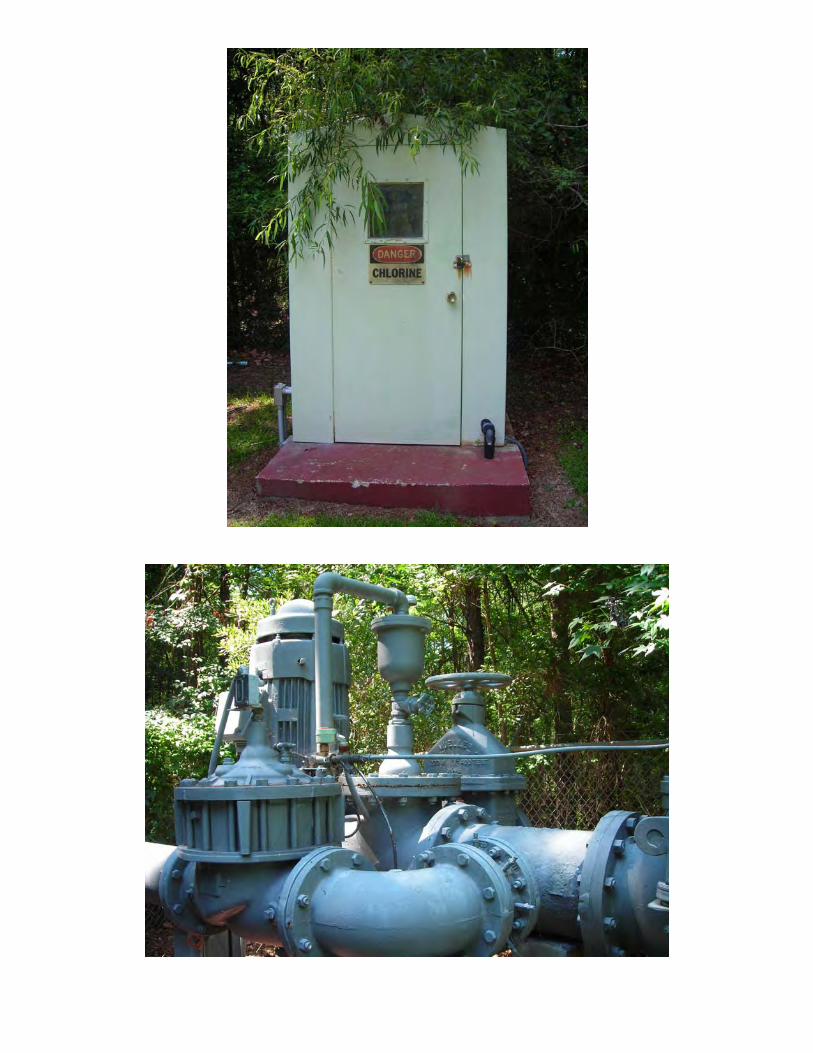
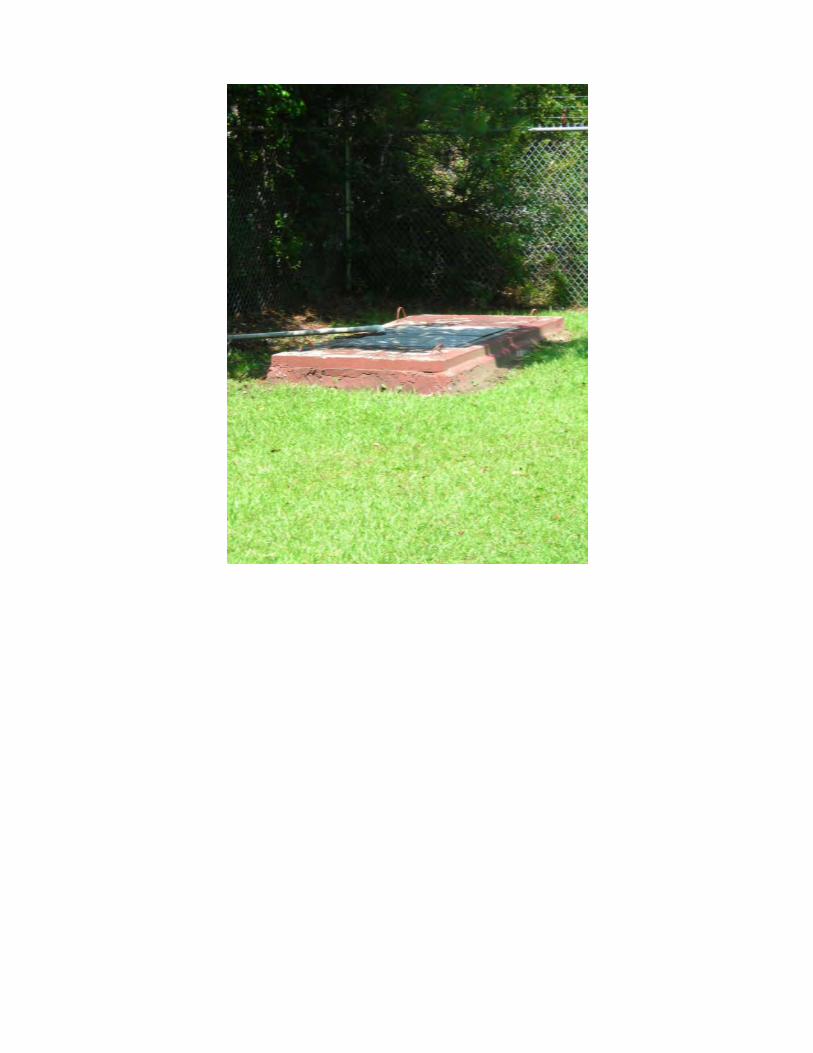
JWSC Goodyear Water Production Facility Site Evaluation Photos
June 19, 2008


JWSC WATER SYSTEM COMPONENTS EVALUATION6/19/2008
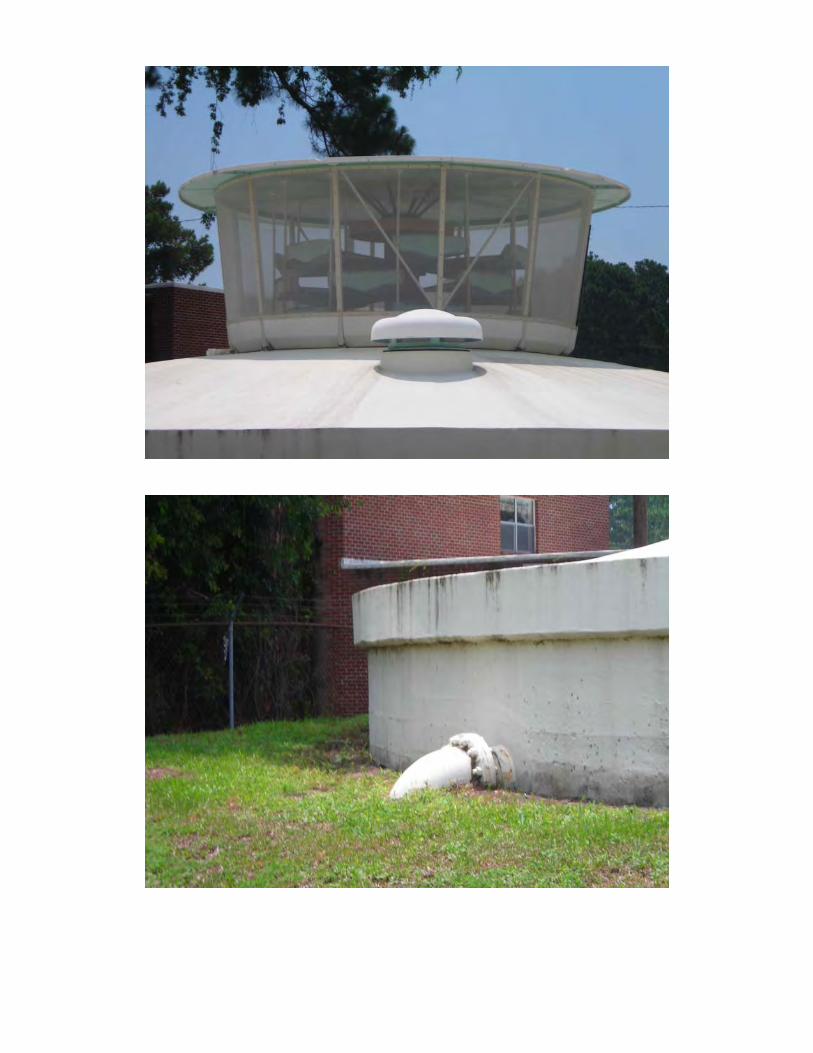
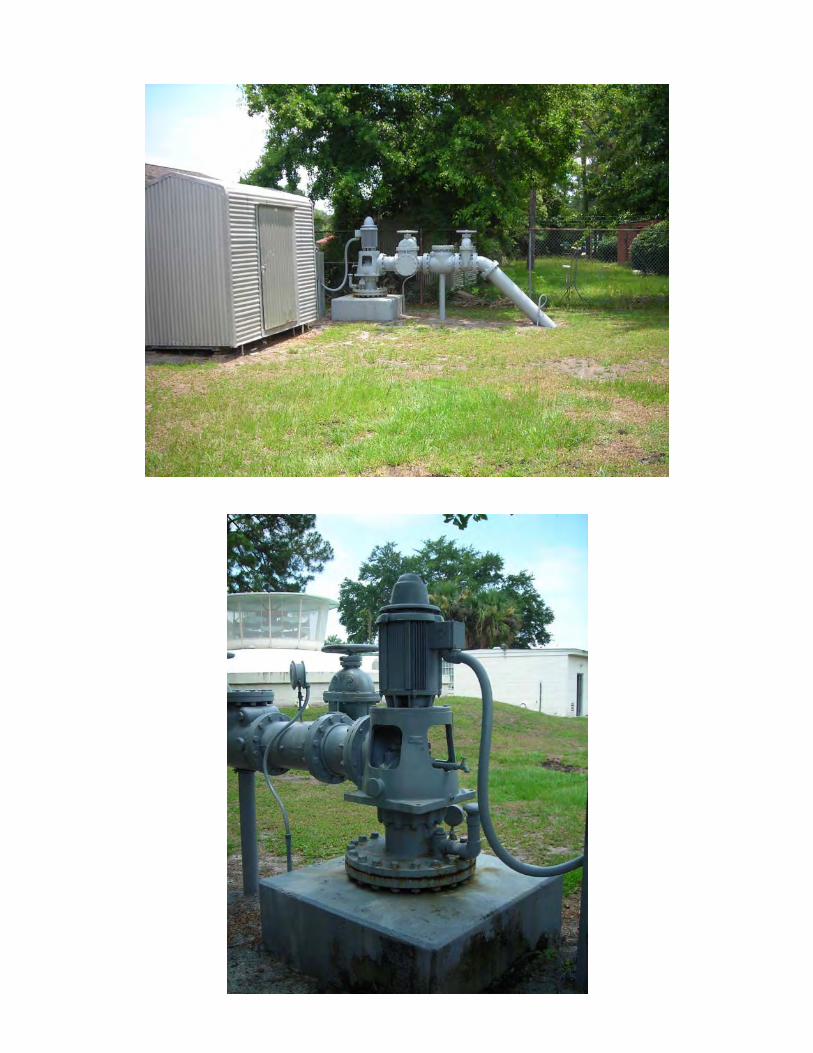
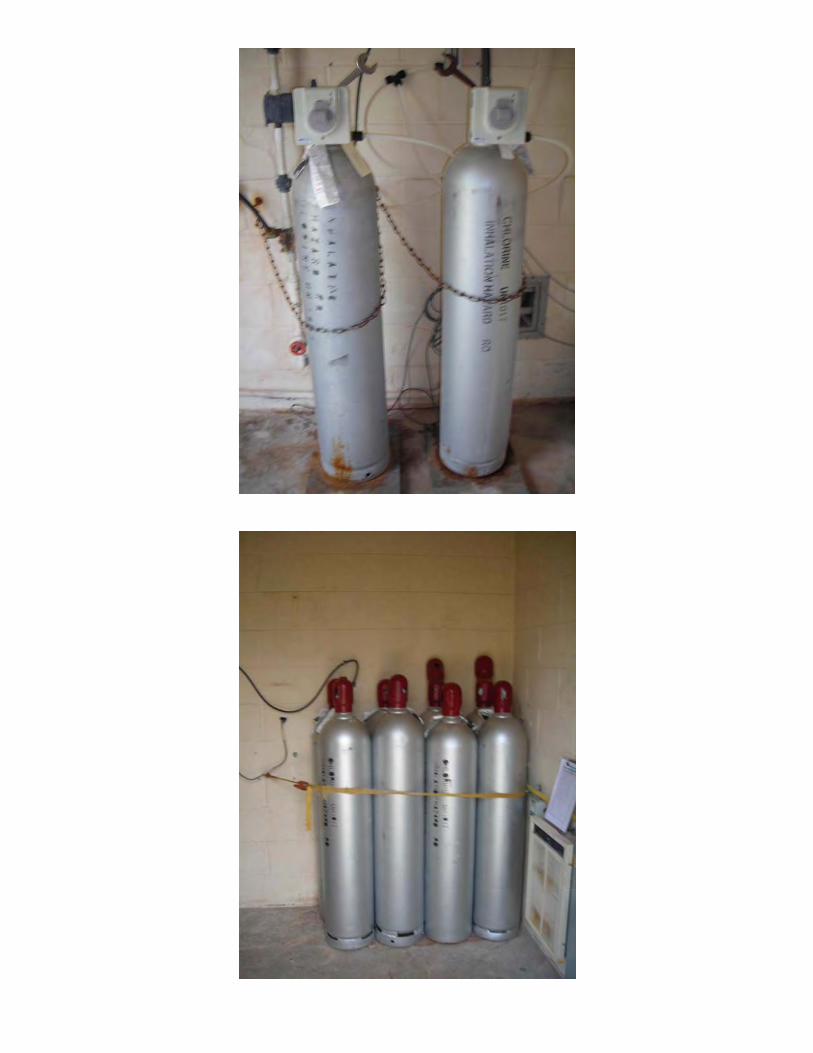
Facility Name: WS-04 Brunswick Villas WPFFacility Permit No: Georgia EPD 063-0011
Permitted eight wells with 9.000 MGD monthly average/8.440 MGD annual average capacityFloridan Aquifer Withdrawals
Components of Facility
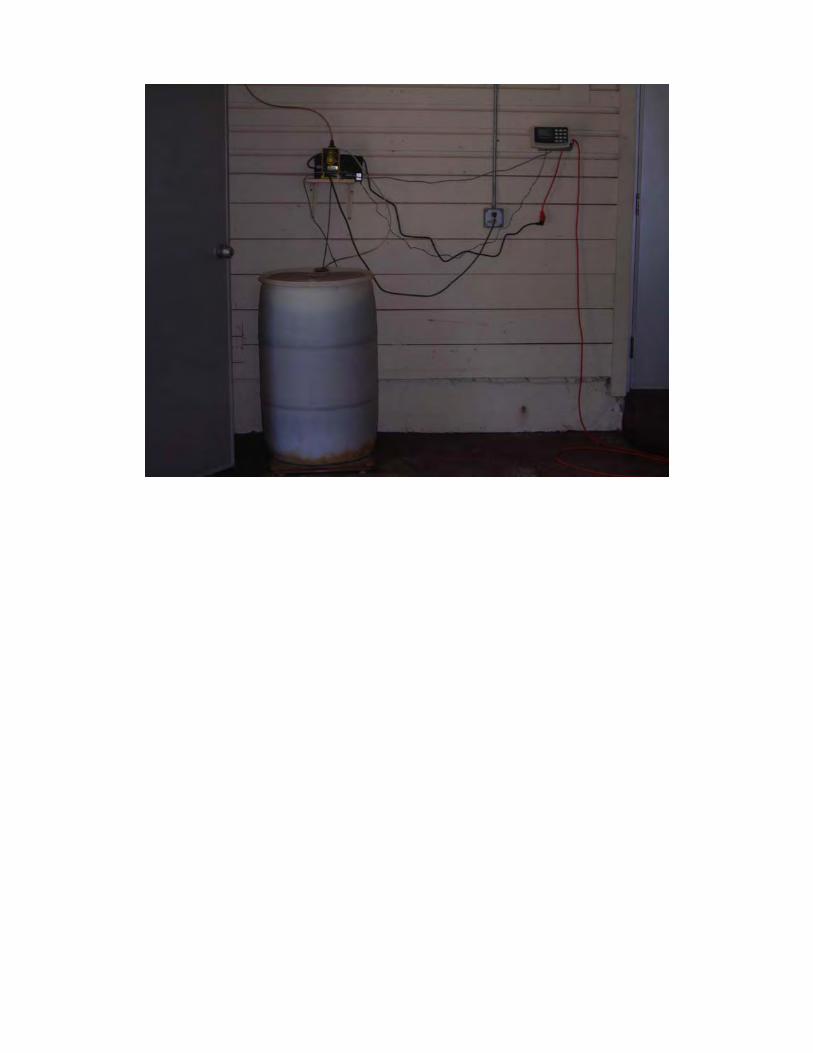
Wells(Y/N): Yes No. of Wells: 1 well in remote location across streetYear of Well(s): UnknownDepth of Well(s) UnknownSize of Well(s)/Casing: UnknownDischarge Piping Size/Mtl: 10" DIPBrackish Water Issues: No - per JWSC staff this is best producing well in system for quality and quantityWell Pump/Motor: No.1 Remote Well No. 2
Horsepower: 75 HpVoltage: 460 VPhase: 3 PhaseRPM: UnknownMfct/Model No: Peerless Pump (2008)Imp. No.Motor Mfct/Model: General Electric Model 5K6267XC1A (old motor)Serial Nos.Design Operating Condition 2550 gpm Condition of Discharge Piping: 10" DIP from well to ground storage tank
Condition of Well Heads: Poor - flange at well corroded; casing/pipe above flange badly corrodedwell located in brick building - painted; fair condition
Condition of Piping: Good condition - paintedControl Method of Wells: GST levels 4.5 on; 6.5 off SCADA: Yes
Ground Storage (Y/N): Yes - 2 Hydro Tank(Y/N): NoTank 1 Raw water well piping discharges to cascade aeratorMaterial: Concrete - rectangular; approximately 5 ft high above groundLength/Width of Tank: UnknownHeight of Tank: UnknownVolume of Tank: 120,000 gallons (approx)Aerator Condition: Cascade aerator trays in good condition - screened in
Tank in good condition; no cracks; concrete is paintedDrain and vent on backside of tank in good condition
Tank 2 "Pool" at end of pump building; fed by gravity flow through piping from Tank 1Material: Concrete/Block - paintedLength/Width of Tank: UnknownHeight of Tank: Water is approximately 6 ft deepVolume of Tank: 31,000 gallons (approx)Aerator Condition: No aerator on Tank 2
Tank in good condition; well maintainedRecently cleaned and painted; new metal roof on tank"Pool" area has locked door inside pump building
High Service Dist. Pumps (Y/N): Yes No. of Pumps: 2No.1 No. 2
Horsepower: 75 Hp 75 HpVoltage: 230/460 V 230/460 VPhase: 3 Phase 3 PhaseRPM: 1780 RPM 1780 RPMMfct/Model No: Peerless Pump Peerless Pump 6AE14Serial Nos. 708187AMotor Mfct/Model: General Electric Motor General Electric MotorSerial Nos. 5K365AL215D 5K365AL215DDesign Operating Condition Unknown Unknown

Condition of Discharge Piping:8" DIP suction and discharge piping for each pumpFair - Piping in building is painted; some peeling paint; small amount of corrosion at flange boltsOne pump can pull suction from either the outside ground storage or the pool; lines areinterconnnected and have valvesOther pump pulls suction only from the pool; some corrosion on suction piping and on pump flangesAll suction and discharge pipes are 8" DIPCheck valve appears to be new
Control Method of Pumps: 1st and Brailsford EST levels SCADA: Yes; Pump 1 lead; Pump 2 lag
Chlorination Facilities (Y/N): Yes Discharge in to ground storage tankMfct: US FilterSize Gas CL Cylinders 150 lb dual cylinders; 8 spare cylindersNo. of Cylinders 2Enclosure: Separate room in block building; single aluminum doorVentilation: Vent/louver at bottom of exterior wall and exhaust fan on other exterior wall
US Filter gas detector in main building
Fluoride Feed (Y/N): Yes Flouride tank located in corner of WPF building; metering pump on shelf above
Additional Chemical Feed: PO4 Phosphates fed into discharge line at remote well - bulk storage, day tank, and metering pump in brick building
Flow Monitoring (Y/N): Yes Raw water flow meter in concrete manhole with hatch - some standing waterthere is a sump pump in the manhole; appears to be RamNek coming down on pipingRaw water flow meter in good conditionFinished water flow meter in brick rectangular vault; lot of mud but in good conditionFinished water flow meter in good conditionBoth flow meters are located near the WPF block building
Generator (Y/N): No
Site Fenced/Secured: WPF site fenced; all buildings are locked
Building Condition:Building Condition: Remote Well Building - painted brick building, lighting in building, fan not on/workingRemote Well Building painted brick building, lighting in building, fan not on/workingdoor is in very bad condition - locked but no knob; badly corroded; needs to be replaced
Rehabilitated: Partial CompleteDate: X
New well pump in 2008; cleaned and painted pool; new metal roof on buildingDeficiencies:
Raw water flow monitor in vault - some standing water - has sump pump but not beveled so can never pump all water downSome corrosion on suction piping of pump (HSP No 1) pulling from "pool" and a little corrosion on pump flanges
(Per JWSC staff - 2009 - has been painted and taken care of)Remote well across street - flange at well corroded/casing/pipe above flange corroded badlyFan not working in remote well building - necessary to keep motor coolDoor on remote well building in very bad condition - corroded and no knob
(Per JWSC staff - 2009 - door has been replaced)Per JWSC staff - 2009 - aerator has wooden frame holding screen which is deteriorating
Overall Condition: WPF - Good; Remote Well Site - Fair
Additional Information: Per JWSC staff the remote well is the best producing well in system for quality and quantityBadge flow meter screens mounted on wall near doorChart meters do not work
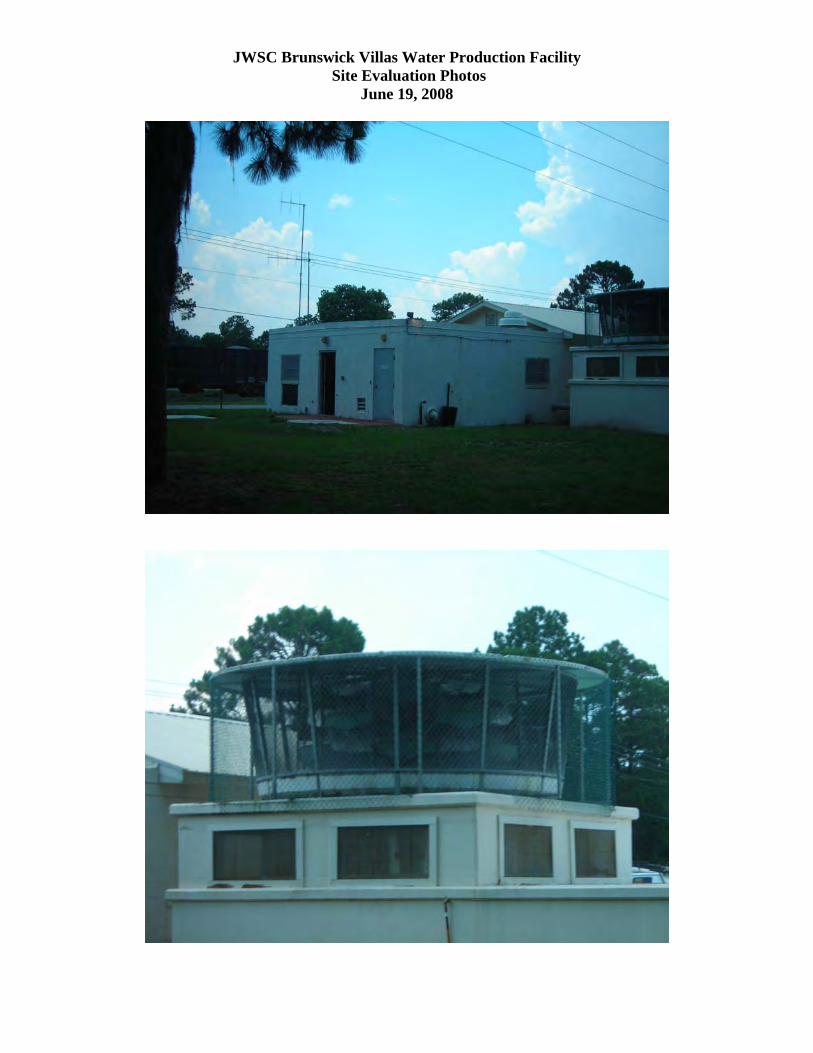
JWSC Brunswick Villas Water Production Facility Site Evaluation Photos
June 19, 2008


Remote Well Site


JWSC WATER SYSTEM COMPONENTS EVALUATION6/20/2008
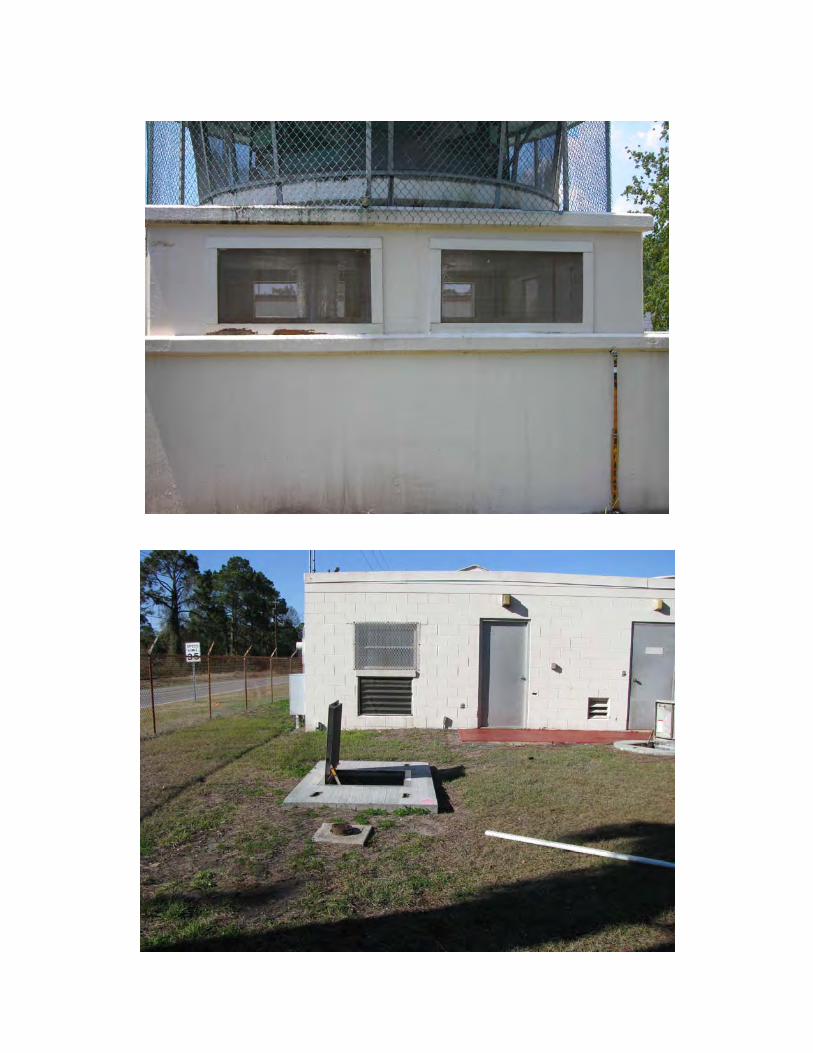
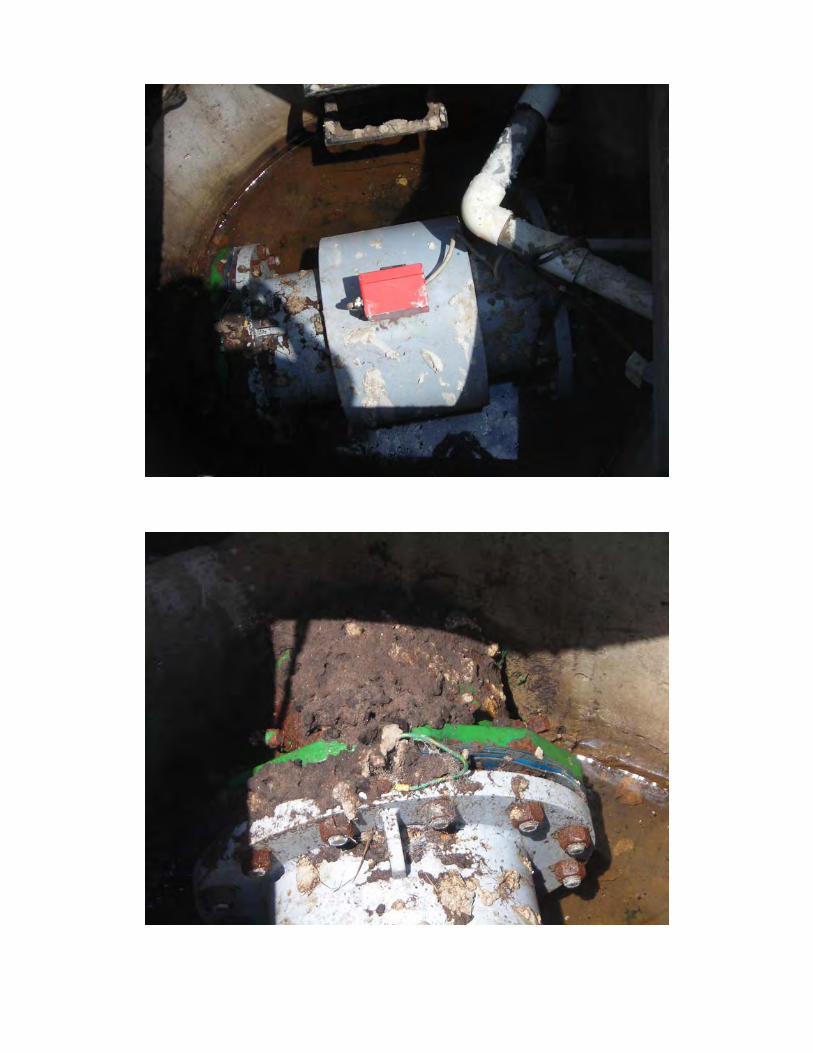
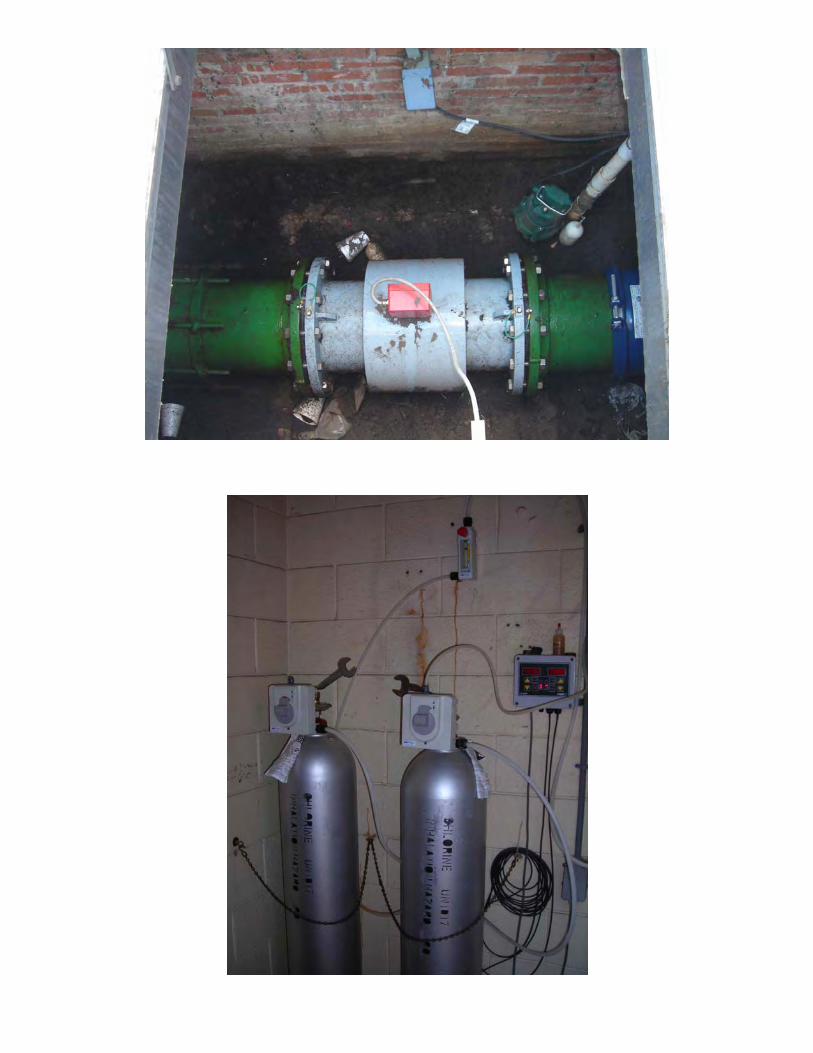
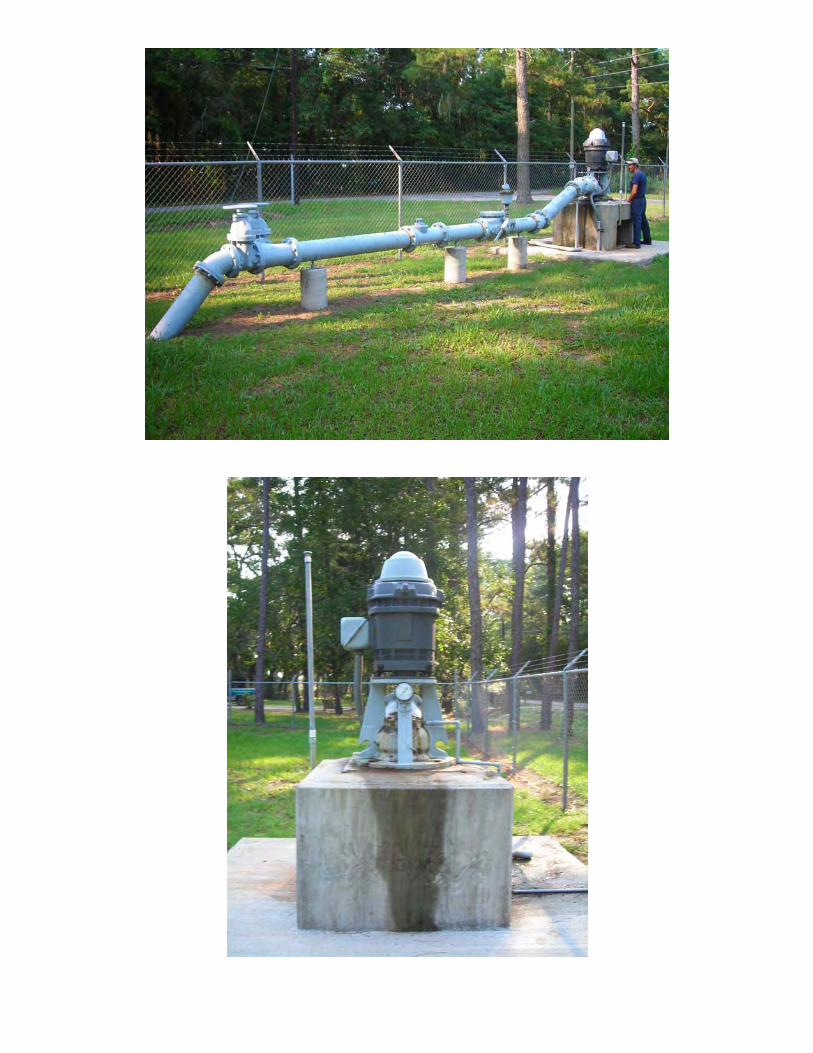
Facility Name: WS08 - FLETC Well/WPFFacility Permit No: Georgia EPD 063-0011
Permitted eight wells with 9.000 MGD monthly average/8.440 MGD annual average capacityFloridan Aquifer Withdrawals
Components of Facility
Wells(Y/N): Yes No. of Wells: 2 - 1 well is remote locationYear of Well(s): UnknownDepth of Well(s) UnknownSize of Well(s)/Casing: UnknownDischarge Piping Size/Mtl: 8" DIP - both wellsBrackish Water Issues:Well Pump/Motor: No.1 At WPF No. 2 Remote
Horsepower: 50 Hp 50 HpVoltage: 230/460 V 220/380/440 VPhase: 3 Phase 3 PhaseRPM: 1760 RPMMfct/Model No: Layne Peerless 10HXB6 Type OLSImp. No. Serial No. TA2307Motor Mfct/Model: US Electric Motors Catalog M050S2RCSerial Nos. Model No. S311ADesign Operating Condition 1000 gpm @ 151' TDHCondition of Discharge Pipine: 8" discharge piping off well 8" discharge piping off well - peeling but is
some corrosion on piping paint underneathARV dripping water at flange
Control Method of Wells: GST levels Well No. 1 - 7.3 on; 9.9 off; Well No. 2 - 6.8 on; 9.0 off SCADA: YesChlorination at Well Site(Y/N): Yes at WPF No - well pumps to FLETC WPFFluoride Feed (Y/N): Yes at WPF No - well pumps to FLETC WPFCondition of Well Heads: No. 1 - Good - concrete wellhead good condition No. 2 - Good - concrete wellhead has some cracks;
lot of corrosion at sitelot of corrosion at site paint all peeling off; no corrosion on pumppaint all peeling off; no corrosion on pumpCondition of Piping: No. 1 piping - Fair No. 2 piping - Fair
Ground Storage (Y/N): Yes Hydro Tank(Y/N): NoMaterial: Concrete - most of tank is buriedDia of Tank: UnknownHeight of Tank: UnknownVolume of Tank: 300,000 gallons (approx)Aerator Condition: Tray cascade aerator
Fenced in - fair condition; no corrosion; no odor; a little greenSome corrosion on feed pipe in to aerator
High Service Dist. Pumps (Y/N): Yes No. of Pumps: 3No.1 No. 2 No. 3
Horsepower: 50 HpVoltage:Phase: 3 PhaseRPM: 1775 RPMMfct/Model No:Serial Nos.Motor Mfct/Model: GE MotorSerial Nos.Design Operating ConditionCondition of Discharge Pipine: 6" DIP suction piping; 8" DIP discharge off pumps; tie in to 10" and 16" DIP manifold
Control Method of Pumps: FLETC EST Levels SCADA: Yes - Pump 2 and 3; Pump 1 local HOA
Chlorination Facilities (Y/N): YesMfct:Size Gas CL Cylinders 150 lb dual cylinders; 2 spare cylindersNo. of Cylinders 2Enclosure: Located in isolated part of building with separate door and louvers at bottom

Ventilation: Fan located in chlorine room - working
Fluoride Feed (Y/N): Yes Fluoride tank located in generator roomsmall booster pump feeds up to ground storage tank
Additional Chemical Feed: Also feed PO4 Phosphates in to the systemfed in to well discharge and chemical day tank housed in aluminum building at WPFBulk storage of PO4 in generator room
Flow Monitoring (Y/N): Yes Finished water flow meter located outside building; outside fence in vaultRaw water monitor in vault by ground storage tank - vault looks new; good condition
Generator (Y/N): Yes - Genset generator located in building at WPF
Site Fenced/Secured: WPF - Yes but fence is flimsy and corroded - however site is very secure inside FLETCRemote site - no fence but well located in block building
Rehabilitated: Partial CompleteDate: N/A
Deficiencies: WPF: No. 1 well has some corrosion on pipe - (Per JWSC staff - 2009 - has been painted)ARV dripping water at flange - Per JWSC staff - 2009 - have worked on but still drip a little - commonWell head No. 1 - concrete good condition but lot of corrosion at siteSome corrosion on feed pipe in to aeratorTray cascade aerator - fair condition - no corrosion but a little greenFencing is flimsy and corroded - but very secure site so not critical
(Per JWSC staff - 2009 - fencing replaced by FLETC)Per JWSC staff - 2009 - aerator is starting to separate from the floor - need to replace
Remote: No. 2 well - lot of debris - parts and busted concrete at site - per JWSC staff - 2009 - has been removedWell head has some cracks in concrete - paint all peeling off but no corrosionDischarge piping is peeling but is paint underneathBlock building in good condition
Overall Condition:Overall Condition: WPF - GoodWPF GoodRemote Well Facility - Fair to Good
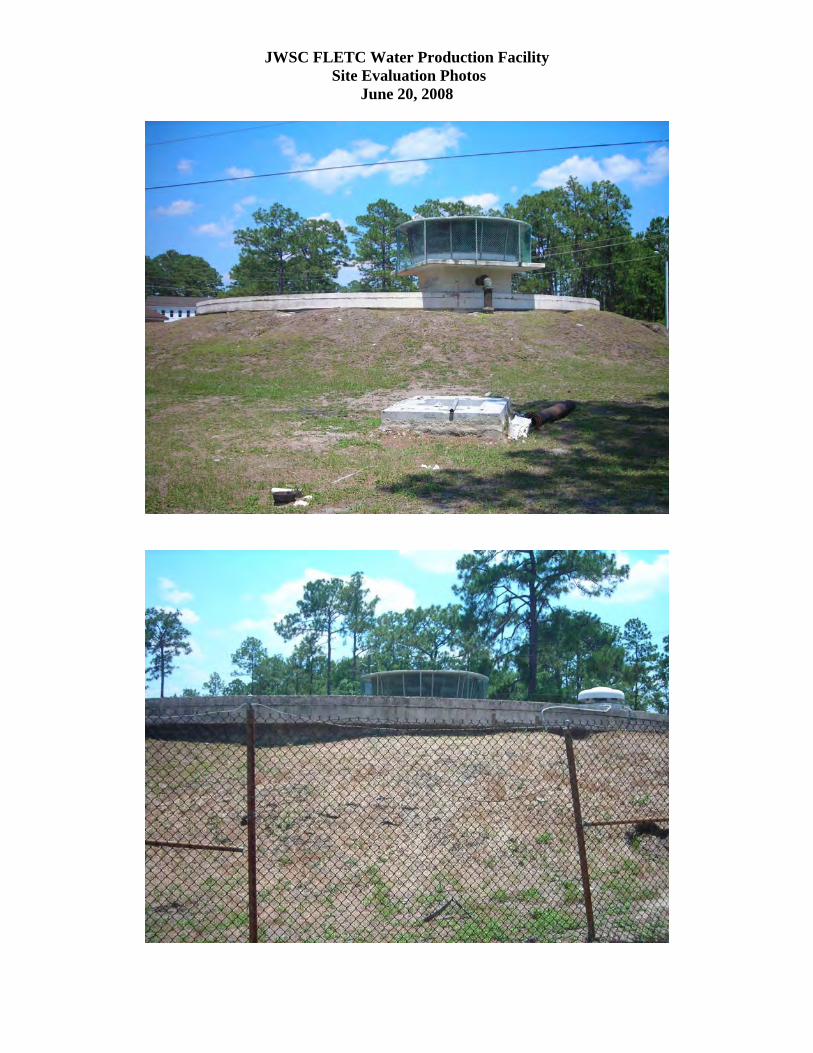
JWSC FLETC Water Production Facility Site Evaluation Photos
June 20, 2008


Remote Well Site

1
JWSC WATER SYSTEM COMPONENTS EVALUATION6/17/2008
Facility Name: WS09 - I-95 Water Production FacilityFacility Location I-95/US 34Facility Permit No: Georgia EPD 063-0011
Permitted eight wells with 9.000 MGD monthly average/8.440 MGD annual average capacityFloridan Aquifer Withdrawals
Components of Facility
Wells(Y/N): Yes No. of Wells: 2Year of Well(s):Depth of Well(s)Size of Well(s)/Casing:Discharge Piping Size/Mtl: 8" DIPBrackish Water Issues:Well Pump o No M tor: .1 - located by fence corner No. 2
Horsepower: 40 Hp 50 HpVoltage: 230/460 V 230/460 VPhase: 3 Phase 3 PhaseRPM:Mfct/Model No: US Electric Motors R-6229-04-791 Emerson Motor H050V2BLSSerial Nos.Design Operating Condition Wells approximately 1400 gpm and 1800 gpm
Control Method of Wells: GST levels Well No. 1 - 9.5 on; 11.8 off; Well No. 2 - 7.0 on; 7.5 off SCADA: YesChlorination at Well Site(Y/N): YesCondition of Well Heads: No 2 Well has some corrosion; well head in good conditionFluoride Feed (Y/N): YesCondition of Piping: No 1 Well piping has some paint peeling off - some corrosion - not bad condition
Ground Storage (Y/N): Yes Hydro Tank(Y/N): NoMaterial:Material: Concrete tank with aerator - good conditionConcrete tank with aerator good conditionDia of Tank: UnknownHeight of Tank: UnknownVolume of Tank: 250,000 gallonsCondition: Fair to Good - no apparent cracksAerator Condition: good condition - some growth
High Service Dist. Pumps (Y/N): Yes No. of Pumps: 3No.1 No. 2 No. 3
Horsepower: 75 Hp 75 Hp 75 HpVoltage: 230/460 V 230/460 V 230/460 VPhase: 3 Phase 3 Phase 3 PhaseRPM: 1780 RPM 1780 RPMMfct/Model No: Peerless Pump Peerless Pump Peerless PumpImp. No. 2693102568 F6Motor Mfct/Model: US Electric Motors US Electric Motors US Electric MotorsSerial Nos. F220-50-Y1IY268 R074M F220-50-Y1IY268 R074H360A/Z09Z193055 OR-1Design Operating ConditionCondition of Discharge Pipine: 8" DI suction piping; 6" DI discharge piping - manifolds to 8" and 10" discharge manifold
suction piping outside building has some paint peeling and some corrosiondischarge piping outside building painted and in good condition
Control Method of Pumps: I-95 EST Levels SCADA: Yes; Pump 3 lead; Pump 2 lag; Pump 1 - local?Mercoid controls on pumps; microswitch on backflow valve
Chlorination Facilities: chlorinators in good conditionMfct:Size Gas CL Cylinders 150 lb dual cylinders; 8 spare cylindersNo. of Cylinders 2Enclosure: chlorination equipment located in separate room in buildingVentilation:Set Point:

Wallace & Tiernen gas detector located on wall in generator room for Chlorine PPMFor month of June 2008 daily Chlorine use range 27 - 35 PPD; residual 0.95 - 1.23 mg/L
Fluoride Feed (Y/N): Yes - hydrofluorosilic acidchlorine and fluoride feed into main line in flow monitor vault by ground storage tank
Additional Chemical Feed: Also feed PO4 Phosphates in to the system
Flow Monitoring (Y/N): Yes - in line in vault; standing water in vault; has sump pumpNew raw and finished water flow meters
Generator (Y/N): Yes - located in separate room in buildingMagnamax 3 Phase; 60 Hz; 250 KW, 432RSL4017B
Site Fenced/Secured: Yes
Rehabilitated: Partial CompleteDate: XMotor - Pump No. 3 repaired 12-07 for vibration and bearing problemsNew raw and finished water meters installed 12-07; on SCADA
Deficiencies:Need more light in pump room - need to move lightStanding water in flow monitor vault - has sump pump - not beveled bottom so will never pump all downNo. 1 well some paint peeling off piping; some corrosion; not bad conditionNo. 2 well head has some minor corrosion but overall in good condition
(Per JWSC staff -2009 - piping has been painted)Electrical evaluation noted WPF power distribution equipment nearing end of lift cycle
(Per JWSC staff - 2009 - continually replace parts in equipment - extends life)(Per JWSC staff - 2009 - No. 1 pump has new VFD)
Overall Condition: Good - equipment and building in good condition
Additional Information:Pumps No. 2 and 3 were operating during site visitChlorination feeding during site visitChlorination feeding during site visitPressure relief valve in line - at Old Jesup Road and Glynndale Driveattempting to bring water from the south to the north
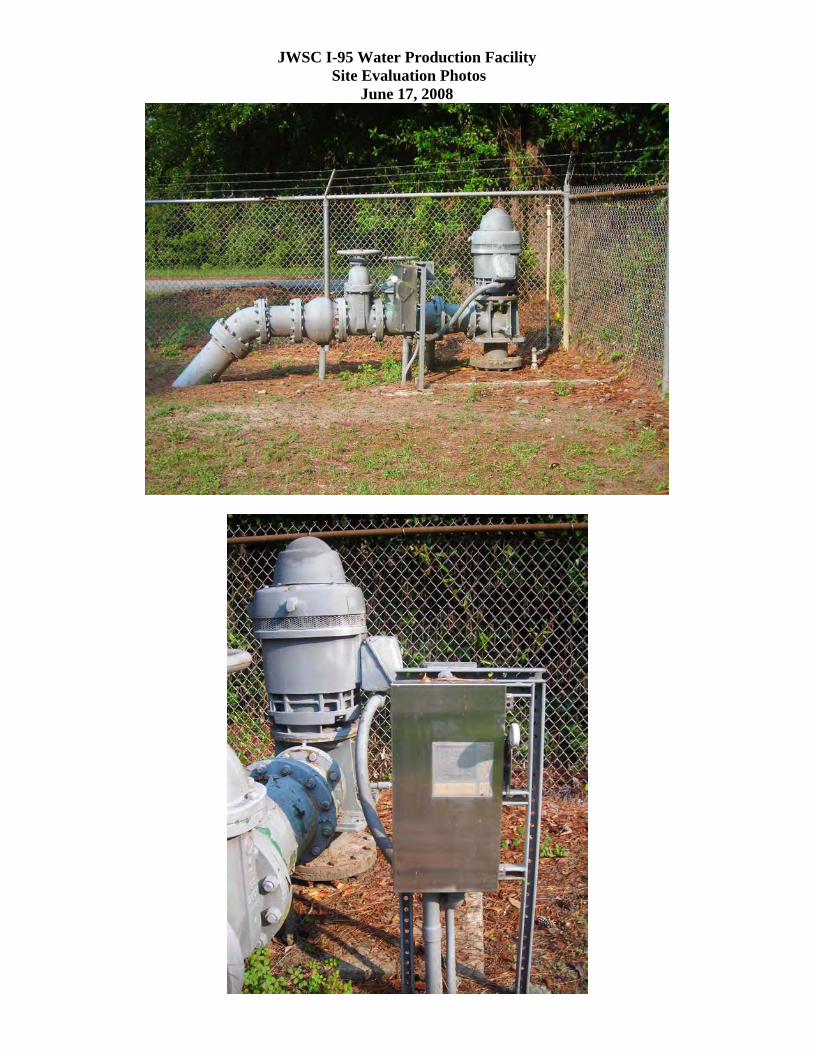
JWSC I-95 Water Production Facility Site Evaluation Photos
June 17, 2008


JWSC WATER SYSTEM COMPONENTS EVALUATION6/19/2008
Facility Name: WS-10 Howard Coffin ParkFacility Permit No: Georgia EPD 063-0011
Permitted eight wells with 9.000 MGD monthly average/8.440 MGD annual average capacityFloridan Aquifer Withdrawals
Components of Facility
Wells(Y/N): Yes No. of Wells: 1Year of Well(s): UnknownDepth of Well(s) UnknownSize of Well(s)/Casing: 12" casingDischarge Piping Size/Mtl: 12" DIPBrackish Water Issues:Well Pump/Motor: No.1
Horsepower: 30 HpVoltage:Phase:RPM:Mfct/Model No: Peerless Pump Imp. No.Motor Mfct/Model: US Electric MotorsSerial Nos.Design Operating Condition 1528 gpmCondition of Discharge Piping: 12" DIP in good condition
Condition of Well Heads: Good - concrete pad has some cracks; well flange good condition; some black residue/debris; smallamount corrosion
Condition of Piping: Good condition - check valve has a leak where shaft comes through at top of flangepipe support under check valve has no plate and pipe support is corroded at top
Control Method of Wells: GST levels 9.5 on; 12.0 off SCADA: Yes
Ground Storage (Y/N): Yes - 2 Hydro Tank(Y/N): NoMaterial: Concrete - Crom 1987; small lateral cracks all way around at mid-heightLength/Width of Tank: UnknownHeight of Tank: UnknownVolume of Tank: 500,000 gallonsAerator Condition: Cascade aerator trays in good condition - screened in
Tank in fair conditionPer gauge on side of tank 18' is full - was full at time of site visit
High Service Dist. Pumps (Y/N): Yes No. of Pumps: 3No.1 No. 2 No. 3
Horsepower: 50 Hp 50 Hp 100 HpVoltage: 460 V 230/460 VPhase: 3 Phase 3 PhaseRPM: 1760 RPM 1785 RPMMfct/Model No: Peerless Pump 5AE14N Peerless Pump H644ASerial Nos.Motor Mfct/Model: US Electric MotorsSerial Nos.Design Operating Condition 880 gpm 1500 gpm 1500 - 1600 gpmCondition of Discharge Piping: Pump No. 1 pump closest to door; corrosion on check valve; valve leaking;
pump ok conditionPump No. 2 new pump - recently changed out; new valves; piping in good conditionPump No. 3 corrosion on pump flanges and check valve spring
Have to have discharge valve mostly closed to stay on pump curve;pump will trip out if valve open all the way
Pumps 1 and 2 have 6" DIP suction and discharge pipingPump 3 has 8" DIP suction and 6" discharge 12" DIP manifold suction piping; 12" DIP manifold discharge piping12" discharge piping under grating - appears to be in good condition

Control Method of Pumps: Prince St. EST levels SCADA: Pumps 2 and 3 SCADA; Pump 1 HOA
Chlorination Facilities (Y/N): YesMfct: Siemens RegulatorsSize Gas CL Cylinders 150 lb dual cylinders; 8 spare cylindersNo. of Cylinders 2Enclosure: Separate room in buildingVentilation: Louver at bottom of wall; ventilation duct in chlorine room - not appear to be operatingSet Point:Booster Pump:
Fluoride Feed (Y/N): Yes Large tank on scale in building; metering pump
Additional Chemical Feed: PO4 Phosphates fed from bulk tank to smaller tank on other side of HSPs behind wall - has booster pump; day tank has metering pump
Flow Monitoring (Y/N): Yes Raw water flow meter in vault between well and building; pipe corroded; standing water in vault;vault and hatch in good condition; read by SCADAFinished water meter in vault on back side of building near fence;finished water main crosses ditch to trackfinished water meter vault full of water up to bottom of meter pipethere is a sump pump in vault
Generator (Y/N): Yes Generator on site; diesel fuel tank outside building
Site Fenced/Secured: WPF site fenced; all buildings are locked; located at park
Building Condition:
Rehabilitated: Yes Partial CompleteDate: X
HSP No. 2 recently replacedDeficiencies:Deficiencies:
Finised water flow monitor in vault - vault full of water up to bottom of meter pipe -not beveled bottom can never all drainRaw water flow meter in vault - pipe corroded - standing water - has sump pump - no bevel can never pump all downWell head concrete cap has some cracks - some black residue and debris; very small amount of corrosion on paint/well
(Per JWSC staff - 2009 - regularly clean and remove residue)Check valve has leak where shaft passes through; at top flangePipe support under check valve has no plate and pipe support is corroded at topCrom tank 1987 - has samll lateral cracks all the way around the tank at mid-height - aesthetic not structuralHSP No 1 has corrosion on check valve - leakingHSP No 3 - corrosion on pump flanges and check valve spring
(Per JWSC staff - 2009 - check valves have O-rings and takes about 6 hours to take apart to fixtypically wait until is significant problem before take out of service)(Per JWSC staff - 2009 - piping has been painted)
Old motor sitting by HSP No 1 - need to remove - (Per JWSC staff - 2009 - has been removed)
Overall Condition: Fair to Good
Additional Information: Site lighting on buildingBadge flow meter screens mounted on wall near HSPsSCADA onsiteCircular chart recorders for Raw/Finished Water/Residual LevelMilltronics Multirange (12.08 reading)Noted on electrical evaluation that not have double wall diesel tank - Per JWSC staff is double wall

JWSC Howard Coffin Park Water Production Facility Site Evaluation Photos
June 19, 2008


A
JWSC WATER SYSTEM COMPONENTS EVALUATION6/16/2008
Facility Name: WS-SM102 Fancy Bluff Water Production FacilityFacility Permit No: Georgia EPD 063-0045
Permitted one well with 1.000 MGD monthly average/annual average capacityMiocene Aquifer Withdrawals
Components of Facility
Wells(Y/N): Yes No. of Wells: 1Year of Well(s): UnknownDepth of Well(s) 540 FTSize of Well(s)/Casing: 12-inch casingYield 1000 gpmDischarge Piping Size/Mtl: 8-inch Ductile IronBrackish Water Issues:Well Pump o M tor: No.1
Horsepower: 40 HpVoltage: 230/460 VPhase: 3 PhRPM: 1780Mfct/Model No: H040V2BLF S331 ModelSerial Nos.Design Operating Condition 1000 gpm
Control Method of Wells: GST levels or local system pressures - can bypass GST SCADA: YesChlorination at Well Site(Y/N): YesCondition of Well Heads: Concrete cap - very top is split - flange is badly corroded; some cracks and rustFluoride Feed (Y/N): NoCondition of Piping: Painted and in good condition
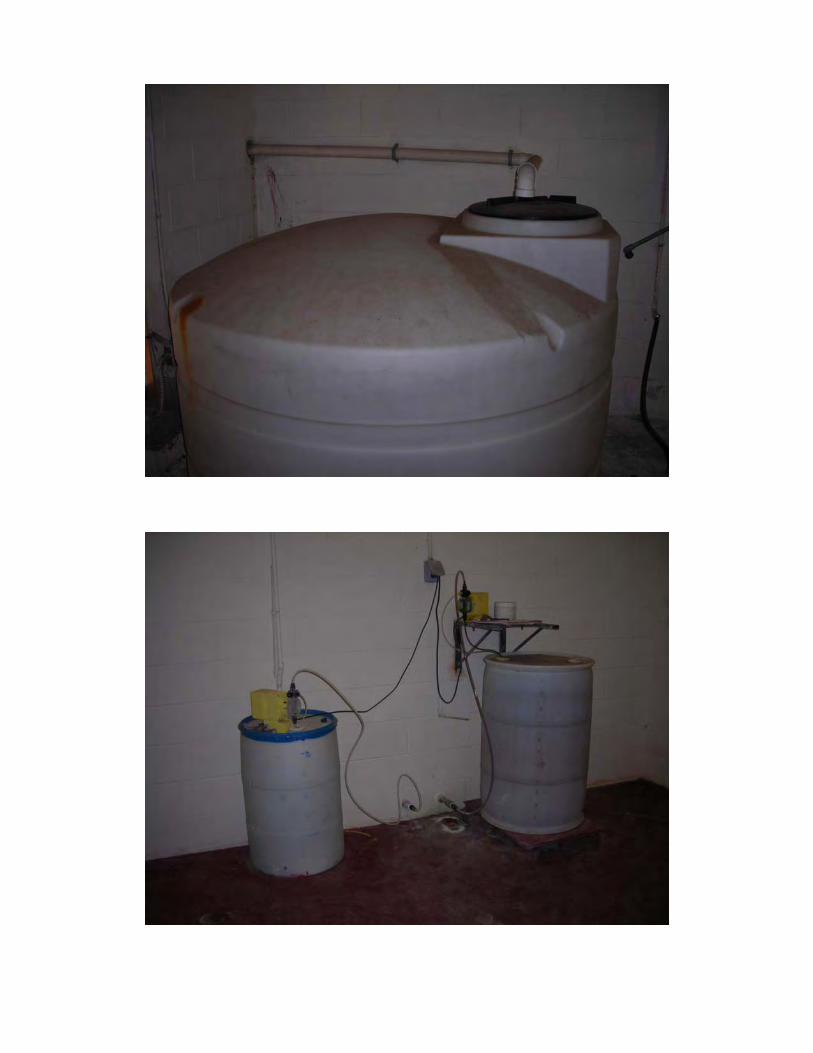
Ground Storage (Y/N): Yes Hydro Tank(Y/N): NoMaterial: Concrete Crom tank with aeratorDia of Tank:Dia of Tank: UnknownUnknownHeight of Tank: UnknownVolume of Tank: UnknownAerator Condition: good condition - some corrosion
High Service Dist. Pumps (Y/N): Yes No. of Pumps: 2No.1 No. 2
Horsepower: 75 Hp 75 HpVoltage: 230/460 V 230/460 VPhase: 3 Phase 3 PhaseRPM: 1735 1735Mfct/Model No: Peerless Pump Model 5 Peerless Pump Model 5AE14Imp. No.Motor Mfct/Model: D75V2B Model 638034 D75V2B Model 638034Serial Nos. 630573B 630573ADesign Operating ConditionCondition of Discharge Pipine: Painted in very good condition - 6" discharge piping; ARVs on top of pumps
butterfly valves before and after check valvesControl Method of Pumps: SCADA: Yes Pump No. 2 appears to run all the time at reduced speed;
Pump No. 1 is either on timer or uses local system pressures; Pumps operated with VFDs
Chlorination Facilities (Y/N): Yes - Dual Gas ChlorinationMfct: Jacuzzi 15H4259-S1 Svern Trent Capital Contols; Solo 1000 ScalesMfct: Series 800 Hydro Instruments; Econometrics Series 4000Size Gas CL Cylinders 150 lb dual ; 4 sparesNo. of Cylinders 2Enclosure: Stand alone fiberglass buildingVentilation: Chlorine fans at top of building - louvers not open all the waySet Point: 18 PPD Constant Rota Meter Setting; 1.5 - 2.0 residual
Has residual analyzer but not on at time of visitchlorination system operates when wells come on
Booster Pump: 5 Hp booster pump
Fluoride Feed (Y/N): No
Flow Monitoring (Y/N): Yes Finished water flow meter located in line in manhole outside of pump buildingflow meter located below grade in manhole - lot of standing waterRaw water flow meter located in line on well discharge piping
Generator (Y/N): No
Site Fenced/Secured: Yes - chain link fence
Rehabilitated: Partial CompleteDate: X - New facility approximately 2-3 years
Deficiencies: light broken on buildingwindow broken in chlorine roomflange at well pump is very corrodedConcrete well cap - very top is split
Overall Condition: Good - facility is new
Additional Information: Approximately 2 -3 years oldPump No. 2 operating at time of visitFacility has SCADAResidual analyzers were not on at time of visit - per staff it is done manuallyHigh service pumps and controls located in block building - very good condition

JWSC Fancy Bluff Water Production Facility Site Evaluation Photos
June 16, 2008


@
JWSC WATER SYSTEM COMPONENTS EVALUATION6/16/2008
Facility Name: Water Production Facility, Exit 29 (South Port)Facility Location: I-95 and US-17 Interchange - Exit 29Facility Permit No: Georgia EPD 063-0025
Permitted three wells with 1.300 MGD monthly average/annual average capacityFloridan Aquifer Withdrawals
Components of Facility
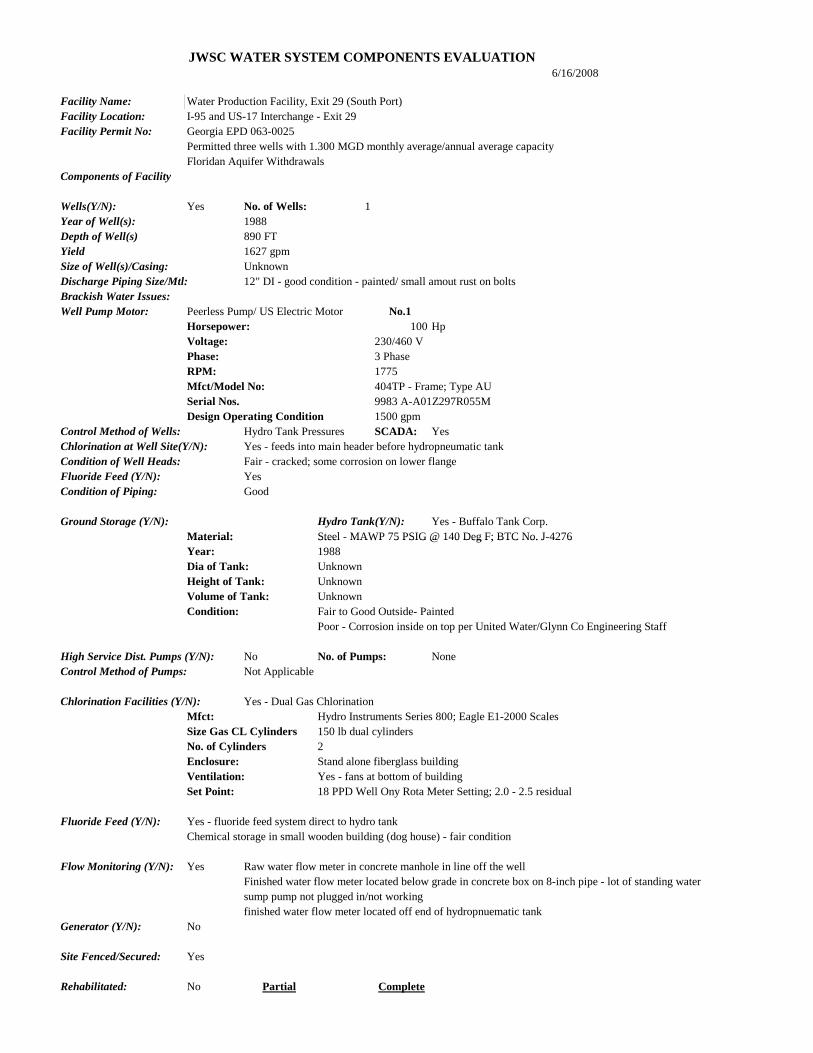
Wells(Y/N): Yes No. of Wells: 1Year of Well(s): 1988Depth of Well(s) 890 FTYield 1627 gpmSize of Well(s)/Casing: UnknownDischarge Piping Size/Mtl: 12" DI - good condition - painted/ small amout rust on boltsBrackish Water Issues:Well Pump Motor: Peerless Pump S lec o r/ U E tric M to No.1
Horsepower: 100 HpVoltage: 230/460 VPhase: 3 PhaseRPM: 1775Mfct/Model No: 404TP - Frame; Type AUSerial Nos. 9983 A-A01Z297R055MDesign Operating Condition 1500 gpm
Control Method of Wells: Hydro Tank Pressures SCADA: YesChlorination at Well Site(Y/N): Yes - feeds into main header before hydropneumatic tankCondition of Well Heads: Fair - cracked; some corrosion on lower flangeFluoride Feed (Y/N): YesCondition of Piping: Good
Ground Storage (Y/N): Hydro Tank(Y/N): Yes - Buffalo Tank Corp.Material:Material: Steel - MAWP 75 PSIG @ 140 Deg F; BTC No. J-4276Steel MAWP 75 PSIG 140 Deg F; BTC No. J 4276Year: 1988Dia of Tank: UnknownHeight of Tank: UnknownVolume of Tank: UnknownCondition: Fair to Good Outside- Painted
Poor - Corrosion inside on top per United Water/Glynn Co Engineering Staff
High Service Dist. Pumps (Y/N): No No. of Pumps: NoneControl Method of Pumps: Not Applicable
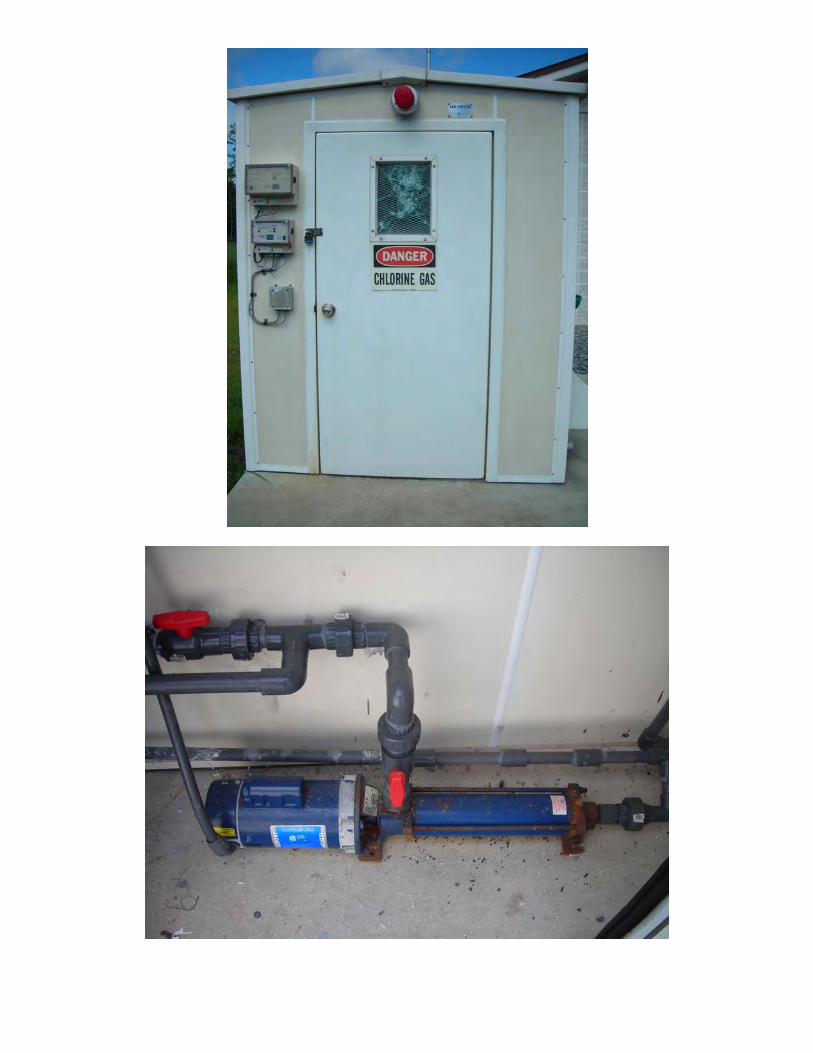
Chlorination Facilities (Y/N): Yes - Dual Gas ChlorinationMfct: Hydro Instruments Series 800; Eagle E1-2000 ScalesSize Gas CL Cylinders 150 lb dual cylindersNo. of Cylinders 2Enclosure: Stand alone fiberglass buildingVentilation: Yes - fans at bottom of buildingSet Point: 18 PPD Well Ony Rota Meter Setting; 2.0 - 2.5 residual
Fluoride Feed (Y/N): Yes - fluoride feed system direct to hydro tankChemical storage in small wooden building (dog house) - fair condition
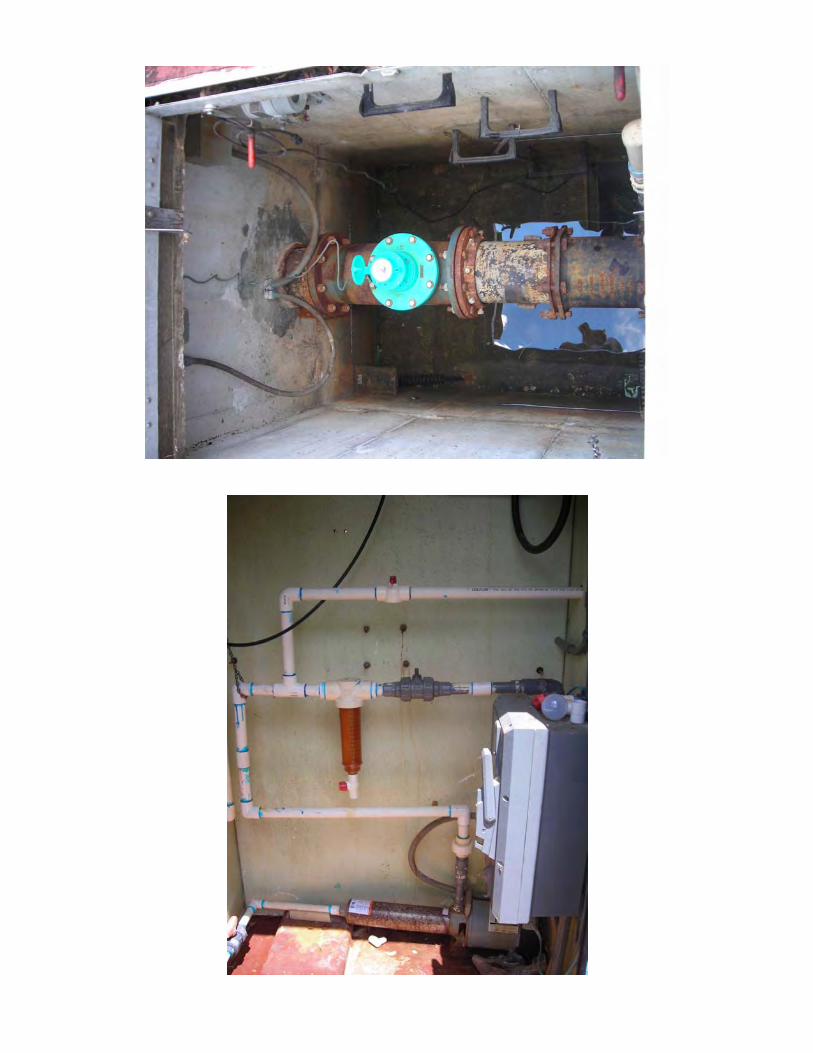
Flow Monitoring (Y/N): Yes Raw water flow meter in concrete manhole in line off the wellFinished water flow meter located below grade in concrete box on 8-inch pipe - lot of standing watersump pump not plugged in/not workingfinished water flow meter located off end of hydropnuematic tank
Generator (Y/N): No
Site Fenced/Secured: Yes
Rehabilitated: No Partial Complete

Date: N/ADeficiencies:
lot of standing water in flow monitor vault - has sump pump but not workingno bevel in bottom of vault - can never pump all water down
well head cracked and some corrosion on lower flangehydrotank in fair to good condition - is paintedChemical storage in small wooden building (dog house) - fair condition
Overall Condition: Fair
Additional Information: Facility has SCADA
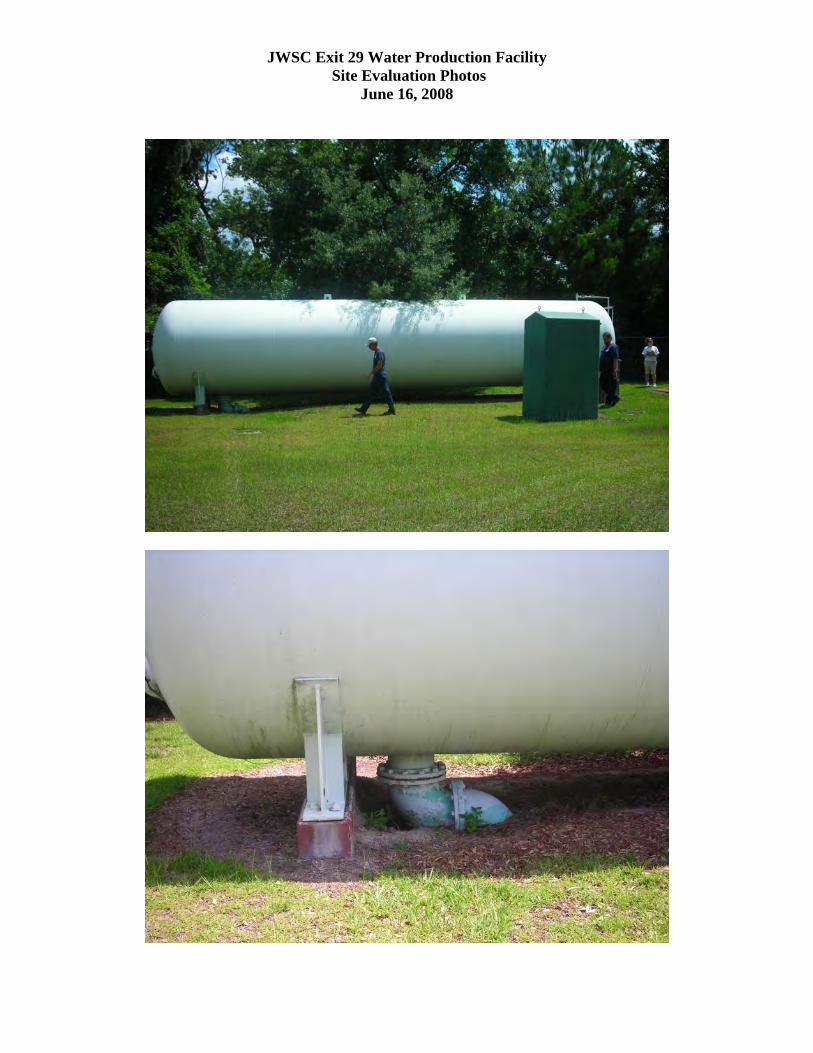
JWSC Exit 29 Water Production Facility Site Evaluation Photos
June 16, 2008


APPENDIX A – SEWER SYSTEM COMPONENT SITE VISIT FIELD FORMS AND PICTURES
Brunswick Glynn County JWSC Applied Technology & Management, Inc.
Water Sewer Master Plan
6/16/2008
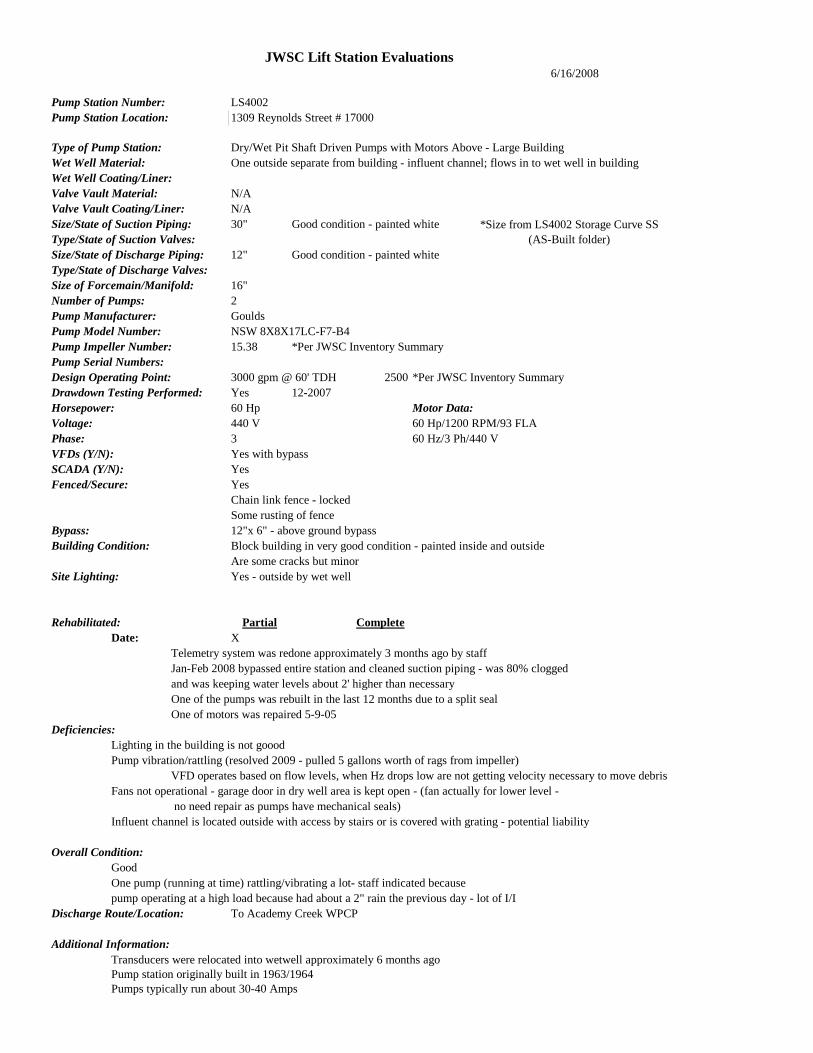
Pump Station Number: LS4002Pump Station Location:
Type of Pump Station: Dry/Wet Pit Shaft Driven Pumps with Motors Above - Large BuildingWet Well Material: One outside separate from building - influent channel; flows in to wet well in buildingWet Well Coating/Liner:Valve Vault Material: N/AValve Vault Coating/Liner: N/ASize/State of Suction Piping: 30" Good condition - painted whiteType/State of Suction Valves:Size/State of Discharge Piping: 12" Good condition - painted whiteType/State of Discharge Valves:Size of Forcemain/Manifold: 16"Number of Pumps: 2Pump Manufacturer: GouldsPump Model Number: NSW 8X8X17LC-F7-B4Pump Impeller Number: 15.38 *Per JWSC Inventory SummaryPump Serial Numbers:Design Operating Point: 3000 gpm @ 60' TDH 2500 *Per JWSC Inventory SummaryDrawdown Testing Performed: Yes 12-2007Horsepower: 60 Hp Motor Data:Voltage: 440 V 60 Hp/1200 RPM/93 FLAPhase: 3 60 Hz/3 Ph/440 VVFDs (Y/N): Yes with bypassSCADA (Y/N): YesFenced/Secure: Yes
Chain link fence - lockedSome rusting of fence
Bypass: 12"x 6" - above ground bypass
JWSC Lift Station Evaluations
1309 Reynolds Street # 17000
*Size from LS4002 Storage Curve SS (AS-Built folder)
Building Condition: Block building in very good condition - painted inside and outsideAre some cracks but minor
Site Lighting: Yes - outside by wet well
Rehabilitated: Partial CompleteDate: X
Telemetry system was redone approximately 3 months ago by staffJan-Feb 2008 bypassed entire station and cleaned suction piping - was 80% cloggedand was keeping water levels about 2' higher than necessaryOne of the pumps was rebuilt in the last 12 months due to a split sealOne of motors was repaired 5-9-05
Deficiencies:Lighting in the building is not gooodPump vibration/rattling (resolved 2009 - pulled 5 gallons worth of rags from impeller)
VFD operates based on flow levels, when Hz drops low are not getting velocity necessary to move debrisFans not operational - garage door in dry well area is kept open - (fan actually for lower level -
no need repair as pumps have mechanical seals)Influent channel is located outside with access by stairs or is covered with grating - potential liability
Overall Condition:GoodOne pump (running at time) rattling/vibrating a lot- staff indicated becausepump operating at a high load because had about a 2" rain the previous day - lot of I/I
Discharge Route/Location: To Academy Creek WPCP
Additional Information:Transducers were relocated into wetwell approximately 6 months agoPump station originally built in 1963/1964Pumps typically run about 30-40 Amps

Ray Tarker has blueprints for the stationWet well flow train comes in flat and then 45s down about 6'-7' drop under buildingPumps have a seal water systemFans on roof of station - not sure if workingWetwell outside of building has grating Per staff when Reynolds Street project is completed - LS2 and LS3 will come offlineMost likely 3-5 years before project will be completedElectrical evaluation noted could not verify 120V transformer condition as could not locate - per JWCS is on ceilingPer JWSC staff transformer has no overcurrent protectionPer JWSC staff in 2009 station upgraded, panels removed, now have 2 VFDs, generator disconnect, SCADA box
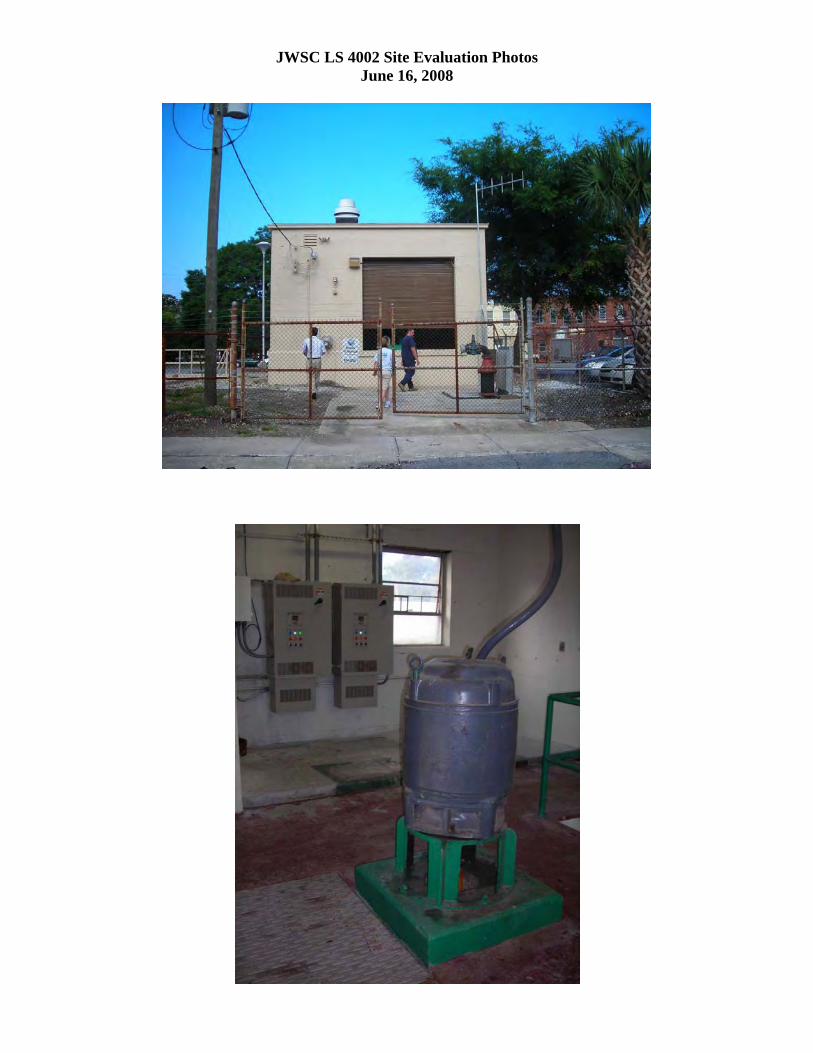
JWSC LS 4002 Site Evaluation Photos June 16, 2008


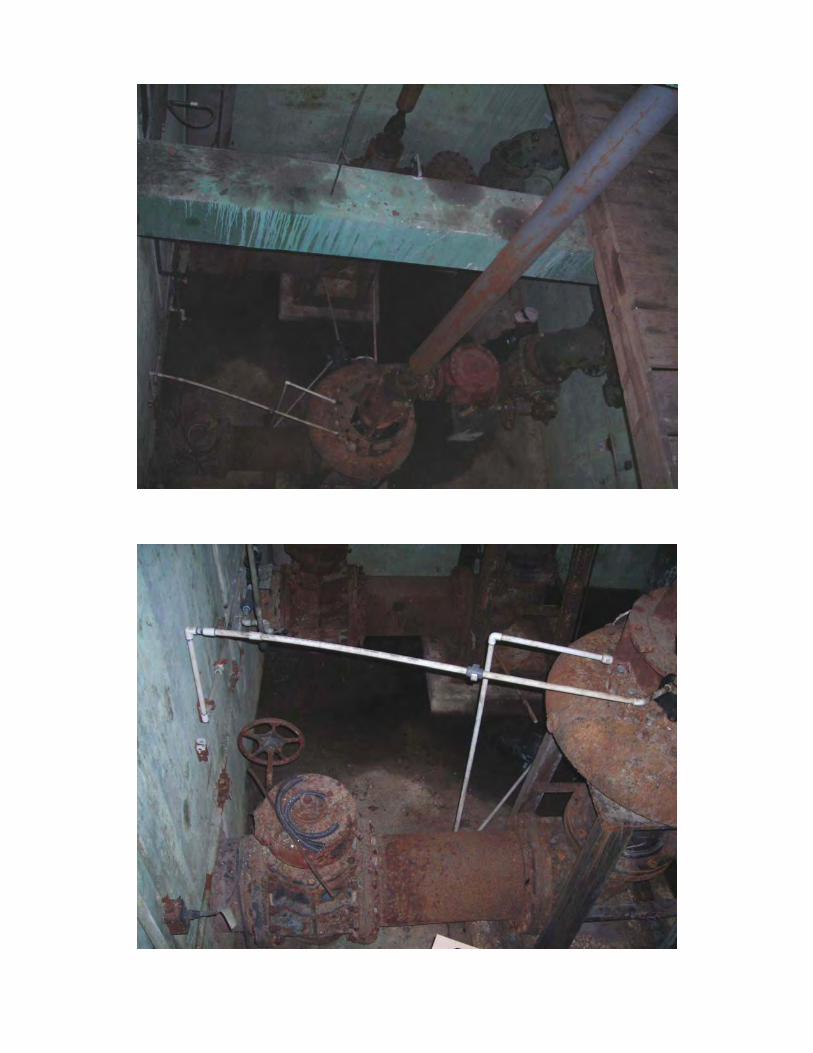
JWSC Lift Station Evaluations6/19/2008
Pump Station Number: LS4003Pump Station Location: 2020 Newcastle Street # 17000
Type of Pump Station: Dry/Wet Pit Shaft Driven Pumps with Motors Above - Large BuildingWet Well Material: One outside separate from building - influent channel; flows in to wet pit in buildingWet Well Coating/Liner:Valve Vault Material: N/AValve Vault Coating/Liner: N/ASize/State of Suction Piping: Badly corrodedType/State of Suction Valves:Size/State of Discharge Piping: 12" Horizontal piping near pumps badly corroded and paint peeling off
Type/State of Discharge Valves:Check valves appear relatively new - on 1 spring lever has O-ring leaking; other has no check valve handle
Size of Forcemain/Manifold: 16" 12"x10" off pumps; 12" discharge piping; 16" at manifoldNumber of Pumps: 2Pump Manufacturer: GouldsPump Model Number: NSW 10X10X21LC-NSWF7C4Pump Impeller Number: 16.62 *Per JWSC Inventory SummaryPump Serial Numbers:Design Operating Point:Drawdown Testing Performed: NoHorsepower: 75 Hp Motor Data:Voltage: 460V 197 FLA/97 FLA 75 HpPhase: 3 Phase 230 V/460 VVFDs (Y/N): Yes - Have 1 - Pumps AlternateSCADA (Y/N): YesFenced/Secure: Yes
Chain link fence - have had break-insGrating off influent channel/wetwell was stolen
Bypass:Building Condition: Fair
Doors deterioratedLighting upstairs is good; gap in grating upstairs- bolted but trip hazardAll handrails in good conditionNo ventilation in dry pit
Site Lighting: On the outside of the building
Rehabilita :ted Partial CompleteDate: X
Influent flow reworked - relatively new manhole outside fence; feeds directly in toinfluent channel area downstream of outside ww/channel where channel is in 45 dropkeeps flow down and now outside wetwell/influent channel primarily for storagePer JWSC staff this construction resulted in improperly laid inverts such that invert at channel/wetwell is higher
Deficiencies: Corrosion bad on suction piping, pump support, volute and top pumps (from seal water)Wooden catwalk/frame over dry pit at intermediate level badly deteriorated - safety hazardOnly one VFD - pumps have to alternateNo ventilation in dry pit areaInfluent channel is located outside with access by stairs or is covered with grating - potential liabilityDoors deterioratedNew gravity sewer construction resulted in invert at channel/wetwell higher than in collection systemcauses sewer to back up into gravity system - approximately 3 blocks (requires about 1.5 ft vertical rise in sewer to overcome)
Overall Condition: Poor to Fair but pumps are operating

Poor due to problems with gravity collection systemBuilding in fair condition; bad corrosion on pump and suction/discharge piping/valvesSafety issues - catwalk and grating
Discharge Route/Location: To Academy Creek WPCP
Additional Information:LS 4002, 4003, 4005 all constructed at same time and about same designWet well flow train comes in flat and then 45s down about 6'-7' drop under buildingConstruction approximately 1964Per staff when Reynolds Street project is completed - LS2 and LS3 will come offlineMost likely 3-5 years before project will be completedLimited flow on station - pumps operate around 36 A typicallyMiltronics level control hanging down between suction lines in wet pit - controls stationPumps have a seal water systemConcrete pads for pumps in fair conditionOne pump was running at time of visitMonitoring wells on site are USGS Test WellsPer JWSC staff (1 pump rebuilt in 2009)
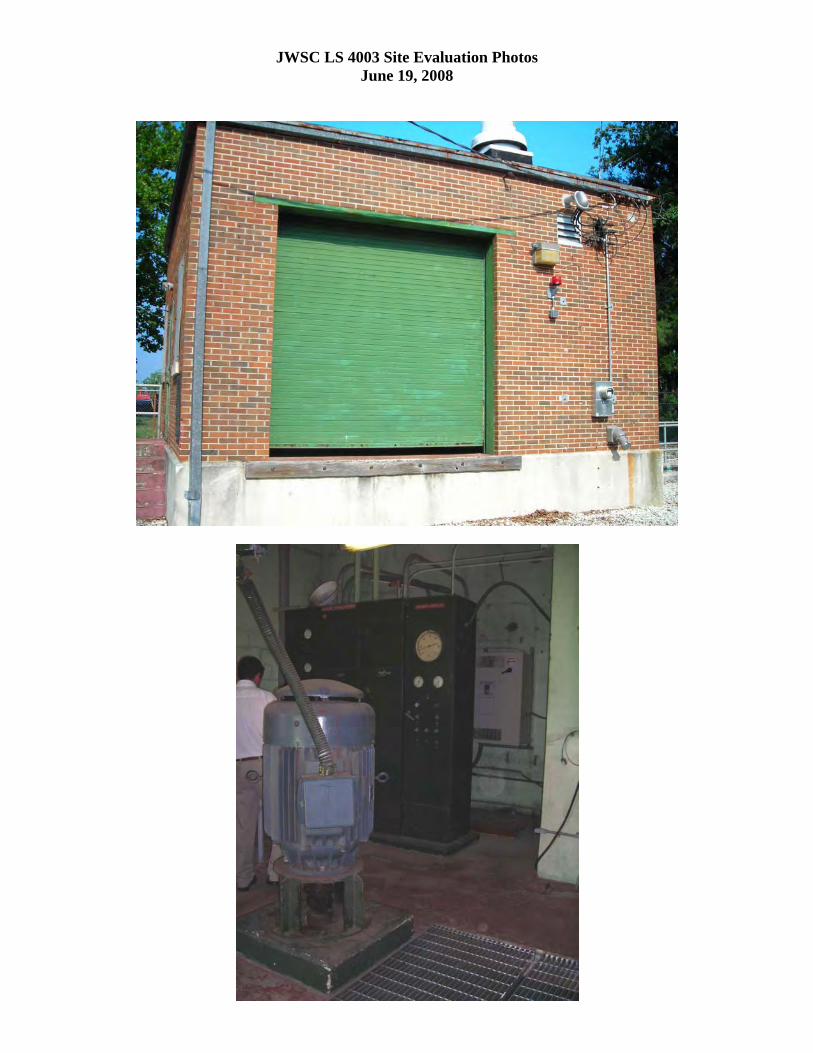
JWSC LS 4003 Site Evaluation Photos June 19, 2008


C i k (
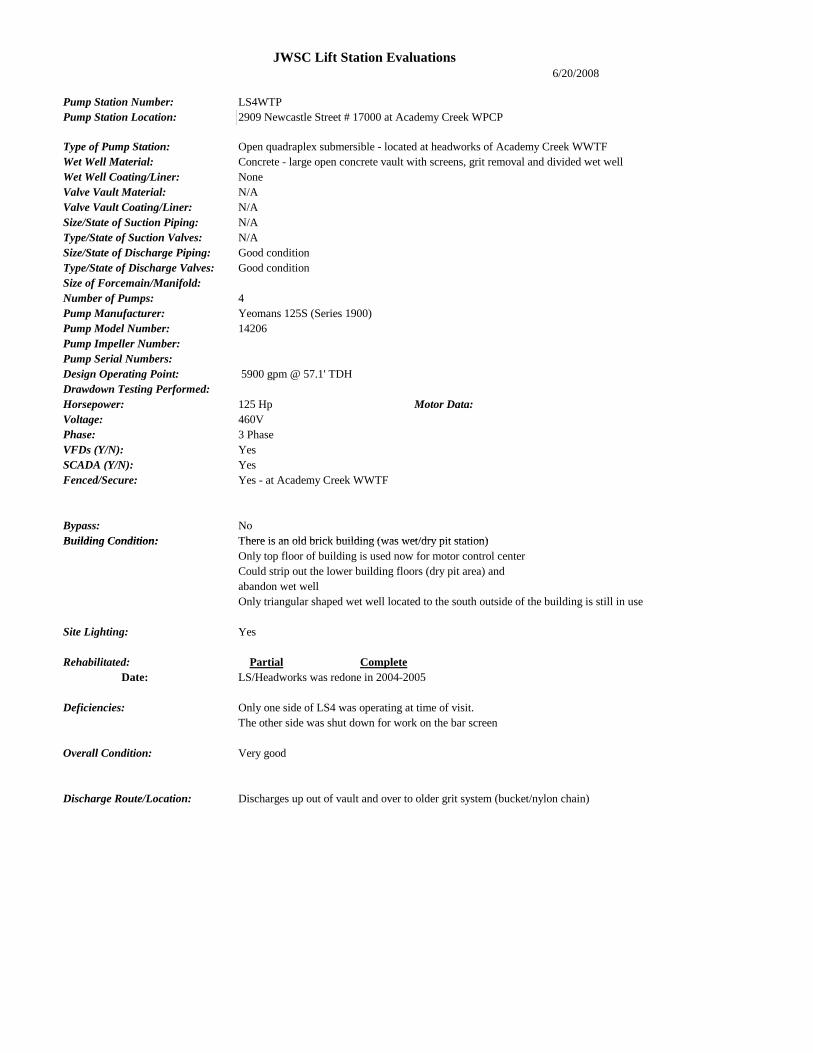
JWSC Lift Station Evaluations6/20/2008
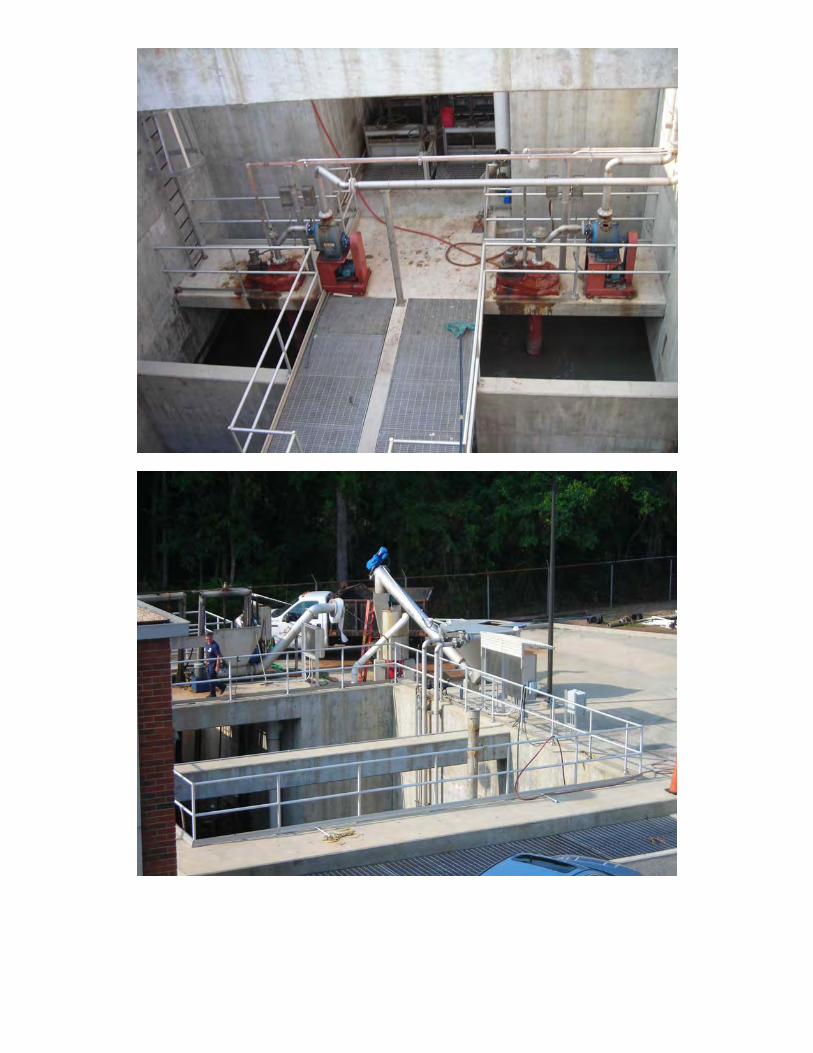
Pump Station Number: LS4WTPPump Station Location: 2909 Newcastle Street # 17000 at Academy Creek WPCP
Type of Pump Station: Open quadraplex submersible - located at headworks of Academy Creek WWTFWet Well Material: Concrete - large open concrete vault with screens, grit removal and divided wet wellWet Well Coating/Liner: NoneValve Vault Material: N/AValve Vault Coating/Liner: N/ASize/State of Suction Piping: N/AType/State of Suction Valves: N/ASize/State of Discharge Piping: Good conditionType/State of Discharge Valves: Good conditionSize of Forcemain/Manifold:Number of Pumps: 4Pump Manufacturer: Yeomans 125S (Series 1900)Pump Model Number: 14206Pump Impeller Number:Pump Serial Numbers:Design Operating Point: 5900 gpm @ 57.1' TDHDrawdown Testing Performed:Horsepower: 125 Hp Motor Data:Voltage: 460VPhase: 3 PhaseVFDs (Y/N): YesSCADA (Y/N): YesFenced/Secure: Yes - at Academy Creek WWTF
Bypass: NoBuilding Condition:Building ondition: There is an old brick building (was wet/dry pit station)There s an old bric building was wet/dry pit station)
Only top floor of building is used now for motor control centerCould strip out the lower building floors (dry pit area) andabandon wet wellOnly triangular shaped wet well located to the south outside of the building is still in use
Site Lighting: Yes
Rehabilitated: Partial CompleteDate: LS/Headworks was redone in 2004-2005
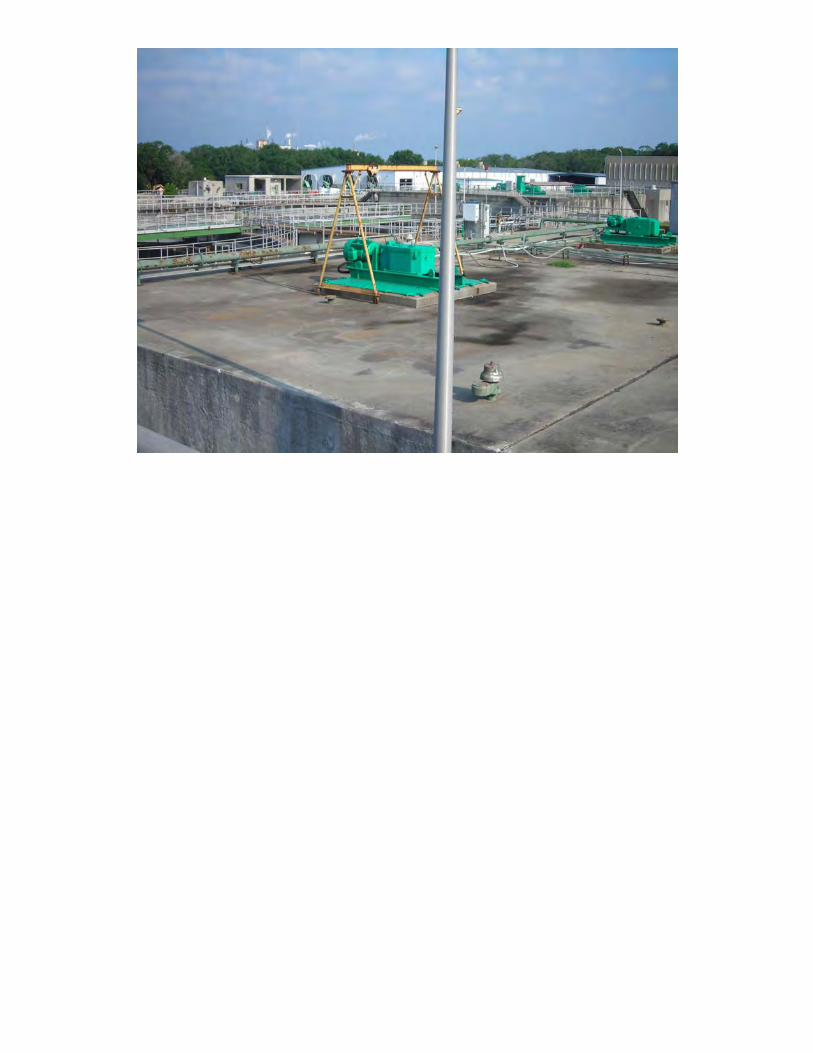
Deficiencies: Only one side of LS4 was operating at time of visit.The other side was shut down for work on the bar screen
Overall Condition: Very good
Discharge Route/Location: Discharges up out of vault and over to older grit system (bucket/nylon chain)
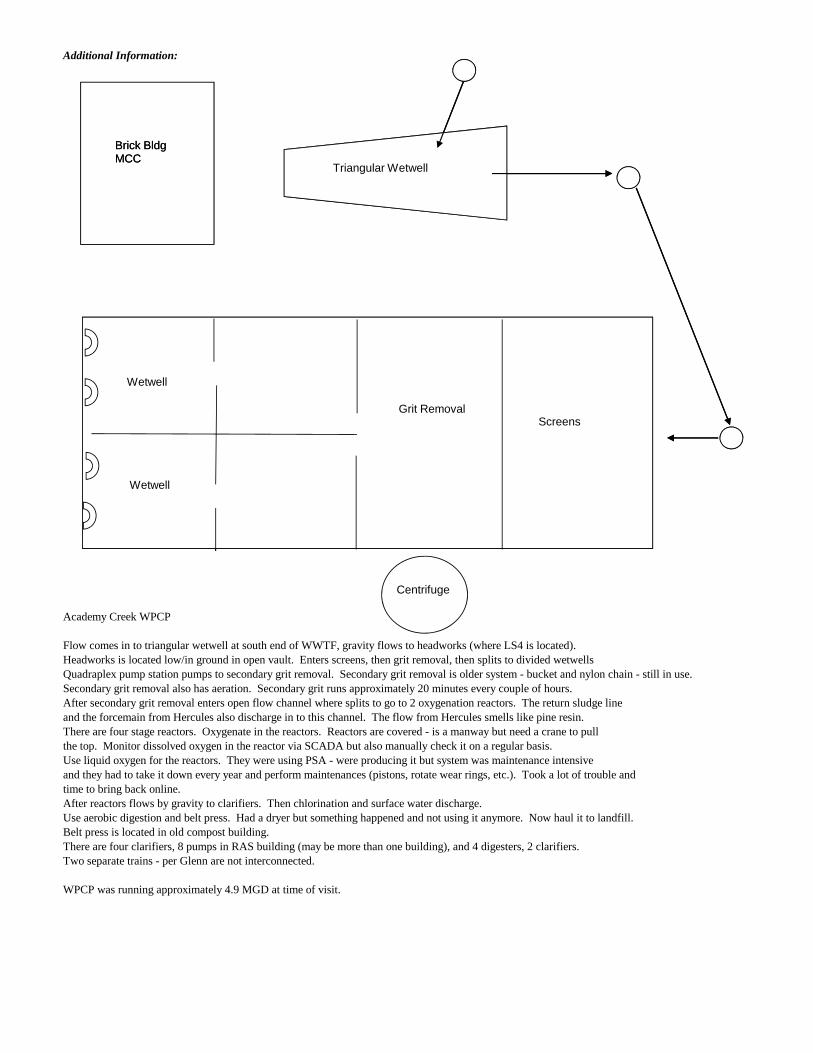
Triangular Wetwell
Brick BldgMCC
ScreensGrit Removal
Wetwell
Wetwell
Additional Information:
Academy Creek WPCP
Flow comes in to triangular wetwell at south end of WWTF, gravity flows to headworks (where LS4 is located).Headworks is located low/in ground in open vault. Enters screens, then grit removal, then splits to divided wetwellsQuadraplex pump station pumps to secondary grit removal. Secondary grit removal is older system - bucket and nylon chain - still in use.Secondary grit removal also has aeration. Secondary grit runs approximately 20 minutes every couple of hours.After secondary grit removal enters open flow channel where splits to go to 2 oxygenation reactors. The return sludge lineand the forcemain from Hercules also discharge in to this channel. The flow from Hercules smells like pine resin.There are four stage reactors. Oxygenate in the reactors. Reactors are covered - is a manway but need a crane to pullthe top. Monitor dissolved oxygen in the reactor via SCADA but also manually check it on a regular basis.Use liquid oxygen for the reactors. They were using PSA - were producing it but system was maintenance intensiveand they had to take it down every year and perform maintenances (pistons, rotate wear rings, etc.). Took a lot of trouble andtime to bring back online.After reactors flows by gravity to clarifiers. Then chlorination and surface water discharge.Use aerobic digestion and belt press. Had a dryer but something happened and not using it anymore. Now haul it to landfill.Belt press is located in old compost building.There are four clarifiers, 8 pumps in RAS building (may be more than one building), and 4 digesters, 2 clarifiers. Two separate trains - per Glenn are not interconnected.
WPCP was running approximately 4.9 MGD at time of visit.
Triangular Wetwell
Brick BldgMCC
ScreensGrit Removal
Wetwell
Wetwell
Centrifuge
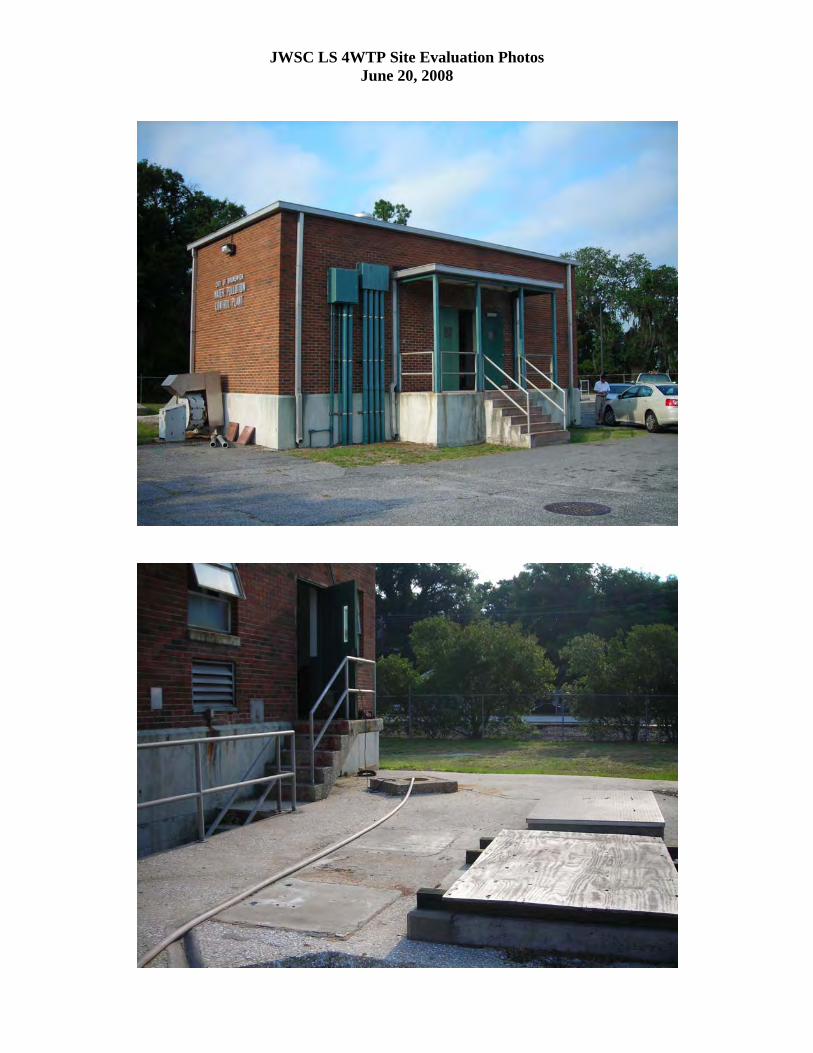
JWSC LS 4WTP Site Evaluation Photos June 20, 2008


JWSC Lift Station Evaluations6/20/2008
Pump Station Number: LS4005Pump Station Location: 3415 Stonewall Street
Type of Pump Station: Duplex Dry/Wet Pit with dry mounted submersibles - Large BuildingWet Well Material: One Outside separate from building - Concrete; also wet pit inside buildingWet Well Coating/Liner: HDPE Liner on outside wetwell in good conditionValve Vault Material: N/AValve Vault Coating/Liner: N/ASize/State of Suction Piping: 16"x14" suction to pump (16" into pump)Type/State of Suction Valves:Size/State of Discharge Piping: 12" discharge off the pumps; 14" manifold outType/State of Discharge Valves:Size of Forcemain/Manifold: 12"Number of Pumps: 2Pump Manufacturer: FlygtPump Model Number: CT3305 Pump Impeller Number: 630Pump Serial Numbers:Design Operating Point: 5200 *Per JWSC Inventory SummaryDrawdown Testing Performed: Yes 9/5/2008Horsepower: 100 Hp Motor Data:Voltage: 460 V 100 HpPhase: 3 PhVFDs (Y/N): Yes - Have 1 but doesn't work (In 2009 JWSC staff installed new drive - pumps are alternating)SCADA (Y/N): YesFenced/Secure: Yes, but fence has been cut over near the stairs
Bypass: 12" discharge bypass with gate valve and quick connectBuilding Condition: Brick building in good condition
aluminum doors in good conditionNo ventilation but does have roll doorHandrails everywhere are in good conditionGenerator in building
Site Lighting: Yes - lighting on outside building and in the dry pit of building
Rehabilita :ted Partial CompleteDate: Scheduled for rehabilitation - have bids on hold
New panels and drives, new generator, motors to staywill be able to start both motors/pumps at same time
Deficiencies:Electrical service is only large enough to run 1 pumpAt 4 pm pumps cycle on for 2 minutes then off for 6 minutesReceive flow from LS4048, 4028, and 4006 directlyNot enough storage - pumps are short cyclingVFDs could reduce short cyclingIf there is a problem at the station and pumps go down they only haveapproximately 30 minutes to figure out the problem before start overflowsRecently blew a fuse at the LS and caused levels to rise - visible in new outside wetwell
(Per JWSC staff fuse is gone since have replaced VFD)Overall Condition: Fair to Good - not enough wetwell storage capacity
Electrical issuesStation is clean and good per operators (when pumps are working)
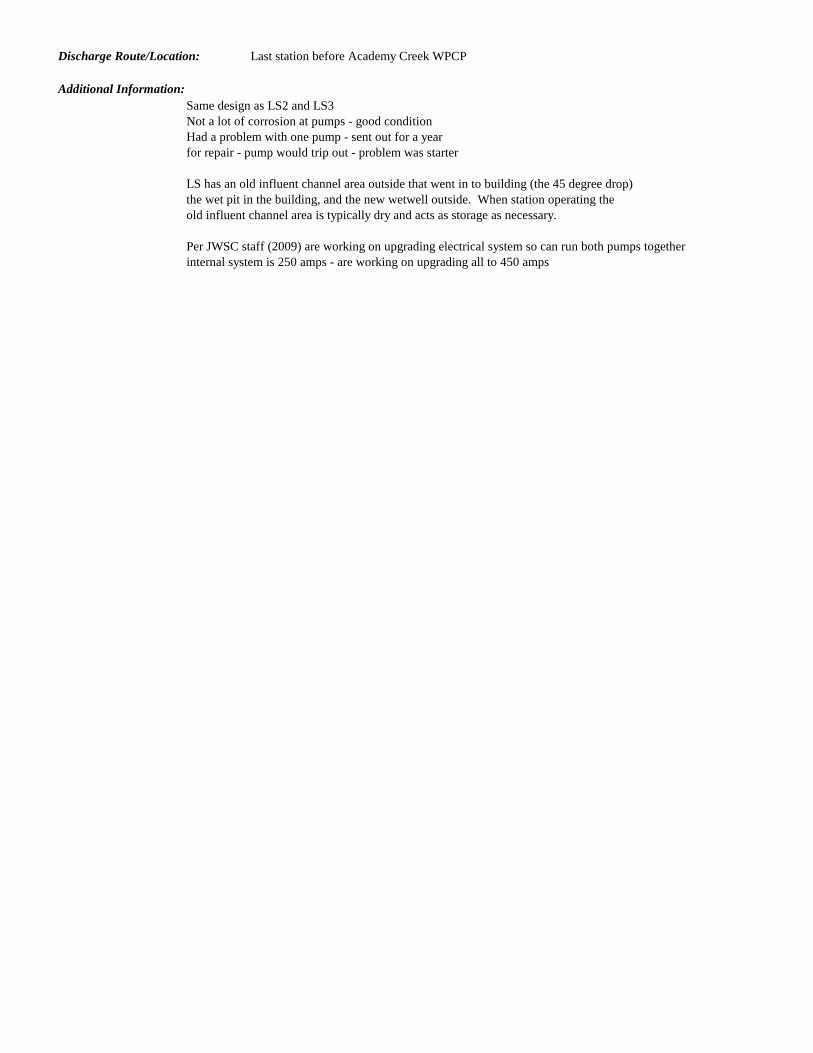
Discharge Route/Location: Last station before Academy Creek WPCP
Additional Information:Same design as LS2 and LS3Not a lot of corrosion at pumps - good condition Had a problem with one pump - sent out for a yearfor repair - pump would trip out - problem was starter
LS has an old influent channel area outside that went in to building (the 45 degree drop)the wet pit in the building, and the new wetwell outside. When station operating theold influent channel area is typically dry and acts as storage as necessary.
Per JWSC staff (2009) are working on upgrading electrical system so can run both pumps togetherinternal system is 250 amps - are working on upgrading all to 450 amps
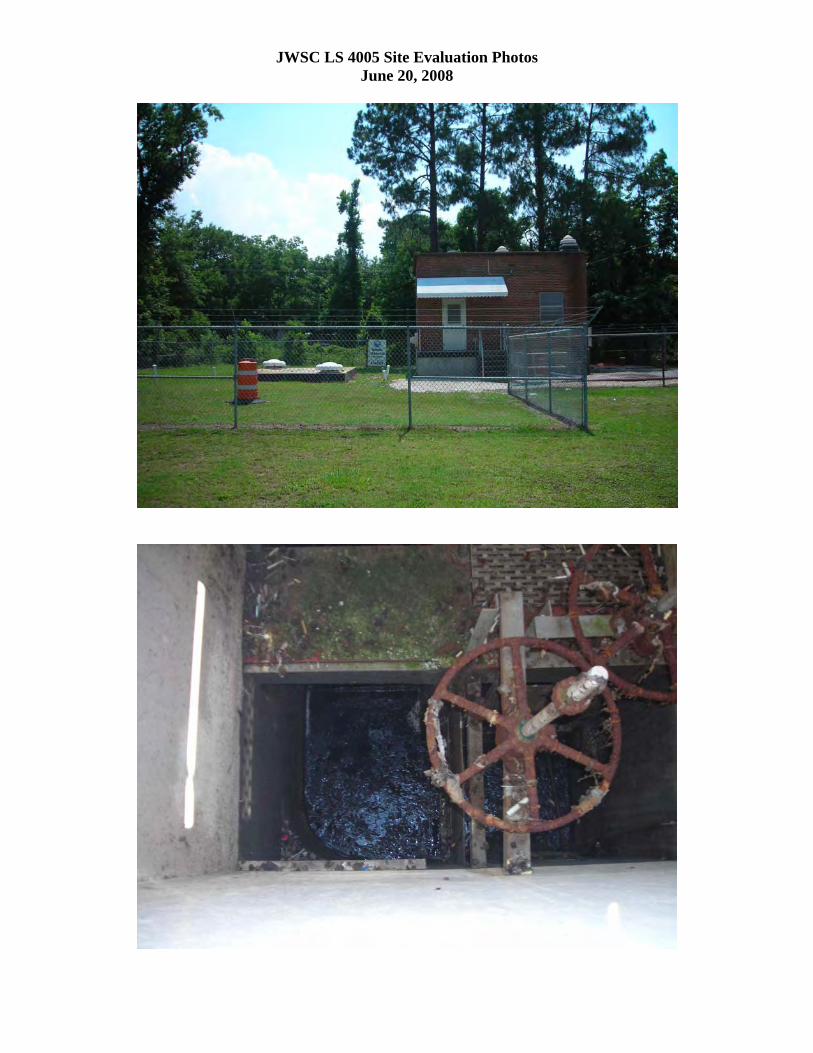
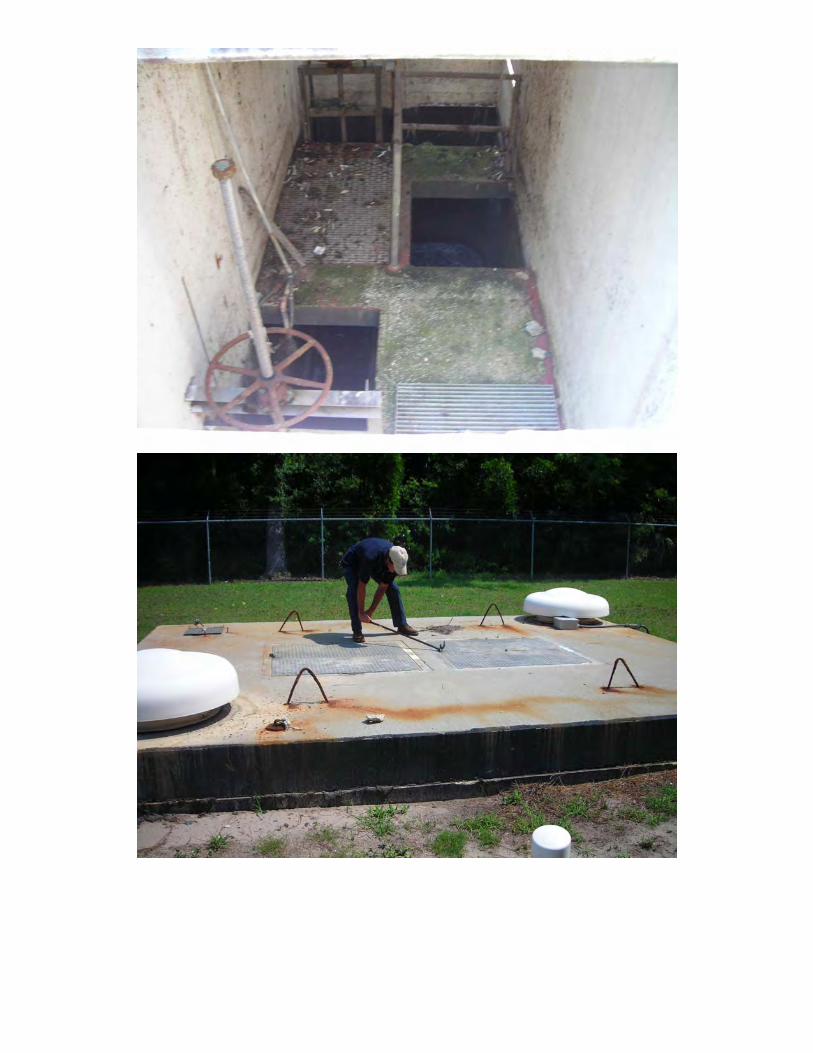
JWSC LS 4005 Site Evaluation Photos June 20, 2008


g
JWSC Lift Station Evaluations6/19/2008
Pump Station Number: LS4006Pump Station Location: 3700 Altama Avenue # 17000
Located at the collegeType of Pump Station: Triplex submersible - same design as LS4028 and LS4048Wet Well Material: ConcreteWet Well Coating/Liner: Sewpercoat or epoxy (?) liner - flakes right off - poor conditionValve Vault Material: ConcreteValve Vault Coating/Liner: Coal Tar - Good conditionSize/State of Suction Piping:Type/State of Suction Valves: N/ASize/State of Discharge Piping: 16" (?) DIP 12"?Type/State of Discharge Valves: Pump #3 Check/Isolation Valves have significant corrosionSize of Forcemain/Manifold: 18"Number of Pumps: Three - one has a different impeller than the other twoPump Manufacturer: FlygtPump Model Number: C3201.180Pump Impeller Number: 637/638 *637 per JWSC Inventory SummaryPump Serial Numbers:Design Operating Point: 2100 *Per JWSC Inventory SummaryDrawdown Testing Performed: Yes 9/16/2008Horsepower: 35 Hp Motor Data:Voltage: 460V 35 HpPhase: 3VFDs (Y/N): NoSCADA (Y/N): YesFenced/Secure: No - no fencing
All hatches are secured but locks on wetwell are corroding
Bypass: 12" - Flanged pipe coming up out of ground (where valve)Building Condition: Very good condition
Generator behind building
Site Lighting: Light on building but far away from wetwell
Rehabilita :ted Partial CompleteDate: X
Liner and pumps rehabilitated (same time as LS28 and LS48)
Deficiencies: Liner/coating in wetwell flakes right off - poor conditionGuide rails have some corrosion - especially at the bottomDIP discharge piping and 90 degree bends (especially) are very badly corrodedLot of debris floating near pump - looks like chunk of linerStrong odor and H2S (2009 per JWSC staff has been resolved by chemical addition upstream)Very bad corrosionWater hammer on Pump #3 when pump shuts off/on check valvePacking nut on Check Valve #1 leaking (just needs to be tightened)Pump #3 check and isolation valves have significant corrosion
(Per JWSC staff in 2009 all check valves rebuilt and cleaned)Manhole on site has ARV - very badly corrodedPer JWSC staff (2009) 1 pump needs a motor starter
Overall Condition: Poor
Discharge Route/Location: Discharges to LS4005

Additional Information: Appears to be 24" influent -heavy flowLiner and coal tar is still visible at bottom of wetwell under pump on levelHose bibb but no hoseLS28 bypasses around this stationHas hoist boomDividing wall at station was taken out

JWSC LS 4006 Site Evaluation Photos June 19, 2008


6/20/2008Pump Station Number: LS4017Pump Station Location:
Type of Pump Station: Duplex SubmersibleWet Well Material: Concrete Rectangular Wetwell - Divided Well with Both Pumps on One SideWet Well Coating/Liner: Concrete/cementitious liner - looks like hand laid - sagging at bottomValve Vault Material: ConcreteValve Vault Coating/Liner: Coal TarSize/State of Suction Piping: N/AType/State of Suction Valves: N/ASize/State of Discharge Piping: 8" DIType/State of Discharge Valves: Check and Plug Valves good condition - some corrosion on pipes and valvesSize of Forcemain/Manifold: 8" Number of Pumps: 2Pump Manufacturer: Tsurumi "B" Series PumpPump Model Number: TOS-200226BPump Impeller Number:Pump Serial Numbers:Design Operating Point: 1400 gpm @ 45' 1750 gpm per JWSC Inventroy SummaryDrawdown Testing Performed: Yes 7/15/2008Horsepower: 30 HpVoltage: 460 VPhase: 3VFDs (Y/N): NoSCADA (Y/N): YesFenced/Secure: Yes - Fenced/Barbed Wire
Bypass: Appears is located outside of fenced site
JWSC Lift Station Evaluations
2845 Parkwood Drive # 17000
yp ppPipe with blind flange - can not find buried valve
Building Condition: N/A
Site Lighting: No site light
Rehabilitated: Partial CompleteDate: N/A
Deficiencies: Strong odors (when hatch open) - have had some complaints(Per JWSC staff - 2009 - odors have been eliminated by placement of chemicals at LS4034 and 4009)Concrete/cementitious liner in wetwell is sagging but appears in tactIs 6" strip around bottom of wetwell (about 1' below overflow)where appears may be exposed concrete (difficult to tell)Some debris/grease in pump well Guide rail brackets completely corroded at top wetwell
(Brackets not available in stainless steel - just have to replace)DI 90 bend on pump discharge all corroded - flanges in bad conditionSome cracks in top slab of wet well
Overall Condition: Fair to Good - some issues - liner/coating, Discharge 90s, Flanges, Guiderail Brackets
Discharge Route/Location: To 4WTP gravity sewer and on to Academy Creek WPCP
Additional Information: JWSC feeds peroxide upstream at another pump stationSite has hose bib but no RPZHospital flow enters hereHave probe in pump well
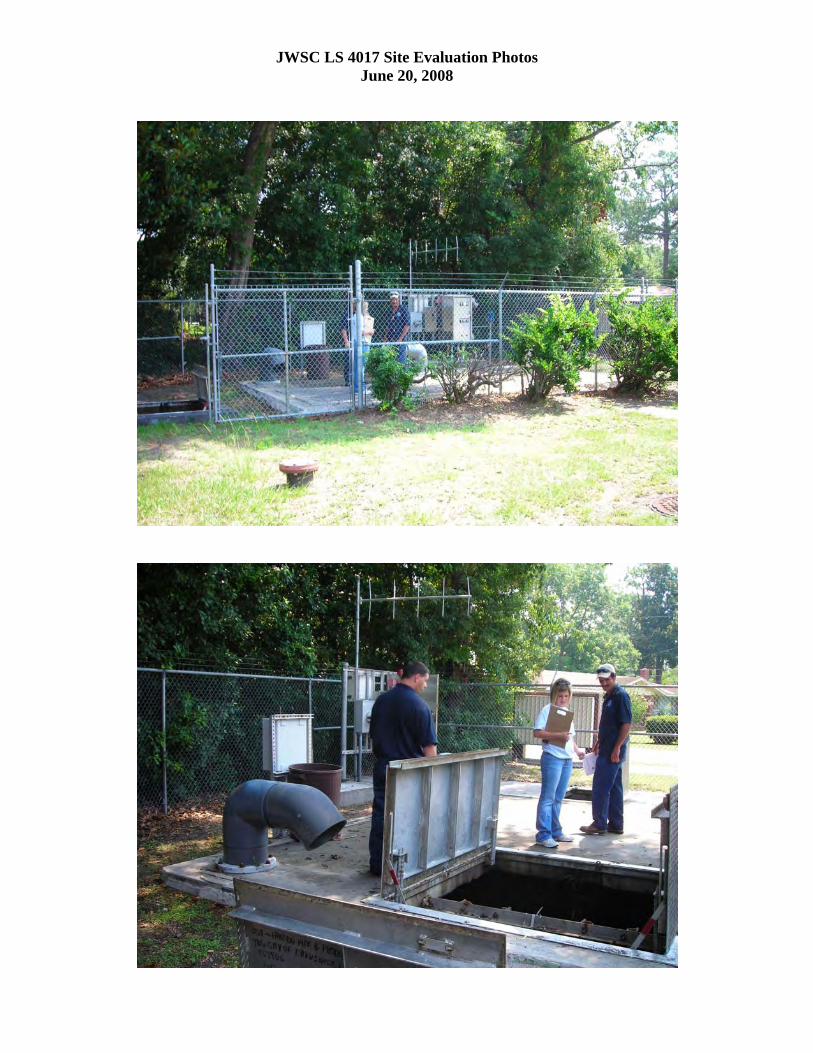
JWSC LS 4017 Site Evaluation Photos June 20, 2008


6/19/2008
Pump Station Number: LS4021Pump Station Location:
Type of Pump Station: Duplex Suction Lift with Rectangular WetwellWet Well Material: Rectangular Concrete - Very Poor Condition Wet Well Coating/Liner: None (if was any has deteriorated)Valve Vault Material: N/A - Pumps and Valves in BuildingValve Vault Coating/Liner: N/ASize/State of Suction Piping: 6" DI/PVC - 90 Degree Bends Outside Building CorrodedType/State of Suction Valves: NoneSize/State of Discharge Piping: 6" DIP/Steel - Fair ConditionType/State of Discharge Valves: 6" Check and Gate/Plug Valves - Good ConditionSize of Forcemain/Manifold: 6"Number of Pumps: 2Pump Manufacturer: Davco CrownPump Model Number: PO6LC 14X-001Pump Impeller Number: 9.75 *Per JWSC Inventory SummaryPump Serial Numbers:Design Operating Point: 1500 gpm *Per JWSC Inventory SummaryDrawdown Testing Performed: Yes 7/15/2008Horsepower: 20 Hp Motor Data:Voltage: 230/460 VPhase: 3 PhaseVFDs (Y/N): NoSCADA (Y/N): YesFenced/Secure: No Fence
Shellface building secured
JWSC Lift Station Evaluations
4727 Altama Avenue #17000
gWetwell locked
Bypass: Located near discharge manhole - pipe with blind flange and buried valve
Building Condition: Concrete block building for pumps and control panelTight fit in room - difficult to move aroundBuilding cracked/wall integrity questionable where discharge pipe passes through
Site Lighting: None
Rehabilitated: Partial CompleteDate: N/A
Deficiencies: Pumps vibrate/rattle a lotExtreme vibration on the discharge lineGuards on belts are corroding and paint is peelingWetwell has bricked top section - approximately 3' highGrout gone between all the bricksConcrete (rectangular) wetwell below - concrete completely deterioratedConcrete is fluffy/sandy looking; flakes right offSome corrosion on one of the suction lines outside building; 90 degree bends badly corrodedCorrosion under SCADA antenae and concrete padErosion toward drivewayDischarge manhole (has liner) is badly deterioratedSome corrosion on 1 pump suction
Overall Condition: PoorSignificant vibration from pumpsWetwell structural integrity is questionable

Discharge Route/Location: Through gravity sewer to LS4006
Additional Information: Top slab of wetwell appears in good condition (from top)Per G. Henderson pump station is on Rehab ListNew motor installed on one of the pumps 12-7-04Discharge manhole is approximately 3.5' deepFloat switchesNext to manhole, flanged up out of the ground (blind flange) is a bypass & valve out of siteof LS4021

JWSC LS 4021 Site Evaluation Photos June 19, 2008


6/18/2008
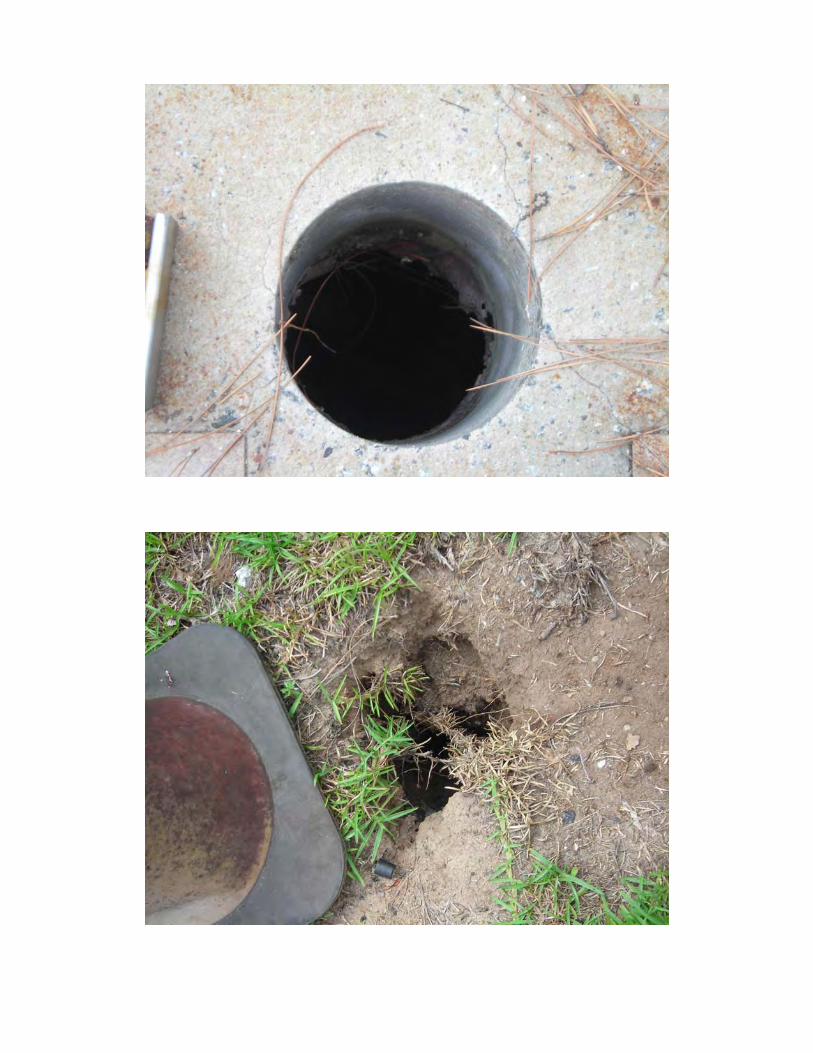
Pump Station Number: LS4023Pump Station Location:
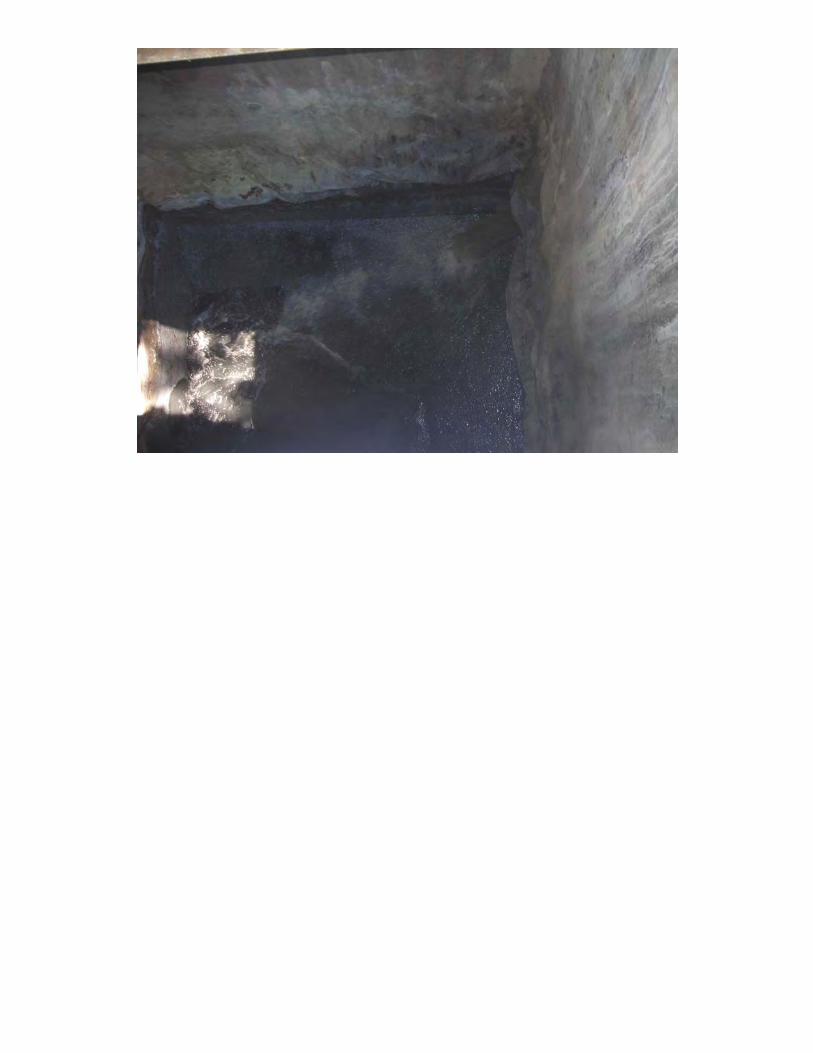
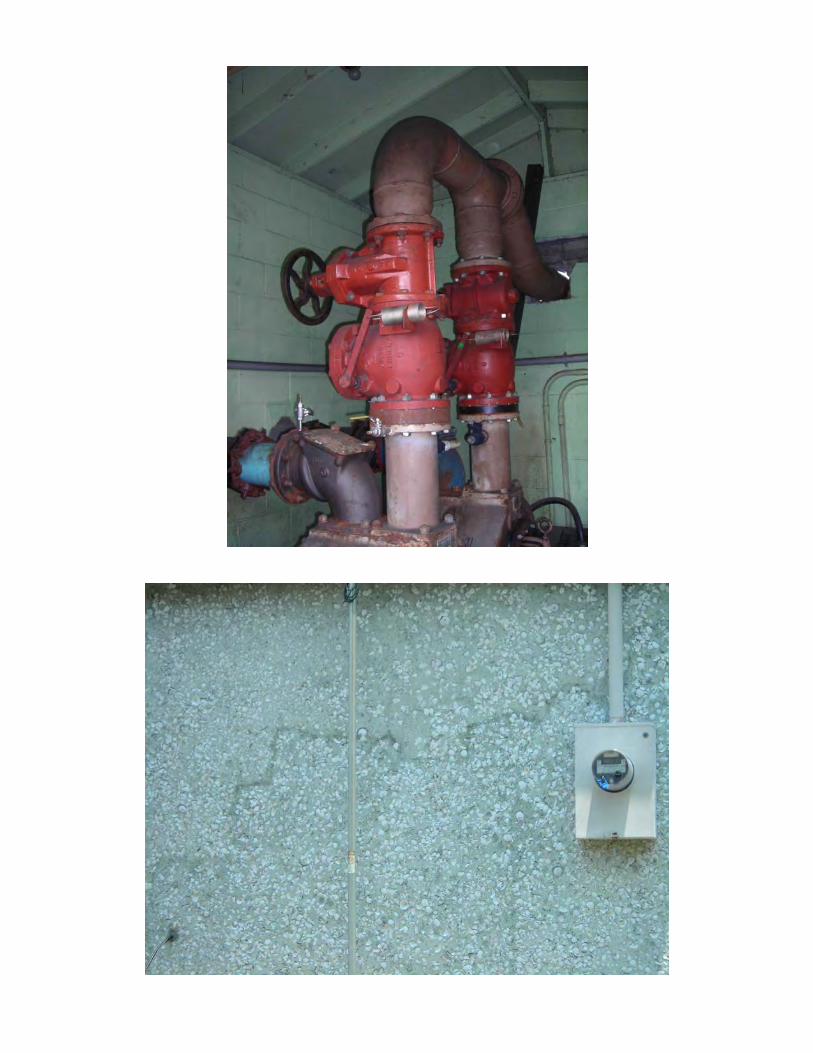
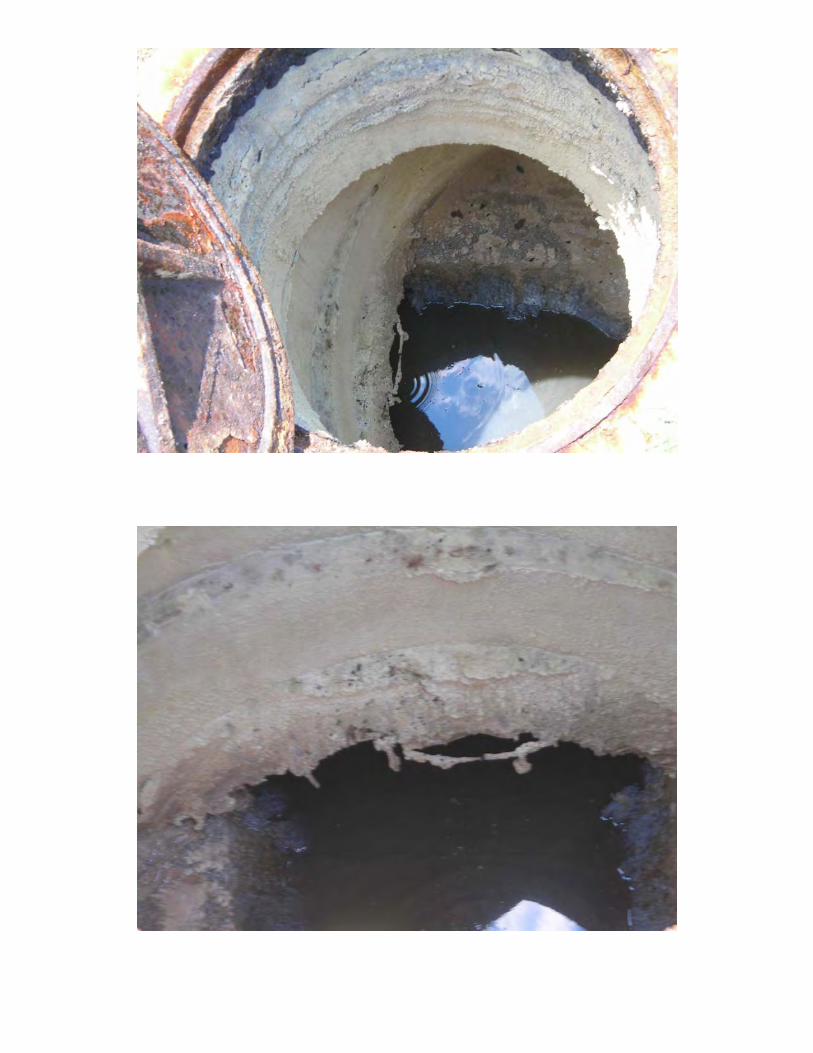
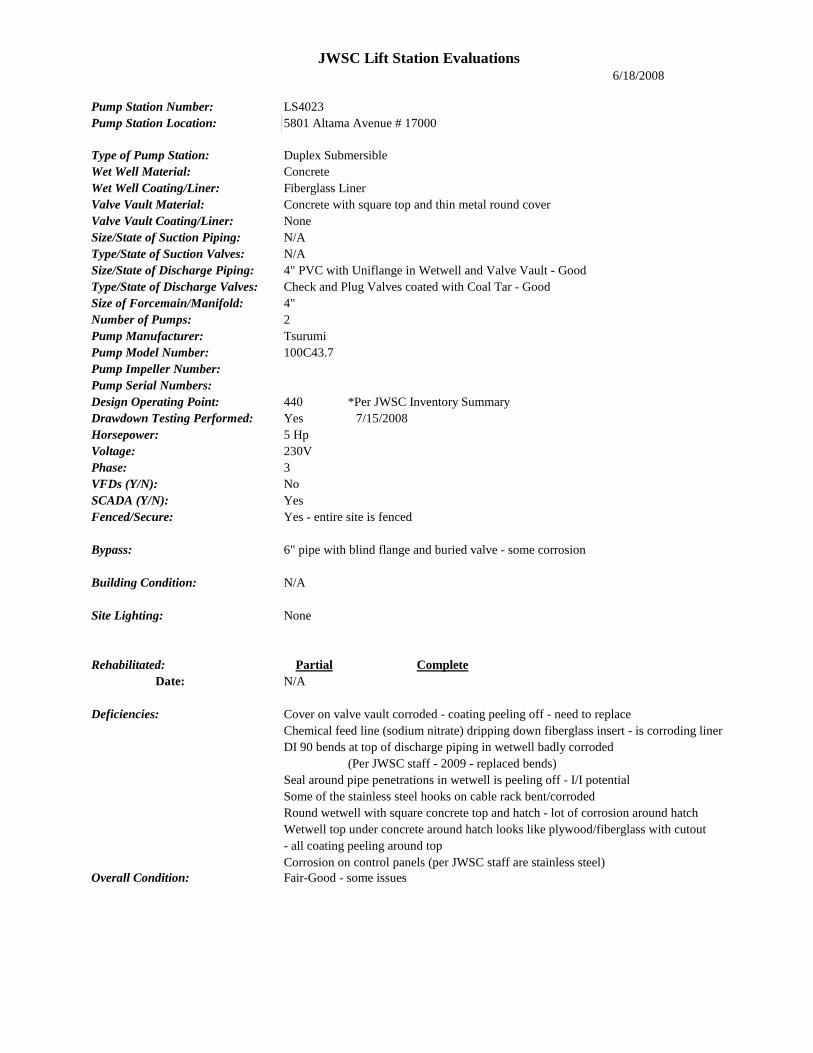
Type of Pump Station: Duplex SubmersibleWet Well Material: ConcreteWet Well Coating/Liner: Fiberglass LinerValve Vault Material: Concrete with square top and thin metal round coverValve Vault Coating/Liner: NoneSize/State of Suction Piping: N/AType/State of Suction Valves: N/ASize/State of Discharge Piping: 4" PVC with Uniflange in Wetwell and Valve Vault - GoodType/State of Discharge Valves: Check and Plug Valves coated with Coal Tar - GoodSize of Forcemain/Manifold: 4"Number of Pumps: 2Pump Manufacturer: Tsurumi Pump Model Number: 100C43.7Pump Impeller Number:Pump Serial Numbers:Design Operating Point: 440 *Per JWSC Inventory SummaryDrawdown Testing Performed: Yes 7/15/2008Horsepower: 5 HpVoltage: 230VPhase: 3VFDs (Y/N): NoSCADA (Y/N): YesFenced/Secure: Yes - entire site is fenced
JWSC Lift Station Evaluations
5801 Altama Avenue # 17000
Bypass: 6" pipe with blind flange and buried valve - some corrosion
Building Condition: N/A
Site Lighting: None
Rehabilitated: Partial CompleteDate: N/A
Deficiencies: Cover on valve vault corroded - coating peeling off - need to replaceChemical feed line (sodium nitrate) dripping down fiberglass insert - is corroding linerDI 90 bends at top of discharge piping in wetwell badly corroded
(Per JWSC staff - 2009 - replaced bends)Seal around pipe penetrations in wetwell is peeling off - I/I potentialSome of the stainless steel hooks on cable rack bent/corrodedRound wetwell with square concrete top and hatch - lot of corrosion around hatchWetwell top under concrete around hatch looks like plywood/fiberglass with cutout - all coating peeling around topCorrosion on control panels (per JWSC staff are stainless steel)
Overall Condition: Fair-Good - some issues

Discharge Route/Location: To LS4006 gravity sewerAdditional Information: Eyewash station on site
Influent line invert is very close to top of pumpFeeding sodium nitrate - have tank on-siteHose bib located on-siteStainless steel J-tube for ventManhole inside fence and manhole outside fenceInfluent is very black in color
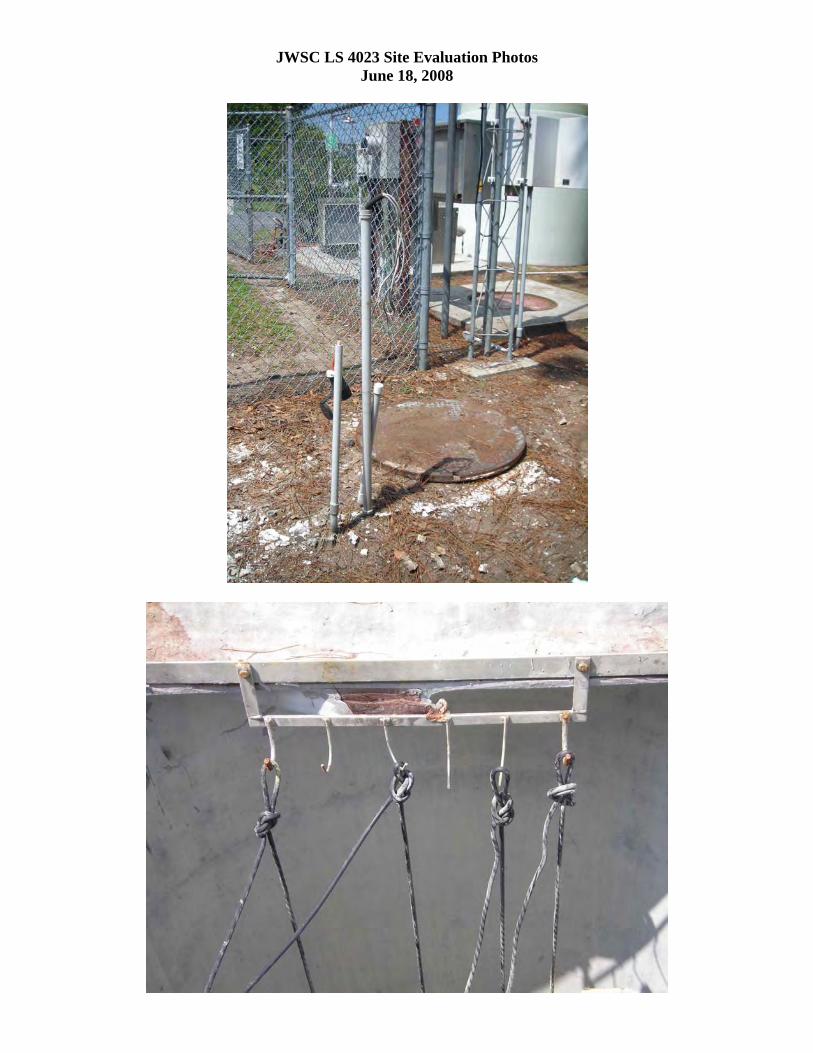
JWSC LS 4023 Site Evaluation Photos June 18, 2008


JWSC Lift Station Evaluations6/19/2008
Pump Station Number: LS4028Pump Station Location: 101 Oscar Lane # 17000
Type of Pump Station: Triplex Submersible with Rectangular Wetwell (same design as LS48)Wet Well Material: ConcreteWet Well Coating/Liner: Spray on coating - some corrosion/deterioration around pump-on elevationValve Vault Material: Concrete Rectangular Valve Vault with Grating for TopValve Vault Coating/Liner: Coal TarSize/State of Suction Piping: N/AType/State of Suction Valves: N/ASize/State of Discharge Piping: 12" PVC with Uniflange and DI fittings - fittings corrodedType/State of Discharge Valves: Check and Plug Valves have significant amount of corrosionSize of Forcemain/Manifold: 16"Number of Pumps: 3Pump Manufacturer: Flygt (original pumps were KSB)Pump Model Number: CP3201Pump Impeller Number: 637Pump Serial Numbers:Design Operating Point: 2100 *Per JWSC Inventory SummaryDrawdown Testing Performed: Yes 9-2008Horsepower: 35 Hp Motor Data:Voltage: 460 35 HpPhase: 3VFDs (Y/N): NoSCADA (Y/N): YesFenced/Secure: Yes- site is completely fenced and secured
Bypass: Yes
Building Condition: N/A
Site Lighting: Yes
Rehabilita :ted Partial CompleteDate: X
Liner installed and pumps changed out at same time as LS4048Deficiencies: Some corrosion on guide rails (not severe)
Significant amount of grease in waterLot of corrosion on DI fittingsCheck and plug valves have significant amount of corrosionLot of debris up on discharge 90 degree bends - had overflows/high levelsCored hole in top of wetwell (PVC pipe for transducer) is trip hazardCoating (coal tar) on piping in valve vault is corroding/peelingSignificant corrosion of liner around pump-on/storage volume elevationsStrong Odors (Per JWSC staff - 2009 - odors under control by chemical addition in upstream stations)
Overall Condition: Fair - some significant issues
Discharge Route/Location: Manifolded with LS4048 and discharges upstream of LS4005

Additional Information: Pump station constructed approximately 1987-88 (per electrical drawings in panel)Flowmeter under transfer switchGenerator on-siteHoist boom on-siteWater meter and hose bib on-siteFeeding sodium nitrate into hatch (same as LS48)Higher floor in influent channel - are 3 openings for flow to pass through to wetwellIs dividing wall between pump well area and influent channelThere are 2 influent pipes - one paralell to flow channel and one perpendicularPipe perpendicular is not used - comes from LS2048 but forcemain has been rerouted around LS2028 & connects in to discharge forcemain from LS2028LS2048 can discharge to LS2028 if necessaryLots of grease

JWSC LS 4028 Site Evaluation Photos June 19, 2008

JWSC Lift Station Evaluations6/20/2008
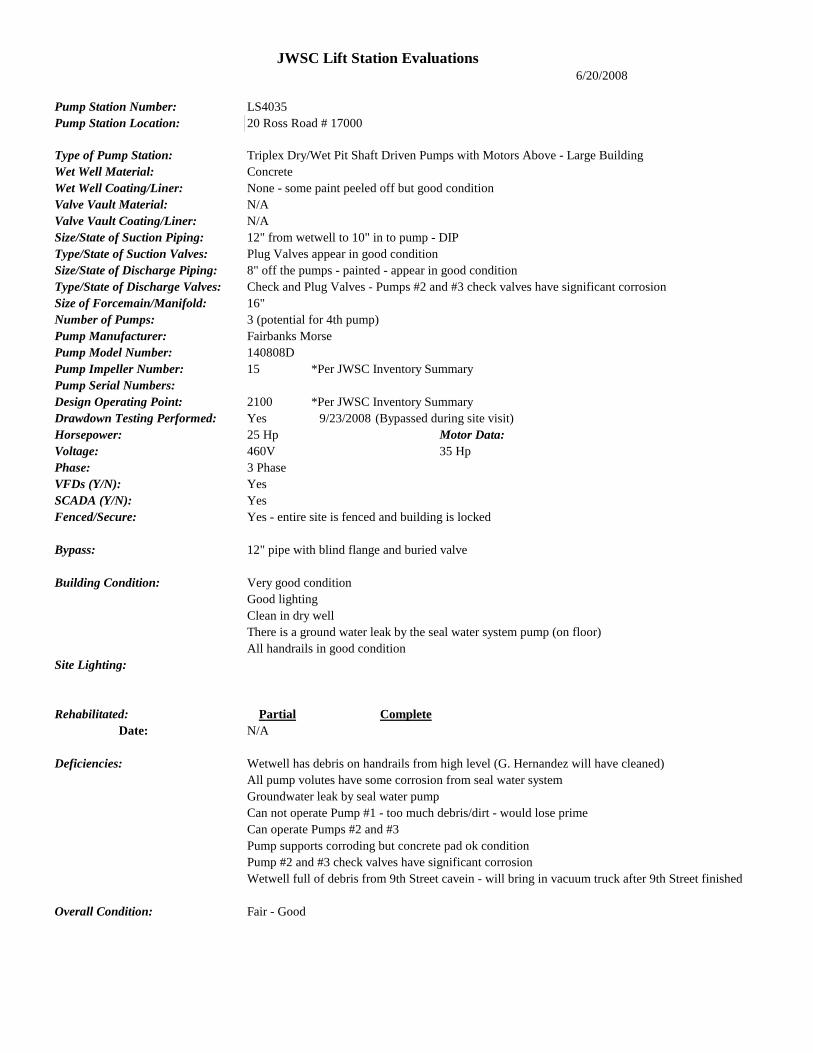
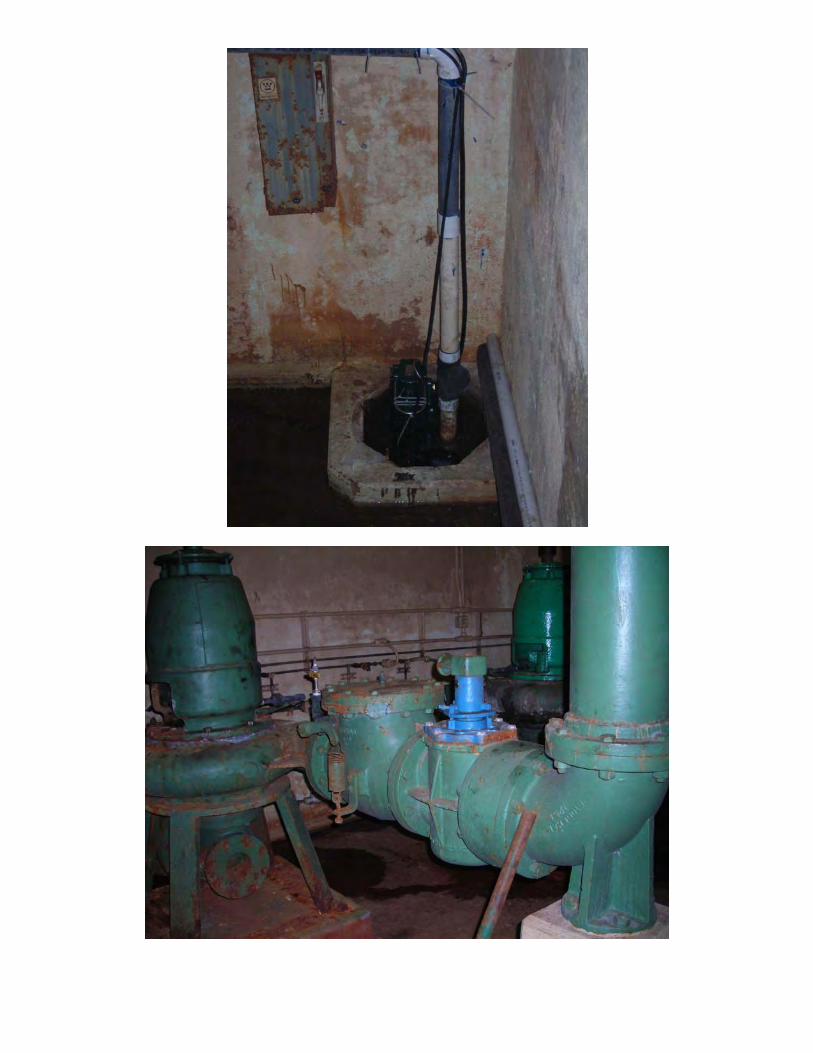
Pump Station Number: LS4035Pump Station Location: 20 Ross Road # 17000
Type of Pump Station: Triplex Dry/Wet Pit Shaft Driven Pumps with Motors Above - Large BuildingWet Well Material: ConcreteWet Well Coating/Liner: None - some paint peeled off but good conditionValve Vault Material: N/AValve Vault Coating/Liner: N/ASize/State of Suction Piping: 12" from wetwell to 10" in to pump - DIPType/State of Suction Valves: Plug Valves appear in good conditionSize/State of Discharge Piping: 8" off the pumps - painted - appear in good conditionType/State of Discharge Valves: Check and Plug Valves - Pumps #2 and #3 check valves have significant corrosionSize of Forcemain/Manifold: 16"Number of Pumps: 3 (potential for 4th pump)Pump Manufacturer: Fairbanks MorsePump Model Number: 140808DPump Impeller Number: 15 *Per JWSC Inventory SummaryPump Serial Numbers:Design Operating Point: 2100 *Per JWSC Inventory SummaryDrawdown Testing Performed: Yes 9/23/2008 (Bypassed during site visit)Horsepower: 25 Hp Motor Data:Voltage: 460V 35 HpPhase: 3 PhaseVFDs (Y/N): YesSCADA (Y/N): YesFenced/Secure: Yes - entire site is fenced and building is locked
Bypass: 12" pipe with blind flange and buried valve
Building Condition: Very good conditionGood lightingClean in dry wellThere is a ground water leak by the seal water system pump (on floor)All handrails in good condition
Site Lighting:
Rehabilita :ted Partial CompleteDate: N/A
Deficiencies: Wetwell has debris on handrails from high level (G. Hernandez will have cleaned)All pump volutes have some corrosion from seal water systemGroundwater leak by seal water pumpCan not operate Pump #1 - too much debris/dirt - would lose primeCan operate Pumps #2 and #3Pump supports corroding but concrete pad ok conditionPump #2 and #3 check valves have significant corrosionWetwell full of debris from 9th Street cavein - will bring in vacuum truck after 9th Street finished
Overall Condition: Fair - Good

Discharge Route/Location: To 4WTP gravity sewer and on to Academy Creek WPCP
Additional Information: Near 9th street cave-in - bypassing to manhole near wetwell30" RCP from LS2035 to LS2036Potential for 4th pump at station next to Pump #3.Pumps have seal water systemDischarge forcemain drops to manhole to right of siteHave water line - RPZ on water line in corner of drywellWhen 9th Street project completed will clean up wetwellWill core drill through dividing wall in wetwell so each side of well gets equal flowFloat hanging by 1st flight of stairs for HLAStairs to wetwell are open and located behind building - 2 flights of stairs downPer JWSC staff - 2009 - all 3 pumps are operating nowPer JWSC staff - 2009 - only the breakers and motor starters (if starting across line) are used in MCCrest of MCC is emptyPer JWSC staff - 2009 - there is a lot of sand coming in to the station from the concrete gravity

JWSC LS 4035 Site Evaluation Photos June 20, 2008

JWSC Lift Station Evaluations6/19/2008
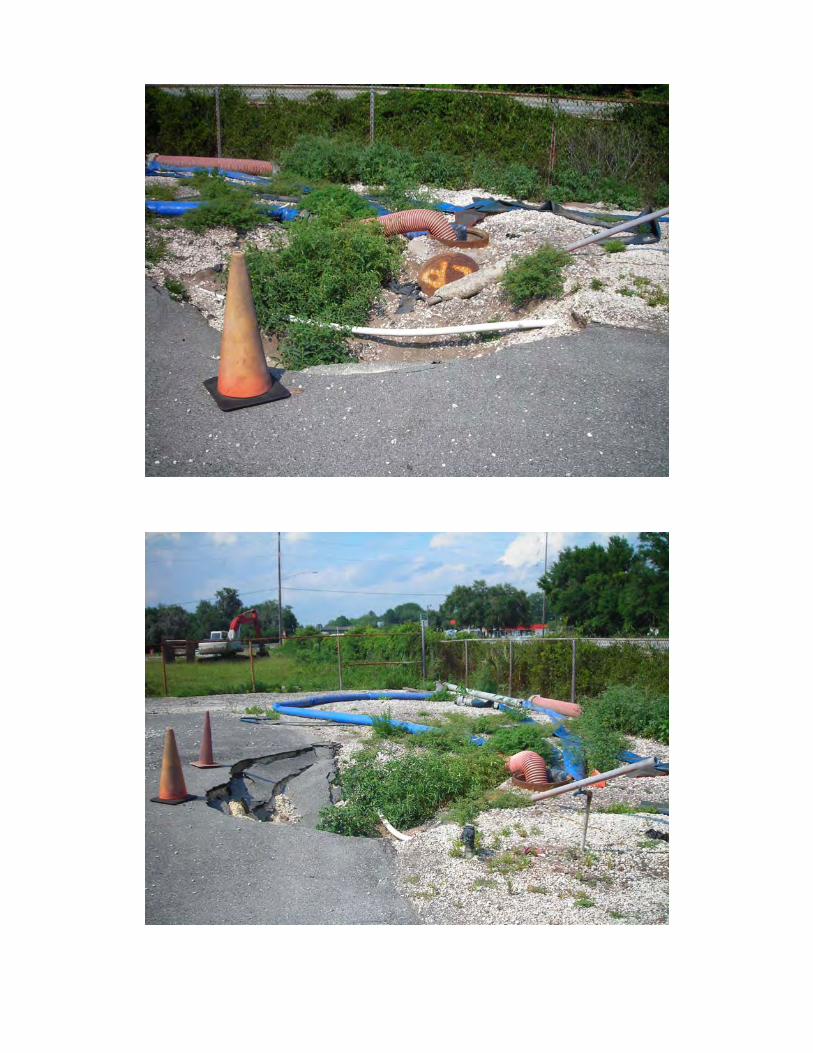
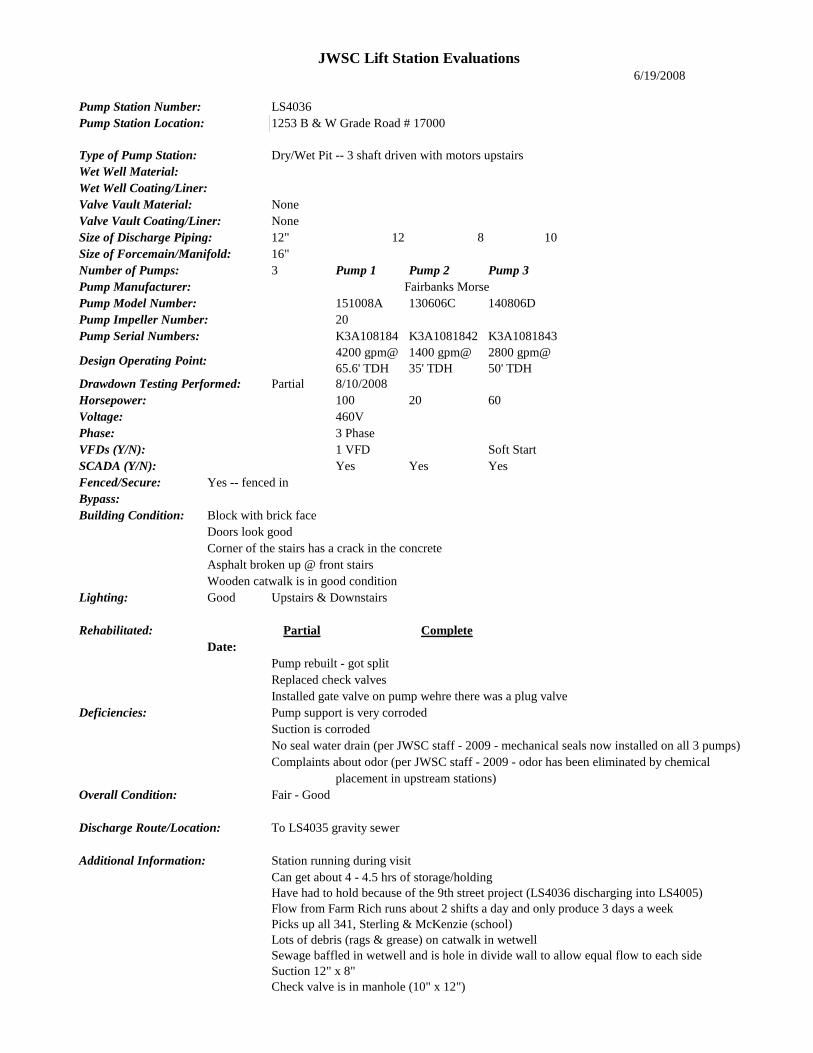
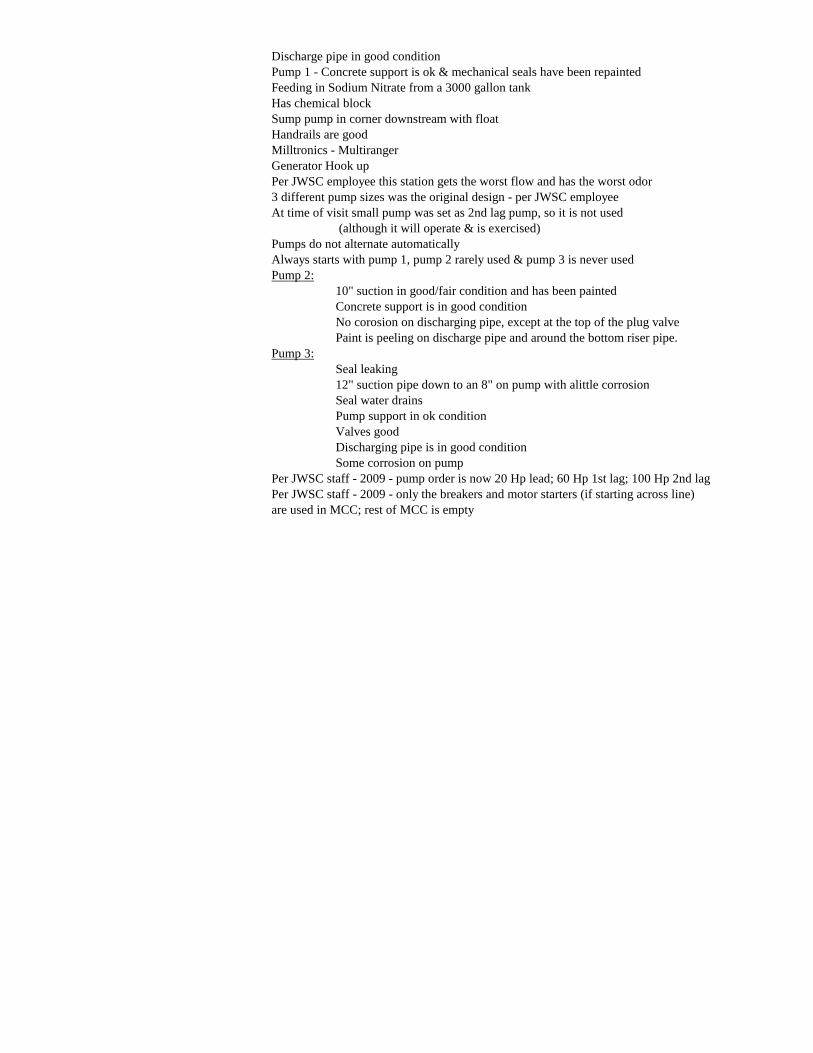
Pump Station Number: LS4036Pump Station Location: 1253 B & W Grade Road # 17000
Type of Pump Station: Dry/Wet Pit -- 3 shaft driven with motors upstairsWet Well Material:Wet Well Coating/Liner:Valve Vault Material: NoneValve Vault Coating/Liner: NoneSize of Discharge Piping: 12" 12 8 10Size of Forcemain/Manifold: 16"Number of Pumps: 3 Pump 1 Pump 2 Pump 3Pump Manufacturer: Fairbanks MorsePump Model Number: 151008A 130606C 140806DPump Impeller Number: 20Pump Serial Numbers: K3A108184 K3A1081842 K3A1081843
Design Operating Point:4200 gpm@ 65.6' TDH
1400 gpm@ 35' TDH
2800 gpm@ 50' TDH
Drawdown Testing Performed: Partial 8/10/2008Horsepower: 100 20 60Voltage: 460VPhase: 3 PhaseVFDs (Y/N): 1 VFD Soft StartSCADA (Y/N): Yes Yes YesFenced/Secure: Yes -- fenced inBypass:Building Condition: Block with brick face
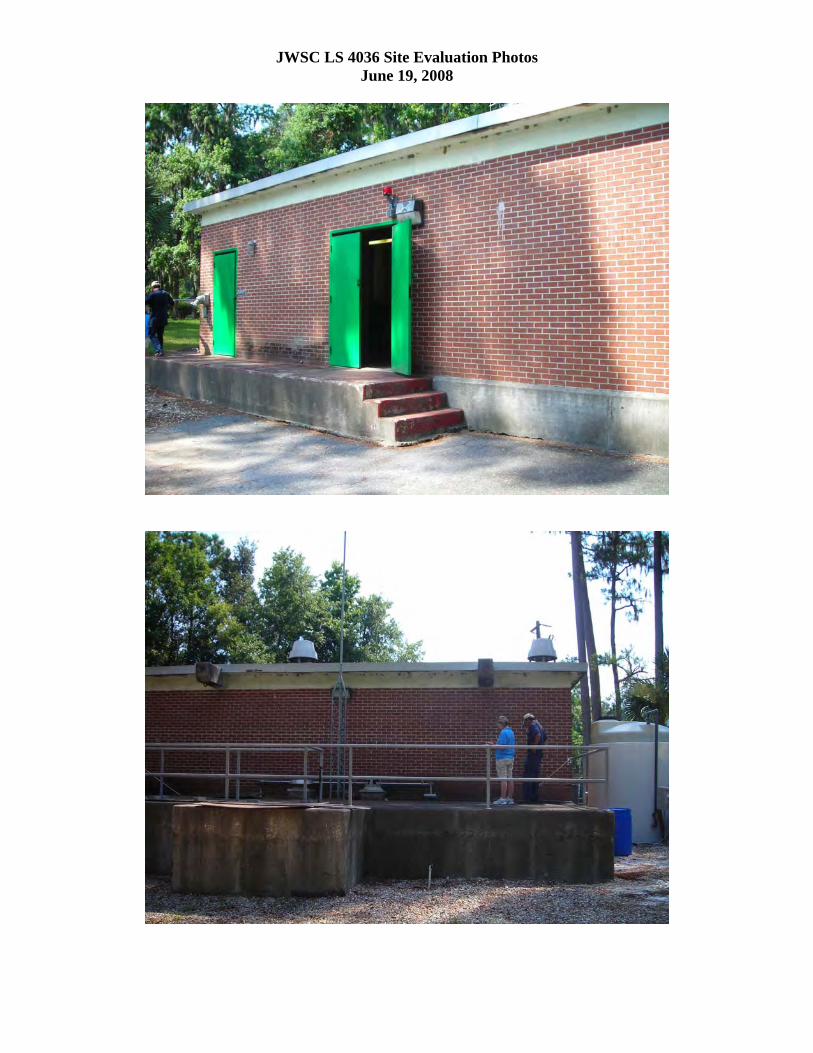
Doors look goodCorner of the stairs has a crack in the concreteAsphalt broken up @ front stairsWooden catwalk is in good condition
Lighting: Good Upstairs & Downstairs
Rehabilita :ted Partial CompleteDate:
Pump rebuilt - got splitReplaced check valves Installed gate valve on pump wehre there was a plug valve
Deficiencies: Pump support is very corrodedSuction is corrodedNo seal water drain (per JWSC staff - 2009 - mechanical seals now installed on all 3 pumps)Complaints about odor (per JWSC staff - 2009 - odor has been eliminated by chemical
placement in upstream stations)Overall Condition: Fair - Good
Discharge Route/Location: To LS4035 gravity sewer
Additional Information: Station running during visitCan get about 4 - 4.5 hrs of storage/holding Have had to hold because of the 9th street project (LS4036 discharging into LS4005)Flow from Farm Rich runs about 2 shifts a day and only produce 3 days a week Picks up all 341, Sterling & McKenzie (school)Lots of debris (rags & grease) on catwalk in wetwellSewage baffled in wetwell and is hole in divide wall to allow equal flow to each sideSuction 12" x 8"Check valve is in manhole (10" x 12")
Discharge pipe in good conditionPump 1 - Concrete support is ok & mechanical seals have been repaintedFeeding in Sodium Nitrate from a 3000 gallon tank Has chemical blockSump pump in corner downstream with floatHandrails are goodMilltronics - MultirangerGenerator Hook upPer JWSC employee this station gets the worst flow and has the worst odor3 different pump sizes was the original design - per JWSC employeeAt time of visit small pump was set as 2nd lag pump, so it is not used
(although it will operate & is exercised)Pumps do not alternate automaticallyAlways starts with pump 1, pump 2 rarely used & pump 3 is never usedPump 2:
10" suction in good/fair condition and has been paintedConcrete support is in good condition No corosion on discharging pipe, except at the top of the plug valve Paint is peeling on discharge pipe and around the bottom riser pipe.
Pump 3:Seal leaking12" suction pipe down to an 8" on pump with alittle corrosionSeal water drains Pump support in ok conditionValves goodDischarging pipe is in good conditionSome corrosion on pump
Per JWSC staff - 2009 - pump order is now 20 Hp lead; 60 Hp 1st lag; 100 Hp 2nd lagPer JWSC staff - 2009 - only the breakers and motor starters (if starting across line) are used in MCC; rest of MCC is empty
JWSC LS 4036 Site Evaluation Photos June 19, 2008


JWSC Lift Station Evaluations6/18/2008
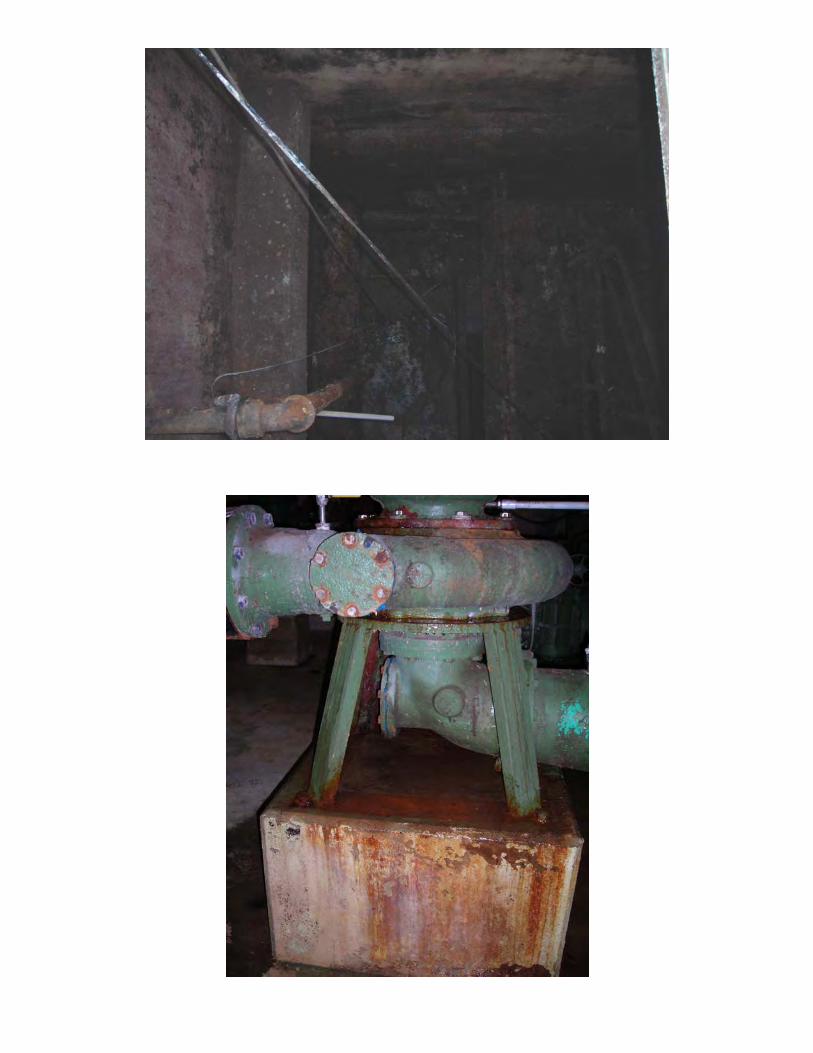
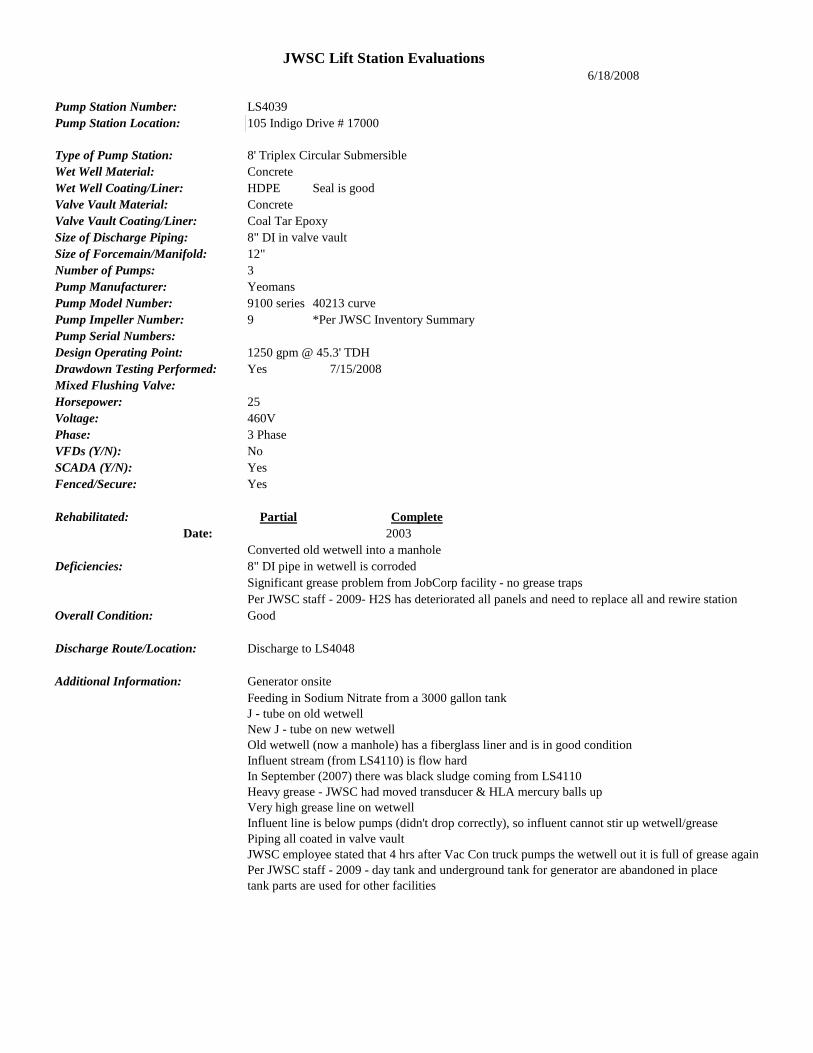
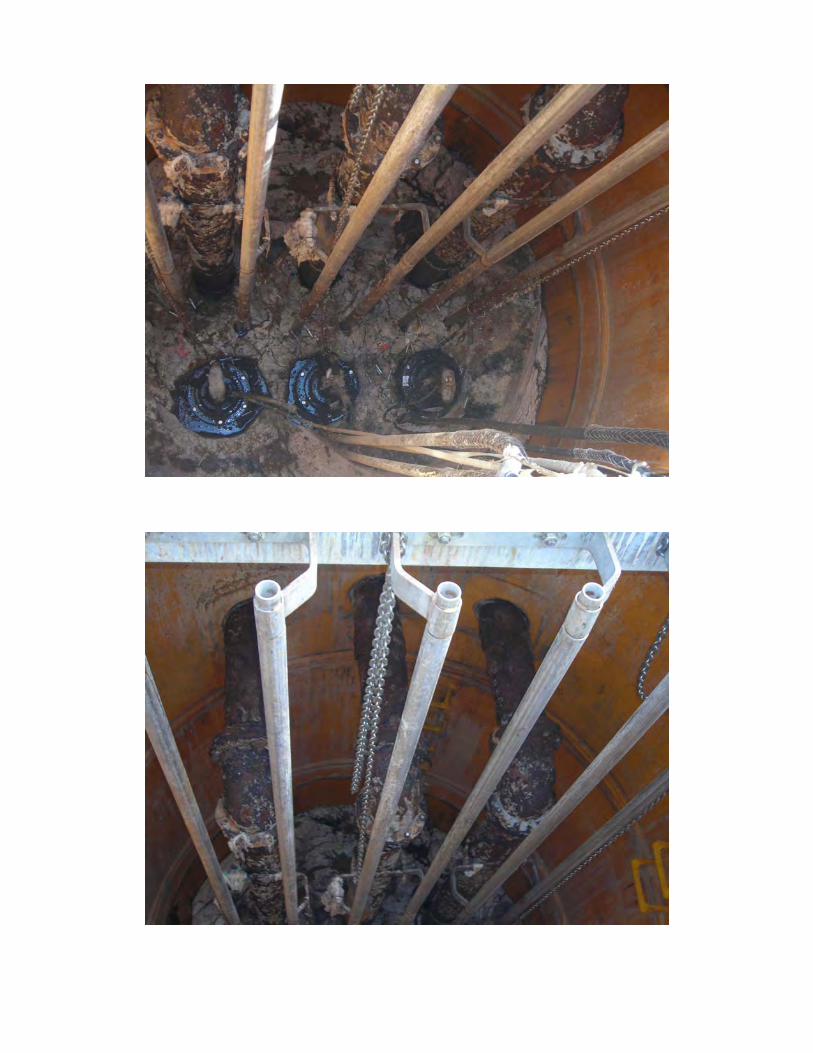
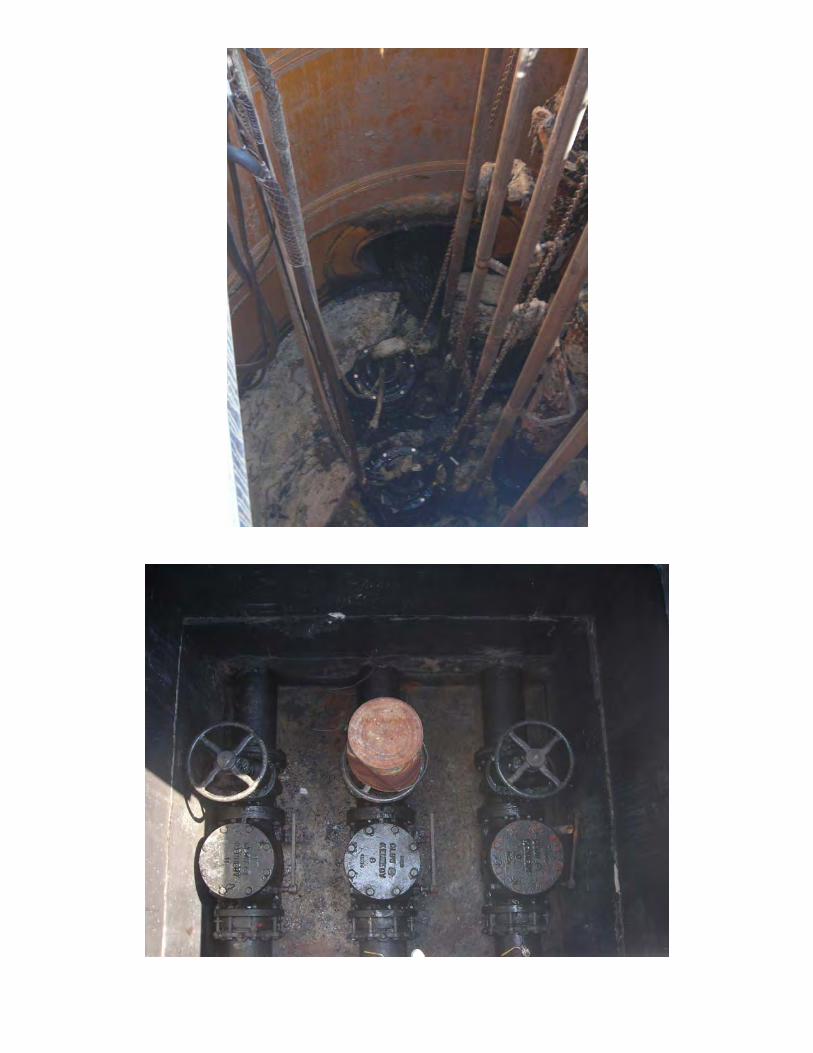
Pump Station Number: LS4039Pump Station Location: 105 Indigo Drive # 17000
Type of Pump Station: 8' Triplex Circular SubmersibleWet Well Material: ConcreteWet Well Coating/Liner: HDPE Seal is goodValve Vault Material: ConcreteValve Vault Coating/Liner: Coal Tar EpoxySize of Discharge Piping: 8" DI in valve vaultSize of Forcemain/Manifold: 12"Number of Pumps: 3Pump Manufacturer: YeomansPump Model Number: 9100 series 40213 curvePump Impeller Number: 9 *Per JWSC Inventory SummaryPump Serial Numbers:Design Operating Point: 1250 gpm @ 45.3' TDHDrawdown Testing Performed: Yes 7/15/2008Mixed Flushing Valve:Horsepower: 25Voltage: 460VPhase: 3 PhaseVFDs (Y/N): NoSCADA (Y/N): YesFenced/Secure: Yes
Rehabilita :ted Partial CompleteDate: 2003
Converted old wetwell into a manholeDeficiencies: 8" DI pipe in wetwell is corroded
Significant grease problem from JobCorp facility - no grease trapsPer JWSC staff - 2009- H2S has deteriorated all panels and need to replace all and rewire station
Overall Condition: Good
Discharge Route/Location: Discharge to LS4048
Additional Information: Generator onsiteFeeding in Sodium Nitrate from a 3000 gallon tank J - tube on old wetwellNew J - tube on new wetwellOld wetwell (now a manhole) has a fiberglass liner and is in good conditionInfluent stream (from LS4110) is flow hardIn September (2007) there was black sludge coming from LS4110Heavy grease - JWSC had moved transducer & HLA mercury balls upVery high grease line on wetwellInfluent line is below pumps (didn't drop correctly), so influent cannot stir up wetwell/greasePiping all coated in valve vaultJWSC employee stated that 4 hrs after Vac Con truck pumps the wetwell out it is full of grease againPer JWSC staff - 2009 - day tank and underground tank for generator are abandoned in placetank parts are used for other facilities

JWSC LS 4039 Site Evaluation Photos June 18, 2008


JWSC Lift Station Evaluations6/19/2008
Pump Station Number: LS4048Pump Station Location: 3983 Darien Highway #17000
Type of Pump Station: 14.8'x13.3 Triplex Rectangular SubmersibleWet Well Material: Concrete RectangularWet Well Coating/Liner: Spray on Bubble lookingValve Vault Material: Concrete Valve Vault Coating/Liner: Coal tar GratedSize of Discharge Piping: 12" DISize of Forcemain/Manifold: 12"Number of Pumps: 3Pump Manufacturer: FlygtPump Model Number: CP3201Pump Impeller Number: 638Pump Serial Numbers:Design Operating Point: 2100 *Per JWSC Inventory SummaryDrawdown Testing Performed: Yes 7/15/2008Horsepower: 35Voltage: 460Phase: 3VFDs (Y/N): NoSCADA (Y/N): YesFenced/Secure: Yes Chain linkLighting: No
Rehabilita :ted Partial CompleteDate: Yes
New Liners, pumps and bases installedPumps 1 and 3 have new wear ringsPump 2 has a new impeller and stationary ring
Deficiencies: Strong odors (Per JWSC staff - 2009 - odors have been eliminated by placement of chemicals in upstream stationsSpray on liner is bubbled and corroding off particularly at pump on and storage elevationLittle rust on guide railsPiping in valve pit is badly corroded and all the paint is peeling offCorrosion around top of wetwell and lid (Per JWSC staff because of way liner installed)
Overall Condition: Fair
Discharge Route/Location: Manifolds with LS4028 and LS4006 and discharges upstream of LS4005
Additional Information: Built in 1987Receives flow from LS4039 (NE side I-95)3000 gallon tank of Sodium Nitrate feed into the wetwellPiping has coating and look to be in ok conditionValve pit has grating4 companies have tried to feed chemicalsTAC 2 Data Flow SystemsCan't get transducer to work due to a treeGenerator on siteHas operating flow meter under transfer switch panelManhole inside fence, but could not locatePossibility that manhole is outside fence and feeds straight to wetwellNo RPZInfluent is full flow and coming in fast - according to JWSC employee this is typical

Additional Information: Overhang/cover over electrical panelsEye WashHose BibbNo more greaseFiberglass insert at top of wetwell in good condition

JWSC LS 4048 Site Evaluation Photos June 19, 2008


JWSC Lift Station Evaluations6/17/2008
Pump Station Number: LS4105Pump Station Location: 10 Cate Service Road
Type of Pump Station: 8' Duplex Circular SubmersibleWet Well Material: ConcreteWet Well Coating/Liner: Coal Tar Worn off in a lot of spots with some corrosionValve Vault Material: ConcreteValve Vault Coating/Liner: NoneSize of Discharge Piping: DI CorrodedSize of Forcemain/Manifold: 8"Number of Pumps: 2Pump Manufacturer: FlygtPump Model Number: CP3127Pump Impeller Number: 432Pump Serial Numbers:Design Operating Point: 400 gpm @ 44' TDHDrawdown Testing Performed: YesHorsepower: 10 Hp Motor Data:Voltage: 230V 1750 RpmPhase: 3VFDs (Y/N): NoSCADA (Y/N): YesFenced/Secure: Yes
Rehabilita :ted Partial CompleteDate: No
Deficiencies: Check valve leaking - significantly when pump is onPipes and valves in valve vault are corroded significantlyJ-tube end has been corroded offGuide rails have some corrosionCoal tar coating is gone - groundwater leaksRebar is exposed on top of wet well slab near hatchWetwell top slab is off set and above grade with the grout and seal chipping off
Overall Condition: Fair - Poor Lots of corrosion
Discharge Route/Location: Discharges upstream of LS4036
Additional Information: Hose bibbs, but no RPZJunction manhole outside fence with above ground topDI J-tubeBioxide in HDPE tank is being feed into wetwellGrease ring around wetwellRound valve vault with hatch

JWSC LS 4105 Site Evaluation Photos June 17, 2008

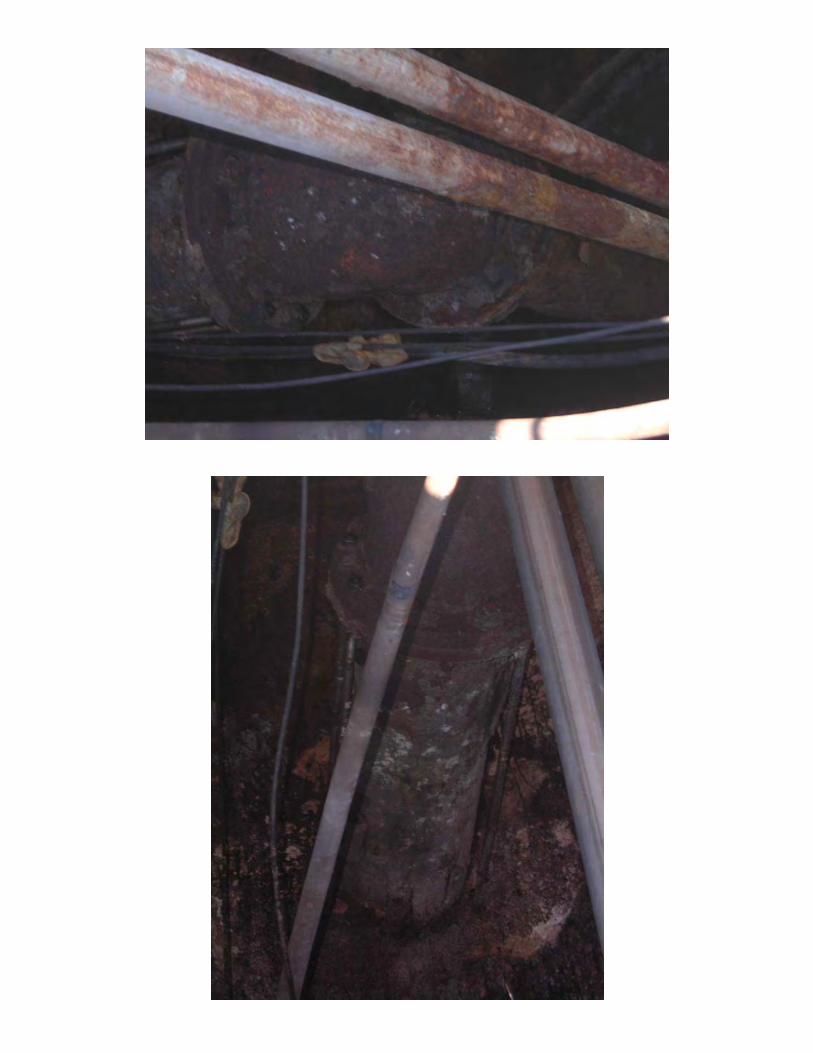


JWSC Lift Station Evaluations6/17/2008
Pump Station Number: LS4107Pump Station Location: 1430 Cate Road
Type of Pump Station: 6' Duplex Circular SubmersibleWet Well Material: Concrete Top slab of wetwell is crackedWet Well Coating/Liner: Coal Tar There is a band of clear concrete midway upValve Vault Material: ConcreteValve Vault Coating/Liner: NoneSize of Discharge Piping: 4"Size of Forcemain/Manifold: 6"Number of Pumps: 2Pump Manufacturer: FlygtPump Model Number: CP3102Pump Impeller Number: 434Pump Serial Numbers:Design Operating Point: 300 gpm @ 17' TDHDrawdown Testing Performed: YesHorsepower: 5 HpVoltage: 230Phase: 3VFDs (Y/N): NoSCADA (Y/N): YesFenced/Secure: YesLighting: Service Pole
Rehabilita :ted Partial CompleteDate: No
Deficiencies: Hatch not set flush on wetwell - locked but gap allowing odors to escapeOpening/crack in concrete around J tubeCorrosion on pipes in valve vault from ground waterExcessive standing water in valve pitCoal tar coating is coming off of interior of wet wellControl panel frame is leaningMild corrosion on guide rails and DI pipes in wetwellValves will not close
Overall Condition: Fair to Good
Discharge Route/Location: Discharges upstream of LS4105
Additional Information: Older stationDI J tube ventNo RPZ - hose bibbsRound valve pit Sump with float that is not onWater in valve vault is below pipesLots of grease, but JWSC has maintenance program to remove grease in wetwellWorks on floats

JWSC LS 4107 Site Evaluation Photos June 17, 2008


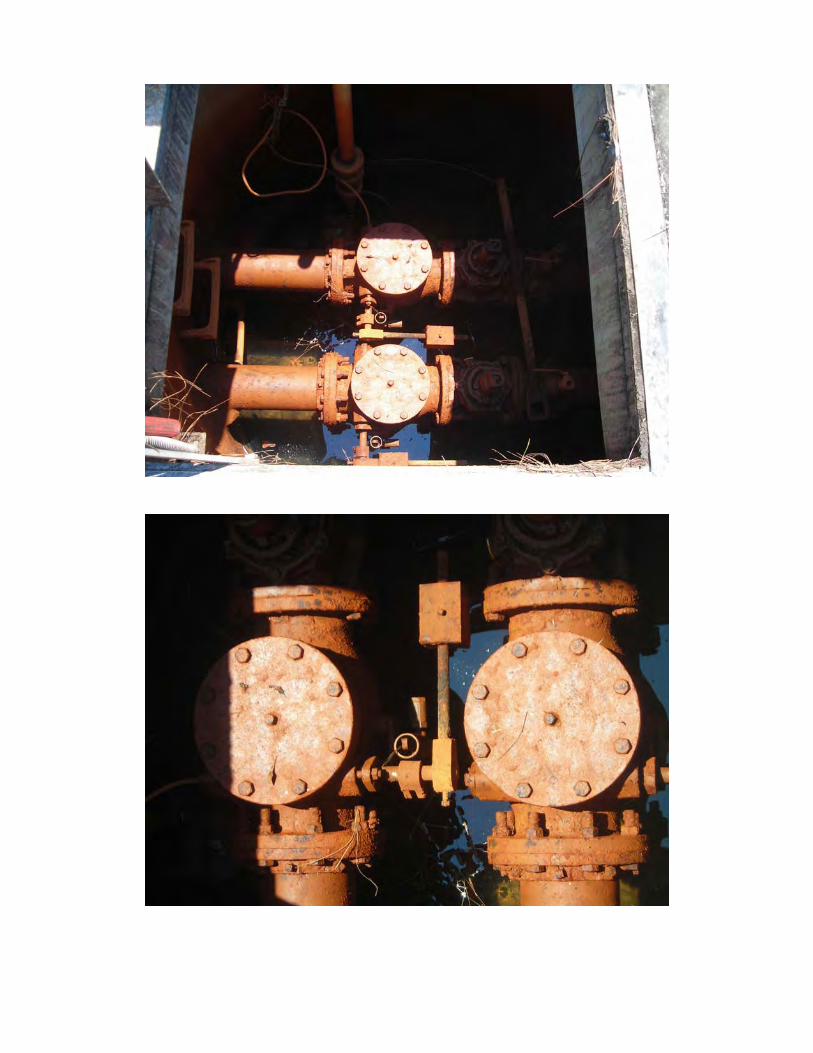

JWSC Lift Station Evaluations6/18/2008
Pump Station Number: LS4109Pump Station Location: 1601 Glynco Parkway
Type of Pump Station: 12' Duplex Circular SubmersibleWet Well Material: ConcreteWet Well Coating/Liner: None Had coal tar epoxy, but looks like it deteriorated awayValve Vault Material: ConcreteValve Vault Coating/Liner: Coal TarSize of Discharge Piping: 6" DI Size of Forcemain/Manifold: 6" DI Number of Pumps: 2Pump Manufacturer: FlygtPump Model Number: CP3102Pump Impeller Number: 435Pump Serial Numbers:Design Operating Point:Drawdown Testing Performed: Yes 22-Jul-08Horsepower: 5 Hp Motor Data:Voltage: 230 13 AmpPhase: 1VFDs (Y/N): NoSCADA (Y/N): YesFenced/Secure: YesLighting: No
Rehabilita :ted Partial CompleteDate: X
Up for rehab - design is by JJ&G
Deficiencies: Guiderails about to collapse due to amount of corrosionBad corrosion on discharging pipeFluffy corrosion over influent pipe in wetwell
Overall Condition: Poor (Entire LS rehabilitation completed in 2009)
Discharge Route/Location: Discharges upstream of LS4039
Additional Information: Manhole on siteJ tube vent on wetwellBig hole on site for workHad been feeding Bioxide - not anymore (USFilter)For about 1 month they have been feeding in new solution to wetwell discharge piping (ANUE Env.)Wetwell clear - no greaseUnable to perform deadhead testing - can't close valves18" influent pipe

JWSC LS 4109 Site Evaluation Photos June 18, 2008


JWSC Lift Station Evaluations6/18/2008
Pump Station Number: LS4110Pump Station Location: 2712 Altamaha Boulevard
Type of Pump Station: 8' Duplex Circular SubmersibleWet Well Material: ConcreteWet Well Coating/Liner: HDPE WhiteValve Vault Material: ConcreteValve Vault Coating/Liner: No CoatingSize of Discharge Piping: 6" DI Size of Forcemain/Manifold: 8"/12"Number of Pumps: 2Pump Manufacturer: FlygtPump Model Number: CP3300Pump Impeller Number: 464Pump Serial Numbers:Design Operating Point:Drawdown Testing Performed: Yes 9/19/2008Horsepower: 88Voltage: 460 V Phase: 3VFDs (Y/N): NoSCADA (Y/N): YesFenced/Secure: Yes Chain link fence with barb wireLighting: Yes on service pole
Rehabilita :ted Partial CompletepDate: N/A
Deficiencies: Influent pipe is below "Pump On" elevation - causes water to back up in systemDI pipes severely corroded in wetwell & valve vaultCorrosion in valve vault due to standing water - clear drainErosion on site (mainly around bypass and gate) Needs to be regraded with gravel laid downHose bibbs from well are corroded
Overall Condition: Fair - Good
Discharge Route/Location: Discharges upstream of LS4039
Additional Information:Plastic J tube ventHose bibbs & RPZBypass with 6" discharge behind valve vaultSeals look pretty good on HDPE Doesn't appear to be any I&I around pipesls press. Transducer on RPZ, but there is a small well @ siteNo water @ site when lift station was constructed12" fm into wetwell @ top 6" pipe below that is approximately 18" below pump on level and stays submergedBioxide Tank on site that was used for a trial period, but is offline because it didn’t resolve the H2S

JWSC LS 4110 Site Evaluation Photos June 18, 2008

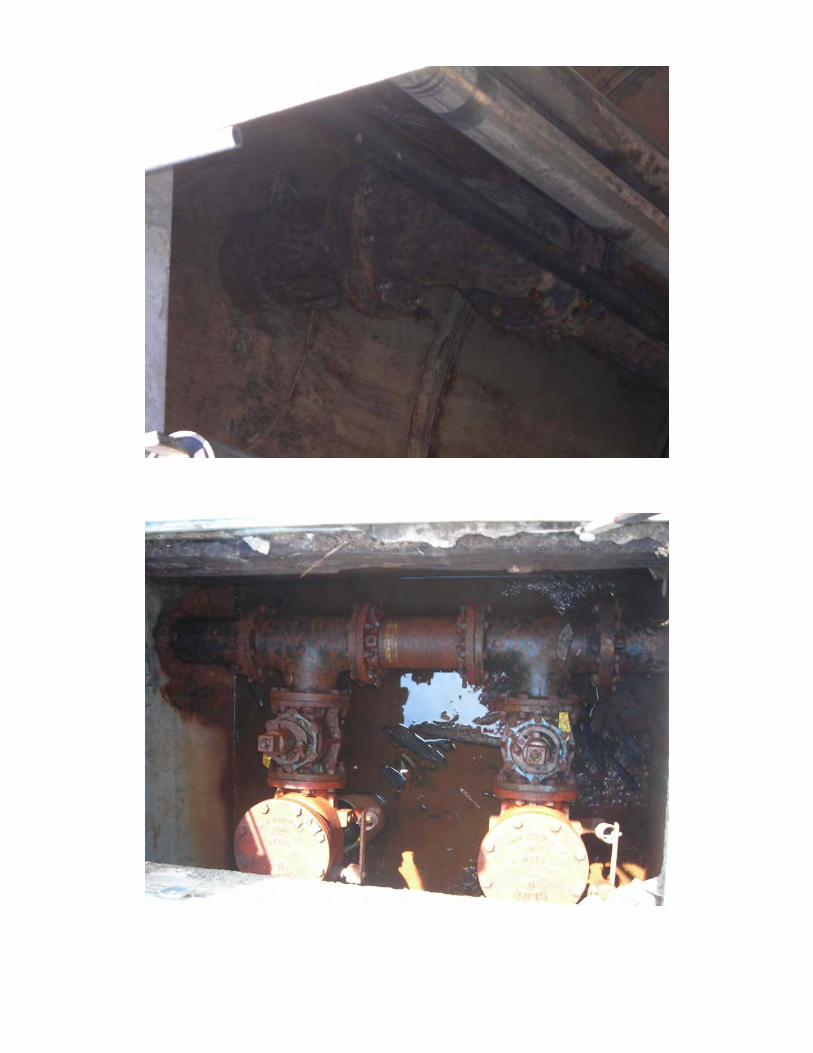


b
JWSC Lift Station Evaluations6/18/2008
Pump Station Number: LS4118Pump Station Location: 105 Shell Road
Type of Pump Station: 10' Duplex Circular SubmersibleWet Well Material: ConcreteWet Well Coating/Liner: HDPE Valve Vault Material: ConcreteValve Vault Coating/Liner: No CoatingSize of Discharge Piping: 8" DI Size of Forcemain/Manifold: 8" DI Number of Pumps: 2Pump Manufacturer: FlygtPump Model Number: CP3140Pump Impeller Number: 436Pump Serial Numbers: 180-0260077Design Operating Point: 700 gpm @ 40' TDHDrawdown Testing Performed: Start up DD TestHorsepower: 15 HpVoltage: 230Phase: 3VFDs (Y/N): No SCADA (Y/N): YesFenced/Secure: YesLighting: Yes Service Pole
R h bilit t dReha ilita : P ti lted Partial C l tCompleteDate: N/A
Deficiencies: HDPE liner - one of electrical pipe penetration seal is badLittle rust on DI discharge pipe in wet well
Overall Condition: Good
Discharge Route/Location: Discharges to LS4110
Additional Information: Steady flow in - influentPlastic J tube ventHose bibbs & RPZBypass with 6" suction & 6" discharge in valve vault

JWSC LS 4118 Site Evaluation Photos June 18, 2008
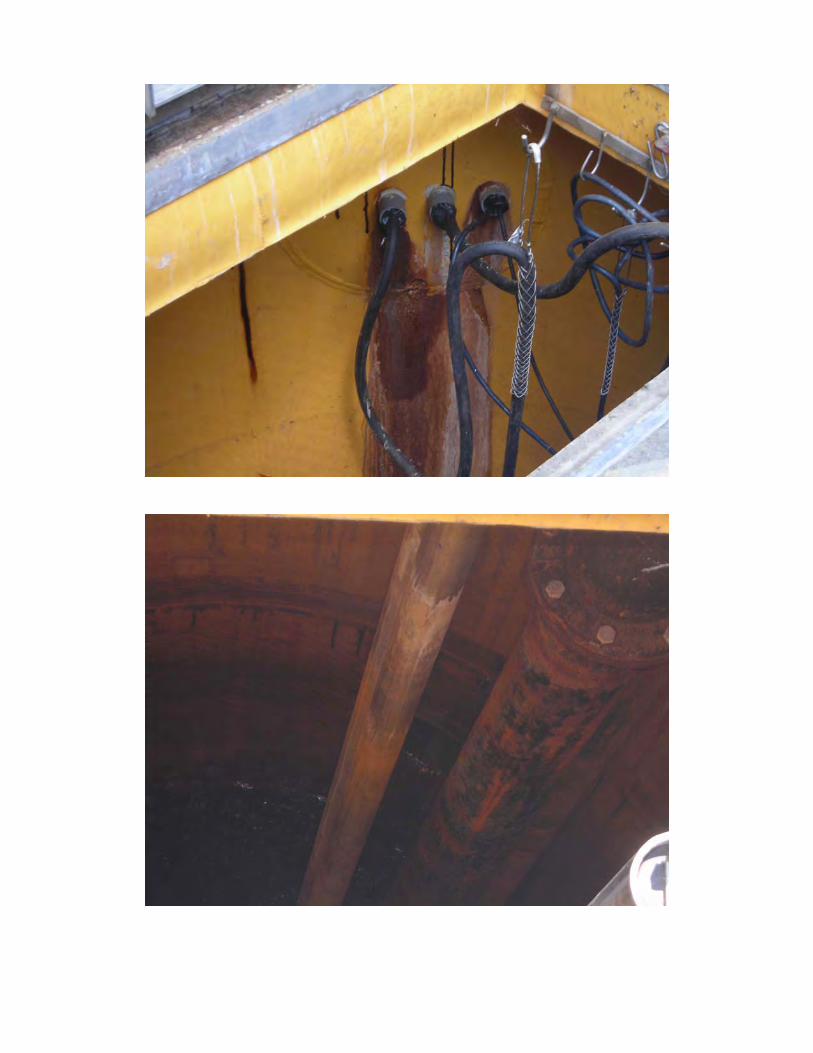

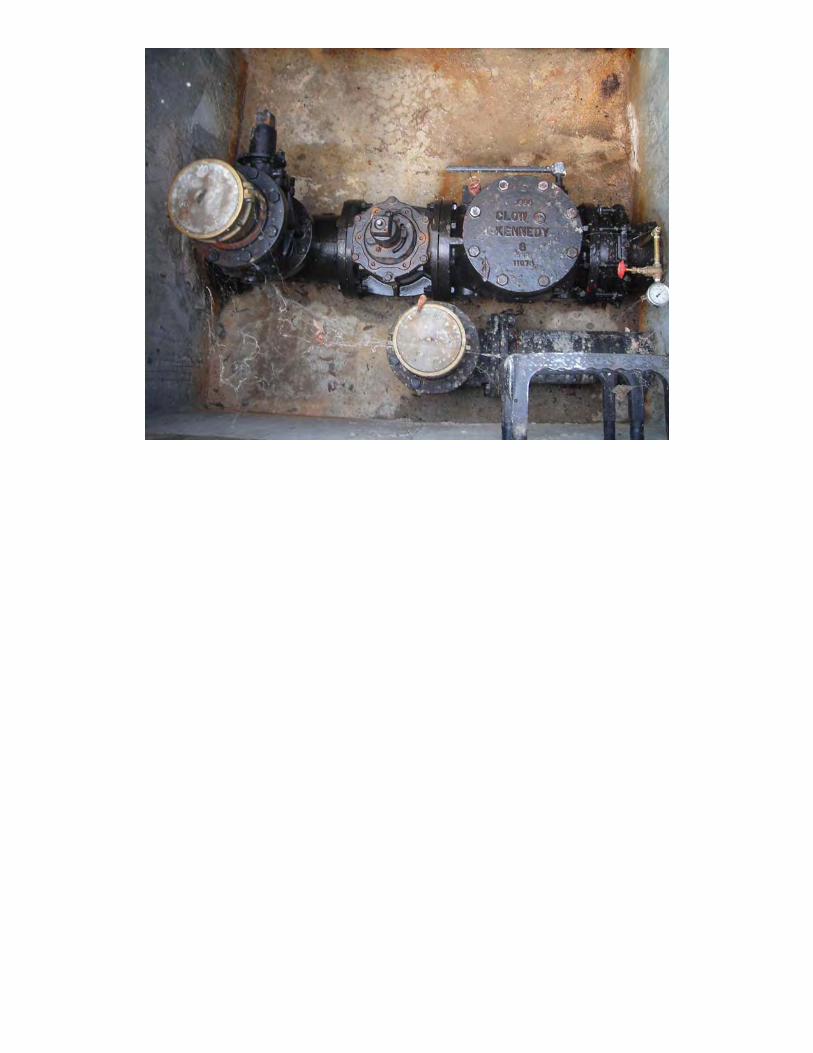

JWSC Lift Station Evaluations6/17/2008
Pump Station Number: LS4119Pump Station Location: 7175 Golden Isles Parkway
Type of Pump Station: 8' Duplex Circular SubmersibleWet Well Material: ConcreteWet Well Coating/Liner: HDPE WhiteValve Vault Material: ConcreteValve Vault Coating/Liner: No CoatingSize of Discharge Piping: 6" DI in valve vaultSize of Forcemain/Manifold: 12"Number of Pumps: 2Pump Manufacturer: FlygtPump Model Number: CP3127Pump Impeller Number: 484Pump Serial Numbers: 180-0260973Design Operating Point: 320 gpm @ 53' TDHDrawdown Testing Performed: YesHorsepower: 10 HpVoltage: 230Phase: 3RPM: 1745 RPMVFDs (Y/N): NoSCADA (Y/N): YesFenced/Secure: Yes Fence with barb wireLighting: Yes On service pole
Rehabilita :ted Partial CompleteDate: N/A
Deficiencies: HDPE seals are not too bad, but appears to be some inflow around pump discharge penetration (Ramneck is bleeding thru)Corrosion on some DI piping in wetwell
Overall Condition: Good
Discharge Route/Location: Discharges to gravity sewer upstream of LS4118
Additional Information: Possible I&I from Sweetwater NeighborhoodBypass with 6" suction & 6" discharge in valve vaultJ-tube vent pipeHose Bibb & RPZ outsideJunction manhole on siteConstructed 2002Press. Transducer on RPZ feed to SCADAMultitrode hook up

JWSC LS 4119 Site Evaluation Photos June 17, 2008

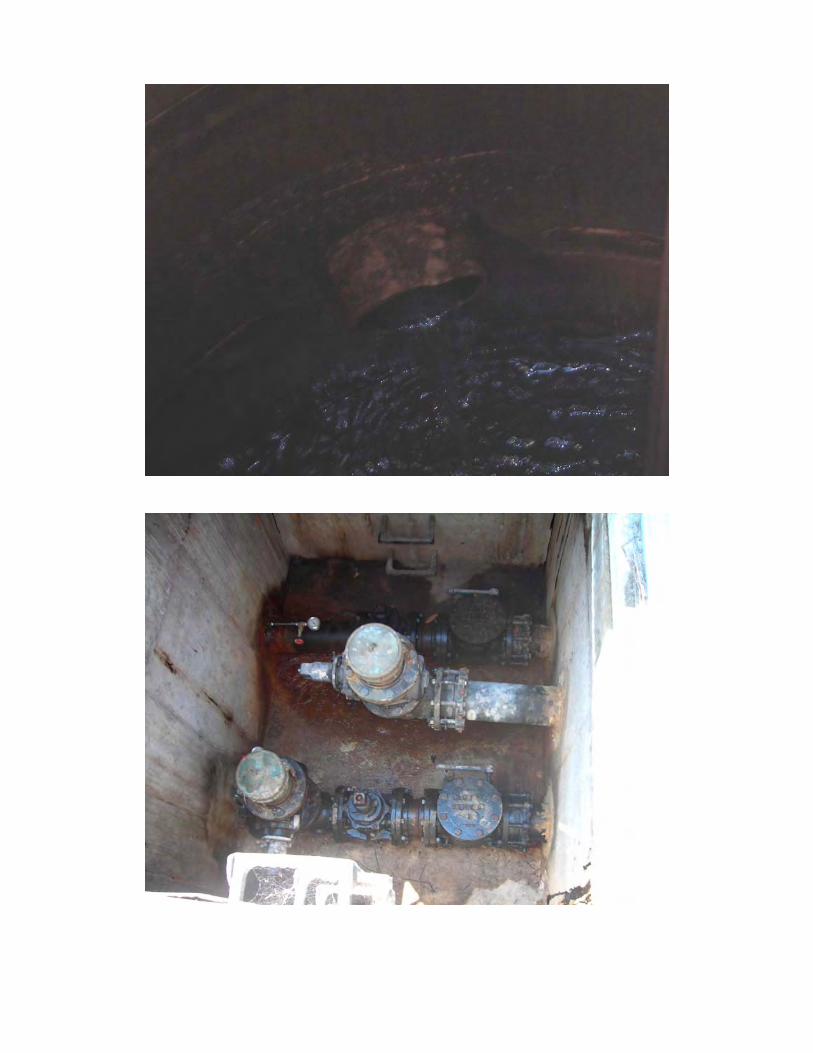
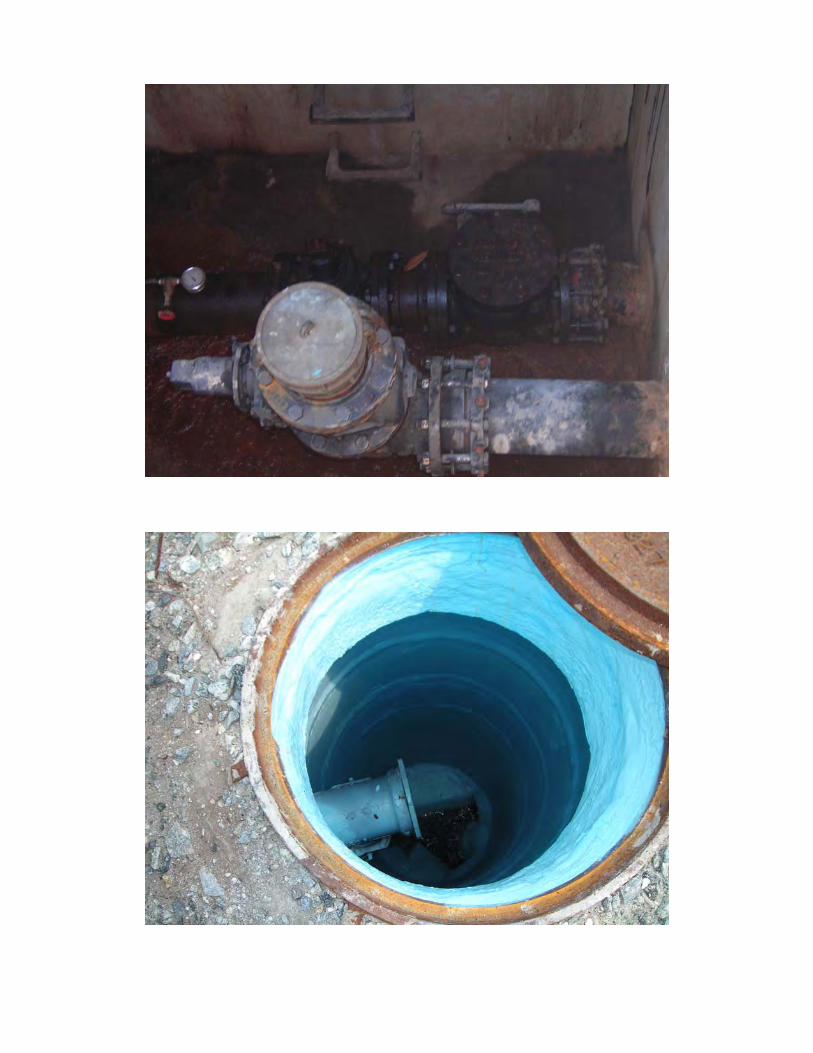

JWSC Lift Station Evaluations6/17/2008
Pump Station Number: LS4126Pump Station Location: 435 McKenzie Drive
Type of Pump Station: 10' Triplex Circular SubmersibleWet Well Material: ConcreteWet Well Coating/Liner: HDPE seal issuesValve Vault Material: ConcreteValve Vault Coating/Liner: No CoatingSize of Discharge Piping: 4"Size of Forcemain/Manifold: 6" in valve vault; 10" down lineNumber of Pumps: 3Pump Manufacturer: FlygtPump Model Number: CP 3152 Pump Impeller Number: 488Pump Serial Numbers: 0710175,74,73Design Operating Point: 667 gpm @ 53 TDHDrawdown Testing Performed: Not enough flowHorsepower: 15 HpVoltage: 460 VPhase: 3VFDs (Y/N): NoSCADA (Y/N): YesFenced/Secure: Yes Chain links
Rehabilita :ted Partial CompleteDate: N/A
Deficiencies: HDPE seams on some pipe penetration allowing leaks - not bad
Overall Condition: Good
Discharge Route/Location: Manifolds with Hermitage Island LS and discharges to LS4127
Additional Information: 316 SS pipe in wetwell Soft StartsJ-tube vent pipeBypass with 6" suction & 6" discharge Hose Bibb & Back flow preventorsJunction manhole @ drivewaySizing odd: 15 Hp but triplex with 4" dischargeNew stationPer JWSC employee only runs about 1 - 2 times a day
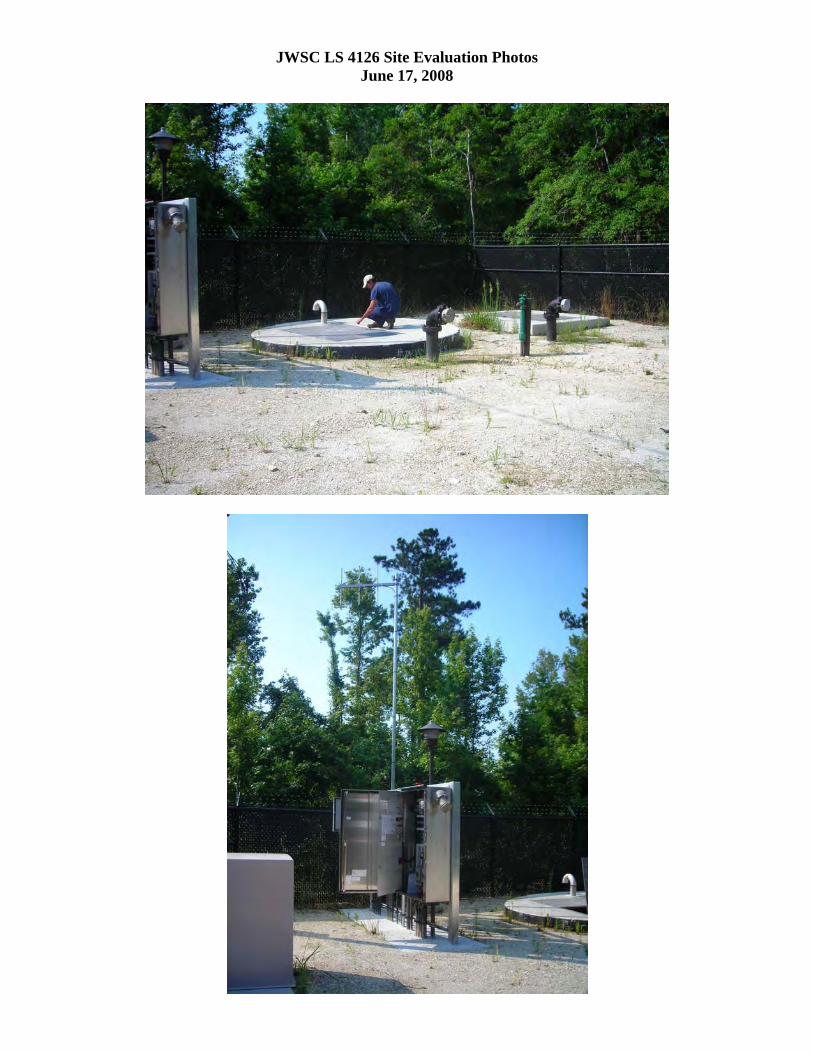
JWSC LS 4126 Site Evaluation Photos June 17, 2008

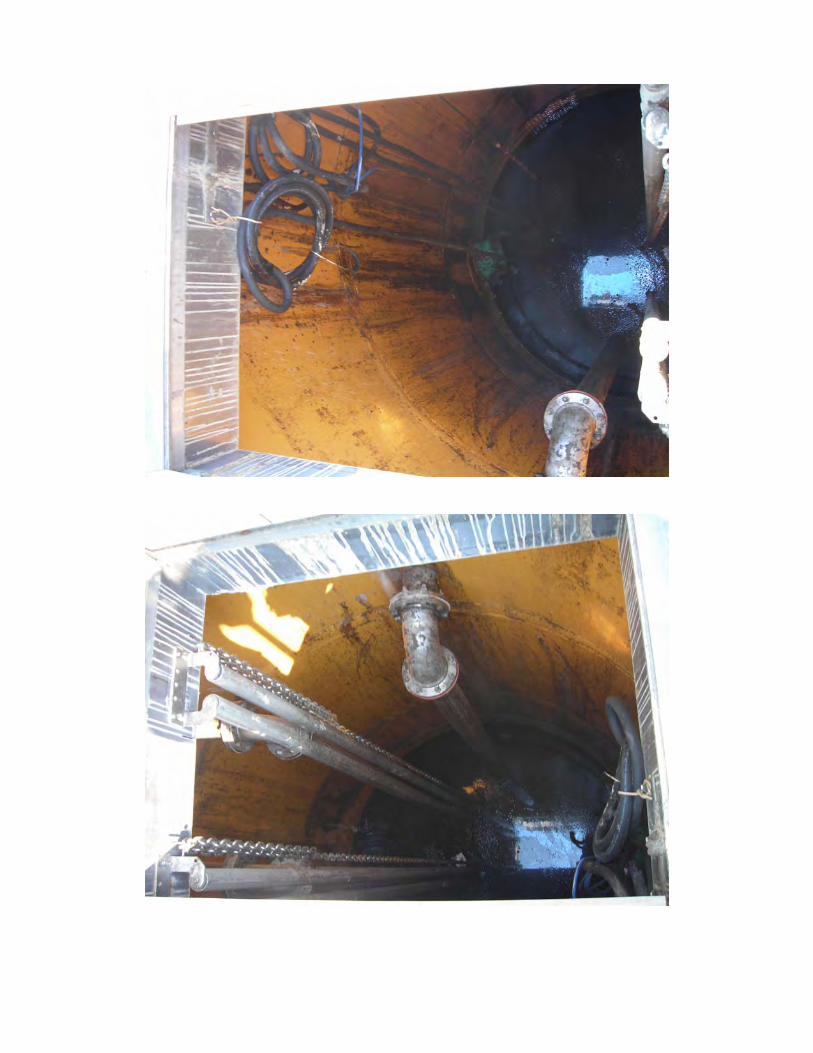
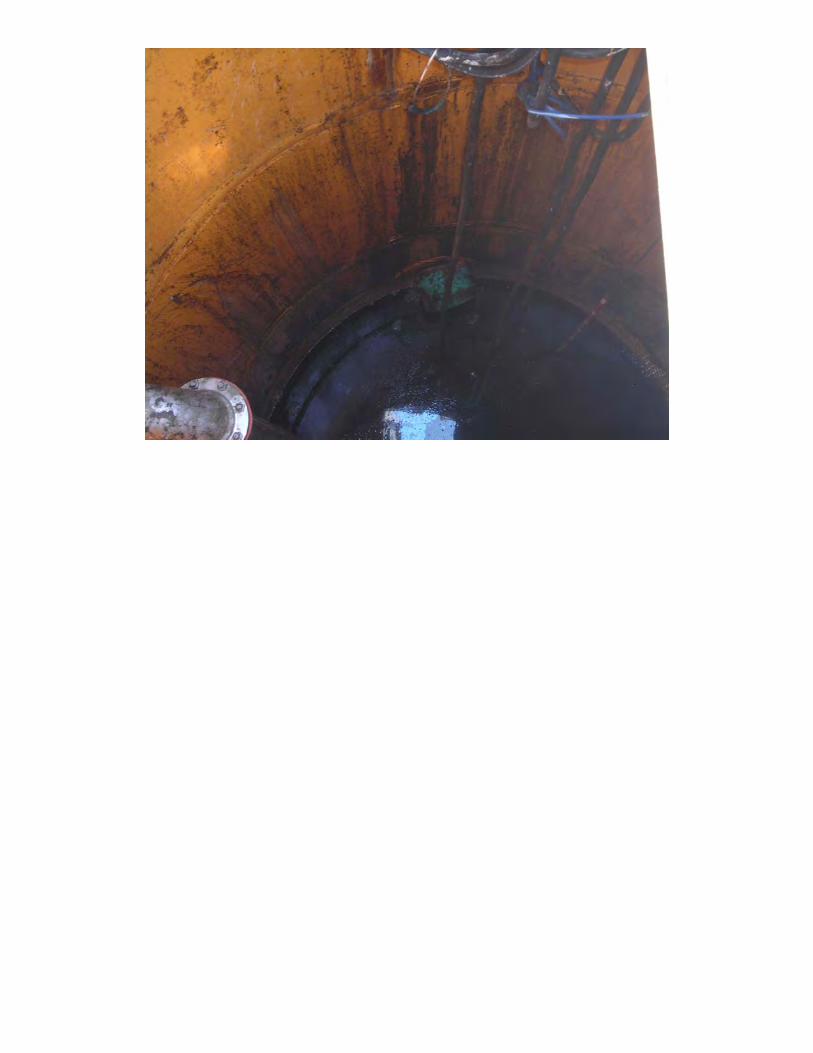
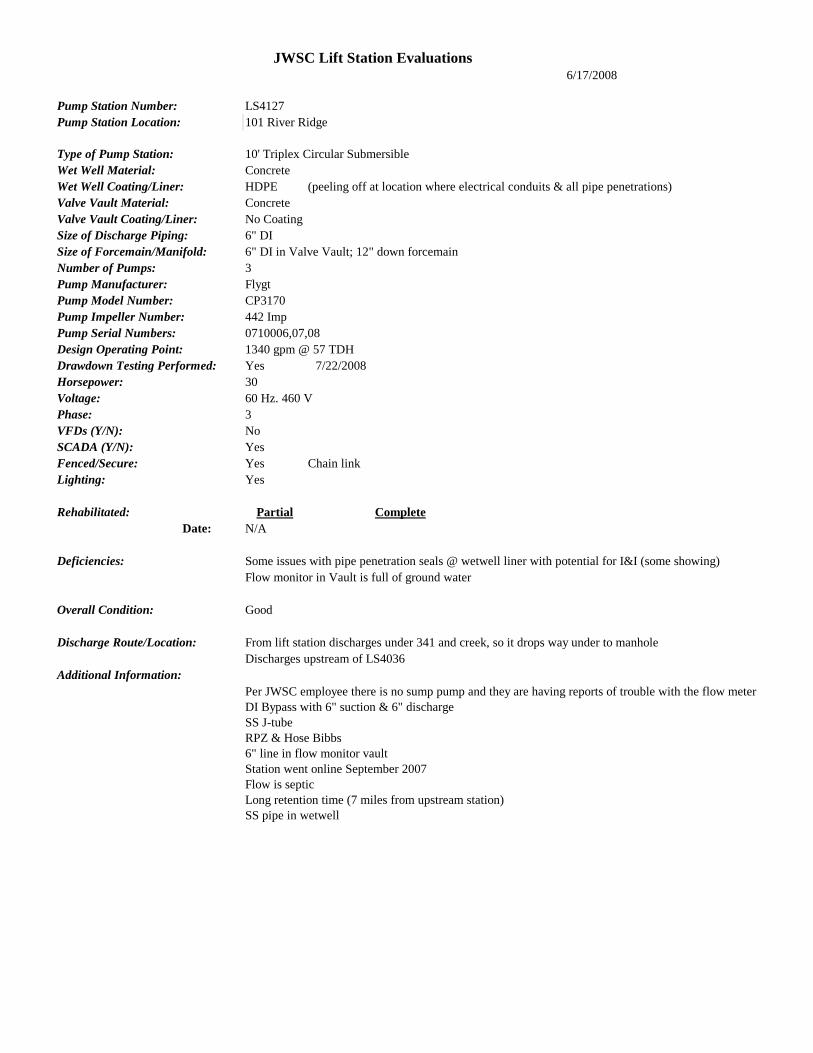
JWSC Lift Station Evaluations6/17/2008
Pump Station Number: LS4127Pump Station Location: 101 River Ridge
Type of Pump Station: 10' Triplex Circular SubmersibleWet Well Material: ConcreteWet Well Coating/Liner: HDPE (peeling off at location where electrical conduits & all pipe penetrations)Valve Vault Material: ConcreteValve Vault Coating/Liner: No CoatingSize of Discharge Piping: 6" DISize of Forcemain/Manifold: 6" DI in Valve Vault; 12" down forcemainNumber of Pumps: 3Pump Manufacturer: FlygtPump Model Number: CP3170 Pump Impeller Number: 442 ImpPump Serial Numbers: 0710006,07,08Design Operating Point: 1340 gpm @ 57 TDHDrawdown Testing Performed: Yes 7/22/2008Horsepower: 30Voltage: 60 Hz. 460 VPhase: 3VFDs (Y/N): NoSCADA (Y/N): YesFenced/Secure: Yes Chain link Lighting: Yes
Rehabilitated: Partial CompleteDate: N/A
Deficiencies: Some issues with pipe penetration seals @ wetwell liner with potential for I&I (some showing)Flow monitor in Vault is full of ground water
Overall Condition: Good
Discharge Route/Location: From lift station discharges under 341 and creek, so it drops way under to manholeDischarges upstream of LS4036
Additional Information:Per JWSC employee there is no sump pump and they are having reports of trouble with the flow meterDI Bypass with 6" suction & 6" discharge SS J-tubeRPZ & Hose Bibbs6" line in flow monitor vaultStation went online September 2007Flow is septic Long retention time (7 miles from upstream station)SS pipe in wetwell

JWSC LS 4127 Site Evaluation Photos June 17, 2008


JWSC Lift Station Evaluations6/16/2008
Pump Station Number: LS3101Pump Station Location: 293 Southport Parkway
Type of Pump Station: 8' Triplex Circular Submersible Only 2 pumps installedWet Well Material: ConcreteWet Well Coating/Liner: Epoxy/HDPE White coatingValve Vault Material: ConcreteValve Vault Coating/Liner: Coal TarSize of Discharge Piping: 4" SS Transfers to DI from SS outside of wetwell and before valve vaultSize of Forcemain/Manifold: 6" out of LS and 8" when manifolds with LS3114Number of Pumps: 2Pump Manufacturer: FlygtPump Model Number: CP3152Pump Impeller Number: 432 434 *Per Ray Inventory SummaryPump Serial Numbers: 180-0560083 / 180-0520052Design Operating Point: 780 gpm @ 60' TDHDrawdown Testing Performed: 7/23/2008 9:00 AMHorsepower: 20Voltage: 230Phase: 3VFDs (Y/N): Yes 0 to 60 Hz 0.3 secSCADA (Y/N): YesFenced/Secure: Yes Chain linkLighting: YesBypass: Suction and discharge
Rehabilita :ted Partial CompletepDate: 2006 X
Deficiencies: Some corrosion on discharge pipe and guide rails where level fluctuatesLiner is peeling off at seam near the bottom of wetwell where the storage volume & levels fluctuateWetwell liner is peeling off around discharge pipe penetrationLiner may have coal tar under itBottom of influent pipe looks eaten outLeads for mercury balls are not through wetwell & in conduits - they are just laid under hatch causing crimping in the lines
Overall Condition: Fair - Good - looks to be relatively newCoating/liner in poor condition considering only 2 yrs old
(Per JWSC staff - 2009 - liner rehab/replacement completed)Discharge Route/Location: To Exit 29 WPCP
Additional Information: Only 2 pumps installedPump No. 1 not installedCan only run 1 pump under generator power per label on control panelLiner may have coal tar under itMultitrode not hooked upSignificant grease/pucky No water or hose bibbsJ-tube ventCan't do dead head test

JWSC LS 3101 Site Evaluation Photos June 16, 2008

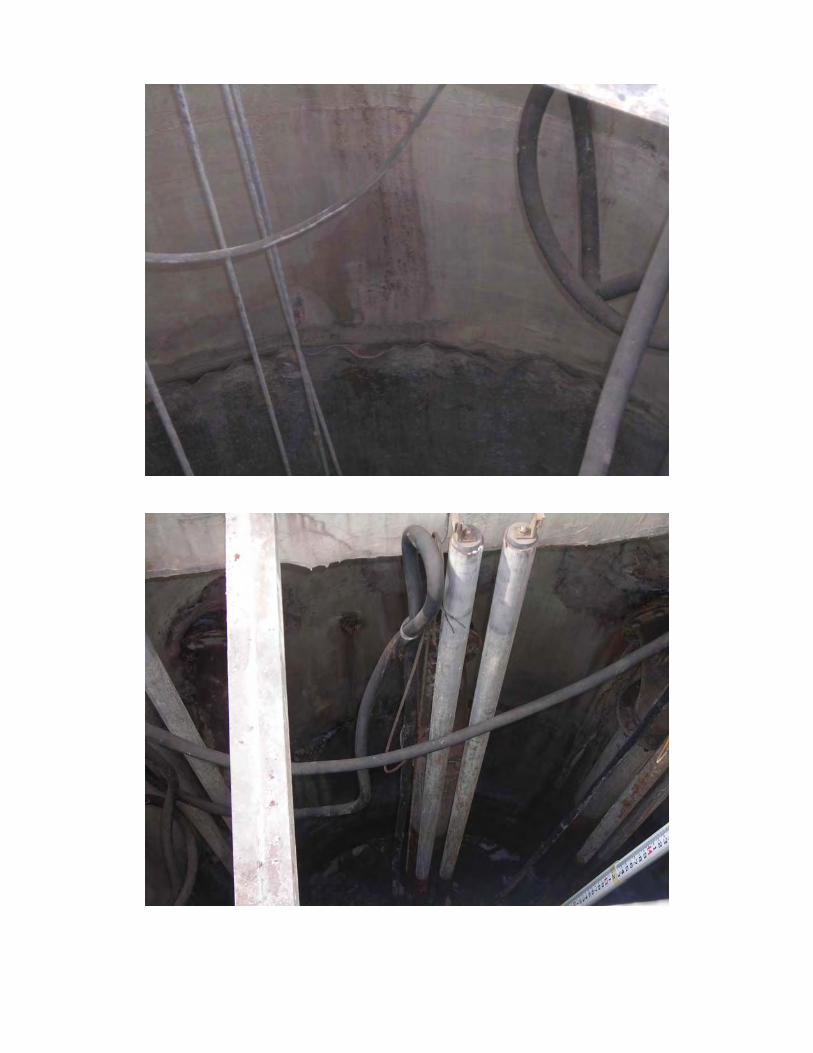

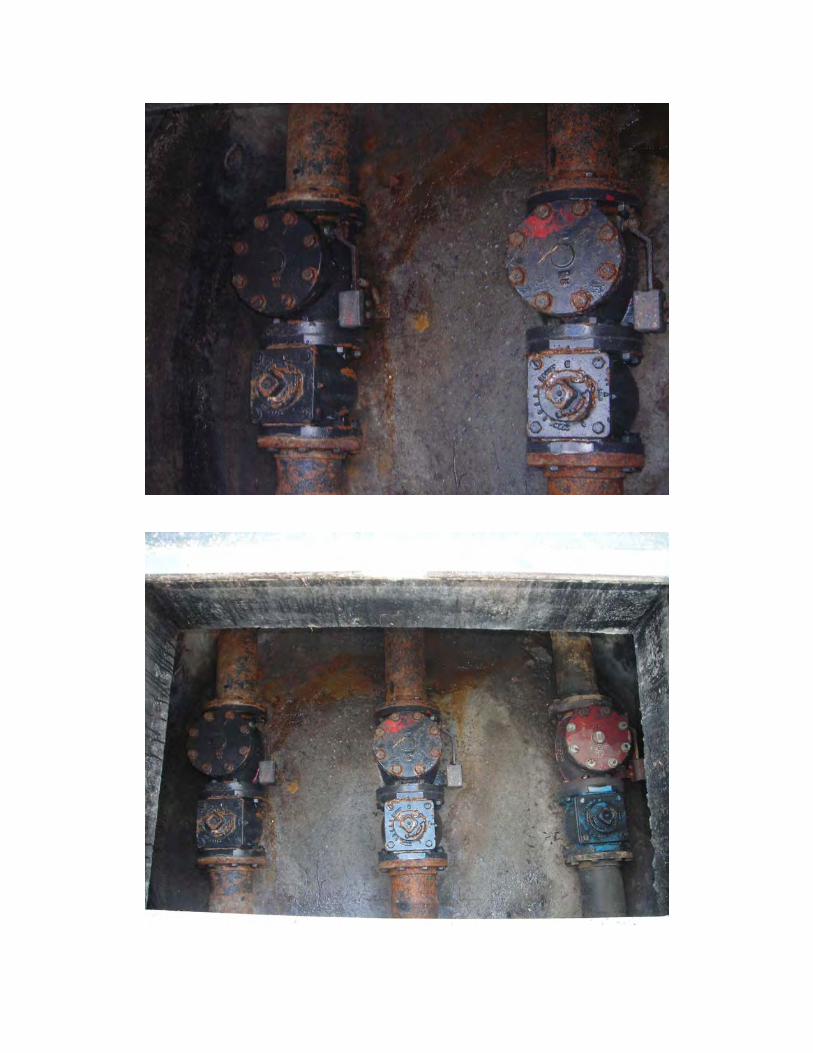

JWSC Lift Station Evaluations6/16/2008
Pump Station Number: LS3103Pump Station Location: 10 Royal Service Road
Type of Pump Station: 6' Duplex Circular SubmersibleWet Well Material: ConcreteWet Well Coating/Liner: Coal tar Some spots where coating is goneValve Vault Material: Concrete Too small to work on valves or remove them (has manhole coverValve Vault Coating/Liner: ok instead of hatch)Size of Discharge Piping: 6"Size of Forcemain/Manifold: 6"Number of Pumps: 2Pump Manufacturer: FlygtPump Model Number: CP3102Pump Impeller Number: 435Pump Serial Numbers: 090-9410110/111Design Operating Point:Drawdown Testing Performed: Yes 7/23/2008 No dead head, because the valves will not closeHorsepower: 5 Hp Written on panel Motor Data:Voltage: 230 13 Amp/1700 RpmPhase: 3VFDs (Y/N): NoSCADA (Y/N): YesFenced/Secure: Yes Chain link Lighting: None
Rehabilita :ted Partial CompletepDate:
Deficiencies: No vent on wetwellCorrosion in panelNo bypassElectric is poorTarp over top of wetwell and electric panel (funneling gas to panel)Bad corrosion on DI pipes in wetwell & on 1 set of guide railsValves will not close
Overall Condition: Fair to poor on piping
Discharge Route/Location: Discharges to gravity sewer upstream of LS3101
Additional Information: PK Nail is on top of wetwellJunction manhole on siteWater/Hose BibbsWooden frame for electricThere was a hoist, but has been pulledSeal on conduits?Need to get info from United Water

JWSC LS 3103 Site Evaluation Photos June 16, 2008


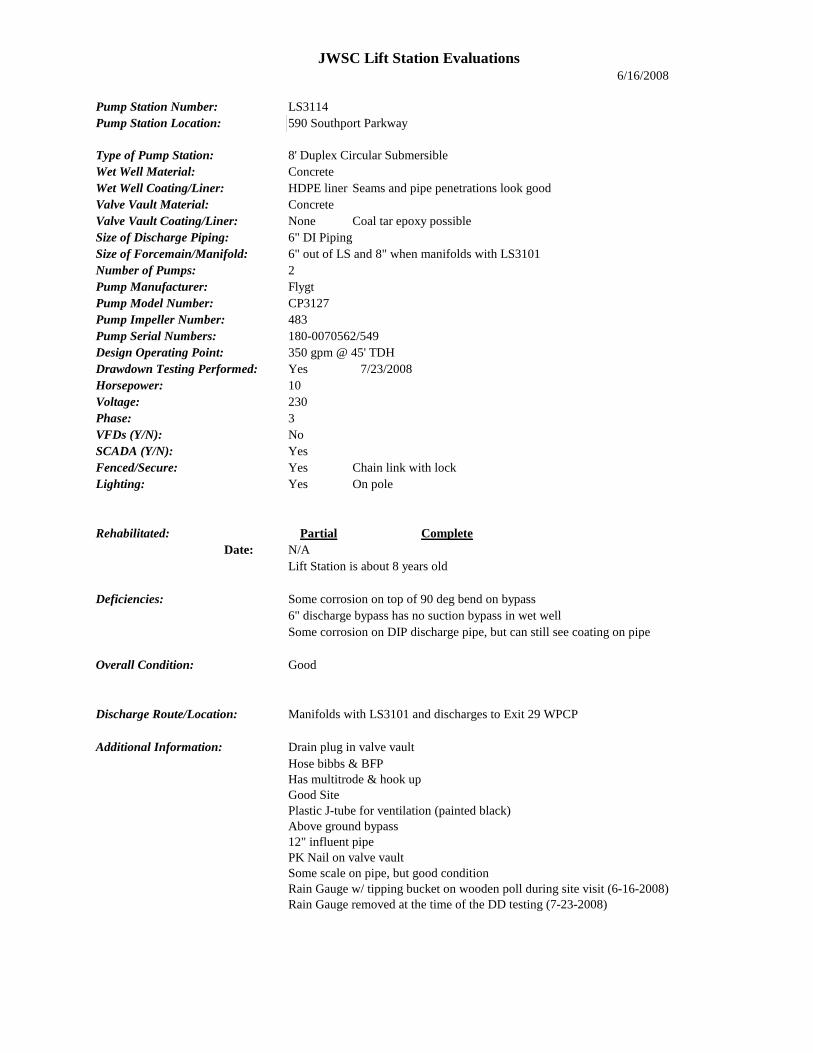
JWSC Lift Station Evaluations6/16/2008
Pump Station Number: LS3114Pump Station Location: 590 Southport Parkway
Type of Pump Station: 8' Duplex Circular SubmersibleWet Well Material: ConcreteWet Well Coating/Liner: HDPE liner Seams and pipe penetrations look goodValve Vault Material: ConcreteValve Vault Coating/Liner: None Coal tar epoxy possibleSize of Discharge Piping: 6" DI PipingSize of Forcemain/Manifold: 6" out of LS and 8" when manifolds with LS3101Number of Pumps: 2Pump Manufacturer: FlygtPump Model Number: CP3127Pump Impeller Number: 483Pump Serial Numbers: 180-0070562/549Design Operating Point: 350 gpm @ 45' TDHDrawdown Testing Performed: Yes 7/23/2008Horsepower: 10Voltage: 230Phase: 3VFDs (Y/N): No SCADA (Y/N): YesFenced/Secure: Yes Chain link with lockLighting: Yes On pole
Rehabilita :ted Partial CompletepDate: N/A
Lift Station is about 8 years old
Deficiencies: Some corrosion on top of 90 deg bend on bypass 6" discharge bypass has no suction bypass in wet wellSome corrosion on DIP discharge pipe, but can still see coating on pipe
Overall Condition: Good
Discharge Route/Location: Manifolds with LS3101 and discharges to Exit 29 WPCP
Additional Information: Drain plug in valve vaultHose bibbs & BFPHas multitrode & hook upGood SitePlastic J-tube for ventilation (painted black)Above ground bypass12" influent pipePK Nail on valve vaultSome scale on pipe, but good conditionRain Gauge w/ tipping bucket on wooden poll during site visit (6-16-2008)Rain Gauge removed at the time of the DD testing (7-23-2008)

JWSC LS 3114 Site Evaluation Photos June 16, 2008
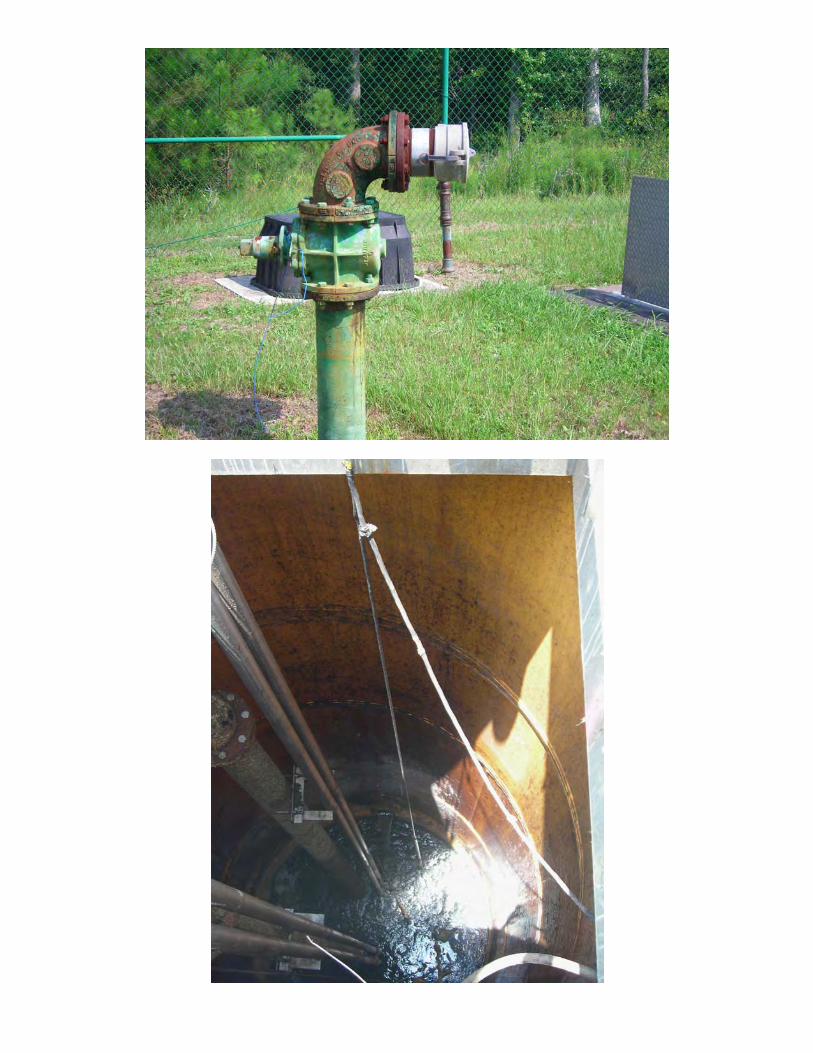


JWSC Lift Station Evaluations6/16/2008
Pump Station Number: LS3121Pump Station Location: 294 Long Way
Type of Pump Station: 6' Duplex Circular SubmersibleWet Well Material: ConcreteWet Well Coating/Liner: Blue HDPE Seals in good conditionValve Vault Material: ConcreteValve Vault Coating/Liner: NoneSize of Discharge Piping: 4" DISize of Forcemain/Manifold: 6" Number of Pumps: 2Pump Manufacturer: FlygtPump Model Number: CP3127Pump Impeller Number: 483Pump Serial Numbers: 180-0450945Design Operating Point: 350 gpm @ 57.92' TDHDrawdown Testing Performed: Yes 7/23/2008Horsepower: 10 HpVoltage: 230 VPhase: 3RPM: 1745 RPMVFDs (Y/N): NoSCADA (Y/N): YesFenced/Secure: Yes In neighborhood with lockLighting: Yes
Bypass:yp Discharge bypass with quick connectg yp q
Rehabilita :ted Partial CompleteDate:
Built Sept/Oct 2004
Deficiencies: No sign for LS # on gate1 DI pipe in valve vault with a little corrosionDI in wetwell has a significant amount of corrosion
Overall Condition: Good Very well maintained
Discharge Route/Location: Discharges to gravity sewer upstream of LS3101
Additional Information: SS guiderails are in good condition Has multitrodeHose bibbs & RPZ - in above grd. Meter boxPlastic J tube ventPK Nail on valve vaultValves underground - 1 on main line from valve vault & 1 on bypassLooks like 1 influent pipe (12" PVC) is a lot higher than needed (planning for future?)

JWSC LS 3121 Site Evaluation Photos June 16, 2008


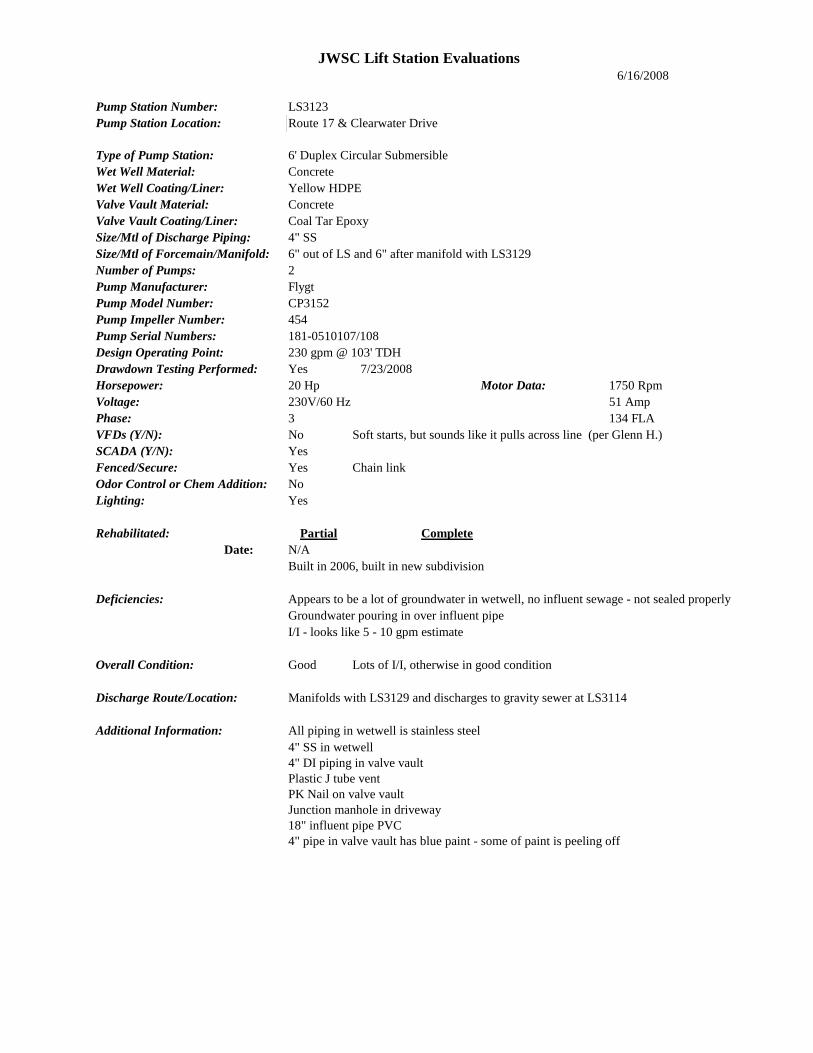
JWSC Lift Station Evaluations6/16/2008
Pump Station Number: LS3123Pump Station Location: Route 17 & Clearwater Drive
Type of Pump Station: 6' Duplex Circular SubmersibleWet Well Material: ConcreteWet Well Coating/Liner: Yellow HDPEValve Vault Material: ConcreteValve Vault Coating/Liner: Coal Tar EpoxySize/Mtl of Discharge Piping: 4" SSSize/Mtl of Forcemain/Manifold: 6" out of LS and 6" after manifold with LS3129Number of Pumps: 2Pump Manufacturer: FlygtPump Model Number: CP3152Pump Impeller Number: 454Pump Serial Numbers: 181-0510107/108Design Operating Point: 230 gpm @ 103' TDHDrawdown Testing Performed: Yes 7/23/2008Horsepower: 20 Hp Motor Data: 1750 RpmVoltage: 230V/60 Hz 51 AmpPhase: 3 134 FLAVFDs (Y/N): No Soft starts, but sounds like it pulls across line (per Glenn H.)SCADA (Y/N): YesFenced/Secure: Yes Chain linkOdor Control or Chem Addition: NoLighting: Yes
Rehabilita :ted Partial CompletepDate: N/A
Built in 2006, built in new subdivision
Deficiencies: Appears to be a lot of groundwater in wetwell, no influent sewage - not sealed properlyGroundwater pouring in over influent pipeI/I - looks like 5 - 10 gpm estimate
Overall Condition: Good Lots of I/I, otherwise in good condition
Discharge Route/Location: Manifolds with LS3129 and discharges to gravity sewer at LS3114
Additional Information: All piping in wetwell is stainless steel4" SS in wetwell4" DI piping in valve vaultPlastic J tube ventPK Nail on valve vaultJunction manhole in driveway18" influent pipe PVC4" pipe in valve vault has blue paint - some of paint is peeling off

JWSC LS 3123 Site Evaluation Photos June 16, 2008

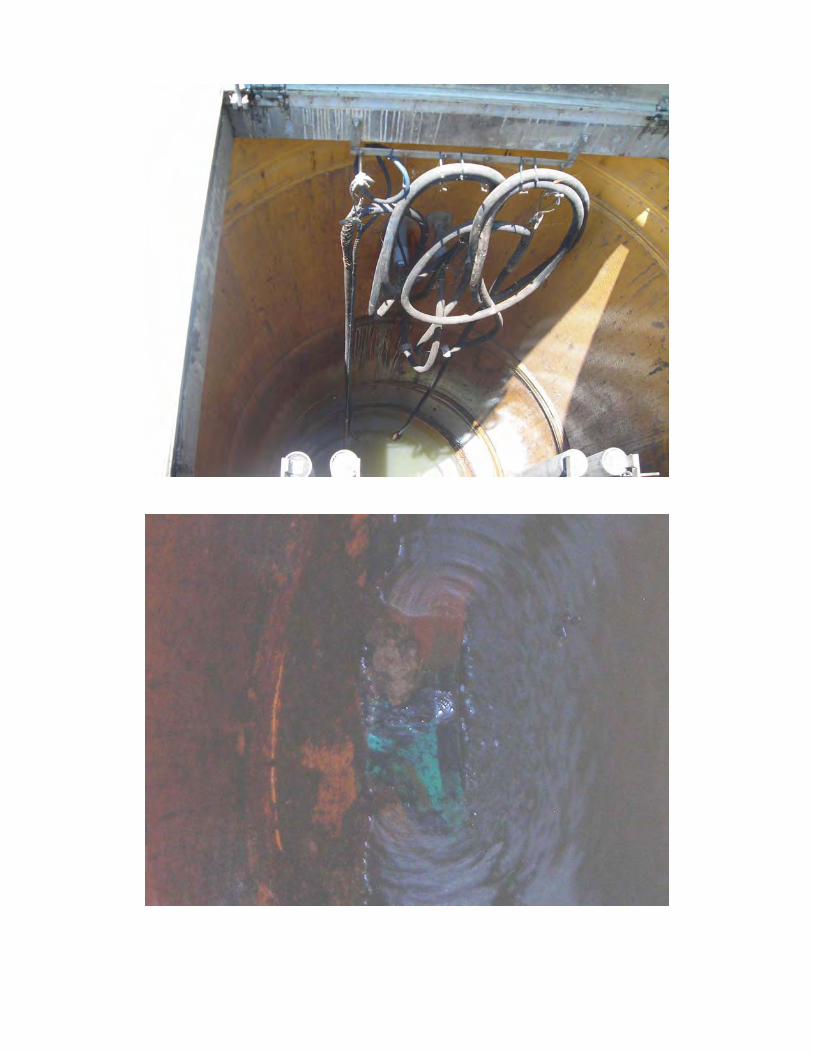
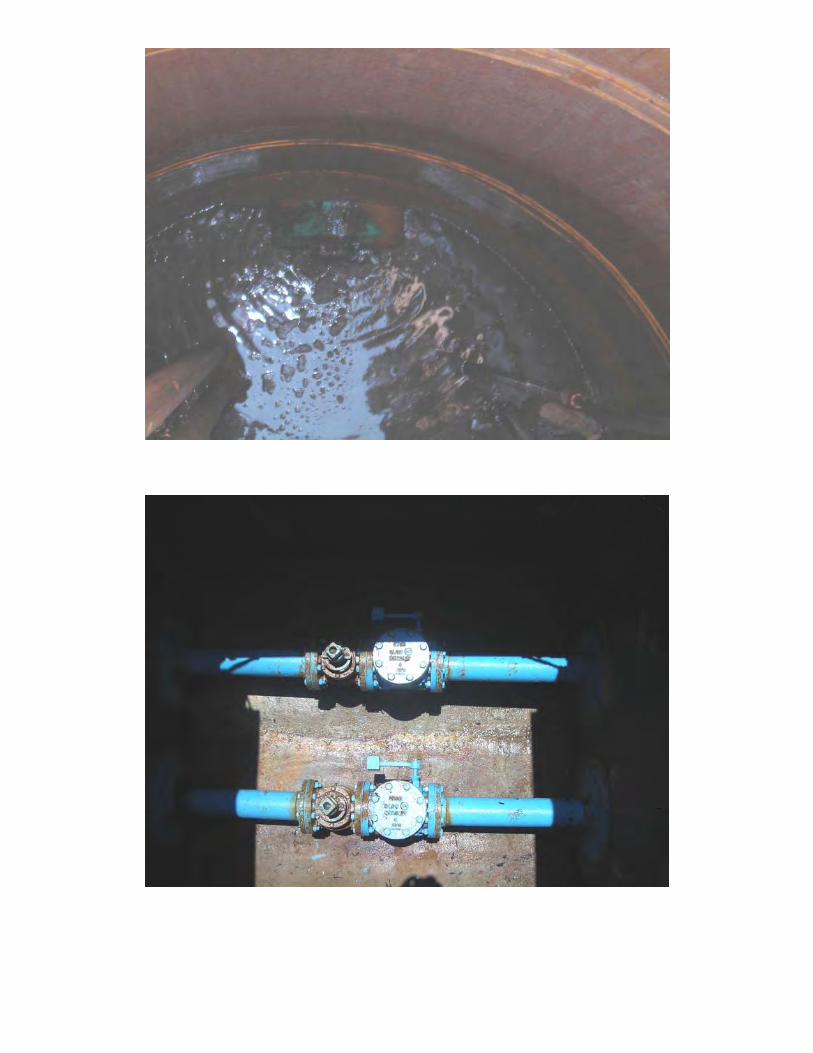

APPENDIX B CHA ELECTRICAL EVALUATION SUMMARY REPORT
Brunswick Glynn County JWSC Applied Technology & Management, Inc.
Water Sewer Master Plan

March 13, 2009
Ms. Angela Bryan, P.E. Applied Technology & Management, Inc. 411 Pablo Avenue Jacksonville Beach, FL 32250 RE: Letter Report
JWSC Water and Sewer System Electrical Assessment CHA Project No. 18770
Dear Ms. Bryan: Clough Harbour & Associates LLP (CHA) was retained by Applied Technology & Management, Inc. (ATM) to provide an electrical assessment of the existing water and sewer components of the Brunswick - Glynn County Joint Water and Sewer Commission’s (JWSC) major transmission systems. During the week of June 16, 2008, Mark Wright of CHA performed a visual assessment of 40 sites. PROJECT BACKGROUND The Brunswick City Commission and Glynn County Commission have merged to form the Brunswick - Glynn Joint Water and Sewer Commission. CHA performed a visual assessment of 40 sites, consisting of 28 wastewater pump stations and 11 well water treatment facilities. The purpose of the assessment was to identify National Electrical Code (NEC) and other relevant code violations or readily apparent safety concerns. Condition of the electrical components was noted. Following is a summary of the Supervisory Control and Data Acquisition (SCADA) and Radio Telemetry Systems: There are two wastewater treatment plants with different SCADA and radio telemetry systems. Most of the wastewater pump stations communicate via two way radio telemetry to the wastewater treatment plant to which they are pumping using licensed radio frequencies. The Academy Creek Wastewater Treatment Plant has standardized on Data Flow Systems (DFS) remote terminal units (RTUs) for the SCADA and radio telemetry system. The operator interface for this system is Web-page based. The graphic screens are easily configured by a user utilizing a graphic software package. Since it is Web based, the system may be remotely accessed by a user with privileges from any remote site having internet access. The data is backed-up on the plant’s file server. The radio RTU is a single module which uses DIP switches for identification. If a module should fail in the field, the technician unplugs the failed module, matches the DIP switch settings on the new module to the failed module, and plugs in the new module. No tools are required. The radio system is then able to indentify and upload the program parameters to the RTU. Maintenance cost for RTUs is minimal.

Ms. Angela Bryan, P.E. Page 2 March 13, 2009 The Glynn County St. Simons Island Wastewater Treatment Plant has standardized on SCADAPack RTUs. These resemble a modular PLC, and I/O modules can be added for supplemental input and output points. At the wastewater treatment plant, there are two PCs that interface to the radio system (one serves as a back-up). Data is manually backed up on a CD. The operator interface is also a graphics screen builder that uses a CLEARSCADA software package. The programming format for the RTUs is relay ladder logic style. The wastewater treatment plant is a networked Allen-Bradley PLC based system with In-Touch Wonderware Factory Suite operator interface software. SITE ASSESSMENT The following are noted electrical deficiencies based on visual site observations, electrical work recommendations, and a preliminary construction cost estimate. Lift Station, LS-2 Due to inaccessibility, it could not be verified that the120 volt transformer that feeds the branch circuit panel had the required primary and secondary overcurrent protection installed. Panel and transformer are obsolete. No emergency battery back-up lighting for emergency means of egress exists. Recommend installing new transformer, overcurrent protection devices, branch panel and two emergency battery back-up lighting fixtures. Estimated Cost (Material and labor) - $7,300 Estimated Cost (Material only) - $1,500 WTP, Fancy Bluff Well This facility is very recent construction. No code violations or electrical deficiencies were observed. Estimated Cost - $0 Lift Station, LS-103 Main disconnect is corroded. Electrical equipment backboard is of wood construction, which is prone to deterioration. No conduit seals are installed between the control panel and wetwell. Recommend installing new main disconnect switch, and replacing the backboard with rigid galvanized steel construction supports and installing the appropriate UL listed conduit seals between the wetwell and control panel. Estimated Cost (Material and labor) - $2,300 Estimated Cost (Material only) - $1,400 Lift Station, LS-101 No conduit seals are installed between the control panel and wetwell. Recommend installing the appropriate UL listed conduit seals between the wetwell and control panel. Estimated Cost (Material and labor) - $600 Estimated Cost (Material only) - $200 WTP, Exit 29 The electric service equipment and motor control center do not have the required working clearance around them. Due to structure housing this equipment, there is no method to achieve this utilizing the existing structure. The existing generator has been removed and the associated wiring has been abandoned in place. Recommend removing replacing the existing structure, electrical power distribution equipment and controls for the site.
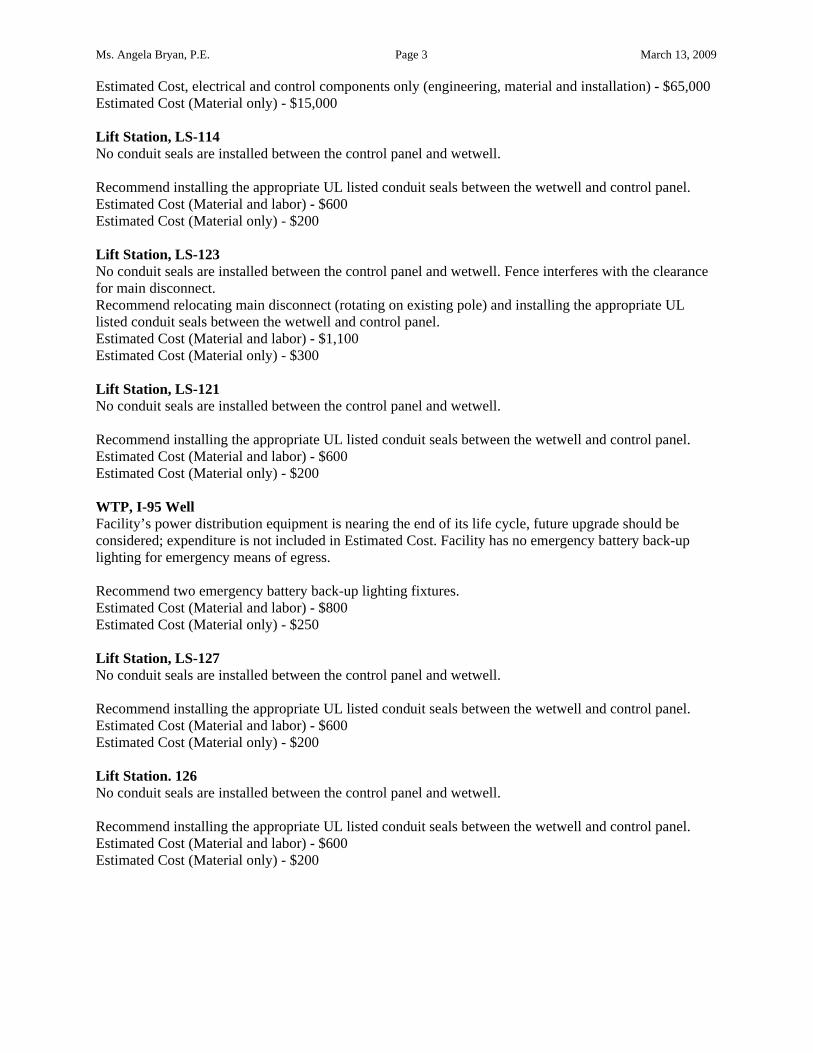
Ms. Angela Bryan, P.E. Page 3 March 13, 2009 Estimated Cost, electrical and control components only (engineering, material and installation) - $65,000 Estimated Cost (Material only) - $15,000 Lift Station, LS-114 No conduit seals are installed between the control panel and wetwell. Recommend installing the appropriate UL listed conduit seals between the wetwell and control panel. Estimated Cost (Material and labor) - $600 Estimated Cost (Material only) - $200 Lift Station, LS-123 No conduit seals are installed between the control panel and wetwell. Fence interferes with the clearance for main disconnect. Recommend relocating main disconnect (rotating on existing pole) and installing the appropriate UL listed conduit seals between the wetwell and control panel. Estimated Cost (Material and labor) - $1,100 Estimated Cost (Material only) - $300 Lift Station, LS-121 No conduit seals are installed between the control panel and wetwell. Recommend installing the appropriate UL listed conduit seals between the wetwell and control panel. Estimated Cost (Material and labor) - $600 Estimated Cost (Material only) - $200 WTP, I-95 Well Facility’s power distribution equipment is nearing the end of its life cycle, future upgrade should be considered; expenditure is not included in Estimated Cost. Facility has no emergency battery back-up lighting for emergency means of egress. Recommend two emergency battery back-up lighting fixtures. Estimated Cost (Material and labor) - $800 Estimated Cost (Material only) - $250 Lift Station, LS-127 No conduit seals are installed between the control panel and wetwell. Recommend installing the appropriate UL listed conduit seals between the wetwell and control panel. Estimated Cost (Material and labor) - $600 Estimated Cost (Material only) - $200 Lift Station. 126 No conduit seals are installed between the control panel and wetwell. Recommend installing the appropriate UL listed conduit seals between the wetwell and control panel. Estimated Cost (Material and labor) - $600 Estimated Cost (Material only) - $200

Ms. Angela Bryan, P.E. Page 4 March 13, 2009 WTP, Golden Isles II Well This facility is very recent construction. No code violations or electrical deficiencies were observed. Estimated Cost - $0 Lift Station, LS-118 No conduit seals are installed between the control panel and wetwell. Recommend installing the appropriate UL listed conduit seals between the wetwell and control panel. Estimated Cost (Material and labor) - $600 Estimated Cost (Material only) - $200 Lift Station, LS-119 No conduit seals are installed between the control panel and wetwell. Recommend installing the appropriate UL listed conduit seals between the wetwell and control panel. Estimated Cost (Material and labor) - $600 Estimated Cost (Material only) - $200 Lift Station, LS-107 Main disconnect, manual transfer switch, and disconnect with generator receptacle are badly corroded. No conduit seals are installed between the control panel and wetwell. Recommend replacing the main disconnect, manual transfer switch, and disconnect with generator receptacle, and installing the appropriate UL listed conduit seals between the wetwell and control panel. Estimated Cost (Material and labor) - $4,800 Estimated Cost (Material only) - $2,600 Lift Station, LS-105 Main disconnect, manual transfer switch and disconnect with generator receptacle are badly corroded. No conduit seals are installed between the control panel and wetwell. Recommend replacing the main disconnect, manual transfer switch, and disconnect with generator receptacle and installing the appropriate UL listed conduit seals between the wetwell and control panel. Estimated Cost (Material and labor) - $4,800 Estimated Cost (Material only) - $2,600 WTP, FLETC Facility has no emergency battery back-up lighting for emergency means of egress. Recommend two emergency battery back-up lighting fixtures. Estimated Cost (Material and labor) - $800 Estimated Cost (Material only) - $250 FLETC Well, Remote Backup Well Pump Facility has no emergency battery back-up lighting for emergency means of egress. Recommend one emergency battery back-up lighting fixture. Estimated Cost (Material and labor) - $400 Estimated Cost (Material only) - $125
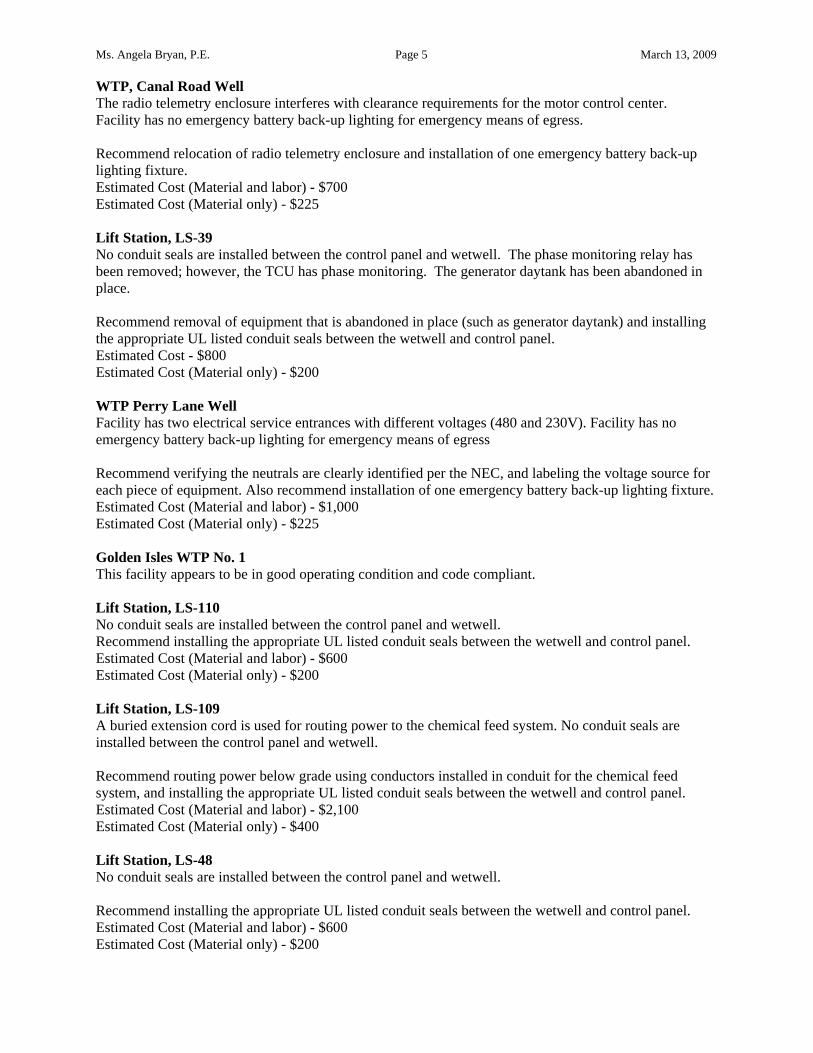
Ms. Angela Bryan, P.E. Page 5 March 13, 2009 WTP, Canal Road Well The radio telemetry enclosure interferes with clearance requirements for the motor control center. Facility has no emergency battery back-up lighting for emergency means of egress. Recommend relocation of radio telemetry enclosure and installation of one emergency battery back-up lighting fixture. Estimated Cost (Material and labor) - $700 Estimated Cost (Material only) - $225 Lift Station, LS-39 No conduit seals are installed between the control panel and wetwell. The phase monitoring relay has been removed; however, the TCU has phase monitoring. The generator daytank has been abandoned in place. Recommend removal of equipment that is abandoned in place (such as generator daytank) and installing the appropriate UL listed conduit seals between the wetwell and control panel. Estimated Cost - $800 Estimated Cost (Material only) - $200 WTP Perry Lane Well Facility has two electrical service entrances with different voltages (480 and 230V). Facility has no emergency battery back-up lighting for emergency means of egress Recommend verifying the neutrals are clearly identified per the NEC, and labeling the voltage source for each piece of equipment. Also recommend installation of one emergency battery back-up lighting fixture. Estimated Cost (Material and labor) - $1,000 Estimated Cost (Material only) - $225 Golden Isles WTP No. 1 This facility appears to be in good operating condition and code compliant. Lift Station, LS-110 No conduit seals are installed between the control panel and wetwell. Recommend installing the appropriate UL listed conduit seals between the wetwell and control panel. Estimated Cost (Material and labor) - $600 Estimated Cost (Material only) - $200 Lift Station, LS-109 A buried extension cord is used for routing power to the chemical feed system. No conduit seals are installed between the control panel and wetwell. Recommend routing power below grade using conductors installed in conduit for the chemical feed system, and installing the appropriate UL listed conduit seals between the wetwell and control panel. Estimated Cost (Material and labor) - $2,100 Estimated Cost (Material only) - $400 Lift Station, LS-48 No conduit seals are installed between the control panel and wetwell. Recommend installing the appropriate UL listed conduit seals between the wetwell and control panel. Estimated Cost (Material and labor) - $600 Estimated Cost (Material only) - $200

Ms. Angela Bryan, P.E. Page 6 March 13, 2009 Lift Station, LS-28 No conduit seals are installed between the control panel and wetwell. Recommend installing the appropriate UL listed conduit seals between the wetwell and control panel. Estimated Cost (Material and labor) - $600 Estimated Cost (Material only) - $200 Lift Station, LS-4 WWTP The abandoned pumps and associated housekeeping pads interfere with the required working space for the motor control center and variable frequency drive. Recommend that pumps and housekeeping pads be removed. Estimated Cost - $2,100 Estimated Cost (Material only) - None Lift Station, LS-3 The obsolete motor control center has been modified to the extent that the UL listing is no longer valid. The motor control center also interferes with the required work clearances of the pump alternator and variable frequency drive. The facility has no emergency battery back-up lighting for emergency means of egress. Recommend removal of the obsolete motor control center, transformer and branch circuit panel. New power distribution equipment. The installation would include a new main power distribution panel low voltage transformer and branch circuit panel. Also recommend installation of two emergency battery back-up lighting fixtures. Estimated Cost (Material and labor) - $12,000 Estimated Cost (Material only) - $5,500 WTP, Howard Coffin Park Well Diesel storage fuel tank does not appear to be a double wall tank with leak detection. Output circuit breaker for generator could not be located. The facility has no emergency battery back-up lighting for emergency means of egress. Verify if fuel tank is double wall tank with leak detection. If it is not, recommend installation of a containment system for the fuel tank. Recommend installation of an output circuit breaker for the generator. Also recommend installation of two emergency battery back-up lighting fixtures. Estimated Cost (electrical only material and labor, does include containment system) - $3,000 Estimated Cost (Material only) -$750 Lift Station, LS-17 No conduit seals are installed between the control panel and wetwell. The small 3KVA transformer is severely deteriorated. Recommend installing the appropriate UL listed conduit seals between the wetwell and control panel, and replacing the 3KVA transformer. Estimated Cost (Material and labor) - $1,100 Estimated Cost (Material only) -$700

Ms. Angela Bryan, P.E. Page 7 March 13, 2009 WTP, Goodyear Well Facility has no emergency battery back-up lighting for emergency means of egress. Recommend installing two emergency battery back-up lighting fixtures. Estimated Cost (Material and labor) - $800 Estimated Cost (Material only) - $250 Lift Station, LS-6 No conduit seals are installed between the disconnect switches and the wetwell. Recommend installing the appropriate UL listed conduit seals between the wetwell and disconnect switches. Estimated Cost (Material and labor) - $600 Estimated Cost (Material only) - $200 Lift Station, LS-21 There are no work clearances for the electrical equipment to be mounted inside this structure. Recommend new service entrance disconnect and lockable control panel to be mounted on the exterior of the building. Recommend relocating the existing telemetry systems to the exterior of the building in a lockable enclosure. Estimated Cost (Material and labor) - $23,000 Estimated Cost (Material only) - $8,500 WTP, Brunswick Villas Well Piping interferes with the required working clearance for the branch circuit lighting panel. Facility has no emergency battery back-up lighting for emergency means of egress. Recommend relocation of the branch circuit panel and installation of two emergency battery back-up lighting fixtures (one for the water treatment facility and one for the remote well structure). Estimated Cost (Material and labor) - $3,500 Estimated Cost (Material only) - $1,350 Lift Station, LS-5 The generator’s automatic transfer switch does not have the proper work clearance. Facility has no emergency battery back-up lighting for emergency means of egress. Recommend relocation of the automatic transfer switch to achieve the required working clearance, and installation of two emergency battery back-up lighting fixtures. Since the time of the site visit, the electrical service has been deemed inadequately sized and is currently being upgraded from a 200amp service to a 400amp service. Safety recommendations will addressed as part of the service upgrade. The estimated cost of the project is $8,000. Lift Station, LS-35 The motor control center is an obsolete Westinghouse that may need to be replaced in the near future. Facility has no emergency battery back-up lighting for emergency means of egress. Recommend installing two emergency battery back-up lighting fixtures. Estimated Cost (Material and labor) - $800 Estimated Cost (Material only) - $250

Ms. Angela Bryan, P.E. Page 8 March 13, 2009 Lift Station, LS-36 The motor control center is an obsolete Westinghouse that has been modified and is no longer UL listed, and a pump interferes with the required working clearance. The facility has no emergency battery back-up lighting for emergency means of egress. Recommend replacing the motor control center in a different location, and installing two emergency battery back-up lighting fixtures. Estimated Cost (Material and labor) - $20,000 Estimated Cost (Material only) - $8,000 CONCLUSIONS The following are the most common and repetitive National Electrical Code violations observed (listed by corrective priority):
Conduit Seals – For a submersible raw waste water pump station, the wetwell is considered to be an electrically classified hazardous area. Conduit seals must be installed in raceways when raceways exit the classified hazardous area to prevent hazardous methane gases methane from traveling to an electrically arcing device where an explosion could occur. Lift Station LS-12 is the only lift station where conduit seals were observed.
Emergency Egress Lighting – For life safety reasons, the code requires emergency egress lighting to enable safe exiting of these facilities. A cost effective way to achieve this is installing emergency battery back-up lighting. If an on-site generator exists, this can be used, but requires a dedicated automatic transfer switch; however, this option is not economically feasible. Code requires the path of egress to have an average illumination of 1 foot-candle with a minimum of 0.1 foot-candle. The layout of emergency egress lighting fixtures would be determined by the photometric data of the fixture installed.
Working Spaces – NEC Article 110.26 dictates the required clear distances around electrical equipment. This is generally three to four feet based on the voltage of the equipment. For the condition of exposed live parts on one side of the work space and grounded parts on the other side the required clearance 0-150 nominal voltage to ground the required clearance depth is 3 feet. For 151-600 nominal voltage to ground the required clearance depth is 3 feet and 6 inches. The width of the work space is the width of the equipment or 30 inches, whichever is greater.
Additional electrical and controls information regarding these sites are included in Appendix A – Electrical Data Spreadsheet. Appendix B – Site Electrical Photos contains photos obtained during the assessment. If you have any questions, please give me a call at your earliest convenience. Very truly yours,
Mark Wright Senior Engineering Designer
WM:ek Enclosure

APPENDIX A
Site Electrical Data Matrix
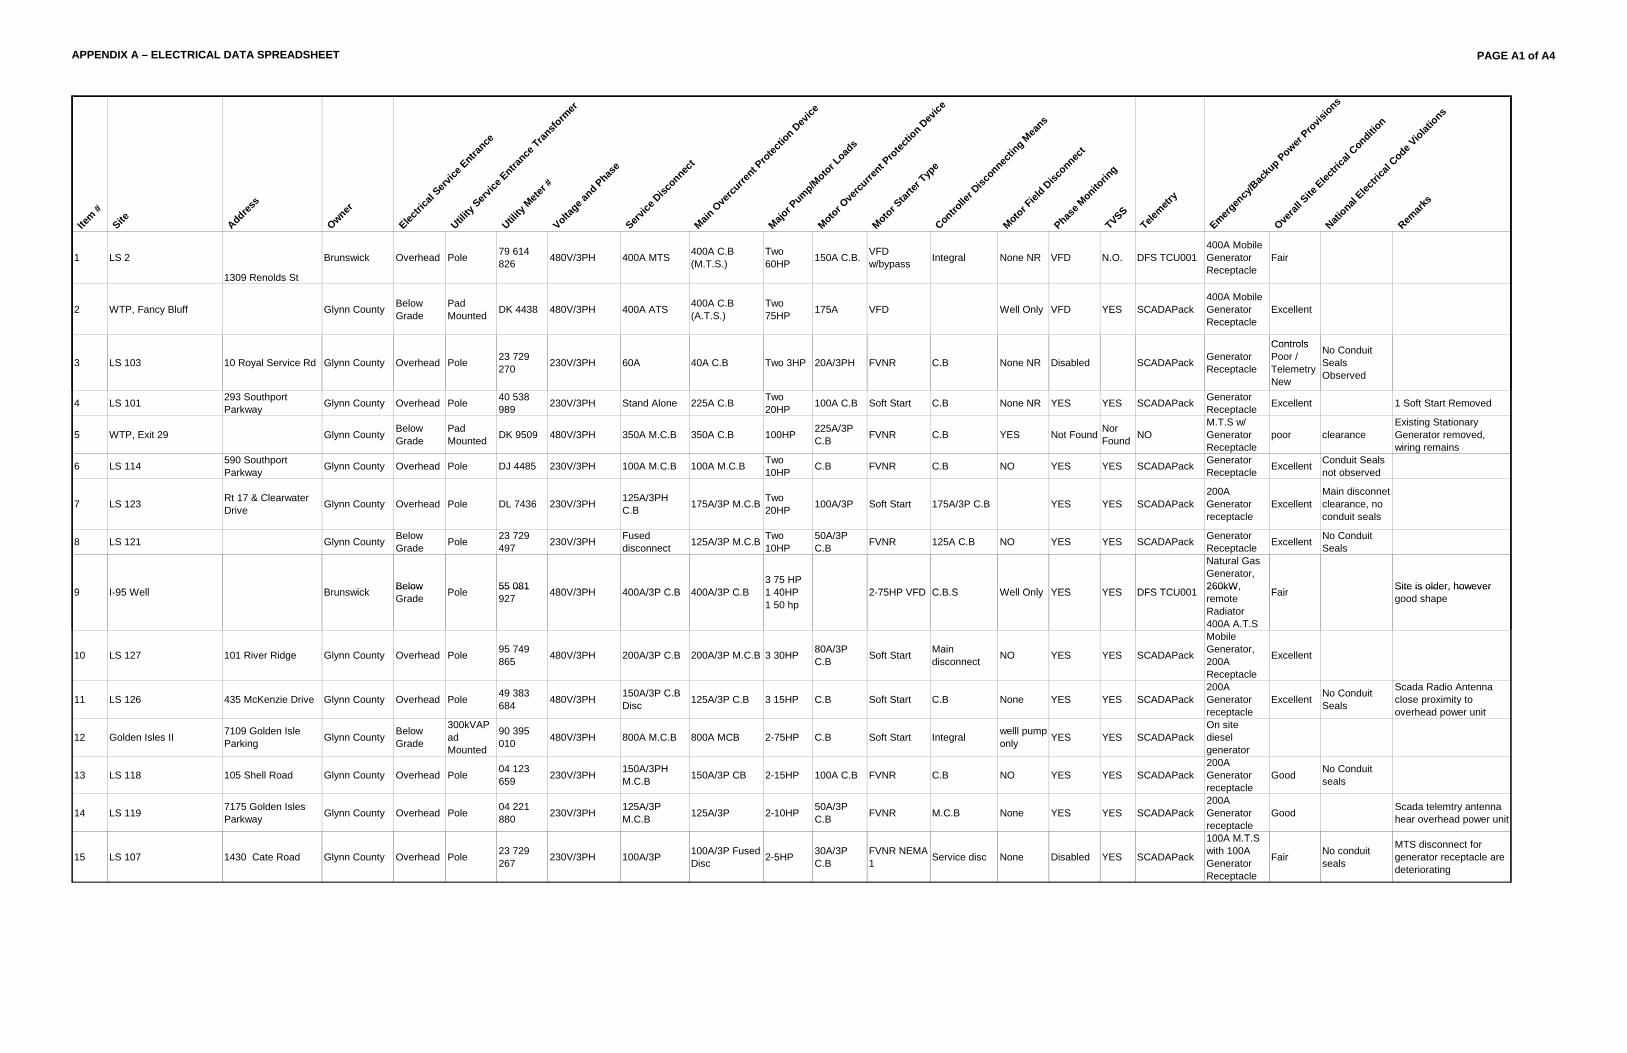
APPENDIX A – ELECTRICAL DATA SPREADSHEET PAGE A1 of A4
Item #
Site
Address
Owner
Electri
cal S
ervice
Entran
ce
Utility
Service
Entrance
Transfo
rmer
Utility
Meter #
Voltage a
nd Phas
eServ
ice D
isconne
ctMain
Ove
rcurre
nt Pro
tectio
n Dev
ice
Major P
ump/Motor L
oads
Motor Ove
rcurre
nt Pro
tectio
n Dev
ice
Motor Star
ter Typ
eContro
ller D
iscon
nectin
g Mea
ns
Motor Fiel
d Disc
onnect
Phase M
onitorin
gTVSS
Telemetr
y
Emergen
cy/B
acku
p Power Pro
visions
Overal
l Site
Electri
cal C
onditio
n
National
Electri
cal C
ode Violat
ions
Remark
s
1 LS 2
1309 Renolds St
Brunswick Overhead Pole 79 614 826 480V/3PH 400A MTS 400A C.B
(M.T.S.)Two 60HP 150A C.B. VFD
w/bypass Integral None NR VFD N.O. DFS TCU001400A Mobile Generator Receptacle
Fair
2 WTP, Fancy Bluff Glynn County Below Grade
Pad Mounted DK 4438 480V/3PH 400A ATS 400A C.B
(A.T.S.)Two 75HP 175A VFD Well Only VFD YES SCADAPack
400A Mobile Generator Receptacle
Excellent
Controls
3 LS 103 10 Royal Service Rd Glynn County Overhead Pole 23 729 270 230V/3PH 60A 40A C.B Two 3HP 20A/3PH FVNR C.B None NR Disabled SCADAPack Generator
Receptacle
Controls Poor / Telemetry New
No Conduit Seals Observed
4 LS 101 293 Southport Parkway Glynn County Overhead Pole 40 538
989 230V/3PH Stand Alone 225A C.B Two 20HP 100A C.B Soft Start C.B None NR YES YES SCADAPack Generator
Receptacle Excellent 1 Soft Start Removed
5 WTP, Exit 29 Glynn County Below Grade
Pad Mounted DK 9509 480V/3PH 350A M.C.B 350A C.B 100HP 225A/3P
C.B FVNR C.B YES Not Found Nor Found NO
M.T.S w/ Generator Receptacle
poor clearanceExisting Stationary Generator removed, wiring remains
6 LS 114 590 Southport Parkway Glynn County Overhead Pole DJ 4485 230V/3PH 100A M.C.B 100A M.C.B Two
10HP C.B FVNR C.B NO YES YES SCADAPack Generator Receptacle Excellent Conduit Seals
not observed
7 LS 123 Rt 17 & Clearwater Drive Glynn County Overhead Pole DL 7436 230V/3PH 125A/3PH
C.B 175A/3P M.C.B Two 20HP 100A/3P Soft Start 175A/3P C.B YES YES SCADAPack
200A Generator receptacle
ExcellentMain disconnet clearance, no conduit seals
8 LS 121 Glynn County Below Grade Pole 23 729
497 230V/3PH Fused disconnect 125A/3P M.C.B Two
10HP50A/3P C.B FVNR 125A C.B NO YES YES SCADAPack Generator
Receptacle Excellent No Conduit Seals
9 I 95 W ll B i k Below P l 55 081 480V/3PH 400A/3P C B 400A/3P C B3 75 HP 1 40HP 2 75HP VFD C B S W ll O l YES YES DFS TCU001
Natural Gas Generator, 260kW, F i Site is older, however9 I-95 Well Brunswick Below
Grade Pole 55 081 927 480V/3PH 400A/3P C.B 400A/3P C.B 1 40HP
1 50 hp2-75HP VFD C.B.S Well Only YES YES DFS TCU001 260kW,
remote Radiator 400A A.T.S
Fair Site is older, however good shape
10 LS 127 101 River Ridge Glynn County Overhead Pole 95 749 865 480V/3PH 200A/3P C.B 200A/3P M.C.B 3 30HP 80A/3P
C.B Soft Start Main disconnect NO YES YES SCADAPack
Mobile Generator, 200A Receptacle
Excellent
11 LS 126 435 McKenzie Drive Glynn County Overhead Pole 49 383 684 480V/3PH 150A/3P C.B
Disc 125A/3P C.B 3 15HP C.B Soft Start C.B None YES YES SCADAPack200A Generator receptacle
Excellent No Conduit Seals
Scada Radio Antenna close proximity to overhead power unit
12 Golden Isles II 7109 Golden Isle Parking Glynn County Below
Grade
300kVAPad Mounted
90 395 010 480V/3PH 800A M.C.B 800A MCB 2-75HP C.B Soft Start Integral welll pump
only YES YES SCADAPackOn site diesel generator
13 LS 118 105 Shell Road Glynn County Overhead Pole 04 123 659 230V/3PH 150A/3PH
M.C.B 150A/3P CB 2-15HP 100A C.B FVNR C.B NO YES YES SCADAPack200A Generator receptacle
Good No Conduit seals
14 LS 119 7175 Golden Isles Parkway Glynn County Overhead Pole 04 221
880 230V/3PH 125A/3P M.C.B 125A/3P 2-10HP 50A/3P
C.B FVNR M.C.B None YES YES SCADAPack200A Generator receptacle
Good Scada telemtry antenna hear overhead power unit
100A M T S
15 LS 107 1430 Cate Road Glynn County Overhead Pole 23 729 267 230V/3PH 100A/3P 100A/3P Fused
Disc 2-5HP 30A/3P C.B
FVNR NEMA 1 Service disc None Disabled YES SCADAPack
100A M.T.S with 100A Generator Receptacle
Fair No conduit seals
MTS disconnect for generator receptacle are deteriorating

APPENDIX A – ELECTRICAL DATA SPREADSHEET PAGE A2 of A4
Item #
Site
Address
Owner
Electri
cal S
ervice
Entran
ce
Utility
Service
Entrance
Transfo
rmer
Utility
Meter #
Voltage a
nd Phas
eServ
ice D
isconne
ctMain
Ove
rcurre
nt Pro
tectio
n Dev
ice
Major P
ump/Motor L
oads
Motor Ove
rcurre
nt Pro
tectio
n Dev
ice
Motor Star
ter Typ
eContro
ller D
iscon
nectin
g Mea
ns
Motor Fiel
d Disc
onnect
Phase M
onitorin
gTVSS
Telemetr
y
Emergen
cy/B
acku
p Power Pro
visions
Overal
l Site
Electri
cal C
onditio
n
National
Electri
cal C
ode Violat
ions
Remark
s
16 LS 105 10 Cate Service Road Glynn County Overhead Pole 01 146
382 230V/3PH 100A Fused Disconnect
100A/3P Fused Disc 2-10HP 50A/3P FVNR NEMA
2MTS/Serv Disc None YES YES SCADAPack
M.T.S w/100A Fused disc for generator receptacle
Fair
No coduits seals, buried extension sord to US filter treatment equip
See item #15
17 WTP, FLETC Brunswick Overhead Pole CF5761 480V/3PH 350A/3P Enclosed CB
350A/3P Enclosed CB 4-50HP Comb
StarterFVNR NEMA 3
MCC-Comb Starter
welll pump only Yes DFS
200kW Diesel Generator
Fair No emergency lighting
Power Distibution Equip is agingGenerator
17BWTP,FLETC Well, Remote Backup Well Pump
Brunswick Overhead Pole CE0473 230V/3PH 200A fused disc switch
200A fused disc switch 1-50HP Comb
StarterFVNR NEMA 4 Mian Disc None No No
Telephone Line Transceiver
None Fair
18 Canal Road Well Glynn County Overhead Pole DK 5896 480V/3PH 200A/3p Enclosed CB
200A/3p Enclosed CB 1-75HP Comb
Starter FVNR MCC-Comb Starter Yes Yes SCADAPack
100kW Naturas Gas Generator
Good Clearance in fornt of MCC
19 LS 39 105 Indigo Drive Brunswick Overhead Pole 04 466 948 480V/3PH
400A disc Fused @ 225A
150A/3P CB 3-25HP 50A/3P C.B
FVNR NEMA 2 M.C.B None Disabled ? DFS TCU001
Standby Diesel genrator
Good No coduit Seals
Abandoned Equipment such as
480V - BG4248 480V/3PH 250A/3P MCB
MCC250A/3P MCB MCC 1-60HP Comb
StarterFVNR NEMA 4 Comb Starter Well only
230V - BF3186 230V/3PH 125A/3P
Enclosed CB125A/3P Enclosed CB
1-15HP 1-1HP CB's FVNR CB's Well Only SCADAPack Nonr Good No Emergency
Lighting
21 Golden Isles WTP No. 1 Glynn County Below
GraadePad Mounted
79 612 424 480V/3PH 400A M.C.B 400A M.C.B 2-60HP
1-40HP150A/3P C.B VFD 150A/3P C.B Well only Yes Yes SCADAPack None Excellent
22 LS 110 2712 Altamaha Blvd Glynn County Overhead Pole 23 057 335 480V/3PH 600A M.C.B 600A M.C.B 2-88HP 250A/3P Soft Start 600A M.C.B None Yes Yes SCADAPack
Mobile Generator receptacle
Good No conduit seals Seal Tight
1601 Glynco 04 123 FNVR NEMA NO single Buried Elec
Two Overhead Services
Pole20 Perry Lane Well Glynn County
23 LS 109 1601 Glynco Parkway Glynn County Overhead Pole 04 123
269 230V/3PH 50A/3P 2-30A.3P C.B\ 2-5HP 30A/3P FNVR NEMA 1
NO single disc means None ? ? SCADAPack None Fair Buried Elec
cord
24 LS 38 398 Marana Circle Brunswick Overhead Pole 10 539 017 230V/3PH 100A/3P 100A/3P M.C.B 2-3HP 15A/3P
C.BNEMA SIZE 0 15A/3P C.B None Yes No DFS TCU001
100A MTS w/100A Generator Receptacle
Fair No emergency lighting
25 LS 48 3983 Dariend Highway Brunswick Overhead Pole 1309 B67 480V/3PH
250A/3PH Enc crkt, breaker
250A/3P C.B 3-35HP pumps
100A/3P C.B's FVNR Service disc YES YES YES DFS TCU001
80kW diesel w/125A output 350 gal tank
Fair
No lockable disconnecting means for controller
26 LS 28 101 Oscar Lane Brunswick Overhead Pole TOU-E0 DG8332 480V/3PH
250A/3PH Enc crkt, breaker
250A/3P C.B 3-35HP pumps
100A/3P C.B's FVNR Service disc YES Yes Yes DFS TCU001
80kW diesel w/125A output 350 gal tank
Fair
No lockable disconnecting means for controllerg
27 LS 23 5801 Altama Ave Brunswick Below Graade Pole CB2563 230V/3PH 60A/3P Fused
disc switch 60A/3P C.B 2-5 HP pumps 30A/3P FVNR NEMA
size 1 Main Disc NO Yes Yes DCS TCU001
Mobile Generator receptacle 100A
GOOD 18" Clearance of main disc

APPENDIX A – ELECTRICAL DATA SPREADSHEET PAGE A3 of A4
Item #
Site
Address
Owner
Electri
cal S
ervice
Entran
ce
Utility
Service
Entrance
Transfo
rmer
Utility
Meter #
Voltage a
nd Phas
eServ
ice D
isconne
ctMain
Ove
rcurre
nt Pro
tectio
n Dev
ice
Major P
ump/Motor L
oads
Motor Ove
rcurre
nt Pro
tectio
n Dev
ice
Motor Star
ter Typ
eContro
ller D
iscon
nectin
g Mea
ns
Motor Fiel
d Disc
onnect
Phase M
onitorin
gTVSS
Telemetr
y
Emergen
cy/B
acku
p Power Pro
visions
Overal
l Site
Electri
cal C
onditio
n
National
Electri
cal C
ode Violat
ions
Remark
s
28 LS 4, WWTP 2909 Newcastle St Brunswick
Below Grade From WWTP
Pole N/A 480V/3PH 600A M.C.B in MCC
600A M.C.B in MCC
4-125HP pumps
250A/3p C.B in MCC
VFD, YASKAWA P4
C.B IN MCC YES Yes
PLC, A-B SLC500 w/ serial commun to WWTP
WWTP Power Distribution
Fair
MCC & VFD Clearance interference with old pumps
400A C B 2 75HP VFD w/400A MTS w/ mobile Obsolete power distrib29 LS 3 2020 Newcastle St Brunswick Overhead Pole DK4321 480V/3PH 400A C.B
MTS 400A C.B MTS 2-75HP Pumps 250A C.B VFD w/
alternator VFD disc n VFD No MODBUS mobile Generator Receptacle
Poor Clearance Obsolete power distrib, no emergency lighing
30 Water Treatement Howard Coffin Park Brunswick Below Grade
Pad Mounted DL6598 480V/3PH 400A
Enclosed C.B400A Enclosed C.B
1-50 HP pump softstart 1-50hp pump VFD 1-100HP pump 2 stage starter 1-30HP well pump
C.B'S in MCC MCC Well only Yes Yes DFS
175kw Diesel generator, above grade tank with no containment
FairNo ouput crkt breaker could be located on the generator
31 LS 17 2845 Parkwood Dr Brunswick Below Grade Pole BD2595 480V/3PH 100A Fused
Disc switch100A Fused Disc switch
2-30HP pumps
80A/3P C.B
FVNR NEMA size 3 Service disc NO Yes Yes DCS PCU
200A mobile generator receptacle
GoodConduit seals, clearance for telemetry
3kVA Contarol Transformer is in poor condition
2 75HP 230kW
32 Goodyear Well WTP Brunswick Below Grade
Pad Mounted CG9076 480V/3PH
400A/3P Loackable enclosed C.B
400A/3P C.B
2-75HP service pumps, 1-30HP well pump
250A/3p C.B
FNVR NEMA 4 MCC Bucket Well only Yes DFS
230kW standby diesel w/400A output C.B
Good NO emergency lighting or exit signage
33 LS 6 3700 Altama Ave Brunswick Overhead Pole DH 2650 480V/3PH 225A Encl C.B 225A Encl C.B 3-35HP
pumps 100A/3P FVNR Service YES Yes No DFS TCU001
80kW Standby diesel w/125A output C.B 350Gal buried tank
Good No conduit seals
34 LS 21 4727 Altama Ave Brunswick Overhead Pole BG7874 230V/3PH None 2-100A / 3PH C.B
2-20HP pumps
100A/3P C.B FVNR NONE NONE Yes No DFS TCU001 NONE Unaccept
able
No clearancees for equipment, not safe
2-75 service FVNR Clearance in Verify well pump starter
35 Brunswick Villas Well Brunswick Below Grade Pole CG9070 480V/3PH 450A/3P Encl
Crkt Breaker 450A/3P C.Bservice pumps 1-75 well pump
250A/3PFVNR, NEMA size 3&4
Combination starters Well only YES DFS NONE Good
Clearance in front of lighting panel
y p pis properly sized for motor, No emergency lighting

APPENDIX A – ELECTRICAL DATA SPREADSHEET PAGE A4 of A4
Item #
Site
Address
Owner
Electri
cal S
ervice
Entran
ce
Utility
Service
Entrance
Transfo
rmer
Utility
Meter #
Voltage a
nd Phas
eServ
ice D
isconne
ctMain
Ove
rcurre
nt Pro
tectio
n Dev
ice
Major P
ump/Motor L
oads
Motor Ove
rcurre
nt Pro
tectio
n Dev
ice
Motor Star
ter Typ
eContro
ller D
iscon
nectin
g Mea
ns
Motor Fiel
d Disc
onnect
Phase M
onitorin
gTVSS
Telemetr
y
Emergen
cy/B
acku
p Power Pro
visions
Overal
l Site
Electri
cal C
onditio
n
National
Electri
cal C
ode Violat
ions
Remark
s
36 LS 5 3415 Stonewall St Brunswick Overhead Pole CF6478 480V/3PH 225A/3P encl crkt breaker
225A/3P encl crkt breaker 2-100 HP 200A/3P
C.BFVNR NEMA size 4 Service disc NO Yes DFS TCU001
150kW Standby diesel generator w/belly tank and 225A output C.B
Fair
ATS Clearance, controller disc means
No emerrgency lighting
37 LS 35 20 Ross Rd Brunswick Below Grade Pole CE4986 480V/3PH 200A fused
disc s itch200A fused disc s itch
3-25HP p mps
C.B in MCC FVNR MCC No Yes Yes DFS TCU001
225A MTS w/generator
Fair MCC is
Control Sequencing is No emergency lighting37 LS 35 20 Ross Rd Brunswick Grade Pole CE4986 480V/3PH disc switch disc switch pumps MCC FVNR MCC No Yes Yes DFS TCU001 w/generator
receptacleis obsolete
Sequencing is hazardous
No emergency lighting
38 LS 12 4614 Altama Ave Brunswick Below Grade Pole DJ2591 230V/3PH
100A/3P Fused lockable disc switch
70A/3P C.B. 2-3HP pumps
20A/3P C.B
FVNR NEMA size 0 70A/3P MCB Yes non-
fused Yes Yes DFS TCU001100A mobile generator receptacle
Excellent
Clearance between fence and electrical panels
Has Conduit seals
39 LS 36 1253 B & W Grade Rd Brunswick Below
GradePad Mounted BE8124 480V/3PH 300A/3P MCB
in MCC300A/3P MCB in MCC
1-100HP 1-20HP 1-60HP
MCC NO DFS
400A MTS w/ mobile generator connections
Fair Clearance for MCC No emergency lighting

APPENDIX B
Site Electrical Photographs

PAGE B-1 of B-26 APPENDIX B – SITE ELECTRICAL PHOTOGRAPHS Lift Station, LS-2
er. Primary and secondary overcurrent protection of transformer could not be verified. WTP, Fancy Bluff
pment, MCC and ATS with overcurrent protection
Obsolete branch circuit panel
Branch circuit panel and wall mounted transform
Recently installed electrical power distribution equi

PAGE B-2 of B-26 APPENDIX B – SITE ELECTRICAL PHOTOGRAPHS Lift Station, LS-103
Main service disconnect mounted on wooden backboard.
el and wetwell.
No conduit seals are installed between the control panel and wetwell.
No conduit seals are installed between the control pan Lift Station, LS-101

PAGE B-3 of B-26 APPENDIX B – SITE ELECTRICAL PHOTOGRAPHS WTP, Exit 29
Weatherproof enclosure housing electrical power distribution equipment. Clearance for equipment is not sufficient.
reasons, the abandoned wiring should be removed also.
between control panel and wetwell.
Backup generator has been removed. For safely Lift Station, LS-114
No conduit seals could be detected

PAGE B-4 of B-26 APPENDIX B – SITE ELECTRICAL PHOTOGRAPHS Lift Station, LS-123
ents for the service disconnect.
between control panel and wetwell. Sunlight will deteriorates the flexible
and wetwell. Sunlight will deteriorate the flexible
Fence interferes with the clearance requirem
No conduit seals install conduits. Lift Station, LS-121
No conduit seals are installed between control panelconduits.
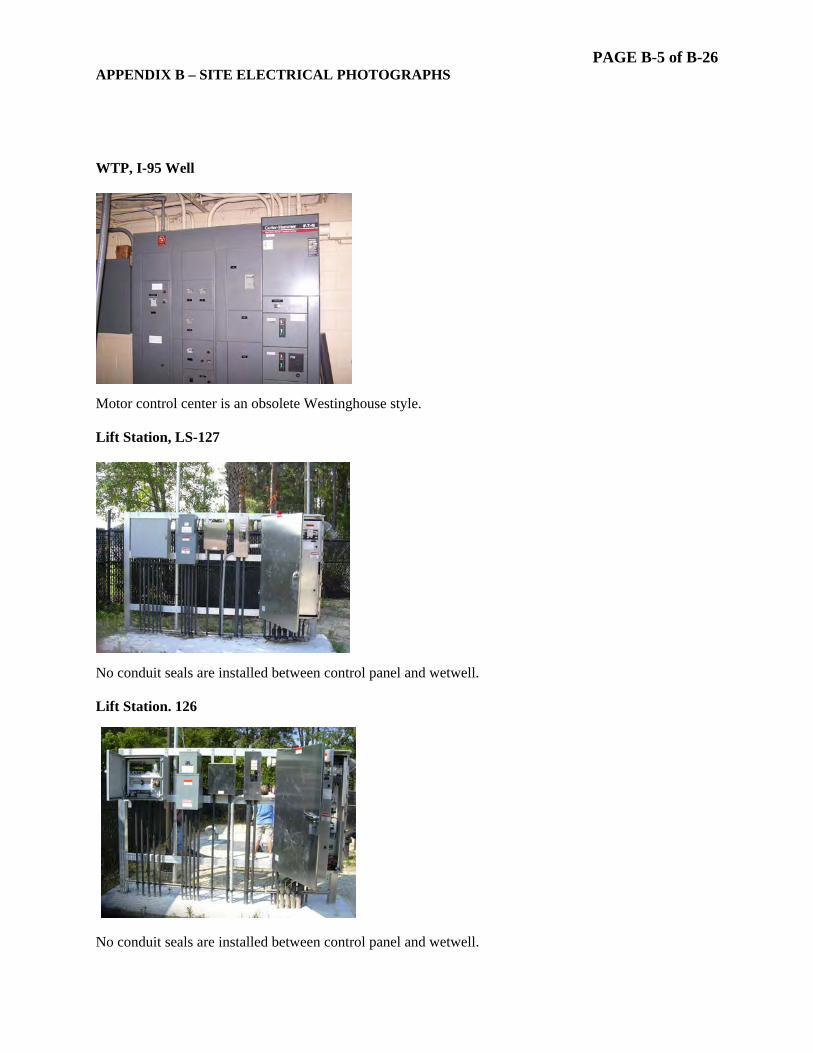
PAGE B-5 of B-26 APPENDIX B – SITE ELECTRICAL PHOTOGRAPHS WTP, I-95 Well
use style.
panel and wetwell.
panel and wetwell.
Motor control center is an obsolete Westingho Lift Station, LS-127
No conduit seals are installed between control
Lift Station. 126
No conduit seals are installed between control

PAGE B-6 of B-26 APPENDIX B – SITE ELECTRICAL PHOTOGRAPHS
Antenna is in close proximately to overhead power lines, this may cause radio interference. WTP, Golden Isles II Well
.
Golden Isles II is a recently constructed facility
The power distribution equipment.
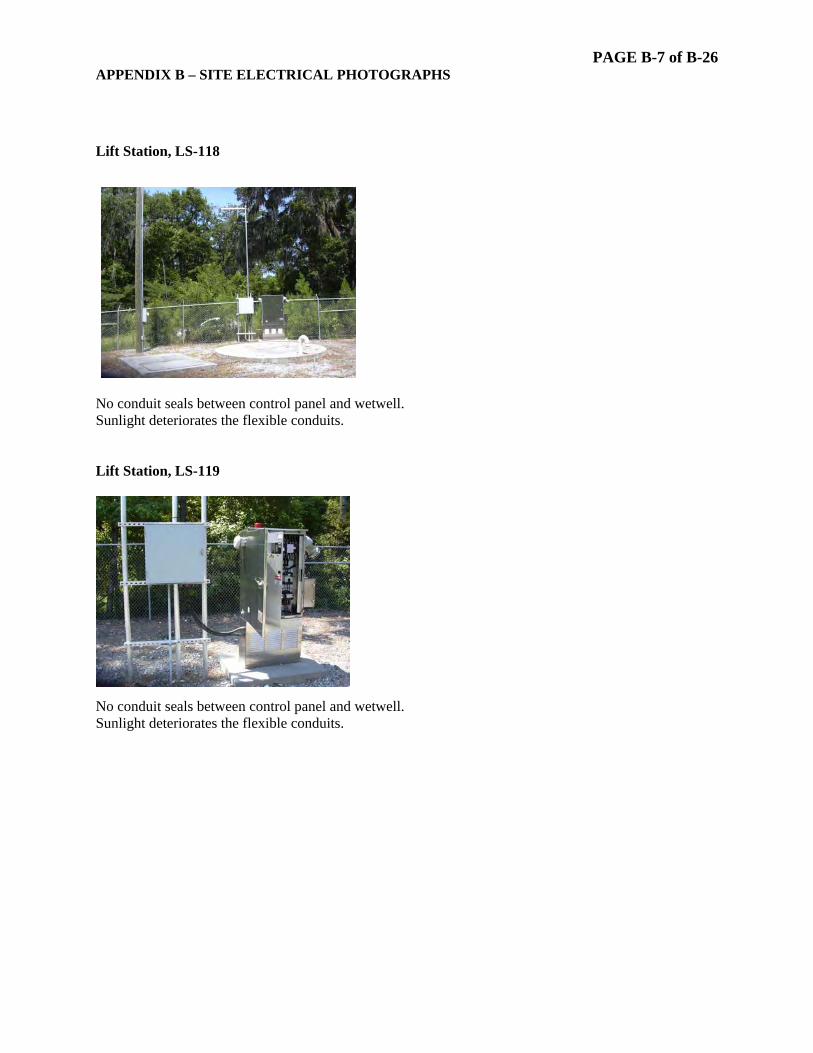
PAGE B-7 of B-26 APPENDIX B – SITE ELECTRICAL PHOTOGRAPHS Lift Station, LS-118
No conduit seals between control panel and wetwell. Sunlight deteriorates the flexible conduits.
Lift Station, LS-119
No conduit seals between control panel and wetwell. Sunlight deteriorates the flexible conduits.

PAGE B-8 of B-26 APPENDIX B – SITE ELECTRICAL PHOTOGRAPHS Lift Station, LS-107
e are badly corroded.
Manual transfer and disconnect for generator receptacle are badly corroded.
No conduit seals between control panel and wetwell. Sunlight deteriorates the flexible conduits Manual transfer and disconnect for generator receptacl
Lift Station, LS-105
Main service disconnect is badly corroded.
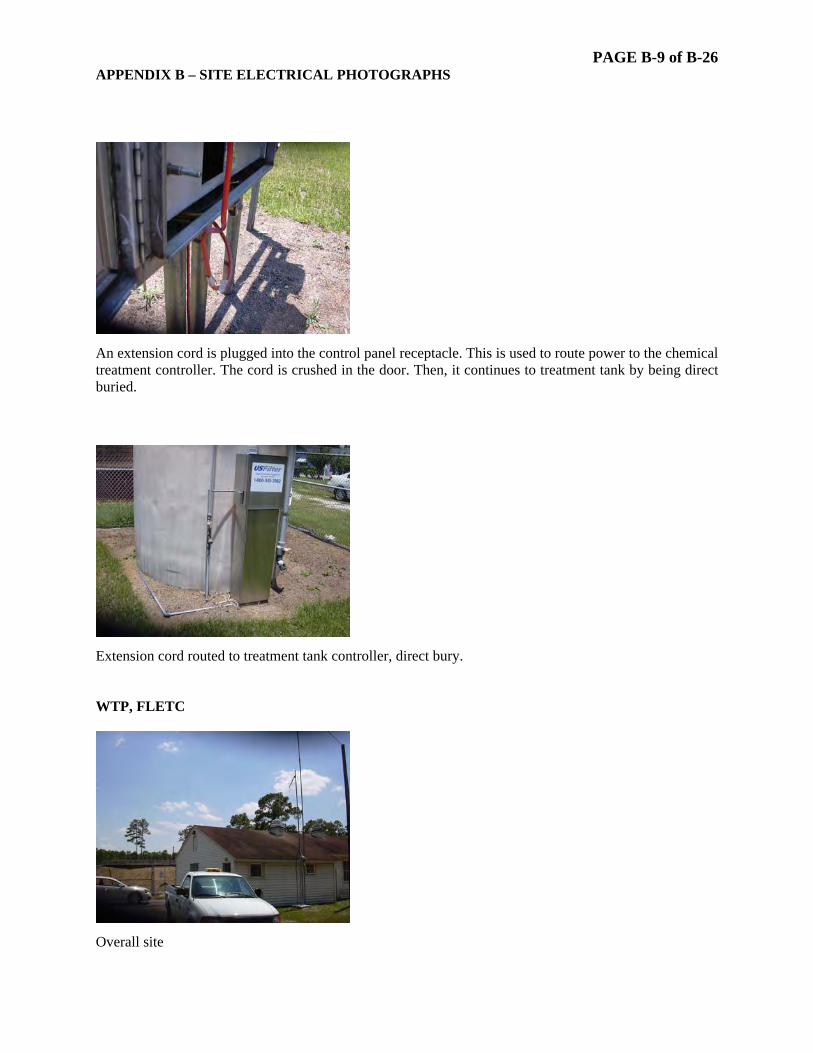
PAGE B-9 of B-26 APPENDIX B – SITE ELECTRICAL PHOTOGRAPHS
tacle. This is used to route power to the chemical the door. Then, it continues to treatment tank by being direct
ect bury.
Overall site
An extension cord is plugged into the control panel receptreatment controller. The cord is crushed in buried.
Extension cord routed to treatment tank controller, dir WTP, FLETC
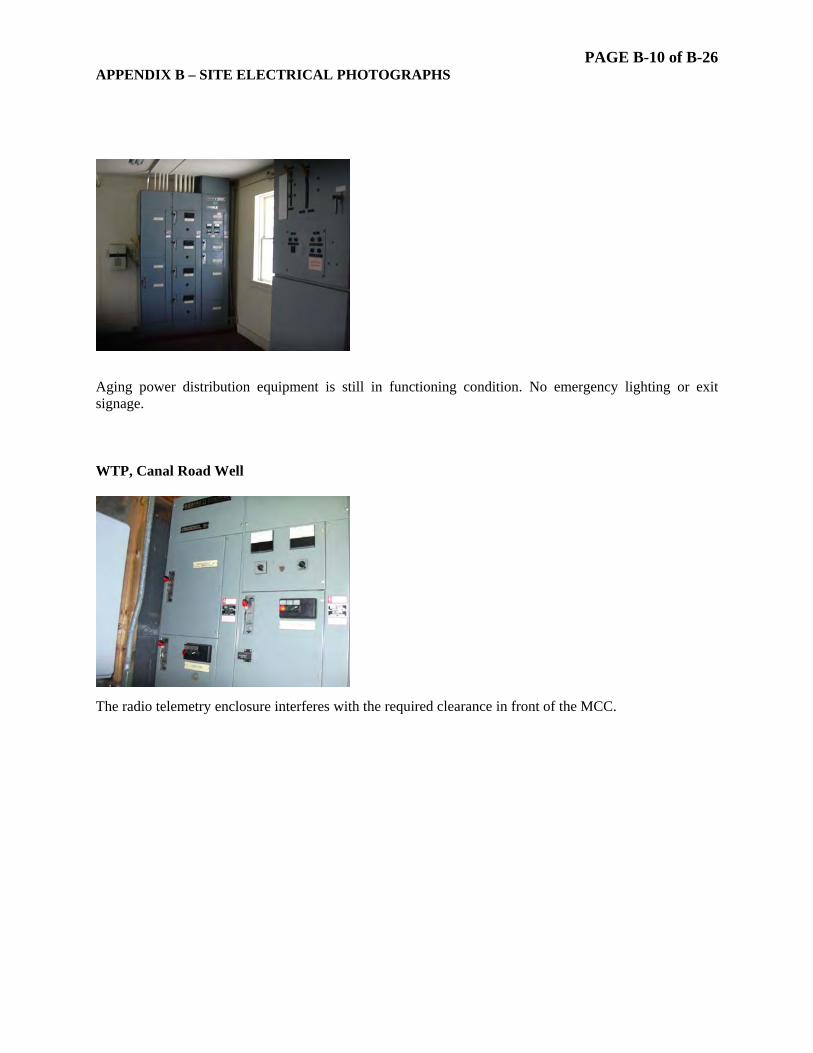
PAGE B-10 of B-26 APPENDIX B – SITE ELECTRICAL PHOTOGRAPHS
ent is still in functioning condition. No emergency lighting or exit signage. WTP, Canal Road Well
the required clearance in front of the MCC.
Aging power distribution equipm
The radio telemetry enclosure interferes with

PAGE B-11 of B-26 APPENDIX B – SITE ELECTRICAL PHOTOGRAPHS Lift Station, LS-39
tank. Abandoned day tank should be removed.
panel and wetwell.
Onsite generator has newly installed belly diesel
No conduit seals between control
The phase monitoring relay has been removed.

PAGE B-12 of B-26 APPENDIX B – SITE ELECTRICAL PHOTOGRAPHS WTP Perry Lane Well
fferent electrical services (480V & 230V)
230 Volt service feed load center located in panel.
Overall site photo. Site has two di
480 Volt service entrance equipment (MCC)

PAGE B-13 of B-26 APPENDIX B – SITE ELECTRICAL PHOTOGRAPHS Golden Isles WTP No. 1
Site photo
480Volt service entrance equipment, MCC with 400A/3P M.C.B.
Facility appears to be fairly new and code compliant.
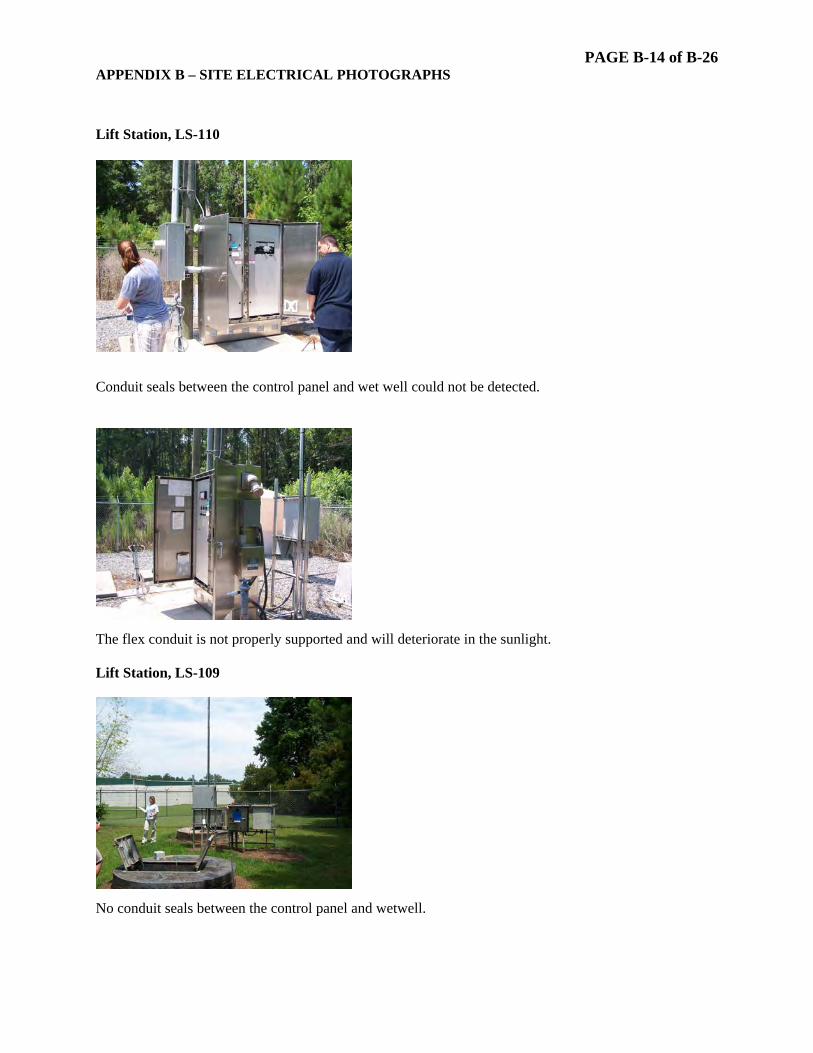
PAGE B-14 of B-26 APPENDIX B – SITE ELECTRICAL PHOTOGRAPHS Lift Station, LS-110
and wet well could not be detected.
d and will deteriorate in the sunlight.
nel and wetwell.
Conduit seals between the control panel
The flex conduit is not properly supporte Lift Station, LS-109
No conduit seals between the control pa
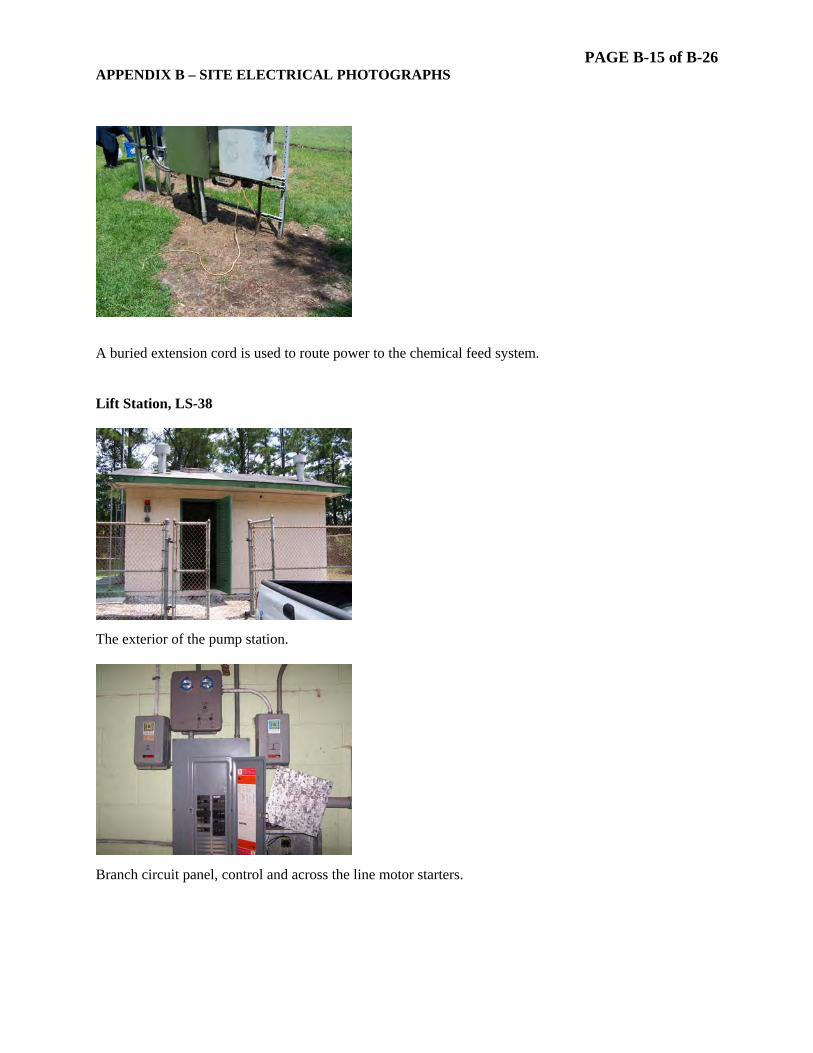
PAGE B-15 of B-26 APPENDIX B – SITE ELECTRICAL PHOTOGRAPHS
A buried extension cord is used to route power to the chemical feed system.
The exterior of the pump station.
Branch circuit panel, control and across the line motor starters.
Lift Station, LS-38
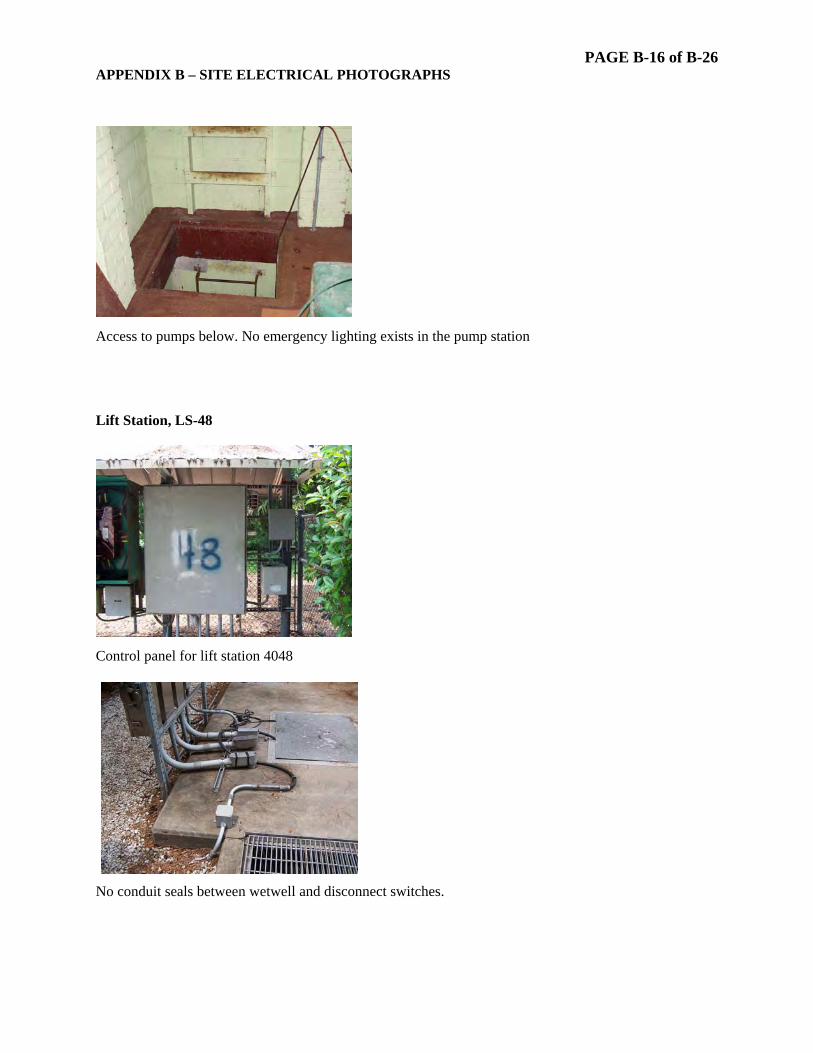
PAGE B-16 of B-26 APPENDIX B – SITE ELECTRICAL PHOTOGRAPHS
ng exists in the pump station
Lift Station, LS-48
Control panel for lift station 4048
and disconnect switches.
Access to pumps below. No emergency lighti
No conduit seals between wetwell

PAGE B-17 of B-26 APPENDIX B – SITE ELECTRICAL PHOTOGRAPHS Lift Station, LS-28
Electrical equipment backboard.
e wetwell and disconnect switches.
No conduit seals installed between wetwell and control panel.
No conduit seal installed between th Lift Station, LS-23
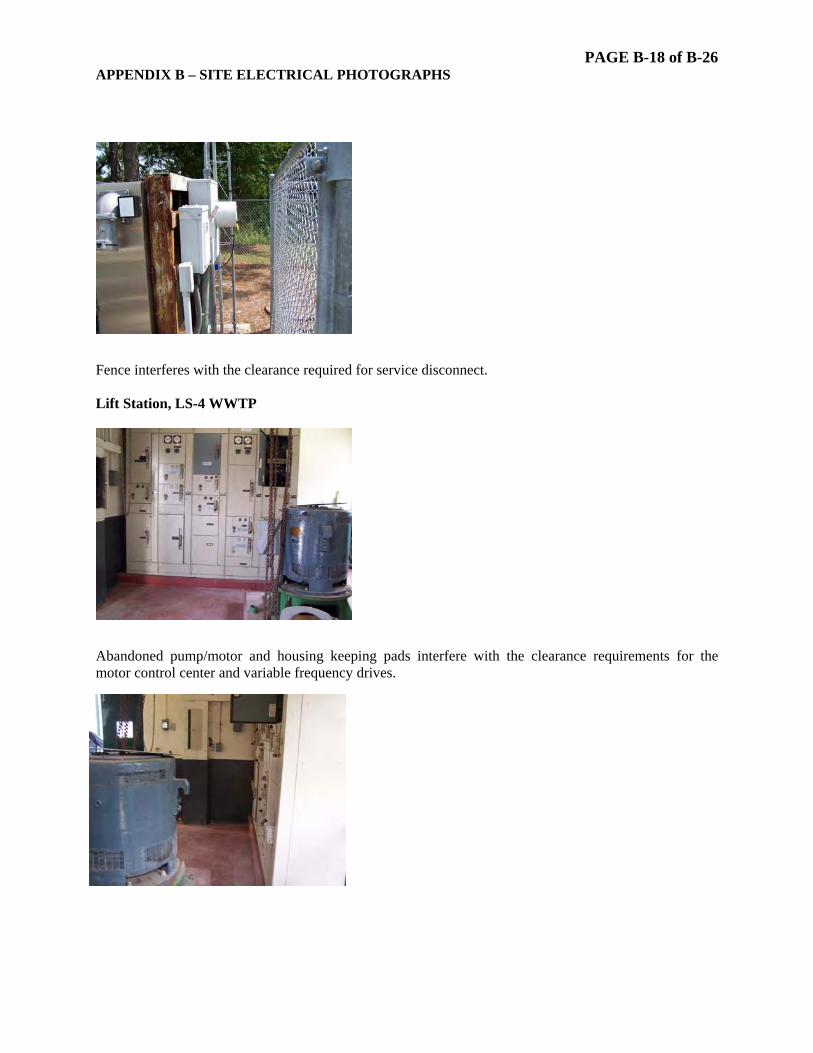
PAGE B-18 of B-26 APPENDIX B – SITE ELECTRICAL PHOTOGRAPHS
required for service disconnect.
keeping pads interfere with the clearance requirements for the
drives.
Fence interferes with the clearance Lift Station, LS-4 WWTP
Abandoned pump/motor and housing motor control center and variable frequency

PAGE B-19 of B-26 APPENDIX B – SITE ELECTRICAL PHOTOGRAPHS Lift Station, LS-3
Obsolete motor control center interferes with clearance requirements for variable frequency drive pump
n system should be replaced. Configuration of MCC has
us telephone).
ainment. Tank needs to be verified for double wall containment
control panel. The obsolete power distributiobeen modified, destroying the UL listing.
Station does not have radio telemetry (Mod b WTP, Howard Coffin Park Well
Diesel tank for backup generator does not have cont

PAGE B-20 of B-26 APPENDIX B – SITE ELECTRICAL PHOTOGRAPHS
t be located.
gnage for the facility. Lift Station, LS-17
d wetwell. metry connections.
MCC is an older vintage. However, it appears to be in good operating condition.
Generator output circuit breaker could noThere is no emergency lighting or exit si
No conduit seal between control panel anFlexible sealtight conduit was used for tele WTP, Goodyear Well
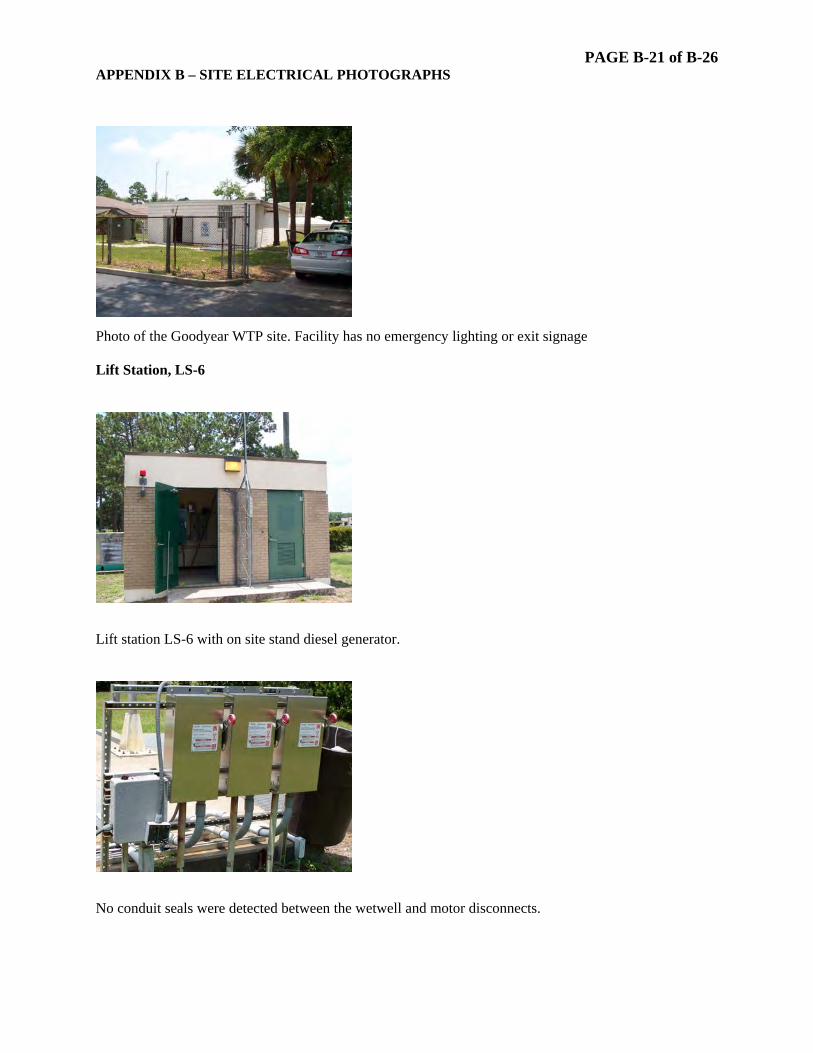
PAGE B-21 of B-26 APPENDIX B – SITE ELECTRICAL PHOTOGRAPHS
lighting or exit signage
the wetwell and motor disconnects.
Photo of the Goodyear WTP site. Facility has no emergency Lift Station, LS-6
Lift station LS-6 with on site stand diesel generator.
No conduit seals were detected between

PAGE B-22 of B-26 APPENDIX B – SITE ELECTRICAL PHOTOGRAPHS Lift Station, LS-21
C violations and posed safety hazards to maintenance personnel.
s. Pumps are belt driven with a guards that provide a ng to access and trouble shoot the electrical equipment.
Electrical service is a direct connection to power distribution block in control panel. No service disconnect exists to isolate this panel.
Lift Station LS-4021 contains many NE
No work clearance in the front of the electrical panelminimal protection to workers attempti
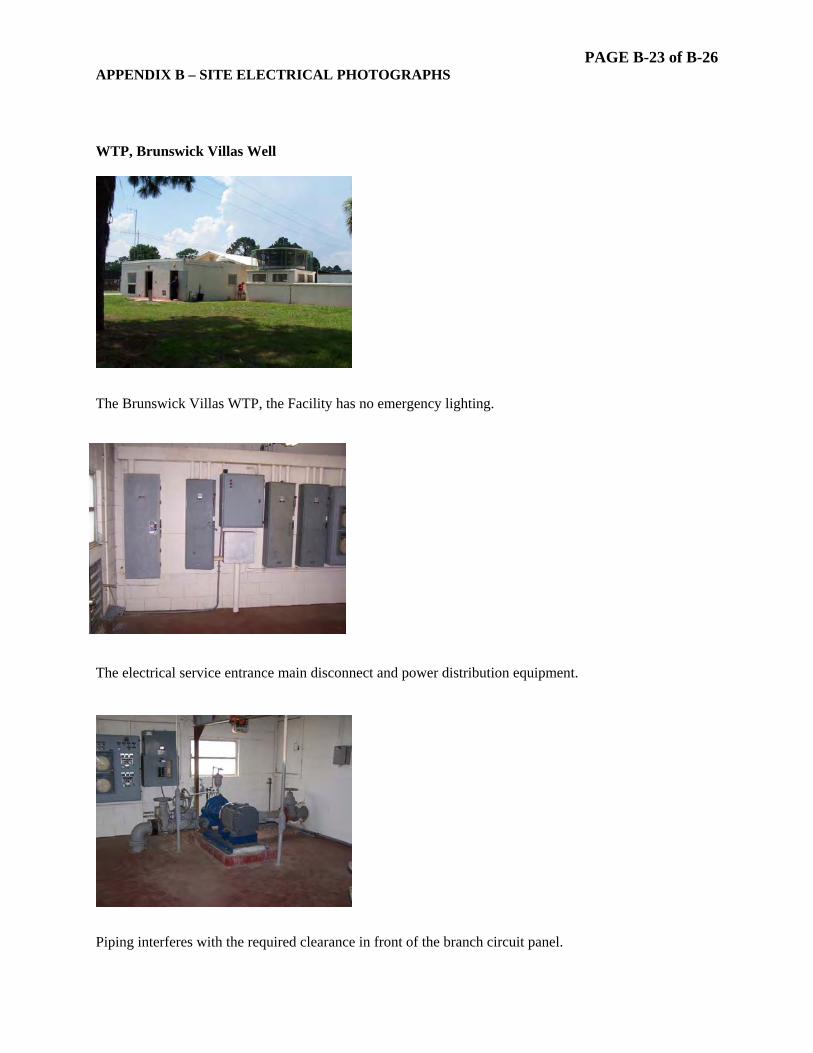
PAGE B-23 of B-26 APPENDIX B – SITE ELECTRICAL PHOTOGRAPHS WTP, Brunswick Villas Well
The Brunswick Villas WTP, the Facility has no emergency lighting.
onnect and power distribution equipment.
in front of the branch circuit panel.
The electrical service entrance main disc
Piping interferes with the required clearance

PAGE B-24 of B-26 APPENDIX B – SITE ELECTRICAL PHOTOGRAPHS Lift Station, LS-5
lighting. the proper working clearance in front of it.
lighting.
Lift station LS-4005, facility has no emergency
The automatic transfer switch does not have Lift Station, LS-35
Lift station LS-4035, facility has no emergency
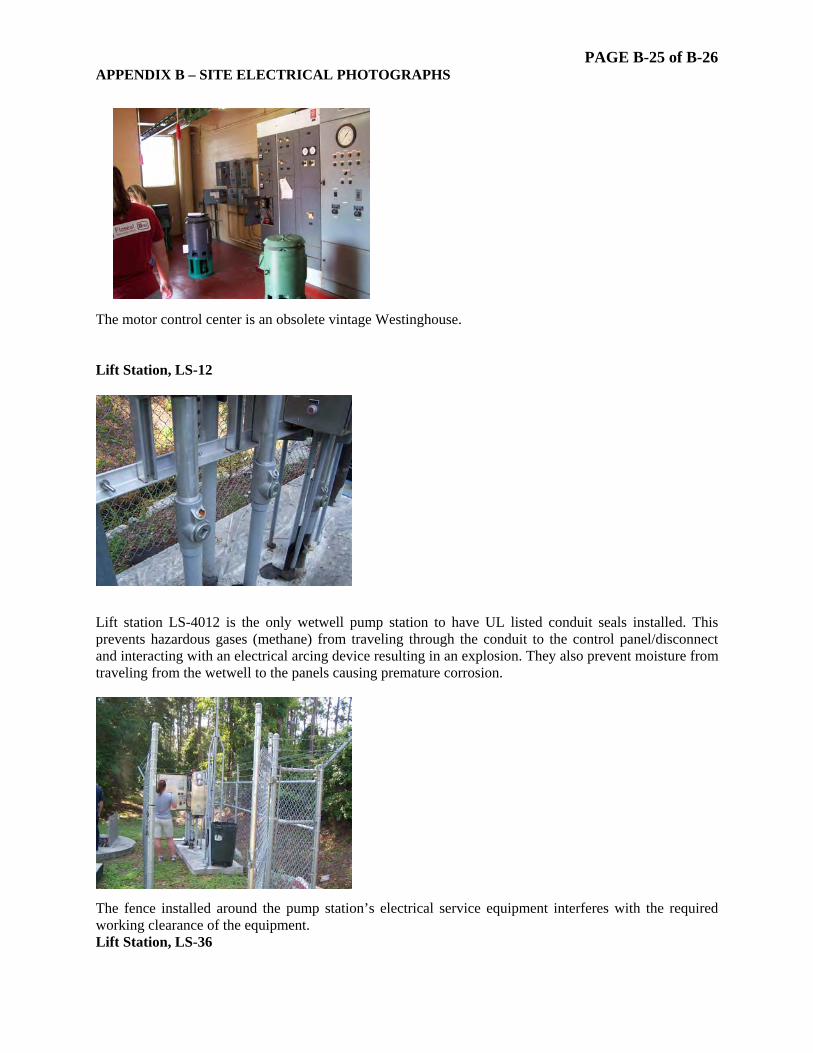
PAGE B-25 of B-26 APPENDIX B – SITE ELECTRICAL PHOTOGRAPHS
The motor control center is an obsolete vintage Westinghouse.
Lift station LS-4012 is the only wetwell pump station to have UL listed conduit seals installed. This
traveling through the conduit to the control panel/disconnect ng in an explosion. They also prevent moisture from
causing premature corrosion.
p station’s electrical service equipment interferes with the required
Lift Station, LS-12
prevents hazardous gases (methane) fromand interacting with an electrical arcing device resultitraveling from the wetwell to the panels
The fence installed around the pumworking clearance of the equipment. Lift Station, LS-36

PAGE B-26 of B-26 APPENDIX B – SITE ELECTRICAL PHOTOGRAPHS
Lift station LS-4036.
ete vintage Westinghouse. The Pump interferes with clearance
ps. The facility has provisions for a mobile
lighting.
The motor control center is an obsolrequirements for the MCC.
The stairway leading down to the location of the pumgenerator connection and has no emergency

APPENDIX C RAINFALL DEPENDENT INFLOW AND INFILTRATION COMPUTATIONS
Brunswick Glynn County JWSC Applied Technology & Management, Inc.
Water Sewer Master Plan
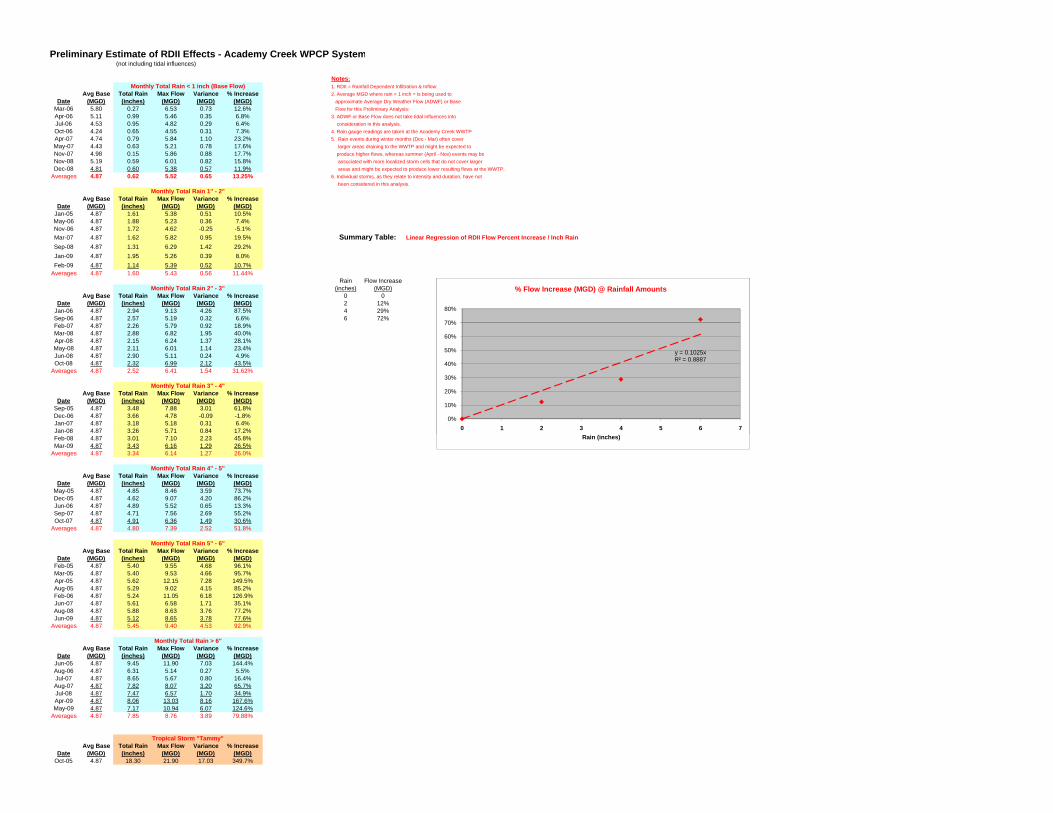
30%
Preliminary Estimate of RDII Effects - Academy Creek WPCP System (not including tidal influences)
Notes:Monthly Total Rain < 1 inch (Base Flow) 1. RDII = Rainfall Dependent Infiltration & Inflow:
Avg Base Total Rain Max Flow Variance % Increase 2. Average MGD where rain < 1 inch = is being used to Date (MGD) (inches) (MGD) (MGD) (MGD) approximate Average Dry Weather Flow (ADWF) or Base
Mar-06 5.80 0.27 6.53 0.73 12.6% Flow for this Preliminary Analysis:Apr-06 5.11 0.99 5.46 0.35 6.8% 3. ADWF or Base Flow does not take tidal influences intoJul-06 4.53 0.95 4.82 0.29 6.4% consideration in this analysis.Oct-06 4.24 0.65 4.55 0.31 7.3% 4. Rain gauge readings are taken at the Academy Creek WWTPApr-07 4.74 0.79 5.84 1.10 23.2% 5. Rain events during winter months (Dec - Mar) often coverMay-07 4.43 0.63 5.21 0.78 17.6% larger areas draining to the WWTP and might be expected to Nov-07 4.98 0.15 5.86 0.88 17.7% produce higher flows, whereas summer (April - Nov) events may beNov-08 5.19 0.59 6.01 0.82 15.8% associated with more localized storm cells that do not cover largerDec-08 4.81 0.60 5.38 0.57 11.9% areas and might be expected to produce lower resulting flows at the WWTP.
Averages 4.87 0.62 5.52 0.65 13.25% 6. Individual storms, as they relate to intensity and duration, have not been considered in this analysis.
Monthly Total Rain 1" - 2"Avg Base Total Rain Max Flow Variance % Increase
Date (MGD) (inches) (MGD) (MGD) (MGD)Jan-05 4.87 1.61 5.38 0.51 10.5%May-06 4.87 1.88 5.23 0.36 7.4%Nov-06 4.87 1.72 4.62 -0.25 -5.1%Mar-07 4.87 1.62 5.82 0.95 19.5% Summary Table: Linear Regression of RDII Flow Percent Increase / Inch RainSep-08 4.87 1.31 6.29 1.42 29.2%Jan-09 4.87 1.95 5.26 0.39 8.0%Feb-09 4.87 1.14 5.39 0.52 10.7%
Averages 4.87 1.60 5.43 0.56 11.44%Rain Flow Increase
Monthly Total Rain 2" - 3" (inches) (MGD) % Flow Increase (MGD) @ Rainfall AmountsAvg Base Total Rain Max Flow Variance % Increase 0 0
Date (MGD) (inches) (MGD) (MGD) (MGD) 2 12%Jan-06 4.87 2.94 9.13 4.26 87.5% 4 29% 80%Sep-06 4.87 2.57 5.19 0.32 6.6% 6 72%Feb-07 4.87 2.26 5.79 0.92 18.9% 70%
Mar-08 4.87 2.88 6.82 1.95 40.0% 60%Apr-08 4.87 2.15 6.24 1.37 28.1%May-08 4.87 2.11 6.01 1.14 23.4% 50%Jun-08 4.87 2.90 5.11 0.24 4.9% y = 0.1025x
Oct-08 4.87 2.32 6.99 2.12 43.5% R² = 0.888740%
Averages 4.87 2.52 6.41 1.54 31.62%
Monthly Total Rain 3" - 4"Avg Base Total Rain Max Flow Variance % Increase 20%
Date (MGD) (inches) (MGD) (MGD) (MGD)Sep-05 4.87 3.48 7.88 3.01 61.8% 10%
Dec-06 4.87 3.66 4.78 -0.09 -1.8% 0%Jan-07 4.87 3.18 5.18 0.31 6.4%J 08Jan-08 4 874.87 3 263.26 5 715.71 0 840.84 17 2% 0 1 2 3 4 5 6 717.2%Feb-08 4.87 3.01 7.10 2.23 45.8%Mar-09 4.87 3.43 6.16 1.29 26.5%
Averages 4.87 3.34 6.14 1.27 26.0%
Monthly Total Rain 4" - 5"Avg Base Total Rain Max Flow Variance % Increase
Date (MGD) (inches) (MGD) (MGD) (MGD)May-05 4.87 4.85 8.46 3.59 73.7%Dec-05 4.87 4.62 9.07 4.20 86.2%Jun-06 4.87 4.89 5.52 0.65 13.3%Sep-07 4.87 4.71 7.56 2.69 55.2%Oct-07 4.87 4.91 6.36 1.49 30.6%
Averages 4.87 4.80 7.39 2.52 51.8%
Monthly Total Rain 5" - 6"Avg Base Total Rain Max Flow Variance % Increase
Date (MGD) (inches) (MGD) (MGD) (MGD)Feb-05 4.87 5.40 9.55 4.68 96.1%Mar-05 4.87 5.40 9.53 4.66 95.7%Apr-05 4.87 5.62 12.15 7.28 149.5%Aug-05 4.87 5.29 9.02 4.15 85.2%Feb-06 4.87 5.24 11.05 6.18 126.9%Jun-07 4.87 5.61 6.58 1.71 35.1%Aug-08 4.87 5.88 8.63 3.76 77.2%Jun-09 4.87 5.12 8.65 3.78 77.6%
Averages 4.87 5.45 9.40 4.53 92.9%
Monthly Total Rain > 6"Avg Base Total Rain Max Flow Variance % Increase
Date (MGD) (inches) (MGD) (MGD) (MGD)Jun-05 4.87 9.45 11.90 7.03 144.4%Aug-06 4.87 6.31 5.14 0.27 5.5%Jul-07 4.87 8.65 5.67 0.80 16.4%Aug-07 4.87 7.82 8.07 3.20 65.7%Jul-08 4.87 7.47 6.57 1.70 34.9%Apr-09 4.87 8.06 13.03 8.16 167.6%May-09 4.87 7.17 10.94 6.07 124.6%
Averages 4.87 7.85 8.76 3.89 79.88%
Tropical Storm "Tammy"Avg Base Total Rain Max Flow Variance % Increase
Date (MGD) (inches) (MGD) (MGD) (MGD)Oct-05 4.87 18.30 21.90 17.03 349.7%
y = 0.1025xR² = 0.8887
0%
10%
20%
30%
40%
50%
60%
70%
80%
0 1 2 3 4 5 6 7Rain (inches)
% Flow Increase (MGD) @ Rainfall Amounts

H/M/S Influent Analysis from Pumping Records (2 Pumps)
Pump 1 Flow Rate 451 during Test (gpm):Facility: LS4001 Pump 2 Flow Rate 451 during Test (gpm):
P1 On-Time P2 On-Time 24-hour Influent Total On-Time Pump1 Pump2 Prince StDate Hours Minutes Seconds Hours Minutes Seconds (gpd) (Minutes) On-Times On-Times Rain (in)
Saturday, August 09, 2008 3 27 31 3 19 51 183,722 407.37 52 53 0Sunday, August 10, 2008 1 10 0 1 12 14 64,147 142.23 31 29 0Monday, August 11, 2008 3 10 10 3 1 45 167,734 371.92 48 49 0.01Tuesday, August 12, 2008 3 57 48 3 39 28 206,227 457.27 55 55 3.3Wednesday, August 13, 2008 5 1 7 4 42 16 263,106 583.38 63 63 0.15Thursday, August 14, 2008 4 50 34 4 37 28 256,183 568.03 63 63 0.07Friday, August 15, 2008 4 24 35 3 59 21 227,274 503.93 58 57 0Saturday, August 16, 2008 3 28 55 3 29 23 188,653 418.30 56 56 0
Average (gpd) = 194,631 431.55 53.25 53.13Average Daily InFlow 135 Rate (gpm) =
Peak Flow 338 @ 2.5 (gpm) =
Weekend Day Influent A #REF!verage (gpd) =Week Days Influent A #REF!verage (gpd) =
Note: Weeks are to start on Sunday and go through Saturday with the Draw Down Test being on one of those days in that week.Note: Pump Flow based on 7-15-08 drawdown testing
4.432 Avg of Total Pump On-times / 24 hour period = Number of Runs per hour (3 to 6)17.981 Avg Total On-Time minutes / 24 hour period = Avg min On-time per hour (21 - 48)4.06 Avg min On-time per hour / Number of Runs per hour = On-time minutes per pump (7 -8 minutes)
Rain Summary
Average Dry (weekend) 183,722 Rain Guage Station: Prince Street Rain Gauge StationLess Percent Weekend Typ Lower 24,625Average Dry (weekday) 208,347 Date Rain (in)
8/9/2008 0Use Day After Storm for Wet - Weekday 263,106 8/10/2008 0
8/11/2008 0.01I/I Flow 54,759 8/12/2008 3.3Percent I/I Flow 26.28% 8/13/2008 0.15
8/14/2008 0.07Something seems off with the Sunday Aug 10th data 8/15/2008 0
8/16/2008 0
RD I/I Fay vs Dec 2007Use Dec 2007 information to compare to Fay event
Peak I/I Weekday - Fay 263,106Dry Weekend Day Average Dec 8 and 9 164,262 22016.3
186,278 Corr dry Weekday Ave - Dec 186,278Dry Weekday Average Dec 10 - 14 186,278
RD I/I Flow 76,828Weekend Day Typ 13.40% Lower than Weekday
Percent RD I/I Flow 41.24%LS4001 Influent Analysis 08-2008

Influent Analysis from Pumping Records
Pump 1 Flow Rate during Test (gpm 451):Facility: LS4001 Pump 2 Flow Rate during Test (gpm 451):
P1 On-Time P2 On-Time 24-hour Influent Total On-Time Pump1 Pump2 Prince StDate Hours Minutes Seconds Hours Minutes Seconds (gpd) (Minutes) On-Times On-Times Rain (in)
Saturday, December 08, 2007 3 37 14 3 3 9 180,573 400.38 51 48 0Sunday, December 09, 2007 3 8 1 2 20 2 147,951 328.05 46 43 0Monday, December 10, 2007 2 34 4 2 51 8 146,665 325.20 46 44 0Tuesday, December 11, 2007 4 12 12 3 6 43 197,951 438.92 58 58 0Wednesday, December 12, 2007 3 51 17 3 29 17 198,696 440.57 63 64 0Thursday, December 13, 2007 3 50 52 3 33 41 200,492 444.55 65 65 0Friday, December 14, 2007 3 33 25 3 22 31 187,586 415.93 59 58 0Saturday, December 15, 2007 3 19 9 3 17 13 178,761 396.37 56 58 0.93Sunday, December 16, 2007 2 55 5 2 40 7 151,175 335.20 53 52 0Monday, December 17, 2007 2 57 31 2 52 53 158,030 350.40 55 56 0Tuesday, December 18, 2007 4 7 22 3 47 28 214,150 474.83 71 72 0
Average 179,988 (gpd) = 399.09 56.64 56.18Average Daily InFlow Rate (gpm 125) =
Peak Flow @ 2.5 (gpm 312) =
Weekend Day Influent Average (gpd) = 164,615Week Days Influent Aver 186,224age (gpd) =
Note: Pump Flow based on 7-15-08 drawdown testing
4.701 Avg of Total Pump On-times / 24 hour period = Number of Runs per hour16.629 Avg Total On-Time minutes / 24 hour period = Avg min On-time per hour
3.54 Avg min On-time per hour / Number of Runs per hour = On-time minutes per pump
Prince Street Rain Gauge StationDec-07 Inches
12/1/2007 012/2/200712/2/2007 0 010.0112/3/2007 0.02
Use Dec 2007 information to com apare to F y event 12/4/2007 012/5/2007 0
Dry Weekend Day Average Dec 8 and 9 164,262 12/6/2007 012/7/2007 0
Dry Weekday Average Dec 10 - 14 186,278 12/8/2007 012/9/2007 0
Storm Event (2nd Day after) - Weekday 158,030 12/10/2007 012/11/2007 0
I/I Flow 11,365 12/12/2007 012/13/2007 0
Percent I/I Flow 7.75% 12/14/2007 012/15/2007 0.9312/16/2007 012/17/2007 012/18/2007 012/19/2007 012/20/2007 0.6212/21/2007 012/22/2007 0.0112/23/2007 012/24/2007 012/25/2007 0.0412/26/2007 012/27/2007 012/28/2007 012/29/2007 012/30/2007 0.4112/31/2007 0
Total 2.04
LS4001 Influent Analysis 12-2007

LS4002 Pumps operate on VFDs - JWSC (Ray Tarker) developed correlation between RPM and Flow
Date GPD Rain (in) Max. Min. Avg.Friday, March 20, 2009 898,215 0.00 924 428 623
Saturday, March 21, 2009 785,843 0.00 698 400 542Sunday, March 22, 2009 801,390 0.00 843 420 556Monday, March 23, 2009 834,258 0.00 844 381 581Tuesday, March 24, 2009 868,654 0.01 926 451 598
Wednesday, March 25, 2009 843,400 0.00 959 393 589Thursday, March 26, 2009 894,015 0.00 1,166 404 628
Friday, March 27, 2009 849,075 0.03 778 422 603Saturday, March 28, 2009 841,728 0.25 924 382 591Sunday, March 29, 2009 997,940 0.99 1,263 474 715Monday, March 30, 2009 1,044,992 0.13 1,011 204 732Tuesday, March 31, 2009 1,009,738 0.53 921 546 704
Wednesday, April 01, 2009 1,496,471 2.40 1,341 751 1,046Thursday, April 02, 2009 1,863,424 2.49 1,639 1,087 1,300
Friday, April 03, 2009 2,227,796 0.19 1,639 1,364 1,479Saturday, April 04, 2009 1,814,698 0.00 1,639 1,235 1,339Sunday, April 05, 2009 1,952,401 0.95 1,564 1,133 1,360Monday, April 06, 2009 1,928,489 0.01 1,639 818 1,422Tuesday, April 07, 2009 1,841,194 0.00 1,467 1,079 1,256
Wednesday, April 08, 2009 1,869,726 0.00 1,469 951 1,290Thursday, April 09, 2009 1,604,725 0.00 1,449 879 1,117
Friday, April 10, 2009 1,703,346 0.00 1,459 725 1,191Saturday, April 11, 2009 1,417,894 0.00 1,371 749 1,003Sunday, April 12, 2009 1,552,108 0.00 1,465 573 1,083Monday, April 13, 2009 1.59
ADWF (GPD): 846,286AWWF (GPD): 1,621,663% I/I Increase: 91.6%
Dec 2007 and August 2008 data not available
Dry Friday March 20, 2009 898,215
Storm Event (Day After) - Friday April 3 2009 2 227 796
RDII Analysis
Flow (gpm)
Influent Analysis from Pumping Records (2 Pumps)
Storm Event (Day After) - Friday April 3, 2009 2,227,796
RD I/I Flow 1,329,582
Percent RD I/I Flow 148.02%
Friday, March 20, 2009 0.00 Friday, March 20, 2009 0.00 Friday, March 20, 2009 0.00Saturday, March 21, 2009 0.00 Saturday, March 21, 2009 0.00 Saturday, March 21, 2009 0.00Sunday, March 22, 2009 0.00 Sunday, March 22, 2009 0.00 Sunday, March 22, 2009 0.00Monday, March 23, 2009 0.00 Monday, March 23, 2009 0.00 Monday, March 23, 2009 0.00Tuesday, March 24, 2009 0.01 Tuesday, March 24, 2009 0.01 Tuesday, March 24, 2009 0.01
Wednesday, March 25, 2009 0.00 Wednesday, March 25, 2009 0.00 Wednesday, March 25, 2009 0.00Thursday, March 26, 2009 0.00 Thursday, March 26, 2009 0.00 Thursday, March 26, 2009 0.00
Friday, March 27, 2009 0.03 Friday, March 27, 2009 0.02 Friday, March 27, 2009 0.03Saturday, March 28, 2009 0.18 Saturday, March 28, 2009 0.32 Saturday, March 28, 2009 0.25Sunday, March 29, 2009 0.67 Sunday, March 29, 2009 1.30 Sunday, March 29, 2009 0.99Monday, March 30, 2009 0.25 Monday, March 30, 2009 0.00 Monday, March 30, 2009 0.13Tuesday, March 31, 2009 0.16 Tuesday, March 31, 2009 0.90 Tuesday, March 31, 2009 0.53
Wednesday, April 01, 2009 2.18 Wednesday, April 01, 2009 2.62 Wednesday, April 01, 2009 2.40Thursday, April 02, 2009 2.54 Thursday, April 02, 2009 2.44 Thursday, April 02, 2009 2.49
Friday, April 03, 2009 0.26 Friday, April 03, 2009 0.11 Friday, April 03, 2009 0.19Saturday, April 04, 2009 0.00 Saturday, April 04, 2009 0.00 Saturday, April 04, 2009 0.00Sunday, April 05, 2009 0.78 Sunday, April 05, 2009 1.12 Sunday, April 05, 2009 0.95Monday, April 06, 2009 0.00 Monday, April 06, 2009 0.02 Monday, April 06, 2009 0.01Tuesday, April 07, 2009 0.00 Tuesday, April 07, 2009 0.00 Tuesday, April 07, 2009 0.00
Wednesday, April 08, 2009 0.00 Wednesday, April 08, 2009 0.00 Wednesday, April 08, 2009 0.00Thursday, April 09, 2009 0.00 Thursday, April 09, 2009 0.00 Thursday, April 09, 2009 0.00
Friday, April 10, 2009 0.00 Friday, April 10, 2009 0.00 Friday, April 10, 2009 0.00Saturday, April 11, 2009 0.00 Saturday, April 11, 2009 0.00 Saturday, April 11, 2009 0.00Sunday, April 12, 2009 0.00 Sunday, April 12, 2009 0.00 Sunday, April 12, 2009 0.00Monday, April 13, 2009 2.07 Monday, April 13, 2009 1.11 Monday, April 13, 2009 1.59
AveragePrince #11 Rain Gauge SiteWWTP4 Rain Gauge Site
LS4002 RPM-Flow 4-09 Storm

LS4003 Pumps operate on VFDs - JWSC (Ray Tarker) developed correlation between RPM and FlowWWTP#4
Date GPD Rain (in) Max. Min. Avg.Friday, March 20, 2009 155,905 0 1,005 10 111
Saturday, March 21, 2009 93,035 0 1,005 10 55Sunday, March 22, 2009 164,272 0 1,005 10 102Monday, March 23, 2009 210,696 0 1,005 10 97Tuesday, March 24, 2009 72,361 0.01 1,005 10 54 Bad Data
Wednesday, March 25, 2009 40,805 0 1,005 10 25 Bad DataThursday, March 26, 2009 41,441 0 1,005 10 117 Bad Data
Friday, March 27, 2009 14,242 0.03 10 10 10 Bad DataSaturday, March 28, 2009 129,333 0.18 1,005 10 236Sunday, March 29, 2009 226,370 0.67 1,005 10 292Monday, March 30, 2009 204,084 0.25 1,005 10 247Tuesday, March 31, 2009 184,716 0.16 1,005 10 197
Wednesday, April 01, 2009 221,322 2.18 984 66 169Thursday, April 02, 2009 474,649 2.54 719 140 344
Friday, April 03, 2009 723,457 0.26 708 358 508Saturday, April 04, 2009 527,835 0 1,005 10 381Sunday, April 05, 2009 530,876 0.78 1,005 10 383Monday, April 06, 2009 657,465 0 1,005 10 483Tuesday, April 07, 2009 487,871 0 980 241 352
Wednesday, April 08, 2009 364,573 0 999 10 258Thursday, April 09, 2009 269,386 0 1,005 10 241
Friday, April 10, 2009 418,195 0 1,005 10 332Saturday, April 11, 2009 375,608 0 1,005 10 291Sunday, April 12, 2009 385,595 0 1,005 10 294Monday, April 13, 2009 2.07
ADWF (GPD): 163,149AWWF (GPD): 435,631
Influent Analysis from Pumping Records (2 Pumps)
Flow (gpm)
RDII Analysis
% I/I Increase: 167.0%
Friday, March 20, 2009 0.00 Dec 2007 and August 2008 data not availableSaturday, March 21, 2009 0.00Sunday, March 22, 2009 0.00 Dry Friday March 20, 2009 155,905Monday, March 23, 2009 0.00Tuesday, March 24, 2009 0.01 Storm Event (Day After) - Friday April 3, 2009 723,457
Wednesday, March 25, 2009 0.00Thursday, March 26, 2009 0.00 RD I/I Flow 567,552
Friday, March 27, 2009 0.03Saturday, March 28, 2009 0.18 Percent RD I/I Flow 364.04%Sunday, March 29, 2009 0.67Monday, March 30, 2009 0.25Tuesday, March 31, 2009 0.16
Wednesday, April 01, 2009 2.18Thursday, April 02, 2009 2.54
Friday, April 03, 2009 0.26Saturday, April 04, 2009 0.00Sunday, April 05, 2009 0.78Monday, April 06, 2009 0.00Tuesday, April 07, 2009 0.00
Wednesday, April 08, 2009 0.00Thursday, April 09, 2009 0.00
Friday, April 10, 2009 0.00Saturday, April 11, 2009 0.00Sunday, April 12, 2009 0.00Monday, April 13, 2009 2.07
WWTP4 Rain Gauge Site
LS4003 RPM-Flow 4-09 Storm

3281Facility: LS4005 3281
24-hour Influent Total On-Time Pump1 Pump2 WWTP #4Date Hours Minutes Seconds Hours Minutes Seconds (gpd) (Minutes) On-Times On-Times Rain (in)
Saturday, August 09, 2008 5 46 59 2 19 27 1,595,988 486.43 120 57 0Sunday, August 10, 2008 2 4 40 5 36 32 1,513,197 461.20 52 112 0Monday, August 11, 2008 5 23 56 2 9 59 1,489,301 453.92 119 50 0.68Tuesday, August 12, 2008 2 3 28 6 3 7 1,596,480 486.58 52 121 1.38Wednesday, August 13, 2008 6 9 43 2 35 24 1,722,908 525.12 123 61 0.13Thursday, August 14, 2008 2 38 17 6 22 32 1,774,419 540.82 61 121 0.01Friday, August 15, 2008 5 54 59 2 45 37 1,708,089 520.60 116 56 0.01
0 0.000 0.000 0.000 0.00
1,628,626 496.38 91.86 82.57 * Averages based on Sat Aug 09 - Fri Aug 15 (LCS)1,1312,827
1,554,5921,658,239
Note: Pump rate based on 9-5-08 drawdown testing
7.268 Avg of Total Pump On-times / 24 hour period = Number of Runs per hour (3 to 6)20.683 Avg Total On-Time minutes / 24 hour period = Avg min On-time per hour (21 - 48)2.85 Avg min On-time per hour / Number of Runs per hour = On-time minutes per pump (7 -8 minutes)
Rain Summary
Average Dry (weekend) 1,554,592 Rain Guage Station:L P t W k d T Hi h 103 551
P1 On-Time P2 On-Time
WWTP#4
Weekend Day Influent Average (gpd) =Week Days Influent Average (gpd) =
Influent Analysis from Pumping Records (2 Pumps)
Pump 1 Flow Rate during Test (gpm):
Average (gpd) =
Peak Flow @ 2.5 (gpm) =Average Daily InFlow Rate (gpm) =
Pump 2 Flow Rate during Test (gpm):
Less Percent Weekend Typ Higher 103,551Calc Average Dry (weekday) 1,451,042 Date Rain (in)
8/9/2008 0Use 2nd Day After Storm for Wet - Weekday1,774,419 8/10/2008 0
8/11/2008 0.68I/I Flow 323,378 8/12/2008 1.38Percent I/I Flow 22.29% 8/13/2008 0.13
8/14/2008 0.018/15/2008 0.01
RD I/I Fay vs Dec 2007
Use Dec 2007 information to compare to Fay event Peak I/I Weekday - Fay 1,774,419
Dry Weekend Day Average Dec 8 and 9 1,469,587 97889 Corr dry Weekday Ave - Dec 1,371,6991,371,699
Dry Weekday Average Dec 10 - 14 1,371,699 RD I/I Flow 402,721
Weekend Day Typ 6.66% Higher than Weekday Percent RD I/I Flow 29.36%
LS4005 Influent Analysis 8-2008
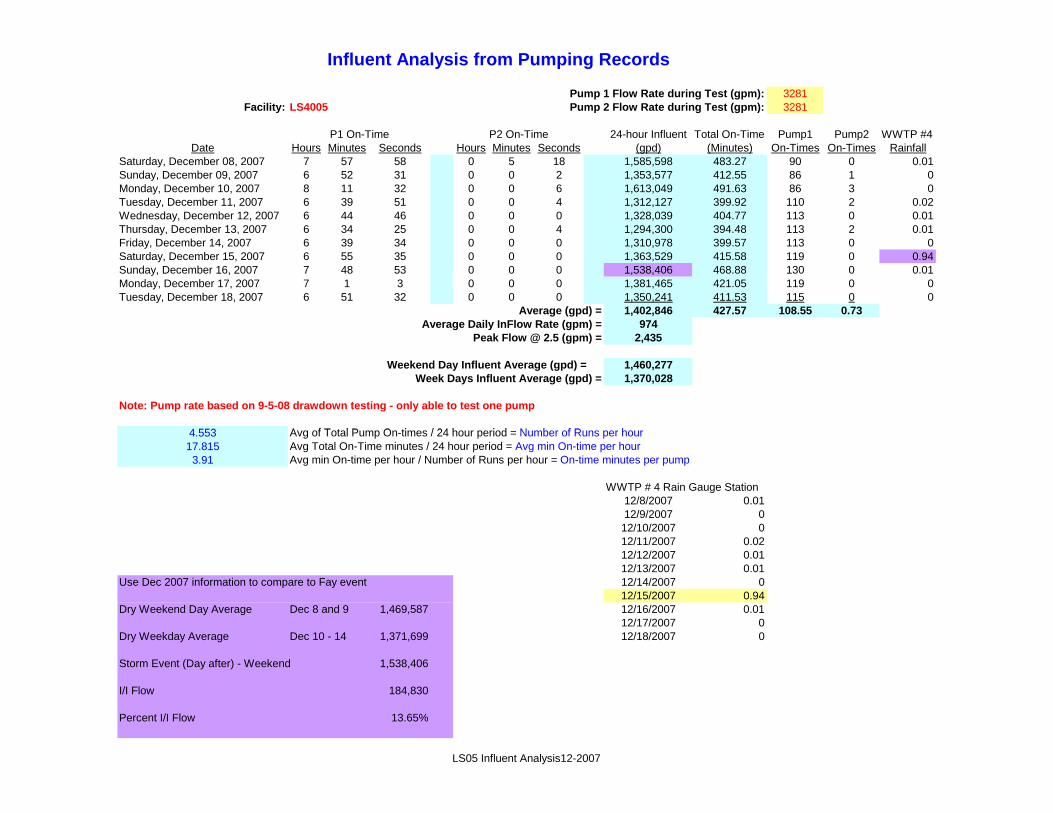
Influent Analysis from Pumping Records
Pump 1 Flow 3281 Rate during Test (gpm):Facility: LS4005 Pump 2 Flow 3281 Rate during Test (gpm):
P1 On-Time P2 On-Time 24-hour Influent Total On-Time Pump1 Pump2 WWTP #4Date Hours Minutes Seconds Hours Minutes Seconds (gpd) (Minutes) On-Times On-Times Rainfall
Saturday, December 08, 2007 7 57 58 0 5 18 1,585,598 483.27 90 0 0.01Sunday, December 09, 2007 6 52 31 0 0 2 1,353,577 412.55 86 1 0Monday, December 10, 2007 8 11 32 0 0 6 1,613,049 491.63 86 3 0Tuesday, December 11, 2007 6 39 51 0 0 4 1,312,127 399.92 110 2 0.02Wednesday, December 12, 2007 6 44 46 0 0 0 1,328,039 404.77 113 0 0.01Thursday, December 13, 2007 6 34 25 0 0 4 1,294,300 394.48 113 2 0.01Friday, December 14, 2007 6 39 34 0 0 0 1,310,978 399.57 113 0 0Saturday, December 15, 2007 6 55 35 0 0 0 1,363,529 415.58 119 0 0.94Sunday, December 16, 2007 7 48 53 0 0 0 1,538,406 468.88 130 0 0.01Monday, December 17, 2007 7 1 3 0 0 0 1,381,465 421.05 119 0 0Tuesday, December 18, 2007 6 51 32 0 0 0 1,350,241 411.53 115 0 0
Average (gpd) = 1,402,846 427.57 108.55 0.73Average Daily InFlow 974 Rate (gpm) =
Peak Flow 2,435 @ 2.5 (gpm) =
Weekend Day Influent Aver 1,460,277age (gpd) =Week Days Influent Av 1,370,028erage (gpd) =
Note: Pump rate based on 9-5-08 drawdown testing - only able to test one pump
4 5534.553 A f T t l P O ti / 24 h i d N b f R hAvg of Total Pump On-times / 24 hour period = Number of Runs per hour17.815 Avg Total On-Time minutes / 24 hour period = Avg min On-time per hour3.91 Avg min On-time per hour / Number of Runs per hour = On-time minutes per pump
WWTP # 4 Rain Gauge Station12/8/2007 0.0112/9/2007 012/10/2007 012/11/2007 0.0212/12/2007 0.0112/13/2007 0.01
Use Dec 2007 inform oation to c mpare to Fay event 12/14/2007 012/15/2007 0.94
Dry Weekend Day Average Dec 8 and 9 1,469,587 12/16/2007 0.0112/17/2007 0
Dry Weekday Average Dec 10 - 14 1,371,699 12/18/2007 0
Storm Event (Day after) - Weekend 1,538,406
I/I Flow 184,830
Percent I/I Flow 13.65%
LS05 Influent Analysis12-2007

1726Facility: 2025
3000
24-hour Influent Total On-Time Pump1 Pump2 Pump3Date Hours Minutes Seconds Hours Minutes Seconds Hours Minutes Seconds (gpd) (Minutes) On-Times On-Times On-Times Rain (in)
Saturday, August 16, 2008 2 19 15 2 45 25 2 15 15 981,064 439.92 47 48 48 0Sunday, August 17, 2008 2 10 54 2 34 51 2 6 30 919,005 412.25 47 46 45 0.41Monday, August 18, 2008 2 20 56 2 32 35 2 14 11 954,782 427.70 47 48 47 0.08Tuesday, August 19, 2008 2 12 43 2 32 7 2 9 21 925,155 414.18 47 47 47 0.06Wednesday, August 20, 2008 2 10 25 2 32 25 2 6 31 913,293 409.35 45 46 46 0.36Thursday, August 21, 2008 2 15 19 3 34 45 2 18 55 1,085,175 488.98 46 45 45 2.38Friday, August 22, 2008 1 53 5 3 53 51 3 26 43 1,288,878 553.65 35 61 61 0.22Saturday, August 23, 2008 2 52 41 3 25 36 2 53 0 1,233,391 551.28 53 53 53 0Sunday, August 24, 2008 2 30 35 3 0 11 2 27 22 1,066,878 478.13 50 50 50 0.02
0 0.000 0.00
1,040,847 464 46 49 49723 * Averages based on Sat Aug 16 - Sun Aug 24 (LCS)
1,807
1,050,0851,033,457
Note: Pump rate based on September 2008 drawdown testing.
6.032 Avg of Total Pump On-times / 24 hour period = Number of Runs per hour (3 to 6)19.331 Avg Total On-Time minutes / 24 hour period = Avg min On-time per hour (21 - 48) Rain Summary3.20 Avg min On-time per hour / Number of Runs per hour = On-time minutes per pump (7 -8 minutes)
Rain Guage Station:
Peak Flow @ 2.5 (gpm) =Average Daily InFlow Rate (gpm) =
P1 On-Time P2 On-Time P3 On-Time
Influent Analysis from Pumping Records (3 Pumps)
4049
Pump 1 Flow Rate during Test (gpm):Pump 2 Flow Rate during Test (gpm):Pump 3 Flow Rate during Test (gpm):
LS 4006
Weekend Day Influent Average (gpd) =Week Days Influent Average (gpd) =
Average (gpd) =
Average Dry (weekend) 950,034 Date Rain (in)Less Percent Weekend Typ Higher 105,778 8/16/2008 0Calc Average Dry (weekday) 844,257 8/17/2008 0.41
8/18/2008 0.08Use Day After Storm for Wet - Weekday 1,288,878 8/19/2008 0.06
8/20/2008 0.36I/I Flow 444,621 8/21/2008 2.38Percent I/I Flow 52.66% 8/22/2008 0.22
8/23/2008 08/24/2008 0.02
RD I/I Fay vs Dec 2007
Use Dec 2007 information to compare to Fay event Peak I/I Weekday - Fay 1,288,878
Dry Weekend Day Average Dec 8 and 9 899,822 100186.9 Corr dry Weekday Ave - Dec 799,635799,635
Dry Weekday Average Dec 10 - 14 799,635 RD I/I Flow 489,243
Weekend Day Typ 11.13% Higher than Weekday Percent RD I/I Flow 61.18%
LS4006 Influent Analysis Storm 8-2008
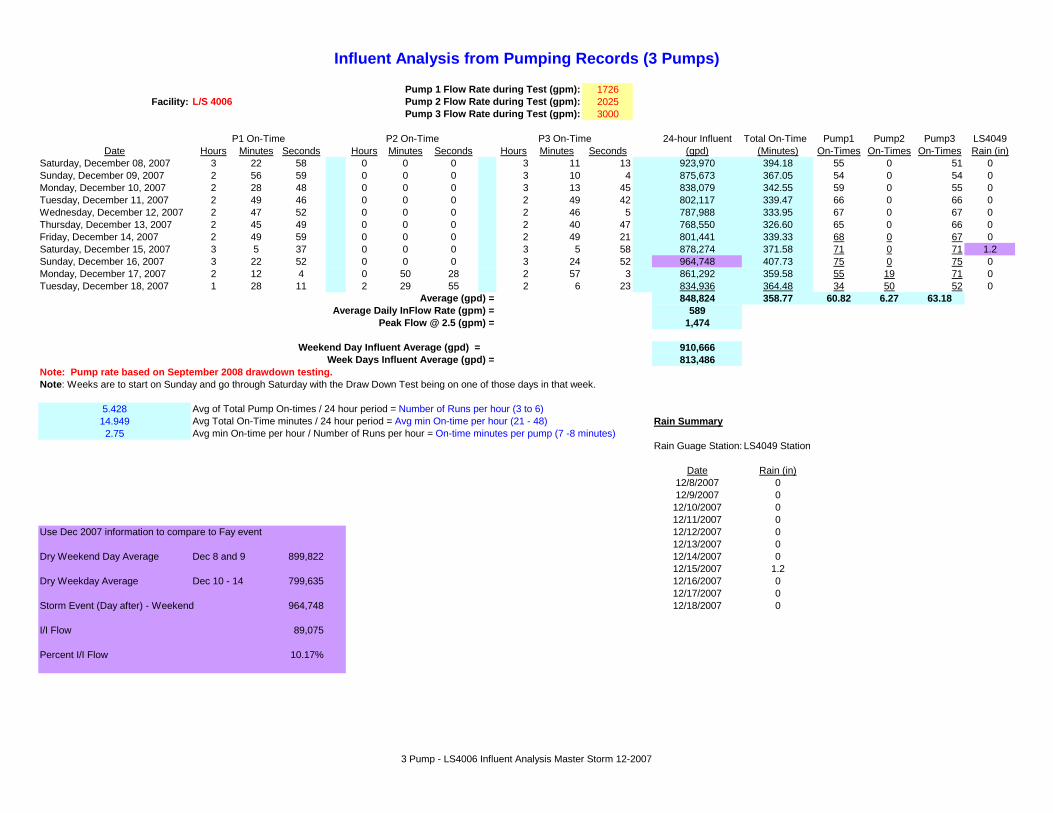
ime 2 On-
6
ge Station: LS4049 Station
Influent Analysis from Pumping Records (3 Pumps)
Pump 1 Flow 1726 Rate during Test (gpm):Facility: L/S 400 Pump 2 Flow 2025 Rate during Test (gpm):
Pump 3 Flow 3000 Rate during Test (gpm):
P1 On-T P Time P3 On-Time 24-hour Influent Total On-Time Pump1 Pump2 Pump3 LS4049Date Hours Minutes Seconds Hours Minutes Seconds H sour Minutes Seconds (gpd) (Minutes) On-Times On-Times On-Times Rain (in)
Saturday, December 08, 2007 3 22 58 0 0 0 3 11 13 923,970 394.18 55 0 51 0Sunday, December 09, 2007 2 56 59 0 0 0 3 10 4 875,673 367.05 54 0 54 0Monday, December 10, 2007 2 28 48 0 0 0 3 13 45 838,079 342.55 59 0 55 0Tuesday, December 11, 2007 2 49 46 0 0 0 2 49 42 802,117 339.47 66 0 66 0Wednesday, December 12, 2007 2 47 52 0 0 0 2 46 5 787,988 333.95 67 0 67 0Thursday, December 13, 2007 2 45 49 0 0 0 2 40 47 768,550 326.60 65 0 66 0Friday, December 14, 2007 2 49 59 0 0 0 2 49 21 801,441 339.33 68 0 67 0Saturday, December 15, 2007 3 5 37 0 0 0 3 5 58 878,274 371.58 71 0 71 1.2Sunday, December 16, 2007 3 22 52 0 0 0 3 24 52 964,748 407.73 75 0 75 0Monday, December 17, 2007 2 12 4 0 50 28 2 57 3 861,292 359.58 55 19 71 0Tuesday, December 18, 2007 1 28 11 2 29 55 2 6 23 834,936 364.48 34 50 52 0
Average (gpd) = 848,824 358.77 60.82 6.27 63.18Average Da 589ily InFlow Rate (gpm) =
Peak 1,474 Flow @ 2.5 (gpm) =
Weekend Day Influent 910,666 Average (gpd) =Week Days Infl 813,486uent Average (gpd) =
Note: Pump rate based on September 2008 drawdown testing.Note: Weeks are to start on Sunday and go through Saturday with the Draw Down Test being on one of those days in that week.
5.428 Avg of Total Pump On-times / 24 hour period = Number of Runs per hour (3 to 6)14.949 Avg Total On-Time minutes / 24 hour period = Avg min On-time per hour (21 - 48) Rain Summary2.75 Avg min On-time per hour / Number of Runs per hour = On-time minutes per pump (7 -8 minutes)
Rain Gua
Date Rain (in)12/8/2007 012/9/2007 012/10/2007 012/11/2007 0
Use Dec 2007 informati om ayon to c pare to F event 12/12/2007 012/13/2007 0
Dry Weekend Day Average Dec 8 and 9 899,822 12/14/2007 012/15/2007 1.2
Dry Weekday Average Dec 10 - 14 799,635 12/16/2007 012/17/2007 0
Storm Event (Day after) - Weekend 964,748 12/18/2007 0
I/I Flow 89,075
Percent I/I Flow 10.17%
3 Pump - LS4006 Influent Analysis Master Storm 12-2007
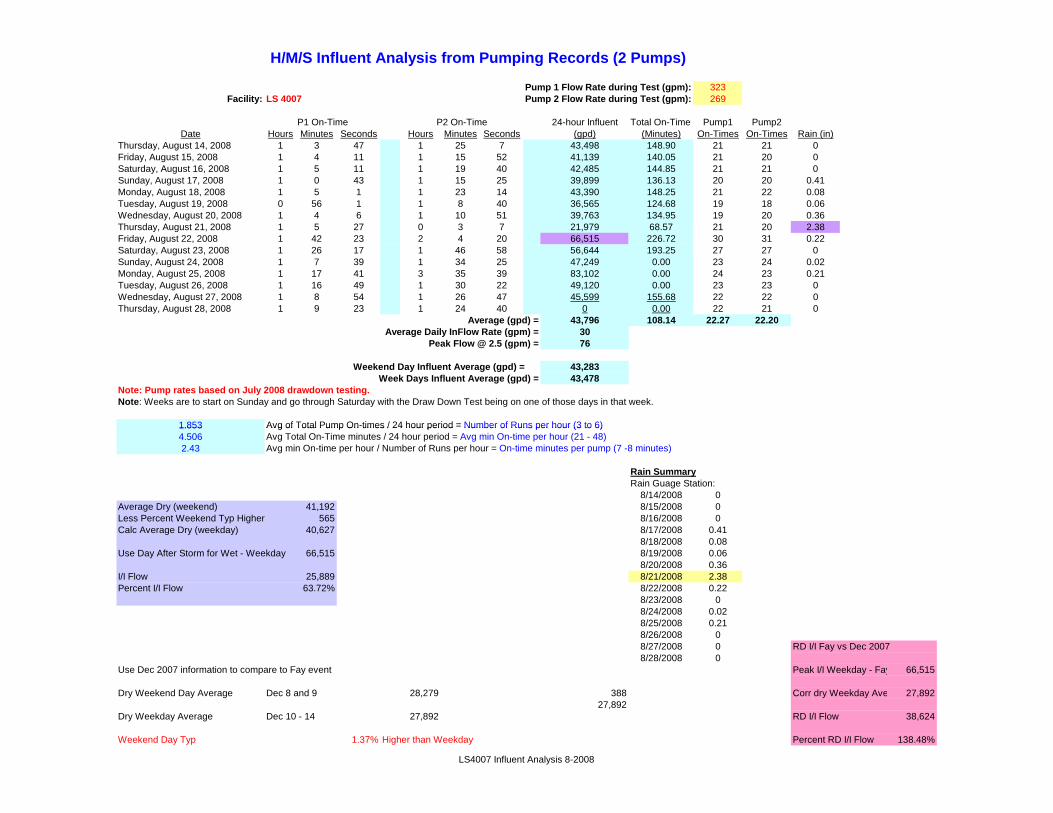
e
H/M/S Influent Analysis from Pumping Records (2 Pumps)
Pump 1 Flow Rate 323 during Test (gpm):Facility: LS 4007 Pump 2 Flow Rate 269 during Test (gpm):
P1 On-Tim P2 On-Time 24-hour Influent Total On-Time Pump1 Pump2Date Hours Minutes Seconds Hours Minutes Seconds (gpd) (Minutes) On-Times On-Times Rain (in)
Thursday, August 14, 2008 1 3 47 1 25 7 43,498 148.90 21 21 0Friday, August 15, 2008 1 4 11 1 15 52 41,139 140.05 21 20 0Saturday, August 16, 2008 1 5 11 1 19 40 42,485 144.85 21 21 0Sunday, August 17, 2008 1 0 43 1 15 25 39,899 136.13 20 20 0.41Monday, August 18, 2008 1 5 1 1 23 14 43,390 148.25 21 22 0.08Tuesday, August 19, 2008 0 56 1 1 8 40 36,565 124.68 19 18 0.06Wednesday, August 20, 2008 1 4 6 1 10 51 39,763 134.95 19 20 0.36Thursday, August 21, 2008 1 5 27 0 3 7 21,979 68.57 21 20 2.38Friday, August 22, 2008 1 42 23 2 4 20 66,515 226.72 30 31 0.22Saturday, August 23, 2008 1 26 17 1 46 58 56,644 193.25 27 27 0Sunday, August 24, 2008 1 7 39 1 34 25 47,249 0.00 23 24 0.02Monday, August 25, 2008 1 17 41 3 35 39 83,102 0.00 24 23 0.21Tuesday, August 26, 2008 1 16 49 1 30 22 49,120 0.00 23 23 0Wednesday, August 27, 2008 1 8 54 1 26 47 45,599 155.68 22 22 0Thursday, August 28, 2008 1 9 23 1 24 40 0 0.00 22 21 0
Average (gpd) = 43,796 108.14 22.27 22.20Average Daily InFlow 30 Rate (gpm) =
Peak Flow 76 @ 2.5 (gpm) =
Weekend Day Influent Av 43,283erage (gpd) =Week Days Influent Av 43,478erage (gpd) =
Note: Pump rates based on July 2008 drawdown testing.Note: Weeks are to start on Sunday and go through Saturday with the Draw Down Test being on one of those days in that week.
1.8531.853 Avg of Total Pump On-times / 24 hour period = Number of Runs per hour (3 to 6)Avg of Total Pump On times / 24 hour period Number of Runs per hour (3 to 6)4.506 Avg Total On-Time minutes / 24 hour period = Avg min On-time per hour (21 - 48)2.43 Avg min On-time per hour / Number of Runs per hour = On-time minutes per pump (7 -8 minutes)
Rain SummaryRain Guage Station:
8/14/2008 0Average Dry (weekend) 41,192 8/15/2008 0Less Percent Weekend Typ Higher 565 8/16/2008 0Calc Average Dry (weekday) 40,627 8/17/2008 0.41
8/18/2008 0.08Use Day After Storm for Wet - Weekday 66,515 8/19/2008 0.06
8/20/2008 0.36I/I Flow 25,889 8/21/2008 2.38Percent I/I Flow 63.72% 8/22/2008 0.22
8/23/2008 08/24/2008 0.028/25/2008 0.218/26/2008 08/27/2008 0 RD I/I Fay vs Dec 20078/28/2008 0
Use Dec 2007 information to compare to Fay event Peak I/I Weekday - Fay 66,515
Dry Weekend Day Average Dec 8 and 9 28,279 388 Corr dry Weekday Ave 27,89227,892
Dry Weekday Average Dec 10 - 14 27,892 RD I/I Flow 38,624
Weekend Day Typ 1.37% Higher than Weekday Percent RD I/I Flow 138.48%
LS4007 Influent Analysis 8-2008

e
Influent Analysis from Pumping Records
Pump 1 Flow 323 Rate during Test (gpm):Facility: LS4007 Pump 2 Flow 269 Rate during Test (gpm):
P1 On-Tim P2 On 2-Time 4-hour Influent Total On-Time Pump1 Pump2 LS4049Date Hours Minutes Seconds Hours Minutes Seconds (gpd) (Minutes) On-Times On-Times Rain (in)
Saturday, December 08, 2007 0 35 52 0 34 34 20,883 70.43 10 10 0Sunday, December 09, 2007 1 9 41 0 48 57 35,675 118.63 11 12 0Monday, December 10, 2007 0 39 50 0 51 15 26,652 91.08 14 12 0Tuesday, December 11, 2007 0 46 3 0 54 11 29,449 100.23 15 15 0Wednesday, December 12, 2007 0 50 24 0 54 4 30,823 104.47 15 15 0Thursday, December 13, 2007 0 41 43 0 49 20 26,745 91.05 14 14 0Friday, December 14, 2007 0 39 56 0 47 55 25,788 87.85 13 14 0Saturday, December 15, 2007 0 42 21 0 46 57 26,309 89.30 14 13 1.2Sunday, December 16, 2007 0 53 36 1 9 0 35,874 122.60 18 19 0Monday, December 17, 2007 0 45 18 0 53 43 29,082 99.02 15 15 0Tuesday, December 18, 2007 0 43 3 0 50 4 27,373 93.12 14 14 0
Average (gpd) = 28,002 94.82 13.91 13.91Average Daily InFlow 19 Rate (gpm) =
Peak Flow 49 @ 2.5 (gpm) =
Weekend Day Influent Aver 29,685age (gpd) =Week Days Influent Av 27,988erage (gpd) =
Note: Pump rates based on July 2008 drawdown testing.
1 1591.159 A f T t l P O ti / 24 h i d N b f R hAvg of Total Pump On-times / 24 hour period = Number of Runs per hour3.951 Avg Total On-Time minutes / 24 hour period = Avg min On-time per hour3.41 Avg min On-time per hour / Number of Runs per hour = On-time minutes per pump
Use Dec 2007 information to compare to Fay event
Dry Weekend Day Average Dec 8 and 9 28,279
Dry Weekday Average Dec 10 - 14 27,892
Storm Event (Day of) - Weekend 26,309
I/I Flow 5,425
Percent I/I Flow 25.98%
LS07 Influent Analysis 12-2007

ime
H/M/S Influent Analysis from Pumping Records (2 Pumps)
Pump 1 Flow 413 Rate during Test (gpm):Facility: 4011 Pump 2 Flow 338 Rate during Test (gpm):
P1 On-T P2 On-Time 24-hour Influent Total On-Time Pump1 Pump2 LS 4049Date Hours Minut Ses econds Hours Minutes Seconds (gpd) (Minutes) On-Times On-Times Rain (in)
Thursday, August 14, 2008 1 3 49 0 59 49 46,574 123.63 31 29 0Friday, August 15, 2008 1 1 20 1 2 36 46,489 123.93 30 30 0Saturday, August 16, 2008 0 57 36 0 56 38 42,931 114.23 28 28 0Sunday, August 17, 2008 1 0 34 1 5 13 47,057 125.78 29 30 0.41Monday, August 18, 2008 1 4 34 0 59 51 46,895 124.42 30 29 0.08Tuesday, August 19, 2008 1 0 44 0 59 59 45,357 120.72 29 29 0.06Wednesday, August 20, 2008 0 57 33 0 57 56 43,350 115.48 27 28 0.36Thursday, August 21, 2008 0 54 14 1 0 0 42,678 114.23 26 26 2.38Friday, August 22, 2008 1 14 32 1 16 42 56,707 151.23 34 35 0.22Saturday, August 23, 2008 1 22 46 1 26 56 63,566 169.70 38 39 0Sunday, August 24, 2008 1 11 3 1 12 10 53,736 0.00 33 33 0.02Monday, August 25, 2008 1 7 54 1 10 27 51,855 0.00 32 30 0.21Tuesday, August 26, 2008 1 1 13 1 1 43 46,143 0.00 28 29 0Wednesday, August 27, 2008 0 56 9 0 55 17 41,876 0.00 26 26 0Thursday, August 28, 2008 0 58 20 1 0 17 44,467 118.62 27 28 0
Average (gpd) 47, = 979 93.47 29.87 29.93Average Daily I 33nFlow Rate (gpm) =
Peak Fl 83ow @ 2.5 (gpm) =
Weekend Day Influent Av 48,112erage (gpd) =Week Days Infl 47,661uent Average (gpd) =
Note: Weeks are to start on Sunday and go through Saturday with the Draw Down Test being on one of those days in that week.Note: Pump Flow from 7-15-08 drawdown testing.
2.4922.492 Avg of Total Pump On-times / 24 hour period = Number of Runs per hour (3 to 6)Avg of Total Pump On times / 24 hour period Number of Runs per hour (3 to 6)3.894 Avg Total On-Time minutes / 24 hour period = Avg min On-time per hour (21 - 48)1.56 Avg min On-time per hour / Number of Runs per hour = On-time minutes per pump (7 -8 minutes)
Rain SummaryRain Guage Station:
8/14/2008 0Average Dry (weekend) 44,994 8/15/2008 0Plus Percent Weekend Typ Lower 585 8/16/2008 0Calc Average Dry (weekday) 45,579 8/17/2008 0.41
8/18/2008 0.08Use 2nd Day After Storm for Wet - Weekend 63,566 8/19/2008 0.06
8/20/2008 0.36I/I Flow 18,572 8/21/2008 2.38Percent I/I Flow 41.28% 8/22/2008 0.22
8/23/2008 08/24/2008 0.028/25/2008 0.218/26/2008 08/27/2008 0 RD I/I Fay vs Dec 20078/28/2008 0
Use Dec 2007 information to compare to Fay event Peak I/I Weekend - Fay 63,566
Dry Weekend Day Average Dec 8 and 9 32,833 427 Corr dry Weekday Ave - Dec 32,83333,261
Dry Weekday Average Dec 10 - 14 33,261 RD I/I Flow 30,733
Weekend Day Typ 1.30% Lowerer than Weekday Percent RD I/I Flow 93.60%
LS4011 Influent Analysis8-2008

e
Influent Analysis from Pumping Records
Pump 1 Flow 413 Rate during Test (gpm):Facility: LS4011 Pump 2 Flow 338 Rate during Test (gpm):
P1 On-Tim P2 On 2-Time 4-hour Influent Total On-Time Pump1 Pump2 LS4049Date Hours Minutes Seconds Hours Minutes Seconds (gpd) (Minutes) On-Times On-Times Rain (in)
Saturday, December 08, 2007 0 40 49 0 47 16 32,833 88.08 19 22 0Sunday, December 09, 2007 1 27 48 0 47 6 52,181 134.90 21 17 0Monday, December 10, 2007 0 53 7 0 34 37 33,638 87.73 16 15 0Tuesday, December 11, 2007 0 36 41 0 43 28 29,842 80.15 18 21 0Wednesday, December 12, 2007 0 44 38 0 44 21 33,424 88.98 22 21 0Thursday, December 13, 2007 0 45 51 0 43 16 33,560 89.12 22 22 0Friday, December 14, 2007 0 47 28 0 48 2 35,839 95.50 23 23 0Saturday, December 15, 2007 0 48 6 0 45 11 35,137 93.28 22 22 1.2Sunday, December 16, 2007 0 42 58 0 43 42 32,516 86.67 21 22 0Monday, December 17, 2007 0 46 7 0 47 46 35,191 93.88 23 23 0Tuesday, December 18, 2007 0 45 31 0 43 34 33,524 89.08 21 21 0
Average (gpd) = 35,902 94.92 20.73 20.82Average Daily InFlow 25 Rate (gpm) =
Peak Flow 62 @ 2.5 (gpm) =
Weekend Day Influent Aver 38,167age (gpd) =Week Days Influent Av 33,574erage (gpd) =
Note: Pump Flow from 7-15-08 drawdown testing.
1 7311.731 A f T t l P O ti / 24 h i d N b f R hAvg of Total Pump On-times / 24 hour period = Number of Runs per hour3.955 Avg Total On-Time minutes / 24 hour period = Avg min On-time per hour2.28 Avg min On-time per hour / Number of Runs per hour = On-time minutes per pump
Use Dec 2007 information to compare to Fay event
Dry Weekend Day Average 8-Dec 32,833 Dec 9th appears to be an outlier in flow
Dry Weekday Average Dec 10 - 14 33,261
Storm Event (Day of) - Weekend 35,137
I/I Flow 2,304
Percent I/I Flow 7.02%
LS11 Influent Analysis12-2007

Influent Analysis from Pumping Records (2 Pumps)
Pump 1 Flow Rate during Test 1381 (gpm):Facility: LS 4017 Pump 2 Flow Rate during Test 1208 (gpm):
P1 On-Time P2 On-Time 24-hour Influent Total On-Time Pump1 Pump2Date Hours Minutes Seconds Hours Minutes Seconds (gpd) (Minutes) On-Times On-Times Rain (in)
Saturday, August 16, 2008 3 28 19 3 44 55 559,385 433.23 39 39 0Sunday, August 17, 2008 2 23 17 3 44 9 468,647 367.43 39 39 0.41Monday, August 18, 2008 3 43 56 4 12 5 613,769 476.02 41 41 0.08Tuesday, August 19, 2008 3 26 42 3 59 30 574,769 446.20 45 45 0.06Wednesday, August 20, 2008 3 18 5 3 51 42 553,447 429.78 42 42 0.36Thursday, August 21, 2008 3 46 56 4 22 56 631,018 489.87 47 45 2.38Friday, August 22, 2008 5 44 35 6 20 49 935,896 725.40 53 52 0.22Saturday, August 23, 2008 5 26 19 6 4 47 891,302 691.10 58 58 0Sunday, August 24, 2008 4 38 23 5 23 51 775,658 602.23 58 58 0.02
0 0.000 0.00
Average 667,099 (gpd) = 518 47 47Average Daily InFlow Rate 463 (gpm) = * Averages based on Sat Aug 16 - Sun Aug 24 (LCS)
Peak Flow @ 2.5 (gp 1,158m) =
Weekend Day Influent Average (gpd) 673,748 =Week Days Influent Average ( 661,780gpd) =
Note: Pump Flow based on 7-15-08 drawdown testing.Note: Weeks are to start on Sunday and go through Saturday with the Draw Down Test being on one of those days in that week.
3.894 Avg of Total Pump On-times / 24 hour period = Number of Runs per hour (3 to 6)21.580 Avg Total On-Time minutes / 24 hour period = Avg min On-time per hour (21 - 48)5.54 Avg min On-time per hour / Number of Runs per hour = On-time minutes per pump (7 -8 minutes)
Rain Summary
Average Dry (weekend) 514,016 Rain Guage Station: 4049Plus Percent Weekend Typ Lower 68,539Calc Average Dry (weekday) 582,555 Date Rain (in)
8/16/2008 0Use Day After Storm for Wet - Weekday 935,896 8/17/2008 0.41
8/18/2008 0.08I/I Flow 353,341 8/19/2008 0.06Percent I/I Flow 60.65% 8/20/2008 0.36
8/21/2008 2.388/22/2008 0.228/23/2008 08/24/2008 0.02
Use Dec 2007 information to compare to Fay event RD I/I Fay vs Dec 2007
Dry Weekend Day Average Dec 8 and 9 358,753 47836 Peak I/I Weekday - Fay 935,896406,589
Dry Weekday Average Dec 10 - 14 406,589 Corr dry Weekday Ave - Dec 406,589
Weekend Day Typ 13.33% Lower than Weekday RD I/I Flow 529,307
Percent RD I/I Flow 130.18%
LS4017 Influent Analysis Storm 8-2008

e
Influent Analysis from Pumping Records
Pump 1 Flow 1381 Rate during Test (gpm):Facility: LS4017 Pump 2 Flow 1208 Rate during Test (gpm):
P1 On-Tim P2 On-Time 24-hour Influent Total On-Time Pump1 Pump2 LS4049Date Hours Minutes Seconds Hours Minutes Seconds (gpd) (Minutes) On-Times On-Times Rain (in)
Saturday, December 08, 2007 1 55 12 1 59 35 303,548 234.78 28 27 0Sunday, December 09, 2007 2 19 17 3 3 27 413,958 322.73 31 28 0Monday, December 10, 2007 2 26 48 3 36 53 464,726 363.68 28 31 0Tuesday, December 11, 2007 2 51 49 3 31 49 493,153 383.63 40 41 0Wednesday, December 12, 2007 2 1 41 2 35 9 355,466 276.83 37 37 0Thursday, December 13, 2007 2 4 53 2 37 53 363,187 282.77 37 37 0Friday, December 14, 2007 1 59 43 2 38 11 356,414 277.90 37 36 0Saturday, December 15, 2007 1 40 53 2 21 14 309,930 242.12 33 33 1.2Sunday, December 16, 2007 1 52 4 2 35 0 342,004 267.07 46 47 0Monday, December 17, 2007 2 11 39 2 43 57 379,860 295.60 50 50 0Tuesday, December 18, 2007 2 25 7 2 44 7 398,659 309.23 51 51 0
Average (gpd) = 380,082 296.03 38.00 38.00Average Daily InFlow 264 Rate (gpm) =
Peak Flow 660 @ 2.5 (gpm) =
Weekend Day Influent Aver 342,360age (gpd) =Week Days Influent Av 401,638erage (gpd) =
Note: Pump Flow based on 7-15-08 drawdown testing.
3 1673.167 A f T t l P O ti / 24 h i d N b f R hAvg of Total Pump On-times / 24 hour period = Number of Runs per hour12.335 Avg Total On-Time minutes / 24 hour period = Avg min On-time per hour3.90 Avg min On-time per hour / Number of Runs per hour = On-time minutes per pump
Use Dec 2007 information to compare to Fay event
Dry Weekend Day Average Dec 8 and 9 358,753
Dry Weekday Average Dec 10 - 14 406,589
Storm Event (Day of) - Weekend 309,930
I/I Flow 6,382
Percent I/I Flow 2.10%
LS17 Influent Analysis 12-2007

Influent Analysis from Pumping Records (2 Pumps)
Pump 1 Flow Rate dur 1047ing Test (gpm):Facility: LS4021 Pump 2 Flow Rate dur 1047ing Test (gpm):
P1 On-Time P2 On-T 24-hime our Influent Total On-Time Pump1 Pump2 LS4025Date Hours Minutes Seconds Hours Minutes Seconds (gpd) (Minutes) On-Times On-Times Rain (in)
Thursday, August 14, 2008 4 49 3 11 4 23 998,245 953.43 70 88 0Friday, August 15, 2008 4 53 20 7 22 4 769,964 735.40 71 71 0Saturday, August 16, 2008 9 24 55 3 58 53 841,579 803.80 113 44 0.1Sunday, August 17, 2008 11 23 58 0 0 0 716,113 683.97 151 0 0.4Monday, August 18, 2008 6 54 36 5 8 42 757,295 723.30 96 45 0.05Tuesday, August 19, 2008 5 8 54 6 10 41 711,524 679.58 74 74 0.01Wednesday, August 20, 2008 4 59 31 5 46 32 676,414 646.05 74 73 0.48Thursday, August 21, 2008 4 53 27 6 38 25 724,384 691.87 70 71 1.65Friday, August 22, 2008 9 22 51 7 2 7 1,031,260 984.97 98 52 0.24Saturday, August 23, 2008 14 39 44 0 0 0 921,081 879.73 140 0 0Sunday, August 24, 2008 13 3 20 0 0 0 820,150 783.33 151 0 0
Average (gpd) = 815,274 778.68 100.73 47.09Average Daily InFlow Ra 566te (gpm) =
Peak Flow @ 1,415 2.5 (gpm) =
Weekend Day Influent Averag 824,731e (gpd) =Week Days Influent A 809,869verage (gpd) =
Note: Pump Flow based on 7-15-08 drawdown testing.
6.159 Avg of Total Pump On-times / 24 hour period = Number of Runs per hour (3 to 6)32.445 Avg Total On-Time minutes / 24 hour period = Avg min On-time per hour (21 - 48)5.27 Avg min On-time per hour / Number of Runs per hour = On-time minutes per pump (7 -8 minutes)
Rain Summary
Average Dry (weekend) 778,846 Rain Guage Station: 4025Less Percent Weekend Typ Higher 128,609Calc Average Dry (weekday) 650,237 Date Rain (in)
8/14/2008 0Use Day After Storm for Wet - Weekday 1,031,260 8/15/2008 0
8/16/2008 0.1I/I Flow 381,023 8/17/2008 0.4Percent I/I Flow 58.60% 8/18/2008 0.05
8/19/2008 0.018/20/2008 0.488/21/2008 1.658/22/2008 0.248/23/2008 08/24/2008 0
Use Dec 2007 information to compare to Fay event
Dry Weekend Day Average Dec 8 and 9 620,792 102510 RD I/I Fay vs Dec 2007518,282
Dry Weekday Average Dec 10 - 14 518,282 Peak I/I Weekday - Fay 1,031,260
Weekend Day Typ 16.51% Highr than Weekday Corr dry Weekday Ave - Dec 518,282
RD I/I Flow 512,978
Percent RD I/I Flow 98.98%
LS4021 Influent Analysis Storm 8-2008

e
Influent Analysis from Pumping Records
Pump 1 Flow 1047 Rate during Test (gpm):Facility: LS4021 Pump 2 Flow 1047 Rate during Test (gpm):
P1 On-Tim P2 On-Time 24-hour Influent Total On-Time Pump1 Pump2 LS4025Date Hours Minutes Seconds Hours Minutes Seconds (gpd) (Minutes) On-Times On-Times Rain (in)
Saturday, December 08, 2007 4 32 0 5 13 44 613,263 585.73 63 63 0Sunday, December 09, 2007 3 37 28 6 22 39 628,322 600.12 61 72 0Monday, December 10, 2007 3 25 15 2 46 57 389,693 372.20 35 37 0Tuesday, December 11, 2007 4 55 44 5 4 50 628,793 600.57 80 80 0Wednesday, December 12, 2007 3 57 20 4 32 47 534,092 510.12 83 82 0Thursday, December 13, 2007 3 48 55 4 24 31 516,625 493.43 82 81 0Friday, December 14, 2007 3 52 25 4 26 21 522,209 498.77 82 82 0Saturday, December 15, 2007 4 8 38 4 46 24 560,180 535.03 82 82 1.09Sunday, December 16, 2007 4 19 29 5 10 17 596,546 569.77 85 85 0Monday, December 17, 2007 3 54 57 4 40 42 539,886 515.65 83 83 0Tuesday, December 18, 2007 4 14 1 4 50 54 570,528 544.92 85 84 0
Average (gpd) = 554,558 529.66 74.64 75.55Average Daily InFlow 385 Rate (gpm) =
Peak Flow 963 @ 2.5 (gpm) =
Weekend Day Influent Aver 599,578age (gpd) =Week Days Influent Av 528,832erage (gpd) =
Note: Pump Flow based on 7-15-08 drawdown testing.
6 2586.258 A f T t l P O ti / 24 h i d N b f R hAvg of Total Pump On-times / 24 hour period = Number of Runs per hour22.069 Avg Total On-Time minutes / 24 hour period = Avg min On-time per hour3.53 Avg min On-time per hour / Number of Runs per hour = On-time minutes per pump
Use Dec 2007 information to compare to Fay event
Dry Weekend Day Average Dec 8 and 9 620,792
Dry Weekday Average Dec 10 - 14 518,282
Storm Event (Day after) - Weekend 596,546
I/I Flow -31,776
Percent I/I Flow -5.06%
LS21 Influent Analysis12-2007

H/M/S Influent Analysis from Pumping Records (2 Pumps)
Pump 1 Flow Rate during T 194est (gpm):Facility: LS 4022 Pump 2 Flow Rate during T 275est (gpm):
P1 On-Time P2 On-Time 24-hour Influent Total On-Time Pump1 Pump2Date Hours Minutes Seconds Hours Minutes Seconds (gpd) (Minutes) On-Times On-Times Rain (in)
Thursday, August 14, 2008 5 51 4 3 16 48 122,227 547.87 98 97 0Friday, August 15, 2008 4 8 40 3 28 6 105,469 456.77 105 107 0Saturday, August 16, 2008 3 52 26 3 25 32 101,614 437.97 107 107 0Sunday, August 17, 2008 3 17 10 3 18 22 92,801 395.53 92 91 0.41Monday, August 18, 2008 3 59 15 3 28 36 103,780 447.85 103 105 0.08Tuesday, August 19, 2008 3 43 23 3 2 56 93,643 406.32 95 94 0.06Wednesday, August 20, 2008 3 22 35 2 50 17 86,129 372.87 93 94 0.36Thursday, August 21, 2008 4 34 11 3 38 38 113,316 492.82 105 106 2.38Friday, August 22, 2008 6 29 35 5 21 4 163,873 710.65 126 125 0.22Saturday, August 23, 2008 5 0 50 4 18 25 129,426 559.25 121 121 0Sunday, August 24, 2008 3 34 47 3 8 40 93,551 403.45 103 103 0.02Monday, August 25, 2008 4 6 53 3 28 7 105,127 455.00 103 102 0.21Tuesday, August 26, 2008 3 53 56 3 24 58 101,749 438.90 99 99 0Wednesday, August 27, 2008 4 8 58 3 23 35 104,285 452.55 100 98 0Thursday, August 28, 2008 4 2 14 3 48 16 109,767 470.50 100 101 0
Average ( 108,gpd) = 450 469.89 103.33 103.33Average Daily InFlow Rate ( 75gpm) =
Peak Flow @ 2.5 ( 188gpm) =
Weekend Day Influent Average ( 126,221gpd) =Week Days Influent Average ( 102,451gpd) =
Note: Pump Flow based on 7-16-08 drawdown testing.Note: Weeks are to start on Sunday and go through Saturday with the Draw Down Test being on one of those days in that week.
8.611 Avg of Total Pump On-times / 24 hour period = Number of Runs per hour (3 to 6)19.579 Avg Total On-Time minutes / 24 hour period = Avg min On-time per hour (21 - 48)
2 272.27 A i O ti h / N b f R h O ti i t (7 8 i t )Avg min On-time per hour / Number of Runs per hour = On-time minutes per pump (7 -8 minutes)
Rain SummaryRain Guage Station: LS4049
Average Dry (weekend) 97,207 Date Rain (in)Less Percent Weekend Typ Higher 2,336 8/14/2008Calc Average Dry (weekday) 99,544 8/15/2008
8/16/2008Use Day After Storm for Wet - Weekday 163,873 8/17/2008
8/18/2008I/I Flow 64,329 8/19/2008Percent I/I Flow 64.62% 8/20/2008
8/21/20088/22/20088/23/20088/24/20088/25/20088/26/2008
Use Dec 2007 information to o compare t Fay event 8/27/20088/28/2008
Dry Weekend Day Average Dec 8 and 9 91,994 2210.88 RD I/I Fay vs Dec 200794,205
Dry Weekday Average Dec 10 - 14 94,205 Peak I/I Weekday - Fay 163,873
Weekend Day Typ 2.40% Lower than Weekday Corr dry Weekday Ave - Dec 94,205
RD I/I Flow 69,668
Percent RD I/I Flow 73.95%
LS 4022 Influent Analysis 8-2008

e
Influent Analysis from Pumping Records
Pump 1 Flow 194 Rate during Test (gpm):Facility: LS4022 Pump 2 Flow 275 Rate during Test (gpm):
P1 On-Tim P2 On 2-Time 4-hour Influent Total On-Time Pump1 Pump2 LS 4049Date Hours Minutes Seconds Hours Minutes Seconds (gpd) (Minutes) On-Times On-Times Rain (in)
Saturday, December 08, 2007 4 59 23 3 0 42 107,773 480.08 69 66 0Sunday, December 09, 2007 3 28 52 2 9 48 76,215 338.67 64 60 0Monday, December 10, 2007 4 22 5 2 52 11 98,195 434.27 62 64 0Tuesday, December 11, 2007 3 10 20 2 46 27 82,698 356.78 78 80 0Wednesday, December 12, 2007 3 58 8 3 13 56 99,530 432.07 86 86 0Thursday, December 13, 2007 3 16 15 2 43 52 83,136 360.12 81 80 0Friday, December 14, 2007 4 11 34 3 33 19 107,466 464.88 91 92 0Saturday, December 15, 2007 5 30 18 4 18 51 135,262 589.15 94 94 1.2Sunday, December 16, 2007 5 46 32 4 17 49 138,127 604.35 105 105 0Monday, December 17, 2007 4 22 33 3 28 6 108,162 470.65 96 96 0Tuesday, December 18, 2007 5 6 13 3 53 53 123,724 540.10 109 108 0
Average (gpd) = 93,573 409.55 85.00 84.64Average Daily InFlow 65 Rate (gpm) =
Peak Flow 162 @ 2.5 (gpm) =
Weekend Day Influent Aver 114,344age (gpd) =Week Days Influent Av 100,416erage (gpd) =
Note: Pump Flow based on 7-16-08 drawdown testing.
7 0687.068 A f T t l P O ti / 24 h i d N b f R hAvg of Total Pump On-times / 24 hour period = Number of Runs per hour17.065 Avg Total On-Time minutes / 24 hour period = Avg min On-time per hour2.41 Avg min On-time per hour / Number of Runs per hour = On-time minutes per pump
Use Dec 2007 information to compare to Fay event
Dry Weekend Day Average Dec 8 and 9 91,994
Dry Weekday Average Dec 10 - 14 94,205
Storm Event (Day after) - Weekend 138,127
I/I Flow 61,912
Percent I/I Flow 81.23%
LS22 Influent Analysis 12-2007
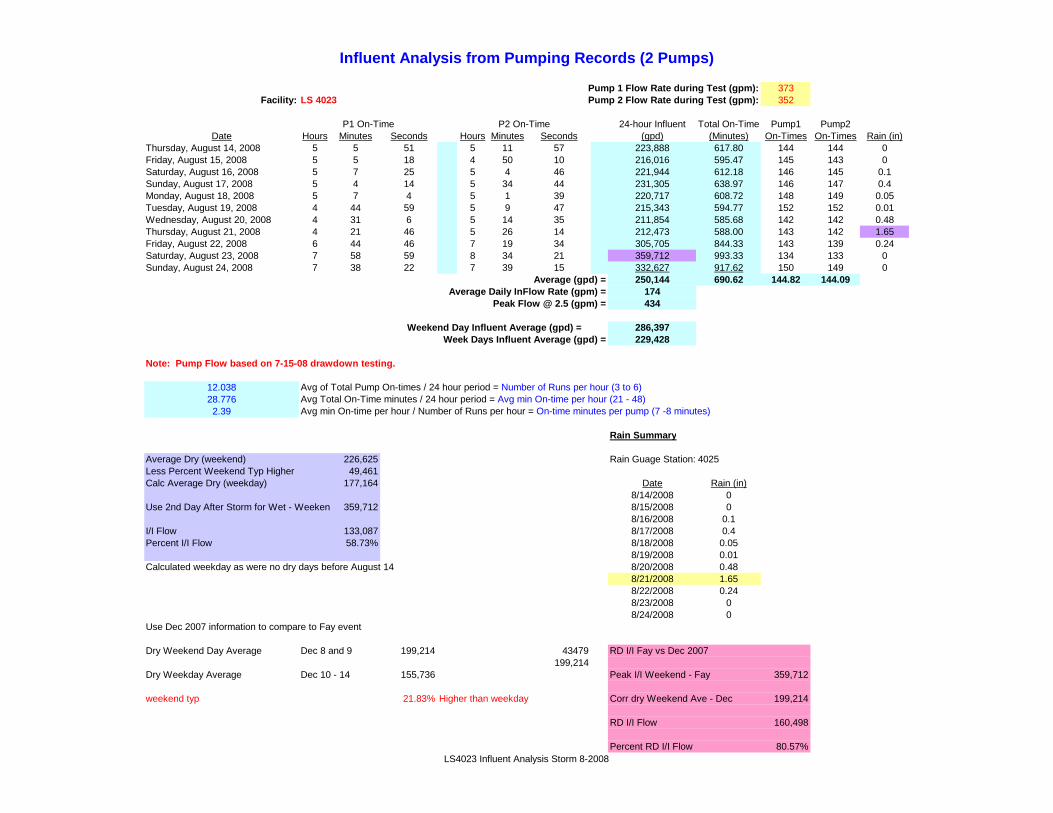
Influent Analysis from Pumping Records (2 Pumps)
Pump 1 Flow Rate 373 during Test (gpm):Facility: LS 4023 Pump 2 Flow Rate 352 during Test (gpm):
P1 On-Time P2 On-T 24ime -hour Influent Total On-Time Pump1 Pump2Date Hours Minutes Seconds Hours Minutes Seconds (gpd) (Minutes) On-Times On-Times Rain (in)
Thursday, August 14, 2008 5 5 51 5 11 57 223,888 617.80 144 144 0Friday, August 15, 2008 5 5 18 4 50 10 216,016 595.47 145 143 0Saturday, August 16, 2008 5 7 25 5 4 46 221,944 612.18 146 145 0.1Sunday, August 17, 2008 5 4 14 5 34 44 231,305 638.97 146 147 0.4Monday, August 18, 2008 5 7 4 5 1 39 220,717 608.72 148 149 0.05Tuesday, August 19, 2008 4 44 59 5 9 47 215,343 594.77 152 152 0.01Wednesday, August 20, 2008 4 31 6 5 14 35 211,854 585.68 142 142 0.48Thursday, August 21, 2008 4 21 46 5 26 14 212,473 588.00 143 142 1.65Friday, August 22, 2008 6 44 46 7 19 34 305,705 844.33 143 139 0.24Saturday, August 23, 2008 7 58 59 8 34 21 359,712 993.33 134 133 0Sunday, August 24, 2008 7 38 22 7 39 15 332,627 917.62 150 149 0
Average (gpd) = 250,144 690.62 144.82 144.09Average Daily InFlow 174 Rate (gpm) =
Peak Flow @ 434 2.5 (gpm) =
Weekend Day Influent Average ( 286,397gpd) =Week Days Influent A 229,428verage (gpd) =
Note: Pump Flow based on 7-15-08 drawdown testing.
12.038 Avg of Total Pump On-times / 24 hour period = Number of Runs per hour (3 to 6)28.776 Avg Total On-Time minutes / 24 hour period = Avg min On-time per hour (21 - 48)2.39 Avg min On-time per hour / Number of Runs per hour = On-time minutes per pump (7 -8 minutes)
Rain Summary
Average Dry (weekend) 226,625 Rain Guage Station: 4025Less Percent Weekend Typ Higher 49,461Calc Average Dry (weekday) 177,164 Date Rain (in)
8/14/2008 0Use 2nd Day After Storm for Wet - Weeken 359,712 8/15/2008 0
8/16/2008 0.1I/I Flow 133,087 8/17/2008 0.4Percent I/I Flow 58.73% 8/18/2008 0.05
8/19/2008 0.01Calculated weekday as were y s t no dr day before Augus 14 8/20/2008 0.48
8/21/2008 1.658/22/2008 0.248/23/2008 08/24/2008 0
Use Dec 2007 information to compare to Fay event
Dry Weekend Day Average Dec 8 and 9 199,214 43479 RD I/I Fay vs Dec 2007199,214
Dry Weekday Average Dec 10 - 14 155,736 Peak I/I Weekend - Fay 359,712
weekend typ 21.83% Higher than weekday Corr dry Weekend Ave - Dec 199,214
RD I/I Flow 160,498
Percent RD I/I Flow 80.57%LS4023 Influent Analysis Storm 8-2008

e
Influent Analysis from Pumping Records
Pump 1 Flow 373 Rate during Test (gpm):Facility: LS4023 Pump 2 Flow 352 Rate during Test (gpm):
P1 On-Tim P2 On 2-Time 4-hour Influent Total On-Time Pump1 Pump2 LS 4025Date Hours Minutes Seconds Hours Minutes Seconds (gpd) (Minutes) On-Times On-Times Rain (in)
Saturday, December 08, 2007 3 16 12 4 35 8 170,030 471.33 81 84 0Sunday, December 09, 2007 5 41 50 4 46 38 228,399 628.47 85 82 0Monday, December 10, 2007 4 14 9 3 43 43 173,546 477.87 89 85 0Tuesday, December 11, 2007 3 21 20 3 28 38 148,536 409.97 103 103 0Wednesday, December 12, 2007 3 36 31 3 43 54 159,574 440.42 111 110 0Thursday, December 13, 2007 3 35 33 3 31 54 154,989 427.45 111 111 0Friday, December 14, 2007 3 10 35 3 21 33 142,033 392.13 106 106 0Saturday, December 15, 2007 3 48 22 3 31 9 159,506 439.52 114 113 1.09Sunday, December 16, 2007 3 57 9 4 10 50 176,750 487.98 117 118 0Monday, December 17, 2007 3 58 2 3 57 39 172,439 475.68 115 114 0Tuesday, December 18, 2007 3 58 30 3 47 27 169,023 465.95 115 115 0
Average (gpd) = 168,620 465.16 104.27 103.73Average Daily InFlow 117 Rate (gpm) =
Peak Flow 293 @ 2.5 (gpm) =
Weekend Day Influent Aver 183,671age (gpd) =Week Days Influent Av 160,020erage (gpd) =
Note: Pump Flow based on 7-15-08 drawdown testing.
8 6678.667 A f T t l P O ti / 24 h i d N b f R hAvg of Total Pump On-times / 24 hour period = Number of Runs per hour19.382 Avg Total On-Time minutes / 24 hour period = Avg min On-time per hour2.24 Avg min On-time per hour / Number of Runs per hour = On-time minutes per pump
Use Dec 2007 information to compare to Fay event
Dry Weekend Day Average Dec 8 and 9 199,214
Dry Weekday Average Dec 10 - 14 155,736
Storm Event (Day of) - Weekend 159,506
I/I Flow -10,524
Percent I/I Flow -6.19%
LS23 Influent Analysis12-2007
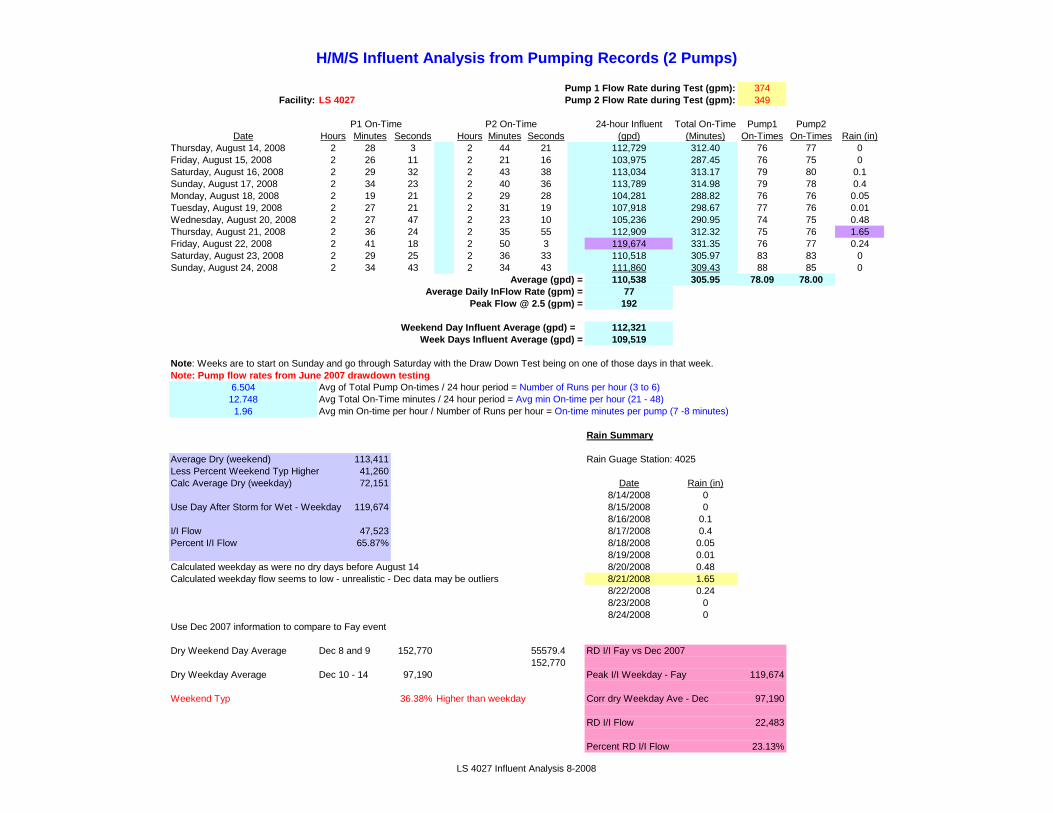
H/M/S Influent Analysis from Pumping Records (2 Pumps)
Pump 1 Flow Rate dur 374ing Test (gpm):Facility: LS 4027 Pump 2 Flow Rate dur 349ing Test (gpm):
P1 On-Time P2 On-Tim 24-houe r Influent Total On-Time Pump1 Pump2Date Hours Minutes Seconds Hours Minutes Seconds (gpd) (Minutes) On-Times On-Times Rain (in)
Thursday, August 14, 2008 2 28 3 2 44 21 112,729 312.40 76 77 0Friday, August 15, 2008 2 26 11 2 21 16 103,975 287.45 76 75 0Saturday, August 16, 2008 2 29 32 2 43 38 113,034 313.17 79 80 0.1Sunday, August 17, 2008 2 34 23 2 40 36 113,789 314.98 79 78 0.4Monday, August 18, 2008 2 19 21 2 29 28 104,281 288.82 76 76 0.05Tuesday, August 19, 2008 2 27 21 2 31 19 107,918 298.67 77 76 0.01Wednesday, August 20, 2008 2 27 47 2 23 10 105,236 290.95 74 75 0.48Thursday, August 21, 2008 2 36 24 2 35 55 112,909 312.32 75 76 1.65Friday, August 22, 2008 2 41 18 2 50 3 119,674 331.35 76 77 0.24Saturday, August 23, 2008 2 29 25 2 36 33 110,518 305.97 83 83 0Sunday, August 24, 2008 2 34 43 2 34 43 111,860 309.43 88 85 0
Average 110 (gpd) = ,538 305.95 78.09 78.00Average Daily InFlow Rate 77 (gpm) =
Peak Flow @ 2. 1925 (gpm) =
Weekend Day Influent Average ( 112,321gpd) =Week Days Influent Averag 109,519e (gpd) =
Note: Weeks are to start on Sunday and go through Saturday with the Draw Down Test being on one of those days in that week.Note: Pump flow rates from June 2007 drawdown testing
6.504 Avg of Total Pump On-times / 24 hour period = Number of Runs per hour (3 to 6)12.748 Avg Total On-Time minutes / 24 hour period = Avg min On-time per hour (21 - 48)1.96 Avg min On-time per hour / Number of Runs per hour = On-time minutes per pump (7 -8 minutes)
Rain Summary
Average Dry (weekend) 113,411 Rain Guage Station: 4025Less Percent Weekend Typ Higher 41,260Calc Average Dry (weekday) 72,151 Date Rain (in)
8/14/2008 0Use Day After Storm for Wet - Weekday 119,674 8/15/2008 0
8/16/2008 0.1I/I Flow 47,523 8/17/2008 0.4Percent I/I Flow 65.87% 8/18/2008 0.05
8/19/2008 0.01Calculated weekday as were y s t no dr day before Augus 14 8/20/2008 0.48Calculated weekday flow seems o tic ay s t low - unrealis - Dec data m be outlier 8/21/2008 1.65
8/22/2008 0.248/23/2008 08/24/2008 0
Use Dec 2007 information to compare to Fay event
Dry Weekend Day Average Dec 8 and 9 152,770 55579.4 RD I/I Fay vs Dec 2007152,770
Dry Weekday Average Dec 10 - 14 97,190 Peak I/I Weekday - Fay 119,674
Weekend Typ 36.38% Higher than weekday Corr dry Weekday Ave - Dec 97,190
RD I/I Flow 22,483
Percent RD I/I Flow 23.13%
LS 4027 Influent Analysis 8-2008
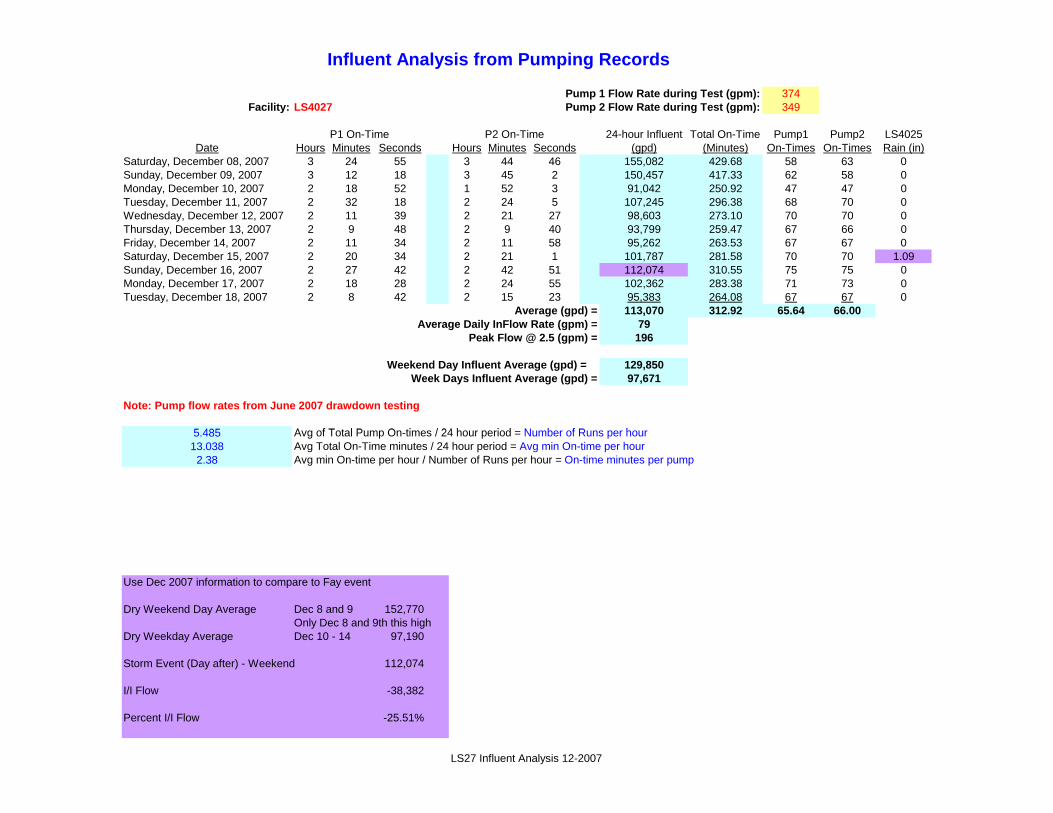
e
Influent Analysis from Pumping Records
Pump 1 Flow 374 Rate during Test (gpm):Facility: LS4027 Pump 2 Flow 349 Rate during Test (gpm):
P1 On-Tim P2 On-Time 24-hour Influent Total On-Time Pump1 Pump2 LS4025Date Hours Minutes Seconds Hours Minutes Seconds (gpd) (Minutes) On-Times On-Times Rain (in)
Saturday, December 08, 2007 3 24 55 3 44 46 155,082 429.68 58 63 0Sunday, December 09, 2007 3 12 18 3 45 2 150,457 417.33 62 58 0Monday, December 10, 2007 2 18 52 1 52 3 91,042 250.92 47 47 0Tuesday, December 11, 2007 2 32 18 2 24 5 107,245 296.38 68 70 0Wednesday, December 12, 2007 2 11 39 2 21 27 98,603 273.10 70 70 0Thursday, December 13, 2007 2 9 48 2 9 40 93,799 259.47 67 66 0Friday, December 14, 2007 2 11 34 2 11 58 95,262 263.53 67 67 0Saturday, December 15, 2007 2 20 34 2 21 1 101,787 281.58 70 70 1.09Sunday, December 16, 2007 2 27 42 2 42 51 112,074 310.55 75 75 0Monday, December 17, 2007 2 18 28 2 24 55 102,362 283.38 71 73 0Tuesday, December 18, 2007 2 8 42 2 15 23 95,383 264.08 67 67 0
Average (gpd) = 113,070 312.92 65.64 66.00Average Daily InFlow 79 Rate (gpm) =
Peak Flow 196 @ 2.5 (gpm) =
Weekend Day Influent Aver 129,850age (gpd) =Week Days Influent Av 97,671erage (gpd) =
Note: Pump flow rates from June 2007 drawdown testing
5 4855.485 A f T t l P O ti / 24 h i d N b f R hAvg of Total Pump On-times / 24 hour period = Number of Runs per hour13.038 Avg Total On-Time minutes / 24 hour period = Avg min On-time per hour2.38 Avg min On-time per hour / Number of Runs per hour = On-time minutes per pump
Use Dec 2007 information to compare to Fay event
Dry Weekend Day Average Dec 8 and 9 152,770Only Dec 8 and 9th this high
Dry Weekday Average Dec 10 - 14 97,190
Storm Event (Day after) - Weekend 112,074
I/I Flow -38,382
Percent I/I Flow -25.51%
LS27 Influent Analysis 12-2007
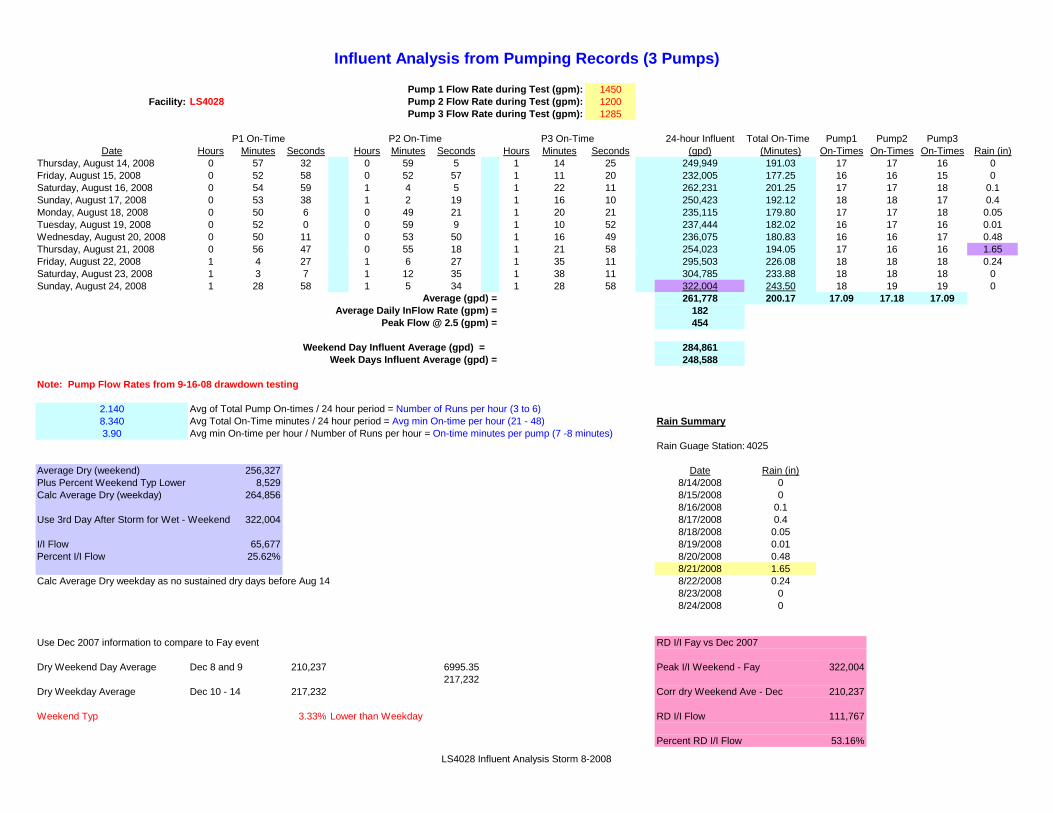
ime P2 On-
ge Station: 4025
Influent Analysis from Pumping Records (3 Pumps)
Pump 1 Flow 1450 Rate during Test (gpm):Facility: LS4028 Pump 2 Flow 1200 Rate during Test (gpm):
Pump 3 Flow 1285 Rate during Test (gpm):
P1 On-T Time P3 On-Time 24-hour Influent Total On-Time Pump1 Pump2 Pump3Date Hours Minutes Seconds Hours Minutes Seconds H sour Minutes Seconds (gpd) (Minutes) On-Times On-Times On-Times Rain (in)
Thursday, August 14, 2008 0 57 32 0 59 5 1 14 25 249,949 191.03 17 17 16 0Friday, August 15, 2008 0 52 58 0 52 57 1 11 20 232,005 177.25 16 16 15 0Saturday, August 16, 2008 0 54 59 1 4 5 1 22 11 262,231 201.25 17 17 18 0.1Sunday, August 17, 2008 0 53 38 1 2 19 1 16 10 250,423 192.12 18 18 17 0.4Monday, August 18, 2008 0 50 6 0 49 21 1 20 21 235,115 179.80 17 17 18 0.05Tuesday, August 19, 2008 0 52 0 0 59 9 1 10 52 237,444 182.02 16 17 16 0.01Wednesday, August 20, 2008 0 50 11 0 53 50 1 16 49 236,075 180.83 16 16 17 0.48Thursday, August 21, 2008 0 56 47 0 55 18 1 21 58 254,023 194.05 17 16 16 1.65Friday, August 22, 2008 1 4 27 1 6 27 1 35 11 295,503 226.08 18 18 18 0.24Saturday, August 23, 2008 1 3 7 1 12 35 1 38 11 304,785 233.88 18 18 18 0Sunday, August 24, 2008 1 28 58 1 5 34 1 28 58 322,004 243.50 18 19 19 0
Average (gpd) = 261,778 200.17 17.09 17.18 17.09Average Daily 182 InFlow Rate (gpm) =
Peak 454 Flow @ 2.5 (gpm) =
Weekend Day Infl 284,861uent Average (gpd) =Week Days Infl 248,588uent Average (gpd) =
Note: Pump Flow Rates from 9-16-08 drawdown testing
2.140 Avg of Total Pump On-times / 24 hour period = Number of Runs per hour (3 to 6)8.340 Avg Total On-Time minutes / 24 hour period = Avg min On-time per hour (21 - 48) Rain Summary3.90 Avg min On-time per hour / Number of Runs per hour = On-time minutes per pump (7 -8 minutes)
Rain Gua
Average Dry (weekend) 256,327 Date Rain (in)Plus Percent Weekend Typ Lower 8,529 8/14/2008 0Calc Average Dry (weekday) 264,856 8/15/2008 0
8/16/2008 0.1Use 3rd Day After Storm for Wet - Weekend 322,004 8/17/2008 0.4
8/18/2008 0.05I/I Flow 65,677 8/19/2008 0.01Percent I/I Flow 25.62% 8/20/2008 0.48
8/21/2008 1.65Calc Average Dry weekday ust y s as no s ained dr day before Aug 14 8/22/2008 0.24
8/23/2008 08/24/2008 0
Use Dec 2007 information to compare to Fay event RD I/I Fay vs Dec 2007
Dry Weekend Day Average Dec 8 and 9 210,237 6995.35 Peak I/I Weekend - Fay 322,004217,232
Dry Weekday Average Dec 10 - 14 217,232 Corr dry Weekend Ave - Dec 210,237
Weekend Typ 3.33% Lower than Weekday RD I/I Flow 111,767
Percent RD I/I Flow 53.16%
LS4028 Influent Analysis Storm 8-2008

Tim P2 On-T
1 f T / N R t
Influent Analysis from Pumping Records (3 Pumps)
Pump 1 Flow 1450 Rate during Test (gpm):Facility: LS 4028 Pump 2 Flow 1200 Rate during Test (gpm):
Pump 3 Flow 1285 Rate during Test (gpm):
P1 On- e ime P3 On-Time 24-hour Influent Total On-Time Pump1 Pump2 Pump3 LS 4025Date Hours Minutes Seconds Hours Minutes Seconds Hours Minutes Seconds (gpd) (Minutes) On-Times On-Times On-Times Rain (in)
Saturday, December 08, 2007 0 48 9 0 24 58 1 5 24 183,817 138.52 8 7 9 0Sunday, December 09, 2007 0 48 23 1 4 9 1 9 40 236,658 182.20 12 11 13 0Monday, December 10, 2007 0 36 41 0 41 14 1 4 30 185,553 142.42 10 12 11 0Tuesday, December 11, 2007 0 52 44 0 48 3 1 19 20 236,067 180.12 13 13 14 0Wednesday, December 12, 2007 0 52 38 0 49 38 1 10 23 226,321 172.65 14 14 13 0Thursday, December 13, 2007 0 49 30 0 46 6 1 17 21 226,490 172.95 13 12 13 0Friday, December 14, 2007 0 41 42 0 47 22 1 13 29 211,731 162.55 12 12 13 0Saturday, December 15, 2007 0 52 0 0 49 21 1 12 35 227,890 173.93 14 14 13 1.09Sunday, December 16, 2007 0 59 0 0 58 38 1 32 21 274,580 209.98 15 15 15 0Monday, December 17, 2007 0 6 34 0 6 12 0 10 46 30,797 23.53 2 2 2 0Tuesday, December 18, 2007 0 0.00 0
Average (gpd) = 185,446 141.71 11.30 11.20 11.60Average Daily 129 InFlow Rate (gpm) =
Peak 322 Flow @ 2.5 (gpm) =
Weekend Day Infl 230,736uent Average (gpd) =Week Days Infl 159,566uent Average (gpd) =
Note: Pump Flow Rates from 9-16-08 drawdown testing
Note: Weeks are to start on Sunday and go through Saturday with the Draw Down Test being on one of those days in that week.
1 421.421 Avg of Total Pump On times / 24 hour period = Number of Runs per hour (3 to 6)Avg o otal Pump On-times 24 hour period = umber of uns per hour (3 o 6)5.905 Avg Total On-Time minutes / 24 hour period = Avg min On-time per hour (21 - 48)4.16 Avg min On-time per hour / Number of Runs per hour = On-time minutes per pump (7 -8 minutes)
Use Dec 2007 information to compare to Fay event
Dry Weekend Day Average Dec 8 and 9 210,237
Dry Weekday Average Dec 10 - 14 217,232
Storm Event (Day after) - Weekend 274,580
I/I Flow 37,922
Percent I/I Flow 16.02%
3 Pump - LS4028 Influent Analysis Master Storm 12-2007

LS4035 Pumps operate on VFDs - JWSC (Ray Tarker) developed correlation between RPM and FlowWWTP#4 SeaPack Less SeaPack
Date GPD Rain (in) Max. Min. Avg. GPD GPDFriday, March 20, 2009 742,213 0 904 166 508 101,078 641,135
Saturday, March 21, 2009 450,175 0 818 8 326 24,566 425,609Sunday, March 22, 2009 430,677 0 1,040 1 299 120,664 310,013Monday, March 23, 2009 852,023 0 905 240 593 121,571 730,452Tuesday, March 24, 2009 484,424 0.01 797 68 355 103,934 380,490
Wednesday, March 25, 2009 570,566 0 1,040 50 368 101,627 468,939Thursday, March 26, 2009 788,431 0 772 127 546 98,262 690,169
Friday, March 27, 2009 539,872 0.03 799 15 390 131,835 408,037Saturday, March 28, 2009 592,873 0.18 1,042 52 408 1,269 591,604Sunday, March 29, 2009 862,960 0.67 1,007 265 599 159,436 703,524Monday, March 30, 2009 616,871 0.25 882 47 437 93,293 523,578Tuesday, March 31, 2009 711,861 0.16 1,042 4 494 167,612 544,249
Wednesday, April 01, 2009 1,105,174 2.18 1,042 4 762 144,377 960,797Thursday, April 02, 2009 1,038,180 2.54 1,039 162 722 76,372 961,808
Friday, April 03, 2009 1,382,351 0.26 1,038 619 906 142,380 1,239,971Saturday, April 04, 2009 1,206,221 0 1,032 632 823 32,116 1,174,105Sunday, April 05, 2009 943,607 0.78 902 61 656 129,239 814,368Monday, April 06, 2009 1,144,258 0 1,036 551 804 131,949 1,012,309Tuesday, April 07, 2009 1,106,008 0 1,032 410 770 156,817 949,191
Wednesday, April 08, 2009 936,550 0 938 184 653 104,874 831,676Thursday, April 09, 2009 1,107,334 0 1,038 187 769 87,742 1,019,592
Friday, April 10, 2009 1,146,040 0 1,038 187 786 143,613 1,002,427Saturday, April 11, 2009 942,982 0 934 181 658 115 942,867Sunday, April 12, 2009 952,584 0 1,040 207 655 117,492 835,092
ADWF (GPD): 516,272 w/o SeaPackAWWF (GPD): 1,016,078 w/o SeaPack% I/I Increase: 96.8%
Dec 2007 and August 2008 data not available
Dry Friday March 20, 2009 w/o SeaPak 641,135
Storm Event (Day After) - Friday April 3, 2009 w/o SeaPak 1,239,971
RD I/I Flow 598,836
Percent RD I/I Flow 93.40%
Influent Analysis from Pumping Records (3 Pumps)
Flow (gpm)
RDII Analysis
Sunday, March 01, 2009 1.48 Monday, March 30, 2009 0.25Monday, March 02, 2009 0.35 Tuesday, March 31, 2009 0.16Tuesday, March 03, 2009 0 Wednesday, April 01, 2009 2.18
Wednesday, March 04, 2009 0.01 Thursday, April 02, 2009 2.54Thursday, March 05, 2009 0 Friday, April 03, 2009 0.26
Friday, March 06, 2009 0 Saturday, April 04, 2009 0Saturday, March 07, 2009 0 Sunday, April 05, 2009 0.78Sunday, March 08, 2009 0 Monday, April 06, 2009 0Monday, March 09, 2009 0 Tuesday, April 07, 2009 0Tuesday, March 10, 2009 0 Wednesday, April 08, 2009 0
Wednesday, March 11, 2009 0 Thursday, April 09, 2009 0Thursday, March 12, 2009 0 Friday, April 10, 2009 0
Friday, March 13, 2009 0 Saturday, April 11, 2009 0Saturday, March 14, 2009 0 Sunday, April 12, 2009 0Sunday, March 15, 2009 0 Monday, April 13, 2009 2.07Monday, March 16, 2009 0.29 Tuesday, April 14, 2009 0.05Tuesday, March 17, 2009 0 Wednesday, April 15, 2009 0
Wednesday, March 18, 2009 0 Thursday, April 16, 2009 0.01Thursday, March 19, 2009 0 Friday, April 17, 2009 0
Friday, March 20, 2009 0 Saturday, April 18, 2009 0Saturday, March 21, 2009 0 Sunday, April 19, 2009 0Sunday, March 22, 2009 0 Monday, April 20, 2009 0.07Monday, March 23, 2009 0 Tuesday, April 21, 2009 0.06Tuesday, March 24, 2009 0.01 Wednesday, April 22, 2009 0.04
Wednesday, March 25, 2009 0 Thursday, April 23, 2009 0Thursday, March 26, 2009 0 Friday, April 24, 2009 0
Friday, March 27, 2009 0.03 Saturday, April 25, 2009 0Saturday, March 28, 2009 0.18 Sunday, April 26, 2009 0Sunday, March 29, 2009 0.67 Monday, April 27, 2009 0
Tuesday, April 28, 2009 0Wednesday, April 29, 2009 0
Thursday, April 30, 2009 0
WTP4 Rain Gauge SiteWTP4 Rain Gauge Site
LS4035 RPM-Flow 4-09 Storm

LS4036 Pumps operate on VFDs - JWSC (Ray Tarker) developed correlation between RPM and FlowAverage SeaPack Less SeaPack
Date GPD Rain (in) Max. Min. Avg. GPD GPDFriday, March 20, 2009 865,092 0 3,118 632 704 101,078 764,014
Saturday, March 21, 2009 800,706 0 3,118 626 706 24,566 776,140Sunday, March 22, 2009 590,487 0 3,118 3,118 3,118 120,664 469,823Monday, March 23, 2009 942,932 0 3,118 632 710 121,571 821,361Tuesday, March 24, 2009 825,768 0 3,118 613 702 103,934 721,834
Wednesday, March 25, 2009 732,481 0 3,118 3,118 3,118 101,627 630,854Thursday, March 26, 2009 860,604 0 3,118 3,118 3,118 98,262 762,342
Friday, March 27, 2009 533,958 0.06 3,118 613 1,166 131,835 402,123Saturday, March 28, 2009 736,097 0.56 3,118 3,118 3,118 1,269 734,828Sunday, March 29, 2009 921,627 2.63 3,118 3,118 3,118 159,436 762,191Monday, March 30, 2009 547,926 0 3,118 3,118 3,118 93,293 454,633Tuesday, March 31, 2009 821,811 1.03 3,118 3,118 3,118 167,612 654,199
Wednesday, April 01, 2009 832,299 1.98 144,377 687,922Thursday, April 02, 2009 717,067 3.01 76,372 640,695
Friday, April 03, 2009 966,242 0.18 142,380 823,862Saturday, April 04, 2009 987,819 0 3,118 670 948 32,116 955,703Sunday, April 05, 2009 502,119 0.68 129,239 372,880Monday, April 06, 2009 810,537 0.01 3,118 31 203 131,949 678,588Tuesday, April 07, 2009 921,835 0 3,118 632 946 156,817 765,018
Wednesday, April 08, 2009 498,416 0 104,874 393,542Thursday, April 09, 2009 702,717 0 87,742 614,975
Friday, April 10, 2009 963,140 0 3,118 701 922 143,613 819,527Saturday, April 11, 2009 573,546 0 750 38 260 115 573,431Sunday, April 12, 2009 592,865 0 3,118 9 182 117,492Monday, April 13, 2009 1.75
Note: Dates with GPD in RED were adjusted due to negative ADWF (GPD): 658,334flows @ RPM below Log Curve. AWWF (GPD): 622,812
% I/I Increase: -5.4%
Influent Analysis from Pumping Records (3 Pumps)
RDII Analysis
Flow (gpm)
Friday, March 20, 2009 0 Dec 2007 and August 2008 data not availableSaturday, March 21, 2009 0Sunday, March 22, 2009 0 Dry Friday March 20, 2009 w/o SeaPak 764,014
Monday, March 23, 2009 0Tuesday, March 24, 2009 0 Storm Event (Day After) - Friday April 3, 2009 w/o SeaPak 823,862
Wednesday, March 25, 2009 0Thursday, March 26, 2009 0 RD I/I Flow 59,848
Friday, March 27, 2009 0.06Saturday, March 28, 2009 0.56 Percent RD I/I Flow 7.83%Sunday, March 29, 2009 2.63Monday, March 30, 2009 0Tuesday, March 31, 2009 1.03
Wednesday, April 01, 2009 1.98Thursday, April 02, 2009 3.01
Friday, April 03, 2009 0.18Saturday, April 04, 2009 0Sunday, April 05, 2009 0.68Monday, April 06, 2009 0.01Tuesday, April 07, 2009 0
Wednesday, April 08, 2009 0Thursday, April 09, 2009 0
Friday, April 10, 2009 0Saturday, April 11, 2009 0Sunday, April 12, 2009 0Monday, April 13, 2009 1.75
WaterLab Rain Gauge Site
LS4036 RPM-Flow 4-09 Storm

ime P2
uage Station: 4051
Influent Analysis from Pumping Records (3 Pumps)
Pump 1 Flow Rate during 500 Pump 1 drawdown could be incorrect Test (gpm):Facility: LS 4039 Pump 2 Flow Rate during 1150 Assumed Pump 3 same as Pump 2 Test (gpm):
Pump 3 Flow 1150 Rate during Test (gpm):
P1 On-T On-Time P3 On-Time 24-hour Influent Total On-Time Pump1 Pump2 Pump3Date Hours Minut Seces onds Hours Minutes Seconds Hours Minutes Seconds (gpd) (Minutes) On-Times On-Times On-Times Rain (in)
Friday, August 15, 2008 0 0 0 0 0 0 5 25 29 374,306 325.48 0 0 153 0Saturday, August 16, 2008 0 0 0 0 0 0 5 31 9 380,823 331.15 0 0 155 0Sunday, August 17, 2008 0 0 0 0 0 0 5 40 26 391,498 340.43 0 0 160 0.35Monday, August 18, 2008 0 0 0 0 0 0 6 1 45 416,013 361.75 0 0 165 0Tuesday, August 19, 2008 0 0 0 0 0 0 5 24 38 373,328 324.63 0 0 159 0.06Wednesday, August 20, 2008 0 0 0 1 53 53 5 2 56 479,339 416.82 0 27 102 0.62Thursday, August 21, 2008 0 0 0 4 30 31 4 46 55 641,048 557.43 0 63 63 1.69Friday, August 22, 2008 0 0 0 5 56 34 5 54 42 817,957 711.27 0 72 71 0.32Saturday, August 23, 2008 0 0 0 5 45 33 4 12 47 688,083 598.33 0 73 73 0Sunday, August 24, 2008 0 0 0 1 56 50 5 50 15 537,146 467.08 0 29 124 0
0 0.00Average (gpd) = 463,595 403.13 0.00 26.40 122.50
Average Daily 322 InFlow Rate (gpm) =P 805eak Flow @ 2.5 (gpm) =
Weekend Day Influent 499,388 Average (gpd) =Week Days Infl 516,998uent Average (gpd) =
Note: Pump flow rates from 7-15-08 drawdown testing
6.204 Avg of Total Pump On-times / 24 hour period = Number of Runs per hour (3 to 6)16.797 Avg Total On-Time minutes / 24 hour period = Avg min On-time per hour (21 - 48) Rain Summary2.71 Avg min On-time per hour / Number of Runs per hour = On-time minutes per pump (7 -8 minutes)g p p p p p ( )
Rain G
Flow Pump ime Run T Date Rain (in)Average Dry (weekend) 386,160 336 8/15/2008 0Plus Percent Weekend Typ Lower 43,588 38 8/16/2008 0Average Dry (weekday) 429,749 374 8/17/2008 0.35
8/18/2008 0Use Day After Storm for Wet - Weekday 817,957 711 8/19/2008 0.06
8/20/2008 0.62I/I Flow 388,208 338 8/21/2008 1.69Percent I/I Flow 90.33% 90.33% 8/22/2008 0.32
8/23/2008 0No sustained dry weather before Aug 15th 8/24/2008 0
RD I/I Fay vs Dec 2007
Use Dec 2007 information to compare to Fay event Peak I/I Weekday - Fay 817,957
Dry Weekend Day Average Dec 8 and 9 299,558 33813.08 Corr dry Weekday Ave - Dec 333,371333,371
Dry Weekday Average Dec 10 - 14 333,371 RD I/I Flow 484,586
Weekend Day Typ 11.29% Lower than Weekday Percent RD I/I Flow 145.36%
LS4039 Influent Analysis Storm 8-2008
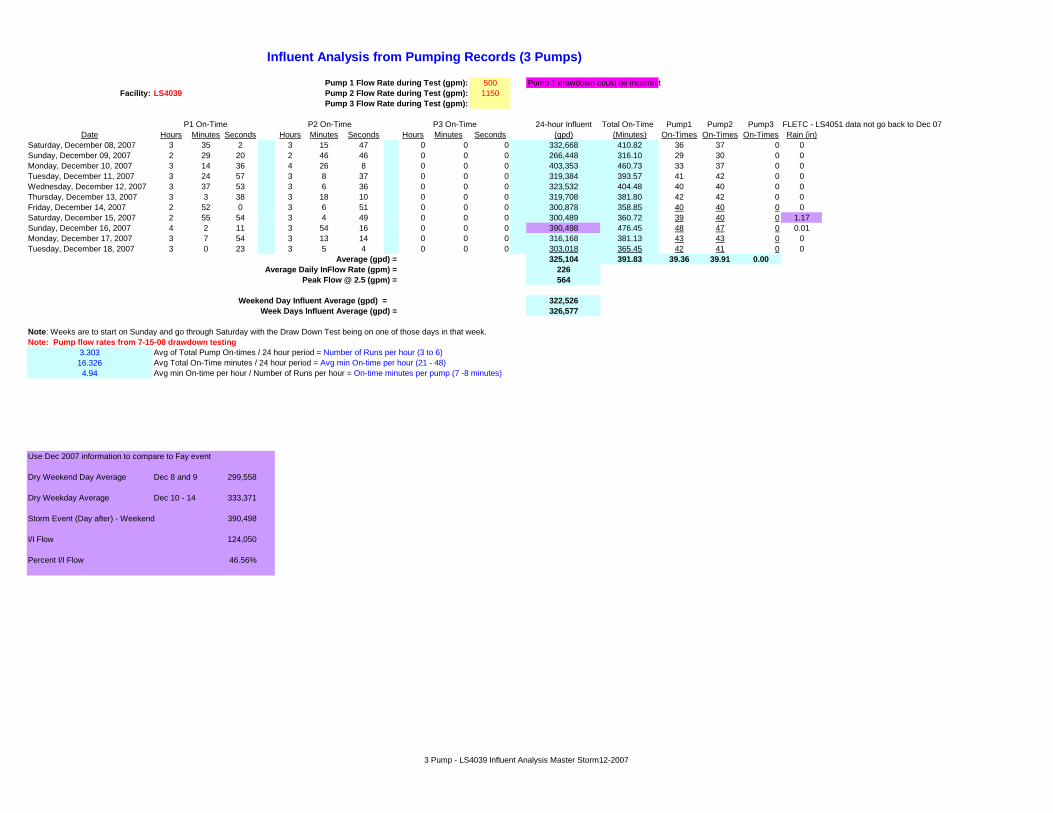
500 Pump 1 drawdown could be incorrectFacility: 1150
24-hour Influent Total On-Time Pump1 Pump2 Pump3 FLETC - LS4051 data not go back to Dec 07Date Hours Minutes Seconds Hours Minutes Seconds Hours Minutes Seconds (gpd) (Minutes) On-Times On-Times On-Times Rain (in)
Saturday, December 08, 2007 3 35 2 3 15 47 0 0 0 332,668 410.82 36 37 0 0Sunday, December 09, 2007 2 29 20 2 46 46 0 0 0 266,448 316.10 29 30 0 0Monday, December 10, 2007 3 14 36 4 26 8 0 0 0 403,353 460.73 33 37 0 0Tuesday, December 11, 2007 3 24 57 3 8 37 0 0 0 319,384 393.57 41 42 0 0Wednesday, December 12, 2007 3 37 53 3 6 36 0 0 0 323,532 404.48 40 40 0 0Thursday, December 13, 2007 3 3 38 3 18 10 0 0 0 319,708 381.80 42 42 0 0Friday, December 14, 2007 2 52 0 3 6 51 0 0 0 300,878 358.85 40 40 0 0Saturday, December 15, 2007 2 55 54 3 4 49 0 0 0 300,489 360.72 39 40 0 1.17Sunday, December 16, 2007 4 2 11 3 54 16 0 0 0 390,498 476.45 48 47 0 0.01Monday, December 17, 2007 3 7 54 3 13 14 0 0 0 316,168 381.13 43 43 0 0Tuesday, December 18, 2007 3 0 23 3 5 4 0 0 0 303,018 365.45 42 41 0 0
325,104 391.83 39.36 39.91 0.00226564
322,526326,577
Note: Weeks are to start on Sunday and go through Saturday with the Draw Down Test being on one of those days in that week.Note: Pump flow rates from 7-15-08 drawdown testing
3.303 Avg of Total Pump On-times / 24 hour period = Number of Runs per hour (3 to 6)16.326 Avg Total On-Time minutes / 24 hour period = Avg min On-time per hour (21 - 48)4.94 Avg min On-time per hour / Number of Runs per hour = On-time minutes per pump (7 -8 minutes)
P1 On-Time P2 On-Time P3 On-Time
Influent Analysis from Pumping Records (3 Pumps)
Pump 1 Flow Rate during Test (gpm):Pump 2 Flow Rate during Test (gpm):Pump 3 Flow Rate during Test (gpm):
LS4039
Weekend Day Influent Average (gpd) =Week Days Influent Average (gpd) =
Average (gpd) =
Peak Flow @ 2.5 (gpm) =Average Daily InFlow Rate (gpm) =
Use Dec 2007 information to compare to Fay event
Dry Weekend Day Average Dec 8 and 9 299,558
Dry Weekday Average Dec 10 - 14 333,371
Storm Event (Day after) - Weekend 390,498
I/I Flow 124,050
Percent I/I Flow 46.56%
3 Pump - LS4039 Influent Analysis Master Storm12-2007
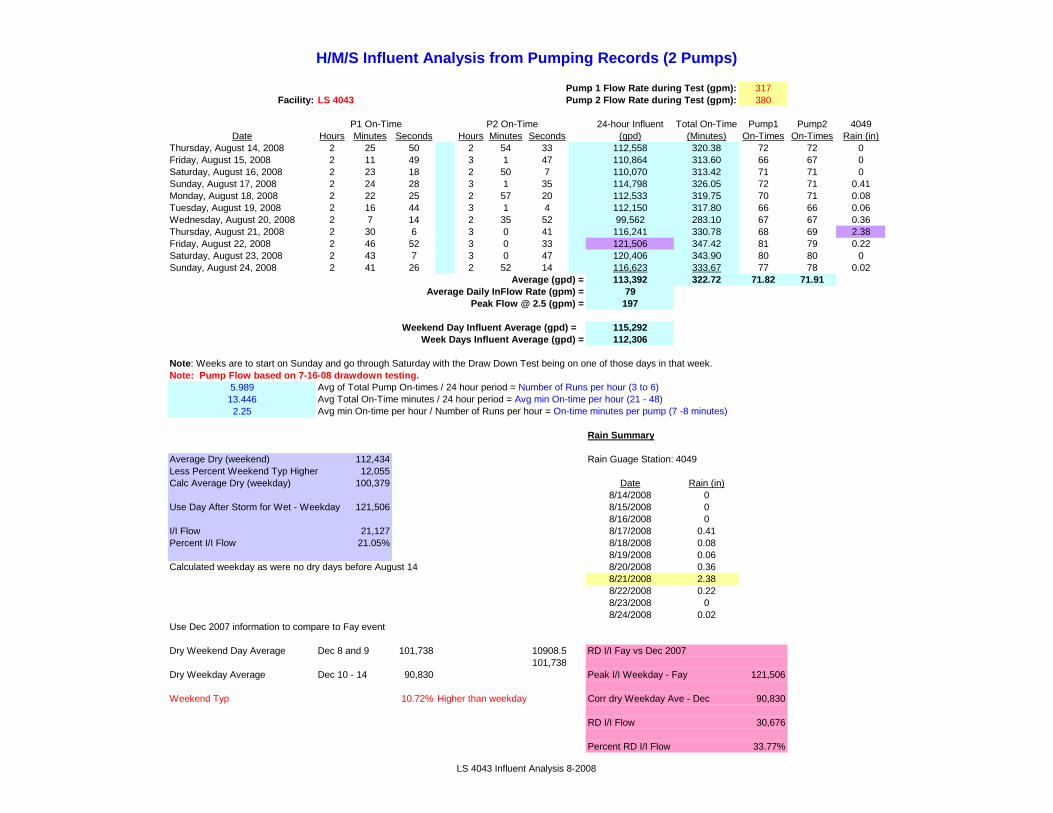
H/M/S Influent Analysis from Pumping Records (2 Pumps)
Pump 1 Flow Rate dur 317ing Test (gpm):Facility: LS 4043 Pump 2 Flow Rate dur 380ing Test (gpm):
P1 On-Time P2 On-Tim 24-houe r Influent Total On-Time Pump1 Pump2 4049Date Hours Minutes Seconds Hours Minutes Seconds (gpd) (Minutes) On-Times On-Times Rain (in)
Thursday, August 14, 2008 2 25 50 2 54 33 112,558 320.38 72 72 0Friday, August 15, 2008 2 11 49 3 1 47 110,864 313.60 66 67 0Saturday, August 16, 2008 2 23 18 2 50 7 110,070 313.42 71 71 0Sunday, August 17, 2008 2 24 28 3 1 35 114,798 326.05 72 71 0.41Monday, August 18, 2008 2 22 25 2 57 20 112,533 319.75 70 71 0.08Tuesday, August 19, 2008 2 16 44 3 1 4 112,150 317.80 66 66 0.06Wednesday, August 20, 2008 2 7 14 2 35 52 99,562 283.10 67 67 0.36Thursday, August 21, 2008 2 30 6 3 0 41 116,241 330.78 68 69 2.38Friday, August 22, 2008 2 46 52 3 0 33 121,506 347.42 81 79 0.22Saturday, August 23, 2008 2 43 7 3 0 47 120,406 343.90 80 80 0Sunday, August 24, 2008 2 41 26 2 52 14 116,623 333.67 77 78 0.02
Average 11 (gpd) = 3,392 322.72 71.82 71.91Average Daily InFlow Rate 79 (gpm) =
Peak Flow @ 2. 1975 (gpm) =
Weekend Day Influent Averag 115,292e (gpd) =Week Days Influent Averag 112,306e (gpd) =
Note: Weeks are to start on Sunday and go through Saturday with the Draw Down Test being on one of those days in that week.Note: Pump Flow based on 7-16-08 drawdown testing.
5.989 Avg of Total Pump On-times / 24 hour period = Number of Runs per hour (3 to 6)13.446 Avg Total On-Time minutes / 24 hour period = Avg min On-time per hour (21 - 48)2.25 Avg min On-time per hour / Number of Runs per hour = On-time minutes per pump (7 -8 minutes)
Rain Summary
Average Dry (weekend) 112,434 Rain Guage Station: 4049Less Percent Weekend Typ Higher 12,055Calc Average Dry (weekday) 100,379 Date Rain (in)
8/14/2008 0Use Day After Storm for Wet - Weekday 121,506 8/15/2008 0
8/16/2008 0I/I Flow 21,127 8/17/2008 0.41Percent I/I Flow 21.05% 8/18/2008 0.08
8/19/2008 0.06Calculated weekday as were y s t no dr day before Augus 14 8/20/2008 0.36
8/21/2008 2.388/22/2008 0.228/23/2008 08/24/2008 0.02
Use Dec 2007 information to compare to Fay event
Dry Weekend Day Average Dec 8 and 9 101,738 10908.5 RD I/I Fay vs Dec 2007101,738
Dry Weekday Average Dec 10 - 14 90,830 Peak I/I Weekday - Fay 121,506
Weekend Typ 10.72% Higher than weekday Corr dry Weekday Ave - Dec 90,830
RD I/I Flow 30,676
Percent RD I/I Flow 33.77%
LS 4043 Influent Analysis 8-2008

e
Influent Analysis from Pumping Records
Pump 1 Flow 317 Rate during Test (gpm):Facility: LS4043 Pump 2 Flow 380 Rate during Test (gpm):
P1 On-Tim P2 On 2-Time 4-hour Influent Total On-Time Pump1 Pump2 LS 4049Date Hours Minutes Seconds Hours Minutes Seconds (gpd) (Minutes) On-Times On-Times Rain (in)
Saturday, December 08, 2007 2 9 14 2 25 39 96,314 274.88 52 52 0Sunday, December 09, 2007 2 39 42 2 28 47 107,163 308.48 56 53 0Monday, December 10, 2007 3 12 29 2 31 56 118,752 344.42 44 44 0Tuesday, December 11, 2007 2 12 28 2 18 47 94,730 271.25 64 63 0Wednesday, December 12, 2007 1 51 7 2 3 48 82,268 234.92 63 63 0Thursday, December 13, 2007 1 54 26 1 58 36 81,343 233.03 59 59 0Friday, December 14, 2007 1 49 30 1 51 26 77,056 220.93 57 56 0Saturday, December 15, 2007 2 0 25 1 58 17 83,120 238.70 60 60 1.2Sunday, December 16, 2007 2 16 23 2 11 38 93,254 268.02 66 66 0Monday, December 17, 2007 2 3 48 2 12 17 89,512 256.08 63 63 0Tuesday, December 18, 2007 2 7 14 2 8 46 89,264 256.00 62 62 0
Average (gpd) = 93,947 269.70 58.73 58.27Average Daily InFlow 65 Rate (gpm) =
Peak Flow 163 @ 2.5 (gpm) =
Weekend Day Influent Aver 94,963age (gpd) =Week Days Influent Av 90,418erage (gpd) =
Note: Pump Flow based on 7-16-08 drawdown testing.
4 8754.875 A f T t l P O ti / 24 h i d N b f R hAvg of Total Pump On-times / 24 hour period = Number of Runs per hour11.238 Avg Total On-Time minutes / 24 hour period = Avg min On-time per hour2.31 Avg min On-time per hour / Number of Runs per hour = On-time minutes per pump
Use Dec 2007 information to compare to Fay event
Dry Weekend Day Average Dec 8 and 9 101,738
Dry Weekday Average Dec 10 - 14 90,830
Storm Event (Day after) - Weekend 93,254
I/I Flow -13,908
Percent I/I Flow -12.98%
LS43 Influent Analysis12-2007
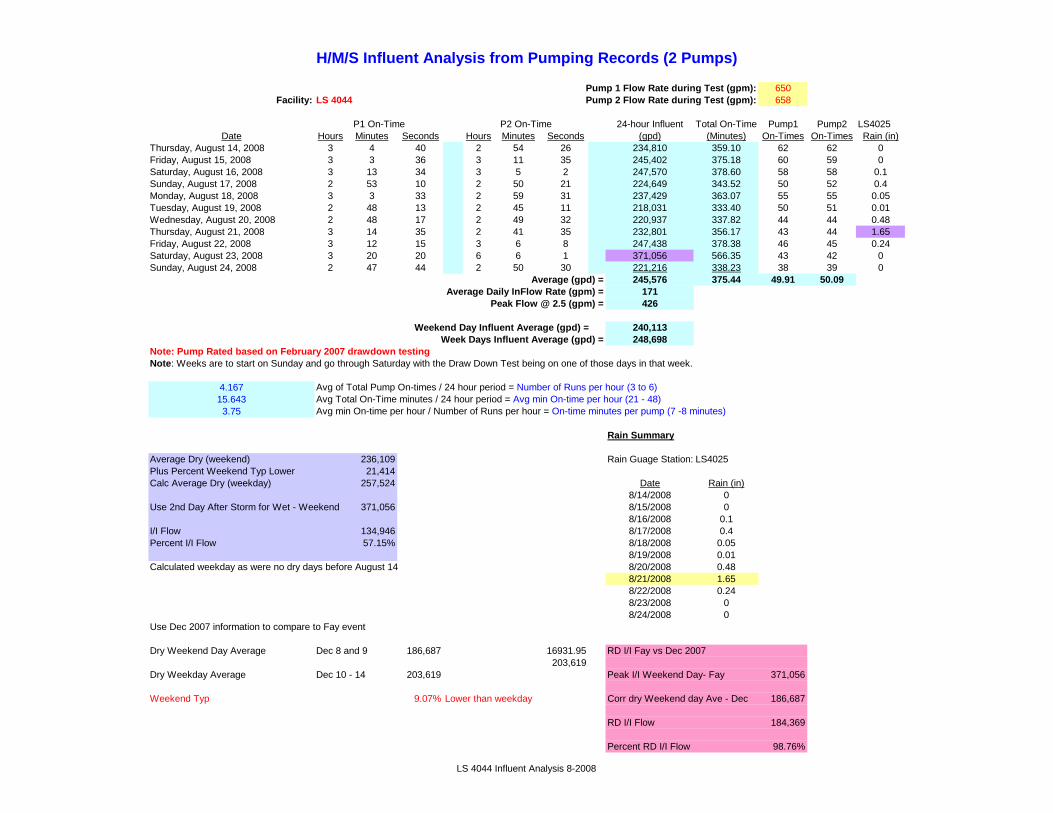
H/M/S Influent Analysis from Pumping Records (2 Pumps)
Pump 1 Flow Rate dur 650ing Test (gpm):Facility: LS 4044 Pump 2 Flow Rate dur 658ing Test (gpm):
P1 On-Time P2 On-T 24-ime hour Influent Total On-Time Pump1 Pump2 LS4025Date Hours Minutes Seconds Hours Minutes Seconds (gpd) (Minutes) On-Times On-Times Rain (in)
Thursday, August 14, 2008 3 4 40 2 54 26 234,810 359.10 62 62 0Friday, August 15, 2008 3 3 36 3 11 35 245,402 375.18 60 59 0Saturday, August 16, 2008 3 13 34 3 5 2 247,570 378.60 58 58 0.1Sunday, August 17, 2008 2 53 10 2 50 21 224,649 343.52 50 52 0.4Monday, August 18, 2008 3 3 33 2 59 31 237,429 363.07 55 55 0.05Tuesday, August 19, 2008 2 48 13 2 45 11 218,031 333.40 50 51 0.01Wednesday, August 20, 2008 2 48 17 2 49 32 220,937 337.82 44 44 0.48Thursday, August 21, 2008 3 14 35 2 41 35 232,801 356.17 43 44 1.65Friday, August 22, 2008 3 12 15 3 6 8 247,438 378.38 46 45 0.24Saturday, August 23, 2008 3 20 20 6 6 1 371,056 566.35 43 42 0Sunday, August 24, 2008 2 47 44 2 50 30 221,216 338.23 38 39 0
Average (gpd) = 245,576 375.44 49.91 50.09Average Daily InFlow R 171ate (gpm) =
Peak Flow @ 426 2.5 (gpm) =
Weekend Day Influent Averag 240,113e (gpd) =Week Days Influent A 248,698verage (gpd) =
Note: Pump Rated based on February 2007 drawdown testingNote: Weeks are to start on Sunday and go through Saturday with the Draw Down Test being on one of those days in that week.
4.167 Avg of Total Pump On-times / 24 hour period = Number of Runs per hour (3 to 6)15.643 Avg Total On-Time minutes / 24 hour period = Avg min On-time per hour (21 - 48)3.75 Avg min On-time per hour / Number of Runs per hour = On-time minutes per pump (7 -8 minutes)
Rain Summary
Average Dry (weekend) 236,109 Rain Guage Station: LS4025Plus Percent Weekend Typ Lower 21,414Calc Average Dry (weekday) 257,524 Date Rain (in)
8/14/2008 0Use 2nd Day After Storm for Wet - Weekend 371,056 8/15/2008 0
8/16/2008 0.1I/I Flow 134,946 8/17/2008 0.4Percent I/I Flow 57.15% 8/18/2008 0.05
8/19/2008 0.01Calculated weekday as were no dry s t day before Augus 14 8/20/2008 0.48
8/21/2008 1.658/22/2008 0.248/23/2008 08/24/2008 0
Use Dec 2007 information to compare to Fay event
Dry Weekend Day Average Dec 8 and 9 186,687 16931.95 RD I/I Fay vs Dec 2007203,619
Dry Weekday Average Dec 10 - 14 203,619 Peak I/I Weekend Day- Fay 371,056
Weekend Typ 9.07% Lower than weekday Corr dry Weekend day Ave - Dec 186,687
RD I/I Flow 184,369
Percent RD I/I Flow 98.76%
LS 4044 Influent Analysis 8-2008

e
Influent Analysis from Pumping Records
Pump 1 Flow 650 Rate during Test (gpm):Facility: LS4044 Pump 2 Flow 658 Rate during Test (gpm):
P1 On-Tim P2 On-Time 24-hour Influent Total On-Time Pump1 Pump2 LS4025Date Hours Minutes Seconds Hours Minutes Seconds (gpd) (Minutes) On-Times On-Times Rain (in)
Saturday, December 08, 2007 2 13 23 0 3 10 88,783 136.55 42 47 0Sunday, December 09, 2007 2 45 4 4 29 27 284,591 434.52 59 60 0Monday, December 10, 2007 2 14 21 3 44 52 235,290 359.22 57 59 0Tuesday, December 11, 2007 2 31 7 2 14 3 186,431 285.17 79 76 0Wednesday, December 12, 2007 2 30 13 2 19 43 189,574 289.93 79 79 0Thursday, December 13, 2007 2 35 17 2 31 29 200,610 306.77 80 79 0Friday, December 14, 2007 2 43 45 2 31 36 206,190 315.35 84 82 0Saturday, December 15, 2007 2 47 52 2 36 27 212,057 324.32 84 83 1.09Sunday, December 16, 2007 2 40 26 2 30 7 203,058 310.55 82 81 0Monday, December 17, 2007 2 36 57 2 31 56 201,990 308.88 80 81 0Tuesday, December 18, 2007 2 39 42 2 33 53 205,060 313.58 81 81 0
Average (gpd) = 198,781 303.93 73.36 73.45Average Daily InFlow 138 Rate (gpm) =
Peak Flow 345 @ 2.5 (gpm) =
Weekend Day Influent Aver 197,123age (gpd) =Week Days Influent Av 203,592erage (gpd) =
Note: Pump Rated based on February 2007 drawdown testing
6 1176.117 A f T t l P O ti / 24 h i d N b f R hAvg of Total Pump On-times / 24 hour period = Number of Runs per hour12.664 Avg Total On-Time minutes / 24 hour period = Avg min On-time per hour2.07 Avg min On-time per hour / Number of Runs per hour = On-time minutes per pump
Rainfall LS402512/8/2007 012/9/2007 012/10/2007 012/11/2007 012/12/2007 0
Use Dec 2007 inform oation to c mpare to Fay event 12/13/2007 012/14/2007 0
Dry Weekend Day Average Dec 8 and 9 186,687 12/15/2007 1.0912/16/2007 0
Dry Weekday Average Dec 10 - 14 203,619 12/17/2007 012/18/2007 0
Storm Event (Day of) - Weekend 212,057
I/I Flow 25,370
Percent I/I Flow 13.59%
Used Dry Weekend Average instead of December 8, 2007 because data looks like an outlier
LS44 Influent Analysis12-2007

e P2
Influent Analysis from Pumping Records (3 Pumps)
Pump 1 Fl 1767ow Rate during Test (gpm):Facility: LS 4048 Pump 2 Fl 1325ow Rate during Test (gpm):
Pump 3 Fl 1325ow Rate during Test (gpm):
P1 On-Tim On-Time P3 On-Time 24-hour Influent Total On-Time Pump1 Pump2 Pump3 LS4025Date Hours Minutes Seconds Hours Minutes Seconds Hours Minutes Seconds (gpd) (Minutes) On-Times On-Times On-Times Rain (in)
Thursday, August 14, 2008 5 22 33 4 20 34 5 17 42 1,336,149 900.82 20 19 19 0Friday, August 15, 2008 4 31 13 4 37 7 4 59 57 1,243,853 848.28 20 19 20 0Saturday, August 16, 2008 4 22 33 4 11 40 4 30 16 1,155,488 784.48 20 20 21 0.1Sunday, August 17, 2008 3 55 53 4 27 45 4 30 19 1,129,744 773.95 20 21 21 0.4Monday, August 18, 2008 5 16 2 4 32 55 4 43 51 1,296,147 872.80 20 20 20 0.05Tuesday, August 19, 2008 4 22 19 5 5 1 4 17 56 1,209,422 825.27 21 22 21 0.01Wednesday, August 20, 2008 5 3 26 5 28 36 3 53 46 1,281,303 865.80 19 20 20 0.48Thursday, August 21, 2008 5 27 27 4 44 47 4 58 7 1,350,947 910.35 17 18 18 1.65Friday, August 22, 2008 6 6 30 7 50 9 11 13 30 2,162,942 1510.15 11 9 10 0.24Saturday, August 23, 2008 3 26 21 9 32 8 9 57 23 1,914,230 1375.87 12 12 13 0Sunday, August 24, 2008 4 51 43 7 27 59 5 15 23 1,526,924 1055.08 16 16 16 0
Average (gpd) = 1,418,832 974.80 17.82 17.82 18.09Average Daily 985 InFlow Rate (gpm) =
Pea 2,463k Flow @ 2.5 (gpm) =
Weekend Day Infl 1,431,596uent Average (gpd) =Week Days Infl 1,411,537uent Average (gpd) =
Note: Pump flow rate based on July 15, 2008 drawdown
2.239 Avg of Total Pump On-times / 24 hour period = Number of Runs per hour (3 to 6) Rain Summary40.617 Avg Total On-Time minutes / 24 hour period = Avg min On-time per hour (21 - 48)18.14 Avg min On-time per hour / Number of Runs per hour = On-time minutes per pump (7 -8 minutes) Rain Guage Station: LS4025
8/14/2008 08/15/2008 08/15/2008 0
Average Dry (weekend) 1,142,616 8/16/2008 0.1Less Percent Weekend Typ Higher 174,816 RD /I s e I Fay v D c 2007 8/17/2008 0.4Calc Average Dry (weekday) 967,800 8/18/2008 0.05
Peak I/I Weekday - Fay 2,162,942 8/19/2008 0.01Use Day After Storm for Wet - Weekday 2,162,942 8/20/2008 0.48
Corr dry Weekday Ave - Dec 1,047,046 8/21/2008 1.65I/I Flow 1,195,142 8/22/2008 0.24Percent I/I Flow 123.49% RD I/I Flow 1,115,896 8/23/2008 0
8/24/2008 0Calculated weekday as were no dry days before August 14 Percent RD I/I Flow 106.58%
Use Dec 2007 information to compare to Fay event
Dry Weekend Day Average Dec 8 and 9 1,236,177 189130.61,047,046
Dry Weekday Average Dec 10 - 14 1,047,046
Weekend Day Typ 15.30% Higher than Weekday
LS4048 Influent Analysis Storm 8-2008

ime P2 On-
Influent Analysis from Pumping Records (3 Pumps)
Pump 1 Flow 1767 Rate during Test (gpm):Facility: LS 4048 Pump 2 Flow 1325 Rate during Test (gpm):
Pump 3 Flow 1325 Rate during Test (gpm):
P1 On-T Time P3 On-Time 24-hour Influent Total On-Time Pump1 Pump2 Pump3 LS 4025Date Hours Minutes Seconds Hours Minutes Seconds H sour Minutes Seconds (gpd) (Minutes) On-Times On-Times On-Times Rain (in)
Saturday, December 08, 2007 1 25 51 15 46 15 1 34 39 1,530,889 1126.75 34 33 37 0Sunday, December 09, 2007 3 17 55 4 18 48 3 7 48 941,464 644.52 50 45 44 0Monday, December 10, 2007 4 1 22 4 55 40 2 51 45 1,045,822 708.78 51 51 47 0Tuesday, December 11, 2007 3 35 33 3 37 52 4 5 35 994,948 679.00 58 53 59 0Wednesday, December 12, 2007 3 39 36 3 44 12 3 57 23 999,631 681.18 69 70 70 0Thursday, December 13, 2007 3 52 38 4 6 1 4 15 30 1,075,573 734.15 94 89 95 0Friday, December 14, 2007 3 59 44 4 1 21 4 43 40 1,119,256 764.75 116 113 117 0Saturday, December 15, 2007 3 38 21 3 42 32 3 39 13 971,143 660.10 65 66 65 1.09Sunday, December 16, 2007 4 53 48 4 39 21 4 46 39 1,269,095 859.80 100 99 97 0Monday, December 17, 2007 4 17 5 4 35 1 4 19 15 1,162,170 791.35 96 100 98 0Tuesday, December 18, 2007 3 58 22 3 28 4 4 2 33 1,018,261 688.98 71 72 69 0
1,102,568 758.12 73.09 71.91 72.55Average Da 766ily InFlow Rate (gpm) =
Peak 1,914 Flow @ 2.5 (gpm) =
Weekend Day Influent 1,178,148 Average (gpd) =Week Days Infl 1,059,380uent Average (gpd) =
Note: Pump flow rate based on July 15, 2008 drawdownNote: Weeks are to start on Sunday and go through Saturday with the Draw Down Test being on one of those days in that week.
9.064 Avg of Total Pump On-times / 24 hour period = Number of Runs per hour (3 to 6)31.589 Avg Total On-Time minutes / 24 hour period = Avg min On-time per hour (21 - 48)3.48 Avg min On-time per hour / Number of Runs per hour = On-time minutes per pump (7 -8 minutes)
Use Dec 2007 information to compare to Fay event
Dry Weekend Day Average Dec 8 and 9 1,236,177
Dry Weekday Average Dec 10 - 14 1,047,046
Storm Event (Day after) - Weekend 1,269,095
I/I Flow 327,631
Percent I/I Flow 34.80%
3 Pump - LS4048 Influent Analysis Master Storm12-2007

H/M/S Influent Analysis from Pumping Records (2 Pumps)
Pump 1 Flow Rate dur 274ing Test (gpm):Facility: LS 4056 Pump 2 Flow Rate dur 290ing Test (gpm):
P1 On-Time P2 On-Tim 24-houe r Influent Total On-Time Pump1 Pump2Date Hours Minutes Seconds Hours Minutes Seconds (gpd) (Minutes) On-Times On-Times Rain (in)
Thursday, August 14, 2008 4 14 20 4 1 18 139,664 495.63 32 32 0Friday, August 15, 2008 0 53 33 6 33 29 128,783 447.03 9 53 0Saturday, August 16, 2008 0 0 0 7 6 49 123,777 426.82 0 60 0.1Sunday, August 17, 2008 0 0 0 7 16 48 126,672 436.80 0 56 0.4Monday, August 18, 2008 2 15 2 4 20 58 112,679 396.00 23 37 0.05Tuesday, August 19, 2008 2 58 14 3 9 37 103,825 367.85 26 26 0.01Wednesday, August 20, 2008 2 54 30 2 59 56 99,994 354.43 25 25 0.48Thursday, August 21, 2008 2 41 4 2 52 0 94,012 333.07 24 24 1.65Friday, August 22, 2008 3 12 1 4 1 16 122,580 433.28 29 34 0.24Saturday, August 23, 2008 3 11 25 3 40 17 116,330 411.70 27 27 0Sunday, August 24, 2008 2 38 48 3 55 4 111,681 393.87 20 34 0
Averag 11e (gpd) = 6,363 408.77 19.55 37.09Average Daily InFlow Rate 81 (gpm) =
Peak Flow @ 2. 2025 (gpm) =
Weekend Day Influent Averag 121,260e (gpd) =Week Days Influent Averag 113,565e (gpd) =
Note: Weeks are to start on Sunday and go through Saturday with the Draw Down Test being on one of those days in that week.Note: Pump flow rates based on February 2007 drawdown
2.360 Avg of Total Pump On-times / 24 hour period = Number of Runs per hour (3 to 6)17.032 Avg Total On-Time minutes / 24 hour period = Avg min On-time per hour (21 - 48)7.22 Avg min On-time per hour / Number of Runs per hour = On-time minutes per pump (7 -8 minutes)
Rain Summary
Average Dry (weekend) 125,224 Rain Guage Station: 4025Plus Percent Weekend Typ Lower 14,211Calc Average Dry (weekday) 139,435 Date Rain (in)
8/14/2008 0Use Day After Storm for Wet - Weekday 122,580 8/15/2008 0
8/16/2008 0.1I/I Flow -16,855 8/17/2008 0.4Percent I/I Flow -12.09% 8/18/2008 0.05
8/19/2008 0.01Calculated weekday as were y s t no dr day before Augus 14 8/20/2008 0.48Saturated conditions - flows t y high during whole period - no ac ual dr period 8/21/2008 1.65Calculated weekday does not ake h ase m sense in t is c 8/22/2008 0.24
8/23/2008 08/24/2008 0
Use Dec 2007 information to compare to Fay event
Dry Weekend Day Average Dec 8 and 9 72,765 8257.49 RD I/I Fay vs Dec 200781,023
Dry Weekday Average Dec 10 - 14 81,023 Peak I/I Weekday - Fay 122,580
Weekend Typ 11.35% Lower than weekday Corr dry Weekday Ave - Dec 81,023
RD I/I Flow 41,557
Percent RD I/I Flow 51.29%
LS 4056 Influent Analysis 8-2008
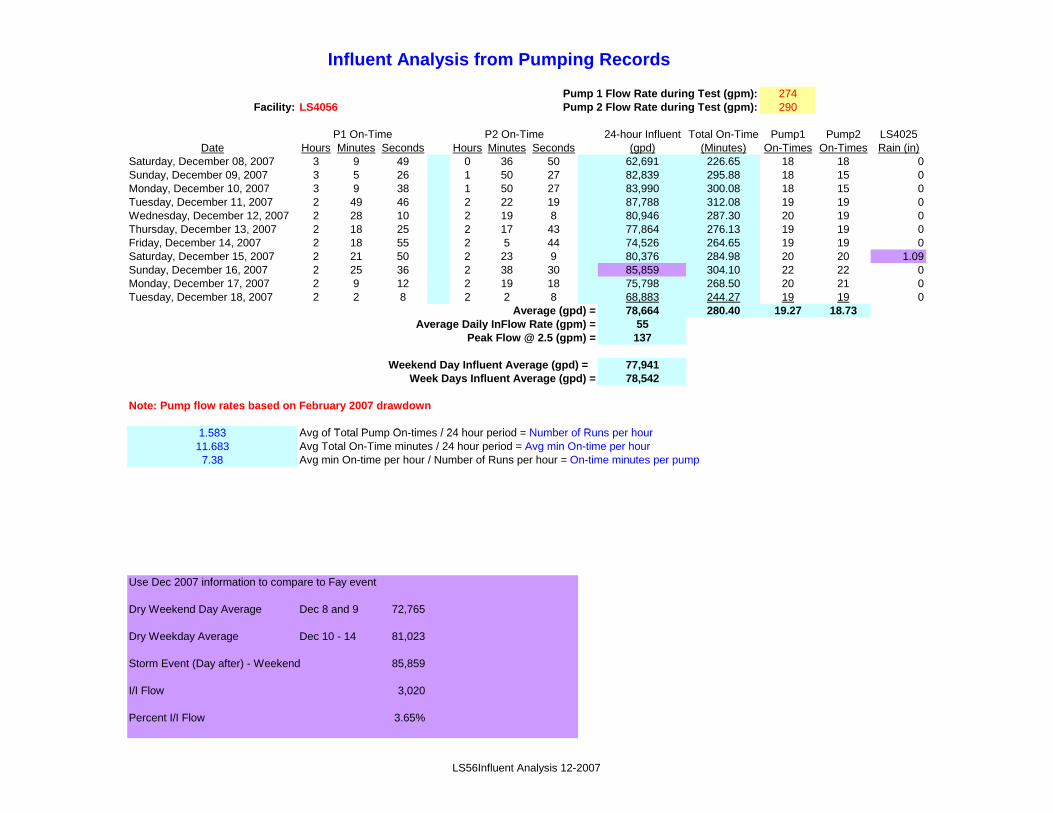
e
Influent Analysis from Pumping Records
Pump 1 Flow 274 Rate during Test (gpm):Facility: LS4056 Pump 2 Flow 290 Rate during Test (gpm):
P1 On-Tim P2 On 2-Time 4-hour Influent Total On-Time Pump1 Pump2 LS4025Date Hours Minutes Seconds Hours Minutes Seconds (gpd) (Minutes) On-Times On-Times Rain (in)
Saturday, December 08, 2007 3 9 49 0 36 50 62,691 226.65 18 18 0Sunday, December 09, 2007 3 5 26 1 50 27 82,839 295.88 18 15 0Monday, December 10, 2007 3 9 38 1 50 27 83,990 300.08 18 15 0Tuesday, December 11, 2007 2 49 46 2 22 19 87,788 312.08 19 19 0Wednesday, December 12, 2007 2 28 10 2 19 8 80,946 287.30 20 19 0Thursday, December 13, 2007 2 18 25 2 17 43 77,864 276.13 19 19 0Friday, December 14, 2007 2 18 55 2 5 44 74,526 264.65 19 19 0Saturday, December 15, 2007 2 21 50 2 23 9 80,376 284.98 20 20 1.09Sunday, December 16, 2007 2 25 36 2 38 30 85,859 304.10 22 22 0Monday, December 17, 2007 2 9 12 2 19 18 75,798 268.50 20 21 0Tuesday, December 18, 2007 2 2 8 2 2 8 68,883 244.27 19 19 0
Average (gpd) = 78,664 280.40 19.27 18.73Average Daily InFlow 55 Rate (gpm) =
Peak Flow 137 @ 2.5 (gpm) =
Weekend Day Influent Aver 77,941age (gpd) =Week Days Influent Av 78,542erage (gpd) =
Note: Pump flow rates based on February 2007 drawdown
1 5831.583 A f T t l P O ti / 24 h i d N b f R hAvg of Total Pump On-times / 24 hour period = Number of Runs per hour11.683 Avg Total On-Time minutes / 24 hour period = Avg min On-time per hour7.38 Avg min On-time per hour / Number of Runs per hour = On-time minutes per pump
Use Dec 2007 information to compare to Fay event
Dry Weekend Day Average Dec 8 and 9 72,765
Dry Weekday Average Dec 10 - 14 81,023
Storm Event (Day after) - Weekend 85,859
I/I Flow 3,020
Percent I/I Flow 3.65%
LS56Influent Analysis 12-2007

Influent Analysis from Pumping Records (2 Pumps)
Pump 1 Flow Rate duri 413ng Test (gpm):Facility: LS 4105 Pump 2 Flow Rate duri 440ng Test (gpm):
P1 On-Time P2 On-Ti 24-home ur Influent Total On-Time Pump1 Pump2Date Hours Minutes Seconds Hours Minutes Seconds (gpd) (Minutes) On-Times On-Times Rain (in)
Friday, August 15, 2008 4 36 0 3 30 58 206,813 486.97 62 62 0Saturday, August 16, 2008 4 46 59 3 9 0 201,684 475.98 61 60 0Sunday, August 17, 2008 4 58 59 3 18 0 210,600 496.98 55 55 0.45Monday, August 18, 2008 4 54 0 3 15 0 207,222 489.00 56 56 0.03Tuesday, August 19, 2008 4 49 59 3 10 59 203,796 480.97 55 56 0.03Wednesday, August 20, 2008 5 3 0 3 0 58 204,764 483.97 53 53 0.42Thursday, August 21, 2008 4 27 58 3 31 59 203,943 479.95 56 56 1.69Friday, August 22, 2008 0 0.00 0.19 SCADA OFFLineSaturday, August 23, 2008 0 0.00 0Sunday, August 24, 2008 0 0.00 0
0 0.00Averag 14e (gpd) = 3,882 339.38 56.86 56.86
Average Daily InFlow Rate (gpm) = 100 *Averages are from Aug Fri 15 to Sun Aug 24 (LCS)Peak Flow @ 2. 2505 (gpm) =
Weekend Day Influent Average 103,071 (gpd) =Week Days Influent Averag 171,090e (gpd) =
Note: Pump rate based on July 22, 2008 drawdown testing
4.738 Avg of Total Pump On-times / 24 hour period = Number of Runs per hour (3 to 6)14.141 Avg Total On-Time minutes / 24 hour period = Avg min On-time per hour (21 - 48)
2.98 Avg min On-time per hour / Number of Runs per hour = On-time minutes per pump (7 -8 minutes)
Rain Summary
Average Dry (weekend) 206,142 Rain Gauge Station: WaterLabPlus Percent Weekend Typ Lower 2,280Calc Average Dry (weekday) 208,422 Date Rain (in)
8/15/2008 0Use Day of Storm for Wet - Weekday 203,943 8/16/2008 0
8/17/2008 0.45I/I Flow -4,479 8/18/2008 0.03Percent I/I Flow -2.15% 8/19/2008 0.03
8/20/2008 0.42Calculated weekday as were y s t no dr day before Augus 15 8/21/2008 1.69Inconclusive as major I/I occurr ains e t med 2nd and 3rd day after r on Dec mber s or 8/22/2008 0.19
8/23/2008 08/24/2008 0.03
Use Dec 2007 information to compare to Fay eventRD I/I Fay vs Dec 2007
Dry Weekend Day Average Dec 8 and 9 228,924 2531.42231,455 Peak I/I Weekday - Fay 203,943
Dry Weekday Average Dec 10 - 14 231,455Corr dry Weekday Ave - Dec 231,455
Weekend Day Typ 1.11% Lower than WeekdayRD I/I Flow -27,512
Percent RD I/I Flow -11.89%
LS4105 Influent Analysis Storm 8-2008

e
Influent Analysis from Pumping Records (2 Pumps)
Pump 1 Flow 413 Rate during Test (gpm):Facility: LS4105 Pump 2 Flow 440 Rate during Test (gpm):
P1 On-Tim P2 On-Time 24-hour Influent Total On-Time Pump1 Pump2 WaterlabDate Hours Minutes Seconds Hours Minutes Seconds (gpd) (Minutes) On-Times On-Times Rain (in)
Saturday, December 08, 2007 6 16 59 2 49 59 230,487 546.97 0Sunday, December 09, 2007 5 12 58 3 42 58 227,361 535.93 0Monday, December 10, 2007 5 21 0 4 9 0 242,133 570.00 0Tuesday, December 11, 2007 5 9 0 3 51 58 229,682 540.97 0Wednesday, December 12, 2007 4 57 58 3 48 58 223,806 526.93 0Thursday, December 13, 2007 5 21 58 3 49 59 234,165 551.95 0.01Friday, December 14, 2007 5 9 0 3 46 59 227,490 535.98 0Saturday, December 15, 2007 5 42 0 3 48 0 241,566 570.00 1.22Sunday, December 16, 2007 6 39 58 4 6 58 273,852 646.93 0.01Monday, December 17, 2007 7 54 58 4 40 59 319,794 755.95 0Tuesday, December 18, 2007 8 33 58 4 10 59 322,701 764.95 0
Average (gpd) = 252,094 595.14 #DIV/0! #DIV/0!Av 175erage Daily InFlow Rate (gpm) =
Peak Flow 438 @ 2.5 (gpm) =
Weekend Day Influent Av 243,316erage (gpd) =Week Days Influent Av 257,110erage (gpd) =
Note: Pump rate based on July 22, 2008 drawdown testingNote: Weeks are to start on Sunday and go through Saturday with the Draw Down Test being on one of those days in that week.
#DIV/0!#DIV/0! A f T t l P O ti / 24 h i d N b f R h (3 t 6)Avg of Total Pump On-times / 24 hour period = Number of Runs per hour (3 to 6)24.798 Avg Total On-Time minutes / 24 hour period = Avg min On-time per hour (21 - 48)#DIV/0! Avg min On-time per hour / Number of Runs per hour = On-time minutes per pump (7 -8 minutes)
Use Dec 2007 information to compare to Fay event
Dry Weekend Day Average Dec 8 and 9 228,924
Dry Weekday Average Dec 10 - 14 231,455
Storm Event (2nd Day after) - Weekday 319,794
I/I Flow 77,661
Percent I/I Flow 32.07%
2 Pump - LS4105 Influent Analysis Master Storm12-2007

Influent Analysis from Pumping Records (2 Pumps)
Pump 1 Flow Rate duri 207ng Test (gpm):Facility: LS4107 Pump 2 Flow Rate duri 190ng Test (gpm):
P1 On-Time P2 On-Tim 24-houre Influent Total On-Time Pump1 Pump2Date Hours Minutes Seconds Hours Minutes oSec nds (gpd) (Minutes) On-Times On-Times Rain (in)
Friday, August 15, 2008 5 40 59 4 12 58 118,647 593.95 13 13 0Saturday, August 16, 2008 5 30 0 3 45 58 111,244 555.97 12 12 0Sunday, August 17, 2008 5 21 58 4 15 0 115,097 576.97 11 12 0.45Monday, August 18, 2008 5 51 0 3 45 0 115,407 576.00 13 12 0.03Tuesday, August 19, 2008 5 24 58 3 52 59 111,535 557.95 16 12 0.03Wednesday, August 20, 2008 5 4 59 4 4 59 109,678 549.97 10 11 0.42Thursday, August 21, 2008 4 36 0 5 9 0 115,842 585.00 10 9 1.69Friday, August 22, 2008 5 42 0 6 9 0 140,904 711.00 10 12 0.19Saturday, August 23, 2008 8 9 0 9 0 58 204,007 1029.97 16 22 0Sunday, August 24, 2008 6 6 0 7 58 59 166,769 844.98 10 10 0.03
0 0.00Average 130 (gpd) = ,913 658 12.10 12.50
Average Daily InFlow Rate 9 (gpm) = 1 *Averages are from Fri Aug 15 to Sat Aug 23 (LCS)Peak Flow @ 2.5 227 (gpm) =
Weekend Day Influent Average 149,279 (gpd) =Week Days Influent Average 118,669 (gpd) =
Note: Pump rate based on July 22, 2008 drawdown testing
1.025 Avg of Total Pump On-times / 24 hour period = Number of Runs per hour (3 to 6)27.424 Avg Total On-Time minutes / 24 hour period = Avg min On-time per hour (21 - 48)26.76 Avg min On-time per hour / Number of Runs per hour = On-time minutes per pump (7 -8 minutes)
Rain Summary
Average Dry (weekend) 113,170 Rain Guage Station: WaterLabPlus Percent Weekend Typ Lower 6,390Calc Average Dry (weekday) 119,560 Date Rain (in)
8/15/2008 0Use 2nd Day After Storm for Wet - Weekend 204,007 8/16/2008 0
8/17/2008 0.45I/I Flow 90,836 8/18/2008 0.03Percent I/I Flow 80.27% 8/19/2008 0.03
8/20/2008 0.42Calculated weekday as were no dry s day before August 15 8/21/2008 1.69
8/22/2008 0.198/23/2008 08/24/2008 0.03
Use Dec 2007 information to compare to Fay eventRD I/I Fay vs Dec 2007
Dry Weekend Day Average Dec 8 and 9 106,537 6015.33112,552 Peak I/I Weekend - Fay 204,007
Dry Weekday Average Dec 10 - 14 112,552Corr dry Weekend Day Ave - Dec 106,537
Weekend Day Typ 5.65% Lower than WeekdayRD I/I Flow 97,470
Percent RD I/I Flow 91.49%
LS4107 Influent Analysis Storm 8-2008

e
Influent Analysis from Pumping Records (2 Pumps)
Pump 1 Flow 207 Rate during Test (gpm):Facility: LS4107 Pump 2 Flow 190 Rate during Test (gpm):
P1 On-Tim P2 2 On-Time 4-hour Influent Total On-Time Pump1 Pump2 WaterlabDate Hours Minutes Seconds Hours Minutes Seconds (gpd) (Minutes) On-Times On-Times Rain (in)
Saturday, December 08, 2007 4 43 59 4 6 0 105,525 529.98 0Sunday, December 09, 2007 4 28 59 4 33 0 107,550 541.98 0Monday, December 10, 2007 5 0 0 5 1 59 119,477 601.98 0Tuesday, December 11, 2007 5 3 58 3 51 58 106,995 535.93 0Wednesday, December 12, 2007 4 31 59 4 49 59 111,397 561.97 0Thursday, December 13, 2007 4 57 58 4 25 59 112,216 563.95 0.01Friday, December 14, 2007 4 51 0 4 36 0 112,677 567.00 0Saturday, December 15, 2007 4 42 58 4 15 0 107,024 537.97 1.22Sunday, December 16, 2007 5 12 58 4 19 59 114,181 572.95 0.01Monday, December 17, 2007 5 24 0 4 36 58 119,692 600.97 0Tuesday, December 18, 2007 5 3 0 4 0 0 108,321 543.00 0
Average (gpd) = 111,369 559.79Average Daily InFlow 77 Rate (gpm) =
Peak Flow 193 @ 2.5 (gpm) =
Weekend Day Influent Aver 108,570age (gpd) =Week Days Influent Av 112,968erage (gpd) =
Note: Pump rate based on July 22, 2008 drawdown testingNote: Weeks are to start on Sunday and go through Saturday with the Draw Down Test being on one of those days in that week.
0 0000.000 A f T t l P O ti / 24 h i d N b f R h (3 t 6)Avg of Total Pump On-times / 24 hour period = Number of Runs per hour (3 to 6)23.325 Avg Total On-Time minutes / 24 hour period = Avg min On-time per hour (21 - 48)#DIV/0! Avg min On-time per hour / Number of Runs per hour = On-time minutes per pump (7 -8 minutes)
Use Dec 2007 information to compare to Fay event
Dry Weekend Day Average Dec 8 and 9 106,537
Dry Weekday Average Dec 10 - 14 112,552
Storm Event (Day after) - Weekend 114,181
I/I Flow 6,631
Percent I/I Flow 6.17%
2 Pump - LS4107 Influent Analysis Master Storm12-2007
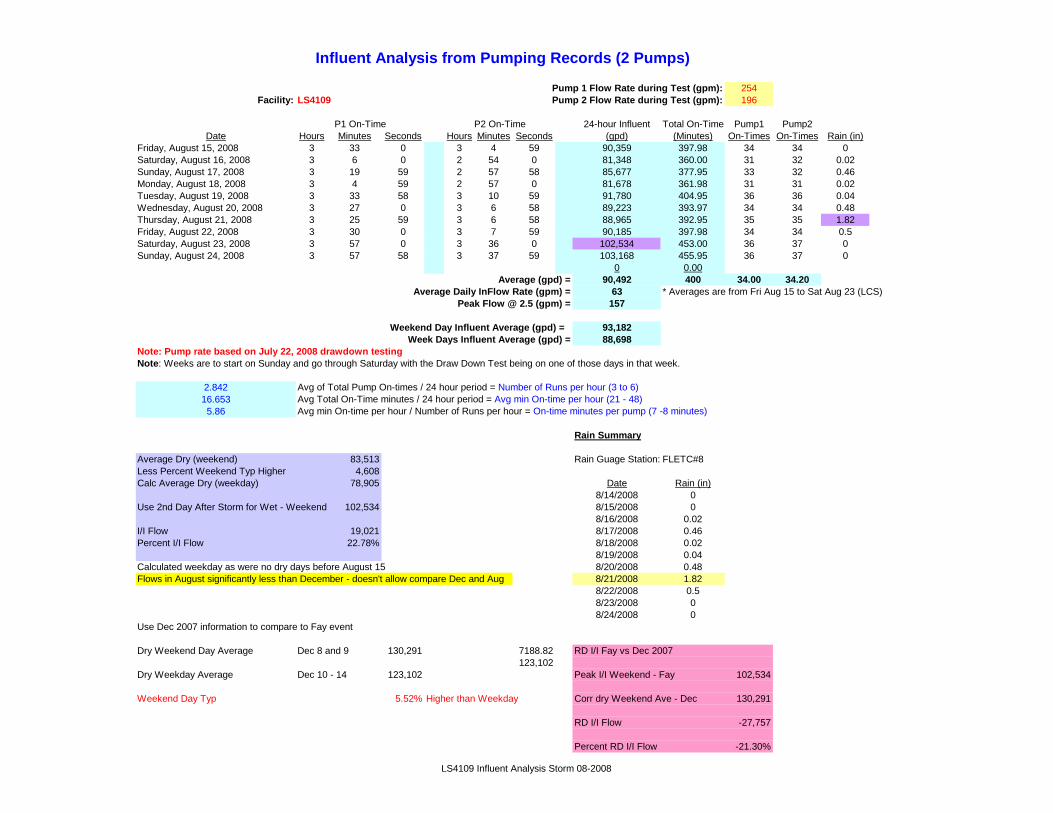
Influent Analysis from Pumping Records (2 Pumps)
Pump 1 Flow Rate during Te 254st (gpm):Facility: LS4109 Pump 2 Flow Rate during Te 196st (gpm):
P1 On-Time P2 On-Time 24-hour Influent Total On-Time Pump1 Pump2Date Hours Minutes Seconds Hours Minutes Seconds (gpd) (Minutes) On-Times On-Times Rain (in)
Friday, August 15, 2008 3 33 0 3 4 59 90,359 397.98 34 34 0Saturday, August 16, 2008 3 6 0 2 54 0 81,348 360.00 31 32 0.02Sunday, August 17, 2008 3 19 59 2 57 58 85,677 377.95 33 32 0.46Monday, August 18, 2008 3 4 59 2 57 0 81,678 361.98 31 31 0.02Tuesday, August 19, 2008 3 33 58 3 10 59 91,780 404.95 36 36 0.04Wednesday, August 20, 2008 3 27 0 3 6 58 89,223 393.97 34 34 0.48Thursday, August 21, 2008 3 25 59 3 6 58 88,965 392.95 35 35 1.82Friday, August 22, 2008 3 30 0 3 7 59 90,185 397.98 34 34 0.5Saturday, August 23, 2008 3 57 0 3 36 0 102,534 453.00 36 37 0Sunday, August 24, 2008 3 57 58 3 37 59 103,168 455.95 36 37 0
0 0.00Average ( 90,gpd) = 492 400 34.00 34.20
Average Daily InFlow Rate ( 63gpm) = * Averages are from Fri Aug 15 to Sat Aug 23 (LCS)Peak Flow @ 2.5 (g 157pm) =
Weekend Day Influent Average ( 93,182gpd) =Week Days Influent Average ( 88,698gpd) =
Note: Pump rate based on July 22, 2008 drawdown testingNote: Weeks are to start on Sunday and go through Saturday with the Draw Down Test being on one of those days in that week.
2.842 Avg of Total Pump On-times / 24 hour period = Number of Runs per hour (3 to 6)16.653 Avg Total On-Time minutes / 24 hour period = Avg min On-time per hour (21 - 48)5.86 Avg min On-time per hour / Number of Runs per hour = On-time minutes per pump (7 -8 minutes)
Rain Summary
Average Dry (weekend) 83,513 Rain Guage Station: FLETC#8Less Percent Weekend Typ Higher 4,608Calc Average Dry (weekday) 78,905 Date Rain (in)
8/14/2008 0Use 2nd Day After Storm for Wet - Weekend 102,534 8/15/2008 0
8/16/2008 0.02I/I Flow 19,021 8/17/2008 0.46Percent I/I Flow 22.78% 8/18/2008 0.02
8/19/2008 0.04Calculated weekday as were no dry s t day before Augus 15 8/20/2008 0.48Flows in August significantly less t em om ughan Dec ber - doesn't allow c pare Dec and A 8/21/2008 1.82
8/22/2008 0.58/23/2008 08/24/2008 0
Use Dec 2007 information to compare to Fay event
Dry Weekend Day Average Dec 8 and 9 130,291 7188.82 RD I/I Fay vs Dec 2007123,102
Dry Weekday Average Dec 10 - 14 123,102 Peak I/I Weekend - Fay 102,534
Weekend Day Typ 5.52% Higher than Weekday Corr dry Weekend Ave - Dec 130,291
RD I/I Flow -27,757
Percent RD I/I Flow -21.30%
LS4109 Influent Analysis Storm 08-2008
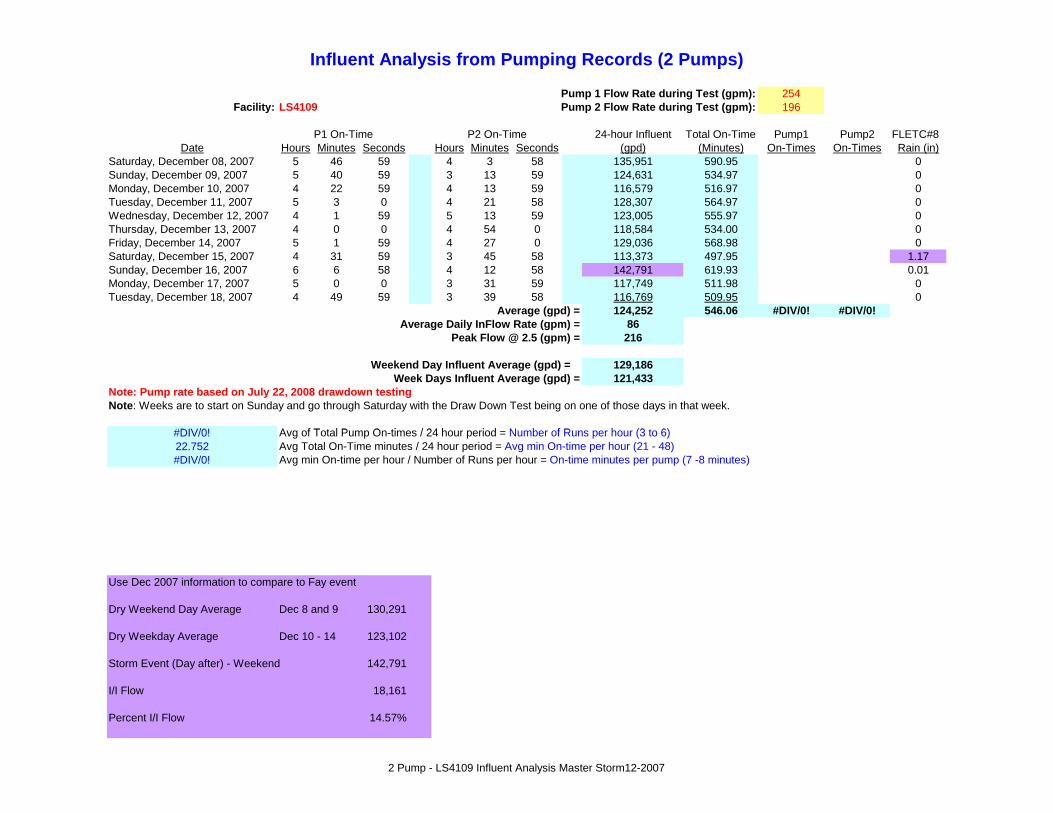
e
Influent Analysis from Pumping Records (2 Pumps)
Pump 1 Flow 254 Rate during Test (gpm):Facility: LS4109 Pump 2 Flow 196 Rate during Test (gpm):
P1 On-Tim P2 On-Time 24-hour Influent Total On-Time Pump1 Pump2 FLETC#8Date Hours Minutes Seconds Hours Minutes Seconds (gpd) (Minutes) On-Times On-Times Rain (in)
Saturday, December 08, 2007 5 46 59 4 3 58 135,951 590.95 0Sunday, December 09, 2007 5 40 59 3 13 59 124,631 534.97 0Monday, December 10, 2007 4 22 59 4 13 59 116,579 516.97 0Tuesday, December 11, 2007 5 3 0 4 21 58 128,307 564.97 0Wednesday, December 12, 2007 4 1 59 5 13 59 123,005 555.97 0Thursday, December 13, 2007 4 0 0 4 54 0 118,584 534.00 0Friday, December 14, 2007 5 1 59 4 27 0 129,036 568.98 0Saturday, December 15, 2007 4 31 59 3 45 58 113,373 497.95 1.17Sunday, December 16, 2007 6 6 58 4 12 58 142,791 619.93 0.01Monday, December 17, 2007 5 0 0 3 31 59 117,749 511.98 0Tuesday, December 18, 2007 4 49 59 3 39 58 116,769 509.95 0
Average (gpd) = 124,252 546.06 #DIV/0! #DIV/0!Av 86erage Daily InFlow Rate (gpm) =
Peak Flow 216 @ 2.5 (gpm) =
Weekend Day Influent Av 129,186erage (gpd) =Week Days Influent Av 121,433erage (gpd) =
Note: Pump rate based on July 22, 2008 drawdown testingNote: Weeks are to start on Sunday and go through Saturday with the Draw Down Test being on one of those days in that week.
#DIV/0!#DIV/0! A f T t l P O ti / 24 h i d N b f R h (3 t 6)Avg of Total Pump On-times / 24 hour period = Number of Runs per hour (3 to 6)22.752 Avg Total On-Time minutes / 24 hour period = Avg min On-time per hour (21 - 48)#DIV/0! Avg min On-time per hour / Number of Runs per hour = On-time minutes per pump (7 -8 minutes)
Use Dec 2007 information to compare to Fay event
Dry Weekend Day Average Dec 8 and 9 130,291
Dry Weekday Average Dec 10 - 14 123,102
Storm Event (Day after) - Weekend 142,791
I/I Flow 18,161
Percent I/I Flow 14.57%
2 Pump - LS4109 Influent Analysis Master Storm12-2007
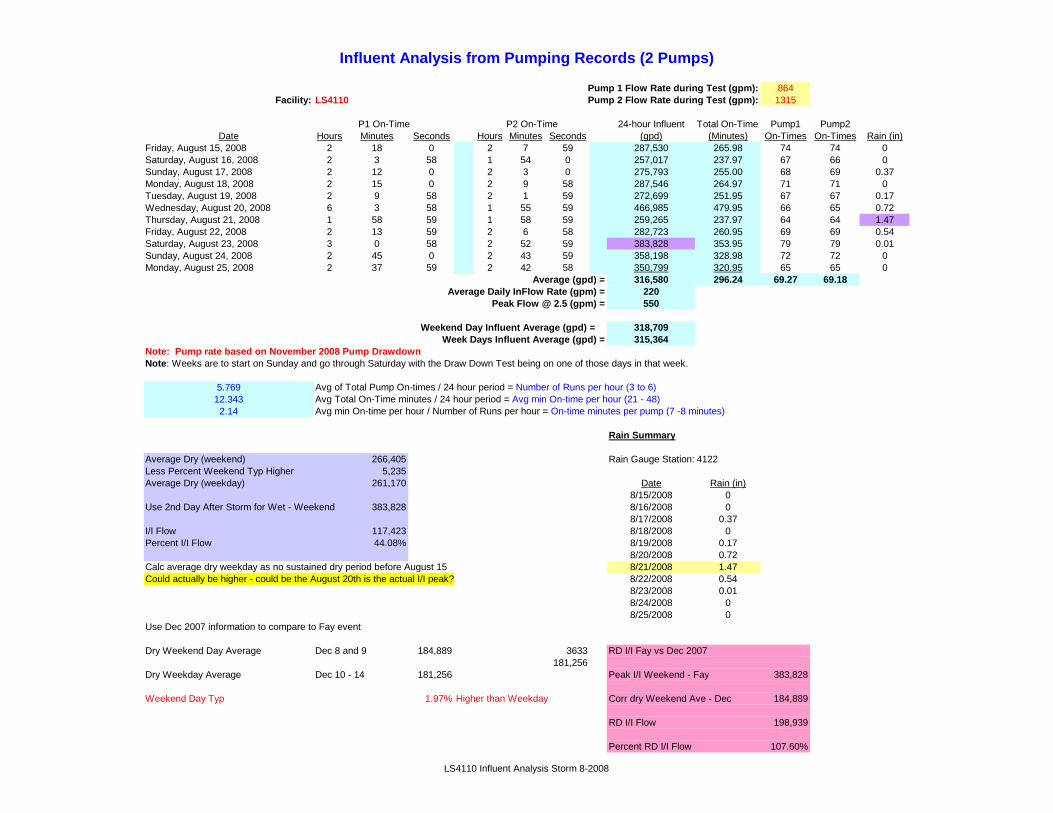
Influent Analysis from Pumping Records (2 Pumps)
Pump 1 Flow Rate 864 during Test (gpm):Facility: LS4110 Pump 2 Flow Rate 1315 during Test (gpm):
P1 On-Time P2 On 24-Time -hour Influent Total On-Time Pump1 Pump2Date Hours Minutes Seconds Hours Minutes Seconds (gpd) (Minutes) On-Times On-Times Rain (in)
Friday, August 15, 2008 2 18 0 2 7 59 287,530 265.98 74 74 0Saturday, August 16, 2008 2 3 58 1 54 0 257,017 237.97 67 66 0Sunday, August 17, 2008 2 12 0 2 3 0 275,793 255.00 68 69 0.37Monday, August 18, 2008 2 15 0 2 9 58 287,546 264.97 71 71 0Tuesday, August 19, 2008 2 9 58 2 1 59 272,699 251.95 67 67 0.17Wednesday, August 20, 2008 6 3 58 1 55 59 466,985 479.95 66 65 0.72Thursday, August 21, 2008 1 58 59 1 58 59 259,265 237.97 64 64 1.47Friday, August 22, 2008 2 13 59 2 6 58 282,723 260.95 69 69 0.54Saturday, August 23, 2008 3 0 58 2 52 59 383,828 353.95 79 79 0.01Sunday, August 24, 2008 2 45 0 2 43 59 358,198 328.98 72 72 0Monday, August 25, 2008 2 37 59 2 42 58 350,799 320.95 65 65 0
Average (gpd) = 316,580 296.24 69.27 69.18Average Daily InFlow 220 Rate (gpm) =
Peak Flow @ 550 2.5 (gpm) =
Weekend Day Influent A 318,709verage (gpd) =Week Days Influent A 315,364verage (gpd) =
Note: Pump rate based on November 2008 Pump DrawdownNote: Weeks are to start on Sunday and go through Saturday with the Draw Down Test being on one of those days in that week.
5.769 Avg of Total Pump On-times / 24 hour period = Number of Runs per hour (3 to 6)12.343 Avg Total On-Time minutes / 24 hour period = Avg min On-time per hour (21 - 48)2.14 Avg min On-time per hour / Number of Runs per hour = On-time minutes per pump (7 -8 minutes)
Rain Summary
Average Dry (weekend) 266,405 Rain Gauge Station: 4122Less Percent Weekend Typ Higher 5,235Average Dry (weekday) 261,170 Date Rain (in)
8/15/2008 0Use 2nd Day After Storm for Wet - Weekend 383,828 8/16/2008 0
8/17/2008 0.37I/I Flow 117,423 8/18/2008 0Percent I/I Flow 44.08% 8/19/2008 0.17
8/20/2008 0.72Calc average dry weekday as no sust y tained dr period before Augus 15 8/21/2008 1.47Could actually be higher - c t t ?ould be the Augus 20th is the ac ual I/I peak 8/22/2008 0.54
8/23/2008 0.018/24/2008 08/25/2008 0
Use Dec 2007 information to compare to Fay event
Dry Weekend Day Average Dec 8 and 9 184,889 3633 RD I/I Fay vs Dec 2007181,256
Dry Weekday Average Dec 10 - 14 181,256 Peak I/I Weekend - Fay 383,828
Weekend Day Typ 1.97% Higher than Weekday Corr dry Weekend Ave - Dec 184,889
RD I/I Flow 198,939
Percent RD I/I Flow 107.60%
LS4110 Influent Analysis Storm 8-2008
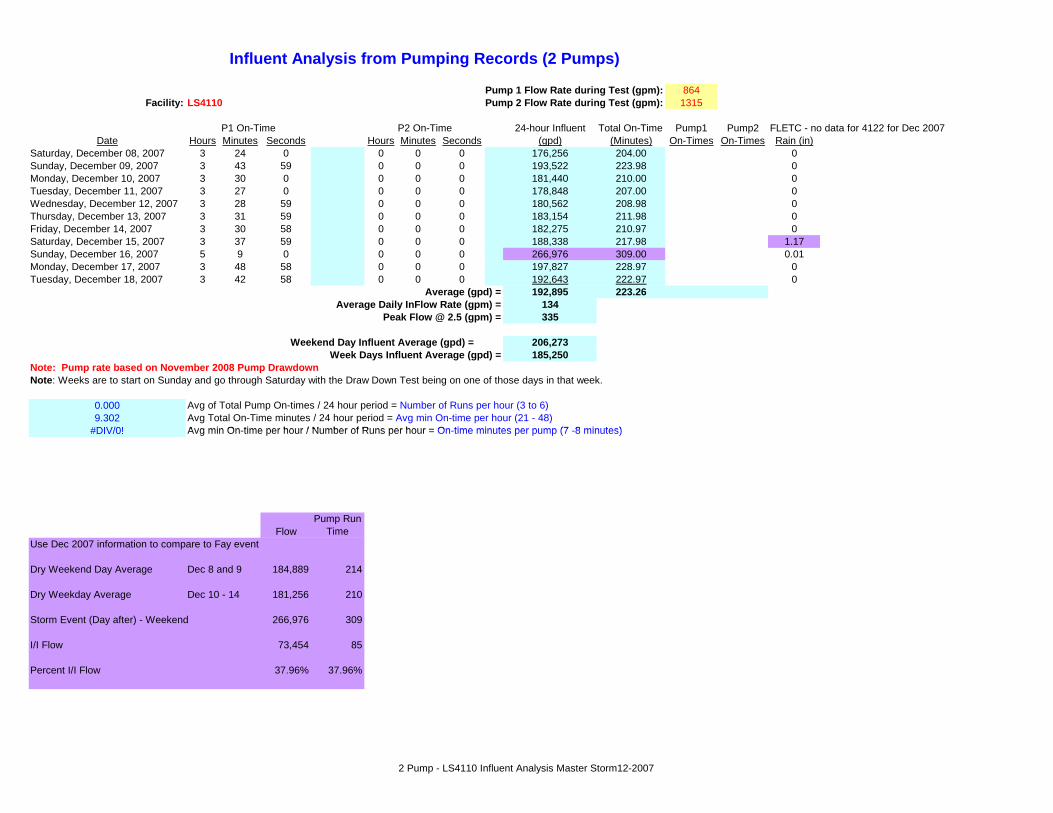
864Facility: LS4110 1315
24-hour Influent Total On-Time Pump1 Pump2 FLETC - no data for 4122 for Dec 2007Date Hours Minutes Seconds Hours Minutes Seconds (gpd) (Minutes) On-Times On-Times Rain (in)
Saturday, December 08, 2007 3 24 0 0 0 0 176,256 204.00 0Sunday, December 09, 2007 3 43 59 0 0 0 193,522 223.98 0Monday, December 10, 2007 3 30 0 0 0 0 181,440 210.00 0Tuesday, December 11, 2007 3 27 0 0 0 0 178,848 207.00 0Wednesday, December 12, 2007 3 28 59 0 0 0 180,562 208.98 0Thursday, December 13, 2007 3 31 59 0 0 0 183,154 211.98 0Friday, December 14, 2007 3 30 58 0 0 0 182,275 210.97 0Saturday, December 15, 2007 3 37 59 0 0 0 188,338 217.98 1.17Sunday, December 16, 2007 5 9 0 0 0 0 266,976 309.00 0.01Monday, December 17, 2007 3 48 58 0 0 0 197,827 228.97 0Tuesday, December 18, 2007 3 42 58 0 0 0 192,643 222.97 0
192,895 223.26134335
206,273185,250
Note: Pump rate based on November 2008 Pump DrawdownNote: Weeks are to start on Sunday and go through Saturday with the Draw Down Test being on one of those days in that week.
0.000 Avg of Total Pump On-times / 24 hour period = Number of Runs per hour (3 to 6)9.302 Avg Total On-Time minutes / 24 hour period = Avg min On-time per hour (21 - 48)
#DIV/0! Avg min On time per hour / Number of Runs per hour = On time minutes per pump (7 8 minutes)
Influent Analysis from Pumping Records (2 Pumps)
Pump 1 Flow Rate during Test (gpm):
Weekend Day Influent Average (gpd) =Week Days Influent Average (gpd) =
Average (gpd) =
Peak Flow @ 2.5 (gpm) =Average Daily InFlow Rate (gpm) =
Pump 2 Flow Rate during Test (gpm):
P1 On-Time P2 On-Time
#DIV/0! Avg min On-time per hour / Number of Runs per hour = On-time minutes per pump (7 -8 minutes)
FlowPump Run
TimeUse Dec 2007 information to compare to Fay event
Dry Weekend Day Average Dec 8 and 9 184,889 214
Dry Weekday Average Dec 10 - 14 181,256 210
Storm Event (Day after) - Weekend 266,976 309
I/I Flow 73,454 85
Percent I/I Flow 37.96% 37.96%
2 Pump - LS4110 Influent Analysis Master Storm12-2007

Minutes Influent Analysis from Pumping Records (2 Pumps)
Pump ate st ): 1 Flow R during Te (gpm 400 No Drawdown Data had to use startup dataFacility: LS 4111 Pump ate st ): 2 Flow R during Te (gpm 400
P1 Run-Time P2 T Run- ime Avg Daily Avg Daily Pump1 Pump2 LS4122Date Minutes Minutes Discharge (gpd) On-Time (Min) Starrts Starts Rain (in)
Friday, August 15, 2008 101 117 87,200 218 42 43 0Saturday, August 16, 2008 118 128 98,400 246 47 46 0Sunday, August 17, 2008 121 137 103,200 258 47 48 0.37Monday, August 18, 2008 109 122 92,400 231 44 44 0Tuesday, August 19, 2008 106 118 89,600 224 43 43 0.17Wednesday, August 20, 2008 109 121 92,000 230 44 43 0.72Thursday, August 21, 2008 109 124 93,200 233 44 45 1.47Friday, August 22, 2008 131 150 112,400 281 52 51 0.54Saturday, August 23, 2008 136 150 114,400 286 51 51 0.01Sunday, August 24, 2008 134 152 114,400 286 51 51 0Monday, August 25, 2008 119 127 98,400 246 46 46 0
Average 99, (gpd) = 600 249.00 46.45 46.45Average a ate ) D ily InFlow R (gpm = 69Peak Flow gpm) @ 2.5 ( = 173
Weekend nfluent Day I Average (gpd) = 103,100W s nfluenteek Day I Average (gpd) = 95,029
Note: Weeks are to start on Sunday and go through Saturday with the Draw Down Test being on one of those days in that week.
3.871 Avg of Total Pump On-times / 24 hour period = Number of Runs per hour (3 to 6)10.375 Avg Total On-Time minutes / 24 hour period = Avg min On-time per hour (21 - 48)2.68 Avg min On-time per hour / Number of Runs per hour = On-time minutes per pump (7 -8 minutes)
Rain Summary
Average Dry (weekend) 100,800 Rain Gauge Station: 4122Plus Percent Weekend Typ Lower 1,727Average Dry (weekday) 102,527 Date Rain (in)
8/15/2008 0Use 2nd Day After Storm for Wet - Weekend 114,400 8/16/2008 0
8/17/2008 0.37I/I Flow 13,600 8/18/2008 0Percent I/I Flow 13.49% 8/19/2008 0.17
8/20/2008 0.72Calc average dry weekday as ust y t no s ained dr period before Augus 15 8/21/2008 1.47
8/22/2008 0.548/23/2008 0.018/24/2008 08/25/2008 0
Use Dec 2007 information to compare to Fay event
Dry Weekend Day Average Dec 8 and 9 87,377 1497 RD I/I Fay vs Dec 200788,873
Dry Weekday Average Dec 10 - 14 88,873 Peak I/I Weekend - Fay 114,400
Weekend Day Typ 1.71% Lower than weekday Corr dry Weekend Ave - Dec 87,377
RD I/I Flow 27,023
Percent RD I/I Flow 30.93%
LS4111 Influent Analysis 8-2008
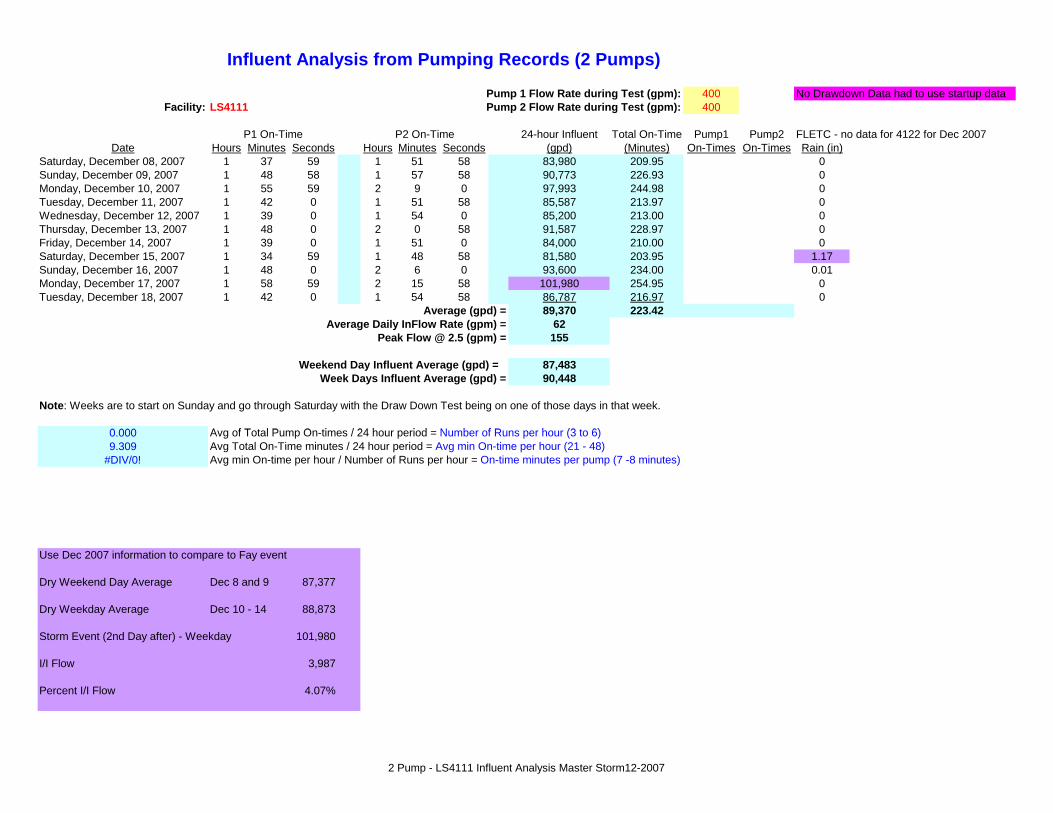
Influent Analysis from Pumping Records (2 Pumps)
Pump 1 Flow Rate during T 400est (gpm): No Drawdown Data had to use startup dataFacility: LS4111 Pump 2 Flow Rate during T 400est (gpm):
P1 On-Time P2 On-Time 24-hour Influent Total On-Time Pump1 Pump2 FLETC - no data for 4122 for Dec 2007Date Hours Minutes Seconds Hours Minutes Seconds (gpd) (Minutes) On-Times On-Times Rain (in)
Saturday, December 08, 2007 1 37 59 1 51 58 83,980 209.95 0Sunday, December 09, 2007 1 48 58 1 57 58 90,773 226.93 0Monday, December 10, 2007 1 55 59 2 9 0 97,993 244.98 0Tuesday, December 11, 2007 1 42 0 1 51 58 85,587 213.97 0Wednesday, December 12, 2007 1 39 0 1 54 0 85,200 213.00 0Thursday, December 13, 2007 1 48 0 2 0 58 91,587 228.97 0Friday, December 14, 2007 1 39 0 1 51 0 84,000 210.00 0Saturday, December 15, 2007 1 34 59 1 48 58 81,580 203.95 1.17Sunday, December 16, 2007 1 48 0 2 6 0 93,600 234.00 0.01Monday, December 17, 2007 1 58 59 2 15 58 101,980 254.95 0Tuesday, December 18, 2007 1 42 0 1 54 58 86,787 216.97 0
Av 89,370erage (gpd) = 223.42Average Daily InFlow 62 Rate (gpm) =
Peak Flow @ 2.5 ( 155gpm) =
Weekend Day Influent Aver 87,483age (gpd) =Week Days Influent Aver 90,448age (gpd) =
Note: Weeks are to start on Sunday and go through Saturday with the Draw Down Test being on one of those days in that week.
0 0000.000 A f T t l P O ti / 24 h i d N b f R h (3 t 6)Avg of Total Pump On-times / 24 hour period = Number of Runs per hour (3 to 6)9.309 Avg Total On-Time minutes / 24 hour period = Avg min On-time per hour (21 - 48)
#DIV/0! Avg min On-time per hour / Number of Runs per hour = On-time minutes per pump (7 -8 minutes)
Use Dec 2007 information to compare to Fay event
Dry Weekend Day Average Dec 8 and 9 87,377
Dry Weekday Average Dec 10 - 14 88,873
Storm Event (2nd Day after) - Weekday 101,980
I/I Flow 3,987
Percent I/I Flow 4.07%
2 Pump - LS4111 Influent Analysis Master Storm12-2007

Influent Analysis from Pumping Records (2 Pumps)
Pump 1 Flow Rate during Test (gpm): 700 No drawdown testing possible due to lack of flow - used design conditionFacility: LS4118 Pump 2 Flow Rate during Test (gpm): 700
P1 On-Time P2 On-Time 24-hour Influent Total On-Time Pump1 Pump2 LS4122Date Hours Minutes Seconds Hours Minutes Seconds (gpd) (Minutes) On-Times On-Times Rain (in)
Friday, August 15, 2008 0 22 59 0 22 59 32,177 45.97 16 16 0Saturday, August 16, 2008 0 15 58 0 15 0 21,677 30.97 11 11 0Sunday, August 17, 2008 0 16 59 0 15 58 23,065 32.95 12 11 0.37Monday, August 18, 2008 0 15 0 0 15 58 21,677 30.97 11 12 0Tuesday, August 19, 2008 0 15 0 0 15 58 21,677 30.97 11 11 0.17Wednesday, August 20, 2008 0 15 0 0 13 59 20,288 28.98 11 10 0.72Thursday, August 21, 2008 0 13 59 0 15 0 20,288 28.98 10 11 1.47Friday, August 22, 2008 0 18 58 0 16 59 25,165 35.95 13 12 0.54Saturday, August 23, 2008 0 51 0 0 49 59 70,688 100.98 31 30 0.01Sunday, August 24, 2008 0 46 59 0 48 0 66,488 94.98 22 23 0Monday, August 25, 2008 0 43 59 0 42 0 60,188 85.98 24 23 0
Average (gpd) = 34,853 49.79 15.64 15.45Average Daily InFlow Rate (gpm) = 24
Peak Flow @ 2.5 (gpm) = 61
Weekend Day Influent Average (gpd) = 45,480Week Days Influent Average (gpd) = 28,780
Note: Pump rate based on design flow rate - could not do drawdown testingNote: Weeks are to start on Sunday and go through Saturday with the Draw Down Test being on one of those days in that week.
1.295 Avg of Total Pump On-times / 24 hour period = Number of Runs per hour (3 to 6)2.075 Avg Total On-Time minutes / 24 hour period = Avg min On-time per hour (21 - 48)1.60 Avg min On-time per hour / Number of Runs per hour = On-time minutes per pump (7 -8 minutes)
Rain SummaryRain Summary
Average Dry (weekend) 22,371 Rain Gauge Station: 4122Less Percent Weekend Typ Higher 121Average Dry (weekday) 22,249 Date Rain (in)
8/15/2008 0Use 2nd Day After Storm for Wet - Weekend 70,688 8/16/2008 0
8/17/2008 0.37I/I Flow 48,318 8/18/2008 0Percent I/I Flow 215.98% 8/19/2008 0.17
8/20/2008 0.72Calc average dry weekday as no sustained dry period before August 15 8/21/2008 1.47
8/22/2008 0.548/23/2008 0.018/24/2008 08/25/2008 0
Use Dec 2007 information to compare to Fay event
Dry Weekend Day Average Dec 8 and 9 22,353 121.333 RD I/I Fay vs Dec 200722,232
Dry Weekday Average Dec 10 - 14 22,232 Peak I/I Weekend - Fay 70,688
Weekend Day Typ 0.54% Higher than Weekday Corr dry Weekend Ave - Dec 22,353
RD I/I Flow 48,335
Percent RD I/I Flow 216.23%
LS4118 Influent Analysis Storm 8-2008
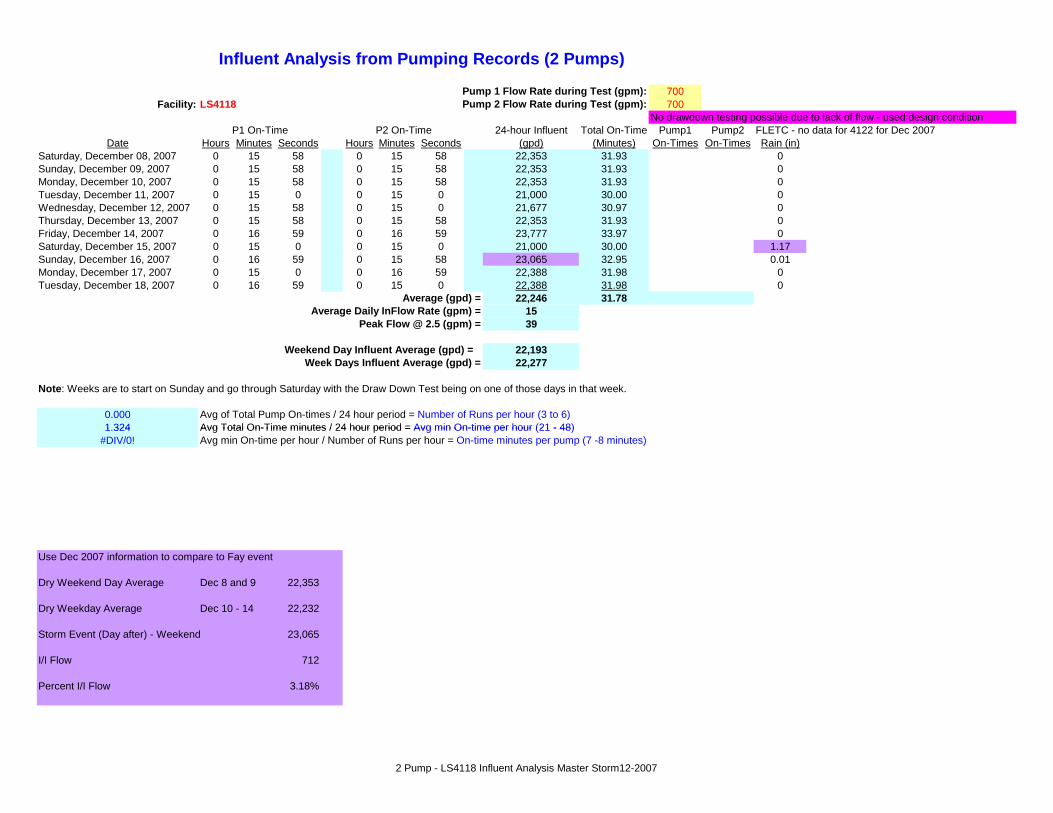
1 - / = -
Influent Analysis from Pumping Records (2 Pumps)
Pump 1 Flow Rate during Test (gpm): 700Facility: LS4118 Pump 2 Flow Rate during Test (gpm): 700
No drawdown testing possible due to lack of flow - used design conditionP1 On-Time P2 On-Time 24-hour Influent Total On-Time Pump1 Pump2 FLETC - no data for 4122 for Dec 2007
Date Hours Minutes Seconds Hours Minutes Seconds (gpd) (Minutes) On-Times On-Times Rain (in)Saturday, December 08, 2007 0 15 58 0 15 58 22,353 31.93 0Sunday, December 09, 2007 0 15 58 0 15 58 22,353 31.93 0Monday, December 10, 2007 0 15 58 0 15 58 22,353 31.93 0Tuesday, December 11, 2007 0 15 0 0 15 0 21,000 30.00 0Wednesday, December 12, 2007 0 15 58 0 15 0 21,677 30.97 0Thursday, December 13, 2007 0 15 58 0 15 58 22,353 31.93 0Friday, December 14, 2007 0 16 59 0 16 59 23,777 33.97 0Saturday, December 15, 2007 0 15 0 0 15 0 21,000 30.00 1.17Sunday, December 16, 2007 0 16 59 0 15 58 23,065 32.95 0.01Monday, December 17, 2007 0 15 0 0 16 59 22,388 31.98 0Tuesday, December 18, 2007 0 16 59 0 15 0 22,388 31.98 0
Average (gpd) = 22,246 31.78Average Daily InFlow Rate (gpm) = 15
Peak Flow @ 2.5 (gpm) = 39
Weekend Day Influent Average (gpd) = 22,193Week Days Influent Average (gpd) = 22,277
Note: Weeks are to start on Sunday and go through Saturday with the Draw Down Test being on one of those days in that week.
0.000 Avg of Total Pump On-times / 24 hour period = Number of Runs per hour (3 to 6)1 324.324 Avg Total On-Time minutes / 24 hour period = Avg min On-time per hour (21 - 48)Avg Total On Time minutes 24 hour period Avg min On time per hour (21 - 48)
#DIV/0! Avg min On-time per hour / Number of Runs per hour = On-time minutes per pump (7 -8 minutes)
Use Dec 2007 information to compare to Fay event
Dry Weekend Day Average Dec 8 and 9 22,353
Dry Weekday Average Dec 10 - 14 22,232
Storm Event (Day after) - Weekend 23,065
I/I Flow 712
Percent I/I Flow 3.18%
2 Pump - LS4118 Influent Analysis Master Storm12-2007

Influent Analysis from Pumping Records (2 Pumps)
Pump 1 Flow Rate 259 during Test (gpm):Facility: LS 4119 Pump 2 Flow Rate 282 during Test (gpm):
P1 On-Time P2 24 On-Time -hour Influent Total On-Time Pump1 Pump2Date Hours Minutes Seconds Hours Minutes Seconds (gpd) (Minutes) On-Times On-Times Rain (in)
Friday, August 15, 2008 1 15 0 1 6 58 38,310 141.97 29 29 0Saturday, August 16, 2008 0 45 0 0 39 58 22,926 84.97 22 21 0Sunday, August 17, 2008 0 43 59 0 40 59 22,949 84.97 22 22 0.37Monday, August 18, 2008 0 45 0 0 43 59 24,058 88.98 25 26 0Tuesday, August 19, 2008 0 45 0 0 40 59 23,212 85.98 24 23 0.17Wednesday, August 20, 2008 0 39 58 0 39 58 21,622 79.93 25 26 0.72Thursday, August 21, 2008 0 39 58 0 37 59 21,063 77.95 27 26 1.47Friday, August 22, 2008 0 46 59 0 48 0 25,705 94.98 25 26 0.54Saturday, August 23, 2008 2 45 0 2 28 59 84,748 313.98 31 32 0.01Sunday, August 24, 2008 2 12 58 2 28 59 76,452 281.95 24 24 0Monday, August 25, 2008 2 6 58 2 0 0 66,724 246.97 24 24 0
Average (gpd) = 38,888 143.88 25.27 25.36Average Daily InFlow 27 Rate (gpm) =
Peak Flow 68 @ 2.5 (gpm) =
Weekend Day Influent A 51,769verage (gpd) =Week Days Influent A 31,528verage (gpd) =
Note: Pump rate based on July 22, 2008 drawdown testingNote: Weeks are to start on Sunday and go through Saturday with the Draw Down Test being on one of those days in that week.
2.110 Avg of Total Pump On-times / 24 hour period = Number of Runs per hour (3 to 6)5.995 Avg Total On-Time minutes / 24 hour period = Avg min On-time per hour (21 - 48)2.84 Avg min On-time per hour / Number of Runs per hour = On-time minutes per pump (7 -8 minutes)
Rain Summary
Average Dry (weekend) 22,937 Rain Gauge Station: 4122Less Percent Weekend Typ Higher 235Calc Average Dry (weekday) 22,702 Date Rain (in)
8/15/2008 0Use 2nd Day After Storm for Wet - Weekend 84,748 8/16/2008 0
8/17/2008 0.37I/I Flow 61,811 8/18/2008 0Percent I/I Flow 269.48% 8/19/2008 0.17
8/20/2008 0.72Calc average dry weekday as no sust y tained dr period before Augus 15 8/21/2008 1.47
8/22/2008 0.548/23/2008 0.018/24/2008 08/25/2008 0
Use Dec 2007 information to compare to Fay event
Dry Weekend Day Average Dec 8 and 9 29,882 306 RD I/I Fay vs Dec 200729,576
Dry Weekday Average Dec 10 - 14 29,576 Peak I/I Weekend - Fay 84,748
Weekend Day Typ 1.03% Higher than Weekday Corr dry Weekend Ave - Dec 29,882
RD I/I Flow 54,866
Percent RD I/I Flow 183.61%
LS4119 Influent Analysis Storm 8-2008

Influent Analysis from Pumping Records (2 Pumps)
Pump 1 Flow Rate during T 259est (gpm):Facility: LS 4119 Pump 2 Flow Rate during T 282est (gpm):
P1 On-Time P2 On-Time 24-hour Influent Total On-Time Pump1 Pump2 FLETC - no data for 4122 for Dec 2007Date Hours Minutes Seconds Hours Minutes Seconds (gpd) (Minutes) On-Times On-Times Rain (in)
Saturday, December 08, 2007 0 54 0 0 54 0 29,214 108.00 0Sunday, December 09, 2007 0 57 0 0 55 59 30,550 112.98 0Monday, December 10, 2007 0 54 58 0 54 58 29,737 109.93 0Tuesday, December 11, 2007 0 54 0 0 51 58 28,641 105.97 0Wednesday, December 12, 2007 0 52 59 0 51 58 28,377 104.95 0Thursday, December 13, 2007 0 55 59 0 55 59 30,287 111.97 0Friday, December 14, 2007 0 57 0 0 57 0 30,837 114.00 0Saturday, December 15, 2007 0 54 0 0 51 0 28,368 105.00 1.17Sunday, December 16, 2007 1 0 0 0 51 0 29,922 111.00 0.01Monday, December 17, 2007 0 54 58 0 58 59 30,870 113.95 0Tuesday, December 18, 2007 0 57 0 0 54 58 30,264 111.97 0
Av 29,733erage (gpd) = 109.97Average Daily InFlow 21 Rate (gpm) =
Peak Flow @ 2.5 ( 52gpm) =
Weekend Day Influent Aver 29,514age (gpd) =Week Days Influent Aver 29,859age (gpd) =
Note: Pump rate based on July 22, 2008 drawdown testingNote: Weeks are to start on Sunday and go through Saturday with the Draw Down Test being on one of those days in that week.
0 0000.000 A f T t l P O ti / 24 h i d N b f R h (3 t 6)Avg of Total Pump On-times / 24 hour period = Number of Runs per hour (3 to 6)4.582 Avg Total On-Time minutes / 24 hour period = Avg min On-time per hour (21 - 48)
#DIV/0! Avg min On-time per hour / Number of Runs per hour = On-time minutes per pump (7 -8 minutes)
Use Dec 2007 information to compare to Fay event
Dry Weekend Day Average Dec 8 and 9 29,882
Dry Weekday Average Dec 10 - 14 29,576
Storm Event 2nd Day after - Weekday 30,870
I/I Flow 1,133
Percent I/I Flow 3.81%
2 Pump - LS4119 Influent Analysis Master Storm12-2007

Minutes Influent Analysis from Pumping Records (2 Pumps)
Pump ate ): 1 Flow R during Test (gpm 82Facility: LS 4120 Pump ate ): 2 Flow R during Test (gpm 82
P1 Run-Time P2 Run-Time Avg Daily Avg Daily Pump1 Pump2Date Minutes Minutes Discharge (gpd) On-Time (Min) Starrts Starts Rain (in)
Friday, August 15, 2008 68 75 11,726 143 16 17 0Saturday, August 16, 2008 90 86 14,432 176 21 20 0Sunday, August 17, 2008 94 101 15,990 195 21 22 0.37Monday, August 18, 2008 82 880 78,884 962 19 18 0Tuesday, August 19, 2008 77 77 12,628 154 18 18 0.17Wednesday, August 20, 2008 77 78 12,710 155 19 19 0.72Thursday, August 21, 2008 75 81 12,792 156 19 19 1.47Friday, August 22, 2008 92 93 15,170 185 22 22 0.54Saturday, August 23, 2008 91 91 14,924 182 23 22 0.01Sunday, August 24, 2008 105 109 17,548 214 26 26 0Monday, August 25, 2008 82 87 13,858 169 21 22 0
Av 20erage (gpd) = ,060 244.64 20.45 20.45Av aily ate )erage D InFlow R (gpm = 14Peak Flow @ 2.5 (gpm) = 35
W ay n veekend D I fluent A erage (gpd) = 15,724W ays n veek D I fluent A erage (gpd) = 22,538
Note: Pump rate based on design condition - could not do drawdownNote: Weeks are to start on Sunday and go through Saturday with the Draw Down Test being on one of those days in that week.
1.705 Avg of Total Pump On-times / 24 hour period = Number of Runs per hour (3 to 6)10.193 Avg Total On-Time minutes / 24 hour period = Avg min On-time per hour (21 - 48)
5.98 Avg min On-time per hour / Number of Runs per hour = On-time minutes per pump (7 -8 minutes)
Rain Summary
Average Dry (weekend) 15,211 Rain Gauge S4122Less Percent Weekend Typ Higher 3,161Calc Average Dry (weekday) 12,050 Date Rain (in)
8/15/2008 0Use Day After Storm for Wet - Weekday 15,170 8/16/2008 0
8/17/2008 0.37I/I Flow 3,120 8/18/2008 0Percent I/I Flow 25.90% 8/19/2008 0.17
8/20/2008 0.72Calc average dry weekday as ust t no s ained dry period before Augus 15 8/21/2008 1.47
8/22/2008 0.548/23/2008 0.018/24/2008 08/25/2008 0
Use Dec 2007 information to compare to Fay event
Dry Weekend Day Average Dec 8 and 9 14,800 3076 RD I/I Fay vs Dec 200711,724
Dry Weekday Average Dec 10 - 14 11,724 Peak I/I Weekday - Fay 15,170
Weekend Day Typ 20.78% Higher than Weekday Corr dry Weekday Ave - D 11,724
RD I/I Flow 3,446
Percent RD I/I Flow 29.39%
LS4120 Influent Analysis 8-2008

Influent Analysis from Pumping Records (2 Pumps)
Pump 1 Flow Rate during T 82est (gpm):Facility: LS4120 Pump 2 Flow Rate during T 82est (gpm):
P1 On-Time P2 On-Time 24-hour Influent Total On-Time Pump1 Pump2 FLETC - no data for 4122 for Dec 2007Date Hours Minutes Seconds Hours Minutes Seconds (gpd) (Minutes) On-Times On-Times Rain (in)
Saturday, December 08, 2007 1 21 0 1 30 58 14,101 171.97 0Sunday, December 09, 2007 1 33 0 1 36 0 15,498 189.00 0Monday, December 10, 2007 1 9 58 1 12 58 11,721 142.93 0Tuesday, December 11, 2007 1 12 0 1 15 0 12,054 147.00 0Wednesday, December 12, 2007 1 12 0 1 12 0 11,808 144.00 0Thursday, December 13, 2007 1 16 59 1 19 59 12,871 156.97 0Friday, December 14, 2007 1 6 58 0 57 0 10,165 123.97 0Saturday, December 15, 2007 1 24 58 1 24 58 13,935 169.93 1.17Sunday, December 16, 2007 1 31 59 1 27 58 14,756 179.95 0.01Monday, December 17, 2007 1 19 59 1 34 59 14,347 174.97 0Tuesday, December 18, 2007 1 18 0 1 21 0 13,038 159.00 0
Av 13,118erage (gpd) = 159.97Average Daily InFlow 9 Rate (gpm) =
Peak Flow @ 2.5 ( 23gpm) =
Weekend Day Influent Aver 14,572age (gpd) =Week Days Influent Aver 12,286age (gpd) =
Note: Pump rate based on design condition - could not do drawdownNote: Weeks are to start on Sunday and go through Saturday with the Draw Down Test being on one of those days in that week.
0 0000.000 A f T t l P O ti / 24 h i d N b f R h (3 t 6)Avg of Total Pump On-times / 24 hour period = Number of Runs per hour (3 to 6)6.665 Avg Total On-Time minutes / 24 hour period = Avg min On-time per hour (21 - 48)
#DIV/0! Avg min On-time per hour / Number of Runs per hour = On-time minutes per pump (7 -8 minutes)
Use Dec 2007 information to compare to Fay event
Dry Weekend Day Average Dec 8 and 9 14,800
Dry Weekday Average Dec 10 - 14 11,724
Storm Event (Day after) - Weekend 14,756
I/I Flow -742
Percent I/I Flow -4.79%
2 Pump - LS4120 Influent Analysis Master Storm12-2007
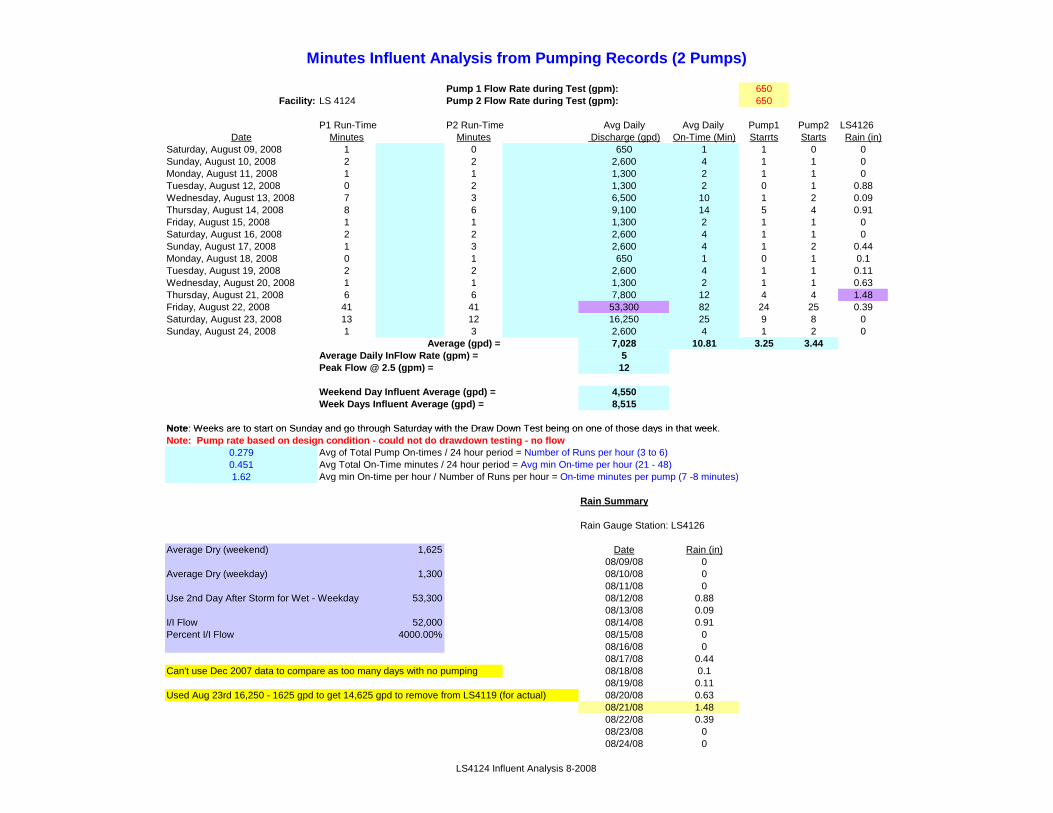
:
Minutes Influent Analysis from Pumping Records (2 Pumps)
Pu i stmp 1 Flow Rate dur ng Te (gpm): 650Facility: LS 4124 Pu i stmp 2 Flow Rate dur ng Te (gpm): 650
P1 Run-Time P2 Run-Time Avg Daily Avg Daily Pump1 Pump2 LS4126Date Minutes Minutes Discharge (gpd) On-Time (Min) Starrts Starts Rain (in)
Saturday, August 09, 2008 1 0 650 1 1 0 0Sunday, August 10, 2008 2 2 2,600 4 1 1 0Monday, August 11, 2008 1 1 1,300 2 1 1 0Tuesday, August 12, 2008 0 2 1,300 2 0 1 0.88Wednesday, August 13, 2008 7 3 6,500 10 1 2 0.09Thursday, August 14, 2008 8 6 9,100 14 5 4 0.91Friday, August 15, 2008 1 1 1,300 2 1 1 0Saturday, August 16, 2008 2 2 2,600 4 1 1 0Sunday, August 17, 2008 1 3 2,600 4 1 2 0.44Monday, August 18, 2008 0 1 650 1 0 1 0.1Tuesday, August 19, 2008 2 2 2,600 4 1 1 0.11Wednesday, August 20, 2008 1 1 1,300 2 1 1 0.63Thursday, August 21, 2008 6 6 7,800 12 4 4 1.48Friday, August 22, 2008 41 41 53,300 82 24 25 0.39Saturday, August 23, 2008 13 12 16,250 25 9 8 0Sunday, August 24, 2008 1 3 2,600 4 1 2 0
Average 7, (gpd) = 028 10.81 3.25 3.44Average ily Da InFlow Rate (gpm) = 5Peak Flow gpm) @ 2.5 ( = 12
W veekend Day Influent A erage (gpd) = 4,550W s veek Day Influent A erage (gpd) = 8,515
Note: Weeks are to start on Sunday and go through Saturday with the Draw Down Test being on one of those days in that weekNote Weeks are to start on Sunday and go through Saturday with the Draw Down Test being on one of those days in that week.Note: Pump rate based on design condition - could not do drawdown testing - no flow
0.279 Avg of Total Pump On-times / 24 hour period = Number of Runs per hour (3 to 6)0.451 Avg Total On-Time minutes / 24 hour period = Avg min On-time per hour (21 - 48)1.62 Avg min On-time per hour / Number of Runs per hour = On-time minutes per pump (7 -8 minutes)
Rain Summary
Rain Gauge Station: LS4126
Average Dry (weekend) 1,625 Date Rain (in)08/09/08 0
Average Dry (weekday) 1,300 08/10/08 008/11/08 0
Use 2nd Day After Storm for Wet - Weekday 53,300 08/12/08 0.8808/13/08 0.09
I/I Flow 52,000 08/14/08 0.91Percent I/I Flow 4000.00% 08/15/08 0
08/16/08 008/17/08 0.44
Can't use Dec 2007 data to co s impare as too many day w th no pumping 08/18/08 0.108/19/08 0.11
Used Aug 23rd 16,250 - e e f 1625 gpd to get 14,625 gpd to r mov from LS4119 ( or actual) 08/20/08 0.6308/21/08 1.4808/22/08 0.3908/23/08 008/24/08 0
LS4124 Influent Analysis 8-2008

Influent Analysis from Pumping Records (2 Pumps)
Pump 1 Flow Rate during T 650est (gpm):Facility: LS4124 Pump 2 Flow Rate during T 650est (gpm):
P1 On-Time P2 On-Time 24-hour Influent Total On-Time Pump1 Pump2 Waterlab - No LS4126 data for Dec 2007Date Hours Minutes Seconds Hours Minutes Seconds (gpd) (Minutes) On-Times On-Times Rain (in)
Saturday, December 08, 2007 0 0 0 0 0 0 0 0.00 0Sunday, December 09, 2007 0 0 0 0 0 0 0 0.00 0Monday, December 10, 2007 0 0 0 0 0 0 0 0.00 0Tuesday, December 11, 2007 0 0 0 0 0 0 0 0.00 0Wednesday, December 12, 2007 0 0 0 0 0 0 0 0.00 0Thursday, December 13, 2007 0 0 0 0 0 0 0 0.00 0.01Friday, December 14, 2007 0 1 59 0 0 0 1,289 1.98 0Saturday, December 15, 2007 0 0 0 0 0 0 0 0.00 1.22Sunday, December 16, 2007 0 0 0 0 0 0 0 0.00 0.01Monday, December 17, 2007 0 0 0 0 1 59 1,289 1.98 0Tuesday, December 18, 2007 0 0 58 0 0 0 628 0.97 0
Av 292erage (gpd) = 0.45Average Daily InFlow 0 Rate (gpm) =
Peak Flow @ 2.5 ( 1gpm) =
Weekend Day Influent Aver 0age (gpd) =Week Days Influent Aver 458age (gpd) =
Note: Pump rate based on design condition - could not do drawdown testing - no flowNote: Weeks are to start on Sunday and go through Saturday with the Draw Down Test being on one of those days in that week.
0 0000.000 A f T t l P O ti / 24 h i d N b f R h (3 t 6)Avg of Total Pump On-times / 24 hour period = Number of Runs per hour (3 to 6)0.019 Avg Total On-Time minutes / 24 hour period = Avg min On-time per hour (21 - 48)
#DIV/0! Avg min On-time per hour / Number of Runs per hour = On-time minutes per pump (7 -8 minutes)
Use Dec 2007 information to compare to Fay event
Typical Dry Weekly Flow Dec 8 - 14 1,289
Flow from Rain Event On Dec 15-18 1,918
I/I Flow 628
Percent I/I Flow 48.74%
Compared a dry week to a wet week for this data
2 Pump - LS4124 Influent Analysis Master Storm12-2007

Tim P2 On-
uge Station: LS4126
Influent Analysis from Pumping Records (3 Pumps)
Pump 1 Flow 667 Rate during Test (gpm):Facility: LS 4126 Pump 2 Flow 667 Rate during Test (gpm):
Pump 3 Flow 667 Rate during Test (gpm):
P1 On- e Time P3 On-Time 24-hour Influent Total On-Time Pump1 Pump2 Pump3 LS4126Date Hours Minutes Seconds Hours Minutes Seconds Hours Minutes Seconds (gpd) (Minutes) On-Times On-Times On-Times Rain (in)
Friday, August 15, 2008 0 7 59 0 3 58 0 3 58 10,616 15.92 2 1 1 0Saturday, August 16, 2008 0 0 0 0 3 0 0 3 58 4,647 6.97 0 1 1 0Sunday, August 17, 2008 0 3 58 0 0 0 0 0 0 2,646 3.97 1 0 0 0.44Monday, August 18, 2008 0 0 0 0 3 58 0 0 0 2,646 3.97 0 1 0 0.1Tuesday, August 19, 2008 0 3 58 0 0 0 0 3 0 4,647 6.97 1 0 1 0.11Wednesday, August 20, 2008 0 0 0 0 3 58 0 3 58 5,292 7.93 0 1 1 0.63Thursday, August 21, 2008 0 3 58 0 3 58 0 3 58 7,937 11.90 1 1 1 1.48Friday, August 22, 2008 0 6 58 0 6 58 0 3 0 11,295 16.93 2 2 1 0.39Saturday, August 23, 2008 0 16 59 0 12 0 0 7 59 24,657 36.97 4 3 2 0Sunday, August 24, 2008 0 4 59 0 28 59 0 9 0 28,659 42.97 1 2 2 0
0 0.00Average (gpd) = 10,304 15 1.20 1.20 1.00
Average Daily InFlow Rate (gpm) = 7 * Averages are from Fri Aug 15 to Sat Aug 24 (LCS)Peak 18 Flow @ 2.5 (gpm) =
Weekend Day Infl 15,152uent Average (gpd) =Week Days Infl 7,072uent Average (gpd) =
Note: Pump rate based on design conditions - could not do drawdown
0.142 Avg of Total Pump On-times / 24 hour period = Number of Runs per hour (3 to 6)0.644 Avg Total On-Time minutes / 24 hour period = Avg min On-time per hour (21 - 48) Rain Summary4.54 Avg min On-time per hour / Number of Runs per hour = On-time minutes per pump (7 -8 minutes)
Rain Ga
Average Dry (weekend) 3,646 Date Rain (in)08/15/08 0
Average Dry (weekday) 3,646 08/16/08 008/17/08 0.44
Use 2nd Day After Storm for Wet - Weekend 24,657 08/18/08 0.108/19/08 0.11
I/I Flow 21,011 08/20/08 0.63Percent I/I Flow 576.22% 08/21/08 1.48
08/22/08 0.3908/23/08 0
Can't use Dec 2007 data to com s ipare as too many day w th no pumping 08/24/08 0
LS4126 Influent Analysis Storm 8-2008

Tim 2 On-T
0 T i t /
Influent Analysis from Pumping Records (3 Pumps)
Pump 1 Flow 667 Rate during Test (gpm):Facility: LS4126 Pump 2 Flow 667 Rate during Test (gpm):
Pump 3 Flow 667 Rate during Test (gpm):
P1 On- e P ime P3 On-Time 24-hour Influent Total On-Time Pump1 Pump2 Pump3 WaterlabDate Hours Minutes Seconds Hours nMi utes Seconds Hours Minutes Seconds (gpd) (Minutes) On-Times On-Times On-Times Rain (in)
Saturday, December 08, 2007 0 0 0 0 0 0 0 0 0 0 0.00 0Sunday, December 09, 2007 0 0 0 0 0 0 0 0 0 0 0.00 0Monday, December 10, 2007 0 1 59 0 0 58 0 1 59 43,291 .93 0Tuesday, December 11, 2007 0 0 58 0 0 0 0 0 58 1,290 1.93 0Wednesday, December 12, 2007 0 0 58 0 0 58 0 0 58 21,934 .90 0Thursday, December 13, 2007 0 0 0 0 0 58 0 0 0 645 0.97 0.01Friday, December 14, 2007 0 0 58 0 0 0 0 1 59 1,968 2.95 0Saturday, December 15, 2007 0 0 0 0 1 59 0 0 0 11,323 .98 1.22Sunday, December 16, 2007 0 0 0 0 0 0 0 0 0 0 0.00 0.01Monday, December 17, 2007 0 1 59 0 0 58 0 0 58 32,612 .92 0Tuesday, December 18, 2007 0 0 0 0 0 0 0 0 0 0 0.00 0
Average (gpd) = 1,187 1.78Average Daily 1 InFlow Rate (gpm) =
Peak 2 Flow @ 2.5 (gpm) =
Weekend Day Infl 331uent Average (gpd) =Week Days Infl 1,677uent Average (gpd) =
Note: Pump rate based on design conditions - could not do drawdownNote: Weeks are to start on Sunday and go through Saturday with the Draw Down Test being on one of those days in that week.
0.000 Avg of Total Pump On-times / 24 hour period = Number of Runs per hour (3 to 6)0 074.074 Avg Total On Time minutes / 24 hour period = Avg min On time per hour (21 48)Avg otal On-Time m nu es 24 hour period = Avg min On-time per hour (21 - 48)
#DIV/0! Avg min On-time per hour / Number of Runs per hour = On-time minutes per pump (7 -8 minutes)
Use Dec 2007 information to compare to Fay event
Typical Sat to Mon Flow (Dry) Dec 8 to 10 3,291
Sat to Mon Flow (Wet) Dec 15 to 17) 3,935
I/I Flow 645
Percent I/I Flow 19.59%
Compared wet Sat to Mon with dry Sat to Mon
3 Pump - LS 4126Influent Analysis Master Storm12-2007

ime P2 On-
ge Station: WaterLab
Influent Analysis from Pumping Records (3 Pumps)
Pump 1 Flow 1340 Rate during Test (gpm):Facility: LS 4127 Pump 2 Flow 1340 Rate during Test (gpm):
Pump 3 Flow 1340 Rate during Test (gpm):
P1 On-T Time P3 On-Time 24-hour Influent Total On-Time Pump1 Pump2 Pump3Date Hours Minutes Seconds Hours Minutes Seconds H sour Minutes Seconds (gpd) (Minutes) On-Times On-Times On-Times Rain (in)
Friday, August 15, 2008 0 3 0 0 3 0 0 3 0 12,060 9.00 5 6 5 0Saturday, August 16, 2008 0 1 59 0 1 59 0 1 59 7,973 5.95 6 6 6 0Sunday, August 17, 2008 0 0 58 0 0 58 0 0 58 3,886 2.90 5 5 6 0.45Monday, August 18, 2008 0 1 59 0 0 0 0 0 0 2,658 1.98 3 2 2 0.03Tuesday, August 19, 2008 0 0 58 0 1 59 0 1 59 6,611 4.93 3 3 3 0.03Wednesday, August 20, 2008 0 1 59 0 1 59 0 0 58 6,611 4.93 5 6 6 0.42Thursday, August 21, 2008 0 3 0 0 3 0 0 3 0 12,060 9.00 11 11 10 1.69Friday, August 22, 2008 0 3 58 0 4 59 0 1 59 14,651 10.93 2 2 1 0.19Saturday, August 23, 2008 0 6 58 0 6 0 0 9 0 29,435 21.97 3 3 4 0Sunday, August 24, 2008 0 6 0 0 4 59 0 3 58 20,033 14.95 3 2 2 0.03
0 0.00Average (gpd) = 11,598 9 4.60 4.60 4.50
Average Daily InFlow Rate (gpm) = 8 *Averages based on Fri Aug 15 - Sat Aug 23 (LCS)Peak 20 Flow @ 2.5 (gpm) =
Weekend Day Infl 15,332uent Average (gpd) =Week Days Infl 9,108uent Average (gpd) =
Note: Pump rate based on design condition - could not do drawdownNote: Weeks are to start on Sunday and go through Saturday with the Draw Down Test being on one of those days in that week.
0.571 Avg of Total Pump On-times / 24 hour period = Number of Runs per hour (3 to 6)0.361 Avg Total On-Time minutes / 24 hour period = Avg min On-time per hour (21 - 48) Rain Summary0.63 Avg min On-time per hour / Number of Runs per hour = On-time minutes per pump (7 -8 minutes)
Rain Gua
Dry August 16 weekend 7,973 Date Rain (in)8/15/2008 0
Wet August 23 weekend 29,435 8/16/2008 08/17/2008 0.45
Use 2nd Day After Storm for Wet - Weekend 29,435 8/18/2008 0.038/19/2008 0.03
I/I Flow 21,462 8/20/2008 0.42Percent I/I Flow 269.19% 8/21/2008 1.69
8/22/2008 0.198/23/2008 0
Can't compare to Dec s i ero 2007 data - too many day w th z pumping 8/24/2008 0.03
LS4127 Influent Analysis Storm 8-2008

Tim 2 On-T
0 T i t /
Influent Analysis from Pumping Records (3 Pumps)
Pump 1 Flow 1340 Rate during Test (gpm):Facility: LS4127 Pump 2 Flow 1340 Rate during Test (gpm):
Pump 3 Flow 1340 Rate during Test (gpm):
P1 On- e P ime P3 On-Time 24-hour Influent Total On-Time Pump1 Pump2 Pump3 WaterlabDate Hours Minutes Seconds Hours nMi utes Seconds Hours Minutes Seconds (gpd) (Minutes) On-Times On-Times On-Times Rain (in)
Saturday, December 08, 2007 0 0 0 0 0 0 0 0 0 0 0.00 0Sunday, December 09, 2007 0 0 0 0 0 0 0 0 0 0 0.00 0Monday, December 10, 2007 0 3 0 0 3 0 0 0 0 8,040 6.00 0Tuesday, December 11, 2007 0 3 0 0 0 0 0 3 0 8,040 6.00 0Wednesday, December 12, 2007 0 0 0 0 1 59 0 1 59 5,315 3.97 0Thursday, December 13, 2007 0 3 0 0 0 0 0 0 0 4,020 3.00 0.01Friday, December 14, 2007 0 0 0 0 3 0 0 3 0 8,040 6.00 0Saturday, December 15, 2007 0 0 0 0 0 0 0 0 0 0 0.00 1.22Sunday, December 16, 2007 0 0 0 0 0 0 0 0 0 0 0.00 0.01Monday, December 17, 2007 0 1 59 0 3 58 0 3 58 13,288 9.92 0Tuesday, December 18, 2007 0 0 0 0 0 0 0 0 0 0 0.00 0
Average (gpd) = 4,249 3.17Average Daily 3 InFlow Rate (gpm) =
Peak 7 Flow @ 2.5 (gpm) =
Weekend Day Infl 0uent Average (gpd) =Week Days Infl 6,678uent Average (gpd) =
Note: Pump rate based on design condition - could not do drawdownNote: Weeks are to start on Sunday and go through Saturday with the Draw Down Test being on one of those days in that week.
0.000 Avg of Total Pump On-times / 24 hour period = Number of Runs per hour (3 to 6)0 132.132 Avg Total On Time minutes / 24 hour period = Avg min On time per hour (21 48)Avg otal On-Time m nu es 24 hour period = Avg min On-time per hour (21 - 48)
#DIV/0! Avg min On-time per hour / Number of Runs per hour = On-time minutes per pump (7 -8 minutes)
Use Dec 2007 information to compare to Fay event
Dry Weekend Day Average Dec 8 and 9 0
Dry Weekday Average Dec 10 - 14 6,691
Storm Event (2nd Day after) - Weekday 13,288
I/I Flow 5,248
Percent I/I Flow 65.28%
3 Pump - LS4127 Influent Analysis Master Storm12-2007
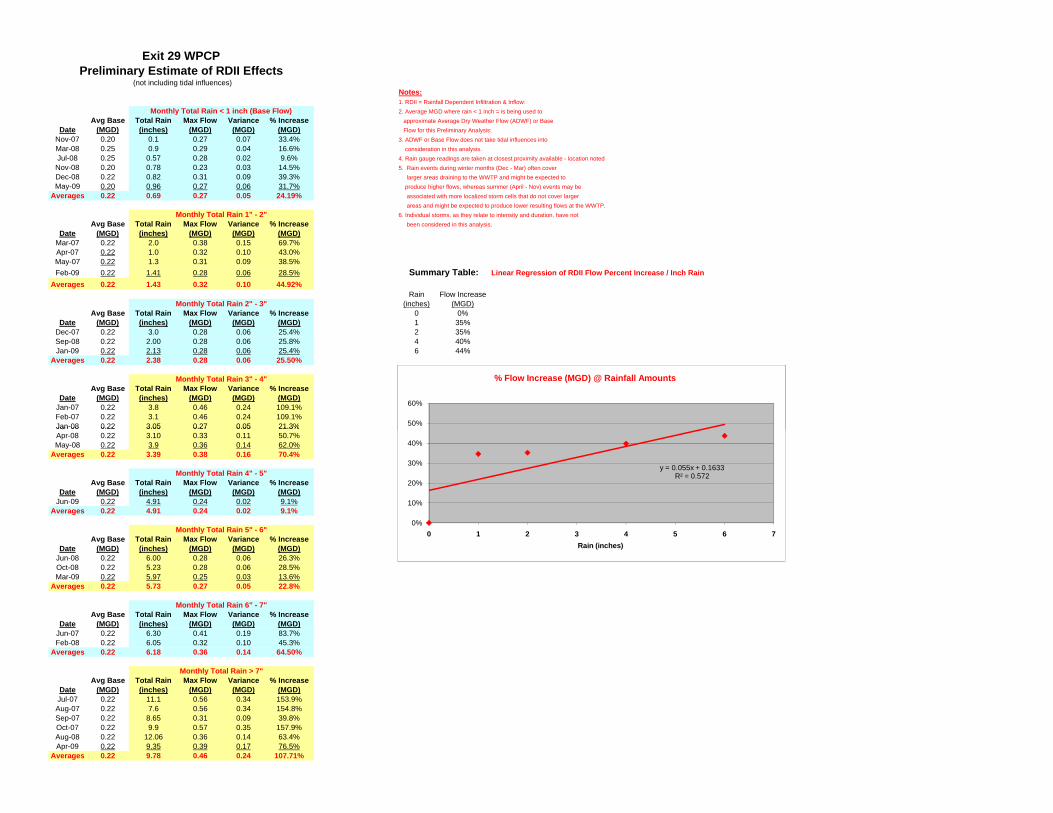
% Flow Increase (MGD) @ Rainfall Amounts
Jan 08 22 05 27 05 21
Exit 29 WPCPPreliminary Estimate of RDII Effects
(not including tidal influences)Notes:1. RDII = Rainfall Dependent Infiltration & Inflow:
Monthly Total Rain < 1 inch (Base Flow) 2. Average MGD where rain < 1 inch = is being used to Avg Base Total Rain Max Flow Variance % Increase approximate Average Dry Weather Flow (ADWF) or Base
Date (MGD) (inches) (MGD) (MGD) (MGD) Flow for this Preliminary Analysis:Nov-07 0.20 0.1 0.27 0.07 33.4% 3. ADWF or Base Flow does not take tidal influences intoMar-08 0.25 0.9 0.29 0.04 16.6% consideration in this analysis.Jul-08 0.25 0.57 0.28 0.02 9.6% 4. Rain gauge readings are taken at closest proximity available - location notedNov-08 0.20 0.78 0.23 0.03 14.5% 5. Rain events during winter months (Dec - Mar) often coverDec-08 0.22 0.82 0.31 0.09 39.3% larger areas draining to the WWTP and might be expected to May-09 0.20 0.96 0.27 0.06 31.7% produce higher flows, whereas summer (April - Nov) events may be
Averages 0.22 0.69 0.27 0.05 24.19% associated with more localized storm cells that do not cover larger areas and might be expected to produce lower resulting flows at the WWTP.
Monthly Total Rain 1" - 2" 6. Individual storms, as they relate to intensity and duration, have notAvg Base Total Rain Max Flow Variance % Increase been considered in this analysis.
Date (MGD) (inches) (MGD) (MGD) (MGD)Mar-07 0.22 2.0 0.38 0.15 69.7%Apr-07 0.22 1.0 0.32 0.10 43.0%May-07 0.22 1.3 0.31 0.09 38.5%Feb-09 0.22 1.41 0.28 0.06 28.5% Summary Table: Linear Regression of RDII Flow Percent Increase / Inch Rain
Averages 0.22 1.43 0.32 0.10 44.92%Rain Flow Increase
Monthly Total Rain 2" - 3" (inches) (MGD)Avg Base Total Rain Max Flow Variance % Increase 0 0%
Date (MGD) (inches) (MGD) (MGD) (MGD) 1 35%Dec-07 0.22 3.0 0.28 0.06 25.4% 2 35%Sep-08 0.22 2.00 0.28 0.06 25.8% 4 40%Jan-09 0.22 2.13 0.28 0.06 25.4% 6 44%
Averages 0.22 2.38 0.28 0.06 25.50%
Monthly Total Rain 3" - 4"Avg Base Total Rain Max Flow Variance % Increase
Date (MGD) (inches) (MGD) (MGD) (MGD)Jan-07 0.22 3.8 0.46 0.24 109.1% 60%
Feb-07 0.22 3.1 0.46 0.24 109.1%Jan-08 0.220. 3.053. 0.270. 0.050. 21.3% 50%.3%Apr-08 0.22 3.10 0.33 0.11 50.7%May-08 0.22 3.9 0.36 0.14 62.0%
Averages 0.22 3.39 0.38 0.16 70.4%
Monthly Total Rain 4" - 5"Avg Base Total Rain Max Flow Variance % Increase
Date (MGD) (inches) (MGD) (MGD) (MGD)Jun-09 0.22 4.91 0.24 0.02 9.1%
Averages 0.22 4.91 0.24 0.02 9.1%
Monthly Total Rain 5" - 6"Avg Base Total Rain Max Flow Variance % Increase
Date (MGD) (inches) (MGD) (MGD) (MGD)Jun-08 0.22 6.00 0.28 0.06 26.3%Oct-08 0.22 5.23 0.28 0.06 28.5%Mar-09 0.22 5.97 0.25 0.03 13.6%
Averages 0.22 5.73 0.27 0.05 22.8%
Monthly Total Rain 6" - 7"Avg Base Total Rain Max Flow Variance % Increase
Date (MGD) (inches) (MGD) (MGD) (MGD)Jun-07 0.22 6.30 0.41 0.19 83.7%Feb-08 0.22 6.05 0.32 0.10 45.3%
Averages 0.22 6.18 0.36 0.14 64.50%
Monthly Total Rain > 7"Avg Base Total Rain Max Flow Variance % Increase
Date (MGD) (inches) (MGD) (MGD) (MGD)Jul-07 0.22 11.1 0.56 0.34 153.9%Aug-07 0.22 7.6 0.56 0.34 154.8%Sep-07 0.22 8.65 0.31 0.09 39.8%Oct-07 0.22 9.9 0.57 0.35 157.9%Aug-08 0.22 12.06 0.36 0.14 63.4%Apr-09 0.22 9.35 0.39 0.17 76.5%
Averages 0.22 9.78 0.46 0.24 107.71%
y = 0.055x + 0.1633R² = 0.572
0%
10%
20%
30%
40%
50%
60%
0 1 2 3 4 5 6 7Rain (inches)
% Flow Increase (MGD) @ Rainfall Amounts
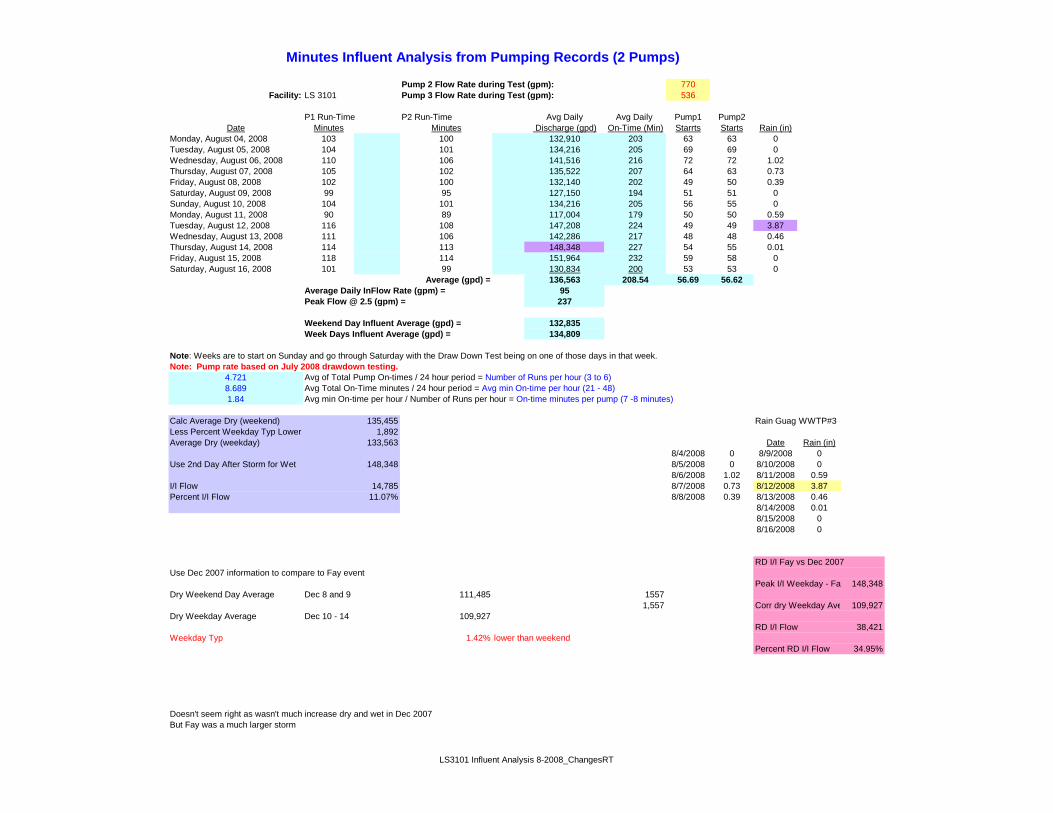
Pump 2 Flow Rate during Test (gpm): 770Facility: LS 3101 Pump 3 Flow Rate during Test (gpm): 536
P1 Run-Time P2 Run-Time Avg Daily Avg Daily Pump1 Pump2Date Minutes Minutes Discharge (gpd) On-Time (Min) Starrts Starts Rain (in)
Monday, August 04, 2008 103 100 132,910 203 63 63 0Tuesday, August 05, 2008 104 101 134,216 205 69 69 0Wednesday, August 06, 2008 110 106 141,516 216 72 72 1.02Thursday, August 07, 2008 105 102 135,522 207 64 63 0.73Friday, August 08, 2008 102 100 132,140 202 49 50 0.39Saturday, August 09, 2008 99 95 127,150 194 51 51 0Sunday, August 10, 2008 104 101 134,216 205 56 55 0Monday, August 11, 2008 90 89 117,004 179 50 50 0.59Tuesday, August 12, 2008 116 108 147,208 224 49 49 3.87Wednesday, August 13, 2008 111 106 142,286 217 48 48 0.46Thursday, August 14, 2008 114 113 148,348 227 54 55 0.01Friday, August 15, 2008 118 114 151,964 232 59 58 0Saturday, August 16, 2008 101 99 130,834 200 53 53 0
136,563 208.54 56.69 56.62Average Daily InFlow Rate (gpm) = 95Peak Flow @ 2.5 (gpm) = 237
Weekend Day Influent Average (gpd) = 132,835Week Days Influent Average (gpd) = 134,809
Note: Weeks are to start on Sunday and go through Saturday with the Draw Down Test being on one of those days in that week.Note: Pump rate based on July 2008 drawdown testing.
4.721 Avg of Total Pump On-times / 24 hour period = Number of Runs per hour (3 to 6)8.689 Avg Total On-Time minutes / 24 hour period = Avg min On-time per hour (21 - 48)1.84 Avg min On-time per hour / Number of Runs per hour = On-time minutes per pump (7 -8 minutes)
Calc Average Dry (weekend) 135,455 Rain GuageL P t W kd T L 1 892
Average (gpd) =
Minutes Influent Analysis from Pumping Records (2 Pumps)
WWTP#3Less Percent Weekday Typ Lower 1,892Average Dry (weekday) 133,563 Date Rain (in)
8/4/2008 0 8/9/2008 0Use 2nd Day After Storm for Wet 148,348 8/5/2008 0 8/10/2008 0
8/6/2008 1.02 8/11/2008 0.59I/I Flow 14,785 8/7/2008 0.73 8/12/2008 3.87Percent I/I Flow 11.07% 8/8/2008 0.39 8/13/2008 0.46
8/14/2008 0.018/15/2008 08/16/2008 0
RD I/I Fay vs Dec 2007Use Dec 2007 information to compare to Fay event
Peak I/I Weekday - Fa 148,348Dry Weekend Day Average Dec 8 and 9 111,485 1557
1,557 Corr dry Weekday Ave 109,927Dry Weekday Average Dec 10 - 14 109,927
RD I/I Flow 38,421Weekday Typ 1.42% lower than weekend
Percent RD I/I Flow 34.95%
Doesn't seem right as wasn't much increase dry and wet in Dec 2007But Fay was a much larger storm
LS3101 Influent Analysis 8-2008_ChangesRT

770Facility: LS3101 536
24-hour Influent Total On-Time Pump1 Pump2 ST #3Date Hours Minutes Seconds Hours Minutes Seconds (gpd) (Minutes) On-Times On-Times Rain (in)
Saturday, December 08, 2007 1 24 58 1 24 0 110,448 168.97 0.01Sunday, December 09, 2007 1 58 59 0 39 0 112,521 157.98 0Monday, December 10, 2007 1 22 59 1 21 0 107,313 163.98 0Tuesday, December 11, 2007 1 18 0 1 22 59 104,539 160.98 0.02Wednesday, December 12, 2007 1 25 59 1 22 59 110,686 168.97 0.01Thursday, December 13, 2007 1 30 58 1 25 59 116,131 176.95 0.01Friday, December 14, 2007 1 24 58 1 24 58 110,966 169.93 0Saturday, December 15, 2007 1 12 0 1 21 0 98,856 153.00 0.94Sunday, December 16, 2007 1 9 58 1 9 0 90,858 138.97 0.01Monday, December 17, 2007 1 13 59 1 13 59 96,622 147.97 0Tuesday, December 18, 2007 1 21 58 1 18 58 105,440 160.93 0
105,853 160.7874184
103,171107,386
Note: Weeks are to start on Sunday and go through Saturday with the Draw Down Test being on one of those days in that week.
0 000 A f T t l P O ti / 24 h i d N b f R h (3 t 6)
Pump 2 Flow Rate during Test (gpm):
P1 On-Time P2 On-Time
Influent Analysis from Pumping Records (2 Pumps)
Pump 1 Flow Rate during Test (gpm):
Weekend Day Influent Average (gpd) =Week Days Influent Average (gpd) =
Average (gpd) =
Peak Flow @ 2.5 (gpm) =Average Daily InFlow Rate (gpm) =
0.000 Avg of Total Pump On-times / 24 hour period = Number of Runs per hour (3 to 6)6.699 Avg Total On-Time minutes / 24 hour period = Avg min On-time per hour (21 - 48)
#DIV/0! Avg min On-time per hour / Number of Runs per hour = On-time minutes per pump (7 -8 minutes)
Use Dec 2007 information to compare to Fay event
Dry Weekend Day Average Dec 8 and 9 111,485
Dry Weekday Average Dec 10 - 14 109,927
Storm Event (Day of) - Weekend 98,856
I/I Flow -11,592
Percent I/I Flow -10.50% Used same day of the week during dry period to calculate I/I
2 Pump - LS3101 Influent Analysis Master Storm12-2007

/
P#3
Minutes Influent Analysis from Pumping Records (2 Pumps)
Pump ate ): 1 Flow R during Test (gpm 361Facility: LS 3103 Pump ate ): 2 Flow R during Test (gpm 260
P1 Run-Time P2 Run-Time Avg Daily Avg Daily Pump1 Pump2Date Minutes Minutes Discharge (gpd) On-Time (Min) Starts Starts Rain (in)
Monday, August 04, 2008 184 192 116,344 376 51 50 0Tuesday, August 05, 2008 199 206 125,399 405 54 55 0Wednesday, August 06, 2008 198 191 121,138 389 54 54 1.02Thursday, August 07, 2008 216 221 135,436 437 60 59 0.73Friday, August 08, 2008 196 202 123,276 398 50 51 0.39Saturday, August 09, 2008 178 191 113,918 369 47 46 0Sunday, August 10, 2008 182 188 114,582 370 47 47 0Monday, August 11, 2008 189 187 116,849 376 48 46 0.59Tuesday, August 12, 2008 253 229 150,873 482 44 45 3.87Wednesday, August 13, 2008 218 174 123,938 392 48 48 0.46Thursday, August 14, 2008 196 189 119,896 385 52 53 0.01Friday, August 15, 2008 216 235 139,076 451 57 56 0Saturday, August 16, 2008 224 204 133,904 428 54 54 0
Av 12erage (gpd) = 5,741 404.46 51.23 51.08Av aily ate )erage D InFlow R (gpm = 87Peak Flow @ 2.5 (gpm) = 218
W ay n veekend D I fluent A erage (gpd) = 127,366W ays n veek D I fluent A erage (gpd) = 123,742
Note: Weeks are to start on Sunday and go through Saturday with the Draw Down Test being on one of those days in that week.Note: Pump rate based on July 2008 drawdown testing.
4.263 Avg of Total Pump On-times / 24 hour period = Number of Runs per hour (3 to 6)16.853 Avg Total On-Time minutes / 24 hour period = Avg min On-time per hour (21 - 48)
3.953.95 Avg min On-time per hour / Number of Runs per hour = On-time minutes per pump (7 -8 minutes)Avg min On time per hour Number of Runs per hour On time minutes per pump (7 8 minutes)
Rain Summary
Calc Average Dry (weekend) 115,563 Rain Guage SWWTPlus Percent Weekend Typ Lower 5,308Average Dry (weekday) 120,872 Date Rain (in)
8/4/2008 0 8/9/2008 0Use Day of Storm for Wet - Weekday 150,873 8/5/2008 0 8/10/2008 0
8/6/2008 1.02 8/11/2008 0.59I/I Flow 30,002 8/7/2008 0.73 8/12/2008 3.87Percent I/I Flow 24.82% 8/8/2008 0.39 8/13/2008 0.46
8/14/2008 0.018/15/2008 08/16/2008 0
RD I/I Fay vs Dec 2007Use Dec 2007 information to compare to Fay event
Peak I/I Weekday - Fay 150,873Dry Weekend Day Average Dec 8 and 9 119,400 5484
5,484 Corr dry Weekday Ave - 124,885Dry Weekday Average Dec 10 - 14 124,885
RD I/I Flow 25,988Weekday Typ 4.39% higher than weekend
Percent RD I/I Flow 20.81%
LS3103 Influent Analysis 8-2008_RT Changes

361Facility: LS3103 260
24-hour Influent Total On-Time Pump1 Pump2 ST. #3Date Hours Minutes Seconds Hours Minutes Seconds (gpd) (Minutes) On-Times On-Times Rain (in)
Saturday, December 08, 2007 3 1 58 3 39 58 122,881 401.93 0.01Sunday, December 09, 2007 3 4 59 3 9 0 115,919 373.98 0Monday, December 10, 2007 3 27 58 3 9 0 124,216 396.97 0Tuesday, December 11, 2007 3 13 59 3 6 0 118,388 379.98 0.02Wednesday, December 12, 2007 3 18 0 3 25 59 125,034 403.98 0.01Thursday, December 13, 2007 3 21 58 3 36 0 129,070 417.97 0.01Friday, December 14, 2007 3 24 0 3 27 58 127,715 411.97 0Saturday, December 15, 2007 3 19 59 3 24 58 125,485 404.95 0.94Sunday, December 16, 2007 2 55 59 3 7 59 112,406 363.97 0.01Monday, December 17, 2007 2 48 0 3 24 0 113,688 372.00 0Tuesday, December 18, 2007 3 16 59 3 9 58 120,502 386.95 0
121,391 392.24 #DIV/0! #DIV/0!84211
119,173122,659
Note: Weeks are to start on Sunday and go through Saturday with the Draw Down Test being on one of those days in that week.
#DIV/0! A f T t l P O ti / 24 h i d N b f R h (3 t 6)
Pump 2 Flow Rate during Test (gpm):
P1 On-Time P2 On-Time
Influent Analysis from Pumping Records (2 Pumps)
Pump 1 Flow Rate during Test (gpm):
Weekend Day Influent Average (gpd) =Week Days Influent Average (gpd) =
Average (gpd) =
Peak Flow @ 2.5 (gpm) =Average Daily InFlow Rate (gpm) =
#DIV/0! Avg of Total Pump On-times / 24 hour period = Number of Runs per hour (3 to 6)16.343 Avg Total On-Time minutes / 24 hour period = Avg min On-time per hour (21 - 48)#DIV/0! Avg min On-time per hour / Number of Runs per hour = On-time minutes per pump (7 -8 minutes)
Use Dec 2007 information to compare to Fay event
Dry Weekend Day Average Dec 8 and 9 119,400
Dry Weekday Average Dec 10 - 14 124,885
Storm Event (Day of) - Weekend 125,485
I/I Flow 2,604
Percent I/I Flow 2.12% Used same day of the week during dry period to calculate I/I
2 Pump - LS3103 Influent Analysis Master Storm12-2007
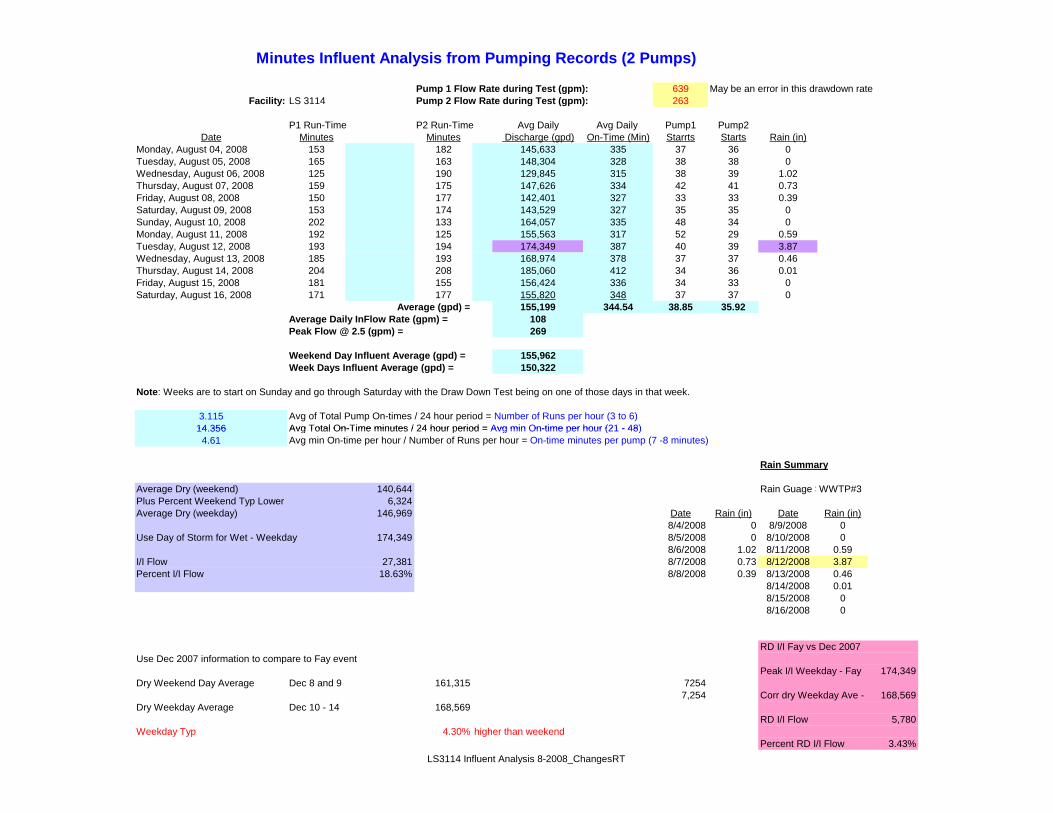
- -
SWWTP#3
Minutes Influent Analysis from Pumping Records (2 Pumps)
Pu i stmp 1 Flow Rate dur ng Te (gpm): 639 May be an error in this drawdown rateFacility: LS 3114 Pu i stmp 2 Flow Rate dur ng Te (gpm): 263
P1 Run-Time P2 Run-Time Avg Daily Avg Daily Pump1 Pump2Date Minutes Minutes Discharge (gpd) On-Time (Min) Starrts Starts Rain (in)
Monday, August 04, 2008 153 182 145,633 335 37 36 0Tuesday, August 05, 2008 165 163 148,304 328 38 38 0Wednesday, August 06, 2008 125 190 129,845 315 38 39 1.02Thursday, August 07, 2008 159 175 147,626 334 42 41 0.73Friday, August 08, 2008 150 177 142,401 327 33 33 0.39Saturday, August 09, 2008 153 174 143,529 327 35 35 0Sunday, August 10, 2008 202 133 164,057 335 48 34 0Monday, August 11, 2008 192 125 155,563 317 52 29 0.59Tuesday, August 12, 2008 193 194 174,349 387 40 39 3.87Wednesday, August 13, 2008 185 193 168,974 378 37 37 0.46Thursday, August 14, 2008 204 208 185,060 412 34 36 0.01Friday, August 15, 2008 181 155 156,424 336 34 33 0Saturday, August 16, 2008 171 177 155,820 348 37 37 0
Averag 1e (gpd) = 55,199 344.54 38.85 35.92Average ily Da InFlow Rate (gpm) = 108Peak Flow gpm) @ 2.5 ( = 269
W veekend Day Influent A erage (gpd) = 155,962W s veek Day Influent A erage (gpd) = 150,322
Note: Weeks are to start on Sunday and go through Saturday with the Draw Down Test being on one of those days in that week.
3.115 Avg of Total Pump On-times / 24 hour period = Number of Runs per hour (3 to 6)14 35614.356 Avg Total On-Time minutes / 24 hour period = Avg min On-time per hour (21 - 48)Avg Total On Time minutes / 24 hour period = Avg min On time per hour (21 - 48)
4.61 Avg min On-time per hour / Number of Runs per hour = On-time minutes per pump (7 -8 minutes)
Rain Summary
Average Dry (weekend) 140,644 Rain Guage Plus Percent Weekend Typ Lower 6,324Average Dry (weekday) 146,969 Date Rain (in) Date Rain (in)
8/4/2008 0 8/9/2008 0Use Day of Storm for Wet - Weekday 174,349 8/5/2008 0 8/10/2008 0
8/6/2008 1.02 8/11/2008 0.59I/I Flow 27,381 8/7/2008 0.73 8/12/2008 3.87Percent I/I Flow 18.63% 8/8/2008 0.39 8/13/2008 0.46
8/14/2008 0.018/15/2008 08/16/2008 0
RD I/I Fay vs Dec 2007Use Dec 2007 information to compare to Fay event
Peak I/I Weekday - Fay 174,349Dry Weekend Day Average Dec 8 and 9 161,315 7254
7,254 Corr dry Weekday Ave - 168,569Dry Weekday Average Dec 10 - 14 168,569
RD I/I Flow 5,780Weekday Typ 4.30% higher than weekend
Percent RD I/I Flow 3.43%LS3114 Influent Analysis 8-2008_ChangesRT
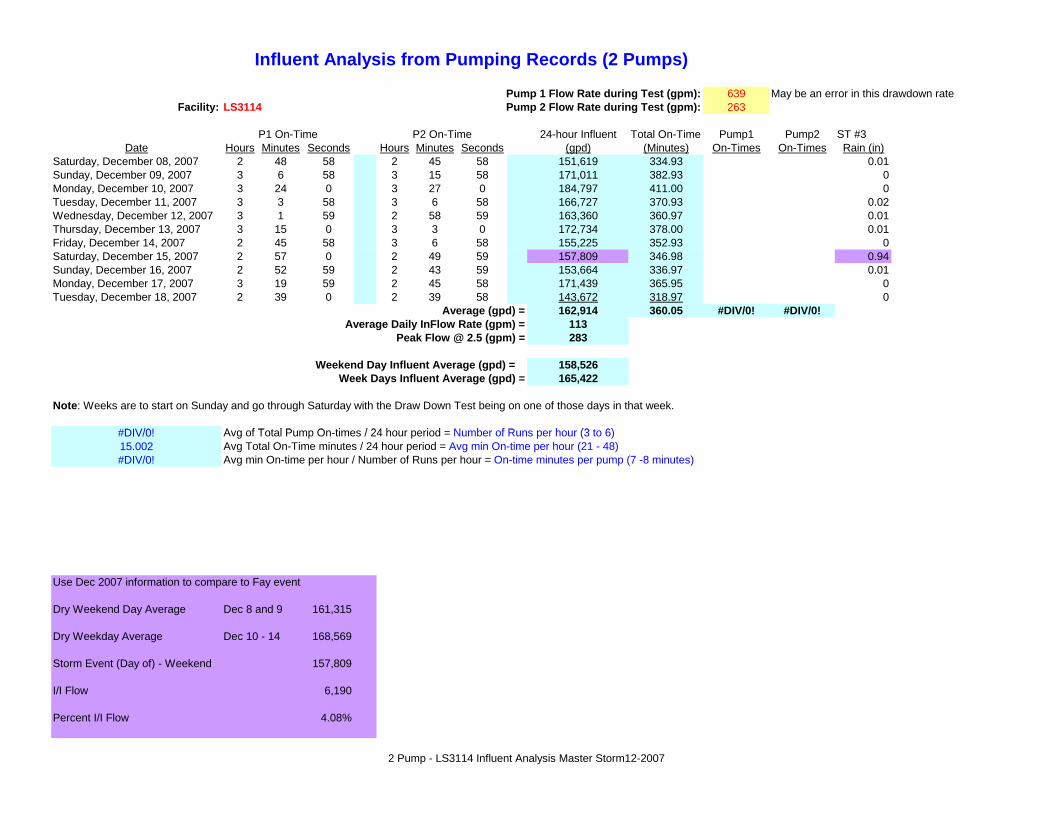
Influent Analysis from Pumping Records (2 Pumps)
Pump 1 Flow Rate during Test (gpm): 639 May be an error in this drawdown rateFacility: LS3114 Pump 2 Flow 263 Rate during Test (gpm):
P1 On-Time P2 On-Tim 24-houre Influent Total On-Time Pump1 Pump2 ST #3Date Hours Minutes Seconds Hours Minutes Seconds (gpd) (Minutes) On-Times On-Times Rain (in)
Saturday, December 08, 2007 2 48 58 2 45 58 151,619 334.93 0.01Sunday, December 09, 2007 3 6 58 3 15 58 171,011 382.93 0Monday, December 10, 2007 3 24 0 3 27 0 184,797 411.00 0Tuesday, December 11, 2007 3 3 58 3 6 58 166,727 370.93 0.02Wednesday, December 12, 2007 3 1 59 2 58 59 163,360 360.97 0.01Thursday, December 13, 2007 3 15 0 3 3 0 172,734 378.00 0.01Friday, December 14, 2007 2 45 58 3 6 58 155,225 352.93 0Saturday, December 15, 2007 2 57 0 2 49 59 157,809 346.98 0.94Sunday, December 16, 2007 2 52 59 2 43 59 153,664 336.97 0.01Monday, December 17, 2007 3 19 59 2 45 58 171,439 365.95 0Tuesday, December 18, 2007 2 39 0 2 39 58 143,672 318.97 0
Av 162erage (gpd) = ,914 360.05 #DIV/0! #DIV/0!Average Daily InFlow 113 Rate (gpm) =
Peak Flow 283 @ 2.5 (gpm) =
Weekend Day Influent Aver 158,526age (gpd) =Week Days Influent Aver 165,422age (gpd) =
Note: Weeks are to start on Sunday and go through Saturday with the Draw Down Test being on one of those days in that week.
#DIV/0!#DIV/0! A f T t l P O ti / 24 h i d N b f R h (3 t 6)Avg of Total Pump On-times / 24 hour period = Number of Runs per hour (3 to 6)15.002 Avg Total On-Time minutes / 24 hour period = Avg min On-time per hour (21 - 48)#DIV/0! Avg min On-time per hour / Number of Runs per hour = On-time minutes per pump (7 -8 minutes)
Use Dec 2007 information to compare to Fay event
Dry Weekend Day Average Dec 8 and 9 161,315
Dry Weekday Average Dec 10 - 14 168,569
Storm Event (Day of) - Weekend 157,809
I/I Flow 6,190
Percent I/I Flow 4.08%
2 Pump - LS3114 Influent Analysis Master Storm12-2007
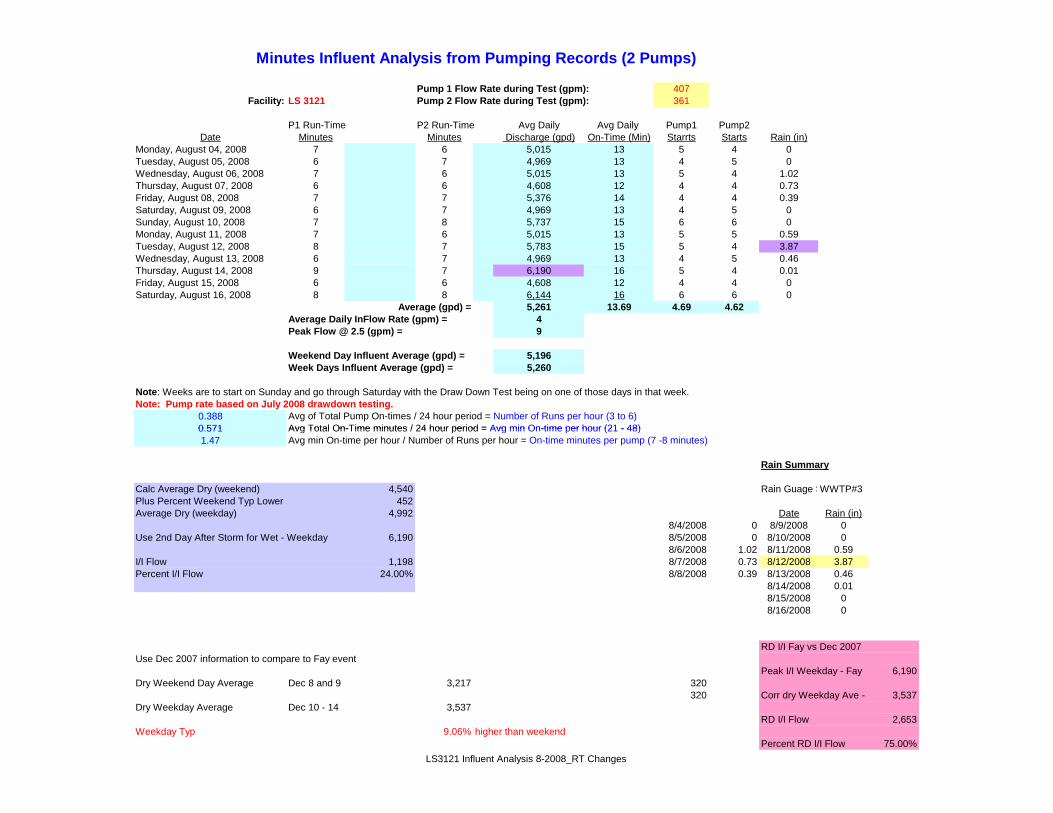
0 - / = -
SWWTP#3
Minutes Influent Analysis from Pumping Records (2 Pumps)
Pu i stmp 1 Flow Rate dur ng Te (gpm): 407Facility: LS 3121 Pu i stmp 2 Flow Rate dur ng Te (gpm): 361
P1 Run-Time P2 Run-Time Avg Daily Avg Daily Pump1 Pump2Date Minutes Minutes Discharge (gpd) On-Time (Min) Starrts Starts Rain (in)
Monday, August 04, 2008 7 6 5,015 13 5 4 0Tuesday, August 05, 2008 6 7 4,969 13 4 5 0Wednesday, August 06, 2008 7 6 5,015 13 5 4 1.02Thursday, August 07, 2008 6 6 4,608 12 4 4 0.73Friday, August 08, 2008 7 7 5,376 14 4 4 0.39Saturday, August 09, 2008 6 7 4,969 13 4 5 0Sunday, August 10, 2008 7 8 5,737 15 6 6 0Monday, August 11, 2008 7 6 5,015 13 5 5 0.59Tuesday, August 12, 2008 8 7 5,783 15 5 4 3.87Wednesday, August 13, 2008 6 7 4,969 13 4 5 0.46Thursday, August 14, 2008 9 7 6,190 16 5 4 0.01Friday, August 15, 2008 6 6 4,608 12 4 4 0Saturday, August 16, 2008 8 8 6,144 16 6 6 0
Average (gpd) = 5,261 13.69 4.69 4.62Average ily Da InFlow Rate (gpm) = 4Peak Flow gpm) @ 2.5 ( = 9
W veekend Day Influent A erage (gpd) = 5,196W s veek Day Influent A erage (gpd) = 5,260
Note: Weeks are to start on Sunday and go through Saturday with the Draw Down Test being on one of those days in that week.Note: Pump rate based on July 2008 drawdown testing.
0.388 Avg of Total Pump On-times / 24 hour period = Number of Runs per hour (3 to 6)0 571.571 Avg Total On-Time minutes / 24 hour period = Avg min On-time per hour (21 - 48)Avg Total On Time minutes 24 hour period Avg min On time per hour (21 - 48)1.47 Avg min On-time per hour / Number of Runs per hour = On-time minutes per pump (7 -8 minutes)
Rain Summary
Calc Average Dry (weekend) 4,540 Rain Guage Plus Percent Weekend Typ Lower 452Average Dry (weekday) 4,992 Date Rain (in)
8/4/2008 0 8/9/2008 0Use 2nd Day After Storm for Wet - Weekday 6,190 8/5/2008 0 8/10/2008 0
8/6/2008 1.02 8/11/2008 0.59I/I Flow 1,198 8/7/2008 0.73 8/12/2008 3.87Percent I/I Flow 24.00% 8/8/2008 0.39 8/13/2008 0.46
8/14/2008 0.018/15/2008 08/16/2008 0
RD I/I Fay vs Dec 2007Use Dec 2007 information to compare to Fay event
Peak I/I Weekday - Fay 6,190Dry Weekend Day Average Dec 8 and 9 3,217 320
320 Corr dry Weekday Ave - 3,537Dry Weekday Average Dec 10 - 14 3,537
RD I/I Flow 2,653Weekday Typ 9.06% higher than weekend
Percent RD I/I Flow 75.00%LS3121 Influent Analysis 8-2008_RT Changes
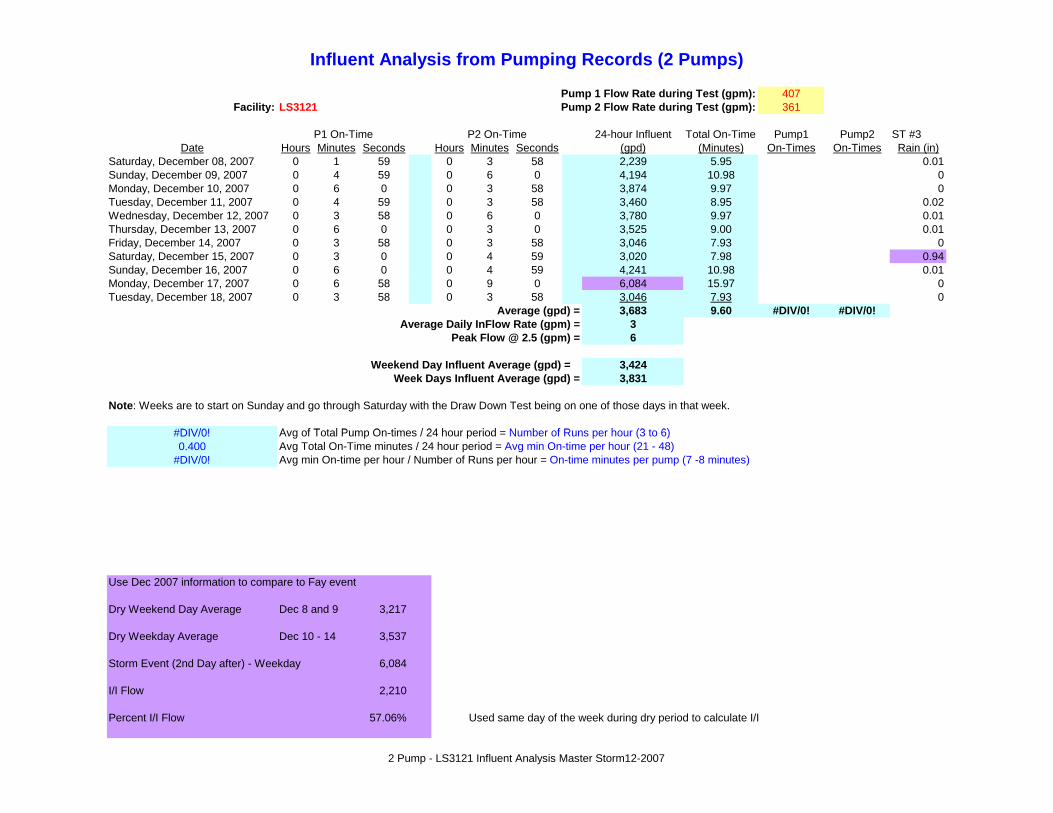
e
Influent Analysis from Pumping Records (2 Pumps)
Pump 1 Flow 407 Rate during Test (gpm):Facility: LS3121 Pump 2 Flow 361 Rate during Test (gpm):
P1 On-Tim P2 On-Time 24-hour Influent Total On-Time Pump1 Pump2 ST #3Date Hours Minutes Seconds Hours Minutes Seconds (gpd) (Minutes) On-Times On-Times Rain (in)
Saturday, December 08, 2007 0 1 59 0 3 58 2,239 5.95 0.01Sunday, December 09, 2007 0 4 59 0 6 0 4,194 10.98 0Monday, December 10, 2007 0 6 0 0 3 58 3,874 9.97 0Tuesday, December 11, 2007 0 4 59 0 3 58 3,460 8.95 0.02Wednesday, December 12, 2007 0 3 58 0 6 0 3,780 9.97 0.01Thursday, December 13, 2007 0 6 0 0 3 0 3,525 9.00 0.01Friday, December 14, 2007 0 3 58 0 3 58 3,046 7.93 0Saturday, December 15, 2007 0 3 0 0 4 59 3,020 7.98 0.94Sunday, December 16, 2007 0 6 0 0 4 59 4,241 10.98 0.01Monday, December 17, 2007 0 6 58 0 9 0 6,084 15.97 0Tuesday, December 18, 2007 0 3 58 0 3 58 3,046 7.93 0
Average (gpd) = 3,683 9.60 #DIV/0! #DIV/0!Av 3erage Daily InFlow Rate (gpm) =
Peak Flow 6 @ 2.5 (gpm) =
Weekend Day Influent Av 3,424erage (gpd) =Week Days Influent Av 3,831erage (gpd) =
Note: Weeks are to start on Sunday and go through Saturday with the Draw Down Test being on one of those days in that week.
#DIV/0!#DIV/0! A f T t l P O ti / 24 h i d N b f R h (3 t 6)Avg of Total Pump On-times / 24 hour period = Number of Runs per hour (3 to 6)0.400 Avg Total On-Time minutes / 24 hour period = Avg min On-time per hour (21 - 48)
#DIV/0! Avg min On-time per hour / Number of Runs per hour = On-time minutes per pump (7 -8 minutes)
Use Dec 2007 information to compare to Fay event
Dry Weekend Day Average Dec 8 and 9 3,217
Dry Weekday Average Dec 10 - 14 3,537
Storm Event (2nd Day after) - Weekday 6,084
I/I Flow 2,210
Percent I/I Flow 57.06% Used same day of the week during dry period to calculate I/I
2 Pump - LS3121 Influent Analysis Master Storm12-2007

- / = -
SWWTP#3
Minutes Influent Analysis from Pumping Records (2 Pumps)
Pu i stmp 1 Flow Rate dur ng Te (gpm): 275Facility: LS 3123 Pu i stmp 2 Flow Rate dur ng Te (gpm): 349
P1 Run-Time P2 Run-Time Avg Daily Avg Daily Pump1 Pump2Date Minutes Minutes Discharge (gpd) On-Time (Min) Starrts Starts Rain (in)
Monday, August 04, 2008 31 33 20,042 64 6 6 0Tuesday, August 05, 2008 32 31 19,619 63 6 6 0Wednesday, August 06, 2008 31 30 18,995 61 6 6 1.02Thursday, August 07, 2008 31 35 20,740 66 6 7 0.73Friday, August 08, 2008 31 36 21,089 67 6 6 0.39Saturday, August 09, 2008 37 31 20,994 68 7 6 0Sunday, August 10, 2008 30 34 20,116 64 6 7 0Monday, August 11, 2008 35 34 21,491 69 7 7 0.59Tuesday, August 12, 2008 35 35 21,840 70 7 6 3.87Wednesday, August 13, 2008 39 38 23,987 77 7 7 0.46Thursday, August 14, 2008 34 38 22,612 72 6 7 0.01Friday, August 15, 2008 38 37 23,363 75 7 6 0Saturday, August 16, 2008 37 36 22,739 73 7 6 0
Average (gpd) = 21,356 68.38 6.46 6.38Average ily Da InFlow Rate (gpm) = 15Peak Flow gpm) @ 2.5 ( = 37
W veekend Day Influent A erage (gpd) = 20,748W s veek Day Influent A erage (gpd) = 21,237
Note: Weeks are to start on Sunday and go through Saturday with the Draw Down Test being on one of those days in that week.Note: Pump rate based on July 2008 drawdown testing.
0.535 Avg of Total Pump On-times / 24 hour period = Number of Runs per hour (3 to 6)2 8492.849 Avg Total On-Time minutes / 24 hour period = Avg min On-time per hour (21 - 48)Avg Total On Time minutes 24 hour period Avg min On time per hour (21 - 48)5.32 Avg min On-time per hour / Number of Runs per hour = On-time minutes per pump (7 -8 minutes)
Rain Summary
Calc Average Dry (weekend) 20,573 Rain Guage Plus Percent Weekend Typ Higher 743Average Dry (weekday) 19,831 Date Rain (in)
8/4/2008 0 8/9/2008 0Use Day After Storm for Wet - Weekday 23,987 8/5/2008 0 8/10/2008 0
8/6/2008 1.02 8/11/2008 0.59I/I Flow 4,157 8/7/2008 0.73 8/12/2008 3.87Percent I/I Flow 20.96% 8/8/2008 0.39 8/13/2008 0.46
8/14/2008 0.018/15/2008 08/16/2008 0
RD I/I Fay vs Dec 2007Use Dec 2007 information to compare to Fay event
Peak I/I Weekday - Fay 23,987Dry Weekend Day Average Dec 8 and 9 18,676 674
674 Corr dry Weekday Ave - 18,001Dry Weekday Average Dec 10 - 14 18,001
RD I/I Flow 5,986Weekday Typ 3.75% lower than weekend
Percent RD I/I Flow 33.25%LS3123 Influent Analysis 8-2008_RT Changes

e
Influent Analysis from Pumping Records (2 Pumps)
Pump 1 Flow 275 Rate during Test (gpm):Facility: LS3123 Pump 2 Flow 349 Rate during Test (gpm):
P1 On-Tim P2 2 On-Time 4-hour Influent Total On-Time Pump1 Pump2 ST #3Date Hours Minutes Seconds Hours Minutes Seconds (gpd) (Minutes) On-Times On-Times Rain (in)
Saturday, December 08, 2007 0 24 58 0 30 58 17,673 55.93 0.01Sunday, December 09, 2007 0 30 58 0 31 59 19,678 62.95 0Monday, December 10, 2007 0 20 58 0 30 58 16,573 51.93 0Tuesday, December 11, 2007 0 31 59 0 27 0 18,218 58.98 0.02Wednesday, December 12, 2007 0 24 58 0 30 58 17,673 55.93 0.01Thursday, December 13, 2007 0 30 58 0 31 59 19,678 62.95 0.01Friday, December 14, 2007 0 31 59 0 25 59 17,864 57.97 0Saturday, December 15, 2007 0 24 58 0 31 59 18,028 56.95 0.94Sunday, December 16, 2007 0 33 0 0 27 0 18,498 60.00 0.01Monday, December 17, 2007 0 33 58 0 28 59 19,456 62.95 0Tuesday, December 18, 2007 0 25 59 0 31 59 18,308 57.97 0
Average (gpd) = 18,332 58.59Average Daily InFlow 13 Rate (gpm) =
Peak Flow 32 @ 2.5 (gpm) =
Weekend Day Influent Aver 18,469age (gpd) =Week Days Influent Av 18,253erage (gpd) =
Note: Weeks are to start on Sunday and go through Saturday with the Draw Down Test being on one of those days in that week.
0 0000.000 A f T t l P O ti / 24 h i d N b f R h (3 t 6)Avg of Total Pump On-times / 24 hour period = Number of Runs per hour (3 to 6)2.441 Avg Total On-Time minutes / 24 hour period = Avg min On-time per hour (21 - 48)
#DIV/0! Avg min On-time per hour / Number of Runs per hour = On-time minutes per pump (7 -8 minutes)
Use Dec 2007 information to compare to Fay event
Dry Weekend Day Average Dec 8 and 9 18,676
Dry Weekday Average Dec 10 - 14 18,001
Storm Event (2nd Day after) - Weekday 19,456
I/I Flow 2,883
Percent I/I Flow 17.39%
2 Pump - LS3123 Influent Analysis Master Storm12-2007

APPENDIX D JRGO MAJOR GRAVITY SEWER EVALUATION REPORT
Brunswick Glynn County JWSC Applied Technology & Management, Inc.
Water Sewer Master Plan

July 8, 2009 Ms. Angela Bryan, P.E. Applied Technology & Management, Inc. 411 Pablo Avenue Jacksonville Beach, FL 32250
RE: Evaluation of Inflow and Infiltration and Appropriate Rehabilitation Methods For JWSC
Dear Angela, We have completed our evaluation of the application of trenchless pipeline rehabilitation methods for the sample of CCTV records we received. Based on our observations, it appears that pipebursting and cured-in-place linings are appropriate methods to repair and rehabilitate these pipelines. PROJECT SCOPE J. R. Giese Operations, LLC (JRGO) was contracted by ATM to conduct a review of a closed circuit television (CCTV) inspection of various pipelines from the JWSC sewer system. This letter report summarizes JRGO’s findings and recommendations. Based on the findings, follow-up maintenance and rehabilitation recommendations and associated costs have been made to address general defects in the system. The information contained in this report and its attachments will enable ATM & JWSC to develop an appropriate follow-up maintenance and rehabilitation program to better operate the waste water collection system. OBJECTIVES The objective of this evaluation is to present solutions to sewer rehabilitation based not only on engineering analysis, but also construction, operation and maintenance considerations. Specific objectives include the following:
3560 Cardinal Point Dr. Suite 201 Jacksonville, FL 32257
Office (904) 730-7994 Fax (904) 221-7521 www.jrgiesoperations.com

3560 Cardinal Point Dr. Suite 201 Jacksonville, FL 32257
Office (904) 730-7994 Fax (904) 221-7521 www.jrgiesoperations.com
• Present a cost effective rehabilitation plan that will minimize maintenance
requirements for the first five to ten years of the rehabilitated pipeline • Reduce infiltration and inflow due to leaking joints and cracks • Begin the standardization process for the application of trenchless
technology SUMMARY OF FINDINGS A review of the project data including plans and CCTV inspection logs was performed and a site visit was conducted. The CCTV logs represented a sample of the overall system and were believed to be problem areas. The recommendations for rehabilitation are presented based on our observations and experience for successful rehabilitation and can be found in the attached spreadsheet. The table shows the worst NAASCO PACP ratings in the structural and O&M categories for each basin reviewed. The structural category describes various types of defects where the pipe has been damaged or otherwise defective. The O&M category describes various types of foreign objects that are found in the sewers and may interfere with the operations of the conveyance system. Both categories are scored on a scale of 0 to 5 and will assist in determining a priority for rehabilitation:
• 5 – Defects requiring immediate attention (Pipe has failed or will likely fail within the next five years)
• 4 – Severe defects that will become Grade 5 defects within the foreseeable future (Pipe will probably fail in 5 – 10 years)
• 3 – Moderate defects that will continue to deteriorate (Pipe may fail in 10 – 20 years)
• 2 – Defects that have not begun to deteriorate (Pipe unlikely to fail for at least 20 years)
• 1 – Minor defects (Failure unlikely in the foreseeable future) • 0 – No visible defects
This attached rehabilitation approach requires a higher initial capital investment but provides an expected lower maintenance effort.

3560 Cardinal Point Dr. Suite 201 Jacksonville, FL 32257
Office (904) 730-7994 Fax (904) 221-7521 www.jrgiesoperations.com
SUMMARY OF COST The following unit cost items are approximate pricing for the rehabilitation: Pipe bursting: Furnish and Install 8" HDPE via Pipe burst LF 1 $ 68.50 Furnish and Install 18" HDPE via Pipe burst LF 1 $ 160.00 Furnish and Install 30" HDPE via Pipe burst LF 1 $ 260.00 Pipe burst 4.5” OD Service Lateral LF 1 $ 40.00 Lateral Connection (4' - 8' Deep) EA 1 $1,065.00 Lateral Connection (8' - 12' Deep) EA 1 $1,330.00 Lateral Connection (12' - 16' Deep) EA 1 $1,600.00 Remove and Replace 6' of 6" - 12 " PVC (4' - 8' Deep) EA 1 $1,900.00 Remove and Replace 6' of 6" - 12 " PVC (8' - 12' Deep) EA 1 $2,450.00
CIPP:
Furnish and Install 30" CIPP LF 1 $ 94.10
Furnish and Install 12" CIPP LF 1 $ 40.00 Reconnect existing services using robotic internal cutter EA 1 $ 175.00 Pipe burst 4.5” OD Service Lateral LF 1 $ 40.00 Lateral Connection (4' - 8' Deep) EA 1 $1,065.00 Lateral Connection (8' - 12' Deep) EA 1 $1,330.00 Lateral Connection (12' - 16' Deep) EA 1 $1,600.00
Notes: Lateral connections would consist of new pipe from the property line to the rehabilitated mainline and secured with a flexible saddle to the mainline. Unit price may vary depending on volume of work released for construction.

3560 Cardinal Point Dr. Suite 201 Jacksonville, FL 32257
Office (904) 730-7994 Fax (904) 221-7521 www.jrgiesoperations.com
If the inside diameter of the pipe can be reduced sliplining is an option and the price per liner foot would be similar to the CIPP pricing. RECOMMENDATIONS There are several methods of addressing rehabilitation and repair of sanitary sewer systems including the two noted in this evaluation. After reviewing the CCTV logs and meeting with Glynn County staff; we have concluded that a rehabilitation approach that involves significant capital investment to repair the severe and moderate problems will provide the best solution for this system. Furthermore, this recommendation is based on the experience and evaluation of other systems with concerns similar to those of Glynn County. Basins with similar age of pipeline and materials appear to have the same rate of deterioration. Generally, pipelines in grass easements have roots entering the pipeline through joints, and cause various levels of O&M issues. A summary of the rehabilitation recommendations are as follows:
• Pipe bursting is recommended for pipe segments meeting the following criteria:
o Sags <50% of the pipe diameter o No more than 3 point repairs o The depth of the pipe is <12’ o Pipe diameter is less than 18” o Pipe material is ductile, concrete, cast iron or VCP o Pipe slope is adequate
• Cured in place pipe is recommended for pipe segments meeting the
following criteria: o Sags <50% of the pipe diameter o No structural defects in pipe o Existing pipe is ductile, concrete, cast iron or VCP o No joints are offset >2” o Pipe slope is adequate
• Replacement is recommended for pipe segments meeting the following
criteria: o Sags >50% of pipe diameter o Multiple structural defects o Required pipe size is more than 2 pipe sizes greater than existing
pipe o Pipe slope is less than adequate
Furthermore, pipelines that are made of concrete, vetrified clay, cast iron and ductile iron should be rehabilitated to remove joints from the system to control against roots and infill. The majority of PVC pipe appears to be in good condition

3560 Cardinal Point Dr. Suite 201 Jacksonville, FL 32257
Office (904) 730-7994 Fax (904) 221-7521 www.jrgiesoperations.com
with the exception of surcharging due to obstructions in the downstream pipelines or pump station malfunction. Implementing these recommendations will provide a long term benefit by reducing infiltration and inflow, minimizing overflows and will decrease labor intensive maintenance work.
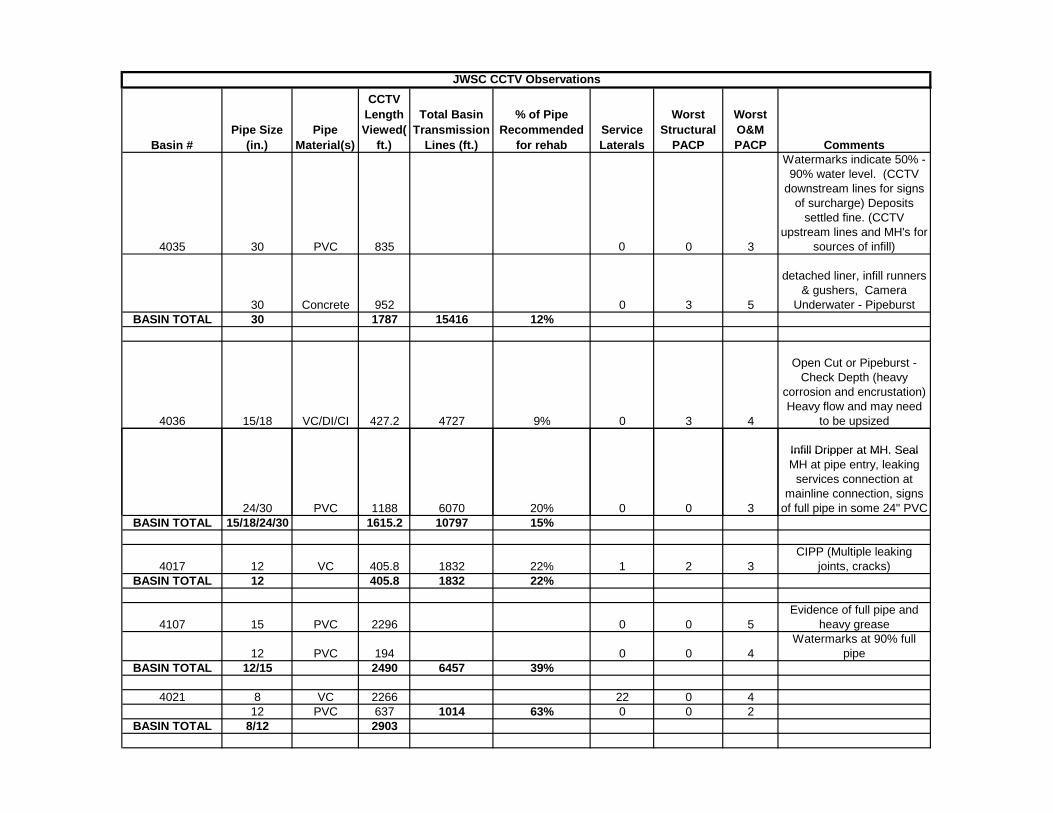
Basin #Pipe Size
(in.)Pipe
Material(s)
CCTV Length Viewed(
ft.)
Total Basin Transmission
Lines (ft.)
% of Pipe Recommended
for rehabService Laterals
Worst Structural
PACP
Worst O&M PACP Comments
4035 30 PVC 835 0 0 3
Watermarks indicate 50% - 90% water level. (CCTV
downstream lines for signs of surcharge) Deposits
settled fine. (CCTV upstream lines and MH's for
sources of infill)
30 Concrete 952 0 3 5
detached liner, infill runners & gushers, Camera
Underwater - PipeburstBASIN TOTAL 30 1787 15416 12%
4036 15/18 VC/DI/CI 427.2 4727 9% 0 3 4
Open Cut or Pipeburst - Check Depth (heavy
corrosion and encrustation) Heavy flow and may need
to be upsized
Infill Dripper at MH. Seal
JWSC CCTV Observations
24/30 PVC 1188 6070 20% 0 0 3
Infill Dripper at MH. Seal MH at pipe entry, leaking
services connection at mainline connection, signs
of full pipe in some 24" PVCBASIN TOTAL 15/18/24/30 1615.2 10797 15%
4017 12 VC 405.8 1832 22% 1 2 3CIPP (Multiple leaking
joints, cracks) BASIN TOTAL 12 405.8 1832 22%
4107 15 PVC 2296 0 0 5Evidence of full pipe and
heavy grease
12 PVC 194 0 0 4Watermarks at 90% full
pipeBASIN TOTAL 12/15 2490 6457 39%
4021 8 VC 2266 22 0 412 PVC 637 1014 63% 0 0 2
BASIN TOTAL 8/12 2903
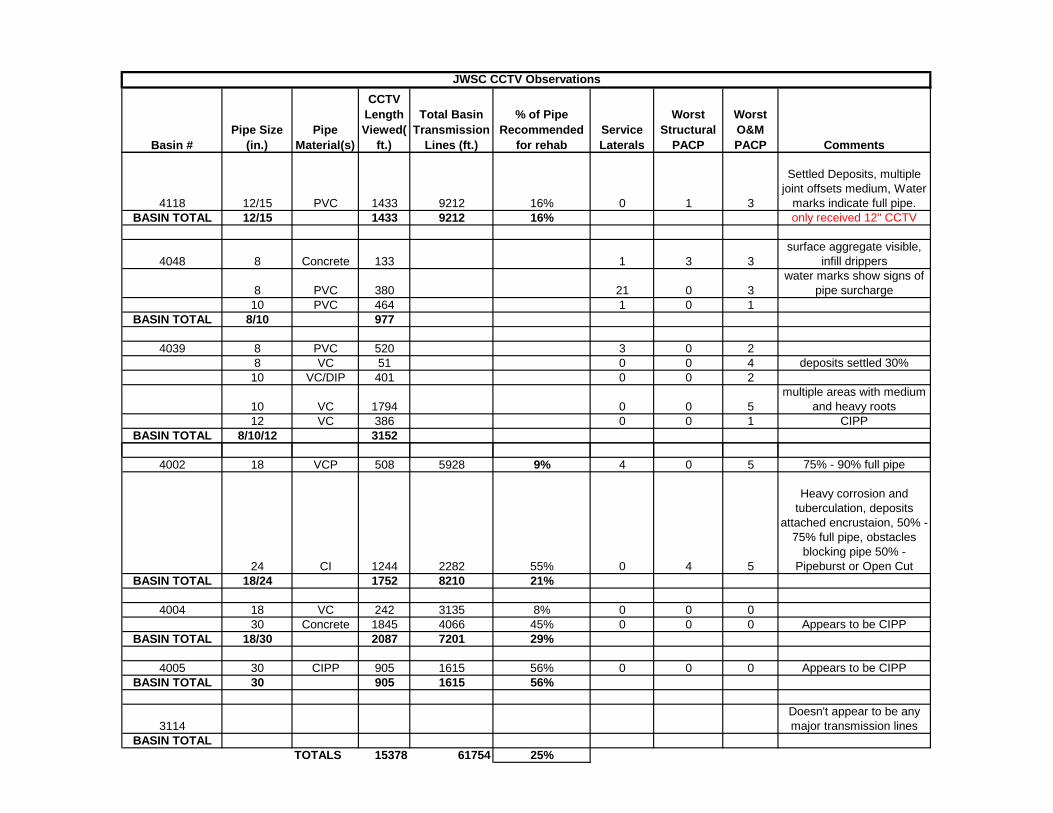
Basin #Pipe Size
(in.)Pipe
Material(s)
CCTV Length Viewed(
ft.)
Total Basin Transmission
Lines (ft.)
% of Pipe Recommended
for rehabService Laterals
Worst Structural
PACP
Worst O&M PACP Comments
JWSC CCTV Observations
4118 12/15 PVC 1433 9212 16% 0 1 3
Settled Deposits, multiple joint offsets medium, Water
marks indicate full pipe. BASIN TOTAL 12/15 1433 9212 16% only received 12" CCTV
4048 8 Concrete 133 1 3 3surface aggregate visible,
infill drippers
8 PVC 380 21 0 3water marks show signs of
pipe surcharge10 PVC 464 1 0 1
BASIN TOTAL 8/10 977
4039 8 PVC 520 3 0 28 VC 51 0 0 4 deposits settled 30%
10 VC/DIP 401 0 0 2
10 VC 1794 0 0 5multiple areas with medium
and heavy roots12 VC 386 0 0 1 CIPP
BASIN TOTAL 8/10/12 3152
4002 18 VCP 508 5928 9% 4 0 5 75% - 90% full pipe
24 CI 1244 2282 55% 0 4 5
Heavy corrosion and tuberculation, deposits
attached encrustaion, 50% - 75% full pipe, obstacles
blocking pipe 50% - Pipeburst or Open Cut
BASIN TOTAL 18/24 1752 8210 21%
4004 18 VC 242 3135 8% 0 0 030 Concrete 1845 4066 45% 0 0 0 Appears to be CIPP
BASIN TOTAL 18/30 2087 7201 29%
4005 30 CIPP 905 1615 56% 0 0 0 Appears to be CIPPBASIN TOTAL 30 905 1615 56%
3114Doesn't appear to be any major transmission lines
BASIN TOTALTOTALS 15378 61754 25%

Basin #Pipe Size
(in.)Pipe
Material(s)
CCTV Length Viewed(
ft.)
Total Basin Transmission
Lines (ft.)
% of Pipe Recommended
for rehabService Laterals
Worst Structural
PACP
Worst O&M PACP Comments
JWSC CCTV Observations
* Recommendations based on CCTV Data only. Site conditions not verified.

APPENDIX E POPULATION PROJECTIONS SUPPORTING DOCUMENTATION
Brunswick Glynn County JWSC Applied Technology & Management, Inc.
Water Sewer Master Plan

APPENDIX E – WATER SYSTEM COMPONENT PER CAPITA PROJECTIONS
Brunswick Glynn County JWSC Applied Technology & Management, Inc.
Water Sewer Master Plan

Per Capita City
Month/Year Monthly Total Gallons (Millions)
Month/Year Monthly Total Gallons (Millions)
Pop. 2007 Per Capita Average Per Capita 150.00
Jan-08 141.17 Jan-08 141.17 28,968.5 157.20Feb-08 128.94 Feb-08 128.94 28,968.5 153.48Mar-08 142.31 Mar-08 142.31 28,968.5 158.47Apr-08 140.79 Apr-08 140.79 28,968.5 162.00May-08 153.18 May-08 153.18 28,968.5 170.58Jun-08 145.27 Jun-08 145.27 28,968.5 167.16Jul-08 148.48 Jul-08 148.48 28,968.5 165.34
Aug-08 138.62 Aug-08 138.62 28,968.5 154.36Sep-08 130.01 Sep-08 130.01 28,968.5 149.60Oct-08 132.09 Oct-08 132.09 28,968.5 147.09Nov-08 129.30 Nov-08 129.30 28,968.5 148.78Dec-08 123.02 Dec-08 123.02 28,968.5 136.99Jan-09 120.11 Jan-09 120.11 28,968.5 133.75
City Total Flow (2008 & 2009) City Per Capita (2008 & 2009)
Feb-09 107.80 Feb-09 107.80 28,968.5 132.91Mar-09 120.43 Mar-09 120.43 28,968.5 134.10Apr-09 119.44 Apr-09 119.44 28,968.5 137.44May-09 126.82 May-09 126.82 28,968.5 141.22Jun-09 129.92 Jun-09 129.92 28,968.5 149.50
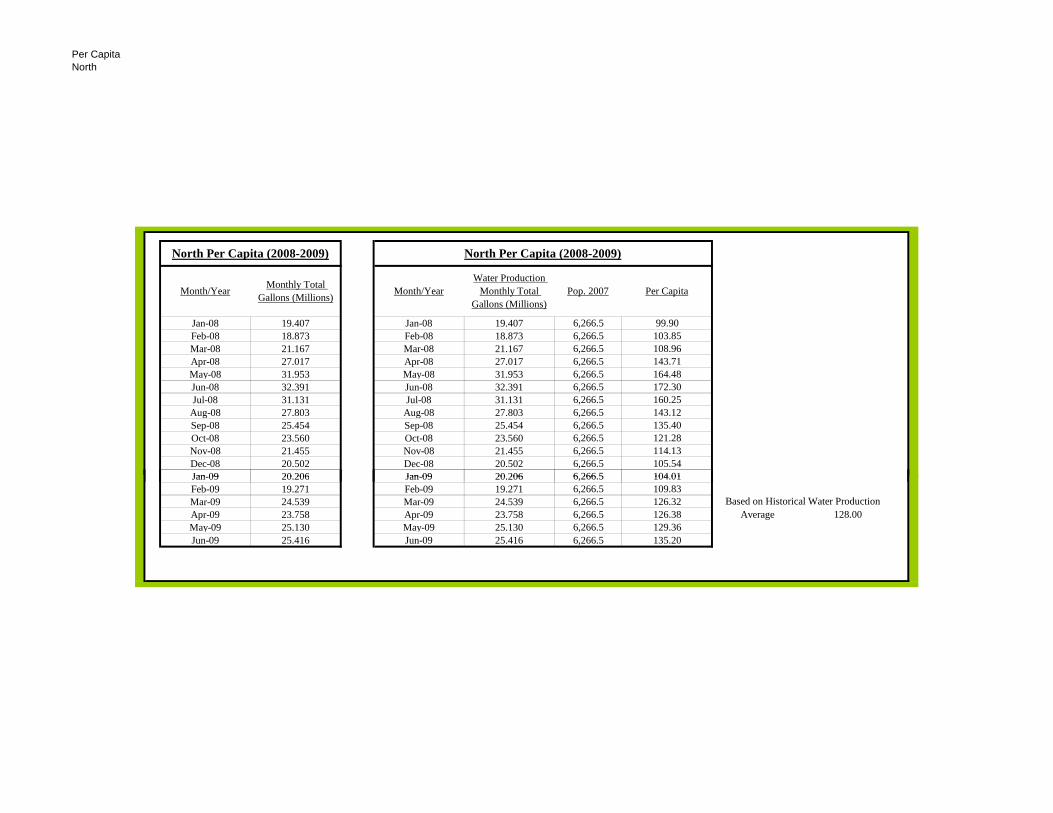
Per Capita North
Jan-08 19.407 Jan-08 19.407 6,266.5 99.90Feb-08 18.873 Feb-08 18.873 6,266.5 103.85Mar-08 21.167 Mar-08 21.167 6,266.5 108.96Apr-08 27.017 Apr-08 27.017 6,266.5 143.71May-08 31.953 May-08 31.953 6,266.5 164.48Jun-08 32.391 Jun-08 32.391 6,266.5 172.30Jul-08 31.131 Jul-08 31.131 6,266.5 160.25
Aug-08 27.803 Aug-08 27.803 6,266.5 143.12Sep-08 25.454 Sep-08 25.454 6,266.5 135.40Oct-08 23.560 Oct-08 23.560 6,266.5 121.28Nov-08 21.455 Nov-08 21.455 6,266.5 114.13Dec-08 20.502 Dec-08 20.502 6,266.5 105.54Jan-09 20 206 Jan-09 20 206 6 266 5 104 01
North Per Capita (2008-2009) North Per Capita (2008-2009)
Month/YearWater Production
Monthly Total Gallons (Millions)
Pop. 2007 Per CapitaMonth/Year Monthly Total Gallons (Millions)
Jan-09 20.206 Jan-09 20.206 6,266.5 104.01Feb-09 19.271 Feb-09 19.271 6,266.5 109.83Mar-09 24.539 Mar-09 24.539 6,266.5 126.32Apr-09 23.758 Apr-09 23.758 6,266.5 126.38 Average 128.00May-09 25.130 May-09 25.130 6,266.5 129.36Jun-09 25.416 Jun-09 25.416 6,266.5 135.20
Based on Historical Water Production

Per Capita Exit 29
South Mainland
Average 206.89
Month/YearWater Production
Monthly Total Gallons (Millions)
Month/YearWater Production
Monthly Total Gallons (Millions)
Pop. 2007 Per Capita
Jan-08 7.416 Jan-08 7.416 1,469.5 162.79
Feb-08 7.174 Feb-08 7.174 1,469.5 168.34Mar-08 8.701 Mar-08 8.701 1,469.5 191.00Apr-08 10.021 Apr-08 10.021 1,469.5 227.31
May-08 11.675 May-08 11.675 1,469.5 256.29 Percent Residential Residential
Jun-08 11.100 Jun-08 11.100 1,469.5 251.79 of Total Jul-08 9.731 Jul-08 9.731 1,469.5 213.61 36.95% 78.938 gpcd
Aug-08 9.389 Aug-08 9.389 1,469.5 206.10Sep-08 8.750 Sep-08 8.750 1,469.5 198.48 6600000 Total Billings July 2008Oct-08 9.015 Oct-08 9.015 1,469.5 197.89N 08 9 034 N 08 9 034 1 469 5 204 92 P C it B d J l 2008 Billi
Exit 29 Total Flow (2008 & 2009)
Exit 29 Per Capita (2008 & 2009)
Heavy Commercial Water Usage
For July 2008 only 6.6 MG total billed for
Appear to be significant water losses or unbilled
Nov-08 9.034 Nov-08 9.034 1,469.5 204.92 Per Capita Based on July 2008 BillingsDec-08 8.531 Dec-08 8.531 1,469.5 187.27 144.88 gpcdJan-09 9.377 Jan-09 9.377 1,469.5 205.84 Based on North Mainland Historical Numbers Commercial FlowFeb-09 7.385 Feb-09 7.385 1,469.5 179.48 represents 1/3 of total flowMar-09 9.104 Mar-09 9.104 1,469.5 199.85 2112000 gallonsApr-09 9.634 Apr-09 9.634 1,469.5 218.53 2595000 gallonsMay-09 10.294 May-09 10.294 1,469.5 225.97 483000 Reduce July 2008 Billings by this amountJun-09 10.073 Jun-09 10.073 1,469.5 228.49 6117000 gallons July 2008 when reduce comm flow to typical north %
Per Capita 134.28 gpcd

APPENDIX E – WATER SYSTEM COMPONENT POPULATION PROJECTIONS
Brunswick Glynn County JWSC Applied Technology & Management, Inc.
Water Sewer Master Plan

APPENDIX E – WATER SYSTEM COMPONENT CITY POPULATION PROJECTIONS
Brunswick Glynn County JWSC Applied Technology & Management, Inc.
Water Sewer Master Plan

City 2009Water Population Projections
Taz # 09 Pop. Estimate
Built Out Basin Zoned Notes Area
1 35.00 Yes L002 GC * Added 14 RES accounts New Town2 60.00 Yes L002 OC * Added 24 RES accounts New Town3 25.00 Yes L002 GC &OC * Added 10 RES accounts Old Town4 117.50 Yes L002 GC & GR * Added 47 RES accounts Old Town5 110.00 Yes L002 GC & GR * Added 44 RES accounts Town Commons6 30.00 Yes L002 GC & GR * Added 12 RES accounts Old Town7 97.50 Yes L002 GC * Added 39 RES accounts Old Town8 20.00 Yes L002 GC &OC * Added 8 RES accounts Old Town9 15.00 Yes L002 GR * Added 6 RES accounts Old Town
10 32.50 Yes L002 GC * Added 13 RES accounts Old Town11 77.50 Yes L002 GC & GR * Added 31 RES accounts Old Town & Downing Place12 17.50 Yes L002 GC * Added 7 RES accounts Old Town13 5.00 Yes L002 GC * Added 2 RES accounts Old Town14 2.50 Yes L002 GC * Added 1 RES accounts Old Town15 7.50 Yes L002 GC * Added 3 RES accounts New Town16 27.50 Yes L035 HC & R9 * Added 11 RES accounts
17 12.50 Yes L035 G/LI, R12, M6, R/M20, & HC
* Added 5 RES accounts Some Sewer & few meters
18 172.50 Yes L035 GI, R6 & MH6 * Added 69 RES accounts Janie Hill, ARCO, DE Franco, Calvery & Dock Junction
19 235.00 Yes L035 GR, R6 & HC * Added 94 RES accounts Brunswick Villas & ARCO20 140.00 Yes None R6 & HC * Added 56 RES accounts Brunswick Villas 21 135.00 Yes L004 R6, GR & HC * Added 54 RES accounts Lawrenceville22 77.50 Yes L004 R6 * Added 31 RES accounts Lawrenceville23 0.00 Yes None GI & LI Use TAZ24 7.50 Yes None HC & LI * Added 3 RES accounts25 467.50 Yes L007/L011 R9 * Added 187 RES accounts26 92.50 Yes L006 R6 & HC * Added 36 RES accounts Brunswick Villas
27 130.00 Yes None R6 & HC * Added 52 RES accounts Brunswick Villas no Sewer, but Water
28 107.50 Yes L005 HC, R6 & GC * Added 43 RES accounts Brunswick Farms & Brunswick Villas28 107.50 Yes L005 HC, R6 & GC Added 43 RES accounts Brunswick Farms & Brunswick Villas
29 660.00 Yes L005 HC, R6 & GR * Added 264 RES accountsBlayton Tract, Bonnie Day, Carver
Heights, Day Tract, Brunswick Villas & Fulk Buhannon
30 90.00 Yes L005 R6 & FA * Added 36 RES accounts Brunswick Villas
31 85.00 Yes None R6 * Added 34 RES accounts Brunswick Villas no Sewer, but Water
32 47.50 Partial L007 R6/9, GC & G/LI * Added 19 RES accounts
33 57.50 Partial L022 HC, GR & R9 * Added 23 RES accounts Brunswick Farms, Coral Park & Cypress Commons
34 70.00 Partial L017 R9, HC & OC * Added 28 RES accounts Lake View & Demere Hammock35 0.00 Yes L006 R9 * College: Added 0 RES accounts36 0.00 Yes L006 R9 * College: Added 0 RES accounts37 235.00 Yes L017 R9, CP, LM * Added 94 RES accounts Good Year Park38 70.00 Yes L017 R9 * Added 28 RES accounts Good Year Park39 215.00 Yes L017 R9 * Added 86 RES accounts Good Year Park40 140.00 Yes L017 R9/12 & HC * Added 56 RES accounts Brunswick Farms & Baker41 370.00 Yes L017 R9 & HC * Added 148 RES accounts Eastview
42 212.50 Yes L017 MED, & R9 * Added 85 RES accounts Day Tract, Lake Forest, Tower Medical Shrine Park & Eastview
43 0.00 Yes L017 MED * Hospital: Added 0 RES accounts Good Year Park
44 277.50 Yes L003 BI * Hercules: Added 111 RES accounts
45 112.50 Yes L017 MED & R9 * Added 45 RES accounts Good Year Park46 397.50 Yes L017 MED, R9 & GR * Added 159 RES accounts Montpelier & Homesite
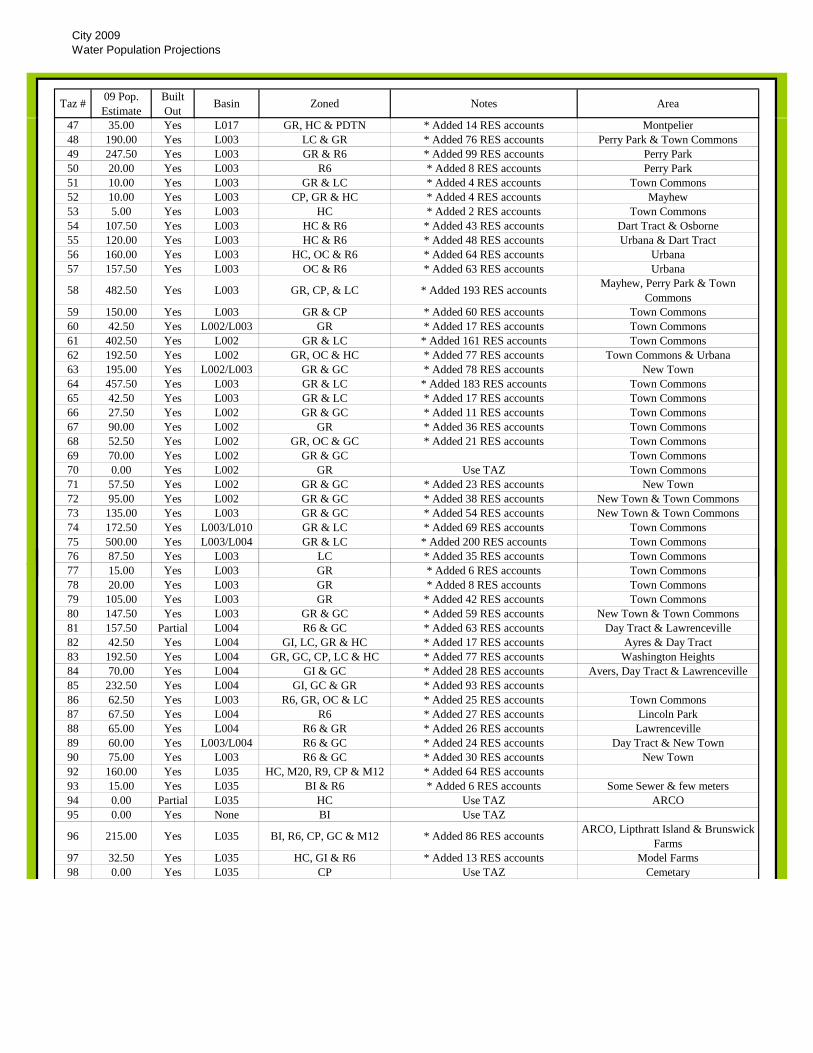
City 2009Water Population Projections
Taz # 09 Pop. Estimate
Built Out Basin Zoned Notes Area
47 35.00 Yes L017 GR, HC & PDTN * Added 14 RES accounts Montpelier48 190.00 Yes L003 LC & GR * Added 76 RES accounts Perry Park & Town Commons49 247.50 Yes L003 GR & R6 * Added 99 RES accounts Perry Park50 20.00 Yes L003 R6 * Added 8 RES accounts Perry Park51 10.00 Yes L003 GR & LC * Added 4 RES accounts Town Commons52 10.00 Yes L003 CP, GR & HC * Added 4 RES accounts Mayhew53 5.00 Yes L003 HC * Added 2 RES accounts Town Commons54 107.50 Yes L003 HC & R6 * Added 43 RES accounts Dart Tract & Osborne55 120.00 Yes L003 HC & R6 * Added 48 RES accounts Urbana & Dart Tract56 160.00 Yes L003 HC, OC & R6 * Added 64 RES accounts Urbana57 157.50 Yes L003 OC & R6 * Added 63 RES accounts Urbana
58 482.50 Yes L003 GR, CP, & LC * Added 193 RES accounts Mayhew, Perry Park & Town Commons
59 150.00 Yes L003 GR & CP * Added 60 RES accounts Town Commons60 42.50 Yes L002/L003 GR * Added 17 RES accounts Town Commons61 402.50 Yes L002 GR & LC * Added 161 RES accounts Town Commons 62 192.50 Yes L002 GR, OC & HC * Added 77 RES accounts Town Commons & Urbana63 195.00 Yes L002/L003 GR & GC * Added 78 RES accounts New Town 64 457.50 Yes L003 GR & LC * Added 183 RES accounts Town Commons65 42.50 Yes L003 GR & LC * Added 17 RES accounts Town Commons66 27.50 Yes L002 GR & GC * Added 11 RES accounts Town Commons67 90.00 Yes L002 GR * Added 36 RES accounts Town Commons68 52.50 Yes L002 GR, OC & GC * Added 21 RES accounts Town Commons69 70.00 Yes L002 GR & GC Town Commons70 0.00 Yes L002 GR Use TAZ Town Commons71 57.50 Yes L002 GR & GC * Added 23 RES accounts New Town 72 95.00 Yes L002 GR & GC * Added 38 RES accounts New Town & Town Commons73 135.00 Yes L003 GR & GC * Added 54 RES accounts New Town & Town Commons74 172.50 Yes L003/L010 GR & LC * Added 69 RES accounts Town Commons75 500.00 Yes L003/L004 GR & LC * Added 200 RES accounts Town Commons76 87.50 Yes L003 LC * Added 35 RES accounts Town Commons77 15.00 Yes L003 GR * Added 6 RES accounts Town Commons78 20.00 Yes L003 GR * Added 8 RES accounts Town Commons79 105.00 Yes L003 GR * Added 42 RES accounts Town Commons80 147.50 Yes L003 GR & GC * Added 59 RES accounts New Town & Town Commons81 157.50 Partial L004 R6 & GC * Added 63 RES accounts Day Tract & Lawrenceville82 42.50 Yes L004 GI, LC, GR & HC * Added 17 RES accounts Ayres & Day Tract83 192.50 Yes L004 GR, GC, CP, LC & HC * Added 77 RES accounts Washington Heights84 70.00 Yes L004 GI & GC * Added 28 RES accounts Avers, Day Tract & Lawrenceville85 232.50 Yes L004 GI, GC & GR * Added 93 RES accounts86 62.50 Yes L003 R6, GR, OC & LC * Added 25 RES accounts Town Commons87 67.50 Yes L004 R6 * Added 27 RES accounts Lincoln Park88 65.00 Yes L004 R6 & GR * Added 26 RES accounts Lawrenceville89 60.00 Yes L003/L004 R6 & GC * Added 24 RES accounts Day Tract & New Town90 75.00 Yes L003 R6 & GC * Added 30 RES accounts New Town92 160.00 Yes L035 HC, M20, R9, CP & M12 * Added 64 RES accounts93 15.00 Yes L035 BI & R6 * Added 6 RES accounts Some Sewer & few meters94 0.00 Partial L035 HC Use TAZ ARCO95 0.00 Yes None BI Use TAZ
96 215.00 Yes L035 BI, R6, CP, GC & M12 * Added 86 RES accounts ARCO, Lipthratt Island & Brunswick Farms
97 32.50 Yes L035 HC, GI & R6 * Added 13 RES accounts Model Farms98 0.00 Yes L035 CP Use TAZ Cemetary
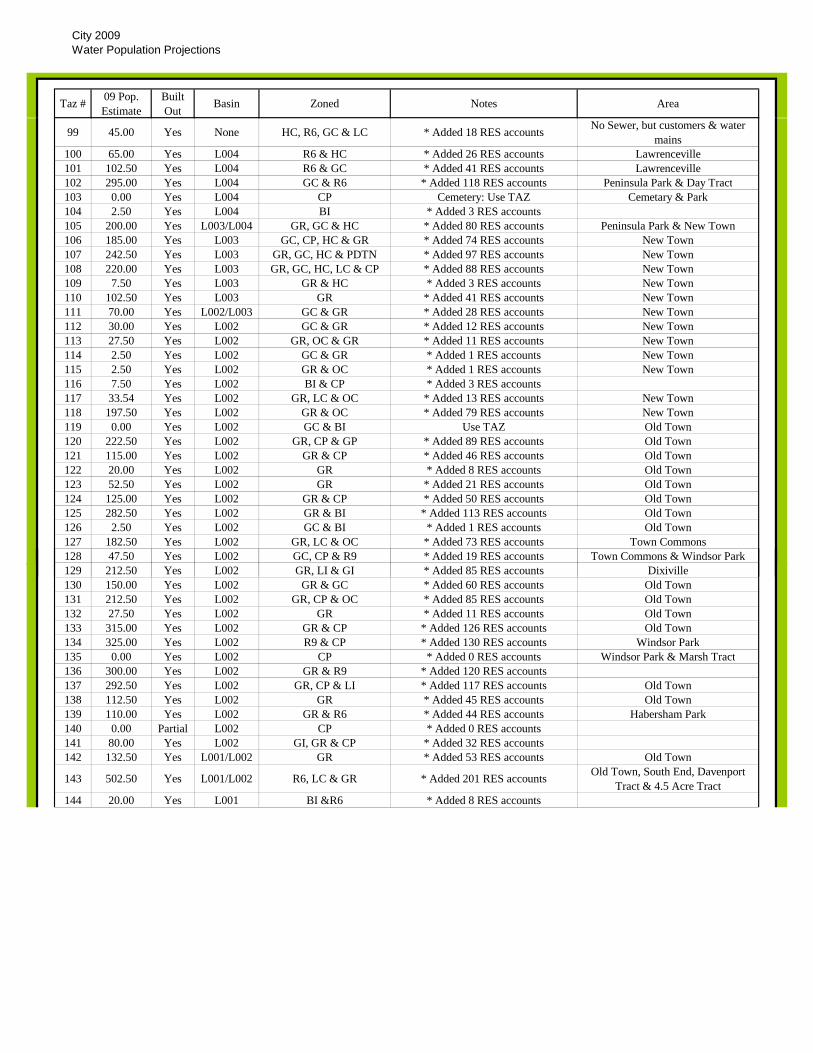
City 2009Water Population Projections
Taz # 09 Pop. Estimate
Built Out Basin Zoned Notes Area
99 45.00 Yes None HC, R6, GC & LC * Added 18 RES accounts No Sewer, but customers & water mains
100 65.00 Yes L004 R6 & HC * Added 26 RES accounts Lawrenceville101 102.50 Yes L004 R6 & GC * Added 41 RES accounts Lawrenceville102 295.00 Yes L004 GC & R6 * Added 118 RES accounts Peninsula Park & Day Tract103 0.00 Yes L004 CP Cemetery: Use TAZ Cemetary & Park104 2.50 Yes L004 BI * Added 3 RES accounts105 200.00 Yes L003/L004 GR, GC & HC * Added 80 RES accounts Peninsula Park & New Town106 185.00 Yes L003 GC, CP, HC & GR * Added 74 RES accounts New Town 107 242.50 Yes L003 GR, GC, HC & PDTN * Added 97 RES accounts New Town 108 220.00 Yes L003 GR, GC, HC, LC & CP * Added 88 RES accounts New Town 109 7.50 Yes L003 GR & HC * Added 3 RES accounts New Town 110 102.50 Yes L003 GR * Added 41 RES accounts New Town 111 70.00 Yes L002/L003 GC & GR * Added 28 RES accounts New Town 112 30.00 Yes L002 GC & GR * Added 12 RES accounts New Town 113 27.50 Yes L002 GR, OC & GR * Added 11 RES accounts New Town 114 2.50 Yes L002 GC & GR * Added 1 RES accounts New Town 115 2.50 Yes L002 GR & OC * Added 1 RES accounts New Town 116 7.50 Yes L002 BI & CP * Added 3 RES accounts117 33.54 Yes L002 GR, LC & OC * Added 13 RES accounts New Town 118 197.50 Yes L002 GR & OC * Added 79 RES accounts New Town 119 0.00 Yes L002 GC & BI Use TAZ Old Town120 222.50 Yes L002 GR, CP & GP * Added 89 RES accounts Old Town121 115.00 Yes L002 GR & CP * Added 46 RES accounts Old Town122 20.00 Yes L002 GR * Added 8 RES accounts Old Town123 52.50 Yes L002 GR * Added 21 RES accounts Old Town124 125.00 Yes L002 GR & CP * Added 50 RES accounts Old Town125 282.50 Yes L002 GR & BI * Added 113 RES accounts Old Town126 2.50 Yes L002 GC & BI * Added 1 RES accounts Old Town127 182.50 Yes L002 GR, LC & OC * Added 73 RES accounts Town Commons128 47.50 Yes L002 GC, CP & R9 * Added 19 RES accounts Town Commons & Windsor Park129 212.50 Yes L002 GR, LI & GI * Added 85 RES accounts Dixiville130 150.00 Yes L002 GR & GC * Added 60 RES accounts Old Town131 212.50 Yes L002 GR, CP & OC * Added 85 RES accounts Old Town132 27.50 Yes L002 GR * Added 11 RES accounts Old Town133 315.00 Yes L002 GR & CP * Added 126 RES accounts Old Town134 325.00 Yes L002 R9 & CP * Added 130 RES accounts Windsor Park135 0.00 Yes L002 CP * Added 0 RES accounts Windsor Park & Marsh Tract136 300.00 Yes L002 GR & R9 * Added 120 RES accounts137 292.50 Yes L002 GR, CP & LI * Added 117 RES accounts Old Town138 112.50 Yes L002 GR * Added 45 RES accounts Old Town139 110.00 Yes L002 GR & R6 * Added 44 RES accounts Habersham Park140 0.00 Partial L002 CP * Added 0 RES accounts141 80.00 Yes L002 GI, GR & CP * Added 32 RES accounts142 132.50 Yes L001/L002 GR * Added 53 RES accounts Old Town
143 502.50 Yes L001/L002 R6, LC & GR * Added 201 RES accounts Old Town, South End, Davenport Tract & 4.5 Acre Tract
144 20.00 Yes L001 BI &R6 * Added 8 RES accounts

City 2009Water Population Projections
Taz # 09 Pop. Estimate
Built Out Basin Zoned Notes Area
145 50.00 Yes L002 GR & GI * Added 20 RES accounts Old Town146 215.00 Yes L001/L002 R6 * Added 86 RES accounts South End147 192.50 Yes L001 R6 * Added 77 RES accounts South Union & 33 Acre Tract148 5.00 Partial L001 PDG & BI * Added 2 RES accounts Liberty Harbor150 2.50 Yes L001 BI * Added 1 RES accounts South Yard151 2.50 Yes L002 GC * Added 1 RES accounts Old Town152 90.00 Yes L003 GR & HC * Added 36 RES accounts New Town 153 62.50 Yes L003 LC, GR & GC * Added 25 RES accounts New Town 154 32.50 Yes L003 GR * Added 13 RES accounts Town Commons155 0.00 Yes L006 R9 * College: Added 0 RES accounts156 675.00 Yes L043 R9, HC M9, OC & GC * Added 270 RES accounts157 2.50 Partial L004/L035 GC & CP * Added 1 RES accounts158 42.50 Yes L006/L007 R9 * Added 17 RES accounts Magnolia Park159 0.00 Partial L006 GC & R9 Use TAZ Brunswick Farms160 57.50 Yes L011 R9, HC & PDH * Added 23 RES accounts Glynn Plaza & Magnolia Park
161 0.00 Partial L035 GI, GC, LI & R6 No RES accounts Sewer, but no customers or water main
162 0.00 Partial None BI Use TAZ
163 17.50 Partial None BI, R9, M20, LC & HC * Added 7 RES accounts No Sewer, but customers & water mains
164 2.50 Partial L035 R12, CP, HC, R9 & MH * Added 1 RES accounts Private Well 165 0.00 Yes L035 HC & GI * Added 0 RES accounts166 7.50 Partial L011 PDI & HC * Added 3 RES accounts179 2.50 Yes L127 GR & HC * Added 1 RES accounts181 10.00 Partial L036 FC, HC, FA, GR & R9 * Added 4 RES accounts195 195.00 Yes L048 G * Added 78 RES accounts FLETC196 917.50 Yes L048 G & R6 * Added 367 RES accounts FLETC200 1,190.00 Yes L023 R9, LC & GC * Added 476 RES accounts Glynco Annex201 120.00 Partial L048 FA, PD & R12 * Added 48 RES accounts
202 857.50 Yes L023 PDR, R12 & R9 * Added 343 RES accounts Cambro Tract, Palmetto Estate & Glynn Marshy
203 1,250.00 Yes L028 R6 & R12 * Added 500 RES accounts Culligans Landing
204 675.00 Yes L021/L027/L028 OC, HC, R6 & R9 * Added 270 RES accounts Beverly Shores & Country Club
Heights205 602.50 Yes L028 PDG * Added 241 RES accounts Hidden Lakes & Marsh Landing206 242.50 Yes L021 HC, R6 & R9 * Added 97 RES accounts Beverly Shores207 260.00 Yes L021 HC, R9 & MR * Added 104 RES accounts Bristol & Beverly Shores208 1,037.50 Yes L027 R9, GR, MH & PDR * Added 415 RES accounts Bridge Water209 7.50 Yes L021 HC * Added 3 RES accounts Glynn Isles
210 372.50 Yes L043 R6, R12, HC, OC & M20 * Added 149 RES accounts Palm Lakes, Lakewood, Sherwood, Azalea Gardens & Crystal Lake
211 0.00 Yes L022 HC * Added 0 RES accounts Azelea Gardens212 292.50 Yes L021 R9 & HC * Added 117 RES accounts College Park & Brunswick Farms213 255.00 Yes L056 LI, HC GR & PDR * Added 102 RES accounts214 817.50 Yes L021/L056 PDR, R12, GR & MR * Added 327 RES accounts Cypress Run215 2.50 Yes L021 R9, HC & GR * Added 1 RES accounts216 330.00 Partial L044 PDR & PDS * Added 132 RES accounts Sewered, but no customers217 62.50 Partial None R12, M20 R20 & LC * Added 25 RES accounts218 205.00 Partial L044 PDS, MR & PDR * Added 82 RES accounts Glynn Place & Peppertree Crossing219 2.50 Yes L044 GC & PDS * Added 1 RES accounts Mall220 35.00 Partial L021 PDS, GC, HC, MR & OC * Added 14 RES accounts221 72.50 Partial L056 PDS, M20 & MR * Added 29 RES accounts Brunswick Farms
222 425.00 Yes L056 R12, GI, HC, LI M20, & R9 * Added 170 RES accounts Mill Crest, Poplar Lake, Pineview &
Olglebsy Tract

City 2009Water Population Projections
Taz # 09 Pop. Estimate
Built Out Basin Zoned Notes Area
223 7.50 Yes L044 PDS, M20, R12, R20 & GC * Added 3 RES accounts Chapel Crossing
224 2.50 Yes None R9, OC, M20, M6 & R12 * Added 1 RES accounts
225 190.00 Partial L036 FA, LI, FC, R9, M20 & GC * Added 76 RES accounts Sewer, but only a few customers
226 17.50 Partial L036 FA, LI, M9, M20, R9 & FC * Added 7 RES accounts Sewer, but only a few customers
227 5.00 Yes None R12, MH, LC, MH6, R9 & GR * Added 2 RES accounts Sewer in some areas, but private well
& no customers or water mains
228 15.00 Yes L035 R9, R12, MH & M20 * Added 6 RES accounts Sewer in some areas, but private well & no customers or water mains
229 2.58 Yes None HC, R9, M12 & LI * Added 1 RES accounts
230 82.50 Yes None FA, MH & PDR * Added 33 RES accounts No Sewer, but customers & water mains
231 0.00 Yes None PDG, FA & HC * Added 0 RES accounts232 35.00 Partial None M20, HC & R9 * Added 14 RES accounts Some Sewer & few meters233 7.50 Yes None R9, GC & OC * Added 3 RES accounts234 0.00 Yes None R20, HC & GC Use TAZ Center Square235 15.00 Yes None R9, M20, R20 & GR * Added 6 RES accounts240 425.00 Yes L048 HC, PDR, FA, PDS & R12 * Added 170 RES accounts Greyfield Villas, Belle Pointe & 241 565.00 Yes None R12 & CP * Added 266 RES accounts Belle Point East242 12.50 Partial None HC, GR & MR * Added 5 RES accounts243 7.50 Partial None GR, R9 & HC * Added 3 RES accounts244 20.00 Partial L043 R9, CP, HC & M12 * Added 8 RES accounts248 0.00 Yes L003 HC & GC * Added 0 RES accounts Maritime & Hercules249 0.00 Partial None GR & CP * Added 0 RES accounts250 342.50 Yes L017 GR, CP, R9, HC & BI * Added 137 RES accounts Riverside & Oak Park
251 75.00 Partial L017 HC &MH * Added 30 RES accounts Brunswick Farms & Marshview Apt
335 112 50 Y L036 R9 R12 FA LI LC & HC * Add d 45 RES t S ti St t l O k335 112.50 Yes L036 R9, R12, FA, LI, LC & HC * Added 45 RES accounts Septic -- Stately Oaks
336 300.00 Yes L036 R6, R12, R9 & FC * Added 120 RES accounts Septic -- Glynn Heights & Glen Meadows
337 112.50 Yes L036 FC, R12 & PD * Added 45 RES accounts Septic -- River Bend
338 0.00 Yes None HC, M20, LC, R9, FA & LI * Added 0 RES accounts
372 140.00 Yes L056 PDR * Added 56 RES accounts Moss Creek Villas373 7.50 Yes L021 PDS * Added 3 RES accounts Village at Glynn Place
374 20.00 Partial None HC, R12, R20, LC & FA * Added 8 RES accounts No Sewer, but customers & water mains
09 Pop. Estimate
Total 31,246.12
* If projection was zero then used RES #'s for missing data. RES #'s came from
billing data. Per 1 RES account, 2.5 residents were added to overall
population projection.
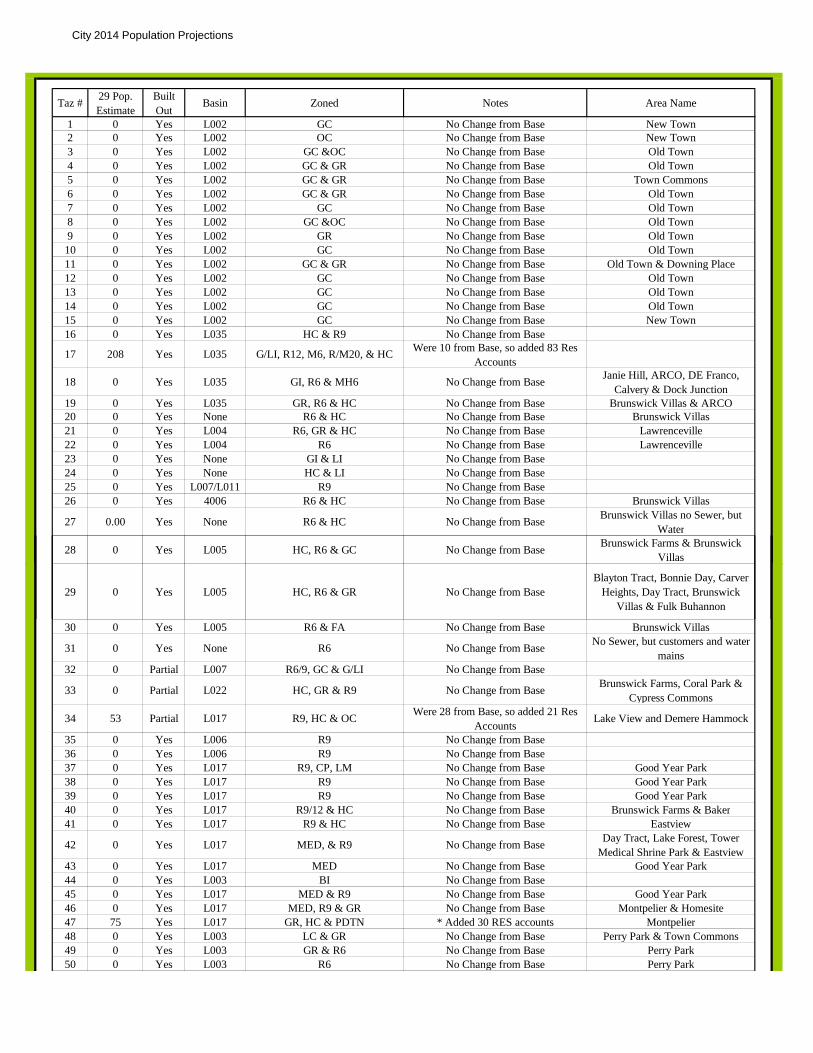
City 2014 Population Projections
Taz # 29 Pop. Estimate
Built Out
Basin Zoned Notes Area Name
1 0 Yes L002 GC No Change from Base New Town2 0 Yes L002 OC No Change from Base New Town3 0 Yes L002 GC &OC No Change from Base Old Town4 0 Yes L002 GC & GR No Change from Base Old Town5 0 Yes L002 GC & GR No Change from Base Town Commons6 0 Yes L002 GC & GR No Change from Base Old Town7 0 Yes L002 GC No Change from Base Old Town8 0 Yes L002 GC &OC No Change from Base Old Town9 0 Yes L002 GR No Change from Base Old Town10 0 Yes L002 GC No Change from Base Old Town11 0 Yes L002 GC & GR No Change from Base Old Town & Downing Place12 0 Yes L002 GC No Change from Base Old Town13 0 Yes L002 GC No Change from Base Old Town14 0 Yes L002 GC No Change from Base Old Town15 0 Yes L002 GC No Change from Base New Town16 0 Yes L035 HC & R9 No Change from Base
17 208 Yes L035 G/LI, R12, M6, R/M20, & HC Were 10 from Base, so added 83 Res Accounts
18 0 Yes L035 GI, R6 & MH6 No Change from Base Janie Hill, ARCO, DE Franco, Calvery & Dock Junction
19 0 Yes L035 GR, R6 & HC No Change from Base Brunswick Villas & ARCO20 0 Yes None R6 & HC No Change from Base Brunswick Villas 21 0 Yes L004 R6, GR & HC No Change from Base Lawrenceville22 0 Yes L004 R6 No Change from Base Lawrenceville23 0 Yes None GI & LI No Change from Base24 0 Yes None HC & LI No Change from Base25 0 Yes L007/L011 R9 No Change from Base26 0 Yes 4006 R6 & HC No Change from Base Brunswick Villas
27 0.00 Yes None R6 & HC No Change from Base Brunswick Villas no Sewer, but Water
28 0 Yes L005 HC, R6 & GC No Change from Base Brunswick Farms & Brunswick Villas
29 0 Yes L005 HC, R6 & GR No Change from BaseBlayton Tract, Bonnie Day, Carver
Heights, Day Tract, Brunswick Villas & Fulk Buhannon
30 0 Yes L005 R6 & FA No Change from Base Brunswick Villas
31 0 Yes None R6 No Change from Base No Sewer, but customers and water mains
32 0 Partial L007 R6/9, GC & G/LI No Change from Base
33 0 Partial L022 HC, GR & R9 No Change from Base Brunswick Farms, Coral Park & Cypress Commons
34 53 Partial L017 R9, HC & OC Were 28 from Base, so added 21 Res Accounts
Lake View and Demere Hammock
35 0 Yes L006 R9 No Change from Base36 0 Yes L006 R9 No Change from Base37 0 Yes L017 R9, CP, LM No Change from Base Good Year Park38 0 Yes L017 R9 No Change from Base Good Year Park39 0 Yes L017 R9 No Change from Base Good Year Park40 0 Yes L017 R9/12 & HC No Change from Base Brunswick Farms & Baker41 0 Yes L017 R9 & HC No Change from Base Eastview
42 0 Yes L017 MED, & R9 No Change from Base Day Tract, Lake Forest, Tower Medical Shrine Park & Eastview
43 0 Yes L017 MED No Change from Base Good Year Park44 0 Yes L003 BI No Change from Base45 0 Yes L017 MED & R9 No Change from Base Good Year Park46 0 Yes L017 MED, R9 & GR No Change from Base Montpelier & Homesite47 75 Yes L017 GR, HC & PDTN * Added 30 RES accounts Montpelier48 0 Yes L003 LC & GR No Change from Base Perry Park & Town Commons49 0 Yes L003 GR & R6 No Change from Base Perry Park50 0 Yes L003 R6 No Change from Base Perry Park

City 2014 Population Projections
Taz # 29 Pop. Estimate
Built Out
Basin Zoned Notes Area Name
51 0 Yes L003 GR & LC No Change from Base Town Commons52 0 Yes L003 CP, GR & HC No Change from Base Mayhew53 0 Yes L003 HC No Change from Base Town Commons54 0 Yes L003 HC & R6 No Change from Base Dart Tract & Osborne55 0 Yes L003 HC & R6 No Change from Base Urbana & Dart Tract56 0 Yes L003 HC, OC & R6 No Change from Base Urbana57 0 Yes L003 OC & R6 No Change from Base Urbana
58 0 Yes L003 GR, CP, & LC No Change from Base Mayhew, Perry Park and Town Commons
59 0 Yes L003 GR & CP No Change from Base Town Commons60 0 Yes L002/L003 GR No Change from Base Town Commons61 0 Yes L002 GR & LC No Change from Base Town Commons 62 0 Yes L002 GR, OC & HC No Change from Base Town Commons & Urbana63 0 Yes L002/L003 GR & GC No Change from Base New Town 64 0 Yes L003 GR & LC No Change from Base Town Commons65 0 Yes L003 GR & LC No Change from Base Town Commons66 0 Yes L002 GR & GC No Change from Base Town Commons67 0 Yes L002 GR No Change from Base Town Commons68 0 Yes L002 GR, OC & GC No Change from Base Town Commons69 0 Yes L002 GR & GC No Change from Base Town Commons70 0 Yes L002 GR No Change from Base Town Commons71 0 Yes L002 GR & GC No Change from Base New Town 72 0 Yes L002 GR & GC No Change from Base New Town & Town Commons73 0 Yes L003 GR & GC No Change from Base New Town & Town Commons74 0 Yes L003/L010 GR & LC No Change from Base Town Commons75 0 Yes L003/L004 GR & LC No Change from Base Town Commons76 0 Yes L003 LC No Change from Base Town Commons77 0 Yes L003 GR No Change from Base Town Commons78 0 Yes L003 GR No Change from Base Town Commons79 0 Yes L003 GR No Change from Base Town Commons80 0 Yes L003 GR & GC No Change from Base New Town & Town Commons81 0 Partial L004 R6 & GC No Change from Base Day Tract & Lawrenceville82 0 Y L004 GI LC GR & HC N Ch f B A & D T t82 0 Yes L004 GI, LC, GR & HC No Change from Base Ayres & Day Tract83 0 Yes L004 GR, GC, CP, LC & HC No Change from Base Washington Heights
84 0 Yes L004 GI & GC No Change from Base Avers, Day Tract & Lawrenceville
85 0 Yes L004 GI, GC & GR No Change from Base86 0 Yes L003 R6, GR, OC & LC No Change from Base Town Commons87 0 Yes L004 R6 No Change from Base Lincoln Park88 0 Yes L004 R6 & GR No Change from Base Lawrenceville89 0 Yes L003/L004 R6 & GC No Change from Base Day Tract & New Town90 0 Yes L003 R6 & GC No Change from Base New Town92 0 Yes L035 HC, M20, R9, CP & M12 No Change from Base93 185 Yes L035 BI & R6 * Added 74 RES accounts ARCO94 0 Partial L035 HC No Change from Base ARCO95 0 Yes None BI No Change from Base
96 0 Yes L035 BI, R6, CP, GC & M12 No Change from Base ARCO, Lipthratt Island & Brunswick Farms
97 0 Yes L035 HC, GI & R6 Model Farms98 0 Yes L035 CP No Change from Base
99 38 Yes None HC, R6, GC & LC * Added 15 RES accounts No Sewer, but customers and water mains
100 0 Yes L004 R6 & HC No Change from Base Lawrenceville101 0 Yes L004 R6 & GC No Change from Base Lawrenceville102 0 Yes L004 GC & R6 No Change from Base Peninsula Park & Day Tract103 0 Yes L004 CP No Change from Base104 0 Yes L004 BI No Change from Base WWTP105 0 Yes L003/L004 GR, GC & HC No Change from Base Peninsula Park & New Town106 0 Yes L003 GC, CP, HC & GR No Change from Base New Town 107 0 Yes L003 GR, GC, HC & PDTN No Change from Base New Town 108 0 Yes L003 GR, GC, HC, LC & CP No Change from Base New Town

City 2014 Population Projections
Taz # 29 Pop. Estimate
Built Out
Basin Zoned Notes Area Name
109 0 Yes L003 GR & HC No Change from Base New Town 110 0 Yes L003 GR No Change from Base New Town 111 0 Yes L002/L003 GC & GR No Change from Base New Town 112 0 Yes L002 GC & GR No Change from Base New Town 113 0 Yes L002 GR, OC & GR No Change from Base New Town 114 0 Yes L002 GC & GR No Change from Base New Town 115 0 Yes L002 GR & OC No Change from Base New Town 116 0 Yes L002 BI & CP No Change from Base117 0 Yes L002 GR, LC & OC No Change from Base New Town 118 0 Yes L002 GR & OC No Change from Base New Town 119 0 Yes L002 GC & BI No Change from Base Old Town120 0 Yes L002 GR, CP & GP No Change from Base Old Town121 0 Yes L002 GR & CP No Change from Base Old Town122 0 Yes L002 GR No Change from Base Old Town123 0 Yes L002 GR No Change from Base Old Town124 0 Yes L002 GR & CP No Change from Base Old Town125 0 Yes L002 GR & BI No Change from Base Old Town126 0 Yes L002 GC & BI No Change from Base Old Town127 0 Yes L002 GR, LC & OC No Change from Base Town Commons128 0 Yes L002 GC, CP & R9 No Change from Base Town Commons & Windsor Park129 0 Yes L002 GR, LI & GI No Change from Base Dixiville130 0 Yes L002 GR & GC No Change from Base Old Town131 0 Yes L002 GR, CP & OC No Change from Base Old Town132 0 Yes L002 GR No Change from Base Old Town133 0 Yes L002 GR & CP No Change from Base Old Town134 0 Yes L002 R9 & CP No Change from Base Windsor Park135 0 Yes L002 CP No Change from Base Windsor Park & Marsh Tract136 300 Yes L002 GR & R9 * Added 120 RES accounts137 0 Yes L002 GR, CP & LI No Change from Base Old Town138 0 Yes L002 GR No Change from Base Old Town139 0 Yes L002 GR & R6 No Change from Base Habersham Park140 0 Partial L002 CP No Change from Base141 20 Y L002 GI GR & CP * Add d 8 RES t141 20 Yes L002 GI, GR & CP * Added 8 RES accounts142 0 Yes L001/L002 GR No Change from Base Old Town
143 0 Yes L001/L002 R6, LC & GR No Change from Base Old Town, South End, Davenport Tract & 4.5 Acre Tract
144 0 Yes L001 BI &R6 No Change from Base145 0 Yes L002 GR & GI No Change from Base Old Town146 0 Yes L001/L002 R6 No Change from Base South End147 0 Yes L001 R6 No Change from Base South Union and 33 Acre Tract
148 2,775 Partial L001 PDG & BI Liberty Harbor: 224 Lots @ 2.5 Residents/HH
Liberty Harbor
150 0 Yes L001 BI No Change from Base South Yard151 0 Yes L002 GC No Change from Base Old Town152 0 Yes L003 GR & HC No Change from Base New Town 153 0 Yes L003 LC, GR & GC No Change from Base New Town 154 0 Yes L003 GR No Change from Base Town Commons155 0 Yes L006 R9 No Change from Base156 0 Yes L043 R9, HC M9, OC & GC No Change from Base157 0 Partial L035/L004 GC & CP No Change from Base158 0 Yes L006/L007 R9 No Change from Base Magnolia Park159 0 Partial L006 GC & R9 No Change from Base Brunswick Farms160 0 Yes L011 R9, HC & PDH No Change from Base Glynn Plaza & Magnolia Park
161 50.00 Partial L035 GI, GC, LI & R6 * Added 20 RES accounts Courson to be serviced with water
162 0 Partial None BI No Change from Base

City 2014 Population Projections
Taz # 29 Pop. Estimate
Built Out
Basin Zoned Notes Area Name
163 308 Partial None BI, R9, M20, LC & HC * Added 123 RES accounts Dock Junction to be serviced with water
164 0 Yes L035 R12, CP, HC, R9 & MH No Change from Base Private Well165 0 Yes L035 HC & GI No Change from Base166 153 Partial L011 PDI & HC * Added 61 RES accounts179 0 Yes L127 GR & HC * Added 0 RES accounts
181 175 Partial L036 FC, HC, FA, GR & R9 * Added 65 RES accounts Assuming water mains will be added
195 0 Yes L048 G COM FLETC196 113 Yes L048 G & R6 * Added 45 RES accounts FLETC200 0 Yes L023 R9, LC & GC No Change from Base Glynco Annex201 0 Partial L048 FA, PD & R12 No Change from Base
202 0 Yes L023 PDR, R12 & R9 No Change from Base Cambro Tract, Palmetto Estate & Glynn Marsh
203 0 Yes L028 R6 & R12 No Change from Base Culligans Landing
204 0 Yes L021/L027/L028
OC, HC, R6 & R9 No Change from Base Beverly Shores & Country Club Heights
205 0 Yes L028 PDG No Change from Base Hidden Lakes & Marsh Landing206 0 Yes L021 HC, R6 & R9 No Change from Base Beverly Shores207 0 Yes L021 HC, R9 & MR No Change from Base Bristol & Beverly Shores208 0 Yes L027 R9, GR, MH & PDR No Change from Base Bridge Water209 0 Yes L021 HC No Change from Base Glynn Isles210 4 Yes L043 R6, R12, HC, OC & M20 * Added 2 RES accounts Palm Lakes211 0 Yes L022 HC No Change from Base Azelea Gardens212 0 Yes L021 R9 & HC No Change from Base College Park & Brunswick Farms213 0 Yes L056 LI, HC GR & PDR No Change from Base214 0 Yes L021/L056 PDR, R12, GR & MR No Change from Base Cypress Run215 0 Yes L021 R9, HC & GR No Change from Base216 409 Partial L044 PDR & PDS Use TAZ Glynn Place217 0 Partial None R12, M20 R20 & LC No Change from Base
218 0 Partial L044 PDS, MR & PDR No Change from Base Glynn Place & Peppertree Crossing
219 0 Y L044 GC & PDS N Ch f B M ll219 0 Yes L044 GC & PDS No Change from Base Mall220 0 Partial L021 PDS, GC, HC, MR & OC No Change from Base221 0 Partial L056 PDS, M20 & MR No Change from Base Brunswick Farms222 0 Yes L056 R12, GI, HC, LI M20, & R9 No Change from Base Mill Crest223 308 Yes L044 PDS, M20, R12, R20 & GC * Added 123 RES accounts Chapel Crossing224 100 Yes None R9, OC, M20, M6 & R12 * Added 40 RES accounts Helveston Oaks and Pine Forest
225 151 Partial L036 FA, LI, FC, R9, M20 & GC Use TAZ Plan to add water in future (Used TAZ (similar to sewer))
226 58 Partial L036 FA, LI, M9, M20, R9 & FC Took 1/2 TAZ Plan to add water in future (Used 1/2 TAZ (similar to sewer))
227 90.00 Yes None R12, MH, LC, MH6, R9 & GR * Added 36 RES accounts Chapel Park and Breeckin Ridge to be serviced with water
228 450.00 Yes L035 R9, R12, MH & M20 * Added 120 RES accountsCoxville, Yellow Bluff Estate,
Vinson Tract and Pine Ridge to be serviced with water
229 88 Yes None HC, R9, M12 & LI * Added 35 RES accountsGlynnwood Estates and Yellow Bluff Estates to be serviced with
water
230 125 Yes None FA, MH & PDR * Added 50 RES accountsGlover Place, J.O. Kinchen Estates and Parkwood to be serviced with
water231 0 Yes None PDG, FA & HC No Change from Base232 0 Partial None M20, HC & R9 No Change from Base233 70 Yes None R9, GC & OC * Added 28 RES accounts Kinstle to be serviced with water234 0 Yes None R20, HC & GC No Change from Base Center Square
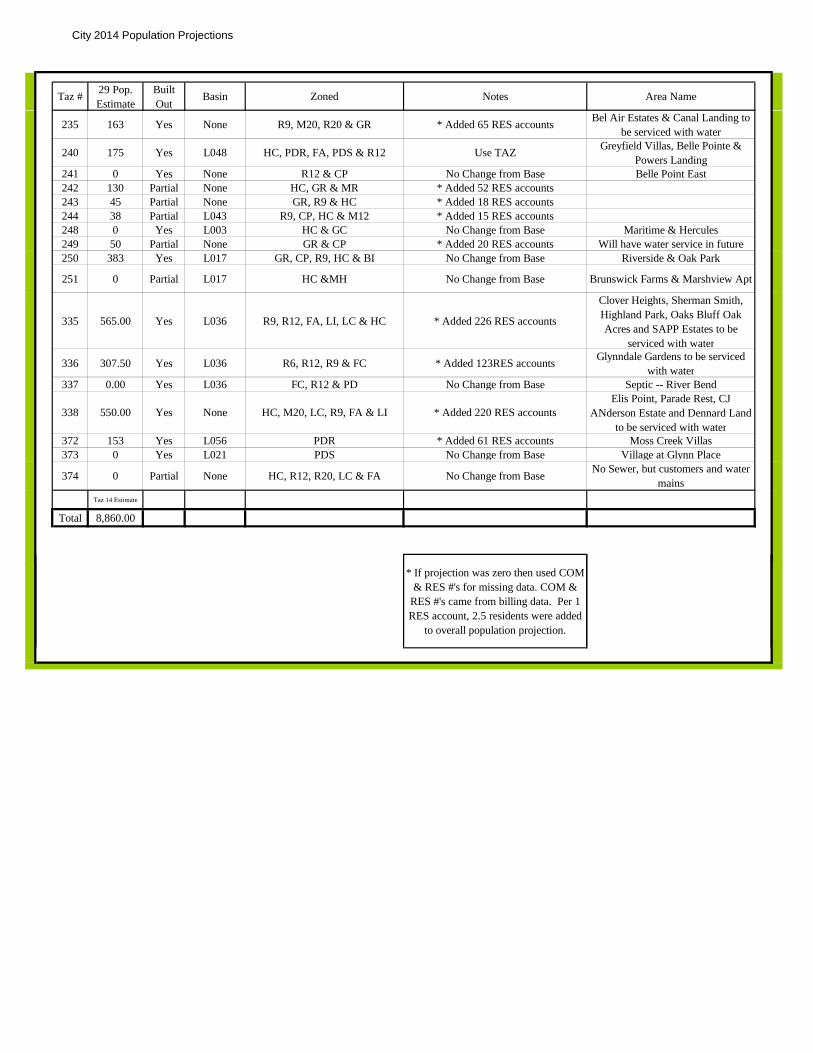
City 2014 Population Projections
Taz # 29 Pop. Estimate
Built Out
Basin Zoned Notes Area Name
235 163 Yes None R9, M20, R20 & GR * Added 65 RES accounts Bel Air Estates & Canal Landing to be serviced with water
240 175 Yes L048 HC, PDR, FA, PDS & R12 Use TAZ Greyfield Villas, Belle Pointe & Powers Landing
241 0 Yes None R12 & CP No Change from Base Belle Point East242 130 Partial None HC, GR & MR * Added 52 RES accounts243 45 Partial None GR, R9 & HC * Added 18 RES accounts244 38 Partial L043 R9, CP, HC & M12 * Added 15 RES accounts248 0 Yes L003 HC & GC No Change from Base Maritime & Hercules249 50 Partial None GR & CP * Added 20 RES accounts Will have water service in future250 383 Yes L017 GR, CP, R9, HC & BI No Change from Base Riverside & Oak Park
251 0 Partial L017 HC &MH No Change from Base Brunswick Farms & Marshview Apt
335 565.00 Yes L036 R9, R12, FA, LI, LC & HC * Added 226 RES accounts
Clover Heights, Sherman Smith, Highland Park, Oaks Bluff Oak Acres and SAPP Estates to be
serviced with water
336 307.50 Yes L036 R6, R12, R9 & FC * Added 123RES accounts Glynndale Gardens to be serviced with water
337 0.00 Yes L036 FC, R12 & PD No Change from Base Septic -- River Bend
338 550.00 Yes None HC, M20, LC, R9, FA & LI * Added 220 RES accountsElis Point, Parade Rest, CJ
ANderson Estate and Dennard Land to be serviced with water
372 153 Yes L056 PDR * Added 61 RES accounts Moss Creek Villas373 0 Yes L021 PDS No Change from Base Village at Glynn Place
374 0 Partial None HC, R12, R20, LC & FA No Change from Base No Sewer, but customers and water mains
Taz 14 Estimate
Total 8,860.00
* If projection was zero then used COM & RES #'s for missing data. COM &
RES #'s came from billing data. Per 1 RES account, 2.5 residents were added
to overall population projection.
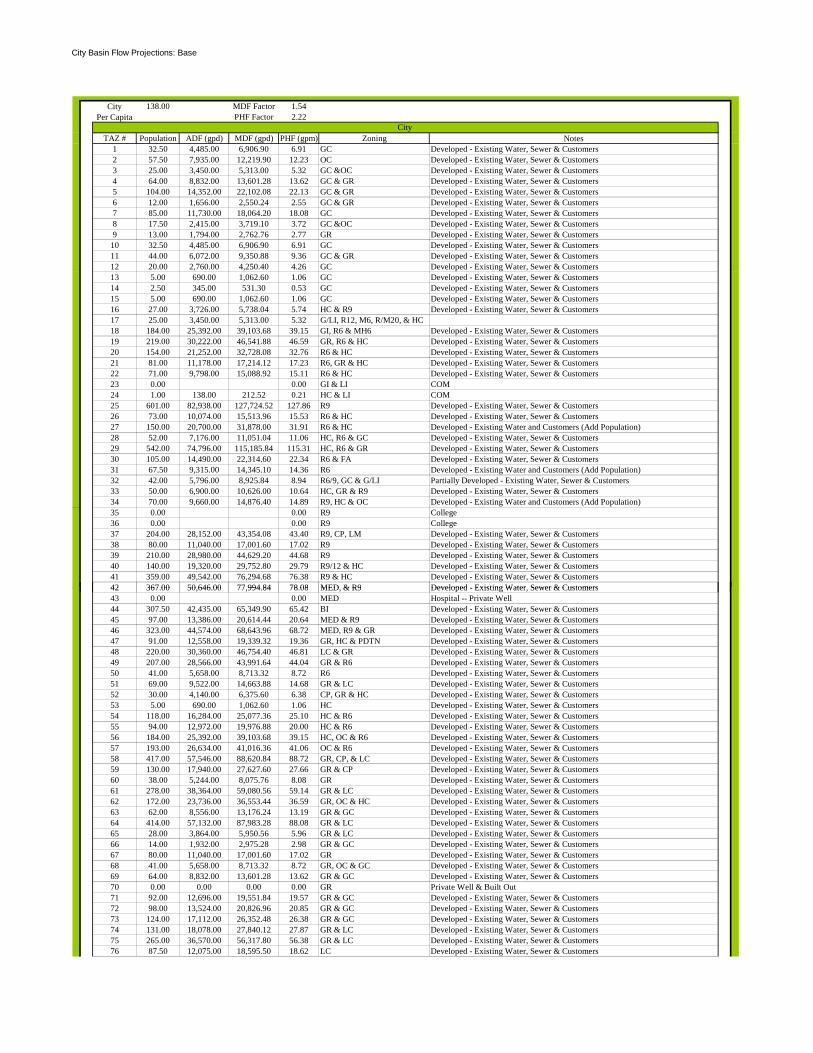
City Basin Flow Projections: Base
City 138.00 MDF Factor 1.54Per Capita PHF Factor 2.22
TAZ # Population ADF (gpd) MDF (gpd) PHF (gpm) Zoning Notes1 32.50 4,485.00 6,906.90 6.91 GC Developed - Existing Water, Sewer & Customers2 57.50 7,935.00 12,219.90 12.23 OC Developed - Existing Water, Sewer & Customers3 25.00 3,450.00 5,313.00 5.32 GC &OC Developed - Existing Water, Sewer & Customers4 64.00 8,832.00 13,601.28 13.62 GC & GR Developed - Existing Water, Sewer & Customers5 104.00 14,352.00 22,102.08 22.13 GC & GR Developed - Existing Water, Sewer & Customers6 12.00 1,656.00 2,550.24 2.55 GC & GR Developed - Existing Water, Sewer & Customers7 85.00 11,730.00 18,064.20 18.08 GC Developed - Existing Water, Sewer & Customers8 17.50 2,415.00 3,719.10 3.72 GC &OC Developed - Existing Water, Sewer & Customers9 13.00 1,794.00 2,762.76 2.77 GR Developed - Existing Water, Sewer & Customers
10 32.50 4,485.00 6,906.90 6.91 GC Developed - Existing Water, Sewer & Customers11 44.00 6,072.00 9,350.88 9.36 GC & GR Developed - Existing Water, Sewer & Customers12 20.00 2,760.00 4,250.40 4.26 GC Developed - Existing Water, Sewer & Customers13 5.00 690.00 1,062.60 1.06 GC Developed - Existing Water, Sewer & Customers14 2.50 345.00 531.30 0.53 GC Developed - Existing Water, Sewer & Customers15 5.00 690.00 1,062.60 1.06 GC Developed - Existing Water, Sewer & Customers16 27.00 3,726.00 5,738.04 5.74 HC & R9 Developed - Existing Water, Sewer & Customers17 25.00 3,450.00 5,313.00 5.32 G/LI, R12, M6, R/M20, & HC 18 184.00 25,392.00 39,103.68 39.15 GI, R6 & MH6 Developed - Existing Water, Sewer & Customers19 219.00 30,222.00 46,541.88 46.59 GR, R6 & HC Developed - Existing Water, Sewer & Customers20 154.00 21,252.00 32,728.08 32.76 R6 & HC Developed - Existing Water, Sewer & Customers21 81.00 11,178.00 17,214.12 17.23 R6, GR & HC Developed - Existing Water, Sewer & Customers22 71.00 9,798.00 15,088.92 15.11 R6 & HC Developed - Existing Water, Sewer & Customers23 0.00 0.00 GI & LI COM24 1.00 138.00 212.52 0.21 HC & LI COM25 601.00 82,938.00 127,724.52 127.86 R9 Developed - Existing Water, Sewer & Customers26 73.00 10,074.00 15,513.96 15.53 R6 & HC Developed - Existing Water, Sewer & Customers27 150.00 20,700.00 31,878.00 31.91 R6 & HC Developed - Existing Water and Customers (Add Population)28 52.00 7,176.00 11,051.04 11.06 HC, R6 & GC Developed - Existing Water, Sewer & Customers29 542.00 74,796.00 115,185.84 115.31 HC, R6 & GR Developed - Existing Water, Sewer & Customers30 105.00 14,490.00 22,314.60 22.34 R6 & FA Developed - Existing Water, Sewer & Customers31 67.50 9,315.00 14,345.10 14.36 R6 Developed - Existing Water and Customers (Add Population)32 42.00 5,796.00 8,925.84 8.94 R6/9, GC & G/LI Partially Developed - Existing Water, Sewer & Customers33 50.00 6,900.00 10,626.00 10.64 HC, GR & R9 Developed - Existing Water, Sewer & Customers34 70.00 9,660.00 14,876.40 14.89 R9, HC & OC Developed - Existing Water and Customers (Add Population)35 0.00 0.00 R9 College36 0.00 0.00 R9 College37 204.00 28,152.00 43,354.08 43.40 R9, CP, LM Developed - Existing Water, Sewer & Customers38 80.00 11,040.00 17,001.60 17.02 R9 Developed - Existing Water, Sewer & Customers39 210.00 28,980.00 44,629.20 44.68 R9 Developed - Existing Water, Sewer & Customers40 140.00 19,320.00 29,752.80 29.79 R9/12 & HC Developed - Existing Water, Sewer & Customers41 359.00 49,542.00 76,294.68 76.38 R9 & HC Developed - Existing Water, Sewer & Customers42 367 00 50 646 00 77 994 84 78 08 MED & R9 Developed - Existing Water Sewer & Customers
City
42 367.00 50,646.00 77,994.84 78.08 MED, & R9 Developed - Existing Water, Sewer & Customers43 0.00 0.00 MED Hospital -- Private Well 44 307.50 42,435.00 65,349.90 65.42 BI Developed - Existing Water, Sewer & Customers45 97.00 13,386.00 20,614.44 20.64 MED & R9 Developed - Existing Water, Sewer & Customers46 323.00 44,574.00 68,643.96 68.72 MED, R9 & GR Developed - Existing Water, Sewer & Customers47 91.00 12,558.00 19,339.32 19.36 GR, HC & PDTN Developed - Existing Water, Sewer & Customers48 220.00 30,360.00 46,754.40 46.81 LC & GR Developed - Existing Water, Sewer & Customers49 207.00 28,566.00 43,991.64 44.04 GR & R6 Developed - Existing Water, Sewer & Customers50 41.00 5,658.00 8,713.32 8.72 R6 Developed - Existing Water, Sewer & Customers51 69.00 9,522.00 14,663.88 14.68 GR & LC Developed - Existing Water, Sewer & Customers52 30.00 4,140.00 6,375.60 6.38 CP, GR & HC Developed - Existing Water, Sewer & Customers53 5.00 690.00 1,062.60 1.06 HC Developed - Existing Water, Sewer & Customers54 118.00 16,284.00 25,077.36 25.10 HC & R6 Developed - Existing Water, Sewer & Customers55 94.00 12,972.00 19,976.88 20.00 HC & R6 Developed - Existing Water, Sewer & Customers56 184.00 25,392.00 39,103.68 39.15 HC, OC & R6 Developed - Existing Water, Sewer & Customers57 193.00 26,634.00 41,016.36 41.06 OC & R6 Developed - Existing Water, Sewer & Customers58 417.00 57,546.00 88,620.84 88.72 GR, CP, & LC Developed - Existing Water, Sewer & Customers59 130.00 17,940.00 27,627.60 27.66 GR & CP Developed - Existing Water, Sewer & Customers60 38.00 5,244.00 8,075.76 8.08 GR Developed - Existing Water, Sewer & Customers61 278.00 38,364.00 59,080.56 59.14 GR & LC Developed - Existing Water, Sewer & Customers62 172.00 23,736.00 36,553.44 36.59 GR, OC & HC Developed - Existing Water, Sewer & Customers63 62.00 8,556.00 13,176.24 13.19 GR & GC Developed - Existing Water, Sewer & Customers64 414.00 57,132.00 87,983.28 88.08 GR & LC Developed - Existing Water, Sewer & Customers65 28.00 3,864.00 5,950.56 5.96 GR & LC Developed - Existing Water, Sewer & Customers66 14.00 1,932.00 2,975.28 2.98 GR & GC Developed - Existing Water, Sewer & Customers67 80.00 11,040.00 17,001.60 17.02 GR Developed - Existing Water, Sewer & Customers68 41.00 5,658.00 8,713.32 8.72 GR, OC & GC Developed - Existing Water, Sewer & Customers69 64.00 8,832.00 13,601.28 13.62 GR & GC Developed - Existing Water, Sewer & Customers70 0.00 0.00 0.00 0.00 GR Private Well & Built Out71 92.00 12,696.00 19,551.84 19.57 GR & GC Developed - Existing Water, Sewer & Customers72 98.00 13,524.00 20,826.96 20.85 GR & GC Developed - Existing Water, Sewer & Customers73 124.00 17,112.00 26,352.48 26.38 GR & GC Developed - Existing Water, Sewer & Customers74 131.00 18,078.00 27,840.12 27.87 GR & LC Developed - Existing Water, Sewer & Customers75 265.00 36,570.00 56,317.80 56.38 GR & LC Developed - Existing Water, Sewer & Customers76 87.50 12,075.00 18,595.50 18.62 LC Developed - Existing Water, Sewer & Customers
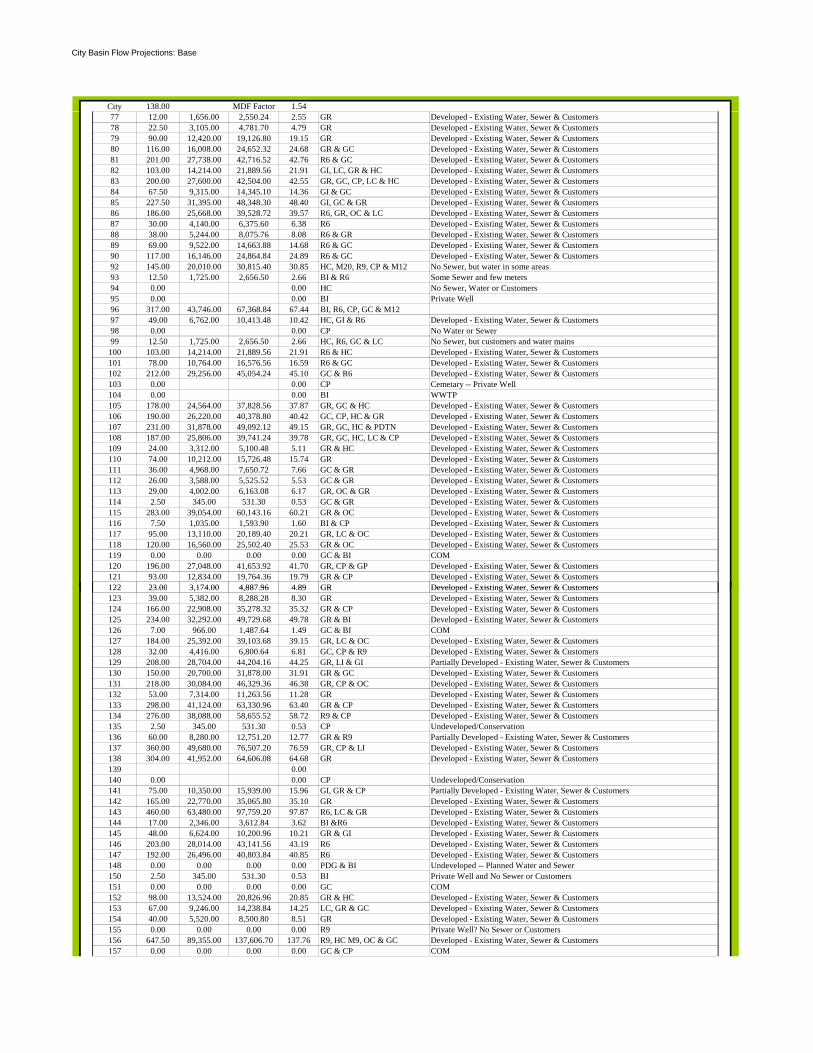
City Basin Flow Projections: Base
City 138.00 MDF Factor 1.5477 12.00 1,656.00 2,550.24 2.55 GR Developed - Existing Water, Sewer & Customers78 22.50 3,105.00 4,781.70 4.79 GR Developed - Existing Water, Sewer & Customers79 90.00 12,420.00 19,126.80 19.15 GR Developed - Existing Water, Sewer & Customers80 116.00 16,008.00 24,652.32 24.68 GR & GC Developed - Existing Water, Sewer & Customers81 201.00 27,738.00 42,716.52 42.76 R6 & GC Developed - Existing Water, Sewer & Customers82 103.00 14,214.00 21,889.56 21.91 GI, LC, GR & HC Developed - Existing Water, Sewer & Customers83 200.00 27,600.00 42,504.00 42.55 GR, GC, CP, LC & HC Developed - Existing Water, Sewer & Customers84 67.50 9,315.00 14,345.10 14.36 GI & GC Developed - Existing Water, Sewer & Customers85 227.50 31,395.00 48,348.30 48.40 GI, GC & GR Developed - Existing Water, Sewer & Customers86 186.00 25,668.00 39,528.72 39.57 R6, GR, OC & LC Developed - Existing Water, Sewer & Customers87 30.00 4,140.00 6,375.60 6.38 R6 Developed - Existing Water, Sewer & Customers88 38.00 5,244.00 8,075.76 8.08 R6 & GR Developed - Existing Water, Sewer & Customers89 69.00 9,522.00 14,663.88 14.68 R6 & GC Developed - Existing Water, Sewer & Customers90 117.00 16,146.00 24,864.84 24.89 R6 & GC Developed - Existing Water, Sewer & Customers92 145.00 20,010.00 30,815.40 30.85 HC, M20, R9, CP & M12 No Sewer, but water in some areas 93 12.50 1,725.00 2,656.50 2.66 BI & R6 Some Sewer and few meters94 0.00 0.00 HC No Sewer, Water or Customers95 0.00 0.00 BI Private Well96 317.00 43,746.00 67,368.84 67.44 BI, R6, CP, GC & M1297 49.00 6,762.00 10,413.48 10.42 HC, GI & R6 Developed - Existing Water, Sewer & Customers98 0.00 0.00 CP No Water or Sewer 99 12.50 1,725.00 2,656.50 2.66 HC, R6, GC & LC No Sewer, but customers and water mains100 103.00 14,214.00 21,889.56 21.91 R6 & HC Developed - Existing Water, Sewer & Customers101 78.00 10,764.00 16,576.56 16.59 R6 & GC Developed - Existing Water, Sewer & Customers102 212.00 29,256.00 45,054.24 45.10 GC & R6 Developed - Existing Water, Sewer & Customers103 0.00 0.00 CP Cemetary -- Private Well104 0.00 0.00 BI WWTP105 178.00 24,564.00 37,828.56 37.87 GR, GC & HC Developed - Existing Water, Sewer & Customers106 190.00 26,220.00 40,378.80 40.42 GC, CP, HC & GR Developed - Existing Water, Sewer & Customers107 231.00 31,878.00 49,092.12 49.15 GR, GC, HC & PDTN Developed - Existing Water, Sewer & Customers108 187.00 25,806.00 39,741.24 39.78 GR, GC, HC, LC & CP Developed - Existing Water, Sewer & Customers109 24.00 3,312.00 5,100.48 5.11 GR & HC Developed - Existing Water, Sewer & Customers110 74.00 10,212.00 15,726.48 15.74 GR Developed - Existing Water, Sewer & Customers111 36.00 4,968.00 7,650.72 7.66 GC & GR Developed - Existing Water, Sewer & Customers112 26.00 3,588.00 5,525.52 5.53 GC & GR Developed - Existing Water, Sewer & Customers113 29.00 4,002.00 6,163.08 6.17 GR, OC & GR Developed - Existing Water, Sewer & Customers114 2.50 345.00 531.30 0.53 GC & GR Developed - Existing Water, Sewer & Customers115 283.00 39,054.00 60,143.16 60.21 GR & OC Developed - Existing Water, Sewer & Customers116 7.50 1,035.00 1,593.90 1.60 BI & CP Developed - Existing Water, Sewer & Customers117 95.00 13,110.00 20,189.40 20.21 GR, LC & OC Developed - Existing Water, Sewer & Customers118 120.00 16,560.00 25,502.40 25.53 GR & OC Developed - Existing Water, Sewer & Customers119 0.00 0.00 0.00 0.00 GC & BI COM120 196.00 27,048.00 41,653.92 41.70 GR, CP & GP Developed - Existing Water, Sewer & Customers121 93.00 12,834.00 19,764.36 19.79 GR & CP Developed - Existing Water, Sewer & Customers122 23 00 3 174 00 4 887 96 4 89 GR Developed - Existing Water Sewer & Customers122 23.00 3,174.00 4,887.96 4.89 GR Developed - Existing Water, Sewer & Customers123 39.00 5,382.00 8,288.28 8.30 GR Developed - Existing Water, Sewer & Customers124 166.00 22,908.00 35,278.32 35.32 GR & CP Developed - Existing Water, Sewer & Customers125 234.00 32,292.00 49,729.68 49.78 GR & BI Developed - Existing Water, Sewer & Customers126 7.00 966.00 1,487.64 1.49 GC & BI COM127 184.00 25,392.00 39,103.68 39.15 GR, LC & OC Developed - Existing Water, Sewer & Customers128 32.00 4,416.00 6,800.64 6.81 GC, CP & R9 Developed - Existing Water, Sewer & Customers129 208.00 28,704.00 44,204.16 44.25 GR, LI & GI Partially Developed - Existing Water, Sewer & Customers130 150.00 20,700.00 31,878.00 31.91 GR & GC Developed - Existing Water, Sewer & Customers131 218.00 30,084.00 46,329.36 46.38 GR, CP & OC Developed - Existing Water, Sewer & Customers132 53.00 7,314.00 11,263.56 11.28 GR Developed - Existing Water, Sewer & Customers133 298.00 41,124.00 63,330.96 63.40 GR & CP Developed - Existing Water, Sewer & Customers134 276.00 38,088.00 58,655.52 58.72 R9 & CP Developed - Existing Water, Sewer & Customers135 2.50 345.00 531.30 0.53 CP Undeveloped/Conservation136 60.00 8,280.00 12,751.20 12.77 GR & R9 Partially Developed - Existing Water, Sewer & Customers137 360.00 49,680.00 76,507.20 76.59 GR, CP & LI Developed - Existing Water, Sewer & Customers138 304.00 41,952.00 64,606.08 64.68 GR Developed - Existing Water, Sewer & Customers139 0.00140 0.00 0.00 CP Undeveloped/Conservation141 75.00 10,350.00 15,939.00 15.96 GI, GR & CP Partially Developed - Existing Water, Sewer & Customers142 165.00 22,770.00 35,065.80 35.10 GR Developed - Existing Water, Sewer & Customers143 460.00 63,480.00 97,759.20 97.87 R6, LC & GR Developed - Existing Water, Sewer & Customers144 17.00 2,346.00 3,612.84 3.62 BI &R6 Developed - Existing Water, Sewer & Customers145 48.00 6,624.00 10,200.96 10.21 GR & GI Developed - Existing Water, Sewer & Customers146 203.00 28,014.00 43,141.56 43.19 R6 Developed - Existing Water, Sewer & Customers147 192.00 26,496.00 40,803.84 40.85 R6 Developed - Existing Water, Sewer & Customers148 0.00 0.00 0.00 0.00 PDG & BI Undeveloped -- Planned Water and Sewer150 2.50 345.00 531.30 0.53 BI Private Well and No Sewer or Customers151 0.00 0.00 0.00 0.00 GC COM152 98.00 13,524.00 20,826.96 20.85 GR & HC Developed - Existing Water, Sewer & Customers153 67.00 9,246.00 14,238.84 14.25 LC, GR & GC Developed - Existing Water, Sewer & Customers154 40.00 5,520.00 8,500.80 8.51 GR Developed - Existing Water, Sewer & Customers155 0.00 0.00 0.00 0.00 R9 Private Well? No Sewer or Customers156 647.50 89,355.00 137,606.70 137.76 R9, HC M9, OC & GC Developed - Existing Water, Sewer & Customers157 0.00 0.00 0.00 0.00 GC & CP COM

City Basin Flow Projections: Base
City 138.00 MDF Factor 1.54158 42.50 5,865.00 9,032.10 9.04 R9 Developed - Existing Water, Sewer & Customers159 0.00 0.00 0.00 0.00 GC & R9 Developed - Existing Water, Sewer & Customers160 60.00 8,280.00 12,751.20 12.77 R9, HC & PDH Developed - Existing Water, Sewer & Customers161 0.00 0.00 0.00 0.00 GI, GC, LI & R6 Sewer, but no customers or water main162 0.00 0.00 BI Septic/Industrial163 15.00 2,070.00 3,187.80 3.19 BI, R9, M20, LC & HC No Sewer, but water in some areas --- add population164 0.00 0.00 0.00 0.00 R12, CP, HC, R9 & MH Private Well and Septic165 7.50 1,035.00 1,593.90 1.60 HC & GI COM166 5.00 690.00 1,062.60 1.06 PDI & HC Partially Developed - Existing Water, Future Sewer & Future Customers179 0.00 0.00 GR & HC Private Well and Built Out181 12.50 1,725.00 2,656.50 2.66 FC, HC, FA, GR & R9 Sewer, but only a few water customers 195 0.00 0.00 0.00 0.00 G FLETC - COM196 650.00 89,700.00 138,138.00 138.29 G & R6 FLETC - Took out COM200 1,133.00 156,354.00 240,785.16 241.05 R9, LC & GC Developed - Existing Water, Sewer & Customers201 100.00 13,800.00 21,252.00 21.28 FA, PD & R12 Developed - Existing Water, Sewer & Customers (Country Club) 202 490.00 67,620.00 104,134.80 104.25 PDR, R12 & R9 Developed - Existing Water, Sewer & Customers203 1,247.00 172,086.00 265,012.44 265.30 R6 & R12 Developed - Existing Water, Sewer & Customers204 1,043.00 143,934.00 221,658.36 221.90 OC, HC, R6 & R9 Developed - Existing Water, Sewer & Customers205 925.00 127,650.00 196,581.00 196.79 PDG Developed - Existing Water, Sewer & Customers206 265.00 36,570.00 56,317.80 56.38 HC, R6 & R9 Developed - Existing Water, Sewer & Customers207 278.00 38,364.00 59,080.56 59.14 HC, R9 & MR Developed - Existing Water, Sewer & Customers208 769.00 106,122.00 163,427.88 163.60 R9, GR, MH & PDR Developed - Existing Water, Sewer & Customers209 0.00 0.00 HC COM210 206.00 28,428.00 43,779.12 43.83 R6, R12, HC, OC & M20 Developed - Existing Water, Sewer & Customers211 0.00 0.00 HC COM212 358.00 49,404.00 76,082.16 76.16 R9 & HC Developed - Existing Water, Sewer & Customers213 245.00 33,810.00 52,067.40 52.12 LI, HC GR & PDR Developed - Existing Water, Sewer & Customers214 121.00 16,698.00 25,714.92 25.74 PDR, R12, GR & MR Developed - Existing Water, Sewer & Customers215 50.00 6,900.00 10,626.00 10.64 R9, HC & GR Developed - Existing Water, Sewer & Customers216 0.00 0.00 0.00 0.00 PDG, FA & HC Sewered, but no customers217 9.00 1,242.00 1,912.68 1.91 R12, M20 R20 & LC Developed - Existing Water, Sewer & Customers218 341.00 47,058.00 72,469.32 72.55 PDS, MR & PDR Developed - Existing Water, Sewer & Customers219 0.00 0.00 GC & PDS COM220 0.00 0.00 PDS, GC, HC, MR & OC COM221 72.50 10,005.00 15,407.70 15.42 PDS, M20 & MR Developed - Existing Water, Sewer & Customers222 301 41,538.00 63,968.52 64.04 R12, GI, HC, LI M20, & R9 No Sewer, but water in some areas --- add population223 14.00 1,932.00 2,975.28 2.98 PDS, M20, R12, R20 & GC Developed - Existing Water, Sewer & Customers (Partially Septic & Private Well)224 0.00 0.00 R9, OC, M20, M6 & R12 Private Well and Built Out225 25.00 3,450.00 5,313.00 5.32 FA, LI, FC, R9, M20 & GC Sewer, but only a few water customers 226 12.50 1,725.00 2,656.50 2.66 FA, LI, M9, M20, R9 & FC Sewer, but only a few water customers 227 0.00 0.00 0.00 0.00 R12, MH, LC, MH6, R9 & GR Sewer in some areas, but private well and no customers or water mains228 12.50 1,725.00 2,656.50 2.66 R9, R12, MH & M20 Sewer in some areas, but private well and no customers or water mains229 0.00 0.00 0.00 0.00 HC, R9, M12 & LI Private Well and Septic 230 62.50 8,625.00 13,282.50 13.30 FA, MH & PDR No Sewer, but water in some areas --- add population231 10 00 1 380 00 2 125 20 2 13 PDG FA & HC Septic -- Water Main but no customers231 10.00 1,380.00 2,125.20 2.13 PDG, FA & HC Septic -- Water Main, but no customers232 12.50 1,725.00 2,656.50 2.66 M20, HC & R9 Some Sewer and few meters233 7.50 1,035.00 1,593.90 1.60 R9, GC & OC Developed - Few Existing Water Customers and Septic 234 0.00 0.00 R20, HC & GC Septic and built out235 0.00 0.00 R9, M20, R20 & GR Private Well and Built Out240 275.00 37,950.00 58,443.00 58.51 HC, PDR, FA, PDS & R12 Partially Developed - Existing Water, Sewer & Customers241 746.00 102,948.00 158,539.92 158.71 R12 & CP Developed - Existing Water, Sewer & Customers242 36.00 4,968.00 7,650.72 7.66 HC, GR & MR Partially Developed - Existing Water, Sewer & Customers (Private Well)243 5.00 690.00 1,062.60 1.06 GR, R9 & HC Septic, Private Well and Built Out244 12.50 1,725.00 2,656.50 2.66 R9, CP, HC & M12 Developed - Existing Water, Sewer & Customers248 20.00 2,760.00 4,250.40 4.26 HC & GC Developed - Existing Water, Sewer & Customers249 0.00 0.00 GR & CP Septic -- Water Main, but no customers250 383.00 52,854.00 81,395.16 81.48 GR, CP, R9, HC & BI Partially Developed - Existing Water, Sewer & Customers251 79.00 10,902.00 16,789.08 16.81 HC &MH Developed - Existing Water, Sewer & Customers335 125.00 17,250.00 26,565.00 26.59 R9, R12, FA, LI, LC & HC Partial Sewer, but water in some areas --- add population336 295.00 40,710.00 62,693.40 62.76 R6, R12, R9 & FC Partial Sewer, but water in some areas --- add population337 125.00 17,250.00 26,565.00 26.59 FC, R12 & PD Partial Sewer, but water in some areas --- add population338 0.00 0.00 0.00 0.00 HC, M20, LC, R9, FA & LI Private Well and Septic372 131.00 18,078.00 27,840.12 27.87 PDR Partially Developed - Existing Water, Sewer & Customers373 5.00 690.00 1,062.60 1.06 PDS COM374 17.50 2,415.00 3,719.10 3.72 HC, R12, R20, LC & FA COM and Developed Residential
Total Base 28,877 3,984,957 6,136,834 6,143

APPENDIX E – WATER SYSTEM COMPONENT NORTH MAINLAND POPULATION PROJECTIONS
Brunswick Glynn County JWSC Applied Technology & Management, Inc.
Water Sewer Master Plan
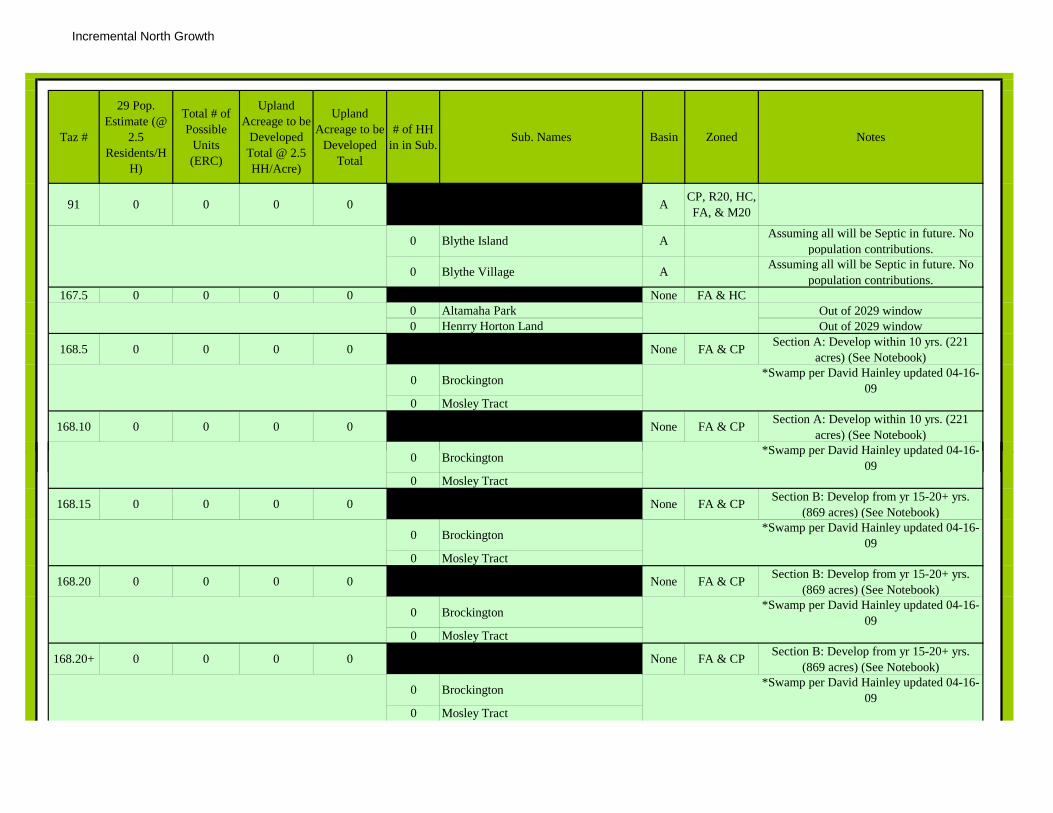
Incremental North Growth
Taz #
29 Pop. Estimate (@
2.5 Residents/H
H)
Total # of Possible
Units (ERC)
Upland Acreage to be
Developed Total @ 2.5 HH/Acre)
Upland Acreage to be
Developed Total
# of HH in in Sub. Sub. Names Basin Zoned Notes
91 0 0 0 0 A CP, R20, HC, FA, & M20
0 Blythe Island A Assuming all will be Septic in future. No population contributions.
0 Blythe Village A Assuming all will be Septic in future. No population contributions.
167.5 0 0 0 0 0 Altamaha Park None FA & HC0 Altamaha Park Out of 2029 window0 Henrry Horton Land Out of 2029 window
168.5 0 0 0 0 None FA & CP Section A: Develop within 10 yrs. (221 acres) (See Notebook)
0 Brockington *Swamp per David Hainley updated 04-16-09
0 Mosley Tract
168.10 0 0 0 0 None FA & CP Section A: Develop within 10 yrs. (221 acres) (See Notebook)
0 ki *Swamp per David Hainley updated 04-16-0 Brockington Swamp per David Hainley updated 04-16-09
0 Mosley Tract
168.15 0 0 0 0 None FA & CP Section B: Develop from yr 15-20+ yrs. (869 acres) (See Notebook)
0 Brockington *Swamp per David Hainley updated 04-16-09
0 Mosley Tract
168.20 0 0 0 0 None FA & CP Section B: Develop from yr 15-20+ yrs. (869 acres) (See Notebook)
0 Brockington *Swamp per David Hainley updated 04-16-09
0 Mosley Tract
168.20+ 0 0 0 0 None FA & CP Section B: Develop from yr 15-20+ yrs. (869 acres) (See Notebook)
0 Brockington *Swamp per David Hainley updated 04-16-09
0 Mosley Tract
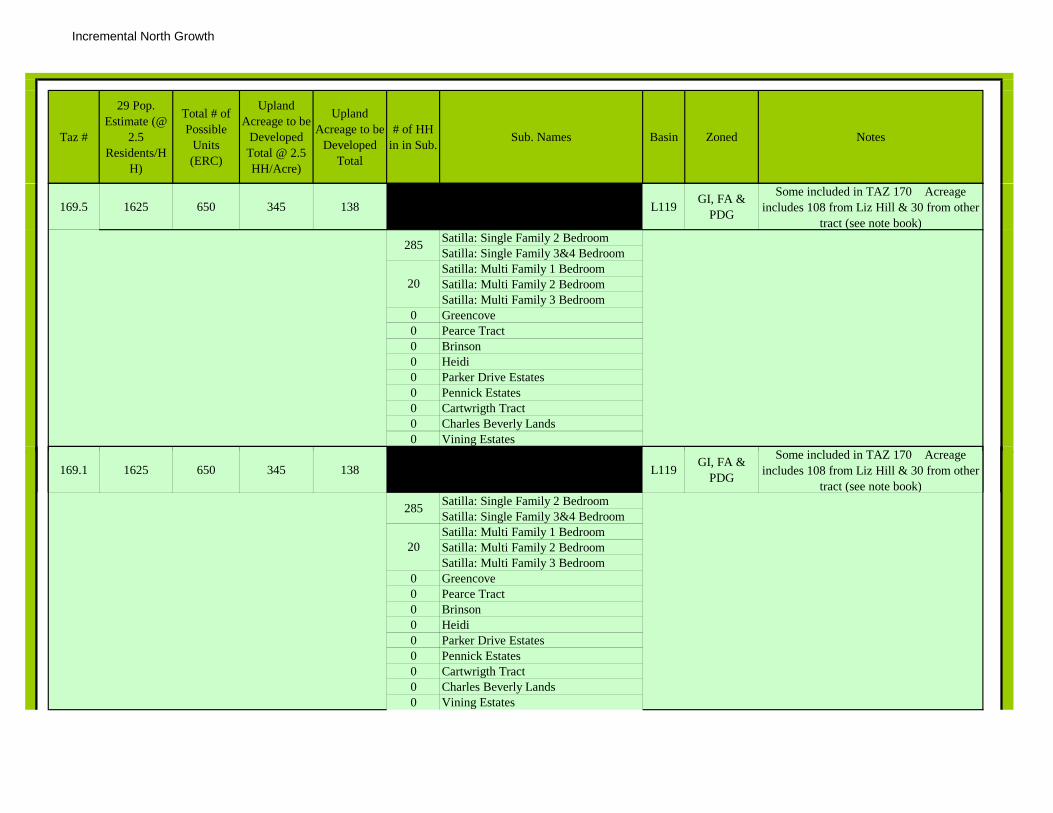
Incremental North Growth
Taz #
29 Pop. Estimate (@
2.5 Residents/H
H)
Total # of Possible
Units (ERC)
Upland Acreage to be
Developed Total @ 2.5 HH/Acre)
Upland Acreage to be
Developed Total
# of HH in in Sub. Sub. Names Basin Zoned Notes
169.5 1625 650 345 138 L119 GI, FA & PDG
Some included in TAZ 170 Acreage includes 108 from Liz Hill & 30 from other
tract (see note book)Satilla: Single Family 2 BedroomSatilla: Single Family 3&4 BedroomSatilla: Multi Family 1 BedroomSatilla: Multi Family 2 BedroomSatilla: Multi Family 3 Bedroom
0 Greencove0 Pearce Tract0 Brinson 0 Heidi0 Parker Drive Estates 0 Pennick Estates0 Cartwrigth Tract0 Charles Beverly Lands0 Vining Estates
Some included in TAZ 170 Acreage
285
20
169.1 1625 650 345 138 L119 GI, FA & PDG
Some included in TAZ 170 Acreage includes 108 from Liz Hill & 30 from other
tract (see note book)Satilla: Single Family 2 BedroomSatilla: Single Family 3&4 BedroomSatilla: Multi Family 1 BedroomSatilla: Multi Family 2 BedroomSatilla: Multi Family 3 Bedroom
0 Greencove0 Pearce Tract0 Brinson 0 Heidi0 Parker Drive Estates 0 Pennick Estates0 Cartwrigth Tract0 Charles Beverly Lands0 Vining Estates
285
20

Incremental North Growth
Taz #
29 Pop. Estimate (@
2.5 Residents/H
H)
Total # of Possible
Units (ERC)
Upland Acreage to be
Developed Total @ 2.5 HH/Acre)
Upland Acreage to be
Developed Total
# of HH in in Sub. Sub. Names Basin Zoned Notes
169.15 1625 650 345 138 L119 GI, FA & PDG
Some included in TAZ 170 Acreage includes 108 from Liz Hill & 30 from other
tract (see note book)Satilla: Single Family 2 BedroomSatilla: Single Family 3&4 BedroomSatilla: Multi Family 1 BedroomSatilla: Multi Family 2 BedroomSatilla: Multi Family 3 Bedroom
0 Greencove0 Pearce Tract0 Brinson 0 Heidi0 Parker Drive Estates 0 Pennick Estates0 Cartwrigth Tract0 Charles Beverly Lands0 Vining Estates
Some included in TAZ 170 Acreage
20
285
169.2 1436.25 574.5 297.5 119 L119 GI, FA & PDG
Some included in TAZ 170 Acreage includes 108 from Liz Hill & 30 from other
tract (see note book)Satilla: Single Family 2 BedroomSatilla: Single Family 3&4 BedroomSatilla: Multi Family 1 BedroomSatilla: Multi Family 2 BedroomSatilla: Multi Family 3 Bedroom
0 Greencove0 Pearce Tract0 Brinson 0 Heidi0 Parker Drive Estates 0 Pennick Estates0 Cartwrigth Tract0 Charles Beverly Lands0 Vining Estates
18
259

Incremental North Growth
Taz #
29 Pop. Estimate (@
2.5 Residents/H
H)
Total # of Possible
Units (ERC)
Upland Acreage to be
Developed Total @ 2.5 HH/Acre)
Upland Acreage to be
Developed Total
# of HH in in Sub. Sub. Names Basin Zoned Notes
169.20 + 14993.75 5997.5 3247.5 1299 L119 GI, FA & PDG
Some included in TAZ 170 Acreage includes 108 from Liz Hill & 30 from other
tract (see note book)Satilla: Single Family 2 BedroomSatilla: Single Family 3&4 BedroomSatilla: Multi Family 1 BedroomSatilla: Multi Family 2 BedroomSatilla: Multi Family 3 Bedroom
0 Greencove0 Pearce Tract0 Brinson 0 Heidi0 Parker Drive Estates 0 Pennick Estates0 Cartwrigth Tract0 Charles Beverly Lands0 Vining Estates
182
2568
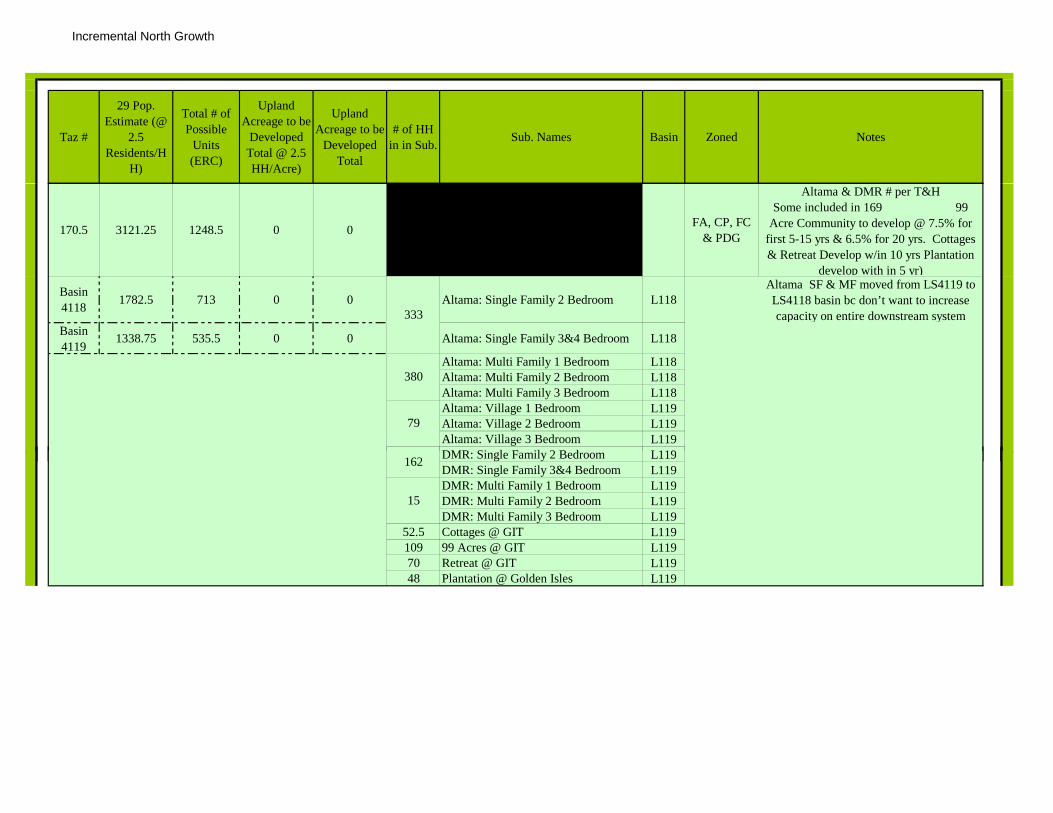
Incremental North Growth
Taz #
29 Pop. Estimate (@
2.5 Residents/H
H)
Total # of Possible
Units (ERC)
Upland Acreage to be
Developed Total @ 2.5 HH/Acre)
Upland Acreage to be
Developed Total
# of HH in in Sub. Sub. Names Basin Zoned Notes
170.5 3121.25 1248.5 0 0 FA, CP, FC & PDG
Altama & DMR # per T&H Some included in 169 99
Acre Community to develop @ 7.5% for first 5-15 yrs & 6.5% for 20 yrs. Cottages & Retreat Develop w/in 10 yrs Plantation
develop with in 5 yr)
Basin 4118 1782.5 713 0 0 Altama: Single Family 2 Bedroom L118
Altama SF & MF moved from LS4119 to LS4118 basin bc don’t want to increase capacity on entire downstream system
Basin 4119
1338.75 535.5 0 0 Altama: Single Family 3&4 Bedroom L118
Altama: Multi Family 1 Bedroom L118Altama: Multi Family 2 Bedroom L118Altama: Multi Family 3 Bedroom L118Altama: Village 1 Bedroom L119Altama: Village 2 Bedroom L119Altama: Village 3 Bedroom L119DMR: Single Family 2 Bedroom L119
380
333
79
DMR: Single Family 2 Bedroom L119DMR: Single Family 3&4 Bedroom L119DMR: Multi Family 1 Bedroom L119DMR: Multi Family 2 Bedroom L119DMR: Multi Family 3 Bedroom L119
52.5 Cottages @ GIT L119109 99 Acres @ GIT L11970 Retreat @ GIT L11948 Plantation @ Golden Isles L119
162
15

Incremental North Growth
Taz #
29 Pop. Estimate (@
2.5 Residents/H
H)
Total # of Possible
Units (ERC)
Upland Acreage to be
Developed Total @ 2.5 HH/Acre)
Upland Acreage to be
Developed Total
# of HH in in Sub. Sub. Names Basin Zoned Notes
170.10 3001.25 1200.5 0 0 FA, CP, FC & PDG
Altama & DMR # per T&H Some included in 169 99
Acre Community to develop @ 7.5% for first 5-15 yrs & 6.5% for 20 yrs. Cottages & Retreat Develop w/in 10 yrs Plantation
develop with in 5 yr)
Basin 4118 1782.5 713 0 0 Altama: Single Family 2 Bedroom L118
Altama SF & MF moved from LS4119 to LS4118 basin bc don’t want to increase capacity on entire downstream system
Basin 4119
1218.75 487.5 0 0 Altama: Single Family 3&4 Bedroom L118
Altama: Multi Family 1 Bedroom L118Altama: Multi Family 2 Bedroom L118Altama: Multi Family 3 Bedroom L118Altama: Village 1 Bedroom L119Altama: Village 2 Bedroom L119Altama: Village 3 Bedroom L119DMR: Single Family 2 Bedroom L119
333
380
79
DMR: Single Family 2 Bedroom L119DMR: Single Family 3&4 Bedroom L119DMR: Multi Family 1 Bedroom L119DMR: Multi Family 2 Bedroom L119DMR: Multi Family 3 Bedroom L119
52.5 Cottages @ GIT L119109 99 Acres @ GIT L11970 Retreat @ GIT L1190 Plantation @ Golden Isles L119
162
15

Incremental North Growth
Taz #
29 Pop. Estimate (@
2.5 Residents/H
H)
Total # of Possible
Units (ERC)
Upland Acreage to be
Developed Total @ 2.5 HH/Acre)
Upland Acreage to be
Developed Total
# of HH in in Sub. Sub. Names Basin Zoned Notes
170.15 2695 1078 0 0 FA, CP, FC & PDG
Altama & DMR # per T&H Some included in 169 99
Acre Community to develop @ 7.5% for first 5-15 yrs & 6.5% for 20 yrs. Cottages & Retreat Develop w/in 10 yrs Plantation
develop with in 5 yr)
Basin 4118 1782.5 713 0 0 Altama: Single Family 2 Bedroom L118
Altama SF & MF moved from LS4119 to LS4118 basin bc don’t want to increase capacity on entire downstream system
Basin 4119
912.5 365 0 0 Altama: Single Family 3&4 Bedroom L118
Altama: Multi Family 1 Bedroom L118Altama: Multi Family 2 Bedroom L118Altama: Multi Family 3 Bedroom L118Altama: Village 1 Bedroom L119Altama: Village 2 Bedroom L119Altama: Village 3 Bedroom L119DMR: Single Family 2 Bedroom L119
333
380
79
DMR: Single Family 2 Bedroom L119DMR: Single Family 3&4 Bedroom L119DMR: Multi Family 1 Bedroom L119DMR: Multi Family 2 Bedroom L119DMR: Multi Family 3 Bedroom L119
0 Cottages @ GIT L119109 99 Acres @ GIT L1190 Retreat @ GIT L1190 Plantation @ Golden Isles L119
162
15
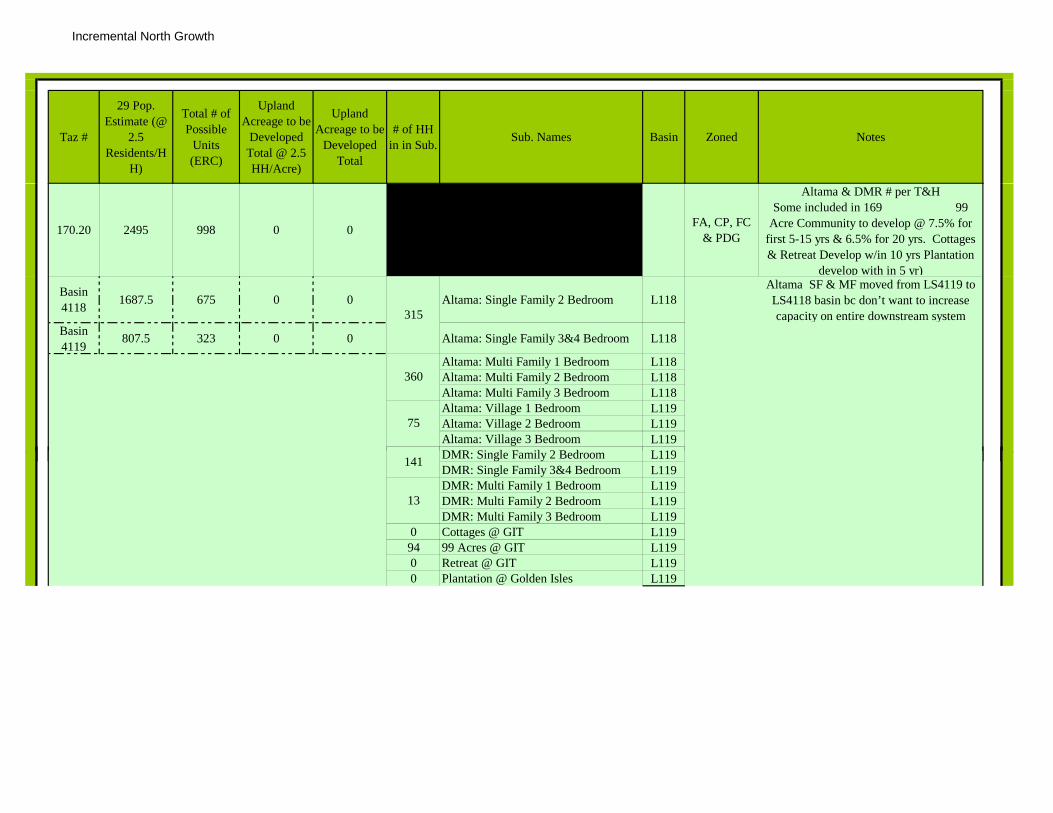
Incremental North Growth
Taz #
29 Pop. Estimate (@
2.5 Residents/H
H)
Total # of Possible
Units (ERC)
Upland Acreage to be
Developed Total @ 2.5 HH/Acre)
Upland Acreage to be
Developed Total
# of HH in in Sub. Sub. Names Basin Zoned Notes
170.20 2495 998 0 0 FA, CP, FC & PDG
Altama & DMR # per T&H Some included in 169 99
Acre Community to develop @ 7.5% for first 5-15 yrs & 6.5% for 20 yrs. Cottages & Retreat Develop w/in 10 yrs Plantation
develop with in 5 yr)
Basin 4118 1687.5 675 0 0 Altama: Single Family 2 Bedroom L118
Altama SF & MF moved from LS4119 to LS4118 basin bc don’t want to increase capacity on entire downstream system
Basin 4119
807.5 323 0 0 Altama: Single Family 3&4 Bedroom L118
Altama: Multi Family 1 Bedroom L118Altama: Multi Family 2 Bedroom L118Altama: Multi Family 3 Bedroom L118Altama: Village 1 Bedroom L119Altama: Village 2 Bedroom L119Altama: Village 3 Bedroom L119DMR: Single Family 2 Bedroom L119
360
75
315
DMR: Single Family 2 Bedroom L119DMR: Single Family 3&4 Bedroom L119DMR: Multi Family 1 Bedroom L119DMR: Multi Family 2 Bedroom L119DMR: Multi Family 3 Bedroom L119
0 Cottages @ GIT L11994 99 Acres @ GIT L1190 Retreat @ GIT L1190 Plantation @ Golden Isles L119
13
141

Incremental North Growth
Taz #
29 Pop. Estimate (@
2.5 Residents/H
H)
Total # of Possible
Units (ERC)
Upland Acreage to be
Developed Total @ 2.5 HH/Acre)
Upland Acreage to be
Developed Total
# of HH in in Sub. Sub. Names Basin Zoned Notes
170.20 + 26647.5 10659 0 0 FA, CP, FC & PDG
Altama & DMR # per T&H Some included in 169 99
Acre Community to develop @ 7.5% for first 5-15 yrs & 6.5% for 20 yrs. Cottages & Retreat Develop w/in 10 yrs Plantation
develop with in 5 yr)
Basin 4118 11205 4482 0 0 Altama: Single Family 2 Bedroom L118
Altama SF & MF moved from LS4119 to LS4118 basin bc don’t want to increase capacity on entire downstream system
Basin 4119
15442.5 6177 0 0 Altama: Single Family 3&4 Bedroom L118
636 Altama: MF 1, 2, & 3 Bedroom LS 4118 L118L118L118
Altama: Village 1 Bedroom L119Altama: Village 2 Bedroom L119Altama: Village 3 Bedroom L119DMR: Single Family 2 Bedroom L119
3846
803
2713 Altama: MF 1, 2, & 3 Bedroom LS 4119
DMR: Single Family 2 Bedroom L119DMR: Single Family 3&4 Bedroom L119DMR: Multi Family 1 Bedroom L119DMR: Multi Family 2 Bedroom L119DMR: Multi Family 3 Bedroom L119
0 Cottages @ GIT L1191025 99 Acres @ GIT L119
0 Retreat @ GIT L1190 Plantation @ Golden Isles L119
171.5 402.5 161 75 30 L119 GI, BI & PDG
Some included in TAZ 170
0 Southern Pines MHP34 The Gallleryat Coastal Pines52 Sweetwater at Golden Isles0 Regents Park
139
1497

Incremental North Growth
Taz #
29 Pop. Estimate (@
2.5 Residents/H
H)
Total # of Possible
Units (ERC)
Upland Acreage to be
Developed Total @ 2.5 HH/Acre)
Upland Acreage to be
Developed Total
# of HH in in Sub. Sub. Names Basin Zoned Notes
171.10 187.5 75 75 30 L119 GI, BI & PDG
Some included in TAZ 170
0 Southern Pines MHP0 The Gallleryat Coastal Pines0 Sweetwater at Golden Isles0 Regents Park
171.15 187.5 75 75 30 L119 GI, BI & PDG
Some included in TAZ 170
0 Southern Pines MHP0 The Gallleryat Coastal Pines0 Sweetwater at Golden Isles0 Regents Park
171.20 162.5 65 65 26 L119 GI, BI & PDG
Some included in TAZ 170
0 Southern Pines MHP0 The Gallleryat Coastal Pines0 Sweetwater at Golden Isles0 Regents Park0 Regents Park
171.20 + 1681.25 672.5 672.5 269 L119 GI, BI & PDG
Some included in TAZ 170
0 Southern Pines MHP0 The Gallleryat Coastal Pines0 Sweetwater at Golden Isles0 Regents Park
172.5 151.875 60.75 60.75 24.3 None GI, FA, R12, M12 & HC
Development over 15 yrs @ 33% for each time increment Sewer
Generation Rate added to industrial acreage for yr 5 & yr 10 (See ADF)
0 Sterling Park0 Rooks Tract0 Brentwood0 Big Oaks Plantation0 Sterling Park

Incremental North Growth
Taz #
29 Pop. Estimate (@
2.5 Residents/H
H)
Total # of Possible
Units (ERC)
Upland Acreage to be
Developed Total @ 2.5 HH/Acre)
Upland Acreage to be
Developed Total
# of HH in in Sub. Sub. Names Basin Zoned Notes
172.10 151.875 60.75 60.75 24.3 None GI, FA, R12, M12 & HC
Development over 15 yrs @ 33% for each time increment Sewer
Generation Rate added to industrial acreage for yr 5 & yr 10 (See ADF)
0 Sterling Park0 Rooks Tract0 Brentwood0 Big Oaks Plantation0 Sterling Park
172.15 151.875 60.75 60.75 24.3 None GI, FA, R12, M12 & HC
Development over 15 yrs @ 33% for each time increment Sewer
Generation Rate added to industrial acreage for yr 5 & yr 10 (See ADF)
0 Sterling Park0 Rooks Tract0 Brentwood0 Big Oaks Plantation0 Sterling Park0 Sterling Park
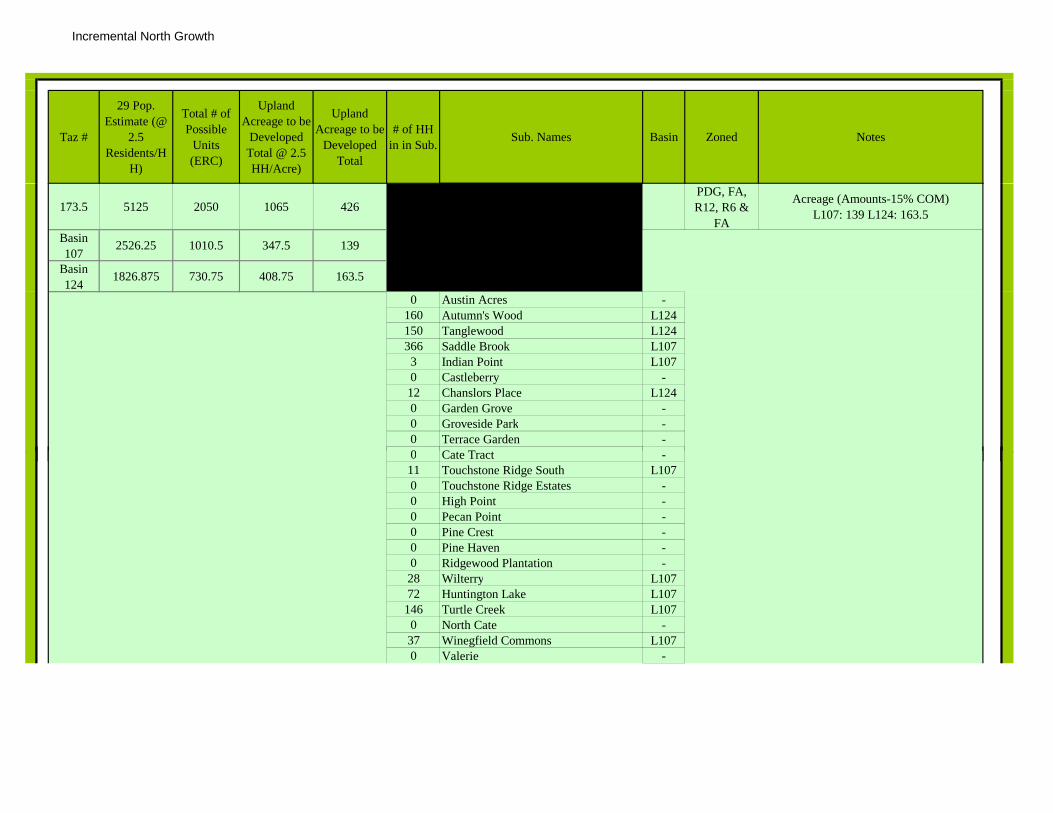
Incremental North Growth
Taz #
29 Pop. Estimate (@
2.5 Residents/H
H)
Total # of Possible
Units (ERC)
Upland Acreage to be
Developed Total @ 2.5 HH/Acre)
Upland Acreage to be
Developed Total
# of HH in in Sub. Sub. Names Basin Zoned Notes
173.5 5125 2050 1065 426PDG, FA, R12, R6 &
FA
Acreage (Amounts-15% COM) L107: 139 L124: 163.5
Basin 107
2526.25 1010.5 347.5 139
Basin 124
1826.875 730.75 408.75 163.5
0 Austin Acres -160 Autumn's Wood L124150 Tanglewood L124366 Saddle Brook L1073 Indian Point L1070 Castleberry -12 Chanslors Place L1240 Garden Grove -0 Groveside Park -0 Terrace Garden -0 Cate Tract0 Cate Tract -11 Touchstone Ridge South L1070 Touchstone Ridge Estates -0 High Point -0 Pecan Point -0 Pine Crest -0 Pine Haven -0 Ridgewood Plantation -28 Wilterry L10772 Huntington Lake L107
146 Turtle Creek L1070 North Cate -37 Winegfield Commons L1070 Valerie -

Incremental North Growth
Taz #
29 Pop. Estimate (@
2.5 Residents/H
H)
Total # of Possible
Units (ERC)
Upland Acreage to be
Developed Total @ 2.5 HH/Acre)
Upland Acreage to be
Developed Total
# of HH in in Sub. Sub. Names Basin Zoned Notes
173.10 1112.5 445 445 178PDG, FA, R12, R6 &
FA
Acreage (Amounts-15% COM) L107: 63.5 L124: 114.5
Basin 107
396.875 158.75 158.75 63.5
Basin 124
715.625 286.25 286.25 114.5
0 Austin Acres -0 Autumn's Wood L1240 Tanglewood L1240 Saddle Brook L1070 Indian Point L1070 Castleberry -0 Chanslors Place L1240 Garden Grove -0 Groveside Park -0 Terrace Garden -0 Cate Tract0 Cate Tract -0 Touchstone Ridge South L1070 Touchstone Ridge Estates -0 High Point -0 Pecan Point -0 Pine Crest -0 Pine Haven -0 Ridgewood Plantation -0 Wilterry L1070 Huntington Lake L1070 Turtle Creek L1070 North Cate -0 Winegfield Commons L1070 Valerie -

Incremental North Growth
Taz #
29 Pop. Estimate (@
2.5 Residents/H
H)
Total # of Possible
Units (ERC)
Upland Acreage to be
Developed Total @ 2.5 HH/Acre)
Upland Acreage to be
Developed Total
# of HH in in Sub. Sub. Names Basin Zoned Notes
173.15 0 0 0 0PDG, FA, R12, R6 &
FA
Acreage (Amounts-15% COM) L107: 63.5 L124: 63.5
Basin 107
0 0 0 0
Basin 124
0 0 0 0
0 Austin Acres -0 Autumn's Wood L1240 Tanglewood L1240 Saddle Brook L1070 Indian Point L1070 Castleberry -0 Chanslors Place L1240 Garden Grove -0 Groveside Park -0 Terrace Garden -0 Cate Tract0 Cate Tract -0 Touchstone Ridge South L1070 Touchstone Ridge Estates -0 High Point -0 Pecan Point -0 Pine Crest -0 Pine Haven -0 Ridgewood Plantation -0 Wilterry L1070 Huntington Lake L1070 Turtle Creek L1070 North Cate -0 Winegfield Commons L1070 Valerie -
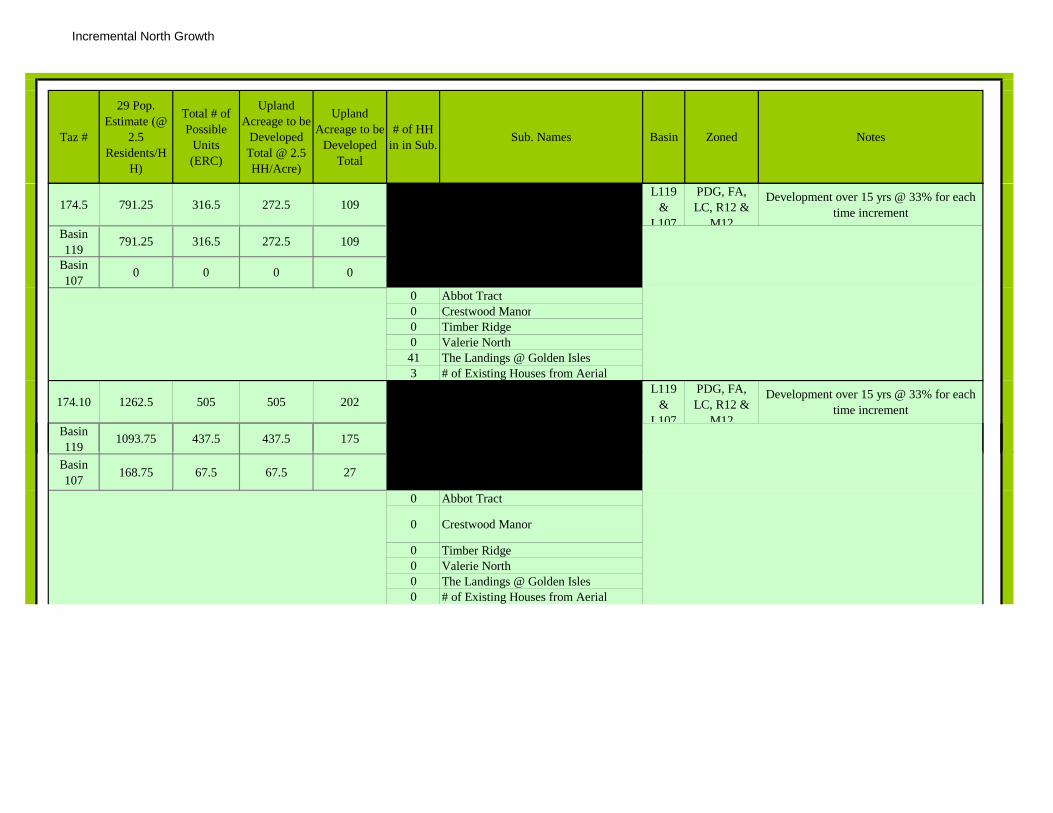
Incremental North Growth
Taz #
29 Pop. Estimate (@
2.5 Residents/H
H)
Total # of Possible
Units (ERC)
Upland Acreage to be
Developed Total @ 2.5 HH/Acre)
Upland Acreage to be
Developed Total
# of HH in in Sub. Sub. Names Basin Zoned Notes
174.5 791.25 316.5 272.5 109L119
& L107
PDG, FA, LC, R12 &
M12
Development over 15 yrs @ 33% for each time increment
Basin 119
791.25 316.5 272.5 109
Basin 107
0 0 0 0
0 Abbot Tract0 Crestwood Manor0 Timber Ridge 0 Valerie North 41 The Landings @ Golden Isles3 # of Existing Houses from Aerial
174.10 1262.5 505 505 202L119
& L107
PDG, FA, LC, R12 &
M12
Development over 15 yrs @ 33% for each time increment
Basin 119
1093.75 437.5 437.5 1759
Basin 107 168.75 67.5 67.5 27
0 Abbot Tract
0 Crestwood Manor
0 Timber Ridge 0 Valerie North 0 The Landings @ Golden Isles0 # of Existing Houses from Aerial

Incremental North Growth
Taz #
29 Pop. Estimate (@
2.5 Residents/H
H)
Total # of Possible
Units (ERC)
Upland Acreage to be
Developed Total @ 2.5 HH/Acre)
Upland Acreage to be
Developed Total
# of HH in in Sub. Sub. Names Basin Zoned Notes
174.15 918.75 367.5 367.5 147L119
& L107
PDG, FA, LC, R12 &
M12
Development over 15 yrs @ 33% for each time increment
Basin 119
750 300 300 120
Basin 107 168.75 67.5 67.5 27
0 Abbot Tract
0 Crestwood Manor
0 Timber Ridge 0 Valerie North 0 The Landings @ Golden Isles0 # of Existing Houses from Aerial
175.5 941.25 376.5 27.5 11 L119 PDGPinecrest only included in ADF *
All development to occur within first 5 years y
22 Villas @ Golden Isles 212 Odyssey Lake 115 Grants Ferry Cove 0 Pinecrest
175.10 0 0 0 0 L119 PDGPinecrest only included in ADF *
All development to occur within first 5 years
0 Villas @ Golden Isles 0 Odyssey Lake 0 Grants Ferry Cove 0 Pinecrest
176.5 190.625 76.25 76.25 30.5 L107 PDG & FC Pinecrest & COM area only included in ADF
176.10 190.625 76.25 76.25 30.5 L107 PDG & FC Pinecrest & COM area only included in ADF
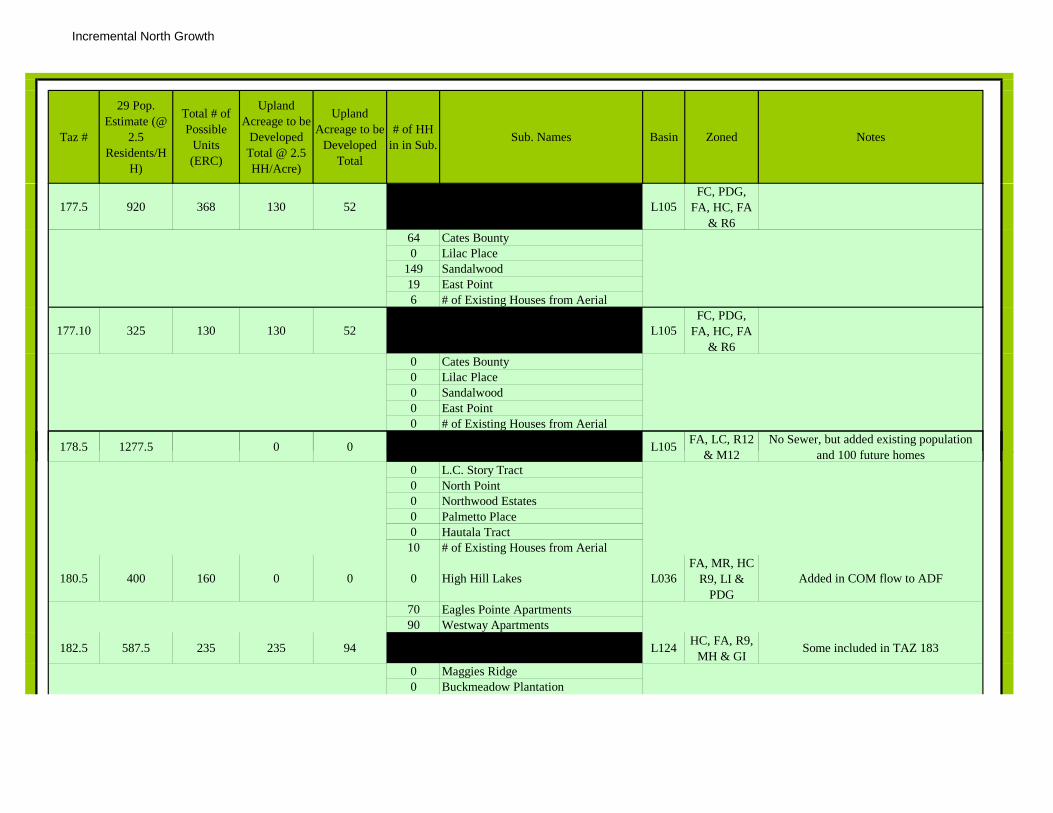
Incremental North Growth
Taz #
29 Pop. Estimate (@
2.5 Residents/H
H)
Total # of Possible
Units (ERC)
Upland Acreage to be
Developed Total @ 2.5 HH/Acre)
Upland Acreage to be
Developed Total
# of HH in in Sub. Sub. Names Basin Zoned Notes
177.5 920 368 130 52 L105FC, PDG,
FA, HC, FA & R6
64 Cates Bounty0 Lilac Place
149 Sandalwood19 East Point6 # of Existing Houses from Aerial
177.10 325 130 130 52 L105FC, PDG,
FA, HC, FA & R6
0 Cates Bounty0 Lilac Place0 Sandalwood0 East Point0 # of Existing Houses from Aerial
178.5 1277.5 0 0 L105 FA, LC, R12 & M12
No Sewer, but added existing population d 100 f t h& M12 and 100 future homes
0 L.C. Story Tract0 North Point0 Northwood Estates0 Palmetto Place0 Hautala Tract10 # of Existing Houses from Aerial
180.5 400 160 0 0 0 High Hill Lakes L036FA, MR, HC
R9, LI & PDG
Added in COM flow to ADF
70 Eagles Pointe Apartments90 Westway Apartments
182.5 587.5 235 235 94 L124 HC, FA, R9, MH & GI
Some included in TAZ 183
0 Maggies Ridge0 Buckmeadow Plantation
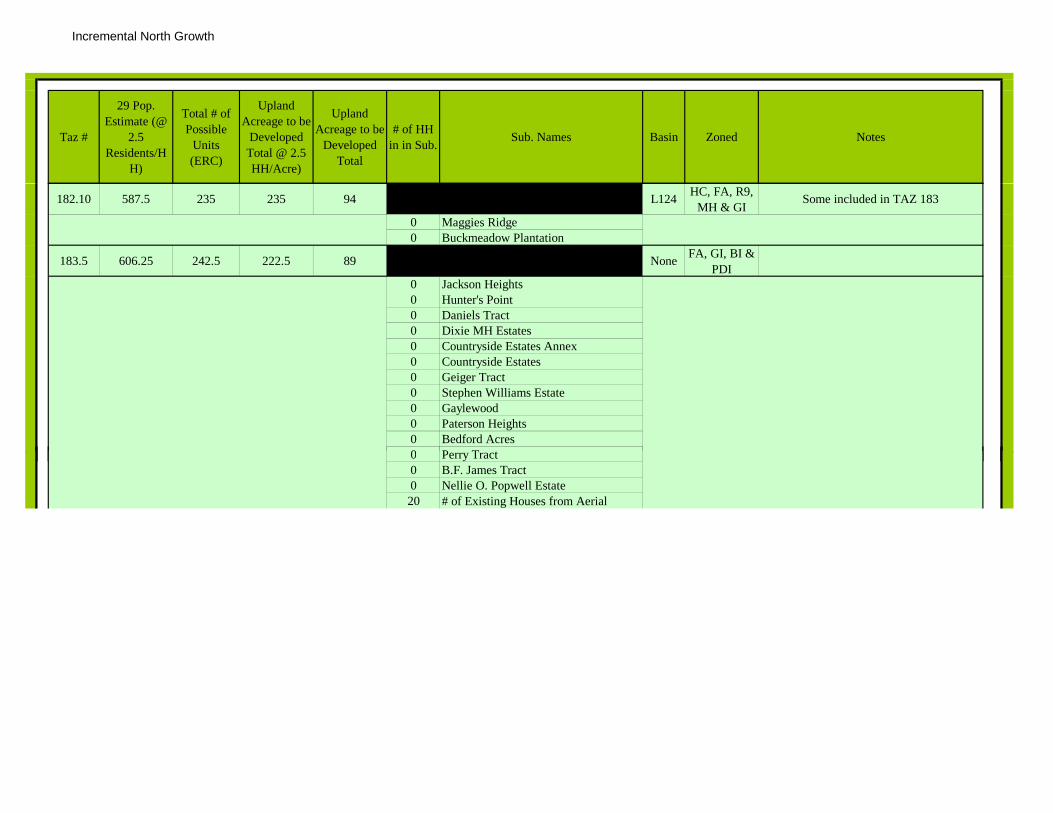
Incremental North Growth
Taz #
29 Pop. Estimate (@
2.5 Residents/H
H)
Total # of Possible
Units (ERC)
Upland Acreage to be
Developed Total @ 2.5 HH/Acre)
Upland Acreage to be
Developed Total
# of HH in in Sub. Sub. Names Basin Zoned Notes
182.10 587.5 235 235 94 L124 HC, FA, R9, MH & GI
Some included in TAZ 183
0 Maggies Ridge0 Buckmeadow Plantation
183.5 606.25 242.5 222.5 89 None FA, GI, BI & PDI
0 Jackson Heights0 Hunter's Point0 Daniels Tract0 Dixie MH Estates0 Countryside Estates Annex0 Countryside Estates0 Geiger Tract0 Stephen Williams Estate0 Gaylewood0 Paterson Heights0 Bedford Acres0 Perry Tract0 Perry Tract0 B.F. James Tract0 Nellie O. Popwell Estate20 # of Existing Houses from Aerial

Incremental North Growth
Taz #
29 Pop. Estimate (@
2.5 Residents/H
H)
Total # of Possible
Units (ERC)
Upland Acreage to be
Developed Total @ 2.5 HH/Acre)
Upland Acreage to be
Developed Total
# of HH in in Sub. Sub. Names Basin Zoned Notes
183.10 556.25 222.5 222.5 89 None FA, GI, BI & PDI
0 Jackson Heights0 Hunter's Point0 Daniels Tract0 Dixie MH Estates0 Countryside Estates Annex0 Countryside Estates0 Geiger Tract0 Stephen Williams Estate0 Gaylewood0 Paterson Heights0 Bedford Acres0 Perry Tract0 B.F. James Tract0 Nellie O. Popwell Estate0 # of Existing Houses from Aerial

Incremental North Growth
Taz #
29 Pop. Estimate (@
2.5 Residents/H
H)
Total # of Possible
Units (ERC)
Upland Acreage to be
Developed Total @ 2.5 HH/Acre)
Upland Acreage to be
Developed Total
# of HH in in Sub. Sub. Names Basin Zoned Notes
183.15 556.25 222.5 222.5 89 None FA, GI, BI & PDI
0 Jackson Heights0 Hunter's Point0 Daniels Tract0 Dixie MH Estates0 Countryside Estates Annex0 Countryside Estates0 Geiger Tract0 Stephen Williams Estate0 Gaylewood0 Paterson Heights0 Bedford Acres0 Perry Tract0 B.F. James Tract0 Nellie O. Popwell Estate0 # of Existing Houses from Aerial
FA R9 BI184.5 0 0 0 0 0 Camp Walker None
FA, R9, BI, HC, GR &
PDGAssuming to stay Septic
0 Country Farms0 Floraville0 E.A. Knight Tract0 Herndon Tract0 Southern Junction
185.20 727.5 291 0 0 None LI, FA, LC & GC
0 Adams Tract0 Basswood Estates0 Blackberry Farms0 Chase Lands0 Clayhole0 Johnson Lands

Incremental North Growth
Taz #
29 Pop. Estimate (@
2.5 Residents/H
H)
Total # of Possible
Units (ERC)
Upland Acreage to be
Developed Total @ 2.5 HH/Acre)
Upland Acreage to be
Developed Total
# of HH in in Sub. Sub. Names Basin Zoned Notes
186.10 180 72 0 0 None LI, HC, GC & FA
Some included in TAZ 185
0 Merrell Tract0 Underwood Tract0 Asbell Tract0 Boyd Tract0 Copper Tract0 Gibbon Airy Acres0 McDonald Mini Farms0 Jerusalem Tract0 Penton Hill Tract0 Crum Tract0 Dessie Mosley Tract0 Dowling Place0 Erwin Tract0 Frazier's Crossing0 Frazier's Tract0 Hawks Landing0 Hawks Landing0 Joe Hightower Lands0 Alexander Tract 2
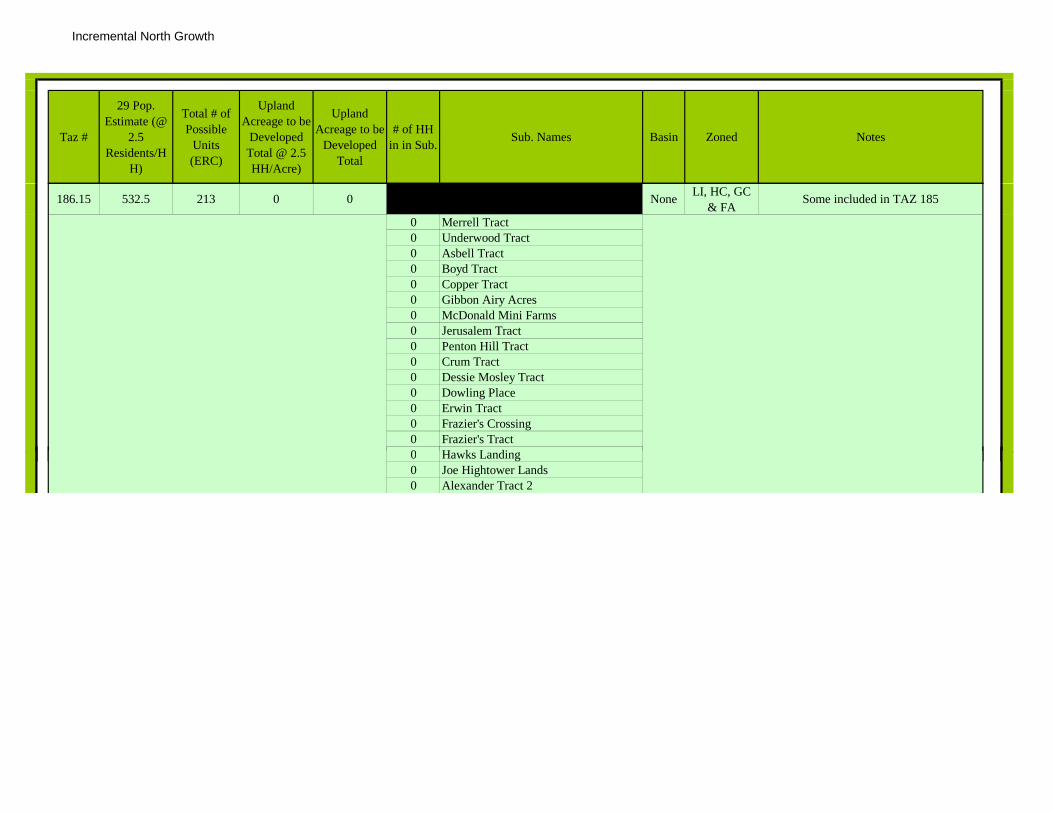
Incremental North Growth
Taz #
29 Pop. Estimate (@
2.5 Residents/H
H)
Total # of Possible
Units (ERC)
Upland Acreage to be
Developed Total @ 2.5 HH/Acre)
Upland Acreage to be
Developed Total
# of HH in in Sub. Sub. Names Basin Zoned Notes
186.15 532.5 213 0 0 None LI, HC, GC & FA
Some included in TAZ 185
0 Merrell Tract0 Underwood Tract0 Asbell Tract0 Boyd Tract0 Copper Tract0 Gibbon Airy Acres0 McDonald Mini Farms0 Jerusalem Tract0 Penton Hill Tract0 Crum Tract0 Dessie Mosley Tract0 Dowling Place0 Erwin Tract0 Frazier's Crossing0 Frazier's Tract0 Hawks Landing0 Hawks Landing0 Joe Hightower Lands0 Alexander Tract 2

Incremental North Growth
Taz #
29 Pop. Estimate (@
2.5 Residents/H
H)
Total # of Possible
Units (ERC)
Upland Acreage to be
Developed Total @ 2.5 HH/Acre)
Upland Acreage to be
Developed Total
# of HH in in Sub. Sub. Names Basin Zoned Notes
186.20 0 0 0 0 None LI, HC, GC & FA
Some included in TAZ 185
0 Merrell Tract0 Underwood Tract0 Asbell Tract0 Boyd Tract0 Copper Tract0 Gibbon Airy Acres0 McDonald Mini Farms0 Jerusalem Tract0 Penton Hill Tract0 Crum Tract0 Dessie Mosley Tract0 Dowling Place0 Erwin Tract0 Frazier's Crossing0 Frazier's Tract0 Hawks Landing0 Hawks Landing0 Joe Hightower Lands0 Alexander Tract 2
187.20+ 7531.25 3012.5 3012.5 1205 None FA188.5 22.5 9 0 0 9 # of Existing Houses from Aerial L118 FC & CP189.5 0 0 0 0 0 Heritage Estates None FC & CP190.5 2032.5 813 120 48 L110 PDG
134 Lexington Place 68 Shadow Lake
120 Fox Run: The Landing 190 Caleb's Crossing 71 Fox Run: The Village
110 Hardwood Forest
191.5 0 0 0 0 L039 PDG, FA & GI
ODI per T& H Acreage (Amounts-60% Paving and Drainage) No Pop, ADF
based on Sewer Generation Rate: Warehouse @ 20/1000 gal/sf

Incremental North Growth
Taz #
29 Pop. Estimate (@
2.5 Residents/H
H)
Total # of Possible
Units (ERC)
Upland Acreage to be
Developed Total @ 2.5 HH/Acre)
Upland Acreage to be
Developed Total
# of HH in in Sub. Sub. Names Basin Zoned Notes
191.10 0 0 0 0 L039 PDG, FA & GI
ODI per T& H Acreage (Amounts-60% Paving and Drainage) No Pop, ADF
based on Sewer Generation Rate: Warehouse @ 20/1000 gal/sf
192.5 0 0 0 0 L039 G Airport193.5 0 0 0 0 L039 GI & PDG
194.5 935 374 160 64 L039FA, PDG,
LC, R20, HC & LI
0 Margaret Knight Property 0 Beasly Farms0 Bay Point 0 Blueberry0 Deerfield Station74 Golden Shores North0 Honey Bee59 Morgan's Mill21 Pinewood21 Pinewood0 Thornhill Creek35 Cabana Court MHP (# from aerial)25 Thornhill MHP (# from aerial)0 WYN-JOY Place
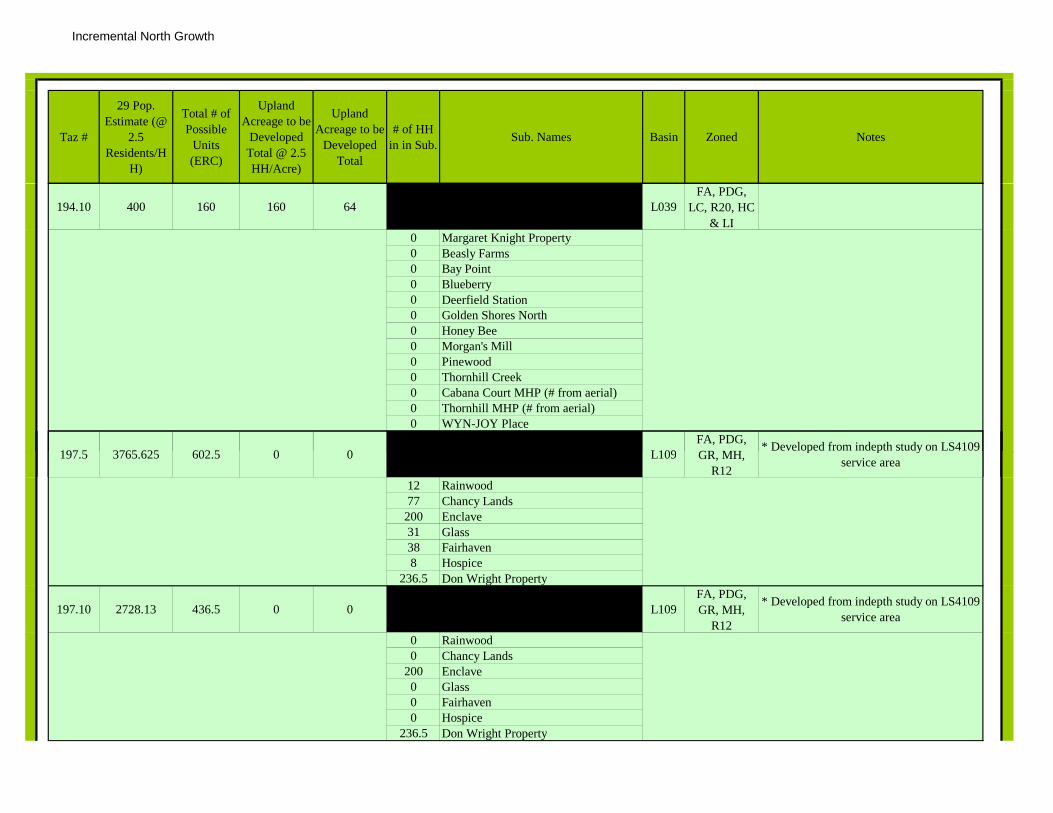
Incremental North Growth
Taz #
29 Pop. Estimate (@
2.5 Residents/H
H)
Total # of Possible
Units (ERC)
Upland Acreage to be
Developed Total @ 2.5 HH/Acre)
Upland Acreage to be
Developed Total
# of HH in in Sub. Sub. Names Basin Zoned Notes
194.10 400 160 160 64 L039FA, PDG,
LC, R20, HC & LI
0 Margaret Knight Property 0 Beasly Farms0 Bay Point 0 Blueberry0 Deerfield Station0 Golden Shores North0 Honey Bee0 Morgan's Mill0 Pinewood0 Thornhill Creek0 Cabana Court MHP (# from aerial)0 Thornhill MHP (# from aerial)0 WYN-JOY Place
197 5 3765 625 602 5 0 0 L109FA, PDG, GR MH
* Developed from indepth study on LS4109 197.5 3765.625 602.5 0 0 L109 GR, MH, R12
p p yservice area
12 Rainwood77 Chancy Lands
200 Enclave31 Glass38 Fairhaven8 Hospice
236.5 Don Wright Property
197.10 2728.13 436.5 0 0 L109FA, PDG, GR, MH,
R12
* Developed from indepth study on LS4109 service area
0 Rainwood0 Chancy Lands
200 Enclave0 Glass0 Fairhaven0 Hospice
236.5 Don Wright Property

Incremental North Growth
Taz #
29 Pop. Estimate (@
2.5 Residents/H
H)
Total # of Possible
Units (ERC)
Upland Acreage to be
Developed Total @ 2.5 HH/Acre)
Upland Acreage to be
Developed Total
# of HH in in Sub. Sub. Names Basin Zoned Notes
198.5 362.5 145 0 0 145 Southern Landing L111 PDG, G, GC & R20
0 Notting Hill199.5 0 0 0 0 0 Boswell Farms turned Res None FC & FA AB - assume this will be septic
0 Church Won't put in LS for 20 gpm and trycross Golden Isles Parkway or I-95
236 0 0 0 0 None PDG, CP, BI MH & HC
Stay Septic
237 0 0 0 0 0 Croft Tract None FA, HC, CP & R12
Stay Septic
0 Crooks Land0 Chump Acres0 Goodtown0 John Law Tract0 Leo Smith Tract0 Macay Cottages0 Macay Place0 Marsh Fork0 Marsh Fork0 Marsh Oaks0 Marshes of Macay0 Needwood0 Riley0 North End0 Tupelo0 South Oak Ridge0 Turton West0 Whip-Poor-Will Park0 Turton Tract0 Palm Grove Island0 East Oglethorpe Manor0 Oglethorpe Manor
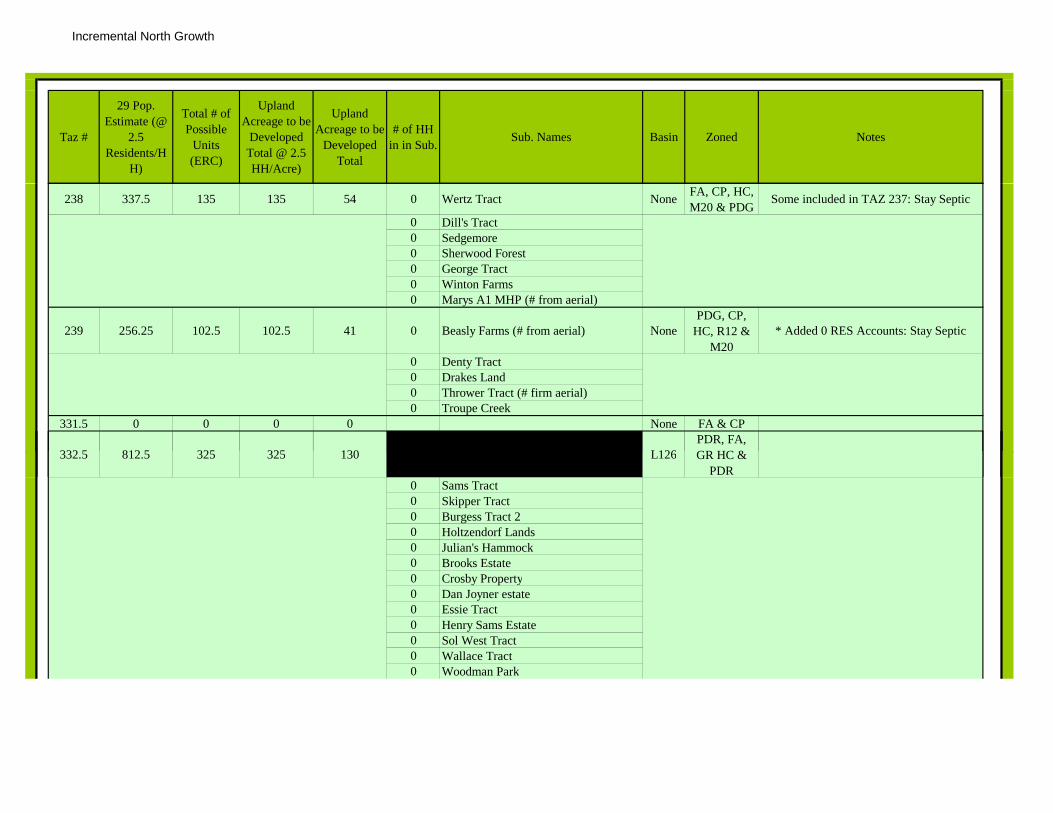
Incremental North Growth
Taz #
29 Pop. Estimate (@
2.5 Residents/H
H)
Total # of Possible
Units (ERC)
Upland Acreage to be
Developed Total @ 2.5 HH/Acre)
Upland Acreage to be
Developed Total
# of HH in in Sub. Sub. Names Basin Zoned Notes
238 337.5 135 135 54 0 Wertz Tract None FA, CP, HC, M20 & PDG
Some included in TAZ 237: Stay Septic
0 Dill's Tract0 Sedgemore0 Sherwood Forest0 George Tract0 Winton Farms0 Marys A1 MHP (# from aerial)
239 256.25 102.5 102.5 41 0 Beasly Farms (# from aerial) NonePDG, CP,
HC, R12 & M20
* Added 0 RES Accounts: Stay Septic
0 Denty Tract0 Drakes Land0 Thrower Tract (# firm aerial)0 Troupe Creek
331.5 0 0 0 0 None FA & CP
332 5 812 5 325 325 130 L126PDR, FA, GR HC &332.5 812.5 325 325 130 L126 GR HC &
PDR0 Sams Tract0 Skipper Tract0 Burgess Tract 20 Holtzendorf Lands0 Julian's Hammock0 Brooks Estate0 Crosby Property0 Dan Joyner estate0 Essie Tract0 Henry Sams Estate0 Sol West Tract0 Wallace Tract0 Woodman Park
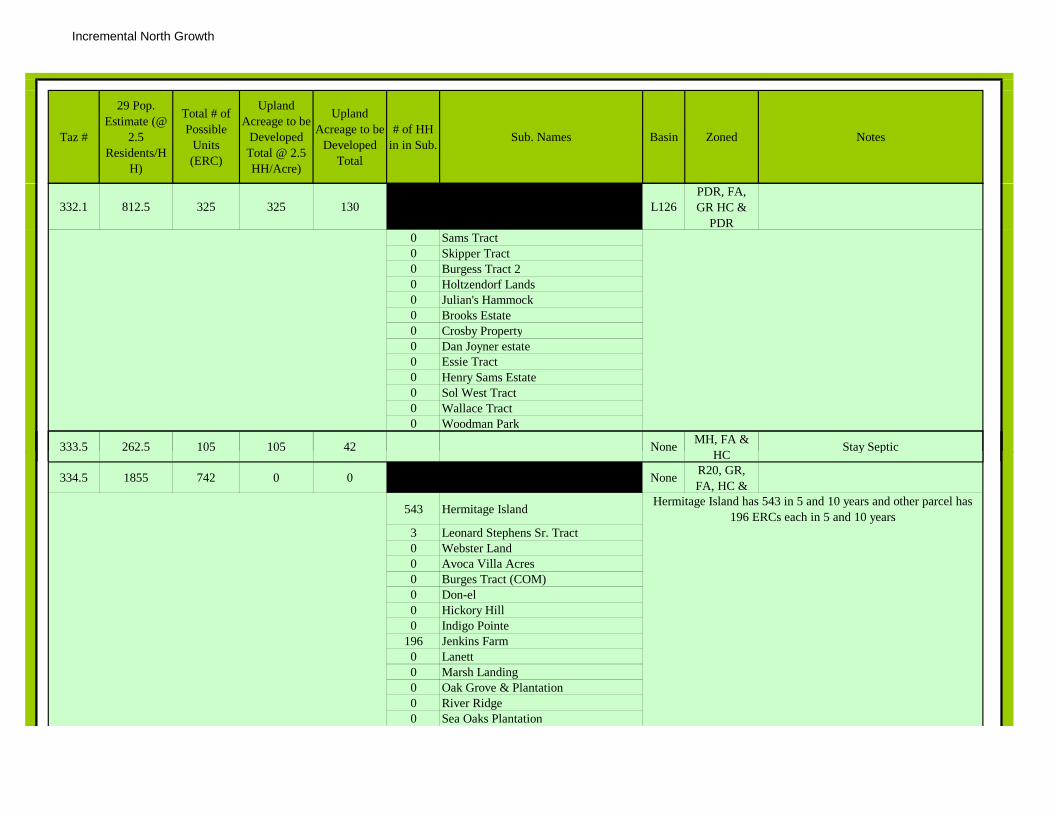
Incremental North Growth
Taz #
29 Pop. Estimate (@
2.5 Residents/H
H)
Total # of Possible
Units (ERC)
Upland Acreage to be
Developed Total @ 2.5 HH/Acre)
Upland Acreage to be
Developed Total
# of HH in in Sub. Sub. Names Basin Zoned Notes
332.1 812.5 325 325 130 L126PDR, FA, GR HC &
PDR0 Sams Tract0 Skipper Tract0 Burgess Tract 20 Holtzendorf Lands0 Julian's Hammock0 Brooks Estate0 Crosby Property0 Dan Joyner estate0 Essie Tract0 Henry Sams Estate0 Sol West Tract0 Wallace Tract0 Woodman Park
333.5 262.5 105 105 42 None MH, FA & HC
Stay SepticHC
y p
334.5 1855 742 0 0 None R20, GR, FA, HC &
543 Hermitage Island
3 Leonard Stephens Sr. Tract0 Webster Land0 Avoca Villa Acres0 Burges Tract (COM)0 Don-el0 Hickory Hill0 Indigo Pointe
196 Jenkins Farm0 Lanett0 Marsh Landing0 Oak Grove & Plantation0 River Ridge0 Sea Oaks Plantation
Hermitage Island has 543 in 5 and 10 years and other parcel has 196 ERCs each in 5 and 10 years
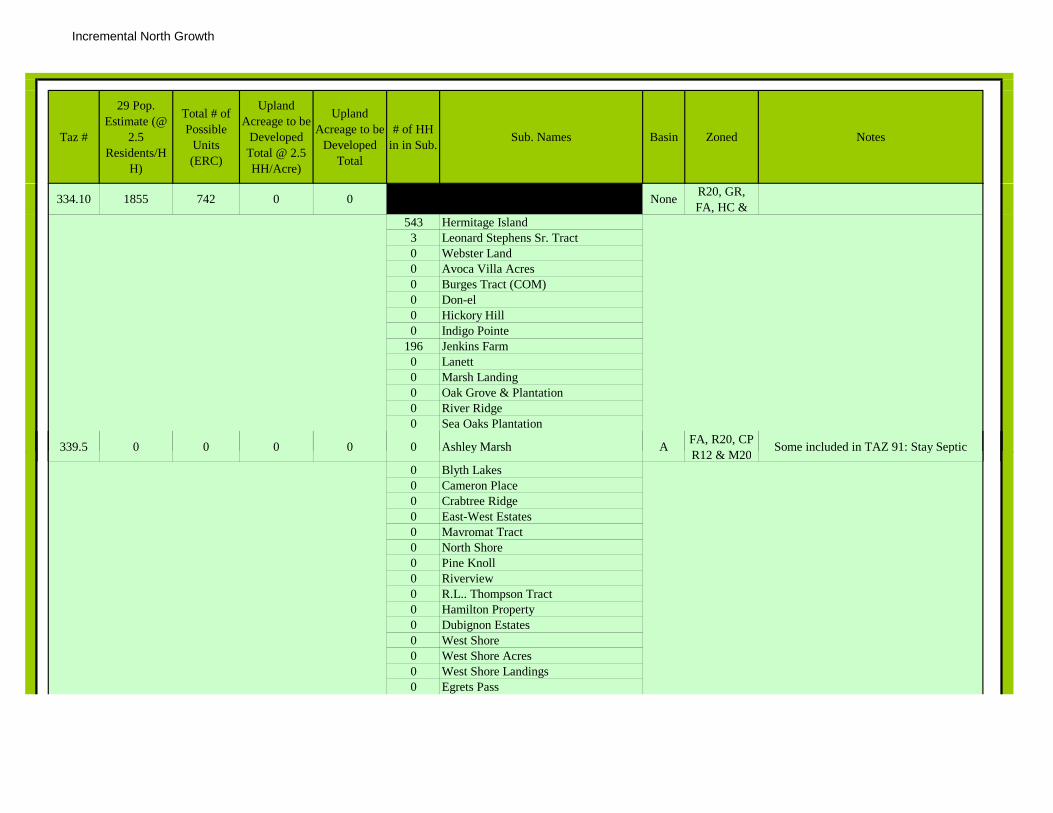
Incremental North Growth
Taz #
29 Pop. Estimate (@
2.5 Residents/H
H)
Total # of Possible
Units (ERC)
Upland Acreage to be
Developed Total @ 2.5 HH/Acre)
Upland Acreage to be
Developed Total
# of HH in in Sub. Sub. Names Basin Zoned Notes
334.10 1855 742 0 0 None R20, GR, FA, HC &
543 Hermitage Island3 Leonard Stephens Sr. Tract0 Webster Land0 Avoca Villa Acres0 Burges Tract (COM)0 Don-el0 Hickory Hill0 Indigo Pointe
196 Jenkins Farm0 Lanett0 Marsh Landing0 Oak Grove & Plantation0 River Ridge0 Sea Oaks Plantation
339.5 0 0 0 0 0 Ashley Marsh A FA, R20, CP R12 & M20
Some included in TAZ 91: Stay SepticyR12 & M20
y p
0 Blyth Lakes0 Cameron Place0 Crabtree Ridge0 East-West Estates0 Mavromat Tract0 North Shore0 Pine Knoll0 Riverview0 R.L.. Thompson Tract0 Hamilton Property0 Dubignon Estates0 West Shore 0 West Shore Acres0 West Shore Landings0 Egrets Pass
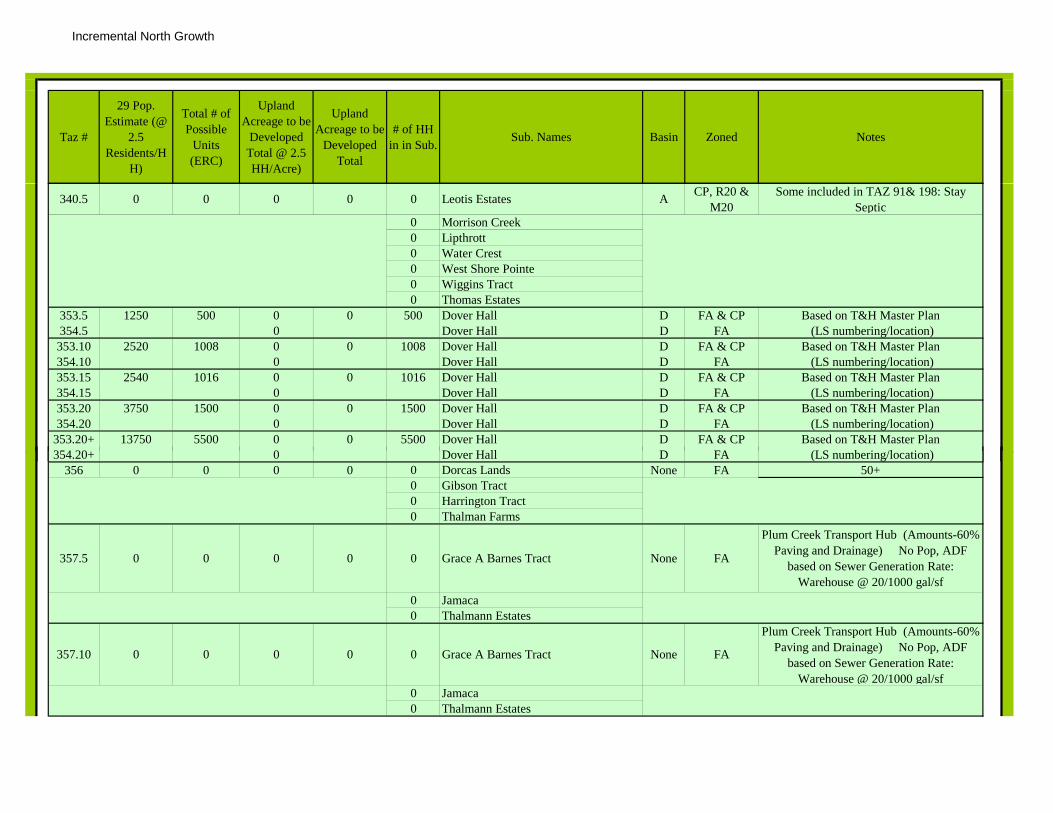
Incremental North Growth
Taz #
29 Pop. Estimate (@
2.5 Residents/H
H)
Total # of Possible
Units (ERC)
Upland Acreage to be
Developed Total @ 2.5 HH/Acre)
Upland Acreage to be
Developed Total
# of HH in in Sub. Sub. Names Basin Zoned Notes
340.5 0 0 0 0 0 Leotis Estates A CP, R20 & M20
Some included in TAZ 91& 198: Stay Septic
0 Morrison Creek0 Lipthrott0 Water Crest0 West Shore Pointe0 Wiggins Tract0 Thomas Estates
353.5 1250 500 0 0 500 Dover Hall D FA & CP Based on T&H Master Plan 354.5 0 Dover Hall D FA (LS numbering/location) 353.10 2520 1008 0 0 1008 Dover Hall D FA & CP Based on T&H Master Plan 354.10 0 Dover Hall D FA (LS numbering/location) 353.15 2540 1016 0 0 1016 Dover Hall D FA & CP Based on T&H Master Plan 354.15 0 Dover Hall D FA (LS numbering/location) 353.20 3750 1500 0 0 1500 Dover Hall D FA & CP Based on T&H Master Plan 354.20 0 Dover Hall D FA (LS numbering/location)
353.20+ 13750 5500 0 0 5500 Dover Hall D FA & CP Based on T&H Master Plan 354 20+ 0 Dover Hall D FA (LS numbering/location)354.20+ 0 Dover Hall D FA (LS numbering/location)
356 0 0 0 0 0 Dorcas Lands None FA 50+0 Gibson Tract0 Harrington Tract0 Thalman Farms
357.5 0 0 0 0 0 Grace A Barnes Tract None FA
Plum Creek Transport Hub (Amounts-60% Paving and Drainage) No Pop, ADF
based on Sewer Generation Rate: Warehouse @ 20/1000 gal/sf
0 Jamaca0 Thalmann Estates
357.10 0 0 0 0 0 Grace A Barnes Tract None FA
Plum Creek Transport Hub (Amounts-60% Paving and Drainage) No Pop, ADF
based on Sewer Generation Rate: Warehouse @ 20/1000 gal/sf
0 Jamaca0 Thalmann Estates
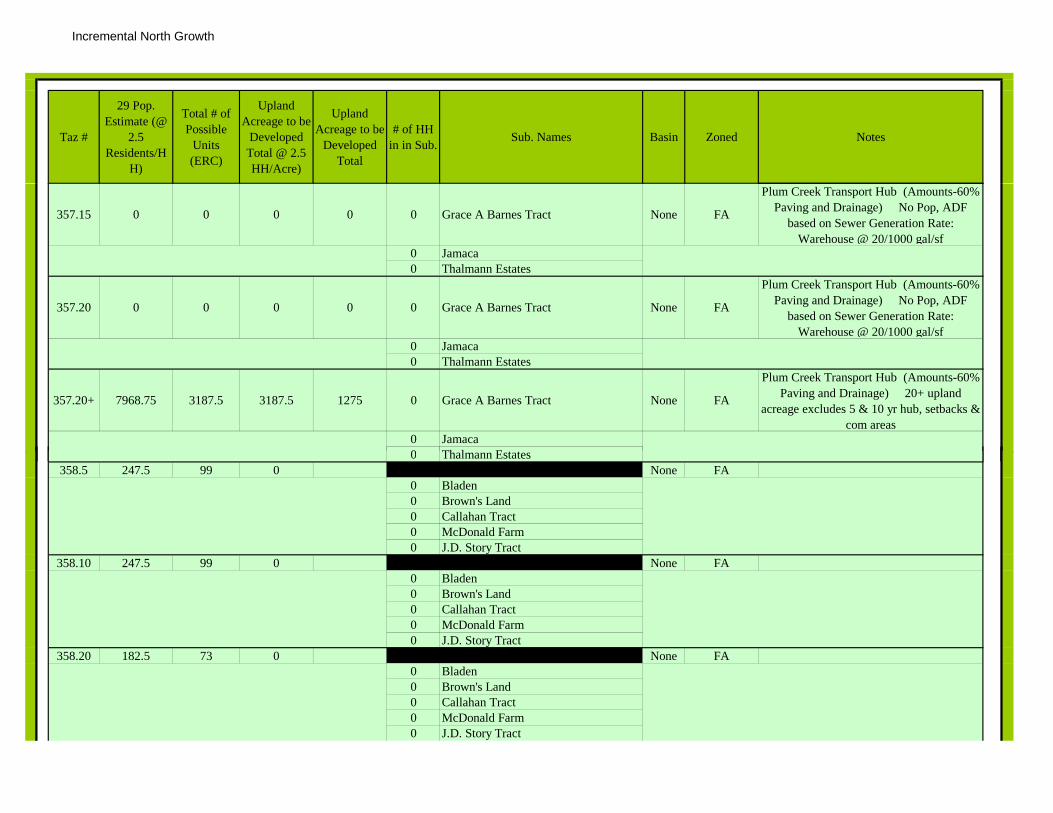
Incremental North Growth
Taz #
29 Pop. Estimate (@
2.5 Residents/H
H)
Total # of Possible
Units (ERC)
Upland Acreage to be
Developed Total @ 2.5 HH/Acre)
Upland Acreage to be
Developed Total
# of HH in in Sub. Sub. Names Basin Zoned Notes
357.15 0 0 0 0 0 Grace A Barnes Tract None FA
Plum Creek Transport Hub (Amounts-60% Paving and Drainage) No Pop, ADF
based on Sewer Generation Rate: Warehouse @ 20/1000 gal/sf
0 Jamaca0 Thalmann Estates
357.20 0 0 0 0 0 Grace A Barnes Tract None FA
Plum Creek Transport Hub (Amounts-60% Paving and Drainage) No Pop, ADF
based on Sewer Generation Rate: Warehouse @ 20/1000 gal/sf
0 Jamaca0 Thalmann Estates
357.20+ 7968.75 3187.5 3187.5 1275 0 Grace A Barnes Tract None FA
Plum Creek Transport Hub (Amounts-60% Paving and Drainage) 20+ upland
acreage excludes 5 & 10 yr hub, setbacks & com areas
0 Jamaca0 Thalmann Estates0 Thalmann Estates
358.5 247.5 99 0 None FA0 Bladen0 Brown's Land0 Callahan Tract0 McDonald Farm0 J.D. Story Tract
358.10 247.5 99 0 None FA0 Bladen0 Brown's Land0 Callahan Tract0 McDonald Farm0 J.D. Story Tract
358.20 182.5 73 0 None FA0 Bladen0 Brown's Land0 Callahan Tract0 McDonald Farm0 J.D. Story Tract

Incremental North Growth
Taz #
29 Pop. Estimate (@
2.5 Residents/H
H)
Total # of Possible
Units (ERC)
Upland Acreage to be
Developed Total @ 2.5 HH/Acre)
Upland Acreage to be
Developed Total
# of HH in in Sub. Sub. Names Basin Zoned Notes
359.20+ 900 360 0 0 None FA Plum Creek Type: 360 HH363.5 0 0 0 0 None FA 50+364.5 0 0 0 0 None FA 50+
365.20 2625 1050 1050 420 None FA Assume 1/2 develop land is to be 2.5 HH/acre
365.20+ 762.5 305 None FA Assume 1/2 develop land is to be 1 HH/acre
366.10 405 162 0 0 None FA & GI0 Roy Shepp Tract0 Ruth Floyd Tract0 Moody Tract0 Water Tract0 Adam Whaley Estate0 Sears Tract0 Jackson Tract0 Timber Oak0 Timber Oaks
366 15 405 162 0 0 None FA & GI366.15 405 162 0 0 None FA & GI0 Roy Shepp Tract0 Ruth Floyd Tract0 Moody Tract0 Water Tract0 Adam Whaley Estate0 Sears Tract0 Jackson Tract0 Timber Oak0 Timber Oaks

Incremental North Growth
Taz #
29 Pop. Estimate (@
2.5 Residents/H
H)
Total # of Possible
Units (ERC)
Upland Acreage to be
Developed Total @ 2.5 HH/Acre)
Upland Acreage to be
Developed Total
# of HH in in Sub. Sub. Names Basin Zoned Notes
366.20 405 162 0 0 None FA & GI0 Roy Shepp Tract0 Ruth Floyd Tract0 Moody Tract0 Water Tract0 Adam Whaley Estate0 Sears Tract0 Jackson Tract0 Timber Oak0 Timber Oaks
367.5 190.625 76.25 76.25 30.5 0 Randolph Estate None FA, HC & LI split 5 and 10 years - use 2.5 HH/ac0 Lane Tract
367.10 190.625 76.25 76.25 30.5 0 Randolph Estate None FA, HC & LI split 5 and 10 years - use 2.5 HH/ac0 Lane Tract
368.5 967.5 387 232 232 None FA
Comparing to Township 110: (Acrage-10Com/10Setbacks) & considering 42% to be open space/amenities (Upland acreage is
@ 1HH/ l d )@ 1HH/upland acre)0 Duggan Tract0 E.D. Underwood0 Faricloth Tract0 Gerald Smith Tract0 L.B. Clay Tract0 Underwood Property
155 Buffalo Creek
368.10 967.5 387 232 232 None FA
Comparing to Township 110: (Acrage-10Com/10Setbacks) & considering 42% to be open space/amenities (Upland acreage is
@ 1HH/upland acre)0 Duggan Tract0 E.D. Underwood0 Faricloth Tract0 Gerald Smith Tract0 L.B. Clay Tract0 Underwood Property
155 Buffalo Creek

Incremental North Growth
Taz #
29 Pop. Estimate (@
2.5 Residents/H
H)
Total # of Possible
Units (ERC)
Upland Acreage to be
Developed Total @ 2.5 HH/Acre)
Upland Acreage to be
Developed Total
# of HH in in Sub. Sub. Names Basin Zoned Notes
368.15 580 232 232 232 None FA
Comparing to Township 110: (Acrage-10Com/10Setbacks) & considering 42% to be open space/amenities (Upland acreage is
@ 1HH/upland acre)0 Duggan Tract0 E.D. Underwood0 Faricloth Tract0 Gerald Smith Tract0 L.B. Clay Tract0 Underwood Property0 Buffalo Creek
368.20 580 232 232 232 None FA
Comparing to Township 110: (Acrage-10Com/10Setbacks) & considering 42% to be open space/amenities (Upland acreage is
@ 1HH/upland acre)0 Duggan Tract0 E.D. Underwood0 Faricloth Tract0 Faricloth Tract0 Gerald Smith Tract0 L.B. Clay Tract0 Underwood Property0 Buffalo Creek
369.20+ 17552.5 7021 7021 3661 None FA, HC & GC
Plum Creek Land: To develop outside 2029 window. Part A - 20+ Pop. Based on
Township 110. (Upland Acreage - 10% COM & 20% Setbacks) = Developable. Then - 42% for open areas (Plum Creek
Style); Part B - 20+ pop based on 2.5 HH/acre with 10% COM, 20% setbacks,
20% open space0 Howe Tract0 Glynn Farms0 Joe's Island
370 0 0 0 0 None FA Out of 2029 window

Incremental North Growth
Taz #
29 Pop. Estimate (@
2.5 Residents/H
H)
Total # of Possible
Units (ERC)
Upland Acreage to be
Developed Total @ 2.5 HH/Acre)
Upland Acreage to be
Developed Total
# of HH in in Sub. Sub. Names Basin Zoned Notes
371 0 0 0 0 0 Arnett Tract None FA & GC Out of 2029 window0 Buffalo Swamp0 Drawdy Property0 Thalman
375.5 1937.5 775 775 310 PAWS East: Steamboat City None PDG Estimate RES by acreage375.10 1937.5 775 775 310 PAWS East: Steamboat City None PDG Estimate RES by acreage375.15 0 0 0 0 PAWS East: Steamboat City None PDG Estimate RES by acreage375.20 0 0 0 0 PAWS East: Steamboat City None PDG Estimate RES by acreage
375.20+ 0 0 0 0 PAWS East: Steamboat City None PDG Estimate RES by acreage
376.5 1207.5 373 0 0 FA & PDG
Acreage (Amounts-10% COM) (Acreages: a.30, b. 27, c. 14, d. 19) 90 total, but a & c
go to LS110 & b. & d. go to LS118 (acreage included in Incremental
spreadsheet) LS4110 1207.5 483 110 44LS4118 0 0 0 0LS4120 0 0
203 Carriage Gate L110203 Carriage Gate L11056 Assumed Carriage Gate P 2 L1100 Dukes Tract -0 Hutcheson Tract -0 Jacobs Acres -0 Petersville -0 Polite Estates -
114 Shell Pointe L120

Incremental North Growth
Taz #
29 Pop. Estimate (@
2.5 Residents/H
H)
Total # of Possible
Units (ERC)
Upland Acreage to be
Developed Total @ 2.5 HH/Acre)
Upland Acreage to be
Developed Total
# of HH in in Sub. Sub. Names Basin Zoned Notes
376.10 696.25 56 0 0 FA & PDG
Acreage (Amounts-10% COM) (Acreages: a.30, b. 27, c. 14, d. 19) 90 total, but a & c
go to LS110 & b. & d. go to LS118 (acreage included in Incremental
spreadsheet) LS4110 415 166 110 44LS4118 281.25 112.5 112.5 45
0 Carriage Gate L11056 Assumed Carriage Gate P 2 L1100 Dukes Tract -0 Hutcheson Tract -0 Jacobs Acres -0 Petersville -0 Polite Estates -0 Shell Pointe L110
376 15 275 0 0 0 FA & PDG
Acreage (Amounts-10% COM) (Acreages: a.30, b. 27, c. 14, d. 19) 90 total, but a & c
t LS110 & b & d t LS118376.15 275 0 0 0 FA & PDG go to LS110 & b. & d. go to LS118 (acreage included in Incremental
spreadsheet) LS4110 275 110 110 44LS4118 0 0 0 0
0 Carriage Gate L1100 Assumed Carriage Gate P 2 L1100 Dukes Tract -0 Hutcheson Tract -0 Jacobs Acres -0 Petersville -0 Polite Estates -0 Shell Pointe L120
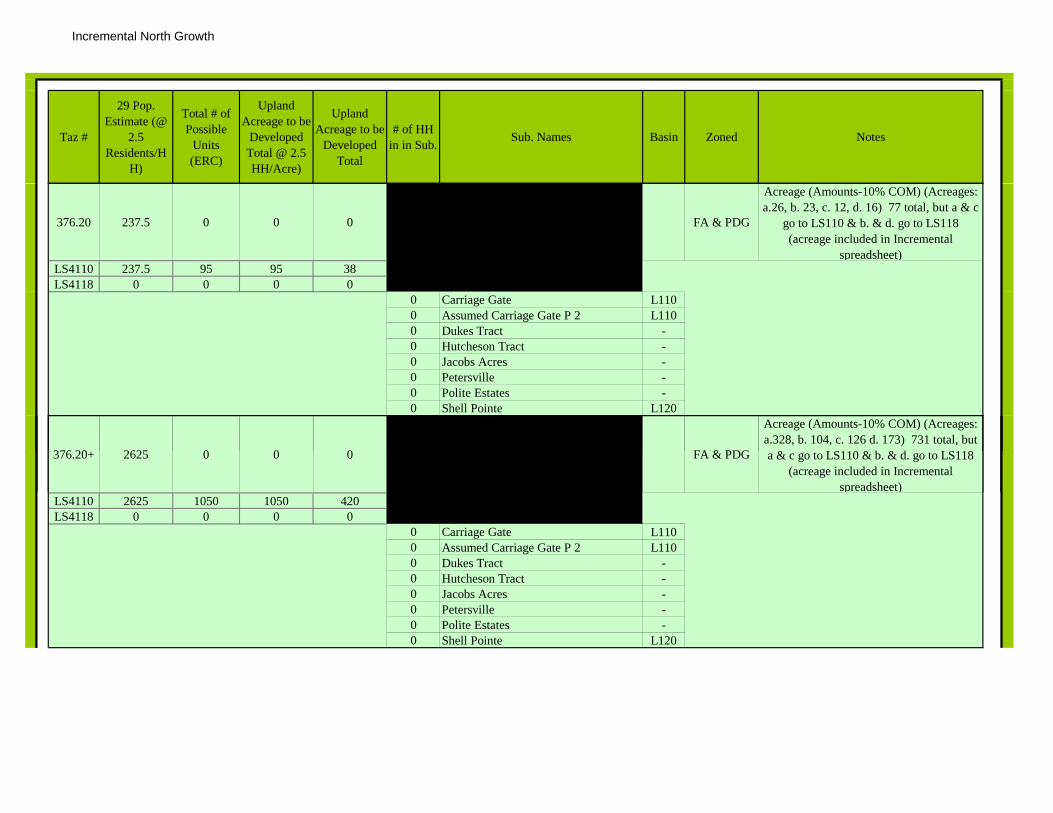
Incremental North Growth
Taz #
29 Pop. Estimate (@
2.5 Residents/H
H)
Total # of Possible
Units (ERC)
Upland Acreage to be
Developed Total @ 2.5 HH/Acre)
Upland Acreage to be
Developed Total
# of HH in in Sub. Sub. Names Basin Zoned Notes
376.20 237.5 0 0 0 FA & PDG
Acreage (Amounts-10% COM) (Acreages: a.26, b. 23, c. 12, d. 16) 77 total, but a & c
go to LS110 & b. & d. go to LS118 (acreage included in Incremental
spreadsheet) LS4110 237.5 95 95 38LS4118 0 0 0 0
0 Carriage Gate L1100 Assumed Carriage Gate P 2 L1100 Dukes Tract -0 Hutcheson Tract -0 Jacobs Acres -0 Petersville -0 Polite Estates -0 Shell Pointe L120
376 20+ 2625 0 0 0 FA & PDG
Acreage (Amounts-10% COM) (Acreages: a.328, b. 104, c. 126 d. 173) 731 total, but
& t LS110 & b & d t LS118376.20+ 2625 0 0 0 FA & PDG a & c go to LS110 & b. & d. go to LS118 (acreage included in Incremental
spreadsheet) LS4110 2625 1050 1050 420LS4118 0 0 0 0
0 Carriage Gate L1100 Assumed Carriage Gate P 2 L1100 Dukes Tract -0 Hutcheson Tract -0 Jacobs Acres -0 Petersville -0 Polite Estates -0 Shell Pointe L120
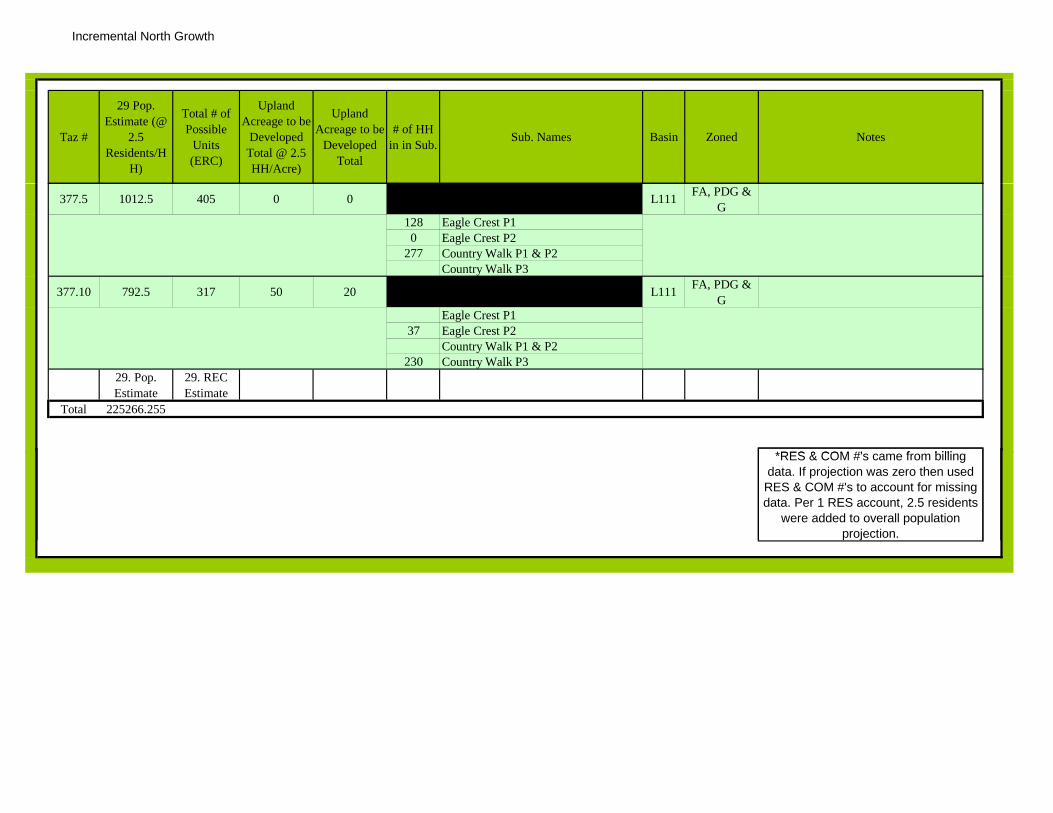
Incremental North Growth
Taz #
29 Pop. Estimate (@
2.5 Residents/H
H)
Total # of Possible
Units (ERC)
Upland Acreage to be
Developed Total @ 2.5 HH/Acre)
Upland Acreage to be
Developed Total
# of HH in in Sub. Sub. Names Basin Zoned Notes
377.5 1012.5 405 0 0 L111 FA, PDG & G
128 Eagle Crest P10 Eagle Crest P2
277 Country Walk P1 & P2Country Walk P3
377.10 792.5 317 50 20 L111 FA, PDG & G
Eagle Crest P137 Eagle Crest P2
Country Walk P1 & P2230 Country Walk P3
29. Pop. Estimate
29. REC Estimate
Total 225266.255
*RES & COM #' f billi*RES & COM #'s came from billing data. If projection was zero then used
RES & COM #'s to account for missing data. Per 1 RES account, 2.5 residents
were added to overall population projection.

North Basin Flow Projections: 2014
North Per Capita 113.00 MDF Factor 1.54PHF Factor 2.22
TAZ # Population ADF (gpd) MDF (gpd) PHF (gpm) Notes91.5 0.00 Private Well and Built Out
167.5 0.00 50+168.5 0.00 Marsh169.5 1,625.00 183,625.00 282,782.50 283.09 Currently Undeveloped and/or Septic170.5 3,121.25 352,701.25 543,159.93 543.75 Currently Undeveloped and/or Septic171.5 402.50 45,482.50 70,043.05 70.12 Parially Developed - Existing Water, Sewer & Customers172.5 151.88 17,161.88 26,429.29 26.46 Currently Undeveloped and/or Septic173.5 5,125.00 579,125.00 891,852.50 892.82 No Sewer, but water --- add population174.5 791.25 89,411.25 137,693.33 137.84 No Sewer, but water --- add population175.5 941.25 106,361.25 163,796.33 163.97 Parially Developed - Existing Water, Sewer & Customers176.5 190.63 21,540.63 33,172.56 33.21 COM177.5 920.00 103,960.00 160,098.40 160.27 Parially Developed - Existing Water, Sewer & Customers178.5 1,277.50 144,357.50 222,310.55 222.55 No Sewer, but water --- add population179.5 0.00 Private Well and Built Out180.5 400.00 45,200.00 69,608.00 69.68 Parially Developed - Existing Water, Sewer & Customers182.5 587.50 66,387.50 102,236.75 102.35 Private Well and Partially Built Out183.5 606.25 68,506.25 105,499.63 105.61 Private Well and Partially Built Out184.5 0.00 Private Well and Built Out185.5 0.00 Currently Undeveloped and/or Septic186.5 0.00 Currently Undeveloped and/or Septic187.5 0.00 Currently Undeveloped and/or Septic188.5 22.50 2,542.50 3,915.45 3.92 Private Well and Built Out189.5 0.00 Private Well and Built Out190.5 2,032.50 229,672.50 353,695.65 354.08 Parially Developed - Existing Water, Sewer & Customers191.5 0.00 COM192.5 0.00 COM/Airport193.5 0.00 COM194.5 935.00 105,655.00 162,708.70 162.88 Parially Developed - Existing Water, Sewer & Customers197.5 3,765.63 425,515.63 655,294.06 656.00198.5 362.50 40,962.50 63,082.25 63.15 Notting Hill199.5 0.00 Private Well and Built Out236.5 0.00 Private Well and Built Out237 5 0 00 P i W ll d P i ll B il O
North
237.5 0.00 Private Well and Partially Built Out238.5 0.00 Private Well and Partially Built Out239.5 256.25 28,956.25 44,592.63 44.64 Private Well and Partially Built Out331.5 0.00 Built Out/Septic332.5 812.50 91,812.50 141,391.25 141.54 Private Well and Partially Built Out333.5 262.50 29,662.50 45,680.25 45.73 Private Well and Partially Built Out334.5 1,855.00 209,615.00 322,807.10 323.16 Currently Undeveloped and/or Septic339.5 0.00 Private Well and Built Out/Septic340.5 0.00 Private Well and Built Out/Septic
356.5 0.00 50+357.5 0.00 Currently Undeveloped and/or Septic358.5 247.50 27,967.50 43,069.95 43.12 Currently Undeveloped and/or Septic359.5 0.00 Currently Undeveloped and/or Septic363.5 0.00 50+364.5 0.00 50+365.5 0.00 Currently Undeveloped and/or Septic366.5 0.00 Currently Undeveloped and/or Septic367.5 190.63 21,540.63 33,172.56 33.21 Currently Undeveloped and/or Septic368.5 967.50 109,327.50 168,364.35 168.55 Currently Undeveloped and/or Septic369.5 0.00 Undeveloped370.5 0.00 Currently Undeveloped and/or Septic371.5 0.00 50+375.5 1,937.50 218,937.50 337,163.75 337.53 Currently Undeveloped and/or Septic376.5 1,207.50 136,447.50 210,129.15 210.36 Parially Developed - Existing Water, Sewer & Customers377.5 1,012.50 114,412.50 176,195.25 176.39 Parially Developed - Existing Water, Sewer & Customers
Total Base 33,257.50 3,758,097.50 5,787,470.15 5,575.97
353.5 & 354.5 1,250.00 Currently Undeveloped141,250.00 217,525.00 0.00

North Basin Flow Projections: 2019
North Per Capita 113.00 MDF Factor 1.54PHF Factor 2.22
TAZ # Population ADF (gpd) MDF (gpd) PHF (gpm) Notes91.10 0.00 Private Well and Built Out
167.10 0.00 50+168.10 0.00 Marsh169.10 1,625.00 183,625.00 282,782.50 283.09 Currently Undeveloped and/or Septic170.10 3,001.25 339,141.25 522,277.53 522.84 Currently Undeveloped and/or Septic171.10 402.50 45,482.50 70,043.05 70.12 Parially Developed - Existing Water, Sewer & Customers172.10 151.88 17,161.88 26,429.29 26.46 Currently Undeveloped and/or Septic173.10 4,353.13 491,903.13 757,530.81 758.35 No Sewer, but water --- add population174.10 1,262.50 142,662.50 219,700.25 219.94 No Sewer, but water --- add population175.10 0.00 Parially Developed - Existing Water, Sewer & Customers176.10 190.63 21,540.63 33,172.56 33.21 COM177.10 325.00 36,725.00 56,556.50 56.62 Parially Developed - Existing Water, Sewer & Customers178.10 0.00 No Sewer, but water --- add population179.10 0.00 Private Well and Built Out180.10 0.00 Parially Developed - Existing Water, Sewer & Customers182.10 587.50 66,387.50 102,236.75 102.35 Private Well and Partially Built Out183.10 556.25 62,856.25 96,798.63 96.90 Private Well and Partially Built Out184.10 0.00 Private Well and Built Out185.10 0.00 Currently Undeveloped and/or Septic186.10 180.00 20,340.00 31,323.60 31.36 Currently Undeveloped and/or Septic187.10 0.00 Currently Undeveloped and/or Septic188.10 0.00 Private Well and Built Out189.10 0.00 Private Well and Built Out190.10 0.00 Parially Developed - Existing Water, Sewer & Customers191.10 0.00 COM192.10 0.00 COM/Airport193.10 0.00 COM194.10 400.00 45,200.00 69,608.00 69.68 Parially Developed - Existing Water, Sewer & Customers197.10 2,728.13 308,278.69 474,749.18 475.26198.10 0.00 Notting Hill199.10 0.00 Private Well and Built Out236.10 0.00 Private Well and Built Out
North
236.10 0.00 Private Well and Built Out237.10 0.00 Private Well and Partially Built Out238.10 0.00 Private Well and Partially Built Out239.10 0.00 Private Well and Partially Built Out331.10 0.00 Built Out/Septic332.10 812.50 91,812.50 141,391.25 141.54 Private Well and Partially Built Out333.10 0.00 Private Well and Partially Built Out334.10 1,855.00 209,615.00 322,807.10 323.16 Currently Undeveloped and/or Septic339.10 0.00 Private Well and Built Out/Septic340.10 0.00 Private Well and Built Out/Septic
356.10 0.00 50+357.10 0.00 Currently Undeveloped and/or Septic358.10 247.50 27,967.50 43,069.95 43.12 Currently Undeveloped and/or Septic359.10 0.00 Currently Undeveloped and/or Septic363.10 0.00 50+364.10 0.00 50+365.10 0.00 Currently Undeveloped and/or Septic366.10 405.00 45,765.00 70,478.10 70.55 Currently Undeveloped and/or Septic367.10 190.63 21,540.63 33,172.56 33.21 Currently Undeveloped and/or Septic368.10 967.50 109,327.50 168,364.35 168.55 Currently Undeveloped and/or Septic369.10 0.00 Undeveloped370.10 0.00 Currently Undeveloped and/or Septic371.10 0.00 50+375.10 1,937.50 218,937.50 337,163.75 337.53 Currently Undeveloped and/or Septic376.10 696.25 78,676.25 121,161.43 121.29 Parially Developed - Existing Water, Sewer & Customers377.10 792.50 89,552.50 137,910.85 138.06 Parially Developed - Existing Water, Sewer & Customers
Total Base 26,188.13 2,959,258.69 4,557,258.38 4,123.19
353.10 & 354.10 2,520.00 Currently Undeveloped284,760.00 438,530.40 0.00

North Basin Flow Projections: 2024
North Per Capita 113.00 MDF Factor 1.54PHF Factor 2.22
TAZ # Population ADF (gpd) MDF (gpd) PHF (gpm) Notes91.15 0.00 Private Well and Built Out
167.15 0.00 50+168.15 0.00 Marsh169.15 1,625.00 183,625.00 282,782.50 283.09 Currently Undeveloped and/or Septic170.15 2,695.00 304,535.00 468,983.90 469.49 Currently Undeveloped and/or Septic171.15 187.50 21,187.50 32,628.75 32.66 Parially Developed - Existing Water, Sewer & Customers172.15 151.88 17,161.88 26,429.29 26.46 Currently Undeveloped and/or Septic173.15 0.00 No Sewer, but water --- add population174.15 918.75 103,818.75 159,880.88 160.05 No Sewer, but water --- add population175.15 0.00 Parially Developed - Existing Water, Sewer & Customers176.15 0.00 COM177.15 0.00 Parially Developed - Existing Water, Sewer & Customers178.15 0.00 No Sewer, but water --- add population179.15 0.00 Private Well and Built Out180.15 0.00 Parially Developed - Existing Water, Sewer & Customers182.15 0.00 Private Well and Partially Built Out183.15 556.25 62,856.25 96,798.63 96.90 Private Well and Partially Built Out184.15 0.00 Private Well and Built Out185.15 0.00 Currently Undeveloped and/or Septic186.15 532.50 60,172.50 92,665.65 92.77 Currently Undeveloped and/or Septic187.15 0.00 Currently Undeveloped and/or Septic188.15 0.00 Private Well and Built Out189.15 0.00 Private Well and Built Out190.15 0.00 Parially Developed - Existing Water, Sewer & Customers191.15 0.00 COM192.15 0.00 COM/Airport193.15 0.00 COM194.15 0.00 Parially Developed - Existing Water, Sewer & Customers197.15 0.00198.15 0.00 Notting Hill199.15 0.00 Private Well and Built Out236.15 0.00 Private Well and Built Out
North
236.15 0.00 Private Well and Built Out237.15 0.00 Private Well and Partially Built Out238.15 0.00 Private Well and Partially Built Out239.15 0.00 Private Well and Partially Built Out331.15 0.00 Built Out/Septic332.15 0.00 Private Well and Partially Built Out333.15 0.00 Private Well and Partially Built Out334.15 0.00 Currently Undeveloped and/or Septic339.15 0.00 Private Well and Built Out/Septic340.15 0.00 Private Well and Built Out/Septic
356.15 0.00 50+357.15 0.00 Currently Undeveloped and/or Septic358.15 0.00 Currently Undeveloped and/or Septic359.15 0.00 Currently Undeveloped and/or Septic363.15 0.00 50+364.15 0.00 50+365.15 0.00 Currently Undeveloped and/or Septic366.15 405.00 45,765.00 70,478.10 70.55 Currently Undeveloped and/or Septic367.15 0.00 Currently Undeveloped and/or Septic368.15 580.00 65,540.00 100,931.60 101.04 Currently Undeveloped and/or Septic369.15 0.00 Undeveloped370.15 0.00 Currently Undeveloped and/or Septic371.15 0.00 50+375.15 0.00 Currently Undeveloped and/or Septic376.15 275.00 31,075.00 47,855.50 Parially Developed - Existing Water, Sewer & Customers377.15 0.00 Parially Developed - Existing Water, Sewer & Customers
Total Base 10,466.88 1,182,756.88 1,821,445.59 1,333.02
353.15 & 354.15 2,540.00 Currently Undeveloped287,020.00 442,010.80 0.00

North Basin Flow Projections: 2029
North Per Capita 113.00 MDF Factor 1.54PHF Factor 2.22
TAZ # Population ADF (gpd) MDF (gpd) PHF (gpm) Notes91.20 0.00 Private Well and Built Out
167.20 0.00 50+168.20 0.00 Marsh169.20 1,436.25 162,296.25 249,936.23 250.21 Currently Undeveloped and/or Septic170.20 2,495.00 281,935.00 434,179.90 434.65 Currently Undeveloped and/or Septic171.20 162.50 18,362.50 28,278.25 28.31 Parially Developed - Existing Water, Sewer & Customers172.20 0.00 Currently Undeveloped and/or Septic173.20 0.00 No Sewer, but water --- add population174.20 0.00 No Sewer, but water --- add population175.20 0.00 Parially Developed - Existing Water, Sewer & Customers176.20 0.00 COM177.20 0.00 Parially Developed - Existing Water, Sewer & Customers178.20 0.00 No Sewer, but water --- add population179.20 0.00 Private Well and Built Out182.20 0.00 Private Well and Partially Built Out182.20 0.00 Private Well and Partially Built Out183.20 0.00 Private Well and Partially Built Out184.20 0.00 Private Well and Built Out185.20 727.50 82,207.50 126,599.55 126.74 Currently Undeveloped and/or Septic186.20 0.00 Currently Undeveloped and/or Septic187.20 0.00 Currently Undeveloped and/or Septic188.20 0.00 Private Well and Built Out189.20 0.00 Private Well and Built Out190.20 0.00 Parially Developed - Existing Water, Sewer & Customers191.20 0.00 COM192.20 0.00 COM/Airport193.20 0.00 COM194.20 0.00 Parially Developed - Existing Water, Sewer & Customers197.20 0.00198.20 0.00 Notting Hill199.20 0.00 Private Well and Built Out236.20 0.00 Private Well and Built Out
North
236.20 0.00 Private Well and Built Out237.20 0.00 Private Well and Partially Built Out238.20 0.00 Private Well and Partially Built Out239.20 0.00 Private Well and Partially Built Out331.20 0.00 Built Out/Septic332.20 0.00 Private Well and Partially Built Out333.20 0.00 Private Well and Partially Built Out334.20 0.00 Currently Undeveloped and/or Septic339.20 0.00 Private Well and Built Out/Septic340.20 0.00 Private Well and Built Out/Septic
356.20 0.00 50+357.20 0.00 Currently Undeveloped and/or Septic358.20 182.50 20,622.50 31,758.65 31.79 Currently Undeveloped and/or Septic359.20 0.00 Currently Undeveloped and/or Septic363.20 0.00 50+364.20 0.00 50+365.20 2,625.00 296,625.00 456,802.50 457.30 Currently Undeveloped and/or Septic366.20 405.00 45,765.00 70,478.10 70.55 Currently Undeveloped and/or Septic367.20 0.00 Currently Undeveloped and/or Septic368.20 580.00 65,540.00 100,931.60 101.04 Currently Undeveloped and/or Septic369.20 0.00 Undeveloped370.20 0.00 Currently Undeveloped and/or Septic371.20 0.00 50+375.20 0.00 Currently Undeveloped and/or Septic376.20 237.50 26,837.50 41,329.75 41.37 Parially Developed - Existing Water, Sewer & Customers377.20 0.00 Parially Developed - Existing Water, Sewer & Customers
Total Base 12,601.25 1,423,941.25 2,192,869.53 1,541.96
353.2 & 354.2 3,750.00 Currently Undeveloped423,750.00 652,575.00 0.00

Brunswick Glynn County JWSC Applied Technology & Management, Inc.
Water Sewer Master Plan
APPENDIX E – WATER SYSTEM COMPONENT EXIT 29 POPULATION PROJECTIONS

Exit 29Incremental Growth
Taz #
29 Pop. Estimate (@ 2.5
Residents/HH)
Total # of Possible
Units (ERC)
Upland Acrage to be Developed Total @ 2.5 HH/Acre)
Upland Acrage to be Developed
Total
# of HH in in Sub. Sub. Names Sub. Id Sewer or
Septic Basin Zoned Notes
308.5 131.3 52.5 53 21 3101 HC, FC, M20, LC & M12 All to develop within 5 years
0 Cottage Point 252 Septic0 Scarlett Estates 539 Septic0 Tidewater Estates MHP 1084 Septic
309.5 313.1 125.3 125 50 3103 FC, PDR & FA
0 Broklyn Ridge 205 Septic0 Creekwood 265 Septic0 Fancy Acres 312 Septic0 Fancy Buffs 313 Septic0 Fancy Bluff Estates 314 Septic0 Price Lands 517 Septic0 Rosedale 533 Septic0 Bayou Oaks 1142 Septic
309.10 313.1 125.3 125 50 3103 FC, PDR & FA
0 Broklyn Ridge 205 Septic0 Creekwood 265 Septic0 Fancy Acres 312 Septic0 Fancy Buffs 313 Septic0 F Bl ff E t t 314 S ti
Acrage (Amounts-10% COM) Develop over next 5 years
Acrage (Amounts-10% COM) Develop over next 5 years
0 Fancy Bluff Estates 314 Septic0 Price Lands 517 Septic0 Rosedale 533 Septic0 Bayou Oaks 1142 Septic
309.15 313.1 125.3 125 50 3103 FC, PDR & FA
0 Broklyn Ridge 205 Septic0 Creekwood 265 Septic0 Fancy Acres 312 Septic0 Fancy Buffs 313 Septic0 Fancy Bluff Estates 314 Septic0 Price Lands 517 Septic0 Rosedale 533 Septic0 Bayou Oaks 1142 Septic
328.5 1,297.5 FC, PDG, FA, FC, R9 & LI
LS3101 242.5 97.0 0 0LS3114 1,012.5 405.0 0 0LS3123 42.5 17.0 0 0
66 Cinder Hill 242 Sewer 31140 Foxcreek 321 Septic -0 McGinty Lands @ Southport 439 Septic -
55 Planting Hammock 510 Sewer 3101198 Somersby Pointe 902 Sewer 311472 Southwinds 910 Sewer 311455 Barrington Oaks 1139 Sewer 31140 Southport 39 Septic
(LS3101 Has 42 lots included in the # of ERC) (LS3114 Has 14 lots included in the # of ERC)
(LS3123 Has 17 lots included in the # of ERC)
Acrage (Amounts-10% COM) Develop over next 5 years

Exit 29Incremental Growth
Taz #
29 Pop. Estimate (@ 2.5
Residents/HH)
Total # of Possible
Units (ERC)
Upland Acrage to be Developed Total @ 2.5 HH/Acre)
Upland Acrage to be Developed
Total
# of HH in in Sub. Sub. Names Sub. Id Sewer or
Septic Basin Zoned Notes
329.5 382.5 153.0 0 0 3103 R20 & FC153 Royal Oaks 534 Sewer
0 Curry Track 2 826 Septic330 18.8 7.5 0 0 4103 R12
0 Satilla Shores 537 Septic0 Satilla Shores Acres 538 Septic
341.5 1,759.8 FA, PDG & CP
3931 1,158.8 463.5 198 79Turtle Total 300.5 171.0 - -
Turtle High 157.5 105.0 105 5
Turtle Med 88.0 44.0 44 11
Turtle Low 55.0 22.0 22 11
0 Wiggins Estate 133 Septic 39310 Battle 177 Septic 39310 Davis Acres 279 Septic 39310 Harris Plantation 360 Septic 39310 Wright Estate 983 Septic 3931
266 Hopewell Creek Phase 1 Planned 39310 H ll C k Ph 2 Pl d 3931
Turtle River is by acrage (High Density: we took half of the acrage with 20HH/acre @
1.5person/HH Medium Density: 4HH/acre @ 2 people/HH Low
Density: 2HH/acre @ 2.5 people/acre)
0 Hopewell Creek Phase 2 Planned 39310 Hopewell Creek Phase 3 Planned 39310 Hopewell Creek Phase 4 Planned 3931
5.25 Turtle River High Density (acres) Step Turtle11 Turtle River Medium Density (acres) Step Turtle11 Turtle River Low Density Step Turtle
341.10 1,402.3 FA, PDG & CP
3931 801.3 320.5 198 79Turtle Total 300.5 171.0 - -
Turtle High 157.5 105.0 105 5
Turtle Med 88.0 44.0 44 11
Turtle Low 55.0 22.0 22 11
0 Wiggins Estate 133 Septic 39310 Battle 177 Septic 39310 Davis Acres 279 Septic 39310 Harris Plantation 360 Septic 39310 Wright Estate 983 Septic 39310 Hopewell Creek Phase 1 Planned 3931
123 Hopewell Creek Phase 2 Planned 39310 Hopewell Creek Phase 3 Planned 39310 Hopewell Creek Phase 4 Planned 3931
5.25 Turtle River High Density (acres) Step Turtle11 Turtle River Medium Density (acres) Step Turtle11 Turtle River Low Density Step Turtle
Turtle River is by acrage (High Density: we took half of the acrage with 20HH/acre @
1.5person/HH Medium Density: 4HH/acre @ 2 people/HH Low
Density: 2HH/acre @ 2.5 people/acre)

Exit 29Incremental Growth
Taz #
29 Pop. Estimate (@ 2.5
Residents/HH)
Total # of Possible
Units (ERC)
Upland Acrage to be Developed Total @ 2.5 HH/Acre)
Upland Acrage to be Developed
Total
# of HH in in Sub. Sub. Names Sub. Id Sewer or
Septic Basin Zoned Notes
341.15 1,402.3 FA, PDG & CP
3931 801.3 320.5 198 79Turtle Total 300.5 171.0 - -
Turtle High 157.5 105.0 105 5
Turtle Med 88.0 44.0 44 11
Turtle Low 55.0 22.0 22 11
0 Wiggins Estate 133 Septic 39310 Battle 177 Septic 39310 Davis Acres 279 Septic 39310 Harris Plantation 360 Septic 39310 Wright Estate 983 Septic 39310 Hopewell Creek Phase 1 Planned 3931
123 Hopewell Creek Phase 2 Planned 39310 Hopewell Creek Phase 3 Planned 39310 Hopewell Creek Phase 4 Planned 3931
5 25 T tl Ri Hi h D it ( ) St T tl
Turtle River is by acrage (High Density: we took half of the acrage with 20HH/acre @
1.5person/HH Medium Density: 4HH/acre @ 2 people/HH Low
Density: 2HH/acre @ 2.5 people/acre)
5.25 Turtle River High Density (acres) Step Turtle11 Turtle River Medium Density (acres) Step Turtle11 Turtle River Low Density Step Turtle
341.20 1,197.00 FA, PDG & CP
3931 690.00 276.0 170 68Turtle Total 253.50 145.0 - -
Turtle High 136.50 91.0 91 5
Turtle Med 72.00 36.0 36 9
Turtle Low 45.00 18.0 18 9
0 Wiggins Estate 133 Septic 39310 Battle 177 Septic 39310 Davis Acres 279 Septic 39310 Harris Plantation 360 Septic 39310 Wright Estate 983 Septic 39310 Hopewell Creek Phase 1 Planned 3931
106 Hopewell Creek Phase 2 Planned 39310 Hopewell Creek Phase 3 Planned 39310 Hopewell Creek Phase 4 Planned 3931
4.55 Turtle River High Density (acres) Step Turtle9 Turtle River Medium Density (acres) Step Turtle9 Turtle River Low Density Step Turtle
Turtle River is by acrage (High Density: we took half of the acrage with 20HH/acre @
1.5person/HH Medium Density: 4HH/acre @ 2 people/HH Low
Density: 2HH/acre @ 2.5 people/acre)
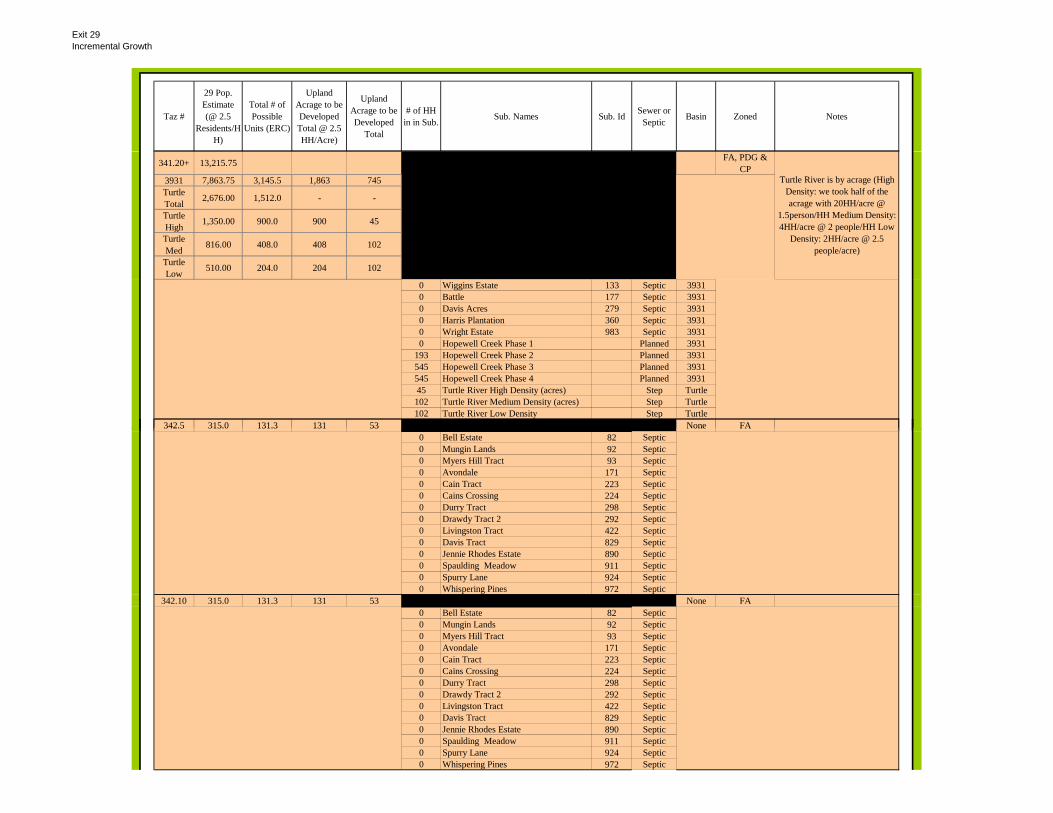
Exit 29Incremental Growth
Taz #
29 Pop. Estimate (@ 2.5
Residents/HH)
Total # of Possible
Units (ERC)
Upland Acrage to be Developed Total @ 2.5 HH/Acre)
Upland Acrage to be Developed
Total
# of HH in in Sub. Sub. Names Sub. Id Sewer or
Septic Basin Zoned Notes
341.20+ 13,215.75 FA, PDG & CP
3931 7,863.75 3,145.5 1,863 745Turtle Total 2,676.00 1,512.0 - -
Turtle High 1,350.00 900.0 900 45
Turtle Med 816.00 408.0 408 102
Turtle Low 510.00 204.0 204 102
0 Wiggins Estate 133 Septic 39310 Battle 177 Septic 39310 Davis Acres 279 Septic 39310 Harris Plantation 360 Septic 39310 Wright Estate 983 Septic 39310 Hopewell Creek Phase 1 Planned 3931
193 Hopewell Creek Phase 2 Planned 3931545 Hopewell Creek Phase 3 Planned 3931545 Hopewell Creek Phase 4 Planned 393145 Turtle River High Density (acres) Step Turtle102 Turtle River Medium Density (acres) Step Turtle102 Turtle River Low Density Step Turtle
342.5 315.0 131.3 131 53 None FA
Turtle River is by acrage (High Density: we took half of the acrage with 20HH/acre @
1.5person/HH Medium Density: 4HH/acre @ 2 people/HH Low
Density: 2HH/acre @ 2.5 people/acre)
342.5 315.0 131.3 131 53 None FA0 Bell Estate 82 Septic0 Mungin Lands 92 Septic0 Myers Hill Tract 93 Septic0 Avondale 171 Septic0 Cain Tract 223 Septic0 Cains Crossing 224 Septic0 Durry Tract 298 Septic0 Drawdy Tract 2 292 Septic0 Livingston Tract 422 Septic0 Davis Tract 829 Septic0 Jennie Rhodes Estate 890 Septic0 Spaulding Meadow 911 Septic0 Spurry Lane 924 Septic0 Whispering Pines 972 Septic
342.10 315.0 131.3 131 53 None FA0 Bell Estate 82 Septic0 Mungin Lands 92 Septic0 Myers Hill Tract 93 Septic0 Avondale 171 Septic0 Cain Tract 223 Septic0 Cains Crossing 224 Septic0 Durry Tract 298 Septic0 Drawdy Tract 2 292 Septic0 Livingston Tract 422 Septic0 Davis Tract 829 Septic0 Jennie Rhodes Estate 890 Septic0 Spaulding Meadow 911 Septic0 Spurry Lane 924 Septic0 Whispering Pines 972 Septic

Exit 29Incremental Growth
Taz #
29 Pop. Estimate (@ 2.5
Residents/HH)
Total # of Possible
Units (ERC)
Upland Acrage to be Developed Total @ 2.5 HH/Acre)
Upland Acrage to be Developed
Total
# of HH in in Sub. Sub. Names Sub. Id Sewer or
Septic Basin Zoned Notes
342.15 315.0 131.3 131 53 None FA0 Bell Estate 82 Septic0 Mungin Lands 92 Septic0 Myers Hill Tract 93 Septic0 Avondale 171 Septic0 Cain Tract 223 Septic0 Cains Crossing 224 Septic0 Durry Tract 298 Septic0 Drawdy Tract 2 292 Septic0 Livingston Tract 422 Septic0 Davis Tract 829 Septic0 Jennie Rhodes Estate 890 Septic0 Spaulding Meadow 911 Septic0 Spurry Lane 924 Septic0 Whispering Pines 972 Septic
342.20 271.44 113.1 113 45 None FA0 Bell Estate 82 Septic0 Mungin Lands 92 Septic0 Myers Hill Tract 93 Septic0 Avondale 171 Septic0 Avondale 171 Septic0 Cain Tract 223 Septic0 Cains Crossing 224 Septic0 Durry Tract 298 Septic0 Drawdy Tract 2 292 Septic0 Livingston Tract 422 Septic0 Davis Tract 829 Septic0 Jennie Rhodes Estate 890 Septic0 Spaulding Meadow 911 Septic0 Spurry Lane 924 Septic0 Whispering Pines 972 Septic
342.20+ 2,964.96 1,235.4 1,235 494 None FA0 Bell Estate 82 Septic0 Mungin Lands 92 Septic0 Myers Hill Tract 93 Septic0 Avondale 171 Septic0 Cain Tract 223 Septic0 Cains Crossing 224 Septic0 Durry Tract 298 Septic0 Drawdy Tract 2 292 Septic0 Livingston Tract 422 Septic0 Davis Tract 829 Septic0 Jennie Rhodes Estate 890 Septic0 Spaulding Meadow 911 Septic0 Spurry Lane 924 Septic0 Whispering Pines 972 Septic

Exit 29Incremental Growth
Taz #
29 Pop. Estimate (@ 2.5
Residents/HH)
Total # of Possible
Units (ERC)
Upland Acrage to be Developed Total @ 2.5 HH/Acre)
Upland Acrage to be Developed
Total
# of HH in in Sub. Sub. Names Sub. Id Sewer or
Septic Basin Zoned Notes
343.5 1,363.8 0 3121 PDG, R20, FA, LI & HC
LS3121 1,249.4 499.8 439 176LS3300 114.4 45.8 46 18
0 Quinnely Estates 107 Septic0 Rainey Tract 108 Septic0 Angelo's Acres 163 Septic0 Deerwood Estates 283 Septic0 Emanual Church Estates 306 Septic0 Fish Hall 316 Septic0 Fish Hall Estates 317 Septic0 Jekyll Heights 390 Septic
61 Majestic Oaks 427 Sewer0 Plott 511 Septic0 Silver Bluff 550 Septic0 Three Oaks 937 Septic0 S l tt P ti 1036 S ti0 Scarlett Properties 1036 Septic0 Avondale 2 1144 Septic0 Ratliff Lake 1147 Septic
343.10 114.38 0 3121 PDG, R20, FA, LI & HC
LS3121 0.00 0.0 0 0LS3300 114.38 45.8 46 18
0 Quinnely Estates 107 Septic0 Rainey Tract 108 Septic0 Angelo's Acres 163 Septic0 Deerwood Estates 283 Septic0 Emanual Church Estates 306 Septic0 Fish Hall 316 Septic0 Fish Hall Estates 317 Septic0 Jekyll Heights 390 Septic0 Majestic Oaks 427 Sewer0 Plott 511 Septic0 Silver Bluff 550 Septic0 Three Oaks 937 Septic0 Scarlett Properties 1036 Septic0 Avondale 2 1144 Septic0 Ratliff Lake 1147 Septic

Exit 29Incremental Growth
Taz #
29 Pop. Estimate (@ 2.5
Residents/HH)
Total # of Possible
Units (ERC)
Upland Acrage to be Developed Total @ 2.5 HH/Acre)
Upland Acrage to be Developed
Total
# of HH in in Sub. Sub. Names Sub. Id Sewer or
Septic Basin Zoned Notes
343.15 114.4 0 3121 PDG, R20, FA, LI & HC
LS3121 0.0 0.0 0 0LS3300 114.4 45.8 46 18
0 Quinnely Estates 107 Septic0 Rainey Tract 108 Septic0 Angelo's Acres 163 Septic0 Deerwood Estates 283 Septic0 Emanual Church Estates 306 Septic0 Fish Hall 316 Septic0 Fish Hall Estates 317 Septic0 Jekyll Heights 390 Septic0 Majestic Oaks 427 Sewer0 Plott 511 Septic0 Silver Bluff 550 Septic0 Three Oaks 937 Septic0 S l tt P ti 1036 S ti0 Scarlett Properties 1036 Septic0 Avondale 2 1144 Septic0 Ratliff Lake 1147 Septic
343.20 99.13 0 3121 PDG, R20, FA, LI & HC
LS3121 0.00 0.0 0 0LS3300 99.13 39.7 40 16
0 Quinnely Estates 107 Septic0 Rainey Tract 108 Septic0 Angelo's Acres 163 Septic0 Deerwood Estates 283 Septic0 Emanual Church Estates 306 Septic0 Fish Hall 316 Septic0 Fish Hall Estates 317 Septic0 Jekyll Heights 390 Septic0 Majestic Oaks 427 Sewer0 Plott 511 Septic0 Silver Bluff 550 Septic0 Three Oaks 937 Septic0 Scarlett Properties 1036 Septic0 Avondale 2 1144 Septic0 Ratliff Lake 1147 Septic
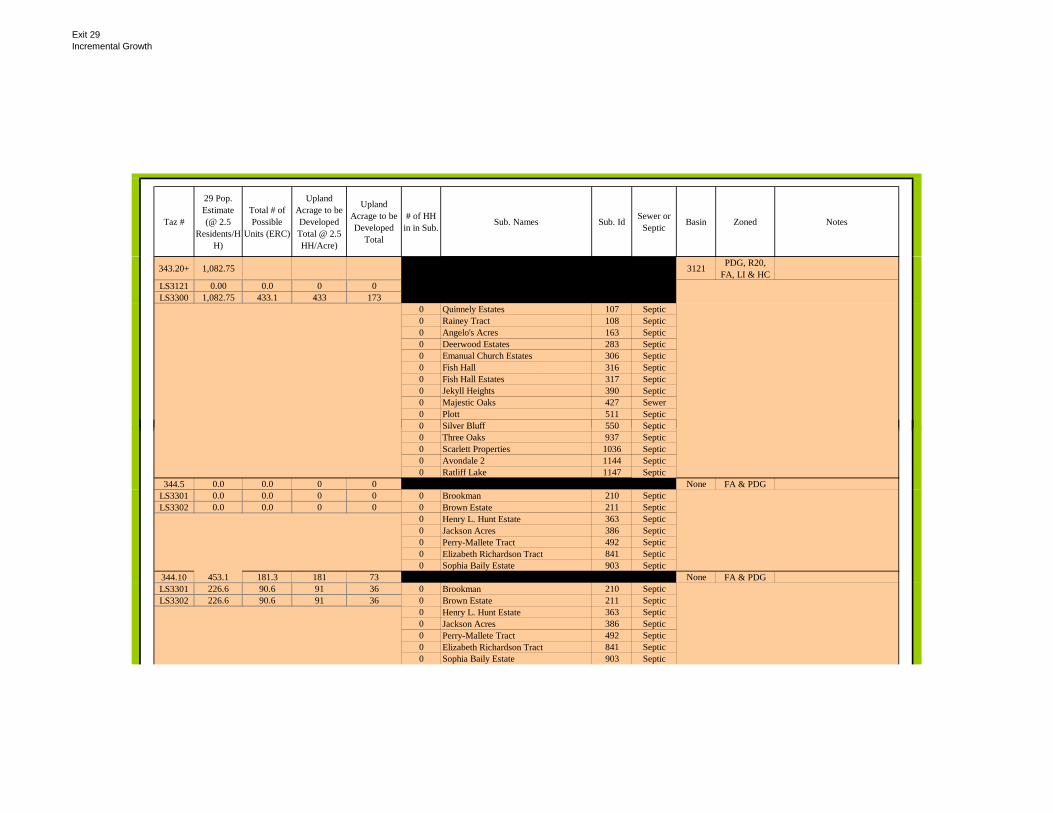
Exit 29Incremental Growth
Taz #
29 Pop. Estimate (@ 2.5
Residents/HH)
Total # of Possible
Units (ERC)
Upland Acrage to be Developed Total @ 2.5 HH/Acre)
Upland Acrage to be Developed
Total
# of HH in in Sub. Sub. Names Sub. Id Sewer or
Septic Basin Zoned Notes
343.20+ 1,082.75 0 3121 PDG, R20, FA, LI & HC
LS3121 0.00 0.0 0 0LS3300 1,082.75 433.1 433 173
0 Quinnely Estates 107 Septic0 Rainey Tract 108 Septic0 Angelo's Acres 163 Septic0 Deerwood Estates 283 Septic0 Emanual Church Estates 306 Septic0 Fish Hall 316 Septic0 Fish Hall Estates 317 Septic0 Jekyll Heights 390 Septic0 Majestic Oaks 427 Sewer0 Plott 511 Septic0 Silver Bluff 550 Septic0 Silver Bluff 550 Septic0 Three Oaks 937 Septic0 Scarlett Properties 1036 Septic0 Avondale 2 1144 Septic0 Ratliff Lake 1147 Septic
344.5 0.0 0.0 0 0 None FA & PDGLS3301 0.0 0.0 0 0 0 Brookman 210 SepticLS3302 0.0 0.0 0 0 0 Brown Estate 211 Septic
0 Henry L. Hunt Estate 363 Septic0 Jackson Acres 386 Septic0 Perry-Mallete Tract 492 Septic0 Elizabeth Richardson Tract 841 Septic0 Sophia Baily Estate 903 Septic
344.10 453.1 181.3 181 73 None FA & PDGLS3301 226.6 90.6 91 36 0 Brookman 210 SepticLS3302 226.6 90.6 91 36 0 Brown Estate 211 Septic
0 Henry L. Hunt Estate 363 Septic0 Jackson Acres 386 Septic0 Perry-Mallete Tract 492 Septic0 Elizabeth Richardson Tract 841 Septic0 Sophia Baily Estate 903 Septic

Exit 29Incremental Growth
Taz #
29 Pop. Estimate (@ 2.5
Residents/HH)
Total # of Possible
Units (ERC)
Upland Acrage to be Developed Total @ 2.5 HH/Acre)
Upland Acrage to be Developed
Total
# of HH in in Sub. Sub. Names Sub. Id Sewer or
Septic Basin Zoned Notes
344.15 453.1 181.3 181 73 None FA & PDGLS3301 226.6 90.6 91 36 0 Brookman 210 SepticLS3302 226.6 90.6 91 36 0 Brown Estate 211 Septic
0 Henry L. Hunt Estate 363 Septic0 Jackson Acres 386 Septic0 Perry-Mallete Tract 492 Septic0 Elizabeth Richardson Tract 841 Septic0 Sophia Baily Estate 903 Septic
344.20 393.13 157.3 157 63 None FA & PDGLS3301 196.56 78.6 79 31 0 Brookman 210 SepticLS3302 196.56 78.6 79 31 0 Brown Estate 211 Septic
0 Henry L. Hunt Estate 363 Septic0 Jackson Acres 386 Septic0 Perry-Mallete Tract 492 Septic0 Elizabeth Richardson Tract 841 Septic0 Sophia Baily Estate 903 Septic
344.20+ 4,743.75 1,897.5 1,898 759 None FA & PDGLS3301 2,371.88 948.8 949 380 0 Brookman 210 SepticLS3302 2 371 88 948 8 949 380 0 B E 211 S iLS3302 2,371.88 948.8 949 380 0 Brown Estate 211 Septic
0 Henry L. Hunt Estate 363 Septic0 Jackson Acres 386 Septic0 Perry-Mallete Tract 492 Septic0 Elizabeth Richardson Tract 841 Septic0 Sophia Baily Estate 903 Septic
345.5 0.0 0.0 0 0 None FA, OC & HC
0 Strafford Waye Tract 124 Septic0 Swain Property 126 Septic0 Wilson Estate 135 Septic0 Baldwin Estate 175 Septic0 Blue - Richardson Tract 196 Septic0 Cuthbert Tract 273 Septic0 Drake's Landing 290 Septic0 Fred Massey Estate 322 Septic0 Hickox Tract 368 Septic0 Johnson Estates 2 397 Septic0 Mary Mack Estate 434 Septic0 Noah Acres 460 Septic0 Palmetto Point 481 Septic0 Ranch 84 521 Septic0 Jackson Estate 883 Septic0 Spring Hill 913 Septic
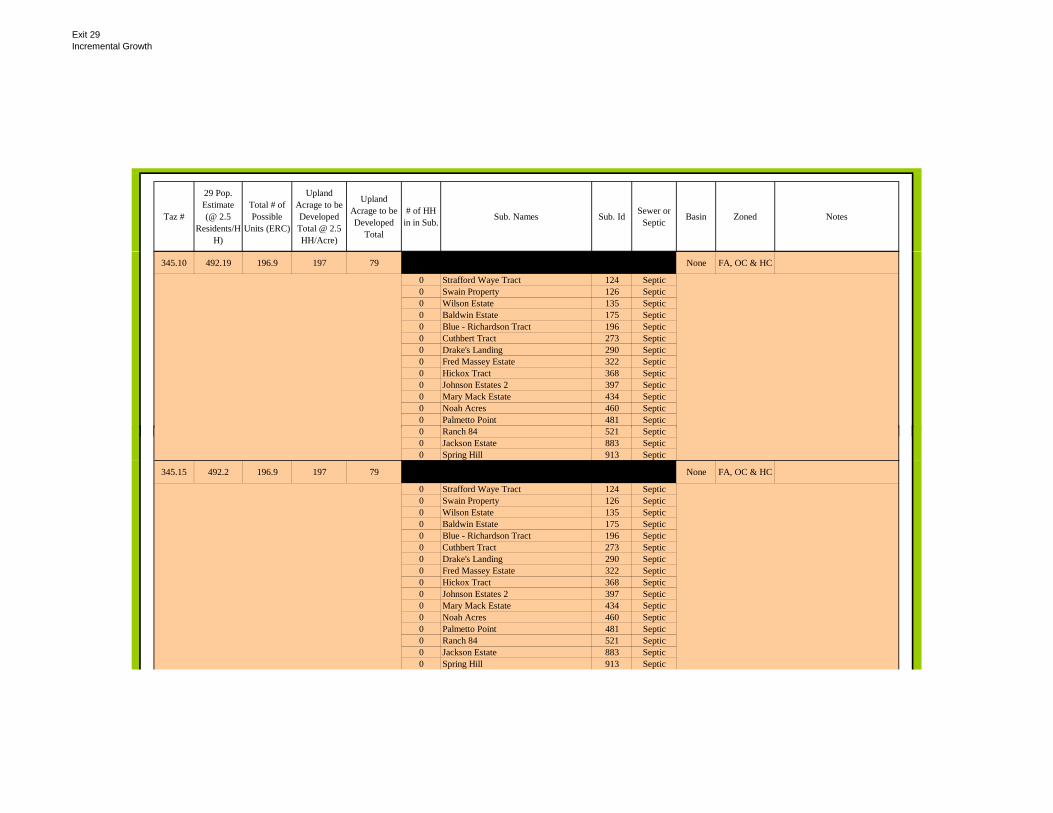
Exit 29Incremental Growth
Taz #
29 Pop. Estimate (@ 2.5
Residents/HH)
Total # of Possible
Units (ERC)
Upland Acrage to be Developed Total @ 2.5 HH/Acre)
Upland Acrage to be Developed
Total
# of HH in in Sub. Sub. Names Sub. Id Sewer or
Septic Basin Zoned Notes
345.10 492.19 196.9 197 79 None FA, OC & HC
0 Strafford Waye Tract 124 Septic0 Swain Property 126 Septic0 Wilson Estate 135 Septic0 Baldwin Estate 175 Septic0 Blue - Richardson Tract 196 Septic0 Cuthbert Tract 273 Septic0 Drake's Landing 290 Septic0 Fred Massey Estate 322 Septic0 Hickox Tract 368 Septic0 Johnson Estates 2 397 Septic0 Mary Mack Estate 434 Septic0 Noah Acres 460 Septic0 Palmetto Point 481 Septic0 R h 84 521 S ti0 Ranch 84 521 Septic0 Jackson Estate 883 Septic0 Spring Hill 913 Septic
345.15 492.2 196.9 197 79 None FA, OC & HC
0 Strafford Waye Tract 124 Septic0 Swain Property 126 Septic0 Wilson Estate 135 Septic0 Baldwin Estate 175 Septic0 Blue - Richardson Tract 196 Septic0 Cuthbert Tract 273 Septic0 Drake's Landing 290 Septic0 Fred Massey Estate 322 Septic0 Hickox Tract 368 Septic0 Johnson Estates 2 397 Septic0 Mary Mack Estate 434 Septic0 Noah Acres 460 Septic0 Palmetto Point 481 Septic0 Ranch 84 521 Septic0 Jackson Estate 883 Septic0 Spring Hill 913 Septic

Exit 29Incremental Growth
Taz #
29 Pop. Estimate (@ 2.5
Residents/HH)
Total # of Possible
Units (ERC)
Upland Acrage to be Developed Total @ 2.5 HH/Acre)
Upland Acrage to be Developed
Total
# of HH in in Sub. Sub. Names Sub. Id Sewer or
Septic Basin Zoned Notes
345.20 426.56 170.6 171 68 None FA, OC & HC
0 Strafford Waye Tract 124 Septic0 Swain Property 126 Septic0 Wilson Estate 135 Septic0 Baldwin Estate 175 Septic0 Blue - Richardson Tract 196 Septic0 Cuthbert Tract 273 Septic0 Drake's Landing 290 Septic0 Fred Massey Estate 322 Septic0 Hickox Tract 368 Septic0 Johnson Estates 2 397 Septic0 Mary Mack Estate 434 Septic0 Noah Acres 460 Septic0 Palmetto Point 481 Septic0 R h 84 521 S ti0 Ranch 84 521 Septic0 Jackson Estate 883 Septic0 Spring Hill 913 Septic
345.20+ 5,151.56 2,060.6 2,061 824 None FA, OC & HC
0 Strafford Waye Tract 124 Septic0 Swain Property 126 Septic0 Wilson Estate 135 Septic0 Baldwin Estate 175 Septic0 Blue - Richardson Tract 196 Septic0 Cuthbert Tract 273 Septic0 Drake's Landing 290 Septic0 Fred Massey Estate 322 Septic0 Hickox Tract 368 Septic0 Johnson Estates 2 397 Septic0 Mary Mack Estate 434 Septic0 Noah Acres 460 Septic0 Palmetto Point 481 Septic0 Ranch 84 521 Septic0 Jackson Estate 883 Septic0 Spring Hill 913 Septic

Exit 29Incremental Growth
Taz #
29 Pop. Estimate (@ 2.5
Residents/HH)
Total # of Possible
Units (ERC)
Upland Acrage to be Developed Total @ 2.5 HH/Acre)
Upland Acrage to be Developed
Total
# of HH in in Sub. Sub. Names Sub. Id Sewer or
Septic Basin Zoned Notes
346.5 611.3 None FA, PDR, R20 & HC
LS3302 56.3 22.5 23 9LS3200 451.9 180.8 19 8LS3300 103.1 41.3 41 17
0 Annabelle Robinson Tract 164 Septic0 Baumgartner Acres 178 Septic0 Baumgartner Circle 179 Septic0 Big Buck 192 Septic0 Cedardale 235 Septic0 Glynn Jekyll Acres 336 Septic0 Good Place 350 Septic0 Ivy 385 Septic0 Laurel Grove 408 Septic0 Leotis-Way Estate 415 Septic0 Live Oak Acres 421 Septic0 Lizzie Brown Estates 423 Septic0 Brooks Mosley Tract 451 Septic0 Mosley Tract 2 452 Septic0 Murray Tract 455 Septic0 Myers Hill Acres 456 Septic0 Myers Hill Estate 457 Septic0 Pinemeadows 504 Septic0 Scarlett Gardens 540 Septic0 Wil C k Pl t ti 975 S ti0 Wilson Creek Plantation 975 Septic0 The Lakes 1157 Septic
162 Cobblestone Septic
346.10 206.3 None FA, PDR, R20 & HC
LS3302 56.3 22.5 23 9LS3200 46.9 18.8 19 8LS3300 103.1 41.3 41 17
0 Annabelle Robinson Tract 164 Septic0 Baumgartner Acres 178 Septic0 Baumgartner Circle 179 Septic0 Big Buck 192 Septic0 Cedardale 235 Septic0 Glynn Jekyll Acres 336 Septic0 Good Place 350 Septic0 Ivy 385 Septic0 Laurel Grove 408 Septic0 Leotis-Way Estate 415 Septic0 Live Oak Acres 421 Septic0 Lizzie Brown Estates 423 Septic0 Brooks Mosley Tract 451 Septic0 Mosley Tract 2 452 Septic0 Murray Tract 455 Septic0 Myers Hill Acres 456 Septic0 Myers Hill Estate 457 Septic0 Pinemeadows 504 Septic0 Scarlett Gardens 540 Septic0 Wilson Creek Plantation 975 Septic0 The Lakes 1157 Septic0 Cobblestone Septic
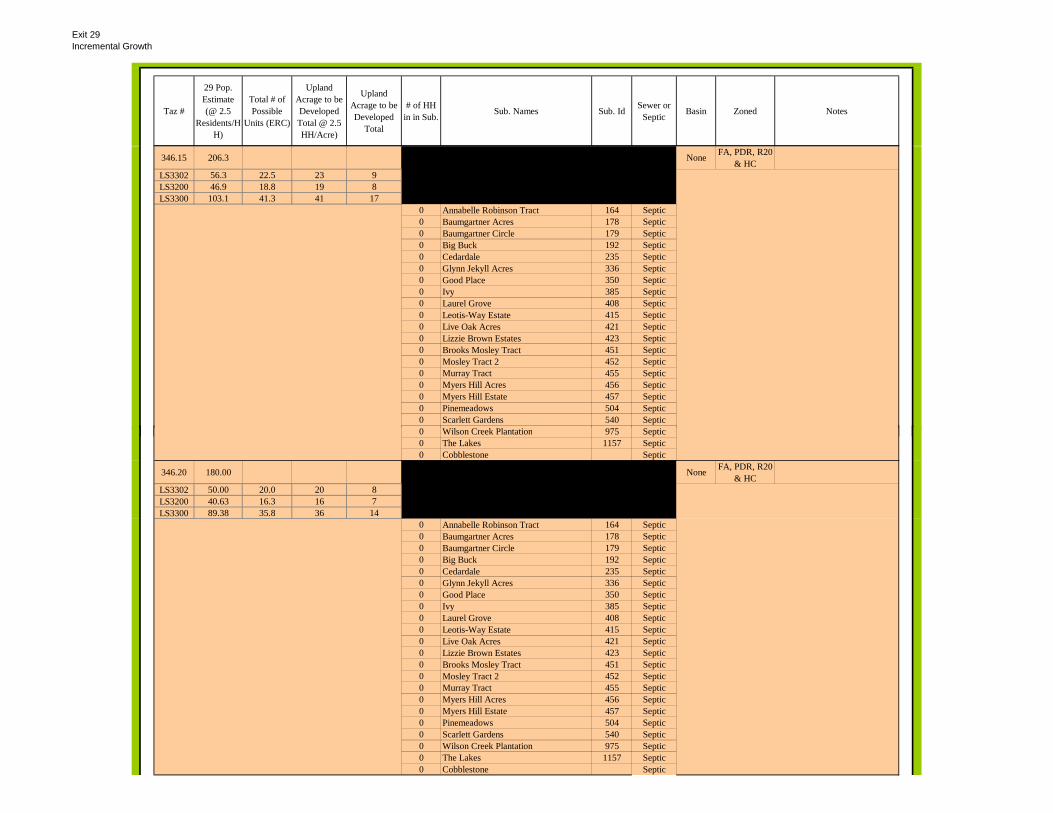
Exit 29Incremental Growth
Taz #
29 Pop. Estimate (@ 2.5
Residents/HH)
Total # of Possible
Units (ERC)
Upland Acrage to be Developed Total @ 2.5 HH/Acre)
Upland Acrage to be Developed
Total
# of HH in in Sub. Sub. Names Sub. Id Sewer or
Septic Basin Zoned Notes
346.15 206.3 None FA, PDR, R20 & HC
LS3302 56.3 22.5 23 9LS3200 46.9 18.8 19 8LS3300 103.1 41.3 41 17
0 Annabelle Robinson Tract 164 Septic0 Baumgartner Acres 178 Septic0 Baumgartner Circle 179 Septic0 Big Buck 192 Septic0 Cedardale 235 Septic0 Glynn Jekyll Acres 336 Septic0 Good Place 350 Septic0 Ivy 385 Septic0 Laurel Grove 408 Septic0 Leotis-Way Estate 415 Septic0 Live Oak Acres 421 Septic0 Lizzie Brown Estates 423 Septic0 Brooks Mosley Tract 451 Septic0 Mosley Tract 2 452 Septic0 Murray Tract 455 Septic0 Myers Hill Acres 456 Septic0 Myers Hill Estate 457 Septic0 Pinemeadows 504 Septic0 Scarlett Gardens 540 Septic0 Wil C k Pl t ti 975 S ti0 Wilson Creek Plantation 975 Septic0 The Lakes 1157 Septic0 Cobblestone Septic
346.20 180.00 None FA, PDR, R20 & HC
LS3302 50.00 20.0 20 8LS3200 40.63 16.3 16 7LS3300 89.38 35.8 36 14
0 Annabelle Robinson Tract 164 Septic0 Baumgartner Acres 178 Septic0 Baumgartner Circle 179 Septic0 Big Buck 192 Septic0 Cedardale 235 Septic0 Glynn Jekyll Acres 336 Septic0 Good Place 350 Septic0 Ivy 385 Septic0 Laurel Grove 408 Septic0 Leotis-Way Estate 415 Septic0 Live Oak Acres 421 Septic0 Lizzie Brown Estates 423 Septic0 Brooks Mosley Tract 451 Septic0 Mosley Tract 2 452 Septic0 Murray Tract 455 Septic0 Myers Hill Acres 456 Septic0 Myers Hill Estate 457 Septic0 Pinemeadows 504 Septic0 Scarlett Gardens 540 Septic0 Wilson Creek Plantation 975 Septic0 The Lakes 1157 Septic0 Cobblestone Septic

Exit 29Incremental Growth
Taz #
29 Pop. Estimate (@ 2.5
Residents/HH)
Total # of Possible
Units (ERC)
Upland Acrage to be Developed Total @ 2.5 HH/Acre)
Upland Acrage to be Developed
Total
# of HH in in Sub. Sub. Names Sub. Id Sewer or
Septic Basin Zoned Notes
346.20+ 1,945.00 None FA, PDR, R20 & HC
LS3302 531.25 212.5 213 85LS3200 437.50 175.0 175 70LS3300 976.25 390.5 391 156
0 Annabelle Robinson Tract 164 Septic0 Baumgartner Acres 178 Septic0 Baumgartner Circle 179 Septic0 Big Buck 192 Septic0 Cedardale 235 Septic0 Glynn Jekyll Acres 336 Septic0 Good Place 350 Septic0 Ivy 385 Septic0 Laurel Grove 408 Septic0 Leotis-Way Estate 415 Septic0 Live Oak Acres 421 Septic0 Live Oak Acres 421 Septic0 Lizzie Brown Estates 423 Septic0 Brooks Mosley Tract 451 Septic0 Mosley Tract 2 452 Septic0 Murray Tract 455 Septic0 Myers Hill Acres 456 Septic0 Myers Hill Estate 457 Septic0 Pinemeadows 504 Septic0 Scarlett Gardens 540 Septic0 Wilson Creek Plantation 975 Septic0 The Lakes 1157 Septic0 Cobblestone Septic
347.5 718.8 288.3 143 57 None PDR & MHLS3123 531.3 212.5 143 57 70 Clearwater 245 SewerLS3129 187.5 75.0 0 0 0 Laurel Grove Plantation 409 Septic
0 Little Oak 420 Septic0 Serenoa Cove 544 Septic0 Curry Tract 825 Septic0 South Creek 904 Septic0 Spaulding MHP 1080 Septic0 Terranova 930 Septic
75 Satilla Sands Sewer
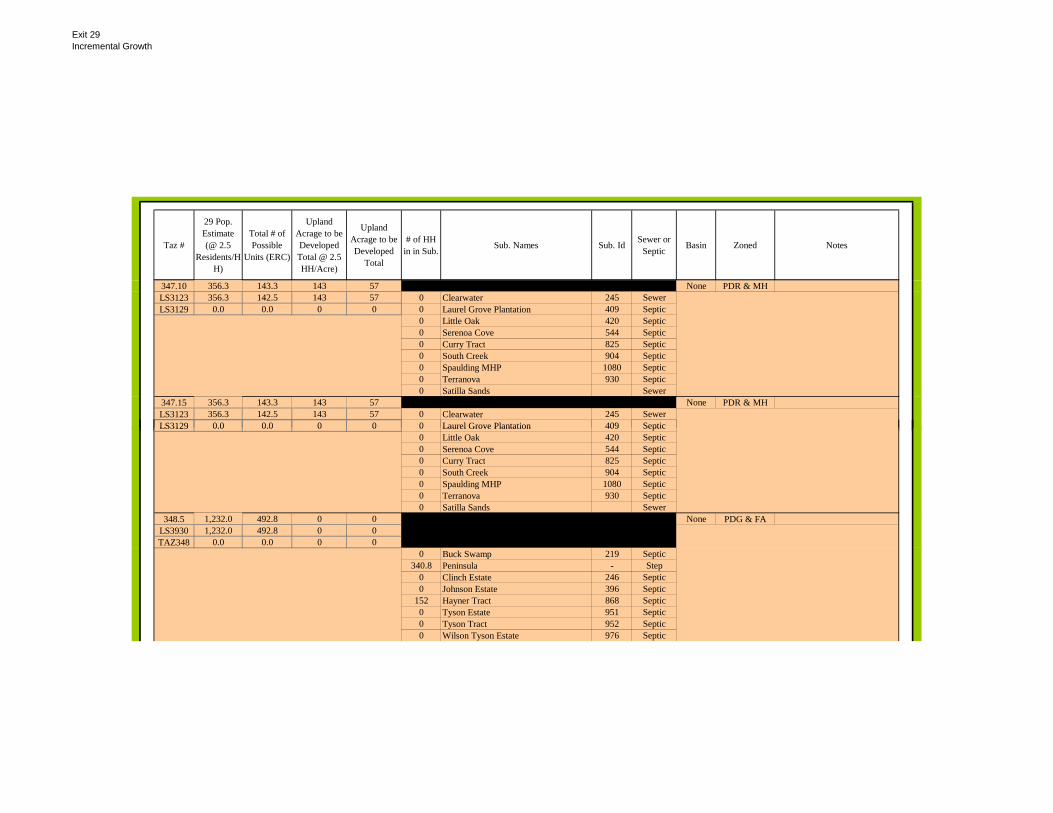
Exit 29Incremental Growth
Taz #
29 Pop. Estimate (@ 2.5
Residents/HH)
Total # of Possible
Units (ERC)
Upland Acrage to be Developed Total @ 2.5 HH/Acre)
Upland Acrage to be Developed
Total
# of HH in in Sub. Sub. Names Sub. Id Sewer or
Septic Basin Zoned Notes
347.10 356.3 143.3 143 57 None PDR & MHLS3123 356.3 142.5 143 57 0 Clearwater 245 SewerLS3129 0.0 0.0 0 0 0 Laurel Grove Plantation 409 Septic
0 Little Oak 420 Septic0 Serenoa Cove 544 Septic0 Curry Tract 825 Septic0 South Creek 904 Septic0 Spaulding MHP 1080 Septic0 Terranova 930 Septic0 Satilla Sands Sewer
347.15 356.3 143.3 143 57 None PDR & MHLS3123 356.3 142.5 143 57 0 Clearwater 245 SewerLS3129 0.0 0.0 0 0 0 Laurel Grove Plantation 409 SepticLS3129 0.0 0.0 0 0 0 Laurel Grove Plantation 409 Septic
0 Little Oak 420 Septic0 Serenoa Cove 544 Septic0 Curry Tract 825 Septic0 South Creek 904 Septic0 Spaulding MHP 1080 Septic0 Terranova 930 Septic0 Satilla Sands Sewer
348.5 1,232.0 492.8 0 0 None PDG & FALS3930 1,232.0 492.8 0 0TAZ348 0.0 0.0 0 0
0 Buck Swamp 219 Septic340.8 Peninsula - Step
0 Clinch Estate 246 Septic0 Johnson Estate 396 Septic
152 Hayner Tract 868 Septic0 Tyson Estate 951 Septic0 Tyson Tract 952 Septic0 Wilson Tyson Estate 976 Septic
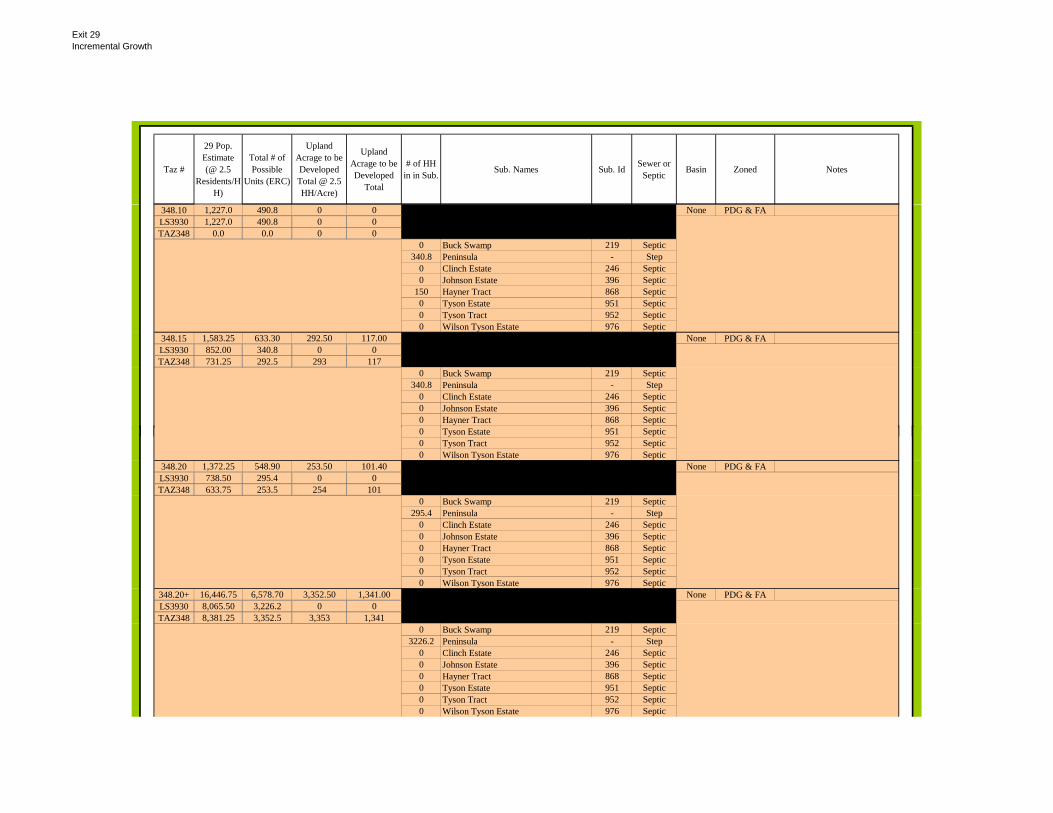
Exit 29Incremental Growth
Taz #
29 Pop. Estimate (@ 2.5
Residents/HH)
Total # of Possible
Units (ERC)
Upland Acrage to be Developed Total @ 2.5 HH/Acre)
Upland Acrage to be Developed
Total
# of HH in in Sub. Sub. Names Sub. Id Sewer or
Septic Basin Zoned Notes
348.10 1,227.0 490.8 0 0 None PDG & FALS3930 1,227.0 490.8 0 0TAZ348 0.0 0.0 0 0
0 Buck Swamp 219 Septic340.8 Peninsula - Step
0 Clinch Estate 246 Septic0 Johnson Estate 396 Septic
150 Hayner Tract 868 Septic0 Tyson Estate 951 Septic0 Tyson Tract 952 Septic0 Wilson Tyson Estate 976 Septic
348.15 1,583.25 633.30 292.50 117.00 None PDG & FALS3930 852.00 340.8 0 0TAZ348 731.25 292.5 293 117
0 Buck Swamp 219 Septic340.8 Peninsula - Step
0 Clinch Estate 246 Septic0 Johnson Estate 396 Septic0 Hayner Tract 868 Septic0 T E t t 951 S ti0 Tyson Estate 951 Septic0 Tyson Tract 952 Septic0 Wilson Tyson Estate 976 Septic
348.20 1,372.25 548.90 253.50 101.40 None PDG & FALS3930 738.50 295.4 0 0TAZ348 633.75 253.5 254 101
0 Buck Swamp 219 Septic295.4 Peninsula - Step
0 Clinch Estate 246 Septic0 Johnson Estate 396 Septic0 Hayner Tract 868 Septic0 Tyson Estate 951 Septic0 Tyson Tract 952 Septic0 Wilson Tyson Estate 976 Septic
348.20+ 16,446.75 6,578.70 3,352.50 1,341.00 None PDG & FALS3930 8,065.50 3,226.2 0 0TAZ348 8,381.25 3,352.5 3,353 1,341
0 Buck Swamp 219 Septic3226.2 Peninsula - Step
0 Clinch Estate 246 Septic0 Johnson Estate 396 Septic0 Hayner Tract 868 Septic0 Tyson Estate 951 Septic0 Tyson Tract 952 Septic0 Wilson Tyson Estate 976 Septic
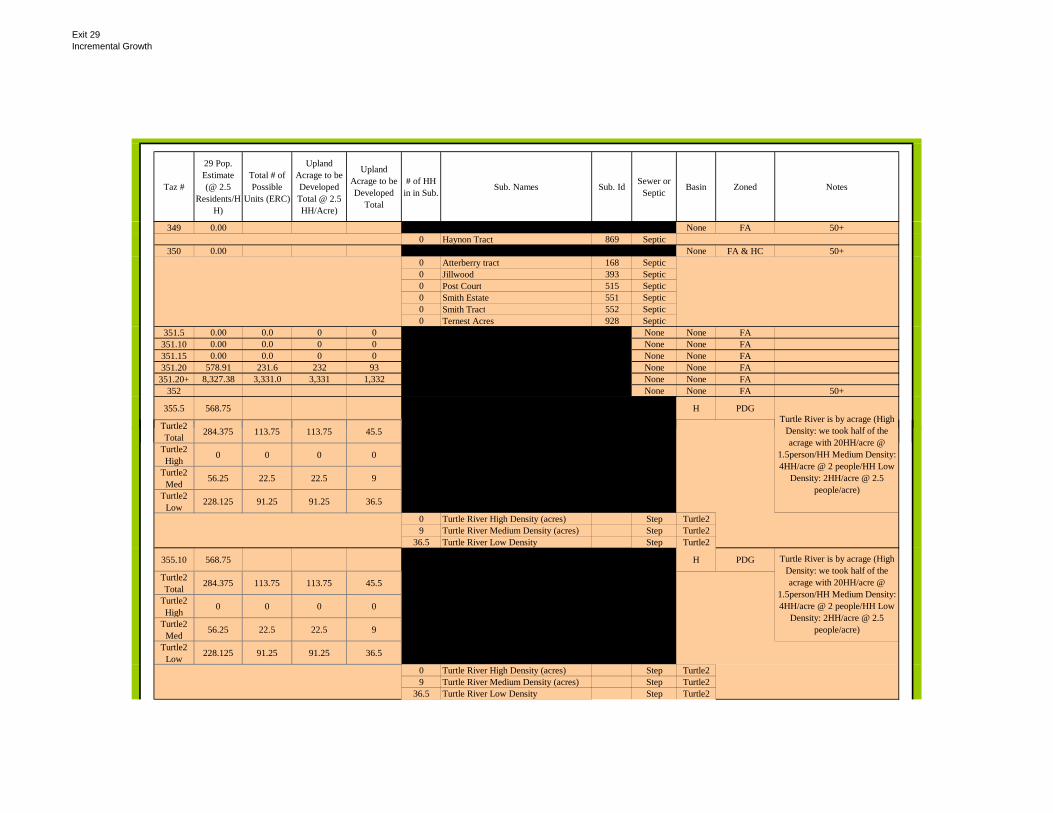
Exit 29Incremental Growth
Taz #
29 Pop. Estimate (@ 2.5
Residents/HH)
Total # of Possible
Units (ERC)
Upland Acrage to be Developed Total @ 2.5 HH/Acre)
Upland Acrage to be Developed
Total
# of HH in in Sub. Sub. Names Sub. Id Sewer or
Septic Basin Zoned Notes
349 0.00 None FA 50+0 Haynon Tract 869 Septic
350 0.00 None FA & HC 50+0 Atterberry tract 168 Septic0 Jillwood 393 Septic0 Post Court 515 Septic0 Smith Estate 551 Septic0 Smith Tract 552 Septic0 Ternest Acres 928 Septic
351.5 0.00 0.0 0 0 None None FA351.10 0.00 0.0 0 0 None None FA351.15 0.00 0.0 0 0 None None FA351.20 578.91 231.6 232 93 None None FA
351.20+ 8,327.38 3,331.0 3,331 1,332 None None FA352 None None FA 50+
355.5 568.75 H PDG
Turtle2 284 375 113 75 113 75 45 5Turtle River is by acrage (High
D it t k h lf f thTurtle2 Total 284.375 113.75 113.75 45.5
Turtle2 High 0 0 0 0
Turtle2 Med 56.25 22.5 22.5 9
Turtle2 Low 228.125 91.25 91.25 36.5
0 Turtle River High Density (acres) Step Turtle29 Turtle River Medium Density (acres) Step Turtle2
36.5 Turtle River Low Density Step Turtle2
355.10 568.75 H PDG
Turtle2 Total 284.375 113.75 113.75 45.5
Turtle2 High 0 0 0 0
Turtle2 Med 56.25 22.5 22.5 9
Turtle2 Low 228.125 91.25 91.25 36.5
0 Turtle River High Density (acres) Step Turtle29 Turtle River Medium Density (acres) Step Turtle2
36.5 Turtle River Low Density Step Turtle2
Turtle River is by acrage (High Density: we took half of the acrage with 20HH/acre @
1.5person/HH Medium Density: 4HH/acre @ 2 people/HH Low
Density: 2HH/acre @ 2.5 people/acre)
Density: we took half of the acrage with 20HH/acre @
1.5person/HH Medium Density: 4HH/acre @ 2 people/HH Low
Density: 2HH/acre @ 2.5 people/acre)
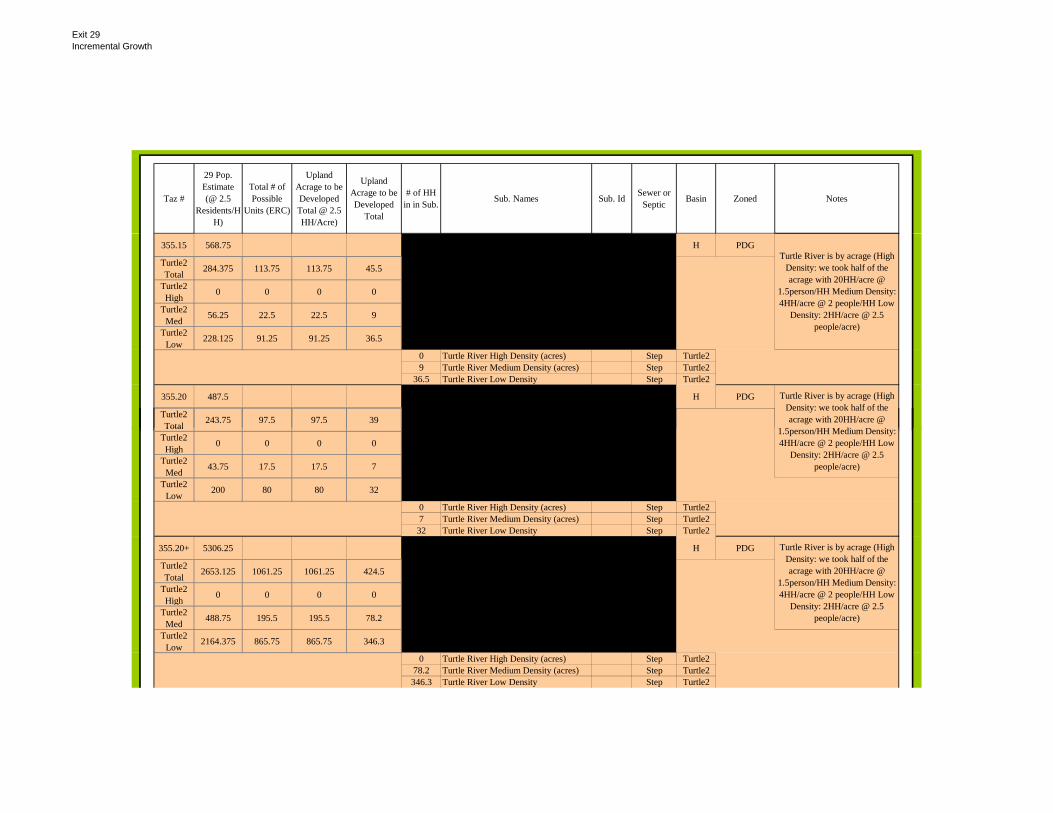
Exit 29Incremental Growth
Taz #
29 Pop. Estimate (@ 2.5
Residents/HH)
Total # of Possible
Units (ERC)
Upland Acrage to be Developed Total @ 2.5 HH/Acre)
Upland Acrage to be Developed
Total
# of HH in in Sub. Sub. Names Sub. Id Sewer or
Septic Basin Zoned Notes
355.15 568.75 H PDG
Turtle2 Total 284.375 113.75 113.75 45.5
Turtle2 High 0 0 0 0
Turtle2 Med 56.25 22.5 22.5 9
Turtle2 Low 228.125 91.25 91.25 36.5
0 Turtle River High Density (acres) Step Turtle29 Turtle River Medium Density (acres) Step Turtle2
36.5 Turtle River Low Density Step Turtle2
355.20 487.5 H PDG
Turtle2 Total 243.75 97.5 97.5 39
Turtle River is by acrage (High Density: we took half of the acrage with 20HH/acre @
1 5 /HH M di D it
Turtle River is by acrage (High Density: we took half of the acrage with 20HH/acre @
1.5person/HH Medium Density: 4HH/acre @ 2 people/HH Low
Density: 2HH/acre @ 2.5 people/acre)
TotalTurtle2 High 0 0 0 0
Turtle2 Med 43.75 17.5 17.5 7
Turtle2 Low 200 80 80 32
0 Turtle River High Density (acres) Step Turtle27 Turtle River Medium Density (acres) Step Turtle2
32 Turtle River Low Density Step Turtle2
355.20+ 5306.25 H PDG
Turtle2 Total 2653.125 1061.25 1061.25 424.5
Turtle2 High 0 0 0 0
Turtle2 Med 488.75 195.5 195.5 78.2
Turtle2 Low 2164.375 865.75 865.75 346.3
0 Turtle River High Density (acres) Step Turtle278.2 Turtle River Medium Density (acres) Step Turtle2346.3 Turtle River Low Density Step Turtle2
Turtle River is by acrage (High Density: we took half of the acrage with 20HH/acre @
1.5person/HH Medium Density: 4HH/acre @ 2 people/HH Low
Density: 2HH/acre @ 2.5 people/acre)
1.5person/HH Medium Density: 4HH/acre @ 2 people/HH Low
Density: 2HH/acre @ 2.5 people/acre)

Exit 29Incremental Growth
Taz #
29 Pop. Estimate (@ 2.5
Residents/HH)
Total # of Possible
Units (ERC)
Upland Acrage to be Developed Total @ 2.5 HH/Acre)
Upland Acrage to be Developed
Total
# of HH in in Sub. Sub. Names Sub. Id Sewer or
Septic Basin Zoned Notes
360.5 175.0 70.0 70 28 Septic TAZ360 FA360.10 175.0 70.0 70 28 Septic TAZ360 FA360.15 175.0 70.0 70 28 Septic TAZ360 FA360.20 150.00 60.0 60 24 Septic TAZ360 FA
360.20+ 1,666.25 666.5 667 267 Septic TAZ360 FA361.5 18.8 7.5 8 3
0 Bennett Tract 188 Septic TAZ361 FA0 B.F. O'Quinn Estate 190 Septic TAZ361 FA0 Dury Tract 295 Septic TAZ361 FA
361.10 18.75 7.5 8 30 Bennett Tract 188 Septic TAZ361 FA0 B.F. O'Quinn Estate 190 Septic TAZ361 FA0 Dury Tract 295 Septic TAZ361 FA
361 15 18 8 7 5 8 3361.15 18.8 7.5 8 30 Bennett Tract 188 Septic TAZ361 FA0 B.F. O'Quinn Estate 190 Septic TAZ361 FA0 Dury Tract 295 Septic TAZ361 FA
361.20 15.63 6.3 6 30 Bennett Tract 188 Septic TAZ361 FA0 B.F. O'Quinn Estate 190 Septic TAZ361 FA0 Dury Tract 295 Septic TAZ361 FA
361.20+ 209.38 83.8 84 340 Bennett Tract 188 Septic TAZ361 FA0 B.F. O'Quinn Estate 190 Septic TAZ361 FA0 Dury Tract 295 Septic TAZ361 FA
362.5 581.9 232.8 233 93 Septic TAZ362 FA362.10 581.88 232.8 233 93 Septic TAZ362 FA362.15 581.9 232.8 233 93 Septic TAZ362 FA362.20 504.38 201.8 202 81 Septic TAZ362 FA
362.20+ 5,506.25 2,202.5 2,203 881 Septic TAZ362 FA

Exit 29 Basin Flow Projections: 2014
Exit 29 Per Capita 139.00 MDF Factor 1.54PHF Factor 2.22
TAZ # Population ADF (gpd) MDF (gpd) PHF (gpm) Notes308.5 131.25 18,243.75 28,095.38 28.13309.5 313.13 43,524.38 67,027.54 67.10328.5 1,297.50 180,352.50 277,742.85 278.04329.5 382.50 53,167.50 81,877.95 81.97330.5 18.75 2,606.25 4,013.63 4.02341.5 1,759.75 244,605.25 376,692.09 377.10342.5 315.00 43,785.00 67,428.90 67.50343.5 1,363.75 189,561.25 291,924.33 292.24344.5 0.00 0.00 0.00 0.00345.5 0.00 0.00 0.00 0.00346.5 611.25 84,963.75 130,844.18 130.99347.5 718.75 99,906.25 153,855.63 154.02348.5 1,232.00 171,248.00 263,721.92 264.01349.5 0.00350.5 0.00351.5 0.00352.5 0.00355.5 568.75 79,056.25 121,746.63 121.88360.5 175.00 24,325.00 37,460.50 37.50361.5 18.75 2,606.25 4,013.63 4.02362.5 581.88 80,880.63 124,556.16 124.69Total 9,488.00 1,318,832.00 2,031,001.28 2,033.20
Exit 29
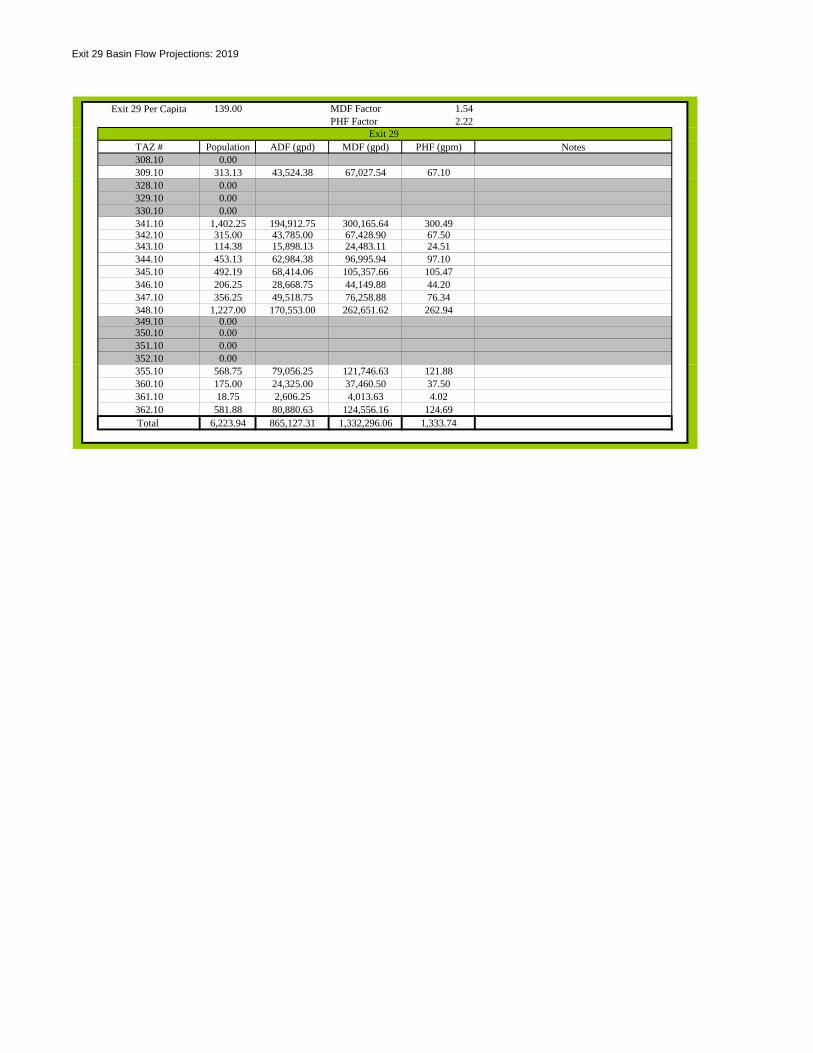
Exit 29 Basin Flow Projections: 2019
Exit 29 Per Capita 139.00 MDF Factor 1.54PHF Factor 2.22
TAZ # Population ADF (gpd) MDF (gpd) PHF (gpm) Notes308.10 0.00309.10 313.13 43,524.38 67,027.54 67.10328.10 0.00329.10 0.00330.10 0.00341.10 1,402.25 194,912.75 300,165.64 300.49342.10 315.00 43,785.00 67,428.90 67.50343.10 114.38 15,898.13 24,483.11 24.51344.10 453.13 62,984.38 96,995.94 97.10345.10 492.19 68,414.06 105,357.66 105.47346.10 206.25 28,668.75 44,149.88 44.20347.10 356.25 49,518.75 76,258.88 76.34348.10 1,227.00 170,553.00 262,651.62 262.94349.10 0.00350.10 0.00351.10 0.00352.10 0.00355.10 568.75 79,056.25 121,746.63 121.88360.10 175.00 24,325.00 37,460.50 37.50361.10 18.75 2,606.25 4,013.63 4.02362.10 581.88 80,880.63 124,556.16 124.69Total 6,223.94 865,127.31 1,332,296.06 1,333.74
Exit 29

Exit 29 Basin Flow Projections: 2024
Exit 29 Per Capita 139.00 MDF Factor 1.54. PHF Factor 2.22
TAZ # Population ADF (gpd) MDF (gpd) PHF (gpm) Notes308.15 0.00309.15 313.13 43,524.38 67,027.54 67.10328.15 0.00329.15 0.00330.15 0.00341.15 1,402.25 194,912.75 300,165.64 300.49342.15 315.00 43,785.00 67,428.90 67.50343.15 114.38 15,898.13 24,483.11 24.51344.15 453.13 62,984.38 96,995.94 97.10345.15 492.19 68,414.06 105,357.66 105.47346.15 206.25 28,668.75 44,149.88 44.20347.15 356.25 49,518.75 76,258.88 76.34348.15 1,583.25 220,071.75 338,910.50 339.28349.15 0.00350.15 0.00351.15 0.00352.15 0.00355.15 568.75 79,056.25 121,746.63 121.88360.15 175.00 24,325.00 37,460.50 37.50361.15 18.75 2,606.25 4,013.63 4.02362.15 581.88 80,880.63 124,556.16 124.69Total 6,580.19 914,646.06 1,408,554.94 1,410.08
Exit 29

Exit 29 Basin Flow Projections: 2029
Exit 29 Per Capita 139.00 MDF Factor 1.54PHF Factor 2.22
TAZ # Population ADF (gpd) MDF (gpd) PHF (gpm) Notes308.20 0.00309.20 0.00328.20 0.00329.20 0.00330.20 0.00341.20 1,197.00 166,383.00 256,229.82 256.51342.20 271.44 37,730.16 58,104.45 58.17343.20 99.13 13,778.38 21,218.70 21.24344.20 393.13 54,644.38 84,152.34 84.24345.20 426.56 59,292.19 91,309.97 91.41346.20 180.00 25,020.00 38,530.80 38.57347.20 0.00348.20 1,372.25 190,742.75 293,743.84 294.06349.20 0.00350.20 0.00351.20 578.91 80,467.97 123,920.67 124.05352.20 0.00355.20 487.5 67,762.50 104,354.25 104.47360.20 150.00 20,850.00 32,109.00 32.14361.20 15.63 2,171.88 3,344.69 3.35362.20 504.38 70,108.13 107,966.51 108.08Total 5,675.91 788,951.32 1,214,985.03 1,216.30
Exit 29

APPENDIX E – SEWER SYSTEM COMPONENT PER CAPITA PROJECTIONS
Brunswick Glynn County JWSC Applied Technology & Management, Inc.
Water Sewer Master Plan

Municipal (w/o Hercules)
Sea Pak Farm Rich
Total w/o SeaPak or Hercules LS 110 LS 109 LS 105 River Ridge Total North
Mainland Total City
Month/YearMonthly Total
Gallons (Millions)
Monthly Total Gallons
(Millions)
Monthly Total Gallons
(Millions)Month/Year
Monthly Total Gallons
(Millions)
Monthly Total Gallons
(Millions)
Monthly Total Gallons
(Millions)
Monthly Total Gallons
(Millions)
Monthly Total Gallons
(Millions)Month/Year
Monthly Total Gallons
(Millions)Mar-07 159.690 6.003 153.687 Mar-07 11.681 1.515 5.889 0.000 19.085 Mar-07 134.602Apr-07 142.110 4.781 137.329 Apr-07 8.422 1.551 8.771 0.000 18.744 Apr-07 118.585May-07 137.200 3.653 133.547 May-07 11.303 1.582 6.744 0.000 19.630 May-07 113.917Jun-07 149.120 3.988 145.132 Jun-07 6.866 1.507 6.376 0.000 14.749 Jun-07 130.382Jul-07 150.040 3.500 146.540 Jul-07 6.616 1.829 7.252 0.000 15.698 Jul-07 130.842
Aug-07 179.620 3.413 176.207 Aug-07 6.741 1.897 9.091 0.000 17.729 Aug-07 158.478Total Mar 07 -
Aug 07 917.780 25.339 892.441 Total Mar 07 - Aug 07 51.628 9.883 44.124 0.000 105.635 Total Mar 07 -
Aug 07 786.806
Municipal (w/o Hercules)
Sea Pak Farm Rich
Total w/o SeaPak or Hercules LS 110 LS 109 LS 105 River Ridge Total North
Mainland Total City
Month/YearMonthly Total
Gallons (Millions)
Monthly Total Gallons
(Millions)
Monthly Total Gallons
(Millions)Month/Year
Monthly Total Gallons
(Millions)
Monthly Total Gallons
(Millions)
Monthly Total Gallons
(Millions)
Monthly Total Gallons
(Millions)
Monthly Total Gallons
(Millions)Month/Year
Monthly Total Gallons
(Millions)Sep-07 177.310 3.361 173.949 Sep-07 6.741 1.930 7.265 0.076 16.012 Sep-07 157.937Oct-07 182.930 4.289 178.641 Oct-07 9.213 1.649 6.800 0.089 17.751 Oct-07 160.891Nov-07 149.470 3.075 146.395 Nov-07 7.383 1.497 7.052 0.152 16.084 Nov-07 130.311Dec-07 143.510 2.963 140.547 Dec-07 7.406 1.483 6.288 0.190 15.367 Dec-07 125.180Jan-08 152.420 3.352 149.068 Jan-08 7.042 1.411 7.379 0.217 16.049 Jan-08 133.019Feb-08 161.350 3.465 157.885 Feb-08 7.218 1.470 7.153 0.009 15.851 Feb-08 142.034
City Total FlowAcademy Creek Total Flow LS 110, LS105 & LS109 Flume Flow
Feb 08 161.350 3.465 157.885 Feb 08 7.218 1.470 7.153 0.009 15.851 Feb 08 142.034Total Sept 07 -
Feb 08 966.990 20.505 946.485 Total Sept 07 - Feb 08 45.004 9.439 41.937 0.733 97.113 Total Sept 07 -
Feb 08 849.372
Month/YearMonthly Total
Gallons (Millions)
Pop. 2007 Per Capita Month/YearMonthly Total
Gallons (Millions)
Pop. 2007 Per Capita Total Annual City Flow 1,636.178 Total North
Annual Flow 202.748 Hercules (MADF)
Mar-07 19.085073 4,046 152.18 Mar-07 134.602 31,929 135.99 City AADF 4.483 North AADF 0.555 0.68
Apr-07 18.743961 4,046 154.44 Apr-07 118.585 31,929 123.80 Hercules Total Annual Flow 12.48 0.39
May-07 19.629666 4,046 156.52 May-07 113.917 31,929 115.09 Hercules AADF 0.634 0.73
Jun-07 14.749433 4,046 121.53 Jun-07 130.382 31,929 136.12 SeaPak Total Annual Flow 45.844 0.73
Jul-07 15.697863 4,046 125.17 Jul-07 130.842 31,929 132.19 SeaPak AADF 0.126 0.28
Aug-07 17.728842 4,046 141.37 Aug-07 158.478 31,929 160.11 0.74Sep-07 16.011925 4,046 131.93 Sep-07 157.937183 31,929 164.89 0.81Oct-07 17.750605 4,046 141.54 Oct-07 160.890627 31,929 162.55 0.16Nov-07 16.084325 4,046 132.53 Nov-07 130.310673 31,929 136.04 5.51
Dec-07 15.366504 4,046 122.53 Dec-07 125.180493 31,929 126.47 City Average 140 gpcd 0.82
Jan-08 16.049140 4,046 127.97 Jan-08 133.018816 31,929 134.39 N Mld Avg 136 gpcd 0.81Feb-08 15.850722 4,046 135.11 Feb-08 142.034447 31,929 153.40 0.83
* Future population based on November 2007 Per Capita
North Mainland Per Capita (2007) City Per Capita (2007)

Per Capita Exit 29
Month/Year Monthly Total Gallons (Millions)
Month/Year Monthly Total Gallons (Millions)
Mar-07 8.477 Mar-07 1.234Apr-07 10.091 Apr-07 1.552May-07 11.462 May-07 1.506Jun-07 9.925 Jun-07 1.257Jul-07 8.972 Jul-07 1.280
Aug-07 10.018 Aug-07 1.500 # of gallonsSep-07 8.463 Sep-07 1.300 11 & upOct-07 6.430 Oct-07 1.100 10-10.99Nov-07 7.948 Nov-07 1.335 9-9.99Dec-07 8.859 Dec-07 1.300 8-8.99Jan-08 6.461 Jan-08 1.100 7-7.99Feb-08 6.899 Feb-08 1.100 6-6.99
Month/Year Monthly Total Gallons (Millions)
Month/Year Monthly Total Gallons (Millions)
Pop. 2007 Per Capita
Mar 07 7 243 Mar 07 7 243 1 469 5 159 00
1.5501.5001.4001.3001.2001.100
Exit 29 Flow w/out Com (2007)
Exit 29 Total Flow (2007) Exit 29 Commercial (2007)
Exit 29 Per Capita (2007)
*We took out commercial flow, because there was a significant amount of flow from the freeway commercial areas that borders I-95 & HWY 82. The billing data #s for commercial are from
the 309 TAZ layer. We were only provided w/ Mar07- Jul07 & Nov07, so we compared monthly flow w/ the commercial flow
to find a pattern. Novemeber not used in the pattern comparisions
Com gallons used
Mar-07 7.243 Mar-07 7.243 1,469.5 159.00Apr-07 8.539 Apr-07 8.539 1,469.5 193.69May-07 9.956 May-07 9.956 1,469.5 218.55Jun-07 8.668 Jun-07 8.668 1,469.5 196.62Jul-07 7.692 Jul-07 7.692 1,469.5 168.85
Aug-07 8.518 Aug-07 8.518 1,469.5 186.98Sep-07 7.163 Sep-07 7.163 1,469.5 162.48Oct-07 5.330 Oct-07 5.330 1,469.5 117.00Nov-07 6.613 Nov-07 6.613 1,469.5 150.01Dec-07 7.559 Dec-07 7.559 1,469.5 165.93Jan-08 5.361 Jan-08 5.361 1,469.5 117.68Feb-08 5.799 Feb-08 5.799 1,469.5 136.08

APPENDIX E – SEWER SYSTEM COMPONENT CITY POPULATION PROJECTIONS
Brunswick Glynn County JWSC Applied Technology & Management, Inc.
Water Sewer Master Plan

City 2007 Population Projections
Taz # Area 07 Pop. Estimate
Sewer or Septic
Built Out Basin Zoned Notes Area
1 City 33 Sewer Yes L002 GC * Added 13 RES accounts New Town2 City 58 Sewer Yes L002 OC * Added 23 RES accounts New Town3 City 25 Sewer Yes L002 GC &OC * Added 10 RES accounts Old Town4 City 64 Sewer Yes L002 GC & GR Use TAZ Old Town5 City 104 Sewer Yes L002 GC & GR Use TAZ Town Commons6 City 12 Sewer Yes L002 GC & GR Use TAZ Old Town7 City 85 Sewer Yes L002 GC * Added 34 RES accounts Old Town8 City 18 Sewer Yes L002 GC &OC * Added 7 RES accounts Old Town9 City 13 Sewer Yes L002 GR Use TAZ Old Town10 City 33 Sewer Yes L002 GC * Added 13 RES accounts Old Town11 City 44 Sewer Yes L002 GC & GR Use TAZ Old Town & Downing Place12 City 20 Sewer Yes L002 GC * Added 8 RES accounts Old Town13 City 5 Sewer Yes L002 GC * Added 2 RES accounts Old Town14 City 3 Sewer Yes L002 GC * Added 1 RES accounts Old Town15 City 5 Sewer Yes L002 GC * Added 2 RES accounts New Town16 City 27 Partial Yes L035 HC & R9 Use TAZ
17 City 259 Partial Yes L035 G/LI, R12, M6, R/M20, & HC
Use TAZ
18 City 184 Partial Yes L035 GI, R6 & MH6 Use TAZ Janie Hill, ARCO, DE Franco, Calvery & Dock Junction
19 City 219 Partial Yes L035 GR, R6 & HC Use TAZ Brunswick Villas & ARCO20 City 154 Partial Yes None R6 & HC Use TAZ Brunswick Villas 21 City 81 Partial Yes L004 R6, GR & HC Use TAZ Lawrenceville22 City 71 Sewer Yes L004 R6 Use TAZ Lawrenceville23 City 0 Septic Yes None GI & LI Use TAZ24 City 1 Septic Yes None HC & LI Use TAZ25 City 601 Sewer Yes L007/L011 R9 Use TAZ26 City 73 Sewer Yes L006 R6 & HC Use TAZ Brunswick Villas27 City 0 Septic Yes None R6 & HC * Added 0 RES accounts Brunswick Villas
28 City 52 Partial Yes L005 HC, R6 & GC Use TAZ Brunswick Farms & Brunswick Villas
29 City 542 Partial Yes L005 HC, R6 & GR Use TAZBlayton Tract, Bonnie Day, Carver
Heights, Day Tract, Brunswick Villas & Fulk Buhannon
30 City 105 Partial Yes L005 R6 & FA Use TAZ Brunswick Villas31 City 0 None Yes None R6 * Added 0 RES accounts32 City 42 Partial Partial L007 R6/9, GC & G/LI Use TAZ
33 City 50 Partial Partial L022 HC, GR & R9 *Mall: Added 20 RES accounts Brunswick Farms, Coral Park & Cypress Commons
34 City 0 Septic Partial L017 R9, HC & OC * Added 0 RES accounts
35 City 0 Partial Yes L006 R9 * College: Added 0 RES accounts
36 City 0 Private Yes L006 R9 * College: Added 0 RES accounts
37 City 204 Sewer Yes L017 R9, CP, LM Use TAZ Good Year Park38 City 80 Partial Yes L017 R9 Use TAZ Good Year Park39 City 210 Sewer Yes L017 R9 Use TAZ Good Year Park40 City 140 Partial Yes L017 R9/12 & HC Use TAZ Brunswick Farms & Baker41 City 359 Sewer Yes L017 R9 & HC Use TAZ Eastview
42 City 367 Sewer Yes L017 MED, & R9 Use TAZ Day Tract, Lake Forest, Tower Medical Shrine Park & Eastview
43 City 0 Private Yes L017 MED * Hospital: Added 0 RES accounts Good Year Park
44 City 308 Sewer Yes L003 BI * Hercules: Added 123 RES accounts
45 City 97 Partial Yes L017 MED & R9 Use TAZ Good Year Park46 City 323 Sewer Yes L017 MED, R9 & GR Use TAZ Montpelier & Homesite47 City 91 Sewer Yes L017 GR, HC & PDTN Use TAZ Montpelier48 City 220 Sewer Yes L003 LC & GR Use TAZ Perry Park & Town Commons49 City 207 Sewer Yes L003 GR & R6 Use TAZ Perry Park50 City 41 Sewer Yes L003 R6 Use TAZ Perry Park51 City 69 Sewer Yes L003 GR & LC Use TAZ Town Commons52 City 30 Sewer Yes L003 CP, GR & HC Use TAZ Mayhew53 City 5 Sewer Yes L003 HC * Added 2 RES accounts Town Commons54 City 118 Sewer Yes L003 HC & R6 Use TAZ Dart Tract & Osborne55 City 94 Sewer Yes L003 HC & R6 Use TAZ Urbana & Dart Tract56 City 184 Sewer Yes L003 HC, OC & R6 Use TAZ Urbana57 City 193 Sewer Yes L003 OC & R6 Use TAZ Urbana
58 City 417.00 Sewer Yes L003 GR, CP, & LC Use TAZ Mayhew, Perry Park and Town Commons
59 City 130.00 Sewer Yes L003 GR & CP Use TAZ Town Commons60 City 38.00 Sewer Yes L002/L003 GR Use TAZ Town Commons61 City 278.00 Sewer Yes L002 GR & LC Use TAZ Town Commons 62 City 172.00 Sewer Yes L002 GR, OC & HC Use TAZ Town Commons & Urbana63 City 62.00 Sewer Yes L002/L003 GR & GC Use TAZ New Town 64 City 414.00 Sewer Yes L003 GR & LC Use TAZ Town Commons

City 2007 Population Projections
Taz # Area 07 Pop. Estimate
Sewer or Septic
Built Out Basin Zoned Notes Area
65 City 28.00 Sewer Yes L003 GR & LC Use TAZ Town Commons66 City 14.00 Sewer Yes L002 GR & GC Use TAZ Town Commons67 City 80.00 Sewer Yes L002 GR Use TAZ Town Commons68 City 41.00 Sewer Yes L002 GR, OC & GC Use TAZ Town Commons69 City 64.00 Sewer Yes L002 GR & GC Use TAZ Town Commons70 City 0.00 Sewer Yes L002 GR Use TAZ Town Commons71 City 92.00 Sewer Yes L002 GR & GC Use TAZ New Town 72 City 98.00 Sewer Yes L002 GR & GC Use TAZ New Town & Town Commons73 City 124.00 Sewer Yes L003 GR & GC Use TAZ New Town & Town Commons74 City 131.00 Sewer Yes L003/L010 GR & LC Use TAZ Town Commons75 City 265.00 Sewer Yes L003/L004 GR & LC Use TAZ Town Commons76 City 87.50 Sewer Yes L003 LC * Added 35 RES accounts Town Commons77 City 12.00 Sewer Yes L003 GR Use TAZ Town Commons78 City 22.50 Sewer Yes L003 GR * Added 9 RES accounts Town Commons79 City 90.00 Sewer Yes L003 GR Use TAZ Town Commons80 City 116.00 Sewer Yes L003 GR & GC Use TAZ New Town & Town Commons81 City 201.00 Sewer Partial L004 R6 & GC Use TAZ Day Tract & Lawrenceville82 City 103.00 Sewer Yes L004 GI, LC, GR & HC Use TAZ Ayres & Day Tract83 City 200.00 Sewer Yes L004 GR, GC, CP, LC & HC Use TAZ Washington Heights
84 City 67.50 Sewer Yes L004 GI & GC * Added 27 RES accounts Avers, Day Tract & Lawrenceville
85 City 227.50 Private Yes L004 GI, GC & GR * Added 91 RES accounts86 City 186.00 Sewer Yes L003 R6, GR, OC & LC Use TAZ Town Commons87 City 30.00 Private Yes L004 R6 * Added 12 RES accounts Lincoln Park88 City 38.00 Sewer Yes L004 R6 & GR Use TAZ Lawrenceville89 City 69.00 Sewer Yes L003/L004 R6 & GC Use TAZ Day Tract & New Town90 City 117.00 Sewer Yes L003 R6 & GC Use TAZ New Town
92 City 145.00 Partial Yes L035 HC, M20, R9, CP & M12 * Added 58 RES accounts
93 City 199.00 Sewer Yes L035 BI & R6 Use TAZ ARCO94 City 0.00 Sewer Partial L035 HC Use TAZ ARCO95 City 0.00 Septic Yes None BI Use TAZ
96 City 317.00 Partial Yes L035 BI, R6, CP, GC & M12 Use TAZ ARCO, Lipthratt Island & Brunswick Farms
97 City 49.00 Partial Yes L035 HC, GI & R6 Use TAZ Model Farms98 City 0.00 Sewer Yes L035 CP Use TAZ99 City 0.00 Septic Yes None HC, R6, GC & LC * Added 0 RES accounts Model Farms
100 City 103.00 Partial Yes L004 R6 & HC Use TAZ Lawrenceville101 City 78.00 Partial Yes L004 R6 & GC Use TAZ Lawrenceville102 City 212.00 Sewer Yes L004 GC & R6 Use TAZ Peninsula Park & Day Tract103 City 0.00 None Yes L004 CP Cemetary: Use TAZ104 City 0.00 Sewer Yes L004 BI WWTP: Use TAZ105 City 178.00 Partial Yes L003/L004 GR, GC & HC Use TAZ Peninsula Park & New Town105 City 178.00 Partial Yes L003/L004 GR, GC & HC Use TAZ Peninsula Park & New Town106 City 190.00 Sewer Yes L003 GC, CP, HC & GR Use TAZ New Town 107 City 231.00 Sewer Yes L003 GR, GC, HC & PDTN Use TAZ New Town 108 City 187.00 Sewer Yes L003 GR, GC, HC, LC & CP Use TAZ New Town 109 City 24.00 Sewer Yes L003 GR & HC Use TAZ New Town 110 City 74.00 Sewer Yes L003 GR Use TAZ New Town 111 City 36.00 Sewer Yes L002/L003 GC & GR Use TAZ New Town 112 City 26.00 Sewer Yes L002 GC & GR Use TAZ New Town 113 City 29.00 Sewer Yes L002 GR, OC & GR Use TAZ New Town 114 City 2.50 Sewer Yes L002 GC & GR * Added 1 RES accounts New Town 115 City 283.00 Sewer Yes L002 GR & OC Use TAZ New Town 116 City 7.50 Private Yes L002 BI & CP * Added 3 RES accounts117 City 95.00 Sewer Yes L002 GR, LC & OC Use TAZ New Town 118 City 120.00 Sewer Yes L002 GR & OC Use TAZ New Town 119 City 0.00 Sewer Yes L002 GC & BI Use TAZ Old Town120 City 196.00 Sewer Yes L002 GR, CP & GP Use TAZ Old Town121 City 93.00 Sewer Yes L002 GR & CP Use TAZ Old Town122 City 23.00 Sewer Yes L002 GR Use TAZ Old Town123 City 39.00 Sewer Yes L002 GR Use TAZ Old Town124 City 166.00 Sewer Yes L002 GR & CP Use TAZ Old Town125 City 234.00 Sewer Yes L002 GR & BI Use TAZ Old Town126 City 7.00 Sewer Yes L002 GC & BI Use TAZ Old Town127 City 184.00 Sewer Yes L002 GR, LC & OC Use TAZ Town Commons
128 City 32.00 Sewer Yes L002 GC, CP & R9 Use TAZ Town Commons & Windsor Park
129 City 208.00 Sewer Yes L002 GR, LI & GI Use TAZ Dixiville130 City 150.00 Sewer Yes L002 GR & GC Use TAZ Old Town131 City 218.00 Sewer Yes L002 GR, CP & OC Use TAZ Old Town132 City 53.00 Sewer Yes L002 GR Use TAZ Old Town133 City 298.00 Sewer Yes L002 GR & CP Use TAZ Old Town134 City 276.00 Sewer Yes L002 R9 & CP Use TAZ Windsor Park135 City 2.50 Sewer Yes L002 CP * Added 1 RES accounts Windsor Park & Marsh Tract136 City 60.00 Planned Yes L002 GR & R9 * Added 24 RES accounts137 City 360.00 Sewer Yes L002 GR, CP & LI Use TAZ Old Town138 City 304.00 Sewer Yes L002 GR Use TAZ Old Town

City 2007 Population Projections
Taz # Area 07 Pop. Estimate
Sewer or Septic
Built Out Basin Zoned Notes Area
139 City 92.00 Planned Yes L002 GR & R6 Use TAZ Habersham Park140 City 0.00 None Partial L002 CP * Added 0 RES accounts141 City 75.00 Planned Yes L002 GI, GR & CP Use TAZ142 City 165.00 Sewer Yes L001/L002 GR Use TAZ Old Town
143 City 460.00 Sewer Yes L001/L002 R6, LC & GR Use TAZ Old Town, South End, Davenport Tract & 4.5 Acre Tract
144 City 17.00 Sewer Yes L001 BI &R6 Use TAZ145 City 48.00 Sewer Yes L002 GR & GI Use TAZ Old Town146 City 203.00 Sewer Yes L001/L002 R6 Use TAZ South End147 City 192.00 Sewer Yes L001 R6 Use TAZ South Union and 33 Acre Tract148 City 0.00 Planned Partial L002 PDG & BI Liberty Harbor: Use TAZ Liberty Harbor150 City 2.50 Partial Yes L001 BI * Added 1 RES accounts South Yard151 City 0.00 Sewer Yes L002 GC Use TAZ Old Town152 City 98.00 Sewer Yes L003 GR & HC Use TAZ New Town 153 City 67.00 Sewer Yes L003 LC, GR & GC Use TAZ New Town 154 City 40.00 Sewer Yes L003 GR Use TAZ Town Commons
155 City 0.00 Private Yes L006 R9 * College: Added 0 RES accounts
156 City 647.50 Private Yes L043 R9, HC M9, OC & GC * Added 259 RES accounts157 City 0.00 Sewer Partial L004/L035 GC & CP Use TAZ158 City 42.50 Partial Yes L006/L007 R9 * Added 17 RES accounts Magnolia Park159 City 0.00 Sewer Partial L006 GC & R9 Use TAZ Brunswick Farms160 City 60.00 Partial Yes L011 R9, HC & PDH * Added 24 RES accounts Glynn Plaza & Magnolia Park
161 City 21.00 Partial Partial L035 GI, GC, LI & R6 Use TAZ Community Commercial / Industrial
162 City 0.00 Septic Partial None BI Use TAZ163 City 15.00 Septic Partial None BI, R9, M20, LC & HC * Added 6 RES accounts
164 City 2.50 Septic Partial L035 R12, CP, HC, R9 & MH * Added 1 RES accounts
165 City 7.50 Sewer Yes L035 HC & GI * Added 3 RES accounts166 City 5.00 Partial Partial L011 PDI & HC * Added 2 RES accounts179 City 0.00 Septic Yes L127 GR & HC * Added 0 RES accounts181 City 134.00 Partial Partial L036 FC, HC, FA, GR & R9 Use TAZ Glyndale
195 City 1,840.00 Private Yes L048 G Website consensus (2300 pop. With 20% off campus) FLETC
196 City 763.00 Sewer Yes L048 G & R6 Use TAZ FLETC200 City 1,133.00 Sewer Yes L023 R9, LC & GC Use TAZ Glynco Annex201 City 35.00 Partial Partial L048 FA, PD & R12 * Added 14 RES accounts
202 City 490.00 Sewer Yes L023 PDR, R12 & R9 Use TAZ Cambro Tract, Palmetto Estate & Glynn Marsh
203 City 1,247.00 Partial Yes L028 R6 & R12 Use TAZ Culligans Landing
204 City 1,043.00 Sewer Yes L021/L027/L028 OC, HC, R6 & R9 Use TAZ Beverly Shores & Country Club
HeightsL028 Heights205 City 925.00 Sewer Yes L028 PDG Use TAZ Hidden Lakes & Marsh Landing206 City 265.00 Sewer Yes L021 HC, R6 & R9 Use TAZ Beverly Shores207 City 278.00 Sewer Yes L021 HC, R9 & MR Use TAZ Bristol & Beverly Shores208 City 769.00 Partial Yes L027 R9, GR, MH & PDR Use TAZ Bridge Water209 City 0.00 Sewer Yes L021 HC * Added 0 RES accounts Glynn Isles
210 City 206.00 Partial Yes L043 R6, R12, HC, OC & M20 Use TAZ Palm Lakes
211 City 0.00 Sewer Yes L022 HC * Added 0 RES accounts Azelea Gardens
212 City 358.00 Sewer Yes L021 R9 & HC Use TAZ College Park & Brunswick Farms
213 City 245.00 Private Yes L056 LI, HC GR & PDR * Added 98 RES accounts214 City 121.00 Sewer Yes L021/L056 PDR, R12, GR & MR Use TAZ Cypress Run215 City 50.00 Sewer Yes L021 R9, HC & GR Use TAZ216 City 409.00 Planned Partial L044 PDR & PDS Use TAZ Glynn Place217 City 9.00 Septic Partial None R12, M20 R20 & LC Use TAZ
218 City 341.00 Planned Partial L044 PDS, MR & PDR Use TAZ Glynn Place & Peppertree Crossing
219 City 0.00 Private Yes L044 GC & PDS Use TAZ Mall
220 City 0.00 Planned Partial L021 PDS, GC, HC, MR & OC Use TAZ
221 City 72.50 Planned Partial L056 PDS, M20 & MR * Added 29 RES accounts Brunswick Farms
222 City 186.00 Partial Yes L056 R12, GI, HC, LI M20, & R9 Use TAZ Mill Crest
223 City 14.00 Private Yes L044 PDS, M20, R12, R20 & GC Use TAZ Chapel Crossing
224 City 0.00 Septic Yes None R9, OC, M20, M6 & R12 * Added 0 RES accounts
225 City 151.00 Partial Partial L036 FA, LI, FC, R9, M20 & GC Use TAZ
226 City 58.00 Partial Partial L036 FA, LI, M9, M20, R9 & FC Took 1/2 TAZ
227 City 438.00 Partial Yes None R12, MH, LC, MH6, R9 Use TAZ Chapel Park228 City 563.00 Partial Yes L035 R9, R12, MH & M20 Use TAZ Pine Ridge & Druid Hills229 City 0.00 Septic Yes None HC, R9, M12 & LI * Added 0 RES accounts

City 2007 Population Projections
Taz # Area 07 Pop. Estimate
Sewer or Septic
Built Out Basin Zoned Notes Area
230 City 0.00 Septic Yes None FA, MH & PDR * Added 0 RES accounts231 City 0.00 Septic Yes None PDG, FA & HC * Added 0 RES accounts232 City 0.00 Private Partial None M20, HC & R9 * Added 0 RES accounts233 City 7.50 Septic Yes None R9, GC & OC * Added 3 RES accounts234 City 0.00 Partial Yes None R20, HC & GC Use TAZ Center Square235 City 0.00 Septic Yes None R9, M20, R20 & GR * Added 0 RES accounts
240 City 275.00 Sewer Yes L048 HC, PDR, FA, PDS & R12 Use TAZ Greyfield Villas, Belle Pointe &
Powers Landing241 City 746.00 Sewer Yes None R12 & CP Use TAZ Belle Point East242 City 36.00 Planned Partial None HC, GR & MR Use TAZ243 City 5.00 Septic Partial None GR, R9 & HC * Added 2 RES accounts244 City 12.50 Private Partial L043 R9, CP, HC & M12 * Added 5 RES accounts248 City 20.00 Private Yes L003 HC & GC Use TAZ Maritime & Hercules249 City 0.00 Septic Partial None GR & CP Use TAZ250 City 383.00 Sewer Yes L017 GR, CP, R9, HC & BI Use TAZ Riverside & Oak Park
251 City 79.00 Private Partial L017 HC &MH Use TAZ Brunswick Farms & Marshview Apt
335 City 0.00 Partial Yes L036 R9, R12, FA, LI, LC & HC * Added 0 RES accounts
336 City 0.00 Partial Yes L036 R6, R12, R9 & FC * Added 0 RES accounts337 City 0.00 Partial Yes L036 FC, R12 & PD * Added 0 RES accounts
338 City 0.00 Septic Yes None HC, M20, LC, R9, FA & LI * Added 0 RES accounts
372 City 131.00 Planned Yes L056 PDR Use TAZ Moss Creek Villas373 City 5.00 Private Yes L021 PDS * Added 2 RES accounts Village at Glynn Place
374 City 0.00 Private Partial None HC, R12, R20, LC & FA Use TAZ
07 Pop. Estimate
Total 31,928.50
* If projection was zero then used RES #'s for missing data. RES #'s came from billing data. Per 1 RES account, 2.5 residents were added
to overall population projection.

City 2014 Population Projections
Taz # Area 29 Pop. Estimate
Sewer or Septic
Built Out Basin Zoned Notes Area Name
1 City 0 Sewer Yes L002 GC * Added 13 RES accounts New Town2 City 0 Sewer Yes L002 OC * Added 23 RES accounts New Town3 City 0 Sewer Yes L002 GC &OC * Added 10 RES accounts Old Town4 City 0 Sewer Yes L002 GC & GR Use TAZ Old Town5 City 0 Sewer Yes L002 GC & GR Use TAZ Town Commons6 City 0 Sewer Yes L002 GC & GR Use TAZ Old Town7 City 0 Sewer Yes L002 GC * Added 34 RES accounts Old Town8 City 0 Sewer Yes L002 GC &OC * Added 7 RES accounts Old Town9 City 0 Sewer Yes L002 GR Use TAZ Old Town10 City 0 Sewer Yes L002 GC * Added 13 RES accounts Old Town11 City 0 Sewer Yes L002 GC & GR Use TAZ Old Town & Downing Place12 City 0 Sewer Yes L002 GC * Added 8 RES accounts Old Town13 City 0 Sewer Yes L002 GC * Added 2 RES accounts Old Town14 City 0 Sewer Yes L002 GC * Added 1 RES accounts Old Town15 City 0 Sewer Yes L002 GC * Added 2 RES accounts New Town16 City 0 Partial Yes L035 HC & R9 Use TAZ17 City 0 Partial Yes L035 G/LI, R12, M6, R/M20, & HC Use TAZ
18 City 0 Partial Yes L035 GI, R6 & MH6 Use TAZ Janie Hill, ARCO, DE Franco, Calvery & Dock Junction
19 City 41 Partial Yes L035 GR, R6 & HC Use TAZ Brunswick Villas & ARCO20 City 49 Partial Yes L004 R6 & HC Use TAZ Brunswick Villas 21 City 59 Partial Yes L004 R6, GR & HC Use TAZ Lawrenceville22 City 0 Sewer Yes L004 R6 Use TAZ Lawrenceville23 City 0 Septic Yes None GI & LI Use TAZ24 City 0 Septic Yes None HC & LI Use TAZ25 City 0 Sewer Yes L007/L011 R9 Use TAZ from 200726 City 0 Sewer Yes 4006 R6 & HC Use TAZ Brunswick Villas27 City 0 Septic Yes None R6 & HC * Added 0 RES accounts Brunswick Villas
28 City 0 Partial Yes L005 HC, R6 & GC Use TAZ Brunswick Farms & Brunswick Villas
29 City 0 Partial Yes L005 HC, R6 & GR Use TAZ from 2007
Blayton Tract, Bonnie Day, Carver Heights, Day Tract,
Brunswick Villas & Fulk Buhannon
30 City 0 Partial Yes L005 R6 & FA Use TAZ Brunswick Villas
31 City 119 None Yes L005 R6 Will be sewered in future: Use TAZ
32 City 0 Partial Partial L007 R6/9, GC & G/LI Use TAZ
33 City 0 Partial Partial L022 HC, GR & R9 *Mall: Added 20 RES accounts Brunswick Farms, Coral Park & Cypress Commons
34 City 88 Septic Partial L017 R9, HC & OC Will be sewered in future: Use TAZ
35 City 0 Partial Yes L006 R9 * College: Added 0 RES accounts35 City 0 Partial Yes L006 R9 * College: Added 0 RES accounts
36 City 0 Private Yes L006 R9 * College: Added 0 RES accounts
37 City 0 Sewer Yes L017 R9, CP, LM Use TAZ Good Year Park38 City 0 Partial Yes L017 R9 Use TAZ Good Year Park39 City 0 Sewer Yes L017 R9 Use TAZ Good Year Park40 City 0 Partial Yes L017 R9/12 & HC Use TAZ Brunswick Farms & Baker41 City 0 Sewer Yes L017 R9 & HC Use TAZ from 2007 Eastview
42 City 0 Sewer Yes L017 MED, & R9 Use TAZ Day Tract, Lake Forest, Tower Medical Shrine Park & Eastview
43 City 0 Private Yes L017 MED * Hospital: Added 0 RES accounts Good Year Park
44 City 0 Sewer Yes L003 BI * Hercules: Added 123 RES accounts
45 City 0 Partial Yes L017 MED & R9 Use TAZ Good Year Park46 City 0 Sewer Yes L017 MED, R9 & GR Use TAZ Montpelier & Homesite47 City 0 Sewer Yes L017 GR, HC & PDTN Use TAZ Montpelier48 City 0 Sewer Yes L003 LC & GR Use TAZ Perry Park & Town Commons49 City 0 Sewer Yes L003 GR & R6 Use TAZ Perry Park50 City 0 Sewer Yes L003 R6 Use TAZ Perry Park51 City 0 Sewer Yes L003 GR & LC Use TAZ Town Commons52 City 0 Sewer Yes L003 CP, GR & HC Use TAZ Mayhew53 City 0 Sewer Yes L003 HC * Added 2 RES accounts Town Commons54 City 0 Sewer Yes L003 HC & R6 Use TAZ Dart Tract & Osborne55 City 0 Sewer Yes L003 HC & R6 Use TAZ Urbana & Dart Tract56 City 0 Sewer Yes L003 HC, OC & R6 Use TAZ Urbana57 City 0 Sewer Yes L003 OC & R6 Use TAZ Urbana
58 City 0 Sewer Yes L003 GR, CP, & LC Use TAZ Mayhew, Perry Park and Town Commons
59 City 0 Sewer Yes L003 GR & CP Use TAZ Town Commons60 City 0 Sewer Yes L002/L003 GR Use TAZ Town Commons61 City 0 Sewer Yes L002 GR & LC Use TAZ Town Commons 62 City 0 Sewer Yes L002 GR, OC & HC Use TAZ Town Commons & Urbana

City 2014 Population Projections
Taz # Area 29 Pop. Estimate
Sewer or Septic
Built Out Basin Zoned Notes Area Name
63 City 0 Sewer Yes L002/L003 GR & GC Use TAZ New Town 64 City 0 Sewer Yes L003 GR & LC Use TAZ from 2007 Town Commons65 City 0 Sewer Yes L003 GR & LC Use TAZ Town Commons66 City 0 Sewer Yes L002 GR & GC Use TAZ Town Commons67 City 0 Sewer Yes L002 GR Use TAZ Town Commons68 City 0 Sewer Yes L002 GR, OC & GC Use TAZ Town Commons69 City 0 Sewer Yes L002 GR & GC Use TAZ Town Commons70 City 0 Sewer Yes L002 GR Use TAZ Town Commons71 City 0 Sewer Yes L002 GR & GC Use TAZ New Town 72 City 0 Sewer Yes L002 GR & GC Use TAZ New Town & Town Commons73 City 0 Sewer Yes L003 GR & GC Use TAZ New Town & Town Commons74 City 0 Sewer Yes L003/L010 GR & LC Use TAZ Town Commons75 City 0 Sewer Yes L003/L004 GR & LC Use TAZ Town Commons76 City 0 Sewer Yes L003 LC * Added 35 RES accounts Town Commons77 City 0 Sewer Yes L003 GR Use TAZ Town Commons78 City 0 Sewer Yes L003 GR * Added 9 RES accounts Town Commons79 City 0 Sewer Yes L003 GR Use TAZ Town Commons80 City 0 Sewer Yes L003 GR & GC Use TAZ New Town & Town Commons81 City 0 Sewer Partial L004 R6 & GC Use TAZ Day Tract & Lawrenceville82 City 0 Sewer Yes L004 GI, LC, GR & HC Use TAZ Ayres & Day Tract83 City 0 Sewer Yes L004 GR, GC, CP, LC & HC Use TAZ Washington Heights
84 City 0 Sewer Yes L004 GI & GC * Added 27 RES accounts Avers, Day Tract & Lawrenceville
85 City 0 Private Yes L004 GI, GC & GR * Added 91 RES accounts86 City 0 Sewer Yes L003 R6, GR, OC & LC Use TAZ Town Commons87 City 0 Private Yes L004 R6 * Added 12 RES accounts Lincoln Park88 City 0 Sewer Yes L004 R6 & GR Use TAZ Lawrenceville89 City 0 Sewer Yes L003/L004 R6 & GC Use TAZ Day Tract & New Town90 City 0 Sewer Yes L003 R6 & GC Use TAZ New Town92 City 0 Partial Yes L035 HC, M20, R9, CP & M12 * Added 58 RES accounts93 City 0 Sewer Yes L035 BI & R6 Use TAZ ARCO94 City 0 Sewer Partial L035 HC Use TAZ ARCO95 City 0 Septic Yes None BI Use TAZ
96 City 80 Partial Yes L035 BI, R6, CP, GC & M12 Use TAZ ARCO, Lipthratt Island & Brunswick Farms
97 City 0 Partial Yes L035 HC, GI & R6 Use TAZ Model Farms98 City 0 Sewer Yes L035 CP Use TAZ99 City 30 Septic Yes L004 HC, R6, GC & LC * Added 0 RES accounts Model Farms
100 City 0 Partial Yes L004 R6 & HC Use TAZ Lawrenceville101 City 0 Partial Yes L004 R6 & GC Use TAZ Lawrenceville102 City 0 Sewer Yes L004 GC & R6 Use TAZ Peninsula Park & Day Tract103 City 0 None Yes L004 CP Cemetary: Use TAZ104 City 0 Sewer Yes L004 BI WWTP: Use TAZ105 Cit 0 P ti l Y L003/L004 GR GC & HC U TAZ P i l P k & N T105 City 0 Partial Yes L003/L004 GR, GC & HC Use TAZ Peninsula Park & New Town106 City 0 Sewer Yes L003 GC, CP, HC & GR Use TAZ New Town 107 City 0 Sewer Yes L003 GR, GC, HC & PDTN Use TAZ New Town 108 City 0 Sewer Yes L003 GR, GC, HC, LC & CP Use TAZ New Town 109 City 0 Sewer Yes L003 GR & HC Use TAZ New Town 110 City 0 Sewer Yes L003 GR Use TAZ New Town 111 City 0 Sewer Yes L002/L003 GC & GR Use TAZ New Town 112 City 0 Sewer Yes L002 GC & GR Use TAZ New Town 113 City 0 Sewer Yes L002 GR, OC & GR Use TAZ New Town 114 City 0 Sewer Yes L002 GC & GR * Added 1 RES accounts New Town 115 City 0 Sewer Yes L002 GR & OC Use TAZ New Town 116 City 0 Private Yes L002 BI & CP * Added 3 RES accounts117 City 0 Sewer Yes L002 GR, LC & OC Use TAZ New Town 118 City 0 Sewer Yes L002 GR & OC Use TAZ New Town 119 City 0 Sewer Yes L002 GC & BI Use TAZ Old Town120 City 0 Sewer Yes L002 GR, CP & GP Use TAZ Old Town121 City 0 Sewer Yes L002 GR & CP Use TAZ Old Town122 City 0 Sewer Yes L002 GR Use TAZ Old Town123 City 0 Sewer Yes L002 GR Use TAZ Old Town124 City 0 Sewer Yes L002 GR & CP Use TAZ Old Town125 City 0 Sewer Yes L002 GR & BI Use TAZ Old Town126 City 0 Sewer Yes L002 GC & BI Use TAZ Old Town127 City 0 Sewer Yes L002 GR, LC & OC Use TAZ Town Commons
128 City 0 Sewer Yes L002 GC, CP & R9 Use TAZ Town Commons & Windsor Park
129 City 0 Sewer Yes L002 GR, LI & GI Use TAZ Dixiville130 City 0 Sewer Yes L002 GR & GC Use TAZ Old Town131 City 0 Sewer Yes L002 GR, CP & OC Use TAZ Old Town132 City 0 Sewer Yes L002 GR Use TAZ Old Town133 City 0 Sewer Yes L002 GR & CP Use TAZ Old Town134 City 0 Sewer Yes L002 R9 & CP Use TAZ Windsor Park135 City 0 Sewer Yes L002 CP * Added 1 RES accounts Windsor Park & Marsh Tract
136 City 300 Planned Yes L002 GR & R9 Will be sewered in future: Use TAZ

City 2014 Population Projections
Taz # Area 29 Pop. Estimate
Sewer or Septic
Built Out Basin Zoned Notes Area Name
137 City 0 Sewer Yes L002 GR, CP & LI Use TAZ Old Town138 City 0 Sewer Yes L002 GR Use TAZ Old Town139 City 0 Planned Yes L002 GR & R6 Use TAZ Habersham Park140 City 0 None Partial L002 CP * Added 0 RES accounts141 City 21 Planned Yes L002 GI, GR & CP Use TAZ142 City 0 Sewer Yes L001/L002 GR Use TAZ Old Town
143 City 0 Sewer Yes L001/L002 R6, LC & GR Use TAZ from 2007Old Town, South End,
Davenport Tract & 4.5 Acre Tract
144 City 0 Sewer Yes L001 BI &R6 Use TAZ145 City 0 Sewer Yes L002 GR & GI Use TAZ Old Town146 City 0 Sewer Yes L001/L002 R6 Use TAZ South End
147 City 0 Sewer Yes L001 R6 Use TAZ South Union and 33 Acre Tract
148 City 2,775 Planned Partial L002 PDG & BILiberty Harbor: 300 Lots @ 2.5
Residents/HH & 2400 Condos @ 2 Residents/Condos
Liberty Harbor
150 City 0 Partial Yes L001 BI * Added 1 RES accounts South Yard151 City 0 Sewer Yes L002 GC Use TAZ Old Town152 City 0 Sewer Yes L003 GR & HC Use TAZ New Town 153 City 0 Sewer Yes L003 LC, GR & GC Use TAZ New Town 154 City 0 Sewer Yes L003 GR Use TAZ Town Commons
155 City 0 Private Yes L006 R9 * College: Added 0 RES accounts
156 City 0 Private Yes L043 R9, HC M9, OC & GC * Added 259 RES accounts157 City 0 Sewer Partial L035/L004 GC & CP Use TAZ158 City 0 Partial Yes L006/L007 R9 * Added 17 RES accounts Magnolia Park159 City 0 Sewer Partial L006 GC & R9 Use TAZ Brunswick Farms160 City 0 Partial Yes L011 R9, HC & PDH * Added 24 RES accounts Glynn Plaza & Magnolia Park
161 City 0 Partial Partial L035 GI, GC, LI & R6 Use TAZ Community Commercial / Industrial
162 City 0 Septic Partial None BI Use TAZ
163 City 48 Septic Partial None BI, R9, M20, LC & HC Will be sewered in future: Estimate 25 HH @ 2.5 Residents/HH
164 City 0 Septic Yes L035 R12, CP, HC, R9 & MH * Added 1 RES accounts165 City 0 Sewer Yes L035 HC & GI * Added 3 RES accounts
166 City 153 Partial Partial L011 PDI & HC Will be sewered in future: Use TAZ
179 City 0 Septic Yes L127 GR & HC * Added 0 RES accounts181 City 0 Partial Partial L036 FC, HC, FA, GR & R9 Use TAZ Glyndale
195 City 0 Private Yes L048 G Website consensus (2300 pop. With 20% off campus) FLETC
196 Cit 0 S Y L048 G & R6 U TAZ f 2007 FLETC196 City 0 Sewer Yes L048 G & R6 Use TAZ from 2007 FLETC200 City 0 Sewer Yes L023 R9, LC & GC Use TAZ Glynco Annex201 City 0 Partial Partial L048 FA, PD & R12 * Added 14 RES accounts
202 City 0 Sewer Yes L023 PDR, R12 & R9 Use TAZ from 2007 Cambro Tract, Palmetto Estate & Glynn Marsh
203 City 0 Partial Yes L028 R6 & R12 Use TAZ from 2007 Culligans Landing
204 City 0 Sewer Yes L021/L027/L028 OC, HC, R6 & R9 Use TAZ from 2007 Beverly Shores & Country Club
Heights
205 City 0 Sewer Yes L028 PDG Use TAZ from 2007 Hidden Lakes & Marsh Landing
206 City 0 Sewer Yes L021 HC, R6 & R9 Use TAZ Beverly Shores207 City 0 Sewer Yes L021 HC, R9 & MR Use TAZ from 2007 Bristol & Beverly Shores208 City 0 Partial Yes L027 R9, GR, MH & PDR Use TAZ Bridge Water209 City 0 Sewer Yes L021 HC * Added 0 RES accounts Glynn Isles210 City 14 Partial Yes L043 R6, R12, HC, OC & M20 Use TAZ Palm Lakes211 City 0 Sewer Yes L022 HC * Added 0 RES accounts Azelea Gardens
212 City 0 Sewer Yes L021 R9 & HC Use TAZ College Park & Brunswick Farms
213 City 0 Private Yes L056 LI, HC GR & PDR * Added 98 RES accounts214 City 0 Sewer Yes L021/L056 PDR, R12, GR & MR Use TAZ Cypress Run215 City 0 Sewer Yes L021 R9, HC & GR Use TAZ216 City 0 Planned Partial L044 PDR & PDS Use TAZ Glynn Place217 City 0 Septic Partial None R12, M20 R20 & LC Use TAZ
218 City 0 Planned Partial L044 PDS, MR & PDR Use TAZ Glynn Place & Peppertree Crossing
219 City 0 Private Yes L044 GC & PDS Use TAZ Mall220 City 0 Planned Partial L021 PDS, GC, HC, MR & OC Use TAZ221 City 0 Planned Partial L056 PDS, M20 & MR * Added 29 RES accounts Brunswick Farms222 City 0 Partial Yes L056 R12, GI, HC, LI M20, & R9 Use TAZ Mill Crest223 City 0 Private Yes L044 PDS, M20, R12, R20 & GC Use TAZ Chapel Crossing224 City 0 Septic Yes None R9, OC, M20, M6 & R12 * Added 0 RES accounts225 City 0 Partial Partial L036 FA, LI, FC, R9, M20 & GC Use TAZ226 City 0 Partial Partial L036 FA, LI, M9, M20, R9 & FC Took 1/2 TAZ227 City 0 Partial Yes None R12, MH, LC, MH6, R9 & GR Use TAZ from 2007 Chapel Park

City 2014 Population Projections
Taz # Area 29 Pop. Estimate
Sewer or Septic
Built Out Basin Zoned Notes Area Name
228 City 0 Partial Yes L035 R9, R12, MH & M20 Use TAZ from 2007 Pine Ridge & Druid Hills229 City 0 Septic Yes None HC, R9, M12 & LI * Added 0 RES accounts230 City 0 Septic Yes None FA, MH & PDR * Added 0 RES accounts231 City 0 Septic Yes None PDG, FA & HC * Added 0 RES accounts232 City 0 Private Partial None M20, HC & R9 * Added 0 RES accounts233 City 0 Septic Yes None R9, GC & OC * Added 3 RES accounts234 City 0 Partial Yes None R20, HC & GC Use TAZ Center Square235 City 0 Septic Yes None R9, M20, R20 & GR * Added 0 RES accounts
240 City 175 Sewer Yes L048 HC, PDR, FA, PDS & R12 Use TAZ Greyfield Villas, Belle Pointe & Powers Landing
241 City 0 Septic Yes None R12 & CP Use TAZ from 2007 Belle Point East242 City 140 Planned Partial None HC, GR & MR Use TAZ243 City 0 Septic Partial None GR, R9 & HC * Added 2 RES accounts244 City 0 Private Partial L043 R9, CP, HC & M12 * Added 5 RES accounts248 City 0 Private Yes L003 HC & GC Use TAZ Maritime & Hercules249 City 0 Septic Partial None GR & CP Use TAZ250 City 0 Sewer Yes L017 GR, CP, R9, HC & BI Use TAZ from 2007 Riverside & Oak Park
251 City 0 Private Partial L017 HC &MH Use TAZ Brunswick Farms & Marshview Apt
335 City 0 Partial Yes L036 R9, R12, FA, LI, LC & HC * Added 0 RES accounts336 City 0 Partial Yes L036 R6, R12, R9 & FC Some included in TAZ 337337 City 0 Partial Yes L036 FC, R12 & PD * Added 0 RES accounts338 City 0 Septic Yes None HC, M20, LC, R9, FA & LI * Added 0 RES accounts372 City 193 Planned Yes L056 PDR Use TAZ Moss Creek Villas373 City 0 Private Yes L021 PDS * Added 2 RES accounts Village at Glynn Place374 City 0 Private Partial None HC, R12, R20, LC & FA Use TAZ
Taz 29 Estimate
Total 4,285
* If projection was zero then used COM & RES #'s for missing data. COM & RES #'s came from billing
data. Per 1 RES account, 2.5 residents were added to overall
population projection.
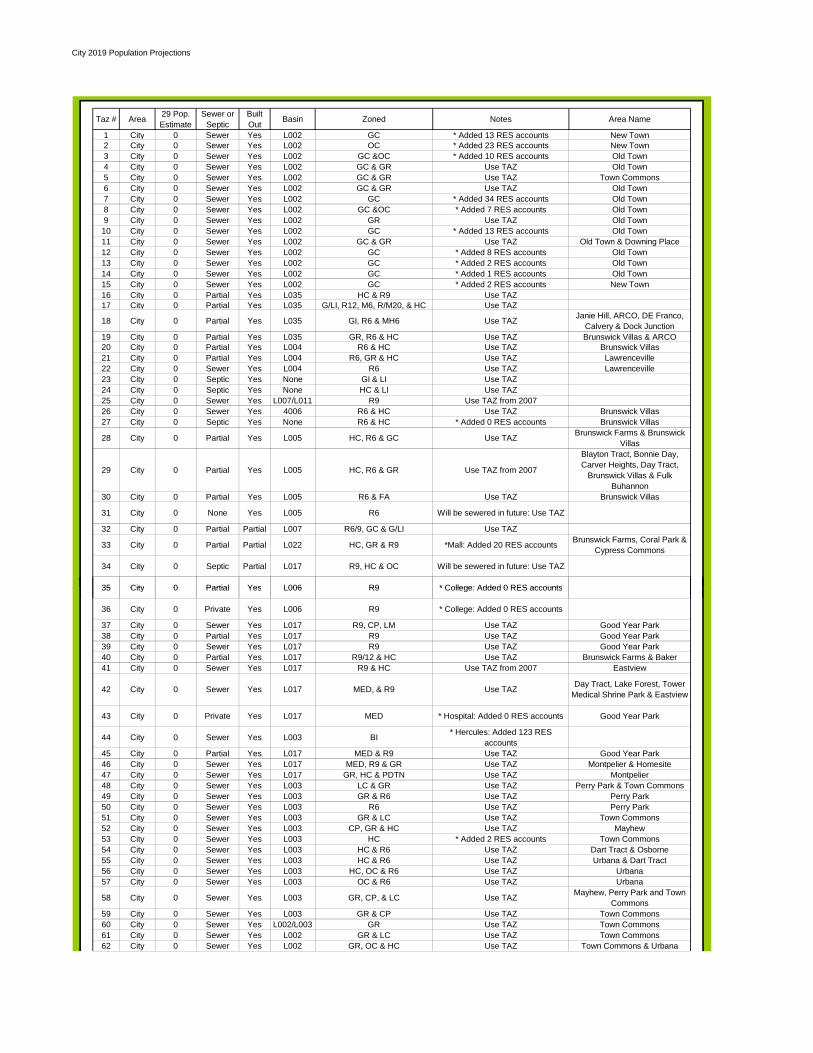
City 2019 Population Projections
Taz # Area 29 Pop. Estimate
Sewer or Septic
Built Out Basin Zoned Notes Area Name
1 City 0 Sewer Yes L002 GC * Added 13 RES accounts New Town2 City 0 Sewer Yes L002 OC * Added 23 RES accounts New Town3 City 0 Sewer Yes L002 GC &OC * Added 10 RES accounts Old Town4 City 0 Sewer Yes L002 GC & GR Use TAZ Old Town5 City 0 Sewer Yes L002 GC & GR Use TAZ Town Commons6 City 0 Sewer Yes L002 GC & GR Use TAZ Old Town7 City 0 Sewer Yes L002 GC * Added 34 RES accounts Old Town8 City 0 Sewer Yes L002 GC &OC * Added 7 RES accounts Old Town9 City 0 Sewer Yes L002 GR Use TAZ Old Town10 City 0 Sewer Yes L002 GC * Added 13 RES accounts Old Town11 City 0 Sewer Yes L002 GC & GR Use TAZ Old Town & Downing Place12 City 0 Sewer Yes L002 GC * Added 8 RES accounts Old Town13 City 0 Sewer Yes L002 GC * Added 2 RES accounts Old Town14 City 0 Sewer Yes L002 GC * Added 1 RES accounts Old Town15 City 0 Sewer Yes L002 GC * Added 2 RES accounts New Town16 City 0 Partial Yes L035 HC & R9 Use TAZ17 City 0 Partial Yes L035 G/LI, R12, M6, R/M20, & HC Use TAZ
18 City 0 Partial Yes L035 GI, R6 & MH6 Use TAZ Janie Hill, ARCO, DE Franco, Calvery & Dock Junction
19 City 0 Partial Yes L035 GR, R6 & HC Use TAZ Brunswick Villas & ARCO20 City 0 Partial Yes L004 R6 & HC Use TAZ Brunswick Villas 21 City 0 Partial Yes L004 R6, GR & HC Use TAZ Lawrenceville22 City 0 Sewer Yes L004 R6 Use TAZ Lawrenceville23 City 0 Septic Yes None GI & LI Use TAZ24 City 0 Septic Yes None HC & LI Use TAZ25 City 0 Sewer Yes L007/L011 R9 Use TAZ from 200726 City 0 Sewer Yes 4006 R6 & HC Use TAZ Brunswick Villas27 City 0 Septic Yes None R6 & HC * Added 0 RES accounts Brunswick Villas
28 City 0 Partial Yes L005 HC, R6 & GC Use TAZ Brunswick Farms & Brunswick Villas
29 City 0 Partial Yes L005 HC, R6 & GR Use TAZ from 2007
Blayton Tract, Bonnie Day, Carver Heights, Day Tract,
Brunswick Villas & Fulk Buhannon
30 City 0 Partial Yes L005 R6 & FA Use TAZ Brunswick Villas
31 City 0 None Yes L005 R6 Will be sewered in future: Use TAZ
32 City 0 Partial Partial L007 R6/9, GC & G/LI Use TAZ
33 City 0 Partial Partial L022 HC, GR & R9 *Mall: Added 20 RES accounts Brunswick Farms, Coral Park & Cypress Commons
34 City 0 Septic Partial L017 R9, HC & OC Will be sewered in future: Use TAZ
35 City 0 Partial Yes L006 R9 * College: Added 0 RES accounts35 City 0 Partial Yes L006 R9 * College: Added 0 RES accounts
36 City 0 Private Yes L006 R9 * College: Added 0 RES accounts
37 City 0 Sewer Yes L017 R9, CP, LM Use TAZ Good Year Park38 City 0 Partial Yes L017 R9 Use TAZ Good Year Park39 City 0 Sewer Yes L017 R9 Use TAZ Good Year Park40 City 0 Partial Yes L017 R9/12 & HC Use TAZ Brunswick Farms & Baker41 City 0 Sewer Yes L017 R9 & HC Use TAZ from 2007 Eastview
42 City 0 Sewer Yes L017 MED, & R9 Use TAZ Day Tract, Lake Forest, Tower Medical Shrine Park & Eastview
43 City 0 Private Yes L017 MED * Hospital: Added 0 RES accounts Good Year Park
44 City 0 Sewer Yes L003 BI * Hercules: Added 123 RES accounts
45 City 0 Partial Yes L017 MED & R9 Use TAZ Good Year Park46 City 0 Sewer Yes L017 MED, R9 & GR Use TAZ Montpelier & Homesite47 City 0 Sewer Yes L017 GR, HC & PDTN Use TAZ Montpelier48 City 0 Sewer Yes L003 LC & GR Use TAZ Perry Park & Town Commons49 City 0 Sewer Yes L003 GR & R6 Use TAZ Perry Park50 City 0 Sewer Yes L003 R6 Use TAZ Perry Park51 City 0 Sewer Yes L003 GR & LC Use TAZ Town Commons52 City 0 Sewer Yes L003 CP, GR & HC Use TAZ Mayhew53 City 0 Sewer Yes L003 HC * Added 2 RES accounts Town Commons54 City 0 Sewer Yes L003 HC & R6 Use TAZ Dart Tract & Osborne55 City 0 Sewer Yes L003 HC & R6 Use TAZ Urbana & Dart Tract56 City 0 Sewer Yes L003 HC, OC & R6 Use TAZ Urbana57 City 0 Sewer Yes L003 OC & R6 Use TAZ Urbana
58 City 0 Sewer Yes L003 GR, CP, & LC Use TAZ Mayhew, Perry Park and Town Commons
59 City 0 Sewer Yes L003 GR & CP Use TAZ Town Commons60 City 0 Sewer Yes L002/L003 GR Use TAZ Town Commons61 City 0 Sewer Yes L002 GR & LC Use TAZ Town Commons 62 City 0 Sewer Yes L002 GR, OC & HC Use TAZ Town Commons & Urbana
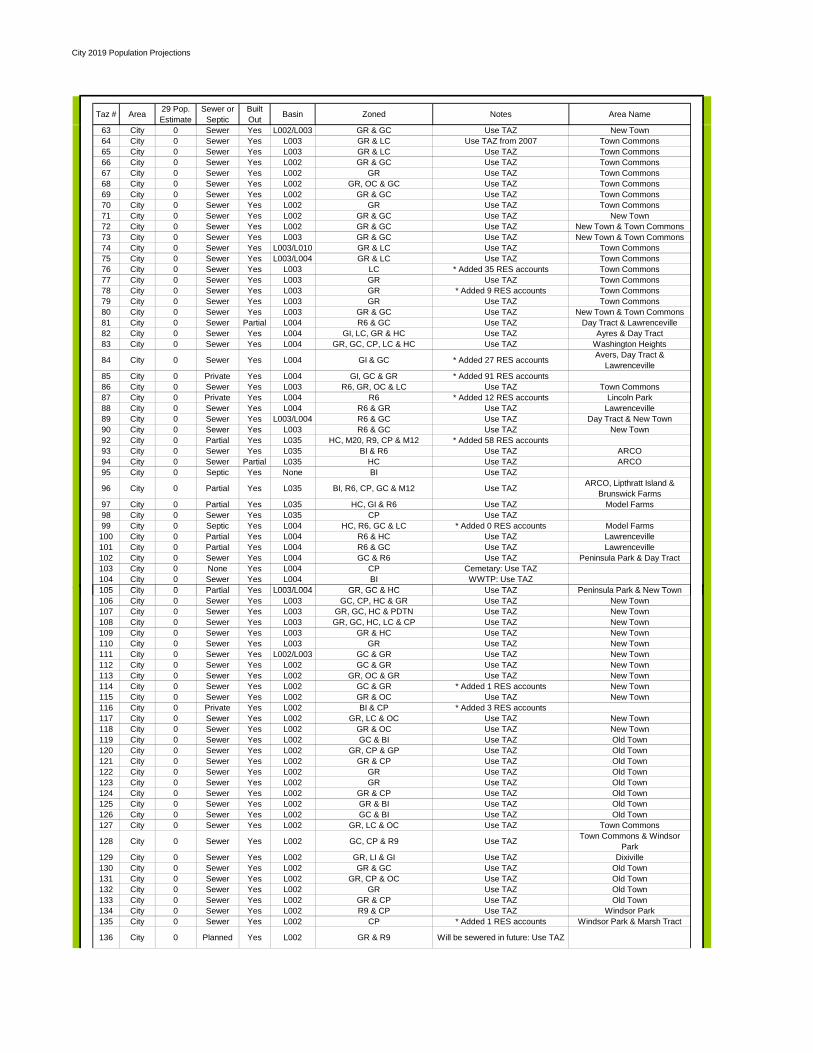
City 2019 Population Projections
Taz # Area 29 Pop. Estimate
Sewer or Septic
Built Out Basin Zoned Notes Area Name
63 City 0 Sewer Yes L002/L003 GR & GC Use TAZ New Town 64 City 0 Sewer Yes L003 GR & LC Use TAZ from 2007 Town Commons65 City 0 Sewer Yes L003 GR & LC Use TAZ Town Commons66 City 0 Sewer Yes L002 GR & GC Use TAZ Town Commons67 City 0 Sewer Yes L002 GR Use TAZ Town Commons68 City 0 Sewer Yes L002 GR, OC & GC Use TAZ Town Commons69 City 0 Sewer Yes L002 GR & GC Use TAZ Town Commons70 City 0 Sewer Yes L002 GR Use TAZ Town Commons71 City 0 Sewer Yes L002 GR & GC Use TAZ New Town 72 City 0 Sewer Yes L002 GR & GC Use TAZ New Town & Town Commons73 City 0 Sewer Yes L003 GR & GC Use TAZ New Town & Town Commons74 City 0 Sewer Yes L003/L010 GR & LC Use TAZ Town Commons75 City 0 Sewer Yes L003/L004 GR & LC Use TAZ Town Commons76 City 0 Sewer Yes L003 LC * Added 35 RES accounts Town Commons77 City 0 Sewer Yes L003 GR Use TAZ Town Commons78 City 0 Sewer Yes L003 GR * Added 9 RES accounts Town Commons79 City 0 Sewer Yes L003 GR Use TAZ Town Commons80 City 0 Sewer Yes L003 GR & GC Use TAZ New Town & Town Commons81 City 0 Sewer Partial L004 R6 & GC Use TAZ Day Tract & Lawrenceville82 City 0 Sewer Yes L004 GI, LC, GR & HC Use TAZ Ayres & Day Tract83 City 0 Sewer Yes L004 GR, GC, CP, LC & HC Use TAZ Washington Heights
84 City 0 Sewer Yes L004 GI & GC * Added 27 RES accounts Avers, Day Tract & Lawrenceville
85 City 0 Private Yes L004 GI, GC & GR * Added 91 RES accounts86 City 0 Sewer Yes L003 R6, GR, OC & LC Use TAZ Town Commons87 City 0 Private Yes L004 R6 * Added 12 RES accounts Lincoln Park88 City 0 Sewer Yes L004 R6 & GR Use TAZ Lawrenceville89 City 0 Sewer Yes L003/L004 R6 & GC Use TAZ Day Tract & New Town90 City 0 Sewer Yes L003 R6 & GC Use TAZ New Town92 City 0 Partial Yes L035 HC, M20, R9, CP & M12 * Added 58 RES accounts93 City 0 Sewer Yes L035 BI & R6 Use TAZ ARCO94 City 0 Sewer Partial L035 HC Use TAZ ARCO95 City 0 Septic Yes None BI Use TAZ
96 City 0 Partial Yes L035 BI, R6, CP, GC & M12 Use TAZ ARCO, Lipthratt Island & Brunswick Farms
97 City 0 Partial Yes L035 HC, GI & R6 Use TAZ Model Farms98 City 0 Sewer Yes L035 CP Use TAZ99 City 0 Septic Yes L004 HC, R6, GC & LC * Added 0 RES accounts Model Farms
100 City 0 Partial Yes L004 R6 & HC Use TAZ Lawrenceville101 City 0 Partial Yes L004 R6 & GC Use TAZ Lawrenceville102 City 0 Sewer Yes L004 GC & R6 Use TAZ Peninsula Park & Day Tract103 City 0 None Yes L004 CP Cemetary: Use TAZ104 City 0 Sewer Yes L004 BI WWTP: Use TAZ105 Cit 0 P ti l Y L003/L004 GR GC & HC U TAZ P i l P k & N T105 City 0 Partial Yes L003/L004 GR, GC & HC Use TAZ Peninsula Park & New Town106 City 0 Sewer Yes L003 GC, CP, HC & GR Use TAZ New Town 107 City 0 Sewer Yes L003 GR, GC, HC & PDTN Use TAZ New Town 108 City 0 Sewer Yes L003 GR, GC, HC, LC & CP Use TAZ New Town 109 City 0 Sewer Yes L003 GR & HC Use TAZ New Town 110 City 0 Sewer Yes L003 GR Use TAZ New Town 111 City 0 Sewer Yes L002/L003 GC & GR Use TAZ New Town 112 City 0 Sewer Yes L002 GC & GR Use TAZ New Town 113 City 0 Sewer Yes L002 GR, OC & GR Use TAZ New Town 114 City 0 Sewer Yes L002 GC & GR * Added 1 RES accounts New Town 115 City 0 Sewer Yes L002 GR & OC Use TAZ New Town 116 City 0 Private Yes L002 BI & CP * Added 3 RES accounts117 City 0 Sewer Yes L002 GR, LC & OC Use TAZ New Town 118 City 0 Sewer Yes L002 GR & OC Use TAZ New Town 119 City 0 Sewer Yes L002 GC & BI Use TAZ Old Town120 City 0 Sewer Yes L002 GR, CP & GP Use TAZ Old Town121 City 0 Sewer Yes L002 GR & CP Use TAZ Old Town122 City 0 Sewer Yes L002 GR Use TAZ Old Town123 City 0 Sewer Yes L002 GR Use TAZ Old Town124 City 0 Sewer Yes L002 GR & CP Use TAZ Old Town125 City 0 Sewer Yes L002 GR & BI Use TAZ Old Town126 City 0 Sewer Yes L002 GC & BI Use TAZ Old Town127 City 0 Sewer Yes L002 GR, LC & OC Use TAZ Town Commons
128 City 0 Sewer Yes L002 GC, CP & R9 Use TAZ Town Commons & Windsor Park
129 City 0 Sewer Yes L002 GR, LI & GI Use TAZ Dixiville130 City 0 Sewer Yes L002 GR & GC Use TAZ Old Town131 City 0 Sewer Yes L002 GR, CP & OC Use TAZ Old Town132 City 0 Sewer Yes L002 GR Use TAZ Old Town133 City 0 Sewer Yes L002 GR & CP Use TAZ Old Town134 City 0 Sewer Yes L002 R9 & CP Use TAZ Windsor Park135 City 0 Sewer Yes L002 CP * Added 1 RES accounts Windsor Park & Marsh Tract
136 City 0 Planned Yes L002 GR & R9 Will be sewered in future: Use TAZ
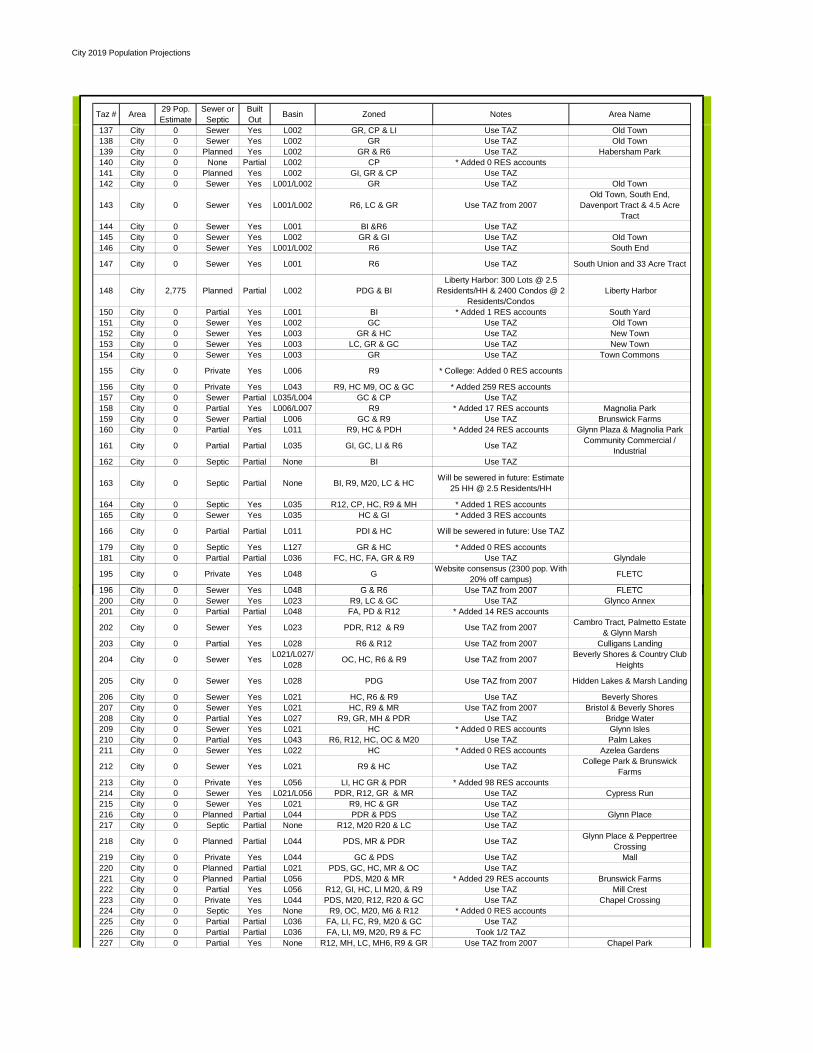
City 2019 Population Projections
Taz # Area 29 Pop. Estimate
Sewer or Septic
Built Out Basin Zoned Notes Area Name
137 City 0 Sewer Yes L002 GR, CP & LI Use TAZ Old Town138 City 0 Sewer Yes L002 GR Use TAZ Old Town139 City 0 Planned Yes L002 GR & R6 Use TAZ Habersham Park140 City 0 None Partial L002 CP * Added 0 RES accounts141 City 0 Planned Yes L002 GI, GR & CP Use TAZ142 City 0 Sewer Yes L001/L002 GR Use TAZ Old Town
143 City 0 Sewer Yes L001/L002 R6, LC & GR Use TAZ from 2007Old Town, South End,
Davenport Tract & 4.5 Acre Tract
144 City 0 Sewer Yes L001 BI &R6 Use TAZ145 City 0 Sewer Yes L002 GR & GI Use TAZ Old Town146 City 0 Sewer Yes L001/L002 R6 Use TAZ South End
147 City 0 Sewer Yes L001 R6 Use TAZ South Union and 33 Acre Tract
148 City 2,775 Planned Partial L002 PDG & BILiberty Harbor: 300 Lots @ 2.5
Residents/HH & 2400 Condos @ 2 Residents/Condos
Liberty Harbor
150 City 0 Partial Yes L001 BI * Added 1 RES accounts South Yard151 City 0 Sewer Yes L002 GC Use TAZ Old Town152 City 0 Sewer Yes L003 GR & HC Use TAZ New Town 153 City 0 Sewer Yes L003 LC, GR & GC Use TAZ New Town 154 City 0 Sewer Yes L003 GR Use TAZ Town Commons
155 City 0 Private Yes L006 R9 * College: Added 0 RES accounts
156 City 0 Private Yes L043 R9, HC M9, OC & GC * Added 259 RES accounts157 City 0 Sewer Partial L035/L004 GC & CP Use TAZ158 City 0 Partial Yes L006/L007 R9 * Added 17 RES accounts Magnolia Park159 City 0 Sewer Partial L006 GC & R9 Use TAZ Brunswick Farms160 City 0 Partial Yes L011 R9, HC & PDH * Added 24 RES accounts Glynn Plaza & Magnolia Park
161 City 0 Partial Partial L035 GI, GC, LI & R6 Use TAZ Community Commercial / Industrial
162 City 0 Septic Partial None BI Use TAZ
163 City 0 Septic Partial None BI, R9, M20, LC & HC Will be sewered in future: Estimate 25 HH @ 2.5 Residents/HH
164 City 0 Septic Yes L035 R12, CP, HC, R9 & MH * Added 1 RES accounts165 City 0 Sewer Yes L035 HC & GI * Added 3 RES accounts
166 City 0 Partial Partial L011 PDI & HC Will be sewered in future: Use TAZ
179 City 0 Septic Yes L127 GR & HC * Added 0 RES accounts181 City 0 Partial Partial L036 FC, HC, FA, GR & R9 Use TAZ Glyndale
195 City 0 Private Yes L048 G Website consensus (2300 pop. With 20% off campus) FLETC
196 Cit 0 S Y L048 G & R6 U TAZ f 2007 FLETC196 City 0 Sewer Yes L048 G & R6 Use TAZ from 2007 FLETC200 City 0 Sewer Yes L023 R9, LC & GC Use TAZ Glynco Annex201 City 0 Partial Partial L048 FA, PD & R12 * Added 14 RES accounts
202 City 0 Sewer Yes L023 PDR, R12 & R9 Use TAZ from 2007 Cambro Tract, Palmetto Estate & Glynn Marsh
203 City 0 Partial Yes L028 R6 & R12 Use TAZ from 2007 Culligans Landing
204 City 0 Sewer Yes L021/L027/L028 OC, HC, R6 & R9 Use TAZ from 2007 Beverly Shores & Country Club
Heights
205 City 0 Sewer Yes L028 PDG Use TAZ from 2007 Hidden Lakes & Marsh Landing
206 City 0 Sewer Yes L021 HC, R6 & R9 Use TAZ Beverly Shores207 City 0 Sewer Yes L021 HC, R9 & MR Use TAZ from 2007 Bristol & Beverly Shores208 City 0 Partial Yes L027 R9, GR, MH & PDR Use TAZ Bridge Water209 City 0 Sewer Yes L021 HC * Added 0 RES accounts Glynn Isles210 City 0 Partial Yes L043 R6, R12, HC, OC & M20 Use TAZ Palm Lakes211 City 0 Sewer Yes L022 HC * Added 0 RES accounts Azelea Gardens
212 City 0 Sewer Yes L021 R9 & HC Use TAZ College Park & Brunswick Farms
213 City 0 Private Yes L056 LI, HC GR & PDR * Added 98 RES accounts214 City 0 Sewer Yes L021/L056 PDR, R12, GR & MR Use TAZ Cypress Run215 City 0 Sewer Yes L021 R9, HC & GR Use TAZ216 City 0 Planned Partial L044 PDR & PDS Use TAZ Glynn Place217 City 0 Septic Partial None R12, M20 R20 & LC Use TAZ
218 City 0 Planned Partial L044 PDS, MR & PDR Use TAZ Glynn Place & Peppertree Crossing
219 City 0 Private Yes L044 GC & PDS Use TAZ Mall220 City 0 Planned Partial L021 PDS, GC, HC, MR & OC Use TAZ221 City 0 Planned Partial L056 PDS, M20 & MR * Added 29 RES accounts Brunswick Farms222 City 0 Partial Yes L056 R12, GI, HC, LI M20, & R9 Use TAZ Mill Crest223 City 0 Private Yes L044 PDS, M20, R12, R20 & GC Use TAZ Chapel Crossing224 City 0 Septic Yes None R9, OC, M20, M6 & R12 * Added 0 RES accounts225 City 0 Partial Partial L036 FA, LI, FC, R9, M20 & GC Use TAZ226 City 0 Partial Partial L036 FA, LI, M9, M20, R9 & FC Took 1/2 TAZ227 City 0 Partial Yes None R12, MH, LC, MH6, R9 & GR Use TAZ from 2007 Chapel Park

City 2019 Population Projections
Taz # Area 29 Pop. Estimate
Sewer or Septic
Built Out Basin Zoned Notes Area Name
228 City 0 Partial Yes L035 R9, R12, MH & M20 Use TAZ from 2007 Pine Ridge & Druid Hills229 City 0 Septic Yes None HC, R9, M12 & LI * Added 0 RES accounts230 City 0 Septic Yes None FA, MH & PDR * Added 0 RES accounts231 City 0 Septic Yes None PDG, FA & HC * Added 0 RES accounts232 City 0 Private Partial None M20, HC & R9 * Added 0 RES accounts233 City 0 Septic Yes None R9, GC & OC * Added 3 RES accounts234 City 0 Partial Yes None R20, HC & GC Use TAZ Center Square235 City 0 Septic Yes None R9, M20, R20 & GR * Added 0 RES accounts
240 City 0 Sewer Yes L048 HC, PDR, FA, PDS & R12 Use TAZ Greyfield Villas, Belle Pointe & Powers Landing
241 City 0 Septic Yes None R12 & CP Use TAZ from 2007 Belle Point East242 City 0 Planned Partial None HC, GR & MR Use TAZ243 City 0 Septic Partial None GR, R9 & HC * Added 2 RES accounts244 City 0 Private Partial L043 R9, CP, HC & M12 * Added 5 RES accounts248 City 0 Private Yes L003 HC & GC Use TAZ Maritime & Hercules249 City 0 Septic Partial None GR & CP Use TAZ250 City 0 Sewer Yes L017 GR, CP, R9, HC & BI Use TAZ from 2007 Riverside & Oak Park
251 City 0 Private Partial L017 HC &MH Use TAZ Brunswick Farms & Marshview Apt
335 City 0 Partial Yes L036 R9, R12, FA, LI, LC & HC * Added 0 RES accounts336 City 0 Partial Yes L036 R6, R12, R9 & FC Some included in TAZ 337337 City 0 Partial Yes L036 FC, R12 & PD * Added 0 RES accounts338 City 0 Septic Yes None HC, M20, LC, R9, FA & LI * Added 0 RES accounts372 City 0 Planned Yes L056 PDR Use TAZ Moss Creek Villas373 City 0 Private Yes L021 PDS * Added 2 RES accounts Village at Glynn Place374 City 0 Private Partial None HC, R12, R20, LC & FA Use TAZ
Taz 29 Estimate
Total 2,775
* If projection was zero then used COM & RES #'s for missing data. COM & RES #'s came from billing
data. Per 1 RES account, 2.5 residents were added to overall
population projection.

City Basin Flow Projections: Base
City Per Capita 136.04 Total City Projected 2007 AAD Flow 4.902 MGD
TAZ # Population ADF (gpd) ADF (gpm) Peak Factor PHF Notes142 55.00 7,482.43 5.20 4.31 22.38 Split btwn (1/3) L001 & (2/3) L002143 230.00 31,290.18 21.73 4.13 89.64 Split btwn (1/2) L001 & (1/2) L002144 17.00 2,312.75 1.61 4.39 7.05146 101.50 13,808.49 9.59 4.24 40.68 Split btwn (1/2) L001 & (1/2) L002147 192.00 26,120.50 18.14 4.15 75.36148 0.00 0.00 0.00 0.00 0.00 Moved to LS4002150 2.50 340.11 0.24 4.46 1.05
Total 598.00 81,354.47 56.50 - 236.15
TAZ # Population ADF (gpd) ADF (gpm) Peak Factor PHF Notes1 32.50 4,421.44 3.07 4.35 13.352 57.50 7,822.54 5.43 4.30 23.373 25.00 3,401.11 2.36 4.37 10.314 64.00 8,706.83 6.05 4.29 25.955 104.00 14,148.60 9.83 4.24 41.656 12.00 1,632.53 1.13 4.41 5.007 85.00 11,563.76 8.03 4.26 34.238 17.50 2,380.77 1.65 4.39 7.259 13.00 1,768.58 1.23 4.40 5.41
10 32.50 4,421.44 3.07 4.35 13.3511 44.00 5,985.95 4.16 4.33 17.9812 20.00 2,720.89 1.89 4.38 8.2813 5.00 680.22 0.47 4.44 2.1014 2.50 340.11 0.24 4.46 1.0515 5.00 680.22 0.47 4.44 2.1060 19.00 2,584.84 1.80 4.38 7.87 Split btwn (1/2) L002 & (1/2) L00361 278.00 37,820.30 26.26 4.09 107.4862 172.00 23,399.61 16.25 4.17 67.7863 41.33 5,623.16 3.90 4.33 16.91 Split btwn (2/3) L002 & (1/3) L00366 14.00 1,904.62 1.32 4.40 5.8267 80.00 10,883.54 7.56 4.27 32.2668 41.00 5,577.81 3.87 4.33 16.7869 64.00 8,706.83 6.05 4.29 25.9570 0.00 0.00 0.00 0.00 0.0071 92.00 12,516.07 8.69 4.25 36.9772 98.00 13,332.34 9.26 4.25 39.31
111 18.00 2,448.80 1.70 4.39 7.46 Split btwn (1/2) L002 & (1/2) L003112 26.00 3,537.15 2.46 4.36 10.72113 29.00 3,945.28 2.74 4.36 11.94114 2.50 340.11 0.24 4.46 1.05115 283.00 38,500.53 26.74 4.09 109.33116 7.50 1,020.33 0.71 4.43 3.14117 95 00 12 924 20 8 98 4 25 38 14
Basin L001
Basin L002
117 95.00 12,924.20 8.98 4.25 38.14118 120.00 16,325.31 11.34 4.22 47.85119 0.00 0.00 0.00 0.00 0.00120 196.00 26,664.67 18.52 4.15 76.87121 93.00 12,652.12 8.79 4.25 37.36122 23.00 3,129.02 2.17 4.37 9.50123 39.00 5,305.73 3.68 4.34 15.97124 166.00 22,583.35 15.68 4.18 65.50125 234.00 31,834.36 22.11 4.12 91.13126 7.00 952.31 0.66 4.43 2.93127 184.00 25,032.14 17.38 4.16 72.33128 32.00 4,353.42 3.02 4.35 13.15129 208.00 28,297.21 19.65 4.14 81.39130 150.00 20,406.64 14.17 4.19 59.39131 218.00 29,657.65 20.60 4.13 85.15132 53.00 7,210.35 5.01 4.31 21.58133 298.00 40,541.19 28.15 4.08 114.86134 276.00 37,548.22 26.08 4.09 106.74135 2.50 340.11 0.24 4.46 1.05136 60.00 8,162.66 5.67 4.30 24.36137 360.00 48,975.93 34.01 4.04 137.52138 304.00 41,357.45 28.72 4.08 117.06139 92.00 12,516.07 8.69 4.25 36.97140 0.00 0.00 0.00 0.00 0.00141 75.00 10,203.32 7.09 4.28 30.30142 110.00 14,964.87 10.39 4.23 43.98 Split btwn (1/3) L001 & (2/3) L002143 230.00 31,290.18 21.73 4.13 89.64 Split btwn (1/2) L001 & (1/2) L002145 48.00 6,530.12 4.53 4.32 19.58146 101.50 13,808.49 9.59 4.24 40.68 Split btwn (1/2) L001 & (1/2) L002151 0.00 0.00 0.00 0.00 0.00148 0.00 0.00 0.00 0.00 0.00 Moved from LS4001 (JUNE2009)
Total 5,559.83 756,383.40 525.27 - 2,193.15

City Basin Flow Projections: Base
City Per Capita 136.04 Total City Projected 2007 AAD Flow 4.902 MGD
TAZ # Population ADF (gpd) ADF (gpm) Peak Factor PHF Notes44 307.50 41,833.61 29.05 4.07 118.3548 220.00 29,929.74 20.78 4.13 85.9049 207.00 28,161.16 19.56 4.14 81.0150 41.00 5,577.81 3.87 4.33 16.7851 69.00 9,387.05 6.52 4.28 27.9352 30.00 4,081.33 2.83 4.35 12.3453 5.00 680.22 0.47 4.44 2.1054 118.00 16,053.22 11.15 4.22 47.0855 94.00 12,788.16 8.88 4.25 37.7556 184.00 25,032.14 17.38 4.16 72.3357 193.00 26,256.54 18.23 4.15 75.7458 417.00 56,730.46 39.40 4.01 158.1259 130.00 17,685.75 12.28 4.21 51.7160 19.00 2,584.84 1.80 4.38 7.87 Split btwn (1/2) L002 & (1/2) L00363 20.67 2,811.58 1.95 4.38 8.55 Split btwn (2/3) L002 & (1/3) L00364 414.00 56,322.32 39.11 4.02 157.0465 28.00 3,809.24 2.65 4.36 11.5373 124.00 16,869.49 11.71 4.22 49.4074 98.25 13,366.35 9.28 4.25 39.41 Split btwn (3/4) L003 & (1/4) L00475 231.88 31,545.26 21.91 4.12 90.34 Split btwn (7/8) L003 & (1/8) L00476 87.50 11,903.87 8.27 4.26 35.2177 12.00 1,632.53 1.13 4.41 5.0078 22.50 3,061.00 2.13 4.37 9.3079 90.00 12,243.98 8.50 4.26 36.1980 116.00 15,781.13 10.96 4.23 46.3186 186.00 25,304.23 17.57 4.16 73.0989 23.00 3,129.02 2.17 4.37 9.50 Split btwn (1/3) L003 & (2/3) L00490 117.00 15,917.18 11.05 4.22 46.69
105 59.33 8,071.96 5.61 4.30 24.10 Split btwn (1/3) L003 & (2/3) L004106 190.00 25,848.41 17.95 4.16 74.60107 231.00 31,426.22 21.82 4.12 90.01108 187.00 25,440.28 17.67 4.16 73.47109 24.00 3,265.06 2.27 4.37 9.91110 74.00 10,067.28 6.99 4.28 29.90111 18.00 2,448.80 1.70 4.39 7.46 Split btwn (1/2) L002 & (1/2) L003152 98.00 13,332.34 9.26 4.25 39.31153 67.00 9,114.97 6.33 4.29 27.14154 40.00 5,441.77 3.78 4.33 16.38248 20.00 2,720.89 1.89 4.38 8.28
Total 4,613.63 627,657.19 435.87 - 1,813.10
TAZ # Population ADF (gpd) ADF (gpm) Peak Factor PHF Notes21 81 00 11 019 58 7 65 4 27 32 66
Basin L003
Basin L004
21 81.00 11,019.58 7.65 4.27 32.6622 71.00 9,659.14 6.71 4.28 28.7274 32.75 4,455.45 3.09 4.35 13.45 Split btwn (3/4) L003 & (1/4) L00475 33.13 4,506.47 3.13 4.35 13.61 Split btwn (7/8) L003 & (1/8) L00481 201.00 27,344.90 18.99 4.15 78.7582 103.00 14,012.56 9.73 4.24 41.2683 200.00 27,208.85 18.90 4.15 78.3884 67.50 9,182.99 6.38 4.29 27.3485 227.50 30,950.07 21.49 4.13 88.7087 30.00 4,081.33 2.83 4.35 12.3488 38.00 5,169.68 3.59 4.34 15.5789 46.00 6,258.04 4.35 4.32 18.78 Split btwn (1/3) L003 & (2/3) L004
100 103.00 14,012.56 9.73 4.24 41.26101 78.00 10,611.45 7.37 4.27 31.48102 212.00 28,841.38 20.03 4.14 82.89103 0.00 0.00 0.00 0.00 0.00104 0.00 0.00 0.00 0.00 0.00105 118.67 16,143.92 11.21 4.22 47.34 Split btwn (1/3) L003 & (2/3) L004157 0.00 0.00 0.00 0.00 0.00 Split btwn (1/2) L004 & (1/2) L035
Total 1,642.54 223,458.36 155.18 - 652.53
TAZ # Population ADF (gpd) ADF (gpm) Peak Factor PHF Notes28 52.00 7,074.30 4.91 4.31 21.1829 542.00 73,735.99 51.21 3.96 202.5730 105.00 14,284.65 9.92 4.24 42.04
Total 699.00 95,094.94 66.04 - 265.78
Basin L005
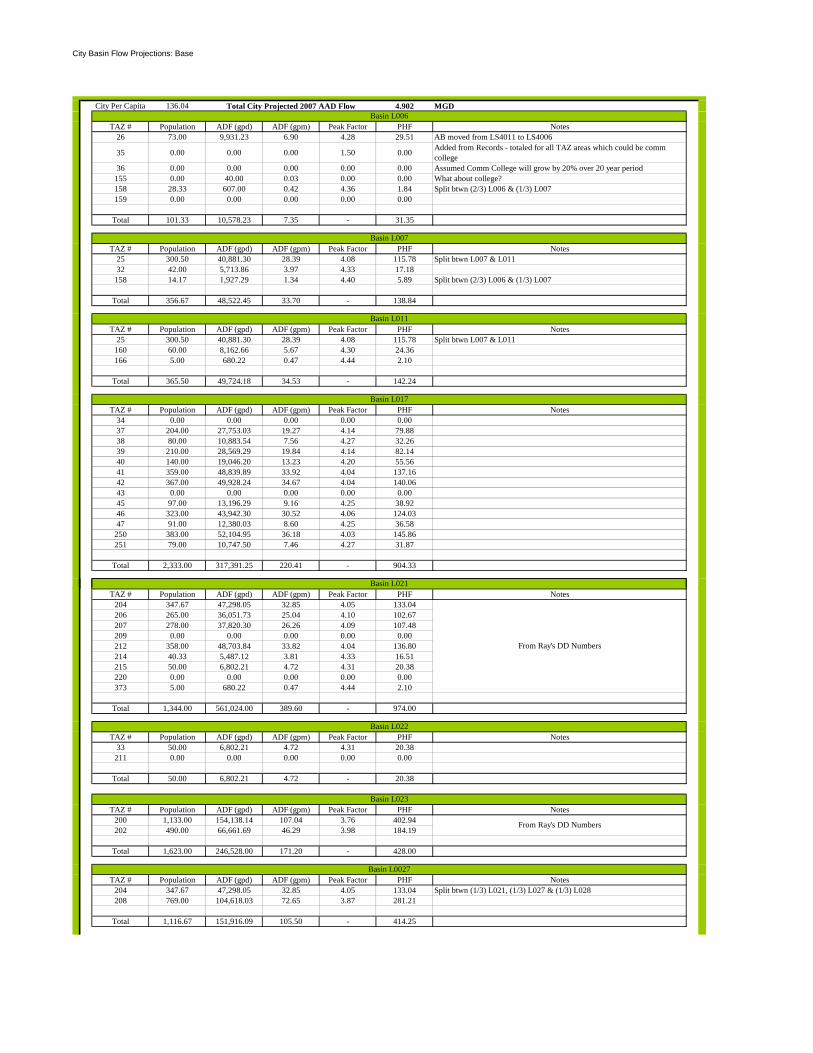
City Basin Flow Projections: Base
City Per Capita 136.04 Total City Projected 2007 AAD Flow 4.902 MGD
TAZ # Population ADF (gpd) ADF (gpm) Peak Factor PHF Notes26 73.00 9,931.23 6.90 4.28 29.51 AB moved from LS4011 to LS4006
35 0.00 0.00 0.00 1.50 0.00 Added from Records - totaled for all TAZ areas which could be comm college
36 0.00 0.00 0.00 0.00 0.00 Assumed Comm College will grow by 20% over 20 year period155 0.00 40.00 0.03 0.00 0.00 What about college?158 28.33 607.00 0.42 4.36 1.84 Split btwn (2/3) L006 & (1/3) L007159 0.00 0.00 0.00 0.00 0.00
Total 101.33 10,578.23 7.35 - 31.35
TAZ # Population ADF (gpd) ADF (gpm) Peak Factor PHF Notes25 300.50 40,881.30 28.39 4.08 115.78 Split btwn L007 & L01132 42.00 5,713.86 3.97 4.33 17.18
158 14.17 1,927.29 1.34 4.40 5.89 Split btwn (2/3) L006 & (1/3) L007
Total 356.67 48,522.45 33.70 - 138.84
TAZ # Population ADF (gpd) ADF (gpm) Peak Factor PHF Notes25 300.50 40,881.30 28.39 4.08 115.78 Split btwn L007 & L011
160 60.00 8,162.66 5.67 4.30 24.36166 5.00 680.22 0.47 4.44 2.10
Total 365.50 49,724.18 34.53 - 142.24
TAZ # Population ADF (gpd) ADF (gpm) Peak Factor PHF Notes34 0.00 0.00 0.00 0.00 0.0037 204.00 27,753.03 19.27 4.14 79.8838 80.00 10,883.54 7.56 4.27 32.2639 210.00 28,569.29 19.84 4.14 82.1440 140.00 19,046.20 13.23 4.20 55.5641 359.00 48,839.89 33.92 4.04 137.1642 367.00 49,928.24 34.67 4.04 140.0643 0.00 0.00 0.00 0.00 0.0045 97.00 13,196.29 9.16 4.25 38.9246 323.00 43,942.30 30.52 4.06 124.0347 91.00 12,380.03 8.60 4.25 36.58
250 383.00 52,104.95 36.18 4.03 145.86251 79.00 10,747.50 7.46 4.27 31.87
Total 2,333.00 317,391.25 220.41 - 904.33
Basin L006
Basin L007
Basin L011
Basin L017
Basin L021TAZ # Population ADF (gpd) ADF (gpm) Peak Factor PHF Notes
204 347.67 47,298.05 32.85 4.05 133.04206 265.00 36,051.73 25.04 4.10 102.67207 278.00 37,820.30 26.26 4.09 107.48209 0.00 0.00 0.00 0.00 0.00212 358.00 48,703.84 33.82 4.04 136.80214 40.33 5,487.12 3.81 4.33 16.51215 50.00 6,802.21 4.72 4.31 20.38220 0.00 0.00 0.00 0.00 0.00373 5.00 680.22 0.47 4.44 2.10
Total 1,344.00 561,024.00 389.60 - 974.00
TAZ # Population ADF (gpd) ADF (gpm) Peak Factor PHF Notes33 50.00 6,802.21 4.72 4.31 20.38
211 0.00 0.00 0.00 0.00 0.00
Total 50.00 6,802.21 4.72 - 20.38
TAZ # Population ADF (gpd) ADF (gpm) Peak Factor PHF Notes200 1,133.00 154,138.14 107.04 3.76 402.94202 490.00 66,661.69 46.29 3.98 184.19
Total 1,623.00 246,528.00 171.20 - 428.00
TAZ # Population ADF (gpd) ADF (gpm) Peak Factor PHF Notes204 347.67 47,298.05 32.85 4.05 133.04 Split btwn (1/3) L021, (1/3) L027 & (1/3) L028208 769.00 104,618.03 72.65 3.87 281.21
Total 1,116.67 151,916.09 105.50 - 414.25
Basin L023
Basin L0027
From Ray's DD Numbers
From Ray's DD Numbers
Basin L022
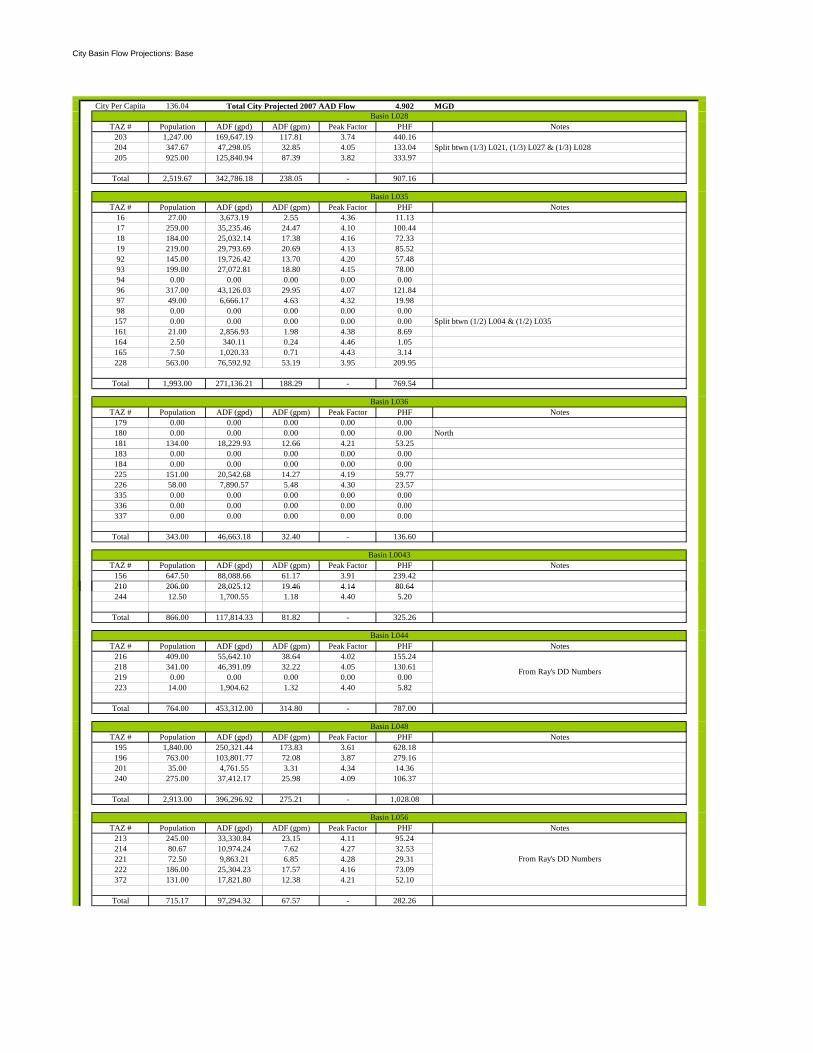
City Basin Flow Projections: Base
City Per Capita 136.04 Total City Projected 2007 AAD Flow 4.902 MGD
TAZ # Population ADF (gpd) ADF (gpm) Peak Factor PHF Notes203 1,247.00 169,647.19 117.81 3.74 440.16204 347.67 47,298.05 32.85 4.05 133.04 Split btwn (1/3) L021, (1/3) L027 & (1/3) L028205 925.00 125,840.94 87.39 3.82 333.97
Total 2,519.67 342,786.18 238.05 - 907.16
TAZ # Population ADF (gpd) ADF (gpm) Peak Factor PHF Notes16 27.00 3,673.19 2.55 4.36 11.1317 259.00 35,235.46 24.47 4.10 100.4418 184.00 25,032.14 17.38 4.16 72.3319 219.00 29,793.69 20.69 4.13 85.5292 145.00 19,726.42 13.70 4.20 57.4893 199.00 27,072.81 18.80 4.15 78.0094 0.00 0.00 0.00 0.00 0.0096 317.00 43,126.03 29.95 4.07 121.8497 49.00 6,666.17 4.63 4.32 19.9898 0.00 0.00 0.00 0.00 0.00
157 0.00 0.00 0.00 0.00 0.00 Split btwn (1/2) L004 & (1/2) L035161 21.00 2,856.93 1.98 4.38 8.69164 2.50 340.11 0.24 4.46 1.05165 7.50 1,020.33 0.71 4.43 3.14228 563.00 76,592.92 53.19 3.95 209.95
Total 1,993.00 271,136.21 188.29 - 769.54
TAZ # Population ADF (gpd) ADF (gpm) Peak Factor PHF Notes179 0.00 0.00 0.00 0.00 0.00180 0.00 0.00 0.00 0.00 0.00 North181 134.00 18,229.93 12.66 4.21 53.25183 0.00 0.00 0.00 0.00 0.00184 0.00 0.00 0.00 0.00 0.00225 151.00 20,542.68 14.27 4.19 59.77226 58.00 7,890.57 5.48 4.30 23.57335 0.00 0.00 0.00 0.00 0.00336 0.00 0.00 0.00 0.00 0.00337 0.00 0.00 0.00 0.00 0.00
Total 343.00 46,663.18 32.40 - 136.60
TAZ # Population ADF (gpd) ADF (gpm) Peak Factor PHF Notes156 647.50 88,088.66 61.17 3.91 239.42210 206.00 28,025.12 19.46 4.14 80.64
Basin L028
Basin L035
Basin L036
Basin L0043
210 206.00 28,025.12 19.46 4.14 80.64244 12.50 1,700.55 1.18 4.40 5.20
Total 866.00 117,814.33 81.82 - 325.26
TAZ # Population ADF (gpd) ADF (gpm) Peak Factor PHF Notes216 409.00 55,642.10 38.64 4.02 155.24218 341.00 46,391.09 32.22 4.05 130.61219 0.00 0.00 0.00 0.00 0.00223 14.00 1,904.62 1.32 4.40 5.82
Total 764.00 453,312.00 314.80 - 787.00
TAZ # Population ADF (gpd) ADF (gpm) Peak Factor PHF Notes195 1,840.00 250,321.44 173.83 3.61 628.18196 763.00 103,801.77 72.08 3.87 279.16201 35.00 4,761.55 3.31 4.34 14.36240 275.00 37,412.17 25.98 4.09 106.37
Total 2,913.00 396,296.92 275.21 - 1,028.08
TAZ # Population ADF (gpd) ADF (gpm) Peak Factor PHF Notes213 245.00 33,330.84 23.15 4.11 95.24214 80.67 10,974.24 7.62 4.27 32.53221 72.50 9,863.21 6.85 4.28 29.31222 186.00 25,304.23 17.57 4.16 73.09372 131.00 17,821.80 12.38 4.21 52.10
Total 715.17 97,294.32 67.57 - 282.26
From Ray's DD Numbers
Basin L044
Basin L048
Basin L056
From Ray's DD Numbers

City Basin Flow Projections: Base
City Per Capita 136.04 Total City Projected 2007 AAD Flow 4.902 MGD
ADF (MGD)Total For City 2029 Flow Proj 4.902
TAZ # Population ADF (gpd) ADF (gpm) Peak Factor PHF Notes20 154.00 20,950.82 14.55 4.19 60.92 Basin 423 0.00 0.00 0.00 0.00 0.0024 1.00 136.04 0.09 4.47 0.4227 0.00 0.00 0.00 0.00 0.0031 0.00 0.00 0.00 0.00 0.00 Baisn 595 0.00 0.00 0.00 0.00 0.0099 0.00 0.00 0.00 0.00 0.00 Baisn 35
162 0.00 0.00 0.00 0.00 0.00163 15.00 2,040.66 1.42 4.40 6.23217 9.00 1,224.40 0.85 4.42 3.76232 0.00 0.00 0.00 0.00 0.00249 0.00 0.00 0.00 0.00 0.00241 746.00 101,489.02 70.48 3.88 273.35242 36.00 4,897.59 3.40 4.34 14.77243 5.00 680.22 0.47 4.44 2.10229 0.00 0.00 0.00 0.00 0.00227 438.00 59,587.39 41.38 4.00 165.65230 0.00 0.00 0.00 0.00 0.00235 0.00 0.00 0.00 0.00 0.00231 0.00 0.00 0.00 0.00 0.00234 0.00 0.00 0.00 0.00 0.00233 7.50 1,020.33 0.71 4.43 3.14374 0.00 0.00 0.00 0.00 0.00338 0.00 0.00 0.00 0.00 0.00
Total 1,411.50 192,026.47 133.35 - 530.33
Total Base 31,929 5,093,764 3,537 - 12,980
None
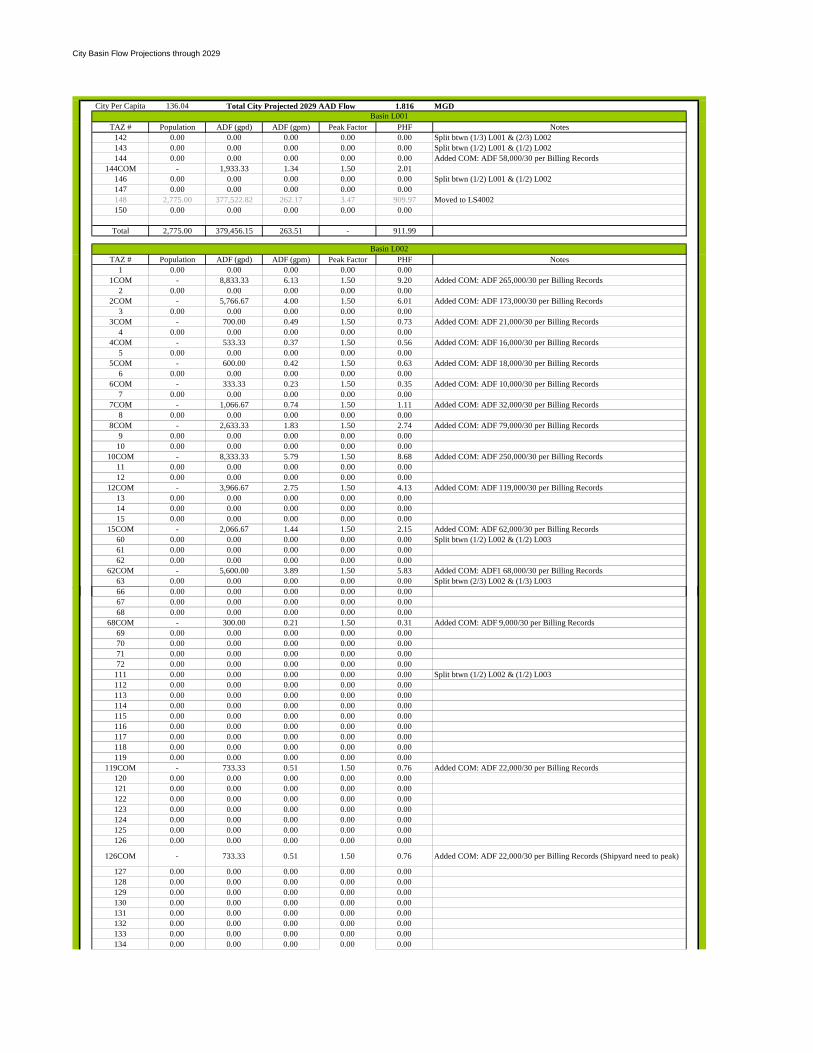
City Basin Flow Projections through 2029
City Per Capita 136.04 Total City Projected 2029 AAD Flow 1.816 MGD
TAZ # Population ADF (gpd) ADF (gpm) Peak Factor PHF Notes142 0.00 0.00 0.00 0.00 0.00 Split btwn (1/3) L001 & (2/3) L002143 0.00 0.00 0.00 0.00 0.00 Split btwn (1/2) L001 & (1/2) L002144 0.00 0.00 0.00 0.00 0.00 Added COM: ADF 58,000/30 per Billing Records
144COM - 1,933.33 1.34 1.50 2.01146 0.00 0.00 0.00 0.00 0.00 Split btwn (1/2) L001 & (1/2) L002147 0.00 0.00 0.00 0.00 0.00148 2,775.00 377,522.82 262.17 3.47 909.97 Moved to LS4002150 0.00 0.00 0.00 0.00 0.00
Total 2,775.00 379,456.15 263.51 - 911.99
TAZ # Population ADF (gpd) ADF (gpm) Peak Factor PHF Notes1 0.00 0.00 0.00 0.00 0.00
1COM - 8,833.33 6.13 1.50 9.20 Added COM: ADF 265,000/30 per Billing Records2 0.00 0.00 0.00 0.00 0.00
2COM - 5,766.67 4.00 1.50 6.01 Added COM: ADF 173,000/30 per Billing Records3 0.00 0.00 0.00 0.00 0.00
3COM - 700.00 0.49 1.50 0.73 Added COM: ADF 21,000/30 per Billing Records4 0.00 0.00 0.00 0.00 0.00
4COM - 533.33 0.37 1.50 0.56 Added COM: ADF 16,000/30 per Billing Records5 0.00 0.00 0.00 0.00 0.00
5COM - 600.00 0.42 1.50 0.63 Added COM: ADF 18,000/30 per Billing Records6 0.00 0.00 0.00 0.00 0.00
6COM - 333.33 0.23 1.50 0.35 Added COM: ADF 10,000/30 per Billing Records7 0.00 0.00 0.00 0.00 0.00
7COM - 1,066.67 0.74 1.50 1.11 Added COM: ADF 32,000/30 per Billing Records8 0.00 0.00 0.00 0.00 0.00
8COM - 2,633.33 1.83 1.50 2.74 Added COM: ADF 79,000/30 per Billing Records9 0.00 0.00 0.00 0.00 0.00
10 0.00 0.00 0.00 0.00 0.0010COM - 8,333.33 5.79 1.50 8.68 Added COM: ADF 250,000/30 per Billing Records
11 0.00 0.00 0.00 0.00 0.0012 0.00 0.00 0.00 0.00 0.00
12COM - 3,966.67 2.75 1.50 4.13 Added COM: ADF 119,000/30 per Billing Records13 0.00 0.00 0.00 0.00 0.0014 0.00 0.00 0.00 0.00 0.0015 0.00 0.00 0.00 0.00 0.00
15COM - 2,066.67 1.44 1.50 2.15 Added COM: ADF 62,000/30 per Billing Records60 0.00 0.00 0.00 0.00 0.00 Split btwn (1/2) L002 & (1/2) L00361 0.00 0.00 0.00 0.00 0.0062 0.00 0.00 0.00 0.00 0.00
62COM - 5,600.00 3.89 1.50 5.83 Added COM: ADF1 68,000/30 per Billing Records63 0.00 0.00 0.00 0.00 0.00 Split btwn (2/3) L002 & (1/3) L003
Basin L002
Basin L001
66 0.00 0.00 0.00 0.00 0.0067 0.00 0.00 0.00 0.00 0.0068 0.00 0.00 0.00 0.00 0.00
68COM - 300.00 0.21 1.50 0.31 Added COM: ADF 9,000/30 per Billing Records69 0.00 0.00 0.00 0.00 0.0070 0.00 0.00 0.00 0.00 0.0071 0.00 0.00 0.00 0.00 0.0072 0.00 0.00 0.00 0.00 0.00
111 0.00 0.00 0.00 0.00 0.00 Split btwn (1/2) L002 & (1/2) L003112 0.00 0.00 0.00 0.00 0.00113 0.00 0.00 0.00 0.00 0.00114 0.00 0.00 0.00 0.00 0.00115 0.00 0.00 0.00 0.00 0.00116 0.00 0.00 0.00 0.00 0.00117 0.00 0.00 0.00 0.00 0.00118 0.00 0.00 0.00 0.00 0.00119 0.00 0.00 0.00 0.00 0.00
119COM - 733.33 0.51 1.50 0.76 Added COM: ADF 22,000/30 per Billing Records120 0.00 0.00 0.00 0.00 0.00121 0.00 0.00 0.00 0.00 0.00122 0.00 0.00 0.00 0.00 0.00123 0.00 0.00 0.00 0.00 0.00124 0.00 0.00 0.00 0.00 0.00125 0.00 0.00 0.00 0.00 0.00126 0.00 0.00 0.00 0.00 0.00
126COM - 733.33 0.51 1.50 0.76 Added COM: ADF 22,000/30 per Billing Records (Shipyard need to peak)
127 0.00 0.00 0.00 0.00 0.00128 0.00 0.00 0.00 0.00 0.00129 0.00 0.00 0.00 0.00 0.00130 0.00 0.00 0.00 0.00 0.00131 0.00 0.00 0.00 0.00 0.00132 0.00 0.00 0.00 0.00 0.00133 0.00 0.00 0.00 0.00 0.00134 0.00 0.00 0.00 0.00 0.00
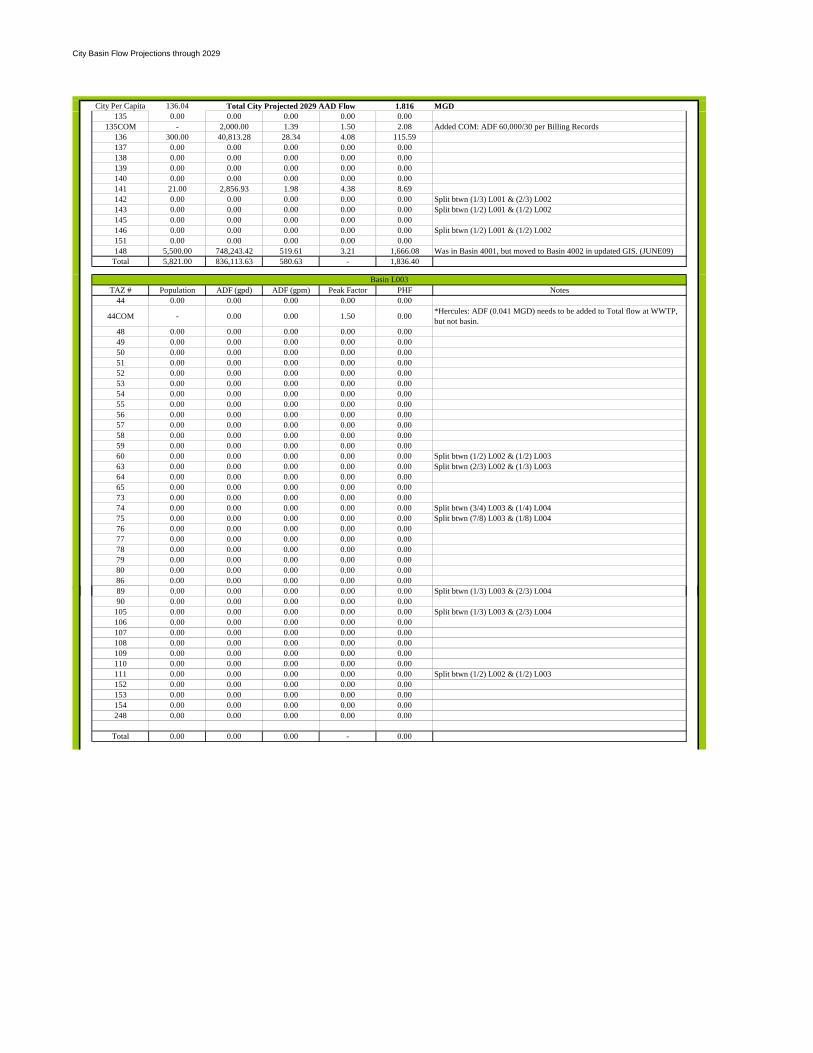
City Basin Flow Projections through 2029
City Per Capita 136.04 Total City Projected 2029 AAD Flow 1.816 MGD135 0.00 0.00 0.00 0.00 0.00
135COM - 2,000.00 1.39 1.50 2.08 Added COM: ADF 60,000/30 per Billing Records136 300.00 40,813.28 28.34 4.08 115.59137 0.00 0.00 0.00 0.00 0.00138 0.00 0.00 0.00 0.00 0.00139 0.00 0.00 0.00 0.00 0.00140 0.00 0.00 0.00 0.00 0.00141 21.00 2,856.93 1.98 4.38 8.69142 0.00 0.00 0.00 0.00 0.00 Split btwn (1/3) L001 & (2/3) L002143 0.00 0.00 0.00 0.00 0.00 Split btwn (1/2) L001 & (1/2) L002145 0.00 0.00 0.00 0.00 0.00146 0.00 0.00 0.00 0.00 0.00 Split btwn (1/2) L001 & (1/2) L002151 0.00 0.00 0.00 0.00 0.00148 5,500.00 748,243.42 519.61 3.21 1,666.08 Was in Basin 4001, but moved to Basin 4002 in updated GIS. (JUNE09)
Total 5,821.00 836,113.63 580.63 - 1,836.40
TAZ # Population ADF (gpd) ADF (gpm) Peak Factor PHF Notes44 0.00 0.00 0.00 0.00 0.00
44COM - 0.00 0.00 1.50 0.00 *Hercules: ADF (0.041 MGD) needs to be added to Total flow at WWTP, but not basin.
48 0.00 0.00 0.00 0.00 0.0049 0.00 0.00 0.00 0.00 0.0050 0.00 0.00 0.00 0.00 0.0051 0.00 0.00 0.00 0.00 0.0052 0.00 0.00 0.00 0.00 0.0053 0.00 0.00 0.00 0.00 0.0054 0.00 0.00 0.00 0.00 0.0055 0.00 0.00 0.00 0.00 0.0056 0.00 0.00 0.00 0.00 0.0057 0.00 0.00 0.00 0.00 0.0058 0.00 0.00 0.00 0.00 0.0059 0.00 0.00 0.00 0.00 0.0060 0.00 0.00 0.00 0.00 0.00 Split btwn (1/2) L002 & (1/2) L00363 0.00 0.00 0.00 0.00 0.00 Split btwn (2/3) L002 & (1/3) L00364 0.00 0.00 0.00 0.00 0.0065 0.00 0.00 0.00 0.00 0.0073 0.00 0.00 0.00 0.00 0.0074 0.00 0.00 0.00 0.00 0.00 Split btwn (3/4) L003 & (1/4) L00475 0.00 0.00 0.00 0.00 0.00 Split btwn (7/8) L003 & (1/8) L00476 0.00 0.00 0.00 0.00 0.0077 0.00 0.00 0.00 0.00 0.0078 0.00 0.00 0.00 0.00 0.0079 0.00 0.00 0.00 0.00 0.0080 0.00 0.00 0.00 0.00 0.0086 0.00 0.00 0.00 0.00 0.0089 0 00 0 00 0 00 0 00 0 00 S li b (1/3) L003 & (2/3) L004
Basin L003
89 0.00 0.00 0.00 0.00 0.00 Split btwn (1/3) L003 & (2/3) L00490 0.00 0.00 0.00 0.00 0.00
105 0.00 0.00 0.00 0.00 0.00 Split btwn (1/3) L003 & (2/3) L004106 0.00 0.00 0.00 0.00 0.00107 0.00 0.00 0.00 0.00 0.00108 0.00 0.00 0.00 0.00 0.00109 0.00 0.00 0.00 0.00 0.00110 0.00 0.00 0.00 0.00 0.00111 0.00 0.00 0.00 0.00 0.00 Split btwn (1/2) L002 & (1/2) L003152 0.00 0.00 0.00 0.00 0.00153 0.00 0.00 0.00 0.00 0.00154 0.00 0.00 0.00 0.00 0.00248 0.00 0.00 0.00 0.00 0.00
Total 0.00 0.00 0.00 - 0.00

City Basin Flow Projections through 2029
City Per Capita 136.04 Total City Projected 2029 AAD Flow 1.816 MGD
TAZ # Population ADF (gpd) ADF (gpm) Peak Factor PHF Notes21 59.00 8,026.61 5.57 4.30 23.9722 0.00 0.00 0.00 0.00 0.0074 0.00 0.00 0.00 0.00 0.00 Split btwn (3/4) L003 & (1/4) L00475 0.00 0.00 0.00 0.00 0.00 Split btwn (7/8) L003 & (1/8) L00481 0.00 0.00 0.00 0.00 0.0082 0.00 0.00 0.00 0.00 0.0083 0.00 0.00 0.00 0.00 0.0084 0.00 0.00 0.00 0.00 0.0085 0.00 0.00 0.00 0.00 0.0087 0.00 0.00 0.00 0.00 0.0088 0.00 0.00 0.00 0.00 0.0089 0.00 0.00 0.00 0.00 0.00 Split btwn (1/3) L003 & (2/3) L004
100 0.00 0.00 0.00 0.00 0.00101 0.00 0.00 0.00 0.00 0.00102 0.00 0.00 0.00 0.00 0.00103 0.00 0.00 0.00 0.00 0.00104 0.00 0.00 0.00 0.00 0.00105 0.00 0.00 0.00 0.00 0.00 Split btwn (1/3) L003 & (2/3) L004157 0.00 0.00 0.00 0.00 0.00 Split btwn (1/2) L004 & (1/2) L035
Total 59.00 8,026.61 5.57 - 23.97
TAZ # Population ADF (gpd) ADF (gpm) Peak Factor PHF Notes28 0.00 0.00 0.00 0.00 0.0029 0.00 0.00 0.00 0.00 0.0030 0.00 0.00 0.00 0.00 0.00
Total 0.00 0.00 0.00 - 0.00
TAZ # Population ADF (gpd) ADF (gpm) Peak Factor PHF Notes26 0.00 0.00 0.00 4.50 0.00 AB moved from LS4011 to LS4006
35 0.00 7,320.00 5.08 1.50 7.63 Added from Records - totaled for all TAZ areas which could be comm college
36 0.00 0.00 0.00 0.00 0.00 Assumed Comm College will grow by 20% over 20 year period155 0.00 40.00 0.03 0.00 0.00 What about college?158 0.00 607.00 0.42 0.00 0.00 Split btwn (2/3) L006 & (1/3) L007159 0.00 0.00 0.00 0.00 0.00
Total 0.00 7,967.00 5.53 - 7.63
TAZ # Population ADF (gpd) ADF (gpm) Peak Factor PHF Notes25 0.00 0.00 0.00 0.00 0.00 Split btwn L007 & L011
Basin L006
Basin L007
Basin L004
Basin L005
25 0.00 0.00 0.00 0.00 0.00 Split btwn L007 & L01132 0.00 0.00 0.00 0.00 0.00
158 0.00 0.00 0.00 0.00 0.00 Split btwn (2/3) L006 & (1/3) L007
Total 0.00 0.00 0.00 - 0.00
TAZ # Population ADF (gpd) ADF (gpm) Peak Factor PHF Notes25 0.00 0.00 0.00 0.00 0.00 Split btwn L007 & L011
160 0.00 0.00 0.00 0.00 0.00166 153.00 20,814.77 14.45 4.19 60.54
Total 153.00 20,814.77 14.45 - 60.54
TAZ # Population ADF (gpd) ADF (gpm) Peak Factor PHF Notes34 88.00 11,971.89 8.31 4.26 35.4037 0.00 0.00 0.00 0.00 0.0038 0.00 0.00 0.00 0.00 0.0039 0.00 0.00 0.00 0.00 0.0040 0.00 0.00 0.00 0.00 0.0041 0.00 0.00 0.00 0.00 0.0042 0.00 0.00 0.00 0.00 0.0043 0.00 0.00 0.00 0.00 0.0045 0.00 0.00 0.00 0.00 0.0046 0.00 0.00 0.00 0.00 0.0047 0.00 0.00 0.00 0.00 0.00
250 0.00 0.00 0.00 0.00 0.00251 0.00 0.00 0.00 0.00 0.00
Total 88.00 11,971.89 8.31 - 35.40
Basin L011
Basin L0017
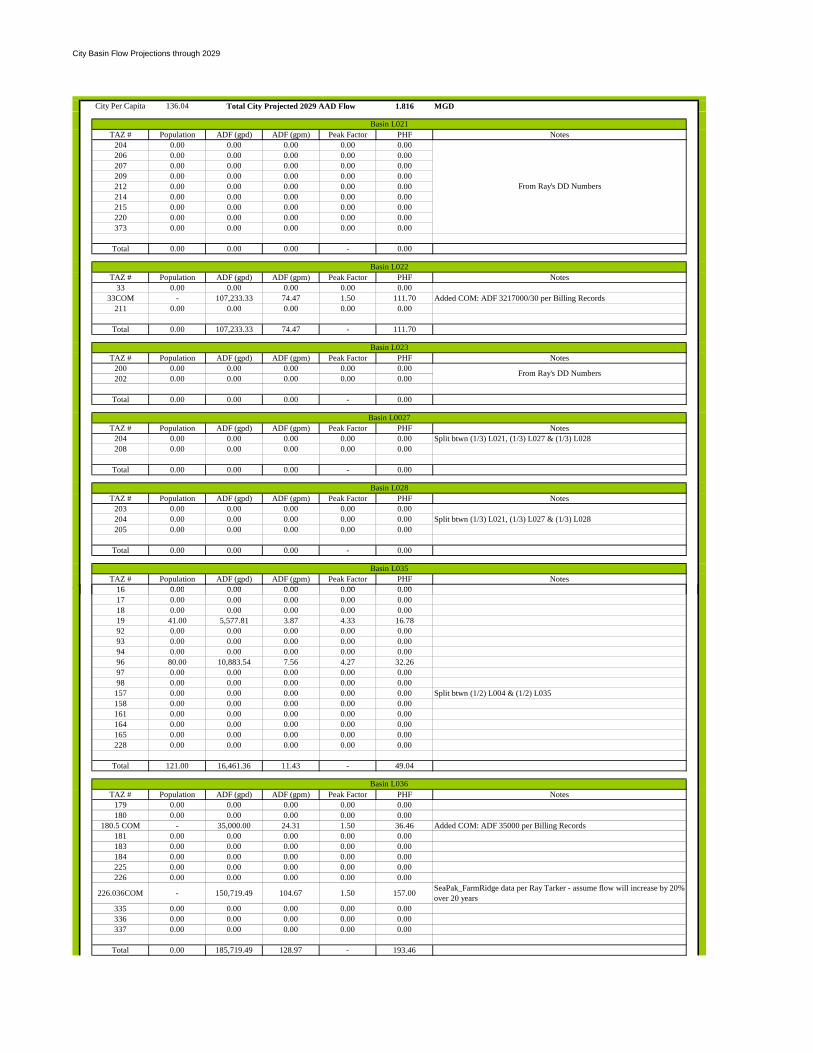
City Basin Flow Projections through 2029
City Per Capita 136.04 Total City Projected 2029 AAD Flow 1.816 MGD
TAZ # Population ADF (gpd) ADF (gpm) Peak Factor PHF Notes204 0.00 0.00 0.00 0.00 0.00206 0.00 0.00 0.00 0.00 0.00207 0.00 0.00 0.00 0.00 0.00209 0.00 0.00 0.00 0.00 0.00212 0.00 0.00 0.00 0.00 0.00214 0.00 0.00 0.00 0.00 0.00215 0.00 0.00 0.00 0.00 0.00220 0.00 0.00 0.00 0.00 0.00373 0.00 0.00 0.00 0.00 0.00
Total 0.00 0.00 0.00 - 0.00
TAZ # Population ADF (gpd) ADF (gpm) Peak Factor PHF Notes33 0.00 0.00 0.00 0.00 0.00
33COM - 107,233.33 74.47 1.50 111.70 Added COM: ADF 3217000/30 per Billing Records211 0.00 0.00 0.00 0.00 0.00
Total 0.00 107,233.33 74.47 - 111.70
TAZ # Population ADF (gpd) ADF (gpm) Peak Factor PHF Notes200 0.00 0.00 0.00 0.00 0.00202 0.00 0.00 0.00 0.00 0.00
Total 0.00 0.00 0.00 - 0.00
TAZ # Population ADF (gpd) ADF (gpm) Peak Factor PHF Notes204 0.00 0.00 0.00 0.00 0.00 Split btwn (1/3) L021, (1/3) L027 & (1/3) L028208 0.00 0.00 0.00 0.00 0.00
Total 0.00 0.00 0.00 - 0.00
TAZ # Population ADF (gpd) ADF (gpm) Peak Factor PHF Notes203 0.00 0.00 0.00 0.00 0.00204 0.00 0.00 0.00 0.00 0.00 Split btwn (1/3) L021, (1/3) L027 & (1/3) L028205 0.00 0.00 0.00 0.00 0.00
Total 0.00 0.00 0.00 - 0.00
TAZ # Population ADF (gpd) ADF (gpm) Peak Factor PHF Notes16 0 00 0 00 0 00 0 00 0 00
Basin L021
From Ray's DD Numbers
From Ray's DD Numbers
Basin L0027
Basin L022
Basin L023
Basin L028
Basin L035
16 0.00 0.00 0.00 0.00 0.0017 0.00 0.00 0.00 0.00 0.0018 0.00 0.00 0.00 0.00 0.0019 41.00 5,577.81 3.87 4.33 16.7892 0.00 0.00 0.00 0.00 0.0093 0.00 0.00 0.00 0.00 0.0094 0.00 0.00 0.00 0.00 0.0096 80.00 10,883.54 7.56 4.27 32.2697 0.00 0.00 0.00 0.00 0.0098 0.00 0.00 0.00 0.00 0.00
157 0.00 0.00 0.00 0.00 0.00 Split btwn (1/2) L004 & (1/2) L035158 0.00 0.00 0.00 0.00 0.00161 0.00 0.00 0.00 0.00 0.00164 0.00 0.00 0.00 0.00 0.00165 0.00 0.00 0.00 0.00 0.00228 0.00 0.00 0.00 0.00 0.00
Total 121.00 16,461.36 11.43 - 49.04
TAZ # Population ADF (gpd) ADF (gpm) Peak Factor PHF Notes179 0.00 0.00 0.00 0.00 0.00180 0.00 0.00 0.00 0.00 0.00
180.5 COM - 35,000.00 24.31 1.50 36.46 Added COM: ADF 35000 per Billing Records181 0.00 0.00 0.00 0.00 0.00183 0.00 0.00 0.00 0.00 0.00184 0.00 0.00 0.00 0.00 0.00225 0.00 0.00 0.00 0.00 0.00226 0.00 0.00 0.00 0.00 0.00
226.036COM - 150,719.49 104.67 1.50 157.00 SeaPak_FarmRidge data per Ray Tarker - assume flow will increase by 20% over 20 years
335 0.00 0.00 0.00 0.00 0.00336 0.00 0.00 0.00 0.00 0.00337 0.00 0.00 0.00 0.00 0.00
Total 0.00 185,719.49 128.97 - 193.46
Basin L036
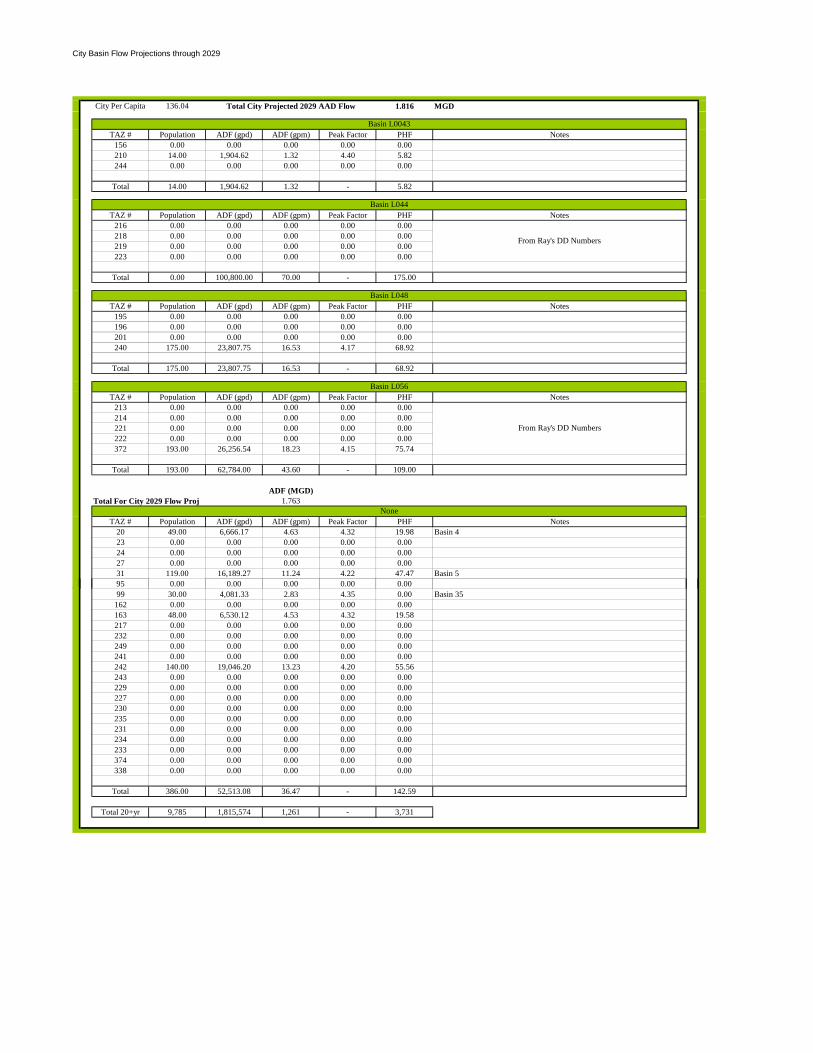
City Basin Flow Projections through 2029
City Per Capita 136.04 Total City Projected 2029 AAD Flow 1.816 MGD
TAZ # Population ADF (gpd) ADF (gpm) Peak Factor PHF Notes156 0.00 0.00 0.00 0.00 0.00210 14.00 1,904.62 1.32 4.40 5.82244 0.00 0.00 0.00 0.00 0.00
Total 14.00 1,904.62 1.32 - 5.82
TAZ # Population ADF (gpd) ADF (gpm) Peak Factor PHF Notes216 0.00 0.00 0.00 0.00 0.00218 0.00 0.00 0.00 0.00 0.00219 0.00 0.00 0.00 0.00 0.00223 0.00 0.00 0.00 0.00 0.00
Total 0.00 100,800.00 70.00 - 175.00
TAZ # Population ADF (gpd) ADF (gpm) Peak Factor PHF Notes195 0.00 0.00 0.00 0.00 0.00196 0.00 0.00 0.00 0.00 0.00201 0.00 0.00 0.00 0.00 0.00240 175.00 23,807.75 16.53 4.17 68.92
Total 175.00 23,807.75 16.53 - 68.92
TAZ # Population ADF (gpd) ADF (gpm) Peak Factor PHF Notes213 0.00 0.00 0.00 0.00 0.00214 0.00 0.00 0.00 0.00 0.00221 0.00 0.00 0.00 0.00 0.00222 0.00 0.00 0.00 0.00 0.00372 193.00 26,256.54 18.23 4.15 75.74
Total 193.00 62,784.00 43.60 - 109.00
ADF (MGD)Total For City 2029 Flow Proj 1.763
TAZ # Population ADF (gpd) ADF (gpm) Peak Factor PHF Notes20 49.00 6,666.17 4.63 4.32 19.98 Basin 423 0.00 0.00 0.00 0.00 0.0024 0.00 0.00 0.00 0.00 0.0027 0.00 0.00 0.00 0.00 0.0031 119.00 16,189.27 11.24 4.22 47.47 Basin 595 0.00 0.00 0.00 0.00 0.00
None
Basin L0043
Basin L056
Basin L048
Basin L044
From Ray's DD Numbers
From Ray's DD Numbers
99 30.00 4,081.33 2.83 4.35 0.00 Basin 35162 0.00 0.00 0.00 0.00 0.00163 48.00 6,530.12 4.53 4.32 19.58217 0.00 0.00 0.00 0.00 0.00232 0.00 0.00 0.00 0.00 0.00249 0.00 0.00 0.00 0.00 0.00241 0.00 0.00 0.00 0.00 0.00242 140.00 19,046.20 13.23 4.20 55.56243 0.00 0.00 0.00 0.00 0.00229 0.00 0.00 0.00 0.00 0.00227 0.00 0.00 0.00 0.00 0.00230 0.00 0.00 0.00 0.00 0.00235 0.00 0.00 0.00 0.00 0.00231 0.00 0.00 0.00 0.00 0.00234 0.00 0.00 0.00 0.00 0.00233 0.00 0.00 0.00 0.00 0.00374 0.00 0.00 0.00 0.00 0.00338 0.00 0.00 0.00 0.00 0.00
Total 386.00 52,513.08 36.47 - 142.59
Total 20+yr 9,785 1,815,574 1,261 - 3,731

APPENDIX E – SEWER SYSTEM COMPONENT NORTH MAINLAND POPULATION PROJECTIONS
Brunswick Glynn County JWSC Applied Technology & Management, Inc.
Water Sewer Master Plan

Incremental North Growth
Taz #
29 Pop. Estimate (@
2.5 Residents/HH)
Total # of Possible
Units (ERC)
Upland Acreage to be
Developed Total @ 2.5 HH/Acre)
Upland Acreage to be
Developed Total
# of HH in in Sub. Sub. Names Basin Zoned Notes
91 0 0 0 0 A CP, R20, HC, FA, & M20
0 Blythe Island A Assuming all will be Septic in future. No population contributions.
0 Blythe Village A Assuming all will be Septic in future. No population contributions.
167.5 0 0 0 0 0 Altamaha Park None FA & HC0 Altamaha Park Out of 2029 window0 Henrry Horton Land Out of 2029 window
168.5 0 0 0 0 None FA & CP Section A: Develop within 10 yrs. (221 acres) (See Notebook)
0 Brockington *Swamp per David Hainley updated 04-16-09
0 Mosley Tract
168.10 0 0 0 0 None FA & CP Section A: Develop within 10 yrs. (221 acres) (See Notebook)
0 Brockington *Swamp per David Hainley updated 04-16-09
0 Mosley Tract
168.15 0 0 0 0 None FA & CP Section B: Develop from yr 15-20+ yrs. (869 acres) (See Notebook)
0 Brockington *Swamp per David Hainley updated 04-16-09
0 Mosley Tract
168.20 0 0 0 0 None FA & CP Section B: Develop from yr 15-20+ yrs. (869 acres) (See Notebook)
0 Brockington *Swamp per David Hainley updated 04-16-09
0 Mosley Tract
168.20+ 0 0 0 0 None FA & CP Section B: Develop from yr 15-20+ yrs. (869 acres) (See Notebook)
0 Brockington *Swamp per David Hainley updated 04-16-09
0 Mosley Tract

Incremental North Growth
Taz #
29 Pop. Estimate (@
2.5 Residents/HH)
Total # of Possible
Units (ERC)
Upland Acreage to be
Developed Total @ 2.5 HH/Acre)
Upland Acreage to be
Developed Total
# of HH in in Sub. Sub. Names Basin Zoned Notes
169.5 4612.5 1845 345 138 L119 GI, FA & PDG
Some included in TAZ 170 Acreage includes 108 from Liz Hill & 30 from other
tract (see note book)Satilla: Single Family 2 BedroomSatilla: Single Family 3&4 BedroomSatilla: Multi Family 1 BedroomSatilla: Multi Family 2 BedroomSatilla: Multi Family 3 Bedroom
0 Greencove0 Pearce Tract0 Brinson 0 Heidi0 Parker Drive Estates 0 Pennick Estates0 Cartwrigth Tract0 Charles Beverly Lands0 Vining Estates
169.1 4612.5 1845 345 138 L119 GI, FA & Some included in TAZ 170 Acreage includes 108 from Liz Hill & 30 from other
1500
169.1 4612.5 1845 345 138 L119 PDG includes 108 from Liz Hill & 30 from other tract (see note book)
Satilla: Single Family 2 BedroomSatilla: Single Family 3&4 BedroomSatilla: Multi Family 1 BedroomSatilla: Multi Family 2 BedroomSatilla: Multi Family 3 Bedroom
0 Greencove0 Pearce Tract0 Brinson 0 Heidi0 Parker Drive Estates 0 Pennick Estates0 Cartwrigth Tract0 Charles Beverly Lands0 Vining Estates
1500

Incremental North Growth
Taz #
29 Pop. Estimate (@
2.5 Residents/HH)
Total # of Possible
Units (ERC)
Upland Acreage to be
Developed Total @ 2.5 HH/Acre)
Upland Acreage to be
Developed Total
# of HH in in Sub. Sub. Names Basin Zoned Notes
169.15 3220 1288 345 138 L119 GI, FA & PDG
Some included in TAZ 170 Acreage includes 108 from Liz Hill & 30 from other
tract (see note book)Satilla: Single Family 2 BedroomSatilla: Single Family 3&4 BedroomSatilla: Multi Family 1 BedroomSatilla: Multi Family 2 BedroomSatilla: Multi Family 3 Bedroom
0 Greencove0 Pearce Tract0 Brinson 0 Heidi0 Parker Drive Estates 0 Pennick Estates0 Cartwrigth Tract0 Charles Beverly Lands0 Vining Estates
169.2 743.75 297.5 297.5 119 L119 GI, FA & Some included in TAZ 170 Acreage includes 108 from Liz Hill & 30 from other
943
169.2 743.75 297.5 297.5 119 L119 PDG includes 108 from Liz Hill & 30 from other tract (see note book)
Satilla: Single Family 2 BedroomSatilla: Single Family 3&4 BedroomSatilla: Multi Family 1 BedroomSatilla: Multi Family 2 BedroomSatilla: Multi Family 3 Bedroom
0 Greencove0 Pearce Tract0 Brinson 0 Heidi0 Parker Drive Estates 0 Pennick Estates0 Cartwrigth Tract0 Charles Beverly Lands0 Vining Estates
0
0
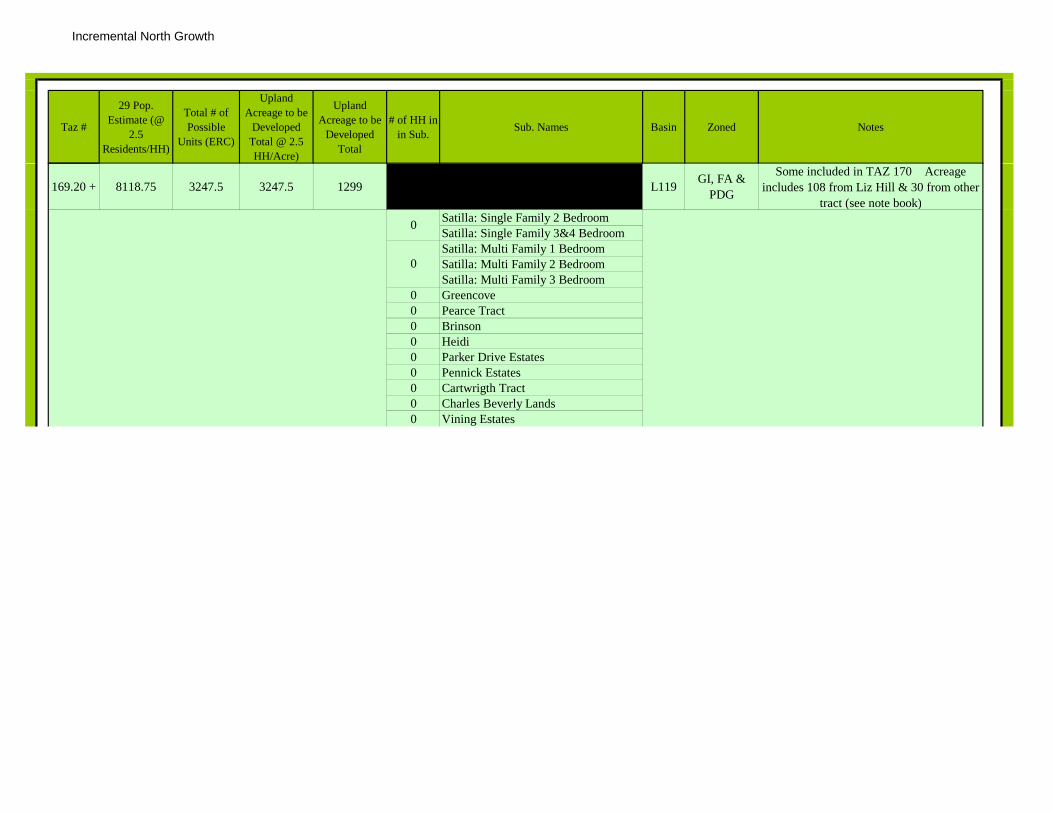
Incremental North Growth
Taz #
29 Pop. Estimate (@
2.5 Residents/HH)
Total # of Possible
Units (ERC)
Upland Acreage to be
Developed Total @ 2.5 HH/Acre)
Upland Acreage to be
Developed Total
# of HH in in Sub. Sub. Names Basin Zoned Notes
169.20 + 8118.75 3247.5 3247.5 1299 L119 GI, FA & PDG
Some included in TAZ 170 Acreage includes 108 from Liz Hill & 30 from other
tract (see note book)Satilla: Single Family 2 BedroomSatilla: Single Family 3&4 BedroomSatilla: Multi Family 1 BedroomSatilla: Multi Family 2 BedroomSatilla: Multi Family 3 Bedroom
0 Greencove0 Pearce Tract0 Brinson 0 Heidi0 Parker Drive Estates 0 Pennick Estates0 Cartwrigth Tract0 Charles Beverly Lands0 Vining Estates
0
0
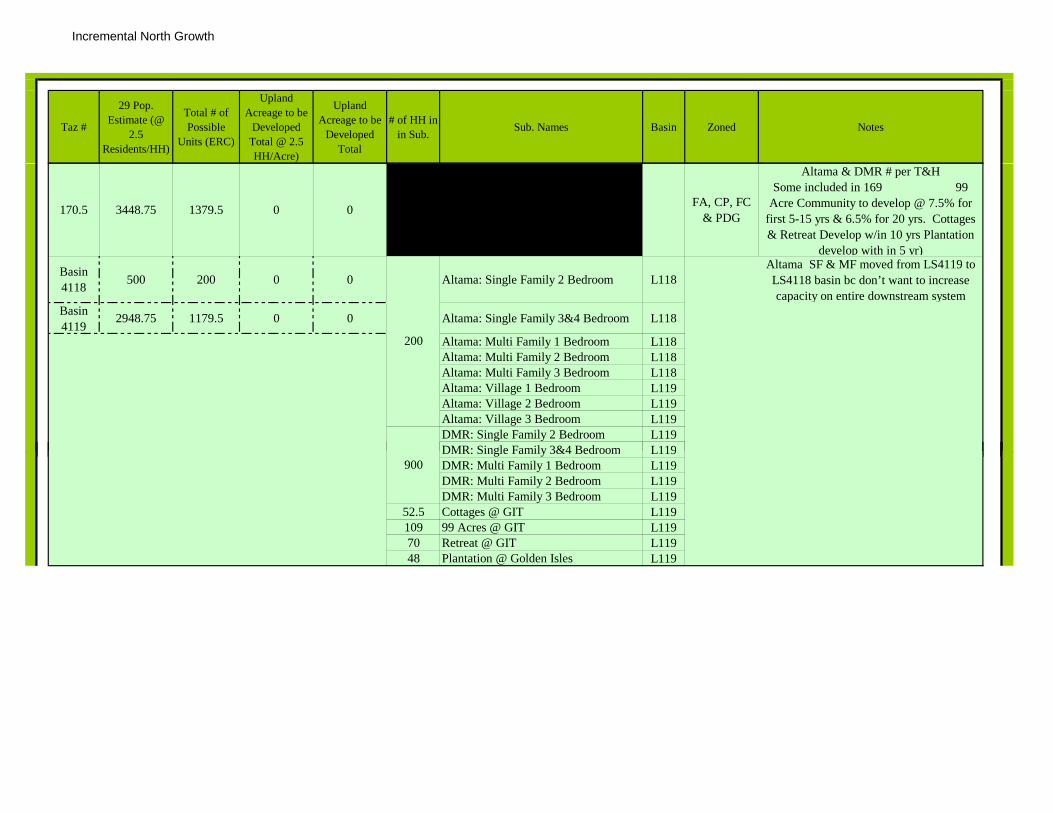
Incremental North Growth
Taz #
29 Pop. Estimate (@
2.5 Residents/HH)
Total # of Possible
Units (ERC)
Upland Acreage to be
Developed Total @ 2.5 HH/Acre)
Upland Acreage to be
Developed Total
# of HH in in Sub. Sub. Names Basin Zoned Notes
170.5 3448.75 1379.5 0 0 FA, CP, FC & PDG
Altama & DMR # per T&H Some included in 169 99
Acre Community to develop @ 7.5% for first 5-15 yrs & 6.5% for 20 yrs. Cottages & Retreat Develop w/in 10 yrs Plantation
develop with in 5 yr)
Basin 4118 500 200 0 0 Altama: Single Family 2 Bedroom L118
Altama SF & MF moved from LS4119 to LS4118 basin bc don’t want to increase capacity on entire downstream system
Basin 4119
2948.75 1179.5 0 0 Altama: Single Family 3&4 Bedroom L118
Altama: Multi Family 1 Bedroom L118Altama: Multi Family 2 Bedroom L118Altama: Multi Family 3 Bedroom L118Altama: Village 1 Bedroom L119Altama: Village 2 Bedroom L119Altama: Village 3 Bedroom L119DMR: Single Family 2 Bedroom L119DMR: Single Family 3&4 Bedroom L119
200
DMR: Single Family 3&4 Bedroom L119DMR: Multi Family 1 Bedroom L119DMR: Multi Family 2 Bedroom L119DMR: Multi Family 3 Bedroom L119
52.5 Cottages @ GIT L119109 99 Acres @ GIT L11970 Retreat @ GIT L11948 Plantation @ Golden Isles L119
900

Incremental North Growth
Taz #
29 Pop. Estimate (@
2.5 Residents/HH)
Total # of Possible
Units (ERC)
Upland Acreage to be
Developed Total @ 2.5 HH/Acre)
Upland Acreage to be
Developed Total
# of HH in in Sub. Sub. Names Basin Zoned Notes
170.10 6578.75 2631.5 0 0 FA, CP, FC & PDG
Altama & DMR # per T&H Some included in 169 99
Acre Community to develop @ 7.5% for first 5-15 yrs & 6.5% for 20 yrs. Cottages & Retreat Develop w/in 10 yrs Plantation
develop with in 5 yr)
Basin 4118 3750 1500 0 0 Altama: Single Family 2 Bedroom L118
Altama SF & MF moved from LS4119 to LS4118 basin bc don’t want to increase capacity on entire downstream system
Basin 4119
2828.75 1131.5 0 0 Altama: Single Family 3&4 Bedroom L118
Altama: Multi Family 1 Bedroom L118Altama: Multi Family 2 Bedroom L118Altama: Multi Family 3 Bedroom L118Altama: Village 1 Bedroom L119Altama: Village 2 Bedroom L119Altama: Village 3 Bedroom L119DMR: Single Family 2 Bedroom L119DMR: Single Family 3&4 Bedroom L119
1500
DMR: Single Family 3&4 Bedroom L119DMR: Multi Family 1 Bedroom L119DMR: Multi Family 2 Bedroom L119DMR: Multi Family 3 Bedroom L119
52.5 Cottages @ GIT L119109 99 Acres @ GIT L11970 Retreat @ GIT L1190 Plantation @ Golden Isles L119
900

Incremental North Growth
Taz #
29 Pop. Estimate (@
2.5 Residents/HH)
Total # of Possible
Units (ERC)
Upland Acreage to be
Developed Total @ 2.5 HH/Acre)
Upland Acreage to be
Developed Total
# of HH in in Sub. Sub. Names Basin Zoned Notes
170.15 5322.5 2129 0 0 FA, CP, FC & PDG
Altama & DMR # per T&H Some included in 169 99
Acre Community to develop @ 7.5% for first 5-15 yrs & 6.5% for 20 yrs. Cottages & Retreat Develop w/in 10 yrs Plantation
develop with in 5 yr)
Basin 4118 3750 1500 0 0 Altama: Single Family 2 Bedroom L118
Altama SF & MF moved from LS4119 to LS4118 basin bc don’t want to increase capacity on entire downstream system
Basin 4119
1572.5 629 0 0 Altama: Single Family 3&4 Bedroom L118
Altama: Multi Family 1 Bedroom L118Altama: Multi Family 2 Bedroom L118Altama: Multi Family 3 Bedroom L118Altama: Village 1 Bedroom L119Altama: Village 2 Bedroom L119Altama: Village 3 Bedroom L119DMR: Single Family 2 Bedroom L119DMR: Single Family 3&4 Bedroom L119
1500
DMR: Single Family 3&4 Bedroom L119DMR: Multi Family 1 Bedroom L119DMR: Multi Family 2 Bedroom L119DMR: Multi Family 3 Bedroom L119
0 Cottages @ GIT L119109 99 Acres @ GIT L1190 Retreat @ GIT L1190 Plantation @ Golden Isles L119
520

Incremental North Growth
Taz #
29 Pop. Estimate (@
2.5 Residents/HH)
Total # of Possible
Units (ERC)
Upland Acreage to be
Developed Total @ 2.5 HH/Acre)
Upland Acreage to be
Developed Total
# of HH in in Sub. Sub. Names Basin Zoned Notes
170.20 5235 2094 0 0 FA, CP, FC & PDG
Altama & DMR # per T&H Some included in 169 99
Acre Community to develop @ 7.5% for first 5-15 yrs & 6.5% for 20 yrs. Cottages & Retreat Develop w/in 10 yrs Plantation
develop with in 5 yr)
Basin 4118 5000 2000 0 0 Altama: Single Family 2 Bedroom L118
Altama SF & MF moved from LS4119 to LS4118 basin bc don’t want to increase capacity on entire downstream system
Basin 4119
235 94 0 0 Altama: Single Family 3&4 Bedroom L118
Altama: Multi Family 1 Bedroom L118Altama: Multi Family 2 Bedroom L118Altama: Multi Family 3 Bedroom L118Altama: Village 1 Bedroom L119Altama: Village 2 Bedroom L119Altama: Village 3 Bedroom L119DMR: Single Family 2 Bedroom L119DMR: Single Family 3&4 Bedroom L119
2000
0DMR: Single Family 3&4 Bedroom L119DMR: Multi Family 1 Bedroom L119DMR: Multi Family 2 Bedroom L119DMR: Multi Family 3 Bedroom L119
0 Cottages @ GIT L11994 99 Acres @ GIT L1190 Retreat @ GIT L1190 Plantation @ Golden Isles L119
0

Incremental North Growth
Taz #
29 Pop. Estimate (@
2.5 Residents/HH)
Total # of Possible
Units (ERC)
Upland Acreage to be
Developed Total @ 2.5 HH/Acre)
Upland Acreage to be
Developed Total
# of HH in in Sub. Sub. Names Basin Zoned Notes
170.20 + 17325 6930 0 0 FA, CP, FC & PDG
Altama & DMR # per T&H Some included in 169 99
Acre Community to develop @ 7.5% for first 5-15 yrs & 6.5% for 20 yrs. Cottages & Retreat Develop w/in 10 yrs Plantation
develop with in 5 yr)
Basin 4118 14762.5 5905 0 0 Altama: Single Family 2 Bedroom L118
Altama SF & MF moved from LS4119 to LS4118 basin bc don’t want to increase capacity on entire downstream system
Basin 4119
2562.5 1025 0 0 Altama: Single Family 3&4 Bedroom L118
Altama: MF 1, 2, & 3 Bedroom LS 4118 L118L118L118
Altama: Village 1 Bedroom L119Altama: Village 2 Bedroom L119Altama: Village 3 Bedroom L119DMR: Single Family 2 Bedroom L119DMR: Single Family 3&4 Bedroom L119
5905
0
Altama: MF 1, 2, & 3 Bedroom LS 4119
DMR: Single Family 3&4 Bedroom L119DMR: Multi Family 1 Bedroom L119DMR: Multi Family 2 Bedroom L119DMR: Multi Family 3 Bedroom L119
0 Cottages @ GIT L1191025 99 Acres @ GIT L119
0 Retreat @ GIT L1190 Plantation @ Golden Isles L119
171.5 402.5 161 75 30 L119 GI, BI & PDG
Some included in TAZ 170
0 Southern Pines MHP34 The Gallleryat Coastal Pines52 Sweetwater at Golden Isles0 Regents Park
0
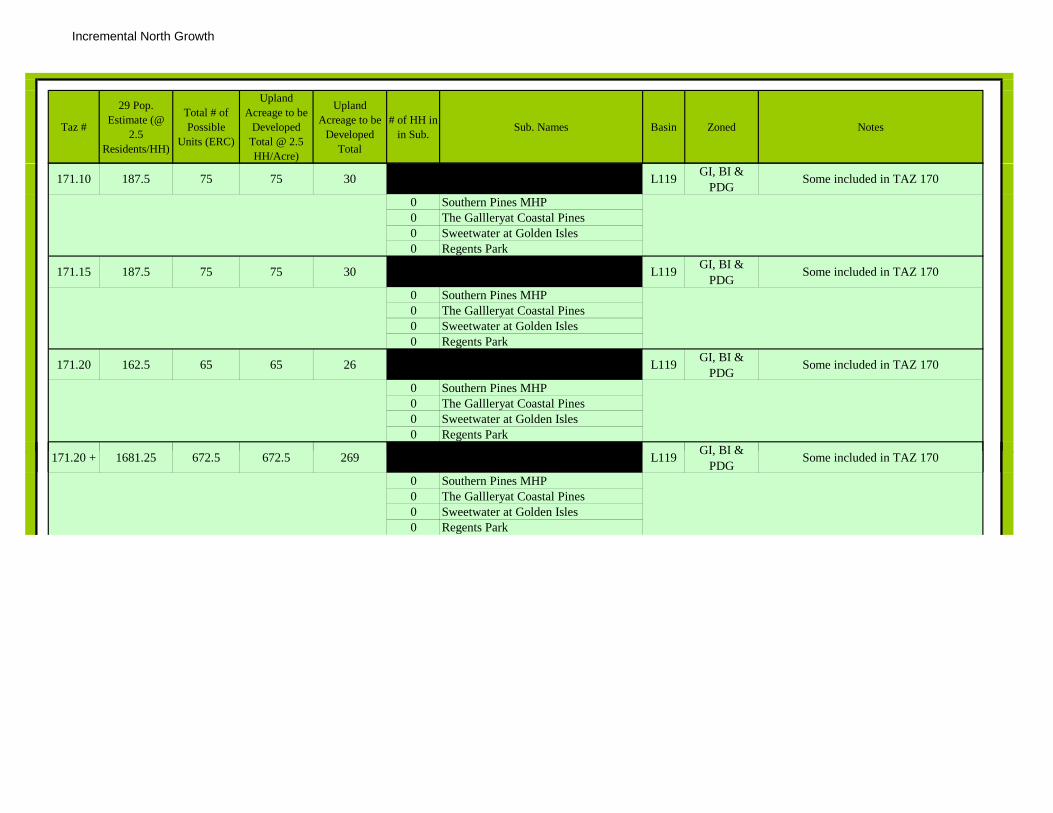
Incremental North Growth
Taz #
29 Pop. Estimate (@
2.5 Residents/HH)
Total # of Possible
Units (ERC)
Upland Acreage to be
Developed Total @ 2.5 HH/Acre)
Upland Acreage to be
Developed Total
# of HH in in Sub. Sub. Names Basin Zoned Notes
171.10 187.5 75 75 30 L119 GI, BI & PDG
Some included in TAZ 170
0 Southern Pines MHP0 The Gallleryat Coastal Pines0 Sweetwater at Golden Isles0 Regents Park
171.15 187.5 75 75 30 L119 GI, BI & PDG
Some included in TAZ 170
0 Southern Pines MHP0 The Gallleryat Coastal Pines0 Sweetwater at Golden Isles0 Regents Park
171.20 162.5 65 65 26 L119 GI, BI & PDG
Some included in TAZ 170
0 Southern Pines MHP0 The Gallleryat Coastal Pines0 Sweetwater at Golden Isles0 Regents Park
1 1 20 1681 2 6 2 6 2 269 119 GI, BI & S i l d d i A 1 0171.20 + 1681.25 672.5 672.5 269 L119 GI, BI & PDG
Some included in TAZ 170
0 Southern Pines MHP0 The Gallleryat Coastal Pines0 Sweetwater at Golden Isles0 Regents Park

Incremental North Growth
Taz #
29 Pop. Estimate (@
2.5 Residents/HH)
Total # of Possible
Units (ERC)
Upland Acreage to be
Developed Total @ 2.5 HH/Acre)
Upland Acreage to be
Developed Total
# of HH in in Sub. Sub. Names Basin Zoned Notes
172.5 151.875 60.75 60.75 24.3 None GI, FA, R12, M12 & HC
Development over 15 yrs @ 33% for each time increment Sewer
Generation Rate added to industrial acreage for yr 5 & yr 10 (See ADF)
0 Sterling Park0 Rooks Tract0 Brentwood0 Big Oaks Plantation0 Sterling Park
172.10 151.875 60.75 60.75 24.3 None GI, FA, R12, M12 & HC
Development over 15 yrs @ 33% for each time increment Sewer
Generation Rate added to industrial acreage for yr 5 & yr 10 (See ADF)
0 Sterling Park0 Rooks Tract0 Brentwood0 Big Oaks Plantation0 Sterling Park
Development over 15 yrs @ 33% for each
172.15 151.875 60.75 60.75 24.3 None GI, FA, R12, M12 & HC
Development over 15 yrs @ 33% for each time increment Sewer
Generation Rate added to industrial acreage for yr 5 & yr 10 (See ADF)
0 Sterling Park0 Rooks Tract0 Brentwood0 Big Oaks Plantation0 Sterling Park

Incremental North Growth
Taz #
29 Pop. Estimate (@
2.5 Residents/HH)
Total # of Possible
Units (ERC)
Upland Acreage to be
Developed Total @ 2.5 HH/Acre)
Upland Acreage to be
Developed Total
# of HH in in Sub. Sub. Names Basin Zoned Notes
173.5 5125 2050 1065 426PDG, FA, R12, R6 &
FA
Acreage (Amounts-15% COM) L107: 139 L124: 163.5
Basin 107
2526.25 1010.5 347.5 139
Basin 124
1826.875 730.75 408.75 163.5
0 Austin Acres -160 Autumn's Wood L124150 Tanglewood L124366 Saddle Brook L1073 Indian Point L1070 Castleberry -12 Chanslors Place L1240 Garden Grove -0 Groveside Park -0 Terrace Garden -0 Cate Tract -11 Touchstone Ridge South L10711 Touchstone Ridge South L1070 Touchstone Ridge Estates -0 High Point -0 Pecan Point -0 Pine Crest -0 Pine Haven -0 Ridgewood Plantation -28 Wilterry L10772 Huntington Lake L107
146 Turtle Creek L1070 North Cate -37 Winegfield Commons L1070 Valerie -
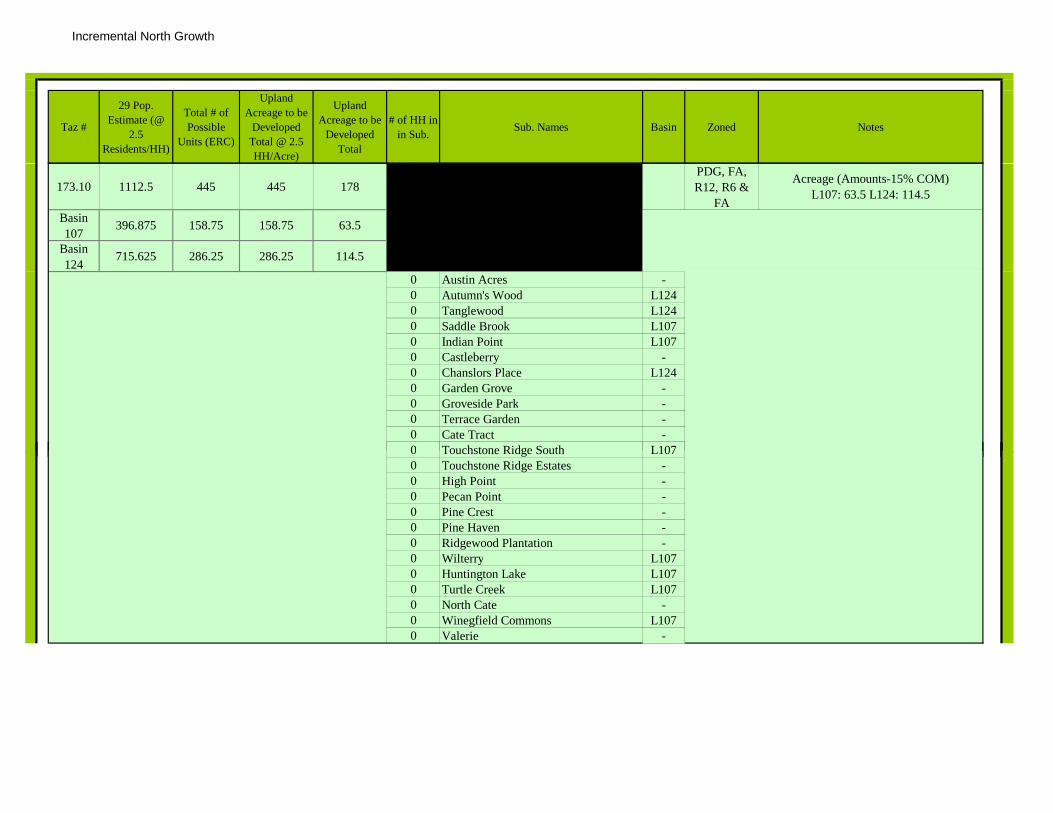
Incremental North Growth
Taz #
29 Pop. Estimate (@
2.5 Residents/HH)
Total # of Possible
Units (ERC)
Upland Acreage to be
Developed Total @ 2.5 HH/Acre)
Upland Acreage to be
Developed Total
# of HH in in Sub. Sub. Names Basin Zoned Notes
173.10 1112.5 445 445 178PDG, FA, R12, R6 &
FA
Acreage (Amounts-15% COM) L107: 63.5 L124: 114.5
Basin 107
396.875 158.75 158.75 63.5
Basin 124
715.625 286.25 286.25 114.5
0 Austin Acres -0 Autumn's Wood L1240 Tanglewood L1240 Saddle Brook L1070 Indian Point L1070 Castleberry -0 Chanslors Place L1240 Garden Grove -0 Groveside Park -0 Terrace Garden -0 Cate Tract -0 Touchstone Ridge South L1070 Touchstone Ridge South L1070 Touchstone Ridge Estates -0 High Point -0 Pecan Point -0 Pine Crest -0 Pine Haven -0 Ridgewood Plantation -0 Wilterry L1070 Huntington Lake L1070 Turtle Creek L1070 North Cate -0 Winegfield Commons L1070 Valerie -

Incremental North Growth
Taz #
29 Pop. Estimate (@
2.5 Residents/HH)
Total # of Possible
Units (ERC)
Upland Acreage to be
Developed Total @ 2.5 HH/Acre)
Upland Acreage to be
Developed Total
# of HH in in Sub. Sub. Names Basin Zoned Notes
173.15 0 0 0 0PDG, FA, R12, R6 &
FA
Acreage (Amounts-15% COM) L107: 63.5 L124: 63.5
Basin 107
0 0 0 0
Basin 124
0 0 0 0
0 Austin Acres -0 Autumn's Wood L1240 Tanglewood L1240 Saddle Brook L1070 Indian Point L1070 Castleberry -0 Chanslors Place L1240 Garden Grove -0 Groveside Park -0 Terrace Garden -0 Cate Tract -0 Touchstone Ridge South L1070 Touchstone Ridge South L1070 Touchstone Ridge Estates -0 High Point -0 Pecan Point -0 Pine Crest -0 Pine Haven -0 Ridgewood Plantation -0 Wilterry L1070 Huntington Lake L1070 Turtle Creek L1070 North Cate -0 Winegfield Commons L1070 Valerie -
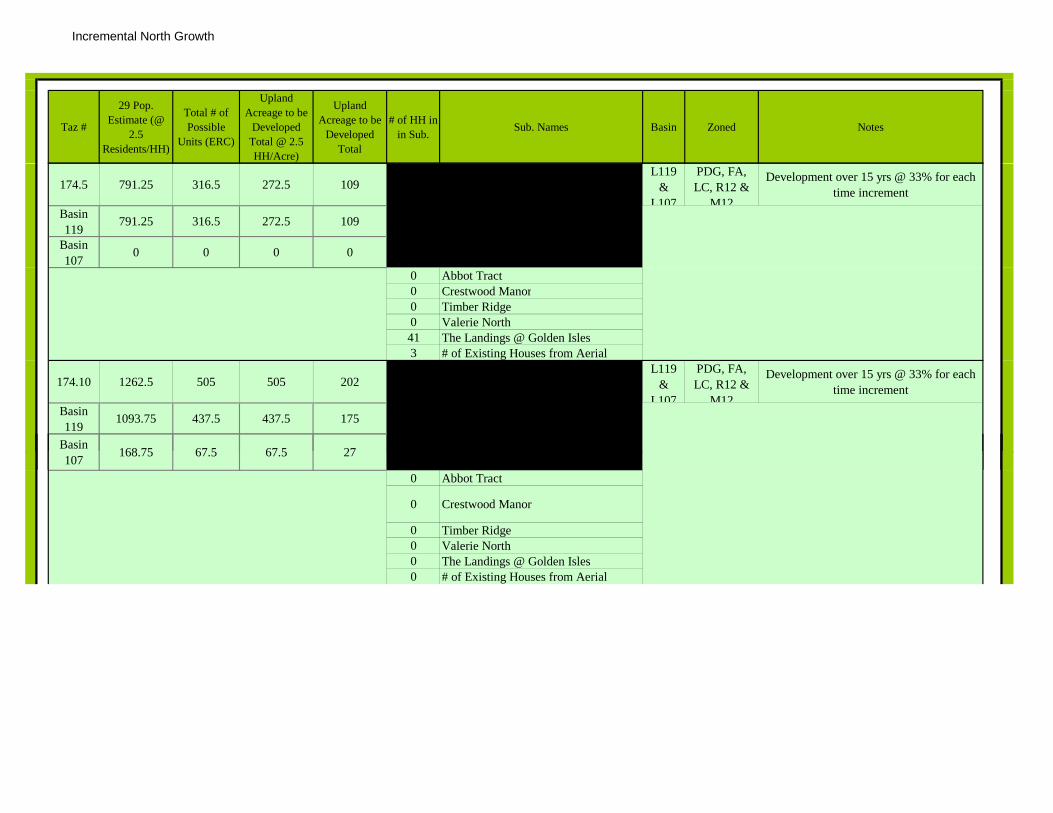
Incremental North Growth
Taz #
29 Pop. Estimate (@
2.5 Residents/HH)
Total # of Possible
Units (ERC)
Upland Acreage to be
Developed Total @ 2.5 HH/Acre)
Upland Acreage to be
Developed Total
# of HH in in Sub. Sub. Names Basin Zoned Notes
174.5 791.25 316.5 272.5 109L119
& L107
PDG, FA, LC, R12 &
M12
Development over 15 yrs @ 33% for each time increment
Basin 119
791.25 316.5 272.5 109
Basin 107
0 0 0 0
0 Abbot Tract0 Crestwood Manor0 Timber Ridge 0 Valerie North 41 The Landings @ Golden Isles3 # of Existing Houses from Aerial
174.10 1262.5 505 505 202L119
& L107
PDG, FA, LC, R12 &
M12
Development over 15 yrs @ 33% for each time increment
Basin 119
1093.75 437.5 437.5 175
Basin 168 75 67 5 67 5 27107 168.75 67.5 67.5 27
0 Abbot Tract
0 Crestwood Manor
0 Timber Ridge 0 Valerie North 0 The Landings @ Golden Isles0 # of Existing Houses from Aerial

Incremental North Growth
Taz #
29 Pop. Estimate (@
2.5 Residents/HH)
Total # of Possible
Units (ERC)
Upland Acreage to be
Developed Total @ 2.5 HH/Acre)
Upland Acreage to be
Developed Total
# of HH in in Sub. Sub. Names Basin Zoned Notes
174.15 918.75 367.5 367.5 147L119
& L107
PDG, FA, LC, R12 &
M12
Development over 15 yrs @ 33% for each time increment
Basin 119
750 300 300 120
Basin 107 168.75 67.5 67.5 27
0 Abbot Tract
0 Crestwood Manor
0 Timber Ridge 0 Valerie North 0 The Landings @ Golden Isles0 # of Existing Houses from Aerial
175.5 941.25 376.5 27.5 11 L119 PDGPinecrest only included in ADF *
All development to occur within first 5 years
22 Villas @ Golden Isles 212 Od L k212 Odyssey Lake 115 Grants Ferry Cove 0 Pinecrest
175.10 0 0 0 0 L119 PDGPinecrest only included in ADF *
All development to occur within first 5 years
0 Villas @ Golden Isles 0 Odyssey Lake 0 Grants Ferry Cove 0 Pinecrest
176.5 190.625 76.25 76.25 30.5 L107 PDG & FC Pinecrest & COM area only included in ADF
176.10 190.625 76.25 76.25 30.5 L107 PDG & FC Pinecrest & COM area only included in ADF

Incremental North Growth
Taz #
29 Pop. Estimate (@
2.5 Residents/HH)
Total # of Possible
Units (ERC)
Upland Acreage to be
Developed Total @ 2.5 HH/Acre)
Upland Acreage to be
Developed Total
# of HH in in Sub. Sub. Names Basin Zoned Notes
177.5 920 368 130 52 L105FC, PDG,
FA, HC, FA & R6
64 Cates Bounty0 Lilac Place
149 Sandalwood19 East Point6 # of Existing Houses from Aerial
177.10 325 130 130 52 L105FC, PDG,
FA, HC, FA & R6
0 Cates Bounty0 Lilac Place0 Sandalwood0 East Point0 # of Existing Houses from Aerial
178 25 10 0 0 L105 FA, LC, R12 & M12
Some included in TAZ 173 & 174
0 L.C. Story Tract0 L.C. Story Tract0 North Point0 Northwood Estates0 Palmetto Place0 Hautala Tract10 # of Existing Houses from Aerial
180.5 400 160 0 0 0 High Hill Lakes L036FA, MR, HC
R9, LI & PDG
Added in COM flow to ADF
70 Eagles Pointe Apartments90 Westway Apartments
182.5 587.5 235 235 94 L124 HC, FA, R9, MH & GI
Some included in TAZ 183
0 Maggies Ridge0 Buckmeadow Plantation
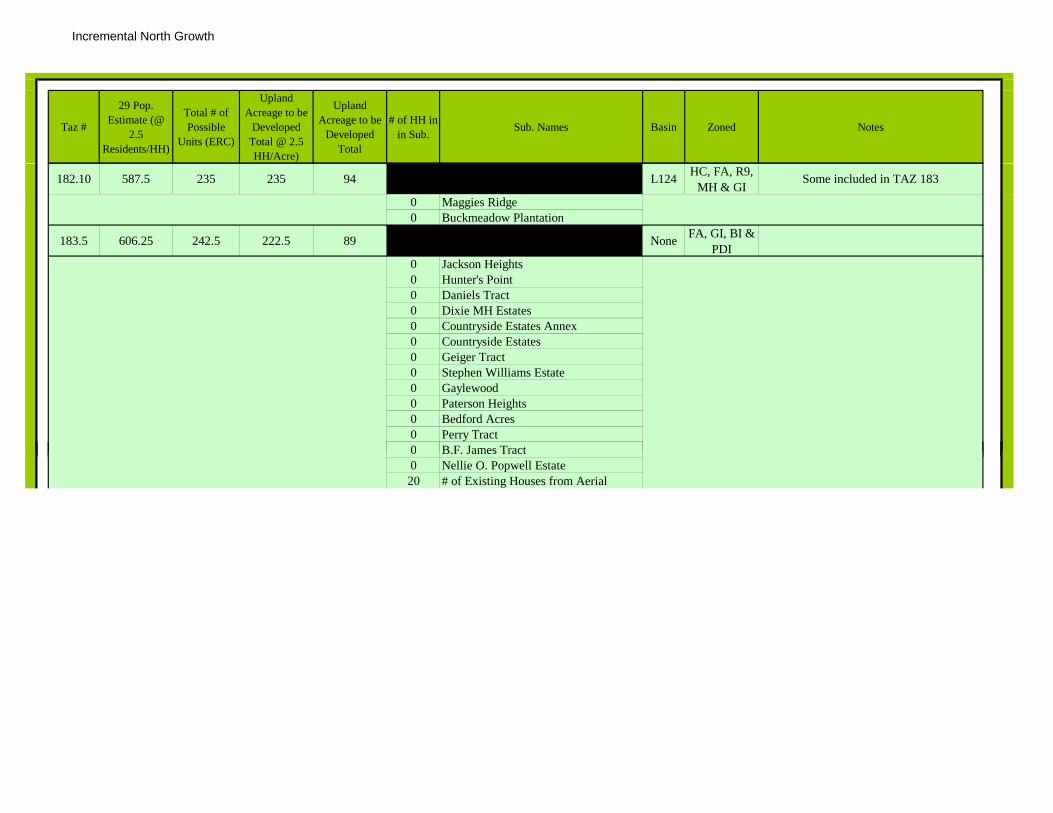
Incremental North Growth
Taz #
29 Pop. Estimate (@
2.5 Residents/HH)
Total # of Possible
Units (ERC)
Upland Acreage to be
Developed Total @ 2.5 HH/Acre)
Upland Acreage to be
Developed Total
# of HH in in Sub. Sub. Names Basin Zoned Notes
182.10 587.5 235 235 94 L124 HC, FA, R9, MH & GI
Some included in TAZ 183
0 Maggies Ridge0 Buckmeadow Plantation
183.5 606.25 242.5 222.5 89 None FA, GI, BI & PDI
0 Jackson Heights0 Hunter's Point0 Daniels Tract0 Dixie MH Estates0 Countryside Estates Annex0 Countryside Estates0 Geiger Tract0 Stephen Williams Estate0 Gaylewood0 Paterson Heights0 Bedford Acres0 Perry Tract0 B.F. James Tract0 B.F. James Tract0 Nellie O. Popwell Estate20 # of Existing Houses from Aerial
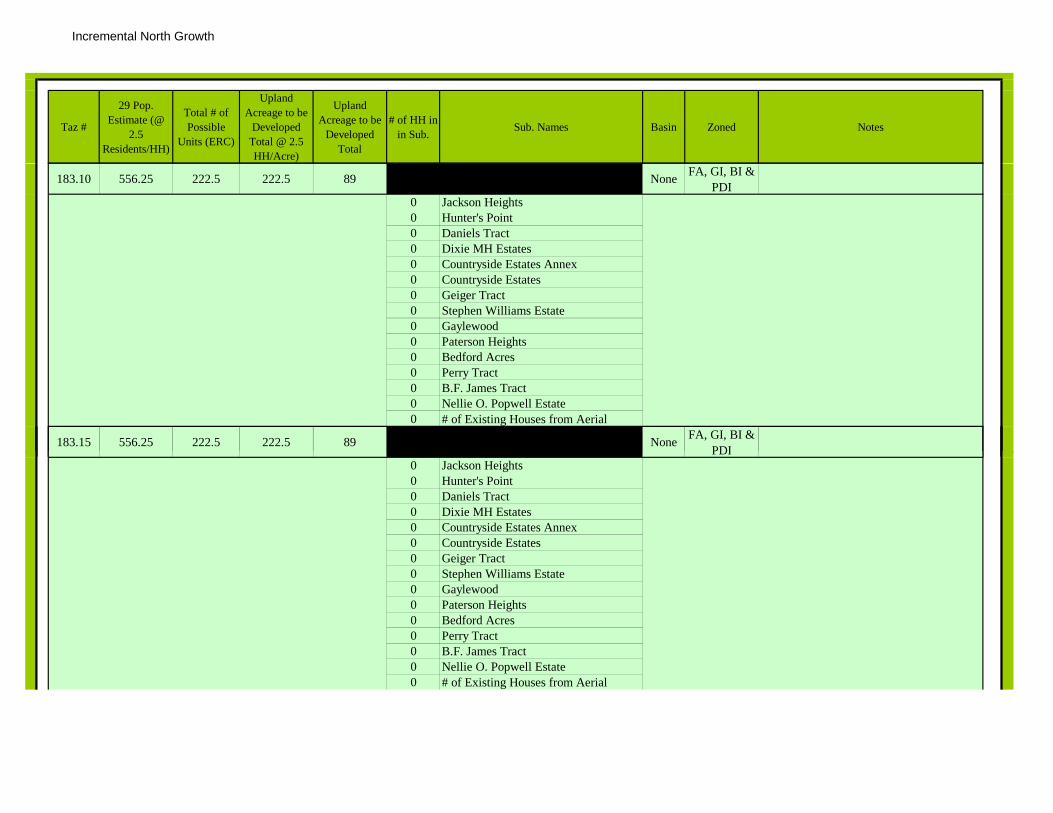
Incremental North Growth
Taz #
29 Pop. Estimate (@
2.5 Residents/HH)
Total # of Possible
Units (ERC)
Upland Acreage to be
Developed Total @ 2.5 HH/Acre)
Upland Acreage to be
Developed Total
# of HH in in Sub. Sub. Names Basin Zoned Notes
183.10 556.25 222.5 222.5 89 None FA, GI, BI & PDI
0 Jackson Heights0 Hunter's Point0 Daniels Tract0 Dixie MH Estates0 Countryside Estates Annex0 Countryside Estates0 Geiger Tract0 Stephen Williams Estate0 Gaylewood0 Paterson Heights0 Bedford Acres0 Perry Tract0 B.F. James Tract0 Nellie O. Popwell Estate0 # of Existing Houses from Aerial
183.15 556.25 222.5 222.5 89 None FA, GI, BI & PDIPDI
0 Jackson Heights0 Hunter's Point0 Daniels Tract0 Dixie MH Estates0 Countryside Estates Annex0 Countryside Estates0 Geiger Tract0 Stephen Williams Estate0 Gaylewood0 Paterson Heights0 Bedford Acres0 Perry Tract0 B.F. James Tract0 Nellie O. Popwell Estate0 # of Existing Houses from Aerial
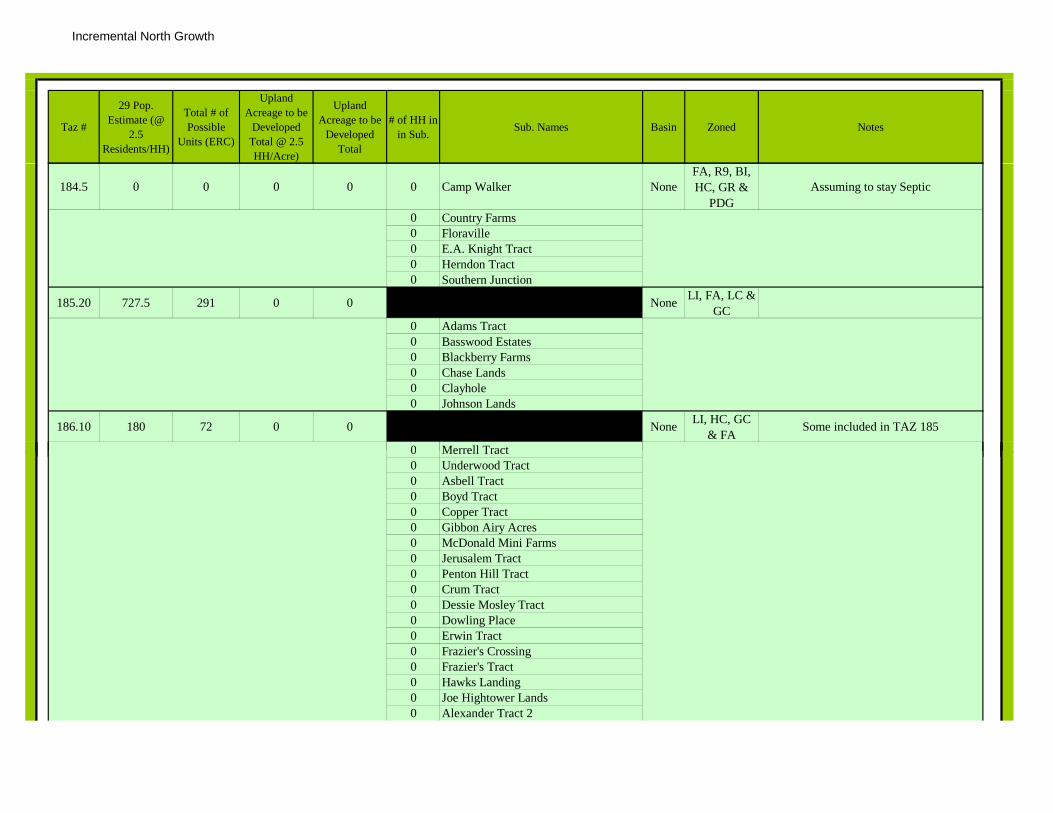
Incremental North Growth
Taz #
29 Pop. Estimate (@
2.5 Residents/HH)
Total # of Possible
Units (ERC)
Upland Acreage to be
Developed Total @ 2.5 HH/Acre)
Upland Acreage to be
Developed Total
# of HH in in Sub. Sub. Names Basin Zoned Notes
184.5 0 0 0 0 0 Camp Walker NoneFA, R9, BI, HC, GR &
PDGAssuming to stay Septic
0 Country Farms0 Floraville0 E.A. Knight Tract0 Herndon Tract0 Southern Junction
185.20 727.5 291 0 0 None LI, FA, LC & GC
0 Adams Tract0 Basswood Estates0 Blackberry Farms0 Chase Lands0 Clayhole0 Johnson Lands
186.10 180 72 0 0 None LI, HC, GC & FA
Some included in TAZ 185
0 Merrell Tract0 Merrell Tract0 Underwood Tract0 Asbell Tract0 Boyd Tract0 Copper Tract0 Gibbon Airy Acres0 McDonald Mini Farms0 Jerusalem Tract0 Penton Hill Tract0 Crum Tract0 Dessie Mosley Tract0 Dowling Place0 Erwin Tract0 Frazier's Crossing0 Frazier's Tract0 Hawks Landing0 Joe Hightower Lands0 Alexander Tract 2
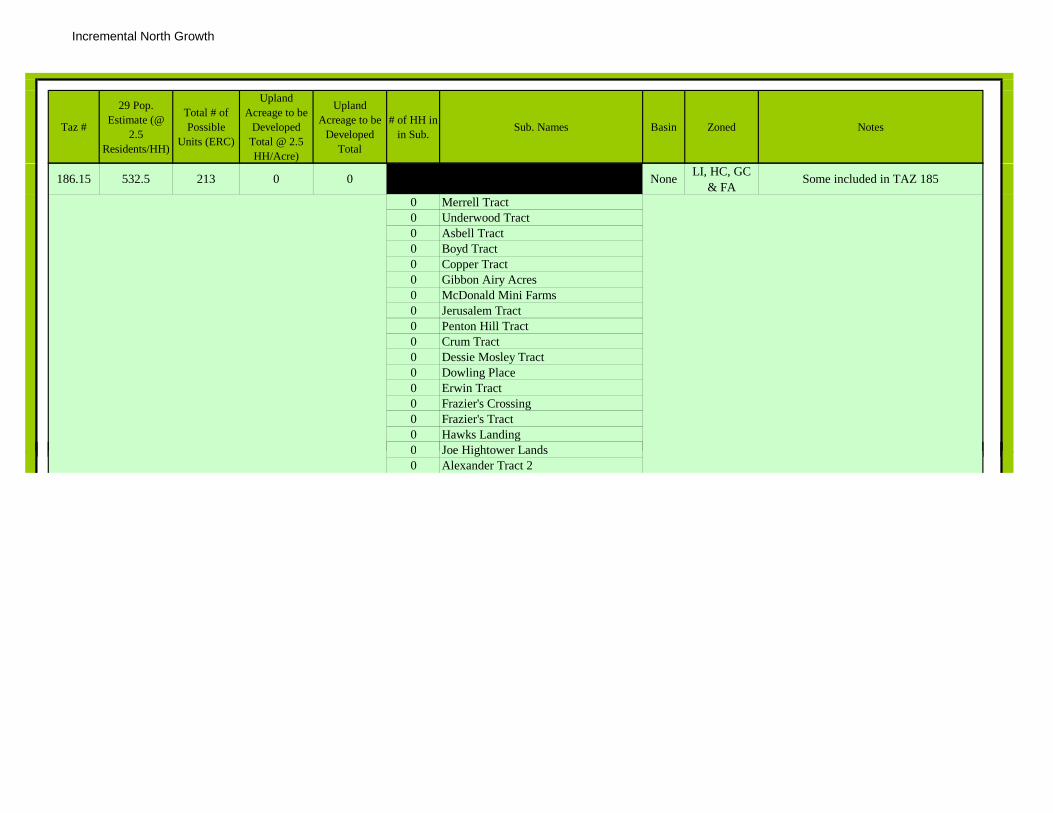
Incremental North Growth
Taz #
29 Pop. Estimate (@
2.5 Residents/HH)
Total # of Possible
Units (ERC)
Upland Acreage to be
Developed Total @ 2.5 HH/Acre)
Upland Acreage to be
Developed Total
# of HH in in Sub. Sub. Names Basin Zoned Notes
186.15 532.5 213 0 0 None LI, HC, GC & FA
Some included in TAZ 185
0 Merrell Tract0 Underwood Tract0 Asbell Tract0 Boyd Tract0 Copper Tract0 Gibbon Airy Acres0 McDonald Mini Farms0 Jerusalem Tract0 Penton Hill Tract0 Crum Tract0 Dessie Mosley Tract0 Dowling Place0 Erwin Tract0 Frazier's Crossing0 Frazier's Tract0 Hawks Landing0 Joe Hightower Lands0 Joe Hightower Lands0 Alexander Tract 2

Incremental North Growth
Taz #
29 Pop. Estimate (@
2.5 Residents/HH)
Total # of Possible
Units (ERC)
Upland Acreage to be
Developed Total @ 2.5 HH/Acre)
Upland Acreage to be
Developed Total
# of HH in in Sub. Sub. Names Basin Zoned Notes
186.20 0 0 0 0 None LI, HC, GC & FA
Some included in TAZ 185
0 Merrell Tract0 Underwood Tract0 Asbell Tract0 Boyd Tract0 Copper Tract0 Gibbon Airy Acres0 McDonald Mini Farms0 Jerusalem Tract0 Penton Hill Tract0 Crum Tract0 Dessie Mosley Tract0 Dowling Place0 Erwin Tract0 Frazier's Crossing0 Frazier's Tract0 Hawks Landing0 Joe Hightower Lands0 Joe Hightower Lands0 Alexander Tract 2

Incremental North Growth
Taz #
29 Pop. Estimate (@
2.5 Residents/HH)
Total # of Possible
Units (ERC)
Upland Acreage to be
Developed Total @ 2.5 HH/Acre)
Upland Acreage to be
Developed Total
# of HH in in Sub. Sub. Names Basin Zoned Notes
187.20+ 7531.25 3012.5 3012.5 1205 None FA188.5 22.5 9 0 0 9 # of Existing Houses from Aerial L118 FC & CP189.5 0 0 0 0 0 Heritage Estates None FC & CP190.5 2032.5 813 120 48 L110 PDG
134 Lexington Place 68 Shadow Lake
120 Fox Run: The Landing 190 Caleb's Crossing 71 Fox Run: The Village
110 Hardwood Forest
191.5 0 0 0 0 L039 PDG, FA & GI
ODI per T& H Acreage (Amounts-60% Paving and Drainage) No Pop, ADF
based on Sewer Generation Rate: Warehouse @ 20/1000 gal/sf
191.10 0 0 0 0 L039 PDG, FA & GI
ODI per T& H Acreage (Amounts-60% Paving and Drainage) No Pop, ADF
based on Sewer Generation Rate: Warehouse @ 20/1000 gal/sf
192.5 0 0 0 0 L039 G Airport192.5 0 0 0 0 L039 G Airport193.5 0 0 0 0 L039 GI & PDG
194.5 935 374 160 64 L039FA, PDG,
LC, R20, HC & LI
0 Margaret Knight Property 0 Beasly Farms0 Bay Point 0 Blueberry0 Deerfield Station74 Golden Shores North0 Honey Bee59 Morgan's Mill21 Pinewood0 Thornhill Creek35 Cabana Court MHP (# from aerial)25 Thornhill MHP (# from aerial)0 WYN-JOY Place

Incremental North Growth
Taz #
29 Pop. Estimate (@
2.5 Residents/HH)
Total # of Possible
Units (ERC)
Upland Acreage to be
Developed Total @ 2.5 HH/Acre)
Upland Acreage to be
Developed Total
# of HH in in Sub. Sub. Names Basin Zoned Notes
194.10 400 160 160 64 L039FA, PDG,
LC, R20, HC & LI
0 Margaret Knight Property 0 Beasly Farms0 Bay Point 0 Blueberry0 Deerfield Station0 Golden Shores North0 Honey Bee0 Morgan's Mill0 Pinewood0 Thornhill Creek0 Cabana Court MHP (# from aerial)0 Thornhill MHP (# from aerial)0 WYN-JOY Place
197.5 3765.625 602.5 0 0 L109FA, PDG, GR, MH,
R12
* Developed from indepth study on LS4109 service area
R1212 Rainwood77 Chancy Lands
200 Enclave31 Glass38 Fairhaven8 Hospice
236.5 Don Wright Property
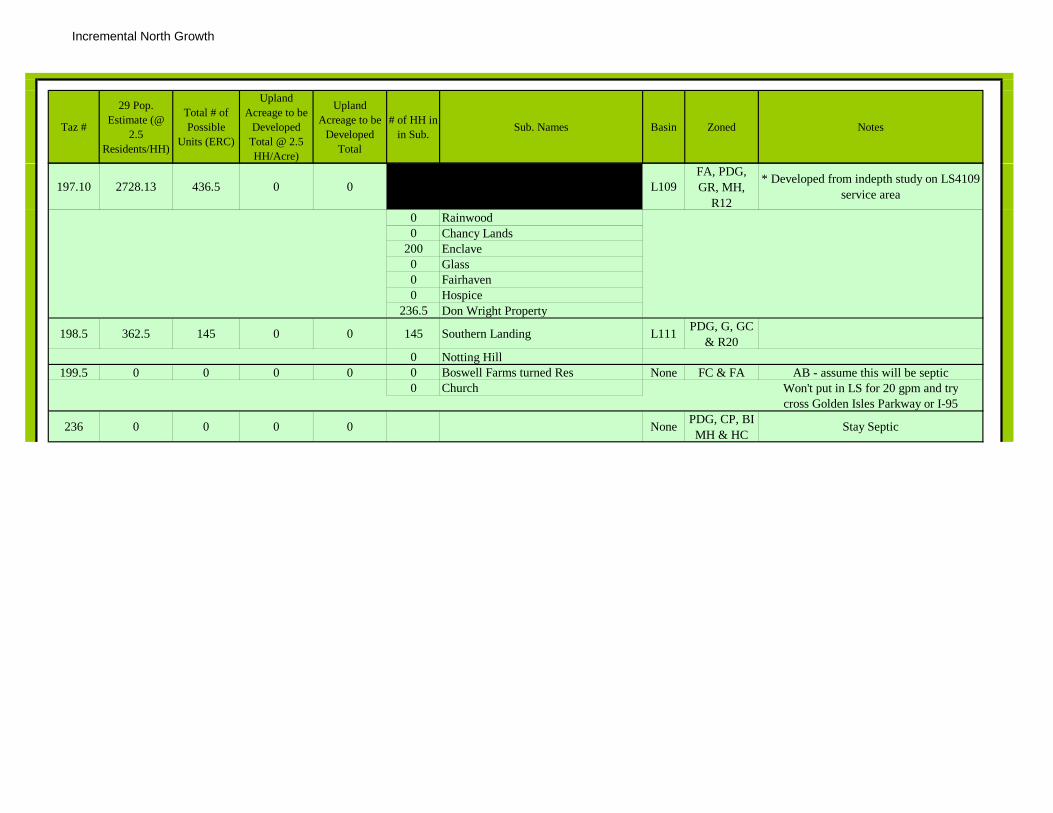
Incremental North Growth
Taz #
29 Pop. Estimate (@
2.5 Residents/HH)
Total # of Possible
Units (ERC)
Upland Acreage to be
Developed Total @ 2.5 HH/Acre)
Upland Acreage to be
Developed Total
# of HH in in Sub. Sub. Names Basin Zoned Notes
197.10 2728.13 436.5 0 0 L109FA, PDG, GR, MH,
R12
* Developed from indepth study on LS4109 service area
0 Rainwood0 Chancy Lands
200 Enclave0 Glass0 Fairhaven0 Hospice
236.5 Don Wright Property
198.5 362.5 145 0 0 145 Southern Landing L111 PDG, G, GC & R20
0 Notting Hill199.5 0 0 0 0 0 Boswell Farms turned Res None FC & FA AB - assume this will be septic
0 Church Won't put in LS for 20 gpm and trycross Golden Isles Parkway or I-95
236 0 0 0 0 None PDG, CP, BI MH & HC
Stay Septic
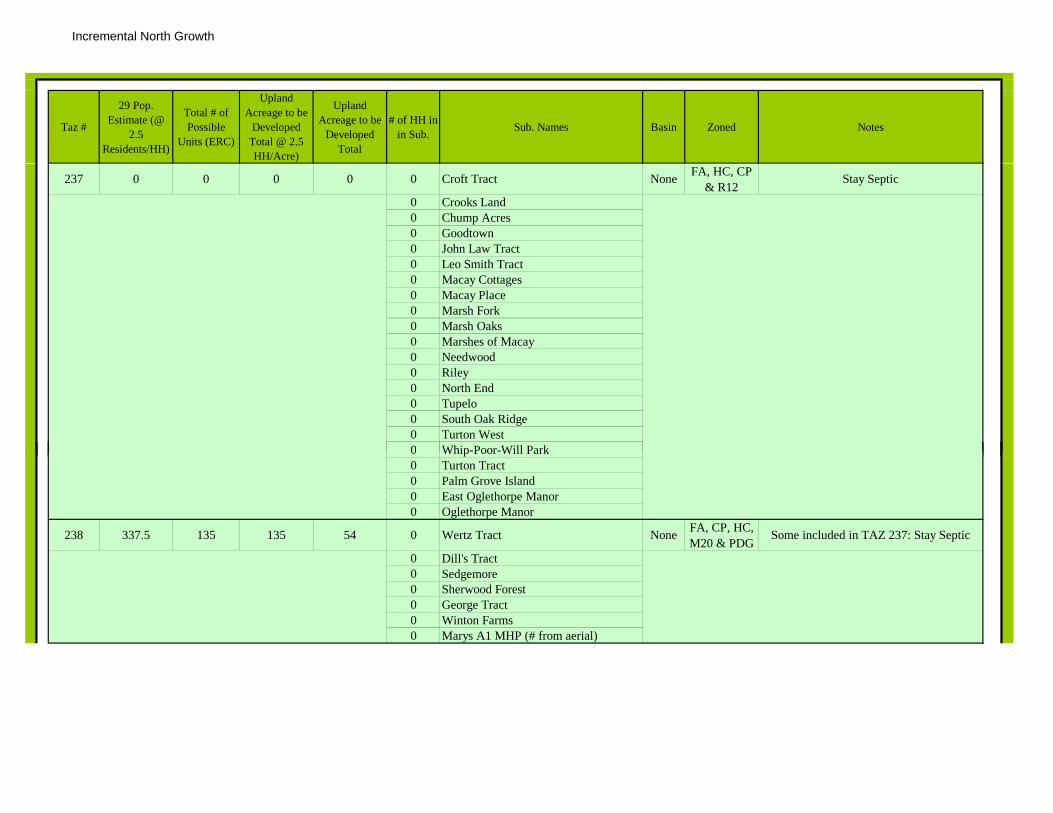
Incremental North Growth
Taz #
29 Pop. Estimate (@
2.5 Residents/HH)
Total # of Possible
Units (ERC)
Upland Acreage to be
Developed Total @ 2.5 HH/Acre)
Upland Acreage to be
Developed Total
# of HH in in Sub. Sub. Names Basin Zoned Notes
237 0 0 0 0 0 Croft Tract None FA, HC, CP & R12
Stay Septic
0 Crooks Land0 Chump Acres0 Goodtown0 John Law Tract0 Leo Smith Tract0 Macay Cottages0 Macay Place0 Marsh Fork0 Marsh Oaks0 Marshes of Macay0 Needwood0 Riley0 North End0 Tupelo0 South Oak Ridge0 Turton West0 Whip-Poor-Will Park0 Whip-Poor-Will Park0 Turton Tract0 Palm Grove Island0 East Oglethorpe Manor0 Oglethorpe Manor
238 337.5 135 135 54 0 Wertz Tract None FA, CP, HC, M20 & PDG
Some included in TAZ 237: Stay Septic
0 Dill's Tract0 Sedgemore0 Sherwood Forest0 George Tract0 Winton Farms0 Marys A1 MHP (# from aerial)
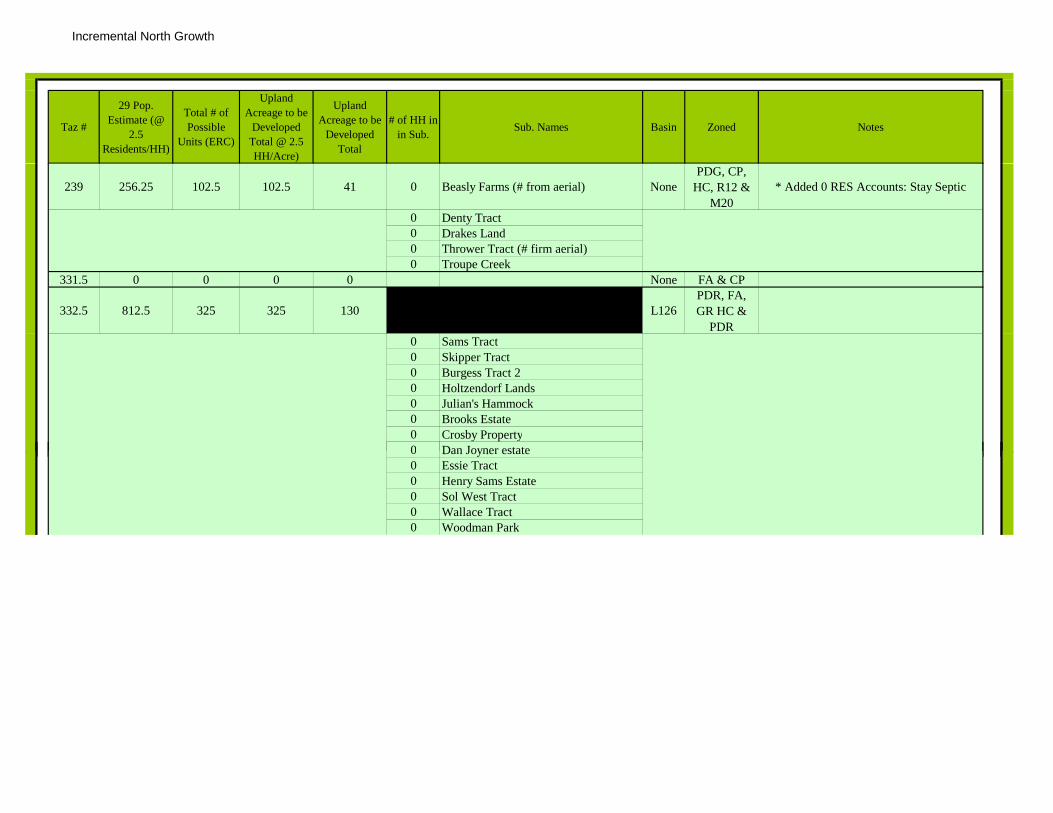
Incremental North Growth
Taz #
29 Pop. Estimate (@
2.5 Residents/HH)
Total # of Possible
Units (ERC)
Upland Acreage to be
Developed Total @ 2.5 HH/Acre)
Upland Acreage to be
Developed Total
# of HH in in Sub. Sub. Names Basin Zoned Notes
239 256.25 102.5 102.5 41 0 Beasly Farms (# from aerial) NonePDG, CP,
HC, R12 & M20
* Added 0 RES Accounts: Stay Septic
0 Denty Tract0 Drakes Land0 Thrower Tract (# firm aerial)0 Troupe Creek
331.5 0 0 0 0 None FA & CP
332.5 812.5 325 325 130 L126PDR, FA, GR HC &
PDR0 Sams Tract0 Skipper Tract0 Burgess Tract 20 Holtzendorf Lands0 Julian's Hammock0 Brooks Estate0 Crosby Property0 Dan Joyner estate0 Dan Joyner estate0 Essie Tract0 Henry Sams Estate0 Sol West Tract0 Wallace Tract0 Woodman Park

Incremental North Growth
Taz #
29 Pop. Estimate (@
2.5 Residents/HH)
Total # of Possible
Units (ERC)
Upland Acreage to be
Developed Total @ 2.5 HH/Acre)
Upland Acreage to be
Developed Total
# of HH in in Sub. Sub. Names Basin Zoned Notes
332.1 812.5 325 325 130 L126PDR, FA, GR HC &
PDR0 Sams Tract0 Skipper Tract0 Burgess Tract 20 Holtzendorf Lands0 Julian's Hammock0 Brooks Estate0 Crosby Property0 Dan Joyner estate0 Essie Tract0 Henry Sams Estate0 Sol West Tract0 Wallace Tract0 Woodman Park
333.5 262.5 105 105 42 None MH, FA & HC
Stay Septic
334 18 42 0 0 R20, GR,334.5 1855 742 0 0 None R20, GR, FA, HC &
543 Hermitage Island
3 Leonard Stephens Sr. Tract0 Webster Land0 Avoca Villa Acres0 Burges Tract (COM)0 Don-el0 Hickory Hill0 Indigo Pointe
196 Jenkins Farm0 Lanett0 Marsh Landing0 Oak Grove & Plantation0 River Ridge0 Sea Oaks Plantation
Hermitage Island has 543 in 5 and 10 years and other parcel has 196 ERCs each in 5 and 10 years

Incremental North Growth
Taz #
29 Pop. Estimate (@
2.5 Residents/HH)
Total # of Possible
Units (ERC)
Upland Acreage to be
Developed Total @ 2.5 HH/Acre)
Upland Acreage to be
Developed Total
# of HH in in Sub. Sub. Names Basin Zoned Notes
334.10 1855 742 0 0 None R20, GR, FA, HC &
543 Hermitage Island3 Leonard Stephens Sr. Tract0 Webster Land0 Avoca Villa Acres0 Burges Tract (COM)0 Don-el0 Hickory Hill0 Indigo Pointe
196 Jenkins Farm0 Lanett0 Marsh Landing0 Oak Grove & Plantation0 River Ridge0 Sea Oaks Plantation
339.5 0 0 0 0 0 Ashley Marsh A FA, R20, CP R12 & M20
Some included in TAZ 91: Stay Septic
0 Blyth Lakes0 Blyth Lakes0 Cameron Place0 Crabtree Ridge0 East-West Estates0 Mavromat Tract0 North Shore0 Pine Knoll0 Riverview0 R.L.. Thompson Tract0 Hamilton Property0 Dubignon Estates0 West Shore 0 West Shore Acres0 West Shore Landings0 Egrets Pass
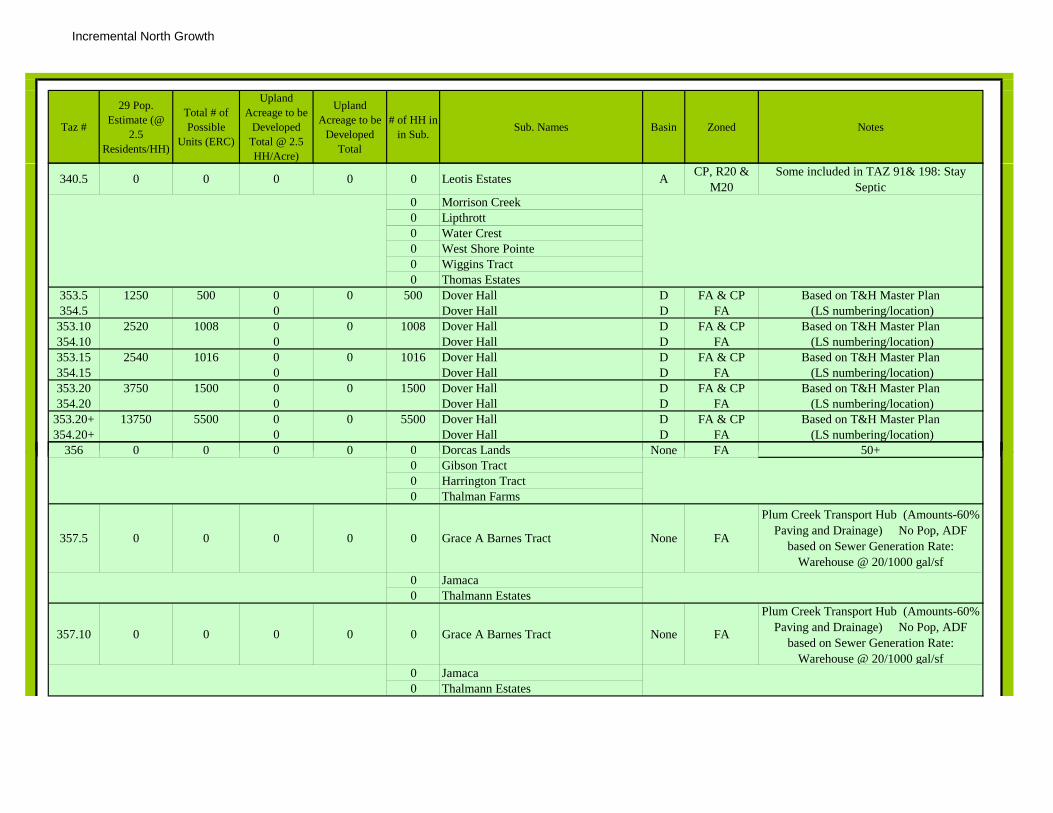
Incremental North Growth
Taz #
29 Pop. Estimate (@
2.5 Residents/HH)
Total # of Possible
Units (ERC)
Upland Acreage to be
Developed Total @ 2.5 HH/Acre)
Upland Acreage to be
Developed Total
# of HH in in Sub. Sub. Names Basin Zoned Notes
340.5 0 0 0 0 0 Leotis Estates A CP, R20 & M20
Some included in TAZ 91& 198: Stay Septic
0 Morrison Creek0 Lipthrott0 Water Crest0 West Shore Pointe0 Wiggins Tract0 Thomas Estates
353.5 1250 500 0 0 500 Dover Hall D FA & CP Based on T&H Master Plan 354.5 0 Dover Hall D FA (LS numbering/location) 353.10 2520 1008 0 0 1008 Dover Hall D FA & CP Based on T&H Master Plan 354.10 0 Dover Hall D FA (LS numbering/location) 353.15 2540 1016 0 0 1016 Dover Hall D FA & CP Based on T&H Master Plan 354.15 0 Dover Hall D FA (LS numbering/location) 353.20 3750 1500 0 0 1500 Dover Hall D FA & CP Based on T&H Master Plan 354.20 0 Dover Hall D FA (LS numbering/location)
353.20+ 13750 5500 0 0 5500 Dover Hall D FA & CP Based on T&H Master Plan 354.20+ 0 Dover Hall D FA (LS numbering/location)
356 0 0 0 0 0 Dorcas Lands None FA 50+356 0 0 0 0 0 Dorcas Lands None FA 50+0 Gibson Tract0 Harrington Tract0 Thalman Farms
357.5 0 0 0 0 0 Grace A Barnes Tract None FA
Plum Creek Transport Hub (Amounts-60% Paving and Drainage) No Pop, ADF
based on Sewer Generation Rate: Warehouse @ 20/1000 gal/sf
0 Jamaca0 Thalmann Estates
357.10 0 0 0 0 0 Grace A Barnes Tract None FA
Plum Creek Transport Hub (Amounts-60% Paving and Drainage) No Pop, ADF
based on Sewer Generation Rate: Warehouse @ 20/1000 gal/sf
0 Jamaca0 Thalmann Estates

Incremental North Growth
Taz #
29 Pop. Estimate (@
2.5 Residents/HH)
Total # of Possible
Units (ERC)
Upland Acreage to be
Developed Total @ 2.5 HH/Acre)
Upland Acreage to be
Developed Total
# of HH in in Sub. Sub. Names Basin Zoned Notes
357.15 0 0 0 0 0 Grace A Barnes Tract None FA
Plum Creek Transport Hub (Amounts-60% Paving and Drainage) No Pop, ADF
based on Sewer Generation Rate: Warehouse @ 20/1000 gal/sf
0 Jamaca0 Thalmann Estates
357.20 0 0 0 0 0 Grace A Barnes Tract None FA
Plum Creek Transport Hub (Amounts-60% Paving and Drainage) No Pop, ADF
based on Sewer Generation Rate: Warehouse @ 20/1000 gal/sf
0 Jamaca0 Thalmann Estates
357.20+ 7968.75 3187.5 3187.5 1275 0 Grace A Barnes Tract None FA
Plum Creek Transport Hub (Amounts-60% Paving and Drainage) 20+ upland
acreage excludes 5 & 10 yr hub, setbacks & com areas
0 Jamaca0 Thalmann Estates
358.5 247.5 99 0 None FA358.5 247.5 99 0 None FA0 Bladen0 Brown's Land0 Callahan Tract0 McDonald Farm0 J.D. Story Tract
358.10 247.5 99 0 None FA0 Bladen0 Brown's Land0 Callahan Tract0 McDonald Farm0 J.D. Story Tract
358.20 182.5 73 0 None FA0 Bladen0 Brown's Land0 Callahan Tract0 McDonald Farm0 J.D. Story Tract
359.20+ 900 360 0 0 None FA Plum Creek Type: 360 HH

Incremental North Growth
Taz #
29 Pop. Estimate (@
2.5 Residents/HH)
Total # of Possible
Units (ERC)
Upland Acreage to be
Developed Total @ 2.5 HH/Acre)
Upland Acreage to be
Developed Total
# of HH in in Sub. Sub. Names Basin Zoned Notes
363.5 0 0 0 0 None FA 50+364.5 0 0 0 0 None FA 50+
365.20 2625 1050 1050 420 None FA Assume 1/2 develop land is to be 2.5 HH/acre
365.20+ 762.5 305 None FA Assume 1/2 develop land is to be 1 HH/acre
366.10 405 162 0 0 None FA & GI0 Roy Shepp Tract0 Ruth Floyd Tract0 Moody Tract0 Water Tract0 Adam Whaley Estate0 Sears Tract0 Jackson Tract0 Timber Oak0 Timber Oaks
366.15 405 162 0 0 None FA & GI0 Roy Shepp Tract0 Ruth Floyd Tract0 Ruth Floyd Tract0 Moody Tract0 Water Tract0 Adam Whaley Estate0 Sears Tract0 Jackson Tract0 Timber Oak0 Timber Oaks
366.20 405 162 0 0 None FA & GI0 Roy Shepp Tract0 Ruth Floyd Tract0 Moody Tract0 Water Tract0 Adam Whaley Estate0 Sears Tract0 Jackson Tract0 Timber Oak0 Timber Oaks

Incremental North Growth
Taz #
29 Pop. Estimate (@
2.5 Residents/HH)
Total # of Possible
Units (ERC)
Upland Acreage to be
Developed Total @ 2.5 HH/Acre)
Upland Acreage to be
Developed Total
# of HH in in Sub. Sub. Names Basin Zoned Notes
367.5 190.625 76.25 76.25 30.5 0 Randolph Estate None FA, HC & LI split 5 and 10 years - use 2.5 HH/ac0 Lane Tract
367.10 190.625 76.25 76.25 30.5 0 Randolph Estate None FA, HC & LI split 5 and 10 years - use 2.5 HH/ac0 Lane Tract
368.5 967.5 387 232 232 None FA
Comparing to Township 110: (Acrage-10Com/10Setbacks) & considering 42% to be open space/amenities (Upland acreage is
@ 1HH/upland acre)0 Duggan Tract0 E.D. Underwood0 Faricloth Tract0 Gerald Smith Tract0 L.B. Clay Tract0 Underwood Property
155 Buffalo Creek
368.10 967.5 387 232 232 None FA
Comparing to Township 110: (Acrage-10Com/10Setbacks) & considering 42% to be open space/amenities (Upland acreage is
@ 1HH/upland acre)@ 1HH/upland acre)0 Duggan Tract0 E.D. Underwood0 Faricloth Tract0 Gerald Smith Tract0 L.B. Clay Tract0 Underwood Property
155 Buffalo Creek
368.15 580 232 232 232 None FA
Comparing to Township 110: (Acrage-10Com/10Setbacks) & considering 42% to be open space/amenities (Upland acreage is
@ 1HH/upland acre)0 Duggan Tract0 E.D. Underwood0 Faricloth Tract0 Gerald Smith Tract0 L.B. Clay Tract0 Underwood Property0 Buffalo Creek

Incremental North Growth
Taz #
29 Pop. Estimate (@
2.5 Residents/HH)
Total # of Possible
Units (ERC)
Upland Acreage to be
Developed Total @ 2.5 HH/Acre)
Upland Acreage to be
Developed Total
# of HH in in Sub. Sub. Names Basin Zoned Notes
368.20 580 232 232 232 None FA
Comparing to Township 110: (Acrage-10Com/10Setbacks) & considering 42% to be open space/amenities (Upland acreage is
@ 1HH/upland acre)0 Duggan Tract0 E.D. Underwood0 Faricloth Tract0 Gerald Smith Tract0 L.B. Clay Tract0 Underwood Property0 Buffalo Creek
369.20+ 17552.5 7021 7021 3661 None FA, HC & GC
Plum Creek Land: To develop outside 2029 window. Part A - 20+ Pop. Based on
Township 110. (Upland Acreage - 10% COM & 20% Setbacks) = Developable. Then - 42% for open areas (Plum Creek
Style); Part B - 20+ pop based on 2.5 HH/acre with 10% COM, 20% setbacks,
20% open space20% open space0 Howe Tract0 Glynn Farms0 Joe's Island
370 0 0 0 0 None FA Out of 2029 window371 0 0 0 0 0 Arnett Tract None FA & GC Out of 2029 window
0 Buffalo Swamp0 Drawdy Property0 Thalman
375.5 1937.5 775 775 310 PAWS East: Steamboat City None PDG Estimate RES by acreage375.10 1937.5 775 775 310 PAWS East: Steamboat City None PDG Estimate RES by acreage375.15 0 0 0 0 PAWS East: Steamboat City None PDG Estimate RES by acreage375.20 0 0 0 0 PAWS East: Steamboat City None PDG Estimate RES by acreage
375.20+ 0 0 0 0 PAWS East: Steamboat City None PDG Estimate RES by acreage

Incremental North Growth
Taz #
29 Pop. Estimate (@
2.5 Residents/HH)
Total # of Possible
Units (ERC)
Upland Acreage to be
Developed Total @ 2.5 HH/Acre)
Upland Acreage to be
Developed Total
# of HH in in Sub. Sub. Names Basin Zoned Notes
376.5 932.5 373 0 0 FA & PDG
Acreage (Amounts-10% COM) (Acreages: a.30, b. 27, c. 14, d. 19) 90 total, but a & c
go to LS110 & b. & d. go to LS118 (acreage included in Incremental
spreadsheet) LS4110 1207.5 483 110 44LS4118 0 0 0 0LS4120 0 0
203 Carriage Gate L11056 Assumed Carriage Gate P 2 L1100 Dukes Tract -0 Hutcheson Tract -0 Jacobs Acres -0 Petersville -0 Polite Estates -
114 Shell Pointe L120
376.10 140 56 0 0 FA & PDG
Acreage (Amounts-10% COM) (Acreages: a.30, b. 27, c. 14, d. 19) 90 total, but a & c
go to LS110 & b & d go to LS118376.10 140 56 0 0 FA & PDG go to LS110 & b. & d. go to LS118 (acreage included in Incremental
spreadsheet) LS4110 415 166 110 44LS4118 281.25 112.5 112.5 45
0 Carriage Gate L11056 Assumed Carriage Gate P 2 L1100 Dukes Tract -0 Hutcheson Tract -0 Jacobs Acres -0 Petersville -0 Polite Estates -0 Shell Pointe L110

Incremental North Growth
Taz #
29 Pop. Estimate (@
2.5 Residents/HH)
Total # of Possible
Units (ERC)
Upland Acreage to be
Developed Total @ 2.5 HH/Acre)
Upland Acreage to be
Developed Total
# of HH in in Sub. Sub. Names Basin Zoned Notes
376.15 0 0 0 0 FA & PDG
Acreage (Amounts-10% COM) (Acreages: a.30, b. 27, c. 14, d. 19) 90 total, but a & c
go to LS110 & b. & d. go to LS118 (acreage included in Incremental
spreadsheet) LS4110 275 110 110 44LS4118 0 0 0 0
0 Carriage Gate L1100 Assumed Carriage Gate P 2 L1100 Dukes Tract -0 Hutcheson Tract -0 Jacobs Acres -0 Petersville -0 Polite Estates -0 Shell Pointe L120
376.20 0 0 0 0 FA & PDG
Acreage (Amounts-10% COM) (Acreages: a.26, b. 23, c. 12, d. 16) 77 total, but a & c
go to LS110 & b. & d. go to LS118 (acreage included in Incremental(acreage included in Incremental
spreadsheet) LS4110 237.5 95 95 38LS4118 0 0 0 0
0 Carriage Gate L1100 Assumed Carriage Gate P 2 L1100 Dukes Tract -0 Hutcheson Tract -0 Jacobs Acres -0 Petersville -0 Polite Estates -0 Shell Pointe L120

Incremental North Growth
Taz #
29 Pop. Estimate (@
2.5 Residents/HH)
Total # of Possible
Units (ERC)
Upland Acreage to be
Developed Total @ 2.5 HH/Acre)
Upland Acreage to be
Developed Total
# of HH in in Sub. Sub. Names Basin Zoned Notes
376.20+ 0 0 0 0 FA & PDG
Acreage (Amounts-10% COM) (Acreages: a.328, b. 104, c. 126 d. 173) 731 total, but a & c go to LS110 & b. & d. go to LS118
(acreage included in Incremental spreadsheet)
LS4110 2625 1050 1050 420LS4118 0 0 0 0
0 Carriage Gate L1100 Assumed Carriage Gate P 2 L1100 Dukes Tract -0 Hutcheson Tract -0 Jacobs Acres -0 Petersville -0 Polite Estates -0 Shell Pointe L120
377.5 1012.5 405 0 0 L111 FA, PDG & G
128 Eagle Crest P10 Eagle Crest P20 Eagle Crest P2
277 Country Walk P1 & P2Country Walk P3
377.10 792.5 317 50 20 L111 FA, PDG & G
Eagle Crest P137 Eagle Crest P2
Country Walk P1 & P2230 Country Walk P3
29. Pop. Estimate
29. REC Estimate
Total 219947.505
*RES & COM #'s came from billing data. If projection was 0 then used RES & COM #'s to account for missing data. Per 1 RES account, 2.5 residents were added to overall population projection.
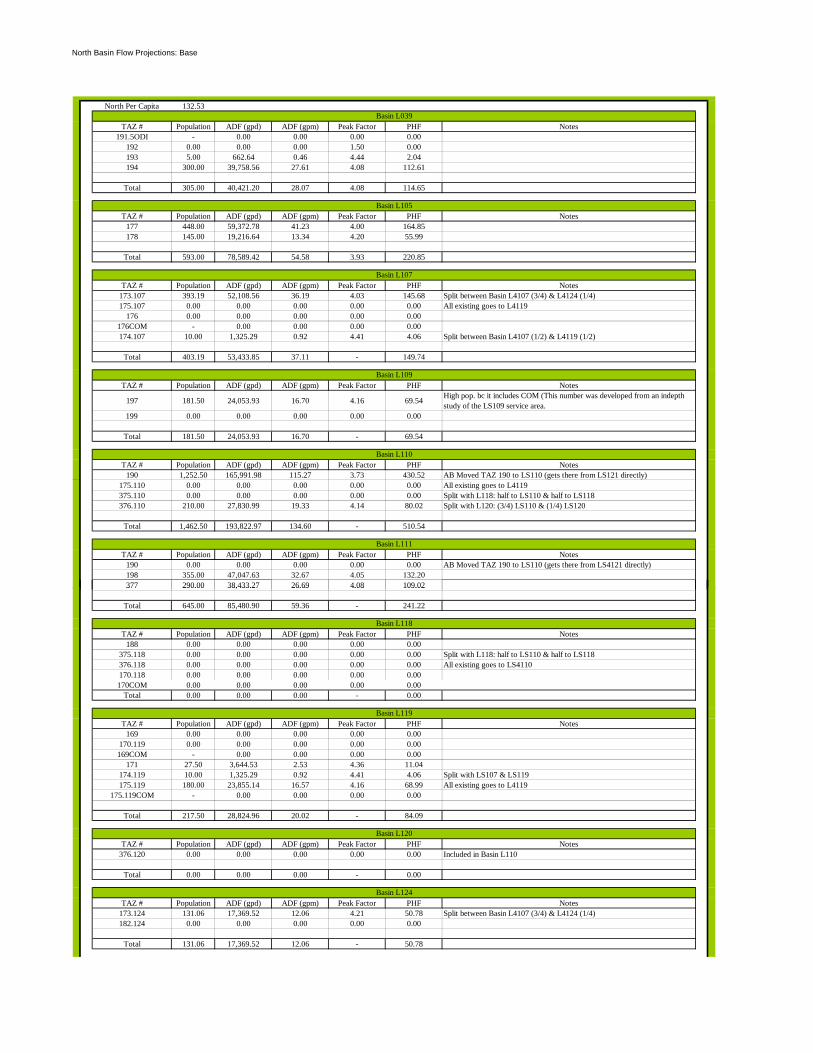
North Basin Flow Projections: Base
North Per Capita 132.53
TAZ # Population ADF (gpd) ADF (gpm) Peak Factor PHF Notes191.5ODI - 0.00 0.00 0.00 0.00
192 0.00 0.00 0.00 1.50 0.00193 5.00 662.64 0.46 4.44 2.04194 300.00 39,758.56 27.61 4.08 112.61
Total 305.00 40,421.20 28.07 4.08 114.65
TAZ # Population ADF (gpd) ADF (gpm) Peak Factor PHF Notes177 448.00 59,372.78 41.23 4.00 164.85178 145.00 19,216.64 13.34 4.20 55.99
Total 593.00 78,589.42 54.58 3.93 220.85
TAZ # Population ADF (gpd) ADF (gpm) Peak Factor PHF Notes173.107 393.19 52,108.56 36.19 4.03 145.68 Split between Basin L4107 (3/4) & L4124 (1/4)175.107 0.00 0.00 0.00 0.00 0.00 All existing goes to L4119
176 0.00 0.00 0.00 0.00 0.00176COM - 0.00 0.00 0.00 0.00174.107 10.00 1,325.29 0.92 4.41 4.06 Split between Basin L4107 (1/2) & L4119 (1/2)
Total 403.19 53,433.85 37.11 - 149.74
TAZ # Population ADF (gpd) ADF (gpm) Peak Factor PHF Notes
197 181.50 24,053.93 16.70 4.16 69.54 High pop. bc it includes COM (This number was developed from an indepth study of the LS109 service area.
199 0.00 0.00 0.00 0.00 0.00
Total 181.50 24,053.93 16.70 - 69.54
TAZ # Population ADF (gpd) ADF (gpm) Peak Factor PHF Notes190 1,252.50 165,991.98 115.27 3.73 430.52 AB Moved TAZ 190 to LS110 (gets there from LS121 directly)
175.110 0.00 0.00 0.00 0.00 0.00 All existing goes to L4119375.110 0.00 0.00 0.00 0.00 0.00 Split with L118: half to LS110 & half to LS118376.110 210.00 27,830.99 19.33 4.14 80.02 Split with L120: (3/4) LS110 & (1/4) LS120
Total 1,462.50 193,822.97 134.60 - 510.54
TAZ # Population ADF (gpd) ADF (gpm) Peak Factor PHF Notes190 0.00 0.00 0.00 0.00 0.00 AB Moved TAZ 190 to LS110 (gets there from LS4121 directly)198 355.00 47,047.63 32.67 4.05 132.20377 290.00 38,433.27 26.69 4.08 109.02
Basin L110
Basin L111
Basin L039
Basin L105
Basin L107
Basin L109
377 290.00 38,433.27 26.69 4.08 109.02
Total 645.00 85,480.90 59.36 - 241.22
TAZ # Population ADF (gpd) ADF (gpm) Peak Factor PHF Notes188 0.00 0.00 0.00 0.00 0.00
375.118 0.00 0.00 0.00 0.00 0.00 Split with L118: half to LS110 & half to LS118376.118 0.00 0.00 0.00 0.00 0.00 All existing goes to LS4110170.118 0.00 0.00 0.00 0.00 0.00170COM 0.00 0.00 0.00 0.00 0.00
Total 0.00 0.00 0.00 - 0.00
TAZ # Population ADF (gpd) ADF (gpm) Peak Factor PHF Notes169 0.00 0.00 0.00 0.00 0.00
170.119 0.00 0.00 0.00 0.00 0.00169COM - 0.00 0.00 0.00 0.00
171 27.50 3,644.53 2.53 4.36 11.04174.119 10.00 1,325.29 0.92 4.41 4.06 Split with LS107 & LS119175.119 180.00 23,855.14 16.57 4.16 68.99 All existing goes to L4119
175.119COM - 0.00 0.00 0.00 0.00
Total 217.50 28,824.96 20.02 - 84.09
TAZ # Population ADF (gpd) ADF (gpm) Peak Factor PHF Notes376.120 0.00 0.00 0.00 0.00 0.00 Included in Basin L110
Total 0.00 0.00 0.00 - 0.00
TAZ # Population ADF (gpd) ADF (gpm) Peak Factor PHF Notes173.124 131.06 17,369.52 12.06 4.21 50.78 Split between Basin L4107 (3/4) & L4124 (1/4)182.124 0.00 0.00 0.00 0.00 0.00
Total 131.06 17,369.52 12.06 - 50.78
Basin L118
Basin L119
Basin L120
Basin L124

North Basin Flow Projections: Base
North Per Capita 132.53
TAZ # Population ADF (gpd) ADF (gpm) Peak Factor PHF Notes182.126 0.00 0.00 0.00 0.00 0.00 Goes to LS4124 basin
332 0.00 0.00 0.00 0.00 0.00333 0.00 0.00 0.00 0.00 0.00 AB moved all to 5 year period given location
Total 0.00 0.00 0.00 - 0.00
TAZ # Population ADF (gpd) ADF (gpm) Peak Factor PHF Notes183 0.00 0.00 0.00 0.00 0.00180 106.75 14,147.42 9.82 4.24 41.61 Actually in north part of LS4036 but put here
Total 106.75 14,147.42 9.82 - 41.61
TAZ # Population ADF (gpd) ADF (gpm) Peak Factor PHF Notes334 0.00 0.00 0.00 0.00 0.00
Total 0.00 0.00 0.00 - 0.00
TAZ # Population ADF (gpd) ADF (gpm) Peak Factor PHF Notes353 & 354 0.00 0.00 0.00 0.00 0.00
Total 0.00 0.00 0.00 - 0.00
TAZ # Population ADF (gpd) ADF (gpm) Peak Factor PHF Notes368 0.00 0.00 0.00 0.00 0.00358 0.00 0.00 0.00 0.00 0.00
Total 0.00 0.00 0.00 - 0.00
TAZ # Population ADF (gpd) ADF (gpm) Peak Factor PHF357 0.00 0.00 0.00 0.00 0.00 Plum Creek Transport Hub359 0.00 0.00 0.00 0.00 0.00 All in 20+ window
Total 0.00 0.00 0.00 - 0.00
TAZ # Population ADF (gpd) ADF (gpm) Peak Factor PHF Notes172 0.00 0.00 0.00 0.00 0.00
172COM - 0.00 0.00 0.00 0.00367 0.00 0.00 0.00 0.00 0.00
Total 0.00 0.00 0.00 - 0.00
Basin L126
Basin OakGrove
LS4127_ TAZ 183
Basin D
Basin Buffalo
Basin Plum Creek_HWY 32
Basin North of LS4126
TAZ # Population ADF (gpd) ADF (gpm) Peak Factor PHF Notes168 0.00 0.00 0.00 0.00 0.00
Total 0.00 0.00 0.00 - 0.00
TAZ # Population ADF (gpd) ADF (gpm) Peak Factor PHF Notes369 0.00 0.00 0.00 0.00 0.00 Out of 2029 window
Total 0.00 0.00 0.00 - 0.00
TAZ # Population ADF (gpd) ADF (gpm) Peak Factor PHF Notes366 0.00 0.00 0.00 0.00 0.00 Split among 10, 15, and 20 year time periods
Total 0.00 0.00 0.00 - 0.00
TAZ # Population ADF (gpd) ADF (gpm) Peak Factor PHF Notes
185 0.00 0.00 0.00 0.00 0.00 0 pop - all either existing on septic or projected to build in 20 year period
Total 0.00 0.00 0.00 - 0.00
Basin Clayhole
Plum Creek_Everett
Possible Future Site of N. Mainland WWTP_TAZ 366
TAZ 185

North Basin Flow Projections: Base
North Per Capita 132.53
TAZ # Population ADF (gpd) ADF (gpm) Peak Factor PHF Notes186 0.00 0.00 0.00 0.00 0.00 10 year window and out
Total 0.00 0.00 0.00 - 0.00
TAZ # Population ADF (gpd) ADF (gpm) Peak Factor PHF Notes187 0.00 0.00 0.00 0.00 0.00 Pop 20+ year window
Total 0.00 0.00 0.00 - 0.00
TAZ # Population ADF (gpd) ADF (gpm) Peak Factor PHF Notes365 0.00 0.00 0.00 0.00 0.00 Pop 20 year and out
Total 0.00 0.00 0.00 - 0.00
TAZ # Population ADF (gpd) ADF (gpm) Peak Factor PHF Notes91 0.00 0.00 0.00 0.00 0.00 Septic
Total 0.00 0.00 0.00 - 0.00
TAZ # Population ADF (gpd) ADF (gpm) Peak Factor PHF Notes167 0.00 0.00 0.00 0.00 0.00 Pop 50+ year and out349 0.00 0.00 0.00 0.00 0.00 Pop 50+ year and out350 0.00 0.00 0.00 0.00 0.00 Pop 50+ year and out352 0.00 0.00 0.00 0.00 0.00 Pop 50+ year and out356 0.00 0.00 0.00 0.00 0.00 Pop 50+ year and out363 0.00 0.00 0.00 0.00 0.00 Pop 50+ year and out364 0.00 0.00 0.00 0.00 0.00 Pop 50+ year and out370 0.00 0.00 0.00 0.00 0.00 Pop 50+ year and out371 0.00 0.00 0.00 0.00 0.00 Pop 50+ year and out
Total 0.00 0.00 0.00 - 0.00
Total Base 4,046 536,144 372 - 1,483
Septic
Next to County Line 50+
TAZ 186
TAZ 187
TAZ_365

North Basin Flow Projections: Year 5
North Per Capita 132.53
TAZ # Population ADF (gpd) ADF (gpm) Peak Factor PHF Notes191.5ODI - 72,310.00 50.22 1.50 75.32 ODI per T& H Acrage
192.5 - 100,000.00 69.44 1.50 104.17 Airport: Adding 100,000 gpd (based on billing records)193.5 0.00 0.00 0.00 0.00 0.00194.5 935.00 123,914.18 86.05 3.82 328.60
Total 935.00 296,224.18 205.71 - 508.09
TAZ # Population ADF (gpd) ADF (gpm) Peak Factor PHF Notes177.5 920.00 121,926.25 84.67 3.82 323.70178.5 25.00 3,313.21 2.30 4.37 10.05
Total 945.00 125,239.46 86.97 - 333.75
TAZ # Population ADF (gpd) ADF (gpm) Peak Factor PHF Notes173.107.5 1,894.69 251,100.15 174.38 3.60 628.44 Split between Basin L4107 (3/4) & L4124 (1/4)
175.107.5 - 160,000.00 111.11 - 278.00 Pinecrest: 1/2 South portion (ADF & PHF based on Ray Tarker's calculations)
176.5 190.63 25,263.25 17.54 4.16 370.90
176.5COM - 174,000.00 120.83 - 320.40
Pinecrest: 1/2 South portion (ADF & PHF based on Ray Tarker's calculations) + 14000 gpm COM from billing records. (320.4 PHF = 278 (R.T) + 42.4) (The 42.4 is derived from the 14000 ADF gpm: 14000=p(132.53(per capita)), where p is equivalent to population. So p = 105.63. The peak factor is 4.24 which comes from (18+SQRT(105.63/1000))/(4+SQRT(105.63/1000)) Therfore, the PHF is 42.34 from (4.24*10ADF (gpm) (10 = 14000 gpd / 1440))
174.107.5 0.00 0.00 0.00 0.00 0.00 Split between Basin L4107 (1/2) & L4119 (1/2)
Total 2,085.31 610,363.40 423.86 - 1,597.74
TAZ # Population ADF (gpd) ADF (gpm) Peak Factor PHF Notes
197.5 3,765.63 584,766.00 406.09 - 811.00High pop. bc it includes COM (This number was developed from an indepth study of the LS109 service area. (ADF 584766 PHF 811 from Memo)
199.5 0.00 0.00 0.00 0.00 0.00 52.5 Pop. - but trapped btwn I-95 and Golden Isles Pkway - assume will be septic
Total 3,765.63 584,766.00 406.09 - 811.00
TAZ # Population ADF (gpd) ADF (gpm) Peak Factor PHF Notes
Basin L039
Basin L105
Basin L107
Basin L109
Basin L110TAZ # Population ADF (gpd) ADF (gpm) Peak Factor PHF Notes190.5 2,032.50 269,364.24 187.06 3.58 669.73 AB Moved TAZ 190 to LS110 (gets there from LS4121 directly)
175.110.5 - 162,000.00 112.50 - 281.00 Pinecrest: Middle portion (ADF & PHF based on Ray Tarker's calculations)
375.110.5 968.75 128,387.01 89.16 3.81 339.59 Split with L118: half to LS110 & half to LS118
376.110.5 1,207.50 160,028.20 111.13 3.75 416.26 Split with L118: acrage a & c are in L110 + carriage gate & shell point (LS118: acrage b&d only)
Total 4,208.75 719,779.45 499.85 - 1,706.58
TAZ # Population ADF (gpd) ADF (gpm) Peak Factor PHF Notes190.5 0.00 0.00 0.00 0.00 0.00 AB Moved TAZ 190 to LS110 (gets there from LS4121 directly)198.5 362.50 48,041.59 33.36 4.04 134.85377.5 1,012.50 134,185.14 93.18 3.80 353.77
Total 1,375.00 182,226.73 126.55 - 488.63
TAZ # Population ADF (gpd) ADF (gpm) Peak Factor PHF Notes188.5 22.50 2,981.89 2.07 4.37 9.06
375.118.5 968.75 128,387.01 89.16 3.81 339.59 Split with L118: half to LS110 & half to LS118
376.118.5 0.00 0.00 0.00 0.00 0.00 Split with L110: acrage a & c are in L110 + carriage gate & shell point (LS118: acrage b&d only)
170.118.5 500.00 66,264.26 46.02 3.97 182.88 Split with LS118 & LS119
175.118.5COM - 681,000.00 472.92 - 1,182.00 Pinecrest: Northern portion (ADF & PHF based on Ray Tarker's calculations) (Was 175.118.5COM, but loaded flow into MH and not LS)
Total 1,491.25 197,633.17 610.17 - 1,713.53170.5COM NW QUAD took out all COM: moved Pinecrest form 119 to 118 and did not want to insert row, so deleted 170.5COM (Note: 82% of NW Quad COM)
Basin L111
Basin L118
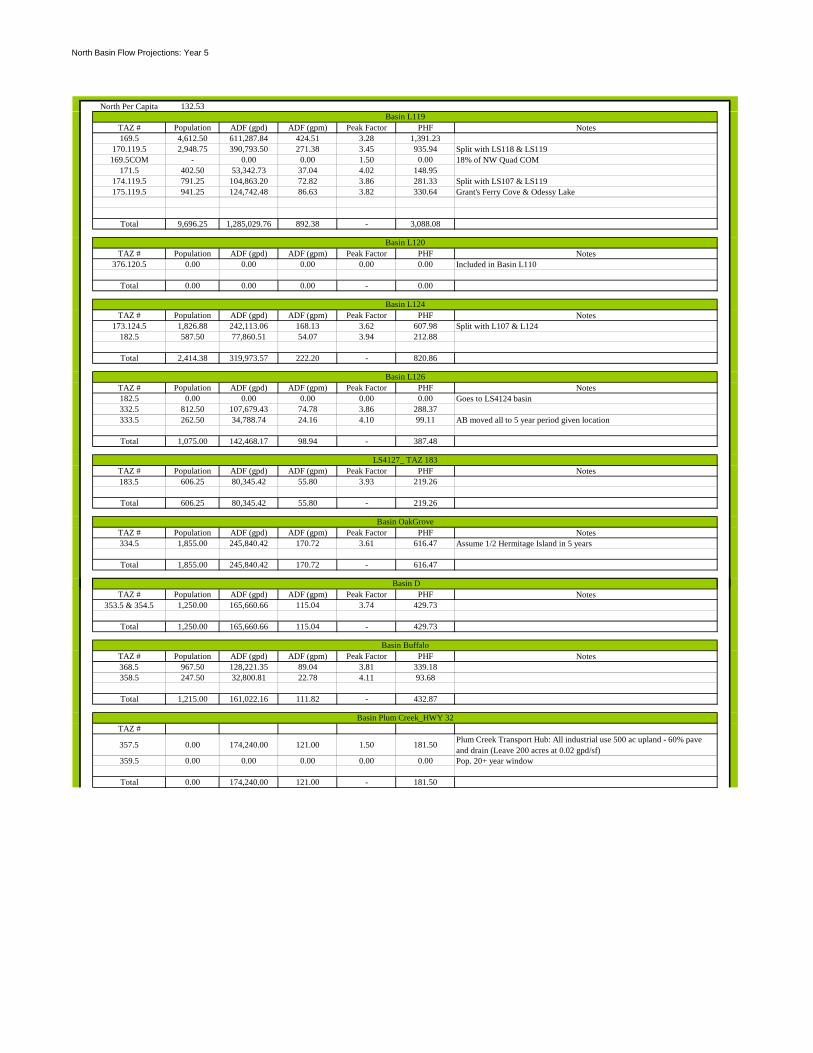
North Basin Flow Projections: Year 5
North Per Capita 132.53
TAZ # Population ADF (gpd) ADF (gpm) Peak Factor PHF Notes169.5 4,612.50 611,287.84 424.51 3.28 1,391.23
170.119.5 2,948.75 390,793.50 271.38 3.45 935.94 Split with LS118 & LS119169.5COM - 0.00 0.00 1.50 0.00 18% of NW Quad COM
171.5 402.50 53,342.73 37.04 4.02 148.95174.119.5 791.25 104,863.20 72.82 3.86 281.33 Split with LS107 & LS119175.119.5 941.25 124,742.48 86.63 3.82 330.64 Grant's Ferry Cove & Odessy Lake
Total 9,696.25 1,285,029.76 892.38 - 3,088.08
TAZ # Population ADF (gpd) ADF (gpm) Peak Factor PHF Notes376.120.5 0.00 0.00 0.00 0.00 0.00 Included in Basin L110
Total 0.00 0.00 0.00 - 0.00
TAZ # Population ADF (gpd) ADF (gpm) Peak Factor PHF Notes173.124.5 1,826.88 242,113.06 168.13 3.62 607.98 Split with L107 & L124
182.5 587.50 77,860.51 54.07 3.94 212.88
Total 2,414.38 319,973.57 222.20 - 820.86
TAZ # Population ADF (gpd) ADF (gpm) Peak Factor PHF Notes182.5 0.00 0.00 0.00 0.00 0.00 Goes to LS4124 basin332.5 812.50 107,679.43 74.78 3.86 288.37333.5 262.50 34,788.74 24.16 4.10 99.11 AB moved all to 5 year period given location
Total 1,075.00 142,468.17 98.94 - 387.48
TAZ # Population ADF (gpd) ADF (gpm) Peak Factor PHF Notes183.5 606.25 80,345.42 55.80 3.93 219.26
Total 606.25 80,345.42 55.80 - 219.26
TAZ # Population ADF (gpd) ADF (gpm) Peak Factor PHF Notes334.5 1,855.00 245,840.42 170.72 3.61 616.47 Assume 1/2 Hermitage Island in 5 years
Total 1,855.00 245,840.42 170.72 - 616.47
Basin OakGrove
Basin D
LS4127_ TAZ 183
Basin L120
Basin L124
Basin L126
Basin L119
TAZ # Population ADF (gpd) ADF (gpm) Peak Factor PHF Notes353.5 & 354.5 1,250.00 165,660.66 115.04 3.74 429.73
Total 1,250.00 165,660.66 115.04 - 429.73
TAZ # Population ADF (gpd) ADF (gpm) Peak Factor PHF Notes368.5 967.50 128,221.35 89.04 3.81 339.18358.5 247.50 32,800.81 22.78 4.11 93.68
Total 1,215.00 161,022.16 111.82 - 432.87
TAZ #
357.5 0.00 174,240.00 121.00 1.50 181.50 Plum Creek Transport Hub: All industrial use 500 ac upland - 60% pave and drain (Leave 200 acres at 0.02 gpd/sf)
359.5 0.00 0.00 0.00 0.00 0.00 Pop. 20+ year window
Total 0.00 174,240.00 121.00 - 181.50
Basin Buffalo
Basin Plum Creek_HWY 32

North Basin Flow Projections: Year 5
North Per Capita 132.53
TAZ # Population ADF (gpd) ADF (gpm) Peak Factor PHF Notes172.5 151.88 20,127.77 13.98 4.19 58.56
172.5COM - 43,560.00 30.25 1.50 45.38 Added in 43560 gpd for sewer generation rate from industrial area367.5 190.63 25,263.25 17.54 4.16 72.90
Total 342.50 88,951.02 61.77 - 176.84
TAZ # Population ADF (gpd) ADF (gpm) Peak Factor PHF Notes168.5 0.00 0.00 0.00 0.00 0.00
Total 0.00 0.00 0.00 - 0.00
TAZ # Population ADF (gpd) ADF (gpm) Peak Factor PHF Notes369.5 0.00 0.00 0.00 0.00 0.00 Out of 2029 window
Total 0.00 0.00 0.00 - 0.00
TAZ # Population ADF (gpd) ADF (gpm) Peak Factor PHF Notes366.5 0.00 0.00 0.00 0.00 0.00
Total 0.00 0.00 0.00 - 0.00
TAZ # Population ADF (gpd) ADF (gpm) Peak Factor PHF Notes
185.5 0.00 0.00 0.00 0.00 0.00 0 pop - all either existing on septic or projected to build in 20 year window
Total 0.00 0.00 0.00 - 0.00
TAZ # Population ADF (gpd) ADF (gpm) Peak Factor PHF Notes186.5 0.00 0.00 0.00 0.00 0.00 Pop. 10 year window
Total 0.00 0.00 0.00 - 0.00
TAZ # Population ADF (gpd) ADF (gpm) Peak Factor PHF Notes187.5 0.00 0.00 0.00 0.00 0.00 Pop 20+ year window
Total 0.00 0.00 0.00 - 0.00
Basin Clayhole
Basin North of LS4126
TAZ 187
TAZ 365
Plum Creek_Everett
Possible Future Site of N. Mainland WWTP_TAZ 366
TAZ 186
TAZ 185
TAZ # Population ADF (gpd) ADF (gpm) Peak Factor PHF Notes365.5 0.00 0.00 0.00 0.00 0.00 Pop 20 year window
Total 0.00 0.00 0.00 - 0.00
TAZ # Population ADF (gpd) ADF (gpm) Peak Factor PHF Notes91.5 0.00 0.00 0.00 0.00 0.00 Septic
Total 0.00 0.00 0.00 - 0.00
TAZ # Population ADF (gpd) ADF (gpm) Peak Factor PHF Notes167.5 0.00 0.00 0.00 0.00 0.00 Pop 50+ year and out349.5 0.00 0.00 0.00 0.00 0.00 Pop 50+ year and out350.5 0.00 0.00 0.00 0.00 0.00 Pop 50+ year and out352.5 0.00 0.00 0.00 0.00 0.00 Pop 50+ year and out356.5 0.00 0.00 0.00 0.00 0.00 Pop 50+ year and out363.5 0.00 0.00 0.00 0.00 0.00 Pop 50+ year and out364.5 0.00 0.00 0.00 0.00 0.00 Pop 50+ year and out370.5 0.00 0.00 0.00 0.00 0.00 Pop 50+ year and out371.5 0.00 0.00 0.00 0.00 0.00 Pop 50+ year and out
Total 0.00 0.00 0.00 - 0.00
Total 2014 33,260 5,379,764 4,209 - 13,512
Septic
Next to County Line 50+
TAZ_365
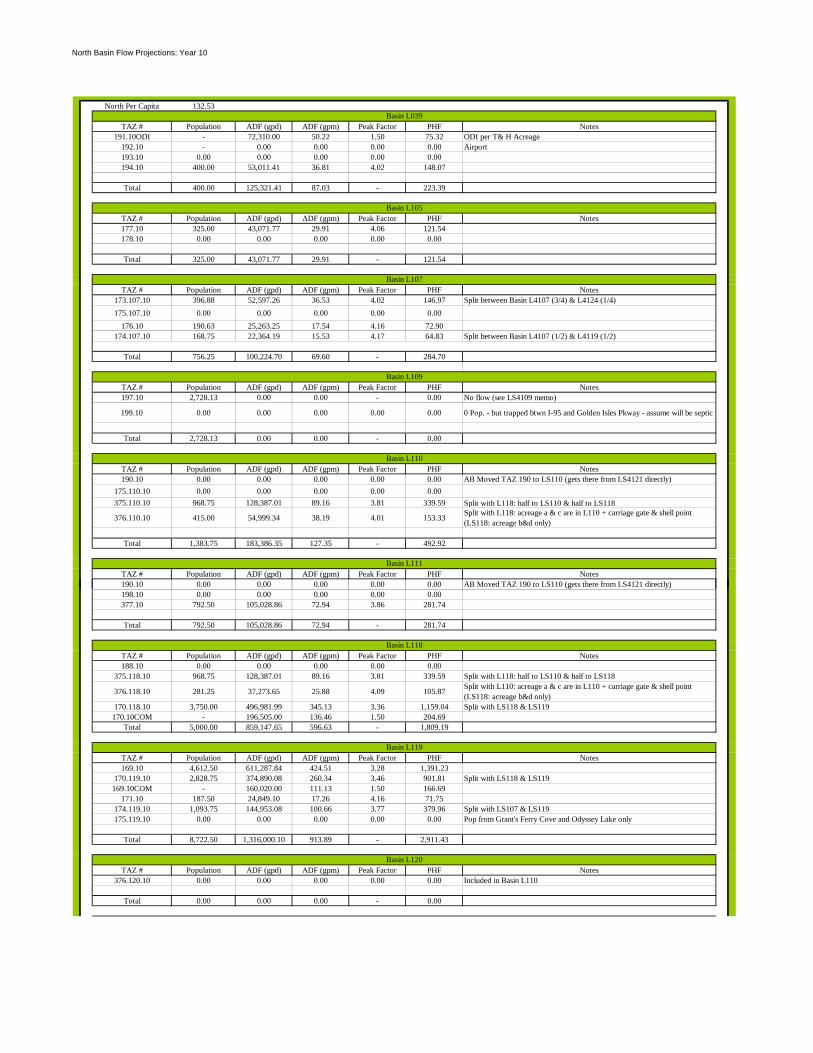
North Basin Flow Projections: Year 10
North Per Capita 132.53
TAZ # Population ADF (gpd) ADF (gpm) Peak Factor PHF Notes191.10ODI - 72,310.00 50.22 1.50 75.32 ODI per T& H Acreage
192.10 - 0.00 0.00 0.00 0.00 Airport193.10 0.00 0.00 0.00 0.00 0.00194.10 400.00 53,011.41 36.81 4.02 148.07
Total 400.00 125,321.41 87.03 - 223.39
TAZ # Population ADF (gpd) ADF (gpm) Peak Factor PHF Notes177.10 325.00 43,071.77 29.91 4.06 121.54178.10 0.00 0.00 0.00 0.00 0.00
Total 325.00 43,071.77 29.91 - 121.54
TAZ # Population ADF (gpd) ADF (gpm) Peak Factor PHF Notes173.107.10 396.88 52,597.26 36.53 4.02 146.97 Split between Basin L4107 (3/4) & L4124 (1/4)175.107.10 0.00 0.00 0.00 0.00 0.00
176.10 190.63 25,263.25 17.54 4.16 72.90174.107.10 168.75 22,364.19 15.53 4.17 64.83 Split between Basin L4107 (1/2) & L4119 (1/2)
Total 756.25 100,224.70 69.60 - 284.70
TAZ # Population ADF (gpd) ADF (gpm) Peak Factor PHF Notes197.10 2,728.13 0.00 0.00 - 0.00 No flow (see LS4109 memo)
199.10 0.00 0.00 0.00 0.00 0.00 0 Pop. - but trapped btwn I-95 and Golden Isles Pkway - assume will be septic
Total 2,728.13 0.00 0.00 - 0.00
TAZ # Population ADF (gpd) ADF (gpm) Peak Factor PHF Notes190.10 0.00 0.00 0.00 0.00 0.00 AB Moved TAZ 190 to LS110 (gets there from LS4121 directly)
175.110.10 0.00 0.00 0.00 0.00 0.00375.110.10 968.75 128,387.01 89.16 3.81 339.59 Split with L118: half to LS110 & half to LS118
376.110.10 415.00 54,999.34 38.19 4.01 153.33 Split with L118: acreage a & c are in L110 + carriage gate & shell point (LS118: acreage b&d only)
Total 1,383.75 183,386.35 127.35 - 492.92
TAZ # Population ADF (gpd) ADF (gpm) Peak Factor PHF Notes190.10 0.00 0.00 0.00 0.00 0.00 AB Moved TAZ 190 to LS110 (gets there from LS4121 directly)
Basin L111
Basin L039
Basin L105
Basin L107
Basin L109
Basin L110
(g y)198.10 0.00 0.00 0.00 0.00 0.00377.10 792.50 105,028.86 72.94 3.86 281.74
Total 792.50 105,028.86 72.94 - 281.74
TAZ # Population ADF (gpd) ADF (gpm) Peak Factor PHF Notes188.10 0.00 0.00 0.00 0.00 0.00
375.118.10 968.75 128,387.01 89.16 3.81 339.59 Split with L118: half to LS110 & half to LS118
376.118.10 281.25 37,273.65 25.88 4.09 105.87 Split with L110: acreage a & c are in L110 + carriage gate & shell point (LS118: acreage b&d only)
170.118.10 3,750.00 496,981.99 345.13 3.36 1,159.04 Split with LS118 & LS119170.10COM - 196,505.00 136.46 1.50 204.69
Total 5,000.00 859,147.65 596.63 - 1,809.19
TAZ # Population ADF (gpd) ADF (gpm) Peak Factor PHF Notes169.10 4,612.50 611,287.84 424.51 3.28 1,391.23
170.119.10 2,828.75 374,890.08 260.34 3.46 901.81 Split with LS118 & LS119169.10COM - 160,020.00 111.13 1.50 166.69
171.10 187.50 24,849.10 17.26 4.16 71.75174.119.10 1,093.75 144,953.08 100.66 3.77 379.96 Split with LS107 & LS119175.119.10 0.00 0.00 0.00 0.00 0.00 Pop from Grant's Ferry Cove and Odyssey Lake only
Total 8,722.50 1,316,000.10 913.89 - 2,911.43
TAZ # Population ADF (gpd) ADF (gpm) Peak Factor PHF Notes376.120.10 0.00 0.00 0.00 0.00 0.00 Included in Basin L110
Total 0.00 0.00 0.00 - 0.00
Basin L118
Basin L119
Basin L120

North Basin Flow Projections: Year 10
North Per Capita 132.53
TAZ # Population ADF (gpd) ADF (gpm) Peak Factor PHF Notes173.124.10 715.63 94,840.73 65.86 3.89 256.14 Split with L107 & L124
182.10 587.50 77,860.51 54.07 3.94 212.88
Total 1,303.13 172,701.24 119.93 - 469.02
TAZ # Population ADF (gpd) ADF (gpm) Peak Factor PHF Notes182.10 0.00 0.00 0.00 0.00 0.00 Goes to LS4124 basin332.10 812.50 107,679.43 74.78 3.86 288.37333.10 0.00 0.00 0.00 0.00 0.00 AB moved all to 5 year period given location
Total 812.50 107,679.43 74.78 - 288.37
TAZ # Population ADF (gpd) ADF (gpm) Peak Factor PHF Notes183.10 556.25 73,718.99 51.19 3.95 202.21
Total 556.25 73,718.99 51.19 - 202.21
TAZ # Population ADF (gpd) ADF (gpm) Peak Factor PHF Notes334.10 1,855.00 245,840.42 170.72 3.61 616.47 Assume other 1/2 Hermitage Island in 10 years
Total 1,855.00 245,840.42 170.72 - 616.47
TAZ # Population ADF (gpd) ADF (gpm) Peak Factor PHF Notes353.10 & 354.10 2,520.00 333,971.89 231.92 3.51 813.04
Total 2,520.00 333,971.89 231.92 - 813.04
TAZ # Population ADF (gpd) ADF (gpm) Peak Factor PHF Notes368.10 967.50 128,221.35 89.04 3.81 339.18358.10 247.50 32,800.81 22.78 4.11 93.68
Total 1,215.00 161,022.16 111.82 - 432.87
TAZ # Population ADF (gpd) ADF (gpm) Peak Factor PHF Notes
357.10 0.00 174,240.00 121.00 1.50 181.50 Plum Creek Transport Hub: All industrial use 500 ac upland - 60% pave and drain (Leave 200 acres at 0.02 gpd/sf)
359.10 0.00 0.00 0.00 0.00 0.00 All in 20+ window
Total 0.00 174,240.00 121.00 - 181.50
Basin L124
Basin L126
Basin OakGrove
LS4127_ TAZ 183
Basin Basin D
Basin Buffalo
Basin Plum Creek_HWY 32
Total 0.00 174,240.00 121.00 - 181.50
TAZ # Population ADF (gpd) ADF (gpm) Peak Factor PHF Notes172.10 151.88 20,127.77 13.98 4.19 58.56
172.10COM - 43,560.00 30.25 1.50 45.38 Added in 43560 gpd for sewer generation rate from industrial area367.10 190.63 25,263.25 17.54 4.16 72.90
Total 342.50 88,951.02 61.77 - 176.84
TAZ # Population ADF (gpd) ADF (gpm) Peak Factor PHF Notes168.10 0.00 0.00 0.00 0.00 0.00
Total 0.00 0.00 0.00 0.00
TAZ # Population ADF (gpd) ADF (gpm) Peak Factor PHF Notes369.10 0.00 0.00 0.00 0.00 0.00 Out of 2029 window
Total 0.00 0.00 0.00 - 0.00
TAZ # Population ADF (gpd) ADF (gpm) Peak Factor PHF Notes366.10 405.00 53,674.05 37.27 4.02 149.82
Total 405.00 53,674.05 37.27 - 149.82
Plum Creek_Everett
Basin North of LS4126
Basin Clayhole
Possible Future Site of N. Mainland WWTP_TAZ 366

North Basin Flow Projections: Year 10
North Per Capita 132.53
TAZ # Population ADF (gpd) ADF (gpm) Peak Factor PHF Notes185.10 0.00 0.00 0.00 0.00 0.00 All either existing on septic or projected to build in 20 year period
Total 0.00 0.00 0.00 - 0.00
TAZ # Population ADF (gpd) ADF (gpm) Peak Factor PHF Notes186.10 180.00 23,855.14 16.57 4.16 68.99
Total 180.00 23,855.14 16.57 - 68.99
TAZ # Population ADF (gpd) ADF (gpm) Peak Factor PHF Notes187.10 0.00 0.00 0.00 0.00 0.00 Pop 20+ year window
Total 0.00 0.00 0.00 - 0.00
TAZ # Population ADF (gpd) ADF (gpm) Peak Factor PHF Notes365.10 0.00 0.00 0.00 0.00 0.00 Pop 20 year and out
Total 0.00 0.00 0.00 - 0.00
TAZ # Population ADF (gpd) ADF (gpm) Peak Factor PHF Notes91.10 0.00 0.00 0.00 0.00 0.00 Septic
Total 0.00 0.00 0.00 - 0.00
TAZ # Population ADF (gpd) ADF (gpm) Peak Factor PHF Notes167.10 0.00 0.00 0.00 0.00 0.00 Pop 20+ year
Total 0.00 0.00 0.00 - 0.00
Total 2014 29,298 4,167,835 2,894 - 9,524
Septic
Pop 20+ Year & Out
TAZ 187
TAZ_365
TAZ 186
TAZ 185

North Basin Flow Projections: Year 15
North Per Capita 132.53
TAZ # Population ADF (gpd) ADF (gpm) Peak Factor PHF Notes191.15ODI - 0.00 0.00 0.00 0.00 ODI per T& H Acreage
192.15 - 0.00 0.00 0.00 0.00 Airport193.15 0.00 0.00 0.00 0.00 0.00194.15 0.00 0.00 0.00 0.00 0.00
Total 0.00 0.00 0.00 - 0.00
TAZ # Population ADF (gpd) ADF (gpm) Peak Factor PHF Notes177.15 0.00 0.00 0.00 0.00 0.00178.15 0.00 0.00 0.00 0.00 0.00
Total 0.00 0.00 0.00 - 0.00
TAZ # Population ADF (gpd) ADF (gpm) Peak Factor PHF Notes173.107.15 0.00 0.00 0.00 4.50 0.00 Split between Basin L4107 (3/4) & L4124 (1/4)175.107.15 0.00 0.00 0.00 0.00 0.00
176.15 0.00 0.00 0.00 0.00 0.00174.107.15 168.75 22,364.19 15.53 4.17 64.83 Split between Basin L4107 (1/2) & L4119 (1/2)
Total 168.75 22,364.19 15.53 - 64.83
TAZ # Population ADF (gpd) ADF (gpm) Peak Factor PHF Notes197.15 0.00 0.00 0.00 0.00 0.00 No flow (see LS4109 memo)
199.15 0.00 0.00 0.00 0.00 0.00 0 Pop. - but trapped btwn I-95 and Golden Isles Pkway - assume will be septic
Total 0.00 0.00 0.00 - 0.00
TAZ # Population ADF (gpd) ADF (gpm) Peak Factor PHF Notes190.15 0.00 0.00 0.00 0.00 0.00 AB Moved TAZ 190 to LS110 (gets there from LS4121 directly)
175.110.15 0.00 0.00 0.00 0.00 0.00375.110.15 0.00 0.00 0.00 0.00 0.00 Split with L118: half to LS110 & half to LS118
376.110.15 275.00 36,445.35 25.31 4.09 103.62 Split with L118: acreage a & c are in L110 + carriage gate & shell point (LS118: acreage b&d only)
Total 275.00 36,445.35 25.31 - 103.62
Basin L039
Basin L105
Basin L107
Basin L109
Basin L110
Basin L111TAZ # Population ADF (gpd) ADF (gpm) Peak Factor PHF Notes190.15 0.00 0.00 0.00 0.00 0.00 AB Moved TAZ 190 to LS110 (gets there from LS4121 directly)198.15 0.00 0.00 0.00 0.00 0.00377.15 0.00 0.00 0.00 0.00 0.00
Total 0.00 0.00 0.00 - 0.00
TAZ # Population ADF (gpd) ADF (gpm) Peak Factor PHF Notes188.15 0.00 0.00 0.00 0.00 0.00
375.118.15 0.00 0.00 0.00 0.00 0.00 Split with L118: half to LS110 & half to LS118
376.118.15 0.00 0.00 0.00 0.00 0.00 Split with L110: acreage a & c are in L110 + carriage gate & shell point (LS118: acreage b&d only)
170.118.15 3,750.00 496,981.99 345.13 3.36 1,159.04 Split with LS118 & LS119170.15COM - 400,050.00 277.81 1.50 416.72
Total 3,750.00 897,031.99 622.94 - 1,575.76
TAZ # Population ADF (gpd) ADF (gpm) Peak Factor PHF Notes169.15 3,220.00 426,741.87 296.35 3.42 1,012.36
170.119.15 1,572.50 208,401.11 144.72 3.66 530.36 Split with LS118 & LS119169.15COM - 213,360.00 148.17 2.50 370.42
171.15 187.50 24,849.10 17.26 4.16 71.75174.119.15 750.00 99,396.40 69.03 3.88 267.62 Split with LS107 & LS119175.119.15 0.00 0.00 0.00 0.00 0.00
Total 5,730.00 972,748.47 675.52 - 2,252.50
TAZ # Population ADF (gpd) ADF (gpm) Peak Factor PHF Notes376.120.15 0.00 0.00 0.00 0.00 0.00 Included in Basin L110
Total 0.00 0.00 0.00 - 0.00
Basin L118
Basin L119
Basin L120
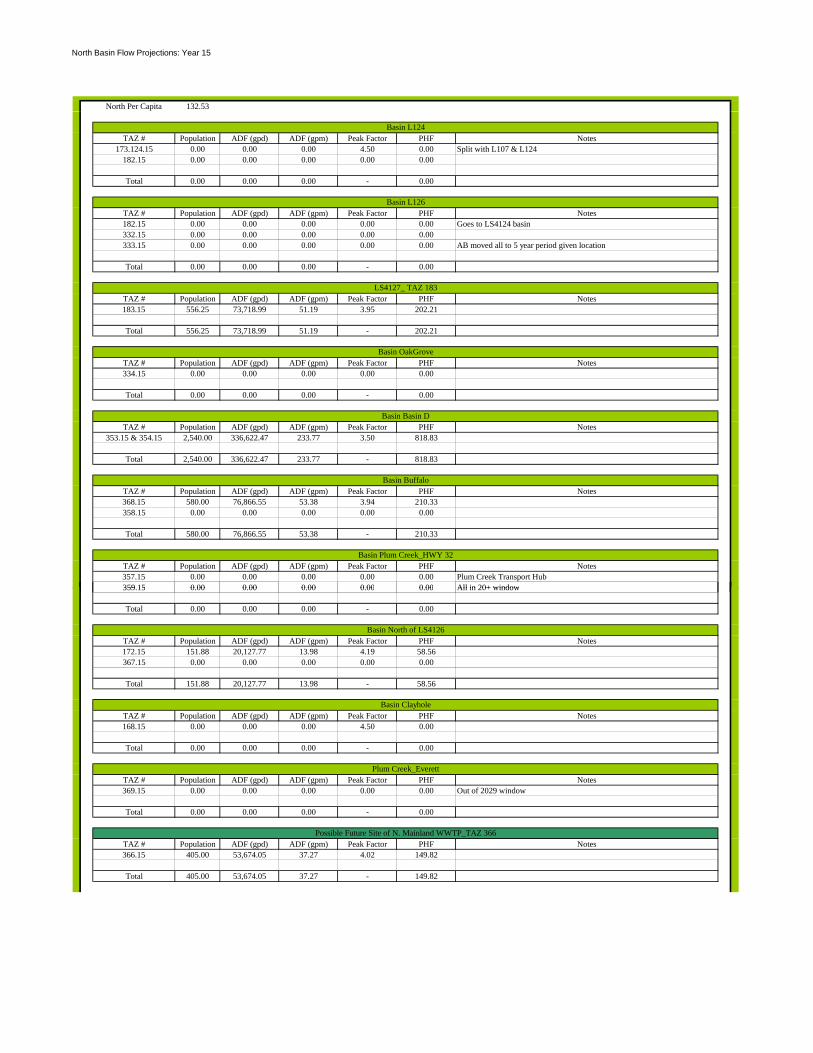
North Basin Flow Projections: Year 15
North Per Capita 132.53
TAZ # Population ADF (gpd) ADF (gpm) Peak Factor PHF Notes173.124.15 0.00 0.00 0.00 4.50 0.00 Split with L107 & L124
182.15 0.00 0.00 0.00 0.00 0.00
Total 0.00 0.00 0.00 - 0.00
TAZ # Population ADF (gpd) ADF (gpm) Peak Factor PHF Notes182.15 0.00 0.00 0.00 0.00 0.00 Goes to LS4124 basin332.15 0.00 0.00 0.00 0.00 0.00333.15 0.00 0.00 0.00 0.00 0.00 AB moved all to 5 year period given location
Total 0.00 0.00 0.00 - 0.00
TAZ # Population ADF (gpd) ADF (gpm) Peak Factor PHF Notes183.15 556.25 73,718.99 51.19 3.95 202.21
Total 556.25 73,718.99 51.19 - 202.21
TAZ # Population ADF (gpd) ADF (gpm) Peak Factor PHF Notes334.15 0.00 0.00 0.00 0.00 0.00
Total 0.00 0.00 0.00 - 0.00
TAZ # Population ADF (gpd) ADF (gpm) Peak Factor PHF Notes353.15 & 354.15 2,540.00 336,622.47 233.77 3.50 818.83
Total 2,540.00 336,622.47 233.77 - 818.83
TAZ # Population ADF (gpd) ADF (gpm) Peak Factor PHF Notes368.15 580.00 76,866.55 53.38 3.94 210.33358.15 0.00 0.00 0.00 0.00 0.00
Total 580.00 76,866.55 53.38 - 210.33
TAZ # Population ADF (gpd) ADF (gpm) Peak Factor PHF Notes357.15 0.00 0.00 0.00 0.00 0.00 Plum Creek Transport Hub359 15 0 00 0 00 0 00 0 00 0 00 All in 20+ window
Basin L124
Basin L126
Basin OakGrove
LS4127_ TAZ 183
Basin Basin D
Basin Buffalo
Basin Plum Creek_HWY 32
359.15 0.00 0.00 0.00 0.00 0.00 All in 20+ window
Total 0.00 0.00 0.00 - 0.00
TAZ # Population ADF (gpd) ADF (gpm) Peak Factor PHF Notes172.15 151.88 20,127.77 13.98 4.19 58.56367.15 0.00 0.00 0.00 0.00 0.00
Total 151.88 20,127.77 13.98 - 58.56
TAZ # Population ADF (gpd) ADF (gpm) Peak Factor PHF Notes168.15 0.00 0.00 0.00 4.50 0.00
Total 0.00 0.00 0.00 - 0.00
TAZ # Population ADF (gpd) ADF (gpm) Peak Factor PHF Notes369.15 0.00 0.00 0.00 0.00 0.00 Out of 2029 window
Total 0.00 0.00 0.00 - 0.00
TAZ # Population ADF (gpd) ADF (gpm) Peak Factor PHF Notes366.15 405.00 53,674.05 37.27 4.02 149.82
Total 405.00 53,674.05 37.27 - 149.82
Plum Creek_Everett
Possible Future Site of N. Mainland WWTP_TAZ 366
Basin North of LS4126
Basin Clayhole

North Basin Flow Projections: Year 15
North Per Capita 132.53
TAZ # Population ADF (gpd) ADF (gpm) Peak Factor PHF Notes185.15 0.00 0.00 0.00 4.50 0.00 All either existing on septic or projected to build in 20 year period
Total 0.00 0.00 0.00 - 0.00
TAZ # Population ADF (gpd) ADF (gpm) Peak Factor PHF Notes186.15 532.50 70,571.44 49.01 3.96 194.07
Total 532.50 70,571.44 49.01 - 194.07
TAZ # Population ADF (gpd) ADF (gpm) Peak Factor PHF Notes187.15 0.00 0.00 0.00 0.00 0.00 Pop 20+ year window
Total 0.00 0.00 0.00 - 0.00
TAZ # Population ADF (gpd) ADF (gpm) Peak Factor PHF Notes365.15 0.00 0.00 0.00 0.00 0.00 Pop 20 year and out
Total 0.00 0.00 0.00 - 0.00
TAZ # Population ADF (gpd) ADF (gpm) Peak Factor PHF Notes91.15 0.00 0.00 0.00 0.00 0.00 Septic
Total 0.00 0.00 0.00 - 0.00
TAZ # Population ADF (gpd) ADF (gpm) Peak Factor PHF Notes167.15 0.00 0.00 0.00 0.00 0.00 Pop 20+ year and out
Total 0.00 0.00 0.00 - 0.00
Total 2014 14,689 2,560,171 1,778 - 5,631
TAZ 185
Septic
Pop 20+ Year & Out
TAZ 187
TAZ_365
TAZ 186

North Basin Flow Projections: Year 20
North Per Capita 132.53
TAZ # Population ADF (gpd) ADF (gpm) Peak Factor PHF Notes191.20ODI - 0.00 0.00 0.00 0.00 ODI per T& H Acreage
192.20 - 0.00 0.00 0.00 0.00 Airport193.20 0.00 0.00 0.00 0.00 0.00194.20 0.00 0.00 0.00 0.00 0.00
Total 0.00 0.00 0.00 - 0.00
TAZ # Population ADF (gpd) ADF (gpm) Peak Factor PHF Notes177.20 0.00 0.00 0.00 0.00 0.00178.20 0.00 0.00 0.00 0.00 0.00
Total 0.00 0.00 0.00 - 0.00
TAZ # Population ADF (gpd) ADF (gpm) Peak Factor PHF Notes173.107.20 0.00 0.00 0.00 0.00 0.00 Split between Basin L4107 (3/4) & L4124 (1/4)175.107.20 0.00 0.00 0.00 0.00 0.00
176.20 0.00 0.00 0.00 0.00 0.00174.107.5 0.00 0.00 0.00 0.00 0.00 Split between Basin L4107 (1/2) & L4119 (1/2)
Total 0.00 0.00 0.00 - 0.00
TAZ # Population ADF (gpd) ADF (gpm) Peak Factor PHF Notes197.20 0.00 63,600.00 44.17 - 110.00 Number from indepth study of LS4109
199.20 0.00 0.00 0.00 0.00 0.00 0 Pop. - but trapped btwn I-95 and Golden Isles Pkway - assume will be septic
Total 0.00 63,600.00 44.17 - 110.00
TAZ # Population ADF (gpd) ADF (gpm) Peak Factor PHF Notes190.20 0.00 0.00 0.00 0.00 0.00 AB Moved TAZ 190 to LS110 (gets there from LS4121 directly)
175.110.20 0.00 0.00 0.00 0.00 0.00375.110.20 0.00 0.00 0.00 0.00 0.00 Split with L118: half to LS110 & half to LS118
376.110.20 237.50 31,475.53 21.86 4.12 90.05 Split with L118: acreage a & c are in L110 + carriage gate & shell point (LS118: acreage b&d only)
Total 237.50 31,475.53 21.86 - 90.05
Basin L039
Basin L105
Basin L107
Basin L109
Basin L110
Basin L111TAZ # Population ADF (gpd) ADF (gpm) Peak Factor PHF Notes190.20 0.00 0.00 0.00 0.00 0.00 AB Moved TAZ 190 to LS110 (gets there from LS4121 directly)198.20 0.00 0.00 0.00 0.00 0.00377.20 0.00 0.00 0.00 0.00 0.00
Total 0.00 0.00 0.00 - 0.00
TAZ # Population ADF (gpd) ADF (gpm) Peak Factor PHF Notes188.20 0.00 0.00 0.00 0.00 0.00
375.118.20 0.00 0.00 0.00 0.00 0.00 Split with L118: half to LS110 & half to LS118
376.118.20 0.00 0.00 0.00 0.00 0.00 Split with L110: acreage a & c are in L110 + carriage gate & shell point (LS118: acreage b&d only)
170.118.20 5,000.00 662,642.65 460.17 3.25 1,493.25 Split with LS118 & LS119170.20COM - 400,050.00 277.81 1.50 416.72
Total 5,000.00 1,062,692.65 737.98 - 1,909.97
TAZ # Population ADF (gpd) ADF (gpm) Peak Factor PHF Notes169.20 743.75 98,568.09 68.45 3.88 265.53
170.119.20 235.00 31,144.20 21.63 4.12 89.14 Split with LS118 & LS119169.20COM - 50,673.00 35.19 2.50 87.97
171.20 162.50 21,535.89 14.96 4.18 62.51174.119.5 0.00 0.00 0.00 0.00 0.00 Split with LS107 & LS119175.119.20 0.00 0.00 0.00 0.00 0.00
Total 1,141.25 201,921.18 140.22 - 505.16
TAZ # Population ADF (gpd) ADF (gpm) Peak Factor PHF Notes376.120.20 0.00 0.00 0.00 0.00 0.00 0 Pop. Included in Basin L110
Total 0.00 0.00 0.00 - 0.00
Basin L111
Basin L118
Basin L119
Basin L120

North Basin Flow Projections: Year 20
North Per Capita 132.53
TAZ # Population ADF (gpd) ADF (gpm) Peak Factor PHF Notes173.124.20 0.00 0.00 0.00 0.00 0.00 Split with L107 & L124
182.20 0.00 0.00 0.00 0.00 0.00
Total 0.00 0.00 0.00 - 0.00
TAZ # Population ADF (gpd) ADF (gpm) Peak Factor PHF Notes182.20 0.00 0.00 0.00 0.00 0.00 Goes to LS4124 basin332.20 0.00 0.00 0.00 0.00 0.00333.20 0.00 0.00 0.00 0.00 0.00 AB moved all to 5 year period given location
Total 0.00 0.00 0.00 - 0.00
TAZ # Population ADF (gpd) ADF (gpm) Peak Factor PHF Notes183.20 0.00 0.00 0.00 0.00 0.00
Total 0.00 0.00 0.00 - 0.00
TAZ # Population ADF (gpd) ADF (gpm) Peak Factor PHF Notes334.20 0.00 0.00 0.00 0.00 0.00
Total 0.00 0.00 0.00 - 0.00
TAZ # Population ADF (gpd) ADF (gpm) Peak Factor PHF Notes353.20 & 354.20 3,750.00 496,981.99 345.13 3.36 1,159.04
Total 3,750.00 496,981.99 345.13 - 1,159.04
TAZ # Population ADF (gpd) ADF (gpm) Peak Factor PHF Notes368.20 580.00 76,866.55 53.38 3.94 210.33358.20 182.50 24,186.46 16.80 4.16 69.91
Total 762.50 101,053.00 70.18 - 280.24
TAZ # Population ADF (gpd) ADF (gpm) Peak Factor PHF Notes357.20 0.00 0.00 0.00 0.00 0.00 Plum Creek Transport Hub359.20 0.00 0.00 0.00 0.00 0.00 All in 20+ window
Basin Basin D
Basin Buffalo
Basin Plum Creek_HWY 32
Basin L126
Basin OakGrove
LS4127_ TAZ 183
Basin L124
Total 0.00 0.00 0.00 - 0.00
TAZ # Population ADF (gpd) ADF (gpm) Peak Factor PHF Notes172.20 0.00 0.00 0.00 0.00 0.00367.20 0.00 0.00 0.00 0.00 0.00
Total 0.00 0.00 0.00 - 0.00
TAZ # Population ADF (gpd) ADF (gpm) Peak Factor PHF Notes168.20 0.00 0.00 0.00 0.00 0.00
Total 0.00 0.00 0.00 - 0.00
TAZ # Population ADF (gpd) ADF (gpm) Peak Factor PHF Notes369.20 0.00 0.00 0.00 0.00 0.00 Out of 2029 window
Total 0.00 0.00 0.00 - 0.00
TAZ # Population ADF (gpd) ADF (gpm) Peak Factor PHF Notes366.20 405.00 53,674.05 37.27 4.02 149.82
Total 405.00 53,674.05 37.27 - 149.82
Basin North of LS4126
Basin Clayhole
Plum Creek_Everett
Possible Future Site of N. Mainland WWTP_TAZ 366
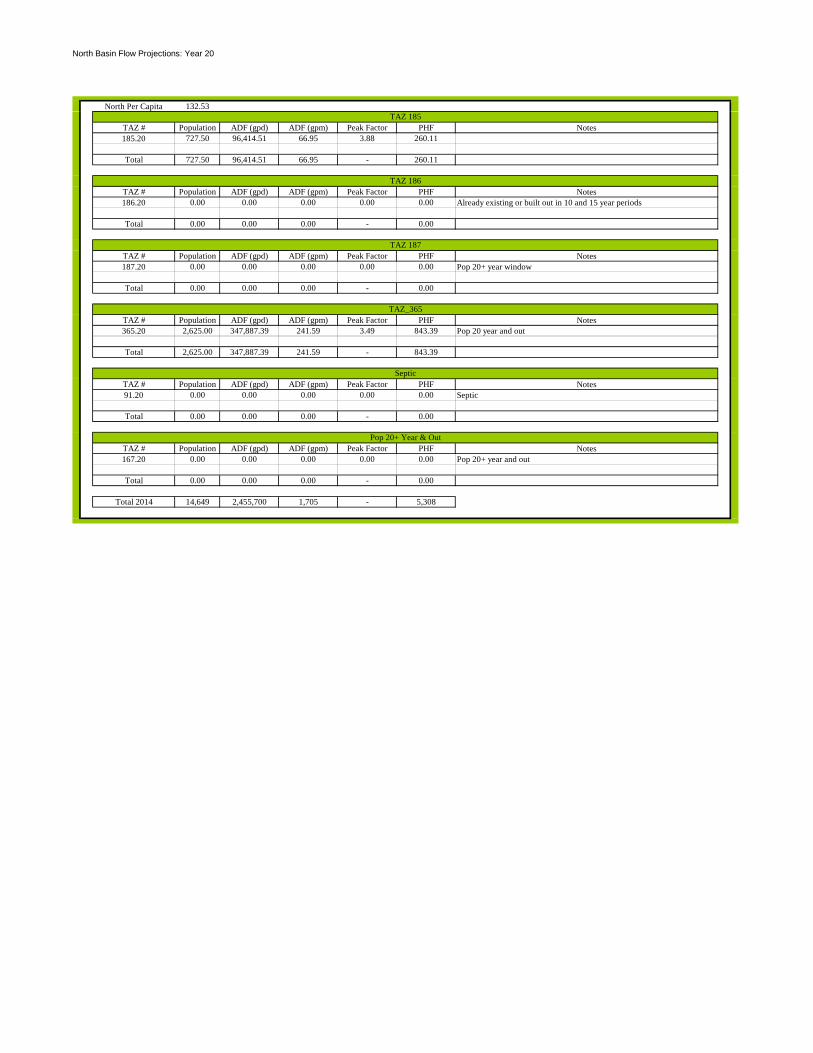
North Basin Flow Projections: Year 20
North Per Capita 132.53
TAZ # Population ADF (gpd) ADF (gpm) Peak Factor PHF Notes185.20 727.50 96,414.51 66.95 3.88 260.11
Total 727.50 96,414.51 66.95 - 260.11
TAZ # Population ADF (gpd) ADF (gpm) Peak Factor PHF Notes186.20 0.00 0.00 0.00 0.00 0.00 Already existing or built out in 10 and 15 year periods
Total 0.00 0.00 0.00 - 0.00
TAZ # Population ADF (gpd) ADF (gpm) Peak Factor PHF Notes187.20 0.00 0.00 0.00 0.00 0.00 Pop 20+ year window
Total 0.00 0.00 0.00 - 0.00
TAZ # Population ADF (gpd) ADF (gpm) Peak Factor PHF Notes365.20 2,625.00 347,887.39 241.59 3.49 843.39 Pop 20 year and out
Total 2,625.00 347,887.39 241.59 - 843.39
TAZ # Population ADF (gpd) ADF (gpm) Peak Factor PHF Notes91.20 0.00 0.00 0.00 0.00 0.00 Septic
Total 0.00 0.00 0.00 - 0.00
TAZ # Population ADF (gpd) ADF (gpm) Peak Factor PHF Notes167.20 0.00 0.00 0.00 0.00 0.00 Pop 20+ year and out
Total 0.00 0.00 0.00 - 0.00
Total 2014 14,649 2,455,700 1,705 - 5,308
Septic
Pop 20+ Year & Out
TAZ_365
TAZ 187
TAZ 186
TAZ 185

Brunswick Glynn County JWSC Applied Technology & Management, Inc.
Water Sewer Master Plan
APPENDIX E – SEWER SYSTEM COMPONENT EXIT 29 POPULATION PROJECTIONS
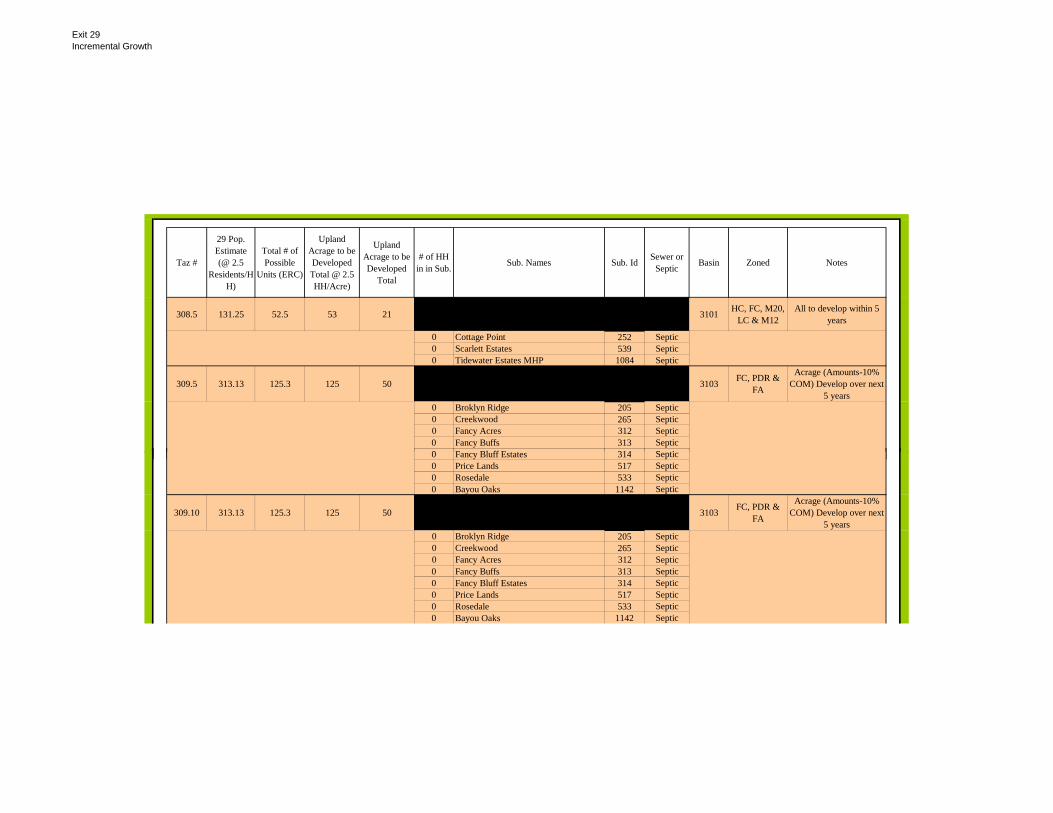
Exit 29Incremental Growth
Taz #
29 Pop. Estimate (@ 2.5
Residents/HH)
Total # of Possible
Units (ERC)
Upland Acrage to be Developed Total @ 2.5 HH/Acre)
Upland Acrage to be Developed
Total
# of HH in in Sub. Sub. Names Sub. Id Sewer or
Septic Basin Zoned Notes
308.5 131.25 52.5 53 21 3101 HC, FC, M20, LC & M12
All to develop within 5 years
0 Cottage Point 252 Septic0 Scarlett Estates 539 Septic0 Tidewater Estates MHP 1084 Septic
309.5 313.13 125.3 125 50 3103 FC, PDR & FA
Acrage (Amounts-10% COM) Develop over next
5 years0 Broklyn Ridge 205 Septic0 Creekwood 265 Septic0 Fancy Acres 312 Septic0 Fancy Buffs 313 Septic0 Fanc Bl ff Estates 314 Septic0 Fancy Bluff Estates 314 Septic0 Price Lands 517 Septic0 Rosedale 533 Septic0 Bayou Oaks 1142 Septic
309.10 313.13 125.3 125 50 3103 FC, PDR & FA
Acrage (Amounts-10% COM) Develop over next
5 years0 Broklyn Ridge 205 Septic0 Creekwood 265 Septic0 Fancy Acres 312 Septic0 Fancy Buffs 313 Septic0 Fancy Bluff Estates 314 Septic0 Price Lands 517 Septic0 Rosedale 533 Septic0 Bayou Oaks 1142 Septic

Exit 29Incremental Growth
Taz #
29 Pop. Estimate (@ 2.5
Residents/HH)
Total # of Possible
Units (ERC)
Upland Acrage to be Developed Total @ 2.5 HH/Acre)
Upland Acrage to be Developed
Total
# of HH in in Sub. Sub. Names Sub. Id Sewer or
Septic Basin Zoned Notes
309.15 313.13 125.3 125 50 3103 FC, PDR & FA
Acrage (Amounts-10% COM) Develop over next
5 years0 Broklyn Ridge 205 Septic0 Creekwood 265 Septic0 Fancy Acres 312 Septic0 Fancy Buffs 313 Septic0 Fancy Bluff Estates 314 Septic0 Price Lands 517 Septic0 Rosedale 533 Septic0 Bayou Oaks 1142 Septic
328.5 2,265.00 906.0 460 184 FC, PDG, FA, FC, R9 & LI
(LS3101 Has 42 lots included in the # of ERC)
(LS3114 Has 14 lots LS3101 242.50 97.0 0 0S3 0 .50 97.0 0 0LS3114 1,012.50 405.0 0 0LS3123 42.50 17.0 0 0
66 Cinder Hill 242 Sewer 31140 Foxcreek 321 Septic -0 McGinty Lands @ Southport 439 Septic -
55 Planting Hammock 510 Sewer 3101198 Somersby Pointe 902 Sewer 311472 Southwinds 910 Sewer 311455 Barrington Oaks 1139 Sewer 31140 Southport 39 Septic
329.5 382.50 153.0 0 0 3103 R20 & FC153 Royal Oaks 534 Sewer
0 Curry Track 2 826 Septic330 18.75 7.5 0 0 4103 R12
0 Satilla Shores 537 Septic0 Satilla Shores Acres 538 Septic

Exit 29Incremental Growth
Taz #
29 Pop. Estimate (@ 2.5
Residents/HH)
Total # of Possible
Units (ERC)
Upland Acrage to be Developed Total @ 2.5 HH/Acre)
Upland Acrage to be Developed
Total
# of HH in in Sub. Sub. Names Sub. Id Sewer or
Septic Basin Zoned Notes
341.5 FA, PDG & CP
Turtle River is by acrage (High Density: we took half of the acrage with
20HH/acre @ 1.5person/HH Medium Density: 4HH/acre @ 2
people/HH Low Density: 2HH/acre @ 2.5
people/acre)
3931 1,158.75 463.5 198 79Turtle Total 300.50 171.0 - -
Turtle High 157.50 105.0 105 5HighTurtle Med 88.00 44.0 44 11
Turtle Low 55.00 22.0 22 11
0 Wiggins Estate 133 Septic 39310 Battle 177 Septic 39310 Davis Acres 279 Septic 39310 Harris Plantation 360 Septic 39310 Wright Estate 983 Septic 3931
266 Hopewell Creek Phase 1 Planned 39310 Hopewell Creek Phase 2 Planned 39310 Hopewell Creek Phase 3 Planned 39310 Hopewell Creek Phase 4 Planned 3931
5.25 Turtle River High Density (acres) Step Turtle11 Turtle River Medium Density (acres) Step Turtle11 Turtle River Low Density Step Turtle

Exit 29Incremental Growth
Taz #
29 Pop. Estimate (@ 2.5
Residents/HH)
Total # of Possible
Units (ERC)
Upland Acrage to be Developed Total @ 2.5 HH/Acre)
Upland Acrage to be Developed
Total
# of HH in in Sub. Sub. Names Sub. Id Sewer or
Septic Basin Zoned Notes
341.10 FA, PDG & CP
Turtle River is by acrage (High Density: we took half of the acrage with
20HH/acre @ 1.5person/HH Medium Density: 4HH/acre @ 2
people/HH Low Density: 2HH/acre @ 2.5
people/acre)
3931 801.25 320.5 198 79Turtle Total 300.50 171.0 - -
Turtle High 157.50 105.0 105 5HighTurtle Med 88.00 44.0 44 11
Turtle Low 55.00 22.0 22 11
0 Wiggins Estate 133 Septic 39310 Battle 177 Septic 39310 Davis Acres 279 Septic 39310 Harris Plantation 360 Septic 39310 Wright Estate 983 Septic 39310 Hopewell Creek Phase 1 Planned 3931
123 Hopewell Creek Phase 2 Planned 39310 Hopewell Creek Phase 3 Planned 39310 Hopewell Creek Phase 4 Planned 3931
5.25 Turtle River High Density (acres) Step Turtle11 Turtle River Medium Density (acres) Step Turtle11 Turtle River Low Density Step Turtle

Exit 29Incremental Growth
Taz #
29 Pop. Estimate (@ 2.5
Residents/HH)
Total # of Possible
Units (ERC)
Upland Acrage to be Developed Total @ 2.5 HH/Acre)
Upland Acrage to be Developed
Total
# of HH in in Sub. Sub. Names Sub. Id Sewer or
Septic Basin Zoned Notes
341.15 FA, PDG & CP
Turtle River is by acrage (High Density: we took half of the acrage with
20HH/acre @ 1.5person/HH Medium Density: 4HH/acre @ 2
people/HH Low Density: 2HH/acre @ 2.5
people/acre)
3931 801.25 320.5 198 79Turtle Total 300.50 171.0 - -
Turtle High 157.50 105.0 105 5HighTurtle Med 88.00 44.0 44 11
Turtle Low 55.00 22.0 22 11
0 Wiggins Estate 133 Septic 39310 Battle 177 Septic 39310 Davis Acres 279 Septic 39310 Harris Plantation 360 Septic 39310 Wright Estate 983 Septic 39310 Hopewell Creek Phase 1 Planned 3931
123 Hopewell Creek Phase 2 Planned 39310 Hopewell Creek Phase 3 Planned 39310 Hopewell Creek Phase 4 Planned 3931
5.25 Turtle River High Density (acres) Step Turtle11 Turtle River Medium Density (acres) Step Turtle11 Turtle River Low Density Step Turtle
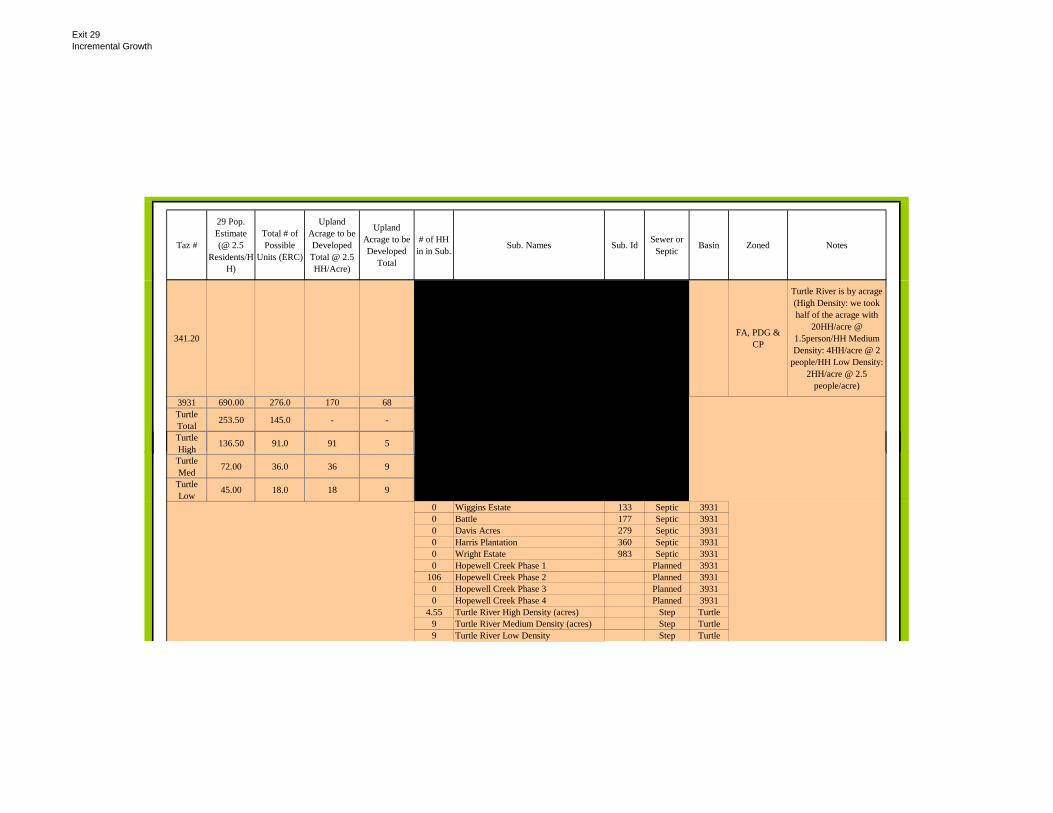
Exit 29Incremental Growth
Taz #
29 Pop. Estimate (@ 2.5
Residents/HH)
Total # of Possible
Units (ERC)
Upland Acrage to be Developed Total @ 2.5 HH/Acre)
Upland Acrage to be Developed
Total
# of HH in in Sub. Sub. Names Sub. Id Sewer or
Septic Basin Zoned Notes
341.20 FA, PDG & CP
Turtle River is by acrage (High Density: we took half of the acrage with
20HH/acre @ 1.5person/HH Medium Density: 4HH/acre @ 2
people/HH Low Density: 2HH/acre @ 2.5
people/acre)
3931 690.00 276.0 170 68Turtle Total 253.50 145.0 - -
Turtle High 136.50 91.0 91 5HighTurtle Med 72.00 36.0 36 9
Turtle Low 45.00 18.0 18 9
0 Wiggins Estate 133 Septic 39310 Battle 177 Septic 39310 Davis Acres 279 Septic 39310 Harris Plantation 360 Septic 39310 Wright Estate 983 Septic 39310 Hopewell Creek Phase 1 Planned 3931
106 Hopewell Creek Phase 2 Planned 39310 Hopewell Creek Phase 3 Planned 39310 Hopewell Creek Phase 4 Planned 3931
4.55 Turtle River High Density (acres) Step Turtle9 Turtle River Medium Density (acres) Step Turtle9 Turtle River Low Density Step Turtle

Exit 29Incremental Growth
Taz #
29 Pop. Estimate (@ 2.5
Residents/HH)
Total # of Possible
Units (ERC)
Upland Acrage to be Developed Total @ 2.5 HH/Acre)
Upland Acrage to be Developed
Total
# of HH in in Sub. Sub. Names Sub. Id Sewer or
Septic Basin Zoned Notes
341.20+ FA, PDG & CP
Turtle River is by acrage (High Density: we took half of the acrage with
20HH/acre @ 1.5person/HH Medium Density: 4HH/acre @ 2
people/HH Low Density: 2HH/acre @ 2.5
people/acre)
3931 7,863.75 3,145.5 1,863 745Turtle Total 2,676.00 1,512.0 - -
Turtle High 1,350.00 900.0 900 45
Turtle Med 816.00 408.0 408 102
Turtle Low 510.00 204.0 204 102
0 Wiggins Estate 133 Septic 39310 Battle 177 Septic 39310 Davis Acres 279 Septic 39310 H i Pl t ti 360 S ti 39310 Harris Plantation 360 Septic 39310 Wright Estate 983 Septic 39310 Hopewell Creek Phase 1 Planned 3931
193 Hopewell Creek Phase 2 Planned 3931545 Hopewell Creek Phase 3 Planned 3931545 Hopewell Creek Phase 4 Planned 393145 Turtle River High Density (acres) Step Turtle102 Turtle River Medium Density (acres) Step Turtle102 Turtle River Low Density Step Turtle
342.5 315.00 131.3 131 53 None FA0 Bell Estate 82 Septic0 Mungin Lands 92 Septic0 Myers Hill Tract 93 Septic0 Avondale 171 Septic0 Cain Tract 223 Septic0 Cains Crossing 224 Septic0 Durry Tract 298 Septic0 Drawdy Tract 2 292 Septic0 Livingston Tract 422 Septic0 Davis Tract 829 Septic0 Jennie Rhodes Estate 890 Septic0 Spaulding Meadow 911 Septic0 Spurry Lane 924 Septic0 Whispering Pines 972 Septic

Exit 29Incremental Growth
Taz #
29 Pop. Estimate (@ 2.5
Residents/HH)
Total # of Possible
Units (ERC)
Upland Acrage to be Developed Total @ 2.5 HH/Acre)
Upland Acrage to be Developed
Total
# of HH in in Sub. Sub. Names Sub. Id Sewer or
Septic Basin Zoned Notes
342.10 315.00 131.3 131 53 None FA0 Bell Estate 82 Septic0 Mungin Lands 92 Septic0 Myers Hill Tract 93 Septic0 Avondale 171 Septic0 Cain Tract 223 Septic0 Cains Crossing 224 Septic0 Durry Tract 298 Septic0 Drawdy Tract 2 292 Septic0 Livingston Tract 422 Septic0 Davis Tract 829 Septic0 Jennie Rhodes Estate 890 Septic0 Spaulding Meadow 911 Septic0 Spurry Lane 924 Septic0 Whispering Pines 972 Septic
342.15 315.00 131.3 131 53 None FA0 Bell Estate 82 Septic0 Mungin Lands 92 Septic0 Myers Hill Tract 93 Septic0 Avondale 171 Septic0 Cain Tract 223 Septic0 Cains Crossing 224 Septic0 Cains Crossing 224 Septic0 Durry Tract 298 Septic0 Drawdy Tract 2 292 Septic0 Livingston Tract 422 Septic0 Davis Tract 829 Septic0 Jennie Rhodes Estate 890 Septic0 Spaulding Meadow 911 Septic0 Spurry Lane 924 Septic0 Whispering Pines 972 Septic
342.20 271.44 113.1 113 45 None FA0 Bell Estate 82 Septic0 Mungin Lands 92 Septic0 Myers Hill Tract 93 Septic0 Avondale 171 Septic0 Cain Tract 223 Septic0 Cains Crossing 224 Septic0 Durry Tract 298 Septic0 Drawdy Tract 2 292 Septic0 Livingston Tract 422 Septic0 Davis Tract 829 Septic0 Jennie Rhodes Estate 890 Septic0 Spaulding Meadow 911 Septic0 Spurry Lane 924 Septic0 Whispering Pines 972 Septic

Exit 29Incremental Growth
Taz #
29 Pop. Estimate (@ 2.5
Residents/HH)
Total # of Possible
Units (ERC)
Upland Acrage to be Developed Total @ 2.5 HH/Acre)
Upland Acrage to be Developed
Total
# of HH in in Sub. Sub. Names Sub. Id Sewer or
Septic Basin Zoned Notes
342.20+ 2,964.96 1,235.4 1,235 494 None FA0 Bell Estate 82 Septic0 Mungin Lands 92 Septic0 Myers Hill Tract 93 Septic0 Avondale 171 Septic0 Cain Tract 223 Septic0 Cains Crossing 224 Septic0 Durry Tract 298 Septic0 Drawdy Tract 2 292 Septic0 Livingston Tract 422 Septic0 Davis Tract 829 Septic0 Jennie Rhodes Estate 890 Septic0 Spaulding Meadow 911 Septic0 Spurry Lane 924 Septic0 Whispering Pines 972 Septic
343.5 2,483.75 993.5 933 373 0 3121 PDG, R20, FA LI & HC343.5 2,483.75 993.5 933 373 0 3121 FA, LI & HC
LS3121 1,249.38 499.8 439 176LS3300 114.38 45.8 46 18
0 Quinnely Estates 107 Septic0 Rainey Tract 108 Septic0 Angelo's Acres 163 Septic0 Deerwood Estates 283 Septic0 Emanual Church Estates 306 Septic0 Fish Hall 316 Septic0 Fish Hall Estates 317 Septic0 Jekyll Heights 390 Septic
61 Majestic Oaks 427 Sewer0 Plott 511 Septic0 Silver Bluff 550 Septic0 Three Oaks 937 Septic0 Scarlett Properties 1036 Septic0 Avondale 2 1144 Septic0 Ratliff Lake 1147 Septic
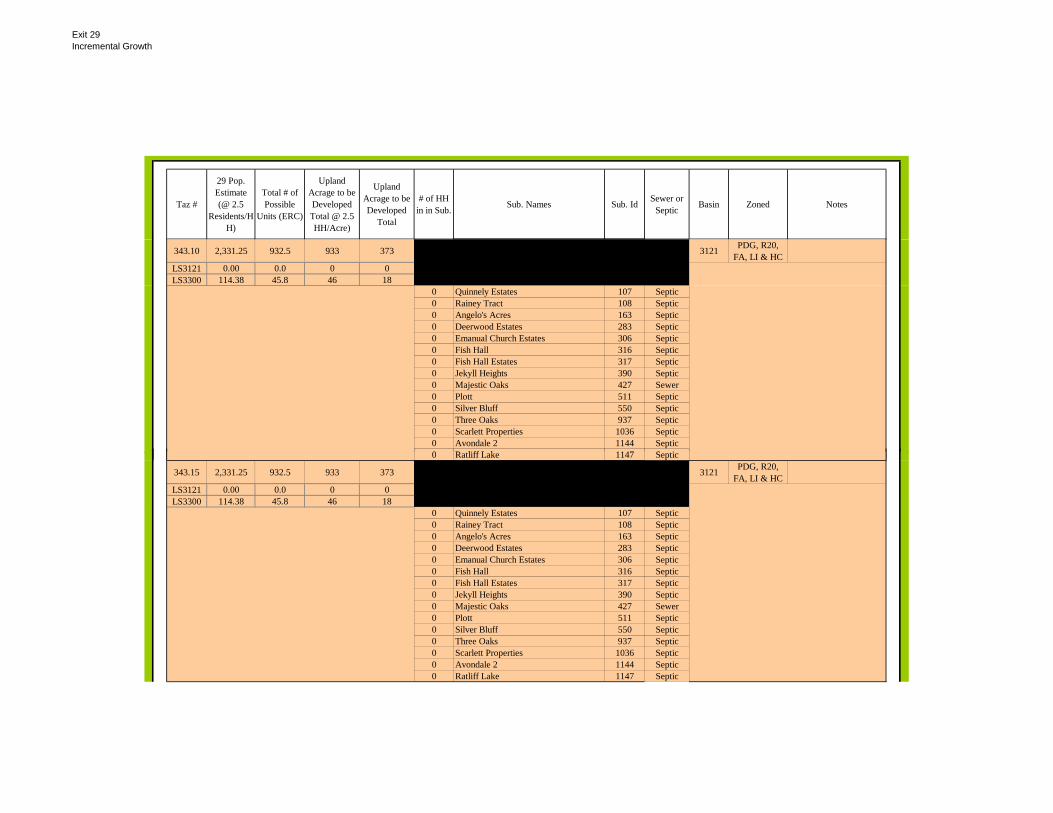
Exit 29Incremental Growth
Taz #
29 Pop. Estimate (@ 2.5
Residents/HH)
Total # of Possible
Units (ERC)
Upland Acrage to be Developed Total @ 2.5 HH/Acre)
Upland Acrage to be Developed
Total
# of HH in in Sub. Sub. Names Sub. Id Sewer or
Septic Basin Zoned Notes
343.10 2,331.25 932.5 933 373 0 3121 PDG, R20, FA, LI & HC
LS3121 0.00 0.0 0 0LS3300 114.38 45.8 46 18
0 Quinnely Estates 107 Septic0 Rainey Tract 108 Septic0 Angelo's Acres 163 Septic0 Deerwood Estates 283 Septic0 Emanual Church Estates 306 Septic0 Fish Hall 316 Septic0 Fish Hall Estates 317 Septic0 Jekyll Heights 390 Septic0 Majestic Oaks 427 Sewer0 Plott 511 Septic0 Silver Bluff 550 Septic0 Three Oaks 937 Septic0 Scarlett Properties 1036 Septic0 Avondale 2 1144 Septic0 R tliff L k 1147 S ti0 Ratliff Lake 1147 Septic
343.15 2,331.25 932.5 933 373 0 3121 PDG, R20, FA, LI & HC
LS3121 0.00 0.0 0 0LS3300 114.38 45.8 46 18
0 Quinnely Estates 107 Septic0 Rainey Tract 108 Septic0 Angelo's Acres 163 Septic0 Deerwood Estates 283 Septic0 Emanual Church Estates 306 Septic0 Fish Hall 316 Septic0 Fish Hall Estates 317 Septic0 Jekyll Heights 390 Septic0 Majestic Oaks 427 Sewer0 Plott 511 Septic0 Silver Bluff 550 Septic0 Three Oaks 937 Septic0 Scarlett Properties 1036 Septic0 Avondale 2 1144 Septic0 Ratliff Lake 1147 Septic

Exit 29Incremental Growth
Taz #
29 Pop. Estimate (@ 2.5
Residents/HH)
Total # of Possible
Units (ERC)
Upland Acrage to be Developed Total @ 2.5 HH/Acre)
Upland Acrage to be Developed
Total
# of HH in in Sub. Sub. Names Sub. Id Sewer or
Septic Basin Zoned Notes
343.20 2,331.25 932.5 933 373 0 3121 PDG, R20, FA, LI & HC
LS3121 0.00 0.0 0 0LS3300 99.13 39.7 40 16
0 Quinnely Estates 107 Septic0 Rainey Tract 108 Septic0 Angelo's Acres 163 Septic0 Deerwood Estates 283 Septic0 Emanual Church Estates 306 Septic0 Fish Hall 316 Septic0 Fish Hall Estates 317 Septic0 Jekyll Heights 390 Septic0 Majestic Oaks 427 Sewer0 Plott 511 Septic0 Silver Bluff 550 Septic0 Three Oaks 937 Septic0 Scarlett Properties 1036 Septic0 Avondale 2 1144 Septic0 R tliff L k 1147 S ti0 Ratliff Lake 1147 Septic
343.20+ 2,331.25 932.5 933 373 0 3121 PDG, R20, FA, LI & HC
LS3121 0.00 0.0 0 0LS3300 1,082.75 433.1 433 173
0 Quinnely Estates 107 Septic0 Rainey Tract 108 Septic0 Angelo's Acres 163 Septic0 Deerwood Estates 283 Septic0 Emanual Church Estates 306 Septic0 Fish Hall 316 Septic0 Fish Hall Estates 317 Septic0 Jekyll Heights 390 Septic0 Majestic Oaks 427 Sewer0 Plott 511 Septic0 Silver Bluff 550 Septic0 Three Oaks 937 Septic0 Scarlett Properties 1036 Septic0 Avondale 2 1144 Septic0 Ratliff Lake 1147 Septic

Exit 29Incremental Growth
Taz #
29 Pop. Estimate (@ 2.5
Residents/HH)
Total # of Possible
Units (ERC)
Upland Acrage to be Developed Total @ 2.5 HH/Acre)
Upland Acrage to be Developed
Total
# of HH in in Sub. Sub. Names Sub. Id Sewer or
Septic Basin Zoned Notes
344.5 0.00 0.0 0 0 None FA & PDGLS3301 0.00 0.0 0 0 0 Brookman 210 SepticLS3302 0.00 0.0 0 0 0 Brown Estate 211 Septic
0 Henry L. Hunt Estate 363 Septic0 Jackson Acres 386 Septic0 Perry-Mallete Tract 492 Septic0 Elizabeth Richardson Tract 841 Septic0 Sophia Baily Estate 903 Septic
344.10 453.13 181.3 181 73 None FA & PDGLS3301 226.56 90.6 91 36 0 Brookman 210 SepticLS3302 226.56 90.6 91 36 0 Brown Estate 211 Septic
0 Henry L. Hunt Estate 363 Septic0 Jackson Acres 386 Septic0 Perry-Mallete Tract 492 Septic0 Elizabeth Richardson Tract 841 Septic0 S hi B il E t t 903 S ti0 Sophia Baily Estate 903 Septic
344.15 453.13 181.3 181 73 None FA & PDGLS3301 226.56 90.6 91 36 0 Brookman 210 SepticLS3302 226.56 90.6 91 36 0 Brown Estate 211 Septic
0 Henry L. Hunt Estate 363 Septic0 Jackson Acres 386 Septic0 Perry-Mallete Tract 492 Septic0 Elizabeth Richardson Tract 841 Septic0 Sophia Baily Estate 903 Septic
344.20 393.13 157.3 157 63 None FA & PDGLS3301 196.56 78.6 79 31 0 Brookman 210 SepticLS3302 196.56 78.6 79 31 0 Brown Estate 211 Septic
0 Henry L. Hunt Estate 363 Septic0 Jackson Acres 386 Septic0 Perry-Mallete Tract 492 Septic0 Elizabeth Richardson Tract 841 Septic0 Sophia Baily Estate 903 Septic
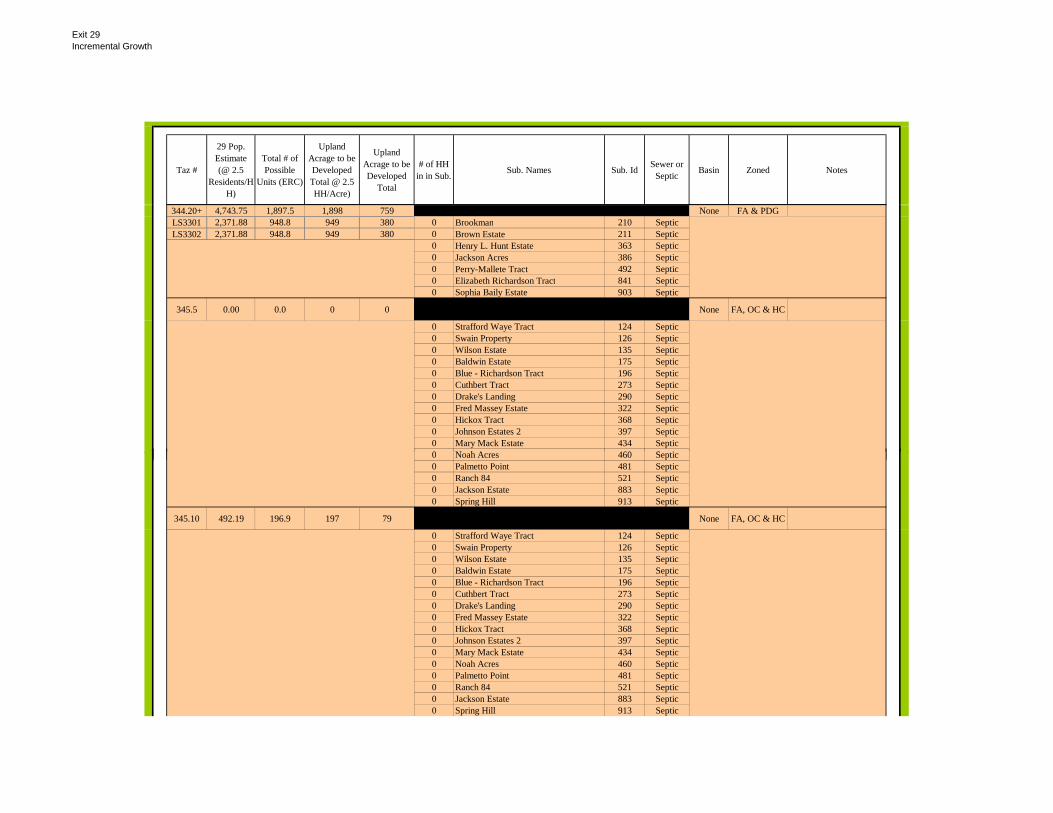
Exit 29Incremental Growth
Taz #
29 Pop. Estimate (@ 2.5
Residents/HH)
Total # of Possible
Units (ERC)
Upland Acrage to be Developed Total @ 2.5 HH/Acre)
Upland Acrage to be Developed
Total
# of HH in in Sub. Sub. Names Sub. Id Sewer or
Septic Basin Zoned Notes
344.20+ 4,743.75 1,897.5 1,898 759 None FA & PDGLS3301 2,371.88 948.8 949 380 0 Brookman 210 SepticLS3302 2,371.88 948.8 949 380 0 Brown Estate 211 Septic
0 Henry L. Hunt Estate 363 Septic0 Jackson Acres 386 Septic0 Perry-Mallete Tract 492 Septic0 Elizabeth Richardson Tract 841 Septic0 Sophia Baily Estate 903 Septic
345.5 0.00 0.0 0 0 None FA, OC & HC
0 Strafford Waye Tract 124 Septic0 Swain Property 126 Septic0 Wilson Estate 135 Septic0 Baldwin Estate 175 Septic0 Blue - Richardson Tract 196 Septic0 Cuthbert Tract 273 Septic0 Drake's Landing 290 Septic0 Fred Massey Estate 322 Septic0 Hickox Tract 368 Septic0 Johnson Estates 2 397 Septic0 Mary Mack Estate 434 Septic0 N h A 460 S ti0 Noah Acres 460 Septic0 Palmetto Point 481 Septic0 Ranch 84 521 Septic0 Jackson Estate 883 Septic0 Spring Hill 913 Septic
345.10 492.19 196.9 197 79 None FA, OC & HC
0 Strafford Waye Tract 124 Septic0 Swain Property 126 Septic0 Wilson Estate 135 Septic0 Baldwin Estate 175 Septic0 Blue - Richardson Tract 196 Septic0 Cuthbert Tract 273 Septic0 Drake's Landing 290 Septic0 Fred Massey Estate 322 Septic0 Hickox Tract 368 Septic0 Johnson Estates 2 397 Septic0 Mary Mack Estate 434 Septic0 Noah Acres 460 Septic0 Palmetto Point 481 Septic0 Ranch 84 521 Septic0 Jackson Estate 883 Septic0 Spring Hill 913 Septic

Exit 29Incremental Growth
Taz #
29 Pop. Estimate (@ 2.5
Residents/HH)
Total # of Possible
Units (ERC)
Upland Acrage to be Developed Total @ 2.5 HH/Acre)
Upland Acrage to be Developed
Total
# of HH in in Sub. Sub. Names Sub. Id Sewer or
Septic Basin Zoned Notes
345.15 492.19 196.9 197 79 None FA, OC & HC
0 Strafford Waye Tract 124 Septic0 Swain Property 126 Septic0 Wilson Estate 135 Septic0 Baldwin Estate 175 Septic0 Blue - Richardson Tract 196 Septic0 Cuthbert Tract 273 Septic0 Drake's Landing 290 Septic0 Fred Massey Estate 322 Septic0 Hickox Tract 368 Septic0 Johnson Estates 2 397 Septic0 Mary Mack Estate 434 Septic0 Noah Acres 460 Septic0 Palmetto Point 481 Septic0 Ranch 84 521 Septic0 Jackson Estate 883 Septic0 S i Hill 913 S ti0 Spring Hill 913 Septic
345.20 426.56 170.6 171 68 None FA, OC & HC
0 Strafford Waye Tract 124 Septic0 Swain Property 126 Septic0 Wilson Estate 135 Septic0 Baldwin Estate 175 Septic0 Blue - Richardson Tract 196 Septic0 Cuthbert Tract 273 Septic0 Drake's Landing 290 Septic0 Fred Massey Estate 322 Septic0 Hickox Tract 368 Septic0 Johnson Estates 2 397 Septic0 Mary Mack Estate 434 Septic0 Noah Acres 460 Septic0 Palmetto Point 481 Septic0 Ranch 84 521 Septic0 Jackson Estate 883 Septic0 Spring Hill 913 Septic

Exit 29Incremental Growth
Taz #
29 Pop. Estimate (@ 2.5
Residents/HH)
Total # of Possible
Units (ERC)
Upland Acrage to be Developed Total @ 2.5 HH/Acre)
Upland Acrage to be Developed
Total
# of HH in in Sub. Sub. Names Sub. Id Sewer or
Septic Basin Zoned Notes
345.20+ 5,151.56 2,060.6 2,061 824 None FA, OC & HC
0 Strafford Waye Tract 124 Septic0 Swain Property 126 Septic0 Wilson Estate 135 Septic0 Baldwin Estate 175 Septic0 Blue - Richardson Tract 196 Septic0 Cuthbert Tract 273 Septic0 Drake's Landing 290 Septic0 Fred Massey Estate 322 Septic0 Hickox Tract 368 Septic0 Johnson Estates 2 397 Septic0 Mary Mack Estate 434 Septic0 Noah Acres 460 Septic0 Palmetto Point 481 Septic0 Ranch 84 521 Septic0 Jackson Estate 883 Septic0 Spring Hill 913 Septic
346.5 1,812.50 725.0 725 290 None FA, PDR, R20 & HC
LS3302 56.25 22.5 23 9LS3200 451.88 180.8 19 8LS3200 451.88 180.8 19 8LS3300 103.13 41.3 41 17
0 Annabelle Robinson Tract 164 Septic0 Baumgartner Acres 178 Septic0 Baumgartner Circle 179 Septic0 Big Buck 192 Septic0 Cedardale 235 Septic0 Glynn Jekyll Acres 336 Septic0 Good Place 350 Septic0 Ivy 385 Septic0 Laurel Grove 408 Septic0 Leotis-Way Estate 415 Septic0 Live Oak Acres 421 Septic0 Lizzie Brown Estates 423 Septic0 Brooks Mosley Tract 451 Septic0 Mosley Tract 2 452 Septic0 Murray Tract 455 Septic0 Myers Hill Acres 456 Septic0 Myers Hill Estate 457 Septic0 Pinemeadows 504 Septic0 Scarlett Gardens 540 Septic0 Wilson Creek Plantation 975 Septic0 The Lakes 1157 Septic
162 Cobblestone Septic
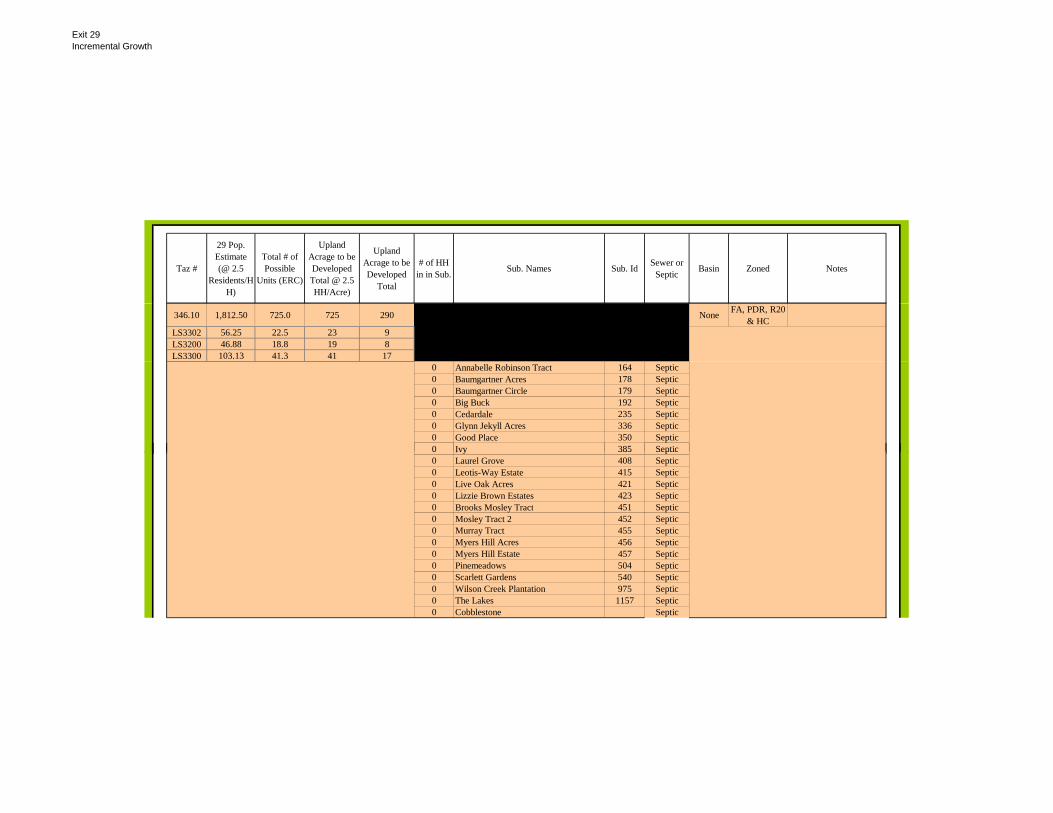
Exit 29Incremental Growth
Taz #
29 Pop. Estimate (@ 2.5
Residents/HH)
Total # of Possible
Units (ERC)
Upland Acrage to be Developed Total @ 2.5 HH/Acre)
Upland Acrage to be Developed
Total
# of HH in in Sub. Sub. Names Sub. Id Sewer or
Septic Basin Zoned Notes
346.10 1,812.50 725.0 725 290 None FA, PDR, R20 & HC
LS3302 56.25 22.5 23 9LS3200 46.88 18.8 19 8LS3300 103.13 41.3 41 17
0 Annabelle Robinson Tract 164 Septic0 Baumgartner Acres 178 Septic0 Baumgartner Circle 179 Septic0 Big Buck 192 Septic0 Cedardale 235 Septic0 Glynn Jekyll Acres 336 Septic0 Good Place 350 Septic0 Ivy 385 Septic0 Ivy 385 Septic0 Laurel Grove 408 Septic0 Leotis-Way Estate 415 Septic0 Live Oak Acres 421 Septic0 Lizzie Brown Estates 423 Septic0 Brooks Mosley Tract 451 Septic0 Mosley Tract 2 452 Septic0 Murray Tract 455 Septic0 Myers Hill Acres 456 Septic0 Myers Hill Estate 457 Septic0 Pinemeadows 504 Septic0 Scarlett Gardens 540 Septic0 Wilson Creek Plantation 975 Septic0 The Lakes 1157 Septic0 Cobblestone Septic

Exit 29Incremental Growth
Taz #
29 Pop. Estimate (@ 2.5
Residents/HH)
Total # of Possible
Units (ERC)
Upland Acrage to be Developed Total @ 2.5 HH/Acre)
Upland Acrage to be Developed
Total
# of HH in in Sub. Sub. Names Sub. Id Sewer or
Septic Basin Zoned Notes
346.15 1,812.50 725.0 725 290 None FA, PDR, R20 & HC
LS3302 56.25 22.5 23 9LS3200 46.88 18.8 19 8LS3300 103.13 41.3 41 17
0 Annabelle Robinson Tract 164 Septic0 Baumgartner Acres 178 Septic0 Baumgartner Circle 179 Septic0 Big Buck 192 Septic0 Cedardale 235 Septic0 Glynn Jekyll Acres 336 Septic0 Good Place 350 Septic0 Ivy 385 Septic0 Ivy 385 Septic0 Laurel Grove 408 Septic0 Leotis-Way Estate 415 Septic0 Live Oak Acres 421 Septic0 Lizzie Brown Estates 423 Septic0 Brooks Mosley Tract 451 Septic0 Mosley Tract 2 452 Septic0 Murray Tract 455 Septic0 Myers Hill Acres 456 Septic0 Myers Hill Estate 457 Septic0 Pinemeadows 504 Septic0 Scarlett Gardens 540 Septic0 Wilson Creek Plantation 975 Septic0 The Lakes 1157 Septic0 Cobblestone Septic

Exit 29Incremental Growth
Taz #
29 Pop. Estimate (@ 2.5
Residents/HH)
Total # of Possible
Units (ERC)
Upland Acrage to be Developed Total @ 2.5 HH/Acre)
Upland Acrage to be Developed
Total
# of HH in in Sub. Sub. Names Sub. Id Sewer or
Septic Basin Zoned Notes
346.20 1,812.50 725.0 725 290 None FA, PDR, R20 & HC
LS3302 50.00 20.0 20 8LS3200 40.63 16.3 16 7LS3300 89.38 35.8 36 14
0 Annabelle Robinson Tract 164 Septic0 Baumgartner Acres 178 Septic0 Baumgartner Circle 179 Septic0 Big Buck 192 Septic0 Cedardale 235 Septic0 Glynn Jekyll Acres 336 Septic0 Good Place 350 Septic0 Ivy 385 Septic0 Ivy 385 Septic0 Laurel Grove 408 Septic0 Leotis-Way Estate 415 Septic0 Live Oak Acres 421 Septic0 Lizzie Brown Estates 423 Septic0 Brooks Mosley Tract 451 Septic0 Mosley Tract 2 452 Septic0 Murray Tract 455 Septic0 Myers Hill Acres 456 Septic0 Myers Hill Estate 457 Septic0 Pinemeadows 504 Septic0 Scarlett Gardens 540 Septic0 Wilson Creek Plantation 975 Septic0 The Lakes 1157 Septic0 Cobblestone Septic

Exit 29Incremental Growth
Taz #
29 Pop. Estimate (@ 2.5
Residents/HH)
Total # of Possible
Units (ERC)
Upland Acrage to be Developed Total @ 2.5 HH/Acre)
Upland Acrage to be Developed
Total
# of HH in in Sub. Sub. Names Sub. Id Sewer or
Septic Basin Zoned Notes
346.20+ 1,812.50 725.0 725 290 None FA, PDR, R20 & HC
LS3302 531.25 212.5 213 85LS3200 437.50 175.0 175 70LS3300 976.25 390.5 391 156
0 Annabelle Robinson Tract 164 Septic0 Baumgartner Acres 178 Septic0 Baumgartner Circle 179 Septic0 Big Buck 192 Septic0 Cedardale 235 Septic0 Glynn Jekyll Acres 336 Septic0 Good Place 350 Septic0 Ivy 385 Septic0 Laurel Grove 408 Septic0 Leotis-Way Estate 415 Septic0 Live Oak Acres 421 Septic0 Lizzie Brown Estates 423 Septic0 Brooks Mosley Tract 451 Septic0 Brooks Mosley Tract 451 Septic0 Mosley Tract 2 452 Septic0 Murray Tract 455 Septic0 Myers Hill Acres 456 Septic0 Myers Hill Estate 457 Septic0 Pinemeadows 504 Septic0 Scarlett Gardens 540 Septic0 Wilson Creek Plantation 975 Septic0 The Lakes 1157 Septic0 Cobblestone Septic
347.5 720.63 288.3 143 57 None PDR & MHLS3123 531.25 212.5 143 57 70 Clearwater 245 SewerLS3129 187.50 75.0 0 0 0 Laurel Grove Plantation 409 Septic
0 Little Oak 420 Septic0 Serenoa Cove 544 Septic0 Curry Tract 825 Septic0 South Creek 904 Septic0 Spaulding MHP 1080 Septic0 Terranova 930 Septic
75 Satilla Sands Sewer

Exit 29Incremental Growth
Taz #
29 Pop. Estimate (@ 2.5
Residents/HH)
Total # of Possible
Units (ERC)
Upland Acrage to be Developed Total @ 2.5 HH/Acre)
Upland Acrage to be Developed
Total
# of HH in in Sub. Sub. Names Sub. Id Sewer or
Septic Basin Zoned Notes
347.10 358.13 143.3 143 57 None PDR & MHLS3123 356.25 142.5 143 57 0 Clearwater 245 SewerLS3129 0.00 0.0 0 0 0 Laurel Grove Plantation 409 Septic
0 Little Oak 420 Septic0 Serenoa Cove 544 Septic0 Curry Tract 825 Septic0 South Creek 904 Septic0 Spaulding MHP 1080 Septic0 Terranova 930 Septic0 Satilla Sands Sewer
347.15 358.13 143.3 143 57 None PDR & MHLS3123 356.25 142.5 143 57 0 Clearwater 245 SewerLS3129 0.00 0.0 0 0 0 Laurel Grove Plantation 409 Septic
0 Little Oak 420 Septic0 Serenoa Cove 544 Septic0 Serenoa Cove 544 Septic0 Curry Tract 825 Septic0 South Creek 904 Septic0 Spaulding MHP 1080 Septic0 Terranova 930 Septic0 Satilla Sands Sewer
348.5 1,232.00 492.8 0 0 None PDG & FALS3930 1,232.00 492.8 0 0TAZ348 0.00 0.0 0 0
0 Buck Swamp 219 Septic340.8 Peninsula - Step
0 Clinch Estate 246 Septic0 Johnson Estate 396 Septic
152 Hayner Tract 868 Septic0 Tyson Estate 951 Septic0 Tyson Tract 952 Septic0 Wilson Tyson Estate 976 Septic
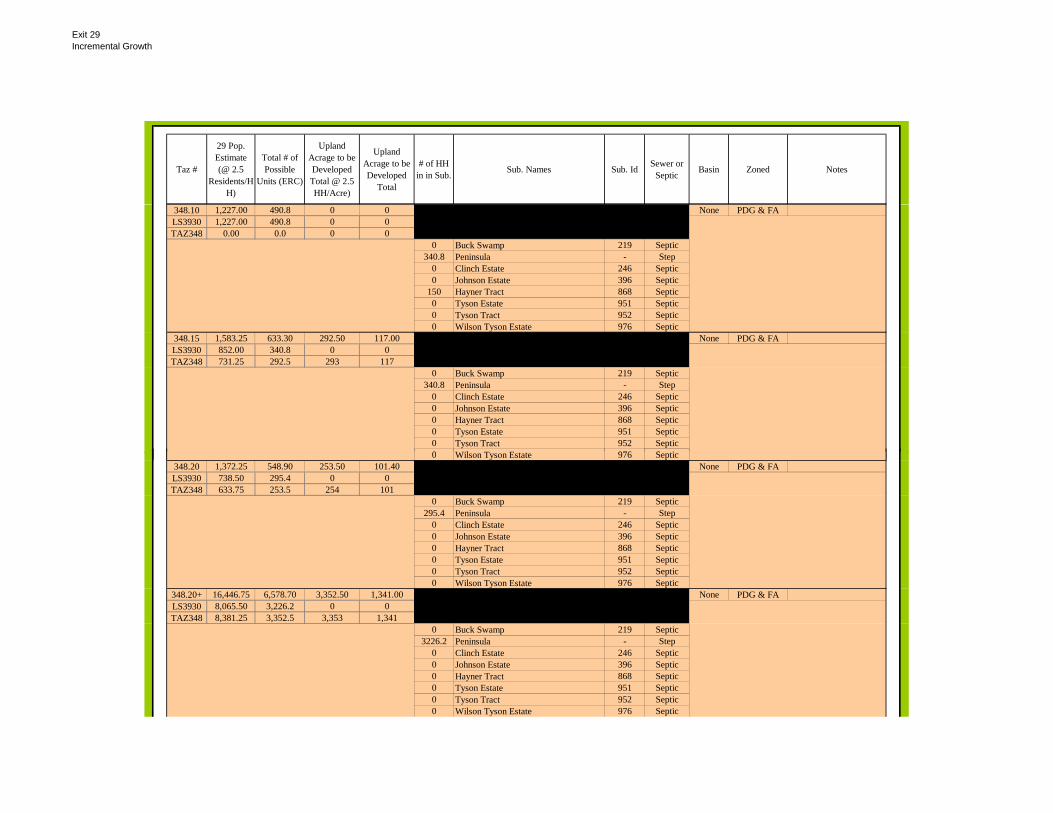
Exit 29Incremental Growth
Taz #
29 Pop. Estimate (@ 2.5
Residents/HH)
Total # of Possible
Units (ERC)
Upland Acrage to be Developed Total @ 2.5 HH/Acre)
Upland Acrage to be Developed
Total
# of HH in in Sub. Sub. Names Sub. Id Sewer or
Septic Basin Zoned Notes
348.10 1,227.00 490.8 0 0 None PDG & FALS3930 1,227.00 490.8 0 0TAZ348 0.00 0.0 0 0
0 Buck Swamp 219 Septic340.8 Peninsula - Step
0 Clinch Estate 246 Septic0 Johnson Estate 396 Septic
150 Hayner Tract 868 Septic0 Tyson Estate 951 Septic0 Tyson Tract 952 Septic0 Wilson Tyson Estate 976 Septic
348.15 1,583.25 633.30 292.50 117.00 None PDG & FALS3930 852.00 340.8 0 0TAZ348 731.25 292.5 293 117
0 Buck Swamp 219 Septic340.8 Peninsula - Step
0 Clinch Estate 246 Septic0 Johnson Estate 396 Septic0 Hayner Tract 868 Septic0 Tyson Estate 951 Septic0 Tyson Tract 952 Septic0 Wil T E t t 976 S ti0 Wilson Tyson Estate 976 Septic
348.20 1,372.25 548.90 253.50 101.40 None PDG & FALS3930 738.50 295.4 0 0TAZ348 633.75 253.5 254 101
0 Buck Swamp 219 Septic295.4 Peninsula - Step
0 Clinch Estate 246 Septic0 Johnson Estate 396 Septic0 Hayner Tract 868 Septic0 Tyson Estate 951 Septic0 Tyson Tract 952 Septic0 Wilson Tyson Estate 976 Septic
348.20+ 16,446.75 6,578.70 3,352.50 1,341.00 None PDG & FALS3930 8,065.50 3,226.2 0 0TAZ348 8,381.25 3,352.5 3,353 1,341
0 Buck Swamp 219 Septic3226.2 Peninsula - Step
0 Clinch Estate 246 Septic0 Johnson Estate 396 Septic0 Hayner Tract 868 Septic0 Tyson Estate 951 Septic0 Tyson Tract 952 Septic0 Wilson Tyson Estate 976 Septic

Exit 29Incremental Growth
Taz #
29 Pop. Estimate (@ 2.5
Residents/HH)
Total # of Possible
Units (ERC)
Upland Acrage to be Developed Total @ 2.5 HH/Acre)
Upland Acrage to be Developed
Total
# of HH in in Sub. Sub. Names Sub. Id Sewer or
Septic Basin Zoned Notes
349 0.00 None FA 50+0 Haynon Tract 869 Septic
350 0.00 None FA & HC 50+0 Atterberry tract 168 Septic0 Jillwood 393 Septic0 Post Court 515 Septic0 Smith Estate 551 Septic0 Smith Tract 552 Septic0 Ternest Acres 928 Septic
351.5 0.00 0.0 0 0 None None FA351.10 0.00 0.0 0 0 None None FA351.15 0.00 0.0 0 0 None None FA351.20 578.91 231.6 232 93 None None FA
351.20+ 8,327.38 3,331.0 3,331 1,332 None None FA352 None None FA 50+
Turtle River is by acrage (High Density: we took
355.5 H PDG
( g e s ty: we toohalf of the acrage with
20HH/acre @ 1.5person/HH Medium Density: 4HH/acre @ 2
people/HH Low Density: 2HH/acre @ 2.5
people/acre)
Turtle2 Total 284.375 113.75 113.75 45.5
Turtle2 High 0 0 0 0
Turtle2 Med 56.25 22.5 22.5 9
Turtle2 Low 228.125 91.25 91.25 36.5
0 Turtle River High Density (acres) Step Turtle29 Turtle River Medium Density (acres) Step Turtle2
36.5 Turtle River Low Density Step Turtle2

Exit 29Incremental Growth
Taz #
29 Pop. Estimate (@ 2.5
Residents/HH)
Total # of Possible
Units (ERC)
Upland Acrage to be Developed Total @ 2.5 HH/Acre)
Upland Acrage to be Developed
Total
# of HH in in Sub. Sub. Names Sub. Id Sewer or
Septic Basin Zoned Notes
355.10 H PDG
Turtle River is by acrage (High Density: we took half of the acrage with
20HH/acre @ 1.5person/HH Medium Density: 4HH/acre @ 2
people/HH Low Density: 2HH/acre @ 2.5
people/acre)
Turtle2 Total 284.375 113.75 113.75 45.5
Turtle2 High 0 0 0 0
Turtle2 Med 56.25 22.5 22.5 9
Turtle2 Low 228.125 91.25 91.25 36.5
0 Turtle River High Density (acres) Step Turtle29 Turtle River Medium Density (acres) Step Turtle2
36 5 T tl Ri L D it St T tl 236.5 Turtle River Low Density Step Turtle2
355.15 H PDG
Turtle River is by acrage (High Density: we took half of the acrage with
20HH/acre @ 1.5person/HH Medium Density: 4HH/acre @ 2
people/HH Low Density: 2HH/acre @ 2.5
people/acre)
Turtle2 Total 284.375 113.75 113.75 45.5
Turtle2 High 0 0 0 0
Turtle2 Med 56.25 22.5 22.5 9
Turtle2 Low 228.125 91.25 91.25 36.5
0 Turtle River High Density (acres) Step Turtle29 Turtle River Medium Density (acres) Step Turtle2
36.5 Turtle River Low Density Step Turtle2
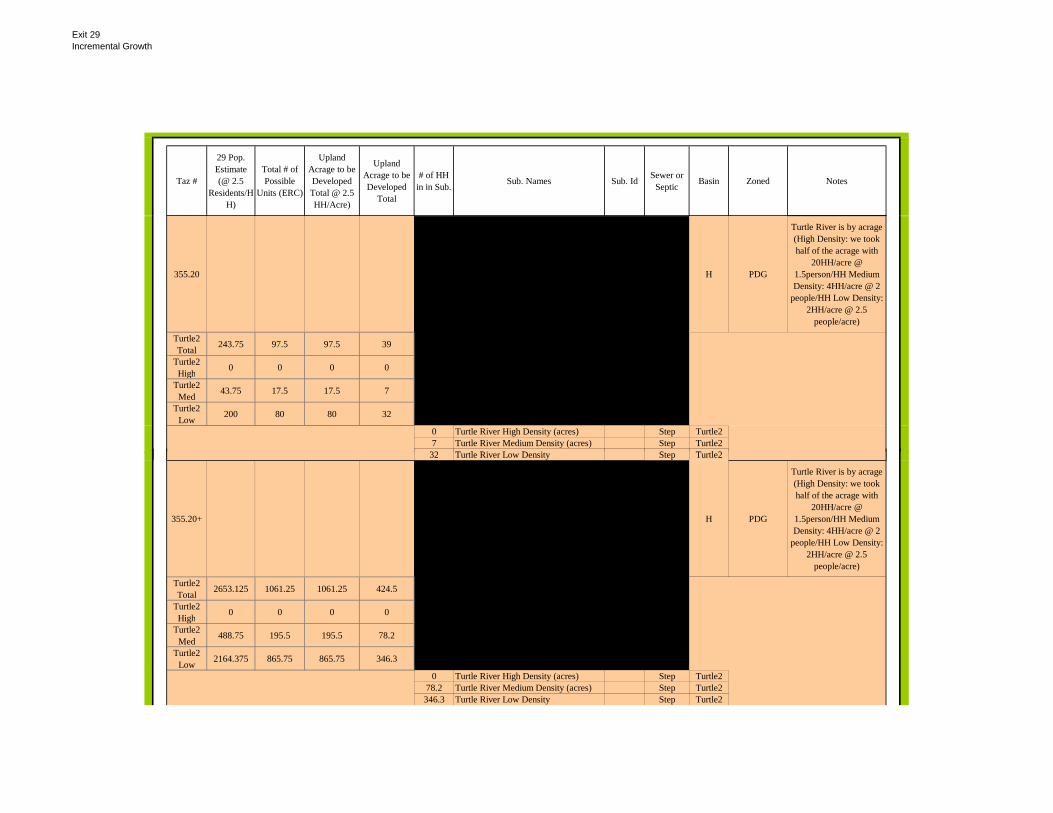
Exit 29Incremental Growth
Taz #
29 Pop. Estimate (@ 2.5
Residents/HH)
Total # of Possible
Units (ERC)
Upland Acrage to be Developed Total @ 2.5 HH/Acre)
Upland Acrage to be Developed
Total
# of HH in in Sub. Sub. Names Sub. Id Sewer or
Septic Basin Zoned Notes
355.20 H PDG
Turtle River is by acrage (High Density: we took half of the acrage with
20HH/acre @ 1.5person/HH Medium Density: 4HH/acre @ 2
people/HH Low Density: 2HH/acre @ 2.5
people/acre)
Turtle2 Total 243.75 97.5 97.5 39
Turtle2 High 0 0 0 0
Turtle2 Med 43.75 17.5 17.5 7
Turtle2 Low 200 80 80 32
0 Turtle River High Density (acres) Step Turtle27 Turtle River Medium Density (acres) Step Turtle2
32 T tl Ri L D it St T tl 232 Turtle River Low Density Step Turtle2
355.20+ H PDG
Turtle River is by acrage (High Density: we took half of the acrage with
20HH/acre @ 1.5person/HH Medium Density: 4HH/acre @ 2
people/HH Low Density: 2HH/acre @ 2.5
people/acre)
Turtle2 Total 2653.125 1061.25 1061.25 424.5
Turtle2 High 0 0 0 0
Turtle2 Med 488.75 195.5 195.5 78.2
Turtle2 Low 2164.375 865.75 865.75 346.3
0 Turtle River High Density (acres) Step Turtle278.2 Turtle River Medium Density (acres) Step Turtle2346.3 Turtle River Low Density Step Turtle2

Exit 29Incremental Growth
Taz #
29 Pop. Estimate (@ 2.5
Residents/HH)
Total # of Possible
Units (ERC)
Upland Acrage to be Developed Total @ 2.5 HH/Acre)
Upland Acrage to be Developed
Total
# of HH in in Sub. Sub. Names Sub. Id Sewer or
Septic Basin Zoned Notes
360.5 175.00 70.0 70 28 Septic TAZ360 FA360.10 175.00 70.0 70 28 Septic TAZ360 FA360.15 175.00 70.0 70 28 Septic TAZ360 FA360.20 150.00 60.0 60 24 Septic TAZ360 FA
360.20+ 1,666.25 666.5 667 267 Septic TAZ360 FA361.5 18.75 7.5 8 3
0 Bennett Tract 188 Septic TAZ361 FA0 B.F. O'Quinn Estate 190 Septic TAZ361 FA0 Dury Tract 295 Septic TAZ361 FA
361.10 18.75 7.5 8 30 Bennett Tract 188 Septic TAZ361 FA0 B.F. O'Quinn Estate 190 Septic TAZ361 FA0 Dury Tract 295 Septic TAZ361 FA
361.15 18.75 7.5 8 30 Bennett Tract 188 Septic TAZ361 FA0 B F O'Q i E t t 190 S ti TAZ361 FA0 B.F. O'Quinn Estate 190 Septic TAZ361 FA0 Dury Tract 295 Septic TAZ361 FA
361.20 15.63 6.3 6 30 Bennett Tract 188 Septic TAZ361 FA0 B.F. O'Quinn Estate 190 Septic TAZ361 FA0 Dury Tract 295 Septic TAZ361 FA
361.20+ 209.38 83.8 84 340 Bennett Tract 188 Septic TAZ361 FA0 B.F. O'Quinn Estate 190 Septic TAZ361 FA0 Dury Tract 295 Septic TAZ361 FA
362.5 581.88 232.8 233 93 Septic TAZ362 FA362.10 581.88 232.8 233 93 Septic TAZ362 FA362.15 581.88 232.8 233 93 Septic TAZ362 FA362.20 504.38 201.8 202 81 Septic TAZ362 FA
362.20+ 5,506.25 2,202.5 2,203 881 Septic TAZ362 FA
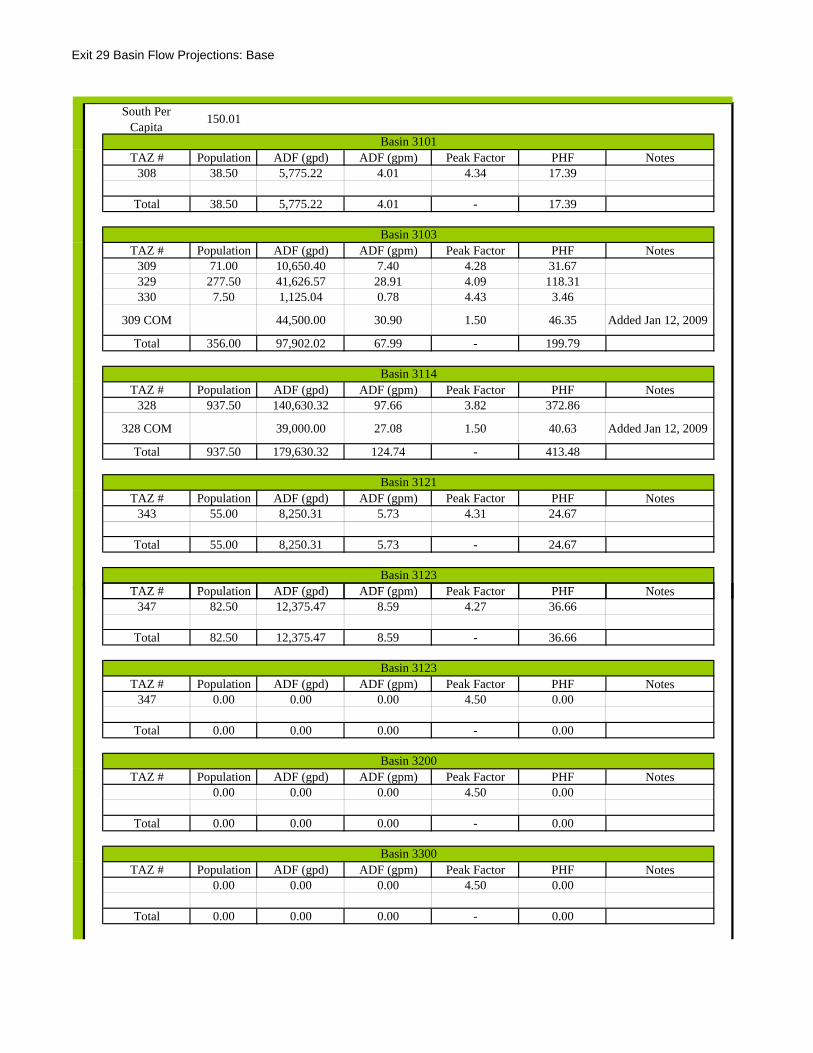
Exit 29 Basin Flow Projections: Base
i ( ( ) PHF
South Per Capita
150.01
Basin 3101TAZ # Population ADF (gpd) ADF (gpm) Peak Factor PHF Notes
308 38.50 5,775.22 4.01 4.34 17.39
Total 38.50 5,775.22 4.01 - 17.39
Basin 3103TAZ # Population ADF (gpd) ADF (gpm) Peak Factor PHF Notes
309 71.00 10,650.40 7.40 4.28 31.67329 277.50 41,626.57 28.91 4.09 118.31330 7.50 1,125.04 0.78 4.43 3.46
309 COM 44,500.00 30.90 1.50 46.35 Added Jan 12, 2009
Total 356.00 97,902.02 67.99 - 199.79
Basin 3114TAZ # Population ADF (gpd) ADF (gpm) Peak Factor PHF Notes
328 937.50 140,630.32 97.66 3.82 372.86
328 COM 39,000.00 27.08 1.50 40.63 Added Jan 12, 2009
Total 937.50 179,630.32 124.74 - 413.48
Basin 3121TAZ # Population ADF (gpd) ADF (gpm) Peak Factor PHF Notes
343 55.00 8,250.31 5.73 4.31 24.67
Total 55.00 8,250.31 5.73 - 24.67
Basin 3123TAZ #TAZ # P l tiPopulat on ADF ( d)ADF gpd) ADF ( )ADF gpm P k F tPeak Factor PHF N tNotes
347 82.50 12,375.47 8.59 4.27 36.66
Total 82.50 12,375.47 8.59 - 36.66
Basin 3123TAZ # Population ADF (gpd) ADF (gpm) Peak Factor PHF Notes
347 0.00 0.00 0.00 4.50 0.00
Total 0.00 0.00 0.00 - 0.00
Basin 3200TAZ # Population ADF (gpd) ADF (gpm) Peak Factor PHF Notes
0.00 0.00 0.00 4.50 0.00
Total 0.00 0.00 0.00 - 0.00
Basin 3300TAZ # Population ADF (gpd) ADF (gpm) Peak Factor PHF Notes
0.00 0.00 0.00 4.50 0.00
Total 0.00 0.00 0.00 - 0.00

Exit 29 Basin Flow Projections: Base
Basin 3301TAZ # Population ADF (gpd) ADF (gpm) Peak Factor PHF Notes
341 0.00 0.00 0.00 4.50 0.00360 0 0.00 0.00 0.00 0.00361 0 0.00 0.00 0.00 0.00362 0 0.00 0.00 0.00 0.00
Total 0.00 0.00 0.00 - 0.00
Basin 3302TAZ # Population ADF (gpd) ADF (gpm) Peak Factor PHF Notes
0.00 0.00 0.00 4.50 0.00
Total 0.00 0.00 0.00 - 0.00
Total_Base 1,469.50 303,933 211 - 692
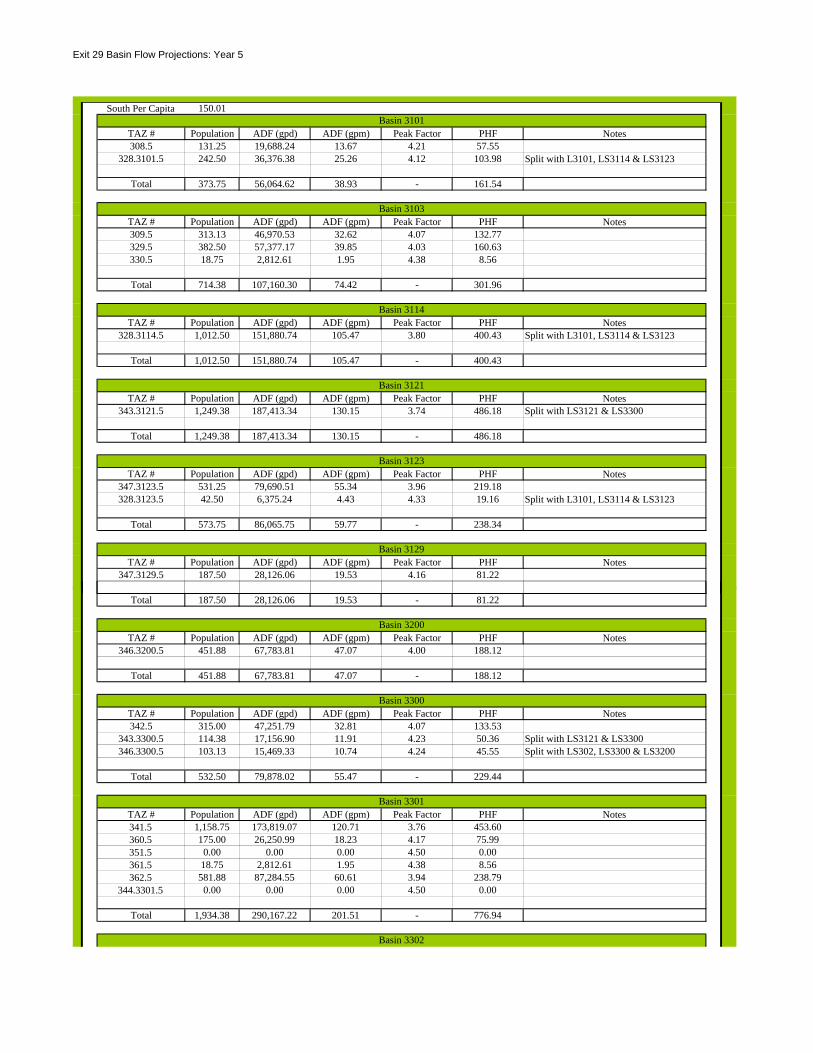
Exit 29 Basin Flow Projections: Year 5
South Per Capita 150.01Basin 3101
TAZ # Population ADF (gpd) ADF (gpm) Peak Factor PHF Notes308.5 131.25 19,688.24 13.67 4.21 57.55
328.3101.5 242.50 36,376.38 25.26 4.12 103.98 Split with L3101, LS3114 & LS3123
Total 373.75 56,064.62 38.93 - 161.54
Basin 3103TAZ # Population ADF (gpd) ADF (gpm) Peak Factor PHF Notes309.5 313.13 46,970.53 32.62 4.07 132.77329.5 382.50 57,377.17 39.85 4.03 160.63330.5 18.75 2,812.61 1.95 4.38 8.56
Total 714.38 107,160.30 74.42 - 301.96
Basin 3114TAZ # Population ADF (gpd) ADF (gpm) Peak Factor PHF Notes
328.3114.5 1,012.50 151,880.74 105.47 3.80 400.43 Split with L3101, LS3114 & LS3123
Total 1,012.50 151,880.74 105.47 - 400.43
Basin 3121TAZ # Population ADF (gpd) ADF (gpm) Peak Factor PHF Notes
343.3121.5 1,249.38 187,413.34 130.15 3.74 486.18 Split with LS3121 & LS3300
Total 1,249.38 187,413.34 130.15 - 486.18
Basin 3123TAZ # Population ADF (gpd) ADF (gpm) Peak Factor PHF Notes
347.3123.5 531.25 79,690.51 55.34 3.96 219.18328.3123.5 42.50 6,375.24 4.43 4.33 19.16 Split with L3101, LS3114 & LS3123
Total 573.75 86,065.75 59.77 - 238.34
Basin 3129TAZ # Population ADF (gpd) ADF (gpm) Peak Factor PHF Notes
347.3129.5 187.50 28,126.06 19.53 4.16 81.22
Total 187.50 28,126.06 19.53 - 81.22
Basin 3200TAZ # Population ADF (gpd) ADF (gpm) Peak Factor PHF Notes
346.3200.5 451.88 67,783.81 47.07 4.00 188.12
Total 451.88 67,783.81 47.07 - 188.12
Basin 3300TAZ # Population ADF (gpd) ADF (gpm) Peak Factor PHF Notes342.5 315.00 47,251.79 32.81 4.07 133.53
343.3300.5 114.38 17,156.90 11.91 4.23 50.36 Split with LS3121 & LS3300346.3300.5 103.13 15,469.33 10.74 4.24 45.55 Split with LS302, LS3300 & LS3200
Total 532.50 79,878.02 55.47 - 229.44
Basin 3301TAZ # Population ADF (gpd) ADF (gpm) Peak Factor PHF Notes341.5 1,158.75 173,819.07 120.71 3.76 453.60360.5 175.00 26,250.99 18.23 4.17 75.99351.5 0.00 0.00 0.00 4.50 0.00361.5 18.75 2,812.61 1.95 4.38 8.56362.5 581.88 87,284.55 60.61 3.94 238.79
344.3301.5 0.00 0.00 0.00 4.50 0.00
Total 1,934.38 290,167.22 201.51 - 776.94
Basin 3302

Exit 29 Basin Flow Projections: Year 5
TAZ # Population ADF (gpd) ADF (gpm) Peak Factor PHF Notes344.3302.5 0.00 0.00 0.00 4.50 0.00
345.5 0.00 0.00 0.00 4.50 0.00348.5 1,232.00 184,806.99 128.34 3.74 479.95
346.3302.5 56.25 8,437.82 5.86 4.30 25.22
Total 1,288.25 193,244.81 134.20 - 505.17
Total 5 Yr 8,318 1,247,785 867 - 3,369

Exit 29 Basin Flow Projections: Year 10
TAZ # Population ADF (gpd) ADF (gpm) Peak Factor PHF Notes
South Per Capita 150.01Basin 3101
TAZ # Population ADF (gpd) ADF (gpm) Peak Factor PHF Notes308.10 0.00 0.00 0.00 0.00 0.00
328.3101.10 0.00 0.00 0.00 0.00 0.00
Total 0.00 0.00 0.00 - 0.00
Basin 3103TAZ # Population ADF (gpd) ADF (gpm) Peak Factor PHF Notes309.10 313.13 46,970.53 32.62 4.07 132.77329.10 0.00 0.00 0.00 0.00 0.00330.10 0.00 0.00 0.00 0.00 0.00
Total 313.13 46,970.53 32.62 - 132.77
Basin 3114TAZ # Population ADF (gpd) ADF (gpm) Peak Factor PHF Notes
328.3114.10 0.00 0.00 0.00 0.00 0.00
Total 0.00 0.00 0.00 - 0.00
Basin 3121TAZ # Population ADF (gpd) ADF (gpm) Peak Factor PHF Notes
343.3121.10 0.00 0.00 0.00 0.00 0.00 Split with LS3121 & TAZ343
Total 0.00 0.00 0.00 - 0.00
Basin 3123TAZ # Population ADF (gpd) ADF (gpm) Peak Factor PHF Notes
347.3123.10 356.25 53,439.52 37.11 4.05 150.13328.3123.10 0.00 0.00 0.00 0.00 0.00
Total 356.25 53,439.52 37.11 - 150.13
Basin 3129TAZ # Population ADF (gpd) ADF (gpm) Peak Factor PHF Notes
347.3129.10 0.00 0.00 0.00 4.50 0.00
Total 0.00 0.00 0.00 - 0.00
Basin 3200TAZ # Population ADF (gpd) ADF (gpm) Peak Factor PHF Notes
346.3200.10 46.88 7,031.52 4.88 4.32 21.10
Total 46.88 7,031.52 4.88 - 21.10
Basin 3300TAZ # Population ADF (gpd) ADF (gpm) Peak Factor PHF Notes342.10 315.00 47,251.79 32.81 4.07 133.53
343.3300.10 114.38 17,156.90 11.91 4.23 50.36 Split with LS3121 & LS3300346.3300.10 103.13 15,469.33 10.74 4.24 45.55 Split with LS302, LS3300 & LS3200
Total 532.50 79,878.02 55.47 - 229.44
Basin 3301TAZ # Population ADF (gpd) ADF (gpm) Peak Factor PHF Notes341.1 801.25 120,192.04 83.47 3.86 322.18360.1 175.00 26,250.99 18.23 4.17 75.99351.1 0.00 0.00 0.00 4.50 0.00361.1 18.75 2,812.61 1.95 4.38 8.56362.1 581.88 87,284.55 60.61 3.94 238.79
344.3301.10 226.56 33,985.66 23.60 4.13 97.42
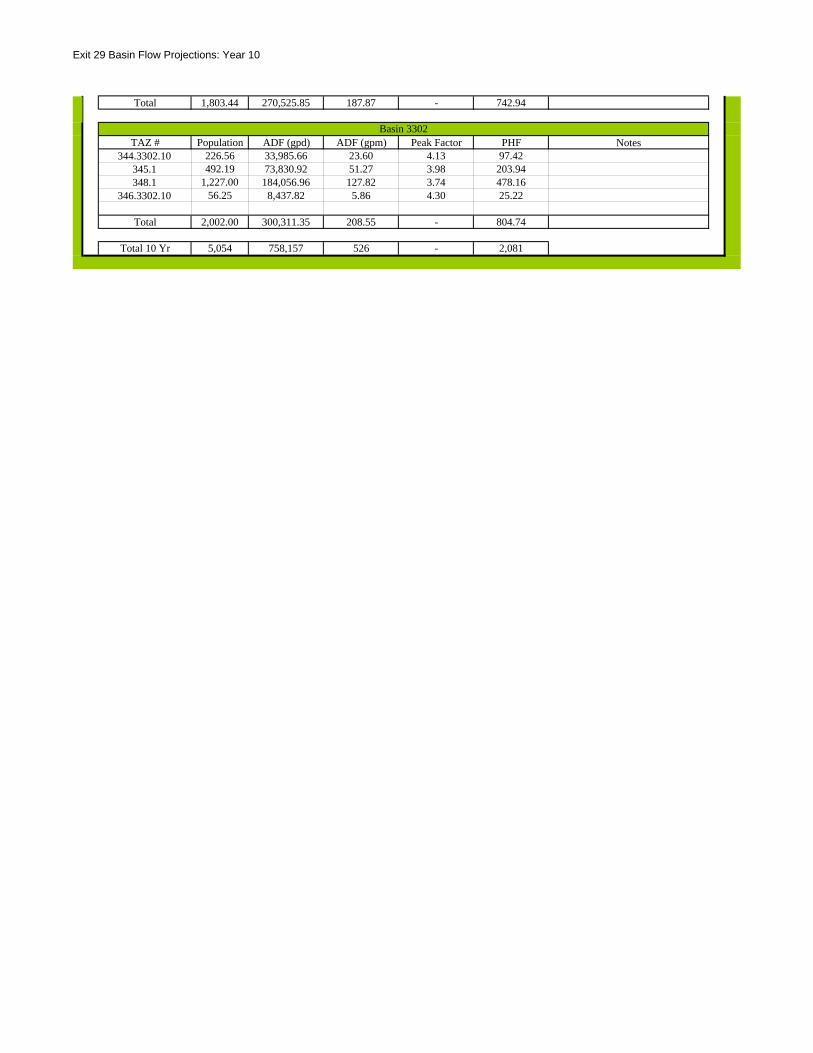
Exit 29 Basin Flow Projections: Year 10
Total 1,803.44 270,525.85 187.87 - 742.94
Basin 3302TAZ # Population ADF (gpd) ADF (gpm) Peak Factor PHF Notes
344.3302.10 226.56 33,985.66 23.60 4.13 97.42345.1 492.19 73,830.92 51.27 3.98 203.94348.1 1,227.00 184,056.96 127.82 3.74 478.16
346.3302.10 56.25 8,437.82 5.86 4.30 25.22
Total 2,002.00 300,311.35 208.55 - 804.74
Total 10 Yr 5,054 758,157 526 - 2,081

Exit 29 Basin Flow Projections: Year 15
347 3129 15 00 00 00 00
South Per Capita 150.01Basin 3101
TAZ # Population ADF (gpd) ADF (gpm) Peak Factor PHF Notes308.15 0.00 0.00 0.00 0.00 0.00
328.3101.15 0.00 0.00 0.00 0.00 0.00
Total 0.00 0.00 0.00 - 0.00
Basin 3103TAZ # Population ADF (gpd) ADF (gpm) Peak Factor PHF Notes309.15 313.13 46,970.53 32.62 4.07 132.77329.15 0.00 0.00 0.00 0.00 0.00330.15 0.00 0.00 0.00 0.00 0.00
Total 313.13 46,970.53 32.62 - 132.77
Basin 3114TAZ # Population ADF (gpd) ADF (gpm) Peak Factor PHF Notes
328.3114.15 0.00 0.00 0.00 0.00 0.00
Total 0.00 0.00 0.00 - 0.00
Basin 3121TAZ # Population ADF (gpd) ADF (gpm) Peak Factor PHF Notes
343.3121.15 0.00 0.00 0.00 0.00 0.00 Split with LS3121 & TAZ343
Total 0.00 0.00 0.00 - 0.00
Basin 3123TAZ # Population ADF (gpd) ADF (gpm) Peak Factor PHF Notes
347.3123.15 356.25 53,439.52 37.11 4.05 150.13328.3123.15 0.00 0.00 0.00 0.00 0.00
Total 356.25 53,439.52 37.11 - 150.13
Basin 3129TAZ # Population ADF (gpd) ADF (gpm) Peak Factor PHF Notes
347 3129 15. . 0 000. 0 000. 0 000. 4 504.50 0 000.
Total 0.00 0.00 0.00 - 0.00
Basin 3200TAZ # Population ADF (gpd) ADF (gpm) Peak Factor PHF Notes
346.3200.15 46.88 7,031.52 4.88 4.32 21.10
Total 46.88 7,031.52 4.88 - 21.10
Basin 3300TAZ # Population ADF (gpd) ADF (gpm) Peak Factor PHF Notes342.15 315.00 47,251.79 32.81 4.07 133.53
343.3300.15 114.38 17,156.90 11.91 4.23 50.36 Split with LS3121 & LS3300346.3300.15 103.13 15,469.33 10.74 4.24 45.55 Split with LS302, LS3300 & LS3200
Total 532.50 79,878.02 55.47 - 229.44
Basin 3301TAZ # Population ADF (gpd) ADF (gpm) Peak Factor PHF Notes341.15 801.25 120,192.04 83.47 3.86 322.183601.5 175.00 26,250.99 18.23 4.17 75.99351.15 0.00 0.00 0.00 4.50 0.00361.15 18.75 2,812.61 1.95 4.38 8.56362.15 581.88 87,284.55 60.61 3.94 238.79
344.3301.15 226.56 33,985.66 23.60 4.13 97.42
Total 1,803.44 270,525.85 187.87 - 742.94

Exit 29 Basin Flow Projections: Year 15
Basin 3302TAZ # Population ADF (gpd) ADF (gpm) Peak Factor PHF Notes
344.3302.15 226.56 33,985.66 23.60 4.13 97.42345.15 492.19 73,830.92 51.27 3.98 203.94348.15 1,583.25 237,496.48 164.93 3.66 604.04
346.3302.15 56.25 8,437.82 5.86 4.30 25.22
Total 2,358.25 353,750.87 245.66 - 930.63
Total 15 Yr 5,410 811,596 564 - 2,207
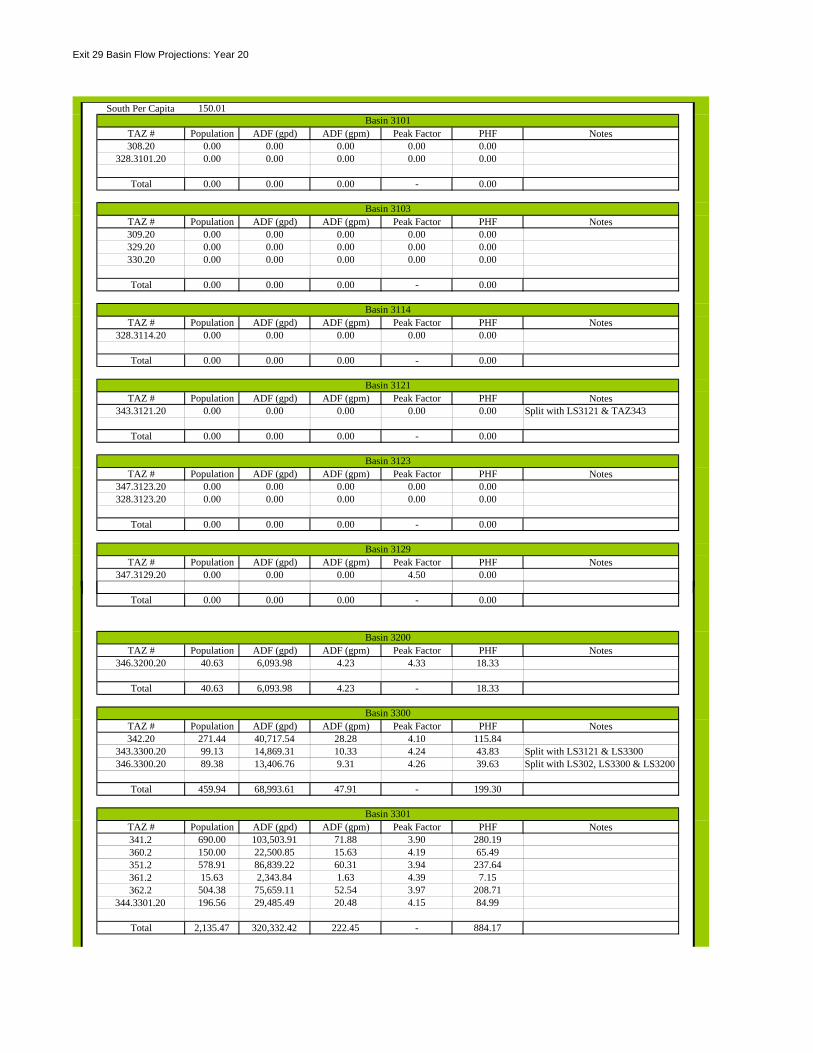
Exit 29 Basin Flow Projections: Year 20
South Per Capita 150.01Basin 3101
TAZ # Population ADF (gpd) ADF (gpm) Peak Factor PHF Notes308.20 0.00 0.00 0.00 0.00 0.00
328.3101.20 0.00 0.00 0.00 0.00 0.00
Total 0.00 0.00 0.00 - 0.00
Basin 3103TAZ # Population ADF (gpd) ADF (gpm) Peak Factor PHF Notes309.20 0.00 0.00 0.00 0.00 0.00329.20 0.00 0.00 0.00 0.00 0.00330.20 0.00 0.00 0.00 0.00 0.00
Total 0.00 0.00 0.00 - 0.00
Basin 3114TAZ # Population ADF (gpd) ADF (gpm) Peak Factor PHF Notes
328.3114.20 0.00 0.00 0.00 0.00 0.00
Total 0.00 0.00 0.00 - 0.00
Basin 3121TAZ # Population ADF (gpd) ADF (gpm) Peak Factor PHF Notes
343.3121.20 0.00 0.00 0.00 0.00 0.00 Split with LS3121 & TAZ343
Total 0.00 0.00 0.00 - 0.00
Basin 3123TAZ # Population ADF (gpd) ADF (gpm) Peak Factor PHF Notes
347.3123.20 0.00 0.00 0.00 0.00 0.00328.3123.20 0.00 0.00 0.00 0.00 0.00
Total 0.00 0.00 0.00 - 0.00
Basin 3129TAZ # Population ADF (gpd) ADF (gpm) Peak Factor PHF Notes
347.3129.20 0.00 0.00 0.00 4.50 0.00
Total 0.00 0.00 0.00 - 0.00
Basin 3200TAZ # Population ADF (gpd) ADF (gpm) Peak Factor PHF Notes
346.3200.20 40.63 6,093.98 4.23 4.33 18.33
Total 40.63 6,093.98 4.23 - 18.33
Basin 3300TAZ # Population ADF (gpd) ADF (gpm) Peak Factor PHF Notes342.20 271.44 40,717.54 28.28 4.10 115.84
343.3300.20 99.13 14,869.31 10.33 4.24 43.83 Split with LS3121 & LS3300346.3300.20 89.38 13,406.76 9.31 4.26 39.63 Split with LS302, LS3300 & LS3200
Total 459.94 68,993.61 47.91 - 199.30
Basin 3301TAZ # Population ADF (gpd) ADF (gpm) Peak Factor PHF Notes341.2 690.00 103,503.91 71.88 3.90 280.19360.2 150.00 22,500.85 15.63 4.19 65.49351.2 578.91 86,839.22 60.31 3.94 237.64361.2 15.63 2,343.84 1.63 4.39 7.15362.2 504.38 75,659.11 52.54 3.97 208.71
344.3301.20 196.56 29,485.49 20.48 4.15 84.99
Total 2,135.47 320,332.42 222.45 - 884.17

Exit 29 Basin Flow Projections: Year 20
Basin 3302TAZ # Population ADF (gpd) ADF (gpm) Peak Factor PHF Notes
344.3302.20 196.56 29,485.49 20.48 4.15 84.99345.2 426.56 63,986.79 44.44 4.01 178.13348.2 1,372.25 205,845.28 142.95 3.71 529.93
346.3302.20 50.00 7,500.28 5.21 4.31 22.47
Total 2,045.38 306,817.85 213.07 - 815.53
Total 20 Yr 4,681 702,238 488 - 1,917

APPENDIX F INFOWATER HYDRAULIC MODEL INPUT DATA
Brunswick Glynn County JWSC Applied Technology & Management, Inc.
Water Sewer Master Plan

APPENDIX F – WATER PRODUCTION FACILITES AND MODEL CONFIGURATIONS
Brunswick Glynn County JWSC Applied Technology & Management, Inc.
Water Sewer Master Plan
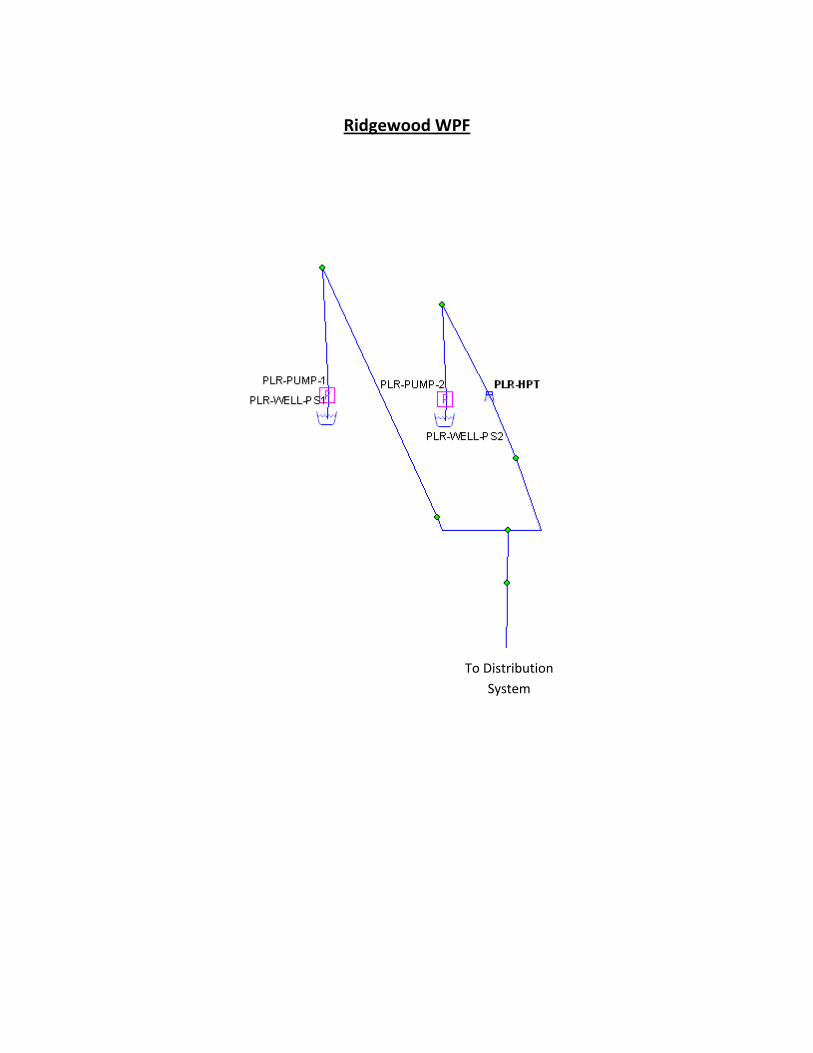
Ridgewood WPF
To Distribution System
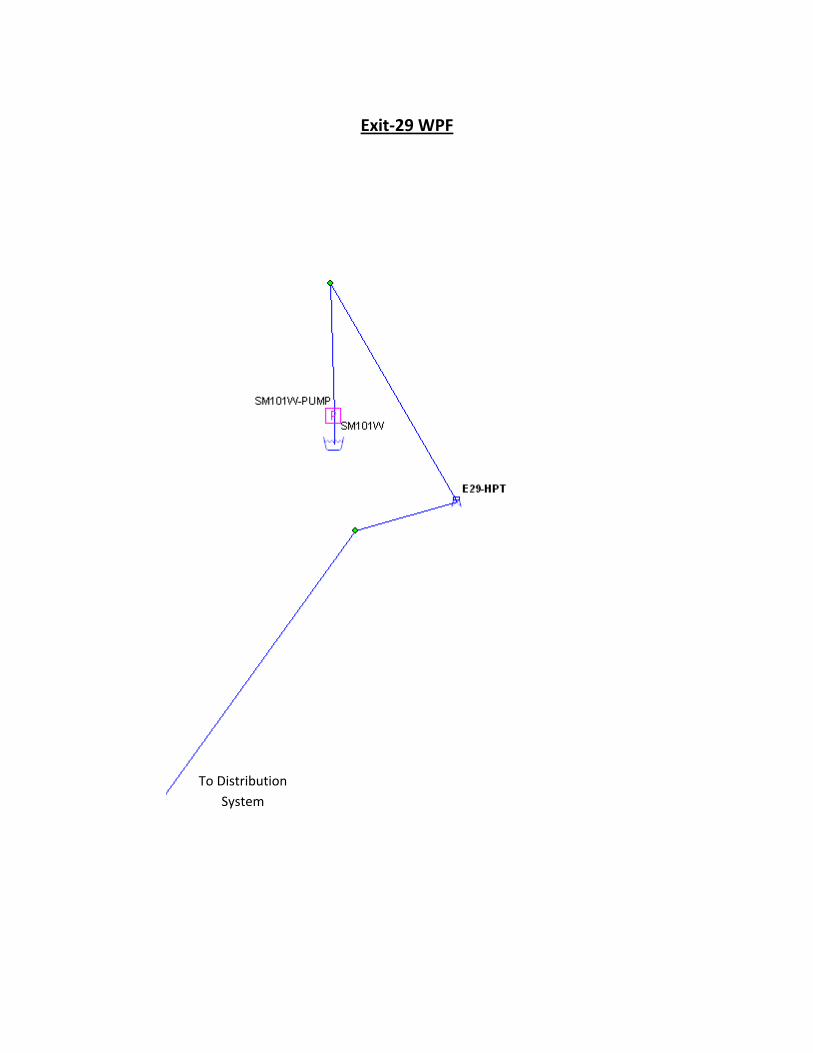
Exit‐29 WPF
To Distribution System
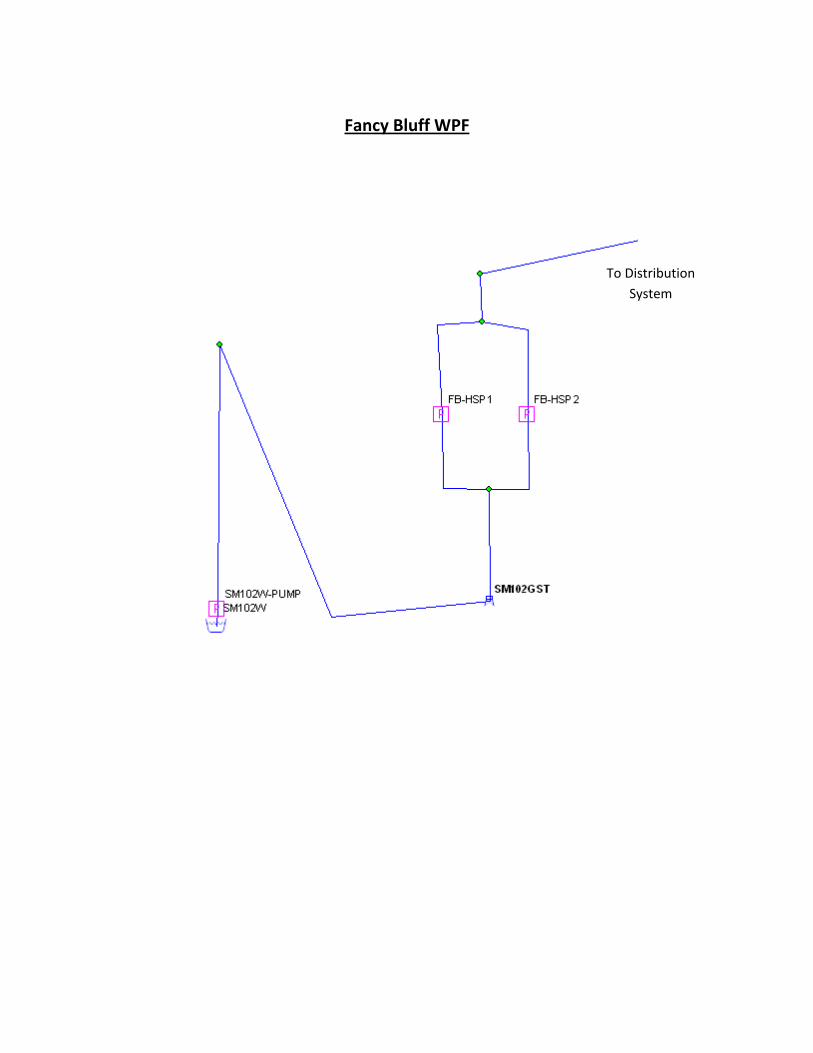
Fancy Bluff WPF
To Distribution System
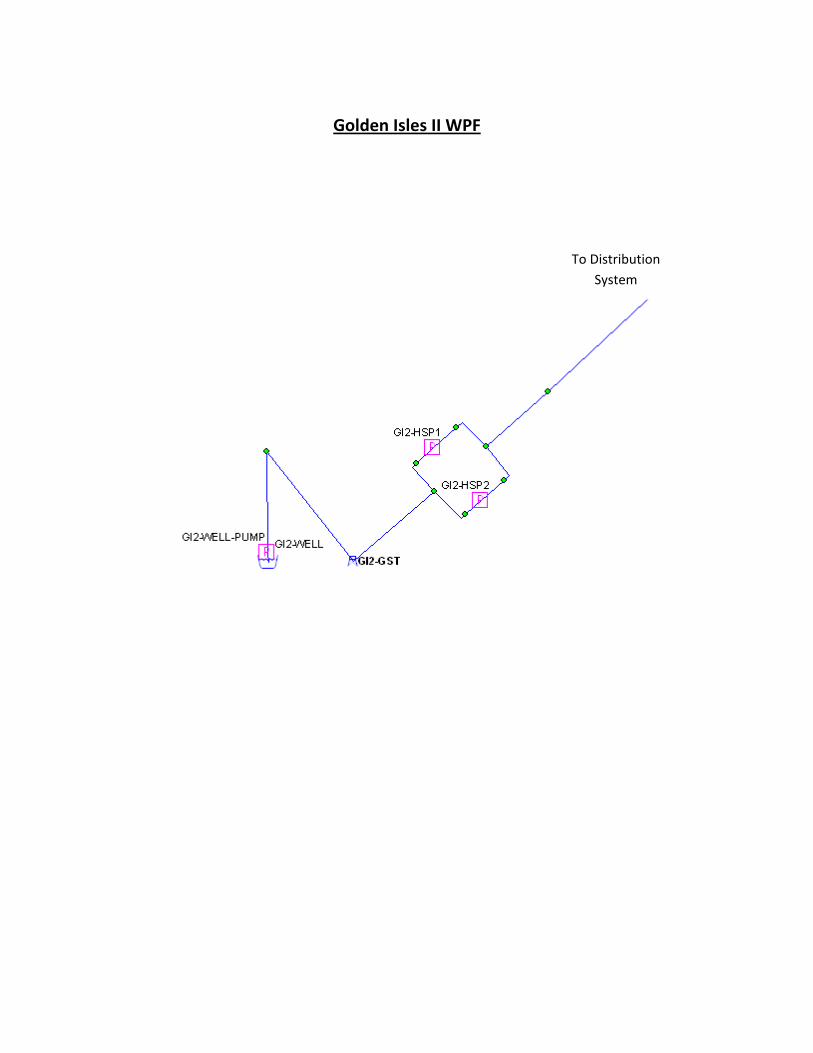
Golden Isles II WPF
To Distribution System

Golden Isles I WPF
To Distribution System
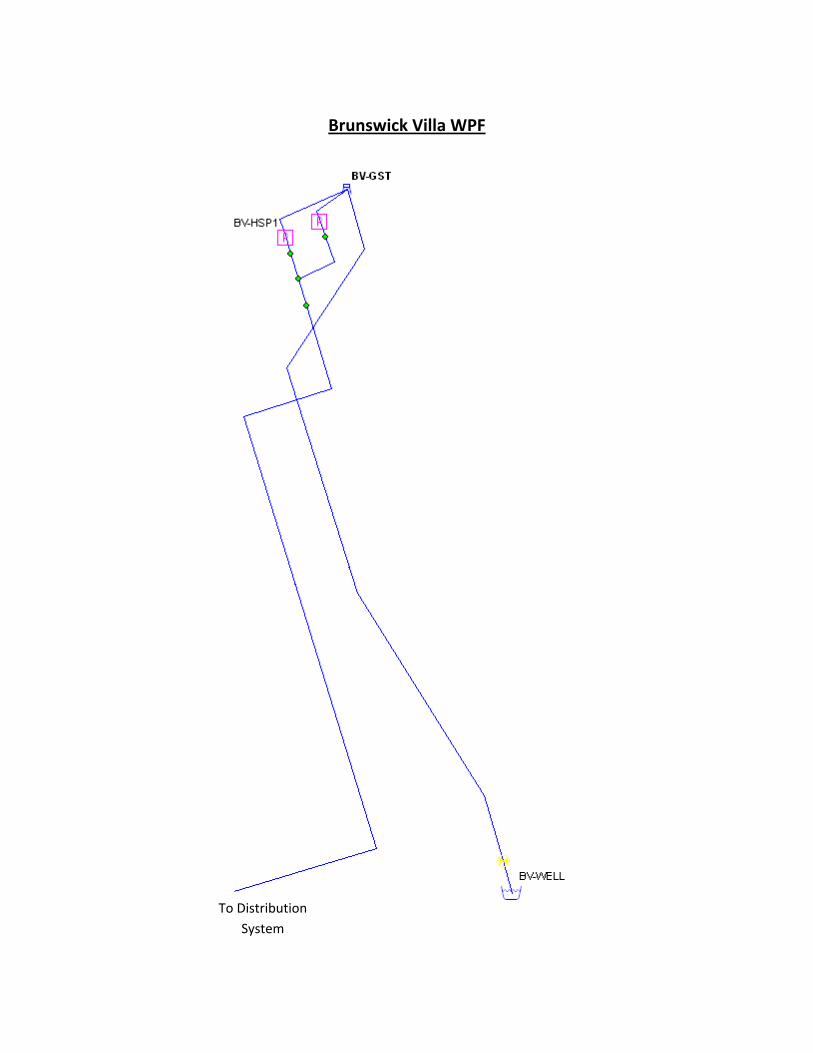
Brunswick Villa WPF
To Distribution System

I‐95 WPF
To Distribution
System

FLETC‐Glynco WPF
To Distribution System

Goodyear WPF
To Distribution System

Howard Coffin Park WPF
To Distribution System

APPENDIX F – PRIMARY MODEL ELEMENTS AND HYDRAULIC INFORMATION (PUMP & TANKS)
Brunswick Glynn County JWSC Applied Technology & Management, Inc.
Water Sewer Master Plan

City of Brunswick ‐ JWSC Elevated water Storage Tank InformationPrepared for Water System Hydraulic Model
Facility Name: Cate Road EST
BG‐JWSC ID: NM103EST
ATM Model ID: CR‐EST
Controlled Pump Station: Golden Isles II PS
Maximum Level 27.5
Tank Bottom Elevation 125.0
ft
ftMinimum Level 0.0 ft
Lead Pump ON 25.0
Lead Pump OFF 27.0
ft /
ft /
psi53.4
psi54.3
Benchmark Elevation 29.96
Transducer Elevation ft
ft
System/Pipe Elevation 27.00 ft
Overflow Elevation 152.5ft /
Initial Level 25.6 ft / psi53.5
psi54.3
ft / 53 psi
ft / 54.3 psi
Lag Pump ON 24.0
Lag Pump OFF 27.0

City of Brunswick ‐ JWSC Elevated water Storage Tank InformationPrepared for Water System Hydraulic Model
Facility Name: First Street EST
BG‐JWSC ID: 12EST
ATM Model ID: 1ST‐EST
Controlled Pump Station: Goodyear & Brunswick Villa PSs
Maximum Level 25.3
Tank Bottom Elevation 120.0
ft
ftMinimum Level 0.0 ft
Lead Pump ON 10.6
Lead Pump OFF 24.0
ft /
ft /
psi52.5
psi58.3
Benchmark Elevation 11.75
Transducer Elevation 20.76 ft
ft
System/Pipe Elevation 9.29 ft
Overflow Elevation 145.3ft /
Initial Level 17.7 ft / psi55.6
psi58.9
ft / 49.9 psi
ft / 51.3 psi
Lag Pump ON 4.6
Lag Pump OFF 7.8

City of Brunswick ‐ JWSC Elevated water Storage Tank InformationPrepared for Water System Hydraulic Model
Facility Name: FLETC EST
BG‐JWSC ID: 108EST
ATM Model ID: FLETC‐EST
Controlled Pump Station: FLETC PS
Maximum Level 22.1
Tank Bottom Elevation 127.0
ft
ftMinimum Level 0.6 ft
Lead Pump ON 7.6
Lead Pump OFF 21.0
ft /
ft /
psi52.3
psi58.1
Benchmark Elevation 15.98
Transducer Elevation 20.40 ft
ft
System/Pipe Elevation 13.76 ft
Overflow Elevation 149.1ft /
Initial Level 18.9 ft / psi57.2
psi58.6
ft / 51.5 psi
ft / 55.4 psi
Lag Pump ON 5.7
Lag Pump OFF 14.7
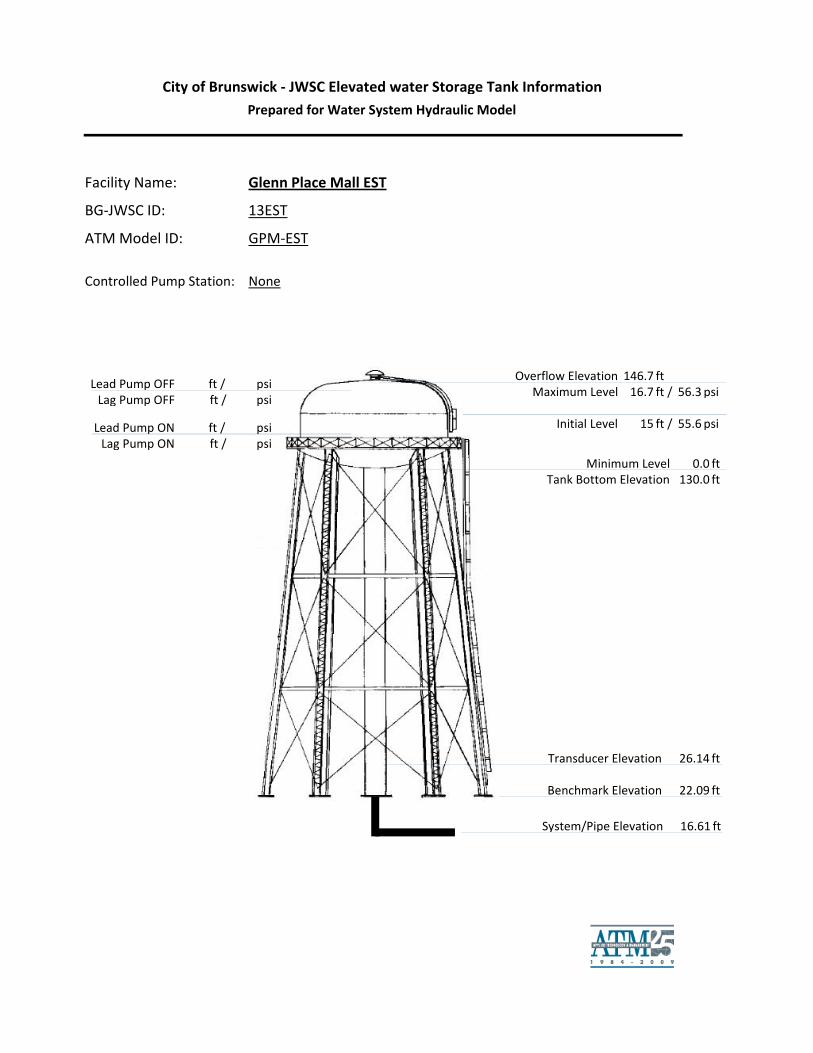
City of Brunswick ‐ JWSC Elevated water Storage Tank InformationPrepared for Water System Hydraulic Model
Facility Name: Glenn Place Mall EST
BG‐JWSC ID: 13EST
ATM Model ID: GPM‐EST
Controlled Pump Station: None
Maximum Level 16.7
Tank Bottom Elevation 130.0
ft
ftMinimum Level 0.0 ft
Lead Pump ON
Lead Pump OFF
ft /
ft /
psi
psi
Benchmark Elevation 22.09
Transducer Elevation 26.14 ft
ft
System/Pipe Elevation 16.61 ft
Overflow Elevation 146.7ft /
Initial Level 15 ft / psi55.6
psi56.3
ft / psi
ft / psi
Lag Pump ON
Lag Pump OFF

City of Brunswick ‐ JWSC Elevated water Storage Tank InformationPrepared for Water System Hydraulic Model
Facility Name: I‐95 EST
BG‐JWSC ID: 114EST
ATM Model ID: I95‐EST
Controlled Pump Station: I‐95 PS
Maximum Level 24.0
Tank Bottom Elevation 128.0
ft
ftMinimum Level 3.3 ft
Lead Pump ON 18.9
Lead Pump OFF 24.0
ft /
ft /
psi53.3
psi55.5
Benchmark Elevation 27.96
Transducer Elevation 36.94 ft
ft
System/Pipe Elevation 23.78 ft
Overflow Elevation 152.0ft /
Initial Level 20 ft / psi53.8
psi55.5
ft / 53 psi
ft / 53.5 psi
Lag Pump ON 18.2
Lag Pump OFF 19.4

City of Brunswick ‐ JWSC Elevated water Storage Tank InformationPrepared for Water System Hydraulic Model
Facility Name: Perry Park EST
BG‐JWSC ID: 15GST
ATM Model ID: PP‐EST
Controlled Pump Station: None
Maximum Level 21.5
Tank Bottom Elevation 122.0
ft
ftMinimum Level 4.0 ft
Lead Pump ON
Lead Pump OFF
ft /
ft /
psi
psi
Benchmark Elevation 11.47
Transducer Elevation 18.67 ft
ft
System/Pipe Elevation 9.26 ft
Overflow Elevation 143.5ft /
Initial Level 15 ft / psi55.3
psi58.1
ft / psi
ft / psi
Lag Pump ON
Lag Pump OFF

City of Brunswick ‐ JWSC Elevated water Storage Tank InformationPrepared for Water System Hydraulic Model
Facility Name: Prince Street EST
BG‐JWSC ID: 11EST
ATM Model ID: PS‐EST
Controlled Pump Station: Howard Coffin PS
Maximum Level 24.7
Tank Bottom Elevation 117.0
ft
ftMinimum Level 3.4 ft
Lead Pump ON 7.6
Lead Pump OFF 18.5
ft /
ft /
psi51.8
psi56.5
Benchmark Elevation 10.34
Transducer Elevation 16.44 ft
ft
System/Pipe Elevation 4.93 ft
Overflow Elevation 141.7ft /
Initial Level 20 ft / psi57.2
psi59.2
ft / 50 psi
ft / 50.8 psi
Lag Pump ON 3.4
Lag Pump OFF 5.3

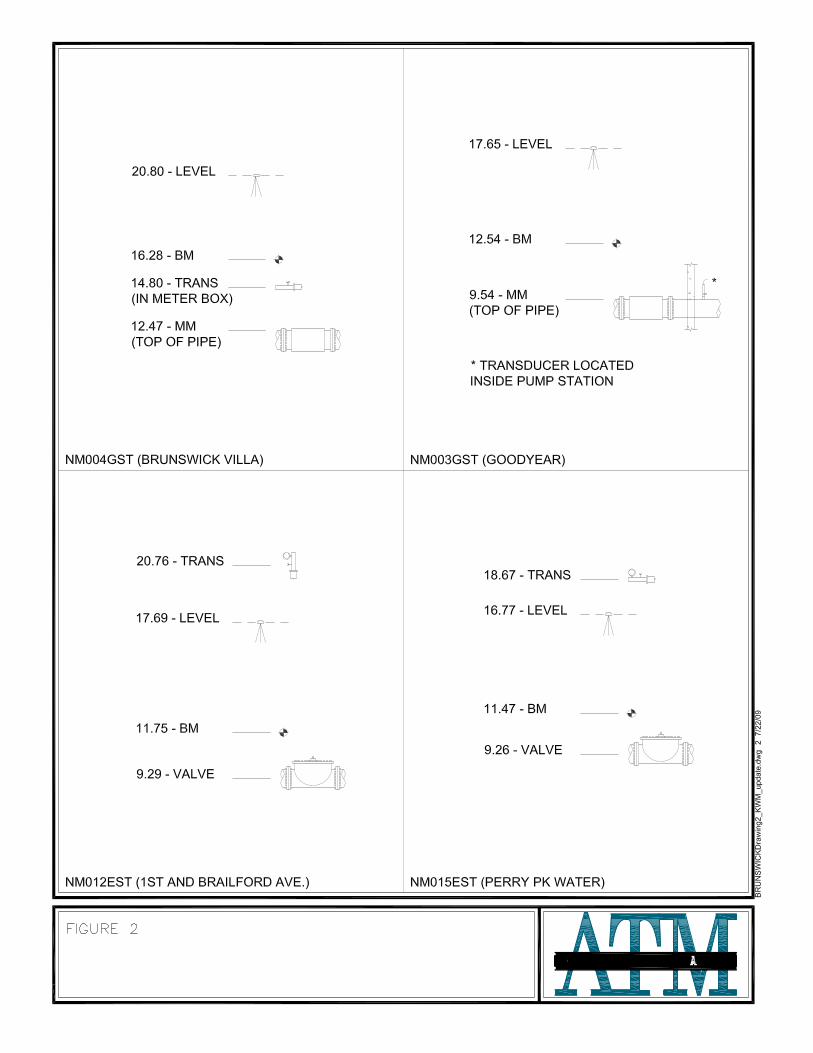
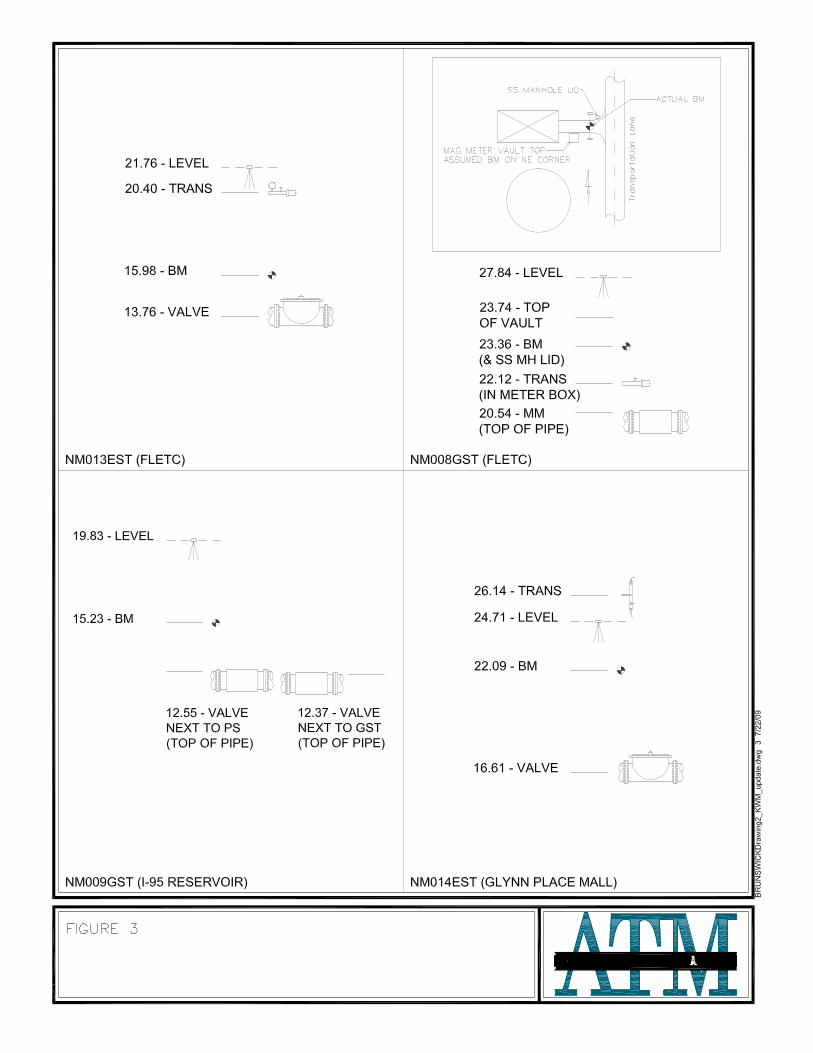

kmoore
Text Box
Howard Coffin HSP 2
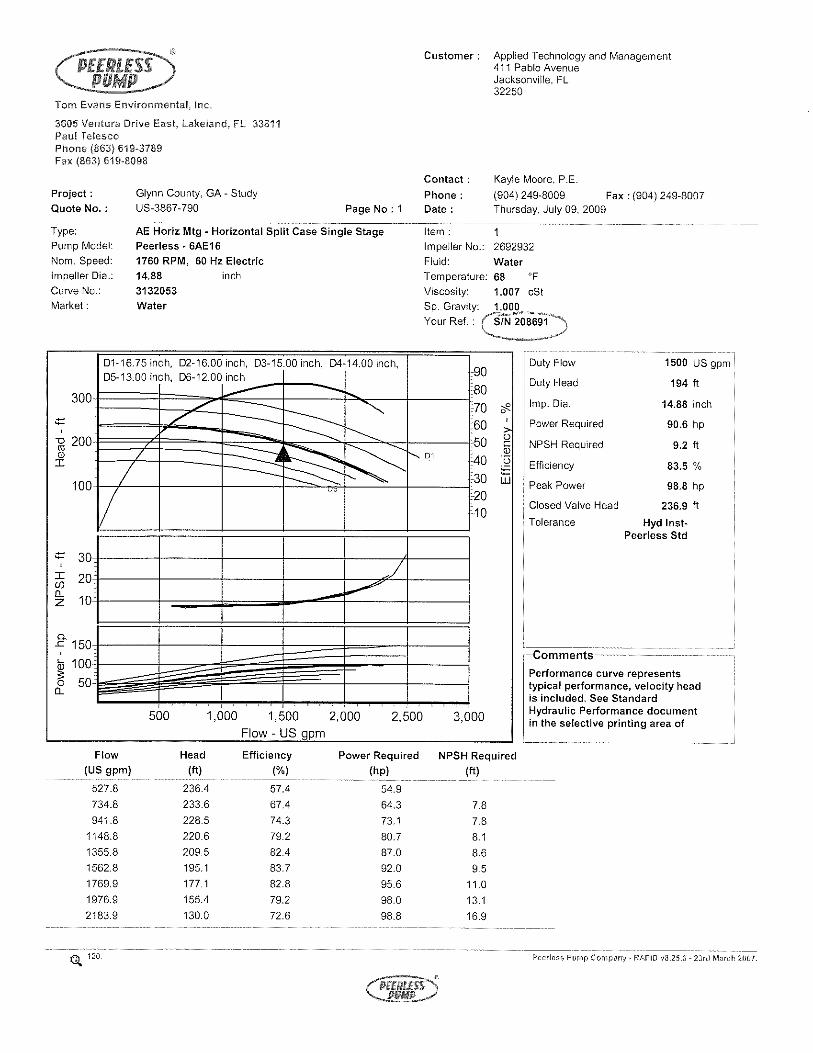
kmoore
Text Box
Howard Coffin HSP 3 -OLD Before Trim - BAD - DO NOT USE
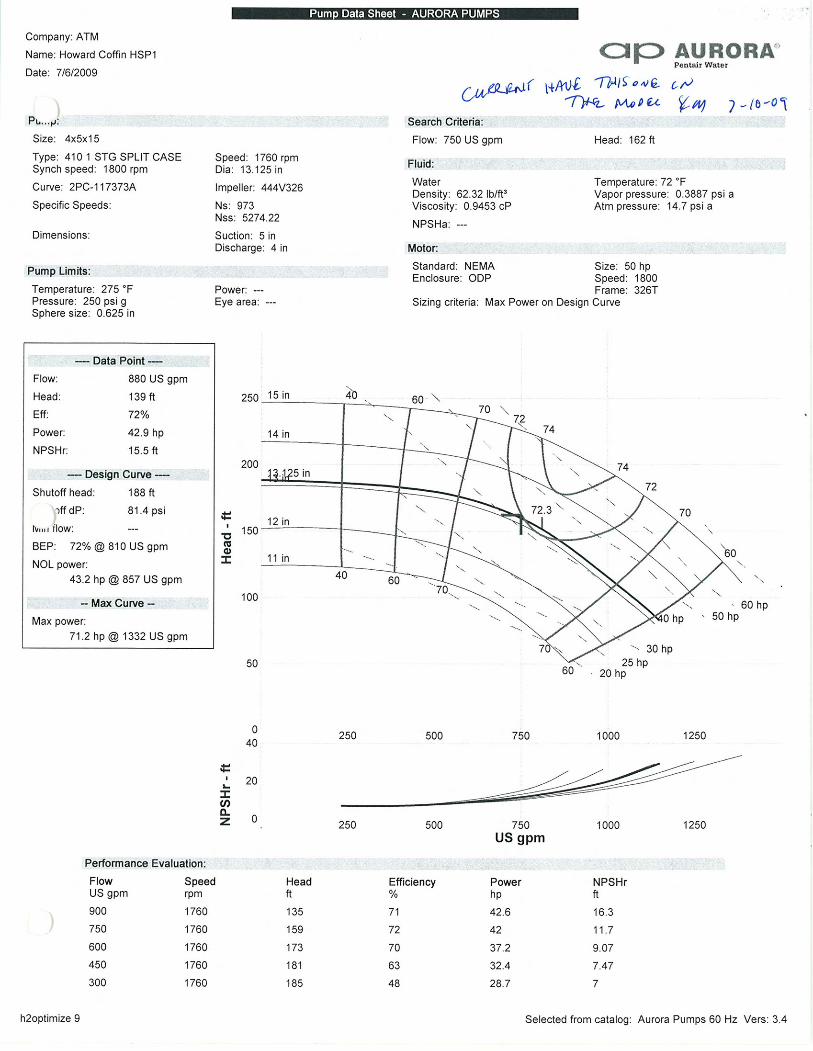


kmoore
Text Box
Goodyear HSP1

kmoore
Text Box
Goodyear HSP 2

kmoore
Text Box
Brunswick Villa HSP 1

kmoore
Text Box
Brunswick Villa HSP 2

kmoore
Text Box
FLETC - Glynco
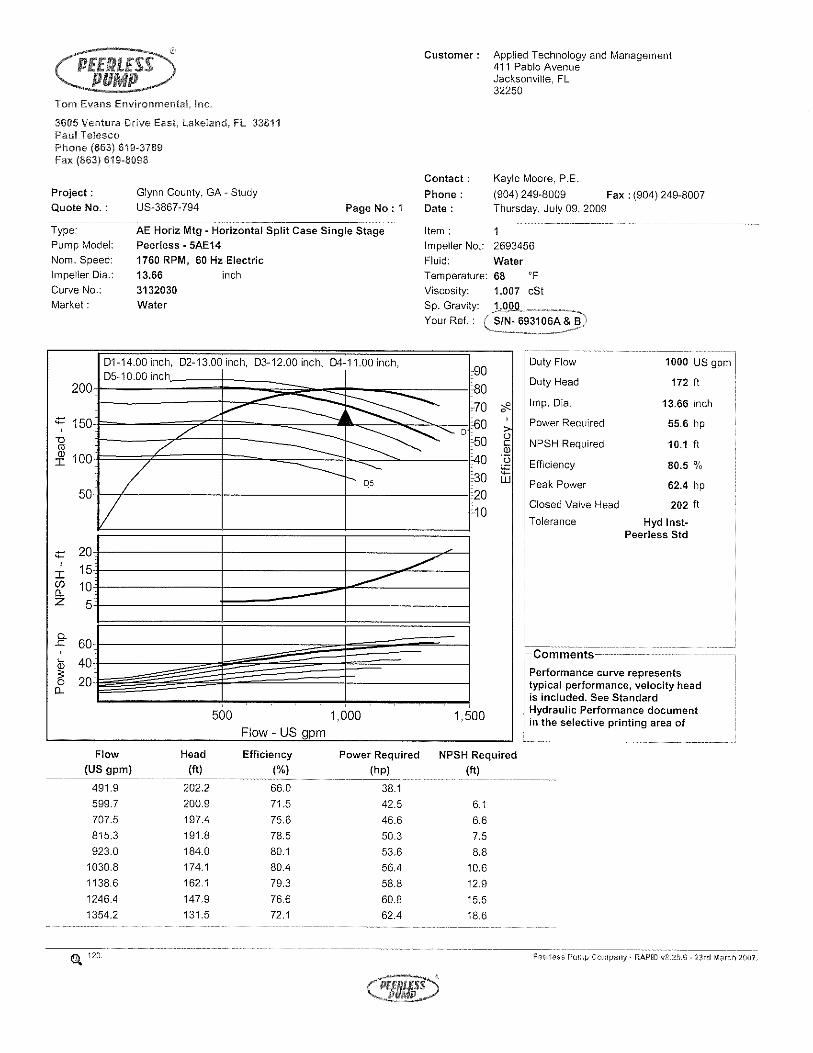
kmoore
Text Box
Golden Isles II HSP 1 & 2

kmoore
Text Box
Canal Rd Well Pump
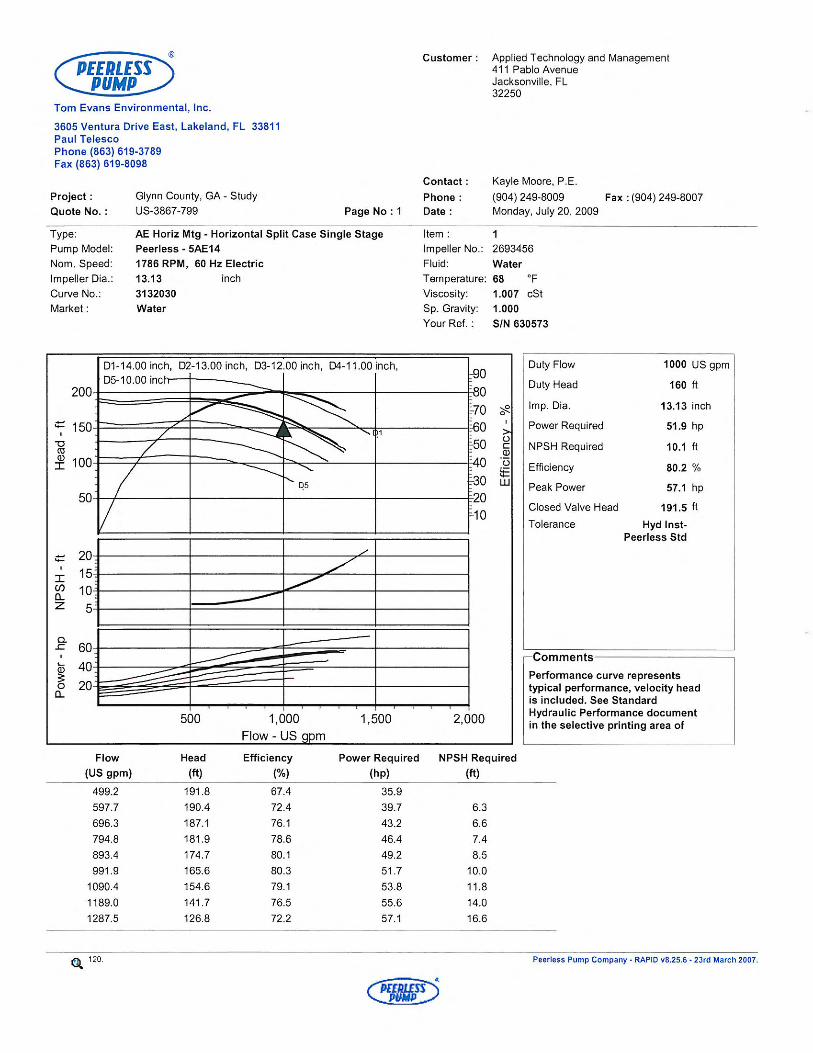
kmoore
Text Box
Fancy Bluff

APPENDIX F – SCADA SYSTEMS, FACILITY & TRENDS AND SCREENSHOTS
Brunswick Glynn County JWSC Applied Technology & Management, Inc.
Water Sewer Master Plan


Water Model Calibration Scenarios: Scenario 1: (July 8th and 9th SCADA records)
• Both Northernmost and Southernmost 12” valves on North-South running line at intersection of Community Road @ Habersham closed;
• 8” valve on 8” line running westward from MLK 12” line closed; • 12” valve on Newcastle 12” line running North-South partially closed (80%- 90%)
Scenario 2: (July 20th – July 28th)
• Both Northernmost and Southernmost 12” valves on North-South running line at intersection of Community Road @ Habersham open;
• 8” valve on 8” line running westward from MLK 12” line closed; • 12” valve on Newcastle 12” line running North-South partially closed (80%- 90%)
Scenario 3: (July 30th – August 7th)
• Northernmost 12” valve closed and Southernmost 12” valve open on North-South running line at intersection of Community Road @ Habersham;
• 8” valve on 8” line running westward from MLK 12” line open; • 12” valve on Newcastle 12” line running North-South fully open.
Scenario 4: (August 11th – August 12th)
• Both 12” valves @ intersection of Community Road and Habersham open; • 16” valve on north side of Jessup Road PRV closed; • 8” valve on MLK and 12” valve on Newcastle open as in Scenario 3.
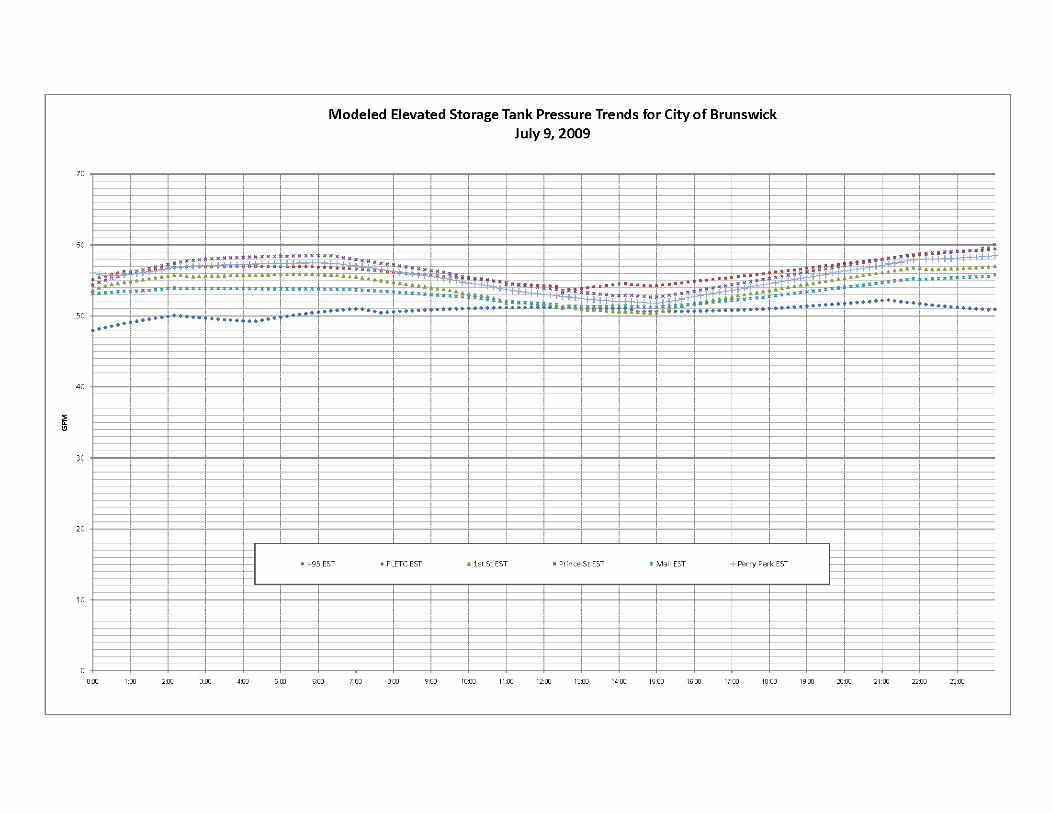


0.0
1.0
2.0
3.0
4.0
5.0
6.0
7.0
8.0
9.0
10.0
11.0
12.0
13.0
0:00
0:30
1:00
1:30
2:00
2:30
3:00
3:30
4:00
4:30
5:00
5:30
6:00
6:30
7:00
7:30
8:00
8:30
9:00
9:30
10:00
10:30
11:00
11:30
12:00
12:30
13:00
13:30
14:00
14:30
15:00
15:30
16:00
16:30
17:00
17:30
18:00
18:30
19:00
19:30
20:00
20:30
21:00
21:30
22:00
22:30
23:00
23:30
0:00
Recorded Ground Storage Tank Level Trends for City of BrunswickJuly 9, 2009
Brunswick Villa GST FLETC GST Goodyear GST Howard Coffin GST I‐95 GST
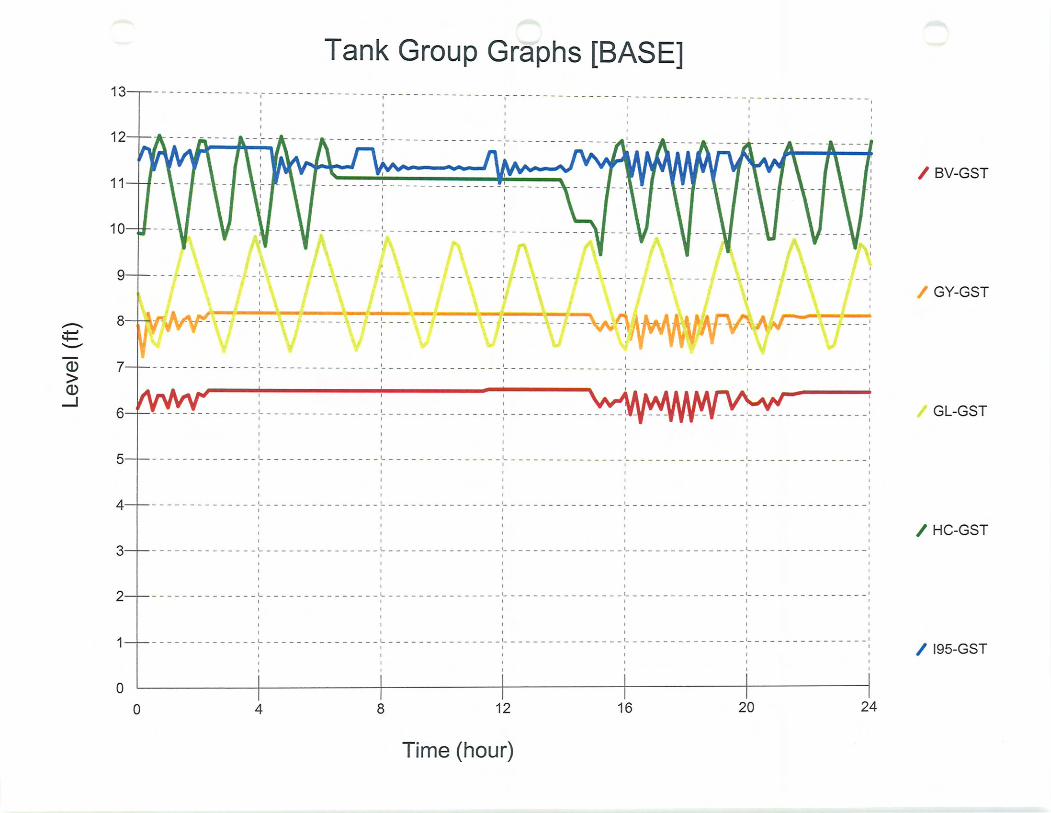


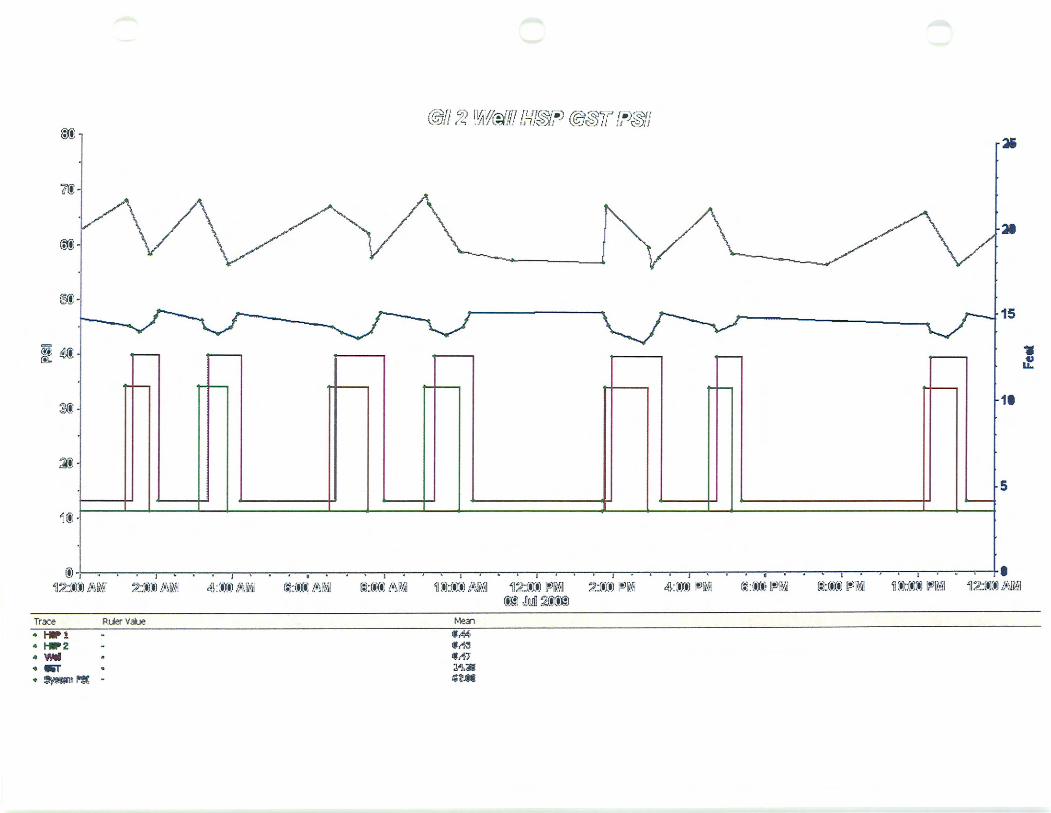

APPENDIX F – WATER SYSTEM HYDRAULIC MODEL PRESSURE CONTOURS
Brunswick Glynn County JWSC Applied Technology & Management, Inc.
Water Sewer Master Plan

HIGHWAY 99
NEW JESUP HW
Y
ALTA
MA
AV
HIGHWAY 17
INTE
RST
ATE
95
DAR
IEN
HW
Y
CAT
E R
DGREEN SWAMP RD
PENNICK RD
GLYNCO PKWY
HONEYGAL RD
HARRY DRIGGERS BLVD
HABER
SHAM
ST
CRISPEN BLVD
VOG
EL R
D
WH
ITLOC
K ST
BLYT
HE IS
LAND
HW
Y
OLD
JESUP R
D
MEMORIAL D
RPE
TER
SV
ILLE
RD
CHAPEL CROSSING RD
KNIGHT RD
OAK GROVE RD
WILLOW
RD
CAR
TER
ET R
D
CAN
AL RD
LEGIS
LATI
VE D
R
ARTESIA AV
OLD CYPRESS MILL RD
SIDNEY LANIER DR
PARKER RD
YACHT RD
GLYNDALE DR
TARA LN
NINTH ST
BUTLER DR
CYPRESS MILL RD
FOURTH ST
JESSICA LN
ALTAMA CONN
NEW
STE
RLIN
G R
D
DEE
S D
R
TOUCHSTONE PKWY
JETPORT RD
CATE ST
FAIRWAY RD
JOYCE DR
WAG
ES R
DGOLDEN ISLES PKW
Y
JULIETTE CIR
MCKENZIE DR
GO
LDEN ISLES PKWY
FLETC AV
PALM DR
PICRIC ST
FREE
DO
M T
R
GLYNDALE
CIR SC
RANT
ON
RD
OLD CATE RD
E ST
PEEK
RD
LAUREN LN
LILLIE W
AY
FRA
ZIER R
D
COMMUNITY RD
YAR
NEL
L D
R
SHORE DR
INDIGO DR
LAKE
DR
BAYSWATER RD
SHANGRI LA AV
SPRUCE RD
SCR
ANTO
N C
ON
N
BRIA
N D
R
SHADY LANE DR
HO
RN
ET D
R
GOODBREA
D RD
KEY DR
KIN
G C
OTT
ON
RD
RO
SE DR
CEDAR ST
EAGLE C
REST D
R
LYN
CH
RD BISHOP ST
SHELL DR
CH
RIS R
D
SHEPARD DR
CH
ARIN
G C
RO
SS
WINNIE TR
HU
NTER
S DR
TERRAPIN TR
BURGESS CIR
BUNKER LN
GLO
VER
DR
ROSWELL DR
CARY ST
RO
ADW
AY STR
OS
S R
D
ABBOTT AV
TEA
K TR
RIVERWOOD RD
DIX
IE B
LVD
APACHE RD
CONNOLE ST
FRA
SER
ST
GR
EENC
OVE D
R
JILL TRC
FANTAIL CT
SAWTELL PL
DEMERY DR
B AND F RD
BRIGHTO
N CIR
OAK S
TBA
ILEY
RD
LAMB RD
TIM
BER
RID
GE
DR
COMMERCIAL DRANNA W
AY
KAREN ST
ELDER ST
GLASS CIR
PIN
E C
IR
LYNN ST
LUCAS RDPR
IOR
AV
SHE
RY
L C
T
WAL
LAC
E R
D
CINDY TR
NEW
JESUP H
WY
HIGHW
AY 99
INTE
RSTATE
95
DAR
IEN
HW
Y
CANAL R
D
HIGHW
AY 1
7
OLD JESUP RD
56.2
7
56.9
6
57.6
6
58.3
5
53.49
59.0
5
54.18
52.1059.74
52.7
9
60.44
51.40
54.88
50.70
50.01
49.3
1
55.57
48.62
47.92
54.1
8
55.57
52.10
51.40
54.1
8
50.70
55.57
47.92
49.3
1
50.70
56.2
756
.96
54.18
54.88
54.18
59.74
50.01
54.88
52.79
56.27
53.49
54.18
55.5
7
56.27
57.6
651
.40
55.5
7
North Mainland Hydraulic Water Model ResultsMinimum System Pressure Contours for2009 Average Day Demand Scenario
0 4,000 8,0002,000
Scale in Feet
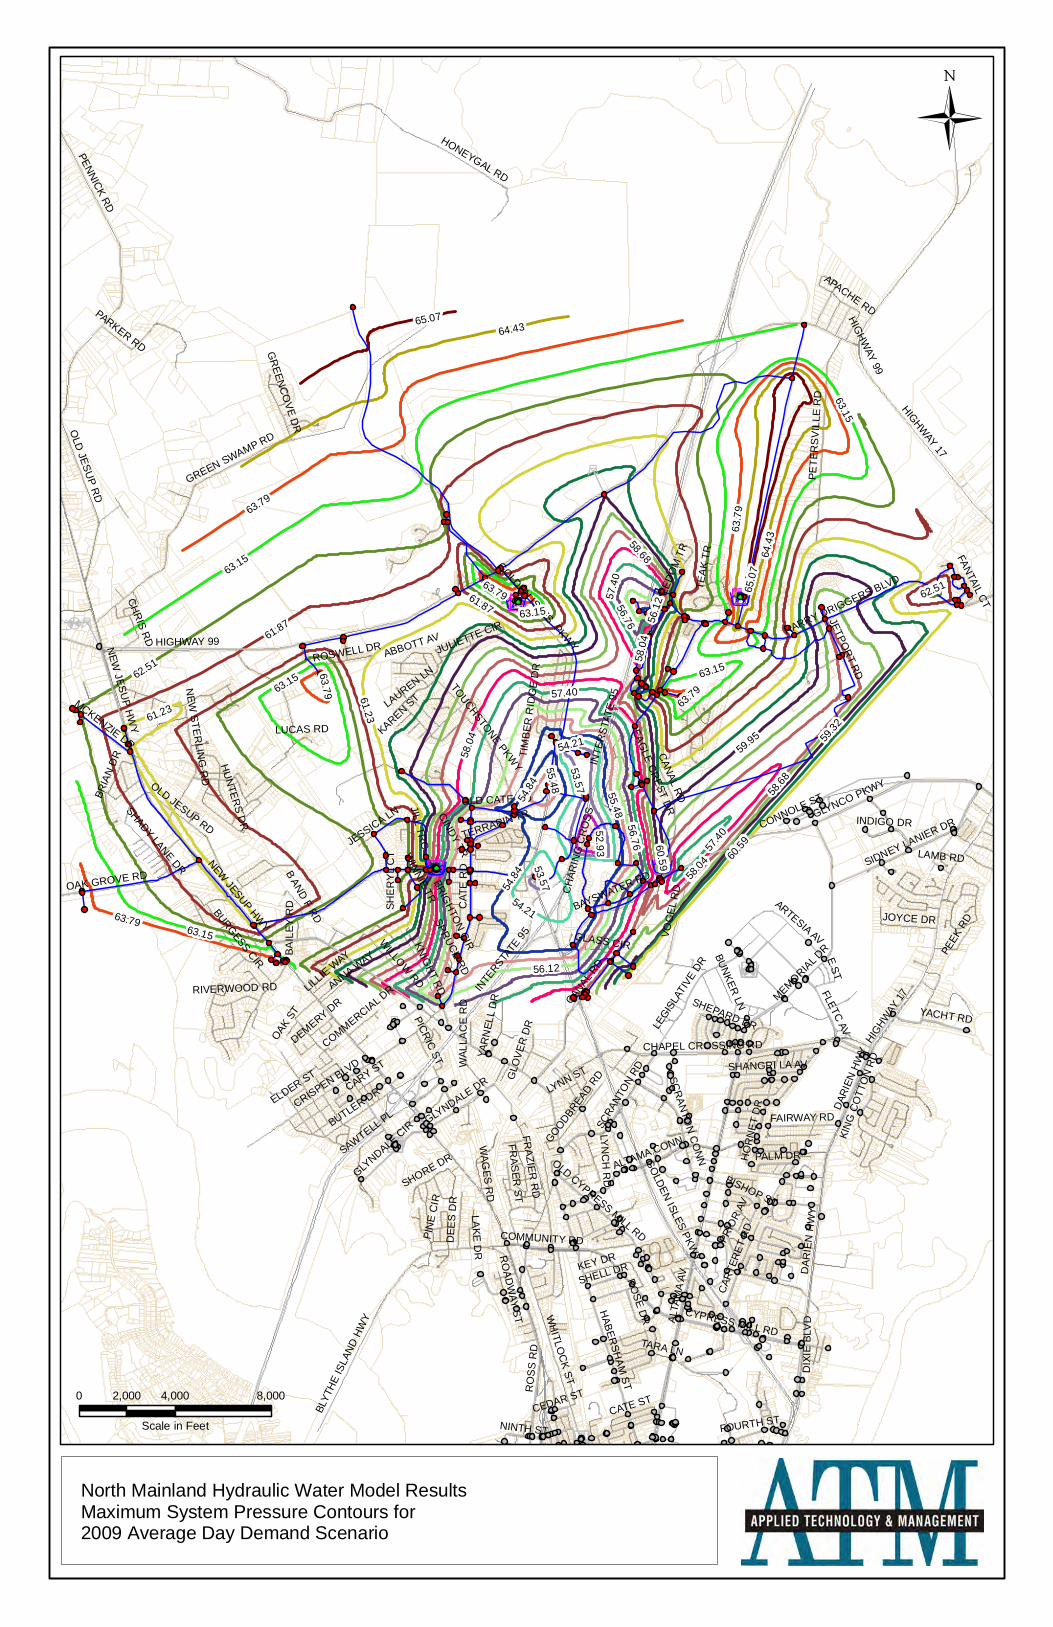
HIGHWAY 99
NEW JESUP HW
Y
ALTA
MA
AV
HIGHWAY 17
INTE
RST
ATE
95
DAR
IEN
HW
Y
CAT
E R
DGREEN SWAMP RD
PENNICK RD
GLYNCO PKWY
HONEYGAL RD
HARRY DRIGGERS BLVD
HABER
SHAM
ST
CRISPEN BLVD
VOG
EL R
D
WH
ITLOC
K ST
BLYT
HE IS
LAND
HW
Y
OLD
JESUP R
D
MEMORIAL D
RPE
TER
SV
ILLE
RD
CHAPEL CROSSING RD
KNIGHT RD
OAK GROVE RD
WILLOW
RD
CAR
TER
ET R
D
CAN
AL RD
LEGIS
LATI
VE D
R
ARTESIA AV
OLD CYPRESS MILL RD
SIDNEY LANIER DR
PARKER RD
YACHT RD
GLYNDALE DR
TARA LN
NINTH ST
BUTLER DR
CYPRESS MILL RD
FOURTH ST
JESSICA LN
ALTAMA CONN
NEW
STE
RLIN
G R
D
DEE
S D
R
TOUCHSTONE PKWY
JETPORT RD
CATE ST
FAIRWAY RD
JOYCE DR
WAG
ES R
DGOLDEN ISLES PKW
Y
JULIETTE CIR
MCKENZIE DR
GO
LDEN ISLES PKWY
FLETC AV
PALM DR
PICRIC ST
FREE
DO
M T
R
GLYNDALE
CIR SC
RANT
ON
RD
OLD CATE RD
E ST
PEEK
RD
LAUREN LN
LILLIE W
AY
FRA
ZIER R
D
COMMUNITY RD
YAR
NEL
L D
R
SHORE DR
INDIGO DR
LAKE
DR
BAYSWATER RD
SHANGRI LA AV
SPRUCE RD
SCR
ANTO
N C
ON
N
BRIA
N D
R
SHADY LANE DR
HO
RN
ET D
R
GOODBREA
D RD
KEY DR
KIN
G C
OTT
ON
RD
RO
SE DR
CEDAR ST
EAGLE C
REST D
R
LYN
CH
RD BISHOP ST
SHELL DR
CH
RIS R
D
SHEPARD DR
CH
ARIN
G C
RO
SS
WINNIE TR
HU
NTER
S DR
TERRAPIN TR
BURGESS CIR
BUNKER LN
GLO
VER
DR
ROSWELL DR
CARY ST
RO
ADW
AY STR
OS
S R
D
ABBOTT AV
TEA
K TR
RIVERWOOD RD
DIX
IE B
LVD
APACHE RD
CONNOLE ST
FRA
SER
ST
GR
EENC
OVE D
R
JILL TRC
FANTAIL CT
SAWTELL PL
DEMERY DR
B AND F RD
BRIGHTO
N CIR
OAK S
TBA
ILEY
RD
LAMB RD
TIM
BER
RID
GE
DR
COMMERCIAL DRANNA W
AY
KAREN ST
ELDER ST
GLASS CIR
PIN
E C
IR
LYNN ST
LUCAS RDPR
IOR
AV
SHE
RY
L C
T
WAL
LAC
E R
D
CINDY TR
NEW
JESUP H
WY
HIGHW
AY 99
INTE
RSTATE
95
DAR
IEN
HW
Y
CANAL R
D
HIGHW
AY 1
7
OLD JESUP RD
62.51
61.87
61.23
60.59
59.95 59.32
58.6856.76
57.40
58.0
4
56.12
55.48
63.15
54.8
4
63.79
64.4
3
65.0
7
54.21
52.93
53.57
56.76
63.79
58.0
4
63.15
63.79
61.87
58.68
62.51
53.57
56.1
2
63.79
54.21
57.4
063.15
57.40
63.7
9
63.15
55.48
64.43
60.59
63.15
58.04
63.79
54.8
4
61.23
63.15
65.07
0 4,000 8,0002,000
Scale in Feet
North Mainland Hydraulic Water Model ResultsMaximum System Pressure Contours for2009 Average Day Demand Scenario

HIGHWAY 99
NEW JESUP HW
Y
ALTA
MA
AV
HIGHWAY 17
INTE
RST
ATE
95
DAR
IEN
HW
Y
CAT
E R
DGREEN SWAMP RD
PENNICK RD
GLYNCO PKWY
HONEYGAL RD
HARRY DRIGGERS BLVD
HABER
SHAM
ST
CRISPEN BLVD
VOG
EL R
D
WH
ITLOC
K ST
BLYT
HE IS
LAND
HW
Y
OLD
JESUP R
D
MEMORIAL D
RPE
TER
SV
ILLE
RD
CHAPEL CROSSING RD
KNIGHT RD
OAK GROVE RD
WILLOW
RD
CAR
TER
ET R
D
CAN
AL RD
LEGIS
LATI
VE D
R
ARTESIA AV
OLD CYPRESS MILL RD
SIDNEY LANIER DR
PARKER RD
YACHT RD
GLYNDALE DR
TARA LN
NINTH ST
BUTLER DR
CYPRESS MILL RD
FOURTH ST
JESSICA LN
ALTAMA CONN
NEW
STE
RLIN
G R
D
DEE
S D
R
TOUCHSTONE PKWY
JETPORT RD
CATE ST
FAIRWAY RD
JOYCE DR
WAG
ES R
DGOLDEN ISLES PKW
Y
JULIETTE CIR
MCKENZIE DR
GO
LDEN ISLES PKWY
FLETC AV
PALM DR
PICRIC ST
FREE
DO
M T
R
GLYNDALE
CIR SC
RANT
ON
RD
OLD CATE RD
E ST
PEEK
RD
LAUREN LN
LILLIE W
AY
FRA
ZIER R
D
COMMUNITY RD
YAR
NEL
L D
R
SHORE DR
INDIGO DR
LAKE
DR
BAYSWATER RD
SHANGRI LA AV
SPRUCE RD
SCR
ANTO
N C
ON
N
BRIA
N D
R
SHADY LANE DR
HO
RN
ET D
R
GOODBREA
D RD
KEY DR
KIN
G C
OTT
ON
RD
RO
SE DR
CEDAR ST
EAGLE C
REST D
R
LYN
CH
RD BISHOP ST
SHELL DR
CH
RIS R
D
SHEPARD DR
CH
ARIN
G C
RO
SS
WINNIE TR
HU
NTER
S DR
TERRAPIN TR
BURGESS CIR
BUNKER LN
GLO
VER
DR
ROSWELL DR
CARY ST
RO
ADW
AY STR
OS
S R
D
ABBOTT AV
TEA
K TR
RIVERWOOD RD
DIX
IE B
LVD
APACHE RD
CONNOLE ST
FRA
SER
ST
GR
EENC
OVE D
R
JILL TRC
FANTAIL CT
SAWTELL PL
DEMERY DR
B AND F RD
BRIGHTO
N CIR
OAK S
TBA
ILEY
RD
LAMB RD
TIM
BER
RID
GE
DR
COMMERCIAL DRANNA W
AY
KAREN ST
ELDER ST
GLASS CIR
PIN
E C
IR
LYNN ST
LUCAS RDPR
IOR
AV
SHE
RY
L C
T
WAL
LAC
E R
D
CINDY TR
NEW
JESUP H
WY
HIGHW
AY 99
INTE
RSTATE
95
DAR
IEN
HW
Y
CANAL R
D
HIGHW
AY 1
7
OLD JESUP RD
59.4
0
60.0
2
60.6
3
57.5
5
56.9
4
56.32
55.71
55.0
9
61.25
54.48
58.17
61.86
53.86
53.24
52.6
3
52.0
1
51.40
58.79
50.78
51.40
55.09
61.2
5
53.24
58.79
52.63
55.09
58.17
60.6
3
59.4
0
54.4
8
60.02
57.55
61.2
5
52.01
58.1
7
57.55
59.40
54.48
58.17
55.71
59.40
53.86
60.0
2
54.48
58.7
9
0 4,000 8,0002,000
Scale in Feet
North Mainland Hydraulic Water Model ResultsAverage System Pressure Contours for2009 Average Day Demand Scenario
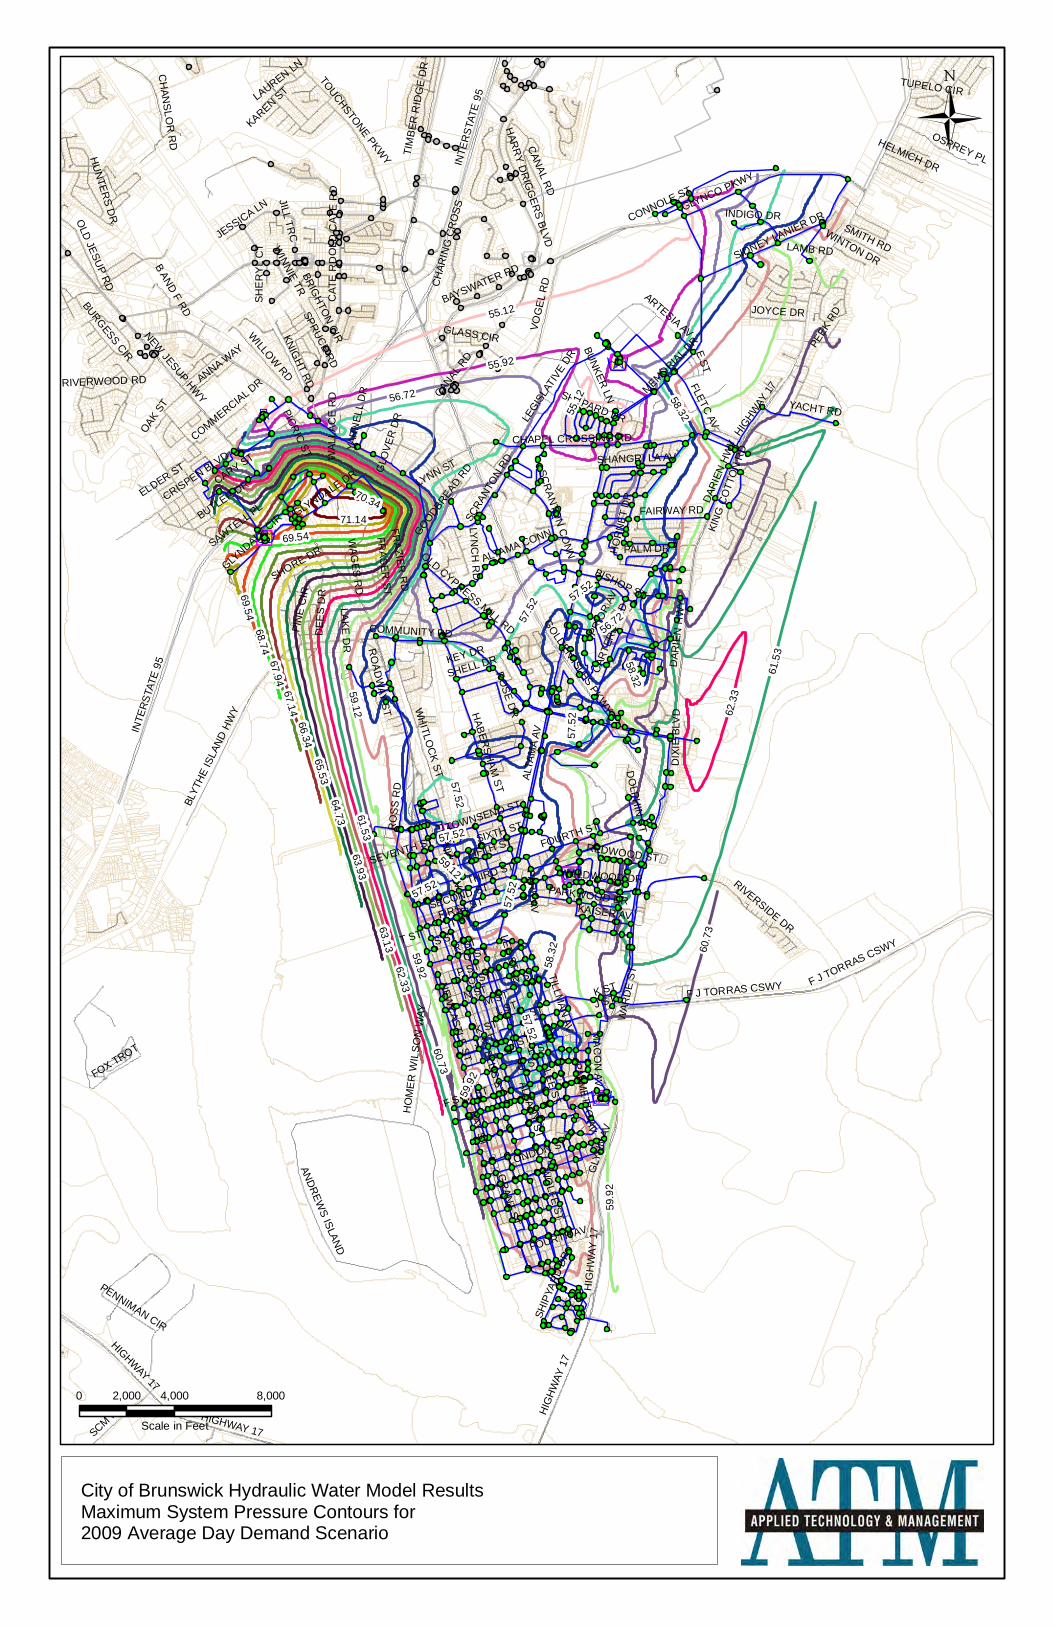
ELLIS ST
I ST
ALTA
MA
AV
NEW JESUP HW
Y
DAR
IEN
HW
Y
L ST
CAT
E R
D
G ST
F ST
GLYNCO PKWY
LEE ST
BAY ST
M ST
R ST
INTE
RST
ATE
95
Q ST
T ST
HABER
SHAM
ST
F J TORRAS CSWYO STNEW
CASTLE ST
HIG
HW
AY 1
7
GLY
NN
AV
RO
SS
RD
GR
ANT ST
CRISPEN BLVD
VOG
EL R
D
H ST
WH
ITLOC
K ST
ALBANY ST
FOURTH ST
AND
REW
S ISLAND
BLYT
HE IS
LAND
HW
Y
P ST
RIVERSIDE DR
LONDON ST
MEMORIAL D
R
FIRST ST
S ST
SCM RD
CHAPEL CROSSING RD
TILLMAN
AV
KNIGHT RD
GOLDEN ISLES PKWY
K ST
WILLOW
RD
HAR
RY D
RIG
GER
S BLVD
PARKWOOD DR
N ST
WO
LFE ST
SECOND ST
CAR
TER
ET R
D
CAN
AL RD
LEGIS
LATI
VE D
R
SEVENTH ST
ARTESIA AV
OLD CYPRESS MILL RD
FOURTH AV
SIDNEY LANIER DR
YACHT RD
CH
ANS
LOR
RD
GLYNDALE DR
BUTLER DR
HO
ME
R W
ILS
ON
WAY
FRAN
KLIN AV
JESSICA LN
ALTAMA CONN
FIFTH ST
DEE
S D
R
TOUCHSTONE PKWY
FAIRWAY RD
KAISER AV
PALMETTO
AV
JOYCE DR
OLD JESUP RD
TOWNSEND ST
WAG
ES R
D
SMITH RD
OSPREY PL
FLETC AV
PALM DRSH
IPYA
RD
DR
PICRIC ST
DO
LPHIN
ST
GLYNDALE
CIR SC
RANT
ON
RD
OLD
CAT
E R
D
WILDWOOD DR
E ST
PEEK
RD
LAUREN LN
FRA
ZIER R
D
SIXTH ST
COMMUNITY RD
YAR
NEL
L D
R
SHORE DR
PENNIMAN CIR
INDIGO DR
LAKE
DR
BAYSWATER RD
SHANGRI LA AV
SPRUCE RD
SCR
ANTO
N C
ON
N HO
RN
ET D
R
GOODBREA
D RD
KEY DR
KIN
G C
OTT
ON
RD
RO
SE DR
LYN
CH
RD
FOX TROT
BISHOP ST
HELMICH DR
SHELL DR
SHEPARD DR
CH
ARIN
G C
RO
SS
WINNIE TR
HU
NTER
S DR
BURGESS CIR
BUNKER LN
REDWOOD ST
MA
CO
N AV
GLO
VER
DR
CARY ST
RO
ADW
AY ST
WINTON DR
THIRD ST
RIVERWOOD RD
DIX
IE B
LVD
PARK
AV
J ST
CONNOLE ST
FRA
SER
ST
JILL TRC
WAR
DE
ST
SAWTELL PL
B AND F RD
BRIGHTO
N CIR
OAK S
T
TUPELO CIR
LAMB RD
TIM
BER
RID
GE
DR
COMMERCIAL DRANNA W
AY
KAREN ST
ELDER ST
GLASS CIR
PIN
E C
IR
LYNN ST
PRIO
R AV
SHE
RY
L C
T
WAL
LAC
E R
D
K ST
T ST LEE ST
F J TORRAS CSWY
HIG
HW
AY 1
7
HIGHWAY 17
CANAL R
D
J ST
F ST
DAR
IEN
HW
Y
HIGHWAY 17
K ST
HIGHW
AY 1
7
N ST
INTE
RST
ATE
95
59.12
59.9260.73
63.13
56.72
63.93
55.92
61.5
3
64.73
65.53
66.34
67.14
67.94
68.74
58.3
2
62.3
3
57.52
69.54
71.14
55.1
2
70.34
55.12
61.53
59.9
2
56.72
62.33
57.52
57.52
58.32
57.5
2
58.32
57.52
57.5
2
60.7
3
57.5
2
59.12
57.52
59.9
2
69.54
0 4,000 8,0002,000
Scale in Feet
City of Brunswick Hydraulic Water Model ResultsMaximum System Pressure Contours for2009 Average Day Demand Scenario
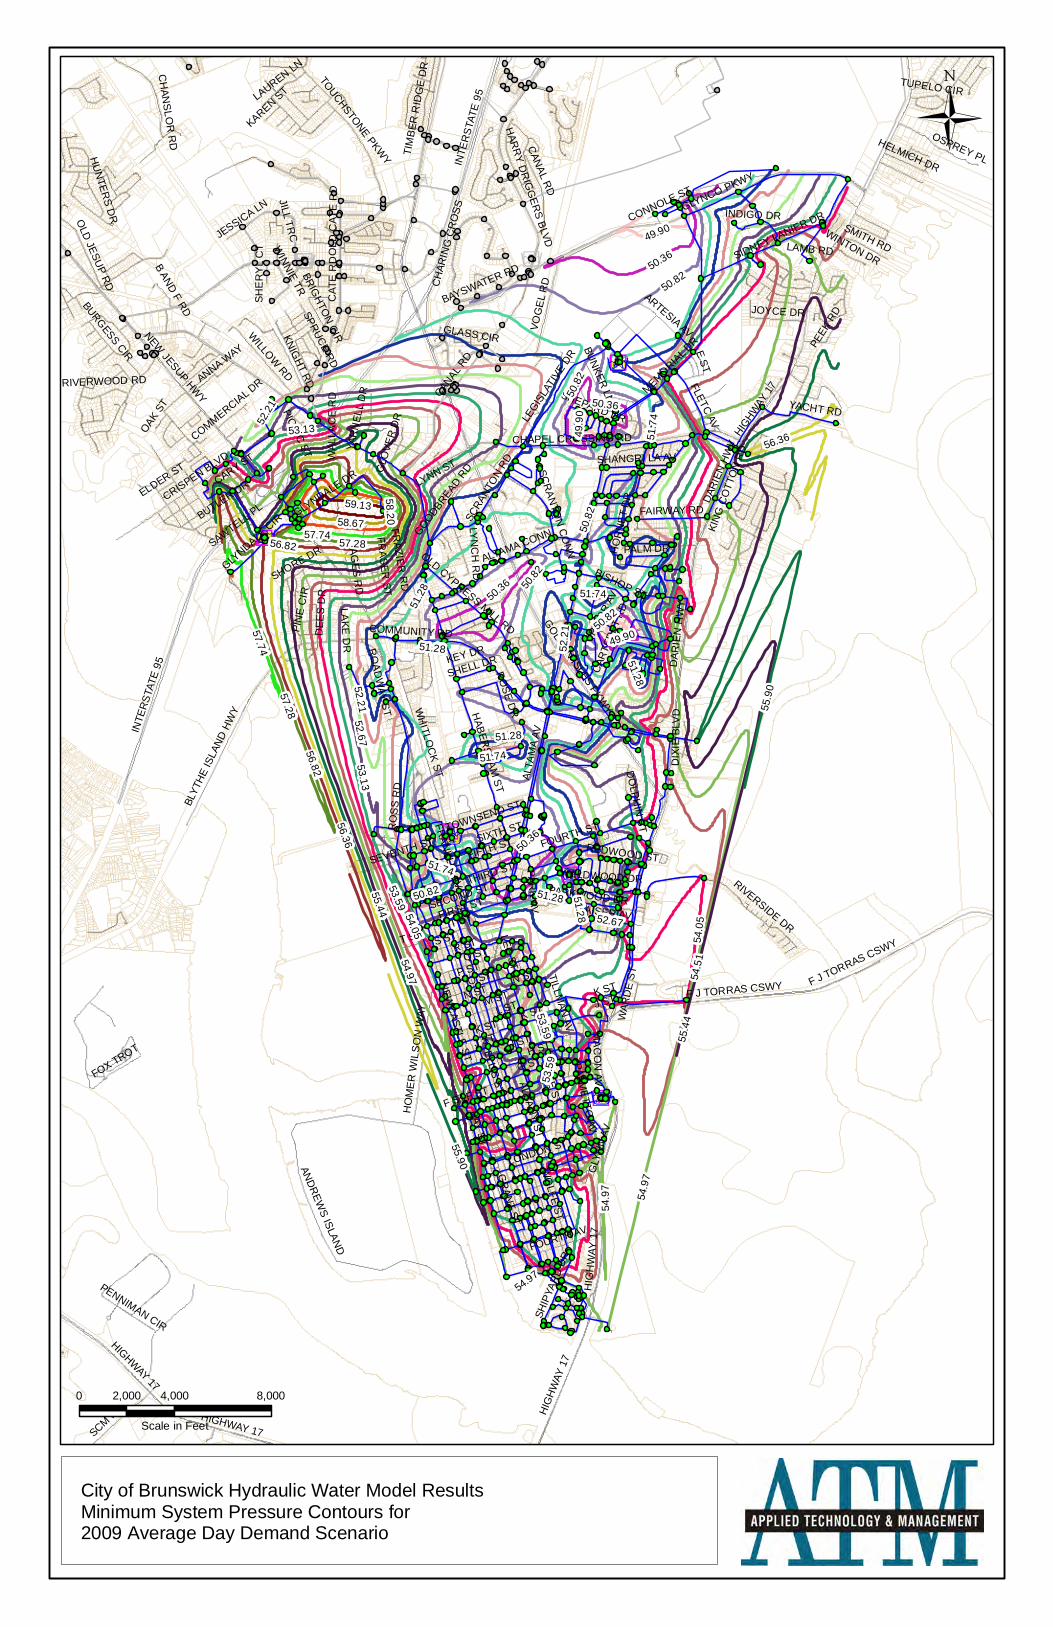
ELLIS ST
I ST
ALTA
MA
AV
NEW JESUP HW
Y
DAR
IEN
HW
Y
L ST
CAT
E R
D
G ST
F ST
GLYNCO PKWY
LEE ST
BAY ST
M ST
R ST
INTE
RST
ATE
95
Q ST
T ST
HABER
SHAM
ST
F J TORRAS CSWYO STNEW
CASTLE ST
HIG
HW
AY 1
7
GLY
NN
AV
RO
SS
RD
GR
ANT ST
CRISPEN BLVD
VOG
EL R
D
H ST
WH
ITLOC
K ST
ALBANY ST
FOURTH ST
AND
REW
S ISLAND
BLYT
HE IS
LAND
HW
Y
P ST
RIVERSIDE DR
LONDON ST
MEMORIAL D
R
FIRST ST
S ST
SCM RD
CHAPEL CROSSING RD
TILLMAN
AV
KNIGHT RD
GOLDEN ISLES PKWY
K ST
WILLOW
RD
HAR
RY D
RIG
GER
S BLVD
PARKWOOD DR
N ST
WO
LFE ST
SECOND ST
CAR
TER
ET R
D
CAN
AL RD
LEGIS
LATI
VE D
R
SEVENTH ST
ARTESIA AV
OLD CYPRESS MILL RD
FOURTH AV
SIDNEY LANIER DR
YACHT RD
CH
ANS
LOR
RD
GLYNDALE DR
BUTLER DR
HO
ME
R W
ILS
ON
WAY
FRAN
KLIN AV
JESSICA LN
ALTAMA CONN
FIFTH ST
DEE
S D
R
TOUCHSTONE PKWY
FAIRWAY RD
KAISER AV
PALMETTO
AV
JOYCE DR
OLD JESUP RD
TOWNSEND ST
WAG
ES R
D
SMITH RD
OSPREY PL
FLETC AV
PALM DRSH
IPYA
RD
DR
PICRIC ST
DO
LPHIN
ST
GLYNDALE
CIR SC
RANT
ON
RD
OLD
CAT
E R
D
WILDWOOD DR
E ST
PEEK
RD
LAUREN LN
FRA
ZIER R
D
SIXTH ST
COMMUNITY RD
YAR
NEL
L D
R
SHORE DR
PENNIMAN CIR
INDIGO DR
LAKE
DR
BAYSWATER RD
SHANGRI LA AV
SPRUCE RD
SCR
ANTO
N C
ON
N HO
RN
ET D
R
GOODBREA
D RD
KEY DR
KIN
G C
OTT
ON
RD
RO
SE DR
LYN
CH
RD
FOX TROT
BISHOP ST
HELMICH DR
SHELL DR
SHEPARD DR
CH
ARIN
G C
RO
SS
WINNIE TR
HU
NTER
S DR
BURGESS CIR
BUNKER LN
REDWOOD ST
MA
CO
N AV
GLO
VER
DR
CARY ST
RO
ADW
AY ST
WINTON DR
THIRD ST
RIVERWOOD RD
DIX
IE B
LVD
PARK
AV
J ST
CONNOLE ST
FRA
SER
ST
JILL TRC
WAR
DE
ST
SAWTELL PL
B AND F RD
BRIGHTO
N CIR
OAK S
T
TUPELO CIR
LAMB RD
TIM
BER
RID
GE
DR
COMMERCIAL DRANNA W
AY
KAREN ST
ELDER ST
GLASS CIR
PIN
E C
IR
LYNN ST
PRIO
R AV
SHE
RY
L C
T
WAL
LAC
E R
D
K ST
T ST LEE ST
F J TORRAS CSWY
HIG
HW
AY 1
7
HIGHWAY 17
CANAL R
D
J ST
F ST
DAR
IEN
HW
Y
HIGHWAY 17
K ST
HIGHW
AY 1
7
N ST
INTE
RST
ATE
95
54.0
5
53.59
54.5
152.21
52.6753.13
55.44
51.7
4
55.90
56.36
56.82
57.28
50.82
57.74
54.97
50.36
58.67
59.13
49.90
51.28
58.20
57.74
51.28
57.28
50.82
51.28
53.13
51.74
55.4
4
52.67
54.9
7
50.82
49.9
0
54.9
7
51.28
54.05
51.28
55.9
0
53.5
9
49.90
50.8
2
51.74
54.97
50.36
52.2
1
50.82
51.74
52.2
1
50.8
2
50.36
53.59
56.36
51.2
8
50.36
56.82
0 4,000 8,0002,000
Scale in Feet
City of Brunswick Hydraulic Water Model ResultsMinimum System Pressure Contours for2009 Average Day Demand Scenario
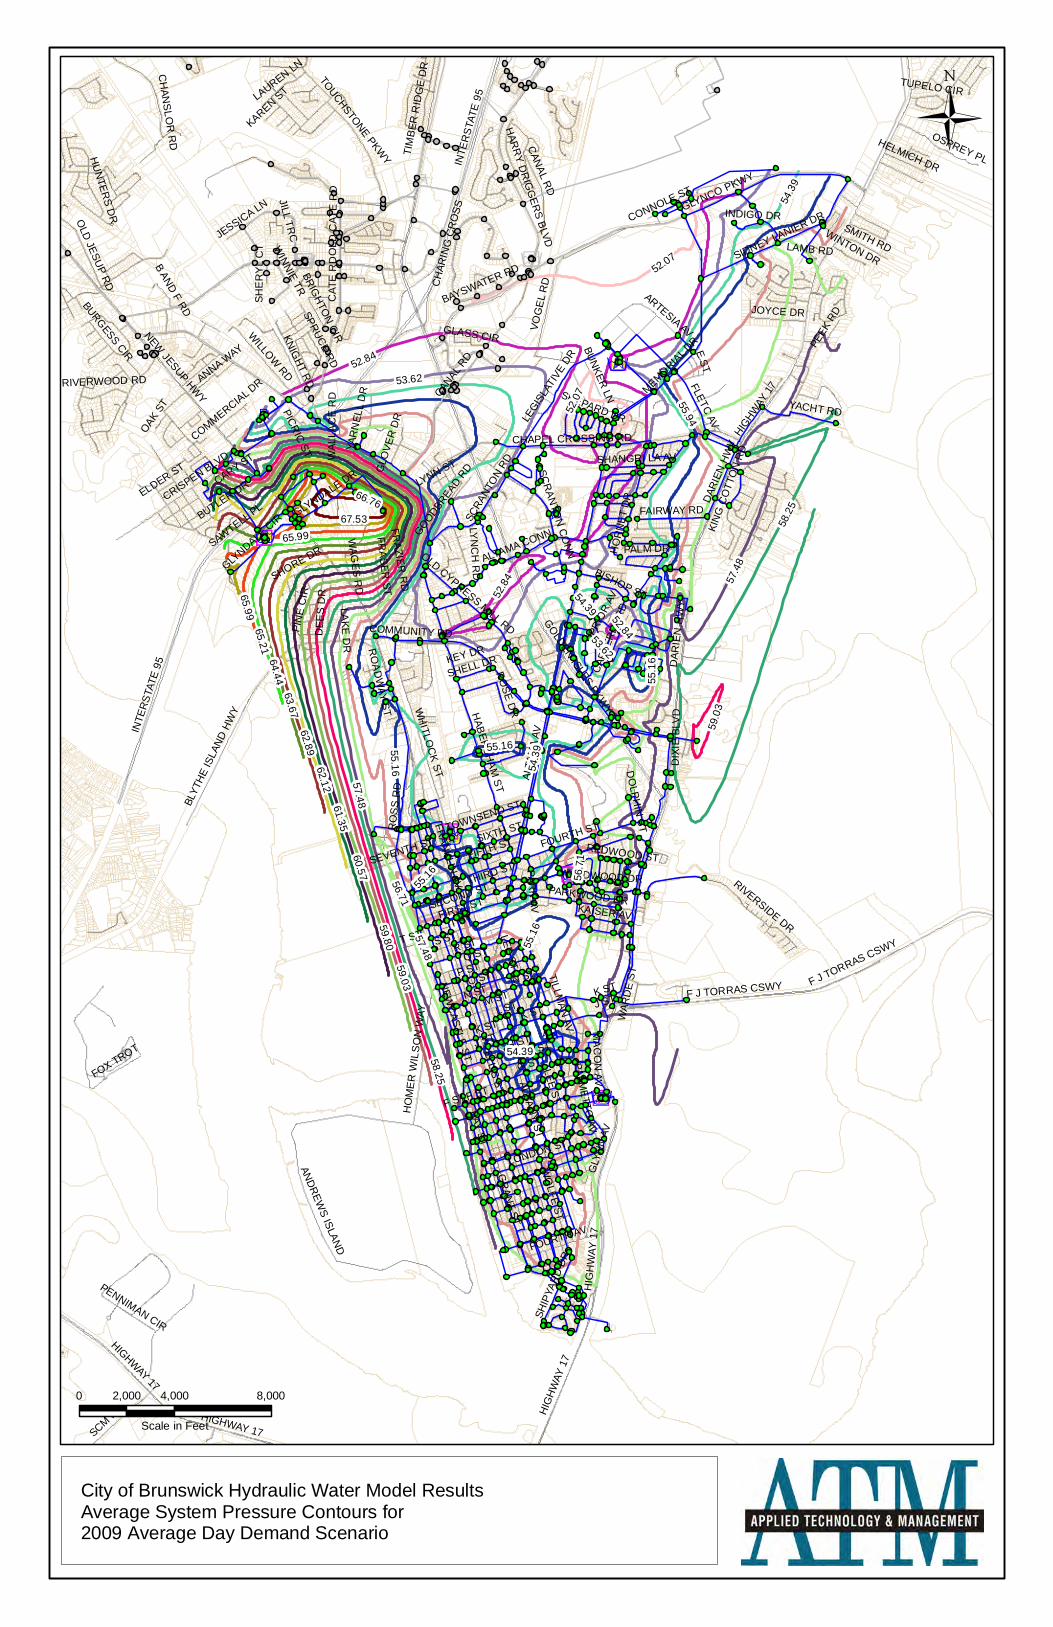
ELLIS ST
I ST
ALTA
MA
AV
NEW JESUP HW
Y
DAR
IEN
HW
Y
L ST
CAT
E R
D
G ST
F ST
GLYNCO PKWY
LEE ST
BAY ST
M ST
R ST
INTE
RST
ATE
95
Q ST
T ST
HABER
SHAM
ST
F J TORRAS CSWYO STNEW
CASTLE ST
HIG
HW
AY 1
7
GLY
NN
AV
RO
SS
RD
GR
ANT ST
CRISPEN BLVD
VOG
EL R
D
H ST
WH
ITLOC
K ST
ALBANY ST
FOURTH ST
AND
REW
S ISLAND
BLYT
HE IS
LAND
HW
Y
P ST
RIVERSIDE DR
LONDON ST
MEMORIAL D
R
FIRST ST
S ST
SCM RD
CHAPEL CROSSING RD
TILLMAN
AV
KNIGHT RD
GOLDEN ISLES PKWY
K ST
WILLOW
RD
HAR
RY D
RIG
GER
S BLVD
PARKWOOD DR
N ST
WO
LFE ST
SECOND ST
CAR
TER
ET R
D
CAN
AL RD
LEGIS
LATI
VE D
R
SEVENTH ST
ARTESIA AV
OLD CYPRESS MILL RD
FOURTH AV
SIDNEY LANIER DR
YACHT RD
CH
ANS
LOR
RD
GLYNDALE DR
BUTLER DR
HO
ME
R W
ILS
ON
WAY
FRAN
KLIN AV
JESSICA LN
ALTAMA CONN
FIFTH ST
DEE
S D
R
TOUCHSTONE PKWY
FAIRWAY RD
KAISER AV
PALMETTO
AV
JOYCE DR
OLD JESUP RD
TOWNSEND ST
WAG
ES R
D
SMITH RD
OSPREY PL
FLETC AV
PALM DRSH
IPYA
RD
DR
PICRIC ST
DO
LPHIN
ST
GLYNDALE
CIR SC
RANT
ON
RD
OLD
CAT
E R
D
WILDWOOD DR
E ST
PEEK
RD
LAUREN LN
FRA
ZIER R
D
SIXTH ST
COMMUNITY RD
YAR
NEL
L D
R
SHORE DR
PENNIMAN CIR
INDIGO DR
LAKE
DR
BAYSWATER RD
SHANGRI LA AV
SPRUCE RD
SCR
ANTO
N C
ON
N HO
RN
ET D
R
GOODBREA
D RD
KEY DR
KIN
G C
OTT
ON
RD
RO
SE DR
LYN
CH
RD
FOX TROT
BISHOP ST
HELMICH DR
SHELL DR
SHEPARD DR
CH
ARIN
G C
RO
SS
WINNIE TR
HU
NTER
S DR
BURGESS CIR
BUNKER LN
REDWOOD ST
MA
CO
N AV
GLO
VER
DR
CARY ST
RO
ADW
AY ST
WINTON DR
THIRD ST
RIVERWOOD RD
DIX
IE B
LVD
PARK
AV
J ST
CONNOLE ST
FRA
SER
ST
JILL TRC
WAR
DE
ST
SAWTELL PL
B AND F RD
BRIGHTO
N CIR
OAK S
T
TUPELO CIR
LAMB RD
TIM
BER
RID
GE
DR
COMMERCIAL DRANNA W
AY
KAREN ST
ELDER ST
GLASS CIR
PIN
E C
IR
LYNN ST
PRIO
R AV
SHE
RY
L C
T
WAL
LAC
E R
D
K ST
T ST LEE ST
F J TORRAS CSWY
HIG
HW
AY 1
7
HIGHWAY 17
CANAL R
D
J ST
F ST
DAR
IEN
HW
Y
HIGHWAY 17
K ST
HIGHW
AY 1
7
N ST
INTE
RST
ATE
95
56.71
55.94
57.48
59.80
60.57
53.62
61.35
62.12
62.89
58.2
5
63.67
64.44
65.21
55.1
6
52.8
4
65.99
59.0
3
54.39
52.0
7
67.53
66.76
52.07
52.84
54.39
59.03
57.4
8
55.16
55.16
56.7
1
55.1
6
65.99
53.62
58.25
52.84
54.3
9
55.16
57.48
54.3
9
0 4,000 8,0002,000
Scale in Feet
City of Brunswick Hydraulic Water Model ResultsAverage System Pressure Contours for2009 Average Day Demand Scenario

HIGHWAY 82
BUCK SWAMP RD
HIGHW
AY 1
7
OLD CCC RD
GAL
ILEE
RD
MYE
RS H
ILL
RD
HIGHWAY 99
INTE
RSTA
TE 9
5
BLYTH
E ISLA
ND HW
Y
EMANUEL CHURCH RD
RATCLIF
FE R
D
JOSIE B RD
FIRETOWER RD
OLD BROOKMAN RD
LAKE
S D
R
GEORGETOWN RD
FANCY BLUFF RD
OY
STE
R R
D
ROYAL DR
BAUMGARDNER RD
LIVE OAK LN
STUTTS R
D
ANCHOR DR
FIS
H H
ALL
RD
SALT CREEK WAY
ZELLWOOD DR
REG
AL R
D
GOOD PLACE RD
TISO
N D
R
LAKE ERIE DR
PALISADE DR
DAW
N C
IRHEAD DR
SATI
LLA
DR
MIS
TER
RD
MARTIN PALM
ER DR
DAVIS RD
BATTLE RD
EMAN
UEL
LO
OP
RD
LON
G W
AY
CARLEE LN
STAFF
ORD RD
WETZEL LN
CAINS TRC
TAYLORS DR
FRONTAGE RD
MADEIRA DR
RACHEL WAY
FANCY BLUFF RD
64.41
64.88
63.94
66.76
67.2363.47
67.70
61.1
3
61.6
062
.07
63.0
1
62.5
4
60.6
660
.19
68.17
59.72
68.64 69.1166.29
65.82
65.35
0 4,000 8,0002,000
Scale in Feet
South Mainland Hydraulic Water Model ResultsMaximum System Pressure Contours for2009 Average Day Demand Scenario
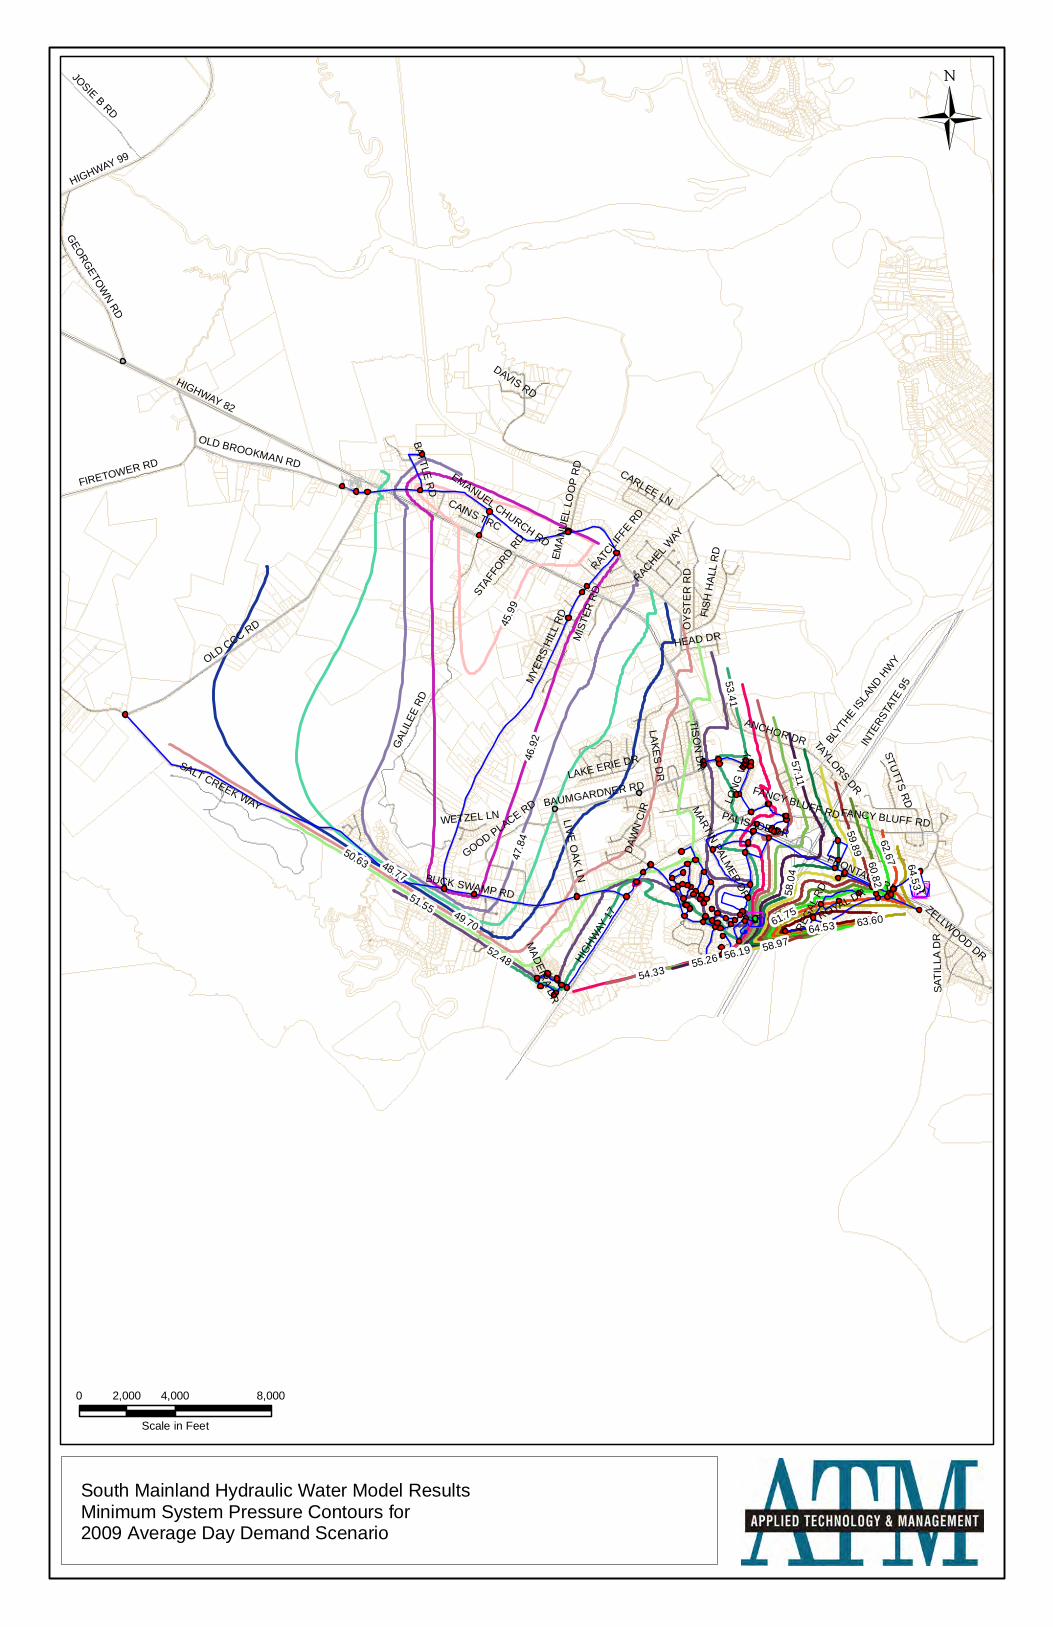
HIGHWAY 82
BUCK SWAMP RD
HIGHW
AY 1
7
OLD CCC RD
GAL
ILEE
RD
MYE
RS H
ILL
RD
HIGHWAY 99
INTE
RSTA
TE 9
5
BLYTH
E ISLA
ND HW
Y
EMANUEL CHURCH RD
RATCLIF
FE R
D
JOSIE B RD
FIRETOWER RD
OLD BROOKMAN RD
LAKE
S D
R
GEORGETOWN RD
FANCY BLUFF RD
OY
STE
R R
D
ROYAL DR
BAUMGARDNER RD
LIVE OAK LN
STUTTS R
D
ANCHOR DR
FIS
H H
ALL
RD
SALT CREEK WAY
ZELLWOOD DR
REG
AL R
D
GOOD PLACE RD
TISO
N D
R
LAKE ERIE DR
PALISADE DR
DAW
N C
IRHEAD DR
SATI
LLA
DR
MIS
TER
RD
MARTIN PALM
ER DR
DAVIS RD
BATTLE RD
EMAN
UEL
LO
OP
RD
LON
G W
AY
CARLEE LN
STAFF
ORD RD
WETZEL LN
CAINS TRC
TAYLORS DR
FRONTAGE RD
MADEIRA DR
RACHEL WAY
FANCY BLUFF RD
50.63
51.55 49.70
52.48
46.9
2
47.8
4
48.77
53.41
54.3355.26 56.19
57.11
58.0
4
58.97
59.89
45.9
9
60.82
63.6061.75
62.67
64.53
64.53
0 4,000 8,0002,000
Scale in Feet
South Mainland Hydraulic Water Model ResultsMinimum System Pressure Contours for2009 Average Day Demand Scenario

HIGHWAY 82
BUCK SWAMP RD
HIGHW
AY 1
7
OLD CCC RD
GAL
ILEE
RD
MYE
RS H
ILL
RD
HIGHWAY 99
INTE
RSTA
TE 9
5
BLYTH
E ISLA
ND HW
Y
EMANUEL CHURCH RD
RATCLIF
FE R
D
JOSIE B RD
FIRETOWER RD
OLD BROOKMAN RD
LAKE
S D
R
GEORGETOWN RD
FANCY BLUFF RD
OY
STE
R R
D
ROYAL DR
BAUMGARDNER RD
LIVE OAK LN
STUTTS R
D
ANCHOR DR
FIS
H H
ALL
RD
SALT CREEK WAY
ZELLWOOD DR
REG
AL R
D
GOOD PLACE RD
TISO
N D
R
LAKE ERIE DR
PALISADE DR
DAW
N C
IRHEAD DR
SATI
LLA
DR
MIS
TER
RD
MARTIN PALM
ER DR
DAVIS RD
BATTLE RD
EMAN
UEL
LO
OP
RD
LON
G W
AY
CARLEE LN
STAFF
ORD RD
WETZEL LN
CAINS TRC
TAYLORS DR
FRONTAGE RD
MADEIRA DR
RACHEL WAY
FANCY BLUFF RD
63.10
63.57
64.05
62.63 65.46
65.94
62.1
5
66.41
59.7
9
60.2
660
.74
61.6
8
61.21
59.3
258
.85
66.88
58.3
7
67.3567.83
64.99
64.52
0 4,000 8,0002,000
Scale in Feet
South Mainland Hydraulic Water Model ResultsAverage System Pressure Contours for2009 Average Day Demand Scenario

APPENDIX G INFOSWMM HYDRAULIC MODEL WETWELL CONSTRUCTION DATA
Brunswick Glynn County JWSC Applied Technology & Management, Inc.
Water Sewer Master Plan


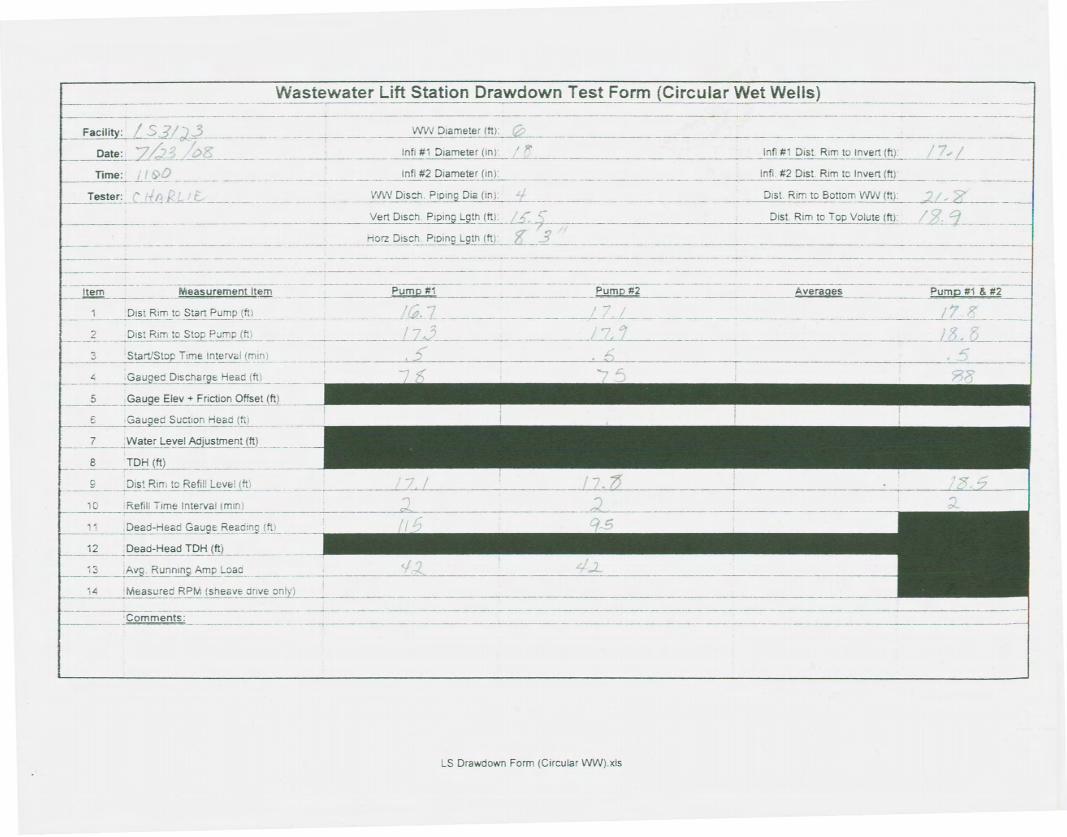


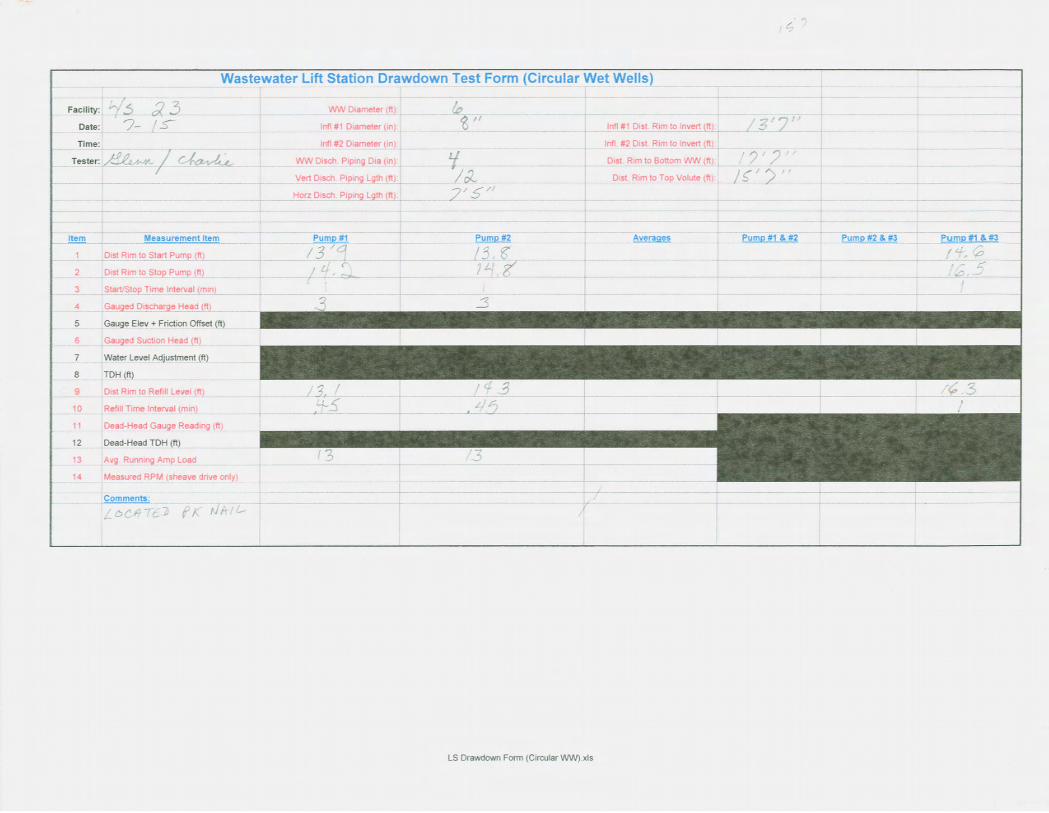
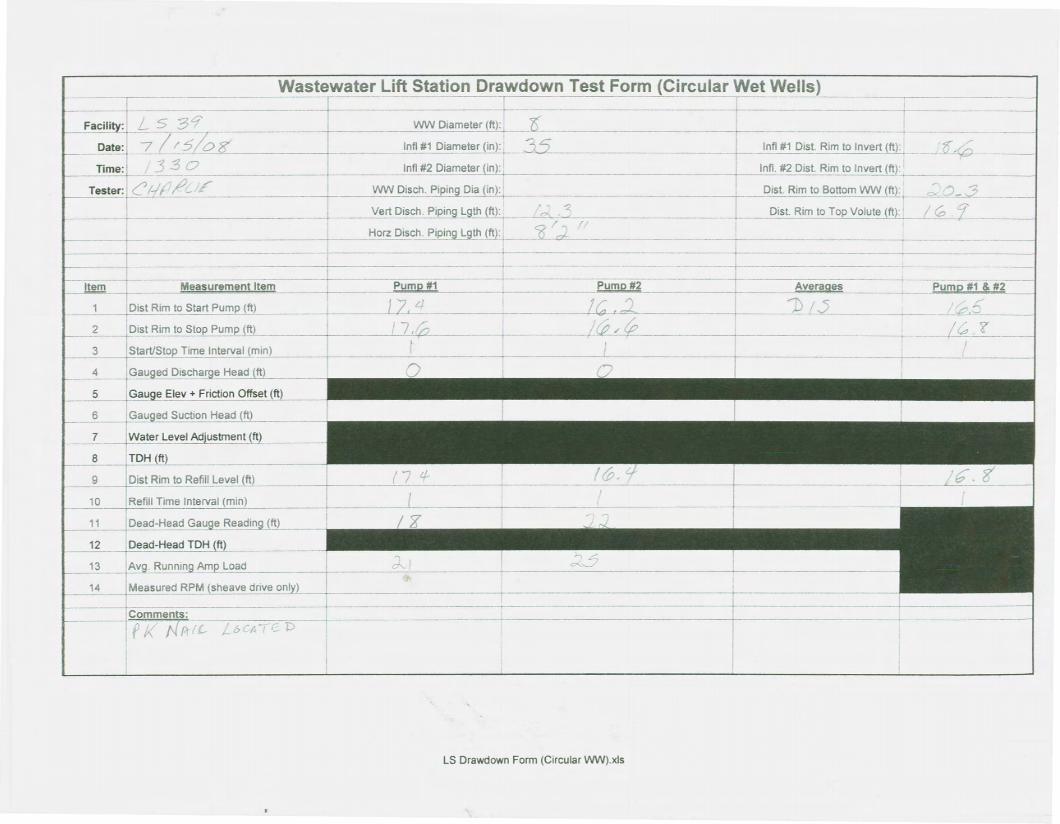


APPENDIX H INFOSWMM HYDRAULIC MODEL PUMP CURVES
Brunswick Glynn County JWSC Applied Technology & Management, Inc.
Water Sewer Master Plan

FU
SC
AT
1.0
(20
0312
01)
PERFORMANCE CURVEDATE PROJECT
1/1-LOAD 3/4-LOAD 1/2-LOAD
POWER FACTOR
EFFICIENCY
MOTOR DATA
COMMENTS INLET/OUTLET
IMP. THROUGHLET
RATEDPOWER .....
STARTINGCURRENT ...
RATEDCURRENT ...
RATEDSPEED .....
TOT.MOM.OFINERTIA ...
NO. OFBLADES
PRODUCT TYPE
CURVE NO ISSUE
MOTOR # STATOR REV
FREQ. PHASES VOLTAGE POLES
GEARTYPE RATIO
NPSHre = NPSH3% + min. operational margin
Performance with clear water and ambient temp 40 °C
C 3152.181 MT
2006-11-30 FLYGT US Catalog 63-432-00-5330 3IMPELLER DIAMETER
266 mm
25-15-4AA 12Y// 11
60 Hz 3 230 V 4
--- ---
0.8487.0 %
---
0.7987.0 %
---
0.6986.0 %
---
-/ 6 inch
3.9 inchNEMA Code Letter: GInstalls: CP/CS/CT/CZ
20 hp
285 A
51 A
1750 rpm
0.20 kgm2
1
FLOW[USgpm]
HE
AD
[ft]
PO
WE
R
[hp]
EFF.[%]
NPSHre[ft]
0 200 400 600 800 1000 1200 1400 16000
10
20
30
40
50
60
70
80
90
0
10
20
30
40
50
60
70
80
90
0
10
20
30
40
50
60
12
14
16
18
20
22
DUTY-POINT FLOW[USgpm] HEAD[ft] POWER [hp] EFF. [%] NPSHre[ft]1008 50.2 ( 19.8) 56.5 (64.7) 13.5B.E.P.
BE
ST
EF
F. P
OIN
T
O *O
VE
RA
LL E
FF
.
PU
MP
EF
F.
O *S
HA
FT
PO
WE
R
CURVE
lsmith
Text Box
LS3101

FU
SC
AT
1.0
(20
0312
01)
PERFORMANCE CURVEDATE PROJECT
1/1-LOAD 3/4-LOAD 1/2-LOAD
POWER FACTOR
EFFICIENCY
MOTOR DATA
COMMENTS INLET/OUTLET
IMP. THROUGHLET
RATEDPOWER .....
STARTINGCURRENT ...
RATEDCURRENT ...
RATEDSPEED .....
TOT.MOM.OFINERTIA ...
NO. OFBLADES
PRODUCT TYPE
CURVE NO ISSUE
MOTOR # STATOR REV
FREQ. PHASES VOLTAGE POLES
GEARTYPE RATIO
NPSHre = NPSH3% + min. operational margin
Performance with clear water and ambient temp 40 °C
C 3102.181 MT
2006-11-30 FLYGT US Catalog 63-435-00-3703 2IMPELLER DIAMETER
189 mm
18-11-4AL 1 Y// 11
60 Hz 3 230 V 4
--- ---
0.8185.0 %
---
0.7585.0 %
---
0.6383.5 %
---
-/ 4 inch
3.0 inchNEMA Code Letter: HInstalls: CP/CS
5 hp
83 A
14 A
1745 rpm
0.039 kgm2
1
FLOW[USgpm]
HE
AD
[ft]
PO
WE
R
[hp]
EFF.[%]
NPSHre[ft]
0 100 200 300 400 500 6000
10
20
30
40
50
0
20
40
60
80
100
0
10
20
30
40
50
60
70
2
3
4
5
6
P
PP
OW
ER
LIM
IT
DUTY-POINT FLOW[USgpm] HEAD[ft] POWER [hp] EFF. [%] NPSHre[ft]405 33.7 ( 4.96) 59.5 (69.7) 26.4B.E.P.
BE
ST
EF
F. P
OIN
T
O *O
VE
RA
LL E
FF
.
PU
MP
EF
F.
O *S
HA
FT
PO
WE
R
CURVE
lsmith
Text Box
LS3103

FU
SC
AT
1.0
(20
0312
01)
PERFORMANCE CURVEDATE PROJECT
1/1-LOAD 3/4-LOAD 1/2-LOAD
POWER FACTOR
EFFICIENCY
MOTOR DATA
COMMENTS INLET/OUTLET
IMP. THROUGHLET
RATEDPOWER .....
STARTINGCURRENT ...
RATEDCURRENT ...
RATEDSPEED .....
TOT.MOM.OFINERTIA ...
NO. OFBLADES
PRODUCT TYPE
CURVE NO ISSUE
MOTOR # STATOR REV
FREQ. PHASES VOLTAGE POLES
GEARTYPE RATIO
NPSHre = NPSH3% + min. operational margin
Performance with clear water and ambient temp 40 °C
C 3127.181 HT
2006-11-30 FLYGT US Catalog 63-483-00-3702 1IMPELLER DIAMETER
228 mm
21-12-4AL 12Y// 11
60 Hz 3 230 V 4
--- ---
0.8983.5 %
---
0.8785.0 %
---
0.8184.5 %
---
-/ 4 inch
3.0 inchNEMA Code Letter: FInstalls: CP/CS
10 hp
128 A
25 A
1735 rpm
0.12 kgm2
1
FLOW[USgpm]
HE
AD
[ft]
PO
WE
R
[hp]
EFF.[%]
NPSHre[ft]
0 100 200 300 400 500 600 700 8000
10
20
30
40
50
60
70
80
0
10
20
30
40
50
60
70
80
0
10
20
30
40
50
60
70
4
6
8
10
NPSHre=36 ft
DUTY-POINT FLOW[USgpm] HEAD[ft] POWER [hp] EFF. [%] NPSHre[ft]480 50.0 ( 9.5) 54.2 (64.0) 13.0B.E.P.
BE
ST
EF
F. P
OIN
T
O *O
VE
RA
LL E
FF
.
PU
MP
EF
F.
O *S
HA
FT
PO
WE
R
CURVE
lsmith
Text Box
LS3114

FU
SC
AT
1.0
(20
0312
01)
PERFORMANCE CURVEDATE PROJECT
1/1-LOAD 3/4-LOAD 1/2-LOAD
POWER FACTOR
EFFICIENCY
MOTOR DATA
COMMENTS INLET/OUTLET
IMP. THROUGHLET
RATEDPOWER .....
STARTINGCURRENT ...
RATEDCURRENT ...
RATEDSPEED .....
TOT.MOM.OFINERTIA ...
NO. OFBLADES
PRODUCT TYPE
CURVE NO ISSUE
MOTOR # STATOR REV
FREQ. PHASES VOLTAGE POLES
GEARTYPE RATIO
NPSHre = NPSH3% + min. operational margin
Performance with clear water and ambient temp 40 °C
C 3127.181 HT
2006-11-30 FLYGT US Catalog 63-483-00-3702 1IMPELLER DIAMETER
228 mm
21-12-4AL 12Y// 11
60 Hz 3 230 V 4
--- ---
0.8983.5 %
---
0.8785.0 %
---
0.8184.5 %
---
-/ 4 inch
3.0 inchNEMA Code Letter: FInstalls: CP/CS
10 hp
128 A
25 A
1735 rpm
0.12 kgm2
1
FLOW[USgpm]
HE
AD
[ft]
PO
WE
R
[hp]
EFF.[%]
NPSHre[ft]
0 100 200 300 400 500 600 700 8000
10
20
30
40
50
60
70
80
0
10
20
30
40
50
60
70
80
0
10
20
30
40
50
60
70
4
6
8
10
NPSHre=36 ft
DUTY-POINT FLOW[USgpm] HEAD[ft] POWER [hp] EFF. [%] NPSHre[ft]480 50.0 ( 9.5) 54.2 (64.0) 13.0B.E.P.
BE
ST
EF
F. P
OIN
T
O *O
VE
RA
LL E
FF
.
PU
MP
EF
F.
O *S
HA
FT
PO
WE
R
CURVE
lsmith
Text Box
LS3121

FU
SC
AT
1.0
(20
0312
01)
PERFORMANCE CURVEDATE PROJECT
1/1-LOAD 3/4-LOAD 1/2-LOAD
POWER FACTOR
EFFICIENCY
MOTOR DATA
COMMENTS INLET/OUTLET
IMP. THROUGHLET
RATEDPOWER .....
STARTINGCURRENT ...
RATEDCURRENT ...
RATEDSPEED .....
TOT.MOM.OFINERTIA ...
NO. OFBLADES
PRODUCT TYPE
CURVE NO ISSUE
MOTOR # STATOR REV
FREQ. PHASES VOLTAGE POLES
GEARTYPE RATIO
NPSHre = NPSH3% + min. operational margin
Performance with clear water and ambient temp 40 °C
C 3152.181 HT
2006-11-30 FLYGT US Catalog 63-454-00-5360 4IMPELLER DIAMETER
275 mm
25-15-4AA 12Y// 11
60 Hz 3 230 V 4
--- ---
0.8487.0 %
---
0.7987.0 %
---
0.6986.0 %
---
-/ 4 inch
3.0 inchNEMA Code Letter: GInstalls: CP/CS/CT/CZ
20 hp
285 A
51 A
1750 rpm
0.24 kgm2
1
FLOW[USgpm]
HE
AD
[ft]
PO
WE
R
[hp]
EFF.[%]
NPSHre[ft]
0 200 400 600 800 1000 12000
20
40
60
80
100
120
0
20
40
60
80
100
120
0
10
20
30
40
50
60
70
12
16
20
DUTY-POINT FLOW[USgpm] HEAD[ft] POWER [hp] EFF. [%] NPSHre[ft]745 69.7 ( 19.7) 58.3 (66.8) 11.4B.E.P.
BE
ST
EF
F. P
OIN
T
O *O
VE
RA
LL E
FF
.
PU
MP
EF
F.
O *S
HA
FT
PO
WE
R
CURVE
lsmith
Text Box
LS3123

lsmith
Text Box
LS3129

Model: NSW Size: 8X8X17LC Group: 60Hz RPM Variable Stages: 1
Job/Inq.No. :Purchaser : UNDEFINEDEnd User : Issued by : Laura SmithItem/Equip.No. : ITEM 001 Quotation No. : LS09-01-20 01 Date : 01/20/2009Service :Order No. :
Operating Conditions Pump Performance @ 1180 RPMLiquid: Water Actual Pump Eff.: 76.0 % Suction Specific Speed:Temp.: 70.0 deg F Actual Pump Power: 60.3 hp Min. Hydraulic Flow: 1,083.3 gpmS.G./Visc.: 1.000/1.000 cp Min. Thermal Flow: N/AFlow: 3,000.0 gpm Rated Total Power: 60.3 hpTDH: 60.0 ft Imp. Dia. First 1 Stg(s): 15.2500 inNPSHa: NPSHr: 18.1 ft Non-Overloading Power: 62.9 hpSolid size: Shut off Head: 100.7 ft% Solids: Vapor Press:Max. Solids Size: 5.0000 in
Notes: 1.The Mechanical seal increased drag effect on power and efficiency is not included, unless the correction is shown in theappropriate field above.2. Magnetic drive eddy current and viscous effect on power and efficiency is not included.3.Elevated temperature effects on performance are not included.4. Non Overloading power does not reflect v-belt/gearlosses.
lsmith
Text Box
LS4002

Model: NSW Size: 10X10X21LC Group: F7-C4 60Hz RPM: 890 Stages: 1
Job/Inq.No. :Purchaser : UNDEFINEDEnd User : Issued by : ANGELA BRYANItem/Equip.No. : ITEM 001 Quotation No. : AB08-08-17 01 Date : 08/22/2008Service :Order No. :
Operating Conditions Pump PerformanceLiquid: Water Actual Pump Eff.: 79.0 % Suction Specific Speed:Temp.: 70.0 deg F Actual Pump Power: 106.3 hp Min. Hydraulic Flow: 1,628.0 gpmS.G./Visc.: 1.000/1.000 cp Total Power Loss: 0.00 hp Min. Thermal Flow: N/AFlow: 5,200.0 gpm Rated Total Power: 106.3 hpTDH: 63.0 ft Imp. Dia. First 1 Stg(s): 20.7500 inNPSHa: NPSHr: 18.2 ft Non-Overloading Power: 111.4 hpSolid size: Shut off Head: 128.5 ft% Solids: Vapor Press:Max. Solids Size: 6.0600 in
Notes: 1.The Mechanical seal increased drag effect on power and efficiency is not included, unless the correction is shown in theappropriate field above.2. Magnetic drive eddy current and viscous effect on power and efficiency is not included.3.Elevated temperature effects on performance are not included.4. Non Overloading power does not reflect v-belt/gearlosses.
lsmith
Text Box
LS4003

Pump Data Sheet - Yeomans Pump, Aurora, IL
Company: ATMName: Angela BryanDate: 8/14/2008
Customer:Project:Location:Quote #:Item ID / Tag #:Qty. of Pumps:
Pump:Model: 14206Type: 9100 Speed: 875 rpmSynch speed: 900 rpm Dia: 19.625 inCurve ID No.: 40206 Impeller ID No.: Y-4689Specific Speeds: Ns: ---
Nss: ---Dimensions: Suction: ---
Discharge: 14 in
Pump Limits:Temperature: 104 °F Power: 125 hpPressure: 150 psi g Eye area: ---Sphere size: 6 in
Search Criteria:Flow: 5900 US gpm Head: 57 ft
Fluid:Water Temperature: 60 °FSG: 1 Vapor pressure: 0.2563 psi aViscosity: 1.105 cP Atm pressure: 14.7 psi aNPSHa: ---
Motor:Size: 125 hpSpeed: 900Frame: 360
Standard: YCCEnclosure: TENV
Sizing criteria: Max Power on Design Curve
Selected from catalog: YP_9100.60 Vers: 1
---- Data Point ----Flow: 5900 US gpmHead: 57.1 ftEff: 82.1%Power: 104 hpNPSHr: ---
---- Design Curve ----Shutoff head: 94.3 ftShutoff dP: 40.8 psiMin flow: ---BEP: 82.9% @ 6381 US gpmNOL power:
108 hp @ 8148 US gpm
-- Max Curve --Max power:
116 hp @ 7500 US gpm
Default motor size is based upon max. power on the design curve plus a margin factor to allow for impeller trim variancesthat may occur to meet H.I. TDH requirements. Efficiencies and data are typical. Please contact the factory for guaranteed
values. FOR TEMP. ABOVE 104 DEG. F (40 DEG C) REFER TO FACTORY FOR ASSISTANCE.
US gpm
NPS
Hr -
ft
10000900080007000600050004000300020000 1000
0.5
1
1.5
Hea
d - f
t
100009000800010 7000
20
30
6000
40
5000
50
4000
60
70
3000
80
2000
90
1000
100
82.9
19.625 in
20 in
18 in
75 hp100 hp
60
60
65
65
70
70
70
70
75
75
75
75
78
7878
78
81
81
82
82
83
83
Performance Evaluation:Flow Speed Head Efficiency Power NPSHrUS gpm rpm ft % hp ft7080 875 48.9 81.9 107 ---5900 875 57.1 82.1 104 ---4720 875 63.6 77.5 97.8 ---3540 875 68.2 68.3 89.1 ---2360 875 74.9 51.1 85.5 ---
lsmith
Text Box
WPCP

lsmith
Text Box
LS4005
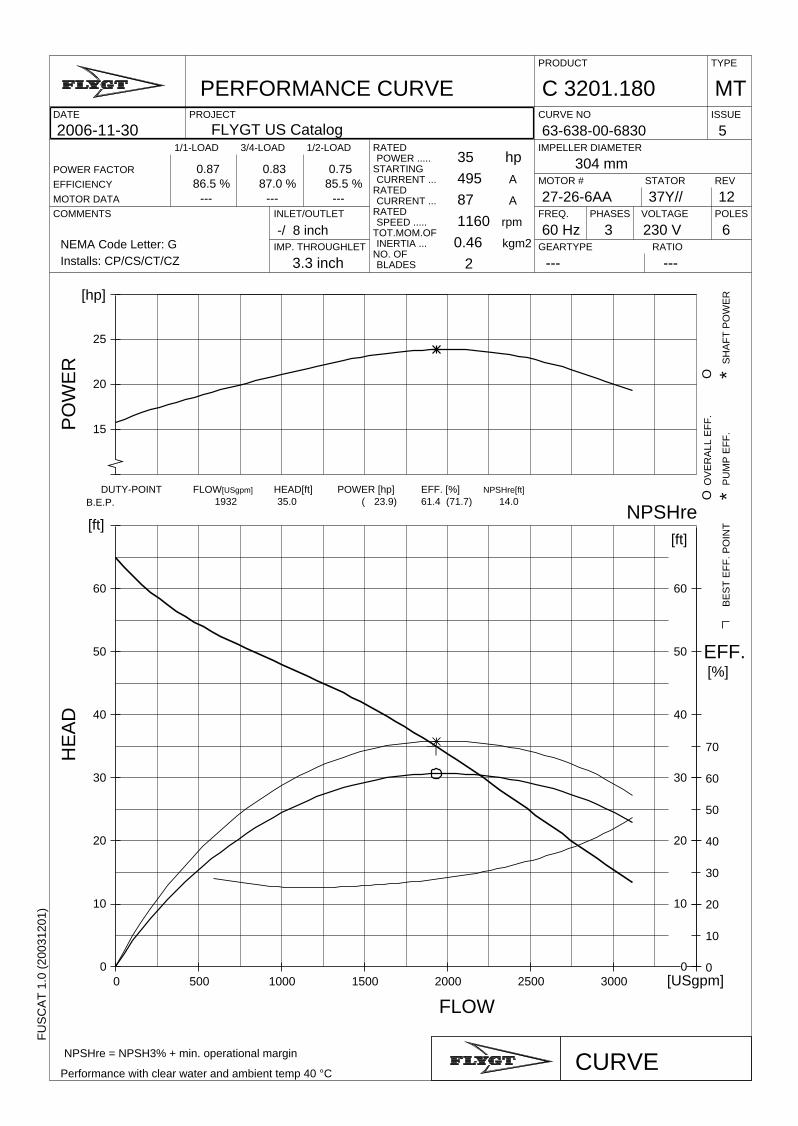
FU
SC
AT
1.0
(20
0312
01)
PERFORMANCE CURVEDATE PROJECT
1/1-LOAD 3/4-LOAD 1/2-LOAD
POWER FACTOR
EFFICIENCY
MOTOR DATA
COMMENTS INLET/OUTLET
IMP. THROUGHLET
RATEDPOWER .....
STARTINGCURRENT ...
RATEDCURRENT ...
RATEDSPEED .....
TOT.MOM.OFINERTIA ...
NO. OFBLADES
PRODUCT TYPE
CURVE NO ISSUE
MOTOR # STATOR REV
FREQ. PHASES VOLTAGE POLES
GEARTYPE RATIO
NPSHre = NPSH3% + min. operational margin
Performance with clear water and ambient temp 40 °C
C 3201.180 MT
2006-11-30 FLYGT US Catalog 63-638-00-6830 5IMPELLER DIAMETER
304 mm
27-26-6AA 37Y// 12
60 Hz 3 230 V 6
--- ---
0.8786.5 %
---
0.8387.0 %
---
0.7585.5 %
---
-/ 8 inch
3.3 inchNEMA Code Letter: GInstalls: CP/CS/CT/CZ
35 hp
495 A
87 A
1160 rpm
0.46 kgm2
2
FLOW[USgpm]
HE
AD
[ft]
PO
WE
R
[hp]
EFF.[%]
NPSHre[ft]
0 500 1000 1500 2000 2500 30000
10
20
30
40
50
60
0
10
20
30
40
50
60
0
10
20
30
40
50
60
70
15
20
25
DUTY-POINT FLOW[USgpm] HEAD[ft] POWER [hp] EFF. [%] NPSHre[ft]1932 35.0 ( 23.9) 61.4 (71.7) 14.0B.E.P.
BE
ST
EF
F. P
OIN
T
O *O
VE
RA
LL E
FF
.
PU
MP
EF
F.
O *S
HA
FT
PO
WE
R
CURVE
lsmith
Text Box
LS4006

lsmith
Text Box
LS4017

SECTION PAGE DATE
364A
USA: (937) 778-8947 • Canada: (905) 457-6223 • International: (937) 615-3598A Crane Co. Company
Self-Priming Solids Handling Pumps
www.cranepumps.com
MAXIMUM DRY PRIMING LIFT
PUMP SPEED850 RPM
1150 RPM1450 RPM1750 RPM
2 Min2 Ft.4 Ft.
23 Ft.25 Ft.
4 Min5 Ft.
11 Ft.25 Ft.25 Ft.
6 Min8 Ft.
16 Ft.25 Ft.25 Ft.
8 Min11 Ft.18 Ft.25 Ft.25 Ft.
10 Min15 Ft.19 Ft.25 Ft.25 Ft.
When pump is operating, the SUCTION LIFT is limited by the available NPSH which is the corrected atmospheric pressure minus the dynamic suction lift, vapor pressure loss and 2 foot safety factor. This net available NPSH must exceed the required NPSH of the pump or a reduction of capacity, loss of effi ciency, noise, vibration and cavitation will result. Calculate the dynamic suction lift from the low liquid level to the centerline of the impeller. When pump is priming, it is limited by the dry PRIMING LIFT which is the vertical distance from the high liquid level to the centerline of the impeller.
DO NOT Operate in "DASHED" Area of HQ Curve. Testing is performed with water, specifi c gravity 1.0 @ 68º F @ (20ºC), other fluids may vary performance
Model: P06LC-14XPerformance CurveVarious RPM
4/05
lsmith
Text Box
LS4021

FU
SC
AT
1.0
(20
0312
01)
PERFORMANCE CURVEDATE PROJECT
1/1-LOAD 3/4-LOAD 1/2-LOAD
POWER FACTOR
EFFICIENCY
MOTOR DATA
COMMENTS INLET/OUTLET
IMP. THROUGHLET
RATEDPOWER .....
STARTINGCURRENT ...
RATEDCURRENT ...
RATEDSPEED .....
TOT.MOM.OFINERTIA ...
NO. OFBLADES
PRODUCT TYPE
CURVE NO ISSUE
MOTOR # STATOR REV
FREQ. PHASES VOLTAGE POLES
GEARTYPE RATIO
NPSHre = NPSH3% + min. operational margin
Performance with clear water and ambient temp 40 °C
C 3201.180 MT
2006-11-30 FLYGT US Catalog 63-637-00-6830 6IMPELLER DIAMETER
323 mm
27-26-6AA 37YSER 12
60 Hz 3 460 V 6
--- ---
0.8786.5 %
---
0.8387.0 %
---
0.7585.5 %
---
-/ 8 inch
3.3 inchNEMA Code Letter: GInstalls: CP/CS/CT/CZ
35 hp
249 A
44 A
1160 rpm
0.53 kgm2
2
FLOW[USgpm]
HE
AD
[ft]
PO
WE
R
[hp]
EFF.[%]
NPSHre[ft]
0 500 1000 1500 2000 2500 30000
10
20
30
40
50
60
70
0
10
20
30
40
50
60
70
0
10
20
30
40
50
60
70
80
15
20
25
30
DUTY-POINT FLOW[USgpm] HEAD[ft] POWER [hp] EFF. [%] NPSHre[ft]2070 41.7 ( 28.9) 65.4 (75.6) 13.7B.E.P.
BE
ST
EF
F. P
OIN
T
O *O
VE
RA
LL E
FF
.
PU
MP
EF
F.
O *S
HA
FT
PO
WE
R
CURVE
lsmith
Text Box
LS4028

Pump Data Sheet Fairbanks Morse Pump, 60 Hz
Company: Applied Technology & Management, Inc.Name: Angela BryanDate: 8/21/2008
BrunswickGlynn County Joint Water & Sewer Commission
System Modeling ProjectLift Station 4035Pump SN...K3A1081844
Pump:Size: 8"5414L (D)Type: 5400NONCLOG Speed: 880 rpmSynch speed: 900 rpm Dia: 14.6875 inCurve: 140808D Impeller: T8D1DSpecific Speeds: Ns: 2304
Nss: 6998Dimensions: Suction: 10 in
Discharge: 8 in
Pump Limits:Temperature: 150 °F Power: Pressure: 75 psi g Eye area: Sphere size: 4 in
Search Criteria:Flow: 2100 US gpm Head: 30 ft
Fluid:Water Temperature: 60 °FDensity: 62.25 lb/ft³ Vapor pressure: 0.2563 psi aViscosity: 1.105 cP Atm pressure: 14.7 psi aNPSHa:
Motor:Size: 25 hpSpeed: 900Frame: 326T
Standard: NEMAEnclosure: TEFC
Sizing criteria: Max Power on Design Curve
H2Optimize FairbanksMorse 9 Selected from catalog: Fairbanks Morse Centrifugal.60 Vers: 3
Data Point Flow: 2100 US gpmHead: 30.4 ftEff: 76%Power: 20.9 hpNPSHr: 10.7 ft
Design Curve Shutoff head: 58.1 ftShutoff dP: 25.1 psiMin flow: 700 US gpmBEP: 78% @ 1809 US gpmNOL power:
21 hp @ 2290 US gpm
Max Curve Max power:
29.1 hp @ 2824 US gpm
Curve efficiencies are typical. For guaranteed values, contact Fairbanks Morse or your local distributor. Laseficiencias en curvas son típicas. Para valores garantizados contacte a Fairbanks Morse o a su distribuidor local.
US gpm
Pow
er
hp
25002000150010005000
25
NPS
Hr
ft
25002000150010005000
10
Hea
d f
t
250020001500
20
30
1000
40
50
500
60
70
77.5
14.6875 in
16 in
13 in
60
60
65
65
70
70 70
70
75
75
78
78
Performance Evaluation:Flow Speed Head Efficiency Power NPSHrUS gpm rpm ft % hp ft2520 880 2100 880 30.4 76 20.9 10.71680 880 37.1 77 20.4 9.081260 880 43.1 73 18.8 8.32840 880 48.3 63 16.2 8.2
lsmith
Text Box
LS4035

Pump Data Sheet Fairbanks Morse Pump, 60 Hz
Company: Applied Technology & Management, Inc.Name: Angela BryanDate: 8/21/2008
BrunswickGlynn County Joint Water & Sewer CommissionSewer System Modeling ProjectLift Station 4036Pump SN...K3A1081842
Pump:Size: 6"5413Type: 5400NONCLOG Speed: 1175 rpmSynch speed: 1200 rpm Dia: 11.3125 inCurve: 130606C Impeller: T6C1CSpecific Speeds: Ns: 2605
Nss: 6843Dimensions: Suction: 6 in
Discharge: 6 in
Pump Limits:Temperature: 150 °F Power: Pressure: 85 psi g Eye area: Sphere size: 3 in
Search Criteria:Flow: 1400 US gpm Head: 35 ft
Fluid:Water Temperature: 60 °FDensity: 62.25 lb/ft³ Vapor pressure: 0.2563 psi aViscosity: 1.105 cP Atm pressure: 14.7 psi aNPSHa:
Motor:Size: 20 hpSpeed: 1200Frame: 286T
Standard: NEMAEnclosure: TEFC
Sizing criteria: Max Power on Design Curve
H2Optimize FairbanksMorse 9 Selected from catalog: Fairbanks Morse Centrifugal.60 Vers: 3
Data Point Flow: 1400 US gpmHead: 35.4 ftEff: 80%Power: 15.5 hpNPSHr: 12.1 ft
Design Curve Shutoff head: 60.1 ftShutoff dP: 26 psiMin flow: 350 US gpmBEP: 81% @ 1295 US gpmNOL power:
16.8 hp @ 2064 US gpm
Max Curve Max power:
21.4 hp @ 2271 US gpm
Curve efficiencies are typical. For guaranteed values, contact Fairbanks Morse or your local distributor. Laseficiencias en curvas son típicas. Para valores garantizados contacte a Fairbanks Morse o a su distribuidor local.
US gpm
Pow
er
hp
2250200017501500125010007505000 250
10
20
NPS
Hr
ft
2250200017501500125010007505000 250
10
20
Hea
d f
t
225020001750150010 1250
20
1000
30
750
40
500
50
60
250
70
81
11.3125 in
12 in
9 in
50
50
60
60
65
6565
65
70
70
74
74
77
77
79
79
81
81
Performance Evaluation:Flow Speed Head Efficiency Power NPSHrUS gpm rpm ft % hp ft1680 1175 29.9 78 16.3 14.21400 1175 35.4 80 15.5 12.11120 1175 40.6 80 14.3 10.6840 1175 45.6 75 12.9 9.27560 1175 50.3 63 11.3 9
lsmith
Text Box
LS4036 20 Hp
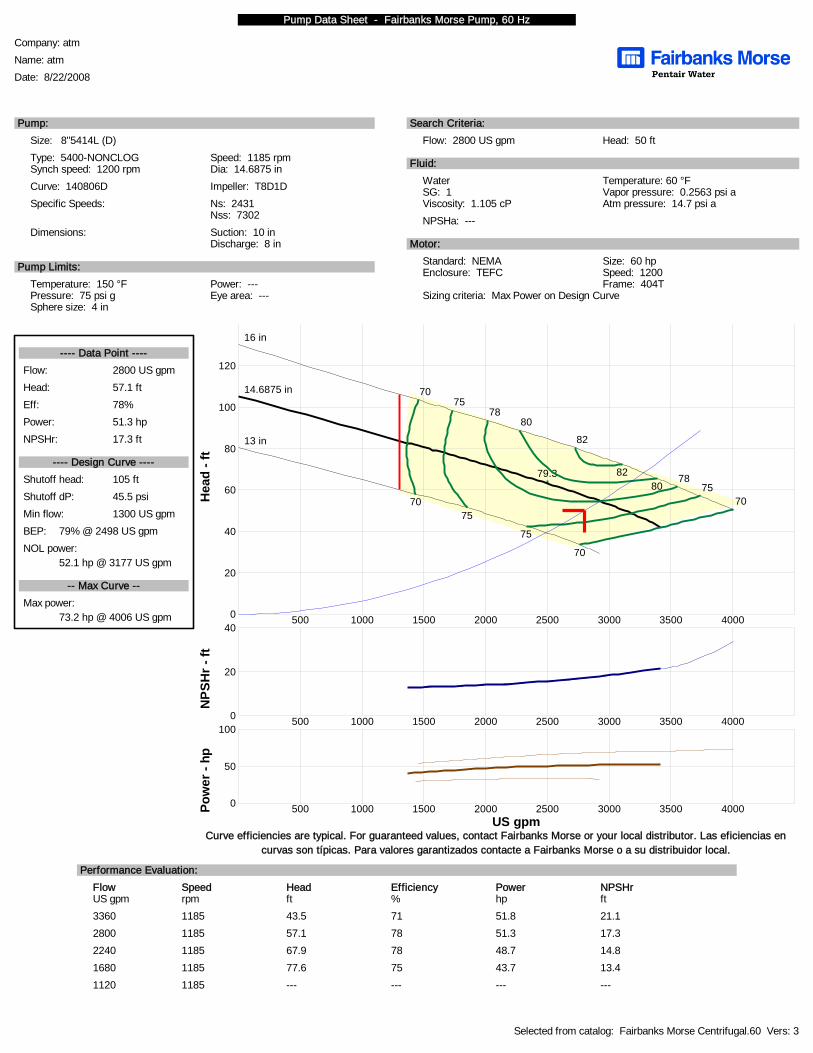
Pump Data Sheet - Fairbanks Morse Pump, 60 Hz
Company: atmName: atmDate: 8/22/2008
Pump:Size: 8"5414L (D)Type: 5400-NONCLOG Speed: 1185 rpmSynch speed: 1200 rpm Dia: 14.6875 inCurve: 140806D Impeller: T8D1DSpecific Speeds: Ns: 2431
Nss: 7302Dimensions: Suction: 10 in
Discharge: 8 in
Pump Limits:Temperature: 150 °F Power: ---Pressure: 75 psi g Eye area: ---Sphere size: 4 in
Search Criteria:Flow: 2800 US gpm Head: 50 ft
Fluid:Water Temperature: 60 °FSG: 1 Vapor pressure: 0.2563 psi aViscosity: 1.105 cP Atm pressure: 14.7 psi aNPSHa: ---
Motor:Size: 60 hpSpeed: 1200Frame: 404T
Standard: NEMAEnclosure: TEFC
Sizing criteria: Max Power on Design Curve
Selected from catalog: Fairbanks Morse Centrifugal.60 Vers: 3
---- Data Point ----Flow: 2800 US gpmHead: 57.1 ftEff: 78%Power: 51.3 hpNPSHr: 17.3 ft
---- Design Curve ----Shutoff head: 105 ftShutoff dP: 45.5 psiMin flow: 1300 US gpmBEP: 79% @ 2498 US gpmNOL power:
52.1 hp @ 3177 US gpm
-- Max Curve --Max power:
73.2 hp @ 4006 US gpm
Curve efficiencies are typical. For guaranteed values, contact Fairbanks Morse or your local distributor. Las eficiencias encurvas son típicas. Para valores garantizados contacte a Fairbanks Morse o a su distribuidor local.
US gpm
Pow
er -
hp
40003500300025002000150010000 500
50
100
NPS
Hr -
ft
40003500300025002000150010000 500
20
40
Hea
d - f
t
40003500300025000
20
2000
40
1500
60
80
1000
100
500
120
79.3
14.6875 in
16 in
13 in
70
70 70
70
75
75
75
75
78
78
80
80
82
82
Performance Evaluation:Flow Speed Head Efficiency Power NPSHrUS gpm rpm ft % hp ft3360 1185 43.5 71 51.8 21.12800 1185 57.1 78 51.3 17.32240 1185 67.9 78 48.7 14.81680 1185 77.6 75 43.7 13.41120 1185 --- --- --- ---
lsmith
Text Box
LS4036 60 Hp

Pump Data Sheet Fairbanks Morse Pump, 60 Hz
Company: Applied Technology & Management, Inc.Name: Angela BryanDate: 8/21/2008
BrunswickGlynn County Joint Water & Sewer CommissionSewer System Modeling ProjectLift Station 4036Pump SN...K3A1081841
Pump:Size: 10"5415Type: 5400NONCLOG Speed: 890 rpmSynch speed: 900 rpm Dia: 19.1875 inCurve: 151008A Impeller: TALE5ASpecific Speeds: Ns: 2030
Nss: 8374Dimensions: Suction: 10 in
Discharge: 10 in
Pump Limits:Temperature: 150 °F Power: Pressure: 75 psi g Eye area: Sphere size: 6 in
Search Criteria:Flow: 4200 US gpm Head: 65 ft
Fluid:Water Temperature: 60 °FDensity: 62.25 lb/ft³ Vapor pressure: 0.2563 psi aViscosity: 1.105 cP Atm pressure: 14.7 psi aNPSHa:
Motor:Size: 100 hpSpeed: 900Frame: 445T
Standard: NEMAEnclosure: TEFC
Sizing criteria: Max Power on Design Curve
H2Optimize FairbanksMorse 9 Selected from catalog: Fairbanks Morse Centrifugal.60 Vers: 3
Data Point Flow: 4200 US gpmHead: 65.6 ftEff: 82%Power: 84.2 hpNPSHr: 14.3 ft
Design Curve Shutoff head: 105 ftShutoff dP: 45.4 psiMin flow: 2100 US gpmBEP: 83% @ 3885 US gpmNOL power:
89.6 hp @ 5253 US gpm
Max Curve Max power:
127 hp @ 5792 US gpm
Curve efficiencies are typical. For guaranteed values, contact Fairbanks Morse or your local distributor. Laseficiencias en curvas son típicas. Para valores garantizados contacte a Fairbanks Morse o a su distribuidor local.
US gpm
Pow
er
hp
6000500040003000200010000
100
NPS
Hr
ft
6000500040003000200010000
10
20
Hea
d f
t
60005000400025
3000
50
2000
75
1000
100
125
83.1
19.1875 in
21 in
17 in
70
70
74
7474
74
76
76
76
76
80
80
80
80
82
82
83
83
Performance Evaluation:Flow Speed Head Efficiency Power NPSHrUS gpm rpm ft % hp ft5040 890 54.4 78 88.7 17.94200 890 65.6 82 84.2 14.33360 890 74.3 82 77.1 12.42520 890 80.7 74 69 121680 890
lsmith
Text Box
LS4036 100 Hp
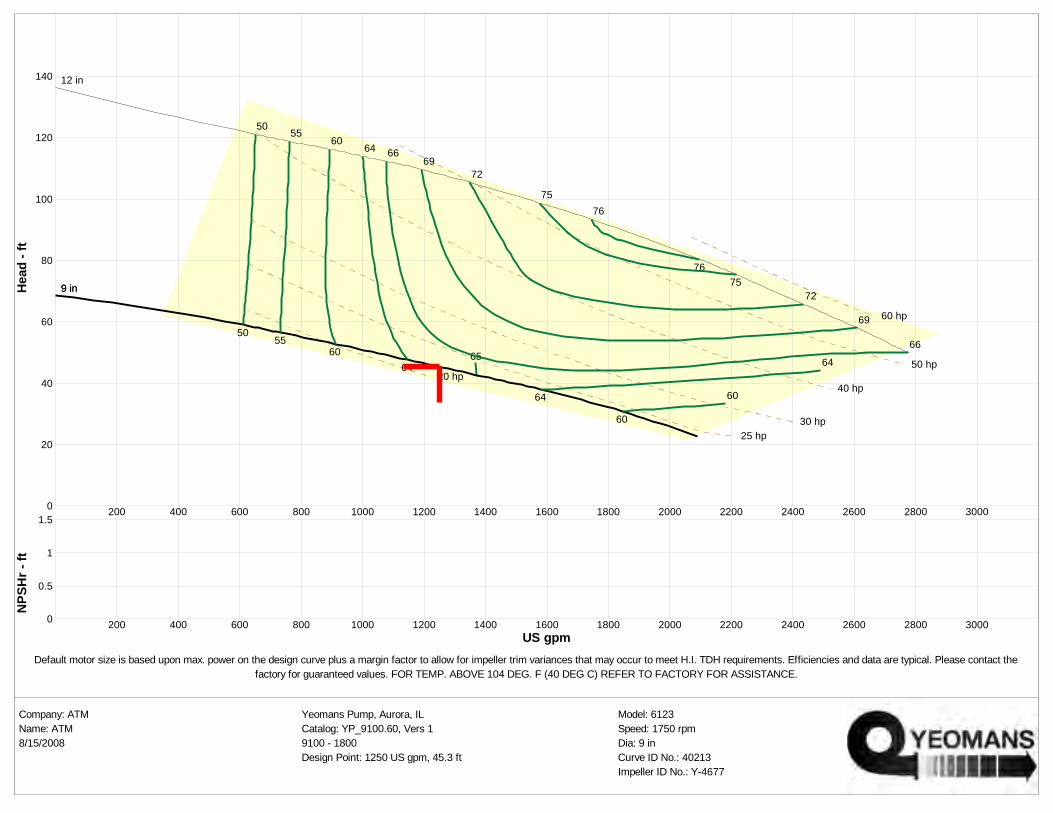
US gpm
NPS
Hr -
ft
300028002600240022002000180016001400120010008006004000
0.5
200
1
1.5
Hea
d - f
t
300028002600240022002000180016000 1400
20
1200
40
1000
60
800
80
100
600400
120
140
200
65
9 in
12 in
9 in
20 hp
25 hp30 hp
40 hp
50 hp
60 hp
50
50
55
55
60
60
60
60
64
64 64
64
66
66
69
69
72
72
75
75
76
76
Default motor size is based upon max. power on the design curve plus a margin factor to allow for impeller trim variances that may occur to meet H.I. TDH requirements. Efficiencies and data are typical. Please contact thefactory for guaranteed values. FOR TEMP. ABOVE 104 DEG. F (40 DEG C) REFER TO FACTORY FOR ASSISTANCE.
Company: ATM Yeomans Pump, Aurora, IL Model: 6123Name: ATM Catalog: YP_9100.60, Vers 1 Speed: 1750 rpm8/15/2008 9100 - 1800 Dia: 9 in
Design Point: 1250 US gpm, 45.3 ft Curve ID No.: 40213Impeller ID No.: Y-4677
lsmith
Text Box
LS4039

FU
SC
AT
1.0
(20
0312
01)
PERFORMANCE CURVEDATE PROJECT
1/1-LOAD 3/4-LOAD 1/2-LOAD
POWER FACTOR
EFFICIENCY
MOTOR DATA
COMMENTS INLET/OUTLET
IMP. THROUGHLET
RATEDPOWER .....
STARTINGCURRENT ...
RATEDCURRENT ...
RATEDSPEED .....
TOT.MOM.OFINERTIA ...
NO. OFBLADES
PRODUCT TYPE
CURVE NO ISSUE
MOTOR # STATOR REV
FREQ. PHASES VOLTAGE POLES
GEARTYPE RATIO
NPSHre = NPSH3% + min. operational margin
Performance with clear water and ambient temp 40 °C
C 3201.180 MT
2006-11-30 FLYGT US Catalog 63-638-00-6830 5IMPELLER DIAMETER
304 mm
27-26-6AA 37YSER 12
60 Hz 3 460 V 6
--- ---
0.8786.5 %
---
0.8387.0 %
---
0.7585.5 %
---
-/ 8 inch
3.3 inchNEMA Code Letter: GInstalls: CP/CS/CT/CZ
35 hp
249 A
44 A
1160 rpm
0.46 kgm2
2
FLOW[USgpm]
HE
AD
[ft]
PO
WE
R
[hp]
EFF.[%]
NPSHre[ft]
0 500 1000 1500 2000 2500 30000
10
20
30
40
50
60
0
10
20
30
40
50
60
0
10
20
30
40
50
60
70
15
20
25
DUTY-POINT FLOW[USgpm] HEAD[ft] POWER [hp] EFF. [%] NPSHre[ft]1932 35.0 ( 23.9) 61.4 (71.7) 14.0B.E.P.
BE
ST
EF
F. P
OIN
T
O *O
VE
RA
LL E
FF
.
PU
MP
EF
F.
O *S
HA
FT
PO
WE
R
CURVE
lsmith
Text Box
LS4048

FU
SC
AT
1.0
(20
0312
01)
PERFORMANCE CURVEDATE PROJECT
1/1-LOAD 3/4-LOAD 1/2-LOAD
POWER FACTOR
EFFICIENCY
MOTOR DATA
COMMENTS INLET/OUTLET
IMP. THROUGHLET
RATEDPOWER .....
STARTINGCURRENT ...
RATEDCURRENT ...
RATEDSPEED .....
TOT.MOM.OFINERTIA ...
NO. OFBLADES
PRODUCT TYPE
CURVE NO ISSUE
MOTOR # STATOR REV
FREQ. PHASES VOLTAGE POLES
GEARTYPE RATIO
NPSHre = NPSH3% + min. operational margin
Performance with clear water and ambient temp 40 °C
C 3127.181 MT
2006-11-30 FLYGT US Catalog 63-432-00-3703 2IMPELLER DIAMETER
225 mm
21-12-4AL 12Y// 11
60 Hz 3 230 V 4
--- ---
0.8983.5 %
---
0.8785.0 %
---
0.8184.5 %
---
-/ 6 inch
---NEMA Code Letter: FInstalls: CP/CS
10 hp
128 A
25 A
1735 rpm
0.082 kgm2
1
FLOW[USgpm]
HE
AD
[ft]
PO
WE
R
[hp]
EFF.[%]
NPSHre[ft]
0 200 400 600 800 10000
10
20
30
40
50
60
70
0
10
20
30
40
50
60
70
0
10
20
30
40
50
60
70
6
8
10
DUTY-POINT FLOW[USgpm] HEAD[ft] POWER [hp] EFF. [%] NPSHre[ft]603 37.7 ( 8.8) 55.6 (65.3) 9.2B.E.P.
BE
ST
EF
F. P
OIN
T
O *O
VE
RA
LL E
FF
.
PU
MP
EF
F.
O *S
HA
FT
PO
WE
R
CURVE
lsmith
Text Box
LS4105

FU
SC
AT
1.0
(20
0312
01)
PERFORMANCE CURVEDATE PROJECT
1/1-LOAD 3/4-LOAD 1/2-LOAD
POWER FACTOR
EFFICIENCY
MOTOR DATA
COMMENTS INLET/OUTLET
IMP. THROUGHLET
RATEDPOWER .....
STARTINGCURRENT ...
RATEDCURRENT ...
RATEDSPEED .....
TOT.MOM.OFINERTIA ...
NO. OFBLADES
PRODUCT TYPE
CURVE NO ISSUE
MOTOR # STATOR REV
FREQ. PHASES VOLTAGE POLES
GEARTYPE RATIO
NPSHre = NPSH3% + min. operational margin
Performance with clear water and ambient temp 40 °C
C 3102.181 MT
2006-11-30 FLYGT US Catalog 63-434-00-3703 3IMPELLER DIAMETER
173 mm
18-11-4AL 1 Y// 11
60 Hz 3 230 V 4
--- ---
0.8185.0 %
---
0.7585.0 %
---
0.6383.5 %
---
-/ 4 inch
3.0 inchNEMA Code Letter: HInstalls: CP/CS
5 hp
83 A
14 A
1745 rpm
0.040 kgm2
1
FLOW[USgpm]
HE
AD
[ft]
PO
WE
R
[hp]
EFF.[%]
NPSHre[ft]
0 100 200 300 400 500 600 7000
5
10
15
20
25
30
35
40
45
0
10
20
30
40
50
60
70
80
90
0
10
20
30
40
50
60
2
3
4
NPSHre=36 ft
DUTY-POINT FLOW[USgpm] HEAD[ft] POWER [hp] EFF. [%] NPSHre[ft]399 24.6 ( 3.95) 53.9 (63.0) 29.4B.E.P.
BE
ST
EF
F. P
OIN
T
O *O
VE
RA
LL E
FF
.
PU
MP
EF
F.
O *S
HA
FT
PO
WE
R
CURVE
lsmith
Text Box
LS4107
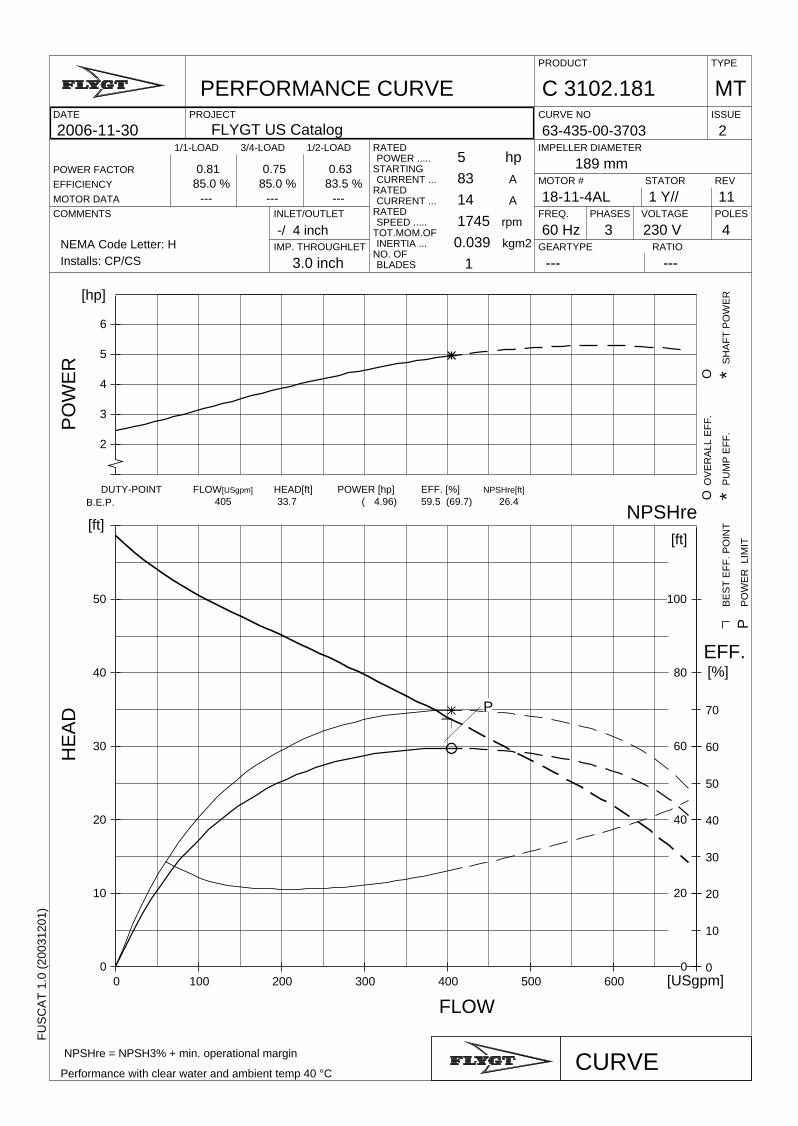
FU
SC
AT
1.0
(20
0312
01)
PERFORMANCE CURVEDATE PROJECT
1/1-LOAD 3/4-LOAD 1/2-LOAD
POWER FACTOR
EFFICIENCY
MOTOR DATA
COMMENTS INLET/OUTLET
IMP. THROUGHLET
RATEDPOWER .....
STARTINGCURRENT ...
RATEDCURRENT ...
RATEDSPEED .....
TOT.MOM.OFINERTIA ...
NO. OFBLADES
PRODUCT TYPE
CURVE NO ISSUE
MOTOR # STATOR REV
FREQ. PHASES VOLTAGE POLES
GEARTYPE RATIO
NPSHre = NPSH3% + min. operational margin
Performance with clear water and ambient temp 40 °C
C 3102.181 MT
2006-11-30 FLYGT US Catalog 63-435-00-3703 2IMPELLER DIAMETER
189 mm
18-11-4AL 1 Y// 11
60 Hz 3 230 V 4
--- ---
0.8185.0 %
---
0.7585.0 %
---
0.6383.5 %
---
-/ 4 inch
3.0 inchNEMA Code Letter: HInstalls: CP/CS
5 hp
83 A
14 A
1745 rpm
0.039 kgm2
1
FLOW[USgpm]
HE
AD
[ft]
PO
WE
R
[hp]
EFF.[%]
NPSHre[ft]
0 100 200 300 400 500 6000
10
20
30
40
50
0
20
40
60
80
100
0
10
20
30
40
50
60
70
2
3
4
5
6
P
PP
OW
ER
LIM
IT
DUTY-POINT FLOW[USgpm] HEAD[ft] POWER [hp] EFF. [%] NPSHre[ft]405 33.7 ( 4.96) 59.5 (69.7) 26.4B.E.P.
BE
ST
EF
F. P
OIN
T
O *O
VE
RA
LL E
FF
.
PU
MP
EF
F.
O *S
HA
FT
PO
WE
R
CURVE
lsmith
Text Box
LS4109

FU
SC
AT
1.0
(20
0312
01)
PERFORMANCE CURVEDATE PROJECT
1/1-LOAD 3/4-LOAD 1/2-LOAD
POWER FACTOR
EFFICIENCY
MOTOR DATA
COMMENTS INLET/OUTLET
IMP. THROUGHLET
RATEDPOWER .....
STARTINGCURRENT ...
RATEDCURRENT ...
RATEDSPEED .....
TOT.MOM.OFINERTIA ...
NO. OFBLADES
PRODUCT TYPE
CURVE NO ISSUE
MOTOR # STATOR REV
FREQ. PHASES VOLTAGE POLES
GEARTYPE RATIO
NPSHre = NPSH3% + min. operational margin
Performance with clear water and ambient temp 40 °C
C 3300.181 HT
2006-11-30 FLYGT US Catalog 63-464-00-2060 3IMPELLER DIAMETER
335 mm
35-28-4AA 38D 12
60 Hz 3 460 V 4
--- ---
0.8592.0 %
---
0.8292.5 %
---
0.7492.0 %
---
-/ 6 inch
3.0 inchNEMA Code Letter: EInstalls: CP/CS/CT/CZ
88 hp
545 A
105 A
1775 rpm
0.83 kgm2
2
FLOW[USgpm]
HE
AD
[ft]
PO
WE
R
[hp]
EFF.[%]
NPSHre[ft]
0 400 800 1200 1600 2000 24000
40
80
120
160
200
0
20
40
60
80
100
0
10
20
30
40
50
60
70
40
60
80
NPSHre=36 ft
PP
PO
WE
R L
IMIT
DUTY-POINT FLOW[USgpm] HEAD[ft] POWER [hp] EFF. [%] NPSHre[ft]1913 130 ( 83.0) 70.2 (76.1) 31.4B.E.P.
BE
ST
EF
F. P
OIN
T
O *O
VE
RA
LL E
FF
.
PU
MP
EF
F.
O *S
HA
FT
PO
WE
R
CURVE
lsmith
Text Box
LS4110

lsmith
Text Box
LS4118

FU
SC
AT
1.0
(20
0312
01)
PERFORMANCE CURVEDATE PROJECT
1/1-LOAD 3/4-LOAD 1/2-LOAD
POWER FACTOR
EFFICIENCY
MOTOR DATA
COMMENTS INLET/OUTLET
IMP. THROUGHLET
RATEDPOWER .....
STARTINGCURRENT ...
RATEDCURRENT ...
RATEDSPEED .....
TOT.MOM.OFINERTIA ...
NO. OFBLADES
PRODUCT TYPE
CURVE NO ISSUE
MOTOR # STATOR REV
FREQ. PHASES VOLTAGE POLES
GEARTYPE RATIO
NPSHre = NPSH3% + min. operational margin
Performance with clear water and ambient temp 40 °C
C 3127.181 HT
2006-11-30 FLYGT US Catalog 63-484-00-3702 1IMPELLER DIAMETER
217 mm
21-12-4AL 12Y// 11
60 Hz 3 230 V 4
--- ---
0.8983.5 %
---
0.8785.0 %
---
0.8184.5 %
---
-/ 4 inch
3.0 inchNEMA Code Letter: FInstalls: CP/CS
10 hp
128 A
25 A
1735 rpm
0.11 kgm2
1
FLOW[USgpm]
HE
AD
[ft]
PO
WE
R
[hp]
EFF.[%]
NPSHre[ft]
0 100 200 300 400 500 600 700 8000
10
20
30
40
50
60
70
80
0
10
20
30
40
50
60
70
80
0
10
20
30
40
50
4
6
8
NPSHre=36 ft
DUTY-POINT FLOW[USgpm] HEAD[ft] POWER [hp] EFF. [%] NPSHre[ft]417 44.4 ( 7.90) 50.4 (59.4) 11.0B.E.P.
BE
ST
EF
F. P
OIN
T
O *O
VE
RA
LL E
FF
.
PU
MP
EF
F.
O *S
HA
FT
PO
WE
R
CURVE
lsmith
Text Box
LS4119

FU
SC
AT
1.0
(20
0312
01)
PERFORMANCE CURVEDATE PROJECT
1/1-LOAD 3/4-LOAD 1/2-LOAD
POWER FACTOR
EFFICIENCY
MOTOR DATA
COMMENTS INLET/OUTLET
IMP. THROUGHLET
RATEDPOWER .....
STARTINGCURRENT ...
RATEDCURRENT ...
RATEDSPEED .....
TOT.MOM.OFINERTIA ...
NO. OFBLADES
PRODUCT TYPE
CURVE NO ISSUE
MOTOR # STATOR REV
FREQ. PHASES VOLTAGE POLES
GEARTYPE RATIO
NPSHre = NPSH3% + min. operational margin
Performance with clear water and ambient temp 40 °C
C 3152.181 HT
2006-11-30 FLYGT US Catalog 63-488-00-3855 2IMPELLER DIAMETER
248 mm
25-11-4AA 12YSER 11
60 Hz 3 460 V 4
--- ---
0.8583.5 %
---
0.8184.5 %
---
0.7283.5 %
---
-/ 4 inch
3.0 inchNEMA Code Letter: GInstalls: CP/CS
15 hp
114 A
20 A
1745 rpm
---
1
FLOW[USgpm]
HE
AD
[ft]
PO
WE
R
[hp]
EFF.[%]
NPSHre[ft]
0 100 200 300 400 500 600 700 800 9000
20
40
60
80
100
0
10
20
30
40
50
0
10
20
30
40
50
60
70
6
8
10
12
14
NPSHre=36 ft
DUTY-POINT FLOW[USgpm] HEAD[ft] POWER [hp] EFF. [%] NPSHre[ft]577 60.3 ( 12.3) 60.7 (71.7) 17.5B.E.P.
BE
ST
EF
F. P
OIN
T
O *O
VE
RA
LL E
FF
.
PU
MP
EF
F.
O *S
HA
FT
PO
WE
R
CURVE
lsmith
Text Box
LS4126
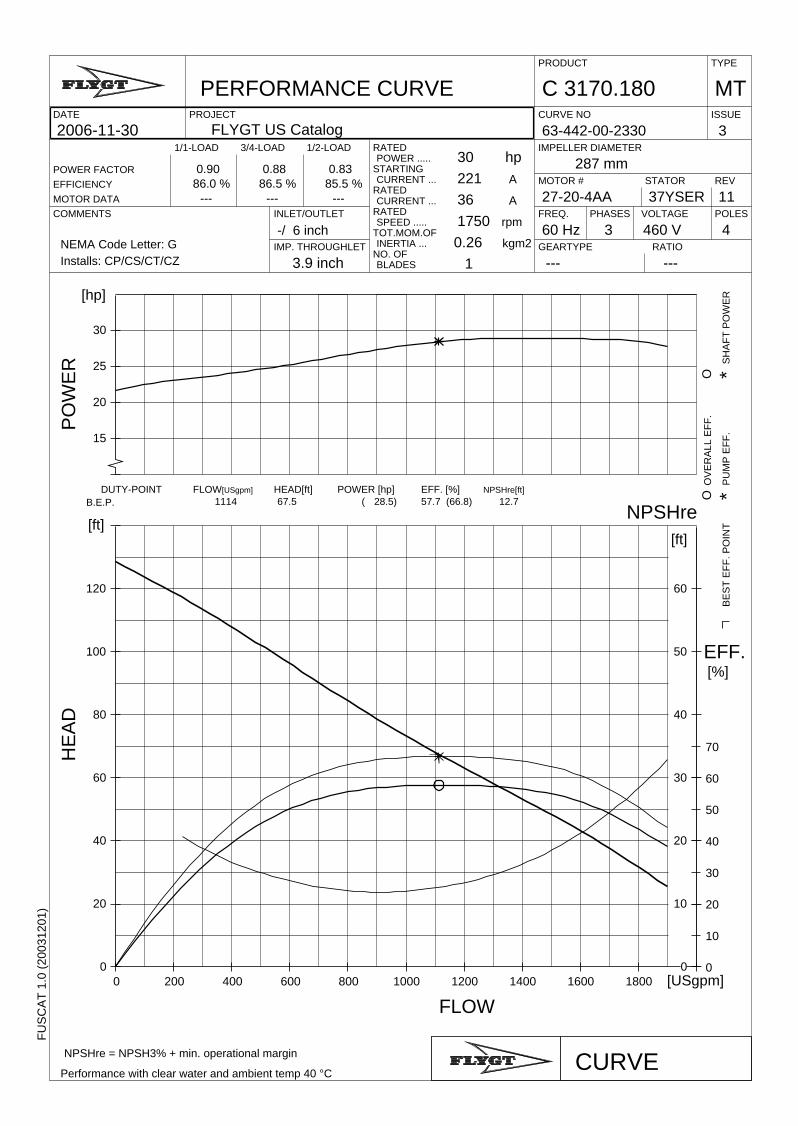
FU
SC
AT
1.0
(20
0312
01)
PERFORMANCE CURVEDATE PROJECT
1/1-LOAD 3/4-LOAD 1/2-LOAD
POWER FACTOR
EFFICIENCY
MOTOR DATA
COMMENTS INLET/OUTLET
IMP. THROUGHLET
RATEDPOWER .....
STARTINGCURRENT ...
RATEDCURRENT ...
RATEDSPEED .....
TOT.MOM.OFINERTIA ...
NO. OFBLADES
PRODUCT TYPE
CURVE NO ISSUE
MOTOR # STATOR REV
FREQ. PHASES VOLTAGE POLES
GEARTYPE RATIO
NPSHre = NPSH3% + min. operational margin
Performance with clear water and ambient temp 40 °C
C 3170.180 MT
2006-11-30 FLYGT US Catalog 63-442-00-2330 3IMPELLER DIAMETER
287 mm
27-20-4AA 37YSER 11
60 Hz 3 460 V 4
--- ---
0.9086.0 %
---
0.8886.5 %
---
0.8385.5 %
---
-/ 6 inch
3.9 inchNEMA Code Letter: GInstalls: CP/CS/CT/CZ
30 hp
221 A
36 A
1750 rpm
0.26 kgm2
1
FLOW[USgpm]
HE
AD
[ft]
PO
WE
R
[hp]
EFF.[%]
NPSHre[ft]
0 200 400 600 800 1000 1200 1400 1600 18000
20
40
60
80
100
120
0
10
20
30
40
50
60
0
10
20
30
40
50
60
70
15
20
25
30
DUTY-POINT FLOW[USgpm] HEAD[ft] POWER [hp] EFF. [%] NPSHre[ft]1114 67.5 ( 28.5) 57.7 (66.8) 12.7B.E.P.
BE
ST
EF
F. P
OIN
T
O *O
VE
RA
LL E
FF
.
PU
MP
EF
F.
O *S
HA
FT
PO
WE
R
CURVE
lsmith
Text Box
LS4127

FU
SC
AT
1.0
(20
0312
01)
PERFORMANCE CURVEDATE PROJECT
1/1-LOAD 3/4-LOAD 1/2-LOAD
POWER FACTOR
EFFICIENCY
MOTOR DATA
COMMENTS INLET/OUTLET
IMP. THROUGHLET
RATEDPOWER .....
STARTINGCURRENT ...
RATEDCURRENT ...
RATEDSPEED .....
TOT.MOM.OFINERTIA ...
NO. OFBLADES
PRODUCT TYPE
CURVE NO ISSUE
MOTOR # STATOR REV
FREQ. PHASES VOLTAGE POLES
GEARTYPE RATIO
NPSHre = NPSH3% + min. operational margin
Performance with clear water and ambient temp 40 °C
C 3152.181 HT
2006-11-30 FLYGT US Catalog 63-454-00-5360 4IMPELLER DIAMETER
275 mm
25-15-4AA 12YSER 11
60 Hz 3 460 V 4
--- ---
0.8487.0 %
---
0.7987.0 %
---
0.6986.0 %
---
-/ 4 inch
3.0 inchNEMA Code Letter: GInstalls: CP/CS/CT/CZ
20 hp
142 A
26 A
1750 rpm
0.24 kgm2
1
FLOW[USgpm]
HE
AD
[ft]
PO
WE
R
[hp]
EFF.[%]
NPSHre[ft]
0 200 400 600 800 1000 12000
20
40
60
80
100
120
0
20
40
60
80
100
120
0
10
20
30
40
50
60
70
12
16
20
DUTY-POINT FLOW[USgpm] HEAD[ft] POWER [hp] EFF. [%] NPSHre[ft]745 69.7 ( 19.7) 58.3 (66.8) 11.4B.E.P.
BE
ST
EF
F. P
OIN
T
O *O
VE
RA
LL E
FF
.
PU
MP
EF
F.
O *S
HA
FT
PO
WE
R
CURVE
lsmith
Text Box
LS4132
APPENDIX I COST BREAKDOWNS FOR REHABILITATION AND EXPANSION CIPS
Brunswick Glynn County JWSC Applied Technology & Management, Inc.
Water Sewer Master Plan

APPENDIX I -- COST BREAKDOWNS FOR WATER REHABILITATION CIP
Brunswick Glynn County JWSC Applied Technology & Management, Inc.
Water Sewer Master Plan

Rehabilitation CIP1
Rehabilitation CIP1
10% Contingency $7 000
Water System Rehabilitation CIPs
City, North Mainland, South Mainland, and Joining North and CityDeficiencies Noted During Site Inspections for Water Systems and from Water Models
Joining North Mainland and City of Brunswick Water Systems
12-inch Watermain at Cate Road to Old Jesup to Join North and City 2009 - 2014
Construction Cost for Rehabilitate No. Unit Cost/Unit Engineer's Opinion of Construction Costs12-inch watermain at Cate Road to Old Jessup Road - connects west side I-95 with City 1000 LF $70 $70,000Total $70,00010% Contingency $7 000,15% Engineering, Permitting, Admin Fees $7,000Total Construction Cost $84,000
12-inch Watermain at Canal Road between Golden Isles Parkway and Old Jessup Road to Join North and City 2009 - 2014
Construction Cost for Rehabilitate No. Unit Cost/Unit Engineer's Opinion of Construction Costs12-inch watermain at Canal Road between Golden Isles and Old Jesup- connects east side I-95 with City 4000 LF $70 $280,000Total $280,00010% Contingency $28,00015% Engineering, Permitting, Admin Fees $28,000Total Construction Cost $336,000
North Mainland Water System
Various Electrical Code Issues
Construction Cost for Rehabilitate No. Unit Cost/Unit Engineer's Opinion of Construction Costs
Perry Lane RD WPF 1 emergency battery backup lighting fixture 400Canal RD WPF/Well Relocate radio telemetry enclosure and install one emergency battery back-up lighting fixture) $700Total $1,10010% Contingency $11010% Engineering, Permitting, Admin Fees $110Total Construction Cost $1,320

Rehabilitation CIP2
Rehabilitation CIP2
g
some on for well
Automatic Flushing Hydrants 2009 - 2014will improve water quality and performance of system
Total Rehabilitation Construction Cost Quantity Unit Per Unit Cost Engineer's Opinion of Construction CostsAutomatic Flushing Hydrants at end of watermains 4 Ea 5500 $22,000
Total $22,00010% Contingency $2,20010% Engineering, Permitting, Admin Fees $2,200Total Construction Cost $26,400
Golden Isles WPF No. 1Overall Condition 1Deficiencies:
Roof caved in on doghouse over HFS tank (fluoride)Well - some corrosion on well casing/flange and pump/motor shaft
concrete in good condition - no debris aroundCascade aerator - some rust/white scale on screenChlorine booster pump - Groundfos CR2 has a lot of corrosion
Construction Cost to Rehabilitate Engineer's Opinion of Construction CostsReplace doghouse $2,500Replace chlorine booster pump $1,500
Total Rehabilitation Construction Cost $4,00010% Contingency $40010% Engineering, Permitting, Admin Fees $400Total Construction Cost $4,800
WPF, Golden Isles II WellOverall Condition 1Deficiencies:
some minor corrosion on plate/flange for well head minor corrosion plate/flange headminor rust on cascade aerator
Construction Cost to Rehabilitate Engineer's Opinion of Construction CostsNo upgrades necessary $0
Total Rehabilitation Construction Cost $010% Contingency $010% Engineering, Permitting, Admin Fees $0Total Construction Cost $0

Rehabilitation CIP3
Rehabilitation CIP3
Total Construction
WPF, Perry Lane Road WPFOverall Condition 2Deficiencies:
No site lightWell No 1 well head has some paint peeling and some corrosion under well head - housekeeping - remove from list
some DI pipe under well corroding - paint bubbling and at bottom where pipe meets concretesome cracks in concrete pad
Well No. 2 - a lot of corrosion on well flange - concrete pad good condition - housekeeping - remove from listsome debris on concrete pad
Hydrotank - well maintained but some paint peeling/worn off
Construction Cost to Rehabilitate Engineer's Opinion of Construction CostsLabel voltage source for each piece of equipment;(separated out - install one emergency battery back-up light fixture) $600Have structural testing of hydropneumatic test done and repaint tank $15,000
Total Rehabilitation Construction Cost $15,60010% Contingency% g y $1,560$ ,10% Engineering, Permitting, Admin Fees $1,560Total Construction Cost $18,720
WPF, Canal Road WellOverall Condition 1Deficiencies:
flow monitor in valve vault - fair conditionwell head - painted pipe and concrete - no corrosionradio telemetry enclosure interferes with clearance for MCC; WPF has no emergency battery backup lighting
Construction Cost to Rehabilitate Engineer's Opinion of Construction CostsPut under electrical code upgrades - Relocate radio telemetry enclosure and (separated out - install one emergency battery back-up lighting fixture) $0
Total Rehabilitation Construction Cost $010% Contingency $010% Engineering, Permitting, Admin Fees $0Total Construction Cost Cost $0$0
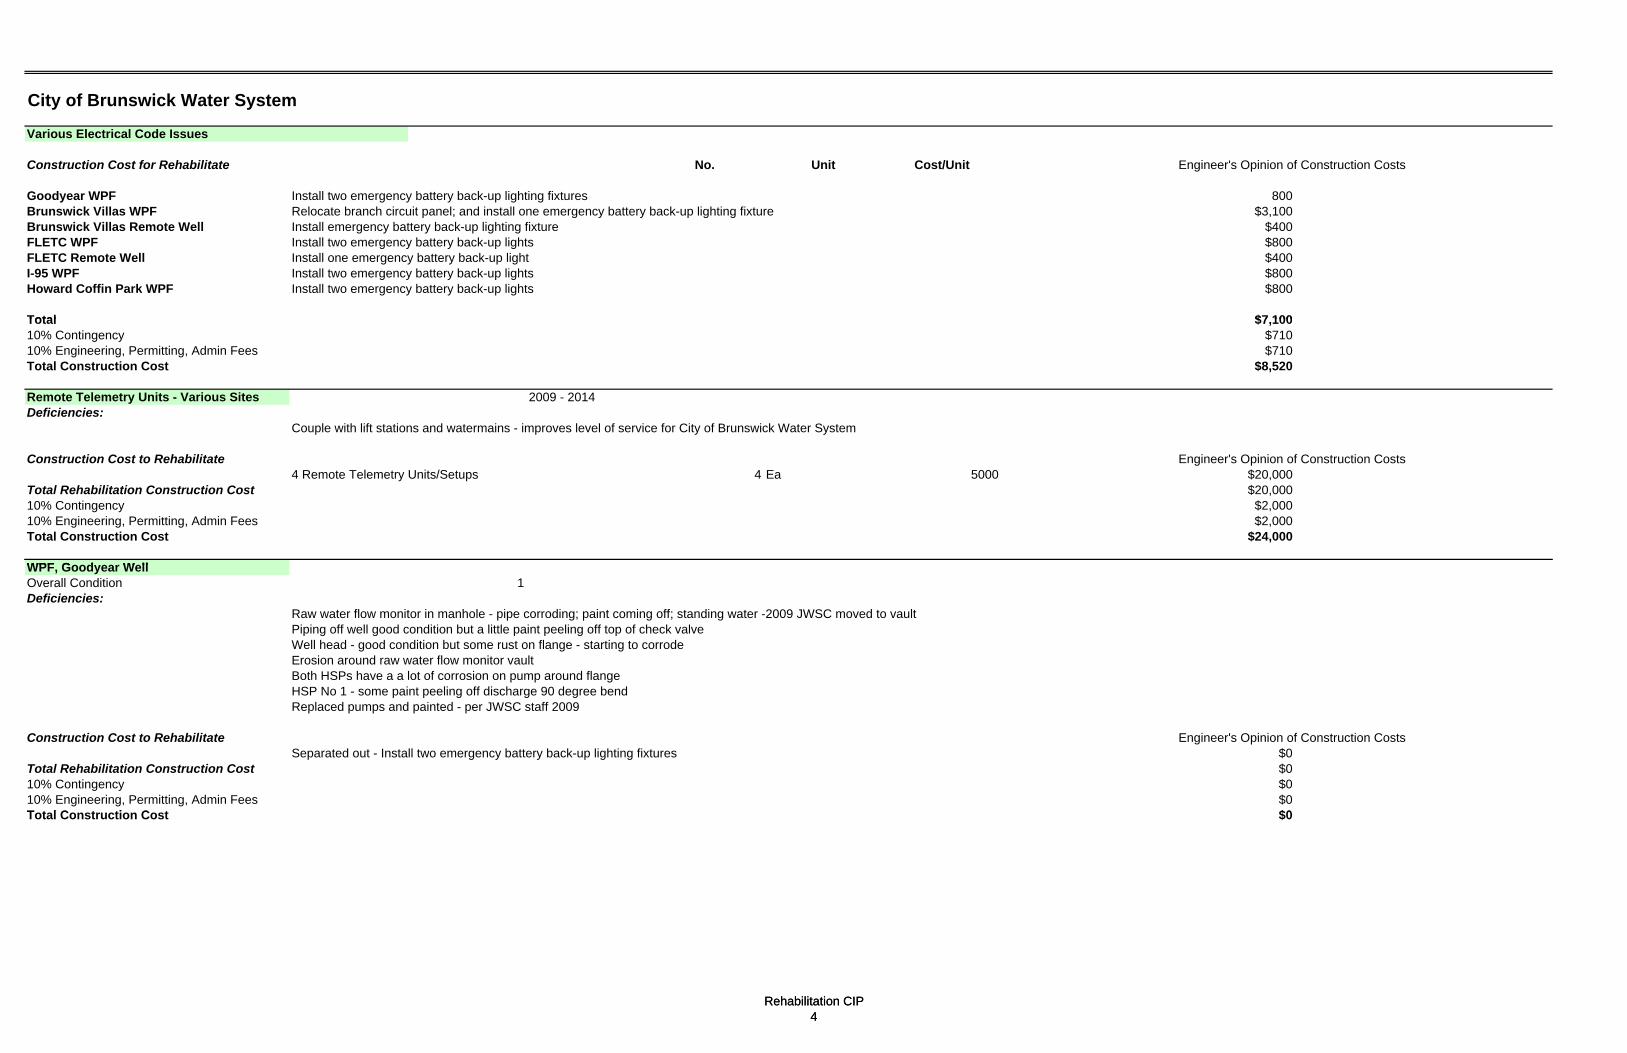
Rehabilitation CIP4
Rehabilitation CIP4
l $7 100
WPF ll
$0
City of Brunswick Water System
Various Electrical Code Issues
Construction Cost for Rehabilitate No. Unit Cost/Unit Engineer's Opinion of Construction Costs
Goodyear WPF Install two emergency battery back-up lighting fixtures 800Brunswick Villas WPF Relocate branch circuit panel; and install one emergency battery back-up lighting fixture $3,100Brunswick Villas Remote Well Install emergency battery back-up lighting fixture $400FLETC WPF Install two emergency battery back-up lights $800FLETC Remote Well Install one emergency battery back-up light $400I-95 WPF Install two emergency battery back-up lights $800Howard Coffin Park WPF Install two emergency battery back-up lights $800
TotalTota $7 100,10% Contingency $71010% Engineering, Permitting, Admin Fees $710Total Construction Cost $8,520
Remote Telemetry Units - Various Sites 2009 - 2014Deficiencies:
Couple with lift stations and watermains - improves level of service for City of Brunswick Water System
Construction Cost to Rehabilitate Engineer's Opinion of Construction Costs4 Remote Telemetry Units/Setups 4 Ea 5000 $20,000
Total Rehabilitation Construction Cost $20,00010% Contingency $2,00010% Engineering, Permitting, Admin Fees $2,000Total Construction Cost $24,000
WPF Goodyear Well, Goodyear WeOverall Condition 1Deficiencies:
Raw water flow monitor in manhole - pipe corroding; paint coming off; standing water -2009 JWSC moved to vaultPiping off well good condition but a little paint peeling off top of check valveWell head - good condition but some rust on flange - starting to corrodeErosion around raw water flow monitor vaultBoth HSPs have a a lot of corrosion on pump around flangeHSP No 1 - some paint peeling off discharge 90 degree bendReplaced pumps and painted - per JWSC staff 2009
Construction Cost to Rehabilitate Engineer's Opinion of Construction CostsSeparated out - Install two emergency battery back-up lighting fixtures $0
Total Rehabilitation Construction Cost $010% Contingency $010% Engineering, Permitting, Admin Fees $0T t l C t ti C tTotal Construction Cost $0
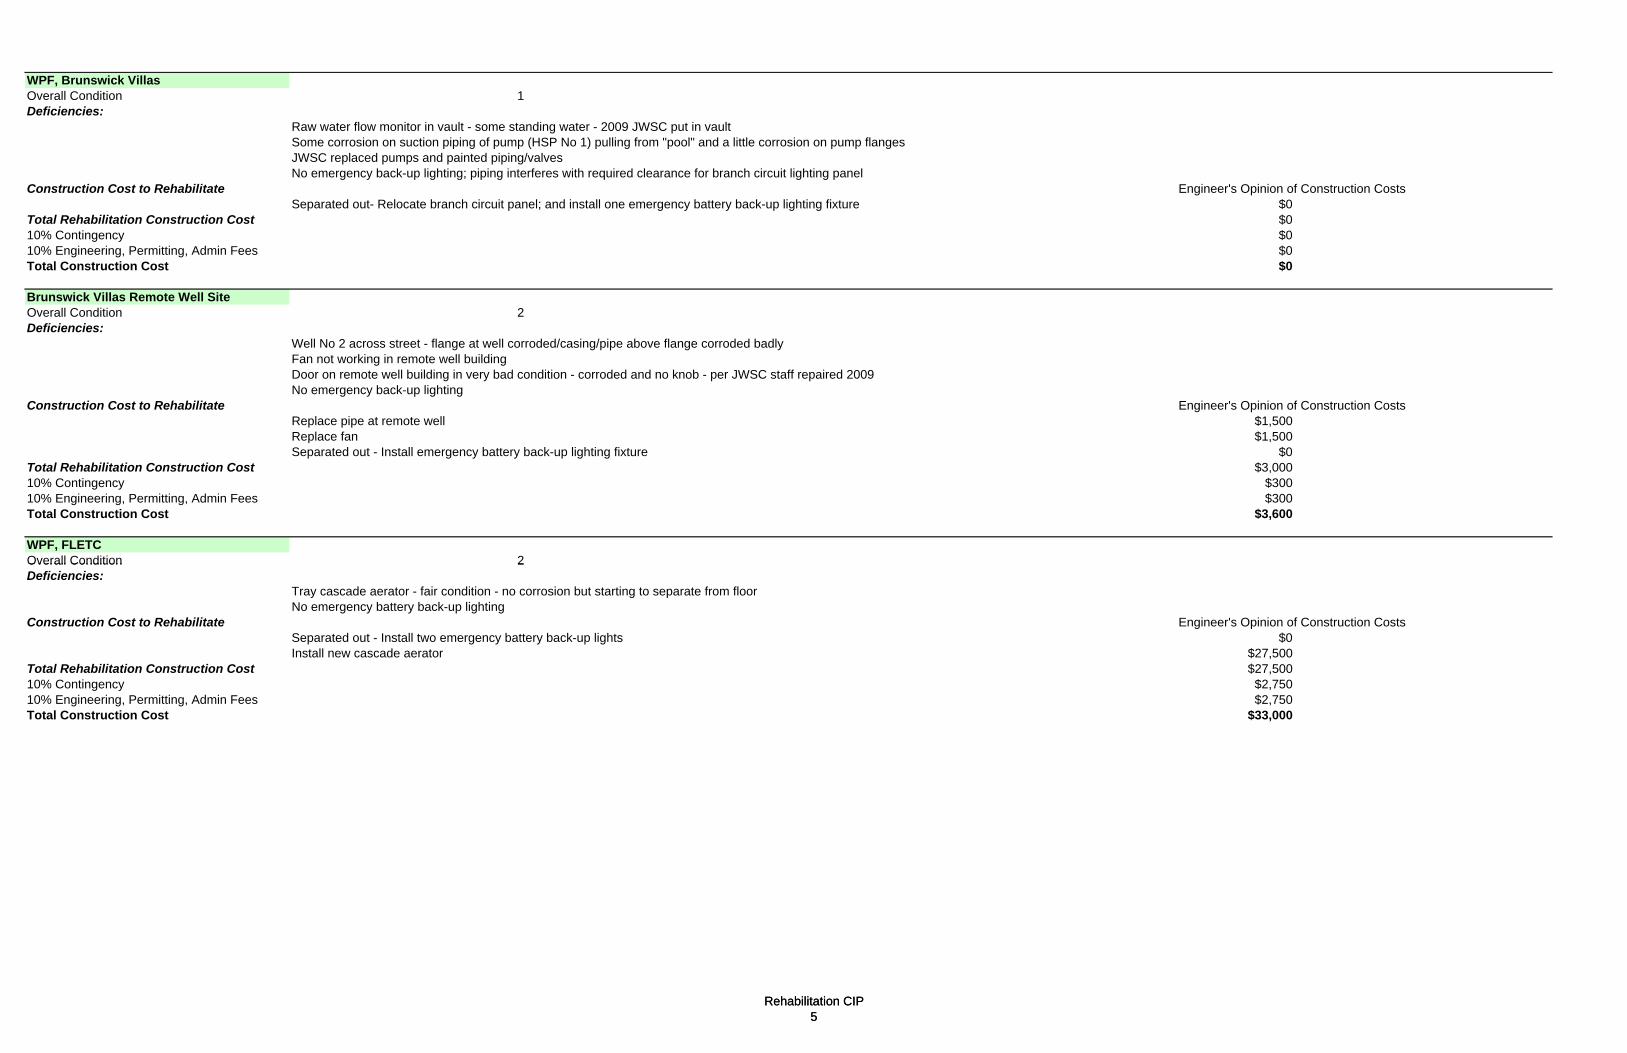
Rehabilitation CIP5
Rehabilitation CIP5
Overall Condition 2
WPF, Brunswick VillasOverall Condition 1Deficiencies:
Raw water flow monitor in vault - some standing water - 2009 JWSC put in vaultSome corrosion on suction piping of pump (HSP No 1) pulling from "pool" and a little corrosion on pump flangesJWSC replaced pumps and painted piping/valvesNo emergency back-up lighting; piping interferes with required clearance for branch circuit lighting panel
Construction Cost to Rehabilitate Engineer's Opinion of Construction CostsSeparated out- Relocate branch circuit panel; and install one emergency battery back-up lighting fixture $0
Total Rehabilitation Construction Cost $010% Contingency $010% Engineering, Permitting, Admin Fees $0Total Construction Cost $0
Brunswick Villas Remote Well SiteOverall Condition 2Deficiencies:
Well No 2 across street - flange at well corroded/casing/pipe above flange corroded badlyFan not working in remote well buildingDoor on remote well building in very bad condition - corroded and no knob - per JWSC staff repaired 2009No emergency back-up lighting
Construction Cost to Rehabilitate Engineer's Opinion of Construction CostsReplace pipe at remote well $1,500Replace fan $1,500Separated out - Install emergency battery back-up lighting fixture $0
Total Rehabilitation Construction Cost $3,00010% Contingency $30010% Engineering, Permitting, Admin Fees $300Total Construction Cost $3,600
WPF, FLETCOverall Condition 2Deficiencies:
Tray cascade aerator - fair condition - no corrosion but starting to separate from floorNo emergency battery back-up lighting
Construction Cost to Rehabilitate Engineer's Opinion of Construction CostsSeparated out - Install two emergency battery back-up lights $0Install new cascade aerator $27,500
Total Rehabilitation Construction Cost $27,50010% Contingency $2,75010% Engineering, Permitting, Admin Fees $2,750Total Construction Cost $33,000
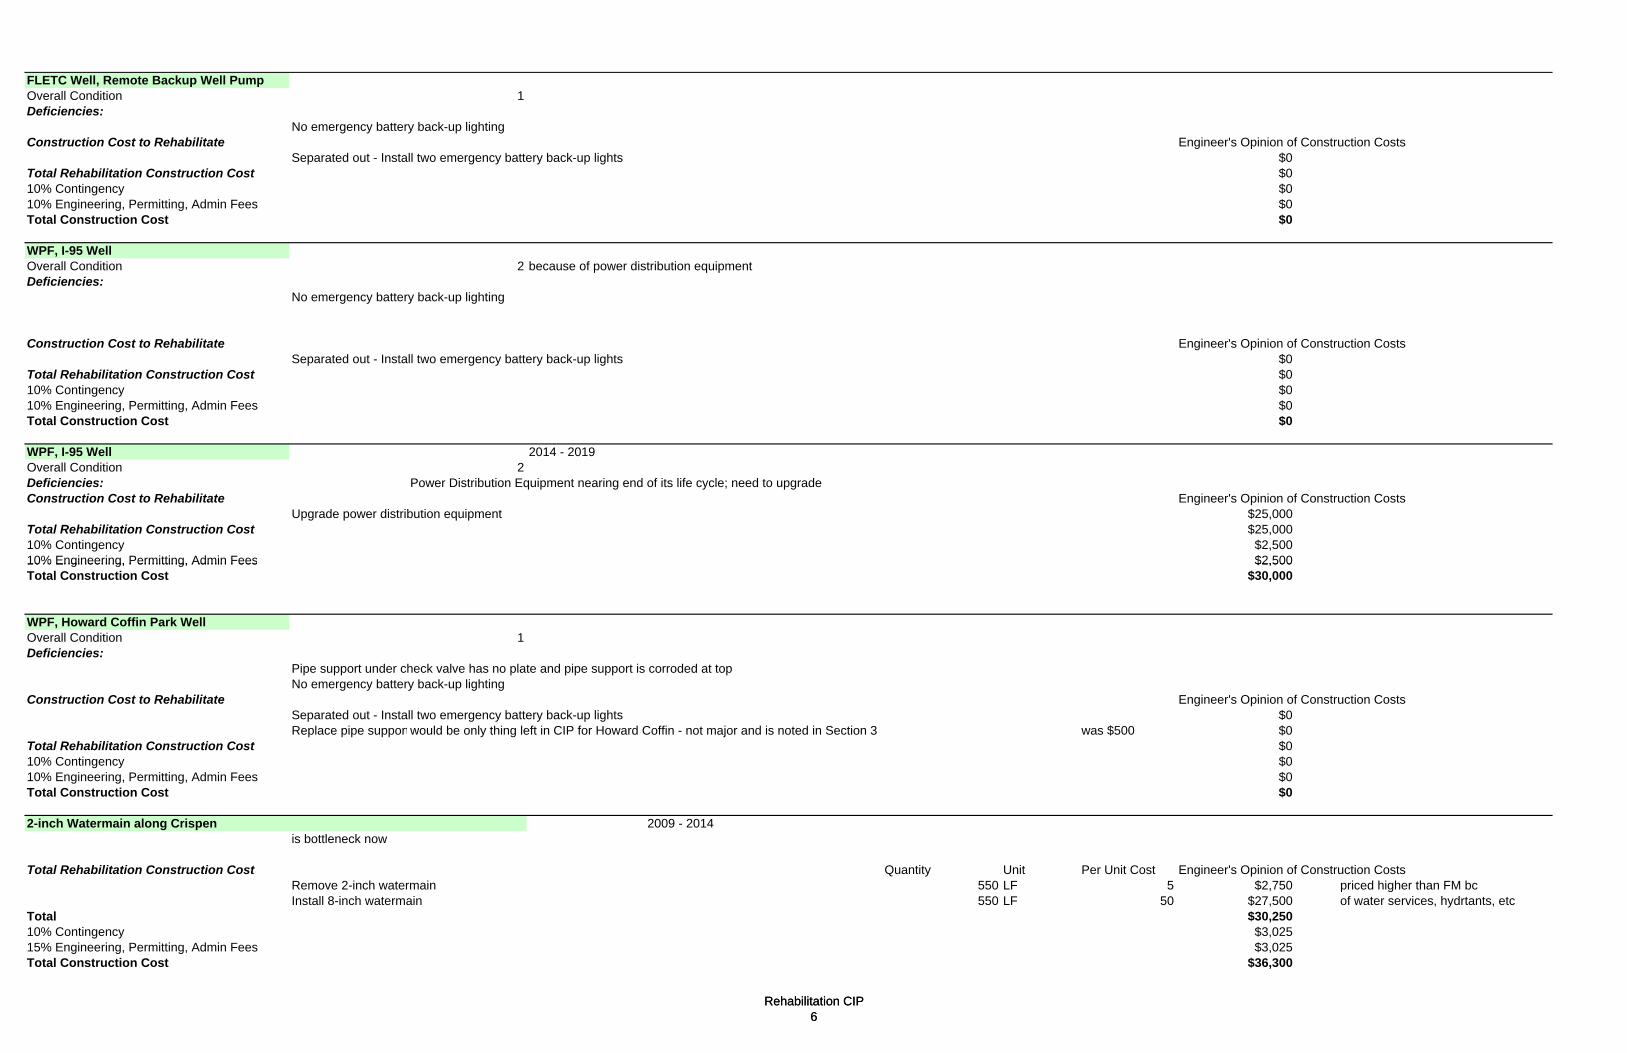
Rehabilitation CIP6
Rehabilitation CIP6
10% ,500
FLETC Well, Remote Backup Well PumpOverall Condition 1Deficiencies:
No emergency battery back-up lightingConstruction Cost to Rehabilitate Engineer's Opinion of Construction Costs
Separated out - Install two emergency battery back-up lights $0Total Rehabilitation Construction Cost $010% Contingency $010% Engineering, Permitting, Admin Fees $0Total Construction Cost $0
WPF, I-95 WellOverall Condition 2 because of power distribution equipmentDeficiencies:
No emergency battery back-up lighting
Construction Cost to Rehabilitate Engineer's Opinion of Construction CostsSeparated out - Install two emergency battery back-up lights $0
Total Rehabilitation Construction Cost $010% Contingency $010% Engineering, Permitting, Admin Fees $0Total Construction Cost $0
WPF, I-95 Well 2014 - 2019Overall Condition 2Deficiencies: Power Distribution Equipment nearing end of its life cycle; need to upgradeConstruction Cost to Rehabilitate Engineer's Opinion of Construction Costs
Upgrade power distribution equipment $25,000Total Rehabilitation Construction Cost $25,00010% Contingency $2,50010% Engineering, Permitting, Admin Fees Engineering, Permitting, Admin Fees $2,500$2Total Construction Cost $30,000
WPF, Howard Coffin Park WellOverall Condition 1Deficiencies:
Pipe support under check valve has no plate and pipe support is corroded at topNo emergency battery back-up lighting
Construction Cost to Rehabilitate Engineer's Opinion of Construction CostsSeparated out - Install two emergency battery back-up lights $0Replace pipe supportwould be only thing left in CIP for Howard Coffin - not major and is noted in Section 3 was $500 $0
Total Rehabilitation Construction Cost $010% Contingency $010% Engineering, Permitting, Admin Fees $0Total Construction Cost $0
2-inch Watermain along Crispen 2009 - 2014is bottleneck now
Total Rehabilitation Construction Cost Quantity Unit Per Unit Cost Engineer's Opinion of Construction CostsRemove 2-inch watermain 550 LF 5 $2,750 priced higher than FM bc Install 8-inch watermain 550 LF 50 $27,500 of water services, hydrtants, etc
Total $30,25010% Contingency $3,02515% Engineering, Permitting, Admin Fees $3,025Total Construction Cost $36,300
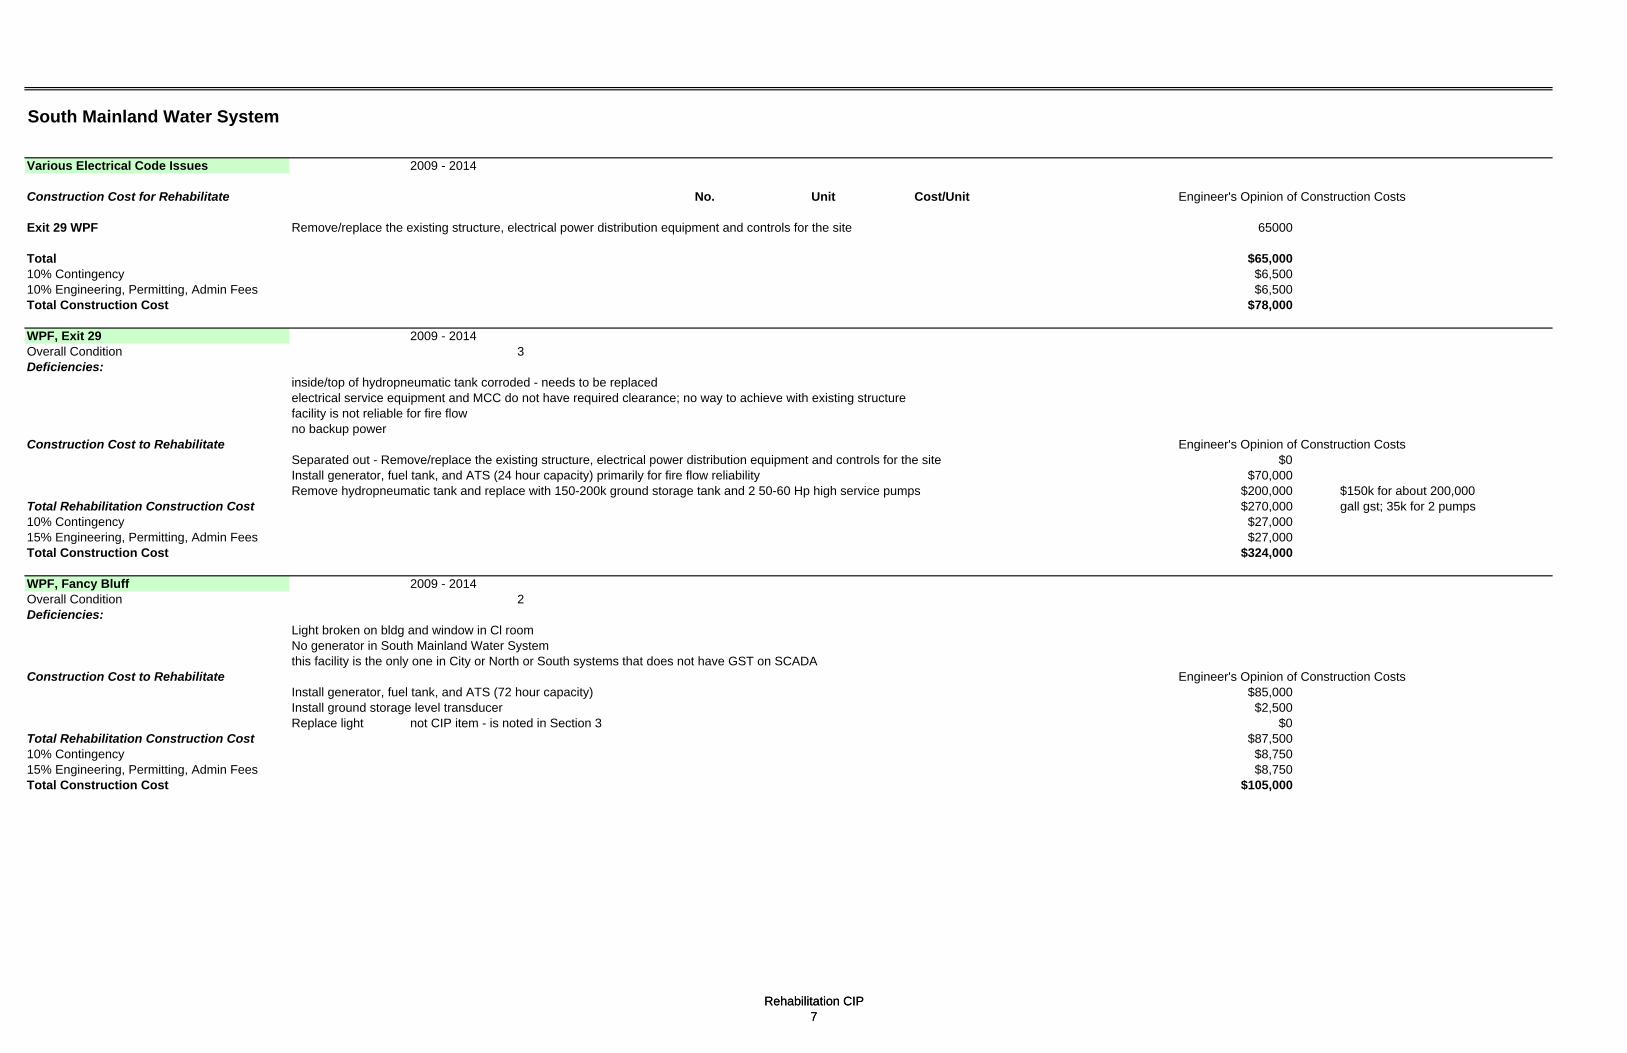
Rehabilitation CIP7
Rehabilitation CIP7
South Mainland Water System
Various Electrical Code Issues 2009 - 2014
Construction Cost for Rehabilitate No. Unit Cost/Unit Engineer's Opinion of Construction Costs
Exit 29 WPF Remove/replace the existing structure, electrical power distribution equipment and controls for the site 65000
Total $65,00010% Contingency $6,50010% Engineering, Permitting, Admin Fees $6,500Total Construction Cost $78,000
WPF, Exit 29 2009 - 2014Overall Condition 3Deficiencies:
inside/top of hydropneumatic tank corroded - needs to be replacedelectrical service equipment and MCC do not have required clearance; no way to achieve with existing structurefacility is not reliable for fire flowno backup power
Construction Cost to Rehabilitate Engineer's Opinion of Construction CostsSeparated out - Remove/replace the existing structure, electrical power distribution equipment and controls for the site $0Install generator, fuel tank, and ATS (24 hour capacity) primarily for fire flow reliability $70,000Remove hydropneumatic tank and replace with 150-200k ground storage tank and 2 50-60 Hp high service pumps $200,000 $150k for about 200,000
Total Rehabilitation Construction Cost $270,000 gall gst; 35k for 2 pumps10% Contingency $27,00015% Engineering, Permitting, Admin Fees $27,000Total Construction Cost $324,000
WPF, Fancy Bluff 2009 - 2014Overall Condition 2Deficiencies:
Light broken on bldg and window in Cl room No generator in South Mainland Water Systemthis facility is the only one in City or North or South systems that does not have GST on SCADA
Construction Cost to Rehabilitate Engineer's Opinion of Construction CostsInstall generator, fuel tank, and ATS (72 hour capacity) $85,000Install ground storage level transducer $2,500Replace light not CIP item - is noted in Section 3 $0
Total Rehabilitation Construction Cost $87,50010% Contingency $8,75015% Engineering, Permitting, Admin Fees $8,750Total Construction Cost $105,000

Rehabilitation CIP8
Rehabilitation CIP8
12-inch Emanuel Church Road Watermain Project 2009 - 2014will provide reliability and redundancy to system and will improve performanc
Total Rehabilitation Construction Cost Quantity Unit Per Unit Cost Engineer's Opinion of Construction Costs12-inch watermain and appurtenances 10500 LF 70 $735,000 priced higher than FM bc
Total $735,000 of water services, hydrtants, etc10% Contingency $73,50015% Engineering, Permitting, Admin Fees $73,500Total Construction Cost $882,000
Automatic Flushing Hydrants 2009 - 2014will improve water quality and performance of system
Total Rehabilitation Construction Cost Quantity Unit Per Unit Cost Engineer's Opinion of Construction CostsAutomatic Flushing Hydrants at end of buck swamp road watermain and other endpoints 5 Ea 5500 $27,500
Total $27,500$ ,10% Contingency $2,75010% Engineering, Permitting, Admin Fees $2,750Total Construction Cost $33,000
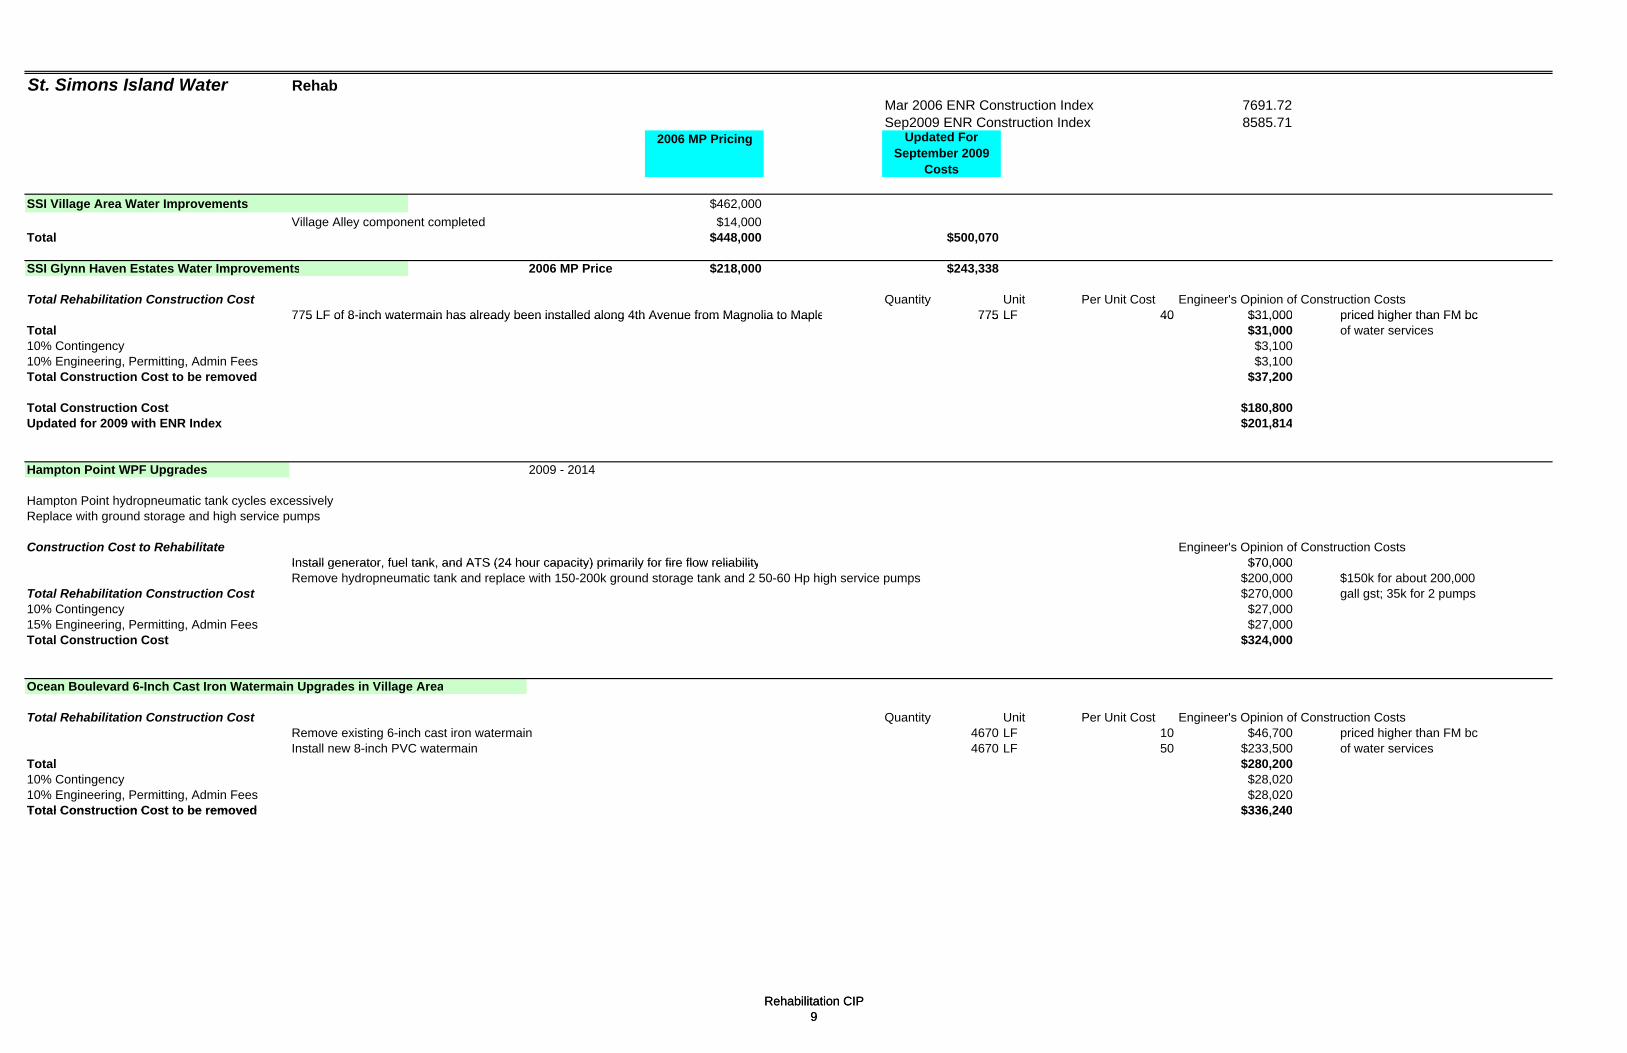
Rehabilitation CIP9
Rehabilitation CIP9
8 to LF FM bc
Install generator fuel tank and ATS (24 hour capacity) primarily for fire flow reliability $70 000
Total Construction Cost to be removed $336 240
St. Simons Island Water Rehab Mar 2006 ENR Construction Index 7691.72Sep2009 ENR Construction Index 8585.71
2006 MP Pricing Updated For September 2009
Costs
SSI Village Area Water Improvements $462,000Village Alley component completed $14,000
Total $448,000 $500,070
SSI Glynn Haven Estates Water Improvements 2006 MP Price $218,000 $243,338
Total Rehabilitation Construction Cost Quantity Unit Per Unit Cost Engineer's Opinion of Construction Costs775 LF of 8-inch watermain has already been installed along 4t775 LF of inch watermain has already been installed along 4thh Avenue from M Avenue from Magnoliaagnolia to Maple Maple 775 LF 40 $31,000 priced higher than FM bc 775 40 $31,000 priced higher than
Total $31,000 of water services10% Contingency $3,10010% Engineering, Permitting, Admin Fees $3,100Total Construction Cost to be removed $37,200
Total Construction Cost $180,800Updated for 2009 with ENR Index $201,814
Hampton Point WPF Upgrades 2009 - 2014
Hampton Point hydropneumatic tank cycles excessivelyReplace with ground storage and high service pumps
Construction Cost to Rehabilitate Engineer's Opinion of Construction CostsInstall generator fuel tank and ATS (24 hour capacity) primarily for fire flow reliability , , $70 000,Remove hydropneumatic tank and replace with 150-200k ground storage tank and 2 50-60 Hp high service pumps $200,000 $150k for about 200,000
Total Rehabilitation Construction Cost $270,000 gall gst; 35k for 2 pumps10% Contingency $27,00015% Engineering, Permitting, Admin Fees $27,000Total Construction Cost $324,000
Ocean Boulevard 6-Inch Cast Iron Watermain Upgrades in Village Area
Total Rehabilitation Construction Cost Quantity Unit Per Unit Cost Engineer's Opinion of Construction CostsRemove existing 6-inch cast iron watermain 4670 LF 10 $46,700 priced higher than FM bc Install new 8-inch PVC watermain 4670 LF 50 $233,500 of water services
Total $280,20010% Contingency $28,02010% Engineering, Permitting, Admin Fees $28,020Total Construction Cost to be removed $336 240,

APPENDIX I -- COST BREAKDOWNS FOR WATER EXPANSION CIP
Brunswick Glynn County JWSC Applied Technology & Management, Inc.
Water Sewer Master Plan

Future Expansion Water System CIPs
City of Brunswick Water System
12-inch watermain interconnect on Highway 17 2009-2014connect city to northConstruction Cost for Rehabilitate No. Unit Cost/Unit Engineer's Opinion of Construction Costs12-inch watermain interconnect on Highway 17 7000 LF $75 $525,000
Total $525,00010% Contingency $52,50015% Engineering, Permitting, Admin Fees $78,750Total Construction Cost $656,250
16-inch Watermain Interconnect on Old Jesup to New Jesup 2009-2014connect city to northConstruction Cost for Rehabilitate No. Unit Cost/Unit Engineer's Opinion of Construction Costs16-inch watermain interconnect on old jesup to new jesup 7200 LF $90 $648,000
Total $648,00010% Contingency $64,80015% Engineering, Permitting, Admin Fees $97,200Total Construction Cost $810,000
12-inch Watermain Interconnect on Vogel Road 2014 - 2019connect city to northConstruction Cost for Rehabilitate No. Unit Cost/Unit Engineer's Opinion of Construction Costs12-inch watermain interconnect on vogel road 6000 LF $75 $450,000
Total $450,00010% Contingency $45,00015% Engineering, Permitting, Admin Fees $67,500Total Construction Cost $562,500
Water Expansion CIP1
Water Expansion CIP1

North Mainland Water System
12-inch Watermain at Highway 99 and New Jesup Road 2009 - 2014
Construction Cost for Rehabilitate No. Unit Cost/Unit Engineer's Opinion of Construction Costs12-inch watermain - Hwy 99 and New Jesup Road 9000 LF $75 $675,000
from Chanslor to New Jesup and south to tie in to existing 12-inch12-inch watermain - Hwy 99 and New Jesup Road 3000 LF $75 $225,000
(separated because 3000 LF may be installed)along Highway 99 from Autumns Wood Dr to Chanslor Rd
Total $900,00010% Contingency $90,00015% Engineering, Permitting, Admin Fees $135,000Total Construction Cost $1,125,000
12-inch Watermain Extension on Canal Road from Existing 12-inch to Vogel Road 2014 - 2019
Construction Cost for Rehabilitate No. Unit Cost/Unit Engineer's Opinion of Construction Costs12-inch watermain on Canal Roa d to Vogel 2500 LF $75 $187,500Total $187,50010% Contingency $18,75015% Engineering, Permitting, Admin Fees $28,125Total Construction Cost $234,375
16-inch Watermain West of Intersection of Highways 99 and 341 2014 - 2019
Construction Cost for Rehabilitate No. Unit Cost/Unit Engineer's Opinion of Construction Costs16-inch Watermain West of New Jesup on Hwy 99 15000 LF $90 $1,350,000Total $1,350,00010% Contingency $135,00015% Engineering, Permitting, Admin Fees $202,500Total Construction Cost $1,687,500
3 0 MGD Water Production Facility and 1 Mgal Tank near Hwy 99 and New Jesup 2014 - 2019
Water Expansion CIP2
3.0 MGD Water Production Facility and 1 Mgal Tank near Hwy 99 and New Jesup 2014 - 2019
Construction Cost for Rehabilitate No. Unit Cost/Unit Engineer's Opinion of Construction Costs3.0 MGD Water Supply, Treatment and Pumping Facility 1 LS $10,200,000 0.6 $10,200,0001,000,000 Ground Storage Tank 1 LS $950,000 $950,000
Total $11,150,00010% Contingency $1,115,00015% Engineering, Permitting, Admin Fees $1,672,500Total Construction Cost $13,937,500
Water Expansion CIP2

1,000,000 Gallon Elevated Storage Tank on Highway 99, between Golden Isles and I-95 (west side) 2014 - 2019
Construction Cost for Rehabilitate No. Unit Cost/Unit Engineer's Opinion of Construction Costs1,000,000 Gallon Elevated Storage Tank 1 LS $1,500,000 $1,500,00012-inch watermain connections, etc. 500 LF $75 $37,500
Total $1,537,50010% Contingency $153,75015% Engineering, Permitting, Admin Fees $230,625Total Construction Cost $1,921,875
2.5 MGD Water Production Facility and 1 Mgal Tank near Hwy 99 and Highway 32 2019 - 2024
Construction Cost for Rehabilitate No. Unit Cost/Unit Engineer's Opinion of Construction Costs2.5 MGD Water Supply, Treatment and Pumping Facility 1 LS $8,500,000 0.6 $8,500,0001,000,000 Ground Storage Tank 1 LS $950,000 $950,000
Total $9,450,00010% Contingency $945,00015% Engineering, Permitting, Admin Fees $1,417,500Total Construction Cost $11,812,500
2.0 MGD Water Production Facility and 1 Mgal Tank out Golden Isles Parkway 2019 - 2024
Construction Cost for Rehabilitate No. Unit Cost/Unit Engineer's Opinion of Construction Costs2.0 MGD Water Supply, Treatment and Pumping Facility 1 LS $7,000,000 0.6 $7,000,0001,000,000 Ground Storage Tank 1 LS $950,000 $950,000
Total $7,950,00010% Contingency $795,00015% Engineering, Permitting, Admin Fees $1,192,500Total Construction Cost $9,937,500
12-inch Watermain on Green Swamp Road 2019 - 2024
Water Expansion CIP3
Construction Cost for Rehabilitate No. Unit Cost/Unit Engineer's Opinion of Construction Costs12-inch watermain -on Green Swamp Road 16000 LF $75 $1,200,000Total $1,200,00010% Contingency $120,00015% Engineering, Permitting, Admin Fees $180,000Total Construction Cost $1,500,000
1.5 MGD Water Production Facility to EST at I-95 and Highway 99 2024 - 2029
Construction Cost for Rehabilitate No. Unit Cost/Unit Engineer's Opinion of Construction Costs1.5 MGD Water Supply, Treatment and Pumping Facility 1 LS $6,500,000 0.6 $6,500,000
Total $6,500,00010% Contingency $650,00015% Engineering, Permitting, Admin Fees $975,000Total Construction Cost $8,125,000
Water Expansion CIP3

10-inch Watermain on New Jesup Highway North 2024 - 2029
Construction Cost for Rehabilitate No. Unit Cost/Unit Engineer's Opinion of Construction Costs10-inch Watermain on New Jesup Highway North 20000 LF $60 $1,200,000Total $1,200,00010% Contingency $120,00015% Engineering, Permitting, Admin Fees $180,000Total Construction Cost $1,500,000
1.5 MGD Expansion of WPF at Highway 99 and New Jesup (to 4.5 MGD total) 2024 - 2029
Construction Cost for Rehabilitate No. Unit Cost/Unit Engineer's Opinion of Construction Costs1.5 MGD Water Supply, Treatment and Pumping Facility Expansion 1 LS $5,250,000 0.6 $5,250,000500,000 Ground Storage Tank 1 LS $500,000 $500,000
Total $5,750,00010% Contingency $575,00015% Engineering, Permitting, Admin Fees $862,500Total Construction Cost $7,187,500
Water Expansion CIP4
Water Expansion CIP4
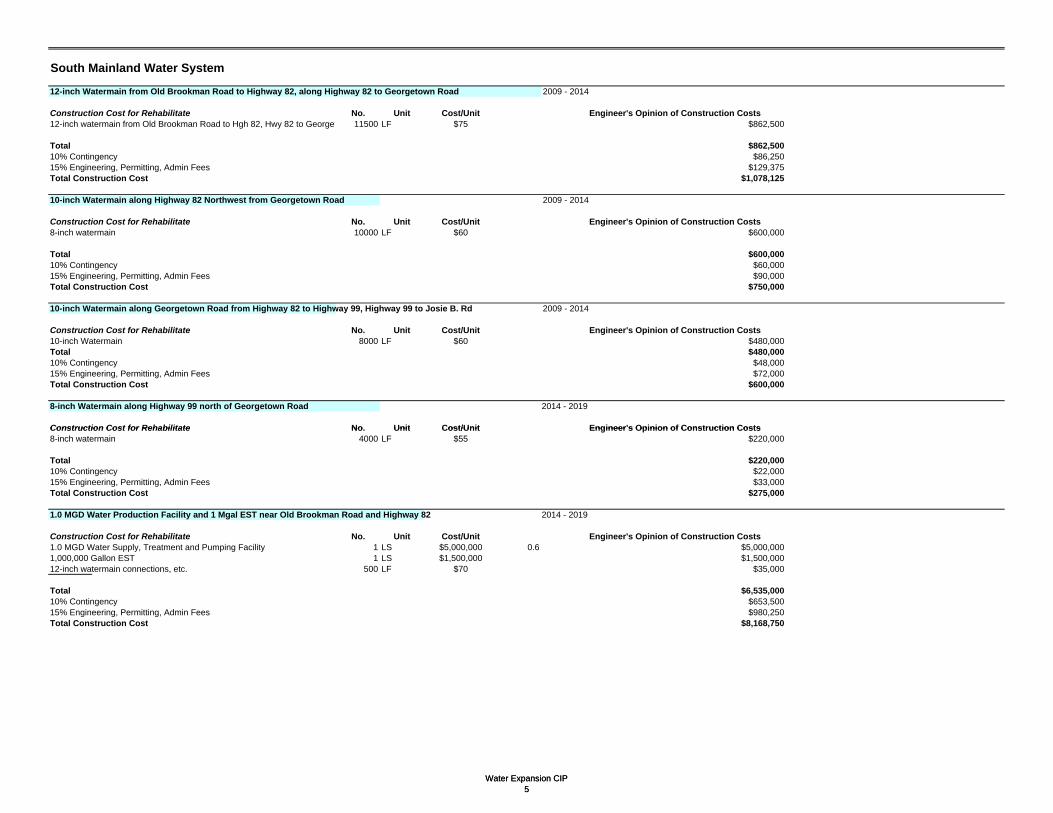
South Mainland Water System
12-inch Watermain from Old Brookman Road to Highway 82, along Highway 82 to Georgetown Road 2009 - 2014
Construction Cost for Rehabilitate No. Unit Cost/Unit Engineer's Opinion of Construction Costs12-inch watermain from Old Brookman Road to Hgh 82, Hwy 82 to Georget 11500 LF $75 $862,500
Total $862,50010% Contingency $86,25015% Engineering, Permitting, Admin Fees $129,375Total Construction Cost $1,078,125
10-inch Watermain along Highway 82 Northwest from Georgetown Road 2009 - 2014
Construction Cost for Rehabilitate No. Unit Cost/Unit Engineer's Opinion of Construction Costs8-inch watermain 10000 LF $60 $600,000
Total $600,00010% Contingency $60,00015% Engineering, Permitting, Admin Fees $90,000Total Construction Cost $750,000
10-inch Watermain along Georgetown Road from Highway 82 to Highway 99, Highway 99 to Josie B. Rd 2009 - 2014
Construction Cost for Rehabilitate No. Unit Cost/Unit Engineer's Opinion of Construction Costs10-inch Watermain 8000 LF $60 $480,000Total $480,00010% Contingency $48,00015% Engineering, Permitting, Admin Fees $72,000Total Construction Cost $600,000
8-inch Watermain along Highway 99 north of Georgetown Road 2014 - 2019
Construction Cost for Rehabilitate No Unit Cost/Unit Engineer's Opinion of Construction Costs
Water Expansion CIP5
Construction Cost for Rehabilitate No. Unit Cost/Unit Engineer s Opinion of Construction Costs8-inch watermain 4000 LF $55 $220,000
Total $220,00010% Contingency $22,00015% Engineering, Permitting, Admin Fees $33,000Total Construction Cost $275,000
1.0 MGD Water Production Facility and 1 Mgal EST near Old Brookman Road and Highway 82 2014 - 2019
Construction Cost for Rehabilitate No. Unit Cost/Unit Engineer's Opinion of Construction Costs1.0 MGD Water Supply, Treatment and Pumping Facility 1 LS $5,000,000 0.6 $5,000,0001,000,000 Gallon EST 1 LS $1,500,000 $1,500,00012-inch watermain connections, etc. 500 LF $70 $35,000
Total $6,535,00010% Contingency $653,50015% Engineering, Permitting, Admin Fees $980,250Total Construction Cost $8,168,750
Water Expansion CIP5

12-inch Watermain along Baumgardener Road and Live Oak 2014 - 2019
Construction Cost for Rehabilitate No. Unit Cost/Unit Engineer's Opinion of Construction Costs12-inch watermain along Baumgardener Road and Live Oak to Create Loop 7200 LF $75 $540,000
to create loop of water system for new developmentsTotal $540,00010% Contingency $54,00015% Engineering, Permitting, Admin Fees $81,000Total Construction Cost $675,000
12-inch Watermain along Old CCC Road to Loop System 2014 - 2019
Construction Cost for Rehabilitate No. Unit Cost/Unit Engineer's Opinion of Construction Costs12-inch watermain - Old CCC Road 14500 LF $75 $1,087,500
to Loop Buckswamp Road watermain back to Hwy 82 & Brookman Rd - will provide redundancy to Peninsula as developsTotal $1,087,50010% Contingency $108,75015% Engineering, Permitting, Admin Fees $163,125Total Construction Cost $1,359,375
1.0 MGD Water Production Facility and 1 Mgal GST near Old CCD Road and Buckswamp Road 2019 - 2024
Construction Cost for Rehabilitate No. Unit Cost/Unit Engineer's Opinion of Construction Costs1.0 MGD Water Supply, Treatment and Pumping Facility 1 LS $5,500,000 $5,500,0001,000,000 Ground Storage Tank 1 LS $900,000 $900,00012-inch watermain connections, etc. 500 LF $70 $35,000
Total $6,435,00010% Contingency $643,50015% Engineering, Permitting, Admin Fees $965,250Total Construction Cost $8,043,750
750,000 gallon EST near Highway 82 and Highway 99 2024-2029
Construction Cost for Rehabilitate No. Unit Cost/Unit Engineer's Opinion of Construction Costs
Water Expansion CIP6
g750,000 gallon EST 1 LS $1,000,000 $1,000,000
Total $1,000,00010% Contingency $100,00015% Engineering, Permitting, Admin Fees $150,000Total Construction Cost $1,250,000
10-inch Watermain along Highway 99 from Highway 82 to Georgetown Road 2024-2029
Construction Cost for Rehabilitate No. Unit Cost/Unit Engineer's Opinion of Construction Costs10-inch watermain - Highway 99 7000 LF $60 $420,000
Total $420,00010% Contingency $42,00015% Engineering, Permitting, Admin Fees $63,000Total Construction Cost $525,000
Water Expansion CIP6
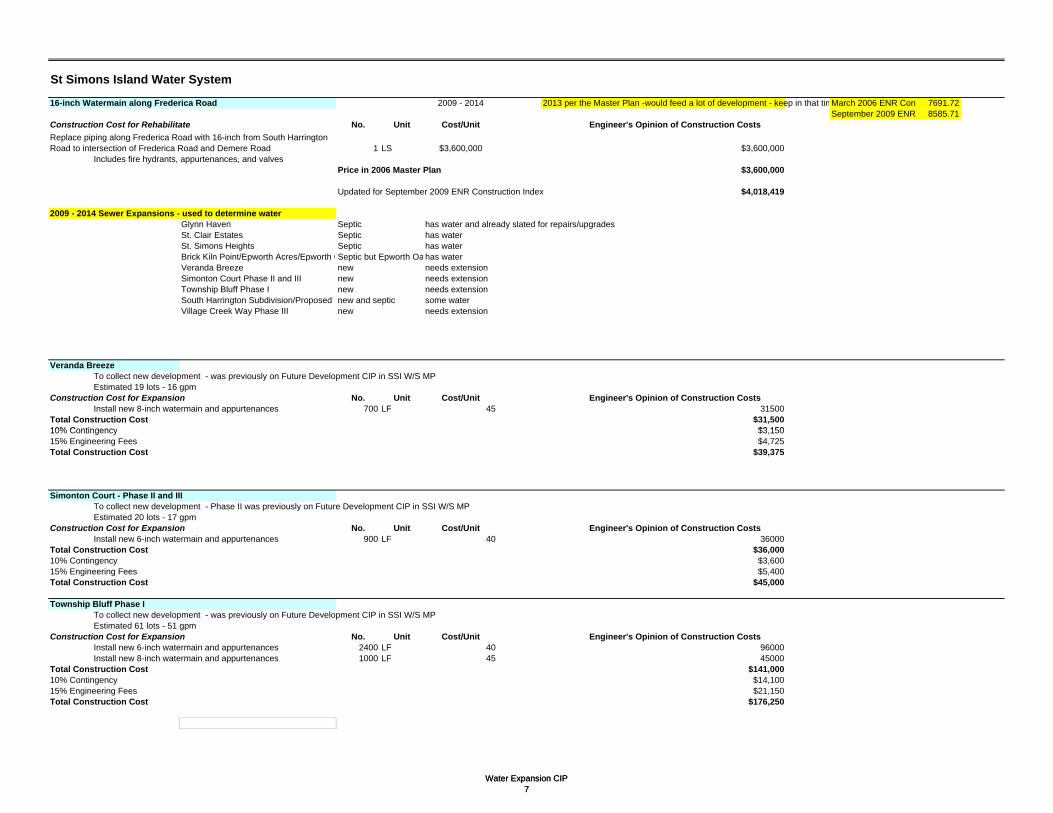
St Simons Island Water System
16-inch Watermain along Frederica Road 2009 - 2014 2013 per the Master Plan -would feed a lot of development - keep in that timMarch 2006 ENR Cons 7691.72September 2009 ENR 8585.71
Construction Cost for Rehabilitate No. Unit Cost/Unit Engineer's Opinion of Construction Costs
1 LS $3,600,000 $3,600,000Includes fire hydrants, appurtenances, and valves
Price in 2006 Master Plan $3,600,000
Updated for September 2009 ENR Construction Index $4,018,419
2009 - 2014 Sewer Expansions - used to determine waterGlynn Haven Septic has water and already slated for repairs/upgradesSt. Clair Estates Septic has waterSt. Simons Heights Septic has waterBrick Kiln Point/Epworth Acres/Epworth OSeptic but Epworth Oa has waterVeranda Breeze new needs extensionSimonton Court Phase II and III new needs extensionTownship Bluff Phase I new needs extensionSouth Harrington Subdivision/Proposed Hnew and septic some waterVillage Creek Way Phase III new needs extension
Veranda BreezeTo collect new development - was previously on Future Development CIP in SSI W/S MPEstimated 19 lots - 16 gpm
Construction Cost for Expansion No. Unit Cost/Unit Engineer's Opinion of Construction CostsInstall new 8-inch watermain and appurtenances 700 LF 45 31500
Total Construction Cost $31,50010% Contingency $3 150
Replace piping along Frederica Road with 16-inch from South Harrington Road to intersection of Frederica Road and Demere Road
Water Expansion CIP7
10% Contingency $3,15015% Engineering Fees $4,725Total Construction Cost $39,375
Simonton Court - Phase II and IIITo collect new development - Phase II was previously on Future Development CIP in SSI W/S MPEstimated 20 lots - 17 gpm
Construction Cost for Expansion No. Unit Cost/Unit Engineer's Opinion of Construction CostsInstall new 6-inch watermain and appurtenances 900 LF 40 36000
Total Construction Cost $36,00010% Contingency $3,60015% Engineering Fees $5,400Total Construction Cost $45,000
Township Bluff Phase ITo collect new development - was previously on Future Development CIP in SSI W/S MPEstimated 61 lots - 51 gpm
Construction Cost for Expansion No. Unit Cost/Unit Engineer's Opinion of Construction CostsInstall new 6-inch watermain and appurtenances 2400 LF 40 96000Install new 8-inch watermain and appurtenances 1000 LF 45 45000
Total Construction Cost $141,00010% Contingency $14,10015% Engineering Fees $21,150Total Construction Cost $176,250
Water Expansion CIP7
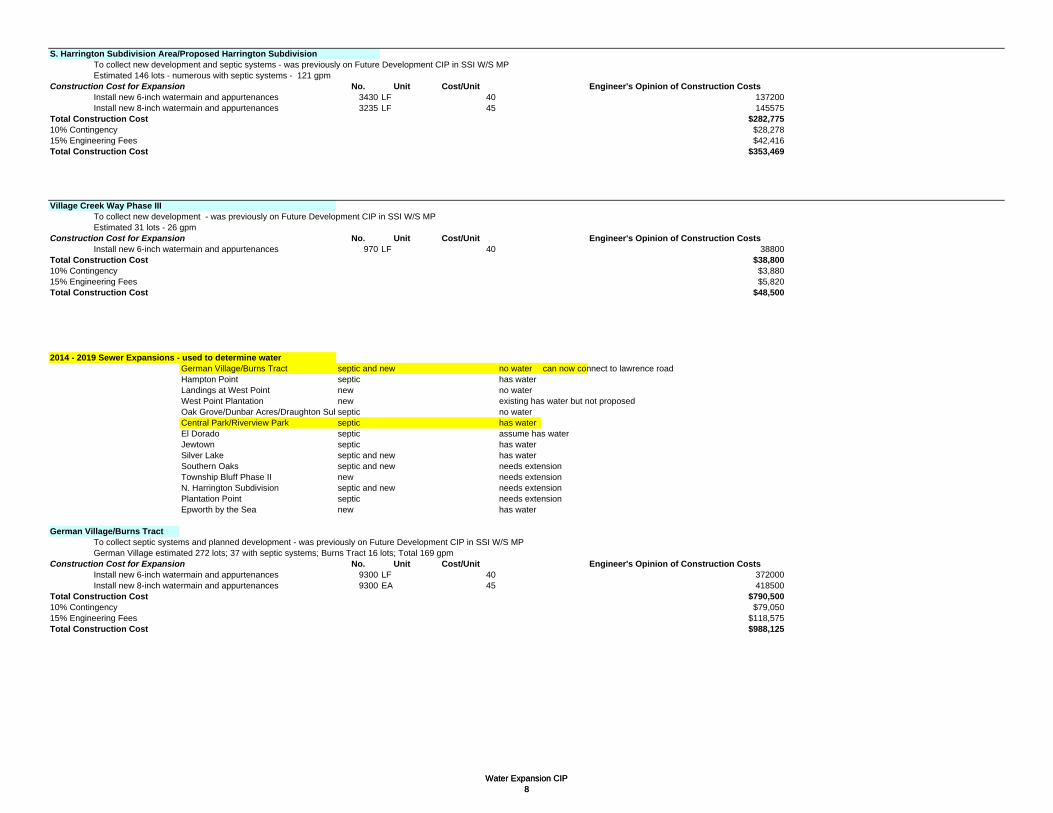
S. Harrington Subdivision Area/Proposed Harrington SubdivisionTo collect new development and septic systems - was previously on Future Development CIP in SSI W/S MPEstimated 146 lots - numerous with septic systems - 121 gpm
Construction Cost for Expansion No. Unit Cost/Unit Engineer's Opinion of Construction CostsInstall new 6-inch watermain and appurtenances 3430 LF 40 137200Install new 8-inch watermain and appurtenances 3235 LF 45 145575
Total Construction Cost $282,77510% Contingency $28,27815% Engineering Fees $42,416Total Construction Cost $353,469
Village Creek Way Phase IIITo collect new development - was previously on Future Development CIP in SSI W/S MPEstimated 31 lots - 26 gpm
Construction Cost for Expansion No. Unit Cost/Unit Engineer's Opinion of Construction CostsInstall new 6-inch watermain and appurtenances 970 LF 40 38800
Total Construction Cost $38,80010% Contingency $3,88015% Engineering Fees $5,820Total Construction Cost $48,500
2014 - 2019 Sewer Expansions - used to determine waterGerman Village/Burns Tract septic and new no water can now connect to lawrence roadHampton Point septic has waterLandings at West Point new no waterWest Point Plantation new existing has water but not proposedOak Grove/Dunbar Acres/Draughton Subseptic no waterCentral Park/Riverview Park septic has water
Water Expansion CIP8
El Dorado septic assume has waterJewtown septic has waterSilver Lake septic and new has waterSouthern Oaks septic and new needs extensionTownship Bluff Phase II new needs extensionN. Harrington Subdivision septic and new needs extensionPlantation Point septic needs extensionEpworth by the Sea new has water
German Village/Burns TractTo collect septic systems and planned development - was previously on Future Development CIP in SSI W/S MPGerman Village estimated 272 lots; 37 with septic systems; Burns Tract 16 lots; Total 169 gpm
Construction Cost for Expansion No. Unit Cost/Unit Engineer's Opinion of Construction CostsInstall new 6-inch watermain and appurtenances 9300 LF 40 372000Install new 8-inch watermain and appurtenances 9300 EA 45 418500
Total Construction Cost $790,50010% Contingency $79,05015% Engineering Fees $118,575Total Construction Cost $988,125
Water Expansion CIP8

The Landings at West PointProposed subdivision in area of West Point Plantation - was previously on Future Development CIP in SSI W/S MPEstimated 22 lots - estimate 18 gpm for subdivision
Construction Cost for Expansion No. Unit Cost/Unit Engineer's Opinion of Construction CostsInstall new 8-inch watermain and appurtenances 1100 LF 45 49500
Total Construction Cost $49,50010% Contingency $4,95015% Engineering Fees $7,425Total Construction Cost $61,875
West Point PlantationPrimarily expansion of existing subdivision - was previously on Future Development CIP in SSI W/S MPExisting West Point Plantation has public sewer; are 20 septic tanks in subdivision area installed 1983 - 1998Estimated 200 lots - 20 have septic systems - estimate 167 gpm for subdivision
Construction Cost for Expansion No. Unit Cost/Unit Engineer's Opinion of Construction CostsInstall new 6-inch watermain and appurtenances 6000 LF 40 240000Install new 8-inch watermain and appurtenances 8560 LF 45 385200
Total Construction Cost $625,20010% Contingency $62,52015% Engineering Fees $93,780Total Construction Cost $781,500
Oak Grove/Dunbar Acres/Draughton SubdivisionTo collect septic systems - was previously on Future Development CIP in SSI W/S MPEstimated 75 (17 Orange Grove, 49 Dunbar Acres, 9 Draughton) homes with septic systems - 65 gpm
Construction Cost for Expansion No. Unit Cost/Unit Engineer's Opinion of Construction CostsInstall new 8-inch watermain and appurtenances 6800 LF 45 306000
Total Construction Cost $306,00010% Contingency $30,60015% Engineering Fees $45,900Total Construction Cost $382,500
Water Expansion CIP9
Southern OaksTo collect septic system and potentially new development - was previously on Future Development CIP in SSI W/S MP1 septic system installed 1963 ; high potential for failureEstimated 9 lots (1 with septic as of 2006) 8 gpm
Construction Cost for Expansion No. Unit Cost/Unit Engineer's Opinion of Construction CostsInstall new 8-inch watermain and appurtenances 850 LF 45 38250
Total Construction Cost $38,25010% Contingency $3,82515% Engineering Fees $5,738Total Construction Cost $47,813
Township Bluff Phase IITo collect new development - was previously on Future Development CIP in SSI W/S MPEstimated 49 lots - 41 gpm
Construction Cost for Expansion No. Unit Cost/Unit Engineer's Opinion of Construction CostsInstall new 6-inch watermain and appurtenances 1300 LF 40 52000Install new 8-inch watermain and appurtenances 1000 LF 45 45000
Total Construction Cost $97,00010% Contingency $9,70015% Engineering Fees $14,550Total Construction Cost $121,250
Water Expansion CIP9

N. Harrington SubdivisionTo collect new development and septic areas - was previously on Future Development CIP in SSI W/S MPEstimated 78 lots - 65 gpm Numerous septic tanks in this area - some constructed back in 1963, high potential for septic system failure
Construction Cost for Expansion No. Unit Cost/Unit Engineer's Opinion of Construction CostsInstall new 6-inch watermain and appurtenances 680 LF 40 27200Install new 8-inch watermain and appurtenances 3000 LF 45 135000Install new 10-inch watermain and appurtenances 1700 LF 55 93500
Total Construction Cost $255,70010% Contingency $25,57015% Engineering Fees $38,355Total Construction Cost $319,625
Plantation PointTo collect septic systems - was previously on Future Development CIP in SSI W/S MPSeptic systems 1968 - 1987; high potential for failures11 lots; 5 with septic systems; Total 12 gpm
Construction Cost for Expansion No. Unit Cost/Unit Engineer's Opinion of Construction CostsInstall new 8-inch watermain and appurtenances 1000 LF 45 45000
Total Construction Cost $45,00010% Contingency $4,50015% Engineering Fees $6,750Total Construction Cost $56,250
2019 - 2024 Sewer Expansions - used to determine waterMusgrove Plantation Phase I new needs extension can't determine
2024 - 2029 Sewer Expansions - used to determine waterJones Creek septic has waterButler Plantation septic needs extensionCarts Subdivision septic has water
Water Expansion CIP10
Settlers Hammock septic has waterGolden Isles Marina Townhouses, Lanier Island futureMusgrove Plantation Phase I new can't determine
Sea Island??
Butler PlantationTo collect septic systems - was previously on Future Development CIP in SSI W/S MPEstimated 23 lots - 10 with septic as of 2006 - Subdivision flow estimated 25 gpmSeptic systems installed 1996 - 2001; high potential for failure by year 2029
Construction Cost for Expansion No. Unit Cost/Unit Engineer's Opinion of Construction CostsInstall new 8-inch watermain and appurtenances 5000 LF 45 $225,000
Total Construction Cost $225,00010% Contingency $22,50015% Engineering Fees $33,750Total Construction Cost $281,250
Golden Isles Marina Townhouses, Lanier IslandTo collect new development on Lanier Island - was previously on Future Development CIP in SSI W/S MPEstimated 48 townhomes - Subdivision flow estimated 40 gpm (sewer)- also marina flows
Construction Cost for Expansion No. Unit Cost/Unit Engineer's Opinion of Construction CostsInstall new 10-inch watermain and appurtenances 8000 LF 75 $600,000 more expensive because parts
Total Construction Cost $600,000 have to be drilled or attached to bridge10% Contingency $60,00015% Engineering Fees $90,000Total Construction Cost $750,000
Water Expansion CIP10

Sea Island Watermain Extensionto serve Sea Island water system
Construction Cost for Expansion No. Unit Cost/Unit Engineer's Opinion of Construction CostsInstall new 16-inch watermain and appurtenances 8000 LF 95 $760,000 more expensive because parts
Total Construction Cost $760,000 have to be drilled or attached to bridge10% Contingency $76,00015% Engineering Fees $114,000Total Construction Cost $950,000
Storage not included but storage and pumping may be necessary
Model has 7528 LF to get along causeway to Sea IslandModel has another 8640 LF to run the length of Sea Island with a 16-inch main
Water Expansion CIP11
Water Expansion CIP11

APPENDIX I -- COST BREAKDOWNS FOR SEWER REHABILITATION CIP
Brunswick Glynn County JWSC Applied Technology & Management, Inc.
Water Sewer Master Plan
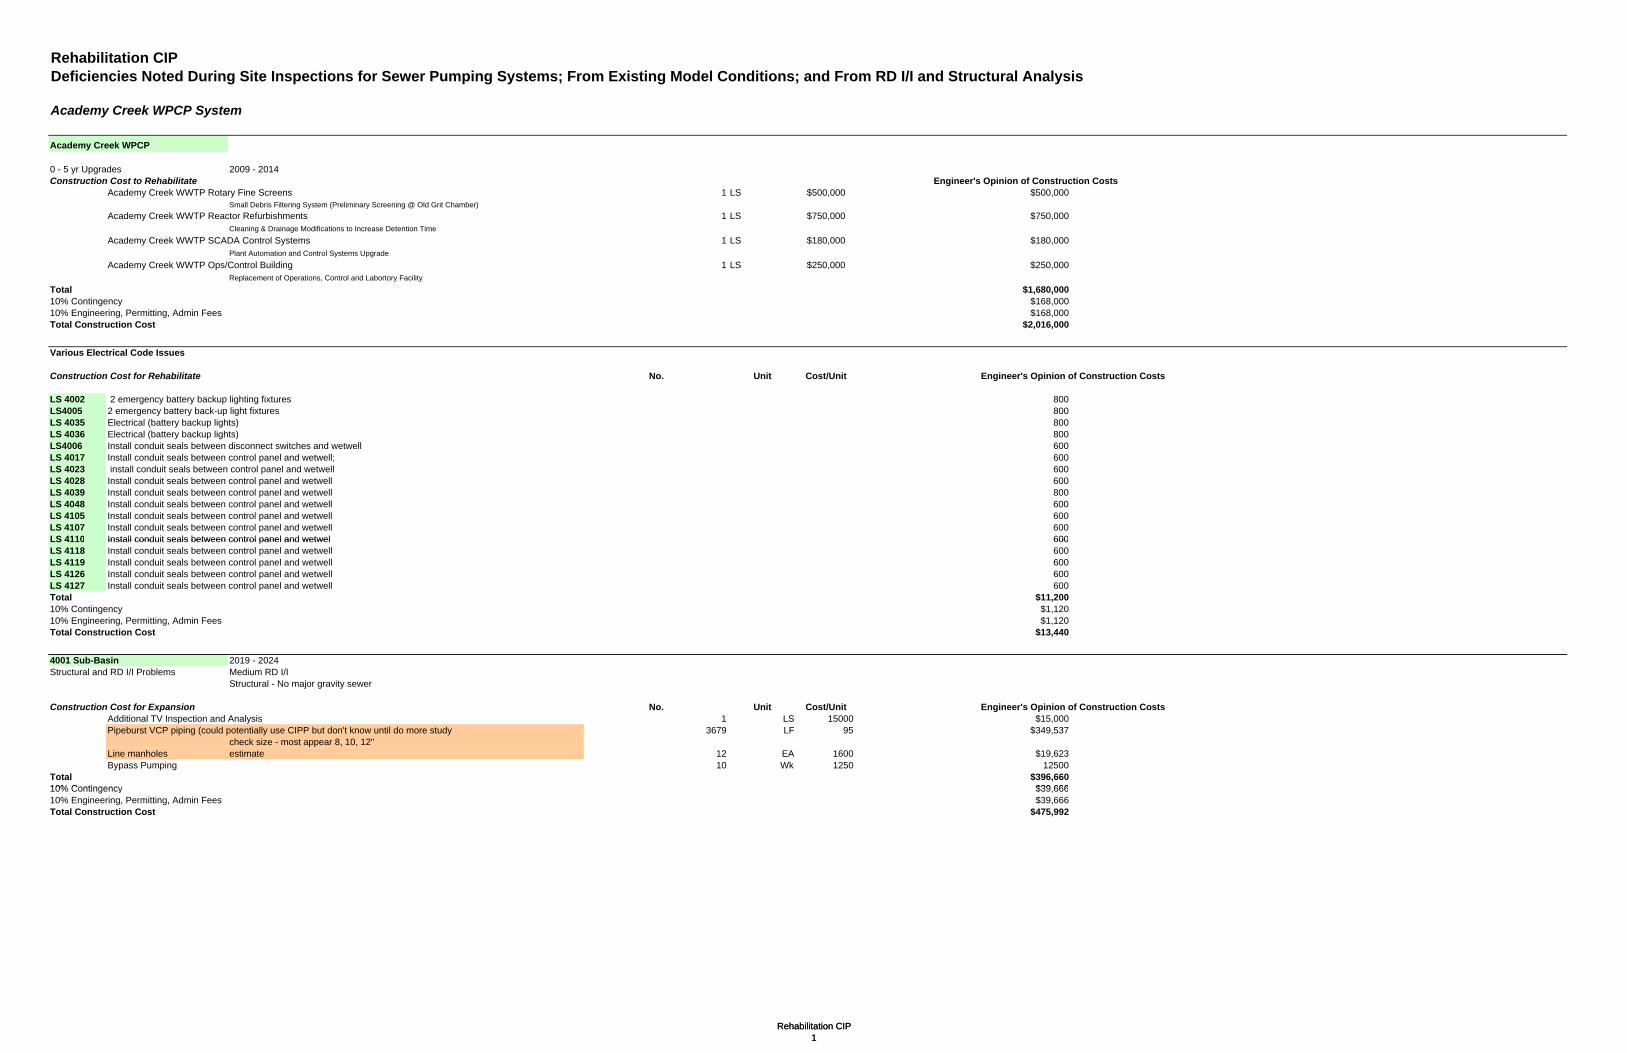
Rehabilitation CIPDeficiencies Noted During Site Inspections for Sewer Pumping Systems; From Existing Model Conditions; and From RD I/I and Structural Analysis
Academy Creek WPCP System
Academy Creek WPCP
0 - 5 yr Upgrades 2009 - 2014Construction Cost to Rehabilitate Engineer's Opinion of Construction Costs
Academy Creek WWTP Rotary Fine Screens 1 LS $500,000 $500,000Small Debris Filtering System (Preliminary Screening @ Old Grit Chamber)
Academy Creek WWTP Reactor Refurbishments 1 LS $750,000 $750,000Cleaning & Drainage Modifications to Increase Detention Time
Academy Creek WWTP SCADA Control Systems 1 LS $180,000 $180,000Plant Automation and Control Systems Upgrade
Academy Creek WWTP Ops/Control Building 1 LS $250,000 $250,000Replacement of Operations, Control and Labortory Facility
Total $1,680,000
Rehabilitation CIP1
$ , ,10% Contingency $168,00010% Engineering, Permitting, Admin Fees $168,000Total Construction Cost $2,016,000
Various Electrical Code Issues
Construction Cost for Rehabilitate No. Unit Cost/Unit Engineer's Opinion of Construction Costs
LS 4002 2 emergency battery backup lighting fixtures 800LS4005 2 emergency battery back-up light fixtures 800LS 4035 Electrical (battery backup lights) 800LS 4036 Electrical (battery backup lights) 800LS4006 Install conduit seals between disconnect switches and wetwell 600LS 4017 Install conduit seals between control panel and wetwell; 600LS 4023 install conduit seals between control panel and wetwell 600LS 4028 Install conduit seals between control panel and wetwell 600LS 4039 Install conduit seals between control panel and wetwell 800LS 4048 Install conduit seals between control panel and wetwell 600LS 4105 Install conduit seals between control panel and wetwell 600LS 4107 Install conduit seals between control panel and wetwell 600LS 4110 Install conduit seals between control panel and wetwel 600LS 4110 Install conduit seals between control panel and wetwel 600LS 4118 Install conduit seals between control panel and wetwell 600LS 4119 Install conduit seals between control panel and wetwell 600LS 4126 Install conduit seals between control panel and wetwell 600LS 4127 Install conduit seals between control panel and wetwell 600Total $11,20010% Contingency $1,12010% Engineering, Permitting, Admin Fees $1,120Total Construction Cost $13,440
4001 Sub-Basin 2019 - 2024Structural and RD I/I Problems Medium RD I/I
Structural - No major gravity sewer
Construction Cost for Expansion No. Unit Cost/Unit Engineer's Opinion of Construction CostsAdditional TV Inspection and Analysis 1 LS 15000 $15,000Pipeburst VCP piping (could potentially use CIPP but don't know until do more study 3679 LF 95 $349,537
check size - most appear 8, 10, 12"Line manholes estimate 12 EA 1600 $19,623Bypass Pumping 10 Wk 1250 12500
Total $396,66010% Contingency $39 66610% Contingency $39,66610% Engineering, Permitting, Admin Fees $39,666Total Construction Cost $475,992
Rehabilitation CIP1

LS 4002 immediate rehab 2009 - 2014Overall Condition 4Deficiencies:
Lighting in the building is not goodPer staff when Reynolds Street project is completed - LS2 and LS3 will come offline18" gravity to the south of LS4002 has negative slopes along 3 runs. Need to replace24" gravity to the east of LS4002 is cast iron and is in poor condition - has significant sags in line in several places - also has Liberty Harbor coming inPer drawdown the pumps can not meet the necessary base flow of 2810 gpm. The pumps only provide approximately 1600 gpm @ 65 ft TDH
Construction Cost to Rehabilitate Engineer's Opinion of Construction CostsNew transformer, overcurrent protection and (separated out - 2 emergency battery backup lighting fixtures) $4,500Replace pumps/impellers in kind with Goulds NSW 8x8x17LC 60 Hp pumps 3000 gpm @ 60 Hp $45,000Bypass Pumping 1 wk 2750 $2,750
Total $52,25010% Contingency $5,22510% Engineering, Permitting, Admin Fees $5,225Total Construction Cost $62,700
LS 4002 Yr 2014 - 2019 As a later rehab take out this pump station and replace with gravityRay concerned about 24" - very old CI - check capacity - Dixville additional flow - 24" pipe is sufficient should be sufficientBuildout flow we have (for basins LS4001 and 4002) is 2812 gpmLS4002 is duplex with pump design condition somewhere 2500 to 3000 gpm - so can handle future flow of 2810 gpm without upgrading pumps
Rehabilitation CIP2
Construction Cost for Rehabilitate No. Unit Cost/Unit Engineer's Opinion of Construction Costs base 2810Demolish existing LS 4002 1 LS 75000 75000 0-5 yr 2810 gpm 4310 w/ liberty harbor gravity lineVarious Bypass pumping 36 wk 2750 99000 5-10 yr 2810 gpm 24" to LS4002 is sufficient w/ libertyInstall new 24" PVC gravity sewer 0.08% slope (to point where LS4003 was) - 16' to 20' deep 4300 LF 340 1462000 10-15 yr 2810 gpm harbor (full flow) 16" FM to manifoldNew 5' manholes with lining 12 Ea 6500 78000 15-20 yr 2810 gpm 16" FM to manifold w/ LS4003 to Abandon Existing 16" forcemain 4300 LF 5 21500 20+ 2810 gpm 18" FM - only if all Liberty Harbor comes
Total Construction Cost $1,735,500 in 5 yrs which will not but LS400310% Contingency $173,550 will come out in 5 yr rehab need15% Engineering Fees $260,325 to make sure enough capacityTotal Construction Cost $2,169,375 for gravity from LS4003 site to WPCP
Check Future Exp CIPs
4002 Sub-Basin 2009 - 2014 Checked 24" gravity to east of station to ensure enough capacity for Liberty Harbor - appears sufficient for entire Liberty Harbor flow if remove and replace as proposed hereStructural and RD I/I Problems High RD I/I
Structural - 24" CI eval TV Inspection - 4 PACP scores; 18" VCP 0 PACP scores
Construction Cost for Expansion No. Unit Cost/Unit Engineer's Opinion of Construction CostsAdditional TV Inspection and Analysis 1 LS 50000 $50,000Remove and Replace 24" Gravity Sewer (10 to 15 ft depth) from MH40020120 to MH40020020 2100 LF 250 $525,000Remove and Replace 4'/5' diameter manholes with liner (10 - 15 ft depth) 11 EA 3900 $42,900Remove and Replace 18" Gravity Sewer (10 - 12 ft depth) to South MH40023200 to MH40020020 375 LF 150 $56,250R d R l 4' di t h l ith li (10 12 ft d th) 4 EA 3250 $13 000Remove and Replace 4' diameter manholes with liner (10 - 12 ft depth) 4 EA 3250 $13,000Bypass Pumping 24 wk 2250 $54,000CIPP Cast Iron piping - 12", 15", 18" 6000 LF 85 $510,000
check size - most appear less 12"Line manholes estimate 20 EA 1600 $32,000Pipeburst VCP piping (could potentially use CIPP but don't know until do more study 28758 LF 85 $2,444,458
check size - most appear less 12"Line manholes estimate 96 EA 1600 $153,600
Total $3,881,20810% Contingency $388,12110% Engineering, Permitting, Admin Fees $388,121Total Construction Cost $4,657,450
Rehabilitation CIP2

LS4003Overall Condition 4Deficiencies: Corrosion bad on suction piping, pump support, volute and top pumps (from seal water)
Wooden catwalk/frame over dry pit at intermediate level badly deteriorated - safety hazardOnly one VFD - pumps have to alternateNo ventilation in dry pit areaInfluent channel is located outside with access by stairs or is covered with grating - potential liabilityDoors deterioratedPer staff when Reynolds Street project is completed - LS2 and LS3 will come offline
Construction Cost to Rehabilitate Based on Field Inspections Engineer's Opinion of Construction CostsElectrical $16,000Clean/sandblast and repaint pumps, pump supports, suction and discharge piping $12,000 inhouse? 12k on water streetReplace catwalk $2,500 inhouseReplace or Rehab Fans/Ventilation in Dry Well $5,500 in houseInstall grating over stairs down to influent channel outside $1,500Install new aluminum doors $1,500 inhouse
Total $39,00010% Contingency $3,90010% Engineering, Permitting, Admin Fees $3,900Total Construction Cost $46,800
Rehabilitation CIP3
LS4003 2009 - 2014 Instead of rehab as above will demolishPer Ray T. line in to LS4003 is higher at WW discharge than in street after K Street Project. Need to decommiss Ls4003Build out flow from Basins LS4001, 4002 and 4003 = 4625 gpm (this for rehab - Liberty Harbor growth 1500 gpm will also add - but proposed sewer should be sufficient)Gravity from demolished LS4003 only needs to be 30" because there is not extreme flow on the 48" gravity line to the east - was oversized for flow from SSI that never cameConstruction Cost to Rehabilitate Quantity Unit Unit Cost Engineer's Opinion of Construction Costs
Demolish/Abandon LS4003 1 LS 75000 $75,000Abandon existing 18" forcemain 1840 LF 5 $9,200Abandon existing 30" gravity sewer from existing LS4003 forcemain discharge to WPCP (will replace) 2225 LF 60 $133,500Abandon existing gravity sewer upstream of LS4003 265 LF 60 $15,900Install new gravity sewer (30" size) approximately 18-20' deep 4065 LF 375 $1,524,375Connect LS4002 forcemain to gravity - will need to leave stubout for later connection to 24" gravity sewer that replace LS4002 1 LS 7500 $7,500Various Bypass pumping 36 wk 2750 $99,000Install new manholes 5' with liner 12 Ea 6500 $78,000
Total $1,942,47510% Contingency $194,24810% Engineering, Permitting, Admin Fees $194,248Total Construction Cost $2,330,970
4003 Sub-Basin 2014 - 2019Structural and RD I/I Problems High RD I/I
Structural - no evaluation by JRGO - similar to 4002 - all major is 36" and 42" PVC - no structural
Construction Cost for Expansion No. Unit Cost/Unit Engineer's Opinion of Construction CostsAdditional TV Inspection and Analysis 1 LS 50000 $50,000Pipeburst VCP piping (could potentially use CIPP but don't know until do more study 23024 LF 85 $1,957,068
check size - most appear less 12"Line manholes estimate 77 EA 1600 $122,795Bypass Pumping 24 Wk 1250 30000
Total $2,159,86310% Contingency $215,98610% Engineering, Permitting, Admin Fees $215,986Total Construction Cost $2,591,836
Rehabilitation CIP3
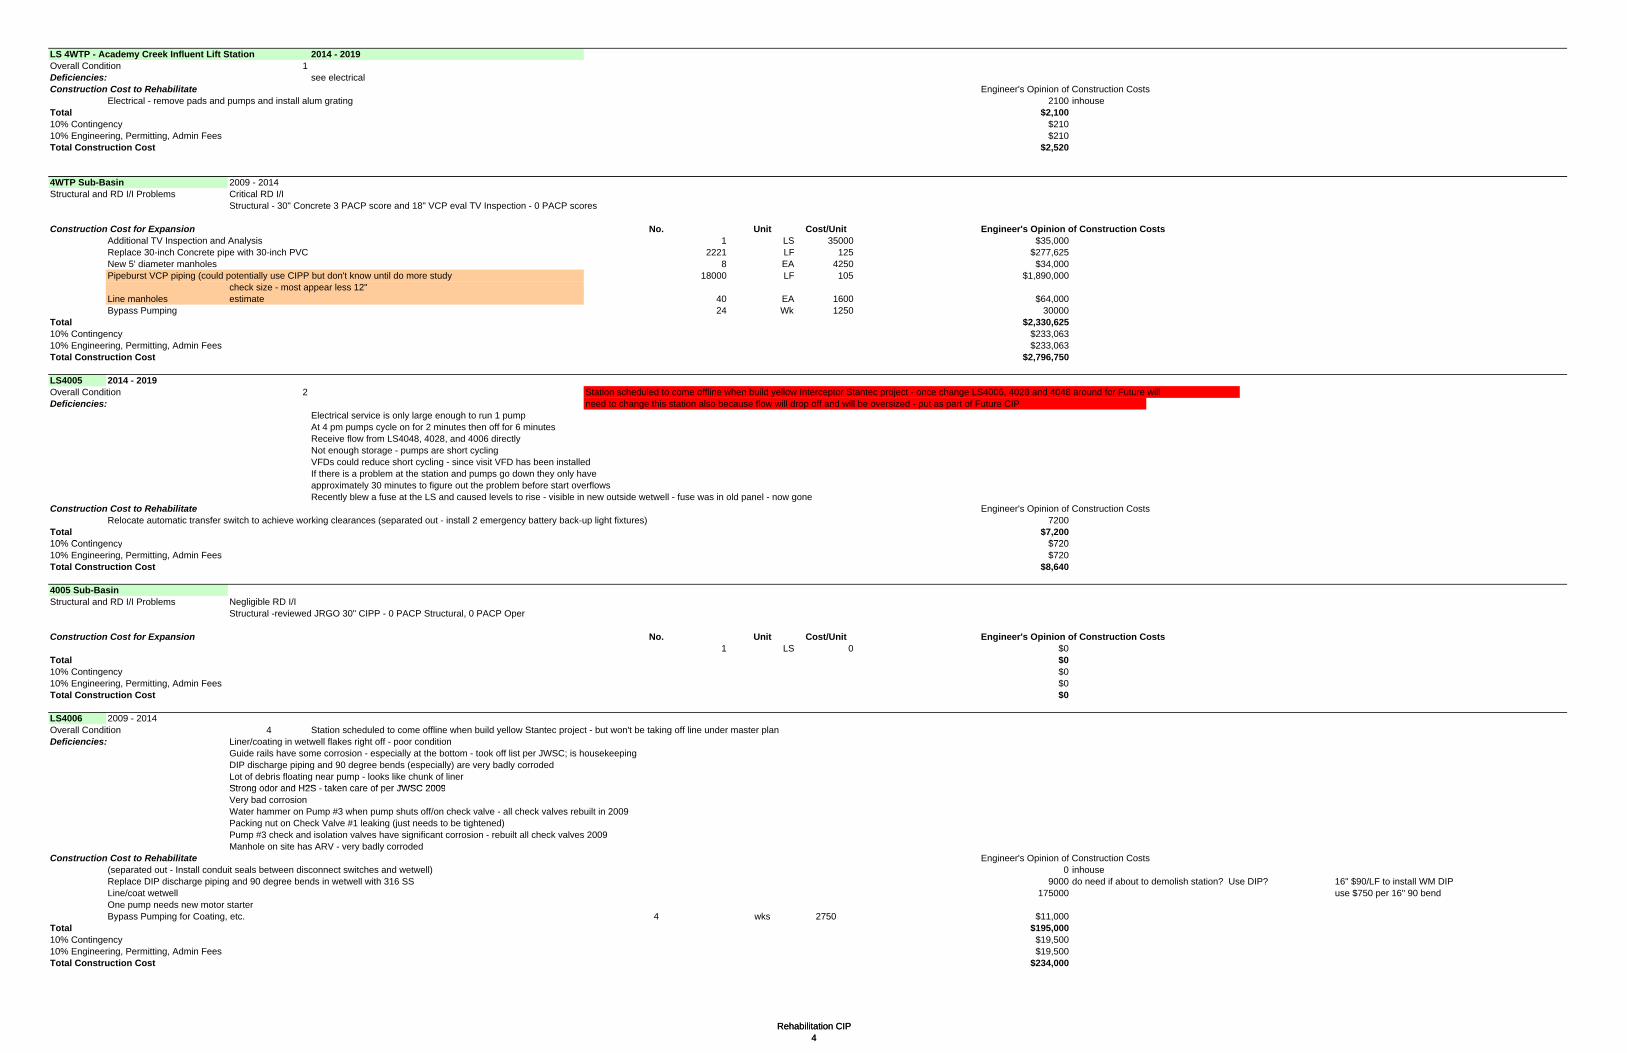
LS 4WTP - Academy Creek Influent Lift Station 2014 - 2019Overall Condition 1Deficiencies: see electrical Construction Cost to Rehabilitate Engineer's Opinion of Construction Costs
Electrical - remove pads and pumps and install alum grating 2100 inhouseTotal $2,10010% Contingency $21010% Engineering, Permitting, Admin Fees $210Total Construction Cost $2,520
4WTP Sub-Basin 2009 - 2014Structural and RD I/I Problems Critical RD I/I
Structural - 30" Concrete 3 PACP score and 18" VCP eval TV Inspection - 0 PACP scores
Construction Cost for Expansion No. Unit Cost/Unit Engineer's Opinion of Construction CostsAdditional TV Inspection and Analysis 1 LS 35000 $35,000Replace 30-inch Concrete pipe with 30-inch PVC 2221 LF 125 $277,625New 5' diameter manholes 8 EA 4250 $34,000Pipeburst VCP piping (could potentially use CIPP but don't know until do more study 18000 LF 105 $1,890,000
check size - most appear less 12"$
Rehabilitation CIP4
Line manholes estimate 40 EA 1600 $64,000Bypass Pumping 24 Wk 1250 30000
Total $2,330,62510% Contingency $233,06310% Engineering, Permitting, Admin Fees $233,063Total Construction Cost $2,796,750
LS4005 2014 - 2019Overall Condition 2 Station scheduled to come offline when build yellow Interceptor Stantec project - once change LS4006, 4028 and 4048 around for Future will Deficiencies: need to change this station also because flow will drop off and will be oversized - put as part of Future CIP
Electrical service is only large enough to run 1 pumpAt 4 pm pumps cycle on for 2 minutes then off for 6 minutesReceive flow from LS4048, 4028, and 4006 directlyNot enough storage - pumps are short cyclingVFDs could reduce short cycling - since visit VFD has been installedIf there is a problem at the station and pumps go down they only haveapproximately 30 minutes to figure out the problem before start overflowsRecently blew a fuse at the LS and caused levels to rise - visible in new outside wetwell - fuse was in old panel - now gone
Construction Cost to Rehabilitate Engineer's Opinion of Construction CostsRelocate automatic transfer switch to achieve working clearances (separated out - install 2 emergency battery back-up light fixtures) 7200
Total $7,20010% C ti $72010% Contingency $72010% Engineering, Permitting, Admin Fees $720Total Construction Cost $8,640
4005 Sub-BasinStructural and RD I/I Problems Negligible RD I/I
Structural -reviewed JRGO 30" CIPP - 0 PACP Structural, 0 PACP Oper
Construction Cost for Expansion No. Unit Cost/Unit Engineer's Opinion of Construction Costs1 LS 0 $0
Total $010% Contingency $010% Engineering, Permitting, Admin Fees $0Total Construction Cost $0
LS4006 2009 - 2014Overall Condition 4 Station scheduled to come offline when build yellow Stantec project - but won't be taking off line under master planDeficiencies: Liner/coating in wetwell flakes right off - poor condition
Guide rails have some corrosion - especially at the bottom - took off list per JWSC; is housekeepingDIP discharge piping and 90 degree bends (especially) are very badly corrodedLot of debris floating near pump - looks like chunk of linerStrong odor and H2S taken care of per JWSC 2009Strong odor and H2S - taken care of per JWSC 2009Very bad corrosionWater hammer on Pump #3 when pump shuts off/on check valve - all check valves rebuilt in 2009Packing nut on Check Valve #1 leaking (just needs to be tightened)Pump #3 check and isolation valves have significant corrosion - rebuilt all check valves 2009Manhole on site has ARV - very badly corroded
Construction Cost to Rehabilitate Engineer's Opinion of Construction Costs(separated out - Install conduit seals between disconnect switches and wetwell) 0 inhouseReplace DIP discharge piping and 90 degree bends in wetwell with 316 SS 9000 do need if about to demolish station? Use DIP? 16" $90/LF to install WM DIPLine/coat wetwell 175000 use $750 per 16" 90 bendOne pump needs new motor starterBypass Pumping for Coating, etc. 4 wks 2750 $11,000
Total $195,00010% Contingency $19,50010% Engineering, Permitting, Admin Fees $19,500Total Construction Cost $234,000
Rehabilitation CIP4

4006 Sub-Basin 2014 - 2019 RD I/I - further TV inspectionStructural and RD I/I Problems RD I/I - negative
Structural - No JRGO eval; similar to 4021 - VCP 0 PACP Structural/ 4 PACP OperMTS gravity is 21" VCP - 1397 LF and 24" VCP - 5379 LF
Construction Cost for Expansion No. Unit Cost/Unit Engineer's Opinion of Construction CostsAdditional TV Inspection and Analysis 1 LS 15000 $15,000
Total $15,00010% Contingency $1,50010% Engineering, Permitting, Admin Fees $1,500Total Construction Cost $18,000
4006 Sub-Basin 2024 - 2029 Eliminated this because are all 0 scores - no defective appearance - not likely to need rehab in 20 yearsStructural and RD I/I Problems RD I/I - negative
Structural - No JRGO eval; similar to 4021 - VCP 0 PACP Structural/ 4 PACP OperMTS gravity is 21" VCP - 1397 LF and 24" VCP - 5379 LF
Construction Cost for Expansion No. Unit Cost/Unit Engineer's Opinion of Construction CostsRemove and replace 21" VCP with 24" gravity sewer 1397 LF 115 $160,655Remove and replace 24" VCP with 24" gravity sewer 5379 LF 140 $753,060Install new 4' diameter manholes with liner/coating 23 EA 3450 $77,924Bypass Pumping 16 Wk 1500 24000
Total $1,015,639$
Rehabilitation CIP5
10% Contingency $101,56410% Engineering, Permitting, Admin Fees $101,564Total Construction Cost $1,218,767
4007 Sub-Basin 2019 - 2024Structural and RD I/I Problems Medium RD I/I
Structural - No major gravity sewer
Construction Cost for Expansion No. Unit Cost/Unit Engineer's Opinion of Construction CostsAdditional TV Inspection and Analysis 1 LS 7500 $7,500Pipeburst VCP/Unknown piping (could potentially use CIPP but don't know until do more study 2099 LF 85 $178,415
check size - most appear 8"Line manholes estimate 7 EA 1600 $11,195Bypass Pumping 6 Wk 1250 7500
Total $204,61010% Contingency $20,46110% Engineering, Permitting, Admin Fees $20,461Total Construction Cost $245,532
4011 Sub-Basin 2019 - 2024Structural and RD I/I Problems Medium RD I/I
St t l N j itStructural - No major gravity sewer
Construction Cost for Expansion No. Unit Cost/Unit Engineer's Opinion of Construction CostsAdditional TV Inspection and Analysis 1 LS 5500 $5,500Pipeburst VCP/Unknown piping (could potentially use CIPP but don't know until do more study 2142 LF 85 $182,098
check size - most appear 8"Line manholes estimate 7 EA 1600 $11,426Bypass Pumping 6 Wk 1250 7500
Total $206,52410% Contingency $20,65210% Engineering, Permitting, Admin Fees $20,652Total Construction Cost $247,829
LS 4017 2009 - 2014Overall Condition 2 Station scheduled to go away with Stantec project - can put in as later rehabDeficiencies: Strong odors (when hatch open) - have had some complaints - has been handled 2009 per JWSC
Concrete/cementitious liner in wetwell is sagging but appears in tactIs 6" strip around bottom of wetwell (about 1' below overflow)where appears may be exposed concrete (difficult to tell)Some debris/grease in pump well (not too bad)Guide rail brackets completely corroded at top wetwell - not available in SSDI 90 bend on pump discharge all corroded flanges in bad conditionDI 90 bend on pump discharge all corroded - flanges in bad condition
Construction Cost to Rehabilitate Engineer's Opinion of Construction Costs(separated out - Install conduit seals between control panel and wetwell); replace 3 KVA transformer 500 inhouseReplace duplex guide rail brackets 316 SS 450 inhouse duplex stationReplace corroded 8" DI 90 degree bends 1000 use $500 per DI 90 bend
Total $1,95010% Contingency $19510% Engineering, Permitting, Admin Fees $195Total Construction Cost $2,340
Rehabilitation CIP5
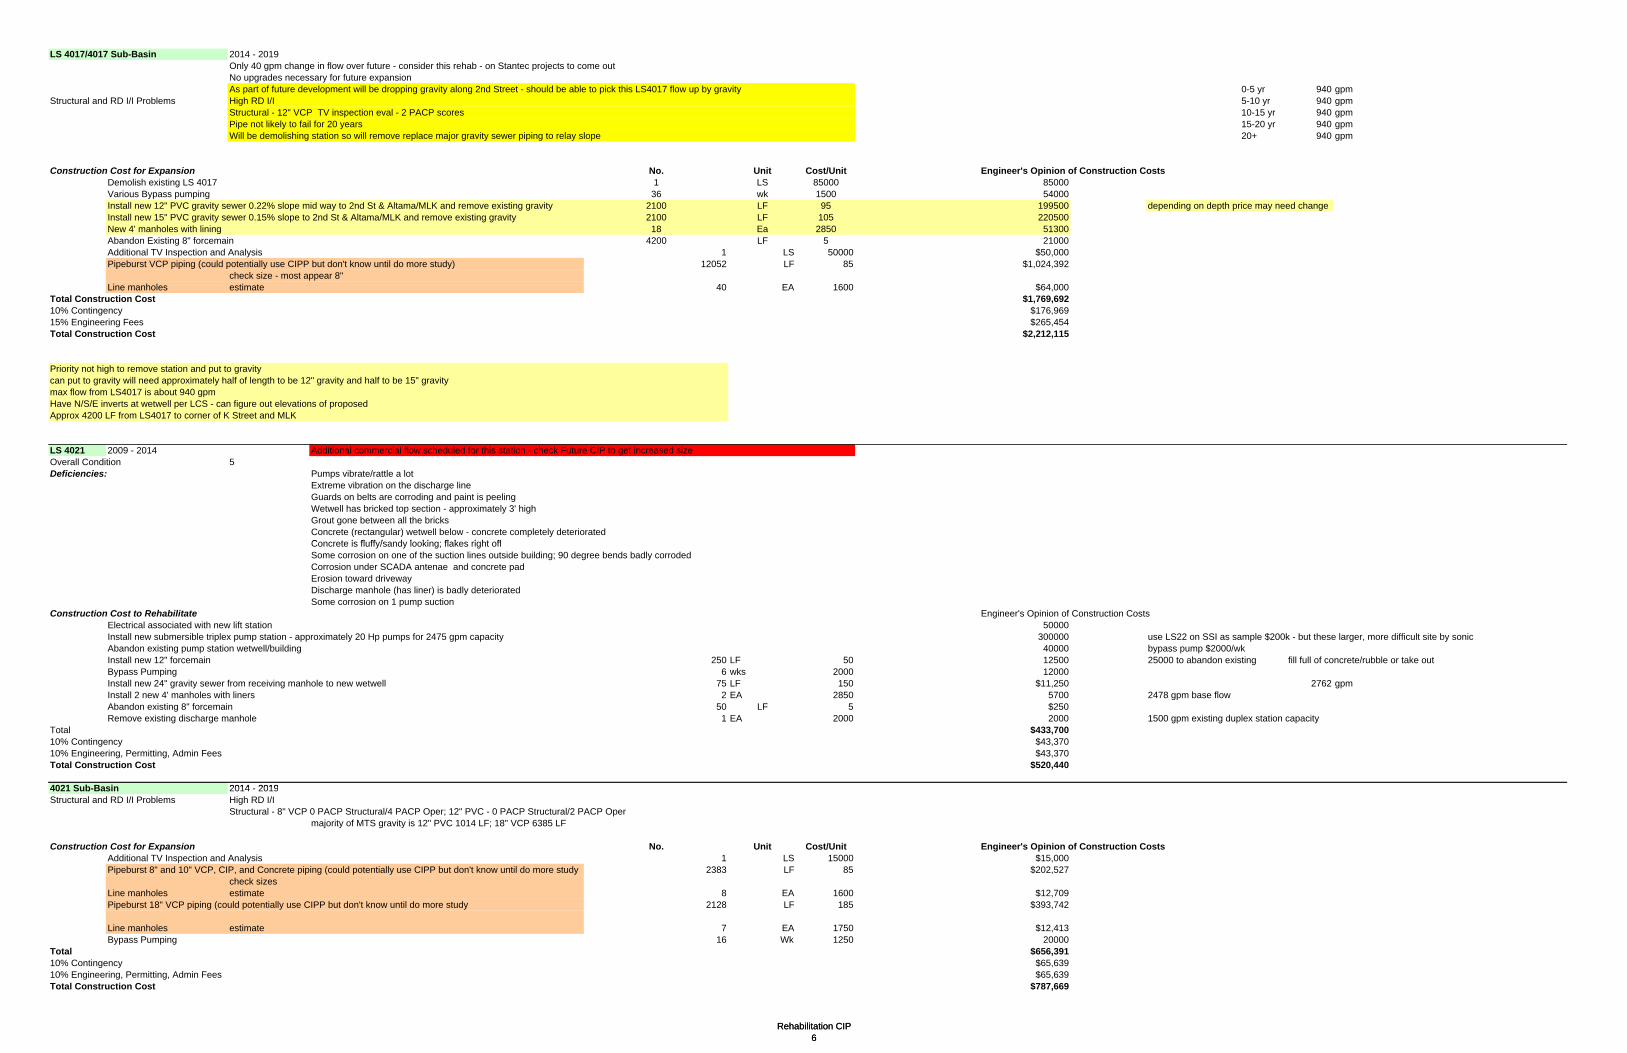
LS 4017/4017 Sub-Basin 2014 - 2019Only 40 gpm change in flow over future - consider this rehab - on Stantec projects to come outNo upgrades necessary for future expansionAs part of future development will be dropping gravity along 2nd Street - should be able to pick this LS4017 flow up by gravity 0-5 yr 940 gpm
Structural and RD I/I Problems High RD I/I 5-10 yr 940 gpmStructural - 12" VCP TV inspection eval - 2 PACP scores 10-15 yr 940 gpmPipe not likely to fail for 20 years 15-20 yr 940 gpmWill be demolishing station so will remove replace major gravity sewer piping to relay slope 20+ 940 gpm
Construction Cost for Expansion No. Unit Cost/Unit Engineer's Opinion of Construction CostsDemolish existing LS 4017 1 LS 85000 85000Various Bypass pumping 36 wk 1500 54000Install new 12" PVC gravity sewer 0.22% slope mid way to 2nd St & Altama/MLK and remove existing gravity 2100 LF 95 199500 depending on depth price may need changeInstall new 15" PVC gravity sewer 0.15% slope to 2nd St & Altama/MLK and remove existing gravity 2100 LF 105 220500New 4' manholes with lining 18 Ea 2850 51300Abandon Existing 8" forcemain 4200 LF 5 21000Additional TV Inspection and Analysis 1 LS 50000 $50,000Pipeburst VCP piping (could potentially use CIPP but don't know until do more study) 12052 LF 85 $1,024,392
check size - most appear 8"Line manholes estimate 40 EA 1600 $64,000
Rehabilitation CIP6
Total Construction Cost $1,769,69210% Contingency $176,96915% Engineering Fees $265,454Total Construction Cost $2,212,115
Priority not high to remove station and put to gravitycan put to gravity will need approximately half of length to be 12" gravity and half to be 15" gravitymax flow from LS4017 is about 940 gpmHave N/S/E inverts at wetwell per LCS - can figure out elevations of proposedApprox 4200 LF from LS4017 to corner of K Street and MLK
LS 4021 2009 - 2014 Additional commercial flow scheduled for this station - check Future CIP to get increased sizeOverall Condition 5Deficiencies: Pumps vibrate/rattle a lot
Extreme vibration on the discharge lineGuards on belts are corroding and paint is peelingWetwell has bricked top section - approximately 3' highGrout gone between all the bricksConcrete (rectangular) wetwell below - concrete completely deterioratedC t i fl ff / d l ki fl k i ht ffConcrete is fluffy/sandy looking; flakes right offSome corrosion on one of the suction lines outside building; 90 degree bends badly corrodedCorrosion under SCADA antenae and concrete padErosion toward drivewayDischarge manhole (has liner) is badly deterioratedSome corrosion on 1 pump suction
Construction Cost to Rehabilitate Engineer's Opinion of Construction CostsElectrical associated with new lift station 50000Install new submersible triplex pump station - approximately 20 Hp pumps for 2475 gpm capacity 300000 use LS22 on SSI as sample $200k - but these larger, more difficult site by sonicAbandon existing pump station wetwell/building 40000 bypass pump $2000/wkInstall new 12" forcemain 250 LF 50 12500 25000 to abandon existing fill full of concrete/rubble or take outBypass Pumping 6 wks 2000 12000Install new 24" gravity sewer from receiving manhole to new wetwell 75 LF 150 $11,250 2762 gpmInstall 2 new 4' manholes with liners 2 EA 2850 5700 2478 gpm base flowAbandon existing 8" forcemain 50 LF 5 $250Remove existing discharge manhole 1 EA 2000 2000 1500 gpm existing duplex station capacity
Total $433,70010% Contingency $43,37010% Engineering, Permitting, Admin Fees $43,370Total Construction Cost $520,440
4021 Sub Basin 2014 20194021 Sub-Basin 2014 - 2019Structural and RD I/I Problems High RD I/I
Structural - 8" VCP 0 PACP Structural/4 PACP Oper; 12" PVC - 0 PACP Structural/2 PACP Opermajority of MTS gravity is 12" PVC 1014 LF; 18" VCP 6385 LF
Construction Cost for Expansion No. Unit Cost/Unit Engineer's Opinion of Construction CostsAdditional TV Inspection and Analysis 1 LS 15000 $15,000Pipeburst 8" and 10" VCP, CIP, and Concrete piping (could potentially use CIPP but don't know until do more study 2383 LF 85 $202,527
check sizesLine manholes estimate 8 EA 1600 $12,709Pipeburst 18" VCP piping (could potentially use CIPP but don't know until do more study 2128 LF 185 $393,742
Line manholes estimate 7 EA 1750 $12,413Bypass Pumping 16 Wk 1250 20000
Total $656,39110% Contingency $65,63910% Engineering, Permitting, Admin Fees $65,639Total Construction Cost $787,669
Rehabilitation CIP6

4022 Sub-Basin 2009 - 2014Structural and RD I/I Problems Critical RD I/I
Structural - No Major GravityTrans
Construction Cost for Expansion No. Unit Cost/Unit Engineer's Opinion of Construction CostsAdditional TV Inspection and Analysis 1 LS 7500 $7,500Pipeburst VCP piping (could potentially use CIPP but don't know until do more study) 3250 LF 85 $276,250
check size - most appear less 12"Line manholes estimate 11 EA 1600 $17,600Bypass Pumping 4 Wk 1250 5000
Total $301,35010% Contingency $30,13510% Engineering, Permitting, Admin Fees $30,135Total Construction Cost $361,620
LS 4023 2014 - 2019Overall Condition 2Deficiencies: Cover on valve vault corroded - coating peeling off - need to replace
Chemical feed line (sodium nitrate) dripping down fiberglass insert - is corroding linerDI 90 bends at top of discharge piping in wetwell badly corroded - have been replaced 2009Seal around pipe penetrations in wetwell is peeling off - I/I potential -fiberglass liner
Rehabilitation CIP7
Some of the stainless steel hooks on cable rack bent/corrodedRound wetwell with square concrete top and hatch - lot of corrosion around hatchWetwell top under concrete around hatch looks like plywood/fiberglass with cutout - all coating peeling around topCorrosion on control panels
Construction Cost to Rehabilitate Engineer's Opinion of Construction CostsRelocated disconnect switch and utility meter for working clearance; (separated out - install conduit seals between control panel and wetwell) 600New Valve vault cover 150Seals around pipe penetrations of liner need to be rehabbed 3750New stainless steel cable rack 300Install new precast top slab with hatch for 6' dia wetwell 2750
Total 755010% Contingency $75510% Engineering, Permitting, Admin Fees $755Total Construction Cost $9,060
4023 Sub-Basin 2019 - 2024Structural and RD I/I Problems Medium RD I/I
Structural - No major gravity sewer
C t ti C t f E i N U it C t/U it E i ' O i i f C t ti C tConstruction Cost for Expansion No. Unit Cost/Unit Engineer's Opinion of Construction CostsAdditional TV Inspection and Analysis 1 LS 15000 $15,000Pipeburst VCP, CIP, Unknown piping (could potentially use CIPP but don't know until do more study 5131 LF 85 $436,173
check size - most appear 8"Line manholes estimate 17 EA 1600 $27,365Bypass Pumping 12 Wk 1250 15000
Total $493,53810% Contingency $49,35410% Engineering, Permitting, Admin Fees $49,354Total Construction Cost $592,246
4027 Sub-Basin 2024 - 2029Structural and RD I/I Problems Low RD I/I
Structural - No major gravity sewer
Construction Cost for Expansion No. Unit Cost/Unit Engineer's Opinion of Construction CostsAdditional TV Inspection and Analysis 1 LS 20000 $20,000Pipeburst VCP piping (could potentially use CIPP but don't know until do more study 2984 LF 85 $253,668
check size - assume most 8"20000 LF in total basin but about 7500 LF of VCP - rest PVCLine manholes estimate - only need 10 added 25 more because may be source of inflow 35 EA 1600 $56,000Bypass Pumping 12 Wk 1250 15000Bypass Pumping 12 Wk 1250 15000
Total $344,66810% Contingency $34,46710% Engineering, Permitting, Admin Fees $34,467Total Construction Cost $413,602
Rehabilitation CIP7

LS 4028 2014 - 2019Overall Condition 3Deficiencies: Some corrosion on guide rails (not severe)
Significant amount of grease/pucky in waterLot of debris up on discharge 90 degree bends - had overflows/high levelsLot of corrosion on 12" DI fittingsCheck and plug valves have significant amount of corrosionCored hole in top of wetwell (PVC pipe for transducer) is trip hazardCoating (coal tar) on piping in valve vault is corroding/peelingSignificant corrosion of liner around pump-on/storage volume elevationsStrong Odors - 2009 JWSC staff indicate has been controlled by upstream chemical addition
Construction Cost to Rehabilitate Engineer's Opinion of Construction Costs(Separated out - Install conduit seals between control panel and wetwell) 0Replace 12" DI fittings with 316 SS fittings 3300 triplex station use $675 per bend for DIReplace 12" check valves 11250 inhouseReplace 12" plug valves 8550 inhouseReplace 12" DI piping in valve vault 3150 $70/LFPlug hole cored in wet well 100Bypass Pumping 4 wks 1750 7000Install new coating in wet well 175000 wetwell 21.5' deep; approx 15'x14' estimate - based on utah/hollybrook PS
Total $208,350 - was $167k I think$
Rehabilitation CIP8
10% Contingency $20,83510% Engineering, Permitting, Admin Fees $20,835Total Construction Cost $250,020
4028 Sub-Basin 2019 - 2024Structural and RD I/I Problems Medium RD I/I
Structural - No major gravity sewer
Construction Cost for Expansion No. Unit Cost/Unit Engineer's Opinion of Construction CostsAdditional TV Inspection and Analysis 1 LS 12000 $12,000Pipeburst VCP/Unknown piping (could potentially use CIPP but don't know until do more study 2956 LF 85 $251,260
check size - most appear 8"Line manholes estimate 10 EA 1600 $15,765Bypass Pumping 8 Wk 1250 10000
Total $289,02510% Contingency $28,90310% Engineering, Permitting, Admin Fees $28,903Total Construction Cost $346,830
LS 4035 2014 - 2019Overall Condition 2D fi i i W t ll h d b i h d il f hi h l l (G H d ill h l d)Deficiencies: Wetwell has debris on handrails from high level (G. Hernandez will have cleaned)
All pump volutes have some corrosion from seal water systemGroundwater leak by seal water pumpCan not operate Pump #1 - too much debris/dirt - would lose prime - 2009 per JWSC staff operates nowCan operate Pumps #2 and #3Pump supports corroding but concrete pad ok conditionPump #2 and #3 check valves have significant corrosionWetwell full of debris from 9th Street cavein - will bring in vacuum truck after 9th Street finishedMotor control center obsolete Westinghouse - replace in near future - per JWSC staff only use breakers and motor starter if across line; rest empty
Construction Cost to Rehabilitate Engineer's Opinion of Construction CostsElectrical (separated out - battery backup lights) 0Clean/sandblast and repaint pumps, valves, and suction discharge piping 12000
Total $12,00010% Contingency $1,20010% Engineering, Permitting, Admin Fees $1,200Total Construction Cost $14,400
Rehabilitation CIP8

4035 Sub-Basin 2009 - 2014Structural and RD I/I Problems Critical
correct - are 13,909 LF of 30" concrete listed in GIS - about 2000 LF have been rehabbedmany sections of 30" with negative slopes; structural defects; probably offset joints
Construction Cost for Expansion No. Unit Cost/Unit Engineer's Opinion of Construction CostsAdditional TV Inspection and Analysis 1 LS 25000 $25,000Replace 30-inch Concrete pipe with 30-inch PVC (10' - 15' depth) 11900 LF 125 $1,487,500New 5' diameter manholes (10' - 15' depth) 40 EA 4250 $170,000Remove existing 30-inch Concrete pipe 11900 LF 20 $238,000Slipline 30-inch Concrete pipe with 28-inch ID slipline 2000 LF 120 $240,000Pipeburst/CIPP VCP piping - 12", 15", 18" 5700 LF 85 $484,500
check sizeLine manholes estimate 23 EA 1600 $36,800Bypass Pumping 30 Wk 2000 60000
Total $2,741,80010% Contingency $274,18010% Engineering, Permitting, Admin Fees $274,180Total Construction Cost $3,290,160
LS 4036 2014 - 2019Overall Condition 2
Rehabilitation CIP9
Deficiencies: Pump support is very corrodedSuction is corrodedNo seal water drain - no need all on mechanical seals nowComplaints about odor - 2009 JWSC staff says taken care of by chemical addition upstream
Construction Cost to Rehabilitate Engineer's Opinion of Construction CostsElectrical (battery backup lights - separated out) 0Clean/sandblast and repaint pumps, pump supports and suction (as necessary) 7200
Total $7,20010% Contingency $72010% Engineering, Permitting, Admin Fees $720Total Construction Cost $8,640
4036 Sub-Basin 2014 - 2019 For StructuralStructural and RD I/I Problems Low RD I/I
Structural - 15/18 VC/DI/CI - 3 PACP Structural/4 PACP Oper; 24/30 PVC - 0 PACP Structural/3 PACP OperIn 10 yr Future CIP are upgrading 18" to 24" and 24" and 30" to 36"
Construction Cost for Expansion No. Unit Cost/Unit Engineer's Opinion of Construction CostsAdditional TV Inspection and Analysis 1 LS 7500 $7,500Pi b t 15" d 18" VCP i i ( ld t ti ll CIPP b t d 't k til d t d 2350 LF 165 $387 750Pipeburst 15" and 18" VCP piping (could potentially use CIPP but don't know until do more study 2350 LF 165 $387,750Line manholes estimate 8 EA 1750 $13,708Remove 24- and 30-inch VCP and replace with 30" PVC (16 - 18' depth) 4800 LF 245 $1,176,000New 5' diameter manholes with liner/coating 12 EA 6250 $75,000Bypass Pumping 24 Wk 1900 45600
Total $1,705,55810% Contingency $170,55610% Engineering, Permitting, Admin Fees $170,556Total Construction Cost $2,046,6704036 Sub-Basin 2024 - 2029 For RD I/IStructural and RD I/I Problems Low RD I/I
Structural - 15/18 VC/DI/CI - 3 PACP Structural/4 PACP Oper; 24/30 PVC/VCP - 0 PACP Structural/3 PACP OperHandle in rehab CIP 2014 - 2019
Construction Cost for Expansion No. Unit Cost/Unit Engineer's Opinion of Construction CostsAdditional TV Inspection and Analysis 1 LS 7500 $7,500Pipeburst VCP piping (could potentially use CIPP but don't know until do more study 1835 LF 85 $155,947
check size - assume most 8"There are approximately 13,000 LF of VCP piping in the basin - much was rehabbed under structural repairs - for major - about 7000 LFLine manholes estimate - only need 6 added 24 more because may be source of inflow 30 EA 1600 $48,000Bypass Pumping 8 Wk 1900 15200
Total $226 647Total $226,64710% Contingency $22,66510% Engineering, Permitting, Admin Fees $22,665Total Construction Cost $271,976LS 4039 2014 - 2019Overall Condition 3Deficiencies: 8" DI pipe in wetwell is corroded
Significant grease problemall electrical systems deteriorated by H2S - JWSC wants to upgrade/rewire
Construction Cost to Rehabilitate Engineer's Opinion of Construction CostsSeparated out - Install conduit seals between control panel and wetwell 0Electrical systems and panels upgrades and rewiring 20000Replace 8" DI pipe with 316 SS piping 6900 est $900 per bend for 316 ss; est $95/ft for 316 ss sch 10Bypass Pumping 2 wks 2500 5000
Total $31,90010% Contingency $3,19010% Engineering, Permitting, Admin Fees $3,190Total Construction Cost $38,280
Rehabilitation CIP9

4039 Sub-Basin 2014 - 2019Structural and RD I/I Problems High RD I/I
Structural - reviewed PVC, VCP, DIP - all 0 PACP structural
Construction Cost for Expansion No. Unit Cost/Unit Engineer's Opinion of Construction CostsAdditional TV Inspection and Analysis 1 LS 10000 $10,000Pipeburst VCP/DIP piping (could potentially use CIPP but don't know until do more study) 4794 LF 105 $503,370
check sizeremoved all that will be rehabbed under the LS4109 project and pipebursting
Line manholes estimate - only need 16 added 16 more because may be source inflow 32 EA 1600 $51,200Bypass Pumping 12 Wk 1500 18000
Total $582,57010% Contingency $58,25710% Engineering, Permitting, Admin Fees $58,257Total Construction Cost $699,084
4043 Sub-Basin 2024 - 2029Structural and RD I/I Problems Low RD I/I
Structural - No major gravity sewer
Rehabilitation CIP10
Construction Cost for Expansion No. Unit Cost/Unit Engineer's Opinion of Construction CostsAdditional TV Inspection and Analysis 1 LS 10000 $10,000Pipeburst VCP piping (could potentially use CIPP but don't know until do more study 3908 LF 85 $332,180
check size - assume most 8"Line manholes estimate - only need 13 added 25 more because may be source of inflow 38 EA 1600 $60,800Bypass Pumping 10 Wk 1250 12500
Total $415,48010% Contingency $41,54810% Engineering, Permitting, Admin Fees $41,548Total Construction Cost $498,576
4044 Sub-Basin 2019 - 2024Structural and RD I/I Problems Medium RD I/I
Structural - No major gravity sewer
Construction Cost for Expansion No. Unit Cost/Unit Engineer's Opinion of Construction CostsAdditional TV Inspection and Analysis 1 LS 15000 $15,000Pipeburst VCP, DIP, Unknown piping (could potentially use CIPP but don't know until do more study 2881 LF 90 $259,260
check size - most appear 8, 10, 12"Line manholes estimate 10 EA 1600 $15,360Bypass Pumping 8 Wk 1250 10000
T t l $299 620Total $299,62010% Contingency $29,96210% Engineering, Permitting, Admin Fees $29,962Total Construction Cost $359,544LS 4048 2014 - 2019Overall Condition 3
Deficiencies: Strong odors - 2009 JWSC staff indicate taken care of by upstream placement of chemicalsSpray on liner is bubbled and corroding offparticularly at pump on and storage elevationLittle rust on guide railsPiping in valve pit is badly corroded and all the paint is peeling offCorrosion around top of wetwell and lid
Construction Cost to Rehabilitate Engineer's Opinion of Construction Costsseparated out - Install conduit seals between control panel and wetwell 0Replace 12" DI fittings with 316 SS fittings 3300 triplex station use $675 per bend for DIReplace 12" check valves 11250 inhouseReplace 12" plug valves 8550 inhouseReplace 12" DI piping in valve vault 3150 $70/LFBypass Pumping 6 wks 2000 12000Install new coating in wet well 175000 wetwell 21.5' deep; approx 15'x14' estimate - based on utah/hollybrook
Total $213 250 was $167k I thinkTotal $213,250 - was $167k I think10% Contingency $21,32510% Engineering, Permitting, Admin Fees $21,325Total Construction Cost $255,900
Rehabilitation CIP10

4048 Sub-Basin 2009 - 2014 RD I/IStructural and RD I/I Problems High RD I/I
Structural - 8" Concrete TV inspection eval - 3 PACP scores; 8 and 10" PVC TV Inspection eval - 0 PACP scores7675 LF of 27/30" DIP - unlikely 27" is DIP - not slated to upsize until 20 year - put structural improvements in 2014-2019 based on condition of 4002
Construction Cost for Expansion No. Unit Cost/Unit Engineer's Opinion of Construction CostsAdditional TV Inspection and Analysis 1 LS 50000 $50,000Pipeburst VCP piping (could potentially use CIPP but don't know until do more study) 11090 LF 85 $942,650
check size - most appear 8"Line manholes estimate 37 EA 1600 $58,667Bypass Pumping 24 Wk 1250 30000
Total $1,081,31710% Contingency $108,13210% Engineering, Permitting, Admin Fees $108,132Total Construction Cost $1,297,5804048 Sub-Basin 2014 - 2019 StructuralStructural and RD I/I Problems High RD I/I - rehab 2009 - 2014
Structural - 8" Concrete TV inspection eval - 3 PACP scores; 8 and 10" PVC TV Inspection eval - 0 PACP scores7675 LF of 27/30" DIP - unlikely 27" is DIP - not slated to upsize until 20 year - put structural improvements in 2014-2019 based on condition of 4002
Construction Cost for Expansion No. Unit Cost/Unit Engineer's Opinion of Construction CostsAdditional TV Inspection and Analysis 1 LS 15000 $15,000CIPP 30" DIP 3838 LF 120 $460,500
$
Rehabilitation CIP11
Line manholes estimate 13 EA 2500 $31,983Bypass Pumping 16 Wk 1250 20000
Total $527,48310% Contingency $52,74810% Engineering, Permitting, Admin Fees $52,748Total Construction Cost $632,9804056 Sub-Basin 2024 - 2029Structural and RD I/I Problems Low RD I/I
Structural - No major gravity sewer
Construction Cost for Expansion No. Unit Cost/Unit Engineer's Opinion of Construction CostsAdditional TV Inspection and Analysis 1 LS 15000 $15,000Pipeburst PVC piping (could potentially use CIPP but don't know until do more study 2931 LF 85 $249,093
check size - assume most 8"Line manholes estimate - only need 10 added 25 more because may be source of inflow 35 EA 1600 $56,000Bypass Pumping 10 Wk 1250 12500
Total $332,59310% Contingency $33,25910% Engineering, Permitting, Admin Fees $33,259Total Construction Cost $399,111LS 4105 2009 - 2014 Was designed - problems with design; awaiting MP resultsO ll C diti 4Overall Condition 4Deficiencies: Check valve leaking - significantly when pump is on
Pipes and valves in valve vault are corroded significantlyJ-tube end has been corroded offGuide rails have some corrosionCoal tar coating is gone - groundwater leaksRebar is exposed on top of wet well slab near hatchWetwell top slab is off set and above grade with the grout and seal chipping off
Construction Cost to Rehabilitate Engineer's Opinion of Construction CostsReplace main disconnect, manual transfer switch, and disconnect with generator receptacle;(separated out - install conduit seals between control panel and wetwell) 4200Replace 6" check valves 3750 est at $1875 eachReplace 6" plug valves 2400 est at $1200 eachReplace 6" DI in valve vault 1500 est at $50/LFReplace J-tube with HDPE J-tube and Core Wetwell 1200 estReplace guide rails with 316 SS 2200Replace 6" DI in wetwell with HDPE/316 SS 5800 est $500 per bend for 316 ss; est $80/LF for 316 ss sch 10Install coating/liner in wet well 35000 est based on bid tabsSet new precast top slab for 6' dia wet wel 5500 inhouseBypass pumping 9600 est at 1200/wk est 2monthsRebuild pumps/panels 25000
Total $96,15010% Contingency $9 615 25000 to abandon existing fill full of concrete/rubble or take out10% Contingency $9,615 25000 to abandon existing fill full of concrete/rubble or take out10% Engineering, Permitting, Admin Fees $9,615Total Construction Cost $115,380
Rehabilitation CIP11
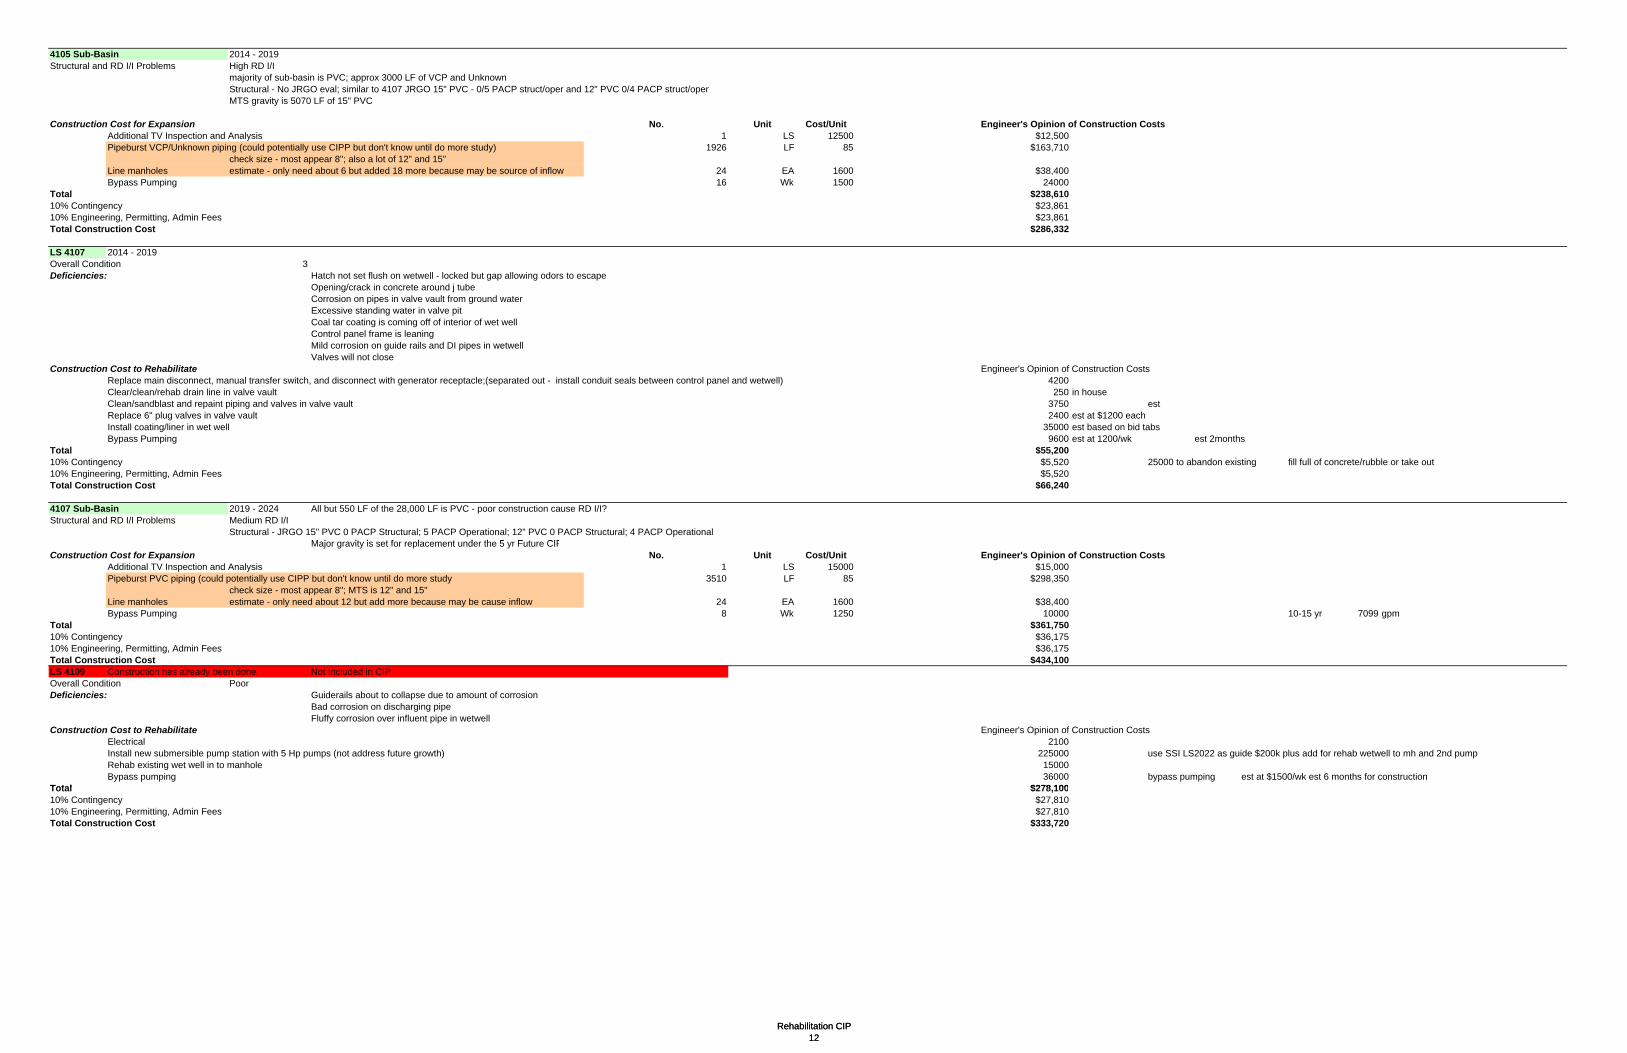
4105 Sub-Basin 2014 - 2019Structural and RD I/I Problems High RD I/I
majority of sub-basin is PVC; approx 3000 LF of VCP and UnknownStructural - No JRGO eval; similar to 4107 JRGO 15" PVC - 0/5 PACP struct/oper and 12" PVC 0/4 PACP struct/operMTS gravity is 5070 LF of 15" PVC
Construction Cost for Expansion No. Unit Cost/Unit Engineer's Opinion of Construction CostsAdditional TV Inspection and Analysis 1 LS 12500 $12,500Pipeburst VCP/Unknown piping (could potentially use CIPP but don't know until do more study) 1926 LF 85 $163,710
check size - most appear 8"; also a lot of 12" and 15"Line manholes estimate - only need about 6 but added 18 more because may be source of inflow 24 EA 1600 $38,400Bypass Pumping 16 Wk 1500 24000
Total $238,61010% Contingency $23,86110% Engineering, Permitting, Admin Fees $23,861Total Construction Cost $286,332
LS 4107 2014 - 2019Overall Condition 3Deficiencies: Hatch not set flush on wetwell - locked but gap allowing odors to escape
Opening/crack in concrete around j tube
Rehabilitation CIP12
Corrosion on pipes in valve vault from ground waterExcessive standing water in valve pitCoal tar coating is coming off of interior of wet wellControl panel frame is leaningMild corrosion on guide rails and DI pipes in wetwellValves will not close
Construction Cost to Rehabilitate Engineer's Opinion of Construction CostsReplace main disconnect, manual transfer switch, and disconnect with generator receptacle;(separated out - install conduit seals between control panel and wetwell) 4200Clear/clean/rehab drain line in valve vault 250 in houseClean/sandblast and repaint piping and valves in valve vault 3750 estReplace 6" plug valves in valve vault 2400 est at $1200 eachInstall coating/liner in wet well 35000 est based on bid tabsBypass Pumping 9600 est at 1200/wk est 2months
Total $55,20010% Contingency $5,520 25000 to abandon existing fill full of concrete/rubble or take out10% Engineering, Permitting, Admin Fees $5,520Total Construction Cost $66,240
4107 Sub-Basin 2019 - 2024 All but 550 LF of the 28,000 LF is PVC - poor construction cause RD I/I?Structural and RD I/I Problems Medium RD I/I
Structural - JRGO 15" PVC 0 PACP Structural; 5 PACP Operational; 12" PVC 0 PACP Structural; 4 PACP OperationalM j it i t f l t d th 5 F t CIPMajor gravity is set for replacement under the 5 yr Future CIP
Construction Cost for Expansion No. Unit Cost/Unit Engineer's Opinion of Construction CostsAdditional TV Inspection and Analysis 1 LS 15000 $15,000Pipeburst PVC piping (could potentially use CIPP but don't know until do more study 3510 LF 85 $298,350
check size - most appear 8"; MTS is 12" and 15"Line manholes estimate - only need about 12 but add more because may be cause inflow 24 EA 1600 $38,400Bypass Pumping 8 Wk 1250 10000 10-15 yr 7099 gpm
Total $361,75010% Contingency $36,17510% Engineering, Permitting, Admin Fees $36,175Total Construction Cost $434,100LS 4109 Construction has already been done. Not Included in CIPOverall Condition PoorDeficiencies: Guiderails about to collapse due to amount of corrosion
Bad corrosion on discharging pipeFluffy corrosion over influent pipe in wetwell
Construction Cost to Rehabilitate Engineer's Opinion of Construction CostsElectrical 2100Install new submersible pump station with 5 Hp pumps (not address future growth) 225000 use SSI LS2022 as guide $200k plus add for rehab wetwell to mh and 2nd pumpRehab existing wet well in to manhole 15000Bypass pumping 36000 bypass pumping est at $1500/wk est 6 months for construction
Total $278 100Total $278,10010% Contingency $27,81010% Engineering, Permitting, Admin Fees $27,810Total Construction Cost $333,720
Rehabilitation CIP12

4109 Sub-Basin 2024 - 2029Structural and RD I/I Problems Low RD I/I
Structural - No major gravity sewer
Construction Cost for Expansion No. Unit Cost/Unit Engineer's Opinion of Construction CostsAdditional TV Inspection and Analysis 1 LS 10000 $10,000Pipeburst PVC/Unknown piping (could potentially use CIPP but don't know until do more study 2134 LF 85 $181,418
check size - assume most 8"Line manholes estimate - only need 7 added 25 more because may be source of inflow 32 EA 1600 $51,200Bypass Pumping 8 Wk 1250 10000
Total $252,61810% Contingency $25,26210% Engineering, Permitting, Admin Fees $25,262Total Construction Cost $303,142LS 4110 2014 - 2019Overall Condition 2Deficiencies: DI pipes severely corroded in wetwell & valve vault
Erosion on site (mainly around bypass and gate) Corrosion in valve vault due to standing water - clear drainNeeds to be repaved & put gravel downHose bibbs from well are corroded
Rehabilitation CIP13
Construction Cost to Rehabilitate Engineer's Opinion of Construction Costs(separated out - Install conduit seals between control panel and wetwell) 0Replace 6" DIP discharge piping and bends in wet well with 6" 316 SS 5800 est $500 per bend for 316 ss; est $80/LF for 316 ss sch 10Clean/sandblast and repaint piping and valves in valve vault 3750 estClear/clean/rehab drain line in valve vault 250 in houseBypass Pumping 3400 est $1700/wk for 2 wksRegrade areas of site and put down additional gravel 3130 est 30'x30' site 8.333333 est gravel at $70/cy
Total $16,33010% Contingency $1,63310% Engineering, Permitting, Admin Fees $1,633Total Construction Cost $19,596
4110 Sub-Basin 2024 - 2029Structural and RD I/I Problems Low RD I/I
Structural - No major gravity sewer
Construction Cost for Expansion No. Unit Cost/Unit Engineer's Opinion of Construction CostsAdditional TV Inspection and Analysis 1 LS 30000 $30,000Pipeburst PVC piping (could potentially use CIPP but don't know until do more study 8682 LF 85 $737,998
check size - assume most 8"Li h l ti t l d 30 dd d 30 b b f i fl 60 EA 1600 $96 000Line manholes estimate - only need 30 added 30 more because may be source of inflow 60 EA 1600 $96,000Bypass Pumping 10 Wk 1250 12500
Total $876,49810% Contingency $87,65010% Engineering, Permitting, Admin Fees $87,650Total Construction Cost $1,051,798LS 4118 2009 - 2014Overall Condition 1Deficiencies: HDPE liner - one of electrical pipe penetration seal is bad
Little rust on DI discharge pipe in wet wellConstruction Cost to Rehabilitate Engineer's Opinion of Construction Costs
(separated out - Install conduit seals between control panel and wetwell) 0Rehab bad seal around electrical conduit in HDPE liner - hydraulic cement from outside 1750 any chance under warranty? per TT is what did Neptune Beach -
Total $1,750 inject hydraulic cement from outside of ww - 10% Contingency $175 cement reacts with water; approx $2500/each10% Engineering, Permitting, Admin Fees $175Total Construction Cost $2,100
4118 Sub-BasinStructural and RD I/I Problems Negligible RD I/I
Structural not reviewed TV but PVC and negligible RD I/I imply no problemsStructural -not reviewed TV but PVC and negligible RD I/I - imply no problems
Construction Cost for Expansion No. Unit Cost/Unit Engineer's Opinion of Construction Costs1 LS 0 $0
Total $010% Contingency $010% Engineering, Permitting, Admin Fees $0Total Construction Cost $0
Rehabilitation CIP13

LS 4119 2014 - 2019Overall Condition 1Deficiencies: HDPE seals are not too bad, but appears to be some inflow around
pump discharge penetration (Ramneck is bleeding thru)Corrosion on some DI piping in wetwell
Construction Cost to Rehabilitate Engineer's Opinion of Construction Costs(separated out - Install conduit seals between control panel and wetwell) 0
Total $010% Contingency $010% Engineering, Permitting, Admin Fees $0Total Construction Cost $0
4119 Sub-Basin 2024 - 2029Structural and RD I/I Problems Low RD I/I
Structural - No major gravity sewer
Construction Cost for Expansion No. Unit Cost/Unit Engineer's Opinion of Construction CostsAdditional TV Inspection and Analysis 1 LS 15000 $15,000Pipeburst PVC piping (could potentially use CIPP but don't know until do more study 2880 LF 85 $244,814
check size - assume most 8"$
Rehabilitation CIP14
Line manholes estimate - only need 10 added 25 more because may be source of inflow 35 EA 1600 $56,000Bypass Pumping 10 Wk 1250 12500
Total $328,31410% Contingency $32,83110% Engineering, Permitting, Admin Fees $32,831Total Construction Cost $393,9774124 Sub-Basin 2009 - 2014Structural and RD I/I Problems High RD I/I
Structural - No Major GravityTrans
Construction Cost for Expansion No. Unit Cost/Unit Engineer's Opinion of Construction CostsAdditional TV Inspection and Analysis 1 LS 4500 $4,500CIPP PVC Pipe - appears poor construction (may need Pipeburst but unlikely) 3537 LF 45 $159,150
check size - most appear 8"Line manholes estimate 12 EA 1600 $19,200Bypass Pumping 6 Wk 1250 7500
Total $190,35010% Contingency $19,03510% Engineering, Permitting, Admin Fees $19,035Total Construction Cost $228,420LS 4126 2009 - 2014O ll C diti 1Overall Condition 1Deficiencies: HDPE seams on some pipe penetration allow leaks - not too bad
Construction Cost to Rehabilitate Engineer's Opinion of Construction CostsSeparated out - Install conduit seals between control panel and wetwell 0
Total $010% Contingency $010% Engineering, Permitting, Admin Fees $0Total Construction Cost $0
4126 Sub-Basin 2014 - 2019Structural and RD I/I Problems High RD I/I
Structural -not reviewed TV but similar to 4118 which has offset joints, 1 PACP structural score
Construction Cost for Expansion No. Unit Cost/Unit Engineer's Opinion of Construction CostsAdditional TV Inspection and Analysis 1 LS 5500 $5,500CIPP 8" PVC piping 2081 LF 45 $93,660
check sizeLine manholes estimate 7 EA 1600 $11,200Bypass Pumping 6 Wk 1200 7200
Total $117 560Total $117,56010% Contingency $11,75610% Engineering, Permitting, Admin Fees $11,756Total Construction Cost $141,072
Rehabilitation CIP14

LS 4127 2014 - 2019Overall Condition 1Deficiencies: Some issues with pipe penetration seals @ wetwell liner with potential for I&I (some showing)
Flow monitor in vault is full of ground waterConstruction Cost to Rehabilitate Engineer's Opinion of Construction Costs
Separated out - Install conduit seals between control panel and wetwell 0Repair pipe penetration seal issues by injecting hydraulic cement behind 10000 Est at $2500 for each
Total $10,00010% Contingency $1,00010% Engineering, Permitting, Admin Fees $1,000Total Construction Cost $12,000
4127 Sub-BasinStructural and RD I/I Problems Negligible RD I/I
Structural -not reviewed TV but PVC and negligible RD I/I - imply no problems
Construction Cost for Expansion No. Unit Cost/Unit Engineer's Opinion of Construction Costs1 LS 0 $0
Rehabilitation CIP15
Total $010% Contingency $010% Engineering, Permitting, Admin Fees $0Total Construction Cost $0
Rehabilitation CIP15
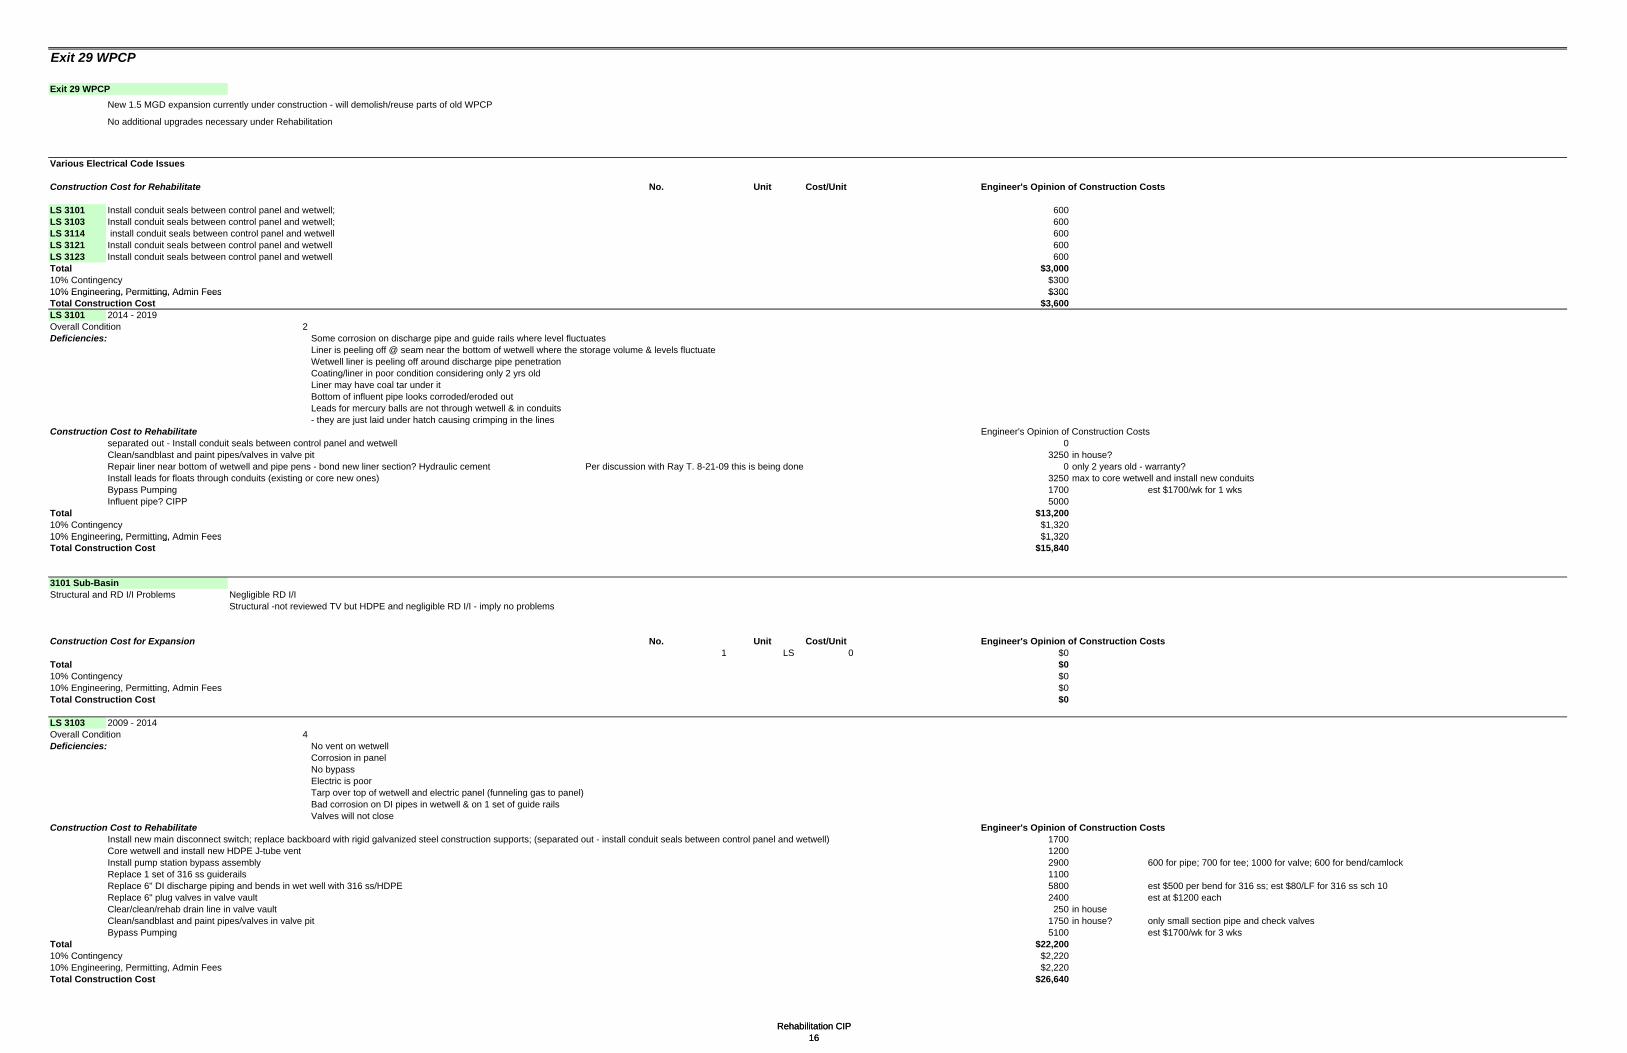
Exit 29 WPCP
Exit 29 WPCPNew 1.5 MGD expansion currently under construction - will demolish/reuse parts of old WPCP
No additional upgrades necessary under Rehabilitation
Various Electrical Code Issues
Construction Cost for Rehabilitate No. Unit Cost/Unit Engineer's Opinion of Construction Costs
LS 3101 Install conduit seals between control panel and wetwell; 600LS 3103 Install conduit seals between control panel and wetwell; 600LS 3114 install conduit seals between control panel and wetwell 600LS 3121 Install conduit seals between control panel and wetwell 600LS 3123 Install conduit seals between control panel and wetwell 600Total $3,00010% Contingency $30010% Engineering, Permitting, Admin Fees $300
Rehabilitation CIP16
10% Engineering, Permitting, Admin Fees $300Total Construction Cost $3,600LS 3101 2014 - 2019Overall Condition 2Deficiencies: Some corrosion on discharge pipe and guide rails where level fluctuates
Liner is peeling off @ seam near the bottom of wetwell where the storage volume & levels fluctuateWetwell liner is peeling off around discharge pipe penetrationCoating/liner in poor condition considering only 2 yrs oldLiner may have coal tar under itBottom of influent pipe looks corroded/eroded outLeads for mercury balls are not through wetwell & in conduits - they are just laid under hatch causing crimping in the lines
Construction Cost to Rehabilitate Engineer's Opinion of Construction Costsseparated out - Install conduit seals between control panel and wetwell 0Clean/sandblast and paint pipes/valves in valve pit 3250 in house?Repair liner near bottom of wetwell and pipe pens - bond new liner section? Hydraulic cement Per discussion with Ray T. 8-21-09 this is being done 0 only 2 years old - warranty?Install leads for floats through conduits (existing or core new ones) 3250 max to core wetwell and install new conduitsBypass Pumping 1700 est $1700/wk for 1 wksInfluent pipe? CIPP 5000
Total $13,20010% Contingency $1,32010% Engineering, Permitting, Admin Fees $1,32010% Engineering, Permitting, Admin Fees $1,320Total Construction Cost $15,840
3101 Sub-BasinStructural and RD I/I Problems Negligible RD I/I
Structural -not reviewed TV but HDPE and negligible RD I/I - imply no problems
Construction Cost for Expansion No. Unit Cost/Unit Engineer's Opinion of Construction Costs1 LS 0 $0
Total $010% Contingency $010% Engineering, Permitting, Admin Fees $0Total Construction Cost $0
LS 3103 2009 - 2014Overall Condition 4Deficiencies: No vent on wetwell
Corrosion in panelNo bypassElectric is poorpTarp over top of wetwell and electric panel (funneling gas to panel)Bad corrosion on DI pipes in wetwell & on 1 set of guide railsValves will not close
Construction Cost to Rehabilitate Engineer's Opinion of Construction CostsInstall new main disconnect switch; replace backboard with rigid galvanized steel construction supports; (separated out - install conduit seals between control panel and wetwell) 1700Core wetwell and install new HDPE J-tube vent 1200Install pump station bypass assembly 2900 600 for pipe; 700 for tee; 1000 for valve; 600 for bend/camlockReplace 1 set of 316 ss guiderails 1100Replace 6" DI discharge piping and bends in wet well with 316 ss/HDPE 5800 est $500 per bend for 316 ss; est $80/LF for 316 ss sch 10Replace 6" plug valves in valve vault 2400 est at $1200 eachClear/clean/rehab drain line in valve vault 250 in houseClean/sandblast and paint pipes/valves in valve pit 1750 in house? only small section pipe and check valvesBypass Pumping 5100 est $1700/wk for 3 wks
Total $22,20010% Contingency $2,22010% Engineering, Permitting, Admin Fees $2,220Total Construction Cost $26,640
Rehabilitation CIP16

3103 Sub-Basin 2024 - 2029Structural and RD I/I Problems Low RD I/I
Structural - No major gravity sewer
Construction Cost for Expansion No. Unit Cost/Unit Engineer's Opinion of Construction CostsAdditional TV Inspection and Analysis 1 LS 12000 $12,000Pipeburst PVC piping (could potentially use CIPP but don't know until do more study 2926 LF 85 $248,724
check size - assume most 8"Line manholes estimate - only need 10 added 25 more because may be source of inflow 35 EA 1600 $56,000Bypass Pumping 10 Wk 1250 12500
Total $329,22410% Contingency $32,92210% Engineering, Permitting, Admin Fees $32,922Total Construction Cost $395,069LS 3114 2009 - 2014Overall Condition 1Deficiencies: Some corrosion on top of 90 deg bend on bypass
6" discharge bypass has no suction - don't have to have oneSome corrosion on DIP discharge pipe, but can still see coating on pipe
Construction Cost to Rehabilitate Engineer's Opinion of Construction CostsSeparated out - Install conduit seals between control panel and wetwell 0
Rehabilitation CIP18
Total $010% Contingency $010% Engineering, Permitting, Admin Fees $0Total Construction Cost $0
3114 Sub-BasinStructural and RD I/I Problems Negligible RD I/I
Structural -not reviewed TV but PVC and negligible RD I/I - imply no problems
Construction Cost for Expansion No. Unit Cost/Unit Engineer's Opinion of Construction Costs1 LS 0 $0
Total $010% Contingency $010% Engineering, Permitting, Admin Fees $0Total Construction Cost $0
LS 3121 2009 - 2014Overall Condition 2Deficiencies: No sign for LS # on gate
1 DI pipe in valve vault with a little corrosionDI i t ll h i ifi t t f iDI in wetwell has a significant amount of corrosion
Construction Cost to Rehabilitate Engineer's Opinion of Construction CostsSeparated out - Install conduit seals between control panel and wetwell 0Bypass Pumping 2400 est $1200/wk for 2 wksReplace 6" DI discharge piping and bends in wet well with 316 ss/HDPE 5800 est $500 per bend for 316 ss; est $80/LF for 316 ss sch 10
Total $8,20010% Contingency $820 25000 to abandon existing fill full of concrete/rubble or take out10% Engineering, Permitting, Admin Fees $820Total Construction Cost $9,840
LS 3123 2014 - 2019Overall Condition 2Deficiencies: Appears to be a lot of groundwater in wetwell, no influent sewage - not sealed properly
Groundwater pouring in over influent pipe - no bootI/I - looks like 5 - 10 gpm estimate
Construction Cost to Rehabilitate Engineer's Opinion of Construction Costs(Separated out - Install conduit seals between control panel and wetwell); relocate main disconnect/rotate on existing pole 500Bypass Pumping 2400 est $1200/wk for 2 wksCost prohibitive to repair seal at bottom of wetwell around influent pipe?? 5500
Total $8,40010% Contingency $84010% Contingency $84010% Engineering, Permitting, Admin Fees $840Total Construction Cost $10,080
Rehabilitation CIP18
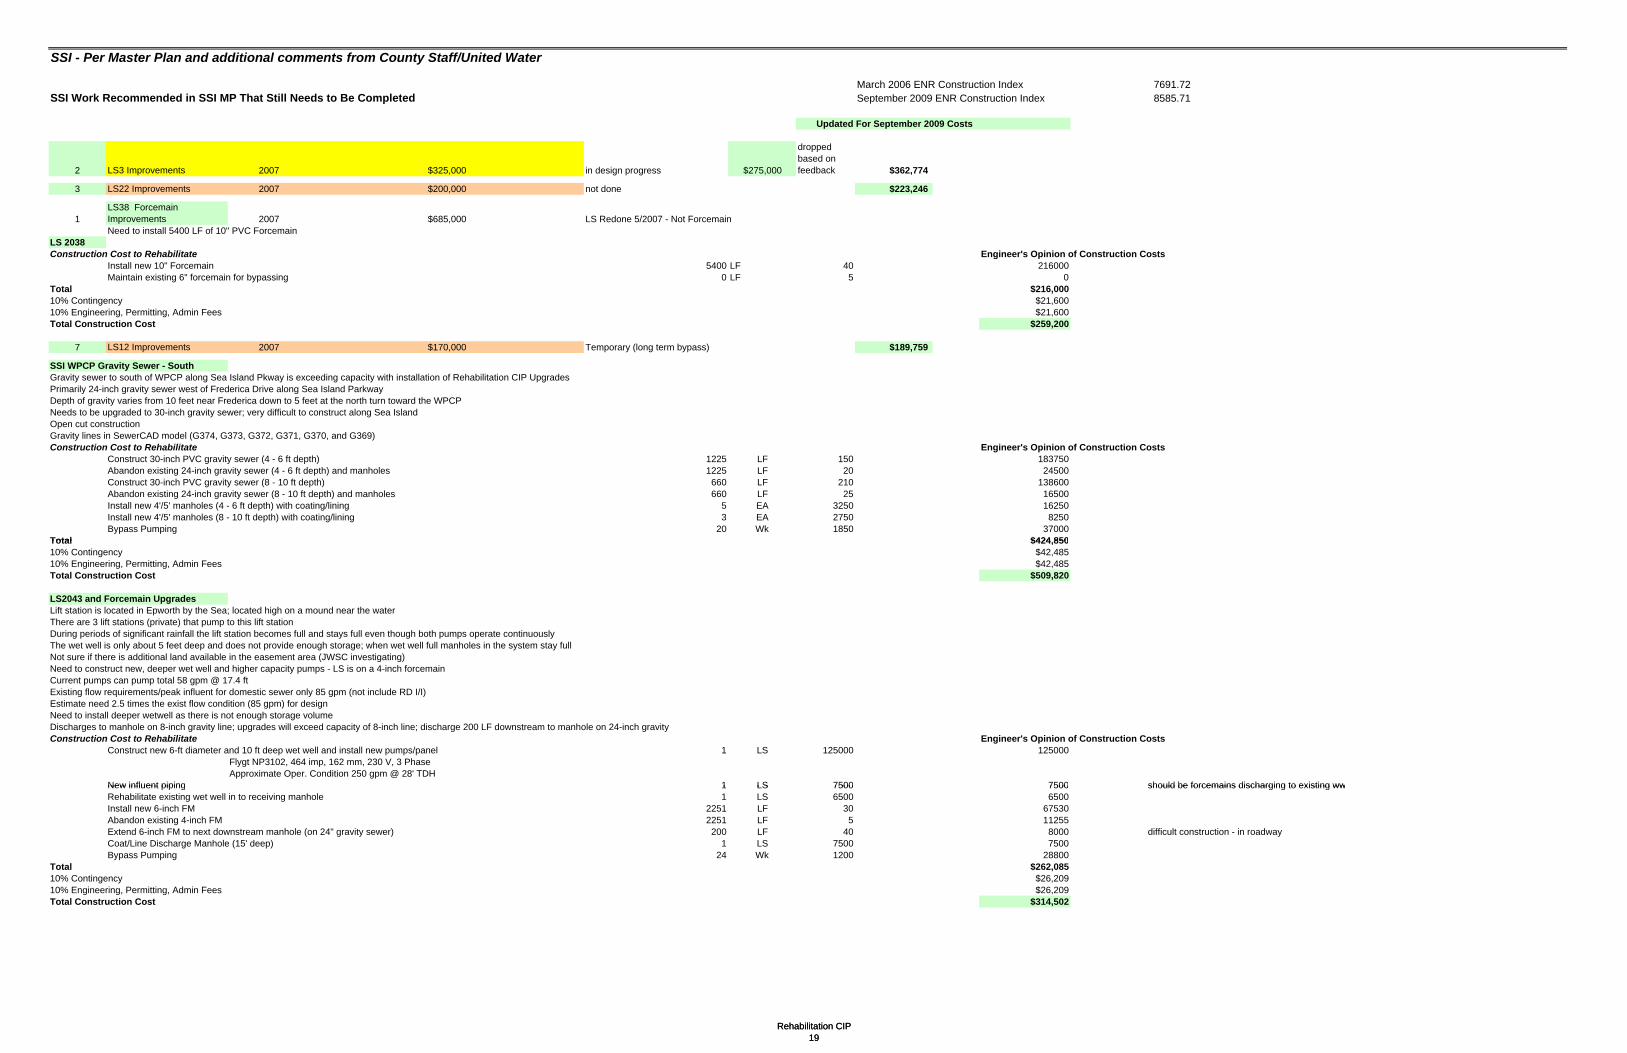
SSI - Per Master Plan and additional comments from County Staff/United Water
March 2006 ENR Construction Index 7691.72SSI Work Recommended in SSI MP That Still Needs to Be Completed September 2009 ENR Construction Index 8585.71
Updated For September 2009 Costs
2 LS3 Improvements 2007 $325,000 in design progress $275,000
dropped based on feedback $362,774
3 LS22 Improvements 2007 $200,000 not done $223,246
1LS38 Forcemain Improvements 2007 $685,000 LS Redone 5/2007 - Not Forcemain
LS 2038Construction Cost to Rehabilitate Engineer's Opinion of Construction Costs
Install new 10" Forcemain 5400 LF 40 216000Maintain existing 6" forcemain for bypassing 0 LF 5 0
Total $216,000
Need to install 5400 LF of 10" PVC Forcemain
Rehabilitation CIP19
,10% Contingency $21,60010% Engineering, Permitting, Admin Fees $21,600Total Construction Cost $259,200
7 LS12 Improvements 2007 $170,000 Temporary (long term bypass) $189,759
SSI WPCP Gravity Sewer - SouthGravity sewer to south of WPCP along Sea Island Pkway is exceeding capacity with installation of Rehabilitation CIP UpgradesPrimarily 24-inch gravity sewer west of Frederica Drive along Sea Island ParkwayDepth of gravity varies from 10 feet near Frederica down to 5 feet at the north turn toward the WPCPNeeds to be upgraded to 30-inch gravity sewer; very difficult to construct along Sea Island Open cut constructionGravity lines in SewerCAD model (G374, G373, G372, G371, G370, and G369)Construction Cost to Rehabilitate Engineer's Opinion of Construction Costs
Construct 30-inch PVC gravity sewer (4 - 6 ft depth) 1225 LF 150 183750Abandon existing 24-inch gravity sewer (4 - 6 ft depth) and manholes 1225 LF 20 24500Construct 30-inch PVC gravity sewer (8 - 10 ft depth) 660 LF 210 138600Abandon existing 24-inch gravity sewer (8 - 10 ft depth) and manholes 660 LF 25 16500Install new 4'/5' manholes (4 - 6 ft depth) with coating/lining 5 EA 3250 16250Install new 4'/5' manholes (8 - 10 ft depth) with coating/lining 3 EA 2750 8250Bypass Pumping 20 Wk 1850 37000
Total $424 850Total $424,85010% Contingency $42,48510% Engineering, Permitting, Admin Fees $42,485Total Construction Cost $509,820
LS2043 and Forcemain UpgradesLift station is located in Epworth by the Sea; located high on a mound near the waterThere are 3 lift stations (private) that pump to this lift stationDuring periods of significant rainfall the lift station becomes full and stays full even though both pumps operate continuouslyThe wet well is only about 5 feet deep and does not provide enough storage; when wet well full manholes in the system stay fullNot sure if there is additional land available in the easement area (JWSC investigating)Need to construct new, deeper wet well and higher capacity pumps - LS is on a 4-inch forcemainCurrent pumps can pump total 58 gpm @ 17.4 ftExisting flow requirements/peak influent for domestic sewer only 85 gpm (not include RD I/I)Estimate need 2.5 times the exist flow condition (85 gpm) for designNeed to install deeper wetwell as there is not enough storage volumeDischarges to manhole on 8-inch gravity line; upgrades will exceed capacity of 8-inch line; discharge 200 LF downstream to manhole on 24-inch gravityConstruction Cost to Rehabilitate Engineer's Opinion of Construction Costs
Construct new 6-ft diameter and 10 ft deep wet well and install new pumps/panel 1 LS 125000 125000Flygt NP3102, 464 imp, 162 mm, 230 V, 3 Phase Approximate Oper. Condition 250 gpm @ 28' TDH
New influent piping 1 LS 7500 7500 should be forcemains discharging to existing wwNew influent piping 1 LS 7500 7500 should be forcemains discharging to existing wwRehabilitate existing wet well in to receiving manhole 1 LS 6500 6500Install new 6-inch FM 2251 LF 30 67530Abandon existing 4-inch FM 2251 LF 5 11255Extend 6-inch FM to next downstream manhole (on 24" gravity sewer) 200 LF 40 8000 difficult construction - in roadwayCoat/Line Discharge Manhole (15' deep) 1 LS 7500 7500Bypass Pumping 24 Wk 1200 28800
Total $262,08510% Contingency $26,20910% Engineering, Permitting, Admin Fees $26,209Total Construction Cost $314,502
Rehabilitation CIP19

10 LS13 Improvements 2008 $175,000 $195,340
6 LS42 Improvements 2007 $100,000 not done $111,623
12 LS26 Improvements 2008 $205,000 $228,827
9 LS8 Improvements 2008 $155,000 $173,015
25 LS28 Improvements 2011 $180,000 $200,921
26 LS35 Improvements 2011 $25,000 plans submitted to JWSC $27,906
5LS41 Forcemain Improvements 2007 $90,000 not done $100,460
11 LS25 Improvements 2008 $195,000 $217,664
13 LS36 Improvements 2008 $95,000 $106,042
14LS32 and Forcemain Improvements 2008 $2,340,000 $2,611,973
LS2045 was upgraded and new gravity sewer was installed along S. Harrington - however there were no recommended up grades to LS2045 under the master plan - the intent was to install a new
forcemain dedicated to LS2032 to alleviate the problems with LS2045
Rehabilitation CIP20
14 Improvements 2008 $2,340,000 $2,611,973
18LS11 Forcemain Improvements 2009 $450,000 LS Completed 5/2007 but Forcemain Not Done $502,302
LS 2011Construction Cost to Rehabilitate Engineer's Opinion of Construction Costs
Install new 8" Forcemain 4200 LF 35 147000Abandon existing 6" Forcemain 2400 LF 5 12000
Total $159,00010% Contingency $15,90010% Engineering, Permitting, Admin Fees $15,900Total Construction Cost $190,800
15 LS57 Improvements 2009 $120,000 Owned by Sea Island - Not Included $133,947
19LS23, Forcemain, and Gravity Sewer Improvements 2009 $640,000 $714,386
20 LS29 Improvements 2010 $240,000 $267,895
LS30 and Forcemain
Need to install 4200 LF of 8" Forcemain
LS2045
22LS30 and Forcemain Improvements 2010 $1,740,000 $1,942,236
LS 2030 Forcemain Extension at SSI WPCPConstruction Cost to Rehabilitate Engineer's Opinion of Construction Costs
Install new 16" Forcemain from Current Discharge Manhole to WPCP 750 LF 55 41250Total $41,25010% Contingency $4,12510% Engineering, Permitting, Admin Fees $4,125FM Total Construction $49,500Total Construction Cost $1,991,736
23 LS54 Improvements 2011 $50,000 $55,811
24 LS1 Improvements 2011 $190,000 $212,083
27 LS40 Improvements 2011 $32,000 $35,719
28 LS51 Improvements 2011 $32,000 $35,719
29 LS53 Improvements 2011 $35,000 $39,068
Sub-Basin 5 RD I/ISub Basin 5 RD I/ICritical RD I/I
Construction Cost for Expansion No. Unit Cost/Unit Engineer's Opinion of Construction CostsAdditional TV Inspection and Analysis 1 LS 40000 $40,000Pipeburst DIP piping (could potentially use CIPP but don't know until do more study) 1400 LF 105 $147,000all of DIP not sure of size so used PB price for 12"Line manholes estimate 5 EA 1600 $8,000Pipeburst PVC piping (could potentially use CIPP but don't know until do more study) 13960 LF 105 $1,465,7481/2 of PVC not sure of size so used PB price for 12"Line manholes estimate 47 EA 1600 $75,200Bypass Pumping 20 Wk 1250 25000
Total $1,760,94810% Contingency $176,09510% Engineering, Permitting, Admin Fees $176,095Total Construction Cost $2,113,137
Rehabilitation CIP20
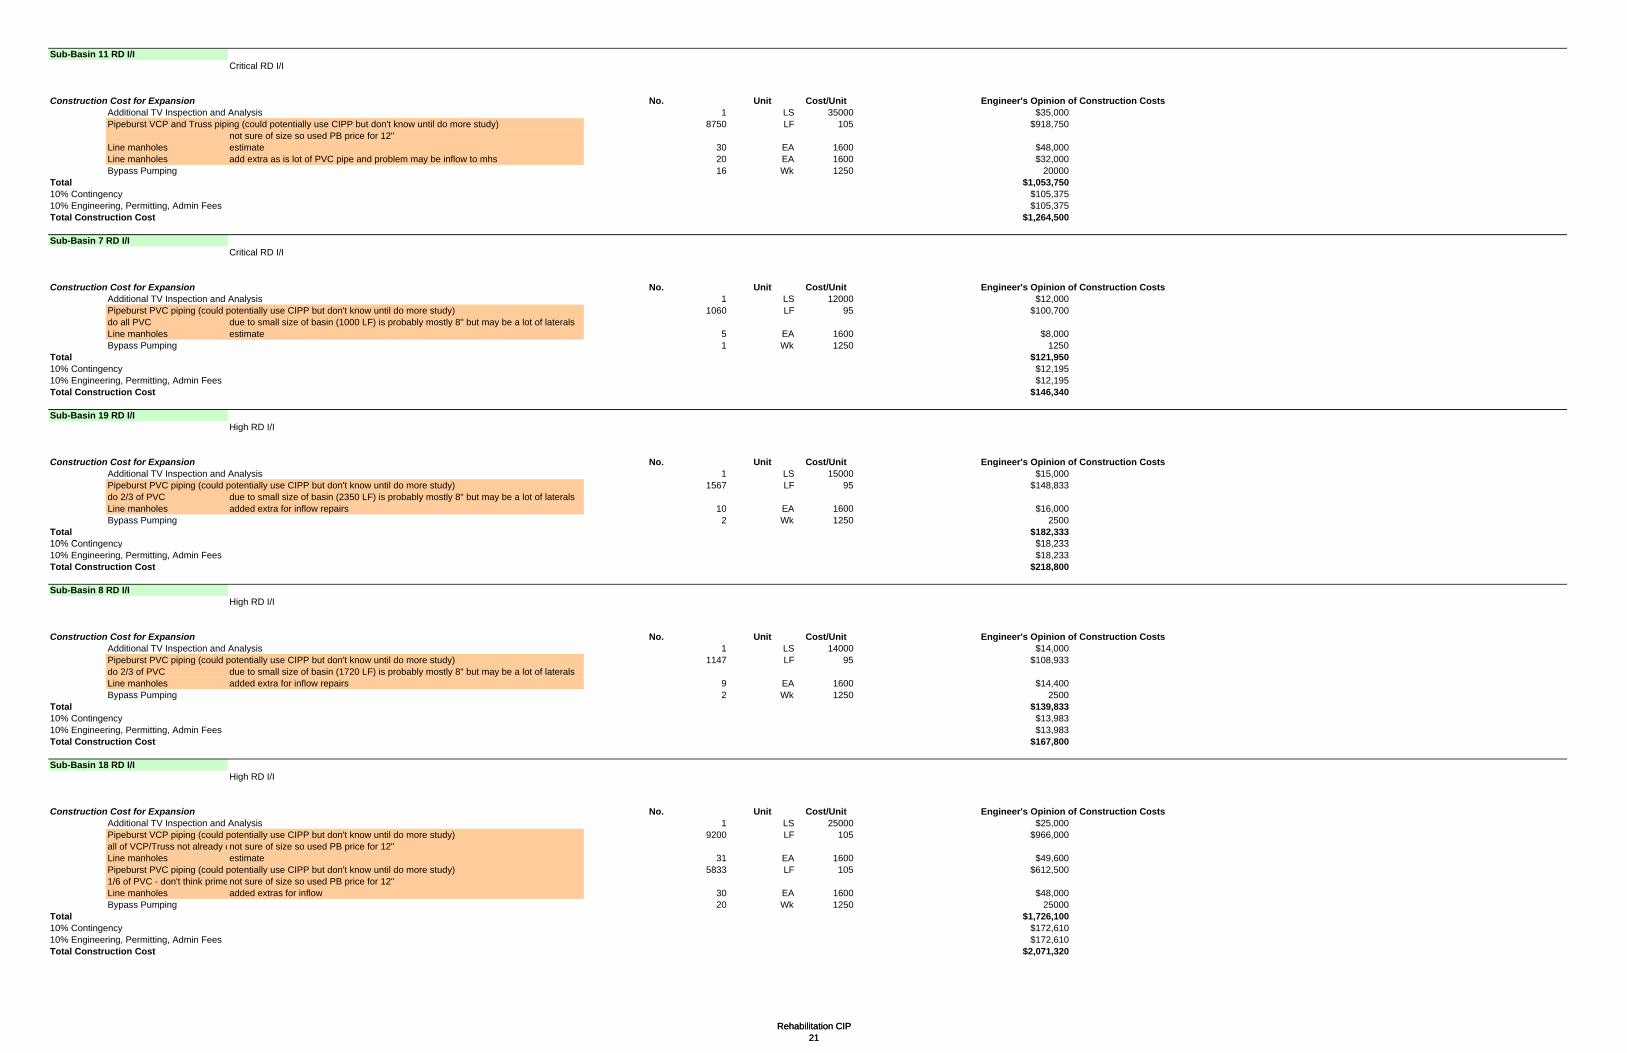
Sub-Basin 11 RD I/ICritical RD I/I
Construction Cost for Expansion No. Unit Cost/Unit Engineer's Opinion of Construction CostsAdditional TV Inspection and Analysis 1 LS 35000 $35,000Pipeburst VCP and Truss piping (could potentially use CIPP but don't know until do more study) 8750 LF 105 $918,750
not sure of size so used PB price for 12"Line manholes estimate 30 EA 1600 $48,000Line manholes add extra as is lot of PVC pipe and problem may be inflow to mhs 20 EA 1600 $32,000Bypass Pumping 16 Wk 1250 20000
Total $1,053,75010% Contingency $105,37510% Engineering, Permitting, Admin Fees $105,375Total Construction Cost $1,264,500
Sub-Basin 7 RD I/ICritical RD I/I
Construction Cost for Expansion No. Unit Cost/Unit Engineer's Opinion of Construction Costs$
Rehabilitation CIP21
Additional TV Inspection and Analysis 1 LS 12000 $12,000Pipeburst PVC piping (could potentially use CIPP but don't know until do more study) 1060 LF 95 $100,700do all PVC due to small size of basin (1000 LF) is probably mostly 8" but may be a lot of lateralsLine manholes estimate 5 EA 1600 $8,000Bypass Pumping 1 Wk 1250 1250
Total $121,95010% Contingency $12,19510% Engineering, Permitting, Admin Fees $12,195Total Construction Cost $146,340
Sub-Basin 19 RD I/IHigh RD I/I
Construction Cost for Expansion No. Unit Cost/Unit Engineer's Opinion of Construction CostsAdditional TV Inspection and Analysis 1 LS 15000 $15,000Pipeburst PVC piping (could potentially use CIPP but don't know until do more study) 1567 LF 95 $148,833do 2/3 of PVC due to small size of basin (2350 LF) is probably mostly 8" but may be a lot of lateralsLine manholes added extra for inflow repairs 10 EA 1600 $16,000Bypass Pumping 2 Wk 1250 2500
Total $182,33310% C ti $18 23310% Contingency $18,23310% Engineering, Permitting, Admin Fees $18,233Total Construction Cost $218,800
Sub-Basin 8 RD I/IHigh RD I/I
Construction Cost for Expansion No. Unit Cost/Unit Engineer's Opinion of Construction CostsAdditional TV Inspection and Analysis 1 LS 14000 $14,000Pipeburst PVC piping (could potentially use CIPP but don't know until do more study) 1147 LF 95 $108,933do 2/3 of PVC due to small size of basin (1720 LF) is probably mostly 8" but may be a lot of lateralsLine manholes added extra for inflow repairs 9 EA 1600 $14,400Bypass Pumping 2 Wk 1250 2500
Total $139,83310% Contingency $13,98310% Engineering, Permitting, Admin Fees $13,983Total Construction Cost $167,800
Sub-Basin 18 RD I/IHigh RD I/I
Construction Cost for Expansion No. Unit Cost/Unit Engineer's Opinion of Construction CostsAdditional TV Inspection and Analysis 1 LS 25000 $25,000Pipeburst VCP piping (could potentially use CIPP but don't know until do more study) 9200 LF 105 $966,000all of VCP/Truss not already dnot sure of size so used PB price for 12"Line manholes estimate 31 EA 1600 $49,600Pipeburst PVC piping (could potentially use CIPP but don't know until do more study) 5833 LF 105 $612,5001/6 of PVC - don't think primenot sure of size so used PB price for 12"Line manholes added extras for inflow 30 EA 1600 $48,000Bypass Pumping 20 Wk 1250 25000
Total $1,726,10010% Contingency $172,61010% Engineering, Permitting, Admin Fees $172,610Total Construction Cost $2,071,320
Rehabilitation CIP21
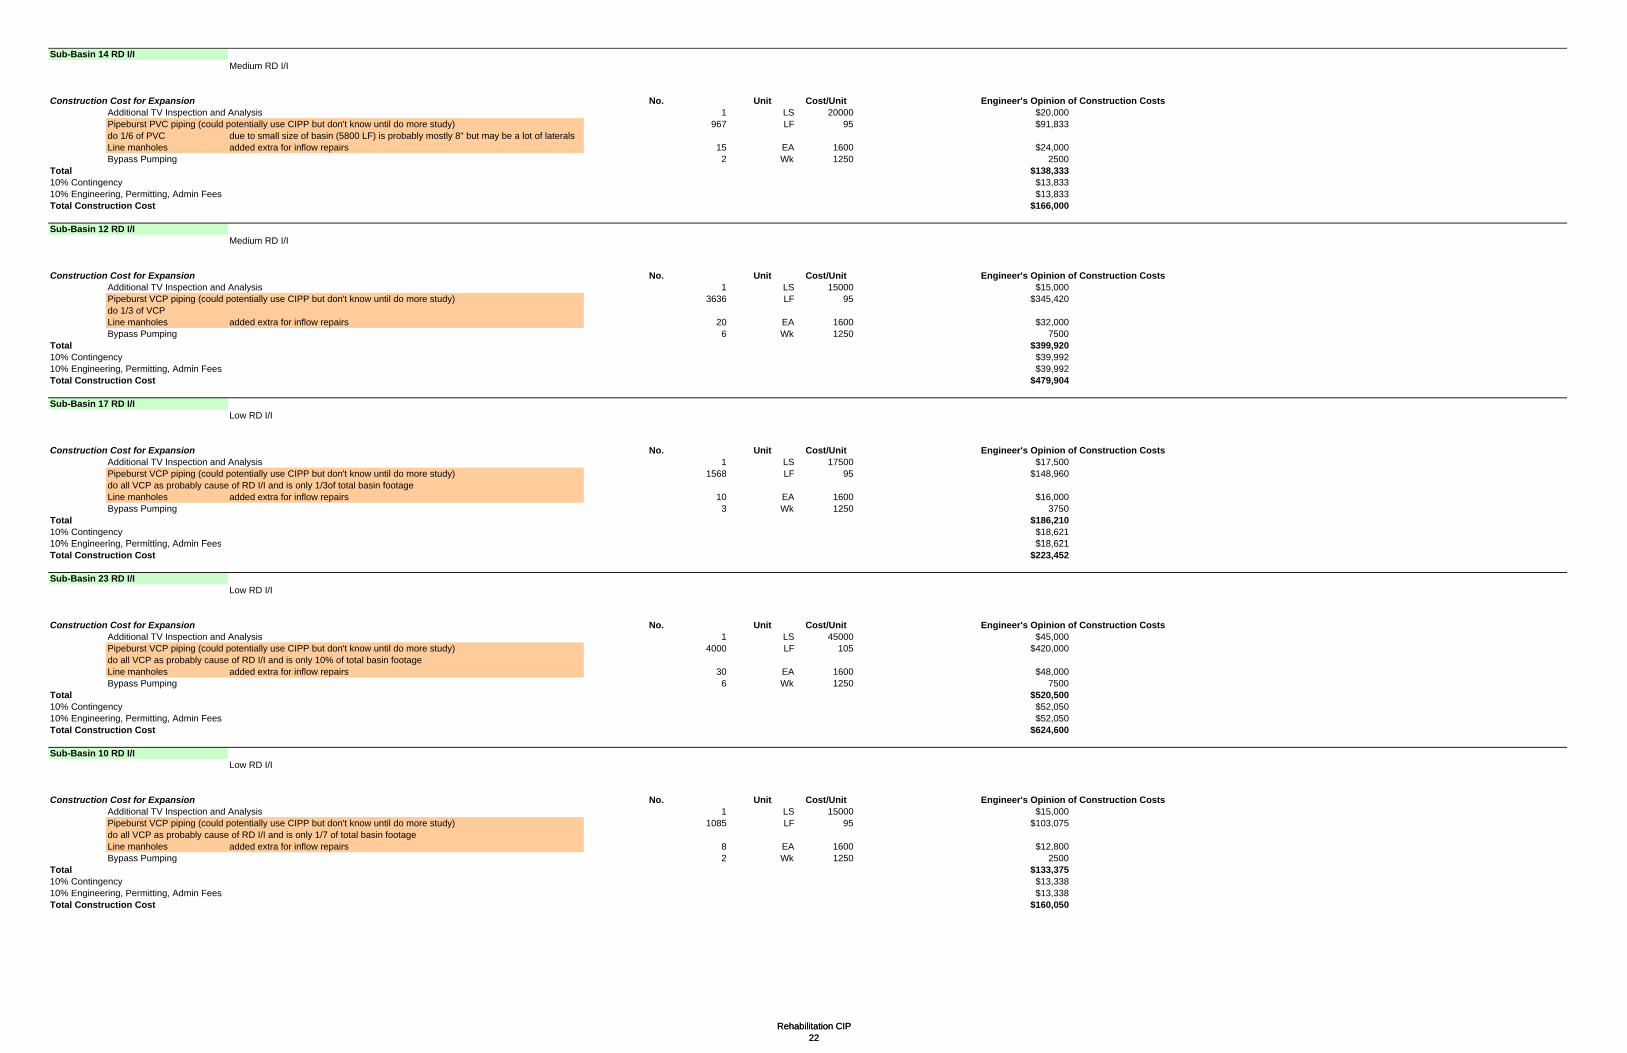
Sub-Basin 14 RD I/IMedium RD I/I
Construction Cost for Expansion No. Unit Cost/Unit Engineer's Opinion of Construction CostsAdditional TV Inspection and Analysis 1 LS 20000 $20,000Pipeburst PVC piping (could potentially use CIPP but don't know until do more study) 967 LF 95 $91,833do 1/6 of PVC due to small size of basin (5800 LF) is probably mostly 8" but may be a lot of lateralsLine manholes added extra for inflow repairs 15 EA 1600 $24,000Bypass Pumping 2 Wk 1250 2500
Total $138,33310% Contingency $13,83310% Engineering, Permitting, Admin Fees $13,833Total Construction Cost $166,000
Sub-Basin 12 RD I/IMedium RD I/I
Construction Cost for Expansion No. Unit Cost/Unit Engineer's Opinion of Construction CostsAdditional TV Inspection and Analysis 1 LS 15000 $15,000
$
Rehabilitation CIP22
Pipeburst VCP piping (could potentially use CIPP but don't know until do more study) 3636 LF 95 $345,420do 1/3 of VCPLine manholes added extra for inflow repairs 20 EA 1600 $32,000Bypass Pumping 6 Wk 1250 7500
Total $399,92010% Contingency $39,99210% Engineering, Permitting, Admin Fees $39,992Total Construction Cost $479,904
Sub-Basin 17 RD I/ILow RD I/I
Construction Cost for Expansion No. Unit Cost/Unit Engineer's Opinion of Construction CostsAdditional TV Inspection and Analysis 1 LS 17500 $17,500Pipeburst VCP piping (could potentially use CIPP but don't know until do more study) 1568 LF 95 $148,960do all VCP as probably cause of RD I/I and is only 1/3of total basin footageLine manholes added extra for inflow repairs 10 EA 1600 $16,000Bypass Pumping 3 Wk 1250 3750
Total $186,21010% Contingency $18,62110% E i i P itti Ad i F $18 62110% Engineering, Permitting, Admin Fees $18,621Total Construction Cost $223,452
Sub-Basin 23 RD I/ILow RD I/I
Construction Cost for Expansion No. Unit Cost/Unit Engineer's Opinion of Construction CostsAdditional TV Inspection and Analysis 1 LS 45000 $45,000Pipeburst VCP piping (could potentially use CIPP but don't know until do more study) 4000 LF 105 $420,000do all VCP as probably cause of RD I/I and is only 10% of total basin footageLine manholes added extra for inflow repairs 30 EA 1600 $48,000Bypass Pumping 6 Wk 1250 7500
Total $520,50010% Contingency $52,05010% Engineering, Permitting, Admin Fees $52,050Total Construction Cost $624,600
Sub-Basin 10 RD I/ILow RD I/I
Construction Cost for Expansion No. Unit Cost/Unit Engineer's Opinion of Construction CostsAdditional TV Inspection and Analysis 1 LS 15000 $15,000Pipeburst VCP piping (could potentially use CIPP but don't know until do more study) 1085 LF 95 $103,075do all VCP as probably cause of RD I/I and is only 1/7 of total basin footageLine manholes added extra for inflow repairs 8 EA 1600 $12,800Bypass Pumping 2 Wk 1250 2500
Total $133,37510% Contingency $13,33810% Engineering, Permitting, Admin Fees $13,338Total Construction Cost $160,050
Rehabilitation CIP22

Sub-Basin 3 RD I/ILow RD I/I
Construction Cost for Expansion No. Unit Cost/Unit Engineer's Opinion of Construction CostsAdditional TV Inspection and Analysis 1 LS 17500 $17,500Pipeburst PVC piping (could potentially use CIPP but don't know until do more study) 2458 LF 95 $233,542do 1/6 of PVC - whole basin is PVCLine manholes added extra for inflow repairs 20 EA 1600 $32,000Bypass Pumping 6 Wk 1250 7500
Total $290,54210% Contingency $29,05410% Engineering, Permitting, Admin Fees $29,054Total Construction Cost $348,650
Sub-Basin 13 RD I/ILow RD I/I
Construction Cost for Expansion No. Unit Cost/Unit Engineer's Opinion of Construction CostsAdditional TV Inspection and Analysis 1 LS 15000 $15,000
$
Rehabilitation CIP23
Pipeburst VCP piping (could potentially use CIPP but don't know until do more study) 1675 LF 95 $159,125do 1/3 of VCP piping (VCP is about 1/2 of total basin piping)Line manholes added extra for inflow repairs 20 EA 1600 $32,000Bypass Pumping 5 Wk 1250 6250
Total $212,37510% Contingency $21,23810% Engineering, Permitting, Admin Fees $21,238Total Construction Cost $254,850
Sub-Basin 4 RD I/ILow RD I/I
Construction Cost for Expansion No. Unit Cost/Unit Engineer's Opinion of Construction CostsAdditional TV Inspection and Analysis 1 LS 15000 $15,000Pipeburst PVC piping (could potentially use CIPP but don't know until do more study) 1510 LF 95 $143,450do 1/6 of PVC - whole basin is PVCLine manholes added extra for inflow repairs 20 EA 1600 $32,000Bypass Pumping 5 Wk 1250 6250
Total $196,70010% Contingency $19,67010% E i i P itti Ad i F $19 67010% Engineering, Permitting, Admin Fees $19,670Total Construction Cost $236,040
Rehabilitation CIP23

Brunswick Glynn County JWSC Applied Technology & Management, Inc.
Water Sewer Master Plan
APPENDIX I -- COST BREAKDOWNS FOR SEWER EXPANSION CIP
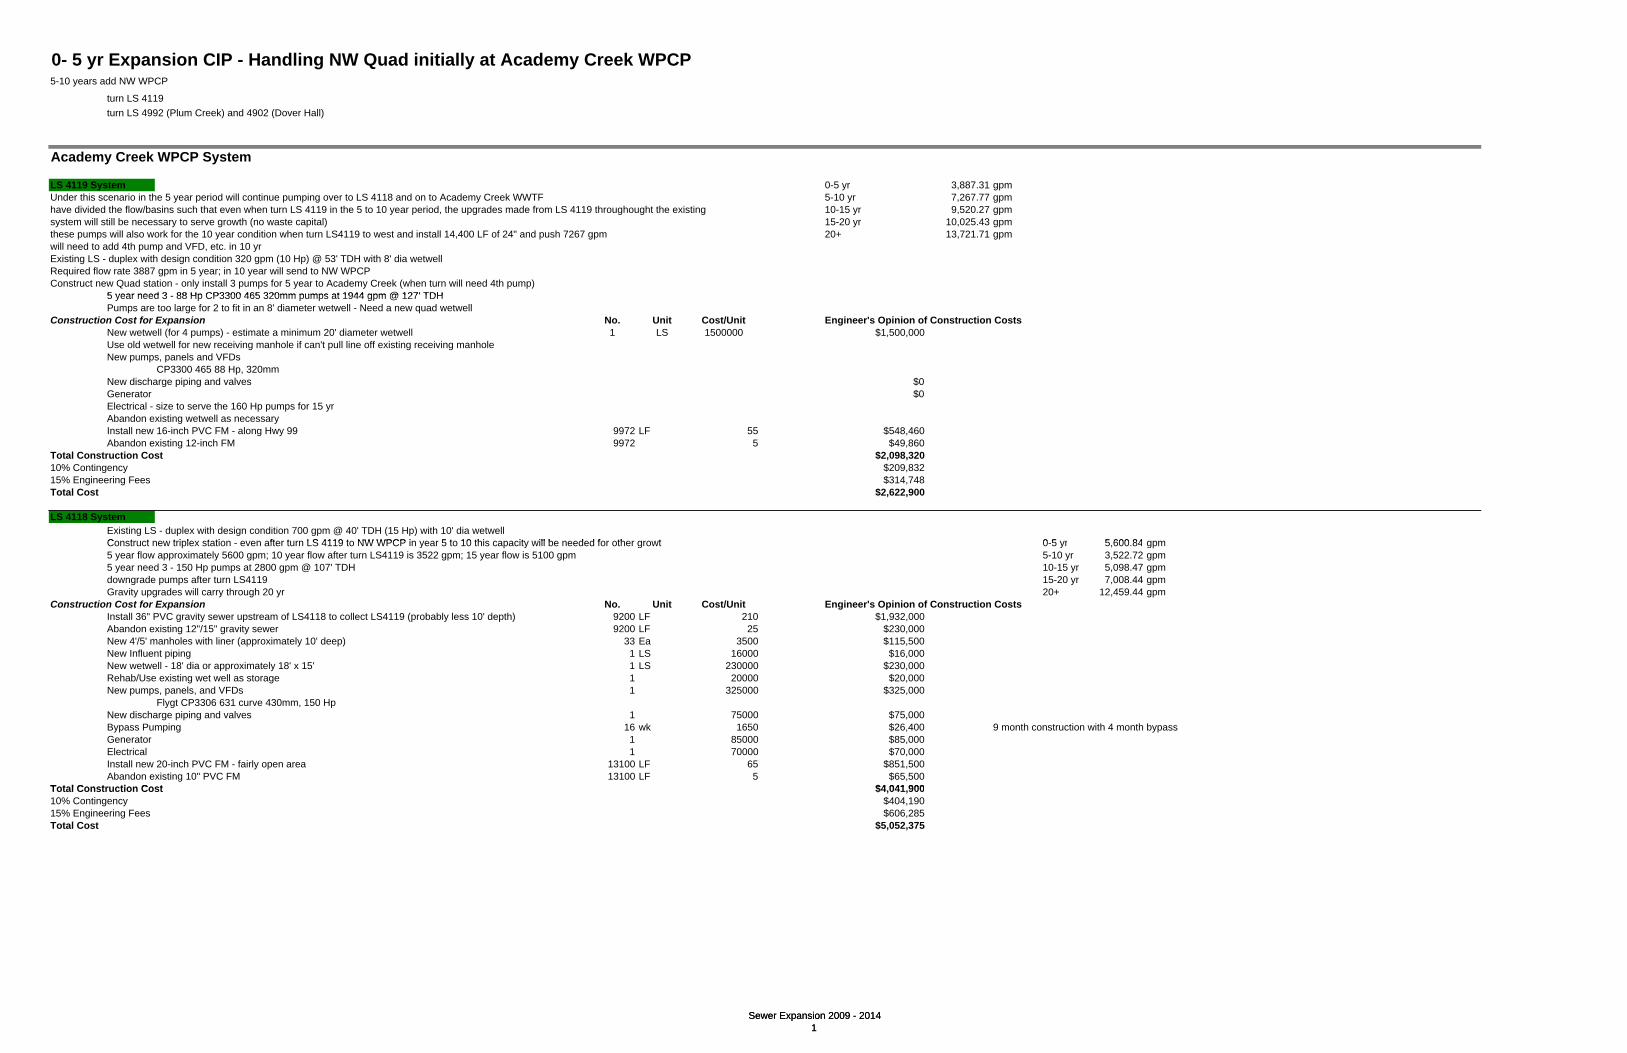
0- 5 yr Expansion CIP - Handling NW Quad initially at Academy Creek WPCP5-10 years add NW WPCP
turn LS 4119turn LS 4992 (Plum Creek) and 4902 (Dover Hall)
Academy Creek WPCP System
LS 4119 System 0-5 yr 3,887.31 gpmUnder this scenario in the 5 year period will continue pumping over to LS 4118 and on to Academy Creek WWTF 5-10 yr 7,267.77 gpmhave divided the flow/basins such that even when turn LS 4119 in the 5 to 10 year period, the upgrades made from LS 4119 throughought the existing 10-15 yr 9,520.27 gpmsystem will still be necessary to serve growth (no waste capital) 15-20 yr 10,025.43 gpmthese pumps will also work for the 10 year condition when turn LS4119 to west and install 14,400 LF of 24" and push 7267 gpm 20+ 13,721.71 gpmwill need to add 4th pump and VFD, etc. in 10 yrExisting LS - duplex with design condition 320 gpm (10 Hp) @ 53' TDH with 8' dia wetwell Required flow rate 3887 gpm in 5 year; in 10 year will send to NW WPCPConstruct new Quad station - only install 3 pumps for 5 year to Academy Creek (when turn will need 4th pump)
5 year need 3 88 Hp CP3300 465 320mm pumps at 1944 gpm @ 127' TDH
Sewer Expansion 2009 - 20141
5 year need 3 - 88 Hp CP3300 465 320mm pumps at 1944 gpm @ 127' TDHPumps are too large for 2 to fit in an 8' diameter wetwell - Need a new quad wetwell
Construction Cost for Expansion No. Unit Cost/Unit Engineer's Opinion of Construction CostsNew wetwell (for 4 pumps) - estimate a minimum 20' diameter wetwell 1 LS 1500000 $1,500,000Use old wetwell for new receiving manhole if can't pull line off existing receiving manholeNew pumps, panels and VFDs
CP3300 465 88 Hp, 320mm New discharge piping and valves $0Generator $0Electrical - size to serve the 160 Hp pumps for 15 yrAbandon existing wetwell as necessaryInstall new 16-inch PVC FM - along Hwy 99 9972 LF 55 $548,460Abandon existing 12-inch FM 9972 5 $49,860
Total Construction Cost $2,098,32010% Contingency $209,83215% Engineering Fees $314,748Total Cost $2,622,900
LS 4118 SystemExisting LS - duplex with design condition 700 gpm @ 40' TDH (15 Hp) with 10' dia wetwellConstruct new triplex station even after turn LS 4119 to NW WPCP in year 5 to 10 this capacity will be needed for other growth 0 5 yr 5 600 84 gpmConstruct new triplex station - even after turn LS 4119 to NW WPCP in year 5 to 10 this capacity will be needed for other growth 0-5 yr 5,600.84 gpm5 year flow approximately 5600 gpm; 10 year flow after turn LS4119 is 3522 gpm; 15 year flow is 5100 gpm 5-10 yr 3,522.72 gpm5 year need 3 - 150 Hp pumps at 2800 gpm @ 107' TDH 10-15 yr 5,098.47 gpmdowngrade pumps after turn LS4119 15-20 yr 7,008.44 gpmGravity upgrades will carry through 20 yr 20+ 12,459.44 gpm
Construction Cost for Expansion No. Unit Cost/Unit Engineer's Opinion of Construction CostsInstall 36" PVC gravity sewer upstream of LS4118 to collect LS4119 (probably less 10' depth) 9200 LF 210 $1,932,000Abandon existing 12"/15" gravity sewer 9200 LF 25 $230,000New 4'/5' manholes with liner (approximately 10' deep) 33 Ea 3500 $115,500New Influent piping 1 LS 16000 $16,000New wetwell - 18' dia or approximately 18' x 15' 1 LS 230000 $230,000Rehab/Use existing wet well as storage 1 20000 $20,000New pumps, panels, and VFDs 1 325000 $325,000
Flygt CP3306 631 curve 430mm, 150 HpNew discharge piping and valves 1 75000 $75,000Bypass Pumping 16 wk 1650 $26,400 9 month construction with 4 month bypass Generator 1 85000 $85,000Electrical 1 70000 $70,000Install new 20-inch PVC FM - fairly open area 13100 LF 65 $851,500Abandon existing 10" PVC FM 13100 LF 5 $65,500
Total Construction Cost $4 041 900Total Construction Cost $4,041,90010% Contingency $404,19015% Engineering Fees $606,285Total Cost $5,052,375
Sewer Expansion 2009 - 20141

LS 4110 SystemExisting LS - duplex with design condition approx 1100 gpm @ 45' TDH (88 Hp) with 8' dia wetwellRequired 5 year flow 7842gpm; 10 year flow after turn LS4119 is 6538 gpmConstruct new Quad station - will need all new wetwell because influent pipe comes in below pump on in LS4110 now 0-5 yr 7,841.83 gpm5 year needs 4 - 150 Hp ABS pumps at 2614 gpm @ 112' TDH 5-10 yr 6,538.36 gpm
Construction Cost for Expansion No. Unit Cost/Unit Engineer's Opinion of Construction Costs 10-15 yr 8,217.74 gpmInstall new wetwell/submersible pump station 1 LS 450000 450000 15-20 yr 10,217.76 gpmNew Influent 1 LS 50000 50000 20+ 12,459.44 gpmNew pumps, panels and VFDs 1 LS 325000 325000New discharge piping and valves 1 LS 125000 125000 WW is already 35' deep so new WW will have to be Use existing wetwell as storage/receiving manhole 1 LS 25000 25000 deeper to alleviate problem with gravity sewer that surchargesBypass Pumping 20 Wk 1850 37000 9 month construction with 5 month bypass Generator 1 LS 95000 95000Electrical 1 LS 175000 175000Install new 24" PVC FM (exist is 8" and 12") - majority of installation is open land 15400 LF 70 1078000Abandon existing 8"/12" FM 15400 LS 5 77000
Total Construction Cost $2,437,00010% Contingency $243,70015% Engineering Fees $365,550Total Cost $3,046,250
Sewer Expansion 2009 - 20142
$ , ,
LS 4109 System Already Under Construction - Removed from CIP - Completed May 2009Existing LS - duplex with design condition 225 @ 42' TDH (5 Hp) with 6' dia wetwell 0-5 yr 811.00 gpmIn very poor shape - needs to be replaced 5-10 yr 811.00 gpm5 yr flow 811 gpm; 10 yr flow is same 10-15 yr 811.00 gpmInstall new triplex (only need duplex) LS as per JJG design - with new 8" FM achieve approx 800 gpm per pump 15-20 yr 921.00 gpm assume adding in septic flow
Construction Cost for Expansion No. Unit Cost/Unit Engineer's Opinion of Construction Costs 20+ 921.00 gpmConstruct new 12' dia triplex (with 2 installed) LS 1 LS 125000 125000Rehab existing wetwell for storage 1 LS 15000 15000
VFDs? New 47 Hp pumps, panels and VFDs 1 LS 65000 65000New discharge piping and valves 1 LS 22500 22500Bypass Pumping 24 Wk 1200 28800 est at $1200/wk est 6 months for constructionElectrical 1 LS 17500 17500Install new 8-inch PVC FM 6600 LF 30 198000Abandon existing 6" FM 6600 5 33000Pipeburst from 8" gravity to 12" gravity 3150 LF 85 267750
Total Construction Cost $772,55010% Contingency $77,25515% Engineering Fees $115,883Total Construction Cost $965,688$ ,
LS 4039 SystemExisting LS - triplex with design condition 1290 gpm @ 46 TDH (25 Hp) with 10' wetwell 0-5 yr 9,158.99 gpm5 yr flow approx 9159 gpm; 10 yr flow approx 8079 gpm 5-10 yr 8,078.93 gpmConstruct new quad station - use existing wetwell (good condition) for 2 of pumps install new wetwell for other 2 10-15 yr 9,758.31 gpm5 year needs 4 - 90 Hp pumps at 3053 gpm @ 87' TDH - Flygt CP3300 640 Curve 403 imp. 15-20 yr 11,868.33 gpm
Construction Cost for Expansion No. Unit Cost/Unit Engineer's Opinion of Construction Costs 20+ 18,162.71 gpmNew 10' dia wetwell for 2 pumps 1 LS 150000 $150,000Reuse existing 10' dia wetwell for 2 pumps 1 LS 55000 $55,000Influent flow splitting 1 LS 45000 $45,000New triplex pumps, panels and VFDs 1 LS 195000 $195,000
Flygt CP3300 640 curve 403 mm, 90 HpNew discharge piping and valves 1 LS 60000 $60,000Bypass Pumping 20 wks 1700 $34,000 9 month construction with 5 month bypass Generator 1 LS 70000 $70,000Electrical 1 LS 75000 $75,000Install new 24" PVC FM 9160 LF 95 $870,200 installation a little tightAbandon existing 12" FM 9160 LF 5 $45,800Upgrade parshall flume size/capacity (100 LF gravity and manholes) 1 LS 50000 $50,000
Total Construction Cost $1,650,000Total Construction Cost $1,650,00010% Contingency $165,00015% Engineering Fees $247,500Total Construction Cost $2,062,500
Sewer Expansion 2009 - 20142
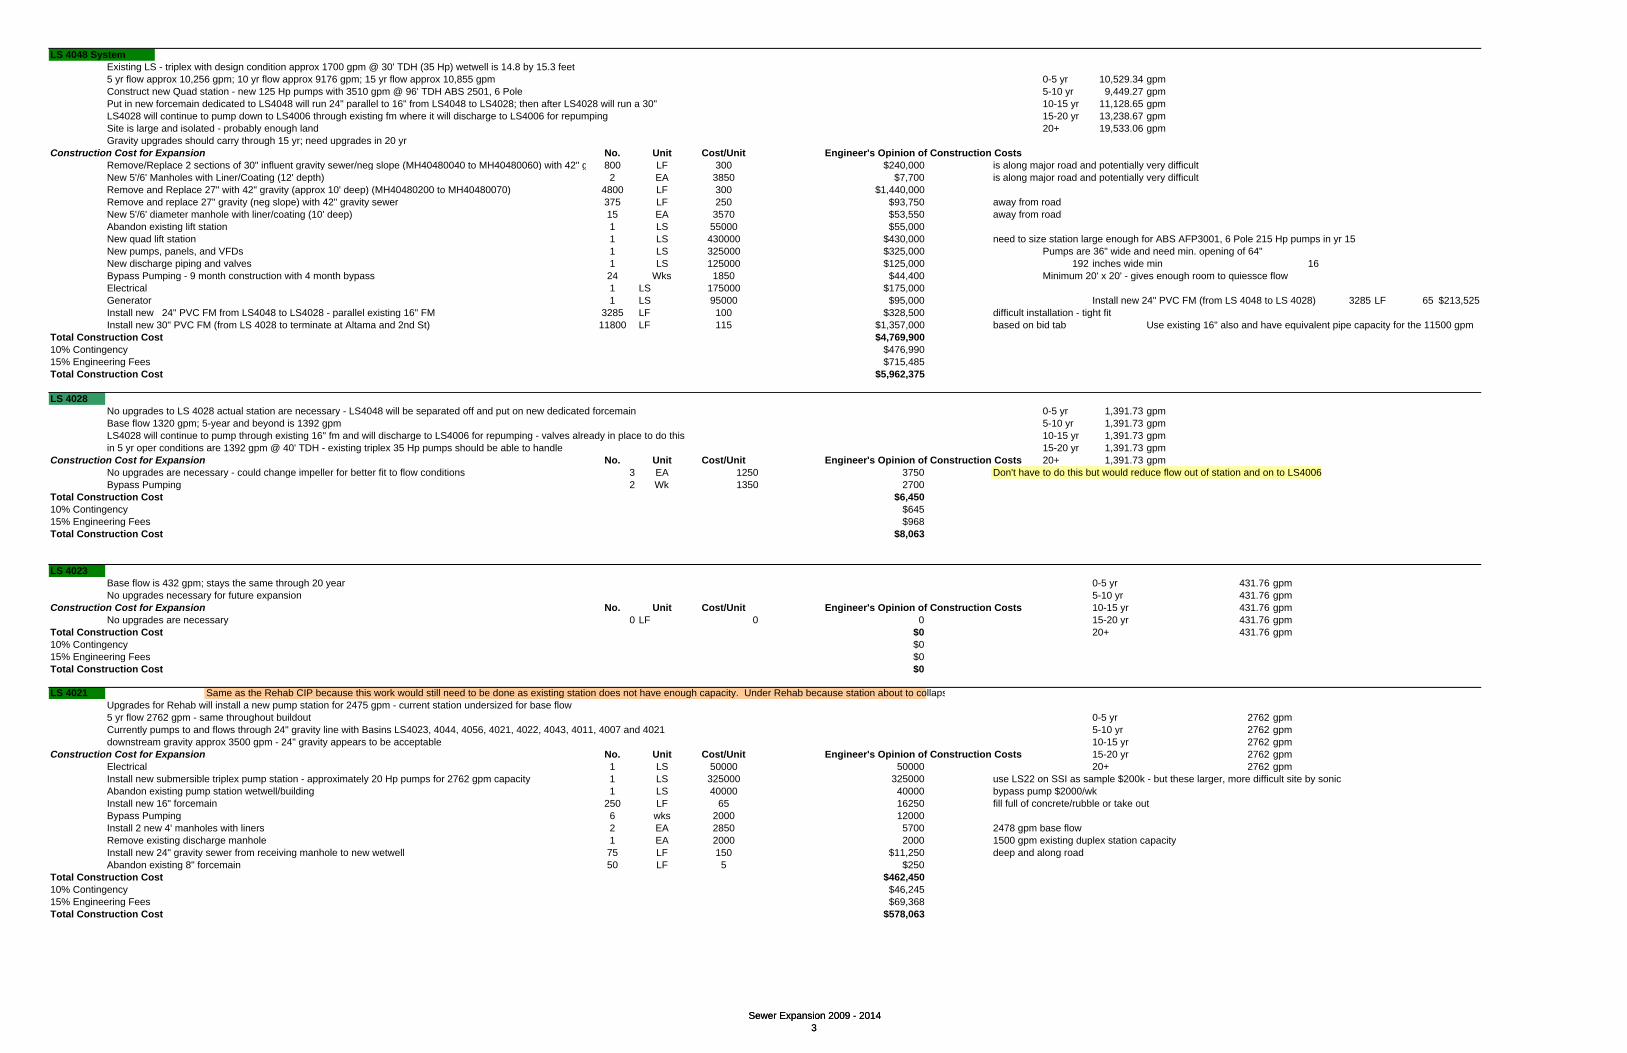
LS 4048 SystemExisting LS - triplex with design condition approx 1700 gpm @ 30' TDH (35 Hp) wetwell is 14.8 by 15.3 feet 5 yr flow approx 10,256 gpm; 10 yr flow approx 9176 gpm; 15 yr flow approx 10,855 gpm 0-5 yr 10,529.34 gpmConstruct new Quad station - new 125 Hp pumps with 3510 gpm @ 96' TDH ABS 2501, 6 Pole 5-10 yr 9,449.27 gpmPut in new forcemain dedicated to LS4048 will run 24" parallel to 16" from LS4048 to LS4028; then after LS4028 will run a 30" 10-15 yr 11,128.65 gpmLS4028 will continue to pump down to LS4006 through existing fm where it will discharge to LS4006 for repumping 15-20 yr 13,238.67 gpmSite is large and isolated - probably enough land 20+ 19,533.06 gpmGravity upgrades should carry through 15 yr; need upgrades in 20 yr
Construction Cost for Expansion No. Unit Cost/Unit Engineer's Opinion of Construction CostsRemove/Replace 2 sections of 30" influent gravity sewer/neg slope (MH40480040 to MH40480060) with 42" g 800 LF 300 $240,000 is along major road and potentially very difficultNew 5'/6' Manholes with Liner/Coating (12' depth) 2 EA 3850 $7,700 is along major road and potentially very difficultRemove and Replace 27" with 42" gravity (approx 10' deep) (MH40480200 to MH40480070) 4800 LF 300 $1,440,000Remove and replace 27" gravity (neg slope) with 42" gravity sewer 375 LF 250 $93,750 away from roadNew 5'/6' diameter manhole with liner/coating (10' deep) 15 EA 3570 $53,550 away from roadAbandon existing lift station 1 LS 55000 $55,000New quad lift station 1 LS 430000 $430,000 need to size station large enough for ABS AFP3001, 6 Pole 215 Hp pumps in yr 15New pumps, panels, and VFDs 1 LS 325000 $325,000 Pumps are 36" wide and need min. opening of 64"New discharge piping and valves 1 LS 125000 $125,000 192 inches wide min 16Bypass Pumping - 9 month construction with 4 month bypass 24 Wks 1850 $44,400 Minimum 20' x 20' - gives enough room to quiessce flowElectrical 1 LS 175000 $175,000
Sewer Expansion 2009 - 20143
Generator 1 LS 95000 $95,000 Install new 24" PVC FM (from LS 4048 to LS 4028) 3285 LF 65 $213,525Install new 24" PVC FM from LS4048 to LS4028 - parallel existing 16" FM 3285 LF 100 $328,500 difficult installation - tight fitInstall new 30" PVC FM (from LS 4028 to terminate at Altama and 2nd St) 11800 LF 115 $1,357,000 based on bid tab Use existing 16" also and have equivalent pipe capacity for the 11500 gpm
Total Construction Cost $4,769,90010% Contingency $476,99015% Engineering Fees $715,485Total Construction Cost $5,962,375
LS 4028No upgrades to LS 4028 actual station are necessary - LS4048 will be separated off and put on new dedicated forcemain 0-5 yr 1,391.73 gpmBase flow 1320 gpm; 5-year and beyond is 1392 gpm 5-10 yr 1,391.73 gpmLS4028 will continue to pump through existing 16" fm and will discharge to LS4006 for repumping - valves already in place to do this 10-15 yr 1,391.73 gpmin 5 yr oper conditions are 1392 gpm @ 40' TDH - existing triplex 35 Hp pumps should be able to handle 15-20 yr 1,391.73 gpm
Construction Cost for Expansion No. Unit Cost/Unit Engineer's Opinion of Construction Costs 20+ 1,391.73 gpmNo upgrades are necessary - could change impeller for better fit to flow conditions 3 EA 1250 3750 Don't have to do this but would reduce flow out of station and on to LS4006Bypass Pumping 2 Wk 1350 2700
Total Construction Cost $6,45010% Contingency $64515% Engineering Fees $968Total Construction Cost $8,063
LS 4023Base flow is 432 gpm; stays the same through 20 year 0-5 yr 431.76 gpmNo upgrades necessary for future expansion 5-10 yr 431.76 gpm
Construction Cost for Expansion No. Unit Cost/Unit Engineer's Opinion of Construction Costs 10-15 yr 431.76 gpmNo upgrades are necessary 0 LF 0 0 15-20 yr 431.76 gpm
Total Construction Cost $0 20+ 431.76 gpm10% Contingency $015% Engineering Fees $0Total Construction Cost $0
LS 4021 Same as the Rehab CIP because this work would still need to be done as existing station does not have enough capacity. Under Rehab because station about to collapsUpgrades for Rehab will install a new pump station for 2475 gpm - current station undersized for base flow5 yr flow 2762 gpm - same throughout buildout 0-5 yr 2762 gpmCurrently pumps to and flows through 24" gravity line with Basins LS4023, 4044, 4056, 4021, 4022, 4043, 4011, 4007 and 4021 5-10 yr 2762 gpmdownstream gravity approx 3500 gpm - 24" gravity appears to be acceptable 10-15 yr 2762 gpm
Construction Cost for Expansion No. Unit Cost/Unit Engineer's Opinion of Construction Costs 15-20 yr 2762 gpmElectrical 1 LS 50000 50000 20+ 2762 gpmInstall new submersible triplex pump station - approximately 20 Hp pumps for 2762 gpm capacity 1 LS 325000 325000 use LS22 on SSI as sample $200k - but these larger, more difficult site by sonic
$Abandon existing pump station wetwell/building 1 LS 40000 40000 bypass pump $2000/wkInstall new 16" forcemain 250 LF 65 16250 fill full of concrete/rubble or take outBypass Pumping 6 wks 2000 12000Install 2 new 4' manholes with liners 2 EA 2850 5700 2478 gpm base flowRemove existing discharge manhole 1 EA 2000 2000 1500 gpm existing duplex station capacityInstall new 24" gravity sewer from receiving manhole to new wetwell 75 LF 150 $11,250 deep and along roadAbandon existing 8" forcemain 50 LF 5 $250
Total Construction Cost $462,45010% Contingency $46,24515% Engineering Fees $69,368Total Construction Cost $578,063
Sewer Expansion 2009 - 20143

LS4006 System Stands alone from Rehab CIP - liner under rehab 0-5 yr 5000 gpmLS4006 will continue to pump the flow from all upstream basins and stations except LS4048; LS4006 will now repump LS4028 5-10 yr 5000 gpmIs not enough depth available to gravity from manhole outside LS4006 down to 2nd Street and on to Academy Creek WPCP unless rip out a lot of structures at WPCP 10-15 yr 5000 gpmWill instead pump LS4006 down to approximate location of LS4010 and install gravity and connect to K Street - will help alleviate problems with no flow and solids deposition in K Street 15-20 yr 5000 gpmWill include demolition of LS4010 in this fee 20+ 5000 gpmExisting triplex pump station with 35 Hp pumpsEvaluated 24" gravity sewer upstream of LS4006 and appears to be adequate for future flows
Construction Cost for Expansion No. Unit Cost/Unit Engineer's Opinion of Construction CostsNew triplex 85 Hp pumps, panels and VFDs 1 LS 185000 $185,000
Flygt NP3301 634 curve, 404mm, 85 HpRemove and replace top slab (may be necessary to provide enough separation for pumps) 1 LS 27500 $27,500 LS4006 dim14.5' x 12.5' inside dimsneed 85 Hp pumps with 18" FM and 70 Hp pumps with 20" FMLiner under rehab CIP 1 LS 0 $0 Flygt NP 3301.180 634 curveNew discharge piping and valves 1 LS 75000 $75,000 85 Hp pumps 2500 gpm @ 81 ft TDHUpgrade Generator 1 LS 75000 $75,000Electrical 1 LS 100000 $100,000Install new 18-inch PVC FM - down to LS4010 area 6250 LF 80 $500,000 very established/congested area for installationAbandon existing 18" FM after LS 4006 site to LS4005 manholes 3090 LF 5 $15,450Bypass Pumping 24 Wks 1850 $44,400 9 month construction with bypasses for 30" gravity main construction and work on LS4006Demolish existing LS4010 1 LS 40000 $40,000Install 30" PVC gravity sewer from location of LS4010 to K Street (along Gordon Rd) (probably less 10' depth) 3145 LF 110 $345,950 105 per bid tab
Sewer Expansion 2009 - 20144
g y ( g ) (p y p pInstall new 4'/5' diameter manholes (probably less than 10' depth) 9 EA 3500 $31,500
Total Construction Cost $1,439,80010% Contingency $143,98015% Engineering Fees $215,970Total Construction Cost $1,799,750
LS4005 SystemBase flow is 326 gpm; will take in some flow from septic areas to north - future flow 394 gpmPer City and Stantec plan - this lift station to be eliminated and gravity sewer to be installed all way to Academy Creek WPCP 0-5 yr 394 gpmAgree with Stantec can do this - but only need to demolish station if remove LS4048, 4028 and 4006 from it because won't operate properly - so listed under future instead of rehab 5-10 yr 394 gpmprobably need to rip out 30" sewer north of LS4005 and lay at higher elevation 10-15 yr 394 gpm
Construction Cost for Expansion No. Unit Cost/Unit Engineer's Opinion of Construction Costs 15-20 yr 394 gpmDemolish existing LS 4005 1 LS 75000 $75,000 20+ 394 gpmVarious Bypass Pumping 16 wk 2750 $44,000 high because is flow route for LS4028, 4006, and 4048Install new 10" PVC gravity sewer (to point where mid of 48" along 2nd Street) 1800 LF 75 $135,000 approx from bid tabsNew 4' manholes with lining ( approx 10 - 12 ft depth) 16 Ea 2750 $44,000Abandon/Remove existing 30" gravity sewer north of LS4005 1600 LF 35 $56,000Install new 10" PVC gravity sewer upstream of LS4005 1639 LF 75 $122,925Install new 8" PVC gravity sewer upstream of LS4005 1392 LF 65 $90,480
Total Construction Cost $567,40510% Contingency $56,74115% Engineering Fees $85,111Total Construction Cost $709,256
LS 4126LS4126 will continue to pump to Academy Creek but in 0-5 yr window will also have flow from Dover Hall (4902/5004) and Plum Creek (4992/5002)5 yr flow 1600 gpm; velocity too hign in existing 10" forcemain10 yr flow 1028 gpm; 15 yr flow 1090 gpm (turned Dover Hall/Plum Creek north in 10 yr) 0-5 yr 1608 gpmExisting station is triplex with design condition of 667 gpm @ 53' - 15 Hp(5 yr with 16" from manifold need 1600 gpm @ 92'/100' TDH) 5-10 yr 1029 gpmNew Master/Regional lift station in Dover Hall (LS4902/5004) will pump to LS 4126- T&H had to manifold with LS 4126 but will not work - too far and would mess up LS 4901 and 4126 10-15 yr 1088 gpmConstruction Cost for Expansion No. Unit Cost/Unit Engineer's Opinion of Construction Costs 15-20 yr 1088 gpm
Upgrade triplex Pumps to 800 gpm @ 91'/100' TDH, 45 Hp Flygt pumps and panel 1 LS 75000 75000 20+ 1088 gpmFlygt NP3202 462 curve 278mm impeller, 45 Hp
New discharge piping, valves, and rails 1 LS 27500 27500Remove and replace top slab (may be necessary to provide enough separation for pumps) 1 LS 17500 $17,500Bypass Pumping 16 Wk 1500 24000Install new 12" FM 8396 LF 50 419800 use higher rate b/c not virgin landInstall new 16" FM 5201 LF 60 $312,060 selected Flyt NP3202 impeller 462 45 Hp Abandon 10" FM 11169 LF 5 $55,845 appears 3 of these will fit in the 10' WW w/ no problem - may have to pull top slab
Total Construction Cost $931,705 9.625 pumps are 22.5"; need 12" space between; need 12" on either side to wetwell wall10% Contingency $93,171 4.1875 pumps are 50.25" long15% Engineering Fees $139,756 Existing wetwell is 10' diameterTotal Construction Cost $1,164,631
Sewer Expansion 2009 - 20144

LS4992 (LS5002 in other scenario) -Plum Creek SiteApprox. 4000LF of FM pumps over to Dover Hall LS4902/5004 0-5 yr 614 gpmincludes basins 4903 and 4904 - is in Plum Creek area and includes Buffalo Creek 5-10 yr 1228 gpm5 year flow is 615 gpm; in 5-10 year window will pump to new WWTF (through Dover Hall LS4902); 10 yr flow approx 1230 gpm; 15 yr flow approx 1450 gpm 10-15 yr 1439 gpmWill pump to Dover Hall for repumping in all cases 15-20 yr 1719 gpmConstruction Cost for Expansion No. Unit Cost/Unit Engineer's Opinion of Construction Costs 20+ 4275 gpm
Install New Triplex Pump Station with 2 pumps initially 1 LS 285000 $285,000Install 10' wetwell
Install 10" Forcemain to LS4902 Dover Hall 4000 LF 40 $160,000Total Construction Cost $445,000 low price due to virgin land10% Contingency $44,50015% Engineering Fees $66,750Total Construction Cost $556,250
LS4902 (LS5004 in other scenario) - Dover Hall Master StationThis lift station will be installed by developer in Dover Hall - will pump to LS4126 via Hwy 99 which will repump on to Academy Creek WPCP 0-5 yr 1044 gpm T&H had to manifold with LS 4126 but will not work - too far and would mess up LS 4126 and 4901 5-10 yr 2472 gpmWas T&H plan to construct single duplex 600 gpm wet well/LS (will build 2nd WW in future) 10-15 yr 3500 gpm5 year flow 1045 gpm (LS4992+LS4902); construct 21120 LF 16" FM to LS 4126 15-20 yr 4940 gpm
Sewer Expansion 2009 - 20145
y gp ( ) y gp10 year flow 2470 gpm; 15 yr flow 3500 gpm (both Dover Hall and Plum creek) 20+ 11059 gpmIn 10 yr window will turn north and pump to LS5001 (23760 LF)Construction Cost for Expansion No. Unit Cost/Unit Engineer's Opinion of Construction Costs
1 LS 350000 $350,000install 12' wetwell
Install new 16" FM 21120 LF 55 $1,161,600 low price due to virgin landDischarge to LS4126 MH 1 LS 7500 $7,500
Total Construction Cost $1,519,10010% Contingency $151,91015% Engineering Fees $227,865Total Construction Cost $1,898,875
LS 4132 System (Hermitage Island) - was 4901 - ATMThis lift station will continue to use the existing flow path to Academy Creek WWTF - LS 4126 north will also utilize itIn 0-5 yr window Dover Hall and Plum Creek will pump to LS4126 which is why need to upgrade the section after manifold to 16" but will still need after turn Dover/Plum in 10 yr5 year flow 616 gpm; 10 year flow 1233 gpm; 15 yr flow 1233 gpm - section after manifold will need upsize but cover under LS4126 0-5 yr 616 gpmExisting station is triplex with pumps 830 gpm @ 64' TDH capacity - 5 yr conditions with 16" FM (616 gpm @ 40'/56' TDH) 5-10 yr 1232 gpmConstruction Cost for Expansion No. Unit Cost/Unit Engineer's Opinion of Construction Costs 10-15 yr 1232 gpm
Existing pumps and 10" up to manifold sufficient for 5 yr but actually have 600 gpm @ 80' TDH capacity - too m 3 LS 1200 $3,600 15-20 yr 1232 gpm
Construct triplex station (large enough for future pumps) with small 500-600 gpm pumps now - can install 1000 gpm pumps on VFDs later
g p p p y y gp @ p y y gpChange Impeller on pumps to Flygt CP3152 248 mm(is under 488 curve - 15 Hp) 20+ 1232 gpmOnly need 2 pumps for 5 yr condition
Bypass Pumping 2 Wks 1000 $2,000Total Construction Cost $5,60010% Contingency $56015% Engineering Fees $840Total Construction Cost $7,000
LS 4127 SystemExisting pumps 1340 gpm @ 57' TDH - existing triplex LS on 12" forcemain5 yr flow 2450 gpm - 5 yr upgrade to 16" FM fine - gives pump oper cond. Of 1200 gpm @ 57' TDH10 yr flow 2700 gpm; 15 yr flow 3000 gpm 0-5 yr 2486 gpmLS4126 continues to LS4127 however in 5-10 yr window Dover Hall and Plum Creek come off of LS4126 and go north 5-10 yr 2725 gpm
10-15 yr 2986 gpmConstruction Cost for Expansion No. Unit Cost/Unit Engineer's Opinion of Construction Costs 15-20 yr 2986 gpm
Existing pumps sufficient for 5 yr with fm upgrades 1 LS 0 $0 20+ 2986 gpmInstall new 16" FM 5600 LF 55 $308,000Abandon 12" FM 5600 LF 5 $28,000
Total Construction Cost $336,00010% Contingency $33,60015% Engineering Fees $50,400Total Construction Cost $420,000
Sewer Expansion 2009 - 20145
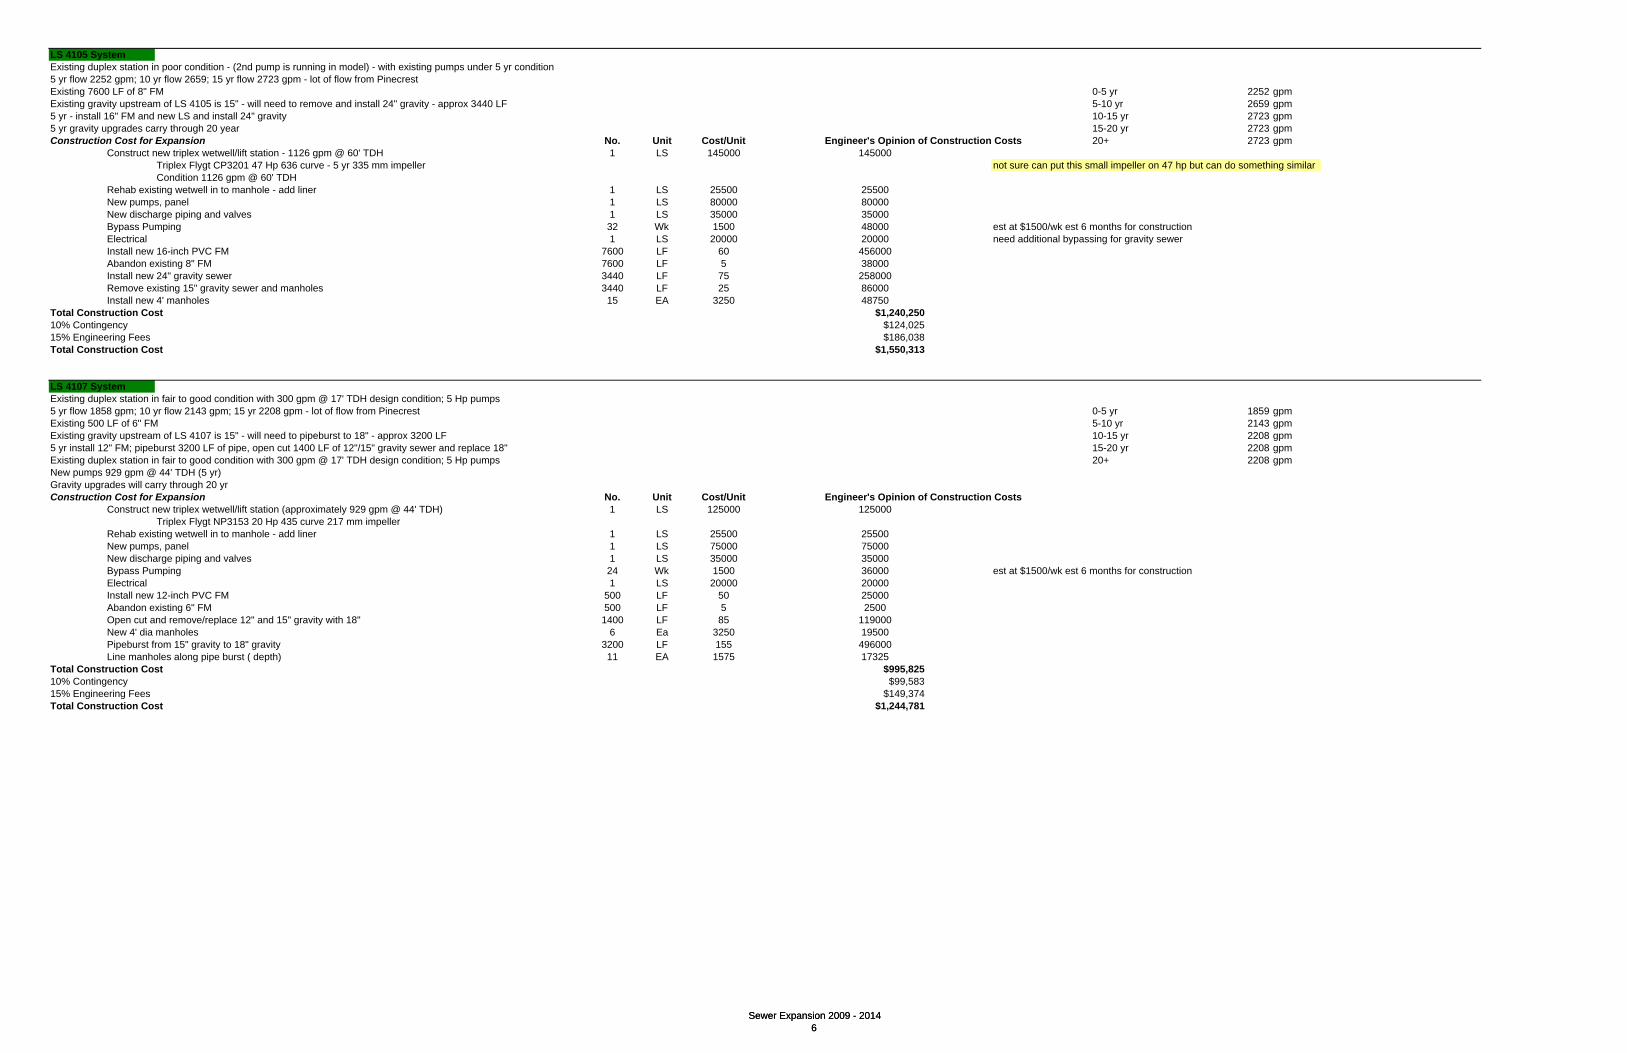
LS 4105 SystemExisting duplex station in poor condition - (2nd pump is running in model) - with existing pumps under 5 yr condition5 yr flow 2252 gpm; 10 yr flow 2659; 15 yr flow 2723 gpm - lot of flow from PinecrestExisting 7600 LF of 8" FM 0-5 yr 2252 gpmExisting gravity upstream of LS 4105 is 15" - will need to remove and install 24" gravity - approx 3440 LF 5-10 yr 2659 gpm5 yr - install 16" FM and new LS and install 24" gravity 10-15 yr 2723 gpm5 yr gravity upgrades carry through 20 year 15-20 yr 2723 gpmConstruction Cost for Expansion No. Unit Cost/Unit Engineer's Opinion of Construction Costs 20+ 2723 gpm
Construct new triplex wetwell/lift station - 1126 gpm @ 60' TDH 1 LS 145000 145000Triplex Flygt CP3201 47 Hp 636 curve - 5 yr 335 mm impeller not sure can put this small impeller on 47 hp but can do something similarCondition 1126 gpm @ 60' TDH
Rehab existing wetwell in to manhole - add liner 1 LS 25500 25500New pumps, panel 1 LS 80000 80000New discharge piping and valves 1 LS 35000 35000Bypass Pumping 32 Wk 1500 48000 est at $1500/wk est 6 months for constructionElectrical 1 LS 20000 20000 need additional bypassing for gravity sewerInstall new 16-inch PVC FM 7600 LF 60 456000Abandon existing 8" FM 7600 LF 5 38000Install new 24" gravity sewer 3440 LF 75 258000Remove existing 15" gravity sewer and manholes 3440 LF 25 86000
Sewer Expansion 2009 - 20146
g g yInstall new 4' manholes 15 EA 3250 48750
Total Construction Cost $1,240,25010% Contingency $124,02515% Engineering Fees $186,038Total Construction Cost $1,550,313
LS 4107 SystemExisting duplex station in fair to good condition with 300 gpm @ 17' TDH design condition; 5 Hp pumps5 yr flow 1858 gpm; 10 yr flow 2143 gpm; 15 yr 2208 gpm - lot of flow from Pinecrest 0-5 yr 1859 gpmExisting 500 LF of 6" FM 5-10 yr 2143 gpmExisting gravity upstream of LS 4107 is 15" - will need to pipeburst to 18" - approx 3200 LF 10-15 yr 2208 gpm5 yr install 12" FM; pipeburst 3200 LF of pipe, open cut 1400 LF of 12"/15" gravity sewer and replace 18" 15-20 yr 2208 gpmExisting duplex station in fair to good condition with 300 gpm @ 17' TDH design condition; 5 Hp pumps 20+ 2208 gpmNew pumps 929 gpm @ 44' TDH (5 yr)Gravity upgrades will carry through 20 yrConstruction Cost for Expansion No. Unit Cost/Unit Engineer's Opinion of Construction Costs
Construct new triplex wetwell/lift station (approximately 929 gpm @ 44' TDH) 1 LS 125000 125000Triplex Flygt NP3153 20 Hp 435 curve 217 mm impeller
Rehab existing wetwell in to manhole - add liner 1 LS 25500 25500gNew pumps, panel 1 LS 75000 75000New discharge piping and valves 1 LS 35000 35000Bypass Pumping 24 Wk 1500 36000 est at $1500/wk est 6 months for constructionElectrical 1 LS 20000 20000Install new 12-inch PVC FM 500 LF 50 25000Abandon existing 6" FM 500 LF 5 2500Open cut and remove/replace 12" and 15" gravity with 18" 1400 LF 85 119000New 4' dia manholes 6 Ea 3250 19500Pipeburst from 15" gravity to 18" gravity 3200 LF 155 496000Line manholes along pipe burst ( depth) 11 EA 1575 17325
Total Construction Cost $995,82510% Contingency $99,58315% Engineering Fees $149,374Total Construction Cost $1,244,781
Sewer Expansion 2009 - 20146

LS 4036 DO we need more wetwell cap put in 10 yrExisting Triplex LS - 3 different pumps5 yr flow 5233 gpm; 10 yr flow 5879 gpm; 15 yr flow 7050 gpmChange imp on 100 Hp pump to 17"5 yr - existing 2154 LF 15/16" FM upgraded to 20" 0-5 yr 5233 gpmGravity is fine for 5 year Existing Pumps (100 HP - 4000 gpm @ 70 TDH) (20 HP 1400 gpm @ 35 TDH) (60 HP - 2800 gpm @ 57 TDH) 5-10 yr 5879 gpmConstruction Cost for Expansion No. Unit Cost/Unit Engineer's Opinion of Construction Costs 10-15 yr 6205 gpm
Install new 20" forcemain 2154 LF 65 140010 15-20 yr 6205 gpmAbandon existing 15"/16" forcemain 2154 LF 5 10770 20+ 6205 gpmChange impeller on 100 Hp pump to 17" (from 19.1875") to provide 4000 gpm @ 40' TDH (runs around 50 Hp) 1 LS 2500 2500
At 5300 gpm in FM get 40' TDH - pumps will give 1200 gpm @ 40' (20 Hp); 2250 gpm @ 40' (60 Hp); 4000 gpm @ 40' (100 Hp)Will have somewhere between approx 4000 gpm and 6000 gpm even with 1 pump out
Install VFDs for 100 Hp and 60 Hp pumps 1 LS 60000 60000Bypass Pumping 24 Wk 1900 45600 est at $1500/wk est 6 months for constructionReplace flow monitor MH40361120 to MH403600M1 - is bottleneck with 10" gravity - need 24" 1 LS 15000 15000
Total Construction Cost $273,88010% Contingency $27,38815% Engineering Fees $41,082Total Construction Cost $342,350
Sewer Expansion 2009 - 20147
LS 4035 may need to start open cutting - 30" and just upsize - not wait til 10-15 yr to upsize as lines are failingExisting Triplex LS - 25 Hp pumps - 2100 gpm @ 30' TDH capacity pumps; run out at 22' TDH station has space for a 4th pump5 yr flow 6078 gpm; 10 yr flow 6722 gpm; 15 yr flow 7050 gpm coul dmake it a quad but probably easier to keep it as a triplexExisting 80 LF 16" FM suction pipe size? It is big enough?5 yr new pumps/possibly rework pumps - change impeller for 10 year new pumps would be 25HP - picked some Flygts - is the possibility that we could just change out the impeller on the Fairbanks Morse 25 Hp that now installed.5 yr upgrade FM to 24"Gravity is 30" and has very steep slope - can take approximately through 10 yr (increase to 36" in 15 Year) 0-5 yr 6078 gpm
5-10 yr 6722 gpmConstruction Cost for Expansion No. Unit Cost/Unit Engineer's Opinion of Construction Costs 10-15 yr 7050 gpm
new pumps - all 3 on VFDs 5 yr condition 3039 gpm @ 19' TDH - Flygt CP3170 606 275 mm 25 hp 1 LS 70000 70000 15-20 yr 7055 gpmNew discharge piping and valves - both Flygt and Fairbanks Morse have 10" discharge - may not need to do 1 LS 47500 47500 20+ 7055 gpmBypass Pumping 16 Wk 1900 30400Install new 24" forcemain 80 LF 70 5600Abandon existing 16" forcemain 80 LF 5 400
Total Construction Cost $153,90010% Contingency $15,39015% Engineering Fees $23,085Total Construction Cost $192,375
LS 4WTP SystemUpgrade from North Interceptor to Academy Creek WPCPcollecting everything but LS4002, LS4003, LS4006 and LS4028
5 yr flow 22,000 gpm; 10 yr flow 21,600 gpm; 15 yr flow 23,300 gpmAt WPCP - will be discharging 48" upgraded pipe from north to trapezoidal junction box; flow from south will connect to MH 4WTP0010 - has what appears to be stubout (abandoned)could make the route south of NW interceptor to WPCP 54" in the 5 yr - question of when the flows will really come?Construction Cost for Expansion No. Unit Cost/Unit Engineer's Opinion of Construction Costs
Remove and replace 18" gravity sewer from MH4WTP340 to MH4WTP440 - has neg slope 50 LF 165 8250Remove and replace 4' diameter manhole with liner MH4WTP340 1 EA 3500 3500 Could use Spirolite for 48" pipe/manholesInstall new 48" PVC gravity sewer (from where collect LS 4017 to intersect Newcastle) along 2nd St (depth 15 4000 LF 400 1600000Install new 48" PVC gravity sewer (from Newcastle and 2nd Street south to WPCP) 2540 LF 425 1079500 Varies throughout basin - can't just use 1 numberNew 5'/6' manholes with lining (depth 15' to 20') 14 EA 7800 109200 0-5 yr 22000 gpmNew 7' manholes with lining (depth 15' to 20') 12 EA 8250 99000 5-10 yr 21600 gpm
use different size manholes as are impacted by number of pipes and angles discharging to MHAbandon existing 18"/24" gravity sewer and manholes 4000 LF 60 $240,000 10-15 yr 23300 gpmAbandon existing 42" gravity sewer 2540 LF 150 381000 15-20 yr gpmUpgrades/modifications to trapezoidal junction box at WPCP - connecting 48" 1 LS 125000 125000 20+ gpmVarious Bypass Pumping 36 wk 2750 99000
Total Construction Cost $3,744,45010% Contingency $374,44515% Engineering Fees $561,668Total Construction Cost $4,680,563
Sewer Expansion 2009 - 20147

LS 4002 Ray concerned about 24" - very old CI - check capacity - Dixville additional flow Existing Station is Duplex and has enough capacity for this flowIs some growth in south of City - need to check and see if need to do these upgrades - take out LS4002 and put in gravity to where LS4003 is now Capacity is approximately 1560 gpm @ 60 Hz 0-5 yr 3512 gpm Liberty HarborBuildout flow we have (for basins LS4001 and 4002) is 4422 gpm - how much more growth? -- Liberty Harbor 5-10 yr 4422 gpm Liberty Harbor
No construction is necessary in 5 year due to future growth (Liberty Harbor, but 24" can handle) - there are issues with both the 24" to the 10-15 yr 4422 gpmeast and the 18" to the south of the LS4002 but this has to do with poor slopes/negative slopes which need to be repaired and deteriorating cast iron pipe 15-20 yr 4422 gpmAdditionally the 24" gravity to the east is cast iron and is in very poor condition 20+ 4422 gpmExisting pumps are only pumping about 1600 gpm @ 65 ft TDH - not enough for existing base or 5 yrConstruction Cost for Expansion No. Unit Cost/Unit Engineer's Opinion of Construction Costs
Replace duplex pumps with larger Goulds NSW 8x8x17LC pumps 1 LS 80000 80000Estimate 100 Hp with 17 inch impeller
Electrical upgrades 1 LS 75000 110000Total Construction Cost $190,00010% Contingency $19,00015% Engineering Fees $28,500Total Construction Cost $237,500
LS4003 This builds on Rehab CIP for LS4003 basinis listed as a rehab project but if bringing flow down from LS4006 and LS4028 and LS4010 to K Street will need to get rid of but use larger gravity pipes than for the rehab projectAssume that because LS4003 rehab needs to be done immediately that this would just build on that - so only worry about gravity sewer, etc. and not demolish lift stationGravity sewer would need to be 48" gravity sewer to serve flow for 9,832 gpm (as opposed to 30" for base flow under Rehab)
Sewer Expansion 2009 - 20148
y g y gp ( ppPer Ray T. line in to LS4003 is higher at WW discharge than in street after K Street Project. Need to decommiss Ls4003 - part of Rehab
Construction Cost for Expansion No. Unit Cost/Unit Engineer's Opinion of Construction Costs Could use Spirolite for 48" pipe/manholesInstall new 48" gravity sewer approximately 18-20' deep 4065 LF 450 $1,829,250
1 LS 8500 $8,500Install new manholes 5'/6' 12 EA 7800 $93,600 0-5 yr 9832 gpm
5-10 yr 9832 gpmTotal Construction Cost $1,931,350 10-15 yr 9832 gpm10% Contingency fz $193,135 15-20 yr 9832 gpm15% Engineering Fees $289,703 20+ 9832 gpmTotal Construction Cost $2,414,188
LS 4WTP - Academy Creek Influent Lift StationNo upgrades necessary for future expansion - entire facility designed for 13.5 MGDPump capacity is 5900 gpm - 4 pumps - 3 in operation have 25 MGD capacity - there are equalization areas at the WPCP - should be sufficient
Construction Cost for Expansion No. Unit Cost/Unit Engineer's Opinion of Construction CostsNo upgrades are necessary 0 LS 0 0
Total Construction Cost $010% Contingency $015% Engineering Fees $0
Connect LS4002 forcemain to gravity - will need to leave stubout for later connection to 24" gravity sewer that replace LS4002
g g $Total Construction Cost $0
LS 4017No upgrades necessary for future expansion 0-5 yr 940 gpmOnly rehab upgrades 5-10 yr 940 gpm
Construction Cost for Expansion No. Unit Cost/Unit Engineer's Opinion of Construction Costs 10-15 yr 940 gpm1 LS 0 0 15-20 yr 940 gpm
Total Construction Cost $0 20+ 940 gpm10% Contingency $015% Engineering Fees $0Total Construction Cost $0
Sewer Expansion 2009 - 20148
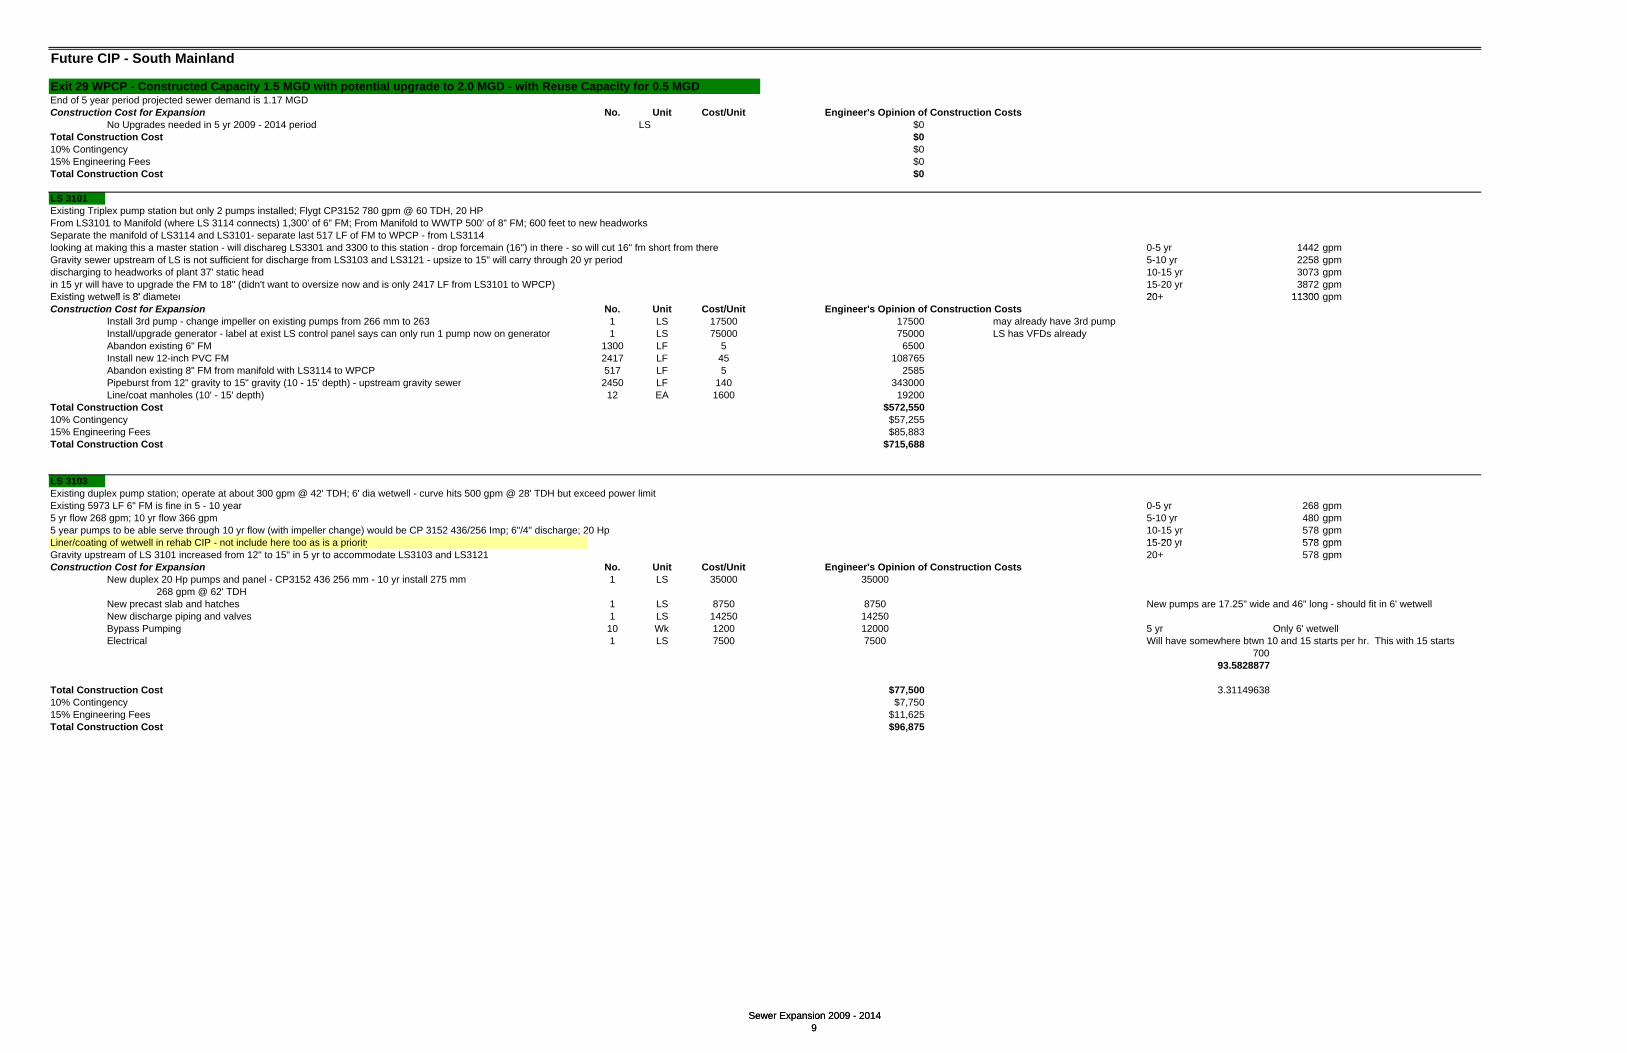
Future CIP - South Mainland
Exit 29 WPCP - Constructed Capacity 1.5 MGD with potential upgrade to 2.0 MGD - with Reuse Capacity for 0.5 MGDEnd of 5 year period projected sewer demand is 1.17 MGDConstruction Cost for Expansion No. Unit Cost/Unit Engineer's Opinion of Construction Costs
No Upgrades needed in 5 yr 2009 - 2014 period LS $0Total Construction Cost $010% Contingency $015% Engineering Fees $0Total Construction Cost $0
LS 3101Existing Triplex pump station but only 2 pumps installed; Flygt CP3152 780 gpm @ 60 TDH, 20 HPFrom LS3101 to Manifold (where LS 3114 connects) 1,300’ of 6” FM; From Manifold to WWTP 500’ of 8” FM; 600 feet to new headworksSeparate the manifold of LS3114 and LS3101- separate last 517 LF of FM to WPCP - from LS3114looking at making this a master station - will dischareg LS3301 and 3300 to this station - drop forcemain (16") in there - so will cut 16" fm short from there 0-5 yr 1442 gpmGravity sewer upstream of LS is not sufficient for discharge from LS3103 and LS3121 - upsize to 15" will carry through 20 yr period 5-10 yr 2258 gpmdischarging to headworks of plant 37' static head 10-15 yr 3073 gpmin 15 yr will have to upgrade the FM to 18" (didn't want to oversize now and is only 2417 LF from LS3101 to WPCP) 15-20 yr 3872 gpmExisting wetwell is 8' diameter 20+ 11300 gpm
Sewer Expansion 2009 - 20149
Existing wetwell is 8' diameter 20+ 11300 gpmConstruction Cost for Expansion No. Unit Cost/Unit Engineer's Opinion of Construction Costs
Install 3rd pump - change impeller on existing pumps from 266 mm to 263 1 LS 17500 17500 may already have 3rd pumpInstall/upgrade generator - label at exist LS control panel says can only run 1 pump now on generator 1 LS 75000 75000 LS has VFDs alreadyAbandon existing 6" FM 1300 LF 5 6500Install new 12-inch PVC FM 2417 LF 45 108765Abandon existing 8" FM from manifold with LS3114 to WPCP 517 LF 5 2585Pipeburst from 12" gravity to 15" gravity (10 - 15' depth) - upstream gravity sewer 2450 LF 140 343000Line/coat manholes (10' - 15' depth) 12 EA 1600 19200
Total Construction Cost $572,55010% Contingency $57,25515% Engineering Fees $85,883Total Construction Cost $715,688
LS 3103Existing duplex pump station; operate at about 300 gpm @ 42' TDH; 6' dia wetwell - curve hits 500 gpm @ 28' TDH but exceed power limitExisting 5973 LF 6" FM is fine in 5 - 10 year 0-5 yr 268 gpm5 yr flow 268 gpm; 10 yr flow 366 gpm 5-10 yr 480 gpm5 year pumps to be able serve through 10 yr flow (with impeller change) would be CP 3152 436/256 Imp; 6"/4" discharge; 20 Hp 10-15 yr 578 gpmLiner/coating of wetwell in rehab CIP not include here too as is a priority 15 20 yr 578 gpmLiner/coating of wetwell in rehab CIP - not include here too as is a priority 15-20 yr 578 gpmGravity upstream of LS 3101 increased from 12" to 15" in 5 yr to accommodate LS3103 and LS3121 20+ 578 gpmConstruction Cost for Expansion No. Unit Cost/Unit Engineer's Opinion of Construction Costs
New duplex 20 Hp pumps and panel - CP3152 436 256 mm - 10 yr install 275 mm 1 LS 35000 35000268 gpm @ 62' TDH
New precast slab and hatches 1 LS 8750 8750 New pumps are 17.25" wide and 46" long - should fit in 6' wetwellNew discharge piping and valves 1 LS 14250 14250Bypass Pumping 10 Wk 1200 12000 5 yr Only 6' wetwellElectrical 1 LS 7500 7500 Will have somewhere btwn 10 and 15 starts per hr. This with 15 starts
70093.5828877
Total Construction Cost $77,500 3.3114963810% Contingency $7,75015% Engineering Fees $11,625Total Construction Cost $96,875
Sewer Expansion 2009 - 20149

LS 3114Existing duplex pump station w/ 8' dia ww; manifolds with LS3101 near Exit 29 WWTF 0-5 yr 1,151.85 gpm 55' TDHExisting FM from LS3114 to Manifold (where LS 3101connects) 2,857’ of 6” FM 5-10 yr 1,872.08 gpm 67.5From Manifold to WPCP 500’ of 8” FM (add 600' for new WPCP site) 10-15 yr 2,685.21 gpm 85Existing Flygt CP 3127 483 Imp 10 Hp pumps existing; 350 gpm @ 45' 15-20 yr 3,300.57 gpmSeparating LS3114 and LS3101 - each have own forcemain 20+ 8,982.02 gpmMaking this a master pump station and will clip forcemains from LS3123, 3129 and Peninsula LS at new manhole at intersection with US 175 yr pumps 575 gpm @ 61'; 10 yr 936 @ 86' clipping the 16" Peninsula forcemain at the north manhole - will improve head conditionclipping the forcemain from 3123 and 3129 at the manhole also or at one right downstream - improve head condition give more capacityNeed 18"/21" gravity sewer handles through 10 year; 24"/30" will take through 20 yrConstruction Cost for Expansion No. Unit Cost/Unit Engineer's Opinion of Construction Costs
Install new receiving manhole on LS site (18' deep) with liner 1 EA 6250 6250Tie in 2 other existing gravity sewer pipes discharging to LS3114 1 LS 15000 $15,000Install new influent 24" gravity sewer (18' deep) 250 LF 195 $48,750Existing influent 10" gravity sewer in street to wetwell - to remain in operation - housing to south 250 LF 0 $0 may need to stayConstruct new 12' diameter wetwell with liner/coating (make couple ft deeper for 15 yr pumps) 1 LS 165000 165000New triplex pumps and panel - 15 Hp Flygt CP3152 488 248 in 5 yr 1 LS 100000 100000
Condition 575 gpm @ 61' TDHAbandon/demolish existing wetwell 1 LS 35000 35000
Sewer Expansion 2009 - 201410
gNew discharge piping and valves 1 LS 75000 $75,000Install Generator 1 LS 75000 75000Install new 18" gravity sewer (18-20' deep) 2500 LF 145 362500Install new 21" gravity sewer (18-20' deep) 150 LF 215 32250 priced cheaper because area not as old as LS4002 and 4003 - not as many issuesInstall new 4'/5' dia manholes with liner 8 EA 5750 46000Install new 12-inch PVC FM 3817 LF 50 190850Abandon existing 16" FM from Peninsula at north manhole at US 17 intersection to LS3114 2500 LF 5 12500Abandon existing 6" FM from LS3123/3129 at north manhole at US17 intersection to LS 3114 2500 LF 5 12500Abandon existing 6" FM from LS3114 3817 LF 5 19085 only to where manifold with LS310 3 pumps won't fit in 8' wetwellElectrical - oversize service for 30 Hp pumps in 15 yr 1 LS 30000 30000 132.75Bypass Pumping 20 wk 1500 30000 11.0625
Total Construction Cost $1,255,68510% Contingency $125,56915% Engineering Fees $188,353Total Construction Cost $1,569,606LS 3121Existing duplex pump station; 10 Hp pumps operate at about 350 gpm @ 57' TDH; 6' dia wetwellExisting 3560 LF 6" FM 0-5 yr 362 gpm5 yr flow 362 gpm; 10 yr flow 362 gpm 5-10 yr 362 gpmExisting FM will have enough capacity; new pumps will be able to serve 362 gpm @ 66' TDH 10-15 yr 362 gpmExisting FM will have enough capacity; new pumps will be able to serve 362 gpm @ 66 TDH 10-15 yr 362 gpmLS3121 discharge to LS3101 15-20 yr 362 gpmGravity upstream of LS 3101 increased from 12" to 15" in 5 yr to accommodate LS3103 and LS3121 20+ 362 gpmConstruction Cost for Expansion No. Unit Cost/Unit Engineer's Opinion of Construction Costs
New pumps and panel - 20 Hp Flygt N3152 434 263 in 5 yr 1 LS 35000 27500Condition 362 gpm @ 65' TDH
New precast slab and hatches 1 LS 5500 5500New discharge piping and valves 1 LS 12500 12500Electrical 1 LS 7500 7500Bypass/vacuum truck 4 Wks 575 2300
Total Construction Cost $55,30010% Contingency $5,53015% Engineering Fees $8,295Total Construction Cost $69,125
LS 3123Existing duplex 6' dia wetwell; 20 Hp pumps 230 gpm @ 103' TDHdischarging to new 18" gravity from LS3114 - shorten FM 0-5 yr 179 gpmDo not need to upgrade FM in 5 yr or 10 yr - acceptable for both LS3123 and LS3129 in 5 and 10 yr to leave on 6" forcemain 5-10 yr 289 gpmSplit flow in the area to 2/3 to LS 3123 and 1/3 to LS 3129 10-15 yr 400 gpmExisting FM from LS3123 to Manifold (where LS 3129 connects) 2 907’ of 6” FM 15-20 yr 400 gpmExisting FM from LS3123 to Manifold (where LS 3129 connects) 2,907 of 6 FM 15-20 yr 400 gpmFrom Manifold to manhole 5,916’ of 6” FM 20+ 400 gpm
Construction Cost for Expansion No. Unit Cost/Unit Engineer's Opinion of Construction CostsChange Pumps 1 LS 25000 25000
Operating Condition 5 yr 179 gpm @ 47'/56' (with LS3129)New Pumps - 10 Hp Flygt CP3127 485 curve 200mm pumps acceptable
Total Construction Cost $25,00010% Contingency $2,50015% Engineering Fees $3,750Total Construction Cost $31,250
Sewer Expansion 2009 - 201410

LS 3129 - Satilla Sands Built Alreadyno design information - is proposed pump stationis built per Ray Tarker 0-5 yr 60 gpm
0-5 yr: 116 gpm 5-10 yr 60 gpm5-10 yr: 167 gpm 10-15 yr 60 gpmConstruction Cost for Expansion No. Unit Cost/Unit Engineer's Opinion of Construction Costs 15-20 yr 60 gpm
New duplex pump station recently constructed 2 EA 1150 2300 20+ 60 gpmOperating condition 5 yr 81 gpm @ 21'/65' (with LS3129)Existing Flygt CP3127 483 curve 228 imp 10 Hp pumps are oversized - throw LS3123 offChange impeller to CP3127 432 curve 225mm, 10 Hp
Bypass Pumping 3 Wks 500 1500Total Construction Cost $3,80010% Contingency $38015% Engineering Fees $570Total Construction Cost $4,750
Cobblestone Subdivision - Not including lift station in Future CIP - but if need pricing is below:Based on construction of 24" gravity sewer along South Port Parkway which will discharge to LS3114, a lift station should not be necessary for this subdivisionGravity sewer at South Port Parkway and US-17/Buckswamp Road will be approximately 22' deep (elevation (-)6.0'should be able to gravity sewer Cobblestone and connect - longest run approximately 5400 LF - start 3.67' deep
Sewer Expansion 2009 - 201411
LS 3200 Cobblestone Locate central to subdivisionno design information - is proposed pump station 0-5 yr 139 gpm
5-10 yr 154 gpm10-15 yr 170 gpm15-20 yr 184 gpm
Construction Cost for Expansion No. Unit Cost/Unit Engineer's Opinion of Construction Costs 20+ 318 gpmNew duplex pump station 1 LS 225000 225000
182 gpm @ 25' TDH - Flygt NP3102 5 Hp, 465 curve 152 mmNew 6" forcemain 1500 LF 30 45000
Total Construction Cost $270,000 is proposed so may have already been paid for??10% Contingency $27,00015% Engineering Fees $40,500Total Construction Cost $337,500
LS3301located farthest proposed pump station on northwest area of south mainlanddischarging to LS3300 for repumpingproposed 12" fm on GIS is enough through 15 yr 0-5 yr 573 gpmProposed: 5-10 yr 1122 gpmFrom LS3301 to LS 3300 12,916’ of 12” FM 10-15 yr 1670 gpm
15-20 yr 2322 gpmConstruction Cost for Expansion No. Unit Cost/Unit Engineer's Opinion of Construction Costs 20+ 8646 gpm
New triplex pump station; install 2 pumps initially - 573 gpm @ 40' 1 LS 380000 380000Install Flygt NP3153 437 194 MT 12 Hp but with 10 yr 20 Hp motor (10 yr pump 463-263mm) assume wetwell about 20' deep and 12' diam. - set hatches for future pumps 15 yr
Install new 12" PVC FM 13000 LF 40 520000 virgin landTotal Construction Cost $900,00010% Contingency $90,00015% Engineering Fees $135,000Total Construction Cost $1,125,000
LS3300discharging to LS3101repumps LS3301going to discharge to to LS3101 - make 3101 and 3114 regional master stations 0-5 yr 743 gpmBring in electrical service/gen for 34Hp pumps (will be in 10 yr) 5-10 yr 1460 gpmFor 10 yr attempt to pick pumps that can handle 10 yr and 15 yr with just impeller change 10-15 yr 2178 gpm
15-20 yr 2977 gpm20+ 10405 gpm
Construction Cost for Expansion No Unit Cost/Unit Engineer's Opinion of Construction CostsConstruction Cost for Expansion No. Unit Cost/Unit Engineer's Opinion of Construction CostsNew triplex pump station; install 2 pumps initially - 934 gpm @ 42' 1 LS 425000 425000 made a little more so can make ww bigger to accommodate larger pumps later
Flygt 3152 434-263mm 20 hp and for 30 hp electrical serviceassume wetwell about 20' deep and 14' diam.
Install new 14" PVC FM 14000 LF 45 630000 virgin landTotal Construction Cost $1,055,00010% Contingency $105,50015% Engineering Fees $158,250Total Construction Cost $1,318,750
LS 3302 - out near Peninsula 0-5 yr 373 gpmbased on ATM evaluation do not need this in the 0-5 yr window and unlikely need in 5-10 yr window. Most flow could be pumped directly into 16" fm 5-10 yr 967 gpm
forcemain is already built from Peninsula to LS3114 manhole and can be cut back to discharge in 24" gravity sewer install up to US17/Buckswamp Road and South Port Pkwy 10-15 yr 1653 gpm15-20 yr 2255 gpm20+ 7802 gpm
LS 3303 Terra Nova - not needed for 5 yr conditionmay be intended for repumping of Peninsula
Sewer Expansion 2009 - 201411

SSI - Future Expansion/Growth
Glynn HavenTo collect septic systems - recommended per United Water and Robert Bowen - was previously on Future Development CIP in SSI W/S MPEstimated 62 homes with septic systems - 52 gpmSeptic systems installed 1963 - 1969; high potential for failureInstall new gravity sewer and discharge to existing Glynn Haven gravity sewerAlready recommending I/I improvements in the 5 yr period - this work can be done in conjunction
Construction Cost for Expansion No. Unit Cost/Unit Engineer's Opinion of Construction CostsInstall new 8" gravity sewer (4' to 8' deep) 3900 LF 85 $331,500Install new 4' diameter manholes with lining/coating 11 EA 2975 $32,725Bypass Pumping 6 Wk 1000 6000
Total Construction Cost $370,22510% Contingency $37,02315% Engineering Fees $55,534Total Construction Cost $462,781
St. Clair EstatesTo collect septic systems - recommended per United Water and Robert Bowen - was previously on Future Development CIP in SSI W/S MP
Sewer Expansion 2009 - 201412
To collect septic systems - recommended per United Water and Robert Bowen - was previously on Future Development CIP in SSI W/S MPSeptic systems installed 1965 - 2002; high potential for failures; 62 repairs documented by County as of 2006Estimated 188 homes with septic systems - 157 gpm Install new gravity sewer, lift station, and forcemain and discharge to SSI WPCP
Construction Cost for Expansion No. Unit Cost/Unit Engineer's Opinion of Construction CostsInstall new 8" gravity sewer (4' to 11' deep) 11400 LF 95 1083000install new 4' diameter manholes with lining/coating 32 EA 3250 104000Install new duplex lift station - Flygt CP3127 483 imp, 10 Hp (LSFUT7) 1 LS 175000 175000Install new 6-inch FM 7000 LF 30 210000Bypass Pumping 4 Wk 1000 4000
Total Construction Cost $1,576,00010% Contingency $157,60015% Engineering Fees $236,400Total Construction Cost $1,970,000
St. Simons HeightsTo collect septic systems - was previously on Future Development CIP in SSI W/S MPEstimated 54 homes with septic systems - 54 gpmSeptic systems installed 1963 - 1994; high potential for failuresInstall new gravity sewer and discharge to St Simons Heights existing gravity seweInstall new gravity sewer and discharge to St. Simons Heights existing gravity seweAlready recommending I/I improvements in the 5 yr period - this work can be done in conjunction
Construction Cost for Expansion No. Unit Cost/Unit Engineer's Opinion of Construction CostsInstall new 8" gravity sewer (4' to 8' deep) 2000 LF 85 $170,000Install new 4' diameter manholes with lining/coating 8 EA 2975 $23,800Bypass Pumping 6 Wk 1000 6000
Total Construction Cost $199,80010% Contingency $19,98015% Engineering Fees $29,970Total Construction Cost $249,750
Brick Kiln Point/Epworth Acres/Epworth OaksTo collect septic systems and for new subdivision Epworth Oaks- was previously on Future Development CIP in SSI W/S MPSeptic systems installed 1963 - 2005 (Epworth Acres), 1968 - 1998 (Brick Kiln Point), Epworth Oaks proposed subdivision ; high potential for failures from Brick Kiln Point and Epworth Acres29 septic failures in Epworth Acres as of 2006 - reportedEstimated 135 (10 Brick Kiln Pt, 107 Epworth Acres, 18 Epworth Oaks) homes - 113 gpm Install new gravity sewer, lift station, and forcemain and discharge to LS2030 forcemain
Construction Cost for Expansion No. Unit Cost/Unit Engineer's Opinion of Construction CostsInstall new 8" gravity sewer (4' to 11' deep) 9400 LF 95 893000Install new 8" gravity sewer (4' to 11' deep) 9400 LF 95 893000install new 4' diameter manholes with lining/coating 28 EA 3250 91000Install new duplex lift station - Flygt CP3102 433 imp, 5 Hp (LSFUT1) 1 LS 150000 150000Install new 4-inch FM 270 LF 27.5 7425Bypass Pumping 4 Wk 1000 4000
Total Construction Cost $1,145,42510% Contingency $114,54315% Engineering Fees $171,814Total Construction Cost $1,431,781
Sewer Expansion 2009 - 201412
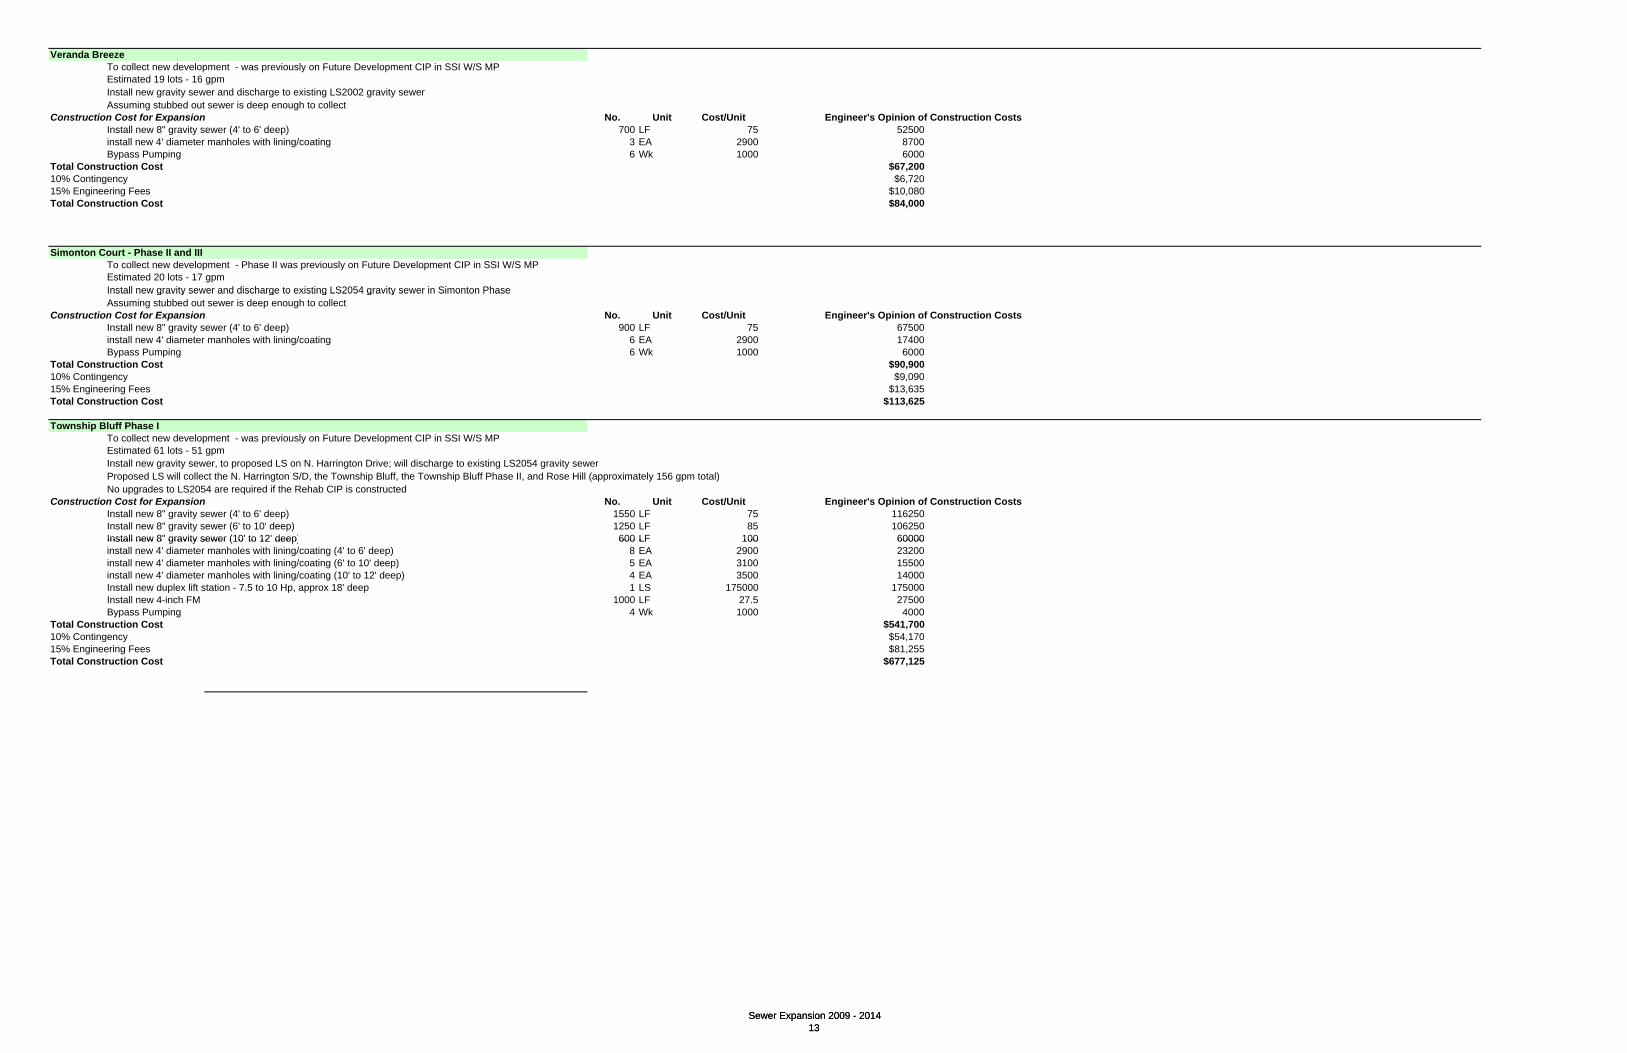
Veranda BreezeTo collect new development - was previously on Future Development CIP in SSI W/S MPEstimated 19 lots - 16 gpm Install new gravity sewer and discharge to existing LS2002 gravity sewerAssuming stubbed out sewer is deep enough to collect
Construction Cost for Expansion No. Unit Cost/Unit Engineer's Opinion of Construction CostsInstall new 8" gravity sewer (4' to 6' deep) 700 LF 75 52500install new 4' diameter manholes with lining/coating 3 EA 2900 8700Bypass Pumping 6 Wk 1000 6000
Total Construction Cost $67,20010% Contingency $6,72015% Engineering Fees $10,080Total Construction Cost $84,000
Simonton Court - Phase II and IIITo collect new development - Phase II was previously on Future Development CIP in SSI W/S MPEstimated 20 lots - 17 gpm Install new gravity sewer and discharge to existing LS2054 gravity sewer in Simonton Phase
Sewer Expansion 2009 - 201413
Install new gravity sewer and discharge to existing LS2054 gravity sewer in Simonton Phase Assuming stubbed out sewer is deep enough to collect
Construction Cost for Expansion No. Unit Cost/Unit Engineer's Opinion of Construction CostsInstall new 8" gravity sewer (4' to 6' deep) 900 LF 75 67500install new 4' diameter manholes with lining/coating 6 EA 2900 17400Bypass Pumping 6 Wk 1000 6000
Total Construction Cost $90,90010% Contingency $9,09015% Engineering Fees $13,635Total Construction Cost $113,625
Township Bluff Phase ITo collect new development - was previously on Future Development CIP in SSI W/S MPEstimated 61 lots - 51 gpm Install new gravity sewer, to proposed LS on N. Harrington Drive; will discharge to existing LS2054 gravity sewer Proposed LS will collect the N. Harrington S/D, the Township Bluff, the Township Bluff Phase II, and Rose Hill (approximately 156 gpm total)No upgrades to LS2054 are required if the Rehab CIP is constructed
Construction Cost for Expansion No. Unit Cost/Unit Engineer's Opinion of Construction CostsInstall new 8" gravity sewer (4' to 6' deep) 1550 LF 75 116250Install new 8" gravity sewer (6' to 10' deep) 1250 LF 85 106250Install new 8" gravity sewer (10' to 12' deep) 600 LF 100 60000Install new 8 gravity sewer (10 to 12 deep) 600 LF 100 60000install new 4' diameter manholes with lining/coating (4' to 6' deep) 8 EA 2900 23200install new 4' diameter manholes with lining/coating (6' to 10' deep) 5 EA 3100 15500install new 4' diameter manholes with lining/coating (10' to 12' deep) 4 EA 3500 14000Install new duplex lift station - 7.5 to 10 Hp, approx 18' deep 1 LS 175000 175000Install new 4-inch FM 1000 LF 27.5 27500Bypass Pumping 4 Wk 1000 4000
Total Construction Cost $541,70010% Contingency $54,17015% Engineering Fees $81,255Total Construction Cost $677,125
Sewer Expansion 2009 - 201413
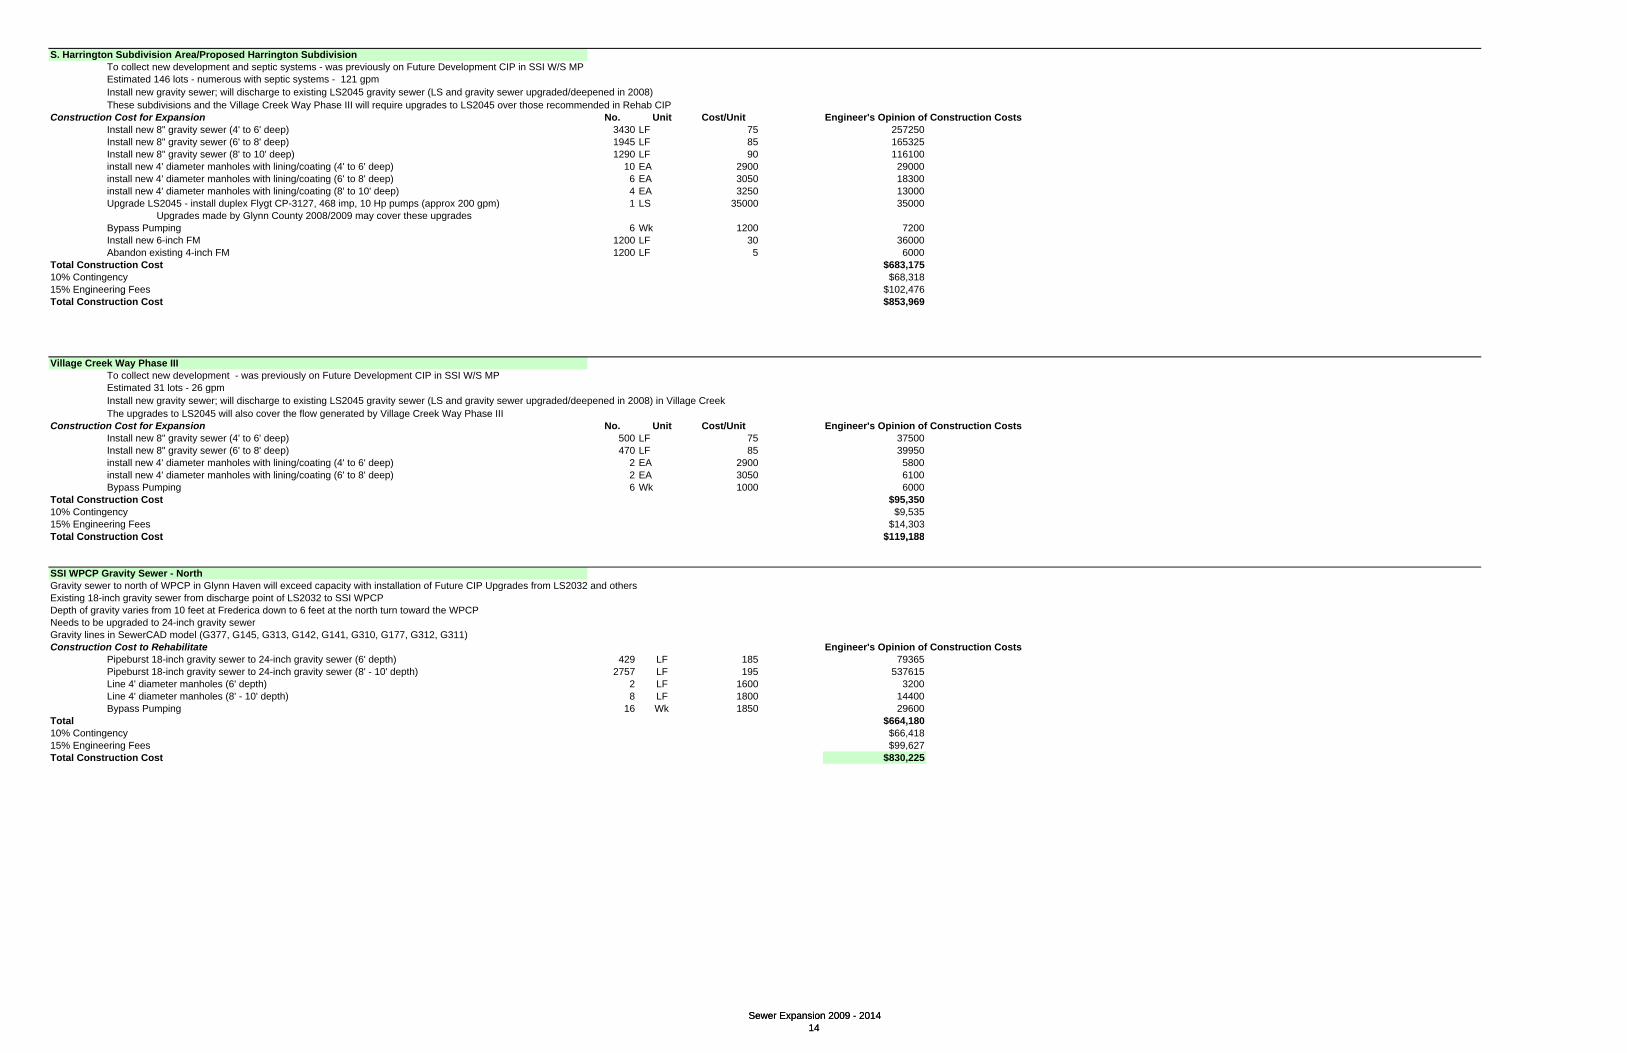
S. Harrington Subdivision Area/Proposed Harrington SubdivisionTo collect new development and septic systems - was previously on Future Development CIP in SSI W/S MPEstimated 146 lots - numerous with septic systems - 121 gpm Install new gravity sewer; will discharge to existing LS2045 gravity sewer (LS and gravity sewer upgraded/deepened in 2008) These subdivisions and the Village Creek Way Phase III will require upgrades to LS2045 over those recommended in Rehab CIP
Construction Cost for Expansion No. Unit Cost/Unit Engineer's Opinion of Construction CostsInstall new 8" gravity sewer (4' to 6' deep) 3430 LF 75 257250Install new 8" gravity sewer (6' to 8' deep) 1945 LF 85 165325Install new 8" gravity sewer (8' to 10' deep) 1290 LF 90 116100install new 4' diameter manholes with lining/coating (4' to 6' deep) 10 EA 2900 29000install new 4' diameter manholes with lining/coating (6' to 8' deep) 6 EA 3050 18300install new 4' diameter manholes with lining/coating (8' to 10' deep) 4 EA 3250 13000Upgrade LS2045 - install duplex Flygt CP-3127, 468 imp, 10 Hp pumps (approx 200 gpm) 1 LS 35000 35000
Upgrades made by Glynn County 2008/2009 may cover these upgradesBypass Pumping 6 Wk 1200 7200Install new 6-inch FM 1200 LF 30 36000Abandon existing 4-inch FM 1200 LF 5 6000
Total Construction Cost $683,17510% Contingency $68,31815% Engineering Fees $102,476
Sewer Expansion 2009 - 201414
g g $ ,Total Construction Cost $853,969
Village Creek Way Phase IIITo collect new development - was previously on Future Development CIP in SSI W/S MPEstimated 31 lots - 26 gpm Install new gravity sewer; will discharge to existing LS2045 gravity sewer (LS and gravity sewer upgraded/deepened in 2008) in Village CreekThe upgrades to LS2045 will also cover the flow generated by Village Creek Way Phase III
Construction Cost for Expansion No. Unit Cost/Unit Engineer's Opinion of Construction CostsInstall new 8" gravity sewer (4' to 6' deep) 500 LF 75 37500Install new 8" gravity sewer (6' to 8' deep) 470 LF 85 39950install new 4' diameter manholes with lining/coating (4' to 6' deep) 2 EA 2900 5800install new 4' diameter manholes with lining/coating (6' to 8' deep) 2 EA 3050 6100Bypass Pumping 6 Wk 1000 6000
Total Construction Cost $95,35010% Contingency $9,53515% Engineering Fees $14,303Total Construction Cost $119,188Total Construction Cost $119,188
SSI WPCP Gravity Sewer - NorthGravity sewer to north of WPCP in Glynn Haven will exceed capacity with installation of Future CIP Upgrades from LS2032 and othersExisting 18-inch gravity sewer from discharge point of LS2032 to SSI WPCPDepth of gravity varies from 10 feet at Frederica down to 6 feet at the north turn toward the WPCPNeeds to be upgraded to 24-inch gravity sewerGravity lines in SewerCAD model (G377, G145, G313, G142, G141, G310, G177, G312, G311)Construction Cost to Rehabilitate Engineer's Opinion of Construction Costs
Pipeburst 18-inch gravity sewer to 24-inch gravity sewer (6' depth) 429 LF 185 79365Pipeburst 18-inch gravity sewer to 24-inch gravity sewer (8' - 10' depth) 2757 LF 195 537615Line 4' diameter manholes (6' depth) 2 LF 1600 3200Line 4' diameter manholes (8' - 10' depth) 8 LF 1800 14400Bypass Pumping 16 Wk 1850 29600
Total $664,18010% Contingency $66,41815% Engineering Fees $99,627Total Construction Cost $830,225
Sewer Expansion 2009 - 201414

5 - 10 yr Future Sewer CIP (5 - 10 yr constructing NW WPCP)5-10 years add NW WPCP
turn LS 4119turn LS 4992 (Plum Creek) and 4902 (Dover Hall)
Northwest Mainland WPCP0-5 yr 0 MGD
New NW Mainland WPCP REUSE?? 5-10 yr 4.32 MGDUnder this scenario much of the north growth will go directly to new WPCP in NW. However, Pinecrest and PAWs East still go to Academy Creek WPCP 10-15 yr 5.83 MGDThis is as flows were divided by Ray Tarker; because Pinecrest/PAWs East continue to AC WPCP there are still a significant number of upgrades required in existing system 15-20 yr 7.13 MGDIn 5-10 yr window AADF to New NW WPCP will be approximately 4.32 MGD 20+ 15.21 MGDwasteload allocation to river (2 MGD) is approx 9 miles awayWhat about reuse? Power plant?Based cost on cost of new Exit 29 WWTF ($22M for 1.5 MGD)
Construction Cost for Expansion No. Unit Cost/Unit Engineer's Opinion of Construction CostsNew 5.0 MGD WPCP (advanced treatment/reuse qual) - Need 4.32 MGD capacity by end of 10 yr 1 LS 50000000 $50,000,000 14666666.67
Total Construction Cost $50,000,000 73333333.33
Sewer Expansion CIP - 2014 - 20191
Total Construction Cost $50,000,000 73333333.3310% Contingency $5,000,00015% Engineering Fees $7,500,000Total Construction Cost $62,500,000
LS 4119 SystemTurn flow to west in 10 yr period - to LS5001 and on to NW WPCP 0-5 yr 3,887.31 gpmJust need to add 4th pump and VFD - same pumps work as for 5 yr - 88 Hp for 2423 gpm @ 92' TDH Flygt CP3300 464 335 mm 5-10 yr 7,267.77 gpmhave divided the flow/basins such that even when turn LS 4119 in the 5 to 10 year period, the upgrades made from LS 4119 throughought the existing 10-15 yr 9,520.27 gpmsystem will still be necessary to serve growth (no waste capital) 15-20 yr 10,025.43 gpmRequired flow rate 3888 gpm in 5 year; in 10 year will send to NW WPCP 20+ 13,721.71 gpmthese pumps will also work for the 10 year condition when turn LS4119 to west and install 14,400 LF of 24" and push 7267 gpmwill need to add 4th pump and VFD, etc. in 10 yrConstructed Quad station in 0-5 yr - only installed 3 pumps for 5 year to Academy Creek (when turn will need 4th pump)Construction Cost for Expansion No. Unit Cost/Unit Engineer's Opinion of Construction Costs
Install new 24-inch PVC FM 14400 LF 70 $1,008,000Leave existing 16-inch PVC FM - along Hwy 99 to LS4118 intact - potential other uses 9972 LF 0 $0Add 4th pump with different imp and VFD 1 LS 60000 $60,000
Wetwell minmum 20' diameter (built 5 yr) - sized for ABS pumps (15-20 yr)Bypass pumping 6 wk 3000 $18 000Bypass pumping 6 wk 3000 $18,000
Total Construction Cost $1,086,00010% Contingency $108,60015% Engineering Fees $162,900Total Cost $1,357,500
LS 5001 System New master lift station located at Hwy 99 - 1/2 way to new NW WWTF from LS 4119; will repump LS 4119, LS4126, and 4905 basin flow10 year flow 9739 gpm; need 30" FM (will also serve future)Install Quadraplex Lift Station 0-5 yr 0 gpmConstruction Cost for Expansion No. Unit Cost/Unit Engineer's Opinion of Construction Costs 5-10 yr 9739 gpm
Install new quadraplex lift station - install 4 pumps initially 1 LS 1750000 $1,750,000 10-15 yr 13021 gpmABS AFP 3001, 6 Pole, 375mm, 80-85 Hp - 3246gpm @ 66' TDH 15-20 yr 14965 gpmVFDs - conditioned space? 20+ 24781 gpmEstimate 20' diameter wetwell minimum
Electrical Upgrades - provide service acceptable for future pumps (160+ Hp) 1 LS 50000 $50,000 Wetwell 20' diameterInstall new 30-inch PVC FM 14100 LF 80 $1,128,000 open land 4 pumps
Total Construction Cost $2,928,000 192 in10% Contingency $292,800 16 ft diameter minimum10% Contingency $292,800 16 ft diameter minimum15% Engineering Fees $439,200Total Construction Cost $3,660,000
Sewer Expansion CIP - 2014 - 20191
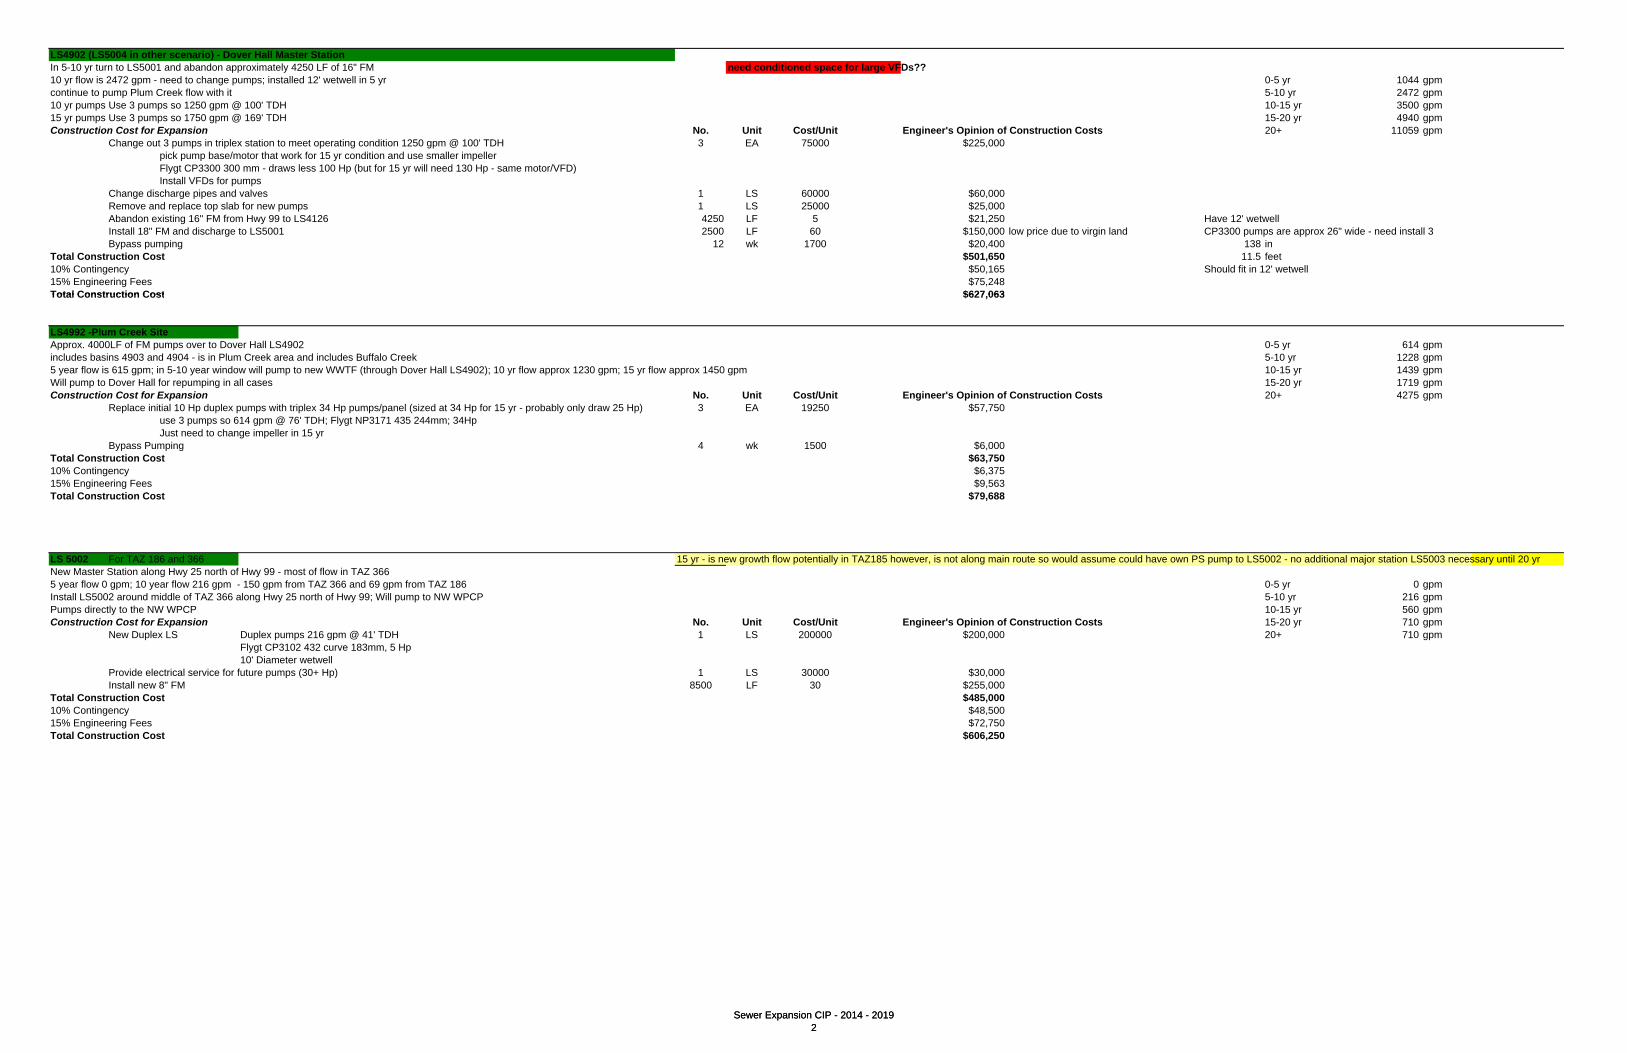
LS4902 (LS5004 in other scenario) - Dover Hall Master StationIn 5-10 yr turn to LS5001 and abandon approximately 4250 LF of 16" FM need conditioned space for large VFDs??10 yr flow is 2472 gpm - need to change pumps; installed 12' wetwell in 5 yr 0-5 yr 1044 gpmcontinue to pump Plum Creek flow with it 5-10 yr 2472 gpm10 yr pumps Use 3 pumps so 1250 gpm @ 100' TDH 10-15 yr 3500 gpm15 yr pumps Use 3 pumps so 1750 gpm @ 169' TDH 15-20 yr 4940 gpmConstruction Cost for Expansion No. Unit Cost/Unit Engineer's Opinion of Construction Costs 20+ 11059 gpm
3 EA 75000 $225,000pick pump base/motor that work for 15 yr condition and use smaller impellerFlygt CP3300 300 mm - draws less 100 Hp (but for 15 yr will need 130 Hp - same motor/VFD)Install VFDs for pumps
Change discharge pipes and valves 1 LS 60000 $60,000Remove and replace top slab for new pumps 1 LS 25000 $25,000Abandon existing 16" FM from Hwy 99 to LS4126 4250 LF 5 $21,250 Have 12' wetwellInstall 18" FM and discharge to LS5001 2500 LF 60 $150,000 low price due to virgin land CP3300 pumps are approx 26" wide - need install 3Bypass pumping 12 wk 1700 $20,400 138 in
Total Construction Cost $501,650 11.5 feet10% Contingency $50,165 Should fit in 12' wetwell 15% Engineering Fees $75,248Total Construction Cost $627 063
Change out 3 pumps in triplex station to meet operating condition 1250 gpm @ 100' TDH
Sewer Expansion CIP - 2014 - 20192
Total Construction Cost $627,063
LS4992 -Plum Creek SiteApprox. 4000LF of FM pumps over to Dover Hall LS4902 0-5 yr 614 gpmincludes basins 4903 and 4904 - is in Plum Creek area and includes Buffalo Creek 5-10 yr 1228 gpm5 year flow is 615 gpm; in 5-10 year window will pump to new WWTF (through Dover Hall LS4902); 10 yr flow approx 1230 gpm; 15 yr flow approx 1450 gpm 10-15 yr 1439 gpmWill pump to Dover Hall for repumping in all cases 15-20 yr 1719 gpmConstruction Cost for Expansion No. Unit Cost/Unit Engineer's Opinion of Construction Costs 20+ 4275 gpm
Replace initial 10 Hp duplex pumps with triplex 34 Hp pumps/panel (sized at 34 Hp for 15 yr - probably only draw 25 Hp) 3 EA 19250 $57,750use 3 pumps so 614 gpm @ 76' TDH; Flygt NP3171 435 244mm; 34HpJust need to change impeller in 15 yr
Bypass Pumping 4 wk 1500 $6,000Total Construction Cost $63,75010% Contingency $6,37515% Engineering Fees $9,563Total Construction Cost $79,688
LS 5002 For TAZ 186 and 366 15 yr - is new growth flow potentially in TAZ185 however, is not along main route so would assume could have own PS pump to LS5002 - no additional major station LS5003 necessary until 20 yrNew Master Station along Hwy 25 north of Hwy 99 - most of flow in TAZ 366 5 year flow 0 gpm; 10 year flow 216 gpm - 150 gpm from TAZ 366 and 69 gpm from TAZ 186 0-5 yr 0 gpmInstall LS5002 around middle of TAZ 366 along Hwy 25 north of Hwy 99; Will pump to NW WPCP 5-10 yr 216 gpmPumps directly to the NW WPCP 10-15 yr 560 gpmConstruction Cost for Expansion No. Unit Cost/Unit Engineer's Opinion of Construction Costs 15-20 yr 710 gpm
New Duplex LS Duplex pumps 216 gpm @ 41' TDH 1 LS 200000 $200,000 20+ 710 gpmFlygt CP3102 432 curve 183mm, 5 Hp10' Diameter wetwell
Provide electrical service for future pumps (30+ Hp) 1 LS 30000 $30,000Install new 8" FM 8500 LF 30 $255,000
Total Construction Cost $485,00010% Contingency $48,50015% Engineering Fees $72,750Total Construction Cost $606,250
Sewer Expansion CIP - 2014 - 20192

City and Mainland to Academy Creek WPCP
LS 4118 System
Constructed new triplex station in 5 yr- even after turn LS 4119 to NW WPCP in year 5 to 10 this capacity will be needed for other growth 0-5 yr 5,600.84 gpm5 year flow approximately 5600 gpm; 10 year flow after turn LS4119 is 3525 gpm; 15 year flow is 5100 gpm 5-10 yr 3,522.72 gpm5 year need 3 - 150 Hp pumps at 2800 gpm @ 107' TDH 10-15 yr 5,098.47 gpmdowngrade pumps after turn LS4119 - save pumps for 15 yr - or is there somewhere else can use them?? 15-20 yr 7,008.44 gpm
Construction Cost for Expansion No. Unit Cost/Unit Engineer's Opinion of Construction Costs 20+ 12,459.44 gpmNew pumps, panels - 1760 gpm @ 60' TDH; 40 Hp; Flygt CP3201 639 350 mm 1 LS 65000 $65,000Change pump rails, base, etc. 1 LS 8500 $8,500Bypass Pumping 8 wk 2000 $16,000
Total Construction Cost $89,50010% Contingency $8,95015% Engineering Fees $13,425Total Cost $111,875
LS 4110 System
Sewer Expansion CIP - 2014 - 20193
LS 4110 System5 yr constructed new Quad station - installed all new wetwell because influent pipe on orig station came in belwo pump on elev quad station 0-5 yr 7,841.83 gpm5 year needs 4 - 150 Hp ABS pumps at 2614 gpm @ 112' TDH 5-10 yr 6,538.36 gpmFor 10 yr flow is reduced so changed pumps bc of head conditions, but can be used for 15 year pump (VFD should be fine) 10-15 yr 8,217.74 gpm
15-20 yr 10,217.76 gpmConstruction Cost for Expansion No. Unit Cost/Unit Engineer's Opinion of Construction Costs 20+ 12,459.44 gpm
Change 4 pumps to Flygt NP3300 634 404 85Hp 4 EA 30000 120000Bypass Pumping 3 Wk 2250 6750
Total Construction Cost $126,75010% Contingency $12,67515% Engineering Fees $19,013Total Cost $158,438
LS 4109 System Already Under Construction - Removed from CIP - Completed May 2009 assume adding in septic flow in 20 yrNo growth in 10 year 0-5 yr 811 gpm
5-10 yr 811 gpm10-15 yr 811 gpm15-20 yr 921 gpm
Construction Cost for Expansion No. Unit Cost/Unit Engineer's Opinion of Construction Costs 20+ 921 gpmNo growth over 5 year - no construction needed 1 LS 0 0
T t l C t ti C t $0Total Construction Cost $010% Contingency $015% Engineering Fees $0Total Construction Cost $0
LS 4039 System5 Yer constructed new wetwell for 2 pumps and made quad station 0-5 yr 9,158.99 gpm10 yr flow drops and can just change impellers or with VFDs should be fine 5-10 yr 8,078.93 gpm10 year pumps need 4 - 90 Hp pumps at 2693 gpm @ 74' TDH - (5 yr pumps are Flygt CP3300 674 403mm Curve - change impeller) 10-15 yr 9,758.31 gpm10 yr switch to 380 impellers 15-20 yr 11,868.33 gpm
Construction Cost for Expansion No. Unit Cost/Unit Engineer's Opinion of Construction Costs 20+ 18,162.71 gpmChange impellers in 4 pumps to Flygt NP3300 640 380 impellers - still 90 Hp 4 EA 1750 7000Bypass Pumping 3 Wk 2500 7500
Total Construction Cost $14,50010% Contingency $1,45015% Engineering Fees $2,175Total Construction Cost $18,125
LS 4048 System5 yr Construct new Quad station - new 125 Hp pumps with 3510 gpm @ 96' TDH ABS 2501, 6 Pole5 yr Construct new Quad station new 125 Hp pumps with 3510 gpm @ 96 TDH ABS 2501, 6 Pole5 yr Put in new forcemain dedicated to LS4048 will run 24" parallel to 16" from LS4048 to LS4028; then after LS4028 will run a 30" 0-5 yr 10,529.34 gpmLS4028 will continue to pump down to LS4006 through existing fm where it will discharge to LS4006 for repumping 5-10 yr 9,449.27 gpmLS4048 discharges to 4004 basin for gravity flow 10-15 yr 11,128.65 gpm
15-20 yr 13,238.67 gpm20+ 19,533.06 gpm
Construction Cost for Expansion No. Unit Cost/Unit Engineer's Opinion of Construction Costs10 yr flow (ABS 2501 6 Pole) Pumps are on VFDs - no need to change 0 LS 0 $0
3150 gpm @ 108' TDH $0Total Construction Cost $010% Contingency $015% Engineering Fees $0Total Construction Cost $0
Sewer Expansion CIP - 2014 - 20193
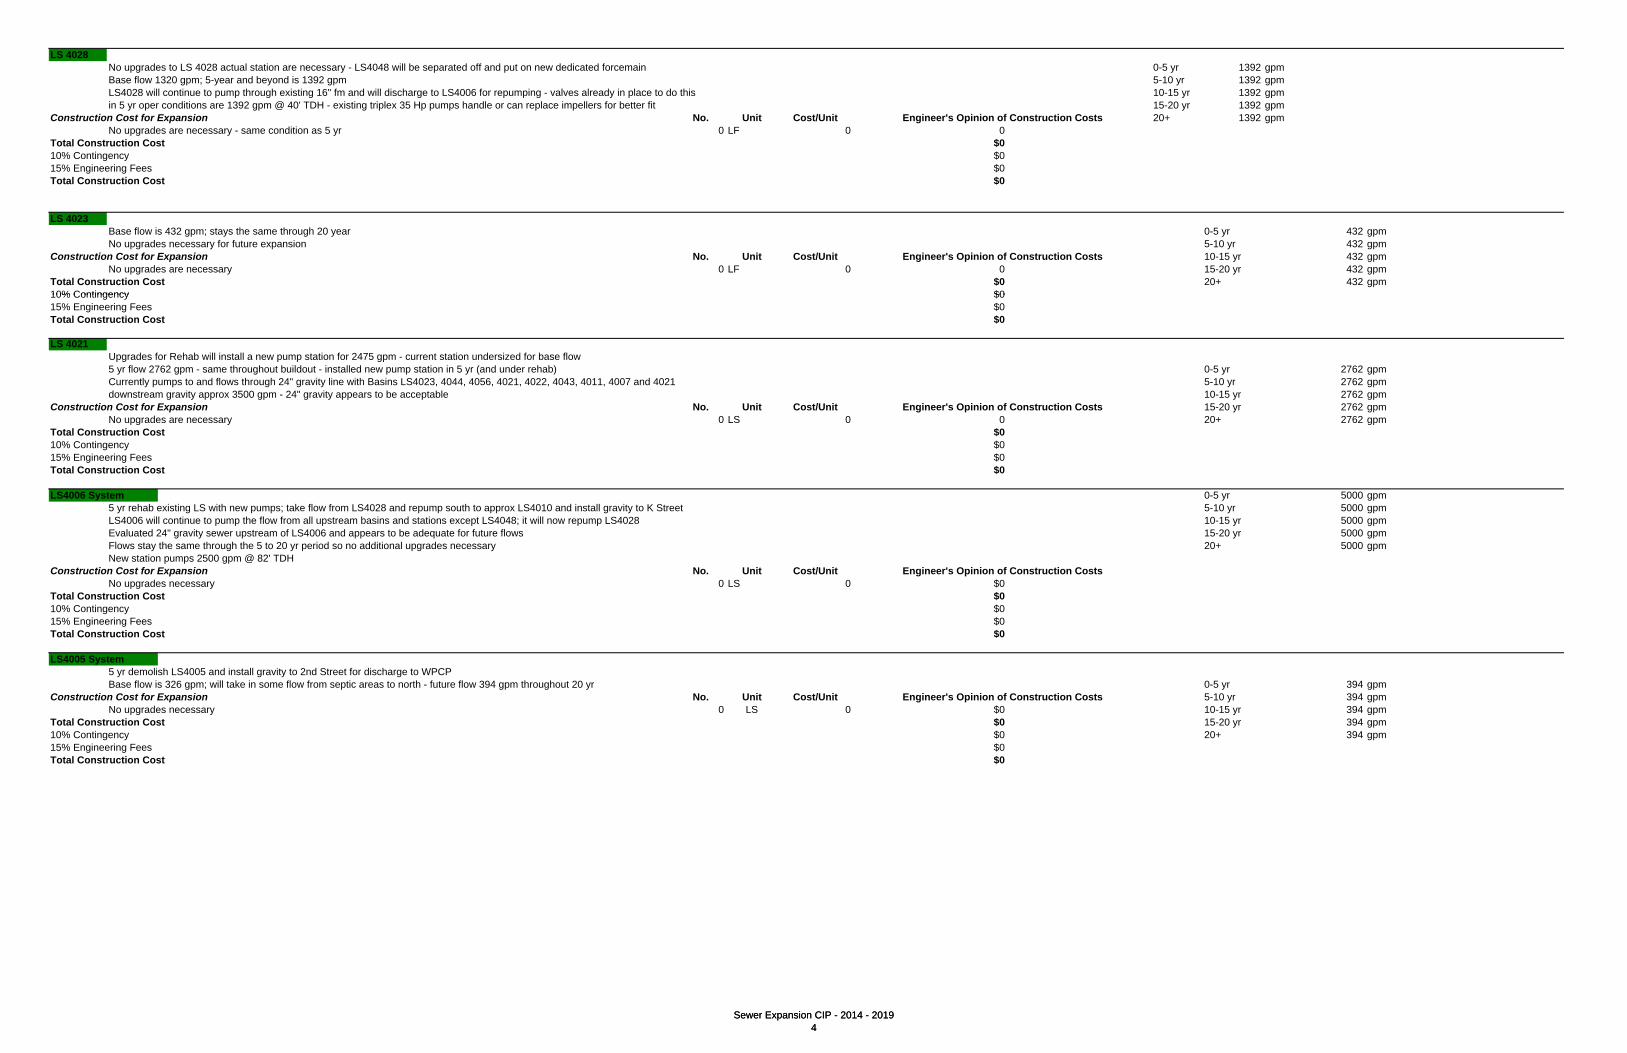
LS 4028No upgrades to LS 4028 actual station are necessary - LS4048 will be separated off and put on new dedicated forcemain 0-5 yr 1392 gpmBase flow 1320 gpm; 5-year and beyond is 1392 gpm 5-10 yr 1392 gpmLS4028 will continue to pump through existing 16" fm and will discharge to LS4006 for repumping - valves already in place to do this 10-15 yr 1392 gpmin 5 yr oper conditions are 1392 gpm @ 40' TDH - existing triplex 35 Hp pumps handle or can replace impellers for better fit 15-20 yr 1392 gpm
Construction Cost for Expansion No. Unit Cost/Unit Engineer's Opinion of Construction Costs 20+ 1392 gpmNo upgrades are necessary - same condition as 5 yr 0 LF 0 0
Total Construction Cost $010% Contingency $015% Engineering Fees $0Total Construction Cost $0
LS 4023Base flow is 432 gpm; stays the same through 20 year 0-5 yr 432 gpmNo upgrades necessary for future expansion 5-10 yr 432 gpm
Construction Cost for Expansion No. Unit Cost/Unit Engineer's Opinion of Construction Costs 10-15 yr 432 gpmNo upgrades are necessary 0 LF 0 0 15-20 yr 432 gpm
Total Construction Cost $0 20+ 432 gpm10% Contingency $0
Sewer Expansion CIP - 2014 - 20194
10% Contingency $015% Engineering Fees $0Total Construction Cost $0
LS 4021Upgrades for Rehab will install a new pump station for 2475 gpm - current station undersized for base flow5 yr flow 2762 gpm - same throughout buildout - installed new pump station in 5 yr (and under rehab) 0-5 yr 2762 gpmCurrently pumps to and flows through 24" gravity line with Basins LS4023, 4044, 4056, 4021, 4022, 4043, 4011, 4007 and 4021 5-10 yr 2762 gpmdownstream gravity approx 3500 gpm - 24" gravity appears to be acceptable 10-15 yr 2762 gpm
Construction Cost for Expansion No. Unit Cost/Unit Engineer's Opinion of Construction Costs 15-20 yr 2762 gpmNo upgrades are necessary 0 LS 0 0 20+ 2762 gpm
Total Construction Cost $010% Contingency $015% Engineering Fees $0Total Construction Cost $0
LS4006 System 0-5 yr 5000 gpm5 yr rehab existing LS with new pumps; take flow from LS4028 and repump south to approx LS4010 and install gravity to K Street 5-10 yr 5000 gpmLS4006 will continue to pump the flow from all upstream basins and stations except LS4048; it will now repump LS4028 10-15 yr 5000 gpmEvaluated 24" gravity sewer upstream of LS4006 and appears to be adequate for future flows 15-20 yr 5000 gpmFlows stay the same through the 5 to 20 yr period so no additional upgrades necessary 20+ 5000 gpmNew station pumps 2500 gpm @ 82' TDH
Construction Cost for Expansion No. Unit Cost/Unit Engineer's Opinion of Construction CostsNo upgrades necessary 0 LS 0 $0
Total Construction Cost $010% Contingency $015% Engineering Fees $0Total Construction Cost $0
LS4005 System5 yr demolish LS4005 and install gravity to 2nd Street for discharge to WPCPBase flow is 326 gpm; will take in some flow from septic areas to north - future flow 394 gpm throughout 20 yr 0-5 yr 394 gpm
Construction Cost for Expansion No. Unit Cost/Unit Engineer's Opinion of Construction Costs 5-10 yr 394 gpmNo upgrades necessary 0 LS 0 $0 10-15 yr 394 gpm
Total Construction Cost $0 15-20 yr 394 gpm10% Contingency $0 20+ 394 gpm15% Engineering Fees $0Total Construction Cost $0
Sewer Expansion CIP - 2014 - 20194
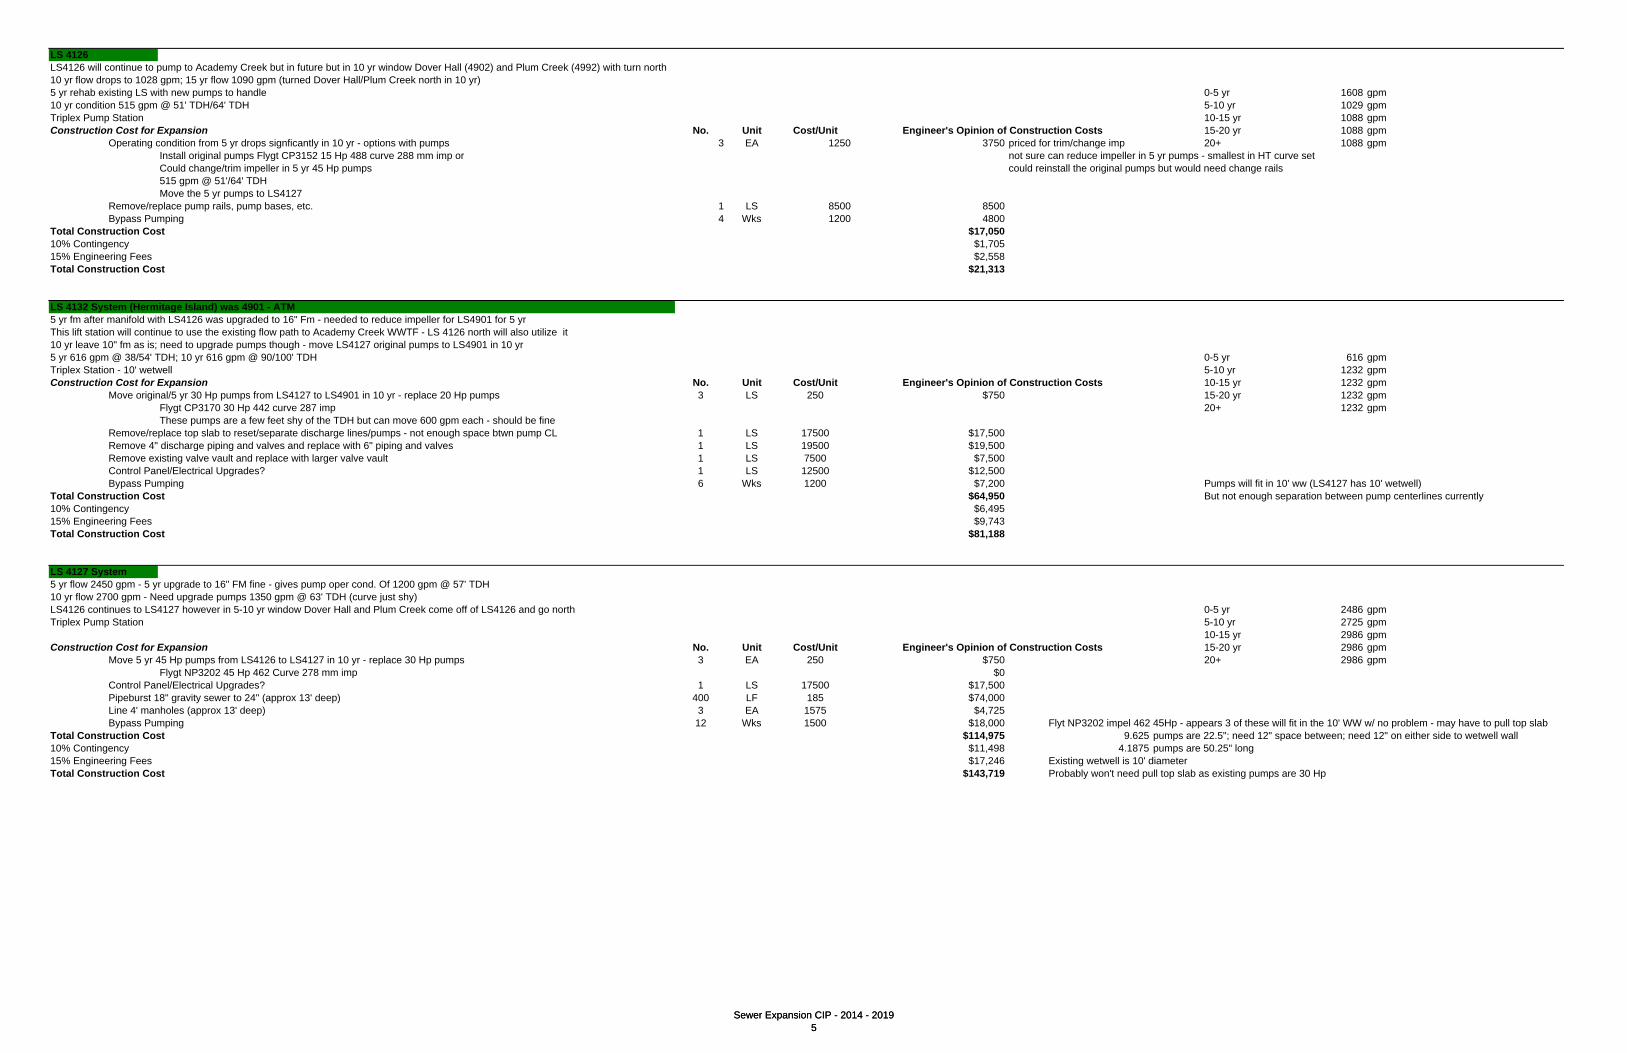
LS 4126LS4126 will continue to pump to Academy Creek but in future but in 10 yr window Dover Hall (4902) and Plum Creek (4992) with turn north10 yr flow drops to 1028 gpm; 15 yr flow 1090 gpm (turned Dover Hall/Plum Creek north in 10 yr)5 yr rehab existing LS with new pumps to handle 0-5 yr 1608 gpm10 yr condition 515 gpm @ 51' TDH/64' TDH 5-10 yr 1029 gpmTriplex Pump Station 10-15 yr 1088 gpmConstruction Cost for Expansion No. Unit Cost/Unit Engineer's Opinion of Construction Costs 15-20 yr 1088 gpm
Operating condition from 5 yr drops signficantly in 10 yr - options with pumps 3 EA 1250 3750 priced for trim/change imp 20+ 1088 gpmInstall original pumps Flygt CP3152 15 Hp 488 curve 288 mm imp or not sure can reduce impeller in 5 yr pumps - smallest in HT curve setCould change/trim impeller in 5 yr 45 Hp pumps could reinstall the original pumps but would need change rails515 gpm @ 51'/64' TDHMove the 5 yr pumps to LS4127
Remove/replace pump rails, pump bases, etc. 1 LS 8500 8500Bypass Pumping 4 Wks 1200 4800
Total Construction Cost $17,05010% Contingency $1,70515% Engineering Fees $2,558Total Construction Cost $21,313
Sewer Expansion CIP - 2014 - 20195
LS 4132 System (Hermitage Island) was 4901 - ATM5 yr fm after manifold with LS4126 was upgraded to 16" Fm - needed to reduce impeller for LS4901 for 5 yrThis lift station will continue to use the existing flow path to Academy Creek WWTF - LS 4126 north will also utilize it10 yr leave 10" fm as is; need to upgrade pumps though - move LS4127 original pumps to LS4901 in 10 yr5 yr 616 gpm @ 38/54' TDH; 10 yr 616 gpm @ 90/100' TDH 0-5 yr 616 gpmTriplex Station - 10' wetwell 5-10 yr 1232 gpmConstruction Cost for Expansion No. Unit Cost/Unit Engineer's Opinion of Construction Costs 10-15 yr 1232 gpm
Move original/5 yr 30 Hp pumps from LS4127 to LS4901 in 10 yr - replace 20 Hp pumps 3 LS 250 $750 15-20 yr 1232 gpmFlygt CP3170 30 Hp 442 curve 287 imp 20+ 1232 gpmThese pumps are a few feet shy of the TDH but can move 600 gpm each - should be fine
Remove/replace top slab to reset/separate discharge lines/pumps - not enough space btwn pump CL 1 LS 17500 $17,500Remove 4" discharge piping and valves and replace with 6" piping and valves 1 LS 19500 $19,500Remove existing valve vault and replace with larger valve vault 1 LS 7500 $7,500Control Panel/Electrical Upgrades? 1 LS 12500 $12,500Bypass Pumping 6 Wks 1200 $7,200 Pumps will fit in 10' ww (LS4127 has 10' wetwell)
Total Construction Cost $64,950 But not enough separation between pump centerlines currently10% Contingency $6,49515% Engineering Fees $9,743Total Construction Cost $81,188
LS 4127 System5 yr flow 2450 gpm - 5 yr upgrade to 16" FM fine - gives pump oper cond. Of 1200 gpm @ 57' TDH10 yr flow 2700 gpm - Need upgrade pumps 1350 gpm @ 63' TDH (curve just shy)LS4126 continues to LS4127 however in 5-10 yr window Dover Hall and Plum Creek come off of LS4126 and go north 0-5 yr 2486 gpmTriplex Pump Station 5-10 yr 2725 gpm
10-15 yr 2986 gpmConstruction Cost for Expansion No. Unit Cost/Unit Engineer's Opinion of Construction Costs 15-20 yr 2986 gpm
Move 5 yr 45 Hp pumps from LS4126 to LS4127 in 10 yr - replace 30 Hp pumps 3 EA 250 $750 20+ 2986 gpmFlygt NP3202 45 Hp 462 Curve 278 mm imp $0
Control Panel/Electrical Upgrades? 1 LS 17500 $17,500Pipeburst 18" gravity sewer to 24" (approx 13' deep) 400 LF 185 $74,000Line 4' manholes (approx 13' deep) 3 EA 1575 $4,725Bypass Pumping 12 Wks 1500 $18,000 Flyt NP3202 impel 462 45Hp - appears 3 of these will fit in the 10' WW w/ no problem - may have to pull top slab
Total Construction Cost $114,975 9.625 pumps are 22.5"; need 12" space between; need 12" on either side to wetwell wall10% Contingency $11,498 4.1875 pumps are 50.25" long15% Engineering Fees $17,246 Existing wetwell is 10' diameterTotal Construction Cost $143,719 Probably won't need pull top slab as existing pumps are 30 Hp
Sewer Expansion CIP - 2014 - 20195
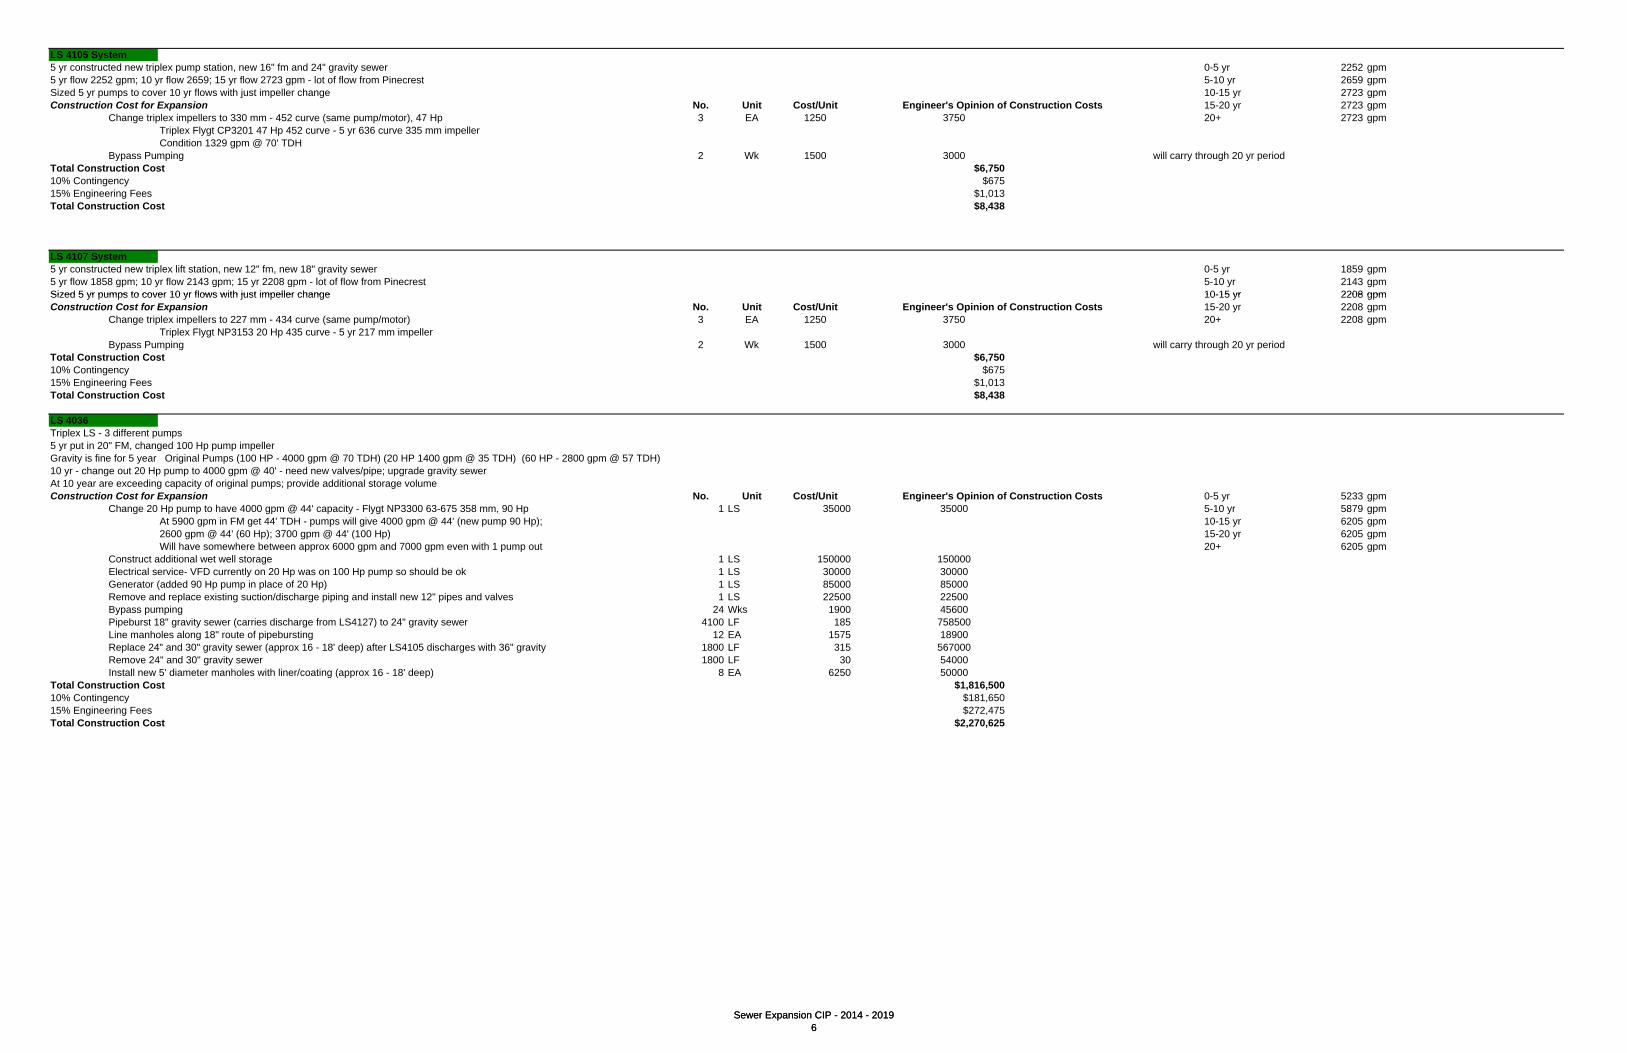
LS 4105 System5 yr constructed new triplex pump station, new 16" fm and 24" gravity sewer 0-5 yr 2252 gpm5 yr flow 2252 gpm; 10 yr flow 2659; 15 yr flow 2723 gpm - lot of flow from Pinecrest 5-10 yr 2659 gpmSized 5 yr pumps to cover 10 yr flows with just impeller change 10-15 yr 2723 gpmConstruction Cost for Expansion No. Unit Cost/Unit Engineer's Opinion of Construction Costs 15-20 yr 2723 gpm
Change triplex impellers to 330 mm - 452 curve (same pump/motor), 47 Hp 3 EA 1250 3750 20+ 2723 gpmTriplex Flygt CP3201 47 Hp 452 curve - 5 yr 636 curve 335 mm impellerCondition 1329 gpm @ 70' TDH
Bypass Pumping 2 Wk 1500 3000 will carry through 20 yr periodTotal Construction Cost $6,75010% Contingency $67515% Engineering Fees $1,013Total Construction Cost $8,438
LS 4107 System5 yr constructed new triplex lift station, new 12" fm, new 18" gravity sewer 0-5 yr 1859 gpm5 yr flow 1858 gpm; 10 yr flow 2143 gpm; 15 yr 2208 gpm - lot of flow from Pinecrest 5-10 yr 2143 gpmSized 5 yr pumps to cover 10 yr flows with just impeller change 10-15 yr 2208 gpm
Sewer Expansion CIP - 2014 - 20196
Sized 5 yr pumps to cover 10 yr flows with just impeller change 10-15 yr 2208 gpmConstruction Cost for Expansion No. Unit Cost/Unit Engineer's Opinion of Construction Costs 15-20 yr 2208 gpm
Change triplex impellers to 227 mm - 434 curve (same pump/motor) 3 EA 1250 3750 20+ 2208 gpmTriplex Flygt NP3153 20 Hp 435 curve - 5 yr 217 mm impeller
Bypass Pumping 2 Wk 1500 3000 will carry through 20 yr periodTotal Construction Cost $6,75010% Contingency $67515% Engineering Fees $1,013Total Construction Cost $8,438
LS 4036Triplex LS - 3 different pumps5 yr put in 20" FM, changed 100 Hp pump impellerGravity is fine for 5 year Original Pumps (100 HP - 4000 gpm @ 70 TDH) (20 HP 1400 gpm @ 35 TDH) (60 HP - 2800 gpm @ 57 TDH) 10 yr - change out 20 Hp pump to 4000 gpm @ 40' - need new valves/pipe; upgrade gravity sewerAt 10 year are exceeding capacity of original pumps; provide additional storage volumeConstruction Cost for Expansion No. Unit Cost/Unit Engineer's Opinion of Construction Costs 0-5 yr 5233 gpm
Change 20 Hp pump to have 4000 gpm @ 44' capacity - Flygt NP3300 63-675 358 mm, 90 Hp 1 LS 35000 35000 5-10 yr 5879 gpmAt 5900 gpm in FM get 44' TDH - pumps will give 4000 gpm @ 44' (new pump 90 Hp); 10-15 yr 6205 gpm2600 gpm @ 44' (60 Hp); 3700 gpm @ 44' (100 Hp) 15-20 yr 6205 gpmgp @ ( p) gp @ ( p) y gpWill have somewhere between approx 6000 gpm and 7000 gpm even with 1 pump out 20+ 6205 gpm
Construct additional wet well storage 1 LS 150000 150000Electrical service- VFD currently on 20 Hp was on 100 Hp pump so should be ok 1 LS 30000 30000Generator (added 90 Hp pump in place of 20 Hp) 1 LS 85000 85000Remove and replace existing suction/discharge piping and install new 12" pipes and valves 1 LS 22500 22500Bypass pumping 24 Wks 1900 45600Pipeburst 18" gravity sewer (carries discharge from LS4127) to 24" gravity sewer 4100 LF 185 758500Line manholes along 18" route of pipebursting 12 EA 1575 18900Replace 24" and 30" gravity sewer (approx 16 - 18' deep) after LS4105 discharges with 36" gravity 1800 LF 315 567000Remove 24" and 30" gravity sewer 1800 LF 30 54000Install new 5' diameter manholes with liner/coating (approx 16 - 18' deep) 8 EA 6250 50000
Total Construction Cost $1,816,50010% Contingency $181,65015% Engineering Fees $272,475Total Construction Cost $2,270,625
Sewer Expansion CIP - 2014 - 20196
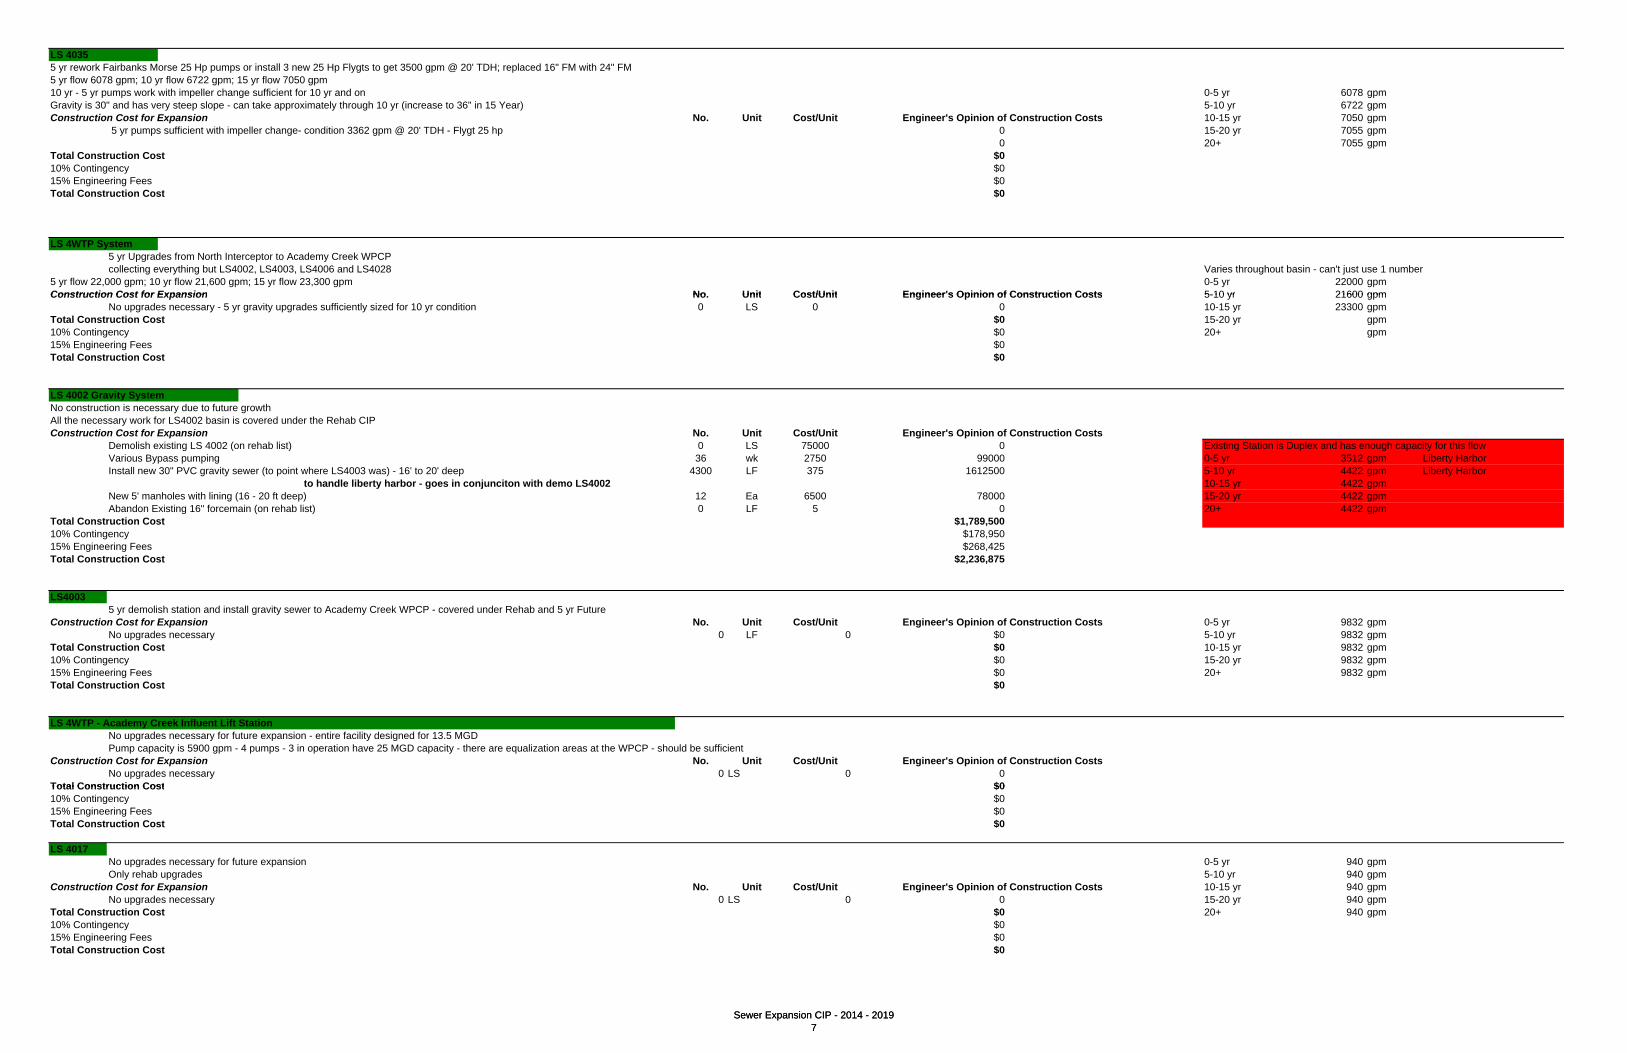
LS 40355 yr rework Fairbanks Morse 25 Hp pumps or install 3 new 25 Hp Flygts to get 3500 gpm @ 20' TDH; replaced 16" FM with 24" FM5 yr flow 6078 gpm; 10 yr flow 6722 gpm; 15 yr flow 7050 gpm10 yr - 5 yr pumps work with impeller change sufficient for 10 yr and on 0-5 yr 6078 gpmGravity is 30" and has very steep slope - can take approximately through 10 yr (increase to 36" in 15 Year) 5-10 yr 6722 gpmConstruction Cost for Expansion No. Unit Cost/Unit Engineer's Opinion of Construction Costs 10-15 yr 7050 gpm
5 yr pumps sufficient with impeller change- condition 3362 gpm @ 20' TDH - Flygt 25 hp 0 15-20 yr 7055 gpm0 20+ 7055 gpm
Total Construction Cost $010% Contingency $015% Engineering Fees $0Total Construction Cost $0
LS 4WTP System5 yr Upgrades from North Interceptor to Academy Creek WPCPcollecting everything but LS4002, LS4003, LS4006 and LS4028 Varies throughout basin - can't just use 1 number
5 yr flow 22,000 gpm; 10 yr flow 21,600 gpm; 15 yr flow 23,300 gpm 0-5 yr 22000 gpmConstruction Cost for Expansion No Unit Cost/Unit Engineer's Opinion of Construction Costs 5-10 yr 21600 gpm
Sewer Expansion CIP - 2014 - 20197
Construction Cost for Expansion No. Unit Cost/Unit Engineer s Opinion of Construction Costs 5-10 yr 21600 gpmNo upgrades necessary - 5 yr gravity upgrades sufficiently sized for 10 yr condition 0 LS 0 0 10-15 yr 23300 gpm
Total Construction Cost $0 15-20 yr gpm10% Contingency $0 20+ gpm15% Engineering Fees $0Total Construction Cost $0
LS 4002 Gravity SystemNo construction is necessary due to future growthAll the necessary work for LS4002 basin is covered under the Rehab CIPConstruction Cost for Expansion No. Unit Cost/Unit Engineer's Opinion of Construction Costs
Demolish existing LS 4002 (on rehab list) 0 LS 75000 0 Existing Station is Duplex and has enough capacity for this flowVarious Bypass pumping 36 wk 2750 99000 0-5 yr 3512 gpm Liberty HarborInstall new 30" PVC gravity sewer (to point where LS4003 was) - 16' to 20' deep 4300 LF 375 1612500 5-10 yr 4422 gpm Liberty Harbor
to handle liberty harbor - goes in conjunciton with demo LS4002 10-15 yr 4422 gpmNew 5' manholes with lining (16 - 20 ft deep) 12 Ea 6500 78000 15-20 yr 4422 gpmAbandon Existing 16" forcemain (on rehab list) 0 LF 5 0 20+ 4422 gpm
Total Construction Cost $1,789,50010% Contingency $178,950g y15% Engineering Fees $268,425Total Construction Cost $2,236,875
LS40035 yr demolish station and install gravity sewer to Academy Creek WPCP - covered under Rehab and 5 yr Future
Construction Cost for Expansion No. Unit Cost/Unit Engineer's Opinion of Construction Costs 0-5 yr 9832 gpmNo upgrades necessary 0 LF 0 $0 5-10 yr 9832 gpm
Total Construction Cost $0 10-15 yr 9832 gpm10% Contingency $0 15-20 yr 9832 gpm15% Engineering Fees $0 20+ 9832 gpmTotal Construction Cost $0
LS 4WTP - Academy Creek Influent Lift StationNo upgrades necessary for future expansion - entire facility designed for 13.5 MGDPump capacity is 5900 gpm - 4 pumps - 3 in operation have 25 MGD capacity - there are equalization areas at the WPCP - should be sufficient
Construction Cost for Expansion No. Unit Cost/Unit Engineer's Opinion of Construction CostsNo upgrades necessary 0 LS 0 0
Total Construction Cost $0Total Construction Cost $010% Contingency $015% Engineering Fees $0Total Construction Cost $0
LS 4017No upgrades necessary for future expansion 0-5 yr 940 gpmOnly rehab upgrades 5-10 yr 940 gpm
Construction Cost for Expansion No. Unit Cost/Unit Engineer's Opinion of Construction Costs 10-15 yr 940 gpmNo upgrades necessary 0 LS 0 0 15-20 yr 940 gpm
Total Construction Cost $0 20+ 940 gpm10% Contingency $015% Engineering Fees $0Total Construction Cost $0
Sewer Expansion CIP - 2014 - 20197
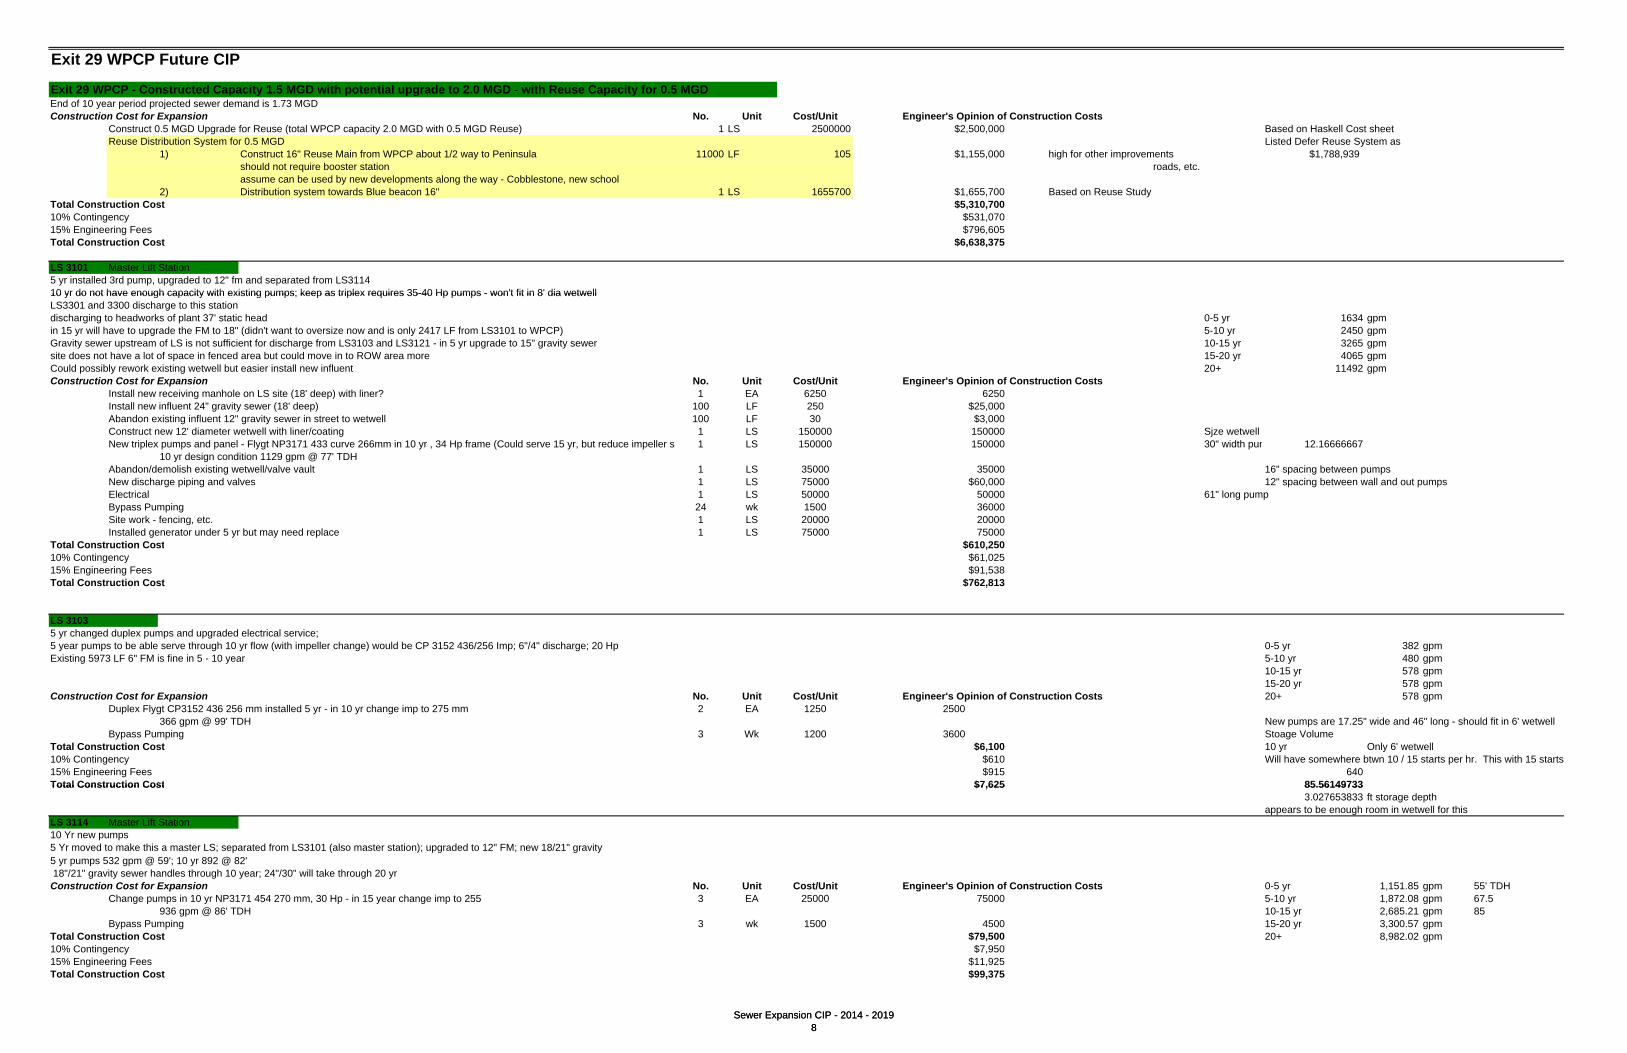
Exit 29 WPCP Future CIP
Exit 29 WPCP - Constructed Capacity 1.5 MGD with potential upgrade to 2.0 MGD - with Reuse Capacity for 0.5 MGDEnd of 10 year period projected sewer demand is 1.73 MGDConstruction Cost for Expansion No. Unit Cost/Unit Engineer's Opinion of Construction Costs
Construct 0.5 MGD Upgrade for Reuse (total WPCP capacity 2.0 MGD with 0.5 MGD Reuse) 1 LS 2500000 $2,500,000 Based on Haskell Cost sheetReuse Distribution System for 0.5 MGD Listed Defer Reuse System as
1) Construct 16" Reuse Main from WPCP about 1/2 way to Peninsula 11000 LF 105 $1,155,000 high for other improvements $1,788,939should not require booster station roads, etc.assume can be used by new developments along the way - Cobblestone, new school
2) Distribution system towards Blue beacon 16" 1 LS 1655700 $1,655,700 Based on Reuse StudyTotal Construction Cost $5,310,70010% Contingency $531,07015% Engineering Fees $796,605Total Construction Cost $6,638,375
LS 3101 Master Lift Station5 yr installed 3rd pump, upgraded to 12" fm and separated from LS311410 yr do not have enough capacity with existing pumps; keep as triplex requires 35-40 Hp pumps - won't fit in 8' dia wetwell
Sewer Expansion CIP - 2014 - 20198
10 yr do not have enough capacity with existing pumps; keep as triplex requires 35-40 Hp pumps - won t fit in 8 dia wetwellLS3301 and 3300 discharge to this stationdischarging to headworks of plant 37' static head 0-5 yr 1634 gpmin 15 yr will have to upgrade the FM to 18" (didn't want to oversize now and is only 2417 LF from LS3101 to WPCP) 5-10 yr 2450 gpmGravity sewer upstream of LS is not sufficient for discharge from LS3103 and LS3121 - in 5 yr upgrade to 15" gravity sewer 10-15 yr 3265 gpmsite does not have a lot of space in fenced area but could move in to ROW area more 15-20 yr 4065 gpmCould possibly rework existing wetwell but easier install new influent 20+ 11492 gpmConstruction Cost for Expansion No. Unit Cost/Unit Engineer's Opinion of Construction Costs
Install new receiving manhole on LS site (18' deep) with liner? 1 EA 6250 6250Install new influent 24" gravity sewer (18' deep) 100 LF 250 $25,000Abandon existing influent 12" gravity sewer in street to wetwell 100 LF 30 $3,000Construct new 12' diameter wetwell with liner/coating 1 LS 150000 150000 Sjze wetwellNew triplex pumps and panel - Flygt NP3171 433 curve 266mm in 10 yr , 34 Hp frame (Could serve 15 yr, but reduce impeller s 1 LS 150000 150000 30" width pum 12.16666667
10 yr design condition 1129 gpm @ 77' TDHAbandon/demolish existing wetwell/valve vault 1 LS 35000 35000 16" spacing between pumpsNew discharge piping and valves 1 LS 75000 $60,000 12" spacing between wall and out pumpsElectrical 1 LS 50000 50000 61" long pumpBypass Pumping 24 wk 1500 36000Site work - fencing, etc. 1 LS 20000 20000Installed generator under 5 yr but may need replace 1 LS 75000 75000
T l C i C $610 2 0Total Construction Cost $610,25010% Contingency $61,02515% Engineering Fees $91,538Total Construction Cost $762,813
LS 31035 yr changed duplex pumps and upgraded electrical service; 5 year pumps to be able serve through 10 yr flow (with impeller change) would be CP 3152 436/256 Imp; 6"/4" discharge; 20 Hp 0-5 yr 382 gpmExisting 5973 LF 6" FM is fine in 5 - 10 year 5-10 yr 480 gpm
10-15 yr 578 gpm15-20 yr 578 gpm
Construction Cost for Expansion No. Unit Cost/Unit Engineer's Opinion of Construction Costs 20+ 578 gpmDuplex Flygt CP3152 436 256 mm installed 5 yr - in 10 yr change imp to 275 mm 2 EA 1250 2500
366 gpm @ 99' TDH New pumps are 17.25" wide and 46" long - should fit in 6' wetwellBypass Pumping 3 Wk 1200 3600 Stoage Volume
Total Construction Cost $6,100 10 yr Only 6' wetwell10% Contingency $610 Will have somewhere btwn 10 / 15 starts per hr. This with 15 starts15% Engineering Fees $915 640Total Construction Cost $7,625 85.56149733Total Construction Cost $7,625 85.56149733
3.027653833 ft storage depthappears to be enough room in wetwell for this
LS 3114 Master Lift Station10 Yr new pumps5 Yr moved to make this a master LS; separated from LS3101 (also master station); upgraded to 12" FM; new 18/21" gravity5 yr pumps 532 gpm @ 59'; 10 yr 892 @ 82' 18"/21" gravity sewer handles through 10 year; 24"/30" will take through 20 yrConstruction Cost for Expansion No. Unit Cost/Unit Engineer's Opinion of Construction Costs 0-5 yr 1,151.85 gpm 55' TDH
Change pumps in 10 yr NP3171 454 270 mm, 30 Hp - in 15 year change imp to 255 3 EA 25000 75000 5-10 yr 1,872.08 gpm 67.5936 gpm @ 86' TDH 10-15 yr 2,685.21 gpm 85
Bypass Pumping 3 wk 1500 4500 15-20 yr 3,300.57 gpmTotal Construction Cost $79,500 20+ 8,982.02 gpm10% Contingency $7,95015% Engineering Fees $11,925Total Construction Cost $99,375
Sewer Expansion CIP - 2014 - 20198

LS 31215 yr upgraded existing pumps 362 gpm @ 65' TDHLS3121 discharge to LS3101 0-5 yr 362 gpmCondition same throughout 20 yr period 5-10 yr 362 gpm
10-15 yr 362 gpm15-20 yr 362 gpm
Construction Cost for Expansion No. Unit Cost/Unit Engineer's Opinion of Construction Costs 20+ 362 gpmNo Upgrades Necessary 0 LS 0 0
Total Construction Cost $010% Contingency $015% Engineering Fees $0Total Construction Cost $0
LS 3123Existing duplex 6' dia wetwell; 20 Hp pumps 230 gpm @ 103' TDHdischarging to new 24" gravity from LS3114 - shorten FM 0-5 yr 203 gpmSplit flow in the area to 2/3 to LS 3123 and 1/3 to LS 3129 5-10 yr 314 gpmExisting FM from LS3123 to Manifold (where LS 3129 connects) 2 907’ of 6” FM 10-15 yr 425 gpm
Sewer Expansion CIP - 2014 - 201910
Existing FM from LS3123 to Manifold (where LS 3129 connects) 2,907 of 6 FM 10-15 yr 425 gpmFrom Manifold to manhole 5,916’ of 6” FM 15-20 yr 425 gpm5 yr pumps do not have enough capacity 20+ 425 gpm
Construction Cost for Expansion No. Unit Cost/Unit Engineer's Opinion of Construction Costs10 year re-install original pumps and change impeller 2 EA 1100 2200
Change to CP3152 432 impeller 432 curve 266 mm - same motor 25-15-4AA 20 HpDesign condition 290 gpm @ 82'/95' TDH (so high with LS3129 because it pumps more than needed)
Bypass pumping 4 wks 550 2200Total Construction Cost $4,40010% Contingency $44015% Engineering Fees $660Total Construction Cost $5,500
LS 3129 - Satilla Sandsno design information - is proposed pump stationFor LS3123 changed forcemain to 8" in 10 yr - potentially cause runout condition for LS3129 and impacts LS3123 because pump so much - change impeller on existing pumps 0-5 yr 60 gpm
0-5 yr: 116 gpm 5-10 yr 60 gpm5-10 yr: 167 gpm 10-15 yr 60 gpmConstruction Cost for Expansion No. Unit Cost/Unit Engineer's Opinion of Construction Costs 15-20 yr 60 gpmp g p y gp
Change impellers on duplex CP3127 pumps - avoid runout and better meet operating point 2 EA 1150 2300 20+ 60 gpmNew impellers Flygt CP3127 463-231mm - only require 7.5 Hp had to change because pumps so much affects LS3123 pumpsCan pump approximately 200 gpm @ 50' TDH with LS3123 in operation
Bypass Pumping 3 Wks 500 1500Total Construction Cost $2,30010% Contingency $23015% Engineering Fees $345Total Construction Cost $2,875
Cobblestone Subdivision - Not including lift station in Future CIP - but if need pricing is below:Based on construction of 24" gravity sewer along South Port Parkway which will discharge to LS3114, a lift station should not be necessary for this subdivisionGravity sewer at South Port Parkway and US-17/Buckswamp Road will be approximately 22' deep (elevation (-)6.0'should be able to gravity sewer Cobblestone and connect - longest run approximately 5400 LF - start 3.67' deep
LS 3200 Cobblestone Located central to subdivisionno design information - is proposed pump station 0-5 yr 139 gpm
5-10 yr 154 gpm5 yr - install duplex pump station and 6" forcemain 10-15 yr 170 gpm15 yr change impeller to 464 curve 162mm 15-20 yr 184 gpm15 yr change impeller to 464 curve 162mm 15-20 yr 184 gpm
Construction Cost for Expansion No. Unit Cost/Unit Engineer's Opinion of Construction Costs 20+ 318 gpmNo Upgrades Necessary 0 LS 0 0Pumps installed in 5 yr sufficient for 10 yr condition 210 gpm @ 26' TDH 0
Flygt NP3102 5 Hp, 465 curve 152 mmTotal Construction Cost $010% Contingency $015% Engineering Fees $0Total Construction Cost $0
Sewer Expansion CIP - 2014 - 201910
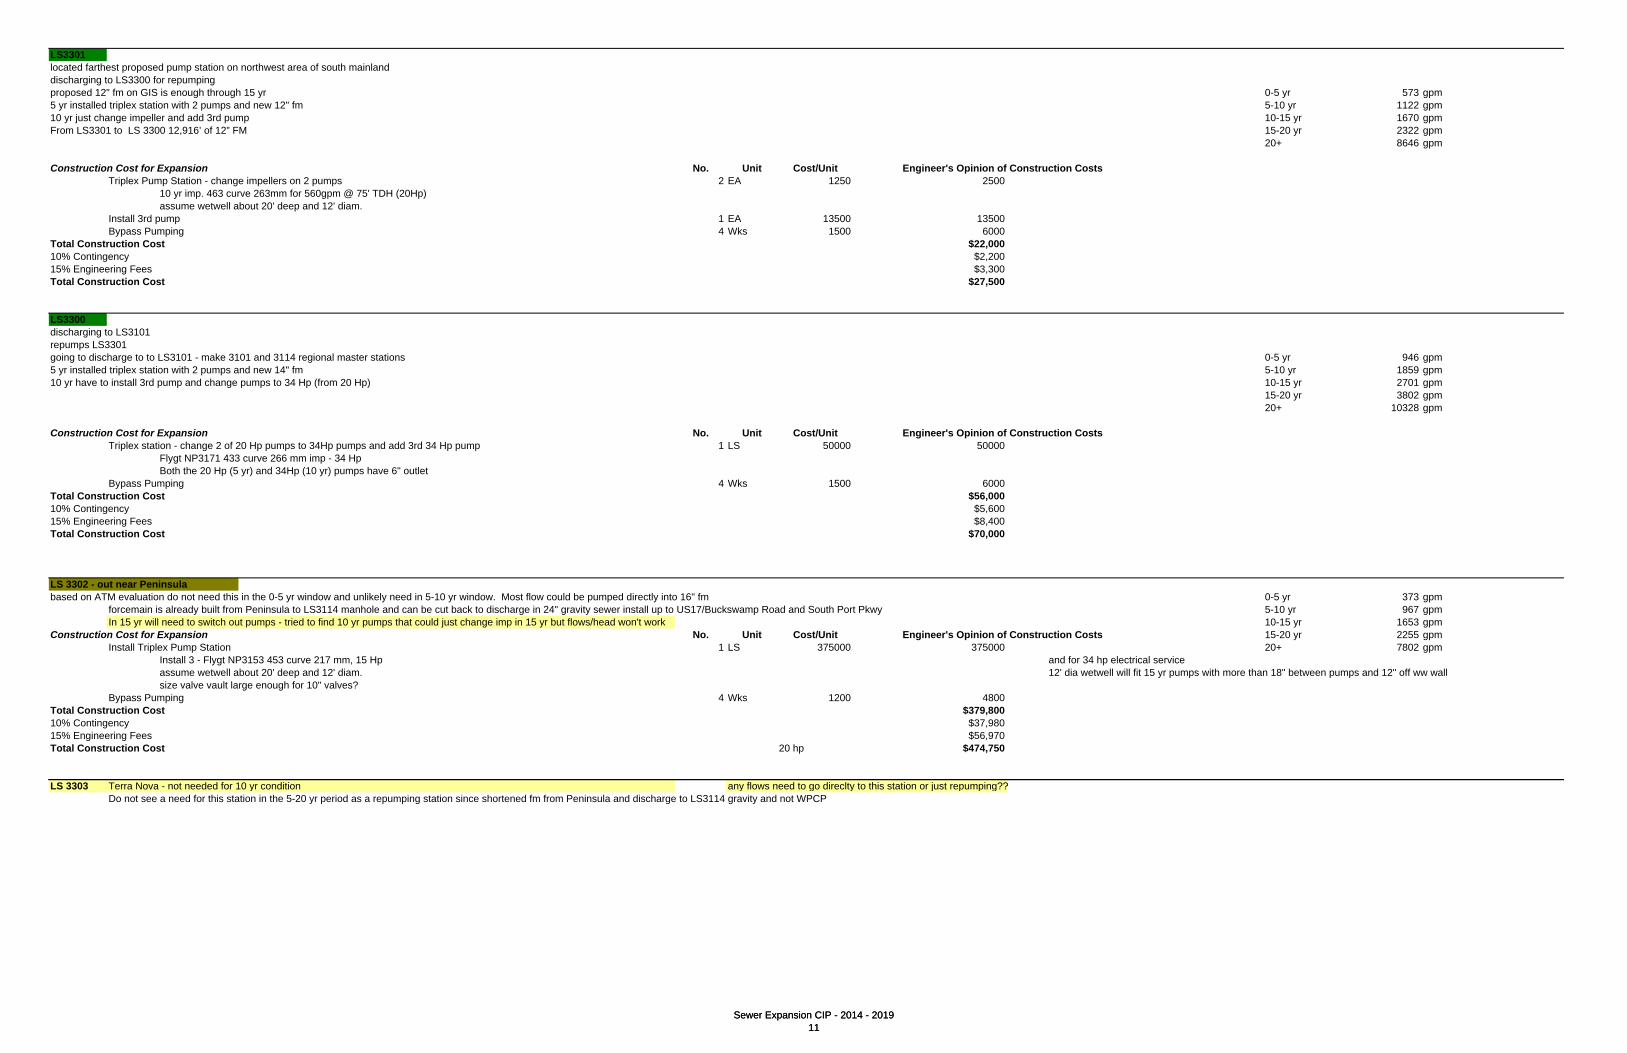
LS3301located farthest proposed pump station on northwest area of south mainlanddischarging to LS3300 for repumpingproposed 12" fm on GIS is enough through 15 yr 0-5 yr 573 gpm5 yr installed triplex station with 2 pumps and new 12" fm 5-10 yr 1122 gpm10 yr just change impeller and add 3rd pump 10-15 yr 1670 gpmFrom LS3301 to LS 3300 12,916’ of 12” FM 15-20 yr 2322 gpm
20+ 8646 gpm
Construction Cost for Expansion No. Unit Cost/Unit Engineer's Opinion of Construction CostsTriplex Pump Station - change impellers on 2 pumps 2 EA 1250 2500
10 yr imp. 463 curve 263mm for 560gpm @ 75' TDH (20Hp)assume wetwell about 20' deep and 12' diam.
Install 3rd pump 1 EA 13500 13500Bypass Pumping 4 Wks 1500 6000
Total Construction Cost $22,00010% Contingency $2,20015% Engineering Fees $3,300Total Construction Cost $27,500
Sewer Expansion CIP - 2014 - 201911
LS3300discharging to LS3101repumps LS3301going to discharge to to LS3101 - make 3101 and 3114 regional master stations 0-5 yr 946 gpm5 yr installed triplex station with 2 pumps and new 14" fm 5-10 yr 1859 gpm10 yr have to install 3rd pump and change pumps to 34 Hp (from 20 Hp) 10-15 yr 2701 gpm
15-20 yr 3802 gpm20+ 10328 gpm
Construction Cost for Expansion No. Unit Cost/Unit Engineer's Opinion of Construction CostsTriplex station - change 2 of 20 Hp pumps to 34Hp pumps and add 3rd 34 Hp pump 1 LS 50000 50000
Flygt NP3171 433 curve 266 mm imp - 34 HpBoth the 20 Hp (5 yr) and 34Hp (10 yr) pumps have 6" outlet
Bypass Pumping 4 Wks 1500 6000Total Construction Cost $56,00010% Contingency $5,60015% Engineering Fees $8,400Total Construction Cost $70,000
LS 3302 - out near Peninsulabased on ATM evaluation do not need this in the 0-5 yr window and unlikely need in 5-10 yr window. Most flow could be pumped directly into 16" fm 0-5 yr 373 gpm
forcemain is already built from Peninsula to LS3114 manhole and can be cut back to discharge in 24" gravity sewer install up to US17/Buckswamp Road and South Port Pkwy 5-10 yr 967 gpmIn 15 yr will need to switch out pumps - tried to find 10 yr pumps that could just change imp in 15 yr but flows/head won't work 10-15 yr 1653 gpm
Construction Cost for Expansion No. Unit Cost/Unit Engineer's Opinion of Construction Costs 15-20 yr 2255 gpmInstall Triplex Pump Station 1 LS 375000 375000 20+ 7802 gpm
Install 3 - Flygt NP3153 453 curve 217 mm, 15 Hp and for 34 hp electrical serviceassume wetwell about 20' deep and 12' diam. 12' dia wetwell will fit 15 yr pumps with more than 18" between pumps and 12" off ww wallsize valve vault large enough for 10" valves?
Bypass Pumping 4 Wks 1200 4800Total Construction Cost $379,80010% Contingency $37,98015% Engineering Fees $56,970Total Construction Cost 20 hp $474,750
LS 3303 Terra Nova - not needed for 10 yr condition any flows need to go direclty to this station or just repumping??LS 3303 Terra Nova - not needed for 10 yr condition any flows need to go direclty to this station or just repumping??Do not see a need for this station in the 5-20 yr period as a repumping station since shortened fm from Peninsula and discharge to LS3114 gravity and not WPCP
Sewer Expansion CIP - 2014 - 201911

SSI - Future Expansion/Growth
German Village/Burns TractTo collect septic systems and planned development - was previously on Future Development CIP in SSI W/S MPSeptic systems in German Village installed 1964 - 2002; high potential for failuresGerman Village estimated 272 lots; 37 with septic systems; Burns Tract 16 lots; Total 169 gpm Install new gravity sewer, lift station, and forcemain and discharge to LS2056Will require upgrades to LS2056 - listed separately
Construction Cost for Expansion No. Unit Cost/Unit Engineer's Opinion of Construction CostsInstall new 8" gravity sewer (4' to 13' deep) 18600 LF 95 1767000install new 4' diameter manholes with lining/coating 54 EA 3250 175500Install new duplex lift station - Flygt CP3127 481 imp, 10 Hp (LSFUT5) 1 LS 175000 175000Install new 4-inch FM 3000 LF 27.5 82500Bypass Pumping 4 Wk 1000 4000
Total Construction Cost $2,204,00010% Contingency $220,40015% Engineering Fees $330,600Total Construction Cost $2,755,000
Sewer Expansion CIP - 2014 - 201912
Hampton PointTo collect septic systems - was previously on Future Development CIP in SSI W/S MPSubdivision over 30 years old; Septic systems installed 1979 - 2005; significant potential for failures; 9 repairs documented by County as of 2006Estimated 202 lots - 131 have septic systems - estimate 196 gpm for subdivision Install new gravity sewer, 2 lift stations, and forcemain and discharge to LS2033Will require upgrades to LSs 2033, 2056, 2032 - listed separately
Construction Cost for Expansion No. Unit Cost/Unit Engineer's Opinion of Construction CostsInstall new 8" gravity sewer (4' to 15' deep) 18300 LF 100 1830000install new 4' diameter manholes with lining/coating 61 EA 3300 201300Install new duplex lift station - Flygt CP3102 432 imp, 5 Hp (LSFUT2) 1 LS 150000 150000Install new duplex lift station - Flygt CP3127 481 imp, 10 Hp (LSFUT3) 1 LS 175000 175000Install new 4-inch FM 4600 LF 27.5 126500Install new 6-inch FM 12000 LF 30 360000Bypass Pumping 4 Wk 1000 4000
Total Construction Cost $2,846,80010% Contingency $284,68015% Engineering Fees $427,020Total Construction Cost $3,558,500
The Landings at West PointProposed subdivision in area of West Point Plantation - was previously on Future Development CIP in SSI W/S MPNo septic tanks as of 2006Estimated 22 lots - estimate 18 gpm for subdivision Install new gravity sewer to discharge to existing West Point (Lake) gravity sewer; based on as-builts for this area is deep enough to collectWill require upgrades to LS 2038 (the West Point Plantation will be the main reason need to upgrade)
Construction Cost for Expansion No. Unit Cost/Unit Engineer's Opinion of Construction CostsInstall new 8" gravity sewer (4' to 6' deep) 500 LF 75 37500Install new 8" gravity sewer (6' to 8' deep) 600 LF 85 51000install new 4' diameter manholes with lining/coating (4 to 6' deep) 2 EA 2900 5800install new 4' diameter manholes with lining/coating (6 to 8' deep) 2 EA 3050 6100Bypass Pumping 6 Wk 1000 6000
Total Construction Cost $106,40010% Contingency $10,64015% Engineering Fees $15,960Total Construction Cost $133,000
Sewer Expansion CIP - 2014 - 201912

West Point PlantationPrimarily expansion of existing subdivision - was previously on Future Development CIP in SSI W/S MPExisting West Point Plantation has public sewer; are 20 septic tanks in subdivision area installed 1983 - 1998Estimated 200 lots - 20 have septic systems - estimate 167 gpm for subdivision Install new gravity sewer, 2 lift stations, and forcemain and discharge to existing West Point gravity sewerUse 1 new lift station on north side of existing West Point Plantation and 1 new lift station on south side of West Point PlantationWill require upgrades to LS 2038
Construction Cost for Expansion No. Unit Cost/Unit Engineer's Opinion of Construction CostsInstall new 8" gravity sewer (4' to 6' deep) 6000 LF 75 450000Install new 8" gravity sewer (6' to 8' deep) 5850 LF 85 497250Install new 8" gravity sewer (8' to 10' deep) 2310 LF 90 207900Install new 8" gravity sewer (10' to 12' deep) 400 LF 100 40000install new 4' diameter manholes with lining/coating (4' to 6' deep) 18 EA 2900 52200install new 4' diameter manholes with lining/coating (6' to 8' deep) 18 EA 3050 54900install new 4' diameter manholes with lining/coating (8' to 10' deep) 8 EA 3250 26000install new 4' diameter manholes with lining/coating (10' to 12' deep) 3 EA 3500 10500Install new duplex lift station - 10 Hp 2 LS 175000 350000Install new 4-inch FM 2000 LF 27.5 55000Upgrades to LS 2038 - need additional 185 gpm capacity 2 EA 18750 37500
Install duplex Flygt CP 3170 464 imp 30 Hp pumps (total capacity 350 gpm @ 108 ft TDH)
Sewer Expansion CIP - 2014 - 201913
Install duplex Flygt CP-3170, 464 imp, 30 Hp pumps (total capacity 350 gpm @ 108 ft TDH)Remove/replace top slab, reset rails/piping 1 LS 6750 6750Electrical Upgrades 1 LS 16500 16500 Pumps Fit 6' diameter wetwellBypass pumping 8 wks 1000 8000 pumps 22" wide and 49" long
Total Construction Cost $1,812,50010% Contingency $181,25015% Engineering Fees $271,875Total Construction Cost $2,265,625
Oak Grove/Dunbar Acres/Draughton SubdivisionTo collect septic systems - was previously on Future Development CIP in SSI W/S MPSeptic systems installed 1964 - 2003 (Dunbar Acres), Orange Grove may have been installed prior to permitting requirements; Draughton subdivision 1994 - 2001 ; high potential for failures from Dunbar Acres and Orange GroveEstimated 75 (17 Orange Grove, 49 Dunbar Acres, 9 Draughton) homes with septic systems - 65 gpm Install new gravity sewer, lift station, and forcemain and discharge to proposed St. Clair Estates SewerPut in 10 year CIP even though septic 40+ years old because already have 3 major systems in 5 year CIP for septic removal based on feedback from United Water/JWSC/Glynn County
Construction Cost for Expansion No. Unit Cost/Unit Engineer's Opinion of Construction CostsInstall new 8" gravity sewer (4' to 15' deep) 6800 LF 100 680000Install new 8 gravity sewer (4 to 15 deep) 6800 LF 100 680000install new 4' diameter manholes with lining/coating 20 EA 3300 66000Install new duplex lift station - Flygt CP3067 265 imp, 2 Hp (LSFUT6) 1 LS 125000 125000Install new 4-inch FM 4000 LF 27.5 110000Bypass Pumping 4 Wk 1000 4000
Total Construction Cost $985,00010% Contingency $98,50015% Engineering Fees $147,750Total Construction Cost $1,231,250
Central Park/Riverview ParkTo collect septic systems - was previously on Future Development CIP in SSI W/S MPSeptic systems installed 1963 - 2000 (Central Park), 1964 - 2002 (Riverview Park); high potential for failuresEstimated 138 (81 Central Park, 57 Riverview Park) homes (40 with septic as of 2006 - 16 failures) 115 gpm Install new gravity sewer, lift station, and forcemain and discharge to LS2003 existing gravity sewerPut in 10 year CIP even though septic 40+ years old because already have 3 major systems in 5 year CIP for septic removal based on feedback from United Water/JWSC/Glynn County
Construction Cost for Expansion No. Unit Cost/Unit Engineer's Opinion of Construction CostsInstall new 8" gravity sewer (4' to 10' deep) 8500 LF 90 765000i t ll 4' di t h l ith li i / ti 25 EA 3250 81250install new 4' diameter manholes with lining/coating 25 EA 3250 81250Install new duplex lift station - Flygt CP3085 434 imp, 3 Hp (LSFUT8) 1 LS 125000 125000Install new 4-inch FM 1400 LF 27.5 38500Bypass Pumping 4 Wk 1000 4000
Total Construction Cost $1,013,75010% Contingency $101,37515% Engineering Fees $152,063Total Construction Cost $1,267,188
Sewer Expansion CIP - 2014 - 201913
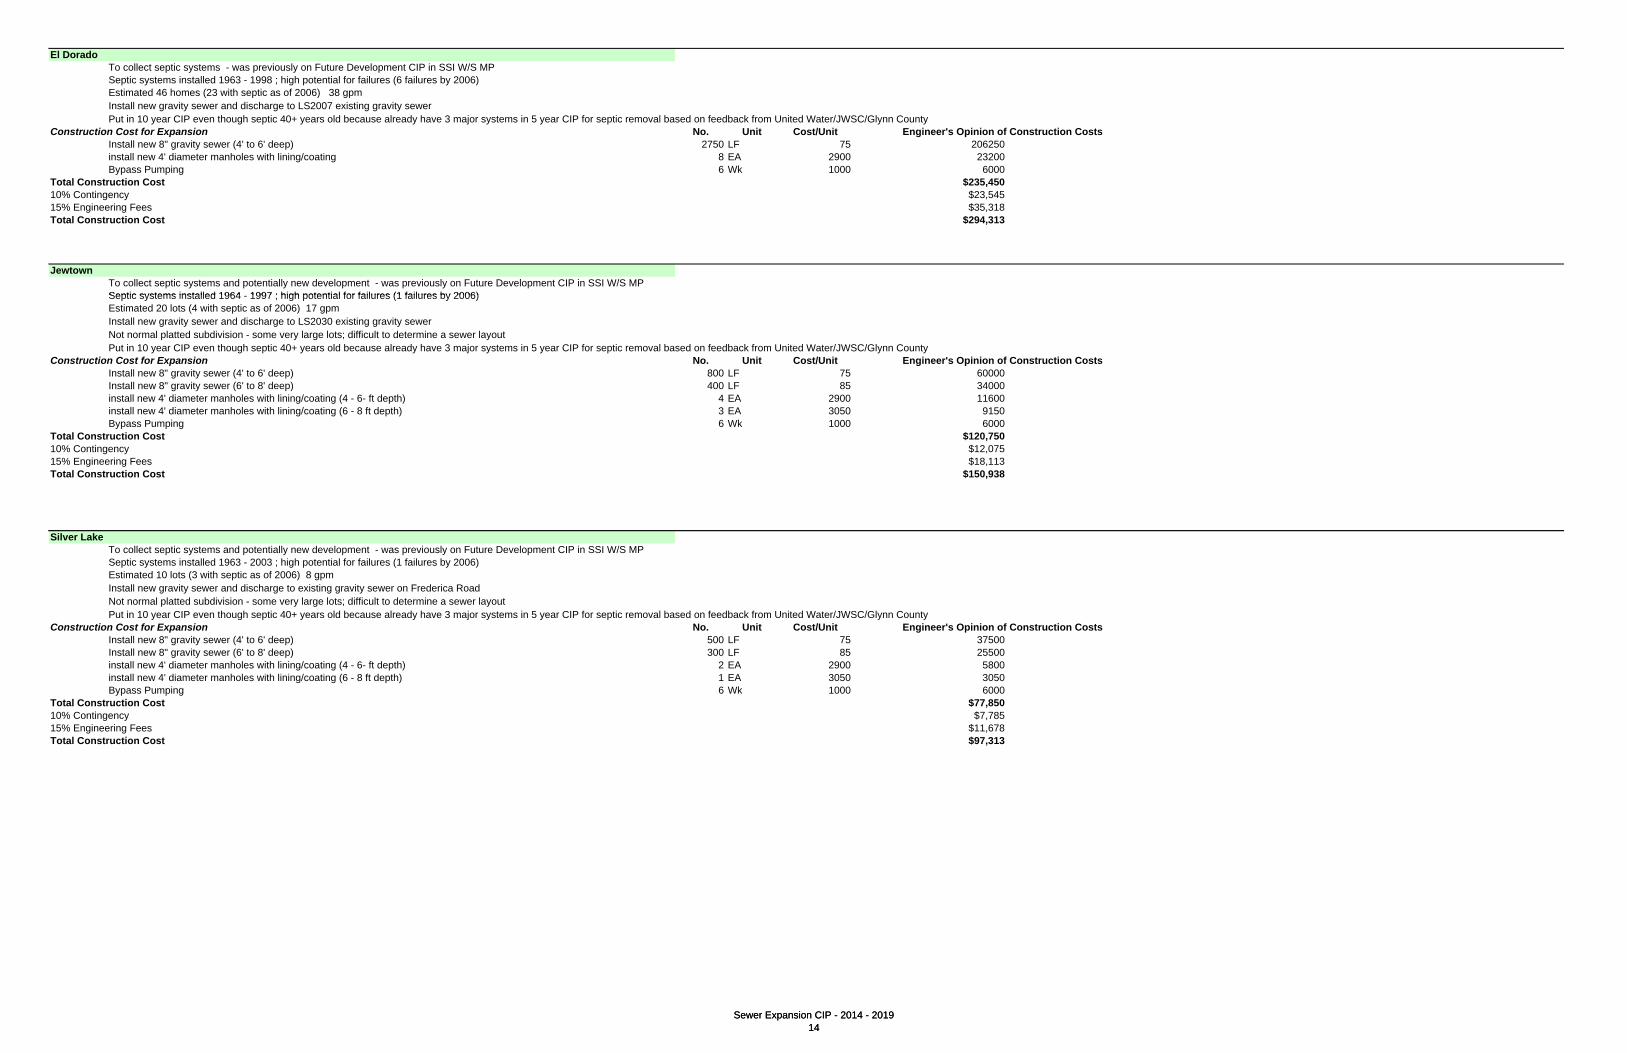
El DoradoTo collect septic systems - was previously on Future Development CIP in SSI W/S MPSeptic systems installed 1963 - 1998 ; high potential for failures (6 failures by 2006)Estimated 46 homes (23 with septic as of 2006) 38 gpm Install new gravity sewer and discharge to LS2007 existing gravity sewerPut in 10 year CIP even though septic 40+ years old because already have 3 major systems in 5 year CIP for septic removal based on feedback from United Water/JWSC/Glynn County
Construction Cost for Expansion No. Unit Cost/Unit Engineer's Opinion of Construction CostsInstall new 8" gravity sewer (4' to 6' deep) 2750 LF 75 206250install new 4' diameter manholes with lining/coating 8 EA 2900 23200Bypass Pumping 6 Wk 1000 6000
Total Construction Cost $235,45010% Contingency $23,54515% Engineering Fees $35,318Total Construction Cost $294,313
JewtownTo collect septic systems and potentially new development - was previously on Future Development CIP in SSI W/S MPSeptic systems installed 1964 1997 ; high potential for failures (1 failures by 2006)
Sewer Expansion CIP - 2014 - 201914
Septic systems installed 1964 - 1997 ; high potential for failures (1 failures by 2006)Estimated 20 lots (4 with septic as of 2006) 17 gpm Install new gravity sewer and discharge to LS2030 existing gravity sewerNot normal platted subdivision - some very large lots; difficult to determine a sewer layoutPut in 10 year CIP even though septic 40+ years old because already have 3 major systems in 5 year CIP for septic removal based on feedback from United Water/JWSC/Glynn County
Construction Cost for Expansion No. Unit Cost/Unit Engineer's Opinion of Construction CostsInstall new 8" gravity sewer (4' to 6' deep) 800 LF 75 60000Install new 8" gravity sewer (6' to 8' deep) 400 LF 85 34000install new 4' diameter manholes with lining/coating (4 - 6- ft depth) 4 EA 2900 11600install new 4' diameter manholes with lining/coating (6 - 8 ft depth) 3 EA 3050 9150Bypass Pumping 6 Wk 1000 6000
Total Construction Cost $120,75010% Contingency $12,07515% Engineering Fees $18,113Total Construction Cost $150,938
Silver LakeSilver LakeTo collect septic systems and potentially new development - was previously on Future Development CIP in SSI W/S MPSeptic systems installed 1963 - 2003 ; high potential for failures (1 failures by 2006)Estimated 10 lots (3 with septic as of 2006) 8 gpm Install new gravity sewer and discharge to existing gravity sewer on Frederica RoadNot normal platted subdivision - some very large lots; difficult to determine a sewer layoutPut in 10 year CIP even though septic 40+ years old because already have 3 major systems in 5 year CIP for septic removal based on feedback from United Water/JWSC/Glynn County
Construction Cost for Expansion No. Unit Cost/Unit Engineer's Opinion of Construction CostsInstall new 8" gravity sewer (4' to 6' deep) 500 LF 75 37500Install new 8" gravity sewer (6' to 8' deep) 300 LF 85 25500install new 4' diameter manholes with lining/coating (4 - 6- ft depth) 2 EA 2900 5800install new 4' diameter manholes with lining/coating (6 - 8 ft depth) 1 EA 3050 3050Bypass Pumping 6 Wk 1000 6000
Total Construction Cost $77,85010% Contingency $7,78515% Engineering Fees $11,678Total Construction Cost $97,313
Sewer Expansion CIP - 2014 - 201914
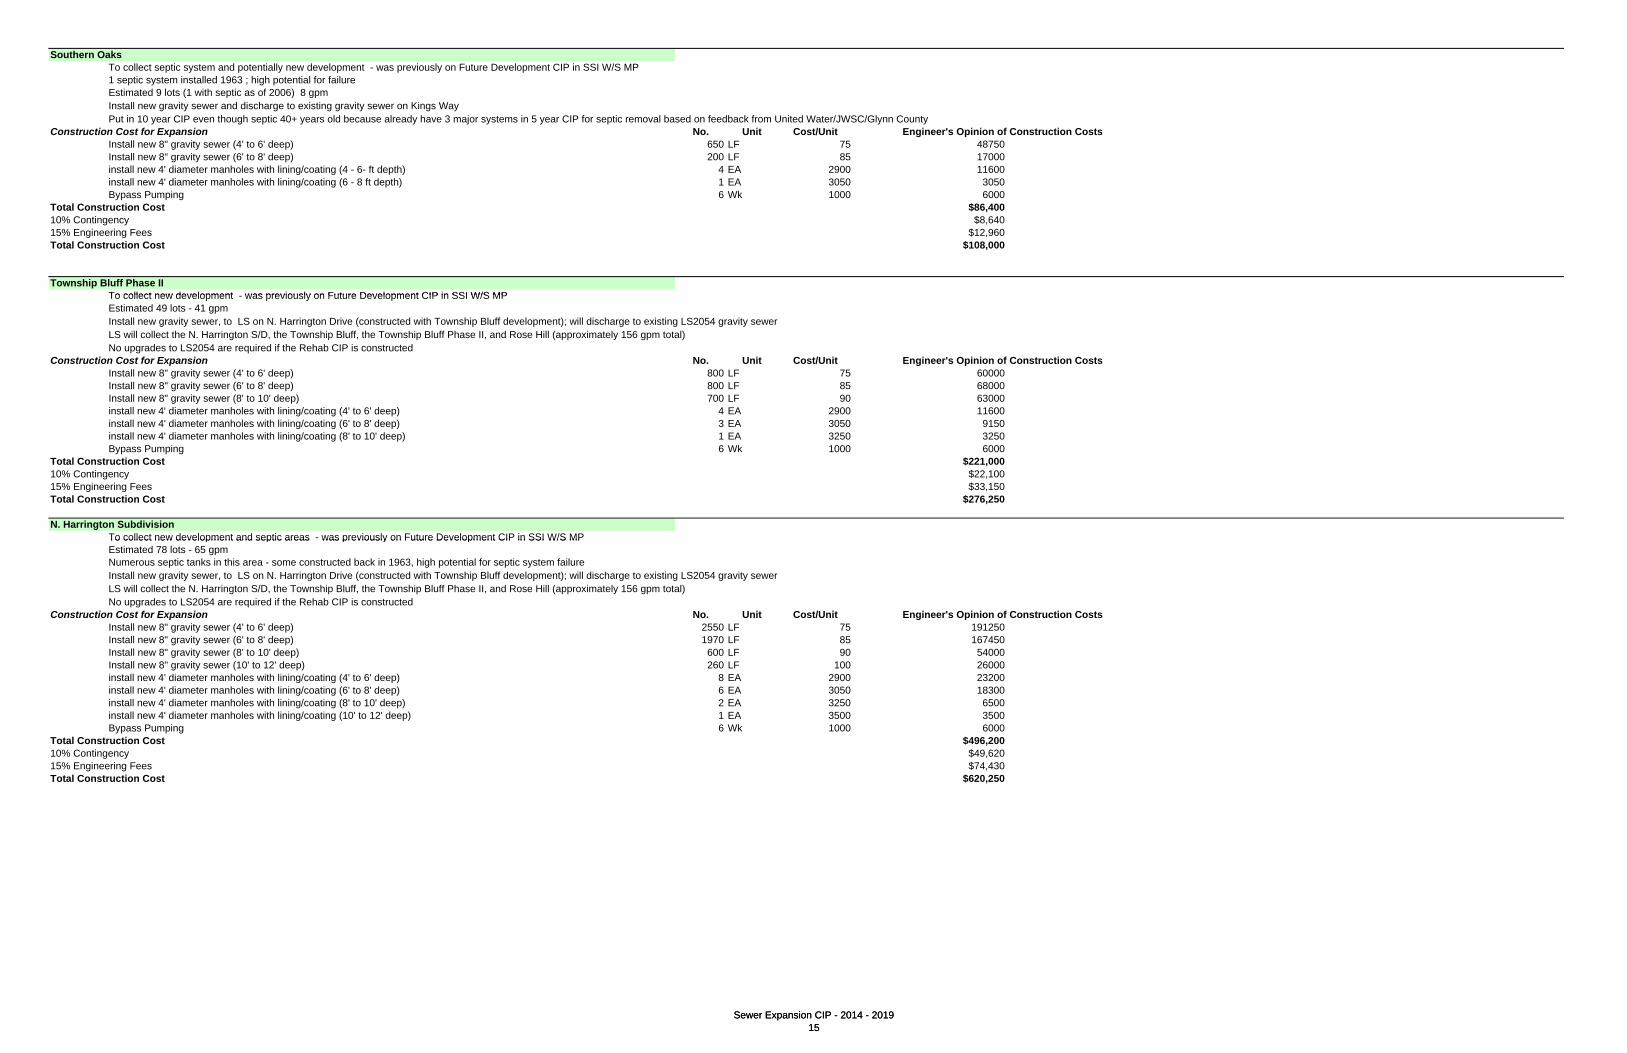
Southern OaksTo collect septic system and potentially new development - was previously on Future Development CIP in SSI W/S MP1 septic system installed 1963 ; high potential for failureEstimated 9 lots (1 with septic as of 2006) 8 gpm Install new gravity sewer and discharge to existing gravity sewer on Kings WayPut in 10 year CIP even though septic 40+ years old because already have 3 major systems in 5 year CIP for septic removal based on feedback from United Water/JWSC/Glynn County
Construction Cost for Expansion No. Unit Cost/Unit Engineer's Opinion of Construction CostsInstall new 8" gravity sewer (4' to 6' deep) 650 LF 75 48750Install new 8" gravity sewer (6' to 8' deep) 200 LF 85 17000install new 4' diameter manholes with lining/coating (4 - 6- ft depth) 4 EA 2900 11600install new 4' diameter manholes with lining/coating (6 - 8 ft depth) 1 EA 3050 3050Bypass Pumping 6 Wk 1000 6000
Total Construction Cost $86,40010% Contingency $8,64015% Engineering Fees $12,960Total Construction Cost $108,000
Township Bluff Phase IITo collect new development was previously on Future Development CIP in SSI W/S MP
Sewer Expansion CIP - 2014 - 201915
To collect new development - was previously on Future Development CIP in SSI W/S MPEstimated 49 lots - 41 gpm Install new gravity sewer, to LS on N. Harrington Drive (constructed with Township Bluff development); will discharge to existing LS2054 gravity sewer LS will collect the N. Harrington S/D, the Township Bluff, the Township Bluff Phase II, and Rose Hill (approximately 156 gpm total)No upgrades to LS2054 are required if the Rehab CIP is constructed
Construction Cost for Expansion No. Unit Cost/Unit Engineer's Opinion of Construction CostsInstall new 8" gravity sewer (4' to 6' deep) 800 LF 75 60000Install new 8" gravity sewer (6' to 8' deep) 800 LF 85 68000Install new 8" gravity sewer (8' to 10' deep) 700 LF 90 63000install new 4' diameter manholes with lining/coating (4' to 6' deep) 4 EA 2900 11600install new 4' diameter manholes with lining/coating (6' to 8' deep) 3 EA 3050 9150install new 4' diameter manholes with lining/coating (8' to 10' deep) 1 EA 3250 3250Bypass Pumping 6 Wk 1000 6000
Total Construction Cost $221,00010% Contingency $22,10015% Engineering Fees $33,150Total Construction Cost $276,250
N. Harrington SubdivisionTo collect new development and septic areas - was previously on Future Development CIP in SSI W/S MPTo collect new development and septic areas was previously on Future Development CIP in SSI W/S MPEstimated 78 lots - 65 gpm Numerous septic tanks in this area - some constructed back in 1963, high potential for septic system failureInstall new gravity sewer, to LS on N. Harrington Drive (constructed with Township Bluff development); will discharge to existing LS2054 gravity sewer LS will collect the N. Harrington S/D, the Township Bluff, the Township Bluff Phase II, and Rose Hill (approximately 156 gpm total)No upgrades to LS2054 are required if the Rehab CIP is constructed
Construction Cost for Expansion No. Unit Cost/Unit Engineer's Opinion of Construction CostsInstall new 8" gravity sewer (4' to 6' deep) 2550 LF 75 191250Install new 8" gravity sewer (6' to 8' deep) 1970 LF 85 167450Install new 8" gravity sewer (8' to 10' deep) 600 LF 90 54000Install new 8" gravity sewer (10' to 12' deep) 260 LF 100 26000install new 4' diameter manholes with lining/coating (4' to 6' deep) 8 EA 2900 23200install new 4' diameter manholes with lining/coating (6' to 8' deep) 6 EA 3050 18300install new 4' diameter manholes with lining/coating (8' to 10' deep) 2 EA 3250 6500install new 4' diameter manholes with lining/coating (10' to 12' deep) 1 EA 3500 3500Bypass Pumping 6 Wk 1000 6000
Total Construction Cost $496,20010% Contingency $49,62015% Engineering Fees $74,430Total Construction Cost $620,250
Sewer Expansion CIP - 2014 - 201915

Plantation PointTo collect septic systems - was previously on Future Development CIP in SSI W/S MPSeptic systems 1968 - 1987; high potential for failures11 lots; 5 with septic systems; Total 12 gpm Install new gravity sewer and discharge to existing LS2032 gravity sewer
Construction Cost for Expansion No. Unit Cost/Unit Engineer's Opinion of Construction CostsInstall new 8" gravity sewer (6' to 10' deep) 1000 LF 95 95000install new 4' diameter manholes with lining/coating (6' to 10' deep) 4 EA 3300 13200Bypass Pumping 6 Wk 1000 6000
Total Construction Cost $114,20010% Contingency $11,42015% Engineering Fees $17,130Total Construction Cost $142,750
Epworth by the Sea - Expansion of Existing Center This project overlaps the Rehab Project for RD I/I - would need to be allocated accordingly for new developmentTo collect new development at Methodist Center - in 2008 Epworth requested change to PD zoning and estimated buildoutEstimated mixed use flow - 65 gpm in 10 year period; additional 65 gpm in 15 year periodCan not determine layout of necessary new development sewerExisting flow 85 gpm; significant RD I/I problems - private infrastructureDesign flo 85 gpm + 65 gpm 150 gpm 250 gpm still pro ides additional capacit for RD I/I
Sewer Expansion CIP - 2014 - 201916
Design flow: 85 gpm + 65 gpm = 150 gpm - 250 gpm still provides additional capacity for RD I/IConstruction Cost for Expansion No. Unit Cost/Unit Engineer's Opinion of Construction Costs
Construct new 6-ft diameter and 10 ft deep wet well and install new pumps/panel 1 LS 115000 115000Flygt NP3102, 5 Hp, 464 imp, 162 mm, 230 V, 3 Phase Approximate Oper. Condition 250 gpm @ 28' TDH
New influent piping 1 LS 7500 7500 should be forcemains discharging to existing wetwellRehabilitate existing wet well in to receiving manhole 1 LS 6500 6500Install new 6-inch FM 2251 LF 30 67530Abandon existing 4-inch FM 2251 LF 5 11255Extend 6-inch FM to next downstream manhole (on 24" gravity sewer) 200 LF 40 8000 difficult construction - in roadwayCoat/Line Discharge Manhole (15' deep) 1 LS 7500 7500Bypass Pumping 24 Wk 1200 28800
Total Construction Cost $252,08510% Contingency $25,20915% Engineering Fees $37,813Total Construction Cost $315,106
LS2033 Upgrades - Triggered by Hampton PointNeed to upgrade forcemain from 6 inch to 8-inchWill allow LS2033 to pump 680 gpm (1 pump) - meets capacity needs of LS59, LSFUT3 and LSFUT4Will allow LS2033 to pump 680 gpm (1 pump) meets capacity needs of LS59, LSFUT3 and LSFUT4
Construction Cost for Expansion No. Unit Cost/Unit Engineer's Opinion of Construction CostsInstall new 8-inch PVC FM 8500 LF 35 297500Abandon existing 6-inch FM 8500 LF 5 42500Bypass Pumping 24 Wk 1200 28800
Total Construction Cost $368,80010% Contingency $36,88015% Engineering Fees $55,320Total Construction Cost $461,000
LS2056 Upgrades - Triggered by German Village and Burns TractNeed to upgrade forcemain from 6-inch forcemain to 10-inch forcemainWill allow LS2056 to pump 1019 gpm (1 pump) which basically meets needs of LSFUT5 (German Village/Burns Tract), LS2033 - upgraded, and Frederica Township (total needed 1093 gpm)
Construction Cost for Expansion No. Unit Cost/Unit Engineer's Opinion of Construction CostsInstall new 10-inch PVC FM 8415 LF 40 336600Abandon existing 6-inch FM 8415 LF 5 42075Bypass Pumping 24 Wk 1200 28800
Total Construction Cost $407,47510% Contingency $40,74815% Engineering Fees $61,121Total Construction Cost $509 344Total Construction Cost $509,344
LS2032 Upgrades - Triggered by Hampton PointNeed to upgrade pumpsWill allow LS2032 to pump approximately 2500 gpm - should just need to upgrade pumps/panel - should fit in wetwell sized under Rehab CIP
Construction Cost for Expansion No. Unit Cost/Unit Engineer's Opinion of Construction CostsUpgrade Quadraplex pumps/panel 4 EA 27000 108000
Flygt CP3201, 462 Imp, 47 Hp, design oper condition 840 gpm @ 106 ft TDHNew discharge piping and valves 1 LS 35000 35000Electrical Upgrades 1 LS 20000 20000Bypass Pumping 16 Wk 1750 28000
Total Construction Cost $191,00010% Contingency $19,10015% Engineering Fees $28,650Total Construction Cost $238,750
Sewer Expansion CIP - 2014 - 201916
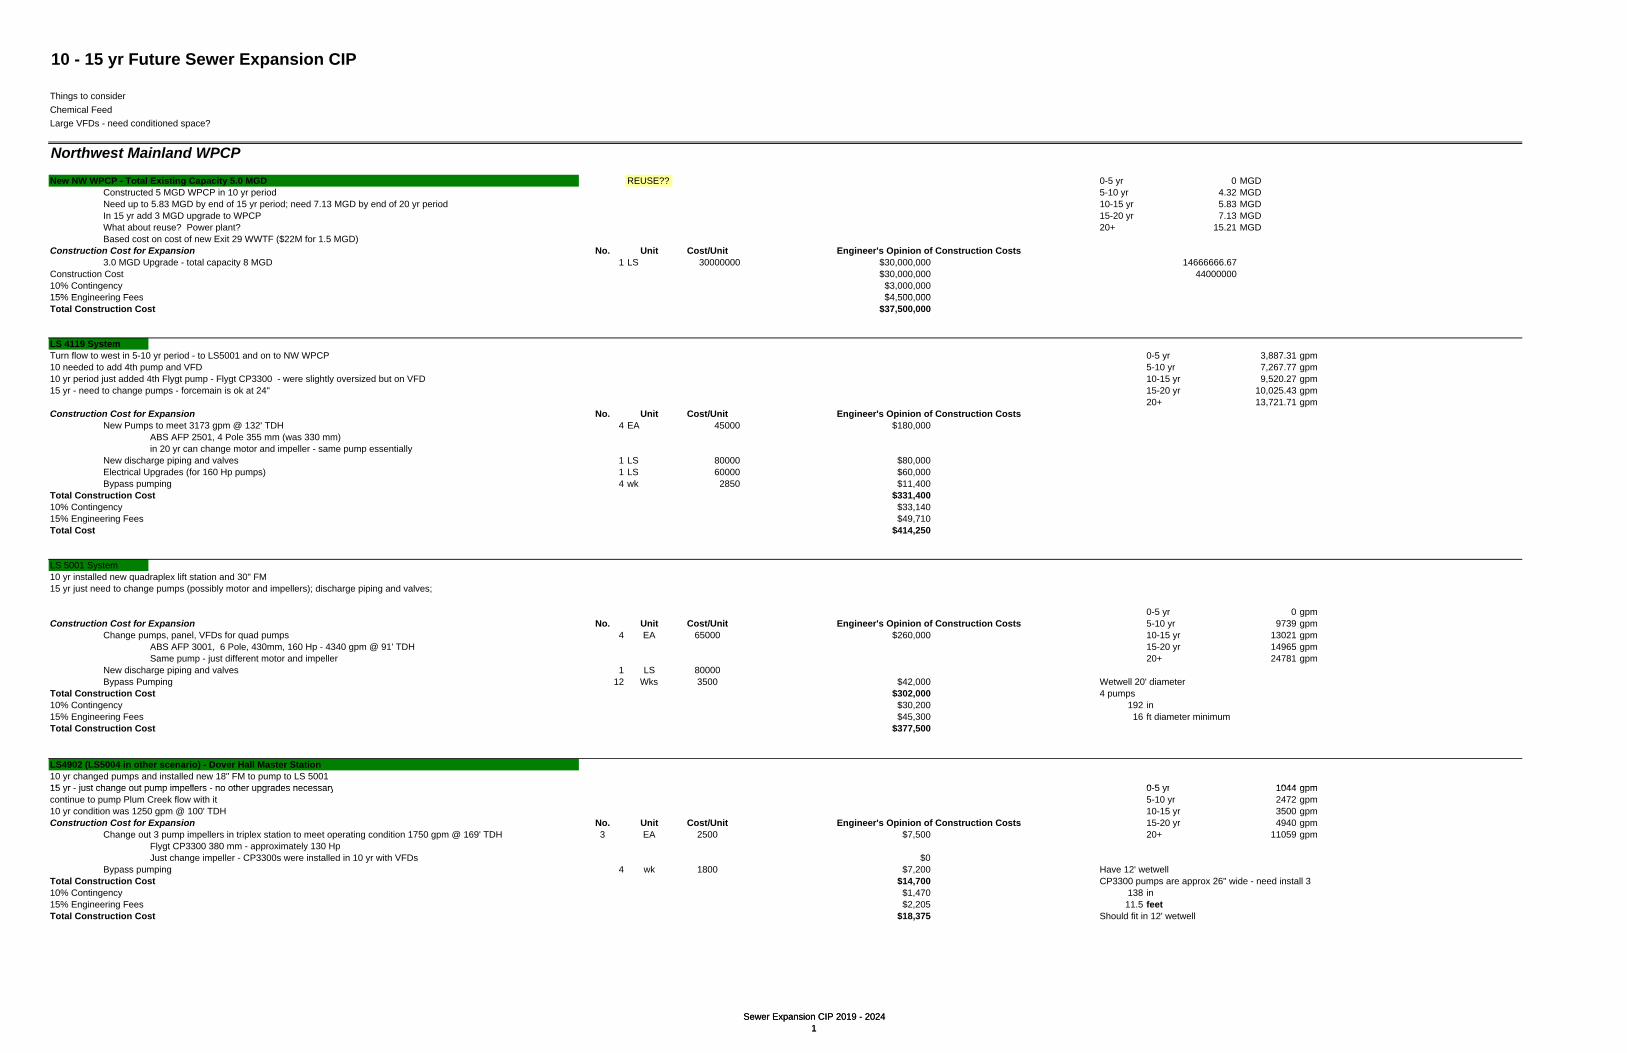
10 - 15 yr Future Sewer Expansion CIP
Things to considerChemical FeedLarge VFDs - need conditioned space?
Northwest Mainland WPCP
New NW WPCP - Total Existing Capacity 5.0 MGD REUSE?? 0-5 yr 0 MGDConstructed 5 MGD WPCP in 10 yr period 5-10 yr 4.32 MGDNeed up to 5.83 MGD by end of 15 yr period; need 7.13 MGD by end of 20 yr period 10-15 yr 5.83 MGDIn 15 yr add 3 MGD upgrade to WPCP 15-20 yr 7.13 MGDWhat about reuse? Power plant? 20+ 15.21 MGDBased cost on cost of new Exit 29 WWTF ($22M for 1.5 MGD)
Construction Cost for Expansion No. Unit Cost/Unit Engineer's Opinion of Construction Costs3.0 MGD Upgrade - total capacity 8 MGD 1 LS 30000000 $30,000,000 14666666.67
Construction Cost $30,000,000 4400000010% Contingency $3,000,00015% E i i F $4 500 000
Sewer Expansion CIP 2019 - 20241
15% Engineering Fees $4,500,000Total Construction Cost $37,500,000
LS 4119 SystemTurn flow to west in 5-10 yr period - to LS5001 and on to NW WPCP 0-5 yr 3,887.31 gpm10 needed to add 4th pump and VFD 5-10 yr 7,267.77 gpm10 yr period just added 4th Flygt pump - Flygt CP3300 - were slightly oversized but on VFD 10-15 yr 9,520.27 gpm15 yr - need to change pumps - forcemain is ok at 24" 15-20 yr 10,025.43 gpm
20+ 13,721.71 gpmConstruction Cost for Expansion No. Unit Cost/Unit Engineer's Opinion of Construction Costs
New Pumps to meet 3173 gpm @ 132' TDH 4 EA 45000 $180,000ABS AFP 2501, 4 Pole 355 mm (was 330 mm)in 20 yr can change motor and impeller - same pump essentially
New discharge piping and valves 1 LS 80000 $80,000Electrical Upgrades (for 160 Hp pumps) 1 LS 60000 $60,000Bypass pumping 4 wk 2850 $11,400
Total Construction Cost $331,40010% Contingency $33,14015% Engineering Fees $49,710Total Cost $414,250
LS 5001 System 10 yr installed new quadraplex lift station and 30" FM15 yr just need to change pumps (possibly motor and impellers); discharge piping and valves;
0-5 yr 0 gpmConstruction Cost for Expansion No. Unit Cost/Unit Engineer's Opinion of Construction Costs 5-10 yr 9739 gpm
Change pumps, panel, VFDs for quad pumps 4 EA 65000 $260,000 10-15 yr 13021 gpmABS AFP 3001, 6 Pole, 430mm, 160 Hp - 4340 gpm @ 91' TDH 15-20 yr 14965 gpmSame pump - just different motor and impeller 20+ 24781 gpm
New discharge piping and valves 1 LS 80000Bypass Pumping 12 Wks 3500 $42,000 Wetwell 20' diameter
Total Construction Cost $302,000 4 pumps10% Contingency $30,200 192 in15% Engineering Fees $45,300 16 ft diameter minimumTotal Construction Cost $377,500
LS4902 (LS5004 in other scenario) - Dover Hall Master Station10 yr changed pumps and installed new 18" FM to pump to LS 500115 yr just change out pump impellers no other upgrades necessary 0 5 yr 1044 gpm15 yr - just change out pump impellers - no other upgrades necessary 0-5 yr 1044 gpmcontinue to pump Plum Creek flow with it 5-10 yr 2472 gpm10 yr condition was 1250 gpm @ 100' TDH 10-15 yr 3500 gpmConstruction Cost for Expansion No. Unit Cost/Unit Engineer's Opinion of Construction Costs 15-20 yr 4940 gpm
3 EA 2500 $7,500 20+ 11059 gpmFlygt CP3300 380 mm - approximately 130 HpJust change impeller - CP3300s were installed in 10 yr with VFDs $0
Bypass pumping 4 wk 1800 $7,200 Have 12' wetwellTotal Construction Cost $14,700 CP3300 pumps are approx 26" wide - need install 310% Contingency $1,470 138 in15% Engineering Fees $2,205 11.5 feetTotal Construction Cost $18,375 Should fit in 12' wetwell
Change out 3 pump impellers in triplex station to meet operating condition 1750 gpm @ 169' TDH
Sewer Expansion CIP 2019 - 20241
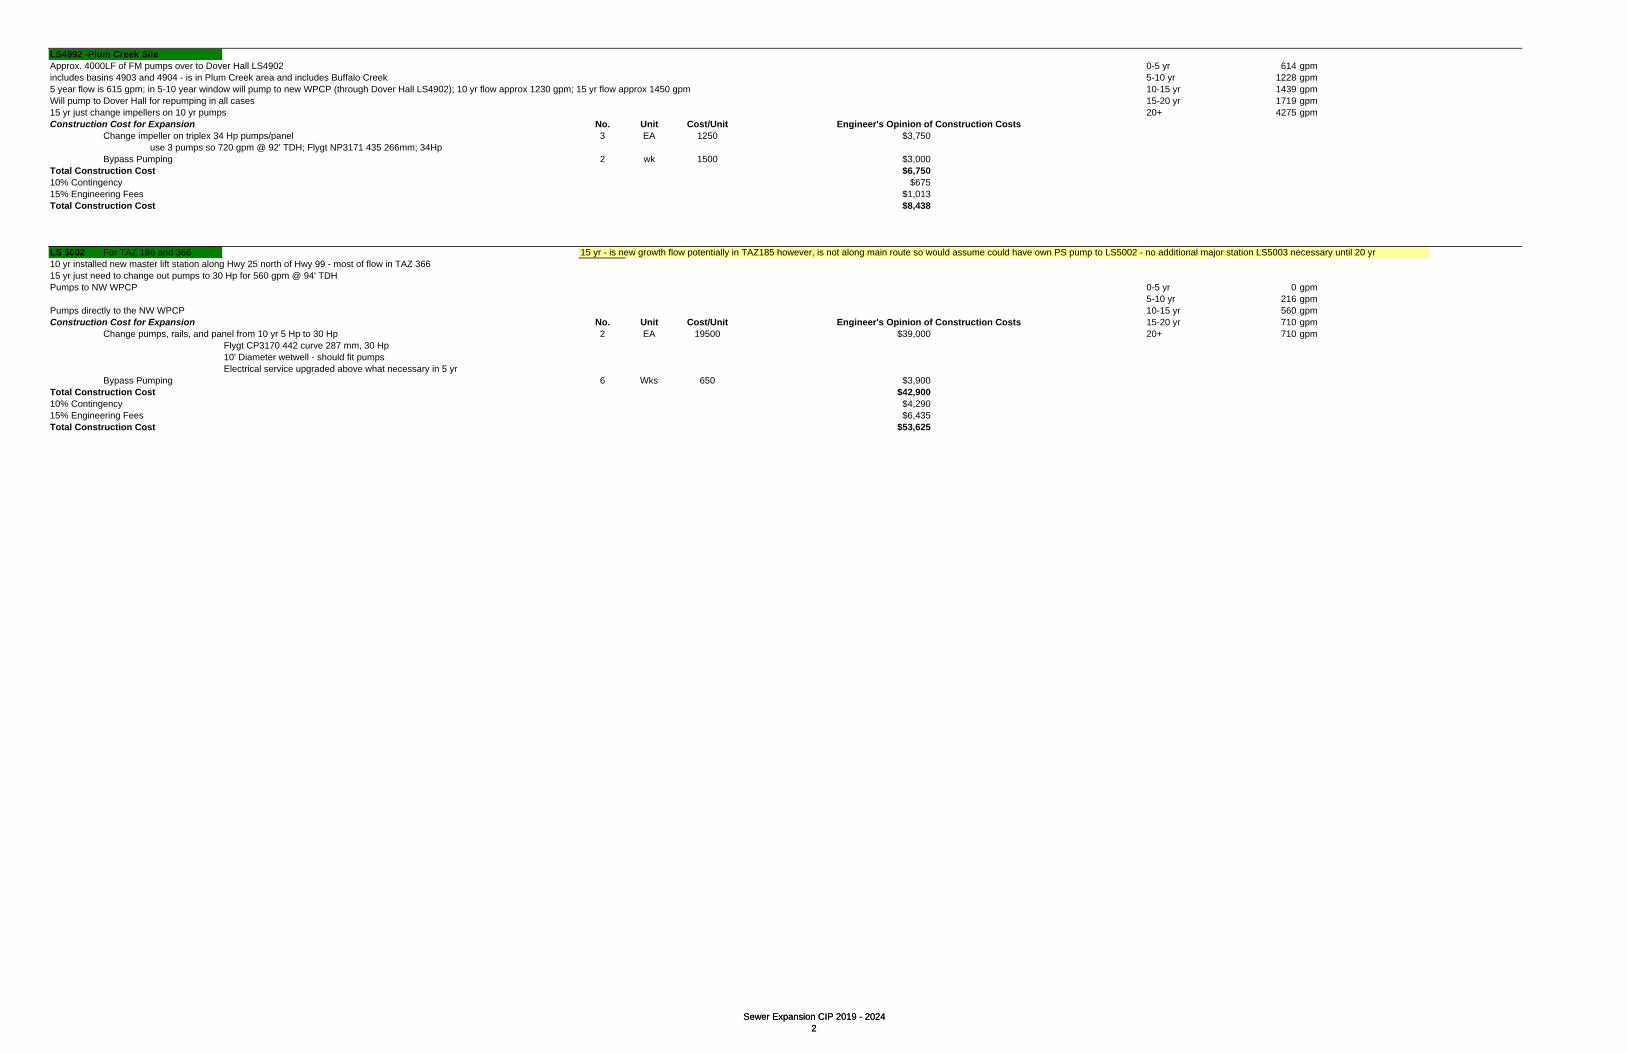
LS4992 -Plum Creek SiteApprox. 4000LF of FM pumps over to Dover Hall LS4902 0-5 yr 614 gpmincludes basins 4903 and 4904 - is in Plum Creek area and includes Buffalo Creek 5-10 yr 1228 gpm5 year flow is 615 gpm; in 5-10 year window will pump to new WPCP (through Dover Hall LS4902); 10 yr flow approx 1230 gpm; 15 yr flow approx 1450 gpm 10-15 yr 1439 gpmWill pump to Dover Hall for repumping in all cases 15-20 yr 1719 gpm15 yr just change impellers on 10 yr pumps 20+ 4275 gpmConstruction Cost for Expansion No. Unit Cost/Unit Engineer's Opinion of Construction Costs
Change impeller on triplex 34 Hp pumps/panel 3 EA 1250 $3,750use 3 pumps so 720 gpm @ 92' TDH; Flygt NP3171 435 266mm; 34Hp
Bypass Pumping 2 wk 1500 $3,000Total Construction Cost $6,75010% Contingency $67515% Engineering Fees $1,013Total Construction Cost $8,438
LS 5002 For TAZ 186 and 366 15 yr - is new growth flow potentially in TAZ185 however, is not along main route so would assume could have own PS pump to LS5002 - no additional major station LS5003 necessary until 20 yr10 yr installed new master lift station along Hwy 25 north of Hwy 99 - most of flow in TAZ 36615 yr just need to change out pumps to 30 Hp for 560 gpm @ 94' TDHPumps to NW WPCP 0-5 yr 0 gpm
Sewer Expansion CIP 2019 - 20242
5-10 yr 216 gpmPumps directly to the NW WPCP 10-15 yr 560 gpmConstruction Cost for Expansion No. Unit Cost/Unit Engineer's Opinion of Construction Costs 15-20 yr 710 gpm
Change pumps, rails, and panel from 10 yr 5 Hp to 30 Hp 2 EA 19500 $39,000 20+ 710 gpmFlygt CP3170 442 curve 287 mm, 30 Hp10' Diameter wetwell - should fit pumpsElectrical service upgraded above what necessary in 5 yr
Bypass Pumping 6 Wks 650 $3,900Total Construction Cost $42,90010% Contingency $4,29015% Engineering Fees $6,435Total Construction Cost $53,625
Sewer Expansion CIP 2019 - 20242

City and Mainland to Academy Creek WPCP
LS 4118 System10 yr flow dropped off and downsized the pumps to 40 Hp5 year flow approximately 5750 gpm; 10 year flow after turn LS4119 is 3525 gpm; 15 year flow is 5100 gpm 0-5 yr 5,600.84 gpm15 yr can reinstall the 5 yr pumps with different impeller CP3306 631 curve 410mm, use 150 Hp motor but only draw about 110 Hp 5-10 yr 3,522.72 gpm
if not using pumps elsewhere 10-15 yr 5,098.47 gpmTriplex Pump Station 15-20 yr 7,008.44 gpm
Construction Cost for Expansion No. Unit Cost/Unit Engineer's Opinion of Construction Costs 20+ 12,459.44 gpmReinstall 5 yr pumps with new impeller 3 EA 3000 $9,000
CP3306 631 curve 410mm (was 430mm in 5 yr) - use 150 Hp motor but only draw about 110 HpCondition 2550 gpm @ 94' TDH
Change pump rails, pump base, etc. 1 LS 8500 $8,500Bypass Pumping 6 wk 2000 $12,000
Total Construction Cost $29,50010% Contingency $2,95015% Engineering Fees $4,425Total Cost $36,875
8684 gpmLS 4110 System
Sewer Expansion CIP 2019 - 20243
LS 4110 System5 yr constructed new Quad station - installed all new wetwell because influent pipe on orig station came in belwo pump on elev quad station 0-5 yr 7,841.83 gpm5 year needs 4 - 160 Hp ABS pumps at 2614 gpm @ 112' TDH - 355 curve 5-10 yr 6,538.36 gpm10 year switched pumps to Flygt NP3300 634 404 85Hp 10-15 yr 8,217.74 gpm15 yr need to switch back to 5 yr pump with 355 impeller 15-20 yr 10,217.76 gpm
Construction Cost for Expansion No. Unit Cost/Unit Engineer's Opinion of Construction Costs 20+ 12,459.44 gpmChange impellers in 5 year pumps to ABS AFP 2501, 4 Pole 355 mm (was 5 yr impeller) 4 EA 5250 21000
Condition 2739 gpm @ 117' TDHBypass Pumping 3 Wk 2500 7500
Total Construction Cost $28,50010% Contingency $2,85015% Engineering Fees $4,275Total Cost $35,625
LS 4109 System Already Under Construction - Removed from CIP - Completed May 2009No growth in 15 year assume adding in septic flow in 20 yr 0-5 yr 811 gpm
5-10 yr 811 gpm10-15 yr 811 gpm15-20 yr 921 gpm
Construction Cost for Expansion No. Unit Cost/Unit Engineer's Opinion of Construction Costs 20+ 921 gpmNo growth over 5 year - no construction needed 1 LS 0 0
Total Construction Cost $0Total Construction Cost $010% Contingency $015% Engineering Fees $0Total Construction Cost $0
LS 4039 System5 Yer constructed new wetwell for 2 pumps and made quad station 0-5 yr 0-5 yr 9,158.99 gpm10 yr flow drops and can just change impellers or with VFDs should be fine 5-10 yr 5-10 yr 8,078.93 gpm15 yr change pumps 10-15 yr 10-15 yr 9,758.31 gpm
15-20 yr 15-20 yr 11,868.33 gpmConstruction Cost for Expansion No. Unit Cost/Unit Engineer's Opinion of Construction Costs 20+ 20+ 18,162.71 gpm
Change pumps to Flygt NP3300 870 410mm - 70 Hp 4 EA 55000 220000Condition 3252 gpm @ 48' TDH
Remove and replace top slab, set pump rails, pump bases, etc. 1 LS 35000 35000 Pumps 30" wide and 65" longElectrical Upgrades 1 LS 40000 40000 102 inGenerator upgrades 1 LS 60000 60000 8.5 ftBypass Pumping 12 Wk 3000 36000Install new 30" PVC FM 9160 LF 115 $1,053,400 based on bid tabAbandon existing 24" FM 9160 LF 5 $45,800Bypass Pumping 4 Wk 2500 10000
Total Construction Cost $1,500,20010% Contingency $150 02010% Contingency $150,02015% Engineering Fees $225,030Total Construction Cost $1,875,250
Sewer Expansion CIP 2019 - 20243

LS 4048 System5 yr Construct new Quad station - new 125 Hp pumps with 3510 gpm @ 96' TDH ABS 2501, 6 Pole5 yr Put in new forcemain dedicated to LS4048 will run 24" parallel to 16" from LS4048 to LS4028; then after LS4028 will run a 30" 0-5 yr 0-5 yr 10,529.34 gpmLS4028 will continue to pump down to LS4006 through existing fm where it will discharge to LS4006 for repumping 5-10 yr 5-10 yr 9,449.27 gpmLS4048 discharges to 4004 basin for gravity flow 10-15 yr 10-15 yr 11,128.65 gpm15 yr have to upgrade the pumps - 215 Hp ABS pumps - will have to potentially modify the wet well for rails/hatches/etc. 15-20 yr 15-20 yr 13,238.67 gpm20 yr will use same pumps but need to upgrade forcemain 20+ 20+ 19,533.06 gpm
Construction Cost for Expansion No. Unit Cost/Unit Engineer's Opinion of Construction CostsChange pumps to ABS AFP 3001, 6 Pole, 12" Discharge, 215 Hp 4 EA 85000 $340,000
3710 gpm @ 115' TDH quad wetwell built in 5 yr sized to fit these pumpsChange control panel and VFDs
Remove and replace rails, new pump bases, reset hatches if necessary, etc. 1 LS 75000 $75,000Bypass pumping 8 Wks 2750 $22,000Electrical Upgrades 1 LS 150000 $150,000Generator Upgrades 1 LS 95000 $95,000
Total Construction Cost $682,00010% Contingency $68,20015% Engineering Fees $102,300Total Construction Cost $852,500
LS 4028
Sewer Expansion CIP 2019 - 20244
No upgrades to LS 4028 actual station are necessary - LS4048 will be separated off and put on new dedicated forcemain 0-5 yr 1392 gpmBase flow 1320 gpm; 5-year and beyond is 1392 gpm 5-10 yr 1392 gpmLS4028 will continue to pump through existing 16" fm and will discharge to LS4006 for repumping - valves already in place to do this 10-15 yr 1392 gpmin 5 yr oper conditions are 1392 gpm @ 40' TDH - existing triplex 35 Hp pumps handle or can replace impellers for better fit 15-20 yr 1392 gpm
Construction Cost for Expansion No. Unit Cost/Unit Engineer's Opinion of Construction Costs 20+ 1392 gpmNo upgrades are necessary - same condition as 5 yr 0 LF 0 0
Total Construction Cost $010% Contingency $015% Engineering Fees $0Total Construction Cost $0
LS 4023Base flow is 432 gpm; stays the same through 20 year 0-5 yr 432 gpmNo upgrades necessary for future expansion 5-10 yr 432 gpm
Construction Cost for Expansion No. Unit Cost/Unit Engineer's Opinion of Construction Costs 10-15 yr 432 gpmNo upgrades are necessary 0 LF 0 0 15-20 yr 432 gpm
Total Construction Cost $0 20+ 432 gpm10% Contingency $015% Engineering Fees $0Total Construction Cost $0
LS 4021Upgrades for Rehab will install a new pump station for 2475 gpm - current station undersized for base flow5 yr flow 2762 gpm - same throughout buildout - installed new pump station in 5 yr (and under rehab) 0-5 yr 2762 gpmCurrently pumps to and flows through 24" gravity line with Basins LS4023, 4044, 4056, 4021, 4022, 4043, 4011, 4007 and 4021 5-10 yr 2762 gpmdownstream gravity approx 3500 gpm - 24" gravity appears to be acceptable 10-15 yr 2762 gpm
Construction Cost for Expansion No. Unit Cost/Unit Engineer's Opinion of Construction Costs 15-20 yr 2762 gpmNo upgrades are necessary 0 LS 0 0 20+ 2762 gpm
Total Construction Cost $010% Contingency $015% Engineering Fees $0Total Construction Cost $0
LS4006 System 0-5 yr 5000 gpm5 yr rehab existing LS with new pumps; take flow from LS4028 and repump south to approx LS4010 and install gravity to K Street 5-10 yr 5000 gpmLS4006 will continue to pump the flow from all upstream basins and stations except LS4048; it will now repump LS4028 10-15 yr 5000 gpmEvaluated 24" gravity sewer upstream of LS4006 and appears to be adequate for future flows 15-20 yr 5000 gpmFlows stay the same through the 5 to 20 yr period so no additional upgrades necessary 20+ 5000 gpmNew station pumps 2500 gpm @ 82' TDH
Construction Cost for Expansion No. Unit Cost/Unit Engineer's Opinion of Construction CostsNo upgrades necessary 0 LS 0 $0
Total Construction Cost $0Total Construction Cost $010% Contingency $015% Engineering Fees $0Total Construction Cost $0
Sewer Expansion CIP 2019 - 20244

LS4005 System5 yr demolish LS4005 and install gravity to 2nd Street for discharge to WPCPBase flow is 326 gpm; will take in some flow from septic areas to north - future flow 394 gpm throughout 20 yr 0-5 yr 394 gpm
Construction Cost for Expansion No. Unit Cost/Unit Engineer's Opinion of Construction Costs 5-10 yr 394 gpmNo upgrades necessary 0 LS 0 $0 10-15 yr 394 gpm
Total Construction Cost $0 15-20 yr 394 gpm10% Contingency $0 20+ 394 gpm15% Engineering Fees $0Total Construction Cost $0
LS 412615 yr slight increase in flow but need to change pumps from 15 Hp to 20 Hp10 yr flow drops to 1028 gpm; 15 yr flow 1090 gpm (turned Dover Hall/Plum Creek north in 10 yr)Triplex Pump Station 0-5 yr 1608 gpm
5-10 yr 1029 gpm10-15 yr 1088 gpm
Construction Cost for Expansion No. Unit Cost/Unit Engineer's Opinion of Construction Costs 15-20 yr 1088 gpmCondition changes enough to require upgrading pumps to 20 Hp from 15 Hp and Panel 3 EA 10500 31500 20+ 1088 gpm
Flygt CP3152 432 curve 266mmCondition 544 gpm @ 54'/68' TDHPumps fit in wetwell with no problem
Sewer Expansion CIP 2019 - 20245
Remove/replace rails, new pump bases, etc. 1 LS 6500 6500Electrical Upgrades 1 LS 15000 15000Bypass Pumping 4 Wks 1250 5000
Total Construction Cost $58,00010% Contingency $5,80015% Engineering Fees $8,700Total Construction Cost $72,500
LS 4132 System (Hermitage Island) - ATM 413210 yr leave 10" fm as is; need to upgrade pumps though - move LS4127 original pumps to LS4901 in 10 yrThis lift station will continue to use the existing flow path to Academy Creek WWTF - LS 4126 north will also utilize it5 yr 616 gpm @ 38/54' TDH; 10 yr 616 gpm @ 90/100' TDH; 15 yr 616 gpm @ 90'/102' TDH
0-5 yr 616 gpmTriplex Station - 10' wetwell 5-10 yr 1232 gpmConstruction Cost for Expansion No. Unit Cost/Unit Engineer's Opinion of Construction Costs 10-15 yr 1232 gpm
No changes necessary - pumps moved from LS4127 in 10 yr to Ls4901 are sufficient 3 LS 0 $0 15-20 yr 1232 gpmFlygt CP3170 30 Hp 442 curve 287 imp 20+ 1232 gpmThese pumps are a few feet shy of the TDH but can move 600 gpm each - should be fine
Total Construction Cost $010% Contingency $015% E i i F $015% Engineering Fees $0Total Construction Cost $0
LS 4127 System5 yr flow 2450 gpm - 5 yr upgrade to 16" FM fine - gives pump oper cond. Of 1200 gpm @ 57' TDH10 yr flow 2700 gpm - Need upgrade pumps 1350 gpm @ 63' TDH (curve just shy)15 yr flow 3000 gpm - 1500 gpm @ 68' TDHLS4126 continues to LS4127 however in 5-10 yr window Dover Hall and Plum Creek come off of LS4126 and go north 0-5 yr 2486 gpmTriplex Pump Station 5-10 yr 2725 gpm15 yr no change necessary 10-15 yr 2986 gpmConstruction Cost for Expansion No. Unit Cost/Unit Engineer's Opinion of Construction Costs 15-20 yr 2986 gpm
No change necessary - 10 yr pumps sufficient for 15 yr condition 3 EA $0 20+ 2986 gpmFlygt NP3202 45 Hp 462 Curve 278 mm imp $01500 gpm @ 68' TDH $0
$0 Flyt NP3202 impeller 462 45 Hp - appears 3 of these will fit in the 10' WW w/ no problem - may have to pull top slabTotal Construction Cost $0 9.625 pumps are 22.5"; need 12" space between; need 12" on either side to wetwell wall10% Contingency $0 4.1875 pumps are 50.25" long15% Engineering Fees $0 Existing wetwell is 10' diameterTotal Construction Cost $0
LS 4105 SystemLS 4105 System15 yr no changes necessary - 10 yr pumps handle flow condition 0-5 yr 2252 gpm5 yr flow 2252 gpm; 10 yr flow 2659; 15 yr flow 2723 gpm - lot of flow from Pinecrest 5-10 yr 2659 gpmTriplex pump station 10-15 yr 2723 gpmConstruction Cost for Expansion No. Unit Cost/Unit Engineer's Opinion of Construction Costs 15-20 yr 2723 gpm
No change necessary - 10 yr pumps meet condition 3 EA 0 0 20+ 2723 gpmTriplex Flygt CP3201 47 Hp 452 curve 330mmCondition 1362 gpm @ 72' TDH will carry through 20 yr period
Total Construction Cost $010% Contingency $015% Engineering Fees $0Total Construction Cost $0
Sewer Expansion CIP 2019 - 20245
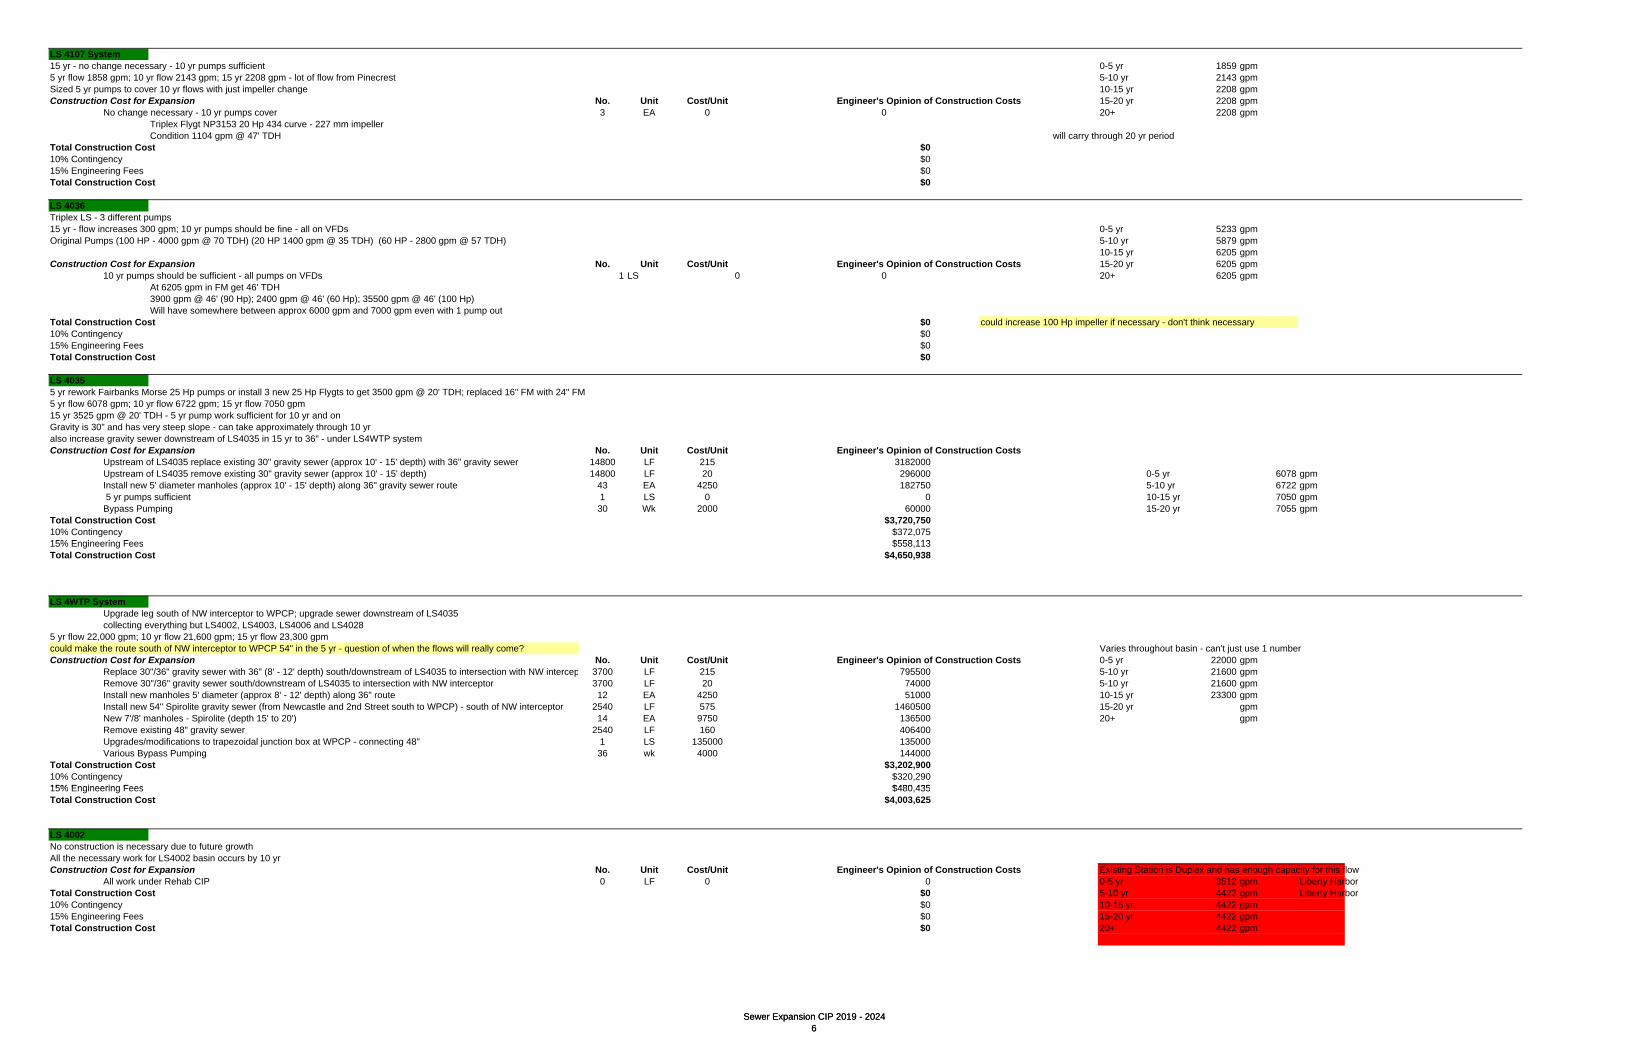
LS 4107 System15 yr - no change necessary - 10 yr pumps sufficient 0-5 yr 1859 gpm5 yr flow 1858 gpm; 10 yr flow 2143 gpm; 15 yr 2208 gpm - lot of flow from Pinecrest 5-10 yr 2143 gpmSized 5 yr pumps to cover 10 yr flows with just impeller change 10-15 yr 2208 gpmConstruction Cost for Expansion No. Unit Cost/Unit Engineer's Opinion of Construction Costs 15-20 yr 2208 gpm
No change necessary - 10 yr pumps cover 3 EA 0 0 20+ 2208 gpmTriplex Flygt NP3153 20 Hp 434 curve - 227 mm impellerCondition 1104 gpm @ 47' TDH will carry through 20 yr period
Total Construction Cost $010% Contingency $015% Engineering Fees $0Total Construction Cost $0
LS 4036Triplex LS - 3 different pumps15 yr - flow increases 300 gpm; 10 yr pumps should be fine - all on VFDs 0-5 yr 5233 gpmOriginal Pumps (100 HP - 4000 gpm @ 70 TDH) (20 HP 1400 gpm @ 35 TDH) (60 HP - 2800 gpm @ 57 TDH) 5-10 yr 5879 gpm
10-15 yr 6205 gpmConstruction Cost for Expansion No. Unit Cost/Unit Engineer's Opinion of Construction Costs 15-20 yr 6205 gpm
10 yr pumps should be sufficient - all pumps on VFDs 1 LS 0 0 20+ 6205 gpmAt 6205 gpm in FM get 46' TDH
Sewer Expansion CIP 2019 - 20246
3900 gpm @ 46' (90 Hp); 2400 gpm @ 46' (60 Hp); 35500 gpm @ 46' (100 Hp)Will have somewhere between approx 6000 gpm and 7000 gpm even with 1 pump out
Total Construction Cost $0 could increase 100 Hp impeller if necessary - don't think necessary10% Contingency $015% Engineering Fees $0Total Construction Cost $0
LS 40355 yr rework Fairbanks Morse 25 Hp pumps or install 3 new 25 Hp Flygts to get 3500 gpm @ 20' TDH; replaced 16" FM with 24" FM5 yr flow 6078 gpm; 10 yr flow 6722 gpm; 15 yr flow 7050 gpm15 yr 3525 gpm @ 20' TDH - 5 yr pump work sufficient for 10 yr and onGravity is 30" and has very steep slope - can take approximately through 10 yralso increase gravity sewer downstream of LS4035 in 15 yr to 36" - under LS4WTP systemConstruction Cost for Expansion No. Unit Cost/Unit Engineer's Opinion of Construction Costs
Upstream of LS4035 replace existing 30" gravity sewer (approx 10' - 15' depth) with 36" gravity sewer 14800 LF 215 3182000Upstream of LS4035 remove existing 30" gravity sewer (approx 10' - 15' depth) 14800 LF 20 296000 0-5 yr 6078 gpmInstall new 5' diameter manholes (approx 10' - 15' depth) along 36" gravity sewer route 43 EA 4250 182750 5-10 yr 6722 gpm 5 yr pumps sufficient 1 LS 0 0 10-15 yr 7050 gpmBypass Pumping 30 Wk 2000 60000 15-20 yr 7055 gpm
Total Construction Cost $3,720,75010% Contingency $372,07515% E i i F $558 11315% Engineering Fees $558,113Total Construction Cost $4,650,938
LS 4WTP SystemUpgrade leg south of NW interceptor to WPCP; upgrade sewer downstream of LS4035collecting everything but LS4002, LS4003, LS4006 and LS4028
5 yr flow 22,000 gpm; 10 yr flow 21,600 gpm; 15 yr flow 23,300 gpmcould make the route south of NW interceptor to WPCP 54" in the 5 yr - question of when the flows will really come? Varies throughout basin - can't just use 1 numberConstruction Cost for Expansion No. Unit Cost/Unit Engineer's Opinion of Construction Costs 0-5 yr 22000 gpm
Replace 30"/36" gravity sewer with 36" (8' - 12' depth) south/downstream of LS4035 to intersection with NW intercep 3700 LF 215 795500 5-10 yr 21600 gpmRemove 30"/36" gravity sewer south/downstream of LS4035 to intersection with NW interceptor 3700 LF 20 74000 5-10 yr 21600 gpmInstall new manholes 5' diameter (approx 8' - 12' depth) along 36" route 12 EA 4250 51000 10-15 yr 23300 gpmInstall new 54" Spirolite gravity sewer (from Newcastle and 2nd Street south to WPCP) - south of NW interceptor 2540 LF 575 1460500 15-20 yr gpmNew 7'/8' manholes - Spirolite (depth 15' to 20') 14 EA 9750 136500 20+ gpmRemove existing 48" gravity sewer 2540 LF 160 406400Upgrades/modifications to trapezoidal junction box at WPCP - connecting 48" 1 LS 135000 135000Various Bypass Pumping 36 wk 4000 144000
Total Construction Cost $3,202,90010% Contingency $320,29015% Engineering Fees $480 43515% Engineering Fees $480,435Total Construction Cost $4,003,625
LS 4002No construction is necessary due to future growthAll the necessary work for LS4002 basin occurs by 10 yrConstruction Cost for Expansion No. Unit Cost/Unit Engineer's Opinion of Construction Costs Existing Station is Duplex and has enough capacity for this flow
All work under Rehab CIP 0 LF 0 0 0-5 yr 3512 gpm Liberty HarborTotal Construction Cost $0 5-10 yr 4422 gpm Liberty Harbor10% Contingency $0 10-15 yr 4422 gpm15% Engineering Fees $0 15-20 yr 4422 gpmTotal Construction Cost $0 20+ 4422 gpm
Sewer Expansion CIP 2019 - 20246

LS40035 yr demolish station and install gravity sewer to Academy Creek WPCP - covered under Rehab and 5 yr Future
Construction Cost for Expansion No. Unit Cost/Unit Engineer's Opinion of Construction Costs 0-5 yr 9832 gpmNo upgrades necessary 0 LF 0 $0 5-10 yr 9832 gpm
Total Construction Cost $0 10-15 yr 9832 gpm10% Contingency $0 15-20 yr 9832 gpm15% Engineering Fees $0 20+ 9832 gpmTotal Construction Cost $0
LS 4WTP - Academy Creek Influent Lift StationNo upgrades necessary for future expansion - entire facility designed for 13.5 MGDPump capacity is 5900 gpm - 4 pumps - 3 in operation have 25 MGD capacity - there are equalization areas at the WPCP - should be sufficient
Construction Cost for Expansion No. Unit Cost/Unit Engineer's Opinion of Construction CostsNo upgrades necessary 0 LS 0 0
Total Construction Cost $010% Contingency $015% Engineering Fees $0Total Construction Cost $0
LS 4017
Sewer Expansion CIP 2019 - 20247
No upgrades necessary for future expansion 0-5 yr 940 gpmOnly rehab upgrades 5-10 yr 940 gpm
Construction Cost for Expansion No. Unit Cost/Unit Engineer's Opinion of Construction Costs 10-15 yr 940 gpmNo upgrades necessary 0 LS 0 0 15-20 yr 940 gpm
Total Construction Cost $0 20+ 940 gpm10% Contingency $015% Engineering Fees $0Total Construction Cost $0
Sewer Expansion CIP 2019 - 20247

Exit 29 WPCP - Future CIP
Exit 29 WPCP - Constructed Capacity 2.0 MGD of which 0.5 MGD of Reuse CapacityEnd of 15 year period projected sewer demand is 2.33 MGDConstruction Cost for Expansion No. Unit Cost/Unit Engineer's Opinion of Construction Costs
Construct 2.0 MGD Upgrade - Will Require Reuse (total capacity 4.0 MGD) 1 LS 22000000 $22,000,000Reuse Distribution System for 0.5 MGD (total reuse dist 1.0 MGD)
1) Construct 16" Reuse Main from WPCP about another 1/4 way to Peninsula 5500 LF 105 $577,500 high for other improvements install booster station 1 LS 165000 $165,000 roads, etc.assume can be used by new developments along the way
2) Distribution system towards Hopewell Creek 15000 LF 105 $1,575,000should not require booster station
Total Construction Cost $24,317,50010% Contingency $2,431,75015% Engineering Fees $3,647,625 14.66667Total Construction Cost $30,396,875 29.33333
LS 3101 Master Lift Station15 yr - change pump impellers and install new 18" FM10 d t h h it ith i ti k t i l i 35 40 H 't fit i 8' di t
Sewer Expansion CIP 2019 - 20248
10 yr do not have enough capacity with existing pumps; keep as triplex requires 35-40 Hp pumps - won't fit in 8' dia wetweLS3301 and 3300 discharge to this stationdischarging to headworks of plant 37' static headGravity sewer upstream of LS is not sufficient for discharge from LS3103 and LS3121 - in 5 yr upsize to 15" will carry through 20 yr period 0-5 yr 1634 gpm
there are some areas where slope is not as great as others but on the whole the capacity of 15" gravity sewer is acceptable 5-10 yr 2450 gpm10-15 yr 3265 gpm
Construction Cost for Expansion No. Unit Cost/Unit Engineer's Opinion of Construction Costs 15-20 yr 4065 gpmChange 10 yr pumps to Flygt CP 3201 350mm 35 Hp 3 EA 18500 55500 20+ 11492 gpm
15 yr condition 1537 gpm @ 49' TDHBypass Pumping 8 wk 1800 14400 Sjze wetwellInstall new 18-inch PVC FM 2417 LF 75 181275 tight installation - lot of pipes there 30" width pump 12.16666667Abandon existing 12" FM from LS3101 to WPCP 2417 LF 5 12085 16" spacing between pumps
Total Construction Cost $263,260 12" spacing between wall and out pumps10% Contingency $26,326 61" long pump15% Engineering Fees $39,489Total Construction Cost $329,075
LS 310315 yr have to change pumps 5 year pumps to be able serve through 10 yr flow (with impeller change) would be CP 3152 436/256 Imp; 6"/4" discharge; 20 Hp 0-5 yr 382 gpm
5 10 yr 480 gpm5-10 yr 480 gpm10-15 yr 578 gpm15-20 yr 578 gpm
Construction Cost for Expansion No. Unit Cost/Unit Engineer's Opinion of Construction Costs 20+ 578 gpmChange duplex pumps to Flygt CP3153 414 curve 207mm, 20 Hp - panel should not need to be changed 2 EA 16500 33000
Condition 463 gpm @ 48' TDH New pumps are 20" wide and 46" long - should fit in 6' wetwellBypass Pumping 8 Wk 1050 8400 Storage VolumeInstall new 8-inch PVC FM 5973 LF 75 447975Abandon existing 6" FM 5973 LF 5 29865 15 yr Only 6' wetwell
tight installation - lot of pipes there 30" width pump 12.1666666716" spacing between pumps
Total Construction Cost $519,240 Will have somewhere btwn 10 and 15 starts per hr. This with 15 starts10% Contingency $51,924 77015% Engineering Fees $77,886 102.9411765Total Construction Cost $649,050 3.642646018 ft storage depth
appears to be enough room in wetwell for thisis 5' difference between influent invert and bottom wetwell
LS 3114 Master Lift Station15 yr need to upgrade triplex pumps to 30 Hp; also need to upgrade gravity sewer along South Port Pkwy5 Yr moved to make this a master LS; separated from LS3101 (also master station); upgraded to 12" FM; new 18/21" gravity18/21" gravity sewer handles through 10 yearConstruction Cost for Expansion No Unit Cost/Unit Engineer's Opinion of Construction Costs 0 5 yr 1 151 85 gpm 55' TDHConstruction Cost for Expansion No. Unit Cost/Unit Engineer's Opinion of Construction Costs 0-5 yr 1,151.85 gpm 55' TDH
15 yr change imp to 255 from 270, 30Hp 3 EA 25000 75000 5-10 yr 1,872.08 gpm 67.5Condition 1342 gpm @ 66' TDH 10-15 yr 2,685.21 gpm 85Pumps will fit in 12' wetwell 15-20 yr 3,300.57 gpm
20+ 8,982.02 gpmBypass Pumping 36 Wks 1800 64800Install new 16-inch PVC FM 3817 LF 60 229020Abandon existing 6" FM from LS3114 3817 LF 5 19085 only to where manifold with LS3101Replace 18" gravity sewer with 24" PVC/Spirolite (18-20' deep) 2500 350Replace 21" gravity sewer with 30" PVC/Spirolite (18-20' deep) 150 LF 400 60000 124 in diameterRemove existing 18" gravity sewer (18 - 20' deep) along South Port Parkway 2500 25 62500Remove existing 21" gravity sewer (18 - 20' deep) along South Port Parkway 150 LF 25 3750Install new influent 30" gravity sewer (18' deep) 200 LF 400 80000Remove/replace 5' dia manholes with liner 10 EA 7250 72500 10.3 ft diameter
Total Construction Cost $666,655 Min length 72" long (6' long) - make longer to quiescce flow10% Contingency $66,666 Installing 12' diameter wetwell - note that these pumps require 2' min. water depth15% Engineering Fees $99,998Total Construction Cost $833,319
Sewer Expansion CIP 2019 - 20248
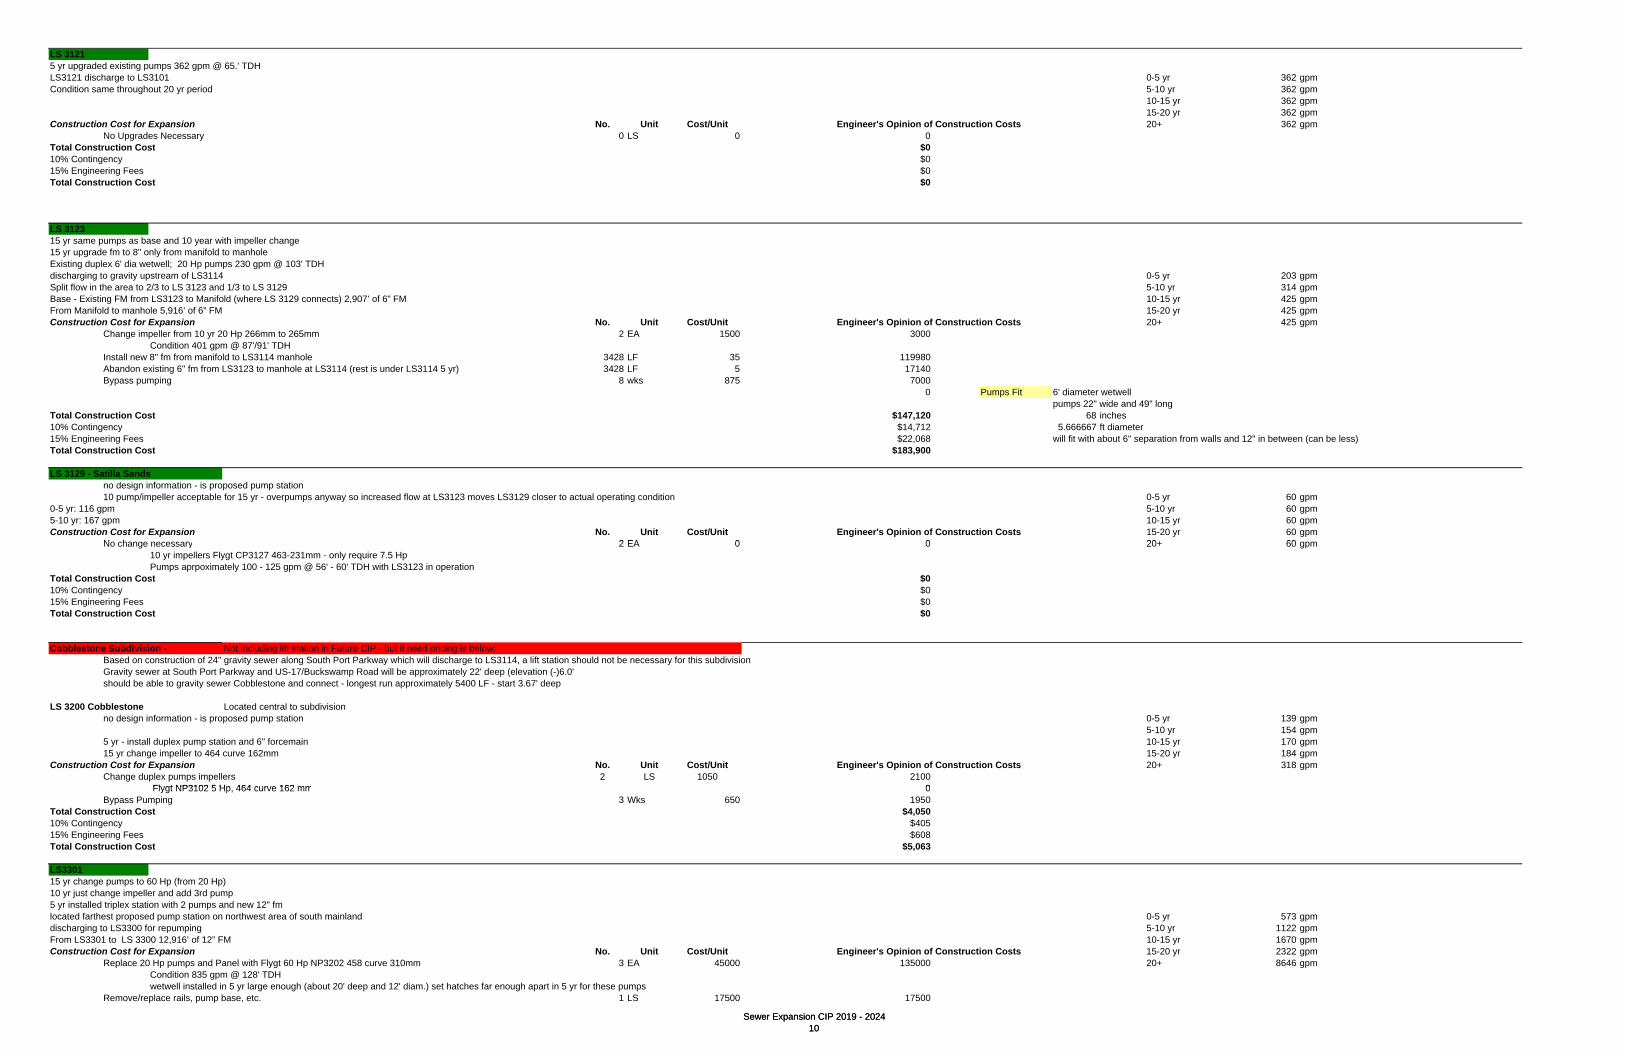
LS 31215 yr upgraded existing pumps 362 gpm @ 65.' TDHLS3121 discharge to LS3101 0-5 yr 362 gpmCondition same throughout 20 yr period 5-10 yr 362 gpm
10-15 yr 362 gpm15-20 yr 362 gpm
Construction Cost for Expansion No. Unit Cost/Unit Engineer's Opinion of Construction Costs 20+ 362 gpmNo Upgrades Necessary 0 LS 0 0
Total Construction Cost $010% Contingency $015% Engineering Fees $0Total Construction Cost $0
LS 312315 yr same pumps as base and 10 year with impeller change15 yr upgrade fm to 8" only from manifold to manholeExisting duplex 6' dia wetwell; 20 Hp pumps 230 gpm @ 103' TDHdischarging to gravity upstream of LS3114 0-5 yr 203 gpmSplit flow in the area to 2/3 to LS 3123 and 1/3 to LS 3129 5-10 yr 314 gpm
Sewer Expansion CIP 2019 - 202410
Base - Existing FM from LS3123 to Manifold (where LS 3129 connects) 2,907’ of 6” FM 10-15 yr 425 gpmFrom Manifold to manhole 5,916’ of 6” FM 15-20 yr 425 gpmConstruction Cost for Expansion No. Unit Cost/Unit Engineer's Opinion of Construction Costs 20+ 425 gpm
Change impeller from 10 yr 20 Hp 266mm to 265mm 2 EA 1500 3000Condition 401 gpm @ 87'/91' TDH
Install new 8" fm from manifold to LS3114 manhole 3428 LF 35 119980Abandon existing 6" fm from LS3123 to manhole at LS3114 (rest is under LS3114 5 yr) 3428 LF 5 17140Bypass pumping 8 wks 875 7000
0 Pumps Fit 6' diameter wetwellpumps 22" wide and 49" long
Total Construction Cost $147,120 68 inches10% Contingency $14,712 5.666667 ft diameter 15% Engineering Fees $22,068 will fit with about 6" separation from walls and 12" in between (can be less)Total Construction Cost $183,900
LS 3129 - Satilla Sandsno design information - is proposed pump station10 pump/impeller acceptable for 15 yr - overpumps anyway so increased flow at LS3123 moves LS3129 closer to actual operating condition 0-5 yr 60 gpm
0-5 yr: 116 gpm 5-10 yr 60 gpm5-10 yr: 167 gpm 10-15 yr 60 gpmConstruction Cost for Expansion No. Unit Cost/Unit Engineer's Opinion of Construction Costs 15-20 yr 60 gpm
N h 2 EA 0 0 20 60No change necessary 2 EA 0 0 20+ 60 gpm10 yr impellers Flygt CP3127 463-231mm - only require 7.5 HpPumps aprpoximately 100 - 125 gpm @ 56' - 60' TDH with LS3123 in operation
Total Construction Cost $010% Contingency $015% Engineering Fees $0Total Construction Cost $0
Cobblestone Subdivision - Not including lift station in Future CIP - but if need pricing is below:Based on construction of 24" gravity sewer along South Port Parkway which will discharge to LS3114, a lift station should not be necessary for this subdivisionGravity sewer at South Port Parkway and US-17/Buckswamp Road will be approximately 22' deep (elevation (-)6.0'should be able to gravity sewer Cobblestone and connect - longest run approximately 5400 LF - start 3.67' deep
LS 3200 Cobblestone Located central to subdivisionno design information - is proposed pump station 0-5 yr 139 gpm
5-10 yr 154 gpm5 yr - install duplex pump station and 6" forcemain 10-15 yr 170 gpm15 yr change impeller to 464 curve 162mm 15-20 yr 184 gpm
Construction Cost for Expansion No. Unit Cost/Unit Engineer's Opinion of Construction Costs 20+ 318 gpmChange duplex pumps impellers 2 LS 1050 2100
Flygt NP3102 5 Hp 464 curve 162 mm 0 Flygt NP3102 5 Hp, 464 curve 162 mm 0Bypass Pumping 3 Wks 650 1950
Total Construction Cost $4,05010% Contingency $40515% Engineering Fees $608Total Construction Cost $5,063
LS330115 yr change pumps to 60 Hp (from 20 Hp)10 yr just change impeller and add 3rd pump5 yr installed triplex station with 2 pumps and new 12" fmlocated farthest proposed pump station on northwest area of south mainland 0-5 yr 573 gpmdischarging to LS3300 for repumping 5-10 yr 1122 gpmFrom LS3301 to LS 3300 12,916’ of 12” FM 10-15 yr 1670 gpmConstruction Cost for Expansion No. Unit Cost/Unit Engineer's Opinion of Construction Costs 15-20 yr 2322 gpm
Replace 20 Hp pumps and Panel with Flygt 60 Hp NP3202 458 curve 310mm 3 EA 45000 135000 20+ 8646 gpmCondition 835 gpm @ 128' TDHwetwell installed in 5 yr large enough (about 20' deep and 12' diam.) set hatches far enough apart in 5 yr for these pumps
Remove/replace rails, pump base, etc. 1 LS 17500 17500
Sewer Expansion CIP 2019 - 202410
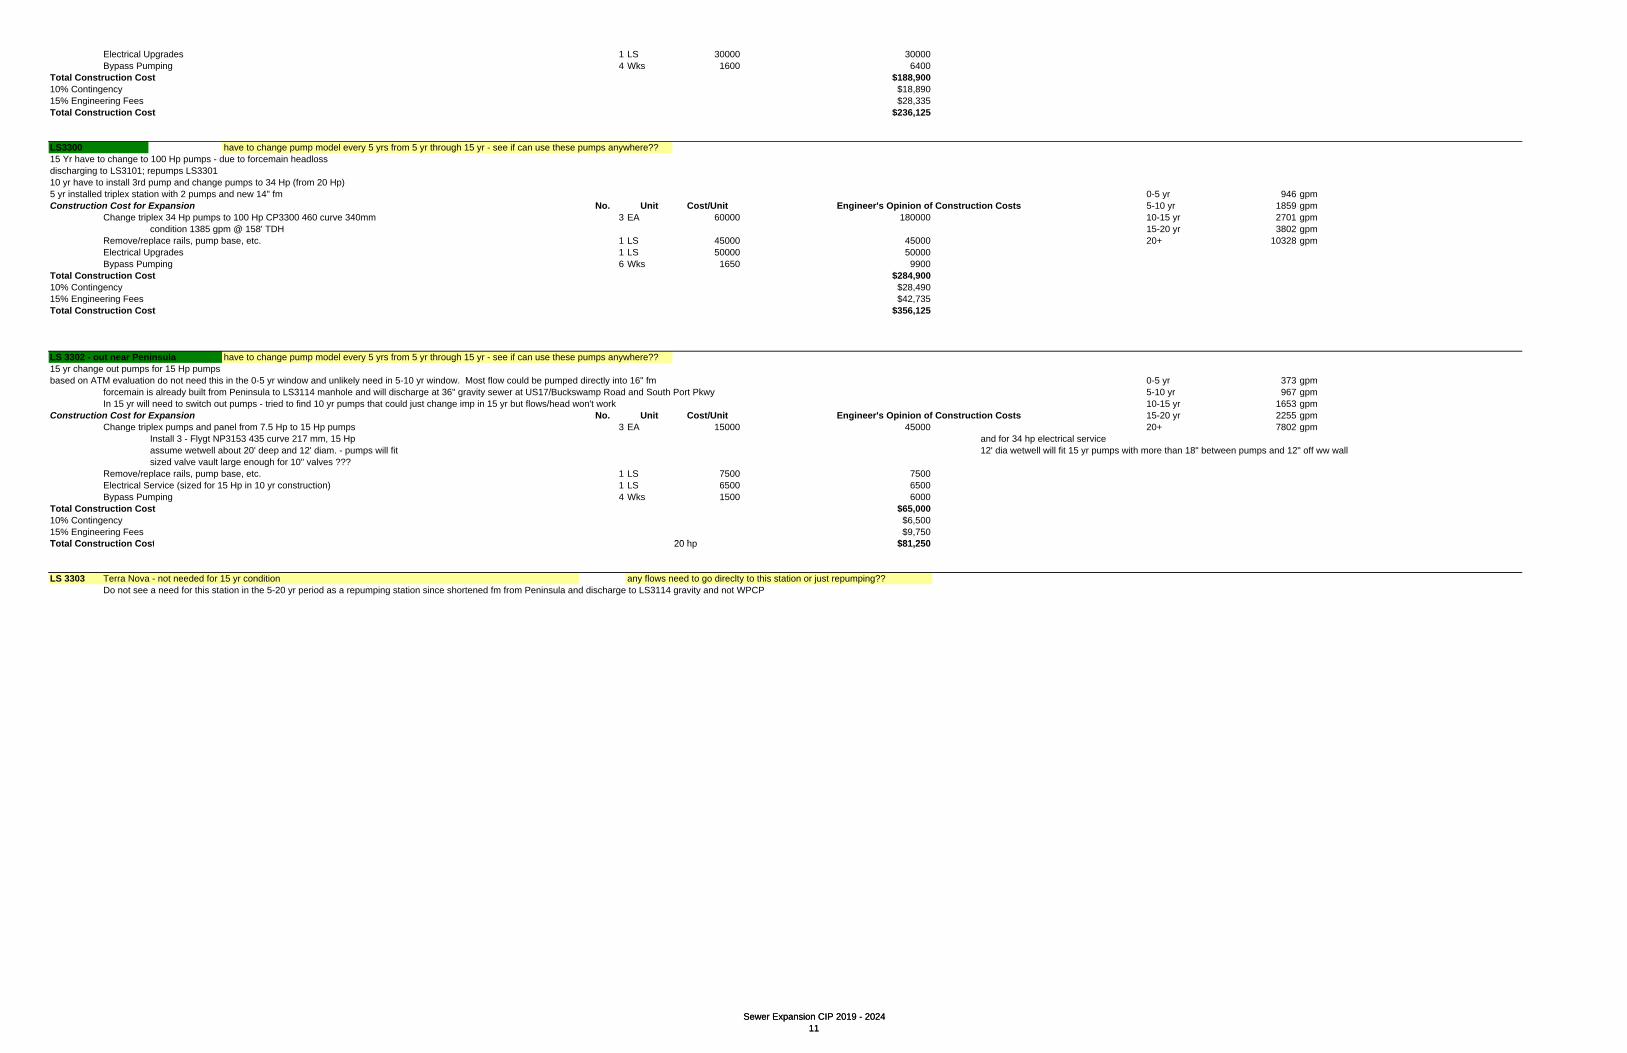
Electrical Upgrades 1 LS 30000 30000Bypass Pumping 4 Wks 1600 6400
Total Construction Cost $188,90010% Contingency $18,89015% Engineering Fees $28,335Total Construction Cost $236,125
LS3300 have to change pump model every 5 yrs from 5 yr through 15 yr - see if can use these pumps anywhere??15 Yr have to change to 100 Hp pumps - due to forcemain headlossdischarging to LS3101; repumps LS330110 yr have to install 3rd pump and change pumps to 34 Hp (from 20 Hp) 5 yr installed triplex station with 2 pumps and new 14" fm 0-5 yr 946 gpmConstruction Cost for Expansion No. Unit Cost/Unit Engineer's Opinion of Construction Costs 5-10 yr 1859 gpm
Change triplex 34 Hp pumps to 100 Hp CP3300 460 curve 340mm 3 EA 60000 180000 10-15 yr 2701 gpmcondition 1385 gpm @ 158' TDH 15-20 yr 3802 gpm
Remove/replace rails, pump base, etc. 1 LS 45000 45000 20+ 10328 gpmElectrical Upgrades 1 LS 50000 50000Bypass Pumping 6 Wks 1650 9900
Total Construction Cost $284,90010% Contingency $28,490
$
Sewer Expansion CIP 2019 - 202411
15% Engineering Fees $42,735Total Construction Cost $356,125
LS 3302 - out near Peninsula have to change pump model every 5 yrs from 5 yr through 15 yr - see if can use these pumps anywhere??15 yr change out pumps for 15 Hp pumpsbased on ATM evaluation do not need this in the 0-5 yr window and unlikely need in 5-10 yr window. Most flow could be pumped directly into 16" fm 0-5 yr 373 gpm
forcemain is already built from Peninsula to LS3114 manhole and will discharge at 36" gravity sewer at US17/Buckswamp Road and South Port Pkwy 5-10 yr 967 gpmIn 15 yr will need to switch out pumps - tried to find 10 yr pumps that could just change imp in 15 yr but flows/head won't work 10-15 yr 1653 gpm
Construction Cost for Expansion No. Unit Cost/Unit Engineer's Opinion of Construction Costs 15-20 yr 2255 gpmChange triplex pumps and panel from 7.5 Hp to 15 Hp pumps 3 EA 15000 45000 20+ 7802 gpm
Install 3 - Flygt NP3153 435 curve 217 mm, 15 Hp and for 34 hp electrical serviceassume wetwell about 20' deep and 12' diam. - pumps will fit 12' dia wetwell will fit 15 yr pumps with more than 18" between pumps and 12" off ww wallsized valve vault large enough for 10" valves ???
Remove/replace rails, pump base, etc. 1 LS 7500 7500Electrical Service (sized for 15 Hp in 10 yr construction) 1 LS 6500 6500Bypass Pumping 4 Wks 1500 6000
Total Construction Cost $65,00010% Contingency $6,50015% Engineering Fees $9,750T t l C t ti C t 20 h $81 250Total Construction Cost 20 hp $81,250
LS 3303 Terra Nova - not needed for 15 yr condition any flows need to go direclty to this station or just repumping??Do not see a need for this station in the 5-20 yr period as a repumping station since shortened fm from Peninsula and discharge to LS3114 gravity and not WPCP
Sewer Expansion CIP 2019 - 202411

SSI - Future Expansion/Growth
Musgrove Plantation Phase IUndeveloped large tract of land near LS2056 - near German Village LS56 deep enough and large enough for 88 Hp??Assumed all - approximately 1000 acre tract; assume 1/2 undevelopable due to marsh/wetlandEstimated 450 - 1 acre lots in total; develop some in 15 yr, 20 yr and 20+ yr
200 lots in 15 yr (225 gpm); 150 lots in 20 yr (167 gpm)Will require new gravity sewer, new lift stations internal and discharge to LS2056 - may require upgrades down the line from LS2056Can not determine layout of subdivision gravity sewer - no plat
Construction Cost for Expansion No. Unit Cost/Unit Engineer's Opinion of Construction CostsInstall new duplex master lift station (No. 1 LS), approximately 20 ft deep, 10 ft diameter 1 LS 180000 180000
Flygt CP 3127, 483 imp, 228 mm, 10 Hp , Design Oper Condition 225 gpm @ 62 ft TDHInstall new 6-inch FM 5660 LF 30 169800Upgrades to LS 2056 - need additional 225 - 400 gpm capacity 2 EA 35000 70000
Install duplex Flygt CP3300, 465 imp, 320 mm, 88 Hp pumps; 1250 gpm @ 92 ft; panel; VFDsInstall VFDs for LS2056 1 LS 60000 60000New discharge piping and valves for LS2056 1 LS 55000 $55,000Generator for LS2056 1 LS 70000 $70,000Electrical upgrades for LS2056 1 LS 30000 30000Bypass Pumping LS2056 20 Wks 1500 30000
Sewer Expansion CIP 2019 - 202412
Bypass Pumping LS2056 20 Wks 1500 30000Upgrades to LS 2032 - need additional 225 - 400 gpm capacity 4 EA 22000 88000
Install quadraplex CP3201, 639 imp, 350 mm, 40 Hp pumps Install new 16-inch PVC FM 7610 LF 60 456600Abandon existing 12" FM from LS2032 to Discharge MH 7610 LF 5 38050Bypass Pumping LS2032 20 Wks 1750 35000
Total Construction Cost $1,282,45010% Contingency $128,24515% Engineering Fees $192,368Total Construction Cost $1,603,063
Epworth by the Sea - Expansion of Existing CenterTo collect new development at Methodist Center - in 2008 Epworth requested change to PD zoning and estimated buildoutEstimated mixed use flow - 65 gpm in 10 year period; additional 65 gpm in 15 year periodCan not determine layout of necessary new development sewer; but will require additional upgrades to LS2043Existing flow 85 + 65 gpm (10 yr) = 150 gpm; significant RD I/I problems - private infrastructure - assume have been resolved by 15 yr periodDesign flow: 85 gpm + 65 gpm + 65 gpm = 215 gpm - 250 gpm still provides some additional capacity for RD I/I
Construction Cost for Expansion No. Unit Cost/Unit Engineer's Opinion of Construction CostsNo upgrades necessary 1 LS 0 0
Total Construction Cost $0Total Construction Cost $010% Contingency $015% Engineering Fees $0Total Construction Cost $0
Sewer Expansion CIP 2019 - 202412
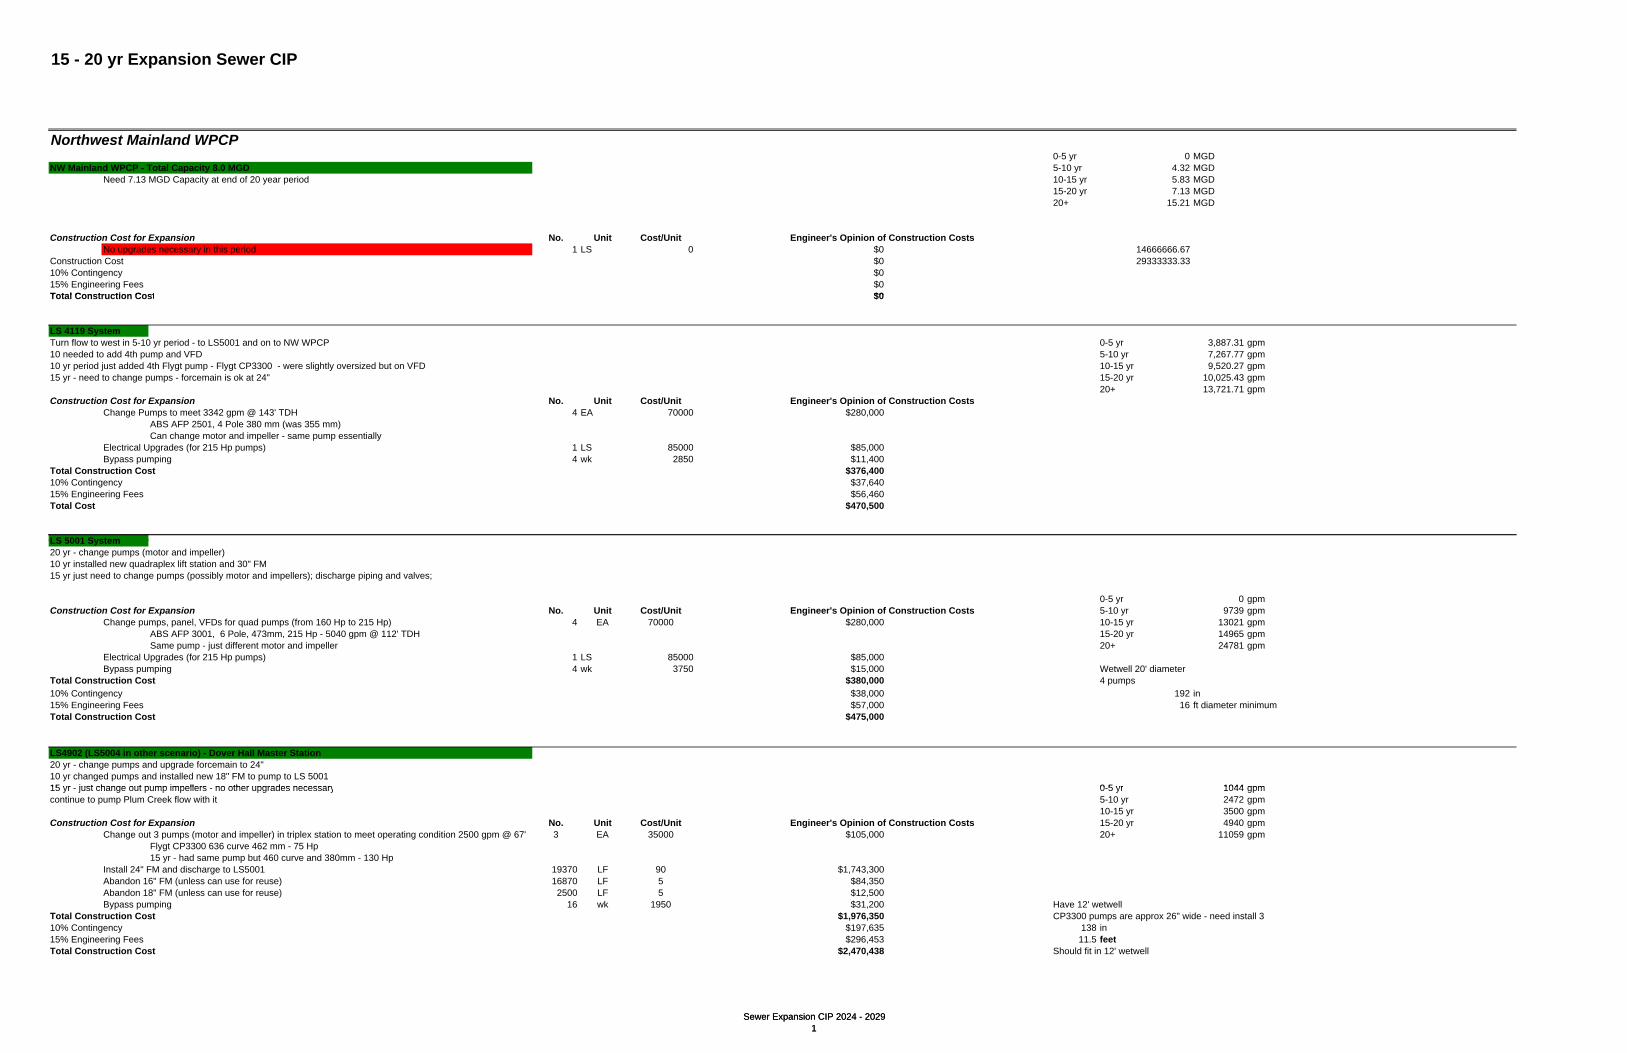
15 - 20 yr Expansion Sewer CIP
Northwest Mainland WPCP0-5 yr 0 MGD
NW Mainland WPCP - Total Capacity 8.0 MGD 5-10 yr 4.32 MGDNeed 7.13 MGD Capacity at end of 20 year period 10-15 yr 5.83 MGD
15-20 yr 7.13 MGD20+ 15.21 MGD
Construction Cost for Expansion No. Unit Cost/Unit Engineer's Opinion of Construction CostsNo upgrades necessary in this period 1 LS 0 $0 14666666.67
Construction Cost $0 29333333.3310% Contingency $015% Engineering Fees $0Total Construction Cost $0
Sewer Expansion CIP 2024 - 20291
Total Construction Cost $0
LS 4119 SystemTurn flow to west in 5-10 yr period - to LS5001 and on to NW WPCP 0-5 yr 3,887.31 gpm10 needed to add 4th pump and VFD 5-10 yr 7,267.77 gpm10 yr period just added 4th Flygt pump - Flygt CP3300 - were slightly oversized but on VFD 10-15 yr 9,520.27 gpm15 yr - need to change pumps - forcemain is ok at 24" 15-20 yr 10,025.43 gpm
20+ 13,721.71 gpmConstruction Cost for Expansion No. Unit Cost/Unit Engineer's Opinion of Construction Costs
Change Pumps to meet 3342 gpm @ 143' TDH 4 EA 70000 $280,000ABS AFP 2501, 4 Pole 380 mm (was 355 mm)Can change motor and impeller - same pump essentially
Electrical Upgrades (for 215 Hp pumps) 1 LS 85000 $85,000Bypass pumping 4 wk 2850 $11,400
Total Construction Cost $376,40010% Contingency $37,64015% Engineering Fees $56,460Total Cost $470,500
LS 5001 SystemLS 5001 System 20 yr - change pumps (motor and impeller)10 yr installed new quadraplex lift station and 30" FM15 yr just need to change pumps (possibly motor and impellers); discharge piping and valves;
0-5 yr 0 gpmConstruction Cost for Expansion No. Unit Cost/Unit Engineer's Opinion of Construction Costs 5-10 yr 9739 gpm
Change pumps, panel, VFDs for quad pumps (from 160 Hp to 215 Hp) 4 EA 70000 $280,000 10-15 yr 13021 gpmABS AFP 3001, 6 Pole, 473mm, 215 Hp - 5040 gpm @ 112' TDH 15-20 yr 14965 gpmSame pump - just different motor and impeller 20+ 24781 gpm
Electrical Upgrades (for 215 Hp pumps) 1 LS 85000 $85,000Bypass pumping 4 wk 3750 $15,000 Wetwell 20' diameter
Total Construction Cost $380,000 4 pumps10% Contingency $38,000 192 in15% Engineering Fees $57,000 16 ft diameter minimumTotal Construction Cost $475,000
LS4902 (LS5004 in other scenario) - Dover Hall Master Station20 yr - change pumps and upgrade forcemain to 24"10 yr changed pumps and installed new 18" FM to pump to LS 500115 yr just change out pump impellers no other upgrades necessary 0 5 yr 1044 gpm15 yr - just change out pump impellers - no other upgrades necessary 0-5 yr 1044 gpmcontinue to pump Plum Creek flow with it 5-10 yr 2472 gpm
10-15 yr 3500 gpmConstruction Cost for Expansion No. Unit Cost/Unit Engineer's Opinion of Construction Costs 15-20 yr 4940 gpm
3 EA 35000 $105,000 20+ 11059 gpmFlygt CP3300 636 curve 462 mm - 75 Hp15 yr - had same pump but 460 curve and 380mm - 130 Hp
Install 24" FM and discharge to LS5001 19370 LF 90 $1,743,300Abandon 16" FM (unless can use for reuse) 16870 LF 5 $84,350Abandon 18" FM (unless can use for reuse) 2500 LF 5 $12,500Bypass pumping 16 wk 1950 $31,200 Have 12' wetwell
Total Construction Cost $1,976,350 CP3300 pumps are approx 26" wide - need install 310% Contingency $197,635 138 in15% Engineering Fees $296,453 11.5 feetTotal Construction Cost $2,470,438 Should fit in 12' wetwell
Change out 3 pumps (motor and impeller) in triplex station to meet operating condition 2500 gpm @ 67'
Sewer Expansion CIP 2024 - 20291

LS4992 -Plum Creek Site20 yr - upgrade forcemain to 16" and change impellersApprox. 4000LF of FM pumps over to Dover Hall LS4902 0-5 yr 614 gpmincludes basins 4903 and 4904 - is in Plum Creek area and includes Buffalo Creek 5-10 yr 1228 gpm5 year flow is 615 gpm; in 5-10 year window will pump to new WPCP (through Dover Hall LS4902); 10 yr flow approx 1230 gpm; 15 yr flow approx 1450 gpm 10-15 yr 1439 gpmWill pump to Dover Hall for repumping in all cases 15-20 yr 1719 gpm15 yr just change impellers on 10 yr pumps 20+ 4275 gpmConstruction Cost for Expansion No. Unit Cost/Unit Engineer's Opinion of Construction Costs
Change impeller on triplex 34 Hp pumps/panel 3 EA 1250 $3,750use 3 pumps so 860 gpm @ 40' TDH; Flygt NP3171 437 224mm; 34Hp
Install 16" Forcemain to LS4902 Dover Hall 4000 LF 60 $240,000Abandon 10" Forcemain from LS4902 Dover Hall (unless can use for reuse) 4000 LF 5 $20,000Bypass Pumping 12 wk 1650 $19,800
Total Construction Cost $283,55010% Contingency $28,35515% Engineering Fees $42,533Total Construction Cost $354,438
LS 5002 For TAZ 186 and 366 15 yr - is new growth flow potentially in TAZ185 however, is not along main route so would assume could have own PS pump to LS5002 - no additional major station LS5003 necessary until 20 yr
Sewer Expansion CIP 2024 - 20292
20 yr change pumps10 yr installed new master lift station along Hwy 25 north of Hwy 99 - most of flow in TAZ 36615 yr just need to change out pumps to 30 Hp for 560 gpm @ 94' TDHPumps to NW WPCP 0-5 yr 0 gpm
5-10 yr 216 gpmPumps directly to the NW WPCP 10-15 yr 560 gpmConstruction Cost for Expansion No. Unit Cost/Unit Engineer's Opinion of Construction Costs 15-20 yr 710 gpm
Change pumps, rails, and panel from 15 yr 30 Hp to 47 Hp 2 EA 26500 $53,000 20+ 710 gpmFlygt CP3201 452 curve 330mm, 47 Hp10' Diameter wetwell - should fit pumps
Electrical Upgrades 1 LS 17500 $17,500Bypass Pumping 6 Wks 750 $4,500
Total Construction Cost $75,00010% Contingency $7,50015% Engineering Fees $11,250Total Construction Cost $93,750
Sewer Expansion CIP 2024 - 20292

City and Mainland to Academy Creek WPCP
Academy Creek WPCP - Total Existing Capacity 13.5 MGD REUSE?? 0-5 yr 0 MGDAt end of 20 year period need 14.25 MGD 5-10 yr 4.32 MGDcould potentially turn more flow to NW Mainald WPCP 10-15 yr 5.83 MGD
15-20 yr 7.13 MGDWhat about reuse? Power plant? 20+ 15.21 MGDBased cost on cost of new Exit 29 WWTF ($22M for 1.5 MGD) - reduced as this expansion of existing facility
Construction Cost for Expansion No. Unit Cost/Unit Engineer's Opinion of Construction Costs2.0 MGD Upgrade - total capacity 15.50 MGD with reuse capacity 1 LS 30000000 $18,000,000 14666666.67
Construction Cost $18,000,000 29333333.3310% Contingency $1,800,00015% Engineering Fees $2,700,000 orig submittal had $37.5M but revised per meeting Keith/Andy Nov 10, 2009Total Construction Cost $22,500,000
LS 4118 System20 yr - install new 24" forcemain - will carry through much of the future growth; change impellers10 yr flow dropped off and downsized the pumps to 40 Hp5 fl i t l 5600 10 fl ft t LS4119 i 3525 15 fl i 5100 0 5 0 5 5 600 84
Sewer Expansion CIP 2024 - 20293
5 year flow approximately 5600 gpm; 10 year flow after turn LS4119 is 3525 gpm; 15 year flow is 5100 gpm 0-5 yr 0-5 yr 5,600.84 gpm15 yr can reinstall the 5 yr pumps with different impeller CP3306 631 curve 410mm, use 150 Hp motor but only draw about 110 Hp 5-10 yr 5-10 yr 3,522.72 gpm
if not using pumps elsewhere 10-15 yr 10-15 yr 5,098.47 gpmTriplex Pump Station 15-20 yr 15-20 yr 7,008.44 gpmNo gravity upgrades needed 20+ 20+ 12,459.44 gpm
Construction Cost for Expansion No. Unit Cost/Unit Engineer's Opinion of Construction CostsChange impeller on 5/15 Yr pumps to 390 mm 3 EA 3000 $9,000
CP3306 631 curve 390mm (was 410mm in 15 yr) - use 150 Hp motor but only draw less 110 HpCondition 3500 gpm @ 76' TDH
New discharge piping and valves - pushing more flow even though same pumps 1 75000 $75,000Bypass Pumping 16 wk 2500 $40,000 9 month construction with 4 month bypass Install new 24-inch PVC FM 13100 LF 90 $1,179,000Abandon existing 20" PVC FM 13100 LF 5 $65,500
Total Construction Cost $1,368,50010% Contingency $136,85015% Engineering Fees $205,275Total Cost $1,710,625
0-5 yr 8684 gpmLS 4110 System 5-10 yr
20 yr - need to upgrade to 30" forcemain; change back to 10 year pumps 10-15 yr 0-5 yr 7,841.83 gpm5 yr constructed new Quad station - installed all new wetwell because influent pipe on orig station came in belwo pump on elev quad station 15-20 yr 5-10 yr 6,538.36 gpm5 year needs 4 160 Hp ABS pumps at 2967 gpm @ 130' TDH 355 curve 20+ 10 15 yr 8 217 74 gpm5 year needs 4 - 160 Hp ABS pumps at 2967 gpm @ 130' TDH - 355 curve 20+ 10-15 yr 8,217.74 gpm10 year switched pumps to Flygt NP3300 634 404 85Hp 15-20 yr 10,217.76 gpm15 yr need to switch back to 5 yr pump with 355 impeller 20+ 12,459.44 gpm
Construction Cost for Expansion No. Unit Cost/Unit Engineer's Opinion of Construction CostsChange back to 10 year pumps 4 EA 2500 10000
Condition 3460 gpm @ 74' TDHBypass Pumping 3 Wk 2850 8550Install new 30" PVC FM 15400 LF 115 1771000Abandon existing 24" FM 15400 LS 5 77000
Total Construction Cost $1,866,55010% Contingency $186,65515% Engineering Fees $279,983Total Cost $2,333,188
LS 4109 System assume adding in septic flow in 20 yr20 yr - add septic tank flow in 0-5 yr 811 gpm
5-10 yr 811 gpm10-15 yr 811 gpm15-20 yr 921 gpm
Construction Cost for Expansion No. Unit Cost/Unit Engineer's Opinion of Construction Costs 20+ 921 gpmAdd 3rd pump - Flygt CP3201 452 curve 330 mm, 47 Hp and VFD 1 EA 35000 35000
Condition 460 gpm @ 148' TDHCondition 460 gpm @ 148' TDHTotal Construction Cost $35,00010% Contingency $3,50015% Engineering Fees $5,250Total Construction Cost $43,750
Sewer Expansion CIP 2024 - 20293
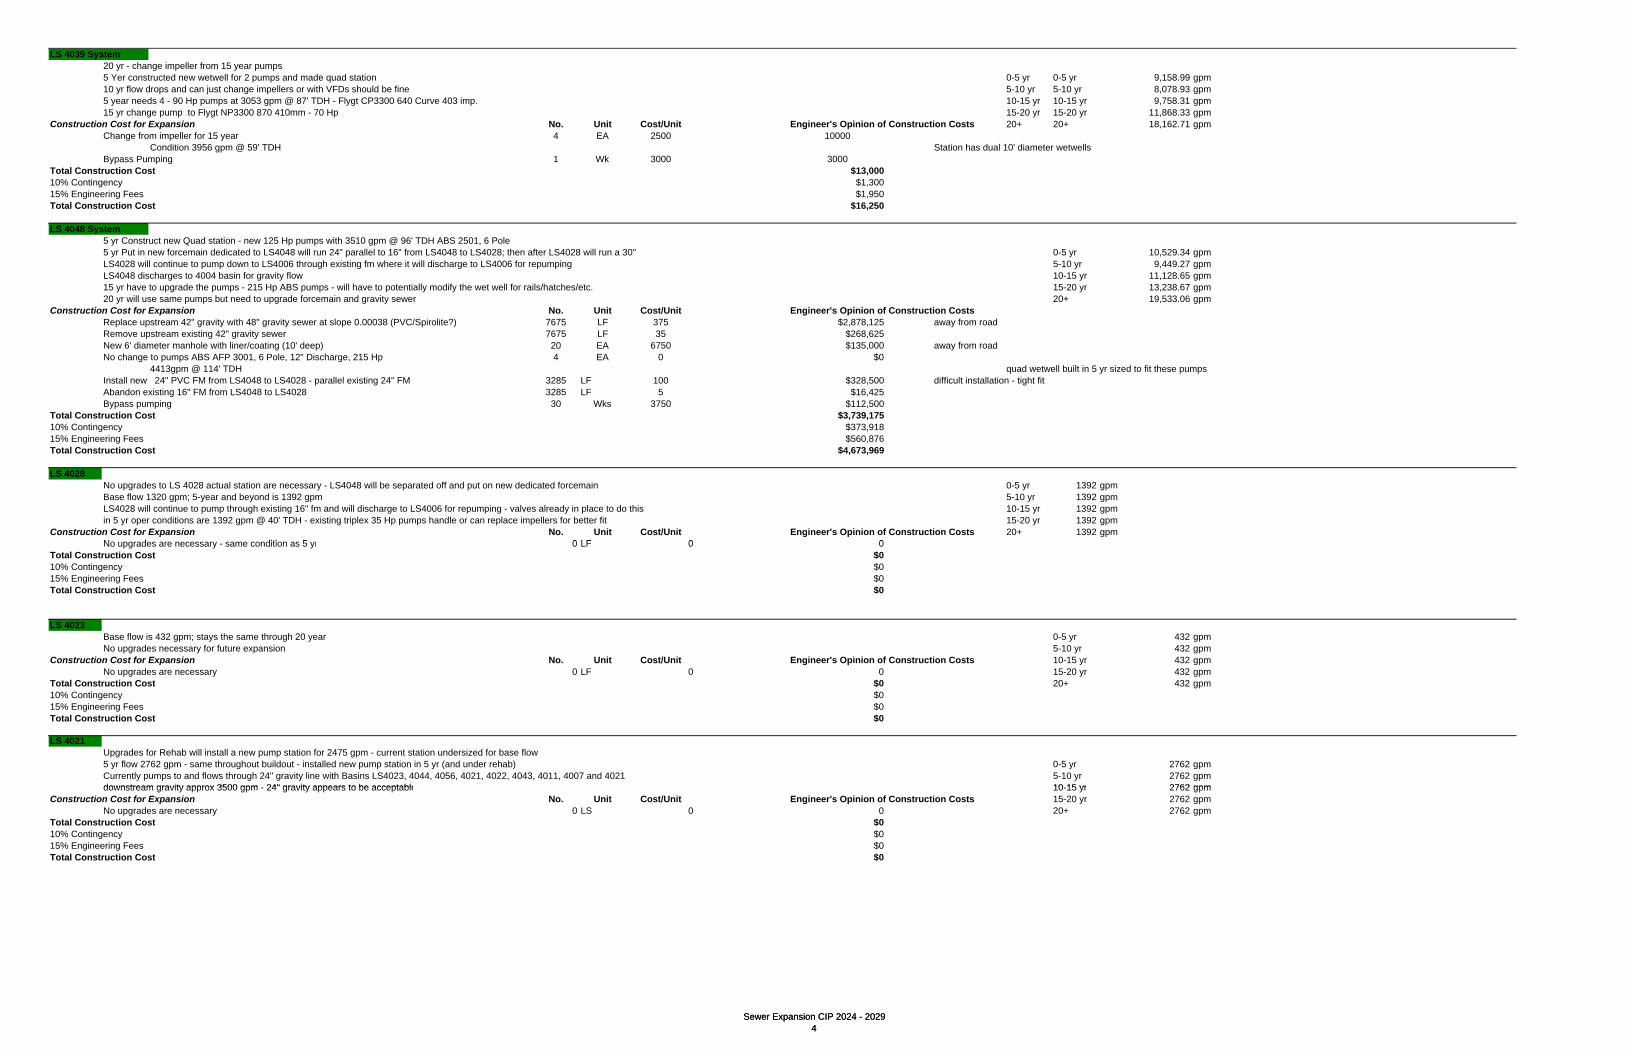
LS 4039 System20 yr - change impeller from 15 year pumps5 Yer constructed new wetwell for 2 pumps and made quad station 0-5 yr 0-5 yr 9,158.99 gpm10 yr flow drops and can just change impellers or with VFDs should be fine 5-10 yr 5-10 yr 8,078.93 gpm5 year needs 4 - 90 Hp pumps at 3053 gpm @ 87' TDH - Flygt CP3300 640 Curve 403 imp. 10-15 yr 10-15 yr 9,758.31 gpm15 yr change pump to Flygt NP3300 870 410mm - 70 Hp 15-20 yr 15-20 yr 11,868.33 gpm
Construction Cost for Expansion No. Unit Cost/Unit Engineer's Opinion of Construction Costs 20+ 20+ 18,162.71 gpmChange from impeller for 15 year 4 EA 2500 10000
Condition 3956 gpm @ 59' TDH Station has dual 10' diameter wetwellsBypass Pumping 1 Wk 3000 3000
Total Construction Cost $13,00010% Contingency $1,30015% Engineering Fees $1,950Total Construction Cost $16,250
LS 4048 System5 yr Construct new Quad station - new 125 Hp pumps with 3510 gpm @ 96' TDH ABS 2501, 6 Pole5 yr Put in new forcemain dedicated to LS4048 will run 24" parallel to 16" from LS4048 to LS4028; then after LS4028 will run a 30" 0-5 yr 10,529.34 gpmLS4028 will continue to pump down to LS4006 through existing fm where it will discharge to LS4006 for repumping 5-10 yr 9,449.27 gpmLS4048 discharges to 4004 basin for gravity flow 10-15 yr 11,128.65 gpm15 yr have to upgrade the pumps - 215 Hp ABS pumps - will have to potentially modify the wet well for rails/hatches/etc. 15-20 yr 13,238.67 gpm
Sewer Expansion CIP 2024 - 20294
20 yr will use same pumps but need to upgrade forcemain and gravity sewer 20+ 19,533.06 gpmConstruction Cost for Expansion No. Unit Cost/Unit Engineer's Opinion of Construction Costs
Replace upstream 42" gravity with 48" gravity sewer at slope 0.00038 (PVC/Spirolite?) 7675 LF 375 $2,878,125 away from roadRemove upstream existing 42" gravity sewer 7675 LF 35 $268,625New 6' diameter manhole with liner/coating (10' deep) 20 EA 6750 $135,000 away from roadNo change to pumps ABS AFP 3001, 6 Pole, 12" Discharge, 215 Hp 4 EA 0 $0
4413gpm @ 114' TDH quad wetwell built in 5 yr sized to fit these pumpsInstall new 24" PVC FM from LS4048 to LS4028 - parallel existing 24" FM 3285 LF 100 $328,500 difficult installation - tight fitAbandon existing 16" FM from LS4048 to LS4028 3285 LF 5 $16,425Bypass pumping 30 Wks 3750 $112,500
Total Construction Cost $3,739,17510% Contingency $373,91815% Engineering Fees $560,876Total Construction Cost $4,673,969
LS 4028No upgrades to LS 4028 actual station are necessary - LS4048 will be separated off and put on new dedicated forcemain 0-5 yr 1392 gpmBase flow 1320 gpm; 5-year and beyond is 1392 gpm 5-10 yr 1392 gpmLS4028 will continue to pump through existing 16" fm and will discharge to LS4006 for repumping - valves already in place to do this 10-15 yr 1392 gpmin 5 yr oper conditions are 1392 gpm @ 40' TDH - existing triplex 35 Hp pumps handle or can replace impellers for better fit 15-20 yr 1392 gpm
Construction Cost for Expansion No. Unit Cost/Unit Engineer's Opinion of Construction Costs 20+ 1392 gpmN d diti 5 0 LF 0 0No upgrades are necessary - same condition as 5 yr 0 LF 0 0
Total Construction Cost $010% Contingency $015% Engineering Fees $0Total Construction Cost $0
LS 4023Base flow is 432 gpm; stays the same through 20 year 0-5 yr 432 gpmNo upgrades necessary for future expansion 5-10 yr 432 gpm
Construction Cost for Expansion No. Unit Cost/Unit Engineer's Opinion of Construction Costs 10-15 yr 432 gpmNo upgrades are necessary 0 LF 0 0 15-20 yr 432 gpm
Total Construction Cost $0 20+ 432 gpm10% Contingency $015% Engineering Fees $0Total Construction Cost $0
LS 4021Upgrades for Rehab will install a new pump station for 2475 gpm - current station undersized for base flow5 yr flow 2762 gpm - same throughout buildout - installed new pump station in 5 yr (and under rehab) 0-5 yr 2762 gpmCurrently pumps to and flows through 24" gravity line with Basins LS4023, 4044, 4056, 4021, 4022, 4043, 4011, 4007 and 4021 5-10 yr 2762 gpmdownstream gravity approx 3500 gpm 24" gravity appears to be acceptable 10 15 yr 2762 gpmdownstream gravity approx 3500 gpm - 24" gravity appears to be acceptable 10-15 yr 2762 gpm
Construction Cost for Expansion No. Unit Cost/Unit Engineer's Opinion of Construction Costs 15-20 yr 2762 gpmNo upgrades are necessary 0 LS 0 0 20+ 2762 gpm
Total Construction Cost $010% Contingency $015% Engineering Fees $0Total Construction Cost $0
Sewer Expansion CIP 2024 - 20294

LS4006 System 0-5 yr 5000 gpm5 yr rehab existing LS with new pumps; take flow from LS4028 and repump south to approx LS4010 and install gravity to K Street 5-10 yr 5000 gpmLS4006 will continue to pump the flow from all upstream basins and stations except LS4048; it will now repump LS4028 10-15 yr 5000 gpmEvaluated 24" gravity sewer upstream of LS4006 and appears to be adequate for future flows 15-20 yr 5000 gpmFlows stay the same through the 5 to 20 yr period so no additional upgrades necessary 20+ 5000 gpmNew station pumps 2500 gpm @ 82' TDH
Construction Cost for Expansion No. Unit Cost/Unit Engineer's Opinion of Construction CostsNo upgrades necessary 0 LS 0 $0
Total Construction Cost $010% Contingency $015% Engineering Fees $0Total Construction Cost $0
LS4005 System5 yr demolish LS4005 and install gravity to 2nd Street for discharge to WPCPBase flow is 326 gpm; will take in some flow from septic areas to north - future flow 394 gpm throughout 20 yr 0-5 yr 394 gpm
Construction Cost for Expansion No. Unit Cost/Unit Engineer's Opinion of Construction Costs 5-10 yr 394 gpmNo upgrades necessary 0 LS 0 $0 10-15 yr 394 gpm
Total Construction Cost $0 15-20 yr 394 gpm10% Contingency $0 20+ 394 gpm15% Engineering Fees $0
Sewer Expansion CIP 2024 - 20295
Total Construction Cost $0
LS 412620 yr no changes necessary15 yr slight increase in flow but need to change pumps from 15 Hp to 20 Hp10 yr flow drops to 1028 gpm; 15 yr flow 1090 gpm (turned Dover Hall/Plum Creek north in 10 yr) 0-5 yr 1608 gpmTriplex Pump Station 5-10 yr 1029 gpmConstruction Cost for Expansion No. Unit Cost/Unit Engineer's Opinion of Construction Costs 10-15 yr 1088 gpm
No upgrades necessary 3 EA 0 0 15-20 yr 1088 gpmFlygt CP3152 432 curve 266mm 20+ 1088 gpm
Total Construction Cost $010% Contingency $015% Engineering Fees $0Total Construction Cost $0
LS 4132 System (Hermitage Island) - ATM 490110 yr leave 10" fm as is; need to upgrade pumps though - move LS4127 original pumps to LS4901 in 10 yrThis lift station will continue to use the existing flow path to Academy Creek WWTF - LS 4126 north will also utilize it5 yr 616 gpm @ 38/54' TDH; 10 yr 616 gpm @ 90/100' TDH; 15 yr 616 gpm @ 90'/102' TDH
0-5 yr 616 gpmT i l St ti 10' t ll 5 10 1232Triplex Station - 10' wetwell 5-10 yr 1232 gpmConstruction Cost for Expansion No. Unit Cost/Unit Engineer's Opinion of Construction Costs 10-15 yr 1232 gpm
No changes necessary - pumps moved from LS4127 in 10 yr to Ls4901 are sufficient 3 LS 0 $0 15-20 yr 1232 gpmFlygt CP3170 30 Hp 442 curve 287 imp 20+ 1232 gpmThese pumps are a few feet shy of the TDH but can move 600 gpm each - should be fine
Total Construction Cost $010% Contingency $015% Engineering Fees $0Total Construction Cost $0
LS 4127 System5 yr flow 2450 gpm - 5 yr upgrade to 16" FM fine - gives pump oper cond. Of 1200 gpm @ 57' TDH10 yr flow 2700 gpm - Need upgrade pumps 1350 gpm @ 63' TDH (curve just shy)15 yr flow 3000 gpm - 1500 gpm @ 68' TDHLS4126 continues to LS4127 however in 5-10 yr window Dover Hall and Plum Creek come off of LS4126 and go north 0-5 yr 2486 gpmTriplex Pump Station 5-10 yr 2725 gpm15 yr no change necessary 10-15 yr 2986 gpmConstruction Cost for Expansion No. Unit Cost/Unit Engineer's Opinion of Construction Costs 15-20 yr 2986 gpm
No change necessary - No change in flow in 20 yr 3 EA $0 20+ 2986 gpmFlygt NP3202 45 Hp 462 Curve 278 mm imp $01500 gpm @ 68' TDH $01500 gpm @ 68' TDH $0
$0 Flyt NP3202 impel 462 45Hp - appears 3 of these will fit in the 10' WW w/ no problem - may have to pull top slabTotal Construction Cost $0 9.625 pumps are 22.5"; need 12" space between; need 12" on either side to wetwell wall10% Contingency $0 4.1875 pumps are 50.25" long15% Engineering Fees $0 Existing wetwell is 10' diameterTotal Construction Cost $0
Sewer Expansion CIP 2024 - 20295
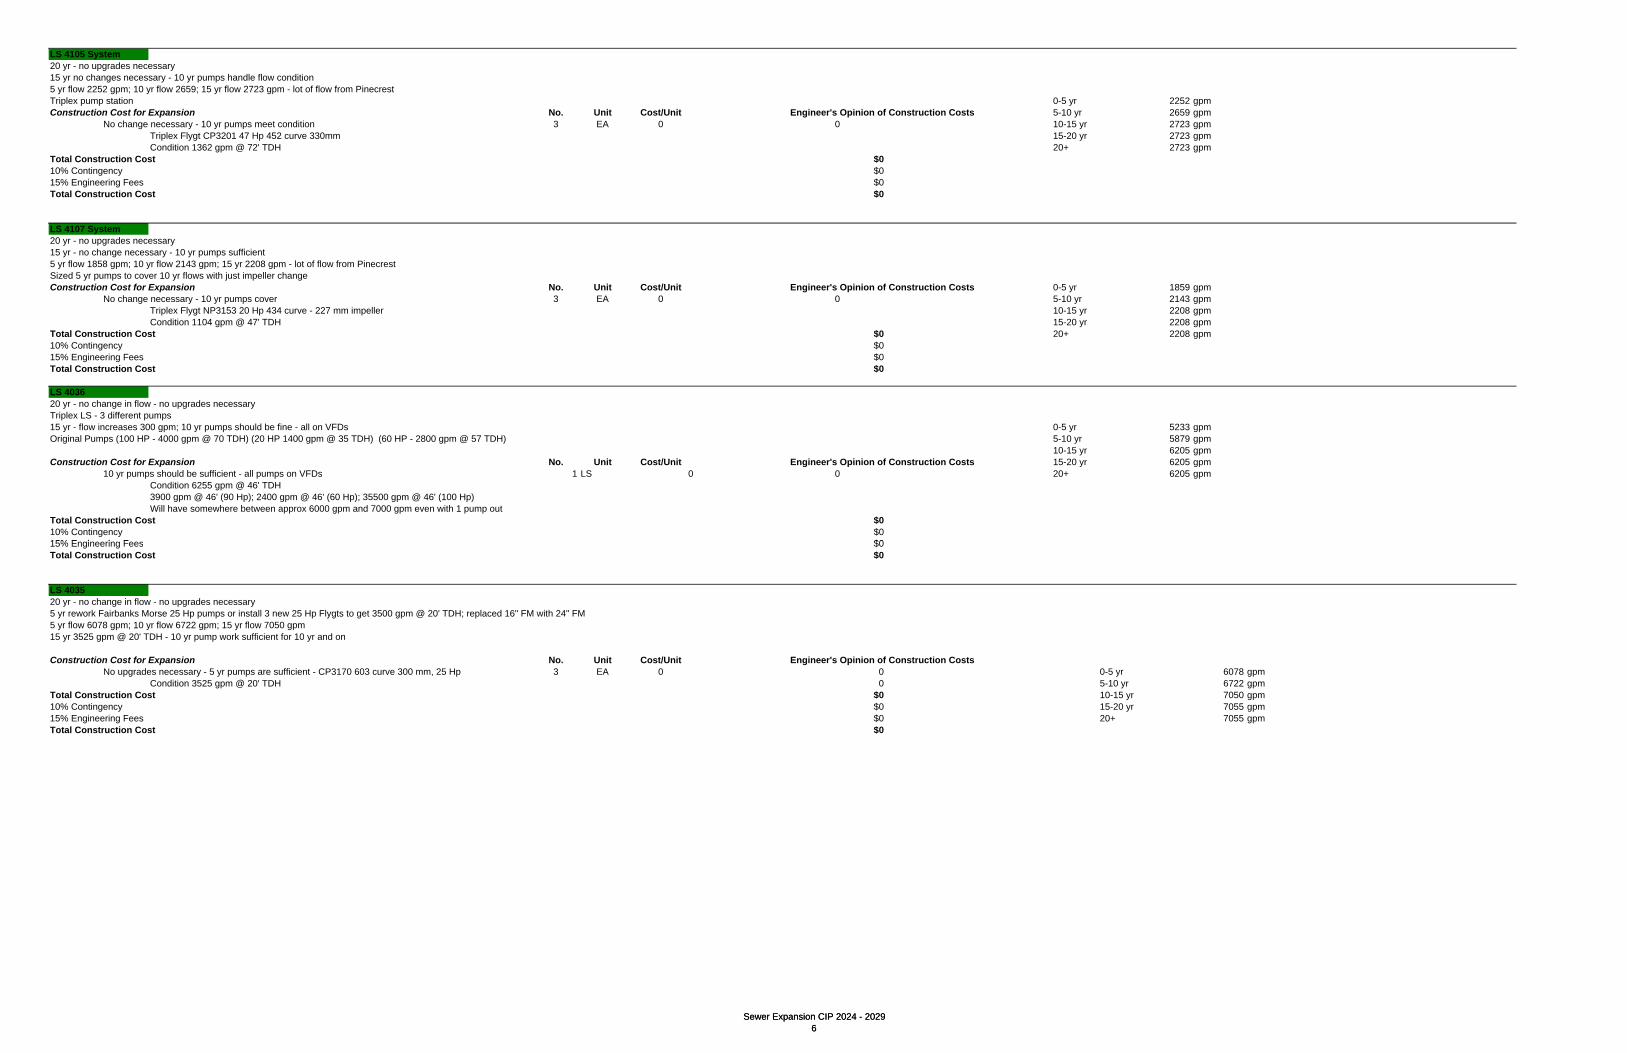
LS 4105 System20 yr - no upgrades necessary15 yr no changes necessary - 10 yr pumps handle flow condition5 yr flow 2252 gpm; 10 yr flow 2659; 15 yr flow 2723 gpm - lot of flow from PinecrestTriplex pump station 0-5 yr 2252 gpmConstruction Cost for Expansion No. Unit Cost/Unit Engineer's Opinion of Construction Costs 5-10 yr 2659 gpm
No change necessary - 10 yr pumps meet condition 3 EA 0 0 10-15 yr 2723 gpmTriplex Flygt CP3201 47 Hp 452 curve 330mm 15-20 yr 2723 gpmCondition 1362 gpm @ 72' TDH 20+ 2723 gpm
Total Construction Cost $010% Contingency $015% Engineering Fees $0Total Construction Cost $0
LS 4107 System20 yr - no upgrades necessary15 yr - no change necessary - 10 yr pumps sufficient5 yr flow 1858 gpm; 10 yr flow 2143 gpm; 15 yr 2208 gpm - lot of flow from PinecrestSized 5 yr pumps to cover 10 yr flows with just impeller changeConstruction Cost for Expansion No. Unit Cost/Unit Engineer's Opinion of Construction Costs 0-5 yr 1859 gpm
Sewer Expansion CIP 2024 - 20296
No change necessary - 10 yr pumps cover 3 EA 0 0 5-10 yr 2143 gpmTriplex Flygt NP3153 20 Hp 434 curve - 227 mm impeller 10-15 yr 2208 gpmCondition 1104 gpm @ 47' TDH 15-20 yr 2208 gpm
Total Construction Cost $0 20+ 2208 gpm10% Contingency $015% Engineering Fees $0Total Construction Cost $0
LS 403620 yr - no change in flow - no upgrades necessaryTriplex LS - 3 different pumps15 yr - flow increases 300 gpm; 10 yr pumps should be fine - all on VFDs 0-5 yr 5233 gpmOriginal Pumps (100 HP - 4000 gpm @ 70 TDH) (20 HP 1400 gpm @ 35 TDH) (60 HP - 2800 gpm @ 57 TDH) 5-10 yr 5879 gpm
10-15 yr 6205 gpmConstruction Cost for Expansion No. Unit Cost/Unit Engineer's Opinion of Construction Costs 15-20 yr 6205 gpm
10 yr pumps should be sufficient - all pumps on VFDs 1 LS 0 0 20+ 6205 gpmCondition 6255 gpm @ 46' TDH 3900 gpm @ 46' (90 Hp); 2400 gpm @ 46' (60 Hp); 35500 gpm @ 46' (100 Hp)Will have somewhere between approx 6000 gpm and 7000 gpm even with 1 pump out
Total Construction Cost $010% Contingency $015% E i i F $015% Engineering Fees $0Total Construction Cost $0
LS 403520 yr - no change in flow - no upgrades necessary5 yr rework Fairbanks Morse 25 Hp pumps or install 3 new 25 Hp Flygts to get 3500 gpm @ 20' TDH; replaced 16" FM with 24" FM5 yr flow 6078 gpm; 10 yr flow 6722 gpm; 15 yr flow 7050 gpm15 yr 3525 gpm @ 20' TDH - 10 yr pump work sufficient for 10 yr and on
Construction Cost for Expansion No. Unit Cost/Unit Engineer's Opinion of Construction CostsNo upgrades necessary - 5 yr pumps are sufficient - CP3170 603 curve 300 mm, 25 Hp 3 EA 0 0 0-5 yr 6078 gpm
Condition 3525 gpm @ 20' TDH 0 5-10 yr 6722 gpmTotal Construction Cost $0 10-15 yr 7050 gpm10% Contingency $0 15-20 yr 7055 gpm15% Engineering Fees $0 20+ 7055 gpmTotal Construction Cost $0
Sewer Expansion CIP 2024 - 20296

LS 4WTP System20 yr - upgrade gravity sewer along 2nd Street -due to increased flow from LS4048collecting everything but LS4002, LS4003, LS4006 and LS4028 Varies throughout basin - can't just use 1 number
0-5 yr 22000 gpmConstruction Cost for Expansion No. Unit Cost/Unit Engineer's Opinion of Construction Costs 5-10 yr 21600 gpm
Upgrade 48" gravity sewer along 2nd Street to 54" (12' - 15' depth) - due to discharge from LS4048 3700 LF 550 2035000 10-15 yr 23300 gpmSpirolite? 15-20 yr gpm
Remove existing 48" gravity sewer along 2nd Street 3700 LF 75 277500 20+ gpmRemove/replace 7/8' manholes (12' - 15' depth) - Spirolite? 13 EA 9750 126750Bypass pumping 24 Wks 4500 108000
Total Construction Cost $2,547,25010% Contingency $254,725 may be alternatives - could extend forcemain from LS4048 to point where LS4005 former flow ties in15% Engineering Fees $382,088Total Construction Cost $3,184,063
LS 4002No construction is necessary due to future growthAll the necessary work for LS4002 basin is covered under the Rehab CIPConstruction Cost for Expansion No. Unit Cost/Unit Engineer's Opinion of Construction Costs Existing Station is Duplex and has enough capacity for this flow
All work under Rehab CIP 0 LF 0 0 0-5 yr 2810 gpm
Sewer Expansion CIP 2024 - 20297
Total Construction Cost $0 5-10 yr 2810 gpm10% Contingency $0 10-15 yr 2810 gpm15% Engineering Fees $0 15-20 yr 2810 gpmTotal Construction Cost $0 20+ 2810 gpm
LS40035 yr demolish station and install gravity sewer to Academy Creek WPCP - covered under Rehab and 5 yr Future
Construction Cost for Expansion No. Unit Cost/Unit Engineer's Opinion of Construction Costs 0-5 yr 9832 gpmNo upgrades necessary 0 LF 0 $0 5-10 yr 9832 gpm
Total Construction Cost $0 10-15 yr 9832 gpm10% Contingency $0 15-20 yr 9832 gpm15% Engineering Fees $0 20+ 9832 gpmTotal Construction Cost $0
LS 4WTP - Academy Creek Influent Lift StationNo upgrades necessary for future expansion - entire facility designed for 13.5 MGDPump capacity is 5900 gpm - 4 pumps - 3 in operation have 25 MGD capacity - there are equalization areas at the WPCP - should be sufficient
Construction Cost for Expansion No. Unit Cost/Unit Engineer's Opinion of Construction CostsNo upgrades necessary 0 LS 0 0
T t l C t ti C t $0Total Construction Cost $010% Contingency $015% Engineering Fees $0Total Construction Cost $0
LS 4017No upgrades necessary for future expansion 0-5 yr 940 gpmOnly rehab upgrades 5-10 yr 940 gpm
Construction Cost for Expansion No. Unit Cost/Unit Engineer's Opinion of Construction Costs 10-15 yr 940 gpmNo upgrades necessary 0 LS 0 0 15-20 yr 940 gpm
Total Construction Cost $0 20+ 940 gpm10% Contingency $015% Engineering Fees $0Total Construction Cost $0
Sewer Expansion CIP 2024 - 20297
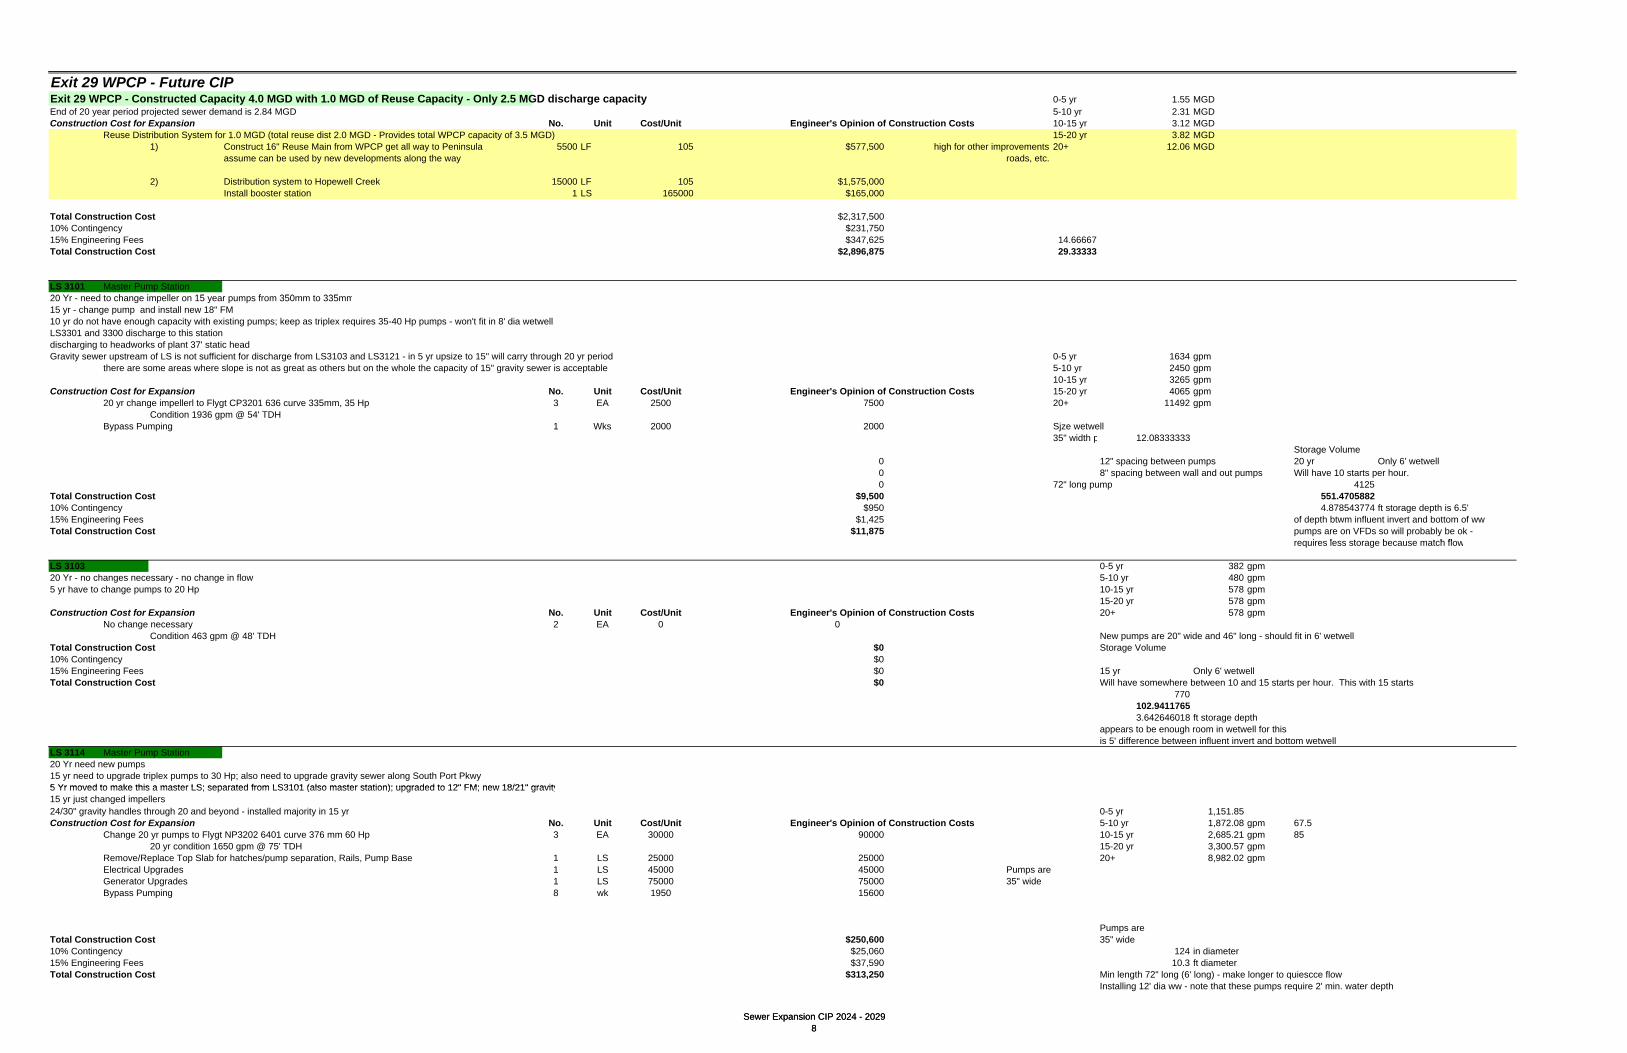
Exit 29 WPCP - Future CIPExit 29 WPCP - Constructed Capacity 4.0 MGD with 1.0 MGD of Reuse Capacity - Only 2.5 MGD discharge capacity 0-5 yr 1.55 MGDEnd of 20 year period projected sewer demand is 2.84 MGD 5-10 yr 2.31 MGDConstruction Cost for Expansion No. Unit Cost/Unit Engineer's Opinion of Construction Costs 10-15 yr 3.12 MGD
Reuse Distribution System for 1.0 MGD (total reuse dist 2.0 MGD - Provides total WPCP capacity of 3.5 MGD) 15-20 yr 3.82 MGD1) Construct 16" Reuse Main from WPCP get all way to Peninsula 5500 LF 105 $577,500 high for other improvements 20+ 12.06 MGD
assume can be used by new developments along the way roads, etc.
2) Distribution system to Hopewell Creek 15000 LF 105 $1,575,000Install booster station 1 LS 165000 $165,000
Total Construction Cost $2,317,50010% Contingency $231,75015% Engineering Fees $347,625 14.66667Total Construction Cost $2,896,875 29.33333
LS 3101 Master Pump Station20 Y d t h i ll 15 f 350 t 335
Sewer Expansion CIP 2024 - 20298
20 Yr - need to change impeller on 15 year pumps from 350mm to 335mm15 yr - change pump and install new 18" FM10 yr do not have enough capacity with existing pumps; keep as triplex requires 35-40 Hp pumps - won't fit in 8' dia wetwellLS3301 and 3300 discharge to this stationdischarging to headworks of plant 37' static headGravity sewer upstream of LS is not sufficient for discharge from LS3103 and LS3121 - in 5 yr upsize to 15" will carry through 20 yr period 0-5 yr 1634 gpm
there are some areas where slope is not as great as others but on the whole the capacity of 15" gravity sewer is acceptable 5-10 yr 2450 gpm10-15 yr 3265 gpm
Construction Cost for Expansion No. Unit Cost/Unit Engineer's Opinion of Construction Costs 15-20 yr 4065 gpm20 yr change impellerl to Flygt CP3201 636 curve 335mm, 35 Hp 3 EA 2500 7500 20+ 11492 gpm
Condition 1936 gpm @ 54' TDHBypass Pumping 1 Wks 2000 2000 Sjze wetwell
35" width p 12.08333333Storage Volume
0 12" spacing between pumps 20 yr Only 6' wetwell0 8" spacing between wall and out pumps Will have 10 starts per hour. 0 72" long pump 4125
Total Construction Cost $9,500 551.470588210% Contingency $950 4.878543774 ft storage depth is 6.5'15% Engineering Fees $1,425 of depth btwm influent invert and bottom of wwTotal Construction Cost $11,875 pumps are on VFDs so will probably be ok -
i l t b t h flrequires less storage because match flow
LS 3103 0-5 yr 382 gpm20 Yr - no changes necessary - no change in flow 5-10 yr 480 gpm5 yr have to change pumps to 20 Hp 10-15 yr 578 gpm
15-20 yr 578 gpmConstruction Cost for Expansion No. Unit Cost/Unit Engineer's Opinion of Construction Costs 20+ 578 gpm
No change necessary 2 EA 0 0Condition 463 gpm @ 48' TDH New pumps are 20" wide and 46" long - should fit in 6' wetwell
Total Construction Cost $0 Storage Volume10% Contingency $015% Engineering Fees $0 15 yr Only 6' wetwellTotal Construction Cost $0 Will have somewhere between 10 and 15 starts per hour. This with 15 starts
770102.94117653.642646018 ft storage depth
appears to be enough room in wetwell for thisis 5' difference between influent invert and bottom wetwell
LS 3114 Master Pump Station20 Yr need new pumps15 yr need to upgrade triplex pumps to 30 Hp; also need to upgrade gravity sewer along South Port Pkwy5 Yr moved to make this a master LS; separated from LS3101 (also master station); upgraded to 12" FM; new 18/21" gravity5 Yr moved to make this a master LS; separated from LS3101 (also master station); upgraded to 12" FM; new 18/21" gravity15 yr just changed impellers24/30" gravity handles through 20 and beyond - installed majority in 15 yr 0-5 yr 1,151.85Construction Cost for Expansion No. Unit Cost/Unit Engineer's Opinion of Construction Costs 5-10 yr 1,872.08 gpm 67.5
Change 20 yr pumps to Flygt NP3202 6401 curve 376 mm 60 Hp 3 EA 30000 90000 10-15 yr 2,685.21 gpm 8520 yr condition 1650 gpm @ 75' TDH 15-20 yr 3,300.57 gpm
Remove/Replace Top Slab for hatches/pump separation, Rails, Pump Base 1 LS 25000 25000 20+ 8,982.02 gpmElectrical Upgrades 1 LS 45000 45000 Pumps are Generator Upgrades 1 LS 75000 75000 35" wideBypass Pumping 8 wk 1950 15600
Pumps are Total Construction Cost $250,600 35" wide10% Contingency $25,060 124 in diameter15% Engineering Fees $37,590 10.3 ft diameterTotal Construction Cost $313,250 Min length 72" long (6' long) - make longer to quiescce flow
Installing 12' dia ww - note that these pumps require 2' min. water depth
Sewer Expansion CIP 2024 - 20298
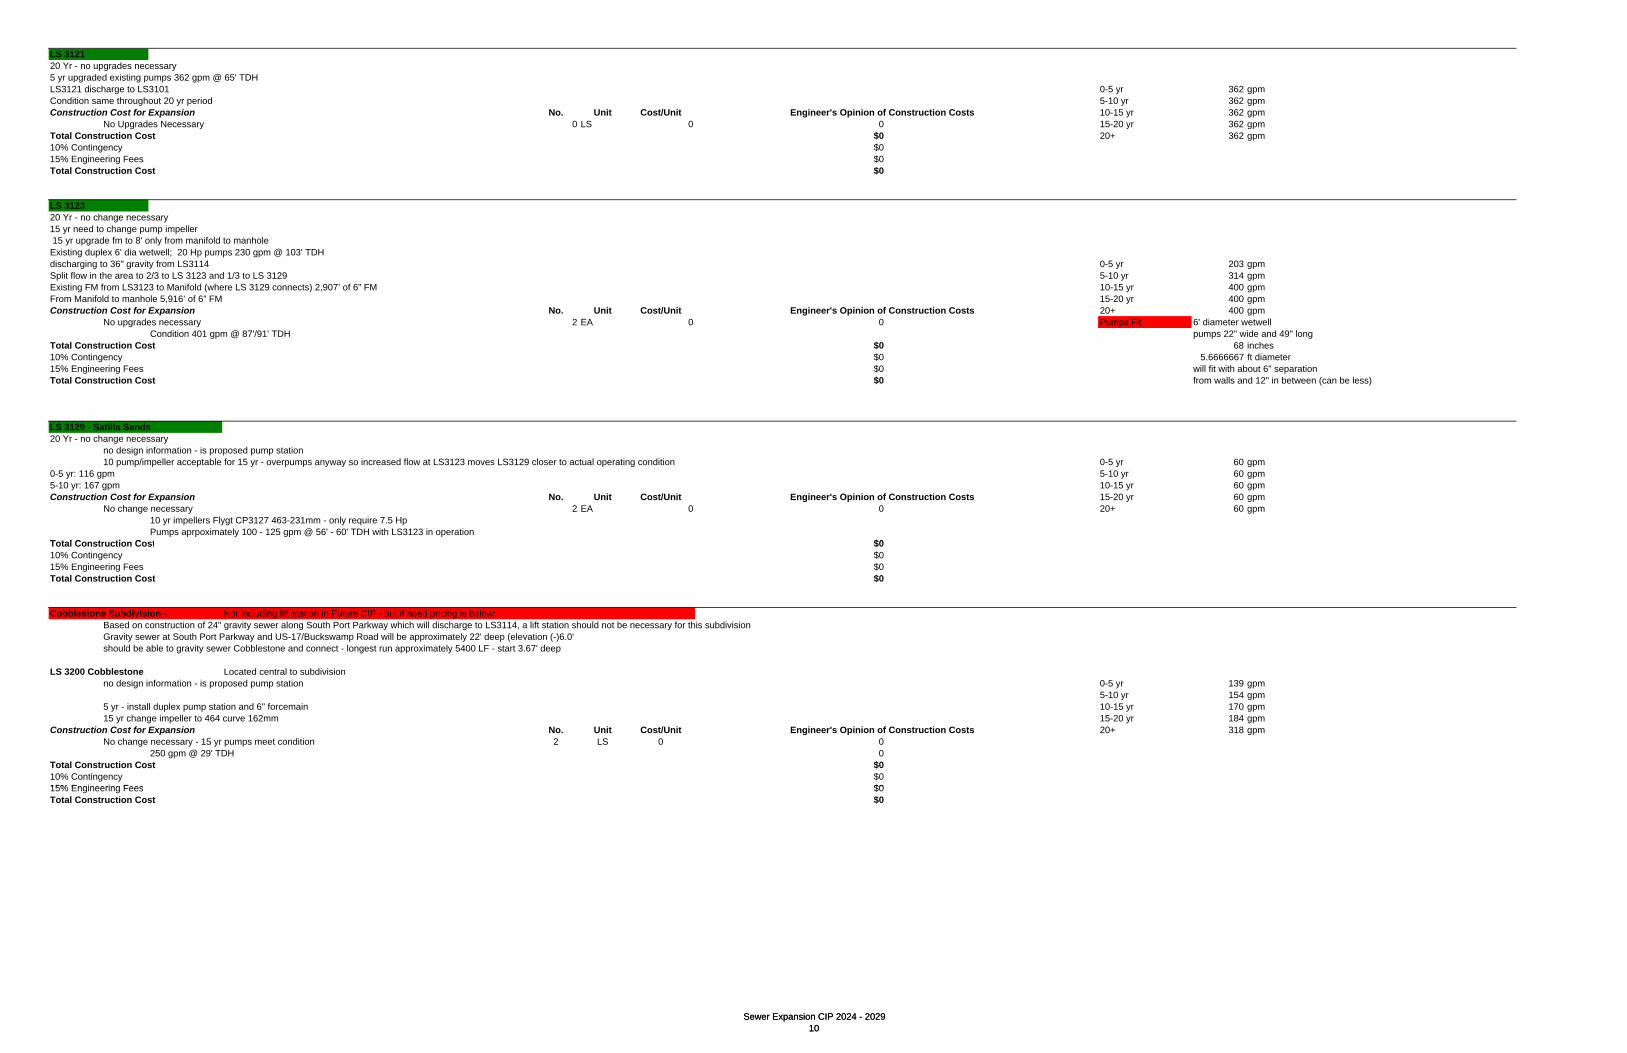
LS 312120 Yr - no upgrades necessary5 yr upgraded existing pumps 362 gpm @ 65' TDHLS3121 discharge to LS3101 0-5 yr 362 gpmCondition same throughout 20 yr period 5-10 yr 362 gpmConstruction Cost for Expansion No. Unit Cost/Unit Engineer's Opinion of Construction Costs 10-15 yr 362 gpm
No Upgrades Necessary 0 LS 0 0 15-20 yr 362 gpmTotal Construction Cost $0 20+ 362 gpm10% Contingency $015% Engineering Fees $0Total Construction Cost $0
LS 312320 Yr - no change necessary15 yr need to change pump impeller 15 yr upgrade fm to 8' only from manifold to manholeExisting duplex 6' dia wetwell; 20 Hp pumps 230 gpm @ 103' TDHdischarging to 36" gravity from LS3114 0-5 yr 203 gpmSplit flow in the area to 2/3 to LS 3123 and 1/3 to LS 3129 5-10 yr 314 gpmExisting FM from LS3123 to Manifold (where LS 3129 connects) 2,907’ of 6” FM 10-15 yr 400 gpm
Sewer Expansion CIP 2024 - 202910
From Manifold to manhole 5,916’ of 6” FM 15-20 yr 400 gpmConstruction Cost for Expansion No. Unit Cost/Unit Engineer's Opinion of Construction Costs 20+ 400 gpm
No upgrades necessary 2 EA 0 0 Pumps Fit 6' diameter wetwellCondition 401 gpm @ 87'/91' TDH pumps 22" wide and 49" long
Total Construction Cost $0 68 inches10% Contingency $0 5.6666667 ft diameter 15% Engineering Fees $0 will fit with about 6" separation Total Construction Cost $0 from walls and 12" in between (can be less)
LS 3129 - Satilla Sands20 Yr - no change necessary
no design information - is proposed pump station10 pump/impeller acceptable for 15 yr - overpumps anyway so increased flow at LS3123 moves LS3129 closer to actual operating condition 0-5 yr 60 gpm
0-5 yr: 116 gpm 5-10 yr 60 gpm5-10 yr: 167 gpm 10-15 yr 60 gpmConstruction Cost for Expansion No. Unit Cost/Unit Engineer's Opinion of Construction Costs 15-20 yr 60 gpm
No change necessary 2 EA 0 0 20+ 60 gpm10 yr impellers Flygt CP3127 463-231mm - only require 7.5 HpPumps aprpoximately 100 - 125 gpm @ 56' - 60' TDH with LS3123 in operation
T t l C t ti C t $0Total Construction Cost $010% Contingency $015% Engineering Fees $0Total Construction Cost $0
Cobblestone Subdivision - Not including lift station in Future CIP - but if need pricing is below:Based on construction of 24" gravity sewer along South Port Parkway which will discharge to LS3114, a lift station should not be necessary for this subdivisionGravity sewer at South Port Parkway and US-17/Buckswamp Road will be approximately 22' deep (elevation (-)6.0'should be able to gravity sewer Cobblestone and connect - longest run approximately 5400 LF - start 3.67' deep
LS 3200 Cobblestone Located central to subdivisionno design information - is proposed pump station 0-5 yr 139 gpm
5-10 yr 154 gpm5 yr - install duplex pump station and 6" forcemain 10-15 yr 170 gpm15 yr change impeller to 464 curve 162mm 15-20 yr 184 gpm
Construction Cost for Expansion No. Unit Cost/Unit Engineer's Opinion of Construction Costs 20+ 318 gpmNo change necessary - 15 yr pumps meet condition 2 LS 0 0
250 gpm @ 29' TDH 0Total Construction Cost $010% Contingency $015% Engineering Fees $015% Engineering Fees $0Total Construction Cost $0
Sewer Expansion CIP 2024 - 202910

LS330120 yr install 18" forcemain - change imp on 15 yr pumps15 yr change pumps to 60 Hp (from 20 Hp)10 yr just change impeller and add 3rd pump5 yr installed triplex station with 2 pumps and new 12" fmlocated farthest proposed pump station on northwest area of south mainland 0-5 yr 573 gpmdischarging to LS3300 for repumping 5-10 yr 1122 gpmFrom LS3301 to LS 3300 12,916’ of 12” FM 10-15 yr 1670 gpmConstruction Cost for Expansion No. Unit Cost/Unit Engineer's Opinion of Construction Costs 15-20 yr 2322 gpm
Change pump imp from 15 ry (310mm) to 314mm 3 EA 2500 7500 20+ 8646 gpmFlygt NP3202 634-314 mm, 35 HpCondition 1161 gpm @ 53' TDH
Install new 18" PVC FM 13000 LF 90 1170000Abandon existing 12" PVC FM (unless can use for reuse?) 13000 LF 5 65000Bypass Pumping 8 Wks 1800 14400
Total Construction Cost $1,256,90010% Contingency $125,69015% Engineering Fees $188,535Total Construction Cost $1,571,125
Sewer Expansion CIP 2024 - 202911
LS3300 have to change pump model every 5 yrs from 5 yr through 15 yr - see if can use these pumps anywhere??20 yr install 20" forcemain - trim impeller on 15 yr pumps15 Yr have to change to 100 Hp pumps discharging to LS3101; repumps LS330110 yr have to install 3rd pump and change pumps to 34 Hp (from 20 Hp) 5 yr installed triplex station with 2 pumps and new 14" fm 0-5 yr 946 gpmConstruction Cost for Expansion No. Unit Cost/Unit Engineer's Opinion of Construction Costs 5-10 yr 1859 gpm
Trim impelleron 15 yr pumps to Flygt CP3300 468 curve 275mm, 60 Hp 3 EA 2500 7500 10-15 yr 2701 gpmCondition 1901 gpm @ 67' TDH 15-20 yr 3802 gpm
20+ 10328 gpmInstall new 20" PVC FM 14000 LF 80 1120000Abandon existing 14" FM (unless can use for reuse?) 14000 LF 5 70000Bypass Pumping 4 Wks 1900 7600
Total Construction Cost $1,205,10010% Contingency $120,51015% Engineering Fees $180,765Total Construction Cost $1,506,375
LS 3302 - out near Peninsula have to change pump model every 5 yrs from 5 yr through 15 yr - see if can use these pumps anywhere??20 yr have to change pumps to 30 Hp15 h t f 15 H15 yr change out pumps for 15 Hp pumpsbased on ATM evaluation do not need this in the 0-5 yr window and unlikely need in 5-10 yr window. Most flow could be pumped directly into 16" fm 0-5 yr 373 gpm
forcemain is already built from Peninsula to LS3114 manhole and can be cut back to discharge in 36" gravity sewer install up to US17/Buckswamp Road and South Port Pkwy 5-10 yr 967 gpmIn 15 yr will need to switch out pumps - tried to find 10 yr pumps that could just change imp in 15 yr but flows/head won't work 10-15 yr 1653 gpm
Construction Cost for Expansion No. Unit Cost/Unit Engineer's Opinion of Construction Costs 15-20 yr 2255 gpmChange triplex pumps and panel from 15 Hp to 30 Hp pumps 3 EA 25000 75000 20+ 7802 gpm
Install 3 Flygt NP3171 434 curve 255 mm, 30 HpCondition 1127 gpm @ 72' TDHassume wetwell about 20' deep and 12' diam. - pumps will fit 12' dia wetwell will fit 15 yr pumps with 18" between pumps and 12" off ww wallsized valve vault large enough for 10" valves pumps 26" wide and 56" long
138 inRemove/replace rails, pump base, etc. 1 LS 20500 20500 11.5 ftElectrical Service 1 LS 25000 25000 pumps fit with 18" separation between pumps and 12" off wallInstall Generator 1 LS 75000 75000Bypass Pumping 12 Wks 1800 21600
Total Construction Cost $217,10010% Contingency $21,71015% Engineering Fees $32,565Total Construction Cost $271,375
LS 3303 Terra Nova not needed for 20 yr condition any flows need to go direclty to this station or just repumping??LS 3303 Terra Nova - not needed for 20 yr condition any flows need to go direclty to this station or just repumping??Do not see a need for this station in the 5-20 yr period as a repumping station since shortened fm from Peninsula and discharge to LS3114 gravity and not WPCP
Sewer Expansion CIP 2024 - 202911

SSI - Future Expansion/Growth
Jones CreekTo collect septic systems - was previously on Future Development CIP in SSI W/S MPEstimated 22 lots - 6 with septic as of 2006 - Subdivision flow estimated 24 gpmSeptic systems installed 1996 - 2003; high potential for failure by year 2029Install new gravity sewer, grinder lift station, and 2-inch forcemain to pump across Lawrence Road (major) and discharge to Stillwater existing gravity sewer
Construction Cost for Expansion No. Unit Cost/Unit Engineer's Opinion of Construction CostsInstall new 8" gravity sewer (4' to 8.5' deep) 2100 LF 80 $168,000Install new 4' diameter manholes with lining/coating 8 EA 3100 $24,800Duplex Grinder Lift Station (25 gpm min capacity @ 15' TDH) 1 LS 22000 $22,0002-inch Forcemain 2500 LF 18 $45,000Bypass Pumping 4 Wk 1000 $4,000
Total Construction Cost $263,80010% Contingency $26,38015% Engineering Fees $39,570Total Construction Cost $329,750
Butler PlantationTo collect septic systems - was previously on Future Development CIP in SSI W/S MP
Sewer Expansion CIP 2024 - 202912
To collect septic systems - was previously on Future Development CIP in SSI W/S MPEstimated 23 lots - 10 with septic as of 2006 - Subdivision flow estimated 25 gpmSeptic systems installed 1996 - 2001; high potential for failure by year 2029Install new gravity sewer, grinder lift station, and 3-inch forcemain and discharge to LS2033Upgrades to LS2033, 2056, and 2032 that cover the flow from this area can be done in 10 yr - not included here.
Construction Cost for Expansion No. Unit Cost/Unit Engineer's Opinion of Construction CostsInstall new 8" gravity sewer (5' to 20' deep) 5000 LF 115 $575,000Install new 4' diameter manholes with lining/coating 15 EA 3400 $51,000Duplex Grinder Lift Station (LFSUT4 - Flygt CP-3067 imp 265, 2 Hp) 1 LS 22000 $22,0003-inch Forcemain 3000 LF 22 $66,000Bypass Pumping 4 Wk 1000 $4,000
Total Construction Cost $718,00010% Contingency $71,80015% Engineering Fees $107,700Total Construction Cost $897,500
Note - could possibly share fm from Hampton Pt proposed in 2014 - 2019 but may not work with small flow from Butler PlantationCarts Subdivision
To collect septic systems - was previously on Future Development CIP in SSI W/S MPEstimated 11 lots - 10 with septic as of 2006 - Subdivision flow estimated 12 gpmSeptic systems installed 1996 - 2006; moderate potential for failure by year 2029Install new gravity sewer, grinder lift station, and 2-inch forcemain to discharge to LS2054 gravity sewer - Carts S/D and Settler's Hammock both useInstall new gravity sewer, grinder lift station, and 2 inch forcemain to discharge to LS2054 gravity sewer Carts S/D and Settler s Hammock both useNo upgrades necessary for LS2054
Construction Cost for Expansion No. Unit Cost/Unit Engineer's Opinion of Construction CostsInstall new 8" gravity sewer (4' to 8' deep) 900 LF 80 $72,000Install new 4' diameter manholes with lining/coating 5 EA 3050 $15,250Duplex Grinder Lift Station (32 gpm min capacity @ 16' TDH) 1 LS 22000 $22,0002-inch Forcemain - discharge to LS2054 exist MH 775 LF 18 $13,950Bypass Pumping 4 Wk 1000 $4,000
Total Construction Cost $127,20010% Contingency $12,72015% Engineering Fees $19,080Total Construction Cost $159,000
Settler's HammockTo collect septic systems - was previously on Future Development CIP in SSI W/S MPEstimated 24 lots - 15 with septic as of 2006 - Subdivision flow estimated 20 gpmSeptic systems installed 2002 - 2005; moderate potential for failure by year 2029Install new gravity sewer to discharge to proposed grinder LS under Carts SubdivisionNo upgrades necessary for LS2054
Construction Cost for Expansion No. Unit Cost/Unit Engineer's Opinion of Construction CostsInstall new 8" gravity sewer (4' to 8' deep) 1000 LF 80 $80,000Install new 4' diameter manholes with lining/coating 4 EA 3050 $12,200Install new 4 diameter manholes with lining/coating 4 EA 3050 $12,200Bypass Pumping 6 Wk 1000 $6,000
Total Construction Cost $98,20010% Contingency $9,82015% Engineering Fees $14,730Total Construction Cost $122,750
Sewer Expansion CIP 2024 - 202912

Golden Isles Marina Townhouses, Lanier IslandTo collect new development on Lanier Island - was previously on Future Development CIP in SSI W/S MPEstimated 48 townhomes - Subdivision flow estimated 40 gpmThese improvements would allow for the decommissioning of the Lanier Island WPCP and would pump the entire Lanier Island wastewater flow to the St Simons Island WPCPInstall new pump station, and forcemain and manifold in to LS2030 forcemain on St Simons IslandWill require upgrades to LS2030 forcemain - part of the 12-inch forcemain must be upgraded
Construction Cost for Expansion No. Unit Cost/Unit Engineer's Opinion of Construction CostsDuplex Lift Station (132 gpm min capacity @ 112' TDH) - pump entire flow Lanier Island WPCP; 1 LS 185000 $185,000
Flygt CP3140, 480 imp, 14.8 Hp4-inch Forcemain 9000 LF 60 $540,000 more expensive because parts have to be drilled or attached to bridgeInstall new 16-inch forcemain from LS2030 2700 LF 60 $162,000Abandon 12-inch forcemain from LS2030 2700 LF 5 $13,500Bypass Pumping 12 Wk 1800 $21,600
Total Construction Cost $922,10010% Contingency $92,21015% Engineering Fees $138,315Total Construction Cost $1,152,625
Musgrove Plantation Phase IIUndeveloped large tract of land near LS2056 - near German Village
Sewer Expansion CIP 2024 - 202913
Assumed all - approximately 1000 acre tract; assume 1/2 undevelopable due to marsh/wetlandEstimated 450 - 1 acre lots in total; develop some in 15 yr, 20 yr and 20+ yr
200 lots in 15 yr (225 gpm); 150 lots in 20 yr (167 gpm)Will require new gravity sewer, new lift stations internal and discharge to LS2056 - necessary upgrades to LS2056 done in 15 yr with Phase I Musgrove PlantationCan not determine layout of subdivision gravity sewer - no plat
Construction Cost for Expansion No. Unit Cost/Unit Engineer's Opinion of Construction CostsUpgrade pumps, panel, and electrical in duplex master lift station (No. 1 LS) 2 EA 28000 56000
Flygt CP3201, 462 Imp, 280 mm, 47 Hp, Design Oper Condition 400 gpm @ 120 ft TDHInstall new duplex lift station for Phase II (No. 2 LS) 1 LS 175000 175000
Flygt CP 3127 220 mm, 7.5 Hp draw - move from LS No. 1 15 yr station and change imp, Design Oper Condition 167 gpm @ 50 ft TDH 0Install new 6-inch FM from LS No. 2 to LS No. 1 5660 LF 30 169800Bypass Pumping 6 wks 1200 7200
Total Construction Cost $408,00010% Contingency $40,80015% Engineering Fees $61,200Total Construction Cost $510,000
Sewer Expansion CIP 2024 - 202913