Appendix A Public Advocates Office Data Request ORA-HB ...
322
$SSHQGL[ $ 3XEOLF $GYRFDWHV 2IILFH 'DWD 5HTXHVW 25$+%6&* -XQH 6R&DO*DV 5HVSRQVH WR 3XEOLF $GYRFDWHV 2IILFH 'DWD 5HTXHVW 25$ +%6&* -XO\ $WWDFKPHQW $ :RUN 3URGXFWV -XQH $WWDFKPHQW % :RUN 3URGXFWV SRVW -XQH $WWDFKPHQW & (PDLOV ZLWK ,28V FILED 07/15/19 04:59 PM 1 / 322
-
Upload
khangminh22 -
Category
Documents
-
view
4 -
download
0
Transcript of Appendix A Public Advocates Office Data Request ORA-HB ...

FILED07/15/1904:59 PM
1 / 322
2 / 322

Ratepayer Advocates in the Gas, Electric, Telecommunications and Water Industries
ORA Office of Ratepayer Advocates
California Public Utilities Commission
505 Van Ness Avenue
San Francisco, CA 94102 Phone: (415) 703-2544
Fax: (415) 703-2057
http://ora.ca.gov
Date: June 29, 2018
To: Phone: (213) 244-5354 Regulatory Case Manager for SoCalGas Email: [email protected]
Phone: (213) 244-8234 Attorney for SoCalGas Email: [email protected]
Phone: (213) 544-2990 Attorney for SoCalGas Email: [email protected]
From: Phone: (415) 696-7311 Analyst for ORA Email: [email protected]
Phone: (415) 703-2624 Attorney for ORA Email: [email protected]
Re: Data Request No. ORA-HB-SCG-2018-09 Response Requested:
You are instructed to answer the following Data Requests with written, verified responses per Public Utilities Code §§ 309.5 and 314, and Rules 1.1 and 10.1 of the California Public Utilities Commission’s Rules of Practice and Procedure. Restate the text of each request prior to providing the response. For any questions, email the ORA contact(s) above with a copy to the ORA attorney.
Each Data Request is continuing in nature. Provide your response as it becomes available, but no later than the due date noted above. If you are unable to provide a response by this date, notify ORA as soon as possible, with a written explanation as to why the response date cannot be met and a best estimate of when the information can be provided. If you acquire additional information after providing an answer to any request, you must supplement your response following the receipt of such additional information.
3 / 322

2
Identify the person providing the answer to each data request and his/her contact information. Responses should be provided both in the original electronic format, if available, and in hard copy. (If available in Word format, send the Word document and do not send the information as a PDF file.) All electronic documents submitted in response to this data request should be in readable, downloadable, printable, and searchable formats, unless use of such formats is infeasible. Each page should be numbered. If any of your answers refer to or reflect calculations, provide a copy of the supporting electronic files that were used to derive such calculations, such as Excel-compatible spreadsheets or computer programs, with data and formulas intact and functioning. Documents produced in response to the data requests should be Bates-numbered, and indexed if voluminous. Responses to data requests that refer to or incorporate documents should identify the particular documents referenced by Bates-numbers or Bates-range.
As to any Data Request consisting of a number of separate subdivisions, or related parts or portions, a complete response is required to each part or portion with the same effect as if it were propounded as a separate Data Request.
If a request, definition, or an instruction, is unclear, notify ORA as soon as possible. In any event, answer the request to the fullest extent possible, specifying the reason for your inability to answer the remaining portion of the Data Request.
Any objection to a Data Request should clearly indicate to which part or portion of the Data Request the objection is directed. If any document, in whole or in part, covered by this request is withheld for whatever reason, please furnish a list identifying all withheld documents in the following manner: (a) a brief description of the document; (b) the date of the document; (c) the name of each author or preparer; (d) the name of each person who received the document; and (e) the reason for withholding it.
In your written response to the question, explain why you are unable to answer in full and describe the limitations of your response.
A. As used herein, the terms “you,” “your(s),” “Company,” and “SoCalGas” mean Southern California Gas Company and any and all of its respective present and former employees, agents, consultants, attorneys, officials, and any and all other persons acting on its behalf.
B. The terms “and” and “or” shall be construed either disjunctively or conjunctively whenever appropriate in order to bring within the scope of these Data Requests any information or documents which might otherwise be considered to be beyond their scope.
C. Date ranges shall be construed to include the beginning and end dates named. For example, the phrases “from January 1 to January 31,” “January 1-31,” January 1 to 31,” and “January 1through January 31” should be understood to include both the 1st of January and the 31st of January. Likewise, phrases such as “since January 1” and “from January 1 to the present”
4 / 322

3
should be understood to include January 1st, and phrases such as “until January 31,” “through January 31,” and “up to January 31” should also be understood to include the 31st.
D. The singular form of a word shall be interpreted as plural, and the plural form of a word shall be interpreted as singular whenever appropriate in order to bring within the scope of these Data Requests any information or documents which might otherwise be considered to be beyond their scope.
E. The term “communications” includes all verbal and written communications of every kind, including but not limited to telephone calls, conferences, notes, correspondence, and all memoranda concerning the requested communications. Where communications are not in writing, provide copies of all memoranda and documents made relating to the requested communication and describe in full the substance of the communication to the extent that the substance is not reflected in the memoranda and documents provided.
F. The term “document” shall include, without limitation, all writings and records of every type in your possession, control, or custody, whether printed or reproduced by any process, including documents sent and received by electronic mail, or written or produced by hand.
G. “Relate to,” “concern,” and similar terms and phrases shall mean consist of, refer to, reflect, comprise, discuss, underlie, comment upon, form the basis for, analyze, mention, or be connected with, in any way, the subject of these Data Requests.
H. When requested to “state the basis” for any analysis (including studies and workpapers), proposal, assertion, assumption, description, quantification, or conclusion, please describe every fact, statistic, inference, supposition, estimate, consideration, conclusion, study, and analysis known to you which you believe to support the analysis, proposal, assertion, assumption, description, quantification, or conclusion, or which you contend to be evidence of the truth or accuracy thereof.
1. How many hours did SoCalGas personnel spend on energy efficiency codes and standards (EECS) advocacy activities from June 1, 2018 to June 5, 2018?
2. How many hours have SoCalGas personnel spent on EECS advocacy activities on or after June 6, 2018?
3. How many SoCalGas personnel were involved in EECS advocacy activities from June 1, 2018 to June 5, 2018?
4. How many SoCalGas personnel have been involved in EECS advocacy activities on or after June 6, 2018?
5. Please describe the areas (subject matter and goals) in which SoCalGas performed work on EECS advocacy from June 1, 2018 to June 5, 2018.
5 / 322

4
6. Please describe the areas (subject matter and goals) in which SoCalGas has performed work on EECS advocacy on or after June 6, 2018.
7. Please describe the specific activities SoCalGas performed related to EECS advocacy from June 1, 2018 to June 5, 2018.
8. Please describe the specific activities SoCalGas has performed related to EECS advocacy on or after June 6, 2018.
9. Please provide the total Company-wide costs that SoCalGas has incurred related to EECS advocacy activities performed from June 1, 2018 to June 5, 2018. Please disaggregate the total into the following categories by the source of funding:
a. Costs that SoCalGas has charged, or expects to charge, to energy efficiency (EE) balancing accounts
b. Costs that SoCalGas has charged, or expects to charge, to other ratepayer funding sources
c. Costs that SoCalGas has charged, or expects to charge, to shareholder funding sources
10. Please provide the total Company-wide costs that SoCalGas has incurred related to EECS advocacy activities performed on or after June 6, 2018. Please disaggregate the total into the following categories by the source of funding:
a. Costs that SoCalGas has charged, or expects to charge, to energy efficiency (EE) balancing accounts
b. Costs that SoCalGas has charged, or expects to charge, to other ratepayer funding sources
c. Costs that SoCalGas has charged, or expects to charge, to shareholder funding sources
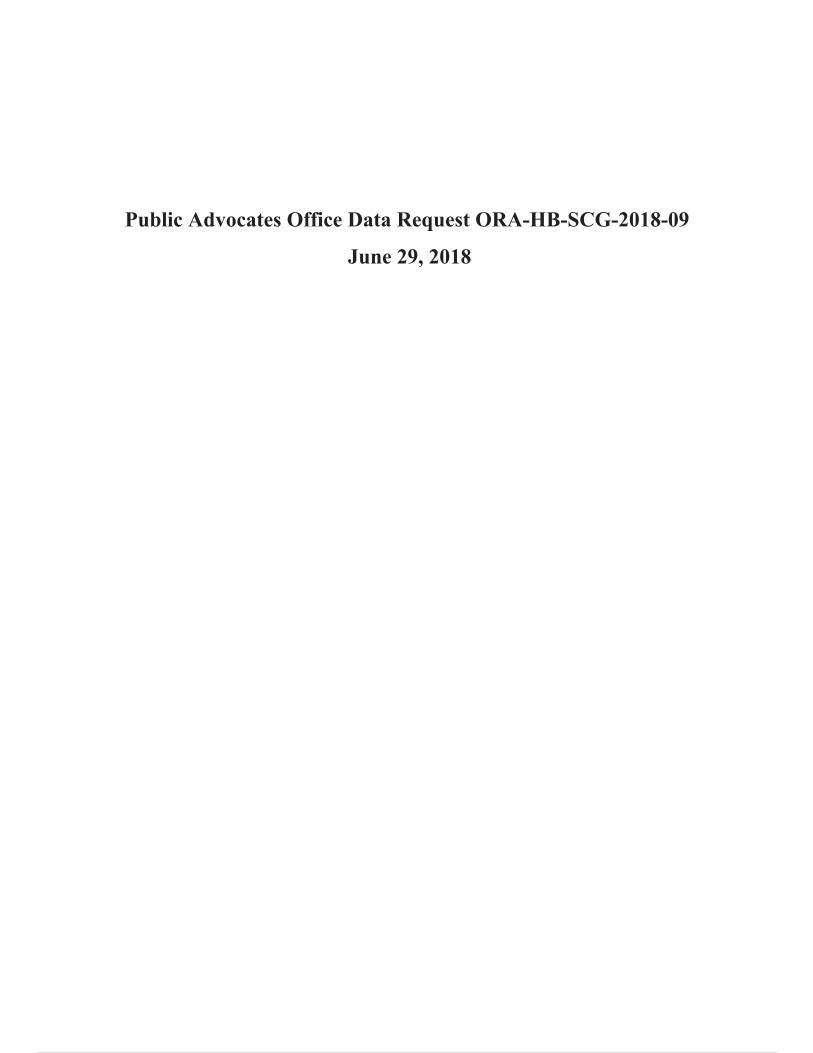
11. Of the total from question 9(a), disaggregate these expenses into the following categories:
a. Labor costs
b. Employee expenses
c. Other. Please provide a list of activities or expenses included in the “Other” category, with the subtotal of charges for each item listed.
12. Of the total from question 10(a), disaggregate these expenses into the following categories:
a. Labor costs
b. Employee expenses
c. Other. Please provide a list of activities or expenses included in the “Other” category, with the subtotal of charges for each item listed.
13. Please provide any and all final or draft work products of EECS advocacy activities performed from June 1, 2018 through June 5, 2018. This should include documents that were written,
6 / 322

5
partially written, revised, finalized, or sent on the days in question. Work products include, but are not limited to:
a. Letters, comments, and testimony submitted to regulatory agencies
b. Letters, talking points, briefings and lobbying documents provided to elected officials, regulatory officials, and the staff to those officials
c. Fliers, articles, and press releases
d. Meetings and phone calls (including requests for meetings or phone calls) with regulatory officials, regulatory agency staff, elected officials, and staff to elected officials. Please provide the date and time of the meeting, names and titles of all people involved, and the subject matter and purpose of the meeting.
14. Please provide any and all final or draft work products of EECS advocacy activities performed on or after June 6, 2018. This should include documents that were written, partially written, revised, finalized, or sent on or after June 6, 2018. Work products include, but are not limited to:
a. Letters, comments, and testimony submitted to regulatory agencies
b. Letters, talking points, briefings and lobbying documents provided to elected officials, regulatory officials, and the staff to those officials
c. Fliers, articles, and press releases
d. Meetings and phone calls (including requests for meetings or phone calls) with regulatory officials, regulatory agency staff, elected officials, and staff to elected officials. Please provide the date and time of the meeting, names and titles of all people involved, and the subject matter and purpose of the meeting.
15. Please provide any written or electronic correspondence with other investor-owned utilities in California regarding EECS advocacy that was sent or received on or after June 1, 2018.
16. Please provide information about any phone conversations or in-person meetings with other investor-owned utilities in California that were related to EECS advocacy, and occurred on or after June 1, 2018.
a. Date and time
b. Name and title of all people involved
c. Subject matter and purpose of the meeting
7 / 322

8 / 322

SOUTHERN CALIFORNIA GAS COMPANY ENERGY EFFICIENCY
TOTAL RESOURCE & PROGRAM ADMINISTRATOR COST (DATA REQUEST ORA-HB-SCG-2018-09)
DATE RECEIVED: JUNE 29, 2018 DATE SUBMITTED: JULY 16, 2018
______________________________________________________________________
1
Preliminary Statement
For the purposes of these responses, SoCalGas understands the to mean conduct directly concerning
statewide energy efficiency codes & standards advocacy, as delineated in Decision 18-05-041. The activities therefore do not include activities for local programs, such as compliance, reach codes, and engagement with the See Decision (D.) 18-05-041 at 12, 91; SoCalGas Business Plan at 298, PG&E Business Plan at 548, Southern California Edison Business Plan at 224. In addition, SoCalGas has continued to monitor and be passively involved with statewide energy efficiency Codes & Standards advocacy. Therefore, the time, work, and personnel identified in the below responses include instances where SoCalGas employees were, for example, not participating in energy efficiency codes and standards (EECS) advocacy, but were merely present for a call. This understanding applies to all responses below unless it is stated otherwise.
QUESTION 1:
How many hours did SoCalGas personnel spend on energy efficiency codes and standards (EECS) advocacy activities from June 1, 2018 to June 5, 2018?
RESPONSE 1:
SoCalGas employees spent approximately 2 hours during the identified time period.
9 / 322

SOUTHERN CALIFORNIA GAS COMPANY ENERGY EFFICIENCY
TOTAL RESOURCE & PROGRAM ADMINISTRATOR COST (DATA REQUEST ORA-HB-SCG-2018-09)
DATE RECEIVED: JUNE 29, 2018 DATE SUBMITTED: JULY 16, 2018
______________________________________________________________________
2
QUESTION 2:
How many hours have SoCalGas personnel spent on EECS advocacy activities on or after June 6, 2018?
RESPONSE 2:
SoCalGas employees spent approximately 10.5 hours during the identified time period.
10 / 322

SOUTHERN CALIFORNIA GAS COMPANY ENERGY EFFICIENCY
TOTAL RESOURCE & PROGRAM ADMINISTRATOR COST (DATA REQUEST ORA-HB-SCG-2018-09)
DATE RECEIVED: JUNE 29, 2018 DATE SUBMITTED: JULY 16, 2018
______________________________________________________________________
3
QUESTION 3:
How many SoCalGas personnel were involved in EECS advocacy activities from June 1, 2018 to June 5, 2018?
RESPONSE 3:
SoCalGas had 1 employee spend time on such activities.
11 / 322

SOUTHERN CALIFORNIA GAS COMPANY ENERGY EFFICIENCY
TOTAL RESOURCE & PROGRAM ADMINISTRATOR COST (DATA REQUEST ORA-HB-SCG-2018-09)
DATE RECEIVED: JUNE 29, 2018 DATE SUBMITTED: JULY 16, 2018
______________________________________________________________________
4
QUESTION 4:
How many SoCalGas personnel have been involved in EECS advocacy activities on or after June 6, 2018?
RESPONSE 4:
SoCalGas has 1 employee who spent time on such activities.
12 / 322

SOUTHERN CALIFORNIA GAS COMPANY ENERGY EFFICIENCY
TOTAL RESOURCE & PROGRAM ADMINISTRATOR COST (DATA REQUEST ORA-HB-SCG-2018-09)
DATE RECEIVED: JUNE 29, 2018 DATE SUBMITTED: JULY 16, 2018
______________________________________________________________________
5
QUESTION 5:
Please describe the areas (subject matter and goals) in which SoCalGas performed work on EECS advocacy from June 1, 2018 to June 5, 2018.
RESPONSE 5:
1. SoCalGas was on a call with the other IOUs regarding dedicated purpose pool pump standards (an electric standard). SoCalGas did not provide any feedback or comments to the IOUs or otherwise on the standards.
2. SoCalGas communicated with representatives from the Los Angeles Department of Water and Power (LADWP) regarding the contract whereby LADWP pays for statewide lighting codes & standards efforts. It was explained to LADWP that PG&E will lead this particular statewide activity going forward.
13 / 322

SOUTHERN CALIFORNIA GAS COMPANY ENERGY EFFICIENCY
TOTAL RESOURCE & PROGRAM ADMINISTRATOR COST (DATA REQUEST ORA-HB-SCG-2018-09)
DATE RECEIVED: JUNE 29, 2018 DATE SUBMITTED: JULY 16, 2018
______________________________________________________________________
6
QUESTION 6:
Please describe the areas (subject matter and goals) in which SoCalGas has performed work on EECS advocacy on or after June 6, 2018.
RESPONSE 6:
1. SoCalGas was involved in an IOU conference call discussing the implementation of the 2019 Title 24 standards. The IOUs pooled resources from each utility to consider using internally for training (thereby saving potential consultant costs for training and implementation).
2. SoCalGas provided comments on a draft Hearth Products CASE report as a follow-up to a previous request.
3. SoCalGas communicated with representatives from the LADWP regarding the contract whereby LADWP pays for statewide lighting codes & standards efforts. It was explained to LADWP that PG&E will lead this particular statewide activity going forward.
4. SoCalGas was present for, but did not participate in, a conference call with the IOUs regarding electric standards for portable air conditioners.
5. SoCalGas was present for, but did not participate in, a conference call with the IOUs regarding electric standards for fans.
14 / 322

SOUTHERN CALIFORNIA GAS COMPANY ENERGY EFFICIENCY
TOTAL RESOURCE & PROGRAM ADMINISTRATOR COST (DATA REQUEST ORA-HB-SCG-2018-09)
DATE RECEIVED: JUNE 29, 2018 DATE SUBMITTED: JULY 16, 2018
______________________________________________________________________
7
QUESTION 7:
Please describe the specific activities SoCalGas performed related to EECS advocacy from June 1, 2018 to June 5, 2018.
RESPONSE 7:
For the work described in Question 5, SoCalGas attended conference calls, and reviewed email correspondence.
15 / 322

SOUTHERN CALIFORNIA GAS COMPANY ENERGY EFFICIENCY
TOTAL RESOURCE & PROGRAM ADMINISTRATOR COST (DATA REQUEST ORA-HB-SCG-2018-09)
DATE RECEIVED: JUNE 29, 2018 DATE SUBMITTED: JULY 16, 2018
______________________________________________________________________
8
QUESTION 8:
Please describe the specific activities SoCalGas has performed related to EECS advocacy on or after June 6, 2018.
RESPONSE 8:
For the work described in Question 6, SoCalGas attended conference calls, provided comments on a draft CASE study, and reviewed email correspondence.
16 / 322

SOUTHERN CALIFORNIA GAS COMPANY ENERGY EFFICIENCY
TOTAL RESOURCE & PROGRAM ADMINISTRATOR COST (DATA REQUEST ORA-HB-SCG-2018-09)
DATE RECEIVED: JUNE 29, 2018 DATE SUBMITTED: JULY 16, 2018
______________________________________________________________________
9
QUESTION 9:
Please provide the total Company-wide costs that SoCalGas has incurred related to EECS advocacy activities performed from June 1, 2018 to June 5, 2018. Please disaggregate the total into the following categories by the source of funding:
a. Costs that SoCalGas has charged, or expects to charge, to energy efficiency (EE) balancing accounts
b. Costs that SoCalGas has charged, or expects to charge, to other ratepayer funding sources
c. Costs that SoCalGas has charged, or expects to charge, to shareholder funding sources
RESPONSE 9:
SoCalGas .SoCalGas understands the term to mean direct costs that are attributed to specific work in statewide energy efficiency Codes & Standards advocacy. Costs such as allocated overheads are therefore excluded. Subject to this objection, and the above understanding, SoCalGas incurred the following costs:
a. Costs that SoCalGas has charged, or expects to charge, to energy efficiency (EE) balancing accounts: SoCalGas has charged or expects to charge approximately $223 to energy efficiency balancing accounts for the work done on statewide EECS during this time period.
b. Costs that SoCalGas has charged, or expects to charge, to other ratepayer funding sources: $0
c. Costs that SoCalGas has charged, or expects to charge, to shareholder funding sources: $0
17 / 322

SOUTHERN CALIFORNIA GAS COMPANY ENERGY EFFICIENCY
TOTAL RESOURCE & PROGRAM ADMINISTRATOR COST (DATA REQUEST ORA-HB-SCG-2018-09)
DATE RECEIVED: JUNE 29, 2018 DATE SUBMITTED: JULY 16, 2018
______________________________________________________________________
10
QUESTION 10:
Please provide the total Company-wide costs that SoCalGas has incurred related to EECS advocacy activities performed on or after June 6, 2018. Please disaggregate the total into the following categories by the source of funding:
a. Costs that SoCalGas has charged, or expects to charge, to energy efficiency (EE) balancing accounts
b. Costs that SoCalGas has charged, or expects to charge, to other ratepayer funding sources
c. Costs that SoCalGas has charged, or expects to charge, to shareholder funding sources
RESPONSE 10:
SoCalGas understands the term to mean direct costs that are attributed to specific work in statewide energy efficiency Codes & Standards advocacy. Costs such as allocated overheads are therefore excluded. Subject to this objection, and the above understanding, SoCalGas incurred the following costs:
a. Costs that SoCalGas has charged, or expects to charge, to energy efficiency (EE) balancing accounts: SoCalGas has charged or expects to charge approximately $5178 to energy efficiency balancing accounts for the work done on statewide EECS during this time period.
b. Costs that SoCalGas has charged, or expects to charge, to other ratepayer funding sources: $0
c. Costs that SoCalGas has charged, or expects to charge, to shareholder funding sources: $0
18 / 322
SOUTHERN CALIFORNIA GAS COMPANY ENERGY EFFICIENCY
TOTAL RESOURCE & PROGRAM ADMINISTRATOR COST (DATA REQUEST ORA-HB-SCG-2018-09)
DATE RECEIVED: JUNE 29, 2018 DATE SUBMITTED: JULY 16, 2018
______________________________________________________________________
11
QUESTION 11:
Of the total from question 9(a), disaggregate these expenses into the following categories:
d. Labor costs
e. Employee expenses
f. with the subtotal of charges for each item listed.
RESPONSE 11:
Subject to the objection identified in the response to question 9, SoCalGas responds as follows:
a. Labor costs: Approximately $98
b. Employee expenses: Approximately $0
c.category, with the subtotal of charges for each item listed.
i. Approximately $125 (Negawatt consulting)
19 / 322

SOUTHERN CALIFORNIA GAS COMPANY ENERGY EFFICIENCY
TOTAL RESOURCE & PROGRAM ADMINISTRATOR COST (DATA REQUEST ORA-HB-SCG-2018-09)
DATE RECEIVED: JUNE 29, 2018 DATE SUBMITTED: JULY 16, 2018
______________________________________________________________________
12
QUESTION 12:
Of the total from question 10(a), disaggregate these expenses into the following categories:
a. Labor costs
b. Employee expenses
c. Other. Please provide a category, with the subtotal of charges for each item listed.
RESPONSE 12:
Subject to the objection identified in the response to question 10, SoCalGas responds as follows:
a. Labor costs: Approximately $516
b. Employee expenses: Approximately $0
c.category, with the subtotal of charges for each item listed.
ii. Approximately $4,662 (Negawatt consulting)
20 / 322

SOUTHERN CALIFORNIA GAS COMPANY ENERGY EFFICIENCY
TOTAL RESOURCE & PROGRAM ADMINISTRATOR COST (DATA REQUEST ORA-HB-SCG-2018-09)
DATE RECEIVED: JUNE 29, 2018 DATE SUBMITTED: JULY 16, 2018
______________________________________________________________________
13
QUESTION 13:
Please provide any and all final or draft work products of EECS advocacy activities performed from June 1, 2018 through June 5, 2018. This should include documents that were written, partially written, revised, finalized, or sent on the days in question. Work products include, but are not limited to:
a. Letters, comments, and testimony submitted to regulatory agencies
b. Letters, talking points, briefings and lobbying documents provided to elected officials, regulatory officials, and the staff to those officials
c. Fliers, articles, and press releases
d. Meetings and phone calls (including requests for meetings or phone calls) with regulatory officials, regulatory agency staff, elected officials, and staff to elected officials. Please provide the date and time of the meeting, names and titles of all people involved, and the subject matter and purpose of the meeting.
RESPONSE 13:
SoCalGas incorporates the preliminary statement. However, SoCalGas is also providing responsive documents relating to federal DOE advocacy. See documents provided concurrently herewith, in Attachment A.
21 / 322

SOUTHERN CALIFORNIA GAS COMPANY ENERGY EFFICIENCY
TOTAL RESOURCE & PROGRAM ADMINISTRATOR COST (DATA REQUEST ORA-HB-SCG-2018-09)
DATE RECEIVED: JUNE 29, 2018 DATE SUBMITTED: JULY 16, 2018
______________________________________________________________________
14
QUESTION 14:
Please provide any and all final or draft work products of EECS advocacy activities performed on or after June 6, 2018. This should include documents that were written, partially written, revised, finalized, or sent on or after June 6, 2018. Work products include, but are not limited to:
a. Letters, comments, and testimony submitted to regulatory agencies
b. Letters, talking points, briefings and lobbying documents provided to elected officials, regulatory officials, and the staff to those officials
c. Fliers, articles, and press releases
d. Meetings and phone calls (including requests for meetings or phone calls) with regulatory officials, regulatory agency staff, elected officials, and staff to elected officials. Please provide the date and time of the meeting, names and titles of all people involved, and the subject matter and purpose of the meeting.
RESPONSE 14:
SoCalGas incorporates the preliminary statement. However, SoCalGas is also providing responsive documents relating to federal DOE advocacy. See documents provided concurrently herewith, in Attachment B.
22 / 322

SOUTHERN CALIFORNIA GAS COMPANY ENERGY EFFICIENCY
TOTAL RESOURCE & PROGRAM ADMINISTRATOR COST (DATA REQUEST ORA-HB-SCG-2018-09)
DATE RECEIVED: JUNE 29, 2018 DATE SUBMITTED: JULY 16, 2018
______________________________________________________________________
15
QUESTION 15:
Please provide any written or electronic correspondence with other investor-owned utilities in California regarding EECS advocacy that was sent or received on or after June 1, 2018.
RESPONSE 15:
SoCalGas incorporates the preliminary statement. However, SoCalGas is also providing responsive documents relating to federal DOE advocacy. See documents provided concurrently herewith, in Attachment C.
23 / 322

SOUTHERN CALIFORNIA GAS COMPANY ENERGY EFFICIENCY
TOTAL RESOURCE & PROGRAM ADMINISTRATOR COST (DATA REQUEST ORA-HB-SCG-2018-09)
DATE RECEIVED: JUNE 29, 2018 DATE SUBMITTED: JULY 16, 2018
______________________________________________________________________
16
QUESTION 16:
Please provide information about any phone conversations or in-person meetings with other investor-owned utilities in California that were related to EECS advocacy, and occurred on or after June 1, 2018.
a. Date and time
b. Name and title of all people involved
c. Subject matter and purpose of the meeting
RESPONSE 16:
SoCalGas incorporates the preliminary statement. However, SoCalGas is also providing responsive documents relating to federal DOE advocacy. See documents provided concurrently herewith, in Attachment D.
24 / 322

25 / 322

26 / 322

27 / 322

Summary of Residential Dishwashers-Petition for Rulemaking- Comment Letter to DOE
Topic: Residential Dishwashers- Petition Rulemaking Milestone Date Petition 3/2018 NOPR Final Rule Potential Effective Date * Italics indicate anticipated dates. Comment Letter Approval Deadline
June 22, 2018
Rulemaking Summary A petition was submitted by the Competitive Enterprise Institute (CEI) to DOE to initiate a rulemaking to create a new product class for residential dishwashers with a cycle time of less than an hour (from washing through drying). According to Consumer Reports, the average cycle time of currently available residential dishwashers is 2 hours and 20 minutes. CEI cites the increasing run times of dishwashers as well as customer dissatisfaction with these increased runtimes from GE Appliances, Consumer Affairs, Consumer Reports, and the AHAM. The petition claims residential dishwashers with a shorter time cycle offer a ‘performance-related feature’ and ‘additional customer choice’ that provides substantial consumer utility, which justifies a different (higher or lower) standard than other residential dishwashers.
Portfolio Impacts There are no California IOUs with residential dishwasher rebate programs.
Impact on Voluntary Programs: 2016 Programs Future Programs No Impact
Estimated First-Year Savings Likely a loss of savings from creation of new product class.
Involvement by Product Development TBD
Advocate Comment Letters ASAP, NRDC, NEEA, ASE, Earth Justice and ACEEE are likely to develop comment letters that likely aligns with many of the recommendations noted here. Stakeholder Allies 1. Perhaps some manufacturers 2. Efficiency advocates
Industry Opponents 3. Competitive Enterprise Institute 4. Perhaps some manufacturers 5. AHAM (unknown, but likely)
Summary IOU Recommendations to DOE The CA IOUs recommend DOE reject the petition for the following reasons: 1. The petition to create a new product class with
a likely weaker standard violates the anti-backsliding provision.
2. The petition sets a dangerous precedent to define a product class based on customer preferences, such as cycle time, which has never been used to define a product class for any product.
3. There are at numerous products on the market with multiple consumer selected cycles, including the option to run shorter cycles, so it is unclear why a separate product class is needed.
4. There is evidence that not all efficiency gains come at the expense of cycle time. The largest increase of cycle times (35 minutes) came between 1995 and 2009 when there were no DOE standard updates.
5. The average cycles/year and load shape information for dishwashers implies that consumers don’t perform more than one cycle per day, so cycle time should be less of a concern.
6. The petition has not provided sufficient data to show that one-hour cycle times are even technically feasible as even before standards, average cycle times were greater than 70 minutes in 1983 according to consumer reports.
View the Comment Letter Tracker for the list of upcoming comment letter deadlines: http://confluence.energy-solution.net/x/cQDY
28 / 322

29 / 322

30 / 322

MEMORANDUM
2
Title 20 Staff, California Energy Commission (CEC)
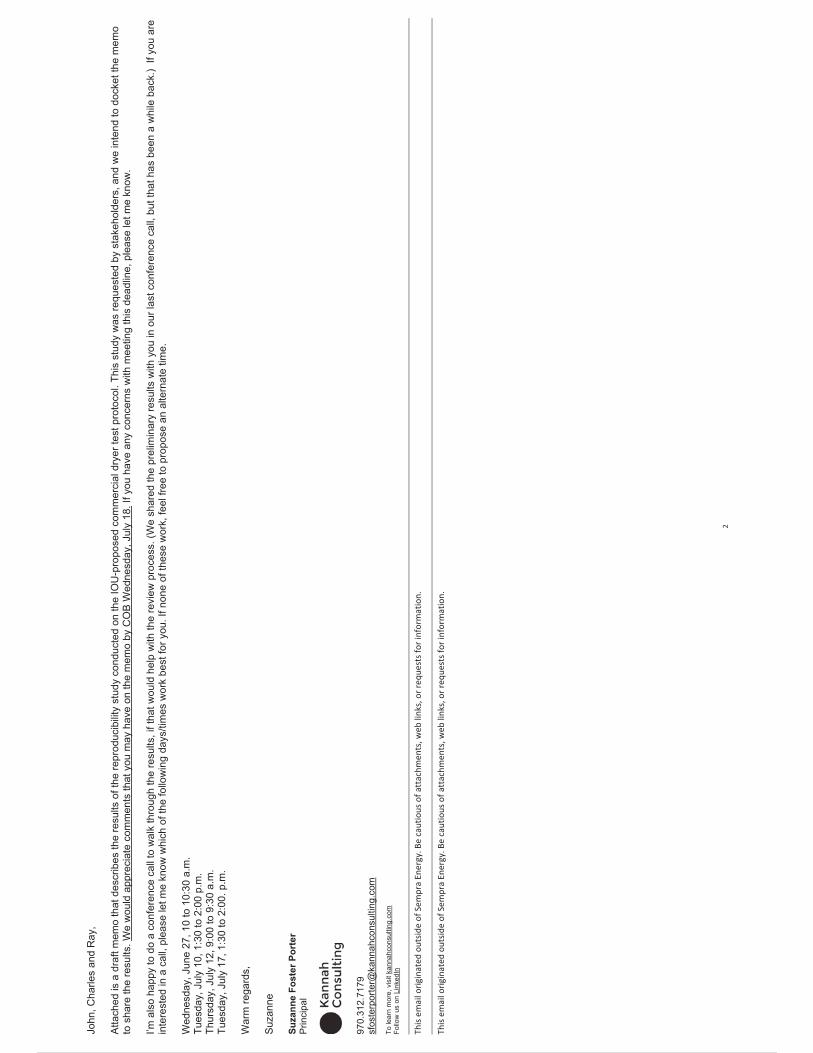
FROM: Suzanne Foster Porter, Kannah Consulting, on behalf of California IOUs
CC: Ed Jerome and Mary Anderson, Pacific Gas and Electric Company; John Barbour, San Diego Gas & Electric Company; Ray Mendoza, Southern California Gas Company; and Charles Kim, Southern California Edison
DATE: DRAFT
SUBJECT: Reproducibility results for the commercial tumble dryer test protocol
Summary
The Investor-Owned Utility (IOU) Codes and Standards Enhancement (CASE) team recently completed an evaluation of the reproducibility of the commercial tumble dryer test protocol to understand the variation of the protocol when subjected to the same dryer at two different labs. This memo contains the methodology, results and conclusions of this testing.
The testing revealed that the average energy factors of one 7.4 cubic-foot dryer as measured by the CASE Team lab and the independent test lab were 5.3 percent different from one another. This result, which is similar to the reproducibility of the U.S. Department of Energy (DOE) residential dryer test procedure, demonstrates that the parameters in the test procedure are effective and that the commercial dryer test procedure is suitable for adoption by the CEC.
Introduction
In late 2017, the CASE team undertook a study to evaluate the reproducibility of the commercial tumble dryer test protocol. Previous studies demonstrated the test protocol was highly repeatable, meaning that the same test on the same dryer provided highly similar results when tested at the same facility (95 percent confidence interval of the repeatability was empirically determined to be between 1 and 2 percent)1. The reproducibility study reported on herein focuses on understanding the variation seen under the test protocol when one dryer was tested under the commercial dryer protocol at two different laboratories.
1 Foster Porter, S., Denkenberger, D. & Jerome, E. (2017, September 1). Commerical tumble dryers, Codes and Standards Enhancement (CASE) initiative for PY 2017: Title 20 standards development, response to draft staff proposal and stakeholder comment (p. 5). Retrieved from http://docketpublic.energy.ca.gov/PublicDocuments/17-AAER-01/TN220988_20170901T081006_Suzanne_Foster_Porter_on_behalf_of_the_California_IOU_CASE_Team.pdf
31 / 322

MEMORANDUM
3
Method
First, the CASE team tested a new 7.4 cubic-foot residential platform commercial dryer in late 2017 using version 2.6 of the test protocol.2 Of note, the CASE team selected this relatively small natural gas commercial dryer specifically because it represented a challenging unit for reproducibility evaluation, as the protocol was principally developed through extensive testing of larger commercial tumblers. This dryer has a smaller capacity and a lower burner output compared to other dryers used to develop the protocol (1/3 horsepower motor; approximately 180 cubic feet per minute airflow, 22,000 BTU per hour; 7.4 cubic foot capacity).
Next, an independent lab tested that exact same dryer under the version 2.6 protocol. The CASE team provided no supplies or equipment to the independent lab other than the dryer under test. The independent lab conducted a full test sequence (Runs A through E) of this dryer two times, as the first test series was inconclusive as to whether the ambient temperature was within the tolerances specified in the test procedure.
After the second test sequence, the CASE team and the independent lab researchers discussed the results, including ideas for improvement to the test protocol and areas where error may have been, or could potentially be, inadvertently introduced. A total of six specific improvements were identified. Of these, four could be incorporated into the final results without compromising the reproducibility study and thus were utilized to better refine calcuationscalculations. The other two suggested improvements are provided at the end of the Results section, but have no direct impact on calculations for this study.
Results
The CASE team and the independent lab identified six opportunities to improve version 2.6 of the test protocol for this study. The following four adjustments are reflected in the results of this study:
1. Instructions given in Section 7.2 for setting up each dryer run is unclear as to how to test dryers with vended controls. For the purposes of this test, the independent lab was instructed by the CASE team to use the manufacturer-supplied instruction manual for direct timer programming, enabling the independent test lab to follow Section 7.2 of the protocol.
2. The remaining moisture content (RMC) adjustment (Section 8.1.2) was changed to be relative to load size instead of being an absolute value based on a full-sized load. This improved the accuracy of the methodology for correcting Run D, which has a partial load size.
3. A typographical error was discovered in Section 5.4.8 that gives tolerances on pressure measurements. The maximum allowed error in the gas supply pressure sensor was corrected to 0.014 psig (0.40 inches of water).
2 Foster Porter, S. et al. Energy Efficiency Test Procedure for Commercial Tumble Dryers, Version 2.6. 29 June 2017. Available at http://docketpublic.energy.ca.gov/PublicDocuments/17-AAER-01/TN219983_20170630T090536_Suzanne_Foster_Porter_Comments_Commercial_Dryer_Test_Protocol_v.pdf
32 / 322

MEMORANDUM
4
4. Water conductivity was not recorded for the dryer runs because this control was not currently within the capability of the independent laboratory. Given that this dryer does not employ an automatic termination sensor that is based on the electrical conductivity of the water, the CASE team and the independent lab researchers concluded this will not impact the results. Furthermore, this also indicates that requiring water conductivity measurement only in the case of automatic termination functionality is as a way to reduce burden (Section 5.5.6).
The energy factors of Run AB, C, D, and E as well as the average of those values are shown in Figure 1. The average energy factor of the CASE Team test values and the independent laboratory tests differed by 5.3 percent.
Figure 1. Comparison of CASE team and independent lab results
The results of the CASE team reproducibility study are comparable to a 2013 U.S. Department of Energy (DOE) reproducibility study of the residential dryer protocol.3 This study evaluated the reproducibility of two different test loads under the DOE automatic termination test (Appendix D2). When nine dryers were tested with DOE test cloths at two independent labs, the variation ranged from 0.3 to 10.8 percent (average variation: 3.0 percent). Eight dryers tested under that same protocol at two facilities with International Electrotechnical Commission (IEC) test cloths revealed 0.0 to 9.8 percent variation in energy factor with an average of 4.7 percent.
3 US DOE energy conservation program: Test procedures for residential clothes dryers, proposed rule. Volume 78, No. 1. Fed Reg. (2 Jan 2013).
+6%
+6 % + 6 %
+1%
+5%
33 / 322

MEMORANDUM
5
As noted previously, the CASE Team and the independent test lab researchers identified two other opportunities to improve the test protocol. These changes were not incorporated into this study; consequently, folding them into protocol may further improve the reproducibility of the test protocol.
1. Ambient temperature measurement probe location may need adjustment. The independent test lab indicated some difficulty with controlling the ambient temperature measurement near the dryer, as specified in Section 5.2.1. Ensuring adequate shielding from thermal radiation may be difficult to confirm and could impact reproducibility from lab to lab. Furthermore, temperature control of the room near, but not next to the dryer is easier to achieve.
2. The use of an extractor in the test cloth preparation instructions needs to be addressed.Although detailed times are given for transfer times between the washer and the dryer in Section 5.7 of the protocol, the transfer time from washer to extractor is not given in the protocol.
The CASE team plans to develop specific changes to the test protocol to address these issues.
Conclusion
The CASE team reproducibility study found that variation between testing of a 7.4 cubic-foot residential-platform dryer at two different labs was 5.3 percent. This is a good result in the context of similar reproducibility findings of residential dryer test protocols published by DOE, with results ranging from zero percent to nearly 11 percent. The test procedure effectively controls variables in commercial tumble dryer testing and is suitable for adoption by the CEC.
Furthermore, the study also identified these specific opportunities to improve the protocol, including:
revising dryer test setup instructions (Section 7.2) adjusting the RMC calculation correction (Section 8.1.2) correcting a typographical error related to gas supply pressure sensors (Section 5.4.8) revising the control on the electrical conductivity of the water used to prepare test cloths
(Section 5.5.6) reviewing the location of the ambient temperature probe location (Section 5.2.1), and revising test cloth instructions to acknowledge and specify use of an extractor (Section
5.7).
The latter two changes may further improve the repeatability of the protocol beyond the results reported herein.
34 / 322

35 / 322

Ray
Men
doza
36 / 322
37 / 322

38 / 322

Summary of Test Procedures for Cooking Products – Petition for Rulemaking – Comment Letter to DOE
Topic: Test Procedures for Cooking Products Petition Rulemaking Milestone Date Petition 03/2018 NOPR TBD Final Rule TBD Potential Effective Date TBD * Italics indicate anticipated dates. Comment Letter Approval Deadline
June 25, 2018
Rulemaking Summary A petition was submitted by the Association of Home Appliance Manufacturers (AHAM) to withdraw and immediately stay the effectiveness of the conventional cooking top test procedure. The DOE test procedure final rule incorporates by reference sections from a European standard. The DOE extends the test procedure from electric cooktops to gas cooktops as well. AHAM’s petition claims that DOE did not demonstrate that the test procedure is representative or accurate for gas products, the test procedure has high variability and is not repeatable or reproducible, the test procedure is burdensome to conduct, and that the final rule is not supported by adequate data.
Portfolio Impacts There are no California IOUs with residential conventional cooking top rebate programs.
Impact on Voluntary Programs: 2016 Programs Future Programs No Impact Estimated First-Year Savings There are no savings directly related to this test procedure.
Involvement by Product Development TBD
Advocate Comment Letters ASAP is expected to develop an advocate comment letter that likely aligns with many of the recommendations noted here
Stakeholder Allies 1. Efficiency Advocates
Industry Opponents 1. AHAM 2. Individual manufacturers
Summary IOU Recommendations to DOE 1. DOE conducted a long and rigorous rulemaking with multiple SNOPRs and many opportunities for comment. In our opinion, DOE addressed all comments appropriately, including some of the issues highlighted in this petition. 2. DOE conducted testing and considered testing data from stakeholders during the test procedure rulemaking. We believe this testing was adequate and support DOE’s Final Rule. 3. There is no evidence to suggest consumers use gas cooking tops and electric cooking tops differently. Products with the same utility should be tested the same to demonstrate their performance under the same test conditions.
4. AHAM’s round robin testing used a slightly different test procedure with some variation from the DOE test procedure; therefore AHAM’s results are not conclusive.
5. There is currently not a performance based efficiency standard for cooking tops (though there is a rulemaking), so there is no need to stay the effectiveness of the updated test procedure at this time. 6. A test procedure for electric and gas products is needed for customer transparency of efficiency information.
View the Comment Letter Tracker for the list of upcoming comment letter deadlines: http://confluence.energy-solution.net/x/cQDY
39 / 322

40 / 322

41 / 322

42 / 322

43 / 322

44 / 322

45 / 322

46 / 322

1 | Statewide IOU CASE Report: Hearth Products|April 12June 7, 2018
47 / 322

2 | Statewide IOU CASE Report: Hearth Products|April 12June 7, 2018
Hearth Products
Prepared by: Cassidee Kido, Bijit Kundu, and Leslie Nelson, ENERGY SOLUTIONS
Prepared for:
PACIFIC GAS &
ELECTRIC COMPANY SOUTHERN
CALIFORNIA EDISON SAN DIEGO GAS AND
ELECTRIC SoCalGas®
This report was prepared by the California Statewide Investor-Owned Utilities Codes and Standards Program and funded by the California utility customers under the auspices of the California Public Utilities Commission. Copyright 2017 Pacific Gas and Electric Company, Southern California Edison, Southern California Gas Company, and San Diego Gas & Electric. All rights reserved, except that this document may be used, copied, and distributed without modification. Neither PG&E, SCE, SoCalGas and SDG&E nor any of its employees makes any warranty, express of implied; or assumes any legal liability or responsibility for the accuracy, completeness or usefulness of any data, information, method, product, policy or process disclosed in this document; or represents that its use will not infringe any privately-owned rights including, but not limited to, patents, trademarks or copyrights.
Analysis of Standards Proposal for Hearth Products 18-AAER-06
Codes and Standards Enhancement (CASE) Initiative For PY 2017: Title 20 Standards Development
June 11, 2018
48 / 322

3 | Statewide IOU CASE Report: Hearth Products|April 12June 7, 2018
TABLE OF CONTENTS
2.1 PRODUCT DEFINITIONS ..................................................................................................................... 62.1.1 Fireplaces ............................................................................................................................... 62.1.2 Inserts ..................................................................................................................................... 82.1.3 Stoves ...................................................................................................................................... 92.1.4 Gas Log Sets ......................................................................................................................... 102.1.5 Outdoor Hearth Products ..................................................................................................... 10
2.2 SCOPE ............................................................................................................................................. 112.3 APPLICATIONS ................................................................................................................................ 112.4 PRODUCT DESIGN ........................................................................................................................... 12
2.4.1 Ignition systems .................................................................................................................... 12
4.1 PROPOSAL DESCRIPTION ................................................................................................................. 134.1.1 Design Standard ................................................................................................................... 134.1.2 Operating Efficiency: Test-and-List ..................................................................................... 14
4.2 PROPOSAL HISTORY ........................................................................................................................ 144.3 PROPOSED CHANGES TO THE TITLE 20 CODE LANGUAGE ............................................................... 15
4.3.1 Proposed Definitions ............................................................................................................ 154.3.2 Proposed Test Procedure ..................................................................................................... 164.3.3 Proposed Standard ............................................................................................................... 164.3.4 Proposed Reporting Requirements ....................................................................................... 16
5.1 SCOPE/FRAMEWORK ....................................................................................................................... 175.2 PRODUCT EFFICIENCY OPPORTUNITIES ........................................................................................... 185.3 TECHNICAL FEASIBILITY ................................................................................................................. 185.4 STATEWIDE ENERGY SAVINGS ........................................................................................................ 19
5.4.1 Per-Unit Energy Savings Methodology ................................................................................ 195.4.2 Summary of Per-Unit Energy Use Impacts ........................................................................... 205.4.3 Stock ..................................................................................................................................... 225.4.4 Shipments .............................................................................................................................. 225.4.5 Current and Future Shipments ............................................................................................. 235.4.6 Statewide Energy Use – Non-Standards and Standards Case .............................................. 235.4.7 Statewide Energy Savings - Methodology............................................................................. 28
5.5 COST-EFFECTIVENESS ..................................................................................................................... 285.5.1 Incremental Cost ................................................................................................................... 285.5.2 Design Life ............................................................................................................................ 295.5.3 Lifecycle Cost / Net Benefit ................................................................................................... 29
5.6 ENVIRONMENTAL IMPACTS/BENEFITS ............................................................................................ 295.6.1 Greenhouse Gases ................................................................................................................ 295.6.2 Indoor or Outdoor Air Quality ............................................................................................. 305.6.3 Hazardous Materials ............................................................................................................ 30
5.7 IMPACT ON CALIFORNIA’S ECONOMY ............................................................................................. 305.8 CONSUMER UTILITY/ACCEPTANCE ................................................................................................. 315.9 MANUFACTURER STRUCTURE AND SUPPLY CHAIN TIMELINES ....................................................... 315.10 STAKEHOLDER POSITIONS............................................................................................................... 315.11 OTHER REGULATORY CONSIDERATIONS ......................................................................................... 31
5.11.1 Federal Regulatory Background ...................................................................................... 31
49 / 322

4 | Statewide IOU CASE Report: Hearth Products|April 12June 7, 2018
5.11.2 California Regulatory Background .................................................................................. 325.11.3 Utility and Other Incentive Programs.............................................................................. 325.11.4 Model Codes and Voluntary Standards ........................................................................... 325.11.5 Compliance ...................................................................................................................... 33
50 / 322

5 | Statewide IOU CASE Report: Hearth Products|April 12June 7, 2018
LIST OF FIGURES Figure 1: Example of masonry fireplace. ....................................................................................................... 7Figure 2: Example of factory-built fireplace. ................................................................................................. 8Figure 3: Example of gas insert. ..................................................................................................................... 9Figure 4: Example of vented gas stove. .......................................................................................................... 9Figure 5: Example of gas log set. ................................................................................................................. 10Figure 6: Examples of different outdoor hearth products: patio heater (left) and fire table/pit (right). ........ 11 LIST OF TABLES Table 1: Summary of Proposal ..................................................................................................................... 12Table 2: Hearth Products Offered in California ............................................................................................ 19Table 3: 2018 Breakdown of Standing Pilot Lights vs. Intermittent Pilot Lights for Hearth Products in California ...................................................................................................................................................... 19Table 4: Sources Used for Per-Unit Energy Savings Methodology ............................................................. 20Table 5: Annual Per-Unit Energy Use for Non-Qualifying Products ........................................................... 21Table 6: Annual Per-Unit Energy Use for Qualifying Products ................................................................... 21Table 7: Annual Per-Unit Energy Savings ................................................................................................... 21Table 8: Hearth Products Stock in California: 2019-2033 ............................................................................ 22Table 9: Hearth Product Shipments in California: 2019 - 2033 ................................................................... 23Table 10: California Shipments and Stock ................................................................................................... 23Table 11: California Statewide Energy Use by Fuel Type - Non-Standards Case (After Effective Date) ... 24Table 12: California Statewide Energy Use – Non-Standards Case (After Effective Date) ......................... 25Table 13: California Statewide Energy Use by Fuel Type – Standards Case (After Effective Date) ........... 25Table 14: California Statewide Energy Use – Standards Case (After Effective Date) ................................. 26Table 15: California Statewide Energy Savings by Fuel Type– Standards Case (After Effective Date) ..... 27Table 16: California Statewide Energy Savings – Standards Case (After Effective Date) ........................... 27Table 17: Incremental Product Costs ............................................................................................................ 29Table 18: Costs and Net Benefits Per-Unit for Qualifying Products ............................................................ 29Table 19: Greenhouse Gas Savings 2019 - 2033 .......................................................................................... 30Table 20: Statewide Total Lifecycle Costs and Benefits for Standards Casea .............................................. 31Table 21: Statewide Sales Weighted Average Residential Natural Gas Rates 2018-2033 (PG&E, SCG, and SDG&E - Three Largest California Natural Gas Utilities) in 2018 $/therm including a 3% discount rate. . 38Table 22: Statewide Residential Electricity Rates 2018 – 2033 (PG&E, SCE, SDG&E, LADWP and SMUD - 5 Largest California Electric Utilities) in 2018 cents/kWh including a 3% discount rate. ............ 39Table 23: 2013 Electricity Consumption and Peak Demand for the Top Five Largest California Electric Utilitiesa ........................................................................................................................................................ 40
51 / 322

6 | Statewide IOU CASE Report: Hearth Products|April 12June 7, 2018
1. Purpose The Codes and Standards Enhancement (CASE) initiative presents recommendations to support California Energy Commission’s (Energy Commission) efforts to update California’s Appliance Efficiency Regulations (Title 20) to include new requirements or to upgrade existing requirements for various technologies. The four California Investor-Owned Utilities (IOUs) – Pacific Gas and Electric Company (PG&E), San Diego Gas and Electric (SDG&E), Southern California Edison (SCE), and SoCalGas® – sponsored this effort (herein referred to as the Statewide CASE Team). The program goal is to prepare and submit proposals that will result in cost-effective enhancements to improve the energy and water efficiency of various products sold in California. This report and the code change proposal presented herein is a part of the effort to develop technical and cost-effectiveness information for potential appliance standards. This CASE Report covers a design standard proposal as well as a testing and reporting requirement for residential hearth products.
In February 2015, the United States (U.S.) Department of Energy (DOE) released a Notice of Proposed Rulemaking (NOPR) on energy conservation standards for hearth products (U.S. DOE 2015c). However, the rulemaking was never finalized and was ultimately withdrawn by U.S. DOE in March 2017.
2. Product/Technology Description
2.1 Product Definitions U.S. DOE defines a hearth product as “a gas-fired appliance that simulates a solid-fueled fireplace or presents a flame pattern (for aesthetics or other purpose) and that may provide space heating directly to the space in which it is installed.” The Statewide CASE Team proposes using this same definition for hearth product coverage in California (U.S. DOE 2015d). Hearth products provide consumers with decoration, heating, lighting, or a combination of functions (U.S. DOE 2015d).
The product categories used in this analysis, as determined by U.S. DOE, are: vented fireplaces, inserts, and stoves; unvented fireplaces, inserts, and stoves; vented gas log sets; unvented gas log sets; and outdoor products. Each product is further described below. Overall, the Statewide CASE Team proposes the same product definitions as used in the U.S. DOE NOPR.
2.1.1 Fireplaces Fireplaces are structures made of fireproof material which are designed to hold a fire; they are often built in conjunction with a chimney or other type of flue to allow smoke and combustion gases to vent to the outside. Fireplaces can be installed during new home construction or as part of a renovation and are installed into the housing envelope or against a wall (NRCan 2015a). Traditional masonry fireplaces are made from brick, stone, or tile and are constructed by builders such that they connect directly to the flue and chimney in the home (Napoleon Fireplaces 2015). An example of a masonry fireplace is shown in Figure 1.
52 / 322

7 | Statewide IOU CASE Report: Hearth Products|April 12June 7, 2018
Figure 1: Example of masonry fireplace.
Source: Merlin Goble Masonry, Inc. 2017.
Fireplaces may be vented or unvented. A vented fireplace has a flue or chimney to channel the exhaust of the fire outside the room, while an unvented fireplace does not have a vent to expel the fumes from the room in which the fireplace is installed (NRCan 2015a; Houselogic 2018). Unvented fireplaces generally provide better space heating because the heated flue gas is not lost to the outside area. However, unvented fireplaces are prohibited in California through the Health and Safety Code (CA HSC 1998). These unvented products are banned because they vent unburned combustion products directly into the home. While unvented products are usually designed to include an oxygen depletion sensor which automatically shuts off the main burner if oxygen levels are depleted to a certain level, the potential release of harmful gases, including carbon monoxide, has led California to continue to implement this ban since 1970 (The Bulletin 2015).
Factory-built fireplace
Factory-built fireplaces (also referred to as prefabricated fireplaces) are flame-holding boxes, often made of metal, that resemble gas inserts (explained below in Section 2.1.2) but are entirely manufactured in a factory with an attached chimney or flue prior to being framed into a house’s building envelope. Made of non-combustible materials and designed to be installed inches away from combustible materials, factory built fireplaces require no masonry work (Napoleon Fireplaces 2015). Because these units include the fireplace housing, firebox, and chimney, factory-built fireplaces are often less expensive than masonry fireplaces. An example of a factory-built fireplace is shown in Figure 2.
53 / 322
8 | Statewide IOU CASE Report: Hearth Products|April 12June 7, 2018
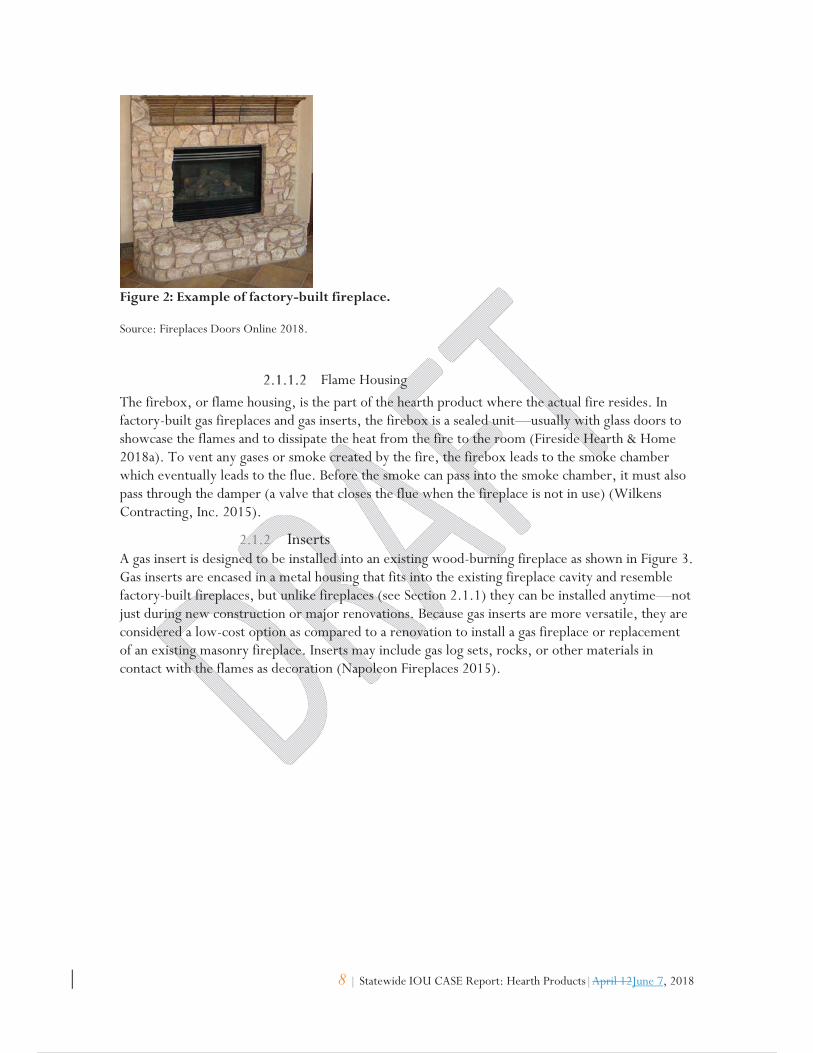
Figure 2: Example of factory-built fireplace.
Source: Fireplaces Doors Online 2018.
Flame Housing
The firebox, or flame housing, is the part of the hearth product where the actual fire resides. In factory-built gas fireplaces and gas inserts, the firebox is a sealed unit—usually with glass doors to showcase the flames and to dissipate the heat from the fire to the room (Fireside Hearth & Home 2018a). To vent any gases or smoke created by the fire, the firebox leads to the smoke chamber which eventually leads to the flue. Before the smoke can pass into the smoke chamber, it must also pass through the damper (a valve that closes the flue when the fireplace is not in use) (Wilkens Contracting, Inc. 2015).
2.1.2 Inserts A gas insert is designed to be installed into an existing wood-burning fireplace as shown in Figure 3. Gas inserts are encased in a metal housing that fits into the existing fireplace cavity and resemble factory-built fireplaces, but unlike fireplaces (see Section 2.1.1) they can be installed anytime—not just during new construction or major renovations. Because gas inserts are more versatile, they are considered a low-cost option as compared to a renovation to install a gas fireplace or replacement of an existing masonry fireplace. Inserts may include gas log sets, rocks, or other materials in contact with the flames as decoration (Napoleon Fireplaces 2015).
54 / 322
9 | Statewide IOU CASE Report: Hearth Products|April 12June 7, 2018
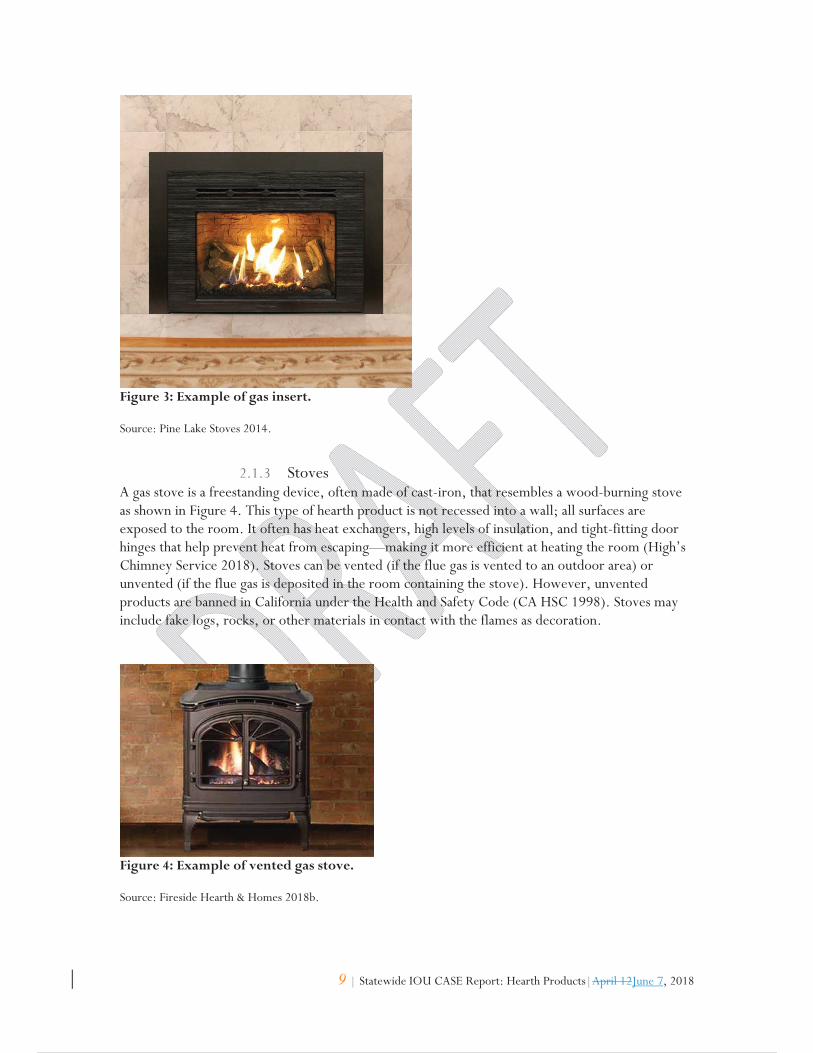
Figure 3: Example of gas insert.
Source: Pine Lake Stoves 2014.
2.1.3 Stoves A gas stove is a freestanding device, often made of cast-iron, that resembles a wood-burning stove as shown in Figure 4. This type of hearth product is not recessed into a wall; all surfaces are exposed to the room. It often has heat exchangers, high levels of insulation, and tight-fitting door hinges that help prevent heat from escaping—making it more efficient at heating the room (High’s Chimney Service 2018). Stoves can be vented (if the flue gas is vented to an outdoor area) or unvented (if the flue gas is deposited in the room containing the stove). However, unvented products are banned in California under the Health and Safety Code (CA HSC 1998). Stoves may include fake logs, rocks, or other materials in contact with the flames as decoration.
Figure 4: Example of vented gas stove.
Source: Fireside Hearth & Homes 2018b.
55 / 322

10 | Statewide IOU CASE Report: Hearth Products|April 12June 7, 2018
2.1.4 Gas Log Sets Gas log sets are “logs” made from ceramic, refractory cement, or other material that can withstand high heat as shown in Figure 5 (Woodland Direct 2018). In addition to imitation logs, units often include a burner and a grate (U.S. DOE 2015d). Gas log sets are often installed into masonry fireplaces to convert a naturally wood burning fireplace to gas burning (Nordic Stove & Fireplace Center 2013). Gas logs sets can be vented or unvented. Vented sets must be installed in a fireplace that has a chimney or other vent to dispose of the fire fumes. These gas log sets are known to have larger flame patterns, but produce less heat because much of the heat is vented out. Unvented gas log sets do not vent out the heat from the fire, and are therefore considered to be better for heating (Fleet Plummer 2014). However, unvented products are banned in California under the Health and Safety Code (CA HSC 1998).
Figure 5: Example of gas log set.
Source: The Fireplace Shop & Grill Center 2018.
2.1.5 Outdoor Hearth Products Outdoor hearth products are very similar to the indoor hearth product categories mentioned but are designed with materials specifically for installation and use outdoors (U.S. DOE 2015d). They may take the form of a fireplace, insert, fire pit, patio heater, or other design. Two examples of outdoor products are shown in Figure 6. Outdoor products do not have a vented or unvented distinction because their outdoor installation inherently means any combustion byproducts are released outdoors. The units can be free standing or permanently installed into a structure of stone, brick, or other material. Similar to indoor hearth products, outdoor hearth products can serve a variety of purposes including heating, decoration, lighting, or some combination of the three.
56 / 322

11 | Statewide IOU CASE Report: Hearth Products|April 12June 7, 2018
Figure 6: Examples of different outdoor hearth products: patio heater (left) and fire table/pit (right).
Source: Schwank Innovative Heating Solutions 2018 (left). Star Fire Direct 2018 (right).
2.2 Scope The Statewide CASE Team proposes the same scope of coverage as defined in the U.S. DOE NOPR. A proposed Title 20 Standard should include coverage for the following product categories:
Vented fireplaces, inserts, and stoves;
Unvented fireplaces, inserts, and stoves;
Vented gas logs;
Unvented gas logs; and
Outdoor products.
Unvented, indoor heaters of any kind are banned in California under the California Health and Safety Code, and therefore the Statewide CASE Team assumes there are no savings associated with these products. For clarity and to ensure full compliance, the Statewide CASE Team is still proposing to include these products in Title 20 to explicitly state that they are banned for sale by existing code (CA HSC 1998).
2.3 Applications Both indoor and outdoor hearth products are designed for use in residential and commercial applications. Fireplaces, inserts, and stoves are usually used indoors, while hearth products used outdoors may include fire pits, patio heaters, and fireplaces.
57 / 322

12 | Statewide IOU CASE Report: Hearth Products|April 12June 7, 2018
2.4 Product Design
2.4.1 Ignition systems This section describes the different ignition systems available for use in hearth products.
Standing Pilot
Standing pilot lights (also known as continuous pilot lights) are pilot lights that, once operating, remain lit until manually interrupted (NRCan 2017b). They are designed such that a gas line terminates to a small burner, whose flame lights a thermocouple. A thermocouple is a device that can generate electricity directly from heat. The end of the thermocouple that produces electricity is connected to a valve in the gas line. When the pilot light goes out, the lack of electricity from the thermocouple closes the gas valve to prevent gas leakage into a home (Professional Heating & Air 2014).
Intermittent Pilot
Intermittent pilot ignitions (IPI), also known as electronic ignitions, are systems that require a switch, remote control, or toggle of some sort to start when the product is off (My Gas Fireplace Repair 2017). They remain ignited only while the main burner is in operation and are automatically extinguished when the main burner is off (NRCan 2017b). Intermittent pilots involve both a spark ignition component and a sensor. When the sensor receives a signal that heat is needed, an electric solenoid valve opens to release gas to the pilot while the spark ignition component sparks to light the gas. As soon as the gas is lit, another electric solenoid opens to allow gas from the main burner to flow (Ward Burner Systems 2004).
On-Demand Pilot
On-demand pilots are designed such that once operating, they remain ignited for a specific period of time after operation of the main burner. They automatically shut off after a specified period of time when no operation of the main burner has occurred (NRCan 2017b).
3. Standards Proposal Overview The Statewide CASE Team proposes a design standard for hearth products which bans the use of standing pilot lights, as well as a test-and-list proposal to collect further information on the energy consumption of hearth products. The Statewide CASE Team’s analysis shows this proposed standard will result in significant natural gas savings and will be cost-effective. Additionally, the standard will have significant environmental benefits by reducing the carbon dioxide released as a result of using hearth products.
Table 1: Summary of Proposal
Topic Description
Description of Standards Proposal
The Statewide CASE Team proposes a design standard which bans standing pilot lights in all hearth products. Additionally, the Statewide CASE Team proposes that hearth products test and report to the CAN/CSA-P.4.1-15 test procedure for test-and-list purposes.
Technical Feasibility
Over 50 percent of the market already complies with the standard and all product categories have a comparable option that incorporates an intermittent pilot light.
58 / 322

13 | Statewide IOU CASE Report: Hearth Products|April 12June 7, 2018
Energy Savings and Demand Reduction
Eliminating standing pilot lights will yield first-year statewide savings of 99,041x MMBtu/year in savings after stock turnover in 2033. Preliminary calculations for a performance standard estimate that this would yield additional first-year statewide savings stock turnover statewide savings would be between 0.01y and 0.15z MMBtu/year (a and b million therms per year).
Environmental Impacts and Benefits
This proposal will yield first-year statewide savings of 5,588x metric tons of carbon dioxide equivalent (MTCO2e) per year and a total of 81,480y MTCO2e after stock turnover in 2033. These figures are based on the projected carbon intensity of the California electricity supply over the coming years (see Section 5.6.1). This does not account for an eventual operating efficiency standard.
Economic Analysis This proposal will lead to significant cost savings for consumers with $14.8 million in first-year savings and over $186 million net present value (NPV) after stock turnover in 2033. Additionally, on a shipment weighted basis, there is a lifecycle benefit-to-cost (B/C) ratio of 9.2. These figures do not account for an eventual operating efficiency standard.
Consumer Acceptance
There are currently no Title 20 Standards in place for hearth products. However, there is already a ban on standing pilot lights for hearth manufacturers under Title 24, Part 6 for low-rise residential new construction, additions, and alterations. Thus, manufacturers and installers should be familiar with compliance to regulations regarding standing pilot bans.
Other Regulatory Considerations
The U.S. DOE withdrew their federal rulemaking on hearth products in March 2017, effectively removing any federal preemption concerns. Additionally, Title 24, Part 6 bans standing pilot lights for hearth products in low-rise residential new construction, additions, and alterations only. This proposal will cover all products not already covered in Title 24. Unvented hearth products are banned by the Health and Safety Code but are covered here to highlight their ban in existing code (CA HSC 1998). Energy savings from unvented products are not included in this analysis.
4. Proposed Standards and Recommendations
4.1 Proposal Description
4.1.1 Design Standard The Statewide CASE Team recommends the Energy Commission adopt a design standard to prohibit the use of standing pilot lights in hearth products, which is equivalent to efficiency level (EL) 1 in the U.S. DOE analysis presented in the NOPR. The Statewide CASE Team also proposes to prohibit controls that provide any means of operating the product with a continuous pilot, either as a default or as an option.
Standing pilot lights have been banned from numerous other appliances in California (including fan-type central furnaces, household cooking appliances,1 pool heaters, and spa heaters) due to their high standby mode energy consumption (CEC 2014). Standing pilot lights are also banned in
1 Excludes appliances without an electrical supply voltage connection and those in which each pilot consumes less than 150 Btu (British thermal units)/hour.
59 / 322

14 | Statewide IOU CASE Report: Hearth Products|April 12June 7, 2018
fireplaces, decorative gas appliances, and gas logs included in new construction, additions, and alterations of low-rise residential buildings under Title 24, Part 6, which has been factored into this analysis (CEC 2015). Expanding the standing pilot ban to all hearth products will result in significant natural gas savings once the standard goes into effect. The details regarding the potential savings are outlined in Section 5.4.6.
4.1.2 Operating Efficiency: Test-and-List In order to collect information on the energy consumption of hearth products, the Statewide CASE Team recommends a test-and-list requirement for the operating efficiency of hearth products. Since there is currently no U.S. DOE test procedure for hearth products, the Statewide CASE Team recommends referencing the CAN/CSA-P.4.1-15 test procedure from the Canadian Standards Association (CSA) Group for a test-and-list requirement (CSA 2015). The CSA Standard applies to vented gas fireplaces,2 as well as vented gas fireplace heaters,3 but not decorative fireplaces.4 Vented gas fireplace heater means any vented appliance that simulates a solid-fuel fireplace and furnishes radiant heat and warm air to the space in which it is installed; it may or may not utilize duct connections (ANSI 2018). Given the definition described in Section 2.1 that hearth products, as defined in this report, may provide space heating, decoration, lighting, or some combination of the three, the Statewide CASE Team proposes that the vented gas fireplace heater definition provided by CSA is pertinent to all hearth products covered in this proposal and thus, allows for the test procedure to be used.
Gas fireplaces manufactured in Canada have been subject to testing and reporting requirements since June 1, 2003. In British Columbia, a label from a designated tester that displays Fireplace Efficiency (FE) has been required since 2007. Based on these requirements, Natural Resources Canada (NRCan) released a Notice of Intent in March 2017 to adopt minimum energy performance standards for gas fireplaces (NRCan 2017a). Additionally, British Columbia recently updated their efficiency standards for gas fireplaces in March 2018 (Ministry of Energy, Mines, and Petroleum Resources of British Columbia 2018). These requirements and updates are discussed further in Section 5.11.4.
The Statewide CASE Team’s proposed code changes will create a new section within Title 20, Section 1605.3: State Standards for Non-Federally-Regulated Appliances.
4.2 Proposal History The California Building Code addresses hearth product standards in Title 24, Part 6 which states that continuous burning pilot lights in the installation of fireplaces, decorative gas appliances, and gas logs are prohibited in low-rise residential new construction (CEC 2015). This effectively eliminates any savings from installations of hearth products in new construction and has been accounted for in this analysis. Title 24, Part 6 also addresses standing pilot lights in fireplaces, decorative gas appliances, and gas logs for additions and alterations. This analysis assumes most installations would not trigger the building code to require compliance with these sections, thus the Statewide CASE Team has covered all products to ensure standing pilot lights are eliminated from all hearth products. Additionally, unvented products have been banned in California under the Health and Safety Code (CA HSC 1998).
2 As defined in ANSI Z21.50/CSA 2.22. 3 As defined in ANSI Z21.88/CSA 2.33. 4 As defined in ANSI Z21.60/CSA 2.26.
60 / 322

15 | Statewide IOU CASE Report: Hearth Products|April 12June 7, 2018
With the withdrawal of the federal rulemaking on energy conservation standards for hearth products, there are no federal preemption concerns for the regulation of hearth products in California. More information on this rulemaking can be found in Section 5.11.1.
To date, there have not been any hearth product standards developed as part of the Title 20 Appliance Efficiency Regulations in California.
4.3 Proposed Changes to the Title 20 Code Language The proposed changes to the Title 20 standards are provided below. Changes to the 2017 standards are marked with underlining (new language) and strikethroughs (deletions).
4.3.1 Proposed Definitions The Statewide CASE Team proposes that the Energy Commission adopt the following definitions in a new “Hearth Products” subsection to Title 20 Section 1602 “Definitions.” Some definitions are adapted from Title 24.
“Factory-built fireplace” or “zero clearance fireplace” means a prefabricated fireplace that may be built in conjunction with an attached chimney or flue to be installed as a single entity in a home.
“Fireplace” means a hearth and fire chamber, or similarly prepared place, in which a fire may be made and which is built in conjunction with a flue or chimney.
“Fireplace Efficiency” or “FE” means the metric defined in CAN/CSA-P.4.1 – 15.
“Gas log” means a self-contained, free-standing, open-flame, gas-burning appliance consisting of a metal frame or base supporting simulated logs.
“Hearth product” means a gas-fired appliance that simulates a solid-fueled fireplace or presents a flame pattern (for aesthetics or other purpose) and that may provide space heating directly to the space in which it is installed.
“Insert” means an appliance designed for installation into an existing masonry fireplace.
“Intermittent pilot light” means a pilot light that is automatically ignited when an appliance is called on to operate and which remains continuously ignited during each period of main burner operation. The pilot is automatically extinguished when each main burner operating cycle is completed.
“Masonry fireplace” means a fireplace constructed from non-combustible material that is part of a home’s structural design.
“On-demand pilot light” means a pilot light that, once placed into operation, is intended to remain ignited for a predetermined period of time following an automatic or manual operation of the main burner gas valve. The pilot is automatically extinguished when no automatic or manual operation of the main burner gas valve occurs during the predetermined period of time.
“Outdoor product” means a hearth product that is specifically designed for installation and use outdoors.
“Remotely operated pilot (ROP)” means a pilot system that provides the user with a ready means of initiating the automatic ignition and extinguishment of a pilot ignition source. The pilot system includes a device that is external to the gas safety combination control and does not require direct interaction with the gas safety combination control by the user.
61 / 322

16 | Statewide IOU CASE Report: Hearth Products|April 12June 7, 2018
“Solid-fuel burning” means a hearth product that burns solid fuel which creates a flame pattern including but not limited to wood, coal, or pellets.
“Standing pilot light” or “continuous pilot light” means a pilot that, once placed in operation, is intended to remain ignited continuously until it is manually interrupted.
“Stove” means a freestanding gas-fired unit used for either heating or decorative purposes.
“Vented hearth product” means a hearth product designed to be used with a vent.
“Unvented hearth product” means a hearth product designed to be used without a vent.
4.3.2 Proposed Test Procedure The Statewide CASE Team proposes a design requirement for hearth products. Thus, there is no applicable test procedure for meeting the prescriptive requirement.
For the purposes of test-and-list for entry into the Energy Commission’s Modernized Appliance Efficiency Database System (MAEDbS), the Statewide CASE Team recommends the Energy Commission require the new standard to reference to the CSA Group Standard CAN/CSA-P.4.1-15 (CSA 2015).
4.3.3 Proposed Standard The standard would reside in Section 1605.3 State Standards for Non-Federally Regulated Appliances.
Hearth Products.
(a) Continuous burning pilot lights or any pilot light that offers the option of continuous operation in hearth products sold in California on or after August 1, 2019 are prohibited.
(b) All hearth products are subject to a test-and-list requirement which must include reporting of Fireplace Efficiency (FE) as tested to CAN/CSA-P.4.1-15.
The proposed regulation is a design requirement that will ban the use of standing pilot lights in hearth products. Manufacturer compliance involves replacing the standing pilot light with an approved type of pilot light. Given its prescriptive nature, there is no efficiency metric associated with this standard. However, the Statewide CASE Team also recommends the use of the CSA Standard CAN/CSA-P.4.1-15 to report FE, as calculated in the test procedure, to inform a potential future performance standard (CSA 2015). The calculation for FE is included in Appendix D: FE Metric.
4.3.4 Proposed Reporting Requirements The Statewide CASE Team proposes the following pieces of information be required to report for entry into the MAEDbS:
Manufacturer;
Brand;
Model number;
Add date;
Regulatory status
o Federally-regulated consumer product
62 / 322

17 | Statewide IOU CASE Report: Hearth Products|April 12June 7, 2018
o Federally-regulated commercial & industrial product
o Non-federally regulated
o Voluntarily certified
o N/A
o No match
Maximum input rate (Btu/hour)
Minimum input rate (Btu/hour)
Fireplace efficiency (FE);5
Type of ignition;
o Intermittent pilot
o On-demand pilot
o Remotely operated pilot
Energy source;
o Natural gas
o Liquefied petroleum gas
o Oil
Outdoor install;
o True
o False
Electrical phase; and
Auxiliary electrical power in watts (W).
5. Analysis of Proposal
5.1 Scope/Framework The scope of hearth products subject to this proposed design standard is identical to the scope in U.S. DOE’s NOPR for hearth product energy conservation standards (U.S. DOE 2015c). See Section 2 for more details regarding covered products. In addition, the Statewide CASE Team proposes that the Energy Commission subject all covered products to test-and-list requirements as described in Section 4.3.4.
5 As defined in CAN/CSA-P.4.1-15.
63 / 322

18 | Statewide IOU CASE Report: Hearth Products|April 12June 7, 2018
5.2 Product Efficiency Opportunities In crafting their prescriptive requirement, U.S. DOE first considered the following technology options which affect active mode energy consumption:
Air-to-fuel ratio;
Burner port design;
Simulated log design;
Pan burner media/bead type;
Reflective walls and/or other components inside the combustion zone;
Air circulating fan;
Electronic ignition; and
Condensing heat exchanger.
After an initial screening analysis, U.S. DOE decided to only pursue a standby mode energy consumption standard, eliminating all the above listed active mode technologies (U.S. DOE 2015c). The Statewide CASE Team decided to align the proposed rulemaking with the U.S. DOE; this analysis only considers standby mode energy consumption, and recommends test-and-list requirements to help inform a potential performance standard. The future performance standard may incorporate one or more of the technology options which address active mode energy consumption.
5.3 Technical Feasibility As noted in U.S. DOE’s analysis, intermittent pilots (i.e., electronic ignitions) are currently commercially available and do not result in adverse impacts on health or safety (U.S. DOE 2015d).
Additionally, U.S. DOE concluded that a prescriptive standard banning standing pilot lights would not lessen the utility or performance of the covered hearth products; all product categories offer comparable products with intermittent pilot lights (U.S. DOE 2015c).
Based on the Hearth, Patio, & Barbecue Association membership6, the manufacturers provided in U.S. DOE’s analysis7, and a general web search, the Statewide CASE Team estimates there are approximately 26 hearth manufacturers based in California and 68 additional hearth manufacturers from the rest of the U.S. and Canada8. After doing a survey of the products offered, the Statewide CASE Team found that of the 94 total manufacturers, they offered approximately 1,9189 products with approximately 70 percent10 of products meeting the proposed design standard11. These results are shown in Table 2.
6 http://www.hpba.org/Membership/Organization-Search 7 https://www.regulations.gov/document?D=EERE-2014-BT-STD-0036-0045 8 Manufacturer lists from U.S. DOE and HPBA also includes one manufacturer from Denmark and two manufacturers from the United Kingdom. 9 Estimated from surveying websites and assessing whether the products fall under the scope of this report. 10 This estimate is conservative as there are some gaps in data due to manufacturer websites not stating which type of pilot light their products use. 11 Includes match-lit products as these products do not fall under the scope of this report.
64 / 322

19 | Statewide IOU CASE Report: Hearth Products|April 12June 7, 2018
Table 2: Hearth Products Offered in California
Hearth Product
Type
Number of California
manufacturers
Percentage of products that
meet the proposed
design standard
Number of additional national
manufacturers
Percentage of products that
meet the proposed
design standard
Vented fireplaces, inserts, and stoves
3 70% 46 67%
Vented gas logs
5 51% 19 65%
Outdoor products
24 47% 41 76%
As of 2018, the Statewide CASE Team’s analysis indicates that in California, over 55 percent of current hearth product stock already utilizes intermittent pilot lights. Detailed numbers are shown in Table 3 below.
Table 3: 2018 Breakdown of Standing Pilot Lights vs. Intermittent Pilot Lights for Hearth Products in California
Stock (all product categories)
Stock market share
Total shipment (all product categories)
Shipments market share
Standing pilot 303,676 44.5% 24,490 44.5% Intermittent pilot 378,143 55.5% 30,495 55.5% Total 681,819 100% 54,985 100%
Source: Statewide CASE Team Analysis;a U.S. DOE 2015d. aBased on national shipments from U.S. DOE Technical Support Document (TSD).
Considering that over half of current stock and shipments meet the proposed standard, the Statewide CASE Team has concluded that this proposed standard is technically feasible for manufacturers.
5.4 Statewide Energy Savings
5.4.1 Per-Unit Energy Savings Methodology This section describes Statewide CASE Team methodology used to estimate energy and environmental impacts. The Statewide CASE Team calculated the impacts of the proposed code change by comparing non-qualifying products to qualifying products.
The Statewide CASE Team drew heavily from the U.S. DOE analysis for information regarding per-unit energy consumption, product lifetime, shipments, and cost data by EL. The sources for this information are shown in Table 4 below.
65 / 322

20 | Statewide IOU CASE Report: Hearth Products|April 12June 7, 2018
Table 4: Sources Used for Per-Unit Energy Savings Methodology
Data Used Source
Per-unit energy consumption TSD Chapter 7: Energy Use Analysisa
Product lifetime TSD Chapter 8: Life-Cycle Cost and Payback Period Analysisa
Shipments National Impact Analysis (NIA)b
Cost data NIAb
Source: U.S. DOE 2015d;a U.S. DOE 2015bb.
The analysis assumes a standard effective year of 2019. In addition, the Statewide CASE Team chose the same scope as U.S. DOE after results showed it would deliver significant, cost-effective savings for California natural gas users.
Annual Per-Unit Energy Use Methodology
As described in Section 5.4.1 above, the per-unit energy use was adapted from the U.S. DOE analysis. Non-qualifying products are products that do not meet the proposed standard and qualifying products are products that meet the proposed standard. Based on survey data, tear down analysis, manufacturer literature, and consultant input, U.S. DOE calculated energy consumption for both qualifying and non-qualifying products in each product category (U.S. DOE 2015d). This included calculations for the main burner operating hours, standing pilot light energy consumption, intermittent pilot light energy consumption, and the secondary effects resulting from the use of hearth products (U.S. DOE 2015d). The Statewide CASE Team assumed that the energy consumption values determined in U.S. DOE’s analysis were reasonable for products in California. Thus, U.S. DOE values for energy consumption are used throughout the analysis.
Peak Demand Methodology
Peak demand was calculated by multiplying daily electricity use by an assumed load factor. A load factor is the ratio of average annual load to coincident peak load. The Statewide CASE Team obtained end-use load factors through consultations with the Energy Commission. The load factors used in this report were developed by the Energy Commission using an Hourly Energy and Load Model (Brown and Koomey 2002) on 2013 utility-level energy demand data. A complete table of updated values for several end uses is included in Appendix C: Load Factors. For the purposes of this report, the Statewide CASE Team included hearth products in the residential space heating end-use category (see Appendix C: Load Factors), and used the corresponding load factor of zero (0) for hearth products. Thus, this proposed standard does not have any demand reduction benefits.
5.4.2 Summary of Per-Unit Energy Use Impacts The per-unit energy use for both non-qualifying and qualifying products is shown in Table 5 and Table 6 below, respectively. Annual per-unit energy savings are presented in Table 7. Although qualifying products use more electricity than non-qualifying products, their lower natural gas usage outweighs the increased electricity usage, resulting in overall lower energy consumption, as shown in the columns displaying MM (a thousand thousand, or million) Btu usage. The methodology used to calculate these estimates is presented above in Section 5.4.1.
66 / 322

21 | Statewide IOU CASE Report: Hearth Products|April 12June 7, 2018
Table 5: Annual Per-Unit Energy Use for Non-Qualifying Products
Product class Electricity use (kilowatt hours
(kWh)/year)
Natural gas use (therms/year)
Peak demand (W)
Total site energy usage
(MMBtu)
Vented fireplaces, inserts, and stoves
0 39.9 0 4.0
Vented gas logs 0 35.2 0 3.5
Outdoor 0 31.3 0 3.1
Source: Statewide CASE Team Analysis; U.S. DOE 2015d.
Table 6: Annual Per-Unit Energy Use for Qualifying Products
Product class Electricity use (kWh/year)
Natural gas use (therms/year)
Peak demand (W)
Total site energy usage
(MMBtu)
Vented fireplaces, inserts, and stoves
13.6 5.0 0 0.6
Vented gas logs 5.8 13.0 0 1.6
Outdoor 0.2 2.9 0 0.3
Source: Statewide CASE Team Analysis; U.S. DOE 2015d.
Table 7: Annual Per-Unit Energy Savings
Product class Electricity savings (kWh/year)
Natural gas savings
(therms/year)
Peak demand (W)
Total site energy savings
(MMBtu)
Vented fireplaces, inserts, and stoves
-13.6 34.9 0 3.4
Vented gas logs -5.8 22.2 0 2.8
Outdoor -0.2 28.4 0 3.9
Source: Statewide CASE Team Analysis; U.S. DOE 2015d.
The Statewide CASE Team also estimates a range of between 0.01 and 0.19 therms of per-unit savings potential assuming a performance standard leveraging data from NRCan’s established database12 and Energy Trust of Oregon.13 Further analysis is on-going and will be made available when completed.
12 http://oee.nrcan.gc.ca/pml-lmp/index.cfm?action=app.search-recherche&appliance=FIREPLACE_G 13 U.S. DOE 2015e.
67 / 322

22 | Statewide IOU CASE Report: Hearth Products|April 12June 7, 2018
5.4.3 Stock [SoCalGas1] To estimate stock for hearth products in California, the Statewide CASE Team used shipment data from the U.S. DOE NIA (U.S. DOE 2015b). These numbers were adjusted to California by removing new construction installations, removing match-lit products since they are not in the scope of this proposal, and using the Residential Energy Consumption Survey (RECS) 2009 data to determine how many Californians use hearth products as compared to the nation as a whole (CEC 2015; RECS 2009). Once the shipment numbers were adjusted, they were multiplied by the product lifetime to get an estimate of the stock. Table 8 shows a summary of projected stock data from 2019 (the year the standard would go into effect) until 2033 (the year stock would fully turnover).
Table 8: Hearth Products Stock in California: 2019-2033
Base case year Stock (total)
2019 695,485
2020 688,027
2021 668,341
2022 658,648
2023 656,333
2024 659,061
2025 672,037
2026 679,220
2027 673,456
2028 662,116
2029 664,285
2030 668,121
2031 661,538
2032 641,056
2033 639,131
Source: Statewide CASE Team Analysis; U.S. DOE 2015b.
5.4.4 Shipments Similar to stock information, the Statewide CASE Team used U.S. DOE shipment data from the National Impact Analysis (U.S. DOE 2015b). This data was used as a proxy for sales for the design standard proposal and was adjusted to California by removing new construction installations and match-lit products (which are not in the scope of this proposal), and using RECS 2009 data to determine how many Californians use hearth products as compared to the nation as a whole (CEC 2015; RECS 2009). Table 9 shows a summary of projected shipments from 2019 (the year the standard would go into effect) until 2033 (the year stock would fully turnover).
68 / 322

23 | Statewide IOU CASE Report: Hearth Products|April 12June 7, 2018
Table 9: Hearth Product Shipments in California: 2019 - 2033
Base case year Shipments (total)
2019 56,087
2020 55,486
2021 53,899
2022 53,117
2023 52,930
2024 53,150
2025 54,197
2026 54,776
2027 54,311
2028 53,396
2029 53,571
2030 53,881
2031 53,350
2032 51,698
2033 51,543
Source: Statewide CASE Team Analysis; U.S. DOE 2015b.
5.4.5 Current and Future Shipments Full stock turnover will occur in 2033, assuming a weighted average 15-year lifetime across all product classes and a standard effective year of 2019. Table 10 summarizes stock and shipment for 2019 and 2033 for the purposes of the design standard.
Table 10: California Shipments and Stock
Annual shipments Stock
2019 (standards take effect) 56,087 695,485
2033 (after stock turnover) 51,543 639,131
Source: Statewide CASE Team Analysis; U.S. DOE 2015d.
5.4.6 Statewide Energy Use – Non-Standards and Standards Case In the following section, “non-standards case” is the term used to describe the scenario where no standard is enacted while “standards case” is used to describe the scenario that would occur with a standard in place.
Table 11 shows the statewide electricity and natural gas usage for the non-standards case while
69 / 322

24 | Statewide IOU CASE Report: Hearth Products|April 12June 7, 2018
Table 12 shows the cumulative non-standards case energy usage in MMBtu. As can be seen, the energy use remains relatively constant throughout the lifetime of the product. Alternatively, Table 13 shows the statewide electricity and natural gas usage for the design standards case, while Table 14 shows the design standards case energy usage in MMBtu. The difference between these two scenarios, which ultimately results in overall savings, is shown in Table 15 and Table 16. Table 15 shows the statewide electricity and natural gas savings for the design standards case, while Table 16 shows the statewide energy savings for the design standards case in MMBtu.
These tables show that with the implementation of a standard, electricity use increases slightly (with more products using intermittent pilots), natural gas usage decreases (with fewer products using excess natural gas from standing pilots), and overall Btu consumption decreases.
Table 11: California Statewide Energy Use by Fuel Type - Non-Standards Case (After Effective Date)
Year
Annual Shipments Stock
Electricity use (gigawatt hours (GWh)/year)
Natural gas use (million
therms/year)
Electricity use (GWh/year)
Natural gas use (million
therms/year)
2019 0.3 1.3 4.5 19.9
2020 0.3 1.3 4.5 19.9
2021 0.3 1.3 4.5 19.9
2022 0.3 1.3 4.5 19.8
2023 0.3 1.3 4.5 19.8
2024 0.3 1.3 4.5 19.7
2025 0.3 1.3 4.5 19.7
2026 0.3 1.3 4.4 19.7
2027 0.3 1.3 4.4 19.6
2028 0.3 1.3 4.4 19.6
2029 0.3 1.3 4.4 19.5
2030 0.3 1.3 4.4 19.5
2031 0.3 1.3 4.4 19.5
2032 0.3 1.2 4.4 19.4
2033 0.3 1.2 4.4 19.3
Source: Statewide CASE Team Analysis.
70 / 322

25 | Statewide IOU CASE Report: Hearth Products|April 12June 7, 2018
Table 12: California Statewide Energy Use – Non-Standards Case (After Effective Date)
Year
Shipments Stock
Total site energy usage
(MMBtu/year)
Total site energy usage
(MMBtu/year)
2019 135,194 2,007,971
2020 133,726 2,007,958
2021 129,914 2,004,117
2022 128,040 1,998,392
2023 127,598 1,992,217
2024 128,144 1,986,572
2025 130,657 1,983,450
2026 132,035 1,981,724
2027 130,906 1,978,877
2028 128,721 1,973,826
2029 129,145 1,969,197
2030 129,876 1,965,314
2031 128,575 1,960,150
2032 124,621 1,951,005
2033 124,257 1,941,486
Source: Statewide CASE Team Analysis.
Table 13: California Statewide Energy Use by Fuel Type – Standards Case (After Effective Date)
Year
Annual shipments Stock
Electricity use (GWh/year)
Natural gas use (million
therms/year)
Electricity use (GWh/year)
Natural gas use (million
therms/year)
2019 0.7 0.3 5.3 18.8
2020 0.7 0.2 5.6 17.8
2021 0.6 0.2 6.0 16.7
2022 0.6 0.2 6.3 15.6
2023 0.6 0.2 6.6 14.5
71 / 322

26 | Statewide IOU CASE Report: Hearth Products|April 12June 7, 2018
2024 0.7 0.2 7.0 13.4
2025 0.7 0.2 7.4 12.3
2026 0.7 0.2 7.7 11.2
2027 0.6 0.2 8.1 10.2
2028 0.7 0.2 8.4 9.1
2029 0.7 0.2 8.8 8.0
2030 0.6 0.2 9.1 6.9
2031 0.6 0.2 9.4 5.8
2032 0.6 0.2 9.8 4.7
2033 0.6 0.2 9.7 3.6
Source: Statewide CASE Team Analysis.
Table 14: California Statewide Energy Use – Standards Case (After Effective Date)
Year
Shipments Stock
Total site energy usage
(MMBtu/year)
Total site energy usage
(MMBtu/year)
2019 27,397 1,901,464
2020 27,063 1,794,757
2021 26,320 1,687,308
2022 25,962 1,579,501
2023 25,888 1,471,620
2024 26,030 1,363,881
2025 26,522 1,256,633
2026 26,762 1,149,626
2027 26,516 1,042,373
2028 26,114 934,718
2029 26,205 827,154
2030 26,322 719,707
2031 26,015 611,953
2032 25,270 503,454
2033 25,216 393,601
Source: Statewide CASE Team Analysis.
72 / 322

27 | Statewide IOU CASE Report: Hearth Products|April 12June 7, 2018
Table 15: California Statewide Energy Savings by Fuel Type– Standards Case (After Effective Date)
Year
Annual shipments Stock
Electricity savings
(GWh/year)
Natural gas savings (million
therms/year)[SoCalGas2]
Electricity savings
(GWh/year)
Natural gas savings (million
therms/year)[SoCalGas3]
2019 -0.7 2.0 -0.7 2.0
2020 -0.7 1.9 -1.4 3.9
2021 -0.7 1.9 -2.0 5.8
2022 -0.6 1.9 -2.7 7.7
2023 -0.6 1.9 -6.3 18.2
2024 -0.6 1.9 -3.9 11.4
2025 -0.7 1.9 -4.6 13.3
2026 -0.7 1.9 -5.3 15.2
2027 -0.7 1.9 -5.9 17.1
2028 -0.6 1.9 -6.6 19.0
2029 -0.7 1.9 -7.2 20.9
2030 -0.7 1.9 -7.9 22.7
2031 -0.6 1.9 -8.5 24.6
2032 -0.6 1.8 -9.2 26.4
2033 -0.6 1.8 -9.8 28.2
Source: Statewide CASE Team Analysis.
Table 16: California Statewide Energy Savings – Standards Case (After Effective Date)
Year
Shipments Stock
Total site energy usage
(MMBtu/year)
Total site energy usage (MMBtu/year)
2019 107,797 106,508
2020 106,663 213,201
2021 103,594 316,809
2022 102,078 418,891
2023 101,710 520,597
2024 102,114 622,691
2025 104,136 726,816
73 / 322
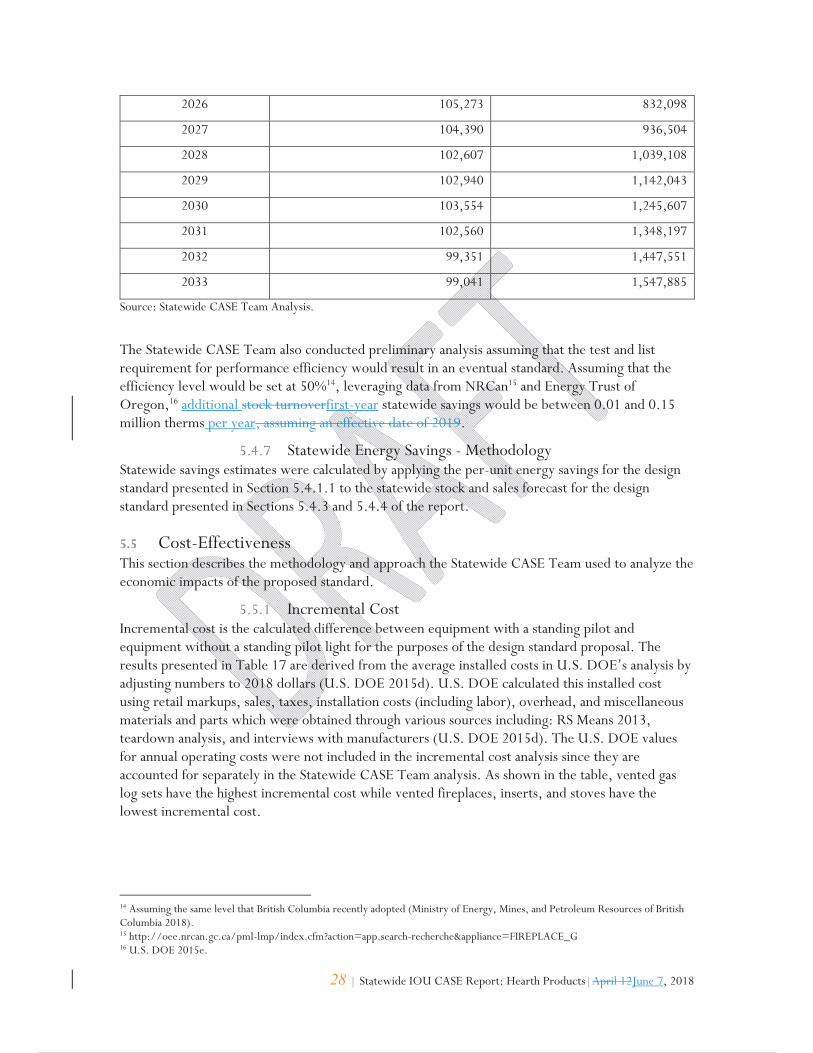
28 | Statewide IOU CASE Report: Hearth Products|April 12June 7, 2018
2026 105,273 832,098
2027 104,390 936,504
2028 102,607 1,039,108
2029 102,940 1,142,043
2030 103,554 1,245,607
2031 102,560 1,348,197
2032 99,351 1,447,551
2033 99,041 1,547,885
Source: Statewide CASE Team Analysis.
The Statewide CASE Team also conducted preliminary analysis assuming that the test and list requirement for performance efficiency would result in an eventual standard. Assuming that the efficiency level would be set at 50%14, leveraging data from NRCan15 and Energy Trust of Oregon,16 additional stock turnoverfirst-year statewide savings would be between 0.01 and 0.15 million therms per year, assuming an effective date of 2019.
5.4.7 Statewide Energy Savings - Methodology Statewide savings estimates were calculated by applying the per-unit energy savings for the design standard presented in Section 5.4.1.1 to the statewide stock and sales forecast for the design standard presented in Sections 5.4.3 and 5.4.4 of the report.
5.5 Cost-Effectiveness This section describes the methodology and approach the Statewide CASE Team used to analyze the economic impacts of the proposed standard.
5.5.1 Incremental Cost Incremental cost is the calculated difference between equipment with a standing pilot and equipment without a standing pilot light for the purposes of the design standard proposal. The results presented in Table 17 are derived from the average installed costs in U.S. DOE’s analysis by adjusting numbers to 2018 dollars (U.S. DOE 2015d). U.S. DOE calculated this installed cost using retail markups, sales, taxes, installation costs (including labor), overhead, and miscellaneous materials and parts which were obtained through various sources including: RS Means 2013, teardown analysis, and interviews with manufacturers (U.S. DOE 2015d). The U.S. DOE values for annual operating costs were not included in the incremental cost analysis since they are accounted for separately in the Statewide CASE Team analysis. As shown in the table, vented gas log sets have the highest incremental cost while vented fireplaces, inserts, and stoves have the lowest incremental cost.
14 Assuming the same level that British Columbia recently adopted (Ministry of Energy, Mines, and Petroleum Resources of British Columbia 2018). 15 http://oee.nrcan.gc.ca/pml-lmp/index.cfm?action=app.search-recherche&appliance=FIREPLACE_G 16 U.S. DOE 2015e.
74 / 322

29 | Statewide IOU CASE Report: Hearth Products|April 12June 7, 2018
Table 17: Incremental Product Costs
Hearth product category Incremental cost over
baseline (2018 $)
Vented fireplace/insert/stove $37.99
Vented gas log sets $162.03
Outdoor $79.52
Source: Statewide CASE Team Analysis; U.S. DOE 2015d.
5.5.2 Design Life To determine product lifetime for hearth products, U.S. DOE used warranty information and the lifetimes of similar appliances to estimate both hearth product and hearth product ignition system lifetimes (U.S. DOE 2015d). In their lifecycle cost analysis, U.S. DOE used a weighted average of 15 years across all products, which was the value used throughout the Statewide CASE Team’s analysis (U.S. DOE 2015a).
5.5.3 Lifecycle Cost / Net Benefit Table 18 presents the per-unit and total lifecycle costs and net benefits of the proposed standard. In this case, the period of analysis is the weighted average product life, 15 years. The cost impacts are presented in present value (PV) and NPV. The energy benefits savings per-unit over the 15-year period are presented for the hearth product classes evaluated, weighted by shipments.
Table 18: Costs and Net Benefits Per-Unit for Qualifying Products
Product Class
Product
life
(years)
Lifecycle costs per-unit (PV)a Lifecycle benefits per-unit (PV)
NPV per-unit
Incremental costb
Additional costc
Total PV
costs
First-year natural gas
savings
Total PV
benefits
Natural gas
Shipment weighted hearth products 15.0 $46.06 $29.43 $75.49 $474.77 $474.77 $399.28
Source: Statewide CASE Team Analysis; U.S. DOE 2015b. a PV calculated using the Energy Commission’s average statewide PV statewide energy rates, and a 3% discount rate (CEC 2017). See Appendix A: Natural Gas Rates for details regarding rates. b Incremental cost is the cost difference between the baseline non-qualifying product and the qualifying product. c Additional cost incurred from the cost of electricity due to fuel switching.
5.6 Environmental Impacts/Benefits
5.6.1 Greenhouse Gases Table 19 presents the annual and stock greenhouse gas (GHG) savings for the first year the design standard takes effect (2019) through the year of full stock turnover (2033). The estimated annual statewide GHG savings is 6,509 MTCO2e the first year the design standard is in effect and 5,790
75 / 322

30 | Statewide IOU CASE Report: Hearth Products|April 12June 7, 2018
MTCO2e after full stock turnover in 2033, with stock GHG savings reaching 64,300 MTCO2e in year 2033. The Statewide CASE Team calculated the avoided GHG emissions from the adoption of the design standard assuming an emissions rate varying by year, in accordance with California’s projected emissions factors as outlined in the 2017 update to the California Air Resources Board (CARB) scoping plan to meet the 2033 greenhouse gas targets (CARB 2017).
Table 19: Greenhouse Gas Savings 2019 - 2033
Year Annual GHG savings
(MTCO2e/year) Stock GHG savings
(MTCO2e/year)
2019 6,509 6,509
2020 6,388 12,845
2022 6,149 18,878
2023 5,986 24,633
2024 5,892 30,223
2025 5,831 35,620
2026 5,941 41,531
2027 6,000 47,499
2028 5,947 53,429
2029 5,843 59,237
2030 5,790 64,300
2031 5,823 70,115
2032 5,764 75,860
2033 5,588 81,480
Source: Statewide CASE Team Analysis.
5.6.2 Indoor or Outdoor Air Quality Indoor air quality enhancements are often associated with switching from an unvented product to a vented product. Given that unvented products are already banned in California under the Health and Safety Code, the Statewide CASE Team does not assume any changes to indoor or outdoor air quality as a direct result of this proposed prescriptive standard.
5.6.3 Hazardous Materials There are no known incremental hazardous materials impact resulting from the proposed prescriptive standard.
5.7 Impact on California’s Economy Table 20 below presents the total lifecycle costs and benefits for the design standards case. The first-year shipments in 2019 have a NPV of $11.3 million while the stock turnover yields over $140 million by 2033.
76 / 322

31 | Statewide IOU CASE Report: Hearth Products|April 12June 7, 2018
Table 20: Statewide Total Lifecycle Costs and Benefits for Standards Casea
Product class
Lifecycle B/C
ratiob
NPV ($)c First-year shipments ($ million)
Stock turnoverd
($) Hearth products (shipment weighted average)
9.2 14.8 186,087,801
Source: Statewide CASE Team Analysis. a The analysis does not include cost savings associated with embedded energy savings. b Total PV benefits divided by total PV costs. Positive value indicates a reduced total cost of ownership over the life of the appliance. c It should be noted that while the proposed standard is cost-effective, it may be more cost-effective if using alternative rate structures. For example, marginal utility rates may more accurately reflect what customers save on utility bills as result of the standard. d Stock turnover NPV is calculated by taking the sum of the NPVs for the products purchased each year following the standard’s effective date through the stock turnover year (i.e. the NPV of “turning over” the whole stock of less efficient products that were in use at the effective date to more efficient products, plus any additional non-replacement units due to market growth, if applicable). For example, for a standard effective in 2015 applying to a product with a five year design life, the NPV of the products purchased in the fifth year (2019) includes lifecycle cost and benefits through 2024, and therefore, so does the Stock turnover NPV.
5.8 Consumer Utility/Acceptance There are currently no equipment standards for hearth products. However, hearth manufacturers and installers must comply with the current ban on standing pilot lights for new construction under Title 24, Part 6. Thus, manufacturers and installers should be familiar with the necessity to comply with regulations around the standing pilot light ban.
5.9 Manufacturer Structure and Supply Chain Timelines Based on calls to local suppliers, the Statewide CASE Team found that most local suppliers sell hearth products directly to consumers and subsequently perform home installation. Suppliers report occasional sales to contractors for installation in new homes. However, local suppliers most often act as both retailer and installer for these types of products.
5.10 Stakeholder Positions The Statewide CASE Team is aware of three California-based hearth manufacturers who submitted comments in response to the 2015 U.S. DOE rulemaking. Williams Furnace Company wanted U.S. DOE to specify that vented direct heating equipment was not included in the rulemaking because they manufacture vented room heater gas furnaces to simulate solid fuel fireplaces (Williams Furnace Company 2015). R.H. Peterson Company, a manufacturer of vented and unvented gas log sets, argued (among other issues) that the cost of implementing this standard would fall on small businesses in the gas log industry (RH Peterson Company 2015). Finally, Rasmussen Iron Works, Inc., which manufacturers gas log sets, argued that gas log sets should not be covered under the proposed U.S. DOE regulation (Rasmussen Iron Works 2015).
5.11 Other Regulatory Considerations
5.11.1 Federal Regulatory Background In February 2015, U.S. DOE released a NOPR on energy conservation standards for hearth products (U.S. DOE 2015c). However, the rulemaking never made it to the final rule stage and was withdrawn in March 2017—removing any federal preemption concerns for California.
77 / 322

32 | Statewide IOU CASE Report: Hearth Products|April 12June 7, 2018
5.11.2 California Regulatory Background There have not been any Title 20 Regulations passed for hearth products. In Title 24, Part 6, there is a provision which bans continuous burning pilot lights in the installation of fireplaces, decorative gas appliances, and gas logs17 in new construction of low-rise residential buildings as well as additions and alterations (CEC 2015). This eliminates any savings associated with hearth product installation in new construction, which has been appropriately accounted for in this analysis.
The Statewide CASE Team is also aware that the upcoming 2019 cycle of Title 24 will prohibit standing pilot lights for fireplaces in new construction, additions, and alterations of all building types. Savings estimates were not adjusted in this analysis, but can be accounted for post-adoption.
5.11.3 Utility and Other Incentive Programs The Statewide CASE Team is not aware of any current utility or incentive programs for hearth products.
5.11.4 Model Codes and Voluntary Standards The Statewide CASE Team recommends a test-and-list using the Canadian Standard CAN/CSA-P.4.1-15 for data entry into MAEDbS, similar to Canada’s current requirement of reporting on gas fireplace models and their energy efficiency.18
While proposing no marking or labeling requirements for products in California at this time, the Statewide CASE Team is aware of voluntary requirements for products in Canada. Currently, gas fireplaces sold in Canada can voluntarily use the EnerGuide label that displays FE19 as a percentage; percentage increase directly correlates to higher product energy efficiency (NRCan 2015b).
Since 2003, NRCan has required that all gas fireplaces manufactured in Canada are subject to testing and reporting requirements (NRCan 2017a). Based on data collected from testing and reporting, the Office of Energy Efficiency at NRCan issued a Notice of Intent in March 2017 to adopt minimum efficiency performance standards for gas fireplaces. NRCan differentiates between decorative gas fireplaces and fireplace heaters; their notice of intent proposes several efficiency requirements for each. They are considering regulating the types of pilots that can be used in any gas fireplaces as well as requiring gas fireplace heaters to have a minimum FE of 50 percent when tested using CAN/CSA-P.4.1-15. Additionally, they are considering requiring decorative gas fireplaces to draw combustion air directly from outside the building unless intended to be installed as a replacement only with proper markings (NRCan 2017a).
Since 2007, British Columbia’s Energy Efficiency Standard Regulation has required that any gas fireplace manufactured or sold in the province includes a label from a designated tester that displays the FE rating of the product. British Columbia also developed a voluntary certification called EnerChoice™ in 2010 to help bring awareness to gas fireplace energy performance. It is awarded to the 25 percent most efficient fireplace models in the categories of inserts, freestanding, and zero clearance (Berkhout and Nowell 2016). Subsequently, in March 2018, British Columbia updated standards for gas fireplaces. Fireplace heaters20 manufactured on or after January 1, 2019 must be tested with CAN/CSA P.4.1-15 to have an FE of at least 50 percent which must be stated on a verification label; must not have a standing pilot light; and must have a pilot-on-demand,
17 As defined in Title 24, Part 6. 18 http://laws-lois.justice.gc.ca/eng/regulations/SOR-2016-311/ 19 As defined in CAN/CSA-P.4.1-15 20 As defined in the scope of CSA 2.33-2016 and CSA 2.22-2016.
78 / 322

33 | Statewide IOU CASE Report: Hearth Products|April 12June 7, 2018
interrupted, or intermittent pilot ignition system. Decorative gas appliances21 manufactured on or after January 1, 2019 must have an efficiency label which states the FE rating and must comply with the same pilot light restrictions as fireplace heaters mentioned previously (Ministry of Energy, Mines, and Petroleum Resources of British Columbia 2018). In calculating potential savings for their standard, British Columbia only included savings associated with taking out standing pilot lights and did not include savings associated with meeting the 50 percent FE rating, as at least 94 percent of products in each of their categories already meet this performance level (Berkhout and Nowell 2016).
5.11.5 Compliance Currently, approximately 30 percent of products on the market do not comply with the proposed standard. However, each product category has a comparable product currently on the market that meets the proposed standard.
6. Conclusion The Statewide CASE Team proposes that the Energy Commission adopt a prescriptive energy conservation standard which bans standing pilot lights for hearth products. Additionally, the Statewide CASE Team proposes testing and reporting requirements for hearth products based on the CAN/CSA-P.4.1-15 test procedure. The data generated from these efforts will help to inform future performance energy conservation standards. Due to U.S. DOE withdrawing their energy conservation standard on hearth products in March 2017, these products are eligible for a state level energy conservation standard. For this analysis, the Statewide CASE Team drew heavily on the analysis previously done by U.S. DOE.
The design standard proposed by the Statewide CASE Team will achieve significant, cost-effective, technically feasible energy savings. The savings are estimated at 99,041 MMBtu/year after stock turnover in 2033. This proposal will yield savings of 5,588 MTCO2e per year, and a total of 81,480 MTCO2e total after stock turnover in 2033. The proposed design standard will lead to significant cost savings for consumers, with $14.8 million in first-year savings, and over $186 million NPV after stock turnover in 2033. Finally, on a shipment weighted basis, there is a lifecycle B/C ratio of 9.2.
Preliminary calculations for a potential performance standard estimate per-unit savings between 0.01 and 0.19 therms. This would result in stock turnover statewide savings being between 0.01 and 0.15 million therms, assuming an effective date of 2019.
21 As defined in the scope of CSA 2.33-2016 and CSA 2.22-2016.
79 / 322

34 | Statewide IOU CASE Report: Hearth Products|April 12June 7, 2018
7. References 1. ANSI (American National Standards Institute). 2018. “ANSI Z21.88-2017/CSA 2.33-2017:
Vented Gas Fireplace Heaters.” https://blog.ansi.org/2018/02/ansi-z21-88-csa-2-33-2017-gas-fireplace/#gref.
2. Berkhout, T. and R. Nowell. 2016. “Gas Fireplaces: Regulatory Proposal.” Energy Efficiency Branch, BC Ministry of Energy and Mines. https://www2.gov.bc.ca/assets/gov/farming-natural-resources-and-industry/electricity-alternative-energy/energy-efficiency/mem_eesr_ris_gas_fireplaces_september_27_2016.pdf.
3. Brown, R.E. and J.G. Koomey. 2002. "Electricity Use in California: Past Trends and Present Usage Patterns." Energy Policy (also LBNL-47992) 31:849-864.
4. The Bulletin. 2015. “Ventless fireplaces: How safe are they?” http://www.bendbulletin.com/lifestyle/homeandgarden/3659538-151/ventless-fireplaces-how-safe-are-they.
5. CA HSC (California Health and Safety Code). 1998. CA HSC §19981 as amended by Stats. 1997, Ch. 17, Sec. 67. Effective January 1, 1998. Accessed March 20, 2018. https://leginfo.legislature.ca.gov/faces/codes_displayText.xhtml?lawCode=HSC&division=13.&title=&part=3.&chapter=12.&article.
6. CARB (California Air Resources Board). 2010. “Proposed Regulation for a California Renewable Electricity Standard Staff Report: Initial Statement of Reasons Appendix D.” http://www.arb.ca.gov/regact/2010/res2010/res10isor.pdf.
7. ___. 2014. “First Update to the Climate Change Scoping Plan.” May. http://www.arb.ca.gov/cc/scopingplan/2013_update/first_update_climate_change_scoping_plan.pdf.
8. ___. 2015. “Assembly Bill 32 Overview.” http://www.arb.ca.gov/cc/ab32/ab32.htm.
9. ___. 2017. “2017 Scoping Plan Appendix D Pathways.” https://www.arb.ca.gov/cc/scopingplan/2030sp_appd_pathways_final.pdf.
10. CEC (California Energy Commission). 2014. “2013 Residential Compliance Manual” http://www.energy.ca.gov/2013publications/CEC-400-2013-001/chapters/04_Building_HVAC_Requirements.pdf.
11. ___. 2015. 2016 Building Energy Efficiency Standards for Residential and Nonresidential Buildings.” http://www.energy.ca.gov/2015publications/CEC-400-2015-037/CEC-400-2015-037-CMF.pdf.
12. ___. 2016. Demand Analysis Office. Communications with M. Tian.
13. ___.2017a. Adopted California Energy Commission Demand Forecast Report 2017-2027. Mid-Case Final Demand Forecast. Form 2.3. Updated January 23, 2017. http://www.energy.ca.gov/2016_energypolicy/documents/2016-12-08_workshop/mid_demand_case.php.
14. ___.2017b. CEC 2017 Revised Baseline Natural Gas Planning Area and Sector Mid Demand Case. Mid-Case Revised Demand Forecast. Form 2.3. Updated February 21, 2018.
80 / 322

35 | Statewide IOU CASE Report: Hearth Products|April 12June 7, 2018
http://www.energy.ca.gov/2017_energypolicy/documents/2018-02-21_business_meeting/2018-02-21_middemandcase_forecst.php.
15. CSA (Canadian Standards Association). 2015. http://shop.csa.ca/en/canada/performance-test-methods/cancsa-p41-15/invt/27015052015.
16. Fireplace Doors Online. 2018. Accessed May 18, 2018. https://www.fireplacedoorsonline.com/learning-center/masonry-fireplace-or-zero-clearance-fireplace.html.
17. Fireside Hearth & Home. 2018a. “Anatomy of a gas fireplace.” Accessed March 28, 2018. http://firesidehearth.com/anatomy-gas-fireplace/.
18. ___. 2018b. “Gas Stoves.” Accessed March 20, 2018. http://www.fireside.com/Browse/Stoves/Gas-Stoves.aspx.
19. The Fireplace Shop & Grill Center. 2018. Accessed March 20, 2018. http://grillsandfireplaces.com/gas-logs.html.
20. Fleet Plummer. 2014. Gas Logs: Vented or Vent-Free? How To Tell The Difference, and Decide Which One You Need. YouTube. Accessed March 28, 2018. https://www.youtube.com/watch?v=niUkweOcZtI.
21. High’s Chimney Service. 2018. “The Heat Efficiency of Wood Burning Stoves vs. Gas Stoves.” Accessed March 28, 2018. https://www.highschimney.com/heat-efficiency-wood-burning-stoves-gas-stoves/.
22. Houselogic. 2018. “Ventless Fireplaces: What You Need to Know.” Accessed March 20, 2018. https://www.houselogic.com/organize-maintain/home-maintenance-tips/ventless-fireplaces-what-you-need-know/.
23. Merlin Goble Masonry, Inc. 2017. Accessed March 20, 2018. https://www.merlingoblemasonry.com/fireplace_masonry.html.
24. My Gas Fireplace Repair. 2017. “Identifying Gas Fireplace Parts.” Accessed March 28, 2018. https://www.mygasfireplacerepair.com/2017/04/identifying-gas-fireplace-parts/.
25. Ministry of Energy, Mines, and Petroleum Resources of British Columbia. 2018. “Energy Efficiency Standards Regulation Amendment.” Accessed May 16, 2018. https://www2.gov.bc.ca/assets/gov/farming-natural-resources-and-industry/electricity-alternative-energy/energy-efficiency/eesr_amendment_6_regulatory_bulletin_march_7_2018.pdf.
26. Napoleon Fireplaces. 2015. “Fireplaces vs. Fireplace Inserts.” Accessed March 20, 2018. http://napoleonfireplaces.com/fireplaces-and-fireplace-inserts/.
27. Nordic Stove & Fireplace Center. 2013. “A Gas Log Set or a Gas Insert – Which is right for me?” Accessed March 28, 2018. http://nordicstoveandfireplace.com/files/photos/gas%20log%20vs%20gas%20insert.pdf.
28. NRCan (Natural Resources Canada). 2015a. “Chapter 3: What to Look For.” Accessed March 20, 2018. http://www.nrcan.gc.ca/energy/publications/efficiency/residential/gas-fireplaces/6807.
81 / 322

36 | Statewide IOU CASE Report: Hearth Products|April 12June 7, 2018
29. ___. 2015b. “Gas fireplaces – EnerGuide.” Accessed March 26, 2018. http://www.nrcan.gc.ca/energy/products/energuide/label/reading/13718.
30. ___. 2017a. “Gas fireplaces.” Accessed March 26, 2018. http://www.nrcan.gc.ca/energy/regulations-codes-standards/19682.
31. ___. 2017b. “Gas Fireplaces: Energy Efficiency Regulations.” Accessed March 26, 2018. http://www.nrcan.gc.ca/energy/regulations-codes-standards/products/6865.
32. Pine Lake Stoves. 2014. “Gas Inserts.” Accessed March 20, 2018. http://lakestoves.com/gas_inserts.html.
33. Professional Heating & Air. 2014. “What is a Standing Pilot?” Accessed March 28, 2018. http://www.aprofessionalheatingandair.com/blog/what-is-a-standing-pilot/.
34. Rasmussen Iron Works, Inc. 2015. “2015-05-09 Comment response to the notice of proposed rulemaking (NOPR).” Accessed March 28, 2018. https://www.regulations.gov/document?D=EERE-2014-BT-STD-0036-0038.
35. RECS (Residential Energy Consumption Survey). 2009. 2009 RECS Survey Data. https://www.eia.gov/consumption/residential/data/2009/.
36. RH Peterson Company. 2015. “2015-05-11 Comment response to published notice of proposed rulemaking (NOPR).” Accessed March 28, 2018. https://www.regulations.gov/document?D=EERE-2014-BT-STD-0036-0037.
37. Schwank Innovative Heating Solutions. 2018. Accessed March 20, 2018. https://www.schwankgroup.com/products/patio-heaters/parasol/.
38. Star Fire Direct. 2018. Accessed March 20, 2018. https://starfiredirect.com/collections/fire-pits-fire-pit-tables/products/manhattan-concrete-fire-table.
39. U.S. Census Bureau, Population Division. 2015. “Annual Estimates of the Resident Population: April 1, 2010 to July 1, 2014.” http://factfinder2.census.gov/bkmk/table/1.0/en/PEP/2014/PEPANNRES/0400000US06.05000.
40. U.S. DOE (United States Department of Energy). 2015a. "Hearth Products Life-Cycle Cost and Payback Period Analysis (hearths_nopr_lcc_2015_01_20).” https://www.regulations.gov/document?D=EERE-2014-BT-STD-0036-0006.
41. ___. 2015b. “Hearth Products National Impact Analysis (NIA) (hearths_nopr_nia_2015_01_20).” https://www.regulations.gov/document?D=EERE-2014-BT-STD-0036-0007.
42. ___. 2015c. “Notice of proposed rulemaking and announcement of public meeting.” https://www.regulations.gov/document?D=EERE-2014-BT-STD-0036-0010.
43. ___. 2015d. “2015-01-30 Technical Support Document: Energy Conservation Program for Consumer Products: Energy Conservation Standards for Hearth Products.” https://www.regulations.gov/document?D=EERE-2014-BT-STD-0036-0002.
44. ___. 2015e. “2015-03-01 Energy Trust of Oregon Studies: Summary of Gas Fireplace Research. Updated with corrected statistic May 22, 2015.” Accessed May 30, 2018. https://www.regulations.gov/document?D=EERE-2014-BT-STD-0036-0046.
82 / 322

37 | Statewide IOU CASE Report: Hearth Products|April 12June 7, 2018
45. U.S. DOL (United States Department of Labor). 2018. Bureau of Labor Statistics. CPI Inflation Calculator. http://www.bls.gov/data/inflation_calculator.htm.
46. U.S. EPA (United States Environmental Protection Agency). 2011. “Calculations and References.” http://www.epa.gov/cleanenergy/energy-resources/refs.html.
47. Ward Burner Systems. 2004. “Pilots: Standing & Intermittent.” Accessed March 28, 2018. http://www.wardburner.com/pilotstypes.html.
48. Wilkens Contracting Inc. 2015. “Fireplace Anatomy.” Accessed March 28, 2018. http://www.wilkens.ca/fireplace-anatomy/.
49. Williams Furnace Company. 2015. “2015-04-13 Comment response to published notice of proposed rulemaking (NOPR) and announcement of public meeting.” Accessed March 28, 2018. https://www.regulations.gov/document?D=EERE-2014-BT-STD-0036-0024.
50. Woodland Direct. 2018. “Gas Log FAQs.” Accessed March 28, 2018. http://www.woodlanddirect.com/Fireplace-Accessories/Gas-Log-Information/Gas-Log-FAQs.
83 / 322

38 | Statewide IOU CASE Report: Hearth Products|April 12June 7, 2018
Appendix A: Natural Gas Rates The natural gas rates used in the analysis presented in this report were derived from projected future prices for the residential sector in the Energy Commission’s “Mid-case” projection of the 2018-2030 Demand Forecast (CEC 2017b), which used no discount rate and provided prices in 2016 dollars. The Statewide CASE Team applied a three percent discount rate to future years relative to 2018. Then, the sales weighted average of the three largest natural gas utilities in California was converted to 2018 dollars using an inflation adjustment of 1.03 (U.S. DOL 2018). See the rates by year below in Table 21.
Table 21: Statewide Sales Weighted Average Residential Natural Gas Rates 2018-2033 (PG&E, SCG, and SDG&E - Three Largest California Natural Gas Utilities) in 2018 $/therm including a 3% discount rate.
Year Residential natural gas
rate (2018 $/therm) 2018 1.19 2019 1.19 2020 1.17 2021 1.15 2022 1.12 2023 1.10 2024 1.08 2025 1.06 2026 1.04 2027 1.02 2028 0.99 2029 0.982030 0.962031 0.96 2032 0.94 2033 0.93
84 / 322

39 | Statewide IOU CASE Report: Hearth Products|April 12June 7, 2018
Appendix B: Electricity Rates The electricity rates used in the analysis presented in this report were derived from projected future prices for the residential sector in the Energy Commission’s “Mid-case” projection of the 2018-2030 Demand Forecast (CEC 2017a), which used no discount rate and provided prices in 2016 dollars. The Statewide CASE Team applied a three percent discount rate to future years relative to 2018. Then, the sales weighted average of the five largest electric utilities in California was converted to 2018 dollars using an inflation adjustment of 1.03 (U.S. DOL 2018). See the rates by year below in Table 22.
Table 22: Statewide Residential Electricity Rates 2018 – 2033 (PG&E, SCE, SDG&E, LADWP and SMUD - 5 Largest California Electric Utilities) in 2018 cents/kWh including a 3% discount rate.
Year
Residential electricity rate (2018 cents/kWh)
2018 19.54 2019 19.53 2020 18.82 2021 18.38 2022 17.81 2023 17.35 2024 16.97 2025 16.56 2026 16.10 2027 15.65 2028 15.282029 14.842030 14.402031 13.98 2032 13.57 2033 13.17
85 / 322

40 | Statewide IOU CASE Report: Hearth Products|April 12June 7, 2018
Appendix C: Load Factors Table 23: 2013 Electricity Consumption and Peak Demand for the Top Five Largest California Electric Utilitiesa
Sector & End-Use Coincident Load Annual Energy Load
Factorb MW % of Total GWh % of Total Residential Cooking 581.4 1% 2833.1 1% 56% Clothes Dryer 759.4 1% 4419.5 2% 66% Dishwasher 211.1 0% 2237 1% 121% Freezer 302.4 1% 2132.1 1% 80% Miscellaneous 2849.3 5% 23139.9 9% 93% Multi-Family Water Heater 114.2 0% 1189.4 0% 119% Pool Heater 33.0 0% 155.6 0% 54% Pool Pump 769.3 1% 3689.7 1% 55% Refrigerator 1736.4 3% 13996.2 5% 92% Solar Water Heat - Back-up 0.0 0% 0.2 0% 63% Solar Water Heat - Pump 0.8 0% 2.3 0% 31% Spa Heater 64.9 0% 247.6 0% 44% Spa Pump 261.5 0% 990.4 0% 43% Single Family Water Heater 196.5 0% 1709.6 1% 99% Television 807.2 1% 6003 2% 85% Waterbed Heater 737.0 1% 12003.7 5% 186% Clothes Washer 122.2 0% 824.6 0% 77% Air Conditioning 15739.6 28% 8378.51 3% 6% Space Heating 0.0 0% 3441.46 1% 0% Commercial Other 3344.8 6% 23762.2 9% 81% Domestic Hot Water 144.5 0% 675.7 0% 53% Cooking 94.5 0% 721.9 0% 87% Office Equipment 263.3 0% 1699.2 1% 74% Refrigeration 888.4 2% 7872.6 3% 101% Exterior Lighting 40.9 0% 5909.2 2% 1649% Interior Lighting 4856.2 9% 30686.2 12% 72% Ventilation 1787.3 3% 10366.1 4% 66% Air Conditioning 7714.7 14% 15724.95 6% 23% Space Heating 0.0 0% 2702.77 1% 0%
Subtotal 19134.6 34% 100120.82 38% 60% Source: CEC 2016. a The top five largest California Electric Utilities are Pacific Gas & Electric (PG&E), San Diego Gas & Electric (SDG&E), Southern California Edison Company (SCE), Sacramento Municipal Utility District (SMUD), and Los Angeles Department of Water and Power (LADWP). b Load Factor is the ratio of average annual load to coincident peak load. The load factors for commercial exterior lighting and residential waterbed heaters are very high because their consumption is mainly off-peak. b Load Factor is the ratio of average annual load to coincident peak load. The load factors for commercial exterior lighting and residential waterbed heaters are very high because their consumption is mainly off-peak.
86 / 322

41 | Statewide IOU CASE Report: Hearth Products|April 12June 7, 2018
Appendix D: FE Metric As defined in CAN/CSA-P.4.1-15, FE is defined as:
Resulting in a percentage, where:
5200 = average number of U.S. heating degree-days.
=
For fireplaces with single-stage controls, , where:
a) for all non-condensing fireplaces, where
latent heat loss and
=sensible heat loss at steady-state maximum input operation; or
b) ,
Where and are as defined above,
= latent heat gain due to condensation at maximum input rate, and
= steady-state heat loss due to condensate at maximum input rate.
For fireplaces without single-stage controls,
, where
= fraction of the heating load at maximum input,
= fraction of the heating load at reduced input,
is as defined above, and
=
a) for non-condensing fireplaces without single-stage controls, where
is as defined above and
= the sensible heat loss at steady-state reduced input; or
b) for condensing fireplaces without single-stage controls, where
and are as defined above,
= latent heat gain due to condensation at reduced input rate, and
= steady-state heat loss due to condensation at minimum input rate.
= for heating seasonal efficiency for vented gas fireplaces, where
87 / 322

42 | Statewide IOU CASE Report: Hearth Products|April 12June 7, 2018
a) 65 = outside air temperature at which home heating fireplaces start operating in degrees Fahrenheit ( F),
b) -15 = outdoor design temperature for home heating fireplaces in F,
c) 24 = number of hours in a day,
d) 4600 = average number of U.S. non-heating season hours per year, and
e) 0.7 = correction factor to account for pilot contribution.
, where
= the energy input rate;
a) For continuous pilots, measured pilot input;
b) For fireplaces with a remotely operated pilot ignition system, = measured pilot input x 0.5;
c) For fireplaces with an intermittent ignition system that are capable of continuous pilot operation, = measured pilot input x 0,5;
d) For fireplaces with an on demand pilot ignition system timed for a maximum of 7 days operation, = measure pilot input x 0.25; and
e) For fireplaces with intermittent ignition systems, .
= the steady-state maximum fuel input rate, determined by multiplying the measured higher heating value of the test gas by the steady-state gas input rate corrected to standard conditions of 60 F (15.6 degrees Celsius ( C)) and 30 inHg (101.3 kilopascal). Measured values of gas temperature and pressure at the meter and the barometric pressure shall be used to correct the metered gas flow rate to standard conditions.
Source: CSA 2015.
88 / 322

89 / 322

90 / 322

91 / 322

92 / 322

93 / 322

94 / 322
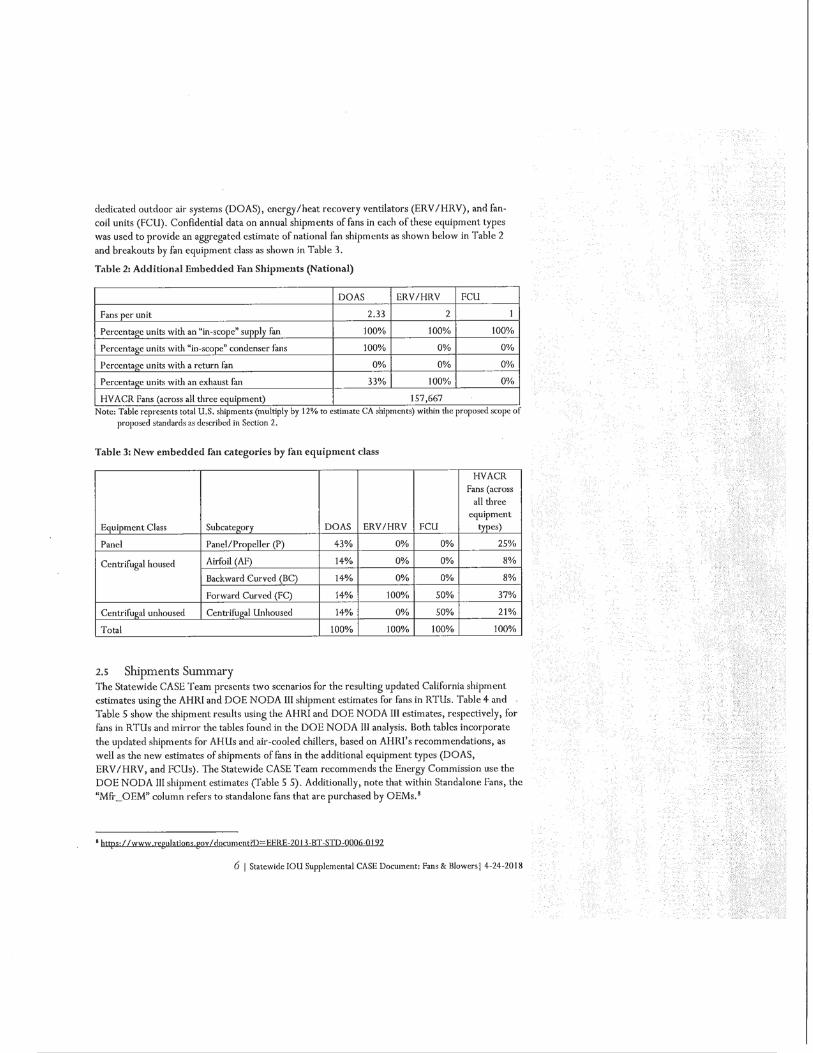
95 / 322

96 / 322
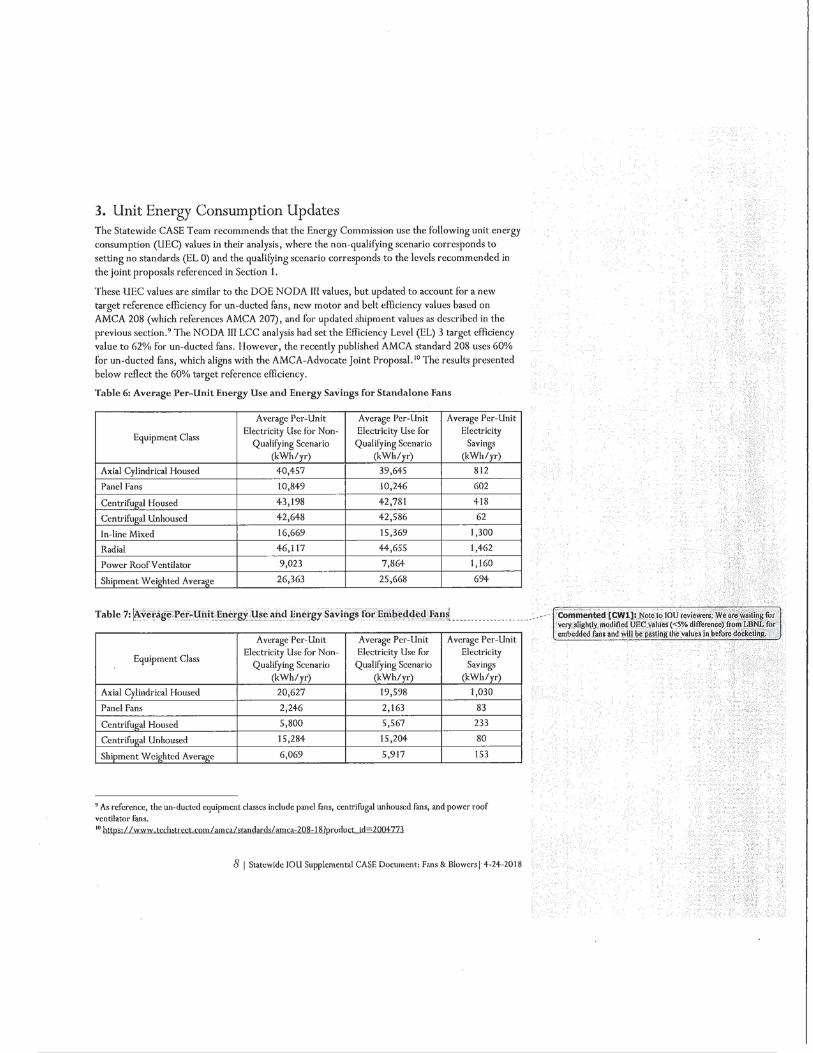
97 / 322

98 / 322

99 / 322

100 / 322

Fans & Blowers
Prepared by: Bryan Boyce and Chad Worth, ENERGY SOLUTIONS
Prepared for:
PACIFIC GAS &
ELECTRIC COMPANY SOUTHERN
CALIFORNIA EDISON SAN DIEGO GAS AND
ELECTRIC SoCalGas®
This report was prepared by the California Statewide Investor-Owned Utilities Codes and Standards Program and funded by the California utility customers under the auspices of the California Public Utilities Commission. Copyright 2017 Pacific Gas and Electric Company, Southern California Edison, Southern California Gas Company, and San Diego Gas & Electric. All rights reserved, except that this document may be used, copied, and distributed without modification. Neither PG&E, SCE, SoCalGas and SDG&E nor any of its employees makes any warranty, express of implied; or assumes any legal liability or responsibility for the accuracy, completeness or usefulness of any data, information, method, product, policy or process disclosed in this document; or represents that its use will not infringe any privately-owned rights including, but not limited to, patents, trademarks or copyrights.
Supplemental CASE Document Fans & Blowers
17-AAER-06
Codes and Standards Enhancement (CASE) Initiative For PY 2017: Title 20 Standards Development
April XX, 2018
101 / 322

2 | Statewide IOU Supplemental CASE Document: Fans & Blowers| 4-24-2018
TABLE OF CONTENTS
2.1 ROOFTOP UNITS .........................................................................2.2 AIR-HANDLING UNITS ...................................................................................................................... 52.3 AIR-COOLED CHILLERS ..................................................................................................................... 52.4 NEW CATEGORIES OF EMBEDDED FANS ............................................................................................ 52.5 SHIPMENT SUMMARY ........................................................................................................................ 6
102 / 322

3 | Statewide IOU Supplemental CASE Document: Fans & Blowers| 4-24-2018
1. Background The Codes and Standards Enhancement (CASE) initiative presents recommendations to support California Energy Commission’s (Energy Commission) efforts to update California’s Appliance Efficiency Regulations (Title 20) to include new requirements or to upgrade existing requirements for various technologies. The four California Investor Owned Utilities (IOUs) – Pacific Gas and Electric Company (PG&E), San Diego Gas and Electric (SDG&E), Southern California Edison (SCE), and SoCalGas® – sponsored this effort (herein referred to as the Statewide CASE Team). The program goal is to prepare and submit proposals that will result in cost-effective enhancements to improve the energy and water efficiency of various products sold in California. This document is a part of the effort to develop technical and cost-effectiveness information for potential appliance standards. This supplemental CASE document includes updated recommendations for inputs to the analysis for commercial and industrial fans and blowers (herein referred to as “fans”).
This analysis was based on the DOE NODA III analysis, with various changes. The updates below include revised unit energy consumption and incremental cost values by efficiency level and updated shipments estimates based on additional inputs and insights from stakeholders.
In September 2017, the Statewide CASE Team submitted a proposal to the Energy Commission for test procedures and standards for standalone fans with the Air Movement and Control Association International (AMCA), Appliance Standards Awareness Project (ASAP), Northwest Energy Efficiency Alliance (NEEA), Natural Resources Defense Council (NRDC), and American Council for an Energy-Efficient Economy (ACEEE).1 The Statewide CASE Team also submitted a proposal for embedded fans with ASAP, NEEA, NRDC, and ACEEE.2
The Statewide CASE Team continues to support each of these proposals. This supplemental CASE document provides updates and/or clarifications on shipments, incremental cost, and unit energy consumption which may be useful to the Energy Commission.3
2. Fan Shipment Updates The Statewide CASE Team has recommendations for the Energy Commission to consider regarding updates to shipment estimates for embedded fans. These recommendations are based upon reviewing stakeholder feedback to the Energy Commission docket and investigating underlying data sources. All shipments represented in this document represent shipments quantities within the proposed scope of coverage the Statewide CASE Team has previously recommended in the joint proposals for standalone and embedded fans as described above. This scope includes all fans with rated shaft input power greater than or equal to 1 horsepower, or, for fans without a rated shaft input power, electrical input power greater than or equal to 1 kW, and fan airpower less than or equal to 150 horsepower.4
1 http://docketpublic.energy.ca.gov/PublicDocuments/17-AAER-06/TN221217_20170918T163210_AMCA_ASAP_NEEA_NRDC_ACEEE_PGE_SDGE_SCE_SoCalGas_Comments_AMCA_a.pdf 2 http://docketpublic.energy.ca.gov/PublicDocuments/17-AAER-06/TN221220_20170918T163646_ASAP_NEEA_NRDC_ACEEE_PGE_SDGE_SCE_SoCalGas_Comments_Efficiency.pdf 3 The data source for this document was provided by Lawrence Berkeley National Labs in 2018. 4 Various exclusions have also been recommended and more information can be found in the joint recommendations the Statewide CASE team supported on standalone and embedded fans.
103 / 322

4 | Statewide IOU Supplemental CASE Document: Fans & Blowers| 4-24-2018
2.1 Commercial Unitary Air Conditioners and Heat Pumps Air-Conditioning, Heating and Refrigeration Institute’s (AHRI) written comments to the Energy Commission on September 18, 2017 stated that an internal survey of their members was conducted regarding the portion of commercial unitary air conditioners and heat pumps (rooftop units or RTUs) that ship with either return or exhaust fans by size category.5 The survey showed a significantly lower portion of units with return/exhaust fan compared to the DOE NODA III estimates. See Table 1 for a reproduction of AHRI’s survey results along with the DOE NODA III estimates.
Table 1: DOE NODA III and AHRI Estimates of the Portion of Rooftop Unit Shipments with Return or Exhaust Fans
Rooftop Unit Size Fan Type DOE AHRI
65,000 Btu/h and <135,000 Btu/h
Return 50% 5 to 7%
Exhaust 0%
135,000 Btu/h and <240,000 Btu/h
Return 50% 7 to 10%
Exhaust 0%
240,000 Btu/h and <760,000 Btu/h
Return 50% 60 to 75%
Exhaust 100%
760,000 Btu/h Return/Exhaust NA 80 to 90% Source: Recreated from Table 6 of AHRI Comments on September 18, 2017, AHRI Survey of Manufacturers
On a national basis, AHRI’s estimates of rooftop units shipped with return or exhaust fans may be reasonable. However, the California Building Energy Efficiency Standards contain a prescriptive requirement that all cooling air handlers with a design total mechanical cooling capacity greater than 54,000 Btu/h be equipped with an economizer (Title 24, part 6, section 140.4(e)1). While it is possible to achieve compliance using the performance option instead of the prescriptive requirements (which results in some RTUs not using an economizer), the Statewide CASE Team believes that a very significant majority of rooftop units sold in California contain economizers.
When an HVAC system operates in economizer mode, the building must have a way to remove air because otherwise the building will become over-pressurized. The methods to regulate indoor air pressure include either barometric dampers, a return fan with dampers, or a power exhaust fan.6 The Statewide CASE Team conducted informal conversations with numerous California-based HVAC experts. Based on these conversations, we believe that the portion of rooftop units with return or exhaust fans in AHRI’s survey significantly underestimate actual California shipments for the 65,000 to 135,000 Btu/h and 135,000 to 240,000 Btu/h capacity ranges.
The Statewide CASE Team recommends that the Energy Commission use the DOE NODA III estimates for return and exhaust fans for all sizes of commercial unitary air conditioners and heat pumps.
5 http://docketpublic.energy.ca.gov/PublicDocuments/17-AAER-06/TN221201-1_20170918T134628_AHRI_Comment__Proposal__Title_20_II_PreRulemaking__Commercial_a.pdf 6 http://www.taylor-engineering.com/Websites/taylorengineering/articles/ASHRAE_Journal_-_Economizer_Relief_Systems.pdf
104 / 322

5 | Statewide IOU Supplemental CASE Document: Fans & Blowers| 4-24-2018
2.2 Air-Handling Units AHRI also suggested that the Energy Commission use significantly lower shipment estimates for air-handlers. AHRI showed that prior to 2005, the Current Industrial Report (CIR) from the U.S. Department of Commerce estimated annual air-handling unit shipments to be on the order of 370,000 units/year, which was used in the NODA III analysis.7 However, as highlighted by AHRI’s comments, this estimate suddenly dropped to the order of 70,000 units/year in 2005 and stayed in this range until the report was discontinued in 2011.
The Statewide CASE Team understands that adjustments were made to the way that the CIR classifies fan-coil units and that they were reclassified out of the “Central station air-handling units (motor-driven fan-type)” category in the CIR. For reference, the product codes in the reports are: 3334151117 (draw through), 3334151119 (blow through), and 3334151121 (heating and ventilating).
The lower estimate of roughly 70,000 units/year (nationally) does appear to be more in line with what would be expected when looking at other central plant HVAC components such as chillers and boilers. The CIR reports also publish the economic value of the shipments so $/ unit can be calculated. For the pre-2005 CIR reports, the price/unit for air-handling units was ~$2,100/unit, and then from 2005 onward ~$11,000/unit, which is a more reasonable cost for an air-handling unit.
The Statewide CASE Team would like to point out that shipments fluctuate across all heat transfer equipment product codes in the CIR, in some cases significantly, from year to year. Also of note is that in the year that fan-coil units were apparently reclassified out of the air-handling units category (2005) of the CIR, no other categories of HVAC equipment increased by several hundred thousand units/year. The Statewide CASE Team has not been able to determine the root cause of this accounting change or what happened to the roughly 300,000 previously classified air-handler unit shipments.
2.3 Air-Cooled Chillers The Statewide CASE Team also reviewed AHRI’s recommendation regarding air-cooled chiller fan shipments. AHRI stated that DOE’s original assumption of 14 fans per chiller would correspond to a 200-ton chiller, and that on a shipment weighted basis, the average chiller size is closer to 100 tons. AHRI stated this would then correspond to roughly 7 fans per chiller. AHRI also stated that DOE’s estimate of air-cooled chiller shipments in the NODA III of 12,759 units per year is low, and that based on the Current Industrial Reports, the average number of air-cooled chiller shipments from 1994-2010 was closer to 27,000 units per year. With a reduction in the number of fans per unit and an increase in the overall number of units, the total number of panel fans shipped in air-cooled chillers remains roughly the same. The Statewide CASE Team believes these suggested changes from AHRI are reasonable and note that they do not significantly impact the overall shipments of panel fans in air-cooled chillers.
2.4 New Categories of Embedded Fan Equipment Types The Statewide CASE Team also recommends that the Energy Commission consider adding more equipment types to capture more of the embedded fan market. These equipment types are:
7 https://www.census.gov/programs-surveys/current-industrial-reports.html
105 / 322

6 | Statewide IOU Supplemental CASE Document: Fans & Blowers| 4-24-2018
dedicated outdoor air systems (DOAS), energy/heat recovery ventilators (ERV/HRV), and fan-coil units (FCU). Confidential data on annual shipments of fans in each of these equipment types was used to provide an aggregated estimate of national fan shipments as shown below in Table 2 and breakouts by fan equipment class as shown in Table 3.
Table 2: Additional Embedded Fan Shipments (National)
DOAS ERV/HRV FCU
Fans per unit 2.33 2 1
Percentage units with an “in-scope” supply fan 100% 100% 100%
Percentage units with “in-scope” condenser fans 100% 0% 0%
Percentage units with a return fan 0% 0% 0%
Percentage units with an exhaust fan 33% 100% 0%
HVACR Fans (across all three equipment) 157,667 Note: Table represents total U.S. shipments (multiply by 12% to estimate CA shipments) within the proposed scope of
proposed standards as described in Section 2.
Table 3: New embedded fan categories by fan equipment class
Equipment Class Subcategory DOAS ERV/HRV FCU
HVACR Fans (across
all three equipment
types)
Panel Panel/Propeller (P) 43% 0% 0% 25%
Centrifugal housed
Airfoil (AF) 14% 0% 0% 8%
Backward Curved (BC) 14% 0% 0% 8%
Forward Curved (FC) 14% 100% 50% 37%
Centrifugal unhoused Centrifugal Unhoused 14% 0% 50% 21%
Total 100% 100% 100% 100%
2.5 Shipments Summary The Statewide CASE Team presents two scenarios for the resulting updated California shipment estimates using the AHRI and DOE NODA III shipment estimates for fans in RTUs. Table 4 and Table 5 show the shipment results using the AHRI and DOE NODA III estimates, respectively, for fans in RTUs and mirror the tables found in the DOE NODA III analysis. Both tables incorporate the updated shipments for AHUs and air-cooled chillers, based on AHRI’s recommendations, as well as the new estimates of shipments of fans in the additional equipment types (DOAS, ERV/HRV, and FCUs). The Statewide CASE Team recommends the Energy Commission use the DOE NODA III shipment estimates (Table 5 5). Additionally, note that within Standalone Fans, the “Mfr_OEM” column refers to standalone fans that are purchased by OEMs.8
8 https://www.regulations.gov/document?D=EERE-2013-BT-STD-0006-0192
106 / 322

7 | Statewide IOU Supplemental CASE Document: Fans & Blowers| 4-24-2018
Table 4: California shipments of standalone and embedded fans in 2012 (using AHRI assumptions for RTUs)
Equipment Class Subcategory
Standalone Fans Embedded Fans
Total Mfr Mfr_OEM OEM Axial Cylindrical Housed
Tube Axial (TA) 1,493 1,327 - 2,820
Vane Axial (VA) 635 565 70 1,270 Panel Panel/Propeller (P) 11,722 6,038 22,080 39,840 Centrifugal housed Airfoil (AF) 2,027 973 2,459 5,459
Backward Curved (BC) 3,973 1,907 1,703 7,583
Forward Curved (FC) 1,135 545 10,502 12,182 Centrifugal unhoused Centrifugal Unhoused 4,680 3,120 9,845 17,645 Inline and mixed flow Centrifugal Inline (CI) 2,098 182 - 2,280
Mixed Flow (MF) 828 72 - 900 Radial Radial 4,100 220 - 4,320 Power Roof Ventilator Axial Power Roof
Ventilator (APRV) 1,711 89 - 1,800 Centrifugal Power Roof Ventilator (CPRV) 5,989 311 - 6,300
Total - 40,391 15,349 46,659 102,399
Table 5: California shipments of standalone and embedded fans in 2012 (using DOE NODA III assumptions for RTUs)
Equipment Class Subcategory
Standalone Fans Embedded Fans
Total Mfr Mfr_OEM OEM Axial Cylindrical Housed
Tube Axial (TA) 1,493 1,327 - 2,820
Vane Axial (VA) 635 565 70 1,270 Panel Panel/Propeller (P) 11,722 6,038 22,080 39,840 Centrifugal housed Airfoil (AF) 2,027 973 2,682 5,682
Backward Curved (BC) 3,973 1,907 3,463 9,343
Forward Curved (FC) 1,135 545 21,023 22,703 Centrifugal unhoused Centrifugal unhoused 4,680 3,120 9,845 17,645 Inline and mixed flow Centrifugal Inline (CI) 2,098 182 - 2,280
Mixed Flow (MF) 828 72 - 900 Radial Radial 4,100 220 - 4,320 Power Roof Ventilator Axial Power Roof
Ventilator (APRV) 1,711 89 - 1,800 Centrifugal Power Roof Ventilator (CPRV) 5,989 311 - 6,300
Total - 40,391 15,349 59,163 114,903
107 / 322

8 | Statewide IOU Supplemental CASE Document: Fans & Blowers| 4-24-2018
3. Unit Energy Consumption Updates The Statewide CASE Team recommends that the Energy Commission use the following unit energy consumption (UEC) values in their analysis, where the non-qualifying scenario corresponds to setting no standards (EL 0) and the qualifying scenario corresponds to the levels recommended in the joint proposals referenced in Section 1.
These UEC values are similar to the DOE NODA III values, but updated to account for a new target reference efficiency for un-ducted fans, new motor and belt efficiency values based on AMCA 208 (which references AMCA 207), and for updated shipment values as described in the previous section.9 The NODA III LCC analysis had set the Efficiency Level (EL) 3 target efficiency value to 62% for un-ducted fans. However, the recently published AMCA standard 208 uses 60% for un-ducted fans, which aligns with the AMCA-Advocate Joint Proposal.10 The results presented below reflect the 60% target reference efficiency.
Table 6: Average Per-Unit Energy Use and Energy Savings for Standalone Fans
Equipment Class
Average Per-Unit Electricity Use for Non-
Qualifying Scenario (kWh/yr)
Average Per-Unit Electricity Use for Qualifying Scenario
(kWh/yr)
Average Per-Unit Electricity
Savings (kWh/yr)
Axial Cylindrical Housed 40,457 39,645 812
Panel Fans 10,849 10,246 602
Centrifugal Housed 43,198 42,781 418
Centrifugal Unhoused 42,648 42,586 62
In-line Mixed 16,669 15,369 1,300
Radial 46,117 44,655 1,462
Power Roof Ventilator 9,023 7,864 1,160
Shipment Weighted Average 26,363 25,668 694
Table 7: Average Per-Unit Energy Use and Energy Savings for Embedded Fans[CW1]
Equipment Class
Average Per-Unit Electricity Use for Non-
Qualifying Scenario (kWh/yr)
Average Per-Unit Electricity Use for Qualifying Scenario
(kWh/yr)
Average Per-Unit Electricity
Savings (kWh/yr)
Axial Cylindrical Housed 20,627 19,598 1,030
Panel Fans 2,246 2,163 83
Centrifugal Housed 5,800 5,567 233
Centrifugal Unhoused 15,284 15,204 80
Shipment Weighted Average 6,069 5,917 153
9 As reference, the un-ducted equipment classes include panel fans, centrifugal unhoused fans, and power roof ventilator fans. 10 https://www.techstreet.com/amca/standards/amca-208-18?product_id=2004773
108 / 322

9 | Statewide IOU Supplemental CASE Document: Fans & Blowers| 4-24-2018
Table 8: Average Per-Unit Energy Use and Energy Savings for All Fans
Product Class
Average Per-Unit Electricity Use for Non-
Qualifying Scenario (kWh/yr)
Average Per-Unit Electricity Use for Qualifying Scenario
(kWh/yr)
Average Per-Unit Electricity
Savings (kWh/yr)
Axial Cylindrical Housed 40,115 39,299 816
Panel Fans 6,081 5,766 314
Centrifugal Housed 21,341 21,031 310
Centrifugal Unhoused 27,382 27,310 72
In-line Mixed 16,669 15,369 1,300
Radial 46,117 44,655 1,462
Power Roof Ventilator 9,023 7,864 1,160
Shipment Weighted Average 17,580 17,156 424
4. Incremental Cost Updates The Statewide CASE Team recommends that the Energy Commission use the following incremental cost values in their analysis, where the non-qualifying scenario corresponds to EL 0 and the qualifying scenario corresponds to the levels recommended in the joint proposals referenced in Section 1.
Table 9: Average Per-Unit Installed Cost and Incremental Cost for Standalone Fans
Product Class
Average Per-Unit Installed Cost for Non-
Qualifying Scenario ($/unit)
Average Per-Unit Installed Cost for
Qualifying Scenario ($/unit)
Average Per-Unit Incremental Installed
Cost ($/unit)
Axial Cylindrical Housed $6,478.09 $6,823.75 $345.65
Panel Fans $1,975.32 $2,035.21 $59.89
Centrifugal Housed $3,018.64 $3,068.46 $49.82
Centrifugal Unhoused $2,931.40 $2,955.25 $23.85
In-line Mixed $3,572.87 $4,263.06 $690.19
Radial $1,931.19 $2,150.47 $219.28
Power Roof Ventilator $3,223.04 $3,817.27 $594.23
Shipment Weighted Average $2,900.55 $3,100.06 $199.51
Table 10: Average Per-Unit Installed Cost and Incremental Cost for Embedded Fans
Product Class
Average Per-Unit Installed Cost for Non-
Qualifying Scenario ($/unit)
Average Per-Unit Installed Cost for
Qualifying Scenario ($/unit)
Average Per-Unit Incremental Installed
Cost ($/unit)
Axial Cylindrical Housed $7,055.94 $7,494.98 $439.05
109 / 322

10 | Statewide IOU Supplemental CASE Document: Fans & Blowers| 4-24-2018
Panel Fans $1,567.09 $1,617.91 $50.82
Centrifugal Housed $1,725.75 $1,899.25 $173.50
Centrifugal Unhoused $3,605.12 $3,661.52 $56.40
Shipment Weighted Average $1,985.58 $2,094.12 $109.54
Table 11: Average Per-Unit Installed Cost and Incremental Cost for All Fans
Product Class
Average Per-Unit Installed Cost for Non-
Qualifying Scenario ($/unit)
Average Per-Unit Installed Cost for
Qualifying Scenario ($/unit)
Average Per-Unit Incremental Installed
Cost ($/unit)
Axial Cylindrical Housed $6,488.07 $6,835.34 $347.27
Panel Fans $1,749.05 $1,803.91 $54.86
Centrifugal Housed $2,263.01 $2,385.12 $122.11
Centrifugal Unhoused $3,307.27 $3,349.28 $42.01
In-line Mixed $3,572.87 $4,263.06 $690.19
Radial $1,931.19 $2,150.47 $219.28
Power Roof Ventilator $3,223.04 $3,817.27 $594.23
Shipment Weighted Average $2,487.01 $2,634.175 $147.16
110 / 322

1. 06-25-2018 -E-mail
2. O60118 - DPP June E-mail
3. 060518 - 2022 Non Res RFP
4. 060718 - 2022 Non Res RFP
5. 060718 - 2022 Non Res SOW RM
6. 060718 - EMV June e-mails
7. 060718 - LADWP e-mail
8. 060818 - EVSE e-mail
9. 060818 - Hearth Products June e-mails
10.060818 - T24 Bidder review
11.061118 - Cooking prod e-mail
12.061118 - Floures Lamps e-mails
13.061818 - Hearth Products June E-mails
14.061218 - Floures Lamps e-mails
15.061218 – IOU call coordination
16.061318 – Cooking prod e-mail
17.061418 – ACM Ref Man Review e-mail
18.061418 – Additions Alterations Sect Review
19.061518 – LPM e-mails
111 / 322

20.061818 – CAC waivers June e-mails
21.061818 – Compliance manuals e-mails
22.061818 – Diswasher e-mails
23.061918 – Floures Lamps e-mails
24.061918 – SDGE T24 & T20 Intgr study presentation
25.062018 – Com dryer e-mail
26.062018 – Software e-mails
27.062118 – Compliance manuals e-mails
28.062118 – Diswasher e-mails
29.062118 – Dishwasher e-mails 2
30.062118 – EMV June e-mails
31.062118 – SDGE T24 & T20 Intgr study presentation
32.062218 – Cooktop test procedure e-mail
33.062218 – Cooktop test procedure1 e-mail
34.062418 – Fan Staff e-mail
35.062518 – Cooking prod e-mails
36.062518 – Electric Vehicle e-mail
37.062518 – Walk in Fridge e-mail
38.062618 - Fans Blowers e-mails
39.CS Attribution Study Draft Research Plan V2-ct-In
40.62218 - PV Event invite
112 / 322

113 / 322

�
����� ������������� ������������������
��� ���������� ! "#$�%"!&�
��� '����(��)�**+
�� ���� ,(-�(./0�1.(%/�*����2�����3*��������*�
������������ ��������������� �������������������� �������������������������������������
��������������� ������� ��������������� �� ����������
����������������������� !�"��#�$��
����%��&��'��(�����)*�+,�-("�"��'�����.�
�� �����/��0� ����1������2 ��������� ��
������������'3�
�
44444���������(3��������+������ �5�������6(/07*���������(3��2�&�5�������2��'���2�����������'�
� ��3��� ��44444�
���(������
�
8������� �+�� � ��&������'�� ������8������� ����� 3�����������5� ����� �����'������������ ��'� 3���3��'������ 3��
������������� 3��2�����5���&���'��'� 3��� ������� �� �����
�
9�� ��
�� �
�
������%��&��'��(�����)*�+,����� ��("�"��'��������
����������������������� !����:�$��
������������� ���-������������� �� �������.�
�� ������6(/07*��0� ����1������2 ��������� ��
�
���������� ����!��"#���������������������������� �����$���������%�����������������������������������������"����������������������"������ ������������������������������������"���"����&���������������������'���(����)�����&������������������������������������*������ ��!�������������!������������� �����&������"���������������������+���� ������������(��������&��"��,�������$�'�"��������-��������������������������������./0�123�2104�;�����������&��"5�"������
�
�
(3�����������'��� ����� ������5�����������'���9����� ������5�� ��3��� ���+�&���2��������<��� ��5�����5���� �����
(3�����������'��� ����� ������5�����������'���9����� ������5�� ��3��� ���+�&���2��������<��� ��5�����5���� �����
114 / 322

115 / 322

o o o
116 / 322

117 / 322

Ray
Men
doza
K
elly
Cun
ning
ham
/ C
odes
& S
tand
ards
/ 5
30-7
57-5
271
(des
k) /
530
-574
-875
6 (m
obile
)
118 / 322

119 / 322

Ray
Men
doza
K
elly
Cun
ning
ham
/ C
odes
& S
tand
ards
/ 5
30-7
57-5
271
(des
k) /
530
-574
-875
6 (m
obile
)
120 / 322

121 / 322

Contract No.: Vendor Name:
Page 1 of 14
2022 Building Energy Efficiency Standards CASE Proposal Development for Nonresidential Properties
The Statewide Codes and Standards Program (“C&S Program”), which is implemented by California’s investor-owned utilities (“IOUs”), including Pacific Gas and Electric Company (“PG&E”), San Diego Gas and Electric, Southern California Gas Company, and Southern California Edison Company, saves energy on behalf of ratepayers by influencing codes and standards-setting organizations to strengthen energy efficiency regulations. The California Long Term Energy Efficiency Strategic Plan directed the C&S Program to perform specific advocacy activities targeted to increasing the stringency of Part 6 and Part 11 of the Building Energy Efficiency Standards (Title 24) that is updated on a triennial timeline by the California Energy Commission (Energy Commission).
The work performed by the successful bidder (Consultant) will assist PG&E and the Statewide Utility Codes and Standards Team in proposing new or revised sections of Part 6 and Part 11 of Title 24 that will provide a path to compliance and statewide energy savings for nonresidential new construction projects, including alterations and additions. Reducing energy use in existing buildings through alterations is critical to reaching multiple statewide greenhouse gas emission reduction goals.
It is expected that the successful bidder will assemble a team of building construction and energy use experts to identify the measures or measure packages that have the highest energy use reduction potential, are cost-effective, technical technically feasible, enforceable by local building departments, and meet the deadlines associated with the upcoming 2022 code cycle. On behalf of the C&S Program and under the direction of PG&E, the Consultant will coordinate and support the development of Codes and Standards Enhancement (CASE) proposals and participation in public rulemaking processes for California’s 2022 Title 24 rulemaking cycle. This includes providing technical input into the supporting documentation and compliance processes that will be used in applying the Title 24 Standards in practice. The CASE proposals provide information for the Energy Commission to make an informed policy decision on efficiency enhancements to the Title 24 Building Energy Efficiency Standards and
122 / 322

Contract No.: Vendor Name:
Page 2 of 14
CALGreen. To view examples of past CASE proposals, visit www.title24stakeholders.com.
Defined TermsCASE Team: Includes the Statewide Utility Codes and Standards Team and all Project
Teams involved in preparing and submitting the CASE studies.
PG&E Project Manager: PG&E staff responsible for leading this effort and managing the contract.
PG&E Program Manager: PG&E staff responsible for leading a Codes and Standards subprogram, such as Title 24 or Title 20 Advocacy.
Project Coordinator: Connect and lead the coordination of the various Project Teams and advocacy efforts across all of the non-residential, residential, and multifamily proposals with the CASE Team.
Statewide Utility Codes and Standards Team (or Statewide Utility Team): Codes and Standards program staff and management employed by California’s investor-owned utilities (IOUs) and municipal utilities.)
Project Team: Group of subject matter experts that perform tasks related to preparing thorough and high-quality CASE reports and supporting the rulemaking process. This includes but is not limited to conducting CASE research, drafting code language and code change proposals, responding to comments, and authoring each CASE report.
Project Team Lead: For each major topic category (residential, nonresidential, and multifamily), the firm and/or individual responsible for tasks related to developing successful CASE reports and supporting the rulemaking process. This includes but is not limited to recruiting Project Team members, coordinating their activities within the category and with other leads across categories, and ensuring all deliverables are completed on time and within budget.
Nonresidential Project Team: Group of subject matter experts that perform tasks related to preparing thorough and high-quality CASE reports on topics related to nonresidential new construction, additions and alterations and supporting the rulemaking process with expertise on these topics. This includes but is not limited to conducting CASE research, drafting code language and code change proposals, responding to comments, and authoring each CASE report.
Nonresidential Project Team Lead: The firm and/or individual responsible for tasks related to developing successful nonresidential-related CASE reports and supporting the rulemaking process. This includes but is not limited to recruiting Project Team members, coordinating their activities within the category and with
123 / 322

Contract No.: Vendor Name:
Page 3 of 14
other leads across categories, and ensuring all deliverables are completed on time and within budget.
Scope of WorkConsultant shall work under the direction of the PG&E Project Manager with guidance from the Project Coordinator and the Statewide Utility Codes and Standards Team. Project Teams include subject matter experts that are adept in energy efficient building systems for non-residential applications including healthcare facilities. For this contract, Consultant shall assume the role of the Nonresidential Measures Project Team Lead and will assemble a Nonresidential Project Team, including subcontractors with expertise in specific areas, such as building envelope, advanced HVAC strategies, building management systems, lighting sources and controls, indoor air quality systems, refrigeration and other topic areas that pertain to nonresidential new construction, additions and alterations. As the measure list is solidified, niche expertise in specific applications may be needed. (laboratories, industrial process facilities, etc.) As newly constructed healthcare facilities are now included in the scope of Building Energy Efficiency Standards, there may be applications within Occupancy Group I that were previously exempt but must now be considered. The project shall consist of the following tasks: 1. Project Coordination 2. Identification of Nonresidential CASE Proposal Topics 3. CASE Proposal Research and Development 4. Support during the Pre-rulemaking and Rulemaking Process 5. Support during the Post-rulemaking Process 6. Coordination with Utilities, State Agencies, and Public Stakeholders 7. Project Reporting
The Consultant shall perform the work necessary to complete each task under the Contract as defined below, and shall provide deliverables as required on the due dates agreed upon by the PG&E Project Manager and Consultant. The project schedule is driven by the Energy Commission Title 24 Standards update schedule, and is subject to changes from the Energy Commission.
Task 1: Project Coordination
Task 1.1: Project Coordination Kick-off Consultant will coordinate and conduct a kick-off meeting with PG&E Project Manager and the Statewide Utility Team to discuss the following items:
Project Plan, including staffing, and timeline;
Project objectives;
Project deliverables (e.g., Work Plans, measure proposals, CASE Reports, Compliance Manuals, and Code Change Savings Reports with supporting documents), staffing, timeline, and budget; and
124 / 322

Contract No.: Vendor Name:
Page 4 of 14
Protocols for engaging PG&E Codes and Standards Program Managers, PG&E Energy Efficiency Program Managers, the Statewide Utility Codes and Standards team, the Project Coordinator for the 2022 cycle, other consultants that are contracted through PG&E to support the 2022 Title 24 code change cycle, stakeholders who implement or enforce the Standards in practice, and Energy Commission staff throughout the term of the project..
Task 1 Deliverables Task 1 Deliverables and Due Dates
1. PG&E Kick-Off Meeting Agenda – Due within ten (10) business days of Contract Effective Date
2. PG&E Kick-Off Meeting Notes – Due within five (5) business days after Kick-Off Meeting
3. Agenda and notes from kick-off calls with subject matter experts or subcontractors that will support each CASE Proposal topic area – Due as determined by Consultant and PG&E Project Manager
Task 2: Identification of Nonresidential CASE Proposal Topics
Task 2.1: Conduct Initial Literature Review and Preliminary Research to Identify Potential Title 24 2022 CASE Proposal Topics
Consultant shall review documents, reports, and other sources to identify and understand the status of the commercial construction market, including but not limited to: new and existing building characteristics, trends, construction materials, opportunities and barriers to improving efficiency, and energy code compliance.
At the close of each code cycle, the CASE team reviews the accepted and rejected measures and develops a list of potential research for the next cycle. This list will be provided for review as part of the preliminary research, taking into account any initial Energy Commission input on the viability of future measures.
Consultant shall identify measures that may be suitable and shall work with the PG&E Program Manager to connect with the statewide utility nonresidential program leads to coordinate program offerings with likely future code requirements. This may include connecting with leads from multiple sectors, including large commercial, high-tech, industrial, healthcare, small and medium businesses, or agriculture.
Consultant shall summarize the findings in a Preliminary Research Report and presentation to share with the Statewide Utility Codes and Standards Team as
125 / 322

Contract No.: Vendor Name:
Page 5 of 14
well as with the Energy Commission Building Standards Office staff as determined by the PG&E Project Manager.
Task 2.2: Identify Potential 2022 Nonresidential Measures
Utilizing the findings from the prior task and potential measures identified prior to the start of this contract, the Consultant shall identify and prioritize potential measures to pursue for CASE Proposals for the 2022 code cycle. Task 2 will culminate in a package of recommended CASE Proposals that the CASE Team will bring to the Energy Commission for review and prioritization. For each opportunity or measure, Consultant shall communicate the current code status, potential energy savings, known cost-effectiveness, technical feasibility, greenhouse gas emissions reduction potential, program opportunities in advance of inclusion in the energy standards, and a brief timeline and plan for developing a robust CASE Proposal.
Gaps in the information, and data that will be needed to develop a robust proposal, should be identified and summarized. Measure-specific work plans that describe research or testing required to support the 2022 code development process must also be identified and summarized as a Task 2 deliverable.
In addition, Consultant may propose revisions to the CBECC-Res or CBECC- Com software calculation engines. Work plans to support these measures will include coordinating with the Project Coordinator, the Statewide Utility Codes and Standards Team, and software developers to test prototypes and assumptions as needed. This may include prototype design characteristics, prescriptive baselines, ACM assumptions, and measures that may be available for compliance credit. Consultant shall determine if existing or in-progress prototype designs represent the existing building stock sufficiently to use in alterations and additions projects, and shall provide a similar set of recommendations for existing prototype design(s).
Results from Task 2 will be presented to the Energy Commission Building Standards Office staff for review and comment. The Energy Commission will determine which proposals will be included in Task 3.
Task 2 Deliverables Task 2 Deliverables and Due Dates
1. Draft Preliminary Research Report – July 10, 2018 2. Final Preliminary Research Report – Due ten (10) business days after
receiving comments from PG&E Project Manager 3. Draft recommendations for 2022 Nonresidential CASE Proposals, including
proposed revisions to Energy Commission compliance software in presentation and written form – as determined by PG&E Project Manager
Commented [KC1]: Statewide Team: Do we want this in here? Or leave it out of this RFP?
126 / 322
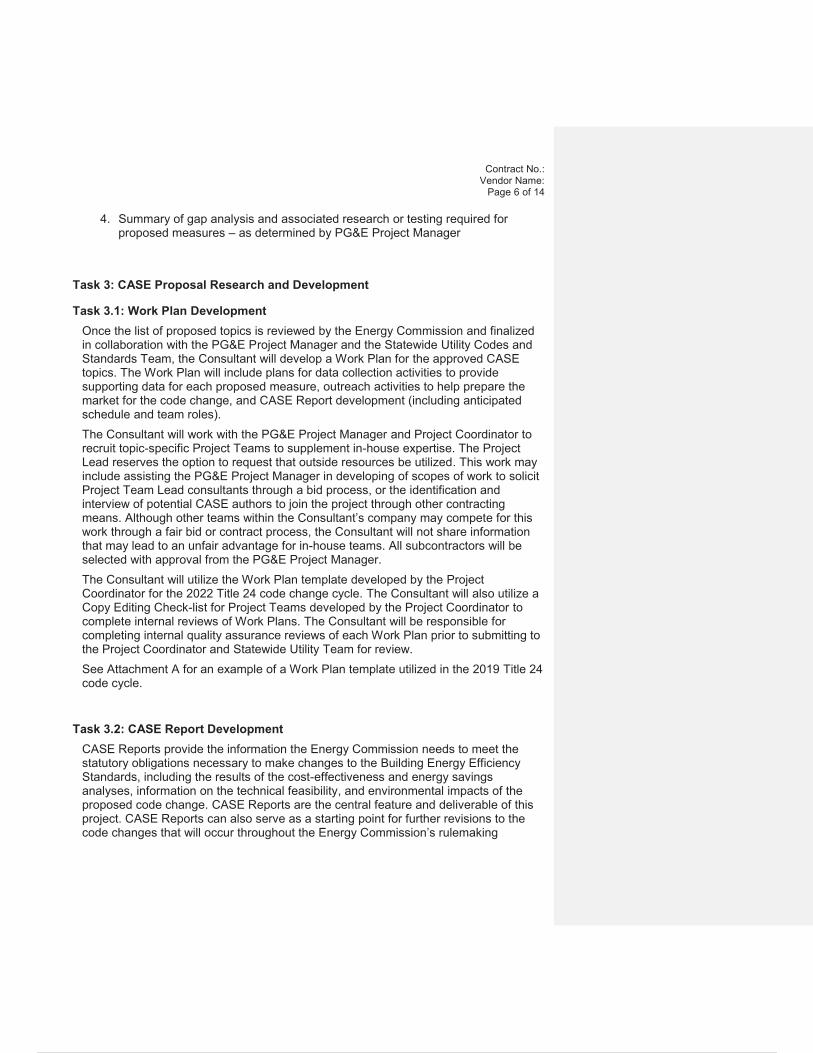
Contract No.: Vendor Name:
Page 6 of 14
4. Summary of gap analysis and associated research or testing required for proposed measures – as determined by PG&E Project Manager
Task 3: CASE Proposal Research and Development
Task 3.1: Work Plan Development Once the list of proposed topics is reviewed by the Energy Commission and finalized in collaboration with the PG&E Project Manager and the Statewide Utility Codes and Standards Team, the Consultant will develop a Work Plan for the approved CASE topics. The Work Plan will include plans for data collection activities to provide supporting data for each proposed measure, outreach activities to help prepare the market for the code change, and CASE Report development (including anticipated schedule and team roles). The Consultant will work with the PG&E Project Manager and Project Coordinator to recruit topic-specific Project Teams to supplement in-house expertise. The Project Lead reserves the option to request that outside resources be utilized. This work may include assisting the PG&E Project Manager in developing of scopes of work to solicit Project Team Lead consultants through a bid process, or the identification and interview of potential CASE authors to join the project through other contracting means. Although other teams within the Consultant’s company may compete for this work through a fair bid or contract process, the Consultant will not share information that may lead to an unfair advantage for in-house teams. All subcontractors will be selected with approval from the PG&E Project Manager. The Consultant will utilize the Work Plan template developed by the Project Coordinator for the 2022 Title 24 code change cycle. The Consultant will also utilize a Copy Editing Check-list for Project Teams developed by the Project Coordinator to complete internal reviews of Work Plans. The Consultant will be responsible for completing internal quality assurance reviews of each Work Plan prior to submitting to the Project Coordinator and Statewide Utility Team for review. See Attachment A for an example of a Work Plan template utilized in the 2019 Title 24 code cycle.
Task 3.2: CASE Report Development CASE Reports provide the information the Energy Commission needs to meet the statutory obligations necessary to make changes to the Building Energy Efficiency Standards, including the results of the cost-effectiveness and energy savings analyses, information on the technical feasibility, and environmental impacts of the proposed code change. CASE Reports are the central feature and deliverable of this project. CASE Reports can also serve as a starting point for further revisions to the code changes that will occur throughout the Energy Commission’s rulemaking
127 / 322

Contract No.: Vendor Name:
Page 7 of 14
process. The CASE Reports can also inform revisions to Title 24, Part 11 (CALGreen). The Consultant will work with PG&E Project Manager and the Project Coordinator to develop schedules for the development, review, and delivery of CASE Reports. The Consultant shall follow the CASE Report template, which provides guidance on methodologies for technical analyses to ensure consistency across all CASE Reports, and data that should be used in all CASE analyses (e.g., time dependent valuation (TDV) and construction forecasts). This template will be distributed to all Project Teams. See Attachment B for the template used to support the 2019 Title 24 code cycle as an example of the type of information that will likely be needed to develop a thorough and useful report. The Consultant will work with Project Coordinator as CASE Reports are being developed to address issues and questions pertaining to the CASE Report template, methodologies, or data collection procedures. The Consultant shall coordinate with the PG&E Project Manager, Project Coordinator, and Energy Commission to obtain (and/or develop) analysis tools needed for completion of CASE Proposals, new construction forecasts, cost-effectiveness methodologies, etc. The Consultant shall conduct outreach, in collaboration with other members of the CASE Team (including the Statewide Utility Team members leading the Compliance Improvement subprogram) to inform the research that goes into the CASE Report and assure that proposals result in code requirements that will be enforceable by those who are responsible for compliance and applicable in practice, and by those who must follow the code, to provide efficient buildings for the citizens of California. Attachment B represents the template used for the 2019 Title 24 code cycle. The Energy Commission approves the template, and has the final word on what must be contained within it. Past CASE Reports are available at www.title24stakeholders.com.
Task 3 Deliverables Task 3 Deliverables and Due Dates
1. Draft Work Plan – Due thirty (30) business days after Contract Effective Date 2. Final Work Plan – Due five (5) business days after receiving comments from
PG&E Project Manager 3. Complete Copy Editing Check-list – Due as determined by Consultant and
PG&E Project Manager 4. CASE Report Outline – Due as determined by Consultant and PG&E Project
Manager5. Preliminary CASE Report – Due as determined by Consultant and PG&E
Project Manager
128 / 322

Contract No.: Vendor Name:
Page 8 of 14
6. Draft CASE Report – Initial deadline determined by the Energy Commission; Due ten (10) business days after receiving comments from PG&E Project Manager
7. Final CASE Report – Initial deadline determined by the Energy Commission; Due ten (10) business days after receiving comments from PG&E Project Manager
Task 4: Support during the Pre-rulemaking and Rulemaking Process
Task 4.1: Participation in Utility-Sponsored Public Stakeholder Meetings Consultant shall work with the PG&E Project Manager and the Project Team Leads to contribute to and participate in a series of utility-sponsored public stakeholder meetings where the CASE Team will present CASE measures, solicit comments and data from the stakeholders, and present methodologies and results that are ready to share publicly at the time of the stakeholder meeting.
Task 4.2: CASE Team Participation in the Energy Commission Pre-rulemaking Process
The Consultant will coordinate with the Project Coordinator to determine what level of participation is needed in all public workshops the Energy Commission hosts to discuss the 2022 Title 24 Standards, including all Energy Commission-sponsored pre-rulemaking workshops. Consultant will prepare comments on the draft language, and work with the Project Coordinator to transmit them to the Energy Commission. Consultant shall track all public comments that are submitted to the Energy Commission during the pre-rulemaking phase on nonresidential-related issues, and ensure that the appropriate Project Team members are aware of issues. This may require the timely preparation of responses to each issue. Consultant shall help to identify potential areas of duplication of effort within the various Project Teams, and recommend revisions to minimize duplicative activities. If the Energy Commission requests the CASE Team’s assistance in responding to public comments on a particular issue, Consultant will work with PG&E Project Manager and the Project Coordinator to develop a strategy for responding to the Energy Commission.
Task 4.3 Participation in the Energy Commission Rulemaking Process The Consultant will support the CASE Team’s participation in all public workshops the Energy Commission hosts to discuss the 2022 Title 24 Standards including, but not limited to, the 45-day hearing(s), 15-day hearing(s), and the adoption hearing. The Consultant will review of each the documents that the Energy Commission releases for public review during the rulemaking, including every version of the
129 / 322

Contract No.: Vendor Name:
Page 9 of 14
Standards language (e.g., 45-Day Language, 15-Day Language, errata). Consultant will provide comments on the draft language to the Project Coordinator, who will deliver them to the Energy Commission. Consultant shall review all public comments pertaining to the nonresidential measures that are submitted to the Energy Commission during the rulemaking phase, and ensure that the appropriate team members are aware of issues. The Consultant may need to prepare timely responses. Consultant shall help to identify potential areas of duplication of effort within the various Project Teams. If the Energy Commission requests the CASE Team’s assistance in responding to public comments on a particular issue, Consultant will work with the PG&E Project Manager, Project Coordinator and other team members to develop a strategy for responding to the Energy Commission.
Task 4 Deliverables and Budget Task 4 Deliverables and Due Dates
1. Draft presentations for utility-sponsored stakeholder meetings – Due as determined by Consultant and PG&E Project Manager
2. Final presentations and notes for utility-sponsored stakeholder meetings – Due ten (10) business days after receiving comments from PG&E Project Manager
3. Stakeholder meeting notes, compiled comments, and responses on the nonresidential components of the draft Standards language (45-Day, 15-Day) –Due as determined by Consultant, PG&E Project Manager and Project Coordinator to meet the Energy Commission’s deadline for docketing comments
4. Pre-rulemaking public comment tracker – Due fifteen (15) business days after the Energy Commission closes all pre-rulemaking dockets.
5. Rulemaking public comment tracker – Due fifteen (15) business days after the Energy Commission closes all rulemaking dockets.
Task 5: Support During Post-rulemaking
Task 5.1: Provide Input on Compliance Manuals, ACM Reference Manuals, and Software Tools
After the 2022 Title 24 Standards are adopted, the Energy Commission will update the Residential and Nonresidential Compliance Manuals, the Residential and Nonresidential Alternative Calculation Method (ACM) Reference Manuals. The Consultant will review the relevant sections of each document and provide input to the Project Coordinator.
130 / 322

Contract No.: Vendor Name: Page 10 of 14
Task 5.2: Final Project Reporting Consultant will develop a final report for PG&E Project Manager and Statewide Utility Codes and Standards Team approval for the following reports:
Final CASE Report: includes final code language, full savings calculations, modeling software runs (including back up files), and final savings estimates.
CASE Study Results Report: reports provides detailed information on the code change that was adopted, and documents any revisions that occurred between the time the CASE Report was submitted to the Energy Commission during the pre-rulemaking phase and the time the Standards were adopted. This report should also include anticipated barriers to compliance, and opportunities to overcome those barriers.
Impact Analysis Report: documents annual and cumulative savings claims for each CASE Proposal.
Code Change Savings Report (CCSR): provides California Public Utilities Commission with information to support their evaluation of PG&E’s contributions to the 2022 Title 24 code change cycle. This will include:
o All regulatory documents o CASE Report strategy o Emails or notes from meetings with industry stakeholders o Market studies, if applicable o Sales data, if applicable o Lab testing data, if applicable o Other supporting documents, if applicable
All documents shall be organized and submitted with the CCSRs. Consultant shall follow all PG&E Project Manager or Project Coordinator instructions for developing and delivering the reports. Consultant will work with PG&E Project Manager and the Project Coordinator to develop schedules for the development, review, and delivery of each deliverable outlined above.
Task 5 Deliverables Task 5 Deliverables and Due Dates
1. Post-adoption public comments – Due fifteen (15) business days after the Energy Commission closes all post-adoption dockets.
2. Draft CASE Study Results Report – Due as determined by Consultant and PG&E Project Manager
131 / 322

Contract No.: Vendor Name: Page 11 of 14
3. Final CASE Study Results Report – Due ten (10) business days after receiving comments from PG&E Project Manager
4. Draft Impact Analysis Report – Due as determined by Consultant and PG&E Project Manager
5. Final Impact Analysis Report – Due ten (10) business days after receiving comments from PG&E Project Manager
6. Draft Compliance Issues Report – Due as determined by Consultant and PG&E Project Manager
7. Final Compliance Issues Report – Due ten (10) business days after receiving comments from PG&E Project Manager
8. Draft Code Change Savings Report – Due as determined by Consultant and PG&E Project Manager
9. Final Code Change Savings Report – Due ten (10) business days after receiving comments from PG&E Project Manager
Task 6: Coordination with Utilities, State Agencies, and Public Stakeholders
Task 6.1: Coordinate with Other CASE Team Participants Consultant shall participate in the project management, and file sharing and project management protocols where CASE Team members and others (as determined by PG&E Project Manager) share and access files related to the 2022 Title 24 code change cycle.
Coordination with Statewide Utility Codes and Standards Team Consultant shall coordinate with the other members of the Statewide Utility Codes and Standards Team, including the other subprograms that work with the Energy Standards. Consultant shall participate in regular project coordination meetings, as requested. Consultant will be responsible for compiling and circulating presentations and/or meeting notes for these meetings, based on input from the Project Coordinator or the PG&E Project Manager. Coordination with Other Groups within the Statewide Utility Codes and Standards Team Consultant shall assist the PG&E Project Manager in maintaining communications with other internal groups at the utilities working on, or impacted by the 2022 Title 24 CASE Team activities.
Coordinate External Stakeholder Outreach and CommunicationThe Consultant will work with the PG&E Project Manager and the Project Coordinator to ensure that the public-facing elements of the project are consistent and appropriate in terms of tone, messaging, style, use of the PG&E or Statewide Utility Team name and logo, etc. Public-facing elements include, but are not limited to, the stakeholder
132 / 322

Contract No.: Vendor Name: Page 12 of 14
website, presentations and reports that are released for public review, and CASE Team communications with stakeholders external to PG&E (email, phone, in-person communications, etc.) The Consultant will follow an established protocol for CASE Team communications with external stakeholders. This protocol will include guidance on how CASE Team members should introduce themselves when representing the Statewide Utility Codes and Standards Team, instructions on consistent messaging about the Statewide Utility Codes and Standards Team’s role in the 2022 Title 24 Standards development process, appropriate protocol for written and verbal communications, and guidance on how communications should be documented so they can be referenced in Code Change Savings Reports. The Project Coordinator will distribute the protocol. Throughout the project, the Consultant will ensure that each CASE Team member working on the measures follows the protocol for communication with external stakeholders.
Task 6 Deliverables Task 6 Deliverables and Due Dates
1. Contribute to document sharing sites that will be accessible to PG&E staff and others (as determined by PG&E Project Manager) – Due ongoing throughout project
2. Maintain list of all individuals contributing to the 2022 Title 24 advocacy effort on behalf of PG&E, their roles and contact information – Due ongoing throughout project
3. Title 24 CASE Development Update Presentations – Due as determined by Consultant and PG&E Project Manager
Task 7: Project Reporting
Task 7.1: Monthly Status Report Consultant shall submit Monthly Status Reports with the invoice to the PG&E Project Manager for review, comment, and approval. Each Monthly Status Report shall include, but is not limited to, a brief description of the proposed standards change and objective, work progress, comparison of budget and actual expenditures for all project tasks (and any other expenditures), status of key deliverables, and other items as requested by the PG&E Project Manager.
Task 7.2: Real-Time Documentation of Advocacy Consultant shall maintain real-time documentation of advocacy activities throughout the term of the contract. Advocacy activities shall be documented monthly, and categorized by attribution factor, following a protocol designed, and distributed by the Project Coordinator. The report may include:
133 / 322

Contract No.: Vendor Name: Page 13 of 14
A description of monthly events and tasks undertaken in support of the overall advocacy effort with each event or task categorized into one of the following attribution factors:
o Development of Compliance Determination Methods o Development of Technical and Cost Information o Feasibility of Meeting the Standard o Other (miscellaneous)
Organization of communications records (e.g., emails, call notes, meeting notes, etc.) relevant to efforts in support of each event or task completed during a given month.
Task 7.3: Final Project Report Consultant shall prepare a Final Report that summarizes all work completed in support of the 2022 Title 24 advocacy effort, and submit Final Report to PG&E Project Manager for review, comment, and approval. The Final Report shall include but not be limited to:
A summary of activities conducted for each task;
Estimated attribution of savings for each measure to the statewide Codes and Standards program;
A summary of workshop and stakeholder meeting activities, disposition and future activities;
A summary of code enhancement efforts other than those related to CASE studies to which the Statewide Utility Codes and Standards Team made significant contributions; and
A summary of review efforts related to the update of the Building Energy Efficiency Standards, ACM, and compliance manuals.
Task 7.4: Contract Deliverables Documentation At the end of the project work, Consultant shall provide via email or approved file sharing service all relevant contract deliverables documentation, including but not limited to:
PDF copies of email contractual project approvals, such as approvals to shift budget from one task to another
PDF documents of deliverables by task, either individually or collectively, as per PG&E Project Manager request.
Task 7 Deliverables Task 7 Deliverables and Due Dates
134 / 322

Contract No.: Vendor Name: Page 14 of 14
1. Monthly Status Report – Due monthly on the 21st day of each month (or nearest business day) with the invoice
2. Draft version of Final Project Report – Due as determined by Consultant and PG&E Project Manager
3. Final version of Final Project Report – Due ten (10) business days after receiving comments from PG&E Project Manager
4. PDF documents and files cataloging all project deliverables – Due ten (10) business days within completion of project Scope of Work
135 / 322

136 / 322

Ray
Men
doza
K
elly
Cun
ning
ham
/ C
odes
& S
tand
ards
/ 5
30-7
57-5
271
(des
k) /
530
-574
-875
6 (m
obile
)
137 / 322

138 / 322

139 / 322

140 / 322

141 / 322

142 / 322

143 / 322

144 / 322

Ray
Men
doza
145 / 322

146 / 322

147 / 322

Kel
ly C
unni
ngha
m /
Cod
es &
Sta
ndar
ds /
530
-757
-527
1 (d
esk)
/ 5
30-5
74-8
756
(mob
ile)
Ray
Men
doza
148 / 322

Kel
ly C
unni
ngha
m /
Cod
es &
Sta
ndar
ds /
530
-757
-527
1 (d
esk)
/ 5
30-5
74-8
756
(mob
ile)
149 / 322

150 / 322

151 / 322

1.
a.
152 / 322

153 / 322

154 / 322

155 / 322

156 / 322

157 / 322

158 / 322

159 / 322

160 / 322

161 / 322

162 / 322

163 / 322

164 / 322
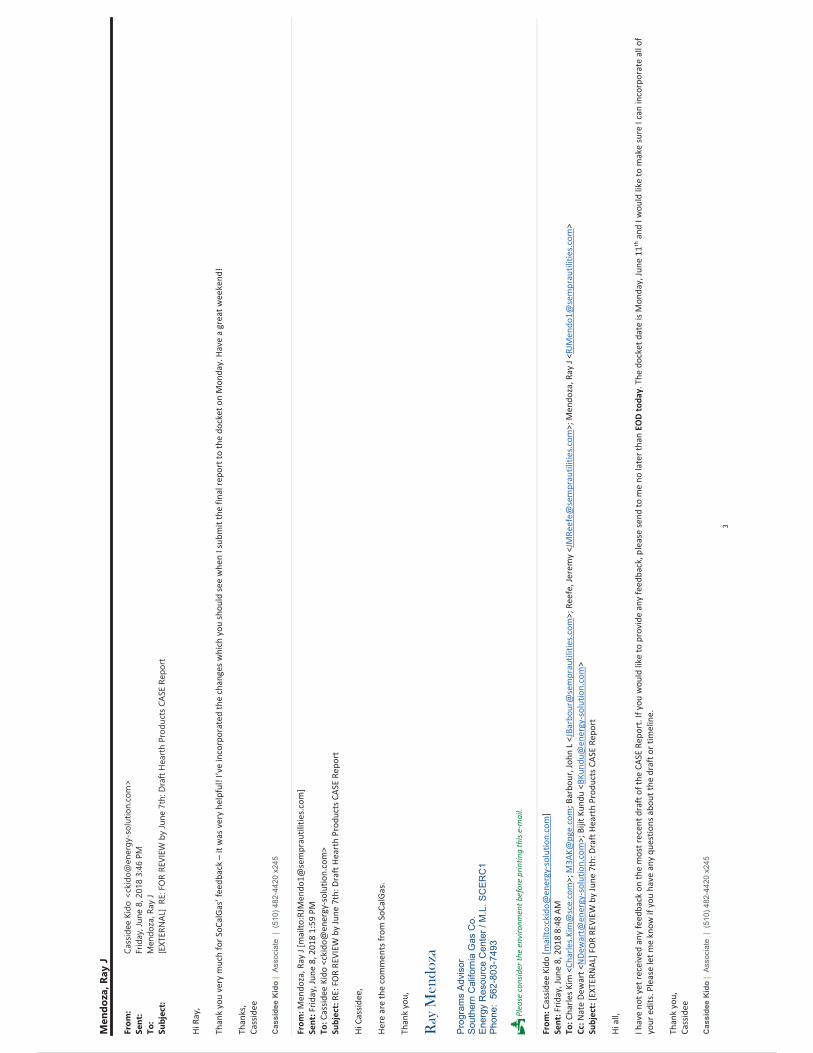
Ray
Men
doza
165 / 322

166 / 322

167 / 322

168 / 322

169 / 322

170 / 322

171 / 322

172 / 322

173 / 322

174 / 322

Ray
Men
doza
175 / 322

176 / 322

177 / 322

178 / 322

179 / 322

o
Kel
ly C
unni
ngha
m /
Cod
es &
Sta
ndar
ds /
530
-757
-527
1 (d
esk)
/ 5
30-5
74-8
756
(mob
ile)
180 / 322

181 / 322

182 / 322

……
……
……
……
……
……
……
……
……
……
Kat
her
ine
Day
em,
Ph
DPr
inci
pal
900
Mai
n Ave
nue,
Sui
te 1
, D
uran
go,
CO
813
01
t: (
970)
459
-458
8 x
102
S
kyp
e: k
athe
rine
.day
em1
ww
w.x
erg
ycon
sult
ing
.com
183 / 322

On
beha
lf of
the
Sta
tew
ide
Util
ity C
odes
and
Sta
ndar
ds T
eam
184 / 322

On
beha
lf of
the
Sta
tew
ide
Util
ity C
odes
and
Sta
ndar
ds T
eam
185 / 322

On
beha
lf of
the
Sta
tew
ide
Util
ity C
odes
and
Sta
ndar
ds T
eam
186 / 322

187 / 322

188 / 322

189 / 322

190 / 322

191 / 322

192 / 322

193 / 322

194 / 322

195 / 322

196 / 322

197 / 322

198 / 322

199 / 322

200 / 322

201 / 322

202 / 322

203 / 322
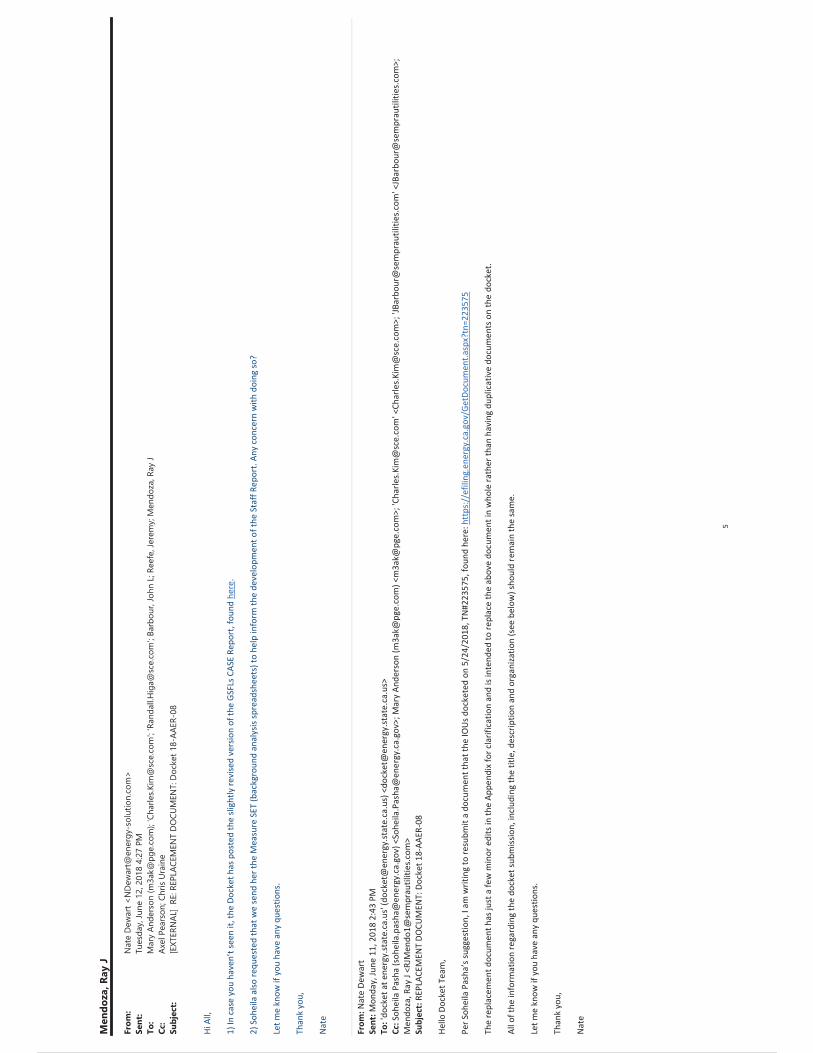
204 / 322

205 / 322
206 / 322

207 / 322

208 / 322

209 / 322

210 / 322

211 / 322

App
endi
x A
: Ele
ctri
city
Rat
es
The
ele
ctri
city
rat
es u
sed
in th
e an
alys
is pr
esen
ted
in th
is re
port
wer
e de
rive
d fr
om p
roje
cted
futu
re p
rice
s for
res
iden
tial,
com
mer
cial
, and
indu
stri
al se
ctor
s in
the
Ener
gy C
omm
issio
n’s “
Mid
-cas
e” p
roje
ctio
n of
the
2018
-203
0 D
eman
d Fo
reca
st (C
EC 2
018)
whi
ch p
rovi
des p
rice
s in
2016
dol
lars
. T
he sa
les w
eigh
ted
aver
age
of th
e fiv
e la
rges
t util
ities
in C
alifo
rnia
was
con
vert
ed to
201
8 do
llars
usin
g an
infla
tion
adju
stm
ent o
f 1.0
3 (U
.S. D
OE
2018
). T
he S
tate
wid
e C
ASE
Tea
m th
en a
pplie
d a
3% d
iscou
nt r
ate
to fu
ture
yea
rs r
elat
ive
to 2
018.
See
the
rate
s by
year
bel
ow in
Tab
le 2
5.
212 / 322

Tabl
e 25
: Sta
tew
ide
Sale
s W
eigh
ted
Ave
rage
Res
iden
tial
, Com
mer
cial
, and
Ind
ustr
ial E
lect
rici
ty R
ates
201
8 –
2030
(PG
&E,
SC
E, S
DG
&E,
LA
DW
P an
d S
MU
D -
Fiv
e La
rges
t U
tili
ties
) in
201
8 ce
nts/
kWh,
incl
udin
g a
3% d
isco
unt
rate
. Use
d in
ana
lyse
s fo
r 2-
foot
an
d 4
-foo
t p
rod
ucts
Yea
r
Res
iden
tial
ele
ctri
city
ra
te (
2018
cen
ts/k
Wh)
C
omm
erci
al e
lect
rici
ty
rate
(20
18 c
ents
/kW
h)
Ind
ustr
ial e
lect
rici
ty
rate
(20
18 c
ents
/kW
h)
Sect
or w
eigh
ted
av
erag
e (2
018
cent
s/kW
h)
2017
18
.98
16.3
6 12
.51
14.7
7 20
18
19.5
4 16
.71
12.7
4 15
.09
2019
19
.53
16.7
4 12
.75
15.1
0 20
20
18.8
2 16
.12
12.3
4 14
.57
2021
18
.38
15.6
7 12
.03
14.1
9 20
22
17.8
1 15
.18
11.7
0 13
.77
2023
17
.35
14.6
6 11
.30
13.3
0 20
24
16.9
7 14
.32
11.0
1 12
.99
2025
16
.56
13.9
8 10
.71
12.6
6 20
26
16.1
0 13
.56
10.4
2 12
.29
2027
15
.65
13.1
4 10
.09
11.9
2 20
28
15.2
8 12
.81
9.83
11
.62
2029
14
.84
12.5
7 9.
57
11.3
5 20
30
14.4
0 12
.33
9.31
11
.09
Tabl
e 26
: Sta
tew
ide
Sale
s W
eigh
ted
Ave
rage
Com
mer
cial
and
Ind
ustr
ial E
lect
rici
ty R
ates
201
8 –
2030
(PG
&E,
SC
E, S
DG
&E,
LA
DW
P an
d S
MU
D -
Fiv
e La
rges
t U
tili
ties
) in
201
8 ce
nts/
kWh,
incl
udin
g a
3% d
isco
unt
rate
. Use
d in
ana
lyse
s fo
r 8-
foot
pro
duc
ts.
Yea
r
Res
iden
tial
ele
ctri
city
ra
te (
2018
cen
ts/k
Wh)
C
omm
erci
al e
lect
rici
ty
rate
(20
18 c
ents
/kW
h)
Ind
ustr
ial e
lect
rici
ty
rate
(20
18 c
ents
/kW
h)
Sect
or w
eigh
ted
av
erag
e (2
018
cent
s/kW
h)
2017
18
.98
16.3
6 12
.51
14.4
3 20
18
19.5
4 16
.71
12.7
4 14
.73
2019
19
.53
16.7
4 12
.75
14.7
5 20
20
18.8
2 16
.12
12.3
4 14
.23
2021
18
.38
15.6
7 12
.03
13.8
5 20
22
17.8
1 15
.18
11.7
0 13
.44
2023
17
.35
14.6
6 11
.30
12.9
8 20
24
16.9
7 14
.32
11.0
1 12
.67
2025
16
.56
13.9
8 10
.71
12.3
4 20
26
16.1
0 13
.56
10.4
2 11
.99
2027
15
.65
13.1
4 10
.09
11.6
2 20
28
15.2
8 12
.81
9.83
11
.32
2029
14
.84
12.5
7 9.
57
11.0
7 20
30
14.4
0 12
.33
9.31
10
.82
213 / 322

App
endi
x A
: Ele
ctri
city
Rat
es
The
ele
ctri
city
rat
es u
sed
in th
e an
alys
is pr
esen
ted
in th
is re
port
wer
e de
rive
d fr
om p
roje
cted
futu
re p
rice
s for
res
iden
tial,
com
mer
cial
, and
indu
stri
al se
ctor
s in
the
Ener
gy C
omm
issio
n’s “
Mid
-cas
e” p
roje
ctio
n of
the
2018
-203
0 D
eman
d Fo
reca
st (C
EC 2
018)
whi
ch p
rovi
des p
rice
s in
2016
dol
lars
. T
he sa
les w
eigh
ted
aver
age
of th
e fiv
e la
rges
t util
ities
in C
alifo
rnia
was
con
vert
ed to
201
8 do
llars
usin
g an
infla
tion
adju
stm
ent o
f 1.0
3 (U
.S. D
OE
2018
). T
he S
tate
wid
e C
ASE
Tea
m th
en a
pplie
d a
3% d
iscou
nt r
ate
to fu
ture
yea
rs r
elat
ive
to 2
018.
See
the
rate
s by
year
bel
ow in
Tab
le 2
5.
Tabl
e 25
: Sta
tew
ide
Sale
s W
eigh
ted
Ave
rage
Res
iden
tial
, Com
mer
cial
, and
Ind
ustr
ial E
lect
rici
ty R
ates
201
8 –
2030
(PG
&E,
SC
E, S
DG
&E,
LA
DW
P an
d S
MU
D -
Fiv
e La
rges
t U
tili
ties
) in
201
8 ce
nts/
kWh,
incl
udin
g a
3% d
isco
unt
rate
. Use
d in
ana
lyse
s fo
r 2-
foot
an
d 4
-foo
t p
rod
ucts
Yea
r
Res
iden
tial
ele
ctri
city
ra
te (
2018
cen
ts/k
Wh)
C
omm
erci
al e
lect
rici
ty
rate
(20
18 c
ents
/kW
h)
Ind
ustr
ial e
lect
rici
ty
rate
(20
18 c
ents
/kW
h)
Sect
or w
eigh
ted
av
erag
e (2
018
cent
s/kW
h)
2017
18
.98
16.3
6 12
.51
14.7
7 20
18
19.5
4 16
.71
12.7
4 15
.09
2019
19
.53
16.7
4 12
.75
15.1
0 20
20
18.8
2 16
.12
12.3
4 14
.57
2021
18
.38
15.6
7 12
.03
14.1
9 20
22
17.8
1 15
.18
11.7
0 13
.77
2023
17
.35
14.6
6 11
.30
13.3
0 20
24
16.9
7 14
.32
11.0
1 12
.99
2025
16
.56
13.9
8 10
.71
12.6
6 20
26
16.1
0 13
.56
10.4
2 12
.29
2027
15
.65
13.1
4 10
.09
11.9
2 20
28
15.2
8 12
.81
9.83
11
.62
2029
14
.84
12.5
7 9.
57
11.3
5 20
30
14.4
0 12
.33
9.31
11
.09
214 / 322

Tabl
e 26
: Sta
tew
ide
Sale
s W
eigh
ted
Ave
rage
Com
mer
cial
and
Ind
ustr
ial E
lect
rici
ty R
ates
201
8 –
2030
(PG
&E,
SC
E, S
DG
&E,
LA
DW
P an
d S
MU
D -
Fiv
e La
rges
t U
tili
ties
) in
201
8 ce
nts/
kWh,
incl
udin
g a
3% d
isco
unt
rate
. Use
d in
ana
lyse
s fo
r 8-
foot
pro
duc
ts.
Yea
r
Res
iden
tial
ele
ctri
city
ra
te (
2018
cen
ts/k
Wh)
C
omm
erci
al e
lect
rici
ty
rate
(20
18 c
ents
/kW
h)
Ind
ustr
ial e
lect
rici
ty
rate
(20
18 c
ents
/kW
h)
Sect
or w
eigh
ted
av
erag
e (2
018
cent
s/kW
h)
2017
18
.98
16.3
6 12
.51
14.4
3 20
18
19.5
4 16
.71
12.7
4 14
.73
2019
19
.53
16.7
4 12
.75
14.7
5 20
20
18.8
2 16
.12
12.3
4 14
.23
2021
18
.38
15.6
7 12
.03
13.8
5 20
22
17.8
1 15
.18
11.7
0 13
.44
2023
17
.35
14.6
6 11
.30
12.9
8 20
24
16.9
7 14
.32
11.0
1 12
.67
2025
16
.56
13.9
8 10
.71
12.3
4 20
26
16.1
0 13
.56
10.4
2 11
.99
2027
15
.65
13.1
4 10
.09
11.6
2 20
28
15.2
8 12
.81
9.83
11
.32
2029
14
.84
12.5
7 9.
57
11.0
7 20
30
14.4
0 12
.33
9.31
10
.82
215 / 322

App
endi
x A
: Ele
ctri
city
Rat
es
The
ele
ctri
city
rat
es u
sed
in th
e an
alys
is pr
esen
ted
in th
is re
port
wer
e de
rive
d fr
om p
roje
cted
futu
re p
rice
s for
res
iden
tial,
com
mer
cial
, and
indu
stri
al se
ctor
s in
the
Ener
gy C
omm
issio
n’s “
Mid
-cas
e” p
roje
ctio
n of
the
2018
-203
0 D
eman
d Fo
reca
st (C
EC 2
018)
whi
ch p
rovi
des p
rice
s in
2016
dol
lars
. T
he sa
les w
eigh
ted
aver
age
of th
e fiv
e la
rges
t util
ities
in C
alifo
rnia
was
con
vert
ed to
201
8 do
llars
usin
g an
infla
tion
adju
stm
ent o
f 1.0
3 (U
.S. D
OE
2018
). T
he S
tate
wid
e C
ASE
Tea
m th
en a
pplie
d a
3% d
iscou
nt r
ate
to fu
ture
yea
rs r
elat
ive
to 2
018.
See
the
rate
s by
year
bel
ow in
Tab
le 2
5.
Tabl
e 25
: Sta
tew
ide
Sale
s W
eigh
ted
Ave
rage
Res
iden
tial
, Com
mer
cial
, and
Ind
ustr
ial E
lect
rici
ty R
ates
201
8 –
2030
(PG
&E,
SC
E, S
DG
&E,
LA
DW
P an
d S
MU
D -
Fiv
e La
rges
t U
tili
ties
) in
201
8 ce
nts/
kWh,
incl
udin
g a
3% d
isco
unt
rate
. Use
d in
ana
lyse
s fo
r 2-
foot
an
d 4
-foo
t p
rod
ucts
Yea
r
Res
iden
tial
ele
ctri
city
ra
te (
2018
cen
ts/k
Wh)
C
omm
erci
al e
lect
rici
ty
rate
(20
18 c
ents
/kW
h)
Ind
ustr
ial e
lect
rici
ty
rate
(20
18 c
ents
/kW
h)
Sect
or w
eigh
ted
av
erag
e (2
018
cent
s/kW
h)
2017
18
.98
16.3
6 12
.51
14.7
7 20
18
19.5
4 16
.71
12.7
4 15
.09
2019
19
.53
16.7
4 12
.75
15.1
0
216 / 322

Yea
r
Res
iden
tial
ele
ctri
city
ra
te (
2018
cen
ts/k
Wh)
C
omm
erci
al e
lect
rici
ty
rate
(20
18 c
ents
/kW
h)
Ind
ustr
ial e
lect
rici
ty
rate
(20
18 c
ents
/kW
h)
Sect
or w
eigh
ted
av
erag
e (2
018
cent
s/kW
h)
2020
18
.82
16.1
2 12
.34
14.5
7 20
21
18.3
8 15
.67
12.0
3 14
.19
2022
17
.81
15.1
8 11
.70
13.7
7 20
23
17.3
5 14
.66
11.3
0 13
.30
2024
16
.97
14.3
2 11
.01
12.9
9 20
25
16.5
6 13
.98
10.7
1 12
.66
2026
16
.10
13.5
6 10
.42
12.2
9 20
27
15.6
5 13
.14
10.0
9 11
.92
2028
15
.28
12.8
1 9.
83
11.6
2 20
29
14.8
4 12
.57
9.57
11
.35
2030
14
.40
12.3
3 9.
31
11.0
9 Ta
ble
26: S
tate
wid
e Sa
les
Wei
ghte
d A
vera
ge C
omm
erci
al a
nd I
ndus
tria
l Ele
ctri
city
Rat
es 2
018
– 20
30 (
PG&
E, S
CE,
SD
G&
E, L
AD
WP
and
SM
UD
- F
ive
Larg
est
Uti
liti
es)
in 2
018
cent
s/kW
h, in
clud
ing
a 3%
dis
coun
t ra
te. U
sed
in a
naly
ses
for
8-fo
ot p
rod
ucts
.
Yea
r
Res
iden
tial
ele
ctri
city
ra
te (
2018
cen
ts/k
Wh)
C
omm
erci
al e
lect
rici
ty
rate
(20
18 c
ents
/kW
h)
Ind
ustr
ial e
lect
rici
ty
rate
(20
18 c
ents
/kW
h)
Sect
or w
eigh
ted
av
erag
e (2
018
cent
s/kW
h)
2017
18
.98
16.3
6 12
.51
14.4
3 20
18
19.5
4 16
.71
12.7
4 14
.73
2019
19
.53
16.7
4 12
.75
14.7
5 20
20
18.8
2 16
.12
12.3
4 14
.23
2021
18
.38
15.6
7 12
.03
13.8
5 20
22
17.8
1 15
.18
11.7
0 13
.44
2023
17
.35
14.6
6 11
.30
12.9
8 20
24
16.9
7 14
.32
11.0
1 12
.67
2025
16
.56
13.9
8 10
.71
12.3
4 20
26
16.1
0 13
.56
10.4
2 11
.99
2027
15
.65
13.1
4 10
.09
11.6
2 20
28
15.2
8 12
.81
9.83
11
.32
2029
14
.84
12.5
7 9.
57
11.0
7 20
30
14.4
0 12
.33
9.31
10
.82
217 / 322

App
endi
x A
: Ele
ctri
city
Rat
es
The
ele
ctri
city
rat
es u
sed
in th
e an
alys
is pr
esen
ted
in th
is re
port
wer
e de
rive
d fr
om p
roje
cted
futu
re p
rice
s for
res
iden
tial,
com
mer
cial
, and
indu
stri
al se
ctor
s in
the
Ener
gy C
omm
issio
n’s “
Mid
-cas
e” p
roje
ctio
n of
the
2018
-203
0 D
eman
d Fo
reca
st (C
EC 2
018)
whi
ch p
rovi
des p
rice
s in
2016
dol
lars
. T
he sa
les w
eigh
ted
aver
age
of th
e fiv
e la
rges
t util
ities
in C
alifo
rnia
was
con
vert
ed to
201
8 do
llars
usin
g an
infla
tion
adju
stm
ent o
f 1.0
3 (U
.S. D
OE
2018
). T
he S
tate
wid
e C
ASE
Tea
m th
en a
pplie
d a
3% d
iscou
nt r
ate
to fu
ture
yea
rs r
elat
ive
to 2
018.
See
the
rate
s by
year
bel
ow in
Tab
le 2
5.
Tabl
e 25
: Sta
tew
ide
Sale
s W
eigh
ted
Ave
rage
Res
iden
tial
, Com
mer
cial
, and
Ind
ustr
ial E
lect
rici
ty R
ates
201
8 –
2030
(PG
&E,
SC
E, S
DG
&E,
LA
DW
P an
d S
MU
D -
Fiv
e La
rges
t U
tili
ties
) in
201
8 ce
nts/
kWh,
incl
udin
g a
3% d
isco
unt
rate
. Use
d in
ana
lyse
s fo
r 2-
foot
an
d 4
-foo
t p
rod
ucts
Yea
r
Res
iden
tial
ele
ctri
city
ra
te (
2018
cen
ts/k
Wh)
C
omm
erci
al e
lect
rici
ty
rate
(20
18 c
ents
/kW
h)
Ind
ustr
ial e
lect
rici
ty
rate
(20
18 c
ents
/kW
h)
Sect
or w
eigh
ted
av
erag
e (2
018
cent
s/kW
h)
2017
18
.98
16.3
6 12
.51
14.7
7 20
18
19.5
4 16
.71
12.7
4 15
.09
2019
19
.53
16.7
4 12
.75
15.1
0 20
20
18.8
2 16
.12
12.3
4 14
.57
2021
18
.38
15.6
7 12
.03
14.1
9 20
22
17.8
1 15
.18
11.7
0 13
.77
2023
17
.35
14.6
6 11
.30
13.3
0 20
24
16.9
7 14
.32
11.0
1 12
.99
2025
16
.56
13.9
8 10
.71
12.6
6 20
26
16.1
0 13
.56
10.4
2 12
.29
2027
15
.65
13.1
4 10
.09
11.9
2 20
28
15.2
8 12
.81
9.83
11
.62
2029
14
.84
12.5
7 9.
57
11.3
5 20
30
14.4
0 12
.33
9.31
11
.09
218 / 322

Tabl
e 26
: Sta
tew
ide
Sale
s W
eigh
ted
Ave
rage
Com
mer
cial
and
Ind
ustr
ial E
lect
rici
ty R
ates
201
8 –
2030
(PG
&E,
SC
E, S
DG
&E,
LA
DW
P an
d S
MU
D -
Fiv
e La
rges
t U
tili
ties
) in
201
8 ce
nts/
kWh,
incl
udin
g a
3% d
isco
unt
rate
. Use
d in
ana
lyse
s fo
r 8-
foot
pro
duc
ts.
Yea
r
Res
iden
tial
ele
ctri
city
ra
te (
2018
cen
ts/k
Wh)
C
omm
erci
al e
lect
rici
ty
rate
(20
18 c
ents
/kW
h)
Ind
ustr
ial e
lect
rici
ty
rate
(20
18 c
ents
/kW
h)
Sect
or w
eigh
ted
av
erag
e (2
018
cent
s/kW
h)
2017
18
.98
16.3
6 12
.51
14.4
3 20
18
19.5
4 16
.71
12.7
4 14
.73
2019
19
.53
16.7
4 12
.75
14.7
5 20
20
18.8
2 16
.12
12.3
4 14
.23
2021
18
.38
15.6
7 12
.03
13.8
5 20
22
17.8
1 15
.18
11.7
0 13
.44
2023
17
.35
14.6
6 11
.30
12.9
8 20
24
16.9
7 14
.32
11.0
1 12
.67
2025
16
.56
13.9
8 10
.71
12.3
4 20
26
16.1
0 13
.56
10.4
2 11
.99
2027
15
.65
13.1
4 10
.09
11.6
2 20
28
15.2
8 12
.81
9.83
11
.32
2029
14
.84
12.5
7 9.
57
11.0
7 20
30
14.4
0 12
.33
9.31
10
.82
219 / 322

220 / 322

o o
221 / 322

222 / 322

223 / 322

224 / 322

225 / 322

226 / 322

227 / 322

228 / 322

229 / 322

230 / 322

231 / 322

232 / 322

o
233 / 322

234 / 322
Schedule
RecentAccomplishm
ents
o o o o o o o
PrioritiesforWeeksofJune
1–June
27,2018
o o o o o o o o o o
235 / 322

o o
Upcom
ingandOngoing
Activities
LastUpdate(May21
–May30,2018):
Schedule
RecentAccomplishm
ents
o o o o
PrioritiesforWeeksofMay21
–May30,2018
o o o o o o o o o o
Upcom
ingandOngoing
Activities
236 / 322

237 / 322

238 / 322

239 / 322

-- Bruce Cheney
Anchors Aweigh Energy LLC
HERS and Title 24
Disabled Veteran Owned Small Business
858-254-1189
www.aae-hers.com
240 / 322
241 / 322

242 / 322

Ray
Men
doza
243 / 322

244 / 322

245 / 322

246 / 322

247 / 322

248 / 322

249 / 322

250 / 322

251 / 322

Ray
Men
doza
252 / 322

253 / 322

254 / 322

255 / 322

256 / 322

257 / 322

258 / 322

259 / 322

260 / 322

261 / 322
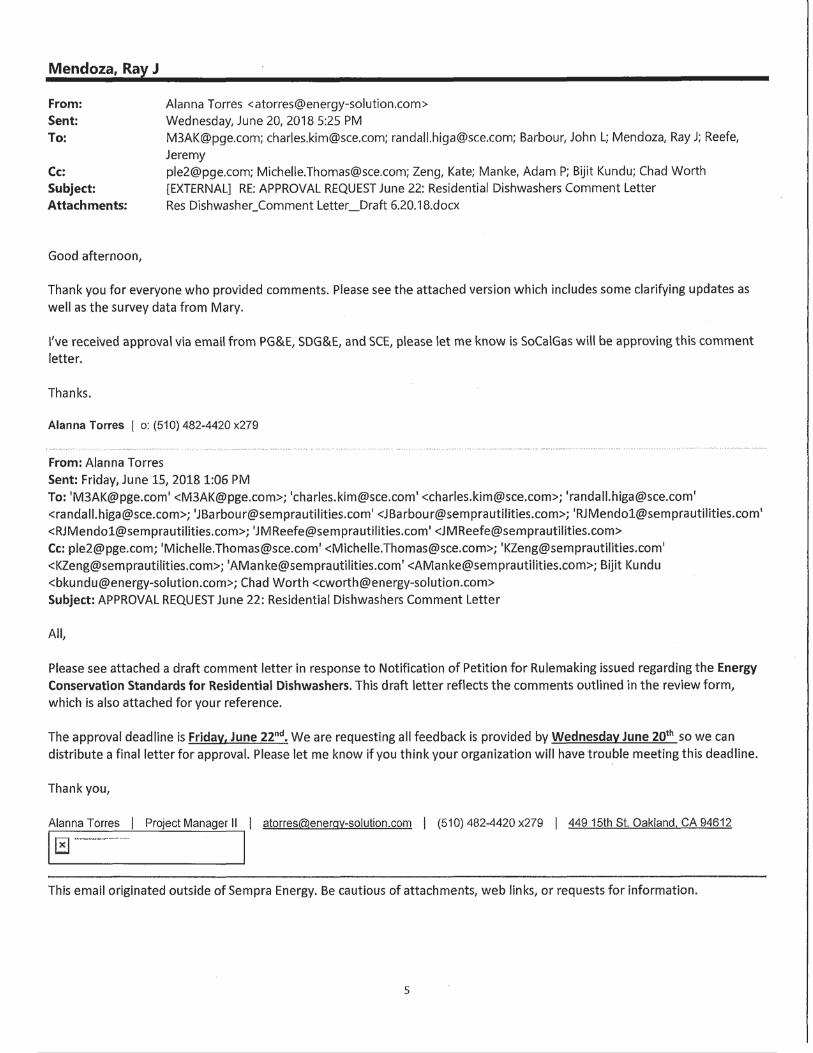
262 / 322

263 / 322

264 / 322

265 / 322

266 / 322

267 / 322

268 / 322

269 / 322

270 / 322

271 / 322

272 / 322

273 / 322

Ray
Men
doza
o o
274 / 322

275 / 322

276 / 322

277 / 322

278 / 322

279 / 322

280 / 322

281 / 322

282 / 322

Ray
Men
doza
R
ay M
endo
za
283 / 322

284 / 322

285 / 322

Ray
Men
doza
286 / 322

287 / 322

288 / 322

289 / 322

290 / 322

291 / 322

292 / 322

293 / 322

294 / 322

295 / 322

296 / 322

297 / 322

Fede
ral R
egis
ter
298 / 322

299 / 322
300 / 322

301 / 322
302 / 322

o o o o o o o
303 / 322

304 / 322

305 / 322

306 / 322

10680 White Rock Road Rancho Cordova, CA 95670 916.844.0157 PHONE
\\SF5FILESRV5\Divisions\DRA\DRA-EPCP Branch\Energy Efficiency\Data requests\SoCalGas codes and standards\SoCalGas 1st data request HB-SCG-2018-09\Attachment C - Emails with IOUs\CS Attribution Study Draft Research Plan V2_ct_ln.docxDocument1 6/21/2018 9:49
AM8/26/2016 11:06 AM
MEMORANDUM
To: Emrah Ozkaya (SCE)
From: Cathy Chappell, Megan Dawe (TRC), and Yanda Zhang (ZYD Energy)
Date: May 25, 2018
CALIFORNIA CODES & STANDARDS PROGRAM ADVOCACY AND ATTRIBUTION STUDY DRAFT RESEARCH PLAN
Introduction and Study Purpose The purpose of this study is to conduct a high-level process evaluation of the overall C&S advocacy efforts and revisit the Attribution methodology to provide recommendations for improving the methodology and the evaluation approach. The goal of the research is to develop recommendations for updates to the model that best reflects C&S program savings. A key outcome of this work is to identify if and how the model and evaluation process can be improved or simplified for timeliness and effectiveness, while also properly accounting for realized C&S program savings.
The four (4) study objectives constitute two related, yet distinct parts;
high-level process evaluation of the overall C&S advocacy efforts (Objective I) review of the 5-step attribution model (Objectives II-IV).
Objective I. C&S Advocacy Efforts High Level Process Evaluation: Provide a solid understanding of C&S program activities. Through interviews with a broad range of stakeholders involved in the process, TRC will develop a deeper understanding of successes and barriers to the IOUs activity, effective roles and activity in the C&S advocacy process and appropriate attribution of those activities. The output of this objective will identify areas of C&S program activities that need to be further reflected in the attribution model or by the evaluation process. The C&S Advocacy program covers Title 24, Title 20, and Federal Appliance Standards; however, this analysis will mainly focus on Title 24 and Title 20 advocacy efforts based on scope and timeline, with an overview and explanation of the role of Federal Appliance Standards. Federal standards advocacy and evaluation process can glean information from the Title 20 analysis. If time and budget permits, advocacy process and interaction with Federal Appliance Standards will also be more closely considered.
Objective II. Assess Current Status of the Attribution Model: Perform in-depth examination of the existing evaluation method/model. We will begin with a prioritization of the attribution model factors. We will review all factors, but expect NOMAD and attribution to be the most critical. The output of this objective will support the analysis of the next two objectives.
Commented [NL1]: Header must include a project ID (from the PSR) for all EM&V studies. Please update the project status in the PSR while you’re at it. CALMAC ID can also be obtained ahead of time from Tim Caulfield.
307 / 322

MEMORANDUM (continued) To: Emrah Ozkaya (SCE) June 21, 2018May 25, 2018 Re: C&S Program Advocacy and Attribution Study Research Plan
Page 2 of 12
Objective III. Identify Data Overlap/Gaps: Examine the data input used for the impact evaluation and attribution model to determine what additional data should be collected to improve the model and evaluation. The output of this objective will support the model modification analysis objective.
Objective IV. Model Refinement & Improvement: Develop recommendations for model and evaluation refinement to improve the C&S Advocacy savings estimates in support of system planning.
Attribution Model and Prioritization The 5-step Attribution Model is shown in Figure 2Figure 1.
Figure 1. C&S Advocacy Program Attribution Model
While the primary outputs of the attribution model for the CPUC Impact Evaluation are Gross and Net savings (orange boxes in the model), the purpose of this analysis is to review the model inputs. Below, we summarize the primary purpose and key factors of all of the input factors. Following this summary, we provide a prioritization of the model components for the focus of data collection and analysis.
Energy Baseline:
Prior standards or Industry standard practice at time of adoption
Energy Baseline can be straight forward for an improvement to an existing code requirement or a stable technology. However for new measures (code proposals) and disruptive technologies (such as LEDs) industry standard practice may be harder to quantify. The evaluation team should review and discuss the consistency of baseline application across measures and how it impacts or is influenced by NOMAD.
Market Baseline:
For Title 24 building standards: Annual construction rates for new construction and alterations For Title 20 and Federal appliance standard: Annual sales of covered appliances
The Market Baseline assumptions should be reviewed to ensure that appropriate assumptions are used for construction and sales data. The TRC team does not think this is a high priority issue.
Unit Energy:
Energy consumption per measure under new standards
308 / 322

MEMORANDUM (continued) To: Emrah Ozkaya (SCE) June 21, 2018May 25, 2018 Re: C&S Program Advocacy and Attribution Study Research Plan
Page 3 of 12
Documented in CASE reports and DOE Rulemaking documents
Unit Energy is a key component of the model, but the data source is generally sound and non-controversial. The TRC team does not expect that Unit Energy assumptions need to be investigated for this study.
Compliance Rate:
Percentage of installation meet the standard requirements• Meet the required design features • Meet the required energy performance In theory, the compliance rate increases over time, at least until the code is updated.
Compliance Rate can be an important factor in the attribution model. In particular, the compliance rate or the method for calculating compliance rate need to be consistent for the baseline and projected conditions. The TRC team does not expect that assessing compliance rate will be an important effort.
NOMAD:
Market penetration without the standards (what would happen without C&S adoption) BASS diffusion curve based on experts’ estimation
Historically, NOMAD has been the most controversial and debated factor in the attribution model. As indicated by several of the research questions, NOMAD continues to be a high priority topic. The TRC team will investigate the effectiveness of the existing evaluation method as well as potential alternatives to existing NOMAD evaluation method. As part of this effort, we will initiate discussion with the CPUC evaluation team (CPUC staff and consultants) to fully understand the evaluation details for each of the factors.
Program Attribution:
Fraction of savings attributable to C&S programs Standard specific attribution Evaluated based on an attribution model factors: compliance method, technical and cost analysis, standard feasibility
Program Attribution, similar to NOMAD is a critical element of the overall model. The TRC team will investigate the evaluation method for each of the attribution factors – compliance methods, technical and cost analysis and feasibility - . The investigation will look at other C&S program activities not covered by these three factors.
An underlying premise of the evaluation framework is that in order to accurately assess C&S program impact, the IOUs’ participation and advocacy efforts in the codes and standards development process, at the state and national level, need to be duly credited for any realized energy savings.
Prioritization of Factors
As summarized above, the TRC Team proposes the following prioritization of the five factors
NOMAD – High priority Program Attribution – High priority Market Baseline – Medium priority Energy Baseline – Medium priorityCompliance Rate – Low priority Unit Energy – Low priority
Commented [ct2]: Minor point – we may want to first make certain with Peter B. (and DNV-GL) that the Commission intent, moving forward, is to continue to employ the current NOMAD process.
309 / 322

MEMORANDUM (continued) To: Emrah Ozkaya (SCE) June 21, 2018May 25, 2018 Re: C&S Program Advocacy and Attribution Study Research Plan
Page 4 of 12
While we are prioritizing the five factors, we will also investigate and discuss with stakeholders whether all five steps are necessary for the model.
Data Collection The first three objectives involve intensive analysis of the existing evaluation process, data input, and results, as well as related analysis to identify any shortcomings in the existing evaluation results. Objective 4 recommendations will be based on data collected and analyzed for the other objectives.
Our primary data collection approach will be through a literature review and interviews with a range of key players and experts in the energy efficiency standards development process. TRC will develop a database to categorize, organize, and prioritize the issues raised during the data collection process. This data collection activity will inform both the process evaluation and attribution model analysis.
Literature Review
TRC will conduct a review of literature/documents to describe the C&S advocacy process, attribution model and data sources. We also propose to research and review the Bass diffusion model and related or alternative approaches. Because there are very limited studies and publications on C&S program evaluation, TRC will search and review publications addressing similar issues on market progress, e.g. product adoption and market transformation processes.
The TRC team will leverage our C&S Advocacy and attribution model knowledge to existing data sources and work with SCE/PCG to identify additional potential sources. Known documents include, but are not limited to:
CPUC Decisions, subsequent to CPUC D.05-09-043 (which accepted the 2005 HMG White Paper recommendations) to confirm that there is no DECISION requiring the evaluation to follow this model.
The Cadmus Group. March 9, 2009. “The Proposed Cadmus Attribution Methodology (Revised).”1
(Internal) White Paper on Voluntary Standards and Specifications Advocacy. TRC Energy Services on behalf of Southern California Edison.
Evaluation methodology regarding NOMAD adjustment based on IOU resource acquisition programs2
Documentation regarding Diffusion of Innovation Theory and the Bass diffusion model
For Title 24 and Title 20:
CPUC California Statewide Codes and Standards Program Impact Evaluation; 2013 Title 24
2019 Title 24 CASE study development documentation
Code Change Theory Reports (CCTR) from previous Title 24 code cycles (2013 and 2016)
For Federal Appliances (if included within the scope):
DOE docketed reports by IOUs and other advocates such as Northwest Energy Efficiency Alliance (NEEA) and Appliance Standards Awareness Project (ASAP).
1 This document is no longer available at http://www.energydataweb.com/cpuc/search.aspx, and will requested from Cadmus. 2 TRC will request this documentation from Cadmus
Commented [ct3]: I hope that the literature review will take some pains to go beyond the energy efficiency universe. I am curious if there is new work on technology diffusion that is more current than the Bass diffusion model work that underpins NOMAD. At a minimum I would like to know if there is nothing more current.
310 / 322

MEMORANDUM (continued) To: Emrah Ozkaya (SCE) June 21, 2018May 25, 2018 Re: C&S Program Advocacy and Attribution Study Research Plan
Page 5 of 12
TRC will review the C&S Advocacy program theory and logic model to summarize how program activities were planned to support California and federal standards development, and whether the logic model accurately represents the activities and process. The purpose of the program theory review is to provide a succinct refresher of the program process conceptualization. The program theory describes:
Explicit and implicit assumptions made by program stakeholders about the actions required to achieve the program goals, and
How these actions lead to specific outcomes that result in the program accomplishing the desirable goals
From these documents, we will summarize the history of the C&S Advocacy process, identify activities that are not captured in the logic model, identify activities that the C&S Advocacy program could further engage in to improve attribution, and understand the methods which C&S Advocacy program document activities. . Through this effort, TRC will identify challenges, barriers, and improvements to the process, including documentation of activities, over time and for future code development cycles.
After collecting and summarizing the data in the literature review task, TRC, with the SCE Program Manager and the PGC, will revisit the proposed research scope to determine if reprioritization is necessary, such as inclusion of federal standards activity.
Interviewees
TRC will conduct 30-40 interviews from the list of potential contacts below. This includes IOU C&S program staff to understand challenges, successes, and current and long-term goals; CASE consultants and other key stakeholders, IOU consultants involved in program planning; leading CEC staff; IOU incentive program staff to assess how theseprograms are or could be supporting the CASE work and data collection; and other utilities and agencies active in C&S advocacy. We will also interview CPUC-ED staff and their evaluation consultant, Cadmus, to provide insight and perspective on the model and the evaluation process. Interview length will range from 30 minutes to 1 hour, depending on the expected level of information and familiarity with the evaluation process for each group. For example, 30 minute interviews are proposed for CASE authors who will have a deep knowledge of C&S Advocacy activities and market adoption for a particular technology, but likely less input for broader advocacy and evaluation model topics.
TRC will develop draft interview guides for each of the interview groups based on a preliminary literature review. The team will ask interviewees, among other things, to describe their role in their relevant area of work, code development process, their opinion of the IOU C&S program goals, approach and activities, C&S evaluation process, and the impact of C&S program activity on the overall code development process.
As input to the second part of the study, TRC will ask for their input on the relative attribution model factors (compliance method, technical and cost analysis, standard feasibility), if they are able to answer. TRC will develop screening questions to confirm each interviewees general understanding of the attribution factors and rationale.
TRC proposes the following interviews:
4 IOU C&S program staff group (1 -2 hour interviews)
1. SCE (Randall Higa, Charles Kim, Michelle Thomas, Chris Kuch, Will Vicent, Bach Tsan and others) 2. PG&E (Kelly Cunningham, Pat Eilert and others) 3. SoCalGas (Adam Manke and others) 4. SDG&E (John Barbour and others)
4-6 CASE T24 authors (30 minute interviews)
1. Energy Solutions
Commented [ct4]: We may want to try to interview some of the folks that Cadmus used for their NOMAD assessment and attribution assessment.
311 / 322

MEMORANDUM (continued) To: Emrah Ozkaya (SCE) June 21, 2018May 25, 2018 Re: C&S Program Advocacy and Attribution Study Research Plan
Page 6 of 12
2. Frontier Energy 3. Integral Group 4. ASWB 5. Taylor Engineering 6. NORESCO Compliance Improvement team
1-2 other IOU CASE team support (1 hour interviews):
1. Jon McHugh 2. Marshall Hunt 3. Alex Chase and Ted Pope (2050 Partners)
2-3 IOU incentive program staff (30 minute interviews):
1. PG&E (Conrad Asper) 2. SCE (Jessica Mack) 3. SDG&E (Jeremey Reefe)
6-8 Title 24 key stakeholders other than IOU CASE team (30 - 60 minute interviews):
1. CBIA (Bob Raymer) 2. Consol (Mike Hodgson) 3. NRDC (Pierre DelForge) 4. CALBO or Building Officials 5. CALSMACNA, or other HVAC industry group 6. SMUD 7. LADWP 8. RENS (BayREN, SoCalREN)
4-6 CEC Building Energy Efficiency and Appliance Standards office staff (30 minute interviews):
1. T24 & T20 Process - Payam Bozorgchami - Mazi Shirakh - Peter Straight
2. Technical Leads - Jeff Miller - Danny Tam - Mark Alatorre (Now at PG&E)
3. Savings Calculation - Bill Pennington - Martha Brook - Ingrid Neumann
1-2 CEC Tech Support Contractors (30 minute interviews):
1. Bruce Wilcox 2. Jim Benya
2-3 CPUC staff and evaluation consultant (30 - 60 minute interviews):
1. Peter Biermayer (ED) 2. Paula Gruendling (ED) 3. Allen Lee – (Cadmus)
312 / 322

MEMORANDUM (continued) To: Emrah Ozkaya (SCE) June 21, 2018May 25, 2018 Re: C&S Program Advocacy and Attribution Study Research Plan
Page 7 of 12
4. Dan Groshans – (formerly Cadmus) 5. DNV-GL
1-2 Potential Users of Attribution Model Results (30-60 minute interviews):
1. NORESCO 2. Navigant 3. E3
These interviewees represent a range of CEC and IOU staff, and CASE authors as well as other code development stakeholders that may or may not support the IOU C&S program activity. Input from CPUC and their evaluation consultant will be focused more on understanding how the model is implemented and the development of evaluation methodology. By interviewing a broad range of stakeholders involved in the process, TRC will develop a deeper understanding of successes and barriers to the IOUs activity, role in the process and attribution.
Research Questions
Figure 2Figure 2 provides the research topics and questions which this study aims to address. These research questions may be modified based on the literature review, and once finalized and approved, TRC will develop interview guides based on these questions.
Figure 2. Research Questions
Topic Research Questions
T24 code adoption process and IOU involvement
How important is IOU involvement to the identification of new C&S opportunities? o What has worked well? o What has not worked well?
What aspects of the code adoption process demand more attention from the IOUs? What are the implications of ZNE code in the C&S development process in CA? Who uses the results of the IOU work (Including energy saving calculations)?
Attribution Model What are the areas of strength of the attribution model? What are known issues of the attribution model? How accurate are Delphi panels compared to alternative approaches? How should model improvements be prioritized? Are evaluation time and resources being used appropriately to address the issues? Where is there potential for bias and what is the result of this bias?
NOMAD alternatives Are there alternatives to estimating the naturally occurring market adoption (NOMAD)? Does the NOMAD properly account for T24, T20, and federal standards advocacy collective benefits? Does the NOMAD adjustment address California and federal standards in a consistent fashion?
o Should it? Could on-going market data collection efforts support an alternative approach?
Data sources What data sources are used? Are there any other data sources that should be considered for use or be developed? Are there overlaps in data collection efforts with other evaluations that should be coordinated? Is there existing C&S program data, e.g. CASE study data, or incentive program data, that can be better utilized to inform the model and improve the evaluation ? Are there long term data collection efforts that could/should be used?
Formatted: Font: +Body (Calibri)
Commented [ct5]: Could we add the following research question: “What are the advantages and disadvantages of alternative approaches?”
313 / 322

MEMORANDUM (continued) To: Emrah Ozkaya (SCE) June 21, 2018May 25, 2018 Re: C&S Program Advocacy and Attribution Study Research Plan
Page 8 of 12
Topic Research Questions
Logic Model comparison
How does the current evaluation process reflect the Logic Model?
Right-size model and evaluation
Can and should the model be simplified? Can and should the model be expanded? What is the right-size for the evaluation effort (cost vs. rigor vs. confidence)? How do the results of a whole building (top down), measure-level (bottom up), and hybrid approach compare in terms of accuracy and cost?
Improving accuracy How should accuracy be defined? Is the current model producing results that can be readily used for system planning purposes? If not, why not? Would any proposed alterations to the current model yield results that would be more accurate for system planning purposes
Relationship between incremental measure cost and impact on program cost-effectiveness
How much do incremental cost assumptions influence C&S program cost-effectiveness? Should Under what conditions should incremental measure costs for C&S be reviewed on a more consistent basis? What are the implications to the NOMAD model? How can measure costs be kept current and what might be the costs of such an effort? Can programs track measure and total measure package costs?
Analysis TRC will conduct an in-depth review of the attribution model framework for determining and evaluating attributable energy impacts of IOUs’ efforts in supporting building code and appliance standards development, mainly focusing on development at the state level with the option of expanding the scope to the national (federal) level. We will explore possible savings attribution and evaluation methodologies to recognize all C&S program activity and achievements to support future program development.
The TRC team will analyze the data to develop a complete understanding and description of the existing evaluation approach and model. The TRC team will conduct a critical review of past evaluation studies. Based on data collection activity and our knowledge of the process, TRC will describe our understanding of the existing evaluation model and approach. The team will present the findings from interviews in ways that illustrate the influence on the model and the evaluation approach.
Analysis will include both a bottom up (in-depth interviews and investigation into evaluation steps), and top down investigation (high-level overview of process and model), looking at the details of each step in the model and prior evaluation approach as well as considering the overall objectives and key outcomes of both. The TRC team expects that this hybrid approach will provide a holistic assessment of where effective and feasible improvements can be made.
The analysis approach and outcomes are: Perform in-depth examination of the existing model and evaluation method, with a focus on NOMAD and attribution. Investigate evaluation alternatives to the Delphi approach. Examine the data input used for evaluation. Determine if there is additional data that should be collected to improve evaluation, and if existing data can be better utilized to improve the evaluation.
314 / 322

MEMORANDUM (continued) To: Emrah Ozkaya (SCE) June 21, 2018May 25, 2018 Re: C&S Program Advocacy and Attribution Study Research Plan
Page 9 of 12
Provide a good understanding of C&S program activities and existing C&S evaluation model, identify areas of C&S program activities that need to be further reflected in attribution model or by evaluation process. Develop recommendation, especially address the question on providing proper C&S savings to support system planning.
After completing the initial high level process evaluation, TRC will develop a prioritized list of issues to be addressed, distribute the list to SCE study manager, statewide C&S teams and ED staff, and schedule a meeting to discuss.
TRC will combine the results of the literature review and interviews to develop a comprehensive picture of the C&S Advocacy program. TRC will use triangulation of multiple data sources to describe the successes and challenges of the C&S Advocacy Program activity, identify improvements over time, and provide recommendations for addressing barriers and process improvement. TRC will an outline of key issues to revisit and address in the 5-step attribution process.
Communications Plan To ensure close coordination over the duration of the study, TRC will conduct a bi-weekly teleconference between the SCE study manager and the TRC study team. Additionally, this study will require continued communication with the statewide C&S team, and CPUC-ED staff. TRC will work with the SCE study manager to establish regular check-in calls. TRC will attend at least one call per month to provide a study update and obtain feedback.
In order for this effort to be successful, it is imperative for the IOU team to get CPUC-ED (ED) input and agreement. The TRC team proposes to actively engage ED and their evaluator in the project, starting with the research plan development. The purpose of the ED engagement is to maximize the possibility of better aligning CPUC’s and IOU’s goals. However, the final study recommendations will be based on IOUs’ goals and priorities, not the CPUC’s.
TRC will provide written Monthly Status Reports that summarize key activities and progress towards completing milestones for each objective. TRC will provide Interim Draft reports describing preliminary findings for each study objective as key milestones are completed.
Schedule and Deliverables TRC proposes the schedule shown in
Figure 3Figure 4 with following report deliverables:
Commented [NL6]: Please include a budget associated with each task in the table below.
315 / 322

MEMORANDUM (continued) To: Emrah Ozkaya (SCE) June 21, 2018May 25, 2018 Re: C&S Program Advocacy and Attribution Study Research Plan
Page 10 of 12
Assuming a project start date in May 14, 2018 A draft interim report, with Process Evaluation results by August 31, 2018, and a final report by September 28, 2018. A draft final report, with all results by October 31, 2018, with a final report by November 30, 2018.
Figure 34. Proposed Schedule
Task # & Name May-
18 Jun-18
Jul-18
Aug-18
Sep-18
Oct-18
Nov-18
1 Project Initiation (PI) Meeting
2 Research Plan 3 Literature Review 4 Data Collection and Analysis data collection data analysis 5 Interim Reports 6 Draft & Final Reports 7 Study Close Out
draft deliverable
final deliverable
Specific deliverables and milestones for each of the remaining tasks includes:
Literature Review: Interim memo summarizing literature review findings
Data Collection: Final list of Interviewees Interview Guide Interim memo summarizing interview findings
316 / 322

MEMORANDUM (continued) To: Emrah Ozkaya (SCE) June 21, 2018May 25, 2018 Re: C&S Program Advocacy and Attribution Study Research Plan
Page 11 of 12
Data Analysis:
Interim memo summarizing analysis findings
The memos will form the basis of the final report.
317 / 322

MEMORANDUM (continued) To: Emrah Ozkaya (SCE) June 21, 2018May 25, 2018 Re: C&S Program Advocacy and Attribution Study Research Plan
Page 12 of 12
APPENDIX: DATA COLLECTION PLAN FROM SOW Data Collection, Interview Audience and Focus Research Question(s) Addressed
Interviews with CASE Authors, IOU C&S staff, CEC staff, other stakeholders,
Review CCTRs from last 2 code cycles (2013, 2016)
1. How important is IOU involvement to the identification of new C&S opportunities? What has worked well? What has not worked well?
2. What aspects of the code adoption process demand more attention from the IOUs?
Interviews with CASE Authors, CEC staff, other stakeholders,
Review 2019 CASE reports for cost data and cost-effectiveness information
Investigate the relationship between incremental measure cost and impact on program.
3. How much do incremental cost assumptions influence C&S program cost-effectiveness?
4. Should incremental measure costs for C&S be reviewed on a more consistent basis?
Review of previous evaluation studies.
Discussions with CPUC evaluation staff and consultant to review the model in detail
5. Are there alternatives to estimating the naturally occurring market adoption (NOMAD)?
Review of previous evaluation studies.
Discussions with CPUC evaluation staff and consultant
TRC team’s understanding of the model
6. Does the NOMAD adjustment address California and federal standards in a consistent fashion?
7. What are the areas of strength of the attribution model?
8. What are known issues of the attribution model?
Review of previous evaluation studies.
Discussions with CPUC evaluation staff and consultant
TRC team’s understanding of the model
Interviews with CASE Authors, CEC staff, other stakeholders,
Review CCTRs from last 2 code cycles (2013, 2016)
Potentially review 2019 CASE reports for cost data collection methodology
9. What data sources are used? Are there any overlaps in data collection efforts? Are there any other data sources that should be considered for use or be developed?
Review of previous evaluation studies.
Discussions with CPUC evaluation staff and consultant
TRC team’s understanding of the model
Interviews with CASE Authors, CEC staff, other stakeholders,
10. What is the right-size for the model (cost vs. rigor vs. confidence)?
11. Can the model be simplified?
12. How does the current evaluation process reflect the Logic Model?
12. Is the current model producing results that can be readily used for system planning purposes? If not, why not?
13. Would any proposed alterations to the current model yield results that would be more accurate for system planning purposes
318 / 322

319 / 322

https://e
vents.solar/summit/
320 / 322

321 / 322