Antioxidant capacity of reaction products limits the applicability of the Trolox Equivalent...
12
45 Antioxidant capacity of reaction products limits the applicability of the Trolox Equivalent Antioxidant Capacity (TEAC) assay Mariken J. T. J. Arts Guido R. M. M. Haenen Hans-Peter Voss Aalt Bast Food and Chemical Toxicology 42, 45-49, 2004 C C C h h h a a a p p p t t t e e e r r r 4 4 4
Transcript of Antioxidant capacity of reaction products limits the applicability of the Trolox Equivalent...

45
Antioxidant capacity of reaction products limits the applicability of the Trolox Equivalent Antioxidant
Capacity (TEAC) assay
Mariken J. T. J. Arts
Guido R. M. M. Haenen
Hans-Peter Voss
Aalt Bast
Food and Chemical Toxicology 42, 45-49, 2004
CCChhhaaapppttteeerrr 444
Chapter 4
46
Abstract
The Trolox Equivalent Antioxidant Capacity (TEAC) assay is based on
the scavenging of the 2,2′-azinobis-(3-ethylbenzothiazoline-6-sulfonic
acid) (ABTS) radical (ABTS•) converting it into a colorless product. The
degree of decolorization induced by a compound is related to that
induced by trolox, giving the TEAC value. The assay is frequently used
for constructing structure activity relationships (SARs). HPLC analysis of
the reaction mixture, obtained after scavenging of ABTS• by the flavonoid
chrysin, shows that a product is formed that also reacts with ABTS•. The
product has a higher antioxidant capacity and reacts faster with ABTS•
than the parent compound, chrysin. In contrast to the reaction product of
chrysin, the reaction product of trolox, which is formed during scavenging
of ABTS•, i.e. trolox quinone, does not react with ABTS•. The
experiments show that the TEAC is the antioxidant capacity of the parent
compound plus the potential antioxidant capacity of the reaction
product(s). This means that the TEAC assay does not necessarily reflect
the antioxidant effect of only one structure. This hampers the applicability
of the assay for the construction of SARs and for ranking antioxidants.

Antioxidant capacity of reaction products limits the applicability of the TEAC assay
47
Introduction
Free radicals play a crucial role in the pathogenesis of several human
diseases, such as cancer, rheumatoid arthritis and various
neurodegenerative and pulmonary diseases [1]. Antioxidants protect
against these radicals and are therefore important tools in obtaining and
preserving good health. Therefore the antioxidant profiles of numerous
compounds, both natural and synthetic, are frequently compared in order
to identify the most potent ones.
One of these assays was based on the peroxidase activity of haem
containing proteins, resulting in the conversion of the colorless ABTS into
the blue green ABTS radical (ABTS•). Originally, this activity was used to
determine the haemoglobin content of tissue samples [2]. In this
haemoglobin assay reductive compounds such as vitamin C interfere,
since they react with ABTS• giving a colorless non-radical product. This
disadvantage was put to use in the TEAC assay. Originally the TEAC
assay was based on the reduction of the accumulation of ABTS• formed
by the peroxidase activity of metmyoglobin by antioxidants [3]. A major
impediment of this assay is that compounds might inhibit the peroxidase
activity [4]. Therefore, the assay has been adapted by using pre-formed
ABTS• [5,6]. In the assay, the decolorisation of ABTS• by a compound-
that reflects the amount of ABTS• that has been scavenged- after a fixed
period of time (usually 5 or 6 min) is related to that of trolox.
The TEAC assay is frequently used to rank antioxidants and for the
construction of structure activity relationships (SARs). There are
indications that the TEAC value does not exactly correlate with the
antioxidant activity. For example, chrysin has a relatively high TEAC
value while its antioxidant activity in most other assays [7] is relatively
low. The aim of this study is to critically review what is being measured in
the TEAC assay. Based on this, the applicability of the TEAC assay is
evaluated.
Materials and methods
Chemicals
2,2′-Azinobis-(3-ethylbenzothiazoline-6-sulfonic acid) (ABTS), 6-hydroxy-
2, 5,7,8-tetramethylchroman-2-carboxylic acid (Trolox) and chrysin were
obtained from Sigma and potassium persulfate (di-potassium
peroxodisulfate) was obtained from Merck. All other chemicals were of
analytical grade purity.

Chapter 4
48
TEAC assay
The standard TEAC assay described by [5,6] has been used with minor
modifications for determination of the TEAC value. This assay assesses
the total radical scavenging capacity based on the ability of a compound
to scavenge the stable ABTS radical (ABTS•) in 6 min. The blue-green
ABTS• was produced through the reaction between 7 mM ABTS and 2.45
mM potassium persulfate in water. This solution was stored in the dark
for 12–16 h before use. The extinction coefficient of ABTS• at 734 nm is
1.5×10⁴ mol
−1 l cm
−1.
The concentrated ABTS• solution was diluted with phosphate buffered
saline (PBS), pH 7.4 to a final absorbance of 0.70±0.02 at 734 nm at
37 °C (i.e. an ABTS• concentration of approximately 47 µM). Stock
solutions of trolox, and chrysin were prepared in ethanol. Ten microliters
of an antioxidant containing solution were added to 990 µl ABTS• solution
and the absorbance at 734 nm was measured in time. This was
compared to a blank where 10 µl of the solvent was added to 990 µl of
the ABTS• solution. The reduction in absorbance 6 min after addition of
the antioxidant was determined. The TEAC of the antioxidant was
calculated by relating this decrease in absorbance to that of a trolox
solution on a molar basis.
The total scavenging capacity
To quantify the total amount of ABTS• that can be scavenged by chrysin
or trolox, the initial concentration of the antioxidant was kept constant at
2.5 or 10 µM respectively. The initial concentration of ABTS• was varied
from 0 µM up to approximately 40 µM ABTS• and the absorbance of the
ABTS• at 734 nm was measured 6 min after starting the reaction. Also
the concentration of chrysin or trolox in the incubation mixture, as well as
the concentration of their products, formed by the reaction between the
antioxidants and ABTS•, was measured. For these determinations an
HPLC method was used at 6 min after starting the reaction.
HPLC-analysis
Fifty microliters of the mixture were injected into the HPLC system to
measure the concentration chrysin or trolox and the products.
Simultaneously, the amount of ABTS• was assessed
spectrophotometrically at 734 nm. HPLC conditions were: UV-Vis-
detector wavelength for chrysin 270 nm, detector wavelength for trolox
290 nm; flow rate 1 ml/min; column Nucleosil C18, 5 µm, 15 cm×3.2 mm

Antioxidant capacity of reaction products limits the applicability of the TEAC assay
49
(Supelco inc.) The mobile phase was 45% PBS/55% methanol containing
2% (v/v) formic acid.
The concentration of the products of chrysin is estimated by assuming
that one mole chrysin gives one mole of product.
Results
Fig. 1 depicts the reduction of the absorbance at 734 nm in the course of
time after addition of chrysin or trolox to an ABTS• solution. The chemical
structures of these antioxidants have been given in Fig. 2. Trolox shows a
very fast reduction in absorbance and the reaction is completed within
seconds (Fig. 1). When higher concentrations of trolox are used, the
reaction is also completed within seconds (data not shown). Chrysin
induces -on a molar basis- a higher degree of decolorization than trolox.
Based on the reduction of the absorbance at 734 nm in the incubation
mixture with chrysin after 6 min, it was calculated that the TEAC of
chrysin is 2.2. It should be noted however, that the reaction of chrysin
with ABTS• has not been finished within the 6-min period.
Fig. 1. Reaction of trolox and chrysin with the ABTS•. The reduction of the ABTS• concentration expressed as the absorbance at 734 nm is followed in time. The first 15 s are not recorded since this time period was needed to transfer the incubation mixture into the spectrophotometer. Initial concentrations of the antioxidants are 5 µM.
0 2 4 6
0,0
0,2
0,4
0,6
0,8
blank
trolox
chrysin
Time (min)
Absorbance at 734 nm
0.8
0.6
0.4
0.2
0.00 2 4 6
0,0
0,2
0,4
0,6
0,8
blank
trolox
chrysin
Time (min)
Absorbance at 734 nm
0.8
0.6
0.4
0.2
0.0

Chapter 4
50
Fig. 2. The structure of trolox and chrysin.
In the experiment depicted in Fig. 3 the reaction between chrysin and
ABTS• was examined using another procedure. A fixed concentration of
chrysin (2.5 µM) was mixed with an increasing concentration of ABTS•
(varying from 0 µM up to approximately 40 µM.) The mixture was
analyzed 6 min after the addition of chrysin, because this is the time
usually used for assessing the TEAC. Increasing the initial concentration
of ABTS• reduced the concentration of chrysin that could be detected
after 6 min. The tangent of the chrysin curve at low ABTS• concentration
crosses the x-axis at an initial ABTS• concentration of 5 µM, indicating
that 2.5 µM chrysin is able to scavenge 5 µM ABTS•. This means that the
stoichiometry of the reaction of chrysin with ABTS• is 1:2.
Fig. 3. The concentration of chrysin, ABTS• and product (Pr. I) formed after addition of a
variable initial concentration of ABTS• to a solution of 2.5 µM chrysin. The initial
concentration of ABTS• varied from 0 µM up to approximately 40 µM. The mixture was
analyzed after 6 min. The dotted line represents the concentration of ABTS• when no chrysin is added to the mixture. The dashed lines show the tangent lines of the initial chrysin
consumption and of the ABTS• that has not been consumed.
H3C
CH3
O
CH3
HO
O
O
OH
HO
CO2H
CH3
trolox chrysin
[Chrysin] or [reaction product] (µM)
[ABTS• ] (µM)
Initial [ABTS•] (µM)
Pr. I
Chrysin ABTS•2
0
1
0 10 20 30 400
10
20
[Chrysin] or [reaction product] (µM)
[ABTS• ] (µM)
Initial [ABTS•] (µM)
Pr. I
Chrysin ABTS•2
0
1
0 10 20 30 400
10
20
Antioxidant capacity of reaction products limits the applicability of the TEAC assay
51
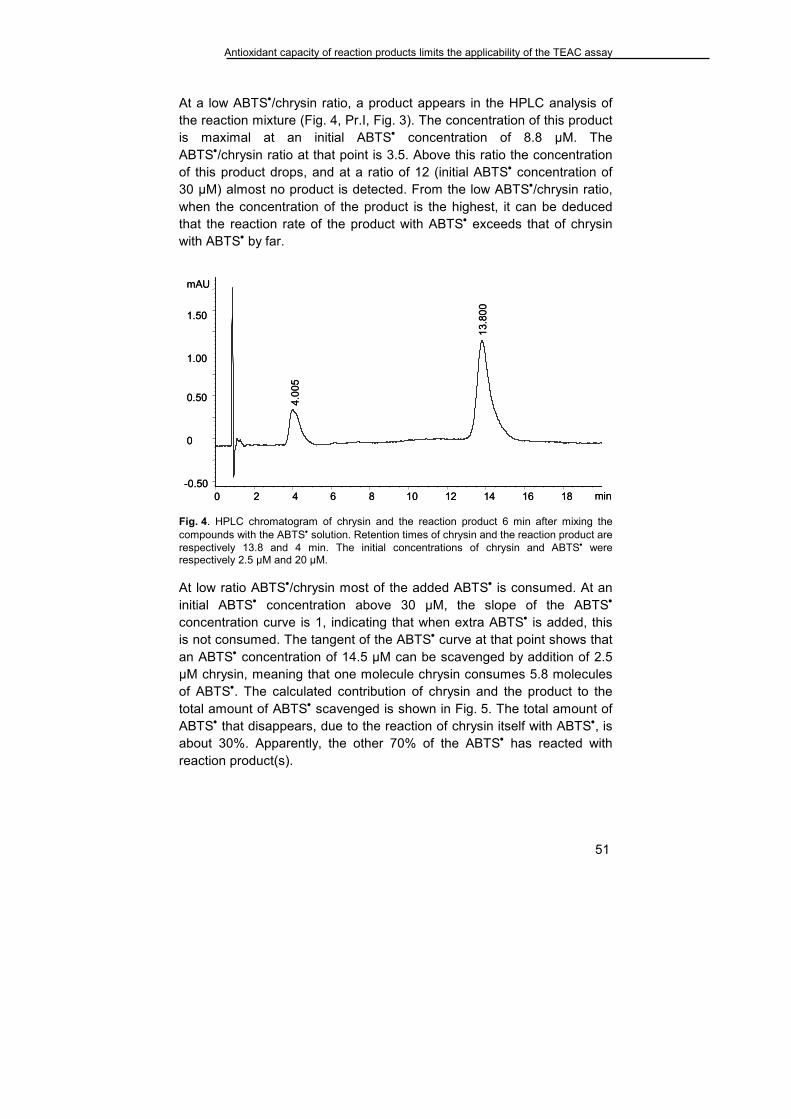
At a low ABTS•/chrysin ratio, a product appears in the HPLC analysis of
the reaction mixture (Fig. 4, Pr.I, Fig. 3). The concentration of this product
is maximal at an initial ABTS• concentration of 8.8 µM. The
ABTS•/chrysin ratio at that point is 3.5. Above this ratio the concentration
of this product drops, and at a ratio of 12 (initial ABTS• concentration of
30 µM) almost no product is detected. From the low ABTS•/chrysin ratio,
when the concentration of the product is the highest, it can be deduced
that the reaction rate of the product with ABTS• exceeds that of chrysin
with ABTS• by far.
Fig. 4. HPLC chromatogram of chrysin and the reaction product 6 min after mixing the
compounds with the ABTS• solution. Retention times of chrysin and the reaction product are
respectively 13.8 and 4 min. The initial concentrations of chrysin and ABTS• were respectively 2.5 µM and 20 µM.
At low ratio ABTS•/chrysin most of the added ABTS• is consumed. At an
initial ABTS• concentration above 30 µM, the slope of the ABTS•
concentration curve is 1, indicating that when extra ABTS• is added, this
is not consumed. The tangent of the ABTS• curve at that point shows that
an ABTS• concentration of 14.5 µM can be scavenged by addition of 2.5
µM chrysin, meaning that one molecule chrysin consumes 5.8 molecules
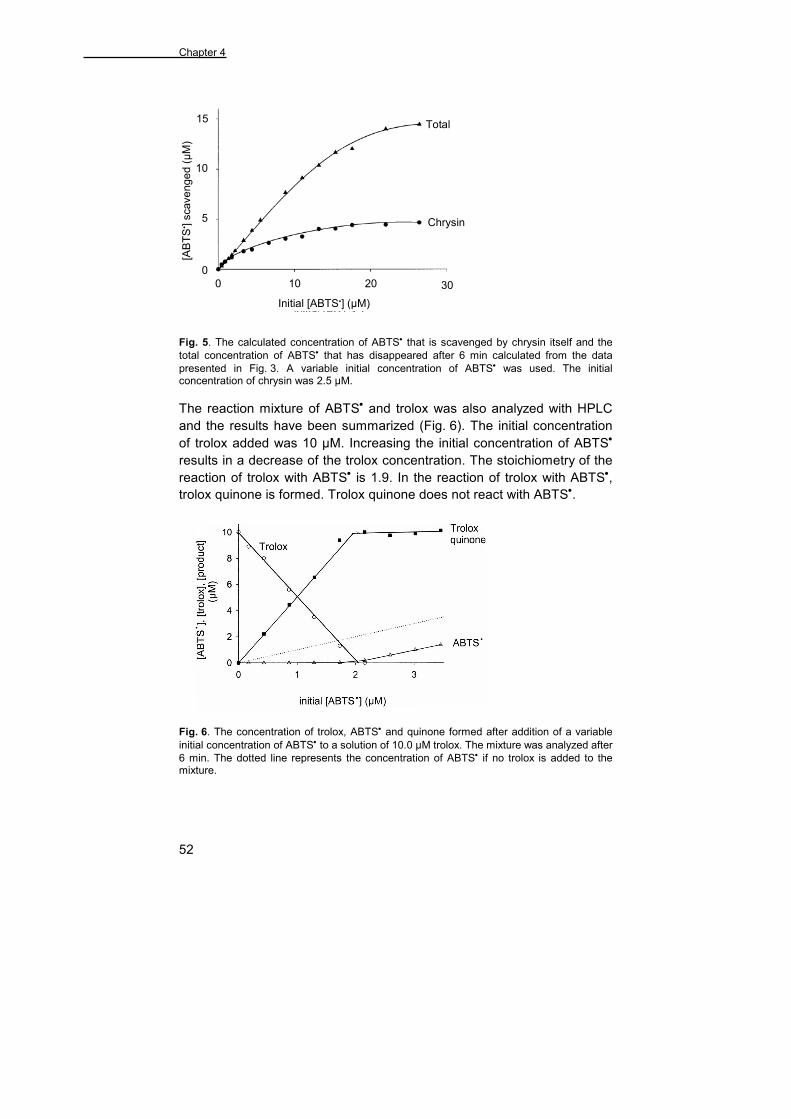
of ABTS•. The calculated contribution of chrysin and the product to the
total amount of ABTS• scavenged is shown in Fig. 5. The total amount of
ABTS• that disappears, due to the reaction of chrysin itself with ABTS•, is
about 30%. Apparently, the other 70% of the ABTS• has reacted with
reaction product(s).
min0 2 4 6 8 10 12 14 16 18
mAU
-0.50
0
0.50
1.00
1.50
4.005
13.800
min0 2 4 6 8 10 12 14 16 18
mAU
-0.50
0
0.50
1.00
1.50
4.005
13.800
Chapter 4
52
Fig. 5. The calculated concentration of ABTS• that is scavenged by chrysin itself and the
total concentration of ABTS• that has disappeared after 6 min calculated from the data
presented in Fig. 3. A variable initial concentration of ABTS• was used. The initial concentration of chrysin was 2.5 µM.
The reaction mixture of ABTS• and trolox was also analyzed with HPLC
and the results have been summarized (Fig. 6). The initial concentration
of trolox added was 10 µM. Increasing the initial concentration of ABTS•
results in a decrease of the trolox concentration. The stoichiometry of the
reaction of trolox with ABTS• is 1.9. In the reaction of trolox with ABTS•,
trolox quinone is formed. Trolox quinone does not react with ABTS•.
Fig. 6. The concentration of trolox, ABTS• and quinone formed after addition of a variable
initial concentration of ABTS• to a solution of 10.0 µM trolox. The mixture was analyzed after
6 min. The dotted line represents the concentration of ABTS• if no trolox is added to the mixture.
Initial [ABTS•] (µM)
[ABTS• ] scavenged (µM)
Initial [ABTS•] (µM)
Chrysin
Total
[ABTS• ] scavenged (µM)
0 20 10 30
0
5
10
15
Initial [ABTS•] (µM)
[ABTS• ] scavenged (µM)
Initial [ABTS•] (µM)
[ABTS• ] scavenged (µM)
Initial [ABTS•] (µM)
Chrysin
Total
[ABTS• ] scavenged (µM)
0 20 10 30
0
5
10
15

Antioxidant capacity of reaction products limits the applicability of the TEAC assay
53
Discussion
Chrysin has a relatively high TEAC compared to its moderate antioxidant
activity in other assays [7]. Therefore the reaction of chrysin with ABTS•
was examined in more detail in order to evaluate what is being measured
in the TEAC assay. It was found that products, formed during the reaction
between chrysin and ABTS•, also react with ABTS•. When chrysin is
added to an ABTS• solution, firstly a fast reaction occurs and
subsequently the reaction proceeds slowly. The reaction is not completed
after 6 min, contrary to the reaction between trolox and ABTS•, which is
finished within seconds. In the reaction between trolox and ABTS•, trolox
quinone is formed, that does not react with ABTS•.
It has been reported that in the reaction of trolox with ABTS• a trolox
radical is formed as intermediate product [8]. The stoichiometry of this
reaction is 1. Analysis of the reaction of trolox with ABTS• shows,
however, that the stoichiometry of the reaction of trolox with ABTS• is 1.9
(Fig. 6). This suggests that the trolox radical, formed as a product of the
reaction of trolox and ABTS•, reacts fast with a second ABTS•. The
observed stoichiometry is not exactly 2. This may be due to competing
reactions e.g. between two trolox radicals [8,9]. The trolox radical has to
be qualified as a potent antioxidant in this assay. Already in 1955, Boozer
et al. demonstrated that phenolic antioxidants react with radicals in a 1: 2
stoichiometry [10].
HPLC analysis of the reaction of chrysin with ABTS• at 6 min shows that
the stoichiometry of the reaction is, comparable to that of trolox, namely
2. In analogy with trolox, an intermediate radical product, i.e. the chrysin
radical, is expected to be involved in the reaction of chrysin with ABTS•.
In contrast to trolox, the relatively stable reaction product that was
detected with HPLC also reacts with ABTS•. One molecule of chrysin
finally leads to the consumption of 5.8 molecules of ABTS• in a sequential
reaction. Thus, the product from chrysin and ABTS•, which was detected
with HPLC, is capable of consuming 3.8 molecules of ABTS•. This means
that the product reacts with more ABTS• molecules than chrysin itself.
Analysis of the data showed that the product also has a higher reactivity
towards ABTS• than chrysin (Fig. 5). Therefore the product can be
qualified as a better antioxidant than the parent compound, chrysin. It
should be noted that in the reaction between the product and ABTS• also
intermediate products will participate and therefore a straightforward
comparison between the antioxidant activity of chrysin and the product is
not possible.

Chapter 4
54
In comparing Fig. 1 and Fig. 3 it has to be noted that the initial
concentration of chrysin in Fig. 1 (5 µM) is different from that of Fig. 3 (2.5
µM). The ABTS•/chrysin ratio in Fig. 1 is 47/5=9.4. At this ratio in Fig. 3
(initial concentration of ABTS• ≈ 23 µM) the ABTS• consumed was ca. 14
µM i.e. 5.6 µM ABTS• per µM chrysin (14/2.5). This nicely corresponds to
the 5.0 µM ABTS• per µM chrysin (i.e. 25/5) found in Fig. 1, where the
reaction has not reached completion. As shown in Fig. 3 and Fig. 5, at
the ABTS•/chrysin ratio used in Fig. 1 the major part of the ABTS• is
consumed in a reaction with the reaction product (and not in the reaction
with chrysin). This confirms the substantial contribution of the reaction
product in the "standard" TEAC assay.
The product formed from chrysin is expected to be more hydrophylic than
the parent compound (shorter retention time, as shown in Fig. 4).
Moreover, the reaction rate of the product with ABTS• exceeds that of
chrysin with ABTS• by far. In trolox, there is a ring opening to give the
quinone in the reaction with ABTS•. A comparable ring opening in chrysin
would yield a chalcone-like product. Recently, it has been reported that
chalcones are potent antioxidants [11]. Based on this information we
speculate that the reaction product formed might be a chalcone-like
product.
As demonstrated in this study, the TEAC of chrysin is in fact the sum of
several compounds, including chrysin, chrysin radical and the product
that was detected by HPLC and other products. The reactivity of these
products explains the relatively high capacity of chrysin. As shown in this
study, one molecule chrysin can lead to the consumption of 5.8
molecules of ABTS• (Fig. 3). Trolox scavenges 1.9 ABTS•. This gives
chrysin a "true" TEAC value of 3.05 (i.e. 5.8/1.9). This is higher than the
observed TEAC value of 1.43 reported in literature [12] or 2.2, based on
the results found in Fig. 1. The lower observed TEAC compared to the
"true" TEAC is due to the fact that the reactions are not completed under
the conditions used to determine the TEAC.
Quercetin is reported to have a TEAC-value of 4.7 [12] to 6.4 [4]
depending on the assay conditions. This means that one molecule of
quercetin reacts with at least 4.7–6.4 times as much ABTS• as trolox (i.e.
4.7×1.9=8.9 to 12.2 molecules of ABTS•) within the time period
measured. The quercetin radical, a reaction product and probably also
further reaction products have to contribute to obtain such a high TEAC.
Previously, it has also been reported that partially oxidized flavonoids can
have a substantial antioxidant activity [13-15].
In summary, the TEAC assay measures the antioxidant capacity of the
parent compound plus that of reaction products. These reaction products

Antioxidant capacity of reaction products limits the applicability of the TEAC assay
55
may have a considerable contribution to the TEAC. As shown for trolox
and chrysin, the contribution of products is not similar for antioxidants.
The relatively high TEAC of chrysin—compared to its moderate
antioxidant activity—is due to the formation of reaction products that also
scavenge ABTS•. A reaction product was found that proved to have a
higher antioxidant capacity than the parent compound. The contribution
of reaction products hampers the use of the TEAC for constructing SARs;
in a SAR the activity has to be related to one structure only.
Nevertheless, TEAC (like-) assays are still frequently applied to rank
antioxidants or to construct SARs without taking the limitations of the
assay into account. It should be realized that a similar impediment as we
described here for the TEAC assay (i.e. the substantial contribution of
reaction products to the overall observed effect of an antioxidant) may
also be found in other screenings assays, based on assessing the total
antioxidant capacity, e.g. the oxygen radical absorbance capacity assay
(ORAC) [16].
Despite its drawbacks, the TEAC assay is a useful tool for tracking down
unknown antioxidants in complex mixtures. For this application, the TEAC
assay has been used with success [17,18]; however, one has to be
aware of possible complications [19].

Chapter 4
56
References
1. Halliwell, B. and J.M.C. Gutteridge, Free Radicals in Biology and Medicine. (third ed.), Oxford University Press, New York (1999). 2. Marklund, S. (1979) A simple specific method for the determination of the hemoglobin content of tissue homogenates, Clin. Chim. Acta 92, 229–234. 3. Miller, N.J., C.A. Rice-Evans, M.J. Davies, V. Gopinathan and A. Milner (1993) A novel method for measuring antioxidant capacity and its application to monitoring the antioxidant status in premature neonates, Clin. Sci. 84, 407–412. 4. Strube, M., G.R.M.M. Haenen, H. van den Berg and A. Bast (1997) Pitfalls in a method for assessment of total antioxidant capacity, Free Rad. Res. 26, 515–521. 5. Van den Berg, R., G.R.M.M. Haenen, H. van den Berg and A. Bast (1999) Applicability of an improved Trolox equivalent antioxidant capacity (TEAC) assay for evaluation of antioxidant capacity measurements of mixtures, Food Chem. 66, 511–517. 6. Re, R., N. Pellegrini, A. Proteggente, A. Pannala, M. Yang and C. Rice-Evans (1999) Antioxidant activity applying an improved ABTS radical cation decolorization assay, Free Radical Biol. Med. 26, 1231–1237. 7. Heijnen, C.G.M., G.R.M.M. Haenen, J.A.J.M. Vekemans and A. Bast (2001) Peroxynitrite scavenging of flavonoids: structure activity relationship, Environ. Toxicol. Pharmacol. 10, 199–206. 8. Aliaga, C. and E. Lissi (1998) Reaction of 2,2′-azinobis (3-ethylbenzothiazoline-6-sulfonic Acid (ABTS) derived radicals with hydroperoxides. Kinetics and mechanism, Int. J. Chem. Kin. 30, 565–570. 9. Campos, A. and E. Lissi (1997) Kinetics of the reaction between 2,2′-azinobis (3-ethylbenzothiazoline-6-sulfonic acid (ABTS) derived radical cations and phenols, Int. J. Chem. Kin. 29, 219–224. 10. Boozer, C.E., G.S. Hammond, C.E. Hamilton and J.N. Sen (1955) Air oxidation of hydrocarbons. The stoichiometry and fate of inhibitors in benzene and chlorobenzene, J. Am. Chem. Soc. 77, 3233–3237. 11. Rezk, B., G.R.M.M. Haenen, W.J.F. van den Vijgh and A. Bast (2002) The antioxidant activity of phloretin: the disclosure of a new antioxidant pharmacophore in flavonoids, Biochem. Biophys. Res. Commun. 295, 9–13. 12. Rice-Evans, C.A., N.J. Miller and G. Paganga (1996) Structure-antioxidant activity relationships of flavonoids and phenolic acids, Free Radical Biol. Med. 20, 933–956. 13. Kondo, K., M. Kurihara, N. Miyata, T. Suzuki and M. Toyoda (1999) Scavenging mechanisms of (−)-epigallocatechin gallate and (−)-epicatechin gallate on peroxyl radicals and formation of superoxide during the inhibitory action, Free Radical Biol. Med. 27, 855–863. 14. Dangles, O., G. Fargeix and C. Dufour (1999) One-electron oxidation of quercetin and quercetin derivates in protic and non protic media, J. Chem. Soc. Perkin Trans. 2, 1387–1395. 15. Dangles, O., G. Fargeix and C. Dufour (2000) Antioxidant properties of anthocyanins and tannins: a mechanstic investigation with catechin and the 3′, 4′, 7-trihydroxyflavylium ion, J. Chem. Soc. Perkin Trans. 2, 1653-1663. 16. Ou, B., M. Hampsch-Woodill and R.L. Prior (2001) Development and validation of an improved oxygen radical absorbance capacity assay using fluorescein as the fluorescent probe, J. Agric. Food Chem. 49, 4619–4626. 17. Van Overveld, F.W.P.C., G.R.M.M. Haenen, J. Rhemrev, J.P.W. Vermeiden and A. Bast (2000) Tyrosine as important contributor to the antioxidant capacity of seminal plasma, Chem. Biol. Interact. 127, 151–161. 18. Miller, N.J. and C.A. Rice-Evans (1997) The relative contributions of ascorbic acid and phenolic antioxidants to the total antioxidant activity of orange and apple fruit juices and blackcurrant drink, Food Chem. 60, 331–337. 19. Arts, M.J.T.J., G.R.M.M. Haenen, H.-P. Voss and A. Bast (2001) Masking of antioxidant capacity by the interaction of flavonoids with protein, Food Chem. Toxicol. 39, 787–791.