Anomalous Emissions of SO 2 During the Recent Eruption of Santa Ana Volcano, El Salvador, Central...
18
Anomalous Emissions of SO 2 During the Recent Eruption of Santa Ana Volcano, El Salvador, Central America RODOLFO OLMOS, 1 JOSE ´ BARRANCOS, 2 CLAUDIA RIVERA, 3 FRANCISCO BARAHONA, 1 DINA L. LO ´ PEZ, 4 BENANCIO HENRIQUEZ, 1 AGUSTI ´ N HERNA ´ NDEZ, 1 EFRAIN BENITEZ, 1 PEDRO A. HERNA ´ NDEZ, 2 NEMESIO M. PE ´ REZ, 2 and BO GALLE 3 Abstract—Santa Ana volcano in western El Salvador, Central America, had a phreatic eruption at 8:05 am (local time) on October 1, 2005, 101 years after its last eruption. However, during the last one hundred years this volcano has presented periods of quiet degassing with fumarolic activity and an acidic lake within its crater. This paper presents results of frequent measurements of SO 2 degassing using the MiniDOAS (Differential Optical Absorption Spectroscopy) system and a comparison with the volcanic seismicity prior to the eruption, during, and after the eruption. Vehicle measurements of SO 2 flux were taken every hour during the first nine days of the eruption and daily after that. The period of time reported here is from August to December, 2005. Three periods of degassing are distinguished: pre-eruptive, eruptive, and post-eruptive periods. The intense activity at Santa Ana volcano started in July 2005. During the pre-eruptive period up to 4306 and 5154 ton/day of SO 2 flux were recorded on October 24 and September 9, 2005, respectively. These values were of the same order of magnitude as the recorded values just after the October 1 st eruption (2925 ton/day at 10:01 am). Hourly measurements of SO 2 flux taken during the first nine days after the main eruptive event indicate that explosions are preceded by an increase in SO 2 flux and that this parameter reaches a peak after the explosion took place. This behavior suggests that increasing accumulation of exsolved magmatic gases occurs within the magmatic chamber before the explosions, increasing the pressure until the point of explosion. A correlation between SO 2 fluxes and RSAM (Real Time Seismic Amplitude Measurements) is observed during the complete sampling period. Periodic fluctuations in the SO 2 and RSAM values during the entire study period are observed. One possible mechanism explaining these fluctuations it that convective circulation within the magmatic chamber can bring fresh magma periodically to shallow levels, allowing increasing degasification and then decreasing degasification as the batch of magma lowers its gas content, becomes denser, and sinks to give space to a new magma pulse. These results illustrate that the measurements of SO 2 flux can provide important warning signals for incoming explosive activity in active volcanoes. Key words: Sulfur dioxide flux, RSAM, magma degassing, volcanic eruption, Santa Ana volcano. 1 Consejo de Investigaciones Cientı `ficas, Universidad de El Salvador, El Salvador, Centro America. E-mail: [email protected] 2 Enviromental Research Division, ITER, 38611 Granadilla, Tenerife, Canary Island, Spain. 3 Department of Radio and Space Science, Chalmers University of Technology, 41296 Gothenburg, Sweden. 4 Department of Geological Sciences, Ohio University, Athens, Ohio 45701, USA. Pure appl. geophys. 164 (2007) 2489–2506 Ó Birkha ¨user Verlag, Basel, 2007 0033–4553/07/122489–18 DOI 10.1007/s00024-007-0276-6 Pure and Applied Geophysics
Transcript of Anomalous Emissions of SO 2 During the Recent Eruption of Santa Ana Volcano, El Salvador, Central...

Anomalous Emissions of SO2 During the Recent Eruption of Santa Ana
Volcano, El Salvador, Central America
RODOLFO OLMOS,1 JOSE BARRANCOS,2 CLAUDIA RIVERA,3 FRANCISCO BARAHONA,1
DINA L. LOPEZ,4 BENANCIO HENRIQUEZ,1 AGUSTIN HERNANDEZ,1 EFRAIN BENITEZ,1
PEDRO A. HERNANDEZ,2 NEMESIO M. PEREZ,2 and BO GALLE3
Abstract—Santa Ana volcano in western El Salvador, Central America, had a phreatic eruption at 8:05 am
(local time) on October 1, 2005, 101 years after its last eruption. However, during the last one hundred years this
volcano has presented periods of quiet degassing with fumarolic activity and an acidic lake within its crater. This
paper presents results of frequent measurements of SO2 degassing using the MiniDOAS (Differential Optical
Absorption Spectroscopy) system and a comparison with the volcanic seismicity prior to the eruption, during,
and after the eruption. Vehicle measurements of SO2 flux were taken every hour during the first nine days of the
eruption and daily after that. The period of time reported here is from August to December, 2005. Three periods
of degassing are distinguished: pre-eruptive, eruptive, and post-eruptive periods. The intense activity at Santa
Ana volcano started in July 2005. During the pre-eruptive period up to 4306 and 5154 ton/day of SO2 flux were
recorded on October 24 and September 9, 2005, respectively. These values were of the same order of magnitude
as the recorded values just after the October 1st eruption (2925 ton/day at 10:01 am). Hourly measurements of
SO2 flux taken during the first nine days after the main eruptive event indicate that explosions are preceded by an
increase in SO2 flux and that this parameter reaches a peak after the explosion took place. This behavior suggests
that increasing accumulation of exsolved magmatic gases occurs within the magmatic chamber before the
explosions, increasing the pressure until the point of explosion. A correlation between SO2 fluxes and RSAM
(Real Time Seismic Amplitude Measurements) is observed during the complete sampling period. Periodic
fluctuations in the SO2 and RSAM values during the entire study period are observed. One possible mechanism
explaining these fluctuations it that convective circulation within the magmatic chamber can bring fresh magma
periodically to shallow levels, allowing increasing degasification and then decreasing degasification as the batch
of magma lowers its gas content, becomes denser, and sinks to give space to a new magma pulse. These results
illustrate that the measurements of SO2 flux can provide important warning signals for incoming explosive
activity in active volcanoes.
Key words: Sulfur dioxide flux, RSAM, magma degassing, volcanic eruption, Santa Ana volcano.
1 Consejo de Investigaciones Cientıficas, Universidad de El Salvador, El Salvador, Centro America.
E-mail: [email protected] Enviromental Research Division, ITER, 38611 Granadilla, Tenerife, Canary Island, Spain.3 Department of Radio and Space Science, Chalmers University of Technology, 41296 Gothenburg,
Sweden.4 Department of Geological Sciences, Ohio University, Athens, Ohio 45701, USA.
Pure appl. geophys. 164 (2007) 2489–2506 � Birkhauser Verlag, Basel, 2007
0033–4553/07/122489–18
DOI 10.1007/s00024-007-0276-6Pure and Applied Geophysics

1. Introduction
In October 1, 2005, Santa Ana volcano in western El Salvador, Central America
(Fig. 1) finally erupted after several years of quiet degassing and seismic activity. Prior to
the October 1st phreatic eruption, from 2001 to 2005, several discrete measurements of
the SO2 fluxes emitted with the plume by Santa Ana volcano were measured occasionally
(see Table 1) using a COSPEC (correlation spectrometer) (RODRIGUEZ et al., 2004). More
recently, frequent measurements of SO2 fluxes using the Mini-DOAS system (GALLE
et al., 2002) were taken before the eruption until December 2005. These measurements
started two months before the October 1st eruption. At the same time, the Servicio
Nacional de Estudios Territoriales of El Salvador (SNET) had been monitoring the
seismic activity of this volcano using three seismic stations at the volcano. These
measurements have allowed us to compare the emissions of SO2 with the seismic and
explosive activity of Santa Ana volcano. This paper presents the results of these
investigations and their significance for the monitoring of the Santa Ana volcano and
other similar volcanoes.
Santa Ana volcano, with a summit of 2365 m, is located in western El Salvador at
13�510 N and 89�380 W, to the west of Coatepeque caldera (Fig. 1). It forms part of the
volcanic system known as the Coatepeque-Izalco-Santa Ana volcanic complex, one of the
most active volcanic systems in the Central American volcanic arc. The volcanism in
Central America is related to the subduction of the Coco’s plate below the Caribbean
plate (MOLNAR and SYKES 1969). Santa Ana volcano was the source of the debris
avalanche that formed the Acajutla peninsula in the Pleistocene or early Holocene
Figure 1
Map of pyroclastic products of the October 1, 2005 at Santa Ana volcano, El Salvador. Central America.
Servicio Nacional de Estudios Territoriales de El Salvador SNET, October (2005).
2490 R. Olmos et al. Pure appl. geophys.,

Table 1
SO2 Flux from Santa Ana Volcano, 2001–2005. Units in tons/day. VS: vertical scans.
Date No. Of Meas.
Min Max Average S.D Technique Reference Periods
1/8/01 13 30 260 393 60 Stationary (VS)
COSPEC/Rodriguez,2004 -
ERP
ER
UPI
VE
PER
IOD
1/9/01 42 100 950 280 140 Vehicular COSPEC/ Rodriguez,2004
1/9/01 3 190 420 270 130 Vehicular COSPEC/ Rodriguez,2004
5/9/01 n.r.d.a. - - 170 - Stationary (VS)
COSPEC/Rodriguez,2004
1/24/02 8 10 220 80 80 Stationary (V S)
COSPEC/Rodriguez,2004
1/25/02 4 10 40 30 10 Stationary (VS)
COSPEC/Rodriguez,2004
1/26/02 14 20 180 50 40 Stationary (VS)
COSPEC/Rodriguez,2004
8/24/04 586 COSPEC/INSIVUMEH 8/25/04 400 COSPEC/INSIVUMEH 8/26/04 176 COSPEC/INSIVUMEH 8/27/04 526 COSPEC/INSIVUMEH 4/13/05 523 COSPEC/INSIVUMEH 4/14/05 520 COSPEC/INSIVUMEH 4/15/05 581
39 COSPEC/INSIVUMEH
8/20/05 5 880 1928 1434 466 Vehicular 8/24/05 2 4265 4306 4285 29 Vehicular 8/29/05 4 2642 3737 3040 509 Vehicular 8/31/05 4 301 482 370 85 Vehicular 9/2/05 7 2317 3768 3129 600 Vehicular
Stage A Incandescenteincreases
9/3/05 4 1405 3593 2315 1052 Vehicular 9/10/05 2 1747 2653 2200 640 Vehicular 9/11/05 12 1348 2541 1881 401 Vehicular 9/12/05 2 2033 2409 2221 266 Vehicular 9/13/05 2 3329 5154 4241 917 Vehicular 9/14/05 4 3324 5099 3882 820 Vehicular 9/15/05 10 1917 4326 3320 777 Vehicular 9/16/05 6 757 4326 1603 1130 Vehicular 9/17/05 9 1135 2191 1731 354 Vehicular 9/18/05 7 1001 1713 1432 281 Vehicular 9/20/05 4 1233 3848 1653 793 Vehicular 9/21/05 1 1866 Vehicular 9/22/05 4 844 1838 1184 446 Vehicular 9/24/05 6 1312 3329 2401 839 Vehicular 9/25/05 8 793 2634 1601 650 Vehicular 9/26/05 3 2879 3633 3315 391 Vehicular 9/27/05 3 713 828 770 57 Vehicular 9/28/05 2 1742 2384 2063 454 Vehicular 9/29/05 3 1363 1798 1564 219 Vehicular 9/30/05 3 1382 1747 1623 291 Vehicular
D
OIR
EP E
V IPU
RE-
ERP
Stage B Higher
incandescence
10/1/05 2 212 2925 1568 1919 Vehicular Eruption 10/2/05 18 240 986 547 229 Vehicular 10/4/05 6 152 1104 438 344 Vehicular
repap sih t ,SA
ODini
M
Stage CSmall
Explosion
10/6/05 2 507 521 514 10 Vehicular 10/7/05 12 380 1158 755 243 Vehicular 10/8/05 5 69 1685 743 726 Vehicular
Vol. 164, 2007 Anomalous Emissions of SO2 2491

(SIEBERT et al., 2004; PULLINGER, 1998). The later activity of Santa Ana volcano produced
volcanic deposits that have filled the depression formed by this volcanic collapse. The
new volcano presents several crescent-shaped concentric craters and several flank vents
along a fault system that extends around 20 km in the NNW direction bisecting the
volcano (PULLINGER, 1998). Moderate eruptions from the summit and flank vents have
characterized Santa Ana’s activity since the 16th century. One of those vents is the San
Marcelino cinder cone that erupted in 1722, producing lava flows that traveled 13 km to
the east (PULLINGER, 1998).
The last recorded eruption of Santa Ana volcano, prior to the October 1, 2005
eruption, occurred in 1904. A crateric acid lake and a fumarolic field on the crater wall
were formed after this eruption (PULLINGER, 1998; BERNARD et al., 2004). The latter crater
has a diameter of about 0.5 km. During the past century, Santa Ana volcano emitted
important gas emissions consisting of a mixture of magmatic gases and steam from the
magmatic-hydrothermal system. During the most recent period of degassing, 2001–2005,
the acid rain associated with the volcanic plume has produced extensive damage to the
surrounding vegetation, particularly in the south and southwest flanks of the volcano.
Table 1
(Contd.)
10/9/05 11 207 2074 727 632 Vehicular 10/10/05 3 276 320 291 25 Vehicular 10/11/05 5 86 562 399 184 Vehicular 10/12/05 10 26 492 245 137 Vehicular 10/16/05 8 199 527 342 104 Vehicular 10/17/05 9 311 674 470 124 Vehicular 10/18/05 4 570 726 652 81 Vehicular 10/19/05 5 363 847 627 204 Vehicular 10/23/05 2 1140 1495 1318 250 Vehicular 10/24/05 2 873 1201 1037 232 Vehicular 10/25/05 3 752 994 858 124 Vehicular 10/26/05 7 294 475 386 63 Vehicular 10/27/05 6 415 1140 710 269 Vehicular 10/28/05 4 181 337 257 66 Vehicular 10/29/05 4 311 415 372 48 Vehicular 10/31/05 6 95 207 154 38 Vehicular
from craterand an
additionalinput of
magmaticgases
11/1/05 6 276 389 314 40 Vehicular 11/2/05 6 847 1210 1024 151 Vehicular 11/3/05 5 82 138 110 22 Vehicular 11/4/05 10 311 648 483 110 Vehicular 11/5/05 7 708 1452 1159 279 Vehicular 11/7/05 3 544 562 553 9 Vehicular 11/8/05 4 380 821 639 230 Vehicular 11/12/05 9 423 527 490 58 Vehicular 11/26/05 7 294 475 386 63 Vehicular 11/27/05 6 415 1140 710 269 Vehicular 11/28/05 4 181 337 257 66 Vehicular 12/2/05 4 233 605 438 161 Vehicular 12/4/05 4 769 933 829 72 Vehicular 12/5/05 6 372 1123 753 275 Vehicular
Stage D Fluctuant-state
degassinginterval
D
OIR
EP E
VITP
UR
E -TS
OP
(a) COSPEC/Rodriguez, (2004); (b) COSPEC/INSIVUMEH.
2492 R. Olmos et al. Pure appl. geophys.,

HERNANDEZ et al. (this volume) reported a significant increase in the extent and intensity
of the fumarolic field inside the crater rim and of the surface temperature of the crater’s
lake a few days before the October 1, 2005 eruption. SO2 flux measurements were taken
using COSPEC during this period of time, showing average values around 140 tons/day
(BERNARD et al., 2004; RODRIGUEZ et al., 2004).
The surface covered by the pyroclastic products ejected during the October 1, 2005
eruption are shown in Figure 1 (SNET, 2005). The eruption produced ashfall on the west
side of the volcano. Ash layers about 3–5 cm were observed in Los Naranjos village. In
addition, the eruption produced lahars and launched ballistic material (up to 2 m in
diameter) at distances up to 3 km from the crater. About 80% of the vegetation in an area
defined by a radial distance of 3 km from the crater was damaged during this eruption.
The villages more affected by ash fall were Los Naranjos, La Majada and Apaneca, as
well as Ahuachapan city.
Increased emissions of volcanic gases usually precede eruptive activity (MALINCONICO,
1979; YOUNG et al., 1998; TARAN et al., 2002). Research and monitoring of these emissions
can provide warning signals for possible eruptions such as has happened in other global
volcanoes, for example the March-April, 1982 eruption of Mount St. Helens (SWANSON et
al., 1985). Previous work on diffuse CO2 at Santa Ana volcanic complex was carried out by
SALAZAR et al., 2001, finding that most of the CO2 degassing at Santa Ana is limited to the
central area of the volcano. An important challenge in volcanic research and monitoring has
been the sampling of volcanic gases within the crater, which is dangerous during active
periods. Therefore, optical remote sensing methods such as Ultraviolet and Infrared
Spectroscopy are suitable to measure volcanic gas emissions. The UV sensor COSPEC has
been used for remote monitoring of volcanic plumes since the early eighties (STOIBER et al.,
1983). COSPEC was a major change from direct gas sampling to remote sensing. Sampling
of gases within craters and determination of their composition are more accurate than
remote methods. However, better safety and increased sampling frequency are the benefits
of remote sensing, greatly improving the ability to evaluate degassing trends. More recently,
Differential Optical Absorption Spectroscopy (DOAS) has allowed highly sensitive and
specific detection of many gases using artificial sources or scattered sunlight (GALLE et al.,
2002). The MiniDOAS is compact, lightweight, portable, and relative simple equipment,
which was successfully introduced for remote sensing of SO2 fluxes in volcanoes in 2002
(GALLE et al., 2002). In this paper, we present measurements of SO2 emissions performed
using a miniDOAS system before, during, and after the last phreatic eruptive period of the
Santa Ana volcano.
2. Methodology
The miniDOAS system is based on a spectrometer (Ocean Optics S2000) coupled to a
telescope through a quartz optical fiber (diameter 800 lm). The unit is powered via the
USB-port of a laptop computer, which also supports data transfer. The spectrometer is
Vol. 164, 2007 Anomalous Emissions of SO2 2493

calibrated using a mercury lamp. The software used for controlling the spectrometer was
developed at Chalmer University of Technology and it is called MobileDoas. In our work,
the spectra were re-evaluated using DOASIS (DOAS Intellingent System). DOASIS is a
software that filters the interference of other chemical species with the SO2 spectrum,
generating a cleaner spectrogram and a better determination of the SO2 fluxes. In a typical
measurement the mini-DOAS was carried on a car and spectra were recorded while the car
moved under the volcanic plume. The plane formed by the moving car with the
MiniDOAS and the trajectory of the car is approximately perpendicular to the direction of
movement of the plume. The distance from the transect to the crater is between 5 and
15 km. The car position was tracked using a handheld GPS receiver. The parameter
obtained at every measurement point along the transect is concentration of SO2 times
meter (ppm.m or mass.length-2) or SO2 column density. The direction of plume transport
was found using the GPS position of the maximum SO2 column density and the crater
position. Integrated path values were obtained by adding the products of the SO2 column
density and perpendicular displacement for each segment along the path (mass.length-1).
SO2 flux values were obtained multiplying the integrated path values times the mean value
of the wind speed during the time of the measurements (mass.time-1). Values of wind
speed were estimated using the FNL model of the National Oceanic and Atmospheric
Administration (NOAA) at 700 and 850 HPa (Hectopascals). Typical transects for this
study are shown in Figure 2.
During the time period of this investigation, SO2 flux measurements were taken at
variable time intervals. From August 24 to December 5, 2005, almost daily measurements
were taken. The number of transects measured every day varied from 1 to 18. When
several transects were measured in one day, the average daily flux is reported. Variations
in SO2 flux at different times of the day were investigated on October 2, 7, and 9. The
results for the different SO2 flux measurements taken by other authors before 2005 and
the values obtained in this work are shown in Table 1.
3. Results and Discussion
3.1. Pre-eruptive Period (June–September 2005)
The relatively low values of SO2 flux measurements taken using COSPEC during
2001 and 2002 (140 tons/day; BERNARD et al., 2004; RODRIGUEZ et al., 2004) are in good
agreement with the low RSAM (Real Time Seismic Amplitude Measurements) values
measured during April–June 2005 (< 20 RSAM units), as shown in Figure 3. This value
of around 20 RSAM units will be considered in this paper as the base line for volcanic
seismicity. The RSAM system was developed by the USGS to study seismic activity
during volcanic crises (EWERT et al., 1993). During volcanic crisis, it is often difficult to
distinguish individual seismic events. Instead of focusing on individual events, the
average amplitude over 10-minutes intervals is computed and stored (RSAM). If the
2494 R. Olmos et al. Pure appl. geophys.,

amplitude or rate of the volcanic tremor increases, RSAM also increases. The importance
of seismicity as a precursor to eruptive activity has been demonstrated (CHOUET, 1996).
This increase in seismicity can be related to magma or gas movement.
At Santa Ana volcano, two stages can be identified during the pre-eruptive period as
shown in Table 1 and Figure 3. Stage A comprises the period between 05/13/2005 and
09/02/2005, as it can be observed in the increase in RSAM and SO2 happening around
that date in May. During stage A, from 05/13/2005 to 08/20/2005, we observed an
anomalous increase in SO2 flux of 893 tons/day (from 541 ± 34 tons/day to
1434 ± 466 tons/day), as shown in Table 1. In comparison, from 08/20/2005 to 08/24/
2005 the flux increased *2850 tons/day (from 1434 ± 466 to 4285 ± 29 tons/day,
respectively). This emission of SO2 is up to 30 times greater than the 140 tons/day found
during the previous period. Increases in SO2 emissions at Santa Ana volcano have been
reported during non-erupting periods. In February, 2001, COSPEC measurements
showed a noticeable increase of SO2 by a factor higher than 8 (WUNDERMAN and ED
VENZKE, 2001). However, that increase is considerable lower than the factor of 30
observed at Santa Ana during the period prior to the eruption of 2005. This increase of
SO2 flux suggested the rise of magma to a level that promoted gas emission and/or gas
transmission through the hydrothermal system. The increase of volcano-tectonic (VT)
seismicity is in good agreement with this interpretation (Fig. 3). The RSAM values,
measured at the San Blas Station increased to values of 54 RSAM units on 08/20/2005.
This value represents an increase of more than 30 RSAM units with respect to the base
line seismicity. Two seismic events occurred on 08/24/2005 on the south flank of the
Santa Ana volcano. These events were located between Cerro Verde and San Blas
Figure 2
Typical transect A: Los Naranjos-Sonsonate B:Santa Ana-El Congo, October (2005).
Vol. 164, 2007 Anomalous Emissions of SO2 2495
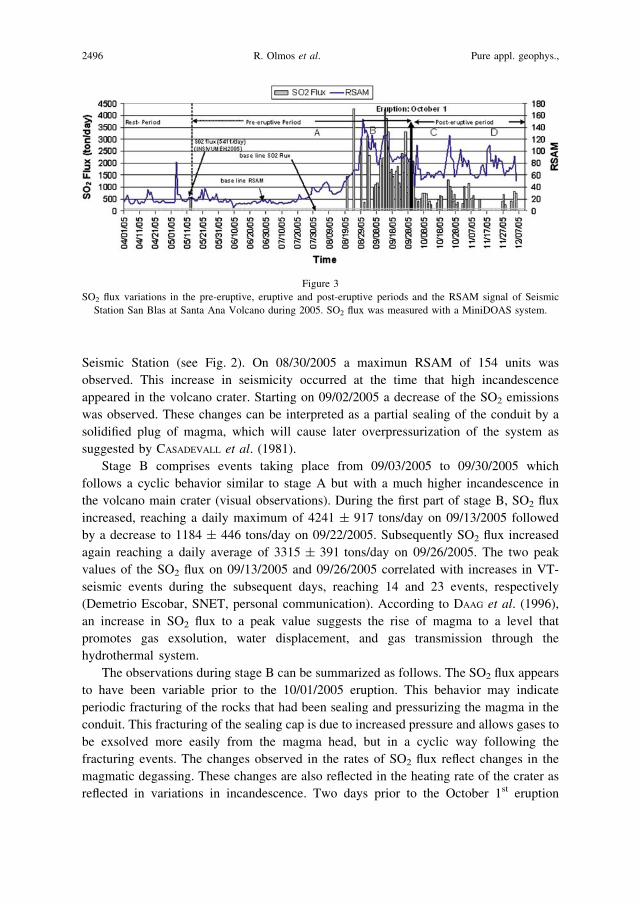
Seismic Station (see Fig. 2). On 08/30/2005 a maximun RSAM of 154 units was
observed. This increase in seismicity occurred at the time that high incandescence
appeared in the volcano crater. Starting on 09/02/2005 a decrease of the SO2 emissions
was observed. These changes can be interpreted as a partial sealing of the conduit by a
solidified plug of magma, which will cause later overpressurization of the system as
suggested by CASADEVALL et al. (1981).
Stage B comprises events taking place from 09/03/2005 to 09/30/2005 which
follows a cyclic behavior similar to stage A but with a much higher incandescence in
the volcano main crater (visual observations). During the first part of stage B, SO2 flux
increased, reaching a daily maximum of 4241 ± 917 tons/day on 09/13/2005 followed
by a decrease to 1184 ± 446 tons/day on 09/22/2005. Subsequently SO2 flux increased
again reaching a daily average of 3315 ± 391 tons/day on 09/26/2005. The two peak
values of the SO2 flux on 09/13/2005 and 09/26/2005 correlated with increases in VT-
seismic events during the subsequent days, reaching 14 and 23 events, respectively
(Demetrio Escobar, SNET, personal communication). According to DAAG et al. (1996),
an increase in SO2 flux to a peak value suggests the rise of magma to a level that
promotes gas exsolution, water displacement, and gas transmission through the
hydrothermal system.
The observations during stage B can be summarized as follows. The SO2 flux appears
to have been variable prior to the 10/01/2005 eruption. This behavior may indicate
periodic fracturing of the rocks that had been sealing and pressurizing the magma in the
conduit. This fracturing of the sealing cap is due to increased pressure and allows gases to
be exsolved more easily from the magma head, but in a cyclic way following the
fracturing events. The changes observed in the rates of SO2 flux reflect changes in the
magmatic degassing. These changes are also reflected in the heating rate of the crater as
reflected in variations in incandescence. Two days prior to the October 1st eruption
Figure 3
SO2 flux variations in the pre-eruptive, eruptive and post-eruptive periods and the RSAM signal of Seismic
Station San Blas at Santa Ana Volcano during 2005. SO2 flux was measured with a MiniDOAS system.
2496 R. Olmos et al. Pure appl. geophys.,

changes in the predominant seismic frequency (from 8 to 5 Hz) were observed (Demetrio
Escobar, SNET, personal communication). The observed changes in gas release could be
the main cause of the changes in seismic frequency. Modeling studies of degassing in
magmatic chambers by BENOIT and MCNUTT (1997) and NEUBERG et al. (2000) show that
gas concentration affects the seismic velocity and the observed spectra in the low
frequency region. Changes in seismic frequency are produced by cycles of pressure
within the magma conduit due to different types of resonance sources at different depths.
As a gas pulse moves upward within the magmatic conduit towards the magma head
intercepts fractures. The magma conduit acts as a resonance source that changes
resonance frequency due to the fractures and produces the changes in spectral frequencies
measured in the seismograms. The degassing and bubbling of magma also changes due to
changes in acoustic vibration. Changes in gas concentrations can produce changes in
dominant seismic frequency and shift in spectral frequencies during hybrid and long-
period seismic events (NEUBERG et al., 1998; BAPTIE et al., 2002;NEUBERG and O’GORMAN,
2002).
3.2. Phreatic Eruption (1st October 2005)
The phreatic eruption occurred at 08:05 a.m. on 10/01/2005 as shown with the arrow
in Figure 3. Two transects were performed during this day around 10:00 am and 04:00
pm producing SO2 flux values of 2925 ± 29 tons/day and 212 ± 21 tons/day, respec-
tively. These values are a factor of 3 and 47 lower than the 10,000 tons measured in the
erupted cloud by the Ozone Monitoring Instrument (OMI) on board NASA’s Aura
satellite during the phreatic eruption of Santa Ana Volcano (NASA EARTH OBSERVATORY,
2005). Ground-based and satellite-based measurements can give different values due to
the uncertainties in the measurements and the different methodologies (fluxes in the
ground-based measurements and SO2 mass content in the OMI measurement). However,
these values show order of magnitude differences. On the other hand, the RSAM values
reached values up to 1368 RSAM units at the time of the eruption, extremely higher than
all previous values. However, similar to the SO2 fluxes, the RSAM values decreased
dramatically after the eruption. At 07:00 pm (11 hours after the eruption), the RSAM
went down to 20 RSAM units.
Observations by the OMI instrument (NASA EARTH OBSERVATORY, 2005) show that
the cloud of gas displaced to the southwest. This is in agreement with the mapped ash fall
as shown in Figure 1 that presents a thickness of up to 10 m close to the crater and the
plume spreading towards the southwest with 2 mm thickness at Ahuchapan City.
3.3. Post-eruptive Period (October 2 – December 5, 2005)
Stage C corresponds to small explosions in the crater from October 2 to October 31,
2005. Measurements of SO2 flux from active volcanoes are not done very frequently due
to instrumental limitations, changes in wind conditions, expensive equipment and time
Vol. 164, 2007 Anomalous Emissions of SO2 2497

consumption (Andres and Rose, 1995). However, on the days following the eruption,
transects of SO2 were measured approximately every hour with the purpose of observing
variations of this parameter and its relationship with subsequent events in the Santa Ana
volcano. The results for the SO2 flux measured at the Santa Ana volcano plume are
presented in Figures 4, 5, and 6 for the dates October 2, 7, and 9. In these graphs, the
occurrence of explosions as detected by San Blas seismic station is also shown. Seismic
tremor, and lahars are indicated with arrows. It should be noted that Hurricane Stan was
hitting El Salvador during early October, increasing the risk for lahars and other related
phenomenon. On October 2nd, an increase from 262 ± 21 to 866 ± 104 tons/day of SO2
flux preceded an explosion. Later that day, a landslide to the east and southeast of the
crater generated a lahar that traveled 5 km away from the crater towards Coatepeque
Lake. In addition, the Stan storm and the small explosions produced during this day
considerable damage to the west and northwest flanks. On October 7 (Fig. 5) peaks of
SO2 flux were observed at 9:14 am,12:30 and 15:32 pm. In addition, a marked increase of
the VT-seismic events at 11:40 am, 14:00 and 20:17 pm due to small explosions was
observed. On October 9 (Fig. 6), the SO2 flux started to increase clearly before an
explosion occurred around 11 a. m. and reached peak values around 12 m. In all these
explosive events, SO2 flux started to increase before the explosions and reached a peak
after the explosions took place. Note that on the explosion of October 2, the peak value
was probably not detected because measurements were not taken during the few hours
after the event. The observational results imply that increased degassing occurs before the
explosions. A low permeability degassed magma cap on top of the magma head can
generate an accumulation of gases and over-pressurization on the magma head. As the
pressure rises, the magma cap starts to break and allows the release of small fluxes of
gases before the explosions. However, before the explosions the rate of accumulation of
gases is greater than the fluxes released to the atmosphere and the pressure continues to
increase. This high pressure is transferred throughout the magmatic conduit and the
magmatic chamber until it is high enough to produce the observed explosions and
subsequent high release of gases. These conditions can be considered similar to those
Figure 4
Hourly SO2 flux at Santa Ana volcano plume during October 2, 2005.
2498 R. Olmos et al. Pure appl. geophys.,

happening on Soufriere Hills volcano, Montserrat, where long period seismic events have
been recorded and occurred at the same time with visual observations of ash and gas
venting at the surface, and immediately preceding rockfalls (LUCKETT et al., 2002).
Increased SO2 emissions often precede and/or occur simultaneously to increases in
eruptive activity (MALINCONICO, 1979; YOUNG et al., 1998). In Figure 3, an additional
input of magmatic gases into the feeding system is suggested during October 24–26, due
to an increase of SO2 flux. At that time, a new crisis of the volcano was suspected with
values of 103 y 127 RSAM units registered at the San Blas seismic station. These high
RSAM values occurred on October 23 and 24, 2005. At the same time, SO2 flux increased
reaching values of 1318 ± 250 and 1037 ± 232 tons/day, respectively. These fluctua-
tions in SO2 flux can be interpreted as decreases in pressure in the magma head that
allows the ascent of intermittent, less dense bubble-bearing magma through the magma
conduit and produces changes in the RSAM signal. On the other hand, LP-events and
hybrid earthquakes are generated from the excitation and resonance of a fluid magma
body surrounded by an elastic medium (FERRAZZINI and AKI, 1987).
Figure 5
Hourly SO2 flux at Santa Ana volcano plume during October 7, 2005.
Figure 6
Hourly SO2 flux at Santa Ana volcano plume during October 9, 2005.
Vol. 164, 2007 Anomalous Emissions of SO2 2499

3.4. Stage D Fluctuant-state Degassing Interval (November–December, 2005)
During the months of November and December, 2005, measurements of SO2 flux
were done more irregularly (Fig. 3). The changes of SO2 flux observed during this time
correlate with small variations in the seismicity of the volcanic system. Visual
observations were done on November 4, at a distance of 2 km from the crater, at the west
side. These observations allowed us to identify a small plume ascending approximately
three hundred meters above the crater (Fig. 7a). In another inspection of the summit
crater on November 11, a change in color in the crater lake was observed (Fig. 7b), from
green before the eruption to turquoise after the eruption. This change in color could
correspond to the deposition of new sulfate minerals that were not present before the
eruption. The fumarolic area that existed at the walls of the crater was found sealed, and
an intensive bubbling was occurring at the crater lake. This bubbling indicates direct
interaction of the lake with the magmatic-hydrothermal system. More recently (March,
2006), a reduction in the size of the crater lake was observed (Fig. 7c) if it is compared
with its original area before the eruption. Heat and gas transfer is changing the chemical
composition and temperature of the lake (Figs. 7b and 7c). For the entire stage D, a
maximum value of SO2 flux of 1024 ± 151 ton/day was measured in November 2, 2004,
and a minimum value of 110 ± 22 ton/day in November 3, 2004, with an average of
599 ± 218 tons/day.
At Santa Ana volcano, frequencies of 2 and 4 Hz (Demetrio Escobar, SNET,
personal communication) in the spectrograms were recorded during stage D. These
dominant frequencies correlated with the decreasing and fluctuating flux of SO2.
JOHNSON and LEES (2000) explains that signals between 1 and 5 Hz can be classified as
degassing ‘‘chugging’’ events. At Pinatubo volcano, similar bands with frequencies
between 3.5 and 4.5 Hz were present on June 12, 1991, and continued until June 16,
1991. These bands were explained as magma movement and release of associated
volatiles into a new system of cracks before the eruption of June 15, 1991 (POWER et al.,
1996). The displacement of frequency patterns correlated well with the RSAM signal.
Figure 7
a) Small plume at Santa Ana volcano on November 4, 2005. b) Sulphurous lake at the Santa Ana volcano crater
as observed on November 12, 2005. c) Sulphurous lake at the Santa Ana volcano crater as observed on February
26, 2006.
2500 R. Olmos et al. Pure appl. geophys.,

These changes in the frequency pattern (long-period earthquakes and tremor) have been
observed in other global volcanoes, for example: Arenal in Costa Rica (HAGERTY et al.,
2000), Karymsky in Russia (JOHNSON and LEES, 2000), Montserrat in West Indies
(NEUBERG et al., 2000), Erebus in Antartica (ROWE et al., 2000), and Lascar in Chile
(HELLWEG, 2000).
The gas pulses identified in the frequent SO2 measurements taken during stage D are
probably explained by changes in the partially sealed conduit of the crater as well as
possible changes in the density of the magma (JAUPART and VERGNIOLLE, 1989). The
pressure within the magma head decreases due to the released gases. The gas composition
of the remaining gases changes because different magmatic gases have different partition
coefficients (GIGGENBACH, 1980). These changes in composition also generate changes in
magma density. The decreasing trends of SO2 flux have also revealed the influence of the
hydrothermal system covering the degassing magma. Open or partially open conduits in
the interior of the crater make possible the leak and rapid ascent of gases through the
hydrothermal system that surrounds the magmatic environment (DOUKAS and GERLACH,
1995). However, the magma that does not have the right pressure for the gases to ascend
and leave the crater, remains trapped in the magma conduit until more gases accumulate
or new batches of magma reach shallower levels. The fluctuations of SO2 flux also can
reflect a convective magma circulation and transfer of gases within the magmatic
chamber, such as is observed in the large period events registered in the seismograms.
New batches of magma arriving at shallow levels by convective circulation from deeper
levels within the chamber should provide higher release of gases. In addition, convection
of magma within the magma conduit has been proposed as a mechanism to transport
volatiles to shallow levels (KAZAHAYA et al., 2004; WITTER et al., 2004). The geometry of
the magma conduit controls the exsolution of gases. KAZAHAYA et al. (2004) have
modeled the ascent of magma within a pipe showing that gas exsolution is affected by the
radius of the magmatic conduit. As heat and gases are transferred to the surrounding
rocks and to the atmosphere, changes in the radius of the magmatic conduit can occur due
to channel erosion or rock collapses. These processes can also produce changes in the
emitted SO2. Variations in density due to the degasification process have been proposed
to drive magmatic convection within magmatic conduits. As magma degas, the denser
magma in the magma head sinks and allows the lighter magma, richer in gases, to ascend
producing an increase in gas release at the magma head (STEVENSON and BLAKE, 1998).
This mechanism explains the degasification process in non-erupting volcanoes that
release gases continuously at their craters (KAZAHAYA et al., 1994; ALLARD, 1997;
STEVENSON and BLAKE, 1998). As the magma batch degasses decreasing the volatile
concentration, the exsolved fluxes should decrease. As convection is a periodic
phenomenon, the fluxes should also behave periodically. Another possible explanation
for the decrease in SO2 flux is the decreasing degasification of the magma as the
concentration of dissolved gases decreases with time (ANDRES et al., 1993; GARDNER and
WHITE, 2002).
Vol. 164, 2007 Anomalous Emissions of SO2 2501

3.5. Correlation between RSAM and SO2 Flux
The SO2 flux and RSAM data versus time plotted in Figure 3 suggest that both variables
are correlated in time. Higher values of both variables occur almost at the same days.
However, the construction of a cross-correlogram between both variables can allow the
identification of any time lag between these two variables (DAVIS, 2002). Figure 8 shows the
cross-correlogram between SO2 and RSAM. In this Figure, a clear lag of zero days can be
observed between the two variables because the cross-correlogram has a peak at zero days
with a correlation coefficient equal to 0.58. The test of significance of the correlation
coefficient (DAVIS, 2002) for the correlation coefficient of 0.58 and 61 data points gives a t
statistics equal to 5.41, which is significant at a confidence level higher than 99.99%. The lag
phase between the two variables is probably lower than 1 day, as suggested by Figures 4–6,
and the occurrence of explosions and seismic events. These figures suggest that the phase lag
is probably only minutes or hours. Time intervals between measurements smaller than 1 day
are needed to find the right phase lag between the variables.
4. Conclusions
At Santa Ana volcano, seismic measurements (RSAM) and fluxes of SO2 have proved
to be a good tool to detect changes in volcanic activity during the recent eruptive period.
Both parameters showed an increase, with some variability, several months before the
eruption. SO2 flux reached thousands of tons/day a few days before the eruption and
RSAM showed similar trends. This behavior indicates that the measurement of these two
parameters in active volcanoes such as Santa Ana is essential to forecast future eruptions
as has happened in other worldwide volcanoes (e.g., Pinatubo and Montserrat volcanoes).
Figure 8
Cross-correlogram of RSAM and SO2 flux at Santa Ana volcano from August to December, 2005. A maximum
in the cross-correlogram at zero lag indicates that the lag phase between the two variables is smaller than one
day.
2502 R. Olmos et al. Pure appl. geophys.,

Within a few days of the eruption, variations in emissions of SO2 were closely related to
seismic and explosive activity at Santa Ana volcano. Increases in SO2 emissions were
observed prior to explosive events and the flux increased to peak values after the explosion.
This initial increase seems to occur within an hour of the explosion. This situation probably
also happens when major eruptions occur but we have not detected it because SO2 fluxes are
not measured very frequently in volcanoes. These changes are probably even more dramatic
at the time of large eruptions as found for Santa Ana volcano by the OMI instrument on
board NASA’s Aura satellite. Consequently, methods to monitor SO2 more frequently are
needed. COSPEC and MiniDOAS measurements made from an Air planes or from vehicles
take too long and can be made only during the day. New sensors that can be operated
remotely and that measure the fluxes at night and day are needed, as well as the improvement
of the resolution of the remote sensors used by satellites.
According to the behavior of the SO2 flux from Santa Ana volcano and the RSAM,
SO2 degassing of magma at Santa Ana volcano after the anomalous changes that started
in May of 2005 have been caused mainly by a high accumulation of volatiles at shallow
levels (magma head) in the magmatic conduit. The periodic fluctuations in SO2 degassing
and seismicity at Santa Ana volcano are probably the result of a combination of processes
such as the convective circulation of magma within the magmatic chamber that transports
fresh magma rich in gases to shallower levels and releases high fluxes as it arrives. Later
the gas fluxes decrease until the magma becomes denser and sinks again to give path to
another magma batch. another possible mechanism is the plugging and unplugging of the
conduits as magma cools and solidifies, then the increase in pressure inside the chamber
can again break the seal, and gases again are released abundantly. Finally, during the
periods of low to moderate release of magmatic gases, external factors such as tidal and
atmospheric effects can also generate cyclic behavior in the seismicity and probably in
the gas released (LoPEZ et al., 2006; NEUBERG, 2000a, b; RYDELEK et al., 1988).
Acknowledgments
The RSAM data used in this paper were kindly provided by SNET (Servicio Nacional
de Estudios Territoriales de El Salvador). This research was supported by the Spanish Aid
Agency (Agencia Espanola de Cooperacion International - AECI), CIC-UES (Consejo de
Investigaciones Cientificas de la Universidad de El Salvador), and additional financial-aid
was provided by the Cabildo Insular de Tenerife, Canary Islands, Spain.
REFERENCES
ALLARD, P. (1997), Endogenous magma degassing and storage at Mount Etna, Geophys. Res. Lett. 24,
2219–2222.
ANDRES, R.J. and ROSE, W.I., Remote sensing spectroscopy of volcanic plumes and clouds. In Monitoring Active
Volcanoes, (McGuire, B., Kilburn, C.R.J., and Murray, J., eds.), (UCL Press 1995).
Vol. 164, 2007 Anomalous Emissions of SO2 2503

ANDRES, R.J., ROSE, W.I., STOIBER, R.E., WILLIAMS, S.N., MATIAS, O., and MORALES, R. (1993), A summary of
sulfur dioxide emission rate measurements from Guatemalan volcanoes, Bull. Volcanol. 55, 379–388.
BAPTIE, B., LUCKETT, R., and NEUBERG, J. (2002), Observations of low-frequency earthquakes and volcanic
tremor at Soufriere Hills Volcano, Montserrat. In The Eruption of Soufriere Hills Volcano, Montserrat, from
1995 to 1999, (Druitt, T.H. and Kokelaar, B.P., eds.), Geological Society, London, Memoirs 21, 611–620.
BENOIT, J. and MCNUTT S. (1997), New constraints on sources processes of volcanic tremor at Arenal Volcano,
Costa Rica, using broadband seismic data, Geophys. Res. Lett. 24, 449–452.
BERNARD, A., ESCOBAR, C.D., MAZOT, A., and GUTTIERREZ, R.E. (2004), The acid crater lake of Santa Ana
volcano, El Salvador. In (Rose, W.I., Bommer, J.J., Lopez, D,L., Carr, M.J., and Major, J.J., eds.) Natural
Hazards in El Salvador: Boulder, Colorado, Geological Sociey of America Special Paper 375.p. 5–23.
CASADEVALL, T.J., JOHNSTON, D.A., HARRIS, D.A., ROSE, W.I., Jr., MALINCONICO, L.L., Jr., STOIBER, R.E.,
BORNHORST, T.J., WILLIAMS, S.N., WOODRUFF, L., and THOMPSON, J.M. (1981), SO2 emission rates at Mount St.
Helens from March 29 through December, 1980. In (Lipman, P.W., and Mullineaux, D.R., eds.), The 1980
eruptions of Mount St. Helens, U.S. Geological Survey Professional Paper 1250, pp. 193–200.
CHOUET, B. (1996), Long-period volcano seismicity: Its source and use in eruption forecasting, Nature 380, 309–
316.
DAAG, A.S., TUBIANOSA, B.S., NEWHALL, C.G., TUNGOL, N.M., JAVIER, D., DOLAN, M.T., REYES, P.J.D., ARBOLEDA,
R.A., MARTINEZ, M.M.L., and REGALADO, M.T.M. (1996), Monitoring sulfur dioxide emission at Mount
Pinatubo. In Fire and Mud: Eruptions and Lahars of Mount Pinatubo, (Newhall, C.G. and Punongbayan,
R.S., eds.), Phillipines, Philippine Institute of Volcanology and Seismology, Quezon City, and University of
Washington Press, Seattle, pp. 409–414.
DAVIS, J.C., Statistics and Data Analysis in Geology, 3rd edition (Wiley, New York 2002).
DOUKAS, M.P. and GERLACH, T.M. (1995), Sulfur dioxide scrubbing during the 1992 eruptions of Crater Peak,
Mount Spurr Volcano, Alaska. In The 1992 Eruptions of Crater Peak Vent, Mount Spurr Volcano, Alaska,
(Keith, T.E.C., ed.), U.S. Geolog Survey Bull. 2139, 47–57.
EWERT, J.W., MURRAY, T.L., LOCKHART, A.B., and MILLER, C.D. (1993), Preventing Volcanic Catastrophe: The
U.S. International Volcano Disaster Assistance Program, Earthquakes and Volcanoes 24, 6.
FERRAZZINI, V. and AKI, K. (1987), Slow waves trapped in a fluid-filled infinite crack: Implication for volcanic
tremor, J. Geophys. Res. 92, 9215–9223.
GALLE B., OPPENHEIMER, C., GEYER, A., MCGONIGLE, A.J.S ., EDMONS, M., and HORROCS L.A. (2002), A
miniaturized UV spectrometer for remote sensing of SO2 fluxes: A new tool for volcano surveillance, J.
Volcanol. Geotherm. Res. 119, 241–254.
GARDNER, C.A. and WHITE, R.A. (2002), Seismicity, gas emission and deformation from 18 July to 25 September
1995 during the initial phreatic phase of the eruption of Soufriere Hills Volcano, Montserrat. In The Eruption
of Soufriere Hills Volcano, Montserrat, from 1995 to 1999 (Druitt, T.H. and Kokelaar, B.P., eds.), Geological
Society, London, Memoirs. 21,567–581.
GIGGENBACH, W. F., Chemical composition of volcanic gases, In (Scarpa, Tilling, eds.) Monitoring and
Mitigation of Volcano Hazard (Springer, 1996) pp. 221–256.
HAGERTY, M., SCHWARTZ, S., GARCES, M., and PROTTI, M. (2000), Analysis of seismic and accoustic observations
at Arenal Volcano, Costa Rica, 1995–1997, J. Volcanol. Geotherm. Res. 101, 27–65.
HELLWEG, M. (2000), Physical models for the source of Lascar’s harmonic tremor, J. Volcanol. Geotherm. Res.
101, 183–198.
HERNANDEZ, P. A., PEREZ, N. M., VAREKAMP, J. C., HENRIQUEZ, B., HERNANDEZ, A., BARRANCOS, J. PADRoN, E.
CALVO, D., and MELIAN, G. (2007), Crater Lake temperature changes of the 2005 eruption of Santa Ana
volcano, El Salvador, Central America, Pure Appl. Geophy. (this volume).
JAUPART, C. and VERGNIOLLE, S. (1989), The generation and collapse of a foam layer at the roof of basaltic
magma chamber, J. Fluid Mech. 203, 247–380.
JOHNSON, J. and LEES, J. (2000), Plugs and chugs-seismic and acoustic observations of degassing explosions at
Karymsky, Russia and Sangay, Ecuador, J. Volcanol. Geotherm. Res. 101, 67–82.
KAZAHAYA, K., SHINOHARA, H., and SAITO, G. (1994), Excessive degassing of Izu-Oshima Volcano: Magma
convection in a conduit, Bull. Volcanol. 56, 207–216.
KAZAHAYA, K, SHINOHARA, H., UTO, K., ODAI, M., NAKAHORI, Y., MORI, H., IINO, H., MIYASHITA, M., and
HIRABAYASHI, J. (2004), Gigantic SO2 emission from Miyakejima volcano, Japan, caused by caldera collapse,
Geology 32, 425–428.
2504 R. Olmos et al. Pure appl. geophys.,

LoPEZ, D.L., BUNDSCHUH, J., SOTO, G.J., FERNANDEZ, J.F., and ALVARADO, G.E. (2006), Chemical evolution of
thermal springs at Arenal Volcano, Costa Rica: Effect of volcanic activity, precipitation, seismic activity, and
Herat tides, J. Volcanol. Geotherm. Res. 157, 166–181.
LUCKETT, R., BAPTIE, B., and NEUBERG, J. (2002), The relationship between degassing and rockfall signals at
Soufriere Hills Volcano, Montserrat. In The Eruption of Soufriere Hills Volcano, Montserrat, from 1995 to
1999 (Druitt, T.H. and Kokelaar, B.P., eds.), Geological Society, London, Memoirs 21, 595–601.
MALINCONICO, L.L., Jr. (1979), Fluctuations in SO2 emission during recent eruptions of Etna. Nature 278, 43–45.
MOLNAR, P. and SYKES, L. (1969), Tectonics of the Caribbean and Middle America regions from focal
mechanisms and seismicity, Geol. Soc. Am. Bull. 80, 16–1684.
NASA‘s EARTH OBSERVATORY web page. (October, 2005), (http://earthobservatory.nasa.gov/NaturalHazards/
natural_hazards_v2.php3?img_id=13191).
NEUBERG, J. and O’GORMAN, C. (2002), A model of the seismic wavefield in gas-charged magma: application to
Soufriere Hills Volcano, Montserrat. In The Eruption of Soufriere Hills Volcano, Montserrat, from 1995 to
1999 (Druitt, T.H. and Kokelaar, B.P. eds.), Geological Society, London, Memoirs 21, 603–609.
NEUBERG, J. (2000a), External modulation of volcanic activity, Geophys. J. Internat. 142, 232–240.
NEUBERG, J. (2000b), Characteristics and causes of shallow seismicity in andesite volcanoes, Philos. Trans. R.
Soc. Lond. 358, 1533–1546.
NEUBERG, J., LUCKETT, R., BAPTIE, B., and OLSEN, K. (2000), Models of tremor and low-frequency earthquake
swarms on Montserrat, J. Volcanol. Geotherm. Res. 101, 83–104.
POWER, J. A., MURRAY, T. L., MARSO, J. N., and LAGUERTA, E. P. (1996), Preliminary observations of seismicity at
Mount Pinatubo by use of the seismic spectral amplitude measurement (SSAM) system, May 13–June 18,
1991. In (Newhall, C. G. and Punongbayan, R. S., eds.), Fire and Mud: Eruptions and Lahars of Mount
Pinatubo, Philippines, Philippine Institute of Volcanology and Seismology, Quezon City, and University of
Washington Press, Seattle, pp. 269–283.
PULLINGER, C. (1998), Evolution of the Santa Ana volcanic complex, El Salvador. Submitted in Partial
fulfillment of the requirements for the degree of Master of Science in Geology, Michigan Technological
University.
RODRIGUEZ, L., WATSON, M., ROSE, W., BRANNAN, Y., BLUTH, G., CHIGNA, G., MATIAS, O., ESCOBAR, D., CARN, S.,
and FISCHER, T. (2004), SO2 emission to the atmosphere from active volcanoes in Guatemala and El Salvador,
1999–2002, J. Volcanol. Res. 138, 325–344.
ROWE, C., ASTER, R., KYLE, P., DIBBLE, R., and SCHLUE, J. (2000), Seismic and accoustic observations at Mount
Erebus volcano, Ross Island, Antartica, 1994–1998, J. Volcanol. Geotherm. Res. 101, 105–128.
RYDELEK, P.A., DAVIS, P.M., and KOYANAGI, R.Y. (1988), Tidal triggering of earthquake swarms at Kilauea
volcano, Hawaii, J. Geophys. Res. 93, 4401–4411.
SALAZAR J.M.L., HERNANDEZ P.A., PEREZ N.M., OLMOS R., BARAHONA F., CARTAGENA R., SORIANO T., LOPEZ K.,
and NOTSU K., (2004), Spatial and temporal variations of diffuse CO2 degassing at Santa Ana-Izalco-
Coatepeque volcanic complex, El Salvador, Central America. Bulletin Geological Society of America Special
Paper, 375, 135–146.
SIEBERT, L., KIMBERLY, P., and PULLINGER, C.R. (2004), The voluminous Acajutla debris avalanche from Santa
Ana volcano, western El Salvador, and comparison with other Central American edifice-failure events. In
(Rose, W.I., Bommer, J.J., Lopez, D.L., Carr, M.J., and Major, J.J., eds.), Natural hazards in El Salvador:
Boulder, Colorado, Geological Society of America Special Paper 375, pp. 5–23.
SNET (2005), (http://www.snet.gob.sv/Geologia/Vulcanologia/erupcion12005vsa.htm).
STEVENSON, D.S. and BLAKE, S. (1998), Modeling the dynamics of volcanic degassing, Bull. Volcanol. 60, 307–
317.
STOIBER, R.E., MALINCONICO, L.L. Jr., and WILLIAMS, S.N. (1983), Use of the correlation spectrometer at
volcanoes. In Forecasting Volcanic Events (Tazieff, H. and Sabroux, J.C., eds.), (Amsterdam-New York
1983), pp. 425–444.
SWANSON, D.A., CASADEVALL, T.J., DZURISIN, D., HOLCOMB, R.T., NEWHALL, C.G., MALONE, S.D., and WEAVER,
C.S. (1985), Forecast and predictions of eruptive activity at Mount St. Helens, USA: 1975–1984, J.
Geodynamics 3, 397–423.
TARAN, Y.A., GAVILANES, J.C., and CORTES, A. (2002), Chemical and isotope composition of fumarolic gases and
the SO2 flux from volcan de Colima, Mexico, between 1994 and 1998 eruptions, J. Volcanol. Geoth. Res. 117,
105–119.
Vol. 164, 2007 Anomalous Emissions of SO2 2505

YOUNG, S.R., FRANCIS, P.W., BARCLAY, J., CASADEVALL, T.J., GARDNER, C.A., DAROUX, B., DAVIES, M.A.,
DELMELLE, P., NORTON, G.E., MACIEJEWSKI, A.J.H., OPPENHEIMER, C.M.M., STIX, J., and WATSON, I.M. (1998),
Monitoring SO2 emission at the Soufriere Hills Volcano: Implications for changes in eruptive conditions,
Geophys. Res. Lett. 25, 3681–3684.
WITTER, J.B., KRESS, V.C, DELMELLE, P., and STIX, J. (2004), Volatile degassing, petrology, and magma dynamics
of the Villarrica Lava Lake, Southern Chile, J. Volcanol. Geotherm. Res. 134, 303–337.
WUNDERMAN, R. and VENZKE, E. eds (2001), Santa Ana (El Salvador) 2000–2001, Observations of glowing
fumaroles and release of magmatic gas, Bull. Global Volcanism Network, BGVN 26, 04.
(Received March 31, 2006, revised June 25, 2007, accepted June 28, 2007)
To access this journal online:
www.birkhauser.ch/pageoph
2506 R. Olmos et al. Pure appl. geophys.,