Annual Report - Western Cape Provincial Parliament
326
Western Cape Government: Health Annual Report 2018 - 2019 Annual Report 2018 - 2019
-
Upload
khangminh22 -
Category
Documents
-
view
4 -
download
0
Transcript of Annual Report - Western Cape Provincial Parliament
Western Cape Government: Health
Annual Report2018 - 2019
Annual Report2018 - 2019

Contents tablePART A: General Information ............................................................................................5Department’s General Information ................................................................................. 6list of abbreviations / acronyms ...................................................................................... 7Foreword by the Minister ................................................................................................. 10Report of the Accounting Officer ...................................................................................11overview of operations at the Department ................................................................ 11overview of the Financial Results of the Department ................................................. 14Unauthorised, Fruitless & Wasteful expenditure ............................................................ 16Future Plans of the Department ..................................................................................... 16Public Private Partnerships .............................................................................................. 17Disclosure notes for projects signed in terms of treasury Regulation 16 ................... 18Changes to activities in 2018/19 .................................................................................... 19supply Chain Management (sCM) ............................................................................... 21Gifts & Donations.............................................................................................................. 22exemptions & Deviations received from national treasury ........................................ 22events after the Reporting Date ..................................................................................... 22other.................................................................................................................................. 22acknowledgements ........................................................................................................ 22Conclusion ........................................................................................................................ 22approval & sign-off .......................................................................................................... 23Statement of Responsibility & Confirmation of the Accuracy of the AR ................... 24Strategic Overview ..........................................................................................................25Legislative & Other Mandates ........................................................................................26Organisational Structure .................................................................................................29entities reporting to the Minister/MeC ............................................................................ 29
PART B: Performance Information ..................................................................................33auditor-General’s Report: Predetermined objectives ................................................ 34Overview of Departmental Performance ......................................................................34service Delivery environment .........................................................................................34Problems encountered and Corrective steps taken ................................................... 35external Developments that impact on the Demand for services ............................ 40service Delivery Improvement Plans ............................................................................. 40organisational environment ........................................................................................... 43Key Policy Developments & legislative Changes ........................................................ 44strategic outcome oriented Goals for 2014/15 – 2019/20 ......................................... 45
Performance Information by Programme .....................................................................51Programme 1: administration ......................................................................................... 52Programme 2: District Health services ........................................................................... 56Programme 3: emergency Medical services ............................................................... 71Programme 4: Provincial Hospital services ................................................................... 74Programme 5: Central Hospital services ....................................................................... 87Programme 6: Health sciences & training .................................................................... 92Programme 7: Health Care support services ............................................................... 97Programme 8: Health Facilities Management ............................................................ 106Transfer Payments..........................................................................................................110Conditional Grants ........................................................................................................114Donor Funds ...................................................................................................................124Capital Investment ........................................................................................................126
PART C: Governance .....................................................................................................135Introduction ....................................................................................................................136Risk Management .........................................................................................................136Fraud & Corruption ........................................................................................................137Minimising Conflict of Interest ......................................................................................138Code of Conduct ..........................................................................................................139Health, Safety & Environmental Issues .........................................................................140SCOPA Resolutions ........................................................................................................141Prior Modification to Audit Reports ..............................................................................141Internal Control Unit .......................................................................................................143Internal Audit & Audit Committees ..............................................................................146Audit Committee Report ...............................................................................................147
Part D: People Management ........................................................................................151Legislation that governs People Management ..........................................................152Introduction ....................................................................................................................154Value of Human Capital in the Department ...............................................................154People Management Priorities for 2018/19 and the Impact of these Priorities .......155Human Resource Oversight Statistics ..........................................................................169
Part E: Financial Management .....................................................................................209Report of the Auditor General ......................................................................................210Report on the Audit of the Financial Statements ........................................................210Report on the Audit of the Annual Performance Report ............................................211Report on Audit of Compliance with Legislation ........................................................213


PART Ageneral information
AnnuAl RepoRt 2018-2019 7Part A: General InformationAnnuAl RepoRt 2018-2019 Part A: General Information6
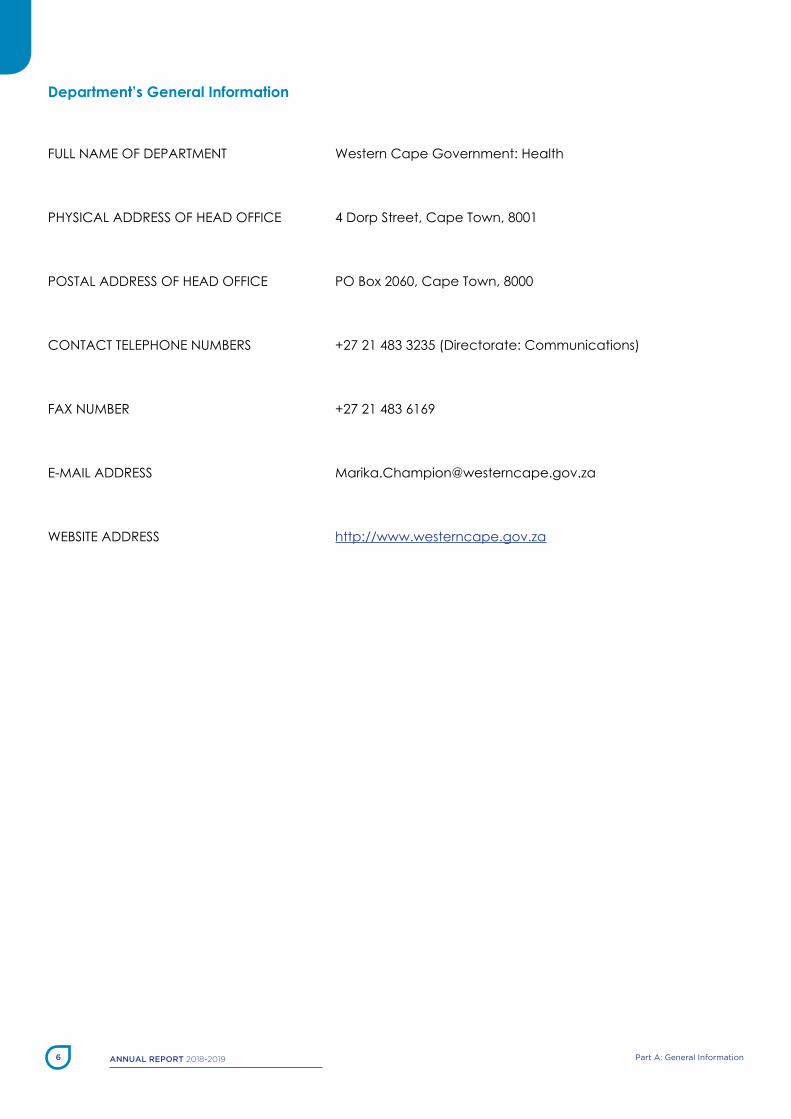
Department’s General Information
FUll naMe oF DePaRtMent Western Cape Government: Health
PHYsICal aDDRess oF HeaD oFFICe 4 Dorp street, Cape town, 8001
Postal aDDRess oF HeaD oFFICe Po box 2060, Cape town, 8000
ContaCt telePHone nUMbeRs +27 21 483 3235 (Directorate: Communications)
FaX nUMbeR +27 21 483 6169
e-MaIl aDDRess [email protected]
WebsIte aDDRess http://www.westerncape.gov.za

AnnuAl RepoRt 2018-2019 7Part A: General InformationAnnuAl RepoRt 2018-2019 Part A: General Information6
List of Abbreviations / Acronyms
AGSA auditor-General south africa
AIDS Acquired Immune Deficiency Syndrome
anC ANC antenatal Care
AO Accounting Officer APP annual Performance Plan
ART antiretroviral therapy
ATA assistant to artisan
BAS basic accounting system
BVS barret Value survey
CAD Computer aided Despatch
CDC Community Day Centre
CHC Community Health Centre
CoCT City of Cape townCOPC Community-oriented Primary Care
CRE Carbapenem-Resistant enterobacteriaceae DHS District Health system
DOCs Department of Community safety
DORA Division of Revenue act
DPSA Department of Public service administration
ECMO extra-Corporeal Membrane oxygenation
EE employment equity
EHWP employee Health and Wellness Programme
EMC emergency Medical Care
EMS emergency Medical services
EPWP expanded Public Works Programme
ERM enterprise Risk Management
ETL extract transform load
EWP employee Wellness Programme
FPL Forensic Pathology laboratory
FPS Forensic Pathology services
GEMS Government employees Medical scheme
GHS Groote schuur Hospital
HCBC Home Community-based Care
HCT HIV Counselling and testing
HIV Human Immunodeficiency Virus
HoD Head of Department
HPCSA Health Professions Council of south africa
AnnuAl RepoRt 2018-2019 9Part A: General InformationAnnuAl RepoRt 2018-2019 Part A: General Information8
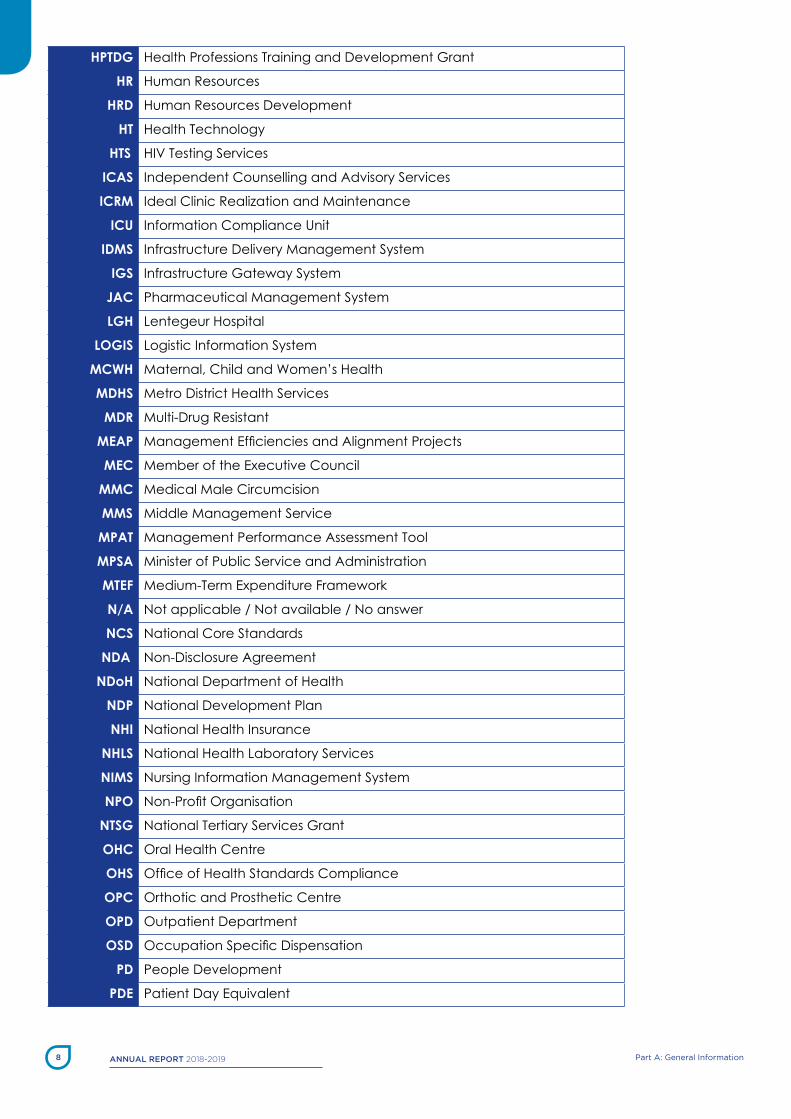
HPTDG Health Professions training and Development Grant
HR Human Resources
HRD Human Resources Development
HT Health technology
HTS HIV testing services
ICAS Independent Counselling and advisory services
ICRM Ideal Clinic Realization and Maintenance
ICU Information Compliance Unit
IDMS Infrastructure Delivery Management system
IGS Infrastructure Gateway system
JAC Pharmaceutical Management system
LGH lentegeur Hospital
LOGIS logistic Information system
MCWH Maternal, Child and Women’s Health
MDHS Metro District Health services
MDR Multi-Drug Resistant
MEAP Management Efficiencies and Alignment Projects
MEC Member of the executive Council
MMC Medical Male Circumcision
MMS Middle Management service
MPAT Management Performance assessment tool
MPSA Minister of Public service and administration
MTEF Medium-term expenditure Framework
N/A not applicable / not available / no answer
NCS national Core standards
NDA non-Disclosure agreement
NDoH national Department of Health
NDP national Development Plan
NHI national Health Insurance
NHLS national Health laboratory services
NIMS nursing Information Management system
NPO Non-Profit Organisation
NTSG national tertiary services Grant
OHC oral Health Centre
OHS Office of Health Standards Compliance
OPC orthotic and Prosthetic Centre
OPD outpatient Department
OSD Occupation Specific Dispensation
PD People Development
PDE Patient Day equivalent

AnnuAl RepoRt 2018-2019 9Part A: General InformationAnnuAl RepoRt 2018-2019 Part A: General Information8
PERSAL Personnel and salary Information system
PFS Provincial Forensic services
PFMA Public Finance Management act
PHC Primary Health Care
PHCIS Primary Health Care Information system
PHDC Provincial Health Data Centre
PM People Management
PPP Public Private Partnership
PPT Planned Patient transport
PSCBC Public service Co-ordinating bargaining Council
PSP Professional service Provider
PSRMF Public sector Risk Management Framework
RAF Road accident Fund
RCWMCH Red Cross War Memorial Children’s Hospital
RMSU Records Management support Unit
SABS south african bureau of standards
SANC south african nursing Council
SCM supply Chain Management
SCOPA standing Committee on Public accounts
SDIP service Delivery Improvement Plan
SHERQ safety, Health, environment, Risk and Quality Management
SPV single Patient Viewer
SINJANI standard Information Jointly assembled by networked infrastructure
SITA state Information technology agency
SLA service level agreement
SMS senior Management service
SSS staff satisfaction survey
SYSPRO software package used by central hospitals for supply chain management and asset management
TB tuberculosis
TBH tygerberg Hospital
UAMP User asset Management Plan
VUCA Volatile, Uncertain, Complex and ambiguous
WCCN Western Cape College of nursing
WCG Western Cape Government
WCGH Western Cape Government: Health
WCGTPW Western Cape Government transport and Public Works
WCRC Western Cape Rehabilitation Centre
WCSD Western Cape supplier Database
WOW Western Cape on Wellness
AnnuAl RepoRt 2018-2019 11Part A: General InformationAnnuAl RepoRt 2018-2019 Part A: General Information10
Foreword by the Minister
The 2018/19 financial year has not been short of its challenges within public healthcare.
the public health system generally is under severe pressure. We are faced with budget cuts, urbanization and in-migration, a burning service platform, drought and water shortages, disease outbreaks and escalating burden of disease, staff safety remains a challenge, and natural disasters like fires.
Despite these challenges, the Western Cape has the best health outcomes out of all 9 provinces. Western Cape citizens have the longest life expectancy in the country.
this is largely due to better population health outcomes (lower mortality rates). We have better coverage and access to healthcare services where approximately, 91.5 per cent of the citizens in the Western Cape have access to health services within 30 minutes of their residence compared to other provinces where it is too far to access. Where there is no physical facility, we bring services through mobile or by other means like public private partnerships. this essentially speaks to the quality of care and access to health care in the Western Cape.
We have invested over the years in building capability including leadership, people, processes, systems, and building blocks such as infrastructure and It systems to get us to this high point in our history, where we can claim amongst the best health outcomes in the country, unqualified audit findings for 15 consecutive years, a clean financial audit for the past 4 years, and the ultimate achievement of a clean audit outcome for 2018/19, and generally, a well performing Department.
Infrastructure remains a priority for this Department, as a way to address patient experience and service pressures. We delivered world class infrastructure projects over the past financial year, and continue to maintain clean and functional infrastructure.
this Department has undertaken several key initiatives as part of its transformation strategy. this includes the Leadership development and Culture change journey, improving systems and efficiencies, a Management Efficiency and Alignment Project (MEAP), Community Orientated Primary Care (COPC), and implementation of our e-vision.
The first phase of MEAP was concluded which involved extensive engagement with staff on the redesign of how best we can improve alignment, functions and efficiencies within administrative structures across the various levels and offices in the Department. We thank all staff for their participation and resilience during this process.
CoPC is a service delivery model where healthcare workers physically go into communities and households, extending the network of healthcare into patient’s homes and often link citizens to other parts of government services, has been rolled out at 20 learning sites and we are actively working at rolling out across the entire province.
our e-vision as part of our ICt strategy is a huge investment, and it holds immense leverage potential for efficiencies and improvements in service delivery and patient care. We have made tremendous progress with innovations such as the unique patient identifier that is now implemented across the whole Department, including provincial hospitals, clinics and local government healthcare facilities. We are one of the few places globally with an integrated data system across the service platform, and we are very proud of this achievement. this reduces waiting times for patients and consequently improves patient experience.
none of the incredible work we have done would have been possible without the support of the Head of Department and her top management team, as well as the nearly thirty-two thousand staff members. I would like to thank each staff member for their resilience amidst the current challenges
Western Cape Government, working better together!
Dr nomafrench MbomboWestern Cape Health Minister

AnnuAl RepoRt 2018-2019 11Part A: General InformationAnnuAl RepoRt 2018-2019 Part A: General Information10
Report of the Accounting Officer
name: Dr beth engelbrecht
title: Head of Department
Western Cape Government: Health
Overview of Operations at the Department
Results and Challenges of the Last Year
Provincial Health System’s Performance in 2018/19
the demand for healthcare services continues to grow and this is unlikely to change in the short to medium term, given the trends in the social determinants of health and wellbeing. the quadruple burden of disease, compounded by increased population growth, places enormous strain on the health system. this is particularly worrying as increasingly people present with multiple, interacting and compounding health problems. the emergency centres at acute hospitals remain key pressure points. the burden of acutely decompensated psychiatric patients in general hospitals is a significant ongoing challenge. These conditions are related to the social environments of our citizens and the structural challenges in society. these challenges coupled with natural disasters and further budget reductions in real terms in the MteF has made 2018/19 a particularly challenging year for the Department.
the Department spent R23.044 billion, which is 99.8 per cent of its total budget. the department maintained a clean financial audit outcome and improved on the performance information audit outcome, to achieve an overall clean audit outcome for 2018/19.
In 2018/19 there were:
• 14.1 million primary care contacts (this does not include contacts in home and community-based care setting)
• 96 249 baby deliveries
• 484 946 patients transported with emergency care services, of which 31.4 per cent were priority 1
• 288 199 patients admitted to 33 acute district hospitals
• 125 976 patients admitted to 16 regional and specialised hospitals
• 140 392 patients admitted in central/tertiary hospitals
• 7 591 cataract operations performed
• 278 027 patients on antiretroviral treatment
• 0.3 per cent mother to child HIV transmission rate at 10 weeks1
• 803 registered home and community based care workers
1 Birth PCR test positive rate 0.9 per cent

AnnuAl RepoRt 2018-2019 13Part A: General InformationAnnuAl RepoRt 2018-2019 Part A: General Information12
the Department managed 18.9 million patient contacts (3.2 million patient days plus 1.6 million outpatient visits across all hospitals, and 14.1 million primary care contacts). From this number of visits the Department received feedback though 5 332 complaints and 7 678 compliments. every feedback is regarded as important to consider how to continuously improve the system.
the patient voice through statutory stakeholder bodies is important to us. the Western Cape Health Facility boards and Committee act was promulgated in 2016, and the regulations were gazetted on 7 December 2017. the process of establishing clinic committees commenced in January 2018 and implementation is work in progress.
People Management
In 2018/19, the Department had 31 914 employees of which:
• 92 per cent of employees are appointed in a permanent capacity
• 65 per cent are health professionals
• 35 per cent administrative support and non-health professional staff
• 72 per cent are female and 28 per cent are male
• 32 per cent are black; 14 per cent are White, 52 per cent are Coloured and 2 per cent are Indian
• 54 per cent of senior management positions are held by females
• 208 employees are classified as disabled
Infrastructure Developments
Infrastructure plays an integral part in the delivery of health services, both from a staff as well as a patient perspective. Various capital infrastructure projects were undertaken in 2018/19, with health technology provided for a large portion of these. extensive maintenance was also carried out on facilities and equipment throughout the province. the following capital projects were completed in 2018/19, with various others in other project stages:
• new Clinic in asla, Mossel bay (donated by Petrosa)
• extensions to the pharmacy at Wellington CDC
• new Wolseley Clinic
In view of climate change and the continued water crisis in the Western Cape, the Department is proceeding with its water security projects to make sure that health facilities will have adequate water to remain functional and to ensure its resilience in the future.
AnnuAl RepoRt 2018-2019 13Part A: General InformationAnnuAl RepoRt 2018-2019 Part A: General Information12
Good Governance
the Departmental transformation strategy aims to build resilience towards Universal Health Coverage. the strategy is based on a values driven approach, focusing on our vision to increase public value and quality of life. the transformation strategy contains three interconnected components:
• service transformation
• Governance transformation
• leadership and organisational culture transformation
the governance transformation component is premised on the need to address both the governance of the health system and the joint action of health and non-health sectors, public and private; and of citizens for improved health. this calls for governing by collaborating; governing by engaging citizens; governing by mixing regulation and persuasion; governing through independent agencies; and governing by adaptive policies, resilient structures and foresight.
Within the Department there has been a focus on designing and implementing an organisational realignment process towards a people-centred learning organisation, through the Management Efficiency and Alignment Project (MEAP). The first phase of MEAP was concluded in 2017. The management functions have been grouped into three broad categories:
• strategic cluster functions
• Corporate functions
• service functions
the design process is aimed at streamlining the manner in which these functions are executed across the various levels of management (Macro, Meso and Micro levels) within the Department, with a big focus on changing the way the Department does its business, from a compliance to a citizen-enabling orientation.
AnnuAl RepoRt 2018-2019 15Part A: General InformationAnnuAl RepoRt 2018-2019 Part A: General Information14
Overview of the Financial results of the Department
Departmental Receipts
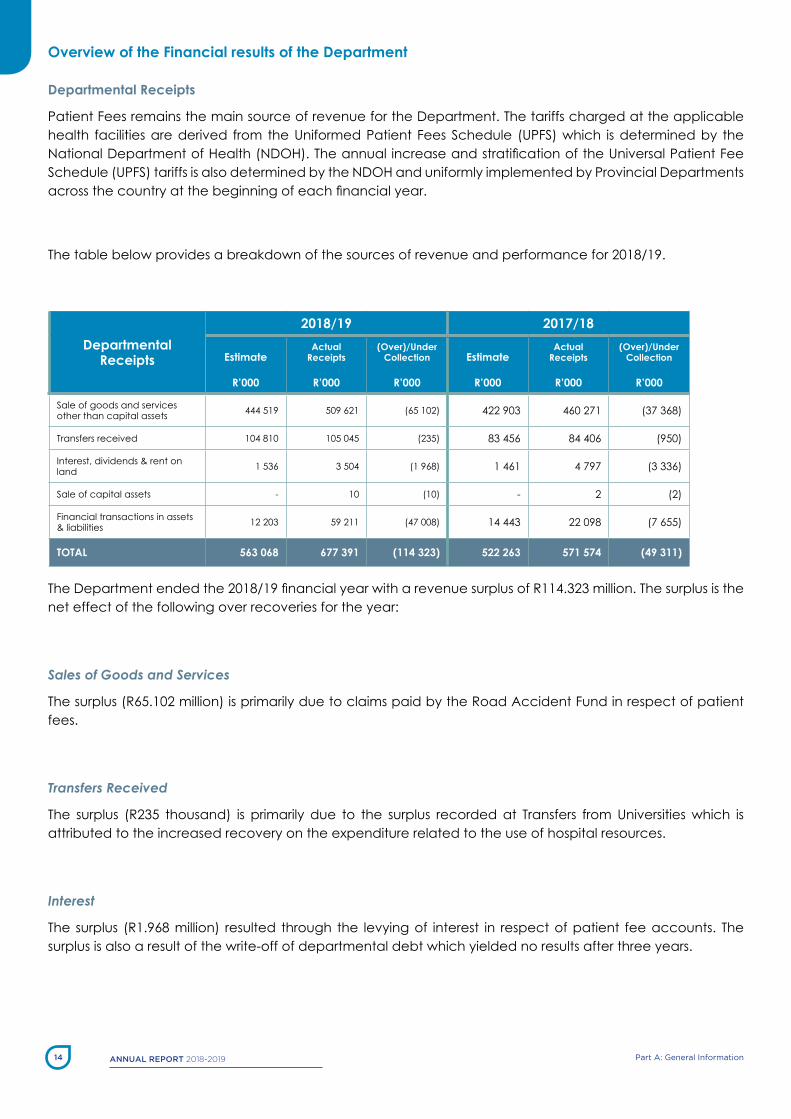
Patient Fees remains the main source of revenue for the Department. the tariffs charged at the applicable health facilities are derived from the Uniformed Patient Fees schedule (UPFs) which is determined by the National Department of Health (NDOH). The annual increase and stratification of the Universal Patient Fee schedule (UPFs) tariffs is also determined by the nDoH and uniformly implemented by Provincial Departments across the country at the beginning of each financial year.
the table below provides a breakdown of the sources of revenue and performance for 2018/19.
Departmental Receipts
2018/19 2017/18
Estimate
R’000
Actual Receipts
R’000
(Over)/Under Collection
R’000
Estimate
R’000
Actual Receipts
R’000
(Over)/Under Collection
R’000
sale of goods and services other than capital assets 444 519 509 621 (65 102) 422 903 460 271 (37 368)
transfers received 104 810 105 045 (235) 83 456 84 406 (950)
Interest, dividends & rent on land 1 536 3 504 (1 968) 1 461 4 797 (3 336)
sale of capital assets - 10 (10) - 2 (2)
Financial transactions in assets & liabilities 12 203 59 211 (47 008) 14 443 22 098 (7 655)
TOTAL 563 068 677 391 (114 323) 522 263 571 574 (49 311)
The Department ended the 2018/19 financial year with a revenue surplus of R114.323 million. The surplus is the net effect of the following over recoveries for the year:
Sales of Goods and Services
the surplus (R65.102 million) is primarily due to claims paid by the Road accident Fund in respect of patient fees.
Transfers Received
the surplus (R235 thousand) is primarily due to the surplus recorded at transfers from Universities which is attributed to the increased recovery on the expenditure related to the use of hospital resources.
Interest
the surplus (R1.968 million) resulted through the levying of interest in respect of patient fee accounts. the surplus is also a result of the write-off of departmental debt which yielded no results after three years.

AnnuAl RepoRt 2018-2019 15Part A: General InformationAnnuAl RepoRt 2018-2019 Part A: General Information14
Sales of Capital Assets
the surplus (R10 thousand) is a nominal amount but is as a result of the sale of obsolete furniture and equipment not budgeted for. the sale of furniture and equipment occurs very seldom, and thus not budgeted for.
Financial Transactions
the surplus (R47.008 million) resulted primarily through the reduction of the Cape Medical Depot’s pharmaceutical Capital Fund balance due to the reduction in required stockholding levels, refund from CPUt for students’ residence and tuition costs and the recovery of previous years’ expenditure, amongst others.
Programme Expenditure
The Department recorded an under-expenditure of R56.386 million in the 2018/19 financial year. Please refer to notes to the appropriation statements on page 251 to 256 for reasons.
Budget Programme
2018/19 2017/18Final
Appropriation
R’000
Actual Expenditure
R’000
(Over)/Under Expenditure
R’000
Final Appropriation
R’000
Actual Expenditure
R’000
(Over)/Under Expenditure
R’000
Programme 1 768 056 766 106 1 950 743 718 720 112 23 606
Programme 2 9 341 766 9 328 752 13 014 8 771 655 8 737 909 33 746
Programme 3 1 106 257 1 102 444 3 813 1 026 563 994 862 31 701
Programme 4 3 630 241 3 622 842 7 399 3 403 167 3 379 527 23 640
Programme 5 6 517 843 6 517 245 598 6 129 748 6 129 748 -
Programme 6 328 616 321 643 6 973 340 063 317 453 22 610
Programme 7 468 707 461 667 7 040 438 845 436 812 2 033
Programme 8 938 493 922 894 15 599 832 723 779 633 53 090
TOTAL 23 099 979 23 043 593 56 386 21 686 482 21 496 056 190 426

AnnuAl RepoRt 2018-2019 17Part A: General InformationAnnuAl RepoRt 2018-2019 Part A: General Information16
Virements / Roll Overs
all virements applied are depicted on page 215 to 250 of the annual Financial statements. Virements were applied to ensure that no unauthorised expenditure occurred per Main Division. all virements were approved by the Accounting Officer.
Virements for 2018/19
Main DivisionR’000 Reason
From To
Programme 3
Programme 5
5 906to address over expenditure as a result of service pressures and burden of disease.Programme 4 5 374
Programme 7 3 500
Programme 1
Programme 5
42 300
to address over expenditure as a result of the necessitated replacement of aging medical equipment and equipment backlogs.
Programme 3 4 094
Programme 4 326
Programme 7 2 000
Programme 4 Programme 5 1 112 to address over expenditure as a result of thefts and losses.
Roll overs were requested amongst other for the following equitable share: Pes Maintenance, Global Fund and bursaries.
Unauthorised, Fruitless and Wasteful Expenditure
no unauthorised expenditure has been recorded after the application of virements.
No fruitless and wasteful expenditure was incurred in the current financial year.
An amount of R 7 000 was written off in the current financial year (2018/19), bringing the 2017/18 brought forward balance of fruitless and wasteful expenditure to zero. this is further explained in Part e on page 291.
Future Plans of the Department
The five-year Strategic Plan of the Department was tabled at the beginning of March 2015. The Plan is a start to implementing the vision of Healthcare 2030 over the medium term and a transformation strategy has been developed to this effect. There has been incremental progress on many aspects of Healthcare 2030. The five-year plan has been distributed widely and is also available on the intranet and the internet. see website links below:
Intranet: http://intrawp.pgwc.gov.za/health/Internet: https://www.westerncape.gov.za/dept/health
The Department is in the process of developing its next five-year plan from 2019 – 2024.

AnnuAl RepoRt 2018-2019 17Part A: General InformationAnnuAl RepoRt 2018-2019 Part A: General Information16
Public Private Partnerships
Existing Public Private Partnerships
Western Cape Rehabilitation Centre (WCRC) and lentegeur Psychiatric Hospital
the Public Private Partnership (PPP) between the Western Cape Department of Health and Mpilisweni Consortium is a 12-year agreement for the provision of estate maintenance, medical and non-medical equipment, hard and soft facilities management and related services in respect of the Western Cape Rehabilitation Centre (WCRC) and lentegeur Psychiatric Hospital. the contract was signed in 2006 and the 2018/19 financial year concludes the 12th year of implementation and operation. the contract has been extended for a year ending March 2020. the monitoring of the PPP continued through the well-functioning governance structures ensuring the contractual obligations were met.
the Department’s main objective with this project was the establishment of centres of excellence in the Western Cape that support improvement of the quality of care, efficiency and cost effectiveness of the health service by enabling staff to focus solely on their core responsibilities of patient care. the PPP enabled this through the transfer of all non-core functions in respect of integrated facilities management through the PPP.
The PPP project continued during the reporting financial year to achieve the needs of the Department through output specifications that enabled the Department to deliver quality specialized clinical rehabilitation services (WCRC) and psychiatric services (lGH). services were delivered against appropriate and measurable output specifications which were monitored by the Department.
The PPP project continued during the reporting financial year to achieve the following objectives:
Departmental needs were addressed through output specifications that enabled the Department to deliver quality specialized clinical rehabilitation services (WCRC) and psychiatric services (lGH);
services were delivered by the Private Party (PP) against appropriate and measurable output specifications which were closely monitored by the Department;
The unitary fee is fixed and increased by inflation/CPI per annum, ensuring that the Department budgets accurately for the services in the MteF;
Preventative maintenance on the buildings and medical –and therapeutic equipment, ensuring that the environment and equipment used are appropriate and in optimal condition for specialized rehabilitation of physically disabled clients and are continuously modernized as technological advances occur in the health care industry;
Reduce future spending on the project by the Department in terms of remedial costs and backlog maintenance, freeing up cash flows for other projects;
Reducing the pressure on the current limited capital budget for addressing the Department’s medical and therapeutic equipment needs;
AnnuAl RepoRt 2018-2019 19Part A: General InformationAnnuAl RepoRt 2018-2019 Part A: General Information18
Continued to achieve economies of scale in terms of the various outsourced contracts combined for both hospitals, thus increasing the effectiveness of service delivery;
The financial penalty regime linked to performance ensures delivery of the required outputs at the required standard/quality and within the stipulated rectification times;
obtained private sector expertise in the rendition of their services;
obligations and risks transferred to the Private Party with substantial obligations to self-monitoring; and
Enabled the Department to focus on fulfilling its core functions of provision of health service delivery and improving the quality of care to patients.
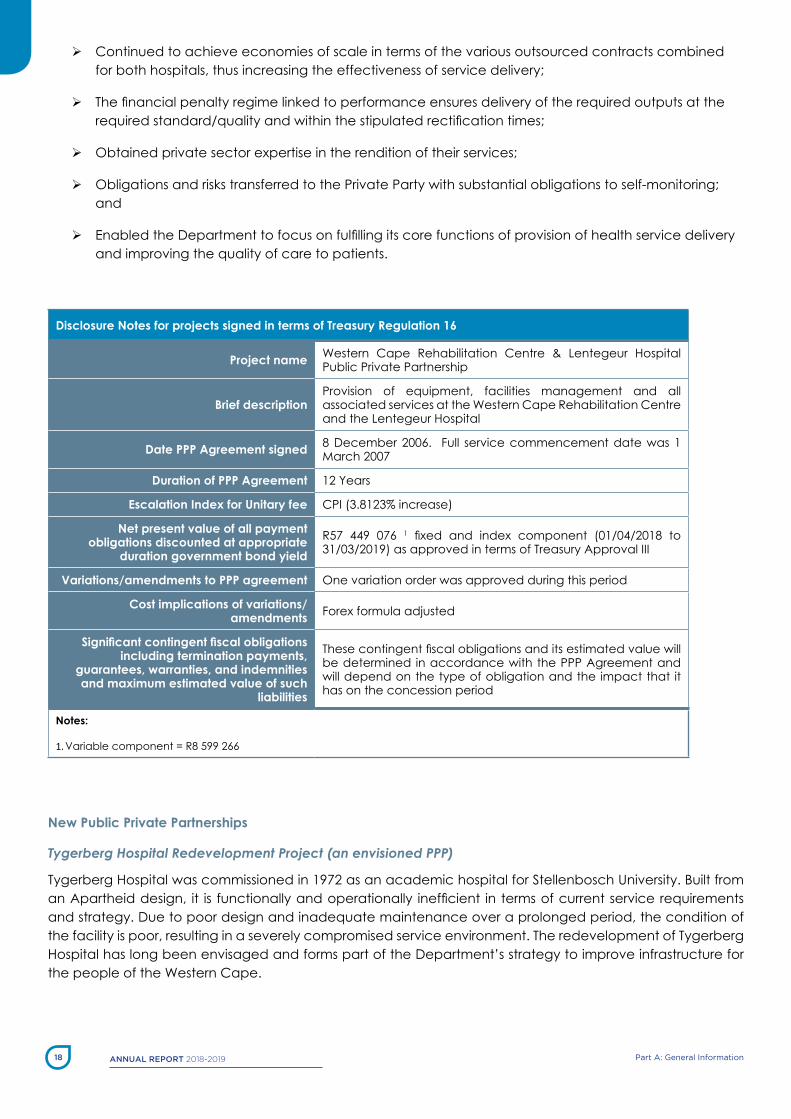
Disclosure Notes for projects signed in terms of Treasury Regulation 16
Project name Western Cape Rehabilitation Centre & lentegeur Hospital Public Private Partnership
Brief descriptionProvision of equipment, facilities management and all associated services at the Western Cape Rehabilitation Centre and the lentegeur Hospital
Date PPP Agreement signed 8 December 2006. Full service commencement date was 1 March 2007
Duration of PPP Agreement 12 Years
Escalation Index for Unitary fee CPI (3.8123% increase)
Net present value of all payment obligations discounted at appropriate
duration government bond yieldR57 449 076 1 fixed and index component (01/04/2018 to 31/03/2019) as approved in terms of treasury approval III
Variations/amendments to PPP agreement one variation order was approved during this period
Cost implications of variations/amendments Forex formula adjusted
Significant contingent fiscal obligations including termination payments,
guarantees, warranties, and indemnities and maximum estimated value of such
liabilities
These contingent fiscal obligations and its estimated value will be determined in accordance with the PPP agreement and will depend on the type of obligation and the impact that it has on the concession period
Notes:
1. Variable component = R8 599 266
New Public Private Partnerships
Tygerberg Hospital Redevelopment Project (an envisioned PPP)
tygerberg Hospital was commissioned in 1972 as an academic hospital for stellenbosch University. built from an Apartheid design, it is functionally and operationally inefficient in terms of current service requirements and strategy. Due to poor design and inadequate maintenance over a prolonged period, the condition of the facility is poor, resulting in a severely compromised service environment. the redevelopment of tygerberg Hospital has long been envisaged and forms part of the Department’s strategy to improve infrastructure for the people of the Western Cape.

AnnuAl RepoRt 2018-2019 19Part A: General InformationAnnuAl RepoRt 2018-2019 Part A: General Information18
a transaction advisor was appointed in october 2013. In order to determine the suitable procurement route, the feasibility study for the redevelopment project, as required by national treasury, has been completed and the treasury approval-1 submission, as per treasury Regulation 16 to the Public Finance Management act of 1999, was submitted to national treasury in september 2018. this study was also submitted in accordance with the budget Facility for Infrastructure Guidelines as published by national treasury.
the feasibility study is currently being reviewed and revised to incorporate subsequent comments received from national treasury and national Department of Health.
the scope of the project is to relocate the tygerberg Central Hospital on the current estate to provide level 2 and level 3 / 4 services. the new tygerberg Regional Hospital, not part of the PPP feasibility study and, which will provide the complementary level 2 and level 1 services, will be built on a site located in belhar. a business Case for this project was approved by nDoH in June 2018.
Changes to Activities in 2018/19
Discontinued Activities / Activities to be Discontinued
Groote Schuur Hospital (GSH)
the theraton Cobalt Unit has become obsolete. Its main service was total body irradiation therapy. these patients are now treated via lInaC. the source from the Cobalt-60 unit is being removed from the premises.
Rural Health Services (RHS)
adolescent projects in Drakenstein, funded by the Global Fund, will come to an end at the end of March 2019.
Metro Health Services (MHS)
services at an intermediate care facility for children were transferred to another nPo for the delivering of the service. This was due to poor governance structures in the organisation that posed severe financial and medico-legal risks to the WCGH. the shift in service provider has led to improved patient care.
Lentegeur Hospital has over the last 2 years undergone some change management and efficiency projects. This has primarily been a reconfiguration of services which ultimately resulted in a reduction of 52 beds (from 742 to 690 beds) without necessarily impacting negatively on patient care.
AnnuAl RepoRt 2018-2019 21Part A: General InformationAnnuAl RepoRt 2018-2019 Part A: General Information20
New / Proposed Activities
Groote Schuur Hospital (GSH)
the transplant and the extra-Corporeal Membrane oxygenation (eCMo) programmes have been scaled up during 2018/19. eCMo outcomes are comparable with those reported in international eCMo registries.
The first cochlea implant at Groote Schuur hospital was performed in 2018 with implants donated by Medel. a new outpatient lymph node biopsy clinic has been started in the Haematology Division. the new 128 Ct-scanner arrived as per schedule on the 11th February 2019. the old scanner was decommissioned and removed.
the brachytherapy equipment had reached its end of life and was rendered non-functional at the end of 2018. the new brachytherapy was purchased and easily integrated into the aRIa system. this allowed us to start treating gynaecological cancer patients immediately after training was completed. HDR brachytherapy involves delivering radiotherapy by temporarily placing a tiny radioactive source directly into the tumour or other targeted area. In the future, GsH is looking forward to extending the program to treat prostate cancer patients, head and neck patients and possibly other groups of cancer patients with HDR brachytherapy.
The Division of Hepatology has been awarded start-up funding for the first ECHO (Extension for Community Healthcare outcomes) program on “Viral hepatitis in sub-saharan africa”, as part of an international collaboration with Ghana, ethiopia and nigeria. the liver Unit acts as an expert Hepatology Hub with spokes around south africa and in Ghana, ethiopia and nigeria. this has allowed and supported outreach of much needed advice on implementation of treatment for viral hepatitis to regions who do not have access to Hepatology expertise.
Rural Health Services (RHS)
Community-oriented primary care (CoPC) is an approach of delivering primary health care to individuals and families in a defined geographic area in collaboration with the organisations and people who contribute to health. In Rural Health services, wellness professional nurses were appointed at 15 sites with the view of testing and developing different strategies and models which will culminate in a CoPC package of care.
In addition to the cataract outreach services rendered by George Hospital, the service has now been extended to Prince Albert for the first time in July 2018 when 35 procedures were performed and a further 40 were performed in January 2019.
Metro Health Services (MHS)
During 2018/19 the Department initiated a pilot project with the aim of establishing a breast clinic at Khayelitsha District Hospital. When fully rolled out, these services will strengthen the early identification and management of breast pathology.
AnnuAl RepoRt 2018-2019 21Part A: General InformationAnnuAl RepoRt 2018-2019 Part A: General Information20
similarly, an eye care clinic was piloted at Khayelitsha District Hospital for Diabetic Retinopathy. this pilot project was done in collaboration with orbis International, in order to assist in managing the waiting list at tygerberg Hospital.
Increased outreach support to Rural Health services by the orthotic and Prosthetic Centre (oPC) to improve access to these services. the expansion of outreach was managed well and within budget.
Roll out of electronic pharmacy queuing system at Mitchells Plain CHC.
strengthening of palliative care services in the Metro to ensure that the clients eligible for palliative care are able to access this within the public sector.
Supply Chain Management (SCM)
Unsolicited Bid Proposals for the Year Under Review
no unsolicited bids were considered during the reporting period.
SCM Processes and Systems to Prevent Irregular Expenditure
The Accounting Officer’s System and Delegations constitute the Department’s SCM Handbook. These documents are updated annually to ensure sound supply chain management processes.
The constitution of Bid Specification, Evaluation & Adjudication Committees (BSC, BEC & BAC, respectively), as well as the Quotation Committees, promotes segregation of duties, and serves as a control measure for early/proactive identification of possible irregular actions that could result in irregular expenditure.
Increase in the scope of transversal provincial contracts reduces the administrative workload on Institutional sCM units, thereby mitigating for the risk of incurring irregular expenditure through low-value transactional procurement.
Challenges Experienced in SCM
the increasing complexity of compliance requirements applicable to all facets of sCM requires a shift of resources towards compliance. The regulatory requirements include e.g. Local Content, asset classification and recognition, reporting of inventory and consumables, use of e-Procurement systems, (IPs, Central supplier Database (CsD), e-tender Publication Portal, i-tender).

AnnuAl RepoRt 2018-2019 23Part A: General InformationAnnuAl RepoRt 2018-2019 Part A: General Information22
lack of integration between Western Cape supplier Database (WCsD) and the national CsD causes duplication of effort for buyers and suppliers, as not all information held on the WCsD is available on CsD.
additional compliance requirements emanating from the new Preference Procurement Regulations also requires a mandatory feasibility study to be undertaken to determine the extent to which contracts valued in excess of R30 million can be subcontracted, in order to meet the minimum subcontracting target of 30 per cent of the contract value.
Gifts and Donations
the Department received gifts and donations to the value of R31.461 million in kind which is disclosed in the annual Financial statements, page 313 to 314.
Exemptions and Deviations received from National Treasury
no exemptions requested or granted.
Events after the Reporting Date
the Department has no events to report after the reporting date.
Other
There are no other material facts or circumstances that affect the understanding of the financial affairs of the Department.
Acknowledgements
the year 2018/19 has been extremely challenging, as in addition to the continued challenges of providing health services to a growing population, in an increasingly resource scarce environment, our employees have also had to cope with the implications of fire, drought, power outages and safety whilst in the line of duty. I can’t thank you all enough for persevering in the face of all these challenges and for the resilience you have demonstrated in the last year. I am incredibly proud to be part of such an amazing team of people.
Conclusion
the Western Cape Department of Health must be proud of its achievements in 2018/19. We had over six hundred thousand patient admissions, over one million emergency Centre visits and over fourteen million Primary Health Care visits, all while leading the country in health outcome indicators, notably the lowest infant

AnnuAl RepoRt 2018-2019 23Part A: General InformationAnnuAl RepoRt 2018-2019 Part A: General Information22
mortality rate and the highest life expectancy. We continue to expand services, including the new District six Community Health Centre, upgrades to Worcester and Helderberg Hospital and over a billion rand spent on infrastructure. this was also the year we celebrated our 15th consecutive unqualified audit. The MEAP process continued, with the finalization of the macro structure of the Department. This is an ambitious project that aims to fundamentally change service delivery in the Department. as we consider our achievements over the last year, there is indeed much to be proud of; but, as we look into the future we must be mindful of the risks that face us.
the Western Cape Department of Health operates in a VUCa environment - a setting that is volatile, uncertain, complex and ambiguous. this is further compounded by a budget that is reducing in real time. our ability to navigate through this burning platform will not be achieved through the routine strategies of increasing efficiency and reducing costs. If we are to weather this storm, we will have to transform our organisation. to that end, in 2019, we will begin our transformation journey, built on the pillars of service, governance and leadership transformation. our aim is to move towards a learning organisation that is both resilient and adaptive. We believe that these are the characteristics that will allow us to navigate the VUCa environment.
as we move towards our transformation journey let us take a moment to look back at 2018/19. there is so much to be proud of, and for this the credit must go to our staff. the 32 000 women and men who work tirelessly, who give of themselves to save lives and treat the sick. We acknowledge and thank them for their contribution towards creating a healthier society. We also thank our multiple partners who work with us, without which it would not have been possible to achieve what we have in 2018/19.
Approval and Sign-off
The Annual Financial Statements set out on pages 215 to 325 have been approved by the Accounting Officer.
_____________________________
Dr beth engelbrechtHead: Health Western Cape31st May 2019
AnnuAl RepoRt 2018-2019 25Part A: General InformationAnnuAl RepoRt 2018-2019 Part A: General Information24
Statement of Responsibility and Confirmation of the Accuracy of the Annual Report
To the best of my knowledge and belief, I confirm the following:
all information and amounts disclosed throughout the annual Report are consistent.
the annual Report is complete, accurate and is free from any omissions.
the annual Report has been prepared in accordance with the Guidelines on the annual Report as issued by national treasury.
The annual financial statements (Part E) have been prepared in accordance with the modified cash standard and the relevant frameworks and guidelines issued by the national treasury.
The Accounting Officer is responsible for the preparation of the annual financial statements and for the judgements made in this information.
The Accounting Officer is responsible for establishing, and implementing a system of internal control that has been designed to provide reasonable assurance as to the integrity and reliability of the performance information, the human resources information and the annual financial statements.
The external auditors are engaged to express an independent opinion on the annual financial statements.
In my opinion, the Annual Report fairly reflects the operations, the performance information, the human resources information and the financial affairs of the Department for the financial year ended 31st March 2019.
Yours faithfully
_____________________________
Dr beth engelbrechtHead: Health Western Cape31st May 2019

AnnuAl RepoRt 2018-2019 25Part A: General InformationAnnuAl RepoRt 2018-2019 Part A: General Information24
Strategic Overview
Vision
access to person-centred quality care.
Mission
We undertake to provide equitable access to quality health services in partnership with the relevant stakeholders within a balanced and well managed health system to the people of the Western Cape and beyond.
Values
the core values of the Department are:

AnnuAl RepoRt 2018-2019 27Part A: General InformationAnnuAl RepoRt 2018-2019 Part A: General Information26
Legislative and Other Mandates
National Legislation
1. allied Health Professions act, 63 of 1982 as amended
2. atmospheric Pollution Prevention act, 45 of 1965
3. basic Conditions of employment act, 75 of 1997
4. births and Deaths Registration act, 51 of 1992
5. broad based black economic empowerment act, 53 of 2003
6. Children’s act, 38 of 2005
7. Chiropractors, Homeopaths and allied Health service Professions act, 63 of 1982
8. Choice on termination of Pregnancy act, 92 of 1996
9. Compensation for occupational Injuries and Diseases act, 130 of 1993
10. Constitution of the Republic of south africa, 1996
11. Constitution of the Western Cape, 1 of 1998
12. Construction Industry Development board act, 38 of 2000
13. Correctional services act, 8 of 1959
14. Council for the built environment act, 43 of 2000
15. Criminal Procedure act, 51 of 1977
16. Dental technicians act, 19 of 1979
17. Division of Revenue act (annually)
18. Domestic Violence act, 116 of 1998
19. Drugs and Drug Trafficking Act, 140 of 1992
20. employment equity act, 55 of 1998
21. environment Conservation act, 73 of 1998
22. Foodstuffs, Cosmetics and Disinfectants act, 54 of 1972
23. Government Immovable asset Management act, 19 of 2007
24. Hazardous substances act, 15 of 1973
25. Health Professions act, 56 of 1974
26. Higher education act, 101 of 1997
27. Human tissue act, 65 of 1983
28. Inquests act, 58 of 1959
29. Intergovernmental Relations Framework, act 13 of 2005
30. Institution of legal Proceedings against Certain organs of state act, 40 of 2002
31. International Health Regulations act, 28 of 1974
32. labour Relations act, 66 of 1995
33. local Government: Municipal Demarcation act, 27 of 1998
34. local Government: Municipal systems act, 32 of 2000
35. Medical schemes act, 131 of 1998
AnnuAl RepoRt 2018-2019 27Part A: General InformationAnnuAl RepoRt 2018-2019 Part A: General Information26
36. Council for Medical schemes levies act, 58 of 2000
37. Medicines and Related substances act, 101 of 1965
38. Medicines and Related substances Control amendment act, 90 of 1997
39. Mental Health Care act, 17 of 2002
40. Municipal Finance Management act, 56 of 2003
41. national building Regulations and building standards act,103 of 1977
42. national environmental Management act, 107 of 1998
43. national Health act, 61 of 2003
44. national Health amendment act, 2013
45. national Health laboratories service act, 37 of 2000
46. Non Profit Organisations Act, 71 of 1977
47. nursing act, 33 of 2005
48. occupational Diseases in Mines and Works act, 78 of 1973
49. occupational Health and safety act, 85 of 1993
50. older Persons act, 13 of 2006
51. Pharmacy act, 53 of 1974, as amended
52. Preferential Procurement Policy Framework act, 5 of 2000
53. Prevention and Combating of Corrupt activities act 12 of 2004
54. Prevention and treatment of Drug Dependency act, 20 of 1992
55. Promotion of access to Information act, 2 of 2000
56. Promotion of administrative Justice act, 3 of 2000
57. Promotion of equality and Prevention of Unfair Discrimination act, 4 of 2000
58. Protected Disclosures act, 26 of 2000
59. Protection of Personal Information act, 4 of 2013
60. Public audit act, 25 of 2005
61. Public Finance Management act, 1 of 1999
62. Public service act, 1994
63. Road accident Fund act, 56 of 1996
64. sexual offences act, 23 of 1957
65. skills Development act, 97 of 1998
66. skills Development levies act, 9 of 1999
67. south african Medical Research Council act, 58 of 1991
68. south african Police services act, 68 of 1978
69. state Information technology agency act, 88 of 1998
70. sterilisation act, 44 of 1998
71. tobacco Products Control act, 83 of 1993
72. traditional Health Practitioners act, 35 of 2004

AnnuAl RepoRt 2018-2019 29Part A: General InformationAnnuAl RepoRt 2018-2019 Part A: General Information28
Provincial Legislation
1. Draft Regulations Relating to the Functioning of the District Health Councils in terms of the Western Cape District Health Councils act, 2010
2. exhumation ordinance, 12 of 1980. Health act, 63 of 1977
3. Regulations Governing the Financial Prescripts in terms of Western Cape Health Facility boards and Committees act, 2016
4. Regulations Governing Private Health establishments. Published in Pn 187 of 2001
5. Regulations relating to the Criteria and Process for the Clustering of Primary Health Care Facilities in terms of the Western Cape Health Facility boards and Committees act, 2017
6. Regulations Governing the Procedures for the nomination of Members for appointment to Health Facility boards in terms of the Western Cape Health Facility boards and Committees act, 2017
7. training of nurses and Midwives ordinance 4 of 1984
8. Western Cape ambulance services act, 3 of 2010
9. Western Cape District Health Councils act, 5 of 2010
10. Western Cape Health Care Waste Management act, 7 of 2007
11. Western Cape Health Facility boards act, 7 of 2001
12. Western Cape Health Facility boards amendment act, 7 of 2012
13. Western Cape Health Facility boards and Committees act, 2016
14. Western Cape Health services Fees act, 5 of 2008
15. Western Cape Independent Health Complaints Committee act, 2 of 2014
16. Western Cape land administration act, 6 of 1998
17. Western Cape Independent Health Complaints Committee Regulations, 2014
Government Policy Framework that governs the Department
1. Millennium Development Goals
2. twelve outcomes of national Government
3. national Development Plan
4. negotiated service Delivery agreement
5. national Health systems Priorities: the ten Point Plan
6. national Health Insurance
7. Human Resources for Health
8. Provincial strategic objectives
9. Western Cape Infrastructure Delivery Management system (IDMs)
10. Healthcare 2030: the Road to Wellness (Western Cape Government: Health)
11. national environmental Health Policy (Gn 951 in GG 37112 of 4 December 2013)
12. national Health act: Publication of Health Infrastructure norms and standards Guidelines (no. R116 of 17 February 2014)
13. national Health act: Policy on Management of Public Hospitals (12 august 2011)

AnnuAl RepoRt 2018-2019 29Part A: General InformationAnnuAl RepoRt 2018-2019 Part A: General Information28
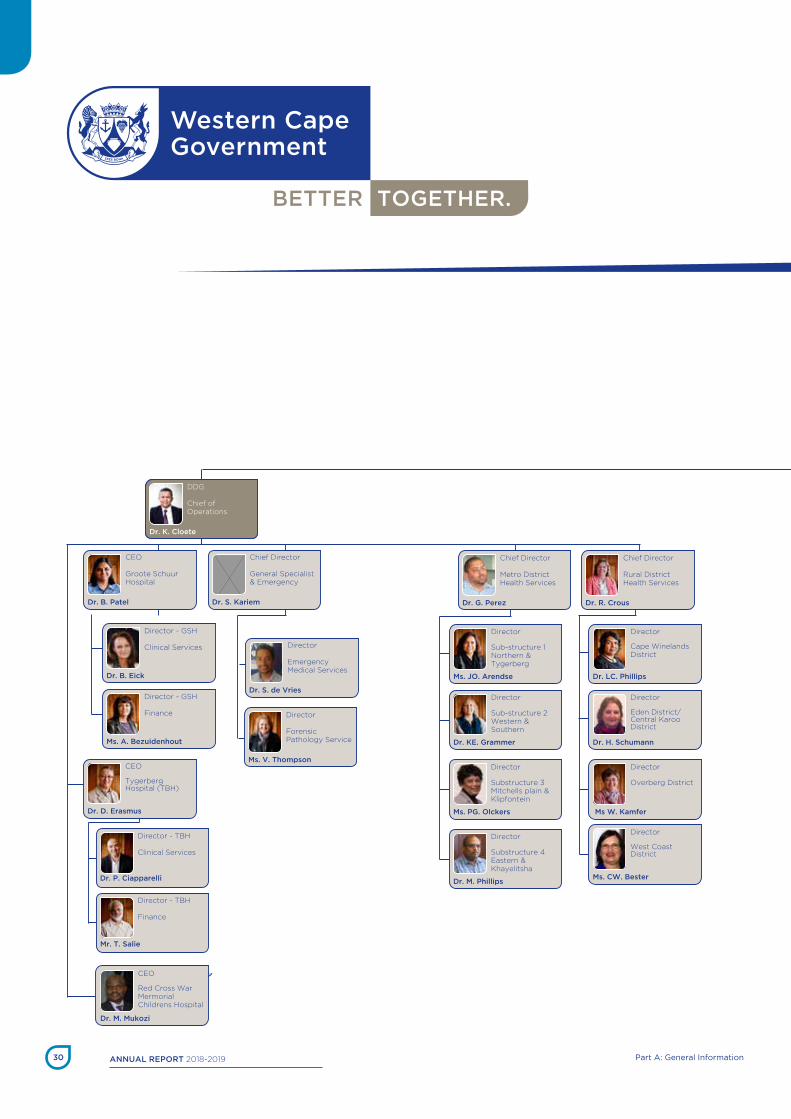
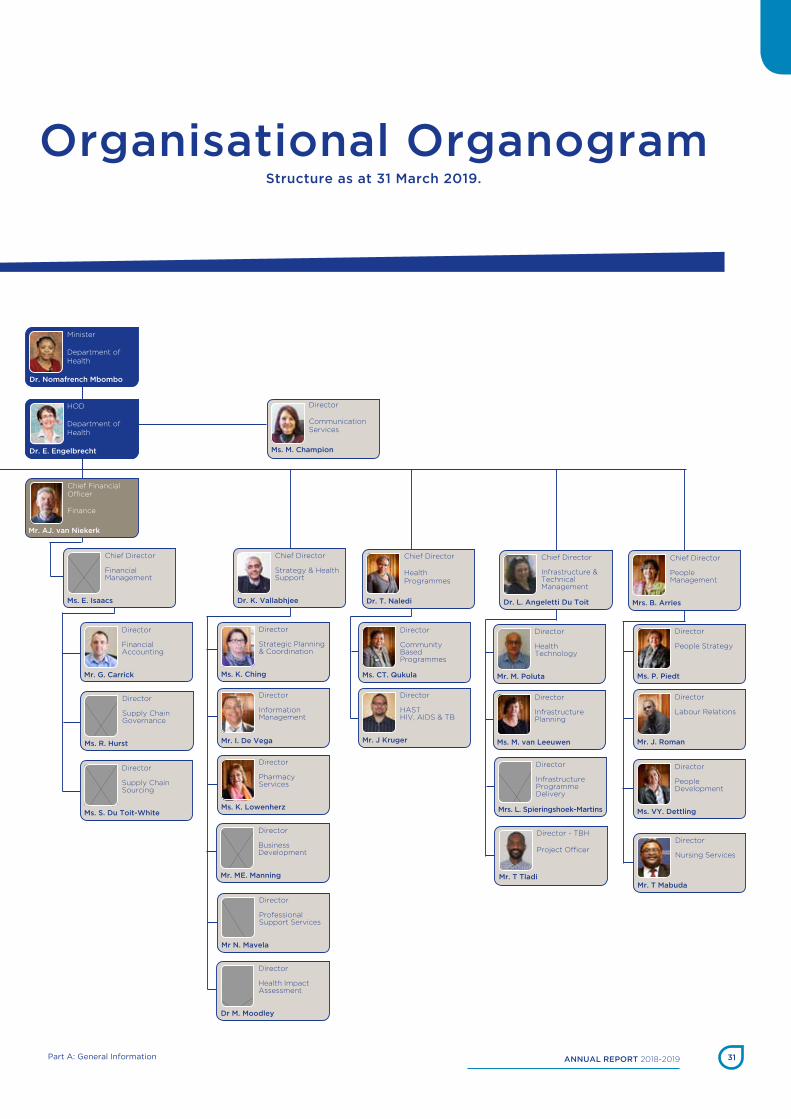
Organisational Structure
The organisational structure reflects the senior management service (SMS) members as at 31 March 2019, see organogram on the following page. the budget programme managers are as follow:
Dr K Vallabhjee Chief Director: Strategy and Health Support
• Programme 1: administration
Dr K Cloete Deputy Director General: Chief of Operations
• Programme 2: District Health services
• Programme 3: emergency Medical services
• Programme 4: Provincial Hospital services
• Programme 5: Central Hospital services
Mrs B Arries Chief Director: People Management
• Programme 6: Health sciences and training
Dr L Angeletti-du Toit Chief Director: Infrastructure and Technical Management
• Programme 7: Health Care support services
• Programme 8: Health Facilities Management
Entities reporting to the Minister/MEC
there are no entities reporting to the Minister/MeC.
AnnuAl RepoRt 2018-2019 31Part A: General InformationAnnuAl RepoRt 2018-2019 Part A: General Information30
Organisational OrganogramStructure as at 1 February 2019.
HOD
Department of Health
Minister
Department of Health
Dr. E. Engelbrecht
Dr. Nomafrench Mbombo
Director
Communication Services
Ms. M. Champion
Director
Eden District/ Central Karoo District
Director
West Coast District
Director
Substructure 3Mitchells plain & Klipfontein
Chief Director
Metro District Health Services
Director
Sub-structure 1Northern & Tygerberg
Director
Sub-structure 2 Western & Southern
Chief Director
Rural District Health Services
Director
Cape Winelands District
Director
Overberg District
Dr. H. Schumann
Ms. CW. Bester
Ms. PG. Olckers
Dr. G. Perez
Ms. JO. Arendse
Dr. KE. Grammer
Dr. R. Crous
Dr. LC. Phillips
Ms W. Kamfer
Director
Substructure 4Eastern & Khayelitsha
Dr. M. Phillips
Chief Financial Officer
Finance
Mr. AJ. van Niekerk
Director
Business Development
Mr. ME. Manning
Chief Director
General Specialist & Emergency
CEO
Groote Schuur Hospital
Director - GSH
Clinical Services Director
Emergency Medical Services
Director
Forensic Pathology Service
Director - TBH
Finance
Director - GSH
Finance
CEO
Tygerberg Hospital (TBH)
Director - TBH
Clinical Services
DDG
Chief of Operations
Dr. S. KariemDr. B. Patel
Dr. B. Eick
Dr. S. de Vries
Ms. V. Thompson
Mr. T. Salie
Director - TBH
Project Officer
Mr. T Tladi
Ms. A. Bezuidenhout
Dr. D. Erasmus
Dr. P. Ciapparelli
Vacant
Chief Director
Strategy & Health Support
Dr. K. Vallabhjee
Director
Strategic Planning & Coordination
Director
Information Management
Director
Pharmacy Services
Ms. K. Ching
Mr. I. De Vega
Ms. K. Lowenherz
Director
Health Impact Assessment
Dr M. Moodley
Director
Professional Support Services
Mr N. Mavela
Chief Director
Infrastructure & Technical Management
Dr. L. Angeletti Du Toit
Director
Health Technology
Director
InfrastructurePlanning
Director
InfrastructureProgrammeDelivery
Mrs. L. Spieringshoek-Martins
Mr. M. Poluta
Ms. M. van Leeuwen
Chief Director
People Management
Mrs. B. Arries
Director
People Development
Director
People Strategy
Director
Labour Relations
Director
Nursing Services
Ms. VY. Dettling
Ms. P. Piedt
Mr. J. Roman
Dr. T Mabuda
HOD
Department of Health
DDG
Chief of Operations
Dr. K. Cloete
CEO
Red Cross War Mermorial Childrens Hospital
Dr. M. Mukozi
Dr. E. Engelbrecht
Director
Community Based Programmes
Director
HASTHIV, AIDS & TB
Mr. J Kruger
Chief Director
Health Programmes
Dr. T. Naledi
Ms. CT. Qukula
Chief Director
Financial Management
Director
Financial Accounting
Ms. E. Isaacs
Mr. G. Carrick
Director
Supply Chain Governance
Director
Supply Chain Sourcing
Ms. PFR. Gouws
Ms. S. Du Toit-White
Director
Eden District/ Central Karoo District
Director
West Coast District
Director
Substructure 3Mitchells plain & Klipfontein
Chief Director
Metro District Health Services
Director
Sub-structure 1Northern & Tygerberg
Director
Sub-structure 2 Western & Southern
Chief Director
Rural District Health Services
Director
Cape Winelands District
Director
Overberg District
Dr. H. Schumann
Ms. CW. Bester
Ms. pG. olckers
Dr. G. perez
Ms. Jo. Arendse
Dr. Ke. Grammer
Dr. R. Crous
Dr. lC. phillips
Ms W. Kamfer
Director
Substructure 4Eastern & Khayelitsha
Dr. M. phillips
Chief Director
General Specialist & Emergency
CEO
Groote Schuur Hospital
Director - GSH
Clinical Services Director
Emergency Medical Services
Director
Forensic Pathology Service
Director - TBH
Finance
Director - GSH
Finance
CEO
Tygerberg Hospital (TBH)
Director - TBH
Clinical Services
DDG
Chief of Operations
Dr. S. KariemDr. B. patel
Dr. B. eick
Dr. S. de Vries
Ms. V. thompson
Mr. t. Salie
Ms. A. Bezuidenhout
Dr. D. erasmus
Dr. p. Ciapparelli
Vacant
DDG
Chief of Operations
Dr. K. Cloete
CEO
Red Cross War Mermorial Childrens Hospital
Dr. M. Mukozi
AnnuAl RepoRt 2018-2019 31Part A: General InformationAnnuAl RepoRt 2018-2019 Part A: General Information30
Organisational OrganogramStructure as at 31 March 2019
organisational organogramStructure as at 31 March 2019.
HOD
Department of Health
Minister
Department of Health
Dr. e. engelbrecht
Dr. nomafrench Mbombo
Director
Communication Services
Ms. M. Champion
Chief Financial Officer
Finance
Mr. AJ. van niekerk
Director
Business Development
Mr. Me. Manning
Chief Director
Strategy & Health Support
Dr. K. Vallabhjee
Director
Strategic Planning & Coordination
Director
Information Management
Director
Pharmacy Services
Ms. K. Ching
Mr. I. De Vega
Ms. K. lowenherz
Director
Health Impact Assessment
Dr M. Moodley
Director
Professional Support Services
Mr n. Mavela
Chief Director
People Management
Mrs. B. Arries
Director
People Development
Director
People Strategy
Director
Labour Relations
Director
Nursing Services
Ms. VY. Dettling
Ms. p. piedt
Mr. J. Roman
Mr. t Mabuda
Director - TBH
Project Officer
Mr. t tladi
Chief Director
Infrastructure & Technical Management
Dr. l. Angeletti Du toit
Director
Health Technology
Director
InfrastructurePlanning
Director
InfrastructureProgrammeDelivery
Mrs. l. Spieringshoek-Martins
Mr. M. poluta
Ms. M. van leeuwen
HOD
Department of Health
Dr. e. engelbrecht
Director
Community Based Programmes
Director
HASTHIV, AIDS & TB
Mr. J Kruger
Chief Director
Health Programmes
Dr. t. naledi
Ms. Ct. Qukula
Chief Director
Financial Management
Director
Financial Accounting
Ms. e. Isaacs
Mr. G. Carrick
Director
Supply Chain Governance
Director
Supply Chain Sourcing
Ms. R. Hurst
Ms. S. Du toit-White


PART BPerformance InformatIon

AnnuAl report 2018-2019 Performace Information34
PART B: Performance Information
Auditor-General’s Report: Predetermined Objectives
the auditor-General of south africa (aGsa) currently performs certain audit procedures on the performance information to provide reasonable assurance in the form of an audit conclusion. the audit conclusion on the performance against predetermined objectives is included in the report to management, with a clean audit being reported under the Predetermined objectives heading in the Report on other legal and regulatory requirements section of the auditor’s report. Refer to page 210 - 213 of the Report of the auditor-General, published in Part e: Financial Information.
Overview of Departmental Performance
Service Delivery Environment
Services Delivered Directly to the Public
Western Cape Government (WCG): Health provides the following health services to a population of approximately 6.5 million, of which 75.3 per cent is uninsured.
Rural Health Services (RHS)
the transnet Phelophepa healthcare train visited the Western Cape Province for 6 weeks during august and september 2018. the train offers general health, dental and eye checks in rural communities and dispenses treatment for diagnosed conditions. Counselling sessions and education is also offered. the stations visited this year were: beaufort West (Central Karoo), swellendam (overberg), and Piketberg and Klawer (West Coast).
Metro Health Services (MHS)
the expansion of CoPC sites in the Metro was prioritised in 2018/19 and is aligned with the strategic direction of the Department. this is seen as a major development that is expected to continue yielding positive results towards improving the delivery of primary care and to strengthen the health system. CoPC has huge potential to reconfigure the role of the community health worker and is envisaged to deliver a more comprehensive service to our communities.
Emergency and Clinical Support Services (ECSS)
Forensic Pathology services provides a medico legal investigation into the cause of death including the death scene investigation, transporting and safe custody of the deceased, the forensic Post Mortem and the presentation of these findings to a Court of Law by the issuing of a Section 212 affidavit and providing oral testimony. the operational environment is fraught with intimidation, personal health and safety risks, protests, untenable case load, high psychological stress all of which impacts on the staff members’ ability to render an efficient and effective service. The Service had during the 2018/19 financial year admitted 11 816 cases for medico-legal examination with 71.23 per cent of the admissions being in the City of Cape town. the service continues to experience increased caseload with the year-on-year admission rate in specifically the City of Cape town outpacing year-on-year estimated population growth by 255 per cent (3.47 per cent vs 1.36 per cent).
AnnuAl report 2018-2019 35Performace Information
the services to the public include investigating the death scene, collection and transportation of the deceased, identification of the deceased, post mortem examination and handing over of the deceased to their chosen undertaker. the primary client is to the Justice system which involves determining the cause of death and presenting the evidence to a Court of law. this ensures that every step of the process has a rigid chain of evidence and all exhibits, specimens and the deceased are securely stored always ensuring that there is no possibility of contamination or tampering of the evidence. the service pressure impacts on the ability to examine cases with the set target and this resulted with tygerberg facility being able to examine only 28 per cent of cases within the target. this further impacts the ability to release the decedent to the next-of-kin and also impact the completion of the post-mortem examination process and conclusion of the post-mortem findings.
Problems Encountered and Corrective Steps Taken
Rural Health services (RHs)
an increase in protest action and civil unrest impacted on access to health care services and resulted in a number of facilities being temporarily closed, sometimes for several days. In some instances, staff members were intimidated and could not report for duty or had to be escorted from the premises under the guidance of the south african Police service (saPs). Where the situation continued for longer periods (e.g. Hermanus CDC was closed between 12 – 24 July 2018), staff were redeployed to the nearest hospital and/or surrounding facilities.
During a protest action on the 13th november 2018 in saldanha bay sub-district, the Diazville Clinic was totally destroyed in a fire. Services and staff were redeployed to Saldanha Clinic and the outpatient department at Vredenburg Hospital to ensure clients still have access to the necessary health care.
the ongoing water crisis in the province resulted in the procurement and installation of water tanks for prioritised facilities and the drilling of bore holes. by doing this, RHs was able to ensure water was available at all health facilities even in areas, like beaufort West, where the town dam was empty and the municipality only provided water for limited hours during the day.
Load shedding during the year had a significant impact on service delivery and power surges damaged computer and other equipment. additional uninterrupted power supplies were procured in an effort to reduce the risk. Problems with generators were also encountered at various facilities and had to be addressed.
In addition to challenges with electricity supply, network connectivity in several rural areas was less than optimal. as health services are becoming more and more dependent on electronic systems, it is crucial to ensure constant electricity supply and network connectivity at health facilities.
AnnuAl report 2018-2019 Performace Information36
Metro Health services (MHs
bed pressure at hospitals remains a challenge due to the increase in burden of disease, inability to discharge or refer patients with complex social and health needs, inter facility transport and transport on discharge for patients with complex health needs. this pressure results in congestion and long waiting periods at our services.
Community related challenges: increase in reporting of theft and vandalism at facilities and community violence and protests. Community violence and protest have impacted on staff wellness and service delivery at health facilities. there has also been an increase in reporting of violent behaviour of patients towards staff members. these community challenges have impacted on the PHC and homebased care service delivery. there has also been an escalating expenditure on security guards, metal detectors, etc., which diverts funding for direct service delivery to support safety and security of staff, patients and infrastructure.
Various initiatives were taken to address these challenges. local engagements with civil society were held to address service delivery protest as well as theft and vandalism at facilities. Violence in communities however remains a challenge. there are partnerships with saPs and Community safety in certain areas to implement safety strategies and early warning systems.
service Pressures
service pressures are felt across the whole system due to the continued mismatch that results from decreasing resources and increasing needs. theatre dependent cases are challenged by the growing trauma burden. orthopaedics: limited number of support staff on the platform and long waiting times for theatre cases. each hospital needs to review current service delivery and identify key strategies to improve on waiting times for orthopaedic services.
Mental health
there is a high number of patients in 72-hour observation wards. Psychiatric hospitals have increased their bed numbers to separately accommodate intermediate care services at these institutions.
• a Mental Health workshop was held on 27 July 2018 which produced a co-creation of ideas from the participants throughout the province to look at challenges and opportunities for a potential reform. the emphasis of the workshop was to see Mental Health as part of a broader system. some of the main issues flagged were:
• Change management• Corporate and Clinical governance• Information management• Inter-sectoral Collaboration• Capacity building• Packages of care

AnnuAl report 2018-2019 37Performace Information
Infrastructure
the workshop is now followed up with workgroups mainly in the Metro unpacking the above areas in order to get to a Mental Health strategy. a data group under the leadership of the Rural Public Health specialist is now starting to unpack what information would add value to a system’s reform with special emphasis on the acute adult mentally ill patient.
Challenges for financial year under review
1. the increase in substance use in the population has escalated the burden on especially district hospitals where they present with substance induced psychosis. an inter sectoral approach would be required to reduce the burden on society.
2. the patient load increases are outstripping the availability of beds and where new buildings are being erected it takes time.
3. the effective management of Mental Health requires greater strengthening of community based services.
Draft Regulations for Mental Health Community based services can potentially have a disabling effect on current community based services. Furthermore, there is an urgent need to address accommodation required for the “bed blockers” in hospital settings. the Department leans towards a more developmental view towards community based mental health services.
the following are Department’s medium-long term goals in dealing with Mental Health issues:
Finalising a sustainable Mental Health strategy for the province within the budget constraints;
Change from a reactive approach to a pro-active system’s approach to better manage Mental Health within the broader health system;
Improve the use of data to better plan in future;
Improve retention in care; and
Include Mental Health into CoPC.
access to Intermediate care beds
Intermediate care bed funding will be protected and possible expansion where appropriate. this will be funded through internal reprioritization with efficiency gains and improved processes.
Community based services
there has been protest action by CHWs and lay counsellors regarding the change in service model. the Department confirmed the delivery approach of home based care through well-governed NGOs, with funding expanded to cover R3 500 per month for 8 hours of work per day. the appropriate model for counselling services will be consulted in the year to come.
Residential facilities for mental health clients and people with intellectual disability remains a challenge. the Department has obtained legal clarity about the distribution of responsibilities across government departments.

AnnuAl report 2018-2019 Performace Information38
Infrastructure: The fire at Mitchells Plain Hospital Emergency Centre caused significant damage. There are challenges with the completion of the work to the emergency centre and clients are currently being seen at a temporary infrastructure.
City of Cape town: the dual authority arrangement for personal primary health care services in relationship with the City of Cape Town remains a challenge of duplication and inefficiency. The Minister personally engaged with the City Mayco member towards reaching an amicable solution.
Disease outbreaks
In January 2019, a Carbapenem-resistant enterobacteriaceae (CRe) outbreak was reported in the neonatal and Paediatric services at tygerberg Hospital (tbH). this has resulted in a major impact on the service platform both within and outside tbH with an associated public health component which has necessitated a Provincial outbreak response.
the Ideal Clinic Realization and Maintenance Programme (ICRM)
the national Department of Health (nDoH) initiated the ICRM in 2013 as a way of systematically improving quality and correcting deficiencies in Primary Health Care (PHC) clinics in the public sector.
The ICRM programme was implemented in the Western Cape in 2016/17 financial year. Facilities have made tremendous progress with the number of provincial which achieved Ideal Clinic (IC) status from 36 (19 per cent) in 2016/17 to 126 (74 per cent) in 2018/19 (this number does not include facilities managed by the City of Cape town which have achieved IC status). Refer to the service Delivery Improvement Plan for details.
Clinics achieve higher levels of compliance with the Ideal clinic than the Office of Health Standards Inspections. this can be ascribed to the following:
• the ideal clinic dashboard and manual are updated annually and are therefore aligned to current practices and processes.
• Facility staff provide inputs annually to improve the ICRM dashboard and manual.• the ICRM has a detailed manual spelling out what is required for each element in the dashboard.• the ICRM has an excellent web-based application to generate reports and monitor progress.
The NDoH is finalizing Ideal Community Health Centre and Hospital Programmes for implementation in 2019/20.
Office of Health Standards Compliance Inspections (OHSC)
The OHSC conducts unannounced inspection at fixed health facilities to monitor compliance with the NCS. these inspections are to be regarded as mock inspections as the Regulated norms and standards only became operational in February 2019 and the inspection tools used for the inspections are as yet not aligned to the Regulations. Findings should be observed with this in mind.

AnnuAl report 2018-2019 39Performace Information
Generally, clinics do not perform as well as hospitals in the inspections. this can be ascribed to the following reasons:
• Clinics do not conduct self-assessments.• nCs inspection tools are not aligned to the Ideal Clinic Requirements (this will change in the 2019/20
financial year as the inspection tools will be aligned to the Ideal Clinic Framework).• the nCs questionnaires were last updated in 2013 and are therefore not aligned to current practices and
processes.
Complaints, compliments and suggestions
the national Guideline to Manage Complaints, Compliments and suggestions in the Public Health sector of south africa: april 2017, was implemented as of 1 april 2018.
In 2018/19 there were 5 332 Complaints lodged, 7 678 Compliments and 37 suggestions received. Complaint Resolution Rate was 97 per cent, with Complaints resolution within 25 working days’ rate at 92 per cent.
Results of the Client satisfaction survey (Css) 2018/19
Fixed facilities conduct annual Client satisfaction surveys: • Coverage: 223 facilities conducted a Css• total number of questionnaires captured: 59 669• satisfaction rate: 86 per cent
safety Health environment Risk Quality (sHeRQ) or occupational Health and safety
the sHeRQ related work in the WCG: H is directed by a team consisting of members from Infrastructure and technical Management, People Management and strategy and Health support (Quality assurance). the team meets quarterly to estimate progress.
Progress was made with regard to section 16.2 appointments*, the procurement of an occupational Medicine Information system and training health workers to be competent in conducting Health Risk assessments. the trained employees are now conducting Health Risk assessments with support from Qa. the team will continue to implement the sHeRQ policy according to the sHeRQ Implementation Plan. the team supported facilities that were inspected by the Department of labour.
Infection Prevention and Control
the best Care always initiative, a collaborative with private sector hospitals, is a continuous quality improvement programme, is now implemented in 7 facilities. the intention is to incrementally increase its uptake in more facilities.
antibiotic resistance is a serious global phenomenon. the Department has developed an antibiotic stewardship programme that is being incrementally implemented across facilities.
* occupational Health and safety act, 85 of 1993
AnnuAl report 2018-2019 Performace Information40
ageing infrastructure – tygerberg Hospital
the failure of the water supply pipeline had a negative impact operationally and required major incident management to ensure continuous service delivery. The water supply lines (domestic and fire) were replaced entirely by the installation of new piping and the commissioning of a refurbished water pump room also occurred.
budget Constraints
As a result of the budget constraints, posts that became vacant during the year could not be filled. This has had a significant impact on service delivery across the Department. The impact on clinical services was reduced by focussing on the non-filling of admin posts.
External Developments that impact on the Demand for Services
Population Growth
the statsa 2017 mid-year estimated the population in the Western Cape to be about 6 510 312, an exponential increase of about 1.9 per cent per annum from the 2011 census population.
Household Vulnerability
the increasingly high cost of living in the country and Province, has meant reduced disposable income, consequently leading to a rise in the number of vulnerable households. this situation compromises health status and increases the demand for public health services as private healthcare becomes unaffordable and social circumstances deteriorate.
Service Delivery Improvement Plans
the Department has completed a service Delivery Improvement Plan (sDIP) for 2018/19. the embedded document below highlights the service delivery plan and the achievements to date.
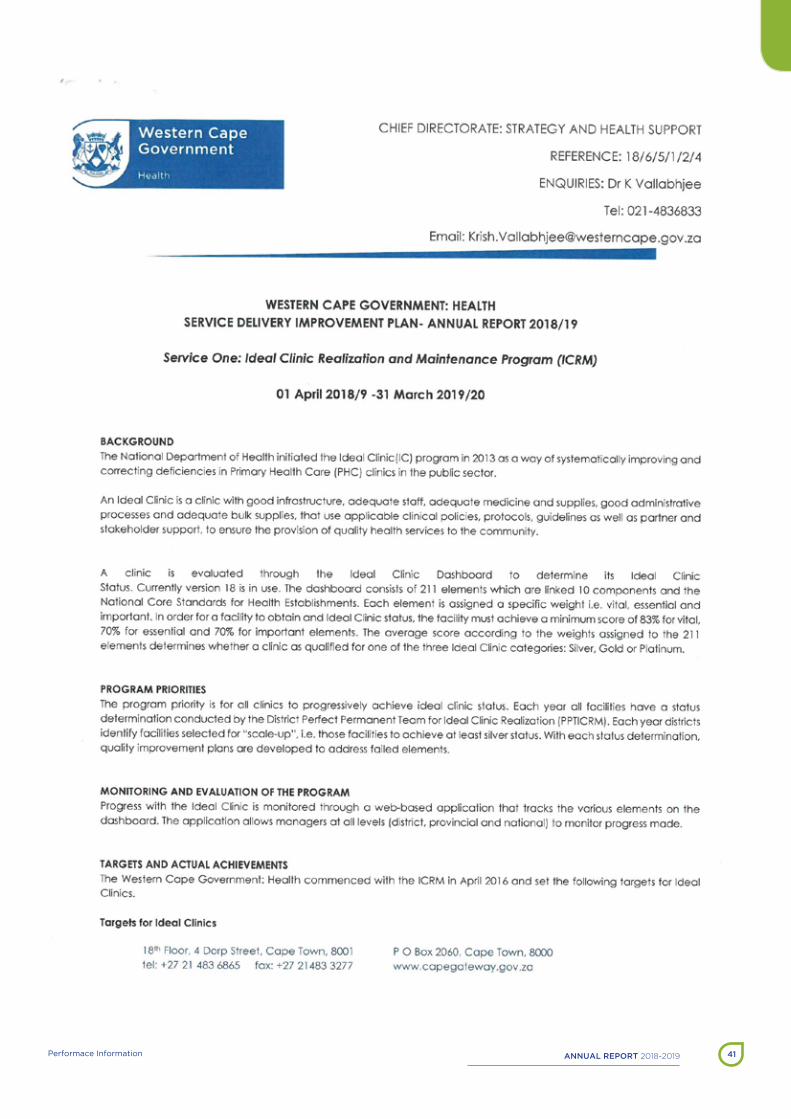
AnnuAl report 2018-2019 41Performace Information

AnnuAl report 2018-2019 Performace Information42

AnnuAl report 2018-2019 43Performace Information
Organisational Environment
Resignations and/or appointments in senior Management service
the following changes occurred in the senior management service (sMs) during 2018/19 as a result of attrition:
Retirements at the end of the previous financial year:• DI Govin, Director Nursing College, Western Cape College of Nursing, 31 March 2018
• MT Salie, Director Financial Accounting, Tygerberg Hospital, 30 November 2018
terminations and transfers out of WCG: Health:• H Burger, Director Medical Physicist, Groote Schuur Hospital, 31 December 2018
• T Tladi, Director, Project Officer TBH PPP, 06 July 2018
• KA Jeenes, Strategy & Technical Advisor, CD: Infrastructure & Technical Management, 31 May 2018
new appointments:• MT Salie, Director Financial Accounting, Tygerberg Hospital, 01 December 2018
• T Tladi, Director, Project Officer TBH PPP, 07 July 2018
• M Moodley, Director, Health Impact Assessment, 01 November 2018
Promotions and transfers:• W Sonnie, Chief Executive Officer, Metro TB, 01 September 2018
• JB Vaughan, Chief Executive Officer, Western Cape Rehab Centre, 01 September 2018
• BL Swartz, Chief Executive Officer, Lentegeur Hospital, 01 September 2018
• ES Isaacs, Chief Director, Supply Chain, Management, 01 December 2018
• N Mavela, Director, Professional Support Services, 01 February 2019

AnnuAl report 2018-2019 Performace Information44
Restructuring Realignment
In August 2016, the Department embarked on a Management Efficiency Alignment Project (MEAP) to re-align the management structure to enable efficient and effective service delivery towards Healthcare 2030. The goal of the project is to improve efficiencies and alignment of the departmental management structures, functions and processes towards the envisaged health outcomes of Healthcare 2030. the intervention will address duplication of functions, the level of centralisation/decentralisation, excessive “red tape” and administrative inefficiencies. The service delivery model and health systems approach in Healthcare 2030 will also be guiding the alignment of organisation and post structures.
a macro architectural design impacting on all management structures at macro, strategic Meso and operational Meso level has recently been developed which will be forwarded to the Department of Public service and administration for approval. In the interim the Department developed and implemented transitional arrangements as it relates to the principles of MeaP, the transformation agenda and related HC2030 deliverables. This will guide managers and organised labour on management processes until finality has been reached on the new management structures.
strike action
there were no strikes during the reporting period.
Significant System Failures
There were no significant system failures during the period under review.
Cases of corruption
The Department addressed various transgressions. These, however, have had no significant impact on service delivery. Refer to page 201 on Part D for the various types of misconduct reported.
Key Policy Developments and Legislative Changes
national Policy and legislative Changes
there were no national policy and legislative changes during the period of review that came into effect.
Provincial Policy & legislative Changes
the Western Cape Health Facility boards and Committees act, 2016 (act no. 4 of 2016), together with its Regulations, came into effect in the fourth quarter of the year under review, thus the Western Cape Health Facility boards act, 2001 was repealed.

AnnuAl report 2018-2019 45Performace Information
Strategic Outcome-Oriented Goals for 2014/15 – 2019/20
Promote Health and Wellness
life expectancy
life expectancy in the Western Cape population continues to be the highest in the country and has increased over the last 15 years. The most recent figures indicate that life expectancy for men in the province is now 66.8 years and for women 71.8 years. the Department has already exceeded the life expectancy targets it set for 2019/20. The strategies for enhancing the comprehensiveness and efficiency of the provincial health services have paid off, and the Department continues to focus on nurturing a culture of continuous quality improvement.
the priority strategies for enhancing the effectiveness of the PHC services, particularly WoW! (Western Cape on Wellness) Healthy lifestyles Initiative and the First 1000 Days Initiative, are starting to have the desired effect and remain central to strengthening PHC care pathway co-ordination, enhancing the health system’s capability for prevention and the retention of patients with chronic conditions in care. the service re-design priority strategy will be formalised into the service Design Project with dedicated staff in 2019/20. Community-oriented Primary Care (CoPC) has become the cornerstone of the PHC service re-design initiative, in giving effect to Universal Health Coverage (UHC), with operational pilot sites in both urban and rural health districts.
the Whole of Government and Whole of society approach in 4 learning sites form part of the strategic Goal 3 aims of improving wellness and safety, and reduce social ills. Cabinet, PtM and the Municipal Managers` Forum have adopted this approach as an area based integrated service delivery approach.
Embed Good Governance and Values-Driven Leadership Practices
Caring for the Carer
Healthy, engaged, and productive employees, who are committed to improving the patient experience, are key to providing patient-centred care and living the departmental values of innovation, caring, competence, accountability, integrity, responsiveness and respect. employee engagement is linked to a number of beneficial departmental outcomes such as increased productivity, servant leadership, job satisfaction, patient satisfaction, reduced employee turnover and physiological wellness outcomes.
It is acknowledged that employees working in the public health sector are faced with challenges that may include long working hours, a highly pressurised working environment and limited resources, against the backdrop of a constrained fiscal economy. Over and above this, employees also experience in their personal capacity emotional, financial, family and other psycho-social problems that impact on their performance in the workplace on a daily basis. the eHW programme focus for 2018/19 was on building resilience for staff within a complex health system.
AnnuAl report 2018-2019 Performace Information46
the following were implemented:
• analysing the nature of problems related to occupational categories and developing tailor made interventions
• Psycho-social support interventions focusing on stress management, resilience, work life balance, and regular debriefing
• Managerial support• Individual engagement through awareness sessions • executive and senior management coaching• life Management services proactive approach to wellbeing• Physical wellness programmes• Disability sensitisation• Diversity awareness
organisational Culture
the 2017 barret Values survey was conducted in august and continues to show survey on survey increases in participation, with significant improvement in 2015 and 2017 respectively. The Department’s entropy level is declining, from 26 per cent in 2011 to a much lower (improved) entropy score of 18 per cent in 2017. this is a positive factor to note and is to be celebrated as an achievement; it indicates that the concerning values highlighted in previous surveys are being effectively addressed, as more positive values are starting to emerge.
The 2017 survey found that the Department’s organisational culture has shifted from a level 3 (efficiency) focus in 2015 to a level 4 (transformation) and level 5 (internal cohesion) in 2017. this means that departmental energies are focused on renewal, transformation and building internal connections. the current culture is highly aligned as there are no immediate hindrances experienced, with the exception of controlling behaviour. There were five value matches, which is internationally regarded as very good. There are many positive aspects to the current culture as employees are able to live out some of their personal values, namely accountability, caring, respect, honesty, responsibility and commitment, which they wish to continue seeing in the desired culture.
the Department is described as being client-orientated and accessibility is an enabling factor in delivering its services. Its employees are described as having a positive attitude; and are responsible, caring and committed public servants who follow a disciplined approach to their work. the values of honesty, respect and family are important to employees; and trust is deeply valued. What is noteworthy is that even though employees confirm several positive values, trust is the one value that is most important for employees personally that is not finding expression in the current culture. It could mean that there is “something missing”; creating a disconnection between employees and the Department, which should be explored.

AnnuAl report 2018-2019 47Performace Information
leadership and Management Development
the focus of leadership development is integral to creating dispersed leadership that will inspire change and provide strategic direction, build cohesion and motivate improvement. Continuously improving the competencies at the individual, team and system level across the leadership spectrum with operational and facility managers a specific target; and measuring the impact of leadership development toward adding public value through person-centred care and improved health outcomes, remains the key objective.
In 2018/19 the following leadership development interventions occurred:
Leadership & Management Development Interventions Number Trained
annual indaba 313
boundary spanning leadership 2019 70
Change competency workshop for HR Managers 28
Change management competency workshop 134
Developing women in leadership 1
engaging leadership programme 215
ethics in the public service 4
Finance for non-financial managers 24
Health management 25
Improvement of leadership in theatres 1
Intermediate project management 25
Junior management development programme block 1 97
Junior management development programme block 2 91
leadership colloquium 5
leadership communication 8
leadership conference 2018 310
leadership development programme 1
leadership management 10
lean management workshop 3
Monitoring and evaluation: data analysis and presentation methods 16
Monitoring and evaluation: information management 4
Monitoring and evaluation: qualitative research methods 3
Monitoring and evaluation: report writing 1
Monitoring and evaluation: orientation 16
Meeting skills for chairpersons and facilitators 71
Mentoring and coaching for middle managers 21

AnnuAl report 2018-2019 Performace Information48
Middle management development programme: module 1 37
Middle management development programme: module 2 33
Middle management development programme: module 3 33
nursing leadership and management conference 10
oliver tambo Fellowship Programme in health management 8
Post graduate diploma in healthcare management: Us 9
Project management 193
Prosci sponsor workshop 8
strategic leadership, management and planning for middle managers 43
supervisory practices for junior managers 153
team cohesion 33
Women in management 29
total 2 086
basic Coverage of Core ICt systems
WCGH has recognised the centrality of It to achieving its objectives. It has been mainstreamed within the generic processes of planning, budgeting, risk management, implementation, monitoring and evaluation in the Department. this has served to systematically elevate the importance and focus of It in the minds of managers. the Department has also developed an It Vision that is coherent and aligned with Healthcare 2030, and the service priorities of the Department.
the Western Cape Government Health (WCGH) Department’s It Vision ultimately seeks to digitise core and support functions that are currently performed on paper. at the recent annual Departmental Indaba 2019 the COPC approach, Whole of Society Approach (WoSA) and Health IT were identified as key levers for efficiency gains and broad milestones for the next five years.
the Department has committed to horizontal integrated approaches to service delivery. therefore, our Health It solutions should follow the business logic to facilitate seamless continuity of patient information across an integrated service delivery platform and ultimately support patient agency. this can be realised by infusing key technologies and platforms into our horizontal solutions, rather than creating a collection of applications based on vertical service paradigms that duplicate these key technologies in each instance. although several projects targeting reception, clinical, analytic, corporate, and infrastructure services are already underway to achieve this, an electronic Health Record (eHR) based on internationally recommended architecture and best practice not only provides for integrative efficient approaches, but also supports the Department’s IT Vision principle to build on our existing enterprise investments and supports our current planning priorities. this incremental approach will result in paperless, folderless health facilities and, ultimately, gains in quality of care, service efficiency, and data reliability.
AnnuAl report 2018-2019 49Performace Information
As part of creating an enabling IT environment, the Department has identified two key game changers, eCCR (electronic Continuity of Care Record) and Provincial Health Data Centre (PHDC), that will form the basis for the realisation of an eHR. the eCCR project is aimed at improving the continuity of care between hospitals and primary health care. It is a collaborative project by Western Cape Government: Health Department and Health system technologies with an initial focus of establishing a web-based electronic Discharge summary. the enhancement of the patient-centred experience necessitates the continuity of care for patients who require multiple packages of care to achieve desired health outcomes in inpatient-, ambulatory-, and community settings. It has been implemented at 99 per cent of the fixed health facilities (Hospitals and PHC facilities) in the Province.
the development of PHDC has demonstrated the potential value to enhance the clinical management of patients. It has the capacity for monitoring of patterns of disease and the access to data for research and the generation of evidence and knowledge. a central pre-requisite to its functionality is the unique patient identifier (PMI) that enables data from the various systems to be connected to the same patient. This has been a major strength in the development of It systems within the province.
PHDC currently loads data from around 20 different provincial source systems, processing in excess of a million rows of data daily. Processes in the PHDC include etl and data harmonisation, data curation (including mapping of clinical concepts to standard code-lists and patient identity mapping), data beneficiation through a multi-evidence inference engine, and pre-processing of data for reporting through the building of disease cascades.
Running off the PHDC are the single Patient Viewer (sPV) as a prototype consolidated visualisation tool for clinicians to ensure continuity of care and as a portal to other systems, actionable line listing reports and associated aggregate reports delivered via ssRs and sharepoint, email alerts on occurrence of certain health conditions, and data extracts and analysis for internal and external data queries, in accordance with data governance prescripts of the Department, informed by legislation. of the prototype tools, sPV has 250 registered users and 50 regular users.
the Department is strengthening a range of business processes, governance arrangements and systems to enable the responsive delivery of It systems and applications to improve patient care and service delivery. It has been elevated to one of the uppermost priorities within the Department as evidenced by top management focus and participation on its governance structures as well as earmarked funding to enable implementation of It priorities.
AnnuAl report 2018-2019 Performace Information50
Create an enabling built environment
This strategic goal – specifically, Outcome 2.4: Build health facilities that are conducive to healing and service excellence at the same time being sustainable, flexible, energy efficient, environmentally friendly and affordable – is being met through what is termed the 5ls agenda2 as outlined in Healthcare 2030 – the Road to Wellness:
• long life (sustainability)
• loose Fit (Flexibility and adaptability)
• low Impact (Reduction of the carbon footprint)
• luminous Healing space (enlightened Healing environment)
• lean Design and Construction (Collaborative and integrated)
Good progress was made during 2018/19 in improving the infrastructure that supports the Department’s health care. Completion of projects is one measure of this, with the following capital infrastructure projects achieving Practical Completion in this period:
• new Clinic in asla, Mossel bay (donated by Petrosa)
• extensions to the pharmacy at Wellington CDC
• new Wolseley Clinic
In addition, the following are scheduled Maintenance projects completed in 2018/19:
• Clanwilliam ambulance station - General upgrade and maintenance
• Fencing projects at various facilities
• Goodwood CDC - Pharmacy Compliance and general maintenance
• Groote schuur Hospital - Maternity block lift upgrade
• Groote schuur Hospital - Mechanical work to air-conditioning in anzio Road building
• Karl bremer Hospital - nurses Home lift upgrade
• lentegeur Hospital - Upgrade and maintenance at Ward 26 and admin
• Red Cross War Memorial Children Hospital - Fire Compliance and Fire Detection
• tygerberg Hospital - boiler upgrade
• tygerberg Hospital - Water reticulation including borehole
• Zolani Clinic - General upgrade and maintenance
the most notable Health technology projects completed and funded through the Health Facility Revitalisation Grant (HFRG) during this period are:
• blackheath - Kleinvlei CDC - Ht - new Woman and Child Health Unit
• Clanwilliam Clinic - Ht - Clinic (alpha)
• Khayelitsha (site b) CHC - Ht - temporary IDU
• Khayelitsha Hospital - Ht - Ct scan
2sir alex Gordon RIba President coined the 3ls agenda – low energy, loose Fit, and long life – in 1971

AnnuAl report 2018-2019 51Performace Information
• Khayelitsha Hospital - Ht - Ward completion
• Mossel bay - alma CDC - Ht - nHI upgrade
• Mossel bay - new Clinic in asla - Ht
• Piketberg - Radie Kotze Hospital - Ht - Hospital layout improvement
• Rondebosch - Red Cross War Memorial Childrens Hospital - Ht - Paeds ICU Upgrade and extension
In addition to the above, nDoH provided assistance to the Department in the eden District through the nHI Indirect Grant. six projects, in excess of R4 million, achieved Practical Completion in 2018/19.
Unqualified Audit
Over the past 15 years the Department has managed to establish a track record for unqualified financial statements, including 2018/19. The past 4 years resulted in a clean financial statements audit, including 2018/19. The financial management systems employed have been continually refined and improved over the years. The under expenditure in the 2018/19 financial year was approximately 0.2 per cent of the budget. To achieve this result, in light of the budget challenges over the MteF period, the Department has had to initiate saving initiatives and maintain fiscal discipline.
Performance Information by Programme
the activities of the Department are organised in the following budget programmes:
Programme 1: administration
Programme 2: District Health services
Programme 3: emergency Medical services
Programme 4: Provincial Hospital services
Programme 5: Central Hospital services
Programme 6: Health sciences and training
Programme 7: Health Care support services
Programme 8: Health Facilities Management
Where indicated expenditure figures were converted to the values of the latest audited year at the time when planned targets were set in the aPP, which is the year 2014/15 for the 2016/17 aPP. the purpose is to be able to compare the reported costs from year to year.

AnnuAl report 2018-2019 Performace Information52
Programme 1: Administration
Purpose
to conduct the strategic management and overall administration of the Department of Health.
Subprogrammes
Subprogramme 1.1: Office of the MEC
Rendering of advisory, secretarial and office support services.
subprogramme 1.2: Management
Policy formulation, overall management and administration support of the Department and the respective regions and institutions within the Department.
To make limited provision for maintenance and accommodation for head office needs.
Strategic Objectives, Performance Indicators, Planned Targets and Actual Achievements
The priorities of the key management components identified to provide strategic leadership and support are financial resources, people management and information management.
strategic objectives
• Promote efficient use of financial resources.
• Develop and implement a comprehensive Human Resource Plan.
• transform the organisational culture.

AnnuAl report 2018-2019 53Performace Information
Actual Achievement
2017/18Planned Target
2018/19Actual Achieve-
ment 2018/19 Deviation
Strategic Objective: Promote efficient use of financial resources
Indicator: Percentage of the annual equitable share budget allocation spent
99.1% 100.0% 99.7% 0.3%
n: 16 048 977 000 17 205 716 000 17 147 363 000 58 353 000
D: 16 201 006 000 17 205 716 000 17 203 595 000 2 121 000
Comment On Deviationthis is a service delivery indicator which means it is not possible for the Department to predict performance with 100% accuracy. the mar-ginal deviation from the set performance target is considered by the Department as acceptable and is therefore considered as having achieved the target.
Strategic Objective: Develop and implement a comprehensive Human Resource Plan
Indicator: timeous submission of a Human Resource Plan for 2015 – 2019 to DPsa
Yes Yes Yes None
Comment On Deviationno deviation, target achieved.
Strategic Objective: Transform the Organisational Culture
Indicator: Cultural entropy level for WCG: Health
17.9%Survey conducted every second year
Survey conducted every second year Nonen: 12 568
D: 70 380
Comment On Deviationnone.
Indicator: number of value matches in the barrett survey
5 Survey conducted every second year
Survey conducted every second year None
Comment On Deviationnone.
transformation of organisation
There were no Barrett Value Survey (BVS) conducted during the financial year 2018/19, as it is a biennial requirement and the previous bVs was conducted in 2017/18. the Department exceeded its planned targets for 2017/18, and the following five cultural value matches highlighted the over-arching relationship between the three spheres (categories) of values, namely, Personal Values (PV), Current Culture Values (CC) and Desired Culture Values (DC): accountability, respect, caring, honesty and responsibility. the higher than anticipated value matching result is considered a positive outcome for the organisation. the next bVs is scheduled for 2019/20.

AnnuAl report 2018-2019 Performace Information54
Performance Indicators
Programme 1: Administration
Actual Achievement
2015/16
Actual Achievement
2016/17
Actual Achievement
2017/18Planned Target
2018/19Actual
Achievement 2018/19
Deviation
Sector Specific Indicators
Indicator: audit opinion from auditor-General of south africa
Unqualified Unqualified Unqualified Unqualified Unqualified None
Comment On Deviationnone.
Indicator: Percentage of hospitals with broadband access
48.1% 69.2% 96.2% 100.0% 98.1% (1.9%)
n: 26 37 51 52 51 (1)
D: 54 54 53 52 52 0
Comment On Deviationthe marginal deviation from the planned performance target is considered by the Department as acceptable and is therefore considered as having achieved the target. (additional note: Murraysburg Hospital is the only hospital that does not currently meet the minimum broadband requirement of 2 Mbps, but it has access to 1 Mbps broadband connectivity.)
Indicator: Percentage of fixed PHC facilities with broadband access
61.4% 84.2% 91.8% 94.8% 93.5% (1.3%)
n: 172 230 246 254 246 (8)
D: 280 273 268 268 263 (5)
Comment On Deviationthe marginal deviation from the planned performance target is considered by the Department as acceptable and is therefore considered as having achieved the target. (additional note: the denominator target of 268 that was set in the FY 2018/19 annual Performance Plan was set prior to the notification that two facilities would close [Robbie Nurock and Woodstock Clinics closed and their services were incorporated into District Six Community Day Centre]. In August 2018, Melkhoutfontein Clinic was reclassified from a (fixed) PHC clinic to a satellite clinic, and Diazville Clinic was closed because it was destroyed in a fire during civil unrest. On 7 Feb 2019, Keurhoek Clinic was reclassified to a satellite clinic. This brought about minor changes to the fixed PHC facility list. The total number of fixed PHC facilities is therefore 263.)
Strategies to Overcome Under-Performance
No strategies were required, as there was no significant under-performance during the financial year that required intervention by the Department. broadband roll-outs were not entirely within the Department’s control as the Department was reliant on external role players and service providers and performance was monitored.
Changes to Planned Targets
There were no changes to planned targets for the financial year.
Link Performance with Budgets
there was an under-spending of R1.950 million in programme 1, as depicted in the table below.

AnnuAl report 2018-2019 55Performace Information
Within the subprogrammes, there were multiple reasons for under/over financial performance, of which the following are the main attributes for the programme’s under-spending:
Subprogramme: Office of the MEC
the under-spending is due to the implementation of cost containment measures within Goods & services.
subprogramme: Management
Compensation of Employees: The under-spending is due to the delay in filling of posts in anticipation of the outcome of the Management Efficiency and Alignment Project. The main goal of MEAP is to improve alignment of functions, streamlining of processes and structures in line with the principles of Healthcare 2030. The Sector Executive Committee (SEC) therefore only approved, advertised and filled critical posts.
Goods and Services: the year-end surplus is a result of the implementation of cost containment measures and slow spending against the funding earmarked for the It Vision for Health. However, the saving was used to offset the payments for much needed capital assets. Further to this, the delays in fully implementing the MeaP operational plans also contributed to the under-spending.
Transfers and Subsidies: the under-spending can be attributed to lower than anticipated number of injury on duty cases and the severity of reported incidences. therefore, the associated expenditure was lower than budgeted.
Payments for Capital assets: The deficit can be attributed to the procurement of IT network infrastructure to strengthen connectivity in clinical areas across the Province.
Subprogramme
2018/19 2017/18Final
Appropriation
R’000
Actual Expenditure
R’000
(Over)/Under Expenditure
R’000
Final Appropriation
R’000
Actual Expenditure
R’000
(Over)/Under Expenditure
R’000
Office of the MEC 7 955 7 925 30 9 136 6 880 2 256
Management 760 101 758 181 1 920 734 582 713 232 21 350
TOTAL 768 056 766 106 1 950 743 718 720 112 23 606

AnnuAl report 2018-2019 Performace Information56
Programme 2: District Health Services
Purpose
to render facility-based District Health services (at clinics, community health centres and district hospitals) and community-based district health services (Cbs) to the population of the Western Cape Province.
Subprogrammes
subprogramme 2.1: District Management
Management of District Health Services, corporate governance, including financial, human resource management and professional support services, e.g. infrastructure and technology planning and quality assurance (including clinical governance).
subprogramme 2.2: Community Health Clinics
Rendering a nurse-driven primary healthcare service at clinic level including visiting points and mobile clinics.
subprogramme 2.3: Community Health Centres
Rendering a primary healthcare service with full-time medical officers, offering services such as: mother and child health, health promotion, geriatrics, chronic disease management, occupational therapy, physiotherapy, psychiatry, speech therapy, communicable disease management, mental health and others.
subprogramme 2.4: Community-based services
Rendering a community-based health service at non–health facilities in respect of home-based care, community care workers, caring for victims of abuse, mental- and chronic care, school health, etc.
subprogramme 2.5: other Community services
Rendering environmental and port health services (port health services have moved to the national Department of Health).
subprogramme 2.6: HIV/aIDs
Rendering a primary healthcare service in respect of HIV/aIDs campaigns.
subprogramme 2.7: nutrition
Rendering a nutrition service aimed at specific target groups, combining direct and indirect nutrition interventions to address malnutrition.
AnnuAl report 2018-2019 57Performace Information
subprogramme 2.8: Coroner services
Rendering forensic and medico-legal services in order to establish the circumstances and causes surrounding unnatural death; these services are reported in subprogramme 7.3: Forensic Pathology services.
subprogramme 2.9: District Hospitals
Rendering of a district hospital service at subdistrict level.
subprogramme 2.10: Global Fund
strengthen and expand the HIV and aIDs prevention, care and treatment Programmes.
note: tuberculosis (tb) hospitals are funded from Programme 4.2 but are managed as part of the District Health system (DHs) and are the
responsibility of the district directors. the narrative and tables for tb hospitals are in subprogramme 4.2.
District Health Services
strategic objectives, Performance Indicators, Planned targets and actual achievements
Performance on District Health services targets are set out below.
strategic objectives
No provincial strategic objectives specified for District Health Services.

AnnuAl report 2018-2019 Performace Information58
Performance Indicators
District Health Services
Actual Achievement 2015/16
Actual Achievement 2016/17
Actual Achievement 2017/18
Planned Target 2018/19
Actual Achievement 2018/19 Deviation
Sector Specific Indicators
Indicator: Ideal clinic status rate1,2
new indicator
77.5% 68.8% (8.7%)
n: 207 181 (26)
D: 267 263 (4)
Comment On Deviationthis indicator includes both City of Cape town and Provincially managed facilities. a minor deviation as targets were incorrectly based on assessments done and not status achieved, this has been addressed in the annual Performance Plan for FY19/20. the denominator target of 267 (should have been 268)2 that was set in the FY 2018/19 Annual Performance Plan was set prior to the notification that two facilities would close (Robbie Nurock and Woodstock Clinics closed and their services were incorporated into District Six Community Day Centre). In August 2018, Melkhoutfontein Clinic was reclassified from a (fixed) PHC clinic to a satellite clinic, and Diazville Clinic was closed because it was destroyed in a fire during civil unrest. On 7 Feb 2019, Keurhoek Clinic was reclassified to a satellite clinic. This brought about minor changes to the fixed PHC facility list. The total number of fixed PHC facilities is therefore 263.
Indicator: PHC utilisation rate - total 3
2.3 2.3 2.2 2.2 2.2 0.0
n: 14 150 180 14 413 350 14 140 046 14 498 396 14 082 696 (415 700)
D: 6 214 017 6 318 283 6 418 069 6 515 589 6 515 589 0
Comment On Deviationtarget achieved.
Indicator: Complaint resolution within 25 working days rate (PHC facilities)
95.5% 95.6% 94.1% 95.5% 95.3% (0.2%)
n: 3 220 3 175 2 365 2 889 2 473 (416)
D: 3 371 3 320 2 514 3 024 2 594 (430)
Comment On Deviationthe resolution of complaints is affected by many factors which makes predicting with 100% accuracy not possible. the marginal deviation is considered as having achieved target.
Notes
1. Definition change from the previous year’s indicator.2. The denominator target for fixed PHC facilities was incorrectly stated in the APP as 267 instead of 268.3. Population data has been updated retrospectively for historical years, as per Circular H11/2017.
strategies to overcome Under-Performance
there were no underperformances in this section.
Changes to Planned targets
No annual targets were changed during this financial year for this section.
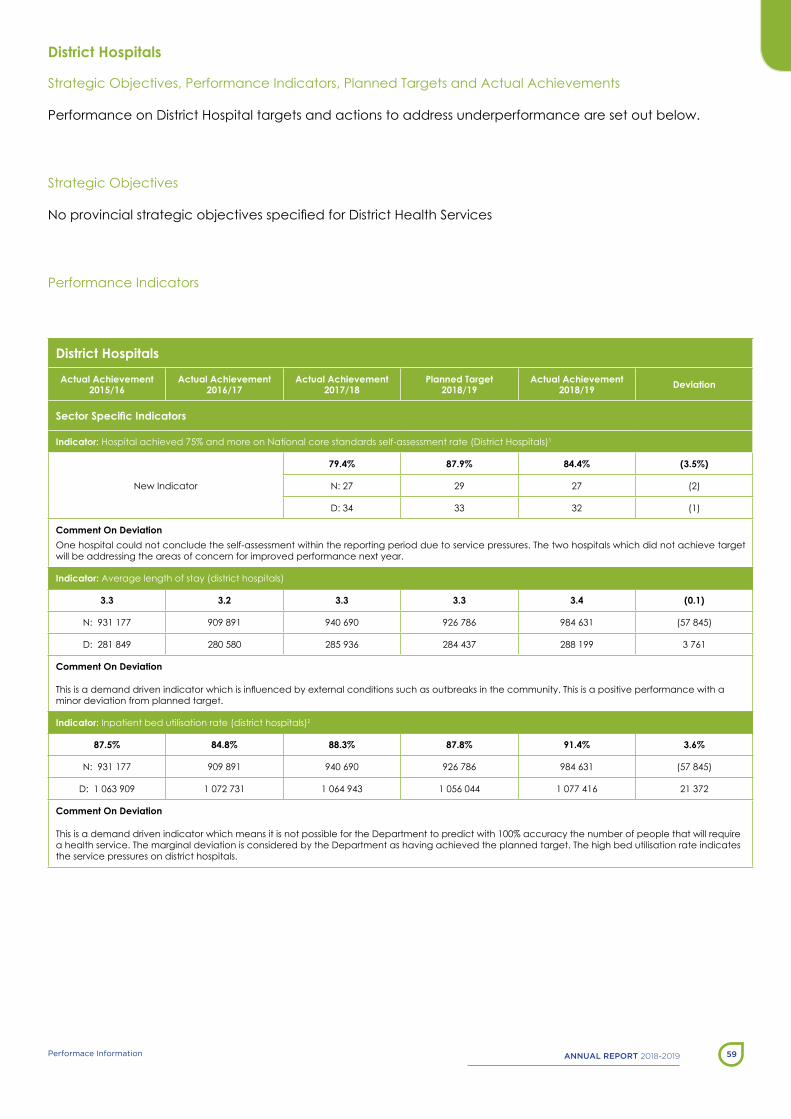
AnnuAl report 2018-2019 59Performace Information
District Hospitals
strategic objectives, Performance Indicators, Planned targets and actual achievements
Performance on District Hospital targets and actions to address underperformance are set out below.
strategic objectives
No provincial strategic objectives specified for District Health Services
Performance Indicators
District Hospitals
Actual Achievement 2015/16
Actual Achievement 2016/17
Actual Achievement 2017/18
Planned Target 2018/19
Actual Achievement 2018/19 Deviation
Sector Specific Indicators
Indicator: Hospital achieved 75% and more on national core standards self-assessment rate (District Hospitals)1
new Indicator
79.4% 87.9% 84.4% (3.5%)
n: 27 29 27 (2)
D: 34 33 32 (1)
Comment On Deviationone hospital could not conclude the self-assessment within the reporting period due to service pressures. the two hospitals which did not achieve target will be addressing the areas of concern for improved performance next year.
Indicator: average length of stay (district hospitals)
3.3 3.2 3.3 3.3 3.4 (0.1)
n: 931 177 909 891 940 690 926 786 984 631 (57 845)
D: 281 849 280 580 285 936 284 437 288 199 3 761
Comment On Deviation
This is a demand driven indicator which is influenced by external conditions such as outbreaks in the community. This is a positive performance with a minor deviation from planned target.
Indicator: Inpatient bed utilisation rate (district hospitals)2
87.5% 84.8% 88.3% 87.8% 91.4% 3.6%
n: 931 177 909 891 940 690 926 786 984 631 (57 845)
D: 1 063 909 1 072 731 1 064 943 1 056 044 1 077 416 21 372
Comment On Deviation
this is a demand driven indicator which means it is not possible for the Department to predict with 100% accuracy the number of people that will require a health service. the marginal deviation is considered by the Department as having achieved the planned target. the high bed utilisation rate indicates the service pressures on district hospitals.

AnnuAl report 2018-2019 Performace Information60
District Hospitals
Actual Achievement 2015/16
Actual Achievement 2016/17
Actual Achievement 2017/18
Planned Target 2018/19
Actual Achievement 2018/19 Deviation
Sector Specific Indicators
Indicator: expenditure per PDe (district hospitals)
R 1 954 R 2 139 R 2 329 R 2 345.24 R 2 385.95 (R40.71)
n: 2 731 832 162 2 923 677 427 3 229 036 306 3 353 736 000 3 453 083 213 (99 347 213)
D: 1 397 974 1 366 830 1 386 403 1 430 021 1 447 259 (17 238)
Comment On Deviationthis is a positive performance. as a demand driven indicator, the minor deviation is considered by the Department as having achieved the planned target.
Indicator: Complaint resolution within 25 working days rate (district hospitals)
90.2% 90.4% 91.1% 93.3% 89.7% (3.6%)
n: 1 590 1 501 1 244 1 362 1 068 (294)
D: 1 763 1 661 1 365 1 460 1 190 (270)
Comment On Deviation
Due to the complex nature, some complaints cannot be resolved within 25 working days. However, every effort is made to do so to the satisfaction of the client.
Notes
1. Definition change from previous years indicators.2. FY2016/17 denominator incorrectly reported as 1 072 730 in Annual Performance Plan 2018/19, correct figure reflected here.
strategies to overcome Underperformance
no extreme underperformance requiring intervention.
Changes to Planned targets
No annual targets were changed during this financial year for this section.

AnnuAl report 2018-2019 61Performace Information
HIV/AIDS, STIs and Tuberculosis (HAST)
strategic objectives, Performance Indicators, Planned targets and actual achievements
the 90 90 90 strategy has been adopted by the Department to address the tb and HIV/aIDs epidemics. Performance on Hast targets and actions to address underperformance are set out below.
strategic objectives
• Improve the tb programme success rate
• Improve the proportion of aRt clients who remain in care
Actual Achievement
2017/18Planned Target
2018/19Actual
Achievement 2018/19
Deviation
Strategic Objective: Improve the tb programme success rate
Indicator: tb programme success rate1
80.2% 81.1% 79.2% (1.9%)
n: 33 694 34 148 32 886 (1 262)
D: 42 009 42 085 41 532 (553)
Comment On Deviationthis is a demand driven indicator which means it is not possible for the Department to predict with 100% accuracy the number of people that will require a health service. the marginal deviation is considered as having achieved the planned target.
Strategic Objective: Improve the proportion of aRt clients who remain in care
Indicator: aRt retention in care after 12 months
61.4% 64.4% 59.6% (4.8%)
n: 28 908 29 667 28 568 (1 099)
D: 47 097 46 090 47 940 1 850
Comment On DeviationIncorrect patient contact details, movement of patients and gangsterism and violence continue to impact negatively especially on the follow up of patients who have missed appointments for aRt. In the Metro, the City of Cape town has reported that suboptimal infrastructure and staffing cannot meet demands of caring for an ever-increasing cohort of patients on ART.
Indicator: aRt retention in care after 48 months
49.5% 53.8% 46.3% (7.5%)
n: 16 088 16 333 15 409 (924)
D: 32 519 30 346 33 250 2 904
Comment On DeviationIncorrect patient contact details, movement of patients and gangsterism and violence continue to impact negatively especially on the follow up of patients who have missed appointments for aRt. In the Metro, the City of Cape town has reported that suboptimal infrastructure and staffing cannot meet demands of caring for an ever-increasing cohort of patients on ART.
Notes
1. strategic objective Indicator “TB programme success rate” utilises the same data as Performance Indicator “TB client treatment success rate”.
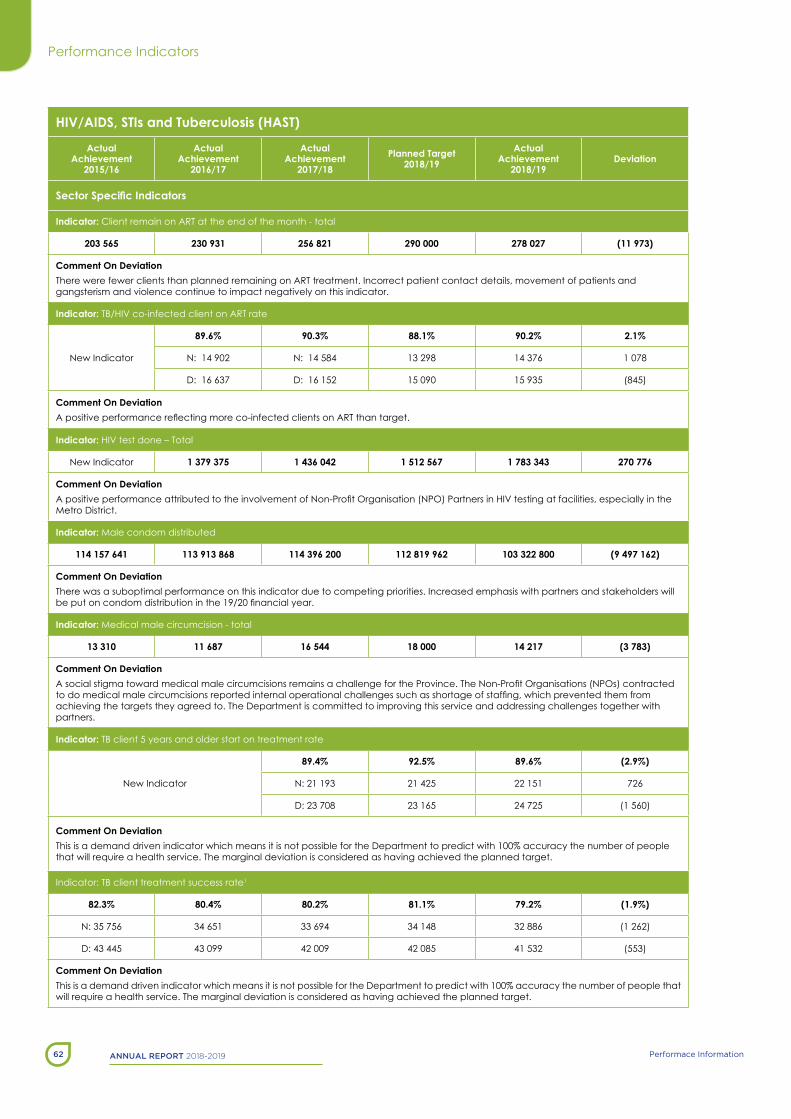
AnnuAl report 2018-2019 Performace Information62
Performance Indicators
HIV/AIDS, STIs and Tuberculosis (HAST)
Actual Achievement
2015/16
Actual Achievement
2016/17
Actual Achievement
2017/18Planned Target
2018/19Actual
Achievement 2018/19
Deviation
Sector Specific Indicators
Indicator: Client remain on aRt at the end of the month - total
203 565 230 931 256 821 290 000 278 027 (11 973)
Comment On Deviationthere were fewer clients than planned remaining on aRt treatment. Incorrect patient contact details, movement of patients and gangsterism and violence continue to impact negatively on this indicator.
Indicator: tb/HIV co-infected client on aRt rate
new Indicator
89.6% 90.3% 88.1% 90.2% 2.1%
n: 14 902 n: 14 584 13 298 14 376 1 078
D: 16 637 D: 16 152 15 090 15 935 (845)
Comment On DeviationA positive performance reflecting more co-infected clients on ART than target.
Indicator: HIV test done – total
new Indicator 1 379 375 1 436 042 1 512 567 1 783 343 270 776
Comment On DeviationA positive performance attributed to the involvement of Non-Profit Organisation (NPO) Partners in HIV testing at facilities, especially in the Metro District.
Indicator: Male condom distributed
114 157 641 113 913 868 114 396 200 112 819 962 103 322 800 (9 497 162)
Comment On Deviationthere was a suboptimal performance on this indicator due to competing priorities. Increased emphasis with partners and stakeholders will be put on condom distribution in the 19/20 financial year.
Indicator: Medical male circumcision - total
13 310 11 687 16 544 18 000 14 217 (3 783)
Comment On DeviationA social stigma toward medical male circumcisions remains a challenge for the Province. The Non-Profit Organisations (NPOs) contracted to do medical male circumcisions reported internal operational challenges such as shortage of staffing, which prevented them from achieving the targets they agreed to. the Department is committed to improving this service and addressing challenges together with partners.
Indicator: tb client 5 years and older start on treatment rate
new Indicator
89.4% 92.5% 89.6% (2.9%)
n: 21 193 21 425 22 151 726
D: 23 708 23 165 24 725 (1 560)
Comment On Deviationthis is a demand driven indicator which means it is not possible for the Department to predict with 100% accuracy the number of people that will require a health service. the marginal deviation is considered as having achieved the planned target.
Indicator: tb client treatment success rate1
82.3% 80.4% 80.2% 81.1% 79.2% (1.9%)
n: 35 756 34 651 33 694 34 148 32 886 (1 262)
D: 43 445 43 099 42 009 42 085 41 532 (553)
Comment On Deviationthis is a demand driven indicator which means it is not possible for the Department to predict with 100% accuracy the number of people that will require a health service. the marginal deviation is considered as having achieved the planned target.

AnnuAl report 2018-2019 63Performace Information
HIV/AIDS, STIs and Tuberculosis (HAST)
Actual Achievement
2015/16
Actual Achievement
2016/17
Actual Achievement
2017/18Planned Target
2018/19Actual
Achievement 2018/19
Deviation
Sector Specific Indicators
Indicator: tb client lost to follow-up rate
new Indicator
11.1% 9.7% 11.1% (1.4%)
n: 4 674 4 083 4 620 (537)
D: 42 009 42 085 41 532 (553)
Comment On Deviationalthough only a marginal deviation from target, the movement of patients, incorrect patient contact details provided, gangsterism and violence and manual information systems impact the tracing of patients and therefore performance of this indicator.
Indicator: tb client death rate2
new Indicator
3.3% 3.8% 3.7% 3.9% (0.2%)
n: 1 419 1 605 1 578 1 630 (52)
D: 42 685 42 009 42 085 41 532 (553)
Comment On Deviationthe Department cannot predict with 100% accuracy the mortality outcome of clients on treatment. the marginal deviation is considered by the Department as having achieved the planned target.
Indicator: tb MDR treatment success rate
39.4% 44.6% 43.4% 43.0% 51.2% 8.2%
n: 604 738 611 371 756 385
D: 1 532 1 653 1 407 862 1 476 614
Comment On DeviationMDR treatment success better than expected due to new treatment regimes.note: Numerator and denominator targets were incorrectly captured in Annual Performance Plan 2018/19 and subsequently are not the full financial year target. Overall performance target is still applicable.
Notes
1. Strategic Objective Indicator “TB programme success rate” utilises the same definition, technical indicator description and data as Performance Indicator “tb client treatment success rate”.
2. numerator incorrectly published in annual Performance Plan 18/19 as “Sum of TB client lost to follow up” but should have been “TB client died during treatment” which is reported here.
strategies to overcome Underperformance
aRt Retention in care after 12 and 48 months
Managers are to investigate ways of better retaining patients on aRt in care. such strategies include strengthening follow-up through the community-based services platform and enhancing electronic data tools to track patient attendances.
Medical Male Circumcision - total
nPos have helped the Department to improve performance on this indicator. the Department is committed to improving this service and addressing challenges together with partners.
Males Condoms distributed
the Department will re-emphasise the importance of maintaining high levels of condom distribution in the 2019/20 financial year.

AnnuAl report 2018-2019 Performace Information64
tb client lost to follow-up rate
service area improvements and electronic tools are to be developed to reduce loss to follow-up.
Changes to Planned targets
• no adjustments to annual planned targets were made.
Maternal, Child and Women’s Health (MCWH) and Nutrition
strategic objectives, Performance Indicators, Planned targets and actual achievements
there were no strategic objectives for this section. Performance is set out below. the First 1000 Days programme managed by the Department aims to improve performance on maternal and child health indicators.
Performance Indicators
Maternal, Child and Women’s Health (MCWH) and Nutrition
Actual Achievement 2015/16Actual
Achievement 2016/17
Actual Achievement
2017/18Planned Target
2018/19Actual
Achievement 2018/19
Deviation
Sector Specific Indicators
Indicator: antenatal 1st visit before 20 weeks rate
67.7% 69.6% 69.7% 70.3% 70.3% 0.0%
n: 60 521 63 901 67 292 66 318 72 593 6 275
D: 89 431 91 849 96 563 94 339 103 241 8 902
Comment On Deviationtarget achieved.
Indicator: Mother postnatal visit within 6 days rate
67.8% 60.0% 59.8% 62.4% 59.6% (2.8%)
n: 63 971 54 816 55 532 57 902 57 410 (492)
D: 94 342 91 322 92 819 92 776 96 249 3 473
Comment On Deviationthis is a demand driven indicator which means it is not possible for the Department to predict with 100% accuracy the number of people that will require a health service. the marginal deviation is considered as having achieved the planned target.
Indicator: antenatal client start on aRt rate
77.5% 90.8% 92.1% 86.8% 78.4% (8.4%)
n: 6 070 7 009 6 420 6 789 5 604 (1 185)
D: 7 834 7 715 6 968 7 818 7 149 (669)
Comment On Deviationthrough increased efforts to track patients by comparing the two registers, HIV testing services and aRt start, it has been detected that clients who restarted on treatment are not reflected in the numerator (Antenatal clients started on ART). as this is lifelong treatment, clients are recognised as “started” only once, however they are still eligible (denominator) if known positive but not presently on treatment. the reporting system requires improvement.
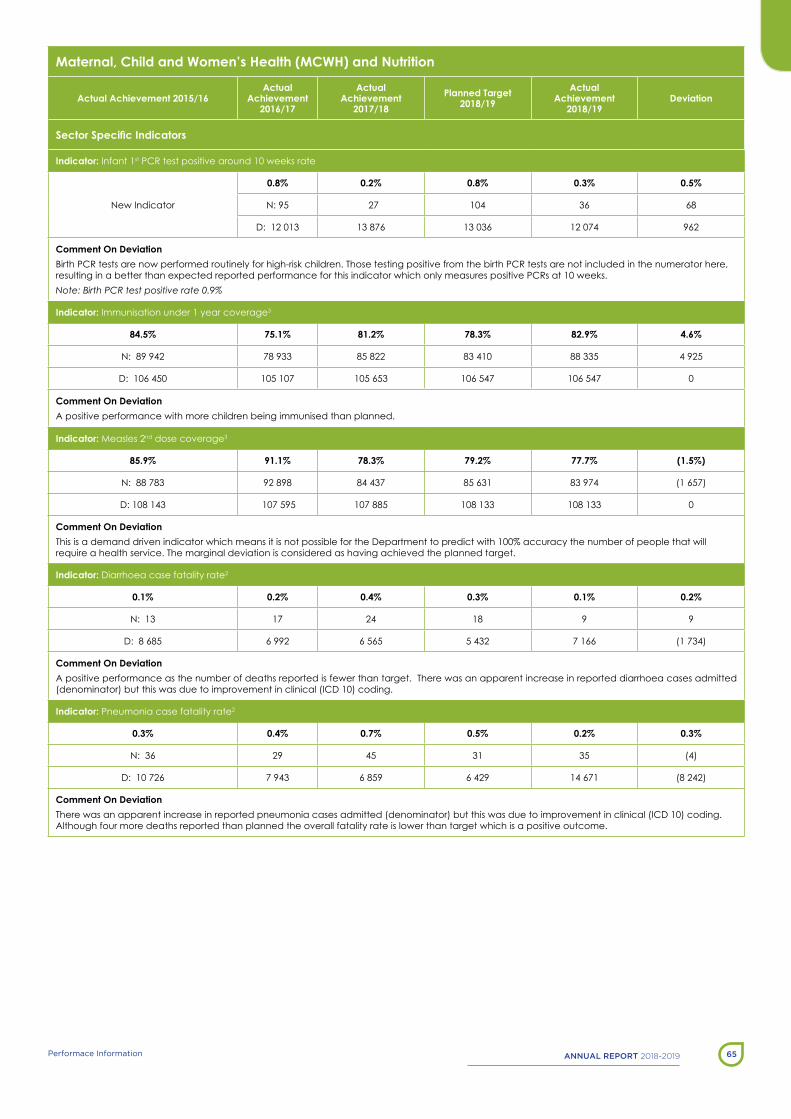
AnnuAl report 2018-2019 65Performace Information
Maternal, Child and Women’s Health (MCWH) and Nutrition
Actual Achievement 2015/16Actual
Achievement 2016/17
Actual Achievement
2017/18Planned Target
2018/19Actual
Achievement 2018/19
Deviation
Sector Specific Indicators
Indicator: Infant 1st PCR test positive around 10 weeks rate
new Indicator
0.8% 0.2% 0.8% 0.3% 0.5%
n: 95 27 104 36 68
D: 12 013 13 876 13 036 12 074 962
Comment On Deviationbirth PCR tests are now performed routinely for high-risk children. those testing positive from the birth PCR tests are not included in the numerator here, resulting in a better than expected reported performance for this indicator which only measures positive PCRs at 10 weeks. Note: Birth PCR test positive rate 0.9%
Indicator: Immunisation under 1 year coverage3
84.5% 75.1% 81.2% 78.3% 82.9% 4.6%
n: 89 942 78 933 85 822 83 410 88 335 4 925
D: 106 450 105 107 105 653 106 547 106 547 0
Comment On Deviationa positive performance with more children being immunised than planned.
Indicator: Measles 2nd dose coverage3
85.9% 91.1% 78.3% 79.2% 77.7% (1.5%)
n: 88 783 92 898 84 437 85 631 83 974 (1 657)
D: 108 143 107 595 107 885 108 133 108 133 0
Comment On Deviationthis is a demand driven indicator which means it is not possible for the Department to predict with 100% accuracy the number of people that will require a health service. the marginal deviation is considered as having achieved the planned target.
Indicator: Diarrhoea case fatality rate2
0.1% 0.2% 0.4% 0.3% 0.1% 0.2%
n: 13 17 24 18 9 9
D: 8 685 6 992 6 565 5 432 7 166 (1 734)
Comment On Deviationa positive performance as the number of deaths reported is fewer than target. there was an apparent increase in reported diarrhoea cases admitted (denominator) but this was due to improvement in clinical (ICD 10) coding.
Indicator: Pneumonia case fatality rate2
0.3% 0.4% 0.7% 0.5% 0.2% 0.3%
n: 36 29 45 31 35 (4)
D: 10 726 7 943 6 859 6 429 14 671 (8 242)
Comment On Deviationthere was an apparent increase in reported pneumonia cases admitted (denominator) but this was due to improvement in clinical (ICD 10) coding. although four more deaths reported than planned the overall fatality rate is lower than target which is a positive outcome.

AnnuAl report 2018-2019 Performace Information66
Maternal, Child and Women’s Health (MCWH) and Nutrition
Actual Achievement 2015/16Actual
Achievement 2016/17
Actual Achievement
2017/18Planned Target
2018/19Actual
Achievement 2018/19
Deviation
Sector Specific Indicators
Indicator: severe acute malnutrition case fatality rate2
0.9% 0.6% 2.2% 1.4% 1.6% (0.2%)
n: 11 5 10 8 9 (1)
D: 1 254 841 462 585 553 32
Comment On DeviationThe Department cannot predict with 100% accuracy the number of people that will die of severe acute malnutrition during a defined period. The marginal deviation is considered as having achieved the planned target.
Indicator: school grade 1 learners screened
54 107 55 171 48 889 55 646 17 686 (37 960)
Comment On DeviationThe School health screening package is provided according to needs. The majority of screenings conducted, specifically within the metro, were targeted partial screenings and not full screenings as defined by the National definition and were therefore not counted here.
Indicator: school grade 8 learners screened
7 657 9 364 11 401 11 964 4 063 (7 901)
Comment On DeviationThe School health screening package is provided according to needs. The majority of screenings conducted, specifically within the Metro, were targeted partial screenings and not full screenings as defined by the National definition and were therefore not counted here.
Indicator: Delivery in 10 to 19 years in facility rate
new Indicator
11.2% 10.3% 11.4% (1.1%)
n: 10 369 9 551 10 938 (1 387)
D: 92 819 92 776 96 249 (3 473)
Comment On DeviationErroneous target setting has resulted in an apparent poor performance. This has been corrected for the 2019/20 financial year.
Indicator: Couple Year Protection Rate (Int)1, 3
new Indicator
81.3% 74.2% 75.9% 1.7%
n: 1 443 501 1 329 431 1 360 609 31 178
D: 1 776 519 1 791 703 1 791 703 0
Comment On DeviationA positive performance reflecting a good uptake of the contraception service.
Indicator: Cervical cancer screening coverage (annualised) 3
55.2% 55.7% 57.8% 55.8% 56.3% 0.5%
n: 87169 90 454 96 469 95 433 96 371 938
D: 157 924 162 461 166 812 171 088 171 088 0
Comment On DeviationA positive performance reflecting more woman screened than planned.
Indicator: HPV 1st dose
33 537 36 182 32 356 33 045 41 604 8 559
Comment On Deviationa positive performance as more girls vaccinated than planned.
Indicator: HPV 2nd dose
new indicator 34 941 34 397 36 051 48 855 12 804
Comment On Deviationa positive performance as more girls vaccinated than planned.

AnnuAl report 2018-2019 67Performace Information
Maternal, Child and Women’s Health (MCWH) and Nutrition
Actual Achievement 2015/16Actual
Achievement 2016/17
Actual Achievement
2017/18Planned Target
2018/19Actual
Achievement 2018/19
Deviation
Sector Specific Indicators
Indicator: Vitamin a dose 12-59 months coverage3
45.9% 48.8% 48.9% 49.2% 52.1% 2.94%
n: 399 480 425 757 427 878 429 540 455 226 25 686
D: 869 839 872 328 874 217 873 395 873 395 0
Comment On DeviationA positive performance reflecting more Vitamin A doses given than planned.
Indicator: Maternal mortality in facility ratio (annualised)
71 per 100 000 59 per 100 000 57 per 100 000 62.9 per 100 000 69.2 per 100 000 (6.3)
n: 67 54 55 61 69 (8)
D: 0.949 0.918 0.961 0.969 0.997 (0.028)
Comment On DeviationDue to the nature of this indicator, the number of deaths cannot be predicted with 100% accuracy. there was an increase in the maternal mortality rate with no immediate cause evident and the Department is investigating the reason for this.
Indicator: neonatal death in facility rate
new indicator
9.3 per 1000 8.5 per 1000 9.3 per 1000 (0.8)
n: 860 794 889 (95)
D: 92.34 93.3 95.9 (2.6)
Comment On DeviationDue to the nature of this indicator, the number of deaths cannot be predicted with 100% accuracy. there was an increase in the neonatal mortality rate with no immediate cause evident and the Department is investigating the reason for this. Changes to electronic patient administration may have contributed to this.
Notes
1. Changes in the weightings of the individual elements used in the calculation of this indicator for FY2017/18 makes it not directly comparable to historical performance.
2. Diarrhoea, Pneumonia and severe acute Malnutrition case fatality rates refer to children under 5 years of age and is counted at separation.3. Population data has been updated retrospectively for historical years, as per Circular H11/2017.
strategies to overcome Underperformance
antenatal client started on aRt
the Department will be reviewing and improving reporting systems to obtain better representation of performance.
school health screening
to expand on the reporting of full screenings, provision has been made for the capture of partial screenings in the 2019/20 financial year. This will allow for an expanded review of the school health service. The school health programme is under review to improve efficacy.
Maternal and neonatal mortality rate

AnnuAl report 2018-2019 Performace Information68
the Department will investigate the reasons for the increased maternal mortality rate and neonatal mortality rate accordingly to institute an appropriate response. It should be noted that although higher than target the Western Cape is within reach of the targets set by the WHo sustainable Development Goal 3.
Changes to Planned targets
No annual targets were changed during this financial year for this section.
Disease Prevention and Control
strategic objectives, Performance Indicators, Planned targets and actual achievements
Performance on Disease Prevention and Control targets are set out below.
strategic objectives
No provincial strategic objectives specified for District Health Services
Performance Indicators
Disease Prevention and Control
Actual Achievement
2015/16
Actual Achievement
2016/17
Actual Achievement
2017/18Planned Target
2018/19Actual
Achievement 2018/19
Deviation
Sector Specific Indicators
Indicator: Cataract surgery rate
1 645 1 692 1 540 1 579 1 547 (32)
n: 7 684 8 050 7 443 7 748 7 591 (157)
D: 4.672 4.759 4.833 4.906 4.906 0
Comment On Deviationthis is a demand driven indicator which means it is not possible for the Department to predict with 100% accuracy the number of people that will require a health service. the marginal deviation is considered as having achieved the planned target.
Indicator: Malaria case fatality rate1
0.0% 0.7% 0.5% 1.0% 0.7% 0.3%
n: 0 1 1 2 1 1
D: 110 139 186 192 134 58
Comment On Deviationa positive performance as one less death and fewer cases reported than planned.
Notes
1. FY2016/17 denominator incorrectly reported as 140 in Annual Performance Plan 2018/19, correct figure reflected here.

AnnuAl report 2018-2019 69Performace Information
strategies to overcome Underperformance
no extreme underperformance requiring intervention.
Changes to Planned targets
No annual targets were changed during this financial year for this section.
Link Performance with Budgets
the under-expenditure can mainly be attributed to:
Compensation of employees
A refund in respect of posts from National Department of Health, combined with the difficulty to recruit and retain certain categories of staff in certain areas due to high attrition rates.
Goods and services:
the spending by south african national aids Council (sanaC) for the Focus for Impact project in Kwazulu-Natal was significantly less than was initially budgeted for in Global Fund. The saving in Anti tuberculosis (TB) medicine due to a reduction in the number of new tb infections as well as a reduction in the tb medicine prices in 2018.
transfers and subsidies
the Global Fund Grant ceased but programme close off activities and claims could not all be accounted for before financial year-end. It will be reflected in the new financial year in line with approval for roll-over funding.

AnnuAl report 2018-2019 Performace Information70
Subprogramme
2018/19 2017/18
Final Appropriation
R’000
Actual Expenditure
R’000
(Over)/Under
Expenditure
R’000
Final Appropriation
R’000
Actual Expenditure
R’000
(Over)/Under
Expenditure
R’000
District Management 441 183 444 106 (2 923) 404 783 394 909 9 874
Community Health Clinics 1 327 648 1 305 678 21 970 1 248 625 1 239 496 9 129
Community Health Centres 2 211 204 2 145 480 65 724 2 089 937 2 037 564 52 373
Community-based services 222 491 227 339 (4 848) 213 600 216 596 (2 996)
other Community services 1 - 1 1 - 1
HIV and aIDs 1 613 625 1 607 733 5 892 1 532 363 1 527 815 4 548
nutrition 50 250 50 153 97 46 381 47 573 (1 192)
Coroner services 1 - 1 1 - 1
District Hospitals 3 372 722 3 457 401 (84 679) 3 164 174 3 232 464 (68 290)
Global Fund 102 641 90 862 11 779 71 790 41 492 30 298
TOTAL 9 341 766 9 328 752 13 014 8 771 655 8 737 909 33 746
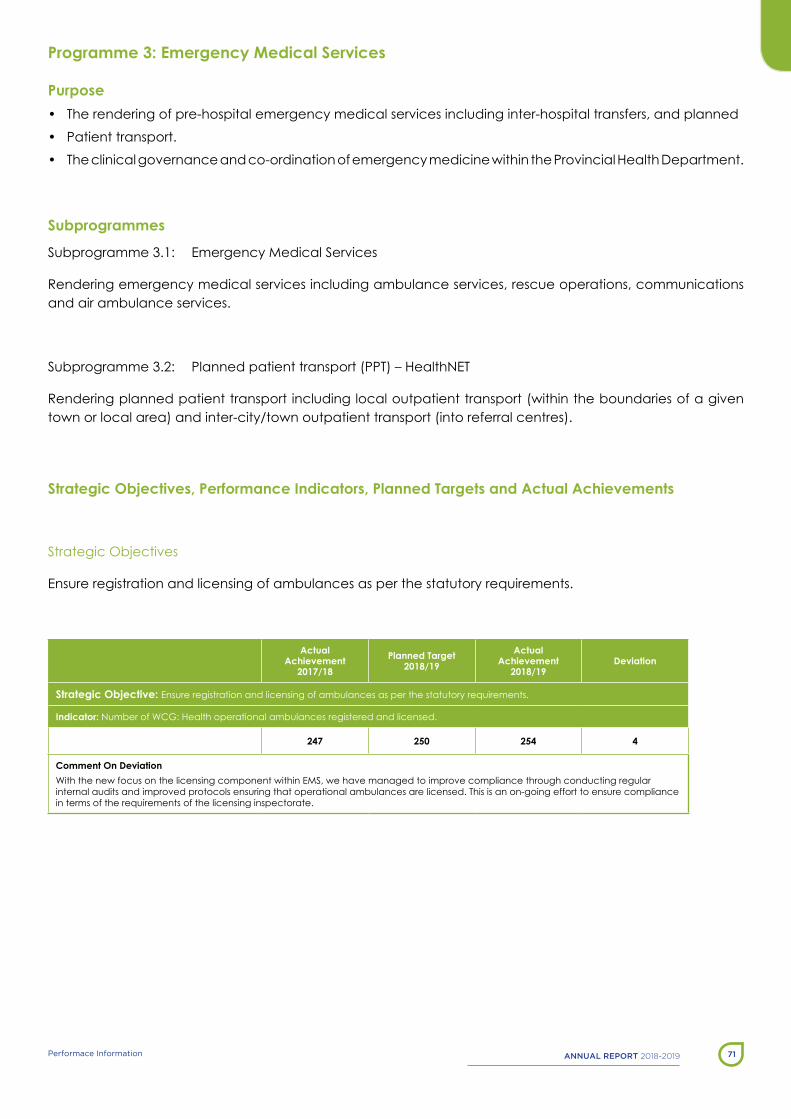
AnnuAl report 2018-2019 71Performace Information
Programme 3: Emergency Medical Services
Purpose• the rendering of pre-hospital emergency medical services including inter-hospital transfers, and planned
• Patient transport.
• the clinical governance and co-ordination of emergency medicine within the Provincial Health Department.
Subprogrammes
subprogramme 3.1: emergency Medical services
Rendering emergency medical services including ambulance services, rescue operations, communications and air ambulance services.
subprogramme 3.2: Planned patient transport (PPt) – Healthnet
Rendering planned patient transport including local outpatient transport (within the boundaries of a given town or local area) and inter-city/town outpatient transport (into referral centres).
Strategic Objectives, Performance Indicators, Planned Targets and Actual Achievements
strategic objectives
ensure registration and licensing of ambulances as per the statutory requirements.
Actual Achievement
2017/18Planned Target
2018/19Actual
Achievement 2018/19
Deviation
Strategic Objective: ensure registration and licensing of ambulances as per the statutory requirements.
Indicator: number of WCG: Health operational ambulances registered and licensed.
247 250 254 4
Comment On DeviationWith the new focus on the licensing component within eMs, we have managed to improve compliance through conducting regular internal audits and improved protocols ensuring that operational ambulances are licensed. this is an on-going effort to ensure compliance in terms of the requirements of the licensing inspectorate.
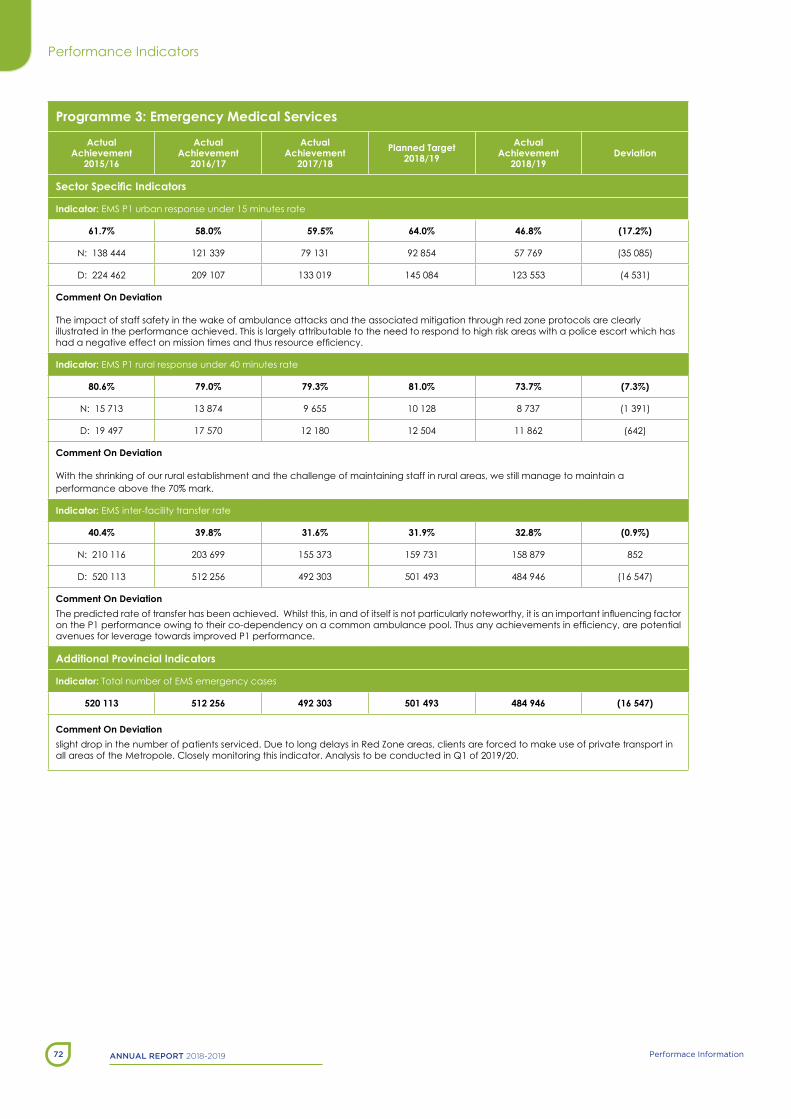
AnnuAl report 2018-2019 Performace Information72
Performance Indicators
Programme 3: Emergency Medical Services
Actual Achievement
2015/16
Actual Achievement
2016/17
Actual Achievement
2017/18Planned Target
2018/19Actual
Achievement 2018/19
Deviation
Sector Specific Indicators
Indicator: eMs P1 urban response under 15 minutes rate
61.7% 58.0% 59.5% 64.0% 46.8% (17.2%)
n: 138 444 121 339 79 131 92 854 57 769 (35 085)
D: 224 462 209 107 133 019 145 084 123 553 (4 531)
Comment On Deviation
the impact of staff safety in the wake of ambulance attacks and the associated mitigation through red zone protocols are clearly illustrated in the performance achieved. this is largely attributable to the need to respond to high risk areas with a police escort which has had a negative effect on mission times and thus resource efficiency.
Indicator: eMs P1 rural response under 40 minutes rate
80.6% 79.0% 79.3% 81.0% 73.7% (7.3%)
n: 15 713 13 874 9 655 10 128 8 737 (1 391)
D: 19 497 17 570 12 180 12 504 11 862 (642)
Comment On Deviation
With the shrinking of our rural establishment and the challenge of maintaining staff in rural areas, we still manage to maintain a performance above the 70% mark. Various
Indicator: eMs inter-facility transfer rate
40.4% 39.8% 31.6% 31.9% 32.8% (0.9%)
n: 210 116 203 699 155 373 159 731 158 879 852
D: 520 113 512 256 492 303 501 493 484 946 (16 547)
Comment On DeviationThe predicted rate of transfer has been achieved. Whilst this, in and of itself is not particularly noteworthy, it is an important influencing factor on the P1 performance owing to their co-dependency on a common ambulance pool. Thus any achievements in efficiency, are potential avenues for leverage towards improved P1 performance.
Additional Provincial Indicators
Indicator: total number of eMs emergency cases
520 113 512 256 492 303 501 493 484 946 (16 547)
Comment On Deviationslight drop in the number of patients serviced. Due to long delays in Red Zone areas, clients are forced to make use of private transport in all areas of the Metropole. Closely monitoring this indicator. analysis to be conducted in Q1 of 2019/20.

AnnuAl report 2018-2019 73Performace Information
Strategies to Overcome Underperformance
the impact of safety protocols on eMs performance continues to be felt over the reporting period. this is particularly marked in neighbourhoods designated as ‘red zones’ which sees the ambulance having to travel with a police escort, crucially prolonging mission times and negatively affecting resource availability. This, coupled with pressure on the staff establishment as a result of the fiscal challenges, has resulted in the notable deterioration in response time performance. this notwithstanding, the ongoing engagements with all stakeholders has seen the strengthening of relationships and the continuation of robust dialogue, most notably organised labour and several key safety partners.
the engagements with the community forums has also yielded success and remains one of our priorities in our strategy to address the safety issue. It is important to note that these neighbourhoods also represent the most vulnerable communities and are themselves plagued by high levels of inter-personal violence and other social determinants of health. the net result is a high burden of disease with escalating demand and a severely constrained resource base. all of which leads to prolonged waiting times and severely congested health facilities. Under such conditions, the Department has elected to adopt a systems wide approach as demonstrated in the Wosa initiatives.
Furthermore, the managing of the resulting PtsD cases and the provision of greater staff support and wellness initiatives, has been a key focus area for 2018/19 and will be intensified in the coming performance cycle. this approach follows what has been an intensive engagement with staff that has seen the Department host a series of staff safety workshops across the province. staff actively participated in robust and forthright conversations around the issues and concerns affecting their working conditions. these were documented and will be incorporated into a collective safety plan and strategy that should see the creation of shared understanding and renewed focus on safety related matters.
Link Performance with Budgets
the under and over expenditures noted in subprogrammes 3.1 and 3.2 respectively illustrate the challenges described above. the net result has been a R 3.8 million under expenditure for programme 3 as a whole and can be attributed to the necessary practices around staffing and associated compensation of employees. the combination of a steady increase in the cost of the aPl combined with the recent DPsa policy related to overtime has created a constraining environment in which to manage compensation. While the Department has made some significant concessions for the period to follow, the prevailing conditions will remain in effect. efforts are however underway to mitigate these.
Subprogramme
2018/19 2017/18
Final Appropriation
R’000
Actual Expenditure
R’000
(Over)/Under Expenditure
R’000
Final Appropriation
R’000
Actual Expenditure
R’000
(Over)/Under Expenditure
R’000
emergency transport 1 019 770 1 010 885 8 885 944 734 903 461 41 273
Planned Patient transport 86 487 91 559 (5 072) 81 829 91 401 (9 572)
TOTAL 1 106 257 1 102 444 3 813 1 026 563 994 862 31 701

AnnuAl report 2018-2019 Performace Information74
Programme 4: Provincial Hospital Services
Purpose
Delivery of hospital services, which are accessible, appropriate, effective and provide general specialist services, tb services, psychiatric services, specialised rehabilitation services, dental services, as well as providing a platform for training health professionals and conducting research.
Subprogrammes
subprogramme 4.1: General (Regional) Hospitals
Rendering of hospital services at a general specialist level and providing a platform for the training of health workers and conducting research.
subprogramme 4.2: tuberculosis Hospitals
to convert present tuberculosis hospitals into strategically placed centres of excellence in which a small percentage of patients may undergo hospitalisation under conditions, which allow for isolation during the intensive level of treatment, as well as the application of the standardised multi-drug and extreme drug-resistant protocols.
subprogramme 4.3: Psychiatric/Mental Hospitals
Rendering a specialist psychiatric hospital service for people with mental illness and intellectual disability and providing a platform for the training of health workers and conducting research.
subprogramme 4.4: sub-acute, step down and Chronic Medical Hospitals
Rendering specialised rehabilitation services for persons with physical disabilities including the provision of orthotic and prosthetic services.
subprogramme 4.5: Dental training Hospitals
Rendering an affordable and comprehensive oral health service and providing a platform for the training of health workers and conducting research.

AnnuAl report 2018-2019 75Performace Information
General (Regional) Hospitals
strategic objectives, Performance Indicators, Planned targets and actual achievements
this subprogramme funded regional hospital services in new somerset and Mowbray Maternity hospitals in the Cape town Metro district (Chief Directorate: Metro Health services), and Paarl, Worcester and George hospitals in the rural districts (Chief Directorate: Rural Health services). the hospitals focused on the provision of general specialist services with continued outreach and support to district hospitals.
Improving the overall quality, safety and access to health services remained a key strategy for this subprogramme.
the ongoing rising cost of healthcare remained a reality and managers continued with saving measures and strategies to target the areas of high cost and ensured that resources were appropriately allocated to improve the overall value in the package of healthcare delivered.
the performance standards within the national Core standards continued to be used to:
Create reliable and comparative performance information to make informed decisions;
Ensure hospital management teams are held accountable for the quality and efficiency of their performance; and
support quality improvement activities.
The hospitals within this subprogramme operated 1427 beds as was reflected in the Annual Performance Plan.
The number of beds increased from 1413 from the 2017/18 financial year to 1427 during the reporting year. Worcester Hospital and new somerset Hospitals opened 4 and 10 additional beds respectively in the Psychiatric ward.
the increasing acute service pressures along with the ongoing mental health service pressures remained in the Metro and despite New Somerset Hospital reconfiguring their beds to commission an additional 10 psychiatric female beds from the previous year, the bed occupancy rate for these beds during the 2018/19 financial year remained above 100 per cent due to high burden of disease and drug induced psychoses.
Paarl Hospital continued to provide support to swartland sub-district after a large part of swartland Hospital was destroyed in a fire during March 2017. This led to an increase of 24.8 per cent in maternity separations at Paarl Hospital.
George Hospital extended their cataract outreach services to include Prince albert and surrounding areas (in the Central Karoo District). two outreaches were conducted during the year (during July 2018 and January 2019 respectively) and a total of 75 cataract procedures were performed.
the Retinopathy of Prematurity (RoP) screening service for premature babies at Mowbray Maternity Hospital stabilised during this reporting period. as with any new service, there have been initial teething problems, which have resulted in delays with screening some children when compared to protocol. However, the backlog now no longer exists. Premature babies are now screened at Mowbray Maternity Hospital and then

AnnuAl report 2018-2019 Performace Information76
appropriately referred for follow-up care as required.
strategic objectives
Provide access to quality general / regional hospital services.
Actual Achievement
2017/18Planned Target
2018/19Actual
Achievement 2018/19
Deviation
Strategic Objective: Provide quality general / regional hospital services.
Indicator: actual (usable) beds in regional hospitals
1 413 1 427 1 427 0
Comment On Deviationtarget achieved, zero deviation.
Performance Indicators
General (Regional) Hospitals
Actual Achievement
2015/16
Actual Achievement
2016/17
Actual Achievement
2017/18Planned Target
2018/19Actual
Achievement 2018/19
Deviation
Sector Specific Indicators
Indicator: Hospital achieved 75% and more on national Core standards self-assessment rate (regional hospitals)
not required to report
100.0% 100.0% 100.0% 0%
n: 5 5 5 0
D: 5 5 5 0
Comment On Deviation
target achieved, zero deviation.
Indicator: average length of stay (regional hospitals)
3.9 4.0 3.9 4.0 4.0 0.0 days
n: 451 758 454 770 455 333 464 070 465 832 (1 762)
D: 116 499 114 099 115 099 114 948 115 652 704
Comment On Deviation
target achieved, zero deviation.

AnnuAl report 2018-2019 77Performace Information
General (Regional) Hospitals
Actual Achievement
2015/16
Actual Achievement
2016/17
Actual Achievement
2017/18Planned Target
2018/19Actual
Achievement 2018/19
Deviation
Sector Specific Indicators
Indicator: Inpatient bed utilisation rate (regional hospitals)
89.1% 89.4% 88.6% 89.1% 89.4% 0.3%
n: 451 758 454 770 455 333 464 070 465 832 (1 762)
D: 507 041 508 501 513 733 520 912 520 912 0
Comment On Deviationthe deviation of 0.3% is regarded as marginal as this is a demand-driven indicator, which implies it is not possible for the Department to predict the performance with 100% accuracy.
Indicator: expenditure per patient day equivalent (PDe) (regional hospitals)
R 2 717 R 2 925 R 3 106 R 3 326 R 3 239 R 87
n: 1 602 371 869 1 725 945 856 1 841 574 080 1 998 148 000 1 970 196 306 273 514 694
D: 589 797 590 126 592 935 600 724 608 319 7 595
Comment On Deviationthe deviation is regarded as marginal. this is a demand-driven indicator, which implies that it is not possible for the Department to predict the performance with 100% accuracy.
Indicator: Complaint resolution within 25 working days rate (regional hospitals)
97.1% 97.6% 98.1% 97.6% 99.4% 1.8%
n: 372 286 265 290 309 19
D: 383 293 270 297 311 14
Comment On Deviationthis is a positive performance as a result of ongoing improvements in the review system.
Additional Provincial Indicators
Indicator: Mortality and morbidity review rate (regional hospitals)
83.8% 83.3% 106.4% 82.4% 101.5% 19.1%
n: 171 170 217 168 207 39
D: 204 204 204 204 204 0
Comment On Deviation
this is a positive performance as a result of ongoing improvements in the review system. More meetings were conducted than planned in terms of the target set, resulting in improved clinical governance and enhancing the overall quality of patient care. over-performance is mainly due to individual clinical units holding separate meetings – the indicator target was set based on the number speciality groups.
strategies to overcome Underperformance
no material underperformance was recorded.
More mortality and morbidity meetings were conducted than planned in terms of the target set, resulting in improved clinical governance and enhancing the overall quality of patient care.
Changes to Planned targets
there were no changes to planned targets.

AnnuAl report 2018-2019 Performace Information78
Tuberculosis Hospitals
strategic objectives, Performance Indicators, Planned targets and actual achievements
this programme funded 6 tb hospitals in the Province. there were no changes to the number of tb hospital beds.
Actual Achievement
2017/18Planned Target
2018/19Actual
Achievement 2018/19
Deviation
Strategic Objective: Provide quality tuberculosis hospital services.
Indicator: actual (usable) beds in tuberculosis hospitals
1 026 1 026 1 026 0
Comment On Deviationtarget achieved, zero deviation.
Performance Indicators
Tuberculosis Hospitals
Actual Achievement
2015/16
Actual Achievement
2016/17
Actual Achievement
2017/18Planned Target
2018/19Actual
Achievement 2018/19
Deviation
Additional Provincial Indicators
Indicator: Mortality and morbidity review rate (tb hospitals)
88.9% 95.8% 93.1% 83.3% 97.2% 13.9%
n: 64 69 67 60 70 10
D: 72 72 72 72 72 0
Comment On DeviationMore reviews were done than was planned, which resulted in an overpeformance.
strategies to overcome Underperformance
no material underperformance was recorded.
More mortality and morbidity review meetings were conducted than planned in terms of the target set, resulting in improved clinical governance and enhancing the overall quality of patient care.
Changes to Planned targets
there were no changes to planned targets.

AnnuAl report 2018-2019 79Performace Information
Psychiatric Hospitals
this subprogramme funded the four psychiatric hospitals and the Mental Health Review board located in the Cape town Metro District. these facilities supported the integration of mental health services into general care settings in line with the Mental Health Care act 17 of 2002 and provided access to the full package of psychiatric hospital services. the four hospitals are alexandra, lentegeur, stikland and Valkenberg.
acute and chronic intellectual disability services for patients with intellectual disability and mental illness or severe challenging behaviour were provided at lentegeur and alexandra hospitals. acute psychiatric services were provided at lentegeur, stikland and Valkenberg hospitals including a range of specialised therapeutic programmes. Forensic psychiatric services included observation services for awaiting trial prisoners were provided at Valkenberg Hospital only, and state patient services for people who have been found unfit to stand trial were provided at Valkenberg and lentegeur hospitals.
strategic objectives, Performance Indicators, Planned targets and actual achievements
the hospitals operated 1 799 beds. the total number of beds in psychiatric hospitals increased by 150 as the 3 psychiatry intermediate care facilities were incorporated into their parent psychiatric hospitals - from 1 700 to 1 850 beds. Previously these beds were separately counted and reported as sub-acute/ intermediate beds. lentegeur Hospital closed 52 beds (mainly in the intellectual disability service) and Valkenberg Hospital had a bed reconfiguration, which resulted in a 1 bed net increase. These adjustments were made after the initial target was set in the annual Performance Plan.
Sufficient and adequate access to services remained the main objective to be achieved despite the ongoing acuity of mental illness and the growing disease burden.
at Valkenberg Hospital a Child Criminal Capacity assessment service has been established. this is the assessment of children for criminal capacity when they have been charged with a crime. This service is fulfilling an essential mental health service that protects the rights of the affected children while also ensuring that the justice system remains in compliance with the Constitution of south africa. Children can thus be placed in appropriate diversionary programs based on the recommendations of the attending clinicians.
The Mental Health Review Board is an efficient and effective body which is serving Mental Health Care Users well and has been a benchmark for the country. a second board with three members have been appointed during the reporting period. Whilst the board plans how best to structure and operate two separate Review boards to best assist the needs of the Mental Health Care Users in the Province, the board will function as a single board to be called the Joint Interim Review board.

AnnuAl report 2018-2019 Performace Information80
strategic objectives
Provide access to quality psychiatric hospital services.
Actual Achievement
2017/18Planned Target
2018/19Actual
Achievement 2018/19
Deviation
Strategic Objective: Provide quality psychiatric hospital services
Indicator: actual (usable) beds in psychiatric hospitals
1 700 1 850 1 799 (51)
Comment On Deviationnumber of beds in psychiatric hospitals increased by 150 as the 3 psychiatry intermediate care facilities were incorporated into their parent psychiatric hospitals) - from 1 700 to 1 850 beds. Previously these beds were separately reported as sub-acute beds. lentegeur Hospital closed 52 beds (mainly in the intellectual disability service) and Valkenberg Hospital had a bed reconfiguration, which resulted in a 1 bed net increase.
Performance Indicators
Psychiatric Hospitals
Actual Achievement
2015/16
Actual Achievement
2016/17
Actual Achievement
2017/18Planned Target
2018/19Actual
Achievement 2018/19
Deviation
Additional Provincial Indicators
Indicator: Mortality and morbidity review rate (psychiatric hospitals)
95.8% 91.7% 91.7% 91.7% 87.5% (4.2%)
n: 46 44 44 44 42 2
D: 48 48 48 48 48 0
Comment On Deviation
a marginal deviation from the performance target is considered by the Department as having achieved the target. on some months, lentegeur and Valkenberg Hospitals replaced their mortality and morbidity review meetings with presentations on related topics.
strategies to overcome Underperformance
acute psychiatric services continued to remain under pressure, particularly as a result of the high rate of substance abuse, acuity of patients and other social factors. this subprogramme continues to focus on the de-institutionalisation of clients and the strengthening of acute, inpatient and outpatient services as well as the district- and community-based services. sub-acute beds are funded within the budgets of Valkenberg, stikland and lentegeur hospitals to support the ongoing service pressures experienced.

AnnuAl report 2018-2019 81Performace Information
Sub-Acute, Step down and Chronic Medical Hospitals
this subprogramme funded the activities of the Western Cape Rehabilitation Centre (WCRC), which provides specialised rehabilitation services for people with physical disabilities. this includes the provision of a wide variety of assistive technology and assistive devices, including custom-made orthotics, Prosthetics and orthopaedic Footwear. the orthotic and Prosthetic Centre (oPC) (situated in Pinelands) resorts under the management of the WCRC.
the Public Private Partnership (PPP) between the Western Cape Department of Health and Mpilisweni Consortium is a 12-year agreement for the provision of estate maintenance, medical and non-medical equipment, hard and soft facilities management and related services in respect of the Western Cape Rehabilitation Centre (WCRC) and lentegeur Psychiatric Hospital. the contract has been extended until 31 March 2020.
strategic objectives, Performance Indicators, Planned targets and actual achievements
the WCRC, a 156-bed facility, provided a specialised, comprehensive, multidisciplinary inpatient rehabilitation service to persons with physical disabilities. specialised outpatient clinics provided services at Urology, orthopaedics, Plastic surgery and specialised seating clinics.
adequate access to rehabilitation services at WCRC has been improved for referrals of patients under the age of 18 for admission. WCRC has embarked on an initiative with relevant role players in the health system to review the neurological rehabilitation pathway for children, particularly those with spinal cord afflictions. Relationship building with st. Joseph’s continues to be strengthened to provide a better service to children with disabilities, the results of which have been shown with improved outcomes for patients.
WCRC accepts patients requiring complex neurological rehabilitation who are medically stable (landrum outcome level 1 and above). the majority of referrals come from the central and regional hospitals and there is increasing focus on strengthening relationships with these partners to ensure the delays in the referral process is kept to a minimum. substance abuse and associated unacceptable behaviour continues to be a challenge especially amongst patients who have no discharge options and have been resident at WCRC for over a year. the resilience of staff in dealing with these issues is commendable and further work is needed to better safeguard staff and patients in this environment.
the oPC renders on-site, off-site and outreach orthotic and prosthetic services to all the hospitals in the Metro and rural districts in the Western Cape, with the exception of the eden and Central Karoo districts, where services are outsourced. the demand for this invaluable service continues to grow and the teams are seeking ways to better integrate into the broader rehabilitation platform.

AnnuAl report 2018-2019 Performace Information82
The PPP project continued during the reporting financial year to achieve the needs of the Department through output specifications that enabled the Department to deliver quality specialized clinical rehabilitation services (WCRC) and psychiatric services (lGH). services were delivered against appropriate and measurable output specifications which were monitored by the Department through the various governance structures. The Exit Phase of the PPP is monitored within same governance structures, which includes both the Provincial and national treasuries.
strategic objectives
Provide access to quality rehabilitation hospital services.
Actual Achievement
2017/18Planned Target
2018/19Actual
Achievement 2018/19
Deviation
Strategic Objective: Provide quality rehabilitation hospital services.
Indicator: actual (usable) beds in rehabilitation hospitals
156 156 156 0
Comment On Deviationtarget achieved, zero deviation.
Performance Indicators
Rehabilitation Hospital
Actual Achievement
2015/16
Actual Achievement
2016/17
Actual Achievement
2017/18Planned Target
2018/19Actual
Achievement 2018/19
Deviation
Additional Provincial Indicators
Indicator: Mortality and morbidity review rate (rehabilitation hospitals)
100.0% 91.7% 91.7% 100.0% 100.0% 0%
n: 12 11 11 12 12 0
D: 12 12 12 12 12 0
Comment On Deviationtarget achieved, zero deviation.
strategies to overcome Underperformance
No material underperformance was identified.
WCRC continued to provide consultancy support to the district health services, especially in the rural areas, to facilitate the development of quality rehabilitation services for persons with physical disabilities through a variety of training- and support mechanisms and building a patient database to ensure adequate support to these patients is ongoing. Work has commenced to strengthen relationships and referral pathways with the

AnnuAl report 2018-2019 83Performace Information
Community based services and Primary Health Care platform to support a smoother transition for patients discharged from the WCRC.
Changes to Planned targets
there were no changes to planned targets.
Specialised Hospitals
strategic objectives, Performance Indicators, Planned targets and actual achievements
Refer to narrative under individual specialised hospitals.
Specialised Hospital
Actual Achievement 2015/16Actual
Achievement 2016/17
Actual Achievement
2017/18Planned Target
2018/19Actual
Achievement 2018/19
Deviation
Sector Specific Indicators
Indicator: Hospital achieved 75% and more on national Core standards self-assessment rate (specialised hospitals)
not required to report
100.0% 81.8% 90.9% 9.1%
n: 11 9 10 1
D: 11 11 11 0
Comment On Deviationover achievement of target due to various management strategies and ongoing attention to improving on the performance of the national Core standards.
Indicator: Complaint resolution within 25 working days rate (specialised hospitals)
not required to report
99.1% 94.4% 98.9% 4.5%
n: 221 219 180 (39)
D: 223 232 182 (50)
Comment On Deviationover achievement of target due to various management strategies. this is a positive deviation as a result of a well-functioning complaints management system.
strategies to overcome Underperformance
Refer to narrative of individual specialised hospitals.
Changes to Planned targets
• there were no changes to planned targets.

AnnuAl report 2018-2019 Performace Information84
Dental training Hospitals
strategic objectives, Performance Indicators, Planned targets and actual achievements
this subprogramme funded oral health services based at the Dental Faculty of the University of the Western Cape (UWC), also referred to as the oral Health Centre (oHC), and was mostly responsible for the training of certain categories of oral health professionals namely dentists, dental specialists and oral hygienists.
the oHC provided dental services to the community of the Western Cape. this service included primary, secondary, tertiary and quaternary levels of oral healthcare and was provided on a platform of oral health training complexes which comprises tygerberg oral Health Centre, Groote schuur Hospital, Red Cross War Memorial Children’s Hospital and the Mitchells Plain oral Health Centre. the other categories of oral health staff, such as the dental technicians, received their training at the Universities of technology.
the package of care provided on the service platform includes consultation and diagnosis, dental X-rays to aid diagnosis, treatment of pain and sepsis, extractions, oral health education, scaling and polishing, fluoride treatment, fissure sealants, fillings, dentures (full upper and lower dentures, chrome cobalt dentures, and special prosthesis), crown and bridgework, root canal treatment, orthodontics (fixed band ups), surgical procedures (for management of tumours and facial deformities) and maxilla-facial procedures (related to injuries sustained in trauma and motor vehicle accident cases).
strategic objectives
Provide access to quality dental training hospital services.
Actual Achievement
2017/18Planned Target
2018/19Actual
Achievement 2018/19
Deviation
Strategic Objective: Provide quality dental training hospital services.
Indicator: oral health patient visits at dental training hospitals
126 938 123 671 125 490 1 819
Comment On Deviationthe number of oral health patient visits is a demand-driven indicator, which means it is not possible for the Department to predict with 100% accuracy the number of patients that will access our services.

AnnuAl report 2018-2019 85Performace Information
Performance Indicators
Dental Training Hospitals
Actual Achievement
2015/16
Actual Achievement
2016/17
Actual Achievement
2017/18Planned Target
2018/19Actual
Achievement 2018/19
Deviation
Additional Provincial Indicators
Indicator: number of removable oral health prosthetic devices manufactured (dentures)
4 315 4 581 4 853 4 435 4 383 (52)
Comment On Deviationthis is a marginal deviation on a target which is mainly a student driven service, supported by service rendering staff. Prosthetic devices can sometimes not be concluded prior to student examinations or holidays and thus the devices will be completed on return of the student holidays or examinations.
strategies to overcome Underperformance
although this subprogram did not materially underperform, the mainly student-driven service will continue to be strengthened by improving the filling of permanent posts and where appropriate, contract appointments will be made as an interim measure to address the service load while posts are in the process of being permanently filled.
the burden of disease is the highest in the Country for caries in children and edentulousness (people without teeth). the Metro Health services is now embarking on the school Health bus program where six (6) year-old children will be targeted with a promotion and prevention (fissure sealants) strategy to reduce the burden of disease over time.
Changes to Planned targets
no targets were changed during the year.
Link Performance with Budgets
Programme 4’s annual expenditure reflects a saving of R7.399 million. This marginal surplus was mainly attributed to the impact of the savings plans implemented during previous financial years and the continued efforts within the 2018/19 financial year to realise savings that could be redirected to other service priorities within the budget programme. overall the budget entities managed well within their resource allocation.
the savings initiatives impacted on the available Goods and services budget and funds could be redirected to other much needed priorities. Funding provided ensured a high quality of service by preventing shortages, stock-outs, contract lapses and unnecessary losses.

AnnuAl report 2018-2019 Performace Information86
additional capital acquisition has been approved to address unforeseen, critical capital needs which impacted directly on quality service delivery. the capital budget and maintenance budget however remains under pressure as hospitals are confronted by ailing infrastructure and equipment.
Sound financial management principles have been applied in all the facilities which included financial compliance, budget planning, implemented and maintained internal controls and the application of principles of cost-effectiveness, and budget constraints were highlighted at all management and relevant committees and meetings.
the priorities as funded within the Programme 4 budget envelope ensured that the full expected package of care rendered by a general specialist service was covered.
Subprogramme
2018/19 2017/18Final
Appropriation
R’000
Actual Expenditure
R’000
(Over)/Under Expenditure
R’000
Final Appropriation
R’000
Actual Expenditure
R’000
(Over)/Under Expenditure
R’000
General (Regional) Hospitals 1 999 288 1 995 181 4 107 1 865 579 1 864 768 811
tuberculosis Hospitals 325 013 324 057 956 305 986 301 129 4 857
Psychiatric/Mental Hospitals 921 562 930 626 (9 064) 870 940 867 702 3 238
Rehabilitation Hospitals 208 925 206 682 2 243 197 626 192 738 4 888
Dental training Hospitals 175 453 166 296 9 157 163 036 153 190 9 846
TOTAL 3 630 241 3 622 842 7 399 3 403 167 3 379 527 23 640

AnnuAl report 2018-2019 87Performace Information
Programme 5: Central Hospital Services
Purpose
to provide specialist (tertiary and quaternary) health services and to create a platform for the training of health professionals and research activities.
Subprogrammes
subprogramme 5.1: Central Hospital services
Rendering of general and highly specialised medical health and quaternary services on a national basis and maintaining a platform for the training of health workers and research.
subprogramme 5.2: Provincial tertiary Hospital services
Rendering of general specialist and tertiary health services on a national basis and maintaining a platform for the training of health workers and research.
Central Hospitals
strategic objectives, Performance Indicators, Planned targets and actual achievements
The central hospitals operated 2 359 beds as was reflected in the annual performance plan. The combined bed occupancy rate was 89.9 per cent reflecting a full utilisation of services. The patient day equivalents (as a proxy for service volume provided) achieved was 1 028 733. the hospitals also provided access to the package of care for tertiary services funded by the national tertiary services Grant.
strategic objectives
Provide access to the full package of Central Hospital services.
Actual Achievement
2017/18Planned Target
2018/19Actual
Achievement 2018/19
Deviation
Strategic Objective: Provide access to the full package of central hospital services
Indicator: actual (usable) beds in central hospitals
2 359 2 359 2 359 0
Comment On Deviation:target achieved.

AnnuAl report 2018-2019 Performace Information88
Performance Indicators
Central Hospitals
Actual Achievement
2015/16
Actual Achievement
2016/17
Actual Achievement
2017/18Planned Target
2018/19Actual
Achievement 2018/19
Deviation
Sector Specific Indicators
Indicator: Hospitals achieved 75% and more on national Core standards self-assessment rate (central hospitals)
not required to report
100.0% 100.0% 100.0% 0%
n: 2 2 2 0
D: 2 2 2 0
Comment On Deviation:target achieved.
Indicator: average length of stay (central hospitals)
6.3 days 6.4 days 6.5 days 6.3 days 6.5 days (0.2 days)
n: 745 141 742 396 750 954 739 457 774 007 (34 550)
D: 117 668 115 448 116 152 116 814 119 554 2 740
Comment On Deviation:This is a demand driven indicator reflecting fluctuations in the disease burden. The marginal deviation is considered acceptable.
Indicator: Inpatient bed utilisation rate (central hospitals)
86.5% 86.2% 87.2% 85.9% 89.9% 4.0%
n: 754 141 742 396 750 954 739 457 774 007 (34 550)
D: 861 129 861 129 861 129 861 129 861 129 0
Comment On Deviation:this is a demand driven indicator which means it is not possible for the Department to predict with 100% accuracy the number of people that will require a health service. The marginal deviation reflects an increased burden of disease with consequent increased pressure on the services.
Indicator: expenditure per PDe (central hospitals)
R 4 602 R 4 987 R 5 319 R 5 578 R 5 506 R 72
n: 4 641 532 537 4 950 578 555 5 328 069 158 5 590 320 000 5 663 750 514 (73 430 514)
D: 1 008 606 992 676 1 001 686 1 002 217 1 028 733 26 516
Comment On Deviation:this is a demand driven indicator which means it is not possible for the Department to predict with 100% accuracy the number of people that will require a health service. the marginal deviation is considered acceptable and deemed as an advantage to the Department.
Indicator: Complaint resolution within 25 working days rate (central hospitals)
83.0% 88.7% 92.0% 91.7% 89.1% (2.6%)
n: 648 716 599 724 498 (226)
D: 781 807 651 789 559 (230)
Comment On Deviation:the number of complaints have dropped as increasingly complaints are being handled on the spot by frontline supervisors. this then results in a preponderance of more complex complaints being recorded which take a little longer to resolve due to their complex nature, resulting in the marginal deviation shown.
Additional Provincial Indicators
Indicator: Mortality and morbidity review rate (central hospital)
103.6% 96.4% 98.8% 94.0% 100.0% 6.0%
n: 87 81 83 79 84 5
D: 84 84 84 84 84 0
Comment On Deviation: the marginal deviation is considered acceptable and deemed as positive performance for the Department as more mortality and morbidity meetings were held.

AnnuAl report 2018-2019 89Performace Information
strategies to overcome Underperformance
no material underperformance was recorded.
Changes to Planned targets
• targets with a positive deviation in 2018/19 noted in the table above will be adjusted for the 2019/20 financial
• Year, in line with the commitment to continual improvement.
• The complaints resolution within 25 working days’ rate target will be adjusted downward to reflect the change in complaints procedures.
Tertiary Hospitals
strategic objectives, Performance Indicators, Planned targets and actual achievements
Red Cross War Memorial Children’s Hospital operated 272 beds as was reflected in the annual performance plan. the combined bed occupancy rate for the hospital for the period under review was 78.8 per cent. the patient day equivalents (as a proxy for service volume provided) achieved for the year was 123 314, with the hospital providing access to the package of care for tertiary services funded by the national tertiary services Grant.
strategic objectives
Provide access to the full package of tertiary hospital services for children.
Actual Achievement
2017/18Planned Target
2018/19Actual
Achievement 2018/19
Deviation
Strategic Objective: Provide access to the full package of tertiary hospital services at Red Cross War Memorial Children’s Hospital
Indicator: actual (usable) beds in (RCWMCH)
272 272 272 0
Comment On Deviationtarget achieved.

AnnuAl report 2018-2019 Performace Information90
Performance Indicators
Tertiary Hospital
Actual Achievement
2015/16
Actual Achievement
2016/17
Actual Achievement
2017/18Planned Target
2018/19Actual
Achievement 2018/19
Deviation
Sector Specific Indicators
Indicator: Hospitals achieved 75% and more on national Core standards self-assessment rate (RCWMCH)
not required to report
100.0% 100.0% 0.0% (100.0%)
n: 1 1 0 (1)
D: 1 1 0 (1)
Comment On Deviation:Not required to conduct an internal assessment of the National Core Standards, as the Office of Health standards Compliance conducted an independent external assessment during 2018/19.
Indicator: average length of stay (RCWMCH)
4.0 days 4.0 days 3.8 days 3.9 days 3.8 days 0.1 days
n: 79 852 78 222 78 402 81 410 78 201 (3 209)
D: 20 166 19 581 20 465 20 874 20 838 (36)
Comment On Deviation:the marginal deviation is considered acceptable and deemed as an advantage to the Department.
Indicator: Inpatient bed utilisation rate (RCWMCH)
80.4% 78.8% 79.0% 82.0% 78.8% (3.2%)
n: 79 852 78 222 78 402 81 410 78 201 (3 209)
D: 99 291 99 291 99 291 99 291 99 291 0
Comment On Deviation:a demand driven indicator reliant on patient numbers, burden of disease, ability of district level facilities to manage patients without referring them and efficiency of patient management as reflected in the average length of stay. The decreased inpatient admissions and the lower average length of stay combined resulted in a slightly lower bed utilisation rate.
Indicator: expenditure per PDe (RCWMCH)
R 5 472 R 5 980 R 6 453 R 6 499 R 6 820 (R 321)
n: 708 917 790 739 990 486 790 081 704 836 248 000 841 027 272 (4 779 272)
D: 129 543 123 748 122 439 128 679 123 314 (5 365)
Comment On Deviation:the marginal increase in PDe is due to the slight decrease in bed utilisation, the decreased length of stay and the decreased admissions while expenditure rose slightly during the fourth quarter.
Indicator: Complaint resolution within 25 working days rate (RCWMCH)
92.2% 95.5% 92.5% 92.0% 92.2% (0.2%)
n: 130 168 123 155 106 (49)
D: 141 176 133 169 115 (54)
Comment On Deviation:target achieved with marginal deviation.
Additional Provincial Indicators
Indicator: Mortality and morbidity review rate (RCWMCH)
91.7% 100.0% 100.0% 91.7% 100.0% 8.3%
n: 11 12 12 11 12 1
D: 12 12 12 12 12 0
Comment On Deviationthe marginal deviation is considered acceptable and deemed as positive performance for the Department.

AnnuAl report 2018-2019 91Performace Information
strategies to overcome Underperformance
no material underperformance was recorded.
Changes to Planned targets
Targets with a positive deviation in 2017/18 noted in the table above will be increased for the 2018/19 financial year in line with the commitment to continual improvement.
Link Performance with Budgets
Programme 5 incurred a negligible underspend of the allocated budget. the central hospitals and tertiary hospital largely achieved their service output targets as reflected in the Annual Performance plan and contributed to the Department’s strategic objectives.
Compensation of employees contributed the major share of the total expenditure. Due to the nature of tertiary and quaternary services rendered these hospitals require highly skilled specialist staff that attract higher than average remuneration.
Subprogramme
2018/19 2017/18Final
Appropriation
R’000
Actual Expenditure
R’000
(Over)/Under Expenditure
R’000
Final Appropriation
R’000
Actual Expenditure
R’000
(Over)/Under Expenditure
R’000
Central Hospital services 5 664 349 5 663 751 598 5 325 267 5 328 069 (2 802)
Provincial tertiary Hospital services 853 494 853 494 - 804 481 801 679 2 802
TOTAL 6 517 843 6 517 245 598 6 129 748 6 129 748 -

AnnuAl report 2018-2019 Performace Information92
Programme 6: Health Sciences and Training
Purpose
to create training and development opportunities for actual and potential employees of the Department of Health.
Subprogrammes
subprogramme 6.1: nurse training College
training of nurses at undergraduate and post-basic level, target group includes actual and potential employees.
subprogramme 6.2: emergency Medical services (eMs) training College
training of rescue and ambulance personnel, target group includes actual and potential employees.
subprogramme 6.3: bursaries
Provision of bursaries for health science training programmes at undergraduate and post graduate levels, target group includes actual and potential employees.
subprogramme 6.4: Primary Health Care (PHC) training
Provision of PHC related training for personnel, provided by the regions.
subprogramme 6.5: training (other)
Provision of skills development interventions for all occupational categories in the Department, target group includes actual and potential employees.
Strategic Objectives, Performance Indicators, Planned Targets and Actual Achievements
Healthcare 2030 represents the strategic framework and vision for health reform in the Western Cape. the main focus area is improving the quality of care. In this regard, the availability of competent and caring staff is important. thus, the biggest challenge facing people management is the re-energising of staff and the building of renewed commitment to the principles, vision and values of Healthcare 2030 and the Western Cape Government (WCG): Health. In order to improve the access to patient-centred quality health care and health outcomes, the Directorate: People Development played an important role in facilitating the continued development of competencies of health and support professionals and workers.
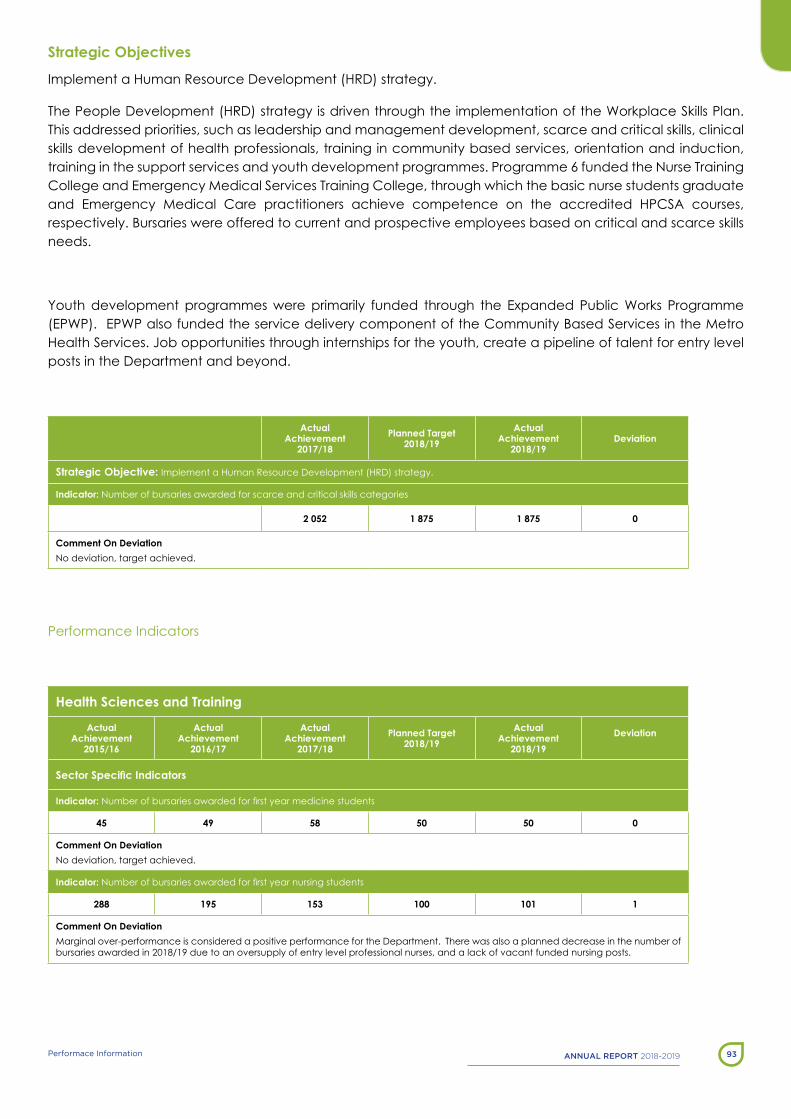
AnnuAl report 2018-2019 93Performace Information
Strategic Objectives
Implement a Human Resource Development (HRD) strategy.
the People Development (HRD) strategy is driven through the implementation of the Workplace skills Plan. this addressed priorities, such as leadership and management development, scarce and critical skills, clinical skills development of health professionals, training in community based services, orientation and induction, training in the support services and youth development programmes. Programme 6 funded the nurse training College and emergency Medical services training College, through which the basic nurse students graduate and emergency Medical Care practitioners achieve competence on the accredited HPCsa courses, respectively. bursaries were offered to current and prospective employees based on critical and scarce skills needs.
Youth development programmes were primarily funded through the expanded Public Works Programme (ePWP). ePWP also funded the service delivery component of the Community based services in the Metro Health services. Job opportunities through internships for the youth, create a pipeline of talent for entry level posts in the Department and beyond.
Actual Achievement
2017/18Planned Target
2018/19Actual
Achievement 2018/19
Deviation
Strategic Objective: Implement a Human Resource Development (HRD) strategy.
Indicator: number of bursaries awarded for scarce and critical skills categories
2 052 1 875 1 875 0
Comment On Deviationno deviation, target achieved.
Performance Indicators
Health Sciences and Training
Actual Achievement
2015/16
Actual Achievement
2016/17
Actual Achievement
2017/18Planned Target
2018/19Actual
Achievement 2018/19
Deviation
Sector Specific Indicators
Indicator: Number of bursaries awarded for first year medicine students
45 49 58 50 50 0
Comment On Deviationno deviation, target achieved.
Indicator: Number of bursaries awarded for first year nursing students
288 195 153 100 101 1
Comment On DeviationMarginal over-performance is considered a positive performance for the Department. there was also a planned decrease in the number of bursaries awarded in 2018/19 due to an oversupply of entry level professional nurses, and a lack of vacant funded nursing posts.

AnnuAl report 2018-2019 Performace Information94
Health Sciences and Training
Actual Achievement
2015/16
Actual Achievement
2016/17
Actual Achievement
2017/18Planned Target
2018/19Actual
Achievement 2018/19
Deviation
Sector Specific Indicators
Additional Provincial Indicators
Indicator: eMC intake on accredited HPCsa courses
78 90 90 90 90 0
Comment On Deviationno deviation, target achieved.
Indicator: Intake of home community based carers (HCbCs)
759 882 1 154 800 803 3
Comment On DeviationMarginal over-performance is considered a positive performance for the Department.
Indicator: Intake of data-capturer interns
192 220 219 180 180 0
Comment On Deviationno deviation, target achieved.
Indicator: Intake of learner basic/post basic pharmacist assistants
87 123 125 130 99 (31)
Comment On DeviationRural Health services had planned an intake for the 2nd Quarter based on tutor ratios, however the sa Pharmacy Council (saPC) closed the legacy Post Basic Pharmacist Assistant (PBPA) qualification on 1 June 2018. The SAPC only informed the accredited service providers that they would be extending the legacy PbPa course until 2020 in December 2018. Rural Health services have subsequently proceeded with the recruitment and selection process. However, the afore-mentioned impacted on the intake of learner basic/post basic pharmacist assistants during the financial year, which was not within the control of the Department.
Indicator: Intake of assistant to artisan (ata) interns
124 119 146 120 120 0
Comment On Deviationno deviation, target achieved.
Indicator: Intake of HR and finance interns
150 153 185 170 167 (3)
Comment On DeviationMarginal under-performance is considered as acceptable to the Department as there was attrition of three (3) interns who failed to sign internship contracts.
Indicator: Intake of emergency medical care (eMC) assistant interns
104 162 137 110 80 (30)
Comment On DeviationUnder-performance was affected by thirty (30) interns absorbed into permanent posts, which the Department deems as a longer-term benefit and positive outcome, due to retention and strengthening support at service delivery level.
Indicator: Intake of forensic pathology service (FPs) assistant interns
15 13 9 20 20 0
Comment On Deviationno deviation, target achieved.

AnnuAl report 2018-2019 95Performace Information
strategies to overcome Under-Performance
The Intake of emergency medical care (EMC) assistant interns, although reflecting an underperformance of thirty (30), is a positive outcome, as these 30 interns were absorbed into permanent posts in eMC.
the deviation in intake of learner post basic pharmacist assistants was because of the south african Pharmacy Council (SAPC) withdrawing the legacy Post Basic Pharmacist Assistant (PBPA) qualification in June 2018. Contingencies were in place to recruit and select the rural cohort as soon as the qualification was re-registered in December 2018. the additional intake for learner post basic pharmacist assistants was mitigated and plans were put in place by april 2019 to address the issue.
Changes to Planned targets
no targets were changed during the year.
Link Performance with Budgets
Programme 6: Health sciences and training recorded a total under expenditure of R6.973 million which is mainly attributed to:
subprogramme 6.1: nurse training College recorded an under expenditure (surplus) as a result of refunds from Cape Peninsula University of technology (CPUt) for the operational cost of training their students which was allocated to the expenditure items. the expenditure contributed to the achievement of outputs with 181 undergraduate and 81 post-basic level students graduating.
subprogramme 6.2: emergency Medical services training College showed over expenditure which was mainly for non-pensionable allowances and other performance awards. the expenditure contributed to the achievement of outputs with an enrolment of 57 students on the emergency Diploma programme, 90 students on the ambulance emergency assistant course and 552 students on the basic, intermediate and advanced life support programmes.
subprogramme 6.3: bursaries recorded an under expenditure due to reduced bursaries payments as there was lower than anticipated students promoted to their next year of study, hence the under expenditure. a rollover request to the Provincial Treasury was made to roll over the unspent funds to the 2019/20 financial year, as students who pass their 2019 academic year will be eligible to continue with their bursary in 2020. the expenditure contributed to the achievement of outputs with a total of 1875 bursaries allocated for health and related professionals.
Subprogramme 6.5: Training Other reflected an over expenditure which was mainly due to following reasons: Inflationary increase on catering & travel costs for Expanded Public Works Programme (EPWP) learners against a reduced budget allocation; increase in training needs; and an increase in staff expenditure for community service placements. the expenditure contributed to the achievement of outputs. this included the training of 225 operational managers on the engaged leadership Programme, the training of 2600 health professionals on clinical skills development; and the funding of 930 interns on the stipended youth development programmes.
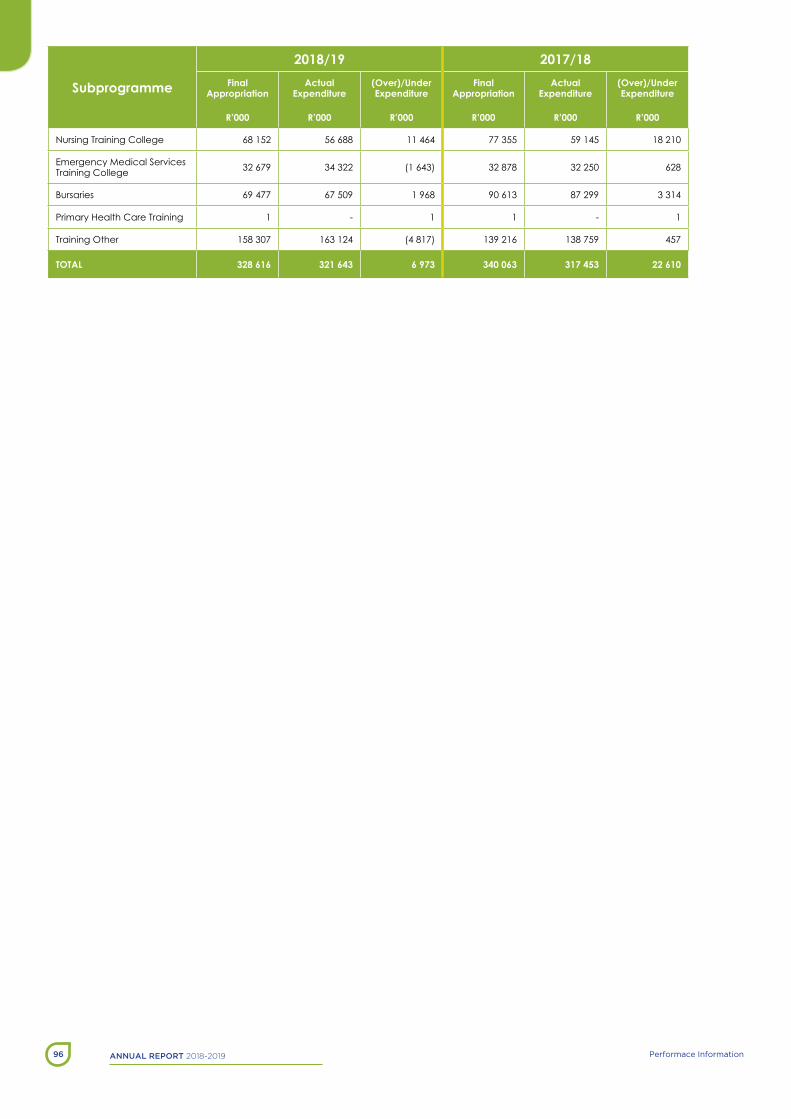
AnnuAl report 2018-2019 Performace Information96
Subprogramme
2018/19 2017/18Final
Appropriation
R’000
Actual Expenditure
R’000
(Over)/Under Expenditure
R’000
Final Appropriation
R’000
Actual Expenditure
R’000
(Over)/Under Expenditure
R’000
nursing training College 68 152 56 688 11 464 77 355 59 145 18 210
emergency Medical services training College 32 679 34 322 (1 643) 32 878 32 250 628
bursaries 69 477 67 509 1 968 90 613 87 299 3 314
Primary Health Care training 1 - 1 1 - 1
training other 158 307 163 124 (4 817) 139 216 138 759 457
TOTAL 328 616 321 643 6 973 340 063 317 453 22 610

AnnuAl report 2018-2019 97Performace Information
Programme 7: Health Care Support Services
Purpose
to render support services required by the Department to realise its aims.
Subprogrammes
subprogramme 7.1: laundry services
to render laundry and related technical support service to health facilities.
subprogramme 7.2: engineering services
Rendering routine, day-to-day and emergency maintenance service to buildings, engineering installations and health technology.
subprogramme 7.3: Forensic Pathology services
to render specialised forensic pathology and medico-legal services in order to establish the circumstances and causes surrounding unnatural death. It includes the provision of the Inspector of anatomy functions, in terms of Chapter 8 of the national Health act and its Regulations.
note: this function has been transferred from subprogramme 2.8.
subprogramme 7.4: orthotic and Prosthetic services
to render specialised orthotic and prosthetic services.
note: this service is reported in subprogramme 4.4.
subprogramme 7.5: Cape Medical Depot
the management and supply of pharmaceuticals and medical supplies to health facilities.
Note: Subprogramme 7.5 has been renamed since 2013, in line with the incorporation of the trading entity into the Department.
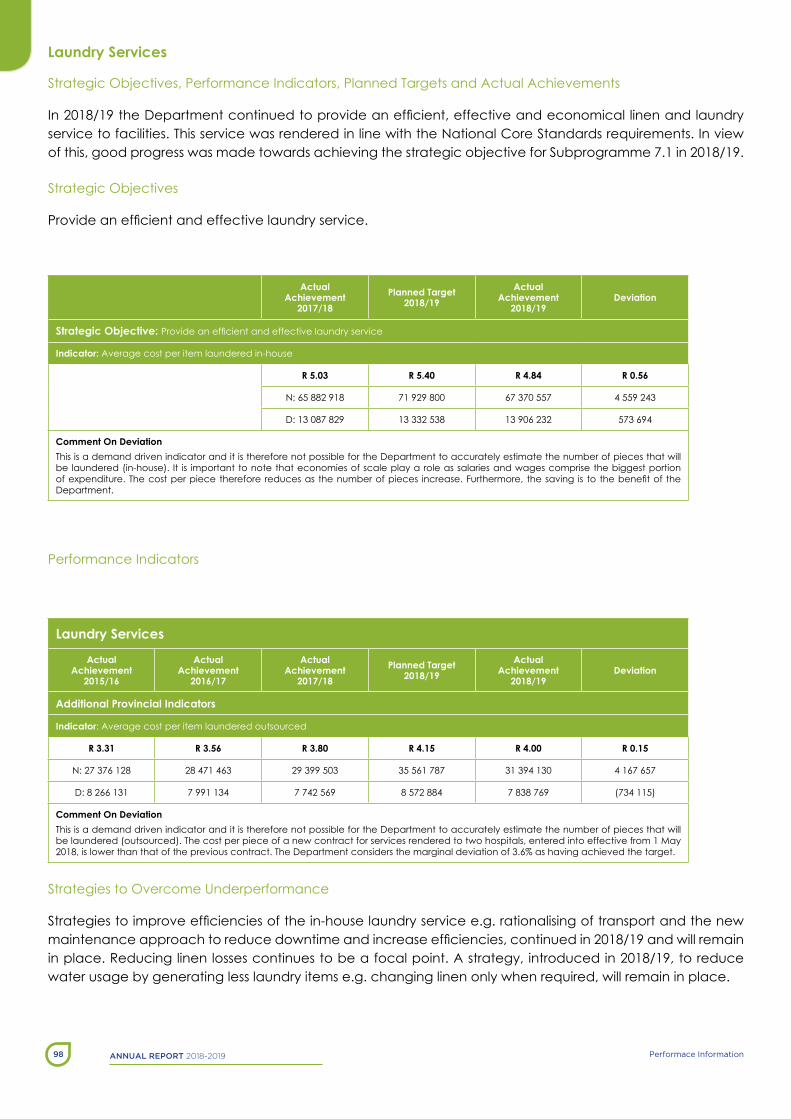
AnnuAl report 2018-2019 Performace Information98
Laundry Services
strategic objectives, Performance Indicators, Planned targets and actual achievements
In 2018/19 the Department continued to provide an efficient, effective and economical linen and laundry service to facilities. this service was rendered in line with the national Core standards requirements. In view of this, good progress was made towards achieving the strategic objective for subprogramme 7.1 in 2018/19.
strategic objectives
Provide an efficient and effective laundry service.
Actual Achievement
2017/18Planned Target
2018/19Actual
Achievement 2018/19
Deviation
Strategic Objective: Provide an efficient and effective laundry service
Indicator: average cost per item laundered in-house
R 5.03 R 5.40 R 4.84 R 0.56
n: 65 882 918 71 929 800 67 370 557 4 559 243
D: 13 087 829 13 332 538 13 906 232 573 694
Comment On Deviationthis is a demand driven indicator and it is therefore not possible for the Department to accurately estimate the number of pieces that will be laundered (in-house). It is important to note that economies of scale play a role as salaries and wages comprise the biggest portion of expenditure. The cost per piece therefore reduces as the number of pieces increase. Furthermore, the saving is to the benefit of the Department.
Performance Indicators
Laundry Services
Actual Achievement
2015/16
Actual Achievement
2016/17
Actual Achievement
2017/18Planned Target
2018/19Actual
Achievement 2018/19
Deviation
Additional Provincial Indicators
Indicator: average cost per item laundered outsourced
R 3.31 R 3.56 R 3.80 R 4.15 R 4.00 R 0.15
n: 27 376 128 28 471 463 29 399 503 35 561 787 31 394 130 4 167 657
D: 8 266 131 7 991 134 7 742 569 8 572 884 7 838 769 (734 115)
Comment On Deviationthis is a demand driven indicator and it is therefore not possible for the Department to accurately estimate the number of pieces that will be laundered (outsourced). the cost per piece of a new contract for services rendered to two hospitals, entered into effective from 1 May 2018, is lower than that of the previous contract. the Department considers the marginal deviation of 3.6% as having achieved the target.
strategies to overcome Underperformance
Strategies to improve efficiencies of the in-house laundry service e.g. rationalising of transport and the new maintenance approach to reduce downtime and increase efficiencies, continued in 2018/19 and will remain in place. Reducing linen losses continues to be a focal point. a strategy, introduced in 2018/19, to reduce water usage by generating less laundry items e.g. changing linen only when required, will remain in place.

AnnuAl report 2018-2019 99Performace Information
Changes to Planned targets
no targets were changed during the year.
Engineering Services
strategic objectives, Performance Indicators, Planned targets and actual achievements
the target for 2018/19 was not achieved. the Department, however, remains committed to reducing energy consumption at its facilities.
strategic objectives
Provide an efficient and effective maintenance service.
Actual Achievement
2017/18Planned Target
2018/19Actual
Achievement 2018/19
Deviation
Strategic Objective: Provide an efficient and effective maintenance service
Indicator: Percentage reduction in energy consumption at provincial hospitals (compared to 2014/15 baseline)
4.0% 10.7% 6.0% (4.7%)
n: 6 197 229 16 366 404 9 262 882 (7 103 522)
D: 153 279 246 153 279 246 153 279 246 0
Comment On Deviationthe performance for energy consumption was below the benchmark in 2018/19. the minimal impact of power outages during the year might have resulted in a shift in focus of both staff and visitors to other matters such as water shortages in the province.
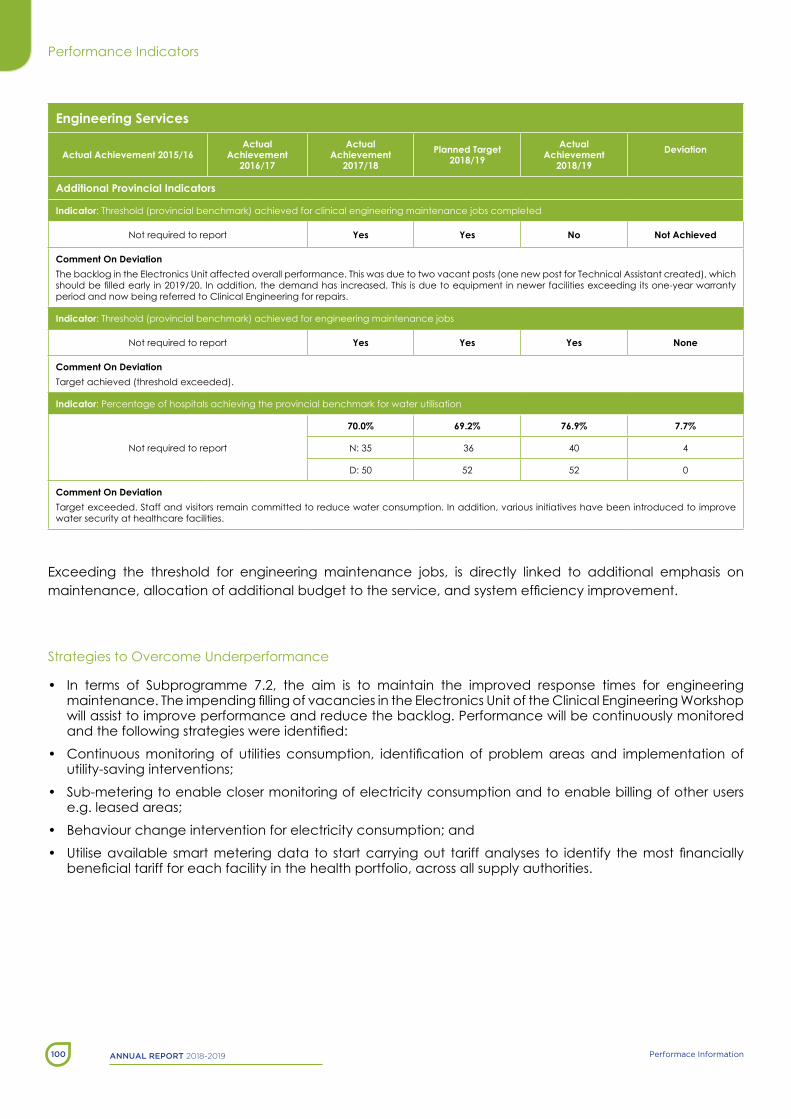
AnnuAl report 2018-2019 Performace Information100
Performance Indicators
Engineering Services
Actual Achievement 2015/16Actual
Achievement 2016/17
Actual Achievement
2017/18Planned Target
2018/19Actual
Achievement 2018/19
Deviation
Additional Provincial Indicators
Indicator: threshold (provincial benchmark) achieved for clinical engineering maintenance jobs completed
not required to report Yes Yes No Not Achieved
Comment On Deviationthe backlog in the electronics Unit affected overall performance. this was due to two vacant posts (one new post for technical assistant created), which should be filled early in 2019/20. In addition, the demand has increased. This is due to equipment in newer facilities exceeding its one-year warranty period and now being referred to Clinical engineering for repairs.
Indicator: threshold (provincial benchmark) achieved for engineering maintenance jobs
not required to report Yes Yes Yes None
Comment On Deviationtarget achieved (threshold exceeded).
Indicator: Percentage of hospitals achieving the provincial benchmark for water utilisation
not required to report
70.0% 69.2% 76.9% 7.7%
n: 35 36 40 4
D: 50 52 52 0
Comment On Deviationtarget exceeded. staff and visitors remain committed to reduce water consumption. In addition, various initiatives have been introduced to improve water security at healthcare facilities.
exceeding the threshold for engineering maintenance jobs, is directly linked to additional emphasis on maintenance, allocation of additional budget to the service, and system efficiency improvement.
strategies to overcome Underperformance
• In terms of subprogramme 7.2, the aim is to maintain the improved response times for engineering maintenance. The impending filling of vacancies in the Electronics Unit of the Clinical Engineering Workshop will assist to improve performance and reduce the backlog. Performance will be continuously monitored and the following strategies were identified:
• Continuous monitoring of utilities consumption, identification of problem areas and implementation of utility-saving interventions;
• sub-metering to enable closer monitoring of electricity consumption and to enable billing of other users e.g. leased areas;
• behaviour change intervention for electricity consumption; and
• Utilise available smart metering data to start carrying out tariff analyses to identify the most financially beneficial tariff for each facility in the health portfolio, across all supply authorities.
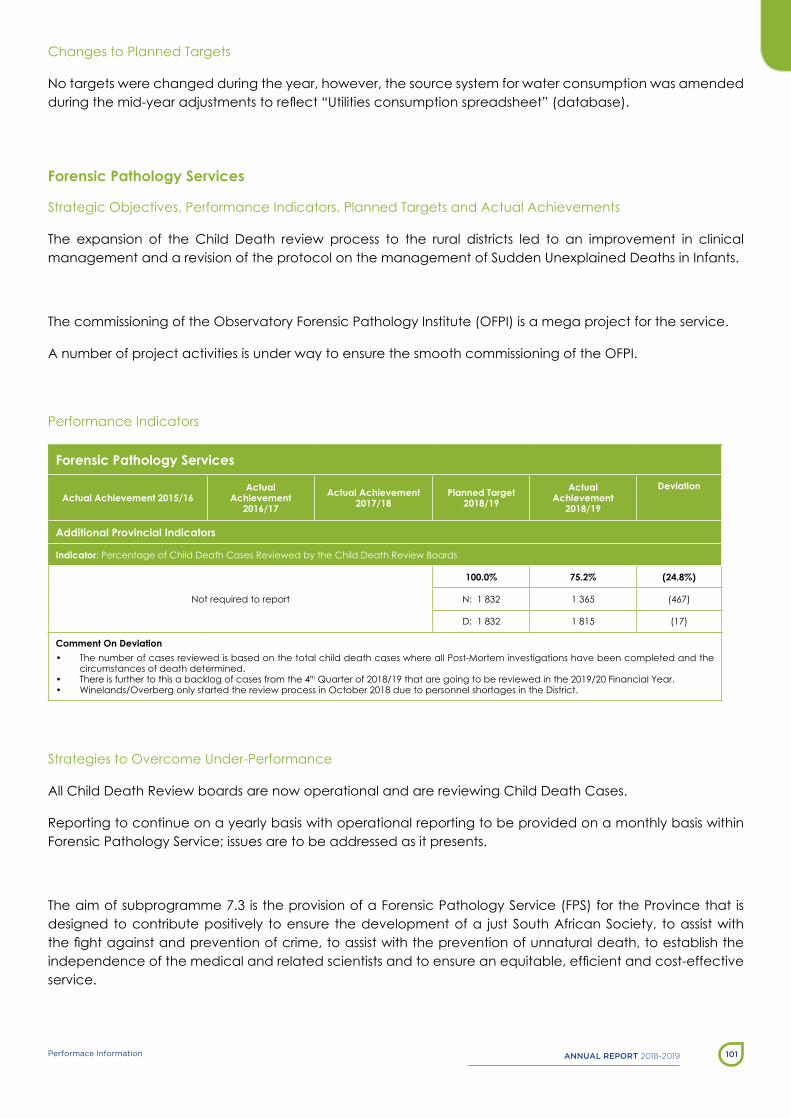
AnnuAl report 2018-2019 101Performace Information
Changes to Planned targets
no targets were changed during the year, however, the source system for water consumption was amended during the mid-year adjustments to reflect “Utilities consumption spreadsheet” (database).
Forensic Pathology Services
strategic objectives, Performance Indicators, Planned targets and actual achievements
the expansion of the Child Death review process to the rural districts led to an improvement in clinical management and a revision of the protocol on the management of sudden Unexplained Deaths in Infants.
the commissioning of the observatory Forensic Pathology Institute (oFPI) is a mega project for the service.
a number of project activities is under way to ensure the smooth commissioning of the oFPI.
Performance Indicators
Forensic Pathology Services
Actual Achievement 2015/16Actual
Achievement 2016/17
Actual Achievement 2017/18
Planned Target 2018/19
Actual Achievement
2018/19
Deviation
Additional Provincial Indicators
Indicator: Percentage of Child Death Cases Reviewed by the Child Death Review boards
not required to report
100.0% 75.2% (24.8%)
n: 1 832 1 365 (467)
D: 1 832 1 815 (17)
Comment On Deviation• the number of cases reviewed is based on the total child death cases where all Post-Mortem investigations have been completed and the
circumstances of death determined.• there is further to this a backlog of cases from the 4th Quarter of 2018/19 that are going to be reviewed in the 2019/20 Financial Year. • Winelands/overberg only started the review process in october 2018 due to personnel shortages in the District.
strategies to overcome Under-Performance
all Child Death Review boards are now operational and are reviewing Child Death Cases.
Reporting to continue on a yearly basis with operational reporting to be provided on a monthly basis within Forensic Pathology service; issues are to be addressed as it presents.
the aim of subprogramme 7.3 is the provision of a Forensic Pathology service (FPs) for the Province that is designed to contribute positively to ensure the development of a just south african society, to assist with the fight against and prevention of crime, to assist with the prevention of unnatural death, to establish the independence of the medical and related scientists and to ensure an equitable, efficient and cost-effective service.

AnnuAl report 2018-2019 Performace Information102
The focus areas during the 2018/19 financial year for the Forensic Pathology Service were:
• Compliance with standard operational procedures
• Reducing the number of unknowns (A deceased that has not been positively identified by the next of kin or through scientific methods after a period of 7 days)
• Maintaining a high level of filled posts
• Well established Child Death Review boards
• Improving the number of Post-mortem (PM) examinations per Full time equivalent (Fte) Forensic Pathology
• Medical Personnel. During the 2018/19 financial year the number of post-mortem examinations per full time equivalent reduced from 870 / Fte to 799 per Fte
this service is rendered by seventeen Forensic Pathology Facilities across the province which include two l3/l4 academic Forensic Pathology laboratories in the Metro, two Departments of Forensic Medicine, three referral FPs laboratories (l2) and smaller FPs laboratories and holding centres (l2 and l1) in the West Cast, Cape Winelands, overberg, eden and Central Karoo Districts.
During the 2018/19 financial year 11 141 medico-legal cases were examined in the Western Cape in order to establish the cause of death in cases defined in the Inquest Act. This amount to 1, 70 post-mortems per 1000 population. of these 8 296 (70.98 per cent) medico-legal post-mortems were performed in the City of Cape town metropolitan area and 3 392 (29.02 per cent) in the rural districts.
Progress as at end March 2019
the Forensic Pathology service is currently being rendered to the estimated 6,516 million population of the Western Cape.
In 2018/19 a total of 12 045 incidents were logged, resulting in 11 816 Forensic Pathology service cases. a total of 229 cases were deferred. the average response time achieved across the province from the time that the incident was logged until the body was received on the scene was 35 minutes. a total of 41 response vehicles travelled 1 009 732 km during body transportation.
In total 11 816 cases were opened whilst 9 902 case filed were closed (83.80 per cent). A total of 5 482 case files were open for a period exceeding 90 days at the end of the last quarter.
the average number of days from admission to release of a body is 12.74 days (7.33 days excluding paupers). A total of 362 bodies were unidentified at the end of March 2019 whilst 234 bodies were released for pauper burial during the period under review.

AnnuAl report 2018-2019 103Performace Information
Changes to Planned targets
there are no changes to the indicator for 2019/20 with the indicator remaining as:
Percentage of Child Death Cases Reviewed, target is 100 per cent.
Orthotic and Prosthetic Services
note the funding and managerial responsibility for orthotic and Prosthetic services has been transferred to subprogramme 4.4.
Cape Medical Depot
strategic objectives, Performance Indicators, Planned targets and actual achievements
the Cape Medical Depot ensures optimum pharmaceutical stock levels to meet the requirements for healthcare service delivery across the Province, with an emphasis on District Health services.
strategic objectives
ensure optimum pharmaceutical stock levels to meet the demand.
Actual Achievement
2017/18Planned Target
2018/19Actual
Achievement 2018/19
Deviation
Strategic Objective: ensure optimum pharmaceutical stock levels to meet the demand.
Indicator: Percentage of pharmaceutical stock available
91.9% 95.1% 89.4% (5.7%)
n: 657 694 634 (60)
D: 715 730 709 (21)
Comment On Deviationthe slight under-performance was as a result of stock outs caused by the late award and continuous extension of pharmaceutical contracts by the national treasury, which impacted on the province’s performance.
Performance Indicators
there are no prescribed sector indicators for the Cape Medical Depot.

AnnuAl report 2018-2019 Performace Information104
strategies to overcome Underperformance
No significant strategies were required, as there was no significant under-performance during the financial year that required intervention. However, as part of being proactive and improving service delivery by mitigating risks of potential / possible stock outs of medicines, the Department is working very closely with the national Department of Health (nDoH), who have taken back the pharmaceutical contracts from national treasury (nt). the Department assists in the administrative and other necessary activities that have to be done for the timeous award of any pharmaceutical contracts, as nDoH at this stage do not have the required and necessary capacity.
Changes to Planned targets
none.
Link Performance with Budgets
Programme 7 achieved a slight under spending of R7.040 million as a whole (1.5 per cent under spending), and performance per subprogramme for 2018/19 is attributed as follows:
• Subprogramme 7.1: laundry services recorded a slight under spending of 0.97 per cent. the under-expenditure is primarily due to cost-saving measures implemented on the in-house laundry service e.g. rationalisation of transport and the utilisation of ePWP staff in vacant posts at tygerberg Regional laundry. In addition, filling of posts at Lentegeur Laundry was, as a planned cost containment strategy, staggered throughout the financial year. The budget allocation for this subprogramme was utilised to successfully support the health care service by supplying it with clean linen throughout the year; an essential service without which quality health care would be severely strained.
• Subprogramme 7.2: engineering services recorded a slight under-expenditure of 0.74 per cent. the under-expenditure is predominantly due to posts not filled, due to the specialised scarce skills requirements attached to these posts; and rationalisation of the use of government vehicles. the budget allocation to this subprogramme enabled the provision of an ongoing maintenance service to buildings, engineering installations and health technology throughout the year, which successfully supported the Department in rendering quality health care services to all.
• Subprogramme 7.3: Forensic Pathology services as a whole, recorded a marginal underspending of R250 000. this was largely as a result of an under expenditure on the Capital equipment allocation due to unforeseen delays in the procurement process including equipment that have not timeously been delivered prior to financial year end. This did not have a significant effect on service delivery.
• Subprogramme 7.5: Cape Medical Depot recorded an under spending mainly due to the unavailability of stock from suppliers. this is as a result of tenders / contracts for pharmaceuticals that were either awarded late or current contracts due to expire that were extended. In essence the orders for medicines placed were not delivered and as such not paid as suppliers were unable to supply. the provincial medicine budget was under-spent by approx. 4 per cent for the same reasons. the Department is working very closely with the national Department of Health (nDoH), who have taken back the pharmaceutical contracts from national treasury (nt).
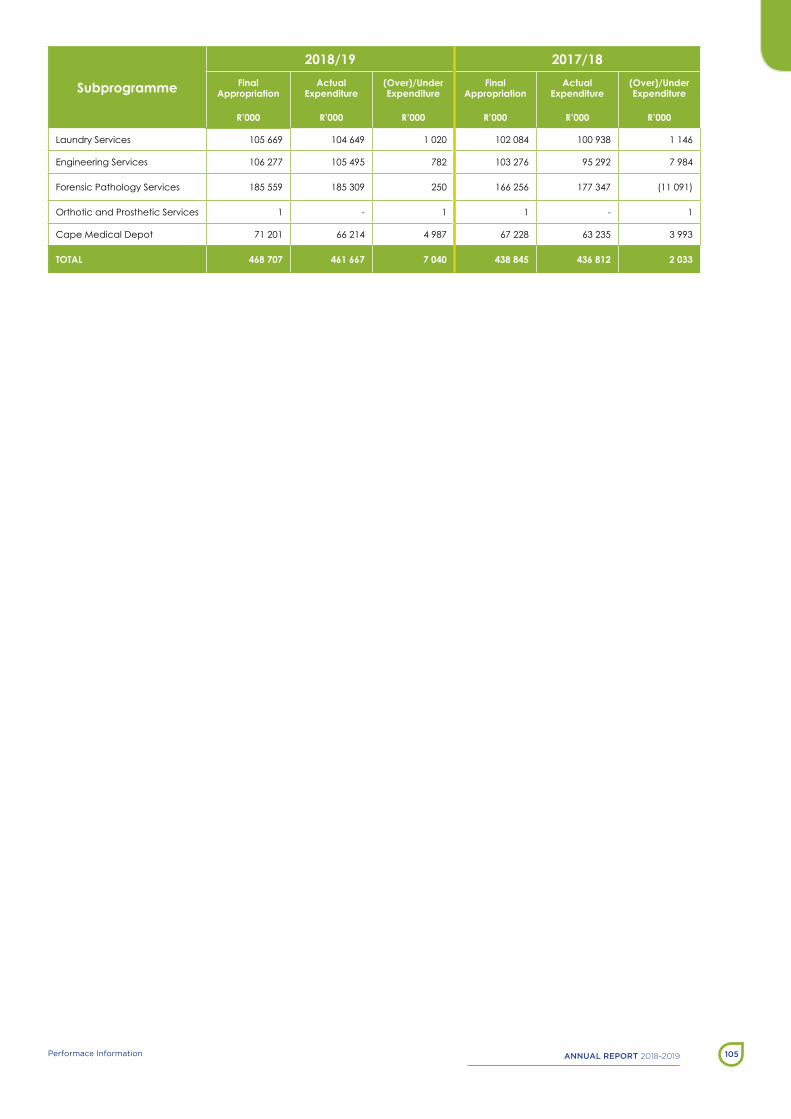
AnnuAl report 2018-2019 105Performace Information
Subprogramme
2018/19 2017/18Final
Appropriation
R’000
Actual Expenditure
R’000
(Over)/Under Expenditure
R’000
Final Appropriation
R’000
Actual Expenditure
R’000
(Over)/Under Expenditure
R’000
laundry services 105 669 104 649 1 020 102 084 100 938 1 146
engineering services 106 277 105 495 782 103 276 95 292 7 984
Forensic Pathology services 185 559 185 309 250 166 256 177 347 (11 091)
orthotic and Prosthetic services 1 - 1 1 - 1
Cape Medical Depot 71 201 66 214 4 987 67 228 63 235 3 993
TOTAL 468 707 461 667 7 040 438 845 436 812 2 033
AnnuAl report 2018-2019 Performace Information106
Programme 8: Health Facilities Management
Purposes
the provision of new health facilities and the refurbishment, upgrading and maintenance of existing facilities, including health technology.
Subprogrammes
subprogramme 8.1: Community Health Facilities
Planning, design, construction, upgrading, refurbishment, additions, and maintenance of community health centres, community day centres, and clinics.
subprogramme 8.2: emergency Medical Rescue services
Planning, design, construction, upgrading, refurbishment, additions, and maintenance of emergency medical services facilities.
subprogramme 8.3: District Hospital services
Planning, design, construction, upgrading, refurbishment, additions, and maintenance of district hospitals.
subprogramme 8.4: Provincial Hospital services
Planning, design, construction, upgrading, refurbishment, additions, and maintenance of provincial hospitals.
subprogramme 8.5: Central Hospital services
Planning, design, construction, upgrading, refurbishment, additions, and maintenance of central hospitals.
subprogramme 8.6: other Facilities
Planning, design, construction, upgrading, refurbishment, additions, and maintenance of other health facilities, including forensic pathology facilities and nursing colleges.
strategic objectives, Performance Indicators, Planned targets and actual achievements
Good progress was made in 2018/19 towards achieving the strategic objective with 98.2 per cent of the capital infrastructure budget spent. this brought about the completion of one new / replacement healthcare facility, whilst various others were in the process of being extended, upgraded and rehabilitated.

AnnuAl report 2018-2019 107Performace Information
strategic objectives
Efficient and effective management of infrastructure.
Actual Achievement
2017/18Planned Target
2018/19Actual
Achievement 2018/19
Deviation
Strategic Objective: Efficient and effective management of infrastructure
Indicator: Percentage of Programme 8 capital infrastructure budget spent (excluding maintenance)
93.1% 100.0% 98.2% 1.8%
n: 287 493 435 320 099 000 342 006 236 (21 907 236)
D: 308 949 000 320 099 000 348 121 000 (28 022 000)
Comment On Deviationthe minor deviation of 1.8% from the set performance target is considered by the Department as acceptable and is therefore considered as having achieved the target, as it is not possible to predict with 100% accuracy the expenditure for capital infrastructure.
Performance Indicators
Health Facilities Management
Actual Achievement 2015/16
Actual Achievement
2016/17
Actual Achievement
2017/18Planned Target
2018/19Actual
Achievement 2018/19
Deviation
Sector Specific Indicators
Indicator: number of health facilities that have undergone major and minor refurbishment in nHI Pilot District (eden District)
not required to report 6 4 2 0 (2)
Comment On Deviation
target not achieved. Work at one of the facilities planned to achieve Practical Completion early in 2018/19 was achieved ahead of schedule, i.e. in March 2018 already, hence reporting could not occur in the 2018/19 financial year. Due to Professional Service Provider (PsP) appointments not progressing as planned and slow progress on design stages, work at the other facility targeted to have achieved completion, has been delayed.
Indicator: number of health facilities that have undergone major and minor refurbishment (excluding facilities in nHI pilot district (eden District))
not required to report 52 38 41 23 (18)
Comment On Deviation
target not achieved. Work was completed at 23 of 41 facilities planned to undergo major and minor refurbishment. Under performance is due to: PsP appointments not progressing as planned; slow progress on design stages; delay in projects progressing to tender; and slow progress in construction stage.
Additional Provincial Indicators
Indicator: Percentage of Programme 8 Maintenance budget spent
not required to report
88.3% 100.0% 88.2% 11.8%
n: 294 424 853 378 091 000 351 680 830 26 410 170
D: 333 603 000 378 091 000 398 780 000 (20 689 000)
Comment On Deviation
target not achieved. Under expenditure is due to: Delays in delivery of design stage reports; and delays in PsP consultant appointments.

AnnuAl report 2018-2019 Performace Information108
Health Facilities Management
Actual Achievement 2015/16
Actual Achievement
2016/17
Actual Achievement
2017/18Planned Target
2018/19Actual
Achievement 2018/19
Deviation
Sector Specific Indicators
Indicator: Percentage of Programme 8 Health technology budget spent
109.4% 167.5% 110.6% 100.0% 136.2% (36.2%)
n: 119 789 046 113 359 879 128 782 098 113 925 000 166 430 755 (52 505 755)
D: 109 545 000 67 665 000 116 394 000 113 925 000 122 156 000 (8 231 000)
Comment On Deviation
target exceeded due to: Mitigation of overall programme under-expenditure; Health technology (Ht) need for Groote schuur and tygerberg Hospitals brought forward due to service-related pressures; and urgent Ht needs at selected other facilities met through additional projects.
strategies to overcome Underperformance
Performance will be continuously monitored and the following strategies were identified:
• Creating a pipeline of projects, developed to tender stage and can proceed to construction if there is a risk of under expenditure.
• Providing briefing documents for large Rehabilitation, Renovations and Refurbishment projects at health facilities to supplement pipeline of maintenance projects.
• Utilising alternative implementing strategies e.g. Framework Contract for a Management Contractor for larger Day-to-day Maintenance projects.
• Use of standard designs to shorten planning processes by Implementing agent.
• Continue with the institutionalisation of the IDMs and Infrastructure Gateway system (IGs) to ensure efficient project monitoring and control.
• Reallocation of infrastructure budget to Health technology and engineering as soon as the risk of under expenditure is raised.
Changes to Planned targets
no targets were changed during the year.
Link Performance with Budgets
Programme 8 recorded an under expenditure of R15.599 million or 1.66 per cent in the 2018/19 financial year, mainly due to the following:
Compensation of employees is underspent by R1.775 million as a result of Occupation Specific Dispensation (OSD) posts not filled, due to the specialised scarce skills requirements attached to these posts. In addition, the Director: Engineering and Technical Support post was not filled due to the MEAP process.

AnnuAl report 2018-2019 109Performace Information
Goods and services is underspent by R57.785 million mainly related to scheduled Maintenance projects due to delays in finalising of project scope, delays in project procurement and lengthy implementation periods.
Payments for capital assets are overspent by R43.878 million. this is mainly attributable to the mitigating strategy to accelerate expenditure (by identifying additional projects) within Health technology to mitigate the under-expenditure within scheduled Maintenance.
The table below reflects under expenditure for Community Health Facilities, Emergency Medical Rescue services, Provincial Hospital services, Central Hospital services and other Facilities. Projects in the District Hospital services subprogramme showed increased expenditure to ensure that maintenance work was undertaken on aging infrastructure, specifically at Tygerberg and Groote Schuur Hospitals. The Programme 8 budget allocation made it possible to render support to health care services by consistently providing it with good quality infrastructure and health technology.
Subprogramme
2018/19 2017/18Final
Appropriation
R’000
Actual Expenditure
R’000
(Over)/Under Expenditure
R’000
Final Appropriation
R’000
Actual Expenditure
R’000
(Over)/Under Expenditure
R’000
Community Health Facilities 151 576 118 211 33 365 212 697 183 278 29 419
emergency Medical Rescue services 10 869 7 214 3 655 11 425 8 055 3 370
District Hospital services 291 158 257 183 33 975 215 535 186 616 28 919
Provincial Hospital services 107 620 93 878 13 742 111 344 103 511 7 833
Central Hospital services 194 507 277 682 (83 175) 194 891 202 150 (7 259)
other Facilities 182 763 168 726 14 037 86 831 96 023 (9 192)
TOTAL 938 493 922 894 15 599 832 723 779 633 53 090

AnnuAl report 2018-2019 Performace Information110
Transfer Payments
Transfer payments to Public Entities
the Department does not have any Public entity.
Transfer payments to all Organisations other than public entities
Transfer Payments Made
Type of Organisation
Purpose for which the funds were used
Compliance with PFMA [S38(1)(J)}
Amount Transferred
(R’000)
Amount Spent
(R’000)
Reasons for Under
ExpenditureGeographical Area
Transfers to Municipalities
City of Cape Town
Municipality
Rendering of personal Primary Health Care, including maternal child and infant health care, antenatal care, stI treatment, tuberculosis treatment and basic medical care. also nutrition, HIVw/aIDs and Global Fund
Yes 549 646 549 646 n/a City of Cape town District
Municipality Vehicle licences Yes 15 15 n/aemergency Medical
and Forensic Pathology services Groups
Transfers to Departmental Agencies and Accounts
Health & Welfare SETA
statutory body People Development Yes 5 703 5 703 n/a Departmental
Radio & Television
licensing authorities television & Radio licences Yes 469 469 n/a Departmental
Transfers to Higher Education Institutions
University of Cape Town
Higher education Institute
neuroscience Department Rehabilitation at Groote schuur Hospital Yes 10 209 10 209 n/a City of Cape town
District
Transfers to Non-Profit Institutions
District Management
Non-profit Institutions
alcohol harms reduction game changer - to reduce alcohol related harms and provide psycho social support in the Western Cape
Yes 2 010 2 010 n/a City of Cape town District
Various Institutions
Community based Programmes
e vision and ICt development Project Yes 1 665 1 665 n/a City of Cape town District
Various Institutions
Non-Profit institutions
Community Health Clinics: Vaccines and tuberculosis treatment Yes 169 169 n/a Central Karoo District
Various Institutions
Non-Profit Institutions tuberculosis treatment
Yes 812 812 n/a Cape Winelands District
Yes 611 611 n/a eden District
Yes 170 170 n/a West Coast District
Aquiries Healthcare
Chronic Care Intermediate care facility - adult & children Yes 42 663 42 663 n/a City of Cape town
District

AnnuAl report 2018-2019 111Performace Information
Transfer Payments Made
Type of Organisation
Purpose for which the funds were used
Compliance with PFMA [S38(1)(J)}
Amount Transferred
(R’000)
Amount Spent
(R’000)
Reasons for Under
ExpenditureGeographical Area
Booth Memorial
Provincially aided hospital Intermediate care facility - adult Yes 26 306 26 306 n/a City of Cape town
District
Sarah Fox
Provincially aided hospital Intermediate care facility - children Yes 5 147 5 147 n/a City of Cape town
District
St Joseph
Provincially aided hospital Intermediate care facility - children Yes 6 531 6 531 n/a City of Cape town
District
Various Institutions
Non-Profit Institutions
Chronic Care: Caring for elderly patients in assisting with wound care, feeding etc. after being discharged
Yes 1 595 1 595 n/a eden District
Various Institutions
Non-Profit Institutions tb adherence and Counselling
Yes 410 410 n/a Khayelitsha/eastern ss
Yes 140 140 n/a Klipfontein/M Plain ss
Yes 257 257 n/a northern/tygerberg ss
Yes 1 1 n/a Western/southern ss
Yes 2 612 2 612 n/a West Coast District
Various Institutions
Non-Profit Institutions Home based care
Yes 12 910 12 910 n/a Khayelitsha/eastern ss
Yes 6 857 6 857 n/a Klipfontein/M Plain ss
Yes 2 506 2 506 n/a northern/tygerberg ss
Yes 4 283 4 283 n/a Western/southern ss
Various Institutions
Non-Profit Institutions Mental Health
Yes 3 501 3 501 n/a Cape Winelands District
Yes 404 404 n/a Central Karoo District
Yes - - n/a eden District
Yes 13 252 13 252 n/a Khayelitsha/eastern ss
Yes 12 636 12 636 n/a Klipfontein/M Plain ss
Yes 9 540 9 540 n/a northern/tygerberg ss
Yes 4 620 4 620 n/a overberg District
Yes 7 986 7 986 n/a Western/southern ss

AnnuAl report 2018-2019 Performace Information112
Transfer Payments Made
Type of Organisation
Purpose for which the funds were used
Compliance with PFMA [S38(1)(J)}
Amount Transferred
(R’000)
Amount Spent
(R’000)
Reasons for Under
ExpenditureGeographical Area
Various Institutions
Non-Profit Institutions
anti-retroviral treatment, home-based care, step-down care, HIV counselling and testing, etc.
Yes 39 008 39 008 n/a Cape Winelands District
Yes 9 093 9 093 n/a Central Karoo District
Yes 36 725 36 725 n/a eden District
Yes - - n/a HIV/aids &tb
Yes 14 186 14 186 n/a Khayelitsha/eastern ss
Yes 7 890 7 890 n/a Klipfontein/M Plain ss
Yes 63 068 63 068 n/a northern/tygerberg ss
Yes 19 877 19 877 n/a overberg District
Yes 27 842 27 842 n/a West Coast District
Yes 11 828 11 828 n/a Western/southern ss
Various Institutions
nutritionRendering of a nutrition intervention service to address malnutrition in the Western Cape
Yes 109 109 n/a Central Karoo District
Yes 642 642 n/a eden District
Yes 1 375 1 375 n/a Khayelitsha/eastern ss
Yes 389 389 n/a Klipfontein/M Plain ss
Yes 756 756 n/a northern/tygerberg ss
Yes 489 489 n/a Western/southern ss
Carel Du Toit & Philani
Non-Profit Institutions
Hearing screening Rehab Workers and mentoring in speech-language and audiology services for children
Yes 1 250 1 250 n/a Klipfontein/M Plain ss
Various Institutions
Global Fund
Investing for Impact against tuberculosis and HIV through innovative HIV prevention strategies within key populations
Yes 4 992 4 992 n/a Cape Winelands Distrcit
Yes 47 47 n/a Central Karoo District
Yes 90 90 n/a eden District
Yes 8 720 8 720 n/a Khayelitsha/eastern ss
Yes 957 957 n/a Community based Programmes
Yes 56 243 56 243 n/a Klipfontein/M Plain ss
Yes 1 1 n/a northern/tygerberg ss
Yes 99 99 n/a overberg District
Yes 105 105 n/a West Coast District
Yes 20 20 n/a Western/southern ss
Open Circle & Hurdy Gurdy
Non-Profit Institutions
Residential care for people with autism or intellectual disability and with challenging behaviour
Yes 3 232 3 232 n/a City of Cape town District
Maitland Cottage
step-down Care Paediatric orthopaedic care Yes 12 467 12 467 n/a City of Cape town District
Various Institutions

AnnuAl report 2018-2019 113Performace Information
Transfer Payments Made
Type of Organisation
Purpose for which the funds were used
Compliance with PFMA [S38(1)(J)}
Amount Transferred
(R’000)
Amount Spent
(R’000)
Reasons for Under
ExpenditureGeographical Area
Non-Profit Institutions
extended Public Works Programme (ePWP) funding used for training and Home based Care
Yes 60 014 60 014 n/a Various
Various Institutions
Non-Profit Institutions
Wellness strategy focused on healthy lifestyle choices to prevent and control chronic diseases of lifestyle; promote safe and healthy pregnancies and child rearing; and a reduction of harmful personal behaviours
Yes 1 875 1 875 n/a Khayelitsha/eastern ss
Yes 1 875 1 875 n/a Klipfontein/M Plain ss
Yes 1 875 1 875 n/a northern/tygerberg ss
Yes 1 875 1 875 n/a Western/southern ss
Various Institutions
Non-Profit Institutions
Provincial employee aids Programme (PeaP), offering a comprehensive package of health screening services
Yes 265 265 n/a Cape Winelands
Yes 183 183 n/a Central Karoo
Yes 253 253 n/a eden District
Yes 946 946 n/a City of Cape town District
Yes 215 215 n/a overberg District
Yes 267 267 n/a West Coast District
Transfers to Households
Employee Social Benefits – cash residents
Various Claimants
Injury on duty, leave Gratuity, Retirement Benefit, Severance Package Yes 50 953 50 953 n/a Departmental
Various Claimants
Various Claimants Claims against the state: households Yes 62 140 62 140 n/a Departmental
Various Claimants
Higher education Institutions bursaries Yes 54 311 54 311 n/a Departmental
Various Claimants
Various Claimants Payment made as act of grace. Yes 103 103 n/a Departmental
Western Cape on Wellness (WoW)
Community based Programmes
Cash donation made to the Department of Cultural affairs & sports, for the healthy lifestyles initiative
Yes 150 150 n/a City of Cape town District
Total Transfers 1 294 436 1 294 436
Transfer Payments Not Made
Type of Organisation Purpose for which the funds were to be used
Amount Budgeted
(R’000)
Amount Transferred
(R’000)
Reasons why funds were not transferred
Geographical Area
Non-Profit Organisation
Human Papillomavirus Vaccine
Non-Profit Institution
to reinforce awareness of the HPV campaign in the Klipfontein/Mitchell’s Plain sub structure. 57 -
Klipfontein/Mitchell Plain sub structure did not spend this amount and was allowed to spend it under the economic classification Goods & services.
City of Cape town District

AnnuAl report 2018-2019 Performace Information114
Conditional Grants
Health Facility Revitalisation Grant
the funding allocation for infrastructure was mainly provided through the Health Facility Revitalisation Grant, as stipulated in the Division of Revenue act, act no. 1 of 2018 and the relevant Grant Framework, with a small portion emanating from the provincial equitable share.
the strategic goal of the grant is “to enable provinces to plan, manage, and transform health infrastructure in line with national and provincial policy objectives”. In the 2018/19 financial year, the Department continued to utilise the Health Facility Revitalisation Grant in line with its Healthcare 2030.
Transferring Department National Department of Health
Purpose of the Grant • to help accelerate construction, maintenance, upgrading and rehabilitation of new and existing infrastructure in health including, health technology, organisational development systems and quality assurance
• to enhance capacity to deliver health infrastructure• To accelerate the fulfilment of the requirements of occupational health and safety
Expected Outputs of the Grant • number of new facilities completed• number of facilities maintained• number of facilities upgraded, and renovated• number of facilities commissioned in terms of health technology
Actual Outputs Achieved Refer to table below
Amount per amended DORA (R’000) R717 226
Amount Received (R’000) R717 226
Reasons if amount as per DORA was not Received not applicable
Amount spent by the Department (R’000) R717 226
Reasons for the funds Unspent by the entity
not applicable
Reasons for Deviations on Performance Refer to table below
Measures taken to Improve Performance
Performance in 2018/19 was very good. As stated before, there is no scientific method to accurately forecast expenditure for capital and scheduled maintenance infrastructure projects. although the Department managed to spend the allocation, the following will continue in 2019/20:
• Creating a pipeline of projects, developed to tender stage and can proceed to construction if there is a risk of under expenditure
• Providing briefing documents for large Rehabilitation, Renovations and Refurbishment projects at health facilities to supplement pipeline of maintenance projects
• Utilising alternative implementing strategies (e.g. Framework Contract for a Management Contractor for larger Day-to-day Maintenance projects)
• Use of standard designs to shorten planning processes by Implementing agent• Continue with the institutionalisation of the IDMs and Infrastructure Gateway system (IGs) to
ensure efficient project monitoring and control• Reallocation of infrastructure budget to Health technology and engineering as soon as the risk of
under expenditure is raised• ongoing joint monitoring of progress on projects
Monitoring Mechanism by the receiving Department
Monthly infrastructure projects progress review and maintenance management review meetings with WCGtPW as the Implementing agent, project meetings and site meetings. In addition to this, monthly Cash Flow Meetings continue to ensure that cash flows on a project level are monitored. The Implementing Agent also records progress on bizProjects and provides project documents on MyContent. In addition to this, the Department utilises the PMIs or Project Management Information system (also referred to as PPo) to update project information and progress, with some of the information being integrated from.

AnnuAl report 2018-2019 115Performace Information
Expected & Actual Outputs for the Health Facility Revitalisation Grant for 2018/19Output Expected Achieved Comment
Number of new facilities completed1 1 1
the following facility was completed in 2018/19:• Wolseley Clinic (replacement)
Number of facilities maintained2 49 55 scheduled Maintenance projects were undertaken at various facilities during the financial year
Number of facilities upgraded and renovated3 8 1
Facilities or areas / units within facilities upgraded and renovated at (Practical Completion achieved):
• Wellington CDC (Pharmacy additions and alterations)
Number of facilities commissioned in terms of health technology4 75 24
Facilities or areas / units within facilities commissioned in 2018/19:• alma CDC• Clanwilliam ambulance station• Clanwilliam Clinic• Clinic in asla• D’almeida Clinic• De Rust Clinic• Dorp street RHC• Kalbaskraal satellite Clinic• Khayelitsha site b CHC• Khayeltisha Hospital• Kleinvlei CDC• Koringberg satellite Clinic• lamberts bay ambulance station• Piketberg Clinic• Radie Kotze Hospital• Red Cross War Memorial Children Hospital• Redelinghuys satellite Clinic• Rietpoort satellite Clinic• touws River ambulance station• Van Rhynsdorp Clinic• Vredenburg Clinic• Vredenburg Hospital• Wellington CDC• Zolani Clinic
Notes
1. output refers to facilities where capital infrastructure projects, categorised as new or replaced infrastructure assets, achieved Practical Com-pletion in the year under review.
2. output considers facilities where expenditure was incurred on scheduled Maintenance projects in the year under review.3. Facilities where capital infrastructure projects, categorised as either ‘Upgrades and additions’, or as ‘Renovations, Rehabilitation or Refurbish-
ments’ have achieved Practical Completion in 2018/19.4. areas / units / facilities are deemed to be commissioned in terms of health technology as soon as the procured health technology items have
been installed, training has been completed and the end user has taken over the health technology.5. It should be noted that the final version of the 2018 DoRA Grant Framework reflected that this indicator had been changed to number of
facilities commissioned in terms of health technology, whereas previously it referred to number of facilities commissioned. the target was thus set for facilities commissioned in terms of infrastructure, but reporting has been amended to refer to facilities commissioned in terms of health technology.

AnnuAl report 2018-2019 Performace Information116
Provincial Treasury confirmed that all transfers were deposited into the accredited bank account of the Provincial treasury. In the management of the Health Facility Revitalisation Grant, the Western Cape complied with the Division of Revenue act requirements and submitted all the required reports to treasury and the national Department of Health as stipulated.
expected outputs of the Grant & the actual outputs achieved
It is important to note that expected output is the project phase as at the beginning of the financial year and the achieved output is the project phase as at the end of the financial year.
EPWP Integrated Grant for Provinces
Transferring Department National Department of Public Works
Purpose of the Grant to incentivise provincial departments to expand work creation efforts through the use of labour intensive delivery methods in the following identified focus areas, in compliance with the Expanded Public Works Programme (ePWP) guidelines:
• Road maintenance and the maintenance of buildings• Low traffic volume roads and rural roads• other economic and social infrastructure• tourism and cultural industries• sustainable land based livelihoods• Waste management
Expected Outputs of the Grant Indicator Annual Target
number of people employed and receiving income through the EPWP (as per approved Project Plan 2018/2019 Beneficiaries) 58
Increased average duration of the work opportunities created (as per approved Project Plan 2018/2019 EPWP Beneficiaries)
average duration of 1 year (with option to extend for
an additional year)
Actual Outputs Achieved Indicator Actual Output
number of people employed and receiving income through the ePWP 43
Increased average duration of the work opportunities created 9.2 months
Amount per amended DORA (R’000) R2 116
Amount Received (R’000) R2 116
Reasons if amount as per DORA was not Received not applicable
Amount spent by the Department (R’000) R2 116
Reasons for the funds Unspent by the entity not applicable
Reasons for Deviations on Performance Although 58 people were appointed at the beginning of the financial year, in line with the annual
target, this total reduced to 43 by the end of the financial year. This reduction was due to six people moving to other positions in the private sector and seven being appointed in permanent positions in the Department.People are appointed for the financial year. Appointments made later in the year are, therefore, only for the remainder of the financial year.
Measures taken to Improve Performance
In-house training and rotation of duties between the various institutions continues. In addition, groundsmen assist in the laundries in winter on rainy days, which provides them with additional training and skills.
Monitoring Mechanism by the receiving Department
Projects are monitored at various levels:• one project manager (not ePWP appointment) and two supervisors (ePWP appointees)
oversee projects.• Written feedback received from facilities.• attendance registers maintained on a daily basis.• Weekly and monthly progress reports submitted by team leaders.• Reporting on ePWP Reporting system (ePWPRs) on all activities e.g. attendance, training.

AnnuAl report 2018-2019 117Performace Information
no administration costs were incurred by the Department with respect to the ePWP Integrated Grant for Provinces. Provincial Treasury confirmed that all transfers were deposited into the accredited bank account of the Provincial treasury.
In the management of the ePWP Integrated Grant for Provinces, the Western Cape complied with the Division of Revenue act requirements and submitted all the required reports as prescribed.
National Tertiary Services Grant
Transferring Department National Department of Health
Purpose of the Grant • to ensure provision of tertiary health services for all south african citizens (including documented foreign nationals)
• to compensate tertiary facilities for the additional costs associated with provision of these services
Expected Outputs of the Grant Indicator Annual Target
number of approved and funded tertiary services provided by the Western Cape Department of Health
45
Actual Outputs Achieved Indicator Actual Output
number of approved and funded tertiary services provided by the Western Cape Department of Health
45
Amount per amended DORA (R’000) R3 049 284
Amount Received (R’000) R3 049 284
Reasons if amount as per DORA was not Received not applicable
Amount spent by the Department (R’000) R3 049 130
Reasons for the funds Unspent by the entity not applicable
Reasons for Deviations on Performance not applicable
Measures taken to Improve Performance not applicable
Monitoring Mechanism by the receiving Department
expenditure and service delivery reports provided to national Department of Health and Provincial treasury. WCG: Health fully complied with the measures and provincial responsibilities as stipulated in the grant framework.
Notes
• As a schedule 4 grant the service outputs are subsidised by the NTSG, as the grant funding is insufficient to fully compensate for the service outputs. Deviation from targets therefore does not necessarily reflect an underperformance in terms of the grant funding received. similarly, when service outputs exceed the expected outputs, it does not mean that funding levels are adequate as the levels of support from the equitable share to fund deficits varies.
• In the management of the ntsG, the Western Cape complied with the Division of Revenue act requirements and submitted all the required reports as prescribed.

AnnuAl report 2018-2019 Performace Information118
Health Professionals Training & Development Grant
Transferring Department National Department of Health
Purpose of the Grant support provinces to fund service costs associated with clinical teaching and training of health science trainees on the public service platform
Expected Outputs of the Grant Indicator Annual Target
number of Registrars supervised on the service platform that receives partial funding support from the Health Professional training and Development Grant Funding
483
(medical & dental registrars)
Actual Outputs Achieved Indicator Actual Output
number of Registrars supervised on the service platform that receives partial funding support from the Health Professional training and Development Grant Funding
483
(medical & dental registrars)
Amount per amended DORA (R’000) R574 177
Amount Received (R’000) R574 177
Reasons if amount as per DORA was not Received not applicable
Amount spent by the Department (R’000) R574 177
Reasons for the funds Unspent by the entity not applicable
Reasons for Deviations on Performance not applicable
Measures taken to Improve Performance not applicable
Monitoring Mechanism by the receiving Department
Quarterly reports (reflecting expenditure and grant outputs) provided to the National Department of Health as well as Provincial treasury.
Notes
• Target reflected demonstrates the number of staff partially supported by the HPTDG that are providing clinical training on the service platform. this number reported does not represent all the staff providing grant related activities in the WCDoH.
• The actual outputs reflect the status at the end of the financial year (31 March 2019). The academic year follows a calendar year while the grant follows a financial year cycle. This results in the financial year spanning two enrolment cycles.
• There was an intake of students for the academic year in the fourth quarter of the financial year. Student enrolment is concluded after the submission of the business plan. students are subjected to a selection process by the higher education institutions before they can enrol. the additional student’s enrolments align to national strategic intent but require additional funding to sustain.
• All grant supported targets were achieved. The growth in the grant funding has not kept up with inflation or ICS over the last few years which resulted in a significant funding gap. A significant contribution by the equitable share is required to bridge this funding gap.
• In the management of the HPtDG, the Western Cape complied with the Division of Revenue act requirements and submitted all the required reports as prescribed.
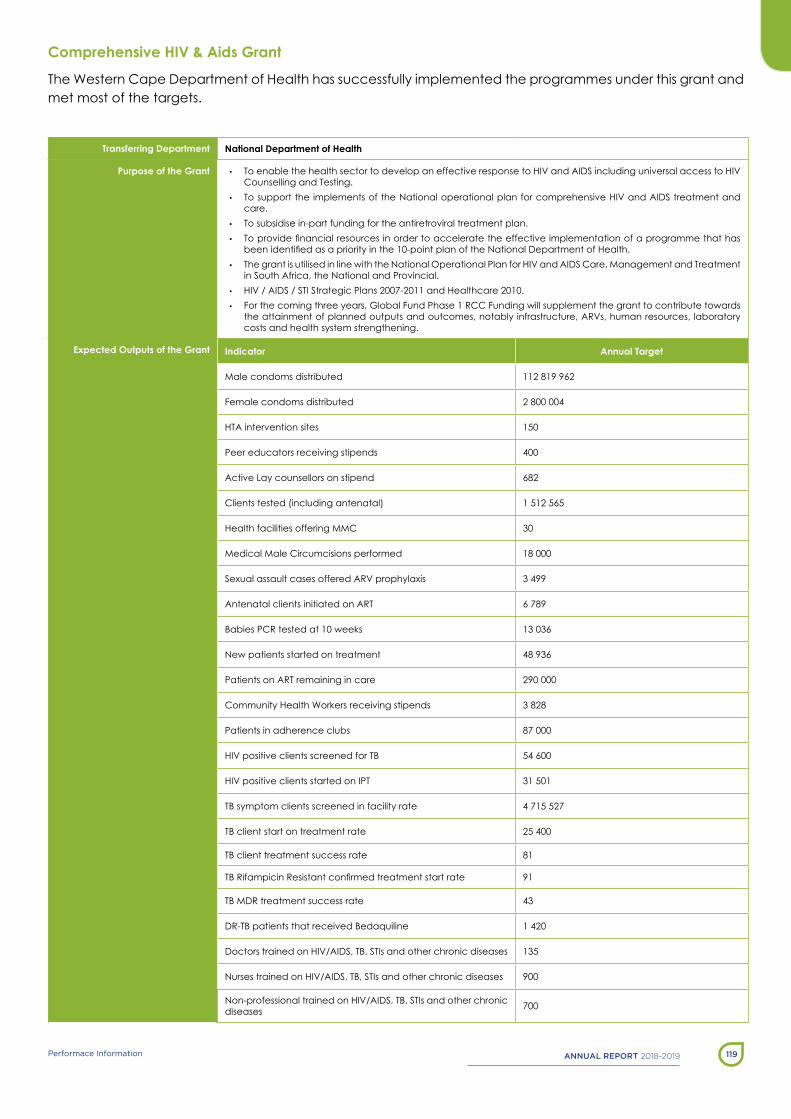
AnnuAl report 2018-2019 119Performace Information
Comprehensive HIV & Aids Grant
the Western Cape Department of Health has successfully implemented the programmes under this grant and met most of the targets.
Transferring Department National Department of Health
Purpose of the Grant • to enable the health sector to develop an effective response to HIV and aIDs including universal access to HIV Counselling and testing.
• to support the implements of the national operational plan for comprehensive HIV and aIDs treatment and care.
• to subsidise in-part funding for the antiretroviral treatment plan.• To provide financial resources in order to accelerate the effective implementation of a programme that has
been identified as a priority in the 10-point plan of the National Department of Health. • the grant is utilised in line with the national operational Plan for HIV and aIDs Care, Management and treatment
in south africa, the national and Provincial. • HIV / aIDs / stI strategic Plans 2007-2011 and Healthcare 2010.• For the coming three years, Global Fund Phase 1 RCC Funding will supplement the grant to contribute towards
the attainment of planned outputs and outcomes, notably infrastructure, aRVs, human resources, laboratory costs and health system strengthening.
Expected Outputs of the Grant Indicator Annual Target
Male condoms distributed 112 819 962
Female condoms distributed 2 800 004
Hta intervention sites 150
Peer educators receiving stipends 400
active lay counsellors on stipend 682
Clients tested (including antenatal) 1 512 565
Health facilities offering MMC 30
Medical Male Circumcisions performed 18 000
sexual assault cases offered aRV prophylaxis 3 499
antenatal clients initiated on aRt 6 789
babies PCR tested at 10 weeks 13 036
new patients started on treatment 48 936
Patients on aRt remaining in care 290 000
Community Health Workers receiving stipends 3 828
Patients in adherence clubs 87 000
HIV positive clients screened for tb 54 600
HIV positive clients started on IPt 31 501
tb symptom clients screened in facility rate 4 715 527
tb client start on treatment rate 25 400
tb client treatment success rate 81
TB Rifampicin Resistant confirmed treatment start rate 91
tb MDR treatment success rate 43
DR-tb patients that received bedaquiline 1 420
Doctors trained on HIV/aIDs, tb, stIs and other chronic diseases 135
nurses trained on HIV/aIDs, tb, stIs and other chronic diseases 900
non-professional trained on HIV/aIDs, tb, stIs and other chronic diseases 700

AnnuAl report 2018-2019 Performace Information120
Actual Outputs Achieved Indicator Actual Output
Male condoms distributed 103 322 800
Female condoms distributed 1 897 400
Hta intervention sites 160
Peer educators receiving stipends 400
active lay counsellors on stipend 664
Clients tested (including antenatal) 1 828 742
Health facilities offering MMC 30
Medical Male Circumcisions performed 14 094
sexual assault cases offered aRV prophylaxis 3 091
antenatal clients initiated on aRt 5 604
babies PCR tested at 10 weeks 13 152
new patients started on treatment 41 318
Patients on aRt remaining in care 278 290
Community Health Workers receiving stipends 3 588
Patients in adherence clubs 87 846
HIV positive clients screened for tb 67 091
HIV positive clients started on IPt 22 259
tb symptom clients screened in facility rate 53%
tb client start on treatment rate 89%
tb client treatment success rate 81%
TB Rifampicin Resistant confirmed treatment start rate 130%
tb MDR treatment success rate 46%
DR-tb patients that received bedaquiline 1 066
Doctors trained on HIV/aIDs, tb, stIs and other chronic diseases 80
nurses trained on HIV/aIDs, tb, stIs and other chronic diseases 989
non-professional trained on HIV/aIDs, tb, stIs and other chronic diseases 1 274
Amount per amended DORA (R’000) 1 531 535
Amount Received (R’000) 1 531 535
Reasons if amount as per DORA was not Received n/a
Amount spent by the Department (R’000) 1 531 535
Reasons for the funds Unspent by the entity
n/a
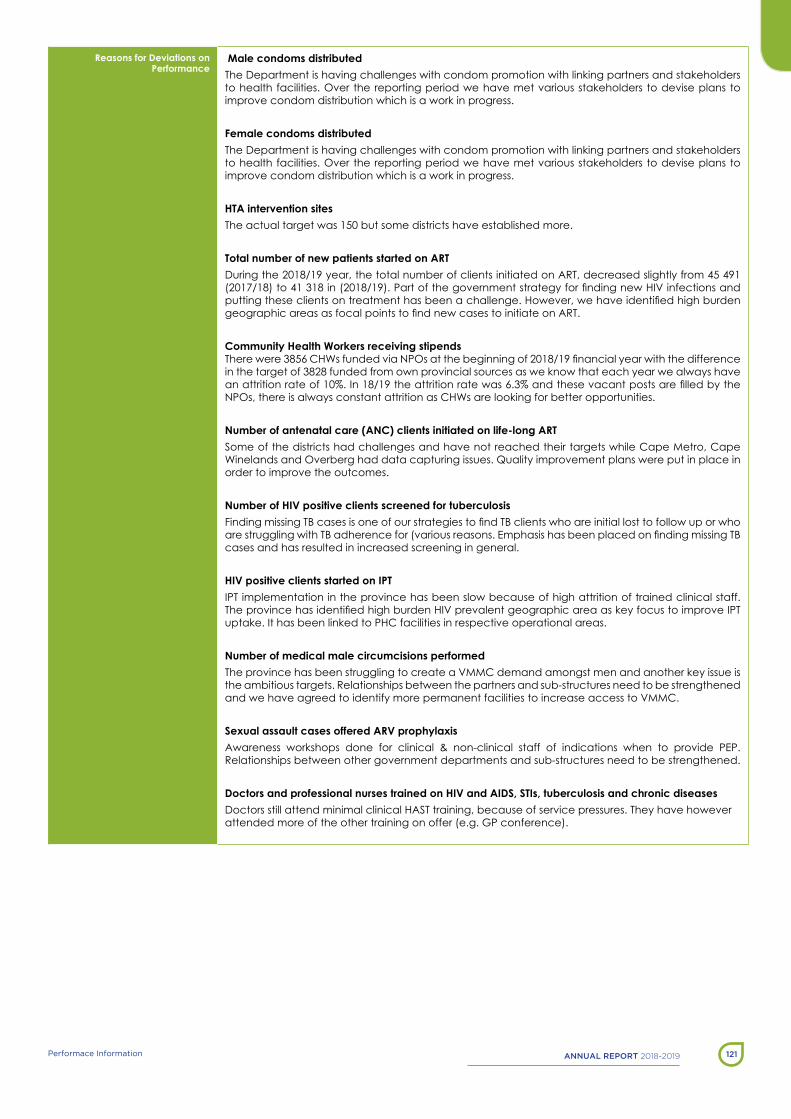
AnnuAl report 2018-2019 121Performace Information
Reasons for Deviations on Performance
Male condoms distributedthe Department is having challenges with condom promotion with linking partners and stakeholders to health facilities. over the reporting period we have met various stakeholders to devise plans to improve condom distribution which is a work in progress.
Female condoms distributedthe Department is having challenges with condom promotion with linking partners and stakeholders to health facilities. over the reporting period we have met various stakeholders to devise plans to improve condom distribution which is a work in progress.
HTA intervention sitesthe actual target was 150 but some districts have established more.
Total number of new patients started on ARTDuring the 2018/19 year, the total number of clients initiated on aRt, decreased slightly from 45 491 (2017/18) to 41 318 in (2018/19). Part of the government strategy for finding new HIV infections and putting these clients on treatment has been a challenge. However, we have identified high burden geographic areas as focal points to find new cases to initiate on ART.
Community Health Workers receiving stipends There were 3856 CHWs funded via NPOs at the beginning of 2018/19 financial year with the difference in the target of 3828 funded from own provincial sources as we know that each year we always have an attrition rate of 10%. In 18/19 the attrition rate was 6.3% and these vacant posts are filled by the nPos, there is always constant attrition as CHWs are looking for better opportunities.
Number of antenatal care (ANC) clients initiated on life-long ARTsome of the districts had challenges and have not reached their targets while Cape Metro, Cape Winelands and overberg had data capturing issues. Quality improvement plans were put in place in order to improve the outcomes.
Number of HIV positive clients screened for tuberculosisFinding missing TB cases is one of our strategies to find TB clients who are initial lost to follow up or who are struggling with TB adherence for (various reasons. Emphasis has been placed on finding missing TB cases and has resulted in increased screening in general.
HIV positive clients started on IPT IPt implementation in the province has been slow because of high attrition of trained clinical staff. The province has identified high burden HIV prevalent geographic area as key focus to improve IPT uptake. It has been linked to PHC facilities in respective operational areas.
Number of medical male circumcisions performedthe province has been struggling to create a VMMC demand amongst men and another key issue is the ambitious targets. Relationships between the partners and sub-structures need to be strengthened and we have agreed to identify more permanent facilities to increase access to VMMC.
Sexual assault cases offered ARV prophylaxisawareness workshops done for clinical & non-clinical staff of indications when to provide PeP. Relationships between other government departments and sub-structures need to be strengthened.
Doctors and professional nurses trained on HIV and AIDS, STIs, tuberculosis and chronic diseasesDoctors still attend minimal clinical Hast training, because of service pressures. they have however attended more of the other training on offer (e.g. GP conference).

AnnuAl report 2018-2019 Performace Information122
Measures taken to Improve Performance
Male condoms distributedthe plan is to establish networks of nPo partnerships and link them to health facilities to support condom distribution. through connecting with various community forums, we will be able to link services to local spaza shops, cafés, shebeens, etc.
Female condoms distributedthe plan is to establish networks of nPo partnerships and link them to health facilities to support condom distribution. through connecting with various community forums, we will be able to link services to local spaza shops, cafés, shebeens, etc.
HTA intervention sitesDistricts will be encouraged to stick to their targets, otherwise they must consolidate the new sites.
Community Health Workers receiving stipends NPOs to fill vacant posts.
Number of antenatal care (ANC) clients initiated on life-long ARTPlan to engage with poor performing districts and address issues related to data capturing challenges.Number of HIV positive clients screened for tuberculosisto maintain trajectory.
Number of medical male circumcisions performedCloser collaboration through meetings, regular support site visits as a team which involves the partner, substructure and Provincial Office.
Sexual assault cases offered ARV prophylaxisContinue with awareness workshops among clinical & non-clinical staff of indications when to provide PeP.
Doctors and professional nurses trained on HIV and AIDS, STIs, tuberculosis and chronic diseasesthe PDC will offer more online training in future to accommodate professionals who prefer that. Central contracts for the Procurement of training will also improve access to training.
Monitoring Mechanism by the receiving Department
• Monthly Financial Reporting• Quarterly programme performance reporting• bi-annual Conditional Grant review conducted by the national DoH• annual HIV Conditional Grant evaluation report

AnnuAl report 2018-2019 123Performace Information
Social Sector EPWP Incentive Grant for Provinces
Transferring Department Western Cape Government Treasury
Purpose of the Grant to incentivise provincial social sector departments to increase job creation by focusing on the strengthening and expansion of social sector programmes that have employment potential.
Expected Outputs of the Grant Output as Per Framework Annual Target
number of Community Health Workers (CHWs) receiving stipends 102
Actual Outputs Achieved Output as Per Framework Actual Output
number of Community Health Workers (CHWs) receiving stipends 102
Amount per amended DORA (R’000) 2 447
Amount Received (R’000) 2 447
Reasons if amount as per DORA was not Received all DoRa payments received on time.
Amount spent by the Department (R’000) 2 447
Reasons for the funds Unspent by the entity all DoRa payments received on time.
Reasons for Deviations on Performance all DoRa payments received on time.
Measures taken to Improve Performance n/a
Monitoring Mechanism by the receiving Department Quarterly Reporting/ Reviews.
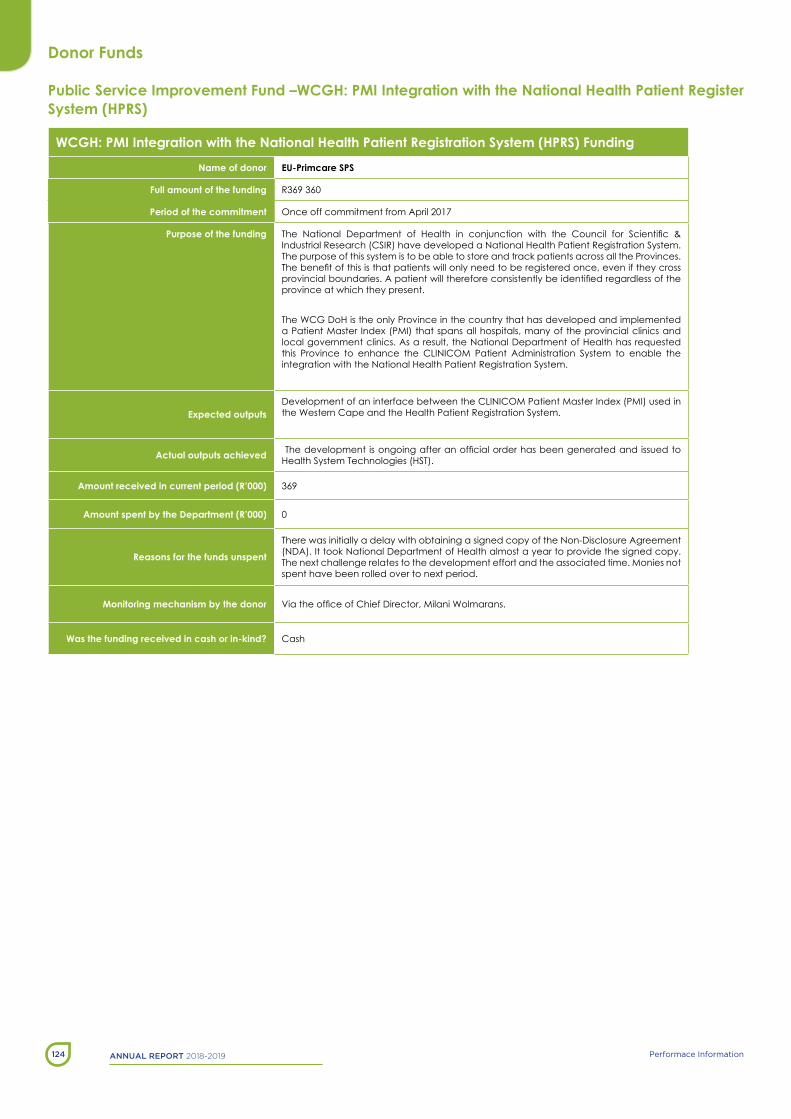
AnnuAl report 2018-2019 Performace Information124
Donor Funds
Public Service Improvement Fund –WCGH: PMI Integration with the National Health Patient Register System (HPRS)
WCGH: PMI Integration with the National Health Patient Registration System (HPRS) Funding
Name of donor EU-Primcare SPS
Full amount of the funding R369 360
Period of the commitment once off commitment from april 2017
Purpose of the funding The National Department of Health in conjunction with the Council for Scientific & Industrial Research (CsIR) have developed a national Health Patient Registration system. the purpose of this system is to be able to store and track patients across all the Provinces. The benefit of this is that patients will only need to be registered once, even if they cross provincial boundaries. A patient will therefore consistently be identified regardless of the province at which they present.
the WCG DoH is the only Province in the country that has developed and implemented a Patient Master Index (PMI) that spans all hospitals, many of the provincial clinics and local government clinics. as a result, the national Department of Health has requested this Province to enhance the ClInICoM Patient administration system to enable the integration with the national Health Patient Registration system.
Expected outputsDevelopment of an interface between the ClInICoM Patient Master Index (PMI) used in the Western Cape and the Health Patient Registration system.
Actual outputs achieved The development is ongoing after an official order has been generated and issued to Health system technologies (Hst).
Amount received in current period (R’000) 369
Amount spent by the Department (R’000) 0
Reasons for the funds unspent
there was initially a delay with obtaining a signed copy of the non-Disclosure agreement (nDa). It took national Department of Health almost a year to provide the signed copy. the next challenge relates to the development effort and the associated time. Monies not spent have been rolled over to next period.
Monitoring mechanism by the donor Via the office of Chief Director, Milani Wolmarans.
Was the funding received in cash or in-kind? Cash

AnnuAl report 2018-2019 125Performace Information
Tirelo Bosha Fund – Catch, Care, Cure funding received for the period 1 April 2018 to 31 March 2019
WCGH: PMI Integration with the National Health Patient Registration System (HPRS) Funding
Name of donor The Tirelo Bosha Grant Year 1 and 11
Full amount of the funding R3 568 276 for Year 1 and 11
Period of the commitmentYear 1: november 2017 – March 2018Year 11: april 2018 – august 2018 (extended until november 2018)
Purpose of the funding build towards tb 90 90 90 (Catch Care Cure) targets through improved Digital Health-enabled linkage to care between community and facility-based services, using an agile developmental approach:
Objective 1: Catch & Match Communities: strengthen systematic community-based model of care to improve screening, prevention and treatment support, with the primary focus on tb
Objective 2: Catch & Match Facilities: Improve facility-based care by improving access to integrated data and bi-directional referrals (to and from community-based teams) through the single Patient Viewer, with the primary focus on tb
Objective 3: Referral linkage and data integration: Develop a novel Health Information Exchange (HIE) linked to the PHDC that enables bi-directional real-time flow of data and referrals to improve screening and adherence
Expected outputs
1. Completion of mHealth development2. Completion of training3. Implementation of Catch and Match communities and facilities4. CCC Data collection and reporting
Actual outputs achieved
1. Health developmentDevelopment of stage 2a (5 sprints) and 2b (7 sprints) were completed. the CHW and team leader apps have been streamlined, and are functioning very well. big improvements have been made to workflow on the app, specifically integration of data fields and tasks, as well as improvements and updates to the HIV and tb algorithms. Minor maintenance of the app and final interoperability work with Jembi and the Provincial Health Data Centre (PHDC) are ongoing.
2. Trainingall training of CHWs and supervisors in maternal and child health, tb and HIV adherence, tb infection prevention and control was completed. During the extension period, two additional groups of new CHWs were trained in a short course of maternal and child health. mHealth training was completed for all users.
3. ImplementationThe teams continue to implement the comprehensive package of care in the field. Both sites are using the digital tool for data capturing and client management. the CHW teams are supported by supervisors, coordinators, 2 dieticians and 2 digital health officers.
4. ReportingImprovements have been made to the team leader app, allowing the team leaders better access to the data from their teams. Monthly reports are available on the activities performed by the CHWs; Vitamin a and deworming doses given by CHWs; and referrals made. the PHDC has provided reports on the Household assessment and individual screening data collected to date. a prototype tb dashboard has been released. More detailed reports on maternal and child health indicators are being designed.
Amount received in current period (R’000) 1 559
Amount spent by the Department (R’000) 3 565
Reasons for the funds unspent Project is ongoing. Delays in implementation reason for savings. Monies not spent have been rolled over to next period.
Monitoring mechanism by the donorQuarterly reports by WCG Health to Dept of Public service and administration (DPsa).DPsa Monitoring visits.
Was the funding received in cash or in-kind? Cash
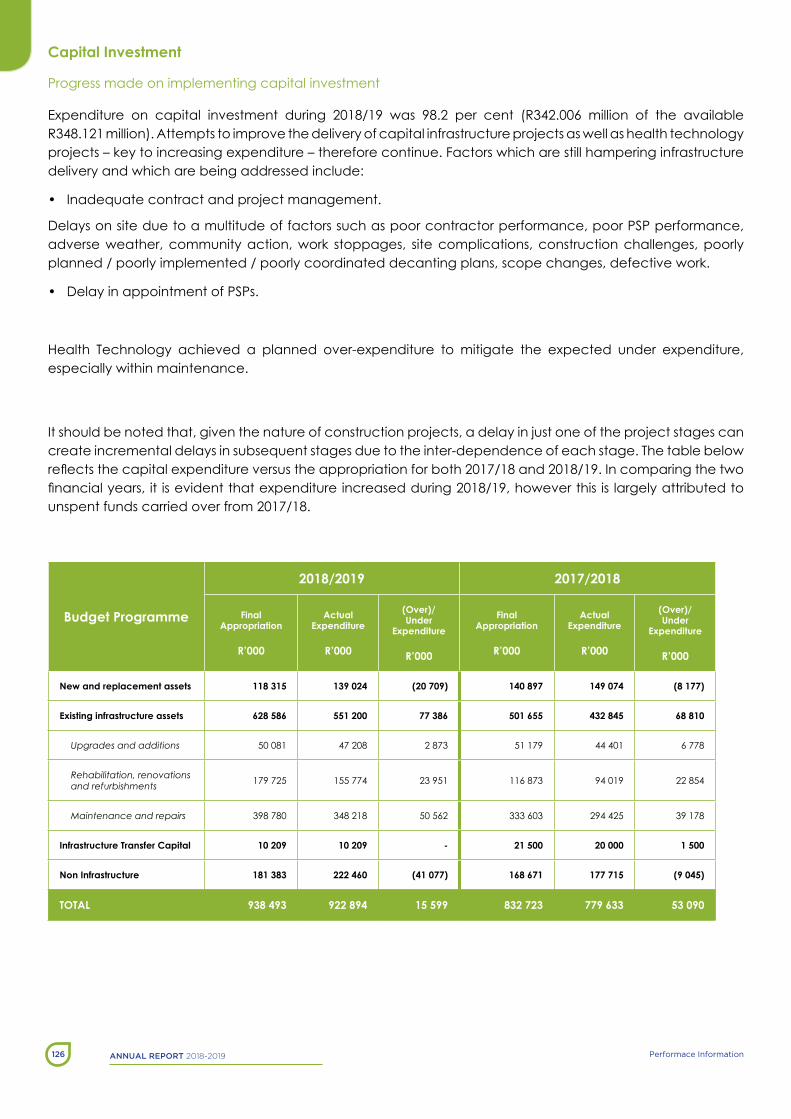
AnnuAl report 2018-2019 Performace Information126
Capital Investment
Progress made on implementing capital investment
expenditure on capital investment during 2018/19 was 98.2 per cent (R342.006 million of the available R348.121 million). attempts to improve the delivery of capital infrastructure projects as well as health technology projects – key to increasing expenditure – therefore continue. Factors which are still hampering infrastructure delivery and which are being addressed include:
• Inadequate contract and project management.
Delays on site due to a multitude of factors such as poor contractor performance, poor PsP performance, adverse weather, community action, work stoppages, site complications, construction challenges, poorly planned / poorly implemented / poorly coordinated decanting plans, scope changes, defective work.
• Delay in appointment of PsPs.
Health technology achieved a planned over-expenditure to mitigate the expected under expenditure, especially within maintenance.
It should be noted that, given the nature of construction projects, a delay in just one of the project stages can create incremental delays in subsequent stages due to the inter-dependence of each stage. the table below reflects the capital expenditure versus the appropriation for both 2017/18 and 2018/19. In comparing the two financial years, it is evident that expenditure increased during 2018/19, however this is largely attributed to unspent funds carried over from 2017/18.
Budget Programme
2018/2019 2017/2018
Final Appropriation
R’000
Actual Expenditure
R’000
(Over)/Under
Expenditure
R’000
Final Appropriation
R’000
Actual Expenditure
R’000
(Over)/Under
Expenditure
R’000
New and replacement assets 118 315 139 024 (20 709) 140 897 149 074 (8 177)
Existing infrastructure assets 628 586 551 200 77 386 501 655 432 845 68 810
Upgrades and additions 50 081 47 208 2 873 51 179 44 401 6 778
Rehabilitation, renovations and refurbishments 179 725 155 774 23 951 116 873 94 019 22 854
Maintenance and repairs 398 780 348 218 50 562 333 603 294 425 39 178
Infrastructure Transfer Capital 10 209 10 209 - 21 500 20 000 1 500
Non Infrastructure 181 383 222 460 (41 077) 168 671 177 715 (9 045)
TOTAL 938 493 922 894 15 599 832 723 779 633 53 090
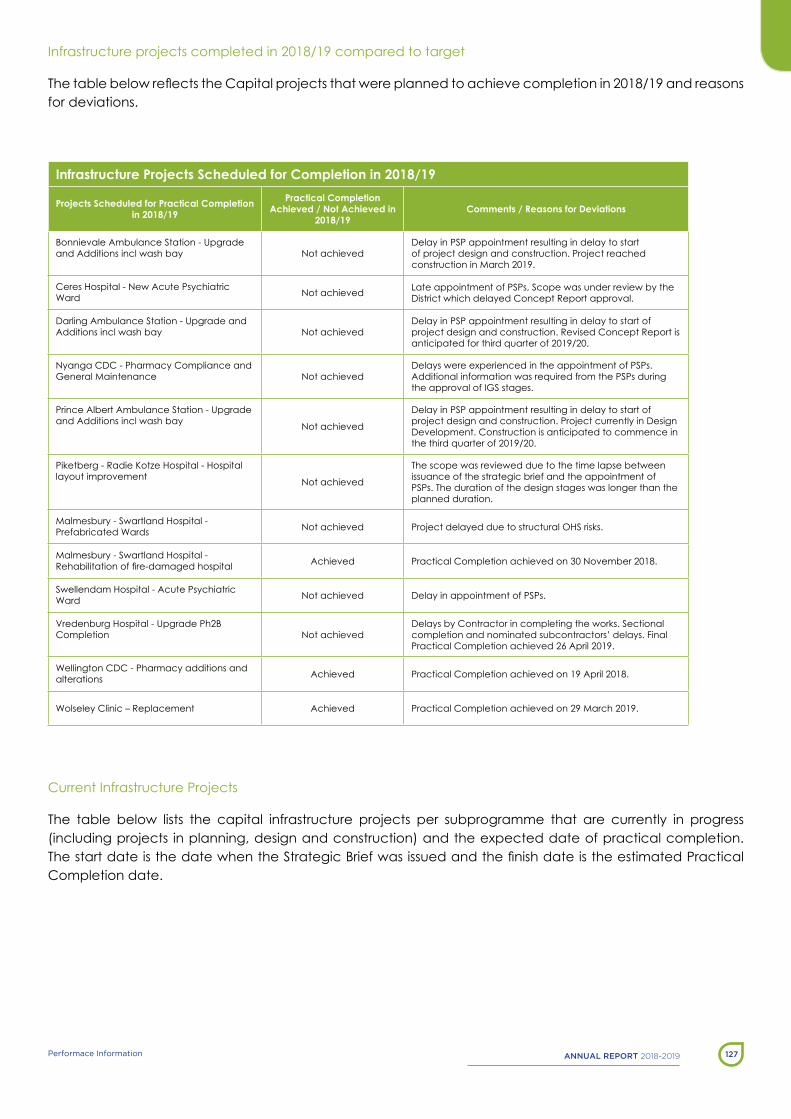
AnnuAl report 2018-2019 127Performace Information
Infrastructure projects completed in 2018/19 compared to target
The table below reflects the Capital projects that were planned to achieve completion in 2018/19 and reasons for deviations.
Infrastructure Projects Scheduled for Completion in 2018/19
Projects Scheduled for Practical Completion in 2018/19
Practical Completion Achieved / Not Achieved in
2018/19Comments / Reasons for Deviations
bonnievale ambulance station - Upgrade and additions incl wash bay not achieved
Delay in PsP appointment resulting in delay to start of project design and construction. Project reached construction in March 2019.
Ceres Hospital - new acute Psychiatric Ward not achieved late appointment of PsPs, scope was under review by the
District which delayed Concept Report approval.
Darling ambulance station - Upgrade and additions incl wash bay not achieved
Delay in PsP appointment resulting in delay to start of project design and construction. Revised Concept Report is anticipated for third quarter of 2019/20.
nyanga CDC - Pharmacy Compliance and General Maintenance not achieved
Delays were experienced in the appointment of PsPs. additional information was required from the PsPs during the approval of IGs stages.
Prince albert ambulance station - Upgrade and additions incl wash bay not achieved
Delay in PsP appointment resulting in delay to start of project design and construction. Project currently in Design Development. Construction is anticipated to commence in the third quarter of 2019/20.
Piketberg - Radie Kotze Hospital - Hospital layout improvement not achieved
the scope was reviewed due to the time lapse between issuance of the strategic brief and the appointment of PsPs. the duration of the design stages was longer than the planned duration.
Malmesbury - swartland Hospital - Prefabricated Wards not achieved Project delayed due to structural oHs risks.
Malmesbury - swartland Hospital - Rehabilitation of fire-damaged hospital achieved Practical Completion achieved on 30 november 2018.
swellendam Hospital - acute Psychiatric Ward not achieved Delay in appointment of PsPs.
Vredenburg Hospital - Upgrade Ph2b Completion not achieved
Delays by Contractor in completing the works. sectional completion and nominated subcontractors’ delays. Final Practical Completion achieved 26 april 2019.
Wellington CDC - Pharmacy additions and alterations achieved Practical Completion achieved on 19 april 2018.
Wolseley Clinic – Replacement achieved Practical Completion achieved on 29 March 2019.
Current Infrastructure Projects
the table below lists the capital infrastructure projects per subprogramme that are currently in progress (including projects in planning, design and construction) and the expected date of practical completion. The start date is the date when the Strategic Brief was issued and the finish date is the estimated Practical Completion date.
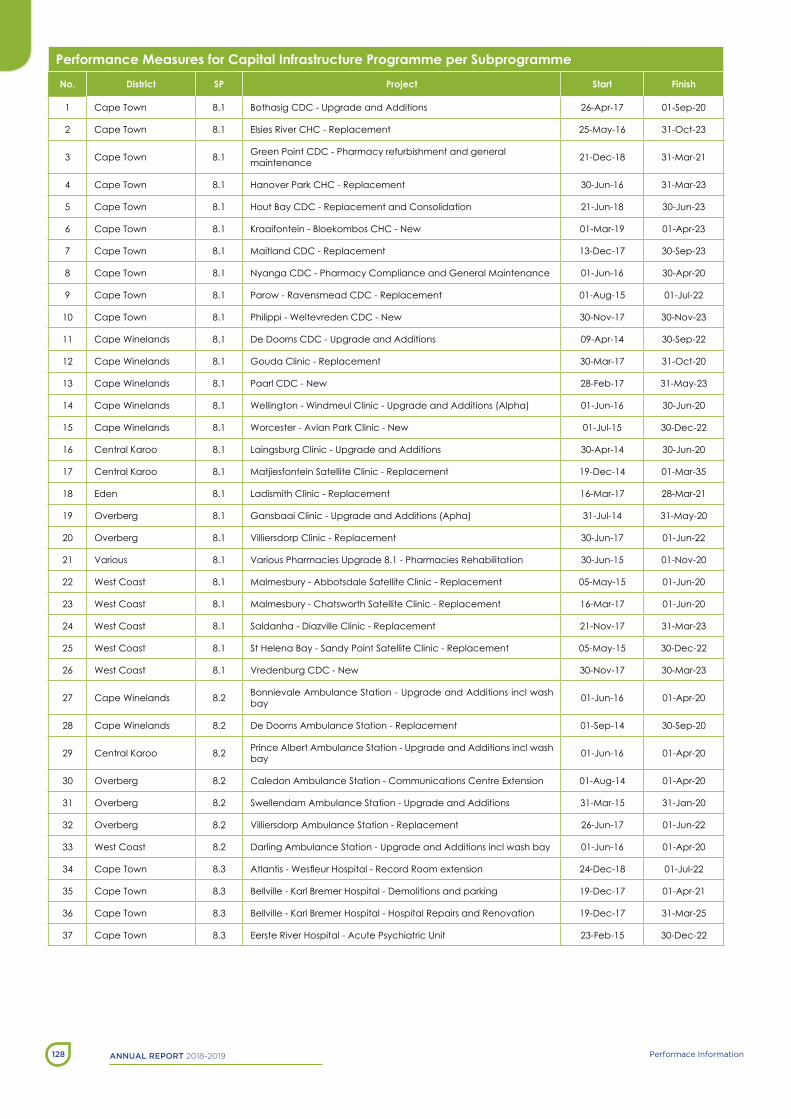
AnnuAl report 2018-2019 Performace Information128
Performance Measures for Capital Infrastructure Programme per SubprogrammeNo. District SP Project Start Finish
1 Cape town 8.1 bothasig CDC - Upgrade and additions 26-apr-17 01-sep-20
2 Cape town 8.1 elsies River CHC - Replacement 25-May-16 31-oct-23
3 Cape town 8.1 Green Point CDC - Pharmacy refurbishment and general maintenance 21-Dec-18 31-Mar-21
4 Cape town 8.1 Hanover Park CHC - Replacement 30-Jun-16 31-Mar-23
5 Cape town 8.1 Hout bay CDC - Replacement and Consolidation 21-Jun-18 30-Jun-23
6 Cape town 8.1 Kraaifontein - bloekombos CHC - new 01-Mar-19 01-apr-23
7 Cape town 8.1 Maitland CDC - Replacement 13-Dec-17 30-sep-23
8 Cape town 8.1 nyanga CDC - Pharmacy Compliance and General Maintenance 01-Jun-16 30-apr-20
9 Cape town 8.1 Parow - Ravensmead CDC - Replacement 01-aug-15 01-Jul-22
10 Cape town 8.1 Philippi - Weltevreden CDC - new 30-nov-17 30-nov-23
11 Cape Winelands 8.1 De Doorns CDC - Upgrade and additions 09-apr-14 30-sep-22
12 Cape Winelands 8.1 Gouda Clinic - Replacement 30-Mar-17 31-oct-20
13 Cape Winelands 8.1 Paarl CDC - new 28-Feb-17 31-May-23
14 Cape Winelands 8.1 Wellington - Windmeul Clinic - Upgrade and additions (alpha) 01-Jun-16 30-Jun-20
15 Cape Winelands 8.1 Worcester - avian Park Clinic - new 01-Jul-15 30-Dec-22
16 Central Karoo 8.1 laingsburg Clinic - Upgrade and additions 30-apr-14 30-Jun-20
17 Central Karoo 8.1 Matjiesfontein satellite Clinic - Replacement 19-Dec-14 01-Mar-35
18 eden 8.1 ladismith Clinic - Replacement 16-Mar-17 28-Mar-21
19 overberg 8.1 Gansbaai Clinic - Upgrade and additions (apha) 31-Jul-14 31-May-20
20 overberg 8.1 Villiersdorp Clinic - Replacement 30-Jun-17 01-Jun-22
21 Various 8.1 Various Pharmacies Upgrade 8.1 - Pharmacies Rehabilitation 30-Jun-15 01-nov-20
22 West Coast 8.1 Malmesbury - abbotsdale satellite Clinic - Replacement 05-May-15 01-Jun-20
23 West Coast 8.1 Malmesbury - Chatsworth satellite Clinic - Replacement 16-Mar-17 01-Jun-20
24 West Coast 8.1 saldanha - Diazville Clinic - Replacement 21-nov-17 31-Mar-23
25 West Coast 8.1 st Helena bay - sandy Point satellite Clinic - Replacement 05-May-15 30-Dec-22
26 West Coast 8.1 Vredenburg CDC - new 30-nov-17 30-Mar-23
27 Cape Winelands 8.2 bonnievale ambulance station - Upgrade and additions incl wash bay 01-Jun-16 01-apr-20
28 Cape Winelands 8.2 De Doorns ambulance station - Replacement 01-sep-14 30-sep-20
29 Central Karoo 8.2 Prince albert ambulance station - Upgrade and additions incl wash bay 01-Jun-16 01-apr-20
30 overberg 8.2 Caledon ambulance station - Communications Centre extension 01-aug-14 01-apr-20
31 overberg 8.2 swellendam ambulance station - Upgrade and additions 31-Mar-15 31-Jan-20
32 overberg 8.2 Villiersdorp ambulance station - Replacement 26-Jun-17 01-Jun-22
33 West Coast 8.2 Darling ambulance station - Upgrade and additions incl wash bay 01-Jun-16 01-apr-20
34 Cape town 8.3 Atlantis - Wesfleur Hospital - Record Room extension 24-Dec-18 01-Jul-22
35 Cape town 8.3 bellville - Karl bremer Hospital - Demolitions and parking 19-Dec-17 01-apr-21
36 Cape town 8.3 bellville - Karl bremer Hospital - Hospital Repairs and Renovation 19-Dec-17 31-Mar-25
37 Cape town 8.3 eerste River Hospital - acute Psychiatric Unit 23-Feb-15 30-Dec-22

AnnuAl report 2018-2019 129Performace Information
Performance Measures for Capital Infrastructure Programme per SubprogrammeNo. District SP Project Start Finish
38 Cape town 8.3 Fish Hoek - False bay Hospital - Fire Compliance Completion and changes to internal spaces 24-Dec-18 01-oct-22
39 Cape town 8.3 Khayelitsha Hospital - acute Psychiatric Unit 23-Feb-15 01-aug-21
40 Cape town 8.3 Mitchell’s Plain Hospital - Rehabilitation of Fire-damaged eC 24-May-18 30-Jun-19
41 Cape town 8.3 Mitchells Plain Hospital - Fire doors 01-Mar-19 31-Mar-21
42 Cape town 8.3 somerset West - Helderberg Hospital - eC Upgrade and additions 01-apr-13 21-Jan-20
43 Cape town 8.3 somerset West - Helderberg Hospital - Repairs and Renovation 30-nov-17 31-Dec-22
44 Cape town 8.3 Wynberg - Victoria Hospital - new eC 01-apr-12 21-nov-20
45 Cape town 8.3 Wynberg - Victoria Hospital - temporary eC 27-Feb-18 30-Jun-19
46 Cape Winelands 8.3 Ceres Hospital - Hospital and nurses Home Repairs and Renovation 28-Feb-18 31-Mar-22
47 Cape Winelands 8.3 Ceres Hospital - new acute Psychiatric Ward 01-Jun-16 01-apr-21
48 Cape Winelands 8.3 Montagu Hospital - Rehabilitation 01-Mar-19 31-Dec-24
49 Cape Winelands 8.3 Robertson Hospital - acute Psychiatric Ward and new eC 15-oct-18 31-May-22
50 Cape Winelands 8.3 stellenbosch Hospital - Hospital and stores Repairs and Renovation 05-oct-17 31-Mar-22
51 Central Karoo 8.3 beaufort West Hospital - Rationalisation 15-oct-18 30-apr-24
52 eden 8.3 Mossel bay Hospital - entrance, admissions and eC 15-oct-18 31-Dec-22
53 overberg 8.3 bredasdorp - otto du Plessis Hospital - acute Psychiatric Ward 30-apr-16 01-Mar-21
54 overberg 8.3 Caledon Hospital - acute Psychiatric Unit and R & R 03-Jul-17 31-aug-20
55 overberg 8.3 Hermanus Hospital - new acute Psychiatric Ward 01-Jun-16 31-Dec-20
56 overberg 8.3 swellendam Hospital - acute Psychiatric Ward 01-Jun-16 01-Mar-21
57 Various 8.3 Various Pharmacies Upgrade 8.3 30-Jun-15 30-apr-20
58 West Coast 8.3 Malmesbury - Swartland Hospital - EC extension to fire-damaged building Ph3 eC and old Kitchen block 26-apr-18 01-apr-20
59 West Coast 8.3 Malmesbury - Swartland Hospital - Rehabilitation of fire-damaged hospital Ph2 17-aug-17 31-oct-19
60 West Coast 8.3 Piketberg - Radie Kotze Hospital - Hospital layout improvement 01-Jun-16 01-May-20
61 Cape town 8.4 Green Point - new somerset Hospital - acute Psychiatric Unit 23-Feb-15 01-oct-21
62 Cape town 8.4 Green Point - new somerset Hospital - Upgrading of theatres and Ventilation 22-May-15 01-aug-21
63 Cape town 8.4 Maitland - alexandra Hospital - Repairs and Renovation (alpha) 18-Mar-18 31-aug-22
64 Cape town 8.4 Maitland - alexandra Hospital - Wards renovations to enable Valkenberg Hospital Forensic Precinct decanting 01-Mar-18 30-Jun-20
65 Cape town 8.4 Manenberg - Klipfontein Regional Hospital - Replacement Ph1 03-Dec-18 31-Mar-26
66 Cape town 8.4 observatory - Valkenberg Hospital - acute Precinct Redevelopment 01-apr-10 30-sep-28
67 Cape town 8.4 observatory - Valkenberg Hospital - Forensic Precinct - admission, assessment, High security 01-apr-10 30-sep-26
68 Cape town 8.4 observatory - Valkenberg Hospital - Forensic Precinct - low security, Chronic and ot 01-apr-10 31-Mar-25
69 Cape town 8.4 observatory - Valkenberg Hospital - Forensic Precinct - Medium security 01-apr-10 30-sep-25
70 Cape town 8.4 observatory - Valkenberg Hospital - Forensic Precinct enabling Work 01-apr-10 01-sep-21
71 Cape town 8.4 observatory - Valkenberg Hospital - Pharmacy and oPD 01-apr-10 30-sep-23
72 Cape Winelands 8.4 Worcester Hospital - Fire Compliance 01-apr-15 31-Dec-21

AnnuAl report 2018-2019 Performace Information130
Performance Measures for Capital Infrastructure Programme per SubprogrammeNo. District SP Project Start Finish
73 Cape Winelands 8.4 Worcester Hospital - Relocation of MoU 30-Jan-18 30-Mar-22
74 Cape town 8.5 observatory - Groote schuur Hospital - bMs Upgrade 01-Jun-16 18-Jun-21
75 Cape town 8.5 observatory - Groote schuur Hospital - eC Upgrade and additions 03-Jul-10 30-Jun-23
76 Cape town 8.5 observatory - Groote schuur Hospital - Greywater recycling 02-Feb-18 16-Jul-19
77 Cape town 8.5 observatory - Groote schuur Hospital - neuroscience Rehabilitation 01-Jun-16 31-Mar-22
78 Cape town 8.5 observatory - Groote schuur Hospital - Ventilation and aC refurbishment incl mechanical installation 25-Jul-17 31-Mar-23
79 Cape town 8.5 Parow - tygerberg Hospital - enabling work for ward decanting (existing buildings) 01-Mar-19 01-Mar-23
80 Cape town 8.5 Parow - tygerberg Hospital - enabling work for ward decanting (prefab solution) 01-Mar-19 01-Mar-22
81 Cape town 8.5 Parow - tygerberg Hospital - 11Kv Generator Panel Upgrade 01-oct-16 13-Dec-19
82 Cape town 8.5 Parow - tygerberg Hospital - 11Kv Main substation Upgrade 01-oct-16 31-Mar-21
83 Cape town 8.5 Parow - tygerberg Hospital - Hot water system upgrade 01-Mar-19 31-Mar-22
84 Cape town 8.5 Parow - tygerberg Hospital - Medical Gas Upgrade 02-May-17 01-Mar-22
85 Cape town 8.5 Parow - tygerberg Hospital - Replacement (PPP) 01-apr-12 30-Jun-24
86 Cape town 8.6 observatory - observatory FPl - Replacement 01-apr-12 07-Jun-19
87 Cape town 8.6 Parow - Cape Medical Depot - Replacement 31-oct-18 30-apr-23
88 Central Karoo 8.6 laingsburg FPl - Replacement 01-aug-14 30-Dec-29
89 Central Karoo 8.6 nelspoort Hospital - Repairs to Wards 15-aug-17 31-Mar-21
90 eden 8.6 Knysna FPl - Replacement 01-nov-14 29-May-22
Facilities that were Closed or Downgraded in 2018/19
no facility was closed down or downgraded in 2018/19.
Current state of Capital assets
as stipulated in the Government Immovable asset Management act, the Department annually prepares a User asset Management Plan. according to the Department’s 2019/20 User asset Management, the current state of the Department’s capital assets is as follows.
Current condition of State-owned FacilitiesCondition Status Number of facilities Percentage
C5 17 5%
C4 174 51%
C3 136 40%
C2 16 4%
C1 0 0%
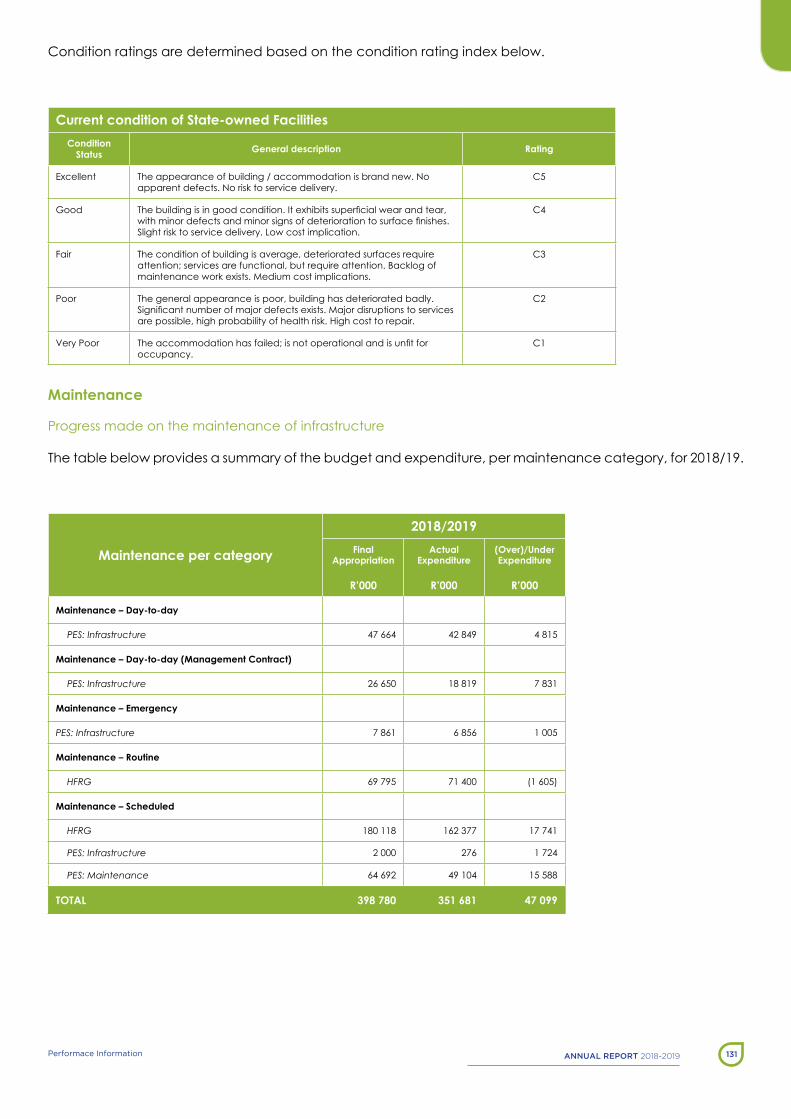
AnnuAl report 2018-2019 131Performace Information
Condition ratings are determined based on the condition rating index below.
Current condition of State-owned FacilitiesCondition
Status General description Rating
excellent the appearance of building / accommodation is brand new. no apparent defects. no risk to service delivery.
C5
Good The building is in good condition. It exhibits superficial wear and tear, with minor defects and minor signs of deterioration to surface finishes. slight risk to service delivery. low cost implication.
C4
Fair the condition of building is average, deteriorated surfaces require attention; services are functional, but require attention. backlog of maintenance work exists. Medium cost implications.
C3
Poor the general appearance is poor, building has deteriorated badly. Significant number of major defects exists. Major disruptions to services are possible, high probability of health risk. High cost to repair.
C2
Very Poor The accommodation has failed; is not operational and is unfit for occupancy.
C1
Maintenance
Progress made on the maintenance of infrastructure
the table below provides a summary of the budget and expenditure, per maintenance category, for 2018/19.
Maintenance per category
2018/2019Final
Appropriation
R’000
Actual Expenditure
R’000
(Over)/Under Expenditure
R’000
Maintenance – Day-to-day
PES: Infrastructure 47 664 42 849 4 815
Maintenance – Day-to-day (Management Contract)
PES: Infrastructure 26 650 18 819 7 831
Maintenance – Emergency
PES: Infrastructure 7 861 6 856 1 005
Maintenance – Routine
HFRG 69 795 71 400 (1 605)
Maintenance – Scheduled
HFRG 180 118 162 377 17 741
PES: Infrastructure 2 000 276 1 724
PES: Maintenance 64 692 49 104 15 588
TOTAL 398 780 351 681 47 099
AnnuAl report 2018-2019 Performace Information132
scheduled Maintenance projects completed in 2018/19
the following scheduled Maintenance projects achieved Practical Completion in 2018/19:
ashton - Zolani Clinic - General upgrade and maintenance (alpha)
bellville - Karl bremer Hospital - nurses Home lift upgrade (alpha)
Clanwilliam ambulance station - General upgrade and maintenance (alpha)
Goodwood CDC - Pharmacy compliance and general maintenance
observatory - Groote schuur Hospital - Mechanical work to aC in anzio building
observatory- Groote schuur Hospital - Maternity block lift Upgrade (alpha)
Parow - tygerberg Hospital - boiler upgrade
Parow - tygerberg Hospital - Water reticulation incl borehole
Rondebosch - Red Cross War Memorial Childrens Hospital - Fire compliance and fire detection
Various Facilities - 8.1 Fencing - overberg (botriver Clinic)
Various Facilities - 8.1 Fencing - overberg (Genadendal Clinic)
Various Facilities - 8.1 Fencing - overberg (Hawston Clinic)
Various Facilities - 8.1 Fencing - overberg (Pearly beach satellite Clinic)
Various Facilities - 8.1 Fencing - overberg (Voorstekraal satellite Clinic)
Various Facilities - 8.1 Fencing Cape Winelands (aan-het-pad Clinic)
Various Facilities - 8.1 Fencing Cape Winelands (breerivier Clinic)
Various Facilities - 8.1 Fencing Cape Winelands (Cloetesville CDC)
Various Facilities - 8.1 Fencing Cape Winelands (De Doorns Clinic)
Various Facilities - 8.1 Fencing Cape Winelands (Idas Valley Clinic)
Various Facilities - 8.1 Fencing Cape Winelands (Kylemore Clinic)
Various Facilities - 8.1 Fencing Cape Winelands (op die berg Clinic)
Various Facilities - 8.1 Fencing Cape Winelands (Worcester CDC)
Processes in place for the Procurement of Infrastructure Projects
Procurement of all construction related projects is governed by the Construction Industry Development board act (no. 38 of 2000). the delivery of Capital and scheduled Maintenance projects is carried out by WCGtPW, as the Implementing agent of WCGH. accordingly, procurement for these projects is carried out by supply Chain Management (sCM) in WCGtPW. However, the implementation of Day-to-day, Routine and emergency Maintenance at health facilities is the responsibility of WCGH, and procurement thereof is thus through WCGH. During the 2017/18 financial year, procurement of these three forms of maintenance was carried out as follows:

AnnuAl report 2018-2019 133Performace Information
• Routine Maintenance: Utilisation of term service Contracts procured through the Directorate: sCM in WCGH
• Day-to-day Maintenance: Utilisation of a Framework agreement, procured by WCGtPW
Day-to-day Maintenance: Utilisation of a Framework Contract for a Management Contractor procured by WCG: education
emergency Maintenance: Procured by WCGH (Directorate: engineering and technical support), in alignment with procedure outlined in the Maintenance Protocol.
Maintenance backlog & Planned Measures to reduce the backlog
The current maintenance backlog is reflected in the table below, which has been extracted from the Department’s 2019/20 User asset Management Plan (U-aMP). the U-aMP is the primary strategic document utilised by the Department with respect to health infrastructure planning.
Health Facilities Maintenance BacklogBacklog 2018/19 2019/20
estimated Value of buildings 45 787 983 000 45 787 983 000
estimated Value of buildings escalated @10% P.a. 45 787 983 000 50 366 781 300
Cost of Maintenance Required @ 3.5% P.a. 1 602 579 405 1 762 837 346
actual Maintenance budget including Rehabilitation, Renovations & Refurbishments, and scheduled, Routine and Day-to-Day Maintenance at Hospitals 725 962 000 661 719 000
estimated total backlog as at March 2018 and increased in following year according to backlog not addressed per annum 876 617 405 1 977 735 751
Notes• Replacement value based on existing building areas. areas not used are to be relinquished to reduce maintenance required per year• bidding amounts for 2020/21 and beyond are not included
While the above figures are only estimations, they do indicate a sharp increase in the maintenance budget required by WCGH to address the maintenance backlog, thereby ensuring that all facilities are returned to optimal condition. such budget is not currently available, and the Chief Directorate therefore analyses the situation annually. Initial work has commenced to further refine the life cycle approach to render a more scientific process. To this end, WCGH is investigating the possible use of WCGTPW’s asset management system and its current data quality.
Implementation plans for the approved Hub and spoke Maintenance Delivery Model are currently being prepared. Implementation will, however, be dependent on resource allocation.
scheduled Maintenance projects are currently being prioritised by means of FCas undertaken by WCGtPW and end-user inputs. these assessment reports have cost estimates and condition ratings to assist in determining budget allocation for maintenance needs. For further information in this regard, please refer to the Department’s U-aMP3.

Development relating to capital investment and maintenance that potentially will impact on expenditure
the following developments relating to capital investment and maintenance will potentially impact on expenditure:
• the continuation of the Performance based Incentive system with the major focus on performance, governance and planning.
• WCGtPW has outsourced additional built environment support services.
Asset Management Plan
all institutions have asset registers for minor and major assets which are maintained on a daily basis. the Department’s assets are housed in the sYsPRo asset management system (for Central Hospitals) and loGIs (for all other Institutions) and asset purchases on these systems are reconciled with bas expenditure bas on a monthly basis.
Departmental asset registers comply with the minimum requirements as determined by national treasury. a strategy to address asset Management has been introduced where high-value assets are checked more often and staff at various levels in the institution has been made responsible for certain categories of assets to ensure the regular monitoring of the existence of assets from the floor to the Asset Register and vice versa.

PART Cgovernance

AnnuAl report 2018-2019 Governance136
PART C: Governance
Introduction
the Department is committed to maintaining the highest standards of governance in managing public finances and resources.
Risk Management
Risk Management Policy & strategy
The Accounting Officer (AO) for the Department of Health takes responsibility for implementing Enterprise Risk Management (eRM) in accordance with the national treasury Public sector Risk Management Framework (PsRMF) and the Chief Director: strategy and Health support has been appointed as the risk champion for the Department.
In compliance with the PsRMF and to further embed risk management within the Department, the Western Cape Government (WCG) has adopted an eRM Policy statement which sets out the WCG’s overall intention with regard to eRM. the Department adopted an eRM Policy and strategy for the period 2018/19 – 2020/21, approved by the Accounting Officer on 27 September 2018 respectively; and an ERM Implementation Plan for 2018/19, approved by the Accounting Officer during the 2018/19 financial year. The ERM Implementation Plan gave effect to the departmental eRM Policy and strategy and outlines the roles and responsibilities of management and staff in embedding risk management in the Department.
Risk assessments
The Department assessed significant risks that could have an impact on the achievement of its objectives, at a strategic level, on a quarterly basis. Risks were prioritised based on its likelihood and impact (inherently and residually) and additional mitigations were agreed upon to reduce risks to acceptable levels. new/emerging risks were identified during the quarterly review processes.
Risk Management Committee
the Department has an established Departmental Risk Management Committee to assist the accounting Officer in executing her responsibilities relating to risk management. The Committee operated under a Terms of Reference for the period 2018/19 – 2020/21, approved by the Accounting Officer on 26 September 2019. the Departmental Risk Management Committee in the main evaluated the effectiveness of the mitigating strategies implemented to address the risks of the Department and recommended further action where relevant. Material changes in the risk profile of the Department were escalated to the Accounting Officer and top executive Management (teXCo).
Role of the audit Committee
the Health audit Committee monitors the internal controls and risk management process independently as part of its quarterly review of the Department.

AnnuAl report 2018 -2019 137Governance
Progress with the Management of Risk
There has been significant progress with the management of risks during the 2018/19 financial year, resulting in a satisfactory MPAT score level 3 in 2018/19. In 2018/19, 7 departmental risks were identified through a rigorous process of engagement. the quality of the conversations around risks has improved. Risk management is also a standing item on the agenda of top Management meetings, where the Department Risk Report is tabled quarterly.
the following table lists the 7 strategic risks with their residual ratings as at 31 March 2019.
Risk Residual Rating1. budget constraints Low (Impact = 1: Likelihood = 2)
2. staff related security incidents High (Impact = 2: Likelihood = 4)
3. stock-outs of essential pharmaceutical goods Moderate (Impact = 2: Likelihood = 2)
4. Fraud Low (Impact = 1: Likelihood = 3)
5. service delivery pressures Extreme (Impact = 3: Likelihood = 4)
6. Water shortage Low (Impact = 1: Likelihood = 2)
7. aging infrastructure & Health technology High (Impact = 2: Likelihood = 4)
Fraud & Corruption
Fraud and corruption represent significant potential risks to the Department’s assets and can negatively impact on service delivery efficiency and the Department’s reputation.
The Western Cape Government (WCG) adopted an Anti-Fraud and Corruption Strategy which confirms the Province’s zero-tolerance stance towards fraud, theft and corruption. In line with this strategy the Department is committed to zero-tolerance with regard to corrupt, fraudulent or any other criminal activities, whether internal or external, and vigorously pursues and prosecutes by all legal means available, any parties who engage in such practices or attempt to do so.
the Department has an approved Fraud and Corruption Prevention and Response Plan as well as a Fraud Prevention Implementation Plan which gives effect to the Prevention Plan.
Various channels for reporting allegations of fraud, theft and corruption exist and these are described in detail in the Provincial anti-Fraud and Corruption strategy and the Departmental Fraud and Corruption Prevention and Response Plan. each allegation received by the Provincial Forensic services (PFs) Unit is recorded in a Case Management system which is used as a management tool to report on progress made with cases relating to the Department and to generate statistics for the Province and Department.
employees and workers who blow the whistle on suspicions of fraud, corruption and theft are protected if the disclosure is a protected disclosure (i.e. meets statutory requirements e.g. was made in good faith).

AnnuAl report 2018-2019 Governance138
Following amendments by the Protected Disclosures amendment act, no 5 of 2017 the transversal Whistle-blowing Policy was reviewed and the revised Whistle-blowing Policy was approved on 18 July 2018. the Policy provides guidelines to employees and workers on how to raise concerns with the appropriate line management, specific designated persons in the WCG or external institutions, where they have reasonable grounds for believing that offences or improprieties have been or are being perpetrated within the WCG. the opportunity to remain anonymous is afforded to any person who would like to report acts of fraud, theft and corruption and should they do so in person, their identities are kept confidential by the person to whom they are reporting.
Once fraud, theft or corruption is confirmed after completion of an investigation, the relevant employee who participated in these acts is subjected to a disciplinary hearing. In all such instances, the WCG representative initiating the disciplinary proceedings is required to recommend dismissal of the employee concerned. Where prima facie evidence of criminal conduct is detected, a criminal matter is reported to the south african Police services.
For the year under review, PFS issued a Case Movement Certificate for the Department noting the following:
Cases No.
open cases as at 1 april 2018 8
new cases (2018/19) 8
Closed cases (2018/19) (10)
open cases as at 31 March 2019 6
the following table further analyses the closed cases indicated above:
Outcomes of Cases Closed No.
allegations substantiated- 1 case of fraud (case reported to saPs);- 1 case of fraud and/or irregularity and/or non-compliance (case was reported to saPs);- 1 case of fraud and/or corruption / Irregularity and/or non-compliance (case was reported
to saPs); and- 1 cases of irregularity and/or non-compliance.
4
Only preliminary investigation with no adverse findings 4
Only preliminary investigation with no findings but with recommendations 2
Minimising Conflict of Interest
All officials in Supply Chain Management (SCM) are required to sign the following documents annually:
• the Code of Conduct document as issued by national treasury;

AnnuAl report 2018 -2019 139Governance
• the Departmental non-Disclosure agreement (nDa); and
• Electronic disclosure of financial interest by all officials as per Public Service Regulations (PSR) 2016.
All members of the Bid Specification Committee (BSC) and Bid Evaluation Committee (BEC) are compelled to sign a declaration of interest prior to their involvement in each bid process. All SCM officials are required to sign the same declaration per bid as well as an annual declaration. In instances where officials have declared an interest, they need to recuse themselves from the process or be replaced by a new member.
The Integration of the Western Cape Supplier Database (WCSD) with PERSAL automatically identifies any overlap between a business interest in and a government official, enabling SCM officials to determine the extent to which a business interest may adversely affect the outcome of an sCM process.
A Conflict of Interest report is received from PT quarterly, indicating any possible conflict of interest to be followed up and resolved.
the Central supplier Database (CsD) now also runs a real-time check on the Companies and Intellectual Property Commission’s website to determine any conflict of interest. Conflict will be indicated on the CSD Report to be followed up and confirmed by the end-user.
The following process is followed where conflict of interest was identified:
• If possible conflict of interest is identified the officials and/or bidder is formally approached, in writing, indicating the Department’s intention to restrict, due to possible conflict of interest arising.
• the parties involved are then afforded 14 working days to present the Department with written representation as to why it should not proceed with the restriction.
• The written representation, received from the official or bidder, will be thoroughly assessed to determine credibility.
• should the response be accepted, the Department will communicate the withdrawal of restriction, in writing, to the bidder or official.
• should the Department not receive any written presentation at all, or non-satisfactory presentation, the Department will communicate in writing the final decision to proceed with the restriction on the National list of restricted suppliers.
Code of Conduct
all Public servants occupy a position of trust. With this trust comes a high level of responsibility which is expected to be matched by the highest standards of ethical behaviour from each Public servant.

AnnuAl report 2018-2019 Governance140
Chapter 2, Part 1 of the Public service Regulations of 2016, encourages the public service employees to behave ethically, to report internally any corrupt activities (whistle blowing) and to create a culture of efficiency and effective administration that promotes ethical Conduct. the Department of Health leadership behaviour charter, set the standard of behaviour expected from each employee within the Department, irrespective of rank or position. these measures enable a workplace culture which is premised on strong ethics and integrity as part of the governance framework, which is fundamental to good organisational performance.
Chapter 2, Part 3 of the Public service Regulations of 2016, also provides for the establishment of an ethics Committee. the ethics Committee is to provide oversight on ethical management in the Department. an ethics and Integrity Management strategy and Implementation Plan was approved by the Head of Department. this implementation plan outline steps to be followed by the Department to promote ethical conduct.
During 2018/19 the Department, sensitised 557 employees by various awareness sessions of the expected standard of conduct and to encouraged ethical conduct.
Health, Safety & Environmental Issues
the WCG: H has approved the strategic 5-year plan to formalise safety, Health, environment, Risk and Quality (sHeRQ) management in the Department. For the next 5 years the following areas will be focused on:
• statuary appointments
• Committee compliance
• oHs Provincial forum
• Risk assessment and Management
• oHs training and
• Medical surveillance
the provision of a healthy workplace remains a focus area. Health risk assessments conducted have highlighted various hazards. In light of the high prevalence of occupational tb, particular attention is being paid to the risk of acquiring occupational tb and of risk control measures of adequate ventilation and space provision to prevent the spread of infectious diseases. In order to standardise medical surveillance and post exposure management for common hazards, four of the 16 identified protocols have been completed with a further six in final draft stages.
In order to ensure the occupational training needs of the Department are met. the Department has contracted nosa Pty ltd for 3 years 2017 – 2019 to render occupational Health and safety training in the following areas. Below please find training statistics.

AnnuAl report 2018 -2019 141Governance
Department of Health Occupational Health Training (July 2017 – March 2019)
First aid level 1
Fire Fighting level 2
oHs Rep training
Incident Investigation
evacuation training
total tRaIneD 809 1 169 466 292 484
The Department is currently developing specifications to appoint a new service provider and revisiting the needs of occupational health and safety in the Department.
the use of alcohol-based hand sanitisers is being rolled out to health facilities. In particular, a new standard of care for surgical hand preparation using alcohol based hand rub was adopted. Whilst the purpose is to adhere to both the national Core standards and national Department of Health’s requirement to promote hand hygiene, it also acts as a water-savings mechanism.
the current contract for a specialist company to remove and process health care risk waste expires in august 2018. Procurement is underway for the appointment of the new service provider(s). alternative health care risk waste management technology, installed at Khayelitsha Hospital in 2016/17 as a pilot project, is being monitored. Compliance with regulations for health care risk waste storage areas remains a priority.
SCOPA Resolutions
Subject Details Response by Department
Resolved (Yes/No)
• Resolution no.: Page: 143 of the 2017/18 annual Report
Heading:“Fraud and Corruption”Description:the Committee notes that during the 2017/18 financial year, 22 cases were investigated by the Provincial Forensic service. at the end of the 2017/18 financial year, 14 of the 22 cases were closed, while 8 remained open.
that the Department, in all future annual reports, provide a footnote in order to give a detailed breakdown of all the cases, the nature of these cases, which cases were referred to the south african Police services, including the outcome of each case.
Implemented Yes
Prior Modification to Audit Reports
Finance
no matters to report.
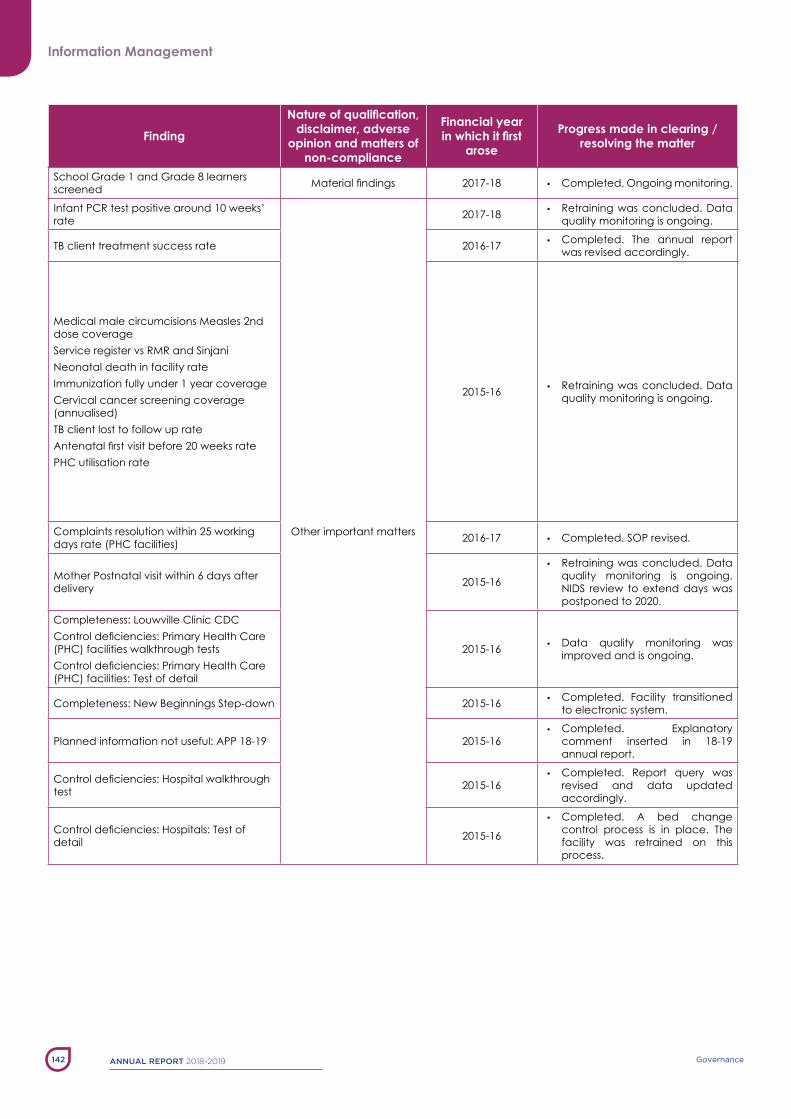
AnnuAl report 2018-2019 Governance142
Information Management
Finding
Nature of qualification, disclaimer, adverse
opinion and matters of non-compliance
Financial year in which it first
arose
Progress made in clearing / resolving the matter
school Grade 1 and Grade 8 learners screened Material findings 2017-18 • Completed. ongoing monitoring.
Infant PCR test positive around 10 weeks’ rate
other important matters
2017-18 • Retraining was concluded. Data quality monitoring is ongoing.
tb client treatment success rate 2016-17 • Completed. the annual report was revised accordingly.
Medical male circumcisions Measles 2nd dose coverageservice register vs RMR and sinjanineonatal death in facility rateImmunization fully under 1 year coverage Cervical cancer screening coverage (annualised)tb client lost to follow up rateAntenatal first visit before 20 weeks ratePHC utilisation rate
2015-16 • Retraining was concluded. Data quality monitoring is ongoing.
Complaints resolution within 25 working days rate (PHC facilities) 2016-17 • Completed. soP revised.
Mother Postnatal visit within 6 days after delivery 2015-16
• Retraining was concluded. Data quality monitoring is ongoing. nIDs review to extend days was postponed to 2020.
Completeness: louwville Clinic CDC Control deficiencies: Primary Health Care (PHC) facilities walkthrough tests Control deficiencies: Primary Health Care (PHC) facilities: test of detail
2015-16 • Data quality monitoring was improved and is ongoing.
Completeness: new beginnings step-down 2015-16 • Completed. Facility transitioned to electronic system.
Planned information not useful: aPP 18-19 2015-16• Completed. explanatory
comment inserted in 18-19 annual report.
Control deficiencies: Hospital walkthrough test 2015-16
• Completed. Report query was revised and data updated accordingly.
Control deficiencies: Hospitals: Test of detail 2015-16
• Completed. a bed change control process is in place. the facility was retrained on this process.
AnnuAl report 2018 -2019 143Governance
Human Resources
no matters to report.
Internal Control Unit
Finance
Currently the Department makes use of the Internal assessment (Ia) to monitor the levels of compliance with the regulatory framework. the Ia is a batch audit instrument, monitoring compliance, mainly in the procurement process, of the transaction relating to a specific batch. The instrument consists of a number of tests to determine whether the procurement process which was followed is regular, as well as whether the batch is complete and audit ready.
a sample is selected monthly of all payment batches, normally consisting of 10 per cent of all batches generated for the month. the batches are selected from a number of expenditure items, which were selected based on the probable risk associated with the specific item, for example maintenance, agency staff, etc. These items are re-assessed every year to ensure that changing risk profiles are addressed. Non-compliance with all the tests relating to the procurement process may result in irregular expenditure.
the Department uses Irregular expenditure (Ie) as an indicator as to the norm to determine whether controls implemented have had the desired effect.
For 2018/19 the Department will report R12.886 million Ie which equates to only 0.17 per cent of the Good and Services Budget and confirms that the Department’s compliance controls are predominantly working effectively.
Information Management
the Department collects and collates data from numerous service points within many facilities ranging from mobile PHC facilities to large central hospitals, forensic pathology laboratories, emergency medical stations as well as all the schools where school health services are provided. We also receive data from municipally managed primary health care facilities in the Metro and some private facilities. each clinician generates multiple data elements at each service point which is recorded in the patient folder, data collection tools (manual registers and electronic systems) and aggregated in the central repository, sinjani. although it is the responsibility of each facility manager, sub-district manager, district manager and budget and health programme manager to ensure compliance with various information management prescripts and ensure accurate data is reported, it is the Accounting Officer’s responsibility to ensure these prescripts are adhered to and data reported is of good quality.
To ensure this the Information Compliance Unit (ICU) was established at provincial office in 2013 consisting of twelve staff and a manager (current capacity is nine) to focus on data management and six Records Management support Unit (RMsU) staff were employed in 2014/15. these teams are deployed to districts to perform internal assessments, identify shortcomings and develop remedial actions to mitigate these shortcomings.

AnnuAl report 2018-2019 Governance144
this ICU is responsible for ensuring these facilities comply with information management guidelines, policies, standard operating procedures and other departmental prescripts to enable good data quality, reliable reporting and audit compliance. With so many facilities and limited capacity, the focus is on public health facilities and support offices in the districts and sub-districts. The RMSU is responsible for assessing records management in facilities, providing training and assisting in implementing appropriate controls like document loans, authorised records disposals, removals of records and regular checks for misfiling.
Facilities are selected for assessment based on previous audit and assessment findings, special requests from districts and facilities for interventions and those identified through routine data monitoring as high risk. The ICU assesses the facilities using a standardised assessment tool which mimics the methodology used by the auditor general as well as issues of compliance identified to be a risk. After the assessment, remedial actions are developed or revised and implemented with the facility and sub-district. General outcomes of ICU assessments are fed back to the broader departmental structures to assist in, amongst other things, training and performance evaluations and to inform information management priorities.
Despite vacancies due to budget constraints within these units this year, these teams have been instrumental in improving records management and data quality in the facilities they have covered which ultimately also reduces audit findings.
the unit also supports the health facilities in preparation for internal and external audits and acts as a liaison between the auditor and the entity being audited. this function goes a long way towards assisting facilities to reduce non-compliance findings during the AGSA audits.
Human Resources
the Department intends maintaining its track record of a clean audit report in respect of PM compliance matters. the purpose of the People Management, Compliance and training sub-directorate is to render an efficient and effective client/consultancy support service to people management offices and line managers at Institutions, districts and regions, with specific reference to the application of the Public Service regulatory framework. In order to achieve the above-mentioned, compliance investigations, informal- and formal functional training as well as continuous evaluation of required capacity in terms of the current and newly created organisational structures are conducted.
Although there has been significant progress in terms of compliance, on-going challenges and gaps still exist as a result of system, individual and institutional weaknesses. there is a need to improve collaboration with internal clients (outreach) and achieve functional training and relief functions where capacity constraints are experienced.

AnnuAl report 2018 -2019 145Governance
During the period under review the following work was performed by the sub-directorate:
• Compliance Investigations were attended to at various Institutions. During these investigations, informal training was provided to all the PM staff at the relevant Institutions.
• Continuous support to Rural District Health services, with compliance and monitoring at the three Regional (Paarl-, George- and Worcester) and Groote schuur hospitals.
• HR Functional training on leave audits were conducted at 14 institutions and training to DICU’s were conducted regarding the Quarterly action Plan and how to conduct compliance investigations.
• ad-hoc investigations were conducted that included the following:
o Commuted overtime Policy, Guidelines and Monitoring tools as well as underpayment of Cot.
o Grievances regarding Radiographers working hours.
o Investigation regarding alleged overtime abuse at a Rural Hospital.
o leave audits of all employees planning to retire within the year is performed order to determine in advance if there is any leave over grants to prevent overpayments.
o Initiated Debt Project in order to ensure correct procedures are followed to recover debt to reduce the amount of debt that is written off by the Department. Informal training was also provided at 36 Institutions on the Management of Debt.
o Cost containment strategies identified in the Internal Audit Report, i.e.
o Internal audit - Cot vs Maternity leave.
o Remunerative work outside the employee’s employment (RWoee) - employees being on leave & Working RWoee and employees performing RWoee with no approval on PeRsal.
o Rostering of nursing shifts at Rural Hospitals.
• Consolidation of PM Functions at Rural Districts.
AnnuAl report 2018-2019 Governance146
Internal Audit & Audit Committee
Internal audit provides management with independent, objective assurance and consulting services designed to add value and to continuously improve the operations of the Department. It should assist the Department to accomplish its objectives by bringing a systematic, disciplined approach to evaluate and improve the effectiveness of Governance, Risk Management and Control processes. the following key activities are performed in this regard:
assess and make appropriate recommendations for improving the governance processes in achieving the Department’s objectives;
evaluate the adequacy and effectiveness and contribute to the improvement of the risk management process; and
Assist the Accounting Officer in maintaining efficient and effective controls by evaluating those controls to determine their effectiveness and efficiency, and by developing recommendations for enhancement or improvement.
Internal audit work completed during the year under review for the Department included four assurance engagements, one consulting engagement and five follow-up areas. The details of these engagements are included in the audit Committee report.
the audit Committee is established as an oversight body, providing independent oversight over governance, risk management and control processes in the Department, which include oversight and review of the following:
• Internal audit function;
• external audit function (auditor General of south africa - aGsa);
• Departmental accounting and reporting;
• Departmental accounting Policies;
• aGsa management and audit report;
• Departmental In-year Monitoring;
• Departmental Risk Management;
• Internal Control;
• Pre-determined objectives; and
• ethics and Forensic Investigations.

AnnuAl report 2018 -2019 147Governance
the table below discloses relevant information on the audit committee members:
Name Qualifications Internal or external
If internal, position in the Department
Date appointed Date Resigned
No. of Meetings attended
Mr Ronnie Kingwill 1bCoM Cta;
Ca(sa); external n/a
01 Jan 2019
(2nd term)
n/a 7
Mr terence
arendseCta, Ca (sa) external n/a
01 Jan 2017
(2nd term)
n/a 7
Ms bonita PetersenbCoM, bCoM
(Hons), Ca (sa)external n/a
01 Jan 2017
(2nd term)
n/a 7
Mr Francois
barnard
bProc bCompt
(Honours); Cta;
Postgrad Dip
audit; MCom
(tax); Ca (sa)
external n/a 01 Jun 2018 n/a 5
Note
• Chairperson since 1 January 2019
Audit Committee Report
We are pleased to present our report for the financial year ended 31st March 2019.
Audit Committee Responsibility
the audit Committee reports that it has complied with its responsibilities arising from Section 38 (1) (a) (ii) of the Public Finance Management Act (PFMA) and National Treasury Regulations 3.1.13. the audit Committee also reports that it has adopted an appropriate formal terms of Reference, has regulated its affairs in compliance with these terms and has discharged all its responsibilities as contained therein.
The Effectiveness of Internal Control
In line with the PFMa and the King IV Report on Corporate Governance requirements, Internal audit provides the audit Committee and Management with reasonable assurance that the internal controls are adequate and effective. this is achieved by an approved risk-based internal audit plan, Internal audit assessing the adequacy of controls mitigating the risks and the audit Committee monitoring implementation of corrective actions.
the following internal audit engagements were approved by the audit Committee and completed by Internal audit during the year under review:

AnnuAl report 2018-2019 Governance148
Assurance Engagements:
DPsa Directive Delegations
transfer Payments
Recruitment and selection
supply Chain Management: Contract Management
Consulting Engagements:
Corporate Governance – enterprise Risk Management
Follow-ups:
two DPsa Directive Delegations
three transfer Payments
safety and security of staff and Infrastructure at Facilities
Facility Warehouse Management
Commuted overtime
the internal audit plan was completed for the year. the areas for improvements, as noted by internal audit during performance of their work, were agreed to by management. the audit committee continues to monitor the actions on an on-going basis.
In-Year management & Monthly/Quarterly Reports
The Audit Committee is satisfied with the content and quality of the quarterly in-year management and performance reports issued during the year under review by the Accounting Officer of the Department in terms of the national treasury Regulations and the Division of Revenue act.
Evaluation of Financial Statements
the audit Committee has:
Reviewed and discussed the audited annual Financial statements to be included in the Annual Report, with the Auditor-General South Africa (AGSA) and the Accounting Officer;
Reviewed the aGsa’s Management Report and Management’s responses thereto;
Reviewed changes to accounting policies and practices as reported in the annual Financial statements; and
Reviewed material adjustments resulting from the audit of the Department.

AnnuAl report 2018 -2019 149Governance
Compliance
the audit Committee has reviewed the Department’s processes for compliance with legal and regulatory provisions.
Performance Information
the audit Committee has reviewed the information on predetermined objectives as reported in the annual Report. We concur with the findings of the AGSA as reviewed and management’s responses thereto.
Report of the Auditor General of South Africa
We have on a quarterly basis reviewed the Department’s implementation plan for audit issues raised in the prior year. the audit Committee has met with the aGsa to ensure that there are no unresolved issues that emanated from the regulatory audit. Corrective actions on the detailed findings raised by the AGSA will continue to be monitored by the audit Committee on a quarterly basis.
the audit Committee concurs and accepts the auditor-General of south africa’s opinion regarding the annual Financial statements, and proposes that these audited annual Financial statements be accepted and read together with their report.
The Audit Committee commends the Accounting Officer and her team on addressing the control deficiencies previously reported and their efforts to progress to a clean audit in this Department.
________________
Mr Ronnie Kingwill
Chairperson of the Health Audit Committee
Date: 25 July 2019


PART DHuman ResouRce management

AnnuAl report 2018-2019 Human Resource Management152
Part D: Human Resource Management
Legislation that governs Human Resource Management
the information provided in this part is prescribed by Public service Regulation 31(1). In addition to the Public service Regulations, 2016, the following prescripts direct Human Resource Management within the Public service:
occupational Health and safety act (85 of 1993)
to provide for the health and safety of persons at work and for the health and safety of persons in connection with the use of plant and machinery; the protection of persons other than persons at work against hazards to health and safety arising out of or in connection with the activities of persons at work; to establish an advisory council for occupational health and safety; and to provide for matters connected therewith.
Public service act 1994, as amended by act (30 of 2007)
to provide for the organisation and administration of the public service of the Republic, the regulation of the conditions of employment, terms of office, discipline, retirement and discharge of members of the public service, and matters connected therewith.
labour Relations act (66 of 1995)
To regulate and guide the employer in recognising and fulfilling its role in effecting labour peace and the democratisation of the workplace.
basic Conditions of employment act (75 of 1997)
to give effect to the right to fair labour practices referred to in section 23(1) of the Constitution by establishing and making provision for the regulation of basic conditions of employment; and thereby to comply with the obligations of the Republic as a member state of the International labour organisation; and to provide for matters connected therewith.
skills Development act (97 of 1998)
to provide an institutional framework to devise and implement national, sector and workplace strategies to develop and improve the skills of the south african workforce; to integrate those strategies within the National Qualifications Framework contemplated in the South African Qualifications Authority Act, 1995; to provide for Iearnerships that lead to recognised occupational qualifications; to provide for the financing of skills development by means of a levy-grant scheme and a national skills Fund; to provide for and regulate employment services; and to provide for matters connected therewith.
AnnuAl report 2018 -2019 153Human Resource Management
employment equity act (55 of 1998)
to promote equality, eliminate unfair discrimination in employment and to ensure the implementation of employment equity measures to redress the effects of discrimination; to achieve a diverse and efficient workforce broadly representative of the demographics of the province.
Public Finance Management act (1 of 1999,)
To regulate financial management in the national government and provincial governments; to ensure that all revenue, expenditure, assets and liabilities of those governments are managed efficiently and effectively; to provide for the responsibilities of persons entrusted with financial management in those governments; and to provide for matters connected therewith.
skills Development levy act (9 of 1999)
to provide any public service employer in the national or provincial sphere of Government with exemption from paying a skills development levy; and for exemption from matters connected therewith.
Promotion of access to Information act (2 of 2000)
to give effect to the constitutional right of access to any information held by the state and any information that is held by another person and that is required for the exercise or protection of any rights; and to provide for matters connected therewith.
Promotion of administrative Justice act (PaJa) (3 of 2000)
to give effect to the right to administrative action that is lawful, reasonable and procedurally fair and to the right to written reasons for administrative action as contemplated in section 33 of the Constitution of the Republic of south africa, 1996; and to provide for matters incidental thereto.

AnnuAl report 2018-2019 Human Resource Management154
Introduction
People Management (PM) has a pivotal role in ensuring the success of the Healthcare 2030 strategy to address the requirements for a person-centred quality health service, as employees are the most critical enabler. the Human Resources for Health strategy (HRH, 2011), in terms of the Public service legislative framework, will significantly influence the strengthening of health systems toward delivering the Public Value of improved health and wellness, a long quality of life and a good experience of the Department’s services. this will contribute to population outcomes and the achievement of the Healthcare 2030 principles below:
Person-centred quality of care
outcomes based approach
the primary health care (PHC) philosophy
strengthening the district health services model
equity
Cost effective and sustainable health service
Developing strategic partnerships
Value of Human Capital in the Department
The Status of Human Resources in the Department
the Department employs 31 549 staff members who are comprised of 63 per cent health professionals and 37 per cent administrative support and non-health professional staff. 93 per cent of the employees are employed in a permanent capacity.
overview of the workforce
the Department employs 31 914 staff members who are comprised of 64 per cent health professionals and 36 per cent administrative support staff. 92 per cent of the employees are employed in a permanent capacity.
overview of the workforce
72 per cent are females and 28 per cent are males. 32 per cent are black; 14 per cent are White, 52 per cent are Coloured and 2 per cent are Indian.
54 per cent of senior management positions are held by females.
sMs breakdown:- 3 per cent african Female
- 6 per cent african Male
- 26 per cent Coloured Female
- 20 per cent Coloured Male
- 2 per cent Indian Female
- 5 per cent Indian Male
- 23 per cent White Female
- 15 per cent White Male

AnnuAl report 2018 -2019 155Human Resource Management
208 persons are classified as disabled.
92 per cent of the staff is employed on a full-time permanent basis.
the length of service ranges from newly appointed staff to forty years.
The age profile of the workforce is:- 3 per cent under 25 years
- 44 per cent aged 25 to 40 years
- 41 per cent aged 41 to 55 years
- 9 per cent aged 56 to 60 years
- 3 per cent aged 61 to 65 years
People management in the main is a line function responsibility that is enabled and supported by PM practitioners and policies at various levels. the People Management roles and responsibilities include the following:
Head office (centralised level) provides for policy development, strategic co-ordination, monitoring and evaluation, and provincial oversight of people management.
Regional/district offices (decentralised level) provides for decentralised oversight and implementation support of PM policies and prescripts.
local institutional level (i.e. district, regional, specialised, tertiary and central hospitals) is where the majority of staff is managed and where the implementation of PM policies occurs.
People Management Priorities for 2018/19 and the Impact of these Priorities
WCG: Health has a staff establishment of 31 914 employees that attend to millions of patients annually within a stressful, busy and resource-constrained environment. It is easy to understand how staff working at the coalface can become mechanistic in the way they perform their tasks, slip into a mentality of clearing crowds and treat patients as cases on a daily basis. the biggest unintentional casualty is the human and caring factor in the service. to effectively address this there will be, amongst others, a greater focus on a transformed organisational culture including increased mindfulness of living the values of the Department on a daily basis. leadership and management development is furthermore regarded as key factors in the Department’s transformation journey. this requires the involvement of leaders at all levels and the incorporation of a values based system within all PM practices and processes.
the core focus of the Department will be on the following:
People strategy (Ps)
People Practices & administration (Pa)
People Development (PD)
employee Relations (eR)
employee Wellness (eW)
Change Management (CM)

AnnuAl report 2018-2019 Human Resource Management156
the task of PM will be to ensure that optimal PM direction, guidance and support (strategic and operational) with regard to Ps, Pa, PD, eR, eW and CM are provided at each level of the organisation.
Scarce Skills
occupational categories are continuously monitored to identify categories of scarcity through analysis of the difficulties in filling posts, attrition and the reasons thereof. Scarce skills planning must ensure that there is a pipeline of talent to meet demand. the recruitment and retention of scarce skills is enabled through the Occupation Specific Dispensation (OSD) and bursary funding. The nurse specialty categories, radiography specialties, forensic pathology specialists and technicians, engineers and medical case managers are the significant areas of focus.
Clean HR Audit
the Department achieved a clean audit report in 2017/18 in respect of PM matters. the implementation of the PM Compliance Monitoring Instrument (CMI) and Quarterly HR audit action Plan, including a focus on training and development in people management processes and practices, has proven to be effective in improving compliance with the PM regulatory framework.
the monthly CMI is utilised as a reporting tool to assist managers but also to hold managers accountable in executing their PM responsibilities. the Quarterly PM audit action Plan is utilised as a reporting tool by all PM offices at institutional level, district / regional offices and head office. The Western Cape Audit Committee is also informed on PM compliance based on the information obtained from the Quarterly PM audit action Plans. the Quarterly PM audit action Plan consists of all matters raised by the auditor-General over the past years and is updated if necessary on an annual basis.
the PM CMI in conjunction with PeRsal reports are furthermore utilised by the Component PM Compliance and training to prioritise institutions for investigations. Information obtained from the aforementioned interventions is used to provide assistance and training in order to enhance compliance.
Labour Relations
an effective Provincial Public Health and social Development sectoral bargaining Chamber where negotiations and consultation with organised labour take place were held throughout the reporting period. there were 8 Chamber meetings.
Disciplinary transgressions such as fraud, theft, sexual harassment, discrimination and Provincial Forensic Services Investigative outcomes are being dealt with at Provincial level, to ensure efficiency and consistency in the handling of such cases. there is continuous capacity building and outreach to managers and employees to effectively handle labour relations matters.

AnnuAl report 2018 -2019 157Human Resource Management
Employment Equity
the Department has developed an ee Plan for the period september 2017 - august 2022. there is currently a need to increase representivity in the disability and MMs categories. these two categories have been identified as performance indicators at the quarterly Departmental Monitoring and Evaluation Committee. the Department is committed to transformation and has developed an action plan and PM is in the process of implementing the actions that will address various employment practices and programmes in order to reach the goals and objectives of the employment equity Plan.
the Department is in the process of reviewing the employment equity clusters to further decentralise the clusters.
a diversity facilitator has been contracted to engage with senior management regarding issues of diversity, transformation and the commitment towards achieving employment equity numerical targets.
Barret Values Survey
organisational Culture is the collective behaviour that dominates how employees live and work within the Department and the organisational culture shows what is valued. organisational Culture has a direct impact on employee engagement and the Department’s performance capability. the prevailing culture that affects the organisation’s functionality versus dysfunctionality is called cultural entropy.
the barrett Values survey is a diagnostic tool to measure organisational culture that exists within an organisation. It gives an indication of personal values of employees and the current culture they experience, but also indicates what the desired culture should be and what to focus on to achieve this. the Department of Health participated in their 4th barrett Value survey in august 2017, which was available to employees online. The Department’s participation rate increased consistently since 2011 with a significant improvement in the participation during 2015 and 2017 respectively. Key factors that influence the willingness of employees to voice their opinion about the organisational culture were the strong advocacy by the Head of Department, senior managers and the Chief Directorate People Management in the Department to complete the survey.
the cultural entropy has decreased by at least 2 percentage points with each survey. the Department’s entropy decreased consistently from 26 per cent in 2011 to a much lower entropy score of 18 per cent in 2017. the Department recognizes that it wishes to continue to improve and reduce the entropy level below the current 18 per cent.
the Department’s current culture is highly aligned based on the outcomes of the barrett Values survey 2017. this means that there are no immediate hindrances experienced in the current culture, with the exception of controlling behaviour being experienced.

AnnuAl report 2018-2019 Human Resource Management158
There were 5 matching values, which is significant in demonstrating the alignment between the desired culture and what the staff experience. excessive attention to controls was noted as a limiting factor.
there are many positive aspects of the Department’s current culture that enables employees to live out some of their personal values, namely accountability, caring, respect, honesty, responsibility and commitment. employees indicated that the organisation is client-orientated and accessibility is a key component of the current culture. these are strong relational and organisational values that employees would like to continue seeing in the desired culture of the Department.
Certain needs have been expressed by employees, which have not been fulfilled since the 2015 Barrett Values survey. these needs are represented by the following values that remain a gap in the current culture:
• employee recognition
• Fairness
the Department has made increased efforts to recognise staff. these include recognising leaders who embody the competencies and abilities to connect, collaborate, learn, adapt and handle complexities. the Boundary Spanning Leadership awards and Innovation Exhibition was celebrated at the 2019 annual Health Indaba to fulfil employee recognition values. These efforts are the Departments intent, in conjunction with recognition awards ceremonies within facilities to be a values driven organisation and address the unfulfilled needs.
DotP, PtM has decided that the barret’s Value survey will not be conducted in 2019 and the pilot Values based leadership Program within DotP, has been prioritised for 2019.
Staff Satisfaction Survey
WCG: Health conducted a staff satisfaction survey (sss) during april and May 2018 throughout all districts, institutions and directorates within the Department. the survey was conducted by means of a self-administered questionnaire which was available in all three official languages. The survey was available online as well as in a paper based format for those staff members who do not have access to emails. there was a total of 7 379 responses received and this represents a 23.6 per cent (31 192) response rate.
the aim of the sss was to assess the organisational climate among employees in terms of their thoughts and opinions of the organisation, their job and their work environment. the primary dimensions assessed in the survey were related to opinion of the organisation, communication and consultation, leadership style, team functioning, drivers of commitment and retention, physical work environment, safety and security, performance appraisal and evaluation, support service provided, education and training, perceptions of change and individual wellness. the staff satisfaction survey comprised of 77 questions. the questionnaire is based on the national core standards as well the DPsa Wellbeing Framework. there was 1 qualitative question that was asked on the survey, “What are the 3 things which will make the place at which you work a better place?” twelve thousand six hundred and ninety-three (12 693) responses were received to this question.
The top five sub-themes that emerged were:
• Physical environment (operating conditions) (14.1 per cent); More staff (10.8 per cent) (other people);
• Resources (10.8 per cent) (operating conditions);
• Communication (8.4 per cent) (other people); and
• supervision (8.2 per cent) (other people).
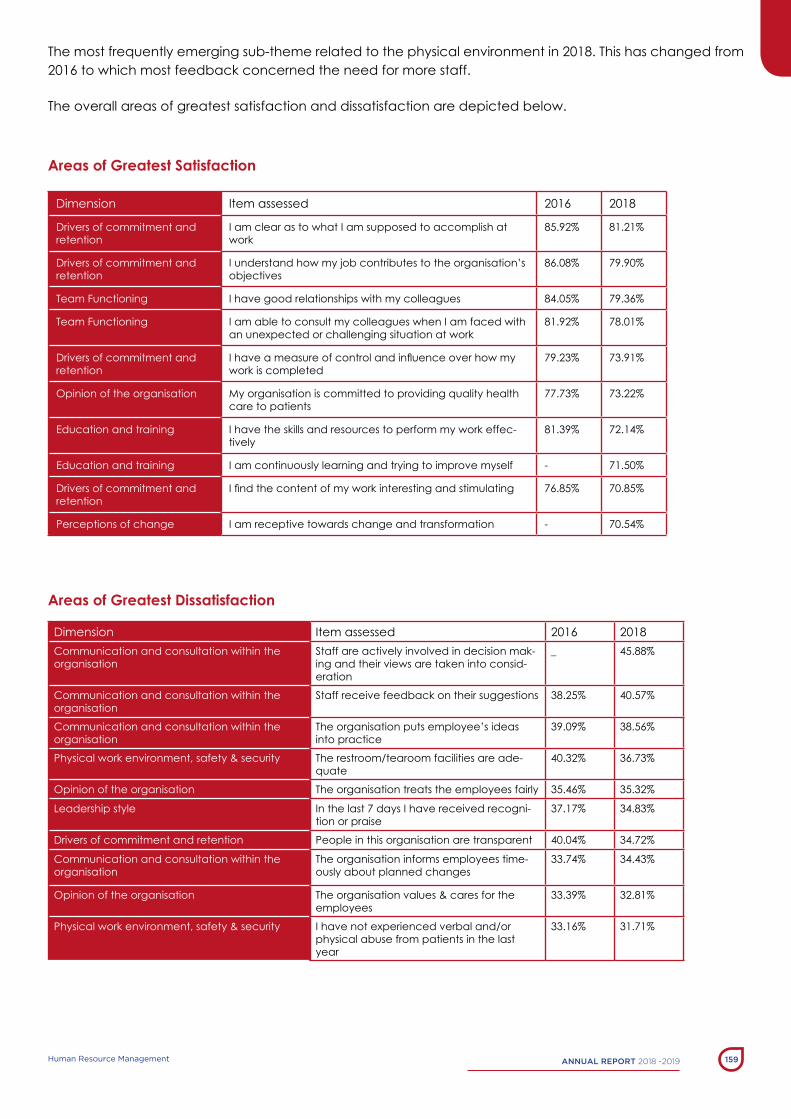
AnnuAl report 2018 -2019 159Human Resource Management
the most frequently emerging sub-theme related to the physical environment in 2018. this has changed from 2016 to which most feedback concerned the need for more staff.
the overall areas of greatest satisfaction and dissatisfaction are depicted below.
Areas of Greatest Satisfaction
Dimension Item assessed 2016 2018
Drivers of commitment and retention
I am clear as to what I am supposed to accomplish at work
85.92% 81.21%
Drivers of commitment and retention
I understand how my job contributes to the organisation’s objectives
86.08% 79.90%
team Functioning I have good relationships with my colleagues 84.05% 79.36%
team Functioning I am able to consult my colleagues when I am faced with an unexpected or challenging situation at work
81.92% 78.01%
Drivers of commitment and retention
I have a measure of control and influence over how my work is completed
79.23% 73.91%
opinion of the organisation My organisation is committed to providing quality health care to patients
77.73% 73.22%
education and training I have the skills and resources to perform my work effec-tively
81.39% 72.14%
education and training I am continuously learning and trying to improve myself - 71.50%
Drivers of commitment and retention
I find the content of my work interesting and stimulating 76.85% 70.85%
Perceptions of change I am receptive towards change and transformation - 70.54%
Areas of Greatest Dissatisfaction
Dimension Item assessed 2016 2018Communication and consultation within the organisation
staff are actively involved in decision mak-ing and their views are taken into consid-eration
_ 45.88%
Communication and consultation within the organisation
staff receive feedback on their suggestions 38.25% 40.57%
Communication and consultation within the organisation
the organisation puts employee’s ideas into practice
39.09% 38.56%
Physical work environment, safety & security the restroom/tearoom facilities are ade-quate
40.32% 36.73%
opinion of the organisation the organisation treats the employees fairly 35.46% 35.32%
leadership style In the last 7 days I have received recogni-tion or praise
37.17% 34.83%
Drivers of commitment and retention People in this organisation are transparent 40.04% 34.72%
Communication and consultation within the organisation
the organisation informs employees time-ously about planned changes
33.74% 34.43%
opinion of the organisation the organisation values & cares for the employees
33.39% 32.81%
Physical work environment, safety & security I have not experienced verbal and/or physical abuse from patients in the last year
33.16% 31.71%

AnnuAl report 2018-2019 Human Resource Management160
the results of the survey will be used as a planning tool within the Department in order to attain person-centred care and strive towards achieving the outcomes as outlined in Healthcare 2030. In total, 13 Feedback sessions were presented to top management as well as sub-structure/district management teams within the Province.
The next Staff Satisfaction Survey will be conducted during the 2019/20 financial year. The Staff and Barret surveys alternate yearly.
Employee Health & Wellness Programme
an employee Health and Wellness programme assists employees and the Department with maintaining a work life balance which has multi-faceted benefits. This includes increased productivity and patient centred care. this leads to reduced absenteeism, improved morale, improved departmental image as an employer of choice. employees are happier at work and patients are able to see this in the level of care that they are provided with.
employee Health and Wellness Programme (eHWP)
eHWP has evolved, with the services available to all employees and their immediate household members, Support to managers is available through the use of formal referrals, conflict mediation and managerial consultancy services. the employee Health and Wellness Programme (eHWP) encompass the following:
Individual wellness (physical);
Individual wellness (psycho-social);
organisational wellness; and
Work-life balance.
The overall engagement rate for the 2018/19 financial year, includes uptake of all services provided, amounted to 30.4 per cent during the period under review, which has increased slightly from 28.3 per cent.
During the period under review and the preceding period, the most commonly utilised service was Professional Counselling, which constitutes 49.9 per cent of total engagement in the most recent period and 46.7 per cent during the previous period.
Problems relating to stress constituted the most commonly presenting broad problem category during the most recent review period, accounting for 20.8 per cent of all difficulties. This is unchanged from the previous comparable period, when stress was the most commonly presenting problem, accounting for 20.0 per cent of all issues dealt with by the eHWP.
Managers accounted for 26.1 per cent (1 042 cases) of all individual utilisation, this is a decrease from 28.5 per cent (978 cases) in the previous year. the managerial consultancy service was used in 717 instances by managers to address workplace challenges in the year under review. the majority (56.0 per cent) of presenting problems from managers pertained to their staff under their management. Managers sought assistance for issues such as absenteeism, conflictual work relationships, disciplinary, performance management, general stress and work/life balance issues pertaining to their subordinates.

AnnuAl report 2018 -2019 161Human Resource Management
the formal referral process has the capacity to proactively identify and mitigate the impact of severely impacting problems on the well-being of employees. It is important that managers understand the importance of the eHWP in improving the productivity of their teams, maintaining team morale and mitigating behavioural risk to the organisation. the proportion of Western Cape Government Health users who were formally referred during the review period was 7.9 per cent (317 cases). this compares to 4.5 per cent to the public health sector. There is a significant increase in the number of assisted referrals. Employees were most commonly referred for absenteeism, stress and work/life balance issues. Face to face to counselling was provided and the majority of the cases were successfully resolved. the managerial consultancy and formal referral process ensures the referring manager is provided with support and guidance on how to manage the employee going forward. Regular reminders of the availability of this service will ensure consistent use.
the e-Care programme enables employees to manage their well-being online and sends employees a weekly e-mail with information on various health topics to promote physical and emotional well-being. For the reporting period 2018/19 (796) employees profiled themselves on the e-Care service which is an increase from the 719 profiled users in the previous reporting period. The top three health concerns amongst users have remained constant, namely and they are back/neck pain, stress, and hay fever/allergic rhinitis.
HIV/aIDs, stI’s & tb
the Department’s HIV workplace programme is guided by the national strategic Plan (nsP) for HIV, tb and stIs: 2017 – 2022 and the transversal Workplace Policy on HIV / aIDs, tb and stIs. It is aimed at minimising the impact of HIV and aIDs in the workplace and subsequently minimising the prevalence of HIV and aIDs in the Province. the HIV testing services (Hts) programme in the workplace was strengthened by not only catering for HIV testing, but also testing for other lifestyle diseases such as hypertension and diabetes, monitoring cholesterol and body mass index. this package of services provided by the Hts programme therefore offers an integrated approach to well-being.
a total number of 2 807 employees were tested during 2018/9, compared to a total number of 3 913 employees in the previous comparable period. the results revealed a decrease in the number of employees testing positive for HIV (17 employees tested positive during 2018/19 and 23 employees in 2017/18). employees that tested positive are immediately provided with on-site counselling, are referred into the medical schemes HIV and aIDs programme and also referred to the employee Wellness Programme, for further support.
safety, Health, environment, Risk & Quality (sHeRQ)
the Department’s safety, Health, environment, Risk and Quality (sHeRQ) programme is guided by the Provincial sHeRQ Policy which has been revised. the policy ensures that the Western Cape Government Health is committed to the provision and promotion of a healthy and safe environment for its employees and clients.

AnnuAl report 2018-2019 Human Resource Management162
there was a substantial increase in the number of oHs trained personnel at facility level. the internal occupational Health and safety Programme is available to institutions. the training is a two-day programme that aims to develop and capacitate employees to be competent oHs representatives. a total of 78 sessions were conducted during the reporting period covering 1202 employees. the learning outcome of the programme is to enable an understanding of the oHs act and its relevance in the workplace with particular emphasis on:
the Duty of the employer (Managers, supervisors (section16 sub-section 4)
the Duty of the employee
the Duties and Function of the safety Representative
the Role and Function of the safety Committee
How to conduct Risk assessments
the Department has improved its legislative compliance to train employees in occupational Health and safety. the below mentioned depicts the total number of employees trained.
• First aid 472 employees
• Fire Fighting 580 employees
• occupational Health & safety Rep 178 employees
• Incident Investigation 201 employees
• emergency evacuation 239 employees
The EHW component assisted with 69 fire drills, fire risk assessments and fire safety induction awareness sessions at various facilities.
Diversity Management
the Department acknowledges the need to engage on matters of diversity in the workplace. there are measures which has been put in place to create awareness, accessibility and accommodation when embracing diversity that are inclusive of race, gender, disability, culture and language.
Disability
During the 2018/19 reporting period the number of employees with a disability has increased to 202 towards the numerical target of 2 per cent on the employment of persons with disabilities.
the Department continues with the implementation of the JobaCCess strategic Framework for disability.

AnnuAl report 2018 -2019 163Human Resource Management
the strategic framework is focused on creating an enabling environment, provide equal opportunity and mainstreaming disability into all projects and programmes of the Department to attain a barrier free workplace by implementing key initiatives such as:
• Disability sensitisation and awareness;
• advocating for disability disclosure in the working environment;
• Facilitating return-to-work due to injury, illness and accident that resulted in disability;
• Provide reasonable accommodation in the form of devices or services when it is required using the allocated budget;
• the mainstreaming of disability into the skills development programmes such as ePWP, bursary and other training and development initiatives of the Department;
• Policy adjustment to be inclusive of disability; and
• Development of guidelines and implementation of workplace accessibility assessments.
Gender
the Gender equality strategic Framework and the Departmental Gender Mainstreaming strategy provide the map for gender transformation within the WCGH. the strategic Framework and Mainstreaming strategy is based on four functional pillars; creating an enabling environment, equal opportunities, a barrier free workplace and gender mainstreaming. this aligns to the Department’s transformation strategy, leadership behaviours charter and the vision of Healthcare 2030.
During the 2018/19 reporting period the Department achieved 55 per cent women in senior Management. Focusing on the four functional pillars, measures have been implemented in order to sustain the target achieved. these include inter alia:
• Diversity facilitation targeted at top Management. this includes institutionalisation;
• Diversity sensitisation and awareness at all levels;
• Diversity Management;
• Gender Mainstreaming; and
• leadership Development aiming to strengthen the leadership pipeline and embed ‘everybody is a leader’.
the Department is committed to creating an enabling organisational culture that embraces diversity, equality of opportunities and a barrier free workplace where person-centered care is the core driving force.
Change Management
to support the Department’s transformation agenda, the Change Management sub directorate implemented Change Management Competency Program across the province to build the organisations

AnnuAl report 2018-2019 Human Resource Management164
change capability. the focus was to align change initiatives to the departmental strategies and objectives, application of change management methodologies and increase change management competency and maturity across the organisation. additional support has been provided to the following initiatives:
• transitioning of the CaIR program to the leadership Development and Culture Change Initiative;• Developing the theory of Change as it relates to the leadership Journey; • Post-Merger support to District 6 Facility to ensure alignment and congruency to the departmental
objectives; • Mowbray Maternity Values and Vision revision; • MeaP project - change management support embedded in the extensive consultation session;• Prosci Change Management Competency training extended to all HR Managers;• Commissioning of observatory Forensics Pathology Institute (oFPI) facility;• nyanga Junction Closure; and • Barrett Values Assessment & Staff Satisfaction Survey: on- going support and feedback provided to
Facilities to address limiting values and develop action plans;
Nursing
the nursing Information Management system (nIMs)
nIMs has 3 (three) Modules:
The NIMS Agency Module
nIMs (nursing information Management system) is an electronic booking system utilized to request and order supplementary nursing staff from private nursing agencies on contract with the Western Cape Government Health facilities. nIMs has been activated and staff trained at 195 health facilities in the Metro and Rural Districts.
The NIMS Staff Module standardizes the capturing of all staff information, streamlining and regulating all processes for capturing of staff information per facility, allocations, all types of leave. the nIMs staff module is currently activated at Helderberg Hospital, Red Cross War Memorial Children’s Hospital and the two (2) central hospitals.
The NIMS Internal Overtime Pool was piloted and is in full use at Mitchells’ Plain and Klipfontein sub-structure. the overtime Module assists institutions to manage and control overtime hours worked whilst allowing staff rotation within the sub-structure.
on-going support in terms of new training, activations, desktop support and upskilling in the various nIMs Modules is provided to the WCGH facilities and the nursing agencies. a generic email has been set-up: [email protected]. training Manuals, pamphlets and step-by-step guides have been developed to facilitate the training on these modules.
QR (Quick Response) codes on all new nIMs pamphlets enables access to nIMs via your mobile device or computer through http://nims.westerncape.gov.za
AnnuAl report 2018 -2019 165Human Resource Management
Formal nursing – Utilization of clinical platform
During the 2018 academic year, 3 370 nursing students, enrolled in different nursing programmes were placed for clinical learning experiences across the accredited health facilities in the province. a coordinated clinical placement system has been established for coordination of placement of all nursing students in the clinical setting from all public and private providers utilizing public health facilities for clinical training.
During the period under review, 390 community service nurses were placed in health facilities to fulfil their community nursing service obligations. the placement of community service nurses is done in collaboration with the national Department of Health and the south african nursing Council (sanC).
nursing Practice
the authorisation of Clinical nurse Practitioners (CnP’s) and the dispensing of medicines by professional nurses has been addressed to comply with the legislative requirements and to promote access to service delivery. a database of authorised nurse Practitioners has been developed and is monitored for compliance on annual bases by the Nursing Services Directorate. Nursing staffing guidelines (nurse-patient ratios) have been developed to ensure proper planning, allocation and utilisation of nurses in the clinical areas and to optimise the provisioning of quality patient care. nursing services Directorate participation in Inter-professional clinical governance structures such as Provincial Coordinated Governance Committees (PCGCs) was strengthened to improve clinical service standards and service delivery.
Workforce Planning Framework & Key Strategies to attract & recruit a skilled & capable workforce
Workforce planning for the health services is challenging and complex, however it is an important process to deliver optimal health care. a dedicated team has been constituted and is currently operational within the Department. the workforce planning framework used by the Department is aligned to the HR planning template provided by the Department of Public service and administration. an analysis is conducted of the external and internal environment, trends and changes of the macro environment and the workforce. this analysis together with the Department’s strategic direction and annual Performance Plan, informs a gap analysis to determine priorities that would have the greatest impact.
Employee Performance Management Framework
a Performance Management and Development system (PMDs), prescribed by the DPsa, has been operational since 2003. the system is managed on a decentralised basis where each district is responsible for the completion of its processes. The head office component also plays a policy management and oversight role in this regard. the new Directive’s from DPsa for salary levels 1-12 and sMs members were successfully implemented with effect from 1 april 2018.
Employee Wellness
Refer to section Employee Health and Wellness Programme under “People Management Priorities”.

AnnuAl report 2018-2019 Human Resource Management166
Policy Development
Policy development has been designated as a transversal function with the Department of the Premier as the custodian. The transversal nature of policy development also means that department-specific inputs are often not included in the final product. Policies therefore need to be accompanied by department-specific guidelines that must be drafted separately and issued in conjunction with the transversal policy. Department-specific guidelines are developed through a process of consultation with role-players in the Department in order to ensure wide participation and buy-in from managers. achievements over the last year include:
Further input to the draft DPsa HR Planning Guideline and toolkit.
Development of a proposal document and process for recognition of leaders and teams who demonstrate boundary spanning leadership.
Further in-depth review of the Recruitment and selection policy.
Process for implementing the revised Directive on Developmental Programmes (Internship).
Challenges faced by the Department
Financial Challenges
the greatest challenge is not with the design of an organisation and post structure itself, but rather the available budget to fund the post structure. The personnel budget is not sufficient to fund all posts on the approved organisation and post structure of the Department. The current funded approved staff establishment reflects a 5.7 per cent vacancy rate.
budget constraints are deemed to continue for the 2019/20 MteF period given the state of the economy and other related factors. this means that the Department will have to do more with less. this includes improving the productivity and efficiency amongst staff in all functional areas and on all levels within the Department. To protect the core business of the Department which is health service delivery and patient care, the impact of budget constraints need to be minimised on clinical functional areas and optimised within the administrative areas.
The Department is also busy with an alignment and efficiency of the current managerial structures within the Department of Health in terms of a Management and Efficiency Alignment Project (MEAP) in partnership with representatives from the Directorate organisation Design of the Department of the Premier. this project is addressing functions, processes and structures and reporting lines of management and support structures across the Department. an important by-product is the revision of the methodology of addressing oD requests in the Department to ensure the resulting staff establishments are financially sustainable.

AnnuAl report 2018 -2019 167Human Resource Management
Competencies
one of the main priority areas of our transformation journey focuses on culture change and dispersed leadership to ensure a people-centred health care system toward the overall goal of delivering public value. the leadership and Management Development strategy considers the individual, team-based and system competencies required to transform the organisation, and how the range of training programmes and workplace based leadership development interventions are best designed to support teamwork and distributed leadership. this will include a focus on inspiring shared values and purpose, engaging and connecting the team, relationship building, caring for self and others, and active communication.
the People Development Centre coordinates the clinical skills development of health professionals through a suite of interventions to meet the needs of staff at different stages of their career life cycle, in line with departmental needs. training is designed to develop the skills and competencies required to deliver the various packages of care. the interventions are also aligned to continuous professional development. Given the service pressures, it is difficult for staff to leave their workstations, therefore blended learning is identified as a medium. the clinical training packages are integrated to include transversal elements in all courses that are offered.
learning packages are clustered to promote a life course approach (children, adolescents, adults and the elderly life cycle). Content is integrated to include: Prevention, promotion, curative, rehabilitation and palliative aspects. empathic skills and monitoring and evaluation are included as an element of all clinical training courses. Health professionals are capacitated to meet the more immediate service challenges. these include inter alia; service pressures, first 1000 days, HIV/TB epidemic and non-communicable diseases, including mental health.
the therapeutic training Unit of the People Development centre is responsible for the training of lay counsellors and community health workers.
the future role and functions of community health workers and lay counsellors within the Department are being reviewed and pose challenges in terms of the planning of appropriate training interventions for these categories.
Full-time bursaries address scarce skills to ensure continuous availability of health and support professions, while part-time bursaries are offered to existing staff to ensure they develop the critical competencies required.
Developing the functional competencies to enable the operational support services of the Department and to ensure cohesion across the different care settings is also an area of focus.
People Development also coordinates the structured youth development programme, stimulating internship, learnership and training opportunities for the young recent matriculants and unemployed graduates. the programmes are based on departmental need and the availability of interns and learners provide a pipeline of talent into entry level posts, dependent on the availability of funded posts and a formal competitive process.
Managing of Grade Progression & accelerated Pay Progression
With the implementation of all the occupational specific dispensation (OSD) categories, grade progression and pay progression as well as accelerated grade and pay progression was introduced. the management thereof still remains a significant challenge as individuals can be grade progressed monthly depending on their years of service and hospitals had to develop manual data systems to ensure compliance.

AnnuAl report 2018-2019 Human Resource Management168
Recruitment of Certain Health Professionals
The recruitment of qualified and competent health professionals poses a challenge due to the scarcity of specialists in rural areas and the restrictive appointment measures that are imposed on certain of the occupations.
the limited number of funded medical intern and community service posts for health professionals is a challenge given that the need for posts exceeds the supply.
age of Workforce
44 per cent of the workforce is between the ages 25 to 40 years and 41 per cent between the ages 41 to 55 years. It is therefore necessary to recruit, train and develop younger persons and undertake succession planning. the average age of initial entry into the Department by professionals is 26 years, e.g. medical officers after completing their studies and compulsory in-service duties. The challenge remains to retain these occupational groups in a permanent capacity. The main reasons for resignations are for financial gain. An analysis indicates that the Department may experience a shortage of skilled staff in the near future due to a relatively high percentage (12 per cent) nearing retirement (65) or early retirement age (55). However, retirees mainly fall in the 60 – 64 age groups.
Future Human Resource Plans/Priorities
the Departmental HR Plan is reviewed on an annual basis in line with the departmental strategic Plan and the annual Performance Plan. the following are key HR priorities:
engagement on organisational Culture and Change Management;
leadership and Management Development;
address the shortage of scarce and critical skills in the Department;
assist with the development and design of an organisational model for the Department (MeaP);
address employment equity to improve ee statistics of Disability and MMs;
occupational Health and safety Capacity building and Compliance;
Clinical skills Development;
Capacity building and on-boarding toolkit;
Capacity building and outreach to managers to effectively manage employee relations;
Dispute Management and Prevention;
building/transforming Workplace Relations;
Develop a non-Financial Incentive system; and
ensure sound people management practices.
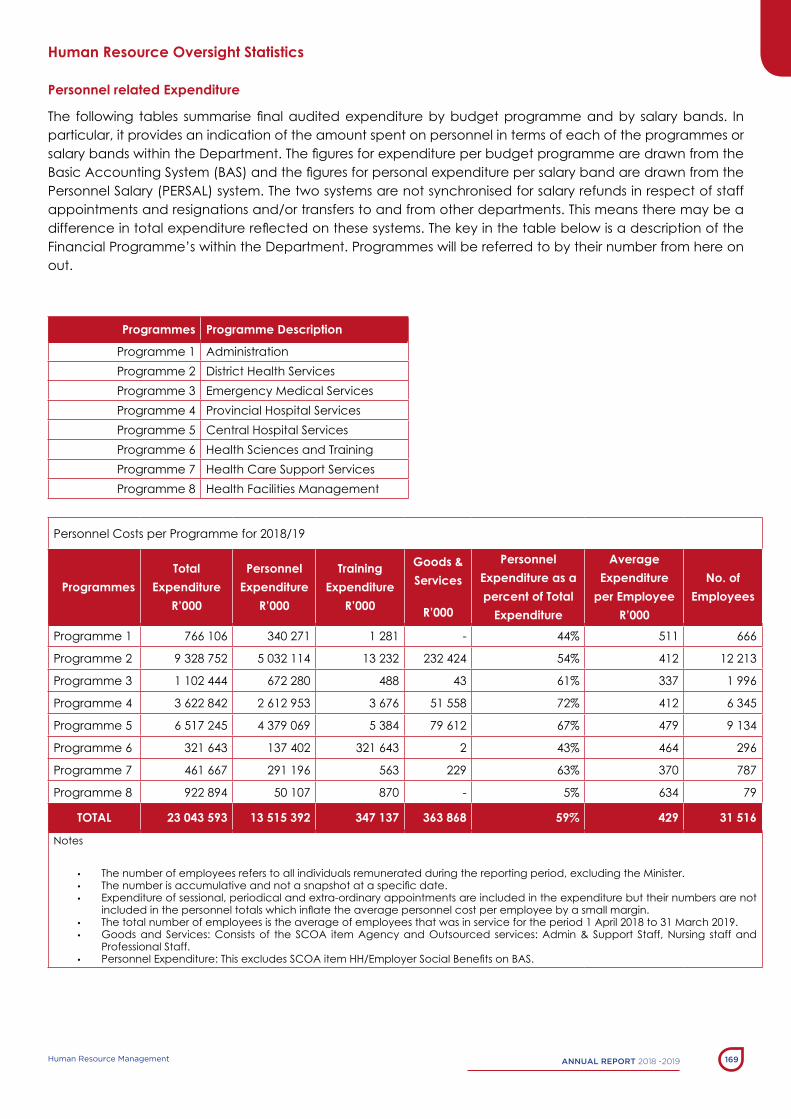
AnnuAl report 2018 -2019 169Human Resource Management
Human Resource Oversight Statistics
Personnel related Expenditure
The following tables summarise final audited expenditure by budget programme and by salary bands. In particular, it provides an indication of the amount spent on personnel in terms of each of the programmes or salary bands within the Department. The figures for expenditure per budget programme are drawn from the Basic Accounting System (BAS) and the figures for personal expenditure per salary band are drawn from the Personnel salary (PeRsal) system. the two systems are not synchronised for salary refunds in respect of staff appointments and resignations and/or transfers to and from other departments. this means there may be a difference in total expenditure reflected on these systems. The key in the table below is a description of the Financial Programme’s within the Department. Programmes will be referred to by their number from here on out.
Programmes Programme Description
Programme 1 administrationProgramme 2 District Health servicesProgramme 3 emergency Medical servicesProgramme 4 Provincial Hospital servicesProgramme 5 Central Hospital servicesProgramme 6 Health sciences and trainingProgramme 7 Health Care support servicesProgramme 8 Health Facilities Management
Personnel Costs per Programme for 2018/19
ProgrammesTotal
Expenditure R’000
Personnel Expenditure
R’000
Training Expenditure
R’000
Goods & Services
R’000
Personnel Expenditure as a percent of Total
Expenditure
Average Expenditure
per Employee R’000
No. of Employees
Programme 1 766 106 340 271 1 281 - 44% 511 666
Programme 2 9 328 752 5 032 114 13 232 232 424 54% 412 12 213
Programme 3 1 102 444 672 280 488 43 61% 337 1 996
Programme 4 3 622 842 2 612 953 3 676 51 558 72% 412 6 345
Programme 5 6 517 245 4 379 069 5 384 79 612 67% 479 9 134
Programme 6 321 643 137 402 321 643 2 43% 464 296
Programme 7 461 667 291 196 563 229 63% 370 787
Programme 8 922 894 50 107 870 - 5% 634 79
TOTAL 23 043 593 13 515 392 347 137 363 868 59% 429 31 516
notes
• the number of employees refers to all individuals remunerated during the reporting period, excluding the Minister. • The number is accumulative and not a snapshot at a specific date.• expenditure of sessional, periodical and extra-ordinary appointments are included in the expenditure but their numbers are not
included in the personnel totals which inflate the average personnel cost per employee by a small margin.• the total number of employees is the average of employees that was in service for the period 1 april 2018 to 31 March 2019. • Goods and services: Consists of the sCoa item agency and outsourced services: admin & support staff, nursing staff and
Professional staff.• Personnel Expenditure: This excludes SCOA item HH/Employer Social Benefits on BAS.
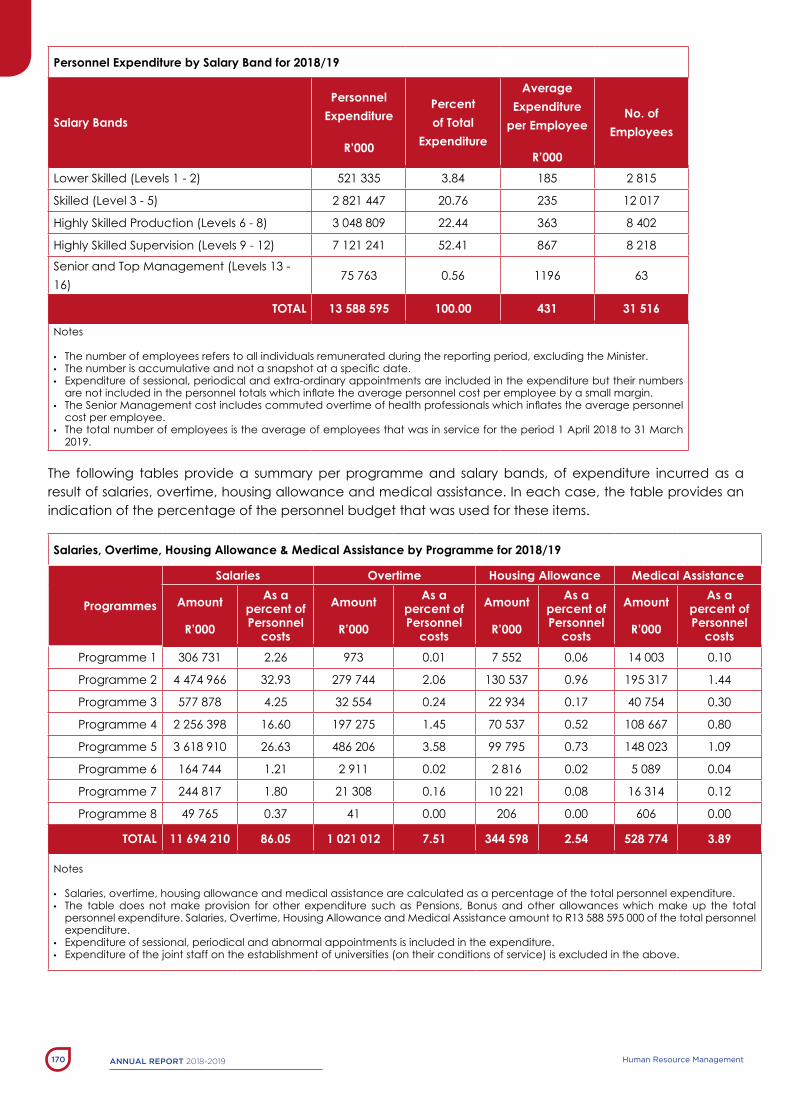
AnnuAl report 2018-2019 Human Resource Management170
Personnel Expenditure by Salary Band for 2018/19
Salary Bands
Personnel Expenditure
R’000
Percent of Total
Expenditure
Average Expenditure
per Employee
R’000
No. of Employees
lower skilled (levels 1 - 2) 521 335 3.84 185 2 815
skilled (level 3 - 5) 2 821 447 20.76 235 12 017
Highly skilled Production (levels 6 - 8) 3 048 809 22.44 363 8 402
Highly skilled supervision (levels 9 - 12) 7 121 241 52.41 867 8 218
senior and top Management (levels 13 - 16)
75 763 0.56 1196 63
TOTAL 13 588 595 100.00 431 31 516
notes
• the number of employees refers to all individuals remunerated during the reporting period, excluding the Minister.• The number is accumulative and not a snapshot at a specific date.• expenditure of sessional, periodical and extra-ordinary appointments are included in the expenditure but their numbers
are not included in the personnel totals which inflate the average personnel cost per employee by a small margin.• The Senior Management cost includes commuted overtime of health professionals which inflates the average personnel
cost per employee.• the total number of employees is the average of employees that was in service for the period 1 april 2018 to 31 March
2019.
the following tables provide a summary per programme and salary bands, of expenditure incurred as a result of salaries, overtime, housing allowance and medical assistance. In each case, the table provides an indication of the percentage of the personnel budget that was used for these items.
Salaries, Overtime, Housing Allowance & Medical Assistance by Programme for 2018/19
Programmes
Salaries Overtime Housing Allowance Medical Assistance
Amount
R’000
As a percent of Personnel
costs
Amount
R’000
As a percent of Personnel
costs
Amount
R’000
As a percent of Personnel
costs
Amount
R’000
As a percent of Personnel
costsProgramme 1 306 731 2.26 973 0.01 7 552 0.06 14 003 0.10
Programme 2 4 474 966 32.93 279 744 2.06 130 537 0.96 195 317 1.44
Programme 3 577 878 4.25 32 554 0.24 22 934 0.17 40 754 0.30
Programme 4 2 256 398 16.60 197 275 1.45 70 537 0.52 108 667 0.80
Programme 5 3 618 910 26.63 486 206 3.58 99 795 0.73 148 023 1.09
Programme 6 164 744 1.21 2 911 0.02 2 816 0.02 5 089 0.04
Programme 7 244 817 1.80 21 308 0.16 10 221 0.08 16 314 0.12
Programme 8 49 765 0.37 41 0.00 206 0.00 606 0.00
TOTAL 11 694 210 86.05 1 021 012 7.51 344 598 2.54 528 774 3.89
notes
• salaries, overtime, housing allowance and medical assistance are calculated as a percentage of the total personnel expenditure. • the table does not make provision for other expenditure such as Pensions, bonus and other allowances which make up the total
personnel expenditure. salaries, overtime, Housing allowance and Medical assistance amount to R13 588 595 000 of the total personnel expenditure.
• expenditure of sessional, periodical and abnormal appointments is included in the expenditure.• expenditure of the joint staff on the establishment of universities (on their conditions of service) is excluded in the above.

AnnuAl report 2018 -2019 171Human Resource Management
Salaries, Overtime, Housing Allowance & Medical Assistance by Salary Band for 2018/19
Salary Bands
Salaries Overtime Housing Allowance Medical Assistance
Amount
R’000
As a percent of Personnel
costs
Amount
R’000
As a percent of Personnel
costs
Amount
R’000
As a percent of Personnel
costs
Amount
R’000
As a percent of Personnel
costslower skilled
(levels 1 - 2)433 449 3.19 8 031 0.06 35 309 0.26 44 547 0.33
skilled
(level 3 - 5)2 374 475 17.47 75 911 0.56 152 959 1.13 218 103 1.60
Highly skilled Production
(levels 6 - 8)2 722 822 20.03 73 600 0.54 98 475 0.72 153 911 1.13
Highly skilled supervision
(levels 9 - 12)6 088 404 44.80 863 470 6.35 57 855 0.43 111 511 0.82
senior and top Management (levels 13 - 16)
75 061 0.55 0 0.00 0 0.00 702 0.01
TOTAL 11 696 220 86.05 1 021 012 7.51 344 598 2.54 528 774 3.89
notes
• the totals in the table above do balance, however, due to the fact that the data is grouped by either programme or salary band and that it is rounded off to thousands, they reflect differently.
• expenditure of sessional, periodical and abnormal appointments is included in the expenditure.• expenditure of the joint establishment (universities conditions of service) is excluded in the above.• Commuted overtime is included in salary bands Highly skilled supervision (levels 9 -12) and senior Management (levels 13 - 16).
Employment & Vacancies
Employment & Vacancies by Programme as at the 31st March 2019
ProgrammesNo. of Funded
PostsNo. of Posts filled
Vacancy Rate percent
No. of persons additional to the
establishmentProgramme 1 750 650 13.33 7
Programme 2 13 092 12 438 5.00 167
Programme 3 2 092 1 981 5.31 0
Programme 4 6 751 6 411 5.04 112
Programme 5 9 860 9 302 5.66 87
Programme 6 374 260 30.48 28
Programme 7 848 788 7.08 0
Programme 8 90 84 6.67 8
TOTAL 33 857 31 914 5.74 409
notes
• nature of appointments periodical and abnormal is excluded. • Vacancy rate is based on funded vacancies.• Majority of the vacant posts in programme 6 are at the Western Cape College of nursing. WCCn was supposed to be
taking over by CPUT which never materialised. WCCN posts has thus become active and is in the process of being filled.

AnnuAl report 2018-2019 Human Resource Management172
Employment & Vacancies by Salary Band as at the 31st March 2019
Salary Bands No. of Funded Posts No. of Posts filledVacancy Rate
percent
No. of persons additional to the
establishment
lower skilled
(levels 1 - 2)3 067 2 870 6.42 0
skilled
(level 3 - 5)12 687 12 118 4.48 15
Highly skilled Production
(levels 6 - 8)
9 165 8 418 8.15 334
Highly skilled supervision
(levels 9 - 12)
8 867 8 443 4.78 59
senior and top Management (levels 13 - 16)
71 65 8.45 1
TOTAL 33 857 31 914 5.74 409
notes
• The information in this section is provided as a snapshot at of the end of the financial year under review.• nature of appointments periodical and abnormal is excluded. • Vacancy rate is based on funded vacancies.
Employment & Vacancies by Critical Occupations as at the 31st March 2019
Critical Occupations No. of Funded Posts No. of Posts filled Vacancy Rate percent
No. of persons
additional to the
establishment
Medical orthotist & prosthetist
14 14 0.00 0
Medical physicist 15 11 26.67 1
Clinical technologist 91 90 1.10 0
Pharmacist 449 436 2.90 9
Industrial technician 70 58 17.14 0
TOTAL 639 609 4.69 10
notes
• The information in this section is provided as a snapshot at of the end of the financial year under review.• nature of appointments periodical and abnormal is excluded. • Vacancy rate is based on funded vacancies.• the high vacancy rate in Medical Physicist and Industrial technicians seems high but there are only a few vacant
posts which inflates the vacancy rate.• the Critical occupations is being relooked at and a new critical occupation list will be reported in the next
financial year.

AnnuAl report 2018 -2019 173Human Resource Management
Job Evaluation
Job evaluation was introduced as a way of ensuring that work of equal value is remunerated equally.Within a nationally determined framework, executing authorities are required to evaluate each newpost in his or her organisation or re-evaluate any post where the post mandate or content has significantlychanged. this job evaluation process determines the grading and salary level of a post. Itshould be understood that Job evaluation and staff Performance Management differ in the sensethat Job evaluation refers to the value/weighting of the activities that are associated with the post.
Job Evaluations 2018/19
Salary Bands No. of posts
No. of jobs
evaluated
Percent of posts
evaluated
Posts Upgraded Posts Downgraded
No.Percent of Posts
EvaluatedNo.
Percent of Posts
Evaluatedlower skilled (levels 1 - 2) 3 067 3 0.10 0 0.00 0 0.00
skilled (level 3 - 5) 12 687 7 0.06 0 0.00 0 0.00
Highly skilled Production (levels 6 - 8) 9 165 12 0.13 0 0.00 0 0.00
Highly skilled supervision (levels 9 - 12) 8 867 11 0.12 0 0.00 0 0.00
senior Management service band a (levels 13) 55 5 9.09 0 0.00 0 0.00
senior Management service band b (levels 14) 10 0 0.00 0 0.00 0 0.00
senior Management service band C (levels 15) 5 0 0.00 0 0.00 0 0.00
senior Management service band D (levels 16) 1 0 0.00 0 0.00 0 0.00
TOTAL 33 857 38 0.11 0 0.00 0 0.00
notes
• the majority of posts on the approved establishment were evaluated during previous reporting years, and the job evaluation results are thus still applicable.
Profile of Employees whose Salary Positions Were Upgraded due to their Posts Being Upgraded, in 2018/19
Gender African Indian Coloured White TOTALFemale 0 0 0 0 0
Male 0 0 0 0 0
Total 0 0 0 0 0
employees with a disability 0 0 0 0 0
notes
none for the reporting period.
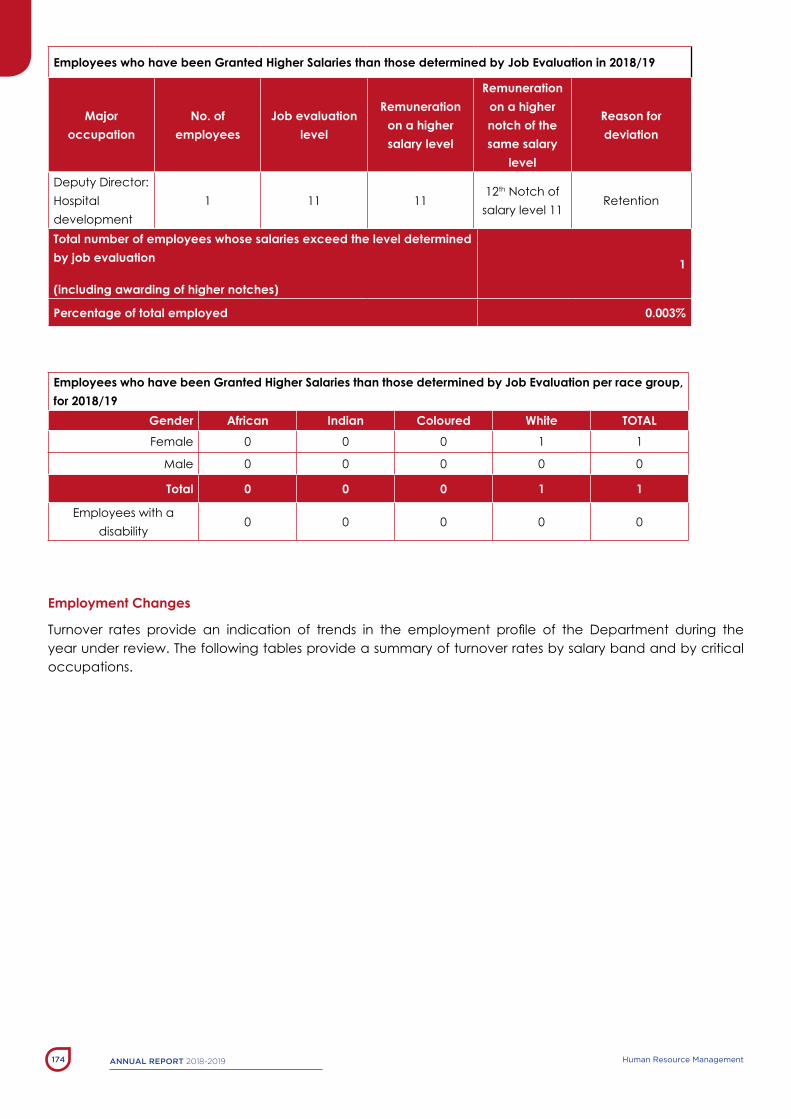
AnnuAl report 2018-2019 Human Resource Management174
Employees who have been Granted Higher Salaries than those determined by Job Evaluation in 2018/19
Major occupation
No. of employees
Job evaluation level
Remuneration on a higher salary level
Remuneration on a higher notch of the same salary
level
Reason for deviation
Deputy Director: Hospital development
1 11 1112th notch of salary level 11
Retention
Total number of employees whose salaries exceed the level determined by job evaluation
(including awarding of higher notches)
1
Percentage of total employed 0.003%
Employees who have been Granted Higher Salaries than those determined by Job Evaluation per race group, for 2018/19
Gender African Indian Coloured White TOTALFemale 0 0 0 1 1
Male 0 0 0 0 0
Total 0 0 0 1 1
employees with a disability
0 0 0 0 0
Employment Changes
Turnover rates provide an indication of trends in the employment profile of the Department during the year under review. the following tables provide a summary of turnover rates by salary band and by critical occupations.

AnnuAl report 2018 -2019 175Human Resource Management
Annual Turnover Rates by Salary Band for 2018/19
Salary Bands
No. of employees per band as at 31/03/18
Turnover rate
2017/18Appointments
Transfers into the
Department
Terminations out of the
Department
Transfers out of the
Department
Turnover rate
2018/19
lower skilled (levels 1 - 2)
2 795 5.32 309 0 156 4 5.72
skilled (level 3 - 5)
12 121 5.58 982 15 680 35 5.90
Highly skilled Production (levels 6 - 8)
8 425 13.73 1 069 6 1 184 12 14.20
Highly skilled supervision (levels 9 - 12)
8 143 16.80 1 320 23 1 218 39 15.44
senior Management service band a (levels 13)
50 5.77 2 0 4 0 8.00
senior Management service band b (levels 14)
10 0.00 0 0 1 0 10.00
senior Management service band C (levels 15)
4 0.00 0 0 0 0 0.00
senior Management service band D (levels 16)
1 0.00 0 0 0 0 0.00
TOTAL 31 549 10.64 3 682 44 3 243 90 10.56
notes
• “transfers” refer to the lateral movement of employees from one Public service Department to another (both Provincially &
nationally).

AnnuAl report 2018-2019 Human Resource Management176
Annual Turnover Rates by Critical Occupation for 2018/19
CRITICAL OCCUPATION
No. of
employees
per band as
at 31/03/18
Turnover rate
2017/18Appointments
Transfers
into the
Department
Terminations
out of the
Department
Transfers
out of the
Department
Turnover rate
2018/19
Clinical technologist
89 17.98 19 0 18 0 20.22
Industrial technician
63 4.76 5 0 7 0 11.11
Medical ort & Prosthetist
12 16.67 3 0 1 0 8.33
Medical Physicist 12 0.00 3 0 4 0 33.33
Pharmacists 429 20.28 90 0 79 3 19.11
TOTAL 605 17.85 120 0 109 3 18.51
notes
• transfers” refer to the lateral movement of employees from one Public service Department to another (both Provincially & nationally).
Staff leaving the employ of the Department in 2018/19
EXIT CATEGORY No. Percent of Total ExitsNo. of exits as a percent of total No. of employees as at 31/03/18
DeatH 62 1.91 0.19
ResIGnatIon 1 173 36.17 3.68
ContRaCt eXPIRY 1 422 43.85 4.46
DIsMIssal: Ill HealtH
80 2.47 0.25
DIsMIssal: InCaPaCItY
1 0.03 0.00
DIsMIssal: MIsConDUCt
32 0.99 0.10
RetIReMent 445 13.72 1.39
otHeR 28 0.86 0.09
TOTAL 3 243 100.00 10.16
notes
• The table identifies the various exit categories for those staff members who have left the employ of the Department.• 1 257 of the 1 422 contract expiries were employees from the medical professions, pharmacy interns, community service and
registrars.
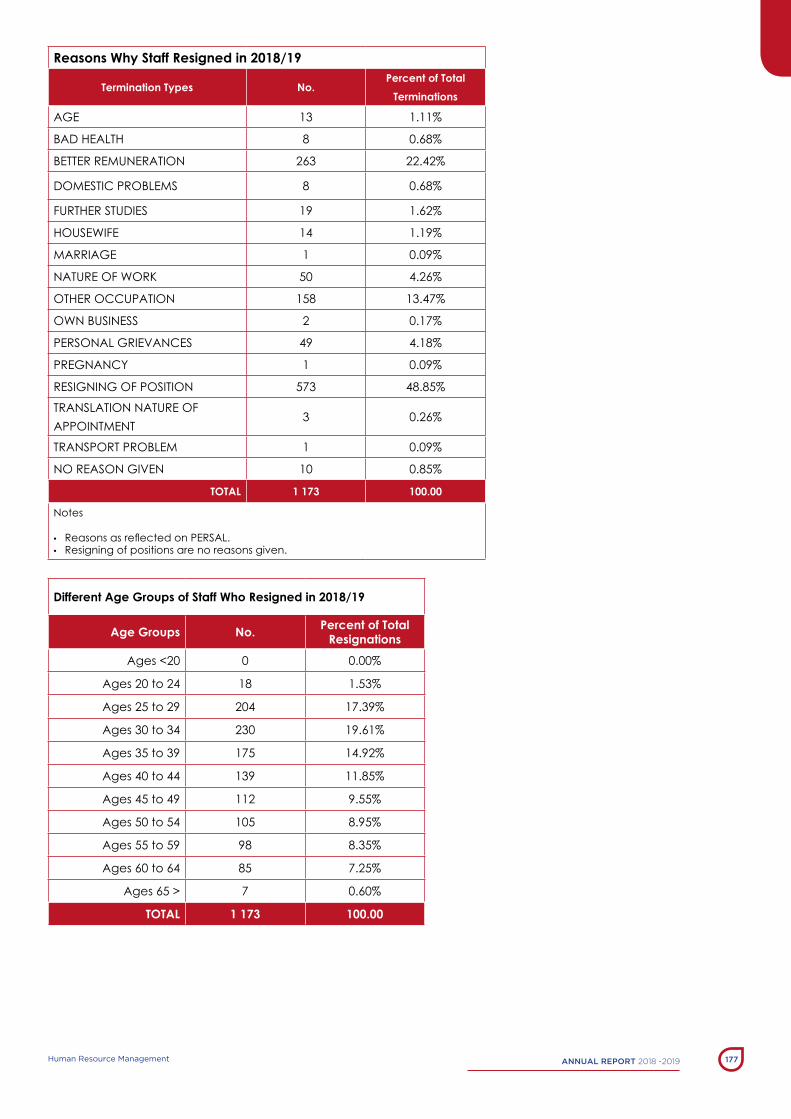
AnnuAl report 2018 -2019 177Human Resource Management
Reasons Why Staff Resigned in 2018/19
Termination Types No.Percent of Total
Terminations
aGe 13 1.11%
baD HealtH 8 0.68%
betteR ReMUneRatIon 263 22.42%
DoMestIC PRobleMs 8 0.68%
FURtHeR stUDIes 19 1.62%
HoUseWIFe 14 1.19%
MaRRIaGe 1 0.09%
natURe oF WoRK 50 4.26%
otHeR oCCUPatIon 158 13.47%
oWn bUsIness 2 0.17%
PeRsonal GRIeVanCes 49 4.18%
PReGnanCY 1 0.09%
ResIGnInG oF PosItIon 573 48.85%
tRanslatIon natURe oF aPPoIntMent
3 0.26%
tRansPoRt PRobleM 1 0.09%
no Reason GIVen 10 0.85%
TOTAL 1 173 100.00
notes
• Reasons as reflected on PERSAL.• Resigning of positions are no reasons given.
Different Age Groups of Staff Who Resigned in 2018/19
Age Groups No. Percent of Total Resignations
ages <20 0 0.00%
ages 20 to 24 18 1.53%
ages 25 to 29 204 17.39%
ages 30 to 34 230 19.61%
ages 35 to 39 175 14.92%
ages 40 to 44 139 11.85%
ages 45 to 49 112 9.55%
ages 50 to 54 105 8.95%
ages 55 to 59 98 8.35%
ages 60 to 64 85 7.25%
ages 65 > 7 0.60%
TOTAL 1 173 100.00

AnnuAl report 2018-2019 Human Resource Management178
Granting of Employee Initiated Severance Packages by Salary Band for 2018/19
SALARY BANDNo. of
applications received
No. of applications
referred to the MPSA
No. of applications supported by
MPSA
No. of packages approved by Department
lower skilled (levels 1 - 2) 0 0 0 0
skilled (level 3 - 5) 0 0 0 0
Highly skilled Production (levels 6 - 8) 0 0 0 0
Highly skilled supervision (levels 9 - 12) 1 0 0 0
senior & top Management
(levels 13 - 16)0 0 0 0
TOTAL 1 0 0 0
Promotions by Salary Band for 2018/19
SALARY BAND Employees as at the 31/03/18
Promotions to another salary
level
Salary band promotions as a percent of
employees by salary level
Progressions to another notch within a salary
level
Notch progression as a percent of
employeeslower skilled(levels 1 - 2) 2 795 315 11.27 1 363 48.77
skilled(level 3 - 5) 12 121 616 5.08 5 957 49.15
Highly skilled Production (levels 6 - 8) 8 425 577 6.85 2 846 33.78
Highly skilled supervision (levels 9 - 12) 8 143 478 5.87 2 898 35.59
senior & top Management (levels 13 - 16)
65 4 6.15 42 64.62
TOTAL 31 549 1 990 6.31 13 106 41.54
Promotions by Critical Occupation in 2018/19
CRITICAL OCCUPATIONNo. of
employees as at 01/04/18
Promotions to another salary
level
Salary level promotions as a percent of employees
Progressions to another notch within a salary
level
Notch progression as a percent of employees
Clinical technologist 89 11 12.36 29 33
Industrial technician 63 5 7.94 29 46
Medical orthotist and prosthetist 12 2 16.67 3 25
Medical physicist 12 0 0.00 7 58
Pharmacists 429 15 3.50 216 50.35
TOTAL 605 33 5.45 284 46.94

AnnuAl report 2018 -2019 179Human Resource Management
Employment Equity
Total Number of Employees per Occupational Band, including employees with disabilities, as at the 31st March 2019
OCCUPATIONAL LEVELS
MALE FEMALE FOREIGN NATIONALS total
African Coloured Indian White African Coloured Indian White Male Female
top Management
(levels 14-16)
1 4 1 2 1 2 1 3 0 0 15
senior Management
(levels 13)
2 7 2 8 1 15 0 12 0 0 47
Professionally qualified / experienced specialists / Mid-management
(levels 11-12)
63 263 89 501 78 404 114 665 41 50 2 268
skilled technical / academically qualified workers / Junior management, / supervisors, foremen, and superintendents
(levels 8- 10)
257 707 16 185 785 2 927 67 921 9 8 5 882
semi-skilled and discretionary decision making (level 4-7)
1 284 2 561 28 241 4066 6 341 40 713 3 7 15 284
Unskilled and defined decision making
(levels 1-3)
805 994 5 45 2389 1 729 4 32 1 1 6 005
SUB-TOTAL 2 412 4 536 141 982 7 320 11 418 226 2 346 54 66 29 501
temporary employees 146 199 90 371 298 502 146 585 35 41 2413
TOTAL 2 558 4 735 231 1 353 7 618 11 920 372 2 931 89 107 31 914
notes:• nature of appointments periodical and abnormal is excluded. • total number of employees includes employees additional to the establishment.
Total Number of Employees with Disabilities per Occupational Band, as at the 31st March 2019
OCCUPATIONAL LEVELS
MALE FEMALE FOREIGN NATIONALS TOTAL
African Coloured Indian White African Coloured Indian White Male Female
top Management(levels 14-16) 0 0 0 0 0 0 0 0 0 0 0
senior Management(levels 13) 0 0 0 0 0 0 0 0 0 0 0
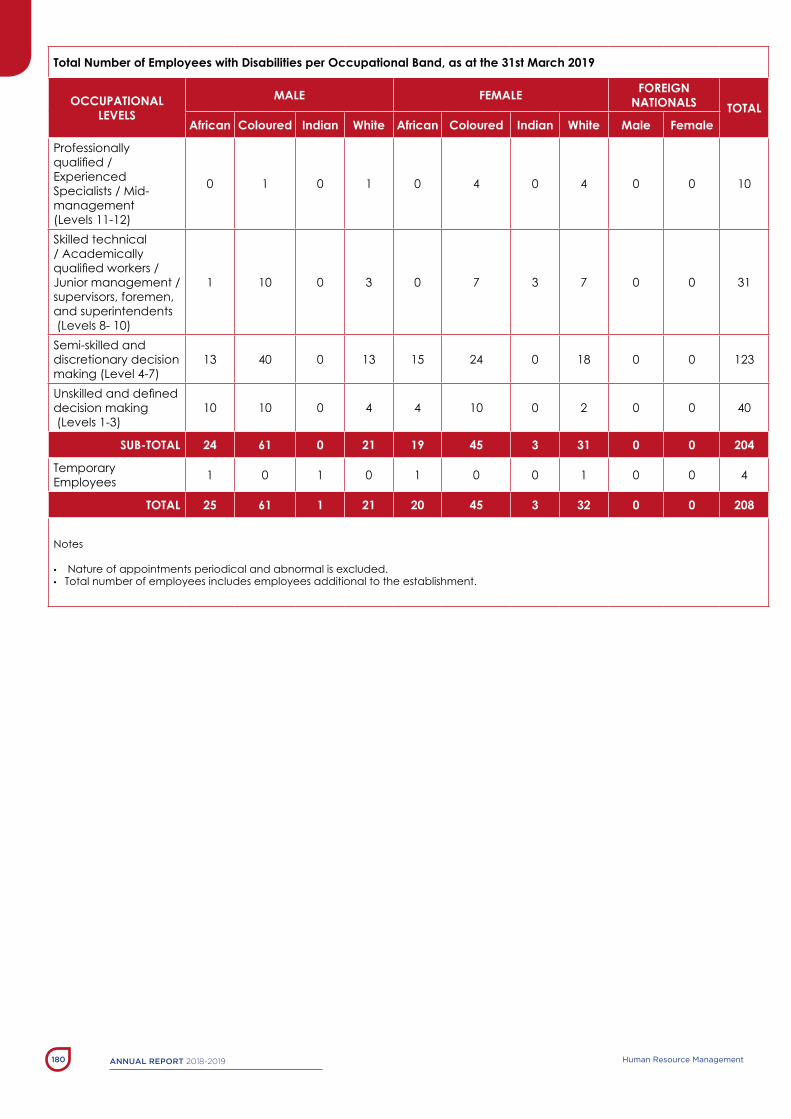
AnnuAl report 2018-2019 Human Resource Management180
Total Number of Employees with Disabilities per Occupational Band, as at the 31st March 2019
OCCUPATIONAL LEVELS
MALE FEMALE FOREIGN NATIONALS TOTAL
African Coloured Indian White African Coloured Indian White Male Female
Professionally qualified / experienced specialists / Mid-management(levels 11-12)
0 1 0 1 0 4 0 4 0 0 10
skilled technical / academically qualified workers / Junior management / supervisors, foremen, and superintendents (levels 8- 10)
1 10 0 3 0 7 3 7 0 0 31
semi-skilled and discretionary decision making (level 4-7)
13 40 0 13 15 24 0 18 0 0 123
Unskilled and defined decision making (levels 1-3)
10 10 0 4 4 10 0 2 0 0 40
SUB-TOTAL 24 61 0 21 19 45 3 31 0 0 204
temporary employees 1 0 1 0 1 0 0 1 0 0 4
TOTAL 25 61 1 21 20 45 3 32 0 0 208
notes
• nature of appointments periodical and abnormal is excluded. • total number of employees includes employees additional to the establishment.

AnnuAl report 2018 -2019 181Human Resource Management
Recruitment in 2018/19
OCCUPATIONAL LEVELS
MALE FEMALE FOREIGN NATIONALS TOTAL
African Coloured Indian White African Coloured Indian White Male Female
top Management(levels 14-16) 0 0 0 0 0 0 0 0 0 0 0
senior Management(levels 13)
0 0 0 0 0 0 0 0 0 0 0
Professionally qualified / experienced specialists / Mid-management(levels 11-12)
11 39 15 76 7 22 13 53 6 8 250
skilled technical / academically qualified workers / Junior management, supervisors, foremen, and superintendents (levels 8- 10)
34 71 3 17 18 13 0 5 0 2 163
semi-skilled and discretionary decision making (level 4-7)
374 313 5 55 126 114 3 9 0 0 999
Unskilled and defined decision making(levels 1-3)
240 140 0 2 86 69 2 1 0 0 540
SUB-TOTAL 659 563 23 150 237 218 18 68 6 10 1 952
temporary employees 268 489 73 409 112 133 41 170 18 17 1730
TOTAL 927 1 052 96 559 349 351 59 238 24 27 3 682
notes
• total number of employees includes employees additional to the establishment.

AnnuAl report 2018-2019 Human Resource Management182
Promotions in 2018/19
OCCUPATIONAL LEVELS
MALE FEMALE FOREIGN NATIONALS TOTAL
African Coloured Indian White African Coloured Indian White Male Female
top Management(levels 14-16) 0 0 0 0 0 1 0 0 0 0 1
senior Management(levels 13)
0 0 0 1 0 2 0 0 0 0 3
Professionally qualified / experienced specialists / Mid-management(levels 11-12)
5 13 3 20 1 22 6 27 1 3 101
skilled technical / academically qualified workers / Junior management, / supervisors, foremen, and superintendents (levels 8- 10)
24 60 1 15 90 249 4 73 2 1 519
semi-skilled and discretionary decision making (level 4-7)
92 157 2 15 325 349 0 28 0 0 968
Unskilled and defined decision making (levels 1-3)
59 57 0 1 91 105 0 4 0 0 317
SUB-TOTAL 180 287 6 52 507 728 10 132 3 4 1 909
temporary employees 8 11 0 9 15 27 0 6 3 2 81
TOTAL 188 298 6 61 522 755 10 138 6 6 1 990
notes
• total number of employees includes employees additional to the establishment.• Promotions refer to the total number of employees who have advanced to a higher post level within the Department.

AnnuAl report 2018 -2019 183Human Resource Management
Terminations in 2018/19
OCCUPATIONAL LEVELS
MALE FEMALE FOREIGN NATIONALS TOTAL
African Coloured Indian White African Coloured Indian White Male Female
top Management
(levels 14-16)0 0 0 0 0 0 0 0 0 0 0
senior Management
(levels 13)
0 2 0 0 0 0 0 1 0 0 3
Professionally qualified / experienced specialists / Mid-management
(levels 11-12)
7 24 7 40 7 32 10 63 2 5 197
skilled technical / academically qualified workers / Junior management, / supervisors, foremen, and superintendents
(levels 8- 10)
66 123 2 19 218 385 2 79 1 0 895
semi-skilled and discretionary decision making (level 4-7)
18 47 1 13 57 193 4 77 0 0 410
Unskilled and defined decision making
(levels 1-3)
46 79 0 2 54 117 1 3 0 0 302
SUB-TOTAL 137 275 10 74 336 727 17 223 3 5 1 807
temporary employees 89 94 28 163 234 410 55 322 21 20 1436
TOTAL 226 369 38 237 570 1 137 72 545 24 25 3 243
notes:
• total number of employees includes employees additional to the establishment.• Temporary employees reflect all contract appointments.

AnnuAl report 2018-2019 Human Resource Management184
Disciplinary Actions in 2018/19
DISCIPLINARY ACTIONS
MALE FEMALE FOREIGN NATIONALS TOTAL
African Coloured Indian White African Coloured Indian White Male Female
total 21 23 1 2 11 16 0 1 0 0 75
notes
the disciplinary actions total refers to formal outcomes only and not headcount. For further information on the outcomes of the disciplinary hearings and types of misconduct addressed at disciplinary hearings.
Skills Development in 2018/19
OCCUPATIONAL LEVELSMALE FEMALE
TOTALAfrican Coloured Indian White African Coloured Indian White
top Management (levels 14-16) 1 4 1 2 0 1 1 3 13
senior Management (levels 13) 2 8 2 7 1 14 0 11 45
Professionally qualified / experienced specialists / Mid-management (levels 11-12)
41 147 46 259 50 209 58 322 1 132
skilled technical / academically qualified workers / Junior management, / supervisors, foremen, and superintendents (levels 8- 10)
147 368 7 88 444 1 735 46 587 3 422
semi-skilled and discretionary decision making (level 4-7)
596 1 200 11 102 1 917 3 057 21 348 7 252
Unskilled and defined decision making (levels 1-3)
278 344 4 14 930 646 2 17 2 235
SUB-TOTAL 1 065 2 071 71 472 3 342 5 662 128 1 288 14 099
temporary employees 2 10 1 5 4 38 1 24 85
TOTAL 1 067 2 081 72 477 3 346 5 700 129 1 312 14 184
Signing of Employment Agreements by SMS Members
All members of the SMS must conclude and sign performance agreements within specific timeframes. Information regarding the signing of performance agreements by sMs members, the reasons for not complying within the prescribed timeframes and disciplinary steps taken is presented here.

AnnuAl report 2018 -2019 185Human Resource Management
Signing of Performance Agreements per SMS Level as at the 31st May 2018
SMS LEVEL No. of funded SMS posts per level
No. of SMS Members per
level
No. of signed performance
agreements per level
Signed performance
agreements as percent of SMS members per
level
Head of Department (HoD) 1 1 1 100
salary level 16 (excl. HoD) 0 0 0 0
salary level 15 4 4 4 100
salary level 14 10 10 8 80
salary level 13 56 48 43 90
TOTAL 71 63 56 89notes:
• The number of funded SMS posts per level.
Reasons for Not Concluding the Performance Agreements of all SMS Members
2 sMs members were on maternity leave. 1 sMs member had a disagreement which was resolved on 5 June 2018.1 sMs member charge of reporting structure. 1 sMs member discussion took place before 31 May 2018 but due to leave commitments and the Manager was not available, completed on the 26 June 2018.1 sMs member currently on sabbatical leave (sl 14).1 sMs member resigned on 31 May 2018 (sl 14).
Disciplinary Steps taken for Not Concluding Performance Agreements
sMs members were informed that will not qualify for pay progression
Filing of SMS Posts
SMS Posts as at 30th September 2018
SMS LEVELTotal No. of funded SMS
posts per level
Total No. of SMS posts
filled per level
percent of SMS posts filled per
level
Total No. of SMS posts
vacant per level
percent of SMS posts vacant
per level
Head of Department (HoD) 1 1 100.00% 0 0.00%
salary level 16 (excl. HoD) 0 0 0.00% 0 0.00%
salary level 15 4 4 100.00% 0 0.00%
salary level 14 9 9 100.00% 0 0.00%
salary level 13 55 51 92.73% 4 7.27%
TOTAL 69 65 94.20% 4 7.25%notes:
• The number of funded SMS posts per level.

AnnuAl report 2018-2019 Human Resource Management186
SMS Post Information as at the 31st March 2019
SMS LEVELTotal No. of funded SMS
posts per level
Total No. of SMS posts
filled per level
percent of SMS posts filled per
level
Total No. of SMS posts
vacant per level
percent of SMS posts vacant
per level
Head of Department (HoD) 1 1 100.00% 0 0.00%
salary level 16 (excl. HoD) 0 0 0.00% 0 0.00%
salary level 15 5 4 80.00% 1 20.00%
salary level 14 10 10 100.00% 0 0.00%
salary level 13 55 50 90.91% 5 9.09%
TOTAL 71 65 91.55% 6 8.45%
Advertising and Filling of SMS Posts as at the 31st March 2019
SMS LEVEL
Advertising Filling of posts
No. of vacancies per level advertised in 6 months of becoming
vacant
No. of vacancies per level filled in 6 months after becoming vacant
No. of vacancies per level not filled in 6 months
but filled in 12 months
Head of Department (HoD) 0 0 0
salary level 16 (excl. HoD) 0 0 0
salary level 15 0 0 0
salary level 14 1 1 0
salary level 13 5 1 2
TOTAL 6 2 2
Reasons for Non-compliance with the timeframes for filling the vacant funded SMS Posts
SMS LEVEL Reasons for non-complianceHead of Department (HoD) n/a
salary level 16 (excl. HoD) n/a
salary level 15 n/a
salary level 14 n/a
salary level 13The Department is currently in a MEAP process and therefore a hold on the filling of SMS posts were placed. These posts will be filled after the approval of the new MaCRo structure of the Department.
Disciplinary steps taken to deal with Non-compliance in meeting the prescribed timeframes for the filling of SMS Posts
n/a

AnnuAl report 2018 -2019 187Human Resource Management
Employee Performance
Notch Progression per Salary Band for 2018/19
SALARY BANDEmployees as at
31 March 2018Progressions to another
notch within a salary level
Notch progressions as a percent of employees by
salary bandlower skilled
(levels 1 - 2)2 795 1 363 48.77
skilled
(level 3 - 5)12 121 5 957 49.15
Highly skilled Production
(levels 6 - 8)8 425 2 846 33.78
Highly skilled supervision
(levels 9 - 12)8 143 2 898 35.59
senior & top Management
(levels 13 - 16)65 42 64.62
TOTAL 31 549 13 106 41.54notes
• nature of appointments periodical and abnormal is excluded. • nurses have a 2 year pay progression cycle.• all staff on the maximum notch cannot receive pay progression.• all staff who are promoted and are not on the new notch for 12 months by 1 april – cannot receive pay progression.• all staff who are newly appointed must be on the notch for 24 months to qualify for pay progression.• In order to qualify for a notch progression there are certain criteria that is newly appointees only qualify for the notch after
completion of 24 months, nurses qualify biennial for a notch progression and other employees must be 12 months on a notch to qualify.
• notch progression is awarded within accepted norms.
Notch Progression per Critical Occupation for 2018/19
CRITICAL OCCUPATIONEmployees as at
31 March 2018Progressions to another
notch within a salary level
Notch progressions as a percent of employees by
salary band
Clinical technologist 89 29 33
Industrial technician 63 29 46
Medical orthotist & Prosthetist 12 3 25
Medical physicist 12 7 58
Pharmacists 429 216 50.35
TOTAL 605 284 46.94notes
• nature of appointments periodical and abnormal is excluded.

AnnuAl report 2018-2019 Human Resource Management188
Performance Reward by Race, Gender & Disability for 2018/19
RACE &GENDER
Beneficiary Profile Cost
No. of Beneficiaries
No. of employees in
group
percent of total group
Cost (R’000)
Per capita cost (R’000)
aFRICan
Male 331 2 500 13.24% 1 718 5
Female 923 7 331 12.59% 4 698 5
InDIan
Male 4 223 1.79% 23 6
Female 20 361 5.54% 141 7
ColoUReD
Male 924 4756 19.43% 5 486 6
Female 2 100 12 023 17.47% 13 546 6
White
Male 93 1 383 6.72% 689 7
Female 288 2 972 9.69% 2 417 8
eMPloYees WItH DIsabIlItIes 41 185 22.16% 235 6
TOTAL 4 683 31 549 14.84 28 718 6
notes
• the above table relates to performance rewards for the performance year 2017/18 and payment effected in the 2018/19 reporting period.
• nature of appointments periodical and abnormal is excluded. • Employees with a disability are included in race and gender figures and in “Total”.• Performance awards are based on a forced distribution curve (bell Curve). only 20% of employees can be awarded
a performance bonus.• In order to remain within the budget and 20% restriction the awards are allocated from the highest percentage
allocated to the lowest until the cut off has been reached.• The table is therefore not a reflection of all the above average performances within the Department but only in
respect of those that received a performance bonus.• only salary levels 1-8 qualify for performance bonuses.
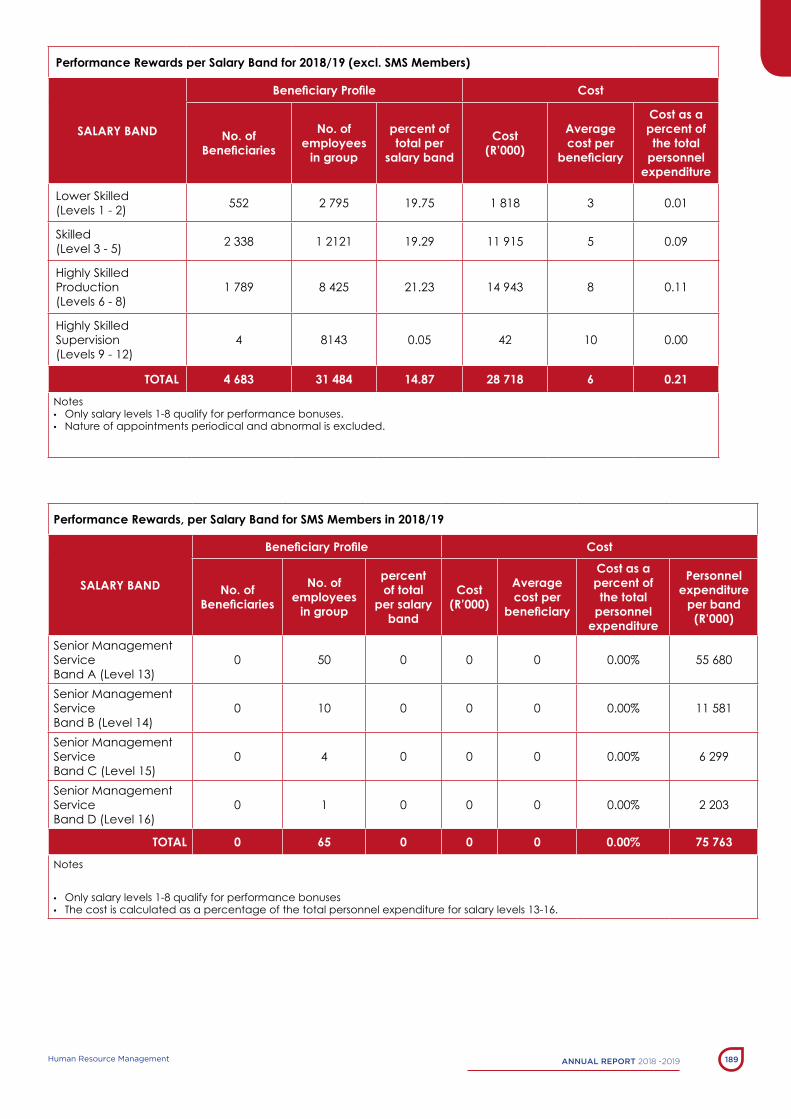
AnnuAl report 2018 -2019 189Human Resource Management
Performance Rewards per Salary Band for 2018/19 (excl. SMS Members)
SALARY BAND
Beneficiary Profile Cost
No. of Beneficiaries
No. of employees
in group
percent of total per
salary band
Cost (R’000)
Average cost per
beneficiary
Cost as a percent of the total
personnel expenditure
lower skilled(levels 1 - 2) 552 2 795 19.75 1 818 3 0.01
skilled(level 3 - 5) 2 338 1 2121 19.29 11 915 5 0.09
Highly skilled Production (levels 6 - 8)
1 789 8 425 21.23 14 943 8 0.11
Highly skilled supervision (levels 9 - 12)
4 8143 0.05 42 10 0.00
TOTAL 4 683 31 484 14.87 28 718 6 0.21
notes• only salary levels 1-8 qualify for performance bonuses. • nature of appointments periodical and abnormal is excluded.
Performance Rewards, per Salary Band for SMS Members in 2018/19
SALARY BAND
Beneficiary Profile Cost
No. of Beneficiaries
No. of employees
in group
percent of total
per salary band
Cost (R’000)
Average cost per
beneficiary
Cost as a percent of the total
personnel expenditure
Personnel expenditure
per band (R’000)
senior Management serviceband a (level 13)
0 50 0 0 0 0.00% 55 680
senior Management serviceband b (level 14)
0 10 0 0 0 0.00% 11 581
senior Management service band C (level 15)
0 4 0 0 0 0.00% 6 299
senior Management serviceband D (level 16)
0 1 0 0 0 0.00% 2 203
TOTAL 0 65 0 0 0 0.00% 75 763
notes
• only salary levels 1-8 qualify for performance bonuses • the cost is calculated as a percentage of the total personnel expenditure for salary levels 13-16.

AnnuAl report 2018-2019 Human Resource Management190
Performance Rewards, per Salary Band for Critical Occupation in 2018/19
CRITICAL OCCUPATION
Beneficiary Profile Cost
No. of Beneficiaries
No. of employees per critical occupation
percent of total per critical
occupation
Cost
(R’000)
Average cost per
beneficiary
Cost as a percent of the total
personnel expenditure
Clinical technologist 6 89 6.74 71 12 0.001%
Industrial technician 3 63 4.76 45 15 0.000%
Medical orthotist & Prosthetist
1 12 8.33 8 8 0.000%
Medical physicist 0 12 0.00 0 0 0.000%
Pharmacists 0 429 0.00 0 0 0.000%
TOTAL 10 605 1.65 124 12 0.001%
notes
• nature of appointments periodical and abnormal is excluded. • only salary levels 1-8 qualify for performance bonuses
Foreign Workers
the tables below summarise the employment of foreign nationals in the Department in terms of salary bands and by major occupation. the tables also summarise changes in the total number of foreign workers in each salary band and by each major occupation.
Foreign Workers per Salary Band for 2018/19
SALARY BAND1 April 2018 31 March 2019 CHANGE
No. Percent of Total No. Percent of
Total No. Percent of Change
lower skilled(levels 1 - 2) 0 0.00 0 0.00 0 0
skilled(level 3 - 5) 8 4.17 6 3.06 -2 -50
Highly skilled Production (levels 6 - 8)
11 5.73 15 7.65 4 100
Highly skilled supervision (levels 9 - 12)
173 90.10 175 89.29 2 50
senior & top Management (levels 13 - 16)
0 0.00 0 0.00 0 0
TOTAL 192 100.00 196 100.00 4 100
notes
• the table above excludes non-citizens with permanent residence in the Republic of south africa.• nature of appointment sessional, periodical and abnormal is not included.

AnnuAl report 2018 -2019 191Human Resource Management
Foreign Workers by major occupation in 2018/19
SALARY BAND1 April 2018 31 March 2019 CHANGE
No. Percent of Total No. Percent of
Total No. Percent of Change
Admin office workers 0 0.00 0 0.00 0 0.00
Craft related workers 0 0.00 0 0.00 0 0.00
elementary occupations 1 0.52 0 0.00 -1 -25.00
Professionals and managers 160 83.33 161 82.14 1 25.00
service workers 6 3.13 6 3.06 0 0.00
Senior officials and managers 0 0.00 0 0.00 0 0.00
technical and associated professionals
25 13.02 29 14.80 4 100.00
TOTAL 192 100.00 196 100 4 100.00
notes
• the table above excludes non-citizens with permanent residence in the Republic of south africa.• nature of appointment sessional, periodical and abnormal is not included.
Leave Utilisation
The Public Service Commission identified the need for careful monitoring of sick leave within the public service. the following tables provide an indication of the use of sick leave and incapacity leave. In both cases, the estimated cost of the leave is also provided.

AnnuAl report 2018-2019 Human Resource Management192
Sick Leave 1st January 2018 to 31st December 2018
SALARY BAND Total days
percent days with medical certification
No. of employees using sick
leave
Total No. of employees 31-12-2018
percent of total
employees using sick
leave
Average days per
employee
Estimated cost
(R’000)
lower skilled
(levels 1 - 2)22 171 86.54% 2 470 2 836 87.09% 8 8 748
skilled
(level 3 - 5)97 181 84.49% 10 684 12 031 88.80% 8 58 519
Highly skilled Production
(levels 6 - 8)
70 900 84.66% 7 605 8 426 90.26% 8 67 857
Highly skilled supervision
(levels 9 - 12)
54 897 82.97% 6 153 8 238 74.69% 7 103 789
senior & top Management
(levels 13 - 16)
278 69.78% 46 65 70.77% 4 869
TOTAL 245 427 84.37 26 958 31 596 85.32 8 239 782notes
• the three-year sick leave cycle started in January 2016.• nature of appointment sessional, periodical and abnormal is not included.• annual leave cycle is from 1 January - 31 December of each year.• sick leave reported in this table includes all categories of leave of 51, 52 and 53 (Incapacity).

AnnuAl report 2018 -2019 193Human Resource Management
Incapacity Leave (incl. temporary & permanent) from the 1st January 2018 - 31st December 2018
SALARY BANDTotal days
percent days with medical certification
No. of employees using incapacity leave
Total No. of employees
percent of total
employees using
incapacity leave
Average days per
employee
Estimated cost
(R’000)
lower skilled
(levels 1 - 2)3 717 100.00% 188 2 836 6.63% 20 1 505
skilled
(level 3 - 5)20 634 100.00% 758 12 031 6.30% 27 12 560
Highly skilled Production
(levels 6 - 8)
18 914 100.00% 683 8 426 8.11% 28 17 771
Highly skilled supervision
(levels 9 - 12)
14 742 100.00% 531 8 238 6.45% 28 27 610
senior & top Management
(levels 13 - 16)
8 100.00% 1 65 1.54% 0 24
TOTAL 58 015 100.00% 2161 31 596 6.84% 27 59 470notes
• the leave dispensation as determined in the “leave Determination”, read with the applicable collective agreements, provides for normal sick leave of 36 working days in a sick leave cycle of three years. If an employee has exhausted his or her normal sick leave, the employer must conduct an investigation into the nature and extent of the employee’s incapacity. such investigations must be carried out in accordance with item 10(1) of schedule 8 of the labour Relations act (lRa).
• Incapacity leave is not an unlimited amount of additional sick leave days at an employee’s disposal. Incapacity leave is additional sick leave granted conditionally at the employer’s discretion, as provided for in the leave Determination and Policy on Incapacity leave and Ill-Health Retirement (PIlIR).
• annual leave cycle is from 1 January - 31 December of each year.
a summary is provided in the table below of the utilisation of annual leave. the wage agreement concluded with trade unions in the Public service Commission bargaining Chamber (PsCbC) in 2000 requires management of annual leave to prevent high levels of accrued leave having to be paid at the time of termination of service.

AnnuAl report 2018-2019 Human Resource Management194
Annual Leave from the 1st January 2018 to 31st December 2018
SALARY BAND Total days takenTotal number of employees using annual leave
Average days per employee
lower skilled(levels 1 - 2) 62 632 2 838 22
skilled(level 3 - 5) 285 492 12 163 23
Highly skilled Production (levels 6 - 8)
216 489 8 855 24
Highly skilled supervision (levels 9 - 12)
206 018 8 528 24
senior & top Management (levels 13 - 16)
1 772 66 27
TOTAL 772 403 32 450 24notes• nature of appointment sessional, periodical and abnormal is not included.• annual leave cycle is from 1 January - 31 December of each year.
Capped Leave for the 1st January 2018 – 31st December 2018
SALARY BAND
Total capped
leave available
as at
31/12/17
Total days of capped
leave taken
No. of employees
using capped
leave
Average No. of days taken per employee
No. of employees
with capped
leave as at
31/12/18
Total capped
leave available
as at
31/12/18
lower skilled
(levels 1 - 2)395 4 2 2 59 325
skilled
(level 3 - 5)33 823 3 223 177 18 1 544 28 559
Highly skilled Production
(levels 6 - 8)
87 124 8 496 357 24 2 322 75 552
Highly skilled supervision
(levels 9 - 12)
73 963 5 390 297 18 1 923 66 738
senior & top Management
(levels 13 - 16)
902 112 5 22 21 877
TOTAL 196 205 17 225 838 21 5 869 172 051
notes• It is possible for the total number of capped leave days to increase as employees who were promoted or transferred
into the Department, retain their capped leave credits, which form part of that specific salary band and ultimately the departmental total.
• nature of appointment sessional, periodical and abnormal is not included.• annual leave cycle is from 1 January - 31 December of each year.

AnnuAl report 2018 -2019 195Human Resource Management
Leave Pay-Outs for 2018/19
REASONSTotal amount
(R’000)
No. of employees
Average per employee
(R’000)leave pay-outs for 2018/19 due to non-utilisation of
leave for the previous cycle348 19 18
Capped leave pay-outs on termination of service for
2018/1928 129 502 56
Current leave pay-outs on termination of service 2018/19 13 718 1 149 12
TOTAL 42 195 1 670 25
notes
• Capped leave are only paid out in case of normal retirement, termination of services due to ill health and death.
HIV/AIDS & Health Promotion Programmes
Steps taken to reduce the risk of occupational exposure, 1 April 2018 to 31 March 2019
HIV and AIDS & Health promotion programmes
Units/categories of employees identified to be at high risk of contracting HIV & related diseases (if any)
Key steps taken to reduce the risk
employees in clinical areas, i.e. doctors, nurses, medical students, general workers and paramedics are more at risk of contracting HIV and related diseases communicable diseases such as tb.
the table below depicts the nature of injuries reported by employees for 2018/19:
nature of injury on duty
total no. of cases reported
needle prick 196tuberculosis (tb) 28
• the HIV and aIDs/stI/tb Policy and safety, Health, environment, Risk and Quality (sHeRQ) policy within the Department identifies the prevention of occupational exposure to potentially infectious blood and blood products as a key focus area. the sHeRQ policy (2016) has been revised to have a greater focus on infection control.
• the WCGH has approved the strategic plan to formalise sHeRQ management in the Department. the following areas will be focused on: • occupational Health & safety statuary
appointments• occupational Health & safety Committee
compliance• occupational Health & safety Provincial Forum• occupational Health & safety Risk assessment
and Management • occupational Health & safety training and • Medical surveillance
• nPos have been appointed in the Districts and substructures providing HIV testing services (Hts) as part of a basket of health screenings that also include testing for blood Pressure, Diabetes, Cholesterol, and body Mass Index as well as tb and stI screening. these services are provided to employees at no cost, in partnership with GeMs.
• Infection control measures are implemented.• Responsive and educational programs targeting
behavioural risks have been implemented.

AnnuAl report 2018-2019 Human Resource Management196
Details of Health Promotion and HIV and AIDS programmes, 1 April 2018 to 31 March 2019
HIV and AIDS & Health promotion programmes
Question Yes No Details, if yes
(1) Has the Department designated a member of the sMs to implement the provisions contained in Part VI e of Chapter 1 of the Public service Regulations, 2001? If so, provide her/his name and position.
Mrs bernadette arries
Chief Director: People Management
(2) Does the Department have a dedicated unit or has it designated specific staff members to promote the health and well-being of your employees? If so, indicate the number of employees who are involved in this task and the annual budget that is available for this purpose.
Health and Wellness within the Directorate: People Practices and Administration, Health and Wellness at Head Office level:
Deputy DirectorMs sandra newman (Wellness,
Diversity & Disability)
assistant DirectorMs M buis (employee Health and
Wellness
assistant Director Mr Clive Cyster (sHeRQ: training)
Practitioner Ms lisl Mullins
acting Practitioner Ms Janice andrews (until the 28 February 2019)
Practitioner Mr nabeel Ismail
Institutional and district level:
• Groote schuur Hospital: Ruth Halford
• tygerberg Hospital: sayeeda Dhansay & Jillene Johnson
• Red Cross Hospital: ntombozuko Ponono & Galiema Haroun
• associated Psychiatric Hospitals: Jessica Minnaar, anne Marie basson, Valerie nel
• Cape Winelands District: bJ Vd Merwe
• overberg District: nico liebenberg
• West Coast District: Willem small
• eden/Central Karoo Districts: lindiwe Mguzulwa
• Metro District Health services: Riaan Van staden
• Rural Districts Health services: nuruh Davids
• eMs: liesel Meter & emma Hoffmeyer
• FPS: Deon Bruiners & Safia Samsodien
budget allocation R 4.7 million

AnnuAl report 2018 -2019 197Human Resource Management
HIV and AIDS & Health promotion programmes
Question Yes No Details, if yes
(3) Has the Department introduced an employee assistance or Health Promotion Programme for your employees? If so, indicate the key elements/services of this programme.
the Department follows an integrated approach whereby internal and external services are utilised. an independent service provider, ICas, has been appointed for the period 2015-2018 to provide this confidential service and two institutions have an internal service in addition to the external service
Programmes and services offered:
(1) Counselling and support services:
• 24/7/365 telephone counselling;
• the service is available to all employees and their household members;
• Face to face counselling (6 session model) per issue;
• Case management;
• trauma/critical incident management; and
• HIV and aIDs counselling.
(2) life management services:
• Family care;
• Financial Wellness; and
• legal information and advice.
(3) Managerial consultancy and referral services:
• Managerial consultancy; and
• Formal Referral Programme.
(4) training services:
• Targeted training interventions based on identified needs and trends.
(5) e - Care
• e-Care is an innovative online healthcare service to help improve employee Health and Wellness.
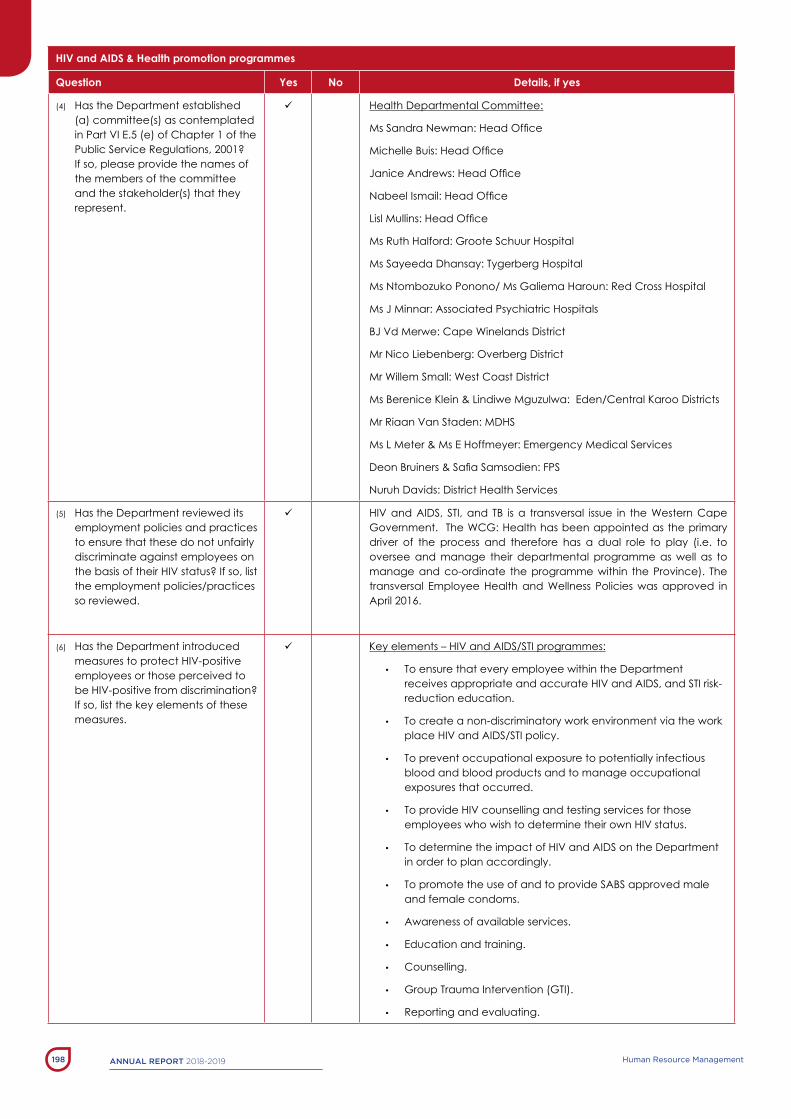
AnnuAl report 2018-2019 Human Resource Management198
HIV and AIDS & Health promotion programmes
Question Yes No Details, if yes
(4) Has the Department established (a) committee(s) as contemplated in Part VI e.5 (e) of Chapter 1 of the Public service Regulations, 2001? If so, please provide the names of the members of the committee and the stakeholder(s) that they represent.
Health Departmental Committee:
Ms Sandra Newman: Head Office
Michelle Buis: Head Office
Janice Andrews: Head Office
Nabeel Ismail: Head Office
Lisl Mullins: Head Office
Ms Ruth Halford: Groote schuur Hospital
Ms sayeeda Dhansay: tygerberg Hospital
Ms ntombozuko Ponono/ Ms Galiema Haroun: Red Cross Hospital
Ms J Minnar: associated Psychiatric Hospitals
bJ Vd Merwe: Cape Winelands District
Mr nico liebenberg: overberg District
Mr Willem small: West Coast District
Ms berenice Klein & lindiwe Mguzulwa: eden/Central Karoo Districts
Mr Riaan Van staden: MDHs
Ms l Meter & Ms e Hoffmeyer: emergency Medical services
Deon Bruiners & Safia Samsodien: FPS
nuruh Davids: District Health services
(5) Has the Department reviewed its employment policies and practices to ensure that these do not unfairly discriminate against employees on the basis of their HIV status? If so, list the employment policies/practices so reviewed.
HIV and aIDs, stI, and tb is a transversal issue in the Western Cape Government. the WCG: Health has been appointed as the primary driver of the process and therefore has a dual role to play (i.e. to oversee and manage their departmental programme as well as to manage and co-ordinate the programme within the Province). the transversal employee Health and Wellness Policies was approved in april 2016.
(6) Has the Department introduced measures to protect HIV-positive employees or those perceived to be HIV-positive from discrimination? If so, list the key elements of these measures.
Key elements – HIV and aIDs/stI programmes:
• to ensure that every employee within the Department receives appropriate and accurate HIV and aIDs, and stI risk-reduction education.
• to create a non-discriminatory work environment via the work place HIV and aIDs/stI policy.
• to prevent occupational exposure to potentially infectious blood and blood products and to manage occupational exposures that occurred.
• to provide HIV counselling and testing services for those employees who wish to determine their own HIV status.
• to determine the impact of HIV and aIDs on the Department in order to plan accordingly.
• to promote the use of and to provide sabs approved male and female condoms.
• awareness of available services.
• education and training.
• Counselling.
• Group trauma Intervention (GtI).
• Reporting and evaluating.
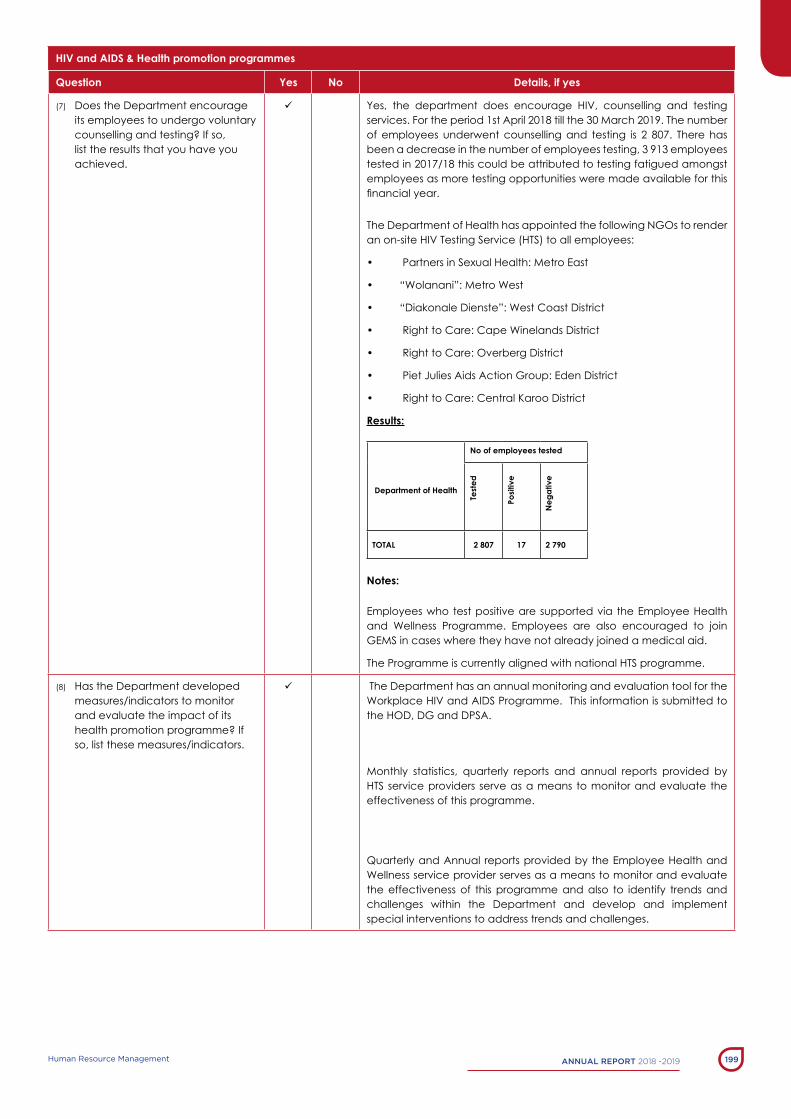
AnnuAl report 2018 -2019 199Human Resource Management
HIV and AIDS & Health promotion programmes
Question Yes No Details, if yes
(7) Does the Department encourage its employees to undergo voluntary counselling and testing? If so, list the results that you have you achieved.
Yes, the department does encourage HIV, counselling and testing services. For the period 1st april 2018 till the 30 March 2019. the number of employees underwent counselling and testing is 2 807. there has been a decrease in the number of employees testing, 3 913 employees tested in 2017/18 this could be attributed to testing fatigued amongst employees as more testing opportunities were made available for this financial year.
the Department of Health has appointed the following nGos to render an on-site HIV testing service (Hts) to all employees:
• Partners in Sexual Health: Metro East
• “Wolanani”: Metro West
• “Diakonale Dienste”: West Coast District
• Right to Care: Cape Winelands District
• Right to Care: Overberg District
• Piet Julies Aids Action Group: Eden District
• Right to Care: Central Karoo District
Results:
Department of Health
No of employees tested
Test
ed
Posit
ive
Neg
ativ
eTOTAL 2 807 17 2 790
Notes:
employees who test positive are supported via the employee Health and Wellness Programme. employees are also encouraged to join GeMs in cases where they have not already joined a medical aid.
the Programme is currently aligned with national Hts programme.
(8) Has the Department developed measures/indicators to monitor and evaluate the impact of its health promotion programme? If so, list these measures/indicators.
the Department has an annual monitoring and evaluation tool for the Workplace HIV and aIDs Programme. this information is submitted to the HoD, DG and DPsa.
Monthly statistics, quarterly reports and annual reports provided by Hts service providers serve as a means to monitor and evaluate the effectiveness of this programme.
Quarterly and annual reports provided by the employee Health and Wellness service provider serves as a means to monitor and evaluate the effectiveness of this programme and also to identify trends and challenges within the Department and develop and implement special interventions to address trends and challenges.

AnnuAl report 2018-2019 Human Resource Management200
Labour Relations
the following collective agreements were entered into with trade unions within the Department.
Collective Agreements for 2018/19
nil nil
the table below summarises the outcome of disciplinary hearings conducted within the Department for the year under review.
Misconduct & Disciplinary Hearings finalised in 2018/19
OUTCOMES OF DISCIPLINARY HEARINGS No. Percent of Total Hearings
Correctional counselling 0 0%
Verbal warning 2 2.7%
Written warning 2 2.7%
Final written warning 6 8%
suspended without pay 5 6.7%
Demotion 0 0%
Dismissal 32 42.6%
Desertion 24 32%
not guilty 4 5.3%
Case withdrawn 0 0%
TOTAL 75 100%
Percentage of total employment 0.23%notes• Outcomes of disciplinary hearings refer to formal cases only.

AnnuAl report 2018 -2019 201Human Resource Management
Types of Misconduct Addressed in Disciplinary Hearing for 2018/19
TYPES OF MISCONDUCT No. Percent of total
absent from work without reason or permission 8 10.7%
Code of conduct (improper/unacceptable manner) 3 4%
Insubordination 1 1.3%
Fails to comply with or contravenes acts 1 1.3%
negligence 2 2.7%
Misuse of WCG property 5 6.7%
steals, bribes or commits fraud 14 18.7%
substance abuse 3 4%
sexual harassment 10 13.3%
Discrimination 1 1.3%
assault or threatens to assault 3 4%
Desertions 24 32%
Protest action 0 0%
social grant fraud 0 0%
TOTAL 75 100%
Grievances Lodged in 2018/19
GRIEVANCES No. Percent of total
number of grievances resolved 121 48.4%
number of grievances not resolved 93 37.2%
Pending 36 14.4%
TOTAL No. OF GRIEVANCES LODGED 250 100%notes:
• number of grievances not resolved, means resolved in favour of employer. • Number of grievances not resolved, means finalised but not to the satisfaction of the employee.• Pending means cases still not finalised.

AnnuAl report 2018-2019 Human Resource Management202
Disputes Lodged with Councils in 2018/19
CONCILIATIONS No. Percent of totalDeadlocked 62 97%
settled 1 1.5%
Withdrawn 1 1.5%
TOTAL NO. OF DISPUTES LODGED 64 100%
ARBITRATIONS No. Percent of total
Upheld in favour of employee 3 4.3%
Dismissed in favour of employer 57 81.4%
settled 10 14.3%
TOTAL No. OF DISPUTES LODGED 70 100%
notes:
• Councils refer to the Public service Co-ordinating bargaining Council (PsCbC) and General Public service sector bargaining Council (GPssbC).
Strike Action in 2018/9
total number of person working days lost 0
total cost (R’000) of working days lost R0
amount (R’000) recovered as a result of no work no pay R0
Precautionary Suspensions in 2018/19
number of people suspended 27
number of people whose suspension exceeded 60 days 9
average number of days suspended 49
Cost of suspension (R’000) R924 616.12
notes:
• Precautionary suspensions refer to staff being suspended with pay whilst the case is being investigated.
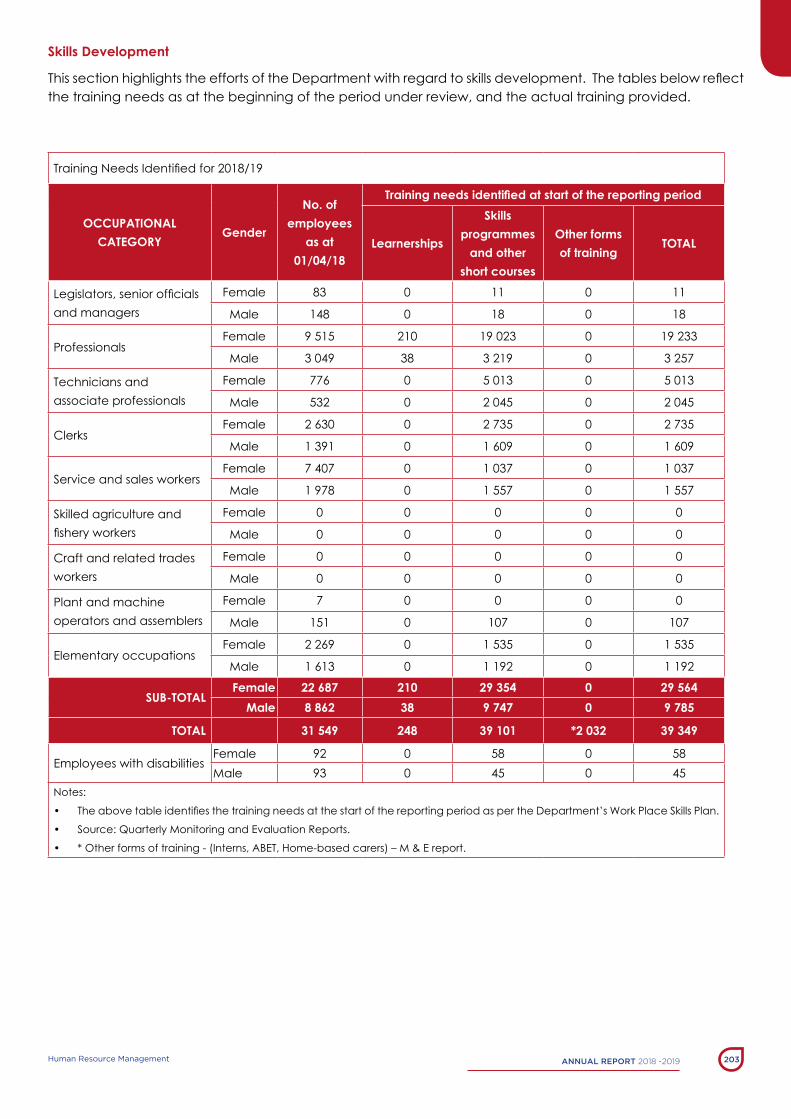
AnnuAl report 2018 -2019 203Human Resource Management
Skills Development
This section highlights the efforts of the Department with regard to skills development. The tables below reflect the training needs as at the beginning of the period under review, and the actual training provided.
Training Needs Identified for 2018/19
OCCUPATIONAL CATEGORY
Gender
No. of employees
as at 01/04/18
Training needs identified at start of the reporting period
Learnerships
Skills programmes
and other short courses
Other forms of training
TOTAL
Legislators, senior officials and managers
Female 83 0 11 0 11
Male 148 0 18 0 18
ProfessionalsFemale 9 515 210 19 023 0 19 233
Male 3 049 38 3 219 0 3 257
technicians and associate professionals
Female 776 0 5 013 0 5 013
Male 532 0 2 045 0 2 045
Clerks Female 2 630 0 2 735 0 2 735
Male 1 391 0 1 609 0 1 609
service and sales workersFemale 7 407 0 1 037 0 1 037
Male 1 978 0 1 557 0 1 557
skilled agriculture and fishery workers
Female 0 0 0 0 0
Male 0 0 0 0 0
Craft and related trades workers
Female 0 0 0 0 0
Male 0 0 0 0 0
Plant and machine operators and assemblers
Female 7 0 0 0 0
Male 151 0 107 0 107
elementary occupationsFemale 2 269 0 1 535 0 1 535
Male 1 613 0 1 192 0 1 192
SUB-TOTALFemale 22 687 210 29 354 0 29 564
Male 8 862 38 9 747 0 9 785
TOTAL 31 549 248 39 101 *2 032 39 349
employees with disabilitiesFemale 92 0 58 0 58Male 93 0 45 0 45
notes:
• The above table identifies the training needs at the start of the reporting period as per the Department’s Work Place Skills Plan.
• source: Quarterly Monitoring and evaluation Reports.
• * other forms of training - (Interns, abet, Home-based carers) – M & e report.

AnnuAl report 2018-2019 Human Resource Management204
Training Provided in 2018/19
OCCUPATIONAL CATEGORY
Gender
No. of employees
as at 31/03/19
Training provided during the reporting period
Learnerships
Skills programmes
and other short courses
Other forms of training
TOTAL
legislators, senior officials and managers
Female 88 0 203 0 203
Male 150 0 277 0 277
ProfessionalsFemale 9 761 56 12 127 0 12 127
Male 3 163 9 3 268 0 3 268
technicians and associate professionals
Female 788 0 606 0 606
Male 550 0 413 0 413
Clerks Female 2 605 0 2 521 0 2 521
Male 1 396 0 1 357 0 1 357
service and sales workers
Female 7 431 0 7 117 0 7 117
Male 1 989 0 2 141 0 2 141
skilled agriculture and fishery workers
Female 0 0 0 0 0
Male 0 0 0 0 0
Craft and related trades workers
Female 0 0 0 0 0
Male 0 0 0 0 0
Plant and machine operators and assemblers
Female 8 0 7 0 7
Male 155 0 70 0 70
elementary occupations
Female 2 249 0 1 408 0 1 408
Male 1 581 0 1 140 0 1 140
SUB-TOTALFemale 22 930 56 23 989 0 23 989
Male 8 984 9 8 666 0 8 666
TOTAL 31 914 65 32 655 *1 915 32 655
employees with disabilities
Female 100 1 143 0 0Male 108 0 149 0 0
notes:• The above table identifies the number of training courses attended by individuals during the period under review. *Other
forms of training • reflect the training of non-employees (Interns, Adult Basic Education and Training (ABET), Community Health Workers). • source: Quarterly Monitoring and evaluation Reports.• * other forms of training - (Interns, abet, Home-based carers) – M & e report.

AnnuAl report 2018 -2019 205Human Resource Management
Injury on Duty
the table below provides basic information on injury on duty.
Injuries on Duty for 2018/19
NATURE OF INJURY ON DUTY No. Percent of total
Required basic medical attention only 272 56.3
temporary disablement 138 28.6
Permanent disablement 72 14.9
Fatal 1 0.2
TOTAL 483 100
PeRCentaGe oF total eMPloYMent 1.51%note:• The information provided above is calculated and provided as per Department of Labour definition of IOD. • i.e. basic IoD equals no leave taken. temporary Disablement is less than 14 days leave for occupational Injuries and
Disease. • Permanent Disablement more than 14 days for leave for occupational Injuries and Disease.

AnnuAl report 2018-2019 Human Resource Management206
Utilisation of Consultants
Consultant/ContractorAmount (R’000)
Purpose
alexander Forbes Health (Pty) ltd 82 evaluation of PIlIR and Incapacity cases
aRUP 611 tygerberg Hospital Redevelopment Feasibility study
bCX 1 229 assistance with data analysis on PeRsal
break through Hr solutions 418 Patient satisfaction survey
business Connextion (Pty) ltd 346 assistance with data analysis on PeRsal
Cebano Consultants 249 organisational scans & leadership Values assessment
Deloitte Consulting 8 Competency assessment
Dept of Cultural affairs & sport 8 translation services
Design thinkers academy 94 Design Thinkers Facilitation & Certification Course
esri south africa 298 training - Geospatial Information system
Firewire system solutions 133Repairs/maintenance of nurse Call system in wards/therapy areas at Western Cape Rehab Centre
Folio online 1 582 tele-interpretation services for foreign patients
Folio translation Consultants 135 as above
Health system technologies (Pty) 428 Maintenance of the Health Information system (HIs)
litha-lethu Management solutions 16 Competency assessment
Mi Consulting 2 582Contractor assisting with the verification of Inventory Code numbers on loGIs
Mie (Pty) ltd 1 981Verification of personal credentials, qualifications and criminal records to minimise CV fraud
Mie Resource services Cc 4 340 as above
Mpilisweni Facility serv 71 936 PPP payments to Mpilisweni Consortium
Pc-Card brewelskloof Hospital 1 translation services
Pc-Card Montagu Hospital 1 satisfaction survey
Pc-Card Robertson Hospital 3 staff survey & translation fee
Pc-Card stellenbosch Hospital 2 translation services
Pc-Card swartland Hospital 6 Project management fees
Pc-Card U3 CFo Office 1 Competency assessment
Pc-Card Wc nursing College 9 examination moderators
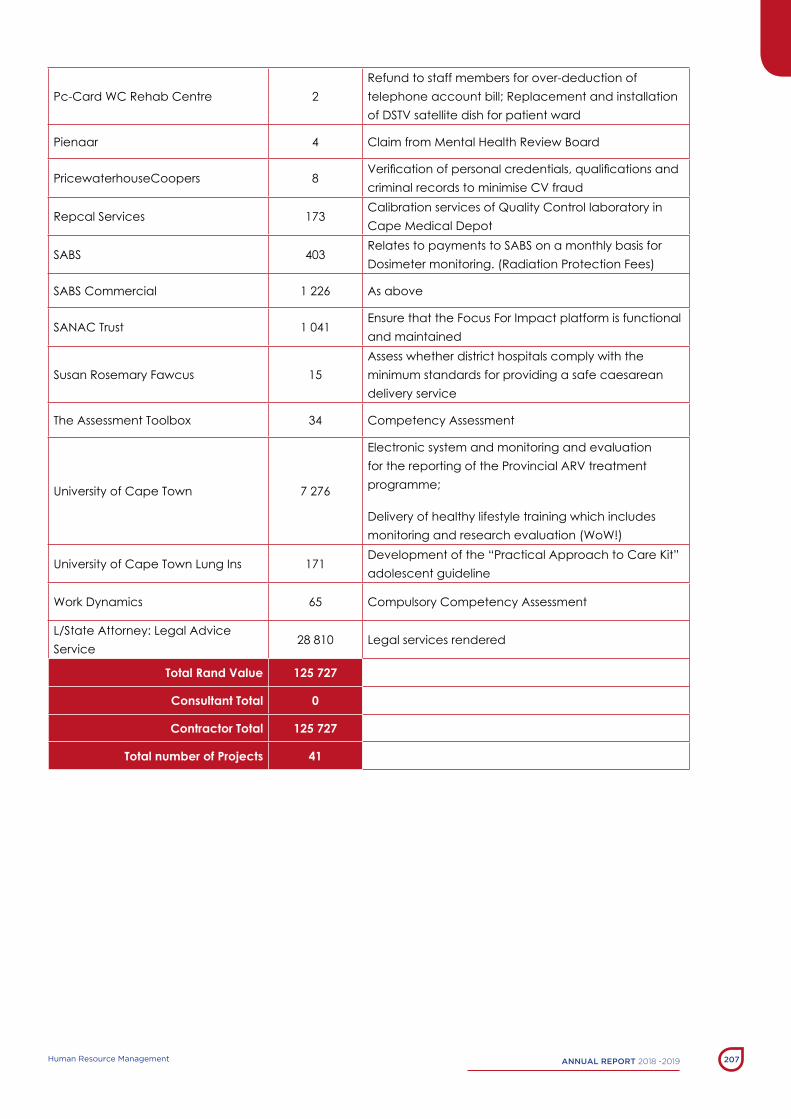
AnnuAl report 2018 -2019 207Human Resource Management
Pc-Card WC Rehab Centre 2Refund to staff members for over-deduction of telephone account bill; Replacement and installation of DstV satellite dish for patient ward
Pienaar 4 Claim from Mental Health Review board
PricewaterhouseCoopers 8Verification of personal credentials, qualifications and criminal records to minimise CV fraud
Repcal services 173Calibration services of Quality Control laboratory in Cape Medical Depot
sabs 403Relates to payments to sabs on a monthly basis for Dosimeter monitoring. (Radiation Protection Fees)
sabs Commercial 1 226 as above
sanaC trust 1 041ensure that the Focus For Impact platform is functional and maintained
susan Rosemary Fawcus 15assess whether district hospitals comply with the minimum standards for providing a safe caesarean delivery service
the assessment toolbox 34 Competency assessment
University of Cape town 7 276
electronic system and monitoring and evaluation for the reporting of the Provincial aRV treatment programme;
Delivery of healthy lifestyle training which includes monitoring and research evaluation (WoW!)
University of Cape town lung Ins 171Development of the “Practical approach to Care Kit” adolescent guideline
Work Dynamics 65 Compulsory Competency assessment
l/state attorney: legal advice service
28 810 legal services rendered
Total Rand Value 125 727
Consultant Total 0
Contractor Total 125 727
Total number of Projects 41


PART EFinancial inFormation

AnnuAl report 2018-2019 Financial Information210
1
Report of the auditor-general to the Western Cape Provincial Parliament on vote no. 6: Western Cape Department of Health Report on the audit of the financial statements Opinion
1. I have audited the financial statements of the Western Cape Department of Health set out on
pages 215 to 307, which comprise the appropriation statement, the statement of financial position as at 31 March 2019, the statement of financial performance, statement of changes in net assets and cash flow statement for the year then ended, as well as the notes to the financial statements, including a summary of significant accounting policies.
2. In my opinion, the financial statements present fairly, in all material respects, the financial position of the Western Cape Department of Health as at 31 March 2019, and its financial performance and cash flows for the year then ended in accordance with the Modified Cash Standard (MCS) prescribed by the National Treasury and the requirements of the Public Finance Management Act of South Africa, 1999 (Act No. 1 of 1999) (PFMA) and the Division of Revenue Act of South Africa, 2018 (Act No. 1 of 2018) (DoRA).
Basis for opinion
3. I conducted my audit in accordance with the International Standards on Auditing (ISAs). My
responsibilities under those standards are further described in the auditor-general’s responsibilities for the audit of the financial statements section of this auditor’s report.
4. I am independent of the department in accordance with sections 290 and 291 of the International Ethics Standards Board for Accountants’ Code of ethics for professional accountants and parts 1 and 3 of the International Ethics Standards Board for Accountants’ International code of ethics for professional accountants (including International Independence Standards) (IESBA codes), as well as the ethical requirements that are relevant to my audit in South Africa. I have fulfilled my other ethical responsibilities in accordance with these requirements and the IESBA codes.
5. I believe that the audit evidence I have obtained is sufficient and appropriate to provide a basis for my opinion.
Emphasis of matters
6. I draw attention to the matters below. My opinion is not modified in respect of these matters.
Material impairments 7. As disclosed in note 22.3 to the financial statements, accrued departmental revenue was
significantly impaired. The impairment allowance amounted to R230,6 million (2017-18: R241 million).
Restatement of corresponding figures 8. As disclosed in note 32 to the financial statements, the corresponding figures for
31 March 2018 were restated as a result of errors discovered during the 2018-19 financial year in the financial statements of the department at, and for the year ended, 31 March 2019.

AnnuAl report 2018 -2019 211Financial Information
2
Other matter
9. I draw attention to the matter below. My opinion is not modified in respect of this matter.
Unaudited supplementary schedules 10. The supplementary information set out on pages 308 to 325 does not form part of the financial
statements and is presented as additional information. I have not audited these schedules and accordingly, I do not express an opinion thereon.
Responsibilities of the accounting officer for the financial statements
11. The accounting officer is responsible for the preparation and fair presentation of the financial statements in accordance with the MCS prescribed by the National Treasury and the requirements of the PFMA and DoRA, and for such internal control as the accounting officer determines is necessary to enable the preparation of financial statements that are free from material misstatement, whether due to fraud or error.
12. In preparing the financial statements, the accounting officer is responsible for assessing the Western Cape Department of Health’s ability to continue as a going concern, disclosing, as applicable, matters relating to going concern and using the going concern basis of accounting unless the appropriate governance structure either intends to liquidate the department or to cease operations, or has no realistic alternative but to do so.
Auditor-general’s responsibilities for the audit of the financial statements
13. My objectives are to obtain reasonable assurance about whether the financial statements as
a whole are free from material misstatement, whether due to fraud or error, and to issue an auditor’s report that includes my opinion. Reasonable assurance is a high level of assurance, but is not a guarantee that an audit conducted in accordance with the ISAs will always detect a material misstatement when it exists. Misstatements can arise from fraud or error and are considered material if, individually or in aggregate, they could reasonably be expected to influence the economic decisions of users taken on the basis of these financial statements.
14. A further description of my responsibilities for the audit of the financial statements is included in the annexure to this auditor’s report.
Report on the audit of the annual performance report Introduction and scope
15. In accordance with the Public Audit Act of South Africa, 2004 (Act No. 25 of 2004) (PAA) and
the general notice issued in terms thereof, I have a responsibility to report material findings on the reported performance information against predetermined objectives for selected programmes presented in the annual performance report. I performed procedures to identify findings but not to gather evidence to express assurance.
16. My procedures address the reported performance information, which must be based on the approved performance planning documents of the department. I have not evaluated the completeness and appropriateness of the performance indicators included in the planning documents. My procedures also did not extend to any disclosures or assertions relating to planned performance strategies and information in respect of future periods that may be included as part of the reported performance information. Accordingly, my findings do not extend to these matters.
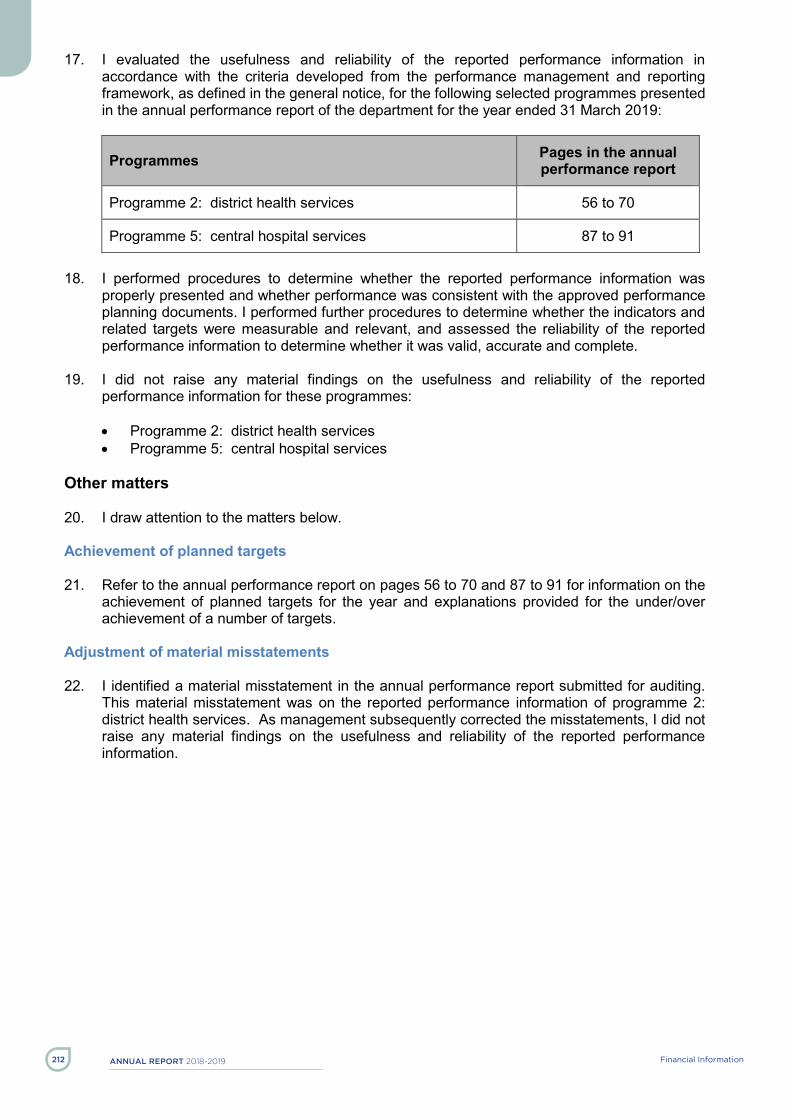
AnnuAl report 2018-2019 Financial Information212
3
17. I evaluated the usefulness and reliability of the reported performance information in accordance with the criteria developed from the performance management and reporting framework, as defined in the general notice, for the following selected programmes presented in the annual performance report of the department for the year ended 31 March 2019:
Programmes Pages in the annual performance report
Programme 2: district health services 56 to 70
Programme 5: central hospital services 87 to 91
18. I performed procedures to determine whether the reported performance information was
properly presented and whether performance was consistent with the approved performance planning documents. I performed further procedures to determine whether the indicators and related targets were measurable and relevant, and assessed the reliability of the reported performance information to determine whether it was valid, accurate and complete.
19. I did not raise any material findings on the usefulness and reliability of the reported performance information for these programmes: Programme 2: district health services Programme 5: central hospital services
Other matters
20. I draw attention to the matters below.
Achievement of planned targets
21. Refer to the annual performance report on pages 56 to 70 and 87 to 91 for information on the
achievement of planned targets for the year and explanations provided for the under/over achievement of a number of targets.
Adjustment of material misstatements
22. I identified a material misstatement in the annual performance report submitted for auditing. This material misstatement was on the reported performance information of programme 2: district health services. As management subsequently corrected the misstatements, I did not raise any material findings on the usefulness and reliability of the reported performance information.

AnnuAl report 2018 -2019 213Financial Information
4
Report on the audit of compliance with legislation Introduction and scope
23. In accordance with the PAA and the general notice issued in terms thereof, I have a
responsibility to report material findings on the compliance of the department with specific matters in key legislation. I performed procedures to identify findings but not to gather evidence to express assurance.
24. I did not raise material findings on compliance with the specific matters in key legislation set out in the general notice issued in terms of the PAA.
Other information
25. The accounting officer is responsible for the other information. The other information comprises
the information included in the annual report. The other information does not include the financial statements, the auditor’s report and those selected programmes presented in the annual performance report that have been specifically reported in this auditor’s report.
26. My opinion on the financial statements and findings on the reported performance information and compliance with legislation do not cover the other information and I do not express an audit opinion or any form of assurance conclusion thereon.
27. In connection with my audit, my responsibility is to read the other information and, in doing so, consider whether the other information is materially inconsistent with the financial statements and the selected programmes presented in the annual performance report, or my knowledge obtained in the audit, or otherwise appears to be materially misstated.
28. If, based on the work I have performed, I conclude that there is a material misstatement in this other information, I am required to report that fact.
29. I have nothing to report in this regard. Internal control deficiencies
30. I considered internal control relevant to my audit of the financial statements, reported
performance information and compliance with applicable legislation; however, my objective was not to express any form of assurance on it.
31. I did not identify any significant deficiencies in internal control. Cape Town 31 July 2019

AnnuAl report 2018-2019 Financial Information214
5
Annexure – Auditor-general’s responsibility for the audit
1. As part of an audit in accordance with the ISAs, I exercise professional judgement and maintain
professional scepticism throughout my audit of the financial statements, and the procedures performed on reported performance information for selected programmes and on the department’s compliance with respect to the selected subject matters.
Financial statements
2. In addition to my responsibility for the audit of the financial statements as described in this auditor’s report, I also: identify and assess the risks of material misstatement of the financial statements whether
due to fraud or error, design and perform audit procedures responsive to those risks, and obtain audit evidence that is sufficient and appropriate to provide a basis for my opinion. The risk of not detecting a material misstatement resulting from fraud is higher than for one resulting from error, as fraud may involve collusion, forgery, intentional omissions, misrepresentations, or the override of internal control
obtain an understanding of internal control relevant to the audit in order to design audit procedures that are appropriate in the circumstances, but not for the purpose of expressing an opinion on the effectiveness of the department’s internal control
evaluate the appropriateness of accounting policies used and the reasonableness of accounting estimates and related disclosures made by the accounting officer
conclude on the appropriateness of the accounting officer’s use of the going concern basis of accounting in the preparation of the financial statements. I also conclude, based on the audit evidence obtained, whether a material uncertainty exists related to events or conditions that may cast significant doubt on the Western Cape Department of Health’s ability to continue as a going concern. If I conclude that a material uncertainty exists, I am required to draw attention in my auditor’s report to the related disclosures in the financial statements about the material uncertainty or, if such disclosures are inadequate, to modify the opinion on the financial statements. My conclusions are based on the information available to me at the date of this auditor’s report. However, future events or conditions may cause a department to cease continuing as a going concern
evaluate the overall presentation, structure and content of the financial statements, including the disclosures, and whether the financial statements represent the underlying transactions and events in a manner that achieves fair presentation
Communication with those charged with governance
3. I communicate with the accounting officer regarding, among other matters, the planned scope
and timing of the audit and significant audit findings, including any significant deficiencies in internal control that I identify during my audit.
4. I also confirm to the accounting officer that I have complied with relevant ethical requirements regarding independence, and communicate all relationships and other matters that may reasonably be thought to have a bearing on my independence and, where applicable, related safeguards.

AnnuAl report 2018 -2019 215Financial Information
WES
TER
N C
APE
DEP
AR
TMEN
T O
F H
EALT
H
VOTE
6
A
PPR
OPR
IATI
ON
STA
TEM
ENT
for t
he y
ear e
nded
31
Mar
ch 2
019
- 3
-
2018
/1920
17/18
Adj
uste
d Ap
prop
riatio
n S
hifti
ng o
f Fu
nds
Vire
men
t F
inal
Appr
opria
tion
Act
ual
Expe
nditu
re
Var
iance
Ex
pend
iture
as
% o
f fin
al ap
prop
riatio
n
Fin
al Ap
prop
riatio
n A
ctua
l Ex
pend
iture
R'00
0R'
000
R'00
0 R'
000
R'00
0 R
'000
%R'
000
R'00
0
1AD
MINI
STRA
TION
81
0 356
-
(42 3
00)
76
8 056
766 1
06
1 950
99
.7%
743 7
18
72
0 112
2
DIST
RICT
HEA
LTH
SERV
ICES
9 34
1 766
-
-
9
341 7
66
9 32
8 752
13 0
14
99.9%
8 77
1 655
8
737 9
09
3EM
ERGE
NCY
MEDI
CAL S
ERVI
CES
1 11
6 257
-
(10 0
00)
1 10
6 257
1
102 4
44
3 813
99
.7%
1
026 5
63
99
4 862
4
PROV
INCI
AL H
OSPI
TAL S
ERVI
CES
3 63
7 053
-
(6 81
2)
3
630 2
41
3 62
2 842
7 3
99
99.8%
3 40
3 167
3
379 5
27
5CE
NTRA
L HOS
PITA
L SER
VICE
S
6
453 2
31
- 64
612
6 51
7 843
6
517 2
45
598
10
0.0%
6 12
9 748
6
129 7
48
6HE
ALTH
SCI
ENCE
S AN
D TR
AINI
NG
328 6
16
- -
32
8 616
321 6
43
6 973
97
.9%
340 0
63
31
7 453
7
HEAL
TH C
ARE
SUPP
ORT
SERV
ICES
47
4 207
-
(5 50
0)
468 7
07
46
1 667
7 0
40
98.5%
43
8 845
436 8
12
8HE
ALTH
FAC
ILITI
ES M
ANAG
EMEN
T
938 4
93
-
-
93
8 493
922 8
94
1
5 599
98
.3%
832 7
23
77
9 633
23 0
99 97
9
-
-
23 0
99 97
9
23 0
43 59
3
56 3
86
99.8%
2
1 686
482
2
1 496
056
2
3 099
979
-
-
2
3 099
979
2
3 043
593
5
6 386
99
.8%
21 6
86 48
2
21 4
96 05
6
Add:
114 3
23
49 31
1
1 5
59
2 3
78
23 21
5 861
21 73
8 171
Add
: 2 2
18
2 1
28
23 04
5 811
21 49
8 184
Appr
opria
tion
per p
rogr
amm
e
Vote
d fu
nds a
nd D
irect
char
ges
Reco
ncilia
tion
with
Sta
tem
ent o
f Fin
ancia
l Per
form
ance
Aid
assis
tance
Act
ual a
mou
nts p
er S
tate
men
t of F
inan
cial P
erfo
rman
ce E
xpen
ditu
re
Dep
artm
ental
rece
ipts
Aid
assis
tance
Act
ual a
mou
nts p
er S
tate
men
t of F
inan
cial P
erfo
rman
ce (T
otal
Rev
enue
)
Prog
ram
me
Prog
ram
me s
ub to
tal
TOTA
L

AnnuAl report 2018-2019 Financial Information216
WES
TER
N C
APE
DEP
AR
TMEN
T O
F H
EALT
H
VOTE
6
A
PPR
OPR
IATI
ON
STA
TEM
ENT
for t
he y
ear e
nded
31
Mar
ch 2
019
- 4
-
2018
/19
2017
/18
Adj
uste
d Ap
prop
riatio
n S
hifti
ng o
f Fu
nds
Vire
men
t F
inal
Ap
prop
riatio
n A
ctua
l Ex
pend
iture
V
aria
nce
Expe
nditu
re a
s %
of f
inal
ap
prop
riatio
n
Fin
al
Appr
opria
tion
Act
ual
Expe
nditu
re
R'0
00R
'000
R'0
00
R'0
00R
'000
R'0
00
%R
'000
R'0
0020
920
589
-
(24
128)
20
896
461
20
734
987
16
1 47
4
99
.2%
19 7
59 8
89
19 5
52 8
20
13 5
63 6
00
-
(9
500
)
13 5
54 1
00
13 5
15 3
92
38 7
08
99.7
%12
742
984
12
660
391
11
956
599
-
(7 5
00)
11
949
099
11
943
906
5
193
100.
0%11
250
684
11
200
934
1
607
001
-
(2 0
00)
1
605
001
1
571
486
33
515
97
.9%
1 49
2 30
0
1 45
9 45
7
7 35
6 98
9
-
(1
4 62
8)
7 34
2 36
1
7 21
9 59
5
122
766
98.3
%7
016
905
6
892
429
36
4
-
-
364
23
0
134
63
.2%
1 16
7
54
16
709
-
-
16
709
16
744
(3
5)
100.
2%20
009
20
754
58
239
-
-
58
239
42
407
15
832
72
.8%
64 8
44
46 9
19
22 2
93
-
-
22 2
93
20 7
69
1 52
4
93
.2%
20 3
12
19 0
28
10 2
97
-
-
10 2
97
10 2
87
10
99.9
%10
279
10
345
5
193
-
-
5 19
3
4
983
210
96
.0%
5 99
5
4
364
76 2
13
-
(5
093
)
71 1
20
55 0
15
16 1
05
77.4
%78
608
60
039
10
5 38
8
-
(707
)
10
4 68
1
91
548
13
133
87
.5%
102
139
81 4
85
105
906
-
-
105
906
92 4
67
13 4
39
87.3
%98
038
85
249
61
801
-
(69)
61
732
19
833
41
899
32
.1%
19 9
45
13 6
93
665
181
-
-
665
181
703
818
(38
637)
10
5.8%
644
956
656
136
26 2
67
-
-
26 2
67
28 8
09
(2 5
42)
10
9.7%
17 7
46
13 8
65
539
766
-
(1
900
)
537
866
537
804
62
100.
0%55
7 85
3
53
6 14
2
46
1 89
0
-
7 19
1
46
9 08
1
48
8 68
5
(1
9 60
4)
104.
2%44
6 84
8
47
1 00
2
21
5
-
-
215
14
8
67
68.8
%34
8
134
18
8 20
8
-
-
18
8 20
8
18
1 05
0
7
158
96.2
%17
9 52
0
17
8 72
7
56
473
-
(592
)
55
881
55
881
-
100.
0%53
543
51
981
1
530
696
-
(4 0
00)
1
526
696
1
526
635
61
10
0.0%
1 45
6 13
5
1 46
5 84
1
1 53
1 00
6
-
(3
592
)
1 52
7 41
4
1 47
1 99
7
55 4
17
96.4
%1
464
333
1
459
321
17
118
-
-
17
118
16
487
63
1
96.3
%16
160
12
145
44
9 38
8
-
(808
)
44
8 58
0
43
7 92
5
10
655
97
.6%
421
034
423
633
96 6
53
-
(3
008
)
93 6
45
88 8
74
4 77
1
94
.9%
92 7
01
88 7
59
30 3
54
-
(2
050
)
28 3
04
20 2
37
8 06
7
71
.5%
26 5
81
21 3
49
1 17
5 76
7
-
-
1 17
5 76
7
1 17
6 80
0
(1 0
33)
10
0.1%
1 09
1 52
2
1 05
6 91
6
1 82
2
-
-
1
822
1 47
7
34
5
81.1
%2
653
1 66
4
40
181
-
-
40
181
39
766
41
5
99.0
%42
387
39
619
34
280
-
-
34
280
36
303
(2
023
)
105.
9%33
126
29
518
24
541
-
-
24
541
26
297
(1
756
)
107.
2%23
999
22
240
92
0
-
-
920
1
384
(464
)
15
0.4%
1 36
7
81
2
23 8
60
-
-
23 8
60
24 9
35
(1 0
75)
10
4.5%
22 7
57
20 6
95
Appr
opria
tion
per e
cono
mic
cla
ssifi
catio
n
Sala
ries
and
wag
esSo
cial
con
tribu
tions
Goo
ds a
nd s
ervi
ces
Adm
inis
trativ
e fe
esAd
verti
sing
Cur
rent
pay
men
tsC
ompe
nsat
ion
of e
mpl
oyee
s
Min
or a
sset
sAu
dit c
osts
: Ext
erna
lBu
rsar
ies:
Em
ploy
ees
Labo
rato
ry s
ervi
ces
Com
mun
icat
ion
(G&S
)C
ater
ing:
Dep
artm
enta
l act
iviti
es
Agen
cy a
nd s
uppo
rt / o
utso
urce
d se
rvic
es
Tran
spor
t pro
vide
d: D
epar
tmen
tal a
ctiv
ityPr
oper
ty p
aym
ents
Ope
ratin
g le
ases
Con
sum
able
: Sta
tione
ry, p
rintin
g an
d of
fice
supp
lies
Con
sum
able
sup
plie
sIn
vent
ory:
Oth
er s
uppl
ies
Infra
stru
ctur
e an
d pl
anni
ng s
ervi
ces
Con
sulta
nts:
Bus
ines
s an
d ad
viso
ry s
ervi
ces
Com
pute
r ser
vice
s
Con
tract
ors
Lega
l ser
vice
s
Ente
rtain
men
t
Inve
ntor
y: M
edic
ine
Inve
ntor
y: M
edic
al s
uppl
ies
Inve
ntor
y: F
ood
and
food
sup
plie
sFl
eet s
ervi
ces
(incl
udin
g go
vern
men
t mot
or tr
ansp
ort)
Ren
tal a
nd h
iring
Venu
es a
nd fa
cilit
ies
Ope
ratin
g pa
ymen
tsTr
aini
ng a
nd d
evel
opm
ent
Trav
el a
nd s
ubsi
sten
ce

AnnuAl report 2018 -2019 217Financial Information
WES
TER
N C
APE
DEP
AR
TMEN
T O
F H
EALT
H
VOTE
6
A
PPR
OPR
IATI
ON
STA
TEM
ENT
for t
he y
ear e
nded
31
Mar
ch 2
019
- 5
-
2018
/19
2017
/18
Adj
uste
d Ap
prop
riatio
n S
hifti
ng o
f Fu
nds
Vire
men
t F
inal
Ap
prop
riatio
n A
ctua
l Ex
pend
iture
V
aria
nce
Expe
nditu
re a
s %
of f
inal
ap
prop
riatio
n
Fin
al
Appr
opria
tion
Act
ual
Expe
nditu
re
R'0
00R
'000
R'0
00
R'0
00R
'000
R'0
00
%R
'000
R'0
001
362
413
-
(42
211)
1
320
202
1
294
436
25
766
98
.0%
1 17
5 59
8
1 18
0 18
2
549
953
-
-
549
953
549
661
292
99
.9%
520
687
520
683
16
-
-
16
15
1
93
.8%
22
18
-
-
-
-
-
-
-
22
18
16
-
-
16
15
1
93.8
%-
-
54
9 93
7
-
-
54
9 93
7
54
9 64
6
29
1
99.9
%52
0 66
5
52
0 66
5
54
9 93
7
-
-
54
9 93
7
54
9 64
6
29
1
99.9
%52
0 66
5
52
0 66
5
6
211
-
-
6 21
1
6
172
39
99.4
%5
874
5 58
0
6
211
-
-
6 21
1
6
172
39
99.4
%5
874
5 58
0
10
209
-
-
10
209
10
209
-
100.
0%10
000
10
000
57
2 68
3
-
-
57
2 68
3
56
0 73
7
11
946
97
.9%
466
528
431
578
223
357
-
(4
2 21
1)
181
146
167
657
13 4
89
92.6
%17
2 50
9
21
2 34
1
62
997
-
(596
)
62
401
50
953
11
448
81
.7%
59 6
02
54 4
14
160
360
-
(4
1 61
5)
118
745
116
704
2 04
1
98
.3%
112
907
157
927
816
977
-
56
209
87
3 18
6
1
004
040
(1
30 8
54)
115.
0%73
9 37
5
75
1 43
4
34
8 12
1
-
-
34
8 12
1
34
2 00
6
6
115
98.2
%30
8 94
9
28
7 49
3
34
8 12
1
-
-
34
8 12
1
34
2 00
6
6
115
98.2
%30
8 94
9
28
7 49
3
45
9 35
1
-
56 2
09
515
560
660
428
(144
868
)
12
8.1%
422
520
458
485
163
730
-
21
5
163
945
180
853
(16
908)
11
0.3%
165
718
173
502
295
621
-
55
994
35
1 61
5
47
9 57
5
(1
27 9
60)
136.
4%25
6 80
2
28
4 98
3
9
505
-
-
9 50
5
1
606
7 89
9
16
.9%
7 90
6
5
456
-
-
10 1
30
10 1
30
10 1
30
-
10
0.0%
11 6
20
11 6
20
Tota
l23
099
979
-
-
23
099
979
23
043
593
56
386
99
.8%
21 6
86 4
82
21 4
96 0
56
Paym
ent f
or fi
nanc
ial a
sset
sSo
ftwar
e an
d ot
her i
ntan
gibl
e as
sets
Oth
er m
achi
nery
and
equ
ipm
ent
Tran
spor
t equ
ipm
ent
Dep
artm
enta
l age
ncie
s an
d ac
coun
ts
Hig
her e
duca
tion
inst
itutio
nsD
epar
tmen
tal a
genc
ies
(non
-bus
ines
s en
titie
s)
Prov
ince
s an
d m
unic
ipal
ities
Tran
sfer
s an
d su
bsid
ies
Mun
icip
al b
ank
acco
unts
Mun
icip
aliti
es
Mac
hine
ry a
nd e
quip
men
tBu
ildin
gsBu
ildin
gs a
nd o
ther
fixe
d st
ruct
ures
Paym
ents
for c
apita
l ass
ets
Oth
er tr
ansf
ers
to h
ouse
hold
sSo
cial
ben
efits
Hou
seho
lds
Non
-pro
fit in
stitu
tions
Prov
inci
al a
genc
ies
and
fund
sPr
ovin
cial
Rev
enue
Fun
dsPr
ovin
ces

AnnuAl report 2018-2019 Financial Information218
WES
TER
N C
APE
DEP
AR
TMEN
T O
F H
EALT
H
VOTE
6
A
PPR
OPR
IATI
ON
STA
TEM
ENT
for t
he y
ear e
nded
31
Mar
ch 2
019
- 6
-
Prog
ram
me
1: A
DM
INIS
TRAT
ION
2018
/19
2017
/18
Adj
uste
d Ap
prop
riatio
n S
hifti
ng o
f Fu
nds
Vire
men
t F
inal
Ap
prop
riatio
n A
ctua
l Ex
pend
iture
V
aria
nce
Expe
nditu
re a
s %
of f
inal
ap
prop
riatio
n
Fin
al
Appr
opria
tion
Act
ual
Expe
nditu
re
Sub
prog
ram
me
R'0
00R
'000
R'0
00
R'0
00R
'000
R'0
00
%R
'000
R'0
00
1O
FFIC
E O
F TH
E M
EC
7 9
55
-
-
7
955
7 9
25
30
99
.6%
9
136
6 8
80
2M
ANAG
EMEN
T
80
2 40
1
-
(42
300)
760
101
758
181
1
920
99
.7%
734
582
713
232
Tota
l81
0 35
6
-
(42
300)
76
8 05
6
76
6 10
6
1
950
99.7
%74
3 71
8
72
0 11
2
2018
/19
2017
/18
Adj
uste
d Ap
prop
riatio
n S
hifti
ng o
f Fu
nds
Vire
men
t F
inal
Ap
prop
riatio
n A
ctua
l Ex
pend
iture
V
aria
nce
Expe
nditu
re a
s %
of f
inal
ap
prop
riatio
n
Fin
al
Appr
opria
tion
Act
ual
Expe
nditu
re
Econ
omic
cla
ssifi
catio
nR
'000
R'0
00 R
'000
R
'000
R'0
00 R
'000
%
R'0
00R
'000
683
697
-
(3 0
00)
680
697
649
179
31
518
95.4
%
68
2 21
9
60
8 91
3
34
5 74
8
-
-
34
5 74
8
34
0 27
1
5 4
77
98.4
%
34
2 24
9
32
2 89
7
30
3 71
0
-
-
30
3 71
0
29
7 15
3
6 5
57
97.8
%
30
4 07
9
28
1 77
1
4
2 03
8
-
-
4
2 03
8
4
3 11
8
(1 0
80)
102.
6%
3
8 17
0
4
1 12
6
33
7 94
9
-
(3
000
)
33
4 94
9
30
8 90
8
2
6 04
1 92
.2%
339
970
286
016
360
-
-
3
60
229
1
31
63.6
%
1 1
63
54
8 5
82
-
-
8
582
9 3
90
(808
)10
9.4%
10
418
11
667
1
406
-
-
1 4
06
1
118
2
88
79.5
%
1 5
02
583
2
2 29
3
-
-
2
2 29
3
2
0 76
9
1 5
24
93.2
%
2
0 31
2
1
9 02
8
6
61
-
-
661
4
88
173
73
.8%
1
617
6
02
9
853
-
-
9 8
53
7
507
2 3
46
76.2
%
1
1 68
8
8 6
70
94
537
-
-
94
537
81
989
12
548
86.7
%
9
1 80
4
7
2 46
1
1
5 32
3
-
-
1
5 32
3
7 4
86
7
837
48
.9%
15
219
7
902
2
6 26
7
-
-
2
6 26
7
2
8 80
9
(2 5
42)
109.
7%
1
7 74
6
1
3 86
5
13
7 92
9
-
(1
900
)
13
6 02
9
13
3 86
1
2 1
68
98.4
%
14
7 89
9
13
1 50
7
50
-
-
50
-
50
-
-
-
76
-
-
76
99
(
23)
130.
3%
1
90
92
3 9
84
-
-
3
984
4 8
03
(819
)12
0.6%
4
367
5 8
50
7
-
-
7
1
6
14.3
%
7
-
4
90
-
-
490
2
86
204
58
.4%
175
3
19
5
797
-
(1
100
)
4 6
97
2
512
2 1
85
53.5
%
4 5
13
4
157
1 3
15
-
-
1
315
6
21
694
47
.2%
1
036
1 3
81
329
-
-
3
29
156
1
73
47.4
%
2
56
163
6 9
47
-
-
6
947
6 1
40
807
88
.4%
7
867
6 0
70
1
031
-
-
1 0
31
1
281
(2
50)
124.
2%
7
56
954
4
93
-
-
493
6
42
(149
)13
0.2%
1
158
2
17
105
-
-
1
05
720
(6
15)
685.
7%
98
435
1
14
-
-
114
1
113
0.
9%
1
79
39
Audi
t cos
ts: E
xter
nal
Adm
inis
trativ
e fe
esAd
verti
sing
Min
or a
sset
s
Cur
rent
pay
men
tsC
ompe
nsat
ion
of e
mpl
oyee
sSa
larie
s an
d w
ages
Soci
al c
ontri
butio
nsG
oods
and
ser
vice
s
Lega
l ser
vice
sC
ontra
ctor
sAg
ency
and
sup
port
/ out
sour
ced
serv
ices
Ente
rtain
men
t
Cat
erin
g: D
epar
tmen
tal a
ctiv
ities
Com
mun
icat
ion
(G&S
)C
ompu
ter s
ervi
ces
Con
sulta
nts:
Bus
ines
s an
d ad
viso
ry s
ervi
ces
Inve
ntor
y: M
edic
al s
uppl
ies
Flee
t ser
vice
s (in
clud
ing
gove
rnm
ent m
otor
tran
spor
t)
Trai
ning
and
dev
elop
men
tO
pera
ting
paym
ents
Venu
es a
nd fa
cilit
ies
Ren
tal a
nd h
iring
Con
sum
able
sup
plie
sC
onsu
mab
le: S
tatio
nery
, prin
ting
and
offic
e su
pplie
sO
pera
ting
leas
esPr
oper
ty p
aym
ents
Trav
el a
nd s
ubsi
sten
ce
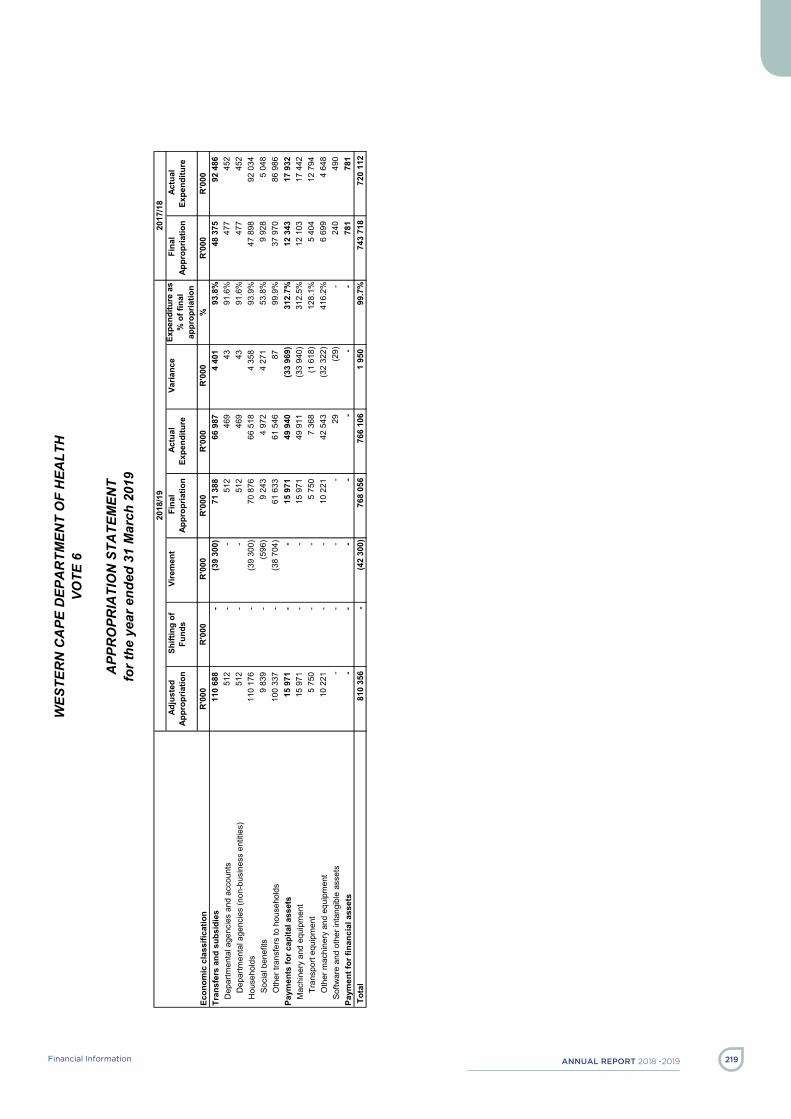
AnnuAl report 2018 -2019 219Financial Information
WES
TER
N C
APE
DEP
AR
TMEN
T O
F H
EALT
H
VOTE
6
A
PPR
OPR
IATI
ON
STA
TEM
ENT
for t
he y
ear e
nded
31
Mar
ch 2
019
- 7
-
2018
/19
2017
/18
Adj
uste
d Ap
prop
riatio
n S
hifti
ng o
f Fu
nds
Vire
men
t F
inal
Ap
prop
riatio
n A
ctua
l Ex
pend
iture
V
aria
nce
Expe
nditu
re a
s %
of f
inal
ap
prop
riatio
n
Fin
al
Appr
opria
tion
Act
ual
Expe
nditu
re
Econ
omic
cla
ssifi
catio
nR
'000
R'0
00 R
'000
R
'000
R'0
00 R
'000
%
R'0
00R
'000
110
688
-
(3
9 30
0)
7
1 38
8
6
6 98
7
4 4
01
93.8
%
4
8 37
5
9
2 48
6
5
12
-
-
512
4
69
43
91
.6%
477
4
52
512
-
-
5
12
469
43
91.6
%
4
77
452
11
0 17
6
-
(39
300)
70
876
66
518
4
358
93
.9%
47
898
92
034
9
839
-
(596
)
9 2
43
4
972
4 2
71
53.8
%
9 9
28
5
048
10
0 33
7
-
(38
704)
61
633
61
546
87
99
.9%
37
970
86
986
15
971
-
-
15
971
49
940
(33
969)
312.
7%
1
2 34
3
1
7 93
2
1
5 97
1
-
-
1
5 97
1
4
9 91
1
(3
3 94
0)31
2.5%
12
103
17
442
5
750
-
-
5 7
50
7
368
(1 6
18)
128.
1%
5 4
04
12
794
10
221
-
-
10
221
42
543
(32
322)
416.
2%
6 6
99
4
648
-
-
-
-
29
(29
)
-
240
4
90
-
-
-
-
-
-
-
7
81
781
To
tal
810
356
-
(4
2 30
0)
768
056
766
106
1 95
0
99
.7%
743
718
720
112
Dep
artm
enta
l age
ncie
s an
d ac
coun
tsD
epar
tmen
tal a
genc
ies
(non
-bus
ines
s en
titie
s)
Tran
sfer
s an
d su
bsid
ies
Hou
seho
lds
Soci
al b
enef
its
Tran
spor
t equ
ipm
ent
Oth
er m
achi
nery
and
equ
ipm
ent
Oth
er tr
ansf
ers
to h
ouse
hold
sPa
ymen
ts fo
r cap
ital a
sset
sM
achi
nery
and
equ
ipm
ent
Softw
are
and
othe
r int
angi
ble
asse
tsPa
ymen
t for
fina
ncia
l ass
ets

AnnuAl report 2018-2019 Financial Information220
WES
TER
N C
APE
DEP
AR
TMEN
T O
F H
EALT
H
VOTE
6
A
PPR
OPR
IATI
ON
STA
TEM
ENT
for t
he y
ear e
nded
31
Mar
ch 2
019
- 8
-
Subp
rogr
amm
e: 1
.1: O
FFIC
E O
F TH
E M
EC20
18/1
920
17/1
8 A
djus
ted
Appr
opria
tion
Shi
fting
of
Fund
s V
irem
ent
Fin
al
Appr
opria
tion
Act
ual
Expe
nditu
re
Var
ianc
e Ex
pend
iture
as
% o
f fin
al
appr
opria
tion
Fin
al
Appr
opria
tion
Act
ual
Expe
nditu
re
Eco
nom
ic c
lass
ifica
tion
R'0
00R
'000
R'0
00
R'0
00R
'000
R'0
00
%R
'000
R'0
00C
urre
nt p
aym
ents
7 49
8
-
-
7
498
6 54
4
95
4
87.3
%8
696
6 29
1
C
ompe
nsat
ion
of e
mpl
oyee
s5
979
-
-
5 97
9
5
349
630
89
.5%
7 18
0
5
466
Goo
ds a
nd s
ervi
ces
1 51
9
-
-
1
519
1 19
5
32
4
78.7
%1
516
825
Tr
ansf
ers
and
subs
idie
s-
-
-
-
47
1
(471
)
-
-
11
8
Hou
seho
lds
-
-
-
-
471
(4
71)
-
-
118
Pa
ymen
ts fo
r cap
ital a
sset
s45
7
-
-
457
91
0
(453
)
19
9.1%
396
42
7
Mac
hine
ry a
nd e
quip
men
t45
7
-
-
457
91
0
(453
)
19
9.1%
396
42
7
Paym
ent f
or fi
nanc
ial a
sset
s-
-
-
-
-
-
-
44
44
Tot
al
7 95
5
-
-
7
955
7 92
5
30
99
.6%
9 13
6
6
880
Subp
rogr
amm
e: 1
.2: M
ANAG
EMEN
T20
18/1
920
17/1
8 A
djus
ted
Appr
opria
tion
Shi
fting
of
Fund
s V
irem
ent
Fin
al
Appr
opria
tion
Act
ual
Expe
nditu
re
Var
ianc
e Ex
pend
iture
as
% o
f fin
al
appr
opria
tion
Fin
al
Appr
opria
tion
Act
ual
Expe
nditu
re
Eco
nom
ic c
lass
ifica
tion
R'0
00R
'000
R'0
00
R'0
00R
'000
R'0
00
%R
'000
R'0
00C
urre
nt p
aym
ents
676
199
-
(3
000
)
673
199
642
635
30 5
64
95.5
%67
3 52
3
60
2 62
2
C
ompe
nsat
ion
of e
mpl
oyee
s33
9 76
9
-
-
33
9 76
9
33
4 92
2
4
847
98.6
%33
5 06
9
31
7 43
1
G
oods
and
ser
vice
s33
6 43
0
-
(3 0
00)
33
3 43
0
30
7 71
3
25
717
92
.3%
338
454
285
191
Tran
sfer
s an
d su
bsid
ies
110
688
-
(3
9 30
0)
71 3
88
66 5
16
4 87
2
93
.2%
48 3
75
92 3
68
Dep
artm
enta
l age
ncie
s an
d ac
coun
ts51
2
-
-
512
46
9
43
91.6
%47
7
452
H
ouse
hold
s11
0 17
6
-
(39
300)
70
876
66
047
4
829
93.2
%47
898
91
916
Pa
ymen
ts fo
r cap
ital a
sset
s15
514
-
-
15
514
49
030
(3
3 51
6)
316.
0%11
947
17
505
M
achi
nery
and
equ
ipm
ent
15 5
14
-
-
15 5
14
49 0
01
(33
487)
31
5.9%
11 7
07
17 0
15
Softw
are
and
othe
r int
angi
ble
asse
ts-
-
-
-
29
(2
9)
-
24
0
490
Pa
ymen
t for
fina
ncia
l ass
ets
-
-
-
-
-
-
-
73
7
737
T
otal
80
2 40
1
-
(42
300)
76
0 10
1
75
8 18
1
1
920
99.7
%73
4 58
2
71
3 23
2

AnnuAl report 2018 -2019 221Financial Information
WES
TER
N C
APE
DEP
AR
TMEN
T O
F H
EALT
H
VOTE
6
A
PPR
OPR
IATI
ON
STA
TEM
ENT
for t
he y
ear e
nded
31
Mar
ch 2
019
- 9
-
Prog
ram
me
2: D
ISTR
ICT
HEA
LTH
SER
VIC
ES20
18/1
920
17/1
8 A
djus
ted
Appr
opria
tion
Shi
fting
of
Fund
s V
irem
ent
Fin
al
Appr
opria
tion
Act
ual
Expe
nditu
re
Var
ianc
e Ex
pend
iture
as
% o
f fin
al
appr
opria
tion
Fin
al
Appr
opria
tion
Act
ual
Expe
nditu
re
R'0
00R
'000
R'0
00
R'0
00R
'000
R'0
00
%R
'000
R'0
00
1D
ISTR
ICT
MAN
AGEM
ENT
441
183
-
-
441
183
444
106
(2
923
)10
0.7%
404
783
394
909
2C
OM
MU
NIT
Y H
EALT
H C
LIN
ICS
1
327
648
-
-
1
327
648
1
305
678
21
970
98.3
%
1 24
8 62
5
1 23
9 49
6 3
CO
MM
UN
ITY
HEA
LTH
CEN
TRES
2
212
735
-
(1 5
31)
2
211
204
2
145
480
65
724
97.0
%
2 08
9 93
7
2 03
7 56
4 4
CO
MM
UN
ITY
BASE
D S
ERVI
CES
222
491
-
-
222
491
227
339
(4
848
)10
2.2%
213
600
216
596
5O
THER
CO
MM
UN
ITY
SER
VIC
ES
1
-
-
1
-
1
-
1
-
6H
IV/A
IDS
1
613
625
-
-
1
613
625
1
607
733
5
892
99
.6%
1
532
363
1
527
815
7N
UTR
ITIO
N
5
0 25
0
-
-
5
0 25
0
5
0 15
3
97
99.8
%
4
6 38
1
4
7 57
3 8
CO
RO
NER
SER
VIC
ES
1
-
-
1
-
1
-
1
-
9D
ISTR
ICT
HO
SPIT
ALS
3
371
191
-
1 5
31
3
372
722
3
457
401
(84
679)
102.
5%
3 16
4 17
4
3 23
2 46
4 10
GLO
BAL
FUN
D
10
2 64
1
-
-
10
2 64
1
9
0 86
2
1
1 77
9 88
.5%
71
790
41
492
9 34
1 76
6
-
-
9 34
1 76
6
9 32
8 75
2
13 0
14
99.9
%8
771
655
8
737
909
2018
/19
2017
/18
Adj
uste
d Ap
prop
riatio
n S
hifti
ng o
f Fu
nds
Vire
men
t F
inal
Ap
prop
riatio
n A
ctua
l Ex
pend
iture
V
aria
nce
Expe
nditu
re a
s %
of f
inal
ap
prop
riatio
n
Fin
al
Appr
opria
tion
Act
ual
Expe
nditu
re
Econ
omic
cla
ssifi
catio
nR
'000
R'0
00 R
'000
R
'000
R'0
00 R
'000
%
R'0
00R
'000
8
176
148
-
(2 6
80)
8
173
468
8
146
720
26
748
99.7
%
7 74
4 69
6
7 74
6 29
9
5 04
9 36
6
-
-
5 04
9 36
6
5 03
2 11
4
1
7 25
2 99
.7%
4
710
278
4
685
005
4
434
001
-
-
4
434
001
4
426
465
7
536
99
.8%
4
137
642
4
127
468
615
365
-
-
615
365
605
649
9
716
98
.4%
572
636
557
537
3
126
782
-
(2 6
80)
3
124
102
3
114
606
9
496
99
.7%
3
034
418
3
061
294
7
525
-
-
7 5
25
7
191
3
34
95.6
%
9 0
87
8
941
1
8 71
5
-
-
1
8 71
5
1
2 08
2
6 6
33
64.6
%
1
7 97
6
1
4 11
8
3 0
59
-
-
3
059
3 2
02
(143
)10
4.7%
3
106
2 3
05
36
052
-
(2 6
80)
33
372
25
659
7
713
76
.9%
36
745
26
880
3
784
-
-
3 7
84
3
397
3
87
89.8
%
5 0
36
3
910
1
5 82
7
-
-
1
5 82
7
1
0 06
4
5 7
63
63.6
%
1
2 65
7
8 7
33
397
651
-
-
397
651
441
387
(43
736)
111.
0%
37
5 25
6
38
8 62
3
10
0 78
7
-
-
10
0 78
7
9
3 78
6
7 0
01
93.1
%
14
5 51
1
15
0 49
9
26
8 70
5
-
-
26
8 70
5
29
0 28
6
(2
1 58
1)10
8.0%
249
843
275
913
104
-
-
1
04
27
77
26.0
%
99
20
3
4 05
5
-
-
3
4 05
5
2
9 29
7
4 7
58
86.0
%
3
1 93
5
2
8 81
8
3
8 90
1
-
-
3
8 90
1
4
0 22
0
(1 3
19)
103.
4%
3
6 27
0
3
5 68
7
46
0 18
8
-
-
46
0 18
8
44
6 10
7
1
4 08
1 96
.9%
439
855
431
728
1
169
635
-
-
1
169
635
1
121
386
48
249
95.9
%
1 13
1 99
4
1 13
1 12
1
4 4
62
-
-
4
462
2
4
460
0.
0%
4 4
78
102
11
7 57
2
-
-
11
7 57
2
12
4 49
0
(6 9
18)
105.
9%
10
7 92
7
12
1 12
6
4
9 50
9
-
-
4
9 50
9
4
8 65
4
8
55
98.3
%
4
9 00
3
4
7 84
1
Tota
l
Sub
prog
ram
me
Goo
ds a
nd s
ervi
ces
Adve
rtisi
ngM
inor
ass
ets
Cur
rent
pay
men
tsC
ompe
nsat
ion
of e
mpl
oyee
sSa
larie
s an
d w
ages
Soci
al c
ontri
butio
ns
Con
tract
ors
Agen
cy a
nd s
uppo
rt / o
utso
urce
d se
rvic
esEn
terta
inm
ent
Flee
t ser
vice
s (in
clud
ing
gove
rnm
ent m
otor
tran
spor
t)
Cat
erin
g: D
epar
tmen
tal a
ctiv
ities
Com
mun
icat
ion
(G&S
)C
ompu
ter s
ervi
ces
Con
sulta
nts:
Bus
ines
s an
d ad
viso
ry s
ervi
ces
Labo
rato
ry s
ervi
ces
Inve
ntor
y: M
edic
al s
uppl
ies
Inve
ntor
y: M
edic
ine
Inve
ntor
y: O
ther
sup
plie
sC
onsu
mab
le s
uppl
ies
Inve
ntor
y: F
ood
and
food
sup
plie
s
Con
sum
able
: Sta
tione
ry, p
rintin
g an
d of
fice
supp
lies

AnnuAl report 2018-2019 Financial Information222
WES
TER
N C
APE
DEP
AR
TMEN
T O
F H
EALT
H
VOTE
6
A
PPR
OPR
IATI
ON
STA
TEM
ENT
for t
he y
ear e
nded
31
Mar
ch 2
019
- 1
0 -
2018
/19
2017
/18
Adj
uste
d Ap
prop
riatio
n S
hifti
ng o
f Fu
nds
Vire
men
t F
inal
Ap
prop
riatio
n A
ctua
l Ex
pend
iture
V
aria
nce
Expe
nditu
re a
s %
of f
inal
ap
prop
riatio
n
Fin
al
Appr
opria
tion
Act
ual
Expe
nditu
re
Econ
omic
cla
ssifi
catio
nR
'000
R'0
00 R
'000
R
'000
R'0
00 R
'000
%
R'0
00R
'000
15
098
-
-
15
098
11
961
3
137
79
.2%
14
034
11
744
329
549
-
-
329
549
346
991
(17
442)
105.
3%
30
8 79
3
32
3 01
1
1 4
32
-
-
1
432
1 2
61
171
88
.1%
1
356
1 2
19
15
366
-
-
15
366
14
699
667
95
.7%
15
897
13
304
13
603
-
-
13
603
13
232
371
97
.3%
13
697
11
450
7
148
-
-
7 1
48
9
617
(2 4
69)
134.
5%
6 7
00
5
976
3
00
-
-
300
2
97
3
99
.0%
369
1
64
17
755
-
-
17
755
19
311
(1
556
)10
8.8%
16
794
18
061
1
064
905
-
-
1
064
905
1
050
684
14
221
98.7
%
91
1 54
9
88
0 84
7
54
9 93
7
-
-
54
9 93
7
54
9 64
6
2
91
99.9
%
52
0 66
5
52
0 66
5
54
9 93
7
-
-
54
9 93
7
54
9 64
6
2
91
99.9
%
52
0 66
5
52
0 66
5
54
9 93
7
-
-
54
9 93
7
54
9 64
6
2
91
99.9
%
52
0 66
5
52
0 66
5
49
6 94
9
-
-
49
6 94
9
48
5 02
4
1
1 92
5 97
.6%
373
920
340
464
18
019
-
-
18
019
16
014
2
005
88
.9%
16
964
19
718
17
485
-
-
17
485
15
238
2
247
87
.1%
16
463
19
558
534
-
-
5
34
776
(2
42)
145.
3%
5
01
160
10
0 71
3
-
-
10
0 71
3
12
8 66
8
(2
7 95
5)12
7.8%
114
064
109
417
100
671
-
-
100
671
128
329
(27
658)
127.
5%
11
2 34
4
10
6 79
5
4
5 24
2
-
-
4
5 24
2
6
0 83
4
(1
5 59
2)13
4.5%
52
160
52
888
55
429
-
-
55
429
67
495
(12
066)
121.
8%
6
0 18
4
5
3 90
7
42
-
-
42
3
39
(297
)80
7.1%
1
720
2 6
22
-
-
2
680
2 6
80
2
680
-
100.
0%
1 3
46
1
346
9
341
766
-
-
9
341
766
9
328
752
13
014
99
.9%
8 77
1 65
5
8 73
7 90
9
Ope
ratin
g pa
ymen
tsVe
nues
and
faci
litie
sR
enta
l and
hiri
ng
Ope
ratin
g le
ases
Prop
erty
pay
men
tsTr
ansp
ort p
rovi
ded:
Dep
artm
enta
l act
ivity
Trav
el a
nd s
ubsi
sten
ceTr
aini
ng a
nd d
evel
opm
ent
Mun
icip
al b
ank
acco
unts
Tran
sfer
s an
d su
bsid
ies
Prov
ince
s an
d m
unic
ipal
ities
Mun
icip
aliti
es
Non
-pro
fit in
stitu
tions
Hou
seho
lds
Soci
al b
enef
itsO
ther
tran
sfer
s to
hou
seho
lds
Oth
er m
achi
nery
and
equ
ipm
ent
Softw
are
and
othe
r int
angi
ble
asse
ts
Paym
ents
for c
apita
l ass
ets
Mac
hine
ry a
nd e
quip
men
tTr
ansp
ort e
quip
men
t
Paym
ent f
or fi
nanc
ial a
sset
sTo
tal
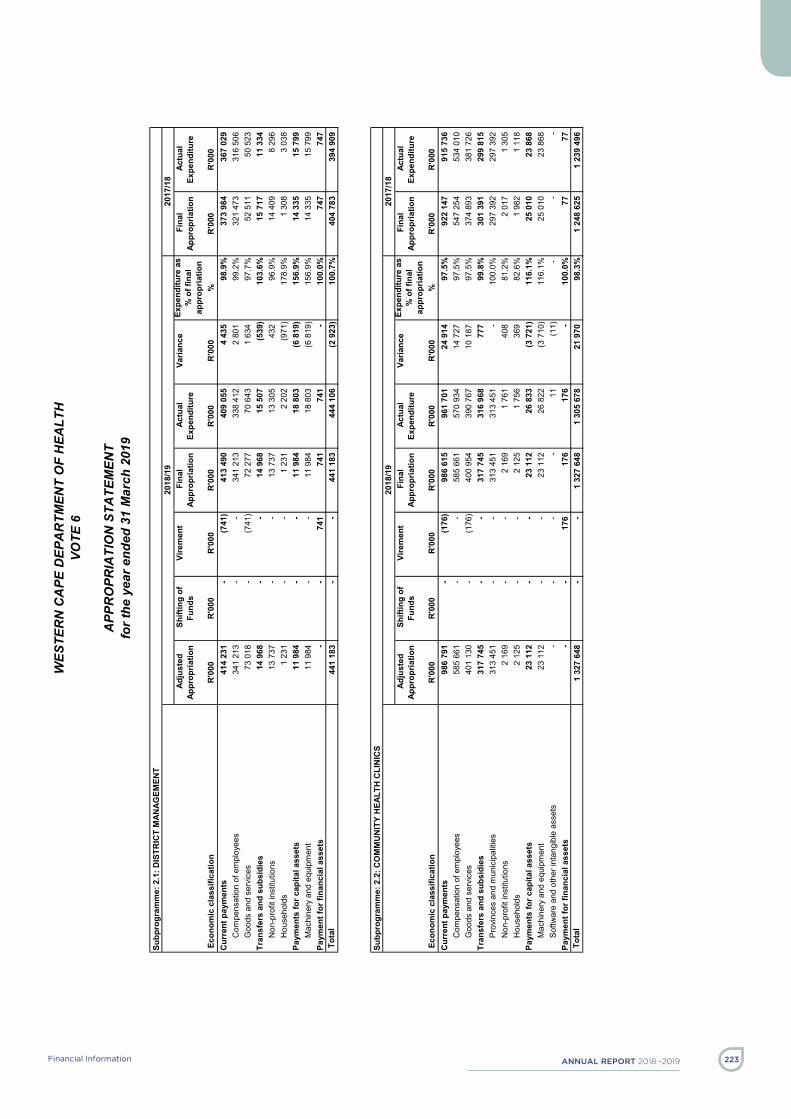
AnnuAl report 2018 -2019 223Financial Information
WES
TER
N C
APE
DEP
AR
TMEN
T O
F H
EALT
H
VOTE
6
A
PPR
OPR
IATI
ON
STA
TEM
ENT
for t
he y
ear e
nded
31
Mar
ch 2
019
- 1
1 -
Subp
rogr
amm
e: 2
.1: D
ISTR
ICT
MAN
AGEM
ENT
2018
/19
2017
/18
Adj
uste
d Ap
prop
riatio
n S
hifti
ng o
f Fu
nds
Vire
men
t F
inal
Ap
prop
riatio
n A
ctua
l Ex
pend
iture
V
aria
nce
Expe
nditu
re a
s %
of f
inal
ap
prop
riatio
n
Fin
al
Appr
opria
tion
Act
ual
Expe
nditu
re
Eco
nom
ic c
lass
ifica
tion
R'0
00R
'000
R'0
00
R'0
00R
'000
R'0
00
%R
'000
R'0
00C
urre
nt p
aym
ents
414
231
-
(7
41)
413
490
409
055
4 43
5
98
.9%
373
984
367
029
Com
pens
atio
n of
em
ploy
ees
341
213
-
-
341
213
338
412
2 80
1
99
.2%
321
473
316
506
Goo
ds a
nd s
ervi
ces
73 0
18
-
(7
41)
72 2
77
70 6
43
1 63
4
97
.7%
52 5
11
50 5
23
Tran
sfer
s an
d su
bsid
ies
14 9
68
-
-
14 9
68
15 5
07
(539
)
10
3.6%
15 7
17
11 3
34
Non
-pro
fit in
stitu
tions
13 7
37
-
-
13 7
37
13 3
05
432
96
.9%
14 4
09
8 29
6
H
ouse
hold
s1
231
-
-
1 23
1
2
202
(971
)
17
8.9%
1 30
8
3
038
Paym
ents
for c
apita
l ass
ets
11 9
84
-
-
11 9
84
18 8
03
(6 8
19)
15
6.9%
14 3
35
15 7
99
Mac
hine
ry a
nd e
quip
men
t11
984
-
-
11
984
18
803
(6
819
)
156.
9%14
335
15
799
Pa
ymen
t for
fina
ncia
l ass
ets
-
-
741
74
1
741
-
100.
0%74
7
747
T
otal
44
1 18
3
-
-
44
1 18
3
44
4 10
6
(2
923
)
100.
7%40
4 78
3
39
4 90
9
Subp
rogr
amm
e: 2
.2: C
OM
MU
NIT
Y H
EALT
H C
LIN
ICS
2018
/19
2017
/18
Adj
uste
d Ap
prop
riatio
n S
hifti
ng o
f Fu
nds
Vire
men
t F
inal
Ap
prop
riatio
n A
ctua
l Ex
pend
iture
V
aria
nce
Expe
nditu
re a
s %
of f
inal
ap
prop
riatio
n
Fin
al
Appr
opria
tion
Act
ual
Expe
nditu
re
Eco
nom
ic c
lass
ifica
tion
R'0
00R
'000
R'0
00
R'0
00R
'000
R'0
00
%R
'000
R'0
00C
urre
nt p
aym
ents
986
791
-
(1
76)
986
615
961
701
24 9
14
97.5
%92
2 14
7
91
5 73
6
C
ompe
nsat
ion
of e
mpl
oyee
s58
5 66
1
-
-
58
5 66
1
57
0 93
4
14
727
97
.5%
547
254
534
010
Goo
ds a
nd s
ervi
ces
401
130
-
(1
76)
400
954
390
767
10 1
87
97.5
%37
4 89
3
38
1 72
6
Tr
ansf
ers
and
subs
idie
s31
7 74
5
-
-
31
7 74
5
31
6 96
8
77
7
99.8
%30
1 39
1
29
9 81
5
Pr
ovin
ces
and
mun
icip
aliti
es31
3 45
1
-
-
31
3 45
1
31
3 45
1
-
100.
0%29
7 39
2
29
7 39
2
N
on-p
rofit
inst
itutio
ns2
169
-
-
2 16
9
1
761
408
81
.2%
2 01
7
1
305
Hou
seho
lds
2 12
5
-
-
2
125
1 75
6
36
9
82.6
%1
982
1 11
8
Pa
ymen
ts fo
r cap
ital a
sset
s23
112
-
-
23
112
26
833
(3
721
)
116.
1%25
010
23
868
M
achi
nery
and
equ
ipm
ent
23 1
12
-
-
23 1
12
26 8
22
(3 7
10)
11
6.1%
25 0
10
23 8
68
Softw
are
and
othe
r int
angi
ble
asse
ts-
-
-
-
11
(1
1)
-
-
-
Pa
ymen
t for
fina
ncia
l ass
ets
-
-
176
17
6
176
-
100.
0%77
77
T
otal
1
327
648
-
-
1
327
648
1
305
678
21
970
98
.3%
1 24
8 62
5
1 23
9 49
6

AnnuAl report 2018-2019 Financial Information224
WES
TER
N C
APE
DEP
AR
TMEN
T O
F H
EALT
H
VOTE
6
A
PPR
OPR
IATI
ON
STA
TEM
ENT
for t
he y
ear e
nded
31
Mar
ch 2
019
- 1
2 -
Subp
rogr
amm
e: 2
.3: C
OM
MU
NIT
Y H
EALT
H C
ENTR
ES20
18/1
920
17/1
8 A
djus
ted
Appr
opria
tion
Shi
fting
of
Fund
s V
irem
ent
Fin
al
Appr
opria
tion
Act
ual
Expe
nditu
re
Var
ianc
e Ex
pend
iture
as
% o
f fin
al
appr
opria
tion
Fin
al
Appr
opria
tion
Act
ual
Expe
nditu
re
Eco
nom
ic c
lass
ifica
tion
R'0
00R
'000
R'0
00
R'0
00R
'000
R'0
00
%R
'000
R'0
00C
urre
nt p
aym
ents
2 18
3 83
0
-
(1
763
)
2 18
2 06
7
2 11
7 73
0
64 3
37
97.1
%2
069
379
2
017
346
C
ompe
nsat
ion
of e
mpl
oyee
s1
257
407
-
-
1
257
407
1
234
252
23
155
98
.2%
1 17
5 99
1
1 15
7 92
3
Goo
ds a
nd s
ervi
ces
926
423
-
(1
763
)
924
660
883
478
41 1
82
95.5
%89
3 38
8
85
9 42
3
Tr
ansf
ers
and
subs
idie
s4
389
-
-
4 38
9
3
843
546
87
.6%
4 09
2
5
148
Hou
seho
lds
4 38
9
-
-
4
389
3 84
3
54
6
87.6
%4
092
5 14
8
Pa
ymen
ts fo
r cap
ital a
sset
s24
516
-
-
24
516
23
675
84
1
96.6
%16
289
14
893
M
achi
nery
and
equ
ipm
ent
24 4
95
-
-
24 4
95
23 4
41
1 05
4
95
.7%
16 2
89
14 8
93
Softw
are
and
othe
r int
angi
ble
asse
ts21
-
-
21
23
4
(213
)
11
14.3
%-
-
Pa
ymen
t for
fina
ncia
l ass
ets
-
-
232
23
2
232
-
100.
0%17
7
177
T
otal
2
212
735
-
(1 5
31)
2
211
204
2
145
480
65
724
97
.0%
2 08
9 93
7
2 03
7 56
4
Subp
rogr
amm
e: 2
.4: C
OM
MU
NIT
Y B
ASED
SER
VIC
ES20
18/1
920
17/1
8 A
djus
ted
Appr
opria
tion
Shi
fting
of
Fund
s V
irem
ent
Fin
al
Appr
opria
tion
Act
ual
Expe
nditu
re
Var
ianc
e Ex
pend
iture
as
% o
f fin
al
appr
opria
tion
Fin
al
Appr
opria
tion
Act
ual
Expe
nditu
re
Eco
nom
ic c
lass
ifica
tion
R'0
00R
'000
R'0
00
R'0
00R
'000
R'0
00
%R
'000
R'0
00C
urre
nt p
aym
ents
56 0
34
-
-
56 0
34
61 8
97
(5 8
63)
11
0.5%
105
418
104
619
Com
pens
atio
n of
em
ploy
ees
48 8
19
-
-
48 8
19
55 1
26
(6 3
07)
11
2.9%
46 1
38
51 2
12
Goo
ds a
nd s
ervi
ces
7 21
5
-
-
7
215
6 77
1
44
4
93.8
%59
280
53
407
Tr
ansf
ers
and
subs
idie
s16
5 76
7
-
-
16
5 76
7
16
4 46
7
1
300
99.2
%10
7 56
4
11
1 24
8
N
on-p
rofit
inst
itutio
ns16
5 44
8
-
-
16
5 44
8
16
4 15
7
1
291
99.2
%10
7 26
6
11
1 23
8
H
ouse
hold
s31
9
-
-
319
31
0
9
97
.2%
298
10
Pa
ymen
ts fo
r cap
ital a
sset
s69
0
-
-
690
97
5
(285
)
14
1.3%
617
72
8
Mac
hine
ry a
nd e
quip
men
t69
0
-
-
690
97
5
(285
)
14
1.3%
617
72
8
Tot
al
222
491
-
-
222
491
227
339
(4 8
48)
10
2.2%
213
600
216
596
Subp
rogr
amm
e: 2
.5: O
THER
CO
MM
UN
ITY
SER
VIC
ES20
18/1
920
17/1
8 A
djus
ted
Appr
opria
tion
Shi
fting
of
Fund
s V
irem
ent
Fin
al
Appr
opria
tion
Act
ual
Expe
nditu
re
Var
ianc
e Ex
pend
iture
as
% o
f fin
al
appr
opria
tion
Fin
al
Appr
opria
tion
Act
ual
Expe
nditu
re
Eco
nom
ic c
lass
ifica
tion
R'0
00R
'000
R'0
00
R'0
00R
'000
R'0
00
%R
'000
R'0
00C
urre
nt p
aym
ents
1
-
-
1
-
1
-
1
-
G
oods
and
ser
vice
s1
-
-
1
-
1
-
1
-
Tot
al
1
-
-
1
-
1
-
1
-

AnnuAl report 2018 -2019 225Financial Information
WES
TER
N C
APE
DEP
AR
TMEN
T O
F H
EALT
H
VOTE
6
A
PPR
OPR
IATI
ON
STA
TEM
ENT
for t
he y
ear e
nded
31
Mar
ch 2
019
- 1
3 -
Subp
rogr
amm
e: 2
.6: H
IV/A
IDS
2018
/19
2017
/18
Adj
uste
d Ap
prop
riatio
n S
hifti
ng o
f Fu
nds
Vire
men
t F
inal
Ap
prop
riatio
n A
ctua
l Ex
pend
iture
V
aria
nce
Expe
nditu
re a
s %
of f
inal
ap
prop
riatio
n
Fin
al
Appr
opria
tion
Act
ual
Expe
nditu
re
Eco
nom
ic c
lass
ifica
tion
R'0
00R
'000
R'0
00
R'0
00R
'000
R'0
00
%R
'000
R'0
00C
urre
nt p
aym
ents
1 14
9 59
4
-
-
1 14
9 59
4
1 14
6 95
7
2 63
7
99
.8%
1 11
9 09
0
1 11
9 55
9
Com
pens
atio
n of
em
ploy
ees
483
129
-
-
483
129
483
521
(392
)
10
0.1%
446
284
434
930
Goo
ds a
nd s
ervi
ces
666
465
-
-
666
465
663
436
3 02
9
99
.5%
672
806
684
629
Tran
sfer
s an
d su
bsid
ies
463
810
-
-
463
810
460
650
3 16
0
99
.3%
413
037
408
162
Prov
ince
s an
d m
unic
ipal
ities
230
558
-
-
230
558
230
558
-
10
0.0%
217
701
217
701
Non
-pro
fit in
stitu
tions
233
252
-
-
233
252
229
517
3 73
5
98
.4%
195
336
189
771
Hou
seho
lds
-
-
-
-
575
(5
75)
-
-
690
Pa
ymen
ts fo
r cap
ital a
sset
s22
1
-
-
221
12
6
95
57.0
%23
6
94
Mac
hine
ry a
nd e
quip
men
t22
1
-
-
221
12
6
95
57.0
%23
6
94
Tot
al
1 61
3 62
5
-
-
1 61
3 62
5
1 60
7 73
3
5 89
2
99
.6%
1 53
2 36
3
1 52
7 81
5
Subp
rogr
amm
e: 2
.7: N
UTR
ITIO
N20
18/1
920
17/1
8 A
djus
ted
Appr
opria
tion
Shi
fting
of
Fund
s V
irem
ent
Fin
al
Appr
opria
tion
Act
ual
Expe
nditu
re
Var
ianc
e Ex
pend
iture
as
% o
f fin
al
appr
opria
tion
Fin
al
Appr
opria
tion
Act
ual
Expe
nditu
re
Eco
nom
ic c
lass
ifica
tion
R'0
00R
'000
R'0
00
R'0
00R
'000
R'0
00
%R
'000
R'0
00C
urre
nt p
aym
ents
40 9
87
-
-
40 9
87
40 7
26
261
99
.4%
37 7
07
38 5
99
Com
pens
atio
n of
em
ploy
ees
9 65
4
-
-
9
654
9 21
2
44
2
95.4
%9
419
9 23
8
G
oods
and
ser
vice
s31
333
-
-
31
333
31
514
(1
81)
100.
6%28
288
29
361
Tr
ansf
ers
and
subs
idie
s9
256
-
-
9 25
6
9
425
(169
)
10
1.8%
8 66
7
8
971
Prov
ince
s an
d m
unic
ipal
ities
5 92
8
-
-
5
928
5 63
7
29
1
95.1
%5
572
5 57
2
N
on-p
rofit
inst
itutio
ns3
328
-
-
3 32
8
3
760
(432
)
11
3.0%
3 09
5
3
388
Hou
seho
lds
-
-
-
-
28
(28)
-
-
11
Pa
ymen
ts fo
r cap
ital a
sset
s7
-
-
7
2
5
28
.6%
7
3
Mac
hine
ry a
nd e
quip
men
t7
-
-
7
2
5
28
.6%
7
3
Tot
al
50 2
50
-
-
50 2
50
50 1
53
97
99.8
%46
381
47
573
Subp
rogr
amm
e: 2
.8: C
OR
ON
ER S
ERVI
CES
2018
/19
2017
/18
Adj
uste
d Ap
prop
riatio
n S
hifti
ng o
f Fu
nds
Vire
men
t F
inal
Ap
prop
riatio
n A
ctua
l Ex
pend
iture
V
aria
nce
Expe
nditu
re a
s %
of f
inal
ap
prop
riatio
n
Fin
al
Appr
opria
tion
Act
ual
Expe
nditu
re
Eco
nom
ic c
lass
ifica
tion
R'0
00R
'000
R'0
00
R'0
00R
'000
R'0
00
%R
'000
R'0
00C
urre
nt p
aym
ents
1
-
-
1
-
1
-
1
-
G
oods
and
ser
vice
s1
-
-
1
-
1
-
1
-
Tot
al
1
-
-
1
-
1
-
1
-

AnnuAl report 2018-2019 Financial Information226
WES
TER
N C
APE
DEP
AR
TMEN
T O
F H
EALT
H
VOTE
6
A
PPR
OPR
IATI
ON
STA
TEM
ENT
for t
he y
ear e
nded
31
Mar
ch 2
019
- 1
4 -
Subp
rogr
amm
e: 2
.9: D
ISTR
ICT
HO
SPIT
ALS
2018
/19
2017
/18
Adj
uste
d Ap
prop
riatio
n S
hifti
ng o
f Fu
nds
Vire
men
t F
inal
Ap
prop
riatio
n A
ctua
l Ex
pend
iture
V
aria
nce
Expe
nditu
re a
s %
of f
inal
ap
prop
riatio
n
Fin
al
Appr
opria
tion
Act
ual
Expe
nditu
re
Eco
nom
ic c
lass
ifica
tion
R'0
00R
'000
R'0
00
R'0
00R
'000
R'0
00
%R
'000
R'0
00C
urre
nt p
aym
ents
3 31
9 49
8
-
-
3 31
9 49
8
3 38
9 15
8
(69
660)
10
2.1%
3 09
5 89
4
3 16
7 43
5
Com
pens
atio
n of
em
ploy
ees
2 30
8 94
9
-
-
2 30
8 94
9
2 32
7 20
6
(18
257)
10
0.8%
2 15
1 80
3
2 17
0 65
6
Goo
ds a
nd s
ervi
ces
1 01
0 54
9
-
-
1 01
0 54
9
1 06
1 95
2
(51
403)
10
5.1%
944
091
996
779
Tran
sfer
s an
d su
bsid
ies
11 6
05
-
-
11 6
05
8 50
3
3
102
73.3
%10
839
10
866
N
on-p
rofit
inst
itutio
ns1
650
-
-
1 65
0
1
250
400
75
.8%
1 55
8
1
166
Hou
seho
lds
9 95
5
-
-
9
955
7 25
3
2
702
72.9
%9
281
9 70
0
Pa
ymen
ts fo
r cap
ital a
sset
s40
088
-
-
40
088
58
209
(1
8 12
1)
145.
2%57
097
53
819
M
achi
nery
and
equ
ipm
ent
40 0
67
-
-
40 0
67
58 1
15
(18
048)
14
5.0%
55 3
77
51 1
97
Softw
are
and
othe
r int
angi
ble
asse
ts21
-
-
21
94
(7
3)
447.
6%1
720
2 62
2
Pa
ymen
t for
fina
ncia
l ass
ets
-
-
1 53
1
1
531
1 53
1
-
100.
0%34
4
344
T
otal
3
371
191
-
1 53
1
3
372
722
3
457
401
(8
4 67
9)
102.
5%3
164
174
3
232
464
Subp
rogr
amm
e: 2
.10:
GLO
BAL
FU
ND
2018
/19
2017
/18
Adj
uste
d Ap
prop
riatio
n S
hifti
ng o
f Fu
nds
Vire
men
t F
inal
Ap
prop
riatio
n A
ctua
l Ex
pend
iture
V
aria
nce
Expe
nditu
re a
s %
of f
inal
ap
prop
riatio
n
Fin
al
Appr
opria
tion
Act
ual
Expe
nditu
re
Eco
nom
ic c
lass
ifica
tion
R'0
00R
'000
R'0
00
R'0
00R
'000
R'0
00
%R
'000
R'0
00C
urre
nt p
aym
ents
25 1
81
-
-
25 1
81
19 4
96
5 68
5
77
.4%
21 0
75
15 9
76
Com
pens
atio
n of
em
ploy
ees
14 5
34
-
-
14 5
34
13 4
51
1 08
3
92
.5%
11 9
16
10 5
30
Goo
ds a
nd s
ervi
ces
10 6
47
-
-
10 6
47
6 04
5
4
602
56.8
%9
159
5 44
6
Tr
ansf
ers
and
subs
idie
s77
365
-
-
77
365
71
321
6
044
92.2
%50
242
25
303
N
on-p
rofit
inst
itutio
ns77
365
-
-
77
365
71
274
6
091
92.1
%50
239
25
300
H
ouse
hold
s-
-
-
-
47
(4
7)
-
3
3
Pa
ymen
ts fo
r cap
ital a
sset
s95
-
-
95
45
50
47
.4%
473
21
3
Mac
hine
ry a
nd e
quip
men
t95
-
-
95
45
50
47
.4%
473
21
3
Tot
al
102
641
-
-
102
641
90 8
62
11 7
79
88.5
%71
790
41
492
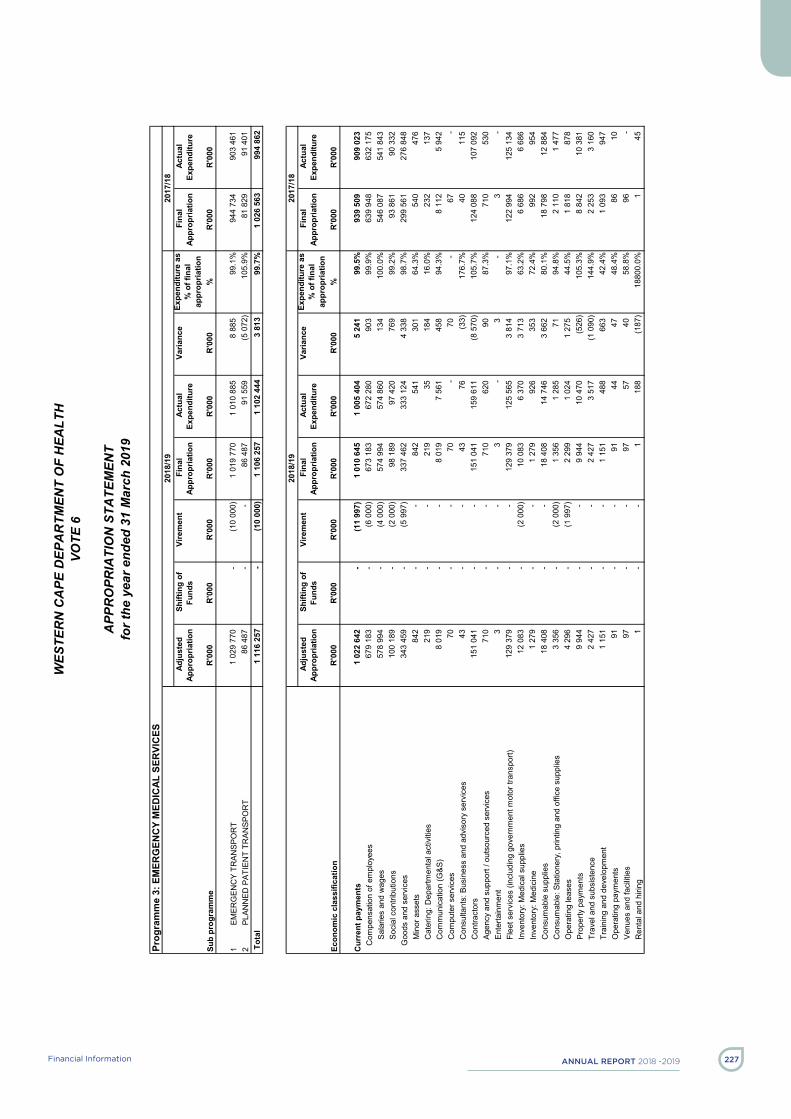
AnnuAl report 2018 -2019 227Financial Information
WES
TER
N C
APE
DEP
AR
TMEN
T O
F H
EALT
H
VOTE
6
A
PPR
OPR
IATI
ON
STA
TEM
ENT
for t
he y
ear e
nded
31
Mar
ch 2
019
- 1
5 -
Prog
ram
me
3: E
MER
GEN
CY
MED
ICAL
SER
VIC
ES20
18/1
920
17/1
8 A
djus
ted
Appr
opria
tion
Shi
fting
of
Fund
s V
irem
ent
Fin
al
Appr
opria
tion
Act
ual
Expe
nditu
re
Var
ianc
e Ex
pend
iture
as
% o
f fin
al
appr
opria
tion
Fin
al
Appr
opria
tion
Act
ual
Expe
nditu
re
R'0
00R
'000
R'0
00
R'0
00R
'000
R'0
00
%R
'000
R'0
00
1EM
ERG
ENC
Y TR
ANSP
OR
T
1 02
9 77
0
-
(10
000)
1
019
770
1
010
885
8
885
99
.1%
944
734
903
461
2PL
ANN
ED P
ATIE
NT
TRAN
SPO
RT
86
487
-
-
86
487
91
559
(5
072
)10
5.9%
81
829
91
401
1 11
6 25
7
-
(1
0 00
0)
1 10
6 25
7
1 10
2 44
4
3 81
3
99
.7%
1 02
6 56
3
994
862
2018
/19
2017
/18
Adj
uste
d Ap
prop
riatio
n S
hifti
ng o
f Fu
nds
Vire
men
t F
inal
Ap
prop
riatio
n A
ctua
l Ex
pend
iture
V
aria
nce
Expe
nditu
re a
s %
of f
inal
ap
prop
riatio
n
Fin
al
Appr
opria
tion
Act
ual
Expe
nditu
re
Econ
omic
cla
ssifi
catio
nR
'000
R'0
00 R
'000
R
'000
R'0
00 R
'000
%
R'0
00R
'000
1
022
642
-
(1
1 99
7)
1 01
0 64
5
1 00
5 40
4
5 2
41
99.5
%
93
9 50
9
90
9 02
3
67
9 18
3
-
(6
000
)
67
3 18
3
67
2 28
0
9
03
99.9
%
63
9 94
8
63
2 17
5
57
8 99
4
-
(4
000
)
57
4 99
4
57
4 86
0
1
34
100.
0%
54
6 08
7
54
1 84
3
10
0 18
9
-
(2
000
)
9
8 18
9
9
7 42
0
7
69
99.2
%
9
3 86
1
9
0 33
2
34
3 45
9
-
(5
997
)
33
7 46
2
33
3 12
4
4 3
38
98.7
%
29
9 56
1
27
6 84
8
8
42
-
-
842
5
41
301
64
.3%
540
4
76
219
-
-
2
19
35
1
84
16.0
%
2
32
137
8 0
19
-
-
8
019
7 5
61
458
94
.3%
8
112
5 9
42
70
-
-
70
-
70
-
67
-
43
-
-
43
76
(33
)17
6.7%
40
1
15
151
041
-
-
151
041
159
611
(8
570
)10
5.7%
124
088
107
092
710
-
-
7
10
620
90
87.3
%
7
10
530
3
-
-
3
-
3
-
3
-
129
379
-
-
129
379
125
565
3
814
97
.1%
122
994
125
134
12
083
-
(2 0
00)
10
083
6
370
3 7
13
63.2
%
6 6
86
6
686
1 2
79
-
-
1
279
9
26
353
72
.4%
992
9
54
18
408
-
-
18
408
14
746
3
662
80
.1%
18
798
12
884
3
356
-
(2
000
)
1 3
56
1
285
71
94.8
%
2 1
10
1
477
4 2
96
-
(1 9
97)
2
299
1 0
24
1
275
44
.5%
1
818
8
78
9
944
-
-
9 9
44
10
470
(526
)10
5.3%
8
842
1
0 38
1
2 4
27
-
-
2
427
3 5
17
(1
090
)14
4.9%
2
253
3 1
60
1
151
-
-
1 1
51
488
6
63
42.4
%
1 0
93
947
91
-
-
91
44
47
48
.4%
86
10
97
-
-
97
57
40
58.8
%
96
-
1
-
-
1
1
88
(187
)18
800.
0%
1
45
Min
or a
sset
sC
ater
ing:
Dep
artm
enta
l act
iviti
es
Cur
rent
pay
men
tsC
ompe
nsat
ion
of e
mpl
oyee
sSa
larie
s an
d w
ages
Soci
al c
ontri
butio
nsG
oods
and
ser
vice
s
Sub
prog
ram
me
Tota
l
Con
tract
ors
Agen
cy a
nd s
uppo
rt / o
utso
urce
d se
rvic
esEn
terta
inm
ent
Flee
t ser
vice
s (in
clud
ing
gove
rnm
ent m
otor
tran
spor
t)
Com
mun
icat
ion
(G&S
)C
ompu
ter s
ervi
ces
Con
sulta
nts:
Bus
ines
s an
d ad
viso
ry s
ervi
ces
Inve
ntor
y: M
edic
al s
uppl
ies
Inve
ntor
y: M
edic
ine
Con
sum
able
sup
plie
sC
onsu
mab
le: S
tatio
nery
, prin
ting
and
offic
e su
pplie
s
Venu
es a
nd fa
cilit
ies
Ren
tal a
nd h
iring
Ope
ratin
g le
ases
Prop
erty
pay
men
tsTr
avel
and
sub
sist
ence
Trai
ning
and
dev
elop
men
tO
pera
ting
paym
ents

AnnuAl report 2018-2019 Financial Information228
WES
TER
N C
APE
DEP
AR
TMEN
T O
F H
EALT
H
VOTE
6
A
PPR
OPR
IATI
ON
STA
TEM
ENT
for t
he y
ear e
nded
31
Mar
ch 2
019
- 1
6 -
2018
/19
2017
/18
Adj
uste
d Ap
prop
riatio
n S
hifti
ng o
f Fu
nds
Vire
men
t F
inal
Ap
prop
riatio
n A
ctua
l Ex
pend
iture
V
aria
nce
Expe
nditu
re a
s %
of f
inal
ap
prop
riatio
n
Fin
al
Appr
opria
tion
Act
ual
Expe
nditu
re
Econ
omic
cla
ssifi
catio
nR
'000
R'0
00 R
'000
R
'000
R'0
00 R
'000
%
R'0
00R
'000
772
-
-
7
72
832
(
60)
107.
8%
7
27
998
16
-
-
16
15
1
93
.8%
22
16
16
-
-
16
15
1
93.8
%
22
16
-
-
-
-
-
-
-
22
16
16
-
-
16
15
1
93.8
%
-
-
7
56
-
-
756
8
17
(61
)10
8.1%
705
9
82
756
-
-
7
56
746
10
98.7
%
7
05
982
-
-
-
-
71
(71
)
-
-
-
92
843
-
-
92
843
94
211
(1
368
)10
1.5%
85
870
84
384
92
843
-
-
92
843
94
211
(1
368
)10
1.5%
85
870
84
384
81
512
-
-
81
512
82
807
(1
295
)10
1.6%
76
609
76
239
11
331
-
-
11
331
11
404
(73
)10
0.6%
9
261
8 1
45
-
-
1
997
1 9
97
1
997
-
100.
0%
4
57
457
1
116
257
-
(10
000)
1
106
257
1
102
444
3
813
99.7
%1
026
563
99
4 86
2
Tran
sfer
s an
d su
bsid
ies
Prov
ince
s an
d m
unic
ipal
ities
Prov
ince
sPr
ovin
cial
Rev
enue
Fun
dsPr
ovin
cial
age
ncie
s an
d fu
nds
Hou
seho
lds
Soci
al b
enef
itsO
ther
tran
sfer
s to
hou
seho
lds
Paym
ents
for c
apita
l ass
ets
Paym
ent f
or fi
nanc
ial a
sset
s
Mac
hine
ry a
nd e
quip
men
tTr
ansp
ort e
quip
men
tO
ther
mac
hine
ry a
nd e
quip
men
t
Tota
l

AnnuAl report 2018 -2019 229Financial Information
WES
TER
N C
APE
DEP
AR
TMEN
T O
F H
EALT
H
VOTE
6
A
PPR
OPR
IATI
ON
STA
TEM
ENT
for t
he y
ear e
nded
31
Mar
ch 2
019
- 1
7 -
Subp
rogr
amm
e: 3
.1: E
MER
GEN
CY
TRAN
SPO
RT
2018
/19
2017
/18
Adj
uste
d Ap
prop
riatio
n S
hifti
ng o
f Fu
nds
Vire
men
t F
inal
Ap
prop
riatio
n A
ctua
l Ex
pend
iture
V
aria
nce
Expe
nditu
re a
s %
of f
inal
ap
prop
riatio
n
Fin
al
Appr
opria
tion
Act
ual
Expe
nditu
re
Eco
nom
ic c
lass
ifica
tion
R'0
00R
'000
R'0
00
R'0
00R
'000
R'0
00
%R
'000
R'0
00C
urre
nt p
aym
ents
947
735
-
(1
1 99
7)
935
738
926
468
9 27
0
99
.0%
868
562
828
095
Com
pens
atio
n of
em
ploy
ees
647
523
-
(6
000
)
641
523
632
485
9 03
8
98
.6%
610
304
593
217
Goo
ds a
nd s
ervi
ces
300
212
-
(5
997
)
294
215
293
983
232
99
.9%
258
258
234
878
Tran
sfer
s an
d su
bsid
ies
689
-
-
68
9
707
(1
8)
102.
6%65
0
968
Pr
ovin
ces
and
mun
icip
aliti
es16
-
-
16
15
1
93.8
%22
16
H
ouse
hold
s67
3
-
-
673
69
2
(19)
10
2.8%
628
95
2
Paym
ents
for c
apita
l ass
ets
81 3
46
-
-
81 3
46
81 7
13
(367
)
10
0.5%
75 0
65
73 9
41
Mac
hine
ry a
nd e
quip
men
t81
346
-
-
81
346
81
713
(3
67)
100.
5%75
065
73
941
Pa
ymen
t for
fina
ncia
l ass
ets
-
-
1 99
7
1
997
1 99
7
-
100.
0%45
7
457
T
otal
1
029
770
-
(10
000)
1
019
770
1
010
885
8
885
99.1
%94
4 73
4
90
3 46
1
Subp
rogr
amm
e: 3
.2: P
LAN
NED
PAT
IEN
T TR
ANSP
OR
T20
18/1
920
17/1
8 A
djus
ted
Appr
opria
tion
Shi
fting
of
Fund
s V
irem
ent
Fin
al
Appr
opria
tion
Act
ual
Expe
nditu
re
Var
ianc
e Ex
pend
iture
as
% o
f fin
al
appr
opria
tion
Fin
al
Appr
opria
tion
Act
ual
Expe
nditu
re
Eco
nom
ic c
lass
ifica
tion
R'0
00R
'000
R'0
00
R'0
00R
'000
R'0
00
%R
'000
R'0
00C
urre
nt p
aym
ents
74 9
07
-
-
74 9
07
78 9
36
(4 0
29)
10
5.4%
70 9
47
80 9
28
Com
pens
atio
n of
em
ploy
ees
31 6
60
-
-
31 6
60
39 7
95
(8 1
35)
12
5.7%
29 6
44
38 9
58
Goo
ds a
nd s
ervi
ces
43 2
47
-
-
43 2
47
39 1
41
4 10
6
90
.5%
41 3
03
41 9
70
Tran
sfer
s an
d su
bsid
ies
83
-
-
83
125
(4
2)
150.
6%77
30
H
ouse
hold
s83
-
-
83
12
5
(42)
15
0.6%
77
30
Paym
ents
for c
apita
l ass
ets
11 4
97
-
-
11 4
97
12 4
98
(1 0
01)
10
8.7%
10 8
05
10 4
43
Mac
hine
ry a
nd e
quip
men
t11
497
-
-
11
497
12
498
(1
001
)
108.
7%10
805
10
443
T
otal
86
487
-
-
86
487
91
559
(5
072
)
105.
9%81
829
91
401
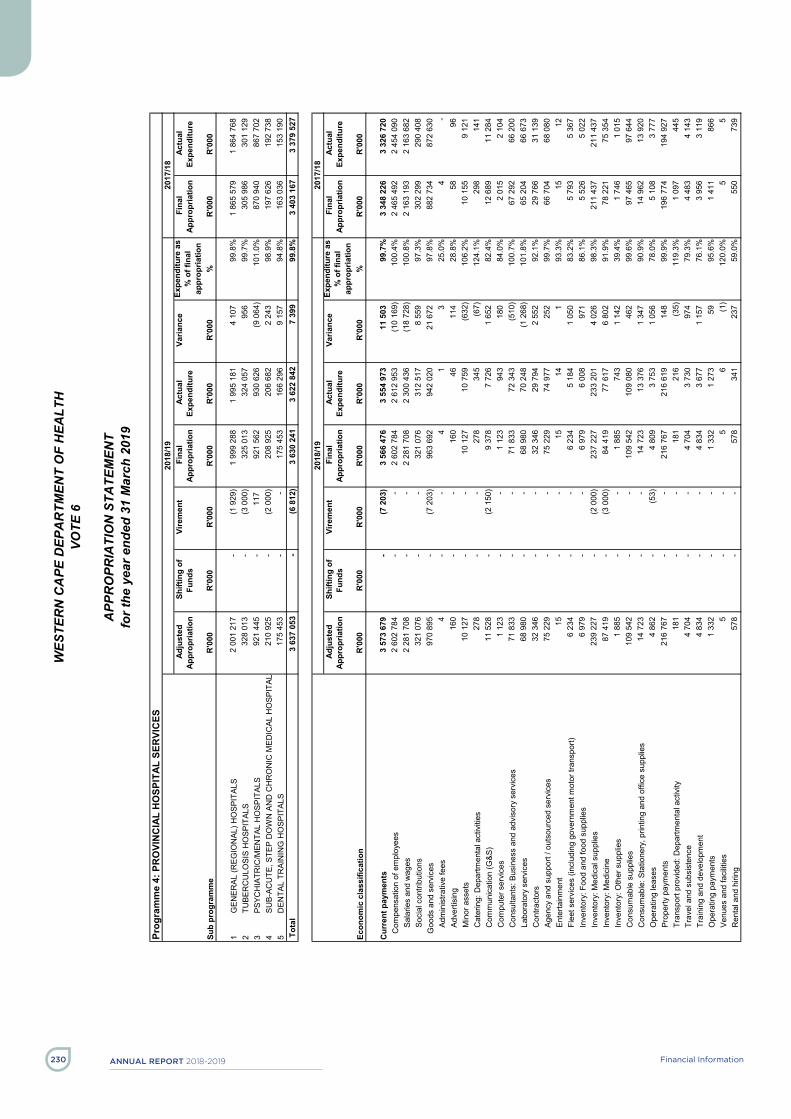
AnnuAl report 2018-2019 Financial Information230
WES
TER
N C
APE
DEP
AR
TMEN
T O
F H
EALT
H
VOTE
6
A
PPR
OPR
IATI
ON
STA
TEM
ENT
for t
he y
ear e
nded
31
Mar
ch 2
019
- 1
8 -
Prog
ram
me
4: P
RO
VIN
CIA
L H
OSP
ITAL
SER
VIC
ES20
18/1
920
17/1
8 A
djus
ted
Appr
opria
tion
Shi
fting
of
Fund
s V
irem
ent
Fin
al
Appr
opria
tion
Act
ual
Expe
nditu
re
Var
ianc
e Ex
pend
iture
as
% o
f fin
al
appr
opria
tion
Fin
al
Appr
opria
tion
Act
ual
Expe
nditu
re
R'0
00R
'000
R'0
00
R'0
00R
'000
R'0
00
%R
'000
R'0
00
1G
ENER
AL (R
EGIO
NAL
) HO
SPIT
ALS
2
001
217
-
(1 9
29)
1
999
288
1
995
181
4
107
99
.8%
1
865
579
1
864
768
2TU
BER
CU
LOSI
S H
OSP
ITAL
S
32
8 01
3
-
(3
000
)
32
5 01
3
32
4 05
7
9
56
99.7
%
30
5 98
6
30
1 12
9 3
PSYC
HIA
TRIC
/MEN
TAL
HO
SPIT
ALS
921
445
-
1
17
921
562
930
626
(9
064
)10
1.0%
870
940
867
702
4SU
B-AC
UTE
, STE
P D
OW
N A
ND
CH
RO
NIC
MED
ICAL
HO
SPIT
ALS
2
10 9
25
-
(2 0
00)
208
925
206
682
2
243
98
.9%
197
626
192
738
5D
ENTA
L TR
AIN
ING
HO
SPIT
ALS
175
453
-
-
175
453
166
296
9
157
94
.8%
163
036
153
190
3 63
7 05
3
-
(6
812
)
3 63
0 24
1
3 62
2 84
2
7 39
9
99
.8%
3 40
3 16
7
3 37
9 52
7
2018
/19
2017
/18
Adj
uste
d Ap
prop
riatio
n S
hifti
ng o
f Fu
nds
Vire
men
t F
inal
Ap
prop
riatio
n A
ctua
l Ex
pend
iture
V
aria
nce
Expe
nditu
re a
s %
of f
inal
ap
prop
riatio
n
Fin
al
Appr
opria
tion
Act
ual
Expe
nditu
re
Econ
omic
cla
ssifi
catio
nR
'000
R'0
00 R
'000
R
'000
R'0
00 R
'000
%
R'0
00R
'000
3
573
679
-
(7 2
03)
3
566
476
3
554
973
11
503
99.7
%
3 34
8 22
6
3 32
6 72
0
2 60
2 78
4
-
-
2 60
2 78
4
2 61
2 95
3
(1
0 16
9)10
0.4%
2
465
492
2
454
090
2
281
708
-
-
2
281
708
2
300
436
(18
728)
100.
8%
2 16
3 19
3
2 16
3 68
2
32
1 07
6
-
-
32
1 07
6
31
2 51
7
8 5
59
97.3
%
30
2 29
9
29
0 40
8
97
0 89
5
-
(7
203
)
96
3 69
2
94
2 02
0
2
1 67
2 97
.8%
882
734
872
630
4
-
-
4
1
3
25.0
%
4
-
1
60
-
-
160
46
114
28
.8%
58
96
10
127
-
-
10
127
10
759
(632
)10
6.2%
10
155
9
121
2
78
-
-
278
3
45
(67
)12
4.1%
298
1
41
11
528
-
(2 1
50)
9
378
7 7
26
1
652
82
.4%
12
689
11
284
1
123
-
-
1 1
23
943
1
80
84.0
%
2 0
15
2
104
7
1 83
3
-
-
7
1 83
3
7
2 34
3
(5
10)
100.
7%
6
7 29
2
6
6 20
0
6
8 98
0
-
-
6
8 98
0
7
0 24
8
(1 2
68)
101.
8%
6
5 20
4
6
6 67
3
3
2 34
6
-
-
3
2 34
6
2
9 79
4
2 5
52
92.1
%
2
9 76
6
3
1 13
9
7
5 22
9
-
-
7
5 22
9
7
4 97
7
2
52
99.7
%
6
6 70
4
6
8 08
0
15
-
-
15
14
1
93
.3%
15
12
6
234
-
-
6 2
34
5
184
1 0
50
83.2
%
5 7
93
5
367
6 9
79
-
-
6
979
6 0
08
971
86
.1%
5
526
5 0
22
239
227
-
(2 0
00)
237
227
233
201
4
026
98
.3%
211
437
211
437
87
419
-
(3 0
00)
84
419
77
617
6
802
91
.9%
78
221
75
354
1
885
-
-
1 8
85
743
1 1
42
39.4
%
1 7
46
1
015
10
9 54
2
-
-
10
9 54
2
10
9 08
0
4
62
99.6
%
9
7 46
5
9
7 64
4
1
4 72
3
-
-
1
4 72
3
1
3 37
6
1 3
47
90.9
%
1
4 96
2
1
3 92
0
4 8
62
-
(
53)
4
809
3 7
53
1
056
78
.0%
5
108
3 7
77
216
767
-
-
216
767
216
619
148
99
.9%
196
774
194
927
181
-
-
1
81
216
(
35)
119.
3%
1 0
97
445
4 7
04
-
-
4
704
3 7
30
974
79
.3%
4
483
4 1
43
4
834
-
-
4 8
34
3
677
1 1
57
76.1
%
3 9
56
3
119
1 3
32
-
-
1
332
1 2
73
59
95
.6%
1
411
8
66
5
-
-
5
6
(1)
120.
0%
5
5
5
78
-
-
578
3
41
237
59
.0%
550
7
39
Adve
rtisi
ngM
inor
ass
ets
Cat
erin
g: D
epar
tmen
tal a
ctiv
ities
Com
mun
icat
ion
(G&S
)
Cur
rent
pay
men
tsC
ompe
nsat
ion
of e
mpl
oyee
sSa
larie
s an
d w
ages
Soci
al c
ontri
butio
nsG
oods
and
ser
vice
sAd
min
istra
tive
fees
Con
tract
ors
Agen
cy a
nd s
uppo
rt / o
utso
urce
d se
rvic
esEn
terta
inm
ent
Flee
t ser
vice
s (in
clud
ing
gove
rnm
ent m
otor
tran
spor
t)
Com
pute
r ser
vice
sC
onsu
ltant
s: B
usin
ess
and
advi
sory
ser
vice
sLa
bora
tory
ser
vice
s
Inve
ntor
y: M
edic
ine
Inve
ntor
y: O
ther
sup
plie
sC
onsu
mab
le s
uppl
ies
Con
sum
able
: Sta
tione
ry, p
rintin
g an
d of
fice
supp
lies
Ope
ratin
g le
ases
Inve
ntor
y: F
ood
and
food
sup
plie
sIn
vent
ory:
Med
ical
sup
plie
s
Ren
tal a
nd h
iring
Prop
erty
pay
men
tsTr
ansp
ort p
rovi
ded:
Dep
artm
enta
l act
ivity
Trav
el a
nd s
ubsi
sten
ceTr
aini
ng a
nd d
evel
opm
ent
Ope
ratin
g pa
ymen
tsVe
nues
and
faci
litie
s
Sub
prog
ram
me
Tota
l

AnnuAl report 2018 -2019 231Financial Information
WES
TER
N C
APE
DEP
AR
TMEN
T O
F H
EALT
H
VOTE
6
A
PPR
OPR
IATI
ON
STA
TEM
ENT
for t
he y
ear e
nded
31
Mar
ch 2
019
- 1
9 -
2018
/19
2017
/18
Adj
uste
d Ap
prop
riatio
n S
hifti
ng o
f Fu
nds
Vire
men
t F
inal
Ap
prop
riatio
n A
ctua
l Ex
pend
iture
V
aria
nce
Expe
nditu
re a
s %
of f
inal
ap
prop
riatio
n
Fin
al
Appr
opria
tion
Act
ual
Expe
nditu
re
Econ
omic
cla
ssifi
catio
nR
'000
R'0
00 R
'000
R
'000
R'0
00 R
'000
%
R'0
00R
'000
18
320
-
-
18
320
13
798
4
522
75
.3%
17
069
12
975
3
253
-
-
3 2
53
3
232
21
99.4
%
3 0
26
3
032
1
5 06
7
-
-
1
5 06
7
1
0 56
6
4 5
01
70.1
%
1
4 04
3
9 9
43
14
758
-
-
14
758
10
566
4
192
71
.6%
13
753
9
943
3
09
-
-
309
-
309
-
290
-
45
054
-
-
45
054
53
680
(8
626
)11
9.1%
37
259
39
219
45
054
-
-
45
054
53
501
(8
447
)11
8.7%
33
259
37
203
9
062
-
-
9 0
62
10
400
(1
338
)11
4.8%
9
232
1
1 18
2
3
5 99
2
-
-
3
5 99
2
4
3 10
1
(7 1
09)
119.
8%
2
4 02
7
2
6 02
1
-
-
-
-
1
79
(179
)
-
4
000
2 0
16
-
-
391
3
91
391
-
100.
0%
6
13
613
3
637
053
-
(6 8
12)
3
630
241
3
622
842
7
399
99.8
%3
403
167
3
379
527
Tran
sfer
s an
d su
bsid
ies
Non
-pro
fit in
stitu
tions
Hou
seho
lds
Soci
al b
enef
itsO
ther
tran
sfer
s to
hou
seho
lds
Paym
ents
for c
apita
l ass
ets
Softw
are
and
othe
r int
angi
ble
asse
tsPa
ymen
t for
fina
ncia
l ass
ets
Mac
hine
ry a
nd e
quip
men
tTr
ansp
ort e
quip
men
tO
ther
mac
hine
ry a
nd e
quip
men
t
Tota
l

AnnuAl report 2018-2019 Financial Information232
WES
TER
N C
APE
DEP
AR
TMEN
T O
F H
EALT
H
VOTE
6
A
PPR
OPR
IATI
ON
STA
TEM
ENT
for t
he y
ear e
nded
31
Mar
ch 2
019
- 2
0 -
Subp
rogr
amm
e: 4
.1: G
ENER
AL (R
EGIO
NAL
) HO
SPIT
ALS
2018
/19
2017
/18
Adj
uste
d Ap
prop
riatio
n S
hifti
ng o
f Fu
nds
Vire
men
t F
inal
Ap
prop
riatio
n A
ctua
l Ex
pend
iture
V
aria
nce
Expe
nditu
re a
s %
of f
inal
ap
prop
riatio
n
Fin
al
Appr
opria
tion
Act
ual
Expe
nditu
re
Eco
nom
ic c
lass
ifica
tion
R'0
00R
'000
R'0
00
R'0
00R
'000
R'0
00
%R
'000
R'0
00C
urre
nt p
aym
ents
1 96
8 74
4
-
(2
131
)
1 96
6 61
3
1 95
7 15
6
9 45
7
99
.5%
1 83
8 01
8
1 83
6 68
3
Com
pens
atio
n of
em
ploy
ees
1 39
5 47
2
-
-
1 39
5 47
2
1 40
4 09
1
(8 6
19)
10
0.6%
1 31
8 24
4
1 31
7 26
2
Goo
ds a
nd s
ervi
ces
573
272
-
(2
131
)
571
141
553
065
18 0
76
96.8
%51
9 77
4
51
9 42
1
Tr
ansf
ers
and
subs
idie
s4
693
-
-
4 69
3
3
556
1 13
7
75
.8%
4 37
4
4
826
Hou
seho
lds
4 69
3
-
-
4
693
3 55
6
1
137
75.8
%4
374
4 82
6
Pa
ymen
ts fo
r cap
ital a
sset
s27
780
-
-
27
780
34
267
(6
487
)
123.
4%22
980
23
052
M
achi
nery
and
equ
ipm
ent
27 7
80
-
-
27 7
80
34 2
10
(6 4
30)
12
3.1%
18 9
80
21 0
36
Softw
are
and
othe
r int
angi
ble
asse
ts-
-
-
-
57
(5
7)
-
4
000
2 01
6
Pa
ymen
t for
fina
ncia
l ass
ets
-
-
202
20
2
202
-
100.
0%20
7
207
T
otal
2
001
217
-
(1 9
29)
1
999
288
1
995
181
4
107
99.8
%1
865
579
1
864
768
Subp
rogr
amm
e: 4
.2: T
UB
ERC
ULO
SIS
HO
SPIT
ALS
2018
/19
2017
/18
Adj
uste
d Ap
prop
riatio
n S
hifti
ng o
f Fu
nds
Vire
men
t F
inal
Ap
prop
riatio
n A
ctua
l Ex
pend
iture
V
aria
nce
Expe
nditu
re a
s %
of f
inal
ap
prop
riatio
n
Fin
al
Appr
opria
tion
Act
ual
Expe
nditu
re
Eco
nom
ic c
lass
ifica
tion
R'0
00R
'000
R'0
00
R'0
00R
'000
R'0
00
%R
'000
R'0
00C
urre
nt p
aym
ents
321
691
-
(3
053
)
318
638
319
325
(687
)
10
0.2%
300
417
296
516
Com
pens
atio
n of
em
ploy
ees
221
324
-
-
221
324
222
588
(1 2
64)
10
0.6%
206
685
206
001
Goo
ds a
nd s
ervi
ces
100
367
-
(3
053
)
97 3
14
96 7
37
577
99
.4%
93 7
32
90 5
15
Tran
sfer
s an
d su
bsid
ies
2 63
3
-
-
2
633
891
1
742
33.8
%2
455
622
H
ouse
hold
s2
633
-
-
2 63
3
89
1
1 74
2
33
.8%
2 45
5
62
2
Paym
ents
for c
apita
l ass
ets
3 68
9
-
-
3
689
3 78
8
(9
9)
102.
7%2
994
3 87
1
M
achi
nery
and
equ
ipm
ent
3 68
9
-
-
3
689
3 78
8
(9
9)
102.
7%2
994
3 87
1
Pa
ymen
t for
fina
ncia
l ass
ets
-
-
53
53
53
-
10
0.0%
120
12
0
Tot
al
328
013
-
(3
000
)
325
013
324
057
956
99
.7%
305
986
301
129
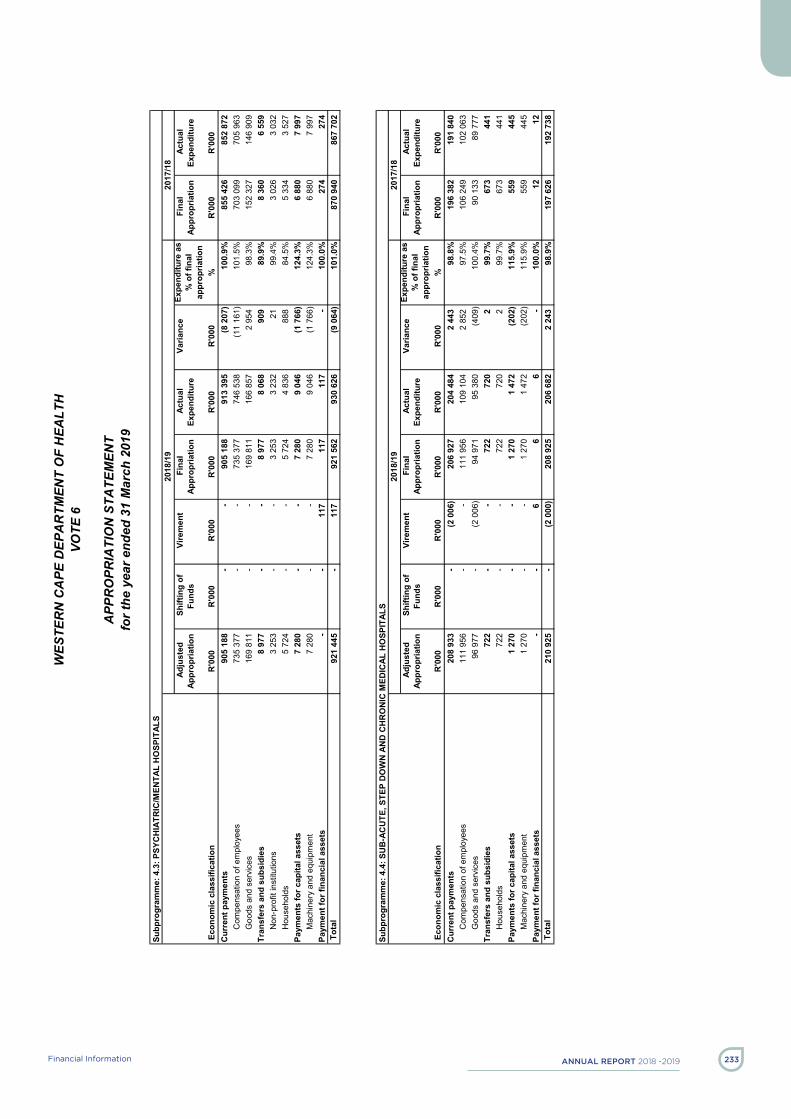
AnnuAl report 2018 -2019 233Financial Information
WES
TER
N C
APE
DEP
AR
TMEN
T O
F H
EALT
H
VOTE
6
A
PPR
OPR
IATI
ON
STA
TEM
ENT
for t
he y
ear e
nded
31
Mar
ch 2
019
- 2
1 -
Subp
rogr
amm
e: 4
.3: P
SYC
HIA
TRIC
/MEN
TAL
HO
SPIT
ALS
2018
/19
2017
/18
Adj
uste
d Ap
prop
riatio
n S
hifti
ng o
f Fu
nds
Vire
men
t F
inal
Ap
prop
riatio
n A
ctua
l Ex
pend
iture
V
aria
nce
Expe
nditu
re a
s %
of f
inal
ap
prop
riatio
n
Fin
al
Appr
opria
tion
Act
ual
Expe
nditu
re
Eco
nom
ic c
lass
ifica
tion
R'0
00R
'000
R'0
00
R'0
00R
'000
R'0
00
%R
'000
R'0
00C
urre
nt p
aym
ents
905
188
-
-
905
188
913
395
(8 2
07)
10
0.9%
855
426
852
872
Com
pens
atio
n of
em
ploy
ees
735
377
-
-
735
377
746
538
(11
161)
10
1.5%
703
099
705
963
Goo
ds a
nd s
ervi
ces
169
811
-
-
169
811
166
857
2 95
4
98
.3%
152
327
146
909
Tran
sfer
s an
d su
bsid
ies
8 97
7
-
-
8
977
8 06
8
90
9
89.9
%8
360
6 55
9
N
on-p
rofit
inst
itutio
ns3
253
-
-
3 25
3
3
232
21
99.4
%3
026
3 03
2
H
ouse
hold
s5
724
-
-
5 72
4
4
836
888
84
.5%
5 33
4
3
527
Paym
ents
for c
apita
l ass
ets
7 28
0
-
-
7
280
9 04
6
(1
766
)
124.
3%6
880
7 99
7
M
achi
nery
and
equ
ipm
ent
7 28
0
-
-
7
280
9 04
6
(1
766
)
124.
3%6
880
7 99
7
Pa
ymen
t for
fina
ncia
l ass
ets
-
-
117
11
7
117
-
100.
0%27
4
274
T
otal
92
1 44
5
-
117
92
1 56
2
93
0 62
6
(9
064
)
101.
0%87
0 94
0
86
7 70
2
Subp
rogr
amm
e: 4
.4: S
UB
-AC
UTE
, STE
P D
OW
N A
ND
CH
RO
NIC
MED
ICAL
HO
SPIT
ALS
2018
/19
2017
/18
Adj
uste
d Ap
prop
riatio
n S
hifti
ng o
f Fu
nds
Vire
men
t F
inal
Ap
prop
riatio
n A
ctua
l Ex
pend
iture
V
aria
nce
Expe
nditu
re a
s %
of f
inal
ap
prop
riatio
n
Fin
al
Appr
opria
tion
Act
ual
Expe
nditu
re
Eco
nom
ic c
lass
ifica
tion
R'0
00R
'000
R'0
00
R'0
00R
'000
R'0
00
%R
'000
R'0
00C
urre
nt p
aym
ents
208
933
-
(2
006
)
206
927
204
484
2 44
3
98
.8%
196
382
191
840
Com
pens
atio
n of
em
ploy
ees
111
956
-
-
111
956
109
104
2 85
2
97
.5%
106
249
102
063
Goo
ds a
nd s
ervi
ces
96 9
77
-
(2
006
)
94 9
71
95 3
80
(409
)
10
0.4%
90 1
33
89 7
77
Tran
sfer
s an
d su
bsid
ies
722
-
-
72
2
720
2
99.7
%67
3
441
H
ouse
hold
s72
2
-
-
722
72
0
2
99
.7%
673
44
1
Paym
ents
for c
apita
l ass
ets
1 27
0
-
-
1
270
1 47
2
(2
02)
115.
9%55
9
445
M
achi
nery
and
equ
ipm
ent
1 27
0
-
-
1
270
1 47
2
(2
02)
115.
9%55
9
445
Pa
ymen
t for
fina
ncia
l ass
ets
-
-
6
6
6
-
100.
0%12
12
T
otal
21
0 92
5
-
(2 0
00)
20
8 92
5
20
6 68
2
2
243
98.9
%19
7 62
6
19
2 73
8

AnnuAl report 2018-2019 Financial Information234
WES
TER
N C
APE
DEP
AR
TMEN
T O
F H
EALT
H
VOTE
6
A
PPR
OPR
IATI
ON
STA
TEM
ENT
for t
he y
ear e
nded
31
Mar
ch 2
019
- 2
2 -
Subp
rogr
amm
e: 4
.5: D
ENTA
L TR
AIN
ING
HO
SPIT
ALS
2018
/19
2017
/18
Adj
uste
d Ap
prop
riatio
n S
hifti
ng o
f Fu
nds
Vire
men
t F
inal
Ap
prop
riatio
n A
ctua
l Ex
pend
iture
V
aria
nce
Expe
nditu
re a
s %
of f
inal
ap
prop
riatio
n
Fin
al
Appr
opria
tion
Act
ual
Expe
nditu
re
Eco
nom
ic c
lass
ifica
tion
R'0
00R
'000
R'0
00
R'0
00R
'000
R'0
00
%R
'000
R'0
00C
urre
nt p
aym
ents
169
123
-
(1
3)
169
110
160
613
8 49
7
95
.0%
157
983
148
809
Com
pens
atio
n of
em
ploy
ees
138
655
-
-
138
655
130
632
8 02
3
94
.2%
131
215
122
801
Goo
ds a
nd s
ervi
ces
30 4
68
-
(1
3)
30 4
55
29 9
81
474
98
.4%
26 7
68
26 0
08
Tran
sfer
s an
d su
bsid
ies
1 29
5
-
-
1
295
563
73
2
43.5
%1
207
527
H
ouse
hold
s1
295
-
-
1 29
5
56
3
732
43
.5%
1 20
7
52
7
Paym
ents
for c
apita
l ass
ets
5 03
5
-
-
5
035
5 10
7
(7
2)
101.
4%3
846
3 85
4
M
achi
nery
and
equ
ipm
ent
5 03
5
-
-
5
035
4 98
5
50
99
.0%
3 84
6
3
854
Softw
are
and
othe
r int
angi
ble
asse
ts-
-
-
-
12
2
(122
)
-
-
-
Paym
ent f
or fi
nanc
ial a
sset
s-
-
13
13
13
-
100.
0%-
-
T
otal
17
5 45
3
-
-
17
5 45
3
16
6 29
6
9
157
94.8
%16
3 03
6
15
3 19
0

AnnuAl report 2018 -2019 235Financial Information
WES
TER
N C
APE
DEP
AR
TMEN
T O
F H
EALT
H
VOTE
6
A
PPR
OPR
IATI
ON
STA
TEM
ENT
for t
he y
ear e
nded
31
Mar
ch 2
019
- 2
3 -
Prog
ram
me
5: C
ENTR
AL H
OSP
ITAL
SER
VIC
ES20
18/1
920
17/1
8 A
djus
ted
Appr
opria
tion
Shi
fting
of
Fund
s V
irem
ent
Fin
al
Appr
opria
tion
Act
ual
Expe
nditu
re
Var
ianc
e Ex
pend
iture
as
% o
f fin
al
appr
opria
tion
Fin
al
Appr
opria
tion
Act
ual
Expe
nditu
re
R'0
00R
'000
R'0
00
R'0
00R
'000
R'0
00
%R
'000
R'0
00
1C
ENTR
AL H
OSP
ITAL
SER
VIC
ES
5 60
2 46
0
-
61
889
5
664
349
5
663
751
598
10
0.0%
5
325
267
5
328
069
2PR
OVI
NC
IAL
TER
TIAR
Y H
OSP
ITAL
SER
VIC
ES
85
0 77
1
-
2
723
85
3 49
4
85
3 49
4
-
100.
0%
80
4 48
1
80
1 67
9 6
453
231
-
64 6
12
6 51
7 84
3
6 51
7 24
5
598
10
0.0%
6 12
9 74
8
6 12
9 74
8
2018
/19
2017
/18
Adj
uste
d Ap
prop
riatio
n S
hifti
ng o
f Fu
nds
Vire
men
t F
inal
Ap
prop
riatio
n A
ctua
l Ex
pend
iture
V
aria
nce
Expe
nditu
re a
s %
of f
inal
ap
prop
riatio
n
Fin
al
Appr
opria
tion
Act
ual
Expe
nditu
re
Econ
omic
cla
ssifi
catio
nR
'000
R'0
00 R
'000
R
'000
R'0
00 R
'000
%
R'0
00R
'000
6
349
779
-
5 2
91
6
355
070
6
345
631
9
439
99
.9%
6
039
726
6
033
098
4
388
508
-
-
4
388
508
4
379
069
9
439
99
.8%
4
141
094
4
126
085
3
922
501
-
-
3
922
501
3
918
801
3
700
99
.9%
3
708
943
3
698
428
466
007
-
-
466
007
460
268
5
739
98
.8%
432
151
427
657
1
961
271
-
5 2
91
1
966
562
1
966
562
- 10
0.0%
1
898
632
1
907
013
208
-
-
2
08
38
1
70
18.3
%
1
99
35
1
1 01
8
-
-
1
1 01
8
9 3
62
1
656
85
.0%
11
507
7
717
78
-
-
78
39
39
50
.0%
76
30
5
713
-
-
5 7
13
3
360
2 3
53
58.8
%
5 4
27
3
765
1 3
07
-
-
1
307
3 5
41
(2
234
)27
0.9%
1
084
8
99
2
294
-
-
2 2
94
2
270
24
99.0
%
2 1
96
2
238
19
7 97
5
-
-
19
7 97
5
19
1 63
2
6 3
43
96.8
%
20
3 84
9
20
0 25
2
10
3 48
6
-
-
10
3 48
6
10
6 95
7
(3 4
71)
103.
4%
9
5 64
3
10
2 75
4
10
3 76
2
-
7
191
11
0 95
3
11
1 66
7
(7
14)
100.
6%
11
3 86
3
11
5 89
1
2
-
-
2
-
2
-
2
1
1
225
-
-
1 2
25
1
084
1
41
88.5
%
1 1
72
965
1
0 59
3
-
(592
)
1
0 00
1
9 6
53
348
96
.5%
11
747
11
272
810
455
-
-
810
455
833
108
(22
653)
102.
8%
78
7 21
2
80
9 88
7
27
2 65
8
-
(592
)
27
2 06
6
27
2 06
6
-
100.
0%
25
3 11
0
25
1 89
0
9 6
14
-
-
9
614
1
1 56
9
(1 9
55)
120.
3%
8 9
13
10
168
138
561
-
(8
08)
137
753
129
712
8
041
94
.2%
132
403
131
900
18
705
-
92
18
797
18
837
(40
)10
0.2%
16
953
17
276
3
158
-
-
3 1
58
1
760
1 3
98
55.7
%
3 0
25
2
239
25
7 17
5
-
-
25
7 17
5
24
7 48
2
9 6
93
96.2
%
23
7 53
3
22
7 89
5
2
09
-
-
209
-
209
-
200
-
1
680
-
-
1 6
80
1
662
18
98.9
%
1 6
08
1
727
5 1
28
-
-
5
128
5 3
84
(256
)10
5.0%
4
909
5 4
58
1
092
-
-
1 0
92
741
3
51
67.9
%
1 0
45
1
332
55
-
-
55
-
55
-
53
-
5
120
-
-
5 1
20
4
638
4
82
90.6
%
4 9
03
1
422
Cur
rent
pay
men
ts
Min
or a
sset
sC
ater
ing:
Dep
artm
enta
l act
iviti
esC
omm
unic
atio
n (G
&S)
Com
pute
r ser
vice
s
Com
pens
atio
n of
em
ploy
ees
Sala
ries
and
wag
esSo
cial
con
tribu
tions
Goo
ds a
nd s
ervi
ces
Adve
rtisi
ng
Agen
cy a
nd s
uppo
rt / o
utso
urce
d se
rvic
esEn
terta
inm
ent
Flee
t ser
vice
s (in
clud
ing
gove
rnm
ent m
otor
tran
spor
t)
Con
sulta
nts:
Bus
ines
s an
d ad
viso
ry s
ervi
ces
Labo
rato
ry s
ervi
ces
Con
tract
ors
Inve
ntor
y: O
ther
sup
plie
sC
onsu
mab
le s
uppl
ies
Con
sum
able
: Sta
tione
ry, p
rintin
g an
d of
fice
supp
lies
Ope
ratin
g le
ases
Prop
erty
pay
men
ts
Inve
ntor
y: F
ood
and
food
sup
plie
sIn
vent
ory:
Med
ical
sup
plie
sIn
vent
ory:
Med
icin
e
Tran
spor
t pro
vide
d: D
epar
tmen
tal a
ctiv
ityTr
avel
and
sub
sist
ence
Trai
ning
and
dev
elop
men
tO
pera
ting
paym
ents
Venu
es a
nd fa
cilit
ies
Ren
tal a
nd h
iring
Sub
prog
ram
me
Tota
l
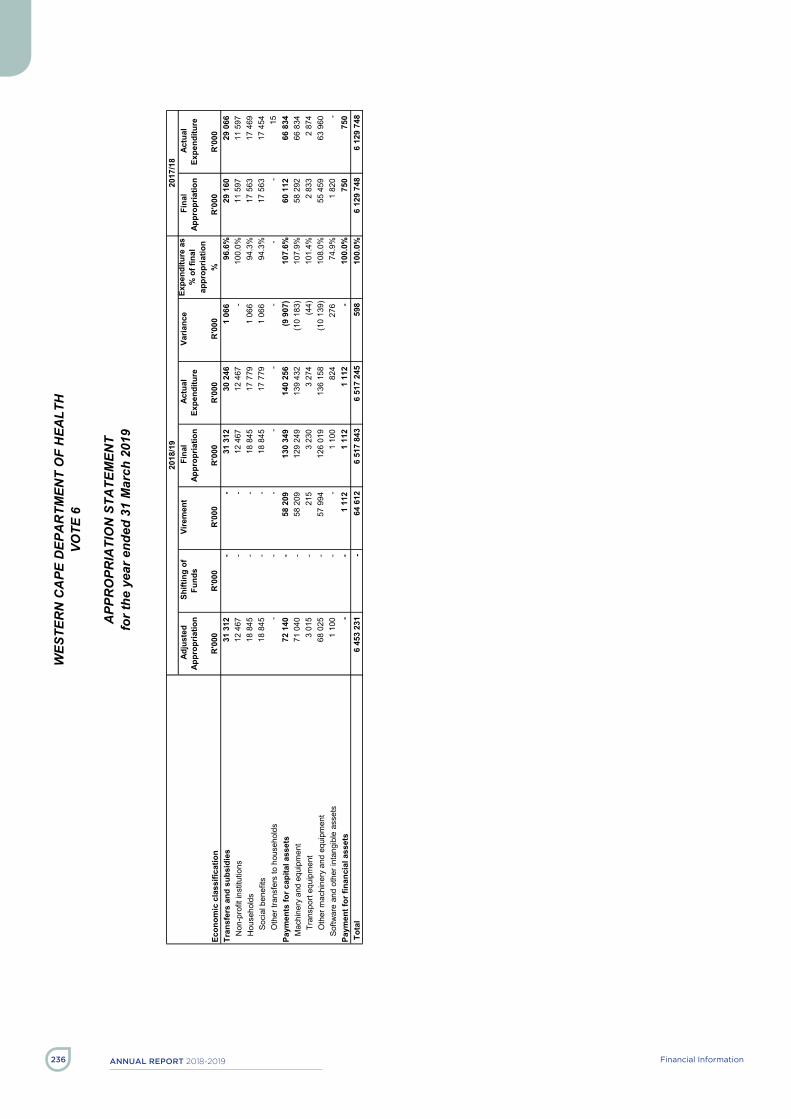
AnnuAl report 2018-2019 Financial Information236
WES
TER
N C
APE
DEP
AR
TMEN
T O
F H
EALT
H
VOTE
6
A
PPR
OPR
IATI
ON
STA
TEM
ENT
for t
he y
ear e
nded
31
Mar
ch 2
019
- 2
4 -
20
18/1
920
17/1
8 A
djus
ted
Appr
opria
tion
Shi
fting
of
Fund
s V
irem
ent
Fin
al
Appr
opria
tion
Act
ual
Expe
nditu
re
Var
ianc
e Ex
pend
iture
as
% o
f fin
al
appr
opria
tion
Fin
al
Appr
opria
tion
Act
ual
Expe
nditu
re
Econ
omic
cla
ssifi
catio
nR
'000
R'0
00 R
'000
R
'000
R'0
00 R
'000
%
R'0
00R
'000
31
312
-
-
31
312
30
246
1
066
96
.6%
29
160
29
066
12
467
-
-
12
467
12
467
- 10
0.0%
11
597
11
597
18
845
-
-
18
845
17
779
1
066
94
.3%
17
563
17
469
18
845
-
-
18
845
17
779
1
066
94
.3%
17
563
17
454
-
-
-
-
-
-
-
-
15
7
2 14
0
-
58
209
130
349
140
256
(9
907
)10
7.6%
60
112
66
834
71
040
-
5
8 20
9
12
9 24
9
13
9 43
2
(1
0 18
3)10
7.9%
58
292
66
834
3
015
-
215
3 2
30
3
274
(
44)
101.
4%
2 8
33
2
874
6
8 02
5
-
57
994
126
019
136
158
(10
139)
108.
0%
5
5 45
9
6
3 96
0
1 1
00
-
-
1
100
8
24
276
74
.9%
1
820
-
-
-
1
112
1 1
12
1
112
-
100.
0%
7
50
750
6
453
231
-
64 6
12
6 51
7 84
3
6 51
7 24
5
598
10
0.0%
6 12
9 74
8
6 12
9 74
8
Tran
sfer
s an
d su
bsid
ies
Hou
seho
lds
Soci
al b
enef
itsO
ther
tran
sfer
s to
hou
seho
lds
Paym
ents
for c
apita
l ass
ets
Non
-pro
fit in
stitu
tions
Softw
are
and
othe
r int
angi
ble
asse
tsPa
ymen
t for
fina
ncia
l ass
ets
Mac
hine
ry a
nd e
quip
men
tTr
ansp
ort e
quip
men
tO
ther
mac
hine
ry a
nd e
quip
men
t
Tota
l

AnnuAl report 2018 -2019 237Financial Information
WES
TER
N C
APE
DEP
AR
TMEN
T O
F H
EALT
H
VOTE
6
A
PPR
OPR
IATI
ON
STA
TEM
ENT
for t
he y
ear e
nded
31
Mar
ch 2
019
- 2
5 -
Subp
rogr
amm
e: 5
.1: C
ENTR
AL H
OSP
ITAL
SER
VIC
ES20
18/1
920
17/1
8 A
djus
ted
Appr
opria
tion
Shi
fting
of
Fund
s V
irem
ent
Fin
al
Appr
opria
tion
Act
ual
Expe
nditu
re
Var
ianc
e Ex
pend
iture
as
% o
f fin
al
appr
opria
tion
Fin
al
Appr
opria
tion
Act
ual
Expe
nditu
re
Eco
nom
ic c
lass
ifica
tion
R'0
00R
'000
R'0
00
R'0
00R
'000
R'0
00
%R
'000
R'0
00C
urre
nt p
aym
ents
5 52
7 02
8
-
14
780
5
541
808
5
543
097
(1
289
)
100.
0%5
262
859
5
264
962
C
ompe
nsat
ion
of e
mpl
oyee
s3
814
459
-
-
3
814
459
3
812
808
1
651
100.
0%3
597
221
3
587
802
G
oods
and
ser
vice
s1
712
569
-
14 7
80
1 72
7 34
9
1 73
0 28
9
(2 9
40)
10
0.2%
1 66
5 63
8
1 67
7 16
0
Tran
sfer
s an
d su
bsid
ies
16 2
57
-
-
16 2
57
14 9
96
1 26
1
92
.2%
15 1
51
14 7
40
Hou
seho
lds
16 2
57
-
-
16 2
57
14 9
96
1 26
1
92
.2%
15 1
51
14 7
40
Paym
ents
for c
apita
l ass
ets
59 1
75
-
46
394
10
5 56
9
10
4 94
3
62
6
99.4
%46
530
47
640
M
achi
nery
and
equ
ipm
ent
58 0
75
-
46
394
10
4 46
9
10
4 46
9
-
100.
0%46
530
47
640
So
ftwar
e an
d ot
her i
ntan
gibl
e as
sets
1 10
0
-
-
1
100
474
62
6
43.1
%-
-
Pa
ymen
t for
fina
ncia
l ass
ets
-
-
715
71
5
715
-
100.
0%72
7
727
T
otal
5
602
460
-
61 8
89
5 66
4 34
9
5 66
3 75
1
598
10
0.0%
5 32
5 26
7
5 32
8 06
9
Subp
rogr
amm
e: 5
.2: P
RO
VIN
CIA
L TE
RTI
ARY
HO
SPIT
AL S
ERVI
CES
2018
/19
2017
/18
Adj
uste
d Ap
prop
riatio
n S
hifti
ng o
f Fu
nds
Vire
men
t F
inal
Ap
prop
riatio
n A
ctua
l Ex
pend
iture
V
aria
nce
Expe
nditu
re a
s %
of f
inal
ap
prop
riatio
n
Fin
al
Appr
opria
tion
Act
ual
Expe
nditu
re
Eco
nom
ic c
lass
ifica
tion
R'0
00R
'000
R'0
00
R'0
00R
'000
R'0
00
%R
'000
R'0
00C
urre
nt p
aym
ents
822
751
-
(9
489
)
813
262
802
534
10 7
28
98.7
%77
6 86
7
76
8 13
6
C
ompe
nsat
ion
of e
mpl
oyee
s57
4 04
9
-
-
57
4 04
9
56
6 26
1
7
788
98.6
%54
3 87
3
53
8 28
3
G
oods
and
ser
vice
s24
8 70
2
-
(9 4
89)
23
9 21
3
23
6 27
3
2
940
98.8
%23
2 99
4
22
9 85
3
Tr
ansf
ers
and
subs
idie
s15
055
-
-
15
055
15
250
(1
95)
101.
3%14
009
14
326
N
on-p
rofit
inst
itutio
ns12
467
-
-
12
467
12
467
-
100.
0%11
597
11
597
H
ouse
hold
s2
588
-
-
2 58
8
2
783
(195
)
10
7.5%
2 41
2
2
729
Paym
ents
for c
apita
l ass
ets
12 9
65
-
11
815
24
780
35
313
(1
0 53
3)
142.
5%13
582
19
194
M
achi
nery
and
equ
ipm
ent
12 9
65
-
11
815
24
780
34
963
(1
0 18
3)
141.
1%11
762
19
194
So
ftwar
e an
d ot
her i
ntan
gibl
e as
sets
-
-
-
-
350
(3
50)
-
1
820
-
Pa
ymen
t for
fina
ncia
l ass
ets
-
-
397
39
7
397
-
100.
0%23
23
T
otal
85
0 77
1
-
2 72
3
85
3 49
4
85
3 49
4
-
100.
0%80
4 48
1
80
1 67
9

AnnuAl report 2018-2019 Financial Information238
WES
TER
N C
APE
DEP
AR
TMEN
T O
F H
EALT
H
VOTE
6
A
PPR
OPR
IATI
ON
STA
TEM
ENT
for t
he y
ear e
nded
31
Mar
ch 2
019
- 2
6 -
Prog
ram
me
6: H
EALT
H S
CIE
NC
ES A
ND
TR
AIN
ING
2018
/19
2017
/18
Adj
uste
d Ap
prop
riatio
n S
hifti
ng o
f Fu
nds
Vire
men
t F
inal
Ap
prop
riatio
n A
ctua
l Ex
pend
iture
V
aria
nce
Expe
nditu
re a
s %
of f
inal
ap
prop
riatio
n
Fin
al
Appr
opria
tion
Act
ual
Expe
nditu
re
R'0
00R
'000
R'0
00
R'0
00R
'000
R'0
00
%R
'000
R'0
00
1N
UR
SE T
RAI
NIN
G C
OLL
EGE
68
152
-
-
68
152
56
688
11
464
83.2
%
7
7 35
5
5
9 14
5 2
EMER
GEN
CY
MED
ICAL
SER
VIC
ES (E
MS)
TR
AIN
ING
CO
LLEG
E
3
2 67
9
-
-
3
2 67
9
3
4 32
2
(1 6
43)
105.
0%
3
2 87
8
3
2 25
0 3
BUR
SAR
IES
69
477
-
-
69
477
67
509
1
968
97
.2%
90
613
87
299
4PR
IMAR
Y H
EALT
H C
ARE
(PH
C) T
RAI
NIN
G
1
-
-
1
-
1
-
1
-
5TR
AIN
ING
(OTH
ER)
158
307
-
-
158
307
163
124
(4
817
)10
3.0%
139
216
138
759
328
616
-
-
328
616
321
643
6 97
3
97
.9%
340
063
317
453
2018
/19
2017
/18
Adj
uste
d Ap
prop
riatio
n S
hifti
ng o
f Fu
nds
Vire
men
t F
inal
Ap
prop
riatio
n A
ctua
l Ex
pend
iture
V
aria
nce
Expe
nditu
re a
s %
of f
inal
ap
prop
riatio
n
Fin
al
Appr
opria
tion
Act
ual
Expe
nditu
re
Econ
omic
cla
ssifi
catio
nR
'000
R'0
00 R
'000
R
'000
R'0
00 R
'000
%
R'0
00R
'000
195
420
-
(
65)
195
355
181
728
13
627
93.0
%
18
2 50
7
16
3 64
7
15
0 35
5
-
-
15
0 35
5
13
7 40
2
1
2 95
3 91
.4%
124
854
121
960
131
937
-
-
131
937
127
920
4
017
97
.0%
111
835
109
559
18
418
-
-
18
418
9
482
8 9
36
51.5
%
1
3 01
9
1
2 40
1
4
5 06
5
-
(65
)
4
5 00
0
4
4 32
6
6
74
98.5
%
5
7 65
3
4
1 68
7
2
34
-
-
234
79
155
33
.8%
247
15
539
-
-
5
39
455
84
84.4
%
9
85
821
1
0 29
7
-
-
1
0 29
7
1
0 28
7
10
99.9
%
1
0 27
9
1
0 34
5
3
23
-
-
323
8
24
(501
)25
5.1%
411
1 0
52
1
000
-
(65
)
9
35
720
2
15
77.0
%
9
95
979
-
-
-
-
19
(19
)
-
1
-
144
-
-
1
44
12
1
32
8.3%
290
32
155
-
-
1
55
297
(1
42)
191.
6%
8
58
20
4 2
05
-
-
4
205
1 5
20
2
685
36
.1%
5
997
2 1
80
4
-
-
4
-
4
-
4
-
1 2
46
-
-
1
246
1 4
99
(253
)12
0.3%
1
672
1 4
54
332
-
-
3
32
182
1
50
54.8
%
3
02
134
14
-
-
14
2
12
14
.3%
14
1
5
168
-
-
5 1
68
2
501
2 6
67
48.4
%
8 3
88
3
243
8
49
-
-
849
1 0
58
(209
)12
4.6%
1
393
6
90
535
-
-
5
35
155
3
80
29.0
%
5
39
278
8 3
38
-
-
8
338
6 4
03
1
935
76
.8%
10
540
4
822
4 6
70
-
-
4
670
6 6
34
(1
964
)14
2.1%
6
506
7 9
07
6
516
-
-
6 5
16
10
808
(4
292
)16
5.9%
7
178
6 9
87
158
-
-
1
58
446
(2
88)
282.
3%
3
21
303
2
56
-
-
256
2
59
(3
)10
1.2%
649
2
08
82
-
-
82
166
(
84)
202.
4%
84
216
Sub
prog
ram
me
Cur
rent
pay
men
tsC
ompe
nsat
ion
of e
mpl
oyee
s
Burs
arie
s: E
mpl
oyee
sC
ater
ing:
Dep
artm
enta
l act
iviti
esC
omm
unic
atio
n (G
&S)
Com
pute
r ser
vice
sC
onsu
ltant
s: B
usin
ess
and
advi
sory
ser
vice
s
Sala
ries
and
wag
esSo
cial
con
tribu
tions
Goo
ds a
nd s
ervi
ces
Adve
rtisi
ngM
inor
ass
ets
Ente
rtain
men
tFl
eet s
ervi
ces
(incl
udin
g go
vern
men
t mot
or tr
ansp
ort)
Con
tract
ors
Agen
cy a
nd s
uppo
rt / o
utso
urce
d se
rvic
es
Con
sum
able
sup
plie
sC
onsu
mab
le: S
tatio
nery
, prin
ting
and
offic
e su
pplie
sO
pera
ting
leas
esPr
oper
ty p
aym
ents
Inve
ntor
y: M
edic
al s
uppl
ies
Inve
ntor
y: M
edic
ine
Trav
el a
nd s
ubsi
sten
ceTr
aini
ng a
nd d
evel
opm
ent
Ope
ratin
g pa
ymen
tsVe
nues
and
faci
litie
sR
enta
l and
hiri
ng
Tota
l

AnnuAl report 2018 -2019 239Financial Information
WES
TER
N C
APE
DEP
AR
TMEN
T O
F H
EALT
H
VOTE
6
A
PPR
OPR
IATI
ON
STA
TEM
ENT
for t
he y
ear e
nded
31
Mar
ch 2
019
- 2
7 -
20
18/1
920
17/1
8 A
djus
ted
Appr
opria
tion
Shi
fting
of
Fund
s V
irem
ent
Fin
al
Appr
opria
tion
Act
ual
Expe
nditu
re
Var
ianc
e Ex
pend
iture
as
% o
f fin
al
appr
opria
tion
Fin
al
Appr
opria
tion
Act
ual
Expe
nditu
re
Econ
omic
cla
ssifi
catio
nR
'000
R'0
00 R
'000
R
'000
R'0
00 R
'000
%
R'0
00R
'000
125
416
-
(2 9
11)
122
505
120
816
1
689
98
.6%
146
515
143
274
5
699
-
-
5 6
99
5
703
(4)
100.
1%
5 3
97
5
128
5 6
99
-
-
5
699
5 7
03
(4
)10
0.1%
5
397
5 1
28
60
014
-
-
60
014
60
014
- 10
0.0%
66
485
66
485
59
703
-
(2 9
11)
56
792
55
099
1
693
97
.0%
74
633
71
661
523
-
-
5
23
788
(2
65)
150.
7%
4
87
895
5
9 18
0
-
(2
911
)
5
6 26
9
5
4 31
1
1 9
58
96.5
%
7
4 14
6
7
0 76
6
7 7
80
-
-
7
780
1
6 12
3
(8 3
43)
207.
2%
4 8
16
4
307
7 7
59
-
-
7
759
1
6 12
3
(8 3
64)
207.
8%
4 8
16
4
282
2 5
16
-
-
2
516
2 5
70
(54
)10
2.1%
2
365
2 0
21
5
243
-
-
5 2
43
13
553
(8
310
)25
8.5%
2
451
2 2
61
21
-
-
21
-
21
-
-
25
-
-
2 9
76
2
976
2 9
76
- 10
0.0%
6
225
6 2
25
328
616
-
-
328
616
321
643
6 97
3
97
.9%
340
063
317
453
Tran
sfer
s an
d su
bsid
ies
Dep
artm
enta
l age
ncie
s (n
on-b
usin
ess
entit
ies)
Dep
artm
enta
l age
ncie
s an
d ac
coun
ts
Soci
al b
enef
itsO
ther
tran
sfer
s to
hou
seho
lds
Paym
ents
for c
apita
l ass
ets
Non
-pro
fit in
stitu
tions
Hou
seho
lds
Softw
are
and
othe
r int
angi
ble
asse
tsPa
ymen
t for
fina
ncia
l ass
ets
Mac
hine
ry a
nd e
quip
men
tTr
ansp
ort e
quip
men
tO
ther
mac
hine
ry a
nd e
quip
men
t
Tota
l
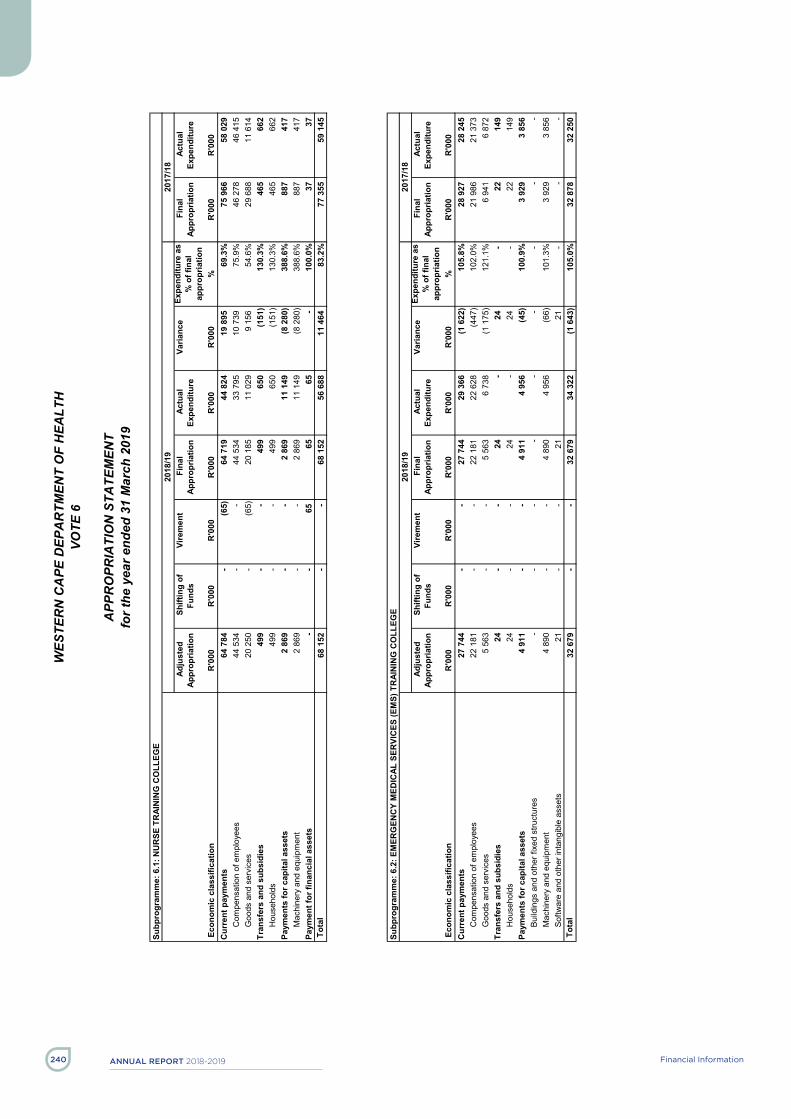
AnnuAl report 2018-2019 Financial Information240
WES
TER
N C
APE
DEP
AR
TMEN
T O
F H
EALT
H
VOTE
6
A
PPR
OPR
IATI
ON
STA
TEM
ENT
for t
he y
ear e
nded
31
Mar
ch 2
019
- 2
8 -
Subp
rogr
amm
e: 6
.1: N
UR
SE T
RAI
NIN
G C
OLL
EGE
2018
/19
2017
/18
Adj
uste
d Ap
prop
riatio
n S
hifti
ng o
f Fu
nds
Vire
men
t F
inal
Ap
prop
riatio
n A
ctua
l Ex
pend
iture
V
aria
nce
Expe
nditu
re a
s %
of f
inal
ap
prop
riatio
n
Fin
al
Appr
opria
tion
Act
ual
Expe
nditu
re
Eco
nom
ic c
lass
ifica
tion
R'0
00R
'000
R'0
00
R'0
00R
'000
R'0
00
%R
'000
R'0
00C
urre
nt p
aym
ents
64 7
84
-
(6
5)
64 7
19
44 8
24
19 8
95
69.3
%75
966
58
029
C
ompe
nsat
ion
of e
mpl
oyee
s44
534
-
-
44
534
33
795
10
739
75
.9%
46 2
78
46 4
15
Goo
ds a
nd s
ervi
ces
20 2
50
-
(6
5)
20 1
85
11 0
29
9 15
6
54
.6%
29 6
88
11 6
14
Tran
sfer
s an
d su
bsid
ies
499
-
-
49
9
650
(1
51)
130.
3%46
5
662
H
ouse
hold
s49
9
-
-
499
65
0
(151
)
13
0.3%
465
66
2
Paym
ents
for c
apita
l ass
ets
2 86
9
-
-
2
869
11 1
49
(8 2
80)
38
8.6%
887
41
7
Mac
hine
ry a
nd e
quip
men
t2
869
-
-
2 86
9
11
149
(8
280
)
388.
6%88
7
417
Pa
ymen
t for
fina
ncia
l ass
ets
-
-
65
65
65
-
10
0.0%
37
37
Tot
al
68 1
52
-
-
68 1
52
56 6
88
11 4
64
83.2
%77
355
59
145
Subp
rogr
amm
e: 6
.2: E
MER
GEN
CY
MED
ICAL
SER
VIC
ES (E
MS)
TR
AIN
ING
CO
LLEG
E20
18/1
920
17/1
8 A
djus
ted
Appr
opria
tion
Shi
fting
of
Fund
s V
irem
ent
Fin
al
Appr
opria
tion
Act
ual
Expe
nditu
re
Var
ianc
e Ex
pend
iture
as
% o
f fin
al
appr
opria
tion
Fin
al
Appr
opria
tion
Act
ual
Expe
nditu
re
Eco
nom
ic c
lass
ifica
tion
R'0
00R
'000
R'0
00
R'0
00R
'000
R'0
00
%R
'000
R'0
00C
urre
nt p
aym
ents
27 7
44
-
-
27 7
44
29 3
66
(1 6
22)
10
5.8%
28 9
27
28 2
45
Com
pens
atio
n of
em
ploy
ees
22 1
81
-
-
22 1
81
22 6
28
(447
)
10
2.0%
21 9
86
21 3
73
Goo
ds a
nd s
ervi
ces
5 56
3
-
-
5
563
6 73
8
(1
175
)
121.
1%6
941
6 87
2
Tr
ansf
ers
and
subs
idie
s24
-
-
24
-
24
-
22
14
9
Hou
seho
lds
24
-
-
24
-
24
-
22
149
Pa
ymen
ts fo
r cap
ital a
sset
s4
911
-
-
4 91
1
4
956
(45)
10
0.9%
3 92
9
3
856
Build
ings
and
oth
er fi
xed
stru
ctur
es-
-
-
-
-
-
-
-
-
Mac
hine
ry a
nd e
quip
men
t4
890
-
-
4 89
0
4
956
(66)
10
1.3%
3 92
9
3
856
Softw
are
and
othe
r int
angi
ble
asse
ts21
-
-
21
21
-
-
-
Tot
al
32 6
79
-
-
32 6
79
34 3
22
(1 6
43)
10
5.0%
32 8
78
32 2
50
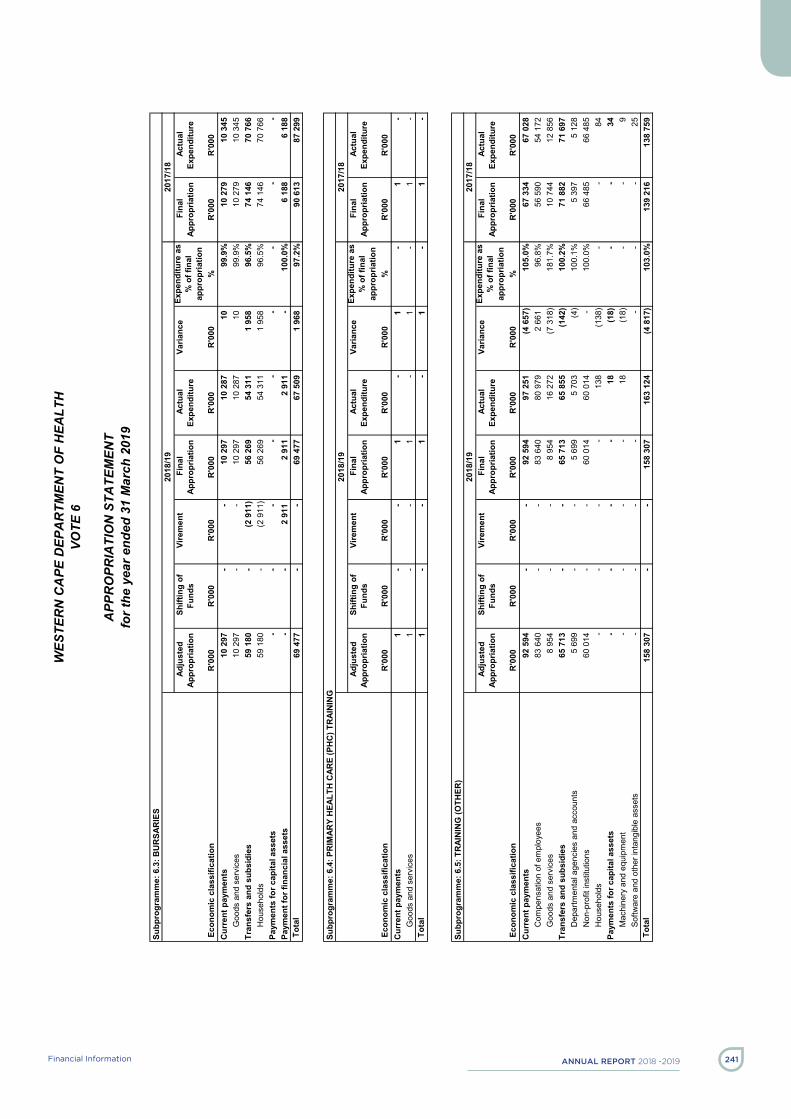
AnnuAl report 2018 -2019 241Financial Information
WES
TER
N C
APE
DEP
AR
TMEN
T O
F H
EALT
H
VOTE
6
A
PPR
OPR
IATI
ON
STA
TEM
ENT
for t
he y
ear e
nded
31
Mar
ch 2
019
- 2
9 -
Subp
rogr
amm
e: 6
.3: B
UR
SAR
IES
2018
/19
2017
/18
Adj
uste
d Ap
prop
riatio
n S
hifti
ng o
f Fu
nds
Vire
men
t F
inal
Ap
prop
riatio
n A
ctua
l Ex
pend
iture
V
aria
nce
Expe
nditu
re a
s %
of f
inal
ap
prop
riatio
n
Fin
al
Appr
opria
tion
Act
ual
Expe
nditu
re
Eco
nom
ic c
lass
ifica
tion
R'0
00R
'000
R'0
00
R'0
00R
'000
R'0
00
%R
'000
R'0
00C
urre
nt p
aym
ents
10 2
97
-
-
10 2
97
10 2
87
10
99.9
%10
279
10
345
G
oods
and
ser
vice
s10
297
-
-
10
297
10
287
10
99
.9%
10 2
79
10 3
45
Tran
sfer
s an
d su
bsid
ies
59 1
80
-
(2
911
)
56 2
69
54 3
11
1 95
8
96
.5%
74 1
46
70 7
66
Hou
seho
lds
59 1
80
-
(2
911
)
56 2
69
54 3
11
1 95
8
96
.5%
74 1
46
70 7
66
Paym
ents
for c
apita
l ass
ets
-
-
-
-
-
-
-
-
-
Pa
ymen
t for
fina
ncia
l ass
ets
-
-
2 91
1
2
911
2 91
1
-
100.
0%6
188
6 18
8
T
otal
69
477
-
-
69
477
67
509
1
968
97.2
%90
613
87
299
Subp
rogr
amm
e: 6
.4: P
RIM
ARY
HEA
LTH
CAR
E (P
HC
) TR
AIN
ING
2018
/19
2017
/18
Adj
uste
d Ap
prop
riatio
n S
hifti
ng o
f Fu
nds
Vire
men
t F
inal
Ap
prop
riatio
n A
ctua
l Ex
pend
iture
V
aria
nce
Expe
nditu
re a
s %
of f
inal
ap
prop
riatio
n
Fin
al
Appr
opria
tion
Act
ual
Expe
nditu
re
Eco
nom
ic c
lass
ifica
tion
R'0
00R
'000
R'0
00
R'0
00R
'000
R'0
00
%R
'000
R'0
00C
urre
nt p
aym
ents
1
-
-
1
-
1
-
1
-
G
oods
and
ser
vice
s1
-
-
1
-
1
-
1
-
Tot
al
1
-
-
1
-
1
-
1
-
Subp
rogr
amm
e: 6
.5: T
RAI
NIN
G (O
THER
)20
18/1
920
17/1
8 A
djus
ted
Appr
opria
tion
Shi
fting
of
Fund
s V
irem
ent
Fin
al
Appr
opria
tion
Act
ual
Expe
nditu
re
Var
ianc
e Ex
pend
iture
as
% o
f fin
al
appr
opria
tion
Fin
al
Appr
opria
tion
Act
ual
Expe
nditu
re
Eco
nom
ic c
lass
ifica
tion
R'0
00R
'000
R'0
00
R'0
00R
'000
R'0
00
%R
'000
R'0
00C
urre
nt p
aym
ents
92 5
94
-
-
92 5
94
97 2
51
(4 6
57)
10
5.0%
67 3
34
67 0
28
Com
pens
atio
n of
em
ploy
ees
83 6
40
-
-
83 6
40
80 9
79
2 66
1
96
.8%
56 5
90
54 1
72
Goo
ds a
nd s
ervi
ces
8 95
4
-
-
8
954
16 2
72
(7 3
18)
18
1.7%
10 7
44
12 8
56
Tran
sfer
s an
d su
bsid
ies
65 7
13
-
-
65 7
13
65 8
55
(142
)
10
0.2%
71 8
82
71 6
97
Dep
artm
enta
l age
ncie
s an
d ac
coun
ts5
699
-
-
5 69
9
5
703
(4)
100.
1%5
397
5 12
8
N
on-p
rofit
inst
itutio
ns60
014
-
-
60
014
60
014
-
100.
0%66
485
66
485
H
ouse
hold
s-
-
-
-
13
8
(138
)
-
-
84
Pa
ymen
ts fo
r cap
ital a
sset
s-
-
-
-
18
(1
8)
-
-
34
Mac
hine
ry a
nd e
quip
men
t-
-
-
-
18
(1
8)
-
-
9
So
ftwar
e an
d ot
her i
ntan
gibl
e as
sets
-
-
-
-
-
-
-
25
T
otal
15
8 30
7
-
-
15
8 30
7
16
3 12
4
(4
817
)
103.
0%13
9 21
6
13
8 75
9
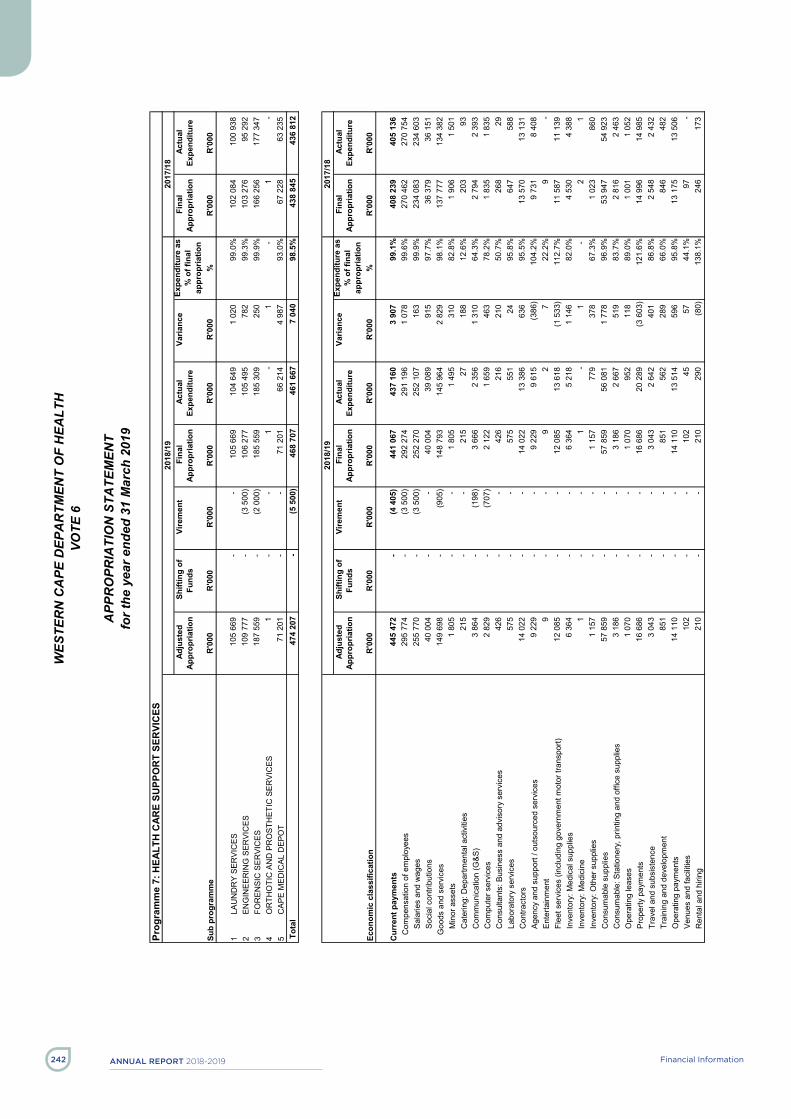
AnnuAl report 2018-2019 Financial Information242
WES
TER
N C
APE
DEP
AR
TMEN
T O
F H
EALT
H
VOTE
6
A
PPR
OPR
IATI
ON
STA
TEM
ENT
for t
he y
ear e
nded
31
Mar
ch 2
019
- 3
0 -
Prog
ram
me
7: H
EALT
H C
ARE
SUPP
OR
T SE
RVI
CES
2018
/19
2017
/18
Adj
uste
d Ap
prop
riatio
n S
hifti
ng o
f Fu
nds
Vire
men
t F
inal
Ap
prop
riatio
n A
ctua
l Ex
pend
iture
V
aria
nce
Expe
nditu
re a
s %
of f
inal
ap
prop
riatio
n
Fin
al
Appr
opria
tion
Act
ual
Expe
nditu
re
R'0
00R
'000
R'0
00
R'0
00R
'000
R'0
00
%R
'000
R'0
00
1LA
UN
DR
Y SE
RVI
CES
105
669
-
-
105
669
104
649
1
020
99
.0%
102
084
100
938
2EN
GIN
EER
ING
SER
VIC
ES
10
9 77
7
-
(3
500
)
10
6 27
7
10
5 49
5
7
82
99.3
%
10
3 27
6
9
5 29
2 3
FOR
ENSI
C S
ERVI
CES
187
559
-
(2 0
00)
185
559
185
309
250
99
.9%
166
256
177
347
4O
RTH
OTI
C A
ND
PR
OST
HET
IC S
ERVI
CES
1
-
-
1
-
1
-
1
- 5
CAP
E M
EDIC
AL D
EPO
T
7
1 20
1
-
-
7
1 20
1
6
6 21
4
4 9
87
93.0
%
6
7 22
8
6
3 23
5 47
4 20
7
-
(5 5
00)
46
8 70
7
46
1 66
7
7
040
98.5
%43
8 84
5
43
6 81
2
2018
/19
2017
/18
Adj
uste
d Ap
prop
riatio
n S
hifti
ng o
f Fu
nds
Vire
men
t F
inal
Ap
prop
riatio
n A
ctua
l Ex
pend
iture
V
aria
nce
Expe
nditu
re a
s %
of f
inal
ap
prop
riatio
n
Fin
al
Appr
opria
tion
Act
ual
Expe
nditu
re
Econ
omic
cla
ssifi
catio
nR
'000
R'0
00 R
'000
R
'000
R'0
00 R
'000
%
R'0
00R
'000
445
472
-
(4 4
05)
441
067
437
160
3
907
99
.1%
408
239
405
136
295
774
-
(3 5
00)
292
274
291
196
1
078
99
.6%
270
462
270
754
255
770
-
(3 5
00)
252
270
252
107
163
99
.9%
234
083
234
603
40
004
-
-
40
004
39
089
915
97
.7%
36
379
36
151
149
698
-
(9
05)
148
793
145
964
2
829
98
.1%
137
777
134
382
1
805
-
-
1 8
05
1
495
3
10
82.8
%
1 9
06
1
501
2
15
-
-
215
27
188
12
.6%
203
93
3
864
-
(198
)
3 6
66
2
356
1 3
10
64.3
%
2 7
94
2
393
2 8
29
-
(7
07)
2
122
1 6
59
463
78
.2%
1
835
1 8
35
426
-
-
4
26
216
2
10
50.7
%
2
68
29
5
75
-
-
575
5
51
24
95
.8%
647
5
88
14
022
-
-
14
022
13
386
636
95
.5%
13
570
13
131
9
229
-
-
9 2
29
9
615
(3
86)
104.
2%
9 7
31
8
408
9
-
-
9
2
7
22
.2%
9
-
12
085
-
-
12
085
13
618
(1
533
)11
2.7%
11
587
11
139
6
364
-
-
6 3
64
5
218
1 1
46
82.0
%
4 5
30
4
388
1
-
-
1
-
1
-
2
1
1
157
-
-
1 1
57
779
3
78
67.3
%
1 0
23
860
5
7 85
9
-
-
5
7 85
9
5
6 08
1
1 7
78
96.9
%
5
3 94
7
5
4 92
3
3 1
86
-
-
3
186
2 6
67
519
83
.7%
2
816
2 4
63
1
070
-
-
1 0
70
952
1
18
89.0
%
1 0
01
1
052
1
6 68
6
-
-
1
6 68
6
2
0 28
9
(3 6
03)
121.
6%
1
4 99
6
1
4 98
5
3 0
43
-
-
3
043
2 6
42
401
86
.8%
2
548
2 4
32
851
-
-
8
51
562
2
89
66.0
%
8
46
482
1
4 11
0
-
-
1
4 11
0
1
3 51
4
5
96
95.8
%
1
3 17
5
1
3 50
6
1
02
-
-
102
45
57
44
.1%
97
-
210
-
-
2
10
290
(
80)
138.
1%
2
46
173
Cur
rent
pay
men
tsC
ompe
nsat
ion
of e
mpl
oyee
sSa
larie
s an
d w
ages
Cat
erin
g: D
epar
tmen
tal a
ctiv
ities
Com
mun
icat
ion
(G&S
)C
ompu
ter s
ervi
ces
Con
sulta
nts:
Bus
ines
s an
d ad
viso
ry s
ervi
ces
Soci
al c
ontri
butio
nsG
oods
and
ser
vice
sM
inor
ass
ets
Flee
t ser
vice
s (in
clud
ing
gove
rnm
ent m
otor
tran
spor
t)
Labo
rato
ry s
ervi
ces
Con
tract
ors
Agen
cy a
nd s
uppo
rt / o
utso
urce
d se
rvic
esEn
terta
inm
ent
Con
sum
able
sup
plie
sC
onsu
mab
le: S
tatio
nery
, prin
ting
and
offic
e su
pplie
sO
pera
ting
leas
esPr
oper
ty p
aym
ents
Trav
el a
nd s
ubsi
sten
ce
Inve
ntor
y: M
edic
al s
uppl
ies
Inve
ntor
y: M
edic
ine
Inve
ntor
y: O
ther
sup
plie
s
Trai
ning
and
dev
elop
men
tO
pera
ting
paym
ents
Venu
es a
nd fa
cilit
ies
Ren
tal a
nd h
iring
Sub
prog
ram
me
Tota
l

AnnuAl report 2018 -2019 243Financial Information
WES
TER
N C
APE
DEP
AR
TMEN
T O
F H
EALT
H
VOTE
6
A
PPR
OPR
IATI
ON
STA
TEM
ENT
for t
he y
ear e
nded
31
Mar
ch 2
019
- 3
1 -
20
18/1
920
17/1
8 A
djus
ted
Appr
opria
tion
Shi
fting
of
Fund
s V
irem
ent
Fin
al
Appr
opria
tion
Act
ual
Expe
nditu
re
Var
ianc
e Ex
pend
iture
as
% o
f fin
al
appr
opria
tion
Fin
al
Appr
opria
tion
Act
ual
Expe
nditu
re
Econ
omic
cla
ssifi
catio
nR
'000
R'0
00 R
'000
R
'000
R'0
00 R
'000
%
R'0
00R
'000
738
-
-
7
38
797
(
59)
108.
0%
6
89
519
-
-
-
-
-
-
-
-
2
-
-
-
-
-
-
-
-
2
-
-
-
-
-
-
-
-
2
738
-
-
7
38
797
(
59)
108.
0%
6
89
517
7
38
-
-
738
7
97
(59
)10
8.0%
689
5
17
27
997
-
(2 0
00)
25
997
22
805
3
192
87
.7%
28
469
29
709
27
997
-
(2 0
00)
25
997
22
805
3
192
87
.7%
28
469
29
709
16
633
-
-
16
633
13
600
3
033
81
.8%
17
115
15
504
11
364
-
(2 0
00)
9
364
9 2
05
159
98
.3%
11
354
14
205
-
-
-
-
-
-
-
-
-
-
-
9
05
905
9
05
- 10
0.0%
1
448
1 4
48
474
207
-
(5
500
)
468
707
461
667
7 04
0
98
.5%
438
845
436
812
Tran
sfer
s an
d su
bsid
ies
Prov
ince
s an
d m
unic
ipal
ities
Prov
ince
sPr
ovin
cial
Rev
enue
Fun
ds
Paym
ents
for c
apita
l ass
ets
Mac
hine
ry a
nd e
quip
men
t
Hou
seho
lds
Soci
al b
enef
its
Softw
are
and
othe
r int
angi
ble
asse
tsPa
ymen
t for
fina
ncia
l ass
ets
Tran
spor
t equ
ipm
ent
Oth
er m
achi
nery
and
equ
ipm
ent
Tota
l

AnnuAl report 2018-2019 Financial Information244
WES
TER
N C
APE
DEP
AR
TMEN
T O
F H
EALT
H
VOTE
6
A
PPR
OPR
IATI
ON
STA
TEM
ENT
for t
he y
ear e
nded
31
Mar
ch 2
019
- 3
2 -
Subp
rogr
amm
e: 7
.1: L
AUN
DR
Y SE
RVI
CES
2018
/19
2017
/18
Adj
uste
d Ap
prop
riatio
n S
hifti
ng o
f Fu
nds
Vire
men
t F
inal
Ap
prop
riatio
n A
ctua
l Ex
pend
iture
V
aria
nce
Expe
nditu
re a
s %
of f
inal
ap
prop
riatio
n
Fin
al
Appr
opria
tion
Act
ual
Expe
nditu
re
Eco
nom
ic c
lass
ifica
tion
R'0
00R
'000
R'0
00
R'0
00R
'000
R'0
00
%R
'000
R'0
00C
urre
nt p
aym
ents
103
650
-
(2
2)
103
628
102
892
736
99
.3%
99 7
73
98 3
51
Com
pens
atio
n of
em
ploy
ees
43 1
99
-
-
43 1
99
42 8
17
382
99
.1%
41 0
19
39 4
46
Goo
ds a
nd s
ervi
ces
60 4
51
-
(2
2)
60 4
29
60 0
75
354
99
.4%
58 7
54
58 9
05
Tran
sfer
s an
d su
bsid
ies
131
-
-
13
1
11
120
8.
4%12
2
78
Hou
seho
lds
131
-
-
13
1
11
120
8.
4%12
2
78
Paym
ents
for c
apita
l ass
ets
1 88
8
-
-
1
888
1 72
4
16
4
91.3
%2
131
2 45
1
M
achi
nery
and
equ
ipm
ent
1 88
8
-
-
1
888
1 72
4
16
4
91.3
%2
131
2 45
1
Pa
ymen
t for
fina
ncia
l ass
ets
-
-
22
22
22
-
10
0.0%
58
58
Tot
al
105
669
-
-
105
669
104
649
1 02
0
99
.0%
102
084
100
938
Subp
rogr
amm
e: 7
.2: E
NG
INEE
RIN
G S
ERVI
CES
2018
/19
2017
/18
Adj
uste
d Ap
prop
riatio
n S
hifti
ng o
f Fu
nds
Vire
men
t F
inal
Ap
prop
riatio
n A
ctua
l Ex
pend
iture
V
aria
nce
Expe
nditu
re a
s %
of f
inal
ap
prop
riatio
n
Fin
al
Appr
opria
tion
Act
ual
Expe
nditu
re
Eco
nom
ic c
lass
ifica
tion
R'0
00R
'000
R'0
00
R'0
00R
'000
R'0
00
%R
'000
R'0
00C
urre
nt p
aym
ents
101
868
-
(3
635
)
98 2
33
98 2
01
32
100.
0%93
492
86
837
C
ompe
nsat
ion
of e
mpl
oyee
s65
106
-
(3 5
00)
61
606
60
336
1
270
97.9
%60
305
54
590
G
oods
and
ser
vice
s36
762
-
(135
)
36
627
37
865
(1
238
)
103.
4%33
187
32
247
Tr
ansf
ers
and
subs
idie
s37
3
-
-
373
54
2
(169
)
14
5.3%
348
30
6
Hou
seho
lds
373
-
-
37
3
542
(1
69)
145.
3%34
8
306
Pa
ymen
ts fo
r cap
ital a
sset
s7
536
-
-
7 53
6
6
617
919
87
.8%
9 37
6
8
089
Mac
hine
ry a
nd e
quip
men
t7
536
-
-
7 53
6
6
617
919
87
.8%
9 37
6
8
089
Paym
ent f
or fi
nanc
ial a
sset
s-
-
13
5
135
13
5
-
10
0.0%
60
60
Tot
al
109
777
-
(3
500
)
106
277
105
495
782
99
.3%
103
276
95 2
92

AnnuAl report 2018 -2019 245Financial Information
WES
TER
N C
APE
DEP
AR
TMEN
T O
F H
EALT
H
VOTE
6
A
PPR
OPR
IATI
ON
STA
TEM
ENT
for t
he y
ear e
nded
31
Mar
ch 2
019
- 3
3 -
Subp
rogr
amm
e: 7
.3: F
OR
ENSI
C S
ERVI
CES
2018
/19
2017
/18
Adj
uste
d Ap
prop
riatio
n S
hifti
ng o
f Fu
nds
Vire
men
t F
inal
Ap
prop
riatio
n A
ctua
l Ex
pend
iture
V
aria
nce
Expe
nditu
re a
s %
of f
inal
ap
prop
riatio
n
Fin
al
Appr
opria
tion
Act
ual
Expe
nditu
re
Eco
nom
ic c
lass
ifica
tion
R'0
00R
'000
R'0
00
R'0
00R
'000
R'0
00
%R
'000
R'0
00C
urre
nt p
aym
ents
169
215
-
(4
1)
169
174
170
804
(1 6
30)
10
1.0%
149
398
158
491
Com
pens
atio
n of
em
ploy
ees
140
621
-
-
140
621
141
197
(576
)
10
0.4%
124
549
133
620
Goo
ds a
nd s
ervi
ces
28 5
94
-
(4
1)
28 5
53
29 6
07
(1 0
54)
10
3.7%
24 8
49
24 8
71
Tran
sfer
s an
d su
bsid
ies
115
-
-
11
5
243
(1
28)
211.
3%10
8
75
Hou
seho
lds
115
-
-
11
5
243
(1
28)
211.
3%10
8
73
Paym
ents
for c
apita
l ass
ets
18 2
29
-
(2
000
)
16 2
29
14 2
21
2 00
8
87
.6%
16 6
94
18 7
25
Mac
hine
ry a
nd e
quip
men
t18
229
-
(2 0
00)
16
229
14
221
2
008
87.6
%16
694
18
725
Pa
ymen
t for
fina
ncia
l ass
ets
-
-
41
41
41
-
10
0.0%
56
56
Tot
al
187
559
-
(2
000
)
185
559
185
309
250
99
.9%
166
256
177
347
Subp
rogr
amm
e: 7
.4: O
RTH
OTI
C A
ND
PR
OST
HET
IC S
ERVI
CES
2018
/19
2017
/18
Adj
uste
d Ap
prop
riatio
n S
hifti
ng o
f Fu
nds
Vire
men
t F
inal
Ap
prop
riatio
n A
ctua
l Ex
pend
iture
V
aria
nce
Expe
nditu
re a
s %
of f
inal
ap
prop
riatio
n
Fin
al
Appr
opria
tion
Act
ual
Expe
nditu
re
Eco
nom
ic c
lass
ifica
tion
R'0
00R
'000
R'0
00
R'0
00R
'000
R'0
00
%R
'000
R'0
00C
urre
nt p
aym
ents
1
-
-
1
-
1
-
1
-
G
oods
and
ser
vice
s1
-
-
1
-
1
-
1
-
Tot
al
1
-
-
1
-
1
-
1
-
Subp
rogr
amm
e: 7
.5: C
APE
MED
ICAL
DEP
OT
2018
/19
2017
/18
Adj
uste
d Ap
prop
riatio
n S
hifti
ng o
f Fu
nds
Vire
men
t F
inal
Ap
prop
riatio
n A
ctua
l Ex
pend
iture
V
aria
nce
Expe
nditu
re a
s %
of f
inal
ap
prop
riatio
n
Fin
al
Appr
opria
tion
Act
ual
Expe
nditu
re
Eco
nom
ic c
lass
ifica
tion
R'0
00R
'000
R'0
00
R'0
00R
'000
R'0
00
%R
'000
R'0
00C
urre
nt p
aym
ents
70 7
38
-
(7
07)
70 0
31
65 2
63
4 76
8
93
.2%
65 5
75
61 4
57
Com
pens
atio
n of
em
ploy
ees
46 8
48
-
-
46 8
48
46 8
46
2
10
0.0%
44 5
89
43 0
98
Goo
ds a
nd s
ervi
ces
23 8
90
-
(7
07)
23 1
83
18 4
17
4 76
6
79
.4%
20 9
86
18 3
59
Tran
sfer
s an
d su
bsid
ies
119
-
-
11
9
1
11
8
0.8%
111
60
H
ouse
hold
s11
9
-
-
119
1
118
0.
8%11
1
60
Paym
ents
for c
apita
l ass
ets
344
-
-
34
4
243
10
1
70.6
%26
8
444
M
achi
nery
and
equ
ipm
ent
344
-
-
34
4
243
10
1
70.6
%26
8
444
Pa
ymen
t for
fina
ncia
l ass
ets
-
-
707
70
7
707
-
100.
0%1
274
1 27
4
T
otal
71
201
-
-
71
201
66
214
4
987
93.0
%67
228
63
235

AnnuAl report 2018-2019 Financial Information246
WES
TER
N C
APE
DEP
AR
TMEN
T O
F H
EALT
H
VOTE
6
A
PPR
OPR
IATI
ON
STA
TEM
ENT
for t
he y
ear e
nded
31
Mar
ch 2
019
- 3
4 -
Prog
ram
me
8: H
EALT
H F
ACIL
ITIE
S M
ANAG
EMEN
T20
18/1
920
17/1
8 A
djus
ted
Appr
opria
tion
Shi
fting
of
Fund
s V
irem
ent
Fin
al
Appr
opria
tion
Act
ual
Expe
nditu
re
Var
ianc
e Ex
pend
iture
as
% o
f fin
al
appr
opria
tion
Fin
al
Appr
opria
tion
Act
ual
Expe
nditu
re
R'0
00R
'000
R'0
00
R'0
00R
'000
R'0
00
%R
'000
R'0
00
1C
OM
MU
NIT
Y H
EALT
H F
ACIL
ITIE
S
15
1 57
6
-
-
15
1 57
6
11
8 21
1
3
3 36
5 78
.0%
212
697
183
278
2EM
ERG
ENC
Y M
EDIC
AL R
ESC
UE
SER
VIC
ES
1
0 86
9
-
-
1
0 86
9
7 2
14
3
655
66
.4%
11
425
8
055
3
DIS
TRIC
T H
OSP
ITAL
SER
VIC
ES
29
1 15
8
-
-
29
1 15
8
25
7 18
3
3
3 97
5 88
.3%
215
535
186
616
4PR
OVI
NC
IAL
HO
SPIT
AL S
ERVI
CES
107
620
-
-
107
620
93
878
13
742
87.2
%
11
1 34
4
10
3 51
1 5
CEN
TRAL
HO
SPIT
AL S
ERVI
CES
194
507
-
-
194
507
277
682
(83
175)
142.
8%
19
4 89
1
20
2 15
0 6
OTH
ER F
ACIL
ITIE
S
18
2 76
3
-
-
18
2 76
3
16
8 72
6
1
4 03
7 92
.3%
86
831
96
023
938
493
-
-
938
493
922
894
15 5
99
98.3
%83
2 72
3
77
9 63
3
2018
/19
2017
/18
Adj
uste
d Ap
prop
riatio
n S
hifti
ng o
f Fu
nds
Vire
men
t F
inal
Ap
prop
riatio
n A
ctua
l Ex
pend
iture
V
aria
nce
Expe
nditu
re a
s %
of f
inal
ap
prop
riatio
n
Fin
al
Appr
opria
tion
Act
ual
Expe
nditu
re
Econ
omic
cla
ssifi
catio
nR
'000
R'0
00 R
'000
R
'000
R'0
00 R
'000
%
R'0
00R
'000
473
752
-
(
69)
473
683
414
192
59
491
87.4
%
41
4 76
7
35
9 98
4
5
1 88
2
-
-
5
1 88
2
5
0 10
7
1 7
75
96.6
%
4
8 60
7
4
7 42
5
4
7 97
8
-
-
4
7 97
8
4
6 16
4
1 8
14
96.2
%
4
4 82
2
4
3 58
0
3 9
04
-
-
3
904
3 9
43
(39
)10
1.0%
3
785
3 8
45
421
870
-
(
69)
421
801
364
085
57
716
86.3
%
36
6 16
0
31
2 55
9
1
3 78
7
-
-
1
3 78
7
6 5
95
7
192
47
.8%
20
273
12
582
360
-
-
3
60
23
3
37
6.4%
52
4
184
-
-
1
84
126
58
68.5
%
1
58
126
1 7
38
-
-
1
738
-
1
738
-
297
2
76
16
-
-
16
-
16
-
76
-
6
1 80
1
-
(69
)
6
1 73
2
1
9 83
3
4
1 89
9 32
.1%
19
945
13
693
-
-
-
-
112
(1
12)
-
5
18
-
2
-
-
2
6
(4
)30
0.0%
26
9
2
040
-
-
2 0
40
2
448
(4
08)
120.
0%
6 1
06
1
581
-
-
-
-
3 3
94
(3
394
)
-
-
-
1
788
-
-
1 7
88
1
029
7
59
57.6
%
1 9
31
1
594
5
28
-
-
528
4
85
43
91
.9%
951
9
35
20
-
-
20
11
9
55.0
%
20
-
33
6 97
9
-
-
33
6 97
9
32
8 39
0
8 5
89
97.5
%
31
3 78
8
28
0 73
2
1 3
44
-
-
1
344
7
42
602
55
.2%
1
225
8
76
1
166
-
-
1 1
66
871
2
95
74.7
%
6
91
121
1
17
-
-
117
20
97
17
.1%
103
30
Cur
rent
pay
men
tsC
ompe
nsat
ion
of e
mpl
oyee
sSa
larie
s an
d w
ages
Soci
al c
ontri
butio
ns
Tota
l
Cat
erin
g: D
epar
tmen
tal a
ctiv
ities
Com
mun
icat
ion
(G&S
)C
ompu
ter s
ervi
ces
Con
sulta
nts:
Bus
ines
s an
d ad
viso
ry s
ervi
ces
Infra
stru
ctur
e an
d pl
anni
ng s
ervi
ces
Goo
ds a
nd s
ervi
ces
Min
or a
sset
s
Con
tract
ors
Ente
rtain
men
t
Con
sum
able
: Sta
tione
ry, p
rintin
g an
d of
fice
supp
lies
Ope
ratin
g le
ases
Prop
erty
pay
men
tsTr
avel
and
sub
sist
ence
Trai
ning
and
dev
elop
men
t
Inve
ntor
y: M
edic
al s
uppl
ies
Inve
ntor
y: O
ther
sup
plie
sC
onsu
mab
le s
uppl
ies
Ope
ratin
g pa
ymen
ts
Sub
prog
ram
me

AnnuAl report 2018 -2019 247Financial Information
WES
TER
N C
APE
DEP
AR
TMEN
T O
F H
EALT
H
VOTE
6
A
PPR
OPR
IATI
ON
STA
TEM
ENT
for t
he y
ear e
nded
31
Mar
ch 2
019
- 3
5 -
2018
/19
2017
/18
Adj
uste
d Ap
prop
riatio
n S
hifti
ng o
f Fu
nds
Vire
men
t F
inal
Ap
prop
riatio
n A
ctua
l Ex
pend
iture
V
aria
nce
Expe
nditu
re a
s %
of f
inal
ap
prop
riatio
n
Fin
al
Appr
opria
tion
Act
ual
Expe
nditu
re
Econ
omic
cla
ssifi
catio
nR
'000
R'0
00 R
'000
R
'000
R'0
00 R
'000
%
R'0
00R
'000
10
262
-
-
10
262
10
276
(14
)10
0.1%
21
514
20
017
10
209
-
-
10
209
10
209
- 10
0.0%
10
000
10
000
-
-
-
-
-
-
-
1
1 50
0
1
0 00
0
53
-
-
53
67
(14
)12
6.4%
14
17
53
-
-
53
67
(
14)
126.
4%
14
17
45
4 47
9
-
-
45
4 47
9
49
8 35
7
(4
3 87
8)10
9.7%
396
442
399
632
348
121
-
-
348
121
342
006
6
115
98
.2%
308
949
287
493
348
121
-
-
348
121
342
006
6
115
98
.2%
308
949
287
493
98
016
-
-
98
016
156
116
(58
100)
159.
3%
8
7 36
7
11
1 83
6
9
8 01
6
-
-
9
8 01
6
15
6 11
6
(5
8 10
0)15
9.3%
87
367
111
836
8
342
-
-
8 3
42
235
8 1
07
2.8%
126
3
03
-
-
69
69
69
-
100.
0%
-
- 93
8 49
3
-
-
93
8 49
3
92
2 89
4
15
599
98
.3%
832
723
779
633
Oth
er m
achi
nery
and
equ
ipm
ent
Paym
ents
for c
apita
l ass
ets
Build
ings
and
oth
er fi
xed
stru
ctur
esBu
ildin
gsM
achi
nery
and
equ
ipm
ent
Non
-pro
fit in
stitu
tions
Hou
seho
lds
Soci
al b
enef
its
Tota
lPa
ymen
t for
fina
ncia
l ass
ets
Softw
are
and
othe
r int
angi
ble
asse
ts
Hig
her e
duca
tion
inst
itutio
nsTr
ansf
ers
and
subs
idie
s
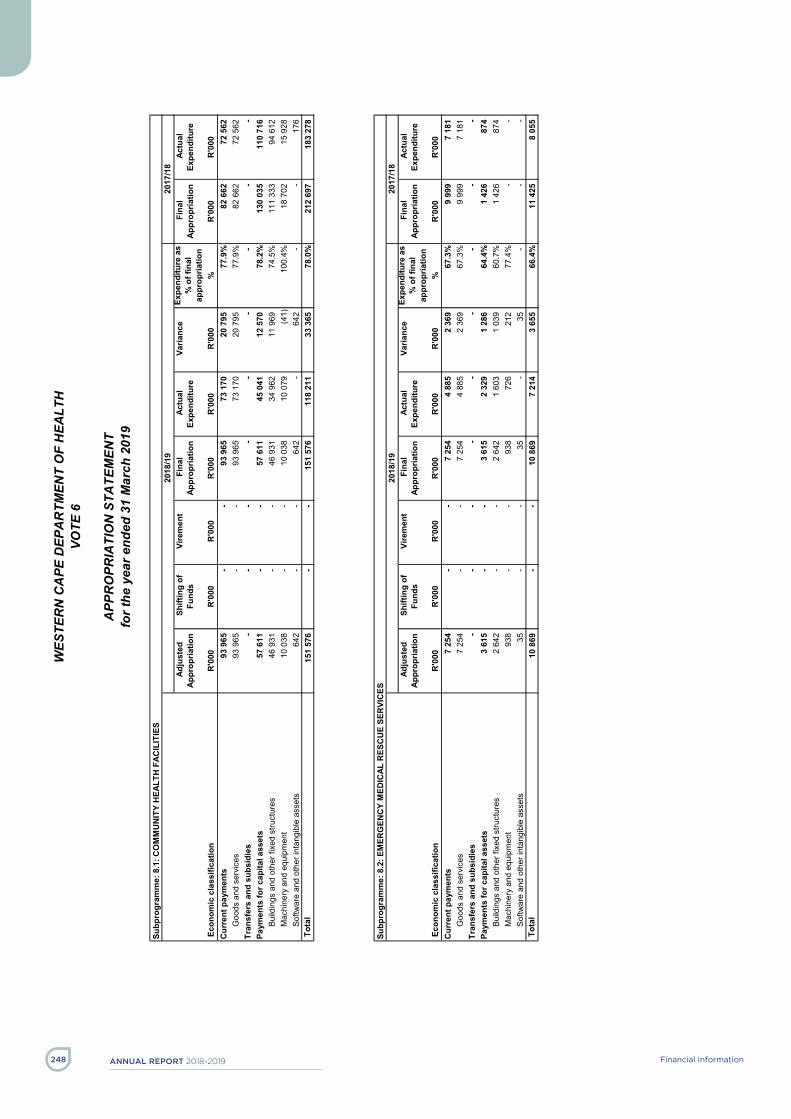
AnnuAl report 2018-2019 Financial Information248
WES
TER
N C
APE
DEP
AR
TMEN
T O
F H
EALT
H
VOTE
6
A
PPR
OPR
IATI
ON
STA
TEM
ENT
for t
he y
ear e
nded
31
Mar
ch 2
019
- 3
6 -
Subp
rogr
amm
e: 8
.1: C
OM
MU
NIT
Y H
EALT
H F
ACIL
ITIE
S20
18/1
920
17/1
8 A
djus
ted
Appr
opria
tion
Shi
fting
of
Fund
s V
irem
ent
Fin
al
Appr
opria
tion
Act
ual
Expe
nditu
re
Var
ianc
e Ex
pend
iture
as
% o
f fin
al
appr
opria
tion
Fin
al
Appr
opria
tion
Act
ual
Expe
nditu
re
Eco
nom
ic c
lass
ifica
tion
R'0
00R
'000
R'0
00
R'0
00R
'000
R'0
00
%R
'000
R'0
00C
urre
nt p
aym
ents
93 9
65
-
-
93 9
65
73 1
70
20 7
95
77.9
%82
662
72
562
G
oods
and
ser
vice
s93
965
-
-
93
965
73
170
20
795
77
.9%
82 6
62
72 5
62
Tran
sfer
s an
d su
bsid
ies
-
-
-
-
-
-
-
-
-
Pa
ymen
ts fo
r cap
ital a
sset
s57
611
-
-
57
611
45
041
12
570
78
.2%
130
035
110
716
Build
ings
and
oth
er fi
xed
stru
ctur
es46
931
-
-
46
931
34
962
11
969
74
.5%
111
333
94 6
12
Mac
hine
ry a
nd e
quip
men
t10
038
-
-
10
038
10
079
(4
1)
100.
4%18
702
15
928
So
ftwar
e an
d ot
her i
ntan
gibl
e as
sets
642
-
-
64
2
-
64
2
-
-
176
T
otal
15
1 57
6
-
-
15
1 57
6
11
8 21
1
33
365
78
.0%
212
697
183
278
Subp
rogr
amm
e: 8
.2: E
MER
GEN
CY
MED
ICAL
RES
CU
E SE
RVI
CES
2018
/19
2017
/18
Adj
uste
d Ap
prop
riatio
n S
hifti
ng o
f Fu
nds
Vire
men
t F
inal
Ap
prop
riatio
n A
ctua
l Ex
pend
iture
V
aria
nce
Expe
nditu
re a
s %
of f
inal
ap
prop
riatio
n
Fin
al
Appr
opria
tion
Act
ual
Expe
nditu
re
Eco
nom
ic c
lass
ifica
tion
R'0
00R
'000
R'0
00
R'0
00R
'000
R'0
00
%R
'000
R'0
00C
urre
nt p
aym
ents
7 25
4
-
-
7
254
4 88
5
2
369
67.3
%9
999
7 18
1
G
oods
and
ser
vice
s7
254
-
-
7 25
4
4
885
2 36
9
67
.3%
9 99
9
7
181
Tran
sfer
s an
d su
bsid
ies
-
-
-
-
-
-
-
-
-
Pa
ymen
ts fo
r cap
ital a
sset
s3
615
-
-
3 61
5
2
329
1 28
6
64
.4%
1 42
6
87
4
Build
ings
and
oth
er fi
xed
stru
ctur
es2
642
-
-
2 64
2
1
603
1 03
9
60
.7%
1 42
6
87
4
Mac
hine
ry a
nd e
quip
men
t93
8
-
-
938
72
6
212
77
.4%
-
-
Softw
are
and
othe
r int
angi
ble
asse
ts35
-
-
35
-
35
-
-
-
T
otal
10
869
-
-
10
869
7
214
3 65
5
66
.4%
11 4
25
8 05
5

AnnuAl report 2018 -2019 249Financial Information
WES
TER
N C
APE
DEP
AR
TMEN
T O
F H
EALT
H
VOTE
6
A
PPR
OPR
IATI
ON
STA
TEM
ENT
for t
he y
ear e
nded
31
Mar
ch 2
019
- 3
7 -
Subp
rogr
amm
e: 8
.3: D
ISTR
ICT
HO
SPIT
AL S
ERVI
CES
2018
/19
2017
/18
Adj
uste
d Ap
prop
riatio
n S
hifti
ng o
f Fu
nds
Vire
men
t F
inal
Ap
prop
riatio
n A
ctua
l Ex
pend
iture
V
aria
nce
Expe
nditu
re a
s %
of f
inal
ap
prop
riatio
n
Fin
al
Appr
opria
tion
Act
ual
Expe
nditu
re
Eco
nom
ic c
lass
ifica
tion
R'0
00R
'000
R'0
00
R'0
00R
'000
R'0
00
%R
'000
R'0
00C
urre
nt p
aym
ents
92 6
65
-
-
92 6
65
70 1
14
22 5
51
75.7
%86
404
80
055
C
ompe
nsat
ion
of e
mpl
oyee
s5
014
-
-
5 01
4
4
588
426
91
.5%
5 28
9
5
041
Goo
ds a
nd s
ervi
ces
87 6
51
-
-
87 6
51
65 5
26
22 1
25
74.8
%81
115
75
014
Tr
ansf
ers
and
subs
idie
s12
-
-
12
12
-
100.
0%11
14
H
ouse
hold
s12
-
-
12
12
-
100.
0%11
14
Pa
ymen
ts fo
r cap
ital a
sset
s19
8 48
1
-
-
19
8 48
1
18
7 05
7
11
424
94
.2%
129
120
106
547
Build
ings
and
oth
er fi
xed
stru
ctur
es17
9 89
6
-
-
17
9 89
6
17
0 43
5
9
461
94.7
%11
2 27
1
90
826
M
achi
nery
and
equ
ipm
ent
17 8
14
-
-
17 8
14
16 3
87
1 42
7
92
.0%
16 7
23
15 5
94
Softw
are
and
othe
r int
angi
ble
asse
ts77
1
-
-
771
23
5
536
30
.5%
126
12
7
Tot
al
291
158
-
-
291
158
257
183
33 9
75
88.3
%21
5 53
5
18
6 61
6
Subp
rogr
amm
e: 8
.4: P
RO
VIN
CIA
L H
OSP
ITAL
SER
VIC
ES20
18/1
920
17/1
8 A
djus
ted
Appr
opria
tion
Shi
fting
of
Fund
s V
irem
ent
Fin
al
Appr
opria
tion
Act
ual
Expe
nditu
re
Var
ianc
e Ex
pend
iture
as
% o
f fin
al
appr
opria
tion
Fin
al
Appr
opria
tion
Act
ual
Expe
nditu
re
Eco
nom
ic c
lass
ifica
tion
R'0
00R
'000
R'0
00
R'0
00R
'000
R'0
00
%R
'000
R'0
00C
urre
nt p
aym
ents
99 3
92
-
-
99 3
92
89 9
56
9 43
6
90
.5%
67 4
00
50 1
18
Com
pens
atio
n of
em
ploy
ees
2 00
1
-
-
2
001
2 00
1
-
100.
0%1
707
1 64
9
G
oods
and
ser
vice
s97
391
-
-
97
391
87
955
9
436
90.3
%65
693
48
469
Tr
ansf
ers
and
subs
idie
s-
-
-
-
-
-
-
-
-
Paym
ents
for c
apita
l ass
ets
8 22
8
-
-
8
228
3 92
2
4
306
47.7
%43
944
53
393
Bu
ildin
gs a
nd o
ther
fixe
d st
ruct
ures
8 22
3
-
-
8
223
3 92
2
4
301
47.7
%41
891
50
847
M
achi
nery
and
equ
ipm
ent
5
-
-
5
-
5
-
2
053
2 54
6
T
otal
10
7 62
0
-
-
10
7 62
0
93
878
13
742
87
.2%
111
344
103
511

AnnuAl report 2018-2019 Financial Information250
WES
TER
N C
APE
DEP
AR
TMEN
T O
F H
EALT
H
VOTE
6
A
PPR
OPR
IATI
ON
STA
TEM
ENT
for t
he y
ear e
nded
31
Mar
ch 2
019
- 3
8 -
Subp
rogr
amm
e: 8
.5: C
ENTR
AL H
OSP
ITAL
SER
VIC
ES20
18/1
920
17/1
8 A
djus
ted
Appr
opria
tion
Shi
fting
of
Fund
s V
irem
ent
Fin
al
Appr
opria
tion
Act
ual
Expe
nditu
re
Var
ianc
e Ex
pend
iture
as
% o
f fin
al
appr
opria
tion
Fin
al
Appr
opria
tion
Act
ual
Expe
nditu
re
Eco
nom
ic c
lass
ifica
tion
R'0
00R
'000
R'0
00
R'0
00R
'000
R'0
00
%R
'000
R'0
00C
urre
nt p
aym
ents
115
060
-
(6
9)
114
991
121
499
(6 5
08)
10
5.7%
109
025
94 8
74
Com
pens
atio
n of
em
ploy
ees
2 57
3
-
-
2
573
2 59
3
(2
0)
100.
8%2
351
2 35
6
G
oods
and
ser
vice
s11
2 48
7
-
(69)
11
2 41
8
11
8 90
6
(6
488
)
105.
8%10
6 67
4
92
518
Tr
ansf
ers
and
subs
idie
s10
209
-
-
10
209
10
209
-
100.
0%21
500
20
000
H
ighe
r edu
catio
n in
stitu
tions
10 2
09
-
-
10 2
09
10 2
09
-
10
0.0%
10 0
00
10 0
00
Non
-pro
fit in
stitu
tions
-
-
-
-
-
-
-
11
500
10
000
Pa
ymen
ts fo
r cap
ital a
sset
s69
238
-
-
69
238
14
5 90
5
(7
6 66
7)
210.
7%64
366
87
276
Bu
ildin
gs a
nd o
ther
fixe
d st
ruct
ures
22 9
50
-
-
22 9
50
17 0
39
5 91
1
74
.2%
15 3
62
9 73
8
M
achi
nery
and
equ
ipm
ent
42 1
36
-
-
42 1
36
128
866
(86
730)
30
5.8%
49 0
04
77 5
38
Softw
are
and
othe
r int
angi
ble
asse
ts4
152
-
-
4 15
2
-
4 15
2
-
-
-
Paym
ent f
or fi
nanc
ial a
sset
s-
-
69
69
69
-
100.
0%-
-
T
otal
19
4 50
7
-
-
19
4 50
7
27
7 68
2
(8
3 17
5)
142.
8%19
4 89
1
20
2 15
0
Subp
rogr
amm
e: 8
.6: O
THER
FAC
ILIT
IES
2018
/19
2017
/18
Adj
uste
d Ap
prop
riatio
n S
hifti
ng o
f Fu
nds
Vire
men
t F
inal
Ap
prop
riatio
n A
ctua
l Ex
pend
iture
V
aria
nce
Expe
nditu
re a
s %
of f
inal
ap
prop
riatio
n
Fin
al
Appr
opria
tion
Act
ual
Expe
nditu
re
Eco
nom
ic c
lass
ifica
tion
R'0
00R
'000
R'0
00
R'0
00R
'000
R'0
00
%R
'000
R'0
00C
urre
nt p
aym
ents
65 4
16
-
-
65 4
16
54 5
68
10 8
48
83.4
%59
277
55
194
C
ompe
nsat
ion
of e
mpl
oyee
s42
294
-
-
42
294
40
925
1
369
96.8
%39
260
38
379
G
oods
and
ser
vice
s23
122
-
-
23
122
13
643
9
479
59.0
%20
017
16
815
Tr
ansf
ers
and
subs
idie
s41
-
-
41
55
(1
4)
134.
1%3
3
H
ouse
hold
s41
-
-
41
55
(1
4)
134.
1%3
3
Pa
ymen
ts fo
r cap
ital a
sset
s11
7 30
6
-
-
11
7 30
6
11
4 10
3
3
203
97.3
%27
551
40
826
Bu
ildin
gs a
nd o
ther
fixe
d st
ruct
ures
87 4
79
-
-
87 4
79
114
045
(26
566)
13
0.4%
26 6
66
40 5
96
Mac
hine
ry a
nd e
quip
men
t27
085
-
-
27
085
58
27
027
0.
2%88
5
230
So
ftwar
e an
d ot
her i
ntan
gibl
e as
sets
2 74
2
-
-
2
742
-
2
742
-
-
-
T
otal
18
2 76
3
-
-
18
2 76
3
16
8 72
6
14
037
92
.3%
86 8
31
96 0
23

AnnuAl report 2018 -2019 251Financial Information
WESTERN CAPE GOVERNMENT HEALTH VOTE 6
NOTES TO THE APPROPRIATION STATEMENT
for the year ended 31 March 2019
- 39 -
1. Detail of transfers and subsidies as per Appropriation Act (after Virement): Detail of these transactions can be viewed in the note on Transfers and subsidies, disclosure notes and Annexure 1 (A-E) to the Annual Financial Statements.
2. Detail of specifically and exclusively appropriated amounts voted (after Virement): Detail of these transactions can be viewed in note 1 (Annual Appropriation) to the Annual Financial Statements.
3. Detail on payments for financial assets Detail of these transactions can be viewed in the note on Payments for financial assets to the Annual Financial Statements.
4. Explanations of material variances from Amounts Voted (after Virement):
4.1 Per programme Final
Appropriation Actual
Expenditure Variance Variance as a %
of Final Approp. Per programme: R’000 R’000 R’000 %
ADMINISTRATION 768 056 766 106 1 950 0% The under-spending can mainly be attributed to: • Compensation of Employees: - the delay in filling of posts in anticipation of the outcome of the Management Efficiency and Alignment Project (MEAP). The goal of MEAP is to improve alignment of functions, streamline processes and structures in line with the principles of Healthcare 2030. The Administration Sector Executive Committee(SEC) therefore only approved, advertised and filled critical posts. • Goods and Services: - underspend on e-vision project, this saving was used to offset the related e-vision payments for capital assets. - delays in fully implementing the MEAP operational plans. • Transfers and Subsidies: - lower than anticipated number of injury on duty cases and the severity of reported incidences. Therefore, the associated expenditure were lower than budgeted. The over- expenditure can be attributed to: • Payments for Capital assets: - the procurement of IT network infrastructure to strengthen connectivity in clinical areas across the Province.

AnnuAl report 2018-2019 Financial Information252
WESTERN CAPE GOVERNMENT HEALTH VOTE 6
NOTES TO THE APPROPRIATION STATEMENT
for the year ended 31 March 2019
- 40 -
Final
Appropriation Actual
Expenditure Variance Variance as a %
of Final Approp. Per programme: R’000 R’000 R’000 %
DISTRICT HEALTH SERVICES 9 341 766 9 328 752 13 014 0%
The under-spending can mainly be attributed to: • Compensation of Employees: - refund in respect of posts from National Department of Health. - the difficulty to recruit and retain certain categories of staff in certain areas due to high attrition rates. • Goods and Services: - spending by South African National Aids Council (SANAC) for the Focus for Impact project in Kwazulu-Natal was significantly less than was initially budgeted for in Global Fund. - saving in Anti tuberculosis (TB) medicine due to a reduction in the number of new TB infections as well as a reduction in the TB medicine prices in 2018. • Transfers and Subsidies: - the Global Fund Grant that came to an end but programme close off activities and claims could not all be accounted for before financial year-end. It will be reflected in the new financial year in line with approval for roll-over funding. Over-expenditure can mainly be attributed to: • Payments for capital assets: - Departmental strategy to use projected savings in the total budget to address the emergency replacement of critical capital equipment.
Final Appropriation
Actual Expenditure
Variance Variance as a % of Final Approp.
Per programme: R’000 R’000 R’000 %
EMERGENCY MEDICAL SERVICES 1 106 257 1 102 444 3 813 0%
The under-spending can mainly be attributed to: • Goods and Services: - saving initiatives that were put in place within various Goods and Services items to cover the projected over expenditure in Capital assets (Financial leases) Over-expenditure can mainly be attributed to: • Payments for capital assets: - replacement of existing ambulances/vehicles with new ambulances/vehicles within the Emergency Medical Service, such replacements result in higher daily tariffs.

AnnuAl report 2018 -2019 253Financial Information
WESTERN CAPE GOVERNMENT HEALTH VOTE 6
NOTES TO THE APPROPRIATION STATEMENT
for the year ended 31 March 2019
- 41 -
Final
Appropriation Actual
Expenditure Variance Variance as a %
of Final Approp. Per programme: R’000 R’000 R’000 %
PROVINCIAL HOSPITAL SERVICE 3 630 241 3 622 842 7 399 0%
The over-expenditure can mainly be attributed to: • Compensation of Employees: - lower than expected attrition rate at some institutions put this programme's Compensation of Employees budget under pressure, • Payments for capital assets: - Departmental strategy to use projected savings in the total budget to address emergency replacement of critical capital equipment. The under-spending can mainly be attributed to: • Goods and Services: - implementation on specific projects to ensure savings under Goods & Services such as Neotel/VoIP and the establishment of blood committee (George Hospital). - saving in Anti tuberculosis (TB) medicine due to less patients affected by TB as well as a reduction in the TB medicine prices in 2018. - overstocked stores during the 2017-18 financial year resulted in a surplus which directly impacted (reduced) on the orders for the 2018-19 financial year. • Transfers and Subsidies: - less employee benefits, than the anticipated budget provided, were paid as the number of employees planning to exit the service was unknown at the time the budget was allocated.
Final Appropriation
Actual Expenditure
Variance Variance as a % of Final Approp.
Per programme: R’000 R’000 R’000 %
CENTRAL HOSPITAL SERVICES 6 517 843 6 517 245 598 0%
The under-spending can mainly be attributed to: • Compensation of Employees: - refund in respect of posts from National Department of Health. • Transfers and Subsidies: - less benefits paid than the anticipated budget provided as the number of employees planning to exit the service was unknown at the time the budget was allocated. The over-expenditure can mainly be attributed to: • Payments for capital assets: - to address over expenditure as a result of the necessitated replacement of aging medical equipment and equipment backlogs.
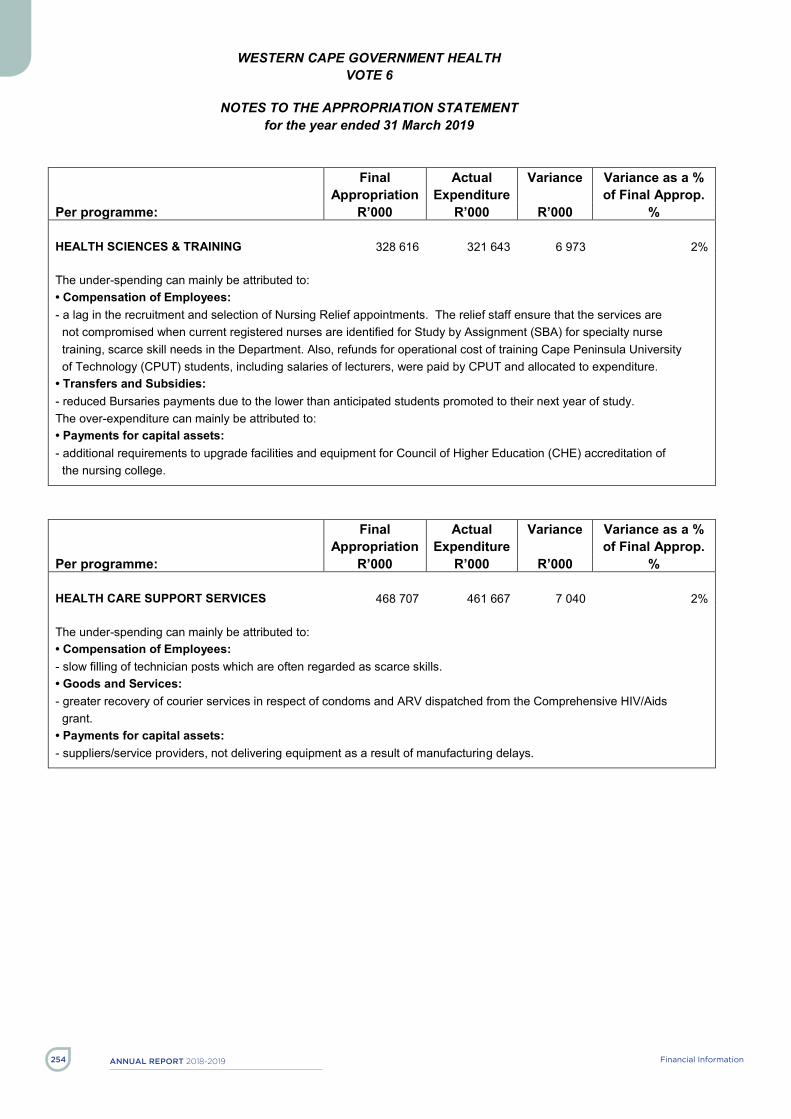
AnnuAl report 2018-2019 Financial Information254
WESTERN CAPE GOVERNMENT HEALTH VOTE 6
NOTES TO THE APPROPRIATION STATEMENT
for the year ended 31 March 2019
- 42 -
Final
Appropriation Actual
Expenditure Variance Variance as a %
of Final Approp. Per programme: R’000 R’000 R’000 %
HEALTH SCIENCES & TRAINING 328 616 321 643 6 973 2%
The under-spending can mainly be attributed to: • Compensation of Employees: - a lag in the recruitment and selection of Nursing Relief appointments. The relief staff ensure that the services are not compromised when current registered nurses are identified for Study by Assignment (SBA) for specialty nurse training, scarce skill needs in the Department. Also, refunds for operational cost of training Cape Peninsula University of Technology (CPUT) students, including salaries of lecturers, were paid by CPUT and allocated to expenditure. • Transfers and Subsidies: - reduced Bursaries payments due to the lower than anticipated students promoted to their next year of study. The over-expenditure can mainly be attributed to: • Payments for capital assets: - additional requirements to upgrade facilities and equipment for Council of Higher Education (CHE) accreditation of the nursing college.
Final Appropriation
Actual Expenditure
Variance Variance as a % of Final Approp.
Per programme: R’000 R’000 R’000 %
HEALTH CARE SUPPORT SERVICES 468 707 461 667 7 040 2%
The under-spending can mainly be attributed to: • Compensation of Employees: - slow filling of technician posts which are often regarded as scarce skills. • Goods and Services: - greater recovery of courier services in respect of condoms and ARV dispatched from the Comprehensive HIV/Aids grant. • Payments for capital assets: - suppliers/service providers, not delivering equipment as a result of manufacturing delays.
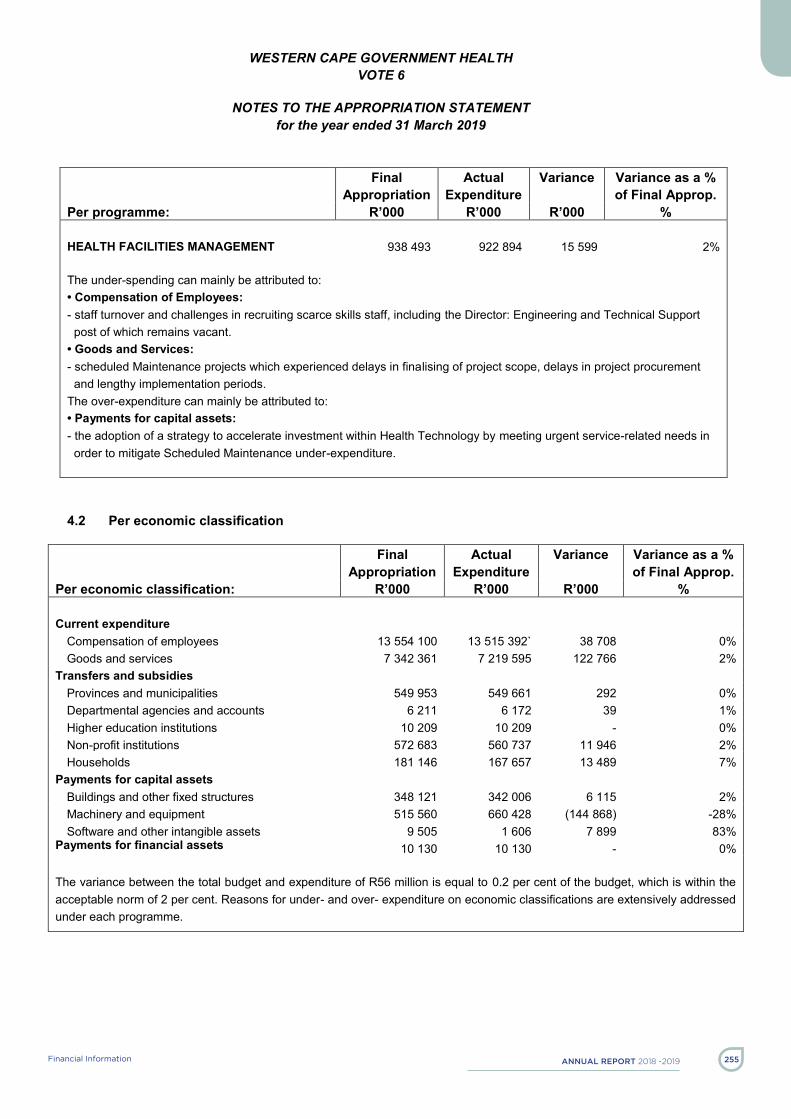
AnnuAl report 2018 -2019 255Financial Information
WESTERN CAPE GOVERNMENT HEALTH VOTE 6
NOTES TO THE APPROPRIATION STATEMENT
for the year ended 31 March 2019
- 43 -
Final
Appropriation Actual
Expenditure Variance Variance as a %
of Final Approp. Per programme: R’000 R’000 R’000 %
HEALTH FACILITIES MANAGEMENT 938 493 922 894 15 599 2%
The under-spending can mainly be attributed to: • Compensation of Employees: - staff turnover and challenges in recruiting scarce skills staff, including the Director: Engineering and Technical Support post of which remains vacant. • Goods and Services: - scheduled Maintenance projects which experienced delays in finalising of project scope, delays in project procurement and lengthy implementation periods. The over-expenditure can mainly be attributed to: • Payments for capital assets: - the adoption of a strategy to accelerate investment within Health Technology by meeting urgent service-related needs in order to mitigate Scheduled Maintenance under-expenditure.
4.2 Per economic classification
Final Appropriation
Actual Expenditure
Variance Variance as a % of Final Approp.
Per economic classification: R’000 R’000 R’000 %
Current expenditure
Compensation of employees 13 554 100 13 515 392` 38 708 0% Goods and services 7 342 361 7 219 595 122 766 2%
Transfers and subsidies Provinces and municipalities 549 953 549 661 292 0% Departmental agencies and accounts 6 211 6 172 39 1% Higher education institutions 10 209 10 209 - 0% Non-profit institutions 572 683 560 737 11 946 2% Households 181 146 167 657 13 489 7%
Payments for capital assets Buildings and other fixed structures 348 121 342 006 6 115 2% Machinery and equipment 515 560 660 428 (144 868) -28% Software and other intangible assets 9 505 1 606 7 899 83%
Payments for financial assets 10 130 10 130 - 0%
The variance between the total budget and expenditure of R56 million is equal to 0.2 per cent of the budget, which is within the acceptable norm of 2 per cent. Reasons for under- and over- expenditure on economic classifications are extensively addressed under each programme.
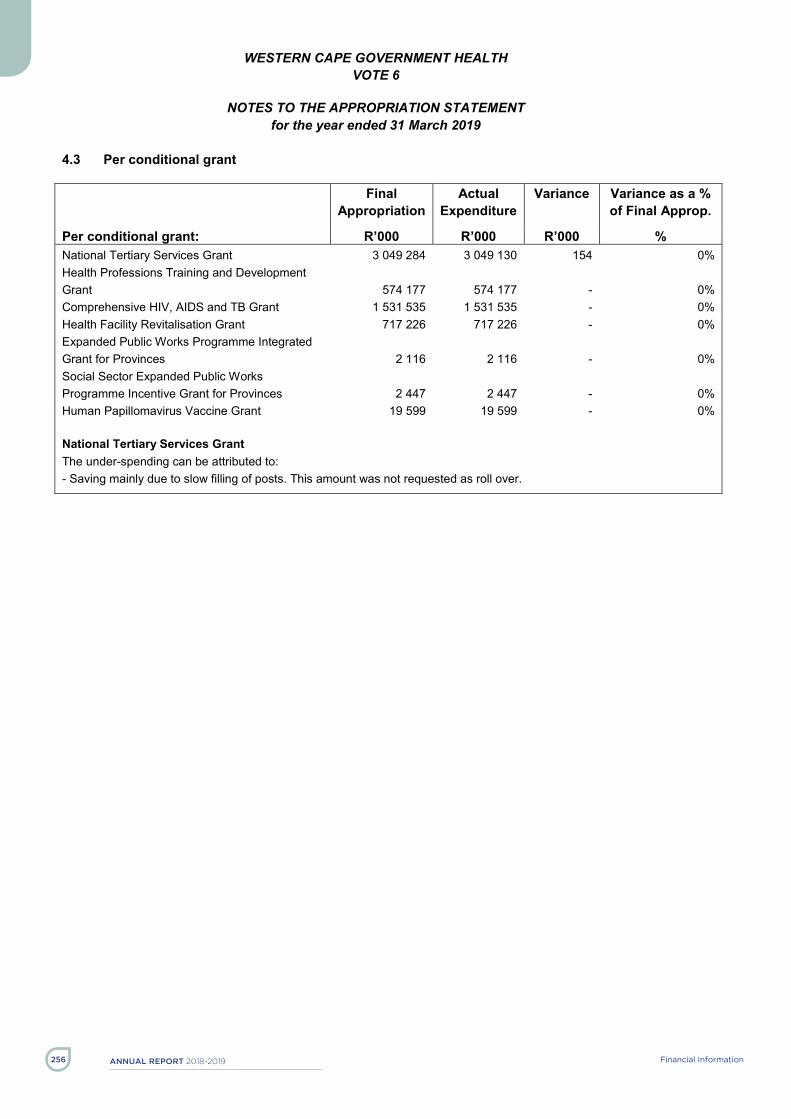
AnnuAl report 2018-2019 Financial Information256
WESTERN CAPE GOVERNMENT HEALTH VOTE 6
NOTES TO THE APPROPRIATION STATEMENT
for the year ended 31 March 2019
- 44 -
4.3 Per conditional grant
Final Appropriation
Actual Expenditure
Variance Variance as a % of Final Approp.
Per conditional grant: R’000 R’000 R’000 % National Tertiary Services Grant 3 049 284 3 049 130 154 0% Health Professions Training and Development Grant 574 177 574 177 - 0% Comprehensive HIV, AIDS and TB Grant 1 531 535 1 531 535 - 0% Health Facility Revitalisation Grant 717 226 717 226 - 0% Expanded Public Works Programme Integrated Grant for Provinces 2 116 2 116 - 0% Social Sector Expanded Public Works Programme Incentive Grant for Provinces 2 447 2 447 - 0% Human Papillomavirus Vaccine Grant 19 599 19 599 - 0%
National Tertiary Services Grant The under-spending can be attributed to: - Saving mainly due to slow filling of posts. This amount was not requested as roll over.

AnnuAl report 2018 -2019 257Financial Information
WESTERN CAPE GOVERNMENT HEALTH VOTE 6
STATEMENT OF FINANCIAL PERFORMANCE for the year ended 31 March 2019
- 45 -
Note 2018/19 2017/18 R'000 R'000 REVENUE
Annual appropriation 1.1 23 099 979 21 686 482 Departmental revenue 2 114 323 49 311 Aid assistance 3 1 559 2 378 TOTAL REVENUE 23 215 861 21 738 171 EXPENDITURE
Current expenditure Compensation of employees 4 13 515 392 12 660 391 Goods and services 5 7 219 595 6 892 429 Aid assistance 3 - 695 Total current expenditure 20 734 987 19 553 515 Transfers and subsidies Transfers and subsidies 7 1 294 436 1 180 182 Aid assistance 3 2 218 1 367 Total transfers and subsidies 1 296 654 1 181 549 Expenditure for capital assets Tangible assets 8 1 002 434 746 044 Intangible assets 8 1 606 5 456 Total expenditure for capital assets 1 004 040 751 500 Payments for financial assets 6 10 130 11 620 TOTAL EXPENDITURE 23 045 811 21 498 184 SURPLUS FOR THE YEAR 170 050 239 987
Reconciliation of Net Surplus for the year
Voted funds 56 386 190 426 Annual appropriation 56 232 152 029 Conditional grants 154 38 397
Departmental revenue and NRF Receipts 114 323 49 311 Aid assistance 3 (659) 250 SURPLUS FOR THE YEAR 170 050 239 987

AnnuAl report 2018-2019 Financial Information258
WWESTERN CAPE GOVERNMENT HEALTH VOTE 6
STATEMENT OF FINANCIAL POSITION
as at 31 March 2019
- 46 -
Note 2018/19 2017/18 R'000 R'000 ASSETS
Current assets 194 532 304 450 Cash and cash equivalents 9 128 963 240 212 Prepayments and advances 10 6 006 12 238 Receivables 11 59 563 51 910
Non-current assets 887 1 235
Receivables 11 887 1 235 TOTAL ASSETS 195 419 305 685 LIABILITIES
Current liabilities 180 588 291 444 Voted funds to be surrendered to the Revenue Fund 12 56 386 190 426 Departmental revenue and NRF Receipts to be surrendered to the Revenue Fund
13
51 686
30 399
Payables 14 72 144 69 588 Aid assistance unutilised 3 372 1 031
TOTAL LIABILITIES 180 588 291 444 NET ASSETS 14 831 14 241
2018/19 2017/18 R'000 R'000 Represented by:
Recoverable revenue 14 831 14 241 TOTAL 14 831 14 241
WESTERN CAPE GOVERNMENT HEALTH

AnnuAl report 2018 -2019 259Financial Information
WWESTERN CAPE GOVERNMENT HEALTH VOTE 6
STATEMENT OF CHANGES IN NET ASSETS
for the year ended 31 March 2019
- 47 -
Note 2018/19 2017/18 R'000 R'000
Recoverable revenue Opening balance 14 241 19 047 Transfers: 590 (4 806)
Irrecoverable amounts written off 6.2 (7 129) (9 241) Debts revised 124 188 Debts recovered (included in departmental receipts) 2 560 2 444 Debts raised 5 035 1 803
Closing balance 14 831 14 241 TOTAL 14 831 14 241
WESTERN CAPE GOVERNMENT HEALTH

AnnuAl report 2018-2019 Financial Information260
WWESTERN CAPE GOVERNMENT HEALTH VOTE 6
CASH FLOW STATEMENT
for the year ended 31 March 2019
- 48 -
Note 2018/19 2017/18 R'000 R’000 CASH FLOWS FROM OPERATING ACTIVITIES
Receipts 23 778 919 22 260 432 Annual appropriated funds received 1.1 23 099 979 21 686 482 Departmental revenue received 2 673 877 566 775 Interest received 2.2 3 504 4 797 Aid assistance received 3 1 559 2 378
Net (increase)/decrease in working capital 1 573 36 207 Surrendered to Revenue Fund (846 530) (633 889) Surrendered to RDP Fund/Donor - (1 123) Current payments (20 734 987) (19 553 515) Payments for financial assets (10 130) (11 620) Transfers and subsidies paid (1 296 654) (1 181 549) Net cash flow available from operating activities 15 892 191 914 943 CASH FLOWS FROM INVESTING ACTIVITIES
Payments for capital assets 8 (1 004 040) (751 500) Proceeds from sale of capital assets 15 10 2 Net cash flows from investing activities (1 004 030) (751 498) CASH FLOWS FROM FINANCING ACTIVITIES
Increase/(decrease) in net assets 590 (4 806) Net cash flows from financing activities 590 (4 806) Net increase/(decrease) in cash and cash equivalents (111 249) 158 639
Cash and cash equivalents at beginning of period 240 212 81 573 Cash and cash equivalents at end of period 9 128 963 240 212
WESTERN CAPE GOVERNMENT HEALTH
AnnuAl report 2018 -2019 261Financial Information
WESTERN CAPE GOVERNMENT HEALTH VOTE 6
NOTES TO THE ANNUAL FINANCIAL STATEMENTS for the year ended 31 March 2019
- 49 -
Summary of significant accounting policies The financial statements have been prepared in accordance with the following policies, which have been applied consistently in all material aspects, unless otherwise indicated. Management has concluded that the financial statements present fairly the department’s primary and secondary information. The historical cost convention has been used, except where otherwise indicated. Management has used assessments and estimates in preparing the annual financial statements. These are based on the best information available at the time of preparation. Where appropriate and meaningful, additional information has been disclosed to enhance the usefulness of the financial statements and to comply with the statutory requirements of the Public Finance Management Act (PFMA), Act 1 of 1999 (as amended by Act 29 of 1999), and the Treasury Regulations issued in terms of the PFMA and the annual Division of Revenue Act.
1 Basis of preparation The financial statements have been prepared in accordance with the Modified Cash Standard.
2 Going concern The financial statements have been prepared on a going concern basis.
3 Presentation currency Amounts have been presented in the currency of the South African Rand (R) which is also the functional currency of the department.
4 Rounding Unless otherwise stated financial figures have been rounded to the nearest one thousand Rand (R’000).
5 Foreign currency translation Cash flows arising from foreign currency transactions are translated into South African Rands using the spot exchange rates prevailing at the date of payment / receipt.
6 Comparative information
6.1 Prior period comparative information Prior period comparative information has been presented in the current year’s financial statements. Where necessary figures included in the prior period financial statements have been reclassified to ensure that the format in which the information is presented is consistent with the format of the current year’s financial statements.
6.2 Current year comparison with budget A comparison between the approved, final budget and actual amounts for each programme and economic classification is included in the appropriation statement.

AnnuAl report 2018-2019 Financial Information262
WESTERN CAPE GOVERNMENT HEALTH VOTE 6
NOTES TO THE ANNUAL FINANCIAL STATEMENTS for the year ended 31 March 2019
- 50 -
7 Revenue
7.1 Appropriated funds Appropriated funds comprises of departmental allocations as well as direct charges against the revenue fund (i.e. statutory appropriation). Appropriated funds are recognised in the statement of financial performance on the date the appropriation becomes effective. Adjustments made in terms of the adjustments budget process are recognised in the statement of financial performance on the date the adjustments become effective. The net amount of any appropriated funds due to / from the relevant revenue fund at the reporting date is recognised as a payable / receivable in the statement of financial position.
7.2 Departmental revenue Departmental revenue is recognised in the statement of financial performance when received and is subsequently paid into the relevant revenue fund, unless stated otherwise. Any amount owing to the relevant revenue fund at the reporting date is recognised as a payable in the statement of financial position.
7.3 Accrued departmental revenue Accruals in respect of departmental revenue (excluding tax revenue) are recorded in the notes to the financial statements when: it is probable that the economic benefits or service potential associated with the
transaction will flow to the department; and the amount of revenue can be measured reliably. The accrued revenue is measured at the fair value of the consideration receivable. Accrued tax revenue (and related interest and / penalties) is measured at amounts receivable from collecting agents. Write-offs are made according to the department’s debt write-off policy
8 Expenditure
8.1 Compensation of employees
8.1.1 Salaries and wages Salaries and wages are recognised in the statement of financial performance on the date of payment.
8.1.2 Social contributions Social contributions made by the department in respect of current employees are recognised in the statement of financial performance on the date of payment. Social contributions made by the department in respect of ex-employees are classified as transfers to households in the statement of financial performance on the date of payment.
8.2 Other expenditure Other expenditure (such as goods and services, transfers and subsidies and payments for capital assets) is recognised in the statement of financial performance on the date of payment. The expense is classified as a capital expense if the total consideration paid is more than the capitalisation threshold.

AnnuAl report 2018 -2019 263Financial Information
WESTERN CAPE GOVERNMENT HEALTH VOTE 6
NOTES TO THE ANNUAL FINANCIAL STATEMENTS for the year ended 31 March 2019
- 51 -
8.3 Accruals and payables not recognised Accruals and payables not recognised are recorded in the notes to the financial statements at cost at the reporting date.
8.4 Leases
8.4.1 Operating leases Operating lease payments made during the reporting period are recognised as current expenditure in the statement of financial performance on the date of payment. The operating lease commitments are recorded in the notes to the financial statements.
8.4.2 Finance leases Finance lease payments made during the reporting period are recognised as capital expenditure in the statement of financial performance on the date of payment. The finance lease commitments are recorded in the notes to the financial statements and are not apportioned between the capital and interest portions. Finance lease assets acquired at the end of the lease term are recorded and measured at the lower of: cost, being the fair value of the asset; or the sum of the minimum lease payments made, including any payments made to acquire
ownership at the end of the lease term, excluding interest. Finance lease liabilities are not recognised in the statement of financial position and as such finance lease payments do not reduce liabilities in the statement of financial position. Payments to the lessors are recognised as payments for capital assets in the statement of financial performance and as a result are reflected as cash for investing activities in the cash flow statement.
9 Aid Assistance
9.1 Aid assistance received Aid assistance received in cash is recognised in the statement of financial performance when received. In-kind aid assistance is recorded in the notes to the financial statements on the date of receipt and is measured at fair value. Aid assistance not spent for the intended purpose and any unutilised funds from aid assistance that are required to be refunded to the donor are recognised as a payable in the statement of financial position.
9.2 Aid assistance paid Aid assistance paid is recognised in the statement of financial performance on the date of payment. Aid assistance payments made prior to the receipt of funds are recognised as a receivable in the statement of financial position.

AnnuAl report 2018-2019 Financial Information264
WESTERN CAPE GOVERNMENT HEALTH VOTE 6
NOTES TO THE ANNUAL FINANCIAL STATEMENTS for the year ended 31 March 2019
- 52 -
10 Cash and cash equivalents Cash and cash equivalents are stated at cost in the statement of financial position. Bank overdrafts are shown separately on the face of the statement of financial position as a current liability. For the purposes of the cash flow statement, cash and cash equivalents comprise cash on hand, deposits held, other short-term highly liquid investments and bank overdrafts.
11 Prepayments and advances Prepayments and advances are recognised in the statement of financial position when the department receives or disburses the cash. Prepayments and advances are initially and subsequently measured at cost.
12 Loans and receivables Loans and receivables are recognised in the statement of financial position at cost plus accrued interest, where interest is charged, less amounts already settled or written-off. Write-offs are made according to the department’s write-off policy.
13 Investments Investments are recognised in the statement of financial position at cost.
14 Financial assets
14.1 Financial assets A financial asset is recognised initially at its cost plus transaction costs that are directly attributable to the acquisition or issue of the financial asset. At the reporting date, a department shall measure its financial assets at cost, less amounts already settled or written-off, except for recognised loans and receivables, which are measured at cost plus accrued interest, where interest is charged, less amounts already settled or written-off.
14.2 Impairment of financial assets Where there is an indication of impairment of a financial asset, an estimation of the reduction in the recorded carrying value, to reflect the best estimate of the amount of the future economic benefits expected to be received from that asset, is recorded in the notes to the financial statements.
15 Payables Payables recognised in the statement of financial position are recognised at cost.

AnnuAl report 2018 -2019 265Financial Information
WESTERN CAPE GOVERNMENT HEALTH VOTE 6
NOTES TO THE ANNUAL FINANCIAL STATEMENTS for the year ended 31 March 2019
- 53 -
16 Capital Assets
16.1 Immovable capital assets Immovable assets reflected in the asset register of the department are recorded in the notes to the financial statements at cost or fair value where the cost cannot be determined reliably. Immovable assets acquired in a non-exchange transaction are recorded at fair value at the date of acquisition. Immovable assets are subsequently carried in the asset register at cost and are not currently subject to depreciation or impairment. Subsequent expenditure of a capital nature forms part of the cost of the existing asset when ready for use. Additional information on immovable assets not reflected in the assets register is provided in the notes to financial statements.
16.2 Movable capital assets Movable capital assets are initially recorded in the notes to the financial statements at cost. Movable capital assets acquired through a non-exchange transaction is measured at fair value as at the date of acquisition. Where the cost of movable capital assets cannot be determined reliably, the movable capital assets are measured at fair value and where fair value cannot be determined; the movable assets are measured at R1. All assets acquired prior to 1 April 2002 (or a later date as approved by the OAG) may be recorded at R1. Movable capital assets are subsequently carried at cost and are not subject to depreciation or impairment. Subsequent expenditure that is of a capital nature forms part of the cost of the existing asset when ready for use.
16.3 Intangible assets Intangible assets are initially recorded in the notes to the financial statements at cost. Intangible assets acquired through a non-exchange transaction are measured at fair value as at the date of acquisition. Internally generated intangible assets are recorded in the notes to the financial statements when the department commences the development phase of the project. Where the cost of intangible assets cannot be determined reliably, the intangible capital assets are measured at fair value and where fair value cannot be determined; the intangible assets are measured at R1. All assets acquired prior to 1 April 2002 (or a later date as approved by the OAG) may be recorded at R1. Intangible assets are subsequently carried at cost and are not subject to depreciation or impairment. Subsequent expenditure of a capital nature forms part of the cost of the existing asset when ready for use.

AnnuAl report 2018-2019 Financial Information266
WESTERN CAPE GOVERNMENT HEALTH VOTE 6
NOTES TO THE ANNUAL FINANCIAL STATEMENTS for the year ended 31 March 2019
- 54 -
16.4 Project Costs: Work-in-progress Expenditure of a capital nature is initially recognised in the statement of financial performance at cost when paid. Amounts paid towards capital projects are separated from the amounts recognised and accumulated in work-in-progress until the underlying asset is ready for use. Once ready for use, the total accumulated payments are recorded in an asset register. Subsequent payments to complete the project are added to the capital asset in the asset register. Where the department is not the custodian of the completed project asset, the asset is transferred to the custodian subsequent to completion.
17 Provisions and Contingents
17.1 Provisions Provisions are recorded in the notes to the financial statements when there is a present legal or constructive obligation to forfeit economic benefits as a result of events in the past and it is probable that an outflow of resources embodying economic benefits or service potential will be required to settle the obligation and a reliable estimate of the obligation can be made. The provision is measured as the best estimate of the funds required to settle the present obligation at the reporting date.
17.2 Contingent liabilities Contingent liabilities are recorded in the notes to the financial statements when there is a possible obligation that arises from past events, and whose existence will be confirmed only by the occurrence or non-occurrence of one or more uncertain future events not within the control of the department or when there is a present obligation that is not recognised because it is not probable that an outflow of resources will be required to settle the obligation or the amount of the obligation cannot be measured reliably.
17.3 Contingent assets Contingent assets are recorded in the notes to the financial statements when a possible asset arises from past events, and whose existence will be confirmed by the occurrence or non-occurrence of one or more uncertain future events not within the control of the department.
17.4 Commitments Commitments (other than for transfers and subsidies) are recorded at cost in the notes to the financial statements when there is a contractual arrangement or an approval by management in a manner that raises a valid expectation that the department will discharge its responsibilities thereby incurring future expenditure that will result in the outflow of cash.
AnnuAl report 2018 -2019 267Financial Information
WESTERN CAPE GOVERNMENT HEALTH VOTE 6
NOTES TO THE ANNUAL FINANCIAL STATEMENTS for the year ended 31 March 2019
- 55 -
18 Unauthorised expenditure Unauthorised expenditure is recognised in the statement of financial position until such time as the expenditure is either: approved by Parliament or the Provincial Legislature with funding and the related funds
are received; or approved by Parliament or the Provincial Legislature without funding and is written off
against the appropriation in the statement of financial performance; or transferred to receivables for recovery. Unauthorised expenditure is measured at the amount of the confirmed unauthorised expenditure.
19 Fruitless and wasteful expenditure Fruitless and wasteful expenditure is recorded in the notes to the financial statements when confirmed. The amount recorded is equal to the total value of the fruitless and or wasteful expenditure incurred. Fruitless and wasteful expenditure is removed from the notes to the financial statements when it is resolved or transferred to receivables for recovery. Fruitless and wasteful expenditure receivables are measured at the amount that is expected to be recoverable and are de-recognised when settled or subsequently written-off as irrecoverable.
20 Irregular expenditure Irregular expenditure is recorded in the notes to the financial statements when confirmed. The amount recorded is equal to the value of the irregular expenditure incurred unless it is impracticable to determine, in which case reasons therefor are provided in the note. Irregular expenditure is removed from the note when it is either condoned by the relevant authority, transferred to receivables for recovery or not condoned and is not recoverable. Irregular expenditure receivables are measured at the amount that is expected to be recoverable and are de-recognised when settled or subsequently written-off as irrecoverable.
21 Changes in accounting policies, accounting estimates and errors Changes in accounting policies that are effected by management have been applied retrospectively in accordance with Modified Cash Standard (MCS) requirements, except to the extent that it is impracticable to determine the period-specific effects or the cumulative effect of the change in policy. In such instances the department shall restate the opening balances of assets, liabilities and net assets for the earliest period for which retrospective restatement is practicable. Changes in accounting estimates are applied prospectively in accordance with MCS requirements. Correction of errors is applied retrospectively in the period in which the error has occurred in accordance with MCS requirements, except to the extent that it is impracticable to determine the period-specific effects or the cumulative effect of the error. In such cases the department shall restate the opening balances of assets, liabilities and net assets for the earliest period for which retrospective restatement is practicable.

AnnuAl report 2018-2019 Financial Information268
WESTERN CAPE GOVERNMENT HEALTH VOTE 6
NOTES TO THE ANNUAL FINANCIAL STATEMENTS for the year ended 31 March 2019
- 56 -
22 Events after the reporting date Events after the reporting date that are classified as adjusting events have been accounted for in the financial statements. The events after the reporting date that are classified as non-adjusting events after the reporting date have been disclosed in the notes to the financial statements.
23 Recoverable revenue Amounts are recognised as recoverable revenue when a payment made in a previous financial year becomes recoverable from a debtor in the current financial year. Amounts are either transferred to the National/Provincial Revenue Fund when recovered or are transferred to the statement of financial performance when written-off.
24 Related party transactions A related party transaction is a transfer of resources, services or obligations between the reporting entity and a related party. Related party transactions within the Minister/MEC’s portfolio are recorded in the notes to the financial statements when the transaction is not at arm’s length. Key management personnel are those persons having the authority and responsibility for planning, directing and controlling the activities of the department. The number of individuals and their full compensation is recorded in the notes to the financial statements.
25 Inventories At the date of acquisition, inventories are recognised at cost in the statement of financial performance. Where inventories are acquired as part of a non-exchange transaction, the inventories are measured at fair value as at the date of acquisition. Inventories are subsequently measured at the lower of cost and net realisable value or where intended for distribution (or consumed in the production of goods for distribution) at no or a nominal charge, the lower of cost and current replacement value. The cost of inventories is assigned by using the weighted average cost basis.
26 Public-Private Partnerships Public Private Partnerships are accounted for based on the nature and or the substance of the partnership. The transaction is accounted for in accordance with the relevant accounting policies. A summary of the significant terms of the PPP agreement, the parties to the agreement, and the date of commencement thereof together with the description and nature of the concession fees received, the unitary fees paid, rights and obligations of the department are recorded in the notes to the financial statements.
27 Employee benefits The value of each major class of employee benefit obligation (accruals, payables not recognised and provisions) is disclosed in the Employee benefits note.
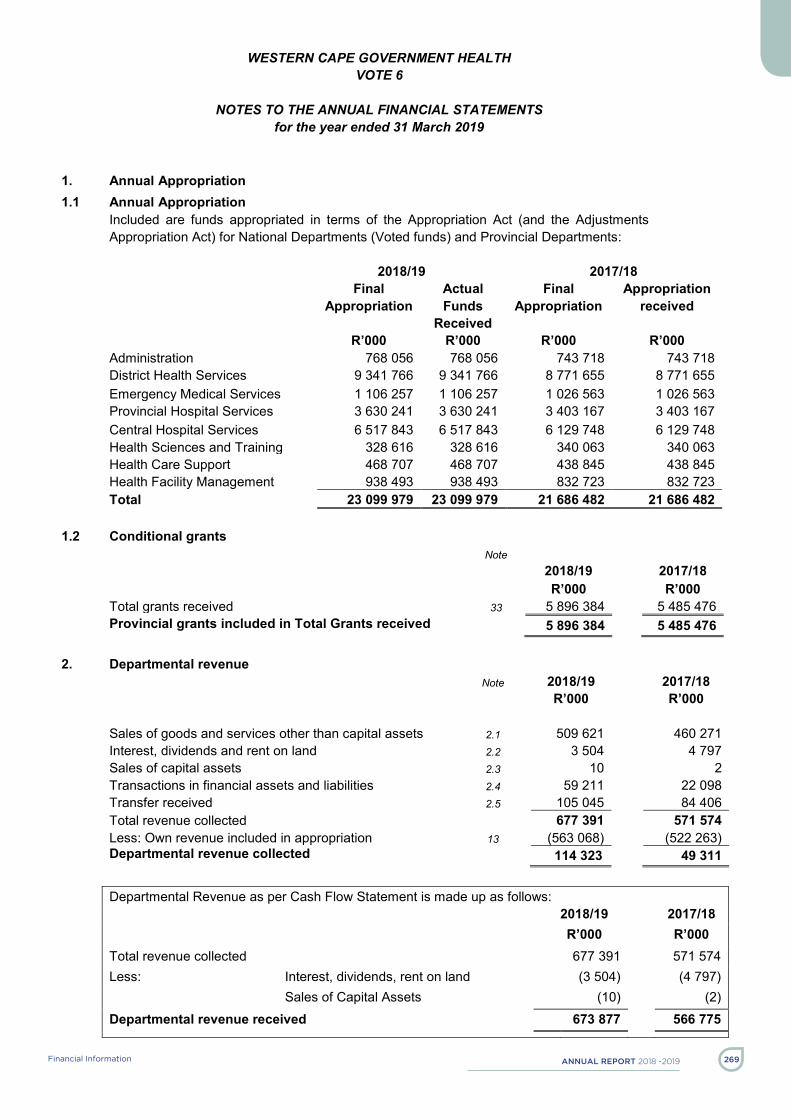
AnnuAl report 2018 -2019 269Financial Information
WESTERN CAPE GOVERNMENT HEALTH VOTE 6
NOTES TO THE ANNUAL FINANCIAL STATEMENTS
for the year ended 31 March 2019
- 57 -
1. Annual Appropriation 1.1 Annual Appropriation
Included are funds appropriated in terms of the Appropriation Act (and the Adjustments Appropriation Act) for National Departments (Voted funds) and Provincial Departments:
1.2 Conditional grants Note 2018/19 2017/18 R’000 R’000 Total grants received 33 5 896 384 5 485 476 Provincial grants included in Total Grants received 5 896 384 5 485 476
2. Departmental revenue Note 2018/19 2017/18 R’000 R’000 Sales of goods and services other than capital assets
2.1
509 621
460 271
Interest, dividends and rent on land 2.2 3 504 4 797 Sales of capital assets 2.3 10 2 Transactions in financial assets and liabilities 2.4 59 211 22 098 Transfer received 2.5 105 045 84 406 Total revenue collected 677 391 571 574 Less: Own revenue included in appropriation 13 (563 068) (522 263) Departmental revenue collected 114 323 49 311
2018/19 2017/18 Final
Appropriation Actual Funds
Received
Final Appropriation
Appropriation received
R’000 R’000 R’000 R’000 Administration 768 056 768 056 743 718 743 718 District Health Services 9 341 766 9 341 766 8 771 655 8 771 655 Emergency Medical Services 1 106 257 1 106 257 1 026 563 1 026 563 Provincial Hospital Services 3 630 241 3 630 241 3 403 167 3 403 167 Central Hospital Services 6 517 843 6 517 843 6 129 748 6 129 748 Health Sciences and Training 328 616 328 616 340 063 340 063 Health Care Support 468 707 468 707 438 845 438 845 Health Facility Management 938 493 938 493 832 723 832 723 Total 23 099 979 23 099 979 21 686 482 21 686 482
Departmental Revenue as per Cash Flow Statement is made up as follows: 2018/19 2017/18 R’000 R’000 Total revenue collected 677 391 571 574 Less: Interest, dividends, rent on land (3 504) (4 797) Sales of Capital Assets (10) (2) Departmental revenue received 673 877 566 775
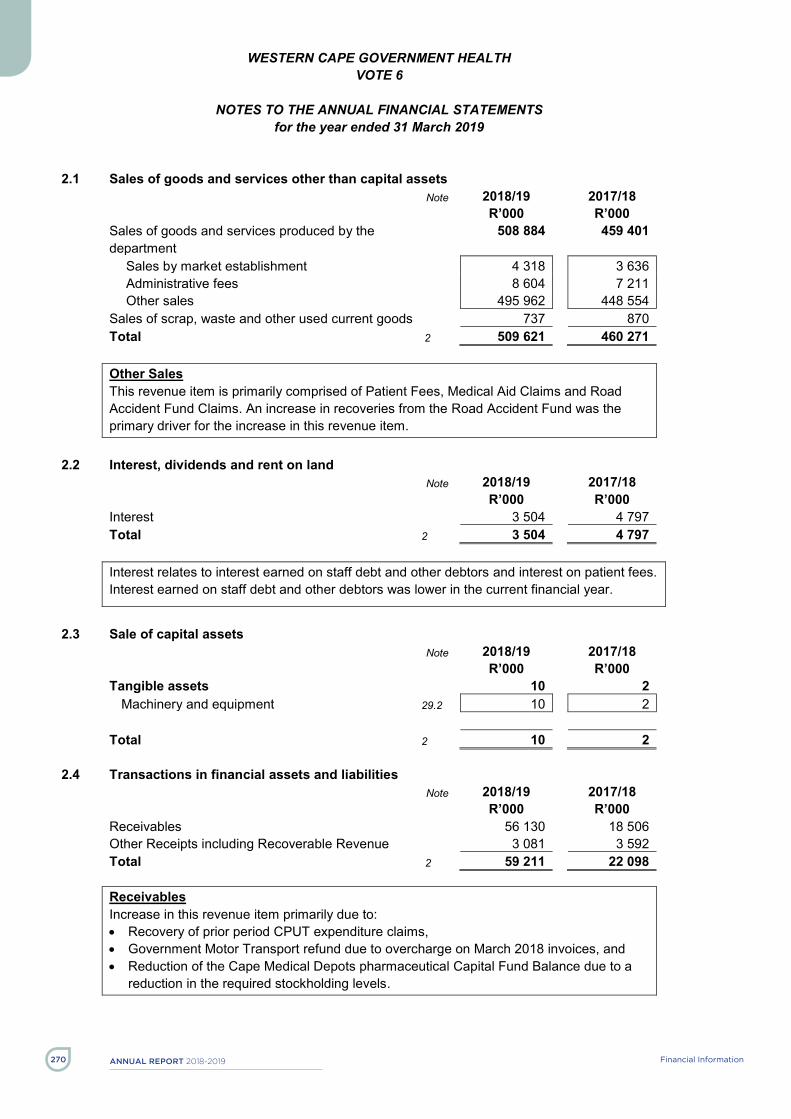
AnnuAl report 2018-2019 Financial Information270
WESTERN CAPE GOVERNMENT HEALTH VOTE 6
NOTES TO THE ANNUAL FINANCIAL STATEMENTS
for the year ended 31 March 2019
- 58 -
2.1 Sales of goods and services other than capital assets Note 2018/19 2017/18 R’000 R’000 Sales of goods and services produced by the department
508 884 459 401
Sales by market establishment 4 318 3 636 Administrative fees 8 604 7 211 Other sales 495 962 448 554
Sales of scrap, waste and other used current goods 737 870 Total 2 509 621 460 271 Other Sales This revenue item is primarily comprised of Patient Fees, Medical Aid Claims and Road Accident Fund Claims. An increase in recoveries from the Road Accident Fund was the primary driver for the increase in this revenue item.
2.2 Interest, dividends and rent on land Note 2018/19 2017/18 R’000 R’000 Interest 3 504 4 797 Total 2 3 504 4 797 Interest relates to interest earned on staff debt and other debtors and interest on patient fees. Interest earned on staff debt and other debtors was lower in the current financial year.
2.3 Sale of capital assets
Note 2018/19 2017/18 R’000 R’000 Tangible assets 10 2
Machinery and equipment 29.2 10 2
Total 2 10 2
2.4 Transactions in financial assets and liabilities Note 2018/19 2017/18 R’000 R’000 Receivables 56 130 18 506 Other Receipts including Recoverable Revenue 3 081 3 592 Total 2 59 211 22 098 Receivables Increase in this revenue item primarily due to: Recovery of prior period CPUT expenditure claims, Government Motor Transport refund due to overcharge on March 2018 invoices, and Reduction of the Cape Medical Depots pharmaceutical Capital Fund Balance due to a
reduction in the required stockholding levels.
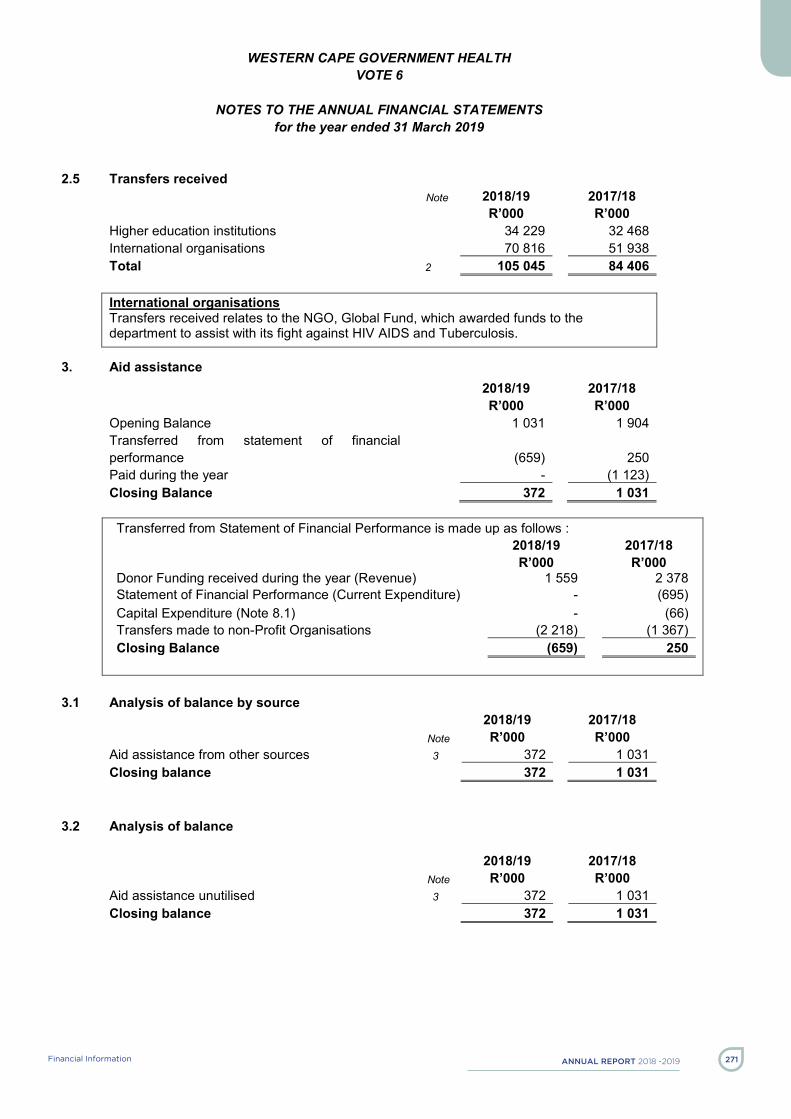
AnnuAl report 2018 -2019 271Financial Information
WESTERN CAPE GOVERNMENT HEALTH VOTE 6
NOTES TO THE ANNUAL FINANCIAL STATEMENTS
for the year ended 31 March 2019
- 59 -
2.5 Transfers received Note 2018/19 2017/18 R’000 R’000 Higher education institutions 34 229 32 468 International organisations 70 816 51 938 Total 2 105 045 84 406 International organisations Transfers received relates to the NGO, Global Fund, which awarded funds to the department to assist with its fight against HIV AIDS and Tuberculosis.
3. Aid assistance 2018/19 2017/18 R’000 R’000 Opening Balance 1 031 1 904 Transferred from statement of financial performance
(659)
250
Paid during the year - (1 123) Closing Balance 372 1 031 Transferred from Statement of Financial Performance is made up as follows : 2018/19 2017/18 R’000 R’000 Donor Funding received during the year (Revenue) 1 559 2 378 Statement of Financial Performance (Current Expenditure) - (695) Capital Expenditure (Note 8.1) - (66) Transfers made to non-Profit Organisations (2 218) (1 367) Closing Balance (659) 250
3.1 Analysis of balance by source
2018/19 2017/18 Note R’000 R’000 Aid assistance from other sources 3 372 1 031 Closing balance 372 1 031
3.2 Analysis of balance 2018/19 2017/18 Note R’000 R’000 Aid assistance unutilised 3 372 1 031 Closing balance 372 1 031

AnnuAl report 2018-2019 Financial Information272
WESTERN CAPE GOVERNMENT HEALTH VOTE 6
NOTES TO THE ANNUAL FINANCIAL STATEMENTS
for the year ended 31 March 2019
- 60 -
3.3 Aid assistance expenditure per economic classification 2018/19 2017/18 Note R’000 R’000 Current - 695 Capital - 66 Transfers and subsidies 2 218 1 367 Total aid assistance expenditure 3 2 218 2 128
4. Compensation of employees 4.1 Salaries and Wages
2018/19 2017/18 R’000 R’000 Basic salary 8 944 356 8 341 971 Performance award 33 102 30 104 Service Based 15 118 17 800 Compensative/circumstantial 1 275 372 1 247 504 Periodic payments 16 927 14 470 Other non-pensionable allowances 1 659 031 1 549 085 Total 11 943 906 11 200 934
The cost of living adjustment between 5.5% and 6% for Senior Manager Service employees and between 6% and 7% for all other employee salary levels is the primary driver behind the increase in employee costs as there was minimal growth in staff levels.
4.2 Social contributions 2018/19 2017/18 R’000 R’000 Employer contributions Pension 1 040 495 971 778 Medical 528 606 485 326 Bargaining council 2 385 2 353 Total 1 571 486 1 459 457
Total compensation of employees 13 515 392 12 660 391 Average number of employees 31 611 31 472

AnnuAl report 2018 -2019 273Financial Information
WESTERN CAPE GOVERNMENT HEALTH VOTE 6
NOTES TO THE ANNUAL FINANCIAL STATEMENTS
for the year ended 31 March 2019
- 61 -
5. Goods and services Note 2018/19 2017/18 R’000 R’000 Administrative fees 230 54 Advertising 16 744 20 754 Minor assets 5.1 42 407 46 919 Bursaries (employees) 10 287 10 345 Catering 4 983 4 364 Communication 55 015 60 039 Computer services 5.2 91 548 81 485 Consultants: Business and advisory services 92 467 85 249 Infrastructure and planning services 19 833 13 693 Laboratory services 703 818 656 136 Legal services 28 809 13 865 Contractors 537 804 536 142 Agency and support / outsourced services 488 685 471 002 Entertainment 148 134 Audit cost – external 5.3 20 769 19 028 Fleet services 181 050 178 727 Inventory 5.4 3 071 000 2 989 288 Consumables 5.5 526 799 512 392 Operating leases 20 237 21 349 Property payments 5.6 1 176 800 1 056 916 Rental and hiring 24 935 20 695 Transport provided as part of the departmental activities
1 477
1 664
Travel and subsistence 5.7 39 766 39 619 Venues and facilities 1 384 812 Training and development 36 303 29 518 Other operating expenditure 5.8 26 297 22 240 Total 7 219 595 6 892 429 Advertising Decrease in Marketing and Promotional Item Advertising was primary driver behind the reduction of this expenditure item. Communication Cost saving due to the continued rollout of Voice Over Internet Protocol (VOIP), specifically in the Regional Health facilities. Consultants: Business and advisory services Increase primarily driven by the annual Inflationary fee increase for the Public Private Partnership for the facilities management at the Western Cape Rehabilitation Centre . Laboratory services Increase primarily driven by the National Health Laboratory Service’s tariff annual escalation of 5.7%. Legal services Increase due to the settlement of prior period invoices related to external counsel costs in respect of the testing of law reform strategies related to the law on damages for medical legal claims.

AnnuAl report 2018-2019 Financial Information274
WESTERN CAPE GOVERNMENT HEALTH VOTE 6
NOTES TO THE ANNUAL FINANCIAL STATEMENTS
for the year ended 31 March 2019
- 62 -
5.1 Minor assets Note 2018/19 2017/18 R’000 R’000 Tangible assets 42 392 46 560
Machinery and equipment 42 392 46 560
Intangible assets 15 359 Software 15 359
Total 5 42 407 46 919
5.2 Computer services Note 2018/19 2017/18 R’000 R’000 SITA computer services 15 298 18 640 External computer service providers 76 250 62 845 Total 5 91 548 81 485
SITA computer services Reduction in process related costs due efficient management of core system utilisation requests (e.g. web based sharing of data reports).
External computer service providers Change in funding model for computer services provided via the Department of the Premier (DotP). Previously budget for Health was allocated directly to DotP. Services are now settled on a per claims basis from own budget and for the current period related to the maintenance and enhancement of core health information systems such as SINJANI and the Primary Health Care Information System.
5.3 Audit cost – External
Note 2018/19 2017/18 R’000 R’000 Regularity audits 20 769 19 028 Total 5 20 769 19 028
5.4 Inventory Note 2018/19 2017/18
R’000 R’000 Food and food supplies 55 881 51 981 Medical supplies 1 526 635 1 465 841 Medicine 1 471 997 1 459 321 Laboratory supplies 13 090 12 145 Water distribution supplies 3 397 - Total 5 3 071 000 2 989 288
Inventory item expenditure in line with inflation, other than that related to Water distribution supplies for the Departments water augmentation projects as a result of the water crisis.

AnnuAl report 2018 -2019 275Financial Information
WESTERN CAPE GOVERNMENT HEALTH VOTE 6
NOTES TO THE ANNUAL FINANCIAL STATEMENTS
for the year ended 31 March 2019
- 63 -
5.5 Consumables Note 2018/19 2017/18
R’000 R’000 Consumable supplies 437 925 423 633
Uniform and clothing 64 222 57 223 Household supplies 247 299 232 629 Building material and supplies 66 242 65 417 Communication accessories 271 910 IT consumables 1 763 1 223 Other consumables 58 128 66 231
Stationery, printing and office supplies 88 874 88 759 Total 5 526 799 512 392 Consumable item expenditure in line with inflation, other than the reduction in other consumables. This item comprises mainly of Medical and Domestic Gas as well as other fuel products. Due to a more stable electrical supply from Eskom during the current financial year the department realised a reduction in its demand for diesel for generators to supplement facilities power requirements during load shedding.
5.6 Property payments
Note 2018/19 2017/18 R’000 R’000 Municipal services 345 389 318 822 Property management fees 464 440 430 700 Property maintenance and repairs 366 971 307 394 Total 5 1 176 800 1 056 916 Property maintenance and repairs Increase as a result of the change in policy by National to focus a larger portion of infrastructure funds on scheduled maintenance on existing facilities, rather than new capital projects.
5.7 Travel and subsistence
Note 2018/19 2017/18 R’000 R’000 Local 39 560 38 903 Foreign 206 716 Total 5 39 766 39 619 Local - % share of total expenditure 2018/19 2017/18 Road Transport 41.4% 43.4% Accommodation 36.8% 35.3% Subsistence 14.3% 12.8% Air Transport 7.5% 8.5% 100.0% 100.0% Travel required for the performance of various officials duties outside of their normal place of work.

AnnuAl report 2018-2019 Financial Information276
WESTERN CAPE GOVERNMENT HEALTH VOTE 6
NOTES TO THE ANNUAL FINANCIAL STATEMENTS
for the year ended 31 March 2019
- 64 -
5.8 Other operating expenditure Note 2018/19 2017/18 R’000 R’000 Professional bodies, membership and subscription fees 1 360 1 156 Resettlement costs 4 149 3 471 Other 20 788 17 613 Total 5 26 297 22 240 Other Relates mainly to courier charges in respect of the distribution of pharmaceuticals by the Cape Medical Depot as well as the Chronic Dispensing unit.
6. Payments for financial assets
Note 2018/19 2017/18
R’000 R’000 Material losses through criminal conduct 1 -
Theft 6.3 1 - Other material losses written off 6.1 3 000 2 379 Debts written off 6.2 7 129 9 241 Total 10 130 11 620
6.1 Other material losses written off Note 2018/19 2017/18 R’000 R’000
Nature of losses Government Vehicle Damages & Losses 2 293 1 307 Redundant Stock (CMD & HIV AIDS) 707 1 072 Total 6 3 000 2 379
6.2 Debts written off Note 2018/19 2017/18
R’000 R’000 Salary over payments 3 139 2 002 Medical Bursaries 2 911 6 205 Supplier Debtors 445 762 Tax 343 245 Telephone account 7 - Other minor incidents 284 27 Total 6 7 129 9 241
6.3 Details of theft Note 2018/19 2017/18 R’000 R’000 Nature of theft Petty Cash Stolen
1
-
Total 6 1 -

AnnuAl report 2018 -2019 277Financial Information

AnnuAl report 2018-2019 Financial Information278
WESTERN CAPE GOVERNMENT HEALTH VOTE 6
NOTES TO THE ANNUAL FINANCIAL STATEMENTS
for the year ended 31 March 2019
- 66 -
8.2 Analysis of funds utilised to acquire capital assets – 2017/18 Voted funds Aid
assistance Total
R’000 R’000 R’000 Tangible assets 745 978 66 746 044
Buildings and other fixed structures 287 493 - 287 493 Machinery and equipment 458 485 66 458 551
Intangible assets 5 456 5 456
Software 5 456 - 5 456 Total 751 434 66 751 500
8.3 Finance lease expenditure included in Expenditure for capital assets Note 2018/19 2017/18 R’000 R’000 Tangible assets
Machinery and equipment 173 138 158 700 Total 173 138 158 700
9. Cash and cash equivalents Note 2018/19 2017/18 R’000 R’000 Consolidated Paymaster General Account 543 802 700 481 Disbursements (415 248) (460 776) Cash on hand 409 507 Total 128 963 240 212 Reduction in cash balance on hand is due to the improved utilisation of the allocated budget, namely 99.8% (2017/18: 99.1%). Refer to the Notes to the Appropriation Statement for further detail.
10. Prepayments and advances Note 2018/19 2017/18 R’000 R’000 Travel and subsistence 1 416 836 Advances paid (Not expensed) 10.1 4 590 11 492 Total 6 006 12 328
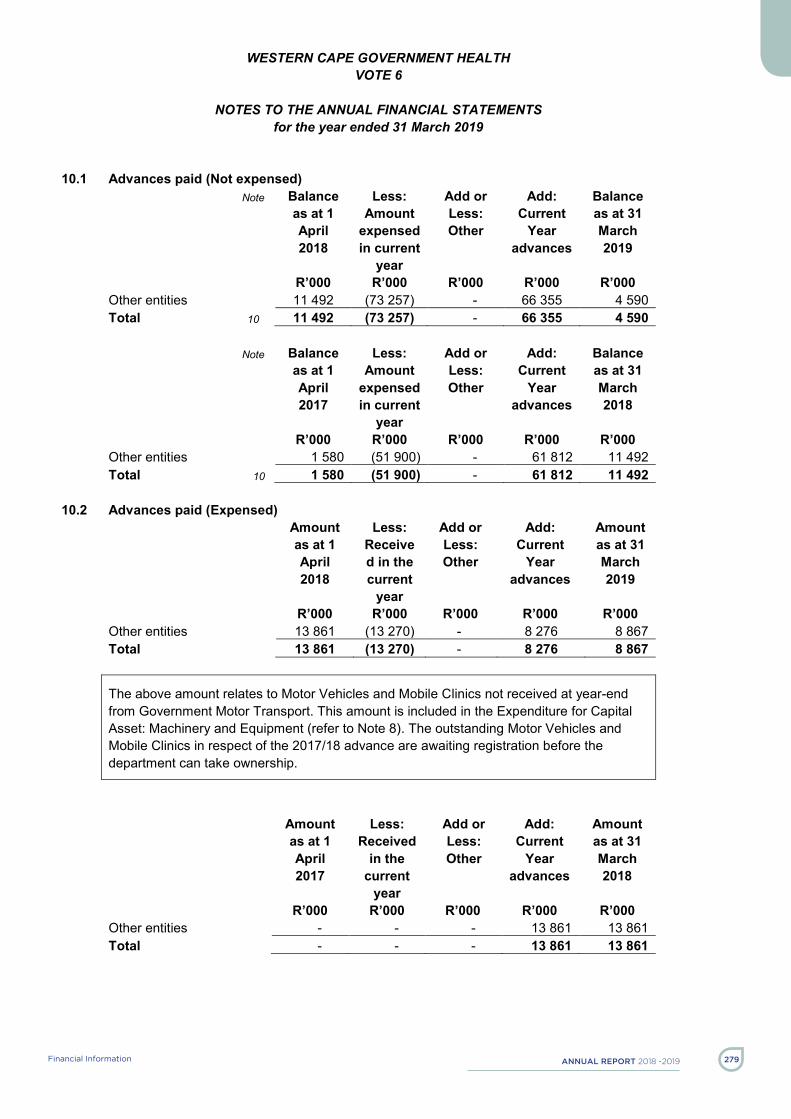
AnnuAl report 2018 -2019 279Financial Information
WESTERN CAPE GOVERNMENT HEALTH VOTE 6
NOTES TO THE ANNUAL FINANCIAL STATEMENTS
for the year ended 31 March 2019
- 67 -
10.1 Advances paid (Not expensed) Note Balance
as at 1 April 2018
Less: Amount
expensed in current
year
Add or Less: Other
Add: Current
Year advances
Balance as at 31 March 2019
R’000 R’000 R’000 R’000 R’000 Other entities 11 492 (73 257) - 66 355 4 590 Total 10 11 492 (73 257) - 66 355 4 590
Note Balance as at 1 April 2017
Less: Amount
expensed in current
year
Add or Less: Other
Add: Current
Year advances
Balance as at 31 March 2018
R’000 R’000 R’000 R’000 R’000 Other entities 1 580 (51 900) - 61 812 11 492 Total 10 1 580 (51 900) - 61 812 11 492
10.2 Advances paid (Expensed) Amount
as at 1 April 2018
Less: Received in the current
year
Add or Less: Other
Add: Current
Year advances
Amount as at 31 March 2019
R’000 R’000 R’000 R’000 R’000 Other entities 13 861 (13 270) - 8 276 8 867 Total 13 861 (13 270) - 8 276 8 867
The above amount relates to Motor Vehicles and Mobile Clinics not received at year-end from Government Motor Transport. This amount is included in the Expenditure for Capital Asset: Machinery and Equipment (refer to Note 8). The outstanding Motor Vehicles and Mobile Clinics in respect of the 2017/18 advance are awaiting registration before the department can take ownership.
Amount as at 1 April 2017
Less: Received
in the current
year
Add or Less: Other
Add: Current
Year advances
Amount as at 31 March 2018
R’000 R’000 R’000 R’000 R’000 Other entities - - - 13 861 13 861 Total - - - 13 861 13 861

AnnuAl report 2018-2019 Financial Information280
WESTERN CAPE GOVERNMENT HEALTH VOTE 6
NOTES TO THE ANNUAL FINANCIAL STATEMENTS
for the year ended 31 March 2019
- 68 -
11. Receivables 2018/19 2017/18
Current Non-current
Total Current Non-current
Total
Note
R’000 R’000 R’000 R’000 R’000 R’000
Claims recoverable 11.1 25 585 - 25 585 25 389 - 25 389 Staff debt 11.2 8 175 237 8 412 10 027 535 10 562 Other debtors 11.3 25 803 650 26 453 16 494 700 17 194 Total 59 563 887 60 450 51 910 1 235 53 145
11.1 Claims recoverable Note 2018/19 2017/18
R’000 R’000 National departments 3 098 5 214 Provincial departments 3 078 3 469 Public entities 7 270 Local governments 19 402 16 436 Total 11 & Annex 3 25 585 25 389
11.2 Staff debt Note 2018/19 2017/18 R’000 R’000
Salary Reversal Control Account 384 28 Salary Tax Debt 389 200 Salary Deduction Disallowance Account 26 5 Debt Account 7 613 10 329 Total 11 8 412 10 562
11.3 Other debtors Note 2018/19 2017/18 R’000 R’000
Disallowance Miscellaneous 1 258 608 Disallowance damage and losses 1 516 1 397 Damage vehicles 190 154 Supplier Debtors 10 734 3 895 Medical Bursaries 12 755 11 140 Total 11 26 453 17 194 Supplier Debtors Related to expenditure recoveries from suppliers and related tertiary institutions. The majority of this balance had been recovered within the 1st quarter 2019/20.

AnnuAl report 2018 -2019 281Financial Information
WESTERN CAPE GOVERNMENT HEALTH VOTE 6
NOTES TO THE ANNUAL FINANCIAL STATEMENTS
for the year ended 31 March 2019
- 69 -
11.4 Impairment of receivables 2018/19 2017/18 R’000 R’000 Estimate of impairment of receivables 4 321 7 498 Total 4 321 7 498
12. Voted funds to be surrendered to the Revenue Fund 2018/19 2017/18 R’000 R’000 Opening balance 190 426 66 361 Transfer from statement of financial performance (as restated)
56 386
190 426
Paid during the year (190 426) (66 361) Closing balance 56 386 190 426
13. Departmental revenue and NRF Receipts to be surrendered to the Revenue Fund 2018/19 2017/18 R’000 R’000 Opening balance 30 399 26 353 Transfer from Statement of Financial Performance (as restated)
114 323
49 311
Own revenue included in appropriation 563 068 522 263 Paid during the year (656 104) (567 528) Closing balance 51 686 30 399
14. Payables – current Note 2018/19 2017/18 R’000 R’000 Amounts owing to other entities Advances received 14.1 56 704 44 598 Clearing accounts 14.2 4 293 3 905 Other payables 14.3 11 147 21 085 Total 72 144 69 588
14.1 Advances received Note 2018/19 2017/18
R’000 R’000 Other institutions 56 704 44 598 Total 14 56 704 44 598 Relates to funds received from the Road Accident Fund that is still to be allocated to specific patient fee revenue accounts. Therefore this amount is not included in the Departmental Revenue as per Note 2.
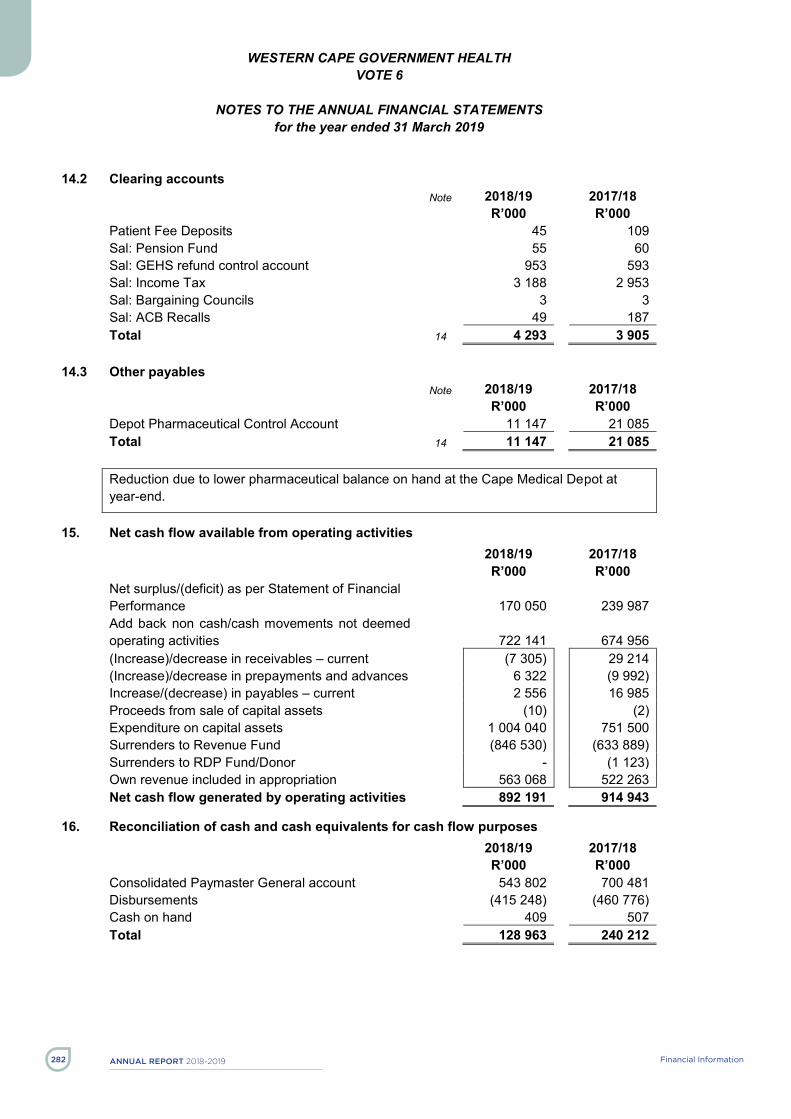
AnnuAl report 2018-2019 Financial Information282
WESTERN CAPE GOVERNMENT HEALTH VOTE 6
NOTES TO THE ANNUAL FINANCIAL STATEMENTS
for the year ended 31 March 2019
- 70 -
14.2 Clearing accounts Note 2018/19 2017/18
R’000 R’000 Patient Fee Deposits 45 109 Sal: Pension Fund 55 60 Sal: GEHS refund control account 953 593 Sal: Income Tax 3 188 2 953 Sal: Bargaining Councils 3 3 Sal: ACB Recalls 49 187 Total 14 4 293 3 905
14.3 Other payables Note 2018/19 2017/18
R’000 R’000 Depot Pharmaceutical Control Account 11 147 21 085 Total 14 11 147 21 085 Reduction due to lower pharmaceutical balance on hand at the Cape Medical Depot at year-end.
15. Net cash flow available from operating activities 2018/19 2017/18 R’000 R’000 Net surplus/(deficit) as per Statement of Financial Performance
170 050
239 987
Add back non cash/cash movements not deemed operating activities
722 141
674 956
(Increase)/decrease in receivables – current (7 305) 29 214 (Increase)/decrease in prepayments and advances 6 322 (9 992) Increase/(decrease) in payables – current 2 556 16 985 Proceeds from sale of capital assets (10) (2) Expenditure on capital assets 1 004 040 751 500 Surrenders to Revenue Fund (846 530) (633 889) Surrenders to RDP Fund/Donor - (1 123) Own revenue included in appropriation 563 068 522 263 Net cash flow generated by operating activities 892 191 914 943
16. Reconciliation of cash and cash equivalents for cash flow purposes 2018/19 2017/18 R’000 R’000 Consolidated Paymaster General account 543 802 700 481 Disbursements (415 248) (460 776) Cash on hand 409 507 Total 128 963 240 212

AnnuAl report 2018 -2019 283Financial Information
WESTERN CAPE GOVERNMENT HEALTH VOTE 6
NOTES TO THE ANNUAL FINANCIAL STATEMENTS
for the year ended 31 March 2019
- 71 -
17. Contingent liabilities and contingent assets 17.1 Contingent liabilities
Note 2018/19 2017/18 R’000 R’000 Liable to Nature Housing loan guarantees Employees Annex 2A 99 99 Claims against the department Annex 2B 125 599 122 260 Intergovernmental payables (unconfirmed balances)
542
-
Total 126 240 122 359
17.2 Contingent assets 2018/19 2017/18 R’000 R’000 Nature of contingent asset Civil 300 233 Total 300 233 Other Contingent Assets – not included in balance above At this stage the Department is not able to reliably measure the contingent asset in terms of the Government Employees Housing Scheme of the Individually Linked Savings Facility (ILSF), relating to resignations and termination of service, as well as contingent asset in terms of Policy and Procedure on Incapacity Leave and Ill-Health Retirement (PILIR) cases under investigation.
18. Commitments 2018/19 2017/18 Prior period
error 2017/18
Restated R’000 R’000 R’000 R’000 Current expenditure Approved and contracted 1 378 621 686 402 78 142 764 544 Approved but not yet contracted 4 751 8 641 - 8 641 1 383 372 695 043 78 142 773 185 Capital expenditure Approved and contracted 372 698 147 759 - 147 759 Approved but not yet contracted 245 - - - 372 943 147 759 - 147 759 Total Commitments 1 756 315 842 802 78 142 920 944 Included in the current year’s commitments are 259 (2017/18: 221) projects that are current in nature and 57 (2017/18: 27) projects that are of a capital nature, all of which are for a total contract period exceeding 12 months.
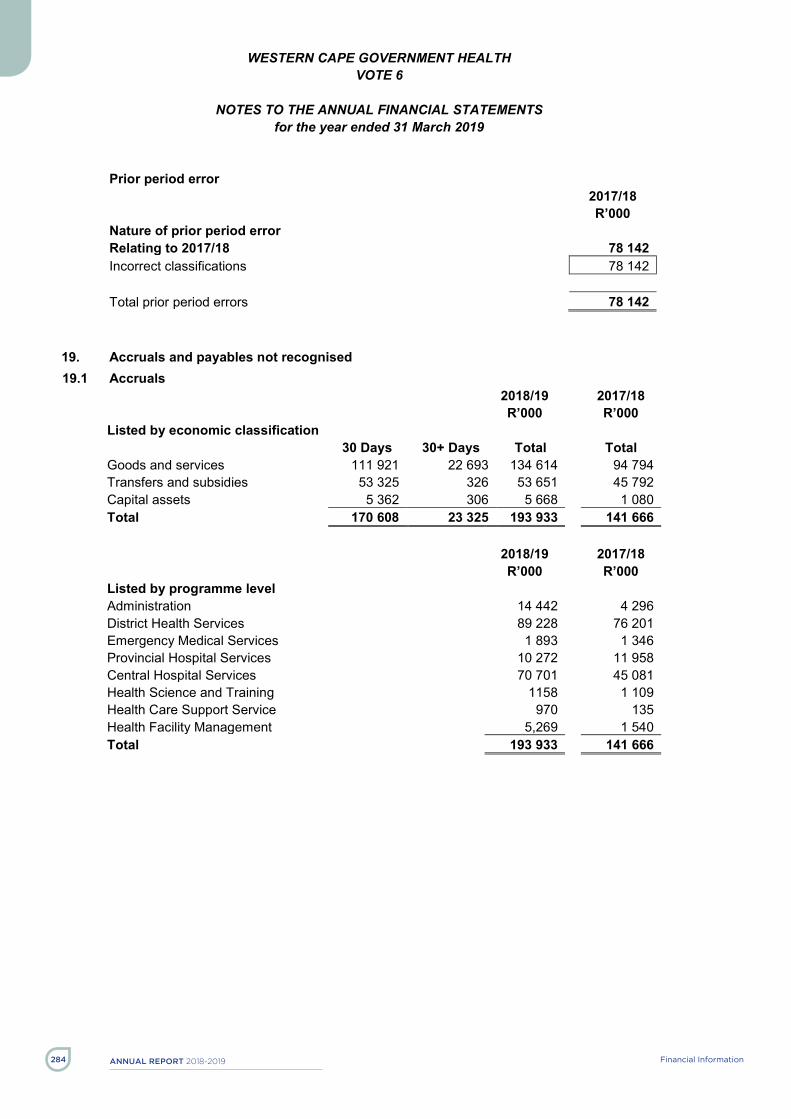
AnnuAl report 2018-2019 Financial Information284
WESTERN CAPE GOVERNMENT HEALTH VOTE 6
NOTES TO THE ANNUAL FINANCIAL STATEMENTS
for the year ended 31 March 2019
- 72 -
Prior period error 2017/18 R’000 Nature of prior period error Relating to 2017/18 78 142 Incorrect classifications 78 142 Total prior period errors 78 142
19. Accruals and payables not recognised 19.1 Accruals
2018/19 2017/18 R’000 R’000 Listed by economic classification
30 Days 30+ Days Total Total Goods and services 111 921 22 693 134 614 94 794 Transfers and subsidies 53 325 326 53 651 45 792 Capital assets 5 362 306 5 668 1 080 Total 170 608 23 325 193 933 141 666 2018/19 2017/18 R’000 R’000 Listed by programme level Administration 14 442 4 296 District Health Services 89 228 76 201 Emergency Medical Services 1 893 1 346 Provincial Hospital Services 10 272 11 958 Central Hospital Services 70 701 45 081 Health Science and Training 1158 1 109 Health Care Support Service 970 135 Health Facility Management 5,269 1 540 Total 193 933 141 666
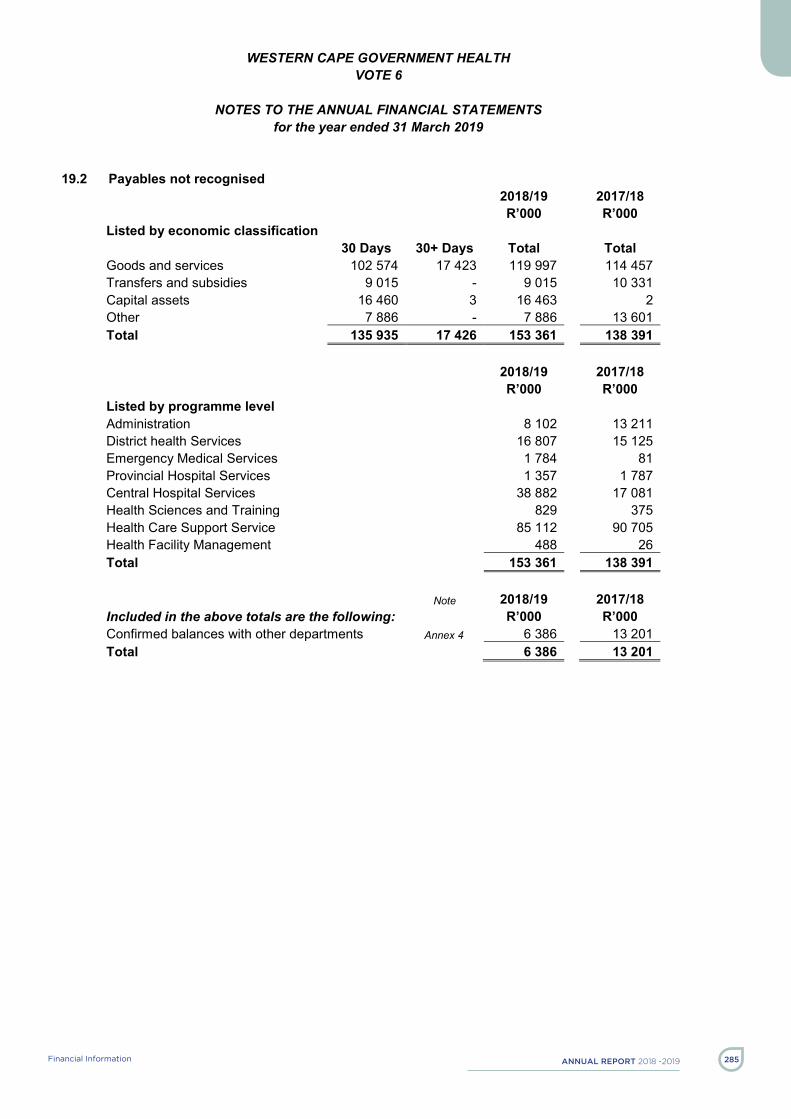
AnnuAl report 2018 -2019 285Financial Information
WESTERN CAPE GOVERNMENT HEALTH VOTE 6
NOTES TO THE ANNUAL FINANCIAL STATEMENTS
for the year ended 31 March 2019
- 73 -
19.2 Payables not recognised 2018/19 2017/18 R’000 R’000 Listed by economic classification
30 Days 30+ Days Total Total Goods and services 102 574 17 423 119 997 114 457 Transfers and subsidies 9 015 - 9 015 10 331 Capital assets 16 460 3 16 463 2 Other 7 886 - 7 886 13 601 Total 135 935 17 426 153 361 138 391 2018/19 2017/18 R’000 R’000 Listed by programme level Administration 8 102 13 211 District health Services 16 807 15 125 Emergency Medical Services 1 784 81 Provincial Hospital Services 1 357 1 787 Central Hospital Services 38 882 17 081 Health Sciences and Training 829 375 Health Care Support Service 85 112 90 705 Health Facility Management 488 26 Total 153 361 138 391 Note 2018/19 2017/18 Included in the above totals are the following: R’000 R’000 Confirmed balances with other departments Annex 4 6 386 13 201 Total 6 386 13 201

AnnuAl report 2018-2019 Financial Information286
WESTERN CAPE GOVERNMENT HEALTH VOTE 6
NOTES TO THE ANNUAL FINANCIAL STATEMENTS
for the year ended 31 March 2019
- 74 -
20. Employee benefits 2018/19 2017/18
R’000 R’000 Leave entitlement 373 718 346 734 Service bonus (Thirteenth cheque) 304 793 284 730 Performance awards 28 739 25 909 Capped leave commitments 224 247 237 220 Other 30 142 32 489 Total 961 639 927 082 Leave Entitlement
2018/19 R’000
2017/18 R’000
Leave Entitlement on PERSAL at year end 368 855 337 947 Add: Negative Leave credits included 27 360 28 588 Less: Leave captured after year end (22 497) (19 801) Recalculated 373 718 346 734 Other Primarily relates to long service awards that will vest in the 2018/19 financial year and accrued overtime. At this stage the department is not able to reliably measure the long term portion of the long service awards.
It also includes an amount of R462 000 (2018/19) and R341 000 (2017/18) in respect of a provision made for an exit gratuity owing to Minister M Mbombo. The exit gratuity was not reported in the prior financial period (see prior period error below).
Prior Period Error – Other: 2017/18
Amount before error correction
Prior period error
Restated amount
Other 32 148 341 32 489
21. Lease commitments 21.1 Operating leases
2018/19
Machinery and equipment
Total R’000 R’000 Not later than 1 year 17 640 17 640 Later than 1 year and not later than 5 years 33 029 33 029 Later than five years 3 226 3 226 Total lease commitments 53 895 53 895

AnnuAl report 2018 -2019 287Financial Information
WESTERN CAPE GOVERNMENT HEALTH VOTE 6
NOTES TO THE ANNUAL FINANCIAL STATEMENTS
for the year ended 31 March 2019
- 75 -
2017/18
Machinery
and equipment
Prior
period error
Total
R’000 R’000 R’000 Not later than 1 year 21 453 (503) 20 950 Later than 1 year and not later than 5 years 35 523 734 36 257 Later than five years 5 295 4 663 9 958 Total lease commitments 62 271 4 894 67 165
Predominantly relates to the leasing of multifunction printing office equipment at various facilities.
Prior period error 2017/18 R’000 Nature of prior period error Relating to 2017/18 4 894 Incorrect classifications 4 894 Total prior period errors 4 894
21.2 Finance leases **
2018/19
Machinery
and equipment
Total R’000 R’000 Not later than 1 year 156 066 156 066 Later than 1 year and not later than 5 years 206 785 206 785 Later than five years 2 872 2 872 Total lease commitments 365 723 365 723 2017/18
Machinery
and equipment
Total
R’000 R’000 Not later than 1 year 154 727 154 727 Later than 1 year and not later than 5 years 249 807 249 807 Later than five years 3 621 3 621 Total lease commitments 408 155 408 155 **This note excludes leases relating to public private partnership as they are separately disclosed in note no. 27.
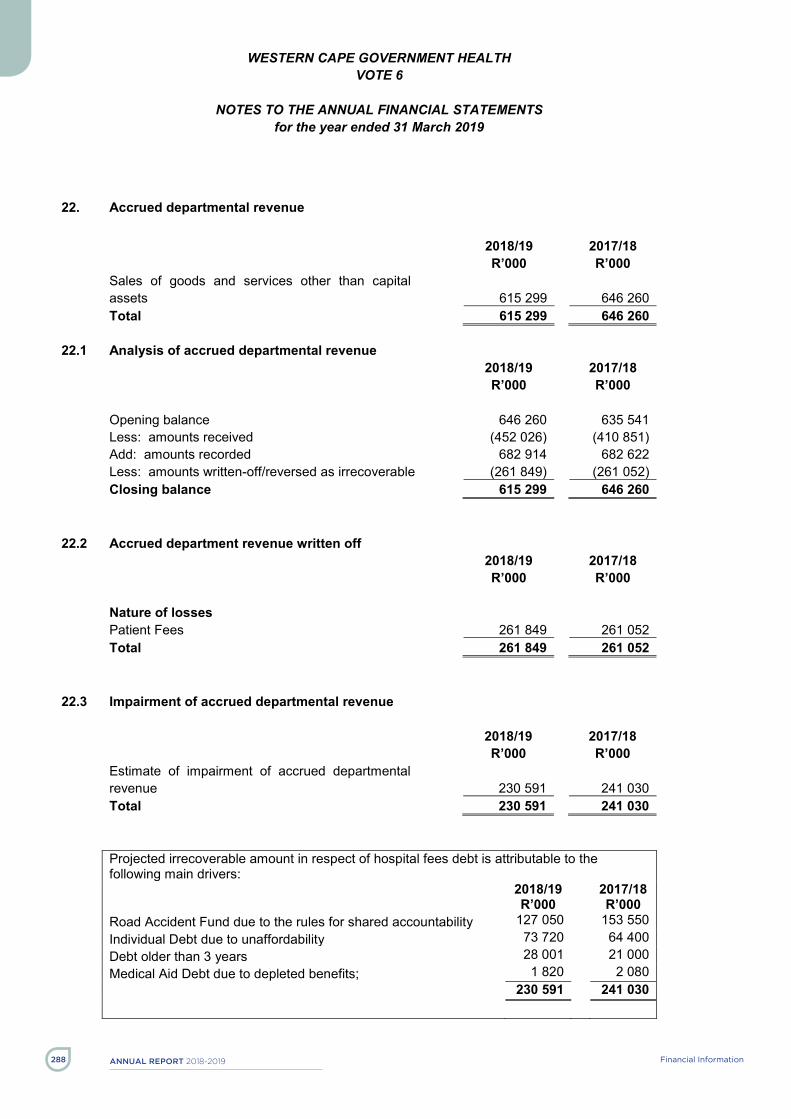
AnnuAl report 2018-2019 Financial Information288
WESTERN CAPE GOVERNMENT HEALTH VOTE 6
NOTES TO THE ANNUAL FINANCIAL STATEMENTS
for the year ended 31 March 2019
- 76 -
22. Accrued departmental revenue 2018/19 2017/18 R’000 R’000 Sales of goods and services other than capital assets
615 299
646 260
Total 615 299 646 260
22.1 Analysis of accrued departmental revenue 2018/19 2017/18 R’000 R’000 Opening balance 646 260 635 541 Less: amounts received (452 026) (410 851) Add: amounts recorded 682 914 682 622 Less: amounts written-off/reversed as irrecoverable (261 849) (261 052) Closing balance 615 299 646 260
22.2 Accrued department revenue written off 2018/19 2017/18 R’000 R’000 Nature of losses Patient Fees 261 849 261 052 Total 261 849 261 052
22.3 Impairment of accrued departmental revenue 2018/19 2017/18 R’000 R’000 Estimate of impairment of accrued departmental revenue
230 591
241 030
Total 230 591 241 030
Projected irrecoverable amount in respect of hospital fees debt is attributable to the following main drivers: 2018/19
R’000 2017/18
R’000 Road Accident Fund due to the rules for shared accountability 127 050 153 550 Individual Debt due to unaffordability 73 720 64 400 Debt older than 3 years 28 001 21 000 Medical Aid Debt due to depleted benefits; 1 820 2 080 230 591 241 030

AnnuAl report 2018 -2019 289Financial Information
WESTERN CAPE GOVERNMENT HEALTH VOTE 6
NOTES TO THE ANNUAL FINANCIAL STATEMENTS
for the year ended 31 March 2019
- 77 -
23. Irregular expenditure 23.1 Reconciliation of irregular expenditure
Note 2018/19 2017/18 R’000 R’000 Opening balance 77 922 69 218 Add: Irregular expenditure – relating to prior year 23.2 - - Add: Irregular expenditure – relating to current year 23.2 12 886 23 553 Less: Prior year amounts condoned 23.3 (38 977) (14 782) Less: Current year amounts condoned - (67) Closing balance 51 831 77 922 Analysis of awaiting condonation per age classification Current year 12 886 23 486 Prior years 38 945 54 436 Total 51 831 77 922
23.2 Details of irregular expenditure – added current year (relating to current and prior years) Incident Disciplinary steps
taken/criminal proceedings 2018/19 R’000
Additional charges not covered by contract * 12 Award made to wrong bidder * 1 348 Contract Expanded without approval * 4 Contract extended without approval * 296 Emergency delegation incorrectly applied * 80 Incorrect bidding process followed < R 500 000 * 3 097 Incorrect delegatee making award * 329 Incorrect delegatee making award * 48 Insufficient proof for not using IPS * 51 Invalid/No quotations attached * 105 Item purchased not on contract * 20 Items on contract procured via IPS without valid reasons * 69 Less than 3 quotations obtained (no reason provided). * 1 Local content not applied * 857 No declaration of interest * 172 No ditcom approval * 28 No formal bidding process followed > R 500 000 * 14 No proof to substantiate Sole Supplier * 72 No valid tax clearance certificate/ CSD Tax Status * 1 322 Pass overs not properly documented * 17 Supplier not registered on relevant database * 4 936 Used invalid contract (incl purchase outside valid contract/item not on contract).
*
8
Total 12 886
* To be confirmed by relevant Institutional Managers

AnnuAl report 2018-2019 Financial Information290
WESTERN CAPE GOVERNMENT HEALTH VOTE 6
NOTES TO THE ANNUAL FINANCIAL STATEMENTS
for the year ended 31 March 2019
- 78 -
23.3 Details of irregular expenditure condoned Incident Condoned by
(condoning authority)
2018/19 R’000
Prior Years Award made to wrong bidder ** 170 Incorrect delegatee making award ** 18 Incorrect delegations ** 364 Invoice amount greater than quoted amount ** 24 Quantity on invoice more than approved order ** 2 Used invalid contract (incl purchase outside valid contract/item not on contract). (AO)
**
361
Items purchased not on contract ** 57 Award made to wrong bidder ^ 477 Award not made ito price <R10 000 ^ 35 Bidding template not dully completed ^ 225 Contract expanded without approval. (AO) ^ 48 Contract/SLA not signed by the delegated official ^ 78 Correct bidding process not followed ^ 73 Correct procurement process omitted. ^ 209 Incorrect bidding process followed <R500 000 ^ 19 979 Incorrect delegations ^ 34 Invalid quotes ^ 302 IPS not used above R10 000 ^ 107 Less than 3 quotations obtained (no reason provided). (AO)
^ 1
Limited bid: prescripts not followed ^ 16 Local Content not applied ^ 267 No approved motivation attached to the documents. ^ 6 No bidding template attached, Tradeworld not used to procure the services
^ 101
No declaration of interest ^ 116 No formal bidding process followed for awards >500 000
^ 9 498
No procurement process followed ^ 549 No valid tax clearance certificate ^ 570 Not correct procedures followed ^ 1 Not registered on relevant database ^ 10 Prohibited/restricted supplier. (NT) ^ 84 Tradeworld not used (above R10000) ^ 5 165 Used invalid contract (incl purchase outside valid contract/item not on contract). (AO)
^ 30
Total 38 977
** Accounting Officer ^ National Treasury
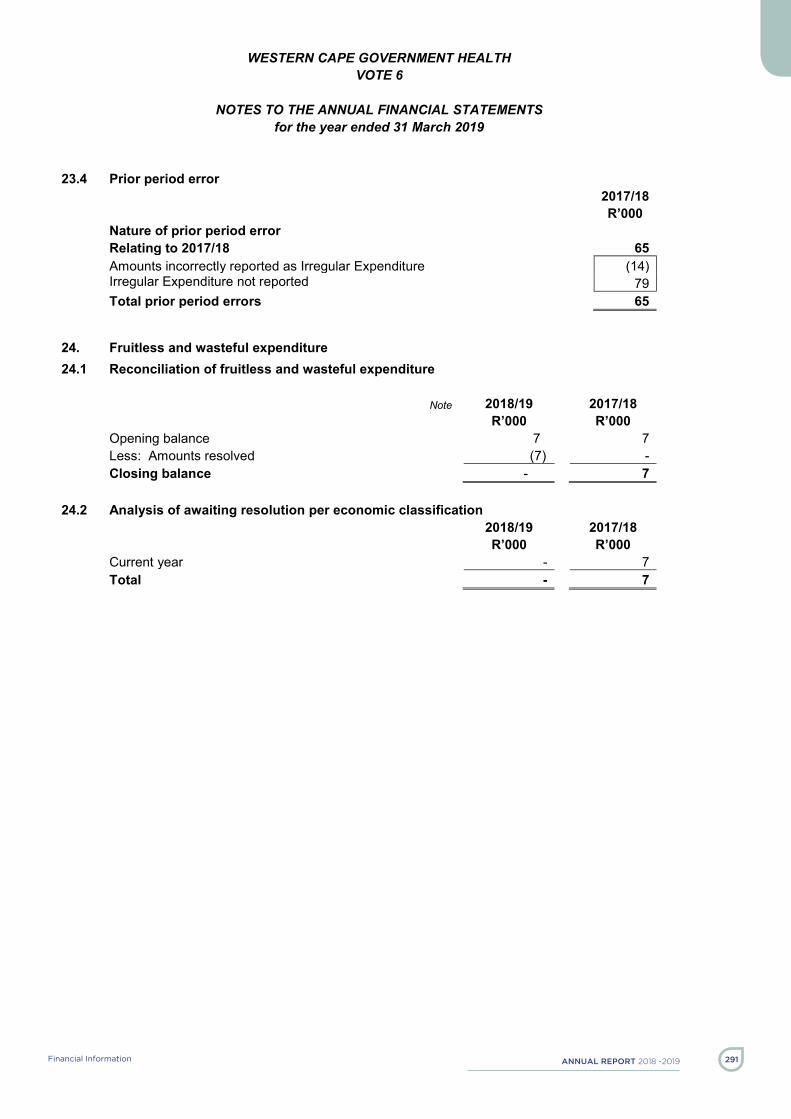
AnnuAl report 2018 -2019 291Financial Information
WESTERN CAPE GOVERNMENT HEALTH VOTE 6
NOTES TO THE ANNUAL FINANCIAL STATEMENTS
for the year ended 31 March 2019
- 79 -
23.4 Prior period error 2017/18 R’000 Nature of prior period error Relating to 2017/18 65 Amounts incorrectly reported as Irregular Expenditure (14) Irregular Expenditure not reported 79 Total prior period errors 65
24. Fruitless and wasteful expenditure 24.1 Reconciliation of fruitless and wasteful expenditure
Note 2018/19 2017/18 R’000 R’000 Opening balance 7 7 Less: Amounts resolved (7) - Closing balance - 7
24.2 Analysis of awaiting resolution per economic classification 2018/19 2017/18 R’000 R’000 Current year - 7 Total - 7

AnnuAl report 2018-2019 Financial Information292
WESTERN CAPE GOVERNMENT HEALTH VOTE 6
NOTES TO THE ANNUAL FINANCIAL STATEMENTS
for the year ended 31 March 2019
- 80 -
25. Related party transactions
The Department of Health occupies a building free of charge managed by the Department of Transport and Public Works. Parking space is also provided for government officials at an approved fee that is not market related.
The Department of Health received corporate service from the Corporate Service Centre of the Department of the Premier in the Western Cape Province with effect from 1 November 2010 in respect of the following service areas:
-Information and Communication Technology -Organisation Development -Provincial Training (transversal) -Enterprise Risk Management -Internal Audit -Provincial Forensic Services -Legal Services -Corporate Communication
The Department of Health make use of government motor vehicles managed by Government Motor Transport (GMT) based of tariffs approved by the Department of Provincial Treasury.
Department of Health received Security Advisory Services and Security Operations from the Department of Community Safety in the Western Cape.
26. Key management personnel No. of
Individuals 2018/19 2017/18
R’000 R’000 Member of the Executive Council (MEC) 1 1 978 1 978 Officials:
Management 16 20 859 20 571 Family members of key management personnel 1 469 442 Total 23 306 22 991 Key Management Personnel for (2018/19) includes all officials, whereas (2017/18) only includes level 14 and above, who have significant influence over the financial and operation policy decisions of the department.

AnnuAl report 2018 -2019 293Financial Information
WESTERN CAPE GOVERNMENT HEALTH VOTE 6
NOTES TO THE ANNUAL FINANCIAL STATEMENTS
for the year ended 31 March 2019
- 81 -
27. Public Private Partnership 2018/19 2017/18 R’000 R’000 Unitary fee paid 57 449 54 968 Fixed component 55 237 51 695 Indexed component 2 212 3 273
Analysis of indexed component 2 212 3 273 Goods and services (excluding lease payments)
2 212
3 273
Capital / (Liabilities)
8 599 7 631
Plant and equipment 8 599 7 631
The Department commissioned the construction and operation of the Western Cape Rehabilitation Centre alongside the "existing Lentegeur Psychiatric Hospital."
The Department required the services of a private partner to provide facilities management at the Western Cape Rehabilitation Centre, as well as certain facilities management services at the Lentegeur Psychiatric Hospital. A request for proposals was issued to the private sector, which included an invite to propose solutions which would satisfy the operational requirements of the facilities. Pursuant to a competitive bidding process, Mpilisweni Consortium was appointed with and the agreement signed on 8 December 2006. The full service commenced effectively on 1 March 2007, and the contract will terminate on 31 March 2020.
For the current financial year, payments to the value of R 57,4m (2017/18: 54,9m) was made for the provision of equipment, facilities management and all other associated services at the Western Cape Rehabilitation Centre (WCRC) and Lentegeur Hospital.
"Excluded from the above expenses are variable costs incurred to the value of R 8,6m (2017/18: R 8,7m)."
28. Provisions 2018/19 2017/18 R’000 R’000 Medico Legal Claims 230 700 230 750 Total 230 700 230 750
The above amount relates to claims instated against the department where merits have been conceded to the claimant. The amount represents the best estimate of the value that will possibly be settled once the matter has been resolved through the courts or a negotiated settlement.

AnnuAl report 2018-2019 Financial Information294
WESTERN CAPE GOVERNMENT HEALTH VOTE 6
NOTES TO THE ANNUAL FINANCIAL STATEMENTS
for the year ended 31 March 2019
- 82 -
28.1 Reconciliation of movement in provisions – 2018/19
Medico Legal Claims
Total provisions
R’000 R’000 Opening balance 230 750 230 750 Increase in provision 78 755 78 755 Settlement of provision (41 131) (41 131) Unused amount reversed (8 874) (8 874) Change in provision due to change in estimation of inputs
(28 800)
(28 800)
Closing balance 230 700 230 700
Reconciliation of movement in provisions – 2017/18 Medico Legal
Claims Total
provisions R’000 R’000
Opening balance 135 700 135 700 Increase in provision 172 967 172 967 Settlement of provision (52 265) (52 265) Unused amount reversed (10 102) (10 102) Change in provision due to change in estimation of inputs
(15 550)
(15 550)
Closing balance 230 750 230 750
29. Movable Tangible Capital Assets MOVEMENT IN MOVABLE TANGIBLE CAPITAL ASSETS PER ASSET REGISTER FOR THE YEAR ENDED 31 MARCH 2019 Opening
balance Additions Disposals Closing
Balance R’000 R’000 R’000 R’000 MACHINERY AND EQUIPMENT 3 581 022 541 191 (145 572) 3 976 641 Transport assets 477 967 59 831 (41 620) 496 178 Computer equipment 312 958 87 032 (23 098) 376 892 Furniture and office equipment 109 169 15 985 (2 700) 122 454 Other machinery and equipment 2 680 928 378 343 (78 154) 2 981 117 TOTAL MOVABLE TANGIBLE CAPITAL ASSETS
3 581 022
541 191
(145 572)
3 976 641

AnnuAl report 2018 -2019 295Financial Information
WESTERN CAPE GOVERNMENT HEALTH VOTE 6
NOTES TO THE ANNUAL FINANCIAL STATEMENTS
for the year ended 31 March 2019
- 83 -
Movable Tangible Capital Assets under investigation Number Value R’000 Included in the above total of the movable tangible capital assets per the asset register are assets that are under investigation:
Machinery and equipment 1 936 59 032
29.1 Additions ADDITIONS TO MOVABLE TANGIBLE CAPITAL ASSETS PER ASSET REGISTER FOR THE YEAR ENDED 31 MARCH 2019 Cash Non-cash (Capital
Work in Progress current
costs and finance lease
payments)
Received current, not paid
(Paid current year,
received prior year)
Total
R’000 R’000 R’000 R’000 R’000 MACHINERY AND EQUIPMENT 660 428 89 240 (209 630) 1 153 541 191 Transport assets 180 853 59 638 (180 660) - 59 831 Computer equipment 84 508 2 484 - 40 87 032 Furniture and office equipment 16 798 1 240 (2 163) 110 15 985 Other machinery and equipment 378 269 25 878 (26 807) 1 003 378 343 TOTAL ADDITIONS TO MOVABLE TANGIBLE CAPITAL ASSETS
660 428
89 240
(209 630)
1 153
541 191
29.2 Disposals DISPOSALS OF MOVABLE TANGIBLE CAPITAL ASSETS PER ASSET REGISTER FOR THE YEAR ENDED 31 MARCH 2019
Sold for cash
Non-cash disposal
Total disposals
R’000 R’000 R’000 MACHINERY AND EQUIPMENT 10 145 562 145 572 Transport assets - 41 620 41 620 Computer equipment - 23 098 23 098 Furniture and office equipment - 2 700 2 700 Other machinery and equipment 10 78 144 78 154 TOTAL DISPOSAL OF MOVABLE TANGIBLE CAPITAL ASSETS
10
145 562
145 572
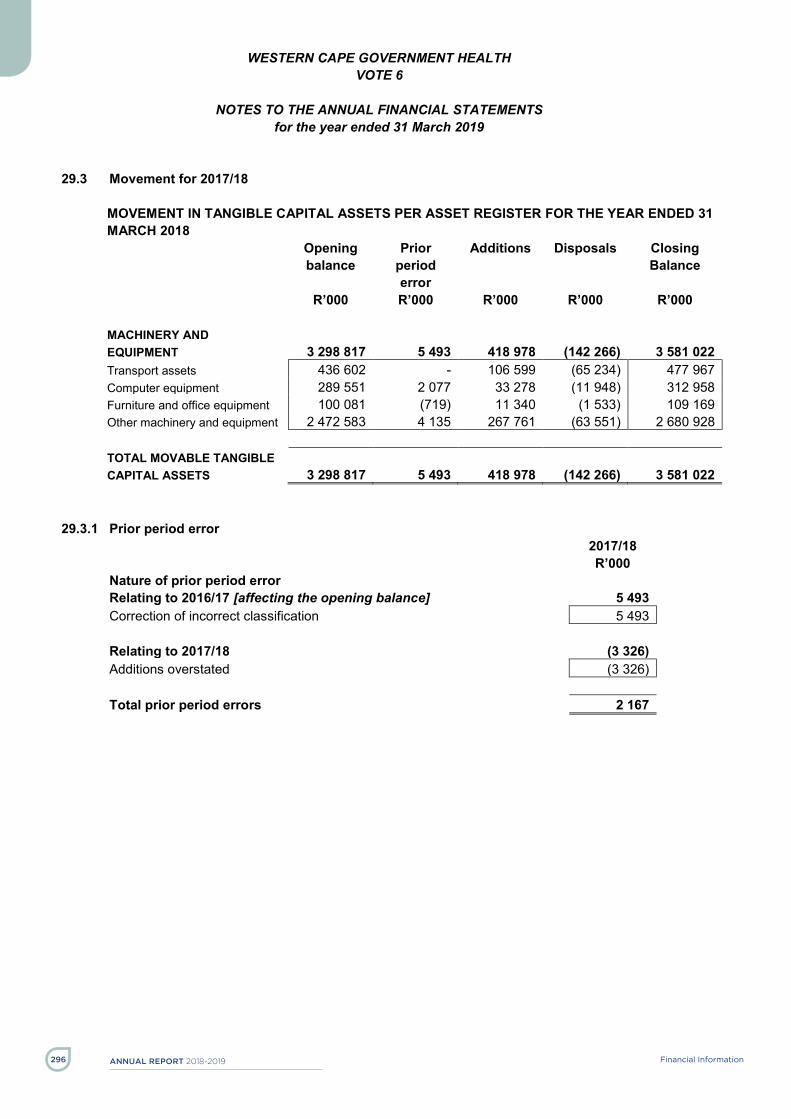
AnnuAl report 2018-2019 Financial Information296
WESTERN CAPE GOVERNMENT HEALTH VOTE 6
NOTES TO THE ANNUAL FINANCIAL STATEMENTS
for the year ended 31 March 2019
- 84 -
29.3 Movement for 2017/18 MOVEMENT IN TANGIBLE CAPITAL ASSETS PER ASSET REGISTER FOR THE YEAR ENDED 31 MARCH 2018 Opening
balance Prior
period error
Additions Disposals Closing Balance
R’000 R’000 R’000 R’000 R’000 MACHINERY AND EQUIPMENT
3 298 817
5 493
418 978
(142 266)
3 581 022
Transport assets 436 602 - 106 599 (65 234) 477 967 Computer equipment 289 551 2 077 33 278 (11 948) 312 958 Furniture and office equipment 100 081 (719) 11 340 (1 533) 109 169 Other machinery and equipment 2 472 583 4 135 267 761 (63 551) 2 680 928 TOTAL MOVABLE TANGIBLE CAPITAL ASSETS
3 298 817
5 493
418 978
(142 266)
3 581 022
29.3.1 Prior period error 2017/18 R’000 Nature of prior period error Relating to 2016/17 [affecting the opening balance] 5 493 Correction of incorrect classification 5 493 Relating to 2017/18
(3 326)
Additions overstated (3 326) Total prior period errors 2 167
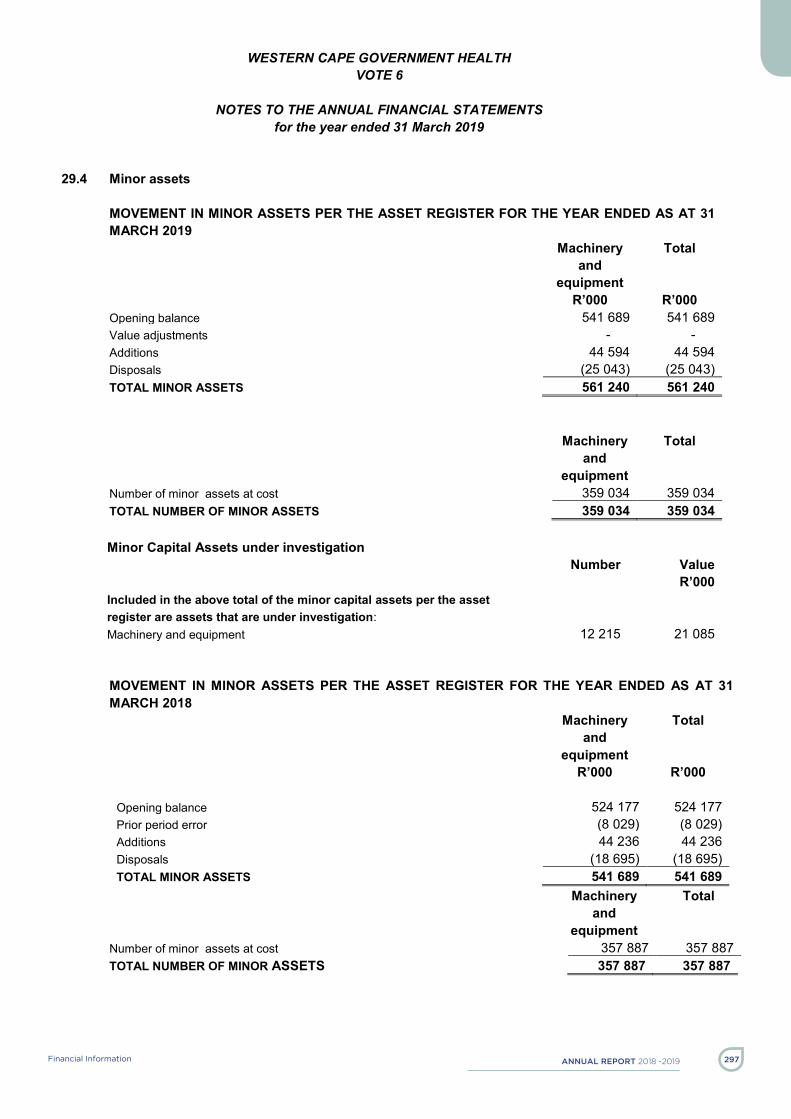
AnnuAl report 2018 -2019 297Financial Information
WESTERN CAPE GOVERNMENT HEALTH VOTE 6
NOTES TO THE ANNUAL FINANCIAL STATEMENTS
for the year ended 31 March 2019
- 85 -
29.4 Minor assets MOVEMENT IN MINOR ASSETS PER THE ASSET REGISTER FOR THE YEAR ENDED AS AT 31 MARCH 2019
Machinery and
equipment
Total
R’000 R’000 Opening balance 541 689 541 689 Value adjustments - - Additions 44 594 44 594 Disposals (25 043) (25 043) TOTAL MINOR ASSETS 561 240 561 240
Machinery and
equipment
Total
Number of minor assets at cost 359 034 359 034 TOTAL NUMBER OF MINOR ASSETS 359 034 359 034 Minor Capital Assets under investigation Number Value R’000 Included in the above total of the minor capital assets per the asset register are assets that are under investigation:
Machinery and equipment 12 215 21 085
MOVEMENT IN MINOR ASSETS PER THE ASSET REGISTER FOR THE YEAR ENDED AS AT 31 MARCH 2018
Machinery and
equipment
Total
R’000 R’000 Opening balance 524 177 524 177 Prior period error (8 029) (8 029) Additions 44 236 44 236 Disposals (18 695) (18 695) TOTAL MINOR ASSETS 541 689 541 689
Machinery and
equipment
Total
Number of minor assets at cost 357 887 357 887 TOTAL NUMBER OF MINOR ASSETS 357 887 357 887
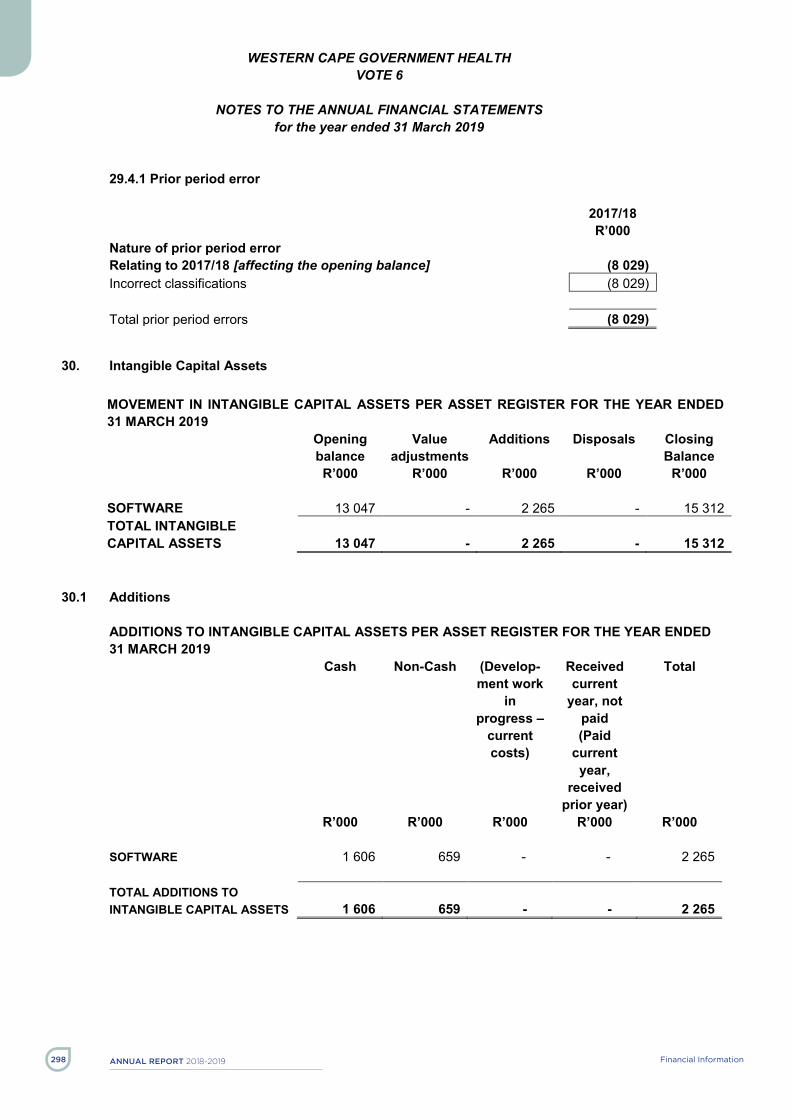
AnnuAl report 2018-2019 Financial Information298
WESTERN CAPE GOVERNMENT HEALTH VOTE 6
NOTES TO THE ANNUAL FINANCIAL STATEMENTS
for the year ended 31 March 2019
- 86 -
29.4.1 Prior period error 2017/18 R’000 Nature of prior period error Relating to 2017/18 [affecting the opening balance] (8 029) Incorrect classifications (8 029) Total prior period errors (8 029)
30. Intangible Capital Assets MOVEMENT IN INTANGIBLE CAPITAL ASSETS PER ASSET REGISTER FOR THE YEAR ENDED 31 MARCH 2019 Opening
balance Value
adjustments Additions Disposals Closing
Balance R’000 R’000 R’000 R’000 R’000 SOFTWARE 13 047 - 2 265 - 15 312 TOTAL INTANGIBLE CAPITAL ASSETS
13 047
-
2 265
-
15 312
30.1 Additions ADDITIONS TO INTANGIBLE CAPITAL ASSETS PER ASSET REGISTER FOR THE YEAR ENDED 31 MARCH 2019 Cash Non-Cash (Develop-
ment work in
progress – current costs)
Received current
year, not paid (Paid
current year,
received prior year)
Total
R’000 R’000 R’000 R’000 R’000 SOFTWARE 1 606 659 - - 2 265 TOTAL ADDITIONS TO INTANGIBLE CAPITAL ASSETS
1 606
659
-
-
2 265

AnnuAl report 2018 -2019 299Financial Information
WESTERN CAPE GOVERNMENT HEALTH VOTE 6
NOTES TO THE ANNUAL FINANCIAL STATEMENTS
for the year ended 31 March 2019
- 87 -
30.2 Movement for 2017/18 MOVEMENT IN INTANGIBLE CAPITAL ASSETS PER ASSET REGISTER FOR THE YEAR ENDED 31 MARCH 2018 Opening
balance Prior
period error
Additions Disposals Closing Balance
R’000 R’000 R’000 R’000 R’000 SOFTWARE 8 506 - 4 653 112 13 047 TOTAL INTANGIBLE CAPITAL ASSETS
8 506
-
4 653
112
13 047
31. Immovable Tangible Capital Assets MOVEMENT IN IMMOVABLE TANGIBLE CAPITAL ASSETS PER ASSET REGISTER FOR THE YEAR ENDED 31 MARCH 2019 Opening
balance Additions Disposals Closing
Balance R’000 R’000 R’000 R’000 BUILDINGS AND OTHER FIXED STRUCTURES
1 784 091
52 571
(732 543)
1 104 119
Non-residential buildings 1 769 520 52 082 (732 543) 1 089 059 Other fixed structures 14 571 489 - 15 060 TOTAL IMMOVABLE TANGIBLE CAPITAL ASSETS
1 784 091
52 571
(732 543)
1 104 119
31.1 Additions
ADDITIONS TO IMMOVABLE TANGIBLE CAPITAL ASSETS PER ASSET REGISTER FOR THE YEAR ENDED 31 MARCH 2019 Cash Non-cash (Capital
Work in Progress current
costs and finance lease
payments)
Received current, not paid
(Paid current year,
received prior year)
Total
R’000 R’000 R’000 R’000 R’000 BUILDING AND OTHER FIXED STRUCTURES
342 006
52 571
(342 006)
-
52 571
Non-residential buildings 342 006 52 082 (342 006) - 52 082 Other fixed structures - 489 - - 489 TOTAL ADDITIONS TO IMMOVABLE TANGIBLE CAPITAL ASSETS
342 006
52 571
(342 006)
-
52 571

AnnuAl report 2018-2019 Financial Information300
WESTERN CAPE GOVERNMENT HEALTH VOTE 6
NOTES TO THE ANNUAL FINANCIAL STATEMENTS
for the year ended 31 March 2019
- 88 -
31.2 Disposals DISPOSALS OF IMMOVABLE TANGIBLE CAPITAL ASSETS PER ASSET REGISTER FOR THE YEAR ENDED 31 MARCH 2019
Non-cash disposal
Total disposals
R’000 R’000 BUILDINGS AND OTHER FIXED STRUCTURES
732 543
732 543
Non-residential buildings 732 543 732 543 TOTAL DISPOSALS OF IMMOVABLE TANGIBLE CAPITAL ASSETS
732 543
732 543
31.3 Movement for 2017/18
MOVEMENT IN IMMOVABLE TANGIBLE CAPITAL ASSETS PER ASSET REGISTER FOR THE YEAR ENDED 31 MARCH 2018 Opening
balance Prior
period error
Additions Disposals Closing Balance
R’000 R’000 R’000 R’000 R’000 BUILDINGS AND OTHER FIXED STRUCTURES
1 257 390
125 402
436 472
(35 173)
1 784 091
Non-residential buildings 1 242 924 125 630 436 008 (35 042) 1 769 520 Other fixed structures 14 466 (228) 464 (131) 14 571 TOTAL IMMOVABLE TANGIBLE CAPITAL ASSETS
1 257 390
125 402
436 472
(35 173)
1 784 091
31.3.1 Prior period error
2017/18 Nature of prior period error R’000 Relating to 2016/17[affecting the opening balance] 125 402 Other fixed structures - Incorrect classifications (228) Non-residential buildings - Items not included in Immovable Assets
90 588
Non-residential buildings – Section 42 Assets removed in incorrect year
35 042
Relating to 2017/18 616 676 Disposals Non-residential buildings – Section 42 Assets removed in incorrect year
651 718
Non-residential buildings – Section 42 Assets to be disposed of in 2017/18
(35 042)
Total prior period errors 742 078

AnnuAl report 2018 -2019 301Financial Information
WESTERN CAPE GOVERNMENT HEALTH VOTE 6
NOTES TO THE ANNUAL FINANCIAL STATEMENTS
for the year ended 31 March 2019
- 89 -
31.4 Capital Work-in-progress
CAPITAL WORK-IN-PROGRESS AS AT 31 MARCH 2019
Note
Opening balance 1 April 2018
Current Year WIP
Ready for use (Assets to the AR) / Contracts terminated
Closing balance
31 March 2019
R’000 R’000 R’000 R’000 Buildings and other fixed structures 248 993 331 889 (42 612) 538 270 TOTAL 248 993 331 889 (42 612) 538 270
The following projects were terminated: Project Number Project Name
R’000 Reason for Cancellation
CI810107 Kleinvlei CDC - Upgrade and Additions
607 Facility is to be replaced in the future, therefore no value in affecting these infrastructure changes.
HCI830003 Helderberg Hospital - Parking 40 Work included within the Helderberg Hospital EC project which is currently under construction.
Total Accumulated Cost 647

AnnuAl report 2018-2019 Financial Information302

AnnuAl report 2018 -2019 303Financial Information
WESTERN CAPE GOVERNMENT HEALTH VOTE 6
NOTES TO THE ANNUAL FINANCIAL STATEMENTS
for the year ended 31 March 2019
- 91 -
CAPITAL WORK-IN-PROGRESS AS AT 31 MARCH 2018
Opening balance 1 April 2017
Prior period error
Current Year WIP
Ready for use
(Assets to the AR) ) / Contracts terminated
Closing balance
31 March 2018
R’000 R’000 R’000 R’000 R’000 Buildings and other fixed structures
403 442
(4 762)
273 934
(423 621)
248 993
TOTAL 403 442 (4 762) 273 934 (423 621) 248 993
31.4.1 Prior period error 2017/18 R’000 Nature of prior period error Relating to 2016/17[affecting the opening balance] (4 762) Incorrect Classification (4 762)
Total prior period errors (4 762)
Age analysis on ongoing projects
Number of projects 2017/18
Planned, Construction not
started
Planned, Construction
started Total R’000
0 to 1 Year 15 1 22 647 1 to 3 Years 11 2 113 090 3 to 5 Years 8 - 45 819 Longer than 5 Years - 2 67 437 Total 34 5 248 993 Projects running longer than 5 years can mainly be attributed to delays from contractors i.e. Contractors not responsive and delaying the process, poor workmanship and certain parts of the projects that needs to be redone, and contracts cancelled due to poor performance and new contractors that had to be appointed to complete projects.

AnnuAl report 2018-2019 Financial Information304
WESTERN CAPE GOVERNMENT HEALTH VOTE 6
NOTES TO THE ANNUAL FINANCIAL STATEMENTS
for the year ended 31 March 2019
- 92 -
31.5 S42 Immovable assets Assets to be transferred in terms of S42 of the PFMA – 2018/19
Number of assets
Value of assets
R’000 BUILDINGS AND OTHER FIXED STRUCTURES
5
76 030
Non-residential buildings 5 76 030 TOTAL 5 76 030 Assets to be transferred in terms of S42 of the PFMA – 2017/18
Number of assets
Value of assets
R’000 BUILDINGS AND OTHER FIXED STRUCTURES 15 702 874 Non-residential buildings 15 702 874 TOTAL 15 702 874
32. Prior period errors
32.1 Correction of prior period errors Note Amount
before error correction
Prior period error
Restated Amount
2017/18 2017/18 2017/18 R’000 R’000 R’000 Assets: Movable tangible capital assets 29.3.1 3 578 855 2 167 3 581 022 Minor tangible assets 29.4.1 549 718 (8 029) 541 689 Immovable tangible assets 31.3.1 1 042 013 742 078 1 784 091 Capital Work in Progress 31.4 253 755 (4 762) 248 993 Net effect 5 424 341 731 454 6 155 795 Note Amount
before error correction
Prior period error
Restated Amount
2017/18 2017/18 2017/18 R’000 R’000 R’000 Liabilities: Employee Benefits - Other 20 32 148 341 32 489 Net effect 32 148 341 32 489
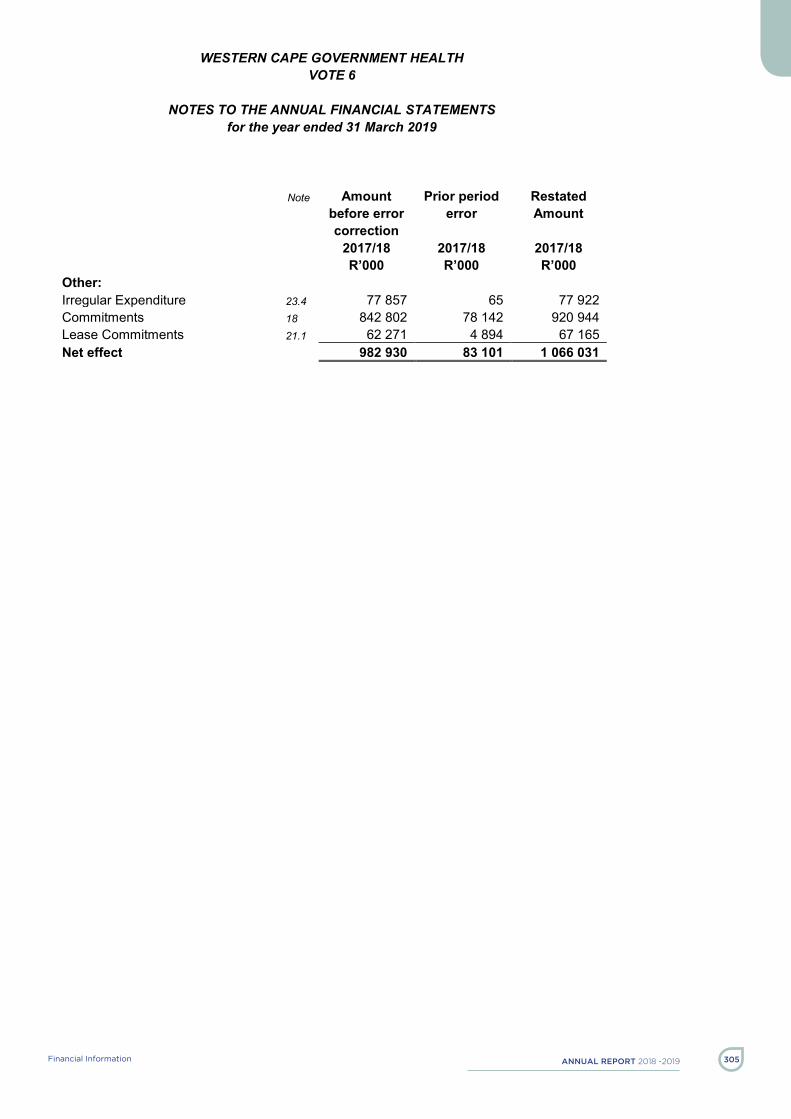
AnnuAl report 2018 -2019 305Financial Information
WESTERN CAPE GOVERNMENT HEALTH VOTE 6
NOTES TO THE ANNUAL FINANCIAL STATEMENTS
for the year ended 31 March 2019
- 93 -
Note Amount
before error correction
Prior period error
Restated Amount
2017/18 2017/18 2017/18 R’000 R’000 R’000 Other: Irregular Expenditure 23.4 77 857 65 77 922 Commitments 18 842 802 78 142 920 944 Lease Commitments 21.1 62 271 4 894 67 165 Net effect 982 930 83 101 1 066 031

AnnuAl report 2018-2019 Financial Information306
WES
TER
N C
APE
GO
VER
NM
ENT
HEA
LTH
VO
TE 6
NO
TES
TO T
HE
AN
NU
AL
FIN
AN
CIA
L ST
ATE
MEN
TS
for t
he y
ear e
nded
31
Mar
ch 2
019
- 9
4 -
33.
STAT
EMEN
T O
F C
ON
DIT
ION
AL G
RAN
TS R
ECEI
VED
N
AME
OF
GR
ANT
Div
isio
n of
R
even
ue
Act/P
rovi
ncia
l G
rant
s
Rol
l Ove
rsD
OR
A Ad
just
men
tsO
ther
Ad
just
men
tsTo
tal
Avai
labl
eAm
ount
re
ceiv
ed b
y de
part
men
t
Amou
nt s
pent
by
dep
artm
ent
Und
er /
(ove
rspe
ndin
g)%
of a
vaila
ble
fu
nds
spen
t by
dep
t
Div
isio
n of
R
even
ue A
ctAm
ount
spe
nt
by d
epar
tmen
t
R'0
00R
'000
R'0
00R
'000
R'0
00R
'000
R'0
00R
'000
%R
'000
R'0
00 N
atio
nal T
ertia
ry S
ervi
ces
Gra
nt
3 04
9 28
4
-
3
049
284
3
049
284
3
049
130
15
4
100%
2 87
6 41
0
2 87
6 41
0
Hea
lth P
rofe
ssio
ns T
rain
ing
and
Dev
elop
men
t Gra
nt
574
177
-
57
4 17
7
57
4 17
7
57
4 17
7
-
10
0%54
2 70
0
54
2 70
0
C
ompr
ehen
sive
HIV
, AID
S an
d TB
Gra
nt
1 53
1 53
5
-
1
531
535
1
531
535
1
531
535
-
10
0%1
454
773
1
454
773
H
ealth
Fac
ility
Rev
italis
atio
n G
rant
67
8 82
9
38
397
717
226
717
226
717
226
-
100%
605
786
567
389
Exp
ande
d Pu
blic
Wor
ks P
rogr
amm
e In
tegr
ated
Gra
nt fo
r Pro
vinc
es
2 11
6
-
2 11
6
2 11
6
2 11
6
-
100%
2 47
3
2 47
3
Soc
ial S
ecto
r Exp
ande
d Pu
blic
Wor
ks
Pro
gram
me
Ince
ntiv
e G
rant
for
Pro
vinc
es
2 44
7
-
2 44
7
2 44
7
2 44
7
-
100%
3 33
4
3 33
4
Hum
an P
apillo
mav
irus
Vacc
ine
Gra
nt
19 5
99
-
19
599
19 5
99
19
599
-
100%
5 85
7 98
7
38 3
97
-
-
5
896
384
5
896
384
5
896
230
15
4
5 48
5 47
6
5 44
7 07
9
GR
ANT
ALLO
CAT
ION
SPEN
T20
17/1
8
.

AnnuAl report 2018 -2019 307Financial Information
WES
TER
N C
APE
GO
VER
NM
ENT
HEA
LTH
VO
TE 6
NO
TES
TO T
HE
AN
NU
AL
FIN
AN
CIA
L ST
ATE
MEN
TS
for t
he y
ear e
nded
31
Mar
ch 2
019
- 9
5 -
34.
STAT
EMEN
T O
F C
ON
DIT
ION
AL G
RAN
TS A
ND
OTH
ER T
RAN
SFER
S PA
ID T
O M
UN
ICIP
ALIT
IES
NAM
E O
F M
UN
ICIP
ALIT
Y
DoR
A an
d ot
her
tran
sfer
s
Rol
l Ove
rsAd
just
men
tsTo
tal
Avai
labl
eAc
tual
Tr
ansf
erFu
nds
With
held
Re-
allo
catio
ns
by N
atio
nal
Trea
sury
or
Nat
iona
l D
epar
tmen
t
R'0
00R
'000
R'0
00R
'000
R'0
00R
'000
R'0
00 C
ity o
f Cap
e To
wn
549
937
549
937
549
646
PD
: Veh
icle
Lic
ence
s 16
16
15
54
9 95
3
-
-
54
9 95
3
54
9 66
1
-
-
GR
ANT
ALLO
CAT
ION
TRAN
SFER
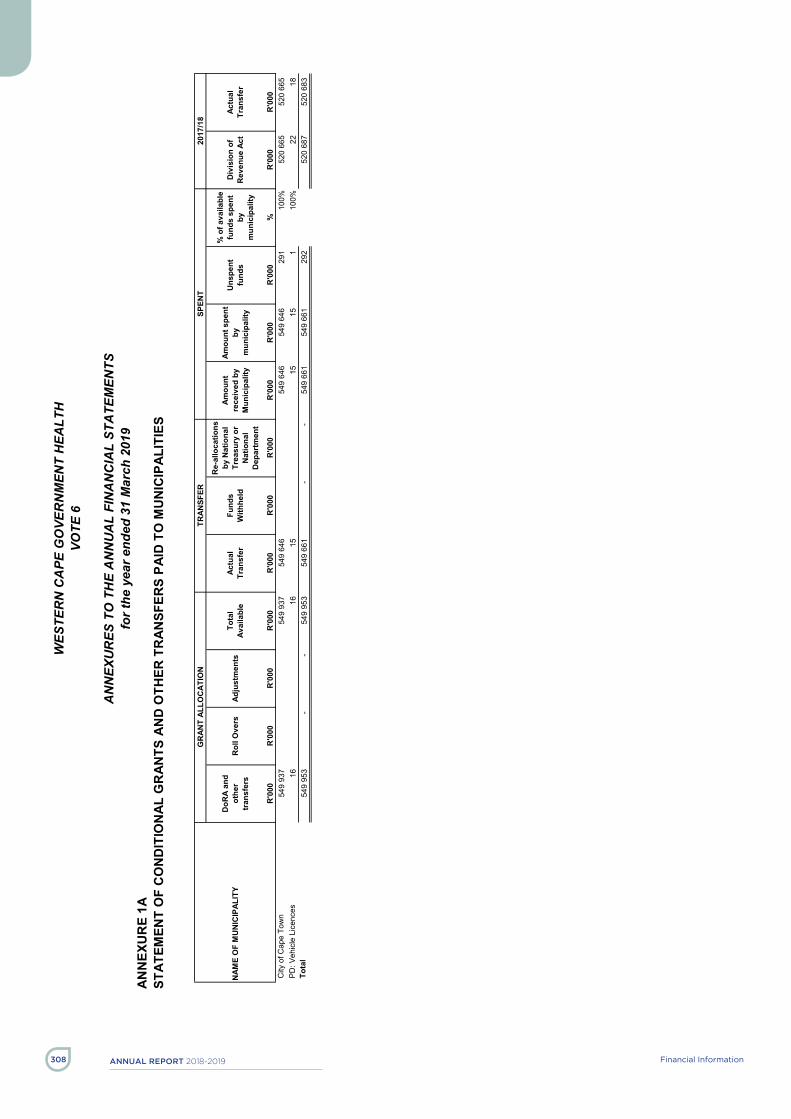
AnnuAl report 2018-2019 Financial Information308
WES
TER
N C
APE
GO
VER
NM
ENT
HEA
LTH
VO
TE 6
AN
NEX
UR
ES T
O T
HE
AN
NU
AL
FIN
AN
CIA
L ST
ATE
MEN
TS
for t
he y
ear e
nded
31
Mar
ch 2
019
- 96
- AN
NEX
UR
E 1A
ST
ATEM
ENT
OF
CO
ND
ITIO
NAL
GR
ANTS
AN
D O
THER
TR
ANSF
ERS
PAID
TO
MU
NIC
IPAL
ITIE
S
NAM
E O
F M
UN
ICIP
ALIT
YD
oRA
and
othe
r tr
ansf
ers
Rol
l Ove
rsAd
just
men
tsTo
tal
Avai
labl
eAc
tual
Tr
ansf
erFu
nds
With
held
Re-
allo
catio
ns
by N
atio
nal
Trea
sury
or
Nat
iona
l D
epar
tmen
t
Amou
nt
rece
ived
by
Mun
icip
ality
Amou
nt s
pent
by
m
unic
ipal
ity
Uns
pent
fu
nds
% o
f ava
ilabl
e
fund
s sp
ent
by
mun
icip
ality
Div
isio
n of
R
even
ue A
ctAc
tual
Tr
ansf
er
R'0
00R
'000
R'0
00R
'000
R'0
00R
'000
R'0
00R
'000
R'0
00R
'000
%R
'000
R'0
00 C
ity o
f Cap
e To
wn
549
937
549
937
549
646
549
646
549
646
291
100%
520
665
520
665
PD
: Veh
icle
Lic
ence
s 16
16
15
15
15
1
10
0%22
18
T
otal
54
9 95
3
-
-
54
9 95
3
54
9 66
1
-
-
54
9 66
1
54
9 66
1
29
2
52
0 68
7
52
0 68
3
GR
ANT
ALLO
CAT
ION
TRAN
SFER
SPEN
T20
17/1
8
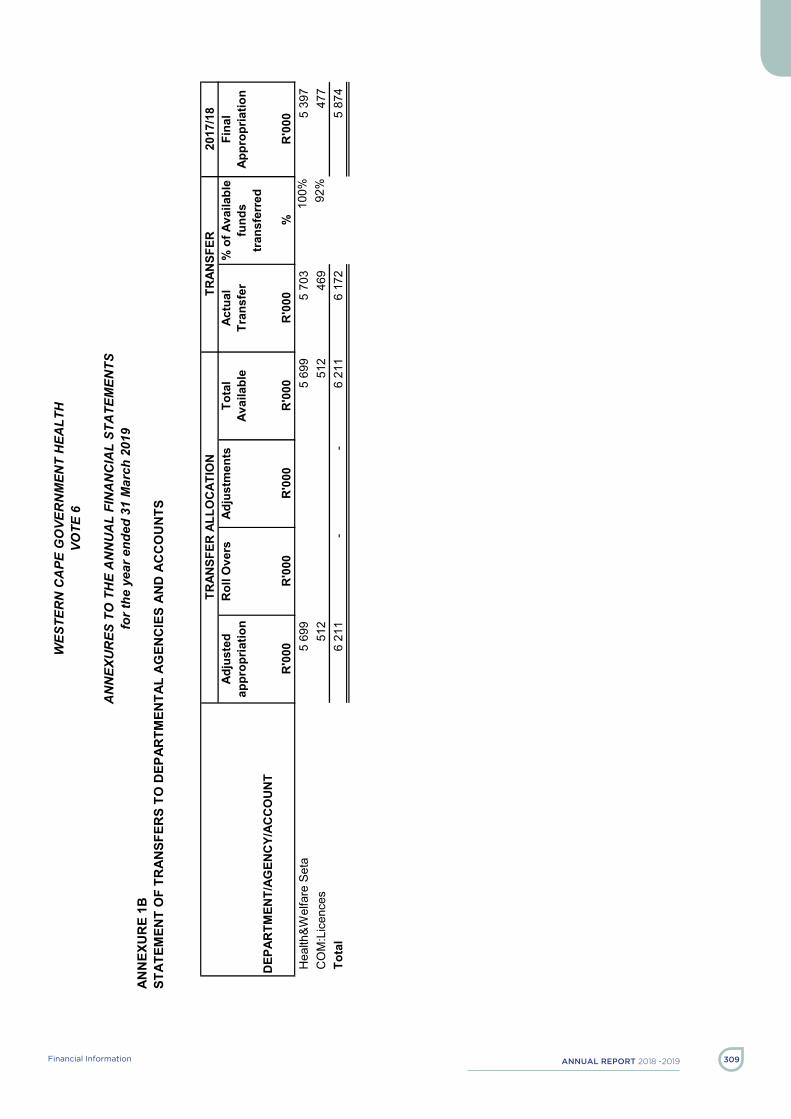
AnnuAl report 2018 -2019 309Financial Information
WES
TER
N C
APE
GO
VER
NM
ENT
HEA
LTH
VO
TE 6
AN
NEX
UR
ES T
O T
HE
AN
NU
AL
FIN
AN
CIA
L ST
ATE
MEN
TS
for t
he y
ear e
nded
31
Mar
ch 2
019
- 97
- AN
NEX
UR
E 1B
ST
ATEM
ENT
OF
TRAN
SFER
S TO
DEP
ARTM
ENTA
L AG
ENC
IES
AND
AC
CO
UN
TS
2017
/18
DEP
ARTM
ENT/
AGEN
CY/
ACC
OU
NT
Adju
sted
ap
prop
riatio
nR
oll O
vers
Adju
stm
ents
Tota
l Av
aila
ble
Actu
al
Tran
sfer
% o
f Ava
ilabl
e fu
nds
tran
sfer
red
Fina
l Ap
prop
riatio
n
R'0
00R
'000
R'0
00R
'000
R'0
00%
R'0
00H
ealth
&Wel
fare
Set
a5
699
5
699
5
703
10
0%5
397
CO
M:L
icen
ces
512
512
469
92%
477
To
tal
6 21
1
-
-
6 21
1
6 17
2
5 87
4
TRAN
SFER
ALL
OC
ATIO
NTR
ANSF
ER

AnnuAl report 2018-2019 Financial Information310
WES
TER
N C
APE
GO
VER
NM
ENT
HEA
LTH
VO
TE 6
AN
NEX
UR
ES T
O T
HE
AN
NU
AL
FIN
AN
CIA
L ST
ATE
MEN
TS
for t
he y
ear e
nded
31
Mar
ch 2
019
- 98
- AN
NEX
UR
E 1C
ST
ATEM
ENT
OF
TRAN
SFER
S TO
HIG
HER
ED
UC
ATIO
N IN
STIT
UTIO
NS
2017
/18
INST
ITU
TIO
N N
AME
Adju
sted
ap
prop
riatio
nR
oll O
vers
Adju
stm
ents
Tota
l Av
aila
ble
Actu
al
Tran
sfer
Amou
nt n
ot
tran
sfer
red
% o
f Ava
ilabl
e fu
nds
tran
sfer
red
Fina
l Ap
prop
riatio
n
R'0
00R
'000
R'0
00R
'000
R'0
00R
'000
%R
'000
Uni
vers
ity o
f Cap
e To
wn
10 2
09
10
209
10 2
09
-
0%10
000
To
tal
10 2
09
-
-
10
209
10 2
09
-
10 0
00
TRAN
SFER
ALL
OC
ATIO
NTR
ANSF
ER

AnnuAl report 2018 -2019 311Financial Information
WES
TER
N C
APE
GO
VER
NM
ENT
HEA
LTH
VO
TE 6
AN
NEX
UR
ES T
O T
HE
AN
NU
AL
FIN
AN
CIA
L ST
ATE
MEN
TS
for t
he y
ear e
nded
31
Mar
ch 2
019
- 99
- A
NN
EXU
RE
1D
STAT
EMEN
T O
F TR
ANSF
ERS
TO N
ON
-PR
OFI
T IN
STIT
UTIO
NS
2017/1
8
NO
N-P
RO
FIT
IN
ST
ITU
TIO
NS
Ad
jus
ted
a
pp
rop
ria
tio
n
Ac
t
Ro
ll O
ve
rsA
dju
stm
en
tsT
ota
l A
va
ila
ble
Ac
tua
l T
ran
sfe
r%
of
Av
aila
ble
fu
nd
s
tra
ns
ferr
ed
Fin
al
Ap
pro
pri
ati
on
R'0
00
R'0
00
R'0
00
R'0
00
R'0
00
%R
'000
Tra
ns
fers
He
alth
Pro
gram
me
s-
-
-
4
67
8
C
om
mu
nit
y B
ase
d P
rogr
amm
es
-
-
-
2 0
00
Dis
tric
t M
anag
em
en
t6
18
0
6
18
0
5
80
4
94%
2 0
01
CO
PC
We
llne
ss7
50
0
7
50
0
7
50
0
100%
5 7
30
Hu
man
Pap
illo
mav
iru
s V
acci
ne
57
5
7
-
0%
-
Co
mm
un
ity
He
alth
Clin
ics
16
9
16
9
16
9
100%
15
7
Tub
erc
ulo
sis
2 0
00
2 0
00
1 5
93
80%
1 8
60
Aq
uar
ies
He
alth
care
46
50
0
46
50
0
42
66
3
92%
-
Bo
oth
Me
mo
rial
26
30
6
26
30
6
26
30
6
100%
24
47
1
Gar
de
n R
ou
te D
istr
ict
Off
ice
(
Ch
ron
ic C
are
) 1
56
4
1
56
4
1
59
5
102%
1 4
55
Sara
h F
ox
5 2
35
5 2
35
5 1
47
98%
10
94
5
St J
ose
ph
6 5
31
6 5
31
6 5
31
100%
-
TB A
dh
ere
nce
Su
pp
ort
3 7
56
3 7
56
3 4
20
91%
3 5
67
Ho
me
Bas
e C
are
25
50
4
25
50
4
26
55
6
104%
20
13
2
Me
nta
l He
alth
50
05
2
50
05
2
51
93
9
104%
46
69
6
HIV
an
d A
IDS
23
3 2
52
23
3 2
52
22
9 5
17
98%
19
5 3
36
N
utr
itio
n3
32
8
3
32
8
3
76
0
113%
3 0
95
Klip
fon
tein
/Mit
che
lls P
lain
su
b-
str
uct
ure
1
65
0
1
65
0
1
25
0
76%
1 5
58
Glo
bal
Fu
nd
7
7 3
65
7
7 3
65
7
1 2
74
92%
50
23
9
Ale
xan
dra
Ho
spit
al3
25
3
3
25
3
3
23
2
99%
3 0
26
Mai
tlan
d C
ott
age
12
46
7
12
46
7
12
46
7
100%
11
59
7
EPW
P6
0 0
14
6
0 0
14
6
0 0
14
100%
66
48
5
Ch
ildre
n's
Ho
spit
al T
rust
-
-
-
11
50
0
To
tal
57
2 6
83
-
-
57
2 6
83
56
0 7
37
46
6 5
28
TR
AN
SF
ER
AL
LO
CA
TIO
NE
XP
EN
DIT
UR
E
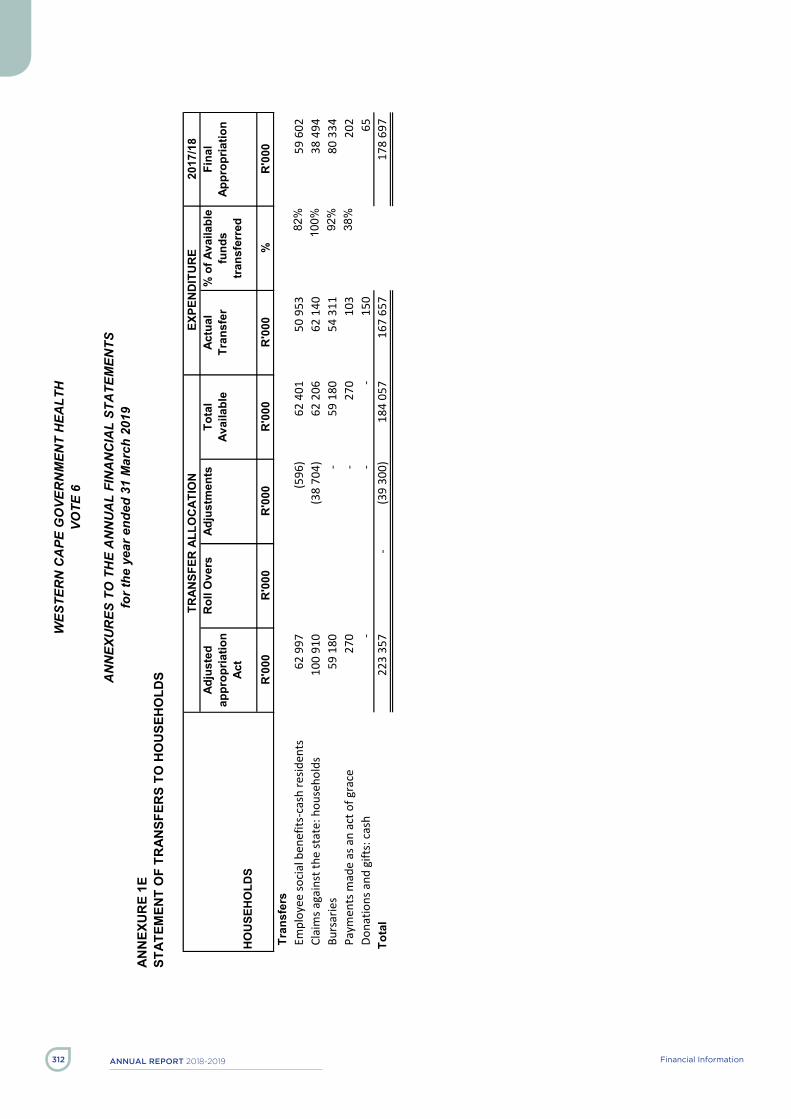
AnnuAl report 2018-2019 Financial Information312
WES
TER
N C
APE
GO
VER
NM
ENT
HEA
LTH
VO
TE 6
AN
NEX
UR
ES T
O T
HE
AN
NU
AL
FIN
AN
CIA
L ST
ATE
MEN
TS
for t
he y
ear e
nded
31
Mar
ch 2
019
- 100
- AN
NEX
UR
E 1E
ST
ATEM
ENT
OF
TRAN
SFER
S TO
HO
USE
HO
LDS
2017
/18
HO
USE
HO
LDS
Adju
sted
ap
prop
riatio
n Ac
t
Rol
l Ove
rsAd
just
men
tsTo
tal
Avai
labl
eAc
tual
Tr
ansf
er%
of A
vaila
ble
fund
s tr
ansf
erre
d
Fina
l Ap
prop
riatio
n
R'0
00R
'000
R'0
00R
'000
R'0
00%
R'0
00Tr
ansf
ers
Empl
oyee
soci
al b
enef
its-c
ash
resid
ents
62 9
97
(596
)
62
401
50
953
82
%59
602
Clai
ms a
gain
st th
e st
ate:
hou
seho
lds
100
910
(38
704)
62 2
06
62 1
40
100%
38 4
94
Bu
rsar
ies
59 1
80
-
59
180
54
311
92
%80
334
Paym
ents
mad
e as
an
act o
f gra
ce27
0
-
27
0
103
38
%20
2
Do
natio
ns a
nd g
ifts:
cas
h-
-
-
150
65
To
tal
223
357
-
(3
9 30
0)
18
4 05
7
16
7 65
7
17
8 69
7
TRAN
SFER
ALL
OC
ATIO
NEX
PEN
DIT
UR
E

AnnuAl report 2018 -2019 313Financial Information
WES
TER
N C
APE
GO
VER
NM
ENT
HEA
LTH
VO
TE 6
AN
NEX
UR
ES T
O T
HE
AN
NU
AL
FIN
AN
CIA
L ST
ATE
MEN
TS
for t
he y
ear e
nded
31
Mar
ch 2
019
- 101
- AN
NEX
UR
E 1F
ST
ATEM
ENT
OF
GIF
TS, D
ON
ATIO
NS
AND
SPO
NSO
RSH
IPS
REC
EIVE
D
NAM
E O
F O
RG
ANIS
ATIO
N
NAT
UR
E O
F G
IFT,
DO
NAT
ION
OR
SPO
NSO
RSH
IP
2018
/19
2017
/18
R’0
00
R’0
00
Rec
eive
d in
kin
d
Gift
s &
Don
atio
ns s
pons
orsh
ips
rece
ived
for t
he y
ear e
ndin
g 31
Mar
ch 2
017
- 36
141
C
ape
Med
ical
Dep
ot
Con
sum
able
s 1
765
- D
u-N
oon
/ Met
ro T
b H
ospi
tal
Con
sum
able
s 7
- D
u-N
oon
/ Met
ro T
b H
ospi
tal
Oth
er M
achi
nery
and
equ
ipm
ent
140
- Ee
rste
Riv
er H
ospi
tal
Furn
iture
& O
ffice
Equ
ipm
ent
110
- G
eorg
e H
ospi
tal
Oth
er M
achi
nery
and
Equ
ipm
ent
544
- G
root
e Sc
huur
Hos
pita
l C
ompu
ter E
quip
men
t 14
-
Gro
ote
Schu
ur H
ospi
tal
Con
sum
able
s 2
645
- G
root
e Sc
huur
Hos
pita
l Fu
rnitu
re &
Offi
ce E
quip
men
t 59
-
Gro
ote
Schu
ur H
ospi
tal
Oth
er M
achi
nery
and
Equ
ipm
ent
2 18
4 -
Hel
derb
erg
O
ther
Mac
hine
ry a
nd E
quip
men
t 35
-
Karl
Brem
er H
ospi
tal -
1B
Con
sum
able
s
12
- Ka
rl Br
emer
Hos
pita
l -1B
O
ther
Mac
hine
ry a
nd E
quip
men
t 5
- Ka
rl Br
emer
Hos
pita
l -2C
C
onsu
mab
les
15
- Ka
rl Br
emer
Hos
pita
l -3C
O
ther
Mac
hine
ry a
nd E
quip
men
t 56
-
Karl
Brem
er H
ospi
tal -
3E
Con
sum
able
s 12
-
Karl
Brem
er H
ospi
tal -
Ec
Con
sum
able
s 13
Karl
Brem
er H
ospi
tal -
Ec
Oth
er M
achi
nery
and
Equ
ipm
ent
3
Khay
elits
ha
Oth
er M
achi
nery
and
Equ
ipm
ent
515
- Kn
ysna
Hos
pita
l O
ther
Mac
hine
ry a
nd E
quip
men
t 6
- Le
nteg
eur H
ospi
tal
Con
sum
able
s 2
- Le
nteg
eur H
ospi
tal
Furn
iture
& O
ffice
Equ
ipm
ent
4
Mow
bray
Mat
erni
ty
Furn
iture
& O
ffice
Equ
ipm
ent
20
- M
owbr
ay M
ater
nity
O
ther
Mac
hine
ry a
nd E
quip
men
t 31
3 -
New
Som
erse
t Hos
pita
l C
ompu
ter E
quip
men
t 6
-

AnnuAl report 2018-2019 Financial Information314
WES
TER
N C
APE
GO
VER
NM
ENT
HEA
LTH
VO
TE 6
AN
NEX
UR
ES T
O T
HE
AN
NU
AL
FIN
AN
CIA
L ST
ATE
MEN
TS
for t
he y
ear e
nded
31
Mar
ch 2
019
- 102
- AN
NEX
UR
E 1F
(CO
NTI
NU
ED)
STAT
EMEN
T O
F G
IFTS
, DO
NAT
ION
S AN
D S
PON
SOR
SHIP
S R
ECEI
VED
NAM
E O
F O
RG
ANIS
ATIO
N
NAT
UR
E O
F G
IFT,
DO
NAT
ION
OR
SPO
NSO
RSH
IP
2018
/19
2017
/18
R’0
00
R’0
00
New
Som
erse
t Hos
pita
l C
onsu
mab
les
119
- N
ew S
omer
set H
ospi
tal
Furn
iture
& O
ffice
Equ
ipm
ent
44
- N
ew S
omer
set H
ospi
tal
Oth
er M
achi
nery
and
Equ
ipm
ent
165
- N
orth
ern
Tyge
rber
g Su
b St
ruct
ure
Con
sum
able
s 1
- Pa
arl H
ospi
tal
Oth
er M
achi
nery
and
Equ
ipm
ent
2 -
Red
Cro
ss H
ospi
tal
Con
sum
able
s 2
587
- R
ed C
ross
Hos
pita
l Fu
rnitu
re &
Offi
ce E
quip
men
t 16
-
Red
Cro
ss H
ospi
tal
Oth
er M
achi
nery
and
Equ
ipm
ent
7 76
3 -
Tyge
rber
g H
ospi
tal
Build
ings
& O
ther
Fix
ed S
truct
ure
245
- Ty
gerb
erg
Hos
pita
l C
onsu
mab
les
122
- Ty
gerb
erg
Hos
pita
l Fu
rnitu
re &
Offi
ce E
quip
men
t 42
-
Tyge
rber
g H
ospi
tal
Inta
ngib
le A
sset
s 30
5 -
Tyge
rber
g H
ospi
tal
Oth
er M
achi
nery
and
Equ
ipm
ent
10 6
49
- Va
lken
berg
Hos
pita
l Fu
rnitu
re &
Offi
ce E
quip
men
t 2
- Va
lken
berg
Hos
pita
l O
ther
Mac
hine
ry a
nd E
quip
men
t 22
-
Vict
oria
Hos
pita
l C
ompu
ter E
quip
men
t 55
-
Vict
oria
Hos
pita
l C
onsu
mab
les
65
- Vi
ctor
ia H
ospi
tal
Furn
iture
& O
ffice
Equ
ipm
ent
75
- Vi
ctor
ia H
ospi
tal
Oth
er M
achi
nery
and
Equ
ipm
ent
650
- Vr
eden
burg
Hos
pita
l O
ther
Mac
hine
ry a
nd E
quip
men
t 29
-
Wes
tern
Cap
e R
ehab
Cen
tre
Oth
er M
achi
nery
and
Equ
ipm
ent
14
- W
orce
ster
Hos
pita
l O
ther
Mac
hine
ry a
nd E
quip
men
t 2
- W
orce
ster
Hos
pita
l O
ther
Mac
hine
ry a
nd E
quip
men
t 2
- TO
TAL
31
461
36
141
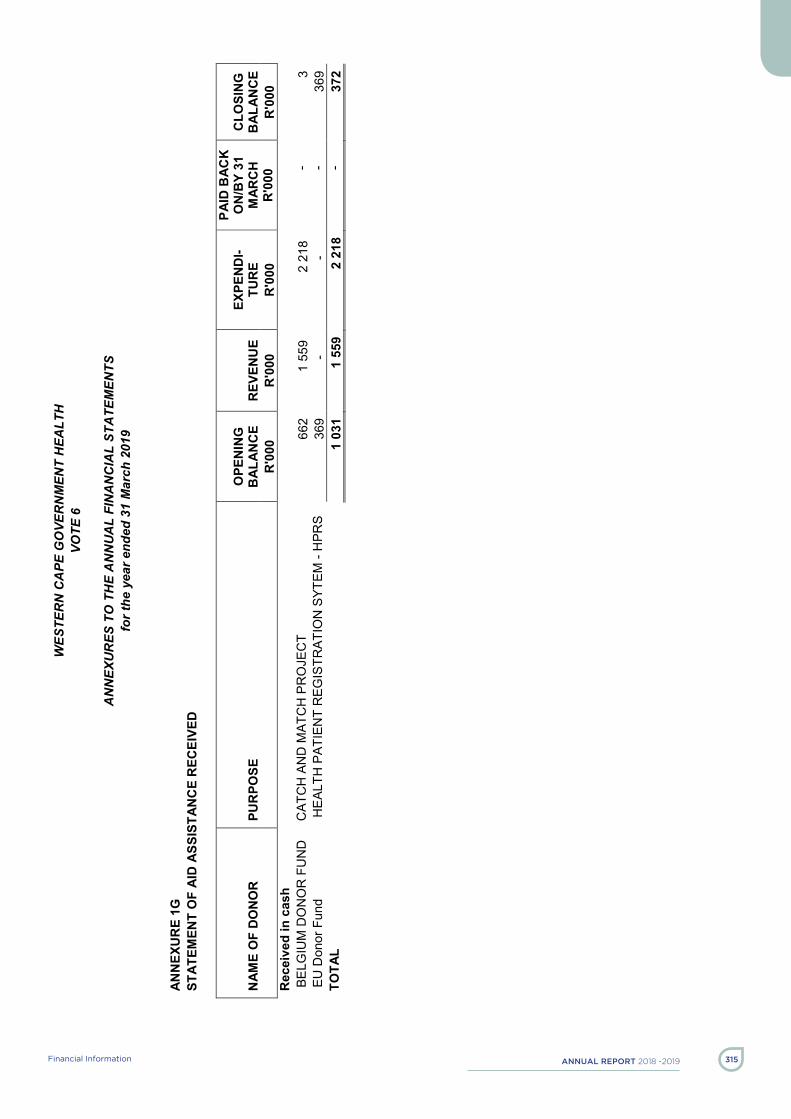
AnnuAl report 2018 -2019 315Financial Information
WES
TER
N C
APE
GO
VER
NM
ENT
HEA
LTH
VO
TE 6
AN
NEX
UR
ES T
O T
HE
AN
NU
AL
FIN
AN
CIA
L ST
ATE
MEN
TS
for t
he y
ear e
nded
31
Mar
ch 2
019
- 103
- AN
NEX
UR
E 1G
ST
ATEM
ENT
OF
AID
ASS
ISTA
NC
E R
ECEI
VED
N
AME
OF
DO
NO
R
PUR
POSE
O
PEN
ING
B
ALAN
CE
REV
ENU
E EX
PEN
DI-
TUR
E
PAID
BAC
K
ON
/BY
31
MAR
CH
C
LOSI
NG
B
ALAN
CE
R'0
00
R'0
00
R'0
00
R'0
00
R'0
00
Rec
eive
d in
cas
h
B
ELG
IUM
DO
NO
R F
UN
D
CAT
CH
AN
D M
ATC
H P
RO
JEC
T
662
1
559
2
218
-
3
E
U D
onor
Fun
d H
EALT
H P
ATIE
NT
REG
ISTR
ATIO
N S
YTEM
- H
PRS
369
-
-
-
369
TO
TAL
1 0
31
1
559
2
218
-
372
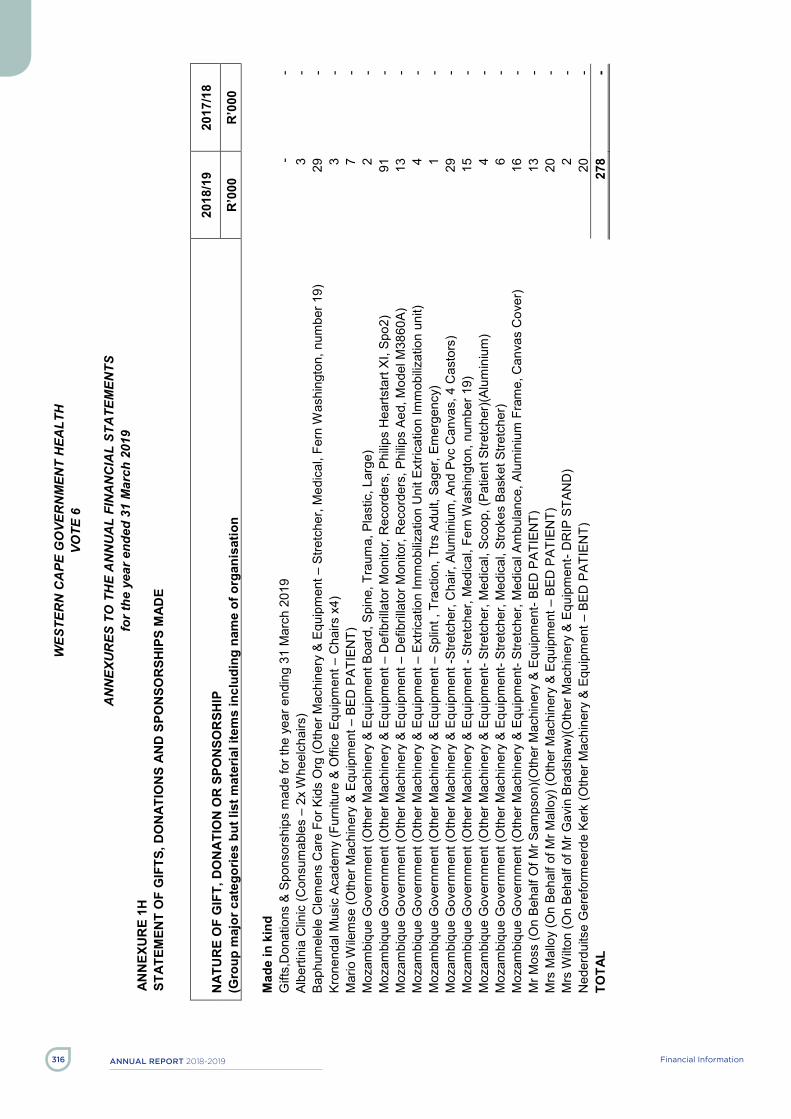
AnnuAl report 2018-2019 Financial Information316
WES
TER
N C
APE
GO
VER
NM
ENT
HEA
LTH
VO
TE 6
AN
NEX
UR
ES T
O T
HE
AN
NU
AL
FIN
AN
CIA
L ST
ATE
MEN
TS
for t
he y
ear e
nded
31
Mar
ch 2
019
- 104
- AN
NEX
UR
E 1H
ST
ATEM
ENT
OF
GIF
TS, D
ON
ATIO
NS
AND
SPO
NSO
RSH
IPS
MAD
E
NAT
UR
E O
F G
IFT,
DO
NAT
ION
OR
SPO
NSO
RSH
IP
(Gro
up m
ajor
cat
egor
ies
but l
ist m
ater
ial i
tem
s in
clud
ing
nam
e of
org
anis
atio
n
2018
/19
2017
/18
R’0
00
R’0
00
M
ade
in k
ind
Gift
s,D
onat
ions
& S
pons
orsh
ips
mad
e fo
r the
yea
r end
ing
31 M
arch
201
9 -
- Al
berti
nia
Clin
ic (C
onsu
mab
les
– 2x
Whe
elch
airs
) 3
- Ba
phum
elel
e C
lem
ens
Car
e Fo
r Kid
s O
rg (O
ther
Mac
hine
ry &
Equ
ipm
ent –
Stre
tche
r, M
edic
al, F
ern
Was
hing
ton,
num
ber 1
9)
29
- Kr
onen
dal M
usic
Aca
dem
y (F
urni
ture
& O
ffice
Equ
ipm
ent –
Cha
irs x
4)
3 -
Mar
io W
ilem
se (O
ther
Mac
hine
ry &
Equ
ipm
ent –
BED
PAT
IEN
T)
7 -
Moz
ambi
que
Gov
ernm
ent (
Oth
er M
achi
nery
& E
quip
men
t Boa
rd, S
pine
, Tra
uma,
Pla
stic
, Lar
ge)
2 -
Moz
ambi
que
Gov
ernm
ent (
Oth
er M
achi
nery
& E
quip
men
t – D
efib
rilla
tor M
onito
r, R
ecor
ders
, Phi
lips
Hea
rtsta
rt XI
, Spo
2)
91
- M
ozam
biqu
e G
over
nmen
t (O
ther
Mac
hine
ry &
Equ
ipm
ent –
Def
ibril
lato
r Mon
itor,
Rec
orde
rs, P
hilip
s Ae
d, M
odel
M38
60A)
13
-
Moz
ambi
que
Gov
ernm
ent (
Oth
er M
achi
nery
& E
quip
men
t – E
xtric
atio
n Im
mob
ilizat
ion
Uni
t Ext
ricat
ion
Imm
obiliz
atio
n un
it)
4 -
Moz
ambi
que
Gov
ernm
ent (
Oth
er M
achi
nery
& E
quip
men
t – S
plin
t , T
ract
ion,
Ttrs
Adu
lt, S
ager
, Em
erge
ncy)
1
- M
ozam
biqu
e G
over
nmen
t (O
ther
Mac
hine
ry &
Equ
ipm
ent -
Stre
tche
r, C
hair,
Alu
min
ium
, And
Pvc
Can
vas,
4 C
asto
rs)
29
- M
ozam
biqu
e G
over
nmen
t (O
ther
Mac
hine
ry &
Equ
ipm
ent -
Stre
tche
r, M
edic
al, F
ern
Was
hing
ton,
num
ber 1
9)
15
- M
ozam
biqu
e G
over
nmen
t (O
ther
Mac
hine
ry &
Equ
ipm
ent-
Stre
tche
r, M
edic
al, S
coop
, (Pa
tient
Stre
tche
r)(Al
umin
ium
) 4
- M
ozam
biqu
e G
over
nmen
t (O
ther
Mac
hine
ry &
Equ
ipm
ent-
Stre
tche
r, M
edic
al, S
troke
s Ba
sket
Stre
tche
r)
6 -
Moz
ambi
que
Gov
ernm
ent (
Oth
er M
achi
nery
& E
quip
men
t- St
retc
her,
Med
ical
Am
bula
nce,
Alu
min
ium
Fra
me,
Can
vas
Cov
er)
16
- M
r Mos
s (O
n Be
half
Of M
r Sam
pson
)(Oth
er M
achi
nery
& E
quip
men
t- BE
D P
ATIE
NT)
13
-
Mrs
Mal
loy
(On
Beha
lf of
Mr M
allo
y) (O
ther
Mac
hine
ry &
Equ
ipm
ent –
BED
PAT
IEN
T)
20
- M
rs W
ilton
(On
Beha
lf of
Mr G
avin
Bra
dsha
w)(O
ther
Mac
hine
ry &
Equ
ipm
ent-
DR
IP S
TAN
D)
2 -
Ned
erdu
itse
Ger
efor
mee
rde
Kerk
(Oth
er M
achi
nery
& E
quip
men
t – B
ED P
ATIE
NT)
20
-
TOTA
L 27
8 -

AnnuAl report 2018 -2019 317Financial Information
WES
TER
N C
APE
GO
VER
NM
ENT
HEA
LTH
VO
TE 6
AN
NEX
UR
ES T
O T
HE
AN
NU
AL
FIN
AN
CIA
L ST
ATE
MEN
TS
for t
he y
ear e
nded
31
Mar
ch 2
019
- 105
- AN
NEX
UR
E 2A
ST
ATEM
ENT
OF
FIN
ANC
IAL
GU
ARAN
TEES
ISSU
ED A
S AT
31
MAR
CH
201
9 –
LOC
AL
Gua
rant
or
inst
itutio
n G
uara
ntee
in
resp
ect o
f
Orig
inal
gu
aran
teed
ca
pita
l am
ount
Ope
ning
ba
lanc
e 1
April
20
18
Gua
rant
ees
draw
do
wns
du
ring
the
year
Gua
rant
ees
repa
ymen
ts/
canc
elle
d/
redu
ced
durin
g th
e ye
ar
Rev
alua
tion
due
to
fore
ign
curr
ency
m
ovem
ents
Clo
sing
ba
lanc
e 31
Mar
ch
2019
Rev
alua
tions
du
e to
in
flatio
n ra
te
mov
emen
ts
Accr
ued
guar
ante
ed
inte
rest
for
year
end
ed
31 M
arch
20
19
R’0
00
R’0
00
R’0
00
R’0
00
R’0
00
R’0
00
R’0
00
R’0
00
Stan
dard
Ban
k H
ousi
ng
- 87
-
- -
87
- -
Firs
t Ran
d Ba
nk
Hou
sing
-
12
- -
- 12
-
-
TOTA
L -
99
- -
- 99
-
-
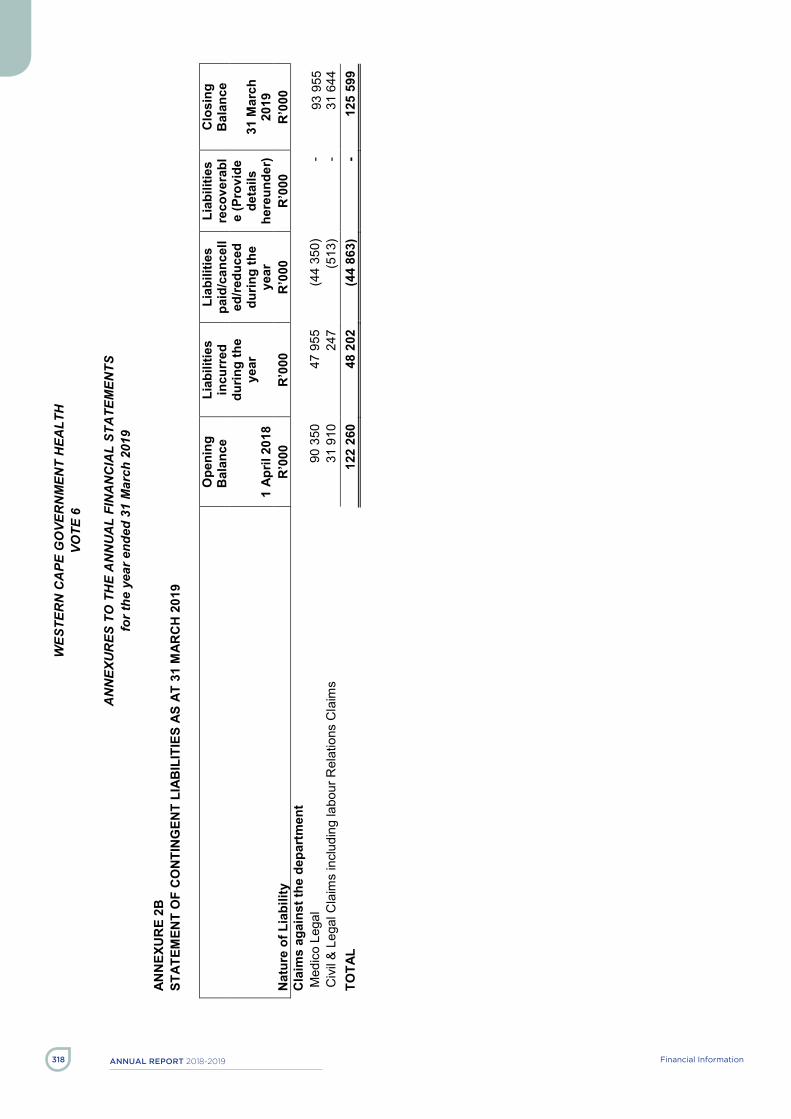
AnnuAl report 2018-2019 Financial Information318
WES
TER
N C
APE
GO
VER
NM
ENT
HEA
LTH
VO
TE 6
AN
NEX
UR
ES T
O T
HE
AN
NU
AL
FIN
AN
CIA
L ST
ATE
MEN
TS
for t
he y
ear e
nded
31
Mar
ch 2
019
- 106
- AN
NEX
UR
E 2B
ST
ATEM
ENT
OF
CO
NTIN
GEN
T LI
ABIL
ITIE
S AS
AT
31 M
ARC
H 2
019
Nat
ure
of L
iabi
lity
Ope
ning
B
alan
ce
Liab
ilitie
s in
curr
ed
durin
g th
e ye
ar
Liab
ilitie
s pa
id/c
ance
lled
/redu
ced
durin
g th
e ye
ar
Liab
ilitie
s re
cove
rabl
e (P
rovi
de
deta
ils
here
unde
r)
Clo
sing
B
alan
ce
1 Ap
ril 2
018
31 M
arch
20
19
R’0
00
R’0
00
R’0
00
R’0
00
R’0
00
Cla
ims
agai
nst t
he d
epar
tmen
t
Med
ico
Lega
l 9
0 35
0 47
955
(4
4 35
0)
- 93
955
C
ivil
& Le
gal C
laim
s in
clud
ing
labo
ur R
elat
ions
Cla
ims
31 9
10
247
(5
13)
- 3
1 64
4 TO
TAL
122
260
48 2
02
(44
863)
-
125
599
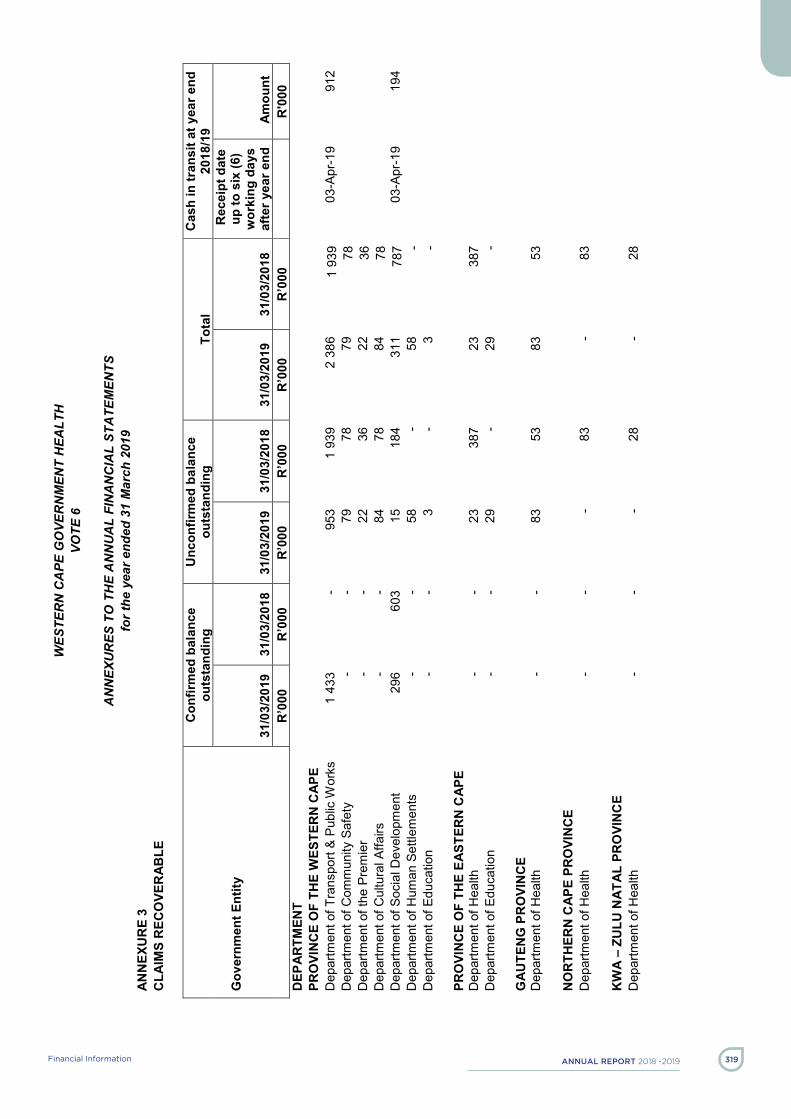
AnnuAl report 2018 -2019 319Financial Information
WES
TER
N C
APE
GO
VER
NM
ENT
HEA
LTH
VO
TE 6
AN
NEX
UR
ES T
O T
HE
AN
NU
AL
FIN
AN
CIA
L ST
ATE
MEN
TS
for t
he y
ear e
nded
31
Mar
ch 2
019
- 107
- AN
NEX
UR
E 3
CLA
IMS
REC
OVE
RAB
LE
Gov
ernm
ent E
ntity
Con
firm
ed b
alan
ce
outs
tand
ing
Unc
onfir
med
bal
ance
ou
tsta
ndin
g To
tal
Cas
h in
tran
sit a
t yea
r end
20
18/1
9
31/0
3/20
19
31/0
3/20
18
31/0
3/20
19
31/0
3/20
18
31/0
3/20
19
31/0
3/20
18
Rec
eipt
dat
e up
to s
ix (6
) w
orki
ng d
ays
afte
r yea
r end
A
mou
nt
R’0
00
R’0
00
R’0
00
R’0
00
R’0
00
R’0
00
R
'000
D
EPAR
TMEN
T
PR
OVI
NC
E O
F TH
E W
ESTE
RN
CAP
E
Dep
artm
ent o
f Tra
nspo
rt &
Publ
ic W
orks
1
433
- 95
3 1
939
2 38
6 1
939
03-A
pr-1
9 9
12
Dep
artm
ent o
f Com
mun
ity S
afet
y -
- 79
78
79
78
D
epar
tmen
t of t
he P
rem
ier
- -
22
36
22
36
Dep
artm
ent o
f Cul
tura
l Affa
irs
- -
84
78
84
78
Dep
artm
ent o
f Soc
ial D
evel
opm
ent
296
603
15
184
311
787
03-A
pr-1
9 1
94
Dep
artm
ent o
f Hum
an S
ettle
men
ts
- -
58
- 58
-
Dep
artm
ent o
f Edu
catio
n -
- 3
- 3
-
PR
OVI
NC
E O
F TH
E EA
STER
N C
APE
Dep
artm
ent o
f Hea
lth
- -
23
387
23
387
Dep
artm
ent o
f Edu
catio
n -
- 29
-
29
-
G
AUTE
NG
PR
OVI
NC
E
Dep
artm
ent o
f Hea
lth
- -
83
53
83
53
N
OR
THER
N C
APE
PRO
VIN
CE
Dep
artm
ent o
f Hea
lth
- -
- 83
-
83
K
WA
– ZU
LU N
ATAL
PR
OVI
NC
E
D
epar
tmen
t of H
ealth
-
- -
28
- 28

AnnuAl report 2018-2019 Financial Information320
WES
TER
N C
APE
GO
VER
NM
ENT
HEA
LTH
VO
TE 6
AN
NEX
UR
ES T
O T
HE
AN
NU
AL
FIN
AN
CIA
L ST
ATE
MEN
TS
for t
he y
ear e
nded
31
Mar
ch 2
019
- 108
- AN
NEX
UR
E 3
(CO
NTI
NU
ED)
CLA
IMS
REC
OVE
RAB
LE
Gov
ernm
ent E
ntity
Con
firm
ed b
alan
ce
outs
tand
ing
Unc
onfir
med
bal
ance
ou
tsta
ndin
g To
tal
Cas
h in
tran
sit a
t yea
r end
20
18/1
9
31/0
3/20
19
31/0
3/20
18
31/0
3/20
19
31/0
3/20
18
31/0
3/20
19
31/0
3/20
18
Rec
eipt
dat
e up
to s
ix (6
) w
orki
ng d
ays
afte
r yea
r end
A
mou
nt
R’0
00
R’0
00
R’0
00
R’0
00
R’0
00
R’0
00
R
'000
PU
BLI
C E
NTI
TIES
Sout
h Af
rican
Rev
enue
Ser
vice
s -
- 7
270
7 27
0
NAT
ION
AL D
EPAR
TMEN
TS
Dep
artm
ent o
f Hea
lth
- -
70
2 04
2 70
2
042
Dep
artm
ent o
f Cor
rect
iona
l Ser
vice
s -
- 90
59
90
59
So
uth
Afric
an S
ocia
l Sec
urity
Age
ncy
1
273
- 1
665
2 89
2 2
938
2 89
2
Ju
stic
e &
Con
stitu
tiona
l Dev
elop
men
t -
- -
221
- 22
1
3 00
2 60
3 3
181
8 35
0 6
183
8 95
3
1 10
6
Oth
er G
over
nmen
t Ent
ities
C
ity o
f Cap
e To
wn
(Cap
e M
edic
al D
epot
) -
- 19
402
16
436
19
402
16
436
-
19
402
16
436
19
402
16
436
-
TO
TAL
3 00
2 60
3 22
583
24
786
25
585
25
389
1 10
6
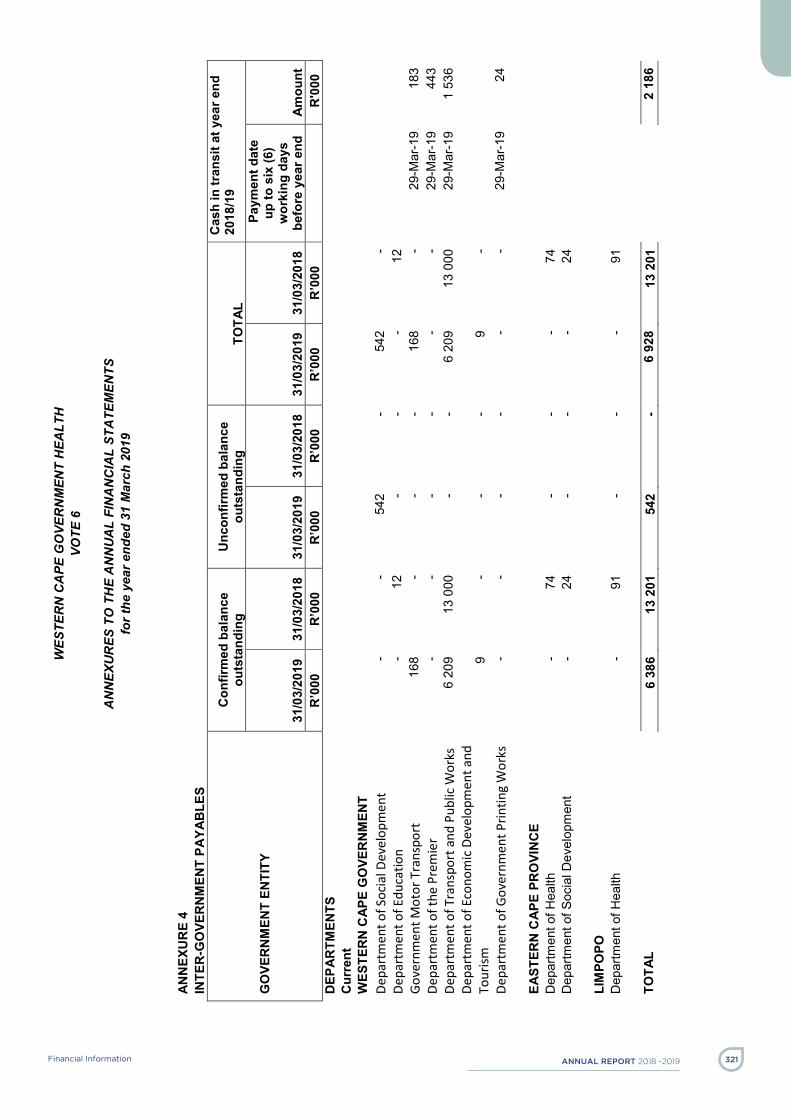
AnnuAl report 2018 -2019 321Financial Information
WES
TER
N C
APE
GO
VER
NM
ENT
HEA
LTH
VO
TE 6
AN
NEX
UR
ES T
O T
HE
AN
NU
AL
FIN
AN
CIA
L ST
ATE
MEN
TS
for t
he y
ear e
nded
31
Mar
ch 2
019
- 109
- AN
NEX
UR
E 4
INTE
R-G
OVE
RN
MEN
T PA
YAB
LES
GO
VER
NM
ENT
ENTI
TY
Con
firm
ed b
alan
ce
outs
tand
ing
Unc
onfir
med
bal
ance
ou
tsta
ndin
g TO
TAL
Cas
h in
tran
sit a
t yea
r end
20
18/1
9
31/0
3/20
19
31/0
3/20
18
31/0
3/20
19
31/0
3/20
18
31/0
3/20
19
31/0
3/20
18
Pay
men
t dat
e up
to s
ix (6
) w
orki
ng d
ays
befo
re y
ear e
nd
Am
ount
R
’000
R
’000
R
’000
R
’000
R
’000
R
’000
R'0
00
DEP
ARTM
ENTS
C
urre
nt
WES
TER
N C
APE
GO
VER
NM
ENT
Depa
rtm
ent o
f Soc
ial D
evel
opm
ent
-
-
542
-
54
2 -
Depa
rtm
ent o
f Edu
catio
n -
1
2
-
-
- 12
Go
vern
men
t Mot
or T
rans
port
1
68
-
-
-
168
- 29
-Mar
-19
183
Depa
rtm
ent o
f the
Pre
mie
r -
-
-
-
-
- 29
-Mar
-19
443
Depa
rtm
ent o
f Tra
nspo
rt a
nd P
ublic
Wor
ks
6 2
09
13
000
-
-
6
209
13 0
00
29-M
ar-1
9 1
536
Depa
rtm
ent o
f Eco
nom
ic D
evel
opm
ent a
nd
Tour
ism
9
-
- -
9 -
Depa
rtm
ent o
f Gov
ernm
ent P
rintin
g W
orks
-
- -
- -
- 29
-Mar
-19
24
EA
STER
N C
APE
PRO
VIN
CE
Dep
artm
ent o
f Hea
lth
- 74
-
- -
74
Dep
artm
ent o
f Soc
ial D
evel
opm
ent
- 24
-
- -
24
LI
MPO
PO
Dep
artm
ent o
f Hea
lth
- 91
-
- -
91
TO
TAL
6 38
6 13
201
54
2 -
6 92
8 13
201
2 18
6

AnnuAl report 2018-2019 Financial Information322
WW
ESTE
RN
CA
PE G
OVE
RN
MEN
T H
EALT
H
VOTE
6
A
NN
EXU
RES
TO
TH
E A
NN
UA
L FI
NA
NC
IAL
STA
TEM
ENTS
fo
r the
yea
r end
ed 3
1 M
arch
201
9
-
110
-
AN
NEX
UR
E 5
INVE
NTO
RIE
S
Inve
ntor
ies
N
ote
Qua
ntity
20
18/1
9 Q
uant
ity
2017
/18
R’0
00
R
’000
O
peni
ng b
alan
ce
27
448
420
60
2 38
3 34
050
260
62
4 83
9 Ad
d/(L
ess)
: Adj
ustm
ents
to p
rior y
ear b
alan
ce
-
4 (4
931
839
) (6
2 12
3)
Add:
Add
ition
s/Pu
rcha
ses
– C
ash
20
4 95
6 31
7 4
480
502
159
877
922
3 33
8 67
1 Ad
d: A
dditi
ons
- Non
-cas
h
614
643
4 06
4 67
1 39
3 2
029
(Les
s): D
ispo
sals
(1 0
88 6
06)
(13
442)
(5
40 0
99)
(8 0
68)
(Les
s): I
ssue
s
(210
565
009
) (4
021
116
) (1
67 7
19 5
98)
(3 4
17 6
03)
Add/
(Les
s): R
ecei
ved
curre
nt, n
ot p
aid
(Pai
d cu
rrent
yea
r, re
ceiv
ed p
rior y
ear)
- -
- -
Add/
(Les
s): A
djus
tmen
ts
10
151
521
(4
26 3
72)
6 04
0 38
1 12
4 63
8 C
losi
ng b
alan
ce
31
517
286
62
6 02
3 27
448
420
60
2 38
3

AnnuAl report 2018 -2019 323Financial Information
WWESTERN CAPE GOVERNMENT HEALTH VOTE
ANNEXURES TO THE ANNUAL FINANCIAL STATEMENTS
for the year ended 31 March 2019
- 111 -
ANNEXURE 6A INTER-ENTITY ADVANCES PAID (note10)
ENTITY
Confirmed balance outstanding
Unconfirmed balance outstanding TOTAL
31/03/2019 31/03/2018 31/03/2019 31/03/2018 31/03/2019 31/03/2018 R’000 R’000 R’000 R’000 R’000 R’000
OTHER ENTITIES ACVV 9 2 9 2 Africa Tikkun 34 18 34 18 Anova - 7 - 7 Aquiries 2 463 - 2 463 - Afrisen Women 81 2 722 81 2 722 Athlone YMCA 22 33 22 33 Aurum 93 - 93 - Baphumelele 1 6 1 6 Bergrivier Motivated Women - - Call to Serve 3 1 3 1 Cape Flats YMCA 2 27 2 27 Caring Network (EAST) 215 54 215 54 Caring Network (Wallacedene)
39 266 39 266
Cederberg Matzikama Aids Network
3 1 3 1
CMH – Eagles Program - 216 - 216 Deaf - 4 - 4 Desmond Tutu Foundation - 3 158 - 3 158 Etafeni 37 5 37 5 FAMSA Karoo 4 - 4 - Groeneweide - 2 - 2 In The Public Interest - 16 - 16 Ithemba Lobomi 14 - 14 - Kheth Impilo Tb Enhanced 163 211 163 211 Koinonia 23 26 23 26 La Leche 4 19 4 19 Lifeline Childline 25 27 25 27 Masincedane 45 11 45 11 Mothers to Mothers - 60 - 60 Oasis - 147 - 147 Omega 21 71 21 71 Opportunity To Serve Ministries
51 42 51 42
Partners in Sexual Health NT 51 63 51 63

AnnuAl report 2018-2019 Financial Information324
WWESTERN CAPE GOVERNMENT HEALTH VOTE
ANNEXURES TO THE ANNUAL FINANCIAL STATEMENTS
for the year ended 31 March 2019
- 112 -
ANNEXURE 6A (CONTINUED) INTER-ENTITY ADVANCES PAID (note10)
ENTITY Confirmed balance outstanding
Unconfirmed balance outstanding
TOTAL
TOTAL
31/03/2019 31/03/2018 31/03/2019 31/03/2018 31/03/2019 31/03/2018 R’000 R’000 R’000 R’000 R’000 R’000 OTHER ENTITIES Philani - - 10 721 10 721 Piet Julies - - 1 - 1 - Prince Albert CBR - - 2 - 2 - Sacla - - 16 - 16 - Sacala - - 349 29 349 29 Sarah Fox - - - 12 - 12 Siyabonga - - 2 - 2 - Spades Yda - - 251 251 251 251 St Johns - - - 35 - 35 St Lukes - - 6 1 6 1 TB/HIV Care Association - - 482 873 482 873 Tehillah - - - 375 - 375 Touch - - 2 59 2 59 Touching Nations - - - 281 - 281 Tygerberg Hospice - - 63 476 63 476 Vredendal Old Age Home - - 3 - 3 - Wolanani - - - 1 164 - 1 164 Subtotal - - 4 590 11 492 4 590 11 492 TOTAL - - 4 590 11 492 4 590 11 492

AnnuAl report 2018 -2019 325Financial Information
WWESTERN CAPE GOVERNMENT HEALTH VOTE
ANNEXURES TO THE ANNUAL FINANCIAL STATEMENTS
for the year ended 31 March 2019
- 113 -
ANNEXURE 6B INTER-ENTITY ADVANCES RECEIVED (note 14)
ENTITY
Confirmed balance outstanding
Unconfirmed balance outstanding TOTAL
31/03/2019 31/03/2018 31/03/2019 31/03/2018 31/03/2019 31/03/2018 R’000 R’000 R’000 R’000 R’000 R’000
OTHER ENTITIES Current Spectramed 8 8 - - 8 8 Fishmed 8 8 - - 8 8 Golden Arrow 12 12 - - 12 12 Discovery 80 80 - - 80 80 RAF Unknown - - 43 449 35 335 43 449 35 335 COIDA/WCA Unknown - - 10 505 7 430 10 505 7 430 Vericred Unknown - - 140 139 140 139 State Departments/Unknown - - 2 502 1 225 2502 1 225 HWSETA - - - 361 - 361 TOTAL 108 108 56 596 44 490 56 704 44 598

To obtain additional information and/or copies of this document, please contact:
Western Cape Government Health P.O. Box 2060,
Cape Town,
8000
tel: +27 21 483 3245
fax: +27 21 483 6169
email: [email protected]
Website: www.westerncape.gov.za
ISBN: 978-0-621-47780-1
Title of Publications: Western Cape Government Health, Annual Report 2018/2019
This publication is also available for download, go to http://www.westerncape.gov.za/health