Annual Report – 2021 - ESMA - europa.eu
107
15 December 2021 | ESMA70-156-4474 Annual Report – 2021 On the application of waivers and deferrals
-
Upload
khangminh22 -
Category
Documents
-
view
0 -
download
0
Transcript of Annual Report – 2021 - ESMA - europa.eu

15 December 2021 | ESMA70-156-4474
Annual Report – 2021 On the application of waivers and deferrals

ESMA REGULAR USE
1
Table of Contents
1 Executive Summary ....................................................................................................... 5
2 Introduction .................................................................................................................... 8
2.1 Legal basis .............................................................................................................. 8
2.2 Treatment of the UK data .......................................................................................10
3 Application of the waivers for equity and equity-like financial instruments .....................11
3.1 Background information .........................................................................................11
3.2 Analysis 1: Statistics on the number of waivers ......................................................12
3.3 Analysis 2: Statistics on the volumes executed under the waivers..........................18
3.3.1 Total turnover and total number of transactions executed in Y2020 ................18
3.3.2 Total turnover and total number of transactions executed under the waivers in
Y2020 19
3.3.3 Total turnover executed under the waivers in Y2020 across Member States ...22
4 Application of proposed arrangements for trade-deferred publication on equity and equity-
like instruments ....................................................................................................................23
4.1 On-venue transactions ...........................................................................................23
4.1.1 Background information ..................................................................................23
4.1.2 Analysis of the application of the deferral regime on-venue .............................24
4.2 OTC transactions ...................................................................................................29
4.2.1 Background information ..................................................................................29
4.2.2 Analysis of the application of the deferral regime off-venue .............................29
5 Application of the waivers for non-equity financial instruments ......................................32
5.1 Background information .........................................................................................32
5.2 Analysis 1: Statistics on the number of waivers ......................................................33
5.3 Analysis 2: Statistics on the volumes executed under the waivers..........................41
5.3.1 Total trading volume executed in Y2020 .........................................................42
5.3.2 Total trading volume executed under the waivers in Y2020 .............................43
5.3.3 Trading volume executed under the waivers for bonds ....................................51
5.3.4 Non-equity waivers packages ..........................................................................55
6 Application of proposed arrangements for trade-deferred publication on non-equity ......56
6.1 Background information .........................................................................................56
6.2 On-venue transactions ...........................................................................................57

ESMA REGULAR USE
2
6.2.1 Background information ..................................................................................57
6.2.2 Analysis of the application of the deferral regime on-venue - per MIC .............57
6.2.3 Analysis of the application of the deferral regime on-venue - trading activity ...63
6.2.4 Use of the deferral regime for bonds ...............................................................66
6.3 OTC transactions ...................................................................................................71
6.3.1 Background information ..................................................................................71
6.3.2 Analysis of the application of the deferral regime off-venue .............................71
7 Annex I - Tables Equity Waivers ....................................................................................75
8 Annex II - Tables Non-equity Waivers ...........................................................................86
9 Annex III – Additional figures on the use of non-equity deferrals ................................. 100

ESMA REGULAR USE
3
Acronyms used
APA Approved Publication Arrangement
BAP Best Available Price
BTS (Electronic) Broker Trading Systems
DCLOB Discretionary Central Limit Order Book
EC European Commission
EEA European Economic Area
EFP Exchange for Physical
ESMA European Securities and Markets Authority
ETC Exchange Traded Commodity
ETF Exchange Traded Fund
ETN Exchange Traded Note
EU European Union
FITRS Financial Instruments Transparency System
IF Investment Firm
ILQ Illiquid
IR Interest Rate
LIS Large in Scale
MIC Market Identifier Code
MiFID I Directive 2004/39 of the European Parliament and of the Council of 21 April
2004 on markets in financial instruments amending Council Directive
85/611/EC and 93/6/EEC and Directive 2000/12/EC of the European
Parliament and of the Council and repealing Council Directive 93/22/EEC
MIFID II Directive 2014/65/EU of the European Parliament and the Council of 15 May
2014 on markets in financial instruments and amending Directive
2002/92/EC and Directive 2011/61/EU
MiFIR Regulation (EU) No 600/2014 of the European Parliament and of the Council
of 15 May 2014 on markets in financial instruments and amending Regulation
(EU) No 648/2012
MTF Multilateral Trading Facility
NCA National Competent Authority
NT Negotiated Transaction
OMF Order Management Facility

ESMA REGULAR USE
4
OTC Over the Counter
RFQ Request for Quote
RFT Request for Trade
RM Regulated Market
RP Reference Price
RTS Regulatory Technical Standard
RTS 1 Commission Delegated Regulation (EU) 2017/587
RTS 2 Commission Delegated Regulation (EU) 2017/583
SAP Simple Average Price
SFP Structured Finance Product
SI Systematic Internaliser
SSTI Size Specific to the Instrument
WAP Weighted Average Price

ESMA REGULAR USE
5
1 Executive Summary
Reasons for publication
Articles 4(4) and 9(2) of MiFIR require ESMA to monitor the application of pre-trade
transparency waivers and to submit an annual report to the European Commission (EC) on
how equity and non-equity waivers are applied in practice. Articles 7(1) and 11(1) of MiFIR
require ESMA to monitor the application of deferred trade-publication and to submit an
annual report to the EC on how they are used in practice.
This annual report therefore includes an analysis based on waivers for both equity and non-
equity instruments for which ESMA issued an opinion to the competent authority (CA) in the
period between 1 January and 31 December 2020 and includes an overview of the deferral
regime applied by CAs. For non-equity instruments, ESMA also carried out a data collection
exercise directed to trading venues aiming at gathering quantitative data on a limited set of
asset classes and information on how waivers and deferrals are applied in practice. With
respect to equity (and equity-like) instruments, ESMA has analysed the use of waivers and
deferrals leveraging on Financial Instruments Transparency System (FITRS) data which
provides an overview of the overall trading activity executed in the EEA.
Contents
Section 2 provides an introduction to the report. Section 3 analyses the application of equity
waivers and their use, in terms of volume and number of transactions in EEA trading venues.
Section 4 describes the application of the deferral regime to equity instruments. In particular,
Section 4.1 provides an analysis related to the on-venue application of the regime and
Section 4.2 to its off-venue application.
In relation to equity instruments, in order to provide the reader with information on the weight
of the UK impact, some charts also including UK data were added to the report, when
possible. Those charts highlight the high share of volume traded in the “dark” on UK trading
venues in 2020. Therefore, it is likely that excluding UK data underestimates the real share
of ”dark” trading in the EEA after Brexit since some UK trading venues relocated to the EU.
At the same time, the data for 2020 including UK data is likely to overestimate the share of
“dark” trading after Brexit.
Overall, the distribution of waiver types is similar to that of 2019, although the number of
waivers submitted to ESMA was significantly lower. The LIS waiver is the most used waiver
type. Shares and ETFs are the instrument types for which waivers are requested most
frequently. The volume under the waivers, both in turnover and number of transactions, is in
large part executed in shares. In line with last year, ETFs are the instruments with the highest
percentage of “dark” trading with respect to the overall volume traded in those instruments.
As far as the on-venue deferral regime is concerned, with respect to 2019, the percentage
of segment MICs applying the LIS deferral regime has largely decreased for shares, ETFs

ESMA REGULAR USE
6
and other equity-like financial instruments and increased for depositary receipts. This is
largely explained by an increase in the number of venues offering the instruments for trading
(denominator), especially for shares and ETFs. Off-venue, in most of the cases deferrals are
allowed and applied by Investment firms/SIs and CAs are broadly applying the same regime
across the different types of equity instruments. Concerning non-equity instruments, Section
5 analyses the application of non-equity waivers and their use, in terms of volume on EEA
trading venues. Section 6 describes the application of the deferral regime to non-equity
instruments. In particular, Section 6.1 provides an analysis related to the on-venue
application of the regime and Section 6.2 to its off-venue application.
As far as pre-trade transparency waivers are concerned, similarly to what was observed last
year, most of the opinions issued covered the LIS waiver (and the Illiquid waiver). The non-
equity waivers assessed related to a variety of non-equity instruments and, covered mainly
bonds, interest rate derivatives and equity derivatives
With respect to the volumes executed under the waivers, the data collection shows that
trading in interest rate derivatives accounted for almost half of the total trading volume
followed by sovereign bonds. The waiver most frequently used in practice is the SSTI waiver.
This result does not seem to be in line with last year’s report were most of the trading volume
was executed under the LIS waiver. However, a number of data quality issues, further
explained in the report, were identified.
As regards post-trade transparency, deferrals for SSTI and LIS transactions as well as
transactions in illiquid instruments were commonly used across trading venues for the
different types of non-equity instruments. The report also presents an analysis on the use of
waivers and deferrals for bonds. Similarly to 2019, in 2020 sovereign bonds were still the
instrument type that mostly benefited from a waiver and retained a high proportion of “dark”
trading, in particular under the SSTI waiver. Similarly, the volume subject to deferrals was
mainly executed in sovereign bonds with the SSTI deferral being the deferral type used the
most.
From this third report on the application of the waivers and deferral regimes it can be
concluded that, also discounting for the UK departure, trading under waivers and deferrals
is significant specifically for ETFs and the bond market. The application of the discretionary
deferral regime across all non-equity instruments by CAs continues resulting in a patchwork
of national approaches across the EEA.
Last but not least, also this year’s exercise showed the importance of receiving the data in
FITRS for the individual waivers and deferrals on equity and non-equity instruments rather
than at aggregated level. This would alleviate the data quality issues faced with ad-hoc data
collections that prevent ESMA from providing a more comprehensive and accurate analysis.
Disclaimer
In relation to this report, the exit of the UK from the EU on 31 December 2020 poses a
problem for the treatment of UK data. Considering that part of the statistics are derived from
a data collection exercise carried out in 2021 (and thus excluding UK venues), UK data was

ESMA REGULAR USE
7
excluded from most of the statistics presented in this Report1. However, when possible,
charts including UK data were added to the report for comparative purposes.
The net effects of Brexit and the new European trading landscape will only be visible with
the data of 2021. That data will also reflect re-locations of trading venues to the EU and the
migration of trading activity to those entities. Therefore, it is important to emphasise that
2020 is a transitional year. While the data presented in this report still provides a valuable
snapshot of the use of waivers and deferrals in the EEA, it should not be taken as the sole
basis for policy conclusions about the state of “dark” versus “lit” trading in the EEA.
Next Steps
A similar report will be published next year.
1 The UK’s Withdrawal agreement entered into force on 31 January 2020. The agreement provided for a transition period until 31 December 2020, during which the UK remained in the single market which was then left on 1 January 2021. During the year 2020 ESMA received data from UK reporting entities which was excluded from this report.

ESMA REGULAR USE
8
2 Introduction
2.1 Legal basis
Article 4 of MiFIR
4. Before granting a waiver in accordance with paragraph 1, competent authorities shall
notify ESMA and other competent authorities of the intended use of each individual waiver
and provide an explanation regarding its functioning, including the details of the trading
venue where the reference price is established as referred to in paragraph 1(a). Notification
of the intention to grant a waiver shall be made not less than four months before the waiver
is intended to take effect. Within two months following receipt of the notification, ESMA shall
issue a non-binding opinion to the competent authority in question assessing the
compatibility of each waiver with the requirements established in paragraph 1 and specified
in the regulatory technical standard adopted pursuant to paragraph 6. Where that competent
authority grants a waiver and a competent authority of another Member State disagrees, that
competent authority may refer the matter back to ESMA, which may act in accordance with
the powers conferred on it under Article 19 of Regulation (EU) No 1095/2010. ESMA shall
monitor the application of the waivers and shall submit an annual report to the Commission
on how they are applied in practice.
Article 7 of MiFIR
Authorisation of deferred publication
1. Competent authorities shall be able to authorise market operators and investment firms
operating a trading venue to provide for deferred publication of the details of transactions
based on their type or size.
In particular, the competent authorities may authorise the deferred publication in respect of
transactions that are large in scale compared with the normal market size for that share,
depositary receipt, ETF, certificate or other similar financial instrument or that class of share,
depositary receipt, ETF, certificate or other similar financial instrument.
Market operators and investment firms operating a trading venue shall obtain the competent
authority’s prior approval of proposed arrangements for deferred trade-publication, and shall
clearly disclose those arrangements to market participants and the public. ESMA shall
monitor the application of those arrangements for deferred trade-publication and shall submit
an annual report to the Commission on how they are applied in practice.
Where a competent authority authorises deferred publication and a competent authority of
another Member State disagrees with the deferral or disagrees with the effective application
of the authorisation granted, that competent authority may refer the matter back to ESMA,

ESMA REGULAR USE
9
which may act in accordance with the powers conferred on it under Article 19 of Regulation
(EU) No 1095/2010.
Article 9 of MiFIR
2. Before granting a waiver in accordance with paragraph 1, competent authorities shall
notify ESMA and other competent authorities of the intended use of each individual waiver
and provide an explanation regarding their functioning. Notification of the intention to grant
a waiver shall be made not less than four months before the waiver is intended to take effect.
Within two months following receipt of the notification, ESMA shall issue an opinion to the
competent authority in question assessing the compatibility of the waiver with the
requirements established in paragraph 1 and specified in the regulatory technical standards
adopted pursuant to paragraph 5. Where that competent authority grants a waiver and a
competent authority of another Member State disagrees, that competent authority may refer
the matter back to ESMA, which may act in accordance with the powers conferred on it
under Article 19 of Regulation (EU) No 1095/2010. ESMA shall monitor the application of
the waivers and submit an annual report to the Commission on how they are applied in
practice.
Article 11 of MiFIR
Authorisation of deferred publication
1. Competent authorities shall be able to authorise market operators and investment firms
operating a trading venue to provide for deferred publication of the details of transactions
based on the size or type of the transaction.
In particular, the competent authorities may authorise the deferred publication in respect of
transactions that:
(a) are large in scale compared with the normal market size for that bond, structured finance
product, emission allowance or derivative traded on a trading venue, or for that class of
bond, structured finance product, emission allowance or derivative traded on a trading
venue; or
(b) are related to a bond, structured finance product, emission allowance or derivative traded
on a trading venue, or a class of bond, structured finance product, emission allowance or
derivative traded on a trading venue for which there is not a liquid market;
(c) are above a size specific to that bond, structured finance product, emission allowance or
derivative traded on a trading venue, or that class of bond, structured finance product,
ESMA REGULAR USE
10
emission allowance or derivative traded on a trading venue, which would expose liquidity
providers to undue risk and takes into account whether the relevant market participants
are retail or wholesale investors.
Market operators and investment firms operating a trading venue shall obtain the competent
authority’s prior approval of proposed arrangements for deferred trade-publication, and shall
clearly disclose those arrangements to market participants and the public. ESMA shall
monitor the application of those arrangements for deferred trade-publication and shall submit
an annual report to the Commission on how they are used in practice.
1. MiFIR requires ESMA to monitor the application of waivers and the arrangements for
deferred publication for equity and non-equity instruments and to submit an annual
report to the Commission. This report summarises how these arrangements were used
in practice for equity and non-equity instruments in 2020.
2.2 Treatment of the UK data
2. In relation to this report, it is important to highlight that with respect to the exit of the UK
from the EU on 31 December 2020 and taking into account that part of the statistics
based on the trading activity are derived from a data collection of venues carried out in
2021, UK data was excluded from all the statistics presented in this Report.
3. Nevertheless, in order to provide stakeholders with some information on the use of
waivers by UK trading venues in 2020, the report includes a few charts based on the
data provided by UK trading venues to the Financial Instruments Transparency System
(FITRS) for equity instruments that highlight the high share of volume traded under a
waiver on UK trading venues in 2020. It is likely that the data excluding UK data
underestimates the real share of dark trading in the EU after Brexit since some UK
trading venues relocated to the EU. At the same time, the data for 2020 including UK
data is likely to overestimate the share of dark trading after Brexit.
4. A more accurate picture and the net effects of Brexit and the new European trading
landscape will only be visible with the data of 2021, which will also consider re-locations
of trading venues to the EU and eventual trading activity migration to those re-located
entities. ESMA therefore would like to reiterate that 2020 should be considered as a
transitional year. While the data presented in this report provides a valuable overview
of the state of EEA markets it should not be taken as the sole basis for policy
conclusions about the state of dark versus lit trading in the EEA.

ESMA REGULAR USE
11
3 Application of the waivers for equity and equity-like
financial instruments
3.1 Background information
5. Article 3 of MiFIR specifies that market operators and investment firms operating a
trading venue shall make public current bid and offer prices and the depth of trading
interests at those prices which are advertised through their systems for shares,
depositary receipts, ETFs, certificates, and other similar financial instruments traded
on a trading venue.
6. Article 4 of MiFIR allows National Competent Authorities (NCAs) to waive the pre-trade
transparency obligations on equity and equity-like instruments for market operators and
Investment firms subject to meeting certain conditions. In addition, Commission
Delegated Regulation (EU) 2017/587 (RTS 1) specifies further technical requirements
for each type of waiver. In particular:
• Article 4(1)(a) of MiFIR provides that the reference price waiver (RP) can be used
when systems match orders based on a trading methodology by which the
reference price of the financial instrument is derived from the trading venue where
that financial instrument was first admitted to trading or the most relevant market in
terms of liquidity, where that reference price is widely published and is regarded by
market participants as a reliable reference price.
• Article 4(1)(b) of MiFIR provides that the negotiated transactions waiver (NT) can
be used when systems formalise negotiated transactions which are:
a) for liquid instruments made within the current volume weighted spread
reflected on the order book or the quotes of the market makers of the trading
venue operating that system, subject to the conditions set out in Article 5 of
MiFIR (NT1);
b) for illiquid instruments dealt within a percentage of a suitable reference price,
being a percentage and a reference price set in advance by the system operator
(NT2); or
c) subject to conditions other than the current market price of that financial
instrument (NT3).
• Article 4(1)(c) of MiFIR provides that the large in scale waiver (LIS) can be used
when orders are large in scale compared with normal market size.
• Article 4(1)(d) of MiFIR provides that the order management facility waiver (OMF)
can be used when orders are held in an order management facility of the trading
venue pending disclosure.

ESMA REGULAR USE
12
7. Article 4(4) of MiFIR provides that before granting a waiver, NCAs shall notify, not less
than four months before the waiver is intended to take effect, ESMA and other NCAs
of the intended use of each individual waiver and provide an explanation regarding its
functioning. Within two months following receipt of the notification, ESMA shall issue a
non-binding opinion to the NCA in question assessing the compatibility of each waiver
with MiFIR and RTS 1.
8. When issuing such opinions, ESMA and NCAs have encountered several challenges
on the practical application of the legislative text. Therefore, with a view to clarify certain
aspects contained in both Level 1 and Level 2, ESMA has published questions and
answers (Q&As)2 related to transparency and pre-trade transparency waivers issues
that are relevant for stakeholders and market participants as well as an Opinion
providing further guidance on pre-trade transparency waivers3.
9. Article 4(4) of MiFIR further requires ESMA to monitor the application of the waivers
and to submit an annual report to the European Commission on how equity waivers
are applied in practice. This report serves such purpose and includes an analysis based
on waivers for which ESMA issued an opinion in 2020.
3.2 Analysis 1: Statistics on the number of waivers
10. In 2020, ESMA received 19 new waiver notifications from 5 EEA countries (See Annex
I, Table 9 – statistics on waivers received and processed).
11. Considering waiver requests received before 1 January 2020 and assessed in the
period between 1 January and 31 December 2020, ESMA issued in total 29 opinions.
Of those, 27 opinions deemed the proposed waiver functionality compliant with MiFIR
and RTS 1 requirements, while 2 opinions deemed the proposed waiver functionality
non-compliant.
12. As highlighted in the introductory section (paragraph 2), the statistics on waiver
received from the UK were excluded from the overall analysis. However, it is worth
nothing that the UK submitted 6 notifications in 2020, of these waivers request, one
was withdrawn. In total, ESMA issued 6 opinions to the UK FCA in 2020, out of which
one deemed the waiver functionality non-compliant.
13. The 29 waiver notifications for which ESMA issued an opinion in 2020 are the basis of
all the statistics presented in Annex I - Tables Equity Waivers and which are further
analysed in the following.
14. With respect to the 2 non-compliant opinions mentioned above, in one case, the
relevant NCA requested the trading venue to adjust its functionality in accordance with
2https://www.esma.europa.eu/sites/default/files/library/esma70-872942901-35_qas_transparency_issues.pdf 3 https://www.esma.europa.eu/sites/default/files/library/esma70-155-6641_opinion_on_the_assessment_of_pre-trade_transparency_waivers.pdf

ESMA REGULAR USE
13
ESMA’s opinion while in the other case, the waiver was withdrawn.
15. Out of the 29 waiver notifications processed, 23 were for a single waiver type and 6 for
a combination of waivers4. Among the applications for a single type of waiver, the ones
encountered relatively more frequently are for LIS and OMF (see Figure 1). Overall,
the distribution of waiver types is similar to that of 20195.
FIGURE 1: WAIVERS OPINIONS ISSUED IN 2020, STATISTICS PER WAIVER TYPE
16. An analysis of the waiver notifications submitted by each jurisdiction shows that Norway
submitted the largest number of notifications, accounting for 53% of the 19 notifications
submitted in 2020. Hungary followed with 16% and the Netherlands, Ireland and France
accounted for 10.5% each of the total notifications received. In the previous years, the
UK had submitted the largest number of notifications (accounting for 22% in 2018, and
37% in 2019). The high numbers of notifications submitted by Norway is largely a
consequence of the migration of the trading of instruments to a new trading technology
platform.
17. Norway also submitted the largest number of notifications per waiver type. The only
exceptions were LIS waivers, where waivers from Norway, the Netherlands and
Hungary accounted for 25% each of the total. As far as pure RP waivers are concerned,
4 OMF and LIS, RP and LIS, NT1 and NT2, NT 1 and LIS. Combinations of NT waivers are not genuine combinations but, for the purposes of the statistics in this report, they are considered as such. 5 Please note that the total number of opinions considered for the purpose of the Annual Reports varies every year. It is therefore not possible to compare the absolute numbers of opinions issued every year and the comparison hence focusses on relative numbers/percentages.
OMF28%
NT14%
NT27%
NT310%
LIS28%
RP4%
COMBO (OMF+LIS)3%
COMBO (RP+LIS)10%
COMBO (NT1+NT2)3%
COMBO (NT1+LIS)3%
Source: ESMA

ESMA REGULAR USE
14
ESMA received only one waiver request from France. Combination of RP/LIS waivers,
where submitted by France, Iceland and the Netherlands which sent one waiver
request each. (See Annex I, Table 11 – statistics per waiver type).
18. The equity waivers notifications processed in 2020 predominantly covered shares and
ETFs (combined they accounted for 46% of the cases6), followed by instruments treated
as shares (e.g., subscription rights or redemption shares, 29%), depositary receipts
(17%) and certificates (8%) (see Figure 2). The distribution across the different
instruments is similar to that of the previous years, with the exception that waivers for
shares represented 17% in 2020 compared to 44% in 2019 and 27% in 2018 and those
for ETFs represented 17% in 2020 compared to 21% in 2019 and 27% in 2018 (See
Annex I, Table 12 – Statistics per asset class).
FIGURE 2: WAIVERS OPINIONS ISSUED IN 2020, STATISTICS PER ASSET CLASS
19. From the information received in the waiver descriptions, ESMA observed that the most
common types of trading systems operating under a waiver were: continuous order
books systems (82.75% of the cases), any other trading system (6.9%), followed by
request-for-quote (RFQ) systems, periodic auction trading and negotiated trade
systems (all with 3.45% of the total) (see Figure 3 and Annex I, Table 12 – statistics on
trading system using the waivers).
20. The most common types of “any other trading systems” described in the waiver
notifications were continuous order books combined with a periodic auction
6 The cases are calculated as the sum of all occurrences of instruments in the 35 waivers notifications, i.e., 201.
Shares23%
Paid subscribed shares
5%
Certificates8%
DR17%
Subscription rights treated as shares
11%
Interim shares treated as shares
8%
ETFs23%
Redemption shares treated as shares
5%
Source: ESMA

ESMA REGULAR USE
15
functionality.
FIGURE 3: STATISTICS ON TRADING SYSTEM USING THE WAIVER
LIS waivers
21. As outlined above, in 2020 the LIS and the OMF waivers together were the most
frequently assessed type of waivers. More specifically, ESMA processed 13 waivers,
which included 8 single type LIS waiver applications and 5 combinations of waivers
with a LIS element (LIS/RP, OMF/LIS and LIS/NT1). Out of those 13 LIS waivers, 5
referred to pre-arranged transactions, with none of them specifying the form of the pre-
arranged trade, 7 waiver notifications did not cover pre-arranged transactions and 1 did
not specify it (See Annex I, Table 14 – statistics on pre-arranged transactions in LIS
waivers).
22. Last but not least, waiver notifications received for LIS presented a large variety of
formulas used to calculate the size of LIS orders: 5 waivers used the quantity multiplied
by the order price, 4 changed the formula depending on the type of order7, and 4 did
not provide information regarding the formula used.
7 Two of the waivers use for limit orders the order quantity multiplied by the limit price; and for non-limit orders the order quantity multiplied by the reference price. Similarly, one waiver uses quantity multiplied by price (where the latter could be either the current primary market mid-price or closing price at order entry or amendment) for market orders; and quantity multiplied by limit price for limit orders. The last waiver uses order quantity multiplied by limit price for orders that are not pegged; order quantity multiplied for mid-point Primary Best Bid and Offer (PBBO) for orders which are pegged,
Continuous order book
82.75%
Periodic auction3.45%
RFQ3.45%
Any other system6.90%
Negotiated trades3.45%
Source: ESMA

ESMA REGULAR USE
16
OMF waivers
23. In 2020, ESMA assessed 9 OMF waivers, including one waiver combining OMF and
LIS elements. Out of those, 56% of the OMF applications referred to reserve (iceberg)
orders, and 11% to stop loss orders. The remaining 33% related to other types of orders
(See Figure 4 and Table 15 – OMF waivers, statistics per order type).
24. More than half of the OMF waivers processed in 2020 were from Norway (See Annex
I, Table 11 – statistics per waiver type).
25. Last but not least, among the other types of orders, ESMA assessed trailing stop
orders8 and immediate or cancel orders.
FIGURE 4: STATISTICS FOR ORDER TYPES OF OMF WAIVERS
26. As highlighted in the Annual Reports for 2018 and 2019, ESMA agreed to have a broad
reading of the Level 2 provisions regarding the obligation to never allow the execution
of orders in the OMF before their disclosure in the order book in case an aggressive
order on the opposite side of the order book is larger in size than the peak of the reserve
order.
8 A trailing stop order is defined as a stop-market order with a specified dynamic stop limit where, with the entry of the order, an obligatory initial Stop Limit as well as a distance to the reference price, expressed as an absolute value or as a percentage, according to which the Stop Limit will be adjusted dynamically may be entered. If exclusively an initial Stop Limit is entered, the adjustment takes place according to the absolute distance to the Reference. From the time of the entry of the order into the order book, the trading system continually checks the dynamic Stop Limit against the Reference. If the Reference increases - in case of a Trailing Stop Sell Order -, the trading system automatically adjusts the dynamic Stop Limit to fit the requirements. If the Reference decreases, the dynamic Stop Limit remains unchanged. If the Reference reaches or falls below the dynamic Stop Limit, the Trailing Stop Order is triggered. The same applies to Trailing Stop Buy orders.
Iceberg order56%
Stop loss11%
Other33%
Source: ESMA

ESMA REGULAR USE
17
27. This functionality was present in more than 80% of the OMF waiver notifications9
including iceberg orders (it was 50% in 2018 and 2019) (see Annex I, Table 16 –
statistics for the execution of the hidden part of iceberg orders of OMF waivers).
28. According to the description of the functionality for those OMF waivers, in most of the
cases, a pro-rata basis or time priority principles applied for the execution of the hidden
part of the iceberg order.
29. Peak volume randomisation (i.e., randomisation of the quantity of the order) was also
a common feature in OMF waiver applications for iceberg orders and was included in
all notifications (See Annex I, Table 18 – statistics on randomization of peaks of iceberg
orders in OMF waivers). However, price peak randomisation was not used.
NT waivers
30. In 2020, ESMA assessed 8 notifications for NT waivers, including 6 applications for a
single type of NT waivers: 1 for NT1, 2 for NT2 and 3 for NT3. Furthermore, of the 2
notifications for combinations of NT waivers processed, 1 is for NT1 and NT2, and
another for NT1 and LIS type of waivers (See Annex I, Table 11 – statistics per waiver
type).
31. Among the waiver notifications received for NT1, the current volume weighted spread
was, in all cases, calculated from the order book. (See Annex I, Table 19 – statistics
on what the current volume weighted spread is reflected on for NT1 waivers).
32. Despite having received only 3 10 waivers notifications for NT2, those notifications
presented a variety of suitable reference prices and percentages within which the
negotiated transaction might be formalised. More specifically, one of the NT2 waiver
notifications analysed referred to having a 12% variation from the last executed trade
for shares, depositary receipts and ETFs, and a variation of 20% for other instruments.
In another case, it was noted that the actual percentage used depends on the
instrument and is subject to change from time to time.
33. Finally, waivers notifications for NT3 usually covered multiple circumstances among
those specified in Article 6 of RTS 1. When notifying a single circumstance, similarly to
what was observed in 2019, NCAs referred, in 2 of the notifications, to waivers where
the negotiated trade is executed by reference to a volume-weighted average price
(Article 6(a) of RTS 1). Furthermore, ESMA also received one waiver notification under
Article 6(c) of RTS 1 (the trade is contingent on the purchase, sale, creation or
redemption of a derivative contract where all the components of the trade are meant to
be executed as a single lot).
9 Please consider the low number of waivers notifications. 10 Including the combination NT1 and NT2.

ESMA REGULAR USE
18
RP waivers
34. In 2020, ESMA assessed 4 notifications for RP waivers, including combinations of
waivers with a RP element. As far as the reference price used is concerned, in 3
notifications the reference price used was the mid-point within the current bid and offer
prices and in another case the mid-point within the current bid and offer prices and,
when not available, the opening or closing price of the relevant trading session.
35. Furthermore, with reference to the market from which the reference price was taken
from, in 3 cases the reference price could be taken either from the trading venue of first
admission to trading or from the most relevant market in terms of liquidity and in one
case from the trading venue of first admission only.
3.3 Analysis 2: Statistics on the volumes executed under the
waivers
36. Differently from last year, when ESMA carried out a data collection exercise from
trading venues, ESMA analysed the use of the waivers for equity instruments using
FITRS data which provides an overview of the overall trading activity executed under
all the waivers, with the exception of the OMF waiver which is not reflected in FITRS
data. The volumes refer to the trading activity executed on regulated markets (RMs)
and multilateral trading facilities (MTFs) only. However, data from the Polish trading
venues is not included since the Polish Financial Supervision Authority (the “KNF”) it is
a non-delegating NCA in the context of the Delegation Agreement which empowers
ESMA to perform the annual transparency calculations.
37. In particular, 140 segment MICs of RMs and MTFs from 28 different jurisdictions
recorded trading activity in 2020. As mentioned in paragraph 2.2, trading activity
executed on UK trading venues was excluded.
38. Last but not least, the data on the trading volume reflects all the waivers in use in 2020,
i.e. it includes the trading activity related to all the waivers in use since 1 January 2018
(or even earlier) and not only to those that were notified and started to be used in 2020.
3.3.1 Total turnover and total number of transactions executed in Y2020
39. According to the data and similarly to last year, the on-venue trading in shares
accounted for 88% of the total turnover, over the period 1 January – 31 December
2020, followed by ETFs (11%). As it can be noted in Figure 5, trading in other equity-
like financial instruments (and depositary receipts) was marginal and accounted for
only about 1% of the total turnover.

ESMA REGULAR USE
19
FIGURE 5: TOTAL TURNOVER EXECUTED IN Y2020, PER ASSET CLASS
40. The predominance of shares was even more evident in the analysis of the total number
of transactions where they represented almost the total (96%) of the total number of
transactions executed in 2020 (see Figure 6).
FIGURE 6: TOTAL NUMBER OF TRANSACTIONS EXECUTED IN Y2020, PER ASSET CLASS
3.3.2 Total turnover and total number of transactions executed under the
waivers in Y2020
41. When analysing the total turnover and the number of transactions traded under a
waiver per asset class, shares and ETFs were by far the most traded types of
instruments as they together represented 99% of the turnover (see Figure 7) and 98%
of the transactions executed under a waiver in 2020 (See Figure 8).
88%
11%1% 0%
SHRS ETFS DPRS OTHR
96%
3% 1% 0%
SHRS ETFS DPRS OTHRSource: ESMA, FITRS
Source: ESMA, FITRS

ESMA REGULAR USE
20
FIGURE 7: TOTAL TURNOVER EXECUTED UNDER A WAIVER IN Y2020, PER ASSET CLASS
FIGURE 8: TOTAL NUMBER OF TRANSACTIONS EXECUTED UNDER A WAIVER IN Y2020, PER
ASSET CLASS
42. When looking at the total turnover under a waiver in relation to the total turnover
(second column in Table 1), the asset class with the highest percentage of turnover
traded in the dark was the one of ETFs (39%), followed by other equity-like financial
instruments (5%), depositary receipts (3%), and shares (3%). Comparing these figures
with those of last year (fourth column in Table 1, which includes the UK data), it can be
inferred that a large portion of dark trading was executed on UK venues which is now
out of scope of the analysis. However, this year’s figures might be underestimating dark
trading. In order to provide a complete picture, the same percentages including the UK
data are also provided for the year 2020 (third column in Table 1). From these figures
it can be inferred that dark trading has a decreasing trend but very limited. A more
34.4%
65.1%
0.5% 0.0%
SHRS ETFS DPRS OTHR
92.9%
4.7% 2.3% 0.1%
SHRS ETFS DPRS OTHRSource: ESMA, FITRS
Source: ESMA, FITRS

ESMA REGULAR USE
21
accurate picture of the landscape of dark trading in the EEA after Brexit should be
available with the data of 2021 when the trading activity recorded on UK venues which
relocated to the EU will also be fully represented.
43. ESMA is aware that the statistics related to the year 2019 presented in the fourth
column (which include UK venues) of Table 1 do not match with those provided in the
context of last year’s report. However, such difference can be explained by the fact that
the data used last year did not come from FITRS but rather from an ad-hoc data
collection directed at trading venues. More specifically, not all trading venues
contributed to last year’s data collection. Furthermore, the data collection, since
granular at waiver type, also included data on the use of the OMF waiver. This
information is currently not included in the data reported to FITRS.
44. Therefore, in order to make the figures more comparable and to keep a consistent
approach between the statistics presented in Table 1, ESMA decided to also provide
the 2019 figures using FITRS data.
45. In this context, ESMA would like to reiterate that 2020 should be considered as a
transitional year. While the data presented in this report should still be considered as
valuable indicator of the state of EEA markets it should not be used as the sole basis
for policy conclusions about the evolution of dark versus lit trading in the EEA.
TABLE 1: TOTAL TURNOVER EXECUTED UNDER A WAIVER IN Y2020 AND Y2019 IN RELATION
TO TOTAL TURNOVER, PER ASSET CLASS
% Turnover executed under the waiver for the asset class / Total turnover executed in
the EEA for the asset class Y2020(*) Y2020(**) Y2019(**)
Shares 2.65% 28.89% 29.56%
ETFs 39.25% 56.39% 61.00%
Depositary Receipts 2.94% 28.07% 33.34%
Other equity-like instruments 4.81% 34.36% 35.29%
TOTAL 6.76% 31.98% 32.58%
Source: ESMA, FITRS (*) The data to calculate these percentages does NOT include UK data (**) The data to calculate these percentages includes UK data.
46. More specifically, as far as ETFs are concerned, it has to be noted that despite the
percentage of dark trading has decreased from 2019 (fourth column in Table 1) to 2020
(second column in Table 1 which excludes the UK data) it is still high. The limited
transparency of the ETF market was highlighted in the CP on the Level 1 Review for
ESMA REGULAR USE
22
equity and equity-like instruments11 and the related Final Report12 which led ESMA, in
order to increase the transparency in this market, to propose in the CP of the RTS 1
and 2 review13 to increase the pre- and post-trade transparency LIS threshold.
47. With respect to the venue of execution, it can be noted that the majority of turnover
traded under a waiver was executed on MTFs and the rest on RMs, 72% and 28%
respectively. The percentages in terms of number of transactions executed under a
waiver on MTFs and RMs are 39% and 61% respectively. From this it can be inferred
that the average size of transactions on RMs benefitting from a waiver is lower than the
one on MTFs. This might be influenced by the high percentage of trading on ETFs on
MTFs. Indeed, while on RMs the trading under the waiver is split 40-60% in favour of
shares, on MTFs, the proportion is 75-25% in favour of ETFs, which are characterised
by a much higher average trade size compared to shares (millions of EUR vs.
thousands of EUR).
3.3.3 Total turnover executed under the waivers in Y2020 across Member States
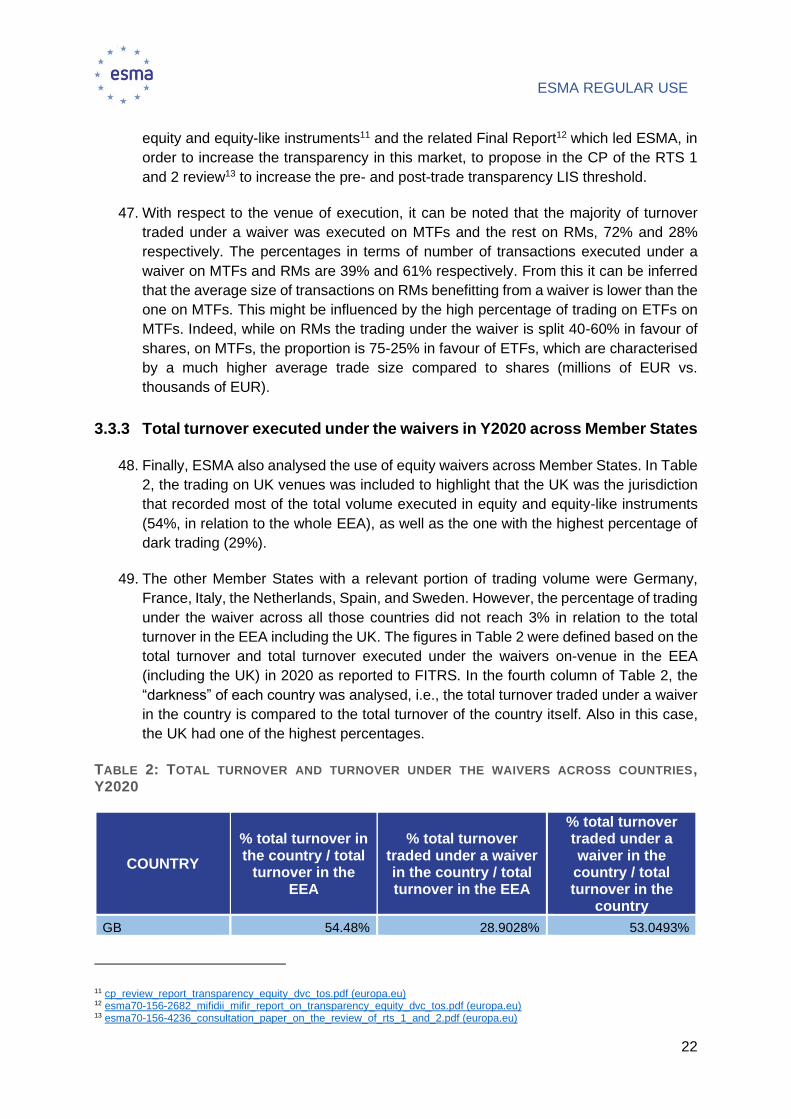
48. Finally, ESMA also analysed the use of equity waivers across Member States. In Table
2, the trading on UK venues was included to highlight that the UK was the jurisdiction
that recorded most of the total volume executed in equity and equity-like instruments
(54%, in relation to the whole EEA), as well as the one with the highest percentage of
dark trading (29%).
49. The other Member States with a relevant portion of trading volume were Germany,
France, Italy, the Netherlands, Spain, and Sweden. However, the percentage of trading
under the waiver across all those countries did not reach 3% in relation to the total
turnover in the EEA including the UK. The figures in Table 2 were defined based on the
total turnover and total turnover executed under the waivers on-venue in the EEA
(including the UK) in 2020 as reported to FITRS. In the fourth column of Table 2, the
“darkness” of each country was analysed, i.e., the total turnover traded under a waiver
in the country is compared to the total turnover of the country itself. Also in this case,
the UK had one of the highest percentages.
TABLE 2: TOTAL TURNOVER AND TURNOVER UNDER THE WAIVERS ACROSS COUNTRIES, Y2020
COUNTRY
% total turnover in the country / total
turnover in the EEA
% total turnover traded under a waiver in the country / total turnover in the EEA
% total turnover traded under a waiver in the
country / total turnover in the
country
GB 54.48% 28.9028% 53.0493%
11 cp_review_report_transparency_equity_dvc_tos.pdf (europa.eu) 12 esma70-156-2682_mifidii_mifir_report_on_transparency_equity_dvc_tos.pdf (europa.eu) 13 esma70-156-4236_consultation_paper_on_the_review_of_rts_1_and_2.pdf (europa.eu)

ESMA REGULAR USE
23
AT 0.22% 0.0000% 0.0000%
BE 0.71% 0.0018% 0.2557%
BG 0.00% 0.0000% 0.0000%
CY 0.00% 0.0000% 0.0000%
CZ 0.03% 0.0000% 0.0000%
DE 13.96% 0.0002% 0.0017%
DK 1.57% 0.1158% 7.3569%
EE 0.00% 0.0002% 9.6319%
ES 2.70% 0.0057% 0.2100%
FI 1.00% 0.0483% 4.8432%
FR 8.44% 0.2469% 2.9238%
GR 0.10% 0.0116% 11.4884%
HR 0.00% 0.0005% 19.1700%
HU 0.06% 0.0000% 0.0231%
IE 1.11% 0.5687% 51.1364%
IS 0.03% 0.0155% 61.5583%
IT 4.47% 0.0732% 1.6368%
LT 0.00% 0.0001% 11.0946%
LU 0.00% 0.0000% 0.0000%
LV 0.00% 0.0000% 13.9538%
MT 0.00% 0.0000% 0.0000%
NL 6.35% 1.6966% 26.7101%
NO 0.90% 0.0194% 2.1438%
PT 0.18% 0.0001% 0.0798%
RO 0.02% 0.0022% 13.4378%
SE 3.66% 0.2684% 7.3414%
SI 0.00% 0.0001% 5.1625%
SK 0.00% 0.0000% 0.0000%
TOTAL 100.00% 31.98% 31.98% Source: ESMA, FITRS
4 Application of proposed arrangements for trade-deferred
publication on equity and equity-like instruments
4.1 On-venue transactions
4.1.1 Background information
50. Article 6(1) of MiFIR provides that market operators and investment firms operating a
trading venue shall make public the price, volume and time of the transactions executed
in respect of shares, depositary receipts, ETFs, certificates and other similar financial

ESMA REGULAR USE
24
instruments traded on that trading venue. Market operators and investment firms
operating a trading venue shall make details of all such transactions public as close to
real-time as technically possible.
51. However, Article 7 of MiFIR allows NCAs to authorise market operators and investment
firms operating a trading venue to provide for deferred publication of the details of
transactions based on their type or size. Furthermore, RTS 1 specifies the additional
technical requirements that should be satisfied for deferred publications. In particular,
Article 15 of RTS 1 specifies the sizes of transactions that are large in scale compared
with the normal market size and for which deferred publication is allowed. NCAs may
authorise the deferred publication in respect of transactions that are LIS compared with
the normal market size for that share, depositary receipt, ETF, certificate or other
similar financial instrument.
52. Market operators and investment firms need to obtain the NCA’s prior approval of
proposed arrangements for deferred trade-publication and shall clearly disclose those
same arrangements. Unlike the application for the use of waivers from pre-trade
transparency, ESMA does not issue an opinion assessing the compatibility of the
deferral with the requirements established in Article 7 of MiFIR and RTS 1.
53. Following Article 7(1) of MiFIR, ESMA has to monitor the application of the deferral
arrangements and submit this information to the Commission by describing how they
are applied in practice.
4.1.2 Analysis of the application of the deferral regime on-venue
54. As already mentioned in section 3.3 above, differently from last year, ESMA did not
carry out a data collection directed to trading venues but leveraged on the data included
in FITRS to analyse the application of the deferral regime to equity and equity-like
instruments on RMs and MTFs. The data from the Polish trading venues is not included
since, as already mentioned, the “KNF” it is a non-delegating NCA in the context of the
Delegation Agreement which empowers ESMA to perform the annual transparency
calculations. Furthermore, as also highlighted in the introductory section (paragraph 2),
the data from the UK was excluded from the overall analysis.
55. The data on the trading volume reflects the deferral regime in place at the moment of
the execution of the transactions in 2020.
56. The turnover subject to the LIS deferral accounted for 3% of the total turnover in 2020.
In terms of number of transactions, the turnover subject to the LIS deferral did not reach
1%. However, as already mentioned, these figures might underestimate the volume
benefitting from the deferral given the exclusion of UK data. A more accurate picture
should be expected with the data of 2021 when the trading activity recorded on UK
venues which relocated to the EU will also be fully represented.
57. The percentage of turnover subject to deferrals per asset class, compared to the total
turnover subject to deferrals recorded over the year 2020 per asset class is presented

ESMA REGULAR USE
25
in Figure 9 below. It is evident that ETFs were those with the highest percentage of
trading subject to the LIS deferral. In terms of number of transactions, shares recorded
99% of the total (See Figure 10).
FIGURE 9: PERCENTAGE OF TURNOVER SUBJECT TO LIS DEFERRAL PER ASSET CLASS OVER
TOTAL TURNOVER SUBJECT TO LIS DEFERRAL ACROSS ASSET CLASSES, Y2020
FIGURE 10: PERCENTAGE OF NUMBER OF TRANSACTIONS SUBJECT TO LIS DEFERRAL PER
ASSET CLASS OVER TOTAL NUMBER OF TRANSACTIONS SUBJECT TO LIS DEFERRAL ACROSS
ASSET CLASSES, Y2020
58. The total turnover executed subject to the LIS deferral over the total turnover (lit and
dark) for each respective asset class was analysed (See Table 3). ETFs were the
26%
74%
0% 0%
SHRS ETFS DPRS OTHRSource: ESMA, FITRS
99.44%
0.47% 0.06% 0.03%
SHRS ETFS DPRS OTHRSource: ESMA, FITRS

ESMA REGULAR USE
26
instruments with the highest percentage (18%) followed by shares and other equity-
like financial instruments (around 1% each) (See second column of Table 3 which
excludes the UK data).
59. Comparing these figures with those of last year (See fourth column of Table 3 which
includes the UK data), it can be inferred that a large portion of dark trading was
executed on UK venues which is now out of scope of the analysis. However, this year’s
figures might be underestimating dark trading. In order to provide a complete picture,
the same percentages including the UK data are also provided for year 2020 (third
column in Table 3). From these figures it can be inferred that post-trade dark trading
might appear to have a decreasing trend but to a much smaller extent. A more accurate
picture should be available with the data of 2021 when the trading activity recorded on
UK venues which relocated to the EU will also be fully represented.
60. As mentioned above, given the transitional nature of the year 2020, ESMA would like
to reiterate that, while the data presented in this report still provides an overview of the
state of the EEA markets it should not be taken as the sole basis for policy conclusions
about the state of dark versus lit trading in the EEA.
TABLE 3: TOTAL TURNOVER EXECUTED SUBJECT TO THE LIS DEFERRAL IN Y2020 AND Y2019
IN RELATION TO TOTAL TURNOVER, PER ASSET CLASS
% Turnover executed subject to LIS deferral for the asset class / Total turnover
executed in the EEA for the asset class Y2020(*) Y2020(**) Y2019(**)
Shares 0.79% 10.59% 13.34%
ETFs 17.61% 26.83% 31.08%
Depositary Receipts 0.49% 15.63% 20.79%
Other equity-like instruments 1.32% 7.21% 16.12%
TOTAL 2.67% 12.49% 15.15%
Source: ESMA, FITRS (*) The data to calculate these percentages does NOT include UK data (**) The data to calculate these percentages includes UK data
61. More specifically, as far as ETFs are concerned, similarly to the pre-trade transparency,
it has to be noted that despite the percentage of post-trade dark trading has decreased
from 2019 (fourth column in Table 3 which includes the UK data) to 2020 (second
column in Table 3 which excludes the UK data), it remains still relevant. The limited
transparency of the ETF market was highlighted in the CP on the Level 1 Review for
equity and equity-like instruments14 and the related Final Report15 which led ESMA, in
14 cp_review_report_transparency_equity_dvc_tos.pdf (europa.eu) 15 esma70-156-2682_mifidii_mifir_report_on_transparency_equity_dvc_tos.pdf (europa.eu)

ESMA REGULAR USE
27
order to increase the transparency in this market, to propose in the CP of the RTS 1
and 2 review 16 to increase the pre- and post-trade transparency LIS threshold (See
Table 3).
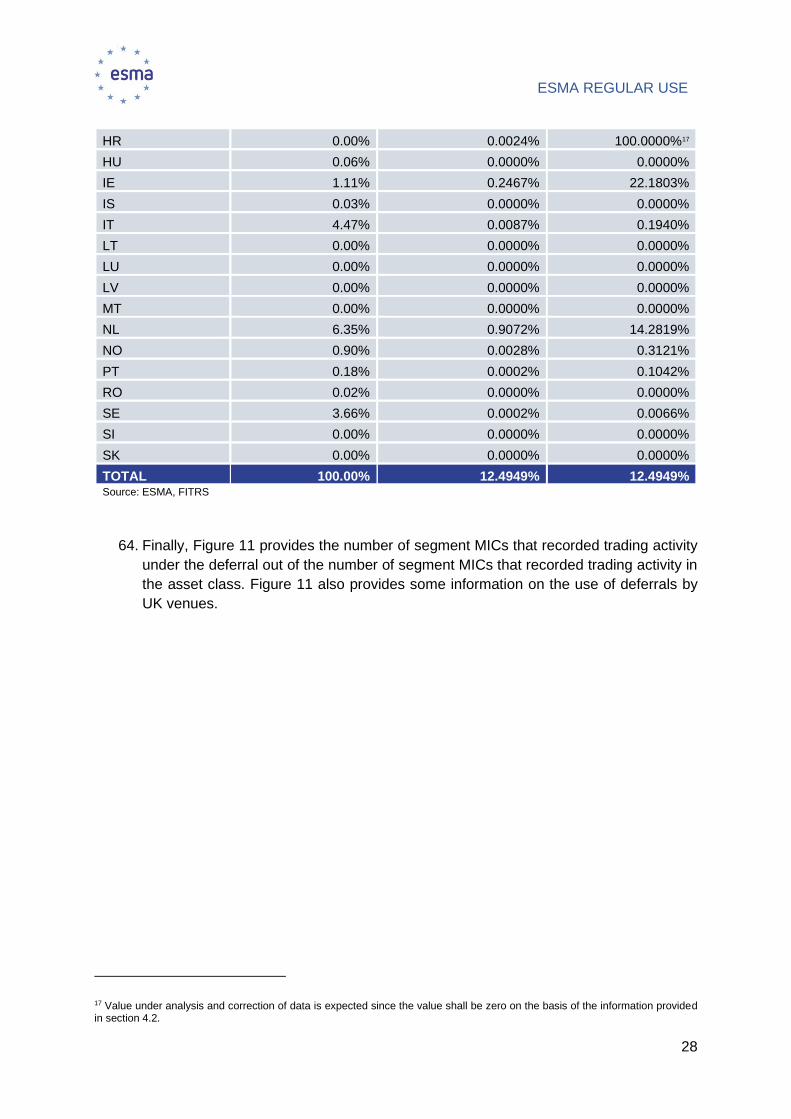
62. Finally, ESMA also analysed the use of the LIS equity deferral across Member States.
In Table 4 the trading on UK venues was included to highlight that the UK was the
jurisdiction that recorded most of the total volume executed in equity and equity-like
instruments (54%, in relation to the whole EEA), as well as the one with the highest
percentage of dark trading (11%).
63. The other Member States with a relevant portion of trading volume were Germany,
France, Italy, the Netherlands, Spain, and Sweden. However, the percentage of trading
subject to deferral across all those countries did not reach 1% on an aggregate basis.
The figures in Table 4 were defined based on the total turnover and total turnover
executed subject to the LIS deferral on-venue in the EEA (including the UK) in 2020 as
reported to FITRS. In the fourth column of Table 4, the “darkness” of each country was
analysed (the total turnover traded subject to LIS deferral in the country is compared
to the total turnover of the country itself) where it is evident that in some countries the
use of the LIS deferrals is much wider if compared to the overall turnover executed
domestically. Also in this case, the UK had one of the highest percentages.
TABLE 4: TOTAL TURNOVER AND TURNOVER SUBJECT TO THE LIS DEFERRAL ACROSS
COUNTRIES, Y2020
COUNTRY
% total turnover in the country / total
turnover in the EEA
% total turnover traded subject to LIS
deferral in the country / total turnover in the
EEA
% total turnover traded subject to LIS deferral in the
country / total turnover in the
country
GB 54.48% 11.2803% 20.7044%
AT 0.22% 0.0000% 0.0000%
BE 0.71% 0.0020% 0.2818%
BG 0.00% 0.0000% 0.0000%
CY 0.00% 0.0003% 58.6910%
CZ 0.03% 0.0000% 0.0000%
DE 13.96% 0.0002% 0.0017%
DK 1.57% 0.0040% 0.2522%
EE 0.00% 0.0000% 0.0000%
ES 2.70% 0.0000% 0.0000%
FI 1.00% 0.0000% 0.0046%
FR 8.44% 0.0099% 0.1171%
GR 0.10% 0.0000% 0.0000%
16 esma70-156-4236_consultation_paper_on_the_review_of_rts_1_and_2.pdf (europa.eu)
ESMA REGULAR USE
28
HR 0.00% 0.0024% 100.0000%17
HU 0.06% 0.0000% 0.0000%
IE 1.11% 0.2467% 22.1803%
IS 0.03% 0.0000% 0.0000%
IT 4.47% 0.0087% 0.1940%
LT 0.00% 0.0000% 0.0000%
LU 0.00% 0.0000% 0.0000%
LV 0.00% 0.0000% 0.0000%
MT 0.00% 0.0000% 0.0000%
NL 6.35% 0.9072% 14.2819%
NO 0.90% 0.0028% 0.3121%
PT 0.18% 0.0002% 0.1042%
RO 0.02% 0.0000% 0.0000%
SE 3.66% 0.0002% 0.0066%
SI 0.00% 0.0000% 0.0000%
SK 0.00% 0.0000% 0.0000%
TOTAL 100.00% 12.4949% 12.4949% Source: ESMA, FITRS
64. Finally, Figure 11 provides the number of segment MICs that recorded trading activity
under the deferral out of the number of segment MICs that recorded trading activity in
the asset class. Figure 11 also provides some information on the use of deferrals by
UK venues.
17 Value under analysis and correction of data is expected since the value shall be zero on the basis of the information provided in section 4.2.

ESMA REGULAR USE
29
FIGURE 11: SEGMENT MICS THAT APPLIED THE LIS DEFERRAL, PER ASSET CLASS, Y2020
4.2 OTC transactions
4.2.1 Background information
65. Article 20(1) of MiFIR provides that investment firms that, either on own account or on
behalf of clients, conclude transactions in shares, depositary receipts, ETFs,
certificates and other similar financial instruments traded on a trading venue, make
public the volume and price of those transactions and the time at which they were
concluded. This information should be made public through an APA.
66. Article 20(2) of MiFIR allows for deferred publication of post-trade information for
certain categories of transactions, where NCAs have authorised the use of deferrals
pursuant to Article 7 of MiFIR.
67. Article 15 of RTS 1 specifies the sizes of transactions that are large in scale compared
with the normal market size and for which deferred publication is allowed.
4.2.2 Analysis of the application of the deferral regime off-venue
68. ESMA undertook a data collection exercise among NCAs in order to analyse how
deferrals were used in practice throughout 2020. ESMA received the requested
149
65
63
51
30
10
6
3
32
31
27
27
9
9
6
5
0 20 40 60 80 100 120 140 160
SHRS
ETFS
DPRS
OTHR
Num of GB-MICs with postive trading volume under the LIS deferral in 2020
Num of GB-MICs trading the asset class
Num of EU30-MICs with postive trading volume under the LIS deferral in 2020
Num of EU30-MICs trading the asset class
Source: ESMA, FITRS

ESMA REGULAR USE
30
information from 28 out of 30 NCAs from the EEA18. However, one NCA stated that in
its jurisdiction MiFID II/MiFIR was not implemented in 2020 and therefore no relevant
information could be provided19.
69. In most of the cases, deferrals were allowed to trading venues and Investment
firms/systematic internalisers. However, it should be noted that NCAs broadly applied
the same regime across the different types of equity instruments. The differences found
in
70. Figure 12Figure 12 below on the number of NCAs allowing for deferrals per type of
instrument were due to some jurisdictions not having trading venues making some
financial instrument types available for trading and, not due to NCAs applying discretion
by allowing for the use of deferrals to only some types of instruments.
71. Out of the 27 NCAs responding to the survey, only in 5 jurisdictions deferrals were not
in place namely, Bulgaria, Croatia, Latvia, Lithuania, and Slovakia (or alternatively, in
some of these NCAs’ jurisdictions, there was no trading venue trading some of the
instruments and therefore the regime could not be applied). ESMA also observed that
3 NCAs (Czech Republic, Estonia and Poland) had not yet taken a decision on the
deferral regime applicable in their jurisdiction.
72. Although the majority of NCAs allowed for deferrals, it is possible to observe that the
number of jurisdictions where deferrals were not applied in practice and those where
deferrals were applied was almost identical. More specifically, deferrals were applied20
in a number of jurisdictions ranging from 8 to 12 (12 for shares and ETFs, 10 for
depositary receipts and other similar financial instruments and 8 for certificates) while
not applied21 in a similar number of jurisdictions (12 for shares, 10 for ETFs, depositary
receipts and certificates and 9 for other similar financial instruments). For the remaining
NCAs, either a decision was not taken yet, or deferrals were not applicable as there
was no trading venue trading such instruments.
IN ITS DATA COLLECTION, ESMA ALSO GATHERED INFORMATION FROM THOSE NCAS ALLOWING THE
APPLICATION OF THE DEFERRAL REGIME ON WHETHER THEY AUTOMATICALLY ALLOWED IT OTC FOR
SYSTEMATIC INTERNALISERS/INVESTMENT FIRMS WITH A GENERAL RULING (OPTION A) OR IF AN
AUTHORISATION FOR THE INDIVIDUAL INVESTMENT FIRM/SYSTEMATIC INTERNALISERS TO BE ABLE TO
18 ESMA received no information on the applicable deferral regime in Cyprus and Lichtenstein. 19 The country of Iceland is the one excluded from the statistics presented in this section of the report. 20 This includes the following options: “Allowed to TVs, applied by TVs but not applied by IFs/SIs (including because there are no IFs and SIs in the jurisdiction)” and “Allowed and applied by TVs and IFs/SIs”. 21 This includes the following options: “Allowed to TVs but not applied by TVs and IFs/SIs”, “Not allowed to TVs and to IFs/SIs” and “Allowed but not applied because there are no IFs and SIs”.

ESMA REGULAR USE
31
APPLY THE DEFERRAL REGIME WAS REQUIRED (OPTION B). OUT OF THE 25 NCAS WHICH
RESPONDED TO THIS QUESTION, 16 APPLIED OPTION A AND 9 OPTION B. MORE DETAILS ARE
PROVIDED IN
73. Figure 12 below.
FIGURE 12: APPLICATION OF THE DEFERRAL REGIME PER TYPE OF FINANCIAL
INSTRUMENT

ESMA REGULAR USE
32
2
6
5
10
3
-
1
2
5
4
10
3
2
1
1
6
3
9
3
4
1
1
5
4
7
3
6
1
2
5
3
8
3
5
1
- 5 10 15
YES - Allowed to TVs, applied by TVs but not appliedby IFs/SIs (inlcuding because there are no IFs and SIs
in the jurisdiction)
YES - Allowed to TVs but not applied by TVs andIFs/Sis
NO - Not allowed to TVs and to IFs/Sis
YES - Allowed and applied by TVs and IFs/Sis
Decision has not been taken yet
There is no TVs trading these instruments.Consequently, it cannot be applied
YES - Allowed but not applied because there are no IFsand Sis
Other similar finacial instruments Certificates Depositary receipts ETFs Shares
Source: ESMA, Data collection from NCAs
Number of CAs

ESMA REGULAR USE
33
5 Application of the waivers for non-equity financial
instruments
5.1 Background information
74. Article 8 of MiFIR specifies that market operators and investment firms operating a
trading venue should make public current bid and offer prices and the depth of trading
interests at those prices which are advertised through their systems for bonds,
structured finance products, emission allowances and derivatives traded on a trading
venue. This requirement also applies to actionable indications of interest. Market
operators and investment firms operating a trading venue should make that information
available to the public on a continuous basis during normal trading hours. Article 8 of
MiFIR exempts from the publication obligation those derivative transactions of non-
financial counterparties which are objectively measurable as reducing risks directly
relating to the commercial activity or treasury financing activity of the non-financial
counterparty or of that group.
75. Article 9 of MiFIR, as further specified in Commission Delegated Regulation (EU)
2017/583 (RTS 2), provides for the cases when NCAs can waive the pre-trade
transparency obligations for market operators and investment firms. In particular:
• Article 9(1)(a) of MiFIR provides that the LIS waiver and the OMF waiver can be
respectively used for orders which are large in scale compared to normal market
size (LIS) and orders held in an order management facility of the trading venue
pending disclosure (OMF).
• Article 9(1)(b) of MiFIR provides that the size specific to the financial instrument
(SSTI) waiver can be used for actionable indications of interest in request-for-quote
and voice trading systems that are above a size specific to the financial instrument.
• Article 9(1)(c) of MiFIR provides that the illiquid waiver (ILQ), can be used for
derivatives which are not subject to the trading obligation as specified in Article 28
of MiFIR and other financial instruments for which there is not a liquid market.
• Article 9(1)(d) of MiFIR provides that exchange for physicals (EFPs) can benefit
from a waiver.
• Article 9(1)(e) of MiFIR provides for the package waiver (Package), which can be
used for package orders that meet one of the following conditions:
a) at least one of its components is a financial instrument for which there is not
a liquid market, unless there is a liquid market for the package order as a whole
(ILQ Package);

ESMA REGULAR USE
34
b) at least one of its components is large in scale compared with the normal
market size, unless there is a liquid market for the package order as a whole
(LIS Package); or
c) all of its components are executed on a request-for-quote or voice system
and are above the size specific to the instrument (SSTI Package).
76. The criteria determining whether a package has a liquid market as a whole are specified
in Commission Delegated Regulation (EU) 2017/2194 (RTS on package orders).
77. Article 9(2) of MiFIR states that before granting a waiver, NCAs shall notify, not less
than four months before the waiver is intended to take effect, ESMA and other NCAs
of the intended use of each individual waiver and provide an explanation regarding its
functioning. Within two months following receipt of the notification, ESMA should issue
a non-binding opinion to the NCA in question assessing the compatibility of each waiver
with MiFIR and RTS 2 requirements.
78. ESMA published numerous Q&As on the most relevant issues identified22 in non-equity
waivers applications over the last couple of years and an opinion providing further
guidance on waivers from pre-trade transparency23.
5.2 Analysis 1: Statistics on the number of waivers
79. ESMA received 44 new non-equity waiver notifications in 2020 from 11 EEA countries
(see Annex II - Tables Non-equity Waivers Table 20 – statistics on waivers received
and processed). Norway submitted the largest number of notifications (20% of the total)
followed by Italy (18%), while Finland, Sweden, and the Netherlands accounted for
11%, 11% and 9% of waivers notifications, respectively. Among the waiver notifications
received, 1 was withdrawn.
80. Also considering waiver notifications received before 2020, ESMA issued in total 127
opinions in 2020. Of the total waivers processed, 112 opinions deemed the proposed
waiver functionality compliant, and 15 opinions deemed the functionality non-compliant
(or partially non-compliant) with MiFIR and RTS 2 requirements. These 127 waivers for
which ESMA issued an opinion in 2020 are the basis of the statistics presented in this
section of the report (see Annex II - Tables Non-equity Waivers).
81. As outlined above, the statistics on waiver received from the UK were excluded from
the overall analysis. However, it is worth nothing that the UK had the largest number of
notifications in 2020 (18 notifications which accounted for 29% of the total). Of these
waivers request, 2 were withdrawn and, considering also notifications received before
1 January 2020, ESMA issued 60 opinions to the UK FCA in 2020, out of which 13
deemed the waiver functionality non-compliant. In this context, ESMA followed up with
22 https://www.esma.europa.eu/sites/default/files/library/esma70-872942901-35_qas_transparency_issues_0.pdf 23 https://www.esma.europa.eu/press-news/esma-news/esma-provides-guidance-waivers-pre-trade-transparency-0

ESMA REGULAR USE
35
the FCA which clarified that it did not require the venues concerned to adapt the
waivers’ functionalities in light of ESMA’s negative opinions.
82. With respect to the 15 non-compliant opinions mentioned above ESMA checked with
the NCAs whether they have taken (or intended to take) any actions in light of ESMA’s
negative opinions for 13 waivers24. For these waivers, an informal check between
ESMA and the NCAs was sufficient to confirm that the trading venues not meeting the
requirements set out in MiFIR and RTS 2, adapted or are in the process of adapting
their functionality in accordance with ESMA’s opinions.
83. ESMA assessed 124 waiver notifications that were for a single waiver type and 3
notifications including waiver combination25 and notifications for multipackage order
waivers26. Among all the waiver functionalities that ESMA assessed throughout 2020,
which also included notifications received before 2020, the Netherlands was the
country with the highest number of waiver requests27, followed by Norway, resulting
respectively in 40% and 20% of all opinions issued by ESMA in 2020.
84. Furthermore, among all opinions issued, the requests encountered more frequently
were for the LIS waiver (28%), followed by the illiquid (19%), OMF (16%) and SSTI
(10%) waivers, which accounted together for more than 70% of all waiver notifications
(see Figure 13 and Annex II, Table 20 – statistics on waivers received and processed
and Table 21 – statistics on waivers received and processed).
24 For the remaining 2 opinions, at the time this report being drafted, ESMA is checking with the relevant NCAs to see whether the functionality has been amended in light of the negative opinion. 25 Such applications for combinations are: OMF and LIS waivers. 26 Such applications for multipackage order waivers are: LIS component package order + Illiquid component package order + SSTI component package order. 27 The high number of notifications received from the AFM is mainly due to the relocation of trading venues from the UK to the Netherlands as a consequence of Brexit.

ESMA REGULAR USE
36
FIGURE 13: WAIVERS OPINIONS ISSUED IN 2020, STATISTICS PER WAIVER TYPE
85. The non-equity waivers assessed related to a variety of non-equity instruments,
including predominantly bonds (25%), IR derivatives (12.5%), equity derivatives (12%),
ETCs and ETNs (10.5%), commodity derivatives and C10 derivatives (7% each). (See
Figure 14 and Annex II, Table 23 – statistics per asset class).
FIGURE 14: WAIVERS OPINIONS ISSUED IN 2020, STATISTICS PER ASSET CLASS
OMF16%
ILQ19%
LIS28%
SSTI10%
ILQ PCKG8%
LIS PCKG10%
SSTI PCKG5%
Multi PCKG2%
EFP2%
COMBO1%
Source: ESMA
SFPs6%
Bonds (except ETCs and ETNs)
25%
ETCs and ETNs10.5%
Emission allowances
1%
C10 derivatives7%Securitised derivatives
4.5%
Emission allowance derivatives
2.5%
IR derivatives12.5%
Equity derivatives12%
FX derivatives7%
Commodity derivatives
7%
Credit derivatives5%
Source: ESMA

ESMA REGULAR USE
37
86. From the information provided in the waivers descriptions, the most common types of
trading systems for which a notification was processed were RFQ and any other
systems (including hybrid systems) which appeared in 24% of the notifications each,
followed by continuous order book systems (21%), systems that formalise pre-arranged
trades (15%) and voice trading systems (8%). 4% of notifications were for periodic
auctions, while quote driven systems appeared in only 2% of the cases (See Figure 15
and Annex II, Table 24 - statistics on trading system using the waivers).
FIGURE 15: STATISTICS ON TRADING SYSTEM USING THE WAIVER
87. The Netherlands accounted for the majority of the notifications submitted for continuous
order book systems (59%) and RFQ systems (51%), while the majority of waivers
applying to pre-arranged systems (39%) were from Norway, and those applying to
voice trading systems from Spain (46%).
88. With respect to those notifications referencing any other systems, in 13% of the cases
those were for systems combining features of screen (or screen assisted voice),
periodic/volume match and voice. Notifications including manual trading systems also
accounted for 13% of the total. Other systems observed included RFQ and pre-
arranged, continuous auction and voice trading, order book and voice, continuous
trading and auction, electronic mid-price matching systems, auto-matching, continuous
order book with periodic auction and voice, Electronic Broker Trading Systems (BTS),
Request for Trade (RFT) and Discretionary Central Limit Order Book (DCLOB) (Annex
II, Table 25 – statistics on trading system using the waives for any other systems
Continuous order book21%
Quote driven2%
Periodic auction4%
RFQ24%
Voice8%
Any other system (including hybrid)
24%
Prearranged (also called negotiated
trades)15%
Does not say2%
Source: ESMA

ESMA REGULAR USE
38
(including hybrid) (1/2) and Table 26 – statistics on trading system using the waives for
any other systems (including hybrid) (2/2)).
LIS waivers
89. Of the 51 LIS waiver notifications28 for which an opinion was issued, 31% included pre-
arranged transactions and Norway accounted for 43% of those pre-arranged LIS
waivers (See Annex II, Table 27 – statistics on pre-arranged transactions in LIS waivers
and combinations thereof).
90. ESMA also assessed one OMF and LIS waiver combination where the LIS applied to
the hidden part of the iceberg order.
Illiquid waivers
91. Among all 127 waiver notifications processed, 36 (i.e., 28%) were for illiquid waivers29.
More than one third of those notifications were received from the Netherlands, followed
by Norway (14%) and Spain (11%).
OMF waivers
92. ESMA processed 21 waivers notifications for OMF waivers applications. 30 Iceberg
orders were the most commonly used order type in such applications (48% of OMF
applications), followed by stop loss orders and combinations of iceberg and stop loss
orders (14% each). The remaining notifications covered mainly combinations of
iceberg, stop loss and other orders and other types of orders (9.5 each%) such as
crossing orders, trailing stop orders, one cancels the other orders and others. (See
Figure 16 and Annex II, Table 28 – statistics for order types in OMF waivers).
93. Norway and the Netherlands submitted the majority of OMF waiver notifications (40%
and 35% respectively) and many of them were requested for iceberg orders (See
Annex II, Table 22 – statistics per waiver type and Table 28 – statistics for order types
in OMF waivers).
28 Including package waivers with a LIS component and LIS waiver combinations. 29 Including package waivers with an illiquid component. 30 Including OMF waiver combinations.

ESMA REGULAR USE
39
FIGURE 16: STATISTICS FOR ORDER TYPES IN OMF WAIVERS
94. For the majority of iceberg orders, peaks were released to the order book prior to be
executed (56% of the cases), whilst in the remaining 44% of the cases, execution could
be carried out without disclosure of the peak to the order book when on the opposite
size of the order book there was an aggressive order that was larger than the disclosed
peak (see Annex II, Table 29 – statistics for the execution of the hidden part of iceberg
orders of OMF waivers).
95. Peak volume randomization appeared to be a common feature in OMF waivers for
iceberg orders, being included in 56% of the waivers’ opinions while this did not seem
to be the case for peak price randomisation. More specifically, in most of the waivers
processed (56%) it was not specified whether this feature was used. Finally, the
remaining portion (44%) did not allow for such feature (See Annex II, Table 30 –
statistics on randomization of peaks of iceberg orders in OMF waivers).
96. Last but not least, only 2 notifications processed (representing 10% of the OMF waiver
notifications) allowed for member preferencing (see Annex II, Table 31 - statistics on
member preferencing in OMF waiver) and none of the notifications processed provided
details on whether the price of the hidden order was better or worse than the visible
order.
Iceberg order48%
Stop loss14%
Other9%
Iceberg order + stop loss
14%
Iceberg order + stop loss + other
10%
Iceberg order + other5%
Source: ESMA

ESMA REGULAR USE
40
SSTI waivers
97. ESMA processed 21 SSTI waiver notifications31 of which, 11 were submitted by the
Netherlands and 6 by Italy. In 71% of the cases, the SSTI waivers were requested for
RFQ systems, in 24% for a voice trading system and in 5% of cases for both systems.
98. Among the possible indicative pre-trade prices and methodology of publications the
venue should make available (as per the requirements of Article 5 of RTS 2), in 48%
of the cases a simple average price (SAP) and in 10% of the cases indicative bid and
offer prices were made available, while the best available price (BAP) was made public
in 5% of the cases.
99. However, it is worth nothing that in 38% of the cases, the trading venue did not specify
the indicative price made public. (See Figure 17 and Annex II, Table 32 – statistics on
the indicative price that the venue makes public and the trading system used).
FIGURE 17: STATISTICS ON THE INDICATIVE PRICE THAT THE TRADING VENUE MAKES PUBLIC
EFP and package waivers
31 Including SSTI package waivers and package waivers with an SSTI component.
Simple average48%
Best available price5%
Indicative pre-trade bid and offer prices
9%
Does not say38%
Source: ESMA

ESMA REGULAR USE
41
100. ESMA issued 3 opinions for EFPs and 31 opinions for various types of package
waivers. Of those package waivers, 13 were for LIS packages, 10 for ILQ packages, 6
for SSTI packages and 2 for multipackage waivers (see Annex II, Table 22 – statistics
per waiver type).
101. In the majority of cases, trading venues ensured that only package
orders/transactions that met the definition in MiFIR were accepted by explaining in the
waivers notifications the methodology used for all package orders (17 out of 31
notifications) with the remaining notifications explaining the approach on the basis of
examples (see Figure 18 and Annex II, Table 33 – statistics on how it is ensured that
only appropriate packages are accepted).
FIGURE 18: STATISTICS ON HOW THE TRADING VENUE ENSURES THAT ONLY PACKAGE
ORDERS/TRANSACTIONS THAT MEET THE DEFINITION IN MIFIR ARE ACCEPTED
102. Moreover, to ensure that only packages that did not have a liquid market as a
whole were accepted under the requested waiver in the majority of cases (42%) trading
venues reported that they made sure that only package orders, where all the
components of the packages were either LIS or ILQ were eligible for the waiver (see
Figure 19 and Annex II, Table 33 – statistics on how it is ensured that only appropriate
packages are accepted).
The venue provides
examples of package orders
meeting the conditions
45%
the venue explains how the
conditions are met on its venue
55%
Source: ESMA

ESMA REGULAR USE
42
FIGURE 19: STATISTICS ON HOW THE TRADING VENUE ENSURES THAT ONLY PACKAGES THAT
DO NOT HAVE A LIQUID MARKET AS A WHOLE ARE ACCEPTED UNDER THE WAIVER
5.3 Analysis 2: Statistics on the volumes executed under the
waivers
103. ESMA carried out a data collection exercise concerning non-equity instruments
directed to trading venues (RMs, MTFs and OTFs) and received responses from 26
jurisdictions and 70 operating MICs. Most of those operating MICs provided information
for multiple segment MICs, which gave an overview of the implementation of waiver
regimes in 169 segment MICs.
104. As also mentioned in the equity part of the report, the data on the trading volume
provided reflects all the waivers in use in 2020, i.e. it includes the trading activity related
to all the waivers in use since 1 January 2018 and not only to those that were notified
and started to be used in 2020.
105. It is worth highlighting that, compared to last year’s exercise or the MiFID II/
MiFIR review report on the transparency regime for non-equity instruments and the
trading obligation for derivatives32, the data collection carried out by ESMA this year
was more limited in scope to ensure a better data quality. More specifically, it covered
only the volume (and not the number of transactions) of a more limited set of asset
32 ESMA70-156-2189
the package order includes
components that are not specified in
the RTS on package orders
(e.g. bonds)13%
all components of the package order are either LIS or
illiquid42%
the package order combines
components of various sub-asset
classes10%
at least one component does
not to have a liquid market16%
Other19%
Source: ESMA
ESMA REGULAR USE
43
classes, namely bonds, interest rate derivatives, equity derivatives, commodity
derivatives, and credit derivatives.
106. Furthermore, as highlighted in the introductory section (paragraph 2), the data
did not include trading activity executed on venues operating in the UK. Moreover,
contrary to FITRS, to which UK reporting entities contributed with data over 2020, UK
trading venues did not participate to this data collection which was carried out after
Brexit. Therefore, any indication on the trading activity in the UK could not be included
in the statistics in this section.
107. Despite the reduced number of asset classes covered in the data collection,
ESMA came across data quality issues which may have had an impact on the statistics
presented in the following sections. More specifically, ESMA would like to highlight that
some relevant trading venues were not able to provide a precise breakdown of the
turnover executed under the three types of waivers (i.e., they were not able to split
volumes in LIS, SSTI and illiquid, thus resulting in double counting). In some instances,
the same logic applied to deferrals. Other data quality issues came from the different
interpretation of what were the trades to be included in the volume and the instrument
classification. Furthermore, not all the same trading venues participated to the data
collections over the years, and this is another factor influencing the different results in
the figures of the different reports.
108. To solve the data quality issues presented above, ESMA has started a revision
of RTS 1 and 2 which will be also complemented by future level work33.
109. Furthermore, ESMA reiterates the view presented in last year’s report34 that, a
more granular reporting to the existing IT system (FITRS), including the necessary
information on waivers, should be envisaged. This would allow ESMA to perform a
holistic and consistent analysis and perform comprehensive and recurrent data quality
checks.
5.3.1 Total trading volume executed in Y2020
110. According to the data received from trading venues, trading in interest rate
derivatives accounted for 46% of the total trading volume35 over the period 1 January -
31 December 2020, followed by sovereign bonds (27%), equity derivatives (21%) and
all bonds other than sovereign bonds (5%). As can be noted in Figure 20, trading in
other non-equity financial instruments including commodity derivatives and credit
derivatives was marginal compared to other asset classes, accounting on an aggregate
basis for less than 1% of the total trading.
111. The distribution of the trading activity is very different compared to last year for
33 esma70-156-4236_consultation_paper_on_the_review_of_rts_1_and_2.pdf (europa.eu) 34 ESMA70-156-3926 Annual_Report_2020_Non-equity_Waivers and Deferrals.pdf (europa.eu) 35 Total trading volume is measured as nominal value (not using the price) for bonds (except ETCs and ETNs), notional amount of traded contracts for IR derivatives, commodity derivatives and credit derivatives.

ESMA REGULAR USE
44
two main reasons (i) the different landscape considered, indeed UK trading venues
were excluded in the year 2020 figures as explained above, and (ii) a big drop in the
trading volume in sovereign bonds registered in one trading venue.
FIGURE 20: TOTAL TRADING VOLUME EXECUTED ON TRADING VENUES IN Y2020, PER ASSET
CLASS
5.3.2 Total trading volume executed under the waivers in Y2020
112. With respect to the total trading volume executed under a waiver, as shown in
Figure 21 below, according to the data gathered from trading venues the waiver most
frequently used in practice was the SSTI waiver, corresponding to 49% of the total
trading volume executed in 2020. The LIS waiver was the second most important
waiver in terms of trading volume (26%) and the Illiquid waiver accounted for 24%. Very
little trading volume, less than 1%, was executed under an OMF waiver.
113. This does not seem to be in line with the data presented in last year’s report
where the LIS waiver was flagged as the waiver most used in practice (55%), followed
by the illiquid one with 40%. However, with respect to the data gathered on the turnover
traded under the SSTI, LIS, and Illiquid waivers, ESMA would like to reiterate that, in
this case, the data quality issues mentioned in paragraph 107 may have slightly
distorted the statistics.
114. Furthermore, the different picture might be also explained to the different
landscape considered, i.e., the exclusion of UK trading venues due to Brexit but also
5%
1%
21%
46%
27%
All bonds other thansovereign bonds
Commodity derivatives
Credit derivatives
Equity derivatives
Interest rate derivatives
Sovereign bonds
Source: ESMA data collection from trading venues

ESMA REGULAR USE
45
the extraordinary circumstances in 2020 due to the Covid-19. However, these
discrepancies further strengthen the need to request data on a per waiver basis in
FITRS which is subject to an on-going data quality programme that would ensure better
data and allow ESMA to better analyse the data, identify the root cause of the
discrepancies and better support the policy work.
FIGURE 21: TOTAL TRADING VOLUME UNDER A WAIVER IN Y2020, PER WAIVER TYPE
115. When analysing the total trading activity under a waiver per asset class in 2020,
it can be noted that sovereign bonds were the type of instrument that most often
benefitted from a waiver (see Figure 22) accounting for 57% of the total, followed by
interest rate derivatives (22%), all bonds other than sovereign bonds (12%), equity
derivatives (8%) and credit derivatives (1%). This seems to be in line with last year’s
findings where sovereign bonds were also the type of instrument that most often
benefited from a waiver.
26%
1%
49%
24%
LIS
OMF
SSTI
Illiquid
Source: ESMA data collection from trading venues

ESMA REGULAR USE
46
FIGURE 22: TOTAL TRADING VOLUME UNDER A WAIVER IN 2020, PER ASSET CLASS
116. Compared to last year, where most of the trading volume under the LIS, Illiquid
and SSTI waivers was executed in sovereign bonds (respectively 91%, 87% and 90%),
and in interest rate derivatives only for the OMF waiver (67%), the situation appeared
more heterogenous this year
117. More specifically, most of the trading volume under the LIS waiver was executed
in interest rate derivatives (59%) (Figure 23); under the illiquid waiver the majority of
the trading was recorded for all other bonds than sovereign bonds (45%) (Figure 24);
under the SSTI waiver, sovereign bonds (91%) accounted for almost the entirety of the
trading (Figure 25); and under the OMF waiver equity derivatives accounted for almost
half of the trading (45%) (Figure 26).
118. It has to be noted that the trading volume under the waivers for bonds might
change over time due to the move to the next stage applied for the determination of the
pre-trade SSTI threshold and the average daily number of transactions parameter used
for the quarterly liquidity assessment. Indeed, since June 2021 the pre-trade SSTI
threshold applied is the 40th instead of the 30th percentile and, since May 2021 the
average daily number of transactions is 10 instead of 15. This means that the trading
volume under the SSTI waiver is expected to decrease due to a higher trade size
necessary to benefit from the waiver, as well as the volume under the illiquid waiver,
due to the expected higher number of liquid bonds.
12% 1%
8%
22%
57%
All bonds other thansovereign bonds
Commodity derivatives
Credit derivatives
Equity derivatives
Interest rate derivatives
Sovereign bonds
Source: ESMA data collection from trading venues

ESMA REGULAR USE
47
FIGURE 23: TOTAL TRADING VOLUME EXECUTED UNDER AN LIS WAIVER - PER ASSET CLASS
FIGURE 24: TOTAL TRADING VOLUME EXECUTED UNDER AN ILLIQUID WAIVER - PER ASSET
CLASS
1% 2%
27%
59%
11%
All bonds other thansovereign bonds
Credit derivatives
Equity derivatives
Interest rate derivatives
Sovereign bonds
Source: ESMA data collection from trading venues
45%
1%2%
12%
40%
All bonds other thansovereign bonds
Commodityderivatives
Credit derivatives
Interest ratederivatives
Sovereign bonds
Source: ESMA data collection from trading venues

ESMA REGULAR USE
48
FIGURE 25: TOTAL TRADING VOLUME EXECUTED UNDER AN SSTI WAIVER - PER ASSET CLASS
FIGURE 26: TOTAL TRADING VOLUME EXECUTED UNDER AN OMF WAIVER - PER ASSET CLASS
2%1%
6%
91%
All bonds other thansovereign bonds
Credit derivatives
Interest rate derivatives
Sovereign bonds
Source: ESMA data collection from trading venues
1%
5%
45%38%
11%
All bonds other thansovereign bonds
Commodity derivatives
Equity derivatives
Interest rate derivatives
Sovereign bonds
Source: ESMA data collection from trading venues

ESMA REGULAR USE
49
119. Furthermore, according to the data gathered from trading venues, the majority
of the trading volume traded under a waiver in 2020 took place in France (65%),
followed by Germany (18%), the Netherlands (14%), Spain (2%) and Italy (1%) (see
Figure 27).
FIGURE 27: TOTAL TRADING VOLUME EXECUTED UNDER A WAIVER - PER COUNTRY
120. When looking at the breakdown per country of the total turnover traded under
the different waivers, it emerged that most of trading took place in Germany for the LIS
and the OMF waiver and in France for the SSTI and for the illiquid waiver. More details
are provided in Figure 28, Figure 29, Figure 30 and Figure 31 below.
0%
10%
20%
30%
40%
50%
60%
70%
AT BE BG CZ DE DK EE ES FI FR GR HR HU IE IT LT LU LV MT NL NO PL PT RO SE SI
Source: ESMA data collection from trading venues

ESMA REGULAR USE
50
FIGURE 28: TOTAL TURNOVER TRADED UNDER AN LIS WAIVER - PER COUNTRY
FIGURE 29: TOTAL TURNOVER TRADED UNDER AN ILLIQUID WAIVER - PER COUNTRY
0%
10%
20%
30%
40%
50%
60%
70%
80%
AT BE BG CZ DE DK EE ES FI FR GR HR HU IE IT LT LU LV MT NL NO PL PT RO SE SI
Source: ESMA data collection from trading venues
0%
10%
20%
30%
40%
50%
60%
70%
80%
90%
AT BE BG CZ DE DK EE ES FI FR GR HR HU IE IT LT LU LV MT NL NO PL PT RO SE SI
Source: ESMA data collection from trading venues

ESMA REGULAR USE
51
FIGURE 30: TOTAL TURNOVER TRADED UNDER AN SSTI WAIVER - PER COUNTRY
FIGURE 31: TOTAL TURNOVER TRADED UNDER AN OMF WAIVER - PER COUNTRY
0%
10%
20%
30%
40%
50%
60%
70%
80%
90%
100%
AT BE BG CZ DE DK EE ES FI FR GR HR HU IE IT LT LU LV MT NL NO PL PT RO SE SI
Source: ESMA data collection from trading venues
0%
10%
20%
30%
40%
50%
60%
70%
80%
90%
AT BE BG CZ DE DK EE ES FI FR GR HR HU IE IT LT LU LV MT NL NO PL PT RO SE SI
Source: ESMA data collection from trading venues

ESMA REGULAR USE
52
121. Last but not least, ESMA also collected information on the type of derivatives
traded under the hedging exemption under Article 8(1) of MiFIR. According to the data
collected, the only asset class benefitting from the hedging exemption is commodity
derivatives.
5.3.3 Trading volume executed under the waivers for bonds36
122. Considering the importance of the bond market, a more in-depth analysis is
provided for this asset class. Indeed, as it is evident from Figure 20, in the year 2020,
bonds were the second most traded asset class after interest rate derivatives,
accounting for 32% of trading activity across all instrument types.
123. When considering the volume traded under the waiver (See Figure 22), bonds
amounted to 69% of volume under waivers compared to other instrument classes in
2020.
124. Compared to the trading activity recorded in year 2019, in year 2020 sovereign
bonds remained the type of instrument that most often benefited from a waiver.
However, the proportion of trading activity executed under a waiver has decreased from
78% to 57%. As mentioned above, this might, be due to the different trading venues
participating to the data collections over the years. Nevertheless, it is important to
stress that the percentage remained extremely high.
125. In terms of distribution of volume under the waivers by market type, 92% took
place on OTFs. This was mainly driven by the high volume executed under the waivers
in sovereign bonds, which accounted for 82% of the total volume under the waivers.
Furthermore, although the venue with the highest bond trading volume executed under
the waiver was identified to be and MTF, only 7% of the trading under the waivers took
place on MTFs, while RMs made up for only 0.5% (See Figure 32).
36 The statistics in this section are based only on trading activity for bonds in numerators and denominators.

ESMA REGULAR USE
53
FIGURE 32: PERCENTAGE OF VOLUME TRADED UNDER THE WAIVERS OVER THE TOTAL
VOLUME TRADED UNDER THE WAIVER PER BOND TYPE AND TRADING VENUE, Y2020
126. When looking at the breakdown per country, most of the trading volumes under
a waiver for bonds took place in France (91%)37, followed by the Netherlands (6%),
Spain (1%) and Italy (1%) (See Table 5).
TABLE 5 – PERCENTAGE OF THE TURNOVER EXECUTED UNDER THE WAIVERS ACROSS
COUNTRIES, Y2020
COUNTRY
% total turnover traded under a waiver in the country / total
turnover traded under a waiver in the EEA
AT 0.0000%
BE 0.0056%
BG 0.0000%
CY NA
CZ 0.0000%
DE 0.0010%
DK 0.0015%
EE 0.0000%
37 A check on the figures reported by a French trading venue justifying this result is in progress.
0%
20%
40%
60%
80%
100%
RM MTF OTF
Sovereign Non-sovereign
Source: ESMA data collection from trading venues
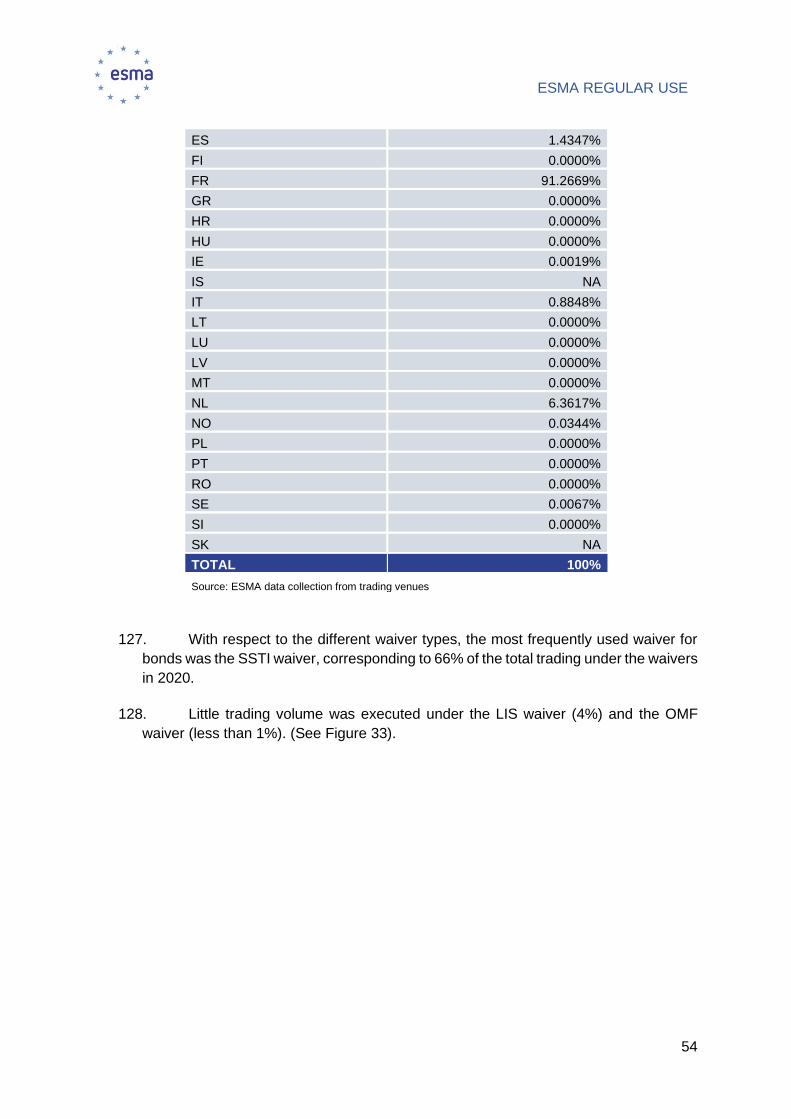
ESMA REGULAR USE
54
ES 1.4347%
FI 0.0000%
FR 91.2669%
GR 0.0000%
HR 0.0000%
HU 0.0000%
IE 0.0019%
IS NA
IT 0.8848%
LT 0.0000%
LU 0.0000%
LV 0.0000%
MT 0.0000%
NL 6.3617%
NO 0.0344%
PL 0.0000%
PT 0.0000%
RO 0.0000%
SE 0.0067%
SI 0.0000%
SK NA
TOTAL 100%
Source: ESMA data collection from trading venues
127. With respect to the different waiver types, the most frequently used waiver for
bonds was the SSTI waiver, corresponding to 66% of the total trading under the waivers
in 2020.
128. Little trading volume was executed under the LIS waiver (4%) and the OMF
waiver (less than 1%). (See Figure 33).

ESMA REGULAR USE
55
FIGURE 33: TOTAL TRADING VOLUME UNDER A WAIVER IN Y2020, PER WAIVER TYPE
129. The SSTI waiver was mostly used for sovereign bonds (98%) and only
marginally for non-sovereign instruments (2%). This might be explained by the fact that
sovereign bonds are in general more liquid (See Figure 34). Therefore, less sovereign
bonds are eligible for the illiquid waiver. The opposite is true for the other bond types.
Therefore, the use of the illiquid waiver for non-sovereign bonds is more relevant.
FIGURE 34: TOTAL TRADING VOLUME UNDER A WAIVER IN Y2020, PER BOND AND WAIVER
TYPE
LIS4.2%
OMF0.1%
SSTI65.7%
Illiquid29.9%
Source: ESMA data collection from trading venues
0%
10%
20%
30%
40%
50%
60%
70%
80%
90%
100%
SSTI Illiquid LIS OMF
Sovereign Non-sovereign
Source: ESMA data collection from trading venues

ESMA REGULAR USE
56
5.3.4 Non-equity waivers packages
130. With respect to non-equity waivers packages, in the context of the data
collection exercise directed to trading venues, ESMA received responses from 16
jurisdictions and 36 operating MICs. Most of those operating MICs provided information
for multiple segment MICs, which gave an overview of the implementation of waiver
regimes in 88 segment MICs.
131. As far as the total trading volume executed in package transactions in 2020 is
concerned, the majority took place on RMs (96%), followed by OTFs (2%) and MTFs
(1%). The picture was rather similar when observing the total trading volume executed
in package transactions subject to any package waiver as the vast majority took place
on RMs (98%) with MTFs and OTFs only accounting for 2% on an aggregated basis.
The different weight of MTFs was due to the exclusion of the UK venues from the data
collection carried out for this report due to Brexit.
132. ESMA also analysed the use of package transactions across Member States
and the results are presented below (see Figure 35). By observing the total volume
traded in package transactions subject to any package waiver in 2020, it can be noted
that, similarly to last year, the majority of trading took place in Germany (90%) followed
by France (5%), the Netherlands (3%), Italy and Sweden (1% each).
FIGURE 35: TOTAL VOLUME TRADED IN PACKAGE TRANSACTIONS SUBJECT TO ANY PACKAGE
WAIVER - PER COUNTRY
0%
10%
20%
30%
40%
50%
60%
70%
80%
90%
100%
AT BE BG DE ES FR GR HU IE IT LU NL NO PT SE SI
Source: ESMA data collection from trading venues

ESMA REGULAR USE
57
6 Application of proposed arrangements for trade-deferred
publication on non-equity
6.1 Background information
133. Article 11 of MiFIR allows NCAs to authorise market operators and investment
firms operating a trading venue to provide for deferred publication of the details of
transactions based on their type or size.
134. In particular, according to Article 11(1) of MiFIR, as further specified in Article 8
of RTS 2, NCAs may authorise the deferred publication in respect of transactions that
are:
a) large in scale compared with the normal market size for that bond, structured finance
product, emission allowance or derivative traded on a trading venue, or for that class
of bond, structured finance product, emission allowance or derivative traded on a
trading venue; or
b) related to a bond, structured finance product, emission allowance or derivative traded
on a trading venue, or a class of bond, structured finance product, emission allowance
or derivative traded on a trading venue for which there is not a liquid market;
c) above a size specific to that bond, structured finance product, emission allowance or
derivative traded on a trading venue, or that class of bond, structured finance product,
emission allowance or derivative traded on a trading venue, which would expose
liquidity providers to undue risk and takes into account whether the relevant market
participants are retail or wholesale investors.
135. Moreover, Article 8 of RTS 2 specifies the criteria for package transactions to
benefit from a deferral following that i) one or more of its components are transactions
in financial instruments which do not have a liquid market; ii) one or more of its
components are transactions in financial instruments that are large in scale compared
with normal market size; or iii) one or more of its components are above the size
specific to the instrument and the transaction is executed between an investment firm
dealing on own account other than on a matched principal basis and another
counterparty.
136. Market operators and investment firms operating a trading venue need to obtain
the NCA’s prior approval of proposed arrangements for deferred trade-publication and
should clearly disclose those same arrangements.
137. Article 11(3) of MiFIR, as further specified in Article 11 of RTS 2, describes the
cases of supplementary deferrals that NCAs authorities may allow or request, in
conjunction with an authorisation of deferred publication. NCAs may:
• as per Article 11(3)(a), request the publication of limited details of a transaction or

ESMA REGULAR USE
58
details of several transactions in an aggregated form, or a combination thereof,
during the time period of deferral;
• as per Article 11(3)(b), allow the omission of the publication of the volume of an
individual transaction during an extended time period of deferral;
• as per Article 11(3)(c), regarding sovereign debt instruments that are not sovereign
debt, allow the publication of several transactions in an aggregated form during an
extended time period of deferral;
• for sovereign debt instruments, as per Article 11(3)(d), allow the publication of
several transactions in an aggregated form for an indefinite period of time. NCAs
may allow applying Article 11(3)(b) and (d) of MiFIR consecutively.
138. Finally, according to Article 11(1) of MiFIR, ESMA has to monitor the application
of the deferral arrangements and submit this information to the Commission by
describing how they are applied in practice. For this reason, a data collection exercise
has been performed together with NCAs and trading venues under their jurisdiction, in
order to have an overview of the applications of deferred trade-publications for both on-
venue and OTC transactions.
6.2 On-venue transactions
6.2.1 Background information
139. Article 10(1) of MiFIR provides that market operators and investment firms
operating a trading venue should make public the price, volume and time of the
transactions executed in respect of bonds, structured finance products, emission
allowances and derivatives traded on that trading venue. Market operators and
investment firms operating a trading venue should make details of all such transactions
public as close to real-time as is technically possible.
140. As set out above, Article 11(1) and (3) of MiFIR, as further specified in Articles
8 and 11 of RTS 2, allow NCAs to authorise the deferred publication of post-trade
information for certain transactions.
6.2.2 Analysis of the application of the deferral regime on-venue - per MIC
141. For non-equity instruments, 26 jurisdictions provided information on the
application of deferral regimes by trading venues (RMs, MTFs and OTFs). ESMA
retrieved data from 69 operating MICs, which in total provided an overview of 166
segment MICs.
142. The information was provided per asset class for each type of deferral (LIS, ILQ

ESMA REGULAR USE
59
and SSTI). As already pointed out in section 5.3, the data collection covered a more
limited set of asset classes, namely bonds, interest rate derivatives, equity derivatives,
commodity derivatives, and credit derivatives. Furthermore, only data on the volume
(and not the number of transactions) was collected and no information on the
application of deferrals to packages was requested.
143. Last but not least, as highlighted in the introductory section (paragraph 2), the
data did not include trading activity executed on venues operating in the UK.
144. In line with last year’s figures, the instruments that were more commonly made
available for trading across segment MICs were all bonds other than sovereign bonds
and sovereign bonds (see Figure 36).
FIGURE 36: PERCENTAGE OF SEGMENTS MIC WHERE THE INSTRUMENT ARE AVAILABLE FOR
TRADING
145. It can be observed that the LIS deferral was a commonly used type of deferral
across trading venues for most types of non-equity instruments, in particular interest
rate derivatives (36% of segments MICs applying the deferral), equity derivatives (26%)
and bonds (sovereign (23%) and all other bonds (23%)) (See Figure 37).
146. Similar conclusions can be drawn when analysing the percentage of segment
MICs applying the deferral for illiquid instruments (Figure 52 in Annex III), and the SSTI
deferral (Figure 53 in Annex III).
0%
10%
20%
30%
40%
50%
60%
70%
80%
All bonds otherthan sovereign
bonds
Commodityderivatives
Creditderivatives
Equityderivatives
Interest ratederivatives
Sovereignbonds
Source: ESMA data collection from trading venues

ESMA REGULAR USE
60
FIGURE 37: PERCENTAGE OF SEGMENT MICS THAT APPLY DEFERRALS FOR LIS
TRANSACTIONS
147. The deferral regime in MiFIR includes the possibility for NCAs, at their
discretion, to require further details of a transaction or allow for supplementary
deferrals.
148. Article 11(3)(a) of MiFIR allows NCAs to request the publication of limited details
of a transaction or several transactions in an aggregated form, or a combination thereof,
during the time period of deferral. Furthermore, Article 11(3)(b) of MiFIR provides that
NCAs may allow the omission of the publication of the volume of an individual
transaction during an extended time period of deferral.
149. The percentage of segment MICs using the different options in the case of the
LIS, Illiquid and SSTI deferrals are provided in the figures below (Figure 38, Figure 39,
Figure 40 respectively). Since no trading venue applied the option provided in Article
11(3)(a) to publish limited details during the time period of the deferral, this option does
not appear in the figures below.
23%12%
10%
26%36% 23%
0
20
40
60
80
100
120
0%
10%
20%
30%
40%
50%
60%
70%
80%
90%
100%
All bondsother thansovereign
bonds
Commodityderivatives
Creditderivatives
Equityderivatives
Interest ratederivatives
Sovereignbonds
Num of segment MICs where instrument is made available for trading (secondary axis)
% of segment MICs applying the LIS deferral
Source: ESMA data collection from trading venues

ESMA REGULAR USE
61
FIGURE 38: APPLICATION OF 11(3)(A) AND (B) – LIS
FIGURE 39: APPLICATION OF 11(3)(A) AND (B) – ILLIQUID
0%
5%
10%
15%
20%
25%
30%
All bonds otherthan sovereign
bonds
Commodityderivatives
Credit derivatives Equity derivatives Interest ratederivatives
Sovereign bonds
Neither 11(3)(a) nor (b) is applied (LIS)
Several transactions published in aggregated form - Article 11(3)(a) MiFIR(LIS)Volume omission - Article 11(3)(b) MiFIR (LIS)
No information was provided (LIS)
Source: ESMA data collection from trading venues
0%
5%
10%
15%
20%
25%
All bonds otherthan sovereign
bonds
Commodityderivatives
Credit derivatives Equity derivatives Interest ratederivatives
Sovereign bonds
Neither 11(3)(a) nor (b) is applied (ILLIQUID)
Several transactions published in aggregated form - Article 11(3)(a) MiFIR(ILLIQUID)
Volume omission - Article 11(3)(b) MiFIR (ILLIQUID)
No information was provided (ILLIQUID)
Source: ESMA data collection from trading venues

ESMA REGULAR USE
62
FIGURE 40: APPLICATION OF 11(3)(A) AND (B) – SSTI
150. For non-equity instruments that are not sovereign debt, Article 11(3)(c) of MiFIR
allows the publication of several transactions in an aggregated form during an extended
time period of deferral. Figure 41 shows the percentages of segment MICs that used
this type of deferral over the total number of MICs that allowed for trading the relevant
asset class. Interest rate derivatives and credit derivatives are the asset classes with
the highest percentages of MICs (20% and 10% respectively) which used this option
across all types of deferrals (LIS, illiquid and SSTI). For sovereign bonds this is not an
option that NCAs can allow, which explains the 0% in the figure below.
0%
2%
4%
6%
8%
10%
12%
14%
16%
All bonds otherthan sovereign
bonds
Commodityderivatives
Credit derivatives Equity derivatives Interest ratederivatives
Sovereign bonds
Neither 11(3)(a) nor (b) is applied (SSTI)
Several transactions published in aggregated form - Article 11(3)(a) MiFIR (SSTI)
Volume omission - Article 11(3)(b) MiFIR (SSTI)
No information was provided (SSTI)
Source: ESMA data collection from trading venues

ESMA REGULAR USE
63
FIGURE 41: APPLICATION OF 11(3)(C) FOR ALL TRANSACTION TYPES
151. Finally, trading venues were required to provide information on whether for
sovereign bonds, in conjunction with the deferred publication, several transactions
were published for an indefinite period in aggregated form as per Article 11(3)(d) of
MiFIR and Article 11 of RTS 2. As indicated in Figure 42, around 16% of the segment
MICs that used SSTI deferral applied this option for sovereign bonds, 15% of MICs
used it under the illiquid deferral and 12% of MICs used it under the LIS deferral. In
addition, although there is a relevant increase of the percentages of MICs which apply
these options in comparison with last year, it can be noted, that a smaller percentage
of segment MICs used the option under Article 11(3)(d) consecutively to the volume
omission as per Article 11(3)(b) compared to the mere publication of several
transactions in aggregated form as per Article 11(3)(d). This is in line with the
information gathered in the context of last year’s data collection.
0%
5%
10%
15%
20%
25%
All bonds otherthan sovereign
bonds
Commodityderivatives
Credit derivatives Equity derivatives Interest ratederivatives
Sovereign bonds
LIS ILLIQUID SSTI
Source: ESMA data collection from trading venues

ESMA REGULAR USE
64
FIGURE 42: APPLICATION OF 11(3)(D) AND 11(3)(B) WITH 11(3)(D) CONSECUTIVELY
6.2.3 Analysis of the application of the deferral regime on-venue - trading
activity
152. In addition to the data on the application of the non-equity deferral regime,
presented above, ESMA also collected data on the trading activity executed per asset
class which benefitted from a deferral.
153. The data on the trading volume reflects the deferral regime in place at the
moment of the execution of the transactions in 2020.
154. According to the quantitative data gathered by ESMA, despite the option
provided in Article 11(3)(a) for NCAs to request trading venues to publish either limited
details or details of several transactions in an aggregated form during the time period
of deferral, this was not applied in practice in 2020. More specifically, trading venues
did not report any volumes benefitting from the LIS, Illiquid and SSTI deferral and which
were subject to the publication of details of several transactions during the time period
of deferral as per Article 11(3)(a).
155. Table 6 and Table 7 respectively provide for the percentage of volume that
benefitted from the LIS, Illiquid and SSTI deferrals and for which, during the extended
period of deferral (4 weeks) either (i) information on volume was omitted from the
publication as per Article 11(3)(b) of MiFIR or (ii) several transactions were published
in aggregated form as per Article 11(3)(c) of MiFIR. Supplementary deferrals under
Article 11(3)(b) and Article 11(3)(c) of MiFIR are both mainly used for interest rate
derivatives (LIS, ILQ, SSTI).
11.54%
14.52%
15.69%
6.41%
9.68% 9.80%
0.00%
2.00%
4.00%
6.00%
8.00%
10.00%
12.00%
14.00%
16.00%
18.00%
several transactions published in aggregated form as per Article 11(3)(d)
(b) and (d) of Article 11(3) of MiFIR used consecutively
Source: ESMA data collection from trading venues
LIS ILLIQUID SSTI

ESMA REGULAR USE
65
TABLE 6: APPLICATION OF 11(3)(B) MIFIR – LIS, ILLIQUID, SSTI IN 2020
LIS Illiquid SSTI
Volume that benefitted from the LIS deferrals and that in conjunction
with the deferred publication, during the
extended period of deferral (4 weeks)
information on volume was omitted from the
publication as per Article 11(3)(b) of MiFIR and
Article 11 of RTS 2
For sovereign bonds: of used separately from
Article 11(3)(d) of MiFIR
Volume that benefitted from the Illiquid deferrals and that in conjunction
with the deferred publication, during the
extended period of deferral (4 weeks)
information on volume was omitted from the
publication as per Article 11(3)(b) of MiFIR and
Article 11 of RTS 2
For sovereign bonds: if used separately from
Article 11(3)(d) of MiFIR
Volume that benefitted from the SSTI deferrals and that in conjunction
with the deferred publication, during the
extended period of deferral (4 weeks)
information on volume was omitted from the
publication as per Article 11(3)(b) of MiFIR and
Article 11 of RTS 2
For sovereign bonds: if used separately from
Article 11(3)(d) of MiFIR
All other bonds other than sovereign 0.02% 0.25% 0.12%
Sovereign bonds 0.12% 0.74% 3.40%
Interest rate derivatives 2.10% 18.20% 21.41%
Equity derivatives 0.00% 0.00% 0.00%
Commodity derivatives 0.00% 0.00% 0.00%
Credit derivatives 0.00% 1.75% 1.87%
2.24% 20.94% 26.8% Source: ESMA data collection from trading venues
TABLE 7: APPLICATION OF 11(3)(C) MIFIR – LIS, ILLIQUID, SSTI IN 2020
LIS Illiquid SSTI Volume that benefitted from the LIS deferrals and that in conjunction
with the deferred publication, during the
extended period of deferral (4-weeks),
several transactions were published in
aggregated form as per Article 11(3)(c) of MiFIR and Article 11 of RTS 2
Volume that benefitted from the Illiquid deferrals and that in conjunction
with the deferred publication, during the
extended period of deferral (4-weeks),
several transactions were published in
aggregated form as per Article 11(3)(c) of MiFIR and Article 11 of RTS 2
Volume that benefitted from the SSTI deferrals and that in conjunction
with the deferred publication, during the
extended period of deferral (4-weeks),
several transactions were published in
aggregated form as per Article 11(3)(c) of MiFIR and Article 11 of RTS 2
All other bonds other than sovereign 0.01% 5.43% 0.86%
Sovereign bonds 0.00% 0.00% 0.00%
Interest rate derivatives 2.00% 18.99% 15.45%
Equity derivatives 0.00% 0.00% 0.00%
Commodity derivatives 0.00% 0.00% 0.00%
Credit derivatives 0.00% 3.69% 3.56%
2.01% 28.11% 19.87% Source: ESMA data collection from trading venues

ESMA REGULAR USE
66
156. Figure 43 presents the application of Articles 11(3)(b) and 11(3)(d) of MiFIR to
sovereign bonds transactions either separately or consecutively across the different
types of deferrals, LIS, Illiquid and SSTI. In this case, in line with last year, the SSTI
deferral appeared to be the most used in practice.
FIGURE 43: APPLICATION OF 11(3)(B) AND (D) OF MIFIR TO SOVEREIGN BONDS
TRANSACTIONS SEPARATELY OR CONSECUTIVELY, IN 2020
157. Last but not least, when looking at the total trading volumes under a
supplementary deferral for all asset classes, it can be noted that, in line with last year,
the type of supplementary deferral mostly used was the one of Article 11(3)(c) of MiFIR,
related to the publication of transactions in aggregated form in the extended period of
deferral (LIS, ILQ, SSTI) (see Figure 44).
8%
7%
16%
9%45%
15%
Total volume traded that benefitted from the LIS deferrals over the period 1/1/2020-31/12/2020 and that in conjunction with the deferred publication, for an indefinite period,several transactions were published in aggregated form as per Article 11(3)(d)
Total volume traded that benefitted from the LIS deferrals over the period 1/1/2020-31/12/2020 and that in conjunction with the deferred publication points (b) and (d) of Article11(3) of MiFIR are used consequently
Total volume traded that benefitted from the ILQ deferrals over the period 1/1/2020-31/12/2020 and that in conjunction with the deferred publication, for an indefinite period,several transactions were published in aggregated form as per Article 11(3)(d)
Total volume traded that benefitted from the ILQ deferrals over the period 1/1/2020-31/12/2020 and that in conjunction with the deferred publication points (b) and (d) of Article11(3) of MiFIR are used consequently
Total volume traded that benefitted from the SSTI deferrals over the period 1/1/2020-31/12/2020 and that in conjunction with the deferred publication, for an indefinite period,several transactions were published in aggregated form as per Article 11(3)(d)
Total volume traded that benefitted from the SSTI deferrals over the period 1/1/2020-31/12/2020 and that in conjunction with the deferred publication points (b) and (d) of Article11(3) of MiFIR are used consequently
Source: ESMA data collection from trading venues

ESMA REGULAR USE
67
FIGURE 44: APPLICATION OF THE DEFERRALS IN 2020
6.2.4 Use of the deferral regime for bonds38
158. Considering the importance of the bond market, as done for the waivers, a more
in-depth analysis is provided for the use of deferrals in bond trading. Indeed, similarly
to the results of the data collection carried out for the 2020 Annual Report, in 2020 the
instruments that were more commonly made available for trading across venues were
bonds.
159. More specifically, 67% of trading venues that participated to the data collection
made non-sovereign bonds available for trading, and almost 62% made sovereign
bonds available for trading as it can be seen in Figure 36 above.
160. The LIS deferral was the most used deferral type across bonds trading venues,
with 23% of venues applying it for both sovereign and non-sovereign bonds. The LIS
deferral was closely followed by the illiquid deferral (22% sovereign, 17% non-
sovereign) and the SSTI deferral (15% sovereign, 17% non-sovereign) (See Figure
45).
38 The statistics in this section are based only on trading activity for bonds in numerators and denominators.
0.00%
1.08%
2.10%
2.05%
1.63%
0.00%
10.00%
29.37%
3.67%
2.11%
0.00%
12.79%
20.74%
10.84%
3.62%
0% 10% 20% 30% 40%
Deferred publication + during the period of deferral (48h)limited details or transactions were published in aggregated
form as per Article 11(3)(a) of MiFIR
Deferred publication + during the extended period of deferral(4 weeks) information on volume was omitted from the
publication as per Article 11(3)(b) of MiFIR (used separatelyfrom Article 11(3)(d) of MiFIR
Deferred publication + during the extended period of deferral(4-weeks), several transactions were published in aggregated
form as per Article 11(3)(c) of MiFIR
Deferred publication + for an indefinite period, severaltransactions were published in aggregated form as per Article
11(3)(d) of MiFIR (used separately from Article 11(3)(b) ofMiFIR
Deferred publication + points (b) and (d) of Article 11(3) ofMiFIR are used consecutively
SSTI Illiquid LIS
Source: ESMA data collection from trading venues

ESMA REGULAR USE
68
FIGURE 45: PERCENTAGE OF SEGMENT MICS APPLYING THE DIFFERENT DEFERRALS PER
BOND TYPE, IN Y2020
161. In terms of market type, contrary to the trading under the waivers, where mostly
took place on OTFs, most of the trading activity subject to deferred publication, took
place on MTFs (56%), while 38% occurred on OTFs and only 6% on RMs (See Figure
46).
162. Similar to waivers, volume subject to deferrals was mainly executed on
sovereign bonds, which accounted for 80% of the overall bond volume subject to
deferrals in 2020, with the remaining 20% traded in non-sovereign bonds (See Figure
46).
163. Trading activity subject to deferred publication was remarkable on MTFs and
OTF for sovereign bonds, accounting for 40% and 36% of the overall volume subject
to deferred publication. The percentages for non-sovereign bonds on the deferred
volume on MTFs and OTFs were respectively 16% and 2% (See Figure 46).
0%
5%
10%
15%
20%
25%
LIS deferral illiquid deferral SSTI deferral
Sovereign Non-sovereign
Source: ESMA data collection from trading venues

ESMA REGULAR USE
69
FIGURE 46: TRADING VOLUME SUBJECT TO THE DEFERRALS, PER BOND AND TRADING VENUE
TYPE, IN Y2020
164. Looking at trading activity executed that benefitted from deferred publication,
41% was subject to the SSTI deferral, 31% to the illiquid deferral and the remaining
28% to the LIS deferral (See Figure 47).
165. When looking at the bond type breakdown of the trading activity that benefitted
from deferrals, the trading subject to SSTI and LIS deferrals was predominantly
executed in sovereign bonds, 89% of the volume subject to the SSTI deferral was in
sovereign bonds (the remaining 11% was in non-sovereign bonds). The percentage
reaches 96% in the case of the LIS deferral (the remaining 4% was in non-sovereign
bonds).
166. The split is more balanced in the case of the illiquid deferral where 48% is
recorded in non-sovereign bonds and 52% in sovereign bonds.
0%
10%
20%
30%
40%
50%
60%
RM MTF OTF
Sovereign bonds Non-sovereign
Source: ESMA data collection from trading venues

ESMA REGULAR USE
70
FIGURE 47: PERCENTAGE OF VOLUME SUBJECT TO THE DEFERRALS, PER BOND TYPE, IN
Y2020
167. For non-sovereign bonds, 72% of the deferred trading activity occurs by using
the illiquid deferral type, while the most used deferrals for sovereign instruments are
the SSTI (46%) and LIS (34%). Similarly, to the use of the waivers, this behaviour may
be explained by the fact that sovereign bonds are in general more liquid. Therefore,
less sovereign bonds are eligible for the illiquid deferral. The opposite is true for the
other bond types. Therefore, the use of the illiquid deferral for non-sovereign bonds is
most relevant (See Figure 48: percentage of volume subject to the deferrals, per
deferral type, in Y2020Figure 48).
FIGURE 48: PERCENTAGE OF VOLUME SUBJECT TO THE DEFERRALS, PER DEFERRAL TYPE, IN
Y2020
0%
5%
10%
15%
20%
25%
30%
35%
40%
45%
SSTI Illiquid LIS
sovereign non-sovereign
Source: ESMA data collection from trading venues
72%
23%
5%
20%
46%
34%
0%
10%
20%
30%
40%
50%
60%
70%
80%
Illiquid SSTI LIS
Non-sovereign Sovereign bonds
Source: ESMA data collection from trading venues

ESMA REGULAR USE
71
168. Most of the trading executed under deferred publication was recorded by trading
venues situated in the Netherlands (50%), followed by France (24%), and Spain (15%)
(See Table 8).
TABLE 8: PERCENTAGE OF TURNOVER SUBJECT TO DEFERRED PUBLICATION ACROSS
COUNTRIES, Y2020
COUNTRY
% total turnover traded subject to deferrals in the
country / total turnover traded subject to deferrals in
the EEA
AT 0.0000%
BE 0.0000%
BG 0.0000%
CY NA
CZ 0.0711%
DE 0.0000%
DK 1.7721%
EE 0.0000%
ES 15.3207%
FI 0.0000%
FR 23.8542%
GR 0.0000%
HR 0.0000%
HU 0.0000%
IE 0.0000%
IS NA
IT 8.2131%
LT 0.0000%
LU 0.0000%
LV 0.0000%
MT 0.0000%
NL 50.1669%
NO 0.6019%
PL 0.0000%
PT 0.0000%
RO 0.0000%
SE 0.0000%
SI 0.0000%
SK NA
TOTAL 100%
Source: ESMA data collection from trading venues

ESMA REGULAR USE
72
6.3 OTC transactions
6.3.1 Background information
169. Article 21(1), (2) and (3) of MiFIR provides that investment firms which, either
on own account or on behalf of clients, conclude transactions in bonds, structured
finance products, emission allowances and derivatives traded on a trading venue,
make public the volume and price of those transactions and the time at which they were
concluded. This information should be made public through an APA.
170. Article 21(4) of MiFIR allows for deferred publication of post-trade information
for certain categories of transactions, where the measures adopted pursuant to Article
11(1) and (3) of MiFIR, as further specified in Articles 8 and 11 of RTS 2, are applicable.
6.3.2 Analysis of the application of the deferral regime off-venue
171. ESMA identified the NCAs allowing and/or applying the deferral regime to non-
equity instruments for OTC transactions through a data collection exercise to which 28
NCAs replied39.
172. The results are presented in Figure 49 below and in Figure 54 and Figure 55 in
Annex III.
173. Similarly, to what was observed last year, in a number of countries deferrals
were granted by general ruling without requiring the notification of NCA of the
application of the deferral by the Investment firms and systematic internalisers.
Therefore, it was not possible to effectively assess to what extent deferrals were used
in practice by Investment firms and systematic internalisers in those jurisdictions.
Consequently, those jurisdictions reported that the regime was allowed and
presumably applied by investment firms and systematic internalisers.
174. The specificities of how the deferral regime was applied across financial
instruments were generally consistent for all transactions under which deferrals are
allowed (LIS, Illiquid, SSTI, see Figure 49 below in addition to Figure 54 and Figure 55
in Annex III).
175. With the exception of emission allowances where many NCAs reported that no
trading venues traded such instruments and therefore the deferral regime could not be
applied, the figures show that in all the other cases, the majority of NCAs allowed the
deferral regime and it was applied by Investment firms and systematic internalisers.
176. It should be noted that since securitised derivatives have per definition a liquid
market, no figures for securitised derivatives are provided for transactions on illiquid
39 ESMA received no information on the applicable deferral regime from Cyprus and Lichtenstein. Furthermore, as already highlighted in section 4.2, MiFID II/MiFIR was not implemented in 2020 Iceland and therefore no relevant information could be provided. Consequently, the NCA is excluded from the statistics presented in this section of the report.

ESMA REGULAR USE
73
instruments as it can be observed in Figure 54 in Annex III.
FIGURE 49: NUMBER OF NCAS APPLYING THE NON-EQUITY DEFERRAL REGIMES FOR
LIS TRANSACTIONS
177. In line with what was observed in the context of the 2020 Annual Report, under
Article 11(3) of MiFIR, the modality that was granted by most NCAs was the omission
of the volume of transactions for a maximum period of 4 weeks, in accordance with
Article 11(3)(b) of MiFIR (18 NCAs for LIS, and 17 for Illiquid and SSTI transactions)
(See Figure 50).
178. The 14 NCAs (for Illiquid and LIS) and 13 (for SSTI) allowing for the Article
11(3)(d) deferral for transactions (which only affects sovereign bonds) also allowed for
its combination with the volume omission for 4 weeks after the transaction took place
(See Figure 50).
179. Finally, 12 NCAs (for Illiquid) and 11 NCAs (for LIS and SSTI) required the
publication of limited details only or the publication of information in aggregated form in
accordance with Article 11(3)(a). This represents a significant difference with respect
0
2
4
6
8
10
12
14
SovereignBonds
Bonds (otherthan
Sovereignbonds)
ETCs/ETNs StructuredFinanceProducts(SFPs)
EmissionAllowances
Securitisedderivatives
Derivatives
YES - Allowed to TVs, applied by TVs but not applied by IFs/SIs ( including becausethere are no IFs and SIs in the jurisdiction)
YES - Allowed to TVs but not applied by TVs and IFs/SIs
NO - Not allowed to TVs and to IFs/SIs
YES - Allowed and applied by TVs and IFs/SIs
Decision has not been taken yet
There is no TVs trading these instruments. Consequently, it cannot be applied
YES - Allowed but not applied because there are no IFs and SIs
Source: ESMA data collection from NCAs

ESMA REGULAR USE
74
to the data gathered in the context of last year’s annual report where the number of
NCAs was much lower (See Figure 50).40
FIGURE 50: NCAS WHERE THE SUPPLEMENTARY DEFERRAL REGIME IS REQUIRED OR
ALLOWED
180. The graph below presents in detail the number of NCAs where each of the
supplementary deferral regimes was applied by Investment firms and systematic
internalisers. More specifically, Figure 51 presents the specificities of the
supplementary deferral regime applied across asset classes by NCAs for LIS
transactions.
181. In general, it seems that there was consistency in the type of the supplementary
deferral regime applied across type of deferral and asset classes, as shown in Figure
56 and Figure 57 in Annex III, for transactions in illiquid instruments and transactions
above the SSTI thresholds respectively.
40 The difference is due to a different dataset used. In the context of last year’s data report, ESMA considered the figures in the ESMA publication https://www.esma.europa.eu/press-news/esma-news/esma-provides-overview-mifid-ii-deferral-regimes , whereas this year’s results are based on the data provided by NCAs in the context of this data collection. More precisely, ESMA has considered the maximum number of NCAs between those allowing for publication of limited details of transactions during the deferral (48h) and those allowing publication of several transactions in aggregated form during the deferral (48h) in accordance with Article 11(3)(a) of MiFIR.
14
14
13
18
11
14
14
13
17
12
13
13
12
17
11
0 2 4 6 8 10 12 14 16 18 20
In accordance with paragraphs (b) and (d) of Article11(3) of MiFIR used consecutively
In accordance with Article 11(3)(d) of MiFIRaggregated form (indefinite)
In accordance with Article 11(3)(c) of MiFIR - volumeomission (4 weeks)
In accordance with Article 11(3)(b) of MiFIR - volumeomission (4 weeks)
In accordance with Article 11(3)(a) of MiFIR - limiteddetails (48h) or aggregated form
SSTI Illiquid LISSource: ESMA data collection from NCAs

ESMA REGULAR USE
75
182. It should be noted that where NCAs allowed for supplementary deferrals, those
deferrals were applied in most cases by investment firms and systematic internalisers
in. For example, the omission of the volume of transactions for a maximum period of 4
weeks, in accordance with Article 11(3)(b) of MiFIR, was applied in most of the
countries where the NCAs allowed it (it was allowed by 17 NCAs for SSTI transactions
and transactions in illiquid instruments and by 18 NCAs for LIS transactions (See Figure
50) and, was applied at most in 17 jurisdictions for LIS and illiquid transactions and at
most in16 jurisdictions for SSTI transactions (See Figure 51, Figure 56 and Figure 57
in Annex III)).
183. As for the case of deferrals according to Article 11(3)(d) or Article 11(3)(c), the
number of jurisdictions in which deferrals were applied by investment firms and
systematic internalisers was in the range of 8-14 jurisdictions, depending on the type
of transactions and instrument (See Figure 51, Figure 56 and Figure 57), while between
12 and 14 were the NCAs allowing for those deferral regimes (See Figure 50).
184. Consequently, there are some NCAs that allowed for the use of certain deferral
regimes but where Investment firms and systematic internalisers did not use them. This
is the case for some of the instruments under the jurisdictions of Austria, Belgium,
Hungary, Luxembourg, Malta, Portugal and Romania.
FIGURE 51: NUMBER OF NCAS APPLYING THE SUPPLEMENTARY DEFERRAL REGIME, FOR LIS
TRANSACTIONS, PER ASSET CLASS
0 5 10 15 20
In accordance with paragraphs (b)and (d) of Article 11(3) of MiFIR used
consecutively
In accordance with Article 11(3)(d) ofMiFIR aggregated form (indefinite)
In accordance with Article 11(3)(c) ofMiFIR - volume omission (4 weeks)
In accordance with Article 11(3)(b) ofMiFIR - volume omission (4 weeks)
In accordance with Article 11(3)(a) ofMiFIR - limited details (48h)
In accordance with Article 11(3)(a) ofMiFIR - aggregated form (48h)
Derivatives
Securitised derivatives
Emission Allowances
Structured Finance Products (SFPs)
ETCs/ETNs
Bonds (other than Sovereign bonds)
Sovereign Bonds
Source: ESMA data collection from NCAs

ESMA REGULAR USE
76
7 Annex I - Tables Equity Waivers
TABLE 9 – STATISTICS ON WAIVERS RECEIVED AND PROCESSED
COUNTRY
CODECOUNTRY
Initial number of
waivers received in
2020
Waivers
withdrawn in 2020
Final number of
waivers for which
an opinion has
been issued in
2020
Final number of
waivers for which it
has been issued a
COMPLIANT
opinion (case 1)
Final number of
waivers for which
it has been issued
a NON-
COMPLIANT
opinion (case 2)
Final number of
waivers for which
it has been issued
a NON-
COMPLIANT
opinion or
PARTIALLY
COMPLIANT which
are no longer in
use
Final number of
waivers for which
it has been issued
a COMPLIANT
opinion which are
no longer in use
OMF
a b c d e f g h i j k l m n o p
AT AUSTRIA - - - - - - - - - - - - - -
BE BELGIUM - - - - - - - - - - - - - -
BG BULGARIA - - - - - - - - - - - - - -
CY CYPRUS - - - - - - - - - - - - - -
CZ CZECH REPUBLIC - - - - - - - - - - - - - -
DE GERMANY - - - - - - - - - - - - - -
DK DENMARK - - - - - - - - - - - - - -
EE ESTONIA - - - - - - - - - - - - - -
ES SPAIN - - - - - - - - - - - - - -
FI FINLAND - - - - - - - - - - - - - -
FR FRANCE 2 10.53% - - 2 6.90% 2 7.41% - - - - - -
GR GREECE - - - - - - - - - - - - - -
HR CROATIA - - - - - - - - - - - - - -
HU HUNGARY 3 15.79% - - 4 13.79% 4 14.81% - - - - - -
IE IRELAND 2 10.53% - - 2 6.90% 2 7.41% - - - - - -
IS ICELAND - - - - 2 6.90% 2 7.41% - - - - - -
IT ITALY - - - - - - - - - - - - - -
LI LIECHTENSTEIN - - - - - - - - - - - - - -
LT LITHUANIA - - - - - - - - - - - - - -
LU LUXEMBOURG - - - - - - - - - - - - - -
LV LATVIA - - - - - - - - - - - - - -
MT MALTA - - - - - - - - - - - - - -
NL THE NETHERLANDS 2 10.53% - - 4 13.79% 4 14.81% - - - - - -
NO NORWAY 10 52.63% - - 14 48.28% 13 48.15% 1 50.00% 1 100.00% - -
PL POLAND - - - - - - - - - - - - - -
PT PORTUGAL - - - - - - - - - - - - - -
RO ROMANIA - - - - - - - - - - - - - -
SE SWEDEN - - - - 1 3.45% - - 1 50.00% - - - -
SI SLOVENIA - - - - - - - - - - - - - -
SK SLOVAK REPUBLIC - - - - - - - - - - - - - -
- - TOTAL 19 100.00% - - 29 100% 27 100% 2 100% 1 100%
93% 7% 3%% WAIVER TYPE ON TOTAL WAIVERS
PROCESSED

ESMA REGULAR USE
77
TABLE 10 – STATISTICS ON WAIVERS RECEIVED AND PROCESSED
COUNTRY
CODECOUNTRY OMF NT1 NT2 NT3 NT - TOTAL LIS RP
COMBO
(OMF+LIS)
COMBO
(RP+LIS)
COMBO
(NT1+NT2)
COMBO
(NT1+LIS)
case
1
case
2
case
3
case
1
case
2
case
3
case
1
case
2
case
3
case
1
case
2
case
3
case
1
(t+w
case
2
(u+x
case
3
(v+y
case
1
case
2
case
3
case
1
case
2
case
3
case
1
case
2
case
3
case
1
case
2
case
3
case
1
case
2
case
3
case
1
case
2
case
3
a b q r s t u v w x y z aa ab ac ad ae af ag ah ai aj ak al am an ao ap aq ar as at ax ay az
AT AUSTRIA - - - - - - - - - - - - - - - - - - - - - - - - - - - - - - - - -
BE BELGIUM - - - - - - - - - - - - - - - - - - - - - - - - - - - - - - - - -
BG BULGARIA - - - - - - - - - - - - - - - - - - - - - - - - - - - - - - - - -
CY CYPRUS - - - - - - - - - - - - - - - - - - - - - - - - - - - - - - - - -
CZ CZECH REPUBLIC - - - - - - - - - - - - - - - - - - - - - - - - - - - - - - - - -
DE GERMANY - - - - - - - - - - - - - - - - - - - - - - - - - - - - - - - - -
DK DENMARK - - - - - - - - - - - - - - - - - - - - - - - - - - - - - - - - -
EE ESTONIA - - - - - - - - - - - - - - - - - - - - - - - - - - - - - - - - -
ES SPAIN - - - - - - - - - - - - - - - - - - - - - - - - - - - - - - - - -
FI FINLAND - - - - - - - - - - - - - - - - - - - - - - - - - - - - - - - - -
FR FRANCE - - - - - - - - - - - - - - - - - - 1 - - - - - 1 - - - - - - - -
GR GREECE - - - - - - - - - - - - - - - - - - - - - - - - - - - - - - - - -
HR CROATIA - - - - - - - - - - - - - - - - - - - - - - - - - - - - - - - - -
HU HUNGARY 2 - - - - - - - - - - - - - - 2 - - - - - - - - - - - - - - - - -
IE IRELAND - - - - - - - - - 1 - - 1 - - 1 - - - - - - - - - - - - - - - - -
IS ICELAND - - - - - - - - - - - - - - - 1 - - - - - - - - 1 - - - - - - - -
IT ITALY - - - - - - - - - - - - - - - - - - - - - - - - - - - - - - - - -
LI LIECHTENSTEIN - - - - - - - - - - - - - - - - - - - - - - - - - - - - - - - - -
LT LITHUANIA - - - - - - - - - - - - - - - - - - - - - - - - - - - - - - - - -
LU LUXEMBOURG - - - - - - - - - - - - - - - - - - - - - - - - - - - - - - - - -
LV LATVIA - - - - - - - - - - - - - - - - - - - - - - - - - - - - - - - - -
MT MALTA - - - - - - - - - - - - - - - - - - - - - - - - - - - - - - - - -
NL THE NETHERLANDS 1 - - - - - - - - - - - - - - 2 - - - - - - - - 1 - - - - - - - -
NO NORWAY 3 1 - 1 - - 2 - - 2 - - 5 - - 2 - - - - - 1 - - - - - 1 - - 1 - -
PL POLAND - - - - - - - - - - - - - - - - - - - - - - - - - - - - - - - - -
PT PORTUGAL - - - - - - - - - - - - - - - - - - - - - - - - - - - - - - - - -
RO ROMANIA - - - - - - - - - - - - - - - - - - - - - - - - - - - - - - - - -
SE SWEDEN - 1 - - - - - - - - - - - - - - - - - - - - - - - - - - - - - - -
SI SLOVENIA - - - - - - - - - - - - - - - - - - - - - - - - - - - - - - - - -
SK SLOVAK REPUBLIC - - - - - - - - - - - - - - - - - - - - - - - - - - - - - - - - -
6 2 - 1 - - 2 - - 3 - - 6 - - 8 - - 1 - - 1 - - 3 - - 1 - - 1 - -
1
28% 3% 3%
8 1 1 3 18 1 2 3 6
21% 3%10%3%3%28%10%7%
TOTAL
% WAIVER TYPE ON TOTAL WAIVERS
PROCESSED

ESMA REGULAR USE
78
TABLE 11 – STATISTICS PER WAIVER TYPE
COUNTRY
CODECOUNTRY OMF NT1 NT2 NT3
NT - TOTAL
(e+h+j)LIS RP
COMBO
(OMF+LIS)COMBO (RP+LIS)
COMBO
(NT1+NT2)
COMBO
(NT1+NT2+NT3)
COMBO
(NT1+NT3)
COMBO
(NT1+LIS)
a b c d e f g h i j k l m n o p q r s t u v w x y z y z
AT AUSTRIA - - - - - - - - - - - - - - - - - - - - - - - - - -
BE BELGIUM - - - - - - - - - - - - - - - - - - - - - - - - - -
BG BULGARIA - - - - - - - - - - - - - - - - - - - - - - - - - -
CY CYPRUS - - - - - - - - - - - - - - - - - - - - - - - - - -
CZ CZECH REPUBLIC - - - - - - - - - - - - - - - - - - - - - - - - - -
DE GERMANY - - - - - - - - - - - - - - - - - - - - - - - - - -
DK DENMARK - - - - - - - - - - - - - - - - - - - - - - - - - -
EE ESTONIA - - - - - - - - - - - - - - - - - - - - - - - - - -
ES SPAIN - - - - - - - - - - - - - - - - - - - - - - - - - -
FI FINLAND - - - - - - - - - - - - - - - - - - - - - - - - - -
FR FRANCE - - - - - - - - - - - - 1 100.00% - - 1 33.33% - - - - - - - -
GR GREECE - - - - - - - - - - - - - - - - - - - - - - - - - -
HR CROATIA - - - - - - - - - - - - - - - - - - - - - - - - - -
HU HUNGARY 2 25.00% - - - - - - - - 2 25.00% - - - - - - - - - - - - - -
IE IRELAND - - - - - - 1 33.33% 1 16.67% 1 12.50% - - - - - - - - - - - - - -
IS ICELAND - - - - - - - - - - 1 12.50% - - - - 1 33.33% - - - - - - - -
IT ITALY - - - - - - - - - - - - - - - - - - - - - - - - - -
LI LIECHTENSTEIN - - - - - - - - - - - - - - - - - - - - - - - - - -
LT LITHUANIA - - - - - - - - - - - - - - - - - - - - - - - - - -
LU LUXEMBOURG - - - - - - - - - - - - - - - - - - - - - - - - - -
LV LATVIA - - - - - - - - - - - - - - - - - - - - - - - - - -
MT MALTA - - - - - - - - - - - - - - - - - - - - - - - - - -
NL THE NETHERLANDS 1 12.50% - - - - - - - - 2 25.00% - - - - 1 33.33% - - - - - - - -
NO NORWAY 4 50.00% 1 100.00% 2 100.00% 2 66.67% 5 83.33% 2 25.00% - - 1 100.00% - - 1 100.00% - - - - 1 100.00%
PL POLAND - - - - - - - - - - - - - - - - - - - - - - - - - -
PT PORTUGAL - - - - - - - - - - - - - - - - - - - - - - - - - -
RO ROMANIA - - - - - - - - - - - - - - - - - - - - - - - - - -
SE SWEDEN 1 12.50% - - - - - - - - - - - - - - - - - - - - - - - -
SI SLOVENIA - - - - - - - - - - - - - - - - - - - - - - - - - -
SK SLOVAK REPUBLIC - - - - - - - - - - - - - - - - - - - - - - - - - -
TOTAL 29 8 100% 1 100% 2 100% 3 100% 6 100% 8 100% 1 100% 1 100% 3 100% 1 100% - - - - 1 100%
% WAIVER TYPE ON TOTAL WAIVERS
PROCESSED3.45% 6.90% 10.34% 20.69% 0.00% 0.00% 3.45%27.59% 3.45% 3.45% 10.34% 3.45%27.59%

ESMA REGULAR USE
79
TABLE 12 – STATISTICS PER ASSET CLASS
COUNTRY
CODECOUNTRY Shares ETFs Certificates
Depositary
receipts
Other similar
financial
instruments
Subscription
rights treated as
shares
Paid subscribed
shares
Interim shares
treated as shares
Redemption
shares treated as
shares
Other
instrumenst
treated as shares
a b c d e f g h i j k l m n o p q r s t u v
AT AUSTRIA - - - - - - - - - - - - - - - - - - - -
BE BELGIUM - - - - - - - - - - - - - - - - - - - -
BG BULGARIA - - - - - - - - - - - - - - - - - - - -
CY CYPRUS - - - - - - - - - - - - - - - - - - - -
CZ CZECH REPUBLIC - - - - - - - - - - - - - - - - - - - -
DE GERMANY - - - - - - - - - - - - - - - - - - - -
DK DENMARK - - - - - - - - - - - - - - - - - - - -
EE ESTONIA - - - - - - - - - - - - - - - - - - - -
ES SPAIN - - - - - - - - - - - - - - - - - - - -
FI FINLAND - - - - - - - - - - - - - - - - - - - -
FR FRANCE 2 6.90% 2 6.90% 2 22.22% 2 9.09% - - 2 13.33% 2 28.57% 2 18.18% 2 28.57% 8 20.00%
GR GREECE - - - - - - - - - - - - - - - - - - - -
HR CROATIA - - - - - - - - - - - - - - - - - - - -
HU HUNGARY 4 13.79% 4 13.79% 4 44.44% - - - - - - - - 4 36.36% - - 4 10.00%
IE IRELAND 2 6.90% 2 6.90% - - - - - - - - - - - - - - - -
IS ICELAND 2 6.90% 2 6.90% - - 2 9.09% - - - - - - - - - - - -
IT ITALY - - - - - - - - - - - - - - - - - - - -
LI LIECHTENSTEIN - - - - - - - - - - - - - - - - - - - -
LT LITHUANIA - - - - - - - - - - - - - - - - - - - -
LU LUXEMBOURG - - - - - - - - - - - - - - - - - - - -
LV LATVIA - - - - - - - - - - - - - - - - - - - -
MT MALTA - - - - - - - - - - - - - - - - - - - -
NL THE NETHERLANDS 4 13.79% 4 13.79% 3 33.33% 3 13.64% - - - - - - - - - - - -
NO NORWAY 14 48.28% 14 48.28% - - 14 63.64% - - 12 80.00% 4 57.14% 4 36.36% 4 57.14% 24 60.00%
PL POLAND - - - - - - - - - - - - - - - - - - - -
PT PORTUGAL - - - - - - - - - - - - - - - - - - - -
RO ROMANIA - - - - - - - - - - - - - - - - - - - -
SE SWEDEN 1 3.45% 1 3.45% - - 1 4.55% - - 1 6.67% 1 14.29% 1 9.09% 1 14.29% 4 10.00%
SI SLOVENIA - - - - - - - - - - - - - - - - - - - -
SK SLOVAK REPUBLIC - - - - - - - - - - - - - - - - - - - -
29 100% 29 100% 9 100% 22 100% - - 15 100% 7 100% 11 100% 7 100% 40 100%
% ASSET CLASS TYPE ON TOTAL
WAIVERS PROCESSED
TOTAL
17% 17% 5% 13% 0.0% 9% 4% 7% 4% 24%

ESMA REGULAR USE
80
TABLE 13 – STATISTICS ON TRADING SYSTEMS USING THE WAIVERS
Trading system Description of other system (including hybrid systems)
Continuous
order bookQuote driven
Periodic
auctionRFQ
Any other
system
Negotiated
tradesPrearranged Does not say
a b c d e f g h i j k l m n o p q r
AT AUSTRIA - - - - - - - - - - - - - - - -
BE BELGIUM - - - - - - - - - - - - - - - -
BG BULGARIA - - - - - - - - - - - - - - - -
CY CYPRUS - - - - - - - - - - - - - - - -
CZ CZECH REPUBLIC - - - - - - - - - - - - - - - -
DE GERMANY - - - - - - - - - - - - - - - -
DK DENMARK - - - - - - - - - - - - - - - -
EE ESTONIA - - - - - - - - - - - - - - - -
ES SPAIN - - - - - - - - - - - - - - - -
FI FINLAND - - - - - - - - - - - - - - - -
FR FRANCE 2 8.33% - - - - - - - - - - - - - -
GR GREECE - - - - - - - - - - - - - - - -
HR CROATIA - - - - - - - - - - - - - - - -
HU HUNGARY 2 8.33% - - - - - - 2 100.00% - - - - - -
IE IRELAND 1 4.17% - - - - 1 100.00% - - - - - - - -
IS ICELAND 1 4.17% - - - - - - - - 1 100.00% - - - -
IT ITALY - - - - - - - - - - - - - - - -
LI LIECHTENSTEIN - - - - - - - - - - - - - - - -
LT LITHUANIA - - - - - - - - - - - - - - - -
LU LUXEMBOURG - - - - - - - - - - - - - - - -
LV LATVIA - - - - - - - - - - - - - - - -
MT MALTA - - - - - - - - - - - - - - - -
NL THE NETHERLANDS 3 12.50% - - 1 100.00% - - - - - - - - - -
NO NORWAY 14 58.33% - - - - - - - - - - - - - -
PL POLAND - - - - - - - - - - - - - - - -
PT PORTUGAL - - - - - - - - - - - - - - - -
RO ROMANIA - - - - - - - - - - - - - - - -
SE SWEDEN 1 4.17% - - - - - - - - - - - - - -
SI SLOVENIA - - - - - - - - - - - - - - - -
SK SLOVAK REPUBLIC - - - - - - - - - - - - - - - -
TOTAL 24 100% - - 1 100% 1 100% 2 100% 1 100% - - - -
% TOTAL 3.45%3.45%82.76% - - - 3.45% 6.90%
COUNTRY
CODECOUNTRY

ESMA REGULAR USE
81
TABLE 14 – STATISTICS ON PRE-ARRANGED TRANSACTIONS IN LIS WAIVERS
Pre-arranged Transactions
Does not say Yes No Block trades Cross ordersBlock trades and
cross ordersDoes not say
a b c d e f g h i j k l m n o p
AT AUSTRIA - - - - - - - - - - - - - -
BE BELGIUM - - - - - - - - - - - - - -
BG BULGARIA - - - - - - - - - - - - - -
CY CYPRUS - - - - - - - - - - - - - -
CZ CZECH REPUBLIC - - - - - - - - - - - - - -
DE GERMANY - - - - - - - - - - - - - -
DK DENMARK - - - - - - - - - - - - - -
EE ESTONIA - - - - - - - - - - - - - -
ES SPAIN - - - - - - - - - - - - - -
FI FINLAND - - - - - - - - - - - - - -
FR FRANCE - - - - 1 14.29% - - - - - - - -
GR GREECE - - - - - - - - - - - - - -
HR CROATIA - - - - - - - - - - - - - -
HU HUNGARY - - 2 40.00% - - - - - - - - 2 40.00%
IE IRELAND - - - - 1 14.29% - - - - - - - -
IS ICELAND - - 1 20.00% 1 14.29% - - - - - - 1 20.00%
IT ITALY - - - - - - - - - - - - - -
LI LIECHTENSTEIN - - - - - - - - - - - - - -
LT LITHUANIA - - - - - - - - - - - - - -
LU LUXEMBOURG - - - - - - - - - - - - - -
LV LATVIA - - - - - - - - - - - - - -
MT MALTA - - - - - - - - - - - - - -
NL THE NETHERLANDS 1 100.00% - - 2 28.57% - - - - - - - -
NO NORWAY - - 2 40.00% 2 28.57% - - - - - - 2 40.00%
PL POLAND - - - - - - - - - - - - - -
PT PORTUGAL - - - - - - - - - - - - - -
RO ROMANIA - - - - - - - - - - - - - -
SE SWEDEN - - - - - - - - - - - - - -
SI SLOVENIA - - - - - - - - - - - - - -
SK SLOVAK REPUBLIC - - - - - - - - - - - - - -
TOTAL 13 1 100% 5 100% 7 100% - - - - - - 5 100%
Does
not
say
7.69% Yes 38.46% No 53.85%
COUNTRY
CODECOUNTRY
% OF PRE-ARRANGED TRADES ON
TOTAL LIS WAIVERS
If pre-arranged: Block trades/ Cross orders?

ESMA REGULAR USE
82
TABLE 15 – OMF WAIVERS, STATISTICS PER ORDER TYPE
Order type in an OMF waiver Type of order when order type is or included "other"
Iceberg order Stop loss OtherIceberg order + stop
lossStop loss + other
Iceberg order +
stop loss + otherNA
Volume Discovery
Order (Iceberg
order + hidden
Large-in-Scale
order)
Trailing Stop Order
One-Cancels-Other
(Limit Order + Stop
Market Order)
IOC Trailing + OCO
a b c d e f g h i j k l m n o p q r s t u v o p q r
AT AUSTRIA - - - - - - - - - - - - - - - - - - - - - - - -
BE BELGIUM - - - - - - - - - - - - - - - - - - - - - - - -
BG BULGARIA - - - - - - - - - - - - - - - - - - - - - - - -
CY CYPRUS - - - - - - - - - - - - - - - - - - - - - - - -
CZ CZECH REPUBLIC - - - - - - - - - - - - - - - - - - - - - - - -
DE GERMANY - - - - - - - - - - - - - - - - - - - - - - - -
DK DENMARK - - - - - - - - - - - - - - - - - - - - - - - -
EE ESTONIA - - - - - - - - - - - - - - - - - - - - - - - -
ES SPAIN - - - - - - - - - - - - - - - - - - - - - - - -
FI FINLAND - - - - - - - - - - - - - - - - - - - - - - - -
FR FRANCE - - - - - - - - - - - - - - - - - - - - - - - -
GR GREECE - - - - - - - - - - - - - - - - - - - - - - - -
HR CROATIA - - - - - - - - - - - - - - - - - - - - - - - -
HU HUNGARY - - - - 2 66.67% - - - - - - - - - - - - - - - - 2 100.00%
IE IRELAND - - - - - - - - - - - - - - - - - - - - - - - -
IS ICELAND - - - - - - - - - - - - - - - - - - - - - - - -
IT ITALY - - - - - - - - - - - - - - - - - - - - - - - -
LI LIECHTENSTEIN - - - - - - - - - - - - - - - - - - - - - - - -
LT LITHUANIA - - - - - - - - - - - - - - - - - - - - - - - -
LU LUXEMBOURG - - - - - - - - - - - - - - - - - - - - - - - -
LV LATVIA - - - - - - - - - - - - - - - - - - - - - - - -
MT MALTA - - - - - - - - - - - - - - - - - - - - - - - -
NL THE NETHERLANDS 1 20.00% - - - - - - - - - - - - - - - - - - - - - -
NO NORWAY 4 80.00% 1 100.00% - - - - - - - - - - - - - - - - - - - -
PL POLAND - - - - - - - - - - - - - - - - - - - - - - - -
PT PORTUGAL - - - - - - - - - - - - - - - - - - - - - - - -
RO ROMANIA - - - - - - - - - - - - - - - - - - - - - - - -
SE SWEDEN - - - - 1 33.33% - - - - - - - - - - - - - - 1 100.00% - -
SI SLOVENIA - - - - - - - - - - - - - - - - - - - - - - - -
SK SLOVAK REPUBLIC - - - - - - - - - - - - - - - - - - - - - - - -
5 100.00% 1 100.00% 3 100.00% - - - - - - - - - - - - - - 1 100.00% 2 100.00%
0% 0% 0%
COUNTRY
CODECOUNTRY
% OMF WAIVER TYPE ON TOTAL OMF
WAIVERS PROCESSED
TOTAL
0% 0% 33% 67%0%56% 11% 33% 0%

ESMA REGULAR USE
83
TABLE 16 – STATISTICS FOR THE EXECUTION OF THE HIDDEN PART OF ICEBERG ORDERS OF OMF WAIVERS
Execution of the hidden part
Release of new
peaks to be
executed
assumed
Release of new
peaks to be
executed explicit
Execution of
hidden part when
aggressive order
as per Q&A
Case 1 Case 2 Case 3
a b c d e f g h
AT AUSTRIA - - - - - -
BE BELGIUM - - - - - -
BG BULGARIA - - - - - -
CY CYPRUS - - - - - -
CZ CZECH REPUBLIC - - - - - -
DE GERMANY - - - - - -
DK DENMARK - - - - - -
EE ESTONIA - - - - - -
ES SPAIN - - - - - -
FI FINLAND - - - - - -
FR FRANCE - - - - - -
GR GREECE - - - - - -
HR CROATIA - - - - - -
HU HUNGARY - - - - - -
IE IRELAND - - - - - -
IS ICELAND - - - - - -
IT ITALY - - - - - -
LI LIECHTENSTEIN - - - - - -
LT LITHUANIA - - - - - -
LU LUXEMBOURG - - - - - -
LV LATVIA - - - - - -
MT MALTA - - - - - -
NL THE NETHERLANDS - - - - 1 25.00%
NO NORWAY - - 1 100.00% 3 75.00%
PL POLAND - - - - - -
PT PORTUGAL - - - - - -
RO ROMANIA - - - - - -
SE SWEDEN - - - - - -
SI SLOVENIA - - - - - -
SK SLOVAK REPUBLIC - - - - - -
- - 1 100% 4 100%
% EXECUTION HIDDEN PART ON
TOTAL ICEBERG WAIVERS
PROCESSED
80%
COUNTRY
CODECOUNTRY
20%-
TOTAL

ESMA REGULAR USE
84
TABLE 17 – STATISTICS ON MEMBER PREFERENCING IN OMF WAIVERS
Member preferencing
Does not say Yes No
a b c d e f g h
AT AUSTRIA - - - - - -
BE BELGIUM - - - - - -
BG BULGARIA - - - - - -
CY CYPRUS - - - - - -
CZ CZECH REPUBLIC - - - - - -
DE GERMANY - - - - - -
DK DENMARK - - - - - -
EE ESTONIA - - - - - -
ES SPAIN - - - - - -
FI FINLAND - - - - - -
FR FRANCE - - - - - -
GR GREECE - - - - - -
HR CROATIA - - - - - -
HU HUNGARY - - - - - -
IE IRELAND - - - - - -
IS ICELAND - - - - - -
IT ITALY - - - - - -
LI LIECHTENSTEIN - - - - - -
LT LITHUANIA - - - - - -
LU LUXEMBOURG - - - - - -
LV LATVIA - - - - - -
MT MALTA - - - - - -
NL THE NETHERLANDS 1 25.00% - - - -
NO NORWAY 3 75.00% 1 100.00% - -
PL POLAND - - - - - -
PT PORTUGAL - - - - - -
RO ROMANIA - - - - - -
SE SWEDEN - - - - - -
SI SLOVENIA - - - - - -
SK SLOVAK REPUBLIC - - - - - -
4 100% 1 100% - -
% MEMBER PREFERENCING ON TOTAL
ICEBERG WAIVERS PROCESSED
COUNTRY
CODECOUNTRY
TOTAL
80.00% 20.00% -

ESMA REGULAR USE
85
TABLE 18 – STATISTICS ON RANDOMIZATION OF PEAKS OF ICEBERG ORDERS IN OMF WAIVERS
Randomised peak quantity Randomised peak price
Does not say Yes No Does not say Yes No Does not say
a b c d e f g h i j k l m n
AT AUSTRIA - - - - - - - - - - - -
BE BELGIUM - - - - - - - - - - - -
BG BULGARIA - - - - - - - - - - - -
CY CYPRUS - - - - - - - - - - - -
CZ CZECH REPUBLIC - - - - - - - - - - - -
DE GERMANY - - - - - - - - - - - -
DK DENMARK - - - - - - - - - - - -
EE ESTONIA - - - - - - - - - - - -
ES SPAIN - - - - - - - - - - - -
FI FINLAND - - - - - - - - - - - -
FR FRANCE - - - - - - - - - - - -
GR GREECE - - - - - - - - - - - -
HR CROATIA - - - - - - - - - - - -
HU HUNGARY - - - - - - - - - - - -
IE IRELAND - - - - - - - - - - - -
IS ICELAND - - - - - - - - - - - -
IT ITALY - - - - - - - - - - - -
LI LIECHTENSTEIN - - - - - - - - - - - -
LT LITHUANIA - - - - - - - - - - - -
LU LUXEMBOURG - - - - - - - - - - - -
LV LATVIA - - - - - - - - - - - -
MT MALTA - - - - - - - - - - - -
NL THE NETHERLANDS - - 1 20.00% - - - - - - 1 20.00%
NO NORWAY - - 4 80.00% - - - - - - 4 80.00%
PL POLAND - - - - - - - - - - - -
PT PORTUGAL - - - - - - - - - - - -
RO ROMANIA - - - - - - - - - - - -
SE SWEDEN - - - - - - - - - - - -
SI SLOVENIA - - - - - - - - - - - -
SK SLOVAK REPUBLIC - - - - - - - - - - - -
- - 5 100% - - - - - - 5 100%
COUNTRY
CODECOUNTRY
% MEMBER PREFERENCING ON TOTAL
ICEBERG WAIVERS PROCESSED - - 100%100% - -
TOTAL

ESMA REGULAR USE
86
TABLE 19 – STATISTICS ON WHAT THE CURRENT VOLUME WEIGHTED SPREAD IS REFLECTED ON FOR NT1 WAIVERS
The order book
The order book or the
quotes of the market
makers
a b c d e f g h
AT AUSTRIA - - - - - -
BE BELGIUM - - - - - -
BG BULGARIA - - - - - -
CY CYPRUS - - - - - -
CZ CZECH REPUBLIC - - - - - -
DE GERMANY - - - - - -
DK DENMARK - - - - - -
EE ESTONIA - - - - - -
ES SPAIN - - - - - -
FI FINLAND - - - - - -
FR FRANCE - - - - - -
GR GREECE - - - - - -
HR CROATIA - - - - - -
HU HUNGARY - - - - - -
IE IRELAND - - - - - -
IS ICELAND - - - - - -
IT ITALY - - - - - -
LI LIECHTENSTEIN - - - - - -
LT LITHUANIA - - - - - -
LU LUXEMBOURG - - - - - -
LV LATVIA - - - - - -
MT MALTA - - - - - -
NL THE NETHERLANDS - - - - - -
NO NORWAY 3 100.00% - - - -
PL POLAND - - - - - -
PT PORTUGAL - - - - - -
RO ROMANIA - - - - - -
SE SWEDEN - - - - - -
SI SLOVENIA - - - - - -
SK SLOVAK REPUBLIC - - - - - -
TOTAL 3 100.00% - - - -
NT1 - Current volume weighted spread reflected on
The quotes of the
market makers
COUNTRY
CODECOUNTRY

ESMA REGULAR USE
87
8 Annex II - Tables Non-equity Waivers
TABLE 20 – STATISTICS ON WAIVERS RECEIVED AND PROCESSED
COUNTRY
CODECOUNTRY
Initial number of
waivers received
in 2020
Waivers received
in 2020 withdrawn
Final number of
waivers for which
an opinion has
been issued
Final number of
waivers for which
it has been issued
a COMPLIANT
opinion (case 1)
Final number of
waivers for which
it has been issued
a NON-
COMPLIANT
opinion (case 2) or
PARTIALLY
COMPLIANT (case
3)
Final number of
waivers for which
it has been issued
a NON-
COMPLIANT
opinion or
PARTIALLY
COMPLIANT which
are no longer in
use
Final number of
waivers for which
it has been issued
a COMPLIANT
opinion which are
no longer in use
OMF
a b c d e f g h i j k l m n o p
AT AUSTRIA - - - - - - - - - - - - - -
BE BELGIUM - - - - 3 2.36% 3 2.68% - - - - - -
BG BULGARIA - - - - - - - - - - - - - -
CY CYPRUS - - - - - - - - - - - - - -
CZ CZECH REPUBLIC - - - - - - - - - - - - - -
DE GERMANY 3 6.82% - - 7 5.51% 7 6.25% - - - - - -
DK DENMARK - - - - - - - - - - - - - -
EE ESTONIA - - - - - - - - - - - - - -
ES SPAIN 2 4.55% - - 9 7.09% 9 8.04% - - - - - -
FI FINLAND 5 11.36% - - - - - - - - - - - -
FR FRANCE 3 6.82% - - 6 4.72% 6 5.36% - - - - - -
GR GREECE 2 4.55% - - - - - - - - - - - -
HR CROATIA - - - - - - - - - - - - - -
HU HUNGARY 1 2.27% - - 3 2.36% 3 2.68% - - - - - -
IE IRELAND 2 4.55% - - 3 2.36% 3 2.68% - - - - - -
IS ICELAND - - - - 4 3.15% 4 3.57% - - - - - -
IT ITALY 45
8 18.18% - - 12 9.45% 7 6.25% 5 33.33% - - - -
LI LIECHTENSTEIN - - - - - - - - - - - - - -
LT LITHUANIA - - - - - - - - - - - - - -
LU LUXEMBOURG - - - - - - - - - - - - - -
LV LATVIA - - - - - - - - - - - - - -
MT MALTA - - - - - - - - - - - - - -
NL THE NETHERLANDS 4 9.09% - - 51 40.16% 43 38.39% 8 53.33% - - - -
NO NORWAY 9 20.45% 1 100.00% 26 20.47% 24 21.43% 2 13.33% - - - -
PL POLAND - - - - - - - - - - - - - -
PT PORTUGAL - - - - 1 0.79% 1 0.89% - - - - - -
RO ROMANIA - - - - 1 0.79% 1 0.89% - - - - - -
SE SWEDEN 5 11.36% - - 1 0.79% 1 0.89% - - - - - -
SI SLOVENIA - - - - - - - - - - - - - -
SK SLOVAK REPUBLIC - - - - - - - - - - - - - -
88% 12% 0% 0%
45 As regards the 5 waiver notifications considered non-compliant, it is noted that already in 2020 the concerned trading venues submitted
revised notifications which were deemed compliant by ESMA in the same year.
- 44 100% 1 100% 127 100% 112 100% 15 100% - - -
% WAIVER TYPE ON TOTAL
WAIVERS PROCESSED
TOTAL

ESMA REGULAR USE
88
TABLE 21 – STATISTICS ON WAIVERS RECEIVED AND PROCESSED
COUNTRY
CODECOUNTRY OMF Illiquid LIS SSTI Illiquid Package LIS Package SSTI Package
LIS component
package order +
Illiquid
component
package order +
SSTI component
package order
EFPCOMBO
(OMF+LIS)
case
1
case
2
case
3
case
1
case
2
case
3
case
1
case
2
case
3
case
1
case
2
case
3
case
1
case
2
case
3
case
1
case
2
case
3
case
1
case
2
case
3
case
1
case
2
case
3
case
1
case
2
case
3
case
1
case
2
case
3
a b q r s t u v w x y z aa ab ac ad ae af ag ah ai aj ak ar as at ax ay az ba bb bc
AT AUSTRIA - - - - - - - - - - - - - - - - - - - - - - - - - - - - - -
BE BELGIUM - - - 1 - - 1 - - - - - - - - 1 - - - - - - - - - - - - - -
BG BULGARIA - - - - - - - - - - - - - - - - - - - - - - - - - - - - - -
CY CYPRUS - - - - - - - - - - - - - - - - - - - - - - - - - - - - - -
CZ CZECH REPUBLIC - - - - - - - - - - - - - - - - - - - - - - - - - - - - - -
DE GERMANY 1 - - 1 - - 2 - - - - - 1 - - 1 - - - - - - - - - - - 1 - -
DK DENMARK - - - - - - - - - - - - - - - - - - - - - - - - - - - - - -
EE ESTONIA - - - - - - - - - - - - - - - - - - - - - - - - - - - - - -
ES SPAIN - - - 3 - - 2 - - 1 - - 1 - - 1 - - 1 - - - - - - - - - - -
FI FINLAND - - - - - - - - - - - - - - - - - - - - - - - - - - - - - -
FR FRANCE - - - 2 - - 1 - - - - - 1 - - 1 - - - - - - - - 1 - - - - -
GR GREECE - - - - - - - - - - - - - - - - - - - - - - - - - - - - - -
HR CROATIA - - - - - - - - - - - - - - - - - - - - - - - - - - - - - -
HU HUNGARY 2 - - 1 - - - - - - - - - - - - - - - - - - - - - - - - - -
IE IRELAND 2 - - - - - - - - 1 - - - - - - - - - - - - - - - - - - - -
IS ICELAND - - - 2 - - 2 - - - - - - - - - - - - - - - - - - - - - - -
IT ITALY - - - 1 1 - 1 1 - 2 3 - 1 - - 1 - - 1 - - - - - - - - - - -
LI LIECHTENSTEIN - - - - - - - - - - - - - - - - - - - - - - - - - - - - - -
LT LITHUANIA - - - - - - - - - - - - - - - - - - - - - - - - - - - - - -
LU LUXEMBOURG - - - - - - - - - - - - - - - - - - - - - - - - - - - - - -
LV LATVIA - - - - - - - - - - - - - - - - - - - - - - - - - - - - - -
MT MALTA - - - - - - - - - - - - - - - - - - - - - - - - - - - - - -
NL THE NETHERLANDS 5 1 1 6 - 1 17 - 1 5 1 - 3 - 1 2 - 1 2 1 - 2 - - 1 - - - - -
NO NORWAY 6 2 - 4 - - 7 - - - - - 1 - - 4 - - 1 - - - - - 1 - - - - -
PL POLAND - - - - - - - - - - - - - - - - - - - - - - - - - - - - - -
PT PORTUGAL - - - - - - - - - - - - - - - 1 - - - - - - - - - - - - - -
RO ROMANIA - - - 1 - - - - - - - - - - - - - - - - - - - - - - - - - -
SE SWEDEN - - - - - - - - - - - - 1 - - - - - - - - - - - - - - - - -
SI SLOVENIA - - - - - - - - - - - - - - - - - - - - - - - - - - - - - -
SK SLOVAK REPUBLIC - - - - - - - - - - - - - - - - - - - - - - - - - - - - - -
16 3 1 22 1 1 33 1 1 9 4 - 9 - 1 12 - 1 5 1 - 2 - - 3 - - 1 - -
16% 19% 28% 8%10%
1
1%
3
2%
13 6 220 24 35 13 10
10% 5% 2%% WAIVER TYPE ON TOTAL WAIVERS
PROCESSED
TOTAL

ESMA REGULAR USE
89
TABLE 22 – STATISTICS PER WAIVER TYPE
COUNTRY
CODECOUNTRY OMF Illiquid LIS SSTI Illiquid Package LIS Package SSTI Package
LIS component
package order +
Illiquid component
package order +
SSTI component
package order
EFPCOMBO
(OMF+LIS)
a b c d e f g h i j k l m n o p u v y z y z
AT AUSTRIA - - - - - - - - - - - - - - - - - - - -
BE BELGIUM - - 1 4.17% 1 2.86% - - - - 1 7.69% - - - - - - - -
BG BULGARIA - - - - - - - - - - - - - - - - - - - -
CY CYPRUS - - - - - - - - - - - - - - - - - - - -
CZ CZECH REPUBLIC - - - - - - - - - - - - - - - - - - - -
DE GERMANY 1 5.00% 1 4.17% 2 5.71% - - 1 10.00% 1 7.69% - - - - - - 1 100.00%
DK DENMARK - - - - - - - - - - - - - - - - - - - -
EE ESTONIA - - - - - - - - - - - - - - - - - - - -
ES SPAIN - - 3 12.50% 2 5.71% 1 7.69% 1 10.00% 1 7.69% 1 16.67% - - - - - -
FI FINLAND - - - - - - - - - - - - - - - - - - - -
FR FRANCE - - 2 8.33% 1 2.86% - - 1 10.00% 1 7.69% - - - - 1 33.33% - -
GR GREECE - - - - - - - - - - - - - - - - - - - -
HR CROATIA - - - - - - - - - - - - - - - - - - - -
HU HUNGARY 2 10.00% 1 4.17% - - - - - - - - - - - - - - - -
IE IRELAND 2 10.00% - - - - 1 7.69% - - - - - - - - - - - -
IS ICELAND - - 2 8.33% 2 5.71% - - - - - - - - - - - - - -
IT ITALY - - 2 8.33% 2 5.71% 5 38.46% 1 10.00% 1 7.69% 1 16.67% - - - - - -
LI LIECHTENSTEIN - - - - - - - - - - - - - - - - - - - -
LT LITHUANIA - - - - - - - - - - - - - - - - - - - -
LU LUXEMBOURG - - - - - - - - - - - - - - - - - - - -
LV LATVIA - - - - - - - - - - - - - - - - - - - -
MT MALTA - - - - - - - - - - - - - - - - - - - -
NL THE NETHERLANDS 7 35.00% 7 29.17% 18 51.43% 6 46.15% 4 40.00% 3 23.08% 3 50.00% 2 100.00% 1 33.33% - -
NO NORWAY 8 40.00% 4 16.67% 7 20.00% - - 1 10.00% 4 30.77% 1 16.67% - - 1 33.33% - -
PL POLAND - - - - - - - - - - - - - - - - - - - -
PT PORTUGAL - - - - - - - - - - 1 7.69% - - - - - - - -
RO ROMANIA - - 1 4.17% - - - - - - - - - - - - - - - -
SE SWEDEN - - - - - - - - 1 10.00% - - - - - - - - - -
SI SLOVENIA - - - - - - - - - - - - - - - - - - - -
SK SLOVAK REPUBLIC - - - - - - - - - - - - - - - - - - - -
20 100% 24 100% 35 100% 13 100% 10 100% 13 100% 6 100% 2 100% 3 100% 1 100%
% WAIVER TYPE ON TOTAL WAIVERS
PROCESSED10% 8% 10% 5% 2% 2% 1%
TOTAL
16% 19% 28%
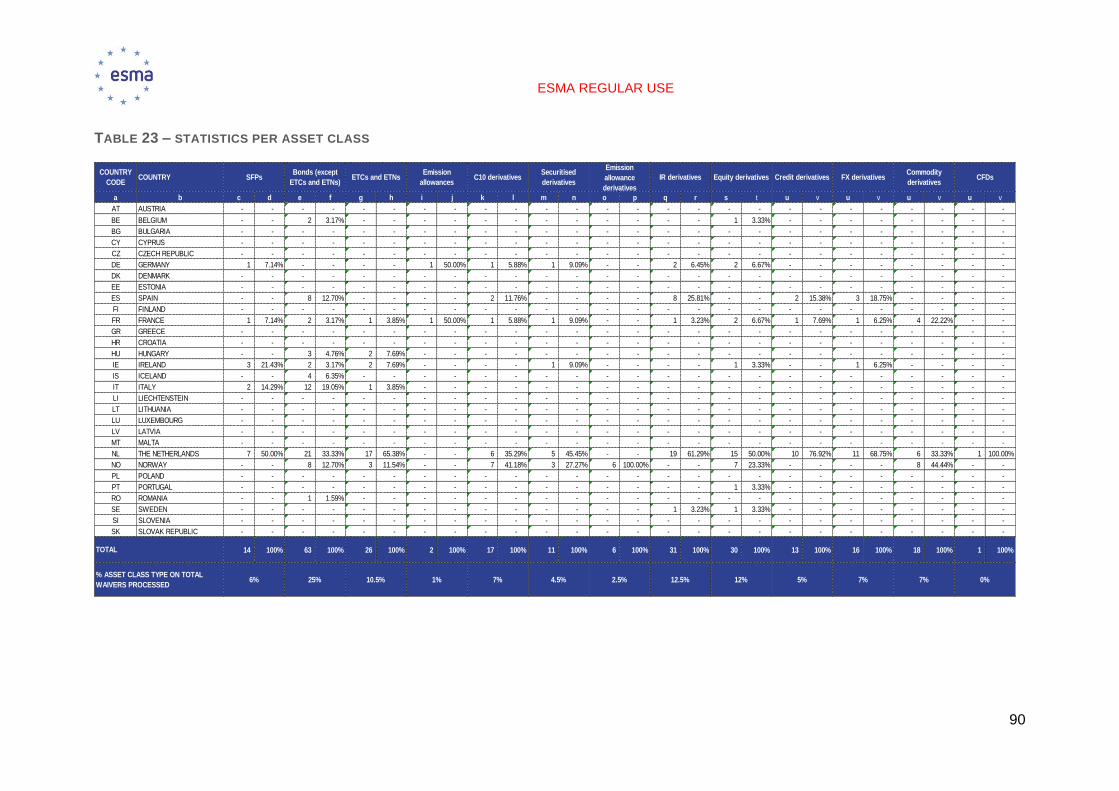
ESMA REGULAR USE
90
TABLE 23 – STATISTICS PER ASSET CLASS
COUNTRY
CODECOUNTRY SFPs
Bonds (except
ETCs and ETNs)ETCs and ETNs
Emission
allowancesC10 derivatives
Securitised
derivatives
Emission
allowance
derivatives
IR derivatives Equity derivatives Credit derivatives FX derivativesCommodity
derivativesCFDs
a b c d e f g h i j k l m n o p q r s t u v u v u v u v
AT AUSTRIA - - - - - - - - - - - - - - - - - - - - - - - - - -
BE BELGIUM - - 2 3.17% - - - - - - - - - - - - 1 3.33% - - - - - - - -
BG BULGARIA - - - - - - - - - - - - - - - - - - - - - - - - - -
CY CYPRUS - - - - - - - - - - - - - - - - - - - - - - - - - -
CZ CZECH REPUBLIC - - - - - - - - - - - - - - - - - - - - - - - - - -
DE GERMANY 1 7.14% - - - - 1 50.00% 1 5.88% 1 9.09% - - 2 6.45% 2 6.67% - - - - - - - -
DK DENMARK - - - - - - - - - - - - - - - - - - - - - - - - - -
EE ESTONIA - - - - - - - - - - - - - - - - - - - - - - - - - -
ES SPAIN - - 8 12.70% - - - - 2 11.76% - - - - 8 25.81% - - 2 15.38% 3 18.75% - - - -
FI FINLAND - - - - - - - - - - - - - - - - - - - - - - - - - -
FR FRANCE 1 7.14% 2 3.17% 1 3.85% 1 50.00% 1 5.88% 1 9.09% - - 1 3.23% 2 6.67% 1 7.69% 1 6.25% 4 22.22% - -
GR GREECE - - - - - - - - - - - - - - - - - - - - - - - - - -
HR CROATIA - - - - - - - - - - - - - - - - - - - - - - - - - -
HU HUNGARY - - 3 4.76% 2 7.69% - - - - - - - - - - - - - - - - - - - -
IE IRELAND 3 21.43% 2 3.17% 2 7.69% - - - - 1 9.09% - - - - 1 3.33% - - 1 6.25% - - - -
IS ICELAND - - 4 6.35% - - - - - - - - - - - - - - - - - - - - - -
IT ITALY 2 14.29% 12 19.05% 1 3.85% - - - - - - - - - - - - - - - - - - - -
LI LIECHTENSTEIN - - - - - - - - - - - - - - - - - - - - - - - - - -
LT LITHUANIA - - - - - - - - - - - - - - - - - - - - - - - - - -
LU LUXEMBOURG - - - - - - - - - - - - - - - - - - - - - - - - - -
LV LATVIA - - - - - - - - - - - - - - - - - - - - - - - - - -
MT MALTA - - - - - - - - - - - - - - - - - - - - - - - - - -
NL THE NETHERLANDS 7 50.00% 21 33.33% 17 65.38% - - 6 35.29% 5 45.45% - - 19 61.29% 15 50.00% 10 76.92% 11 68.75% 6 33.33% 1 100.00%
NO NORWAY - - 8 12.70% 3 11.54% - - 7 41.18% 3 27.27% 6 100.00% - - 7 23.33% - - - - 8 44.44% - -
PL POLAND - - - - - - - - - - - - - - - - - - - - - - - - - -
PT PORTUGAL - - - - - - - - - - - - - - - - 1 3.33% - - - - - - - -
RO ROMANIA - - 1 1.59% - - - - - - - - - - - - - - - - - - - - - -
SE SWEDEN - - - - - - - - - - - - - - 1 3.23% 1 3.33% - - - - - - - -
SI SLOVENIA - - - - - - - - - - - - - - - - - - - - - - - - - -
SK SLOVAK REPUBLIC - - - - - - - - - - - - - - - - - - - - - - - - - -
14 100% 63 100% 26 100% 2 100% 17 100% 11 100% 6 100% 31 100% 30 100% 13 100% 16 100% 18 100% 1 100%
25% 10.5% 1% 0%7%7%5%12%12.5%2.5%4.5%7%
TOTAL
6%% ASSET CLASS TYPE ON TOTAL
WAIVERS PROCESSED

ESMA REGULAR USE
91
TABLE 24 - STATISTICS ON TRADING SYSTEM USING THE WAIVERS
Trading system Description of other system (including hybrid systems)
Continuous order
bookQuote driven Periodic auction RFQ Voice
Any other system
(including hybrid)
Prearranged (also
called negotiated
trades)
Does not say
a b c d e f g h i j k l m n o p q r
AT AUSTRIA - - - - - - - - - - - - - - - -
BE BELGIUM 1 3.13% - - - - - - - - 2 5.26% - - - -
BG BULGARIA - - - - - - - - - - - - - - - -
CY CYPRUS - - - - - - - - - - - - - - - -
CZ CZECH REPUBLIC - - - - - - - - - - - - - - - -
DE GERMANY 1 3.13% - - 2 28.57% 2 5.41% - - 1 2.63% 1 4.35% - -
DK DENMARK - - - - - - - - - - - - - - - -
EE ESTONIA - - - - - - - - - - - - - - - -
ES SPAIN - - 2 66.67% - - - - 6 46.15% 5 13.16% 1 4.35% - -
FI FINLAND - - - - - - - - - - - - - - - -
FR FRANCE - - - - - - - - 2 15.38% 3 7.89% 1 4.35% - -
GR GREECE - - - - - - - - - - - - - - - -
HR CROATIA - - - - - - - - - - - - - - - -
HU HUNGARY - - - - - - - - - - 1 2.63% 1 4.35% 1 33.33%
IE IRELAND 2 6.25% - - - - 1 2.70% - - - - - - - -
IS ICELAND - - - - - - - - - - 2 5.26% 2 8.70% - -
IT ITALY - - - - - - 12 32.43% - - - - - - - -
LI LIECHTENSTEIN - - - - - - - - - - - - - - - -
LT LITHUANIA - - - - - - - - - - - - - - - -
LU LUXEMBOURG - - - - - - - - - - - - - - - -
LV LATVIA - - - - - - - - - - - - - - - -
MT MALTA - - - - - - - - - - - - - - - -
NL THE NETHERLANDS 19 59.38% - - 5 71.43% 19 51.35% 3 23.08% 14 36.84% 7 30.43% 1 33.33%
NO NORWAY 9 28.13% - - - - 3 8.11% 2 15.38% 9 23.68% 9 39.13% - -
PL POLAND - - - - - - - - - - - - - - - -
PT PORTUGAL - - - - - - - - - - - - 1 4.35% - -
RO ROMANIA - - 1 33.33% - - - - - - - - - - 1 33.33%
SE SWEDEN - - - - - - - - - - 1 2.63% - - - -
SI SLOVENIA - - - - - - - - - - - - - - - -
SK SLOVAK REPUBLIC - - - - - - - - - - - - - - - -
32 100% 3 100% 7 100% 37 100% 13 100% 38 100% 23 100% 3 100%
COUNTRY
CODECOUNTRY
2%15%24%8%24%4%2%21%% ON TOTAL WAIVERS PROCESSED
TOTAL

ESMA REGULAR USE
92
TABLE 25 – STATISTICS ON TRADING SYSTEM USING THE WAIVES FOR ANY OTHER SYSTEMS (INCLUDING HYBRID) (1/2)
Central limit order
book (CLOB) +
Quote-driven
Auto-matchingElectronic + voice
tradingContinuos Auction
Continuous
Trading + Auction
Voice+ electronic
continuous and
periodic auctions
+ CLOB
Electronic order
book
Mid-price-
matching
Order book +
Prearranged
Request for
Stream (RFS)IOI matching
a b s t u v y z aa ab ac ad ae af ag ah ai aj ak al am an as at
AT AUSTRIA - - - - - - - - - - - - - - - - - - - - - -
BE BELGIUM - - - - - - - - - - - - - - 2 100.00% - - - - - -
BG BULGARIA - - - - - - - - - - - - - - - - - - - - - -
CY CYPRUS - - - - - - - - - - - - - - - - - - - - - -
CZ CZECH REPUBLIC - - - - - - - - - - - - - - - - - - - - - -
DE GERMANY 1 100.00% - - - - - - - - - - - - - - - - - - - -
DK DENMARK - - - - - - - - - - - - - - - - - - - - - -
EE ESTONIA - - - - - - - - - - - - - - - - - - - - - -
ES SPAIN - - - - - - - - - - - - - - - - - - - - - -
FI FINLAND - - - - - - - - - - - - - - - - - - - - - -
FR FRANCE - - - - - - - - - - - - - - - - - - - - - -
GR GREECE - - - - - - - - - - - - - - - - - - - - - -
HR CROATIA - - - - - - - - - - - - - - - - - - - - - -
HU HUNGARY - - - - - - - - 1 100.00% - - - - - - - - - - - -
IE IRELAND - - - - - - - - - - - - - - - - - - - - - -
IS ICELAND - - 2 100.00% - - - - - - - - - - - - - - - - - -
IT ITALY - - - - - - - - - - - - - - - - - - - - - -
LI LIECHTENSTEIN - - - - - - - - - - - - - - - - - - - - - -
LT LITHUANIA - - - - - - - - - - - - - - - - - - - - - -
LU LUXEMBOURG - - - - - - - - - - - - - - - - - - - - - -
LV LATVIA - - - - - - - - - - - - - - - - - - - - - -
MT MALTA - - - - - - - - - - - - - - - - - - - - - -
NL THE NETHERLANDS - - - - - - - - - - - - - - - - 1 100.00% 1 100.00% 1 100.00%
NO NORWAY - - - - - - - - - - - - - - - - - - - - - -
PL POLAND - - - - - - - - - - - - - - - - - - - - - -
PT PORTUGAL - - - - - - - - - - - - - - - - - - - - - -
RO ROMANIA - - - - - - - - - - - - - - - - - - - - - -
SE SWEDEN - - - - - - - - - - - - 1 100.00% - - - - - - - -
SI SLOVENIA - - - - - - - - - - - - - - - - - - - - - -
SK SLOVAK REPUBLIC - - - - - - - - - - - - - - - - - - - - - -
1 100% 2 100% - - - - 1 100% - - 1 100% 2 100% 1 100% 1 100% 1 100%
Description of other system (including hybrid systems)
% ON TOTAL WAIVERS PROCESSED
TOTAL
3%3%5%- - 5%3% 3%3%- 3%
COUNTRY
CODECOUNTRY

ESMA REGULAR USE
93
TABLE 26 – STATISTICS ON TRADING SYSTEM USING THE WAIVES FOR ANY OTHER SYSTEMS (INCLUDING HYBRID) (2/2)
Description of other system (including hybrid systems)
RFQ + Request for
Trade (RTF) +
Firm Quote
Posting (FQP)
Electronic Broker
Trading System
(BTS)
Electronic +
Manual trading
Electronic +
Human/Voice
Screen/Screen
assisted Voice +
Periodic/volume
match + Voice
Manual Trading
SystemTelephone + chat
Telephone + chat
Block Cross
FeatureNA
a b au av bc bd be bf bi bj bk bl bm bn bq br bs bt bu bv
AT AUSTRIA - - - - - - - - - - - - - - - - - - - -
BE BELGIUM - - - - - - - - - - - - - - - - - - 1 1.12%
BG BULGARIA - - - - - - - - - - - - - - - - - - - -
CY CYPRUS - - - - - - - - - - - - - - - - - - - -
CZ CZECH REPUBLIC - - - - - - - - - - - - - - - - - - - -
DE GERMANY - - - - - - - - - - - - - - - - - - 6 6.74%
DK DENMARK - - - - - - - - - - - - - - - - - - - -
EE ESTONIA - - - - - - - - - - - - - - - - - - - -
ES SPAIN - - - - - - - - 5 100.00% - - - - - - - - 4 4.49%
FI FINLAND - - - - - - - - - - - - - - - - - - - -
FR FRANCE - - - - - - 3 100.00% - - - - - - - - - 3 3.37%
GR GREECE - - - - - - - - - - - - - - - - - - - -
HR CROATIA - - - - - - - - - - - - - - - - - - - -
HU HUNGARY - - - - - - - - - - - - - - - - - - 2 2.25%
IE IRELAND - - - - - - - - - - - - - - - - - - 3 3.37%
IS ICELAND - - - - - - - - - - - - - - - - - - 2 2.25%
IT ITALY - - - - - - - - - - - - - - - - - - 12 13.48%
LI LIECHTENSTEIN - - - - - - - - - - - - - - - - - - - -
LT LITHUANIA - - - - - - - - - - - - - - - - - - - -
LU LUXEMBOURG - - - - - - - - - - - - - - - - - - - -
LV LATVIA - - - - - - - - - - - - - - - - - - - -
MT MALTA - - - - - - - - - - - - - - - - - - - -
NL THE NETHERLANDS 4 100.00% - - - - - - - - - - 2 100.00% 3 100.00% 2 100.00% 37 41.57%
NO NORWAY - - 2 100.00% 2 100.00% - - - - 5 100.00% - - - - - - 17 19.10%
PL POLAND - - - - - - - - - - - - - - - - - - - -
PT PORTUGAL - - - - - - - - - - - - - - - - - - 1 1.12%
RO ROMANIA - - - - - - - - - - - - - - - - - - 1 1.12%
SE SWEDEN - - - - - - - - - - - - - - - - - - - -
SI SLOVENIA - - - - - - - - - - - - - - - - - - - -
SK SLOVAK REPUBLIC - - - - - - - - - - - - - - - - - - - -
4 100% 2 100% 2 100% 3 100% 5 100% 5 100% 2 100% 3 100% 2 89 100%
% ON TOTAL WAIVERS PROCESSED
TOTAL
11% 13%8%5%5% 5%8%5%13%
COUNTRY
CODECOUNTRY

ESMA REGULAR USE
94
TABLE 27 – STATISTICS ON PRE-ARRANGED TRANSACTIONS IN LIS WAIVERS AND COMBINATIONS THEREOF
Pre-arranged Transactions If pre-arranged: Block trades/ Cross orders?
Does not say Yes No Block trades Cross ordersBlock trades and
cross ordersDoes not say
a b c d e f g h i j k l m n o p
AT AUSTRIA - - - - - - - - - - - - - -
BE BELGIUM 2 7.69% - - - - - - - - - - - -
BG BULGARIA - - - - - - - - - - - - - -
CY CYPRUS - - - - - - - - - - - - - -
CZ CZECH REPUBLIC - - - - - - - - - - - - - -
DE GERMANY - - 3 18.75% 1 11.11% 1 20.00% - - - - 2 20.00%
DK DENMARK - - - - - - - - - - - - - -
EE ESTONIA - - - - - - - - - - - - - -
ES SPAIN 3 11.54% - - - - - - - - - - - -
FI FINLAND - - - - - - - - - - - - - -
FR FRANCE 2 7.69% - - - - - - - - - - - -
GR GREECE - - - - - - - - - - - - - -
HR CROATIA - - - - - - - - - - - - - -
HU HUNGARY - - - - - - - - - - - - - -
IE IRELAND - - - - - - - - - - - - - -
IS ICELAND - - 1 6.25% 1 11.11% - - - - - - 1 10.00%
IT ITALY 3 11.54% - - - - - - - - - - - -
LI LIECHTENSTEIN - - - - - - - - - - - - - -
LT LITHUANIA - - - - - - - - - - - - - -
LU LUXEMBOURG - - - - - - - - - - - - - -
LV LATVIA - - - - - - - - - - - - - -
MT MALTA - - - - - - - - - - - - - -
NL THE NETHERLANDS 11 42.31% 5 31.25% 7 77.78% 2 40.00% - - - - 3 30.00%
NO NORWAY 4 15.38% 7 43.75% - - 2 40.00% 1 100.00% - - 4 40.00%
PL POLAND - - - - - - - - - - - - - -
PT PORTUGAL 1 3.85% - - - - - - - - - - - -
RO ROMANIA - - - - - - - - - - - - - -
SE SWEDEN - - - - - - - - - - - - - -
SI SLOVENIA - - - - - - - - - - - - - -
SK SLOVAK REPUBLIC - - - - - - - - - - - - - -
26 100% 16 100% 9 100% 5 100% 1 100% - - 10 100%TOTAL
63%51% 18%31% 31% 6% - % OF PRE-ARRANGED TRADES ON
TOTAL LIS WAIVERS
COUNTRY
CODECOUNTRY

ESMA REGULAR USE
95
TABLE 28 – STATISTICS FOR ORDER TYPES IN OMF WAIVERS
Order type in an OMF waiver Type of order when order type is or included "other"
Iceberg order Stop loss OtherIceberg order +
stop lossStop loss + other
Iceberg order +
stop loss + other
Iceberg order +
otherNA
Trailing Stop
Order + One-
cancels-other
(OCO)
Done-If-Touched Crossing order
a b c d e f g h i j k l m n o p o p q r w x ac ad
AT AUSTRIA - - - - - - - - - - - - - - - - - - - - - -
BE BELGIUM - - - - - - - - - - - - - - - - - - - - - -
BG BULGARIA - - - - - - - - - - - - - - - - - - - - - -
CY CYPRUS - - - - - - - - - - - - - - - - - - - - - -
CZ CZECH REPUBLIC - - - - - - - - - - - - - - - - - - - - - -
DE GERMANY 1 10.00% 1 33.33% - - - - - - - - - - 2 12.50% - - - - - -
DK DENMARK - - - - - - - - - - - - - - - - - - - - - -
EE ESTONIA - - - - - - - - - - - - - - - - - - - - - -
ES SPAIN - - - - - - - - - - - - - - - - - - - - - -
FI FINLAND - - - - - - - - - - - - - - - - - - - - - -
FR FRANCE - - - - - - - - - - - - - - - - - - - - - -
GR GREECE - - - - - - - - - - - - - - - - - - - - - -
HR CROATIA - - - - - - - - - - - - - - - - - - - - - -
HU HUNGARY - - - - 1 50.00% - - - - 1 50.00% - - - - 2 100.00% - - - -
IE IRELAND 1 10.00% 1 33.33% - - - - - - - - - - 2 12.50% - - - - - -
IS ICELAND - - - - - - - - - - - - - - - - - - - - - -
IT ITALY - - - - - - - - - - - - - - - - - - - - - -
LI LIECHTENSTEIN - - - - - - - - - - - - - - - - - - - - - -
LT LITHUANIA - - - - - - - - - - - - - - - - - - - - - -
LU LUXEMBOURG - - - - - - - - - - - - - - - - - - - - - -
LV LATVIA - - - - - - - - - - - - - - - - - - - - - -
MT MALTA - - - - - - - - - - - - - - - - - - - - - -
NL THE NETHERLANDS 3 30.00% - - 1 50.00% 1 33.33% - - 1 50.00% 1 100.00% 4 25.00% - - 1 100.00% 2 100.00%
NO NORWAY 5 50.00% 1 33.33% - - 2 66.67% - - - - - - 8 50.00% - - - - - -
PL POLAND - - - - - - - - - - - - - - - - - - - - - -
PT PORTUGAL - - - - - - - - - - - - - - - - - - - - - -
RO ROMANIA - - - - - - - - - - - - - - - - - - - - - -
SE SWEDEN - - - - - - - - - - - - - - - - - - - - - -
SI SLOVENIA - - - - - - - - - - - - - - - - - - - - - -
SK SLOVAK REPUBLIC - - - - - - - - - - - - - - - - - - - - - -
10 100% 3 100% 2 100% 3 100% - - 2 100% 1 100% 16 100% 2 100% 1 100% 2 100%
5%9.5%0%14% 9.5% 14%
COUNTRY
CODECOUNTRY
TOTAL
48%% OMF WAIVER TYPE ON TOTAL OMF
WAIVERS PROCESSED

ESMA REGULAR USE
96
TABLE 29 – STATISTICS FOR THE EXECUTION OF THE HIDDEN PART OF ICEBERG ORDERS OF OMF WAIVERS
Execution of the hidden part
Release of new peaks
to be executed
assumed (Case 1)
Release of new peaks
to be executed explicit
(Case 2)
Execution of hidden
part when aggressive
order as per Q&A
(Case 3)Case 1 Case 2 Case 3
a b c d e f g h
AT AUSTRIA - - - - - -
BE BELGIUM - - - - - -
BG BULGARIA - - - - - -
CY CYPRUS - - - - - -
CZ CZECH REPUBLIC - - - - - -
DE GERMANY - - 1 11.11% - -
DK DENMARK - - - - - -
EE ESTONIA - - - - - -
ES SPAIN - - - - - -
FI FINLAND - - - - - -
FR FRANCE - - - - - -
GR GREECE - - - - - -
HR CROATIA - - - - - -
HU HUNGARY - - - - 1 14.29%
IE IRELAND - - 1 11.11% - -
IS ICELAND - - - - - -
IT ITALY - - - - - -
LI LIECHTENSTEIN - - - - - -
LT LITHUANIA - - - - - -
LU LUXEMBOURG - - - - - -
LV LATVIA - - - - - -
MT MALTA - - - - - -
NL THE NETHERLANDS - - 4 44.44% 2 28.57%
NO NORWAY - - 3 33.33% 4 57.14%
PL POLAND - - - - - -
PT PORTUGAL - - - - - -
RO ROMANIA - - - - - -
SE SWEDEN - - - - - -
SI SLOVENIA - - - - - -
SK SLOVAK REPUBLIC - - - - - -
- - 9 100% 7 100%
56% 44%
COUNTRY
CODECOUNTRY
% EXECUTION HIDDEN PART ON
TOTAL ICEBERG WAIVERS
PROCESSED
TOTAL
-

ESMA REGULAR USE
97
TABLE 30 – STATISTICS ON RANDOMIZATION OF PEAKS OF ICEBERG ORDERS IN OMF WAIVERS
Randomised peak quantity Randomised peak price
Does not say Yes No Does not say Yes No Does not say
a b c d e f g h i j k l m n
AT AUSTRIA - - - - - - - - - - - -
BE BELGIUM - - - - - - - - - - - -
BG BULGARIA - - - - - - - - - - - -
CY CYPRUS - - - - - - - - - - - -
CZ CZECH REPUBLIC - - - - - - - - - - - -
DE GERMANY - - 1 11.11% - - - - - - 1 14.29%
DK DENMARK - - - - - - - - - - - -
EE ESTONIA - - - - - - - - - - - -
ES SPAIN - - - - - - - - - - - -
FI FINLAND - - - - - - - - - - - -
FR FRANCE - - - - - - - - - - - -
GR GREECE - - - - - - - - - - - -
HR CROATIA - - - - - - - - - - - -
HU HUNGARY - - 1 11.11% - - - - - - 1 14.29%
IE IRELAND - - 1 11.11% - - - - - - 1 14.29%
IS ICELAND - - - - - - - - - - - -
IT ITALY - - - - - - - - - - - -
LI LIECHTENSTEIN - - - - - - - - - - - -
LT LITHUANIA - - - - - - - - - - - -
LU LUXEMBOURG - - - - - - - - - - - -
LV LATVIA - - - - - - - - - - - -
MT MALTA - - - - - - - - - - - -
NL THE NETHERLANDS 4 66.67% 1 11.11% 1 100.00% 4 44.44% - - 2 28.57%
NO NORWAY 2 33.33% 5 55.56% - - 5 55.56% - - 2 28.57%
PL POLAND - - - - - - - - - - - -
PT PORTUGAL - - - - - - - - - - - -
RO ROMANIA - - - - - - - - - - - -
SE SWEDEN - - - - - - - - - - - -
SI SLOVENIA - - - - - - - - - - - -
SK SLOVAK REPUBLIC - - - - - - - - - - - -
6 100% 9 100% 1 100% 9 100% - - 7 100%TOTAL
37.50% 43.75%56.25% 6.25% 56.25% -
% RANDOMISED PEAK
QUANTITY/PRICE ON TOTAL ICEBER
WAIVERS PROCESSED
COUNTRY
CODECOUNTRY

ESMA REGULAR USE
98
TABLE 31 - STATISTICS ON MEMBER PREFERENCING IN OMF WAIVER
Member preferencing
Does not say Yes No
a b c d e f g h
AT AUSTRIA - - - - - -
BE BELGIUM - - - - - -
BG BULGARIA - - - - - -
CY CYPRUS - - - - - -
CZ CZECH REPUBLIC - - - - - -
DE GERMANY 1 6.25% - - 1 33.33%
DK DENMARK - - - - - -
EE ESTONIA - - - - - -
ES SPAIN - - - - - -
FI FINLAND - - - - - -
FR FRANCE - - - - - -
GR GREECE - - - - - -
HR CROATIA - - - - - -
HU HUNGARY 1 6.25% - - 1 33.33%
IE IRELAND 2 12.50% - - - -
IS ICELAND - - - - - -
IT ITALY - - - - - -
LI LIECHTENSTEIN - - - - - -
LT LITHUANIA - - - - - -
LU LUXEMBOURG - - - - - -
LV LATVIA - - - - - -
MT MALTA - - - - - -
NL THE NETHERLANDS 6 37.50% - - 1 33.33%
NO NORWAY 6 37.50% 2 100.00% - -
PL POLAND - - - - - -
PT PORTUGAL - - - - - -
RO ROMANIA - - - - - -
SE SWEDEN - - - - - -
SI SLOVENIA - - - - - -
SK SLOVAK REPUBLIC - - - - - -
16 100% 2 100% 3 100%
9.52% 14.29%% MEMBER PREFERENCING ON TOTAL
ICEBERG WAIVERS PROCESSED
COUNTRY
CODECOUNTRY
TOTAL
76.19%

ESMA REGULAR USE
99
TABLE 32 – STATISTICS ON THE INDICATIVE PRICE THAT THE VENUE MAKES PUBLIC AND THE TRADING SYSTEM USED
indicative price that the trading venue makes public Type of trading system used
WAP Simple average Best available price
Simple average or
Best available
price
Best available
price or Simple
average price or
WAP
Indicative pre-
trade bid and
offer prices
Does not say Voice RFQ RFQ + Voice
a b c d e f g h i j l m n o p q t u v w v w
AT AUSTRIA - - - - - - - - - - - - - - - - - - - -
BE BELGIUM - - - - - - - - - - - - - - - - - - - -
BG BULGARIA - - - - - - - - - - - - - - - - - - - -
CY CYPRUS - - - - - - - - - - - - - - - - - - - -
CZ CZECH REPUBLIC - - - - - - - - - - - - - - - - - - - -
DE GERMANY - - - - - - - - - - - - - - - - - - - -
DK DENMARK - - - - - - - - - - - - - - - - - - - -
EE ESTONIA - - - - - - - - - - - - - - - - - - - -
ES SPAIN - - - - - - - - - - - - 2 25.00% 2 40.00% - - - -
FI FINLAND - - - - - - - - - - - - - - - - - - - -
FR FRANCE - - - - - - - - - - - - - - - - - - - -
GR GREECE - - - - - - - - - - - - - - - - - - - -
HR CROATIA - - - - - - - - - - - - - - - - - - - -
HU HUNGARY - - - - - - - - - - - - - - - - - - - -
IE IRELAND - - 1 10.00% - - - - - - - - - - - - 1 6.67% - -
IS ICELAND - - - - - - - - - - - - - - - - - - - -
IT ITALY - - 5 50.00% - - - - - - - - 1 12.50% - - 6 40.00% - -
LI LIECHTENSTEIN - - - - - - - - - - - - - - - - - - - -
LT LITHUANIA - - - - - - - - - - - - - - - - - - - -
LU LUXEMBOURG - - - - - - - - - - - - - - - - - - - -
LV LATVIA - - - - - - - - - - - - - - - - - - - -
MT MALTA - - - - - - - - - - - - - - - - - - - -
NL THE NETHERLANDS - - 4 40.00% 1 100.00% - - - - 2 100.00% 4 50.00% 3 60.00% 8 53.33% - -
NO NORWAY - - - - - - - - - - - - 1 12.50% - - - - 1 100.00%
PL POLAND - - - - - - - - - - - - - - - - - - - -
PT PORTUGAL - - - - - - - - - - - - - - - - - - - -
RO ROMANIA - - - - - - - - - - - - - - - - - - - -
SE SWEDEN - - - - - - - - - - - - - - - - - - - -
SI SLOVENIA - - - - - - - - - - - - - - - - - - - -
SK SLOVAK REPUBLIC - - - - - - - - - - - - - - - - - - - -
- - 10 100% 1 100% - - - - 2 100% 8 100% 5 100% 15 100% 1 100%
COUNTRY
CODE
TOTAL
COUNTRY
% OF DIFFERENT INDICATIVE PRICES
AND TYPES OF TRADING SYSTEMS ON
TOTAL SSTI WAIVERS
47.62% - 23.81% 71.43% 4.76%38.10%9.52% - - 4.76%

ESMA REGULAR USE
100
TABLE 33 – STATISTICS ON HOW IT IS ENSURED THAT ONLY APPROPRIATE PACKAGES ARE ACCEPTED
How does the venue ensure that only package orders/transactions that meet the
definition in MiFIR are accepted?
How does the venue ensure that only packages that do not have a liquid market as a whole are accepted under the
waiver?
The venue provides examples
of package orders meeting the
conditions
the venue explains how the
conditions are met on its
venue
other
the package order includes
components that are not
specified in the RTS on
package orders (e.g. bonds)
all components of the package
order are either LIS or illiquid
the package order combines
components of various sub-
asset classes
Other
a b c d e f g h c d p q n o r r
AT AUSTRIA - - - - - - - - - - - - - -
BE BELGIUM - - 1 5.88% - - - - - - - - 1 16.67%
BG BULGARIA - - - - - - - - - - - - - -
CY CYPRUS - - - - - - - - - - - - - -
CZ CZECH REPUBLIC - - - - - - - - - - - - - -
DE GERMANY - - 2 11.76% - - - - - - - - 1 16.67%
DK DENMARK - - - - - - - - - - - - - -
EE ESTONIA - - - - - - - - - - - - - -
ES SPAIN - - 3 17.65% - - - - 3 23.08% - - - -
FI FINLAND - - - - - - - - - - - - - -
FR FRANCE 2 14.29% - - - - 1 25.00% - - - - 1 16.67%
GR GREECE - - - - - - - - - - - - - -
HR CROATIA - - - - - - - - - - - - - -
HU HUNGARY - - - - - - - - - - - - - -
IE IRELAND - - - - - - - - - - - - - -
IS ICELAND - - - - - - - - - - - - - -
IT ITALY 1 7.14% 2 11.76% - - 3 75.00% - - - - - -
LI LIECHTENSTEIN - - - - - - - - - - - - - -
LT LITHUANIA - - - - - - - - - - - - - -
LU LUXEMBOURG - - - - - - - - - - - - - -
LV LATVIA - - - - - - - - - - - - - -
MT MALTA - - - - - - - - - - - - - -
NL THE NETHERLANDS 5 35.71% 7 41.18% - - - - 6 46.15% 1 33.33% 1 16.67%
NO NORWAY 5 35.71% 1 5.88% - - - - 3 23.08% 2 66.67% 1 16.67%
PL POLAND - - - - - - - - - - - - - -
PT PORTUGAL 1 7.14% - - - - - - - - - - 1 16.67%
RO ROMANIA - - - - - - - - - - - - - -
SE SWEDEN - - 1 5.88% - - - - 1 7.69% - - - -
SI SLOVENIA - - - - - - - - - - - - - -
SK SLOVAK REPUBLIC - - - - - - - - - - - - - -
14 100% 17 100% - - 4 100% 13 100% 3 100% 6 100%
19%
TOTAL
45% 55% 0% 42% 10%13%% ON TOTAL PACKAGE WAIVERS
COUNTRYCOUNTRY
CODE
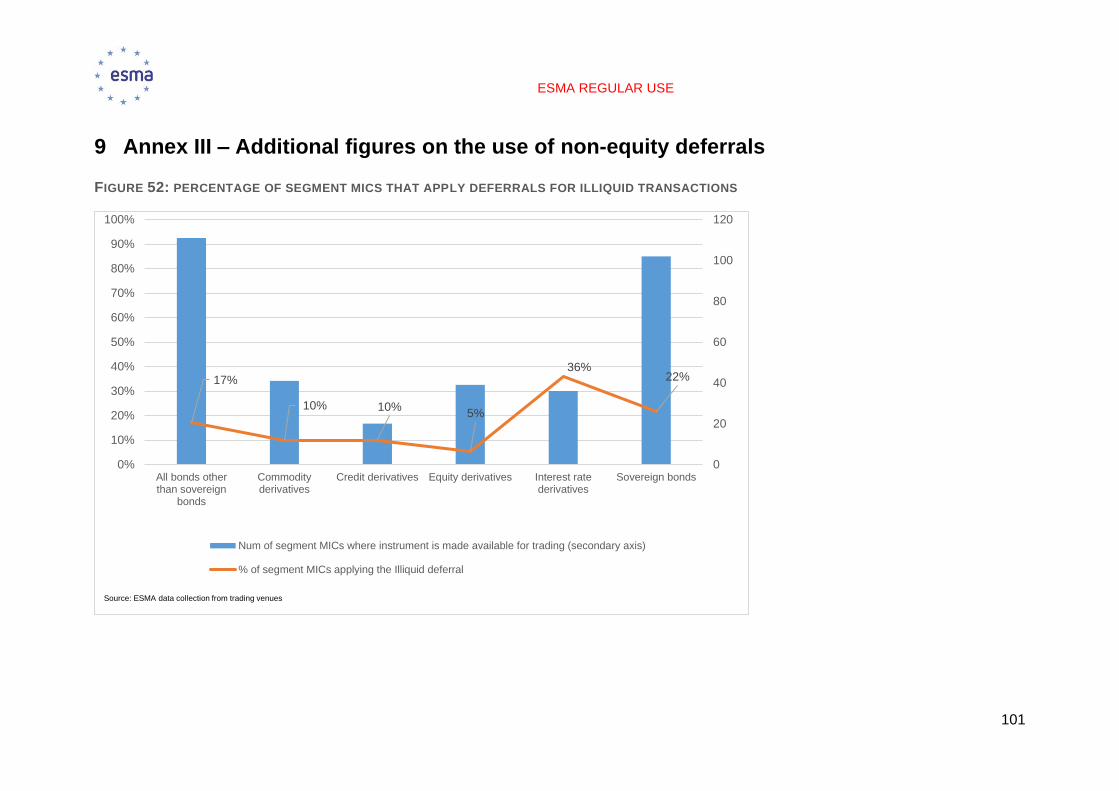
ESMA REGULAR USE
101
9 Annex III – Additional figures on the use of non-equity deferrals
FIGURE 52: PERCENTAGE OF SEGMENT MICS THAT APPLY DEFERRALS FOR ILLIQUID TRANSACTIONS
17%
10% 10%5%
36%22%
0
20
40
60
80
100
120
0%
10%
20%
30%
40%
50%
60%
70%
80%
90%
100%
All bonds otherthan sovereign
bonds
Commodityderivatives
Credit derivatives Equity derivatives Interest ratederivatives
Sovereign bonds
Num of segment MICs where instrument is made available for trading (secondary axis)
% of segment MICs applying the Illiquid deferral
Source: ESMA data collection from trading venues

ESMA REGULAR USE
102
FIGURE 53: PERCENTAGE OF SEGMENT MICS THAT APPLY DEFERRALS FOR SSTI TRANSACTIONS
17%7% 10%
5%
28%15%
0
20
40
60
80
100
120
0%
10%
20%
30%
40%
50%
60%
70%
80%
90%
100%
All bonds other thansovereign bonds
Commodityderivatives
Credit derivatives Equity derivatives Interest ratederivatives
Sovereign bonds
Num of segment MICs where instrument is made available for trading (secondary axis)
% of segment MICs applying the SSTI deferral
Source: ESMA data collection from trading venues

ESMA REGULAR USE
103
FIGURE 54: NUMBER OF NCAS APPLYING THE NON-EQUITY DEFERRAL REGIMES FOR TRANSACTIONS IN ILLIQUID INSTRUMENTS
0
2
4
6
8
10
12
14
Sovereign Bonds Bonds (otherthan Sovereign
bonds)
ETCs/ETNs StructuredFinance Products
(SFPs)
EmissionAllowances
Derivatives
YES - Allowed to TVs, applied by TVs but not applied by IFs/SIs ( including because thereare no IFs and SIs in the jurisdiction)
YES - Allowed to TVs but not applied by TVs and IFs/SIs
NO - Not allowed to TVs and to IFs/SIs
YES - Allowed and applied by TVs and IFs/SIs
Decision has not been taken yet
There is no TVs trading these instruments. Consequently, it cannot be applied
YES - Allowed but not applied because there are no IFs and SIs
Source: ESMA data collection from NCAs
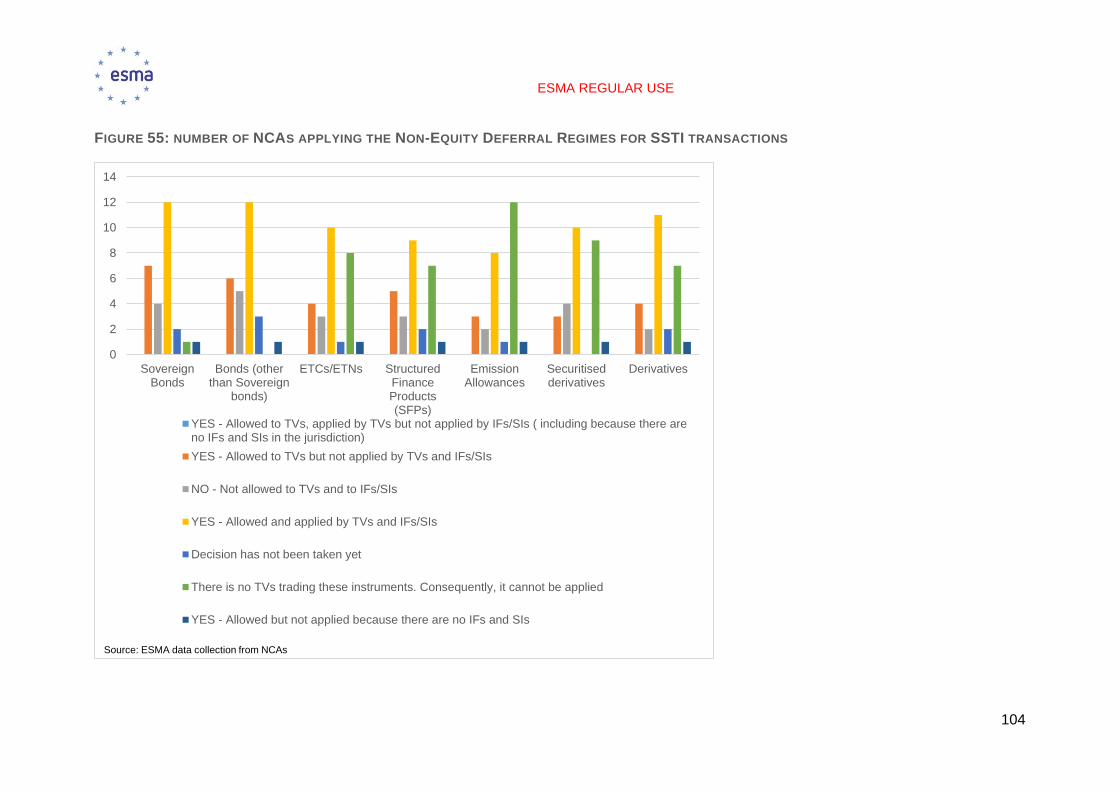
ESMA REGULAR USE
104
FIGURE 55: NUMBER OF NCAS APPLYING THE NON-EQUITY DEFERRAL REGIMES FOR SSTI TRANSACTIONS
0
2
4
6
8
10
12
14
SovereignBonds
Bonds (otherthan Sovereign
bonds)
ETCs/ETNs StructuredFinanceProducts(SFPs)
EmissionAllowances
Securitisedderivatives
Derivatives
YES - Allowed to TVs, applied by TVs but not applied by IFs/SIs ( including because there areno IFs and SIs in the jurisdiction)
YES - Allowed to TVs but not applied by TVs and IFs/SIs
NO - Not allowed to TVs and to IFs/SIs
YES - Allowed and applied by TVs and IFs/SIs
Decision has not been taken yet
There is no TVs trading these instruments. Consequently, it cannot be applied
YES - Allowed but not applied because there are no IFs and SIs
Source: ESMA data collection from NCAs

ESMA REGULAR USE
105
FIGURE 56: NUMBER OF NCAS APPLYING THE SUPPLEMENTARY DEFERRAL REGIME FOR TRANSACTIONS IN ILLIQUID FINANCIAL INSTRUMENTS, PER ASSET CLASS
0 5 10 15 20
In accordance with paragraphs (b) and(d) of Article 11(3) of MiFIR used
consecutively
In accordance with Article 11(3)(d) ofMiFIR aggregated form (indefinite)
In accordance with Article 11(3)(c) ofMiFIR - volume omission (4 weeks)
In accordance with Article 11(3)(b) ofMiFIR - volume omission (4 weeks)
In accordance with Article 11(3)(a) ofMiFIR - limited details (48h)
In accordance with Article 11(3)(a) ofMiFIR - aggregated form (48h)
Derivatives
Securitised derivatives
Emission Allowances
Structured Finance Products (SFPs)
ETCs/ETNs
Bonds (other than Sovereign bonds)
Sovereign Bonds
Source: ESMA data collection from NCAs

ESMA REGULAR USE
106
FIGURE 57: NUMBER OF NCAS APPLYING THE SUPPLEMENTARY DEFERRAL REGIME FOR TRANSACTIONS ABOVE SSTI, PER ASSET CLASS
0 2 4 6 8 10 12 14 16 18
In accordance with paragraphs (b) and (d)of Article 11(3) of MiFIR used consecutively
In accordance with Article 11(3)(d) of MiFIRaggregated form (indefinite)
In accordance with Article 11(3)(c) of MiFIR- volume omission (4 weeks)
In accordance with Article 11(3)(b) of MiFIR- volume omission (4 weeks)
In accordance with Article 11(3)(a) of MiFIR- limited details (48h)
Derivatives
Securitised derivatives
Emission Allowances
Structured Finance Products (SFPs)
ETCs/ETNs
Bonds (other than Sovereign bonds)
Sovereign Bonds
Source: ESMA data collection from NCAs