Annual Report 2016 - Attock Cement
132
Annual Report 2016 W I T H P R O G R E S S
-
Upload
khangminh22 -
Category
Documents
-
view
3 -
download
0
Transcript of Annual Report 2016 - Attock Cement
Annual Report 2016
W I T H P R O G R E S S
ContentsVision & Mission -------------------------------------------------------------------------------------------02
Company Information ------------------------------------------------------------------------------------04
Board of Directors -----------------------------------------------------------------------------------------06
Quality, Health, Safety & Environmental Policy ---------------------------------------------------------09
Core Values -----------------------------------------------------------------------------------------------10
Whistle Blowing Policy Statement -----------------------------------------------------------------------11
Corporate Social Responsibility -------------------------------------------------------------------------12
Corporate Strategy ----------------------------------------------------------------------------------------24
Management ----------------------------------------------------------------------------------------------26
Awards and Certificates ----------------------------------------------------------------------------------28
Chairman’s Review ----------------------------------------------------------------------------------------30
Directors’ Report -----------------------------------------------------------------------------------------32
Shareholders’ Information --------------------------------------------------------------------------------44
Notice of the Thirty-Seventh (37th) Annual General Meeting ------------------------------------------56
Statement of Compliance with the Code of Corporate Governance ---------------------------------61
Review Report to the Members on Statement of Compliance with the Code of Corporate Governance -------------------------------------------------------------63
Auditors’ Report to the Members ------------------------------------------------------------------------64
Balance Sheet --------------------------------------------------------------------------------------------66
Profit and Loss Account ---------------------------------------------------------------------------------67
Cash Flow Statement ------------------------------------------------------------------------------------68
Statement of Changes in Equity ------------------------------------------------------------------------69
Notes to the Financial Statements ----------------------------------------------------------------------70
Pattern of Shareholding -------------------------------------------------------------------------------- 100
Events --------------------------------------------------------------------------------------------------- 101
Notice of the Thirty-Seventh (37th) Annual General Meeting (Urdu) ------------------------------- 113
Directors’ Report (Urdu) -------------------------------------------------------------------------------- 122
Form of Proxy ------------------------------------------------------------------------------------------- 123
E-Statement Consent Form ---------------------------------------------------------------------------- 125
VisionTo be the leading organization continuously providing high quality cement, excelling in every aspect of its business and to remain market leader in Cement Industry.
I N T I M E
Attock Cement Pakistan Limited2
MissionTo be a premier and reputable cement manufacturing company dedicated to become an industry leader by producing quality products, providing excellent services, enhancing customer satisfaction and maximizing shareholders’ value through professionalism and dedicated teamwork.
Annual Report 2016 3
Company InformationBoard of DirectorsDr. Ghaith R. Pharaon (Chairman)Laith G. PharaonWael G. PharaonShuaib A. MalikAbdus SattarAgha Sher ShahBabar Bashir Nawaz
Chief ExecutiveBabar Bashir Nawaz
Alternate DirectorsShuaib A. MalikIrfan AmanullahFakhrul Islam Baig
Audit Committee of the BoardAbdus Sattar ChairmanShuaib A. Malik MemberAgha Sher Shah Member
HR & Remuneration CommitteeShuaib A. Malik ChairmanAbdus Sattar MemberBabar Bashir Nawaz Member
Company Secretary Irfan Amanullah
BankersThe Bank of Punjab LimitedAllied Bank LimitedMCB Bank LimitedAskari Bank LimitedUnited Bank LimitedNIB Bank LimitedBank Al-Habib LimitedMeezan Bank LimitedNational Bank of Pakistan LimitedHabib Bank LimitedSamba Bank LimitedDubai Islamic Bank limitedFaysal Bank Limited
AuditorsA.F. Ferguson & Co.Chartered Accountants
Cost AuditorsNaveed Zafar Ashfaq Jaffery & Co. Chartered Accountants
Registered OfficeD - 70, Block-4, Kehkashan-5Clifton, Karachi-75600Tel: (92-21) 35309773-4UAN: (92-21) 111 17 17 17Fax: (92-21) 35309775Email: [email protected]: www.attockcement.com
Plant Hub Chowki, LasbellaBaluchistan
Legal AdvisorSattar & SattarAttorneys at Law
Share RegistrarTechnology Trade (Pvt) LimitedDagia House, 241 - C, Block - 2PECHS, Off: Shahrah-e-Quaideen, Karachi.Tel: (92-21) 34391316 - 17Fax: (92-21) 34391318
Board of Directors
Dr. Ghaith R. PharaonChairman
Attock Cement Pakistan Limited6
Wael G. Pharaon
Agha Sher Shah Babar Bashir NawazAbdus Sattar
Laith G. Pharaon Shuaib A. Malik
Annual Report 2016 7

W I T H Q U A L I T Y
Attock Cement Pakistan Limited8
We are committed to produce premium quality cement to the satisfaction of our valued customers.
We will achieve this standard through:
• Effective implementation of an Integrated Quality, Environment, Health & Safety Management System based on ISO 9001, ISO 14001 and OHSAS 18001 requirements;
• Compliance with applicable and relevant legal & customer requirements with regards to Product Specification, Environment and Health & Safety;
• Prevention of product rejection, Environmental pollution and safety incidents / accidents in our operations;
• Continual improvement in our processes and products by developing SMART Objectives / Targets and achieving them; and
• Creating awareness, understanding and ownership of this policy throughout the organization.
Quality, Health, Safety & Environmental Policy
Annual Report 2016 9
Core Values
The Company follows highest standards of ETHICS with special reference to business integrity and process transparency. All our standards and processes can stand the test of scrutiny. We maintain the highest level of integrity both as individuals and as a corporate organization.
Ethics
The Company ensures that it operates in a safe environment conducive to efficient productivity. The Company is committed to provide an environment free from discrimination for its people. Open communication, participative decision making approach and nurturing of the leadership qualities are the values followed by the Company. An employee reward system has been developed guided by a transparent system of recognition. We encourage and respect team spirit among our human resources.
People
The Company is committed to provide its customers QUALITY products that provide them best value for their money. We promote high standard and timely delivery of quality products.
Quality
The Company believes in maximizing shareholders’ value through strategic investment, sustainable growth and application of best available technology to achieve desired results.
Business Excellence
Attock Cement Pakistan Limited10
Whistle BlowingPolicy StatementThe Management encourages whistle blowing culture in the organization and has adopted a culture to detect, identify and report any activity which is not in line with the Company policies, any misuse of Company’s properties or any breach of law which may affect the reputation of the Company. The Company has adopted the best corporate policies to protect employee(s) who report corporate wrongdoings, illegal conduct, internal fraud and discrimination against retaliation.
The Company promotes transparency and accountability through publication of accurate financial information to all the stakeholders, implementation of sound, effective and efficient internal control system and operational procedures.
All Executives have signed a code of conduct and the Company takes any deviation very seriously.
The Company encourages Whistle Blowing System to raise the issue directly to Chief Executive and / or to the Company Secretary provided that:-
• The Whistleblower has sufficient evidence(s) to ensure genuineness of the fact after a proper investigation at his own end;
• The Whistleblower understands that his act will cause more good than harm to the Company and he / she is doing this because of his loyalty with the Company; and
• The Whistleblower understands the seriousness of his / her action and is ready to assume his / her own responsibility.
The Management understands that through the use of a good Whistle Blowing Plan, they can discover and develop a powerful ally in building trust with its employees and manage fair and transparent operations. The Company therefore provides a mechanism whereby any employee who meets the above referred conditions can report any case based on merit without any fear of retaliation and reprisal.
Annual Report 2016 11
Attock Cement Pakistan Limited12
Corporate Social
ResponsibilityWe define Corporate Social Responsibility (CSR) as our commitment to work as partners with all our stakeholders to effectively improve the quality of life of the members of our workforce, their families and the local communities around our facilities.
CSR is locally managed and specific responsibilities have been assigned for coordinating local projects, communicating CSR activities internally and to external stakeholders, establishing stakeholders’ dialogue and relations, as well as participating in corporate monitoring, evaluation and reporting.
Our CSR approach focuses on six main pillars; business conduct, employment practices, occupational health & safety (OH&S), community involvement, customer and supplier relations and monitoring & reporting.
Employment PracticesAttock Cement counted 812 employees as at June 30, 2016. A large share of this number live in Communities where we are a major employer and source of income.
We pay competitive wages and offer employees numerous benefits, including professional development opportunities through internal training and payment of tuition for approved external programs.

W I T H S T R E N G T H
Annual Report 2016 13

W I T H C A R E
Attock Cement Pakistan Limited14
Occupational Health & SafetyWe are committed to provide healthy and safe workplaces. Towards this end, we have embarked on a comprehensive assessment and renewal of our approach to the management of occupational health and safety and all production facilities are fully compliant with quality standards. The Company operates a 6 beds hospital in the area near its factory

Annual Report 2016 15
premises. The treatment is free for the local communities. Medical camps are also organised in nearby goths to provide general medical treatment and medicines to sick and needy people.

Attock Cement Pakistan Limited16
W I T H D I R E C T I O N
Community RelationsWe are committed to be responsible neighbours. This means operating in compliance with applicable regulations and being an integral part of the life of our communities. We accomplish this through support of local non profit organizations, providing access to our properties and engaging in constant dialogue with residents to inform them of our activities and listen and respond to their concerns.
Through these and other actions, we seek to make a difference in our community. Our presence has a measurable positive economic impact on our community.
Annual Report 2016 17
Our products are essential to the construction industry, a key driver of economic activity that generates significant direct and indirect benefits in the value chain. Because our cement is generally consumed in proximity to their source, their utilization benefits local communities.
Combined with the salaries and benefits, direct and indirect taxes that we pay annually, as well as our capital expenditures, our presence has a measurable positive economic impact not only on our communities but also on the country as a whole.

W I T H A W A R E N E S S
Attock Cement Pakistan Limited18
The Company currently operates two Primary and Secondary level schools that impart education to children of both plant employees and also those from neighbouring villages.
Education
Annual Report 2016 19
The Company sponsored TCF - Dr. Rachad Pharaon Campus, primary section has started its academic activities from April, 2010 under the supervision of The Citizen Foundation (TCF), a non profit organization.
Primary and Secondary sections have the capacity of over 600 students. This school has been equipped with all modern facilities.
Attock Cement Pakistan Limited20
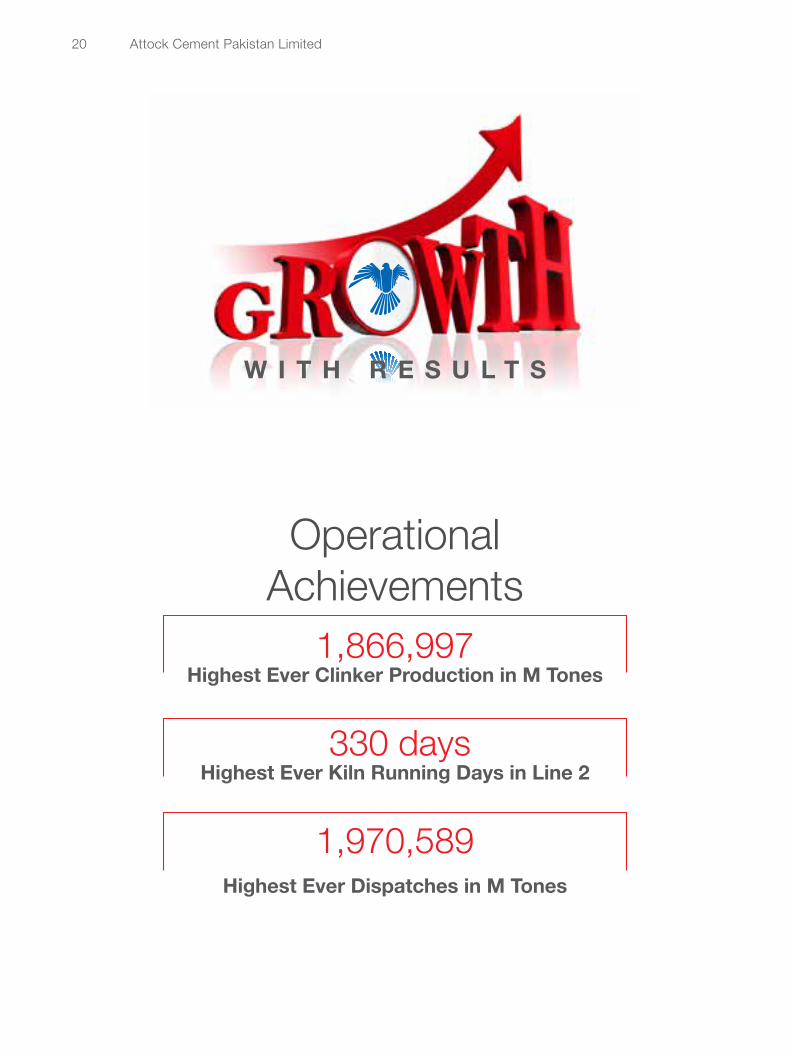
W I T H R E S U L T S
1,866,997 Highest Ever Clinker Production in M Tones
330 daysHighest Ever Kiln Running Days in Line 2
1,970,589 Highest Ever Dispatches in M Tones
OperationalAchievements
Annual Report 2016 21
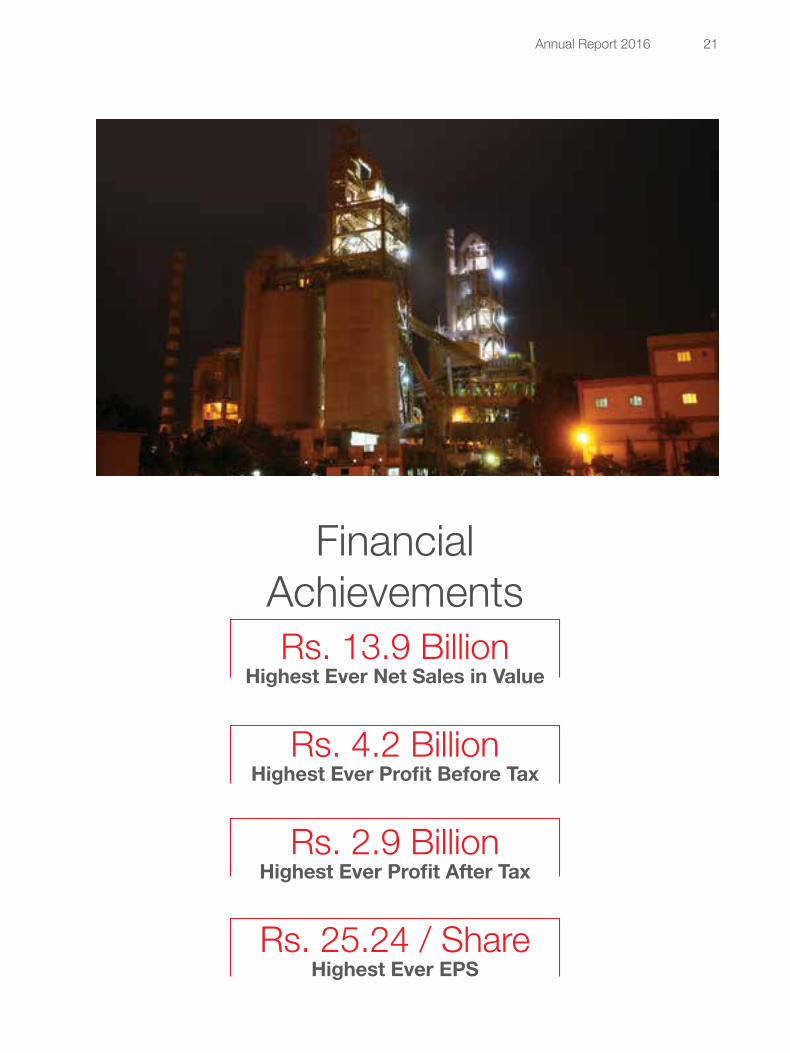
FinancialAchievementsRs. 13.9 Billion
Highest Ever Net Sales in Value
Rs. 4.2 BillionHighest Ever Profit Before Tax
Rs. 2.9 Billion
Highest Ever Profit After Tax
Rs. 25.24 / ShareHighest Ever EPS
Attock Cement Pakistan Limited22
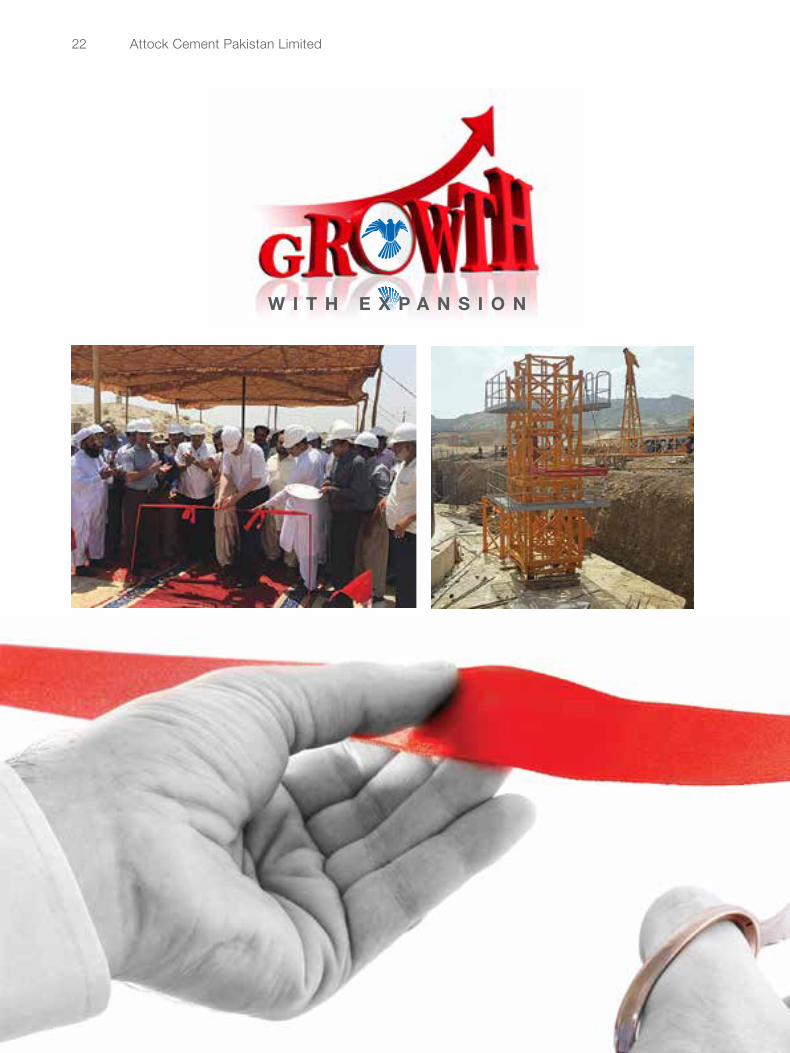
W I T H E X P A N S I O N
Annual Report 2016 23
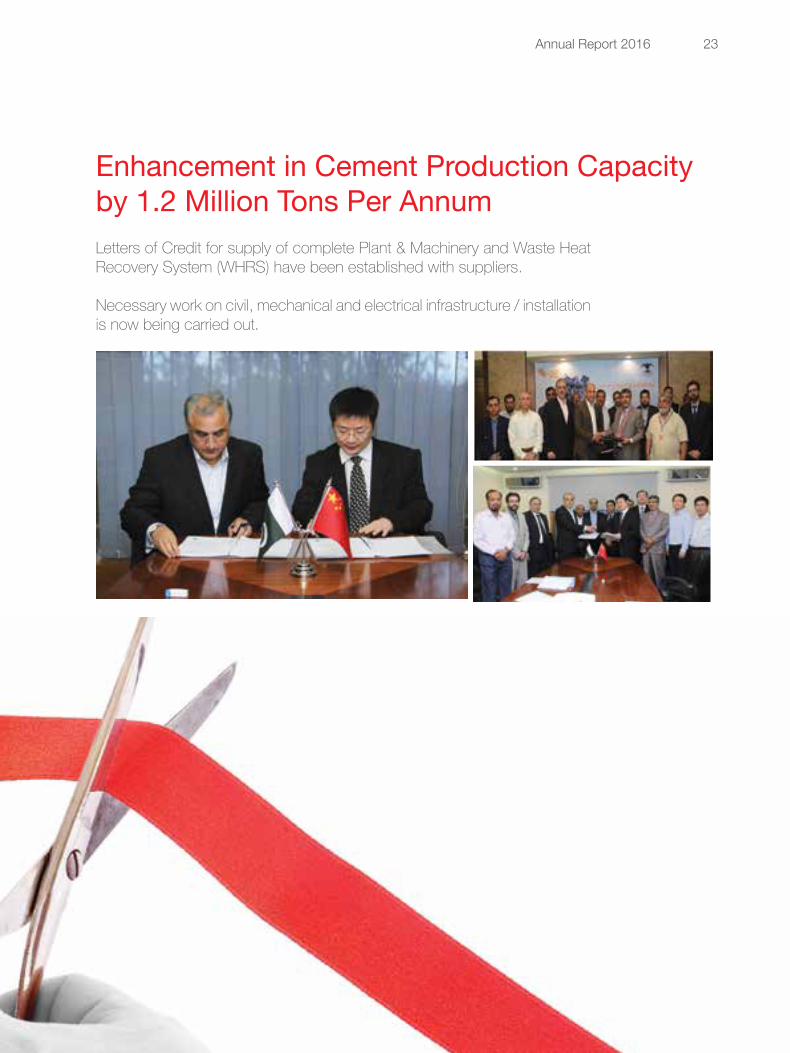
Letters of Credit for supply of complete Plant & Machinery and Waste Heat Recovery System (WHRS) have been established with suppliers.
Necessary work on civil, mechanical and electrical infrastructure / installation is now being carried out.
Enhancement in Cement Production Capacity by 1.2 Million Tons Per Annum
Attock Cement Pakistan Limited24
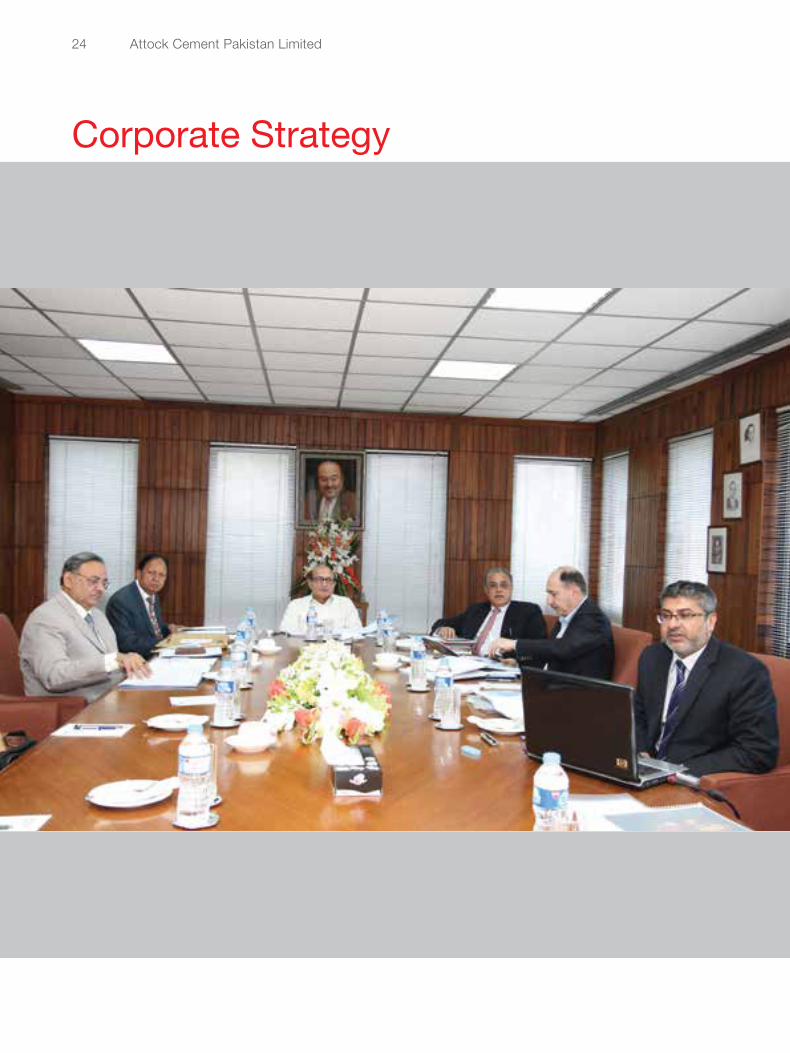
Corporate Strategy
Annual Report 2016 25
ObjectivesThe Company follows a duly approved Corporate Objectives, which consists of the following main points:-
• To maintain its position as a leading manufacturer of quality products that surpass both national and international standards.
• Growth, expansion and sustained profitability are the guiding principles of ACPL’s business model. Focusing on the strategic plans to grow the business beyond the borders, while enhancing the market share locally in South.
• To retain its lines of processes at highest level of operational efficiency.
• To achieve competitive operating margins with continuous growth both in productivity and profitability.
• To provide competitive rate of return to its shareholders on their investments.
• To remain committed in delivering quality and value to its customers and providing high quality cement products suitable for all construction purposes. To embrace consistency in high standards of service delivery.
• To continue with the commitment to provide a secure and innovative workplace for all its human resources.
• To remain committed by producing products in an environmentally and socially responsible manner.
To achieve these strategic corporate objectives, the Company generally follows the following broad and approved strategy:
StrategyThe Company would continue to invest in the product quality by enhancing and upgrading its production and quality facilities through strategic investments in its plant operations and ensure that such investment results in cost-effective operations. The company would also invest in continuous product development pegged on changing global and national market trends, industrial and hi-tech progression and dynamic customer needs. The company is dedicated to discover and implement change to achieve continuous customer satisfaction.
The Company would supply its products in diverse markets to achieve a healthy and growth oriented sales mix, focus towards a strong presence of its products in all the markets to achieve dynamic financial results, with maximum returns to all the stakeholders.
The Company would continue to invest in projects which ensure a healthy and safer environment for its employees. It would also continue to demonstrate its commitment to better and brighten lives for the community by sponsoring a wide range of community development projects. ACPL has played a major role and it will continue its contribution in building the nation.
Attock Cement Pakistan Limited26
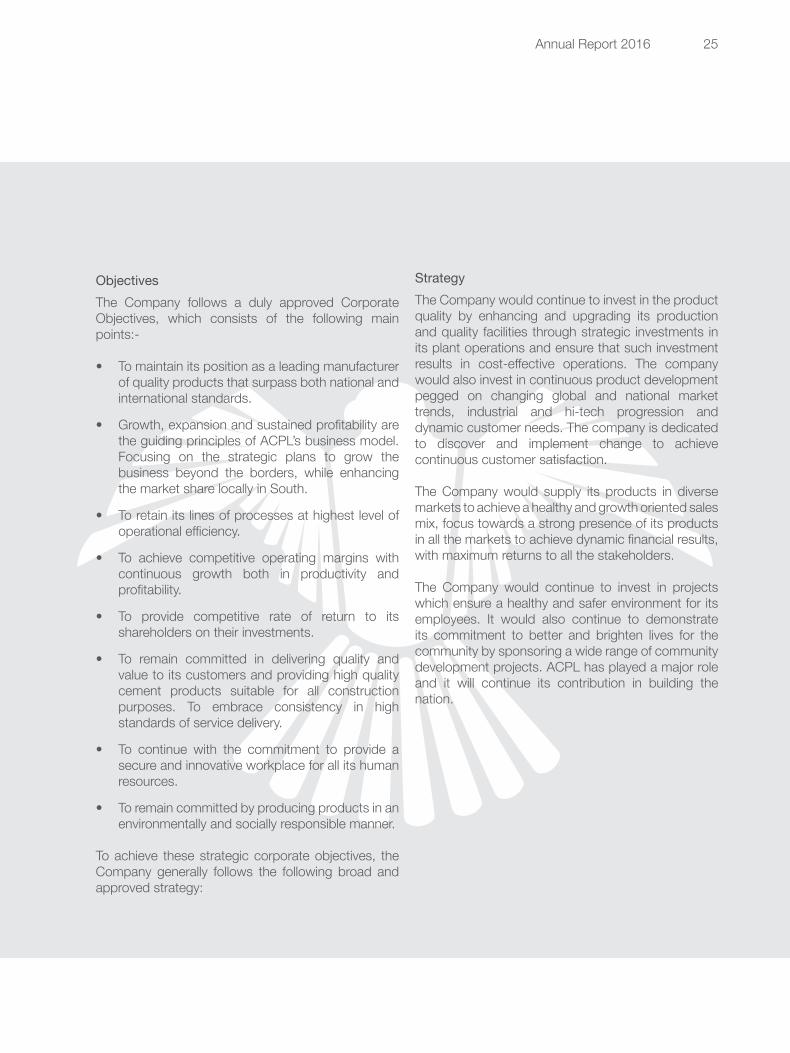
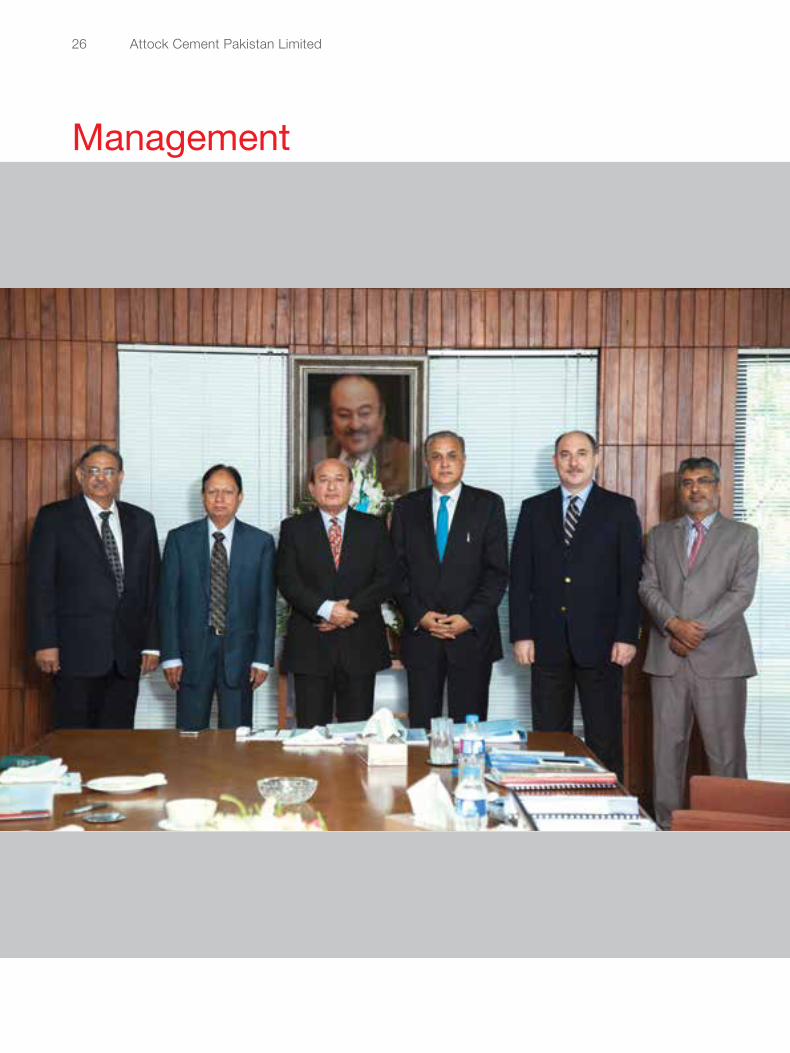
Management
Annual Report 2016 27
Management CommitteeThe Committee meets under the chairmanship of the Group Regional Chief Executive to coordinate the activities and operations of the Company.
Executive CommitteeCEO leads the Executive Committee. The Committee is responsible for preparing the strategic plan for the future growth of the Company. The Committee also reviews major projects and formulates recommendations after evaluation from technical and commercial aspects.
Procurement CommitteeThe Procurement Committee is responsible for ensuring that procurement of assets, goods and services are made in accordance with Company policies and procedures on competitive and transparent terms.
Risk Management CommitteeThe Risk Management Committee is responsible for ensuring that procedures to identify and continuously update risks are in place. The Committee oversees the process of assessment of the possible impact and likelihood of occurrence of identified risks. The Committee is also responsible for formulating a risk management response to effectively address and manage risks.
IT Steering CommitteeIT Steering Committee is responsible for developing and implementing an IT strategy for the Company. The Committee oversees the automation of processes and systems in line with latest technology. The Committee is also responsible for development of contingency and disaster recovery plans.
Budget CommitteeThe Budget Committee reviews and approves the annual budget proposals prior to being presented for the approval of the Board. The Committee also monitors utilization of the approved budget.
Safety CommitteeThe Safety Committee reviews and monitors company wide safety practices. It oversees the safety planning function of the Company and is responsible for safety training and awareness initiatives.
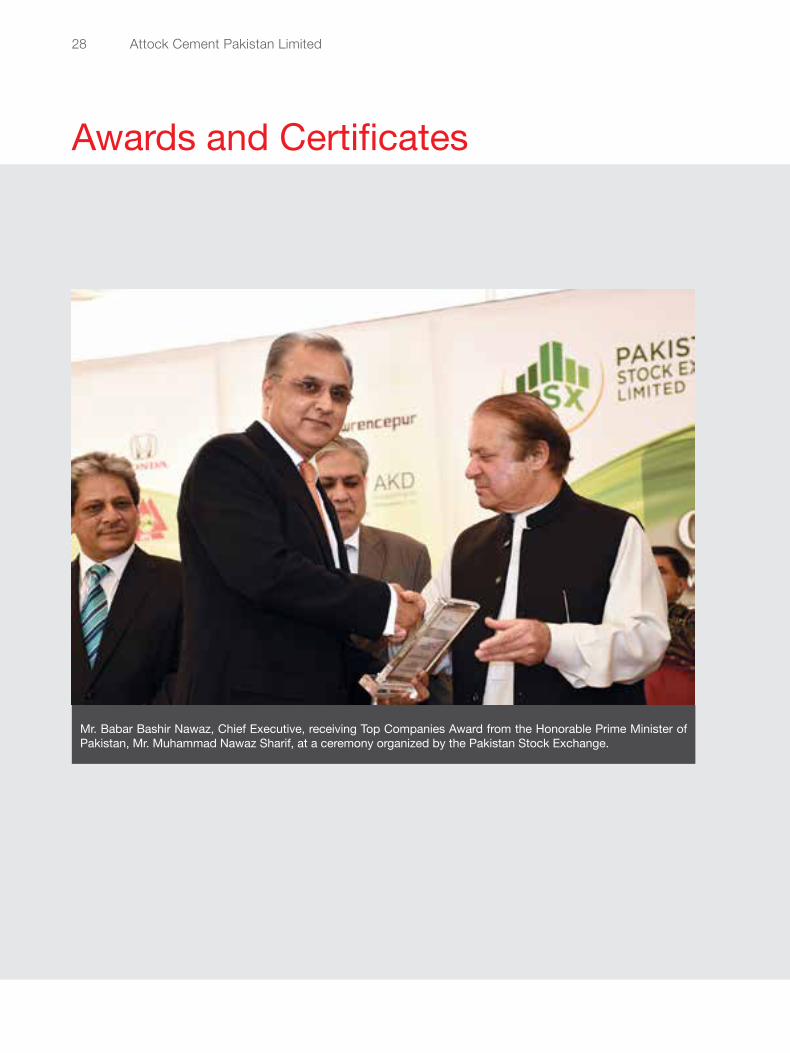
Mr. Babar Bashir Nawaz, Chief Executive, receiving Top Companies Award from the Honorable Prime Minister of Pakistan, Mr. Muhammad Nawaz Sharif, at a ceremony organized by the Pakistan Stock Exchange.
Attock Cement Pakistan Limited28
Awards and Certificates
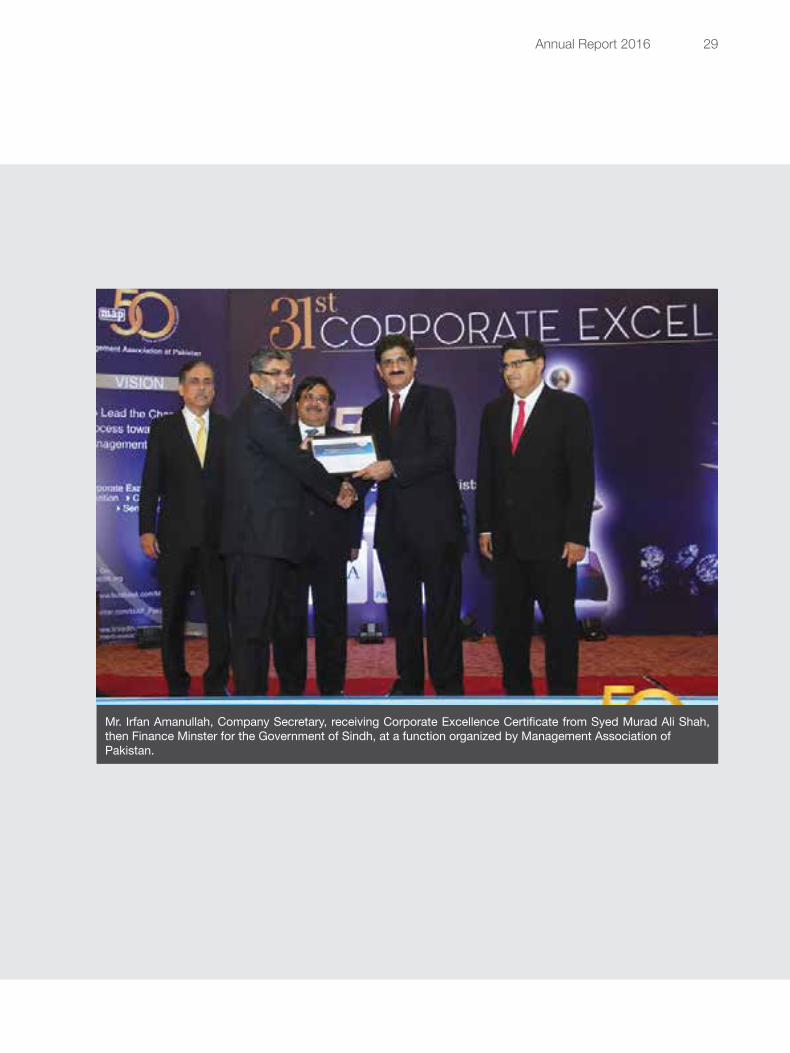
Mr. Irfan Amanullah, Company Secretary, receiving Corporate Excellence Certificate from Syed Murad Ali Shah, then Finance Minster for the Government of Sindh, at a function organized by Management Association ofPakistan.
Annual Report 2016 29
Attock Cement Pakistan Limited30
Chairman’s Review
I welcome you all in the 37th Annual General Meeting of the company.
Annual Report 2016 31
Overview of the EconomyThe Government during the past three years has done remarkably well in turning around about the state of the economy of the country. With successful completion of periodic reviews by International Monetary Fund (IMF) and ratings awarded and confirmed by international agencies, the confidence of investors on Pakistan’s economy has been restored and as a result the short to medium term outlook of the economy of the country looks very positive.
The GDP growth of 4.7% in the year 2015-16 duly backed by strong growth of 6.8% achieved by industrial sector clearly coupled with lowest ever interest rates and inflation clearly show that economy is on the right path. Government is aggressively addressing energy shortage issues and has introduced investor friendly policies in order to attract local and foreign investment in this sector. The rupee dollar parity has remained stable which has given added confidence to investors in undertaking major initiatives. Going forward, CPEC would unquestionably give further boost to the economy and will contribute further in the overall GDP growth of the country.
Industry ReviewDuring the year, under review, the cement sector registered a net growth of 10% as compared to same period last year. The local despatches increased by 17% whereas export sales have shown a decline of 18% as compared to same period last year. The average capacity utilization of industry was recorded at 85% as compared to 78% during the last year.
In the market of south, during the year under review, the local despatches witnessed a phenomenal growth of 25% and diluted the effects of major decline in exports of about 26% due to imposition of anti dumping duty in South Africa and Iraq. Still a net growth at 6% was registered in the market of south as compared to same period last year, which is very encouraging. Keeping in view the fast improvement in law and order situation in Karachi, it is anticipated that there will be further
acceleration in cement demand in the market of South in months to come.
Operational & Financial PerformanceThe year 2015-2016 was a record breaking year for the company both in operational and financial terms. The company achieved record production and record despatches. Beside this, the company achieved record sales in value and cloaked highest ever profit after tax. The margins, both gross and operating, improved to 40% and 31% as compared to previous year’s level of 34% and 25% respectively.
The cement sales prices, during the year under review, largely remained stable and cost parameters with specific reference to coal and power remained favourable toward the company. The average coal prices in the international market cut down by around 18% as compared to last year which positively contributed towards company’s margins. Further, the average power rate also diluted owing to special subsidy given by the federal government with effect from Jan 1, 2016.
AcknowledgementThe Company deeply acknowledges and offers its sincere thanks to the support it has received from both Federal and Provincial Governments, regulatory bodies, its customers, bankers and suppliers.
The Company also recognizes the efforts put in by both management and non-management staff and the support it has always received from the Collective Bargaining Agent.
Dr. Ghaith R. Pharaon Chairman
August 16, 2016Rawalpindi
Directors’ Report
Attock Cement Pakistan Limited32
Annual Report 2016 33
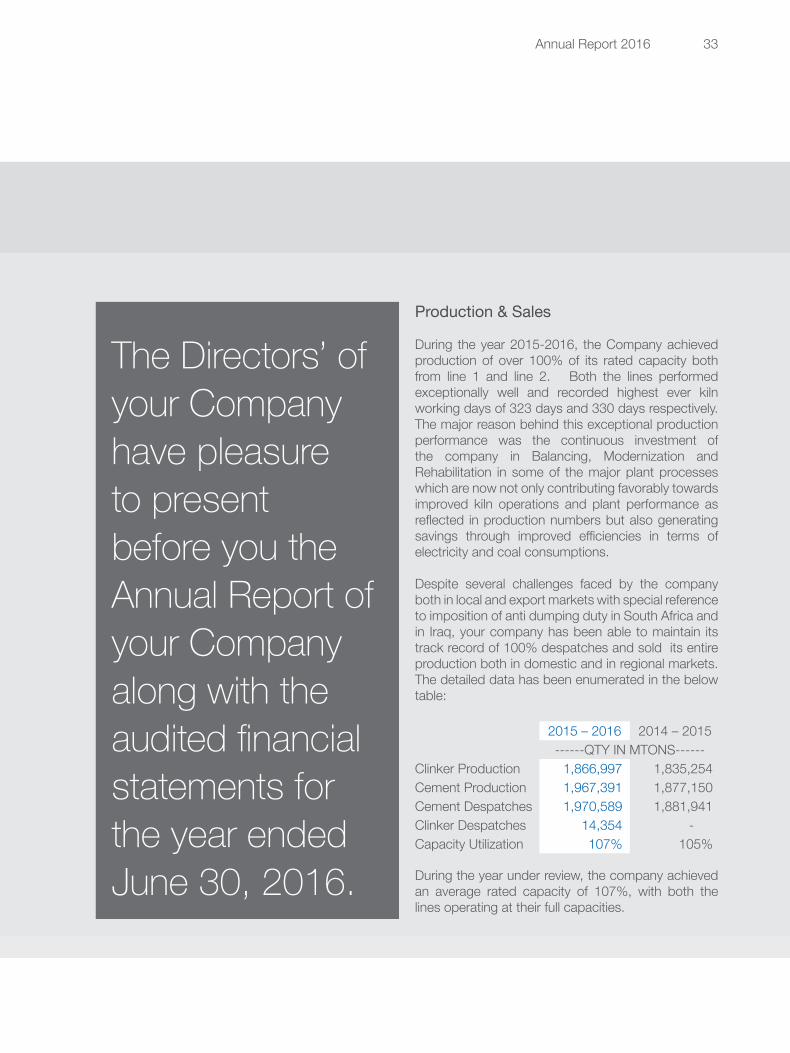
The Directors’ of your Company have pleasure to present before you the Annual Report of your Company along with the audited financial statements for the year ended June 30, 2016.
Production & Sales
During the year 2015-2016, the Company achieved production of over 100% of its rated capacity both from line 1 and line 2. Both the lines performed exceptionally well and recorded highest ever kiln working days of 323 days and 330 days respectively. The major reason behind this exceptional production performance was the continuous investment of the company in Balancing, Modernization and Rehabilitation in some of the major plant processes which are now not only contributing favorably towards improved kiln operations and plant performance as reflected in production numbers but also generating savings through improved efficiencies in terms of electricity and coal consumptions.
Despite several challenges faced by the company both in local and export markets with special reference to imposition of anti dumping duty in South Africa and in Iraq, your company has been able to maintain its track record of 100% despatches and sold its entire production both in domestic and in regional markets. The detailed data has been enumerated in the below table:
2015 – 2016 2014 – 2015------QTY IN MTONS------
Clinker Production 1,866,997 1,835,254Cement Production 1,967,391 1,877,150Cement Despatches 1,970,589 1,881,941Clinker Despatches 14,354 -Capacity Utilization 107% 105%
During the year under review, the company achieved an average rated capacity of 107%, with both the lines operating at their full capacities.
Attock Cement Pakistan Limited34
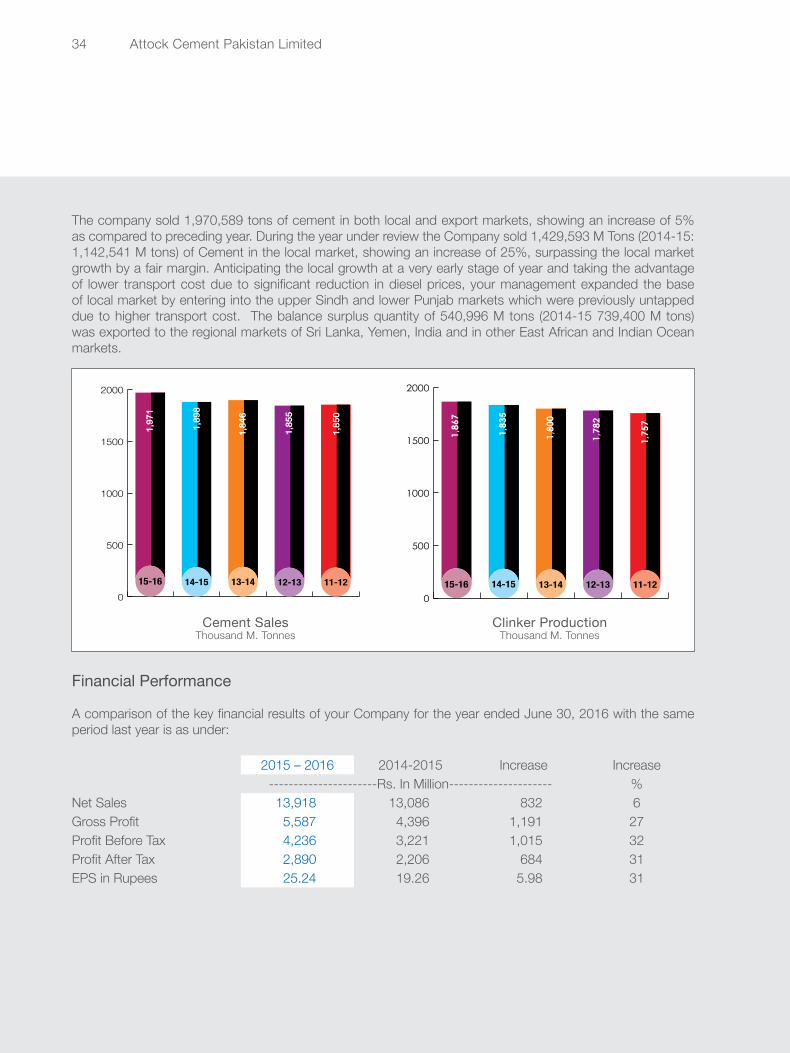
The company sold 1,970,589 tons of cement in both local and export markets, showing an increase of 5% as compared to preceding year. During the year under review the Company sold 1,429,593 M Tons (2014-15: 1,142,541 M tons) of Cement in the local market, showing an increase of 25%, surpassing the local market growth by a fair margin. Anticipating the local growth at a very early stage of year and taking the advantage of lower transport cost due to significant reduction in diesel prices, your management expanded the base of local market by entering into the upper Sindh and lower Punjab markets which were previously untapped due to higher transport cost. The balance surplus quantity of 540,996 M tons (2014-15 739,400 M tons) was exported to the regional markets of Sri Lanka, Yemen, India and in other East African and Indian Ocean markets.
Financial Performance
A comparison of the key financial results of your Company for the year ended June 30, 2016 with the same period last year is as under:
2015 – 2016 2014-2015 Increase Increase----------------------Rs. In Million--------------------- %
Net Sales 13,918 13,086 832 6Gross Profit 5,587 4,396 1,191 27Profit Before Tax 4,236 3,221 1,015 32Profit After Tax 2,890 2,206 684 31EPS in Rupees 25.24 19.26 5.98 31
Clinker ProductionThousand M. Tonnes
0
500
1000
1500
2000
1,97
1
1,89
8
1,84
6
1,85
5
1,85
0
15-16 14-15 13-14 12-13 11-12
0
500
1000
1500
2000
1,83
5
1,80
0
1,78
2
1,75
7
1,86
7
15-16 14-15 13-14 12-13 11-12
Cement SalesThousand M. Tonnes
Annual Report 2016 35
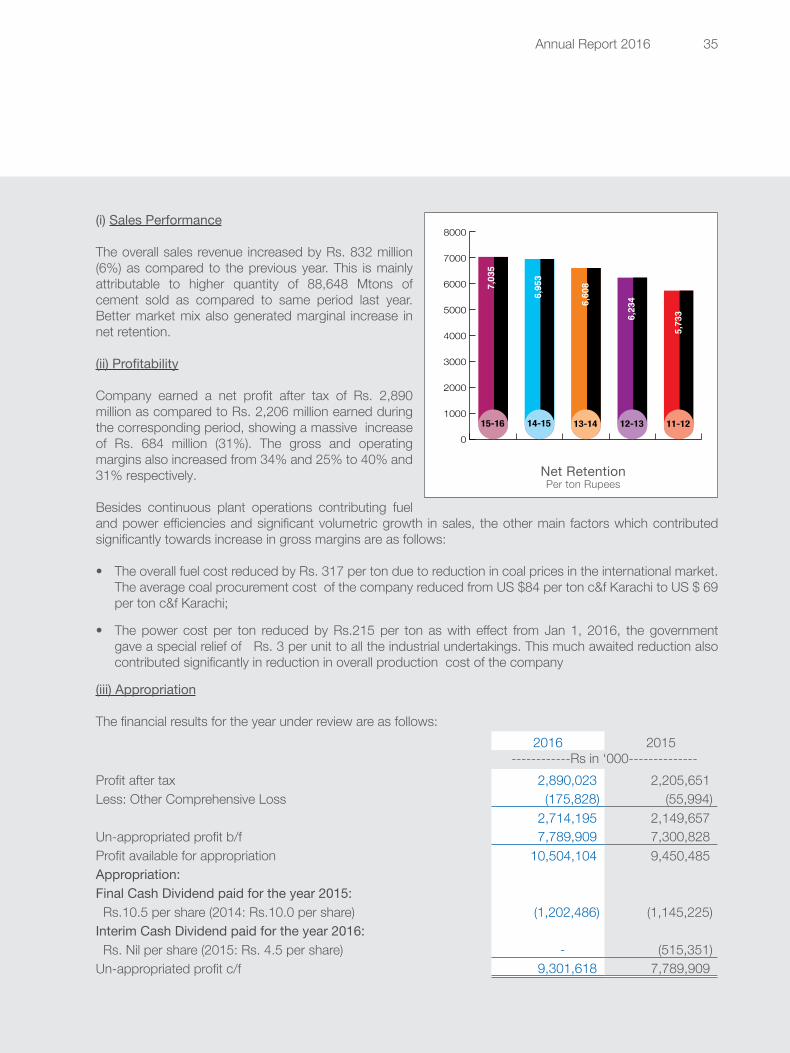
(i) Sales Performance
The overall sales revenue increased by Rs. 832 million (6%) as compared to the previous year. This is mainly attributable to higher quantity of 88,648 Mtons of cement sold as compared to same period last year. Better market mix also generated marginal increase in net retention.
(ii) Profitability
Company earned a net profit after tax of Rs. 2,890 million as compared to Rs. 2,206 million earned during the corresponding period, showing a massive increase of Rs. 684 million (31%). The gross and operating margins also increased from 34% and 25% to 40% and 31% respectively.
Besides continuous plant operations contributing fuel and power efficiencies and significant volumetric growth in sales, the other main factors which contributed significantly towards increase in gross margins are as follows:
• The overall fuel cost reduced by Rs. 317 per ton due to reduction in coal prices in the international market. The average coal procurement cost of the company reduced from US $84 per ton c&f Karachi to US $ 69 per ton c&f Karachi;
• The power cost per ton reduced by Rs.215 per ton as with effect from Jan 1, 2016, the government gave a special relief of Rs. 3 per unit to all the industrial undertakings. This much awaited reduction also contributed significantly in reduction in overall production cost of the company
(iii) Appropriation
The financial results for the year under review are as follows:2016 2015
------------Rs in ‘000--------------Profit after tax 2,890,023 2,205,651Less: Other Comprehensive Loss (175,828) (55,994)
2,714,195 2,149,657Un-appropriated profit b/f 7,789,909 7,300,828Profit available for appropriation 10,504,104 9,450,485Appropriation:Final Cash Dividend paid for the year 2015: Rs.10.5 per share (2014: Rs.10.0 per share) (1,202,486) (1,145,225)Interim Cash Dividend paid for the year 2016: Rs. Nil per share (2015: Rs. 4.5 per share) - (515,351)Un-appropriated profit c/f 9,301,618 7,789,909
Net RetentionPer ton Rupees
0
1000
2000
3000
4000
5000
6000
7000
8000
14-15 14-15 14-15 14-15 14-15
6,95
3
6,60
8
6,23
4
5,73
3
7,03
5
15-16 14-15 13-14 12-13 11-12
Attock Cement Pakistan Limited36
For the year ended June 30, 2016 the Board in its meeting held on August 16, 2016 has proposed a final cash dividend of Rs. 12.50 per share (125%) amounting to Rs. 1,432 million.
Contribution to National Exchequer
The Company contributed Rs. 4,130 million during the year to the national exchequer on account of payments towards Sales tax, Income tax, Excise duty and other statutory levies. An amount of approximately Rs. 385 million was also paid as withholding income tax deducted by the Company from shareholders, employees, suppliers and contractors. In addition to that your Company earned precious foreign exchange of approximate US$ 30 million during the year under review from export sales.
Marketing
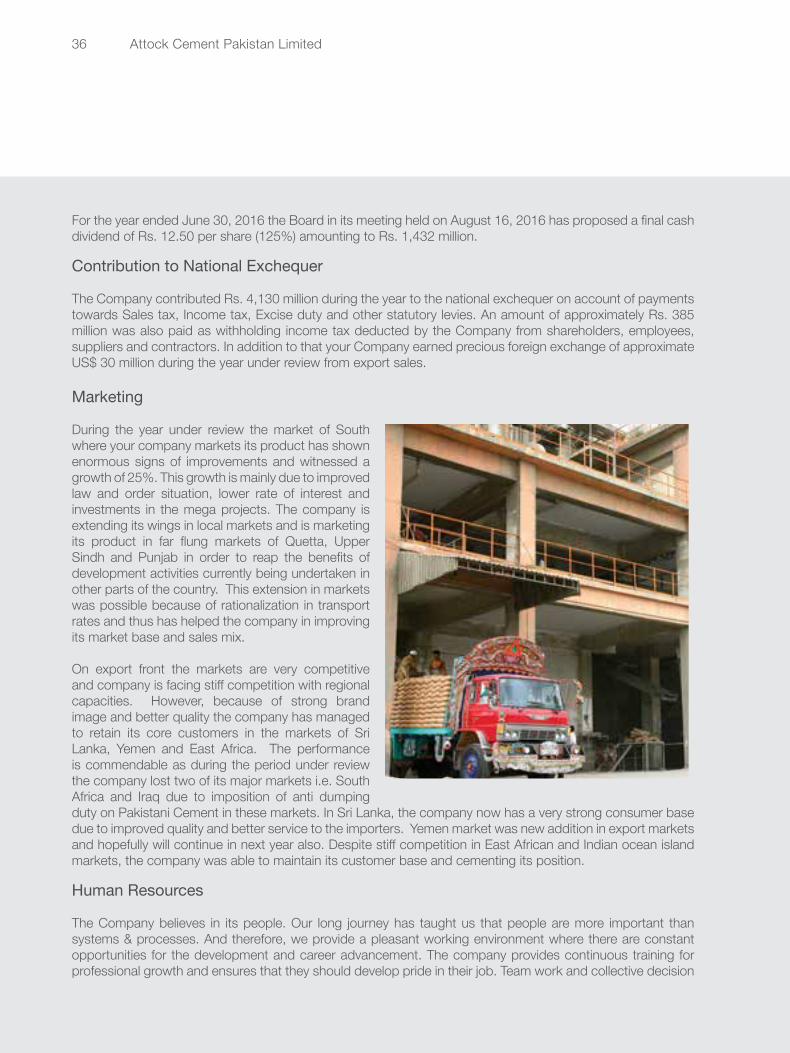
During the year under review the market of South where your company markets its product has shown enormous signs of improvements and witnessed a growth of 25%. This growth is mainly due to improved law and order situation, lower rate of interest and investments in the mega projects. The company is extending its wings in local markets and is marketing its product in far flung markets of Quetta, Upper Sindh and Punjab in order to reap the benefits of development activities currently being undertaken in other parts of the country. This extension in markets was possible because of rationalization in transport rates and thus has helped the company in improving its market base and sales mix.
On export front the markets are very competitive and company is facing stiff competition with regional capacities. However, because of strong brand image and better quality the company has managed to retain its core customers in the markets of Sri Lanka, Yemen and East Africa. The performance is commendable as during the period under review the company lost two of its major markets i.e. South Africa and Iraq due to imposition of anti dumping duty on Pakistani Cement in these markets. In Sri Lanka, the company now has a very strong consumer base due to improved quality and better service to the importers. Yemen market was new addition in export markets and hopefully will continue in next year also. Despite stiff competition in East African and Indian ocean island markets, the company was able to maintain its customer base and cementing its position.
Human Resources
The Company believes in its people. Our long journey has taught us that people are more important than systems & processes. And therefore, we provide a pleasant working environment where there are constant opportunities for the development and career advancement. The company provides continuous training for professional growth and ensures that they should develop pride in their job. Team work and collective decision
Annual Report 2016 37
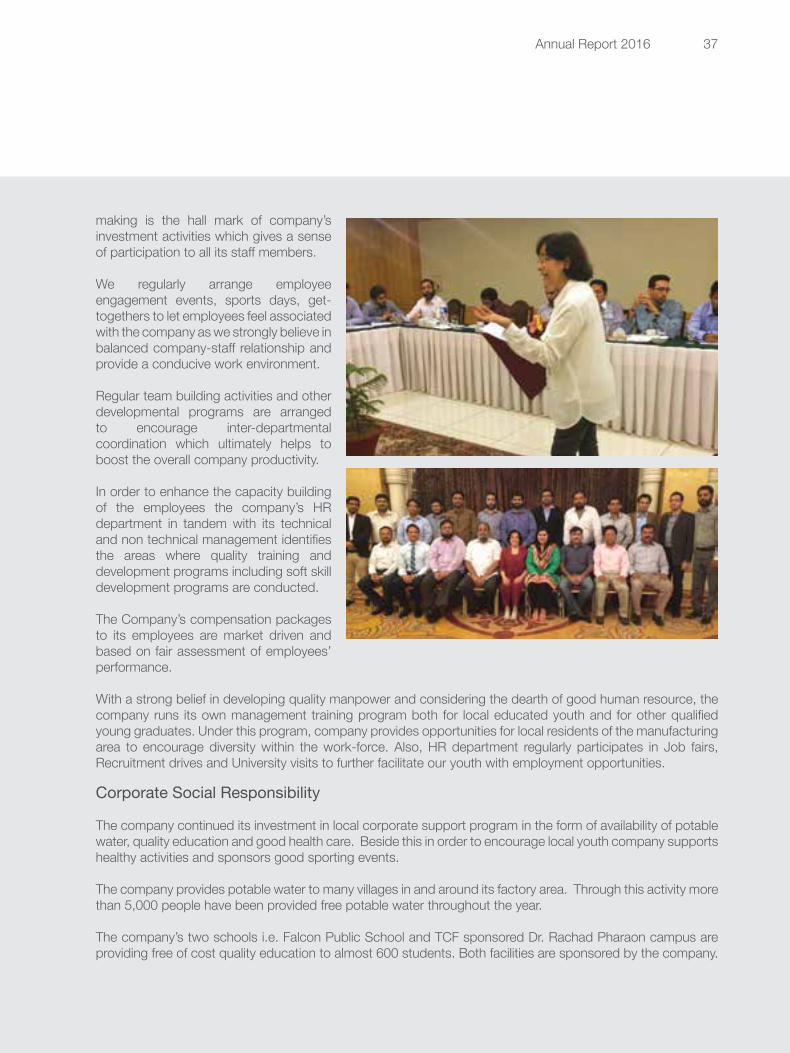
making is the hall mark of company’s investment activities which gives a sense of participation to all its staff members.
We regularly arrange employee engagement events, sports days, get-togethers to let employees feel associated with the company as we strongly believe in balanced company-staff relationship and provide a conducive work environment.
Regular team building activities and other developmental programs are arranged to encourage inter-departmental coordination which ultimately helps to boost the overall company productivity.
In order to enhance the capacity building of the employees the company’s HR department in tandem with its technical and non technical management identifies the areas where quality training and development programs including soft skill development programs are conducted.
The Company’s compensation packages to its employees are market driven and based on fair assessment of employees’ performance.
With a strong belief in developing quality manpower and considering the dearth of good human resource, the company runs its own management training program both for local educated youth and for other qualified young graduates. Under this program, company provides opportunities for local residents of the manufacturing area to encourage diversity within the work-force. Also, HR department regularly participates in Job fairs, Recruitment drives and University visits to further facilitate our youth with employment opportunities.
Corporate Social Responsibility
The company continued its investment in local corporate support program in the form of availability of potable water, quality education and good health care. Beside this in order to encourage local youth company supports healthy activities and sponsors good sporting events.
The company provides potable water to many villages in and around its factory area. Through this activity more than 5,000 people have been provided free potable water throughout the year.
The company’s two schools i.e. Falcon Public School and TCF sponsored Dr. Rachad Pharaon campus are providing free of cost quality education to almost 600 students. Both facilities are sponsored by the company.
Attock Cement Pakistan Limited38
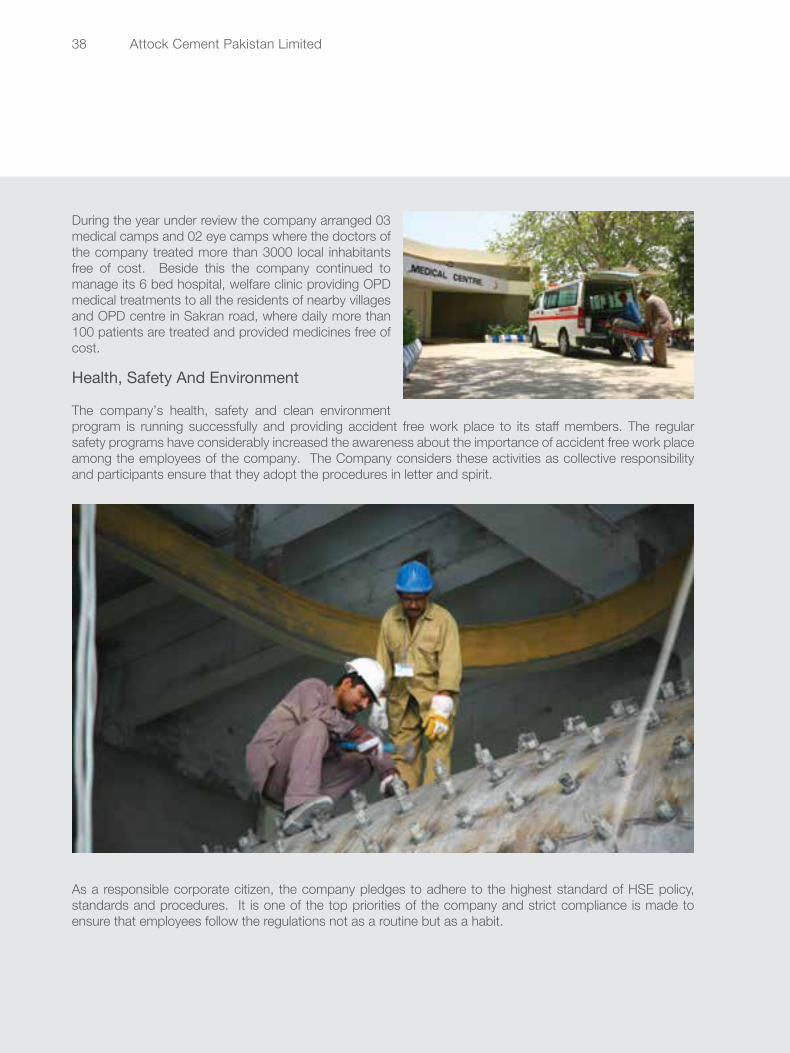
During the year under review the company arranged 03 medical camps and 02 eye camps where the doctors of the company treated more than 3000 local inhabitants free of cost. Beside this the company continued to manage its 6 bed hospital, welfare clinic providing OPD medical treatments to all the residents of nearby villages and OPD centre in Sakran road, where daily more than 100 patients are treated and provided medicines free of cost.
Health, Safety And Environment
The company’s health, safety and clean environment program is running successfully and providing accident free work place to its staff members. The regular safety programs have considerably increased the awareness about the importance of accident free work place among the employees of the company. The Company considers these activities as collective responsibility and participants ensure that they adopt the procedures in letter and spirit.
As a responsible corporate citizen, the company pledges to adhere to the highest standard of HSE policy, standards and procedures. It is one of the top priorities of the company and strict compliance is made to ensure that employees follow the regulations not as a routine but as a habit.
Annual Report 2016 39
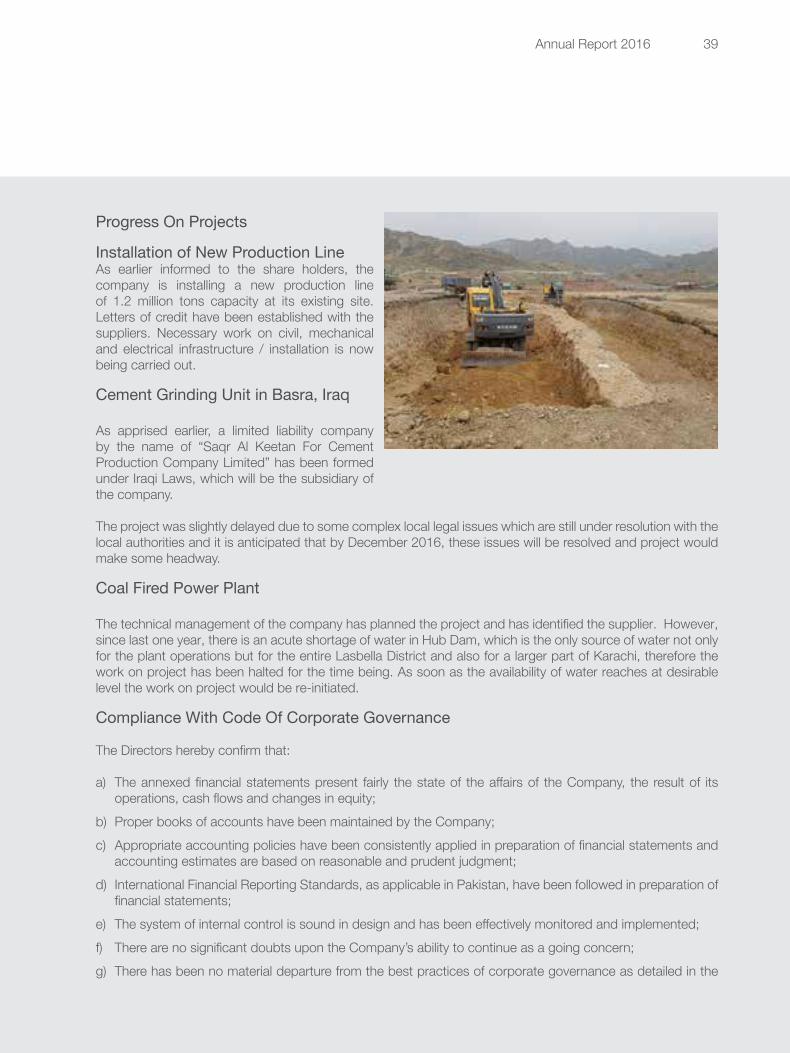
Progress On Projects
Installation of New Production LineAs earlier informed to the share holders, the company is installing a new production line of 1.2 million tons capacity at its existing site. Letters of credit have been established with the suppliers. Necessary work on civil, mechanical and electrical infrastructure / installation is now being carried out.
Cement Grinding Unit in Basra, Iraq
As apprised earlier, a limited liability company by the name of “Saqr Al Keetan For Cement Production Company Limited” has been formed under Iraqi Laws, which will be the subsidiary of the company.
The project was slightly delayed due to some complex local legal issues which are still under resolution with the local authorities and it is anticipated that by December 2016, these issues will be resolved and project would make some headway. Coal Fired Power Plant
The technical management of the company has planned the project and has identified the supplier. However, since last one year, there is an acute shortage of water in Hub Dam, which is the only source of water not only for the plant operations but for the entire Lasbella District and also for a larger part of Karachi, therefore the work on project has been halted for the time being. As soon as the availability of water reaches at desirable level the work on project would be re-initiated.
Compliance With Code Of Corporate Governance
The Directors hereby confirm that:
a) The annexed financial statements present fairly the state of the affairs of the Company, the result of its operations, cash flows and changes in equity;
b) Proper books of accounts have been maintained by the Company;c) Appropriate accounting policies have been consistently applied in preparation of financial statements and
accounting estimates are based on reasonable and prudent judgment;d) International Financial Reporting Standards, as applicable in Pakistan, have been followed in preparation of
financial statements;e) The system of internal control is sound in design and has been effectively monitored and implemented;f) There are no significant doubts upon the Company’s ability to continue as a going concern;g) There has been no material departure from the best practices of corporate governance as detailed in the
Attock Cement Pakistan Limited40
listing regulations;h) The following is the value of investments of terminal benefit schemes based on their respective latest
accounts:
Rupees in Million Year EndedProvident Fund (audited) 479 December, 2015Gratuity Funds (unaudited) 241 June, 2016Pension Funds (unaudited) 309 June, 2016
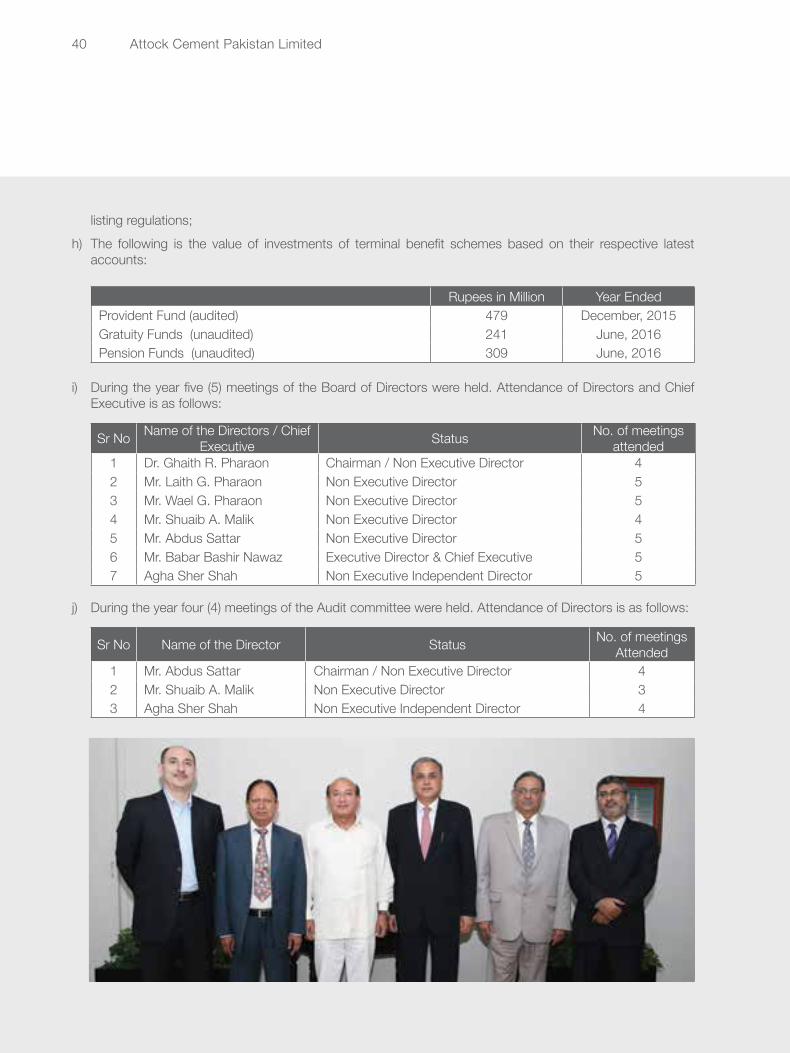
i) During the year five (5) meetings of the Board of Directors were held. Attendance of Directors and Chief Executive is as follows:
Sr No Name of the Directors / Chief Executive Status No. of meetings
attended1 Dr. Ghaith R. Pharaon Chairman / Non Executive Director 42 Mr. Laith G. Pharaon Non Executive Director 53 Mr. Wael G. Pharaon Non Executive Director 54 Mr. Shuaib A. Malik Non Executive Director 45 Mr. Abdus Sattar Non Executive Director 56 Mr. Babar Bashir Nawaz Executive Director & Chief Executive 57 Agha Sher Shah Non Executive Independent Director 5
j) During the year four (4) meetings of the Audit committee were held. Attendance of Directors is as follows:
Sr No Name of the Director Status No. of meetingsAttended
1 Mr. Abdus Sattar Chairman / Non Executive Director 42 Mr. Shuaib A. Malik Non Executive Director 33 Agha Sher Shah Non Executive Independent Director 4
Annual Report 2016 41
k) The details of shares transacted by Directors, Executives and their spouses and minor children during the year 2015-16 have been given on page 100.
l) The key operating and financial data for the last 6 years is set out on page 51.
Pattern Of Shareholding
The pattern of shareholding of the Company as at June 30, 2016 is given on page 100.
Auditors
The retiring auditors, Messrs. A.F. Ferguson & Co., Chartered Accountants retire at the conclusion of the 37th Annual General Meeting and offer themselves for reappointment. The Audit Committee has recommended for their reappointment. Audit Committee
The Board of Directors has established an Audit Committee in compliance with the Code of Corporate Governance with the following members:
Sr No Name of the Director Position Status1 Mr. Abdus Sattar Chairman Non-Executive Director2 Mr. Shuaib A. Malik Member Non-Executive Director3 Agha Sher Shah Member Non-Executive Independent Director
Terms of Reference
1. Determination of appropriate measures to safeguard the assets.
2. Review of preliminary announcements of results prior to publication.
3. Review of quarterly, half yearly and annual financial statements prior to the approval by the Board of Directors, major focus on:
• Judgmental areas• Significant adjustments resulting from the audit• Going concern assumption• Changes in accounting policies and practices• Compliance with applicable accounting standards • Compliance with the listing regulations and other statutory and regulatory requirements and• Significant related party transactions
4. Review of management letter issued by external auditors and management response thereto.
Attock Cement Pakistan Limited42
5. Ensuring coordination between the internal and external auditors.
6. Review of the scope and extent of internal audit and ensuring that the internal audit function has adequate resources and is appropriately placed.
7. Consideration of major findings of internal investigations of activities characterized by fraud, corruption and abuse of power and management’s response thereto.
8. Ascertaining that the internal control system includes financial and operational controls, accounting systems for timely and appropriate recording of purchases and sales, receipts and payments, assets and liabilities and the reporting structure are adequate and effective.
9. Review of statement on internal control systems prior to the endorsement by the Board of Directors.
10. Instituting special projects, value for money studies or other investigations on any matters specified by the Board of Directors, in consultation with the Chief Executive and to consider remittance of any matter to the external auditors or to any other external body.
11. Determination of compliance with relevant statutory requirements.
12. Consideration of any other issue or matter as may be assigned by the Board of Directors.
13. External Auditors
• Recommendations regarding the appointment of External Auditors.• Resignation and removal of External Auditors.• Audit fees.• Provision by external auditors of any services to the company in addition to the audit of the Financial
Statements. • Facilitating external audit and discussion with external auditors of major observations arising from
interim and final audits and any other matter that auditors wish to highlight.
Human Resource Committee
The Board, in compliance with the new Code of Corporate Governance has formed Human Resource Committee comprising of the following members:
Sr No Name of the Members Status1 Mr. Shuaib A. Malik Non- Executive Director / Chairman2 Mr. Abdus Sattar Non- Executive Director / Member3 Mr. Babar Bashir Nawaz Executive Director / Member
Terms of Reference
The broad terms of reference of this committee are as follows:
• Recommending Human resource management policies to the Board;
Annual Report 2016 43
• Recommending to the board the selection, evaluation, compensation (including retirement benefits) and succession planning of the CEO;
• Recommending to the board the selection, evaluation, compensation (including retirement benefits) and succession planning of the COO, CFO , Company Secretary and Head of Internal Audit; and
• Consideration and approval on recommendation of CEO on such matters for key management positions who report directly to CEO or COO.
Future Outlook
The recent surge in cement demand is very encouraging and paving the way for further investment in the sector. Investments in housing, infrastructure and industrial sectors of the economy would further boost the ongoing cement demand pattern. It is anticipated that positive economic indicators will push the local demands to new heights. With the per capita consumption of 170 kg, the long term prospects of Pakistan’s cement sector will always remain attractive. In the past this potential was largely overshadowed due to serious security issues and political uncertainty. However, the progress on multiple fronts has created a renewed confidence of investors in Pakistan’s economy. With lower oil prices, improved security and committed investments through China Pakistan Economic Corridor the domestic cement demand would continue to attract higher double digit growth in short to medium term.
The Pakistan’s cement sector has now matured and has a sizeable interest in the regional economies. These markets have been earned through untiring efforts and with new expansions it is anticipated that country’s foothold in these markets will remain in-tact in foreseeable future.
In the Finance Act 2016, the government increased the Federal excise Duty (FED) by around 110% and it has now been fixed at Rs. 1,000/ton. This enhancement in FED will increase the cost of construction and may discourage the construction of low cost housing in the short to medium term.
Further, the coal prices in the international market have also started to increase lately because of increase in the demand of larger economies and if this increase will continue then this may have a negative impact on the margins. However, the Management is making every effort to maximize its margins by increasing productivity through higher kiln running days, improving plant efficiencies through technological advancements & changing sales mix which would yield high net retention to ensure a sustainable profitability for the company.
On behalf of the Board
BABAR BASHIR NAWAZChief Executive
August 16, 2016Rawalpindi

Shareholders’
Information
Attock Cement Pakistan Limited46
Verti
cal A
naly
sis
Profi
t & L
oss
Acco
unt
for t
he y
ear e
nded
Jun
e 30
, 201
6
----
----
--20
16--
----
----
----
----
--20
15--
----
----
----
----
--20
14--
----
----
----
----
--20
13--
----
----
----
----
--20
12--
----
----
----
----
--20
11--
----
----
Rs
in m
illion
%
R
s in
milli
on
%
Rs
in m
illion
%
R
s in
milli
on
%
Rs
in m
illion
%
R
s in
milli
on
%
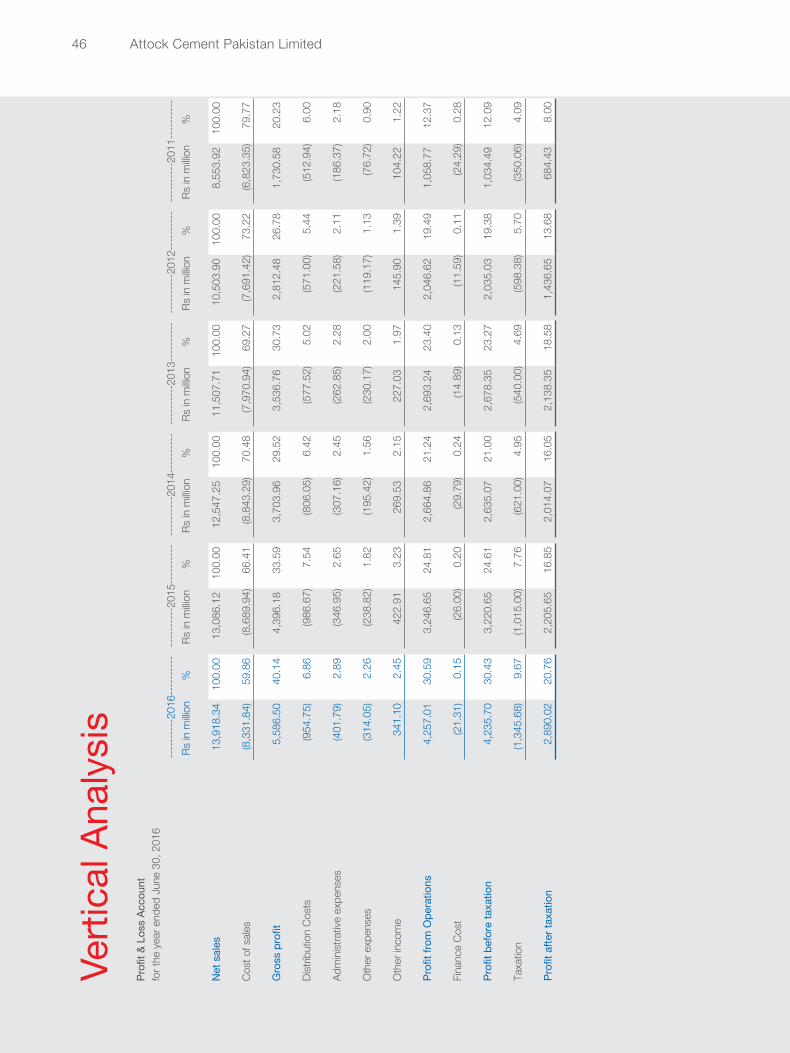
Net
sal
es 1
3,91
8.34
1
00.0
0 1
3,08
6.12
1
00.0
0 1
2,54
7.25
1
00.0
0 1
1,50
7.71
1
00.0
0 1
0,50
3.90
1
00.0
0 8
,553
.92
100
.00
Cost
of s
ales
(8,3
31.8
4) 5
9.86
(8
,689
.94)
66.
41
(8,8
43.2
9) 7
0.48
(7
,970
.94)
69.
27
(7,6
91.4
2) 7
3.22
(6
,823
.35)
79.
77
Gro
ss p
rofit
5,5
86.5
0 4
0.14
4
,396
.18
33.
59
3,7
03.9
6 2
9.52
3
,536
.76
30.
73
2,8
12.4
8 2
6.78
1
,730
.58
20.
23
Dist
ribut
ion
Cost
s (9
54.7
5) 6
.86
(986
.67)
7.5
4 (8
06.0
5) 6
.42
(577
.52)
5.0
2 (5
71.0
0) 5
.44
(512
.94)
6.0
0
Adm
inist
rativ
e ex
pens
es (4
01.7
9) 2
.89
(346
.95)
2.6
5 (3
07.1
6) 2
.45
(262
.85)
2.2
8 (2
21.5
8) 2
.11
(186
.37)
2.1
8
Oth
er e
xpen
ses
(314
.05)
2.2
6 (2
38.8
2) 1
.82
(195
.42)
1.5
6 (2
30.1
7) 2
.00
(119
.17)
1.1
3 (7
6.72
) 0
.90
Oth
er in
com
e 3
41.1
0 2
.45
422
.91
3.2
3 2
69.5
3 2
.15
227
.03
1.9
7 1
45.9
0 1
.39
104
.22
1.2
2
Profi
t fro
m O
pera
tions
4,2
57.0
1 3
0.59
3
,246
.65
24.
81
2,6
64.8
6 2
1.24
2
,693
.24
23.
40
2,0
46.6
2 1
9.49
1
,058
.77
12.
37
Fina
nce
Cost
(21.
31)
0.1
5 (2
6.00
) 0
.20
(29.
79)
0.2
4 (1
4.89
) 0
.13
(11.
59)
0.1
1 (2
4.29
) 0
.28
Profi
t bef
ore
taxa
tion
4,2
35.7
0 3
0.43
3
,220
.65
24.
61
2,6
35.0
7 2
1.00
2
,678
.35
23.
27
2,0
35.0
3 1
9.38
1
,034
.49
12.
09
Taxa
tion
(1,3
45.6
8) 9
.67
(1,0
15.0
0) 7
.76
(621
.00)
4.9
5 (5
40.0
0) 4
.69
(598
.38)
5.7
0 (3
50.0
6) 4
.09
Profi
t afte
r tax
atio
n 2
,890
.02
20.
76
2,2
05.6
5 1
6.85
2
,014
.07
16.
05
2,1
38.3
5 1
8.58
1
,436
.65
13.
68
684
.43
8.0
0
Bala
nce
Shee
t as
at J
une
30, 2
016
--
----
----
2016
----
----
----
----
----
2015
----
----
----
----
----
2014
----
----
----
----
----
2013
----
----
----
----
----
2012
----
----
----
----
----
2011
----
----
-- R
s in
milli
on
%
Rs
in m
illion
%
R
s in
milli
on
%
Rs
in m
illion
%
R
s in
milli
on
%
Rs
in m
illion
%
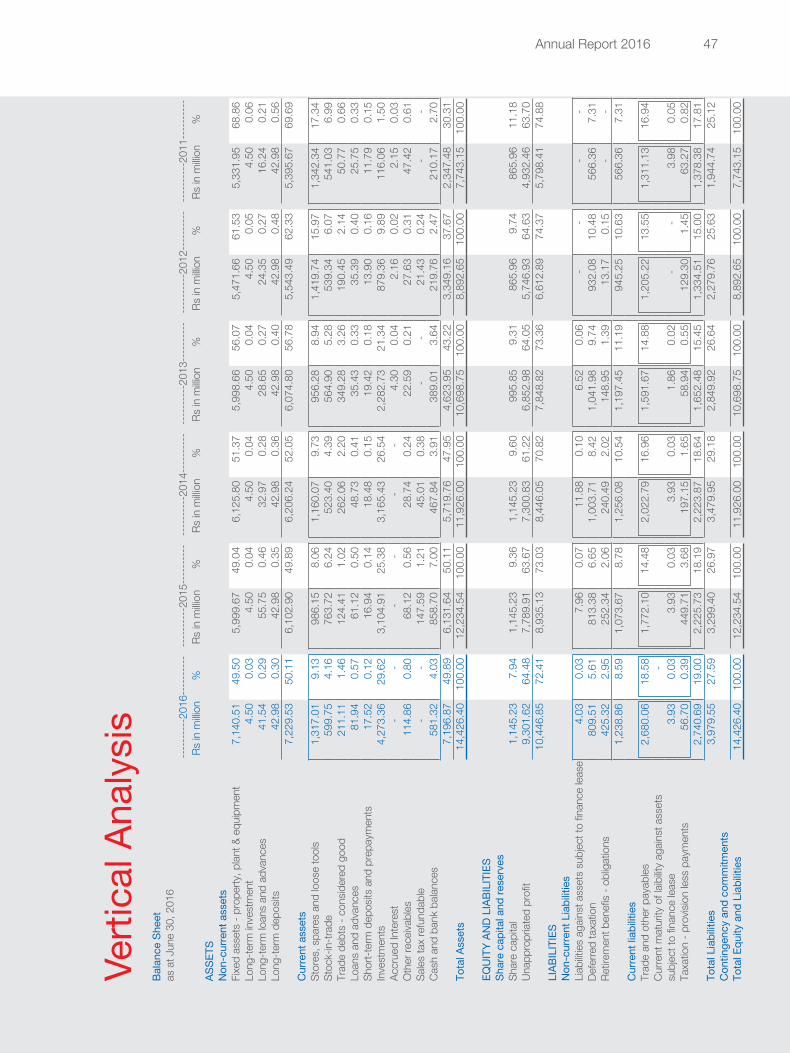
AS
SETS
Non
-cur
rent
ass
ets
Fixe
d as
sets
- pr
oper
ty, p
lant &
equ
ipm
ent
7,1
40.5
1 4
9.50
5
,999
.67
49.
04
6,1
25.8
0 5
1.37
5
,998
.66
56.
07
5,4
71.6
6 6
1.53
5
,331
.95
68.
86
Long
-term
inve
stm
ent
4.5
0 0
.03
4.5
0 0
.04
4.5
0 0
.04
4.5
0 0
.04
4.5
0 0
.05
4.5
0 0
.06
Long
-term
loan
s an
d ad
vanc
es 4
1.54
0
.29
55.
75
0.4
6 3
2.97
0
.28
28.
65
0.2
7 2
4.35
0
.27
16.
24
0.2
1 Lo
ng-te
rm d
epos
its 4
2.98
0
.30
42.
98
0.3
5 4
2.98
0
.36
42.
98
0.4
0 4
2.98
0
.48
42.
98
0.5
6 7
,229
.53
50.
11
6,1
02.9
0 4
9.89
6
,206
.24
52.
05
6,0
74.8
0 5
6.78
5
,543
.49
62.
33
5,3
95.6
7 6
9.69
C
urre
nt a
sset
s
St
ores
, spa
res
and
loos
e to
ols
1,3
17.0
1 9
.13
986
.15
8.0
6 1
,160
.07
9.7
3 9
56.2
8 8
.94
1,4
19.7
4 1
5.97
1
,342
.34
17.
34
Stoc
k-in
-trad
e 5
99.7
5 4
.16
763
.72
6.2
4 5
23.4
0 4
.39
564
.90
5.2
8 5
39.3
4 6
.07
541
.03
6.9
9 Tr
ade
debt
s - c
onsid
ered
goo
d 2
11.1
1 1
.46
124
.41
1.0
2 2
62.0
6 2
.20
349
.28
3.2
6 1
90.4
5 2
.14
50.
77
0.6
6 Lo
ans
and
adva
nces
81.
94
0.5
7 6
1.12
0
.50
48.
73
0.4
1 3
5.43
0
.33
35.
39
0.4
0 2
5.75
0
.33
Shor
t-ter
m d
epos
its a
nd p
repa
ymen
ts 1
7.52
0
.12
16.
94
0.1
4 1
8.48
0
.15
19.
42
0.1
8 1
3.90
0
.16
11.
79
0.1
5 In
vest
men
ts 4
,273
.36
29.
62
3,1
04.9
1 2
5.38
3
,165
.43
26.
54
2,2
82.7
3 2
1.34
8
79.3
6 9
.89
116
.06
1.5
0 Ac
crue
d In
tere
st -
-
-
- -
- 4
.30
0.0
4 2
.16
0.0
2 2
.15
0.0
3 O
ther
rece
ivabl
es 1
14.8
6 0
.80
68.
12
0.5
6 2
8.74
0
.24
22.
59
0.2
1 2
7.63
0
.31
47.
42
0.6
1 Sa
les ta
x re
fund
able
-
-
147
.59
1.2
1 4
5.01
0
.38
- -
21.
43
0.2
4 -
- Ca
sh a
nd b
ank
balan
ces
581
.32
4.0
3 8
58.7
0 7
.00
467
.84
3.9
1 3
89.0
1 3
.64
219
.76
2.4
7 2
10.1
7 2
.70
7,1
96.8
7 4
9.89
6
,131
.64
50.
11
5,7
19.7
6 4
7.95
4
,623
.95
43.
22
3,3
49.1
6 3
7.67
2
,347
.48
30.
31
Tota
l Ass
ets
14,
426.
40
100
.00
12,
234.
54
100
.00
11,
926.
00
100
.00
10,
698.
75
100
.00
8,8
92.6
5 1
00.0
0 7
,743
.15
100
.00
EQU
ITY
AND
LIAB
ILIT
IES
Shar
e ca
pita
l and
rese
rves
Shar
e ca
pita
l 1
,145
.23
7.9
4 1
,145
.23
9.3
6 1
,145
.23
9.6
0 9
95.8
5 9
.31
865
.96
9.7
4 8
65.9
6 1
1.18
Un
appr
opria
ted
profi
t 9
,301
.62
64.
48
7,7
89.9
1 6
3.67
7
,300
.83
61.
22
6,8
52.9
8 6
4.05
5
,746
.93
64.
63
4,9
32.4
6 6
3.70
1
0,44
6.85
7
2.41
8
,935
.13
73.
03
8,4
46.0
5 7
0.82
7
,848
.82
73.
36
6,6
12.8
9 7
4.37
5
,798
.41
74.
88
LIAB
ILIT
IES
Non
-cur
rent
Lia
bilit
ies
Liab
ilities
aga
inst
ass
ets
subj
ect t
o fin
ance
leas
e 4
.03
0.0
3 7
.96
0.0
7 1
1.88
0
.10
6.5
2 0
.06
- -
- -
Defe
rred
taxa
tion
809
.51
5.6
1 8
13.3
8 6
.65
1,0
03.7
1 8
.42
1,0
41.9
8 9
.74
932
.08
10.
48
566
.36
7.3
1 Re
tirem
ent b
enefi
s - o
blig
atio
ns 4
25.3
2 2
.95
252
.34
2.0
6 2
40.4
9 2
.02
148
.95
1.3
9 1
3.17
0
.15
- -
1,2
38.8
6 8
.59
1,0
73.6
7 8
.78
1,2
56.0
8 1
0.54
1
,197
.45
11.
19
945
.25
10.
63
566
.36
7.3
1 C
urre
nt li
abilit
ies
Tr
ade
and
othe
r pay
ables
2,6
80.0
6 1
8.58
1
,772
.10
14.
48
2,0
22.7
9 1
6.96
1
,591
.67
14.
88
1,2
05.2
2 1
3.55
1
,311
.13
16.
94
Curre
nt m
atur
ity o
f laib
ility
again
st a
sset
s -
su
bjec
t to
finan
ce le
ase
3.9
3 0
.03
3.9
3 0
.03
3.9
3 0
.03
1.8
6 0
.02
- -
3.9
8 0
.05
Taxa
tion
- pro
visio
n les
s pa
ymen
ts
56.
70
0.3
9 4
49.7
1 3
.68
197
.15
1.6
5 5
8.94
0
.55
129
.30
1.4
5 6
3.27
0
.82
2,7
40.6
9 1
9.00
2
,225
.73
18.
19
2,2
23.8
7 1
8.64
1
,652
.48
15.
45
1,3
34.5
1 1
5.00
1
,378
.38
17.
81
Tota
l Lia
bilit
ies
3,9
79.5
5 2
7.59
3
,299
.40
26.
97
3,4
79.9
5 2
9.18
2
,849
.92
26.
64
2,2
79.7
6 2
5.63
1
,944
.74
25.
12
Con
tinge
ncy
and
com
mitm
ents
Tota
l Equ
ity a
nd L
iabi
litie
s 1
4,42
6.40
1
00.0
0 1
2,23
4.54
1
00.0
0 1
1,92
6.00
1
00.0
0 1
0,69
8.75
1
00.0
0 8
,892
.65
100
.00
7,7
43.1
5 1
00.0
0
Annual Report 2016 47
Profi
t & L
oss
Acco
unt
for t
he y
ear e
nded
Jun
e 30
, 201
6
----
----
--20
16--
----
----
----
----
--20
15--
----
----
----
----
--20
14--
----
----
----
----
--20
13--
----
----
----
----
--20
12--
----
----
----
----
--20
11--
----
----
Rs
in m
illion
%
R
s in
milli
on
%
Rs
in m
illion
%
R
s in
milli
on
%
Rs
in m
illion
%
R
s in
milli
on
%
Net
sal
es 1
3,91
8.34
1
00.0
0 1
3,08
6.12
1
00.0
0 1
2,54
7.25
1
00.0
0 1
1,50
7.71
1
00.0
0 1
0,50
3.90
1
00.0
0 8
,553
.92
100
.00
Cost
of s
ales
(8,3
31.8
4) 5
9.86
(8
,689
.94)
66.
41
(8,8
43.2
9) 7
0.48
(7
,970
.94)
69.
27
(7,6
91.4
2) 7
3.22
(6
,823
.35)
79.
77
Gro
ss p
rofit
5,5
86.5
0 4
0.14
4
,396
.18
33.
59
3,7
03.9
6 2
9.52
3
,536
.76
30.
73
2,8
12.4
8 2
6.78
1
,730
.58
20.
23
Dist
ribut
ion
Cost
s (9
54.7
5) 6
.86
(986
.67)
7.5
4 (8
06.0
5) 6
.42
(577
.52)
5.0
2 (5
71.0
0) 5
.44
(512
.94)
6.0
0
Adm
inist
rativ
e ex
pens
es (4
01.7
9) 2
.89
(346
.95)
2.6
5 (3
07.1
6) 2
.45
(262
.85)
2.2
8 (2
21.5
8) 2
.11
(186
.37)
2.1
8
Oth
er e
xpen
ses
(314
.05)
2.2
6 (2
38.8
2) 1
.82
(195
.42)
1.5
6 (2
30.1
7) 2
.00
(119
.17)
1.1
3 (7
6.72
) 0
.90
Oth
er in
com
e 3
41.1
0 2
.45
422
.91
3.2
3 2
69.5
3 2
.15
227
.03
1.9
7 1
45.9
0 1
.39
104
.22
1.2
2
Profi
t fro
m O
pera
tions
4,2
57.0
1 3
0.59
3
,246
.65
24.
81
2,6
64.8
6 2
1.24
2
,693
.24
23.
40
2,0
46.6
2 1
9.49
1
,058
.77
12.
37
Fina
nce
Cost
(21.
31)
0.1
5 (2
6.00
) 0
.20
(29.
79)
0.2
4 (1
4.89
) 0
.13
(11.
59)
0.1
1 (2
4.29
) 0
.28
Profi
t bef
ore
taxa
tion
4,2
35.7
0 3
0.43
3
,220
.65
24.
61
2,6
35.0
7 2
1.00
2
,678
.35
23.
27
2,0
35.0
3 1
9.38
1
,034
.49
12.
09
Taxa
tion
(1,3
45.6
8) 9
.67
(1,0
15.0
0) 7
.76
(621
.00)
4.9
5 (5
40.0
0) 4
.69
(598
.38)
5.7
0 (3
50.0
6) 4
.09
Profi
t afte
r tax
atio
n 2
,890
.02
20.
76
2,2
05.6
5 1
6.85
2
,014
.07
16.
05
2,1
38.3
5 1
8.58
1
,436
.65
13.
68
684
.43
8.0
0
Bala
nce
Shee
t as
at J
une
30, 2
016
--
----
----
2016
----
----
----
----
----
2015
----
----
----
----
----
2014
----
----
----
----
----
2013
----
----
----
----
----
2012
----
----
----
----
----
2011
----
----
-- R
s in
milli
on
%
Rs
in m
illion
%
R
s in
milli
on
%
Rs
in m
illion
%
R
s in
milli
on
%
Rs
in m
illion
%
AS
SETS
Non
-cur
rent
ass
ets
Fixe
d as
sets
- pr
oper
ty, p
lant &
equ
ipm
ent
7,1
40.5
1 4
9.50
5
,999
.67
49.
04
6,1
25.8
0 5
1.37
5
,998
.66
56.
07
5,4
71.6
6 6
1.53
5
,331
.95
68.
86
Long
-term
inve
stm
ent
4.5
0 0
.03
4.5
0 0
.04
4.5
0 0
.04
4.5
0 0
.04
4.5
0 0
.05
4.5
0 0
.06
Long
-term
loan
s an
d ad
vanc
es 4
1.54
0
.29
55.
75
0.4
6 3
2.97
0
.28
28.
65
0.2
7 2
4.35
0
.27
16.
24
0.2
1 Lo
ng-te
rm d
epos
its 4
2.98
0
.30
42.
98
0.3
5 4
2.98
0
.36
42.
98
0.4
0 4
2.98
0
.48
42.
98
0.5
6 7
,229
.53
50.
11
6,1
02.9
0 4
9.89
6
,206
.24
52.
05
6,0
74.8
0 5
6.78
5
,543
.49
62.
33
5,3
95.6
7 6
9.69
C
urre
nt a
sset
s
St
ores
, spa
res
and
loos
e to
ols
1,3
17.0
1 9
.13
986
.15
8.0
6 1
,160
.07
9.7
3 9
56.2
8 8
.94
1,4
19.7
4 1
5.97
1
,342
.34
17.
34
Stoc
k-in
-trad
e 5
99.7
5 4
.16
763
.72
6.2
4 5
23.4
0 4
.39
564
.90
5.2
8 5
39.3
4 6
.07
541
.03
6.9
9 Tr
ade
debt
s - c
onsid
ered
goo
d 2
11.1
1 1
.46
124
.41
1.0
2 2
62.0
6 2
.20
349
.28
3.2
6 1
90.4
5 2
.14
50.
77
0.6
6 Lo
ans
and
adva
nces
81.
94
0.5
7 6
1.12
0
.50
48.
73
0.4
1 3
5.43
0
.33
35.
39
0.4
0 2
5.75
0
.33
Shor
t-ter
m d
epos
its a
nd p
repa
ymen
ts 1
7.52
0
.12
16.
94
0.1
4 1
8.48
0
.15
19.
42
0.1
8 1
3.90
0
.16
11.
79
0.1
5 In
vest
men
ts 4
,273
.36
29.
62
3,1
04.9
1 2
5.38
3
,165
.43
26.
54
2,2
82.7
3 2
1.34
8
79.3
6 9
.89
116
.06
1.5
0 Ac
crue
d In
tere
st -
-
-
- -
- 4
.30
0.0
4 2
.16
0.0
2 2
.15
0.0
3 O
ther
rece
ivabl
es 1
14.8
6 0
.80
68.
12
0.5
6 2
8.74
0
.24
22.
59
0.2
1 2
7.63
0
.31
47.
42
0.6
1 Sa
les ta
x re
fund
able
-
-
147
.59
1.2
1 4
5.01
0
.38
- -
21.
43
0.2
4 -
- Ca
sh a
nd b
ank
balan
ces
581
.32
4.0
3 8
58.7
0 7
.00
467
.84
3.9
1 3
89.0
1 3
.64
219
.76
2.4
7 2
10.1
7 2
.70
7,1
96.8
7 4
9.89
6
,131
.64
50.
11
5,7
19.7
6 4
7.95
4
,623
.95
43.
22
3,3
49.1
6 3
7.67
2
,347
.48
30.
31
Tota
l Ass
ets
14,
426.
40
100
.00
12,
234.
54
100
.00
11,
926.
00
100
.00
10,
698.
75
100
.00
8,8
92.6
5 1
00.0
0 7
,743
.15
100
.00
EQU
ITY
AND
LIAB
ILIT
IES
Shar
e ca
pita
l and
rese
rves
Shar
e ca
pita
l 1
,145
.23
7.9
4 1
,145
.23
9.3
6 1
,145
.23
9.6
0 9
95.8
5 9
.31
865
.96
9.7
4 8
65.9
6 1
1.18
Un
appr
opria
ted
profi
t 9
,301
.62
64.
48
7,7
89.9
1 6
3.67
7
,300
.83
61.
22
6,8
52.9
8 6
4.05
5
,746
.93
64.
63
4,9
32.4
6 6
3.70
1
0,44
6.85
7
2.41
8
,935
.13
73.
03
8,4
46.0
5 7
0.82
7
,848
.82
73.
36
6,6
12.8
9 7
4.37
5
,798
.41
74.
88
LIAB
ILIT
IES
Non
-cur
rent
Lia
bilit
ies
Liab
ilities
aga
inst
ass
ets
subj
ect t
o fin
ance
leas
e 4
.03
0.0
3 7
.96
0.0
7 1
1.88
0
.10
6.5
2 0
.06
- -
- -
Defe
rred
taxa
tion
809
.51
5.6
1 8
13.3
8 6
.65
1,0
03.7
1 8
.42
1,0
41.9
8 9
.74
932
.08
10.
48
566
.36
7.3
1 Re
tirem
ent b
enefi
s - o
blig
atio
ns 4
25.3
2 2
.95
252
.34
2.0
6 2
40.4
9 2
.02
148
.95
1.3
9 1
3.17
0
.15
- -
1,2
38.8
6 8
.59
1,0
73.6
7 8
.78
1,2
56.0
8 1
0.54
1
,197
.45
11.
19
945
.25
10.
63
566
.36
7.3
1 C
urre
nt li
abilit
ies
Tr
ade
and
othe
r pay
ables
2,6
80.0
6 1
8.58
1
,772
.10
14.
48
2,0
22.7
9 1
6.96
1
,591
.67
14.
88
1,2
05.2
2 1
3.55
1
,311
.13
16.
94
Curre
nt m
atur
ity o
f laib
ility
again
st a
sset
s -
su
bjec
t to
finan
ce le
ase
3.9
3 0
.03
3.9
3 0
.03
3.9
3 0
.03
1.8
6 0
.02
- -
3.9
8 0
.05
Taxa
tion
- pro
visio
n les
s pa
ymen
ts
56.
70
0.3
9 4
49.7
1 3
.68
197
.15
1.6
5 5
8.94
0
.55
129
.30
1.4
5 6
3.27
0
.82
2,7
40.6
9 1
9.00
2
,225
.73
18.
19
2,2
23.8
7 1
8.64
1
,652
.48
15.
45
1,3
34.5
1 1
5.00
1
,378
.38
17.
81
Tota
l Lia
bilit
ies
3,9
79.5
5 2
7.59
3
,299
.40
26.
97
3,4
79.9
5 2
9.18
2
,849
.92
26.
64
2,2
79.7
6 2
5.63
1
,944
.74
25.
12
Con
tinge
ncy
and
com
mitm
ents
Tota
l Equ
ity a
nd L
iabi
litie
s 1
4,42
6.40
1
00.0
0 1
2,23
4.54
1
00.0
0 1
1,92
6.00
1
00.0
0 1
0,69
8.75
1
00.0
0 8
,892
.65
100
.00
7,7
43.1
5 1
00.0
0
Verti
cal A
naly
sis
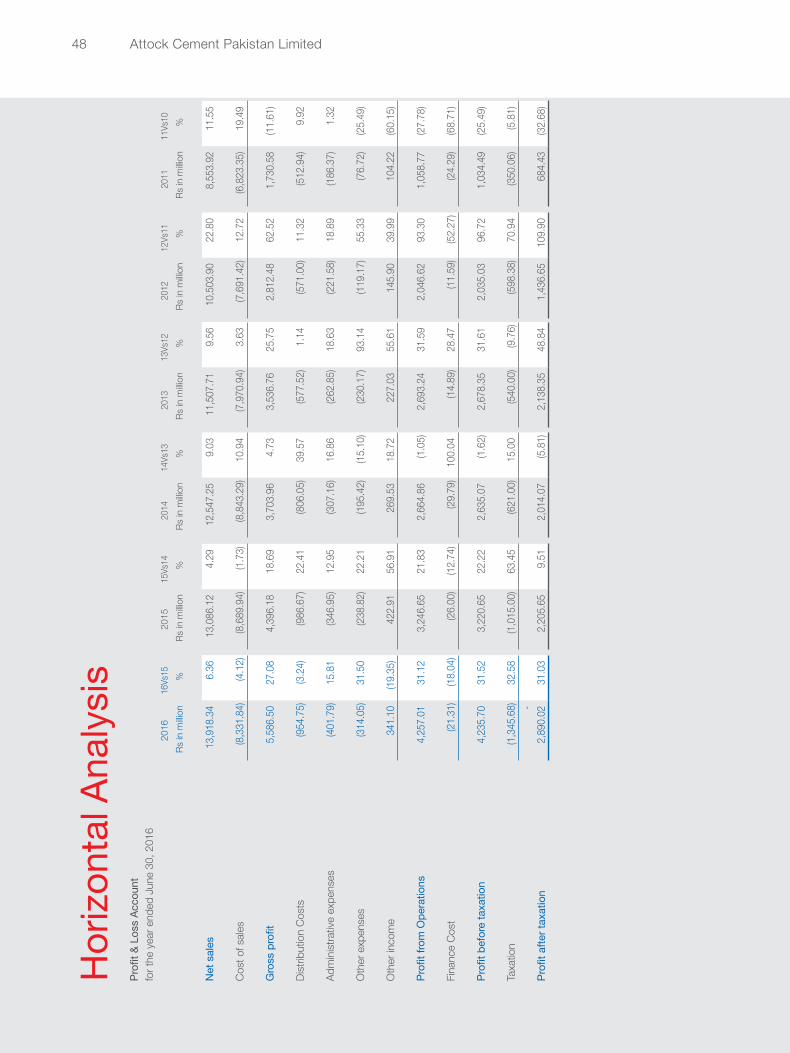
Hor
izont
al A
naly
sis
Profi
t & L
oss
Acco
unt
for t
he y
ear e
nded
Jun
e 30
, 201
6
2016
16Vs
1520
1515
Vs14
2014
14Vs
1320
1313
Vs12
2012
12Vs
1120
1111
Vs10
Rs
in m
illion
%
R
s in
milli
on
%
Rs
in m
illion
%
R
s in
milli
on
%
Rs
in m
illion
%
R
s in
milli
on
%
Net
sal
es 1
3,91
8.34
6
.36
13,
086.
12
4.2
9 1
2,54
7.25
9
.03
11,
507.
71
9.5
6 1
0,50
3.90
2
2.80
8
,553
.92
11.
55
Co
st o
f sale
s (8
,331
.84)
(4.1
2) (8
,689
.94)
(1.7
3) (8
,843
.29)
10.
94
(7,9
70.9
4) 3
.63
(7,6
91.4
2) 1
2.72
(6
,823
.35)
19.
49
Gro
ss p
rofit
5,5
86.5
0 2
7.08
4
,396
.18
18.
69
3,7
03.9
6 4
.73
3,5
36.7
6 2
5.75
2
,812
.48
62.
52
1,7
30.5
8 (1
1.61
)
Di
strib
utio
n Co
sts
(954
.75)
(3.2
4) (9
86.6
7) 2
2.41
(8
06.0
5) 3
9.57
(5
77.5
2) 1
.14
(571
.00)
11.
32
(512
.94)
9.9
2
Ad
min
istra
tive
expe
nses
(401
.79)
15.
81
(346
.95)
12.
95
(307
.16)
16.
86
(262
.85)
18.
63
(221
.58)
18.
89
(186
.37)
1.3
2
O
ther
exp
ense
s (3
14.0
5) 3
1.50
(2
38.8
2) 2
2.21
(1
95.4
2) (1
5.10
) (2
30.1
7) 9
3.14
(1
19.1
7) 5
5.33
(7
6.72
) (2
5.49
)
O
ther
inco
me
341
.10
(19.
35)
422
.91
56.
91
269
.53
18.
72
227
.03
55.
61
145
.90
39.
99
104
.22
(60.
15)
Profi
t fro
m O
pera
tions
4,2
57.0
1 3
1.12
3
,246
.65
21.
83
2,6
64.8
6 (1
.05)
2,6
93.2
4 3
1.59
2
,046
.62
93.
30
1,0
58.7
7 (2
7.78
)
Fi
nanc
e Co
st (2
1.31
) (1
8.04
) (2
6.00
) (1
2.74
) (2
9.79
) 1
00.0
4 (1
4.89
) 2
8.47
(1
1.59
) (5
2.27
) (2
4.29
) (6
8.71
)
Pr
ofit b
efor
e ta
xatio
n 4
,235
.70
31.
52
3,2
20.6
5 2
2.22
2
,635
.07
(1.6
2) 2
,678
.35
31.
61
2,0
35.0
3 9
6.72
1
,034
.49
(25.
49)
Taxa
tion
(1,3
45.6
8) 3
2.58
(1
,015
.00)
63.
45
(621
.00)
15.
00
(540
.00)
(9.7
6) (5
98.3
8) 7
0.94
(3
50.0
6) (5
.81)
-
Profi
t afte
r tax
atio
n 2
,890
.02
31.
03
2,2
05.6
5 9
.51
2,0
14.0
7 (5
.81)
2,1
38.3
5 4
8.84
1
,436
.65
109
.90
684
.43
(32.
68)
Bala
nce
Shee
t as
at J
une
30, 2
016
20
1616
Vs15
2015
15Vs
1420
1414
Vs13
2013
13Vs
1220
1212
Vs11
2011
11Vs
10 R
s in
millio
n %
R
s in
millio
n %
R
s in
millio
n %
R
s in
millio
n %
R
s in
millio
n %
R
s in
millio
n %
AS
SETS
Non-
curre
nt a
sset
sFi
xed
asse
ts -
prop
erty,
plan
t and
equ
ipm
ent
7,1
40.5
1 1
9.02
5
,999
.67
(2.0
6) 6
,125
.80
2.1
2 5
,998
.66
9.6
3 5
,471
.66
2.6
2 5
,331
.95
26.
89
Long
-term
inve
stm
ent
4.5
0 -
4
.50
- 4
.50
- 4
.50
- 4
.50
- 4
.50
- Lo
ng-te
rm lo
ans
and
adva
nces
41.
54
(25.
50)
55.
75
69.
12
32.
97
15.
06
28.
65
17.
68
24.
35
49.
95
16.
24
(4.0
5)Lo
ng-te
rm d
epos
its 4
2.98
-
4
2.98
-
42.
98
- 4
2.98
-
42.
98
- 4
2.98
-
7,2
29.5
3 1
8.46
6
,102
.90
(1.6
7) 6
,206
.24
2.1
6 6
,074
.80
9.5
8 5
,543
.49
2.7
4 5
,395
.67
26.
47
Cur
rent
ass
ets
St
ores
, spa
res
and
loos
e to
ols
1,3
17.0
1 3
3.55
9
86.1
5 (1
4.99
) 1
,160
.07
21.
31
956
.28
(32.
64)
1,4
19.7
4 5
.77
1,3
42.3
4 1
07.6
3 St
ock-
in-tr
ade
599
.75
(21.
47)
763
.72
45.
91
523
.40
(7.3
5) 5
64.9
0 4
.74
539
.34
(0.3
1) 5
41.0
3 4
7.75
Tr
ade
debt
s - c
onsid
ered
goo
d 2
11.1
1 6
9.69
1
24.4
1 (5
2.53
) 2
62.0
6 (2
4.97
) 3
49.2
8 8
3.40
1
90.4
5 2
75.1
0 5
0.77
(8
.30)
Loan
s an
d ad
vanc
es 8
1.94
3
4.07
6
1.12
2
5.42
4
8.73
3
7.52
3
5.43
0
.12
35.
39
37.
42
25.
75
(44.
17)
Shor
t-ter
m d
epos
its a
nd p
repa
ymen
ts 1
7.52
3
.42
16.
94
(8.3
3) 1
8.48
(4
.87)
19.
42
39.
71
13.
90
17.
92
11.
79
11.
87
Inve
stm
ents
4,2
73.3
6 3
7.63
3
,104
.91
(1.9
1) 3
,165
.43
38.
67
2,2
82.7
3 1
59.5
9 8
79.3
6 6
57.6
5 1
16.0
6 (9
0.28
)Ac
crue
d In
tere
st -
-
- -
(100
.00)
4.3
0 1
00.0
0 2
.16
- 2
.15
(18.
78)
Oth
er re
ceiva
bles
114
.86
68.
63
68.
12
137
.04
28.
74
27.
19
22.
59
(18.
24)
27.
63
(41.
73)
47.
42
64.
44
Sales
tax
refu
ndab
le -
(1
00.0
0) 1
47.5
9 2
27.0
9 4
5.01
-
- (1
00.0
0) 2
1.43
-
- -
Cash
and
ban
k ba
lance
s 5
81.3
2 (3
2.30
) 8
58.7
0 8
3.55
4
67.8
4 2
0.26
3
89.0
1 7
7.02
2
19.7
6 4
.57
210
.17
(52.
46)
7,1
96.8
7 1
7.37
6
,131
.64
7.2
0 5
,719
.76
23.
70
4,6
23.9
5 3
8.06
3
,349
.14
42.
67
2,3
47.4
8 (1
5.94
)To
tal A
sset
s 1
4,42
6.40
1
7.92
1
2,23
4.54
2
.59
11,
926.
00
11.
47
10,
698.
75
20.
31
8,8
92.6
5 1
4.85
7
,743
.15
9.6
9
EQU
ITY
AND
LIAB
ILIT
IES
Shar
e ca
pita
l and
rese
rves
Shar
e ca
pita
l 1
,145
.23
-
1,1
45.2
3 -
1,1
45.2
3 1
5.00
9
95.8
5 1
5.00
8
65.9
6 -
865
.96
- Un
appr
opria
ted
profi
t 9
,301
.62
19.
41
7,7
89.9
1 6
.70
7,3
00.8
3 6
.54
6,8
52.9
8 1
9.25
5
,746
.93
16.
51
4,9
32.4
6 8
.90
10,
446.
85
16.
92
8,9
35.1
3 5
.79
8,4
46.0
5 7
.61
7,8
48.8
2 1
8.69
6
,612
.89
14.
05
5,7
98.4
1 7
.47
LIAB
ILIT
IES
Non
-cur
rent
Lia
bilit
ies
Liab
ilities
aga
inst
ass
ets
subj
ect t
o fin
ance
leas
e 4
.03
(49.
36)
7.9
6 (3
3.05
) 1
1.88
8
2.34
6
.52
- -
-
Defe
rred
taxa
tion
809
.51
(0.4
7) 8
13.3
8 (1
8.96
) 1
,003
.71
(3.6
7) 1
,041
.98
11.
79
932
.08
64.
57
566
.36
(5.3
4)Re
tirem
ent b
enefi
ts -
oblig
atio
ns 4
25.3
2 6
8.56
2
52.3
4 4
.92
240
.49
61.
46
148
.95
1,03
0.91
1
3.17
-
- -
1,2
38.8
6 1
5.39
1
,073
.67
(14.
52)
1,2
56.0
8 4
.90
1,1
97.4
5 2
6.68
9
45.2
5 6
6.90
5
66.3
6 (5
.34)
Cur
rent
liab
ilitie
s
Tr
ade
and
othe
r pay
ables
2,6
80.0
6 5
1.24
1
,772
.10
(12.
39)
2,0
22.7
9 2
7.09
1
,591
.67
32.
07
1,2
05.2
2 (8
.08)
1,3
11.1
3 2
9.08
Cu
rrent
mat
urity
of l
iabilit
y ag
ainst
ass
ets
subj
ect t
o fin
ance
leas
e 3
.93
-
3.9
3 -
3.9
3 1
10.9
0 1
.86
- -
- 3
.98
- Ta
xatio
n - p
rovis
ion
less
paym
ents
5
6.70
(8
7.39
) 4
49.7
1 1
28.1
0 1
97.1
5 2
34.4
8 5
8.94
(5
4.41
) 1
29.3
0 1
04.3
7 6
3.27
2
7.90
2
,740
.69
23.
14
2,2
25.7
3 0
.08
2,2
23.8
7 3
4.58
1
,652
.48
23.
83
1,3
34.5
1 (3
.18)
1,3
78.3
8 2
9.40
To
tal L
iabi
litie
s 3
,979
.55
20.
61
3,2
99.4
0 (5
.19)
3,4
79.9
5 2
2.11
2
,849
.92
25.
01
2,2
79.7
6 1
7.23
1
,944
.74
16.
91
Con
tinge
ncy
and
com
mitm
ents
Tota
l Equ
ity a
nd L
iabi
litie
s 1
4,42
6.40
1
7.92
1
2,23
4.54
2
.59
11,
926.
00
11.
47
10,
698.
75
20.
31
8,8
92.6
5 1
4.85
7
,743
.15
9.6
9
Attock Cement Pakistan Limited48
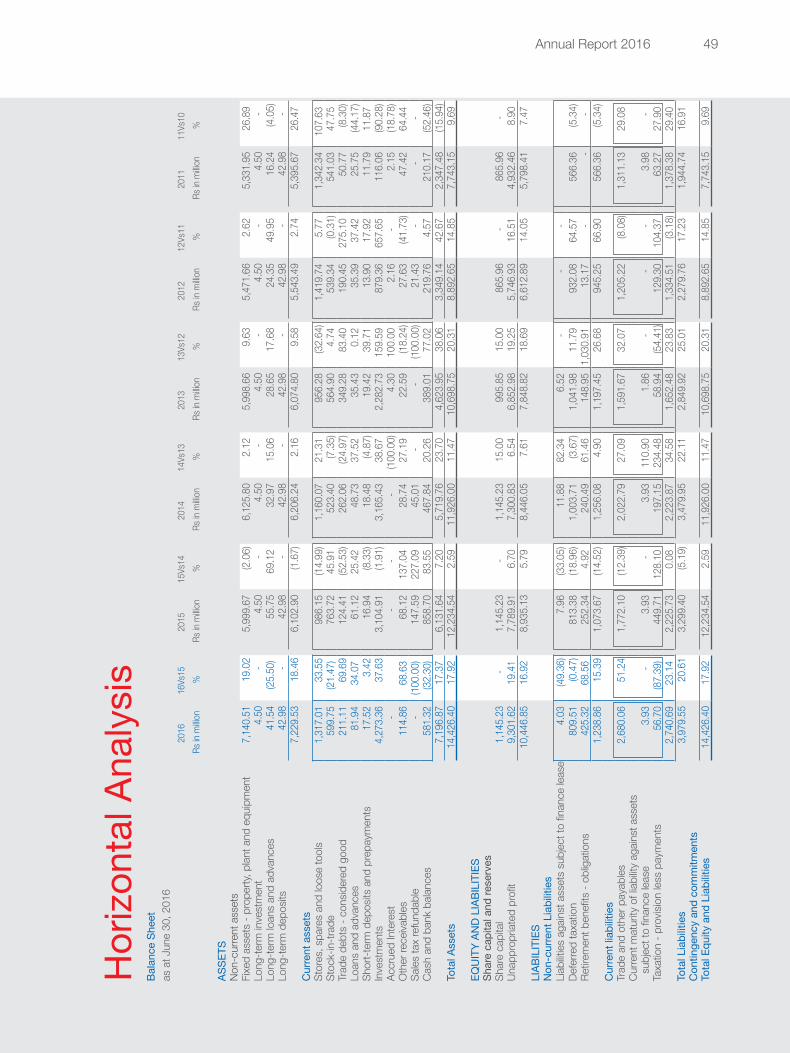
Profi
t & L
oss
Acco
unt
for t
he y
ear e
nded
Jun
e 30
, 201
6
2016
16Vs
1520
1515
Vs14
2014
14Vs
1320
1313
Vs12
2012
12Vs
1120
1111
Vs10
Rs
in m
illion
%
R
s in
milli
on
%
Rs
in m
illion
%
R
s in
milli
on
%
Rs
in m
illion
%
R
s in
milli
on
%
Net
sal
es 1
3,91
8.34
6
.36
13,
086.
12
4.2
9 1
2,54
7.25
9
.03
11,
507.
71
9.5
6 1
0,50
3.90
2
2.80
8
,553
.92
11.
55
Co
st o
f sale
s (8
,331
.84)
(4.1
2) (8
,689
.94)
(1.7
3) (8
,843
.29)
10.
94
(7,9
70.9
4) 3
.63
(7,6
91.4
2) 1
2.72
(6
,823
.35)
19.
49
Gro
ss p
rofit
5,5
86.5
0 2
7.08
4
,396
.18
18.
69
3,7
03.9
6 4
.73
3,5
36.7
6 2
5.75
2
,812
.48
62.
52
1,7
30.5
8 (1
1.61
)
Di
strib
utio
n Co
sts
(954
.75)
(3.2
4) (9
86.6
7) 2
2.41
(8
06.0
5) 3
9.57
(5
77.5
2) 1
.14
(571
.00)
11.
32
(512
.94)
9.9
2
Ad
min
istra
tive
expe
nses
(401
.79)
15.
81
(346
.95)
12.
95
(307
.16)
16.
86
(262
.85)
18.
63
(221
.58)
18.
89
(186
.37)
1.3
2
O
ther
exp
ense
s (3
14.0
5) 3
1.50
(2
38.8
2) 2
2.21
(1
95.4
2) (1
5.10
) (2
30.1
7) 9
3.14
(1
19.1
7) 5
5.33
(7
6.72
) (2
5.49
)
O
ther
inco
me
341
.10
(19.
35)
422
.91
56.
91
269
.53
18.
72
227
.03
55.
61
145
.90
39.
99
104
.22
(60.
15)
Profi
t fro
m O
pera
tions
4,2
57.0
1 3
1.12
3
,246
.65
21.
83
2,6
64.8
6 (1
.05)
2,6
93.2
4 3
1.59
2
,046
.62
93.
30
1,0
58.7
7 (2
7.78
)
Fi
nanc
e Co
st (2
1.31
) (1
8.04
) (2
6.00
) (1
2.74
) (2
9.79
) 1
00.0
4 (1
4.89
) 2
8.47
(1
1.59
) (5
2.27
) (2
4.29
) (6
8.71
)
Pr
ofit b
efor
e ta
xatio
n 4
,235
.70
31.
52
3,2
20.6
5 2
2.22
2
,635
.07
(1.6
2) 2
,678
.35
31.
61
2,0
35.0
3 9
6.72
1
,034
.49
(25.
49)
Taxa
tion
(1,3
45.6
8) 3
2.58
(1
,015
.00)
63.
45
(621
.00)
15.
00
(540
.00)
(9.7
6) (5
98.3
8) 7
0.94
(3
50.0
6) (5
.81)
-
Profi
t afte
r tax
atio
n 2
,890
.02
31.
03
2,2
05.6
5 9
.51
2,0
14.0
7 (5
.81)
2,1
38.3
5 4
8.84
1
,436
.65
109
.90
684
.43
(32.
68)
Bala
nce
Shee
t as
at J
une
30, 2
016
20
1616
Vs15
2015
15Vs
1420
1414
Vs13
2013
13Vs
1220
1212
Vs11
2011
11Vs
10 R
s in
millio
n %
R
s in
millio
n %
R
s in
millio
n %
R
s in
millio
n %
R
s in
millio
n %
R
s in
millio
n %
AS
SETS
Non-
curre
nt a
sset
sFi
xed
asse
ts -
prop
erty,
plan
t and
equ
ipm
ent
7,1
40.5
1 1
9.02
5
,999
.67
(2.0
6) 6
,125
.80
2.1
2 5
,998
.66
9.6
3 5
,471
.66
2.6
2 5
,331
.95
26.
89
Long
-term
inve
stm
ent
4.5
0 -
4
.50
- 4
.50
- 4
.50
- 4
.50
- 4
.50
- Lo
ng-te
rm lo
ans
and
adva
nces
41.
54
(25.
50)
55.
75
69.
12
32.
97
15.
06
28.
65
17.
68
24.
35
49.
95
16.
24
(4.0
5)Lo
ng-te
rm d
epos
its 4
2.98
-
4
2.98
-
42.
98
- 4
2.98
-
42.
98
- 4
2.98
-
7,2
29.5
3 1
8.46
6
,102
.90
(1.6
7) 6
,206
.24
2.1
6 6
,074
.80
9.5
8 5
,543
.49
2.7
4 5
,395
.67
26.
47
Cur
rent
ass
ets
St
ores
, spa
res
and
loos
e to
ols
1,3
17.0
1 3
3.55
9
86.1
5 (1
4.99
) 1
,160
.07
21.
31
956
.28
(32.
64)
1,4
19.7
4 5
.77
1,3
42.3
4 1
07.6
3 St
ock-
in-tr
ade
599
.75
(21.
47)
763
.72
45.
91
523
.40
(7.3
5) 5
64.9
0 4
.74
539
.34
(0.3
1) 5
41.0
3 4
7.75
Tr
ade
debt
s - c
onsid
ered
goo
d 2
11.1
1 6
9.69
1
24.4
1 (5
2.53
) 2
62.0
6 (2
4.97
) 3
49.2
8 8
3.40
1
90.4
5 2
75.1
0 5
0.77
(8
.30)
Loan
s an
d ad
vanc
es 8
1.94
3
4.07
6
1.12
2
5.42
4
8.73
3
7.52
3
5.43
0
.12
35.
39
37.
42
25.
75
(44.
17)
Shor
t-ter
m d
epos
its a
nd p
repa
ymen
ts 1
7.52
3
.42
16.
94
(8.3
3) 1
8.48
(4
.87)
19.
42
39.
71
13.
90
17.
92
11.
79
11.
87
Inve
stm
ents
4,2
73.3
6 3
7.63
3
,104
.91
(1.9
1) 3
,165
.43
38.
67
2,2
82.7
3 1
59.5
9 8
79.3
6 6
57.6
5 1
16.0
6 (9
0.28
)Ac
crue
d In
tere
st -
-
- -
(100
.00)
4.3
0 1
00.0
0 2
.16
- 2
.15
(18.
78)
Oth
er re
ceiva
bles
114
.86
68.
63
68.
12
137
.04
28.
74
27.
19
22.
59
(18.
24)
27.
63
(41.
73)
47.
42
64.
44
Sales
tax
refu
ndab
le -
(1
00.0
0) 1
47.5
9 2
27.0
9 4
5.01
-
- (1
00.0
0) 2
1.43
-
- -
Cash
and
ban
k ba
lance
s 5
81.3
2 (3
2.30
) 8
58.7
0 8
3.55
4
67.8
4 2
0.26
3
89.0
1 7
7.02
2
19.7
6 4
.57
210
.17
(52.
46)
7,1
96.8
7 1
7.37
6
,131
.64
7.2
0 5
,719
.76
23.
70
4,6
23.9
5 3
8.06
3
,349
.14
42.
67
2,3
47.4
8 (1
5.94
)To
tal A
sset
s 1
4,42
6.40
1
7.92
1
2,23
4.54
2
.59
11,
926.
00
11.
47
10,
698.
75
20.
31
8,8
92.6
5 1
4.85
7
,743
.15
9.6
9
EQU
ITY
AND
LIAB
ILIT
IES
Shar
e ca
pita
l and
rese
rves
Shar
e ca
pita
l 1
,145
.23
-
1,1
45.2
3 -
1,1
45.2
3 1
5.00
9
95.8
5 1
5.00
8
65.9
6 -
865
.96
- Un
appr
opria
ted
profi
t 9
,301
.62
19.
41
7,7
89.9
1 6
.70
7,3
00.8
3 6
.54
6,8
52.9
8 1
9.25
5
,746
.93
16.
51
4,9
32.4
6 8
.90
10,
446.
85
16.
92
8,9
35.1
3 5
.79
8,4
46.0
5 7
.61
7,8
48.8
2 1
8.69
6
,612
.89
14.
05
5,7
98.4
1 7
.47
LIAB
ILIT
IES
Non
-cur
rent
Lia
bilit
ies
Liab
ilities
aga
inst
ass
ets
subj
ect t
o fin
ance
leas
e 4
.03
(49.
36)
7.9
6 (3
3.05
) 1
1.88
8
2.34
6
.52
- -
-
Defe
rred
taxa
tion
809
.51
(0.4
7) 8
13.3
8 (1
8.96
) 1
,003
.71
(3.6
7) 1
,041
.98
11.
79
932
.08
64.
57
566
.36
(5.3
4)Re
tirem
ent b
enefi
ts -
oblig
atio
ns 4
25.3
2 6
8.56
2
52.3
4 4
.92
240
.49
61.
46
148
.95
1,03
0.91
1
3.17
-
- -
1,2
38.8
6 1
5.39
1
,073
.67
(14.
52)
1,2
56.0
8 4
.90
1,1
97.4
5 2
6.68
9
45.2
5 6
6.90
5
66.3
6 (5
.34)
Cur
rent
liab
ilitie
s
Tr
ade
and
othe
r pay
ables
2,6
80.0
6 5
1.24
1
,772
.10
(12.
39)
2,0
22.7
9 2
7.09
1
,591
.67
32.
07
1,2
05.2
2 (8
.08)
1,3
11.1
3 2
9.08
Cu
rrent
mat
urity
of l
iabilit
y ag
ainst
ass
ets
subj
ect t
o fin
ance
leas
e 3
.93
-
3.9
3 -
3.9
3 1
10.9
0 1
.86
- -
- 3
.98
- Ta
xatio
n - p
rovis
ion
less
paym
ents
5
6.70
(8
7.39
) 4
49.7
1 1
28.1
0 1
97.1
5 2
34.4
8 5
8.94
(5
4.41
) 1
29.3
0 1
04.3
7 6
3.27
2
7.90
2
,740
.69
23.
14
2,2
25.7
3 0
.08
2,2
23.8
7 3
4.58
1
,652
.48
23.
83
1,3
34.5
1 (3
.18)
1,3
78.3
8 2
9.40
To
tal L
iabi
litie
s 3
,979
.55
20.
61
3,2
99.4
0 (5
.19)
3,4
79.9
5 2
2.11
2
,849
.92
25.
01
2,2
79.7
6 1
7.23
1
,944
.74
16.
91
Con
tinge
ncy
and
com
mitm
ents
Tota
l Equ
ity a
nd L
iabi
litie
s 1
4,42
6.40
1
7.92
1
2,23
4.54
2
.59
11,
926.
00
11.
47
10,
698.
75
20.
31
8,8
92.6
5 1
4.85
7
,743
.15
9.6
9
Hor
izont
al A
naly
sis
Annual Report 2016 49
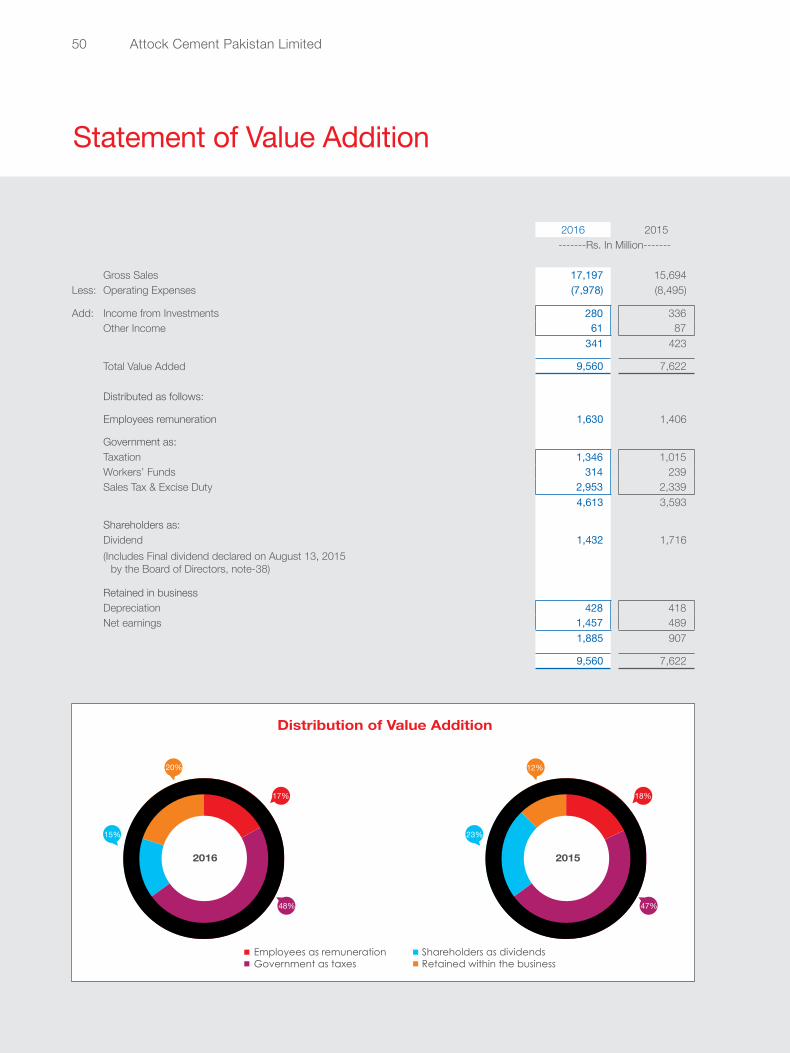
Attock Cement Pakistan Limited50
Statement of Value Addition
2016 2015-------Rs. In Million-------
Gross Sales 17,197 15,694 Less: Operating Expenses (7,978) (8,495)
Add: Income from Investments 280 336 Other Income 61 87
341 423
Total Value Added 9,560 7,622
Distributed as follows:
Employees remuneration 1,630 1,406
Government as:Taxation 1,346 1,015 Workers’ Funds 314 239 Sales Tax & Excise Duty 2,953 2,339
4,613 3,593
Shareholders as:Dividend 1,432 1,716 (Includes Final dividend declared on August 13, 2015
by the Board of Directors, note-38)
Retained in businessDepreciation 428 418 Net earnings 1,457 489
1,885 907
9,560 7,622
Employees as remunerationGovernment as taxes
Distribution of Value Addition
Shareholders as dividendsRetained within the business
17%
15%
48%
20%
18%
23%
47%
12%
2016 2015
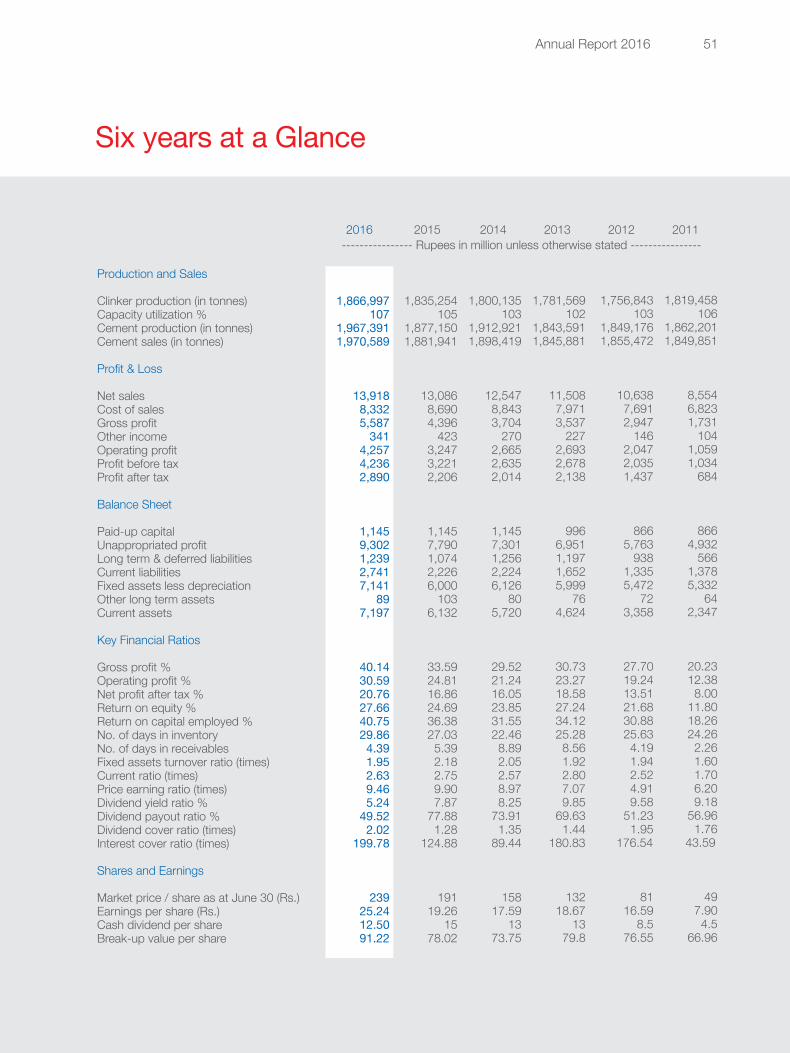
Annual Report 2016 51
Six years at a Glance
2016 2015 2014 2013 2012 2011---------------- Rupees in million unless otherwise stated ----------------
Production and Sales
Clinker production (in tonnes)Capacity utilization %Cement production (in tonnes)Cement sales (in tonnes)
Profit & Loss
Net salesCost of salesGross profitOther incomeOperating profitProfit before taxProfit after tax
Balance Sheet
Paid-up capitalUnappropriated profitLong term & deferred liabilitiesCurrent liabilitiesFixed assets less depreciationOther long term assetsCurrent assets
Key Financial Ratios
Gross profit %Operating profit %Net profit after tax %Return on equity %Return on capital employed %No. of days in inventoryNo. of days in receivablesFixed assets turnover ratio (times)Current ratio (times)Price earning ratio (times)Dividend yield ratio %Dividend payout ratio %Dividend cover ratio (times)Interest cover ratio (times)
Shares and Earnings
Market price / share as at June 30 (Rs.)Earnings per share (Rs.)Cash dividend per shareBreak-up value per share
1,866,997 107
1,967,391 1,970,589
13,918 8,332 5,587
341 4,257 4,236 2,890
1,145 9,302 1,239 2,741 7,141
89 7,197
40.1430.5920.7627.6640.7529.864.391.952.639.465.24
49.522.02
199.78
23925.2412.5091.22
1,835,254 105
1,877,150 1,881,941
13,086 8,690 4,396
423 3,247 3,221 2,206
1,145 7,790 1,074 2,226 6,000
103 6,132
33.5924.8116.8624.6936.3827.03 5.39 2.18 2.75 9.90 7.87
77.88 1.28
124.88
191 19.26
15 78.02
1,800,135103
1,912,9211,898,419
12,5478,8433,704
2702,6652,6352,014
1,1457,3011,2562,2246,126
805,720
29.5221.2416.0523.8531.5522.468.892.052.578.978.25
73.911.35
89.44
15817.59
1373.75
1,781,569102
1,843,5911,845,881
11,5087,9713,537
2272,6932,6782,138
9966,9511,1971,6525,999
764,624
30.7323.2718.5827.2434.1225.288.561.922.807.079.85
69.631.44
180.83
13218.67
1379.8
1,756,843103
1,849,1761,855,472
10,6387,6912,947
1462,0472,0351,437
8665,763
9381,3355,472
723,358
27.7019.2413.5121.6830.8825.634.191.942.524.919.58
51.231.95
176.54
8116.59
8.576.55
1,819,458106
1,862,2011,849,851
8,5546,8231,731
1041,0591,034
684
8664,932
5661,3785,332
642,347
20.2312.38
8.0011.8018.2624.26
2.261.601.706.209.18
56.961.76
43.59
497.90
4.566.96
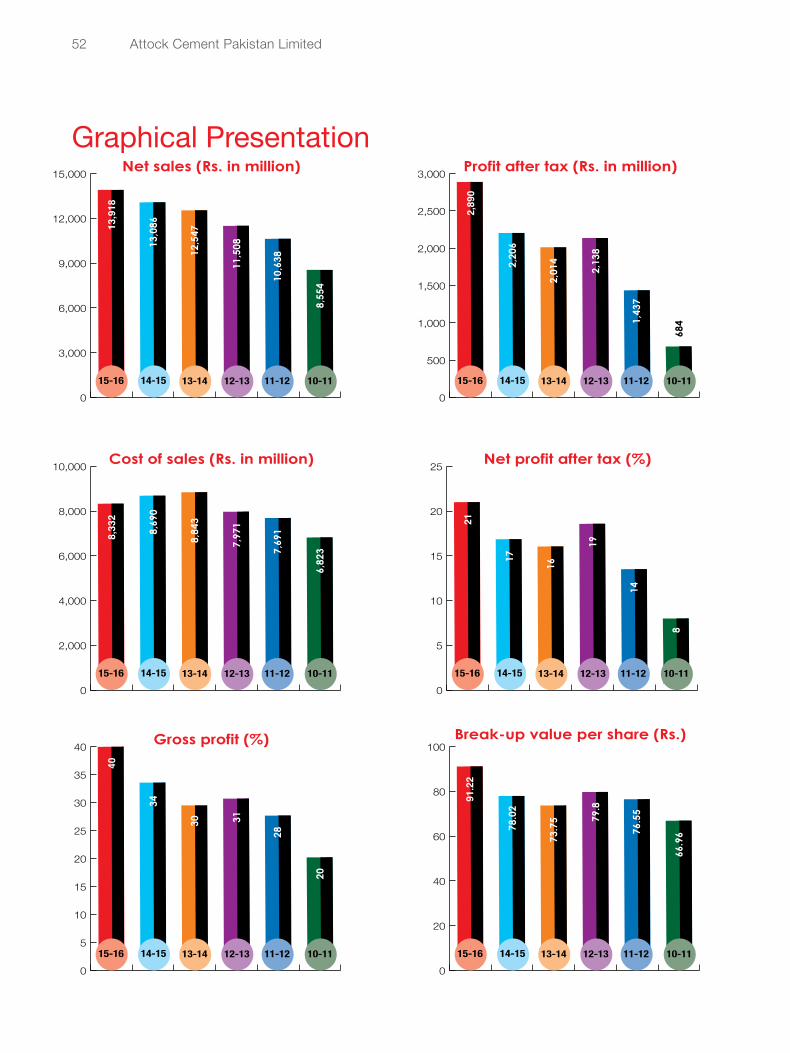
Attock Cement Pakistan Limited52
Graphical PresentationNet sales (Rs. in million)
0
3,000
6,000
9,000
12,000
15,000
13,9
18
13,0
86
12,5
47
11,5
08
10,6
38
8,55
4
15-16 14-15 13-14 12-13 11-12 10-11
Cost of sales (Rs. in million)
0
2,000
4,000
6,000
8,000
10,000
8,33
2
8,69
0
8,84
3
7,97
1
7,69
1
6,82
3
15-16 14-15 13-14 12-13 11-12 10-11
Gross profit (%)
0
5
10
15
20
25
30
35
40
40
34
30 31
28
20
15-16 14-15 13-14 12-13 11-12 10-11
Break-up value per share (Rs.)
0
20
40
60
80
100
91.2
2
78.0
2
73.7
5 79.8
76.5
5
66.9
6
15-16 14-15 13-14 12-13 11-12 10-11
Net profit after tax (%)
0
5
10
15
20
2521
17
16
19
14
815-16 14-15 13-14 12-13 11-12 10-11
Profit after tax (Rs. in million)
0
500
1,000
1,500
2,000
2,500
3,000
2,89
0
2,20
6
2,01
4
2,13
8
1,43
7
684
15-16 14-15 13-14 12-13 11-12 10-11
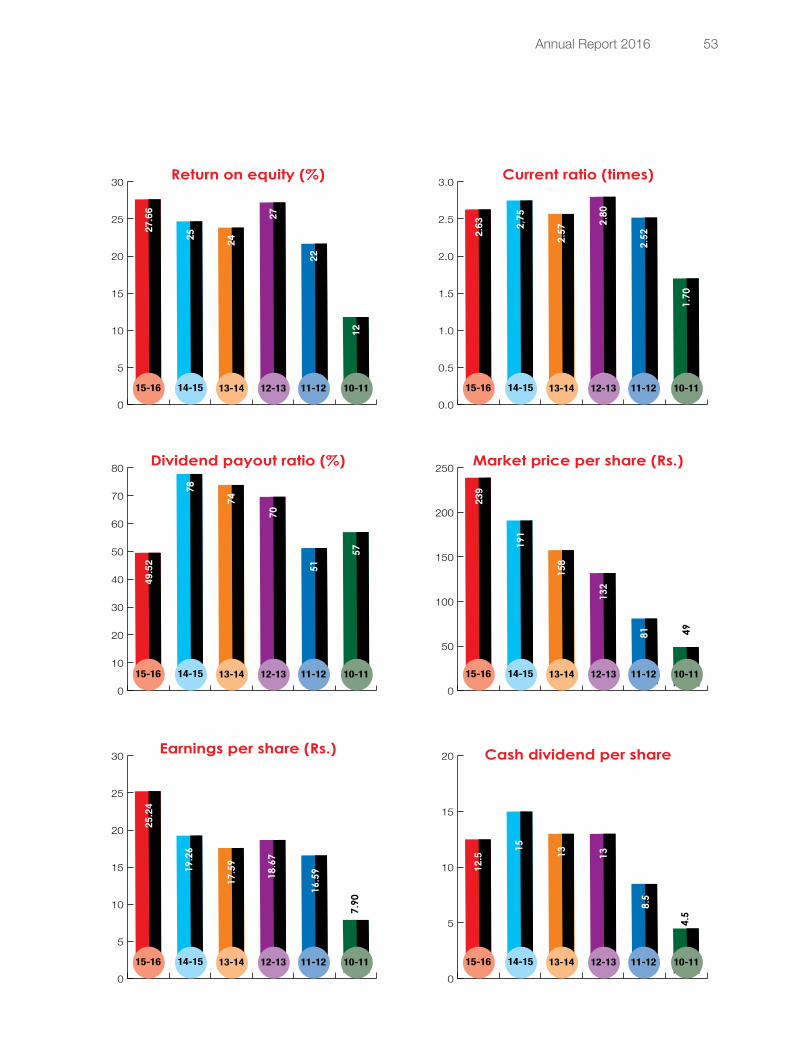
Annual Report 2016 53
Return on equity (%)
0
5
10
15
20
25
30
27.6
6
25 24
27
22
12
15-16 14-15 13-14 12-13 11-12 10-11
Dividend payout ratio (%)
0
10
20
30
40
50
60
70
80
49.5
2
78
74
70
51
57
15-16 14-15 13-14 12-13 11-12 10-11
Earnings per share (Rs.)
0
5
10
15
20
25
30
25.2
4
19.2
6
17.5
9
18.6
7
16.5
9
7.90
15-16 14-15 13-14 12-13 11-12 10-11
Cash dividend per share
0
5
10
15
20
12.5
15
13 13
8.5
4.5
15-16 14-15 13-14 12-13 11-12 10-11
Market price per share (Rs.)
0
50
100
150
200
25023
9
191
158
132
81 4915-16 14-15 13-14 12-13 11-12 10-11
Current ratio (times)
0.0
0.5
1.0
1.5
2.0
2.5
3.0
2.63 2,
75
2.57
2.80
2.52
1.70
15-16 14-15 13-14 12-13 11-12 10-11
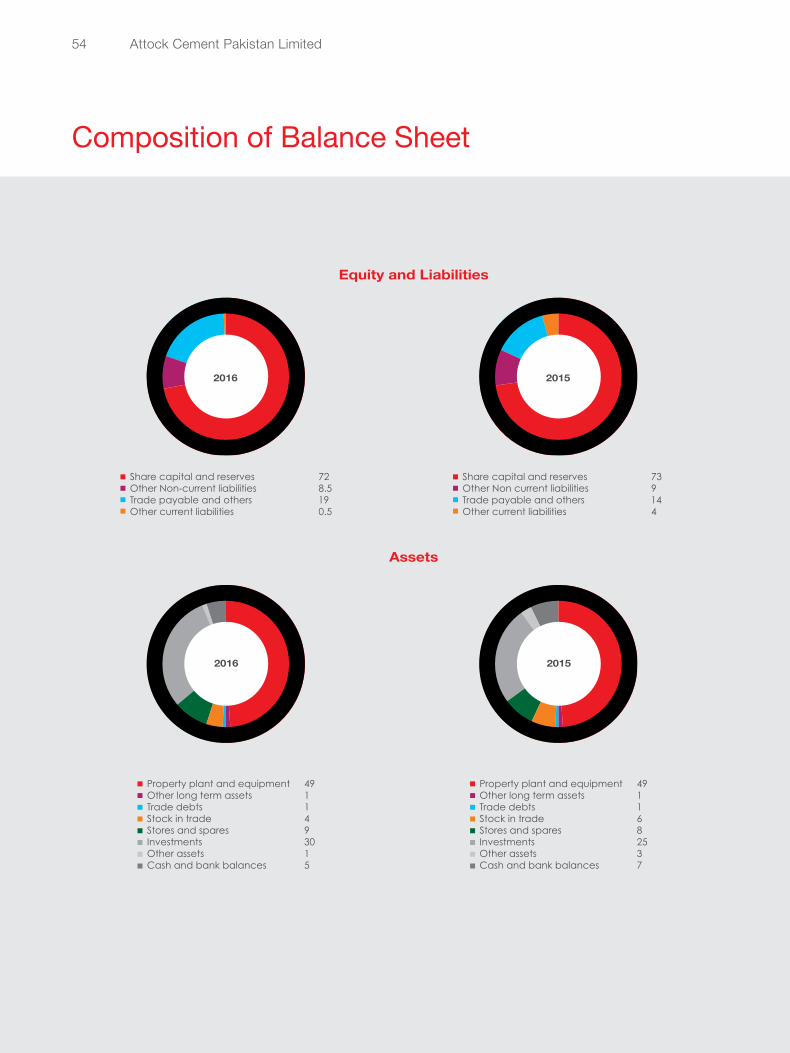
Attock Cement Pakistan Limited54
Composition of Balance Sheet
Share capital and reserves 72Other Non-current liabilities 8.5Trade payable and others 19Other current liabilities 0.5
Equity and Liabilities
Assets
2016
Share capital and reserves 73Other Non current liabilities 9Trade payable and others 14Other current liabilities 4
2015
Property plant and equipment 49Other long term assets 1Trade debts 1Stock in trade 4Stores and spares 9Investments 30Other assets 1Cash and bank balances 5
2016
Property plant and equipment 49Other long term assets 1Trade debts 1Stock in trade 6Stores and spares 8Investments 25Other assets 3Cash and bank balances 7
2015
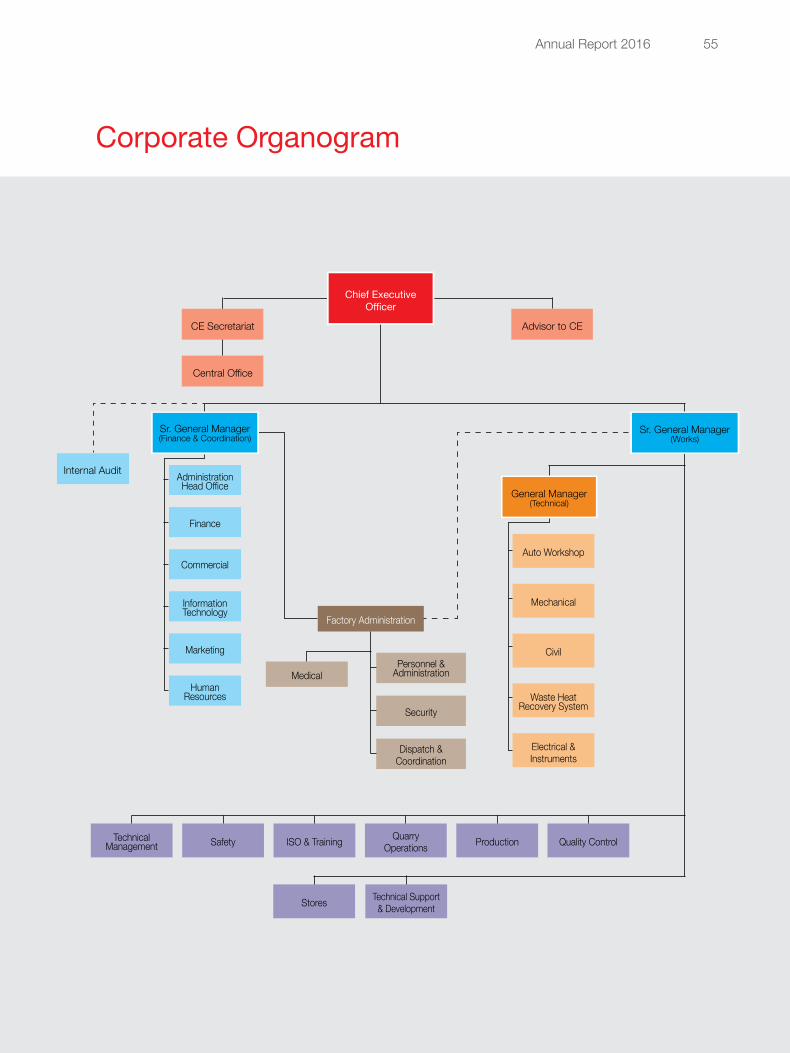
Annual Report 2016 55
Corporate Organogram
Advisor to CE
Central Office
Internal Audit AdministrationHead Office
InformationTechnology
HumanResources Waste Heat
Recovery System
TechnicalManagement
Stores Technical Support & Development
Safety ISO & Training QuarryOperations Production Quality Control
Electrical &Instruments
Auto Workshop
Mechanical
Civil
Factory Administration
Commercial
Marketing
Finance
General Manager(Technical)
Chief Executive Officer
CE Secretariat
MedicalPersonnel &
Administration
Dispatch &Coordination
Security
Sr. General Manager(Works)
Sr. General Manager(Finance & Coordination)
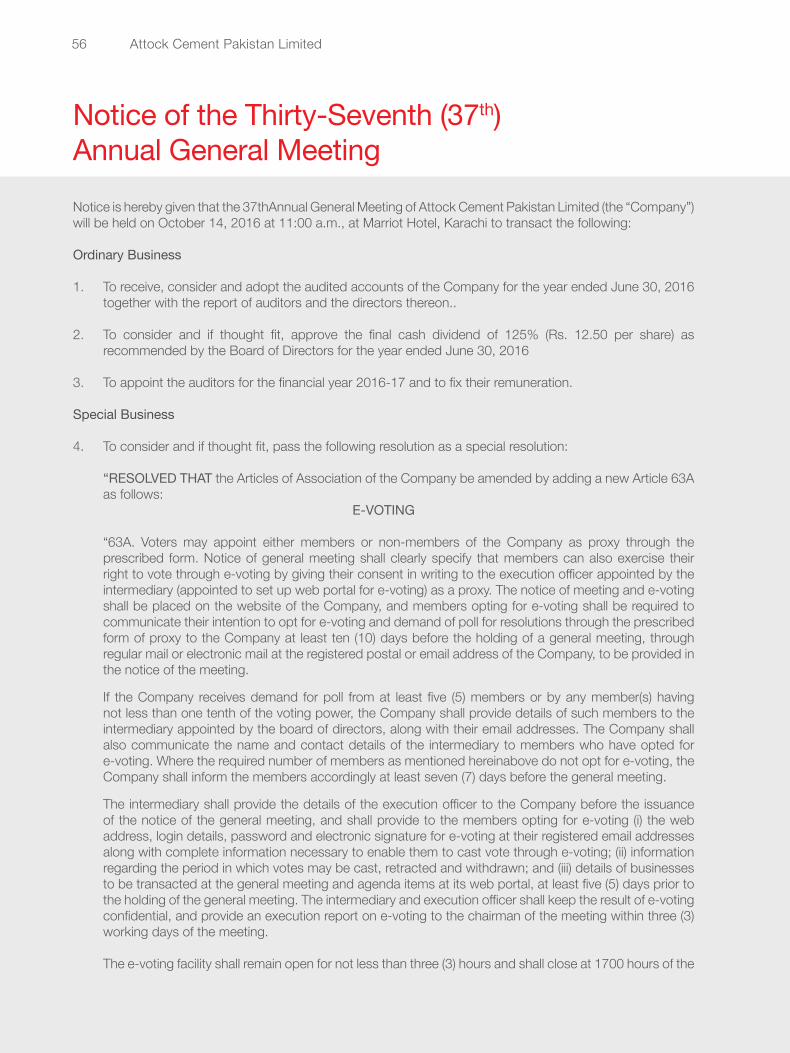
Attock Cement Pakistan Limited56
Notice of the Thirty-Seventh (37th)Annual General MeetingNotice is hereby given that the 37thAnnual General Meeting of Attock Cement Pakistan Limited (the “Company”) will be held on October 14, 2016 at 11:00 a.m., at Marriot Hotel, Karachi to transact the following:
Ordinary Business
1. To receive, consider and adopt the audited accounts of the Company for the year ended June 30, 2016 together with the report of auditors and the directors thereon..
2. To consider and if thought fit, approve the final cash dividend of 125% (Rs. 12.50 per share) as recommended by the Board of Directors for the year ended June 30, 2016
3. To appoint the auditors for the financial year 2016-17 and to fix their remuneration.
Special Business
4. To consider and if thought fit, pass the following resolution as a special resolution:
“RESOLVED THAT the Articles of Association of the Company be amended by adding a new Article 63A as follows:
E-VOTING
“63A. Voters may appoint either members or non-members of the Company as proxy through the prescribed form. Notice of general meeting shall clearly specify that members can also exercise their right to vote through e-voting by giving their consent in writing to the execution officer appointed by the intermediary (appointed to set up web portal for e-voting) as a proxy. The notice of meeting and e-voting shall be placed on the website of the Company, and members opting for e-voting shall be required to communicate their intention to opt for e-voting and demand of poll for resolutions through the prescribed form of proxy to the Company at least ten (10) days before the holding of a general meeting, through regular mail or electronic mail at the registered postal or email address of the Company, to be provided in the notice of the meeting.
If the Company receives demand for poll from at least five (5) members or by any member(s) having not less than one tenth of the voting power, the Company shall provide details of such members to the intermediary appointed by the board of directors, along with their email addresses. The Company shall also communicate the name and contact details of the intermediary to members who have opted for e-voting. Where the required number of members as mentioned hereinabove do not opt for e-voting, the Company shall inform the members accordingly at least seven (7) days before the general meeting.
The intermediary shall provide the details of the execution officer to the Company before the issuance of the notice of the general meeting, and shall provide to the members opting for e-voting (i) the web address, login details, password and electronic signature for e-voting at their registered email addresses along with complete information necessary to enable them to cast vote through e-voting; (ii) information regarding the period in which votes may be cast, retracted and withdrawn; and (iii) details of businesses to be transacted at the general meeting and agenda items at its web portal, at least five (5) days prior to the holding of the general meeting. The intermediary and execution officer shall keep the result of e-voting confidential, and provide an execution report on e-voting to the chairman of the meeting within three (3) working days of the meeting.
The e-voting facility shall remain open for not less than three (3) hours and shall close at 1700 hours of the
Annual Report 2016 57
date preceding the date of the general meeting. The identity of the members intending to cast an e-vote shall be authenticated through secured electronic signatures provided by the intermediary. The chairman shall, after the closure of period for e-voting and before the start of the general meeting, have access to details relating to the members, such as their names, folios, number of shares held by members who have cast votes through e-voting but not the manner in which they have cast their votes, to ensure that members who have cast their votes through e-voting do not vote again at the general meeting. The chairman of the meeting shall announce that voting for resolutions will be through poll as the demand for poll is received.
The execution officer shall verify the vote cast through e-voting and shall deem to be a proxy during the time of a poll. The chairman or his nominee shall immediately after the conclusion of voting at the general meeting, count the votes cast at the meeting and thereafter check the results of e-voting in the presence of two witnesses not in the employment of the Company.
The voting outcome on resolutions shall be announced by the chairman of the meeting and shall also be published on the web portal of the intermediary at the earliest, but not later than twenty-four (24) hours from the conclusion of the general meeting.
Where a resolution is passed at an adjourned meeting, the resolution shall, for all purposes, be treated as having been passed on the date on which it was in fact passed.
The Company shall maintain and arrange to send a copy of the execution report provided by the intermediary along with the minutes of the general meeting to the stock exchange and the Commission as and when required.”
5. To consider and if thought fit, pass the following resolution as a special resolution:
“RESOLVED THAT subject to the approval of the State Bank of Pakistan, the Company shall from time to time as and when deemed appropriate by the Board of Directors, make investment (in the form of equity) in Saqr Al-Keetan for Cement Production Company Limited, a company incorporated in Iraq, having its office at House No. 35, Square 29, Al Rbeea District, Al Buradia, Basra, Iraq, for an amount not exceeding Pak Rupees equivalent to US Dollars 24,000,000 (United States Dollars Twenty-Four Million) for such period of time and on such terms as the board may deem appropriate.”
By Order of the Board
IRFAN AMANULLAHCompany Secretary
Karachi: September 23, 2016
Notes:
1. The Register of members and share transfer books of the Company will remain closed from October 07, 2016 to October 14, 2016 (both days inclusive).
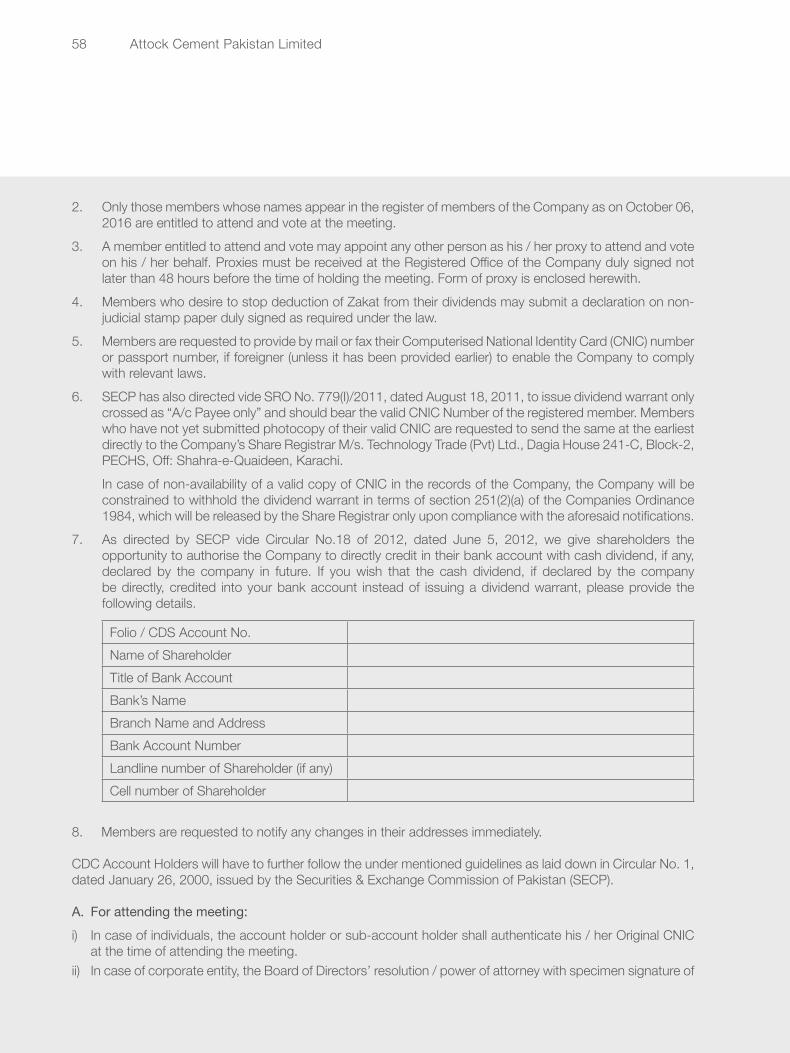
Attock Cement Pakistan Limited58
2. Only those members whose names appear in the register of members of the Company as on October 06, 2016 are entitled to attend and vote at the meeting.
3. A member entitled to attend and vote may appoint any other person as his / her proxy to attend and vote on his / her behalf. Proxies must be received at the Registered Office of the Company duly signed not later than 48 hours before the time of holding the meeting. Form of proxy is enclosed herewith.
4. Members who desire to stop deduction of Zakat from their dividends may submit a declaration on non-judicial stamp paper duly signed as required under the law.
5. Members are requested to provide by mail or fax their Computerised National Identity Card (CNIC) number or passport number, if foreigner (unless it has been provided earlier) to enable the Company to comply with relevant laws.
6. SECP has also directed vide SRO No. 779(I)/2011, dated August 18, 2011, to issue dividend warrant only crossed as “A/c Payee only” and should bear the valid CNIC Number of the registered member. Members who have not yet submitted photocopy of their valid CNIC are requested to send the same at the earliest directly to the Company’s Share Registrar M/s. Technology Trade (Pvt) Ltd., Dagia House 241-C, Block-2, PECHS, Off: Shahra-e-Quaideen, Karachi.
In case of non-availability of a valid copy of CNIC in the records of the Company, the Company will be constrained to withhold the dividend warrant in terms of section 251(2)(a) of the Companies Ordinance 1984, which will be released by the Share Registrar only upon compliance with the aforesaid notifications.
7. As directed by SECP vide Circular No.18 of 2012, dated June 5, 2012, we give shareholders the opportunity to authorise the Company to directly credit in their bank account with cash dividend, if any, declared by the company in future. If you wish that the cash dividend, if declared by the company be directly, credited into your bank account instead of issuing a dividend warrant, please provide the following details.
Folio / CDS Account No. Name of Shareholder Title of Bank Account Bank’s Name Branch Name and Address Bank Account NumberLandline number of Shareholder (if any)Cell number of Shareholder
8. Members are requested to notify any changes in their addresses immediately.
CDC Account Holders will have to further follow the under mentioned guidelines as laid down in Circular No. 1, dated January 26, 2000, issued by the Securities & Exchange Commission of Pakistan (SECP).
A. For attending the meeting:i) In case of individuals, the account holder or sub-account holder shall authenticate his / her Original CNIC
at the time of attending the meeting.ii) In case of corporate entity, the Board of Directors’ resolution / power of attorney with specimen signature of
Annual Report 2016 59
the nominee(s) shall be produced (unless it has been provided earlier) at the time of the meeting.For appointing proxies:i) In case of individuals, the account holder or sub-account holder shall submit the proxy form as per the
above requirements.
ii) The proxy form shall be witnessed by two persons whose names, addresses and CNIC numbers shall be mentioned on the form.
iii) Attested copies of CNIC or the passport of the beneficial owners shall be furnished with the proxy form.
iv) The proxy shall produce his / her original CNIC or original Passport at the time of meeting.
v) In case of corporate entity, the Board of Directors’ resolution / power of attorney with specimen signature shall be submitted (unless it has been provided earlier) along with proxy form to the Company.
STATEMENT UNDER SRO 27(I)/2012 DATED 16 JANUARY, 2012i) In the Extraordinary General Meeting held on May 12, 2015, shareholders approved investments in Saqr
Al-Keetan for Cement Production Company Limited, Iraq (“Saqr Al-Keetan”).
a. Total investment approved: USD 24,000,000 (US Dollars Twenty-Four Million)
b. Amount of investment made to date: Nil
c. Reason for not making investment:
Certain regulatory matters are still pending in Iraq.
d. Major change in financial position of invitee companies since the date of last resolution: There has been no major change in financial position of Saqr Al-Keetan.ii) In the 28th Annual General Meeting held on October 22, 2007, shareholders approved investments in the
following associated companies: Pakistan Oilfields Ltd. (POL)
Attock Refinery Ltd. (ARL)Attock Petroleum Ltd. (APL) National Refinery Ltd. (NRL)
Collectively referred to as the “Attock Group Associated Companies”
a Total investment approved: Rs. 2,500,000,000 (Rupees Two Billion Five Hundred Million)
b. Amount of investment made to date: Nil
c. Reason for not making investment:
The Company is focusing on Line-3 Project
d. Major change in financial position of invitee companies since the date of last resolution:
No major changes
Attock Cement Pakistan Limited60
The Company vide Board Resolution dated 23 June 2016 has decided not to invest in the Attock Group Associated Companies. For any investment in the Attock Group Associated Companies in the future, further approval of the shareholders will be required to be solicited. Deduction of Income Tax from Dividend under Section 150 of the Income Tax Ordinance 2001 (“Income Tax Ordinance”)
Pursuant to the provisions of the Finance Act 2016, effective July 1, 2016, the rates of deduction of Income tax from dividend payments under the Income Tax Ordinance have been revised as follows:
(a) Rate of tax deduction for filer of income tax returns 12.5%(b) Rate of tax deduction for non-filers of income tax returns 20.0%
All shareholders / members of the Company who hold share in Physical form are therefore requested to send a valid copy of their CNIC and NTN Certificates, to the Company’s shares Registrar, M/s. Technology Trade (Pvt.) Limited, to allow the Company to ascertain the status of the shareholder/member.
Shareholders/members of the Company who hold shares in the scrip-less form on Central Depository System (CDS) of Central Depository Company of Pakistan Limited (CDC) are requested to send valid copies of their CNIC and NTN Certificates to their CDC Participants/CDC Investor Account Services.
Where the above required documents are not submitted, the Company will be constrained to treat the non-complying shareholder/member as a non-filer thereby attracting a higher rate of withholding tax.
Circulation of Annual Audited Accounts through Electronic Mail (e-mail)
Members are hereby informed that pursuant to SRO No. 470(I)/2016, dated May 31, 2016, read in conjunction with the SRO No. 787(I)/2014, dated September 8, 2014, companies have been allowed to circulate Annual Audited Accounts and Notice of General Meeting via email.
If any member wishes to receive the Annual Audited Accounts and Notices of General Meeting via email, such member is requested to duly complete the Standard Request Form attached with this Notice and return to the registered office of the Company at D-70, Block-4, Kehkashan-5, Clifton, Karachi, or complete the Standard Request Form placed on the website of the Company (www.attockcement.com). Members are also requested to intimate to the Company any change in their registered email addresses in a timely manner, to ensure effective communication by the Company.
The Annual Report 2016 has been uploaded on the Company’s website at www.attockcement.com .
Annual Report 2016 61
Statement of Compliance with the Code of Corporate Governancefor the year ended June 30, 2016
This statement is being presented to comply with the Code of Corporate Governance contained in Regulation No. 5.19 of listing regulations of the Pakistan Stock Exchange for the purpose of establishing a framework of good governance, whereby a listed company is managed in compliance with the best practices of corporate governance.
The company has applied the principles contained in the Code in the following manner:
1. The Company encourages the representation of independent, non-executive directors and directors representing minority interests on its Board of Directors. At present the Board includes:
Non-Executive Directors Executive Directors Independent Director
Dr. Gaith R. Pharaon Mr. Babar Bashir Nawaz Agha Sher Shah
Mr. Laith G. Pharaon Mr. Fakhr-ul-Islam Baig (Alternate Director)
Mr. Wael G. Pharaon Mr. Irfan Amanullah (Alternate Director)
Mr. Shuaib A. Malik
Mr. Abdus Sattar
The independent director meets the criteria of independence under clause 5.19.1 (b) of the CCG.
2. The directors have confirmed that none of them is serving as a director on more than seven listed companies, including this company.
3. All the resident directors of the company are registered as taxpayers and none of them has defaulted in payment of any loan to a banking company, a DFI or an NBFI or, being a member of a stock exchange, has been declared as a defaulter by that stock exchange.
4. No casual vacancy occurred in the Board of Directors during the year ended June 30, 2016.
5. The company has prepared a “Code of Conduct” and has ensured that appropriate steps have been taken to disseminate it throughout the company along with its supporting policies and procedures.
6. The Board has developed a vision/mission statement, overall corporate strategy and significant policies of the company. A complete record of particulars of significant policies along with the dates on which they were approved or amended has been maintained.
7. All the powers of the Board have been duly exercised and decisions on material transactions, including determination of remuneration and terms and conditions of employment of the CEO, other executive and non-executive directors, have been taken by the Board.
8. The meetings of the Board were presided over by the Chairman and, in his absence, by a director elected by the Board for this purpose and the Board met at least once in every quarter. Written notices of the board meetings, along with agenda and working papers, were circulated at least seven days before the meeting. The minutes of the meetings were appropriately recorded and circulated.
9. All the directors are either exempted or have attended the required training in prior years.
10. The Board has approved the appointment, remuneration and terms and conditions of employment of the Head of Internal Audit and the CFO, who is also the Company Secretary.
11. The directors’ report for this year has been prepared in compliance with the requirements of the Code and fully describes the salient matters required to be disclosed.
Attock Cement Pakistan Limited62
12. The financial statements of the company were duly endorsed by CEO and CFO before approval of the Board.
13. The directors, CEO and executives do not hold any interest in the shares of the company other than that disclosed in the pattern of shareholding.
14. The company has complied with all the corporate and financial reporting requirements of the Code.
15. The Board has formed an Audit Committee. It comprises of three members, of whom two are non-executive directors including the chairman of the committee and one is an independent director.
16. The meetings of the audit committee were held at least once every quarter prior to approval of interim and final results of the company and as required by the Code. The terms of reference of the committee have been formed and advised to the committee for compliance.
17. The Board has formed an HR and Remuneration Committee. It comprises of three members, of whom two are non-executive directors including the chairman of the committee.
18. The Board has outsourced the internal audit function to Ernst & Young Ford Rhodes Sidat Hyder & Co., Chartered Accountants, who are considered suitably qualified and experienced for the purpose and are conversant with the policies and procedures of the company.
19. The statutory auditors of the company have confirmed that they have been given a satisfactory rating under the quality control review program of the Institute of Chartered Accountants of Pakistan (ICAP), that they or any of the partners of the firm, their spouses and minor children do not hold shares of the company and that the firm and all its partners are in compliance with International Federation of Accountants (IFAC) guidelines on code of ethics as adopted by ICAP.
20. The statutory auditors or the persons associated with them have not been appointed to provide other services except in accordance with the listing regulations and the auditors have confirmed that they have observed IFAC guidelines in this regard.
21. The ‘closed period’, prior to the announcement of interim/final results, and business decisions, which may materially affect the market price of company’s securities, was determined and intimated to directors, executive employees and stock exchange.
22. Material/price sensitive information has been disseminated among all market participants at once through the stock exchange.
23. The related party transactions have been placed before the Audit Committee and approved by the Board of Directors along with pricing methods. The transactions were carried out on terms equivalent to those that prevail in the arm’s length transactions.
24. The Board has ensured that a mechanism is put in place for an annual evaluation of the board’s own performance as required by the Code.
25. We confirm that all other material principles enshrined in the Code have been complied with. On behalf of the Board
Babar Bashir Nawaz Chief Executive August 16, 2016

Annual Report 2016 63
Review Report to the Members on Statement ofCompliance with the Code of Corporate GovernanceWe have reviewed the enclosed Statement of Compliance with the best practices contained in the Code of Corporate Governance (the Code) prepared by the Board of Directors of Attock Cement Pakistan Limited for the year ended June 30, 2016 to comply with the requirements of Regulation No. 5.19 of the Pakistan Stock Exchange Limited Regulations where the company is listed.
The responsibility for compliance with the Code is that of the Board of Directors of the company. Our responsibility is to review, to the extent where such compliance can be objectively verified, whether the Statement of Compliance reflects the status of the company’s compliance with the provisions of the Code and report if it does not and to highlight any non-compliance with the requirements of the Code. A review is limited primarily to inquiries of the company’s personnel and review of various documents prepared by the company to comply with the Code.
As part of our audit of the financial statements we are required to obtain an understanding of the accounting and internal control systems sufficient to plan the audit and develop an effective audit approach. We are not required to consider whether the Board of Directors’ statement on internal control covers all risks and controls or to form an opinion on the effectiveness of such internal controls, the company’s corporate governance procedures and risks.
The Code requires the company to place before the Audit Committee, and upon recommendation of the Audit Committee, place before the Board of Directors for their review and approval its related party transactions distinguishing between transactions carried out on terms equivalent to those that prevail in arm’s length transactions and transactions which are not executed at arm’s length price and recording proper justification for using such alternate pricing mechanism. We are only required and have ensured compliance of this requirement to the extent of the approval of the related party transactions by the Board of Directors upon recommendation of the Audit Committee. We have not carried out any procedures to determine whether the related party transactions were undertaken at arm’s length price or not.
Based on our review, nothing has come to our attention which causes us to believe that the Statement of Compliance does not appropriately reflect the company’s compliance, in all material respects, with the best practices contained in the Code as applicable to the company for the year ended June 30, 2016.
Chartered Accountants
Karachi
Dated: August 26, 2016
Attock Cement Pakistan Limited64
We have audited the annexed balance sheet of Attock Cement Pakistan Limited as at June 30, 2016 and the related profit and loss account, cash flow statement and statement of changes in equity together with the notes forming part thereof, for the year then ended and we state that we have obtained all the information and explanations which, to the best of our knowledge and belief, were necessary for the purposes of our audit. It is the responsibility of the company’s management to establish and maintain a system of internal control, and prepare and present the above said statements in conformity with the approved accounting standards and the requirements of the Companies Ordinance, 1984. Our responsibility is to express an opinion on these statements based on our audit. We conducted our audit in accordance with the auditing standards as applicable in Pakistan. These standards require that we plan and perform the audit to obtain reasonable assurance about whether the above said statements are free of any material misstatement. An audit includes examining on a test basis, evidence supporting the amounts and disclosures in the above said statements. An audit also includes assessing the accounting policies and significant estimates made by management, as well as, evaluating the overall presentation of the above said statements. We believe that our audit provides a reasonable basis for our opinion and, after due verification, we report that:
a) in our opinion, proper books of account have been kept by the company as required by the Companies Ordinance, 1984;
b) in our opinion:
(I) the balance sheet and profit and loss account together with the notes thereon have been drawn up in conformity with the Companies Ordinance, 1984, and are in agreement with the books of accounts and are further in accordance with accounting policies consistently applied;
(II) the expenditure incurred during the year was for the purpose of the company’s business; and
(III) the business conducted, investments made and the expenditure incurred during the year were in accordance with the objects of the company;
c) in our opinion and to the best of our information and according to the explanations given to us, the balance sheet, profit and loss account, cash flow statement and statement of changes in equity together with the notes forming part thereof conform with approved accounting standards as applicable in Pakistan, and, give the information required by the Companies Ordinance, 1984, in the manner so required and respectively give a true and fair view of the state of the company’s affairs as at June 30, 2016 and of the profit, its cash flows and changes in equity for the year then ended; and
d) in our opinion Zakat deductible at source under the Zakat and Ushr Ordinance, 1980 (XVIII of 1980), was deducted by the company and deposited in the Central Zakat Fund established under section 7 of that Ordinance.
Chartered AccountantsKarachiDated: August 26, 2016 Name of the engagement partner: Farrukh Rehman
Auditors’ Report to the Members

Annual Report 2016 65
Financial
Statementsfor the year ended June 30, 2016
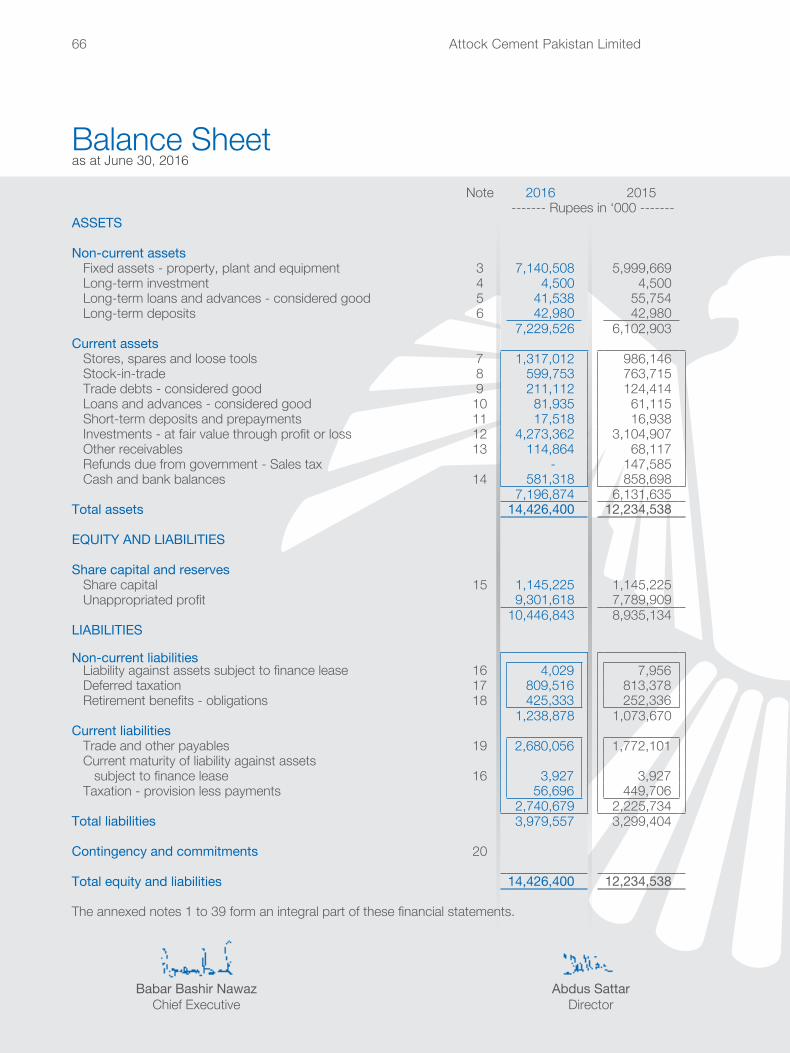
Attock Cement Pakistan Limited66
Note 2016 2015------- Rupees in ‘000 -------
ASSETS
Non-current assetsFixed assets - property, plant and equipment 3 7,140,508 5,999,669 Long-term investment 4 4,500 4,500 Long-term loans and advances - considered good 5 41,538 55,754 Long-term deposits 6 42,980 42,980
7,229,526 6,102,903 Current assets
Stores, spares and loose tools 7 1,317,012 986,146 Stock-in-trade 8 599,753 763,715 Trade debts - considered good 9 211,112 124,414 Loans and advances - considered good 10 81,935 61,115 Short-term deposits and prepayments 11 17,518 16,938 Investments - at fair value through profit or loss 12 4,273,362 3,104,907 Other receivables 13 114,864 68,117 Refunds due from government - Sales tax - 147,585 Cash and bank balances 14 581,318 858,698
7,196,874 6,131,635 Total assets 14,426,400 12,234,538
EQUITY AND LIABILITIES
Share capital and reservesShare capital 15 1,145,225 1,145,225 Unappropriated profit 9,301,618 7,789,909
10,446,843 8,935,134 LIABILITIES
Non-current liabilitiesLiability against assets subject to finance lease 16 4,029 7,956 Deferred taxation 17 809,516 813,378 Retirement benefits - obligations 18 425,333 252,336
1,238,878 1,073,670 Current liabilities
Trade and other payables 19 2,680,056 1,772,101 Current maturity of liability against assets subject to finance lease 16 3,927 3,927 Taxation - provision less payments 56,696 449,706
2,740,679 2,225,734 Total liabilities 3,979,557 3,299,404
Contingency and commitments 20
Total equity and liabilities 14,426,400 12,234,538
The annexed notes 1 to 39 form an integral part of these financial statements.
Balance Sheetas at June 30, 2016
Babar Bashir NawazChief Executive
Abdus SattarDirector
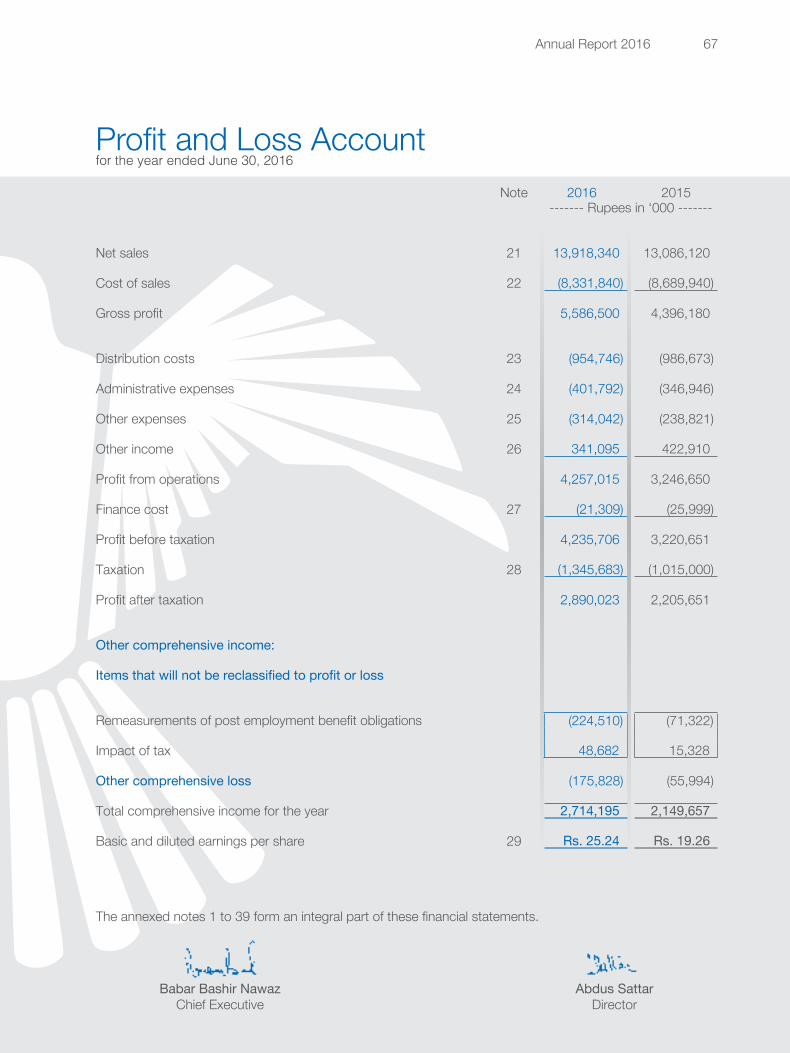
Annual Report 2016 67
Babar Bashir NawazChief Executive
Abdus SattarDirector
Note 2016 2015------- Rupees in ‘000 -------
Net sales 21 13,918,340 13,086,120
Cost of sales 22 (8,331,840) (8,689,940)
Gross profit 5,586,500 4,396,180
Distribution costs 23 (954,746) (986,673)
Administrative expenses 24 (401,792) (346,946)
Other expenses 25 (314,042) (238,821)
Other income 26 341,095 422,910
Profit from operations 4,257,015 3,246,650
Finance cost 27 (21,309) (25,999)
Profit before taxation 4,235,706 3,220,651
Taxation 28 (1,345,683) (1,015,000)
Profit after taxation 2,890,023 2,205,651
Other comprehensive income:
Items that will not be reclassified to profit or loss
Remeasurements of post employment benefit obligations (224,510) (71,322)
Impact of tax 48,682 15,328
Other comprehensive loss (175,828) (55,994)
Total comprehensive income for the year 2,714,195 2,149,657
Basic and diluted earnings per share 29 Rs. 25.24 Rs. 19.26
The annexed notes 1 to 39 form an integral part of these financial statements.
Profit and Loss Accountfor the year ended June 30, 2016
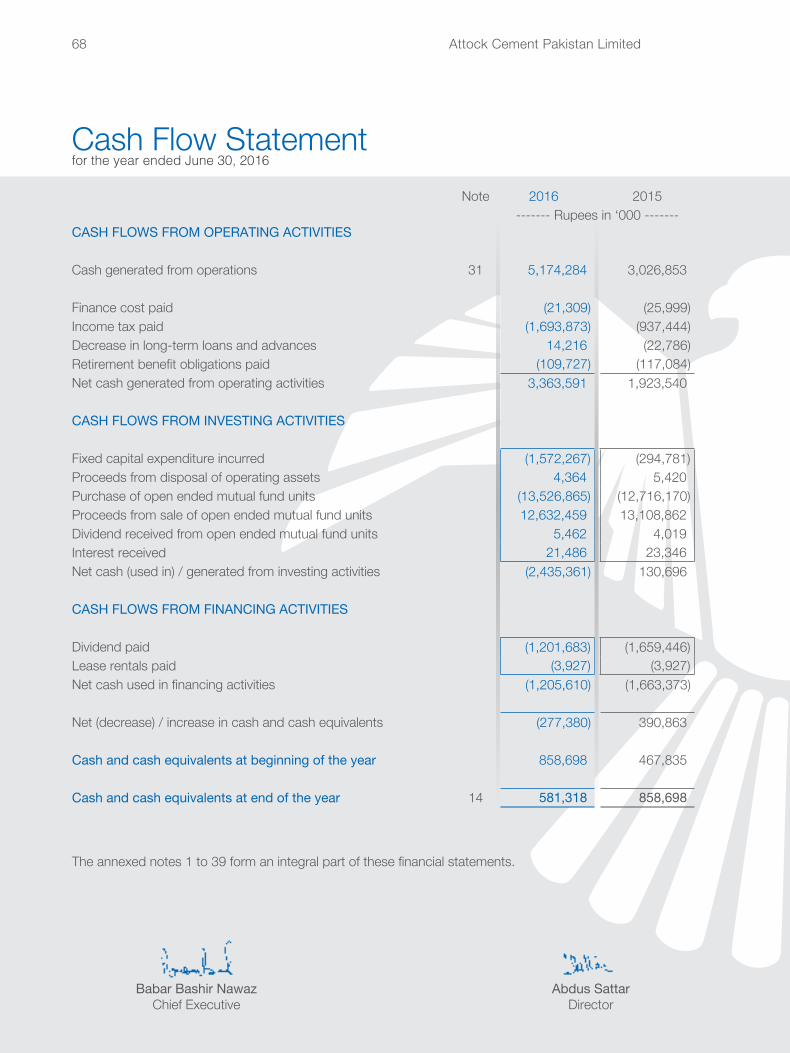
Attock Cement Pakistan Limited68
Cash Flow Statementfor the year ended June 30, 2016
Note 2016 2015------- Rupees in ‘000 -------
CASH FLOWS FROM OPERATING ACTIVITIES
Cash generated from operations 31 5,174,284 3,026,853
Finance cost paid (21,309) (25,999)Income tax paid (1,693,873) (937,444)Decrease in long-term loans and advances 14,216 (22,786)Retirement benefit obligations paid (109,727) (117,084)Net cash generated from operating activities 3,363,591 1,923,540
CASH FLOWS FROM INVESTING ACTIVITIES
Fixed capital expenditure incurred (1,572,267) (294,781)Proceeds from disposal of operating assets 4,364 5,420 Purchase of open ended mutual fund units (13,526,865) (12,716,170)Proceeds from sale of open ended mutual fund units 12,632,459 13,108,862 Dividend received from open ended mutual fund units 5,462 4,019 Interest received 21,486 23,346 Net cash (used in) / generated from investing activities (2,435,361) 130,696
CASH FLOWS FROM FINANCING ACTIVITIES
Dividend paid (1,201,683) (1,659,446)Lease rentals paid (3,927) (3,927)Net cash used in financing activities (1,205,610) (1,663,373)
Net (decrease) / increase in cash and cash equivalents (277,380) 390,863
Cash and cash equivalents at beginning of the year 858,698 467,835
Cash and cash equivalents at end of the year 14 581,318 858,698
The annexed notes 1 to 39 form an integral part of these financial statements.
Babar Bashir NawazChief Executive
Abdus SattarDirector
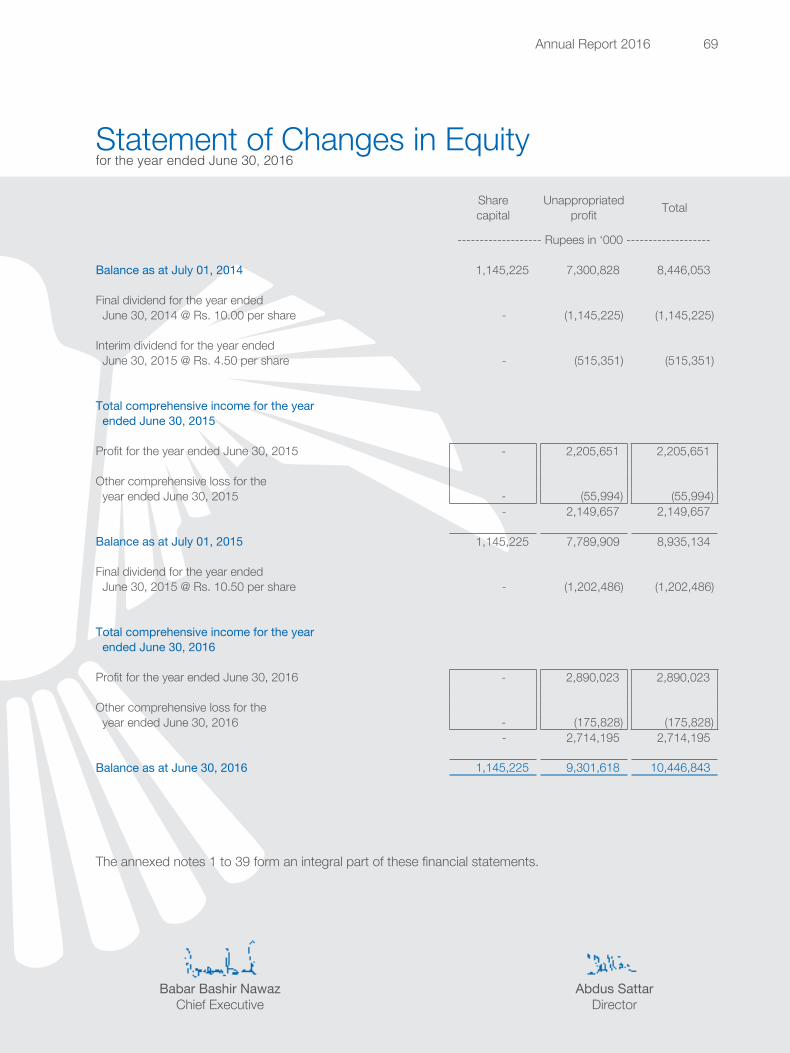
Annual Report 2016 69
Babar Bashir NawazChief Executive
Abdus SattarDirector
Statement of Changes in Equityfor the year ended June 30, 2016
Share Unappropriated Totalcapital profit
------------------- Rupees in ‘000 -------------------
Balance as at July 01, 2014 1,145,225 7,300,828 8,446,053
Final dividend for the year ended June 30, 2014 @ Rs. 10.00 per share - (1,145,225) (1,145,225)
Interim dividend for the year ended June 30, 2015 @ Rs. 4.50 per share - (515,351) (515,351)
Total comprehensive income for the year ended June 30, 2015 Profit for the year ended June 30, 2015 - 2,205,651 2,205,651
Other comprehensive loss for the year ended June 30, 2015 - (55,994) (55,994)
- 2,149,657 2,149,657
Balance as at July 01, 2015 1,145,225 7,789,909 8,935,134
Final dividend for the year ended June 30, 2015 @ Rs. 10.50 per share - (1,202,486) (1,202,486)
Total comprehensive income for the year ended June 30, 2016
Profit for the year ended June 30, 2016 - 2,890,023 2,890,023
Other comprehensive loss for the year ended June 30, 2016 - (175,828) (175,828)
- 2,714,195 2,714,195
Balance as at June 30, 2016 1,145,225 9,301,618 10,446,843
The annexed notes 1 to 39 form an integral part of these financial statements.
Attock Cement Pakistan Limited70
Notes to the Financial Statements 1. THE COMPANY AND ITS OPERATIONS
The company was incorporated in Pakistan on October 14, 1981 as a public limited company and is listed on Pakistan Stock Exchange (formerly Karachi Stock Exchange). Its main business activity is manufacturing and sale of cement. The registered office of the company is at D-70, Block-4, Kehkashan-5, Clifton, Karachi. The company’s cement manufacturing plant is located in Tehsil Hub, District Lasbella, Balochistan. The company also has a representative / liaison office in Dubai, UAE, to explore business opportunities in the growing markets of Middle East and Africa.
The company is a subsidiary of Pharaon Investment Group Limited Holding S.A.L., Lebanon.
1.2 The company has entered into a Joint Venture agreement with Al Geetan Commercial Agencies, Iraq, to form a limited liability company in Iraq. The principal activity of the company will be to build and operate a cement grinding plant having production capacity of approximately 900,000 metric tons per annum. The new limited liability company has been established and registered under the Iraqi law on November 3, 2014 by the name Saqr Al-Keetan for Cement Production Company Limited having share capital of 30,000,000 Iraqi Dinar. Attock Cement Pakistan Limited will hold 60% share in the company. The expected investment of the company in foreign subsidiary would be USD 24 million. The company has obtained approval from State Bank of Pakistan for capital remittance. However, no capital has yet been remitted.
As required under section 208 of the Companies Ordinance, 1984, equity investment in Saqr Al-Keetan for Cement Production Company Limited, Basra Iraq has been approved by the members in its Extra Ordinary General Meeting held on May 12, 2015.
1.3 The company has entered into an agreement with Hefei Cement Research & Design Institute (HCRDI), China, for installation of new production line of 4,000 tonnes per day and Waste Heat Recovery System at its existing plant site. The total project cost would be approximately USD 130 million. The project will be financed partially through syndicated loan (note 36.2). The work on this project has been started.
2. SUMMARY OF SIGNIFICANT ACCOUNTING POLICIES
The principal accounting policies applied in the preparation of these financial statements are set out below:
2.1 Basis of preparation
2.1.1 Statement of compliance
These financial statements have been prepared in accordance with approved accounting standards as applicable in Pakistan. Approved accounting standards comprise of such International Financial Reporting Standards (IFRS) issued by the International Accounting Standards Board as are notified under the Companies Ordinance, 1984, provisions of and directives issued under the Companies Ordinance, 1984. In case requirements differ, the provisions or directives of the Companies Ordinance, 1984 shall prevail.
2.1.2 Critical accounting estimates and judgments
The preparation of financial statements in conformity with approved accounting standards require the use of certain critical accounting estimates. It also requires management to exercise its judgement in the process of applying the company’s accounting policies. The matters involving a higher degree of judgement or complexity, or areas where assumptions and estimates are significant to the financial statements are:
for the year ended June 30, 2016
Annual Report 2016 71
Notes to the Financial Statements for the year ended June 30, 2016
(i) Taxation - notes 17 & 28(ii) Staff retirement benefits - note 18.1
Estimates and judgements are continually evaluated and adjusted based on historical experience and other factors, including expectations of future events that are believed to be reasonable under the circumstances.
There have been no critical judgements made by the company’s management in applying the accounting policies that would have significant effect on the amounts recognised in the financial statements.
2.1.3 Changes in accounting standards, interpretations and pronouncements
a) Standards, interpretations and amendments to published approved accounting standards that became effective during the year and relevant
IFRS 13, ‘Fair value measurement’, aims to improve consistency and reduce complexity by providing a precise definition of fair value and a single source of fair value measurement and disclosure requirement for use across IFRSs. The requirement do not extend the use of fair value accounting but provide guidance on how it should be applied where its use is already required or permitted by other standards within IFRSs. The standard has only affected the disclosures in the financial statements of the company.
IFRS 12 – Disclosure of Interests in Other Entities includes the disclosure requirements for all forms of interests in other entities, including joint arrangements, associates, special purpose vehicles and other off-balance-sheet vehicles. There are no changes to disclosures on application of the standard on the company’s financial statements.
IAS 28 (Revised) – Investment in associates and joint ventures replaces the current IAS 28 ‘Investment in Associates’ (as amended in 2003). This standard includes the requirements for joint ventures, as well as associates, to be equity accounted following the issue of IFRS 11. There is no implication on the company on application of the standard.
b) Standards, interpretations and amendments to published approved accounting standards that are effective but not relevant
There are other new standards, amendments and interpretations that are mandatory for accounting periods beginning on or after January 1, 2015 are considered not to be relevant for company’s financial statements and hence have not been detailed here.
c) Standards, interpretations and amendments to published approved accounting standards that are not yet effective but relevant
Amendments to IAS 1 - Disclosure initiative
The amendments provides clarification on number of issues, including :
- Materiality - an entity should not aggregate or disaggregate information in a manner that obscures useful information. Where items are material, sufficient information must be provided to explain the impact on the financial position or performance.
- Disaggregation and subtotals – line items specified in IAS 1 may need to be disaggregated where this is relevant to an understanding of the entity’s financial position or performance. There is also new guidance on the use of subtotals.
- Notes – confirmation that the notes do not need to be presented in a particular order.
Attock Cement Pakistan Limited72
Notes to the Financial Statements for the year ended June 30, 2016
- Other Comprehensive Income (OCI) - arising from investments accounted for under the equtiy method - the share of the OCI arising from equity - accounted investments is grouped based on whether the items will or will not subsequently be reclassified to profit or loss. Each group should then be presented as a single line item in the statement of comprehensive income.
The change will impact the disclosures of the Company’s financial statements.
2.2 Overall valuation policy
These financial statements have been prepared under the historical cost convention except as otherwise disclosed in the accounting policies below.
2.3 Fixed Assets - property, plant and equipment
These are stated at cost less accumulated depreciation and impairment losses (if any) except freehold land, capital work-in-progress and stores held for capital expenditures which are stated at cost. Depreciation is calculated using the straight-line method on all assets in use to charge off their cost excluding residual value, if not insignificant, over their estimated useful lives.
Depreciation on acquisition is charged from the month of addition whereas no depreciation is charged in the month of disposal.
Company accounts for impairment, where indications exist, by reducing its carrying value to the estimated recoverable amount.
Maintenance and normal repairs are charged to profit and loss account as and when incurred. Major renewals and improvements are capitalised and the assets so replaced, if any, are retired.
Gains and losses on disposal / retirement of fixed assets are included in profit and loss account.
2.4 Staff retirement benefits
Defined benefit plans
The company operates approved funded gratuity and pension schemes for all its management and non-management employees. Contributions to the schemes are based on actuarial valuations.
The latest actuarial valuations of the schemes have been carried out as at June 30, 2016 using the Projected Unit Credit method. The amount arising as a result of remeasurements are recognised in the Balance Sheet immediately, with a charge or credit to Other Comprehensive Income in the periods in which they occur. Past-service costs are recognised immediately in income.
Retirement benefits are payable to employees on completion of prescribed qualifying period of service under the schemes.
Defined contribution plan
The company also operates an approved provident fund for its permanent employees. Equal monthly contributions are made, both by company and the employees, at the rate of 10% of basic salary.
2.5 Investments
The company determines the appropriate classification of its investment at the time of purchase as follows:
Annual Report 2016 73
Notes to the Financial Statements for the year ended June 30, 2016
Long-term investments
The investment in associated company is stated at cost. Impairment loss is recognised whenever the carrying amount of investment exceeds its recoverable amount. An impairment loss is recognised inincome currently. The equity method of accounting has not been followed as the effect of applying this method is immaterial.
Investments - held to maturity
These are investments with fixed or determinable payments and fixed maturity with the company having positive intent and ability to hold till maturity. These are stated at amortised cost.
Investments - at fair value through profit or loss
Investments held for trading are classified at fair value through profit or loss account. These are measured at fair value which is re-assessed at each reporting date. In case of investments in open ended mutual funds, fair value is determined on the basis of period end Net Asset Value (NAV) as announced by the Asset Management Company. Changes in fair value are recognised in profit and loss account.
2.6 Stores, spares and loose tools
These are valued at monthly weighted average cost less provision for slow moving and obsolete stores, spares and loose tools. Items in transit are stated at cost.
2.7 Stock-in-trade
Stocks are valued at lower of cost and net realisable value except goods-in-transit which are stated at cost. Raw and packing materials, work-in-process and finished goods are valued at the weighted average cost. Cost of work-in-process and finished stocks comprise of direct costs and appropriate portion of production overheads.
Net realisable value is determined on the basis of estimated selling price of the product in the ordinary course of business less costs of completion and costs necessarily to be incurred in order to make the sale.
2.8 Trade debts and other receivables
Trade debts and other receivables are recognised and carried at original invoice amount less a provision for impairment. A provision for impairment is established when there is objective evidence that the company will not be able to collect all amounts due according to the original terms of receivables. Trade debts and other receivables considered irrecoverable are written-off.
2.9 Cash and cash equivalents
Cash and cash equivalents are carried in the balance sheet at cost. For the purposes of cash flow statement, cash and cash equivalents comprise of cash and cheques in hand and in transit, balances with banks on current and deposit accounts and finance under mark-up arrangements.
Attock Cement Pakistan Limited74
Notes to the Financial Statements for the year ended June 30, 2016
2.10 Leases
Finance leases
The company leases motor vehicles. Leases of motor vehicles where the company has substantially all the risks and rewards of ownership are classified as finance leases. Finance leases are capitalised at the lease’s commencement at the lower of the fair value of the leased motor vehicles and the present value of the minimum lease payments.
Each lease payment is allocated between the liability and finance charges. The interest element of the finance cost is charged to profit and loss account over the lease period so as to produce a constant periodic rate of interest on the remaining balance of the liability for each period. The motor vehicles acquired under finance leases is depreciated over the shorter of the useful life of the asset and the lease term.
Operating leases
Leases in which a significant portion of the risks and rewards of ownership is retained by the lessor are classified as operating leases. Payments made under operating leases are charged to profit and loss account on a straight-line basis over the period of the lease.
2.11 Trade and other payables
Trade and other payables are recognised initially at fair value and subsequently measured at amortised cost using the effective interest rate method.
2.12 Provisions
Provisions are recognised in the balance sheet when the company has a legal or constructive obligation as a result of past events, it is probable that an outflow of economic benefits will be required to settle the obligation and a reliable estimate of the amount can be made. However, provisions are reviewed at each balance sheet date and adjusted to reflect current best estimate.
2.13 Taxation
Current
The charge for current taxation is based on the taxable income at the rate of taxation after taking into account tax credits, rebates available, if any.
Deferred
Deferred tax is accounted for using the balance sheet liability method on all temporary differences arising between tax base of assets and liabilities and their carrying amounts in the financial statements. Deferred tax liability is generally recognised for all taxable temporary differences and deferred tax asset is recognised to the extent that it is probable that future taxable profits will be available against which the deductible temporary differences, unused tax losses and tax credits can be utilised. Deferred tax is charged to or credited in the profit and loss account.
Annual Report 2016 75
Notes to the Financial Statements for the year ended June 30, 2016
2.14 Borrowings and their cost
Borrowings are recognised initially at fair value and subsequently at amortised cost using the effective interest method. Borrowing costs are recognised as an expense in the period in which these are incurred except to the extent of borrowing costs that are directly attributable to the acquisition, construction or production of a qualifying asset. Such borrowing costs are capitalised as part of the cost of that asset. Borrowings payable within next twelve months are classified as current liabilities.
2.15 Foreign currencies
Transactions in foreign currencies are recorded in Pakistani Rupee at the rates of exchange approximating those prevailing at the date of transaction. Monetary assets and liabilities in foreign currencies are translated into Pakistani Rupee using the exchange rates approximating those prevailing at the balance sheet date. Exchange differences are included in income currently.
The financial statements are presented in Pakistani Rupee, which is the company’s functional and presentation currency and figures are rounded off to the nearest thousand of Rupees.
2.16 Revenue recognition
Revenue is measured at the fair value of the consideration received or receivable, and represents amount receivable for goods supplied, stated net of commission, discounts, returns and value added taxes.
Revenue from sale of goods is recognised on despatch of goods to customers i.e. when the significant risks and reward of ownership have been transferred to the customer.
Interest income is recognised using the effective interest method.
Dividend income is recognised when the right to receive payment is established.
2.17 Financial assets and liabilities
All financial assets and liabilities are initially measured at cost, which is the fair value of the consideration given and received respectively. These financial assets and liabilities are subsequently measured at fair value, amortised cost or cost, as the case may be.
Financial assets and liabilities are off set and the net amount is reported in the balance sheet if the company has a legal right to set off the transaction and also intends either to settle on a net basis or to realise the asset and settle the liability simultaneously.
2.18 Dividend
Dividend distribution to shareholders is accounted for in the period in which the dividend is declared.
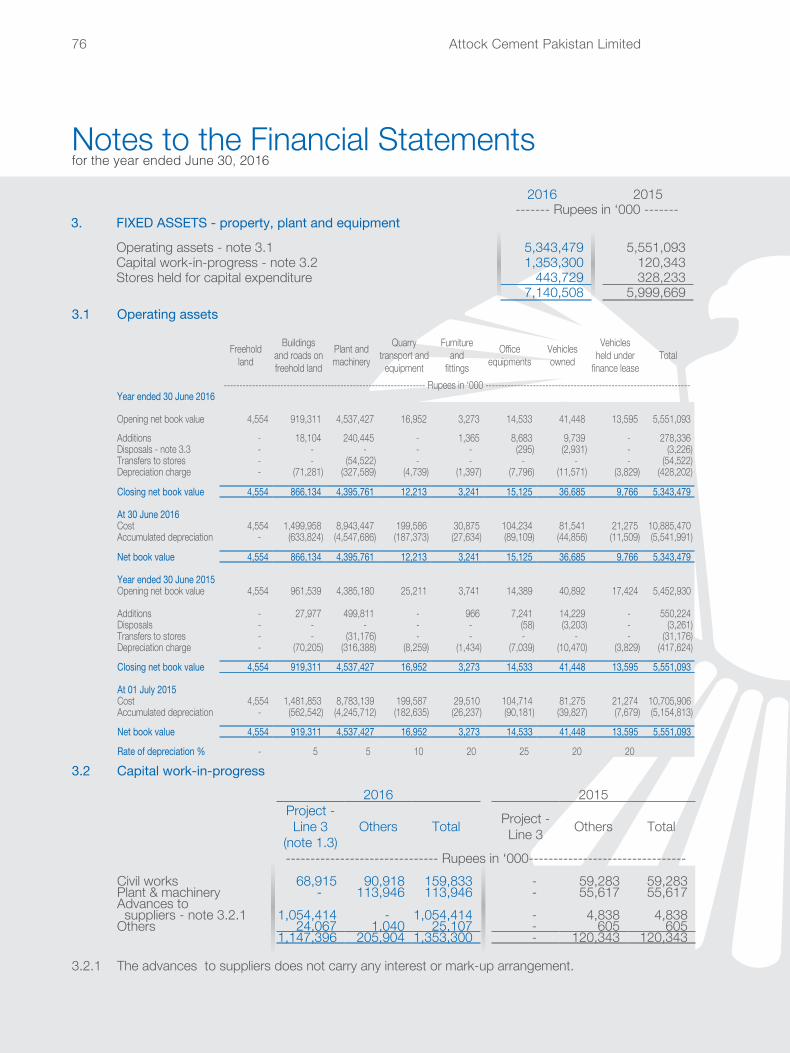
Attock Cement Pakistan Limited76
3.1 Operating assets
Freehold land
Buildings and roads on freehold land
Plant and machinery
Quarry transport and
equipment
Furniture and
fittings
Office equipments
Vehicles owned
Vehicles held under
finance leaseTotal
---------------------------------------------------------------- Rupees in ‘000 -----------------------------------------------------------------Year ended 30 June 2016
Opening net book value 4,554 919,311 4,537,427 16,952 3,273 14,533 41,448 13,595 5,551,093 Additions - 18,104 240,445 - 1,365 8,683 9,739 - 278,336 Disposals - note 3.3 - - - - - (295) (2,931) - (3,226)Transfers to stores - - (54,522) - - - - - (54,522)Depreciation charge - (71,281) (327,589) (4,739) (1,397) (7,796) (11,571) (3,829) (428,202)
Closing net book value 4,554 866,134 4,395,761 12,213 3,241 15,125 36,685 9,766 5,343,479
At 30 June 2016Cost 4,554 1,499,958 8,943,447 199,586 30,875 104,234 81,541 21,275 10,885,470 Accumulated depreciation - (633,824) (4,547,686) (187,373) (27,634) (89,109) (44,856) (11,509) (5,541,991)
Net book value 4,554 866,134 4,395,761 12,213 3,241 15,125 36,685 9,766 5,343,479
Year ended 30 June 2015Opening net book value 4,554 961,539 4,385,180 25,211 3,741 14,389 40,892 17,424 5,452,930
Additions - 27,977 499,811 - 966 7,241 14,229 - 550,224 Disposals - - - - - (58) (3,203) - (3,261)Transfers to stores - - (31,176) - - - - - (31,176)Depreciation charge - (70,205) (316,388) (8,259) (1,434) (7,039) (10,470) (3,829) (417,624)
Closing net book value 4,554 919,311 4,537,427 16,952 3,273 14,533 41,448 13,595 5,551,093
At 01 July 2015Cost 4,554 1,481,853 8,783,139 199,587 29,510 104,714 81,275 21,274 10,705,906 Accumulated depreciation - (562,542) (4,245,712) (182,635) (26,237) (90,181) (39,827) (7,679) (5,154,813)
Net book value 4,554 919,311 4,537,427 16,952 3,273 14,533 41,448 13,595 5,551,093
Rate of depreciation % - 5 5 10 20 25 20 20
Notes to the Financial Statements for the year ended June 30, 2016
3.2 Capital work-in-progress
2016 2015Project - Line 3
(note 1.3)Others Total Project -
Line 3 Others Total
------------------------------- Rupees in ‘000--------------------------------Civil works 68,915 90,918 159,833 - 59,283 59,283 Plant & machinery - 113,946 113,946 - 55,617 55,617 Advances to suppliers - note 3.2.1 1,054,414 - 1,054,414 - 4,838 4,838 Others 24,067 1,040 25,107 - 605 605
1,147,396 205,904 1,353,300 - 120,343 120,343
3.2.1 The advances to suppliers does not carry any interest or mark-up arrangement.
2016 2015------- Rupees in ‘000 -------
3. FIXED ASSETS - property, plant and equipment
Operating assets - note 3.1 5,343,479 5,551,093 Capital work-in-progress - note 3.2 1,353,300 120,343 Stores held for capital expenditure 443,729 328,233
7,140,508 5,999,669
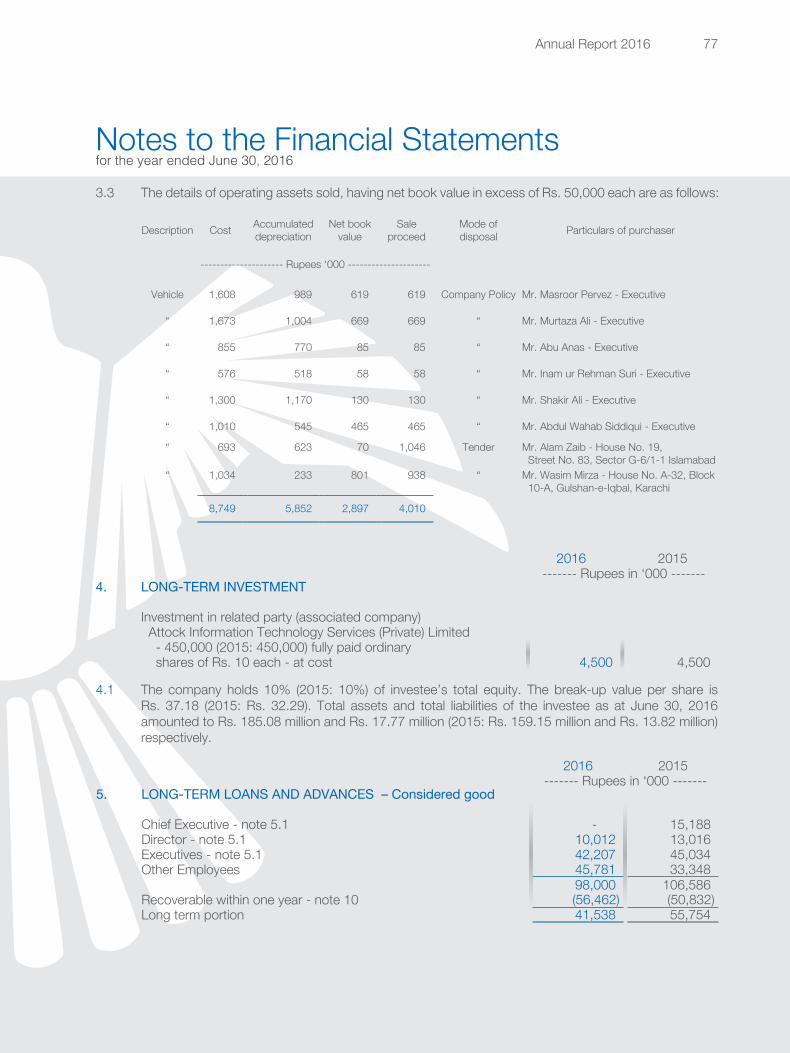
Annual Report 2016 77
Notes to the Financial Statements for the year ended June 30, 2016
3.3 The details of operating assets sold, having net book value in excess of Rs. 50,000 each are as follows:
Description Cost Accumulated depreciation
Net book value
Sale proceed
Mode of disposal Particulars of purchaser
--------------------- Rupees ‘000 ---------------------
Vehicle 1,608 989 619 619 Company Policy Mr. Masroor Pervez - Executive
“ 1,673 1,004 669 669 “ Mr. Murtaza Ali - Executive
“ 855 770 85 85 “ Mr. Abu Anas - Executive
“ 576 518 58 58 “ Mr. Inam ur Rehman Suri - Executive
“ 1,300 1,170 130 130 “ Mr. Shakir Ali - Executive
“ 1,010 545 465 465 “ Mr. Abdul Wahab Siddiqui - Executive
“ 693 623 70 1,046 Tender Mr. Alam Zaib - House No. 19, Street No. 83, Sector G-6/1-1 Islamabad
“ 1,034 233 801 938 “ Mr. Wasim Mirza - House No. A-32, Block 10-A, Gulshan-e-Iqbal, Karachi
8,749 5,852 2,897 4,010
2016 2015------- Rupees in ‘000 -------
4. LONG-TERM INVESTMENT
Investment in related party (associated company) Attock Information Technology Services (Private) Limited - 450,000 (2015: 450,000) fully paid ordinary shares of Rs. 10 each - at cost 4,500 4,500
4.1 The company holds 10% (2015: 10%) of investee’s total equity. The break-up value per share is Rs. 37.18 (2015: Rs. 32.29). Total assets and total liabilities of the investee as at June 30, 2016 amounted to Rs. 185.08 million and Rs. 17.77 million (2015: Rs. 159.15 million and Rs. 13.82 million) respectively.
2016 2015------- Rupees in ‘000 -------
5. LONG-TERM LOANS AND ADVANCES – Considered good
Chief Executive - note 5.1 - 15,188 Director - note 5.1 10,012 13,016 Executives - note 5.1 42,207 45,034 Other Employees 45,781 33,348
98,000 106,586 Recoverable within one year - note 10 (56,462) (50,832)Long term portion 41,538 55,754

Attock Cement Pakistan Limited78
Notes to the Financial Statements for the year ended June 30, 2016
5.1 Reconciliation of the carrying amount of loans and advances to Chief Executive, Directors and Executives:
Chief Executive Director Executives2016 2015 2016 2015 2016 2015
------------------------------------- Rupees in ‘000--------------------------------------
Opening balance 15,188 2,218 13,016 - 45,034 37,311
Disbursements - 17,086 - 15,019 31,598 40,072
Repayments (15,188) (4,116) (3,004) (2,003) (34,425) (32,349) - 15,188 10,012 13,016 42,207 45,034
5.2 Amounts receivable from Chief Executive, Director and Executives represent house rent advances given according to the company’s service rules. Executives and other employees are also provided with car, motor cycle, marriage and welfare loans. These loans and advances are recoverable in twelve to sixty monthly installments and are interest free. These loans and advances are secured against the retirement fund balances of employees.
5.3 Rent advance was given to Director with the prior approval of Securities and Exchange Commission of Pakistan as required under section 195 of Companies Ordinance, 1984.
5.4 The maximum amounts due from Chief Executive, Director and Executives at the end of any month during the year were Rs. 14.71 (2015: Rs. 16.61 million), Rs. 12.77 million (2015: Rs. 14.78) and Rs. 52.69 million (2015: Rs. 44.99 million) respectively.
5.5 These loans and advances do not carry any mark up arrangement.
5.6 Long term loans and advances have been carried at cost as the effect of carrying these balances at amortised cost would not be material in the overall context of these financial statements.
6. LONG-TERM DEPOSITS
These are security deposits held with K-Electric Limited and do not carry any mark-up arrangement.
2016 2015------- Rupees in ‘000 -------
7. STORES, SPARES AND LOOSE TOOLS
Coal 606,443 332,005 Stores and spares 647,014 621,282 Bricks 97,366 72,725 Loose tools 2,691 2,387
1,353,514 1,028,399 Less: Provision for slow moving and obsolete items (36,502) (42,253)
1,317,012 986,146
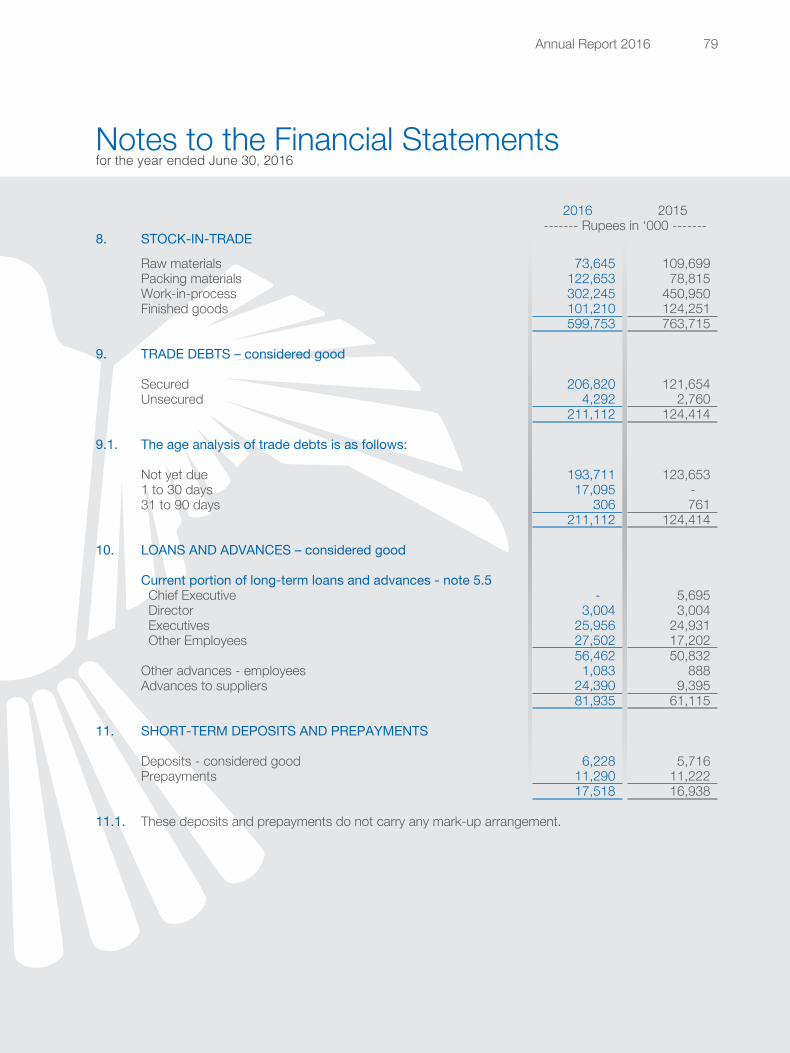
Annual Report 2016 79
Notes to the Financial Statements for the year ended June 30, 2016
2016 2015------- Rupees in ‘000 -------
8. STOCK-IN-TRADE
Raw materials 73,645 109,699 Packing materials 122,653 78,815 Work-in-process 302,245 450,950 Finished goods 101,210 124,251
599,753 763,715
9. TRADE DEBTS – considered good
Secured 206,820 121,654 Unsecured 4,292 2,760
211,112 124,414
9.1. The age analysis of trade debts is as follows:
Not yet due 193,711 123,653 1 to 30 days 17,095 - 31 to 90 days 306 761
211,112 124,414
10. LOANS AND ADVANCES – considered good
Current portion of long-term loans and advances - note 5.5 Chief Executive - 5,695 Director 3,004 3,004 Executives 25,956 24,931 Other Employees 27,502 17,202
56,462 50,832 Other advances - employees 1,083 888 Advances to suppliers 24,390 9,395
81,935 61,115
11. SHORT-TERM DEPOSITS AND PREPAYMENTS
Deposits - considered good 6,228 5,716 Prepayments 11,290 11,222
17,518 16,938
11.1. These deposits and prepayments do not carry any mark-up arrangement.
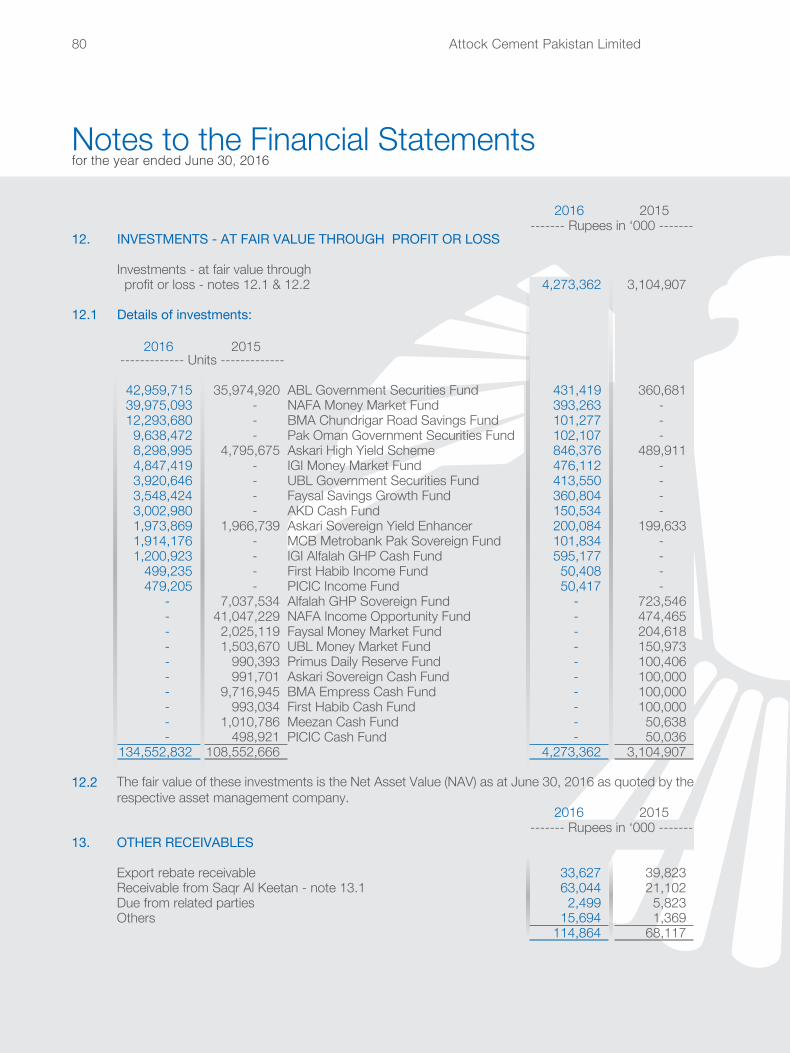
Attock Cement Pakistan Limited80
Notes to the Financial Statements for the year ended June 30, 2016
2016 2015------- Rupees in ‘000 -------
12. INVESTMENTS - AT FAIR VALUE THROUGH PROFIT OR LOSS
Investments - at fair value through profit or loss - notes 12.1 & 12.2 4,273,362 3,104,907
12.1 Details of investments:
2016 2015------------- Units -------------
42,959,715 35,974,920 ABL Government Securities Fund 431,419 360,681 39,975,093 - NAFA Money Market Fund 393,263 - 12,293,680 - BMA Chundrigar Road Savings Fund 101,277 - 9,638,472 - Pak Oman Government Securities Fund 102,107 - 8,298,995 4,795,675 Askari High Yield Scheme 846,376 489,911 4,847,419 - IGI Money Market Fund 476,112 - 3,920,646 - UBL Government Securities Fund 413,550 - 3,548,424 - Faysal Savings Growth Fund 360,804 - 3,002,980 - AKD Cash Fund 150,534 - 1,973,869 1,966,739 Askari Sovereign Yield Enhancer 200,084 199,633 1,914,176 - MCB Metrobank Pak Sovereign Fund 101,834 - 1,200,923 - IGI Alfalah GHP Cash Fund 595,177 -
499,235 - First Habib Income Fund 50,408 - 479,205 - PICIC Income Fund 50,417 -
- 7,037,534 Alfalah GHP Sovereign Fund - 723,546 - 41,047,229 NAFA Income Opportunity Fund - 474,465 - 2,025,119 Faysal Money Market Fund - 204,618 - 1,503,670 UBL Money Market Fund - 150,973 - 990,393 Primus Daily Reserve Fund - 100,406 - 991,701 Askari Sovereign Cash Fund - 100,000 - 9,716,945 BMA Empress Cash Fund - 100,000 - 993,034 First Habib Cash Fund - 100,000 - 1,010,786 Meezan Cash Fund - 50,638 - 498,921 PICIC Cash Fund - 50,036
134,552,832 108,552,666 4,273,362 3,104,907
12.2 The fair value of these investments is the Net Asset Value (NAV) as at June 30, 2016 as quoted by the respective asset management company.
2016 2015------- Rupees in ‘000 -------
13. OTHER RECEIVABLES
Export rebate receivable 33,627 39,823 Receivable from Saqr Al Keetan - note 13.1 63,044 21,102 Due from related parties 2,499 5,823 Others 15,694 1,369
114,864 68,117
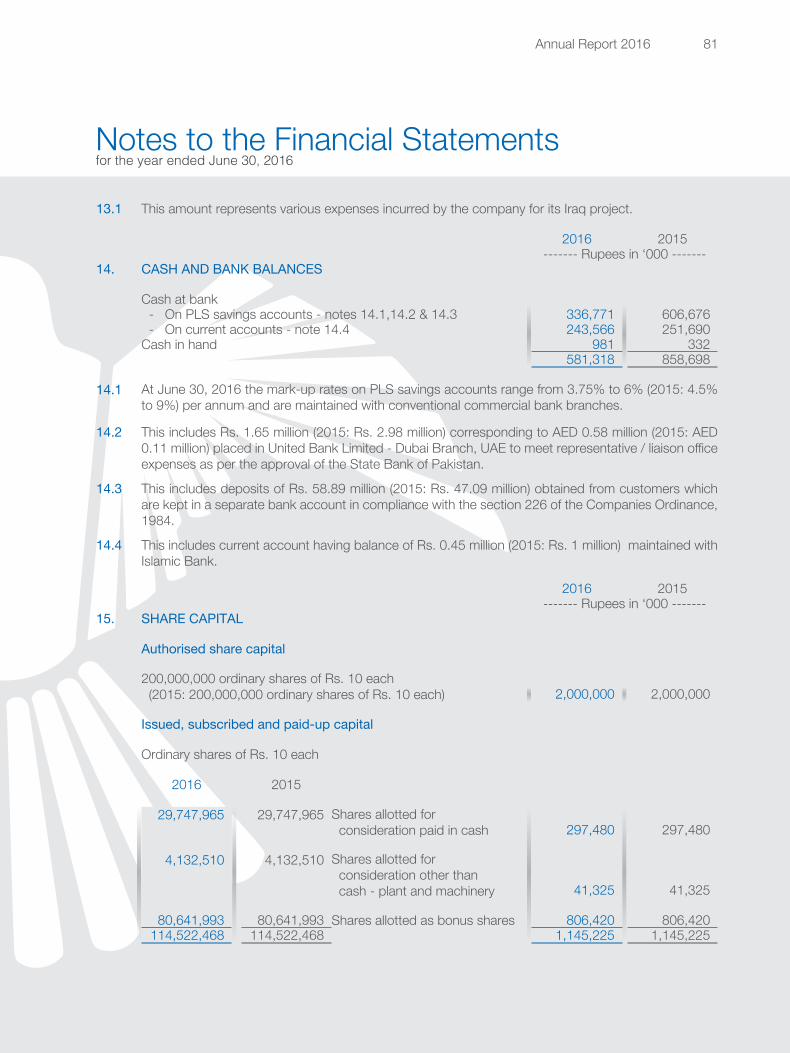
Annual Report 2016 81
13.1 This amount represents various expenses incurred by the company for its Iraq project.
2016 2015------- Rupees in ‘000 -------
14. CASH AND BANK BALANCES
Cash at bank- On PLS savings accounts - notes 14.1,14.2 & 14.3 336,771 606,676 - On current accounts - note 14.4 243,566 251,690
Cash in hand 981 332 581,318 858,698
14.1 At June 30, 2016 the mark-up rates on PLS savings accounts range from 3.75% to 6% (2015: 4.5% to 9%) per annum and are maintained with conventional commercial bank branches.
14.2 This includes Rs. 1.65 million (2015: Rs. 2.98 million) corresponding to AED 0.58 million (2015: AED 0.11 million) placed in United Bank Limited - Dubai Branch, UAE to meet representative / liaison office expenses as per the approval of the State Bank of Pakistan.
14.3 This includes deposits of Rs. 58.89 million (2015: Rs. 47.09 million) obtained from customers which are kept in a separate bank account in compliance with the section 226 of the Companies Ordinance, 1984.
14.4 This includes current account having balance of Rs. 0.45 million (2015: Rs. 1 million) maintained with Islamic Bank.
2016 2015------- Rupees in ‘000 -------
15. SHARE CAPITAL
Authorised share capital
200,000,000 ordinary shares of Rs. 10 each (2015: 200,000,000 ordinary shares of Rs. 10 each) 2,000,000 2,000,000
Issued, subscribed and paid-up capital
Ordinary shares of Rs. 10 each
2016 2015
29,747,965 29,747,965 Shares allotted for consideration paid in cash 297,480 297,480
4,132,510 4,132,510 Shares allotted for consideration other than cash - plant and machinery 41,325 41,325
80,641,993 80,641,993 Shares allotted as bonus shares 806,420 806,420 114,522,468 114,522,468 1,145,225 1,145,225
Notes to the Financial Statements for the year ended June 30, 2016
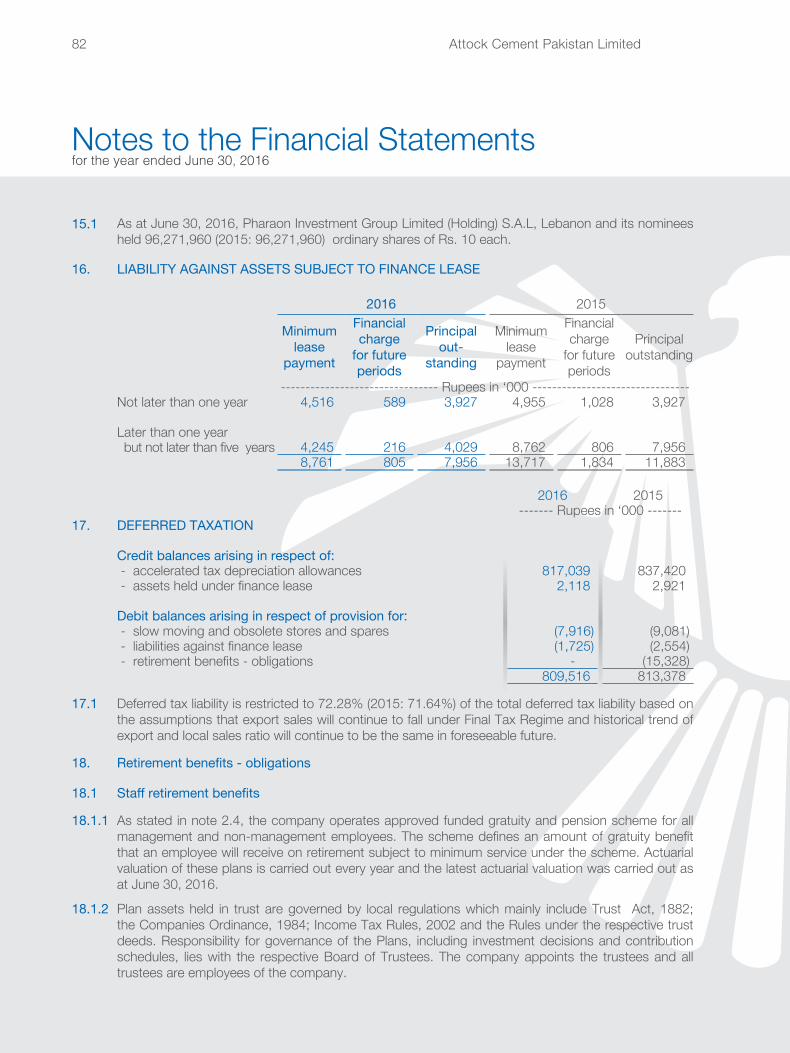
Attock Cement Pakistan Limited82
Notes to the Financial Statements for the year ended June 30, 2016
15.1 As at June 30, 2016, Pharaon Investment Group Limited (Holding) S.A.L, Lebanon and its nominees held 96,271,960 (2015: 96,271,960) ordinary shares of Rs. 10 each.
16. LIABILITY AGAINST ASSETS SUBJECT TO FINANCE LEASE
2016 2015
Minimum lease
payment
Financial charge
for future periods
Principal out-
standing
Minimum lease
payment
Financial charge
for future periods
Principal outstanding
-------------------------------- Rupees in ‘000 --------------------------------Not later than one year 4,516 589 3,927 4,955 1,028 3,927
Later than one year but not later than five years 4,245 216 4,029 8,762 806 7,956
8,761 805 7,956 13,717 1,834 11,883
2016 2015------- Rupees in ‘000 -------
17. DEFERRED TAXATION
Credit balances arising in respect of: - accelerated tax depreciation allowances 817,039 837,420 - assets held under finance lease 2,118 2,921
Debit balances arising in respect of provision for: - slow moving and obsolete stores and spares (7,916) (9,081) - liabilities against finance lease (1,725) (2,554) - retirement benefits - obligations - (15,328)
809,516 813,378
17.1 Deferred tax liability is restricted to 72.28% (2015: 71.64%) of the total deferred tax liability based on the assumptions that export sales will continue to fall under Final Tax Regime and historical trend of export and local sales ratio will continue to be the same in foreseeable future.
18. Retirement benefits - obligations
18.1 Staff retirement benefits
18.1.1 As stated in note 2.4, the company operates approved funded gratuity and pension scheme for all management and non-management employees. The scheme defines an amount of gratuity benefit that an employee will receive on retirement subject to minimum service under the scheme. Actuarial valuation of these plans is carried out every year and the latest actuarial valuation was carried out as at June 30, 2016.
18.1.2 Plan assets held in trust are governed by local regulations which mainly include Trust Act, 1882; the Companies Ordinance, 1984; Income Tax Rules, 2002 and the Rules under the respective trust deeds. Responsibility for governance of the Plans, including investment decisions and contribution schedules, lies with the respective Board of Trustees. The company appoints the trustees and all trustees are employees of the company.
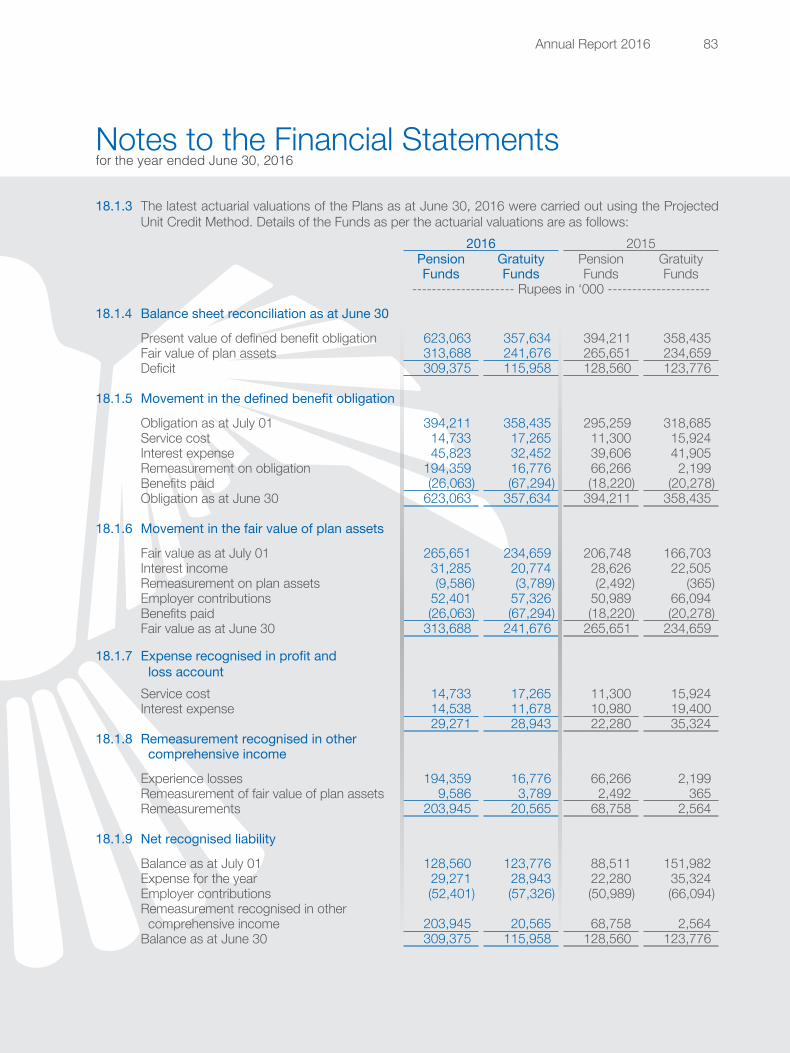
Annual Report 2016 83
Notes to the Financial Statements for the year ended June 30, 2016
18.1.3 The latest actuarial valuations of the Plans as at June 30, 2016 were carried out using the Projected Unit Credit Method. Details of the Funds as per the actuarial valuations are as follows:
2016 2015Pension Gratuity Pension GratuityFunds Funds Funds Funds
--------------------- Rupees in ‘000 ---------------------
18.1.4 Balance sheet reconciliation as at June 30
Present value of defined benefit obligation 623,063 357,634 394,211 358,435 Fair value of plan assets 313,688 241,676 265,651 234,659 Deficit 309,375 115,958 128,560 123,776
18.1.5 Movement in the defined benefit obligation
Obligation as at July 01 394,211 358,435 295,259 318,685 Service cost 14,733 17,265 11,300 15,924 Interest expense 45,823 32,452 39,606 41,905 Remeasurement on obligation 194,359 16,776 66,266 2,199 Benefits paid (26,063) (67,294) (18,220) (20,278)Obligation as at June 30 623,063 357,634 394,211 358,435
18.1.6 Movement in the fair value of plan assets
Fair value as at July 01 265,651 234,659 206,748 166,703 Interest income 31,285 20,774 28,626 22,505 Remeasurement on plan assets (9,586) (3,789) (2,492) (365)Employer contributions 52,401 57,326 50,989 66,094 Benefits paid (26,063) (67,294) (18,220) (20,278)Fair value as at June 30 313,688 241,676 265,651 234,659
18.1.7 Expense recognised in profit and loss accountService cost 14,733 17,265 11,300 15,924 Interest expense 14,538 11,678 10,980 19,400
29,271 28,943 22,280 35,324 18.1.8 Remeasurement recognised in other
comprehensive income
Experience losses 194,359 16,776 66,266 2,199 Remeasurement of fair value of plan assets 9,586 3,789 2,492 365 Remeasurements 203,945 20,565 68,758 2,564
18.1.9 Net recognised liability
Balance as at July 01 128,560 123,776 88,511 151,982 Expense for the year 29,271 28,943 22,280 35,324 Employer contributions (52,401) (57,326) (50,989) (66,094)Remeasurement recognised in other comprehensive income 203,945 20,565 68,758 2,564 Balance as at June 30 309,375 115,958 128,560 123,776
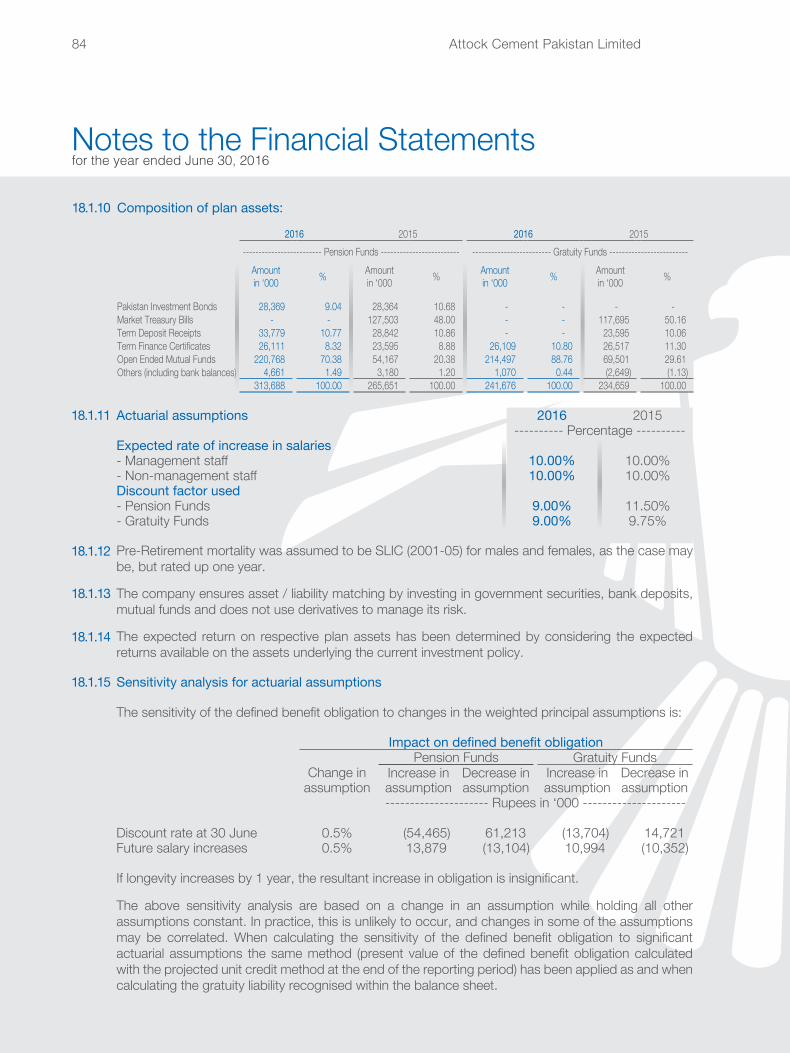
Attock Cement Pakistan Limited84
18.1.11 Actuarial assumptions 2016 2015---------- Percentage ----------
Expected rate of increase in salaries - Management staff 10.00% 10.00%- Non-management staff 10.00% 10.00%Discount factor used - Pension Funds 9.00% 11.50%- Gratuity Funds 9.00% 9.75%
18.1.12 Pre-Retirement mortality was assumed to be SLIC (2001-05) for males and females, as the case may be, but rated up one year.
18.1.13 The company ensures asset / liability matching by investing in government securities, bank deposits, mutual funds and does not use derivatives to manage its risk.
18.1.14 The expected return on respective plan assets has been determined by considering the expected returns available on the assets underlying the current investment policy.
18.1.15 Sensitivity analysis for actuarial assumptions
The sensitivity of the defined benefit obligation to changes in the weighted principal assumptions is:
Impact on defined benefit obligationPension Funds Gratuity Funds
Change in Increase in Decrease in Increase in Decrease inassumption assumption assumption assumption assumption
--------------------- Rupees in ‘000 ---------------------
Discount rate at 30 June 0.5% (54,465) 61,213 (13,704) 14,721 Future salary increases 0.5% 13,879 (13,104) 10,994 (10,352)
If longevity increases by 1 year, the resultant increase in obligation is insignificant.
The above sensitivity analysis are based on a change in an assumption while holding all other assumptions constant. In practice, this is unlikely to occur, and changes in some of the assumptions may be correlated. When calculating the sensitivity of the defined benefit obligation to significant actuarial assumptions the same method (present value of the defined benefit obligation calculated with the projected unit credit method at the end of the reporting period) has been applied as and when calculating the gratuity liability recognised within the balance sheet.
Notes to the Financial Statements for the year ended June 30, 2016
18.1.10 Composition of plan assets:
2016 2015 2016 2015------------------------- Pension Funds ------------------------- ------------------------- Gratuity Funds -------------------------
Amount in ‘000 % Amount
in ‘000 % Amount in ‘000 % Amount
in ‘000 %
Pakistan Investment Bonds 28,369 9.04 28,364 10.68 - - - - Market Treasury Bills - - 127,503 48.00 - - 117,695 50.16 Term Deposit Receipts 33,779 10.77 28,842 10.86 - - 23,595 10.06 Term Finance Certificates 26,111 8.32 23,595 8.88 26,109 10.80 26,517 11.30 Open Ended Mutual Funds 220,768 70.38 54,167 20.38 214,497 88.76 69,501 29.61 Others (including bank balances) 4,661 1.49 3,180 1.20 1,070 0.44 (2,649) (1.13)
313,688 100.00 265,651 100.00 241,676 100.00 234,659 100.00
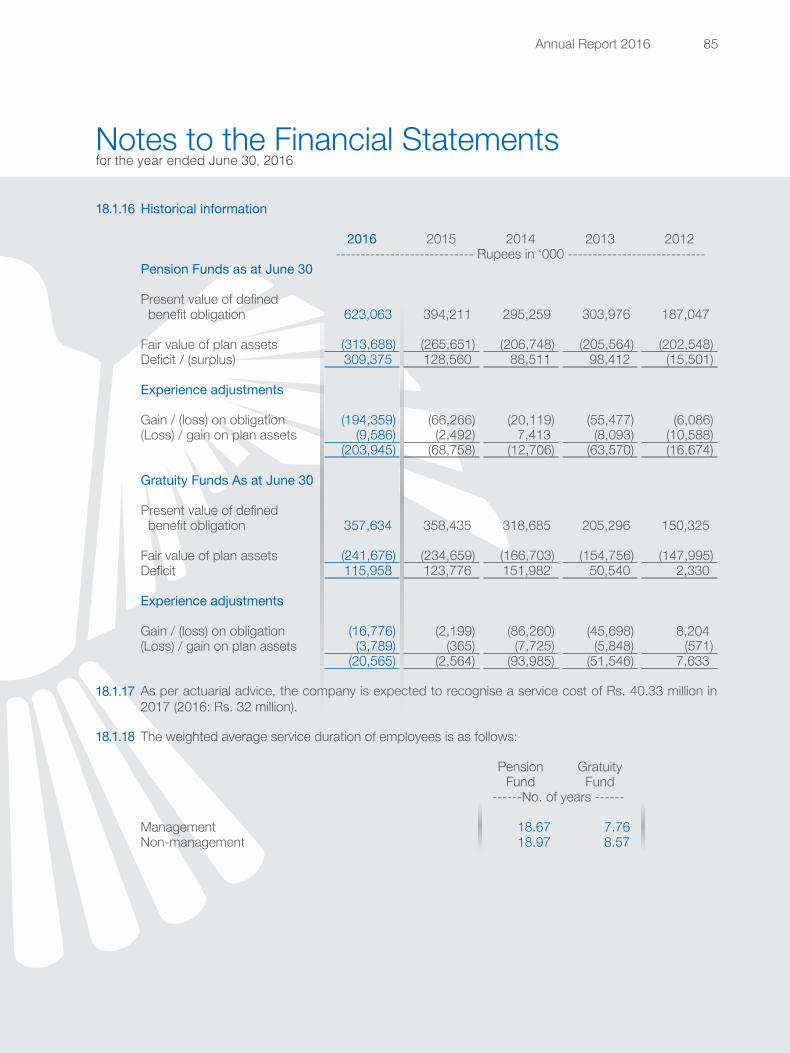
Annual Report 2016 85
Notes to the Financial Statements for the year ended June 30, 2016
18.1.16 Historical information
2016 2015 2014 2013 2012---------------------------- Rupees in ‘000 ----------------------------
Pension Funds as at June 30
Present value of defined benefit obligation 623,063 394,211 295,259 303,976 187,047
Fair value of plan assets (313,688) (265,651) (206,748) (205,564) (202,548)Deficit / (surplus) 309,375 128,560 88,511 98,412 (15,501)
Experience adjustments
Gain / (loss) on obligation (194,359) (66,266) (20,119) (55,477) (6,086)(Loss) / gain on plan assets (9,586) (2,492) 7,413 (8,093) (10,588)
(203,945) (68,758) (12,706) (63,570) (16,674)
Gratuity Funds As at June 30
Present value of defined benefit obligation 357,634 358,435 318,685 205,296 150,325
Fair value of plan assets (241,676) (234,659) (166,703) (154,756) (147,995)Deficit 115,958 123,776 151,982 50,540 2,330
Experience adjustments
Gain / (loss) on obligation (16,776) (2,199) (86,260) (45,698) 8,204 (Loss) / gain on plan assets (3,789) (365) (7,725) (5,848) (571)
(20,565) (2,564) (93,985) (51,546) 7,633
18.1.17 As per actuarial advice, the company is expected to recognise a service cost of Rs. 40.33 million in 2017 (2016: Rs. 32 million).
18.1.18 The weighted average service duration of employees is as follows:
Pension GratuityFund Fund
------No. of years ------
Management 18.67 7.76 Non-management 18.97 8.57
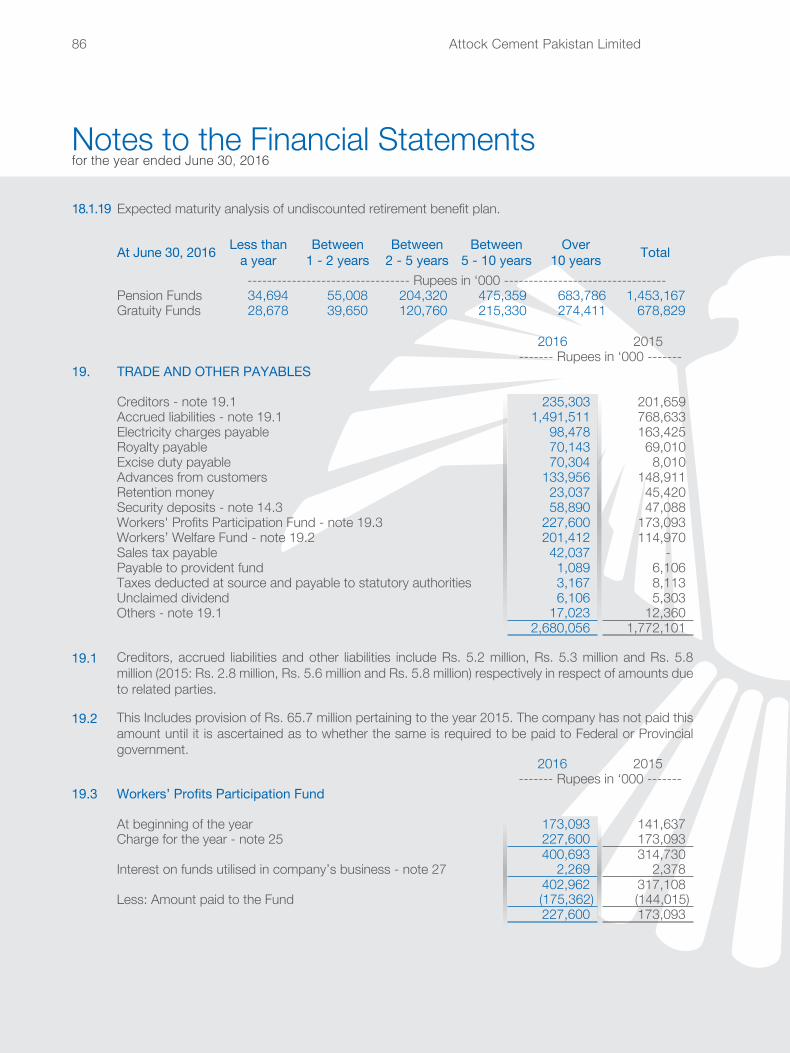
Attock Cement Pakistan Limited86
Notes to the Financial Statements for the year ended June 30, 2016
18.1.19 Expected maturity analysis of undiscounted retirement benefit plan.
At June 30, 2016 Less than a year
Between 1 - 2 years
Between 2 - 5 years
Between 5 - 10 years
Over 10 years Total
--------------------------------- Rupees in ‘000 ---------------------------------Pension Funds 34,694 55,008 204,320 475,359 683,786 1,453,167 Gratuity Funds 28,678 39,650 120,760 215,330 274,411 678,829
2016 2015------- Rupees in ‘000 -------
19. TRADE AND OTHER PAYABLES
Creditors - note 19.1 235,303 201,659 Accrued liabilities - note 19.1 1,491,511 768,633 Electricity charges payable 98,478 163,425 Royalty payable 70,143 69,010 Excise duty payable 70,304 8,010 Advances from customers 133,956 148,911 Retention money 23,037 45,420 Security deposits - note 14.3 58,890 47,088 Workers' Profits Participation Fund - note 19.3 227,600 173,093 Workers’ Welfare Fund - note 19.2 201,412 114,970 Sales tax payable 42,037 - Payable to provident fund 1,089 6,106 Taxes deducted at source and payable to statutory authorities 3,167 8,113 Unclaimed dividend 6,106 5,303 Others - note 19.1 17,023 12,360
2,680,056 1,772,101
19.1 Creditors, accrued liabilities and other liabilities include Rs. 5.2 million, Rs. 5.3 million and Rs. 5.8 million (2015: Rs. 2.8 million, Rs. 5.6 million and Rs. 5.8 million) respectively in respect of amounts due to related parties.
19.2 This Includes provision of Rs. 65.7 million pertaining to the year 2015. The company has not paid this amount until it is ascertained as to whether the same is required to be paid to Federal or Provincial government.
2016 2015------- Rupees in ‘000 -------
19.3 Workers’ Profits Participation Fund
At beginning of the year 173,093 141,637 Charge for the year - note 25 227,600 173,093
400,693 314,730 Interest on funds utilised in company’s business - note 27 2,269 2,378
402,962 317,108 Less: Amount paid to the Fund (175,362) (144,015)
227,600 173,093
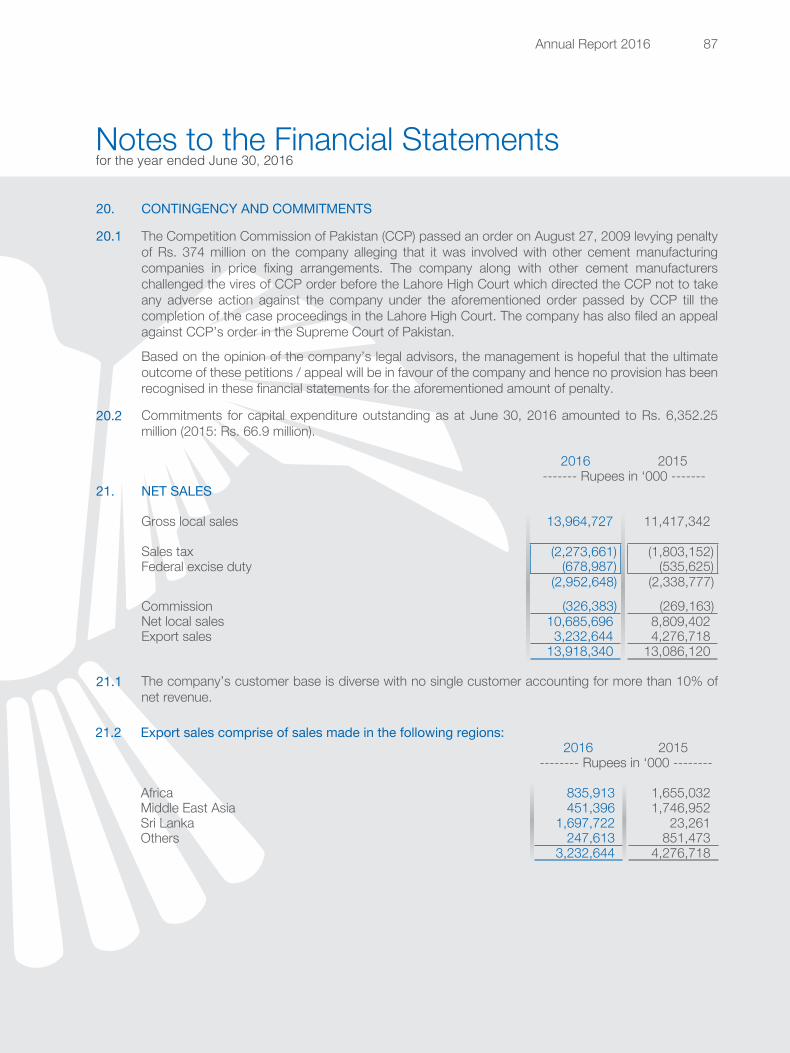
Annual Report 2016 87
Notes to the Financial Statements for the year ended June 30, 2016
20. CONTINGENCY AND COMMITMENTS
20.1 The Competition Commission of Pakistan (CCP) passed an order on August 27, 2009 levying penalty of Rs. 374 million on the company alleging that it was involved with other cement manufacturing companies in price fixing arrangements. The company along with other cement manufacturers challenged the vires of CCP order before the Lahore High Court which directed the CCP not to take any adverse action against the company under the aforementioned order passed by CCP till the completion of the case proceedings in the Lahore High Court. The company has also filed an appeal against CCP’s order in the Supreme Court of Pakistan.
Based on the opinion of the company’s legal advisors, the management is hopeful that the ultimate outcome of these petitions / appeal will be in favour of the company and hence no provision has been recognised in these financial statements for the aforementioned amount of penalty.
20.2 Commitments for capital expenditure outstanding as at June 30, 2016 amounted to Rs. 6,352.25 million (2015: Rs. 66.9 million).
2016 2015------- Rupees in ‘000 -------
21. NET SALES
Gross local sales 13,964,727 11,417,342
Sales tax (2,273,661) (1,803,152)Federal excise duty (678,987) (535,625)
(2,952,648) (2,338,777)
Commission (326,383) (269,163)Net local sales 10,685,696 8,809,402 Export sales 3,232,644 4,276,718
13,918,340 13,086,120
21.1 The company’s customer base is diverse with no single customer accounting for more than 10% of net revenue.
21.2 Export sales comprise of sales made in the following regions:2016 2015
-------- Rupees in ‘000 --------
Africa 835,913 1,655,032 Middle East Asia 451,396 1,746,952 Sri Lanka 1,697,722 23,261 Others 247,613 851,473
3,232,644 4,276,718
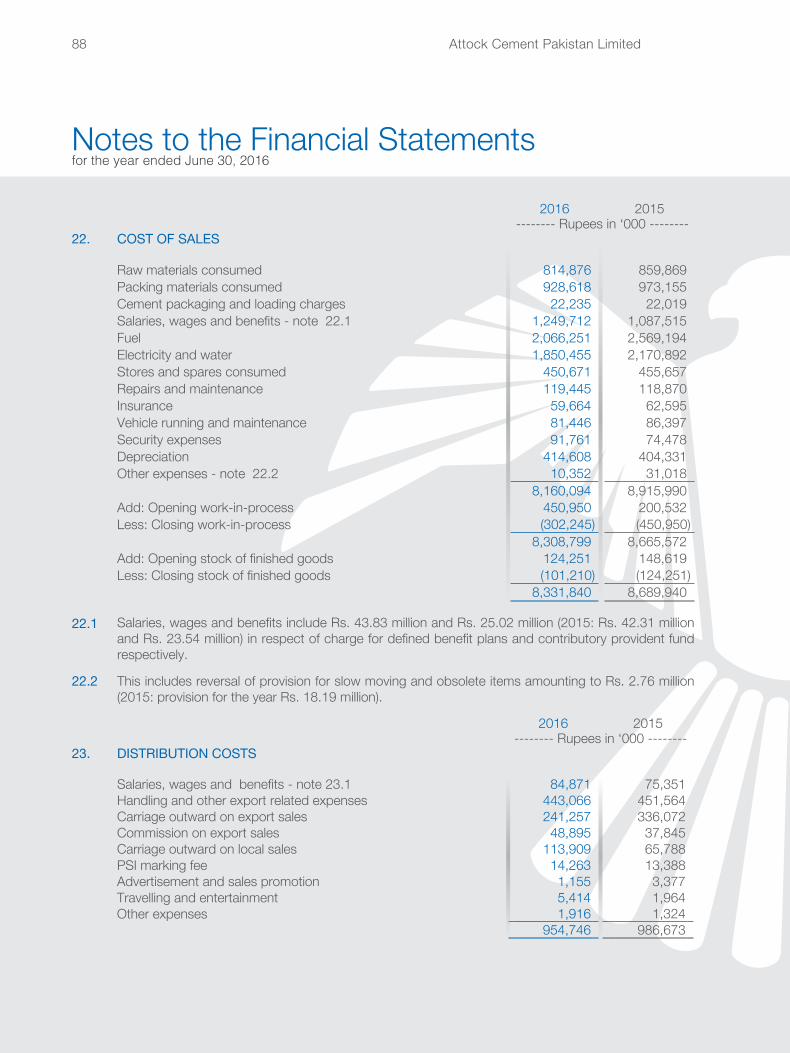
Attock Cement Pakistan Limited88
Notes to the Financial Statements for the year ended June 30, 2016
2016 2015-------- Rupees in ‘000 --------
22. COST OF SALES
Raw materials consumed 814,876 859,869 Packing materials consumed 928,618 973,155 Cement packaging and loading charges 22,235 22,019 Salaries, wages and benefits - note 22.1 1,249,712 1,087,515 Fuel 2,066,251 2,569,194 Electricity and water 1,850,455 2,170,892 Stores and spares consumed 450,671 455,657 Repairs and maintenance 119,445 118,870 Insurance 59,664 62,595 Vehicle running and maintenance 81,446 86,397 Security expenses 91,761 74,478 Depreciation 414,608 404,331 Other expenses - note 22.2 10,352 31,018
8,160,094 8,915,990 Add: Opening work-in-process 450,950 200,532 Less: Closing work-in-process (302,245) (450,950)
8,308,799 8,665,572 Add: Opening stock of finished goods 124,251 148,619 Less: Closing stock of finished goods (101,210) (124,251)
8,331,840 8,689,940
22.1 Salaries, wages and benefits include Rs. 43.83 million and Rs. 25.02 million (2015: Rs. 42.31 million and Rs. 23.54 million) in respect of charge for defined benefit plans and contributory provident fund respectively.
22.2 This includes reversal of provision for slow moving and obsolete items amounting to Rs. 2.76 million (2015: provision for the year Rs. 18.19 million).
2016 2015-------- Rupees in ‘000 --------
23. DISTRIBUTION COSTS
Salaries, wages and benefits - note 23.1 84,871 75,351 Handling and other export related expenses 443,066 451,564 Carriage outward on export sales 241,257 336,072 Commission on export sales 48,895 37,845 Carriage outward on local sales 113,909 65,788 PSI marking fee 14,263 13,388 Advertisement and sales promotion 1,155 3,377 Travelling and entertainment 5,414 1,964 Other expenses 1,916 1,324
954,746 986,673
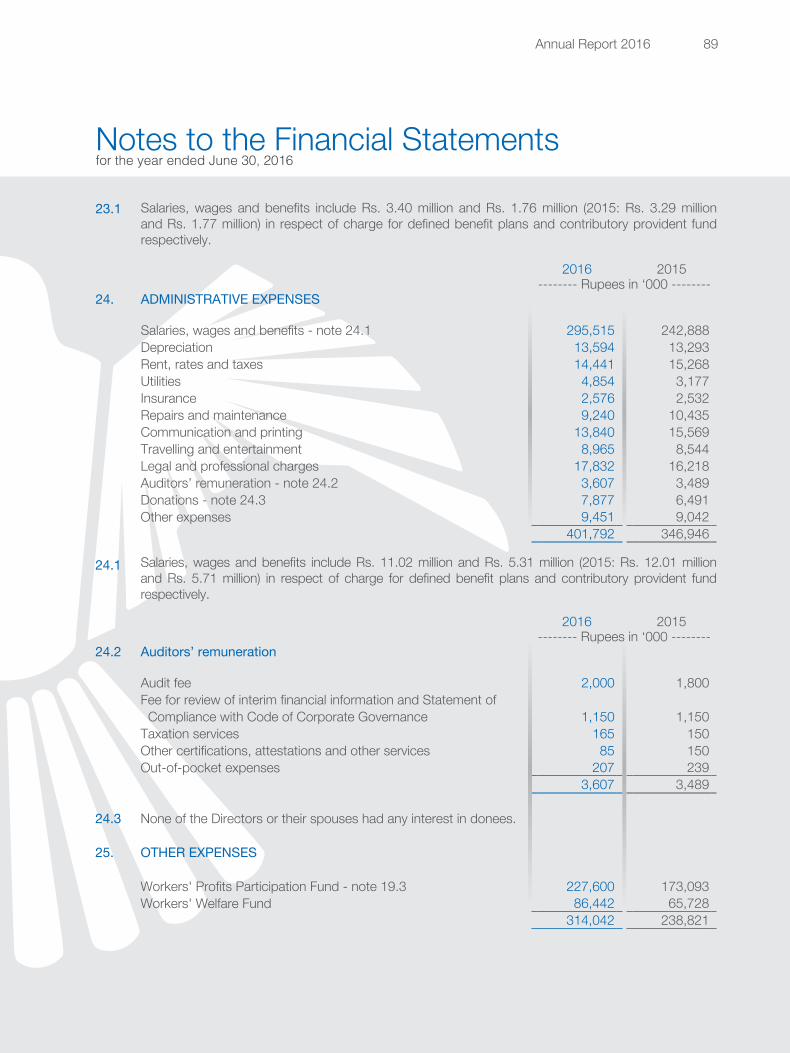
Annual Report 2016 89
Notes to the Financial Statements for the year ended June 30, 2016
23.1 Salaries, wages and benefits include Rs. 3.40 million and Rs. 1.76 million (2015: Rs. 3.29 million and Rs. 1.77 million) in respect of charge for defined benefit plans and contributory provident fund respectively.
2016 2015-------- Rupees in ‘000 --------
24. ADMINISTRATIVE EXPENSES
Salaries, wages and benefits - note 24.1 295,515 242,888 Depreciation 13,594 13,293 Rent, rates and taxes 14,441 15,268 Utilities 4,854 3,177 Insurance 2,576 2,532 Repairs and maintenance 9,240 10,435 Communication and printing 13,840 15,569 Travelling and entertainment 8,965 8,544 Legal and professional charges 17,832 16,218 Auditors’ remuneration - note 24.2 3,607 3,489 Donations - note 24.3 7,877 6,491 Other expenses 9,451 9,042
401,792 346,946
24.1 Salaries, wages and benefits include Rs. 11.02 million and Rs. 5.31 million (2015: Rs. 12.01 million and Rs. 5.71 million) in respect of charge for defined benefit plans and contributory provident fund respectively.
2016 2015-------- Rupees in ‘000 --------
24.2 Auditors’ remuneration
Audit fee 2,000 1,800 Fee for review of interim financial information and Statement of Compliance with Code of Corporate Governance 1,150 1,150 Taxation services 165 150 Other certifications, attestations and other services 85 150 Out-of-pocket expenses 207 239
3,607 3,489
24.3 None of the Directors or their spouses had any interest in donees.
25. OTHER EXPENSES
Workers' Profits Participation Fund - note 19.3 227,600 173,093 Workers' Welfare Fund 86,442 65,728
314,042 238,821

Attock Cement Pakistan Limited90
Notes to the Financial Statements for the year ended June 30, 2016
2016 2015-------- Rupees in ‘000 --------
26. OTHER INCOME
Income from financial assets
Income on PLS savings accounts under interest / mark-up arrangements- note 26.1 21,486 23,346
Gain on sale of open ended mutual fund units - note 26.2 269,914 332,001
Gain on re-measurement of fair value of open ended mutual fund units - note 26.2 4,135 170
Dividend from open ended mutual funds - note 26.2 5,462 4,019 279,511 336,190
Exchange gain - note 26.3 8,511 16,887
Income from non-financial assets
Gain on disposal of operating assets 1,138 2,136
Others
Export rebate 16,913 23,196 Scrap sales 12,997 19,414 Others 539 1,741
341,095 422,910
26.1 This profit is earned from bank accounts under mark up arrangements maintained with conventional commercial bank branches.
26.2 These amounts represent gain and dividend from mutual funds that as per their offering documents are not specifically categorised as Islamic mutual funds except Rs 0.47 million (2015: Rs 5.77 million) earned on Islamic Funds.
26.3 Income earned from exchange gain is from actual currency and not by derivative financial instruments.
2016 2015-------- Rupees in ‘000 --------
27. FINANCE COST
Bank charges and commission 18,120 22,226 Interest on Workers’ Profits Participation Fund - note 19.3 2,269 2,378 Finance charges on finance lease 920 1,395
21,309 25,999
28. TAXATION
Current- for the year - note 28.2 1,365,545 950,000 - prior years (16,000) 240,000 Deferred (3,862) (175,000)
1,345,683 1,015,000
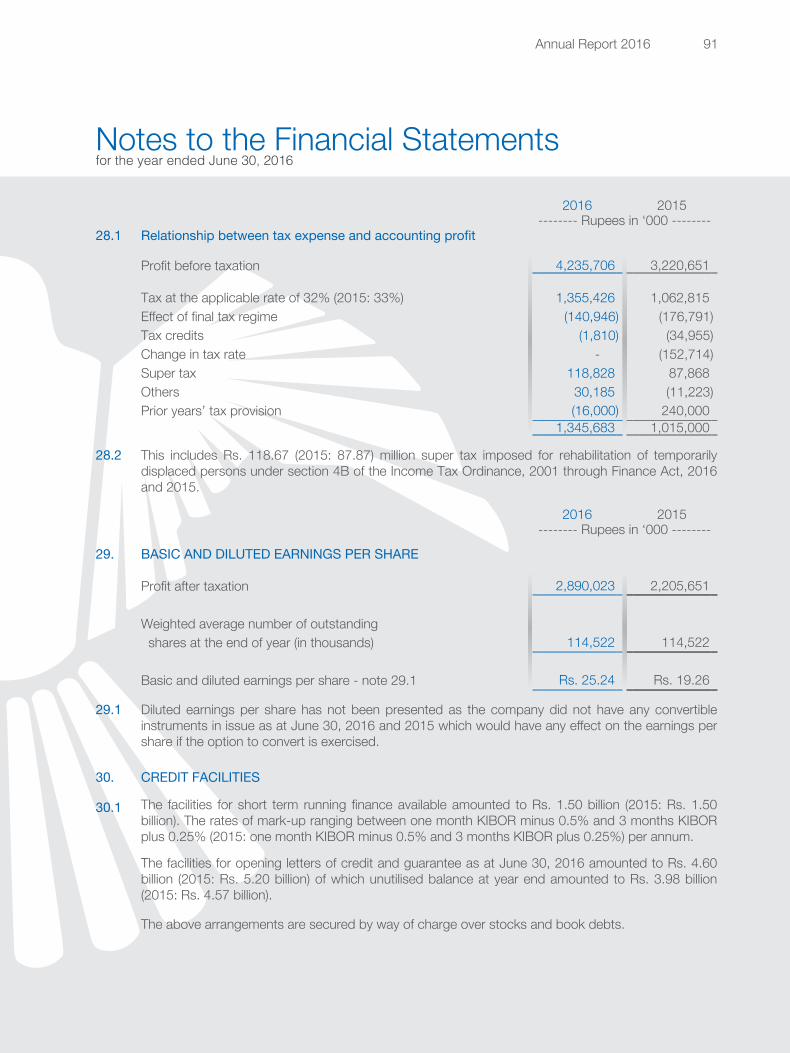
Annual Report 2016 91
Notes to the Financial Statements for the year ended June 30, 2016
2016 2015-------- Rupees in ‘000 --------
28.1 Relationship between tax expense and accounting profit
Profit before taxation 4,235,706 3,220,651
Tax at the applicable rate of 32% (2015: 33%) 1,355,426 1,062,815 Effect of final tax regime (140,946) (176,791)Tax credits (1,810) (34,955)Change in tax rate - (152,714)Super tax 118,828 87,868 Others 30,185 (11,223)Prior years’ tax provision (16,000) 240,000
1,345,683 1,015,000
28.2 This includes Rs. 118.67 (2015: 87.87) million super tax imposed for rehabilitation of temporarily displaced persons under section 4B of the Income Tax Ordinance, 2001 through Finance Act, 2016 and 2015.
2016 2015-------- Rupees in ‘000 --------
29. BASIC AND DILUTED EARNINGS PER SHARE
Profit after taxation 2,890,023 2,205,651
Weighted average number of outstanding shares at the end of year (in thousands) 114,522 114,522
Basic and diluted earnings per share - note 29.1 Rs. 25.24 Rs. 19.26
29.1 Diluted earnings per share has not been presented as the company did not have any convertible instruments in issue as at June 30, 2016 and 2015 which would have any effect on the earnings per share if the option to convert is exercised.
30. CREDIT FACILITIES
30.1 The facilities for short term running finance available amounted to Rs. 1.50 billion (2015: Rs. 1.50 billion). The rates of mark-up ranging between one month KIBOR minus 0.5% and 3 months KIBOR plus 0.25% (2015: one month KIBOR minus 0.5% and 3 months KIBOR plus 0.25%) per annum.
The facilities for opening letters of credit and guarantee as at June 30, 2016 amounted to Rs. 4.60 billion (2015: Rs. 5.20 billion) of which unutilised balance at year end amounted to Rs. 3.98 billion (2015: Rs. 4.57 billion).
The above arrangements are secured by way of charge over stocks and book debts.
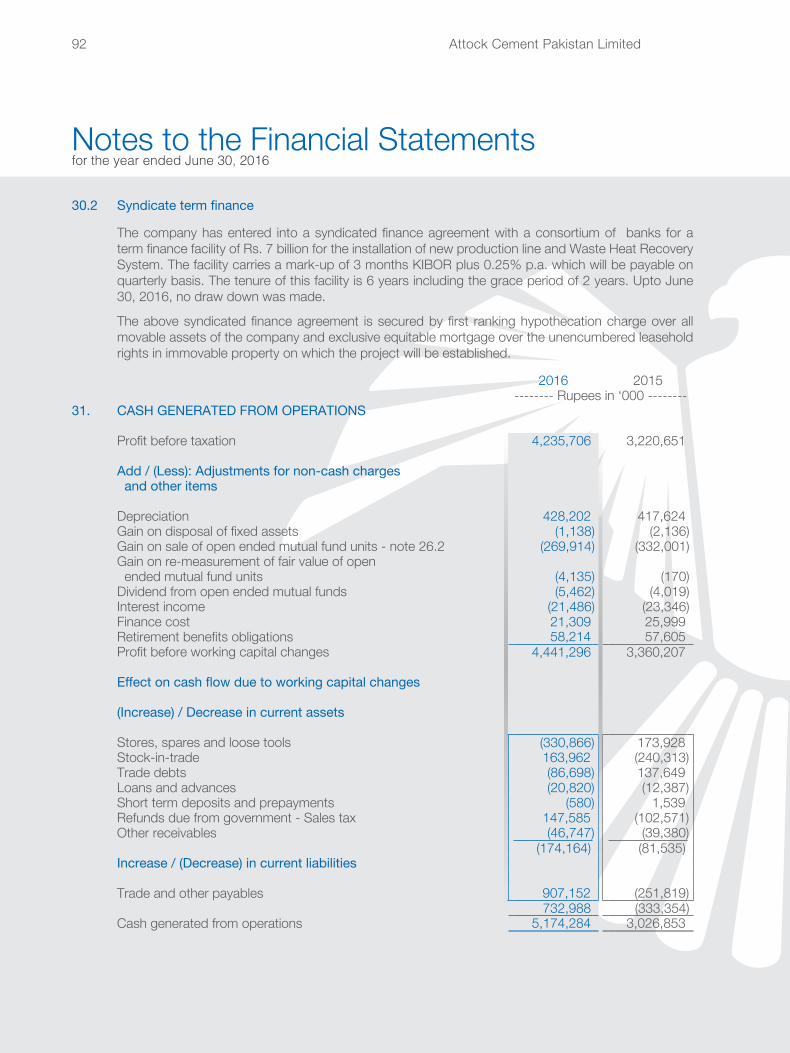
Attock Cement Pakistan Limited92
Notes to the Financial Statements for the year ended June 30, 2016
30.2 Syndicate term finance
The company has entered into a syndicated finance agreement with a consortium of banks for a term finance facility of Rs. 7 billion for the installation of new production line and Waste Heat Recovery System. The facility carries a mark-up of 3 months KIBOR plus 0.25% p.a. which will be payable on quarterly basis. The tenure of this facility is 6 years including the grace period of 2 years. Upto June 30, 2016, no draw down was made.
The above syndicated finance agreement is secured by first ranking hypothecation charge over all movable assets of the company and exclusive equitable mortgage over the unencumbered leasehold rights in immovable property on which the project will be established.
2016 2015-------- Rupees in ‘000 --------
31. CASH GENERATED FROM OPERATIONS
Profit before taxation 4,235,706 3,220,651
Add / (Less): Adjustments for non-cash charges and other items
Depreciation 428,202 417,624 Gain on disposal of fixed assets (1,138) (2,136)Gain on sale of open ended mutual fund units - note 26.2 (269,914) (332,001)Gain on re-measurement of fair value of open ended mutual fund units (4,135) (170)Dividend from open ended mutual funds (5,462) (4,019)Interest income (21,486) (23,346)Finance cost 21,309 25,999 Retirement benefits obligations 58,214 57,605 Profit before working capital changes 4,441,296 3,360,207
Effect on cash flow due to working capital changes
(Increase) / Decrease in current assets
Stores, spares and loose tools (330,866) 173,928 Stock-in-trade 163,962 (240,313)Trade debts (86,698) 137,649 Loans and advances (20,820) (12,387)Short term deposits and prepayments (580) 1,539 Refunds due from government - Sales tax 147,585 (102,571)Other receivables (46,747) (39,380)
(174,164) (81,535)Increase / (Decrease) in current liabilities
Trade and other payables 907,152 (251,819) 732,988 (333,354)
Cash generated from operations 5,174,284 3,026,853
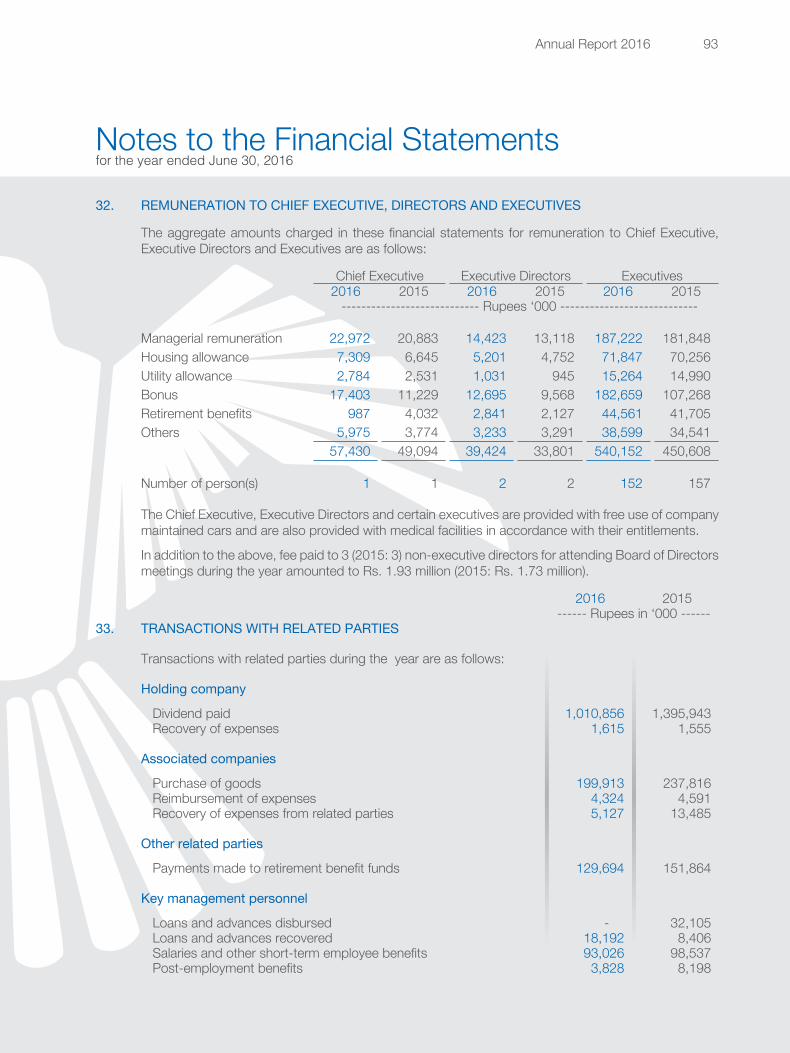
Annual Report 2016 93
Notes to the Financial Statements for the year ended June 30, 2016
32. REMUNERATION TO CHIEF EXECUTIVE, DIRECTORS AND EXECUTIVES
The aggregate amounts charged in these financial statements for remuneration to Chief Executive, Executive Directors and Executives are as follows:
Chief Executive Executive Directors Executives2016 2015 2016 2015 2016 2015 ---------------------------- Rupees ‘000 ----------------------------
Managerial remuneration 22,972 20,883 14,423 13,118 187,222 181,848 Housing allowance 7,309 6,645 5,201 4,752 71,847 70,256 Utility allowance 2,784 2,531 1,031 945 15,264 14,990 Bonus 17,403 11,229 12,695 9,568 182,659 107,268 Retirement benefits 987 4,032 2,841 2,127 44,561 41,705 Others 5,975 3,774 3,233 3,291 38,599 34,541
57,430 49,094 39,424 33,801 540,152 450,608
Number of person(s) 1 1 2 2 152 157
The Chief Executive, Executive Directors and certain executives are provided with free use of company maintained cars and are also provided with medical facilities in accordance with their entitlements.
In addition to the above, fee paid to 3 (2015: 3) non-executive directors for attending Board of Directors meetings during the year amounted to Rs. 1.93 million (2015: Rs. 1.73 million).
2016 2015------ Rupees in ‘000 ------
33. TRANSACTIONS WITH RELATED PARTIES Transactions with related parties during the year are as follows:
Holding company
Dividend paid 1,010,856 1,395,943 Recovery of expenses 1,615 1,555
Associated companies
Purchase of goods 199,913 237,816 Reimbursement of expenses 4,324 4,591 Recovery of expenses from related parties 5,127 13,485
Other related parties
Payments made to retirement benefit funds 129,694 151,864
Key management personnel
Loans and advances disbursed - 32,105 Loans and advances recovered 18,192 8,406 Salaries and other short-term employee benefits 93,026 98,537 Post-employment benefits 3,828 8,198
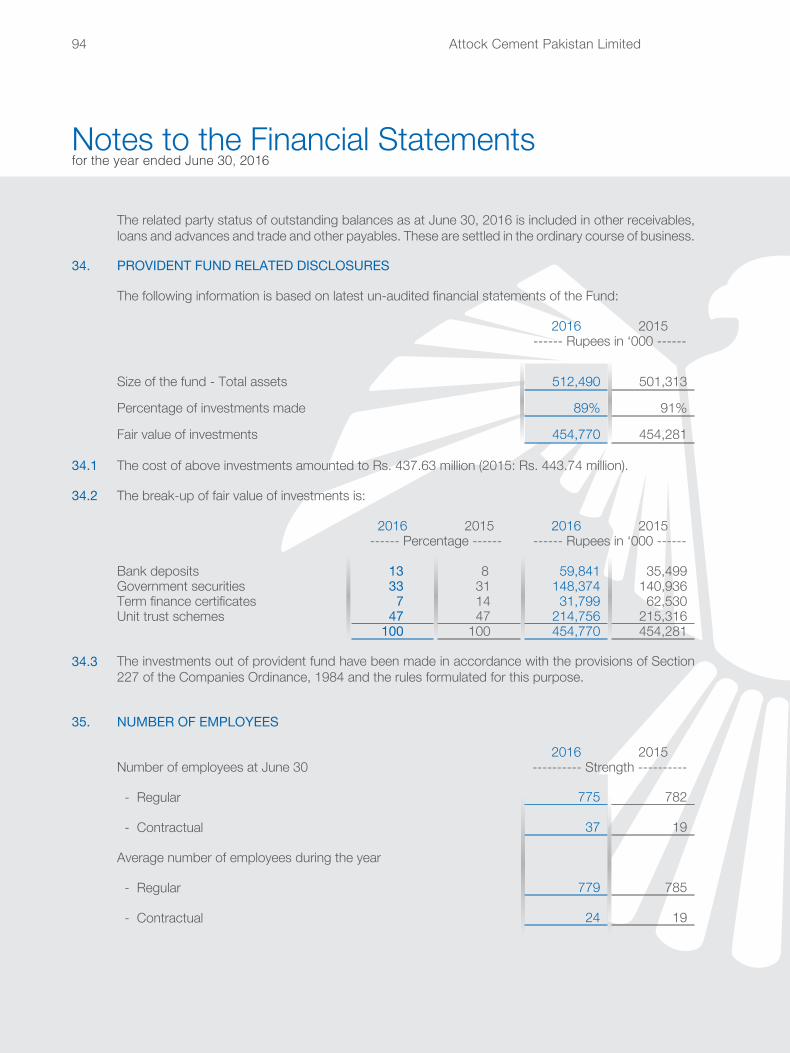
Attock Cement Pakistan Limited94
Notes to the Financial Statements for the year ended June 30, 2016
The related party status of outstanding balances as at June 30, 2016 is included in other receivables, loans and advances and trade and other payables. These are settled in the ordinary course of business.
34. PROVIDENT FUND RELATED DISCLOSURES
The following information is based on latest un-audited financial statements of the Fund:
2016 2015------ Rupees in ‘000 ------
Size of the fund - Total assets 512,490 501,313
Percentage of investments made 89% 91%
Fair value of investments 454,770 454,281
34.1 The cost of above investments amounted to Rs. 437.63 million (2015: Rs. 443.74 million).
34.2 The break-up of fair value of investments is:
2016 2015 2016 2015------ Percentage ------ ------ Rupees in ‘000 ------
Bank deposits 13 8 59,841 35,499 Government securities 33 31 148,374 140,936 Term finance certificates 7 14 31,799 62,530 Unit trust schemes 47 47 214,756 215,316
100 100 454,770 454,281
34.3 The investments out of provident fund have been made in accordance with the provisions of Section 227 of the Companies Ordinance, 1984 and the rules formulated for this purpose.
35. NUMBER OF EMPLOYEES
2016 2015Number of employees at June 30 ---------- Strength ----------
- Regular 775 782
- Contractual 37 19
Average number of employees during the year
- Regular 779 785
- Contractual 24 19
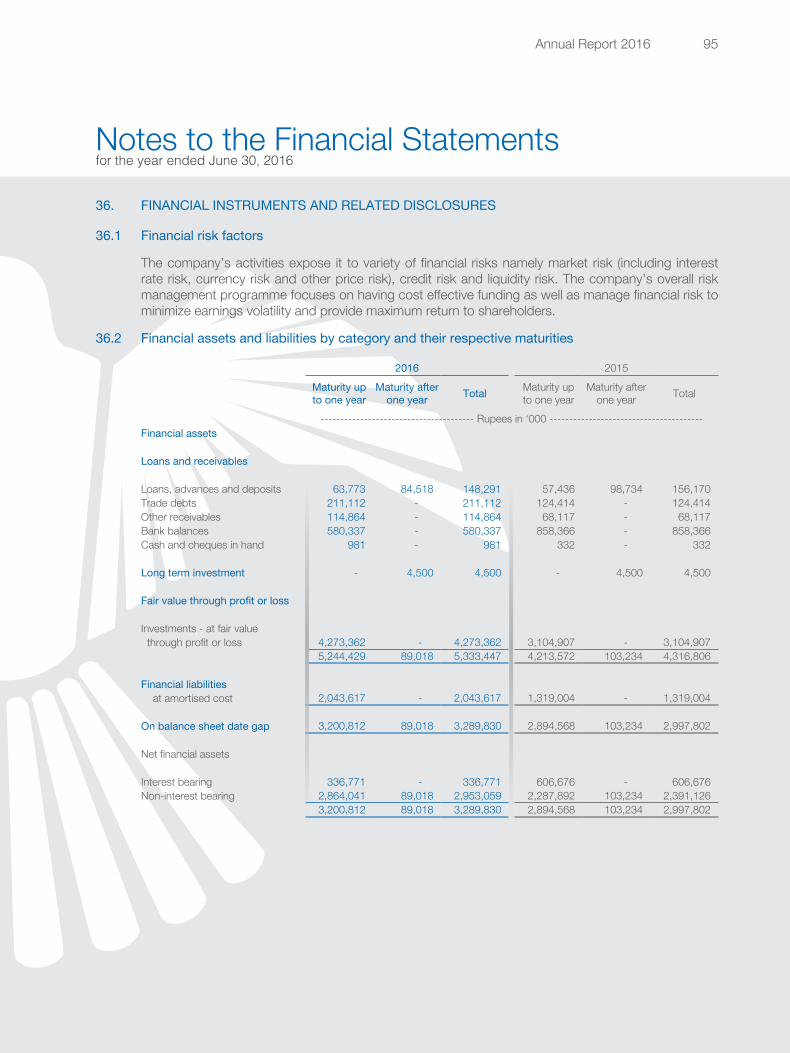
Annual Report 2016 95
Notes to the Financial Statements for the year ended June 30, 2016
36. FINANCIAL INSTRUMENTS AND RELATED DISCLOSURES
36.1 Financial risk factors
The company’s activities expose it to variety of financial risks namely market risk (including interest rate risk, currency risk and other price risk), credit risk and liquidity risk. The company’s overall risk management programme focuses on having cost effective funding as well as manage financial risk to minimize earnings volatility and provide maximum return to shareholders.
36.2 Financial assets and liabilities by category and their respective maturities
2016 2015
Maturity up to one year
Maturity after one year Total Maturity up
to one yearMaturity after
one year Total
--------------------------------------- Rupees in ‘000 ---------------------------------------Financial assets
Loans and receivables
Loans, advances and deposits 63,773 84,518 148,291 57,436 98,734 156,170 Trade debts 211,112 - 211,112 124,414 - 124,414 Other receivables 114,864 - 114,864 68,117 - 68,117 Bank balances 580,337 - 580,337 858,366 - 858,366 Cash and cheques in hand 981 - 981 332 - 332
Long term investment - 4,500 4,500 - 4,500 4,500
Fair value through profit or loss
Investments - at fair value through profit or loss 4,273,362 - 4,273,362 3,104,907 - 3,104,907
5,244,429 89,018 5,333,447 4,213,572 103,234 4,316,806
Financial liabilities at amortised cost 2,043,617 - 2,043,617 1,319,004 - 1,319,004
On balance sheet date gap 3,200,812 89,018 3,289,830 2,894,568 103,234 2,997,802
Net financial assets
Interest bearing 336,771 - 336,771 606,676 - 606,676 Non-interest bearing 2,864,041 89,018 2,953,059 2,287,892 103,234 2,391,126
3,200,812 89,018 3,289,830 2,894,568 103,234 2,997,802
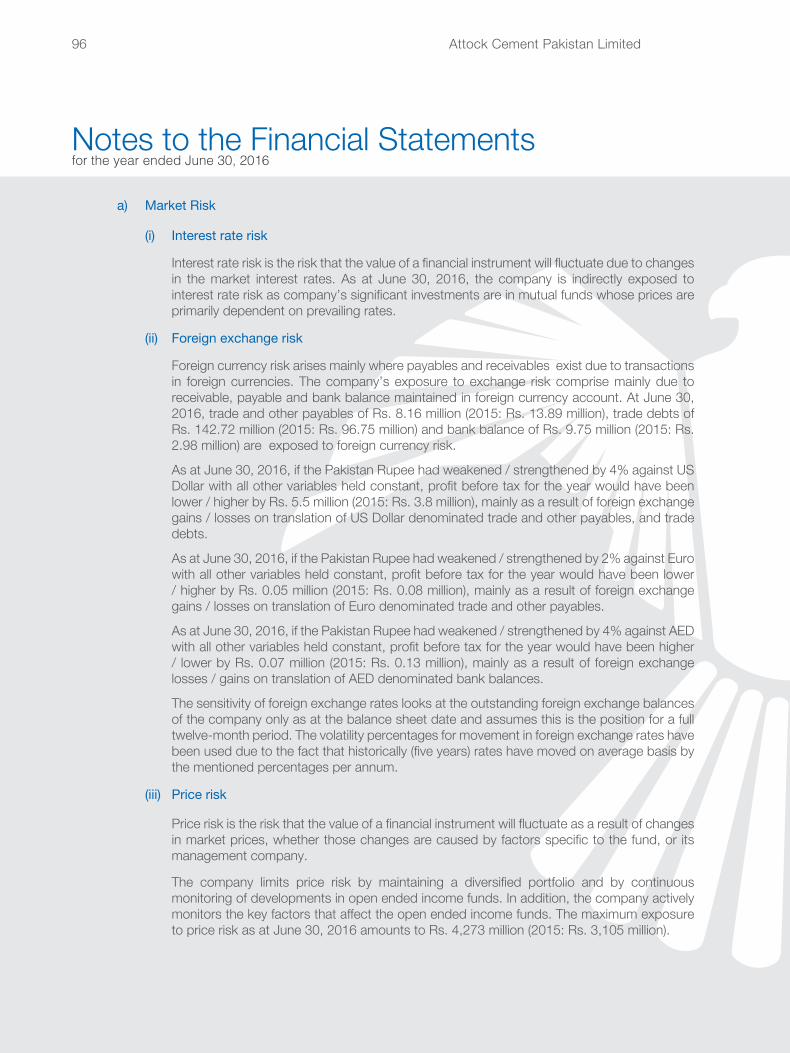
Attock Cement Pakistan Limited96
Notes to the Financial Statements for the year ended June 30, 2016
a) Market Risk
(i) Interest rate risk
Interest rate risk is the risk that the value of a financial instrument will fluctuate due to changes in the market interest rates. As at June 30, 2016, the company is indirectly exposed to interest rate risk as company’s significant investments are in mutual funds whose prices are primarily dependent on prevailing rates.
(ii) Foreign exchange risk
Foreign currency risk arises mainly where payables and receivables exist due to transactions in foreign currencies. The company’s exposure to exchange risk comprise mainly due to receivable, payable and bank balance maintained in foreign currency account. At June 30, 2016, trade and other payables of Rs. 8.16 million (2015: Rs. 13.89 million), trade debts of Rs. 142.72 million (2015: Rs. 96.75 million) and bank balance of Rs. 9.75 million (2015: Rs. 2.98 million) are exposed to foreign currency risk.
As at June 30, 2016, if the Pakistan Rupee had weakened / strengthened by 4% against US Dollar with all other variables held constant, profit before tax for the year would have been lower / higher by Rs. 5.5 million (2015: Rs. 3.8 million), mainly as a result of foreign exchange gains / losses on translation of US Dollar denominated trade and other payables, and trade debts.
As at June 30, 2016, if the Pakistan Rupee had weakened / strengthened by 2% against Euro with all other variables held constant, profit before tax for the year would have been lower / higher by Rs. 0.05 million (2015: Rs. 0.08 million), mainly as a result of foreign exchange gains / losses on translation of Euro denominated trade and other payables.
As at June 30, 2016, if the Pakistan Rupee had weakened / strengthened by 4% against AED with all other variables held constant, profit before tax for the year would have been higher / lower by Rs. 0.07 million (2015: Rs. 0.13 million), mainly as a result of foreign exchange losses / gains on translation of AED denominated bank balances.
The sensitivity of foreign exchange rates looks at the outstanding foreign exchange balances of the company only as at the balance sheet date and assumes this is the position for a full twelve-month period. The volatility percentages for movement in foreign exchange rates have been used due to the fact that historically (five years) rates have moved on average basis by the mentioned percentages per annum.
(iii) Price risk
Price risk is the risk that the value of a financial instrument will fluctuate as a result of changes in market prices, whether those changes are caused by factors specific to the fund, or its management company.
The company limits price risk by maintaining a diversified portfolio and by continuous monitoring of developments in open ended income funds. In addition, the company actively monitors the key factors that affect the open ended income funds. The maximum exposure to price risk as at June 30, 2016 amounts to Rs. 4,273 million (2015: Rs. 3,105 million).
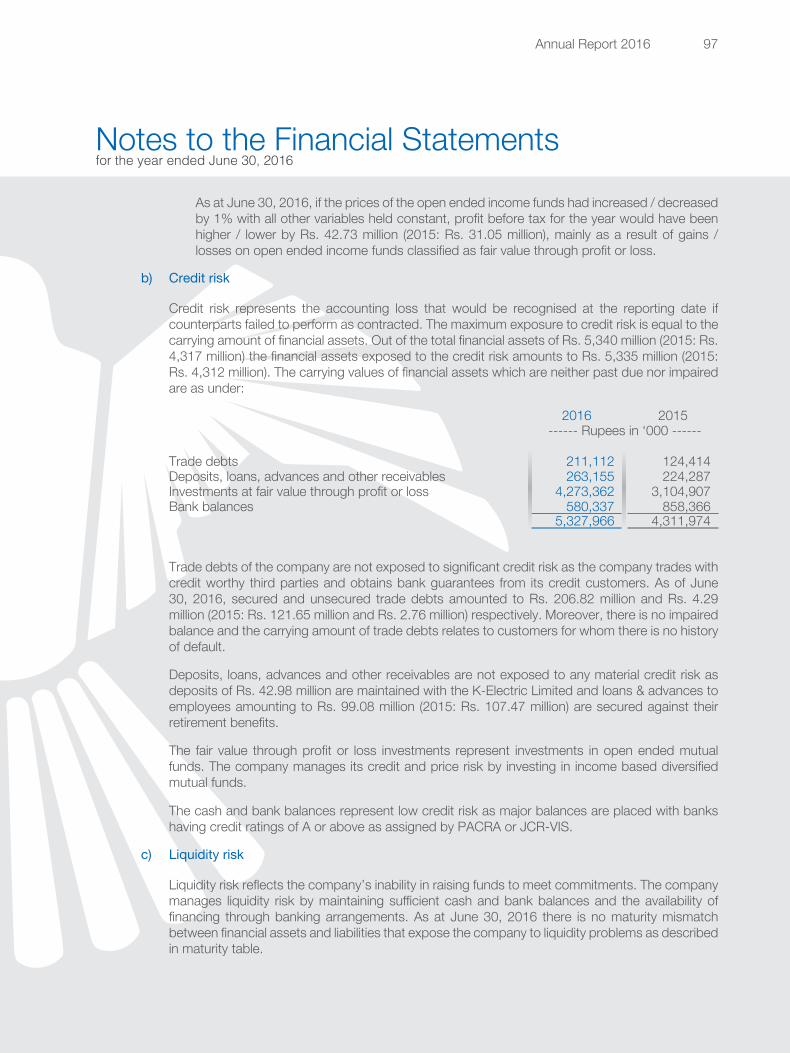
Annual Report 2016 97
Notes to the Financial Statements for the year ended June 30, 2016
As at June 30, 2016, if the prices of the open ended income funds had increased / decreased by 1% with all other variables held constant, profit before tax for the year would have been higher / lower by Rs. 42.73 million (2015: Rs. 31.05 million), mainly as a result of gains / losses on open ended income funds classified as fair value through profit or loss.
b) Credit risk
Credit risk represents the accounting loss that would be recognised at the reporting date if counterparts failed to perform as contracted. The maximum exposure to credit risk is equal to the carrying amount of financial assets. Out of the total financial assets of Rs. 5,340 million (2015: Rs. 4,317 million) the financial assets exposed to the credit risk amounts to Rs. 5,335 million (2015: Rs. 4,312 million). The carrying values of financial assets which are neither past due nor impaired are as under:
2016 2015------ Rupees in ‘000 ------
Trade debts 211,112 124,414 Deposits, loans, advances and other receivables 263,155 224,287 Investments at fair value through profit or loss 4,273,362 3,104,907 Bank balances 580,337 858,366
5,327,966 4,311,974
Trade debts of the company are not exposed to significant credit risk as the company trades with credit worthy third parties and obtains bank guarantees from its credit customers. As of June 30, 2016, secured and unsecured trade debts amounted to Rs. 206.82 million and Rs. 4.29 million (2015: Rs. 121.65 million and Rs. 2.76 million) respectively. Moreover, there is no impaired balance and the carrying amount of trade debts relates to customers for whom there is no history of default.
Deposits, loans, advances and other receivables are not exposed to any material credit risk as deposits of Rs. 42.98 million are maintained with the K-Electric Limited and loans & advances to employees amounting to Rs. 99.08 million (2015: Rs. 107.47 million) are secured against their retirement benefits.
The fair value through profit or loss investments represent investments in open ended mutual funds. The company manages its credit and price risk by investing in income based diversified mutual funds.
The cash and bank balances represent low credit risk as major balances are placed with banks having credit ratings of A or above as assigned by PACRA or JCR-VIS.
c) Liquidity risk
Liquidity risk reflects the company’s inability in raising funds to meet commitments. The company manages liquidity risk by maintaining sufficient cash and bank balances and the availability of financing through banking arrangements. As at June 30, 2016 there is no maturity mismatch between financial assets and liabilities that expose the company to liquidity problems as described in maturity table.
Attock Cement Pakistan Limited98
Notes to the Financial Statements for the year ended June 30, 2016
d) Fair values of the financial instruments
Fair value is the price that would be received to sell an asset or paid to transfer a liability in an orderly transaction in the principal (or most advantageous) market at the measurement date under current market conditions (i.e. an exit price) regardless of whether that price is directly observable or estimated using another valuation technique.
As at June 30, 2016, all financial assets and financial liabilities are carried at amortised cost except for investment in mutual funds which are carried at their fair values.
The Company classifies fair value measurements using a fair value hierarchy that reflects the significance of the inputs used in making the measurements. The fair value hierarchy has the following levels:
a) Quoted prices (unadjusted) in active markets for identical assets or liabilities (level 1).
b) Inputs other than quoted prices included within level 1 that are observable for the asset or liability, either directly (that is, as prices) or indirectly (that is, derived from prices) (level 2).
c) Inputs for the asset or liability that are not based on observable market data (that is, unobservable inputs) (level 3).
The Company recognises transfers between levels of the fair value hierarchy at the end of the reporting period during which the transfer has occurred.
The Company’s policy for determining when transfers between levels in the hierarchy have occurred includes monitoring of the following factors:
- changes in market and trading activity (eg. significant increases / decreases in activity)
- changes in inputs used in valuation techniques (eg inputs becoming / ceasing to be observable in the market)
There were no transfers between level 1, 2 or 3 of the fair value hierarchy during the year.
The valuation technique used is as follows:
Level 1: Quoted prices (unadjusted) in active markets
The fair value of financial instruments traded in active markets is based on Net Asset Values (NAVs) of the units of the mutual funds at the reporting date. A market is regarded as active when it is a market in which transactions for the asset or liability take place with sufficient frequency and volume to provide pricing information on an ongoing basis.
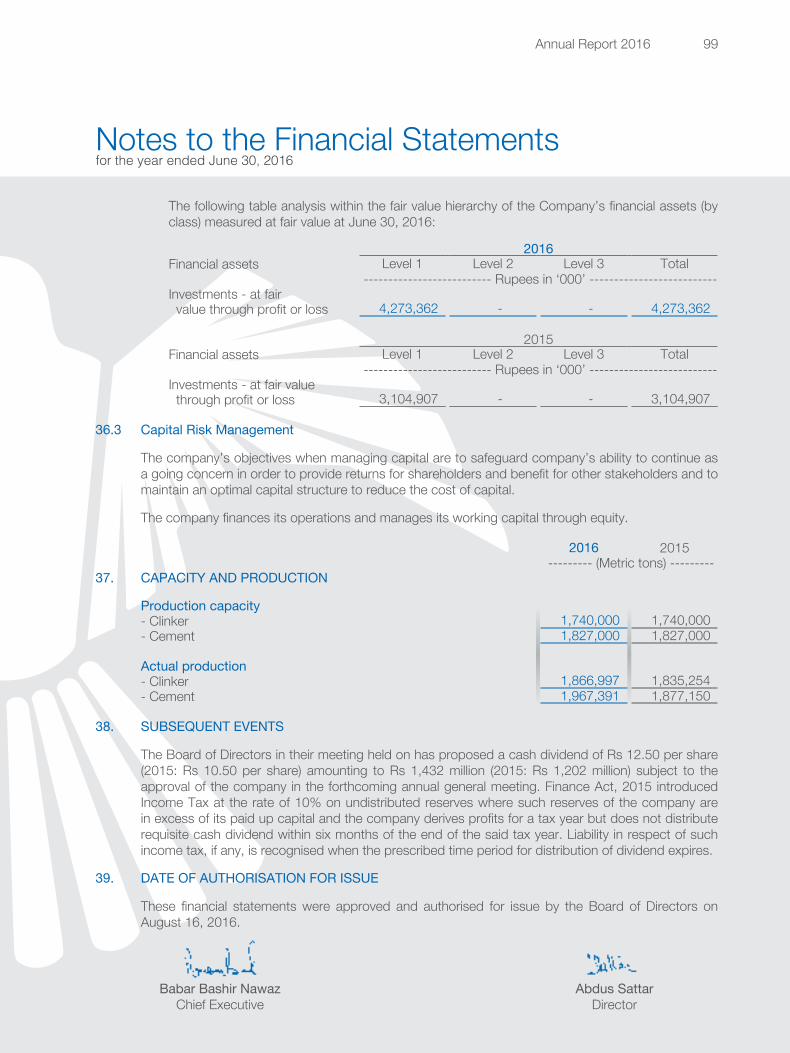
Annual Report 2016 99
Notes to the Financial Statements for the year ended June 30, 2016
The following table analysis within the fair value hierarchy of the Company’s financial assets (by class) measured at fair value at June 30, 2016:
2016Financial assets Level 1 Level 2 Level 3 Total
-------------------------- Rupees in ‘000’ --------------------------Investments - at fair value through profit or loss 4,273,362 - - 4,273,362
2015Financial assets Level 1 Level 2 Level 3 Total
-------------------------- Rupees in ‘000’ --------------------------Investments - at fair value through profit or loss 3,104,907 - - 3,104,907
36.3 Capital Risk Management
The company’s objectives when managing capital are to safeguard company’s ability to continue as a going concern in order to provide returns for shareholders and benefit for other stakeholders and to maintain an optimal capital structure to reduce the cost of capital.
The company finances its operations and manages its working capital through equity.
2016 2015 --------- (Metric tons) ---------
37. CAPACITY AND PRODUCTION
Production capacity- Clinker 1,740,000 1,740,000 - Cement 1,827,000 1,827,000
Actual production- Clinker 1,866,997 1,835,254 - Cement 1,967,391 1,877,150
38. SUBSEQUENT EVENTS
The Board of Directors in their meeting held on has proposed a cash dividend of Rs 12.50 per share (2015: Rs 10.50 per share) amounting to Rs 1,432 million (2015: Rs 1,202 million) subject to the approval of the company in the forthcoming annual general meeting. Finance Act, 2015 introduced Income Tax at the rate of 10% on undistributed reserves where such reserves of the company are in excess of its paid up capital and the company derives profits for a tax year but does not distribute requisite cash dividend within six months of the end of the said tax year. Liability in respect of such income tax, if any, is recognised when the prescribed time period for distribution of dividend expires.
39. DATE OF AUTHORISATION FOR ISSUE
These financial statements were approved and authorised for issue by the Board of Directors on August 16, 2016.
Babar Bashir NawazChief Executive
Abdus SattarDirector
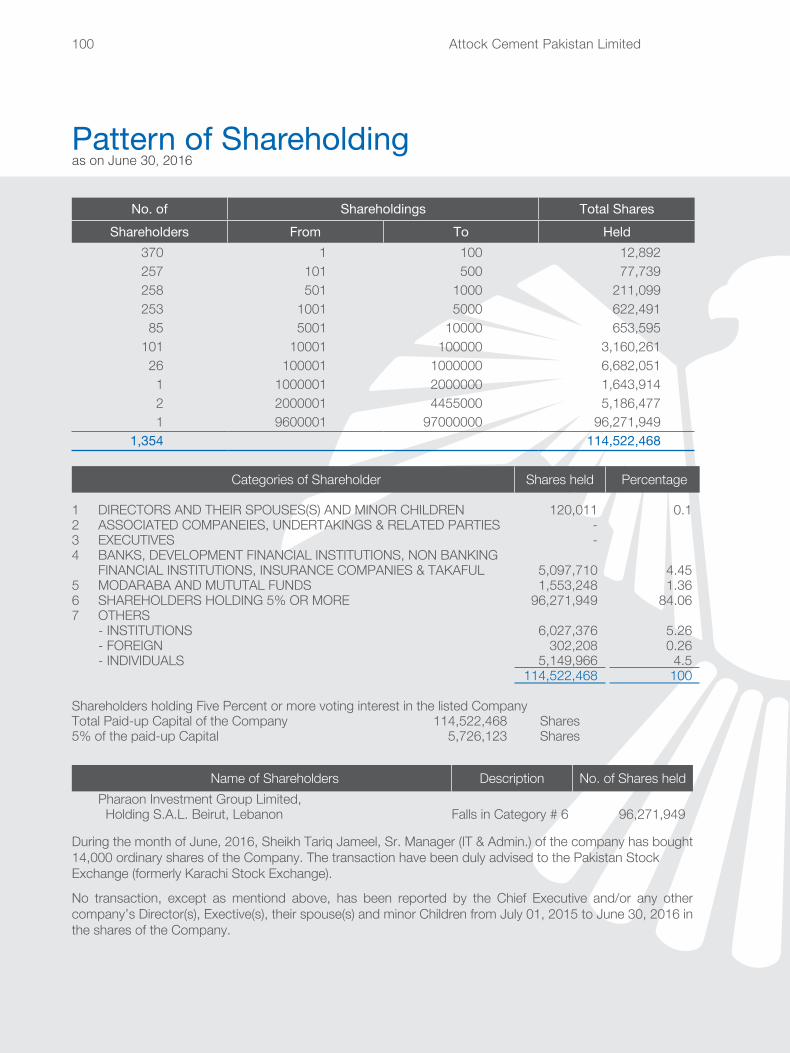
Attock Cement Pakistan Limited100
Pattern of Shareholdingas on June 30, 2016
No. of Shareholdings Total SharesShareholders From To Held
370 1 100 12,892 257 101 500 77,739 258 501 1000 211,099 253 1001 5000 622,491 85 5001 10000 653,595
101 10001 100000 3,160,261 26 100001 1000000 6,682,051
1 1000001 2000000 1,643,914 2 2000001 4455000 5,186,477 1 9600001 97000000 96,271,949
1,354 114,522,468
Categories of Shareholder Shares held Percentage
1 DIRECTORS AND THEIR SPOUSES(S) AND MINOR CHILDREN 120,011 0.12 ASSOCIATED COMPANEIES, UNDERTAKINGS & RELATED PARTIES - 3 EXECUTIVES - 4 BANKS, DEVELOPMENT FINANCIAL INSTITUTIONS, NON BANKING
FINANCIAL INSTITUTIONS, INSURANCE COMPANIES & TAKAFUL 5,097,710 4.455 MODARABA AND MUTUTAL FUNDS 1,553,248 1.366 SHAREHOLDERS HOLDING 5% OR MORE 96,271,949 84.067 OTHERS
- INSTITUTIONS 6,027,376 5.26- FOREIGN 302,208 0.26- INDIVIDUALS 5,149,966 4.5
114,522,468 100
Shareholders holding Five Percent or more voting interest in the listed CompanyTotal Paid-up Capital of the Company 114,522,468 Shares5% of the paid-up Capital 5,726,123 Shares
Name of Shareholders Description No. of Shares heldPharaon Investment Group Limited, Holding S.A.L. Beirut, Lebanon Falls in Category # 6 96,271,949
During the month of June, 2016, Sheikh Tariq Jameel, Sr. Manager (IT & Admin.) of the company has bought 14,000 ordinary shares of the Company. The transaction have been duly advised to the Pakistan Stock Exchange (formerly Karachi Stock Exchange).
No transaction, except as mentiond above, has been reported by the Chief Executive and/or any other company’s Director(s), Exective(s), their spouse(s) and minor Children from July 01, 2015 to June 30, 2016 in the shares of the Company.

EVENTS
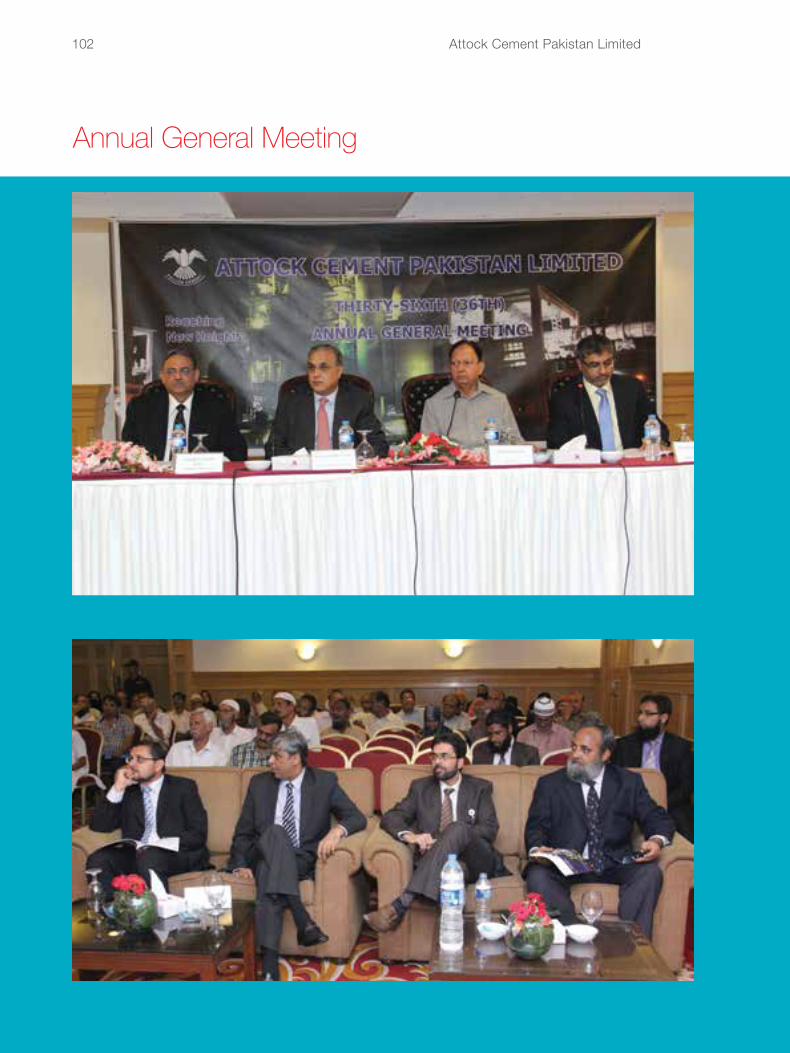
Attock Cement Pakistan Limited102
Annual General Meeting
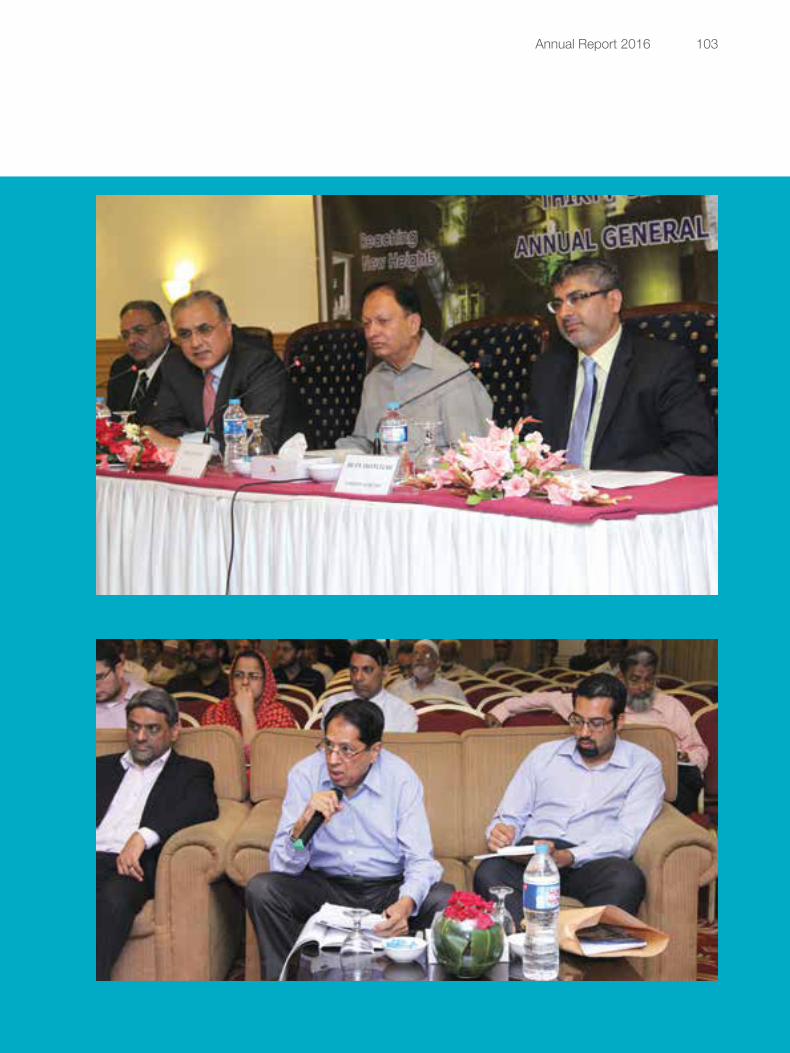
Annual Report 2016 103
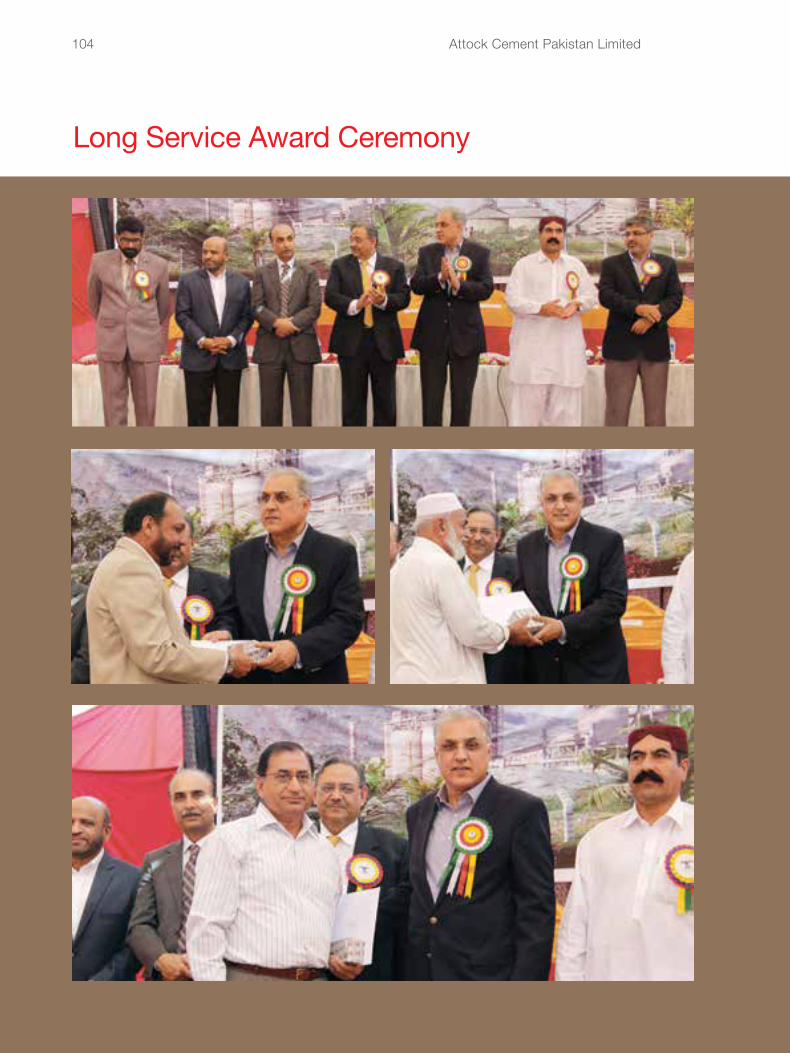
Attock Cement Pakistan Limited104
Long Service Award Ceremony
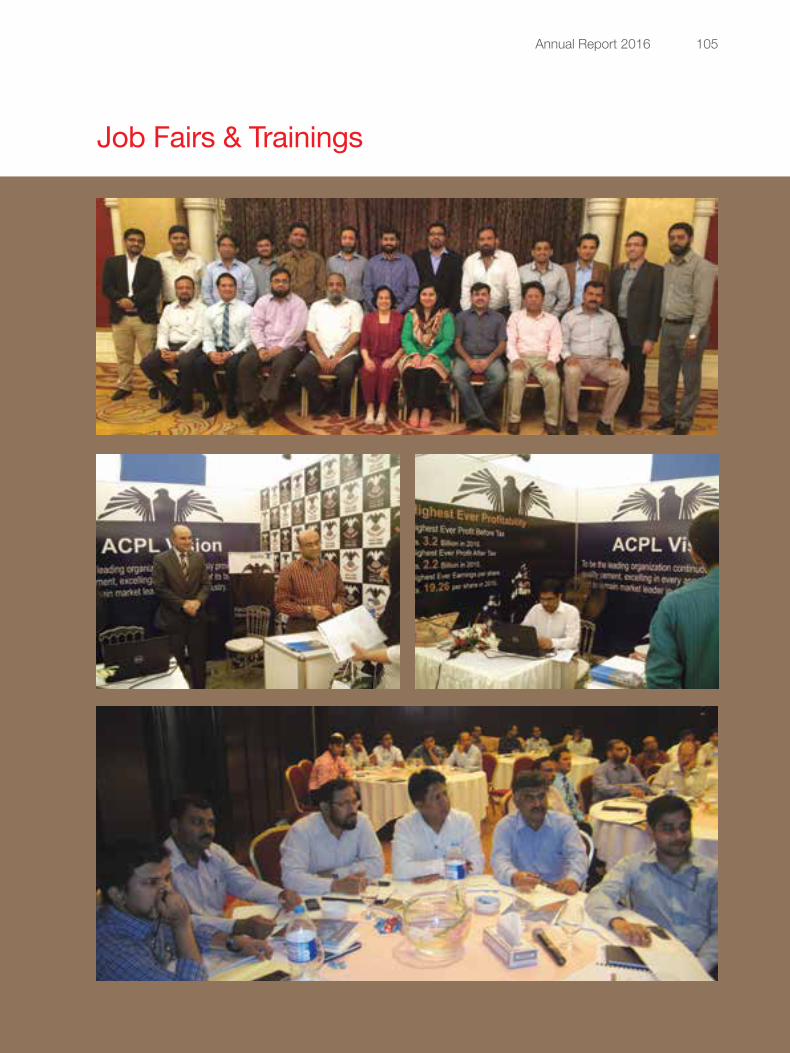
Annual Report 2016 105
Job Fairs & Trainings
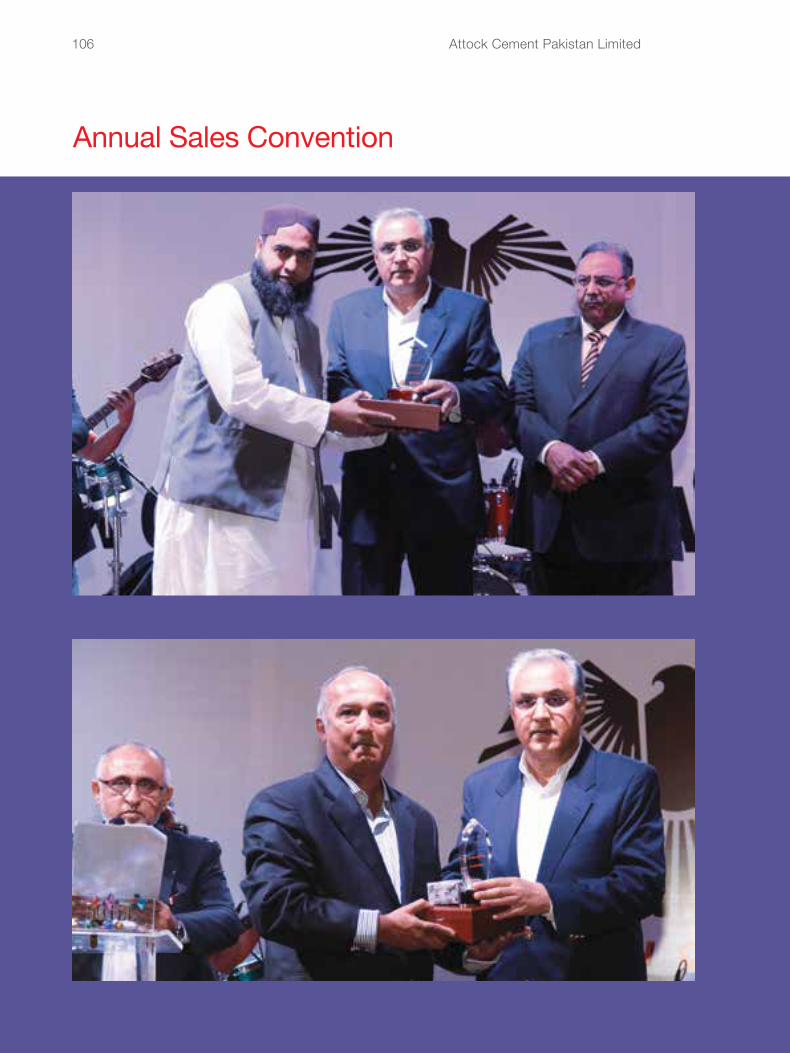
Attock Cement Pakistan Limited106
Annual Sales Convention
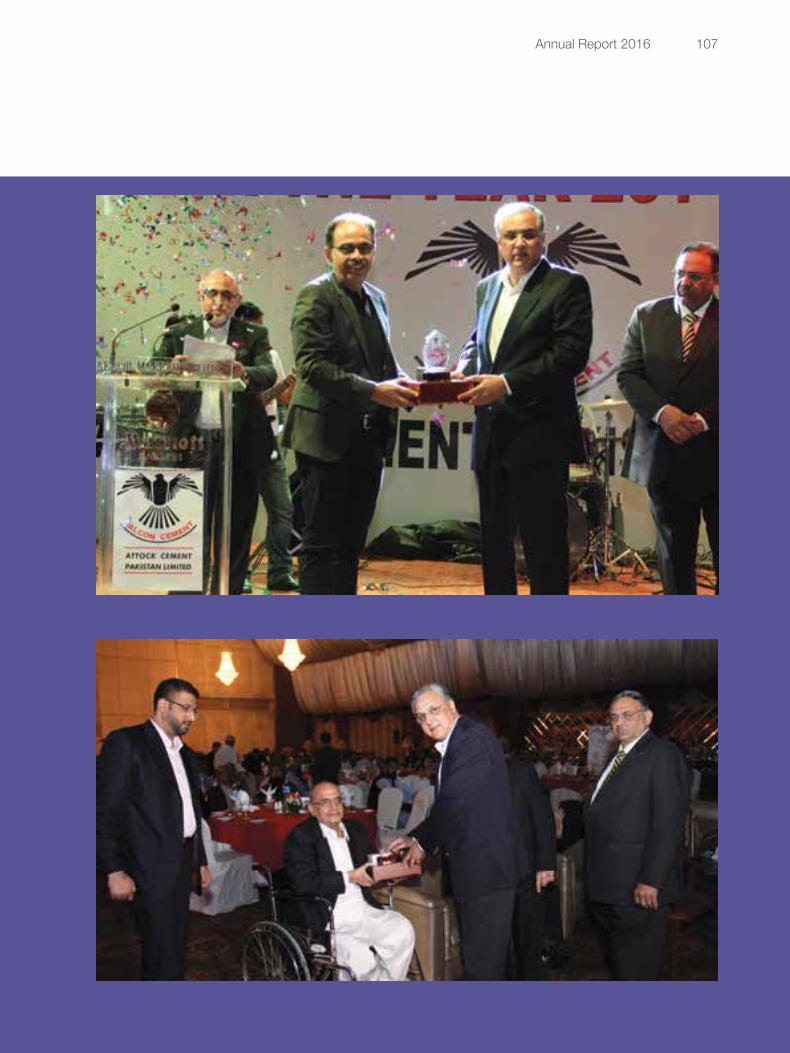
Annual Report 2016 107
Attock Cement Pakistan Limited108
Annual Report 2016 109
Attock Cement Pakistan Limited110
Annual Report 2016 111
Attock Cement Pakistan Limited112
Annual Report 2016 113
Attock Cement Pakistan Limited114
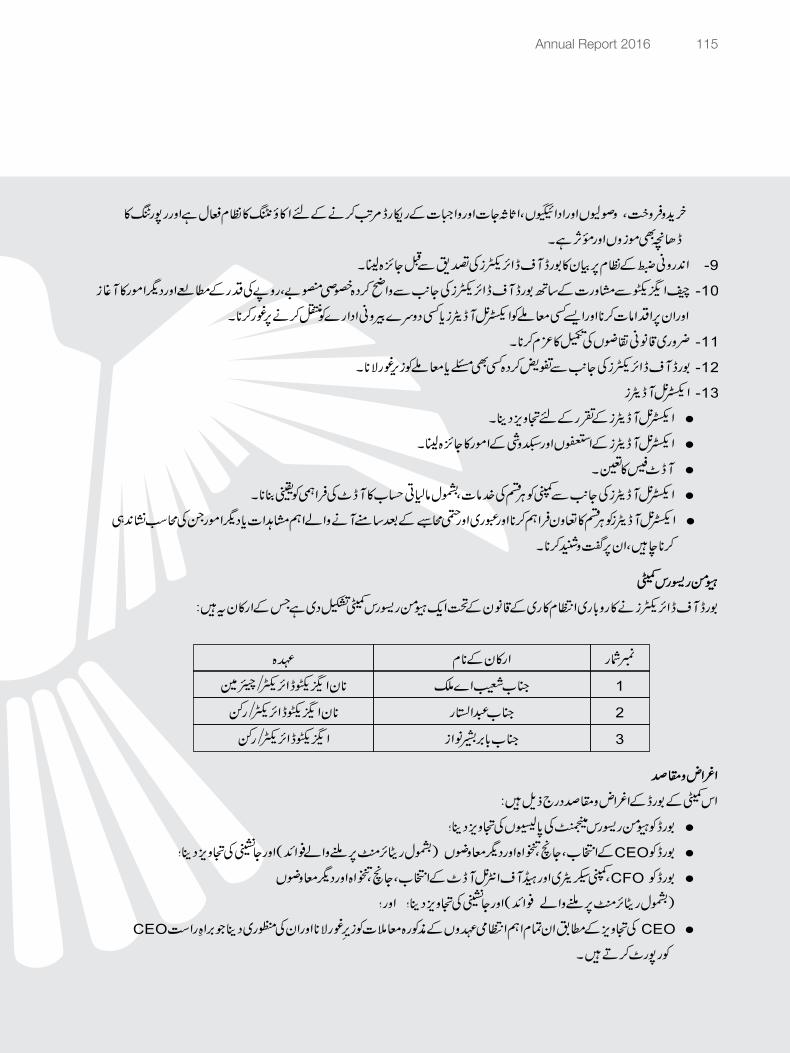
Annual Report 2016 115
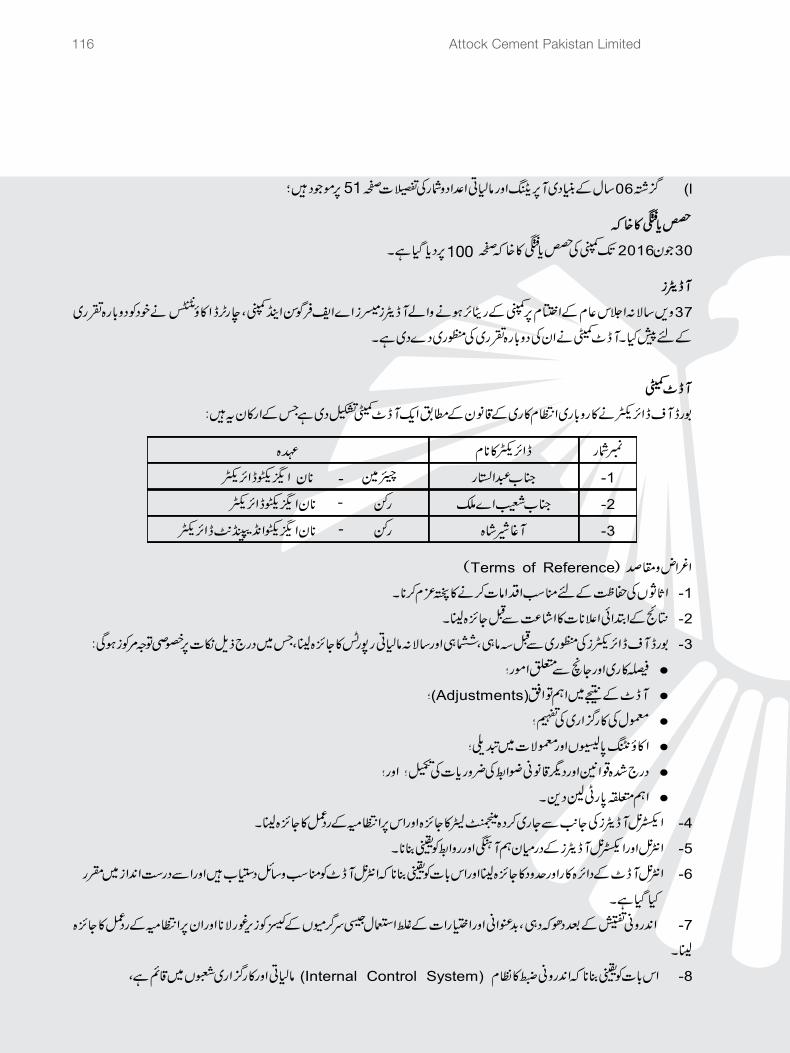
Attock Cement Pakistan Limited116
51
100
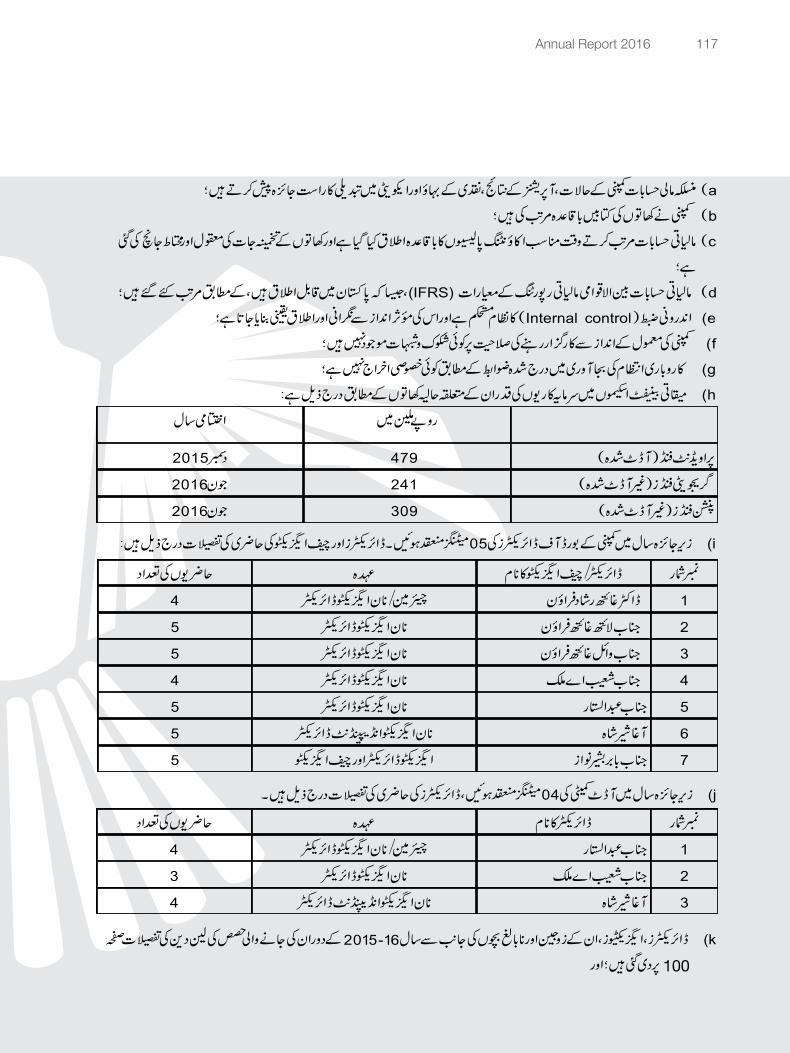
Annual Report 2016 117
100
Attock Cement Pakistan Limited118
Annual Report 2016 119
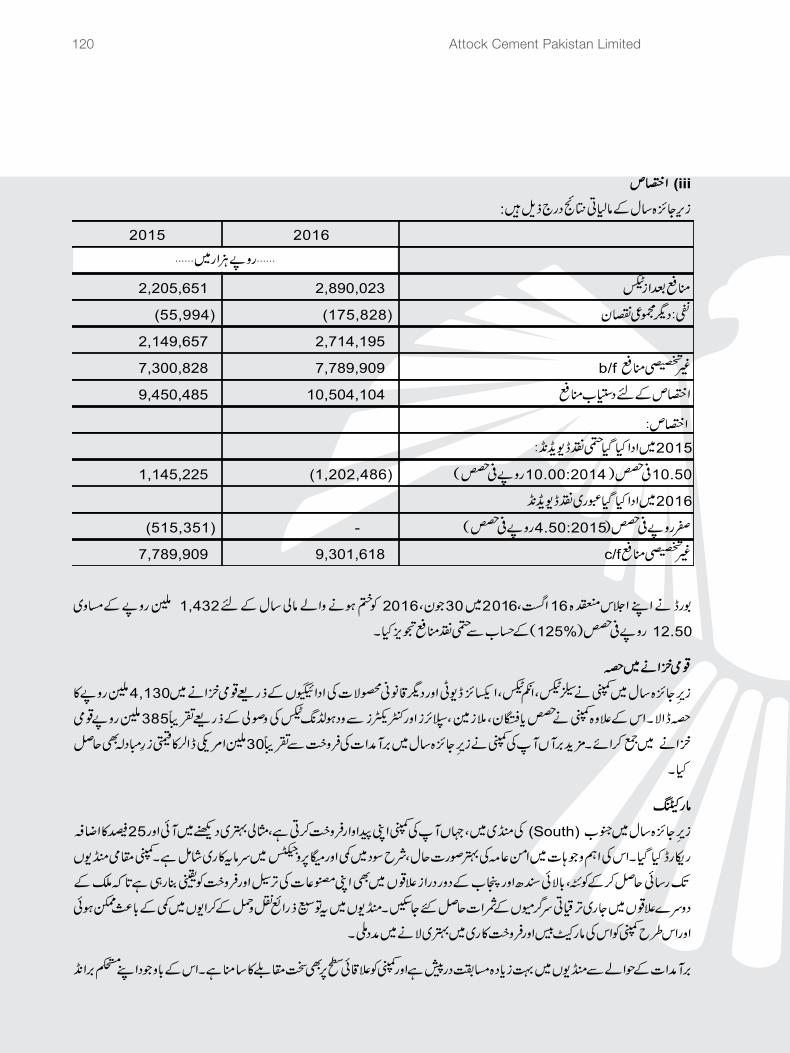
Attock Cement Pakistan Limited120
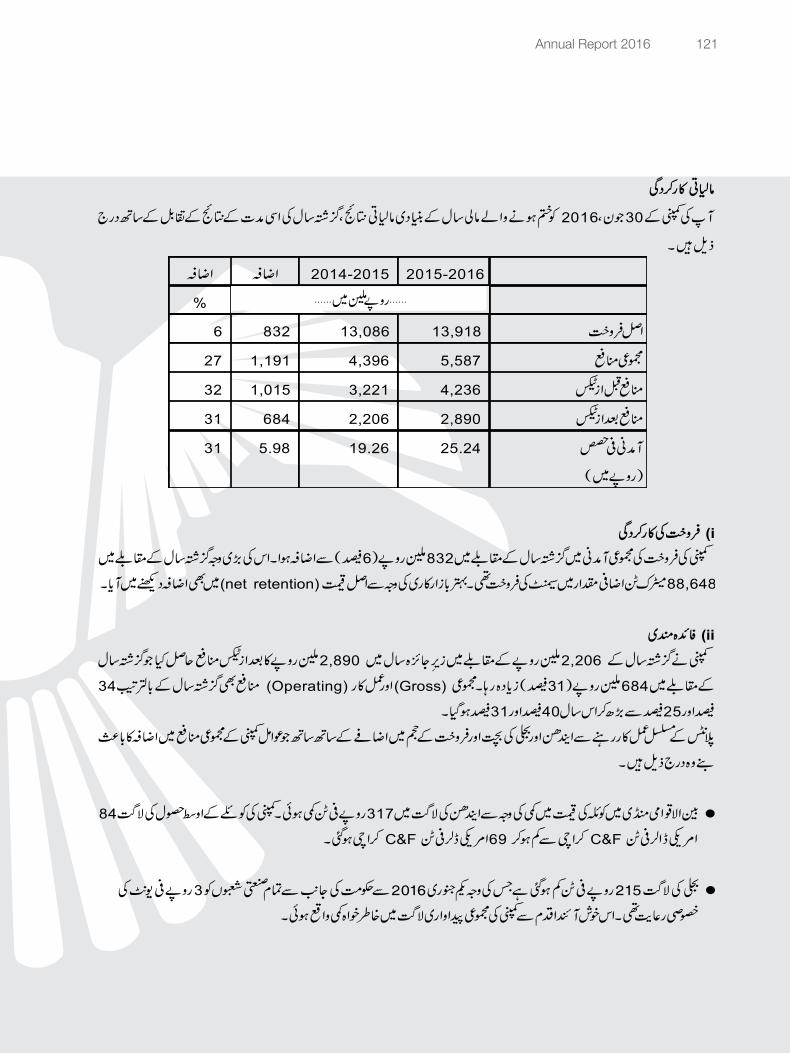
Annual Report 2016 121
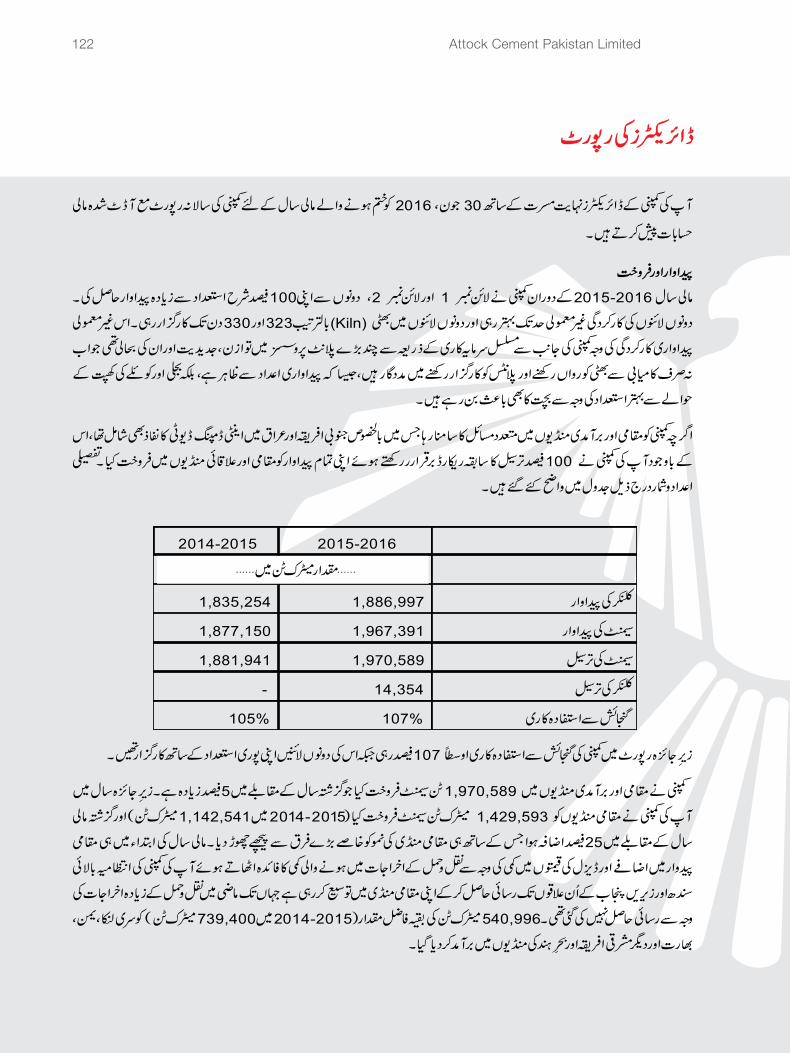
Attock Cement Pakistan Limited122
Form of Proxy37th Annual General Meeting of Attock Cement Pakistan Limited
Signed this ___________________________________ day of _______________________ 2016.
____________________________ Signature (Signature must agree with the specimen
signature registered with the Company)
Witness:
1. Name: ______________________________________ Address: ____________________________________ CNIC / Passport No. __________________________
2. Name: ______________________________________ Address: ____________________________________ CNIC / Passport No. __________________________
Important:
1.
2. A Proxy need not be a member of the Company.
3.
For CDC Account Holders / Corporate Entities:
1.
2.
3. The proxy shall produce his / her original CNIC / Passport at the time of the meeting.
4.
This Proxy Form, duly completed and signed, must be received at the Registered Office of the Company, D-70 Block-4, Kehkashan-5, Clifton, Karachi-75600, not less than 48 hours before the time of holding the meeting and must be duly signed and witnessed.
If a member appoints more than one proxy and more than one instrument of proxy are deposited by a member with the Company, all such instruments of proxy shall be rendered invalid.
In case of Government of Pakistan, State Bank of Pakistan, Corporate entity, the Board of Directors’ resolution / power of attorney with specimen signature shall be submitted along with proxy form to the Company.
The proxy form shall be witnessed by two persons whose names, addresses and CNIC numbers shall be mentioned on the form.
Attested copies of CNIC or the passport of the beneficial owners and the proxy shall be furnished with the proxy form.
I/We ______________________________________________________________________________________________ of_____________________________________________________________________________________________ being a member(s) of Attock Cement Pakistan Limited holding ______________________________________ ordinary shares as per share register folio No. _________________________ or CDC participant ID No. and sub-account No. ___________________________________ hereby appoint _______________________________ of _________________________________________________ or failing him / her ____________________________of ______________________________________________ as my / our Proxy in my / our absence to attend and vote for me / us and on my / our behalf at the 37th Annual General Meeting of the Company to be held on October 14, 2016 and at any adjournment thereof.
Consent Form for the Transmission of Audited Financial Statements along with the Notice of the Annual General Meeting (AGM) through E-mail
Date: _______________
The Chief Executive
Technology Trade (Pvt.) Limited
Dagia House, 241 – C, Block – 2
P.E.C.H.S., Off: Shahrah-e-Quaideen, Karachi.
Tel: (92-21) 34391316 – 17
Fax: (92-21) 34391318
Sub: Consent for transmission of Audited Financial Statements along with the Notice of the Annual
General Meeting (AGM) through E-mail.
I hereby instruct the Company M/s Attock Cement Pakistan Limited to send me the Company’s An-nual Balance Sheet and Profit and Loss Account, Auditors’ and Directors’ reports thereon along with Notice of Annual General Meeting (AGM) (Audited Annual financial Statements) at my email address as per details given below:
Folio / CDS Account No.:
Name of the Shareholder:Valid E-mail Address:Contact No: CNIC Number:Signature of the Shareholder:
Yours sincerely,
Shareholder’s name:
____________________
Shareholder’s Signature


This page has been left blank intentionally

w w w. a t t o c k c e m e n t . c o mEmail: [email protected]
D-70, Block-4, Kehkashan-5 Clifton, Karachi-75600Tel: (92-21) 35309773-4
UAN: (92-21) 111 17 17 17Fax: (92-21) 35309775
Attock Cement Pakistan Limited